UNITED STATES
SECURITIES AND EXCHANGE COMMISSION
Washington, D.C. 20549
FORM N-CSR
CERTIFIED SHAREHOLDER REPORT OF REGISTERED MANAGEMENT
INVESTMENT COMPANIES
Investment Company Act file number: 811-00558
THE HARTFORD MUTUAL FUNDS II, INC.
(Exact name of registrant as specified in charter)
690 Lee Road, Wayne, Pennsylvania 19087
(Address of Principal Executive Offices) (Zip Code)
Thomas R. Phillips, Esquire
Hartford Funds Management Company, LLC
690 Lee Road
Wayne, Pennsylvania 19087
(Name and Address of Agent for Service)
Copy to:
John V. O’Hanlon, Esquire
Dechert LLP
One International Place, 40th Floor
100 Oliver Street
Boston, Massachusetts 02110-2605
Registrant’s telephone number, including area code: (610) 386-4068
Date of fiscal year end: October 31
Date of reporting period: October 31, 2021
Form N-CSR is to be used by management investment companies to file reports with the Commission not later than 10 days after the transmission to stockholders of any report that is required to be transmitted to stockholders under Rule 30e-1 under the Investment Company Act of 1940 (17 CFR 270.30e-1). The Commission may use the information provided on Form N-CSR in its regulatory, disclosure review, inspection, and policymaking roles.
A registrant is required to disclose the information specified by Form N-CSR, and the Commission will make this information public. A registrant is not required to respond to the collection of information contained in Form N-CSR unless the Form displays a currently valid Office of Management and Budget (“OMB”) control number. Please direct comments concerning the accuracy of the information collection burden estimate and any suggestions for reducing the burden to Secretary, Securities and Exchange Commission, 100 F Street, NE, Washington, DC 20549. The OMB has reviewed this collection of information under the clearance requirements of 44 U.S.C. § 3507.
Item 1. Reports to Stockholders.


| ■ Hartford Schroders China A Fund |
| ■ Hartford Schroders Diversified Emerging Markets Fund |
| ■ Hartford Schroders Emerging Markets Equity Fund |
| ■ Hartford Schroders Emerging Markets Multi-Sector Bond Fund |
| ■ Hartford Schroders International Multi-Cap Value Fund |
| ■ Hartford Schroders International Stock Fund |
| ■ Hartford Schroders Securitized Income Fund |
| ■ Hartford Schroders Tax-Aware Bond Fund |
| ■ Hartford Schroders US MidCap Opportunities Fund |
| ■ Hartford Schroders US Small Cap Opportunities Fund |
 |

President
Hartford Funds
| 1 | S&P 500 Index is a market capitalization-weighted price index composed of 500 widely held common stocks. The index is unmanaged and not available for direct investment. Past performance does not guarantee future results. |
| 2 | The Personal Consumption Expenditures Price Index, which excludes food and energy prices, rose 3.6% in July 2021. Source: U.S. Bureau of Economic Analysis and the St. Louis Fed, as of September 2021. |
October 31, 2021 (Unaudited)
| Inception 03/31/2020 Sub-advised by Schroder Investment Management North America Inc. and its sub-sub-adviser, Schroder Investment Management North America Limited | Investment objective – The Fund seeks long-term capital appreciation. |

| Average Annual Total Returns | ||
| for the Periods Ending 10/31/2021 | ||
| 1 Year | Since Inception1 | |
| Class A2 | 15.20% | 41.52% |
| Class A3 | 8.86% | 36.57% |
| Class C2 | 14.31% | 40.37% |
| Class C4 | 13.31% | 40.37% |
| Class I2 | 15.45% | 41.84% |
| Class Y2 | 15.57% | 41.93% |
| Class F2 | 15.63% | 42.03% |
| Class SDR2 | 15.70% | 42.09% |
| MSCI China A Onshore Index (Net) | 16.66% | 34.16% |
| 1 | Inception: 03/31/2020 |
| 2 | Without sales charge |
| 3 | Reflects maximum sales charge of 5.50% |
| 4 | Reflects a contingent deferred sales charge of 1.00% |
| Operating Expenses* | Gross | Net |
| Class A | 4.30% | 1.45% |
| Class C | 5.08% | 2.25% |
| Class I | 4.01% | 1.15% |
| Class Y | 3.95% | 1.11% |
| Class F | 3.85% | 0.99% |
| Class SDR | 3.85% | 0.99% |
| * | Expenses as shown in the Fund’s most recent prospectus. Gross expenses do not reflect contractual expense reimbursement arrangements. Net expenses reflect such arrangements in instances when they reduce gross expenses. These arrangements remain in effect until 02/28/2022 unless the Fund’s Board of Directors approves an earlier termination. Actual expenses may be higher or lower. Please see accompanying Financial Highlights for expense ratios for the period ended 10/31/2021. |
| 2 |
October 31, 2021 (Unaudited)
Manager Discussion
| 3 |
October 31, 2021 (Unaudited)
| Composition by Sector(1) | |
| as of 10/31/2021 | |
| Sector | Percentage of Net Assets |
| Equity Securities | |
| Communication Services | 2.2% |
| Consumer Discretionary | 16.2 |
| Consumer Staples | 8.7 |
| Financials | 12.1 |
| Health Care | 11.2 |
| Industrials | 11.7 |
| Information Technology | 14.9 |
| Materials | 18.5 |
| Real Estate | 1.6 |
| Total | 97.1% |
| Short-Term Investments | 1.0 |
| Other Assets & Liabilities | 1.9 |
| Total | 100.0% |
| (1) | A sector may be comprised of several industries. For Fund compliance purposes, the Fund may not use the same classification system. These sector classifications are used for financial reporting purposes. |
| 4 |
October 31, 2021 (Unaudited)
| Inception 09/30/2021 Sub-advised by Schroder Investment Management North America Inc. and its sub-sub-adviser, Schroder Investment Management North America Limited | Investment objective – The Fund seeks long-term capital appreciation. |

| Cumulative Total Returns | |
| for the Period Ending 10/31/2021 | |
| Since Inception1 | |
| Class SDR | 1.00% |
| MSCI Emerging Markets Index (Net) | 0.99% |
| 1 | Inception: 09/30/2021 |
| Operating Expenses* | Gross | Net |
| Class SDR | 0.99% | 0.89% |
| * | Expenses as shown in the Fund’s most recent prospectus. Gross expenses do not reflect contractual expense reimbursement arrangements. Net expenses reflect such arrangements in instances when they reduce gross expenses. These arrangements remain in effect until 9/30/2022 unless the Fund’s Board of Directors approves an earlier termination. Please see accompanying Financial Highlights for expense ratios for the period ended 10/31/2021. |
| 5 |
October 31, 2021 (Unaudited)
Manager Discussion
| 6 |
October 31, 2021 (Unaudited)
| Composition by Sector(1) | |
| as of 10/31/2021 | |
| Sector | Percentage of Net Assets |
| Equity Securities | |
| Communication Services | 9.6% |
| Consumer Discretionary | 14.1 |
| Consumer Staples | 3.7 |
| Energy | 2.4 |
| Financials | 15.0 |
| Health Care | 3.9 |
| Industrials | 5.0 |
| Information Technology | 24.6 |
| Materials | 6.4 |
| Real Estate | 2.2 |
| Utilities | 0.9 |
| Total | 87.8% |
| Short-Term Investments | 11.2 |
| Other Assets & Liabilities | 1.0 |
| Total | 100.0% |
| (1) | A sector may be comprised of several industries. For Fund compliance purposes, the Fund may not use the same classification system. These sector classifications are used for financial reporting purposes. |
| 7 |
October 31, 2021 (Unaudited)
| Inception 03/31/2006 Sub-advised by Schroder Investment Management North America Inc. and its sub-sub-adviser, Schroder Investment Management North America Limited | Investment objective – The Fund seeks capital appreciation. |

| Average Annual Total Returns | |||
| for the Periods Ending 10/31/2021 | |||
| 1 Year | 5 Years | 10 Years | |
| Class A1 | 17.47% | 10.89% | 6.00% |
| Class A2 | 11.02% | 9.65% | 5.40% |
| Class C1 | 16.77% | 10.15% | 5.75% |
| Class C3 | 15.77% | 10.15% | 5.75% |
| Class I1 | 17.82% | 11.15% | 6.24% |
| Class R31 | 17.27% | 10.71% | 6.02% |
| Class R41 | 17.57% | 11.02% | 6.17% |
| Class R51 | 17.87% | 11.21% | 6.26% |
| Class Y1 | 17.88% | 11.30% | 6.30% |
| Class F1 | 18.05% | 11.32% | 6.32% |
| Class SDR1 | 18.02% | 11.34% | 6.36% |
| MSCI Emerging Markets Index (Net) | 16.96% | 9.39% | 4.88% |
| 1 | Without sales charge |
| 2 | Reflects maximum sales charge of 5.50% |
| 3 | Reflects a contingent deferred sales charge of 1.00% |
| 8 |
October 31, 2021 (Unaudited)
| Operating Expenses* | Gross | Net |
| Class A | 1.53% | 1.53% |
| Class C | 2.16% | 2.16% |
| Class I | 1.25% | 1.25% |
| Class R3 | 1.79% | 1.79% |
| Class R4 | 1.49% | 1.49% |
| Class R5 | 1.19% | 1.19% |
| Class Y | 1.17% | 1.17% |
| Class F | 1.08% | 1.08% |
| Class SDR | 1.07% | 1.07% |
| * | Expenses as shown in the Fund’s most recent prospectus. Actual expenses may be higher or lower. Please see accompanying Financial Highlights for expense ratios for the period ended 10/31/2021. |
Manager Discussion
| 9 |
October 31, 2021 (Unaudited)
| 10 |
October 31, 2021 (Unaudited)
| Composition by Sector(1) | |
| as of 10/31/2021 | |
| Sector | Percentage of Net Assets |
| Equity Securities | |
| Communication Services | 11.1% |
| Consumer Discretionary | 16.9 |
| Consumer Staples | 6.0 |
| Energy | 4.8 |
| Financials | 22.7 |
| Health Care | 3.4 |
| Industrials | 1.5 |
| Information Technology | 25.2 |
| Materials | 5.4 |
| Real Estate | 0.9 |
| Utilities | 0.8 |
| Total | 98.7% |
| Short-Term Investments | 1.6 |
| Other Assets & Liabilities | (0.3) |
| Total | 100.0% |
| (1) | A sector may be comprised of several industries. For Fund compliance purposes, the Fund may not use the same classification system. These sector classifications are used for financial reporting purposes. |
| 11 |
October 31, 2021 (Unaudited)
| Inception 06/25/2013 Sub-advised by Schroder Investment Management North America Inc. and its sub-sub-adviser, Schroder Investment Management North America Limited | Investment objective – The Fund seeks to provide a return of long-term capital growth and income. |

| Average Annual Total Returns | |||
| for the Periods Ending 10/31/2021 | |||
| 1 Year | 5 Years | Since Inception1 | |
| Class A2 | 4.92% | 2.35% | 2.68% |
| Class A3 | 0.17% | 1.41% | 2.12% |
| Class C2 | 4.15% | 1.55% | 2.28% |
| Class C4 | 3.15% | 1.55% | 2.28% |
| Class I2 | 5.06% | 2.61% | 2.92% |
| Class R32 | 4.60% | 2.31% | 2.74% |
| Class R42 | 4.92% | 2.51% | 2.86% |
| Class R52 | 5.11% | 2.62% | 2.93% |
| Class Y2 | 5.11% | 2.67% | 2.96% |
| Class F2 | 5.29% | 2.65% | 2.94% |
| Class SDR2 | 5.22% | 2.69% | 3.01% |
| JP Morgan Emerging Markets Blended Index (JEMB) – Equal Weighted | 3.54% | 3.79% | 3.89% |
| 1 | Inception: 06/25/2013 |
| 2 | Without sales charge |
| 3 | Reflects maximum sales charge of 4.50% |
| 4 | Reflects a contingent deferred sales charge of 1.00% |
| 12 |
October 31, 2021 (Unaudited)
| Operating Expenses* | Gross | Net |
| Class A | 1.41% | 1.15% |
| Class C | 2.23% | 1.90% |
| Class I | 1.05% | 0.90% |
| Class R3 | 1.70% | 1.45% |
| Class R4 | 1.40% | 1.15% |
| Class R5 | 1.10% | 0.85% |
| Class Y | 1.09% | 0.85% |
| Class F | 0.98% | 0.75% |
| Class SDR | 0.98% | 0.75% |
| * | Expenses as shown in the Fund’s most recent prospectus. Gross expenses do not reflect contractual expense reimbursement arrangements. Net expenses reflect such arrangements in instances when they reduce gross expenses. These arrangements remain in effect until 02/28/2022 unless the Fund’s Board of Directors approves an earlier termination. Actual expenses may be higher or lower. Please see accompanying Financial Highlights for expense ratios for the period ended 10/31/2021. |
Manager Discussion
| 13 |
October 31, 2021 (Unaudited)
| Composition by Security Type(1) | |
| as of 10/31/2021 | |
| Category | Percentage of Net Assets |
| Fixed Income Securities | |
| Corporate Bonds | 39.1% |
| Foreign Government Obligations | 50.3 |
| Total | 89.4% |
| Short-Term Investments | 11.9 |
| Other Assets & Liabilities | (1.3) |
| Total | 100.0% |
| (1) | A sector may be comprised of several industries. For Fund compliance purposes, the Fund may not use the same classification system. These sector classifications are used for financial reporting purposes. |
| 14 |
October 31, 2021 (Unaudited)
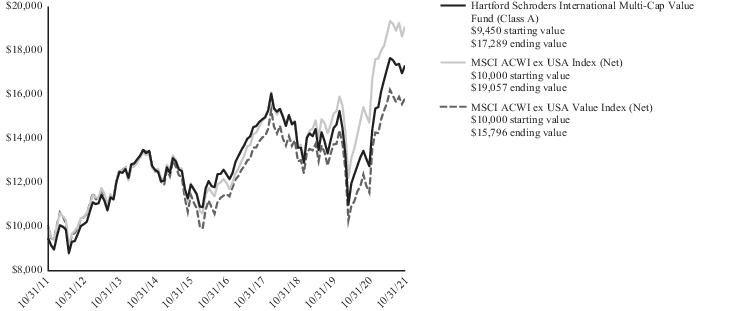
| Inception 08/30/2006 Sub-advised by Schroder Investment Management North America Inc. and its sub-sub-adviser, Schroder Investment Management North America Limited | Investment objective – The Fund seeks long-term capital appreciation. |
| Average Annual Total Returns | |||
| for the Periods Ending 10/31/2021 | |||
| 1 Year | 5 Years | 10 Years | |
| Class A1 | 36.00% | 6.97% | 6.22% |
| Class A2 | 28.55% | 5.77% | 5.63% |
| Class C1 | 34.97% | 6.15% | 5.95% |
| Class C3 | 33.97% | 6.15% | 5.95% |
| Class I1 | 36.41% | 7.24% | 6.51% |
| Class R31 | 35.61% | 6.62% | 6.19% |
| Class R41 | 35.96% | 6.92% | 6.34% |
| Class R51 | 36.25% | 7.23% | 6.49% |
| Class Y1 | 36.43% | 7.34% | 6.54% |
| Class F1 | 36.35% | 7.33% | 6.55% |
| Class SDR1 | 36.57% | 7.35% | 6.57% |
| MSCI ACWI ex USA Index (Net) | 29.66% | 9.77% | 6.66% |
| MSCI ACWI ex USA Value Index (Net) | 37.09% | 6.66% | 4.68% |
| 1 | Without sales charge |
| 2 | Reflects maximum sales charge of 5.50% |
| 3 | Reflects a contingent deferred sales charge of 1.00% |
| 15 |
October 31, 2021 (Unaudited)
| Operating Expenses* | Gross | Net |
| Class A | 1.12% | 1.12% |
| Class C | 1.86% | 1.86% |
| Class I | 0.85% | 0.85% |
| Class R3 | 1.48% | 1.48% |
| Class R4 | 1.18% | 1.18% |
| Class R5 | 0.86% | 0.86% |
| Class Y | 0.86% | 0.83% |
| Class F | 0.76% | 0.76% |
| Class SDR | 0.76% | 0.76% |
| * | Expenses as shown in the Fund’s most recent prospectus. Gross expenses do not reflect contractual fee waivers or expense reimbursement arrangements. Net expenses reflect such arrangements only with respect to Class Y. These arrangements remain in effect until 02/28/2022 unless the Fund’s Board of Directors approves an earlier termination. Actual expenses may be higher or lower. Please see accompanying Financial Highlights for expense ratios for the period ended 10/31/2021. |
| * | The Fund supplemented its prospectus on 11/23/2021, which reflected updates to the Fund's portfolio managers. The portfolio managers disclosed in this section are the Fund's portfolio managers as of 10/31/2021. The supplement indicated that effective 4/1/2022, Justin Abercrombie will no longer serve as a portfolio manager to the Fund, and effective 11/23/2021, Daniel Woodbridge no longer serves as a portfolio manager to the Fund. In addition, effective 11/23/2021, Lukas Kamblevicius was added as a portfolio manager to the Fund. |
Manager Discussion
| 16 |
October 31, 2021 (Unaudited)
| 17 |
October 31, 2021 (Unaudited)
| Composition by Sector(1) | |
| as of 10/31/2021 | |
| Sector | Percentage of Net Assets |
| Equity Securities | |
| Communication Services | 8.7% |
| Consumer Discretionary | 9.2 |
| Consumer Staples | 5.5 |
| Energy | 8.0 |
| Financials | 18.5 |
| Health Care | 11.6 |
| Industrials | 9.1 |
| Information Technology | 9.6 |
| Materials | 12.1 |
| Real Estate | 1.6 |
| Utilities | 2.1 |
| Total | 96.0% |
| Short-Term Investments | 3.0 |
| Other Assets & Liabilities | 1.0 |
| Total | 100.0% |
| (1) | A sector may be comprised of several industries. For Fund compliance purposes, the Fund may not use the same classification system. These sector classifications are used for financial reporting purposes. |
| 18 |
October 31, 2021 (Unaudited)
| Inception 12/19/1985 Sub-advised by Schroder Investment Management North America Inc. and its sub-sub-adviser, Schroder Investment Management North America Limited | Investment objective – The Fund seeks long-term capital appreciation through investment in securities markets outside the United States. |

| Average Annual Total Returns | |||
| for the Periods Ending 10/31/2021 | |||
| 1 Year | 5 Years | 10 Years | |
| Class A1 | 34.90% | 14.14% | 9.42% |
| Class A2 | 27.50% | 12.86% | 8.81% |
| Class C1 | 33.80% | 13.31% | 9.17% |
| Class C3 | 32.80% | 13.31% | 9.17% |
| Class I1 | 35.30% | 14.46% | 9.73% |
| Class R31 | 34.34% | 14.01% | 9.51% |
| Class R41 | 34.78% | 14.23% | 9.61% |
| Class R51 | 35.20% | 14.47% | 9.73% |
| Class Y1 | 35.17% | 14.51% | 9.75% |
| Class F1 | 35.36% | 14.55% | 9.77% |
| Class SDR1 | 35.31% | 14.54% | 9.79% |
| MSCI ACWI ex USA Index (Net) | 29.66% | 9.77% | 6.66% |
| 1 | Without sales charge |
| 2 | Reflects maximum sales charge of 5.50% |
| 3 | Reflects a contingent deferred sales charge of 1.00% |
| 19 |
October 31, 2021 (Unaudited)
| Operating Expenses* | Gross | Net |
| Class A | 1.12% | 1.12% |
| Class C | 1.85% | 1.85% |
| Class I | 0.83% | 0.83% |
| Class R3 | 1.46% | 1.46% |
| Class R4 | 1.15% | 1.15% |
| Class R5 | 0.87% | 0.87% |
| Class Y | 0.82% | 0.82% |
| Class F | 0.75% | 0.75% |
| Class SDR | 0.75% | 0.75% |
| * | Expenses as shown in the Fund’s most recent prospectus. Actual expenses may be higher or lower. Please see accompanying Financial Highlights for expense ratios for the period ended 10/31/2021. |
Manager Discussion
| 20 |
October 31, 2021 (Unaudited)
| Composition by Sector(1) | |
| as of 10/31/2021 | |
| Sector | Percentage of Net Assets |
| Equity Securities | |
| Communication Services | 4.3% |
| Consumer Discretionary | 17.7 |
| Consumer Staples | 9.6 |
| Energy | 4.5 |
| Financials | 17.5 |
| Health Care | 10.1 |
| Industrials | 18.3 |
| Information Technology | 11.3 |
| Materials | 1.5 |
| Utilities | 2.8 |
| Total | 97.6% |
| Short-Term Investments | 2.5 |
| Other Assets & Liabilities | (0.1) |
| Total | 100.0% |
| (1) | A sector may be comprised of several industries. For Fund compliance purposes, the Fund may not use the same classification system. These sector classifications are used for financial reporting purposes. |
| 21 |
October 31, 2021 (Unaudited)
| Inception 02/28/2019 Sub-advised by Schroder Investment Management North America Inc. | Investment objective – The Fund seeks to provide current income and long-term total return consistent with preservation of capital. |

| Average Annual Total Returns | ||
| for the Periods Ending 10/31/2021 | ||
| 1 Year | Since Inception1 | |
| Class A2 | 2.77% | 1.64% |
| Class A3 | -0.29% | 0.48% |
| Class C2 | 1.69% | 0.99% |
| Class C4 | 0.69% | 0.99% |
| Class I2 | 2.81% | 1.71% |
| Class Y2 | 2.87% | 1.73% |
| Class F2 | 2.97% | 1.79% |
| Class SDR2 | 2.97% | 1.77% |
| ICE BofA US ABS & CMBS Index | 1.46% | 3.86% |
| S&P/LSTA Leveraged Loan Index | 8.45% | 4.53% |
| 1 | Inception: 02/28/2019 |
| 2 | Without sales charge |
| 3 | Reflects maximum sales charge of 3.00% |
| 4 | Reflects a contingent deferred sales charge of 1.00% |
| 22 |
October 31, 2021 (Unaudited)
| Operating Expenses* | Gross | Net |
| Class A | 1.62% | 1.48% |
| Class C | 2.54% | 2.33% |
| Class I | 1.35% | 1.23% |
| Class Y | 1.35% | 1.18% |
| Class F | 1.30% | 1.08% |
| Class SDR | 1.30% | 1.08% |
| * | Expenses as shown in the Fund’s prospectus dated 03/01/2021. Gross expenses do not reflect contractual expense reimbursement arrangements. Net expenses reflect such arrangements in instances when they reduce gross expenses. These arrangements remain in effect until 02/28/2022 unless the Fund’s Board of Directors approves an earlier termination. Expenses shown include acquired fund fees and expenses. The Fund supplemented its prospectus on 12/01/2021, which updated the Fund’s total annual fund operating expense table. However, the information in this annual report is as of 10/31/2021 and does not reflect any changes made to the total annual fund operating expense table in the prospectus, as supplemented. The net expense ratios shown in the supplement are as follows: 0.86% (Class A), 1.71% (Class C), 0.61% (Class I), 0.56% (Class Y), 0.46% (Class F) and 0.46% (Class SDR). The gross expense ratios shown in the supplement are as follows: 0.92% (Class A), 1.72% (Class C), 0.66% (Class I), 0.65% (Class Y), 0.60% (Class F) and 0.60% (Class SDR). The expense reimbursement arrangements remain in effect until 02/28/2023 unless the Fund’s Board of Directors approves an earlier termination. Actual expenses may be higher or lower. Please see accompanying Financial Highlights for expense ratios for the period ended 10/31/2021. |
Manager Discussion
| 23 |
October 31, 2021 (Unaudited)
| Composition by Security Type(1) | |
| as of 10/31/2021 | |
| Category | Percentage of Net Assets |
| Equity Securities | |
| Common Stocks | 1.0% |
| Fixed Income Securities | |
| Asset & Commercial Mortgage-Backed Securities | 85.5% |
| Corporate Bonds | 3.9 |
| U.S. Government Agencies(2) | 3.1 |
| Total | 92.5% |
| Short-Term Investments | 7.7 |
| Other Assets & Liabilities | (1.2) |
| Total | 100.0% |
| (1) | For Fund compliance purposes, the Fund may not use the same classification system. These classifications are used for financial reporting purposes. |
| (2) | All, or a portion of the securities categorized as U.S. Government Agencies, were agency mortgage-backed securities as of October 31, 2021. |
| 24 |
October 31, 2021 (Unaudited)
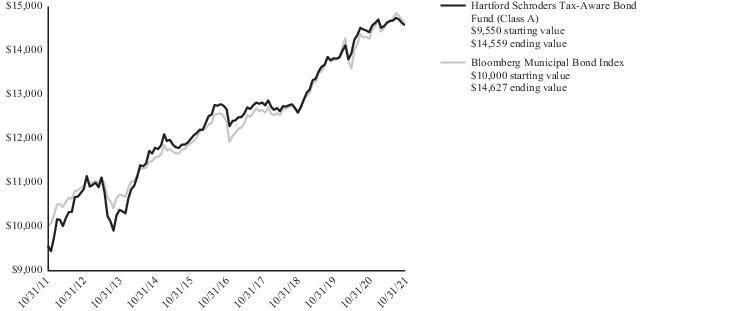
| Inception 10/03/2011 Sub-advised by Schroder Investment Management North America Inc. and its sub-sub-adviser, Schroder Investment Management North America Limited | Investment objective – The Fund seeks total return on an after-tax basis. |
| Average Annual Total Returns | |||
| for the Periods Ending 10/31/2021 | |||
| 1 Year | 5 Years | 10 Years | |
| Class A1 | 1.08% | 2.85% | 4.31% |
| Class A2 | -3.49% | 1.90% | 3.83% |
| Class C1 | 0.11% | 1.99% | 4.00% |
| Class C3 | -0.89% | 1.99% | 4.00% |
| Class I1 | 1.30% | 3.08% | 4.57% |
| Class Y1 | 1.14% | 3.04% | 4.54% |
| Class F1 | 1.24% | 3.09% | 4.57% |
| Class SDR1 | 1.24% | 3.10% | 4.57% |
| Bloomberg Municipal Bond Index | 2.64% | 3.41% | 3.88% |
| 1 | Without sales charge |
| 2 | Reflects maximum sales charge of 4.50% |
| 3 | Reflects a contingent deferred sales charge of 1.00% |
| 25 |
October 31, 2021 (Unaudited)
| Operating Expenses* | Gross | Net |
| Class A | 0.83% | 0.72% |
| Class C | 1.62% | 1.60% |
| Class I | 0.61% | 0.50% |
| Class Y | 0.64% | 0.57% |
| Class F | 0.53% | 0.47% |
| Class SDR | 0.53% | 0.47% |
| * | Expenses as shown in the Fund’s most recent prospectus. Gross expenses do not reflect contractual expense reimbursement arrangements. Net expenses reflect such arrangements in instances when they reduce gross expenses. These arrangements remain in effect until 02/28/2022 unless the Fund’s Board of Directors approves an earlier termination. Expenses shown include acquired fund fees and expenses. Actual expenses may be higher or lower. Please see accompanying Financial Highlights for expense ratios for the period ended 10/31/2021. |
Manager Discussion
| 26 |
October 31, 2021 (Unaudited)
| Composition by Security Type(1) | |
| as of 10/31/2021 | |
| Category | Percentage of Net Assets |
| Fixed Income Securities | |
| Corporate Bonds | 35.5% |
| Municipal Bonds | 55.2 |
| U.S. Government Securities | 8.8 |
| Total | 99.5% |
| Short-Term Investments | 0.1 |
| Other Assets & Liabilities | 0.4 |
| Total | 100.0% |
| (1) | For Fund compliance purposes, the Fund may not use the same classification system. These classifications are used for financial reporting purposes. |
| 27 |
October 31, 2021 (Unaudited)
| Inception 03/31/2006 Sub-advised by Schroder Investment Management North America Inc. | Investment objective – The Fund seeks capital appreciation. |

| Average Annual Total Returns | |||
| for the Periods Ending 10/31/2021 | |||
| 1 Year | 5 Years | 10 Years | |
| Class A1 | 41.71% | 12.84% | 13.09% |
| Class A2 | 33.90% | 11.56% | 12.46% |
| Class C1 | 40.70% | 12.01% | 12.82% |
| Class C3 | 39.70% | 12.01% | 12.82% |
| Class I1 | 42.13% | 13.16% | 13.40% |
| Class R31 | 41.22% | 12.46% | 13.04% |
| Class R41 | 41.71% | 12.80% | 13.22% |
| Class R51 | 42.03% | 13.10% | 13.37% |
| Class Y1 | 42.15% | 13.17% | 13.41% |
| Class F1 | 42.23% | 13.25% | 13.44% |
| Class SDR1 | 42.24% | 13.24% | 13.47% |
| Russell Midcap Index | 45.40% | 16.47% | 14.78% |
| Russell 2500 Index | 49.43% | 16.31% | 14.25% |
| 1 | Without sales charge |
| 2 | Reflects maximum sales charge of 5.50% |
| 3 | Reflects a contingent deferred sales charge of 1.00% |
| 28 |
October 31, 2021 (Unaudited)
| Operating Expenses* | Gross | Net |
| Class A | 1.19% | 1.19% |
| Class C | 1.93% | 1.93% |
| Class I | 0.91% | 0.91% |
| Class R3 | 1.54% | 1.54% |
| Class R4 | 1.24% | 1.24% |
| Class R5 | 0.94% | 0.94% |
| Class Y | 0.92% | 0.92% |
| Class F | 0.82% | 0.82% |
| Class SDR | 0.82% | 0.82% |
| * | Expenses as shown in the Fund’s most recent prospectus. Expenses shown include acquired fund fees and expenses. Actual expenses may be higher or lower. Please see accompanying Financial Highlights for expense ratios for the period ended 10/31/2021. |
Manager Discussion
| 29 |
October 31, 2021 (Unaudited)
| 30 |
October 31, 2021 (Unaudited)
| Composition by Sector(1) | |
| as of 10/31/2021 | |
| Sector | Percentage of Net Assets |
| Equity Securities | |
| Communication Services | 3.4% |
| Consumer Discretionary | 9.1 |
| Consumer Staples | 1.8 |
| Energy | 2.6 |
| Financials | 15.0 |
| Health Care | 8.7 |
| Industrials | 18.3 |
| Information Technology | 24.2 |
| Materials | 4.2 |
| Real Estate | 4.1 |
| Utilities | 4.2 |
| Total | 95.6% |
| Short-Term Investments | 4.5 |
| Other Assets & Liabilities | (0.1) |
| Total | 100.0% |
| (1) | A sector may be comprised of several industries. For Fund compliance purposes, the Fund may not use the same classification system. These sector classifications are used for financial reporting purposes. |
| 31 |
October 31, 2021 (Unaudited)
| Inception 08/06/1993 Sub-advised by Schroder Investment Management North America Inc. | Investment objective – The Fund seeks capital appreciation. |

| Average Annual Total Returns | |||
| for the Periods Ending 10/31/2021 | |||
| 1 Year | 5 Years | 10 Years | |
| Class A1 | 44.31% | 13.58% | 12.59% |
| Class A2 | 36.37% | 12.31% | 11.96% |
| Class C1 | 43.29% | 12.74% | 12.33% |
| Class C3 | 42.29% | 12.74% | 12.33% |
| Class I1 | 44.78% | 13.93% | 12.92% |
| Class R31 | 43.97% | 13.33% | 12.62% |
| Class R41 | 44.31% | 13.67% | 12.79% |
| Class R51 | 44.81% | 13.91% | 12.91% |
| Class Y1 | 44.75% | 13.96% | 12.94% |
| Class F1 | 44.92% | 14.03% | 12.97% |
| Class SDR1 | 44.91% | 14.03% | 12.99% |
| Russell 2000 Index | 50.80% | 15.52% | 13.50% |
| 1 | Without sales charge |
| 2 | Reflects maximum sales charge of 5.50% |
| 3 | Reflects a contingent deferred sales charge of 1.00% |
| 32 |
October 31, 2021 (Unaudited)
| Operating Expenses* | Gross | Net |
| Class A | 1.46% | 1.39% |
| Class C | 2.21% | 2.14% |
| Class I | 1.15% | 1.14% |
| Class R3 | 1.77% | 1.69% |
| Class R4 | 1.47% | 1.39% |
| Class R5 | 1.17% | 1.09% |
| Class Y | 1.16% | 1.09% |
| Class F | 1.05% | 0.99% |
| Class SDR | 1.05% | 0.99% |
| * | Expenses as shown in the Fund’s most recent prospectus. Gross expenses do not reflect contractual expense reimbursement arrangements. Net expenses reflect such arrangements in instances when they reduce gross expenses. These arrangements remain in effect until 02/28/2022 unless the Fund’s Board of Directors approves an earlier termination. Expenses shown include acquired fund fees and expenses. Actual expenses may be higher or lower. Please see accompanying Financial Highlights for expense ratios for the period ended 10/31/2021. |
Manager Discussion
| 33 |
October 31, 2021 (Unaudited)
| 34 |
October 31, 2021 (Unaudited)
| Composition by Sector(1) | |
| as of 10/31/2021 | |
| Sector | Percentage of Net Assets |
| Equity Securities | |
| Communication Services | 2.1% |
| Consumer Discretionary | 10.5 |
| Consumer Staples | 3.7 |
| Energy | 1.4 |
| Financials | 16.9 |
| Health Care | 13.2 |
| Industrials | 16.5 |
| Information Technology | 17.6 |
| Materials | 7.2 |
| Real Estate | 3.7 |
| Utilities | 2.7 |
| Total | 95.5% |
| Short-Term Investments | 5.8 |
| Other Assets & Liabilities | (1.3) |
| Total | 100.0% |
| (1) | A sector may be comprised of several industries. For Fund compliance purposes, the Fund may not use the same classification system. These sector classifications are used for financial reporting purposes. |
| 35 |
| Bloomberg Municipal Bond Index (reflects no deduction for fees, expenses or taxes) is designed to cover the USD-denominated long-term tax-exempt bond market. |
| ICE BofA US ABS & CMBS Index (reflects no deduction for fees, expenses or taxes) tracks the performance of US dollar denominated investment grade fixed and floating rate asset backed securities and fixed rate commercial mortgage backed securities publicly issued in the US domestic market. Qualifying securities must have an investment grade rating (based on an average of Moody’s, S&P and Fitch), at least one year remaining term to final stated maturity and at least one month to the last expected cash flow. 144a securities qualify for inclusion in the Index. Callable perpetual securities qualify provided they are at least one year from the first call date. Inverse floating rate, interest only and principal only tranches of qualifying deals are excluded from the Index as are all tranches of re-securitized deals. |
| JP Morgan Emerging Markets Blended Index (JEMB)— Equal Weighted (reflects no deduction for fees, expenses or taxes) is a blended index produced by JP Morgan that is comprised of 1/3 JP Morgan GBI Emerging Markets Global Diversified Index, 1/3 JP Morgan EMBI Global Diversified Index, and 1/3 JP Morgan CEMBI Broad Diversified Index. The JEMB — Equal Weighted is designed to blend U.S. dollar and local currency denominated sovereign, quasi-sovereign and corporate bonds in equal proportion. |
| MSCI ACWI (All Country World) ex USA Index (Net) (reflects reinvested dividends net of withholding taxes but reflects no deduction for fees, expenses or other taxes) is designed to capture large and mid cap representation across developed markets (excluding the United States) and emerging market countries. |
| MSCI ACWI (All Country World) ex USA Value Index (Net) (reflects reinvested dividends net of withholding taxes but reflects no deduction for fees, expenses or other taxes) is designed to capture large and mid cap securities exhibiting overall value style characteristics across developed (excluding the U.S.) and emerging market countries. The value investment style characteristics for index construction are defined using three variables: book value to price, 12-month forward earnings to price and dividend yield. |
| MSCI China A Onshore Index (Net) (reflects reinvested dividends net of withholding taxes but reflects no deduction for fees, expenses or other taxes) is designed to capture large and mid-cap representation across China securities listed on the Shanghai and Shenzhen exchanges. The index covers only those securities that are accessible through “Stock Connect”. |
| MSCI Emerging Markets Index (Net) (reflects reinvested dividends net of withholding taxes but reflects no deduction for fees, expenses or other taxes) is designed to capture large and mid cap representation across emerging market countries. |
| Russell 2000 Index (reflects no deduction for fees, expenses or taxes) is an index comprised of 2,000 of the smallest U.S.-domiciled company common stocks based on a combination of their market capitalization and current index membership. |
| Russell 2500 Index (reflects no deduction for fees, expenses or taxes) is designed to measure the performance of the small to mid-cap segment of the U.S. equity universe, commonly referred to as “smid” cap. The Russell 2500 Index is a subset of the Russell 3000 Index and includes approximately 2,500 of the smallest U.S. Companies based on a combination of their market capitalization and current index membership. |
| Russell Midcap Index (reflects no deduction for fees, expenses or taxes) is designed to measure the performance of the mid-cap segment of the U.S. equity universe. The Russell Midcap Index is a subset of the Russell 1000 Index. It includes approximately 800 of the smallest securities based on a combination of their market cap and current index membership. |
| S&P/LSTA Leveraged Loan Index (reflects no deduction for fees, expenses or taxes) is a market-value-weighted index that is designed to measure the performance of the U.S. leveraged loan market based upon market weightings, spreads and interest payments. |
| “Bloomberg®” and the above referenced Bloomberg index(es) are service marks of Bloomberg Finance L.P. and its affiliates, including Bloomberg Index Services Limited (“BISL”), the administrator of the index (collectively, “Bloomberg”), and have been licensed for use for certain purposes by Hartford Funds Management Company, LLC ("HFMC"). The Funds are not sponsored, endorsed, sold or promoted by Bloomberg. Bloomberg does not make any representation or warranty, express or implied, to the owners of or counterparties to the Funds or any member of the public regarding the advisability of investing in securities generally or in the Funds particularly. The only relationship of Bloomberg to HFMC is the licensing of certain trademarks, trade names and service marks and of the above referenced Bloomberg index(es), which is determined, composed and calculated by BISL without regard to HFMC or the Funds. Bloomberg has no obligation to take the needs of HFMC or the owners of the Funds into consideration in determining, composing or calculating the above referenced Bloomberg index(es). Bloomberg is not responsible for and has not participated in the determination of the timing of, prices at, or quantities of the Funds to be issued. Bloomberg shall not have any obligation or liability, including, without limitation, to the Funds' customers, in connection with the administration, marketing or trading of the Funds. |
| 36 |
| BLOOMBERG DOES NOT GUARANTEE THE ACCURACY AND/OR THE COMPLETENESS OF THE ABOVE REFERENCED BLOOMBERG INDEX(ES) OR ANY DATA RELATED THERETO AND SHALL HAVE NO LIABILITY FOR ANY ERRORS, OMISSIONS OR INTERRUPTIONS THEREIN. BLOOMBERG DOES NOT MAKE ANY WARRANTY, EXPRESS OR IMPLIED, AS TO RESULTS TO BE OBTAINED BY HFMC, OWNERS OF THE FUNDS OR ANY OTHER PERSON OR ENTITY FROM THE USE OF THE ABOVE REFERENCED BLOOMBERG INDEX(ES) OR ANY DATA RELATED THERETO. BLOOMBERG DOES NOT MAKE ANY EXPRESS OR IMPLIED WARRANTIES AND EXPRESSLY DISCLAIMS ALL WARRANTIES OF MERCHANTABILITY OR FITNESS FOR A PARTICULAR PURPOSE OR USE WITH RESPECT TO THE ABOVE REFERENCED BLOOMBERG INDEX(ES) OR ANY DATA RELATED THERETO. WITHOUT LIMITING ANY OF THE FOREGOING, TO THE MAXIMUM EXTENT ALLOWED BY LAW, BLOOMBERG, ITS LICENSORS, AND ITS AND THEIR RESPECTIVE EMPLOYEES, CONTRACTORS, AGENTS, SUPPLIERS, AND VENDORS SHALL HAVE NO LIABILITY OR RESPONSIBILITY WHATSOEVER FOR ANY INJURY OR DAMAGES --WHETHER DIRECT, INDIRECT, CONSEQUENTIAL, INCIDENTAL, PUNITIVE OR OTHERWISE --ARISING IN CONNECTION WITH THE ABOVE REFERENCED BLOOMBERG INDEX(ES) OR ANY DATA OR VALUES RELATING THERETO --WHETHER ARISING FROM THEIR NEGLIGENCE OR OTHERWISE, EVEN IF NOTIFIED OF THE POSSIBILITY THEREOF. |
| 37 |
| Actual Return | Hypothetical (5% return before expenses) | ||||||||||||
| Beginning Account Value May 1, 2021 | Ending Account Value October 31, 2021 | Expenses paid during the period May 1, 2021 through October 31, 2021 | Beginning Account Value May 1, 2021 | Ending Account Value October 31, 2021 | Expenses paid during the period May 1, 2021 through October 31, 2021 | Annualized expense ratio | |||||||
| Hartford Schroders China A Fund | |||||||||||||
| Class A | $ 1,000.00 | $ 977.10 | $ 7.23 | $ 1,000.00 | $ 1,017.90 | $ 7.38 | 1.45% | ||||||
| Class C | $ 1,000.00 | $ 973.80 | $ 10.75 | $ 1,000.00 | $ 1,014.32 | $ 10.97 | 2.16% | ||||||
| Class I | $ 1,000.00 | $ 978.30 | $ 5.73 | $ 1,000.00 | $ 1,019.41 | $ 5.85 | 1.15% | ||||||
| Class Y | $ 1,000.00 | $ 979.00 | $ 5.54 | $ 1,000.00 | $ 1,019.61 | $ 5.65 | 1.11% | ||||||
| Class F | $ 1,000.00 | $ 979.00 | $ 4.94 | $ 1,000.00 | $ 1,020.21 | $ 5.04 | 0.99% | ||||||
| Class SDR | $ 1,000.00 | $ 979.60 | $ 4.94 | $ 1,000.00 | $ 1,020.21 | $ 5.04 | 0.99% | ||||||
| Hartford Schroders Diversified Emerging Markets Fund(1) | |||||||||||||
| Class SDR | $ 1,000.00 | $ 1,010.00 | $ 0.76(2) | $ 1,000.00 | $ 1,020.72 | $ 4.53(3) | 0.89% | ||||||
| Hartford Schroders Emerging Markets Equity Fund | |||||||||||||
| Class A | $ 1,000.00 | $ 947.10 | $ 8.00 | $ 1,000.00 | $ 1,016.99 | $ 8.29 | 1.63% | ||||||
| Class C | $ 1,000.00 | $ 944.60 | $ 10.49 | $ 1,000.00 | $ 1,014.42 | $ 10.87 | 2.14% | ||||||
| Class I | $ 1,000.00 | $ 948.60 | $ 6.09 | $ 1,000.00 | $ 1,018.95 | $ 6.31 | 1.24% | ||||||
| Class R3 | $ 1,000.00 | $ 946.50 | $ 8.29 | $ 1,000.00 | $ 1,016.69 | $ 8.59 | 1.69% | ||||||
| Class R4 | $ 1,000.00 | $ 947.90 | $ 7.32 | $ 1,000.00 | $ 1,017.69 | $ 7.58 | 1.49% | ||||||
| Class R5 | $ 1,000.00 | $ 949.10 | $ 5.80 | $ 1,000.00 | $ 1,019.26 | $ 6.01 | 1.18% | ||||||
| Class Y | $ 1,000.00 | $ 949.30 | $ 5.70 | $ 1,000.00 | $ 1,019.36 | $ 5.90 | 1.16% | ||||||
| Class F | $ 1,000.00 | $ 950.00 | $ 5.16 | $ 1,000.00 | $ 1,019.91 | $ 5.35 | 1.05% | ||||||
| Class SDR | $ 1,000.00 | $ 949.70 | $ 5.16 | $ 1,000.00 | $ 1,019.91 | $ 5.35 | 1.05% | ||||||
| 38 |
| Actual Return | Hypothetical (5% return before expenses) | ||||||||||||
| Beginning Account Value May 1, 2021 | Ending Account Value October 31, 2021 | Expenses paid during the period May 1, 2021 through October 31, 2021 | Beginning Account Value May 1, 2021 | Ending Account Value October 31, 2021 | Expenses paid during the period May 1, 2021 through October 31, 2021 | Annualized expense ratio | |||||||
| Hartford Schroders Emerging Markets Multi-Sector Bond Fund | |||||||||||||
| Class A | $ 1,000.00 | $ 995.10 | $ 5.78 | $ 1,000.00 | $ 1,019.41 | $ 5.85 | 1.15% | ||||||
| Class C | $ 1,000.00 | $ 991.30 | $ 9.54 | $ 1,000.00 | $ 1,015.63 | $ 9.65 | �� | 1.90% | |||||
| Class I | $ 1,000.00 | $ 995.20 | $ 4.53 | $ 1,000.00 | $ 1,020.67 | $ 4.58 | 0.90% | ||||||
| Class R3 | $ 1,000.00 | $ 993.60 | $ 7.29 | $ 1,000.00 | $ 1,017.90 | $ 7.38 | 1.45% | ||||||
| Class R4 | $ 1,000.00 | $ 995.10 | $ 5.78 | $ 1,000.00 | $ 1,019.41 | $ 5.85 | 1.15% | ||||||
| Class R5 | $ 1,000.00 | $ 995.40 | $ 4.28 | $ 1,000.00 | $ 1,020.92 | $ 4.33 | 0.85% | ||||||
| Class Y | $ 1,000.00 | $ 995.40 | $ 4.28 | $ 1,000.00 | $ 1,020.92 | $ 4.33 | 0.85% | ||||||
| Class F | $ 1,000.00 | $ 995.70 | $ 3.77 | $ 1,000.00 | $ 1,021.48 | $ 3.82 | 0.75% | ||||||
| Class SDR | $ 1,000.00 | $ 996.00 | $ 3.77 | $ 1,000.00 | $ 1,021.42 | $ 3.82 | 0.75% | ||||||
| Hartford Schroders International Multi-Cap Value Fund | |||||||||||||
| Class A | $ 1,000.00 | $ 1,009.20 | $ 5.62 | $ 1,000.00 | $ 1,019.61 | $ 5.65 | 1.11% | ||||||
| Class C | $ 1,000.00 | $ 1,004.40 | $ 9.35 | $ 1,000.00 | $ 1,015.88 | $ 9.40 | 1.85% | ||||||
| Class I | $ 1,000.00 | $ 1,010.50 | $ 4.41 | $ 1,000.00 | $ 1,020.82 | $ 4.43 | 0.87% | ||||||
| Class R3 | $ 1,000.00 | $ 1,006.60 | $ 7.18 | $ 1,000.00 | $ 1,018.05 | $ 7.22 | 1.42% | ||||||
| Class R4 | $ 1,000.00 | $ 1,009.00 | $ 5.98 | $ 1,000.00 | $ 1,019.26 | $ 6.01 | 1.18% | ||||||
| Class R5 | $ 1,000.00 | $ 1,010.40 | $ 4.31 | $ 1,000.00 | $ 1,020.92 | $ 4.33 | 0.85% | ||||||
| Class Y | $ 1,000.00 | $ 1,010.60 | $ 4.16 | $ 1,000.00 | $ 1,021.07 | $ 4.18 | 0.82% | ||||||
| Class F | $ 1,000.00 | $ 1,010.00 | $ 3.80 | $ 1,000.00 | $ 1,021.42 | $ 3.82 | 0.75% | ||||||
| Class SDR | $ 1,000.00 | $ 1,011.00 | $ 3.80 | $ 1,000.00 | $ 1,021.42 | $ 3.82 | 0.75% | ||||||
| Hartford Schroders International Stock Fund | |||||||||||||
| Class A | $ 1,000.00 | $ 1,054.80 | $ 5.54 | $ 1,000.00 | $ 1,019.81 | $ 5.45 | 1.07% | ||||||
| Class C | $ 1,000.00 | $ 1,050.90 | $ 9.36 | $ 1,000.00 | $ 1,016.08 | $ 9.20 | 1.81% | ||||||
| Class I | $ 1,000.00 | $ 1,056.60 | $ 4.20 | $ 1,000.00 | $ 1,021.12 | $ 4.13 | 0.81% | ||||||
| Class R3 | $ 1,000.00 | $ 1,052.90 | $ 7.35 | $ 1,000.00 | $ 1,018.05 | $ 7.22 | 1.42% | ||||||
| Class R4 | $ 1,000.00 | $ 1,054.40 | $ 6.06 | $ 1,000.00 | $ 1,019.31 | $ 5.96 | 1.17% | ||||||
| Class R5 | $ 1,000.00 | $ 1,056.00 | $ 4.25 | $ 1,000.00 | $ 1,021.07 | $ 4.18 | 0.82% | ||||||
| Class Y | $ 1,000.00 | $ 1,056.40 | $ 4.30 | $ 1,000.00 | $ 1,021.02 | $ 4.23 | 0.83% | ||||||
| Class F | $ 1,000.00 | $ 1,057.10 | $ 3.63 | $ 1,000.00 | $ 1,021.68 | $ 3.57 | 0.70% | ||||||
| Class SDR | $ 1,000.00 | $ 1,056.50 | $ 3.68 | $ 1,000.00 | $ 1,021.63 | $ 3.62 | 0.71% | ||||||
| Hartford Schroders Securitized Income Fund | |||||||||||||
| Class A | $ 1,000.00 | $ 1,002.40 | $ 4.69 | $ 1,000.00 | $ 1,020.52 | $ 4.74 | 0.93% | ||||||
| Class C | $ 1,000.00 | $ 997.10 | $ 9.66 | $ 1,000.00 | $ 1,015.53 | $ 9.75 | 1.92% | ||||||
| Class I | $ 1,000.00 | $ 1,002.60 | $ 4.49 | $ 1,000.00 | $ 1,020.72 | $ 4.53 | 0.89% | ||||||
| Class Y | $ 1,000.00 | $ 1,002.90 | $ 4.19 | $ 1,000.00 | $ 1,021.02 | $ 4.23 | 0.83% | ||||||
| Class F | $ 1,000.00 | $ 1,004.40 | $ 3.59 | $ 1,000.00 | $ 1,021.63 | $ 3.62 | 0.71% | ||||||
| Class SDR | $ 1,000.00 | $ 1,003.40 | $ 3.74 | $ 1,000.00 | $ 1,021.48 | $ 3.77 | 0.74% | ||||||
| Hartford Schroders Tax-Aware Bond Fund | |||||||||||||
| Class A | $ 1,000.00 | $ 995.90 | $ 3.57 | $ 1,000.00 | $ 1,021.63 | $ 3.62 | 0.71% | ||||||
| Class C | $ 1,000.00 | $ 990.70 | $ 7.98 | $ 1,000.00 | $ 1,017.19 | $ 8.08 | 1.59% | ||||||
| Class I | $ 1,000.00 | $ 997.00 | $ 2.47 | $ 1,000.00 | $ 1,022.74 | $ 2.50 | 0.49% | ||||||
| Class Y | $ 1,000.00 | $ 995.80 | $ 2.82 | $ 1,000.00 | $ 1,022.38 | $ 2.85 | 0.56% | ||||||
| Class F | $ 1,000.00 | $ 996.30 | $ 2.31 | $ 1,000.00 | $ 1,022.89 | $ 2.35 | 0.46% | ||||||
| Class SDR | $ 1,000.00 | $ 996.30 | $ 2.31 | $ 1,000.00 | $ 1,022.89 | $ 2.35 | 0.46% | ||||||
| 39 |
| Actual Return | Hypothetical (5% return before expenses) | ||||||||||||
| Beginning Account Value May 1, 2021 | Ending Account Value October 31, 2021 | Expenses paid during the period May 1, 2021 through October 31, 2021 | Beginning Account Value May 1, 2021 | Ending Account Value October 31, 2021 | Expenses paid during the period May 1, 2021 through October 31, 2021 | Annualized expense ratio | |||||||
| Hartford Schroders US MidCap Opportunities Fund | |||||||||||||
| Class A | $ 1,000.00 | $ 1,046.10 | $ 5.98 | $ 1,000.00 | $ 1,019.36 | $ 5.90 | 1.16% | ||||||
| Class C | $ 1,000.00 | $ 1,043.00 | $ 9.78 | $ 1,000.00 | $ 1,015.63 | $ 9.65 | 1.90% | ||||||
| Class I | $ 1,000.00 | $ 1,048.20 | $ 4.59 | $ 1,000.00 | $ 1,020.72 | $ 4.53 | 0.89% | ||||||
| Class R3 | $ 1,000.00 | $ 1,044.10 | $ 8.09 | $ 1,000.00 | $ 1,017.29 | $ 7.98 | 1.57% | ||||||
| Class R4 | $ 1,000.00 | $ 1,046.50 | $ 6.04 | $ 1,000.00 | $ 1,019.31 | $ 5.96 | 1.17% | ||||||
| Class R5 | $ 1,000.00 | $ 1,047.30 | $ 4.75 | $ 1,000.00 | $ 1,020.57 | $ 4.69 | 0.92% | ||||||
| Class Y | $ 1,000.00 | $ 1,047.80 | $ 4.70 | $ 1,000.00 | $ 1,020.62 | $ 4.63 | 0.91% | ||||||
| Class F | $ 1,000.00 | $ 1,048.70 | $ 4.13 | $ 1,000.00 | $ 1,021.17 | $ 4.08 | 0.80% | ||||||
| Class SDR | $ 1,000.00 | $ 1,048.10 | $ 4.13 | $ 1,000.00 | $ 1,021.17 | $ 4.08 | 0.80% | ||||||
| Hartford Schroders US Small Cap Opportunities Fund | |||||||||||||
| Class A | $ 1,000.00 | $ 1,017.00 | $ 6.86 | $ 1,000.00 | $ 1,018.40 | $ 6.87 | 1.35% | ||||||
| Class C | $ 1,000.00 | $ 1,013.50 | $ 10.66 | $ 1,000.00 | $ 1,014.62 | $ 10.66 | 2.10% | ||||||
| Class I | $ 1,000.00 | $ 1,018.40 | $ 5.55 | $ 1,000.00 | $ 1,019.71 | $ 5.55 | 1.09% | ||||||
| Class R3 | $ 1,000.00 | $ 1,015.80 | $ 8.33 | $ 1,000.00 | $ 1,016.94 | $ 8.34 | 1.64% | ||||||
| Class R4 | $ 1,000.00 | $ 1,017.10 | $ 6.86 | $ 1,000.00 | $ 1,018.40 | $ 6.87 | 1.35% | ||||||
| Class R5 | $ 1,000.00 | $ 1,018.70 | $ 5.34 | $ 1,000.00 | $ 1,019.91 | $ 5.35 | 1.05% | ||||||
| Class Y | $ 1,000.00 | $ 1,018.70 | $ 5.34 | $ 1,000.00 | $ 1,019.91 | $ 5.35 | 1.05% | ||||||
| Class F | $ 1,000.00 | $ 1,019.30 | $ 4.84 | $ 1,000.00 | $ 1,020.42 | $ 4.84 | 0.95% | ||||||
| Class SDR | $ 1,000.00 | $ 1,019.30 | $ 4.84 | $ 1,000.00 | $ 1,020.42 | $ 4.84 | 0.95% | ||||||
| (1) | Hartford Schroders Diversified Emerging Markets Fund commenced operations on September 30, 2021. |
| (2) | Expenses paid during the period from September 30, 2021 (commencement of operations) through October 31, 2021. |
| (3) | Please note that while the Fund commenced operations on September 30, 2021, the hypothetical expenses paid during the period reflect projected activity for the full six month period for purposes of comparability. This projection assumes that annualized expense ratios were in effect during period May 1, 2021 to October 31, 2021. |
| 40 |
October 31, 2021
| Shares or Principal Amount | Market Value† | ||
| COMMON STOCKS - 85.2% | |||
| Automobiles & Components - 3.5% | |||
| 87,982 | Huizhou Desay Sv Automotive Co., Ltd. Class A | $ 1,472,125 | |
| 67,200 | Keboda Technology Co., Ltd. | 695,115 | |
| 107,327 | Streamax Technology Co., Ltd. | 559,031 | |
| 2,726,271 | |||
| Banks - 5.6% | |||
| 227,902 | Bank of Ningbo Co., Ltd. | 1,358,661 | |
| 365,233 | China Merchants Bank Co., Ltd. Class A | 3,076,415 | |
| 4,435,076 | |||
| Capital Goods - 9.3% | |||
| 76,487 | Eve Energy Co., Ltd. Class A | 1,355,787 | |
| 16,300 | Gongniu Group Co., Ltd. | 401,600 | |
| 197,300 | Hongfa Technology Co., Ltd. Class A | 2,282,862 | |
| 102,610 | Shandong Himile Mechanical Science & Technology Co., Ltd. | 400,680 | |
| 88,589 | Shenzhen Inovance Technology Co., Ltd. Class A | 902,616 | |
| 299,800 | Weichai Power Co., Ltd. Class A | 707,779 | |
| 357,400 | Zhejiang Sanhua Intelligent Controls Co., Ltd. Class A* | 1,324,703 | |
| 7,376,027 | |||
| Consumer Durables & Apparel - 9.9% | |||
| 241,900 | Hang Zhou Great Star Industrial Co., Ltd.* | 1,211,303 | |
| 294,400 | Joyoung Co., Ltd.* | 1,074,217 | |
| 252,700 | Midea Group Co., Ltd. Class A | 2,710,614 | |
| 143,689 | Oppein Home Group, Inc. Class A | 2,858,864 | |
| 7,854,998 | |||
| Diversified Financials - 1.5% | |||
| 68,300 | Hithink RoyalFlush Information Network Co., Ltd. Class A | 1,203,614 | |
| Food, Beverage & Tobacco - 8.0% | |||
| 224,995 | Chacha Food Co., Ltd. Class A | 2,004,062 | |
| 7,345 | Kweichow Moutai Co., Ltd. Class A | 2,095,960 | |
| 280,860 | Toly Bread Co., Ltd. | 1,379,097 | |
| 24,000 | Wuliangye Yibin Co., Ltd. Class A | 810,994 | |
| 6,290,113 | |||
| Health Care Equipment & Services - 1.1% | |||
| 315,900 | Edan Instruments, Inc. | 533,183 | |
| 197,165 | Shanghai Kinetic Medical Co., Ltd. Class A | 308,681 | |
| 841,864 | |||
| Insurance - 4.2% | |||
| 427,600 | Ping An Insurance Group Co. of China Ltd. Class A | 3,302,997 | |
| Materials - 17.2% | |||
| 718,316 | China Jushi Co., Ltd. Class A | 2,145,922 | |
| 164,364 | Chongqing Zaisheng Technology Corp. Ltd. Class A | 286,318 | |
| 452,200 | Citic Pacific Special Steel Group Co., Ltd. Class A | 1,347,621 | |
| 242,180 | Hengli Petrochemical Co., Ltd. Class A | 835,121 | |
| 760,678 | Huafon Chemical Co., Ltd. | 1,415,189 | |
| 223,000 | Lomon Billions Group Co., Ltd. Class A | 991,334 | |
| 242,400 | Shandong Sinocera Functional Material Co., Ltd. Class A | 1,616,798 | |
| 260,299 | Shenzhen Senior Technology Material Co., Ltd. | 2,176,826 | |
| 35,124 | Skshu Paint Co., Ltd. Class A | 611,773 | |
| 59,400 | Wanhua Chemical Group Co., Ltd. Class A | 981,549 | |
| 727,357 | Zijin Mining Group Co., Ltd. | 1,187,581 | |
| 13,596,032 | |||
| Media & Entertainment - 2.2% | |||
| 284,400 | Mango Excellent Media Co., Ltd. Class A | 1,744,495 | |
| Pharmaceuticals, Biotechnology & Life Sciences - 7.1% | |||
| 262,876 | Jiangsu Hengrui Medicine Co., Ltd. Class A | 2,019,412 | |
| 118,539 | Livzon Pharmaceutical Group, Inc. Class A | 650,536 | |
| Shares or Principal Amount | Market Value† | ||
| COMMON STOCKS - 85.2% - (continued) | |||
| Pharmaceuticals, Biotechnology & Life Sciences - 7.1% - (continued) | |||
| 40,800 | Shenzhen Kangtai Biological Products Co., Ltd. Class A | $ 729,509 | |
| 68,060 | WuXi AppTec Co., Ltd. Class A | 1,466,723 | |
| 53,800 | Yunnan Baiyao Group Co., Ltd. | 753,163 | |
| 5,619,343 | |||
| Real Estate - 1.6% | |||
| 656,944 | Poly Developments and Holdings Group Co., Ltd. Class A | 1,289,316 | |
| Semiconductors & Semiconductor Equipment - 4.6% | |||
| 48,500 | Gigadevice Semiconductor Beijing, Inc. | 1,286,088 | |
| 79,040 | LONGi Green Energy Technology Co., Ltd. Class A* | 1,205,120 | |
| 62,400 | Shenzhen SC New Energy Technology Corp. | 1,111,746 | |
| 3,602,954 | |||
| Technology Hardware & Equipment - 7.4% | |||
| 139,900 | GoerTek, Inc. Class A | 950,177 | |
| 41,010 | Guangzhou Shiyuan Electronic Technology Co., Ltd. Class A | 486,372 | |
| 331,059 | Shenzhen Sunlord Electronics Co., Ltd. Class A | 1,708,437 | |
| 82,420 | Wuhan Jingce Electronic Group Co., Ltd. | 671,174 | |
| 35,500 | Xiamen Faratronic Co., Ltd. Class A | 1,072,580 | |
| 135,200 | Zhejiang Jiecang Linear Motion Technology Co., Ltd. | 972,380 | |
| 5,861,120 | |||
| Transportation - 2.0% | |||
| 152,300 | SF Holding Co., Ltd. Class A | 1,535,735 | |
| Total Common Stocks (cost $65,772,033) | $ 67,279,955 | ||
| WARRANTS - 11.9% | |||
| Consumer Durables & Apparel - 1.9% | |||
| 3,552 | Beijing Roborock Technology Co., Ltd.* | $ 500,307 | |
| 129,810 | Shanghai Milkground Food Tech Co., Ltd.* | 1,012,020 | |
| 1,512,327 | |||
| Diversified Financials - 0.8% | |||
| 107,100 | Sinoseal Holding Co., Ltd.* | 651,811 | |
| Food & Staples Retailing - 0.7% | |||
| 85,100 | Qingdao Richen Food Co., Ltd.* | 579,446 | |
| Health Care Equipment & Services - 4.5% | |||
| 6,732 | iRay Technology Co., Ltd.* | 477,837 | |
| 23,570 | Micro-Tech Nanjing Co., Ltd.* | 911,923 | |
| 81,053 | Ninebot Ltd.* | 700,472 | |
| 102,355 | Qingdao Haier Biomedical Co., Ltd.* | 1,482,016 | |
| 3,572,248 | |||
| Materials - 0.4% | |||
| 179,952 | Chongqing Zaisheng Technology Corp. Ltd.* | 313,263 | |
| Semiconductors & Semiconductor Equipment - 1.4% | |||
| 46,673 | Wuxi NCE Power Co., Ltd.* | 1,061,781 | |
| Technology Hardware & Equipment - 2.2% | |||
| 28,774 | Advanced Micro-Fabrication Equipment, Inc. China* | 702,342 | |
| 41 |
October 31, 2021
| Shares or Principal Amount | Market Value† | ||
| WARRANTS - 11.9% - (continued) | |||
| Technology Hardware & Equipment - 2.2% - (continued) | |||
| 27,337 | Gongniu Group Co., Ltd.* | $ 673,247 | |
| 49,312 | Wuxi Xinje Electric Co., Ltd.* | 331,870 | |
| 1,707,459 | |||
| Total Warrants (cost $10,165,992) | $ 9,398,335 | ||
| Total Long-Term Investments (Cost $75,938,025) | $ 76,678,290 | ||
| SHORT-TERM INVESTMENTS - 1.0% | |||
| Other Investment Pools & Funds - 1.0% | |||
| 818,295 | Morgan Stanley Institutional Liquidity Funds, Treasury Portfolio, Institutional Class, 0.01%(1) | $ 818,295 | |
| Total Short-Term Investments (cost $818,295) | $ 818,295 | ||
| Total Investments (cost $76,756,320) | 98.1% | $ 77,496,585 | |
| Other Assets and Liabilities | 1.9% | 1,495,863 | |
| Total Net Assets | 100.0% | $ 78,992,448 | |
| Note: | Percentage of investments as shown is the ratio of the total market value to total net assets. |
| Prices of foreign equities that are principally traded on certain foreign markets will generally be adjusted daily pursuant to a fair value pricing service approved by the Board of Directors in order to reflect an adjustment for factors occurring after the close of certain foreign markets but before the close of the New York Stock Exchange. | |
| The Fund may refer to any one or more of the industry classifications used by one or more widely recognized market indices, ratings group and/or as defined by Fund management. Industry classifications may not be identical across all security types. | |
| Equity industry classifications used in this report are the Global Industry Classification Standard, which was developed by and is the exclusive property and service mark of MSCI, Inc. and Standard & Poor’s. | |
| For Fund compliance purposes, the Fund may not use the same classification system. These classifications are used for financial reporting purposes. | |
| See “Glossary” for abbreviation descriptions. |
| * | Non-income producing. |
| (1) | Current yield as of period end. |
| † | See Significant Accounting Policies of accompanying Notes to Financial Statements regarding valuation of investments. |
| Description | Total | Level 1 | Level 2 | Level 3(1) | ||||
| Assets | ||||||||
| Common Stocks | ||||||||
| Automobiles & Components | $ 2,726,271 | $ — | $ 2,726,271 | $ — | ||||
| Banks | 4,435,076 | — | 4,435,076 | — | ||||
| Capital Goods | 7,376,027 | — | 7,376,027 | — | ||||
| Consumer Durables & Apparel | 7,854,998 | 1,074,217 | 6,780,781 | — | ||||
| Diversified Financials | 1,203,614 | — | 1,203,614 | — | ||||
| Food, Beverage & Tobacco | 6,290,113 | — | 6,290,113 | — | ||||
| Health Care Equipment & Services | 841,864 | — | 841,864 | — | ||||
| Insurance | 3,302,997 | — | 3,302,997 | — | ||||
| Materials | 13,596,032 | 611,773 | 12,984,259 | — | ||||
| Media & Entertainment | 1,744,495 | — | 1,744,495 | — | ||||
| Pharmaceuticals, Biotechnology & Life Sciences | 5,619,343 | — | 5,619,343 | — | ||||
| Real Estate | 1,289,316 | — | 1,289,316 | — | ||||
| Semiconductors & Semiconductor Equipment | 3,602,954 | — | 3,602,954 | — | ||||
| Technology Hardware & Equipment | 5,861,120 | — | 5,861,120 | — | ||||
| Transportation | 1,535,735 | — | 1,535,735 | — | ||||
| Warrants | 9,398,335 | 9,398,335 | — | — | ||||
| Short-Term Investments | 818,295 | 818,295 | — | — | ||||
| Total | $ 77,496,585 | $ 11,902,620 | $ 65,593,965 | $ — |
| (1) | For the year ended October 31, 2021, there were no transfers in and out of Level 3. |
| 42 |
October 31, 2021
| Shares or Principal Amount | Market Value† | ||
| COMMON STOCKS - 86.9% | |||
| Brazil - 1.7% | |||
| 1,800 | AES Brasil Energia S.A. | $ 3,476 | |
| 14,000 | B3 S.A. - Brasil Bolsa Balcao | 29,544 | |
| 2,100 | Boa Vista Servicos S.A. | 3,397 | |
| 700 | Cia de Saneamento Basico do Estado de Sao Paulo | 4,366 | |
| 2,000 | Cia de Saneamento de Minas Gerais-COPASA | 4,823 | |
| 8,400 | Cosan S.A. | 29,455 | |
| 3,200 | Dexco S.A. | 8,794 | |
| 1,200 | Equatorial Energia S.A. | 4,865 | |
| 2,800 | Light S.A. | 4,803 | |
| 600 | LOG Commercial Properties e Participacoes S.A. | 2,491 | |
| 2,500 | Randon S.A. Implementos e Participacoes | 4,501 | |
| 6,300 | Santos Brasil Participacoes S.A.* | 5,749 | |
| 2,000 | Sao Martinho S.A. | 13,572 | |
| 2,100 | Tres Tentos Agroindustrial S.A.* | 3,252 | |
| 7,200 | Ultrapar Participacoes S.A. | 16,648 | |
| 600 | Unipar Carbocloro S.A. | 7,938 | |
| 215 | Vinci Partners Investments Ltd. | 2,642 | |
| 3,300 | WEG S.A. | 21,634 | |
| 171,950 | |||
| Cayman Islands - 0.9% | |||
| 1,046 | Patria Investments Ltd. | 17,949 | |
| 5,000 | Wuxi Biologics Cayman, Inc.*(1) | 75,735 | |
| 93,684 | |||
| Chile - 0.2% | |||
| 350 | Sociedad Quimica y Minera de Chile S.A. | 19,211 | |
| China - 28.5% | |||
| 7,500 | 3SBio, Inc.*(1) | 6,863 | |
| 25,000 | Alibaba Group Holding Ltd.* | 514,066 | |
| 750 | A-Living Smart City Services Co., Ltd.(1) | 2,490 | |
| 2,800 | ANTA Sports Products Ltd. | 43,382 | |
| 3,000 | Archosaur Games, Inc.(1) | 3,566 | |
| 200 | Asymchem Laboratories Tianjin Co., Ltd. | 12,437 | |
| 23,000 | BAIC Motor Corp. Ltd. Class H(1) | 7,619 | |
| 850 | Baidu, Inc.* | 17,369 | |
| 4,100 | Bank of Chengdu Co., Ltd. | 8,177 | |
| 1,500 | Bank of Ningbo Co., Ltd. | 8,942 | |
| 300 | Beijing United Information Technology Co., Ltd. | 5,254 | |
| 1,500 | Brii Biosciences Ltd.* | 4,725 | |
| 2,000 | BYD Co., Ltd. Class H | 76,495 | |
| 1,000 | BYD Electronic International Co., Ltd. | 2,969 | |
| 600 | CanSino Biologics, Inc.*(1) | 15,345 | |
| 100 | Changchun High & New Technology Industry Group, Inc. Class A | 4,264 | |
| 7,000 | China Datang Corp. Renewable Power Co., Ltd. Class H | 2,962 | |
| 37,000 | China Feihe Ltd.(1) | 61,431 | |
| 7,500 | China Harmony Auto Holding Ltd. | 3,836 | |
| 12,000 | China Lesso Group Holdings Ltd. Class L | 18,548 | |
| 12,000 | China Life Insurance Co., Ltd. Class H | 20,847 | |
| 9,000 | China Medical System Holdings Ltd. | 15,239 | |
| 27,000 | China Molybdenum Co., Ltd. | 16,691 | |
| 11,800 | China Pacific Insurance Group Co., Ltd. Class H | 36,083 | |
| 2,000 | China Renaissance Holdings Ltd.(1) | 4,833 | |
| 3,000 | China Shineway Pharmaceutical Group Ltd. | 2,876 | |
| 9,000 | China Suntien Green Energy Corp. Ltd. Class H | 7,153 | |
| 14,500 | China Yongda Automobiles Services Holdings Ltd. | 23,071 | |
| 200 | Chongqing Zhifei Biological Products Co., Ltd. | 4,702 | |
| 12,000 | CMGE Technology Group Ltd. | 4,680 | |
| 500 | Contemporary Amperex Technology Co., Ltd. | 50,086 | |
| 10,000 | CSPC Pharmaceutical Group Ltd. | 10,435 | |
| Shares or Principal Amount | Market Value† | ||
| COMMON STOCKS - 86.9% - (continued) | |||
| China - 28.5% - (continued) | |||
| 400 | Ecovacs Robotics Co., Ltd. | $ 10,725 | |
| 3,000 | Flat Glass Group Co., Ltd. Class H | 16,082 | |
| 20,000 | Fosun International Ltd. | 23,432 | |
| 16,000 | Fu Shou Yuan International Group Ltd. | 13,736 | |
| 1,200 | Ganfeng Lithium Co., Ltd.(1) | 22,483 | |
| 8,000 | GEM Co., Ltd. | 13,607 | |
| 12,600 | GF Securities Co., Ltd. | 21,371 | |
| 900 | Gotion High-tech Co., Ltd.* | 8,288 | |
| 11,500 | Great Wall Motor Co., Ltd. Class H | 51,745 | |
| 4,000 | Guangzhou Automobile Group Co., Ltd. Class H | 3,776 | |
| 1,500 | Guangzhou Tinci Materials Technology Co., Ltd. | 38,602 | |
| 700 | Hangzhou First Applied Material Co., Ltd. | 15,709 | |
| 700 | Hangzhou Tigermed Consulting Co., Ltd. Class H(1) | 13,653 | |
| 5,500 | Hengan International Group Co., Ltd. | 28,743 | |
| 2,000 | Hua Hong Semiconductor Ltd.*(1) | 10,036 | |
| 10,300 | Huafon Chemical Co., Ltd. | 19,162 | |
| 95,000 | Industrial & Commercial Bank of China Ltd. Class H | 52,075 | |
| 5,250 | JD.com, Inc.* | 205,522 | |
| 8,000 | Jiangsu Expressway Co., Ltd. Class H | 7,586 | |
| 3,900 | Jiangsu Zhongtian Technology Co., Ltd. | 6,163 | |
| 4,000 | Jiumaojiu International Holdings Ltd.(1) | 10,013 | |
| 7,500 | Kingfa Sci & Tech Co., Ltd. | 13,757 | |
| 1,000 | Kintor Pharmaceutical Ltd.*(1) | 4,990 | |
| 3,500 | Li Ning Co., Ltd. | 38,623 | |
| 3,500 | Livzon Pharmaceutical Group, Inc. | 11,529 | |
| 2,700 | LONGi Green Energy Technology Co., Ltd. Class A | 41,167 | |
| 19,000 | Lonking Holdings Ltd. | 5,545 | |
| 7,400 | Luxi Chemical Group Co., Ltd. | 18,989 | |
| 4,600 | Maoyan Entertainment*(1) | 5,556 | |
| 4,700 | Ming Yang Smart Energy Group Ltd. | 22,749 | |
| 100 | NAURA Technology Group Co., Ltd. | 5,800 | |
| 2,500 | NetDragon Websoft Holdings Ltd. | 5,476 | |
| 900 | NetEase, Inc. | 17,458 | |
| 6,800 | New China Life Insurance Co., Ltd. Class H | 19,617 | |
| 2,800 | Nongfu Spring Co., Ltd.(1) | 14,203 | |
| 200 | Ovctek China, Inc. | 2,129 | |
| 45,000 | People's Insurance Co., Group of China Ltd. Class H | 14,037 | |
| 800 | Pharmaron Beijing Co., Ltd. Class H(1) | 17,310 | |
| 13,500 | Ping An Insurance Group Co. of China Ltd. Class H | 96,697 | |
| 2,200 | Pop Mart International Group Ltd.(1) | 12,977 | |
| 2,000 | Powerlong Commercial Management Holdings Ltd. | 4,477 | |
| 4,000 | Q Technology Group Co., Ltd. | 5,840 | |
| 300 | SG Micro Corp. | 15,187 | |
| 24,500 | Shandong Nanshan Aluminum Co., Ltd. | 16,561 | |
| 4,000 | Shandong Weigao Group Medical Polymer Co., Ltd. Class H | 6,813 | |
| 700 | Shenzhen Capchem Technology Co., Ltd. | 15,695 | |
| 100 | Shenzhen Mindray Bio-Medical Electronics Co., Ltd. Class A | 5,860 | |
| 800 | Shenzhen SC New Energy Technology Corp. | 14,253 | |
| 1,100 | Shenzhou International Group Holdings Ltd. | 23,699 | |
| 3,400 | Sichuan Chuantou Energy Co., Ltd. | 6,955 | |
| 3,300 | Sinoma Science & Technology Co., Ltd. | 19,497 | |
| 15,000 | Sinopec Engineering Group Co., Ltd. Class H | 7,906 | |
| 4,800 | Sinopharm Group Co., Ltd. Class H | 11,398 | |
| 24,000 | Sinotrans Ltd. Class H | 7,889 | |
| 8,000 | Sinotruk Hong Kong Ltd. | 11,042 | |
| 1,300 | Sungrow Power Supply Co., Ltd. Class A | 33,415 | |
| 100 | Suzhou Maxwell Technologies Co., Ltd. | 11,982 | |
| 43 |
October 31, 2021
| Shares or Principal Amount | Market Value† | ||
| COMMON STOCKS - 86.9% - (continued) | |||
| China - 28.5% - (continued) | |||
| 8,100 | Tencent Holdings Ltd. | $ 492,721 | |
| 3,000 | Tian Lun Gas Holdings Ltd. | 2,777 | |
| 1,600 | Tianjin Zhonghuan Semiconductor Co., Ltd. | 13,123 | |
| 12,000 | Tianneng Power International Ltd. | 13,703 | |
| 7,200 | Tongcheng-Elong Holdings Ltd.* | 16,046 | |
| 1,900 | Tongwei Co., Ltd. | 16,965 | |
| 900 | WuXi AppTec Co., Ltd. Class H(1) | 19,216 | |
| 1,100 | Wuxi Lead Intelligent Equipment Co., Ltd. Class A | 14,016 | |
| 8,600 | Xinjiang Goldwind Science & Technology Co., Ltd. Class H | 19,232 | |
| 5,200 | Xinte Energy Co., Ltd. Class H | 16,631 | |
| 4,000 | Yadea Group Holdings Ltd.(1) | 6,873 | |
| 14,000 | Zhejiang Expressway Co., Ltd. Class H | 12,434 | |
| 900 | Zhejiang Jingsheng Mechanical & Electrical Co., Ltd. | 10,760 | |
| 4,900 | Zhuzhou Kibing Group Co., Ltd. | 12,161 | |
| 14,600 | Zoomlion Heavy Industry Science and Technology Co., Ltd. Class H | 10,516 | |
| 2,874,197 | |||
| Colombia - 0.1% | |||
| 209 | Tecnoglass, Inc. | 6,036 | |
| Cyprus - 0.3% | |||
| 1,577 | Polymetal International plc | 29,152 | |
| Hong Kong - 1.8% | |||
| 1,200 | AIA Group Ltd. | 13,448 | |
| 6,200 | China Gas Holdings Ltd. | 15,475 | |
| 5,000 | China High Speed Transmission Equipment Group Co., Ltd.* | 3,876 | |
| 3,000 | China Overseas Land & Investment Ltd. | 6,617 | |
| 8,000 | China Water Affairs Group Ltd. | 8,222 | |
| 4,000 | CK Asset Holdings Ltd. | 24,708 | |
| 60,000 | Concord New Energy Group Ltd. | 6,327 | |
| 10,000 | Hang Lung Properties Ltd. | 23,209 | |
| 4,800 | Hongkong Land Holdings Ltd. | 26,507 | |
| 3,500 | Kerry Properties Ltd. | 9,894 | |
| 1,000 | Kingboard Holdings Ltd. | 4,358 | |
| 6,000 | Kunlun Energy Co., Ltd. | 5,465 | |
| 8,000 | PAX Global Technology Ltd. | 5,544 | |
| 39,000 | Sino Biopharmaceutical Ltd. | 28,758 | |
| 8,000 | SSY Group Ltd. | 3,800 | |
| 186,208 | |||
| Hungary - 0.9% | |||
| 443 | OTP Bank Nyrt* | 26,619 | |
| 2,253 | Richter Gedeon Nyrt | 63,115 | |
| 89,734 | |||
| India - 1.1% | |||
| 300 | HDFC Bank Ltd. ADR | 21,573 | |
| 782 | ICICI Bank Ltd. ADR | 16,539 | |
| 2,992 | Infosys Ltd. ADR | 66,662 | |
| 148 | Reliance Industries Ltd. GDR(1) | 10,064 | |
| 114,838 | |||
| Indonesia - 2.3% | |||
| 101,500 | Bank Central Asia Tbk PT | 53,671 | |
| 67,100 | Bank Mandiri Persero Tbk PT | 33,924 | |
| 52,300 | Bank Negara Indonesia Persero Tbk PT | 25,864 | |
| 133,400 | Bank Rakyat Indonesia Persero Tbk PT | 40,044 | |
| 74,300 | Bumi Serpong Damai Tbk PT* | 5,833 | |
| 85,400 | Erajaya Swasembada Tbk PT | 3,925 | |
| 96,400 | Industri Jamu Dan Farmasi Sido Muncul Tbk PT | 5,750 | |
| 39,300 | Japfa Comfeed Indonesia Tbk PT | 4,800 | |
| Shares or Principal Amount | Market Value† | ||
| COMMON STOCKS - 86.9% - (continued) | |||
| Indonesia - 2.3% - (continued) | |||
| 88,400 | Media Nusantara Citra Tbk PT | $ 5,623 | |
| 197,300 | Sarana Menara Nusantara Tbk PT | 16,171 | |
| 123,100 | Telekomunikasi Indonesia Persero Tbk PT | 32,903 | |
| 23,700 | Vale Indonesia Tbk PT | 8,122 | |
| 236,630 | |||
| Luxembourg - 0.1% | |||
| 28 | Globant S.A.* | 8,937 | |
| Malaysia - 2.4% | |||
| 9,900 | Astro Malaysia Holdings Bhd | 2,379 | |
| 2,500 | Bursa Malaysia Bhd | 4,534 | |
| 34,200 | CIMB Group Holdings Bhd | 43,151 | |
| 17,800 | Dialog Group Bhd | 12,172 | |
| 10,300 | Frontken Corp. Bhd | 9,504 | |
| 800 | Hong Leong Financial Group Bhd | 3,545 | |
| 7,700 | IOI Properties Group Bhd | 2,380 | |
| 21,000 | Malayan Banking Bhd | 40,823 | |
| 21,800 | Malaysia Building Society Bhd | 3,374 | |
| 4,900 | Mega First Corp. Bhd | 4,264 | |
| 16,300 | MR DIY Group M Bhd(1) | 14,857 | |
| 100 | Nestle Malaysia Bhd | 3,249 | |
| 4,900 | Pentamaster Corp. Bhd | 6,350 | |
| 66,800 | Public Bank Bhd | 67,268 | |
| 11,100 | RHB Bank Bhd | 14,977 | |
| 3,900 | TIME dotCom Bhd | 4,257 | |
| 2,900 | UWC Bhd | 4,314 | |
| 241,398 | |||
| Mexico - 2.0% | |||
| 14,600 | Bolsa Mexicana de Valores S.A.B. de C.V. | 27,941 | |
| 19,200 | Concentradora Fibra Danhos S.A. de C.V. REIT | 23,399 | |
| 16,200 | Gentera S.A.B. de C.V.* | 9,757 | |
| 90 | Grupo Aeroportuario del Pacifico S.A.B. de C.V. ADR | 11,365 | |
| 7,800 | Grupo Financiero Banorte S.A.B. de C.V. Class O | 49,305 | |
| 9,800 | Grupo Financiero Inbursa S.A.B. de C.V. Class O* | 9,815 | |
| 43,800 | Kimberly-Clark de Mexico S.A.B. de C.V. Class A | 69,227 | |
| 1,000 | Qualitas Controladora S.A.B. de C.V. | 4,612 | |
| 205,421 | |||
| Philippines - 0.1% | |||
| 5,800 | Converge Information and Communications Technology Solutions, Inc.* | 3,667 | |
| 89,000 | Megaworld Corp. | 5,422 | |
| 1,900 | Security Bank Corp. | 4,559 | |
| 13,648 | |||
| Poland - 1.5% | |||
| 1,393 | Allegro.eu S.A.*(1) | 15,754 | |
| 766 | Bank Polska Kasa Opieki S.A. | 25,309 | |
| 239 | Dino Polska S.A.*(1) | 21,350 | |
| 840 | KGHM Polska Miedz S.A. | 32,300 | |
| 3,624 | Powszechna Kasa Oszczednosci Bank Polski S.A.* | 44,372 | |
| 153 | Santander Bank Polska S.A. | 14,208 | |
| 153,293 | |||
| Romania - 0.1% | |||
| 464 | BRD-Groupe Societe Generale S.A. | 2,001 | |
| 1,661 | NEPI Rockcastle plc | 11,135 | |
| 13,136 | |||
| Russia - 2.0% | |||
| 221 | HeadHunter Group plc | 11,682 | |
| 267 | LUKOIL PJSC ADR | 27,242 | |
| 227 | MD Medical Group Investments plc | 2,724 | |
| 381 | Mobile TeleSystems PJSC ADR | 3,501 | |
| 44 |
October 31, 2021
| Shares or Principal Amount | Market Value† | ||
| COMMON STOCKS - 86.9% - (continued) | |||
| Russia - 2.0% - (continued) | |||
| 248 | Novatek PJSC GDR | $ 62,960 | |
| 299 | Polyus PJSC GDR | 29,560 | |
| 3,122 | Sberbank of Russia PJSC ADR | 62,612 | |
| 200,281 | |||
| South Africa - 3.1% | |||
| 533 | AECI Ltd. | 3,958 | |
| 2,491 | AVI Ltd. | 12,899 | |
| 890 | Barloworld Ltd. | 7,475 | |
| 177 | Capitec Bank Holdings Ltd. | 19,777 | |
| 1,528 | Coronation Fund Managers Ltd. | 5,063 | |
| 3,855 | Gold Fields Ltd. ADR | 35,774 | |
| 23,726 | Growthpoint Properties Ltd. | 20,130 | |
| 1,491 | Imperial Logistics Ltd. | 6,089 | |
| 526 | JSE Ltd. | 3,675 | |
| 1,411 | Kumba Iron Ore Ltd. | 42,937 | |
| 323 | Mr. Price Group Ltd. | 4,228 | |
| 4,142 | MultiChoice Group Ltd. | 32,938 | |
| 875 | Ninety One Ltd. | 3,017 | |
| 1,084 | PSG Group Ltd. | 5,428 | |
| 2,063 | Royal Bafokeng Platinum Ltd. | 14,794 | |
| 3,416 | Sappi Ltd.* | 10,493 | |
| 3,158 | Telkom S.A. SOC Ltd.* | 10,488 | |
| 8,228 | Vodacom Group Ltd. | 73,031 | |
| 312,194 | |||
| South Korea - 15.0% | |||
| 131 | AfreecaTV Co., Ltd. | 21,703 | |
| 7 | CJ CheilJedang Corp. | 2,275 | |
| 212 | Classys, Inc. | 4,045 | |
| 233 | CS Wind Corp. | 13,910 | |
| 213 | Daesang Corp. | 4,358 | |
| 1,860 | Daewoo Engineering & Construction Co., Ltd.* | 9,958 | |
| 875 | Dongkuk Steel Mill Co., Ltd. | 12,771 | |
| 63 | Doosan Bobcat, Inc.* | 2,059 | |
| 178 | Duk San Neolux Co., Ltd.* | 8,277 | |
| 94 | Ecopro BM Co., Ltd. | 33,049 | |
| 77 | Ecopro Co., Ltd. | 6,621 | |
| 40 | GOLFZON Co., Ltd. | 4,848 | |
| 794 | GS Engineering & Construction Corp. | 28,174 | |
| 143 | HAESUNG DS Co., Ltd. | 5,336 | |
| 91 | Hansol Chemical Co., Ltd. | 25,681 | |
| 421 | HDC Hyundai Development Co-Engineering & Construction | 9,232 | |
| 75 | Humedix Co., Ltd. | 1,783 | |
| 32 | Hyosung TNC Corp. | 16,452 | |
| 153 | Hyundai Construction Equipment Co., Ltd.* | 5,296 | |
| 403 | Hyundai Greenfood Co., Ltd. | 3,351 | |
| 62 | Hyundai Home Shopping Network Corp. | 3,722 | |
| 202 | Hyundai Mobis Co., Ltd. | 43,666 | |
| 438 | JYP Entertainment Corp. | 19,699 | |
| 169 | Kakao Games Corp.* | 11,551 | |
| 138 | KIWOOM Securities Co., Ltd. | 12,441 | |
| 145 | Kolmar BNH Co., Ltd. | 4,411 | |
| 85 | Kolon Industries, Inc. | 6,504 | |
| 166 | Korea Investment Holdings Co., Ltd. | 12,415 | |
| 40 | Krafton, Inc.* | 16,071 | |
| 371 | LG Electronics, Inc. | 38,381 | |
| 155 | LG Innotek Co., Ltd. | 27,862 | |
| 2,304 | LG Uplus Corp. | 28,356 | |
| 149 | Lotte Chemical Corp. | 28,659 | |
| 230 | LOTTE Fine Chemical Co., Ltd. | 16,792 | |
| 322 | Lutronic Corp.* | 5,198 | |
| 37 | Maeil Dairies Co., Ltd. | 2,233 | |
| Shares or Principal Amount | Market Value† | ||
| COMMON STOCKS - 86.9% - (continued) | |||
| South Korea - 15.0% - (continued) | |||
| 10 | NAVER Corp. | $ 3,477 | |
| 30 | NCSoft Corp. | 16,119 | |
| 183 | Neowiz * | 4,128 | |
| 161 | Osstem Implant Co., Ltd. | 17,066 | |
| 178 | Pearl Abyss Corp.* | 15,849 | |
| 183 | PI Advanced Materials Co., Ltd. | 7,088 | |
| 8,716 | Samsung Electronics Co., Ltd. | 521,854 | |
| 91 | Samsung SDI Co., Ltd. | 57,414 | |
| 41 | Samyang Holdings Corp. | 3,614 | |
| 349 | Sangsangin Co., Ltd.* | 2,675 | |
| 408 | SD Biosensor, Inc.* | 15,991 | |
| 68 | Sebang Global Battery Co., Ltd. | 4,781 | |
| 1,492 | Seohee Construction Co., Ltd. | 2,359 | |
| 56 | Silicon Works Co., Ltd. | 5,266 | |
| 2,237 | SK Hynix, Inc. | 197,193 | |
| 143 | SK IE Technology Co., Ltd.*(1) | 20,350 | |
| 159 | SK Innovation Co., Ltd.* | 33,159 | |
| 105 | SK Telecom Co., Ltd.*(2)(3) | 27,803 | |
| 132 | SKC Co., Ltd. | 20,294 | |
| 422 | S-Oil Corp. | 36,924 | |
| 172 | Webzen, Inc.* | 3,982 | |
| 1,514,526 | |||
| Taiwan - 17.3% | |||
| 5,000 | Advantech Co., Ltd. | 65,390 | |
| 1,000 | Alchip Technologies Ltd. | 37,145 | |
| 4,000 | ASE Technology Holding Co., Ltd. | 14,308 | |
| 1,000 | Asustek Computer, Inc. | 12,714 | |
| 10,000 | AU Optronics Corp. | 6,872 | |
| 12,000 | Cathay Financial Holding Co., Ltd. | 25,014 | |
| 3,000 | Century Iron & Steel Industrial Co., Ltd. | 12,221 | |
| 739 | Century Wind Power Co., Ltd. | 4,690 | |
| 17,000 | China Development Financial Holding Corp. | 8,689 | |
| 6,000 | ChipMOS Technologies, Inc. | 9,977 | |
| 58,000 | CTBC Financial Holding Co., Ltd. | 48,433 | |
| 1,000 | Eclat Textile Co., Ltd. | 21,853 | |
| 4,000 | Elite Material Co., Ltd. | 34,642 | |
| 11,000 | Fubon Financial Holding Co., Ltd. | 29,078 | |
| 2,000 | Giant Manufacturing Co., Ltd. | 23,229 | |
| 16,000 | Hon Hai Precision Industry Co., Ltd. | 61,765 | |
| 11,000 | Innolux Corp. | 6,617 | |
| 12,000 | King's Town Bank Co., Ltd. | 17,918 | |
| 1,000 | KMC Kuei Meng International, Inc. | 7,286 | |
| 1,000 | Merida Industry Co., Ltd. | 10,416 | |
| 1,000 | Micro-Star International Co., Ltd. | 5,047 | |
| 2,000 | Nan Ya Printed Circuit Board Corp. | 35,389 | |
| 3,000 | Nien Made Enterprise Co., Ltd. | 41,229 | |
| 1,000 | Novatek Microelectronics Corp. | 14,999 | |
| 2,000 | O-TA Precision Industry Co., Ltd. | 12,537 | |
| 1,000 | Parade Technologies Ltd. | 64,420 | |
| 1,000 | Powertech Technology, Inc. | 3,509 | |
| 3,000 | President Chain Store Corp. | 30,321 | |
| 3,000 | Quanta Computer, Inc. | 8,429 | |
| 1,000 | Realtek Semiconductor Corp. | 17,988 | |
| 4,000 | Simplo Technology Co., Ltd. | 43,093 | |
| 5,000 | Taiwan Fertilizer Co., Ltd. | 12,227 | |
| 41,000 | Taiwan Semiconductor Manufacturing Co., Ltd. | 870,032 | |
| 2,000 | TCI Co., Ltd. | 16,254 | |
| 1,000 | TURVO International Co., Ltd. | 3,730 | |
| 5,000 | USI Corp. | 6,194 | |
| 11,000 | Vanguard International Semiconductor Corp. | 57,318 | |
| 4,000 | Winbond Electronics Corp. | 3,793 | |
| 45 |
October 31, 2021
| Shares or Principal Amount | Market Value† | ||
| COMMON STOCKS - 86.9% - (continued) | |||
| Taiwan - 17.3% - (continued) | |||
| 2,000 | Yageo Corp. | $ 31,303 | |
| 15,000 | Yuanta Financial Holding Co., Ltd. | 13,333 | |
| 1,749,402 | |||
| Thailand - 1.6% | |||
| 13,300 | Bangchak Corp. PCL | 11,020 | |
| 7,700 | Bangkok Bank PCL NVDR | 28,496 | |
| 2,900 | Carabao Group PCL | 10,852 | |
| 50,500 | Chularat Hospital PCL | 5,801 | |
| 5,200 | Com7 PCL NVDR | 11,267 | |
| 7,800 | Kasikornbank PCL NVDR | 33,252 | |
| 18,300 | KGI Securities Thailand PCL | 3,650 | |
| 6,500 | MCS Steel PCL | 2,840 | |
| 11,500 | Osotspa PCL | 11,364 | |
| 4,500 | Siam Commercial Bank PCL NVDR | 17,110 | |
| 10,200 | SPCG PCL | 5,472 | |
| 12,800 | Supalai PCL | 9,029 | |
| 6,400 | Thanachart Capital PCL NVDR | 6,808 | |
| 12,900 | TTW PCL NVDR | 4,548 | |
| 161,509 | |||
| Turkey - 1.4% | |||
| 2,398 | Arcelik AS | 8,413 | |
| 4,379 | BIM Birlesik Magazalar A.S. | 28,308 | |
| 962 | Coca-Cola Icecek AS | 8,498 | |
| 2,826 | Enerjisa Enerji AS(1) | 3,457 | |
| 1,607 | Ford Otomotiv Sanayi AS | 31,023 | |
| 1,504 | Is Yatirim Menkul Degerler AS Class A | 2,503 | |
| 554 | Mavi Giyim Sanayi Ve Ticaret AS(1) | 4,153 | |
| 1,162 | MLP Saglik Hizmetleri AS*(1) | 3,278 | |
| 1,543 | Tofas Turk Otomobil Fabrikasi AS | 9,437 | |
| 8,648 | Turk Telekomunikasyon AS | 6,773 | |
| 185 | Turk Traktor ve Ziraat Makineleri AS | 3,184 | |
| 16,207 | Turkcell Iletisim Hizmetleri AS | 25,775 | |
| 1,685 | Yatas Yatak ve Yorgan Sanayi ve Ticaret AS | 2,342 | |
| 137,144 | |||
| United Arab Emirates - 2.2% | |||
| 9,401 | Abu Dhabi National Oil Co. for Distribution PJSC | 10,954 | |
| 35,762 | Emaar Properties PJSC | 39,150 | |
| 20,852 | Emirates NBD Bank PJSC | 79,192 | |
| 5,295 | Emirates Telecommunications Group Co. PJSC | 36,935 | |
| 11,667 | First Abu Dhabi Bank PJSC | 56,628 | |
| 222,859 | |||
| United Kingdom - 0.2% | |||
| 605 | Mondi plc | 15,085 | |
| United States - 0.1% | |||
| 9,000 | Nexteer Automotive Group Ltd. | 11,108 | |
| Total Common Stocks (cost $8,699,400) | $ 8,781,581 | ||
| EXCHANGE-TRADED FUNDS - 0.5% | |||
| Other Investment Pools & Funds - 0.5% | |||
| 1,178 | iShares MSCI Saudi Arabia ETF | $ 50,937 | |
| Total Exchange-Traded Funds (cost $50,678) | $ 50,937 | ||
| Shares or Principal Amount | Market Value† | ||
| PREFERRED STOCKS - 0.4% | |||
| Brazil - 0.4% | |||
| 11,100 | Banco Bradesco S.A. | $ 39,138 | |
| Total Preferred Stocks (cost $42,487) | $ 39,138 | ||
| Total Long-Term Investments (cost $8,792,565) | $ 8,871,656 | ||
| SHORT-TERM INVESTMENTS - 11.2% | |||
| Other Investment Pools & Funds - 11.2% | |||
| $ 1,136,188 | Morgan Stanley Institutional Liquidity Funds, Treasury Portfolio, Institutional Class, 0.01%(4) | $ 1,136,188 | |
| Total Short-Term Investments (cost $1,136,188) | $ 1,136,188 | ||
| Total Investments (cost $9,928,753) | 99.0% | $ 10,007,844 | |
| Other Assets and Liabilities | 1.0% | 96,879 | |
| Total Net Assets | 100.0% | $ 10,104,723 | |
| Note: | Percentage of investments as shown is the ratio of the total market value to total net assets. |
| Prices of foreign equities that are principally traded on certain foreign markets will generally be adjusted daily pursuant to a fair value pricing service approved by the Board of Directors in order to reflect an adjustment for factors occurring after the close of certain foreign markets but before the close of the New York Stock Exchange. | |
| The Fund may refer to any one or more of the industry classifications used by one or more widely recognized market indices, ratings group and/or as defined by Fund management. Industry classifications may not be identical across all security types. | |
| For Fund compliance purposes, the Fund may not use the same classification system. These classifications are used for financial reporting purposes. | |
| See “Glossary” for abbreviation descriptions. |
| * | Non-income producing. |
| (1) | Security was purchased pursuant to Rule 144A under the Securities Act of 1933 and may be sold in transactions that are exempt from registration (typically only to qualified institutional buyers) or in a public offering registered under the Securities Act of 1933. At October 31, 2021, the aggregate value of these securities was $408,456, representing 4.0% of net assets. |
| (2) | This security is valued in good faith at fair value as determined under policies and procedures established by and under the supervision of the Board of Directors. At October 31, 2021, the aggregate fair value of this security was $27,803, which represented 0.3% of total net assets. This amount excludes securities that are principally traded in certain foreign markets and whose prices are adjusted pursuant to a third party pricing service methodology approved by the Board of Directors. |
| (3) | Investment valued using significant unobservable inputs. |
| (4) | Current yield as of period end. |
| 46 |
October 31, 2021
| Futures Contracts Outstanding at October 31, 2021 | ||||||||
| Description | Number of Contracts | Expiration Date | Current Notional Amount | Value and Unrealized Appreciation/ (Depreciation) | ||||
| Long position contracts: | ||||||||
| MSCI India Index Futures | 11 | 12/17/2021 | $ 1,108,360 | $ (9,512) | ||||
| Total futures contracts | $ (9,512) | |||||||
| Foreign Currency Contracts Outstanding at October 31, 2021 | ||||||||||
| Amount and Description of Currency to be Purchased | Amount and Description of Currency to be Sold | Counterparty | Settlement Date | Appreciation/ (Depreciation) | ||||||
| 446,600 | ZAR | 29,552 | USD | MSC | 12/15/2021 | $ (482) | ||||
| 51,420 | USD | 750,300 | ZAR | JPM | 12/15/2021 | 2,582 | ||||
| Total foreign currency contracts | $ 2,100 | |||||||||
| 47 |
October 31, 2021
| Description | Total | Level 1 | Level 2 | Level 3(1) | ||||
| Assets | ||||||||
| Common Stocks | ||||||||
| Brazil | $ 171,949 | $ 171,949 | $ — | $ — | ||||
| Cayman Islands | 93,684 | 17,949 | 75,735 | — | ||||
| Chile | 19,212 | 19,212 | — | — | ||||
| China | 2,874,201 | 30,088 | 2,844,113 | — | ||||
| Colombia | 6,036 | 6,036 | — | — | ||||
| Cyprus | 29,152 | — | 29,152 | — | ||||
| Hong Kong | 186,207 | — | 186,207 | — | ||||
| Hungary | 89,734 | 63,115 | 26,619 | — | ||||
| India | 114,838 | 114,838 | — | — | ||||
| Indonesia | 236,633 | 5,750 | 230,883 | — | ||||
| Luxembourg | 8,937 | 8,937 | — | — | ||||
| Malaysia | 241,399 | 121,642 | 119,757 | — | ||||
| Mexico | 205,420 | 205,420 | — | — | ||||
| Philippines | 13,648 | — | 13,648 | — | ||||
| Poland | 153,294 | 51,312 | 101,982 | — | ||||
| Romania | 13,136 | 11,135 | 2,001 | — | ||||
| Russia | 200,281 | 45,149 | 155,132 | — | ||||
| South Africa | 312,193 | 248,717 | 63,476 | — | ||||
| South Korea | 1,514,526 | 32,062 | 1,454,661 | 27,803 | ||||
| Taiwan | 1,749,399 | 4,690 | 1,744,709 | — | ||||
| Thailand | 161,509 | 12,860 | 148,649 | — | ||||
| Turkey | 137,143 | 110,393 | 26,750 | — | ||||
| United Arab Emirates | 222,858 | 90,146 | 132,712 | — | ||||
| United Kingdom | 15,085 | — | 15,085 | — | ||||
| United States | 11,107 | — | 11,107 | — | ||||
| Exchange-Traded Funds | 50,937 | 50,937 | — | — | ||||
| Preferred Stocks | 39,138 | 39,138 | — | — | ||||
| Short-Term Investments | 1,136,188 | 1,136,188 | — | — | ||||
| Foreign Currency Contracts(2) | 2,582 | — | 2,582 | — | ||||
| Total | $ 10,010,426 | $ 2,597,663 | $ 7,384,960 | $ 27,803 | ||||
| Liabilities | ||||||||
| Foreign Currency Contracts(2) | $ (482) | $ — | $ (482) | $ — | ||||
| Futures Contracts(2) | (9,512) | (9,512) | — | — | ||||
| Total | $ (9,994) | $ (9,512) | $ (482) | $ — |
| (1) | For the period ended October 31, 2021, there were no transfers in and out of Level 3. |
| (2) | Derivative instruments (excluding purchased and written options, if applicable) are valued at the unrealized appreciation/(depreciation) on the investments. |
| 48 |
October 31, 2021
| Shares or Principal Amount | Market Value† | ||
| COMMON STOCKS - 98.7% | |||
| Argentina - 0.4% | |||
| 17,856 | MercadoLibre, Inc.* | $ 26,445,093 | |
| Brazil - 6.3% | |||
| 17,992,446 | B3 S.A. - Brasil Bolsa Balcao | 37,969,105 | |
| 4,323,073 | Dexco S.A. | 11,880,446 | |
| 6,190,962 | Gerdau S.A. | 29,507,934 | |
| 9,117,356 | Hapvida Participacoes e Investimentos S.A.(1) | 18,642,455 | |
| 23,767,659 | Itau Unibanco Holding S.A. ADR | 96,734,372 | |
| 3,974,304 | Klabin S.A.* | 16,154,104 | |
| 7,045,951 | Lojas Renner S.A. | 40,237,252 | |
| 10,296,748 | Magazine Luiza S.A. | 19,722,146 | |
| 664,695 | Pagseguro Digital Ltd. Class A* | 24,061,959 | |
| 8,973,634 | Raia Drogasil S.A. | 36,967,467 | |
| 987,396 | Telefonica Brasil S.A. | 7,963,830 | |
| 2,630,726 | Vale S.A. ADR | 33,489,142 | |
| 5,487,927 | WEG S.A. | 35,978,118 | |
| 3,549,723 | YDUQS Participacoes S.A. | 13,120,100 | |
| 422,428,430 | |||
| Cayman Islands - 1.1% | |||
| 4,713,000 | Wuxi Biologics Cayman, Inc.*(1) | 71,387,585 | |
| Chile - 0.4% | |||
| 1,361,866 | Banco Santander Chile ADR | 24,132,266 | |
| China - 27.2% | |||
| 7,924,236 | Alibaba Group Holding Ltd.* | 162,943,354 | |
| 828,551 | Alibaba Group Holding Ltd. ADR* | 136,661,202 | |
| 738,192 | Baidu, Inc.* | 15,084,314 | |
| 276,822 | Baidu, Inc. ADR* | 44,911,601 | |
| 7,990,168 | Centre Testing International Group Co., Ltd. Class A | 34,442,869 | |
| 14,388,000 | China Mengniu Dairy Co., Ltd.* | 91,544,550 | |
| 13,132,000 | China Pacific Insurance Group Co., Ltd. Class H | 40,155,980 | |
| 2,958,000 | ENN Energy Holdings Ltd. | 50,961,835 | |
| 19,960,000 | Great Wall Motor Co., Ltd. Class H | 89,810,903 | |
| 983,152 | Huazhu Group Ltd. ADR* | 45,578,927 | |
| 3,497,500 | Innovent Biologics, Inc.*(1) | 31,303,851 | |
| 3,395,342 | JD.com, Inc.* | 132,917,397 | |
| 808,724 | JD.com, Inc. ADR* | 63,306,915 | |
| 6,110,500 | Li Ning Co., Ltd. | 67,429,712 | |
| 3,809,485 | LONGi Green Energy Technology Co., Ltd. Class A* | 58,083,105 | |
| 9,111,222 | Midea Group Co., Ltd. Class A | 97,732,496 | |
| 51,008,000 | PICC Property & Casualty Co., Ltd. Class H | 47,485,665 | |
| 5,371,000 | Ping An Insurance Group Co. of China Ltd. Class H | 38,471,020 | |
| 3,112,800 | Shenzhou International Group Holdings Ltd. | 67,062,786 | |
| 6,556,400 | Tencent Holdings Ltd. | 398,824,454 | |
| 6,832,209 | Weichai Power Co., Ltd. Class A | 16,129,728 | |
| 9,565,000 | Weichai Power Co., Ltd. Class H | 17,121,029 | |
| 1,148,199 | Yum China Holdings, Inc. | 65,938,519 | |
| 2,448,356 | Zhejiang Supor Co., Ltd. Class A* | 20,265,804 | |
| 1,834,168,016 | |||
| Czech Republic - 0.5% | |||
| 3,993,499 | Avast plc(1) | 30,583,852 | |
| Egypt - 0.2% | |||
| 5,378,933 | Commercial International Bank Egypt S.A.E. GDR* | 16,674,692 | |
| Shares or Principal Amount | Market Value† | ||
| COMMON STOCKS - 98.7% - (continued) | |||
| Greece - 0.8% | |||
| 12,086,234 | Alpha Services and Holdings S.A.* | $ 15,408,268 | |
| 15,326,075 | Eurobank Ergasias S.A.* | 16,097,240 | |
| 1,086,545 | Hellenic Telecommunications Organization S.A. | 19,290,316 | |
| 50,795,824 | |||
| Hong Kong - 2.3% | |||
| 11,968,800 | AIA Group Ltd. | 134,134,447 | |
| 8,958,000 | Hang Lung Properties Ltd. | 20,790,204 | |
| 154,924,651 | |||
| Hungary - 1.8% | |||
| 1,386,857 | OTP Bank Nyrt* | 83,332,642 | |
| 1,351,359 | Richter Gedeon Nyrt | 37,856,598 | |
| 121,189,240 | |||
| India - 8.2% | |||
| 5,696,214 | Bharti Airtel Ltd.* | 52,253,312 | |
| 3,016,357 | Cipla Ltd. | 36,514,347 | |
| 4,418,347 | HDFC Bank Ltd. | 93,597,538 | |
| 13,026,598 | ICICI Bank Ltd. | 140,258,760 | |
| 425,372 | Maruti Suzuki India Ltd. | 42,591,516 | |
| 1,746,815 | Reliance Industries Ltd. | 59,278,440 | |
| 1,985,181 | Tata Consultancy Services Ltd. | 90,235,396 | |
| 2,100,941 | Tech Mahindra Ltd. | 41,586,188 | |
| 556,315,497 | |||
| Indonesia - 1.1% | |||
| 95,415,700 | Bank Mandiri Persero Tbk PT | 48,239,482 | |
| 93,290,220 | Bank Rakyat Indonesia Persero Tbk PT | 28,004,198 | |
| 76,243,680 | |||
| Luxembourg - 0.2% | |||
| 231,449 | Ternium S.A. ADR | 10,723,032 | |
| Malaysia - 0.4% | |||
| 21,802,574 | CIMB Group Holdings Bhd | 27,509,036 | |
| Mexico - 1.9% | |||
| 8,274,211 | Cemex S.A.B. de C.V.* | 5,337,163 | |
| 2,225,762 | Cemex S.A.B. de C.V. ADR* | 14,311,650 | |
| 561,962 | Fomento Economico Mexicano S.A.B. de C.V. ADR | 46,187,657 | |
| 10,238,034 | Grupo Financiero Banorte S.A.B. de C.V. Class O | 64,716,230 | |
| 130,552,700 | |||
| Peru - 0.3% | |||
| 154,818 | Credicorp Ltd. | 20,073,702 | |
| Poland - 0.9% | |||
| 3,266,802 | Powszechna Kasa Oszczednosci Bank Polski S.A.* | 39,998,335 | |
| 1,783,674 | Powszechny Zaklad Ubezpieczen S.A. | 17,845,672 | |
| 57,844,007 | |||
| Qatar - 0.2% | |||
| 2,805,914 | Qatar National Bank QPSC | 15,798,197 | |
| Russia - 7.9% | |||
| 759,856 | Lukoil PJSC ADR | 77,452,763 | |
| 14,174 | LUKOIL PJSC ADR | 1,446,173 | |
| 447,041 | Magnit PJSC | 40,777,378 | |
| 422,584 | Novatek PJSC GDR | 107,281,339 | |
| 98,293 | Polyus PJSC* | 19,513,720 | |
| 74,118 | Polyus PJSC GDR | 7,327,458 | |
| 8,826,543 | Rosneft Oil Co. PJSC | 79,254,942 | |
| 49 |
October 31, 2021
| Shares or Principal Amount | Market Value† | ||
| COMMON STOCKS - 98.7% - (continued) | |||
| Russia - 7.9% - (continued) | |||
| 5,972,204 | Sberbank of Russia PJSC ADR | $ 119,772,635 | |
| 580,039 | X5 Retail Group N.V. GDR | 19,759,612 | |
| 733,563 | Yandex N.V. Class A* | 60,768,359 | |
| 533,354,379 | |||
| Singapore - 0.4% | |||
| 79,271 | Sea Ltd. ADR* | 27,235,137 | |
| South Africa - 4.9% | |||
| 1,902,936 | Aspen Pharmacare Holdings Ltd. | 30,303,711 | |
| 3,408,058 | AVI Ltd.(2) | 17,648,274 | |
| 1,125,621 | Bid Corp. Ltd. | 24,158,664 | |
| 27,220,191 | FirstRand Ltd. | 103,400,611 | |
| 2,286,680 | Foschini Group Ltd.* | 19,416,196 | |
| 4,154,207 | Gold Fields Ltd. | 38,601,846 | |
| 3,611,033 | Impala Platinum Holdings Ltd. | 46,735,254 | |
| 1,514,979 | Nedbank Group Ltd. | 17,263,244 | |
| 2,842,166 | Shoprite Holdings Ltd. | 33,769,212 | |
| 331,297,012 | |||
| South Korea - 14.5% | |||
| 1,013,503 | Hana Financial Group, Inc. | 39,080,500 | |
| 920,875 | KB Financial Group, Inc. | 44,573,928 | |
| 503,945 | Kia Motors Corp. | 36,774,041 | |
| 74,954 | Korea Zinc Co., Ltd. | 34,510,303 | |
| 126,755 | LG Chem Ltd. | 90,953,674 | |
| 33,570 | LG Household & Health Care Ltd. | 33,599,746 | |
| 2,391,702 | LG Uplus Corp. | 29,435,049 | |
| 267,286 | NAVER Corp. | 92,930,690 | |
| 6,120,610 | Samsung Electronics Co., Ltd. | 366,459,984 | |
| 202,101 | Samsung Fire & Marine Insurance Co., Ltd. | 40,060,972 | |
| 135,773 | Samsung SDI Co., Ltd. | 85,662,963 | |
| 954,635 | SK Hynix, Inc. | 84,151,615 | |
| 978,193,465 | |||
| Taiwan - 14.6% | |||
| 3,532,000 | Accton Technology Corp. | 30,879,709 | |
| 18,845,036 | ASE Technology Holding Co., Ltd. | 67,409,001 | |
| 46,367,000 | CTBC Financial Holding Co., Ltd. | 38,719,180 | |
| 24,077,000 | Hon Hai Precision Industry Co., Ltd. | 92,945,360 | |
| 4,334,000 | MediaTek, Inc. | 142,643,572 | |
| 27,379,139 | Taiwan Semiconductor Manufacturing Co., Ltd. | 580,993,265 | |
| 12,144,000 | Uni-President Enterprises Corp. | 29,132,509 | |
| 982,722,596 | |||
| Thailand - 0.9% | |||
| 14,168,300 | Kasikornbank PCL NVDR | 60,401,262 | |
| Turkey - 0.4% | |||
| 3,042,327 | BIM Birlesik Magazalar A.S. | 19,667,217 | |
| 4,055,940 | KOC Holding AS | 9,947,895 | |
| 29,615,112 | |||
| United Arab Emirates - 0.6% | |||
| 39,388,280 | Emaar Properties PJSC | 43,119,526 | |
| Shares or Principal Amount | Market Value† | ||
| COMMON STOCKS - 98.7% - (continued) | |||
| United Kingdom - 0.3% | |||
| 1,091,622 | Prudential plc | $ 22,277,770 | |
| Total Common Stocks (cost $5,007,646,920) | $ 6,656,005,759 | ||
| RIGHTS - 0.0% | |||
| India - 0.0% | |||
| 406,872 | Bharti Airtel Ltd.*(3) | $ 1,543,675 | |
| Total Rights (cost $726,830) | $ 1,543,675 | ||
| Total Long-Term Investments (cost $5,008,373,750) | $ 6,657,549,434 | ||
| SHORT-TERM INVESTMENTS - 1.6% | |||
| Other Investment Pools & Funds - 1.5% | |||
| $ 101,498,495 | Morgan Stanley Institutional Liquidity Funds, Treasury Portfolio, Institutional Class, 0.01%(4) | $ 101,498,495 | |
| Securities Lending Collateral - 0.1% | |||
| 22,455 | Fidelity Investments Money Market Funds, Government Portfolio, Institutional Class, 0.01%(4) | 22,455 | |
| 3,447,397 | Goldman Sachs Financial Square Funds, Government Fund, Institutional Class, 0.03%(4) | 3,447,397 | |
| 247,498 | Invesco Government & Agency Portfolio, Institutional Class, 0.03%(4) | 247,498 | |
| 3,717,350 | |||
| Total Short-Term Investments (cost $105,215,845) | $ 105,215,845 | ||
| Total Investments (cost $5,113,589,595) | 100.3% | $ 6,762,765,279 | |
| Other Assets and Liabilities | (0.3)% | (20,987,068) | |
| Total Net Assets | 100.0% | $ 6,741,778,211 | |
| Note: | Percentage of investments as shown is the ratio of the total market value to total net assets. |
| Prices of foreign equities that are principally traded on certain foreign markets will generally be adjusted daily pursuant to a fair value pricing service approved by the Board of Directors in order to reflect an adjustment for factors occurring after the close of certain foreign markets but before the close of the New York Stock Exchange. | |
| The Fund may refer to any one or more of the industry classifications used by one or more widely recognized market indices, ratings group and/or as defined by Fund management. Industry classifications may not be identical across all security types. | |
| For Fund compliance purposes, the Fund may not use the same classification system. These classifications are used for financial reporting purposes. | |
| See “Glossary” for abbreviation descriptions. |
| 50 |
October 31, 2021
| * | Non-income producing. |
| (1) | Security was purchased pursuant to Rule 144A under the Securities Act of 1933 and may be sold in transactions that are exempt from registration (typically only to qualified institutional buyers) or in a public offering registered under the Securities Act of 1933. At October 31, 2021, the aggregate value of these securities was $151,917,743, representing 2.3% of net assets. |
| (2) | Represents entire or partial securities on loan. See Note 8 in the accompanying Notes to Financial Statements for securities lending information. |
| (3) | This security is valued in good faith at fair value as determined under policies and procedures established by and under the supervision of the Board of Directors. At October 31, 2021, the aggregate fair value of this security was $1,543,675, which represented 0.0% of total net assets. This amount excludes securities that are principally traded in certain foreign markets and whose prices are adjusted pursuant to a third party pricing service methodology approved by the Board of Directors. |
| (4) | Current yield as of period end. |
| † | See Significant Accounting Policies of accompanying Notes to Financial Statements regarding valuation of investments. |
| Description | Total | Level 1 | Level 2 | Level 3(1) | ||||
| Assets | ||||||||
| Common Stocks | ||||||||
| Argentina | $ 26,445,093 | $ 26,445,093 | $ — | $ — | ||||
| Brazil | 422,428,430 | 422,428,430 | — | — | ||||
| Cayman Islands | 71,387,585 | — | 71,387,585 | — | ||||
| Chile | 24,132,266 | 24,132,266 | — | — | ||||
| China | 1,834,168,016 | 341,599,414 | 1,492,568,602 | — | ||||
| Czech Republic | 30,583,852 | 30,583,852 | — | — | ||||
| Egypt | 16,674,692 | 16,674,692 | — | — | ||||
| Greece | 50,795,824 | — | 50,795,824 | — | ||||
| Hong Kong | 154,924,651 | — | 154,924,651 | — | ||||
| Hungary | 121,189,240 | 37,856,598 | 83,332,642 | — | ||||
| India | 556,315,497 | — | 556,315,497 | — | ||||
| Indonesia | 76,243,680 | — | 76,243,680 | — | ||||
| Luxembourg | 10,723,032 | 10,723,032 | — | — | ||||
| Malaysia | 27,509,036 | — | 27,509,036 | — | ||||
| Mexico | 130,552,700 | 130,552,700 | — | — | ||||
| Peru | 20,073,702 | 20,073,702 | — | — | ||||
| Poland | 57,844,007 | — | 57,844,007 | — | ||||
| Qatar | 15,798,197 | 15,798,197 | — | — | ||||
| Russia | 533,354,379 | 201,760,572 | 331,593,807 | — | ||||
| Singapore | 27,235,137 | 27,235,137 | — | — | ||||
| South Africa | 331,297,012 | 125,296,057 | 206,000,955 | — | ||||
| South Korea | 978,193,465 | — | 978,193,465 | — | ||||
| Taiwan | 982,722,596 | — | 982,722,596 | — | ||||
| Thailand | 60,401,262 | — | 60,401,262 | — | ||||
| Turkey | 29,615,112 | 29,615,112 | — | — | ||||
| United Arab Emirates | 43,119,526 | — | 43,119,526 | — | ||||
| United Kingdom | 22,277,770 | — | 22,277,770 | — | ||||
| Rights | 1,543,675 | — | 1,543,675 | — | ||||
| Short-Term Investments | 105,215,845 | 105,215,845 | — | — | ||||
| Total | $ 6,762,765,279 | $ 1,565,990,699 | $ 5,196,774,580 | $ — |
| (1) | For the year ended October 31, 2021, there were no transfers in and out of Level 3. |
| 51 |
October 31, 2021
| Shares or Principal Amount | Market Value† | ||
| CORPORATE BONDS - 39.1% | |||
| Argentina - 1.1% | |||
| $ 117,000 | YPF Energia Electrica S.A. 10.00%, 07/25/2026(1) | $ 107,055 | |
| YPF S.A. | |||
| 160,000 | 8.50%, 07/28/2025(2) | 128,922 | |
| 300,000 | 8.50%, 06/27/2029(1)(3) | 230,253 | |
| 466,230 | |||
| Austria - 0.2% | |||
| 81,000 | Suzano Austria GmbH 3.13%, 01/15/2032 | 76,464 | |
| British Virgin Islands - 1.8% | |||
| 200,000 | CAS Capital Ltd. 4.00%, 07/12/2026, (4.00% fixed rate until 07/12/2026; 5 year USD CMT + 3.642% thereafter)(2)(4)(5) | 200,400 | |
| 200,000 | China Railway Xunjie Co., Ltd. 3.25%, 07/28/2026(2) | 209,255 | |
| 200,000 | Elect Global Investments Ltd. 4.85%, 08/25/2023(2)(5) | 201,767 | |
| 200,000 | Huarong Finance II Co., Ltd. 5.00%, 11/19/2025(2) | 197,500 | |
| 808,922 | |||
| Canada - 1.9% | |||
| 200,000 | Canacol Energy Ltd. 7.25%, 05/03/2025(1) | 208,302 | |
| 200,000 | First Quantum Minerals Ltd. 7.50%, 04/01/2025(1) | 207,000 | |
| 200,000 | Gran Colombia Gold Corp. 6.88%, 08/09/2026(1) | 198,864 | |
| 200,000 | MEGlobal Canada ULC 5.88%, 05/18/2030(1) | 242,840 | |
| 857,006 | |||
| Cayman Islands - 2.2% | |||
| 200,000 | Baidu, Inc. 4.38%, 05/14/2024 | 214,626 | |
| 200,000 | Dar Al-Arkan Sukuk Co., Ltd. 6.75%, 02/15/2025(2) | 210,758 | |
| 200,000 | Melco Resorts Finance Ltd. 5.38%, 12/04/2029(1) | 196,750 | |
| 200,000 | Sunac China Holdings Ltd. 7.95%, 10/11/2023(2) | 153,300 | |
| 200,000 | Wynn Macau Ltd. 5.63%, 08/26/2028(2) | 186,676 | |
| 962,110 | |||
| Chile - 1.1% | |||
| 200,000 | AES Gener S.A. 7.13%, 03/26/2079, (7.12% fixed rate until 04/07/2024; 5 year USD Swap + 4.644% thereafter)(1)(4) | 209,250 | |
| 272,576 | Empresa Electrica Cochrane S.p.A. 5.50%, 05/14/2027(1) | 278,371 | |
| 487,621 | |||
| China - 0.4% | |||
| 200,000 | Wens Foodstuffs Group Co., Ltd. 2.35%, 10/29/2025(2) | 168,000 | |
| Colombia - 1.1% | |||
| 200,000 | Banco Davivienda S.A. 6.65%, 04/22/2031, (6.65% fixed rate until 04/22/2031; 10 year USD CMT + 5.097% thereafter)(1)(4)(5) | 208,502 | |
| Ecopetrol S.A. | |||
| 155,000 | 4.63%, 11/02/2031 | 153,699 | |
| Shares or Principal Amount | Market Value† | ||
| CORPORATE BONDS - 39.1% - (continued) | |||
| Colombia - 1.1% - (continued) | |||
| $ 51,000 | 5.88%, 05/28/2045 | $ 51,630 | |
| 79,000 | 6.88%, 04/29/2030 | 91,245 | |
| 505,076 | |||
| Hong Kong - 1.4% | |||
| 200,000 | Beijing State-Owned Assets Management Hong Kong Co., Ltd. 4.13%, 05/26/2025(2) | 210,688 | |
| 200,000 | Lenovo Group Ltd. 5.88%, 04/24/2025(2) | 222,305 | |
| 200,000 | Xiaomi Best Time International Ltd. 2.88%, 07/14/2031(1) | 198,416 | |
| 631,409 | |||
| India - 1.8% | |||
| 200,000 | Adani Ports & Special Economic Zone Ltd. 4.38%, 07/03/2029(2) | 209,650 | |
| 200,000 | JSW Steel Ltd. 5.05%, 04/05/2032(1) | 203,429 | |
| 200,000 | ReNew Power Pvt Ltd. 5.88%, 03/05/2027(1)(3) | 209,162 | |
| 200,000 | Summit Digitel Infrastructure Pvt Ltd. 2.88%, 08/12/2031(1) | 191,420 | |
| 813,661 | |||
| Indonesia - 1.0% | |||
| 360,000 | Pertamina Persero PT 6.00%, 05/03/2042(1) | 442,072 | |
| Ireland - 1.4% | |||
| 200,000 | Hacienda Investments Ltd. Via DME Airport DAC 5.35%, 02/08/2028(1) | 209,218 | |
| 200,000 | Lukoil Capital DAC 2.80%, 04/26/2027(1) | 199,300 | |
| 200,000 | Metalloinvest Finance DAC 3.38%, 10/22/2028(1) | 199,536 | |
| 608,054 | |||
| Israel - 0.2% | |||
| 75,000 | Energean Israel Finance Ltd. 4.50%, 03/30/2024(1)(2) | 76,500 | |
| Jersey - 0.4% | |||
| 200,000 | Galaxy Pipeline Assets Bidco Ltd. 2.63%, 03/31/2036(1) | 194,843 | |
| Kazakhstan - 1.1% | |||
| 485,000 | KazMunayGas National Co. JSC 3.50%, 04/14/2033(1) | 501,616 | |
| Luxembourg - 2.7% | |||
| 407,793 | FEL Energy S.a.r.l. 5.75%, 12/01/2040(1) | 402,696 | |
| 200,000 | Jbs Finance Luxembourg S.a.r.l. 3.63%, 01/15/2032(1) | 197,468 | |
| 200,000 | MC Brazil Downstream Trading S.a.r.l. 7.25%, 06/30/2031(1)(3) | 194,750 | |
| 200,000 | Puma International Financing S.A. 5.00%, 01/24/2026(1) | 200,760 | |
| 200,000 | Unigel Luxembourg S.A. 8.75%, 10/01/2026(1) | 212,452 | |
| 1,208,126 | |||
| Malaysia - 0.7% | |||
| 310,000 | Petronas Capital Ltd. 3.50%, 04/21/2030(1) | 332,649 | |
| Mexico - 8.6% | |||
| 200,000 | Axtel S.A.B. de C.V. 6.38%, 11/14/2024(1) | 206,302 | |
| 52 |
October 31, 2021
| Shares or Principal Amount | Market Value† | ||
| CORPORATE BONDS - 39.1% - (continued) | |||
| Mexico - 8.6% - (continued) | |||
| $ 200,000 | Banco Mercantil del Norte S.A. 7.63%, 01/10/2028, (7.62% fixed rate until 01/10/2028; 10 year USD CMT + 5.353% thereafter)(1)(4)(5) | $ 219,602 | |
| 200,000 | BBVA Bancomer S.A. 5.88%, 09/13/2034, (5.88% fixed rate until 09/13/2029; 5 year USD CMT + 4.308% thereafter)(1)(4) | 217,500 | |
| 200,000 | Braskem Idesa 6.99%, 02/20/2032(1) | 204,719 | |
| 200,000 | Cemex S.A.B. de C.V. 5.13%, 06/08/2026, (5.13% fixed rate until 06/08/2026; 5 year USD CMT + 4.534% thereafter)(1)(4)(5) | 206,500 | |
| 350,000 | Cibanco Sa Ins De Banca 4.38%, 07/22/2031(1) | 335,160 | |
| MXN 16,510,000 | Grupo Televisa S.A.B. 7.25%, 05/14/2043 | 553,247 | |
| $ 200,000 | Infraestructura Energetica Nova S.A.B. de C.V. 4.88%, 01/14/2048(1) | 204,500 | |
| Petroleos Mexicanos | |||
| 355,000 | 6.49%, 01/23/2027 | 378,430 | |
| 180,000 | 6.50%, 01/23/2029 | 187,542 | |
| 230,000 | 6.63%, 06/15/2035 | 222,732 | |
| 660,000 | 7.69%, 01/23/2050 | 633,600 | |
| 250,000 | Total Play Telecomunicaciones S.A. de C.V. 6.38%, 09/20/2028(1) | 245,937 | |
| 3,815,771 | |||
| Netherlands - 3.0% | |||
| 200,000 | Braskem Netherlands Finance B.V. 8.50%, 01/23/2081, (8.50% fixed rate until 10/24/2025; 5 year USD CMT + 8.220% thereafter)(1)(4) | 222,852 | |
| 200,000 | CIMPOR Financial Operations B.V. 5.75%, 07/17/2024(1)(3) | 185,752 | |
| 200,000 | Metinvest B.V. 7.65%, 10/01/2027(1) | 219,300 | |
| 100,000 | Petrobras Global Finance B.V. 6.90%, 03/19/2049 | 105,100 | |
| 200,000 | SABIC Capital B.V. 2.15%, 09/14/2030(2) | 192,466 | |
| 200,000 | Teva Pharmaceutical Finance Netherlands B.V. 3.15%, 10/01/2026 | 188,500 | |
| 200,000 | VEON Holdings B.V. 3.38%, 11/25/2027(1) | 200,384 | |
| 1,314,354 | |||
| Panama - 0.5% | |||
| 200,000 | AES Panama Generation Holdings 4.38%, 05/31/2030(1) | 206,236 | |
| Peru - 1.0% | |||
| 127,000 | Banco BBVA Peru S.A. 5.25%, 09/22/2029, (5.25% fixed rate until 09/22/2024; 5 year USD CMT + 2.750% thereafter)(1)(3)(4) | 134,049 | |
| 300,000 | Banco Internacional del Peru SAA Interbank 4.00%, 07/08/2030, (4.00% fixed rate until 07/08/2025; 12 mo. USD CMT + 3.711% thereafter)(1)(4) | 302,925 | |
| 436,974 | |||
| Qatar - 1.0% | |||
| 440,000 | Qatar Petroleum 3.13%, 07/12/2041(1) | 444,044 | |
| Shares or Principal Amount | Market Value† | ||
| CORPORATE BONDS - 39.1% - (continued) | |||
| South Korea - 0.5% | |||
| $ 200,000 | SK Innovation Co., Ltd. 4.13%, 07/13/2023(2) | $ 208,306 | |
| Spain - 0.6% | |||
| 250,000 | AI Candelaria Spain SLU 7.50%, 12/15/2028(1) | 269,063 | |
| Turkey - 0.9% | |||
| 200,000 | Limak Iskenderun Uluslararasi Liman Isletmeciligi AS 9.50%, 07/10/2036(1) | 199,353 | |
| 200,000 | Ulker Biskuvi Sanayi AS 6.95%, 10/30/2025(1) | 209,710 | |
| 409,063 | |||
| United Arab Emirates - 0.5% | |||
| 200,000 | First Abu Dhabi Bank PJSC 4.50%, 04/05/2026, (4.50% fixed rate until 04/05/2026; 5 year USD CMT + 4.138% thereafter)(2)(4)(5) | 210,504 | |
| United Kingdom - 1.1% | |||
| 200,000 | Endeavour Mining plc 5.00%, 10/14/2026(1) | 201,500 | |
| 310,000 | Gazprom PJSC via Gaz Finance plc 3.25%, 02/25/2030(1) | 306,125 | |
| 507,625 | |||
| United States - 0.9% | |||
| 400,000 | Sasol Financing USA LLC 5.50%, 03/18/2031 | 410,920 | |
| Total Corporate Bonds (cost $17,348,730) | $ 17,373,219 | ||
| FOREIGN GOVERNMENT OBLIGATIONS - 50.3% | |||
| Argentina - 1.0% | |||
| 200,000 | Autonomous City of Buenos Aires Argentina 7.50%, 06/01/2027(1) | $ 177,500 | |
| 371,291 | Provincia de Cordoba 5.00%, 12/10/2025(1) | 280,362 | |
| 457,862 | |||
| Azerbaijan - 0.4% | |||
| 180,000 | Republic of Azerbaijan International Bond 3.50%, 09/01/2032(1) | 184,047 | |
| Brazil - 2.5% | |||
| Brazil Notas do Tesouro Nacional | |||
| BRL 1,700,000 | 10.00%, 01/01/2023 | 294,464 | |
| 3,898,000 | 10.00%, 01/01/2025 | 653,175 | |
| 100,000 | 10.00%, 01/01/2027 | 16,336 | |
| 900,000 | 10.00%, 01/01/2031 | 141,541 | |
| 1,105,516 | |||
| Cameroon - 0.3% | |||
| EUR 110,000 | Republic of Cameroon International Bond 5.95%, 07/07/2032(1) | 123,780 | |
| Chile - 1.2% | |||
| Bonos de la Tesoreria de la Republica en pesos | |||
| CLP 225,000,000 | 2.30%, 10/01/2028(1)(2) | 219,157 | |
| 53 |
October 31, 2021
| Shares or Principal Amount | Market Value† | ||
| FOREIGN GOVERNMENT OBLIGATIONS - 50.3% - (continued) | |||
| Chile - 1.2% - (continued) | |||
| CLP 55,000,000 | 4.70%, 09/01/2030(1)(2) | $ 61,799 | |
| $ 275,000 | Chile Government International Bond 2.55%, 07/27/2033 | 265,977 | |
| 546,933 | |||
| Colombia - 1.6% | |||
| Colombia Government International Bond | |||
| 200,000 | 3.00%, 01/30/2030(3) | 188,664 | |
| 200,000 | 5.20%, 05/15/2049 | 201,222 | |
| COP 1,028,000,000 | 9.85%, 06/28/2027 | 312,871 | |
| 702,757 | |||
| Czech Republic - 1.4% | |||
| Czech Republic Government Bond | |||
| CZK 2,410,000 | 0.05%, 11/29/2029 | 87,659 | |
| 11,630,000 | 2.40%, 09/17/2025(2) | 515,668 | |
| 603,327 | |||
| Dominican Republic - 1.7% | |||
| Dominican Republic International Bond | |||
| $ 650,000 | 5.30%, 01/21/2041(1) | 643,506 | |
| 110,000 | 6.85%, 01/27/2045(1) | 122,375 | |
| 765,881 | |||
| Ecuador - 1.7% | |||
| Ecuador Government International Bond | |||
| 809,597 | 0.50%, 07/31/2040(1) | 483,734 | |
| 260,000 | 1.00%, 07/31/2035(1) | 171,278 | |
| 140,165 | 5.00%, 07/31/2030(1) | 116,337 | |
| 771,349 | |||
| Egypt - 1.0% | |||
| 460,000 | Egypt Government International Bond 8.70%, 03/01/2049(1) | 428,987 | |
| El Salvador - 0.1% | |||
| 70,000 | El Salvador Government International Bond 8.63%, 02/28/2029(1) | 55,650 | |
| Guatemala - 1.0% | |||
| Guatemala Government Bond | |||
| 250,000 | 3.70%, 10/07/2033(1)(3) | 248,125 | |
| 200,000 | 4.65%, 10/07/2041(1)(3) | 203,900 | |
| 452,025 | |||
| Hungary - 1.0% | |||
| Hungary Government Bond | |||
| HUF 11,200,000 | 1.50%, 08/23/2023 | 35,862 | |
| 50,960,000 | 2.75%, 12/22/2026 | 159,015 | |
| 21,710,000 | 3.00%, 06/26/2024 | 70,533 | |
| 50,910,000 | 3.00%, 08/21/2030 | 154,784 | |
| 11,050,000 | 6.00%, 11/24/2023 | 38,396 | |
| 458,590 | |||
| Indonesia - 4.3% | |||
| Indonesia Treasury Bond | |||
| IDR 5,193,000,000 | 7.00%, 05/15/2027 | 392,568 | |
| 1,441,000,000 | 7.50%, 08/15/2032 | 109,035 | |
| 5,032,000,000 | 8.25%, 06/15/2032 | 401,326 | |
| 843,000,000 | 8.38%, 09/15/2026 | 67,357 | |
| 4,833,000,000 | 8.75%, 05/15/2031 | 398,614 | |
| 6,409,000,000 | 9.00%, 03/15/2029 | 528,824 | |
| 1,897,724 | |||
| Shares or Principal Amount | Market Value† | ||
| FOREIGN GOVERNMENT OBLIGATIONS - 50.3% - (continued) | |||
| Ivory Coast - 1.1% | |||
| EUR 440,000 | Ivory Coast Government International Bond 6.63%, 03/22/2048(1) | $ 505,953 | |
| Jordan - 0.5% | |||
| $ 200,000 | Jordan Government International Bond 5.75%, 01/31/2027(1) | 213,525 | |
| Kenya - 1.0% | |||
| 400,000 | Kenya Government International Bond 8.00%, 05/22/2032(1) | 434,472 | |
| Malaysia - 2.9% | |||
| Malaysia Government Bond | |||
| MYR 2,080,000 | 3.89%, 08/15/2029 | 512,056 | |
| 3,198,000 | 3.90%, 11/30/2026 | 797,052 | |
| 1,309,108 | |||
| Mexico - 2.2% | |||
| Mexican Bonos | |||
| MXN 7,360,000 | 7.75%, 05/29/2031 | 363,049 | |
| 2,050,000 | 7.75%, 11/23/2034 | 100,847 | |
| 4,040,000 | 7.75%, 11/13/2042 | 192,534 | |
| $ 300,000 | Mexico Government International Bond 4.28%, 08/14/2041 | 311,763 | |
| 968,193 | |||
| Nigeria - 0.9% | |||
| 400,000 | Nigeria Government International Bond 7.14%, 02/23/2030(1) | 403,244 | |
| Oman - 1.5% | |||
| Oman Government International Bond | |||
| 200,000 | 5.38%, 03/08/2027(1) | 210,018 | |
| 200,000 | 6.75%, 10/28/2027(1) | 223,754 | |
| 232,000 | 7.00%, 01/25/2051(1) | 241,637 | |
| 675,409 | |||
| Pakistan - 0.5% | |||
| 200,000 | Pakistan Government International Bond 7.38%, 04/08/2031(1) | 202,996 | |
| Paraguay - 0.4% | |||
| 200,000 | Paraguay Government International Bond 2.74%, 01/29/2033(1)(3) | 193,202 | |
| Peru - 2.3% | |||
| Peru Government Bond | |||
| PEN 1,300,000 | 5.35%, 08/12/2040 | 275,158 | |
| 1,472,000 | 5.40%, 08/12/2034 | 336,382 | |
| 520,000 | 6.95%, 08/12/2031 | 140,854 | |
| $ 293,000 | Peruvian Government International Bond 3.00%, 01/15/2034 | 289,777 | |
| 1,042,171 | |||
| Poland - 0.8% | |||
| Republic of Poland Government Bond | |||
| PLN 336,000 | 2.25%, 10/25/2024 | 84,569 | |
| 710,000 | 2.50%, 01/25/2023 | 179,620 | |
| 380,000 | 2.75%, 10/25/2029 | 96,056 | |
| 360,245 | |||
| Qatar - 1.0% | |||
| Qatar Government International Bond | |||
| $ 200,000 | 3.40%, 04/16/2025(1) | 214,000 | |
| 200,000 | 3.75%, 04/16/2030(1) | 223,000 | |
| 437,000 | |||
| 54 |
October 31, 2021
| Shares or Principal Amount | Market Value† | ||
| FOREIGN GOVERNMENT OBLIGATIONS - 50.3% - (continued) | |||
| Romania - 0.9% | |||
| Romania Government Bond | |||
| RON 1,040,000 | 4.50%, 06/17/2024 | $ 244,778 | |
| 190,000 | 5.00%, 02/12/2029 | 44,638 | |
| $ 92,000 | Romanian Government International Bond 4.00%, 02/14/2051(1) | 92,543 | |
| 381,959 | |||
| Russia - 6.6% | |||
| Russian Federal Bond - OFZ | |||
| RUB 15,300,000 | 6.50%, 02/28/2024 | 207,960 | |
| 20,660,000 | 7.05%, 01/19/2028 | 276,006 | |
| 8,790,000 | 7.15%, 11/12/2025 | 119,404 | |
| 3,259,000 | 7.25%, 05/10/2034 | 43,323 | |
| 15,450,000 | 7.70%, 03/23/2033 | 212,568 | |
| 7,840,000 | 7.75%, 09/16/2026 | 108,636 | |
| 36,035,000 | 8.15%, 02/03/2027 | 508,237 | |
| 21,022,000 | 8.50%, 09/17/2031 | 305,811 | |
| Russian Foreign Bond - Eurobond | |||
| $ 400,000 | 4.75%, 05/27/2026(1) | 448,500 | |
| 600,000 | 5.10%, 03/28/2035(1) | 717,769 | |
| 2,948,214 | |||
| Saudi Arabia - 1.1% | |||
| Saudi Government International Bond | |||
| 230,000 | 3.25%, 10/26/2026(1) | 246,238 | |
| 200,000 | 4.50%, 10/26/2046(1) | 230,500 | |
| 476,738 | |||
| Senegal - 0.4% | |||
| 200,000 | Senegal Government International Bond 6.75%, 03/13/2048(2) | 198,012 | |
| South Africa - 3.0% | |||
| Republic of South Africa Government Bond | |||
| ZAR 9,949,200 | 7.00%, 02/28/2031 | 535,075 | |
| 2,336,400 | 8.50%, 01/31/2037 | 127,259 | |
| 2,450,400 | 8.88%, 02/28/2035 | 141,551 | |
| Republic of South Africa Government International Bond | |||
| $ 300,000 | 4.30%, 10/12/2028 | 302,250 | |
| 200,000 | 4.85%, 09/30/2029 | 204,996 | |
| 1,311,131 | |||
| Thailand - 0.7% | |||
| THB 9,518,000 | Thailand Government Bond 3.63%, 06/16/2023 | 300,533 | |
| Turkey - 0.4% | |||
| $ 200,000 | Turkey Government International Bond 5.88%, 06/26/2031 | 185,287 | |
| Ukraine - 1.8% | |||
| Ukraine Government International Bond | |||
| 500,000 | 7.38%, 09/25/2032(1) | 514,240 | |
| 270,000 | 7.75%, 09/01/2025(1) | 291,290 | |
| 805,530 | |||
| Shares or Principal Amount | Market Value† | ||
| FOREIGN GOVERNMENT OBLIGATIONS - 50.3% - (continued) | |||
| United Arab Emirates - 1.1% | |||
| $ 450,000 | Abu Dhabi Government International Bond 3.13%, 04/16/2030(1) | $ 484,893 | |
| Total Foreign Government Obligations (cost $22,643,099) | $ 22,392,243 | ||
| Total Long-Term Investments (cost $39,991,829) | $ 39,765,462 | ||
| SHORT-TERM INVESTMENTS - 11.9% | |||
| Other Investment Pools & Funds - 4.3% | |||
| 1,905,188 | Morgan Stanley Institutional Liquidity Funds, Treasury Portfolio, Institutional Class, 0.01%(6) | $ 1,905,188 | |
| Securities Lending Collateral - 3.1% | |||
| 8,495 | Fidelity Investments Money Market Funds, Government Portfolio, Institutional Class, 0.01%(6) | 8,495 | |
| 1,304,205 | Goldman Sachs Financial Square Funds, Government Fund, Institutional Class, 0.03%(6) | 1,304,205 | |
| 93,633 | Invesco Government & Agency Portfolio, Institutional Class, 0.03%(6) | 93,633 | |
| 1,406,333 | |||
| U.S. Treasury Securities - 4.5% | |||
| 2,000,000 | U.S. Treasury Bills 0.03%, 02/03/2022(7) | 1,999,674 | |
| Total Short-Term Investments (cost $5,311,341) | $ 5,311,195 | ||
| Total Investments (cost $45,303,170) | 101.3% | $ 45,076,657 | |
| Other Assets and Liabilities | (1.3)% | (595,313) | |
| Total Net Assets | 100.0% | $ 44,481,344 | |
| Note: | Percentage of investments as shown is the ratio of the total market value to total net assets. |
| Prices of foreign equities that are principally traded on certain foreign markets will generally be adjusted daily pursuant to a fair value pricing service approved by the Board of Directors in order to reflect an adjustment for factors occurring after the close of certain foreign markets but before the close of the New York Stock Exchange. | |
| The Fund may refer to any one or more of the industry classifications used by one or more widely recognized market indices, ratings group and/or as defined by Fund management. Industry classifications may not be identical across all security types. | |
| For Fund compliance purposes, the Fund may not use the same classification system. These classifications are used for financial reporting purposes. | |
| See “Glossary” for abbreviation descriptions. |
| 55 |
October 31, 2021
| (1) | Security was purchased pursuant to Rule 144A under the Securities Act of 1933 and may be sold in transactions that are exempt from registration (typically only to qualified institutional buyers) or in a public offering registered under the Securities Act of 1933. At October 31, 2021, the aggregate value of these securities was $20,807,298, representing 46.8% of net assets. |
| (2) | Security is exempt from registration under Regulation S under the Securities Act of 1933, which exempts from registration securities offered and sold outside of the United States. Security may not be offered or sold in the United States except pursuant to an exemption from, or in a transaction not subject to, the registration requirements of the Securities Act of 1933. At October 31, 2021, the aggregate value of these securities was $3,981,633, representing 9.0% of net assets. |
| (3) | Represents entire or partial securities on loan. See Note 8 in the accompanying Notes to Financial Statements for securities lending information. |
| (4) | Fixed to variable rate investment. The rate shown reflects the fixed rate in effect at October 31, 2021. Rate will reset at a future date. Base lending rates may be subject to a floor or cap. |
| (5) | Perpetual maturity security. Maturity date shown is the next call date or final legal maturity date, whichever comes first. |
| (6) | Current yield as of period end. |
| (7) | The rate shown represents current yield to maturity. |
| OTC Credit Default Swap Contracts Outstanding at October 31, 2021 | |||||||||||||||||||
| Reference Entity | Counter- party | Notional Amount | (Pay)/Receive Fixed Rate | Expiration Date | Periodic Payment Frequency | Upfront Premiums Paid | Upfront Premiums Received | Market Value† | Unrealized Appreciation/ (Depreciation) | ||||||||||
| Credit default swaps on single-name issues: | |||||||||||||||||||
| Sell protection: | |||||||||||||||||||
| Chile Republic (BBB-) | MSC | USD | 80,000 | 1.00% | 12/20/2026 | Quarterly | $ 475 | $ — | $ 564 | $ 89 | |||||||||
| Chile Republic (BBB-) | MSC | USD | 370,000 | 1.00% | 12/20/2026 | Quarterly | 2,709 | — | 2,608 | (101) | |||||||||
| Colombia Republic (BBB-) | MSC | USD | 380,000 | 1.00% | 12/20/2026 | Quarterly | — | (12,823) | (11,019) | 1,804 | |||||||||
| Colombia Republic (BBB-) | MSC | USD | 80,000 | 1.00% | 12/20/2026 | Quarterly | — | (2,695) | (2,320) | 375 | |||||||||
| Total OTC credit default swap contracts | $ 3,184 | $ (15,518) | $ (10,167) | $ 2,167 | |||||||||||||||
| Foreign Currency Contracts Outstanding at October 31, 2021 | ||||||||||
| Amount and Description of Currency to be Purchased | Amount and Description of Currency to be Sold | Counterparty | Settlement Date | Appreciation/ (Depreciation) | ||||||
| 6,500,000 | CNY | 994,735 | USD | UBS | 11/12/2021 | $ 20,122 | ||||
| 3,214,554 | CNY | 494,590 | USD | UBS | 12/01/2021 | 6,552 | ||||
| 1,370,000 | CNY | 211,208 | USD | UBS | 01/19/2022 | 1,351 | ||||
| 1,419,660,000 | COP | 377,569 | USD | UBS | 01/14/2022 | (2,537) | ||||
| 180,000 | EUR | 213,491 | USD | BOA | 11/12/2021 | (5,362) | ||||
| 890,000 | PLN | 224,573 | USD | MSC | 12/01/2021 | (1,647) | ||||
| 700,000 | PLN | 184,036 | USD | JPM | 12/01/2021 | (8,700) | ||||
| 2,220,000 | PLN | 573,528 | USD | CBK | 12/01/2021 | (17,464) | ||||
| 10,335,000 | THB | 308,117 | USD | UBS | 11/12/2021 | 3,308 | ||||
| 18,970,000 | THB | 571,928 | USD | MSC | 01/18/2022 | (497) | ||||
| 155,744 | USD | 1,010,000 | CNY | UBS | 11/12/2021 | (1,949) | ||||
| 78,923 | USD | 510,000 | CNY | UBS | 12/01/2021 | (585) | ||||
| 14,243 | USD | 53,910,000 | COP | UBS | 01/14/2022 | 2 | ||||
| 211,244 | USD | 180,000 | EUR | JPM | 11/12/2021 | 3,116 | ||||
| 549,721 | USD | 469,000 | EUR | BOA | 12/29/2021 | 6,656 | ||||
| 103,908 | USD | 90,000 | EUR | JPM | 12/29/2021 | (305) | ||||
| 194,388 | USD | 770,000 | PLN | UBS | 12/01/2021 | 1,519 | ||||
| 13,358 | USD | 450,000 | THB | CBK | 11/12/2021 | (202) | ||||
| 13,475 | USD | 450,000 | THB | CBK | 01/18/2022 | (81) | ||||
| Total foreign currency contracts | $ 3,297 | |||||||||
| 56 |
October 31, 2021
| Description | Total | Level 1 | Level 2 | Level 3(1) | ||||
| Assets | ||||||||
| Corporate Bonds | $ 17,373,219 | $ — | $ 17,373,219 | $ — | ||||
| Foreign Government Obligations | 22,392,243 | — | 22,392,243 | — | ||||
| Short-Term Investments | 5,311,195 | 3,311,521 | 1,999,674 | — | ||||
| Foreign Currency Contracts(2) | 42,634 | — | 42,634 | — | ||||
| Swaps - Credit Default(2) | 2,268 | — | 2,268 | — | ||||
| Total | $ 45,121,559 | $ 3,311,521 | $ 41,810,038 | $ — | ||||
| Liabilities | ||||||||
| Foreign Currency Contracts(2) | $ (39,337) | $ — | $ (39,337) | $ — | ||||
| Swaps - Credit Default(2) | (101) | — | (101) | — | ||||
| Total | $ (39,438) | $ — | $ (39,438) | $ — |
| (1) | For the year ended October 31, 2021, there were no transfers in and out of Level 3. |
| (2) | Derivative instruments (excluding purchased and written options, if applicable) are valued at the unrealized appreciation/(depreciation) on the investments. |
| 57 |
October 31, 2021
| Shares or Principal Amount | Market Value† | ||
| COMMON STOCKS - 95.1% | |||
| Australia - 1.6% | |||
| 2,446,571 | Beach Energy Ltd. | $ 2,570,138 | |
| 184,312 | BHP Group Ltd.(1) | 5,062,494 | |
| 165,724 | BHP Group plc | 4,377,031 | |
| 117,220 | Champion Iron Ltd.* | 391,544 | |
| 583,468 | Fortescue Metals Group Ltd. | 6,079,758 | |
| 411,892 | Iluka Resources Ltd. | 2,938,601 | |
| 38,953 | McMillan Shakespeare Ltd. | 403,057 | |
| 120,381 | Mineral Resources Ltd. | 3,538,996 | |
| 506,379 | OceanaGold Corp.* | 945,164 | |
| 475,648 | Perenti Global Ltd. | 368,230 | |
| 1,778,527 | Perseus Mining Ltd.* | 2,109,016 | |
| 677,024 | Regis Resources Ltd. | 1,015,298 | |
| 160,021 | Rio Tinto Ltd. | 10,963,476 | |
| 1,143,562 | St. Barbara Ltd. | 1,257,460 | |
| 42,020,263 | |||
| Austria - 0.8% | |||
| 32,991 | BAWAG Group AG(2) | 2,074,976 | |
| 111,507 | Erste Group Bank AG | 4,782,057 | |
| 120,149 | OMV AG | 7,274,219 | |
| 149,398 | Raiffeisen Bank International AG | 4,365,397 | |
| 33,703 | voestalpine AG | 1,280,076 | |
| 19,776,725 | |||
| Belgium - 0.4% | |||
| 69,511 | Ageas S.A. | 3,381,549 | |
| 50,069 | bpost S.A.* | 428,958 | |
| 42,034 | KBC Group N.V. | 3,914,331 | |
| 28,108 | Ontex Group N.V.* | 265,049 | |
| 23,395 | Solvay S.A. | 2,781,012 | |
| 14,559 | Telenet Group Holding N.V. | 523,047 | |
| 3,927 | Wereldhave Belgium Comm REIT | 221,079 | |
| 11,515,025 | |||
| Bermuda - 0.0% | |||
| 181,687 | DHT Holdings, Inc. | 1,182,782 | |
| Brazil - 0.7% | |||
| 216,000 | Atacadao S.A. | 636,848 | |
| 867,500 | B3 S.A. - Brasil Bolsa Balcao | 1,830,668 | |
| 388,346 | Cia de Saneamento Basico do Estado de Sao Paulo | 2,422,088 | |
| 2,102,553 | Cia de Saneamento do Parana | 1,385,857 | |
| 499,800 | Cosan S.A. | 1,752,550 | |
| 255,900 | EDP - Energias do Brasil S.A. | 888,699 | |
| 381,100 | Engie Brasil Energia S.A. | 2,627,414 | |
| 668,500 | Equatorial Energia S.A. | 2,710,103 | |
| 166,100 | Hypera S.A. | 825,821 | |
| 297,500 | Light S.A. | 510,259 | |
| 121,200 | Sao Martinho S.A. | 822,488 | |
| 56,600 | Unipar Carbocloro S.A. | 748,843 | |
| 17,161,638 | |||
| Canada - 8.2% | |||
| 599,902 | ARC Resources Ltd. | 5,753,756 | |
| 15,200 | AutoCanada, Inc.* | 547,647 | |
| 969,354 | B2Gold Corp. | 4,002,423 | |
| 727,376 | Baytex Energy Corp.* | 2,439,084 | |
| 381,424 | BCE, Inc. | 19,635,200 | |
| 75,657 | BRP, Inc. | 6,652,387 | |
| 52,100 | Canaccord Genuity Group, Inc. | 602,838 | |
| 47,818 | Canadian National Railway Co. | 6,355,127 | |
| 165,154 | Canadian Natural Resources Ltd. | 7,019,312 | |
| 67,136 | Canadian Pacific Railway Ltd. | 5,196,313 | |
| 45,856 | Canadian Solar, Inc.* | 1,905,317 | |
| Shares or Principal Amount | Market Value† | ||
| COMMON STOCKS - 95.1% - (continued) | |||
| Canada - 8.2% - (continued) | |||
| 58,853 | Canfor Corp.* | $ 1,219,288 | |
| 120,470 | Capstone Mining Corp.* | 505,203 | |
| 39,500 | Cascades, Inc. | 457,684 | |
| 33,676 | Celestica, Inc.* | 331,971 | |
| 211,855 | Cenovus Energy, Inc. | 2,533,495 | |
| 212,700 | Centerra Gold, Inc. | 1,594,906 | |
| 252,171 | CI Financial Corp. | 5,750,053 | |
| 16,231 | Cogeco Communications, Inc. | 1,393,983 | |
| 152,253 | Corus Entertainment, Inc. Class B | 690,158 | |
| 418,876 | Crescent Point Energy Corp. | 2,105,211 | |
| 362,410 | Dundee Precious Metals, Inc. | 2,383,660 | |
| 200 | E-L Financial Corp. Ltd. | 146,249 | |
| 140,795 | Equinox Gold Corp.* | 1,044,359 | |
| 20,200 | Equitable Group, Inc. | 1,261,521 | |
| 59,288 | ERO Copper Corp.* | 1,106,141 | |
| 1,693 | Fairfax Financial Holdings Ltd. | 685,695 | |
| 135,110 | First Quantum Minerals Ltd. | 3,198,710 | |
| 7,800 | goeasy Ltd. | 1,222,311 | |
| 37,400 | Home Capital Group, Inc.* | 1,213,626 | |
| 216,999 | Hudbay Minerals, Inc. | 1,513,172 | |
| 81,267 | iA Financial Corp., Inc. | 4,807,334 | |
| 593,349 | IAMGOLD Corp.* | 1,634,874 | |
| 30,101 | IGM Financial, Inc. | 1,195,187 | |
| 140,510 | Imperial Oil Ltd. | 4,757,086 | |
| 115,221 | Innergex Renewable Energy, Inc. | 1,917,867 | |
| 80,860 | Interfor Corp. | 1,851,626 | |
| 14,040 | Intertape Polymer Group, Inc. | 319,008 | |
| 942,732 | Kinross Gold Corp. | 5,667,361 | |
| 23,725 | Largo Resources Ltd.*(1) | 295,987 | |
| 33,600 | Linamar Corp. | 1,848,054 | |
| 99,049 | Magna International, Inc. | 8,056,935 | |
| 318,925 | Manulife Financial Corp. | 6,213,059 | |
| 42,700 | Martinrea International, Inc. | 396,431 | |
| 377,852 | MEG Energy Corp.* | 3,385,891 | |
| 165,661 | National Bank of Canada | 13,714,953 | |
| 519,294 | New Gold, Inc.* | 730,100 | |
| 55,674 | Nutrien Ltd. | 3,891,242 | |
| 70,397 | Open Text Corp. | 3,546,016 | |
| 40,283 | Parex Resources, Inc. | 782,159 | |
| 113,820 | Royal Bank of Canada | 11,847,360 | |
| 22,100 | Stelco Holdings, Inc. | 767,321 | |
| 22,249 | Stella-Jones, Inc. | 798,742 | |
| 44,909 | Sun Life Financial, Inc. | 2,559,334 | |
| 71,949 | Suncor Energy, Inc. | 1,892,324 | |
| 191,630 | Teck Resources Ltd. Class B | 5,348,174 | |
| 46,537 | TFI International, Inc. | 5,160,207 | |
| 5,637 | Topicus.com, Inc.* | 629,061 | |
| 190,325 | Toronto-Dominion Bank | 13,816,094 | |
| 123,507 | Tourmaline Oil Corp. | 4,463,856 | |
| 38,664 | Transcontinental, Inc. Class A | 612,326 | |
| 116,513 | Wesdome Gold Mines Ltd.* | 1,047,826 | |
| 70,301 | West Fraser Timber Co., Ltd. | 5,628,738 | |
| 680,706 | Whitecap Resources, Inc. | 4,086,656 | |
| 214,135,989 | |||
| Cayman Islands - 0.1% | |||
| 203,256 | Hello Group, Inc. | 2,530,537 | |
| Chile - 0.0% | |||
| 5,118,246 | Aguas Andinas S.A. Class A | 975,204 | |
| 196,370 | Enel Chile S.A. ADR(1) | 426,123 | |
| 1,401,327 | |||
| China - 5.4% | |||
| 55,327 | 360 DigiTech, Inc. ADR* | 1,129,224 | |
| 58 |
October 31, 2021
| Shares or Principal Amount | Market Value† | ||
| COMMON STOCKS - 95.1% - (continued) | |||
| China - 5.4% - (continued) | |||
| 809,000 | 3SBio, Inc.*(2) | $ 740,323 | |
| 3,579,000 | Agricultural Bank of China Ltd. Class H | 1,216,170 | |
| 824,250 | A-Living Smart City Services Co., Ltd.(2) | 2,736,080 | |
| 2,526,500 | BAIC Motor Corp. Ltd. Class H(2) | 836,902 | |
| 218,550 | Baidu, Inc.* | 4,465,880 | |
| 4,229,000 | Bank of China Ltd. Class H | 1,496,650 | |
| 999,000 | Bank of Communications Co., Ltd. Class H | 594,288 | |
| 185,000 | CanSino Biologics, Inc.*(2) | 4,731,301 | |
| 4,676,000 | China BlueChemical Ltd. Class H | 1,563,564 | |
| 1,123,500 | China Conch Venture Holdings Ltd. | 5,459,475 | |
| 5,825,000 | China Construction Bank Corp. Class H | 3,964,382 | |
| 1,729,000 | China Datang Corp. Renewable Power Co., Ltd. Class H | 731,497 | |
| 3,372,000 | China Feihe Ltd.(2) | 5,598,512 | |
| 1,272,800 | China International Capital Corp. Ltd. Class H(2) | 3,151,158 | |
| 1,267,000 | China Lesso Group Holdings Ltd. Class L | 1,958,360 | |
| 1,737,000 | China Life Insurance Co., Ltd. Class H | 3,017,637 | |
| 681,000 | China Lilang Ltd. | 387,920 | |
| 1,889,000 | China Longyuan Power Group Corp. Ltd. Class H | 4,418,439 | |
| 1,977,000 | China Medical System Holdings Ltd. | 3,347,493 | |
| 5,565,000 | China Molybdenum Co., Ltd. | 3,440,298 | |
| 948,600 | China Pacific Insurance Group Co., Ltd. Class H | 2,900,698 | |
| 1,184,000 | China SCE Group Holdings Ltd. | 369,261 | |
| 984,000 | China Shineway Pharmaceutical Group Ltd. | 943,367 | |
| 2,230,000 | China Suntien Green Energy Corp. Ltd. Class H | 1,772,328 | |
| 32,662,000 | China Tower Corp. Ltd. Class H(2) | 4,232,954 | |
| 906,500 | China Yongda Automobiles Services Holdings Ltd. | 1,442,309 | |
| 735,000 | CITIC Securities Co., Ltd. Class H | 1,866,134 | |
| 1,598,000 | COFCO Meat Holdings Ltd.(1) | 618,473 | |
| 1,708,000 | Consun Pharmaceutical Group Ltd. | 731,967 | |
| 1,077,500 | CSC Financial Co., Ltd. Class H(1)(2) | 1,139,005 | |
| 3,120,000 | CSPC Pharmaceutical Group Ltd. | 3,255,719 | |
| 2,761,000 | Dali Foods Group Co. Ltd.(2) | 1,536,550 | |
| 93,975 | Daqo New Energy Corp. ADR* | 7,310,315 | |
| 2,416,000 | Dongfeng Motor Group Co., Ltd. Class H | 2,250,158 | |
| 58,200 | ENN Energy Holdings Ltd. | 1,002,697 | |
| 409,000 | Fu Shou Yuan International Group Ltd. | 351,132 | |
| 424,000 | Greentown China Holdings Ltd. | 584,165 | |
| 2,256,000 | Guangzhou Automobile Group Co., Ltd. Class H | 2,129,573 | |
| 228,000 | Haitian International Holdings Ltd. | 664,505 | |
| 512,500 | Hengan International Group Co., Ltd. | 2,678,290 | |
| 9,628,000 | Industrial & Commercial Bank of China Ltd. Class H | 5,277,704 | |
| 36,934 | JinkoSolar Holding Co., Ltd. ADR*(1) | 2,209,392 | |
| 121,500 | Kintor Pharmaceutical Ltd.*(1)(2) | 606,296 | |
| 1,634,000 | Lenovo Group Ltd. | 1,774,472 | |
| 587,400 | Livzon Pharmaceutical Group, Inc. | 1,934,880 | |
| 6,369,000 | Lonking Holdings Ltd. | 1,858,738 | |
| 129,500 | NetDragon Websoft Holdings Ltd. | 283,633 | |
| 1,196,000 | Ping An Insurance Group Co. of China Ltd. Class H | 8,566,624 | |
| 304,000 | Q Technology Group Co., Ltd. | 443,813 | |
| 68,000 | Qingling Motors Co., Ltd. Class H | 15,311 | |
| 159,000 | S-Enjoy Service Group Co., Ltd. | 309,407 | |
| 201,500 | Shanghai Pharmaceuticals Holding Co., Ltd. Class H | 368,791 | |
| 1,755,000 | Sinopec Engineering Group Co., Ltd. Class H | 925,013 | |
| Shares or Principal Amount | Market Value† | ||
| COMMON STOCKS - 95.1% - (continued) | |||
| China - 5.4% - (continued) | |||
| 1,020,800 | Sinopharm Group Co., Ltd. Class H | $ 2,423,903 | |
| 1,754,000 | Sinotrans Ltd. Class H | 576,578 | |
| 838,000 | Sinotruk Hong Kong Ltd. | 1,156,671 | |
| 1,068,000 | Tianneng Power International Ltd.(1) | �� 1,219,542 | |
| 435,000 | Times Neighborhood Holdings Ltd.(1) | 204,186 | |
| 161,000 | Vipshop Holdings Ltd. ADR* | 1,796,760 | |
| 312,000 | Weichai Power Co., Ltd. Class H | 558,470 | |
| 1,720,400 | Xinjiang Goldwind Science & Technology Co., Ltd. Class H(1) | 3,847,320 | |
| 375,200 | Xinte Energy Co., Ltd. Class H | 1,200,023 | |
| 1,268,000 | Yadea Group Holdings Ltd.(2) | 2,178,641 | |
| 388,000 | Yangtze Optical Fibre and Cable Joint Stock Ltd. Co., Class H(2) | 653,422 | |
| 814,000 | Yangzijiang Shipbuilding Holdings Ltd. | 859,379 | |
| 538,200 | YiChang HEC ChangJiang Pharmaceutical Co., Ltd. Class H*(2) | 251,628 | |
| 489,000 | Zhongsheng Group Holdings Ltd. | 4,408,993 | |
| 1,693,600 | Zoomlion Heavy Industry Science and Technology Co., Ltd. Class H | 1,219,870 | |
| 139,894,613 | |||
| Cyprus - 0.3% | |||
| 406,097 | Polymetal International plc | 7,507,081 | |
| Czech Republic - 0.0% | |||
| 47,895 | O2 Czech Republic AS | 550,054 | |
| Denmark - 0.9% | |||
| 3,562 | AP Moller - Maersk A/S Class B | 10,322,489 | |
| 65,383 | Carlsberg A/S Class B | 10,795,766 | |
| 8,628 | Pandora A/S | 1,207,364 | |
| 80,953 | Spar Nord Bank A/S | 1,042,891 | |
| 21,948 | Sydbank A/S | 754,245 | |
| 24,122,755 | |||
| Finland - 0.2% | |||
| 260,466 | Nokia Oyj* | 1,494,946 | |
| 258,131 | Outokumpu Oyj* | 1,607,871 | |
| 34,854 | TietoEVRY Oyj | 1,068,878 | |
| 4,171,695 | |||
| France - 5.7% | |||
| 12,213 | Amundi S.A.(2) | 1,088,143 | |
| 49,652 | Atos SE | 2,590,478 | |
| 109,715 | BNP Paribas S.A. | 7,344,016 | |
| 112,684 | Cie de Saint-Gobain | 7,776,608 | |
| 29,225 | Cie Generale des Etablissements Michelin SCA | 4,594,680 | |
| 58,767 | Coface S.A.* | 840,239 | |
| 193,311 | Danone S.A. | 12,601,120 | |
| 49,561 | Derichebourg S.A.* | 564,018 | |
| 6,943 | Eramet S.A.* | 580,227 | |
| 240,045 | Eutelsat Communications S.A. | 3,411,793 | |
| 109,887 | Faurecia SE | 5,739,177 | |
| 8,735 | Fnac Darty S.A. | 567,098 | |
| 34,077 | Gaztransport Et Technigaz S.A. | 2,816,824 | |
| 78,350 | Ipsen S.A. | 8,108,744 | |
| 35,999 | IPSOS | 1,687,183 | |
| 230,244 | Metropole Television S.A. | 5,073,048 | |
| 14,187 | Nexans S.A. | 1,423,432 | |
| 900,689 | Orange S.A.(1) | 9,821,968 | |
| 74,210 | Publicis Groupe S.A. | 4,981,971 | |
| 152,925 | Rexel S.A. | 3,039,567 | |
| 12,552 | Rothschild & Co. | 552,110 | |
| 21,910 | Rubis SCA | 702,200 | |
| 326,442 | Sanofi | 32,789,175 | |
| 59 |
October 31, 2021
| Shares or Principal Amount | Market Value† | ||
| COMMON STOCKS - 95.1% - (continued) | |||
| France - 5.7% - (continued) | |||
| 15,775 | Societe BIC S.A. | $ 916,354 | |
| 179,926 | Societe Generale S.A. | 6,010,234 | |
| 61,770 | Technip Energies N.V.* | 950,664 | |
| 306,023 | TotalEnergies SE | 15,324,086 | |
| 2,935 | Trigano S.A. | 550,938 | |
| 190,834 | Valeo S.A. | 5,607,096 | |
| 67,015 | Valneva SE*(1) | 1,481,078 | |
| 149,534,269 | |||
| Georgia - 0.1% | |||
| 68,559 | TBC Bank Group plc | 1,473,076 | |
| Germany - 3.5% | |||
| 14,141 | Aurubis AG | 1,218,528 | |
| 59,420 | BASF SE | 4,276,674 | |
| 65,552 | Bayer AG | 3,694,357 | |
| 35,842 | Bayerische Motoren Werke AG | 3,621,332 | |
| 58,376 | BioNTech SE* | 16,271,142 | |
| 118,072 | CECONOMY AG* | 576,066 | |
| 129,356 | Covestro AG(2) | 8,283,779 | |
| 52,583 | Daimler AG | 5,219,516 | |
| 322,589 | Deutsche Bank AG* | 4,143,755 | |
| 23,257 | Deutsche Boerse AG | 3,860,826 | |
| 19,318 | Deutsche Post AG | 1,195,919 | |
| 10,186 | Draegerwerk AG & Co. KGaA | 801,878 | |
| 17,823 | DWS Group GmbH & Co. KgaA(2) | 770,943 | |
| 46,161 | Freenet AG | 1,188,888 | |
| 191,069 | Fresenius Medical Care AG & Co. KGaA | 12,692,535 | |
| 80,780 | Fresenius SE & Co. KGaA | 3,671,754 | |
| 21,272 | Hochtief AG | 1,641,139 | |
| 5,294 | Hornbach Holding AG & Co. KGaA | 669,466 | |
| 57,297 | Kloeckner & Co. SE* | 769,817 | |
| 51,322 | Porsche Automobil Holding SE | 5,341,411 | |
| 87,233 | ProSiebenSat.1 Media SE | 1,461,217 | |
| 30,112 | Salzgitter AG* | 1,104,808 | |
| 251,499 | Schaeffler AG | 1,998,446 | |
| 12,042 | Volkswagen AG | 2,702,603 | |
| 17,892 | Wacker Chemie AG | 3,233,208 | |
| 90,410,007 | |||
| Greece - 0.0% | |||
| 31,735 | JUMBO S.A. | 472,354 | |
| Hong Kong - 2.6% | |||
| 161,600 | ASM Pacific Technology Ltd. | 1,748,578 | |
| 267,000 | Bank of East Asia Ltd. | 438,486 | |
| 965,000 | BOC Hong Kong Holdings Ltd. | 3,057,935 | |
| 2,314,000 | Brilliance China Automotive Holdings Ltd.*(3)(4) | 765,831 | |
| 292,400 | China Gas Holdings Ltd. | 729,836 | |
| 970,000 | China Overseas Grand Oceans Group Ltd. | 465,065 | |
| 2,138,500 | China Overseas Land & Investment Ltd. | 4,716,581 | |
| 2,126,000 | China Traditional Chinese Medicine Co., Ltd. | 1,011,015 | |
| 656,303 | CK Asset Holdings Ltd. | 4,054,019 | |
| 401,200 | Dah Sing Banking Group Ltd. | 383,846 | |
| 111,600 | Dah Sing Financial Holdings Ltd. | 345,933 | |
| 264,000 | Hang Lung Group Ltd. | 618,169 | |
| 99,000 | Hang Lung Properties Ltd. | 229,765 | |
| 735,000 | Henderson Land Development Co., Ltd. | 3,077,577 | |
| 394,400 | Hongkong Land Holdings Ltd. | 2,177,983 | |
| 531,000 | Hysan Development Co., Ltd. | 1,846,096 | |
| 841,500 | JS Global Lifestyle Co., Ltd.(2) | 1,558,349 | |
| 232,000 | Kerry Logistics Network Ltd. | 562,552 | |
| 276,000 | Kerry Properties Ltd. | 780,169 | |
| 271,500 | Kingboard Holdings Ltd. | 1,183,144 | |
| Shares or Principal Amount | Market Value† | ||
| COMMON STOCKS - 95.1% - (continued) | |||
| Hong Kong - 2.6% - (continued) | |||
| 1,822,000 | Kunlun Energy Co., Ltd. | $ 1,659,441 | |
| 3,106,000 | Pacific Basin Shipping Ltd. | 1,433,439 | |
| 962,000 | Pacific Textiles Holdings Ltd. | 480,433 | |
| 929,000 | PAX Global Technology Ltd. | 643,772 | |
| 321,000 | Shenzhen International Holdings Ltd. | 386,457 | |
| 12,430,000 | Sino Biopharmaceutical Ltd. | 9,165,688 | |
| 720,000 | Sino Land Co., Ltd. | 946,357 | |
| 900,000 | SITC International Holdings Co., Ltd. | 3,041,857 | |
| 850,000 | SSY Group Ltd. | 403,781 | |
| 390,000 | Sun Hung Kai Properties Ltd. | 5,170,746 | |
| 280,000 | Swire Pacific Ltd. Class A | 1,760,245 | |
| 708,800 | Swire Properties Ltd. | 1,900,269 | |
| 41,000 | TAI Cheung Holdings Ltd. | 25,712 | |
| 713,000 | TCL Electronics Holdings Ltd. | 386,584 | |
| 1,242,000 | Untrade Youyuan(1)(3)(4) | — | |
| 1,399,089 | WH Group Ltd.(2) | 980,781 | |
| 668,000 | Wharf Real Estate Investment Co., Ltd. | 3,773,036 | |
| 1,956,000 | Xinyi Glass Holdings Ltd. | 5,511,900 | |
| 67,421,427 | |||
| Hungary - 0.2% | |||
| 128,870 | MOL Hungarian Oil & Gas plc | 1,101,235 | |
| 161,929 | Richter Gedeon Nyrt | 4,536,234 | |
| 5,637,469 | |||
| Indonesia - 0.3% | |||
| 3,014,900 | Bank Mandiri Persero Tbk PT | 1,524,248 | |
| 1,683,900 | Indofood Sukses Makmur Tbk PT | 755,846 | |
| 16,392,700 | Telekomunikasi Indonesia Persero Tbk PT | 4,381,532 | |
| 1,481,900 | Vale Indonesia Tbk PT | 507,869 | |
| 7,169,495 | |||
| Ireland - 0.4% | |||
| 1,218,668 | AIB Group plc* | 3,298,297 | |
| 819,529 | Bank of Ireland Group plc* | 4,882,087 | |
| 432,166 | Glenveagh Properties plc*(2) | 544,546 | |
| 129,726 | Kenmare Resources plc | 760,255 | |
| 9,485,185 | |||
| Isle of Man - 0.1% | |||
| 637,632 | Strix Group plc | 2,552,448 | |
| Israel - 0.8% | |||
| 232,162 | Bank Hapoalim BM | 2,286,554 | |
| 233,412 | Bank Leumi Le-Israel BM | 2,230,104 | |
| 1,074,697 | Bezeq The Israeli Telecommunication Corp. Ltd.* | 1,348,058 | |
| 70,000 | Check Point Software Technologies Ltd.* | 8,372,000 | |
| 229,013 | Israel Chemicals Ltd. | 1,962,640 | |
| 1 | Mehadrin Ltd.* | 39 | |
| 30,769 | Phoenix Holdings Ltd. | 388,918 | |
| 113,019 | Plus500 Ltd. | 2,034,686 | |
| 295,027 | Teva Pharmaceutical Industries Ltd.* | 2,578,536 | |
| 17,092 | ZIM Integrated Shipping Services Ltd. | 875,452 | |
| 22,076,987 | |||
| Italy - 1.4% | |||
| 364,471 | Anima Holding S.p.A.(2) | 1,936,595 | |
| 69,136 | Azimut Holding S.p.A. | 1,990,999 | |
| 63,299 | Banca Farmafactoring S.p.A.(2) | 566,781 | |
| 708,158 | Eni S.p.A. | 10,149,632 | |
| 355,253 | Mediobanca Banca di Credito Finanziario S.p.A.* | 4,239,136 | |
| 103,018 | Prysmian S.p.A. | 3,895,014 | |
| 11,273,148 | Telecom Italia S.p.A. | 4,021,692 | |
| 60 |
October 31, 2021
| Shares or Principal Amount | Market Value† | ||
| COMMON STOCKS - 95.1% - (continued) | |||
| Italy - 1.4% - (continued) | |||
| 1,119,448 | Terna Rete Elettrica Nazionale S.p.A. | $ 8,340,776 | |
| 170,981 | UniCredit S.p.A. | 2,260,273 | |
| 18,464 | Unieuro S.p.A.(2) | 433,827 | |
| 37,834,725 | |||
| Japan - 15.8% | |||
| 94,500 | ADEKA Corp. | 2,102,186 | |
| 78,500 | AGC, Inc. | 3,908,951 | |
| 128,700 | Aisin Corp. | 4,709,489 | |
| 173,000 | Amada Co., Ltd. | 1,709,148 | |
| 25,600 | Arcland Sakamoto Co., Ltd. | 382,922 | |
| 54,300 | Arisawa Manufacturing Co., Ltd. | 462,640 | |
| 75,400 | Asahi Diamond Industrial Co., Ltd. | 463,628 | |
| 80,000 | Asahi Holdings, Inc. | 1,427,850 | |
| 27,200 | Asahi Yukizai Corp. | 328,691 | |
| 9,000 | Asanuma Corp. | 359,926 | |
| 1,382,500 | Astellas Pharma, Inc. | 23,307,247 | |
| 1,500 | Bando Chemical Industries Ltd. | 11,591 | |
| 25,700 | Canon Electronics, Inc. | 353,751 | |
| 29,700 | Canon Marketing Japan, Inc. | 588,367 | |
| 428,100 | Citizen Watch Co., Ltd. | 1,866,970 | |
| 48,700 | CKD Corp. | 965,485 | |
| 38,700 | Coca-Cola Bottlers Japan Holdings, Inc. | 532,573 | |
| 3,100 | Corona Corp. | 24,907 | |
| 69,400 | Cosmo Energy Holdings Co., Ltd. | 1,418,718 | |
| 100,300 | Dai Nippon Printing Co., Ltd. | 2,484,939 | |
| 17,900 | Daido Steel Co., Ltd. | 685,799 | |
| 31,200 | Daiho Corp.(1) | 1,050,997 | |
| 71,700 | Daikyonishikawa Corp. | 430,869 | |
| 1,800 | Dainichi Co., Ltd. | 12,456 | |
| 26,900 | Dainichiseika Color & Chemicals Manufacturing Co., Ltd. | 621,798 | |
| 13,600 | Daito Pharmaceutical Co., Ltd. | 383,524 | |
| 523,700 | Daiwa Securities Group, Inc. | 2,942,225 | |
| 234,000 | Daiwabo Holdings Co., Ltd. | 4,119,563 | |
| 95,900 | DCM Holdings Co., Ltd. | 935,036 | |
| 16,100 | Denso Corp. | 1,167,172 | |
| 29,700 | Dexerials Corp. | 600,808 | |
| 57,700 | DIC Corp. | 1,527,709 | |
| 19,900 | Doutor Nichires Holdings Co., Ltd. | 285,452 | |
| 46,800 | Dowa Holdings Co., Ltd. | 1,954,551 | |
| 36,000 | Eagle Industry Co., Ltd. | 384,539 | |
| 78,000 | EDION Corp.(1) | 740,273 | |
| 184,900 | ENEOS Holdings, Inc. | 745,563 | |
| 61,600 | Exedy Corp. | 917,579 | |
| 104,600 | FCC Co., Ltd. | 1,448,166 | |
| 42,100 | Ferrotec Holdings Corp. | 1,412,224 | |
| 46,400 | Foster Electric Co., Ltd. | 330,772 | |
| 78,300 | FUJIFILM Holdings Corp. | 6,050,818 | |
| 8,800 | Fujimi, Inc. | 553,390 | |
| 1,100 | FuKoKu Co., Ltd. | 9,562 | |
| 24,100 | Goldcrest Co., Ltd. | 345,304 | |
| 64,200 | GS Yuasa Corp. | 1,397,611 | |
| 29,400 | G-Tekt Corp. | 366,529 | |
| 33,700 | GungHo Online Entertainment, Inc. | 632,241 | |
| 237,400 | Hachijuni Bank Ltd. | 793,436 | |
| 26,300 | Hamakyorex Co., Ltd. | 729,151 | |
| 247,600 | Haseko Corp. | 3,224,010 | |
| 226,500 | Hazama Ando Corp. | 1,533,791 | |
| 36,100 | Hitachi Ltd. | 2,080,246 | |
| 106,900 | Hokuetsu Kishu Paper Co., Ltd. | 706,342 | |
| 222,100 | Honda Motor Co., Ltd. | 6,569,243 | |
| 57,400 | Hosiden Corp. | 605,197 | |
| Shares or Principal Amount | Market Value† | ||
| COMMON STOCKS - 95.1% - (continued) | |||
| Japan - 15.8% - (continued) | |||
| 27,000 | Iida Group Holdings Co., Ltd. | $ 665,671 | |
| 10,500 | Imasen Electric Industrial | 65,392 | |
| 1,106,000 | Inpex Corp. | 9,223,287 | |
| 408,300 | Isuzu Motors Ltd. | 5,492,778 | |
| 217,300 | ITOCHU Corp. | 6,197,584 | |
| 210,000 | Iyo Bank Ltd. | 1,027,429 | |
| 51,300 | Japan Petroleum Exploration Co., Ltd. | 933,542 | |
| 47,200 | Japan Post Insurance Co., Ltd. | 765,805 | |
| 211,600 | JGC Holdings Corp. | 1,988,470 | |
| 173,100 | JTEKT Corp. | 1,532,214 | |
| 21,800 | K&O Energy Group, Inc. | 312,385 | |
| 122,000 | Kajima Corp. | 1,502,156 | |
| 119,000 | Kamigumi Co., Ltd. | 2,396,059 | |
| 77,600 | Kanamoto Co., Ltd. | 1,662,253 | |
| 63,800 | Kandenko Co., Ltd. | 494,567 | |
| 61,300 | Kaneka Corp. | 2,350,789 | |
| 33,600 | Kanematsu Corp. | 390,203 | |
| 42,700 | Kanto Denka Kogyo Co., Ltd. | 392,764 | |
| 802,400 | KDDI Corp. | 24,537,378 | |
| 19,800 | KH Neochem Co., Ltd. | 508,876 | |
| 29,600 | Kinden Corp. | 485,754 | |
| 26,400 | Kintetsu World Express, Inc. | 634,039 | |
| 18,100 | Kissei Pharmaceutical Co., Ltd. | 362,060 | |
| 251,300 | Kobe Steel Ltd. | 1,476,486 | |
| 22,000 | Kohnan Shoji Co., Ltd. | 688,013 | |
| 26,400 | Komeri Co., Ltd. | 609,663 | |
| 29,600 | Kumagai Gumi Co., Ltd. | 732,643 | |
| 29,700 | Kureha Corp. | 1,930,139 | |
| 31,200 | Kyokuto Kaihatsu Kogyo Co., Ltd. | 426,406 | |
| 45,600 | Kyudenko Corp. | 1,446,437 | |
| 14,300 | Life Corp. | 469,388 | |
| 36,700 | Makino Milling Machine Co., Ltd. | 1,320,396 | |
| 535,600 | Marubeni Corp. | 4,544,737 | |
| 573,700 | Mazda Motor Corp.* | 5,160,014 | |
| 57,300 | MCJ Co., Ltd. | 645,122 | |
| 25,800 | Meidensha Corp. | 543,072 | |
| 691,300 | Mitsubishi Chemical Holdings Corp. | 5,722,182 | |
| 139,400 | Mitsubishi Gas Chemical Co., Inc. | 2,805,597 | |
| 435,300 | Mitsubishi Motors Corp.* | 1,393,187 | |
| 22,200 | Mitsuboshi Belting Ltd. | 394,581 | |
| 299,800 | Mitsui & Co., Ltd. | 6,860,777 | |
| 112,600 | Mitsui Chemicals, Inc. | 3,348,029 | |
| 26,300 | Mitsui Mining & Smelting Co., Ltd. | 754,683 | |
| 46,600 | Mitsui OSK Lines Ltd. | 2,938,199 | |
| 34,600 | Mitsui Sugar Co., Ltd. | 614,847 | |
| 35,400 | Mizuno Corp. | 823,872 | |
| 3,900 | Murakami Corp. | 88,883 | |
| 105,800 | Musashi Seimitsu Industry Co., Ltd. | 1,991,273 | |
| 88,300 | Nagase & Co., Ltd. | 1,494,546 | |
| 21,700 | Nextage Co., Ltd. | 397,691 | |
| 159,400 | NGK Spark Plug Co., Ltd. | 2,546,414 | |
| 229,000 | NHK Spring Co., Ltd. | 1,727,526 | |
| 16,200 | Nichias Corp. | 396,657 | |
| 4,000 | Nichireki Co., Ltd. | 47,464 | |
| 10,868 | Nichirin Co., Ltd. | 174,068 | |
| 41,700 | Nikkon Holdings Co., Ltd. | 814,706 | |
| 319,000 | Nikon Corp. | 3,517,215 | |
| 14,100 | Nippon Carbon Co., Ltd. | 544,340 | |
| 86,500 | Nippon Kayaku Co., Ltd. | 911,024 | |
| 96,950 | Nippon Light Metal Holdings Co., Ltd. | 1,609,104 | |
| 26,600 | Nippon Seiki Co., Ltd. | 267,612 | |
| 29,400 | Nippon Shokubai Co., Ltd. | 1,535,995 | |
| 23,700 | Nippon Soda Co., Ltd. | 712,084 | |
| 61 |
October 31, 2021
| Shares or Principal Amount | Market Value† | ||
| COMMON STOCKS - 95.1% - (continued) | |||
| Japan - 15.8% - (continued) | |||
| 107,600 | Nippon Suisan Kaisha Ltd. | $ 611,523 | |
| 890,500 | Nippon Telegraph & Telephone Corp. | 24,950,860 | |
| 78,100 | Nippon Yusen KK | 5,627,673 | |
| 53,300 | Nishio Rent All Co., Ltd. | 1,317,994 | |
| 630,500 | Nissan Motor Co., Ltd.* | 3,209,156 | |
| 15,000 | Nisshin Oillio Group Ltd. | 397,622 | |
| 22,200 | Nitta Corp. | 508,938 | |
| 26,800 | Nojima Corp. | 587,752 | |
| 137,100 | NOK Corp. | 1,591,424 | |
| 869,200 | Nomura Holdings, Inc. | 4,139,578 | |
| 12,400 | Noritake Co. Ltd. | 542,182 | |
| 433,100 | Obayashi Corp. | 3,656,332 | |
| 514,400 | Oji Holdings Corp. | 2,549,746 | |
| 31,000 | Okinawa Cellular Telephone Co. | 1,396,743 | |
| 20,600 | Okura Industrial Co., Ltd. | 380,913 | |
| 622,700 | Ono Pharmaceutical Co., Ltd. | 13,065,321 | |
| 65,000 | Osaki Electric Co., Ltd. | 320,445 | |
| 28,500 | Oyo Corp. | 436,739 | |
| 424,100 | Panasonic Corp. | 5,244,430 | |
| 238,100 | Penta-Ocean Construction Co., Ltd. | 1,640,730 | |
| 36,000 | Piolax, Inc. | 517,875 | |
| 198,500 | Press Kogyo Co., Ltd. | 578,379 | |
| 358,800 | Renesas Electronics Corp.* | 4,413,751 | |
| 159,600 | Rengo Co., Ltd. | 1,210,267 | |
| 6,500 | Rohm Co., Ltd. | 594,344 | |
| 10,200 | Rorze Corp. | 977,645 | |
| 26,100 | Ryosan Co., Ltd. | 538,048 | |
| 29,200 | Sanki Engineering Co., Ltd. | 367,785 | |
| 2,000 | Sanko Metal Industrial Co., Ltd. | 44,156 | |
| 25,200 | Sankyu, Inc. | 1,137,698 | |
| 13,000 | Sanyo Chemical Industries Ltd. | 643,691 | |
| 46,900 | Sawai Group Holdings Co., Ltd. | 2,068,958 | |
| 132,300 | SBI Holdings, Inc. | 3,429,145 | |
| 35,700 | SCREEN Holdings Co., Ltd. | 3,318,287 | |
| 18,600 | SEC Carbon Ltd.(1) | 950,228 | |
| 122,700 | Seino Holdings Co., Ltd. | 1,486,621 | |
| 187,200 | Sekisui House Ltd. | 3,892,033 | |
| 42,300 | Sekisui Jushi Corp. | 788,032 | |
| 51,200 | Senko Group Holdings Co., Ltd. | 455,405 | |
| 41,300 | Shikoku Chemicals Corp. | 507,539 | |
| 23,000 | Shima Seiki Manufacturing Ltd. | 442,257 | |
| 310,900 | Shimizu Corp. | 2,277,915 | |
| 70,600 | Shinnihon Corp. | 516,771 | |
| 108,700 | Shizuoka Bank Ltd. | 875,294 | |
| 48,800 | Showa Denko KK | 1,223,906 | |
| 43,000 | Sintokogio Ltd. | 282,595 | |
| 29,500 | SK-Electronics Co., Ltd. | 238,537 | |
| 327,100 | SKY Perfect JSAT Holdings, Inc. | 1,226,714 | |
| 311,600 | Softbank Corp. | 4,253,239 | |
| 103,300 | Sumco Corp. | 1,973,919 | |
| 26,700 | Sumitomo Bakelite Co., Ltd. | 1,199,969 | |
| 345,500 | Sumitomo Chemical Co., Ltd. | 1,702,042 | |
| 125,600 | Sumitomo Corp. | 1,789,757 | |
| 268,200 | Sumitomo Electric Industries Ltd. | 3,559,782 | |
| 115,500 | Sumitomo Forestry Co., Ltd. | 2,206,160 | |
| 87,700 | Sumitomo Heavy Industries Ltd. | 2,257,880 | |
| 146,500 | Sumitomo Mitsui Construction Co., Ltd. | 621,693 | |
| 146,000 | Sumitomo Mitsui Financial Group, Inc. | 4,737,647 | |
| 140,800 | Sumitomo Rubber Industries Ltd. | 1,735,229 | |
| 33,600 | Sumitomo Seika Chemicals Co., Ltd. | 956,981 | |
| 32,900 | Tachi-S Co., Ltd. | 398,469 | |
| 19,000 | Taihei Dengyo Kaisha Ltd. | 448,810 | |
| 121,400 | Taisei Corp. | 3,809,427 | |
| Shares or Principal Amount | Market Value† | ||
| COMMON STOCKS - 95.1% - (continued) | |||
| Japan - 15.8% - (continued) | |||
| 30,100 | Taiyo Yuden Co., Ltd. | $ 1,525,661 | |
| 63,600 | TBS Holdings, Inc. | 1,005,996 | |
| 107,100 | Toagosei Co., Ltd. | 1,196,958 | |
| 31,900 | Toho Holdings Co., Ltd. | 516,460 | |
| 113,500 | Tokai Carbon Co., Ltd. | 1,484,663 | |
| 41,700 | Tokai Rika Co., Ltd. | 583,703 | |
| 37,900 | Tokyo Seimitsu Co., Ltd. | 1,543,137 | |
| 61,200 | Tokyo Steel Manufacturing Co., Ltd. | 681,018 | |
| 174,300 | Tokyu Construction Co., Ltd. | 1,232,459 | |
| 210,100 | Toppan, Inc. | 3,391,460 | |
| 74,800 | Topre Corp. | 865,214 | |
| 275,200 | Toray Industries, Inc. | 1,714,913 | |
| 9,900 | Torii Pharmaceutical Co., Ltd. | 257,022 | |
| 70,200 | Tosoh Corp. | 1,182,239 | |
| 105,600 | Toyo Construction Co., Ltd. | 528,597 | |
| 38,200 | Toyo Ink SC Holdings Co., Ltd. | 672,745 | |
| 120,100 | Toyo Seikan Group Holdings Ltd. | 1,426,072 | |
| 38,400 | Toyo Tanso Co., Ltd. | 1,043,922 | |
| 87,600 | Toyo Tire Corp. | 1,456,649 | |
| 21,400 | Toyoda Gosei Co., Ltd. | 437,893 | |
| 36,100 | Toyota Boshoku Corp. | 694,096 | |
| 81,800 | Toyota Tsusho Corp. | 3,548,171 | |
| 44,400 | TPR Co., Ltd. | 565,774 | |
| 151,600 | TS Tech Co., Ltd. | 2,028,413 | |
| 34,400 | Tsubakimoto Chain Co. | 1,016,429 | |
| 20,200 | Tv Tokyo Holdings Corp. | 383,035 | |
| 47,000 | Ulvac, Inc. | 2,636,935 | |
| 75,400 | Unipres Corp. | 615,166 | |
| 37,600 | Ushio, Inc. | 672,678 | |
| 15,800 | Valor Holdings Co., Ltd. | 334,629 | |
| 92,000 | Wakita & Co., Ltd. | 832,420 | |
| 253,400 | Yamaha Motor Co., Ltd. | 7,063,221 | |
| 52,900 | Yokogawa Bridge Holdings Corp. | 1,066,264 | |
| 104,500 | Yokohama Rubber Co., Ltd. | 1,768,261 | |
| 18,500 | Yuasa Trading Co., Ltd. | 494,421 | |
| 54,500 | Yurtec Corp. | 319,245 | |
| 46,600 | Zenkoku Hosho Co., Ltd. | 2,251,927 | |
| 411,919,299 | |||
| Luxembourg - 0.3% | |||
| 31,704 | Aperam S.A. | 1,890,307 | |
| 60,496 | ArcelorMittal S.A. | 2,045,983 | |
| 6,749 | Befesa S.A.(2) | 502,123 | |
| 66,373 | RTL Group S.A. | 3,833,589 | |
| 8,272,002 | |||
| Malaysia - 0.4% | |||
| 48,400 | AFFIN Bank Bhd | 19,895 | |
| 396,800 | AMMB Holdings Bhd* | 321,963 | |
| 9,062,400 | Astro Malaysia Holdings Bhd | 2,177,515 | |
| 396,700 | Kossan Rubber Industries | 226,084 | |
| 768,200 | Lingkaran Trans Kota Holdings Bhd | 714,216 | |
| 573,070 | Lynas Corp. Ltd.* | 3,196,872 | |
| 1,462,800 | Public Bank Bhd | 1,473,044 | |
| 944,900 | RHB Bank Bhd | 1,274,945 | |
| 558,600 | Scientex BHD | 628,610 | |
| 638,600 | Supermax Corp. Bhd | 296,091 | |
| 530,800 | Westports Holdings Bhd | 572,972 | |
| 10,902,207 | |||
| Mexico - 0.6% | |||
| 470,800 | Banco del Bajio S.A.(2) | 882,235 | |
| 1,223,601 | Bolsa Mexicana de Valores S.A.B. de C.V. | 2,341,649 | |
| 2,296,000 | Concentradora Fibra Danhos S.A. de C.V. REIT(1) | 2,798,069 | |
| 62 |
October 31, 2021
| Shares or Principal Amount | Market Value† | ||
| COMMON STOCKS - 95.1% - (continued) | |||
| Mexico - 0.6% - (continued) | |||
| 658,100 | Gentera S.A.B. de C.V.* | $ 396,369 | |
| 3,705 | Grupo Aeroportuario del Pacifico S.A.B. de C.V. ADR(1) | 467,867 | |
| 1,043,300 | Grupo Financiero Inbursa S.A.B. de C.V. Class O* | 1,044,922 | |
| 4,820,933 | Kimberly-Clark de Mexico S.A.B. de C.V. Class A | 7,619,641 | |
| 2 | Urbi Desarrollos Urbanos S.A.B. de C.V.* | 1 | |
| 15,550,753 | |||
| Monaco - 0.0% | |||
| 33,512 | Costamare, Inc. | 449,396 | |
| Netherlands - 3.3% | |||
| 365,540 | ABN Amro Bank N.V.(2) | 5,376,256 | |
| 9,743 | Accell Group N.V.* | 401,685 | |
| 222,608 | Aegon N.V. | 1,129,132 | |
| 84,464 | AMG Advanced Metallurgical Group N.V.(1) | 2,491,274 | |
| 145,426 | ASR Nederland N.V. | 6,797,823 | |
| 119,971 | Euronext N.V.(2) | 13,498,365 | |
| 24,577 | EXOR N.V. | 2,318,371 | |
| 12,916 | Flow Traders(2) | 438,371 | |
| 388,196 | ING Groep N.V. | 5,888,507 | |
| 45,042 | Intertrust N.V.*(2) | 681,057 | |
| 20,107 | Koninklijke Vopak N.V. | 800,216 | |
| 135,518 | NN Group N.V. | 7,244,353 | |
| 440,234 | PostNL N.V. | 1,910,668 | |
| 548,157 | Royal Dutch Shell plc Class A | 12,557,660 | |
| 521,895 | Royal Dutch Shell plc Class B | 11,976,823 | |
| 100,891 | Signify N.V.(2) | 4,888,813 | |
| 316,866 | Stellantis N.V. | 6,326,055 | |
| 84,725,429 | |||
| Norway - 1.4% | |||
| 49,584 | Aker BP ASA | 1,902,633 | |
| 64,802 | Austevoll Seafood ASA | 877,328 | |
| 674,678 | Equinor ASA | 17,095,212 | |
| 234,105 | Europris ASA(2) | 1,733,540 | |
| 186,850 | Frontline Ltd. | 1,660,825 | |
| 175,415 | Nordic American Tankers Ltd.(1) | 412,225 | |
| 249,135 | Norsk Hydro ASA | 1,830,013 | |
| 108,023 | Telenor ASA | 1,706,818 | |
| 154,487 | Yara International ASA | 8,073,933 | |
| 35,292,527 | |||
| Philippines - 0.0% | |||
| 373,000 | Metropolitan Bank & Trust Co. | 352,781 | |
| Poland - 0.2% | |||
| 104,670 | KGHM Polska Miedz S.A. | 4,024,894 | |
| 47,461 | Powszechna Kasa Oszczednosci Bank Polski S.A.* | 581,107 | |
| 4,606,001 | |||
| Portugal - 0.0% | |||
| 138,445 | NOS SGPS S.A. | 539,983 | |
| Russia - 1.0% | |||
| 64,397 | Globaltrans Investment plc GDR | 569,080 | |
| 32,553 | Lukoil PJSC ADR | 3,318,155 | |
| 17,314 | LUKOIL PJSC ADR | 1,766,547 | |
| 131,644 | MMC Norilsk Nickel PJSC ADR | 4,113,996 | |
| 314,255 | Mobile TeleSystems PJSC ADR | 2,888,003 | |
| 201,999 | PhosAgro PJSC GDR | 4,831,816 | |
| Shares or Principal Amount | Market Value† | ||
| COMMON STOCKS - 95.1% - (continued) | |||
| Russia - 1.0% - (continued) | |||
| 81,232 | Polyus PJSC GDR | $ 8,030,763 | |
| 539,390 | RusHydro PJSC ADR | 590,139 | |
| 26,108,499 | |||
| Singapore - 1.4% | |||
| 181,000 | AEM Holdings Ltd. | 563,706 | |
| 74,100 | BOC Aviation Ltd.(2) | 648,432 | |
| 31,600 | China Yuchai International Ltd. | 416,488 | |
| 186,400 | DBS Group Holdings Ltd. | 4,355,768 | |
| 1,400,000 | IGG, Inc. | 1,301,682 | |
| 1,434,700 | Oversea-Chinese Banking Corp. Ltd. | 12,541,899 | |
| 448,600 | Riverstone Holdings Ltd. | 286,455 | |
| 1,378,600 | Singapore Press Holdings Ltd. | 2,041,030 | |
| 493,800 | United Overseas Bank Ltd. | 9,815,922 | |
| 712,100 | UOL Group Ltd. | 3,819,296 | |
| 35,790,678 | |||
| South Africa - 2.0% | |||
| 76,147 | AECI Ltd. | 565,377 | |
| 61,250 | Anglo American Platinum Ltd. | 6,188,756 | |
| 275,426 | AngloGold Ashanti Ltd. ADR | 5,089,872 | |
| 57,565 | Aspen Pharmacare Holdings Ltd. | 916,706 | |
| 268,724 | Barloworld Ltd. | 2,256,930 | |
| 868,410 | Gold Fields Ltd. ADR | 8,058,845 | |
| 94,262 | Hudaco Industries Ltd. | 844,995 | |
| 493,386 | Impala Platinum Holdings Ltd. | 6,385,574 | |
| 92,152 | Kumba Iron Ore Ltd. | 2,804,203 | |
| 49,775 | Mr. Price Group Ltd. | 651,588 | |
| 203,027 | MTN Group Ltd.* | 1,820,569 | |
| 226,987 | MultiChoice Group Ltd. | 1,805,048 | |
| 2,733,223 | Netcare Ltd.* | 3,025,781 | |
| 73,987 | Oceana Group Ltd. | 296,723 | |
| 80,499 | Royal Bafokeng Platinum Ltd. | 577,274 | |
| 184,094 | Sappi Ltd.* | 565,499 | |
| 227,873 | Standard Bank Group Ltd. | 2,019,279 | |
| 303,456 | Truworths International Ltd. | 1,071,185 | |
| 705,513 | Vodacom Group Ltd. | 6,262,092 | |
| 51,206,296 | |||
| South Korea - 5.6% | |||
| 6,959 | AfreecaTV Co., Ltd. | 1,152,906 | |
| 30,450 | Asia Paper Manufacturing Co., Ltd. | 1,196,651 | |
| 131,840 | BH Co., Ltd. | 2,118,310 | |
| 17,741 | Bioneer Corp.* | 761,269 | |
| 4,478 | CJ CheilJedang Corp. | 1,455,366 | |
| 10,034 | Com2uSCorp | 1,105,425 | |
| 36,255 | Coway Co., Ltd. | 2,458,269 | |
| 19,133 | Daesang Corp. | 391,420 | |
| 84,741 | Daewoo Engineering & Construction Co., Ltd.* | 453,696 | |
| 20,973 | DB HiTek Co., Ltd. | 1,036,658 | |
| 48,189 | Dongkuk Steel Mill Co., Ltd. | 703,346 | |
| 15,137 | Echo Marketing, Inc. | 225,157 | |
| 10,382 | Eo Technics Co., Ltd. | 957,591 | |
| 28,576 | Eugene Technology Co., Ltd. | 1,089,506 | |
| 31,308 | Fila Holdings Corp. | 997,501 | |
| 24,999 | GS Holdings Corp. | 905,326 | |
| 110,742 | Hana Financial Group, Inc. | 4,270,192 | |
| 18,238 | Handsome Co., Ltd. | 658,985 | |
| 70,539 | Hankook Tire & Technology Co., Ltd. | 2,499,292 | |
| 10,274 | Hansol Chemical Co., Ltd. | 2,899,411 | |
| 116,319 | Hanwha Chemical Corp.* | 4,080,795 | |
| 31,319 | Hanyang Eng Co., Ltd. | 412,754 | |
| 57,065 | HMM Co., Ltd.* | 1,305,662 | |
| 1,217 | Hyosung Advanced Materials Corp.* | 743,335 | |
| 1,390 | Hyosung Chemical Corp.* | 344,254 | |
| 63 |
October 31, 2021
| Shares or Principal Amount | Market Value† | ||
| COMMON STOCKS - 95.1% - (continued) | |||
| South Korea - 5.6% - (continued) | |||
| 6,257 | Hyosung Corp. | $ 553,977 | |
| 1,807 | Hyosung TNC Corp. | 929,008 | |
| 27,797 | Hyundai Department Store Co., Ltd. | 1,973,702 | |
| 35,233 | Hyundai Greenfood Co., Ltd. | 292,944 | |
| 6,416 | Hyundai Home Shopping Network Corp. | 385,137 | |
| 16,458 | Hyundai Mobis Co., Ltd. | 3,557,710 | |
| 10,730 | Hyundai Motor Co. | 1,919,119 | |
| 11,716 | Hyundai Wia Corp. | 846,080 | |
| 30,973 | INTOPS Co., Ltd. | 617,791 | |
| 94,761 | KB Financial Group, Inc. | 4,586,801 | |
| 125,899 | Kia Motors Corp. | 9,187,143 | |
| 7,236 | KIWOOM Securities Co., Ltd. | 652,337 | |
| 10,965 | Kolmar BNH Co., Ltd. | 333,527 | |
| 15,866 | Kolon Industries, Inc. | 1,213,994 | |
| 3,314 | Krafton, Inc.* | 1,331,499 | |
| 59,066 | KT Skylife Co., Ltd. | 512,567 | |
| 55,238 | LG Corp. | 4,318,368 | |
| 84,654 | LG Electronics, Inc. | 8,757,784 | |
| 10,965 | LG Innotek Co., Ltd. | 1,971,031 | |
| 99,775 | LG Uplus Corp. | 1,227,946 | |
| 12,606 | Lotte Chemical Corp. | 2,424,657 | |
| 13,440 | Lotte Corp. | 376,453 | |
| 37,058 | LOTTE Fine Chemical Co., Ltd. | 2,705,526 | |
| 88,082 | NH Investment & Securities Co., Ltd. | 994,864 | |
| 10,364 | Osstem Implant Co., Ltd. | 1,098,598 | |
| 20,680 | Samsung Card Co., Ltd. | 607,203 | |
| 184,402 | Samsung Electronics Co., Ltd. | 11,040,722 | |
| 4,331 | Samsung Electronics Co., Ltd. GDR | 6,484,967 | |
| 32,897 | Samsung Securities Co., Ltd. | 1,337,378 | |
| 20,741 | SD Biosensor, Inc.* | 812,920 | |
| 10,305 | Seegene, Inc. | 471,477 | |
| 634,176 | Seohee Construction Co., Ltd. | 1,002,776 | |
| 12,783 | SFA Engineering Corp. | 386,610 | |
| 13,569 | Shindaeyang Paper Co., Ltd. | 1,018,583 | |
| 29,771 | Shinhan Financial Group Co., Ltd. | 971,931 | |
| 7,977 | Silicon Works Co., Ltd. | 750,067 | |
| 19,109 | SK Bioscience Co., Ltd.* | 3,761,131 | |
| 156,269 | SK Hynix, Inc. | 13,775,201 | |
| 21,215 | SK Innovation Co., Ltd.* | 4,424,388 | |
| 22,763 | SK Telecom Co., Ltd.(3)(4) | 6,027,338 | |
| 11,456 | S-Oil Corp. | 1,002,373 | |
| 3,575 | Soulbrain Co., Ltd. | 802,499 | |
| 22,135 | Soulbrain Holdings Co., Ltd.* | 829,109 | |
| 16,337 | Spigen Korea Co., Ltd. | 639,697 | |
| 4,195 | Tokai Carbon Korea Co., Ltd. | 448,663 | |
| 16,888 | Webzen, Inc.* | 390,929 | |
| 32,095 | Wonik IPS Co., Ltd. | 1,113,911 | |
| 10,343 | Youngone Holdings Co., Ltd. | 416,399 | |
| 145,507,912 | |||
| Spain - 1.5% | |||
| 68,192 | Acerinox S.A. | 949,391 | |
| 119,821 | Atresmedia Corp. de Medios de Comunicacion S.A.* | 488,421 | |
| 498,265 | Banco Bilbao Vizcaya Argentaria S.A. | 3,486,921 | |
| 514,588 | CaixaBank S.A. | 1,479,268 | |
| 53,723 | CIE Automotive S.A. | 1,462,332 | |
| 305,678 | Mediaset Espana Comunicacion S.A.* | 1,590,137 | |
| 10,727 | Pharma Mar S.A. | 832,564 | |
| 874,960 | Prosegur Cash S.A.(2) | 600,974 | |
| 560,783 | Red Electrica Corp. S.A. | 11,676,480 | |
| Shares or Principal Amount | Market Value† | ||
| COMMON STOCKS - 95.1% - (continued) | |||
| Spain - 1.5% - (continued) | |||
| 973,428 | Repsol S.A. | $ 12,468,183 | |
| 233,781 | Sacyr S.A. | 666,379 | |
| 792,519 | Telefonica S.A. | 3,442,431 | |
| 39,143,481 | |||
| Sweden - 1.9% | |||
| 40,298 | Bilia AB Class A | 716,557 | |
| 130,942 | Boliden AB | 4,616,256 | |
| 17,394 | Bure Equity AB | 807,383 | |
| 433,165 | Essity AB Class B | 14,030,942 | |
| 37,169 | Granges AB | 405,399 | |
| 42,700 | Intrum AB | 1,212,017 | |
| 258,930 | Lundin Energy AB | 10,226,031 | |
| 85,627 | Nobia AB | 527,755 | |
| 720,234 | Skandinaviska Enskilda Banken AB Class A | 11,262,895 | |
| 93,410 | SKF AB Class B | 2,169,465 | |
| 274,124 | SSAB AB* | 1,562,051 | |
| 119,768 | Telefonaktiebolaget LM Ericsson Class B | 1,307,316 | |
| 111,733 | Tethys Oil AB | 813,481 | |
| 49,657,548 | |||
| Switzerland - 4.6% | |||
| 9,748 | Baloise Holding AG | 1,553,442 | |
| 930,783 | Credit Suisse Group AG | 9,681,731 | |
| 203,487 | Ferrexpo plc | 868,054 | |
| 173,059 | Julius Baer Group Ltd. | 12,517,717 | |
| 390,061 | Novartis AG | 32,263,000 | |
| 86,368 | Roche Holding AG | 33,458,442 | |
| 22,358 | Swisscom AG | 12,174,475 | |
| 4,684 | Swissquote Group Holding S.A. | 950,145 | |
| 867,292 | UBS Group AG | 15,787,037 | |
| 14,856 | Vontobel Holding AG | 1,375,800 | |
| 120,629,843 | |||
| Taiwan - 5.8% | |||
| 1,150,000 | ASE Technology Holding Co., Ltd. | 4,113,569 | |
| 240,000 | Asia Vital Components Co., Ltd. | 717,167 | |
| 169,000 | Asustek Computer, Inc. | 2,148,635 | |
| 6,706,000 | AU Optronics Corp. | 4,608,518 | |
| 252,000 | Catcher Technology Co., Ltd. | 1,461,199 | |
| 2,580,000 | Cathay Financial Holding Co., Ltd. | 5,377,990 | |
| 178,000 | Chenbro Micom Co., Ltd. | 481,921 | |
| 279,000 | Cheng Uei Precision Industry Co., Ltd. | 387,854 | |
| 281,000 | Chia Chang Co., Ltd. | 471,148 | |
| 954,000 | Chicony Electronics Co., Ltd. | 2,727,987 | |
| 164,000 | Chicony Power Technology Co., Ltd. | 411,699 | |
| 260,208 | China Life Insurance Co., Ltd. | 271,988 | |
| 250,400 | China Motor Corp. | 623,782 | |
| 619,000 | Chipbond Technology Corp. | 1,436,814 | |
| 443,000 | ChipMOS Technologies, Inc. | 736,646 | |
| 12,947 | ChipMOS Technologies, Inc. ADR | 430,747 | |
| 561,000 | Compeq Manufacturing Co., Ltd. | 816,397 | |
| 421,000 | Elan Microelectronics Corp. | 2,534,576 | |
| 271,000 | Elite Material Co., Ltd. | 2,346,967 | |
| 1,528,000 | Evergreen Marine Corp. Taiwan Ltd. | 5,498,784 | |
| 320,000 | Foxconn Technology Co., Ltd. | 794,531 | |
| 271,000 | Fusheng Precision Co., Ltd. | 1,839,632 | |
| 135,000 | General Interface Solution Holding Ltd. | 472,467 | |
| 104,000 | Giant Manufacturing Co., Ltd. | 1,207,884 | |
| 272,000 | Gigabyte Technology Co., Ltd. | 1,104,514 | |
| 104,000 | Globalwafers Co., Ltd. | 2,853,552 | |
| 288,000 | Gold Circuit Electronics Ltd. | 689,947 | |
| 64 |
October 31, 2021
| Shares or Principal Amount | Market Value† | ||
| COMMON STOCKS - 95.1% - (continued) | |||
| Taiwan - 5.8% - (continued) | |||
| 1,238,829 | Hannstar Board Corp. | $ 1,860,620 | |
| 62,285 | Himax Technologies, Inc. ADR(1) | 657,730 | |
| 244,000 | Holtek Semiconductor, Inc. | 906,836 | |
| 5,775,000 | Innolux Corp. | 3,473,841 | |
| 108,000 | ITEQ Corp. | 499,901 | |
| 899,000 | King Yuan Electronics Co., Ltd. | 1,289,966 | |
| 91,000 | Kinsus Interconnect Technology Corp. | 800,853 | |
| 65,000 | Lotes Co., Ltd. | 1,354,286 | |
| 1,244,000 | Macronix International Co., Ltd. | 1,760,104 | |
| 227,000 | MediaTek, Inc. | 7,471,179 | |
| 59,000 | Merida Industry Co., Ltd. | 614,560 | |
| 311,000 | Micro-Star International Co., Ltd. | 1,569,471 | |
| 167,000 | Nan Ya Plastics Corp. | 512,500 | |
| 206,000 | Nan Ya Printed Circuit Board Corp. | 3,645,015 | |
| 33,000 | Nien Made Enterprise Co., Ltd. | 453,520 | |
| 700,000 | Novatek Microelectronics Corp. | 10,499,258 | |
| 66,000 | Parade Technologies Ltd. | 4,251,688 | |
| 757,000 | Pegatron Corp. | 1,853,166 | |
| 696,000 | Powertech Technology, Inc. | 2,442,122 | |
| 318,000 | Radiant Opto-Electronics Corp. | 1,114,177 | |
| 579,000 | Realtek Semiconductor Corp. | 10,414,839 | |
| 147,000 | RichWave Technology Corp. | 1,528,586 | |
| 333,000 | Shinkong Insurance Co., Ltd. | 552,629 | |
| 14,008 | Silicon Motion Technology Corp. ADR | 1,000,311 | |
| 191,000 | Simplo Technology Co., Ltd. | 2,057,709 | |
| 628,000 | Sino-American Silicon Products, Inc. | 4,301,586 | |
| 227,000 | Sunonwealth Electric Machine Industry Co., Ltd. | 314,773 | |
| 85,000 | Swancor Holding Co., Ltd. | 301,706 | |
| 666,000 | Synnex Technology International Corp. | 1,290,406 | |
| 227,000 | Taiwan Fertilizer Co., Ltd. | 555,119 | |
| 237,000 | Taiwan Semiconductor Manufacturing Co., Ltd. | 5,029,209 | |
| 238,000 | Taiwan Surface Mounting Technology Corp. | 960,318 | |
| 164,000 | Taiwan Union Technology Corp. | 565,502 | |
| 296,000 | Topco Scientific Co., Ltd. | 1,471,054 | |
| 310,000 | Tripod Technology Corp. | 1,313,001 | |
| 461,000 | Tung Ho Steel Enterprise Corp. | 670,097 | |
| 311,000 | TXC Corp. | 1,149,385 | |
| 466,000 | Unimicron Technology Corp. | 3,194,355 | |
| 205,000 | United Integrated Services Co., Ltd. | 1,355,405 | |
| 1,851,000 | United Microelectronics Corp. | 3,842,628 | |
| 524,000 | USI Corp. | 649,096 | |
| 968,000 | Vanguard International Semiconductor Corp. | 5,044,027 | |
| 436,000 | Wan Hai Lines Ltd. | 2,515,324 | |
| 1,657,000 | Winbond Electronics Corp. | 1,571,073 | |
| 245,000 | Yageo Corp. | 3,834,671 | |
| 152,000 | Zhen Ding Technology Holding Ltd. | 526,379 | |
| 54,000 | ZillTek Technology Corp. | 617,561 | |
| 150,224,457 | |||
| Thailand - 0.5% | |||
| 1,184,000 | Bangkok Bank PCL NVDR | 4,381,644 | |
| 877,600 | Kasikornbank PCL NVDR | 3,741,320 | |
| 3,865,800 | Krung Thai Bank PCL NVDR | 1,341,824 | |
| 832,000 | Siam Commercial Bank PCL NVDR | 3,163,404 | |
| 617,500 | Sri Trang Agro-Industry PCL NVDR | 605,276 | |
| 2,722,400 | TTW PCL NVDR | 959,906 | |
| 14,193,374 | |||
| Turkey - 0.6% | |||
| 129,629 | Anadolu Efes Biracilik Ve Malt Sanayii AS | 299,331 | |
| 181,398 | Arcelik AS | 636,409 | |
| 556,944 | BIM Birlesik Magazalar A.S. | 3,600,382 | |
| Shares or Principal Amount | Market Value† | ||
| COMMON STOCKS - 95.1% - (continued) | |||
| Turkey - 0.6% - (continued) | |||
| 77,490 | Coca-Cola Icecek AS | $ 684,538 | |
| 1,938,567 | Enka Insaat ve Sanayi AS | 2,238,444 | |
| 60,018 | Ford Otomotiv Sanayi AS | 1,158,658 | |
| 391,991 | KOC Holding AS | 961,426 | |
| 873,791 | Petkim Petrokimya Holding A.S.* | 594,059 | |
| 91,308 | Tofas Turk Otomobil Fabrikasi AS | 558,447 | |
| 1,279,577 | Turk Telekomunikasyon AS | 1,002,207 | |
| 26,155 | Turk Traktor ve Ziraat Makineleri AS | 450,081 | |
| 1,703,961 | Turkcell Iletisim Hizmetleri AS | 2,709,961 | |
| 112,907 | Ulker Biskuvi Sanayi AS | 236,994 | |
| 541,802 | Vestel Beyaz Esya Sanayi ve Ticaret AS | 344,437 | |
| 15,475,374 | |||
| United Kingdom - 14.2% | |||
| 594,188 | Airtel Africa plc(2) | 891,241 | |
| 76,408 | Ashtead Group plc | 6,403,764 | |
| 268,639 | AstraZeneca plc | 33,607,089 | |
| 984,553 | Aviva plc | 5,312,566 | |
| 4,573,252 | Barclays plc | 12,619,766 | |
| 349,165 | Barratt Developments plc | 3,169,745 | |
| 276,921 | Beazley plc* | 1,478,024 | |
| 89,745 | Bellway plc | 4,072,077 | |
| 100,595 | Biffa plc*(2) | 547,924 | |
| 1,661,902 | BP plc | 7,962,007 | |
| 313,016 | Britvic plc | 3,803,999 | |
| 3,540,852 | BT Group plc* | 6,727,013 | |
| 174,873 | Bunzl plc | 6,463,321 | |
| 165,936 | Central Asia Metals plc | 557,510 | |
| 4,313,209 | Centrica plc* | 3,560,496 | |
| 315,849 | Clinigen Group plc | 2,649,725 | |
| 291,316 | CNH Industrial N.V. | 5,018,081 | |
| 13,925 | Coca-Cola Europacific Partners plc | 733,151 | |
| 269,961 | Crest Nicholson Holdings plc | 1,315,261 | |
| 274,765 | Direct Line Insurance Group plc | 1,098,209 | |
| 48,319 | Draper Esprit plc* | 637,615 | |
| 341,595 | Drax Group plc | 2,484,360 | |
| 1,680,136 | GlaxoSmithKline plc | 34,881,017 | |
| 789,440 | Gulf Keystone Petroleum Ltd. | 2,147,813 | |
| 433,636 | Harbour Energy plc* | 2,075,533 | |
| 4,476,731 | HSBC Holdings plc | 26,964,426 | |
| 115,910 | Hunting plc | 268,717 | |
| 584,648 | IG Group Holdings plc | 6,348,956 | |
| 365,375 | Indivior plc* | 1,216,083 | |
| 4,793,117 | ITV plc* | 7,054,501 | |
| 606,101 | J Sainsbury plc | 2,482,504 | |
| 126,645 | Johnson Matthey plc | 4,733,423 | |
| 422,493 | Jupiter Fund Management plc | 1,447,063 | |
| 3,427,024 | Legal & General Group plc | 13,515,438 | |
| 41,813 | Liontrust Asset Management plc | 1,247,466 | |
| 2,381,991 | Lloyds Banking Group plc | 1,630,189 | |
| 1,055,208 | M&G plc | 2,882,933 | |
| 853,953 | Man Group plc | 2,719,514 | |
| 1,126,625 | Marks & Spencer Group plc* | 2,832,049 | |
| 3,755,859 | Natwest Group plc | 11,324,570 | |
| 110,957 | Norcros plc | 505,661 | |
| 100,523 | OSB Group plc | 694,733 | |
| 114,276 | PayPoint plc | 1,079,108 | |
| 156,765 | Petrofac Ltd.*(1) | 277,830 | |
| 57,934 | Polar Capital Holdings plc | 658,071 | |
| 52,448 | Rathbone Brothers plc | 1,410,136 | |
| 210,978 | Reach plc | 914,984 | |
| 243,459 | Reckitt Benckiser Group plc | 19,764,683 | |
| 297,805 | Redrow plc | 2,622,093 | |
| 319,404 | Rio Tinto plc | 19,915,307 | |
| 65 |
October 31, 2021
| Shares or Principal Amount | Market Value† | ||
| COMMON STOCKS - 95.1% - (continued) | |||
| United Kingdom - 14.2% - (continued) | |||
| 534,855 | Royal Dutch Shell plc Class A | $ 12,323,616 | |
| 821,567 | Royal Mail plc | 4,736,186 | |
| 52,455 | Severn Trent plc | 1,964,558 | |
| 1,738,849 | Standard Chartered plc | 11,759,836 | |
| 217,382 | Subsea 7 S.A. | 1,951,330 | |
| 309,892 | Synthomer plc | 2,148,081 | |
| 2,236,160 | Taylor Wimpey plc | 4,731,289 | |
| 242,439 | TI Fluid Systems plc(2) | 878,431 | |
| 542,833 | TP ICAP Group plc | 1,153,715 | |
| 603,556 | Unilever plc | 32,315,522 | |
| 174,005 | United Utilities Group plc | 2,473,157 | |
| 105,777 | Vistry Group plc | 1,771,310 | |
| 360,355 | WPP plc | 5,208,849 | |
| 122,689 | Yellow Cake plc*(2) | 590,190 | |
| 368,733,815 | |||
| United States - 0.3% | |||
| 592,300 | Argonaut Gold, Inc.* | 1,502,765 | |
| 148,745 | Bausch Health Cos., Inc.* | 4,169,331 | |
| 120,000 | Bizlink Holding, Inc. | 1,109,240 | |
| 100,205 | Sims Ltd. | 1,090,836 | |
| 7,872,172 | |||
| Total Common Stocks (cost $2,259,436,317) | $ 2,477,191,753 | ||
| PREFERRED STOCKS - 0.9% | |||
| Germany - 0.9% | |||
| 255,752 | Henkel AG & Co. KGaA | $ 22,912,183 | |
| Total Preferred Stocks (cost $26,048,521) | $ 22,912,183 | ||
| RIGHTS - 0.0% | |||
| United Kingdom - 0.0% | |||
| 39,191 | Petrofac Ltd. | $ 7,777 | |
| Total Rights (cost $—) | $ 7,777 | ||
| WARRANTS - 0.0% | |||
| Malaysia - 0.0% | |||
| 254,080 | VS Industry Bhd* | $ 30,986 | |
| Total Warrants (cost $—) | $ 30,986 | ||
| Total Long-Term Investments (cost $2,285,484,838) | $ 2,500,142,699 | ||
| SHORT-TERM INVESTMENTS - 3.0% | |||
| Other Investment Pools & Funds - 2.7% | |||
| $ 68,745,596 | Morgan Stanley Institutional Liquidity Funds, Treasury Portfolio, Institutional Class, 0.01%(5) | $ 68,745,596 | |
| Securities Lending Collateral - 0.3% | |||
| 46,955 | Fidelity Investments Money Market Funds, Government Portfolio, Institutional Class, 0.01%(5) | 46,955 | |
| Shares or Principal Amount | Market Value† | ||
| SHORT-TERM INVESTMENTS - 3.0% - (continued) | |||
| Securities Lending Collateral - 0.3% - (continued) | |||
| 7,208,611 | Goldman Sachs Financial Square Funds, Government Fund, Institutional Class, 0.03%(5) | $ 7,208,611 | |
| 517,525 | Invesco Government & Agency Portfolio, Institutional Class, 0.03%(5) | 517,525 | |
| 7,773,091 | |||
| Total Short-Term Investments (cost $76,518,687) | $ 76,518,687 | ||
| Total Investments (cost $2,362,003,525) | 99.0% | $ 2,576,661,386 | |
| Other Assets and Liabilities | 1.0% | 27,114,565 | |
| Total Net Assets | 100.0% | $ 2,603,775,951 | |
| Note: | Percentage of investments as shown is the ratio of the total market value to total net assets. |
| Prices of foreign equities that are principally traded on certain foreign markets will generally be adjusted daily pursuant to a fair value pricing service approved by the Board of Directors in order to reflect an adjustment for factors occurring after the close of certain foreign markets but before the close of the New York Stock Exchange. | |
| Equity industry classifications used in this report are the Global Industry Classification Standard, which was developed by and is the exclusive property and service mark of MSCI, Inc. and Standard & Poor’s. | |
| For Fund compliance purposes, the Fund may not use the same classification system. These classifications are used for financial reporting purposes. | |
| See “Glossary” for abbreviation descriptions. |
| * | Non-income producing. |
| (1) | Represents entire or partial securities on loan. See Note 8 in the accompanying Notes to Financial Statements for securities lending information. |
| (2) | Security was purchased pursuant to Rule 144A under the Securities Act of 1933 and may be sold in transactions that are exempt from registration (typically only to qualified institutional buyers) or in a public offering registered under the Securities Act of 1933. At October 31, 2021, the aggregate value of these securities was $78,789,444, representing 3.0% of net assets. |
| (3) | These securities are valued in good faith at fair value as determined under policies and procedures established by and under the supervision of the Board of Directors. At October 31, 2021, the aggregate fair value of these securities are $6,793,169, which represented 0.3% of total net assets. This amount excludes securities that are principally traded in certain foreign markets and whose prices are adjusted pursuant to a third party pricing service methodology approved by the Board of Directors. |
| (4) | Investment valued using significant unobservable inputs. |
| (5) | Current yield as of period end. |
| 66 |
October 31, 2021
| Futures Contracts Outstanding at October 31, 2021 | ||||||||
| Description | Number of Contracts | Expiration Date | Current Notional Amount | Value and Unrealized Appreciation/ (Depreciation) | ||||
| Long position contracts: | ||||||||
| MSCI EAFE Index Future | 216 | 12/17/2021 | $ 25,267,680 | $ 11,758 | ||||
| Total futures contracts | $ 11,758 | |||||||
| Foreign Currency Contracts Outstanding at October 31, 2021 | ||||||||||
| Amount and Description of Currency to be Purchased | Amount and Description of Currency to be Sold | Counterparty | Settlement Date | Appreciation/ (Depreciation) | ||||||
| 126,575,452 | USD | 91,985,300 | GBP | BOA | 12/15/2021 | $ 665,682 | ||||
| 17,391,563 | USD | 253,768,500 | ZAR | JPM | 12/15/2021 | 873,255 | ||||
| 11,662,997 | USD | 176,379,500 | ZAR | MSC | 12/15/2021 | 182,097 | ||||
| Total foreign currency contracts | $ 1,721,034 | |||||||||
| 67 |
October 31, 2021
| Description | Total | Level 1 | Level 2 | Level 3(1) | ||||
| Assets | ||||||||
| Common Stocks | ||||||||
| Australia | $ 42,020,263 | $ 945,164 | $ 41,075,099 | $ — | ||||
| Austria | 19,776,725 | — | 19,776,725 | — | ||||
| Belgium | 11,515,025 | 221,079 | 11,293,946 | — | ||||
| Bermuda | 1,182,782 | 1,182,782 | — | — | ||||
| Brazil | 17,161,638 | 17,161,638 | — | — | ||||
| Canada | 214,135,989 | 214,135,989 | — | — | ||||
| Cayman Islands | 2,530,537 | 2,530,537 | — | — | ||||
| Chile | 1,401,327 | 1,401,327 | — | — | ||||
| China | 139,894,613 | 14,722,564 | 125,172,049 | — | ||||
| Cyprus | 7,507,081 | — | 7,507,081 | — | ||||
| Czech Republic | 550,054 | 550,054 | — | — | ||||
| Denmark | 24,122,755 | 1,042,891 | 23,079,864 | — | ||||
| Finland | 4,171,695 | — | 4,171,695 | — | ||||
| France | 149,534,269 | 6,541,512 | 142,992,757 | — | ||||
| Georgia | 1,473,076 | 1,473,076 | — | — | ||||
| Germany | 90,410,007 | 17,073,020 | 73,336,987 | — | ||||
| Greece | 472,354 | — | 472,354 | — | ||||
| Hong Kong | 67,421,427 | 2,857,111 | 63,798,485 | 765,831 | ||||
| Hungary | 5,637,469 | 4,536,234 | 1,101,235 | — | ||||
| Indonesia | 7,169,495 | — | 7,169,495 | — | ||||
| Ireland | 9,485,185 | 544,546 | 8,940,639 | — | ||||
| Isle of Man | 2,552,448 | 2,552,448 | — | — | ||||
| Israel | 22,076,987 | 11,825,988 | 10,250,999 | — | ||||
| Italy | 37,834,725 | — | 37,834,725 | — | ||||
| Japan | 411,919,299 | — | 411,919,299 | — | ||||
| Luxembourg | 8,272,002 | — | 8,272,002 | — | ||||
| Malaysia | 10,902,207 | 6,410,495 | 4,491,712 | — | ||||
| Mexico | 15,550,753 | 15,550,753 | — | — | ||||
| Monaco | 449,396 | 449,396 | — | — | ||||
| Netherlands | 84,725,429 | 2,491,616 | 82,233,813 | — | ||||
| Norway | 35,292,527 | 412,225 | 34,880,302 | — | ||||
| Philippines | 352,781 | — | 352,781 | — | ||||
| Poland | 4,606,001 | — | 4,606,001 | — | ||||
| Portugal | 539,983 | 539,983 | — | — | ||||
| Russia | 26,108,499 | 9,486,366 | 16,622,133 | — | ||||
| Singapore | 35,790,678 | 416,488 | 35,374,190 | — | ||||
| South Africa | 51,206,296 | 37,045,795 | 14,160,501 | — | ||||
| South Korea | 145,507,912 | 5,905,550 | 133,575,024 | 6,027,338 | ||||
| Spain | 39,143,481 | 2,422,701 | 36,720,780 | — | ||||
| Sweden | 49,657,548 | — | 49,657,548 | — | ||||
| Switzerland | 120,629,843 | — | 120,629,843 | — | ||||
| Taiwan | 150,224,457 | 2,088,788 | 148,135,669 | — | ||||
| Thailand | 14,193,374 | 959,906 | 13,233,468 | — | ||||
| Turkey | 15,475,374 | 10,527,406 | 4,947,968 | — | ||||
| United Kingdom | 368,733,815 | 33,032,773 | 335,701,042 | — | ||||
| United States | 7,872,172 | 5,672,096 | 2,200,076 | — | ||||
| Preferred Stocks | 22,912,183 | — | 22,912,183 | — | ||||
| Rights | 7,777 | — | 7,777 | — | ||||
| Warrants | 30,986 | 30,986 | — | — | ||||
| Short-Term Investments | 76,518,687 | 76,518,687 | — | — | ||||
| Foreign Currency Contracts(2) | 1,721,034 | — | 1,721,034 | — | ||||
| Futures Contracts(2) | 11,758 | 11,758 | — | — | ||||
| Total | $ 2,578,394,178 | $ 511,271,728 | $ 2,060,329,281 | $ 6,793,169 |
| (1) | For the year ended October 31, 2021, investments valued at $3,449,151 were transferred into Level 3 due to the unavailability of active market pricing. There were no transfers out of Level 3. |
| (2) | Derivative instruments (excluding purchased and written options, if applicable) are valued at the unrealized appreciation/(depreciation) on the investments. |
| 68 |
October 31, 2021
| Shares or Principal Amount | Market Value† | ||
| COMMON STOCKS - 97.6% | |||
| Argentina - 1.8% | |||
| 44,604 | MercadoLibre, Inc.* | $ 66,059,416 | |
| Austria - 1.5% | |||
| 1,230,221 | Erste Group Bank AG | 52,758,898 | |
| Brazil - 2.2% | |||
| 20,010,222 | B3 S.A. - Brasil Bolsa Balcao | 42,227,177 | |
| 9,484,944 | Raia Drogasil S.A. | 39,073,842 | |
| 81,301,019 | |||
| Canada - 2.8% | |||
| 767,666 | Canadian National Railway Co. | 102,024,648 | |
| China - 2.6% | |||
| 1,556,400 | Tencent Holdings Ltd. | 94,675,490 | |
| Denmark - 2.1% | |||
| 1,730,586 | Vestas Wind Systems A/S | 74,812,562 | |
| France - 3.7% | |||
| 523,477 | Legrand S.A. | 57,106,118 | |
| 443,402 | Schneider Electric SE | 76,450,518 | |
| 133,556,636 | |||
| Germany - 11.6% | |||
| 204,111 | adidas AG | 66,805,778 | |
| 595,512 | Bayerische Motoren Werke AG | 60,168,151 | |
| 565,737 | Daimler AG | 56,156,422 | |
| 1,458,349 | Infineon Technologies AG | 68,296,429 | |
| 456,866 | Knorr-Bremse AG | 48,218,548 | |
| 115,999 | SAP SE | 16,797,941 | |
| 368,058 | Siemens AG | 59,839,562 | |
| 483,506 | Zalando SE*(1) | 45,681,917 | |
| 421,964,748 | |||
| Hong Kong - 3.3% | |||
| 6,217,200 | AIA Group Ltd. | 69,676,215 | |
| 805,911 | Hong Kong Exchanges & Clearing Ltd. | 48,549,453 | |
| 118,225,668 | |||
| India - 2.2% | |||
| 3,785,829 | HDFC Bank Ltd. | 80,198,381 | |
| Italy - 3.5% | |||
| 2,472,399 | FinecoBank Banca Fineco S.p.A.* | 47,217,358 | |
| 27,560,555 | Intesa Sanpaolo S.p.A. | 78,331,947 | |
| 125,549,305 | |||
| Japan - 9.9% | |||
| 1,730,100 | Bridgestone Corp. | 76,538,390 | |
| 1,784,700 | Kubota Corp. | 38,019,454 | |
| 1,313,900 | Recruit Holdings Co., Ltd. | 87,399,312 | |
| 121,700 | SMC Corp. | 72,626,307 | |
| 748,100 | Sony Corp. | 86,627,201 | |
| 361,210,664 | |||
| Netherlands - 3.5% | |||
| 158,120 | ASML Holding N.V. | 128,535,685 | |
| Shares or Principal Amount | Market Value† | ||
| COMMON STOCKS - 97.6% - (continued) | |||
| New Zealand - 1.5% | |||
| 464,302 | Xero Ltd.* | $ 52,941,011 | |
| Norway - 1.6% | |||
| 2,247,398 | Equinor ASA | 56,945,308 | |
| Singapore - 1.7% | |||
| 181,009 | Sea Ltd. ADR* | 62,189,262 | |
| Spain - 3.6% | |||
| 10,488,535 | Banco Bilbao Vizcaya Argentaria S.A. | 73,400,091 | |
| 4,908,364 | Iberdrola S.A. | 57,960,606 | |
| 131,360,697 | |||
| Sweden - 1.8% | |||
| 81,435 | Industrivarden AB Class A(2) | 2,686,395 | |
| 5,347,746 | Svenska Handelsbanken AB Class A(2) | 61,297,658 | |
| 63,984,053 | |||
| Switzerland - 13.3% | |||
| 680,978 | Alcon, Inc. | 56,465,686 | |
| 6,210 | Chocoladefabriken Lindt & Spruengli AG | 73,182,503 | |
| 469,527 | Cie Financiere Richemont S.A. | 58,104,142 | |
| 75,212 | Lonza Group AG | 61,809,254 | |
| 713,435 | Nestle S.A. | 94,107,195 | |
| 219,664 | Roche Holding AG | 85,096,507 | |
| 161,451 | Sika AG | 54,696,308 | |
| 483,461,595 | |||
| Taiwan - 3.9% | |||
| 6,680,000 | Taiwan Semiconductor Manufacturing Co., Ltd. | 141,751,536 | |
| United Kingdom - 17.7% | |||
| 749,857 | AstraZeneca plc | 93,808,089 | |
| 27,083,130 | Barclays plc | 74,735,169 | |
| 1,430,318 | Bunzl plc | 52,864,673 | |
| 2,303,953 | Burberry Group plc | 60,891,330 | |
| 1,499,496 | Diageo plc | 74,602,458 | |
| 3,314,947 | GlaxoSmithKline plc | 68,821,049 | |
| 3,537,042 | National Grid plc | 45,286,733 | |
| 840,242 | Reckitt Benckiser Group plc | 68,213,196 | |
| 4,503,933 | Royal Dutch Shell plc Class A | 103,775,302 | |
| 642,997,999 | |||
| United States - 1.8% | |||
| 27,408 | Booking Holdings, Inc.* | 66,348,738 | |
| Total Common Stocks (cost $2,996,813,746) | $ 3,542,853,319 | ||
| SHORT-TERM INVESTMENTS - 2.5% | |||
| Other Investment Pools & Funds - 2.4% | |||
| $ 87,709,676 | Morgan Stanley Institutional Liquidity Funds, Treasury Portfolio, Institutional Class, 0.01%(3) | $ 87,709,676 | |
| 69 |
October 31, 2021
| Shares or Principal Amount | Market Value† | ||
| SHORT-TERM INVESTMENTS - 2.5% - (continued) | |||
| Securities Lending Collateral - 0.1% | |||
| 25,382 | Fidelity Investments Money Market Funds, Government Portfolio, Institutional Class, 0.01%(3) | $ 25,382 | |
| 3,896,736 | Goldman Sachs Financial Square Funds, Government Fund, Institutional Class, 0.03%(3) | 3,896,736 | |
| 279,757 | Invesco Government & Agency Portfolio, Institutional Class, 0.03%(3) | 279,757 | |
| 4,201,875 | |||
| Total Short-Term Investments (cost $91,911,551) | $ 91,911,551 | ||
| Total Investments (cost $3,088,725,297) | 100.1% | $ 3,634,764,870 | |
| Other Assets and Liabilities | (0.1)% | (3,311,473) | |
| Total Net Assets | 100.0% | $ 3,631,453,397 | |
| Note: | Percentage of investments as shown is the ratio of the total market value to total net assets. |
| Prices of foreign equities that are principally traded on certain foreign markets will generally be adjusted daily pursuant to a fair value pricing service approved by the Board of Directors in order to reflect an adjustment for factors occurring after the close of certain foreign markets but before the close of the New York Stock Exchange. |
| * | Non-income producing. |
| (1) | Security was purchased pursuant to Rule 144A under the Securities Act of 1933 and may be sold in transactions that are exempt from registration (typically only to qualified institutional buyers) or in a public offering registered under the Securities Act of 1933. At October 31, 2021, the aggregate value of this security was $45,681,917, representing 1.3% of net assets. |
| (2) | Represents entire or partial securities on loan. See Note 8 in the accompanying Notes to Financial Statements for securities lending information. |
| (3) | Current yield as of period end. |
| † | See Significant Accounting Policies of accompanying Notes to Financial Statements regarding valuation of investments. |
| Description | Total | Level 1 | Level 2 | Level 3(1) | ||||
| Assets | ||||||||
| Common Stocks | ||||||||
| Argentina | $ 66,059,416 | $ 66,059,416 | $ — | $ — | ||||
| Austria | 52,758,898 | — | 52,758,898 | — | ||||
| Brazil | 81,301,019 | 81,301,019 | — | — | ||||
| Canada | 102,024,648 | 102,024,648 | — | — | ||||
| China | 94,675,490 | — | 94,675,490 | — | ||||
| Denmark | 74,812,562 | — | 74,812,562 | — | ||||
| France | 133,556,636 | — | 133,556,636 | — | ||||
| Germany | 421,964,748 | — | 421,964,748 | — | ||||
| Hong Kong | 118,225,668 | — | 118,225,668 | — | ||||
| India | 80,198,381 | — | 80,198,381 | — | ||||
| Italy | 125,549,305 | — | 125,549,305 | — | ||||
| Japan | 361,210,664 | — | 361,210,664 | — | ||||
| Netherlands | 128,535,685 | — | 128,535,685 | — | ||||
| New Zealand | 52,941,011 | — | 52,941,011 | — | ||||
| Norway | 56,945,308 | — | 56,945,308 | — | ||||
| Singapore | 62,189,262 | 62,189,262 | — | — | ||||
| Spain | 131,360,697 | 57,960,606 | 73,400,091 | — | ||||
| Sweden | 63,984,053 | — | 63,984,053 | — | ||||
| Switzerland | 483,461,595 | 73,182,503 | 410,279,092 | — | ||||
| Taiwan | 141,751,536 | — | 141,751,536 | — | ||||
| United Kingdom | 642,997,999 | — | 642,997,999 | — | ||||
| United States | 66,348,738 | 66,348,738 | — | — | ||||
| Short-Term Investments | 91,911,551 | 91,911,551 | — | — | ||||
| Total | $ 3,634,764,870 | $ 600,977,743 | $ 3,033,787,127 | $ — |
| (1) | For the year ended October 31, 2021, there were no transfers in and out of Level 3. |
| 70 |
October 31, 2021
| Shares or Principal Amount | Market Value† | ||
| ASSET & COMMERCIAL MORTGAGE-BACKED SECURITIES - 85.5% | |||
| Asset-Backed - Automobile - 0.8% | |||
| $ 1,000,000 | JP Morgan Chase & Co. 3.69%, 02/26/2029(1) | $ 987,573 | |
| Asset-Backed - Finance & Insurance - 27.6% | |||
| 1,573,000 | Ares LXI CLO Ltd. 1.28%, 10/20/2034, 3 mo. USD LIBOR + 1.150%(1)(2) | 1,572,596 | |
| 2,097,000 | Atrium XII 2.93%, 04/22/2027, 3 mo. USD LIBOR + 2.800%(1)(2) | 2,090,856 | |
| 793,000 | Avery Point VII CLO Ltd. 3.72%, 01/15/2028, 3 mo. USD LIBOR + 3.600%(1)(2) | 794,197 | |
| EUR 1,215,000 | Avoca CLO XXI 0.89%, 04/15/2033, 3 mo. Euribor + 0.890%(2)(3) | 1,405,639 | |
| 570,000 | Avoca CLO XXIII 0.84%, 04/15/2034, 3 mo. Euribor + 0.840%(1)(2) | 656,619 | |
| $ 839,000 | Barings CLO Ltd. 1.27%, 10/15/2036, 3 mo. USD LIBOR + 1.150%(1)(2) | 839,163 | |
| Bellemeade Re Ltd. | |||
| 859,000 | 2.79%, 03/25/2029, 1 mo. USD LIBOR + 2.700%(1)(2) | 862,174 | |
| 1,857,000 | 2.99%, 04/25/2028, 1 mo. USD LIBOR + 2.900%(1)(2) | 1,866,936 | |
| 940,000 | 3.19%, 04/25/2029, 1 mo. USD LIBOR + 3.100%(1)(2) | 950,998 | |
| 1,242,816 | 3.44%, 10/25/2027, 1 mo. USD LIBOR + 3.350%(1)(2) | 1,245,910 | |
| 1,188,000 | BlueMountain CLO Ltd. 3.03%, 11/20/2028, 3 mo. USD LIBOR + 2.900%(1)(2) | 1,177,513 | |
| EUR 805,000 | Cairn CLO B.V. 0.86%, 10/30/2030, 3 mo. Euribor + 0.860% | 931,589 | |
| $ 1,000,000 | Carbone CLO Ltd. 1.27%, 01/20/2031, 3 mo. USD LIBOR + 1.140%(1)(2) | 1,001,439 | |
| CIFC Funding Ltd. | |||
| 1,102,074 | 0.93%, 01/20/2028, 3 mo. USD LIBOR + 0.800%(1)(2) | 1,102,933 | |
| 1,746,000 | 1.24%, 01/22/2031, 3 mo. USD LIBOR + 1.110%(1)(2) | 1,748,860 | |
| 445,886 | Countrywide Asset-Backed Certificates Trust 5.71%, 05/25/2036(4) | 451,658 | |
| CVC Cordatus Loan Fund DAC | |||
| EUR 1,102,000 | 0.81%, 06/22/2034, 3 mo. Euribor + 0.810%(1)(2) | 1,267,118 | |
| 1,840,000 | 1.40%, 06/22/2034, 3 mo. Euribor + 1.400%(1)(2) | 2,104,540 | |
| Madison Park Funding Ltd. | |||
| $ 774,000 | 2.97%, 04/19/2030, 3 mo. USD LIBOR + 2.850%(1)(2) | 768,842 | |
| 1,000,000 | 3.38%, 01/20/2029, 3 mo. USD LIBOR + 3.250 | 999,578 | |
| 1,036,000 | Magnetite Ltd. 2.17%, 01/15/2028, 3 mo. USD LIBOR + 2.050%(1)(2) | 1,024,609 | |
| 1,500,000 | Neuberger Berman CLO Ltd. 3.02%, 10/17/2027, 3 mo. USD LIBOR + 2.900%(1)(2) | 1,498,621 | |
| 140,693 | OCP CLO Ltd. 0.94%, 10/26/2027, 3 mo. USD LIBOR + 0.820%(1)(2) | 140,658 | |
| Preston Ridge Partners Mortgage Trust LLC | |||
| 894,402 | 2.12%, 03/25/2026(1)(4) | 892,660 | |
| 920,338 | 3.67%, 08/25/2025(1)(5) | 921,978 | |
| 1,254,044 | TAL Advantage VII LLC 2.05%, 09/20/2045(1) | 1,251,147 | |
| Towd Point Mortgage Trust | |||
| 818,525 | 4.40%, 11/25/2058(1)(4) | 821,304 | |
| 1,053,000 | 4.50%, 11/25/2058(1)(4) | 1,055,355 | |
| 1,000,000 | 5.00%, 11/25/2058(1)(4) | 1,013,532 | |
| Shares or Principal Amount | Market Value† | ||
| ASSET & COMMERCIAL MORTGAGE-BACKED SECURITIES - 85.5% - (continued) | |||
| Asset-Backed - Finance & Insurance - 27.6% - (continued) | |||
| $ 424,011 | Treman Park CLO Ltd. 1.20%, 10/20/2028, 3 mo. USD LIBOR + 1.070%(1)(2) | $ 424,386 | |
| 974,000 | Tricon American Homes 4.88%, 07/17/2038(1) | 1,014,343 | |
| 780,000 | Venture CLO Ltd. 1.87%, 10/20/2034, 3 mo. USD LIBOR + 1.750%(1)(2) | 779,984 | |
| 34,677,735 | |||
| Asset-Backed - Home Equity - 6.4% | |||
| 295,219 | CWABS Revolving Home Equity Loan Trust 0.38%, 02/15/2034, 1 mo. USD LIBOR + 0.290%(2) | 294,073 | |
| 442,205 | CWHEQ Revolving Home Equity Loan Resecuritization Trust 0.28%, 11/15/2035, 1 mo. USD LIBOR + 0.190%(1)(2) | 421,339 | |
| CWHEQ Revolving Home Equity Loan Trust | |||
| 577,507 | 0.23%, 07/15/2036, 1 mo. USD LIBOR + 0.140%(2) | 547,195 | |
| 557,591 | 0.23%, 01/15/2037, 1 mo. USD LIBOR + 0.140%(2) | 531,586 | |
| 119,872 | Home Equity Loan Trust 0.22%, 05/25/2036, 1 mo. USD LIBOR + 0.130%(2) | 118,659 | |
| Home Re Ltd. | |||
| 1,199,000 | 2.85%, 01/25/2034, 1 mo. USD SOFR + 2.800%(1)(2) | 1,200,546 | |
| 899,000 | 3.09%, 10/25/2028, 1 mo. USD LIBOR + 3.000%(1)(2) | 903,482 | |
| 1,933,000 | 3.34%, 05/25/2029, 1 mo. USD LIBOR + 3.250%(1)(2) | 1,955,549 | |
| 1,134,000 | 4.09%, 10/25/2028, 1 mo. USD LIBOR + 4.000%(1)(2) | 1,155,261 | |
| 500,000 | 4.24%, 10/25/2030, 1 mo. USD LIBOR + 4.150%(1)(2) | 506,230 | |
| 398,069 | Option One Mortgage Loan Trust 5.86%, 01/25/2037(5) | 401,459 | |
| 8,035,379 | |||
| Commercial Mortgage-Backed Securities - 10.8% | |||
| BDS Ltd. | |||
| 500,000 | 1.43%, 01/18/2036, 1 mo. USD LIBOR + 1.350%(1)(2) | 499,697 | |
| 1,093,000 | 1.63%, 01/18/2036, 1 mo. USD LIBOR + 1.550%(1)(2) | 1,090,301 | |
| 648,000 | BX Commercial Mortgage Trust 2.04%, 03/15/2037, 1 mo. USD LIBOR + 1.951%(1)(2) | 646,766 | |
| 1,015,000 | BX Trust 1.86%, 05/15/2030, 1 mo. USD LIBOR + 1.770%(1)(2) | 1,006,068 | |
| 1,000,000 | CAMB Commercial Mortgage Trust 2.64%, 12/15/2037, 1 mo. USD LIBOR + 2.550%(1)(2) | 997,475 | |
| Citigroup Commercial Mortgage Trust | |||
| 500,000 | 2.89%, 12/15/2036, 1 mo. USD LIBOR + 2.800%(1)(2) | 494,978 | |
| 1,000,000 | 3.52%, 05/10/2035(1)(4) | 1,008,445 | |
| 375,200 | Commercial Mortgage Trust 2.29%, 10/15/2034, 1 mo. USD LIBOR + 2.200%(1)(2) | 373,805 | |
| 668,000 | Core Mortgage Trust 1.99%, 12/15/2031, 1 mo. USD LIBOR + 1.900%(1)(2) | 657,918 | |
| Credit Suisse Mortgage Capital Certificates | |||
| 1,708,000 | 2.24%, 05/15/2036, 1 mo. USD LIBOR + 2.150%(1)(2) | 1,709,060 | |
| 539,000 | 2.74%, 05/15/2036, 1 mo. USD LIBOR + 2.650%(1)(2) | 538,677 | |
| 71 |
October 31, 2021
| Shares or Principal Amount | Market Value† | ||
| ASSET & COMMERCIAL MORTGAGE-BACKED SECURITIES - 85.5% - (continued) | |||
| Commercial Mortgage-Backed Securities - 10.8% - (continued) | |||
| $ 813,535 | HPLY Trust 2.44%, 11/15/2036, 1 mo. USD LIBOR + 2.350%(1)(2) | $ 807,918 | |
| Morgan Stanley Capital Trust | |||
| 250,000 | 2.64%, 07/15/2035, 1 mo. USD LIBOR + 2.550%(1)(2) | ��� 247,802 | |
| 900,000 | 3.74%, 12/15/2036, 1 mo. USD LIBOR + 2.244%(1)(2) | 899,881 | |
| 1,413,000 | MSSG Trust 3.74%, 09/13/2039(1)(4) | 1,438,523 | |
| 463,789 | Preston Ridge Partners Mortgage Trust LLC 2.12%, 01/25/2026(1)(4) | 462,840 | |
| GBP 505,000 | Taurus DAC 1.70%, 05/17/2031, SONIA + 1.650%(1)(2) | 691,811 | |
| 13,571,965 | |||
| Other Asset-Backed Securities - 11.0% | |||
| $ 586,000 | AGL CLO Ltd. 1.73%, 07/20/2034, 3 mo. USD LIBOR + 1.600%(1)(2) | 586,270 | |
| Arbor Realty Commercial Real Estate Notes Ltd. | |||
| 500,000 | 1.19%, 05/15/2036, 1 mo. USD LIBOR + 1.100%(1)(2) | 499,922 | |
| 500,000 | 2.04%, 05/15/2036, 1 mo. USD LIBOR + 1.950%(1)(2) | 500,461 | |
| 565,000 | BDS Ltd. 1.16%, 06/16/2036, 1 mo. USD LIBOR + 1.070%(1)(2) | 564,567 | |
| 417,722 | BlueMountain CLO Ltd. 1.36%, 01/20/2029, 3 mo. USD LIBOR + 1.230%(1)(2) | 417,892 | |
| 1,750,000 | CBAM Ltd. 1.39%, 01/15/2031, 3 mo. USD LIBOR + 1.270%(1)(2) | 1,760,211 | |
| 850,000 | Dryden CLO Ltd. 1.24%, 01/15/2031, 3 mo. USD LIBOR + 1.120%(1)(2) | 850,958 | |
| 1,119,000 | FirstKey Homes Trust 3.64%, 08/17/2037(1) | 1,134,528 | |
| 1,679,000 | HGI CRE CLO Ltd. 1.14%, 06/16/2036, 1 mo. USD LIBOR + 1.050%(1)(2) | 1,676,426 | |
| 719,447 | JP Morgan Mortgage Acquisition Trust 4.71%, 11/25/2036(5) | 753,345 | |
| 2,819,946 | LCM L.P. 1.26%, 07/19/2027, 3 mo. USD LIBOR + 1.140%(1)(2) | 2,822,763 | |
| 1,000,000 | LCM XXIII Ltd. 1.20%, 10/20/2029, 3 mo. USD LIBOR + 1.070%(1)(2) | 1,000,172 | |
| 1,252,000 | OCP CLO Ltd. 1.00%, 01/26/2034 | 1,252,000 | |
| 13,819,515 | |||
| Whole Loan Collateral CMO - 28.9% | |||
| GBP 3,086,490 | Alba plc 0.24%, 12/15/2038, 3 mo. GBP LIBOR + 0.170%(2)(3) | 4,099,338 | |
| $ 1,174,000 | Bank of America Funding Trust 2.29%, 06/26/2035(1)(4) | 1,161,479 | |
| GBP 910,776 | Banna Rmbs DAC 1.25%, 12/30/2063, SONIO + 1.200%(2)(3) | 1,254,358 | |
| Bellemeade Re Ltd. | |||
| $ 1,508,000 | 2.94%, 10/25/2029, 1 mo. USD LIBOR + 2.850%(1)(2) | 1,525,806 | |
| 2,485,000 | 3.20%, 09/25/2031, 1 mo. USD SOFR + 3.150%(1)(2) | 2,491,402 | |
| Eagle RE Ltd. | |||
| 510,728 | 1.89%, 04/25/2029, 1 mo. USD LIBOR + 1.800%(1)(2) | 512,080 | |
| 617,000 | 2.10%, 04/25/2034, 1 mo. USD SOFR + 2.050% | 617,000 | |
| Shares or Principal Amount | Market Value† | ||
| ASSET & COMMERCIAL MORTGAGE-BACKED SECURITIES - 85.5% - (continued) | |||
| Whole Loan Collateral CMO - 28.9% - (continued) | |||
| $ 1,450,000 | 4.09%, 11/25/2028, 1 mo. USD LIBOR + 4.000%(1)(2) | $ 1,484,887 | |
| 80,075 | 4.09%, 10/25/2030, 1 mo. USD LIBOR + 4.000%(1)(2) | 80,101 | |
| 878,000 | 4.59%, 10/25/2030, 1 mo. USD LIBOR + 4.500%(1)(2) | 882,574 | |
| GBP 159,507 | EMF plc 1.05%, 03/13/2046, 3 mo. GBP LIBOR + 0.980%(2)(3) | 218,319 | |
| $ 2,393,769 | JP Morgan Mortgage Trust 2.50%, 12/25/2051(1)(4) | 2,416,024 | |
| GBP 464,087 | Landmark Mortgage Securities plc 0.27%, 06/17/2039, 3 mo. GBP LIBOR + 0.200%(2)(3) | 610,666 | |
| Newgate Funding plc | |||
| 620,195 | 0.23%, 12/01/2050, 3 mo. GBP LIBOR + 0.160%(2)(3) | 822,221 | |
| 461,656 | 0.23%, 12/15/2050, 3 mo. GBP LIBOR + 0.160%(2)(3) | 611,181 | |
| Oaktown Re Ltd. | |||
| $ 34,429 | 1.49%, 07/25/2029, 1 mo. USD LIBOR + 1.400%(1)(2) | 34,444 | |
| 976,000 | 2.94%, 07/25/2028, 1 mo. USD LIBOR + 2.850%(1)(2) | 981,771 | |
| 1,190,000 | 3.05%, 10/25/2033, 1 mo. USD SOFR + 3.000%(1)(2) | 1,210,513 | |
| 844,457 | 4.09%, 04/25/2027, 1 mo. USD LIBOR + 4.000%(1)(2) | 852,016 | |
| 500,000 | 5.34%, 10/25/2030, 1 mo. USD LIBOR + 5.250%(1)(2) | 519,124 | |
| 1,200,000 | Oaktown Re VI Ltd. 2.10%, 10/25/2033, 1 mo. USD SOFR + 2.050%(1)(2) | 1,211,972 | |
| Preston Ridge Partners Mortgage Trust LLC | |||
| 1,853,240 | 1.79%, 06/25/2026(1)(5) | 1,839,702 | |
| 1,769,000 | 2.36%, 10/25/2026(1)(4) | 1,767,673 | |
| Radnor RE Ltd. | |||
| 746,440 | 2.04%, 02/25/2029, 1 mo. USD LIBOR + 1.950%(1)(2) | 746,918 | |
| 1,520,000 | 2.09%, 01/25/2030, 1 mo. USD LIBOR + 2.000%(1)(2) | 1,519,999 | |
| 702,000 | 3.20%, 12/27/2033, 1 mo. USD SOFR + 3.150%(1)(2) | 694,988 | |
| 753,836 | 4.69%, 10/25/2030, 1 mo. USD LIBOR + 4.600%(1)(2) | 755,473 | |
| GBP 1,081,893 | Resloc plc 0.23%, 12/15/2043, 3 mo. GBP LIBOR + 0.160%(2)(3) | 1,432,878 | |
| 2,985,543 | RMAC Securities plc 0.24%, 06/12/2044, 3 mo. GBP LIBOR + 0.170%(2)(3) | 3,968,648 | |
| 36,323,555 | |||
| Total Asset & Commercial Mortgage-Backed Securities (cost $106,976,350) | $ 107,415,722 | ||
| CORPORATE BONDS - 3.9% | |||
| Diversified Financial Services - 2.7% | |||
| OneMain Finance Corp. | |||
| $ 2,050,000 | 3.50%, 01/15/2027 | $ 2,003,875 | |
| 72 |
October 31, 2021
| Shares or Principal Amount | Market Value† | ||
| CORPORATE BONDS - 3.9% - (continued) | |||
| Diversified Financial Services - 2.7% - (continued) | |||
| $ 643,000 | 8.88%, 06/01/2025 | $ 696,851 | |
| 764,000 | Quicken Loans LLC / Quicken Loans Co-Issuer, Inc. 3.88%, 03/01/2031(1) | 754,680 | |
| 3,455,406 | |||
| Insurance - 1.2% | |||
| 451,000 | MGIC Investment Corp. 5.25%, 08/15/2028 | 479,796 | |
| 841,000 | NMI Holdings, Inc. 7.38%, 06/01/2025(1) | 966,284 | |
| 1,446,080 | |||
| Total Corporate Bonds (cost $4,818,567) | $ 4,901,486 | ||
| U.S. GOVERNMENT AGENCIES - 3.1% | |||
| U.S. Government Agencies - 3.1% | |||
| FHLMC - 0.3% | |||
| 430,067 | 2.00%, 09/25/2050(6) | $ 40,178 | |
| 1,212,621 | 3.00%, 10/25/2050(6) | 174,929 | |
| 420,154 | 3.50%, 12/25/2050(6) | 59,746 | |
| 315,101 | 4.00%, 12/15/2047(6) | 50,592 | |
| 518,126 | 4.00%, 12/25/2050(6) | 81,412 | |
| 406,857 | |||
| FNMA - 2.2% | |||
| 1,001,204 | 2.50%, 11/25/2050(6) | 140,018 | |
| 627,514 | 2.50%, 02/25/2051(6) | 71,694 | |
| 2,474,349 | 2.50%, 07/01/2051 | 2,564,243 | |
| 260,314 | 3.50%, 03/25/2051(6) | 38,704 | |
| 2,814,659 | |||
| GNMA - 0.6% | |||
| 876,106 | 2.00%, 10/20/2050(6) | 91,150 | |
| 1,501,618 | 2.00%, 11/20/2050(6) | 158,652 | |
| 3,745,777 | 2.50%, 11/20/2050(6) | 428,360 | |
| 371,672 | 3.00%, 02/20/2051(6) | 42,609 | |
| 720,771 | |||
| Total U.S. Government Agencies (cost $3,931,660) | $ 3,942,287 | ||
| COMMON STOCKS - 1.0% | |||
| Real Estate - 1.0% | |||
| 29,612 | Invitation Homes, Inc. REIT | $ 1,221,495 | |
| Total Common Stocks (cost $1,203,341) | $ 1,221,495 | ||
| Total Long-Term Investments (Cost $116,929,918) | $ 117,480,990 | ||
| SHORT-TERM INVESTMENTS - 7.7% | |||
| Other Investment Pools & Funds - 7.7% | |||
| 9,638,724 | Morgan Stanley Institutional Liquidity Funds, Treasury Portfolio, Institutional Class, 0.01%(7) | $ 9,638,724 | |
| Total Short-Term Investments (cost $9,638,724) | $ 9,638,724 | ||
| Total Investments (cost $126,568,642) | 101.2% | $ 127,119,714 | |
| Other Assets and Liabilities | (1.2)% | (1,510,344) | |
| Total Net Assets | 100.0% | $ 125,609,370 | |
| Note: | Percentage of investments as shown is the ratio of the total market value to total net assets. |
| The Fund may refer to any one or more of the industry classifications used by one or more widely recognized market indices, ratings group and/or as defined by Fund management. Industry classifications may not be identical across all security types. | |
| For Fund compliance purposes, the Fund may not use the same classification system. These classifications are used for financial reporting purposes. | |
| See “Glossary” for abbreviation descriptions. |
| (1) | Security was purchased pursuant to Rule 144A under the Securities Act of 1933 and may be sold in transactions that are exempt from registration (typically only to qualified institutional buyers) or in a public offering registered under the Securities Act of 1933. At October 31, 2021, the aggregate value of these securities was $87,815,296, representing 69.9% of net assets. |
| (2) | Variable rate securities; the rate reported is the coupon rate in effect at October 31, 2021. Base lending rates may be subject to a floor or cap. |
| (3) | Security is exempt from registration under Regulation S under the Securities Act of 1933, which exempts from registration securities offered and sold outside of the United States. Security may not be offered or sold in the United States except pursuant to an exemption from, or in a transaction not subject to, the registration requirements of the Securities Act of 1933. At October 31, 2021, the aggregate value of these securities was $14,423,248, representing 11.5% of net assets. |
| (4) | Variable or floating rate security, which interest rate adjusts periodically based on changes in current interest rates and prepayments on the underlying pool of assets. Rate shown is the rate in effect as of period end. |
| (5) | Security is a “step-up” bond where coupon increases or steps up at a predetermined date. Rate shown is current coupon rate. |
| (6) | Securities disclosed are interest-only strips. |
| (7) | Current yield as of period end. |
| 73 |
October 31, 2021
| Futures Contracts Outstanding at October 31, 2021 | ||||||||
| Description | Number of Contracts | Expiration Date | Current Notional Amount | Value and Unrealized Appreciation/ (Depreciation) | ||||
| Long position contracts: | ||||||||
| U.S. Treasury 10-Year Note Future | 81 | 12/21/2021 | $ 10,586,953 | $ (224,360) | ||||
| Total futures contracts | $ (224,360) | |||||||
| Foreign Currency Contracts Outstanding at October 31, 2021 | ||||||||||
| Amount and Description of Currency to be Purchased | Amount and Description of Currency to be Sold | Counterparty | Settlement Date | Appreciation/ (Depreciation) | ||||||
| 6,429,914 | USD | 5,538,543 | EUR | JPM | 11/24/2021 | $ 24,373 | ||||
| 13,756,436 | USD | 10,000,798 | GBP | BNP | 11/24/2021 | 69,623 | ||||
| 126,571 | USD | 92,495 | GBP | UBS | 11/24/2021 | (15) | ||||
| Total foreign currency contracts | $ 93,981 | |||||||||
| Description | Total | Level 1 | Level 2 | Level 3(1) | ||||
| Assets | ||||||||
| Asset & Commercial Mortgage-Backed Securities | $ 107,415,722 | $ — | $ 107,415,722 | $ — | ||||
| Corporate Bonds | 4,901,486 | — | 4,901,486 | — | ||||
| U.S. Government Agencies | 3,942,287 | — | 3,942,287 | — | ||||
| Common Stocks | ||||||||
| Real Estate | 1,221,495 | 1,221,495 | — | — | ||||
| Short-Term Investments | 9,638,724 | 9,638,724 | — | — | ||||
| Foreign Currency Contracts(2) | 93,996 | — | 93,996 | — | ||||
| Total | $ 127,213,710 | $ 10,860,219 | $ 116,353,491 | $ — | ||||
| Liabilities | ||||||||
| Foreign Currency Contracts(2) | $ (15) | $ — | $ (15) | $ — | ||||
| Futures Contracts(2) | (224,360) | (224,360) | — | — | ||||
| Total | $ (224,375) | $ (224,360) | $ (15) | $ — |
| (1) | For the year ended October 31, 2021, there were no transfers in and out of Level 3. |
| (2) | Derivative instruments (excluding purchased and written options, if applicable) are valued at the unrealized appreciation/(depreciation) on the investments. |
| 74 |
October 31, 2021
| Shares or Principal Amount | Market Value† | ||
| CORPORATE BONDS - 35.5% | |||
| Aerospace/Defense - 1.0% | |||
| $ 4,609,000 | Boeing Co. 1.43%, 02/04/2024(1) | $ 4,611,627 | |
| Auto Manufacturers - 3.0% | |||
| 6,008,000 | BMW U.S. Capital LLC 0.58%, 04/01/2024, 3 mo. USD SOFR + 0.530%(2)(3) | 6,059,092 | |
| 2,370,000 | General Motors Financial Co., Inc. 1.20%, 10/15/2024 | 2,359,992 | |
| 5,477,000 | Hyundai Capital America 0.88%, 06/14/2024(2) | 5,416,059 | |
| 13,835,143 | |||
| Chemicals - 0.2% | |||
| 829,000 | Westlake Chemical Corp. 0.88%, 08/15/2024 | 828,973 | |
| Commercial Banks - 15.2% | |||
| Banco Santander S.A. | |||
| 6,400,000 | 0.70%, 06/30/2024, 12 mo. USD CMT + 0.450%(3) | 6,380,867 | |
| 2,200,000 | 1.72%, 09/14/2027, 12 mo. USD CMT + 0.900%(3) | 2,167,164 | |
| 5,255,000 | Barclays plc 1.01%, 12/10/2024, 12 mo. USD CMT + 0.800%(3) | 5,255,322 | |
| 2,735,000 | Canadian Imperial Bank of Commerce 2.61%, 07/22/2023, (2.61% fixed rate until 07/22/2022; 3 mo. USD LIBOR + 0.785% thereafter)(4) | 2,775,148 | |
| Goldman Sachs Group, Inc. | |||
| 2,600,000 | 0.55%, 09/10/2024, 3 mo. USD SOFR + 0.500%(3) | 2,602,900 | |
| 6,656,000 | 0.63%, 03/08/2024, 3 mo. USD SOFR + 0.580%(3) | 6,664,968 | |
| 1,844,000 | HSBC Holdings plc 3.97%, 05/22/2030, 3 mo. USD LIBOR + 1.610%(3) | 2,017,727 | |
| JP Morgan Chase & Co. | |||
| 3,397,000 | 0.63%, 03/16/2024, 3 mo. USD SOFR + 0.580%(3) | 3,408,439 | |
| 1,833,000 | 0.93%, 04/22/2027, 3 mo. USD SOFR + 0.885%(1)(3) | 1,856,818 | |
| 4,756,000 | 2.01%, 03/13/2026, 3 mo. USD SOFR +1.585%(3) | 4,847,239 | |
| 2,859,000 | 2.08%, 04/22/2026, (2.08% fixed rate until 04/22/2025; 3 mo. USD SOFR + 1.850% thereafter)(4) | 2,916,297 | |
| 6,980,000 | Macquarie Group Ltd. 0.97%, 09/23/2027, 3 mo. USD SOFR + 0.920%(2)(3) | 7,020,994 | |
| 6,057,000 | National Bank of Canada 2.10%, 02/01/2023 | 6,167,837 | |
| 2,313,000 | NatWest Markets plc 0.80%, 08/12/2024(2) | 2,290,329 | |
| 2,013,000 | PNC Financial Services Group, Inc. 3.50%, 01/23/2024 | 2,124,994 | |
| 2,154,000 | Royal Bank of Canada 2.25%, 11/01/2024(1) | 2,232,900 | |
| 1,213,000 | Toronto-Dominion Bank 2.65%, 06/12/2024 | 1,266,421 | |
| 968,000 | Truist Financial Corp. 2.20%, 03/16/2023 | 989,093 | |
| 4,616,000 | UniCredit S.p.A. 1.98%, 06/03/2027, 12 mo. USD CMT + 1.200%(2)(3) | 4,538,009 | |
| 1,466,000 | Wells Fargo & Co. 3.75%, 01/24/2024 | 1,555,482 | |
| 69,078,948 | |||
| Commercial Services - 0.0% | |||
| 145,447 | Alternative Building Concepts Group 4.16%, 12/20/2032 | 162,406 | |
| Shares or Principal Amount | Market Value† | ||
| CORPORATE BONDS - 35.5% - (continued) | |||
| Diversified Financial Services - 1.9% | |||
| $ 6,882,000 | AerCap Ireland Capital DAC / AerCap Global Aviation Trust 2.45%, 10/29/2026 | $ 6,945,729 | |
| 1,953,000 | Ally Financial, Inc. 2.20%, 11/02/2028 | 1,928,886 | |
| 8,874,615 | |||
| Gas - 0.5% | |||
| 2,070,000 | CenterPoint Energy Resources Corp. 0.70%, 03/02/2023 | 2,064,335 | |
| Healthcare - Services - 1.8% | |||
| 1,965,000 | CommonSpirit Health 3.35%, 10/01/2029 | 2,096,226 | |
| 6,132,000 | Humana, Inc. 0.65%, 08/03/2023 | 6,125,873 | |
| 8,222,099 | |||
| IT Services - 1.1% | |||
| 4,991,000 | Kyndryl Holdings, Inc. 2.05%, 10/15/2026(2) | 4,937,585 | |
| Packaging & Containers - 0.9% | |||
| 4,086,000 | Sealed Air Corp. 1.57%, 10/15/2026(2) | 4,019,006 | |
| Pharmaceuticals - 1.5% | |||
| 3,635,000 | AmerisourceBergen Corp. 0.74%, 03/15/2023 | 3,637,066 | |
| 2,997,000 | CVS Health Corp. 3.75%, 04/01/2030 | 3,303,842 | |
| 6,940,908 | |||
| Pipelines - 0.3% | |||
| 1,447,000 | Enbridge, Inc. 0.45%, 02/17/2023, 3 mo. USD SOFR + 0.400%(3) | 1,449,788 | |
| Real Estate Investment Trusts - 2.3% | |||
| 2,227,000 | Boston Properties L.P. 3.40%, 06/21/2029 | 2,388,905 | |
| Crown Castle International Corp. | |||
| 3,405,000 | 1.05%, 07/15/2026 | 3,297,103 | |
| 3,266,000 | 1.35%, 07/15/2025 | 3,252,839 | |
| 1,318,000 | Ventas Realty L.P. 2.65%, 01/15/2025 | 1,367,756 | |
| 10,306,603 | |||
| Retail - 0.6% | |||
| 2,860,000 | McDonald's Corp. 1.45%, 09/01/2025 | 2,877,225 | |
| Semiconductors - 0.5% | |||
| 2,108,000 | Broadcom, Inc. 1.95%, 02/15/2028(2) | 2,065,327 | |
| 257,000 | Qorvo, Inc. 4.38%, 10/15/2029 | 275,954 | |
| 2,341,281 | |||
| Software - 2.7% | |||
| 5,009,000 | Oracle Corp. 2.80%, 04/01/2027 | 5,236,081 | |
| VMware, Inc. | |||
| 4,653,000 | 1.00%, 08/15/2024 | 4,658,789 | |
| 2,511,000 | 1.40%, 08/15/2026 | 2,473,781 | |
| 12,368,651 | |||
| Telecommunications - 2.0% | |||
| 4,535,000 | AT&T, Inc. 0.69%, 03/25/2024, 3 mo. USD SOFR + 0.640%(3) | 4,539,273 | |
| 4,357,000 | Verizon Communications, Inc. 0.55%, 03/22/2024, 3 mo. USD SOFR + 0.500%(3) | 4,378,001 | |
| 8,917,274 | |||
| Total Corporate Bonds (cost $160,488,997) | $ 161,836,467 | ||
| 75 |
October 31, 2021
| Shares or Principal Amount | Market Value† | ||
| MUNICIPAL BONDS - 55.2% | |||
| Arizona - 0.2% | |||
| City of Phoenix, AZ, Civic Improvement Corp. | |||
| $ 350,000 | 5.00%, 07/01/2026 | $ 418,722 | |
| 350,000 | 5.00%, 07/01/2027 | 429,860 | |
| 848,582 | |||
| California - 4.8% | |||
| California County, CA, Tobacco Securitization Agency | |||
| 120,000 | 4.00%, 06/01/2022 | 122,371 | |
| 150,000 | 4.00%, 06/01/2023 | 157,966 | |
| 2,835,000 | California State Health Facs Finance Auth Rev 5.00%, 04/01/2033 | 3,632,575 | |
| City of El Cajon, CA | |||
| 190,000 | 0.93%, 04/01/2024 | 189,280 | |
| 275,000 | 1.18%, 04/01/2025 | 273,012 | |
| City of Los Angeles, CA, Department of Airports | |||
| 405,000 | 0.85%, 05/15/2026 | 392,770 | |
| 405,000 | 1.10%, 05/15/2027 | 390,554 | |
| 460,000 | 1.25%, 05/15/2028 | 440,705 | |
| City of Pomona, CA | |||
| 205,000 | 4.00%, 08/01/2023 | 215,220 | |
| 305,000 | 4.00%, 08/01/2024 | 326,079 | |
| City of Riverside, CA | |||
| 200,000 | 1.90%, 06/01/2023 | 203,591 | |
| 360,000 | 2.11%, 06/01/2024 | 368,716 | |
| County of Sacramento, CA, Airport System Rev | |||
| 705,000 | 5.00%, 12/01/2022 | 741,685 | |
| 550,000 | 5.00%, 07/01/2032 | 708,162 | |
| 960,000 | 5.00%, 07/01/2033 | 1,232,511 | |
| 600,000 | 5.00%, 07/01/2034 | 766,665 | |
| 20,000 | East Side, CA, Union High School Dist, GO, (NATL Insured) 5.25%, 02/01/2024 | 22,226 | |
| 835,000 | Golden State, CA, Tobacco Securitization Corp. 3.00%, 06/01/2046 | 856,386 | |
| 1,000,000 | Merced, CA, Union High School Dist, GO 0.00%, 08/01/2034(5) | 766,894 | |
| 4,675,000 | Moreno Valley, CA, Unified School Dist, GO, (NATL Insured) 0.00%, 08/01/2025(5) | 4,503,118 | |
| 200,000 | North Orange County, CA, Community College Dist, GO, (NATL Insured) 0.00%, 08/01/2028(5) | 182,256 | |
| 300,000 | Rialto, CA, Unified School Dist, GO, (AGM Insured) 0.00%, 08/01/2029(5) | 266,360 | |
| 4,090,000 | San Diego County, CA, Regional Transportation Commission 5.00%, 10/01/2022 | 4,269,654 | |
| San Francisco, CA, Community College Dist, GO | |||
| 310,000 | 1.33%, 06/15/2026 | 308,803 | |
| 410,000 | 2.02%, 06/15/2029 | 410,459 | |
| 21,748,018 | |||
| Shares or Principal Amount | Market Value† | ||
| MUNICIPAL BONDS - 55.2% - (continued) | |||
| Colorado - 1.0% | |||
| $ 950,000 | City & County of Denver, CO, Airport System Rev 5.00%, 11/15/2032 | $ 1,221,843 | |
| 2,850,000 | Colorado Housing and Finance Auth, (GNMA/FNMA/FHLMC Insured) 3.50%, 05/01/2050 | 3,099,200 | |
| 4,321,043 | |||
| Connecticut - 0.6% | |||
| 2,195,000 | Connecticut Housing Finance Auth Rev, (GNMA/FNMA/FHLMC Insured) 4.25%, 05/15/2042 | 2,389,880 | |
| 150,000 | State of Connecticut, GO 4.00%, 06/01/2023 | 158,882 | |
| 2,548,762 | |||
| Delaware - 0.4% | |||
| Delaware Transportation Auth | |||
| 630,000 | 5.00%, 09/01/2029 | 806,715 | |
| 285,000 | 5.00%, 07/01/2032 | 370,729 | |
| 570,000 | 5.00%, 09/01/2033 | 736,113 | |
| 1,913,557 | |||
| District of Columbia - 1.4% | |||
| 5,225,000 | Dist of Columbia Water & Sewer Auth Rev 5.00%, 10/01/2052 | 6,183,847 | |
| Florida - 1.3% | |||
| County of Miami-Dade FL | |||
| 460,000 | 1.00%, 10/01/2024 | 456,159 | |
| 440,000 | 1.15%, 10/01/2025 | 432,914 | |
| 435,000 | County of Miami-Dade FL Aviation Rev 1.23%, 10/01/2025 | 436,146 | |
| Florida Housing Finance Corp. Rev, (GNMA/FNMA/FHLMC Insured) | |||
| 310,000 | 3.00%, 07/01/2051 | 332,155 | |
| 2,435,000 | 3.00%, 07/01/2052 | 2,632,599 | |
| 710,000 | 3.50%, 07/01/2051 | 772,953 | |
| 825,000 | 4.00%, 07/01/2049 | 886,678 | |
| 5,949,604 | |||
| Georgia - 3.5% | |||
| Georgia Municipal Association, Inc. | |||
| 50,000 | 5.00%, 12/01/2026 | 60,628 | |
| 35,000 | 5.00%, 12/01/2027 | 43,506 | |
| 25,000 | 5.00%, 12/01/2028 | 30,884 | |
| 80,000 | 5.00%, 12/01/2029 | 98,305 | |
| 55,000 | 5.00%, 12/01/2030 | 67,429 | |
| 55,000 | 5.00%, 12/01/2032 | 67,368 | |
| 35,000 | 5.00%, 12/01/2033 | 42,922 | |
| Main Street, GA, Natural Gas, Inc. | |||
| 3,945,000 | 4.00%, 08/01/2048(6) | 4,214,352 | |
| 8,250,000 | 4.00%, 03/01/2050(6) | 9,390,035 | |
| 1,520,000 | 4.00%, 05/01/2052(6) | 1,779,710 | |
| 15,795,139 | |||
| Illinois - 6.0% | |||
| 475,000 | Champaign County, IL, Community Unit School Dist No. 4 Champaign, GO 5.00%, 01/01/2029 | 558,566 | |
| 76 |
October 31, 2021
| Shares or Principal Amount | Market Value† | ||
| MUNICIPAL BONDS - 55.2% - (continued) | |||
| Illinois - 6.0% - (continued) | |||
| Chicago Transit Auth Capital Grant Receipts Rev | |||
| $ 475,000 | 5.00%, 06/01/2022 | $ 487,614 | |
| 290,000 | 5.00%, 06/01/2023 | 310,642 | |
| 695,000 | Chicago, IL, Metropolitan Water Reclamation Dist, GO 5.25%, 12/01/2032 | 949,172 | |
| 7,735,000 | Chicago, IL, O'Hare International Airport 5.00%, 01/01/2033 | 9,718,968 | |
| 1,145,000 | Chicago, IL, Transit Auth 5.00%, 06/01/2025 | 1,320,765 | |
| Illinois Housing Dev Auth | |||
| 985,000 | 3.00%, 04/01/2051 | 1,060,827 | |
| 7,655,000 | , (GNMA/FNMA/FHLMC Insured) 3.75%, 04/01/2050 | 8,386,333 | |
| 1,265,000 | 4.50%, 10/01/2048 | 1,403,055 | |
| 90,000 | Metropolitan Pier & Exposition Auth, IL, (NATL Insured) 0.00%, 06/15/2028(5) | 80,157 | |
| 1,350,000 | Railsplitter, IL, Tobacco Settlement Auth 5.00%, 06/01/2022 | 1,386,654 | |
| Rock Island County, IL, School Dist No. 41, GO, (BAM Insured) | |||
| 125,000 | 4.00%, 12/01/2023 | 133,417 | |
| 140,000 | 5.00%, 12/01/2024 | 157,792 | |
| 470,000 | Southwestern Illinois Dev Auth 6.38%, 11/01/2023 | 497,993 | |
| State of Illinois, GO | |||
| 485,000 | 4.00%, 03/01/2024 | 522,700 | |
| 410,000 | 5.00%, 03/01/2024 | 451,340 | |
| 27,425,995 | |||
| Indiana - 0.5% | |||
| Indiana Housing & Community Dev Auth Rev, (GNMA/FNMA/FHLMC/COLL Insured) | |||
| 1,390,000 | 3.00%, 07/01/2050 | 1,496,654 | |
| 835,000 | 4.00%, 07/01/2048 | 901,531 | |
| 2,398,185 | |||
| Iowa - 1.9% | |||
| Iowa Finance Auth, (GNMA/FNMA/FHLMC Insured) | |||
| 6,750,000 | 3.00%, 07/01/2051 | 7,317,143 | |
| 620,000 | 3.25%, 07/01/2050 | 669,790 | |
| 625,000 | 4.00%, 07/01/2048 | 674,513 | |
| 8,661,446 | |||
| Kentucky - 3.1% | |||
| Kentucky Public Energy Auth | |||
| 6,080,000 | 4.00%, 12/01/2049(6) | 6,728,955 | |
| 6,265,000 | 4.00%, 02/01/2050(6) | 7,276,532 | |
| 14,005,487 | |||
| Louisiana - 2.8% | |||
| 280,000 | Louisiana Housing Corp. Rev 4.50%, 12/01/2047 | 307,969 | |
| 12,250,000 | Louisiana State Local Gov't Environmental Facs & Community Dev Auth Rev 2.50%, 04/01/2036 | 12,411,905 | |
| 12,719,874 | |||
| Maine - 0.7% | |||
| Maine Municipal Bond Bank | |||
| 325,000 | 5.00%, 09/01/2029 | 416,442 | |
| 535,000 | 5.00%, 09/01/2031 | 692,793 | |
| Shares or Principal Amount | Market Value† | ||
| MUNICIPAL BONDS - 55.2% - (continued) | |||
| Maine - 0.7% - (continued) | |||
| $ 415,000 | 5.00%, 09/01/2032 | $ 535,856 | |
| 1,600,000 | Maine State Housing Auth 4.00%, 11/15/2048 | 1,721,354 | |
| 3,366,445 | |||
| Massachusetts - 1.1% | |||
| 1,685,000 | Commonwealth of Massachusetts, GO 5.00%, 01/01/2035 | 2,068,158 | |
| Massachusetts Educational Financing Auth | |||
| 665,000 | 3.17%, 07/01/2025 | 703,906 | |
| 510,000 | 3.27%, 07/01/2026 | 544,739 | |
| 560,000 | 3.38%, 07/01/2027 | 603,198 | |
| 1,255,000 | Massachusetts Water Resource Auth 0.06%, 08/01/2037(6) | 1,255,000 | |
| 5,175,001 | |||
| Minnesota - 0.0% | |||
| 40,000 | Minnesota Housing Finance Agency Rev, (GNMA/FNMA/FHLMC Insured) 3.00%, 01/01/2051 | 42,831 | |
| Mississippi - 0.5% | |||
| 1,410,000 | Mississippi Home Corp., (GNMA/FNMA/FHLMC Insured) 3.25%, 12/01/2050 | 1,521,038 | |
| 645,000 | State of Mississippi, GO 5.00%, 06/01/2031 | 837,020 | |
| 2,358,058 | |||
| Missouri - 1.4% | |||
| Missouri Housing Dev Commission Rev, (GNMA/FNMA/FHLMC Insured) | |||
| 1,895,000 | 3.25%, 05/01/2051 | 2,053,943 | |
| 1,075,000 | 3.50%, 11/01/2050 | 1,173,323 | |
| 1,590,000 | 4.25%, 05/01/2049 | 1,750,200 | |
| 1,375,000 | 4.75%, 05/01/2049 | 1,535,066 | |
| 6,512,532 | |||
| Nebraska - 1.1% | |||
| Nebraska Investment Finance Auth Rev, (GNMA/FNMA/FHLMC Insured) | |||
| 3,840,000 | 3.00%, 09/01/2050 | 4,115,512 | |
| 1,020,000 | 4.00%, 09/01/2048 | 1,109,432 | |
| 5,224,944 | |||
| Nevada - 0.5% | |||
| Nevada Housing Division, (GNMA/FNMA/FHLMC Collateral Insured) | |||
| 910,000 | 3.00%, 04/01/2051 | 981,792 | |
| 1,310,000 | 4.00%, 10/01/2049 | 1,435,219 | |
| 2,417,011 | |||
| New Jersey - 1.5% | |||
| 1,430,000 | Garden State, NJ, Preservation Trust, (AGM Insured) 5.75%, 11/01/2028 | 1,745,396 | |
| New Jersey Economic Dev Auth | |||
| 150,000 | 5.00%, 06/15/2023 | 161,032 | |
| 95,000 | 5.00%, 06/15/2024 | 106,033 | |
| 70,000 | 5.00%, 03/01/2026 | 74,150 | |
| 285,000 | 5.00%, 06/15/2027 | 345,752 | |
| 565,000 | 5.00%, 06/15/2028 | 681,739 | |
| New Jersey Transportation Trust Fund Auth | |||
| 140,000 | 4.00%, 06/15/2035 | 162,832 | |
| 1,530,000 | 5.00%, 12/15/2028 | 1,911,772 | |
| 685,000 | 5.50%, 12/15/2022 | 725,091 | |
| 77 |
October 31, 2021
| Shares or Principal Amount | Market Value† | ||
| MUNICIPAL BONDS - 55.2% - (continued) | |||
| New Jersey - 1.5% - (continued) | |||
| New Jersey Turnpike Auth Rev | |||
| $ 110,000 | 5.00%, 01/01/2023 | $ 115,931 | |
| 605,000 | 5.00%, 01/01/2029 | 748,878 | |
| 6,778,606 | |||
| New Mexico - 1.6% | |||
| New Mexico Mortgage Finance Auth, (GNMA/FNMA/FHLMC Insured) | |||
| 4,250,000 | 3.00%, 01/01/2051 | 4,564,056 | |
| 1,480,000 | 3.00%, 01/01/2052 | 1,598,732 | |
| 845,000 | 4.00%, 01/01/2049 | 920,213 | |
| 7,083,001 | |||
| New York - 3.2% | |||
| 4,210,000 | City of New York, NY, GO 5.00%, 08/01/2033 | 5,399,056 | |
| 2,605,000 | New York City Transitional Finance Auth, Future Tax Secured Rev 5.00%, 05/01/2033 | 3,372,226 | |
| New York Transportation Dev Corp. | |||
| 300,000 | 1.36%, 12/01/2021 | 300,207 | |
| 455,000 | 1.61%, 12/01/2022 | 459,417 | |
| 475,000 | 5.00%, 12/01/2028 | 580,551 | |
| Port Auth of New York & New Jersey Rev | |||
| 750,000 | 5.00%, 07/15/2031 | 934,350 | |
| 2,585,000 | 5.00%, 07/15/2033 | 3,336,246 | |
| 14,382,053 | |||
| Ohio - 1.8% | |||
| Ohio Housing Finance Agency | |||
| 445,000 | 3.00%, 03/01/2052 | 479,365 | |
| 3,160,000 | 3.25%, 03/01/2050 | 3,413,649 | |
| 1,380,000 | 4.50%, 09/01/2048 | 1,522,589 | |
| Ohio State University | |||
| 5,000 | 5.00%, 12/01/2030 | 6,646 | |
| 5,000 | 5.00%, 12/01/2031 | 6,741 | |
| Ohio Turnpike & Infrastructure Commission Rev | |||
| 1,680,000 | 0.00%, 02/15/2038(5) | 1,130,162 | |
| 1,395,000 | 0.00%, 02/15/2041(5) | 847,558 | |
| 525,000 | State of Ohio, GO 5.00%, 05/01/2032 | 680,351 | |
| 8,087,061 | |||
| Oklahoma - 0.3% | |||
| 1,120,000 | Oklahoma Housing Finance Agency, (GNMA/FNMA/FHLMC Insured) 4.00%, 03/01/2050 | 1,239,641 | |
| Pennsylvania - 2.0% | |||
| 635,000 | Commonwealth Finance Auth, PA 5.00%, 06/01/2032 | 772,344 | |
| 1,295,000 | Geisinger, PA, Health System Auth Rev 5.00%, 02/15/2032 | 1,546,920 | |
| 1,960,000 | Pennsylvania Housing Finance Agency 3.50%, 04/01/2049 | 2,086,561 | |
| Pennsylvania Turnpike Commission Rev | |||
| 240,000 | 5.00%, 12/01/2026 | 289,020 | |
| 705,000 | 5.00%, 12/01/2027 | 867,415 | |
| 300,000 | 5.00%, 12/01/2032 | 388,850 | |
| 310,000 | 5.00%, 12/01/2033 | 399,760 | |
| Philadelphia, PA, Gas Works Co., (AGM Insured) | |||
| 440,000 | 5.00%, 08/01/2029 | 557,339 | |
| 910,000 | 5.00%, 08/01/2030 | 1,173,277 | |
| 820,000 | 5.00%, 08/01/2033 | 1,046,972 | |
| Shares or Principal Amount | Market Value† | ||
| MUNICIPAL BONDS - 55.2% - (continued) | |||
| Pennsylvania - 2.0% - (continued) | |||
| Reading, PA, School Dist, GO, (AGM State Aid Withholding Insured) | |||
| $ 70,000 | 5.00%, 03/01/2025 | $ 79,755 | |
| 55,000 | 5.00%, 03/01/2026 | 64,537 | |
| 50,000 | 5.00%, 03/01/2027 | 60,240 | |
| 9,332,990 | |||
| Rhode Island - 1.5% | |||
| 6,070,000 | Rhode Island Housing & Mortgage Finance Corp., (GNMA Insured) 3.75%, 10/01/2049 | 6,612,212 | |
| South Carolina - 2.1% | |||
| 6,425,000 | Patriots Energy Group Financing Agency, SC 4.00%, 10/01/2048(6) | 6,899,982 | |
| 2,190,000 | South Carolina Jobs-Economic Dev Auth 3.75%, 01/01/2050 | 2,409,576 | |
| 250,000 | Tobacco Settlement Rev Mgmt Auth, SC 6.38%, 05/15/2030 | 342,646 | |
| 9,652,204 | |||
| South Dakota - 0.1% | |||
| South Dakota Conservancy Dist | |||
| 245,000 | 5.00%, 08/01/2029 | 316,587 | |
| 235,000 | 5.00%, 08/01/2030 | 308,622 | |
| 625,209 | |||
| Tennessee - 0.3% | |||
| 250,000 | Metropolitan Nashville, TN, Airport Auth 5.00%, 07/01/2049 | 306,471 | |
| 1,150,000 | Tennessee Housing Dev Agency 4.50%, 07/01/2049 | 1,268,421 | |
| 1,574,892 | |||
| Texas - 6.8% | |||
| 3,770,000 | Arlington, TX, Higher Education Finance Corp., (PSF-GTD Insured) 5.00%, 08/15/2033 | 4,770,987 | |
| 705,000 | Bexar County, TX, Hospital Dist, GO 5.00%, 02/15/2030 | 873,004 | |
| City of Houston, TX, Airport System Rev | |||
| 2,385,000 | 5.00%, 07/01/2029 | 3,028,470 | |
| 1,325,000 | 5.00%, 07/01/2030 | 1,713,413 | |
| 1,695,000 | Cypress-Fairbanks, TX, Independent School Dist, GO, (PSF-GTD Insured) 4.00%, 02/15/2033 | 2,040,878 | |
| 1,190,000 | Dallas-Fort Worth, TX, International Airport Rev 2.04%, 11/01/2024 | 1,225,787 | |
| Harris County, TX, Cultural Education Facs Finance Corp. | |||
| 450,000 | 5.00%, 11/15/2028 | 554,428 | |
| 430,000 | 5.00%, 11/15/2029 | 527,810 | |
| Lower Colorado River, TX, Auth Rev | |||
| 370,000 | 5.00%, 05/15/2029 | 469,927 | |
| 140,000 | 5.00%, 05/15/2030 | 180,501 | |
| Northside, TX, Independent School Dist, GO, (PSF-GTD Insured) | |||
| 90,000 | 5.00%, 02/15/2026 | 106,136 | |
| 365,000 | 5.00%, 02/15/2030 | 472,423 | |
| Texas Department of Housing & Community Affairs Rev, (GNMA Insured) | |||
| 1,820,000 | 3.00%, 01/01/2052 | 1,969,275 | |
| 5,520,000 | 3.00%, 03/01/2052 | 5,986,931 | |
| 1,935,000 | 3.50%, 03/01/2051 | 2,129,342 | |
| 78 |
October 31, 2021
| Shares or Principal Amount | Market Value† | ||
| MUNICIPAL BONDS - 55.2% - (continued) | |||
| Texas - 6.8% - (continued) | |||
| $ 1,195,000 | 4.00%, 03/01/2050 | $ 1,331,266 | |
| 855,000 | 4.75%, 03/01/2049 | 944,689 | |
| 1,245,000 | Texas Municipal Gas Acquisition & Supply Corp. 5.00%, 12/15/2028 | 1,537,681 | |
| 880,000 | University of Texas 5.00%, 05/15/2035 | 1,065,284 | |
| 30,928,232 | |||
| Washington - 0.8% | |||
| Washington State Housing Finance Commission Rev, (GNMA/FNMA/FHLMC Insured) | |||
| 2,385,000 | 4.00%, 12/01/2048 | 2,580,838 | |
| 1,090,000 | 4.00%, 06/01/2050 | 1,203,016 | |
| 3,783,854 | |||
| Wisconsin - 0.2% | |||
| 650,000 | Wisconsin Health & Educational Facs Auth Rev 5.00%, 04/01/2033 | 774,283 | |
| Wyoming - 0.2% | |||
| 1,025,000 | Wyoming Community Dev Auth 4.00%, 06/01/2043 | 1,106,123 | |
| Total Municipal Bonds (cost $244,402,777) | $ 251,576,722 | ||
| U.S. GOVERNMENT SECURITIES - 8.8% | |||
| U.S. Treasury Securities - 8.8% | |||
| U.S. Treasury Notes - 8.8% | |||
| 21,353,300 | 0.13%, 01/15/2024 | $ 21,140,601 | |
| 8,456,000 | 0.25%, 09/30/2023 | 8,422,308 | |
| 10,638,000 | 0.38%, 09/15/2024 | 10,529,958 | |
| Total U.S. Government Securities (cost $40,180,291) | $ 40,092,867 | ||
| Total Long-Term Investments (Cost $445,072,065) | $ 453,506,056 | ||
| SHORT-TERM INVESTMENTS - 0.1% | |||
| Other Investment Pools & Funds - 0.0% | |||
| 163,152 | Morgan Stanley Institutional Liquidity Funds, Treasury Portfolio, Institutional Class, 0.01%(7) | $ 163,152 | |
| Securities Lending Collateral - 0.1% | |||
| 2,656 | Fidelity Investments Money Market Funds, Government Portfolio, Institutional Class 0.01%(7) | 2,656 | |
| 407,648 | Goldman Sachs Financial Square Funds, Government Fund, Institutional Class 0.03%(7) | 407,648 | |
| 29,266 | Invesco Government & Agency Portfolio, Institutional Class 0.03%(7) | 29,266 | |
| 439,570 | |||
| Total Short-Term Investments (cost $602,722) | $ 602,722 | ||
| Total Investments (cost $445,674,787) | 99.6% | $ 454,108,778 | |
| Other Assets and Liabilities | 0.4% | 1,753,337 | |
| Total Net Assets | 100.0% | $ 455,862,115 | |
| Note: | Percentage of investments as shown is the ratio of the total market value to total net assets. |
| The Fund may refer to any one or more of the industry classifications used by one or more widely recognized market indices, ratings group and/or as defined by Fund management. Industry classifications may not be identical across all security types. | |
| For Fund compliance purposes, the Fund may not use the same classification system. These classifications are used for financial reporting purposes. | |
| See “Glossary” for abbreviation descriptions. |
| (1) | Represents entire or partial securities on loan. See Note 8 in the accompanying Notes to Financial Statements for securities lending information. |
| (2) | Security was purchased pursuant to Rule 144A under the Securities Act of 1933 and may be sold in transactions that are exempt from registration (typically only to qualified institutional buyers) or in a public offering registered under the Securities Act of 1933. At October 31, 2021, the aggregate value of these securities was $36,346,401, representing 8.0% of net assets. |
| (3) | Variable rate securities; the rate reported is the coupon rate in effect at October 31, 2021. Base lending rates may be subject to a floor or cap. |
| (4) | Fixed to variable rate investment. The rate shown reflects the fixed rate in effect at October 31, 2021. Rate will reset at a future date. Base lending rates may be subject to a floor or cap. |
| (5) | Security is a zero-coupon bond. |
| (6) | Variable or floating rate security, which interest rate adjusts periodically based on changes in current interest rates and prepayments on the underlying pool of assets. Rate shown is the rate in effect as of period end. |
| (7) | Current yield as of period end. |
| 79 |
October 31, 2021
| Futures Contracts Outstanding at October 31, 2021 | ||||||||
| Description | Number of Contracts | Expiration Date | Current Notional Amount | Value and Unrealized Appreciation/ (Depreciation) | ||||
| Short position contracts: | ||||||||
| U.S. Treasury 5-Year Note Future | 229 | 12/31/2021 | $ 27,880,750 | $ 403,918 | ||||
| Total futures contracts | $ 403,918 | |||||||
| Description | Total | Level 1 | Level 2 | Level 3(1) | ||||
| Assets | ||||||||
| Corporate Bonds | $ 161,836,467 | $ — | $ 161,836,467 | $ — | ||||
| Municipal Bonds | 251,576,722 | — | 251,576,722 | — | ||||
| U.S. Government Securities | 40,092,867 | — | 40,092,867 | — | ||||
| Short-Term Investments | 602,722 | 602,722 | — | — | ||||
| Futures Contracts(2) | 403,918 | 403,918 | — | — | ||||
| Total | $ 454,512,696 | $ 1,006,640 | $ 453,506,056 | $ — |
| (1) | For the year ended October 31, 2021, there were no transfers in and out of Level 3. |
| (2) | Derivative instruments (excluding purchased and written options, if applicable) are valued at the unrealized appreciation/(depreciation) on the investments. |
| 80 |
October 31, 2021
| Shares or Principal Amount | Market Value† | ||
| COMMON STOCKS - 95.6% | |||
| Banks - 3.8% | |||
| 106,318 | Commerce Bancshares, Inc. | $ 7,496,482 | |
| 260,254 | Fifth Third Bancorp | 11,328,857 | |
| 61,909 | First Republic Bank | 13,392,774 | |
| 32,218,113 | |||
| Capital Goods - 11.1% | |||
| 185,145 | BWX Technologies, Inc. | 10,505,127 | |
| 71,061 | Dover Corp. | 12,014,994 | |
| 140,187 | Fortune Brands Home & Security, Inc. | 14,214,962 | |
| 58,735 | IDEX Corp. | 13,072,649 | |
| 80,753 | Nordson Corp. | 20,528,220 | |
| 53,901 | Snap-on, Inc. | 10,954,300 | |
| 66,831 | Trane Technologies plc | 12,091,733 | |
| 93,381,985 | |||
| Commercial & Professional Services - 6.6% | |||
| 172,475 | IAA, Inc.* | 10,288,134 | |
| 114,386 | Leidos Holdings, Inc. | 11,436,312 | |
| 83,232 | Robert Half International, Inc. | 9,411,042 | |
| 56,606 | Verisk Analytics, Inc. | 11,902,544 | |
| 92,547 | Waste Connections, Inc. | 12,587,317 | |
| 55,625,349 | |||
| Consumer Durables & Apparel - 1.9% | |||
| 82,081 | Brunswick Corp. | 7,640,920 | |
| 48,726 | Mohawk Industries, Inc.* | 8,634,735 | |
| 16,275,655 | |||
| Consumer Services - 2.5% | |||
| 286,800 | Aramark | 10,462,464 | |
| 43,767 | Churchill Downs, Inc. | 10,066,410 | |
| 20,528,874 | |||
| Diversified Financials - 2.6% | |||
| 98,697 | Raymond James Financial, Inc. | 9,730,537 | |
| 186,695 | SEI Investments Co. | 11,769,253 | |
| 21,499,790 | |||
| Energy - 2.6% | |||
| 312,240 | Coterra Energy, Inc. | 6,656,957 | |
| 63,398 | Diamondback Energy, Inc. | 6,795,632 | |
| 45,628 | Pioneer Natural Resources Co. | 8,531,523 | |
| 21,984,112 | |||
| Food, Beverage & Tobacco - 1.8% | |||
| 84,869 | Hershey Co. | 14,881,779 | |
| Health Care Equipment & Services - 5.1% | |||
| 22,471 | Cooper Cos., Inc. | 9,368,609 | |
| 159,525 | Encompass Health Corp. | 10,139,409 | |
| 46,628 | Masimo Corp.* | 13,220,903 | |
| 27,323 | Teleflex, Inc. | 9,752,672 | |
| 42,481,593 | |||
| Insurance - 8.6% | |||
| 98,539 | Arthur J Gallagher & Co. | 16,522,034 | |
| 143,541 | Assurant, Inc. | 23,154,599 | |
| 104,419 | Globe Life, Inc. | 9,295,379 | |
| 96,575 | Reinsurance Group of America, Inc. | 11,403,576 | |
| 325,334 | Ryan Specialty Group Holdings, Inc.* | 12,294,372 | |
| 72,669,960 | |||
| Materials - 4.2% | |||
| 71,478 | AptarGroup, Inc. | 8,633,113 | |
| 266,295 | Axalta Coating Systems Ltd.* | 8,305,741 | |
| Shares or Principal Amount | Market Value† | ||
| COMMON STOCKS - 95.6% - (continued) | |||
| Materials - 4.2% - (continued) | |||
| 101,296 | Crown Holdings, Inc. | $ 10,533,771 | |
| 82,991 | Westlake Chemical Corp. | 8,078,344 | |
| 35,550,969 | |||
| Media & Entertainment - 3.4% | |||
| 221,202 | Interpublic Group of Cos., Inc. | 8,089,357 | |
| 53,303 | Match Group, Inc.* | 8,037,026 | |
| 70,338 | Take-Two Interactive Software, Inc.* | 12,731,178 | |
| 28,857,561 | |||
| Pharmaceuticals, Biotechnology & Life Sciences - 3.6% | |||
| 102,588 | Catalent, Inc.* | 14,142,782 | |
| 113,341 | Royalty Pharma plc Class A | 4,480,370 | |
| 27,389 | West Pharmaceutical Services, Inc. | 11,773,983 | |
| 30,397,135 | |||
| Real Estate - 4.1% | |||
| 54,451 | Alexandria Real Estate Equities, Inc. REIT | 11,115,627 | |
| 216,102 | American Homes 4 Rent Class A, REIT | 8,773,742 | |
| 180,511 | Americold Realty Trust REIT | 5,319,659 | |
| 408,457 | Brixmor Property Group, Inc. REIT | 9,574,232 | |
| 34,783,260 | |||
| Retailing - 4.7% | |||
| 78,866 | Advance Auto Parts, Inc. | 17,785,860 | |
| 35,638 | Burlington Stores, Inc.* | 9,846,423 | |
| 220,907 | LKQ Corp.* | 12,167,558 | |
| 39,799,841 | |||
| Semiconductors & Semiconductor Equipment - 5.7% | |||
| 94,146 | Entegris, Inc. | 13,253,874 | |
| 44,680 | First Solar, Inc.* | 5,343,281 | |
| 189,082 | Microchip Technology, Inc. | 14,009,085 | |
| 325,392 | ON Semiconductor Corp.* | 15,641,594 | |
| 48,247,834 | |||
| Software & Services - 11.0% | |||
| 78,425 | Akamai Technologies, Inc.* | 8,270,700 | |
| 141,777 | Amdocs Ltd. | 11,035,922 | |
| 119,510 | Black Knight, Inc.* | 8,378,846 | |
| 152,260 | Dolby Laboratories, Inc. Class A | 13,452,171 | |
| 238,733 | Genpact Ltd. | 11,781,474 | |
| 28,064 | Palo Alto Networks, Inc.* | 14,287,102 | |
| 96,261 | PTC, Inc.* | 12,258,838 | |
| 56,967 | VeriSign, Inc.* | 12,684,842 | |
| 92,149,895 | |||
| Technology Hardware & Equipment - 7.5% | |||
| 59,787 | CDW Corp. | 11,159,244 | |
| 223,748 | Ciena Corp.* | 12,147,279 | |
| 61,025 | Motorola Solutions, Inc. | 15,170,205 | |
| 87,316 | TE Connectivity Ltd. | 12,748,136 | |
| 25,393 | Teledyne Technologies, Inc.* | 11,407,043 | |
| 62,631,907 | |||
| Transportation - 0.6% | |||
| 93,428 | Alaska Air Group, Inc.* | 4,932,998 | |
| Utilities - 4.2% | |||
| 152,868 | Alliant Energy Corp. | 8,647,743 | |
| 319,852 | CenterPoint Energy, Inc. | 8,328,946 | |
| 100,114 | CMS Energy Corp. | 6,041,880 | |
| 81 |
October 31, 2021
| Shares or Principal Amount | Market Value† | ||
| COMMON STOCKS - 95.6% - (continued) | |||
| Utilities - 4.2% - (continued) | |||
| 51,098 | Eversource Energy | $ 4,338,220 | |
| 204,342 | FirstEnergy Corp. | 7,873,297 | |
| 35,230,086 | |||
| Total Common Stocks (cost $537,056,287) | $ 804,128,696 | ||
| SHORT-TERM INVESTMENTS - 4.5% | |||
| Other Investment Pools & Funds - 4.5% | |||
| 37,719,893 | Morgan Stanley Institutional Liquidity Funds, Treasury Portfolio, Institutional Class, 0.01%(1) | $ 37,719,893 | |
| Total Short-Term Investments (cost $37,719,893) | $ 37,719,893 | ||
| Total Investments (cost $574,776,180) | 100.1% | $ 841,848,589 | |
| Other Assets and Liabilities | (0.1)% | (778,718) | |
| Total Net Assets | 100.0% | $ 841,069,871 | |
| Note: | Percentage of investments as shown is the ratio of the total market value to total net assets. |
| Prices of foreign equities that are principally traded on certain foreign markets will generally be adjusted daily pursuant to a fair value pricing service approved by the Board of Directors in order to reflect an adjustment for factors occurring after the close of certain foreign markets but before the close of the New York Stock Exchange. |
| * | Non-income producing. |
| (1) | Current yield as of period end. |
| † | See Significant Accounting Policies of accompanying Notes to Financial Statements regarding valuation of investments. |
| Description | Total | Level 1 | Level 2 | Level 3(1) | ||||
| Assets | ||||||||
| Common Stocks | ||||||||
| Banks | $ 32,218,113 | $ 32,218,113 | $ — | $ — | ||||
| Capital Goods | 93,381,985 | 93,381,985 | — | — | ||||
| Commercial & Professional Services | 55,625,349 | 55,625,349 | — | — | ||||
| Consumer Durables & Apparel | 16,275,655 | 16,275,655 | — | — | ||||
| Consumer Services | 20,528,874 | 20,528,874 | — | — | ||||
| Diversified Financials | 21,499,790 | 21,499,790 | — | — | ||||
| Energy | 21,984,112 | 21,984,112 | — | — | ||||
| Food, Beverage & Tobacco | 14,881,779 | 14,881,779 | — | — | ||||
| Health Care Equipment & Services | 42,481,593 | 42,481,593 | — | — | ||||
| Insurance | 72,669,960 | 72,669,960 | — | — | ||||
| Materials | 35,550,969 | 35,550,969 | — | — | ||||
| Media & Entertainment | 28,857,561 | 28,857,561 | — | — | ||||
| Pharmaceuticals, Biotechnology & Life Sciences | 30,397,135 | 30,397,135 | — | — | ||||
| Real Estate | 34,783,260 | 34,783,260 | — | — | ||||
| Retailing | 39,799,841 | 39,799,841 | — | — | ||||
| Semiconductors & Semiconductor Equipment | 48,247,834 | 48,247,834 | — | — | ||||
| Software & Services | 92,149,895 | 92,149,895 | — | — | ||||
| Technology Hardware & Equipment | 62,631,907 | 62,631,907 | — | — | ||||
| Transportation | 4,932,998 | 4,932,998 | — | — | ||||
| Utilities | 35,230,086 | 35,230,086 | — | — | ||||
| Short-Term Investments | 37,719,893 | 37,719,893 | — | — | ||||
| Total | $ 841,848,589 | $ 841,848,589 | $ — | $ — |
| (1) | For the year ended October 31, 2021, there were no transfers in and out of Level 3. |
| 82 |
October 31, 2021
| Shares or Principal Amount | Market Value† | ||
| COMMON STOCKS - 95.5% | |||
| Automobiles & Components - 0.8% | |||
| 38,044 | Gentherm, Inc.* | $ 2,801,180 | |
| Banks - 9.0% | |||
| 18,818 | Cambridge Bancorp | 1,727,681 | |
| 348,707 | First BanCorp | 4,759,851 | |
| 103,771 | First Interstate BancSystem, Inc. Class A | 4,313,760 | |
| 109,817 | First Merchants Corp. | 4,566,191 | |
| 102,203 | Heritage Financial Corp. | 2,538,722 | |
| 81,885 | OceanFirst Financial Corp. | 1,815,390 | |
| 119,499 | Seacoast Banking Corp. of Florida | 4,353,349 | |
| 47,673 | South State Corp. | 3,722,785 | |
| 133,254 | United Community Banks, Inc. | 4,642,569 | |
| 32,440,298 | |||
| Capital Goods - 12.6% | |||
| 45,504 | Albany International Corp. Class A | 3,669,898 | |
| 166,213 | Custom Truck One Source, Inc.*(1) | 1,504,228 | |
| 39,055 | EnPro Industries, Inc. | 3,501,671 | |
| 40,575 | ESCO Technologies, Inc. | 3,431,022 | |
| 40,416 | Gibraltar Industries, Inc.* | 2,633,506 | |
| 72,375 | Hexcel Corp.* | 4,106,557 | |
| 117,229 | Maxar Technologies, Inc. | 3,112,430 | |
| 44,819 | McGrath Rent Corp. | 3,233,243 | |
| 48,775 | Primoris Services Corp. | 1,314,486 | |
| 33,589 | Simpson Manufacturing Co., Inc. | 3,563,457 | |
| 48,854 | Standex International Corp. | 5,435,985 | |
| 208,500 | Univar Solutions, Inc.* | 5,333,430 | |
| 18,660 | Valmont Industries, Inc. | 4,458,994 | |
| 45,298,907 | |||
| Commercial & Professional Services - 3.9% | |||
| 53,029 | ASGN, Inc.* | 6,345,450 | |
| 194,019 | Interface, Inc. | 2,786,113 | |
| 52,609 | Science Applications International Corp. | 4,723,236 | |
| 13,854,799 | |||
| Consumer Durables & Apparel - 5.5% | |||
| 19,244 | Cavco Industries, Inc.* | 4,625,873 | |
| 49,449 | Oxford Industries, Inc. | 4,584,911 | |
| 79,188 | Skyline Champion Corp. | 5,014,184 | |
| 119,609 | Steven Madden Ltd. | 5,394,366 | |
| 19,619,334 | |||
| Consumer Services - 2.4% | |||
| 9,574 | Cracker Barrel Old Country Store, Inc. | 1,274,970 | |
| 158,274 | Membership Collective Group, Inc.* | 1,663,460 | |
| 137,201 | Terminix Global Holdings, Inc.* | 5,553,896 | |
| 8,492,326 | |||
| Diversified Financials - 3.1% | |||
| 167,460 | Compass Diversified Holdings | 4,998,681 | |
| 23,967 | Houlihan Lokey, Inc. | 2,686,222 | |
| 256,431 | Perella Weinberg Partners(1) | 3,600,291 | |
| 11,285,194 | |||
| Energy - 1.4% | |||
| 42,828 | Cactus, Inc. Class A | 1,863,018 | |
| 96,934 | Delek U.S. Holdings, Inc.* | 1,885,366 | |
| 186,101 | Solaris Oilfield Infrastructure, Inc. Class A | 1,412,507 | |
| 5,160,891 | |||
| Food, Beverage & Tobacco - 3.7% | |||
| 69,556 | Darling Ingredients, Inc.* | 5,878,873 | |
| Shares or Principal Amount | Market Value† | ||
| COMMON STOCKS - 95.5% - (continued) | |||
| Food, Beverage & Tobacco - 3.7% - (continued) | |||
| 247,844 | Primo Water Corp. | $ 3,940,720 | |
| 206,702 | Sovos Brands, Inc.* | 3,340,304 | |
| 13,159,897 | |||
| Health Care Equipment & Services - 7.7% | |||
| 83,359 | AdaptHealth Corp.* | 2,271,533 | |
| 129,124 | Envista Holdings Corp.* | 5,048,748 | |
| 30,818 | ICU Medical, Inc.* | 7,215,418 | |
| 49,837 | LivaNova plc* | 3,823,495 | |
| 13,037 | Mesa Laboratories, Inc. | 3,985,411 | |
| 129,841 | Neuronetics, Inc.* | 675,173 | |
| 45,788 | Progyny, Inc.* | 2,812,757 | |
| 313,098 | Sientra, Inc.* | 1,834,754 | |
| 27,667,289 | |||
| Insurance - 4.8% | |||
| 34,396 | Axis Capital Holdings Ltd. | 1,791,000 | |
| 79,157 | James River Group Holdings Ltd. | 2,529,066 | |
| 63,631 | Kemper Corp. | 4,039,296 | |
| 33,273 | Reinsurance Group of America, Inc. | 3,928,876 | |
| 114,965 | Ryan Specialty Group Holdings, Inc.* | 4,344,527 | |
| 57,092 | Trean Insurance Group, Inc.* | 536,665 | |
| 17,169,430 | |||
| Materials - 7.2% | |||
| 44,995 | Ashland Global Holdings, Inc. | 4,319,970 | |
| 30,944 | Balchem Corp. | 4,737,217 | |
| 24,281 | Eagle Materials, Inc. | 3,602,329 | |
| 171,306 | Element Solutions, Inc. | 3,890,359 | |
| 51,642 | Neenah, Inc. | 2,609,987 | |
| 94,070 | PureCycle Technologies, Inc.*(1) | 1,259,598 | |
| 164,693 | Valvoline, Inc. | 5,592,974 | |
| 26,012,434 | |||
| Media & Entertainment - 2.1% | |||
| 44,119 | Madison Square Garden Entertainment Corp.* | 3,109,066 | |
| 352,629 | Stagwell, Inc.* | 3,060,820 | |
| 80,500 | Tremor International Ltd.* | 1,525,475 | |
| 7,695,361 | |||
| Pharmaceuticals, Biotechnology & Life Sciences - 5.5% | |||
| 18,577 | Catalent, Inc.* | 2,561,024 | |
| 176,703 | Evolus, Inc.* | 1,381,817 | |
| 55,552 | Intra-Cellular Therapies, Inc.* | 2,392,625 | |
| 25,529 | Natera, Inc.* | 2,924,857 | |
| 59,993 | NeoGenomics, Inc.* | 2,759,678 | |
| 24,814 | Pacira BioSciences, Inc.* | 1,297,276 | |
| 69,084 | Syneos Health, Inc.* | 6,448,301 | |
| 19,765,578 | |||
| Real Estate - 3.7% | |||
| 128,988 | Douglas Emmett, Inc. REIT | 4,215,328 | |
| 210,892 | Kennedy-Wilson Holdings, Inc. | 4,717,654 | |
| 59,301 | Terreno Realty Corp. REIT | 4,336,682 | |
| 13,269,664 | |||
| Retailing - 1.8% | |||
| 23,864 | Asbury Automotive Group, Inc.* | 4,670,423 | |
| 297,032 | Quotient Technology, Inc.* | 1,912,886 | |
| 6,583,309 | |||
| Semiconductors & Semiconductor Equipment - 5.3% | |||
| 103,402 | Allegro MicroSystems, Inc.* | 3,449,491 | |
| 63,433 | MACOM Technology Solutions Holdings, Inc.* | 4,428,892 | |
| 83 |
October 31, 2021
| Shares or Principal Amount | Market Value† | ||
| COMMON STOCKS - 95.5% - (continued) | |||
| Semiconductors & Semiconductor Equipment - 5.3% - (continued) | |||
| 109,608 | ON Semiconductor Corp.* | $ 5,268,856 | |
| 68,498 | Semtech Corp.* | 5,824,385 | |
| 18,971,624 | |||
| Software & Services - 8.1% | |||
| 44,762 | CommVault Systems, Inc.* | 2,752,863 | |
| 126,182 | LiveRamp Holdings, Inc.* | 6,751,999 | |
| 94,350 | ON24, Inc.* | 1,804,916 | |
| 42,569 | Perficient, Inc.* | 5,261,528 | |
| 202,655 | Sabre Corp.* | 2,103,559 | |
| 83,465 | Teradata Corp.* | 4,720,780 | |
| 64,309 | WNS Holdings Ltd. ADR* | 5,711,282 | |
| 29,106,927 | |||
| Technology Hardware & Equipment - 4.2% | |||
| 62,790 | Ciena Corp.* | 3,408,869 | |
| 47,730 | Lumentum Holdings, Inc.* | 3,941,543 | |
| 121,437 | Plantronics, Inc.* | 3,249,654 | |
| 278,137 | Viavi Solutions, Inc.* | 4,283,310 | |
| 14,883,376 | |||
| Utilities - 2.7% | |||
| 31,845 | Avista Corp. | 1,267,750 | |
| 19,420 | Chesapeake Utilities Corp. | 2,545,379 | |
| 27,453 | IDACORP, Inc. | 2,863,897 | |
| 45,762 | SJW Group | 3,016,631 | |
| 9,693,657 | |||
| Total Common Stocks (cost $254,091,674) | $ 342,931,475 | ||
| SHORT-TERM INVESTMENTS - 5.8% | |||
| Other Investment Pools & Funds - 4.9% | |||
| 17,575,771 | Morgan Stanley Institutional Liquidity Funds, Treasury Portfolio, Institutional Class, 0.01%(2) | $ 17,575,771 | |
| Securities Lending Collateral - 0.9% | |||
| 19,862 | Fidelity Investments Money Market Funds, Government Portfolio, Institutional Class, 0.01%(2) | 19,862 | |
| 3,049,196 | Goldman Sachs Financial Square Funds, Government Fund, Institutional Class, 0.03%(2) | 3,049,196 | |
| 218,910 | Invesco Government & Agency Portfolio, Institutional Class, 0.03%(2) | 218,910 | |
| 3,287,968 | |||
| Total Short-Term Investments (cost $20,863,739) | $ 20,863,739 | ||
| Total Investments (cost $274,955,413) | 101.3% | $ 363,795,214 | |
| Other Assets and Liabilities | (1.3)% | (4,615,179) | |
| Total Net Assets | 100.0% | $ 359,180,035 | |
| Note: | Percentage of investments as shown is the ratio of the total market value to total net assets. |
| Prices of foreign equities that are principally traded on certain foreign markets will generally be adjusted daily pursuant to a fair value pricing service approved by the Board of Directors in order to reflect an adjustment for factors occurring after the close of certain foreign markets but before the close of the New York Stock Exchange. | |
| The Fund may refer to any one or more of the industry classifications used by one or more widely recognized market indices, ratings group and/or as defined by Fund management. Industry classifications may not be identical across all security types. | |
| Equity industry classifications used in this report are the Global Industry Classification Standard, which was developed by and is the exclusive property and service mark of MSCI, Inc. and Standard & Poor’s. | |
| For Fund compliance purposes, the Fund may not use the same classification system. These classifications are used for financial reporting purposes. | |
| See “Glossary” for abbreviation descriptions. |
| * | Non-income producing. |
| (1) | Represents entire or partial securities on loan. See Note 8 in the accompanying Notes to Financial Statements for securities lending information. |
| (2) | Current yield as of period end. |
| 84 |
October 31, 2021
| Future PIPE Purchase Commitments Outstanding as of October 31, 2021 | ||||||||||
| Period Committed | Security Name | Committed Shares | Committed Cost | Market Value | Unrealized Appreciation (Depreciation) | |||||
| 02/01/2021 | Restaurant & Gaming PIPE | 218,778 | $ 2,187,780 | $ 2,565,610 | $ 377,830 | |||||
| Special purpose acquisition companies (“SPACs”) are collective investment structures that allow for private investments in public equity investments (“PIPE”). These commitments are valued in good faith at fair value as determined under policies and procedures established by and under the supervision of the Board of Directors. Hartford Schroders US Small Cap Opportunities Fund had contingent commitments outstanding of $2,187,780 to purchase restricted PIPE shares as of October 31, 2021. Effective after the fiscal year end, this contingent commitment was canceled. | ||||||||||
| The aggregate unrealized appreciation/depreciation of PIPE commitments represents 0.1% of net assets. | ||||||||||
| Description | Total | Level 1 | Level 2 | Level 3(1) | ||||
| Assets | ||||||||
| Common Stocks | ||||||||
| Automobiles & Components | $ 2,801,180 | $ 2,801,180 | $ — | $ — | ||||
| Banks | 32,440,298 | 32,440,298 | — | — | ||||
| Capital Goods | 45,298,907 | 45,298,907 | — | — | ||||
| Commercial & Professional Services | 13,854,799 | 13,854,799 | — | — | ||||
| Consumer Durables & Apparel | 19,619,334 | 19,619,334 | — | — | ||||
| Consumer Services | 8,492,326 | 8,492,326 | — | — | ||||
| Diversified Financials | 11,285,194 | 11,285,194 | — | — | ||||
| Energy | 5,160,891 | 5,160,891 | — | — | ||||
| Food, Beverage & Tobacco | 13,159,897 | 13,159,897 | — | — | ||||
| Health Care Equipment & Services | 27,667,289 | 27,667,289 | — | — | ||||
| Insurance | 17,169,430 | 17,169,430 | — | — | ||||
| Materials | 26,012,434 | 26,012,434 | — | — | ||||
| Media & Entertainment | 7,695,361 | 7,695,361 | — | — | ||||
| Pharmaceuticals, Biotechnology & Life Sciences | 19,765,578 | 19,765,578 | — | — | ||||
| Real Estate | 13,269,664 | 13,269,664 | — | — | ||||
| Retailing | 6,583,309 | 6,583,309 | — | — | ||||
| Semiconductors & Semiconductor Equipment | 18,971,624 | 18,971,624 | — | — | ||||
| Software & Services | 29,106,927 | 29,106,927 | — | — | ||||
| Technology Hardware & Equipment | 14,883,376 | 14,883,376 | — | — | ||||
| Utilities | 9,693,657 | 9,693,657 | — | — | ||||
| Future PIPE Purchase Commitment | 377,830 | — | 377,830 | — | ||||
| Short-Term Investments | 20,863,739 | 20,863,739 | — | — | ||||
| Total | $ 364,173,044 | $ 363,795,214 | $ 377,830 | $ — |
| (1) | For the year ended October 31, 2021, there were no transfers in and out of Level 3. |
| 85 |
| Counterparty Abbreviations: | |
| BNP | BNP Paribas Securities Services |
| BOA | Bank of America Securities LLC |
| CBK | Citibank NA |
| HSBC | HSBC Bank USA |
| JPM | JP Morgan Chase & Co. |
| MSC | Morgan Stanley |
| UBS | UBS AG |
| WEST | Westpac International |
| Currency Abbreviations: | |
| BRL | Brazil Real |
| CLP | Chile Peso |
| COP | Colombia Peso |
| CZK | Czech Republic Koruna |
| EUR | Euro Member Countries |
| GBP | British Pound |
| HUF | Hungary Forint |
| IDR | Indonesia Rupiah |
| MXN | Mexican Peso |
| MYR | Malaysia Ringgit |
| PEN | Peru Nuevo Sol |
| PLN | Poland Zloty |
| RON | Romania New Leu |
| RUB | Russia Ruble |
| THB | Thailand Baht |
| USD | United States Dollar |
| ZAR | South Africa Rand |
| Index Abbreviations: | |
| CMS | Constant Maturity Swap |
| CMT | Constant Maturity Treasury Index |
| EAFE | Europe, Australasia and Far East |
| Municipal Abbreviations: | |
| Auth | Authority |
| Dev | Development |
| Dist | District |
| Facs | Facilities |
| GO | General Obligation |
| PA | Port Authority |
| Rev | Revenue |
| Other Abbreviations: | |
| ADR | American Depositary Receipt |
| AGC | Assured Guarantee Corp. |
| AGM | Assured Guaranty Municipal |
| BAM | Build America Mutual Assurance Corp. |
| Bhd | Berhad |
| CLO | Collateralized Loan Obligation |
| CMO | Collateralized Mortgage Obligation |
| EURIBOR | Euro Interbank Offered Rate |
| FHLMC | Federal Home Loan Mortgage Corp. |
| FNMA | Federal National Mortgage Association |
| GDR | Global Depositary Receipt |
| GNMA | Government National Mortgage Association |
| JSC | Joint Stock Company |
| LIBOR | London Interbank Offered Rate |
| MSCI | Morgan Stanley Capital International |
| NATL | National Public Finance Guarantee Corp. |
| NVDR | Non-Voting Depositary Receipt |
| PJSC | Private Joint Stock Company |
| PSF-GTD | Permanent School Fund Guaranteed |
| PT | Perseroan Terbatas |
| REIT | Real Estate Investment Trust |
| SOFR | Secured Overnight Financing Rate |
| SONIA | Sterling Overnight Index Average |
| SONIO | Sterling Overnight Index Average |
| Tbk | Terbuka |
| 86 |
October 31, 2021
| Hartford Schroders China A Fund | Hartford Schroders Diversified Emerging Markets Fund | Hartford Schroders Emerging Markets Equity Fund | Hartford Schroders Emerging Markets Multi-Sector Bond Fund | Hartford Schroders International Multi-Cap Value Fund | |||||
| Assets: | |||||||||
| Investments in securities, at market value(1) | $ 77,496,585 | $ 10,007,844 | $ 6,762,765,279 | $ 45,076,657 | $ 2,576,661,386 | ||||
| Cash collateral due from broker on futures contracts | — | 94,267 | — | — | 1,054,266 | ||||
| Cash collateral held for securities on loan | — | — | 195,650 | 74,017 | 409,110 | ||||
| Foreign currency | 66,486 | 10,476 | 1,977,532 | 1,133 | 5,770,041 | ||||
| Unrealized appreciation on OTC swap contracts | — | — | — | 2,268 | — | ||||
| Unrealized appreciation on foreign currency contracts | — | 2,582 | — | 42,634 | 1,721,034 | ||||
| Receivables: | |||||||||
| From affiliates | 10,680 | 32,647 | — | 14,374 | — | ||||
| Investment securities sold | 116 | 18,943 | 3,944,237 | 879,115 | 25,061,624 | ||||
| Fund shares sold | 1,519,808 | — | 10,060,044 | 23,963 | 5,060,244 | ||||
| Dividends and interest | 30 | 2,717 | 8,250,595 | 591,674 | 6,086,960 | ||||
| Securities lending income | — | — | 91,787 | 529 | 40,299 | ||||
| Variation margin on futures contracts | — | — | — | — | 91,001 | ||||
| Tax reclaims | — | 76 | 80,901 | 30,592 | 2,358,356 | ||||
| OTC swap contracts premiums paid | — | — | — | 3,184 | — | ||||
| Other assets | 27,067 | — | 110,581 | 65,030 | 96,479 | ||||
| Total assets | 79,120,772 | 10,169,552 | 6,787,476,606 | 46,805,170 | 2,624,410,800 | ||||
| Liabilities: | |||||||||
| Unrealized depreciation on foreign currency contracts | — | 482 | — | 39,337 | — | ||||
| Obligation to return securities lending collateral | — | — | 3,913,000 | 1,480,350 | 8,182,201 | ||||
| Unrealized depreciation on OTC swap contracts | — | — | — | 101 | — | ||||
| Payables: | |||||||||
| Investment securities purchased | — | 8,658 | 3,660,834 | 696,427 | 8,775,367 | ||||
| Fund shares redeemed | 26,421 | — | 15,296,062 | 12,172 | 1,654,189 | ||||
| Investment management fees | 58,180 | 7,214 | 5,802,564 | 25,078 | 1,521,055 | ||||
| Transfer agent fees | 1,881 | 3 | 883,012 | 4,188 | 212,296 | ||||
| Accounting services fees | 2,083 | 166 | 163,009 | 1,264 | 64,140 | ||||
| Board of Directors' fees | 186 | 17 | 21,098 | 124 | 7,568 | ||||
| Variation margin on futures contracts | — | 15,636 | — | — | — | ||||
| Foreign taxes | — | — | 15,383,570 | 6,310 | — | ||||
| Distribution fees | 67 | — | 5,840 | 40 | 8,274 | ||||
| Accrued expenses | 39,506 | 32,653 | 569,406 | 42,917 | 209,759 | ||||
| OTC swap contracts premiums received | — | — | — | 15,518 | — | ||||
| Total liabilities | 128,324 | 64,829 | 45,698,395 | 2,323,826 | 20,634,849 | ||||
| Net assets | $ 78,992,448 | $ 10,104,723 | $ 6,741,778,211 | $ 44,481,344 | $ 2,603,775,951 | ||||
| Summary of Net Assets: | |||||||||
| Capital stock and paid-in-capital | $ 77,816,895 | $ 10,000,000 | $ 5,335,515,190 | $ 57,155,538 | $ 2,433,943,406 | ||||
| Distributable earnings (loss) | 1,175,553 | 104,723 | 1,406,263,021 | (12,674,194) | 169,832,545 | ||||
| Net assets | $ 78,992,448 | $ 10,104,723 | $ 6,741,778,211 | $ 44,481,344 | $ 2,603,775,951 | ||||
| Shares authorized | 300,000,000 | 350,000,000 | 1,405,000,000 | 500,000,000 | 830,000,000 | ||||
| Par value | $ 0.0001 | $ 0.0001 | $ 0.0001 | $ 0.0001 | $ 0.0001 | ||||
| Class A: Net asset value per share | $ 15.80 | $ — | $ 20.05 | $ 8.29 | $ 10.32 | ||||
| Maximum offering price per share | 16.72 | — | 21.22 | 8.68 | 10.92 | ||||
| Shares outstanding | 49,443 | — | 4,939,359 | 189,820 | 9,548,212 | ||||
| Net Assets | $ 781,306 | $ — | $ 99,011,099 | $ 1,573,944 | $ 98,511,132 | ||||
| Class C: Net asset value per share | $ 15.59 | $ — | $ 19.76 | $ 8.26 | $ 10.25 | ||||
| Shares outstanding | 12,790 | — | 447,043 | 16,407 | 1,433,916 | ||||
| Net Assets | $ 199,405 | $ — | $ 8,835,352 | $ 135,603 | $ 14,700,230 | ||||
| Class I: Net asset value per share | $ 15.81 | $ — | $ 20.13 | $ 8.28 | $ 10.31 | ||||
| Shares outstanding | 491,980 | — | 115,577,175 | 2,291,984 | 69,243,061 | ||||
| Net Assets | $ 7,776,134 | $ — | $ 2,326,810,911 | $ 18,975,981 | $ 713,834,706 | ||||
| Class R3: Net asset value per share | $ — | $ — | $ 19.99 | $ 8.30 | $ 10.28 | ||||
| Shares outstanding | — | — | 5,010 | 3,722 | 1,669,384 | ||||
| Net Assets | $ — | $ — | $ 100,129 | $ 30,904 | $ 17,168,749 |
| 87 |
October 31, 2021
| Hartford Schroders China A Fund | Hartford Schroders Diversified Emerging Markets Fund | Hartford Schroders Emerging Markets Equity Fund | Hartford Schroders Emerging Markets Multi-Sector Bond Fund | Hartford Schroders International Multi-Cap Value Fund | |||||
| Class R4: Net asset value per share | $ — | $ — | $ 20.18 | $ 8.29 | $ 10.29 | ||||
| Shares outstanding | — | — | 271,839 | 1,353 | 572,464 | ||||
| Net Assets | $ — | $ — | $ 5,484,530 | $ 11,219 | $ 5,889,795 | ||||
| Class R5: Net asset value per share | $ — | $ — | $ 20.14 | $ 8.28 | $ 10.30 | ||||
| Shares outstanding | — | — | 20,447 | 1,363 | 1,754,124 | ||||
| Net Assets | $ — | $ — | $ 411,833 | $ 11,286 | $ 18,070,370 | ||||
| Class Y: Net asset value per share | $ 15.82 | $ — | $ 20.20 | $ 8.28 | $ 10.31 | ||||
| Shares outstanding | 188,740 | — | 44,090,712 | 355,895 | 27,707,234 | ||||
| Net Assets | $ 2,986,640 | $ — | $ 890,765,324 | $ 2,945,940 | $ 285,533,023 | ||||
| Class F: Net asset value per share | $ 15.82 | $ — | $ 20.15 | $ 7.77 | $ 10.31 | ||||
| Shares outstanding | 4,000,011 | — | 52,065,326 | 1,555 | 56,062,875 | ||||
| Net Assets | $ 63,292,068 | $ — | $ 1,049,336,044 | $ 12,075 | $ 578,284,268 | ||||
| Class SDR: Net asset value per share | $ 15.83 | $ 10.10 | $ 20.19 | $ 8.28 | $ 10.30 | ||||
| Shares outstanding | 250,000 | 1,000,000 | 116,931,580 | 2,510,362 | 84,640,412 | ||||
| Net Assets | $ 3,956,895 | $ 10,104,723 | $ 2,361,022,989 | $ 20,784,392 | $ 871,783,678 | ||||
| Cost of investments | $ 76,756,320 | $ 9,928,753 | $ 5,113,589,595 | $ 45,303,170 | $ 2,362,003,525 | ||||
| Cost of foreign currency | $ 66,486 | $ 10,429 | $ 1,971,226 | $ 1,157 | $ 5,778,941 | ||||
| (1) Includes Investment in securities on loan, at market value | $ — | $ — | $ 3,624,880 | $ 1,430,817 | $ 17,879,508 |
| 88 |
October 31, 2021
| Hartford Schroders International Stock Fund | Hartford Schroders Securitized Income Fund | Hartford Schroders Tax-Aware Bond Fund | Hartford Schroders US MidCap Opportunities Fund | Hartford Schroders US Small Cap Opportunities Fund | |||||
| Assets: | |||||||||
| Investments in securities, at market value(1) | $ 3,634,764,870 | $ 127,119,714 | $ 454,108,778 | $ 841,848,589 | $ 363,795,214 | ||||
| PIPE Purchase Commitments | — | — | — | — | 377,830 | ||||
| Cash collateral due from broker on futures contracts | — | 159,600 | 166,025 | — | — | ||||
| Cash collateral held for securities on loan | 221,151 | — | 23,135 | — | 173,051 | ||||
| Foreign currency | 6,108 | 7,309 | — | — | — | ||||
| Unrealized appreciation on foreign currency contracts | — | 93,996 | — | — | — | ||||
| Receivables: | |||||||||
| From affiliates | — | 6,042 | 44,673 | — | 6,013 | ||||
| Investment securities sold | 50,832,477 | — | 2,799,587 | — | 296,910 | ||||
| Fund shares sold | 10,463,523 | 23,341 | 477,550 | 496,340 | 194,042 | ||||
| Dividends and interest | 548,311 | 240,215 | 2,752,808 | 130,749 | 25,990 | ||||
| Securities lending income | 79,011 | — | 108 | — | 13,037 | ||||
| Tax reclaims | 2,607,429 | — | — | — | — | ||||
| Other assets | 155,969 | 28,731 | 48,797 | 60,781 | 61,893 | ||||
| Total assets | 3,699,678,849 | 127,678,948 | 460,421,461 | 842,536,459 | 364,943,980 | ||||
| Liabilities: | |||||||||
| Unrealized depreciation on foreign currency contracts | — | 15 | — | — | — | ||||
| Obligation to return securities lending collateral | 4,423,026 | — | 462,705 | — | 3,461,019 | ||||
| Payables: | |||||||||
| Investment securities purchased | 53,042,654 | 1,799,972 | 3,203,400 | — | 1,294,251 | ||||
| Fund shares redeemed | 7,090,278 | 133,063 | 600,557 | 737,412 | 629,567 | ||||
| Investment management fees | 1,933,612 | 68,660 | 175,384 | 529,941 | 272,565 | ||||
| Transfer agent fees | 358,258 | 8,185 | 49,573 | 107,645 | 51,680 | ||||
| Accounting services fees | 76,066 | 4,079 | 15,417 | 23,959 | 11,475 | ||||
| Board of Directors' fees | 5,681 | 294 | 1,325 | 2,173 | 980 | ||||
| Variation margin on futures contracts | — | 2,265 | 5,331 | — | — | ||||
| Foreign taxes | 1,165,638 | — | — | — | — | ||||
| Distribution fees | 15,403 | 282 | 3,888 | 13,574 | 3,124 | ||||
| Distributions payable | — | — | — | — | — | ||||
| Accrued expenses | 114,836 | 52,763 | 41,766 | 51,884 | 39,284 | ||||
| Total liabilities | 68,225,452 | 2,069,578 | 4,559,346 | 1,466,588 | 5,763,945 | ||||
| Net assets | $ 3,631,453,397 | $ 125,609,370 | $ 455,862,115 | $ 841,069,871 | $ 359,180,035 | ||||
| Summary of Net Assets: | |||||||||
| Capital stock and paid-in-capital | $ 3,037,303,643 | $ 126,394,267 | $ 441,484,632 | $ 464,389,283 | $ 233,014,664 | ||||
| Distributable earnings (loss) | 594,149,754 | (784,897) | 14,377,483 | 376,680,588 | 126,165,371 | ||||
| Net assets | $ 3,631,453,397 | $ 125,609,370 | $ 455,862,115 | $ 841,069,871 | $ 359,180,035 | ||||
| Shares authorized | 760,000,000 | 300,000,000 | 360,000,000 | 500,000,000 | 500,000,000 | ||||
| Par value | $ 0.0001 | $ 0.0001 | $ 0.0001 | $ 0.0001 | $ 0.0001 | ||||
| Class A: Net asset value per share | $ 19.07 | $ 9.91 | $ 11.27 | $ 20.63 | $ 33.48 | ||||
| Maximum offering price per share | 20.18 | 10.22 | 11.80 | 21.83 | 35.43 | ||||
| Shares outstanding | 14,958,083 | 521,359 | 5,633,716 | 5,184,772 | 1,151,700 | ||||
| Net Assets | $ 285,277,655 | $ 5,166,735 | $ 63,474,542 | $ 106,981,841 | $ 38,561,399 | ||||
| Class C: Net asset value per share | $ 17.97 | $ 9.89 | $ 11.28 | $ 20.64 | $ 33.73 | ||||
| Shares outstanding | 1,156,532 | 43,699 | 688,679 | 2,655,421 | 254,233 | ||||
| Net Assets | $ 20,787,691 | $ 432,139 | $ 7,767,786 | $ 54,795,216 | $ 8,574,119 | ||||
| Class I: Net asset value per share | $ 18.49 | $ 9.89 | $ 11.28 | $ 21.52 | $ 35.38 | ||||
| Shares outstanding | 107,195,918 | 9,022,106 | 24,748,787 | 21,268,403 | 6,195,823 | ||||
| Net Assets | $ 1,981,792,728 | $ 89,260,227 | $ 279,048,154 | $ 457,620,578 | $ 219,196,604 | ||||
| Class R3: Net asset value per share | $ 18.31 | $ — | $ — | $ 21.07 | $ 34.71 | ||||
| Shares outstanding | 64,951 | — | — | 102,357 | 39,730 | ||||
| Net Assets | $ 1,189,553 | $ — | $ — | $ 2,157,125 | $ 1,378,928 | ||||
| Class R4: Net asset value per share | $ 18.42 | $ — | $ — | $ 21.37 | $ 35.14 | ||||
| Shares outstanding | 208,470 | — | — | 40,070 | 21,037 | ||||
| Net Assets | $ 3,840,528 | $ — | $ — | $ 856,156 | $ 739,319 |
| 89 |
October 31, 2021
| Hartford Schroders International Stock Fund | Hartford Schroders Securitized Income Fund | Hartford Schroders Tax-Aware Bond Fund | Hartford Schroders US MidCap Opportunities Fund | Hartford Schroders US Small Cap Opportunities Fund | |||||
| Class R5: Net asset value per share | $ 18.49 | $ — | $ — | $ 21.47 | $ 35.34 | ||||
| Shares outstanding | 1,329,515 | — | — | 40,696 | 19,449 | ||||
| Net Assets | $ 24,588,244 | $ — | $ — | $ 873,946 | $ 687,327 | ||||
| Class Y: Net asset value per share | $ 18.54 | $ 9.89 | $ 11.28 | $ 21.50 | $ 35.37 | ||||
| Shares outstanding | 13,378,829 | 423,485 | 25,329 | 3,859,141 | 1,081,884 | ||||
| Net Assets | $ 248,057,561 | $ 4,187,336 | $ 285,664 | $ 82,957,861 | $ 38,267,265 | ||||
| Class F: Net asset value per share | $ 18.52 | $ 9.88 | $ 11.28 | $ 21.53 | $ 35.42 | ||||
| Shares outstanding | 33,406,587 | 212,015 | 3,634,653 | 3,885,805 | 498,686 | ||||
| Net Assets | $ 618,602,308 | $ 2,095,515 | $ 40,994,021 | $ 83,647,400 | $ 17,664,453 | ||||
| Class SDR: Net asset value per share | $ 18.50 | $ 9.88 | $ 11.27 | $ 21.56 | $ 35.46 | ||||
| Shares outstanding | 24,176,459 | 2,477,406 | 5,705,703 | 2,373,417 | 961,873 | ||||
| Net Assets | $ 447,317,129 | $ 24,467,418 | $ 64,291,948 | $ 51,179,748 | $ 34,110,621 | ||||
| Cost of investments | $ 3,088,725,297 | $ 126,568,642 | $ 445,674,787 | $ 574,776,180 | $ 274,955,413 | ||||
| Cost of foreign currency | $ 6,109 | $ 7,369 | $ — | $ — | $ — | ||||
| (1) Includes Investment in securities on loan, at market value | $ 4,190,637 | $ — | $ 450,097 | $ — | $ 3,413,684 |
| 90 |
For the Year Ended October 31, 2021
| Hartford Schroders China A Fund | Hartford Schroders Diversified Emerging Markets Fund(1) | Hartford Schroders Emerging Markets Equity Fund | Hartford Schroders Emerging Markets Multi-Sector Bond Fund | Hartford Schroders International Multi-Cap Value Fund | |||||
| Investment Income: | |||||||||
| Dividends | $ 293,267 | $ 6,157 | $ 132,402,835 | $ — | $ 84,158,584 | ||||
| Non-cash dividends | — | — | 23,479,866 | — | 552,113 | ||||
| Interest | 127 | 21 | 34,645 | 2,677,347 | — | ||||
| Securities lending | — | — | 324,909 | 5,487 | 1,246,045 | ||||
| Less: Foreign tax withheld | (28,514) | (755) | (16,409,633) | (25,464) | (8,221,250) | ||||
| Total investment income, net | 264,880 | 5,423 | 139,832,622 | 2,657,370 | 77,735,492 | ||||
| Expenses: | |||||||||
| Investment management fees | 249,064 | 7,214 | 62,672,412 | 350,713 | 16,688,783 | ||||
| Transfer agent fees | |||||||||
| Class A | 1,522 | — | 462,752 | 2,860 | 96,535 | ||||
| Class C | 248 | — | 7,367 | 458 | 15,786 | ||||
| Class I | 3,142 | — | 3,853,765 | 18,038 | 756,849 | ||||
| Class R3 | — | — | 218 | 68 | 37,520 | ||||
| Class R4 | — | — | 9,162 | 19 | 7,779 | ||||
| Class R5 | — | — | 504 | 14 | 19,829 | ||||
| Class Y | 175 | — | 600,921 | 1,312 | 279,544 | ||||
| Class F | 155 | — | 6,725 | — | 6,523 | ||||
| Class SDR | 159 | 3 | 3,683 | 326 | 31,899 | ||||
| Distribution fees | |||||||||
| Class A | 2,521 | — | 800,388 | 4,382 | 214,733 | ||||
| Class C | 2,068 | — | 85,664 | 1,831 | 149,452 | ||||
| Class R3 | — | — | 496 | 155 | 85,273 | ||||
| Class R4 | — | — | 13,486 | 29 | 11,514 | ||||
| Custodian fees | 14,214 | 3,804 | 633,485 | 8,552 | 328,146 | ||||
| Registration and filing fees | 110,507 | 2,384 | 248,961 | 114,444 | 154,012 | ||||
| Accounting services fees | 4,895 | 167 | 900,311 | 8,156 | 355,977 | ||||
| Board of Directors' fees | 865 | 17 | 170,453 | 1,111 | 62,866 | ||||
| Audit and tax fees | 27,948 | 26,024 | 47,519 | 29,738 | 59,808 | ||||
| Other expenses | 17,668 | 677 | 548,480 | 22,095 | 188,498 | ||||
| Total expenses (before waivers, reimbursements and fees paid indirectly) | 435,151 | 40,290 | 71,066,752 | 564,301 | 19,551,326 | ||||
| Expense waivers | (146,017) | (32,647) | — | (150,729) | — | ||||
| Transfer agent fee waivers | — | — | — | — | (90,370) | ||||
| Distribution fee reimbursements | (1,474) | — | (180) | (232) | (11,029) | ||||
| Total waivers, reimbursements and fees paid indirectly | (147,491) | (32,647) | (180) | (150,961) | (101,399) | ||||
| Total expenses | 287,660 | 7,643 | 71,066,572 | 413,340 | 19,449,927 | ||||
| Net Investment Income (Loss) | (22,780) | (2,220) | 68,766,050 | 2,244,030 | 58,285,565 | ||||
| Net Realized Gain (Loss) on Investments, Other Financial Instruments and Foreign Currency Transactions on: | |||||||||
| Investments | 572,181 | 14,969 | 197,505,996 | 228,917 | 207,717,833 | ||||
| Less: Foreign taxes paid on realized capital gains | — | — | (951,032) | (10,036) | — | ||||
| Futures contracts | (92,970) | 25,311 | (61,403) | 94,561 | 4,080,366 | ||||
| Swap contracts | — | — | — | (36,335) | — | ||||
| Foreign currency contracts | — | (2,035) | 71 | 252,140 | (9,922,050) | ||||
| Other foreign currency transactions | (20,578) | (3,003) | (4,864,442) | (21,365) | (1,353,515) | ||||
| Net Realized Gain (Loss) on Investments, Other Financial Instruments and Foreign Currency Transactions | 458,633 | 35,242 | 191,629,190 | 507,882 | 200,522,634 | ||||
| Net Changes in Unrealized Appreciation (Depreciation) of Investments, Other Financial Instruments and Foreign Currency Transactions of: | |||||||||
| Investments * | (997,904) | 79,091 | 384,833,331 | 647,869 | 376,883,808 | ||||
| Futures contracts | — | (9,512) | — | — | 11,758 | ||||
| Swap contracts | — | — | — | 63,234 | — | ||||
| Foreign currency contracts | — | 2,100 | — | (82,230) | 2,523,788 | ||||
| Translation of other assets and liabilities in foreign currencies | 112 | 22 | (405,895) | 2 | (165,187) | ||||
| Net Changes in Unrealized Appreciation (Depreciation) of Investments, Other Financial Instruments and Foreign Currency Transactions | (997,792) | 71,701 | 384,427,436 | 628,875 | 379,254,167 | ||||
| Net Gain (Loss) on Investments, Other Financial Instruments and Foreign Currency Transactions | (539,159) | 106,943 | 576,056,626 | 1,136,757 | 579,776,801 | ||||
| Net Increase (Decrease) in Net Assets Resulting from Operations | $ (561,939) | $ 104,723 | $ 644,822,676 | $ 3,380,787 | $ 638,062,366 |
| 91 |
For the Year Ended October 31, 2021
| Hartford Schroders China A Fund | Hartford Schroders Diversified Emerging Markets Fund(1) | Hartford Schroders Emerging Markets Equity Fund | Hartford Schroders Emerging Markets Multi-Sector Bond Fund | Hartford Schroders International Multi-Cap Value Fund | |||||
| * Includes change in unrealized appreciation (depreciation) on deferred capital gains tax | $ — | $ — | $ (14,475,254) | $ 13,943 | $ — |
| (1) | Commenced operations on September 30, 2021. |
| 92 |
For the Year Ended October 31, 2021
| Hartford Schroders International Stock Fund | Hartford Schroders Securitized Income Fund | Hartford Schroders Tax-Aware Bond Fund | Hartford Schroders US MidCap Opportunities Fund | Hartford Schroders US Small Cap Opportunities Fund | |||||
| Investment Income: | |||||||||
| Dividends | $ 45,730,798 | $ 9,914 | $ — | $ 8,332,488 | $ 3,246,223 | ||||
| Non-cash dividends | 6,363,590 | — | — | — | — | ||||
| Interest | — | 2,897,771 | 8,209,382 | 2,694 | 1,571 | ||||
| Securities lending | 356,960 | — | 1,779 | 984 | 49,501 | ||||
| Less: Foreign tax withheld | (5,041,345) | (77) | — | (17,194) | (22,935) | ||||
| Total investment income, net | 47,410,003 | 2,907,608 | 8,211,161 | 8,318,972 | 3,274,360 | ||||
| Expenses: | |||||||||
| Investment management fees | 15,884,459 | 701,666 | 2,052,123 | 5,886,510 | 2,926,748 | ||||
| Transfer agent fees | |||||||||
| Class A | 223,538 | 1,872 | 35,434 | 105,515 | 48,328 | ||||
| Class C | 14,380 | 540 | 10,566 | 54,971 | 11,870 | ||||
| Class I | 1,172,340 | 45,022 | 240,688 | 377,998 | 187,221 | ||||
| Class R3 | 2,531 | — | — | 4,374 | 1,737 | ||||
| Class R4 | 5,770 | — | — | 1,243 | 730 | ||||
| Class R5 | 21,258 | — | — | 1,148 | 670 | ||||
| Class Y | 190,254 | 659 | 238 | 93,204 | 37,568 | ||||
| Class F | 804 | 83 | 159 | 1,460 | 206 | ||||
| Class SDR | 10,519 | 246 | 812 | 1,890 | 1,282 | ||||
| Distribution fees | |||||||||
| Class A | 530,348 | 13,868 | 157,469 | 233,821 | 84,767 | ||||
| Class C | 143,145 | 5,472 | 83,250 | 528,929 | 86,858 | ||||
| Class R3 | 5,762 | — | — | 10,086 | 3,953 | ||||
| Class R4 | 8,498 | — | — | 1,850 | 1,077 | ||||
| Custodian fees | 78,460 | 11,900 | 13,528 | 7,457 | 6,706 | ||||
| Registration and filing fees | 305,625 | 97,387 | 100,011 | 125,115 | 122,904 | ||||
| Accounting services fees | 350,327 | 18,735 | 78,198 | 127,339 | 55,940 | ||||
| Board of Directors' fees | 67,052 | 2,798 | 11,640 | 19,778 | 8,645 | ||||
| Audit and tax fees | 35,656 | 45,282 | 31,774 | 23,444 | 23,340 | ||||
| Other expenses | 218,151 | 22,686 | 41,725 | 90,648 | 55,940 | ||||
| Total expenses (before waivers, reimbursements and fees paid indirectly) | 19,268,877 | 968,216 | 2,857,615 | 7,696,780 | 3,666,490 | ||||
| Interest expense | — | 148,903 | — | — | — | ||||
| Total expenses (after interest expense) | — | 1,117,119 | — | — | — | ||||
| Expense waivers | — | (84,281) | (422,215) | — | (60,958) | ||||
| Distribution fee reimbursements | (556) | (9,134) | (141) | (943) | (1,188) | ||||
| Total waivers, reimbursements and fees paid indirectly | (556) | (93,415) | (422,356) | (943) | (62,146) | ||||
| Total expenses | 19,268,321 | 1,023,704 | 2,435,259 | 7,695,837 | 3,604,344 | ||||
| Net Investment Income (Loss) | 28,141,682 | 1,883,904 | 5,775,902 | 623,135 | (329,984) | ||||
| Net Realized Gain (Loss) on Investments, Other Financial Instruments and Foreign Currency Transactions on: | |||||||||
| Investments | 29,511,958 | (378,449) | 2,294,552 | 122,807,725 | 48,336,250 | ||||
| Futures contracts | — | (224,526) | 3,358,564 | — | — | ||||
| Foreign currency contracts | — | 66,287 | — | — | — | ||||
| Other foreign currency transactions | (256,999) | (228,448) | — | (25) | — | ||||
| Net Realized Gain (Loss) on Investments, Other Financial Instruments and Foreign Currency Transactions | 29,254,959 | (765,136) | 5,653,116 | 122,807,700 | 48,336,250 | ||||
| Net Changes in Unrealized Appreciation (Depreciation) of Investments, Other Financial Instruments and Foreign Currency Transactions of: | |||||||||
| Investments * | 436,646,100 | 1,731,596 | (6,058,004) | 138,362,727 | 56,709,046 | ||||
| Futures contracts | — | (224,360) | (116,417) | — | — | ||||
| Foreign currency contracts | — | 98,796 | — | — | — | ||||
| Translation of other assets and liabilities in foreign currencies | (57,494) | (26,520) | — | — | — | ||||
| Net Changes in Unrealized Appreciation (Depreciation) of Investments, Other Financial Instruments and Foreign Currency Transactions | 436,588,606 | 1,579,512 | (6,174,421) | 138,362,727 | 56,709,046 | ||||
| Net Gain (Loss) on Investments, Other Financial Instruments and Foreign Currency Transactions | 465,843,565 | 814,376 | (521,305) | 261,170,427 | 105,045,296 | ||||
| Net Increase (Decrease) in Net Assets Resulting from Operations | $ 493,985,247 | $ 2,698,280 | $ 5,254,597 | $ 261,793,562 | $ 104,715,312 |
| 93 |
For the Year Ended October 31, 2021
| Hartford Schroders International Stock Fund | Hartford Schroders Securitized Income Fund | Hartford Schroders Tax-Aware Bond Fund | Hartford Schroders US MidCap Opportunities Fund | Hartford Schroders US Small Cap Opportunities Fund | |||||
| * Includes change in unrealized appreciation (depreciation) on deferred capital gains tax | $ (1,106,558) | $ — | $ — | $ — | $ — |
| 94 |
For the Year Ended October 31, 2021
| Hartford Schroders China A Fund | Hartford Schroders Diversified Emerging Markets Fund | ||||
| For the Year Ended October 31, 2021 | For the Period Ended October 31, 2020(1) | For the Period Ended October 31, 2021(2) | |||
| Operations: | |||||
| Net investment income (loss) | $ (22,780) | $ 45,426 | $ (2,220) | ||
| Net realized gain (loss) on investments, other financial instruments and foreign currency transactions | 458,633 | 769,946 | 35,242 | ||
| Net changes in unrealized appreciation (depreciation) of investments, other financial instruments and foreign currency transactions | (997,792) | 1,738,173 | 71,701 | ||
| Net Increase (Decrease) in Net Assets Resulting from Operations | (561,939) | 2,553,545 | 104,723 | ||
| Distributions to Shareholders: | |||||
| Class A | (51,074) | — | — | ||
| Class C | (17,324) | — | — | ||
| Class I | (23,649) | — | — | ||
| Class Y | (16,158) | — | — | ||
| Class F | (324,076) | — | — | ||
| Class SDR | (383,976) | — | — | ||
| Total distributions | (816,257) | — | — | ||
| Capital Share Transactions: | |||||
| Sold | 106,251,339 | 5,537,911 | 10,000,010 | ||
| Issued on reinvestment of distributions | 432,281 | — | — | ||
| Redeemed | (34,134,687) | (269,745) | (10) | ||
| Net increase (decrease) from capital share transactions | 72,548,933 | 5,268,166 | 10,000,000 | ||
| Net Increase (Decrease) in Net Assets | 71,170,737 | 7,821,711 | 10,104,723 | ||
| Net Assets: | |||||
| Beginning of period | 7,821,711 | — | — | ||
| End of period | $ 78,992,448 | $ 7,821,711 | $ 10,104,723 | ||
| (1) | Commenced operations on March 31, 2020. |
| (2) | Commenced operations on September 30, 2021. |
| 95 |
For the Year Ended October 31, 2021
| Hartford Schroders Emerging Markets Equity Fund | Hartford Schroders Emerging Markets Multi-Sector Bond Fund | ||||||
| For the Year Ended October 31, 2021 | For the Year Ended October 31, 2020 | For the Year Ended October 31, 2021 | For the Year Ended October 31, 2020 | ||||
| Operations: | |||||||
| Net investment income (loss) | $ 68,766,050 | $ 27,210,851 | $ 2,244,030 | $ 3,874,164 | |||
| Net realized gain (loss) on investments, other financial instruments and foreign currency transactions | 191,629,190 | (146,838,820) | 507,882 | (5,222,785) | |||
| Net changes in unrealized appreciation (depreciation) of investments, other financial instruments and foreign currency transactions | 384,427,436 | 477,156,752 | 628,875 | (2,084,337) | |||
| Net Increase (Decrease) in Net Assets Resulting from Operations | 644,822,676 | 357,528,783 | 3,380,787 | (3,432,958) | |||
| Distributions to Shareholders: | |||||||
| From distributable earnings: | |||||||
| Class A | (5,312,511) | (1,276,901) | (69,629) | (60,738) | |||
| Class C | — | (135,012) | (5,800) | (7,559) | |||
| Class I | (13,377,299) | (42,224,830) | (808,597) | (995,009) | |||
| Class R3 | (330) | (1,392) | (1,124) | (966) | |||
| Class R4 | (37,977) | (394) | (447) | (448) | |||
| Class R5 | (2,909) | (15,146) | (484) | (453) | |||
| Class Y | (589,255) | (3,396,489) | (109,352) | (96,816) | |||
| Class F | (9,554,982) | (10,265,925) | (563) | (143,762) | |||
| Class SDR | (14,545,085) | (28,457,971) | (1,083,054) | (1,493,256) | |||
| From return of capital: | |||||||
| Class A | — | — | — | (17,785) | |||
| Class C | — | — | — | (2,214) | |||
| Class I | — | — | — | (291,352) | |||
| Class R3 | — | — | — | (283) | |||
| Class R4 | — | — | — | (131) | |||
| Class R5 | — | — | — | (133) | |||
| Class Y | — | — | — | (28,349) | |||
| Class F | — | — | — | (42,096) | |||
| Class SDR | — | — | — | (437,245) | |||
| Total distributions | (43,420,348) | (85,774,060) | (2,079,050) | (3,618,595) | |||
| Capital Share Transactions: | |||||||
| Sold | 4,842,961,004 | 2,338,027,384 | 25,345,037 | 15,086,632 | |||
| Issued on reinvestment of distributions | 32,176,805 | 52,562,018 | 2,078,786 | 3,616,560 | |||
| Redeemed | (2,926,986,156) | (2,049,052,553) | (44,370,189) | (45,608,267) | |||
| Net increase (decrease) from capital share transactions | 1,948,151,653 | 341,536,849 | (16,946,366) | (26,905,075) | |||
| Net Increase (Decrease) in Net Assets | 2,549,553,981 | 613,291,572 | (15,644,629) | (33,956,628) | |||
| Net Assets: | |||||||
| Beginning of period | 4,192,224,230 | 3,578,932,658 | 60,125,973 | 94,082,601 | |||
| End of period | $ 6,741,778,211 | $ 4,192,224,230 | $ 44,481,344 | $ 60,125,973 | |||
| 96 |
For the Year Ended October 31, 2021
| Hartford Schroders International Multi-Cap Value Fund | Hartford Schroders International Stock Fund | ||||||
| For the Year Ended October 31, 2021 | For the Year Ended October 31, 2020 | For the Year Ended October 31, 2021 | For the Year Ended October 31, 2020 | ||||
| Operations: | |||||||
| Net investment income (loss) | $ 58,285,565 | $ 46,568,325 | $ 28,141,682 | $ 4,769,518 | |||
| Net realized gain (loss) on investments, other financial instruments and foreign currency transactions | 200,522,634 | (97,642,693) | 29,254,959 | 815,135 | |||
| Net changes in unrealized appreciation (depreciation) of investments, other financial instruments and foreign currency transactions | 379,254,167 | (184,162,311) | 436,588,606 | 61,298,952 | |||
| Net Increase (Decrease) in Net Assets Resulting from Operations | 638,062,366 | (235,236,679) | 493,985,247 | 66,883,605 | |||
| Distributions to Shareholders: | |||||||
| Class A | (1,921,493) | (2,469,969) | (32,727) | (551,218) | |||
| Class C | (224,044) | (323,461) | — | (10,939) | |||
| Class I | (17,086,178) | (18,811,004) | (2,419,301) | (2,937,044) | |||
| Class R3 | (328,949) | (369,795) | — | (2,018) | |||
| Class R4 | (103,502) | (68,291) | (701) | (3,576) | |||
| Class R5 | (473,876) | (570,494) | (52,125) | (21,848) | |||
| Class Y | (6,351,823) | (4,370,513) | (340,321) | (12,698) | |||
| Class F | (12,981,174) | (11,330,692) | (990,397) | (1,036,195) | |||
| Class SDR | (20,557,285) | (18,442,460) | (872,187) | (957,577) | |||
| Total distributions | (60,028,324) | (56,756,679) | (4,707,759) | (5,533,113) | |||
| Capital Share Transactions: | |||||||
| Sold | 1,001,256,584 | 798,908,249 | 2,595,240,179 | 714,548,186 | |||
| Issued on reinvestment of distributions | 53,767,304 | 50,947,105 | 4,373,503 | 5,300,485 | |||
| Redeemed | (778,260,331) | (881,294,700) | (483,052,970) | (196,939,513) | |||
| Net increase (decrease) from capital share transactions | 276,763,557 | (31,439,346) | 2,116,560,712 | 522,909,158 | |||
| Net Increase (Decrease) in Net Assets | 854,797,599 | (323,432,704) | 2,605,838,200 | 584,259,650 | |||
| Net Assets: | |||||||
| Beginning of period | 1,748,978,352 | 2,072,411,056 | 1,025,615,197 | 441,355,547 | |||
| End of period | $ 2,603,775,951 | $ 1,748,978,352 | $ 3,631,453,397 | $ 1,025,615,197 | |||
| 97 |
For the Year Ended October 31, 2021
| Hartford Schroders Securitized Income Fund | Hartford Schroders Tax-Aware Bond Fund | ||||||
| For the Year Ended October 31, 2021 | For the Year Ended October 31, 2020 | For the Year Ended October 31, 2021 | For the Year Ended October 31, 2020 | ||||
| Operations: | |||||||
| Net investment income (loss) | $ 1,883,904 | $ 1,683,155 | $ 5,775,902 | $ 6,131,232 | |||
| Net realized gain (loss) on investments, other financial instruments and foreign currency transactions | (765,136) | (684,572) | 5,653,116 | 5,692,704 | |||
| Net changes in unrealized appreciation (depreciation) of investments, other financial instruments and foreign currency transactions | 1,579,512 | (977,272) | (6,174,421) | 5,001,707 | |||
| Net Increase (Decrease) in Net Assets Resulting from Operations | 2,698,280 | 21,311 | 5,254,597 | 16,825,643 | |||
| Distributions to Shareholders: | |||||||
| Class A | (84,434) | (89,717) | (1,450,548) | (1,459,342) | |||
| Class C | (3,248) | (1,709) (3) | (129,755) | (217,886) | |||
| Class I | (1,292,341) | (720,698) | (7,512,352) | (8,545,891) | |||
| Class Y | (72,758) | (82,780) | (5,542) | (7,512) | |||
| Class F | (39,737) | (53,914) | (913,441) | (939,696) | |||
| Class SDR | (399,130) | (858,565) | (1,616,470) | (2,255,888) | |||
| Total distributions | (1,891,648) | (1,807,383) | (11,628,108) | (13,426,215) | |||
| Capital Share Transactions: | |||||||
| Sold | 65,753,561 | 97,752,072 | 153,934,962 | 263,674,922 | |||
| Issued on reinvestment of distributions | 1,653,658 | 1,439,757 | 9,364,337 | 10,792,934 | |||
| Redeemed | (36,531,227) | (98,425,735) | (144,506,187) | (168,973,451) | |||
| Net increase (decrease) from capital share transactions | 30,875,992 | 766,094 | 18,793,112 | 105,494,405 | |||
| Net Increase (Decrease) in Net Assets | 31,682,624 | (1,019,978) | 12,419,601 | 108,893,833 | |||
| Net Assets: | |||||||
| Beginning of period | 93,926,746 | 94,946,724 | 443,442,514 | 334,548,681 | |||
| End of period | $ 125,609,370 | $ 93,926,746 | $ 455,862,115 | $ 443,442,514 | |||
| (3) | Commenced operations on February 28, 2020. |
| 98 |
For the Year Ended October 31, 2021
| Hartford Schroders US MidCap Opportunities Fund | Hartford Schroders US Small Cap Opportunities Fund | ||||||
| For the Year Ended October 31, 2021 | For the Year Ended October 31, 2020 | For the Year Ended October 31, 2021 | For the Year Ended October 31, 2020 | ||||
| Operations: | |||||||
| Net investment income (loss) | $ 623,135 | $ 1,941,902 | $ (329,984) | $ 700,322 | |||
| Net realized gain (loss) on investments, other financial instruments and foreign currency transactions | 122,807,700 | (1,692,169) | 48,336,250 | (9,386,097) | |||
| Net changes in unrealized appreciation (depreciation) of investments, other financial instruments and foreign currency transactions | 138,362,727 | (22,415,488) | 56,709,046 | (4,072,609) | |||
| Net Increase (Decrease) in Net Assets Resulting from Operations | 261,793,562 | (22,165,755) | 104,715,312 | (12,758,384) | |||
| Distributions to Shareholders: | |||||||
| Class A | (69,958) | (618,118) | — | (1,122,710) | |||
| Class C | — | (401,295) | — | (365,812) | |||
| Class I | (1,312,243) | (4,612,066) | (89,287) | (7,302,285) | |||
| Class R3 | — | (8,911) | — | (4,953) | |||
| Class R4 | — | (4,116) | — | (13,210) | |||
| Class R5 | (3,796) | (13,317) | (462) | (4,561) | |||
| Class Y | (258,077) | (1,235,418) | (27,753) | (1,302,907) | |||
| Class F | (265,270) | (581,930) | (25,755) | (257,410) | |||
| Class SDR | (175,684) | (830,635) | (57,905) | (585,075) | |||
| Total distributions | (2,085,028) | (8,305,806) | (201,162) | (10,958,923) | |||
| Capital Share Transactions: | |||||||
| Sold | 149,305,285 | 165,475,065 | 87,392,291 | 125,609,869 | |||
| Issued on reinvestment of distributions | 2,008,748 | 7,957,824 | 197,351 | 10,784,153 | |||
| Redeemed | (211,486,538) | (403,818,804) | (66,867,177) | (88,923,234) | |||
| Net increase (decrease) from capital share transactions | (60,172,505) | (230,385,915) | 20,722,465 | 47,470,788 | |||
| Net Increase (Decrease) in Net Assets | 199,536,029 | (260,857,476) | 125,236,615 | 23,753,481 | |||
| Net Assets: | |||||||
| Beginning of period | 641,533,842 | 902,391,318 | 233,943,420 | 210,189,939 | |||
| End of period | $ 841,069,871 | $ 641,533,842 | $ 359,180,035 | $ 233,943,420 | |||
| 99 |
For the Year Ended October 31, 2021
| Hartford Schroders Securitized Income Fund | |
| Increase (decrease) in cash | |
| Cash flows from operating activities | |
| Net increase in net assets resulting from operations | $ 2,698,280 |
| Adjustments to reconcile net decrease in net assets resulting from operations to net cash used for operating activities: | |
| Purchases of investment securities | $ (82,591,237) |
| Sales of investment securities | 91,180,717 |
| Net purchases, sales and maturities of short-term investments | (7,482,925) |
| Net amortization/accretion of premium (discount) | 215,511 |
| Increase in dividends and interest receivable | (6,900) |
| Decrease in receivable from affiliates | 9,769 |
| Decrease in variation margin on futures contracts | 2,265 |
| Decrease in other assets | 787 |
| Increase in investment management fees payables | 19,775 |
| Increase in accounting services fees payables | 3,028 |
| Increase in transfer agent fees payable | 4,250 |
| Decrease in Board of Directors' fees payables | (26) |
| Decrease in distribution fees payables | (18) |
| Decrease in interest on reverse repurchase agreements | (29,130) |
| Increase in accrued expenses | 4,467 |
| Net realized loss on investments | 378,449 |
| Net change in unrealized appreciation (depreciation) of investments in securities | (1,731,596) |
| Net change unrealized (appreciation) depreciation on foreign currency contracts | (98,796) |
| Net Cash used for operating activities | $ 2,576,670 |
| Cash flows from financing activities | |
| Proceeds from reverse repurchase agreements | $ 110,095,834 |
| Repayment of reverse repurchase agreements | (141,958,408) |
| Proceeds from shares sold | 65,804,136 |
| Cost of shares repurchased | (36,398,414) |
| Dividends paid to shareholders | (237,990) |
| Net cash provided by financing activities | $ (2,694,842) |
| Net decrease in cash and foreign currency | $ (118,172) |
| Cash and foreign currency, beginning of year* | $ 285,081 |
| Cash and foreign currency, end of year* | $ 166,909 |
| Supplemental disclosure of cash flow information: | |
| Reinvestment of dividends | $ 1,653,658 |
| Cash paid during the year for interest | $ 178,033 |
| * | Components of cash |
| Beginning of Year | End of Year | ||
| Cash | $ 5,048 | $ — | |
| Restricted cash | 235,261 | 159,600 | |
| Foreign currency | 44,772 | �� | 7,309 |
| $ 285,081 | $ 166,909 |
| 100 |
| — Selected Per-Share Data(1) — | — Ratios and Supplemental Data — | |||||||||||||||||||||||||||||
| Class | Net Asset Value at Beginning of Period | Net Investment Income (Loss) | Net Realized and Unrealized Gain (Loss) on Investments | Total from Investment Operations | Dividends from Net Investment Income | Distributions from Capital Gains | Returns of Capital | Total Dividends and Distributions | Net Asset Value at End of Period | Total Return(2) | Net Assets at End of Period (000s) | Ratio of Expenses to Average Net Assets Before Adjust- ments(3) | Ratio of Expenses to Average Net Assets After Adjust- ments(3) | Ratio of Net Investment Income (Loss) to Average Net Assets | Portfolio Turnover | |||||||||||||||
| Hartford Schroders China A Fund | ||||||||||||||||||||||||||||||
| For the Year Ended October 31, 2021(4) | ||||||||||||||||||||||||||||||
| A | $ 15.06 | $ (0.05) | $ 2.25 | $ 2.20 | $ —(5) | $ (1.46) | $ — | $ (1.46) | $ 15.80 | 15.20% | $ 781 | 1.94% | 1.42% | (0.28)% | 73% | |||||||||||||||
| C | 14.98 | (0.18) | 2.25 | 2.07 | — | (1.46) | — | (1.46) | 15.59 | 14.31 | 199 | 2.66 | 2.19 | (1.14) | 73 | |||||||||||||||
| I | 15.08 | (0.03) | 2.27 | 2.24 | (0.05) | (1.46) | — | (1.51) | 15.81 | 15.45 | 7,776 | 1.65 | 1.15 | (0.19) | 73 | |||||||||||||||
| Y | 15.08 | 0.14 | 2.12 | 2.26 | (0.06) | (1.46) | — | (1.52) | 15.82 | 15.57 | 2,987 | 1.55 | 1.11 | 0.88 | 73 | |||||||||||||||
| F | 15.09 | (0.03) | 2.30 | 2.27 | (0.08) | (1.46) | — | (1.54) | 15.82 | 15.63 | 63,292 | 1.54 | 0.99 | (0.18) | 73 | |||||||||||||||
| SDR | 15.09 | 0.01 | 2.27 | 2.28 | (0.08) | (1.46) | — | (1.54) | 15.83 | 15.70 | 3,957 | 1.54 | 0.99 | 0.06 | 73 | |||||||||||||||
| For the Period Ended October 31, 2020(4) | ||||||||||||||||||||||||||||||
| A | $ 10.00 | $ 0.04 | $ 5.02 | $ 5.06 | $ — | $ — | $ — | $ — | $ 15.06 | 50.60% (6) | $ 369 | 4.28% (7) | 1.29% (7) | 0.55% (7) | 46% | |||||||||||||||
| C | 10.00 | 0.00 (5) | 4.98 | 4.98 | — | — | — | — | 14.98 | 49.80 (6) | 178 | 5.08 (7) | 2.22 (7) | (0.04) (7) | 46 | |||||||||||||||
| I | 10.00 | 0.07 | 5.01 | 5.08 | — | — | — | — | 15.08 | 50.80 (6) | 183 | 4.01 (7) | 1.15 (7) | 0.93 (7) | 46 | |||||||||||||||
| Y | 10.00 | 0.09 | 4.99 | 5.08 | — | — | — | — | 15.08 | 50.80 (6) | 151 | 3.95 (7) | 1.10 (7) | 1.14 (7) | 46 | |||||||||||||||
| F | 10.00 | 0.10 | 4.99 | 5.09 | — | — | — | — | 15.09 | 50.90 (6) | 3,169 | 3.85 (7) | 0.99 (7) | 1.24 (7) | 46 | |||||||||||||||
| SDR | 10.00 | 0.10 | 4.99 | 5.09 | — | — | — | — | 15.09 | 50.90 (6) | 3,772 | 3.85 (7) | 0.99 (7) | 1.24 (7) | 46 | |||||||||||||||
| Hartford Schroders Diversified Emerging Markets Fund | ||||||||||||||||||||||||||||||
| For the Period Ended October 31, 2021(8) | ||||||||||||||||||||||||||||||
| SDR | $ 10.00 | $ —(5) | $ 0.10 | $ 0.10 | $ — | $ — | $ — | $ — | $ 10.10 | 1.00% (6) | $ 10,105 | 4.69% (7) | 0.89% (7) | (0.26)% (7) | 9% (9) | |||||||||||||||
| Hartford Schroders Emerging Markets Equity Fund | ||||||||||||||||||||||||||||||
| For the Year Ended October 31, 2021 | ||||||||||||||||||||||||||||||
| A | $ 17.22 | $ 0.06 | $ 2.95 | $ 3.01 | $ (0.18) | $ — | $ — | $ (0.18) | $ 20.05 | 17.47% | $ 99,011 | 1.44% | 1.44% | 0.28% | 36% | |||||||||||||||
| C | 16.93 | 0.01 | 2.82 | 2.83 | — | — | — | — | 19.76 | 16.72 | 8,835 | 2.13 | 2.13 | 0.03 | 36 | |||||||||||||||
| I | 17.22 | 0.21 | 2.86 | 3.07 | (0.16) | — | — | (0.16) | 20.13 | 17.82 | 2,326,811 | 1.23 | 1.23 | 1.01 | 36 | |||||||||||||||
| R3 | 17.11 | 0.10 | 2.85 | 2.95 | (0.07) | — | — | (0.07) | 19.99 | 17.27 | 100 | 1.77 | 1.68 | 0.47 | 36 | |||||||||||||||
| R4 | 17.29 | 0.14 | 2.90 | 3.04 | (0.15) | — | — | (0.15) | 20.18 | 17.57 | 5,485 | 1.47 | 1.47 | 0.68 | 36 | |||||||||||||||
| R5 | 17.22 | 0.21 | 2.86 | 3.07 | (0.15) | — | — | (0.15) | 20.14 | 17.87 | 412 | 1.17 | 1.17 | 1.01 | 36 | |||||||||||||||
| Y | 17.25 | 0.29 | 2.78 | 3.07 | (0.12) | — | — | (0.12) | 20.20 | 17.82 | 890,765 | 1.16 | 1.16 | 1.41 | 36 | |||||||||||||||
| F | 17.24 | 0.24 | 2.86 | 3.10 | (0.19) | — | — | (0.19) | 20.15 | 17.99 | 1,049,336 | 1.05 | 1.05 | 1.15 | 36 | |||||||||||||||
| SDR | 17.27 | 0.26 | 2.85 | 3.11 | (0.19) | — | — | (0.19) | 20.19 | 18.02 | 2,361,023 | 1.05 | 1.05 | 1.23 | 36 | |||||||||||||||
| For the Year Ended October 31, 2020 | ||||||||||||||||||||||||||||||
| A | $ 15.78 | $ 0.06 | $ 1.71 | $ 1.77 | $ (0.33) | $ — | $ — | $ (0.33) | $ 17.22 | 11.28% | $ 62,843 | 1.53% | 1.53% | 0.40% | 52% | |||||||||||||||
| C | 15.51 | (0.05) | 1.67 | 1.62 | (0.20) | — | — | (0.20) | 16.93 | 10.51 | 7,127 | 2.16 | 2.16 | (0.34) | 52 | |||||||||||||||
| I | 15.77 | 0.10 | 1.71 | 1.81 | (0.36) | — | — | (0.36) | 17.22 | 11.56 | 1,443,799 | 1.25 | 1.25 | 0.63 | 52 | |||||||||||||||
| R3 | 15.66 | 0.03 | 1.70 | 1.73 | (0.28) | — | — | (0.28) | 17.11 | 11.08 | 88 | 1.79 | 1.71 | 0.21 | 52 | |||||||||||||||
| R4 | 15.74 | 0.17 | 1.62 | 1.79 | (0.24) | — | — | (0.24) | 17.29 | 11.43 | 4,500 | 1.43 | 1.43 | 1.09 | 52 | |||||||||||||||
| R5 | 15.78 | 0.11 | 1.70 | 1.81 | (0.37) | — | — | (0.37) | 17.22 | 11.55 | 322 | 1.20 | 1.20 | 0.69 | 52 | |||||||||||||||
| Y | 15.79 | 0.13 | 1.70 | 1.83 | (0.37) | — | — | (0.37) | 17.25 | 11.69 | 505,338 | 1.18 | 1.18 | 0.85 | 52 | |||||||||||||||
| F | 15.78 | 0.14 | 1.71 | 1.85 | (0.39) | — | — | (0.39) | 17.24 | 11.79 | 861,337 | 1.08 | 1.08 | 0.85 | 52 | |||||||||||||||
| SDR | 15.81 | 0.13 | 1.72 | 1.85 | (0.39) | — | — | (0.39) | 17.27 | 11.77 | 1,306,890 | 1.08 | 1.08 | 0.83 | 52 | |||||||||||||||
| For the Year Ended October 31, 2019 | ||||||||||||||||||||||||||||||
| A | $ 14.07 | $ 0.29 | $ 1.56 | $ 1.85 | $ (0.14) | $ — | $ — | $ (0.14) | $ 15.78 | 13.27% | $ 60,356 | 1.45% | 1.45% | 1.95% | 43% | |||||||||||||||
| C | 13.86 | 0.19 | 1.53 | 1.72 | (0.07) | — | — | (0.07) | 15.51 | 12.50 | 10,532 | 2.17 | 2.17 | 1.27 | 43 | |||||||||||||||
| I | 14.06 | 0.31 | 1.57 | 1.88 | (0.17) | — | — | (0.17) | 15.77 | 13.54 | 1,838,077 | 1.23 | 1.23 | 2.07 | 43 | |||||||||||||||
| R3 | 13.98 | 0.23 | 1.57 | 1.80 | (0.12) | — | — | (0.12) | 15.66 | 13.01 | 83 | 1.79 | 1.72 | 1.51 | 43 | |||||||||||||||
| R4 | 14.02 | (0.05) | 1.95 | 1.90 | (0.18) | — | — | (0.18) | 15.74 | 13.78 | 26 | 1.43 | 1.42 | (0.32) | 43 | |||||||||||||||
| R5 | 14.07 | 0.33 | 1.56 | 1.89 | (0.18) | — | — | (0.18) | 15.78 | 13.61 | 600 | 1.19 | 1.19 | 2.19 | 43 | |||||||||||||||
| Y | 14.09 | 0.32 | 1.57 | 1.89 | (0.19) | — | — | (0.19) | 15.79 | 13.62 | 120,308 | 1.13 | 1.13 | 2.11 | 43 | |||||||||||||||
| F | 14.07 | 0.42 | 1.48 | 1.90 | (0.19) | — | — | (0.19) | 15.78 | 13.73 | 419,520 | 1.07 | 1.07 | 2.77 | 43 | |||||||||||||||
| SDR | 14.10 | 0.34 | 1.56 | 1.90 | (0.19) | — | — | (0.19) | 15.81 | 13.71 | 1,129,431 | 1.07 | 1.07 | 2.28 | 43 | |||||||||||||||
| 101 |
| — Selected Per-Share Data(1) — | — Ratios and Supplemental Data — | |||||||||||||||||||||||||||||
| Class | Net Asset Value at Beginning of Period | Net Investment Income (Loss) | Net Realized and Unrealized Gain (Loss) on Investments | Total from Investment Operations | Dividends from Net Investment Income | Distributions from Capital Gains | Returns of Capital | Total Dividends and Distributions | Net Asset Value at End of Period | Total Return(2) | Net Assets at End of Period (000s) | Ratio of Expenses to Average Net Assets Before Adjust- ments(3) | Ratio of Expenses to Average Net Assets After Adjust- ments(3) | Ratio of Net Investment Income (Loss) to Average Net Assets | Portfolio Turnover | |||||||||||||||
| Hartford Schroders Emerging Markets Equity Fund – (continued) | ||||||||||||||||||||||||||||||
| For the Year Ended October 31, 2018 | ||||||||||||||||||||||||||||||
| A | $ 16.23 | $ 0.16 | $ (2.22) | $ (2.06) | $ (0.10) | $ — | $ — | $ (0.10) | $ 14.07 | (12.79)% | $ 46,162 | 1.45% | 1.45% | 0.98% | 24% | |||||||||||||||
| C | 16.08 | 0.07 | (2.22) | (2.15) | (0.07) | — | — | (0.07) | 13.86 | (13.44) | 7,217 | 2.19 | 2.19 | 0.45 | 24 | |||||||||||||||
| I | 16.23 | 0.19 | (2.22) | (2.03) | (0.14) | — | — | (0.14) | 14.06 | (12.66) | 1,733,270 | 1.24 | 1.24 | 1.19 | 24 | |||||||||||||||
| R3 | 16.20 | 0.22 | (2.30) | (2.08) | (0.14) | — | — | (0.14) | 13.98 | (12.99) | 90 | 1.80 | 1.70 | 1.36 | 24 | |||||||||||||||
| R4 | 16.19 | 0.05 | (2.11) | (2.06) | (0.11) | — | — | (0.11) | 14.02 | (12.88) | 3,710 | 1.49 | 1.48 | 0.36 | 24 | |||||||||||||||
| R5 | 16.23 | 0.27 | (2.29) | (2.02) | (0.14) | — | — | (0.14) | 14.07 | (12.56) | 484 | 1.20 | 1.20 | 1.69 | 24 | |||||||||||||||
| Y | 16.25 | 0.23 | (2.24) | (2.01) | (0.15) | — | — | (0.15) | 14.09 | (12.48) | 123,082 | 1.11 | 1.11 | 1.43 | 24 | |||||||||||||||
| F | 16.23 | 0.30 | (2.30) | (2.00) | (0.16) | — | — | (0.16) | 14.07 | (12.48) | 154,306 | 1.08 | 1.08 | 1.89 | 24 | |||||||||||||||
| SDR | 16.26 | 0.23 | (2.23) | (2.00) | (0.16) | — | — | (0.16) | 14.10 | (12.46) | 930,480 | 1.08 | 1.08 | 1.43 | 24 | |||||||||||||||
| For the Year Ended October 31, 2017 | ||||||||||||||||||||||||||||||
| A | $ 12.59 | $ 0.10 | $ 3.62 | $ 3.72 | $ (0.08) | $ — | $ — | $ (0.08) | $ 16.23 | 29.83% | $ 53,107 | 1.56% | 1.50% | 0.69% | 33% | |||||||||||||||
| C | 12.58 | 0.04 | 3.57 | 3.61 | (0.11) | — | — | (0.11) | 16.08 | 29.00 | 3,658 | 2.25 | 2.25 | 0.25 | 33 | |||||||||||||||
| I | 12.59 | 0.14 | 3.61 | 3.75 | (0.11) | — | — | (0.11) | 16.23 | 30.14 | 1,848,368 | 1.35 | 1.25 | 0.98 | 33 | |||||||||||||||
| R3 | 12.58 | 0.10 | 3.62 | 3.72 | (0.10) | — | — | (0.10) | 16.20 | 29.87 | 13 | 1.86 | 1.48 | 0.71 | 33 | |||||||||||||||
| R4 | 12.58 | 0.16 | 3.56 | 3.72 | (0.11) | — | — | (0.11) | 16.19 | 29.86 | 136 | 1.52 | 1.50 | 1.11 | 33 | |||||||||||||||
| R5 | 12.58 | 0.13 | 3.63 | 3.76 | (0.11) | — | — | (0.11) | 16.23 | 30.26 | 13 | 1.25 | 1.20 | 0.97 | 33 | |||||||||||||||
| Y | 12.58 | 0.26 | 3.53 | 3.79 | (0.12) | — | — | (0.12) | 16.25 | 30.45 | 97,758 | 1.14 | 1.14 | 1.72 | 33 | |||||||||||||||
| F (10) | 12.98 | 0.16 | 3.09 | 3.25 | — | — | — | — | 16.23 | 25.04 (6) | 42,462 | 1.10 (7) | 1.10 (7) | 1.57 (7) | 33 | |||||||||||||||
| SDR | 12.60 | 0.15 | 3.63 | 3.78 | (0.12) | — | — | (0.12) | 16.26 | 30.32 | 710,039 | 1.10 | 1.10 | 1.10 | 33 | |||||||||||||||
| Hartford Schroders Emerging Markets Multi-Sector Bond Fund | ||||||||||||||||||||||||||||||
| For the Year Ended October 31, 2021 | ||||||||||||||||||||||||||||||
| A | $ 8.22 | $ 0.36 | $ 0.05 | $ 0.41 | $ (0.34) | $ — | $ — | $ (0.34) | $ 8.29 | 4.92% | $ 1,574 | 1.48% | 1.15% | 4.14% | 168% | |||||||||||||||
| C | 8.20 | 0.29 | 0.04 | 0.33 | (0.27) | — | — | (0.27) | 8.26 | 4.02 | 136 | 2.32 | 1.90 | 3.41 | 168 | |||||||||||||||
| I | 8.21 | 0.38 | 0.05 | 0.43 | (0.36) | — | — | (0.36) | 8.28 | 5.19 | 18,976 | 1.16 | 0.88 | 4.41 | 168 | |||||||||||||||
| R3 | 8.23 | 0.33 | 0.05 | 0.38 | (0.31) | — | — | (0.31) | 8.30 | 4.60 | 31 | 1.79 | 1.41 | 3.89 | 168 | |||||||||||||||
| R4 | 8.22 | 0.37 | 0.04 | 0.41 | (0.34) | — | — | (0.34) | 8.29 | 4.92 | 11 | 1.49 | 1.09 | 4.24 | 168 | |||||||||||||||
| R5 | 8.21 | 0.38 | 0.05 | 0.43 | (0.36) | — | — | (0.36) | 8.28 | 5.24 | 11 | 1.19 | 0.85 | 4.45 | 168 | |||||||||||||||
| Y | 8.21 | 0.38 | 0.05 | 0.43 | (0.36) | — | — | (0.36) | 8.28 | 5.24 | 2,946 | 1.12 | 0.83 | 4.46 | 168 | |||||||||||||||
| F | 7.72 | 0.37 | 0.05 | 0.42 | (0.37) | — | — | (0.37) | 7.77 | 5.43 | 12 | 1.07 | 0.75 | 4.54 | 168 | |||||||||||||||
| SDR | 8.21 | 0.39 | 0.05 | 0.44 | (0.37) | — | — | (0.37) | 8.28 | 5.35 | 20,784 | 1.07 | 0.75 | 4.57 | 168 | |||||||||||||||
| For the Year Ended October 31, 2020 | ||||||||||||||||||||||||||||||
| A | $ 9.12 | $ 0.44 | $ (0.90) | $ (0.46) | $ (0.34) | $ — | $ (0.10) | $ (0.44) | $ 8.22 | (4.85)% | $ 1,727 | 1.41% | 1.15% | 5.22% | 141% | |||||||||||||||
| C | 9.08 | 0.38 | (0.89) | (0.51) | (0.29) | — | (0.08) | (0.37) | 8.20 | (5.43) | 215 | 2.23 | 1.90 | 4.48 | 141 | |||||||||||||||
| I | 9.11 | 0.47 | (0.90) | (0.43) | (0.37) | — | (0.10) | (0.47) | 8.21 | (4.50) | 21,211 | 1.05 | 0.82 | 5.56 | 141 | |||||||||||||||
| R3 | 9.13 | 0.43 | (0.89) | (0.46) | (0.34) | — | (0.10) | (0.44) | 8.23 | (4.79) | 29 | 1.70 | 1.24 | 5.15 | 141 | |||||||||||||||
| R4 | 9.11 | 0.46 | (0.89) | (0.43) | (0.36) | — | (0.10) | (0.46) | 8.22 | (4.45) | 11 | 1.40 | 0.92 | 5.48 | 141 | |||||||||||||||
| R5 | 9.10 | 0.46 | (0.88) | (0.42) | (0.37) | — | (0.10) | (0.47) | 8.21 | (4.41) | 11 | 1.10 | 0.85 | 5.52 | 141 | |||||||||||||||
| Y | 9.10 | 0.47 | (0.89) | (0.42) | (0.36) | — | (0.11) | (0.47) | 8.21 | (4.34) | 2,376 | 0.98 | 0.76 | 5.60 | 141 | |||||||||||||||
| F | 9.10 | 0.51 | (1.02) | (0.51) | (0.67) | — | (0.20) | (0.87) | 7.72 | (4.66) | 11 | 0.98 | 0.75 | 5.58 | 141 | |||||||||||||||
| SDR | 9.11 | 0.47 | (0.90) | (0.43) | (0.36) | — | (0.11) | (0.47) | 8.21 | (4.44) | 34,536 | 0.98 | 0.75 | 5.62 | 141 | |||||||||||||||
| 102 |
| — Selected Per-Share Data(1) — | — Ratios and Supplemental Data — | |||||||||||||||||||||||||||||
| Class | Net Asset Value at Beginning of Period | Net Investment Income (Loss) | Net Realized and Unrealized Gain (Loss) on Investments | Total from Investment Operations | Dividends from Net Investment Income | Distributions from Capital Gains | Returns of Capital | Total Dividends and Distributions | Net Asset Value at End of Period | Total Return(2) | Net Assets at End of Period (000s) | Ratio of Expenses to Average Net Assets Before Adjust- ments(3) | Ratio of Expenses to Average Net Assets After Adjust- ments(3) | Ratio of Net Investment Income (Loss) to Average Net Assets | Portfolio Turnover | |||||||||||||||
| Hartford Schroders Emerging Markets Multi-Sector Bond Fund – (continued) | ||||||||||||||||||||||||||||||
| For the Year Ended October 31, 2019 | ||||||||||||||||||||||||||||||
| A | $ 8.79 | $ 0.55 | $ 0.25 | $ 0.80 | $ (0.43) | $ — | $ (0.04) | $ (0.47) | $ 9.12 | 9.21% | $ 1,829 | 1.29% | 1.11% | 6.12% | 240% | |||||||||||||||
| C | 8.74 | 0.48 | 0.25 | 0.73 | (0.36) | — | (0.03) | (0.39) | 9.08 | 8.44 | 266 | 2.14 | 1.90 | 5.39 | 240 | |||||||||||||||
| I | 8.78 | 0.58 | 0.25 | 0.83 | (0.46) | — | (0.04) | (0.50) | 9.11 | 9.65 | 29,715 | 1.00 | 0.83 | 6.37 | 240 | |||||||||||||||
| R3 | 8.80 | 0.57 | 0.25 | 0.82 | (0.45) | — | (0.04) | (0.49) | 9.13 | 9.46 | 11 | 1.55 | 0.88 | 6.33 | 240 | |||||||||||||||
| R4 | 8.78 | 0.57 | 0.25 | 0.82 | (0.45) | — | (0.04) | (0.49) | 9.11 | 9.45 | 11 | 1.28 | 0.86 | 6.35 | 240 | |||||||||||||||
| R5 | 8.78 | 0.58 | 0.24 | 0.82 | (0.46) | — | (0.04) | (0.50) | 9.10 | 9.56 | 11 | 1.00 | 0.81 | 6.39 | 240 | |||||||||||||||
| Y | 8.78 | 0.58 | 0.24 | 0.82 | (0.46) | — | (0.04) | (0.50) | 9.10 | 9.61 | 2,046 | 0.94 | 0.76 | 6.39 | 240 | |||||||||||||||
| F | 8.78 | 0.58 | 0.25 | 0.83 | (0.47) | — | (0.04) | (0.51) | 9.10 | 9.66 | 23,084 | 0.93 | 0.75 | 6.45 | 240 | |||||||||||||||
| SDR | 8.79 | 0.58 | 0.25 | 0.83 | (0.47) | — | (0.04) | (0.51) | 9.11 | 9.65 | 37,109 | 0.93 | 0.75 | 6.44 | 240 | |||||||||||||||
| For the Year Ended October 31, 2018 | ||||||||||||||||||||||||||||||
| A | $ 9.98 | $ 0.50 | $ (1.02) | $ (0.52) | $ (0.32) | $ (0.13) | $ (0.22) | $ (0.67) | $ 8.79 | (5.34)% | $ 3,389 | 1.29% | 1.08% | 5.42% | 285% | |||||||||||||||
| C | 9.95 | 0.41 | (1.01) | (0.60) | (0.28) | (0.13) | (0.20) | (0.61) | 8.74 | (6.27) | 414 | 2.16 | 1.90 | 4.52 | 285 | |||||||||||||||
| I | 9.97 | 0.52 | (1.02) | (0.50) | (0.34) | (0.13) | (0.22) | (0.69) | 8.78 | (5.22) | 36,557 | 1.02 | 0.85 | 5.63 | 285 | |||||||||||||||
| R3 | 9.97 | 0.50 | (1.03) | (0.53) | (0.30) | (0.13) | (0.21) | (0.64) | 8.80 | (5.43) | 10 | 1.65 | 1.25 | 5.23 | 285 | |||||||||||||||
| R4 | 9.97 | 0.52 | (1.03) | (0.51) | (0.33) | (0.13) | (0.22) | (0.68) | 8.78 | (5.25) | 10 | 1.35 | 0.92 | 5.54 | 285 | |||||||||||||||
| R5 | 9.97 | 0.53 | (1.03) | (0.50) | (0.34) | (0.13) | (0.22) | (0.69) | 8.78 | (5.23) | 10 | 1.06 | 0.85 | 5.58 | 285 | |||||||||||||||
| Y | 9.97 | 0.49 | (0.98) | (0.49) | (0.34) | (0.13) | (0.23) | (0.70) | 8.78 | (5.17) | 970 | 0.95 | 0.77 | 5.29 | 285 | |||||||||||||||
| F | 9.96 | 0.53 | (1.01) | (0.48) | (0.34) | (0.13) | (0.23) | (0.70) | 8.78 | (5.04) | 28,842 | 0.94 | 0.75 | 5.67 | 285 | |||||||||||||||
| SDR | 9.98 | 0.56 | (1.05) | (0.49) | (0.34) | (0.13) | (0.23) | (0.70) | 8.79 | (5.11) | 34,841 | 0.94 | 0.75 | 5.89 | 285 | |||||||||||||||
| For the Year Ended October 31, 2017 | ||||||||||||||||||||||||||||||
| A | $ 9.79 | $ 0.55 | $ 0.27 | $ 0.82 | $ (0.53) | $ (0.10) | $ — | $ (0.63) | $ 9.98 | 8.83% | $ 2,472 | 1.15% | 1.03% | 5.65% | 212% | |||||||||||||||
| C | 9.78 | 0.46 | 0.29 | 0.75 | (0.48) | (0.10) | — | (0.58) | 9.95 | 8.01 | 73 | 2.03 | 1.90 | 4.72 | 212 | |||||||||||||||
| I | 9.78 | 0.57 | 0.28 | 0.85 | (0.56) | (0.10) | — | (0.66) | 9.97 | 9.08 | 15,441 | 0.94 | 0.82 | 5.86 | 212 | |||||||||||||||
| R3 | 9.78 | 0.54 | 0.28 | 0.82 | (0.53) | (0.10) | — | (0.63) | 9.97 | 8.74 | 36 | 1.63 | 1.19 | 5.53 | 212 | |||||||||||||||
| R4 | 9.78 | 0.55 | 0.28 | 0.83 | (0.54) | (0.10) | — | (0.64) | 9.97 | 8.88 | 11 | 1.33 | 1.02 | 5.67 | 212 | |||||||||||||||
| R5 | 9.78 | 0.57 | 0.27 | 0.84 | (0.55) | (0.10) | — | (0.65) | 9.97 | 9.07 | 11 | 1.04 | 0.85 | 5.82 | 212 | |||||||||||||||
| Y | 9.78 | 0.57 | 0.28 | 0.85 | (0.56) | (0.10) | — | (0.66) | 9.97 | 9.16 | 122 | 0.91 | 0.79 | 5.81 | 212 | |||||||||||||||
| F | 9.70 | 0.39 | 0.30 | 0.69 | (0.43) | — | — | (0.43) | 9.96 | 7.22 (6) | 11 | 0.87 (7) | 0.75 (7) | 5.90 (7) | 212 | |||||||||||||||
| SDR | 9.79 | 0.58 | 0.27 | 0.85 | (0.56) | (0.10) | — | (0.66) | 9.98 | 9.16 | 57,054 | 0.87 | 0.75 | 5.93 | 212 | |||||||||||||||
| Hartford Schroders International Multi-Cap Value Fund | ||||||||||||||||||||||||||||||
| For the Year Ended October 31, 2021 | ||||||||||||||||||||||||||||||
| A | $ 7.76 | $ 0.21 | $ 2.57 | $ 2.78 | $ (0.22) | $ — | $ — | $ (0.22) | $ 10.32 | 36.00% | $ 98,511 | 1.11% | 1.11% | 2.12% | 85% | |||||||||||||||
| C | 7.71 | 0.13 | 2.56 | 2.69 | (0.15) | — | — | (0.15) | 10.25 | 34.97 | 14,700 | 1.85 | 1.85 | 1.34 | 85 | |||||||||||||||
| I | 7.75 | 0.24 | 2.57 | 2.81 | (0.25) | — | — | (0.25) | 10.31 | 36.41 | 713,835 | 0.85 | 0.85 | 2.39 | 85 | |||||||||||||||
| R3 | 7.73 | 0.18 | 2.56 | 2.74 | (0.19) | — | — | (0.19) | 10.28 | 35.61 | 17,169 | 1.46 | 1.40 | 1.81 | 85 | |||||||||||||||
| R4 | 7.74 | 0.23 | 2.54 | 2.77 | (0.22) | — | — | (0.22) | 10.29 | 35.96 | 5,890 | 1.16 | 1.16 | 2.28 | 85 | |||||||||||||||
| R5 | 7.75 | 0.23 | 2.57 | 2.80 | (0.25) | — | — | (0.25) | 10.30 | 36.25 | 18,070 | 0.85 | 0.85 | 2.28 | 85 | |||||||||||||||
| Y | 7.75 | 0.24 | 2.57 | 2.81 | (0.25) | — | — | (0.25) | 10.31 | 36.43 | 285,533 | 0.85 | 0.82 | 2.44 | 85 | |||||||||||||||
| F | 7.76 | 0.25 | 2.56 | 2.81 | (0.26) | — | — | (0.26) | 10.31 | 36.35 | 578,284 | 0.75 | 0.75 | 2.52 | 85 | |||||||||||||||
| SDR | 7.74 | 0.25 | 2.57 | 2.82 | (0.26) | — | — | (0.26) | 10.30 | 36.57 | 871,784 | 0.75 | 0.75 | 2.49 | 85 | |||||||||||||||
| 103 |
| — Selected Per-Share Data(1) — | — Ratios and Supplemental Data — | |||||||||||||||||||||||||||||
| Class | Net Asset Value at Beginning of Period | Net Investment Income (Loss) | Net Realized and Unrealized Gain (Loss) on Investments | Total from Investment Operations | Dividends from Net Investment Income | Distributions from Capital Gains | Returns of Capital | Total Dividends and Distributions | Net Asset Value at End of Period | Total Return(2) | Net Assets at End of Period (000s) | Ratio of Expenses to Average Net Assets Before Adjust- ments(3) | Ratio of Expenses to Average Net Assets After Adjust- ments(3) | Ratio of Net Investment Income (Loss) to Average Net Assets | Portfolio Turnover | |||||||||||||||
| Hartford Schroders International Multi-Cap Value Fund – (continued) | ||||||||||||||||||||||||||||||
| For the Year Ended October 31, 2020 | ||||||||||||||||||||||||||||||
| A | $ 9.05 | $ 0.17 | $ (1.24) | $ (1.07) | $ (0.22) | $ — | $ — | $ (0.22) | $ 7.76 | (12.01)% | $ 65,123 | 1.12% | 1.12% | 2.12% | 119% | |||||||||||||||
| C | 8.99 | 0.11 | (1.23) | (1.12) | (0.16) | — | — | (0.16) | 7.71 | (12.69) | 12,691 | 1.86 | 1.86 | 1.32 | 119 | |||||||||||||||
| I | 9.05 | 0.20 | (1.26) | (1.06) | (0.24) | — | — | (0.24) | 7.75 | (11.86) | 538,073 | 0.85 | 0.85 | 2.37 | 119 | |||||||||||||||
| R3 | 9.02 | 0.14 | (1.24) | (1.10) | (0.19) | — | — | (0.19) | 7.73 | (12.42) | 13,398 | 1.48 | 1.48 | 1.71 | 119 | |||||||||||||||
| R4 | 9.03 | 0.17 | (1.24) | (1.07) | (0.22) | — | — | (0.22) | 7.74 | (12.07) | 2,328 | 1.18 | 1.18 | 2.13 | 119 | |||||||||||||||
| R5 | 9.04 | 0.20 | (1.25) | (1.05) | (0.24) | — | — | (0.24) | 7.75 | (11.75) | 17,008 | 0.86 | 0.86 | 2.42 | 119 | |||||||||||||||
| Y | 9.04 | 0.20 | (1.24) | (1.04) | (0.25) | — | — | (0.25) | 7.75 | (11.72) | 165,134 | 0.86 | 0.81 | 2.49 | 119 | |||||||||||||||
| F | 9.05 | 0.21 | (1.25) | (1.04) | (0.25) | — | — | (0.25) | 7.76 | (11.65) | 357,583 | 0.76 | 0.76 | 2.58 | 119 | |||||||||||||||
| SDR | 9.04 | 0.21 | (1.26) | (1.05) | (0.25) | — | — | (0.25) | 7.74 | (11.78) | 577,640 | 0.76 | 0.76 | 2.54 | 119 | |||||||||||||||
| For the Year Ended October 31, 2019 | ||||||||||||||||||||||||||||||
| A | $ 8.97 | $ 0.27 | $ 0.28 | $ 0.55 | $ (0.25) | $ (0.22) | $ — | $ (0.47) | $ 9.05 | 6.61% | $ 106,530 | 1.12% | 1.12% | 3.03% | 119% | |||||||||||||||
| C | 8.90 | 0.19 | 0.30 | 0.49 | (0.18) | (0.22) | — | (0.40) | 8.99 | 5.91 | 21,500 | 1.87 | 1.87 | 2.12 | 119 | |||||||||||||||
| I | 8.96 | 0.28 | 0.30 | 0.58 | (0.27) | (0.22) | — | (0.49) | 9.05 | 6.98 | 740,680 | 0.86 | 0.86 | 3.13 | 119 | |||||||||||||||
| R3 | 8.94 | 0.28 | 0.25 | 0.53 | (0.23) | (0.22) | — | (0.45) | 9.02 | 6.36 | 19,748 | 1.48 | 1.48 | 3.25 | 119 | |||||||||||||||
| R4 | 8.95 | 0.26 | 0.29 | 0.55 | (0.25) | (0.22) | — | (0.47) | 9.03 | 6.57 | 2,746 | 1.18 | 1.18 | 3.01 | 119 | |||||||||||||||
| R5 | 8.95 | 0.26 | 0.32 | 0.58 | (0.27) | (0.22) | — | (0.49) | 9.04 | 6.97 | 21,262 | 0.87 | 0.87 | 2.99 | 119 | |||||||||||||||
| Y | 8.96 | 0.29 | 0.29 | 0.58 | (0.28) | (0.22) | — | (0.50) | 9.04 | 6.93 | 146,587 | 0.85 | 0.80 | 3.29 | 119 | |||||||||||||||
| F | 8.97 | 0.29 | 0.29 | 0.58 | (0.28) | (0.22) | — | (0.50) | 9.05 | 6.98 | 377,025 | 0.76 | 0.76 | 3.31 | 119 | |||||||||||||||
| SDR | 8.96 | 0.29 | 0.29 | 0.58 | (0.28) | (0.22) | — | (0.50) | 9.04 | 6.99 | 636,333 | 0.76 | 0.76 | 3.27 | 119 | |||||||||||||||
| For the Year Ended October 31, 2018 | ||||||||||||||||||||||||||||||
| A | $ 10.18 | $ 0.23 | $ (1.09) | $ (0.86) | $ (0.24) | $ (0.11) | $ — | $ (0.35) | $ 8.97 | (8.71)% | $ 67,252 | 1.13% | 1.10% | 2.26% | 87% | |||||||||||||||
| C | 10.12 | 0.17 | (1.10) | (0.93) | (0.18) | (0.11) | — | (0.29) | 8.90 | (9.47) | 25,614 | 1.88 | 1.85 | 1.71 | 87 | |||||||||||||||
| I | 10.17 | 0.26 | (1.09) | (0.83) | (0.27) | (0.11) | — | (0.38) | 8.96 | (8.47) | 875,109 | 0.87 | 0.84 | 2.64 | 87 | |||||||||||||||
| R3 | 10.15 | 0.22 | (1.10) | (0.88) | (0.22) | (0.11) | — | (0.33) | 8.94 | (8.96) | 613 | 1.50 | 1.43 | 2.22 | 87 | |||||||||||||||
| R4 | 10.16 | 0.20 | (1.06) | (0.86) | (0.24) | (0.11) | — | (0.35) | 8.95 | (8.76) | 1,312 | 1.20 | 1.16 | 2.03 | 87 | |||||||||||||||
| R5 | 10.17 | 0.27 | (1.11) | (0.84) | (0.27) | (0.11) | — | (0.38) | 8.95 | (8.58) | 22,482 | 0.88 | 0.85 | 2.68 | 87 | |||||||||||||||
| Y | 10.17 | 0.25 | (1.07) | (0.82) | (0.28) | (0.11) | — | (0.39) | 8.96 | (8.42) | 80,993 | 0.83 | 0.81 | 2.57 | 87 | |||||||||||||||
| F | 10.18 | 0.28 | (1.10) | (0.82) | (0.28) | (0.11) | — | (0.39) | 8.97 | (8.38) | 251,677 | 0.78 | 0.75 | 2.78 | 87 | |||||||||||||||
| SDR | 10.17 | 0.27 | (1.09) | (0.82) | (0.28) | (0.11) | — | (0.39) | 8.96 | (8.38) | 540,822 | 0.78 | 0.75 | 2.69 | 87 | |||||||||||||||
| For the Year Ended October 31, 2017 | ||||||||||||||||||||||||||||||
| A | $ 8.61 | $ 0.20 | $ 1.53 | $ 1.73 | $ (0.16) | $ — | $ — | $ (0.16) | $ 10.18 | 20.26% | $ 58,977 | 1.20% | 1.12% | 2.08% | 63% | |||||||||||||||
| C | 8.60 | 0.15 | 1.50 | 1.65 | (0.13) | — | — | (0.13) | 10.12 | 19.31 | 15,580 | 1.93 | 1.85 | 1.51 | 63 | |||||||||||||||
| I | 8.60 | 0.24 | 1.52 | 1.76 | (0.19) | — | — | (0.19) | 10.17 | 20.47 | 706,652 | 0.91 | 0.82 | 2.48 | 63 | |||||||||||||||
| R3 | 8.60 | 0.20 | 1.49 | 1.69 | (0.14) | — | — | (0.14) | 10.15 | 19.82 | 105 | 1.58 | 1.42 | 2.03 | 63 | |||||||||||||||
| R4 | 8.60 | 0.18 | 1.54 | 1.72 | (0.16) | — | — | (0.16) | 10.16 | 20.23 | 809 | 1.24 | 1.15 | 1.83 | 63 | |||||||||||||||
| R5 | 8.60 | 0.23 | 1.52 | 1.75 | (0.18) | — | — | (0.18) | 10.17 | 20.57 | 14,212 | 0.93 | 0.85 | 2.32 | 63 | |||||||||||||||
| Y | 8.60 | 0.21 | 1.56 | 1.77 | (0.20) | — | — | (0.20) | 10.17 | 20.80 | 4,440 | 0.84 | 0.76 | 2.30 | 63 | |||||||||||||||
| F (10) | 9.13 | 0.17 | 1.02 | 1.19 | (0.14) | — | — | (0.14) | 10.18 | 13.07 (6) | 110,585 | 0.83 (7) | 0.75 (7) | 2.60 (7) | 63 | |||||||||||||||
| SDR | 8.60 | 0.23 | 1.53 | 1.76 | (0.19) | — | — | (0.19) | 10.17 | 20.70 | 448,891 | 0.83 | 0.75 | 2.43 | 63 | |||||||||||||||
| 104 |
| — Selected Per-Share Data(1) — | — Ratios and Supplemental Data — | |||||||||||||||||||||||||||||
| Class | Net Asset Value at Beginning of Period | Net Investment Income (Loss) | Net Realized and Unrealized Gain (Loss) on Investments | Total from Investment Operations | Dividends from Net Investment Income | Distributions from Capital Gains | Returns of Capital | Total Dividends and Distributions | Net Asset Value at End of Period | Total Return(2) | Net Assets at End of Period (000s) | Ratio of Expenses to Average Net Assets Before Adjust- ments(3) | Ratio of Expenses to Average Net Assets After Adjust- ments(3) | Ratio of Net Investment Income (Loss) to Average Net Assets | Portfolio Turnover | |||||||||||||||
| Hartford Schroders International Stock Fund | ||||||||||||||||||||||||||||||
| For the Year Ended October 31, 2021 | ||||||||||||||||||||||||||||||
| A | $ 14.14 | $ 0.16 | $ 4.77 | $ 4.93 | $ (0.00) (5) | $ — | $ — | $ — | $ 19.07 | 34.90% | $ 285,278 | 1.06% | 1.06% | 0.89% | 28% | |||||||||||||||
| C | 13.43 | 0.02 | 4.52 | 4.54 | — | — | — | — | 17.97 | 33.80 | 20,788 | 1.80 | 1.80 | 0.13 | 28 | |||||||||||||||
| I | 13.71 | 0.21 | 4.62 | 4.83 | (0.05) | — | — | (0.05) | 18.49 | 35.30 | 1,981,793 | 0.79 | 0.79 | 1.18 | 28 | |||||||||||||||
| R3 | 13.63 | 0.10 | 4.58 | 4.68 | — | — | — | — | 18.31 | 34.34 | 1,190 | 1.42 | 1.41 | 0.55 | 28 | |||||||||||||||
| R4 | 13.67 | 0.14 | 4.61 | 4.75 | (0.00) (5) | — | — | — | 18.42 | 34.78 | 3,841 | 1.12 | 1.12 | 0.79 | 28 | |||||||||||||||
| R5 | 13.72 | 0.20 | 4.62 | 4.82 | (0.05) | — | — | (0.05) | 18.49 | 35.20 | 24,588 | 0.81 | 0.81 | 1.14 | 28 | |||||||||||||||
| Y | 13.76 | 0.21 | 4.62 | 4.83 | (0.05) | — | — | (0.05) | 18.54 | 35.17 | 248,058 | 0.81 | 0.81 | 1.17 | 28 | |||||||||||||||
| F | 13.74 | 0.22 | 4.63 | 4.85 | (0.07) | — | — | (0.07) | 18.52 | 35.36 | 618,602 | 0.70 | 0.70 | 1.25 | 28 | |||||||||||||||
| SDR | 13.73 | 0.22 | 4.62 | 4.84 | (0.07) | — | — | (0.07) | 18.50 | 35.31 | 447,317 | 0.71 | 0.71 | 1.25 | 28 | |||||||||||||||
| For the Year Ended October 31, 2020 | ||||||||||||||||||||||||||||||
| A | $ 12.91 | $ 0.07 | $ 1.30 | $ 1.37 | $ (0.14) | $ — | $ — | $ (0.14) | $ 14.14 | 10.63% | $ 114,042 | 1.12% | 1.11% | 0.49% | 34% | |||||||||||||||
| C | 12.25 | (0.03) | 1.25 | 1.22 | (0.04) | — | — | (0.04) | 13.43 | 9.93 | 6,687 | 1.85 | 1.85 | (0.21) | 34 | |||||||||||||||
| I | 12.51 | 0.10 | 1.26 | 1.36 | (0.16) | — | — | (0.16) | 13.71 | 10.93 | 516,721 | 0.83 | 0.83 | 0.79 | 34 | |||||||||||||||
| R3 | 12.47 | 0.03 | 1.26 | 1.29 | (0.13) | — | — | (0.13) | 13.63 | 10.38 | 734 | 1.46 | 1.45 | 0.25 | 34 | |||||||||||||||
| R4 | 12.50 | 0.07 | 1.25 | 1.32 | (0.15) | — | — | (0.15) | 13.67 | 10.62 | 2,536 | 1.15 | 1.15 | 0.51 | 34 | |||||||||||||||
| R5 | 12.52 | 0.11 | 1.26 | 1.37 | (0.17) | — | — | (0.17) | 13.72 | 10.96 | 12,208 | 0.83 | 0.83 | 0.84 | 34 | |||||||||||||||
| Y | 12.52 | 0.06 | 1.32 | 1.38 | (0.14) | — | — | (0.14) | 13.76 | 11.09 | 66,753 | 0.82 | 0.82 | 0.45 | 34 | |||||||||||||||
| F | 12.52 | 0.11 | 1.28 | 1.39 | (0.17) | — | — | (0.17) | 13.74 | 11.13 | 169,576 | 0.75 | 0.75 | 0.86 | 34 | |||||||||||||||
| SDR | 12.52 | 0.11 | 1.27 | 1.38 | (0.17) | — | — | (0.17) | 13.73 | 11.07 | 136,358 | 0.75 | 0.75 | 0.86 | 34 | |||||||||||||||
| For the Year Ended October 31, 2019 | ||||||||||||||||||||||||||||||
| A | $ 12.46 | $ 0.17 | $ 1.18 | $ 1.35 | $ (0.15) | $ (0.75) | $ — | $ (0.90) | $ 12.91 | 12.04% | $ 46,241 | 1.16% | 1.14% | 1.42% | 37% | |||||||||||||||
| C | 11.90 | 0.10 | 1.10 | 1.20 | (0.10) | (0.75) | — | (0.85) | 12.25 | 11.16 | 3,530 | 1.90 | 1.87 | 0.88 | 37 | |||||||||||||||
| I | 12.09 | 0.21 | 1.13 | 1.34 | (0.17) | (0.75) | — | (0.92) | 12.51 | 12.39 | 218,391 | 0.86 | 0.83 | 1.81 | 37 | |||||||||||||||
| R3 | 12.08 | 0.16 | 1.13 | 1.29 | (0.15) | (0.75) | — | (0.90) | 12.47 | 11.93 | 190 | 1.44 | 1.33 | 1.35 | 37 | |||||||||||||||
| R4 | 12.09 | 0.15 | 1.17 | 1.32 | (0.16) | (0.75) | — | (0.91) | 12.50 | 12.15 | 292 | 1.12 | 1.05 | 1.24 | 37 | |||||||||||||||
| R5 | 12.10 | 0.15 | 1.19 | 1.34 | (0.17) | (0.75) | — | (0.92) | 12.52 | 12.33 | 1,066 | 0.80 | 0.78 | 1.21 | 37 | |||||||||||||||
| Y | 12.11 | 0.21 | 1.12 | 1.33 | (0.17) | (0.75) | — | (0.92) | 12.52 | 12.38 | 676 | 0.87 | 0.84 | 1.80 | 37 | |||||||||||||||
| F | 12.10 | 0.22 | 1.12 | 1.34 | (0.17) | (0.75) | — | (0.92) | 12.52 | 12.47 | 70,305 | 0.78 | 0.76 | 1.85 | 37 | |||||||||||||||
| SDR | 12.10 | 0.21 | 1.14 | 1.35 | (0.18) | (0.75) | — | (0.93) | 12.52 | 12.45 | 100,663 | 0.80 | 0.76 | 1.80 | 37 | |||||||||||||||
| For the Year Ended October 31, 2018 | ||||||||||||||||||||||||||||||
| A | $ 13.62 | $ 0.19 | $ (1.22) | $ (1.03) | $ (0.13) | $ — | $ — | $ (0.13) | $ 12.46 | (7.63)% | $ 11,234 | 1.25% | 1.16% | 1.40% | 65% | |||||||||||||||
| C | 13.11 | 0.13 | (1.21) | (1.08) | (0.13) | — | — | (0.13) | 11.90 | (8.33) | 1,824 | 2.01 | 1.92 | 0.97 | 65 | |||||||||||||||
| I | 13.20 | 0.22 | (1.17) | (0.95) | (0.16) | — | — | (0.16) | 12.09 | (7.32) | 129,528 | 0.93 | 0.85 | 1.70 | 65 | |||||||||||||||
| R3 | 13.19 | 0.21 | (1.19) | (0.98) | (0.13) | — | — | (0.13) | 12.08 | (7.49) | 12 | 1.61 | 1.02 | 1.59 | 65 | |||||||||||||||
| R4 | 13.20 | 0.22 | (1.19) | (0.97) | (0.14) | — | — | (0.14) | 12.09 | (7.42) | 12 | 1.31 | 0.97 | 1.64 | 65 | |||||||||||||||
| R5 | 13.22 | 0.22 | (1.18) | (0.96) | (0.16) | — | — | (0.16) | 12.10 | (7.36) | 12 | 1.01 | 0.90 | 1.69 | 65 | |||||||||||||||
| Y | 13.23 | 0.12 | (1.07) | (0.95) | (0.17) | — | — | (0.17) | 12.11 | (7.32) | 5,693 | 0.90 | 0.81 | 0.97 | 65 | |||||||||||||||
| F | 13.22 | 0.22 | (1.17) | (0.95) | (0.17) | — | — | (0.17) | 12.10 | (7.32) | 9,204 | 0.89 | 0.80 | 1.69 | 65 | |||||||||||||||
| SDR | 13.23 | 0.23 | (1.18) | (0.95) | (0.18) | — | — | (0.18) | 12.10 | (7.33) | 67,339 | 0.89 | 0.80 | 1.71 | 65 | |||||||||||||||
| 105 |
| — Selected Per-Share Data(1) — | — Ratios and Supplemental Data — | |||||||||||||||||||||||||||||
| Class | Net Asset Value at Beginning of Period | Net Investment Income (Loss) | Net Realized and Unrealized Gain (Loss) on Investments | Total from Investment Operations | Dividends from Net Investment Income | Distributions from Capital Gains | Returns of Capital | Total Dividends and Distributions | Net Asset Value at End of Period | Total Return(2) | Net Assets at End of Period (000s) | Ratio of Expenses to Average Net Assets Before Adjust- ments(3) | Ratio of Expenses to Average Net Assets After Adjust- ments(3) | Ratio of Net Investment Income (Loss) to Average Net Assets | Portfolio Turnover | |||||||||||||||
| Hartford Schroders International Stock Fund – (continued) | ||||||||||||||||||||||||||||||
| For the Year Ended October 31, 2017 | ||||||||||||||||||||||||||||||
| A | $ 11.02 | $ 0.12 | $ 2.64 | $ 2.76 | $ (0.16) | $ — | $ — | $ (0.16) | $ 13.62 | 25.41% | $ 5,930 | 1.32% | 1.20% | 0.98% | 53% | |||||||||||||||
| C | 10.69 | (0.02) | 2.60 | 2.58 | (0.16) | — | — | (0.16) | 13.11 | 24.60 | 321 | 2.01 | 1.94 | (0.13) | 53 | |||||||||||||||
| I | 10.69 | 0.14 | 2.55 | 2.69 | (0.18) | — | — | (0.18) | 13.20 | 25.69 | 116,660 | 1.02 | 0.95 | 1.24 | 53 | |||||||||||||||
| R3 | 10.69 | 0.12 | 2.55 | 2.67 | (0.17) | — | — | (0.17) | 13.19 | 25.45 | 13 | 1.62 | 1.18 | 1.04 | 53 | |||||||||||||||
| R4 | 10.69 | 0.13 | 2.56 | 2.69 | (0.18) | — | — | (0.18) | 13.20 | 25.61 | 13 | 1.34 | 1.08 | 1.15 | 53 | |||||||||||||||
| R5 | 10.69 | 0.16 | 2.55 | 2.71 | (0.18) | — | — | (0.18) | 13.22 | 25.88 | 13 | 1.02 | 0.90 | 1.34 | 53 | |||||||||||||||
| Y | 10.69 | 0.13 | 2.59 | 2.72 | (0.18) | — | — | (0.18) | 13.23 | 25.99 | 115 | 0.88 | 0.79 | 1.04 | 53 | |||||||||||||||
| F (10) | 10.87 | 0.04 | 2.31 | 2.35 | — | — | — | — | 13.22 | 21.62 (6) | 844 | 0.85 (7) | 0.80 (7) | 0.52 (7) | 53 | |||||||||||||||
| SDR | 10.70 | 0.17 | 2.55 | 2.72 | (0.19) | — | — | (0.19) | 13.23 | 25.88 | 77,051 | 0.86 | 0.80 | 1.45 | 53 | |||||||||||||||
| Hartford Schroders Securitized Income Fund | ||||||||||||||||||||||||||||||
| For the Year Ended October 31, 2021 | ||||||||||||||||||||||||||||||
| A | $ 9.79 | $ 0.17 | $ 0.10 | $ 0.27 | $ (0.15) | $ — | $ — | $ (0.15) | $ 9.91 | 2.77% | $ 5,167 | 1.26% (11) | 1.06% (12) | 1.66% (13) | 71% | |||||||||||||||
| C | 9.79 | 0.07 | 0.10 | 0.17 | (0.07) | — | — | (0.07) | 9.89 | 1.69 | 432 | 2.07 (11) | 2.06 (12) | 0.66 (13) | 71 | |||||||||||||||
| I | 9.79 | 0.17 | 0.10 | 0.27 | (0.17) | — | — | (0.17) | 9.89 | 2.82 | 89,260 | 1.03 (11) | 0.97 (12) | 1.73 (13) | 71 | |||||||||||||||
| Y | 9.79 | 0.18 | 0.10 | 0.28 | (0.18) | — | — | (0.18) | 9.89 | 2.87 | 4,187 | 0.99 (11) | 0.92 (12) | 1.78 (13) | 71 | |||||||||||||||
| F | 9.78 | 0.19 | 0.10 | 0.29 | (0.19) | — | — | (0.19) | 9.88 | 2.97 | 2,096 | 0.98 (11) | 0.84 (12) | 1.88 (13) | 71 | |||||||||||||||
| SDR | 9.78 | 0.18 | 0.11 | 0.29 | (0.19) | — | — | (0.19) | 9.88 | 2.97 | 24,467 | 0.97 (11) | 0.84 (12) | 1.84 (13) | 71 | |||||||||||||||
| For the Year Ended October 31, 2020 | ||||||||||||||||||||||||||||||
| A | $ 10.06 | $ 0.21 | $ (0.25) | $ (0.04) | $ (0.22) | $ (0.01) | $ — | $ (0.23) | $ 9.79 | (0.41)% | $ 5,553 | 1.54% (14) | 1.10% (15)(16) | 2.12% (17) | 78% | |||||||||||||||
| C (18) | 10.12 | 0.04 | (0.31) | (0.27) | (0.06) | 0.00 | — | (0.06) | 9.79 | (2.64) (6) | 443 | 2.52 (7)(14) | 2.29 (7)(15)(16) | 0.55 (7)(17) | 78 | |||||||||||||||
| I | 10.06 | 0.19 | (0.23) | (0.04) | (0.22) | (0.01) | — | (0.23) | 9.79 | (0.42) | 65,636 | 1.34 (14) | 1.12 (15)(16) | 1.94 (17) | 78 | |||||||||||||||
| Y | 10.06 | 0.21 | (0.25) | (0.04) | (0.22) | (0.01) | — | (0.23) | 9.79 | (0.36) | 3,571 | 1.29 (14) | 1.07 (15)(16) | 2.20 (17) | 78 | |||||||||||||||
| F | 10.05 | 0.22 | (0.26) | (0.04) | (0.22) | (0.01) | — | (0.23) | 9.78 | (0.34) | 2,035 | 1.28 (14) | 1.06 (15)(16) | 2.25 (17) | 78 | |||||||||||||||
| SDR | 10.05 | 0.23 | (0.26) | (0.03) | (0.23) | (0.01) | — | (0.24) | 9.78 | (0.31) | 16,688 | 1.28 (14) | 1.07 (15)(16) | 2.32 (17) | 78 | |||||||||||||||
| For the Period Ended October 31, 2019(19) | ||||||||||||||||||||||||||||||
| A | $ 10.00 | $ 0.17 | $ 0.03 | $ 0.20 | $ (0.14) | $ — | $ — | $ (0.14) | $ 10.06 | 2.04% (6) | $ 3,571 | 1.58% (7)(20) | 1.00% (7)(16)(21) | 2.49% (7)(22) | 35% | |||||||||||||||
| I | 10.00 | 0.17 | 0.04 | 0.21 | (0.15) | — | — | (0.15) | 10.06 | 2.09 (6) | 4,633 | 1.33 (7)(20) | 0.96 (7)(16)(21) | 2.52 (7)(22) | 35 | |||||||||||||||
| Y | 10.00 | 0.17 | 0.04 | 0.21 | (0.15) | — | — | (0.15) | 10.06 | 2.13 (6) | 3,583 | 1.27 (7)(20) | 0.91 (7)(16)(21) | 2.58 (7)(22) | 35 | |||||||||||||||
| F | 10.00 | 0.18 | 0.03 | 0.21 | (0.16) | — | — | (0.16) | 10.05 | 2.06 (6) | 2,544 | 1.26 (7)(20) | 0.89 (7)(16)(21) | 2.61 (7)(22) | 35 | |||||||||||||||
| SDR | 10.00 | 0.17 | 0.04 | 0.21 | (0.16) | — | — | (0.16) | 10.05 | 2.19 (6) | 80,616 | 1.24 (7)(20) | 0.86 (7)(16)(21) | 2.55 (7)(22) | 35 | |||||||||||||||
| Hartford Schroders Tax-Aware Bond Fund | ||||||||||||||||||||||||||||||
| For the Year Ended October 31, 2021 | ||||||||||||||||||||||||||||||
| A | $ 11.42 | $ 0.12 | $ —(5) | $ 0.12 | $ (0.12) | $ (0.15) | $ — | $ (0.27) | $ 11.27 | 1.08% | $ 63,475 | 0.82% | 0.71% | 1.09% | 109% | |||||||||||||||
| C | 11.44 | 0.03 | (0.02) | 0.01 | (0.02) | (0.15) | — | (0.17) | 11.28 | 0.11 | 7,768 | 1.64 | 1.58 | 0.22 | 109 | |||||||||||||||
| I | 11.43 | 0.15 | (0.01) | 0.14 | (0.14) | (0.15) | — | (0.29) | 11.28 | 1.30 | 279,048 | 0.59 | 0.49 | 1.31 | 109 | |||||||||||||||
| Y | 11.44 | 0.14 | (0.01) | 0.13 | (0.14) | (0.15) | — | (0.29) | 11.28 | 1.14 | 286 | 0.62 | 0.56 | 1.24 | 109 | |||||||||||||||
| F | 11.44 | 0.15 | (0.01) | 0.14 | (0.15) | (0.15) | — | (0.30) | 11.28 | 1.24 | 40,994 | 0.51 | 0.46 | 1.34 | 109 | |||||||||||||||
| SDR | 11.43 | 0.15 | (0.01) | 0.14 | (0.15) | (0.15) | — | (0.30) | 11.27 | 1.24 | 64,292 | 0.51 | 0.46 | 1.34 | 109 | |||||||||||||||
| For the Year Ended October 31, 2020 | ||||||||||||||||||||||||||||||
| A | $ 11.34 | $ 0.16 | $ 0.32 | $ 0.48 | $ (0.17) | $ (0.23) | $ — | $ (0.40) | $ 11.42 | 4.31% | $ 56,486 | 0.82% | 0.71% | 1.39% | 186% | |||||||||||||||
| C | 11.34 | 0.06 | 0.33 | 0.39 | (0.06) | (0.23) | — | (0.29) | 11.44 | 3.53 | 8,731 | 1.61 | 1.55 | 0.56 | 186 | |||||||||||||||
| I | 11.34 | 0.18 | 0.34 | 0.52 | (0.20) | (0.23) | — | (0.43) | 11.43 | 4.64 | 283,060 | 0.60 | 0.49 | 1.61 | 186 | |||||||||||||||
| Y | 11.35 | 0.18 | 0.33 | 0.51 | (0.19) | (0.23) | — | (0.42) | 11.44 | 4.56 | 213 | 0.63 | 0.56 | 1.56 | 186 | |||||||||||||||
| F | 11.35 | 0.19 | 0.33 | 0.52 | (0.20) | (0.23) | — | (0.43) | 11.44 | 4.67 | 33,074 | 0.52 | 0.46 | 1.64 | 186 | |||||||||||||||
| SDR | 11.34 | 0.19 | 0.33 | 0.52 | (0.20) | (0.23) | — | (0.43) | 11.43 | 4.68 | 61,878 | 0.52 | 0.46 | 1.66 | 186 | |||||||||||||||
| 106 |
| — Selected Per-Share Data(1) — | — Ratios and Supplemental Data — | |||||||||||||||||||||||||||||
| Class | Net Asset Value at Beginning of Period | Net Investment Income (Loss) | Net Realized and Unrealized Gain (Loss) on Investments | Total from Investment Operations | Dividends from Net Investment Income | Distributions from Capital Gains | Returns of Capital | Total Dividends and Distributions | Net Asset Value at End of Period | Total Return(2) | Net Assets at End of Period (000s) | Ratio of Expenses to Average Net Assets Before Adjust- ments(3) | Ratio of Expenses to Average Net Assets After Adjust- ments(3) | Ratio of Net Investment Income (Loss) to Average Net Assets | Portfolio Turnover | |||||||||||||||
| Hartford Schroders Tax-Aware Bond Fund – (continued) | ||||||||||||||||||||||||||||||
| For the Year Ended October 31, 2019 | ||||||||||||||||||||||||||||||
| A | $ 10.66 | $ 0.23 | $ 0.80 | $ 1.03 | $ (0.23) | $ (0.12) | $ — | $ (0.35) | $ 11.34 | 9.79% | $ 36,158 | 0.83% | 0.71% | 2.08% | 161% | |||||||||||||||
| C | 10.65 | 0.14 | 0.80 | 0.94 | (0.13) | (0.12) | — | (0.25) | 11.34 | 8.91 | 7,894 | 1.61 | 1.54 | 1.26 | 161 | |||||||||||||||
| I | 10.67 | 0.26 | 0.79 | 1.05 | (0.26) | (0.12) | — | (0.38) | 11.34 | 9.95 | 209,719 | 0.61 | 0.48 | 2.31 | 161 | |||||||||||||||
| Y | 10.67 | 0.26 | 0.79 | 1.05 | (0.25) | (0.12) | — | (0.37) | 11.35 | 9.98 | 204 | 0.60 | 0.53 | 2.31 | 161 | |||||||||||||||
| F | 10.67 | 0.26 | 0.80 | 1.06 | (0.26) | (0.12) | — | (0.38) | 11.35 | 10.06 | 20,569 | 0.53 | 0.46 | 2.33 | 161 | |||||||||||||||
| SDR | 10.66 | 0.26 | 0.80 | 1.06 | (0.26) | (0.12) | — | (0.38) | 11.34 | 10.08 | 60,005 | 0.53 | 0.46 | 2.38 | 161 | |||||||||||||||
| For the Year Ended October 31, 2018 | ||||||||||||||||||||||||||||||
| A | $ 11.08 | $ 0.23 | $ (0.42) | $ (0.19) | $ (0.22) | $ (0.01) | $ — | $ (0.23) | $ 10.66 | (1.77)% | $ 25,186 | 0.86% | 0.71% | 2.07% | 161% | |||||||||||||||
| C | 11.07 | 0.14 | (0.43) | (0.29) | (0.12) | (0.01) | — | (0.13) | 10.65 | (2.64) | 4,819 | 1.62 | 1.53 | 1.24 | 161 | |||||||||||||||
| I | 11.10 | 0.25 | (0.42) | (0.17) | (0.25) | (0.01) | — | (0.26) | 10.67 | (1.59) | 120,282 | 0.62 | 0.46 | 2.31 | 161 | |||||||||||||||
| Y | 11.10 | 0.25 | (0.43) | (0.18) | (0.24) | (0.01) | — | (0.25) | 10.67 | (1.63) | 214 | 0.57 | 0.48 | 2.30 | 161 | |||||||||||||||
| F | 11.10 | 0.26 | (0.44) | (0.18) | (0.24) | (0.01) | — | (0.25) | 10.67 | (1.60) | 8,689 | 0.55 | 0.46 | 2.36 | 161 | |||||||||||||||
| SDR | 11.09 | 0.25 | (0.43) | (0.18) | (0.24) | (0.01) | — | (0.25) | 10.66 | (1.60) | 59,590 | 0.55 | 0.46 | 2.30 | 161 | |||||||||||||||
| For the Year Ended October 31, 2017 | ||||||||||||||||||||||||||||||
| A | $ 11.19 | $ 0.20 | $ (0.07) | $ 0.13 | $ (0.20) | $ (0.04) | $ — | $ (0.24) | $ 11.08 | 1.20% | $ 22,948 | 0.86% | 0.71% | 1.83% | 72% | |||||||||||||||
| C | 11.20 | 0.11 | (0.07) | 0.04 | (0.13) | (0.04) | — | (0.17) | 11.07 | 0.40 | 4,712 | 1.58 | 1.50 | 0.96 | 72 | |||||||||||||||
| I | 11.21 | 0.23 | (0.07) | 0.16 | (0.23) | (0.04) | — | (0.27) | 11.10 | 1.45 | 147,851 | 0.58 | 0.46 | 2.10 | 72 | |||||||||||||||
| Y | 11.20 | 0.23 | (0.07) | 0.16 | (0.22) | (0.04) | — | (0.26) | 11.10 | 1.53 | 10 | 0.54 | 0.46 | 2.08 | 72 | |||||||||||||||
| F | 10.93 | 0.14 | 0.17 | 0.31 | (0.14) | — | — | (0.14) | 11.10 | 2.85 (6) | 2,377 | 0.53 (7) | 0.46 (7) | 1.96 (7) | 72 | |||||||||||||||
| SDR | 11.20 | 0.23 | (0.07) | 0.16 | (0.23) | (0.04) | — | (0.27) | 11.09 | 1.46 | 70,615 | 0.54 | 0.46 | 2.12 | 72 | |||||||||||||||
| Hartford Schroders US MidCap Opportunities Fund | ||||||||||||||||||||||||||||||
| For the Year Ended October 31, 2021 | ||||||||||||||||||||||||||||||
| A | $ 14.57 | $ (0.02) | $ 6.09 | $ 6.07 | $ (0.01) | $ — | $ — | $ (0.01) | $ 20.63 | 41.71% | $ 106,982 | 1.16% | 1.16% | (0.10)% | 47% | |||||||||||||||
| C | 14.67 | (0.16) | 6.13 | 5.97 | — | — | — | — | 20.64 | 40.70 | 54,795 | 1.90 | 1.90 | (0.84) | 47 | |||||||||||||||
| I | 15.19 | 0.03 | 6.36 | 6.39 | (0.06) | — | — | (0.06) | 21.52 | 42.13 | 457,621 | 0.89 | 0.89 | 0.17 | 47 | |||||||||||||||
| R3 | 14.92 | (0.09) | 6.24 | 6.15 | — | — | — | — | 21.07 | 41.22 | 2,157 | 1.52 | 1.52 | (0.46) | 47 | |||||||||||||||
| R4 | 15.08 | (0.02) | 6.31 | 6.29 | — | — | — | — | 21.37 | 41.71 | 856 | 1.22 | 1.17 | (0.11) | 47 | |||||||||||||||
| R5 | 15.16 | 0.03 | 6.33 | 6.36 | (0.05) | — | — | (0.05) | 21.47 | 42.03 | 874 | 0.92 | 0.92 | 0.17 | 47 | |||||||||||||||
| Y | 15.18 | 0.03 | 6.34 | 6.37 | (0.05) | — | — | (0.05) | 21.50 | 42.05 | 82,958 | 0.91 | 0.91 | 0.15 | 47 | |||||||||||||||
| F | 15.20 | 0.05 | 6.35 | 6.40 | (0.07) | — | — | (0.07) | 21.53 | 42.23 | 83,647 | 0.80 | 0.80 | 0.26 | 47 | |||||||||||||||
| SDR | 15.23 | 0.05 | 6.35 | 6.40 | (0.07) | — | — | (0.07) | 21.56 | 42.14 | 51,180 | 0.80 | 0.80 | 0.26 | 47 | |||||||||||||||
| For the Year Ended October 31, 2020 | ||||||||||||||||||||||||||||||
| A | $ 15.01 | $ 0.01 | $ (0.35) | $ (0.34) | $ 0.00(5) | $ (0.10) | $ — | $ (0.10) | $ 14.57 | (2.25)% | $ 71,370 | 1.18% | 1.18% | 0.06% | 53% | |||||||||||||||
| C | 15.21 | (0.10) | (0.34) | (0.44) | — | (0.10) | — | (0.10) | 14.67 | (2.90) | 43,785 | 1.92 | 1.92 | (0.67) | 53 | |||||||||||||||
| I | 15.63 | 0.05 | (0.35) | (0.30) | (0.04) | (0.10) | — | (0.14) | 15.19 | (1.92) | 352,667 | 0.90 | 0.90 | 0.35 | 53 | |||||||||||||||
| R3 | 15.41 | (0.04) | (0.35) | (0.39) | — | (0.10) | — | (0.10) | 14.92 | (2.54) | 975 | 1.53 | 1.53 | (0.28) | 53 | |||||||||||||||
| R4 | 15.53 | 0.00 (5) | (0.35) | (0.35) | — | (0.10) | — | (0.10) | 15.08 | (2.26) | 567 | 1.23 | 1.23 | 0.01 | 53 | |||||||||||||||
| R5 | 15.60 | 0.05 | (0.35) | (0.30) | (0.04) | (0.10) | — | (0.14) | 15.16 | (1.96) | 1,229 | 0.93 | 0.93 | 0.31 | 53 | |||||||||||||||
| Y | 15.63 | 0.05 | (0.35) | (0.30) | (0.05) | (0.10) | — | (0.15) | 15.18 | (1.93) | 77,493 | 0.91 | 0.90 | 0.34 | 53 | |||||||||||||||
| F | 15.64 | 0.06 | (0.34) | (0.28) | (0.06) | (0.10) | — | (0.16) | 15.20 | (1.82) | 55,554 | 0.81 | 0.81 | 0.42 | 53 | |||||||||||||||
| SDR | 15.67 | 0.07 | (0.35) | (0.28) | (0.06) | (0.10) | — | (0.16) | 15.23 | (1.81) | 37,895 | 0.81 | 0.81 | 0.45 | 53 | |||||||||||||||
| 107 |
| — Selected Per-Share Data(1) — | — Ratios and Supplemental Data — | |||||||||||||||||||||||||||||
| Class | Net Asset Value at Beginning of Period | Net Investment Income (Loss) | Net Realized and Unrealized Gain (Loss) on Investments | Total from Investment Operations | Dividends from Net Investment Income | Distributions from Capital Gains | Returns of Capital | Total Dividends and Distributions | Net Asset Value at End of Period | Total Return(2) | Net Assets at End of Period (000s) | Ratio of Expenses to Average Net Assets Before Adjust- ments(3) | Ratio of Expenses to Average Net Assets After Adjust- ments(3) | Ratio of Net Investment Income (Loss) to Average Net Assets | Portfolio Turnover | |||||||||||||||
| Hartford Schroders US MidCap Opportunities Fund – (continued) | ||||||||||||||||||||||||||||||
| For the Year Ended October 31, 2019 | ||||||||||||||||||||||||||||||
| A | $ 13.68 | $ 0.02 | $ 1.58 | $ 1.60 | $ — | $ (0.27) | $ — | $ (0.27) | $ 15.01 | 12.12% | $ 87,831 | 1.27% | 1.27% | 0.14% | 39% | |||||||||||||||
| C | 13.97 | (0.09) | 1.60 | 1.51 | — | (0.27) | — | (0.27) | 15.21 | 11.29 | 60,195 | 2.02 | 2.02 | (0.61) | 39 | |||||||||||||||
| I | 14.24 | 0.06 | 1.64 | 1.70 | (0.04) | (0.27) | — | (0.31) | 15.63 | 12.41 | 496,725 | 1.00 | 1.00 | 0.42 | 39 | |||||||||||||||
| R3 | 14.09 | (0.04) | 1.63 | 1.59 | — | (0.27) | — | (0.27) | 15.41 | 11.69 | 1,423 | 1.62 | 1.62 | (0.25) | 39 | |||||||||||||||
| R4 | 14.17 | 0.01 | 1.64 | 1.65 | (0.02) | (0.27) | — | (0.29) | 15.53 | 12.09 | 627 | 1.32 | 1.32 | 0.09 | 39 | |||||||||||||||
| R5 | 14.24 | 0.06 | 1.62 | 1.68 | (0.05) | (0.27) | — | (0.32) | 15.60 | 12.32 | 1,476 | 1.02 | 1.02 | 0.39 | 39 | |||||||||||||||
| Y | 14.24 | 0.07 | 1.64 | 1.71 | (0.05) | (0.27) | — | (0.32) | 15.63 | 12.50 | 116,557 | 0.97 | 0.95 | 0.44 | 39 | |||||||||||||||
| F | 14.25 | 0.07 | 1.64 | 1.71 | (0.05) | (0.27) | — | (0.32) | 15.64 | 12.52 | 54,955 | 0.91 | 0.91 | 0.48 | 39 | |||||||||||||||
| SDR | 14.28 | 0.07 | 1.64 | 1.71 | (0.05) | (0.27) | — | (0.32) | 15.67 | 12.49 | 82,604 | 0.91 | 0.91 | 0.48 | 39 | |||||||||||||||
| For the Year Ended October 31, 2018 | ||||||||||||||||||||||||||||||
| A | $ 13.97 | $ 0.01 | $ (0.10) | $ (0.09) | $ — | $ (0.20) | $ — | $ (0.20) | $ 13.68 | (0.66)% | $ 96,491 | 1.26% | 1.25% | 0.05% | 37% | |||||||||||||||
| C | 14.37 | (0.11) | (0.09) | (0.20) | — | (0.20) | — | (0.20) | 13.97 | (1.49) | 67,037 | 2.02 | 2.01 | (0.72) | 37 | |||||||||||||||
| I | 14.52 | 0.05 | (0.11) | (0.06) | (0.02) | (0.20) | — | (0.22) | 14.24 | (0.44) | 648,971 | 0.99 | 0.98 | 0.31 | 37 | |||||||||||||||
| R3 | 14.43 | (0.05) | (0.09) | (0.14) | — | (0.20) | — | (0.20) | 14.09 | (1.06) | 950 | 1.63 | 1.60 | (0.31) | 37 | |||||||||||||||
| R4 | 14.48 | — | (0.10) | (0.10) | (0.01) | (0.20) | — | (0.21) | 14.17 | (0.74) | 775 | 1.33 | 1.30 | (0.03) | 37 | |||||||||||||||
| R5 | 14.51 | 0.04 | (0.09) | (0.05) | (0.02) | (0.20) | — | (0.22) | 14.24 | (0.42) | 1,864 | 1.03 | 1.00 | 0.26 | 37 | |||||||||||||||
| Y | 14.53 | 0.04 | (0.10) | (0.06) | (0.03) | (0.20) | — | (0.23) | 14.24 | (0.46) | 108,680 | 0.96 | 0.94 | 0.25 | 37 | |||||||||||||||
| F | 14.53 | 0.06 | (0.11) | (0.05) | (0.03) | (0.20) | — | (0.23) | 14.25 | (0.37) | 45,449 | 0.91 | 0.90 | 0.38 | 37 | |||||||||||||||
| SDR | 14.56 | 0.06 | (0.11) | (0.05) | (0.03) | (0.20) | — | (0.23) | 14.28 | (0.37) | 57,898 | 0.91 | 0.90 | 0.38 | 37 | |||||||||||||||
| For the Year Ended October 31, 2017 | ||||||||||||||||||||||||||||||
| A | $ 11.98 | $ (0.02) | $ 2.22 | $ 2.20 | $ (0.02) | $ (0.19) | $ — | $ (0.21) | $ 13.97 | 18.57% | $ 116,594 | 1.28% | 1.27% | (0.12)% | 54% | |||||||||||||||
| C | 12.41 | (0.13) | 2.31 | 2.18 | (0.03) | (0.19) | — | (0.22) | 14.37 | 17.75 | 48,121 | 2.04 | 2.02 | (0.94) | 54 | |||||||||||||||
| I | 12.42 | 0.02 | 2.30 | 2.32 | (0.03) | (0.19) | — | (0.22) | 14.52 | 18.91 | 620,850 | 1.02 | 1.01 | 0.15 | 54 | |||||||||||||||
| R3 | 12.41 | (0.07) | 2.30 | 2.23 | (0.02) | (0.19) | — | (0.21) | 14.43 | 18.28 | 425 | 1.64 | 1.60 | (0.49) | 54 | |||||||||||||||
| R4 | 12.42 | (0.04) | 2.31 | 2.27 | (0.02) | (0.19) | — | (0.21) | 14.48 | 18.52 | 274 | 1.39 | 1.30 | (0.28) | 54 | |||||||||||||||
| R5 | 12.42 | 0.02 | 2.29 | 2.31 | (0.03) | (0.19) | — | (0.22) | 14.51 | 18.82 | 56 | 1.14 | 1.00 | 0.18 | 54 | |||||||||||||||
| Y | 12.42 | 0.02 | 2.31 | 2.33 | (0.03) | (0.19) | — | (0.22) | 14.53 | 19.00 | 11,479 | 0.96 | 0.94 | 0.16 | 54 | |||||||||||||||
| F (10) | 13.63 | 0.01 | 0.89 | 0.90 | — | — | — | — | 14.53 | 6.60 (6) | 8,436 | 0.91 (7) | 0.90 (7) | 0.14 (7) | 54 | |||||||||||||||
| SDR | 12.44 | 0.03 | 2.31 | 2.34 | (0.03) | (0.19) | — | (0.22) | 14.56 | 19.06 | 21,490 | 0.91 | 0.90 | 0.24 | 54 | |||||||||||||||
| Hartford Schroders US Small Cap Opportunities Fund | ||||||||||||||||||||||||||||||
| For the Year Ended October 31, 2021 | ||||||||||||||||||||||||||||||
| A | $ 23.20 | $ (0.11) | $ 10.39 | $ 10.28 | $ — | $ — | $ — | $ — | $ 33.48 | 44.31% | $ 38,561 | 1.38% | 1.35% | (0.34)% | 56% | |||||||||||||||
| C | 23.54 | (0.34) | 10.53 | 10.19 | — | — | — | — | 33.73 | 43.29 | 8,574 | 2.12 | 2.10 | (1.09) | 56 | |||||||||||||||
| I | 24.45 | (0.02) | 10.97 | 10.95 | (0.02) | — | — | (0.02) | 35.38 | 44.78 | 219,197 | 1.08 | 1.07 | (0.06) | 56 | |||||||||||||||
| R3 | 24.11 | (0.21) | 10.81 | 10.60 | — | — | — | — | 34.71 | 43.97 | 1,379 | 1.70 | 1.63 | (0.64) | 56 | |||||||||||||||
| R4 | 24.35 | (0.11) | 10.90 | 10.79 | — | — | — | — | 35.14 | 44.31 | 739 | 1.40 | 1.35 | (0.34) | 56 | |||||||||||||||
| R5 | 24.44 | (0.02) | 10.95 | 10.93 | (0.03) | — | — | (0.03) | 35.34 | 44.75 | 687 | 1.10 | 1.05 | (0.06) | 56 | |||||||||||||||
| Y | 24.46 | (0.01) | 10.95 | 10.94 | (0.03) | — | — | (0.03) | 35.37 | 44.75 | 38,267 | 1.09 | 1.05 | (0.05) | 56 | |||||||||||||||
| F | 24.49 | 0.02 | 10.97 | 10.99 | (0.06) | — | — | (0.06) | 35.42 | 44.92 | 17,664 | 0.99 | 0.95 | 0.06 | 56 | |||||||||||||||
| SDR | 24.52 | 0.02 | 10.98 | 11.00 | (0.06) | — | — | (0.06) | 35.46 | 44.91 | 34,111 | 0.99 | 0.95 | 0.06 | 56 | |||||||||||||||
| 108 |
| — Selected Per-Share Data(1) — | — Ratios and Supplemental Data — | |||||||||||||||||||||||||||||
| Class | Net Asset Value at Beginning of Period | Net Investment Income (Loss) | Net Realized and Unrealized Gain (Loss) on Investments | Total from Investment Operations | Dividends from Net Investment Income | Distributions from Capital Gains | Returns of Capital | Total Dividends and Distributions | Net Asset Value at End of Period | Total Return(2) | Net Assets at End of Period (000s) | Ratio of Expenses to Average Net Assets Before Adjust- ments(3) | Ratio of Expenses to Average Net Assets After Adjust- ments(3) | Ratio of Net Investment Income (Loss) to Average Net Assets | Portfolio Turnover | |||||||||||||||
| Hartford Schroders US Small Cap Opportunities Fund – (continued) | ||||||||||||||||||||||||||||||
| For the Year Ended October 31, 2020 | ||||||||||||||||||||||||||||||
| A | $ 25.69 | $ 0.01 | $ (1.19) | $ (1.18) | $ (0.02) | $ (1.29) | $ — | $ (1.31) | $ 23.20 | (5.02)% | $ 23,897 | 1.42% | 1.35% | 0.06% | 47% | |||||||||||||||
| C | 26.23 | (0.16) | (1.24) | (1.40) | — | (1.29) | — | (1.29) | 23.54 | (5.77) | 6,957 | 2.17 | 2.10 | (0.67) | 47 | |||||||||||||||
| I | 27.00 | 0.09 | (1.27) | (1.18) | (0.08) | (1.29) | — | (1.37) | 24.45 | (4.78) | 144,885 | 1.11 | 1.05 | 0.38 | 47 | |||||||||||||||
| R3 | 26.71 | (0.07) | (1.24) | (1.31) | — | (1.29) | — | (1.29) | 24.11 | (5.31) | 242 | 1.73 | 1.64 | (0.30) | 47 | |||||||||||||||
| R4 | 26.93 | 0.02 | (1.27) | (1.25) | (0.04) | (1.29) | — | (1.33) | 24.35 | (5.04) | 194 | 1.43 | 1.35 | 0.08 | 47 | |||||||||||||||
| R5 | 26.98 | 0.06 | (1.23) | (1.17) | (0.08) | (1.29) | — | (1.37) | 24.44 | (4.78) | 293 | 1.13 | 1.05 | 0.25 | 47 | |||||||||||||||
| Y | 27.00 | 0.09 | (1.26) | (1.17) | (0.08) | (1.29) | — | (1.37) | 24.46 | (4.74) | 23,531 | 1.12 | 1.05 | 0.39 | 47 | |||||||||||||||
| F | 27.03 | 0.10 | (1.25) | (1.15) | (0.10) | (1.29) | — | (1.39) | 24.49 | (4.68) | 10,407 | 1.01 | 0.95 | 0.41 | 47 | |||||||||||||||
| SDR | 27.06 | 0.08 | (1.23) | (1.15) | (0.10) | (1.29) | — | (1.39) | 24.52 | (4.66) | 23,538 | 1.01 | 0.95 | 0.36 | 47 | |||||||||||||||
| For the Year Ended October 31, 2019 | ||||||||||||||||||||||||||||||
| A | $ 25.55 | $ 0.02 | $ 2.38 | $ 2.40 | $ (0.01) | $ (2.25) | $ — | $ (2.26) | $ 25.69 | 11.21% | $ 20,928 | 1.43% | 1.35% | 0.07% | 45% | |||||||||||||||
| C | 26.20 | 0.16 | 2.44 | 2.28 | — | (2.2500) | — | (2.25) | 26.23 | 10.43 | 7,096 | 2.18 | 2.10 | (0.65) | 45 | |||||||||||||||
| I | 26.71 | 0.10 | 2.50 | 2.60 | 0.06 | (2.25) | — | (2.31) | 27.00 | 11.59 | 140,024 | 1.11 | 1.04 | 0.40 | 45 | |||||||||||||||
| R3 | 26.53 | (0.05) | 2.48 | 2.43 | — | (2.25) | — | (2.25) | 26.71 | 10.90 | 111 | 1.74 | 1.63 | (0.21) | 45 | |||||||||||||||
| R4 | 26.68 | — | 2.54 | 2.54 | (0.04) | (2.25) | — | (2.29) | 26.93 | 11.33 | 259 | 1.44 | 1.31 | (0.01) | 45 | |||||||||||||||
| R5 | 26.70 | 0.08 | 2.51 | 2.59 | (0.06) | (2.25) | — | (2.31) | 26.98 | 11.56 | 78 | 1.12 | 1.05 | 0.31 | 45 | |||||||||||||||
| Y | 26.73 | 0.11 | 2.50 | 2.61 | (0.09) | 2.25 | — | (2.34) | 27.00 | 11.62 | 25,883 | 1.08 | 1.01 | 0.43 | 45 | |||||||||||||||
| F | 26.74 | 0.12 | 2.51 | 2.63 | (0.09) | (2.25) | — | (2.34) | 27.03 | 11.69 | 4,483 | 1.02 | 0.95 | 0.47 | 45 | |||||||||||||||
| SDR | 26.78 | 0.13 | 2.49 | 2.62 | (0.09) | (2.25) | — | (2.34) | 27.06 | 11.67 | 11,328 | 1.02 | 0.95 | 0.50 | 45 | |||||||||||||||
| For the Year Ended October 31, 2018 | ||||||||||||||||||||||||||||||
| A | $ 27.97 | $ (0.02) | $ (0.04) | $ (0.06) | $ — | $ (2.36) | $ — | $ (2.36) | $ 25.55 | (0.34)% | $ 13,976 | 1.43% | 1.34% | (0.08)% | 42% | |||||||||||||||
| C | 28.82 | (0.23) | (0.03) | (0.26) | — | (2.36) | — | (2.36) | 26.20 | (1.08) | 6,892 | 2.18 | 2.09 | (0.84) | 42 | |||||||||||||||
| I | 29.14 | 0.07 | (0.05) | 0.02 | (0.09) | (2.36) | — | (2.45) | 26.71 | (0.05) | 109,710 | 1.12 | 1.04 | 0.25 | 42 | |||||||||||||||
| R3 | 29.06 | (0.08) | (0.05) | (0.13) | (0.04) | (2.36) | — | (2.40) | 26.53 | (0.58) | 66 | 1.75 | 1.58 | (0.30) | 42 | |||||||||||||||
| R4 | 29.08 | 0.04 | (0.04) | — | (0.04) | (2.36) | — | (2.40) | 26.68 | (0.11) | 11 | 1.45 | 1.13 | 0.12 | 42 | |||||||||||||||
| R5 | 29.11 | 0.07 | (0.05) | 0.02 | (0.07) | (2.36) | — | (2.43) | 26.70 | (0.02) | 19 | 1.15 | 1.05 | 0.23 | 42 | |||||||||||||||
| Y | 29.14 | 0.09 | (0.05) | 0.04 | (0.09) | (2.36) | — | (2.45) | 26.73 | (0.03) | 23,507 | 1.03 | 0.95 | 0.33 | 42 | |||||||||||||||
| F | 29.15 | 0.08 | (0.04) | 0.04 | (0.09) | (2.36) | — | (2.45) | 26.74 | 0.04 | 2,841 | 1.03 | 0.95 | 0.30 | 42 | |||||||||||||||
| SDR | 29.19 | 0.13 | (0.08) | 0.05 | (0.10) | (2.36) | — | (2.46) | 26.78 | 0.07 | 10,952 | 1.03 | 0.95 | 0.44 | 42 | |||||||||||||||
| For the Year Ended October 31, 2017 | ||||||||||||||||||||||||||||||
| A | $ 23.78 | $ (0.07) | $ 5.71 | $ 5.64 | $ (0.07) | $ (1.38) | $ — | $ (1.45) | $ 27.97 | 24.43% | $ 17,379 | 1.41% | 1.35% | (0.25)% | 69% | |||||||||||||||
| C | 24.66 | (0.27) | 5.90 | 5.63 | (0.09) | (1.38) | — | (1.47) | 28.82 | 23.50 | 4,426 | 2.14 | 2.08 | (1.00) | 69 | |||||||||||||||
| I | 24.67 | 0.05 | 5.90 | 5.95 | (0.10) | (1.38) | — | (1.48) | 29.14 | 24.85 | 124,651 | 1.05 | 1.00 | (0.20) | 69 | |||||||||||||||
| R3 | 24.67 | (0.07) | 5.91 | 5.84 | (0.07) | (1.38) | — | (1.45) | 29.06 | 24.36 | 54 | 1.76 | 1.38 | (0.27) | 69 | |||||||||||||||
| R4 | 24.67 | (0.01) | 5.88 | 5.87 | (0.08) | (1.38) | — | (1.46) | 29.08 | 24.51 | 11 | 1.46 | 1.22 | (0.03) | 69 | |||||||||||||||
| R5 | 24.67 | 0.04 | 5.88 | 5.92 | (0.10) | (1.38) | — | (1.48) | 29.11 | 24.72 | 20 | 1.25 | 1.05 | 0.13 | 69 | |||||||||||||||
| Y | 24.67 | (0.05) | 6.00 | 5.95 | (0.10) | (1.38) | — | (1.48) | 29.14 | 24.86 | 26,227 | 1.04 | 0.95 | (0.17) | 69 | |||||||||||||||
| F | 26.78 | 0.02 | 2.35 | 2.37 | — | — | — | — | 29.15 | 8.85 (6) | 1,256 | 1.00 (7) | 0.96 (7) | 0.10 (7) | 69 | |||||||||||||||
| SDR | 24.71 | 0.05 | 5.91 | 5.96 | (0.10) | (1.38) | — | (1.48) | 29.19 | 24.86 | 32,525 | 1.00 | 0.95 | 0.17 | 69 | |||||||||||||||
| FINANCIAL HIGHLIGHTS FOOTNOTES | |
| (1) | Information presented relates to a share outstanding throughout the indicated period. Net investment income (loss) per share amounts are calculated based on average shares outstanding unless otherwise noted. |
| (2) | Assumes initial investment at net asset value at the beginning of each period, reinvestment of all distributions, the complete redemption of the investment at net asset value at the end of each period and no sales charge. Total return would be reduced if sales charges were taken into account. |
| (3) | Adjustments include waivers and reimbursements, if applicable. Ratios do not include fees paid indirectly (see Expenses in the accompanying Notes to Financial Statements). |
| (4) | Commenced operations on March 31, 2020. |
| (5) | Amount is less than $0.01 per share. |
| (6) | Not annualized. |
| (7) | Annualized. |
| 109 |
| (8) | Commenced operations on September 30, 2021. |
| (9) | Reflects the Fund's portfolio turnover for the period September 30, 2021 through October 31, 2021. |
| (10) | Commenced operations on February 28, 2017. |
| (11) | The ratio of expenses before adjustments to average net assets excluding interest expense for the year ended October 31, 2021 was 1.12%, 1.93%, 0.89%, 0.85%, 0.84% and 0.84% for Class A, Class C, Class I, Class Y, Class F and Class SDR, respectively. |
| (12) | The ratio of expenses after adjustments to average net assets excluding interest expense for the year ended October 31, 2021 was 0.92%, 1.92%, 0.83%, 0.78%, 0.70% and 0.70% for Class A, Class C, Class I, Class Y, Class F and Class SDR, respectively. |
| (13) | The ratio of net investment income to average net assets excluding interest expense for the year ended October 31, 2021 was 1.80%, 0.80%, 1.87%, 1.92%, 2.02% and 1.98% for Class A, Class C, Class I, Class Y, Class F and Class SDR, respectively. |
| (14) | The ratio of expenses before adjustments to average net assets excluding interest expense for the year ended October 31, 2020 was 1.18%, 2.16%, 0.97%, 0.92%, 0.92% and 0.92% for Class A, Class C, Class I, Class Y, Class F and Class SDR, respectively. |
| (15) | The ratio of expenses after adjustments to average net assets excluding interest expense for the year ended October 31, 2020 was 0.74%, 1.93%, 0.76%, 0.71%, 0.70% and 0.70% for Class A, Class C, Class I, Class Y, Class F and Class SDR, respectively. |
| (16) | Includes the impact of certain non-contractual waivers. Please see the fee table in the Fund’s prospectus for the Fund’s estimated total annual fund operating expenses (before and after contractual waivers and/or reimbursements). |
| (17) | The ratio of net investment income to average net assets excluding interest expense for the year ended October 31, 2020 was 2.48%, 0.91%, 2.30%, 2.56%, 2.61% and 2.69% for Class A, Class C, Class I, Class Y, Class F and Class SDR, respectively. |
| (18) | Commenced operations on February 28, 2020. |
| (19) | Commenced operations on February 28, 2019. |
| (20) | The ratio of expenses before adjustments to average net assets excluding interest expense for the period February 28, 2019 through October 31, 2019 was 1.39%, 1.14%, 1.09%, 1.07% and 1.07% for Class A, Class I, Class Y, Class F and Class SDR, respectively. |
| (21) | The ratio of expenses after adjustments to average net assets excluding interest expense for the period February 28, 2019 through October 31, 2019 was 0.79%, 0.76%, 0.70%, 0.68% and 0.70% for Class A, Class I, Class Y, Class F and Class SDR, respectively. This includes the impact of certain non-contractual waivers. |
| (22) | The ratio of net investment income to average net assets excluding interest expense for the period February 28, 2019 through October 31, 2019 was 2.68%, 2.71%, 2.77%, 2.81% and 2.71% for Class A, Class I, Class Y, Class F and Class SDR, respectively. |
| 110 |
October 31, 2021
| 1. | Organization: |
| The Hartford Mutual Funds II, Inc. (the “Company”) is an open-end registered management investment company comprised of thirteen series, as of October 31, 2021. Financial statements of each series of the Company listed below (each, a “Fund” and collectively, the “Funds”) are included in this report. | |
| The Hartford Mutual Funds II, Inc.: |
| Hartford Schroders China A Fund (the "China A Fund") |
| Hartford Schroders Diversified Emerging Markets Fund (the "Diversified Emerging Markets Fund") |
| Hartford Schroders Emerging Markets Equity Fund (the "Emerging Markets Equity Fund") |
| Hartford Schroders Emerging Markets Multi-Sector Bond Fund (the "Emerging Markets Multi-Sector Bond Fund") |
| Hartford Schroders International Multi-Cap Value Fund (the "International Multi-Cap Value Fund") |
| Hartford Schroders International Stock Fund (the "International Stock Fund") |
| Hartford Schroders Securitized Income Fund (the "Securitized Income Fund") |
| Hartford Schroders Tax-Aware Bond Fund (the "Tax-Aware Bond Fund") |
| Hartford Schroders US MidCap Opportunities Fund (the "US MidCap Opportunities Fund") |
| Hartford Schroders US Small Cap Opportunities Fund (the "US Small Cap Opportunities Fund") |
| 2. | Significant Accounting Policies: |
| The following is a summary of significant accounting policies of each Fund used in the preparation of its financial statements, which are in accordance with United States Generally Accepted Accounting Principles (“U.S. GAAP”). The preparation of financial statements in accordance with U.S. GAAP may require management to make estimates and assumptions that affect the reported amounts of assets and liabilities and disclosure of contingent assets and liabilities at the date of the financial statements and the reported amounts of increases and decreases in net assets from operations during the reporting period. Actual results could differ from those estimates. |
| a) | Determination of Net Asset Value – The net asset value ("NAV") of each class of each Fund's shares is determined as of the close of regular trading on the New York Stock Exchange (the “Exchange”) (normally 4:00 p.m. Eastern Time) (the “NYSE Close”) on each day that the Exchange is open (“Valuation Date”). If the Exchange is closed due to weather or other extraordinary circumstances on a day it would typically be open for business, each Fund may treat such day as a typical business day and accept purchase and redemption orders and calculate each Fund’s NAV in accordance with applicable law. The NAV of each class of each Fund's shares is determined by dividing the value of the Fund’s net assets attributable to the class of shares by the number of shares outstanding for that class. Information that becomes known to the Funds after the NAV has been calculated on a particular day will not generally be used to retroactively adjust the NAV determined earlier that day. |
| b) | Investment Valuation and Fair Value Measurements – For purposes of calculating the NAV of each class of each Fund, portfolio securities and other assets held in the Fund’s portfolio for which market prices are readily available are valued at market value. Market value is generally determined on the basis of official close price or last reported trade price. If no trades were reported, market value is based on |
| 111 |
October 31, 2021
| prices obtained from a quotation reporting system, established market makers (including evaluated prices), or independent pricing services. Pricing vendors may use matrix pricing or valuation models that utilize certain inputs and assumptions to derive values, including transaction data, credit quality information, general market conditions, news, and other factors and assumptions. | |
| If market prices are not readily available or are deemed unreliable, a Fund will use the fair value of the security or other instrument as determined in good faith under policies and procedures established by and under the supervision of the Board of Directors of the Company (the “Board of Directors”) (“Valuation Procedures”). Market prices are considered not readily available where there is an absence of current or reliable market-based data (e.g., trade information or broker quotes), including where events occur after the close of the relevant market, but prior to the NYSE Close, that materially affect the values of a Fund’s portfolio holdings or assets. In addition, market prices are considered not readily available when, due to extraordinary circumstances, the exchanges or markets on which the securities or other instruments trade do not open for trading for the entire day and no other market prices are available. Fair value pricing is subjective in nature and the use of fair value pricing by a Fund may cause the NAV of its shares to differ significantly from the NAV that would have been calculated using market prices at the close of the exchange on which a portfolio holding is primarily traded. There can be no assurance that a Fund could obtain the fair value assigned to an investment if the Fund were to sell the investment at approximately the time at which the Fund determines its NAV. | |
| Prices of foreign equities that are principally traded on certain foreign markets will generally be adjusted daily pursuant to a fair value pricing service in order to reflect an adjustment for the factors occurring after the close of certain foreign markets but before the NYSE Close. Securities and other instruments that are primarily traded on foreign markets may trade on days that are not business days of the Funds. The value of the foreign securities or other instruments in which a Fund invests may change on days when a shareholder will not be able to purchase, redeem or exchange shares of the Fund. | |
| Fixed income investments (other than short-term obligations) and non-exchange traded derivatives held by a Fund are normally valued at prices supplied by independent pricing services in accordance with the Valuation Procedures. Short-term investments maturing in 60 days or less are generally valued at amortized cost which approximates fair value. | |
| Exchange-traded derivatives, such as options, futures and options on futures, are valued at the last sale price determined by the exchange where such instruments principally trade as of the close of such exchange (“Exchange Close”). If a last sale price is not available, the value will be the mean of the most recently quoted bid and ask prices as of the Exchange Close. If a mean of the bid and ask prices cannot be calculated for the day, the value will be the most recently quoted bid price as of the Exchange Close. Over-the-counter derivatives are normally valued based on prices supplied by independent pricing services in accordance with the Valuation Procedures. | |
| Investments valued in currencies other than U.S. dollars are converted to U.S. dollars using the prevailing spot currency exchange rates obtained from independent pricing services for calculation of the NAV. As a result, the NAV of a Fund’s shares may be affected by changes in the value of currencies in relation to the U.S. dollar. The value of securities or other instruments traded in markets outside the United States or denominated in currencies other than the U.S. dollar may be affected significantly on a day that the Exchange is closed and the market value may change on days when an investor is not able to purchase, redeem or exchange shares of a Fund. | |
| Foreign currency contracts represent agreements to exchange currencies on specific future dates at predetermined rates. Foreign currency contracts are valued using foreign currency exchange rates and forward rates as provided by an independent pricing service on the Valuation Date. | |
| Investments in investment companies that are not listed or traded on an exchange ("Non-Traded Funds"), if any, are valued at the respective NAV of each Non-Traded Fund on the Valuation Date. Shares of investment companies listed and traded on an exchange are valued in the same manner as any exchange-listed equity security. Such Non-Traded Funds and listed investment companies may use fair value pricing as disclosed in their prospectuses. | |
| Financial instruments for which prices are not available from an independent pricing service may be valued using market quotations obtained from one or more dealers that make markets in the respective financial instrument in accordance with the Valuation Procedures. | |
| U.S. GAAP defines fair value as the price that a Fund would receive to sell an asset or pay to transfer a liability in an orderly transaction between market participants. The U.S. GAAP fair value measurement standards require disclosure of a fair value hierarchy for each major category of assets and liabilities. Various inputs are used in determining the fair value of each Fund’s investments. These inputs are summarized into three broad hierarchy levels. This hierarchy is based on whether the valuation inputs are observable or unobservable. These levels are: |
| • | Level 1 – Quoted prices in active markets for identical investments. Level 1 may include exchange traded instruments, such as domestic equities, some foreign equities, options, futures, mutual funds, exchange traded funds, rights and warrants. |
| • | Level 2 – Observable inputs other than Level 1 prices, such as quoted prices for similar investments; quoted prices in markets that are not active; or other inputs that are observable or can be corroborated by observable market data. Level 2 may include debt investments |
| 112 |
October 31, 2021
| that are traded less frequently than exchange traded instruments and which are valued using independent pricing services; foreign equities, which are principally traded on certain foreign markets and are adjusted daily pursuant to a fair value pricing service in order to reflect an adjustment for the factors occurring after the close of certain foreign markets but before the NYSE Close; senior floating rate interests, which are valued using an aggregate of dealer bids; short-term investments, which are valued at amortized cost; and swaps, which are valued based upon the terms of each swap contract. | |
| • | Level 3 – Significant unobservable inputs that are supported by limited or no market activity. Level 3 may include financial instruments whose values are determined using indicative market quotes or require significant management judgment or estimation. These unobservable valuation inputs may include estimates for current yields, maturity/duration, prepayment speed, and indicative market quotes for comparable investments along with other assumptions relating to credit quality, collateral value, complexity of the investment structure, general market conditions and liquidity. This category may include investments where trading has been halted or there are certain restrictions on trading. While these investments are priced using unobservable inputs, the valuation of these investments reflects the best available data and management believes the prices are a reasonable representation of exit price. |
| c) | Investment Transactions and Investment Income – Investment transactions are recorded as of the trade date (the date the order to buy or sell is executed) for financial reporting purposes. Investments purchased or sold on a when-issued or delayed-delivery basis may be settled a month or more after the trade date. Realized gains and losses are determined on the basis of identified cost. |
| The trade date for senior floating rate interests purchased in the primary loan market is considered the date on which the loan allocations are determined. The trade date for senior floating rate interests purchased in the secondary loan market is the date on which the transaction is entered into. | |
| Dividend income from domestic securities is accrued on the ex-dividend date. In general, dividend income from foreign securities is recorded on the ex-date; however, dividend notifications in certain foreign jurisdictions may not be available in a timely manner and as a result, a Fund will record the dividend as soon as the relevant details (i.e., rate per share, payment date, shareholders of record, etc.) are publicly available. | |
| Interest income, including amortization of premium, accretion of discounts and additional principal received in-kind in lieu of cash, is accrued on a daily basis. Paydown gains and losses on mortgage-related and other asset-backed securities are included in interest income in the Statements of Operations, as applicable. |
| d) | Taxes – A Fund may be subject to taxes imposed on realized gains on securities of certain foreign countries in which such Fund invests. A Fund may also be subject to taxes withheld on foreign dividends and interest from securities in which a Fund invests. The amount of any foreign taxes withheld and foreign tax expense is included on the accompanying Statements of Operations as a reduction to net investment income or net realized or unrealized gain (loss) on investments in these securities, if applicable. |
| e) | Foreign Currency Transactions – Assets and liabilities denominated in currencies other than U.S. dollars are translated into U.S. dollars at the exchange rates in effect on the Valuation Date. Purchases and sales of investments, income and expenses are translated into U.S. dollars at the exchange rates on the dates of such transactions. |
| A Fund does not isolate that portion of portfolio investment valuation resulting from fluctuations in the foreign currency exchange rates from the fluctuations arising from changes in the market prices of investments held. Exchange rate fluctuations are included with the net realized and unrealized gain or loss on investments in the accompanying financial statements. | |
| Net realized foreign exchange gains or losses arise from sales of foreign currencies and the difference between asset and liability amounts initially stated in foreign currencies and the U.S. dollar value of the amounts actually received or paid. Net unrealized foreign exchange gains or losses arise from changes in the value of other assets and liabilities at the end of the reporting period, resulting from changes in the exchange rates. |
| 113 |
October 31, 2021
| f) | Joint Trading Account – A Fund may invest cash balances into a joint trading account that may be invested in one or more repurchase agreements. |
| g) | Fund Share Valuation and Dividend Distributions to Shareholders – Orders for each class of each Fund’s shares are executed in accordance with the investment instructions of the shareholders. The NAV of each class of each Fund’s shares is determined as of the close of business on each business day of the Exchange (see Note 2(a)). The NAV is determined separately for each class of shares of a Fund by dividing the Fund's net assets attributable to that class by the number of shares of the class outstanding. Each class of shares offered by a Fund has equal rights as to assets and voting privileges (except that shareholders of a class have exclusive voting rights regarding any matter relating solely to that class of shares). Income and non-class specific expenses are allocated daily to each class on the basis of the relative net assets of the class of the Fund. Realized and unrealized gains and losses are allocated daily based on the relative net assets of each class of shares of each Fund. |
| Orders for the purchase of a Fund's shares received prior to the close of the Exchange on any day the Exchange is open for business are priced at the NAV determined as of the close of the Exchange. Orders received after the close of the Exchange, or on a day on which the Exchange and/or the Funds are not open for business, are priced at the next determined NAV. | |
| Dividends are declared pursuant to a policy adopted by the Company’s Board of Directors. Dividends and/or distributions to shareholders are recorded on ex-date. The policy of China A Fund, Diversified Emerging Markets Fund, Emerging Markets Equity Fund, International Stock Fund, US MidCap Opportunities Fund and US Small Cap Opportunities Fund is to pay dividends from net investment income and realized gains, if any, at least once a year. The policy of Securitized Income Fund and Tax-Aware Bond Fund is to pay dividends from net investment income, if any, monthly, and realized gains, if any, at least once a year. The policy of Emerging Markets Multi-Sector Bond Fund and International Multi-Cap Value Fund is to pay dividends from net investment income, if any, quarterly, and realized gains, if any, at least once a year. | |
| Income dividends and capital gains distributions are determined in accordance with federal income tax regulations, which may differ from U.S. GAAP with respect to character and timing (see Federal Income Taxes: Distributions and Components of Distributable Earnings and Reclassification of Capital Accounts notes). |
| h) | Cash Flow Information – The Securitized Income Fund has included a Statement of Cash Flows, which provides additional information on cash receipts and cash payments, as a result of its significant investments in reverse repurchase agreements throughout the year. Cash may include domestic and foreign currency as well as restricted cash held at brokers. |
| 3. | Securities and Other Investments: |
| a) | Restricted Securities – Each Fund may invest in securities that are subject to legal or contractual restrictions on resale. These securities generally may be resold in transactions exempt from registration or to the public if the securities are registered. Disposal of these securities may involve time-consuming negotiations and expense, and prompt sale at an acceptable price may be difficult. Information regarding restricted securities, if applicable, is included at the end of each Fund's Schedule of Investments. |
| b) | Investments Purchased on a When-Issued or Delayed-Delivery Basis – Delivery and payment for investments that have been purchased by a Fund on a forward commitment, or when-issued or delayed-delivery basis, take place beyond the customary settlement period. A Fund may dispose of or renegotiate a delayed-delivery transaction after it is entered into, and may sell delayed-delivery investments before they are delivered, which may result in a realized gain or loss. During this period, such investments are subject to market fluctuations, and a Fund identifies investments segregated in its records with a value at least equal to the amount of the commitment. See each Fund’s Schedule of Investments, if applicable, for when-issued or delayed-delivery investments as of October 31, 2021. |
| In connection with a Fund's ability to purchase investments on a when-issued or forward commitment basis, the Fund may enter into to-be announced (“TBA”) commitments. TBA commitments are forward agreements for the purchase or sale of mortgage-backed securities for a fixed price, with payment and delivery on an agreed-upon future settlement date. The specific securities to be delivered are not identified at the trade date; however, delivered securities must meet specified terms, including issuer, rate and mortgage terms. Although a Fund may enter into TBA commitments with the intention of acquiring or delivering securities for its portfolio, the Fund can extend the settlement date, roll the transaction, or dispose of a commitment prior to settlement if deemed appropriate to do so. If the TBA commitment is closed through the acquisition of an offsetting TBA commitment, a Fund realizes a gain or loss. In a TBA roll transaction, a Fund generally purchases or sells the initial TBA commitment prior to the agreed upon settlement date and enters into a new TBA commitment for future delivery or receipt of the mortgage-backed securities. TBA commitments involve a risk of loss if the value of the security to be purchased or sold declines or increases, respectively, prior to settlement date. These transactions are excluded from a Fund's portfolio turnover rate. See each Fund's Schedule of Investments, if applicable, for TBA commitments as of October 31, 2021. |
| 114 |
October 31, 2021
| c) | Mortgage-Related and Other Asset-Backed Securities – A Fund may invest in mortgage-related and other asset-backed securities. These securities include mortgage pass-through securities, collateralized mortgage obligations, commercial mortgage-backed securities, stripped mortgage-backed securities, asset-backed securities, collateralized debt obligations and other securities that directly or indirectly represent a participation in, or are secured by and payable from, mortgage loans on real property. Mortgage-related securities are created from pools of residential or commercial mortgage loans, including mortgage loans made by savings and loan institutions, mortgage bankers, commercial banks and others. Asset-backed securities are created from many types of assets, including auto loans, credit card receivables, home equity loans, and student loans. These securities provide a monthly payment that consists of both interest and principal payments. Interest payments may be determined by fixed or adjustable rates. The rate of prepayments on underlying mortgages will affect the price and volatility of a mortgage-related security, and may have the effect of shortening or extending the effective duration of the security relative to what was anticipated at the time of purchase. The timely payment of principal and interest of certain mortgage-related securities is guaranteed by the full faith and credit of the United States Government. Mortgage-related and other asset-backed securities created and guaranteed by non-governmental issuers, including government-sponsored corporations, may be supported by various forms of insurance or guarantees, but there can be no assurance that the private insurers or guarantors can meet their obligations under the insurance policies or guarantee arrangements. See each Fund's Schedule of Investments, if applicable, for mortgage-related and other asset-backed securities as of October 31, 2021. |
| d) | Inflation-Indexed Bonds – A Fund may invest in inflation-indexed bonds. Inflation-indexed bonds are fixed income investments whose principal value is periodically adjusted to the rate of inflation. The interest rate on these bonds is generally fixed at issuance at a rate lower than typical bonds. Over the life of an inflation-indexed bond, however, interest will be paid based on a principal value, which is adjusted for inflation. Any increase or decrease in the principal amount of an inflation-indexed bond will be included as interest income on the Statements of Operations, even though investors do not receive the principal amount until maturity. See each Fund's Schedule of Investments, if applicable, for inflation-indexed bonds as of October 31, 2021. |
| e) | Reverse Repurchase Agreements – Reverse repurchase agreements involve the sale of securities held by a Fund with an agreement to repurchase the securities at an agreed-upon price, date and interest payment. Reverse repurchase agreements carry the risk that the market value of the securities that a Fund is obligated to repurchase may decline below the repurchase price. A Fund could also lose money if it is unable to recover the securities and the value of any collateral held or assets segregated by the Fund to cover the transaction is less than the value of securities. The use of reverse repurchase agreements may increase the possibility of fluctuation in a Fund’s net asset value. |
| During the year ended October 31, 2021, Securitized Income Fund had used Reverse Repurchase Agreements. For the year ended October 31, 2021, the average amount of borrowings was $18,937,484 and the annualized weighted average interest rate was 0.79% during the year. |
| f) | Special Purpose Acquisition Companies – A Fund may invest in special purpose acquisition companies (“SPACs”) or similar special purpose entities. SPACs are collective investment structures that pool funds in order to seek potential acquisition opportunities. SPACs and similar entities may be blank check companies with no operating history or ongoing business other than to seek a potential acquisition. Because SPACs and similar entities have no operating history or ongoing business other than seeking acquisitions, the value of their securities is particularly dependent on the ability of the entity’s management to identify and complete a profitable acquisition. Some SPACs may pursue acquisitions only within certain industries or regions, which may increase the volatility of their securities’ prices. In addition, these securities, which are typically traded in the OTC market, may be considered illiquid and/or be subject to restrictions on resale. A Fund may enter into a contingent commitment with a SPAC to purchase shares of private investments in public equity investments (“PIPE”) if and when the SPAC completes its merger or acquisition; however if the commitment expires, then no shares are purchased. Purchased PIPE shares will be restricted from trading until the registration statement for the shares is declared effective. Upon registration, the shares can be freely sold; however, in certain circumstances, the issuer may have the right to temporarily suspend trading of the shares in the first year after the merger. The US Small Cap Opportunities Fund had contingent commitments outstanding of approximately $2,187,780 to purchase PIPE shares as of October 31, 2021. |
| 4. | Financial Derivative Instruments: |
| The following disclosures contain information on how and why a Fund may use derivative instruments, the credit-risk-related contingent features in certain derivative instruments, and how derivative instruments affect a Fund’s financial position and results of operations. The location and fair value amounts of these instruments on the Statements of Assets and Liabilities and the realized gains and losses and changes in unrealized gains and losses on the Statements of Operations, each categorized by type of derivative contract, are included in the following Additional Derivative Instrument Information footnote. The derivative instruments outstanding as of period-end are disclosed in the notes to the Schedules of Investments, if applicable. The amounts of realized gains and losses and changes in unrealized gains and losses on derivative instruments during the period are disclosed in the Statements of Operations. |
| 115 |
October 31, 2021
| a) | Foreign Currency Contracts – A Fund may enter into foreign currency contracts that obligate the Fund to purchase or sell currencies at specified future dates. Foreign currency contracts may be used in connection with settling purchases or sales of securities to hedge the currency exposure associated with some or all of a Fund’s investments and/or as part of an investment strategy. Foreign currency contracts are marked to market daily and the change in value is recorded by a Fund as an unrealized gain or loss. A Fund will record a realized gain or loss when the foreign currency contract is settled. |
| Foreign currency contracts involve elements of market risk in excess of the amounts reflected in the Statements of Assets and Liabilities. In addition, risks may arise upon entering into these contracts from the potential inability of the counterparties to meet the terms of the contracts and from unanticipated movements in the value of the foreign currencies relative to the U.S. dollar. Upon entering into a foreign currency contract, a Fund may be required to post margin equal to its outstanding exposure thereunder. | |
| During the year ended October 31, 2021, each of Diversified Emerging Markets Fund, Emerging Markets Equity Fund, Emerging Markets Multi-Sector Bond Fund, International Multi-Cap Value Fund, International Stock Fund and Securitized Income Fund had used Foreign Currency Contracts. |
| b) | Futures Contracts – A Fund may enter into futures contracts. A futures contract is an agreement between two parties to buy or sell an asset at a set price on a future date. A Fund may use futures contracts to manage risk or obtain exposure to the investment markets, commodities, or movements in interest rates and currency values. The primary risks associated with the use of futures contracts are the imperfect correlation between the change in market value of the investments held by a Fund and the prices of futures contracts and the possibility of an illiquid market. Upon entering into a futures contract, a Fund is required to deposit with a futures commission merchant (“FCM”) an amount of cash or U.S. Government or Agency Obligations in accordance with the initial margin requirements of the broker or exchange. Futures contracts are marked to market daily and an appropriate amount equal to the change in value (“variation margin”) is paid or received by a Fund. Gains or losses are recognized but not considered realized until the contracts expire or are closed. Futures contracts involve, to varying degrees, risk of loss in excess of the variation margin disclosed on the Statements of Assets and Liabilities. |
| During the year ended October 31, 2021, each of China A Fund, Diversified Emerging Markets Fund, Emerging Markets Multi-Sector Bond Fund, International Multi-Cap Value Fund, Securitized Income Fund and Tax-Aware Bond Fund had used Futures Contracts. |
| c) | Swap Contracts – A Fund may invest in swap contracts. Swap contracts are agreements to exchange or swap investment cash flows, assets, foreign currencies or market-linked returns at specified future intervals. Swap contracts are either privately negotiated in the over-the-counter market (“OTC swaps”) or cleared through a central counterparty or derivatives clearing organization (“centrally cleared swaps”). A Fund may enter into credit default, total return, cross-currency, interest rate, inflation and other forms of swap contracts to manage its exposure to credit, currency, interest rate, commodity and inflation risk. Swap contracts are also used to gain exposure to certain markets. In connection with these contracts, investments or cash may be identified as collateral or margin in accordance with the terms of the respective swap contracts and/or master netting arrangement to provide assets of value and recourse in the event of default or bankruptcy/insolvency. |
| Swaps are valued in accordance with the Valuation Procedures. Changes in market value, if any, are reflected as a component of net changes in unrealized appreciation or depreciation on the Statements of Operations. Daily changes in valuation of centrally cleared swaps, if any, are recorded as a receivable or payable for the change in value (“variation margin”) on the Statements of Assets and Liabilities. Realized gains or losses on centrally cleared swaps are recorded upon the termination of the swaps. OTC swap payments received or paid at the beginning of the measurement period are reflected as such on the Statements of Assets and Liabilities and represent premiums paid or received upon entering into the swap contract to compensate for differences between the stated terms of the swap contract and prevailing market conditions (credit spreads, currency exchange rates, interest rates and other relevant factors). These upfront premiums are recorded as realized gains or losses on the Statements of Operations upon termination or maturity of the swap. A liquidation payment received or made at the termination or maturity of the swap is recorded as a realized gain or loss on the Statements of Operations. Net periodic payments received or paid by a Fund are included as part of realized gains or losses on the Statements of Operations. | |
| Entering into these contracts involves, to varying degrees, elements of liquidation, counterparty, credit and market risk in excess of the amounts recognized on the Statements of Assets and Liabilities. Such risks involve the possibility that there will be no liquid market for these contracts, that the counterparty to the contracts may default on its obligation to perform or disagree as to the meaning of contractual terms in the contracts, and that there may be unfavorable changes in market conditions (credit spreads, currency exchange rates, interest rates and other relevant factors). | |
| A Fund’s maximum risk of loss from counterparty risk for OTC swaps is the net value of the discounted cash flows to be received from the counterparty over the contract’s remaining life, and current market value, to the extent that amount is positive. The risk is mitigated by having a master netting arrangement between a Fund and the counterparty, which allows for the netting of payments made or received (although such amounts are presented on a gross basis within the Statements of Assets and Liabilities, as applicable) as well as the posting of collateral to a Fund to cover the Fund’s exposure to the counterparty. In a centrally cleared swap, while a Fund enters into an agreement with |
| 116 |
October 31, 2021
| a clearing broker to execute contracts with a counterparty, the performance of the swap is guaranteed by the central clearinghouse, which reduces the Fund’s exposure to counterparty risk. However, the Fund is still exposed to a certain amount of counterparty risk through the clearing broker and clearinghouse. The clearinghouse attempts to minimize this risk to its participants through the use of mandatory margin requirements, daily cash settlements and other procedures. Likewise, the clearing broker reduces its risk through margin requirements and required segregation of customer balances. | |
| Credit Default Swap Contracts – The credit default swap market allows a Fund to manage credit risk through buying and selling credit protection on a specific issuer, asset or basket of assets. Certain credit default swaps involve the exchange of a fixed rate premium for protection against the loss in value of an underlying investment or index in the event of a credit event, such as payment default or bankruptcy. | |
| Under a credit default swap contract, one party acts as guarantor by receiving the fixed periodic payment in exchange for the commitment to purchase the underlying investment at par if the defined credit event occurs. Upon the occurrence of a defined credit event, the difference between the value of the reference obligation and the swap’s notional amount is recorded as realized gain or loss on swap transactions in the Statements of Operations. A “buyer” of credit protection agrees to pay a counterparty to assume the credit risk of an issuer upon the occurrence of certain events. The “seller” of the protection receives periodic payments and agrees to assume the credit risk of an issuer upon the occurrence of certain events. Although specified events are contract specific, credit events are generally defined as bankruptcy, failure to pay, restructuring, obligation acceleration, obligation default or repudiation/moratorium. A “seller’s” exposure is limited to the total notional amount of the credit default swap contract. These potential amounts would be partially offset by any recovery values of the respective referenced obligations or upfront payments received upon entering into the contract. | |
| Implied credit spreads, represented in absolute terms, utilized in determining the market value of credit default swap contracts on corporate issues, sovereign government issues or U.S. municipal issues as of year-end are disclosed in the notes to the Schedules of Investments, as applicable, and serve as an indicator of the current status of the payment/performance risk and represent the likelihood or risk of default for the credit derivative. The implied credit spread of a particular referenced entity reflects the cost of buying/selling protection and there may also be upfront payments required to be made to enter into the contract. Wider credit spreads represent a deterioration of the referenced entity’s credit soundness and a greater likelihood or risk of default or other credit event occurring as defined under the terms of the contract. For credit default swap contracts on credit indices, the quoted market prices and resulting values serve as the indicator of the current status of the payment/performance risk. Increasing market values, in absolute terms when compared to the notional amount of the swap, represent a deterioration of the referenced equity’s credit soundness and a greater likelihood or risk of default or other credit event occurring as defined under the terms of the contract. |
| d) | Additional Derivative Instrument Information: |
| China A Fund | |
| The Effect of Derivative Instruments on the Statement of Operations for the year ended October 31, 2021: | |||||||||||
| Risk Exposure Category | |||||||||||
| Interest Rate Contracts | Foreign Currency Contracts | Credit Contracts | Equity Contracts | Commodity Contracts | Total | ||||||
| Net realized gain (loss) on futures contracts | $ — | $ — | $ — | $ (92,970) | $ — | $ (92,970) | |||||
| Total | $ — | $ — | $ — | $ (92,970) | $ — | $ (92,970) | |||||
| Derivative Description | Average Notional Par, Contracts or Face Amount | |
| Futures Contracts Number of Long Contracts | 111 | |
| Futures Contracts Number of Short Contracts | (111) |
| 117 |
October 31, 2021
| The Effect of Derivative Instruments on the Statement of Assets and Liabilities as of October 31, 2021: | |||||||||||
| Risk Exposure Category | |||||||||||
| Interest Rate Contracts | Foreign Currency Contracts | Credit Contracts | Equity Contracts | Commodity Contracts | Total | ||||||
| Assets: | |||||||||||
| Unrealized appreciation on foreign currency contracts | $ — | $ 2,582 | $ — | $ — | $ — | $ 2,582 | |||||
| Total | $ — | $ 2,582 | $ — | $ — | $ — | $ 2,582 | |||||
| Liabilities: | |||||||||||
| Unrealized depreciation on futures contracts(1) | $ — | $ — | $ — | $ 9,512 | $ — | $ 9,512 | |||||
| Unrealized depreciation on foreign currency contracts | — | 482 | — | — | — | 482 | |||||
| Total | $ — | $ 482 | $ — | $ 9,512 | $ — | $ 9,994 | |||||
| (1) | Amount represents the cumulative appreciation and depreciation on futures contracts as disclosed within the Schedule of Investments under the open “Futures Contracts” section. Only current day’s variation margin, if any, is reported within the Statement of Assets and Liabilities. |
| The Effect of Derivative Instruments on the Statement of Operations for the year ended October 31, 2021: | |||||||||||
| Risk Exposure Category | |||||||||||
| Interest Rate Contracts | Foreign Currency Contracts | Credit Contracts | Equity Contracts | Commodity Contracts | Total | ||||||
| Realized Gain (Loss) on Derivatives Recognized as a Result of Operations: | |||||||||||
| Net realized gain (loss) on futures contracts | $ — | $ — | $ — | $ 25,311 | $ — | $ 25,311 | |||||
| Net realized gain (loss) on foreign currency contracts | — | (2,035) | — | — | — | (2,035) | |||||
| Total | $ — | $ (2,035) | $ — | $ 25,311 | $ — | $ 23,276 | |||||
| Net Change in Unrealized Appreciation (Depreciation) on Derivatives Recognized as a Result of Operations: | |||||||||||
| Net change in unrealized appreciation (depreciation) of futures contracts | $ — | $ — | $ — | $ (9,512) | $ — | $ (9,512) | |||||
| Net change in unrealized appreciation (depreciation) of foreign currency contracts | — | 2,100 | — | — | — | 2,100 | |||||
| Total | $ — | $ 2,100 | $ — | $ (9,512) | $ — | $ (7,412) | |||||
| Derivative Description | Average Notional Par, Contracts or Face Amount | |
| Futures Contracts Number of Long Contracts | 4 | |
| Foreign Currency Contracts Purchased at Contract Amount | $ 2,463 | |
| Foreign Currency Contracts Sold at Contract Amount | $ 8,427 |
| The Effect of Derivative Instruments on the Statement of Operations for the year ended October 31, 2021: | |||||||||||
| Risk Exposure Category | |||||||||||
| Interest Rate Contracts | Foreign Currency Contracts | Credit Contracts | Equity Contracts | Commodity Contracts | Total | ||||||
| Net realized gain (loss) on futures contracts | $ — | $ — | $ — | $ (61,403) | $ — | $ (61,403) | |||||
| Net realized gain (loss) on foreign currency contracts | — | 71 | — | — | — | 71 | |||||
| Total | $ — | $ 71 | $ — | $ (61,403) | $ — | $ (61,332) | |||||
| 118 |
October 31, 2021
| The Effect of Derivative Instruments on the Statement of Assets and Liabilities as of October 31, 2021: | |||||||||||
| Risk Exposure Category | |||||||||||
| Interest Rate Contracts | Foreign Currency Contracts | Credit Contracts | Equity Contracts | Commodity Contracts | Total | ||||||
| Assets: | |||||||||||
| Unrealized appreciation on foreign currency contracts | $ — | $ 42,634 | $ — | $ — | $ — | $ 42,634 | |||||
| Unrealized appreciation on swap contracts(1) | — | — | 2,268 | — | — | 2,268 | |||||
| Total | $ — | $ 42,634 | $ 2,268 | $ — | $ — | $ 44,902 | |||||
| Liabilities: | |||||||||||
| Unrealized depreciation on foreign currency contracts | $ — | $ 39,337 | $ — | $ — | $ — | $ 39,337 | |||||
| Unrealized depreciation on swap contracts(1) | — | — | 101 | — | — | 101 | |||||
| Total | $ — | $ 39,337 | $ 101 | $ — | $ — | $ 39,438 | |||||
| (1) | Amount represents the cumulative appreciation and depreciation on centrally cleared swaps, if applicable, as disclosed within the Schedule of Investments. Only the current day’s variation margin, if any, are reported within the Statements of Assets and Liabilities. OTC swaps are reported within the Statement of Assets and Liabilities within Unrealized appreciation and depreciation on OTC swap contracts, if applicable. |
| The Effect of Derivative Instruments on the Statement of Operations for the year ended October 31, 2021: | |||||||||||
| Risk Exposure Category | |||||||||||
| Interest Rate Contracts | Foreign Currency Contracts | Credit Contracts | Equity Contracts | Commodity Contracts | Total | ||||||
| Net realized gain (loss) on futures contracts | $ 94,561 | $ — | $ — | $ — | $ — | $ 94,561 | |||||
| Net realized gain (loss) on swap contracts | — | — | (36,335) | — | — | (36,335) | |||||
| Net realized gain (loss) on foreign currency contracts | — | 252,140 | — | — | — | 252,140 | |||||
| Total | $ 94,561 | $ 252,140 | $ (36,335) | $ — | $ — | $ 310,366 | |||||
| Net Change in Unrealized Appreciation (Depreciation) on Derivatives Recognized as a Result of Operations: | |||||||||||
| Net change in unrealized appreciation (depreciation) of swap contracts | $ — | $ — | $ 63,234 | $ — | $ — | $ 63,234 | |||||
| Net change in unrealized appreciation (depreciation) of foreign currency contracts | — | (82,230) | — | — | — | (82,230) | |||||
| Total | $ — | $ (82,230) | $ 63,234 | $ — | $ — | $ (18,996) | |||||
| Derivative Description | Average Notional Par, Contracts or Face Amount | |
| Futures Contracts Number of Short Contracts | (2) | |
| Swap Contracts at Notional Amount | 1,303,333 | |
| Foreign Currency Contracts Purchased at Contract Amount | $ 5,092,260 | |
| Foreign Currency Contracts Sold at Contract Amount | $ 2,170,255 |
| The Effect of Derivative Instruments on the Statement of Assets and Liabilities as of October 31, 2021: | |||||||||||
| Risk Exposure Category | |||||||||||
| Interest Rate Contracts | Foreign Currency Contracts | Credit Contracts | Equity Contracts | Commodity Contracts | Total | ||||||
| Assets: | |||||||||||
| Unrealized appreciation on futures contracts(1) | $ — | $ — | $ — | $ 11,758 | $ — | $ 11,758 | |||||
| Unrealized appreciation on foreign currency contracts | — | 1,721,034 | — | — | — | 1,721,034 | |||||
| Total | $ — | $ 1,721,034 | $ — | $ 11,758 | $ — | $ 1,732,792 | |||||
| (1) | Amount represents the cumulative appreciation and depreciation on futures contracts as disclosed within the Schedule of Investments under the open “Futures Contracts” section. Only current day’s variation margin, if any, is reported within the Statement of Assets and Liabilities. |
| 119 |
October 31, 2021
| The Effect of Derivative Instruments on the Statement of Operations for the year ended October 31, 2021: | |||||||||||
| Risk Exposure Category | |||||||||||
| Interest Rate Contracts | Foreign Currency Contracts | Credit Contracts | Equity Contracts | Commodity Contracts | Total | ||||||
| Realized Gain (Loss) on Derivatives Recognized as a Result of Operations: | |||||||||||
| Net realized gain (loss) on futures contracts | $ — | $ — | $ — | $ 4,080,366 | $ — | $ 4,080,366 | |||||
| Net realized gain (loss) on foreign currency contracts | — | (9,922,050) | — | — | — | (9,922,050) | |||||
| Total | $ — | $ (9,922,050) | $ — | $ 4,080,366 | $ — | $ (5,841,684) | |||||
| Net Change in Unrealized Appreciation (Depreciation) on Derivatives Recognized as a Result of Operations: | |||||||||||
| Net change in unrealized appreciation (depreciation) of futures contracts | $ — | $ — | $ — | $ 11,758 | $ — | $ 11,758 | |||||
| Net change in unrealized appreciation (depreciation) of foreign currency contracts | — | 2,523,788 | — | — | — | 2,523,788 | |||||
| Total | $ — | $ 2,523,788 | $ — | $ 11,758 | $ — | $ 2,535,546 | |||||
| Derivative Description | Average Notional Par, Contracts or Face Amount | |
| Futures Contracts Number of Long Contracts | 268 | |
| Foreign Currency Contracts Purchased at Contract Amount | $ 12,270,354 | |
| Foreign Currency Contracts Sold at Contract Amount | $ 106,503,972 |
| The Effect of Derivative Instruments on the Statement of Assets and Liabilities as of October 31, 2021: | |||||||||||
| Risk Exposure Category | |||||||||||
| Interest Rate Contracts | Foreign Currency Contracts | Credit Contracts | Equity Contracts | Commodity Contracts | Total | ||||||
| Assets: | |||||||||||
| Unrealized appreciation on foreign currency contracts | $ — | $ 93,996 | $ — | $ — | $ — | $ 93,996 | |||||
| Total | $ — | $ 93,996 | $ — | $ — | $ — | $ 93,996 | |||||
| Liabilities: | |||||||||||
| Unrealized depreciation on futures contracts(1) | $ 224,360 | $ — | $ — | $ — | $ — | $ 224,360 | |||||
| Unrealized depreciation on foreign currency contracts | — | 15 | — | — | — | 15 | |||||
| Total | $ 224,360 | $ 15 | $ — | $ — | $ — | $ 224,375 | |||||
| (1) | Amount represents the cumulative appreciation and depreciation on futures contracts as disclosed within the Schedule of Investments under the open “Futures Contracts” section. Only current day’s variation margin, if any, is reported within the Statement of Assets and Liabilities. |
| 120 |
October 31, 2021
| The Effect of Derivative Instruments on the Statement of Operations for the year ended October 31, 2021: | |||||||||||
| Risk Exposure Category | |||||||||||
| Interest Rate Contracts | Foreign Currency Contracts | Credit Contracts | Equity Contracts | Commodity Contracts | Total | ||||||
| Realized Gain (Loss) on Derivatives Recognized as a Result of Operations: | |||||||||||
| Net realized gain (loss) on futures contracts | $ (224,526) | $ — | $ — | $ — | $ — | $ (224,526) | |||||
| Net realized gain (loss) on foreign currency contracts | — | 66,287 | — | — | — | 66,287 | |||||
| Total | $ (224,526) | $ 66,287 | $ — | $ — | $ — | $ (158,239) | |||||
| Net Change in Unrealized Appreciation (Depreciation) on Derivatives Recognized as a Result of Operations: | |||||||||||
| Net change in unrealized appreciation (depreciation) of futures contracts | $ (224,360) | $ — | $ — | $ — | $ — | $ (224,360) | |||||
| Net change in unrealized appreciation (depreciation) of foreign currency contracts | — | 98,796 | — | — | — | 98,796 | |||||
| Total | $ (224,360) | $ 98,796 | $ — | $ — | $ — | $ (125,564) | |||||
| Derivative Description | Average Notional Par, Contracts or Face Amount | |
| Futures Contracts Number of Long Contracts | 36 | |
| Foreign Currency Contracts Purchased at Contract Amount | $ 928,439 | |
| Foreign Currency Contracts Sold at Contract Amount | $ 17,679,721 |
| The Effect of Derivative Instruments on the Statement of Assets and Liabilities as of October 31, 2021: | |||||||||||
| Risk Exposure Category | |||||||||||
| Interest Rate Contracts | Foreign Currency Contracts | Credit Contracts | Equity Contracts | Commodity Contracts | Total | ||||||
| Assets: | |||||||||||
| Unrealized appreciation on futures contracts(1) | $ 403,918 | $ — | $ — | $ — | $ — | $ 403,918 | |||||
| Total | $ 403,918 | $ — | $ — | $ — | $ — | $ 403,918 | |||||
| (1) | Amount represents the cumulative appreciation and depreciation on futures contracts as disclosed within the Schedule of Investments under the open “Futures Contracts” section. Only current day’s variation margin, if any, is reported within the Statement of Assets and Liabilities. |
| The Effect of Derivative Instruments on the Statement of Operations for the year ended October 31, 2021: | |||||||||||
| Risk Exposure Category | |||||||||||
| Interest Rate Contracts | Foreign Currency Contracts | Credit Contracts | Equity Contracts | Commodity Contracts | Total | ||||||
| Realized Gain (Loss) on Derivatives Recognized as a Result of Operations: | |||||||||||
| Net realized gain (loss) on futures contracts | $ 3,358,564 | $ — | $ — | $ — | $ — | $ 3,358,564 | |||||
| Total | $ 3,358,564 | $ — | $ — | $ — | $ — | $ 3,358,564 | |||||
| Net Change in Unrealized Appreciation (Depreciation) on Derivatives Recognized as a Result of Operations: | |||||||||||
| Net change in unrealized appreciation (depreciation) of futures contracts | $ (116,417) | $ — | $ — | $ — | $ — | $ (116,417) | |||||
| Total | $ (116,417) | $ — | $ — | $ — | $ — | $ (116,417) | |||||
| 121 |
October 31, 2021
| Derivative Description | Average Notional Par, Contracts or Face Amount | |
| Futures Contracts Number of Short Contracts | (582) |
| e) | Balance Sheet Offsetting Information – Set forth below are tables which disclose both gross information and net information about instruments and transactions eligible for offset in the financial statements, and instruments and transactions that are subject to a master netting arrangement, as well as amounts related to margin, reflected as financial collateral (including cash collateral), held at clearing brokers, counterparties and a Fund's custodian. The master netting arrangements allow the clearing brokers to net any collateral held in or on behalf of a Fund, or liabilities or payment obligations of the clearing brokers to a Fund, against any liabilities or payment obligations of a Fund to the clearing brokers. A Fund is required to deposit financial collateral (including cash collateral) at the Fund's custodian on behalf of clearing brokers and counterparties to continually meet the original and maintenance requirements established by the clearing brokers and counterparties. Such requirements are specific to the respective clearing broker or counterparty. Certain master netting arrangements may not be enforceable in a bankruptcy. |
| The following tables present a Fund's derivative assets and liabilities, presented on a gross basis as no amounts are netted within the Statements of Assets and Liabilities, by counterparty net of amounts available for offset under a master netting agreement or similar agreement ("MNA") and net of the related collateral received/pledged by a Fund as of October 31, 2021: | |
| Diversified Emerging Markets Fund | ||||
| Derivative Financial Instruments: | Assets | Liabilities | ||
| Foreign currency contracts | $ 2,582 | $ (482) | ||
| Futures contracts | — | (9,512) | ||
| Total gross amount of derivative assets and liabilities in the Statement of Assets and Liabilities | 2,582 | (9,994) | ||
| Derivatives not subject to a MNA | — | 9,512 | ||
| Total gross amount of assets and liabilities subject to MNA or similar agreements | $ 2,582 | $ (482) |
| Counterparty | Gross Amount of Assets | Financial Instruments and Derivatives Available for Offset | Non-cash Collateral Received | Cash Collateral Received | Net Amount of Assets | |||||
| JP Morgan Chase & Co. | $ 2,582 | $ — | $ — | $ — | $ 2,582 | |||||
| Total | $ 2,582 | $ — | $ — | $ — | $ 2,582 | |||||
| Counterparty | Gross Amount of Liabilities | Financial Instruments and Derivatives Available for Offset | Non-cash Collateral Pledged | Cash Collateral Pledged | Net Amount of Liabilities | |||||
| Morgan Stanley | $ (482) | $ — | $ — | $ — | $ (482) | |||||
| Total | $ (482) | $ — | $ — | $ — | $ (482) |
| Emerging Markets Multi-Sector Bond Fund | ||||
| Derivative Financial Instruments: | Assets | Liabilities | ||
| Foreign currency contracts | $ 42,634 | $ (39,337) | ||
| Swap contracts | 2,268 | (101) | ||
| Total gross amount of derivative assets and liabilities in the Statement of Assets and Liabilities | 44,902 | (39,438) | ||
| Derivatives not subject to a MNA | — | — | ||
| Total gross amount of assets and liabilities subject to MNA or similar agreements | $ 44,902 | $ (39,438) |
| 122 |
October 31, 2021
| Counterparty | Gross Amount of Assets | Financial Instruments and Derivatives Available for Offset | Non-cash Collateral Received | Cash Collateral Received | Net Amount of Assets | |||||
| Bank of America Securities LLC | $ 6,656 | $ (5,362) | $ — | $ — | $ 1,294 | |||||
| JP Morgan Chase & Co. | 3,116 | (3,116) | — | — | — | |||||
| Morgan Stanley | 2,268 | (2,245) | — | — | 23 | |||||
| UBS AG | 32,862 | (5,079) | — | — | 27,783 | |||||
| Total | $ 44,902 | $ (15,802) | $ — | $ — | $ 29,100 | |||||
| Counterparty | Gross Amount of Liabilities | Financial Instruments and Derivatives Available for Offset | Non-cash Collateral Pledged | Cash Collateral Pledged | Net Amount of Liabilities | |||||
| Bank of America Securities LLC | $ (5,362) | $ 5,362 | $ — | $ — | $ — | |||||
| Citibank NA | (17,747) | — | — | — | (17,747) | |||||
| JP Morgan Chase & Co. | (9,005) | 3,116 | — | — | (5,889) | |||||
| Morgan Stanley | (2,245) | 2,245 | — | — | — | |||||
| UBS AG | (5,079) | 5,079 | — | — | — | |||||
| Total | $ (39,438) | $ 15,802 | $ — | $ — | $ (23,636) |
| International Multi-Cap Value Fund | ||||
| Derivative Financial Instruments: | Assets | Liabilities | ||
| Foreign currency contracts | $ 1,721,034 | $ — | ||
| Futures contracts | 11,758 | — | ||
| Total gross amount of derivative assets and liabilities in the Statement of Assets and Liabilities | 1,732,792 | — | ||
| Derivatives not subject to a MNA | (11,758) | — | ||
| Total gross amount of assets and liabilities subject to MNA or similar agreements | $ 1,721,034 | $ — |
| Counterparty | Gross Amount of Assets | Financial Instruments and Derivatives Available for Offset | Non-cash Collateral Received | Cash Collateral Received | Net Amount of Assets | |||||
| Bank of America Securities LLC | $ 665,682 | $ — | $ — | $ — | $ 665,682 | |||||
| JP Morgan Chase & Co. | 873,255 | — | — | — | 873,255 | |||||
| Morgan Stanley | 182,097 | — | — | — | 182,097 | |||||
| Total | $ 1,721,034 | $ — | $ — | $ — | $ 1,721,034 | |||||
| Securitized Income Fund | ||||
| Derivative Financial Instruments: | Assets | Liabilities | ||
| Foreign currency contracts | $ 93,996 | $ (15) | ||
| Futures contracts | — | (224,360) | ||
| Total gross amount of derivative assets and liabilities in the Statement of Assets and Liabilities | 93,996 | (224,375) | ||
| Derivatives not subject to a MNA | — | 224,360 | ||
| Total gross amount of assets and liabilities subject to MNA or similar agreements | $ 93,996 | $ (15) |
| Counterparty | Gross Amount of Assets | Financial Instruments and Derivatives Available for Offset | Non-cash Collateral Received | Cash Collateral Received | Net Amount of Assets | |||||
| BNP Paribas Securities Services | $ 69,623 | $ — | $ — | $ — | $ 69,623 | |||||
| JP Morgan Chase & Co. | 24,373 | — | — | — | 24,373 | |||||
| Total | $ 93,996 | $ — | $ — | $ — | $ 93,996 | |||||
| 123 |
October 31, 2021
| Counterparty | Gross Amount of Liabilities | Financial Instruments and Derivatives Available for Offset | Non-cash Collateral Pledged | Cash Collateral Pledged | Net Amount of Liabilities | |||||
| UBS AG | $ (15) | $ — | $ — | $ — | $ (15) | |||||
| Total | $ (15) | $ — | $ — | $ — | $ (15) |
| Tax-Aware Bond Fund | ||||
| Derivative Financial Instruments: | Assets | Liabilities | ||
| Futures contracts | $ 403,918 | $ — | ||
| Total gross amount of derivative assets and liabilities in the Statement of Assets and Liabilities | 403,918 | — | ||
| Derivatives not subject to a MNA | (403,918) | — | ||
| Total gross amount of assets and liabilities subject to MNA or similar agreements | $ — | $ — |
| 5. | Principal Risks: |
| A Fund’s investments expose it to various types of risks associated with financial instruments and the markets. A Fund may be exposed to the risks described below. Each Fund’s prospectus provides details of its principal risks. | |
| The market values of equity securities, such as common stocks and preferred stocks, or equity related derivative investments, such as futures and options, may decline due to general market conditions which are not specifically related to a particular company, such as real or perceived adverse economic conditions, changes in the general outlook for corporate earnings, changes in interest or currency rates or adverse investor sentiment generally. The market value of equity securities may also decline due to factors which affect a particular industry or industries, such as labor shortages or increased production costs and competitive conditions within an industry. Equity securities and equity related investments generally have greater market price volatility than fixed income securities. The extent of each Fund’s exposure to market risk is the market value of the investments held as shown in the Fund’s Schedule of Investments. | |
| A widespread health crisis, such as a global pandemic, could cause substantial market volatility, exchange trading suspensions or restrictions and closures of securities exchanges and businesses, impact the ability to complete redemptions, and adversely impact Fund performance. The current ongoing outbreak of COVID-19, a respiratory disease caused by a novel coronavirus, has negatively affected the worldwide economy, created supply chain disruptions and labor shortages, and impacted the financial health of individual companies and the market in significant and unforeseen ways. The future impact of the ongoing COVID-19 pandemic remains unclear. The effects to public health, business and market conditions resulting from COVID-19 pandemic may have a significant negative impact on the performance of a Fund’s investments, including exacerbating other pre-existing political, social and economic risks. | |
| Certain investments held by a Fund expose the Fund to various risks which may include, but are not limited to, interest rate, prepayment, and extension risks. Interest rate risk is the risk that fixed income securities will decline in value because of changes in interest rates. As nominal interest rates rise, the values of certain fixed income securities held by a Fund are likely to decrease. A nominal interest rate can be described as the sum of a real interest rate and an expected inflation rate. Fixed income securities with longer durations tend to be more sensitive to changes in interest rates, usually making them more volatile than securities with shorter durations. Duration is useful primarily as a measure of the sensitivity of a fixed income security’s market price to interest rate (i.e., yield) movements. Senior floating rate interests and securities subject to prepayment and extension risk generally offer less potential for gains when interest rates decline. Rising interest rates may cause prepayments to occur at a slower than expected rate, thereby effectively lengthening the maturity of the security and making the security more sensitive to interest rate changes. Prepayment and extension risk are major risks of mortgage-backed securities, senior floating rate interests and certain asset-backed securities. For certain asset-backed securities, the actual maturity may be less than the stated maturity shown in the Schedule of Investments, if applicable. As a result, the timing of income recognition relating to these securities may vary based upon the actual maturity. | |
| Investing in the securities of non-U.S. issuers, whether directly or indirectly, involves certain considerations and risks not typically associated with securities of U.S. issuers. Such risks include, but are not limited to: generally less liquid and less efficient securities markets; generally greater price volatility; exchange rate fluctuations; imposition of restrictions on the expatriation of funds or other protectionist measures; less publicly available information about issuers; the imposition of withholding or other taxes; higher transaction and custody costs; settlement delays and risk of loss attendant in settlement procedures; difficulties in enforcing contractual obligations; less regulation of securities markets; different accounting, disclosure and reporting requirements; more substantial governmental involvement in the economy; higher inflation rates; and greater social, economic and political uncertainties. Non-U.S. issuers may also be affected by political, social, economic or diplomatic developments in a foreign country or region or the U.S. (including the imposition of sanctions, tariffs, or other governmental restrictions). These risks are heightened for investments in issuers from countries with less developed markets. |
| 124 |
October 31, 2021
| Securities lending involves the risk that a Fund may lose money because the borrower of the loaned securities fails to return the securities in a timely manner or at all. A Fund could also lose money in the event of a decline in the value of the collateral provided for the loaned securities or a decline in the value of any investments made with cash collateral. These events could also trigger adverse tax consequences for a Fund that lends its holdings. | |
| As a result of the China A Fund’s focus in China A shares, the China A Fund may be subject to increased currency, political, economic, social, environmental, regulatory and other risks not typically associated with investing in a larger number of countries or regions. Over the last few decades, the Chinese government has undertaken reform of economic and market practices and has expanded the sphere of private ownership of property in China. Nevertheless, China remains an emerging market and demonstrates significantly higher volatility from time to time in comparison to developed markets. China A shares are equity securities of companies located in mainland China that trade on the Shanghai Stock Exchange and the Shenzhen Stock Exchange. The China A Fund may invest in China A shares through the Shanghai-Hong Kong and Shenzhen-Hong Kong Stock Connect programs (collectively, “Stock Connect”). The Shanghai and Shenzhen stock exchanges may close for extended periods for holidays or otherwise, which impacts the China A Fund’s ability to trade in China A shares during those periods. Trading suspensions in certain stocks and extended market closures could lead to greater market execution risk, valuation risks, liquidity risks, and costs for the China A Fund. The China A Fund’s investments in China A shares are generally subject to the laws of the People’s Republic of China (“PRC”), including local securities regulations and listing rules. As a result of different legal standards, the China A Fund faces the risk of being unable to enforce its rights with respect to its China A shares holdings. Investing in China A shares is subject to trading, clearance, settlement and other procedures, which could pose risks to the China A Fund. Trading through Stock Connect is currently subject to a daily quota, which may restrict the China A Fund’s ability to invest in China A shares through Stock Connect on a timely basis and could affect the China A Fund’s ability to effectively pursue its investment strategy. Stock Connect will only operate on days when both the Chinese and Hong Kong markets are open for trading and when banking services are available in both markets on the corresponding settlement days. Therefore, an investment in China A shares through Stock Connect may subject the China A Fund to the risk of price fluctuations on days when the Chinese markets are open, but Stock Connect is not trading. If the China A Fund invests through the Qualified Foreign Institutional Investor or Renminbi Qualified Foreign Institutional Investor systems, it may be subject to additional risks, such as failure to achieve best execution, trading disruption, custody risk and credit loss. In difficult market conditions, the China A Fund may not be able to sell its investments easily or at all, which could affect Fund performance and the China A Fund’s liquidity. | |
| Credit risk depends largely on the perceived financial health of bond issuers. In general, the credit rating is inversely related to the credit risk of the issuer. Higher rated bonds generally are deemed to have less credit risk, while lower or unrated bonds are deemed to have higher risk of default. The share price, yield and total return of a fund that holds securities with higher credit risk may be more volatile than those of a fund that holds bonds with lower credit risk. A Fund may be exposed to counterparty risk, or the risk that an institution or other entity with which a Fund has unsettled or open transactions will default. | |
| The Funds may invest in certain debt securities, derivatives or other financial instruments that utilize the London Interbank Offered Rate (“LIBOR”) as a “benchmark” or “reference rate” for various interest rate calculations. The use of certain LIBORs are expected to be phased out by the end of 2021. However, it is possible that certain LIBORs may continue beyond 2021 and the most widely used LIBORs may continue until mid-2023. There remains uncertainty regarding the future use of LIBOR and the nature of any replacement rate. As such, the potential effect of a transition away from LIBOR on a Fund or the LIBOR-based instruments in which the Fund invests cannot yet be determined. The transition process away from LIBOR may involve, among other things, increased volatility or illiquidity in markets for instruments that currently rely on LIBOR. The transition process may also result in a reduction in the value of certain instruments held by a Fund or reduce the effectiveness of related Fund transactions, such as hedges. Volatility, the potential reduction in value, and/or the hedge effectiveness of financial instruments may be heightened for financial instruments that do not include fallback provisions that address the cessation of LIBOR. Any potential effects of the transition away from LIBOR on a Fund or on financial instruments in which the Fund invests, as well as other unforeseen effects, could result in losses to the Fund. Since the usefulness of LIBOR as a benchmark or reference rate could deteriorate during the transition period, these effects could occur prior to and/or subsequent to the end of 2021 with respect to certain LIBORs or mid-2023 for the remaining LIBORs. |
| 6. | Federal Income Taxes: |
| a) | Each Fund intends to continue to qualify as a Regulated Investment Company ("RIC") under Subchapter M of the Internal Revenue Code (“IRC”) by distributing substantially all of its taxable net investment income and net realized capital gains to its shareholders each year. Each Fund has distributed substantially all of its income and capital gains in prior years, if applicable, and intends to distribute substantially all of its income and capital gains during the calendar year ending December 31, 2021. Accordingly, no provision for federal income or excise taxes has been made in the accompanying financial statements. Distributions from short-term capital gains are treated as ordinary income distributions for federal income tax purposes. |
| b) | Net Investment Income (Loss), Net Realized Gains (Losses) and Distributions – Net investment income (loss) and net realized gains (losses) may differ for financial statement and tax purposes primarily because of losses deferred due to wash sale adjustments, foreign currency gains and losses, adjustments related to Passive Foreign Investment Companies ("PFICs"), Real Estate Investment Trusts ("REITs"), RICs, |
| 125 |
October 31, 2021
| certain derivatives and partnerships. The character of distributions made during the year from net investment income or net realized gains may differ from their ultimate characterization for federal income tax purposes. Also, due to the timing of dividend distributions, the fiscal year in which amounts are distributed may differ from the year that the income or realized gains (losses) were recorded by each Fund. | |
| c) | Distributions and Components of Distributable Earnings – The tax character of distributions paid by each Fund for the years or periods ended October 31, 2021 and October 31, 2020 are as follows: |
| For the Year Ended October 31, 2021 | For the Year Ended October 31, 2020 | |||||||||||||
| Fund | Tax Exempt Income | Ordinary Income | Long-Term Capital Gains(1) | Tax Exempt Income | Ordinary Income | Long-Term Capital Gains(1) | Return of Capital | |||||||
| China A Fund | $ — | $ 816,257 | $ — | $ — | $ — | $ — | $ — | |||||||
| Diversified Emerging Markets Fund(2) | — | — | — | — | — | — | — | |||||||
| Emerging Markets Equity Fund | — | 43,420,348 | — | — | 85,774,060 | — | — | |||||||
| Emerging Markets Multi-Sector Bond Fund | — | 2,079,050 | — | — | 2,799,007 | — | 819,588 | |||||||
| International Multi-Cap Value Fund | — | 60,028,324 | — | — | 56,756,679 | — | — | |||||||
| International Stock Fund | — | 4,707,759 | — | — | 5,533,113 | — | — | |||||||
| Securitized Income Fund | — | 1,891,648 | — | — | 1,774,094 | 33,289 | — | |||||||
| Tax-Aware Bond Fund | 3,851,447 | 5,221,719 | 2,554,942 | 4,164,856 | 6,023,461 | 3,237,898 | — | |||||||
| US MidCap Opportunities Fund | — | 2,085,028 | — | — | 2,157,050 | 6,148,756 | — | |||||||
| US Small Cap Opportunities Fund | — | 201,162 | — | — | 1,091,183 | 9,867,740 | — | |||||||
| (1) | The Funds designate these distributions as long-term capital gains dividends pursuant to IRC Sec 852(b)(3)(c) |
| (2) | Commenced operations on September 30, 2021. |
| Fund | Tax Exempt Income | Undistributed Ordinary Income | Undistributed Long-Term Capital Gains | Accumulated Capital and Other Losses | Other Temporary Differences | Unrealized Appreciation (Depreciation) on Investments(1) | Total Accumulated Earnings (Deficit) | |||||||
| China A Fund | $ — | $ 758,739 | $ 350,173 | $ — | $ — | $ 66,641 | $ 1,175,553 | |||||||
| Diversified Emerging Markets Fund | — | 19,554 | 9,481 | — | (2,228) | 77,916 | 104,723 | |||||||
| Emerging Markets Equity Fund | — | 76,635,709 | — | (280,433,397) | — | 1,610,060,709 | 1,406,263,021 | |||||||
| Emerging Markets Multi-Sector Bond Fund | — | 162,267 | — | (12,328,122) | — | (508,339) | (12,674,194) | |||||||
| International Multi-Cap Value Fund | — | 20,420,993 | — | (46,178,684) | — | 195,590,236 | 169,832,545 | |||||||
| International Stock Fund | — | 29,011,550 | 26,951,731 | — | — | 538,186,473 | 594,149,754 | |||||||
| Securitized Income Fund | — | 243,246 | — | (1,167,248) | — | 139,105 | (784,897) | |||||||
| Tax-Aware Bond Fund | 213,581 | 1,613,818 | 4,018,602 | — | (5,785) | 8,537,267 | 14,377,483 | |||||||
| US MidCap Opportunities Fund | — | 21,914,418 | 89,680,048 | — | — | 265,086,122 | 376,680,588 | |||||||
| US Small Cap Opportunities Fund | — | — | 37,200,873 | — | — | 88,964,498 | 126,165,371 |
| (1) | Differences between book-basis and tax basis unrealized appreciation (depreciation) may be attributable to the losses deferred due to wash sale adjustments, foreign currency gains and losses, adjustments related to PFICs, REITS, certain derivatives and partnerships. |
| d) | Reclassification of Capital Accounts – The Funds may record reclassifications in their capital accounts. These reclassifications have no impact on the total net assets of the Funds. The reclassifications are a result of permanent differences between U.S. GAAP and tax accounting for such items adjustments to prior year accumulated balances. Adjustments are made to reflect the impact these items have on the current and future earnings distributions to shareholders. Therefore, the source of the Funds’ distributions may be shown in the accompanying Statements of Changes in Net Assets as from distributable earnings or from capital depending on the type of book and tax differences that exist. For the year ended October 31, 2021, the Funds recorded reclassifications to increase (decrease) the accounts listed below: |
| Fund | Paid-in-Capital | Distributable Earnings (Loss) | ||
| US MidCap Opportunities Fund | $ 9,891,985 | $ (9,891,985) | ||
| US Small Cap Opportunities Fund | 1,632,959 | (1,632,959) |
| e) | Capital Loss Carryforward – Under the Regulated Investment Company Modernization Act of 2010, funds are permitted to carry forward capital losses for an unlimited period. |
| 126 |
October 31, 2021
| At October 31, 2021 (tax year end), each Fund's capital loss carryforwards for U.S. federal income tax purposes were as follows: | |
| Fund | Short-Term Capital Loss Carryforward with No Expiration | Long-Term Capital Loss Carryforward with No Expiration | ||
| Emerging Markets Equity Fund | $ 280,433,397 | $ — | ||
| Emerging Markets Multi-Sector Bond Fund* | 8,800,443 | 3,527,679 | ||
| International Multi-Cap Value Fund | — | 46,178,684 | ||
| Securitized Income Fund | 320,533 | 846,715 |
| * | Future utilization of losses are subject to limitation under current tax laws. |
| f) | Tax Basis of Investments – The aggregate cost of investments for federal income tax purposes at October 31, 2021 is different from book purposes primarily due to wash sale loss deferrals and adjustments related to PFICs. The net unrealized appreciation/depreciation on investments for tax purposes, which consists of gross unrealized appreciation and depreciation, was also different from book purposes primarily due to wash sale loss deferrals, and market to market adjustments on futures, PFICs, partnership adjustments and non-taxable distributions from underlying investments. Both the cost and unrealized appreciation and depreciation for federal income tax purposes are disclosed below: |
| Fund | Tax Cost | Gross Unrealized Appreciation | Gross Unrealized (Depreciation) | Net Unrealized Appreciation (Depreciation) | ||||
| China A Fund | $ 77,430,060 | $ 4,701,401 | $ (4,634,876) | $ 66,525 | ||||
| Diversified Emerging Markets Fund | 9,929,950 | 288,822 | (210,928) | 77,894 | ||||
| Emerging Markets Equity Fund | 5,137,266,468 | 1,825,079,592 | (199,580,781) | 1,625,498,811 | ||||
| Emerging Markets Multi-Sector Bond Fund | 45,575,627 | 637,018 | (1,135,988) | (498,970) | ||||
| International Multi-Cap Value Fund | 2,381,009,990 | 331,255,877 | (135,604,481) | 195,651,396 | ||||
| International Stock Fund | 3,095,417,044 | 597,359,383 | (58,011,557) | 539,347,826 | ||||
| Securitized Income Fund | 126,955,449 | 1,105,081 | (940,816) | 164,265 | ||||
| Tax-Aware Bond Fund | 445,571,511 | 10,098,924 | (1,561,657) | 8,537,267 | ||||
| US MidCap Opportunities Fund | 576,762,467 | 269,917,687 | (4,831,565) | 265,086,122 | ||||
| US Small Cap Opportunities Fund | 275,208,546 | 95,497,545 | (6,910,877) | 88,586,668 |
| g) | Accounting for Uncertainty in Income Taxes – Pursuant to provisions set forth by U.S. GAAP, Hartford Funds Management Company, LLC ("HFMC") reviews each Fund’s tax positions for all open tax years. As of October 31, 2021, HFMC had reviewed the open tax years and concluded that there was no reason to record a liability for net unrecognized tax obligations relating to uncertain income tax positions. Each Fund files U.S. tax returns. Although the statute of limitations for examining a Fund’s U.S. tax returns remains open for 3 years, no examination is currently in progress. The Funds recognize interest and penalties, if any, related to unrecognized tax benefits as income tax expense on the Statements of Operations. During the year ended October 31, 2021, the Funds did not incur any interest or penalties. HFMC is not aware of any tax positions for which it is reasonably possible that the total amounts of unrecognized tax obligations will significantly change in the next twelve months. |
| 7. | Expenses: |
| a) | Investment Management Agreement – HFMC serves as each Fund’s investment manager pursuant to an Investment Management Agreement with the Company. HFMC is an indirect subsidiary of The Hartford Financial Services Group, Inc. ("The Hartford"). HFMC has overall investment supervisory responsibility for each Fund. In addition, HFMC provides administrative personnel, services, equipment, facilities and office space for proper operation of each Fund. HFMC has contracted with Schroder Investment Management North America Inc. ("SIMNA") under a sub-advisory agreement and SIMNA has contracted with Schroder Investment Management North America Limited (“SIMNA Ltd.”) under a sub-sub-advisory agreement with respect to certain Funds. SIMNA performs the daily investment of the assets for each Fund, and, with respect to each of China A Fund, Diversified Emerging Markets Fund, Emerging Markets Equity Fund, Emerging Markets Multi-Sector Bond Fund, International Multi-Cap Value Fund, International Stock Fund, and Tax-Aware Bond Fund, SIMNA may allocate assets to or from SIMNA Ltd., an affiliate of SIMNA, in connection with the daily investment of the assets for each of |
| 127 |
October 31, 2021
| these Funds. SIMNA pays the sub-sub-advisory fees to SIMNA Ltd. | |
| The schedule below reflects the rates of compensation paid to HFMC for investment management services rendered as of October 31, 2021; the rates are accrued daily and paid monthly based on each Fund’s average daily net assets, at the following annual rates: | |
| Fund | Management Fee Rates | |
| China A Fund | 0.9000% on first $1 billion and; | |
| 0.8900% over $1 billion | ||
| Diversified Emerging Markets Fund | 0.8400% on first $1 billion and; | |
| 0.7800% over $1 billion | ||
| Emerging Markets Equity Fund | 1.0500% on first $1 billion and; | |
| 1.0000% on next $4 billion and; | ||
| 0.9900% on next $5 billion and; | ||
| 0.9850% over $10 billion | ||
| Emerging Markets Multi-Sector Bond Fund | 0.7000% on first $1 billion and; | |
| 0.6500% on next $4 billion and; | ||
| 0.6400% on next $5 billion and; | ||
| 0.6350% over $10 billion | ||
| International Multi-Cap Value Fund | 0.7200% on first $1 billion and; | |
| 0.6800% on next $4 billion and; | ||
| 0.6750% on next $5 billion and; | ||
| 0.6700% over $10 billion | ||
| International Stock Fund | 0.6700% on first $1 billion and; | |
| 0.6500% on next $4 billion and; | ||
| 0.6450% on next $5 billion and; | ||
| 0.6400% over $10 billion | ||
| Securitized Income Fund | 0.6500% on first $1 billion and; | |
| 0.6000% over $1 billion | ||
| Tax-Aware Bond Fund | 0.4500% on first $1 billion and; | |
| 0.4300% on next $4 billion and; | ||
| 0.4250% on next $5 billion and; | ||
| 0.4200% over $10 billion | ||
| US MidCap Opportunities Fund | 0.7500% on first $1 billion and; | |
| 0.7000% on next $1.5 billion and; | ||
| 0.6500% on next $2.5 billion and; | ||
| 0.6450% on next $5 billion and; | ||
| 0.6400% over $10 billion | ||
| US Small Cap Opportunities Fund | 0.9000% on first $1 billion and; | |
| 0.8900% on next $4 billion and; | ||
| 0.8800% on next $5 billion and; | ||
| 0.8700% over $10 billion |
| b) | Accounting Services Agreement – HFMC provides the Funds with accounting services pursuant to a fund accounting agreement by and between the Company, on behalf of each Fund, and HFMC. HFMC has delegated certain accounting and administrative service functions to State Street Bank and Trust Company (“State Street”). In consideration of services rendered and expenses assumed pursuant to the fund accounting agreement, each Fund pays HFMC a fee. Effective May 1, 2021, the fund accounting fee schedule as set forth in the fund accounting agreement by and between the Company, on behalf of the Funds, and HFMC, was revised. Effective May 1, 2021, the fund accounting fee for each Fund is equal to the greater of: (A) the sum of (i) the sub-accounting fee payable by HFMC with respect to the Fund; (ii) the fee payable for tax preparation services for the Fund; and (iii) the amount of expenses that HFMC allocates for providing the fund accounting services to the Fund; plus a target profit margin; or (B) $40,000 per year; provided, however, that to the extent the annual amount of the fund accounting fee exceeds 0.02% of the Fund’s average net assets (calculated during its current fiscal year), HFMC shall waive such portion of the fund accounting fee. For the period November 1, 2020 through April 30, 2021, HFMC received the following fee with respect to each Fund: any sub-accounting fee payable by HFMC plus the amount of expenses that HFMC allocates for providing the fund accounting services. |
| c) | Operating Expenses – Allocable expenses incurred by the Company are allocated to each series within the Company, and allocated to classes within each such series, in proportion to the average daily net assets of such series and classes, except where allocation of certain expenses is more fairly made directly to a Fund or to specific classes within a Fund. As of October 31, 2021, HFMC contractually agreed to limit the total annual fund operating expenses (exclusive of taxes, interest expenses, brokerage commissions, acquired fund fees and |
| 128 |
October 31, 2021
| expenses, and extraordinary expenses) through February 28, 2022 for each Fund except for Diversified Emerging Markets Fund (September 30, 2022 for Diversified Emerging Markets Fund) (unless the Board of Directors approves its earlier termination) as follows for each of the following Funds: | |
| Expense Limit as a Percentage of Average Daily Net Assets | ||||||||||||||||||
| Fund | Class A | Class C | Class I | Class R3 | Class R4 | Class R5 | Class Y | Class F | Class SDR | |||||||||
| China A Fund | 1.45% | 2.25% | 1.15% | N/A | N/A | N/A | 1.11% | 0.99% | 0.99% | |||||||||
| Diversified Emerging Markets Fund | N/A | N/A | N/A | N/A | N/A | N/A | N/A | N/A | 0.89% | |||||||||
| Emerging Markets Multi-Sector Bond Fund | 1.15% | 1.90% | 0.90% | 1.45% | 1.15% | 0.85% | 0.85% | 0.75% | 0.75% | |||||||||
| Securitized Income Fund | 1.10% | 1.95% | 0.85% | N/A | N/A | N/A | 0.80% | 0.70% | 0.70% | |||||||||
| Tax-Aware Bond Fund | 0.71% | 1.59% | 0.49% | N/A | N/A | N/A | 0.56% | 0.46% | 0.46% | |||||||||
| US Small Cap Opportunities Fund | 1.35% | 2.10% | 1.10% | 1.65% | 1.35% | 1.05% | 1.05% | 0.95% | 0.95% | |||||||||
| Expense Limit as a Percentage of Average Daily Net Assets | ||||||||||||||||||
| Fund | Class A | Class C | Class I | Class R3 | Class R4 | Class R5 | Class Y | Class F | Class SDR | |||||||||
| International Stock Fund | 1.15% | 1.95% | 0.85% | 1.45% | 1.15% | 0.85% | 0.85% | 0.75% | 0.75% | |||||||||
| d) | Fees Paid Indirectly – Certain Funds have entered into agreements with State Street Global Markets, LLC and Russell Implementation Services, Inc. to partially recapture non-discounted trade commissions. Such rebates are used to pay a portion of a Fund's expenses. For the year ended October 31, 2021, these amounts, if any, are included in the Statements of Operations. |
| The ratio of expenses to average net assets in the accompanying financial highlights excludes the reduction in expenses related to fees paid indirectly. The annualized expense ratio after waivers reflecting the reduction for fees paid indirectly for the period is as follows: | |
| Fund | Class A | Class C | Class I | Class R3 | Class R4 | Class R5 | Class Y | Class F | Class SDR | |||||||||
| China A Fund | 1.42% | 2.19% | 1.15% | N/A | N/A | N/A | 1.11% | 0.99% | 0.99% | |||||||||
| Diversified Emerging Markets Fund | N/A | N/A | N/A | N/A | N/A | N/A | N/A | N/A | 0.89% | |||||||||
| Emerging Markets Equity Fund | 1.44% | 2.13% | 1.23% | 1.68% | 1.47% | 1.17% | 1.16% | 1.05% | 1.05% | |||||||||
| Emerging Markets Multi-Sector Bond Fund | 1.15% | 1.90% | 0.88% | 1.41% | 1.11% | 0.85% | 0.83% | 0.75% | 0.75% | |||||||||
| International Multi-Cap Value Fund | 1.11% | 1.85% | 0.85% | 1.40% | 1.16% | 0.85% | 0.82% | 0.75% | 0.75% | |||||||||
| International Stock Fund | 1.06% | 1.80% | 0.79% | 1.41% | 1.12% | 0.81% | 0.81% | 0.70% | 0.71% | |||||||||
| Securitized Income Fund | 1.06% | 2.06% | 0.97% | N/A | N/A | N/A | 0.92% | 0.84% | 0.84% | |||||||||
| Tax-Aware Bond Fund | 0.71% | 1.58% | 0.49% | N/A | N/A | N/A | 0.56% | 0.46% | 0.46% | |||||||||
| US MidCap Opportunities Fund | 1.16% | 1.90% | 0.89% | 1.52% | 1.18% | 0.92% | 0.91% | 0.80% | 0.80% | |||||||||
| US Small Cap Opportunities Fund | 1.35% | 2.10% | 1.07% | 1.63% | 1.35% | 1.05% | 1.05% | 0.95% | 0.95% |
| e) | Sales Charges and Distribution and Service Plan for Class A, C, R3 and R4 Shares – Hartford Funds Distributors, LLC (“HFD”), an indirect subsidiary of The Hartford, is the principal underwriter and distributor of each Fund. For the year ended October 31, 2021, HFD received front-end sales charges and contingent deferred sales charges for each Fund as follows: |
| Fund | Front-End Sales Charges | Contingent Deferred Sales Charges | ||
| China A Fund | $ 1,867 | $ 29 | ||
| Diversified Emerging Markets Fund | — | — | ||
| Emerging Markets Equity Fund | 121,715 | 4,002 | ||
| Emerging Markets Multi-Sector Bond Fund | 1,995 | — | ||
| International Multi-Cap Value Fund | 237,202 | 792 | ||
| International Stock Fund | 878,525 | 6,131 | ||
| Securitized Income Fund | 4,950 | 2 | ||
| Tax-Aware Bond Fund | 128,821 | 16,403 | ||
| US MidCap Opportunities Fund | 199,339 | 984 | ||
| US Small Cap Opportunities Fund | 67,032 | 3,480 |
| 129 |
October 31, 2021
| f) | Other Related Party Transactions – Certain officers of the Company are directors and/or officers of HFMC and/or The Hartford or its subsidiaries. For the year ended October 31, 2021, a portion of the Company’s Chief Compliance Officer’s (“CCO”) compensation was paid by all of the investment companies in the Hartford fund complex. The portion allocated to each Fund, as represented in other expenses on the Statements of Operations, is outlined in the table below. |
| Fund | CCO Compensation Paid by Fund | |
| China A Fund | $ 92 | |
| Diversified Emerging Markets Fund | 0 | |
| Emerging Markets Equity Fund | 11,592 | |
| Emerging Markets Multi-Sector Bond Fund | 73 | |
| International Multi-Cap Value Fund | 4,361 | |
| International Stock Fund | 4,891 | |
| Securitized Income Fund | 194 | |
| Tax-Aware Bond Fund | 785 | |
| US MidCap Opportunities Fund | 1,381 | |
| US Small Cap Opportunities Fund | 583 |
| Share Class | Specified Amount (as a percentage average daily net assets) | |
| Class A | 0.25% | |
| Class C | 0.25% | |
| Class I | 0.20% | |
| Class R3 | 0.22% | |
| Class R4 | 0.17% | |
| Class R5 | 0.12% | |
| Class Y | 0.11% | |
| Class F | 0.004% | |
| Class SDR | 0.004% |
| 130 |
October 31, 2021
| Fund | Class A | Class C | Class I | Class R3 | Class R4 | Class R5 | Class Y | Class F | Class SDR | |||||||||
| China A Fund | 0.15% | 0.12% | 0.11% | N/A | N/A | N/A | 0.01% | 0.00%* | 0.00%* | |||||||||
| Diversified Emerging Markets Fund | N/A | N/A | N/A | N/A | N/A | N/A | N/A | N/A | 0.00%* | |||||||||
| Emerging Markets Equity Fund | 0.14% | 0.09% | 0.18% | 0.22% | 0.17% | 0.12% | 0.11% | 0.00%* | 0.00%* | |||||||||
| Emerging Markets Multi-Sector Bond Fund | 0.16% | 0.25% | 0.09% | 0.22% | 0.17% | 0.12% | 0.05% | 0.00%* | 0.00%* | |||||||||
| International Multi-Cap Value Fund | 0.11% | 0.11% | 0.11% | 0.22% | 0.17% | 0.11% | 0.07% | 0.00%* | 0.00%* | |||||||||
| International Stock Fund | 0.11% | 0.10% | 0.09% | 0.22% | 0.17% | 0.11% | 0.11% | 0.00%* | 0.00%* | |||||||||
| Securitized Income Fund | 0.03% | 0.10% | 0.06% | N/A | N/A | N/A | 0.02% | 0.00%* | 0.00%* | |||||||||
| Tax-Aware Bond Fund | 0.06% | 0.13% | 0.08% | N/A | N/A | N/A | 0.11% | 0.00%* | 0.00%* | |||||||||
| US MidCap Opportunities Fund | 0.11% | 0.10% | 0.09% | 0.22% | 0.17% | 0.12% | 0.11% | 0.00%* | 0.00%* | |||||||||
| US Small Cap Opportunities Fund | 0.14% | 0.14% | 0.09% | 0.22% | 0.17% | 0.12% | 0.11% | 0.00%* | 0.00%* |
| * | Amount rounds to 0.00%. |
| 8. | Securities Lending: |
| The Company has entered into a securities lending agency agreement (“lending agreement”) with Citibank, N.A. (“Citibank”). A Fund may lend portfolio securities to certain borrowers in U.S. and non-U.S. markets in an amount not to exceed one-third (33 1/3%) of the value of its total assets. A Fund may lend portfolio securities, provided that the borrower provides collateral that is maintained in an amount at least equal to the current market value of the securities loaned. Cash collateral is invested for the benefit of a Fund by the Fund’s lending agent pursuant to collateral investment guidelines. The collateral is marked to market daily, in an amount at least equal to the current market value of the securities loaned. Each of the China A Fund and the Securitized Income Fund do not currently engage in securities lending. | |
| A Fund is subject to certain risks while its securities are on loan, including the following: (i) the risk that the borrower defaults on the loan and the collateral is inadequate to cover the Fund’s loss; (ii) the risk that the earnings on the collateral invested are not sufficient to pay fees incurred in connection with the loan; (iii) the Fund could lose money in the event of a decline in the value of the collateral provided for loaned securities or a decline in the value of any investments made with cash collateral; (iv) the risk that the borrower may use the loaned securities to cover a short sale, which may in turn place downward pressure on the market prices of the loaned securities; (v) the risk that return of loaned securities could be delayed and interfere with portfolio management decisions; and (vi) the risk that any efforts to restrict or recall the securities for purposes of voting may not be effective. These events could also trigger adverse tax consequences for the Fund. | |
| A Fund retains loan fees and the interest on cash collateral investments but is required to pay the borrower a rebate for the use of cash collateral. In cases where the lent security is of high value to borrowers, there may be a negative rebate (i.e., a net payment from the borrower to the applicable Fund). Upon termination of a loan, a Fund is required to return to the borrower an amount equal to the cash collateral, plus any rebate owed to the borrowers. | |
| The net income earned on the securities lending (after payment of rebates and Citibank’s fee) is included on the Statements of Operations as Investment Income from securities lending. A Fund also receives payments from the borrower during the period of the loan, equivalent to dividends and interest earned on the securities loaned, which are recorded as Investment Income from dividends or interest, respectively, on the Statements of Operations. |
| 131 |
October 31, 2021
| The following table presents for each Fund that lends its portfolio securities the market value of the securities on loan; the collateral posted by the borrower; and the net amount, if any, due from the borrower in the event of default as of October 31, 2021. | |
| Fund | Investment Securities on Loan, at market value, Presented on the Statements of Assets and Liabilities | Collateral Posted by Borrower(1) | Net Amount(2) | |||
| Diversified Emerging Markets Fund | $ — | $ — | $ — | |||
| Emerging Markets Equity Fund | 3,624,880 | (3,624,880) | — | |||
| Emerging Markets Multi-Sector Bond Fund | 1,430,817 | (1,430,817) | — | |||
| International Multi-Cap Value Fund | 17,879,508 | (17,879,508) (3) | — | |||
| International Stock Fund | 4,190,637 | (4,190,637) | — | |||
| Tax-Aware Bond Fund | 450,097 | (450,097) | — | |||
| US MidCap Opportunities Fund | — | — | — | |||
| US Small Cap Opportunities Fund | 3,413,684 | (3,413,684) | — |
| (1) | It is each Fund’s policy to obtain additional collateral from, or return excess collateral to, the borrower by the end of the next business day following the valuation date of the securities loaned. Therefore, the value of the collateral held may be temporarily less than that required under the lending contract due to timing. Pursuant to the lending agreement, the borrower will provide collateral in an amount at least equal to the current market value of securities loaned. Collateral received in excess or in deficit of the market value is not presented in this table. |
| (2) | Net amount represents the net amount receivable due from the borrower in the event of default. |
| (3) | Includes non-cash collateral of $11,008,047. |
| 9. | Secured Borrowings: |
| The following tables reflect a breakdown of transactions accounted for as secured borrowings, the gross obligation by the type of collateral pledged, and the remaining contractual maturity of those transactions as of October 31, 2021. | |
| Certain Transfers Accounted For As Secured Borrowings | |
| Remaining Contractual Maturity of the Agreements | |
| Overnight and Continuous | < 30 days | Between 30 & 90 days | > 90 days | Total | |||||
| Emerging Markets Equity Fund | |||||||||
| Securities Lending Transactions(1) | |||||||||
| Common Stocks | $ 3,913,000 | $ — | $ — | $ — | $ 3,913,000 | ||||
| Total Borrowings | $ 3,913,000 | $ — | $ — | $ — | $ 3,913,000 | ||||
| Gross amount of recognized liabilities for securities lending transactions | $ 3,913,000 | ||||||||
| Emerging Markets Multi-Sector Bond Fund | |||||||||
| Securities Lending Transactions(1) | |||||||||
| Corporate Bonds | $ 827,978 | $ — | $ — | $ — | $ 827,978 | ||||
| Foreign Government Obligations | 652,372 | — | — | — | 652,372 | ||||
| Total Borrowings | $ 1,480,350 | $ — | $ — | $ — | $ 1,480,350 | ||||
| Gross amount of recognized liabilities for securities lending transactions | $ 1,480,350 | ||||||||
| International Multi-Cap Value Fund | |||||||||
| Securities Lending Transactions(1) | |||||||||
| Common Stocks | $ 8,182,201 | $ — | $ — | $ — | $ 8,182,201 | ||||
| Total Borrowings | $ 8,182,201 | $ — | $ — | $ — | $ 8,182,201 | ||||
| Gross amount of recognized liabilities for securities lending transactions | $ 8,182,201 | ||||||||
| International Stock Fund | |||||||||
| Securities Lending Transactions(1) | |||||||||
| Common Stocks | $ 4,423,026 | $ — | $ — | $ — | $ 4,423,026 | ||||
| Total Borrowings | $ 4,423,026 | $ — | $ — | $ — | $ 4,423,026 | ||||
| Gross amount of recognized liabilities for securities lending transactions | $ 4,423,026 | ||||||||
| Tax-Aware Bond Fund | |||||||||
| Securities Lending Transactions(1) | |||||||||
| Corporate Bonds | $ 462,705 | $ — | $ — | $ — | $ 462,705 | ||||
| Total Borrowings | $ 462,705 | $ — | $ — | $ — | $ 462,705 | ||||
| Gross amount of recognized liabilities for securities lending transactions | $ 462,705 | ||||||||
| 132 |
October 31, 2021
| Overnight and Continuous | < 30 days | Between 30 & 90 days | > 90 days | Total | |||||
| US Small Cap Opportunities Fund | |||||||||
| Securities Lending Transactions(1) | |||||||||
| Common Stocks | $ 3,461,019 | $ — | $ — | $ — | $ 3,461,019 | ||||
| Total Borrowings | $ 3,461,019 | $ — | $ — | $ — | $ 3,461,019 | ||||
| Gross amount of recognized liabilities for securities lending transactions | $ 3,461,019 | ||||||||
| (1) | Amount represents the payable for cash collateral received on securities on loan. This will generally be in the “Overnight and Continuous” column as the securities are typically callable on demand. |
| 10. | Affiliate Holdings: |
| As of October 31, 2021, affiliates of The Hartford had ownership of shares in each Fund as follows: | |
| Percentage of a Class: | ||||||||||||||||||
| Fund | Class A | Class C | Class I | Class R3 | Class R4 | Class R5 | Class Y | Class F | Class SDR | |||||||||
| China A Fund | 22% | 86% | 2% | N/A | N/A | N/A | 6% | 6% | 0%* | |||||||||
| Diversified Emerging Markets Fund | N/A | N/A | N/A | N/A | N/A | N/A | N/A | N/A | 50% | |||||||||
| Emerging Markets Equity Fund | — | — | — | 16% | — | — | — | — | — | |||||||||
| Emerging Markets Multi-Sector Bond Fund | — | — | — | 36% | 100% | 100% | 0%* | 100% | — | |||||||||
| Securitized Income Fund | 71% | 2% | 4% | N/A | N/A | N/A | 87% | 100% | — | |||||||||
| Tax-Aware Bond Fund | — | — | — | N/A | N/A | N/A | 4% | — | — |
| * | Percentage rounds to zero. |
| Percentage of Fund by Class: | ||||||||||||||||||
| Fund | Class A | Class C | Class I | Class R3 | Class R4 | Class R5 | Class Y | Class F | Class SDR | |||||||||
| China A Fund | 0% * | 0%* | 0%* | N/A | N/A | N/A | 0%* | 5% | 0%* | |||||||||
| Diversified Emerging Markets Fund | N/A | N/A | N/A | N/A | N/A | N/A | N/A | N/A | 50% | |||||||||
| Emerging Markets Equity Fund | — | — | — | 0%* | — | — | — | — | — | |||||||||
| Emerging Markets Multi-Sector Bond Fund | — | — | — | 0%* | 0%* | 0%* | 0%* | 0%* | — | |||||||||
| Securitized Income Fund | 3% | 0%* | 3% | N/A | N/A | N/A | 3% | 2% | — | |||||||||
| Tax-Aware Bond Fund | — | — | — | N/A | N/A | N/A | 0%* | — | — |
| * | Percentage rounds to zero. |
| Fund | Percentage of Fund* | |
| Emerging Markets Equity Fund | 1% | |
| International Multi-Cap Value Fund | 3% |
| * | As of October 31, 2021, affiliated funds of funds and the 529 plan were invested in Class F shares. |
| 11. | Beneficial Fund Ownership: |
| As of October 31, 2021, to the knowledge of a Fund, the shareholders listed below beneficially held more than 25% of the shares outstanding of a Fund. Such shareholders may be deemed to control the Fund under the 1940 Act because it owned beneficially more than 25% of the outstanding shares of the Fund. | |
| Fund | Shareholder | Percentage of Ownership | ||
| Diversified Emerging Markets Fund | Schroder US Holdings, Inc | 50% | ||
| Hartford Funds Management Company, LLC | 50% |
| 133 |
October 31, 2021
| 12. | Investment Transactions: |
| For the year ended October 31, 2021, the cost of purchases and proceeds from sales of investment securities (excluding short-term investments) were as follows: | |
| Fund | Cost of Purchases Excluding U.S. Government Obligations | Sales Proceeds Excluding U.S. Government Obligations | Cost of Purchases For U.S. Government Obligations | Sales Proceeds For U.S. Government Obligations | Total Cost of Purchases | Total Sales Proceeds | ||||||
| China A Fund | $ 80,694,675 | $ 18,569,024 | $ — | $ — | $ 80,694,675 | $ 18,569,024 | ||||||
| Diversified Emerging Markets Fund | 9,469,824 | 692,227 | — | — | 9,469,824 | 692,227 | ||||||
| Emerging Markets Equity Fund | 4,138,573,842 | 2,151,316,122 | — | — | 4,138,573,842 | 2,151,316,122 | ||||||
| Emerging Markets Multi-Sector Bond Fund | 77,092,267 | 92,669,778 | — | — | 77,092,267 | 92,669,778 | ||||||
| International Multi-Cap Value Fund | 2,136,317,858 | 1,946,233,561 | — | — | 2,136,317,858 | 1,946,233,561 | ||||||
| International Stock Fund | 2,738,689,909 | 659,901,278 | — | — | 2,738,689,909 | 659,901,278 | ||||||
| Securitized Income Fund | 76,466,625 | 72,431,413 | 8,785,677 | 20,410,901 | 85,252,302 | 92,842,314 | ||||||
| Tax-Aware Bond Fund | 227,007,877 | 169,433,181 | 284,870,344 | 315,956,865 | 511,878,221 | 485,390,046 | ||||||
| US MidCap Opportunities Fund | 355,410,357 | 431,353,830 | — | — | 355,410,357 | 431,353,830 | ||||||
| US Small Cap Opportunities Fund | 184,736,150 | 170,739,906 | — | — | 184,736,150 | 170,739,906 |
| 13. | Capital Share Transactions: |
| The following information is for the years or periods ended October 31, 2021 and October 31, 2020: | |
| For the Year Ended October 31, 2021 | For the Year Ended October 31, 2020 | ||||||
| Shares | Amount | Shares | Amount | ||||
| China A Fund(1) | |||||||
| Class A | |||||||
| Shares Sold | 79,611 | $ 1,298,148 | 24,506 | $ 304,161 | |||
| Shares Issued for Reinvested Dividends | 3,414 | 51,074 | — | — | |||
| Shares Redeemed | (58,087) | (925,156) | (1) | (10) | |||
| Net Increase (Decrease) | 24,938 | 424,066 | 24,505 | 304,151 | |||
| Class C | |||||||
| Shares Sold | 401 | $ 6,000 | 11,860 | $ 125,436 | |||
| Shares Issued for Reinvested Dividends | 1,166 | 17,324 | — | — | |||
| Shares Redeemed | (636) | (10,083) | (1) | (10) | |||
| Net Increase (Decrease) | 931 | 13,241 | 11,859 | 125,426 | |||
| Class I | |||||||
| Shares Sold | 559,782 | $ 9,060,215 | 30,549 | $ 408,284 | |||
| Shares Issued for Reinvested Dividends | 1,578 | 23,649 | — | — | |||
| Shares Redeemed | (81,523) | (1,288,921) | (18,406) | (269,695) | |||
| Net Increase (Decrease) | 479,837 | 7,794,943 | 12,143 | 138,589 | |||
| Class Y | |||||||
| Shares Sold | 1,609,643 | $ 26,810,000 | 10,001 | $ 100,010 | |||
| Shares Issued for Reinvested Dividends | 1,078 | 16,158 | — | — | |||
| Shares Redeemed | (1,431,981) | (23,642,005) | (1) | (10) | |||
| Net Increase (Decrease) | 178,740 | 3,184,153 | 10,000 | 100,000 | |||
| Class F | |||||||
| Shares Sold | 4,287,332 | $ 69,076,976 | 210,001 | $ 2,100,010 | |||
| Shares Issued for Reinvested Dividends | 21,609 | 324,076 | — | — | |||
| Shares Redeemed | (518,930) | (8,268,522) | (1) | (10) | |||
| Net Increase (Decrease) | 3,790,011 | 61,132,530 | 210,000 | 2,100,000 | |||
| Class SDR | |||||||
| Shares Sold | — | $ — | 250,001 | $ 2,500,010 | |||
| Shares Redeemed | — | — | (1) | (10) | |||
| Net Increase (Decrease) | — | — | 250,000 | 2,500,000 | |||
| Total Net Increase (Decrease) | 4,474,457 | $ 72,548,933 | 518,507 | $ 5,268,166 | |||
| 134 |
October 31, 2021
| For the Year Ended October 31, 2021 | For the Year Ended October 31, 2020 | ||||||
| Shares | Amount | Shares | Amount | ||||
| Diversified Emerging Markets Fund | |||||||
| Class SDR(2) | |||||||
| Shares Sold | 1,000,001 | $ 10,000,010 | |||||
| Shares Redeemed | (1) | (10) | |||||
| Net Increase (Decrease) | 1,000,000 | 10,000,000 | |||||
| Total Net Increase (Decrease) | 1,000,000 | $ 10,000,000 | |||||
| Emerging Markets Equity Fund | |||||||
| Class A | |||||||
| Shares Sold | 36,308,664 | $ 733,571,336 | 1,951,438 | $ 30,166,742 | |||
| Shares Issued for Reinvested Dividends | 258,333 | 5,148,579 | 70,589 | 1,177,420 | |||
| Shares Redeemed | (35,276,754) | (754,119,916) | (2,196,877) | (34,272,320) | |||
| Net Increase (Decrease) | 1,290,243 | (15,400,001) | (174,850) | (2,928,158) | |||
| Class C | |||||||
| Shares Sold | 123,952 | $ 2,605,435 | 7,253 | $ 113,752 | |||
| Shares Issued for Reinvested Dividends | — | — | 8,192 | 135,012 | |||
| Shares Redeemed | (97,854) | (1,992,405) | (273,764) | (4,230,625) | |||
| Net Increase (Decrease) | 26,098 | 613,030 | (258,319) | (3,981,861) | |||
| Class I | |||||||
| Shares Sold | 56,431,151 | $ 1,193,073,411 | 62,234,607 | $ 937,883,560 | |||
| Shares Issued for Reinvested Dividends | 464,881 | 9,279,021 | 874,907 | 14,558,445 | |||
| Shares Redeemed | (25,131,200) | (525,557,724) | (95,824,442) | (1,429,672,320) | |||
| Net Increase (Decrease) | 31,764,832 | 676,794,708 | (32,714,928) | (477,230,315) | |||
| Class R3 | |||||||
| Shares Sold | 645 | $ 13,351 | 740 | $ 11,570 | |||
| Shares Issued for Reinvested Dividends | 17 | 330 | 84 | 1,392 | |||
| Shares Redeemed | (792) | (14,775) | (971) | (15,292) | |||
| Net Increase (Decrease) | (130) | (1,094) | (147) | (2,330) | |||
| Class R4 | |||||||
| Shares Sold | 59,355 | $ 1,241,955 | 278,404 | $ 3,757,186 | |||
| Shares Issued for Reinvested Dividends | 1,894 | 37,977 | 24 | 394 | |||
| Shares Redeemed | (49,612) | (1,048,202) | (19,862) | (316,545) | |||
| Net Increase (Decrease) | 11,637 | 231,730 | 258,566 | 3,441,035 | |||
| Class R5 | |||||||
| Shares Sold | 4,821 | $ 105,573 | 6,643 | $ 104,685 | |||
| Shares Issued for Reinvested Dividends | 146 | 2,909 | 910 | 15,146 | |||
| Shares Redeemed | (3,234) | (66,710) | (26,899) | (439,527) | |||
| Net Increase (Decrease) | 1,733 | 41,772 | (19,346) | (319,696) | |||
| Class Y | |||||||
| Shares Sold | 56,182,329 | $ 1,188,725,143 | 38,460,003 | $ 583,444,406 | |||
| Shares Issued for Reinvested Dividends | 27,484 | 550,220 | 196,853 | 3,277,595 | |||
| Shares Redeemed | (41,414,742) | (832,689,032) | (16,978,392) | (234,989,979) | |||
| Net Increase (Decrease) | 14,795,071 | 356,586,331 | 21,678,464 | 351,732,022 | |||
| Class F | |||||||
| Shares Sold | 22,506,430 | $ 474,432,411 | 32,828,464 | $ 535,113,218 | |||
| Shares Issued for Reinvested Dividends | 171,016 | 3,411,762 | 445,955 | 7,416,236 | |||
| Shares Redeemed | (20,567,063) | (417,122,964) | (9,898,445) | (156,103,638) | |||
| Net Increase (Decrease) | 2,110,383 | 60,721,209 | 23,375,974 | 386,425,816 | |||
| Class SDR | |||||||
| Shares Sold | 59,760,937 | $ 1,249,192,389 | 15,360,330 | $ 247,432,265 | |||
| Shares Issued for Reinvested Dividends | 687,644 | 13,746,007 | 1,559,446 | 25,980,378 | |||
| Shares Redeemed | (19,170,448) | (394,374,428) | (12,685,174) | (189,012,307) | |||
| Net Increase (Decrease) | 41,278,133 | 868,563,968 | 4,234,602 | 84,400,336 | |||
| Total Net Increase (Decrease) | 91,278,000 | $ 1,948,151,653 | 16,380,016 | $ 341,536,849 | |||
| 135 |
October 31, 2021
| For the Year Ended October 31, 2021 | For the Year Ended October 31, 2020 | ||||||
| Shares | Amount | Shares | Amount | ||||
| Emerging Markets Multi-Sector Bond Fund | |||||||
| Class A | |||||||
| Shares Sold | 47,327 | $ 412,229 | 74,672 | $ 618,886 | |||
| Shares Issued for Reinvested Dividends | 8,151 | 69,539 | 9,815 | 78,407 | |||
| Shares Redeemed | (75,660) | (659,703) | (75,075) | (615,139) | |||
| Net Increase (Decrease) | (20,182) | (177,935) | 9,412 | 82,154 | |||
| Class C | |||||||
| Shares Sold | 3,257 | $ 28,142 | 3,580 | $ 31,316 | |||
| Shares Issued for Reinvested Dividends | 682 | 5,800 | 1,233 | 9,773 | |||
| Shares Redeemed | (13,769) | (116,669) | (7,896) | (69,036) | |||
| Net Increase (Decrease) | (9,830) | (82,727) | (3,083) | (27,947) | |||
| Class I | |||||||
| Shares Sold | 1,037,078 | $ 8,815,527 | 1,645,820 | $ 12,948,623 | |||
| Shares Issued for Reinvested Dividends | 94,845 | 808,423 | 160,130 | 1,284,545 | |||
| Shares Redeemed | (1,422,965) | (12,291,788) | (2,486,187) | (20,380,676) | |||
| Net Increase (Decrease) | (291,042) | (2,667,838) | (680,237) | (6,147,508) | |||
| Class R3 | |||||||
| Shares Sold | 95 | $ 814 | 2,121 | $ 19,070 | |||
| Shares Issued for Reinvested Dividends | 132 | 1,124 | 158 | 1,249 | |||
| Shares Redeemed | (4) | (35) | (2) | (20) | |||
| Net Increase (Decrease) | 223 | 1,903 | 2,277 | 20,299 | |||
| Class R4 | |||||||
| Shares Issued for Reinvested Dividends | 52 | $ 447 | 73 | $ 580 | |||
| Net Increase (Decrease) | 52 | 447 | 73 | 580 | |||
| Class R5 | |||||||
| Shares Issued for Reinvested Dividends | 56 | $ 484 | 74 | $ 587 | |||
| Net Increase (Decrease) | 56 | 484 | 74 | 587 | |||
| Class Y | |||||||
| Shares Sold | 53,623 | $ 450,000 | 50,335 | $ 433,573 | |||
| Shares Issued for Reinvested Dividends | 12,859 | 109,352 | 15,666 | 125,165 | |||
| Shares Redeemed | — | — | (1,300) | (9,222) | |||
| Net Increase (Decrease) | 66,482 | 559,352 | 64,701 | 549,516 | |||
| Class F | |||||||
| Shares Sold | — | $ — | 33,302 | $ 300,908 | |||
| Shares Issued for Reinvested Dividends | 71 | 563 | 20,620 | 185,754 | |||
| Shares Redeemed | — | — | (2,588,818) | (22,892,216) | |||
| Net Increase (Decrease) | 71 | 563 | (2,534,896) | (22,405,554) | |||
| Class SDR | |||||||
| Shares Sold | 1,855,889 | $ 15,638,325 | 84,913 | $ 734,256 | |||
| Shares Issued for Reinvested Dividends | 127,085 | 1,083,054 | 241,781 | 1,930,500 | |||
| Shares Redeemed | (3,676,965) | (31,301,994) | (196,044) | (1,641,958) | |||
| Net Increase (Decrease) | (1,693,991) | (14,580,615) | 130,650 | 1,022,798 | |||
| Total Net Increase (Decrease) | (1,948,161) | $ (16,946,366) | (3,011,029) | $ (26,905,075) | |||
| International Multi-Cap Value Fund | |||||||
| Class A | |||||||
| Shares Sold | 3,119,668 | $ 31,670,732 | 2,803,699 | $ 23,129,829 | |||
| Shares Issued for Reinvested Dividends | 192,316 | 1,906,426 | 289,911 | 2,459,995 | |||
| Shares Redeemed | (2,158,176) | (21,202,027) | (6,470,234) | (51,893,152) | |||
| Net Increase (Decrease) | 1,153,808 | 12,375,131 | (3,376,624) | (26,303,328) | |||
| Class C | |||||||
| Shares Sold | 192,389 | $ 1,951,130 | 324,556 | $ 2,741,385 | |||
| Shares Issued for Reinvested Dividends | 22,890 | 223,413 | 36,931 | 323,041 | |||
| Shares Redeemed | (427,573) | (4,192,351) | (1,107,190) | (9,046,175) | |||
| Net Increase (Decrease) | (212,294) | (2,017,808) | (745,703) | (5,981,749) | |||
| 136 |
October 31, 2021
| For the Year Ended October 31, 2021 | For the Year Ended October 31, 2020 | ||||||
| Shares | Amount | Shares | Amount | ||||
| Class I | |||||||
| Shares Sold | 27,019,314 | $ 273,064,831 | 32,274,441 | $ 263,656,289 | |||
| Shares Issued for Reinvested Dividends | 1,579,191 | 15,688,134 | 1,997,972 | 16,815,231 | |||
| Shares Redeemed | (28,763,882) | (283,248,146) | (46,737,444) | (366,171,373) | |||
| Net Increase (Decrease) | (165,377) | 5,504,819 | (12,465,031) | (85,699,853) | |||
| Class R3 | |||||||
| Shares Sold | 451,422 | $ 4,539,473 | 533,231 | $ 4,354,149 | |||
| Shares Issued for Reinvested Dividends | 33,416 | 328,548 | 43,227 | 369,526 | |||
| Shares Redeemed | (547,780) | (5,546,589) | (1,034,516) | (7,910,074) | |||
| Net Increase (Decrease) | (62,942) | (678,568) | (458,058) | (3,186,399) | |||
| Class R4 | |||||||
| Shares Sold | 345,107 | $ 3,431,953 | 64,552 | $ 497,841 | |||
| Shares Issued for Reinvested Dividends | 10,331 | 103,502 | 8,123 | 68,291 | |||
| Shares Redeemed | (83,743) | (835,688) | (75,981) | (596,629) | |||
| Net Increase (Decrease) | 271,695 | 2,699,767 | (3,306) | (30,497) | |||
| Class R5 | |||||||
| Shares Sold | 554,831 | $ 5,385,186 | 545,218 | $ 4,339,616 | |||
| Shares Issued for Reinvested Dividends | 48,233 | 473,876 | 68,186 | 570,494 | |||
| Shares Redeemed | (1,044,634) | (10,154,724) | (769,515) | (6,216,129) | |||
| Net Increase (Decrease) | (441,570) | (4,295,662) | (156,111) | (1,306,019) | |||
| Class Y | |||||||
| Shares Sold | 11,839,608 | $ 116,506,159 | 8,488,795 | $ 66,739,293 | |||
| Shares Issued for Reinvested Dividends | 640,600 | 6,350,181 | 525,988 | 4,368,637 | |||
| Shares Redeemed | (6,086,109) | (62,073,760) | (3,913,403) | (30,436,867) | |||
| Net Increase (Decrease) | 6,394,099 | 60,782,580 | 5,101,380 | 40,671,063 | |||
| Class F | |||||||
| Shares Sold | 19,714,834 | $ 200,134,513 | 18,264,798 | $ 141,630,520 | |||
| Shares Issued for Reinvested Dividends | 914,358 | 9,110,634 | 1,036,549 | 8,642,893 | |||
| Shares Redeemed | (10,673,807) | (106,051,569) | (14,852,644) | (118,345,910) | |||
| Net Increase (Decrease) | 9,955,385 | 103,193,578 | 4,448,703 | 31,927,503 | |||
| Class SDR | |||||||
| Shares Sold | 36,805,961 | $ 364,572,607 | 37,557,550 | $ 291,819,327 | |||
| Shares Issued for Reinvested Dividends | 1,978,197 | 19,582,590 | 2,074,664 | 17,328,997 | |||
| Shares Redeemed | (28,732,672) | (284,955,477) | (35,442,799) | (290,678,391) | |||
| Net Increase (Decrease) | 10,051,486 | 99,199,720 | 4,189,415 | 18,469,933 | |||
| Total Net Increase (Decrease) | 26,944,290 | $ 276,763,557 | (3,465,335) | $ (31,439,346) | |||
| International Stock Fund | |||||||
| Class A | |||||||
| Shares Sold | 8,837,396 | $ 158,876,977 | 5,577,386 | $ 75,874,561 | |||
| Shares Issued for Reinvested Dividends | 1,911 | 32,461 | 39,981 | 548,940 | |||
| Shares Redeemed | (1,944,352) | (35,151,106) | (1,136,723) | (15,107,254) | |||
| Net Increase (Decrease) | 6,894,955 | 123,758,332 | 4,480,644 | 61,316,247 | |||
| Class C | |||||||
| Shares Sold | 740,492 | $ 12,700,219 | 269,016 | $ 3,489,435 | |||
| Shares Issued for Reinvested Dividends | — | — | 835 | 10,939 | |||
| Shares Redeemed | (82,030) | (1,412,935) | (59,927) | (722,473) | |||
| Net Increase (Decrease) | 658,462 | 11,287,284 | 209,924 | 2,777,901 | |||
| Class I | |||||||
| Shares Sold | 87,401,083 | $ 1,526,402,071 | 28,960,331 | $ 372,494,734 | |||
| Shares Issued for Reinvested Dividends | 128,684 | 2,114,283 | 203,818 | 2,706,694 | |||
| Shares Redeemed | (18,010,716) | (319,129,489) | (8,951,030) | (109,417,598) | |||
| Net Increase (Decrease) | 69,519,051 | 1,209,386,865 | 20,213,119 | 265,783,830 | |||
| Class R3 | |||||||
| Shares Sold | 35,715 | $ 599,480 | 44,105 | $ 484,380 | |||
| Shares Issued for Reinvested Dividends | — | — | 152 | 2,018 | |||
| Shares Redeemed | (24,649) | (436,671) | (5,601) | (71,632) | |||
| Net Increase (Decrease) | 11,066 | 162,809 | 38,656 | 414,766 | |||
| 137 |
October 31, 2021
| For the Year Ended October 31, 2021 | For the Year Ended October 31, 2020 | ||||||
| Shares | Amount | Shares | Amount | ||||
| Class R4 | |||||||
| Shares Sold | 55,476 | $ 972,356 | 205,916 | $ 2,649,316 | |||
| Shares Issued for Reinvested Dividends | 43 | 701 | 269 | 3,576 | |||
| Shares Redeemed | (32,578) | (571,973) | (44,021) | (566,181) | |||
| Net Increase (Decrease) | 22,941 | 401,084 | 162,164 | 2,086,711 | |||
| Class R5 | |||||||
| Shares Sold | 610,480 | $ 10,516,058 | 844,651 | $ 10,244,540 | |||
| Shares Issued for Reinvested Dividends | 3,171 | 52,125 | 1,644 | 21,848 | |||
| Shares Redeemed | (173,831) | (3,084,332) | (41,811) | (545,593) | |||
| Net Increase (Decrease) | 439,820 | 7,483,851 | 804,484 | 9,720,795 | |||
| Class Y | |||||||
| Shares Sold | 9,099,927 | $ 157,454,989 | 4,875,805 | $ 68,074,361 | |||
| Shares Issued for Reinvested Dividends | 20,632 | 340,017 | 953 | 12,698 | |||
| Shares Redeemed | (594,350) | (10,590,133) | (78,087) | (1,012,281) | |||
| Net Increase (Decrease) | 8,526,209 | 147,204,873 | 4,798,671 | 67,074,778 | |||
| Class F | |||||||
| Shares Sold | 24,072,686 | $ 422,064,011 | 8,417,664 | $ 110,434,434 | |||
| Shares Issued for Reinvested Dividends | 60,241 | 990,360 | 77,909 | 1,036,195 | |||
| Shares Redeemed | (3,069,438) | (53,817,085) | (1,765,969) | (22,190,196) | |||
| Net Increase (Decrease) | 21,063,489 | 369,237,286 | 6,729,604 | 89,280,433 | |||
| Class SDR | |||||||
| Shares Sold | 17,507,759 | $ 305,654,018 | 5,469,722 | $ 70,802,425 | |||
| Shares Issued for Reinvested Dividends | 51,342 | 843,556 | 72,052 | 957,577 | |||
| Shares Redeemed | (3,315,061) | (58,859,246) | (3,650,626) | (47,306,305) | |||
| Net Increase (Decrease) | 14,244,040 | 247,638,328 | 1,891,148 | 24,453,697 | |||
| Total Net Increase (Decrease) | 121,380,033 | $ 2,116,560,712 | 39,328,414 | $ 522,909,158 | |||
| Securitized Income Fund | |||||||
| Class A | |||||||
| Shares Sold | 121,794 | $ 1,209,452 | 223,922 | $ 2,163,016 | |||
| Shares Issued for Reinvested Dividends | 8,519 | 84,434 | 9,226 | 89,718 | |||
| Shares Redeemed | (176,058) | (1,751,542) | (21,058) | (203,567) | |||
| Net Increase (Decrease) | (45,745) | (457,656) | 212,090 | 2,049,167 | |||
| Class C(3) | |||||||
| Shares Sold | 22,841 | $ 226,983 | 45,049 | $ 419,720 | |||
| Shares Issued for Reinvested Dividends | 329 | 3,248 | 181 | 1,709 | |||
| Shares Redeemed | (24,701) | (245,738) | — | — | |||
| Net Increase (Decrease) | (1,531) | (15,507) | 45,230 | 421,429 | |||
| Class I | |||||||
| Shares Sold | 5,640,264 | $ 56,021,872 | 7,995,486 | $ 77,608,778 | |||
| Shares Issued for Reinvested Dividends | 130,288 | 1,291,127 | 75,068 | 720,669 | |||
| Shares Redeemed | (3,450,666) | (34,224,582) | (1,829,000) | (17,600,511) | |||
| Net Increase (Decrease) | 2,319,886 | 23,088,417 | 6,241,554 | 60,728,936 | |||
| Class Y | |||||||
| Shares Sold | 82,467 | $ 817,254 | — | $ — | |||
| Shares Issued for Reinvested Dividends | 7,346 | 72,758 | 8,517 | 82,781 | |||
| Shares Redeemed | (31,177) | (309,365) | — | — | |||
| Net Increase (Decrease) | 58,636 | 580,647 | 8,517 | 82,781 | |||
| Class F | |||||||
| Shares Issued for Reinvested Dividends | 4,014 | $ 39,737 | 4,889 | $ 47,466 | |||
| Shares Redeemed | — | — | (49,950) | (473,832) | |||
| Net Increase (Decrease) | 4,014 | 39,737 | (45,061) | (426,366) | |||
| Class SDR | |||||||
| Shares Sold | 754,606 | $ 7,478,000 | 1,764,121 | $ 17,560,558 | |||
| Shares Issued for Reinvested Dividends | 16,390 | 162,354 | 50,038 | 497,414 | |||
| Shares Redeemed | — | — | (8,125,902) | (80,147,825) | |||
| Net Increase (Decrease) | 770,996 | 7,640,354 | (6,311,743) | (62,089,853) | |||
| Total Net Increase (Decrease) | 3,106,256 | $ 30,875,992 | 150,587 | $ 766,094 | |||
| 138 |
October 31, 2021
| For the Year Ended October 31, 2021 | For the Year Ended October 31, 2020 | ||||||
| Shares | Amount | Shares | Amount | ||||
| Tax-Aware Bond Fund | |||||||
| Class A | |||||||
| Shares Sold | 1,741,910 | $ 19,878,259 | 2,723,410 | $ 30,536,275 | |||
| Shares Issued for Reinvested Dividends | 126,621 | 1,442,775 | 129,314 | 1,446,053 | |||
| Shares Redeemed | (1,179,190) | (13,432,195) | (1,098,300) | (12,306,927) | |||
| Net Increase (Decrease) | 689,341 | 7,888,839 | 1,754,424 | 19,675,401 | |||
| Class C | |||||||
| Shares Sold | 70,850 | $ 808,470 | 228,661 | $ 2,567,436 | |||
| Shares Issued for Reinvested Dividends | 11,340 | 129,366 | 19,583 | 217,827 | |||
| Shares Redeemed | (156,997) | (1,790,148) | (181,060) | (2,039,469) | |||
| Net Increase (Decrease) | (74,807) | (852,312) | 67,184 | 745,794 | |||
| Class I | |||||||
| Shares Sold | 9,285,209 | $ 105,989,966 | 18,128,116 | $ 204,446,822 | |||
| Shares Issued for Reinvested Dividends | 518,954 | 5,918,013 | 598,224 | 6,698,427 | |||
| Shares Redeemed | (9,814,495) | (111,991,453) | (12,453,205) | (139,682,475) | |||
| Net Increase (Decrease) | (10,332) | (83,474) | 6,273,135 | 71,462,774 | |||
| Class Y | |||||||
| Shares Sold | 6,206 | $ 70,000 | — | $ — | |||
| Shares Issued for Reinvested Dividends | 486 | 5,542 | 671 | 7,512 | |||
| Shares Redeemed | (6) | (67) | — | (3) | |||
| Net Increase (Decrease) | 6,686 | 75,475 | 671 | 7,509 | |||
| Class F | |||||||
| Shares Sold | 1,578,206 | $ 18,003,067 | 1,631,466 | $ 18,408,527 | |||
| Shares Issued for Reinvested Dividends | 79,668 | 908,464 | 83,707 | 938,185 | |||
| Shares Redeemed | (915,304) | (10,439,970) | (635,600) | (7,140,624) | |||
| Net Increase (Decrease) | 742,570 | 8,471,561 | 1,079,573 | 12,206,088 | |||
| Class SDR | |||||||
| Shares Sold | 806,356 | $ 9,185,200 | 679,071 | $ 7,715,862 | |||
| Shares Issued for Reinvested Dividends | 84,192 | 960,177 | 133,183 | 1,484,930 | |||
| Shares Redeemed | (600,601) | (6,852,354) | (688,386) | (7,803,953) | |||
| Net Increase (Decrease) | 289,947 | 3,293,023 | 123,868 | 1,396,839 | |||
| Total Net Increase (Decrease) | 1,643,405 | $ 18,793,112 | 9,298,855 | $ 105,494,405 | |||
| US MidCap Opportunities Fund | |||||||
| Class A | |||||||
| Shares Sold | 1,210,595 | $ 22,793,512 | 1,295,034 | $ 17,576,606 | |||
| Shares Issued for Reinvested Dividends | 4,107 | 69,120 | 39,994 | 614,359 | |||
| Shares Redeemed | (927,065) | (17,122,126) | (2,290,621) | (31,642,314) | |||
| Net Increase (Decrease) | 287,637 | 5,740,506 | (955,593) | (13,451,349) | |||
| Class C | |||||||
| Shares Sold | 288,995 | $ 5,282,477 | 334,429 | $ 4,807,929 | |||
| Shares Issued for Reinvested Dividends | — | — | 25,799 | 401,177 | |||
| Shares Redeemed | (618,074) | (11,506,800) | (1,332,162) | (19,041,400) | |||
| Net Increase (Decrease) | (329,079) | (6,224,323) | (971,934) | (13,832,294) | |||
| Class I | |||||||
| Shares Sold | 4,168,468 | $ 79,622,315 | 6,013,572 | $ 86,511,259 | |||
| Shares Issued for Reinvested Dividends | 70,646 | 1,237,010 | 265,164 | 4,268,155 | |||
| Shares Redeemed | (6,184,627) | (118,224,917) | (14,836,185) | (214,488,799) | |||
| Net Increase (Decrease) | (1,945,513) | (37,365,592) | (8,557,449) | (123,709,385) | |||
| Class R3 | |||||||
| Shares Sold | 58,182 | $ 1,003,819 | 14,647 | $ 200,693 | |||
| Shares Issued for Reinvested Dividends | — | — | 565 | 8,911 | |||
| Shares Redeemed | (21,164) | (409,218) | (42,185) | (637,892) | |||
| Net Increase (Decrease) | 37,018 | 594,601 | (26,973) | (428,288) | |||
| Class R4 | |||||||
| Shares Sold | 5,663 | $ 117,506 | 15,518 | $ 239,097 | |||
| Shares Issued for Reinvested Dividends | — | — | 259 | 4,116 | |||
| Shares Redeemed | (3,200) | (62,093) | (18,555) | (269,708) | |||
| Net Increase (Decrease) | 2,463 | 55,413 | (2,778) | (26,495) | |||
| 139 |
October 31, 2021
| For the Year Ended October 31, 2021 | For the Year Ended October 31, 2020 | ||||||
| Shares | Amount | Shares | Amount | ||||
| Class R5 | |||||||
| Shares Sold | 9,243 | $ 172,463 | 14,557 | $ 204,228 | |||
| Shares Issued for Reinvested Dividends | 217 | 3,796 | 830 | 13,318 | |||
| Shares Redeemed | (49,797) | (904,365) | (28,943) | (444,803) | |||
| Net Increase (Decrease) | (40,337) | (728,106) | (13,556) | (227,257) | |||
| Class Y | |||||||
| Shares Sold | 477,180 | $ 9,436,657 | 2,006,363 | $ 27,085,522 | |||
| Shares Issued for Reinvested Dividends | 14,753 | 258,023 | 76,744 | 1,235,384 | |||
| Shares Redeemed | (1,738,687) | (34,340,663) | (4,434,892) | (63,212,927) | |||
| Net Increase (Decrease) | (1,246,754) | (24,645,983) | (2,351,785) | (34,892,021) | |||
| Class F | |||||||
| Shares Sold | 1,124,576 | $ 22,004,533 | 1,381,323 | $ 19,610,748 | |||
| Shares Issued for Reinvested Dividends | 15,153 | 265,184 | 36,082 | 581,769 | |||
| Shares Redeemed | (909,052) | (17,727,319) | (1,275,220) | (18,368,516) | |||
| Net Increase (Decrease) | 230,677 | 4,542,398 | 142,185 | 1,824,001 | |||
| Class SDR | |||||||
| Shares Sold | 451,019 | $ 8,872,003 | 623,631 | $ 9,238,983 | |||
| Shares Issued for Reinvested Dividends | 10,018 | 175,615 | 51,452 | 830,635 | |||
| Shares Redeemed | (576,471) | (11,189,037) | (3,456,941) | (55,712,445) | |||
| Net Increase (Decrease) | (115,434) | (2,141,419) | (2,781,858) | (45,642,827) | |||
| Total Net Increase (Decrease) | (3,119,322) | $ (60,172,505) | (15,519,741) | $ (230,385,915) | |||
| US Small Cap Opportunities Fund | |||||||
| Class A | |||||||
| Shares Sold | 277,286 | $ 8,677,102 | 464,472 | $ 10,513,320 | |||
| Shares Issued for Reinvested Dividends | — | — | 44,207 | 1,122,066 | |||
| Shares Redeemed | (155,738) | (4,695,935) | (293,039) | (6,419,169) | |||
| Net Increase (Decrease) | 121,548 | 3,981,167 | 215,640 | 5,216,217 | |||
| Class C | |||||||
| Shares Sold | 35,829 | $ 1,124,826 | 96,832 | $ 2,425,589 | |||
| Shares Issued for Reinvested Dividends | — | — | 14,029 | 363,339 | |||
| Shares Redeemed | (77,129) | (2,416,272) | (85,890) | (1,926,037) | |||
| Net Increase (Decrease) | (41,300) | (1,291,446) | 24,971 | 862,891 | |||
| Class I | |||||||
| Shares Sold | 1,618,994 | $ 54,075,726 | 3,443,438 | $ 83,623,348 | |||
| Shares Issued for Reinvested Dividends | 2,920 | 85,749 | 267,211 | 7,158,748 | |||
| Shares Redeemed | (1,350,665) | (44,554,890) | (2,972,119) | (67,833,627) | |||
| Net Increase (Decrease) | 271,249 | 9,606,585 | 738,530 | 22,948,469 | |||
| Class R3 | |||||||
| Shares Sold | 41,262 | $ 1,394,324 | 9,177 | $ 223,702 | |||
| Shares Issued for Reinvested Dividends | — | — | 187 | 4,953 | |||
| Shares Redeemed | (11,574) | (370,424) | (3,484) | (85,582) | |||
| Net Increase (Decrease) | 29,688 | 1,023,900 | 5,880 | 143,073 | |||
| Class R4 | |||||||
| Shares Sold | 17,843 | $ 622,180 | 2,691 | $ 67,760 | |||
| Shares Issued for Reinvested Dividends | — | — | 495 | 13,210 | |||
| Shares Redeemed | (4,761) | (161,866) | (4,857) | (129,117) | |||
| Net Increase (Decrease) | 13,082 | 460,314 | (1,671) | (48,147) | |||
| Class R5 | |||||||
| Shares Sold | 11,260 | $ 367,453 | 9,115 | $ 215,817 | |||
| Shares Issued for Reinvested Dividends | 16 | 462 | 170 | 4,561 | |||
| Shares Redeemed | (3,825) | (131,445) | (193) | (4,710) | |||
| Net Increase (Decrease) | 7,451 | 236,470 | 9,092 | 215,668 | |||
| Class Y | |||||||
| Shares Sold | 304,107 | $ 10,256,879 | 174,823 | $ 4,133,695 | |||
| Shares Issued for Reinvested Dividends | 945 | 27,753 | 48,634 | 1,302,907 | |||
| Shares Redeemed | (185,283) | (6,074,145) | (219,884) | (5,234,892) | |||
| Net Increase (Decrease) | 119,769 | 4,210,487 | 3,573 | 201,710 | |||
| 140 |
October 31, 2021
| For the Year Ended October 31, 2021 | For the Year Ended October 31, 2020 | ||||||
| Shares | Amount | Shares | Amount | ||||
| Class F | |||||||
| Shares Sold | 205,102 | $ 6,865,644 | 366,918 | $ 8,709,292 | |||
| Shares Issued for Reinvested Dividends | 877 | 25,755 | 8,742 | 234,558 | |||
| Shares Redeemed | (132,190) | (4,388,595) | (116,641) | (2,581,035) | |||
| Net Increase (Decrease) | 73,789 | 2,502,804 | 259,019 | 6,362,815 | |||
| Class SDR | |||||||
| Shares Sold | 122,265 | $ 4,008,157 | 714,406 | $ 15,697,346 | |||
| Shares Issued for Reinvested Dividends | 1,960 | 57,632 | 21,587 | 579,811 | |||
| Shares Redeemed | (122,234) | (4,073,605) | (194,734) | (4,709,065) | |||
| Net Increase (Decrease) | 1,991 | (7,816) | 541,259 | 11,568,092 | |||
| Total Net Increase (Decrease) | 597,267 | $ 20,722,465 | 1,796,293 | $ 47,470,788 | |||
| (1) | China A Fund commenced operations on March 31, 2020. |
| (2) | Diversified Emerging Markets Fund commenced operations on September 30, 2021. |
| (3) | Class C of the Securitized Income Fund commenced operations on February 28, 2020. |
| 14. | Line of Credit: |
| As of October 31, 2021, each Fund, except Diversified Emerging Markets Fund, participates in a committed line of credit pursuant to a credit agreement dated March 4, 2021. Each Fund that participates in the committed line of credit may borrow under the line of credit for temporary or emergency purposes. The Funds that participate in the committed line of credit (together with certain other Hartford Funds) may borrow up to $350 million in the aggregate, subject to asset coverage and other limitations specified in the credit agreement. The interest rate on borrowings varies depending on the nature of the loan. The facility also charges certain fees, such as an upfront fee and a commitment fee. From November 1, 2020 through March 4, 2021, the Funds that participate in the committed line of credit (together with certain other Hartford Funds) had a similar agreement that enabled them to participate in a $350 million committed line of credit. The fees incurred by the Funds in connection with the committed lines of credit during the period appear in the Statements of Operations under “Other expenses.” During and as of the year ended October 31, 2021, none of the Funds that participate in the committed line of credit had borrowings under this facility. |
| 15. | Indemnifications: |
| Under the Company’s organizational documents, the Company shall indemnify its officers and directors to the full extent required or permitted under Maryland General Corporation Law and federal securities laws. In addition, the Company, on behalf of each Fund, may enter into contracts that contain a variety of indemnifications. The Company’s maximum exposure under these arrangements is unknown. However, as of the date of these financial statements, the Company has not had prior claims or losses pursuant to these contracts and expects the risk of loss to be remote. |
| 16. | Recent Accounting Pronouncement: |
| In March 2020, FASB issued Accounting Standards Update (“ASU”) No. 2020-04, Reference Rate Reform (Topic 848); Facilitation of the Effects of Reference Rate Reform on Financial Reporting, which provides optional guidance for a limited period of time to ease the potential burden in accounting for (or recognizing the effects of) reference rate reform. The guidance is applicable to contracts referencing LIBOR or another reference rate that is expected to be discontinued due to reference rate reform. The ASU is effective as of March 12, 2020 and generally can be applied through December 31, 2022. Management is evaluating the underlying securities referencing LIBOR or another reference rate that is expected to be discontinued over the period of time the ASU is effective. |
| 17. | Change in Independent Registered Public Accounting Firm: |
| On November 6, 2019, the Company, on behalf of each of Emerging Markets Equity Fund, Emerging Markets Multi-Sector Bond Fund, International Multi-Cap Value Fund, International Stock Fund, Securitized Income Fund, Tax-Aware Bond Fund, US MidCap Opportunities Fund and US Small Cap Opportunities Fund, dismissed Ernst and Young LLP (“EY”) as the Funds’ independent registered public accounting firm effective upon the issuance of EY’s report on the Funds’ financial statements as of and for the fiscal year ended October 31, 2019. EY’s report on the Funds’ financial statements for the fiscal periods ended October 31, 2018 and October 31, 2019 contained no adverse opinion or disclaimer of opinion nor was EY’s report qualified or modified as to uncertainty, audit scope or accounting principles. During the Funds’ fiscal year ended on October 31, 2018 and October 31, 2019, and through December 30, 2019 (the “Covered Period”), (i) there were no disagreements with EY on any matter of accounting principles or practices, financial statement disclosure or auditing scope or procedure, which disagreements, |
| 141 |
October 31, 2021
| if not resolved to the satisfaction of EY, would have caused it to make reference to the subject matter of the disagreements in connection with its reports on the Funds’ financial statements for the Covered Period, and (ii) there were no “reportable events” of the kind described in Item 304(a)(1)(v) of Regulation S-K under the Securities Exchange Act of 1934, as amended. | |
| On November 6, 2019, the Audit Committee of the Company’s Board of Directors participated in and approved the decision to engage PricewaterhouseCoopers LLP (“PwC”) as the independent registered public accounting firm for each of Emerging Markets Equity Fund, Emerging Markets Multi-Sector Bond Fund, International Multi-Cap Value Fund, International Stock Fund, Securitized Income Fund, Tax-Aware Bond Fund, US MidCap Opportunities Fund and US Small Cap Opportunities Fund for the fiscal year ended October 31, 2020. The selection of PwC does not reflect any disagreements with or dissatisfaction by the Company or the Board of Directors with the performance of the Funds’ prior independent registered public accounting firm, EY. During the Covered Period, neither the Funds, nor anyone on their behalf, consulted with PwC on items which: (i) concerned the application of accounting principles to a specified transaction, either completed or proposed, or the type of audit opinion that might be rendered on the Funds’ financial statements; or (ii) concerned the subject of a disagreement (as defined in paragraph (a)(1)(iv) of Item 304 of Regulation S-K) or reportable events (as described in paragraph (a)(1)(v) of Item 304 of Regulation S-K). PwC has also been appointed to serve as the independent registered public accounting firm for the China A Fund for the fiscal year ended October 31, 2020. | |
| 18. | Subsequent Events: |
| In connection with the preparation of the financial statements of the Funds as of and for the year ended October 31, 2021, events and transactions subsequent to October 31, 2021, through the date the financial statements were issued have been evaluated by the Funds’ management for possible adjustment and/or disclosure. | |
| Effective December 1, 2021, the management fee set forth in the investment management agreement with respect to the Securitized Income Fund is 0.4000% of the first $1 billion and 0.3900% in excess of $1 billion annually of the Fund’s average daily net assets. Effective December 1, 2021, HFMC has contractually agreed to reimburse expenses (exclusive of taxes, interest expenses, brokerage commissions, acquired fund fees and expenses and extraordinary expenses) to the extent necessary to limit total annual fund operating expenses as follows for the Securitized Income Fund: 0.85% (Class A), 1.70% (Class C), 0.60% (Class I), 0.55% (Class Y), 0.45% (Class F), and 0.45% (Class SDR). This contractual arrangement will remain in effect until February 28, 2023 unless the Board of Directors of the Company approves its earlier termination. Effective December 1, 2021, the Securitized Income Fund modified its principal investment strategy and, effective December 31, 2021, the Securitized Income Fund will change its benchmark to the ICE BofA 1-3 Year U.S. Corporate Index. For more information, please see the supplement to the Securitized Income Fund's prospectus dated December 1, 2021. | |
| Effective November 15, 2021, the Diversified Emerging Markets Fund is eligible to participate in the committed line of credit discussed under Note 14. |
| 142 |
| Fund Name | |||
| Hartford Schroders China A Fund(1) | |||
| Hartford Schroders Diversified Emerging Markets Fund (2) | |||
| Hartford Schroders Emerging Markets Equity Fund(3) | |||
| Hartford Schroders Emerging Markets Multi-Sector Bond Fund(3) | |||
| Hartford Schroders International Multi-Cap Value Fund (3) | |||
| Hartford Schroders International Stock Fund (3) | |||
| Hartford Schroders Securitized Income Fund (4) | |||
| Hartford Schroders Tax-Aware Bond Fund (3) | |||
| Hartford Schroders US MidCap Opportunities Fund(3) | |||
| Hartford Schroders US Small Cap Opportunities Fund(3) |
| (1) | Statement of operations for the year ended October 31, 2021 and the statements of changes in net assets and financial highlights for the year ended October 31, 2021 and the period March 31, 2020 (commencement of operations) through October 31, 2020. |
| (2) | Statement of operations, statement of changes in net assets and financial highlights for the period September 30, 2021 (commencement of operations) through October 31, 2021. |
| (3) | Statements of operations for the year ended October 31, 2021 and the statements of changes in net assets and financial highlights for each of the two years in the period ended October 31, 2021. |
| (4) | Statements of operations and cash flows for the year ended October 31, 2021, statements of changes in net assets for each of the two years in the period ended October 31, 2021 and financial highlights for each of the periods indicated therein ended on or subsequent to October 31, 2020. |
| 143 |
| 144 |
| • | the operation of the LRM Program (and related policies and procedures utilized in connection with management of the Funds’ liquidity risk); |
| • | an assessment of the adequacy and effectiveness of the LRM Program’s (and related policies and procedures’) implementation; |
| • | the operation, and assessment of the adequacy and effectiveness, of each Fund’s HLIM; |
| • | whether the third-party liquidity vendor’s (“LRM Program Vendor”) processes for determining preliminary liquidity classifications, including the particular methodologies or factors used and metrics analyzed by the LRM Program Vendor, are sufficient under the Liquidity Rule and appropriate in light of each Fund’s specific circumstances; and |
| • | any material changes to the LRM Program. |
| 145 |
| NAME, YEAR OF BIRTH AND ADDRESS(1) | POSITION HELD WITH THE COMPANY | TERM OF OFFICE(2) AND LENGTH OF TIME SERVED | PRINCIPAL OCCUPATION(S) DURING PAST 5 YEARS | NUMBER OF PORTFOLIOS IN FUND COMPLEX(3) OVERSEEN BY DIRECTOR | OTHER DIRECTORSHIPS FOR PUBLIC COMPANIES AND OTHER REGISTERED INVESTMENT COMPANIES BY DIRECTOR | |||||
| NON-INTERESTED DIRECTORS | ||||||||||
| HILARY E. ACKERMANN (1956) | Director | Since 2014 | Ms. Ackermann served as Chief Risk Officer at Goldman Sachs Bank USA from October 2008 to November 2011. | 75 | Ms. Ackermann served as a Director of Dynegy, Inc. from October 2012 until its acquisition by Vistra Energy Corporation (“Vistra”) in 2018, and since that time she has served as a Director of Vistra. Ms. Ackermann serves as a Director of Credit Suisse Holdings (USA), Inc. from January 2017 to present. | |||||
| ROBIN C. BEERY (1967) | Director | Since 2017 | Ms. Beery has served as a consultant to ArrowMark Partners (an alternative asset manager) since March of 2015 and since November 2018 has been employed by ArrowMark Partners as a Senior Advisor. Previously, she was Executive Vice President, Head of Distribution, for Janus Capital Group, and Chief Executive Officer and President of the Janus Mutual Funds (a global asset manager) from September 2009 to August 2014. | 75 | Ms. Beery serves as an independent Director of UMB Financial Corporation (January 2015 to present), has chaired the Compensation Committee since April 2017, and serves on the Audit Committee and the Risk Committee. | |||||
| LYNN S. BIRDSONG(4), (5) (1946) | Director and Chair of the Board | Director since 2003; Chair of the Board since 2019 | From January 1981 through December 2013, Mr. Birdsong was a partner in Birdsong Company, an advertising specialty firm. From 1979 to 2002, Mr. Birdsong was a Managing Director of Zurich Scudder Investments, an investment management firm. | 75 | None | |||||
| DERRICK D. CEPHAS (1952) | Director | Since 2020 | Mr. Cephas currently serves as Of Counsel to Squire Patton Boggs LLP, an international law firm with 45 offices in 20 countries. Until his retirement in October 2020, Mr. Cephas was a Partner of Weil, Gotshal & Manges LLP, an international law firm headquartered in New York, where he served as the Head of the Financial Institutions Practice (April 2011 to October 2020). | 75 | Mr. Cephas currently serves as a Director of Signature Bank, a New York-based commercial bank, and is a member of the Credit Committee, Examining Committee and Risk Committee. Mr. Cephas currently serves as a Director of Claros Mortgage Trust, Inc., a real estate investment trust. | |||||
| CHRISTINE R. DETRICK(5) (1958) | Director | Since 2016 | Ms. Detrick served as a Senior Partner/Advisor at Bain & Company (a management consulting firm) from September 2002 to December 2012. | 75 | Ms. Detrick serves as a Director and Chair of the Nominating and Governance Committee of Reinsurance Group of America (from January 2014 to present). She also serves as a Director of Charles River Associates (May 2020 to present). | |||||
| 146 |
| NAME, YEAR OF BIRTH AND ADDRESS(1) | POSITION HELD WITH THE COMPANY | TERM OF OFFICE(2) AND LENGTH OF TIME SERVED | PRINCIPAL OCCUPATION(S) DURING PAST 5 YEARS | NUMBER OF PORTFOLIOS IN FUND COMPLEX(3) OVERSEEN BY DIRECTOR | OTHER DIRECTORSHIPS FOR PUBLIC COMPANIES AND OTHER REGISTERED INVESTMENT COMPANIES BY DIRECTOR | |||||
| ANDREW A. JOHNSON (1962) | Director | Since 2020 | Mr. Johnson currently serves as a Diversity and Inclusion Advisor at Neuberger Berman, a private, global investment management firm. Prior to his current role, Mr. Johnson served as Chief Investment Officer and Head of Global Investment Grade Fixed Income at Neuberger Berman (January 2009 to December 2018). | 75 | Mr. Johnson currently serves as a Director of AGNC Investment Corp., a real estate investment trust. | |||||
| PAUL L. ROSENBERG (1953) | Director | Since 2020 | Mr. Rosenberg is a Partner of The Bridgespan Group, a global nonprofit consulting firm that is a social impact advisor to nonprofits, non-governmental organizations, philanthropists and institutional investors (October 2007 to present). | 75 | None | |||||
| LEMMA W. SENBET(4) (1946) | Director | Since 2005 | Dr. Senbet currently serves as the William E. Mayer Chair Professor of Finance in the Robert H. Smith School of Business at the University of Maryland, where he was chair of the Finance Department from 1998 to 2006. In June 2013, he began a sabbatical from the University to serve as Executive Director of the African Economic Research Consortium which focuses on economic policy research and training, which he completed in 2018. | 75 | None | |||||
| DAVID SUNG (1953) | Director | Since 2017 | Mr. Sung was a Partner at Ernst & Young LLP from October 1995 to July 2014. | 75 | Mr. Sung serves as a Trustee of Ironwood Institutional Multi-Strategy Fund, LLC and Ironwood Multi-Strategy Fund, LLC (October 2015 to present). | |||||
| OFFICERS AND INTERESTED DIRECTORS | ||||||||||
| JAMES E. DAVEY(6) (1964) | Director, President and Chief Executive Officer | President and Chief Executive Officer since 2010; Director since 2012 | Mr. Davey serves as Executive Vice President of The Hartford Financial Services Group, Inc. Mr. Davey has served in various positions within The Hartford and its subsidiaries and joined The Hartford in 2002. Additionally, Mr. Davey serves as Director, Chairman, President, and Senior Managing Director for Hartford Funds Management Group, Inc. ("HFMG"). Mr. Davey also serves as President, Manager, Chairman of the Board, and Senior Managing Director for Hartford Funds Management Company, LLC (“HFMC”); Manager, Chairman of the Board, and President of Lattice Strategies LLC (“Lattice”); Chairman of the Board, Manager, and Senior Managing Director of Hartford Funds Distributors, LLC (“HFD”); and Chairman of the Board, President and Senior Managing Director of Hartford Administrative Services Company (“HASCO”), each of which is an affiliate of HFMG. | 75 | None | |||||
| ANDREW S. DECKER (1963) | AML Compliance Officer | Since 2015 | Mr. Decker serves as Chief Compliance Officer and AML Compliance Officer of HASCO (since April 2015) and Vice President of HASCO (since April 2018). Mr. Decker serves as AML Officer of HFD (since May 2015). Mr. Decker also serves as Vice President of HFMG (since April 2018). Prior to joining The Hartford, Mr. Decker served as Vice President and AML Officer at Janney Montgomery Scott (a broker dealer) from April 2011 to January 2015. | N/A | N/A | |||||
| AMY N. FURLONG (1979) | Vice President | Since 2018 | Ms. Furlong serves as Vice President and Assistant Treasurer of HFMC (since September 2019). From 2018 through March 15, 2021, Ms. Furlong served as the Treasurer of the Company. Ms. Furlong has served in various positions within The Hartford and its subsidiaries in connection with the operation of the Hartford funds. Ms. Furlong joined The Hartford in 2004. | N/A | N/A | |||||
| 147 |
| NAME, YEAR OF BIRTH AND ADDRESS(1) | POSITION HELD WITH THE COMPANY | TERM OF OFFICE(2) AND LENGTH OF TIME SERVED | PRINCIPAL OCCUPATION(S) DURING PAST 5 YEARS | NUMBER OF PORTFOLIOS IN FUND COMPLEX(3) OVERSEEN BY DIRECTOR | OTHER DIRECTORSHIPS FOR PUBLIC COMPANIES AND OTHER REGISTERED INVESTMENT COMPANIES BY DIRECTOR | |||||
| WALTER F. GARGER (1965) | Vice President and Chief Legal Officer | Since 2016 | Mr. Garger serves as Secretary, Managing Director and General Counsel of HFMG, HFMC, HFD, and HASCO (since 2013). Mr. Garger also serves as Secretary and General Counsel of Lattice (since July 2016). Mr. Garger has served in various positions within The Hartford and its subsidiaries in connection with the operation of the Hartford funds. Mr. Garger joined The Hartford in 1995. | N/A | N/A | |||||
| THEODORE J. LUCAS (1966) | Vice President | Since 2017 | Mr. Lucas serves as Executive Vice President of HFMG (since July 2016) and as Executive Vice President of Lattice (since June 2017). Previously, Mr. Lucas served as Managing Partner of Lattice (2003 to 2016). | N/A | N/A | |||||
| JOSEPH G. MELCHER (1973) | Vice President and Chief Compliance Officer | Since 2013 | Mr. Melcher serves as Executive Vice President of HFMG and HASCO (since December 2013). Mr. Melcher also serves as Executive Vice President (since December 2013) and Chief Compliance Officer (since December 2012) of HFMC, serves as Executive Vice President and Chief Compliance Officer of Lattice (since July 2016), serves as Executive Vice President of HFD (since December 2013), and served as President and Chief Executive Officer of HFD (from April 2018 to June 2019). | N/A | N/A | |||||
| VERNON J. MEYER (1964) | Vice President | Since 2006 | Mr. Meyer serves as Managing Director and Chief Investment Officer of HFMC and Managing Director of HFMG (since 2013). Mr. Meyer also serves as Senior Vice President-Investments of Lattice (since March 2019). Mr. Meyer has served in various positions within The Hartford and its subsidiaries in connection with the operation of the Hartford funds. Mr. Meyer joined The Hartford in 2004. | N/A | N/A | |||||
| DAVID A. NAAB (1985) | Vice President and Treasurer | Since March 15, 2021 | Mr. Naab serves as Vice President and Assistant Treasurer of HFMC (since June 2021). Prior to joining HFMC in 2021, Mr. Naab served in various positions as an associate, senior associate, manager, senior manager, and director within the investment management, financial services, and asset & wealth management practice groups of PricewaterhouseCoopers, LLP from 2007 to 2020. | N/A | N/A | |||||
| ALICE A. PELLEGRINO (1960) | Vice President and Assistant Secretary | Since 2016 | Ms. Pellegrino serves as Vice President of HFMG (since December 2013). Ms. Pellegrino also serves as Vice President and Assistant Secretary of Lattice (since June 2017). Ms. Pellegrino is a Senior Counsel and has served in various positions within The Hartford and its subsidiaries in connection with the operation of the Hartford funds. Ms. Pellegrino joined The Hartford in 2007. | N/A | N/A | |||||
| THOMAS R. PHILLIPS (1960) | Vice President and Secretary | Since 2017 | Mr. Phillips is Deputy General Counsel for HFMG and currently serves as a Senior Vice President (since June 2021) and Assistant Secretary (since June 2017) for HFMG. Mr. Phillips also serves as Vice President of HFMC (since June 2021). Prior to joining HFMG in 2017, Mr. Phillips was a Director and Chief Legal Officer of Saturna Capital Corporation from 2014–2016. Prior to that, Mr. Phillips was a Partner and Deputy General Counsel of Lord, Abbett & Co. LLC. | N/A | N/A |
| 148 |
| (1) | The address for each officer and Director is c/o Hartford Funds 690 Lee Road, Wayne, Pennsylvania 19087. |
| (2) | Term of Office: Each Director holds an indefinite term until his or her retirement, resignation, removal, or death. Directors generally must retire no later than December 31 of the year in which the Director turns 75 years of age. Each Fund officer generally serves until his or her resignation, removal, or death. |
| (3) | The portfolios of the “Fund Complex” are operational series of The Hartford Mutual Funds, Inc., The Hartford Mutual Funds II, Inc., Hartford Series Fund, Inc., Hartford HLS Series Fund II, Inc., Lattice Strategies Trust, and Hartford Funds Exchange-Traded Trust. |
| (4) | Effective as of December 31, 2021, Messrs. Birdsong and Senbet will retire as Directors. |
| (5) | Mr. Birdsong will retire effective December 31, 2021. Anticipating Mr. Birdsong's retirement, the Board has elected Christine R. Detrick to serve as Chair of the Board effective November 4, 2021. Accordingly, effective November 4, 2021, Mr. Birdsong will no longer serve as Chair of the Board. Effective November 5, 2021, Ms. Detrick also will serve as a Director of Capital One Financial Corporation. |
| (6) | “Interested person,” as defined in the 1940 Act, of the Company because of the person’s affiliation with, or equity ownership of, HFMC, HFD or affiliated companies. |
| 149 |
| 150 |
| 151 |
| 152 |
| 153 |
| 154 |
| 155 |
| • | The Board noted that the Fund’s performance was in the 2nd quintile of its performance universe for the 1-year period. The Board also noted that the Fund’s performance was above its benchmark for the 1-year period. |
| • | The Board noted that the Fund’s contractual management fee, actual management fee, and total expenses (less 12b-1 and shareholder service fees) were in the 1st quintile of its expense group. The Board noted that Class A shares of the Fund have a contractual expense cap of 1.45% through February 28, 2022, which resulted in HFMC reimbursing the Fund for certain expenses. |
| • | The Board noted that the Fund’s performance was in the 3rd quintile of its performance universe for the 1-year period, the 2nd quintile for the 3-year period, and the 1st quintile for the 5-year period. The Board also noted that the Fund’s performance was above its benchmark for the 1-, 3-, and 5-year periods. |
| • | The Board noted that the Fund’s contractual management fee was in the 4th quintile of its expense group, while its actual management fee was in the 5th quintile and its total expenses (less 12b-1 and shareholder service fees) were in the 3rd quintile. |
| • | The Board noted that the Fund’s performance was in the 2nd quintile of its performance universe for the 1-year period and the 5th quintile for the 3- and 5-year periods. The Board also noted that the Fund’s performance was above its benchmark for the 1-year period and below its custom blended benchmark for the 3- and 5-year periods. The Board noted recent changes to the Fund’s portfolio management team. |
| • | The Board noted that the Fund’s contractual management fee and actual management fee were in the 2nd quintile of its expense group and its total expenses (less 12b-1 and shareholder service fees) were in the 3rd quintile. The Board noted that Class A shares of the Fund have a contractual expense cap of 1.15% through February 28, 2022, which resulted in HFMC reimbursing the Fund for certain expenses. |
| • | The Board noted that the Fund’s performance was in the 3rd quintile of its performance universe for the 1- and 3-year periods and the 2nd quintile for the 5-year period. The Board also noted that the Fund’s performance was above its benchmark for the 1-year period and below its benchmark for the 3- and 5-year periods. The Board noted recent changes to the Fund’s portfolio management team. |
| • | The Board noted that the Fund’s contractual management fee was in the 2nd quintile of its expense group, while its actual management fee was in the 3rd quintile and its total expenses (less 12b-1 and shareholder service fees) were in the 1st quintile. The Board noted that Class Y shares of the Fund have a contractual transfer agency expense cap of 0.08% through February 28, 2022. |
| • | The Board noted that the Fund’s performance was in the 1st quintile of its performance universe for the 1-, 3-, and 5-year periods. The Board also noted that the Fund’s performance was above its benchmark for the 1-, 3-, and 5-year periods. |
| • | The Board noted that the Fund’s contractual management fee and its total expenses (less 12b-1 and shareholder service fees) were in the 1st quintile of its expense group, while its actual management fee was in the 2nd quintile. |
| 156 |
| • | The Board noted that the Fund’s performance was in the 5th quintile of its performance universe for the 1-year period. The Board also noted that the Fund’s performance was above its benchmark for the 1-year period. |
| • | The Board noted that the Fund’s contractual management fee and actual management fee were in the 3rd quintile of its expense group and its total expenses (less 12b-1 and shareholder service fees) were in the 4th quintile. The Board noted that Class A shares of the Fund have a contractual expense cap of 1.10% through February 28, 2022, which resulted in HFMC reimbursing the Fund for certain expenses. |
| • | The Board noted that the Fund’s performance was in the 4th quintile of its performance universe for the 1-year period and the 3rd quintile for the 3- and 5-year periods. The Board also noted that the Fund’s performance was in line with its benchmark for the 1-, 3-, and 5-year periods. The Board noted recent changes to the Fund’s portfolio management team. |
| • | The Board noted that the Fund’s contractual management fee, actual management fee, and total expenses (less 12b-1 and shareholder service fees) were in the 1st quintile of its expense group. The Board noted that Class A shares of the Fund have a contractual expense cap of 0.71% through February 28, 2022, which resulted in HFMC reimbursing the Fund for certain expenses. |
| • | The Board noted that the Fund’s performance was in the 4th quintile of its performance universe for the 1-year period and the 3rd quintile for the 3- and 5-year periods. The Board also noted that the Fund’s performance was below its benchmark for the 1-, 3-, and 5-year periods. |
| • | The Board noted that the Fund’s contractual management fee and its total expenses (less 12b-1 and shareholder service fees) were in the 2nd quintile of its expense group, while its actual management fee was in the 3rd quintile. |
| • | The Board noted that the Fund’s performance was in the 4th quintile of its performance universe for the 1-year period and the 2nd quintile for the 3- and 5-year periods. The Board also noted that the Fund’s performance was below its benchmark for the 1-, 3-, and 5-year periods. |
| • | The Board noted that the Fund’s contractual management fee was in the 3rd quintile of its expense group, while its actual management fee and its total expenses (less 12b-1 and shareholder service fees) were in the 4th quintile. The Board noted that Class A shares of the Fund have a contractual expense cap of 1.35% through February 28, 2022, which resulted in HFMC reimbursing the Fund for certain expenses. |
| 157 |
| 158 |
| 159 |
| 160 |
| 161 |
| a) | management; |
| b) | use; and |
| c) | protection; |
| a) | service your Transactions with us; and |
| b) | support our business functions. |
| a) | You; |
| b) | your Transactions with us; and |
| c) | third parties such as a consumer-reporting agency. |
| a) | your name; |
| b) | your address; |
| c) | your income; |
| d) | your payment; or |
| e) | your credit history; |
| a) | our insurance companies; |
| b) | our employee agents; |
| c) | our brokerage firms; and |
| d) | our administrators. |
| a) | market our products; or |
| b) | market our services; |
| a) | independent agents; |
| b) | brokerage firms; |
| c) | insurance companies; |
| d) | administrators; and |
| e) | service providers; |
| a) | taking surveys; |
| b) | marketing our products or services; or |
| c) | offering financial products or services under a joint agreement |
| a) | cookies; |
| b) | pixel tagging; or |
| c) | other technologies; |
| a) | “opt-out;” or |
| b) | “opt-in;” |
| a) | your authorization; or |
| b) | as otherwise allowed or required by law. |
| a) | underwriting policies; |
| b) | paying claims; |
| c) | developing new products; or |
| d) | advising customers of our products and services. |
| a) | the confidentiality; and |
| b) | the integrity of; |
| a) | secured files; |
| b) | user authentication; |
| c) | encryption; |
| d) | firewall technology; and |
| e) | the use of detection software. |
| a) | identify information to be protected; |
| b) | provide an adequate level of protection for that data; and |
| c) | grant access to protected data only to those people who must use |
| a) | credit history; |
| b) | income; |
| c) | financial benefits; or |
| d) | policy or claim information. |
| a) | your medical records; or |
| b) | information about your illness, disability or injury. |
| a) | Personal Financial Information; and |
| b) | Personal Health Information. |
| a) | your Application; |
| b) | your request for us to pay a claim; and |
| c) | your request for us to take an action on your account. |
| a) | asking about; |
| b) | applying for; or |
| c) | obtaining; |


Equity Funds
| ■ The Hartford Capital Appreciation Fund |
| ■ Hartford Core Equity Fund |
| ■ The Hartford Dividend and Growth Fund |
| ■ The Hartford Equity Income Fund |
| ■ The Hartford Growth Opportunities Fund |
| ■ The Hartford Healthcare Fund |
| ■ The Hartford MidCap Fund |
| ■ The Hartford MidCap Value Fund |
| ■ Hartford Quality Value Fund |
| ■ The Hartford Small Cap Growth Fund |
| ■ Hartford Small Cap Value Fund |
| ■ The Hartford Small Company Fund |
 |

President
Hartford Funds
| 1 | S&P 500 Index is a market capitalization-weighted price index composed of 500 widely held common stocks. The index is unmanaged and not available for direct investment. Past performance does not guarantee future results. |
| 2 | The Personal Consumption Expenditures Price Index, which excludes food and energy prices, rose 3.6% in July 2021. Source: U.S. Bureau of Economic Analysis and the St. Louis Fed, as of September 2021. |
October 31, 2021 (Unaudited)
| Inception 07/22/1996 Sub-advised by Wellington Management Company LLP | Investment objective – The Fund seeks growth of capital. |

| Average Annual Total Returns | |||
| for the Periods Ending 10/31/2021 | |||
| 1 Year | 5 Years | 10 Years | |
| Class A1 | 33.83% | 16.44% | 14.37% |
| Class A2 | 26.47% | 15.13% | 13.72% |
| Class C1 | 32.78% | 15.56% | 13.54% |
| Class C3 | 31.78% | 15.56% | 13.54% |
| Class I1 | 34.18% | 16.76% | 14.71% |
| Class R31 | 33.32% | 16.03% | 14.01% |
| Class R41 | 33.72% | 16.39% | 14.36% |
| Class R51 | 34.13% | 16.74% | 14.70% |
| Class R61 | 34.27% | 16.86% | 14.81% |
| Class Y1 | 34.16% | 16.81% | 14.79% |
| Class F1 | 34.28% | 16.85% | 14.75% |
| Russell 3000 Index | 43.90% | 18.91% | 16.10% |
| S&P 500 Index | 42.91% | 18.93% | 16.21% |
| 1 | Without sales charge |
| 2 | Reflects maximum sales charge of 5.50% |
| 3 | Reflects a contingent deferred sales charge of 1.00% |
| Operating Expenses* | Gross | Net |
| Class A | 1.07% | 1.07% |
| Class C | 1.84% | 1.84% |
| Class I | 0.78% | 0.78% |
| Class R3 | 1.41% | 1.41% |
| Class R4 | 1.10% | 1.10% |
| Class R5 | 0.80% | 0.80% |
| Class R6 | 0.70% | 0.70% |
| Class Y | 0.80% | 0.80% |
| Class F | 0.70% | 0.70% |
| * | Expenses as shown in the Fund’s most recent prospectus. Actual expenses may be higher or lower. Please see accompanying Financial Highlights for expense ratios for the period ended 10/31/2021. |
| 2 |
October 31, 2021 (Unaudited)
Manager Discussion
| 3 |
October 31, 2021 (Unaudited)
| 4 |
October 31, 2021 (Unaudited)
| Composition by Sector(1) | |
| as of 10/31/2021 | |
| Sector | Percentage of Net Assets |
| Equity Securities | |
| Communication Services | 7.7% |
| Consumer Discretionary | 14.9 |
| Consumer Staples | 7.5 |
| Energy | 1.0 |
| Financials | 11.5 |
| Health Care | 13.1 |
| Industrials | 12.2 |
| Information Technology | 22.3 |
| Materials | 3.1 |
| Real Estate | 4.1 |
| Utilities | 0.2 |
| Total | 97.6% |
| Short-Term Investments | 3.1 |
| Other Assets & Liabilities | (0.7) |
| Total | 100.0% |
| (1) | A sector may be comprised of several industries. For Fund compliance purposes, the Fund may not use the same classification system. These sector classifications are used for financial reporting purposes. |
| 5 |
October 31, 2021 (Unaudited)
| Inception 04/30/1998 Sub-advised by Wellington Management Company LLP | Investment objective – The Fund seeks growth of capital. |
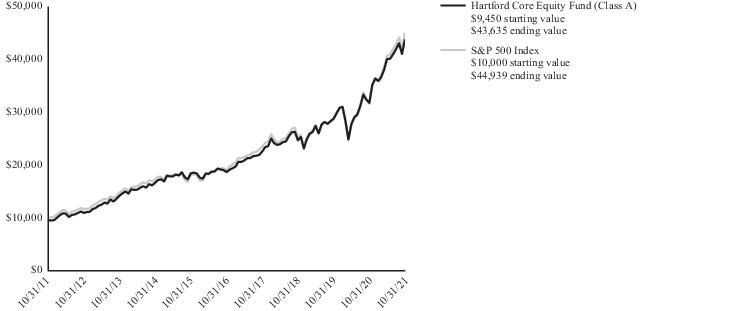
| Average Annual Total Returns | |||
| for the Periods Ending 10/31/2021 | |||
| 1 Year | 5 Years | 10 Years | |
| Class A1 | 37.85% | 18.68% | 16.53% |
| Class A2 | 30.27% | 17.34% | 15.87% |
| Class C1 | 36.86% | 17.81% | 15.69% |
| Class C3 | 35.86% | 17.81% | 15.69% |
| Class I1 | 38.19% | 18.99% | 16.73% |
| Class R31 | 37.38% | 18.27% | 16.20% |
| Class R41 | 37.82% | 18.66% | 16.57% |
| Class R51 | 38.17% | 18.98% | 16.90% |
| Class R61 | 38.31% | 19.10% | 16.97% |
| Class Y1 | 38.20% | 19.03% | 16.95% |
| Class F1 | 38.33% | 19.09% | 16.78% |
| S&P 500 Index | 42.91% | 18.93% | 16.21% |
| 1 | Without sales charge |
| 2 | Reflects maximum sales charge of 5.50% |
| 3 | Reflects a contingent deferred sales charge of 1.00% |
| 6 |
October 31, 2021 (Unaudited)
| Operating Expenses* | Gross | Net |
| Class A | 0.73% | 0.73% |
| Class C | 1.47% | 1.47% |
| Class I | 0.46% | 0.46% |
| Class R3 | 1.07% | 1.07% |
| Class R4 | 0.78% | 0.78% |
| Class R5 | 0.48% | 0.48% |
| Class R6 | 0.38% | 0.38% |
| Class Y | 0.48% | 0.46% |
| Class F | 0.38% | 0.38% |
| * | Expenses as shown in the Fund’s most recent prospectus. Gross expenses do not reflect contractual fee waivers or expense reimbursement arrangements. Net expenses reflect such arrangements only with respect to Class Y. These arrangements remain in effect until 02/28/2022 unless the Fund’s Board of Directors approves an earlier termination. Actual expenses may be higher or lower. Please see accompanying Financial Highlights for expense ratios for the period ended 10/31/2021. |
Manager Discussion
| 7 |
October 31, 2021 (Unaudited)
| 8 |
October 31, 2021 (Unaudited)
| Composition by Sector(1) | |
| as of 10/31/2021 | |
| Sector | Percentage of Net Assets |
| Equity Securities | |
| Communication Services | 12.7% |
| Consumer Discretionary | 11.9 |
| Consumer Staples | 5.9 |
| Energy | 1.3 |
| Financials | 12.6 |
| Health Care | 14.4 |
| Industrials | 9.4 |
| Information Technology | 26.1 |
| Materials | 1.1 |
| Real Estate | 1.7 |
| Utilities | 2.0 |
| Total | 99.1% |
| Short-Term Investments | 0.6 |
| Other Assets & Liabilities | 0.3 |
| Total | 100.0% |
| (1) | A sector may be comprised of several industries. For Fund compliance purposes, the Fund may not use the same classification system. These sector classifications are used for financial reporting purposes. |
| 9 |
October 31, 2021 (Unaudited)
| Inception 07/22/1996 Sub-advised by Wellington Management Company LLP | Investment objective – The Fund seeks a high level of current income consistent with growth of capital. |

| Average Annual Total Returns | |||
| for the Periods Ending 10/31/2021 | |||
| 1 Year | 5 Years | 10 Years | |
| Class A1 | 46.01% | 15.72% | 13.87% |
| Class A2 | 37.98% | 14.42% | 13.23% |
| Class C1 | 44.92% | 14.85% | 13.02% |
| Class C3 | 43.92% | 14.85% | 13.02% |
| Class I1 | 46.39% | 16.02% | 14.14% |
| Class R31 | 45.43% | 15.31% | 13.49% |
| Class R41 | 45.92% | 15.66% | 13.84% |
| Class R51 | 46.35% | 16.01% | 14.18% |
| Class R61 | 46.52% | 16.13% | 14.29% |
| Class Y1 | 46.47% | 16.09% | 14.27% |
| Class F1 | 46.55% | 16.13% | 14.19% |
| S&P 500 Index | 42.91% | 18.93% | 16.21% |
| Russell 1000 Value Index | 43.76% | 12.39% | 12.85% |
| 1 | Without sales charge |
| 2 | Reflects maximum sales charge of 5.50% |
| 3 | Reflects a contingent deferred sales charge of 1.00% |
| 10 |
October 31, 2021 (Unaudited)
| Operating Expenses* | Gross | Net |
| Class A | 1.00% | 1.00% |
| Class C | 1.78% | 1.78% |
| Class I | 0.74% | 0.74% |
| Class R3 | 1.36% | 1.36% |
| Class R4 | 1.05% | 1.05% |
| Class R5 | 0.75% | 0.75% |
| Class R6 | 0.65% | 0.65% |
| Class Y | 0.74% | 0.69% |
| Class F | 0.65% | 0.65% |
| * | Expenses as shown in the Fund’s most recent prospectus. Gross expenses do not reflect contractual fee waivers or expense reimbursement arrangements. Net expenses reflect such arrangements only with respect to Class Y. These arrangements remain in effect until 02/28/2022 unless the Fund’s Board of Directors approves an earlier termination. Actual expenses may be higher or lower. Please see accompanying Financial Highlights for expense ratios for the period ended 10/31/2021. |
Manager Discussion
| 11 |
October 31, 2021 (Unaudited)
| 12 |
October 31, 2021 (Unaudited)
| Composition by Sector(1) | |
| as of 10/31/2021 | |
| Sector | Percentage of Net Assets |
| Equity Securities | |
| Communication Services | 8.2% |
| Consumer Discretionary | 6.2 |
| Consumer Staples | 5.8 |
| Energy | 4.2 |
| Financials | 20.0 |
| Health Care | 14.9 |
| Industrials | 8.1 |
| Information Technology | 19.0 |
| Materials | 3.4 |
| Real Estate | 3.2 |
| Utilities | 3.8 |
| Total | 96.8% |
| Short-Term Investments | 2.5 |
| Other Assets & Liabilities | 0.7 |
| Total | 100.0% |
| (1) | A sector may be comprised of several industries. For Fund compliance purposes, the Fund may not use the same classification system. These sector classifications are used for financial reporting purposes. |
| 13 |
October 31, 2021 (Unaudited)
| Inception 08/28/2003 Sub-advised by Wellington Management Company LLP | Investment objective – The Fund seeks a high level of current income consistent with growth of capital. |
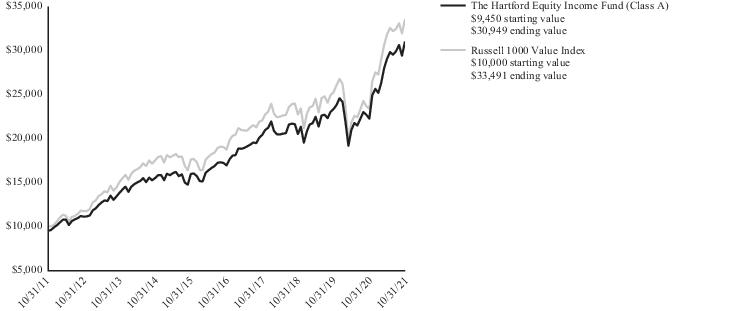
| Average Annual Total Returns | |||
| for the Periods Ending 10/31/2021 | |||
| 1 Year | 5 Years | 10 Years | |
| Class A1 | 39.45% | 12.89% | 12.60% |
| Class A2 | 31.78% | 11.62% | 11.96% |
| Class C1 | 38.31% | 12.02% | 11.76% |
| Class C3 | 37.31% | 12.02% | 11.76% |
| Class I1 | 39.69% | 13.15% | 12.88% |
| Class R31 | 38.83% | 12.47% | 12.20% |
| Class R41 | 39.25% | 12.80% | 12.54% |
| Class R51 | 39.75% | 13.15% | 12.89% |
| Class R61 | 39.82% | 13.26% | 13.00% |
| Class Y1 | 39.77% | 13.21% | 12.97% |
| Class F1 | 39.81% | 13.25% | 12.93% |
| Russell 1000 Value Index | 43.76% | 12.39% | 12.85% |
| 1 | Without sales charge |
| 2 | Reflects maximum sales charge of 5.50% |
| 3 | Reflects a contingent deferred sales charge of 1.00% |
| Operating Expenses* | Gross | Net |
| Class A | 1.01% | 1.01% |
| Class C | 1.76% | 1.76% |
| Class I | 0.74% | 0.74% |
| Class R3 | 1.36% | 1.36% |
| Class R4 | 1.06% | 1.06% |
| Class R5 | 0.77% | 0.77% |
| Class R6 | 0.66% | 0.66% |
| Class Y | 0.76% | 0.76% |
| Class F | 0.66% | 0.66% |
| * | Expenses as shown in the Fund’s most recent prospectus. Actual expenses may be higher or lower. Please see accompanying Financial Highlights for expense ratios for the period ended 10/31/2021. |
| 14 |
October 31, 2021 (Unaudited)
| * | Michael Reckmeyer, III, CFA announced his plan to retire and withdraw from the partnership of Wellington Management Company LLP’s parent company, and effective June 30, 2022, he will no longer serve as a portfolio manager for the Fund. Mr. Reckmeyer’s portfolio management responsibilities will transition to Matthew C. Hand, CFA in the months leading up to his departure. |
Manager Discussion
| 15 |
October 31, 2021 (Unaudited)
| Composition by Sector(1) | |
| as of 10/31/2021 | |
| Sector | Percentage of Net Assets |
| Equity Securities | |
| Communication Services | 3.6% |
| Consumer Discretionary | 4.6 |
| Consumer Staples | 11.7 |
| Energy | 5.3 |
| Financials | 20.6 |
| Health Care | 19.1 |
| Industrials | 12.7 |
| Information Technology | 9.3 |
| Materials | 4.3 |
| Real Estate | 2.0 |
| Utilities | 5.7 |
| Total | 98.9% |
| Short-Term Investments | 1.4 |
| Other Assets & Liabilities | (0.3) |
| Total | 100.0% |
| (1) | A sector may be comprised of several industries. For Fund compliance purposes, the Fund may not use the same classification system. These sector classifications are used for financial reporting purposes. |
| 16 |
October 31, 2021 (Unaudited)
| Inception 03/31/1963 Sub-advised by Wellington Management Company LLP | Investment objective – The Fund seeks capital appreciation. |
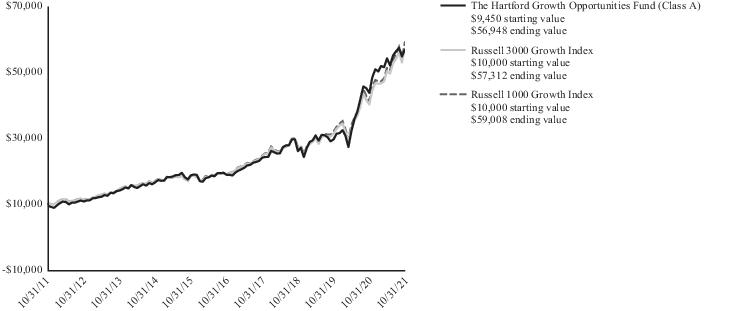
| Average Annual Total Returns | |||
| for the Periods Ending 10/31/2021 | |||
| 1 Year | 5 Years | 10 Years | |
| Class A1 | 30.45% | 24.75% | 19.68% |
| Class A2 | 23.28% | 23.34% | 19.00% |
| Class C1 | 29.47% | 23.82% | 18.80% |
| Class C3 | 28.47% | 23.82% | 18.80% |
| Class I1 | 30.75% | 25.07% | 19.97% |
| Class R31 | 29.96% | 24.31% | 19.29% |
| Class R41 | 30.36% | 24.69% | 19.65% |
| Class R51 | 30.74% | 25.07% | 20.01% |
| Class R61 | 30.87% | 25.19% | 20.12% |
| Class Y1 | 30.74% | 25.14% | 20.10% |
| Class F1 | 30.87% | 25.18% | 20.03% |
| Russell 3000 Growth Index | 42.81% | 24.96% | 19.08% |
| Russell 1000 Growth Index | 43.21% | 25.49% | 19.42% |
| 1 | Without sales charge |
| 2 | Reflects maximum sales charge of 5.50% |
| 3 | Reflects a contingent deferred sales charge of 1.00% |
| Operating Expenses* | Gross | Net |
| Class A | 1.10% | 1.10% |
| Class C | 1.85% | 1.85% |
| Class I | 0.82% | 0.82% |
| Class R3 | 1.43% | 1.43% |
| Class R4 | 1.13% | 1.13% |
| Class R5 | 0.84% | 0.84% |
| Class R6 | 0.74% | 0.74% |
| Class Y | 0.82% | 0.82% |
| Class F | 0.74% | 0.74% |
| * | Expenses as shown in the Fund’s most recent prospectus. Actual expenses may be higher or lower. Please see accompanying Financial Highlights for expense ratios for the period ended 10/31/2021. |
| 17 |
October 31, 2021 (Unaudited)
Manager Discussion
| 18 |
October 31, 2021 (Unaudited)
| Composition by Sector(1) | |
| as of 10/31/2021 | |
| Sector | Percentage of Net Assets |
| Equity Securities | |
| Communication Services | 20.2% |
| Consumer Discretionary | 20.8 |
| Consumer Staples | 1.1 |
| Financials | 4.1 |
| Health Care | 14.3 |
| Industrials | 6.1 |
| Information Technology | 31.4 |
| Real Estate | 0.1 |
| Total | 98.1% |
| Short-Term Investments | 1.7 |
| Other Assets & Liabilities | 0.2 |
| Total | 100.0% |
| (1) | A sector may be comprised of several industries. For Fund compliance purposes, the Fund may not use the same classification system. These sector classifications are used for financial reporting purposes. |
| 19 |
October 31, 2021 (Unaudited)
| Inception 05/01/2000 Sub-advised by Wellington Management Company LLP | Investment objective – The Fund seeks long-term capital appreciation. |

| Average Annual Total Returns | |||
| for the Periods Ending 10/31/2021 | |||
| 1 Year | 5 Years | 10 Years | |
| Class A1 | 22.83% | 16.76% | 17.26% |
| Class A2 | 16.07% | 15.44% | 16.60% |
| Class C1 | 21.90% | 15.88% | 16.41% |
| Class C3 | 20.90% | 15.88% | 16.41% |
| Class I1 | 23.16% | 17.07% | 17.61% |
| Class R31 | 22.41% | 16.37% | 16.91% |
| Class R41 | 22.78% | 16.72% | 17.27% |
| Class R51 | 23.14% | 17.07% | 17.62% |
| Class R61 | 23.26% | 17.18% | 17.73% |
| Class Y1 | 23.17% | 17.14% | 17.71% |
| Class F1 | 23.28% | 17.18% | 17.66% |
| S&P Composite 1500 Health Care Index | 33.53% | 17.21% | 17.26% |
| S&P 500 Index | 42.91% | 18.93% | 16.21% |
| 1 | Without sales charge |
| 2 | Reflects maximum sales charge of 5.50% |
| 3 | Reflects a contingent deferred sales charge of 1.00% |
| Operating Expenses* | Gross | Net |
| Class A | 1.27% | 1.27% |
| Class C | 2.04% | 2.04% |
| Class I | 0.99% | 0.99% |
| Class R3 | 1.60% | 1.60% |
| Class R4 | 1.30% | 1.30% |
| Class R5 | 1.00% | 1.00% |
| Class R6 | 0.90% | 0.90% |
| Class Y | 1.00% | 1.00% |
| Class F | 0.90% | 0.90% |
| * | Expenses as shown in the Fund’s most recent prospectus. Actual expenses may be higher or lower. Please see accompanying Financial Highlights for expense ratios for the period ended 10/31/2021. |
| 20 |
October 31, 2021 (Unaudited)
| * | Robert L. Deresiewicz announced his plan to retire and withdraw from the partnership of Wellington Management Company LLP’s parent company, and effective June 30, 2022, he will no longer serve as a portfolio manager for the Fund. Robert Deresiewicz’s portfolio management responsibilities will transition to Wen Shi in the months leading up to his departure. |
Manager Discussion
| 21 |
October 31, 2021 (Unaudited)
| Composition by Subsector(1) | |
| as of 10/31/2021 | |
| Subsector | Percentage of Net Assets |
| Equity Securities | |
| Biotechnology | 17.9% |
| Consumer Finance | 0.1 |
| Diversified Financial Services | 0.3 |
| Diversified Telecommunication Services | 0.2 |
| Health Care Equipment & Supplies | 25.8 |
| Health Care Providers & Services | 20.2 |
| Insurance | 0.2 |
| Life Sciences Tools & Services | 7.9 |
| Pharmaceuticals | 26.1 |
| Total | 98.7% |
| Short-Term Investments | 1.7 |
| Other Assets & Liabilities | (0.4) |
| Total | 100.0% |
| (1) | For Fund compliance purposes, the Fund may not use the same classification system. These subsector classifications are used for financial reporting purposes. |
| 22 |
October 31, 2021 (Unaudited)
| Inception 12/31/1997 Sub-advised by Wellington Management Company LLP | Investment objective – The Fund seeks long-term growth of capital. |

| Average Annual Total Returns | |||
| for the Periods Ending 10/31/2021 | |||
| 1 Year | 5 Years | 10 Years | |
| Class A1 | 35.51% | 17.26% | 15.30% |
| Class A2 | 28.06% | 15.94% | 14.65% |
| Class C1 | 34.49% | 16.38% | 14.45% |
| Class C3 | 33.49% | 16.38% | 14.45% |
| Class I1 | 35.79% | 17.55% | 15.58% |
| Class R31 | 35.03% | 16.85% | 14.92% |
| Class R41 | 35.45% | 17.21% | 15.28% |
| Class R51 | 35.84% | 17.56% | 15.62% |
| Class R61 | 36.00% | 17.68% | 15.75% |
| Class Y1 | 35.96% | 17.64% | 15.72% |
| Class F1 | 36.01% | 17.67% | 15.64% |
| S&P MidCap 400 Index | 48.90% | 14.89% | 13.90% |
| 1 | Without sales charge |
| 2 | Reflects maximum sales charge of 5.50% |
| 3 | Reflects a contingent deferred sales charge of 1.00% |
| 23 |
October 31, 2021 (Unaudited)
| Operating Expenses* | Gross | Net |
| Class A | 1.11% | 1.11% |
| Class C | 1.87% | 1.87% |
| Class I | 0.88% | 0.87% |
| Class R3 | 1.47% | 1.47% |
| Class R4 | 1.17% | 1.17% |
| Class R5 | 0.85% | 0.85% |
| Class R6 | 0.75% | 0.75% |
| Class Y | 0.86% | 0.79% |
| Class F | 0.75% | 0.75% |
| * | Expenses as shown in the Fund’s most recent prospectus. Gross expenses do not reflect contractual fee waivers or expense reimbursement arrangements if any. Net expenses reflect such arrangements only with respect to Classes I and Y and in instances when they reduce gross expenses. These arrangements remain in effect until 02/28/2022 unless the Fund’s Board of Directors approves an earlier termination. Actual expenses may be higher or lower. Please see accompanying Financial Highlights for expense ratios for the period ended 10/31/2021. |
Manager Discussion
| 24 |
October 31, 2021 (Unaudited)
| Composition by Sector(1) | |
| as of 10/31/2021 | |
| Sector | Percentage of Net Assets |
| Equity Securities | |
| Communication Services | 2.9% |
| Consumer Discretionary | 12.0 |
| Consumer Staples | 1.5 |
| Energy | 0.1 |
| Financials | 12.1 |
| Health Care | 18.2 |
| Industrials | 16.5 |
| Information Technology | 25.8 |
| Materials | 2.8 |
| Real Estate | 5.3 |
| Utilities | 2.5 |
| Total | 99.7% |
| Short-Term Investments | 2.2 |
| Other Assets & Liabilities | (1.9) |
| Total | 100.0% |
| (1) | A sector may be comprised of several industries. For Fund compliance purposes, the Fund may not use the same classification system. These sector classifications are used for financial reporting purposes. |
| 25 |
October 31, 2021 (Unaudited)
| Inception 04/30/2001 Sub-advised by Wellington Management Company LLP | Investment objective – The Fund seeks long-term capital appreciation. |
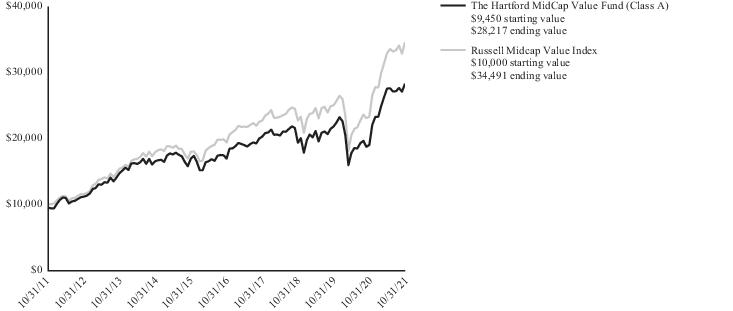
| Average Annual Total Returns | |||
| for the Periods Ending 10/31/2021 | |||
| 1 Year | 5 Years | 10 Years | |
| Class A1 | 48.99% | 10.82% | 11.56% |
| Class A2 | 40.80% | 9.58% | 10.93% |
| Class C1 | 47.83% | 9.98% | 10.75% |
| Class C3 | 46.83% | 9.98% | 10.75% |
| Class I1 | 49.48% | 11.15% | 11.92% |
| Class R31 | 48.57% | 10.49% | 11.26% |
| Class R41 | 48.99% | 10.82% | 11.60% |
| Class R51 | 49.39% | 11.16% | 11.93% |
| Class Y1 | 49.49% | 11.23% | 12.03% |
| Class F1 | 49.64% | 11.28% | 11.98% |
| Russell Midcap Value Index | 48.60% | 12.30% | 13.18% |
| 1 | Without sales charge |
| 2 | Reflects maximum sales charge of 5.50% |
| 3 | Reflects a contingent deferred sales charge of 1.00% |
| Operating Expenses* | Gross | Net |
| Class A | 1.26% | 1.26% |
| Class C | 2.03% | 2.03% |
| Class I | 0.91% | 0.91% |
| Class R3 | 1.54% | 1.54% |
| Class R4 | 1.24% | 1.24% |
| Class R5 | 0.92% | 0.92% |
| Class Y | 0.92% | 0.92% |
| Class F | 0.82% | 0.82% |
| * | Expenses as shown in the Fund’s most recent prospectus. Actual expenses may be higher or lower. Please see accompanying Financial Highlights for expense ratios for the period ended 10/31/2021. |
| 26 |
October 31, 2021 (Unaudited)
Manager Discussion
| 27 |
October 31, 2021 (Unaudited)
| Composition by Sector(1) | |
| as of 10/31/2021 | |
| Sector | Percentage of Net Assets |
| Equity Securities | |
| Communication Services | 1.8% |
| Consumer Discretionary | 10.0 |
| Consumer Staples | 2.8 |
| Energy | 3.9 |
| Financials | 19.1 |
| Health Care | 9.0 |
| Industrials | 22.3 |
| Information Technology | 8.5 |
| Materials | 5.6 |
| Real Estate | 11.5 |
| Utilities | 5.3 |
| Total | 99.8% |
| Short-Term Investments | 0.5 |
| Other Assets & Liabilities | (0.3) |
| Total | 100.0% |
| (1) | A sector may be comprised of several industries. For Fund compliance purposes, the Fund may not use the same classification system. These sector classifications are used for financial reporting purposes. |
| 28 |
October 31, 2021 (Unaudited)
| Inception 01/02/1996 Sub-advised by Wellington Management Company LLP | Investment objective – The Fund seeks long-term capital appreciation. |

| Average Annual Total Returns | |||
| for the Periods Ending 10/31/2021 | |||
| 1 Year | 5 Years | 10 Years | |
| Class A1 | 44.08% | 12.34% | 11.87% |
| Class A2 | 36.16% | 11.08% | 11.24% |
| Class C1 | 42.97% | 11.49% | 11.04% |
| Class C3 | 41.97% | 11.49% | 11.04% |
| Class I1 | 44.56% | 12.71% | 12.24% |
| Class R31 | 43.73% | 12.04% | 11.59% |
| Class R41 | 44.20% | 12.38% | 11.94% |
| Class R51 | 44.59% | 12.70% | 12.26% |
| Class R61 | 44.79% | 12.84% | 12.35% |
| Class Y1 | 44.65% | 12.75% | 12.31% |
| Class F1 | 44.84% | 12.82% | 12.29% |
| Russell 1000 Value Index | 43.76% | 12.39% | 12.85% |
| 1 | Without sales charge |
| 2 | Reflects maximum sales charge of 5.50% |
| 3 | Reflects a contingent deferred sales charge of 1.00% |
| 29 |
October 31, 2021 (Unaudited)
| Operating Expenses* | Gross | Net |
| Class A | 1.03% | 0.96% |
| Class C | 1.82% | 1.71% |
| Class I | 0.67% | 0.66% |
| Class R3 | 1.29% | 1.18% |
| Class R4 | 0.98% | 0.88% |
| Class R5 | 0.69% | 0.63% |
| Class R6 | 0.58% | 0.46% |
| Class Y | 0.68% | 0.57% |
| Class F | 0.58% | 0.46% |
| * | Expenses as shown in the Fund’s most recent prospectus. Gross expenses do not reflect contractual fee waivers or expense reimbursement arrangements. Net expenses reflect such arrangements in instances when they reduce gross expenses. These arrangements remain in effect until 02/28/2022 unless the Fund’s Board of Directors approves an earlier termination. Actual expenses may be higher or lower. Please see accompanying Financial Highlights for expense ratios for the period ended 10/31/2021. |
Manager Discussion
| 30 |
October 31, 2021 (Unaudited)
| 31 |
October 31, 2021 (Unaudited)
| Composition by Sector(1) | |
| as of 10/31/2021 | |
| Sector | Percentage of Net Assets |
| Equity Securities | |
| Communication Services | 4.6% |
| Consumer Discretionary | 7.2 |
| Consumer Staples | 6.6 |
| Energy | 5.1 |
| Financials | 23.9 |
| Health Care | 17.1 |
| Industrials | 10.4 |
| Information Technology | 10.4 |
| Materials | 3.6 |
| Real Estate | 4.4 |
| Utilities | 4.6 |
| Total | 97.9% |
| Short-Term Investments | 2.0 |
| Other Assets & Liabilities | 0.1 |
| Total | 100.0% |
| (1) | A sector may be comprised of several industries. For Fund compliance purposes, the Fund may not use the same classification system. These sector classifications are used for financial reporting purposes. |
| 32 |
October 31, 2021 (Unaudited)
| Inception 01/04/1988 Sub-advised by Wellington Management Company LLP | Investment objective – The Fund seeks long-term capital appreciation. |

| Average Annual Total Returns | |||
| for the Periods Ending 10/31/2021 | |||
| 1 Year | 5 Years | 10 Years | |
| Class A1 | 35.76% | 17.17% | 14.44% |
| Class A2 | 28.29% | 15.85% | 13.80% |
| Class C1 | 34.80% | 16.37% | 13.66% |
| Class C3 | 33.80% | 16.37% | 13.66% |
| Class I1 | 36.23% | 17.57% | 14.82% |
| Class R31 | 35.34% | 16.85% | 14.16% |
| Class R41 | 35.76% | 17.20% | 14.51% |
| Class R51 | 36.18% | 17.56% | 14.86% |
| Class R61 | 36.31% | 17.69% | 14.96% |
| Class Y1 | 36.24% | 17.64% | 14.95% |
| Class F1 | 36.32% | 17.68% | 14.87% |
| Russell 2000 Growth Index | 38.45% | 17.90% | 14.57% |
| 1 | Without sales charge |
| 2 | Reflects maximum sales charge of 5.50% |
| 3 | Reflects a contingent deferred sales charge of 1.00% |
| 33 |
October 31, 2021 (Unaudited)
| Operating Expenses* | Gross | Net |
| Class A | 1.26% | 1.26% |
| Class C | 1.90% | 1.90% |
| Class I | 0.85% | 0.85% |
| Class R3 | 1.49% | 1.49% |
| Class R4 | 1.19% | 1.19% |
| Class R5 | 0.89% | 0.89% |
| Class R6 | 0.77% | 0.77% |
| Class Y | 0.88% | 0.83% |
| Class F | 0.77% | 0.77% |
| * | Expenses as shown in the Fund’s most recent prospectus. Gross expenses do not reflect contractual fee waivers or expense reimbursement arrangements. Net expenses reflect such arrangements only with respect to Class Y. These arrangements remain in effect until 02/28/2022 unless the Fund’s Board of Directors approves an earlier termination. Actual expenses may be higher or lower. Please see accompanying Financial Highlights for expense ratios for the period ended 10/31/2021. |
Manager Discussion
| 34 |
October 31, 2021 (Unaudited)
| 35 |
October 31, 2021 (Unaudited)
| Composition by Sector(1) | |
| as of 10/31/2021 | |
| Sector | Percentage of Net Assets |
| Equity Securities | |
| Communication Services | 2.4% |
| Consumer Discretionary | 14.7 |
| Consumer Staples | 4.6 |
| Energy | 0.5 |
| Financials | 5.1 |
| Health Care | 25.6 |
| Industrials | 16.6 |
| Information Technology | 23.0 |
| Materials | 2.1 |
| Real Estate | 4.5 |
| Total | 99.1% |
| Short-Term Investments | 0.8 |
| Other Assets & Liabilities | 0.1 |
| Total | 100.0% |
| (1) | A sector may be comprised of several industries. For Fund compliance purposes, the Fund may not use the same classification system. These sector classifications are used for financial reporting purposes. |
| 36 |
October 31, 2021 (Unaudited)
| Inception 01/01/2005 Sub-advised by Wellington Management Company LLP | Investment objective – The Fund seeks long-term capital appreciation. |

| Average Annual Total Returns | |||
| for the Periods Ending 10/31/2021 | |||
| 1 Year | 5 Years | 10 Years | |
| Class A1 | 62.61% | 12.33% | 11.03% |
| Class A2 | 53.67% | 11.06% | 10.41% |
| Class C1 | 61.49% | 11.50% | 10.21% |
| Class C3 | 60.49% | 11.50% | 10.21% |
| Class I1 | 63.20% | 12.70% | 11.28% |
| Class R31 | 62.64% | 12.15% | 10.84% |
| Class R41 | 62.83% | 12.40% | 11.13% |
| Class R51 | 63.34% | 12.77% | 11.47% |
| Class R61 | 63.49% | 12.84% | 11.53% |
| Class Y1 | 63.37% | 12.80% | 11.51% |
| Class F1 | 63.53% | 12.83% | 11.34% |
| Russell 2000 Value Index | 64.30% | 12.61% | 12.12% |
| 1 | Without sales charge |
| 2 | Reflects maximum sales charge of 5.50% |
| 3 | Reflects a contingent deferred sales charge of 1.00% |
| 37 |
October 31, 2021 (Unaudited)
| Operating Expenses* | Gross | Net |
| Class A | 1.41% | 1.30% |
| Class C | 2.15% | 2.05% |
| Class I | 1.04% | 1.00% |
| Class R3 | 1.63% | 1.50% |
| Class R4 | 1.33% | 1.20% |
| Class R5 | 1.03% | 0.90% |
| Class R6 | 0.92% | 0.80% |
| Class Y | 1.02% | 0.85% |
| Class F | 0.91% | 0.80% |
| * | Expenses as shown in the Fund’s most recent prospectus. Gross expenses do not reflect contractual expense reimbursement arrangements. Net expenses reflect such arrangements in instances when they reduce gross expenses. These arrangements remain in effect until 02/28/2022 unless the Fund’s Board of Directors approves an earlier termination. Actual expenses may be higher or lower. Please see accompanying Financial Highlights for expense ratios for the period ended 10/31/2021. |
Manager Discussion
| 38 |
October 31, 2021 (Unaudited)
| Composition by Sector(1) | |
| as of 10/31/2021 | |
| Sector | Percentage of Net Assets |
| Equity Securities | |
| Communication Services | 0.8% |
| Consumer Discretionary | 11.5 |
| Consumer Staples | 4.3 |
| Energy | 1.7 |
| Financials | 33.4 |
| Health Care | 4.8 |
| Industrials | 20.7 |
| Information Technology | 12.4 |
| Materials | 3.1 |
| Real Estate | 3.2 |
| Utilities | 3.3 |
| Total | 99.2% |
| Short-Term Investments | 0.4 |
| Other Assets & Liabilities | 0.4 |
| Total | 100.0% |
| (1) | A sector may be comprised of several industries. For Fund compliance purposes, the Fund may not use the same classification system. These sector classifications are used for financial reporting purposes. |
| 39 |
October 31, 2021 (Unaudited)
| Inception 07/22/1996 Sub-advised by Wellington Management Company LLP | Investment objective – The Fund seeks growth of capital. |

| Average Annual Total Returns | |||
| for the Periods Ending 10/31/2021 | |||
| 1 Year | 5 Years | 10 Years | |
| Class A1 | 30.50% | 22.84% | 15.11% |
| Class A2 | 23.32% | 21.46% | 14.46% |
| Class C1 | 29.39% | 21.86% | 14.24% |
| Class C3 | 28.39% | 21.86% | 14.24% |
| Class I1 | 30.84% | 23.16% | 15.40% |
| Class R31 | 30.04% | 22.54% | 14.86% |
| Class R41 | 30.46% | 22.91% | 15.21% |
| Class R51 | 30.85% | 23.27% | 15.56% |
| Class R61 | 30.97% | 23.36% | 15.65% |
| Class Y1 | 30.92% | 23.31% | 15.63% |
| Class F1 | 30.98% | 23.32% | 15.48% |
| Russell 2000 Growth Index | 38.45% | 17.90% | 14.57% |
| 1 | Without sales charge |
| 2 | Reflects maximum sales charge of 5.50% |
| 3 | Reflects a contingent deferred sales charge of 1.00% |
| Operating Expenses* | Gross | Net |
| Class A | 1.32% | 1.32% |
| Class C | 2.14% | 2.14% |
| Class I | 1.00% | 1.00% |
| Class R3 | 1.61% | 1.61% |
| Class R4 | 1.30% | 1.30% |
| Class R5 | 1.01% | 1.01% |
| Class R6 | 0.90% | 0.90% |
| Class Y | 0.96% | 0.96% |
| Class F | 0.90% | 0.90% |
| * | Expenses as shown in the Fund’s most recent prospectus. Actual expenses may be higher or lower. Please see accompanying Financial Highlights for expense ratios for the period ended 10/31/2021. |
| 40 |
October 31, 2021 (Unaudited)
Manager Discussion
| 41 |
October 31, 2021 (Unaudited)
| Composition by Sector(1) | |
| as of 10/31/2021 | |
| Sector | Percentage of Net Assets |
| Equity Securities | |
| Communication Services | 4.1% |
| Consumer Discretionary | 16.3 |
| Energy | 2.3 |
| Financials | 6.5 |
| Health Care | 24.9 |
| Industrials | 12.8 |
| Information Technology | 28.6 |
| Materials | 0.7 |
| Real Estate | 2.6 |
| Total | 98.8% |
| Short-Term Investments | 3.2 |
| Other Assets & Liabilities | (2.0) |
| Total | 100.0% |
| (1) | A sector may be comprised of several industries. For Fund compliance purposes, the Fund may not use the same classification system. These sector classifications are used for financial reporting purposes. |
| 42 |
| Russell 1000 Growth Index (reflects no deduction for fees, expenses or taxes) is designed to measure the performance of those Russell 1000 Index companies with higher price-to-book ratios and higher forecasted growth values. The Russell 1000 Index is designed to measure the performance of the 1,000 largest companies in the Russell 3000 Index based on their market capitalization and current index membership. |
| Russell 1000 Value Index (reflects no deduction for fees, expenses or taxes) is designed to measure the performance of those Russell 1000 Index companies with lower price-to-book ratios and lower forecasted growth values. The Russell 1000 Index is designed to measure the performance of the 1,000 largest companies in the Russell 3000 Index based on their market capitalization and current index membership. |
| Russell 2000 Growth Index (reflects no deduction for fees, expenses or taxes) is designed to measure the performance of those Russell 2000 Index companies with higher price-to-book ratios and higher forecasted growth values. The Russell 2000 Index is an index comprised of 2,000 of the smallest U.S.-domiciled company common stocks based on a combination of their market capitalization and current index membership. |
| Russell 2000 Value Index (reflects no deduction for fees, expenses or taxes) is designed to measure the performance of those Russell 2000 Index companies with lower price-to-book ratios and lower forecasted growth values. The Russell 2000 Index is an index comprised of 2,000 of the smallest U.S.-domiciled company common stocks based on a combination of their market capitalization and current index membership. |
| Russell 3000 Growth Index (reflects no deduction for fees, expenses or taxes) is designed to measure the performance of those Russell 3000 Index companies with higher price-to-book ratios and higher forecasted growth values. The Russell 3000 Index is designed to measures the performance of the 3,000 largest U.S. companies based on total market capitalization. |
| Russell 3000 Index (reflects no deduction for fees, expenses or taxes) is designed to measure the performance of the 3,000 largest U.S. companies based on total market capitalization. |
| Russell Midcap Value Index (reflects no deduction for fees, expenses or taxes) is designed to measure the performance of the mid-cap value segment of the U.S. equity universe. It includes those Russell Midcap Index companies with lower price-to-book ratios and lower forecasted growth values. |
| S&P 500 Index (reflects no deduction for fees, expenses or taxes) is a float-adjusted market capitalization-weighted price index composed of 500 widely held common stocks. |
| S&P Composite 1500 Health Care Index (reflects no deduction for fees, expenses or taxes) is a float-adjusted market capitalization-weighted index comprised of those companies included in the S&P Composite 1500 that are classified as members of the Global Industry Classification Standard (GICS®) health care sector. |
| S&P MidCap 400 Index (reflects no deduction for fees, expenses or taxes) is a float-adjusted market capitalization-weighted index designed to measure the performance of the mid-cap segment of the market. The index is composed of 400 constituent companies. |
| 43 |
| Actual Return | Hypothetical (5% return before expenses) | ||||||||||||
| Beginning Account Value May 1, 2021 | Ending Account Value October 31, 2021 | Expenses paid during the period May 1, 2021 through October 31, 2021 | Beginning Account Value May 1, 2021 | Ending Account Value October 31, 2021 | Expenses paid during the period May 1, 2021 through October 31, 2021 | Annualized expense ratio | |||||||
| The Hartford Capital Appreciation Fund | |||||||||||||
| Class A | $ 1,000.00 | $ 1,037.80 | $ 5.29 | $ 1,000.00 | $ 1,020.01 | $ 5.24 | 1.03% | ||||||
| Class C | $ 1,000.00 | $ 1,033.90 | $ 9.33 | $ 1,000.00 | $ 1,016.03 | $ 9.25 | 1.82% | ||||||
| Class I | $ 1,000.00 | $ 1,039.20 | $ 3.96 | $ 1,000.00 | $ 1,021.32 | $ 3.92 | 0.77% | ||||||
| Class R3 | $ 1,000.00 | $ 1,035.80 | $ 7.24 | $ 1,000.00 | $ 1,018.10 | $ 7.17 | 1.41% | ||||||
| Class R4 | $ 1,000.00 | $ 1,037.40 | $ 5.65 | $ 1,000.00 | $ 1,019.66 | $ 5.60 | 1.10% | ||||||
| Class R5 | $ 1,000.00 | $ 1,039.30 | $ 4.11 | $ 1,000.00 | $ 1,021.17 | $ 4.08 | 0.80% | ||||||
| Class R6 | $ 1,000.00 | $ 1,039.70 | $ 3.55 | $ 1,000.00 | $ 1,021.73 | $ 3.52 | 0.69% | ||||||
| Class Y | $ 1,000.00 | $ 1,039.20 | $ 4.11 | $ 1,000.00 | $ 1,021.17 | $ 4.08 | 0.80% | ||||||
| Class F | $ 1,000.00 | $ 1,039.70 | $ 3.55 | $ 1,000.00 | $ 1,021.73 | $ 3.52 | 0.69% | ||||||
| Hartford Core Equity Fund | |||||||||||||
| Class A | $ 1,000.00 | $ 1,092.70 | $ 3.69 | $ 1,000.00 | $ 1,021.68 | $ 3.57 | 0.70% | ||||||
| Class C | $ 1,000.00 | $ 1,088.80 | $ 7.63 | $ 1,000.00 | $ 1,017.90 | $ 7.38 | 1.45% | ||||||
| Class I | $ 1,000.00 | $ 1,094.20 | $ 2.43 | $ 1,000.00 | $ 1,022.89 | $ 2.35 | 0.46% | ||||||
| Class R3 | $ 1,000.00 | $ 1,090.90 | $ 5.64 | $ 1,000.00 | $ 1,019.81 | $ 5.45 | 1.07% | ||||||
| Class R4 | $ 1,000.00 | $ 1,092.50 | $ 3.85 | $ 1,000.00 | $ 1,021.53 | $ 3.72 | 0.73% | ||||||
| Class R5 | $ 1,000.00 | $ 1,094.10 | $ 2.48 | $ 1,000.00 | $ 1,022.84 | $ 2.40 | 0.47% | ||||||
| Class R6 | $ 1,000.00 | $ 1,094.60 | $ 1.90 | $ 1,000.00 | $ 1,023.39 | $ 1.84 | 0.36% | ||||||
| Class Y | $ 1,000.00 | $ 1,094.20 | $ 2.32 | $ 1,000.00 | $ 1,022.99 | $ 2.24 | 0.44% | ||||||
| Class F | $ 1,000.00 | $ 1,094.80 | $ 1.90 | $ 1,000.00 | $ 1,023.39 | $ 1.84 | 0.36% | ||||||
| 44 |
| Actual Return | Hypothetical (5% return before expenses) | ||||||||||||
| Beginning Account Value May 1, 2021 | Ending Account Value October 31, 2021 | Expenses paid during the period May 1, 2021 through October 31, 2021 | Beginning Account Value May 1, 2021 | Ending Account Value October 31, 2021 | Expenses paid during the period May 1, 2021 through October 31, 2021 | Annualized expense ratio | |||||||
| The Hartford Dividend and Growth Fund | |||||||||||||
| Class A | $ 1,000.00 | $ 1,086.00 | $ 5.05 | $ 1,000.00 | $ 1,020.37 | $ 4.89 | 0.96% | ||||||
| Class C | $ 1,000.00 | $ 1,081.60 | $ 9.13 | $ 1,000.00 | $ 1,016.43 | $ 8.84 | 1.74% | ||||||
| Class I | $ 1,000.00 | $ 1,087.20 | $ 3.79 | $ 1,000.00 | $ 1,021.58 | $ 3.67 | 0.72% | ||||||
| Class R3 | $ 1,000.00 | $ 1,083.70 | $ 7.14 | $ 1,000.00 | $ 1,018.35 | $ 6.92 | 1.36% | ||||||
| Class R4 | $ 1,000.00 | $ 1,085.40 | $ 5.36 | $ 1,000.00 | $ 1,020.06 | $ 5.19 | 1.02% | ||||||
| Class R5 | $ 1,000.00 | $ 1,087.20 | $ 3.84 | $ 1,000.00 | $ 1,021.53 | $ 3.72 | 0.73% | ||||||
| Class R6 | $ 1,000.00 | $ 1,088.00 | $ 3.32 | $ 1,000.00 | $ 1,022.03 | $ 3.21 | 0.63% | ||||||
| Class Y | $ 1,000.00 | $ 1,087.50 | $ 3.53 | $ 1,000.00 | $ 1,021.83 | $ 3.41 | 0.67% | ||||||
| Class F | $ 1,000.00 | $ 1,087.70 | $ 3.32 | $ 1,000.00 | $ 1,022.03 | $ 3.21 | 0.63% | ||||||
| The Hartford Equity Income Fund | |||||||||||||
| Class A | $ 1,000.00 | $ 1,067.60 | $ 5.11 | $ 1,000.00 | $ 1,020.27 | $ 4.99 | 0.98% | ||||||
| Class C | $ 1,000.00 | $ 1,063.00 | $ 9.05 | $ 1,000.00 | $ 1,016.43 | $ 8.84 | 1.74% | ||||||
| Class I | $ 1,000.00 | $ 1,068.50 | $ 3.86 | $ 1,000.00 | $ 1,021.48 | $ 3.77 | 0.74% | ||||||
| Class R3 | $ 1,000.00 | $ 1,065.30 | $ 7.08 | $ 1,000.00 | $ 1,018.35 | $ 6.92 | 1.36% | ||||||
| Class R4 | $ 1,000.00 | $ 1,067.00 | $ 5.42 | $ 1,000.00 | $ 1,019.96 | $ 5.30 | 1.04% | ||||||
| Class R5 | $ 1,000.00 | $ 1,068.60 | $ 3.96 | $ 1,000.00 | $ 1,021.37 | $ 3.87 | 0.76% | ||||||
| Class R6 | $ 1,000.00 | $ 1,069.00 | $ 3.39 | $ 1,000.00 | $ 1,021.93 | $ 3.31 | 0.65% | ||||||
| Class Y | $ 1,000.00 | $ 1,068.40 | $ 3.86 | $ 1,000.00 | $ 1,021.48 | $ 3.77 | 0.74% | ||||||
| Class F | $ 1,000.00 | $ 1,068.90 | $ 3.39 | $ 1,000.00 | $ 1,021.93 | $ 3.31 | 0.65% | ||||||
| The Hartford Growth Opportunities Fund | |||||||||||||
| Class A | $ 1,000.00 | $ 1,052.90 | $ 5.48 | $ 1,000.00 | $ 1,019.86 | $ 5.40 | 1.06% | ||||||
| Class C | $ 1,000.00 | $ 1,048.80 | $ 9.45 | $ 1,000.00 | $ 1,015.98 | $ 9.30 | 1.83% | ||||||
| Class I | $ 1,000.00 | $ 1,054.20 | $ 4.30 | $ 1,000.00 | $ 1,021.02 | $ 4.23 | 0.83% | ||||||
| Class R3 | $ 1,000.00 | $ 1,050.90 | $ 7.50 | $ 1,000.00 | $ 1,017.90 | $ 7.38 | 1.45% | ||||||
| Class R4 | $ 1,000.00 | $ 1,052.60 | $ 5.90 | $ 1,000.00 | $ 1,019.46 | $ 5.80 | 1.14% | ||||||
| Class R5 | $ 1,000.00 | $ 1,054.20 | $ 4.35 | $ 1,000.00 | $ 1,020.97 | $ 4.28 | 0.84% | ||||||
| Class R6 | $ 1,000.00 | $ 1,054.80 | $ 3.83 | $ 1,000.00 | $ 1,021.48 | $ 3.77 | 0.74% | ||||||
| Class Y | $ 1,000.00 | $ 1,054.00 | $ 4.45 | $ 1,000.00 | $ 1,020.87 | $ 4.38 | 0.86% | ||||||
| Class F | $ 1,000.00 | $ 1,054.70 | $ 3.78 | $ 1,000.00 | $ 1,021.53 | $ 3.72 | 0.73% | ||||||
| The Hartford Healthcare Fund | |||||||||||||
| Class A | $ 1,000.00 | $ 1,045.80 | $ 6.39 | $ 1,000.00 | $ 1,018.95 | $ 6.31 | 1.24% | ||||||
| Class C | $ 1,000.00 | $ 1,041.50 | $ 10.34 | $ 1,000.00 | $ 1,015.07 | $ 10.21 | 2.01% | ||||||
| Class I | $ 1,000.00 | $ 1,047.00 | $ 5.11 | $ 1,000.00 | $ 1,020.21 | $ 5.04 | 0.99% | ||||||
| Class R3 | $ 1,000.00 | $ 1,043.70 | $ 8.19 | $ 1,000.00 | $ 1,017.19 | $ 8.08 | 1.59% | ||||||
| Class R4 | $ 1,000.00 | $ 1,045.30 | $ 6.65 | $ 1,000.00 | $ 1,018.70 | $ 6.56 | 1.29% | ||||||
| Class R5 | $ 1,000.00 | $ 1,046.90 | $ 5.21 | $ 1,000.00 | $ 1,020.11 | $ 5.14 | 1.01% | ||||||
| Class R6 | $ 1,000.00 | $ 1,047.40 | $ 4.59 | $ 1,000.00 | $ 1,020.72 | $ 4.53 | 0.89% | ||||||
| Class Y | $ 1,000.00 | $ 1,046.90 | $ 5.11 | $ 1,000.00 | $ 1,020.21 | $ 5.04 | 0.99% | ||||||
| Class F | $ 1,000.00 | $ 1,047.60 | $ 4.59 | $ 1,000.00 | $ 1,020.72 | $ 4.53 | 0.89% | ||||||
| The Hartford MidCap Fund | |||||||||||||
| Class A | $ 1,000.00 | $ 1,000.30 | $ 5.45 | $ 1,000.00 | $ 1,019.76 | $ 5.50 | 1.08% | ||||||
| Class C | $ 1,000.00 | $ 996.10 | $ 9.26 | $ 1,000.00 | $ 1,015.93 | $ 9.35 | 1.84% | ||||||
| Class I | $ 1,000.00 | $ 1,001.00 | $ 4.34 | $ 1,000.00 | $ 1,020.87 | $ 4.38 | 0.86% | ||||||
| Class R3 | $ 1,000.00 | $ 998.30 | $ 7.35 | $ 1,000.00 | $ 1,017.85 | $ 7.43 | 1.46% | ||||||
| Class R4 | $ 1,000.00 | $ 999.80 | $ 5.75 | $ 1,000.00 | $ 1,019.46 | $ 5.80 | 1.14% | ||||||
| Class R5 | $ 1,000.00 | $ 1,001.30 | $ 4.19 | $ 1,000.00 | $ 1,021.02 | $ 4.23 | 0.83% | ||||||
| Class R6 | $ 1,000.00 | $ 1,001.90 | $ 3.73 | $ 1,000.00 | $ 1,021.48 | $ 3.77 | 0.74% | ||||||
| Class Y | $ 1,000.00 | $ 1,001.70 | $ 3.88 | $ 1,000.00 | $ 1,021.32 | $ 3.92 | 0.77% | ||||||
| Class F | $ 1,000.00 | $ 1,002.10 | $ 3.68 | $ 1,000.00 | $ 1,021.53 | $ 3.72 | 0.73% | ||||||
| 45 |
| Actual Return | Hypothetical (5% return before expenses) | ||||||||||||
| Beginning Account Value May 1, 2021 | Ending Account Value October 31, 2021 | Expenses paid during the period May 1, 2021 through October 31, 2021 | Beginning Account Value May 1, 2021 | Ending Account Value October 31, 2021 | Expenses paid during the period May 1, 2021 through October 31, 2021 | Annualized expense ratio | |||||||
| The Hartford MidCap Value Fund | |||||||||||||
| Class A | $ 1,000.00 | $ 1,027.20 | $ 5.98 | $ 1,000.00 | $ 1,019.31 | $ 5.96 | 1.17% | ||||||
| Class C | $ 1,000.00 | $ 1,023.70 | $ 9.84 | $ 1,000.00 | $ 1,015.48 | $ 9.80 | 1.93% | ||||||
| Class I | $ 1,000.00 | $ 1,029.10 | $ 4.30 | $ 1,000.00 | $ 1,020.97 | $ 4.28 | 0.84% | ||||||
| Class R3 | $ 1,000.00 | $ 1,025.10 | $ 7.66 | $ 1,000.00 | $ 1,017.64 | $ 7.63 | 1.50% | ||||||
| Class R4 | $ 1,000.00 | $ 1,026.70 | $ 6.08 | $ 1,000.00 | $ 1,019.21 | $ 6.06 | 1.19% | ||||||
| Class R5 | $ 1,000.00 | $ 1,028.30 | $ 4.60 | $ 1,000.00 | $ 1,020.67 | $ 4.58 | 0.90% | ||||||
| Class Y | $ 1,000.00 | $ 1,028.80 | $ 4.55 | $ 1,000.00 | $ 1,020.72 | $ 4.53 | 0.89% | ||||||
| Class F | $ 1,000.00 | $ 1,029.10 | $ 3.94 | $ 1,000.00 | $ 1,021.32 | $ 3.92 | 0.77% | ||||||
| Hartford Quality Value Fund | |||||||||||||
| Class A | $ 1,000.00 | $ 1,067.50 | $ 5.00 | $ 1,000.00 | $ 1,020.37 | $ 4.89 | 0.96% | ||||||
| Class C | $ 1,000.00 | $ 1,063.70 | $ 8.89 | $ 1,000.00 | $ 1,016.59 | $ 8.69 | 1.71% | ||||||
| Class I | $ 1,000.00 | $ 1,069.30 | $ 3.34 | $ 1,000.00 | $ 1,021.98 | $ 3.26 | 0.64% | ||||||
| Class R3 | $ 1,000.00 | $ 1,066.30 | $ 6.15 | $ 1,000.00 | $ 1,019.26 | $ 6.01 | 1.18% | ||||||
| Class R4 | $ 1,000.00 | $ 1,068.00 | $ 4.59 | $ 1,000.00 | $ 1,020.77 | $ 4.48 | 0.88% | ||||||
| Class R5 | $ 1,000.00 | $ 1,069.30 | $ 3.29 | $ 1,000.00 | $ 1,022.03 | $ 3.21 | 0.63% | ||||||
| Class R6 | $ 1,000.00 | $ 1,070.40 | $ 2.40 | $ 1,000.00 | $ 1,022.89 | $ 2.35 | 0.46% | ||||||
| Class Y | $ 1,000.00 | $ 1,070.10 | $ 2.97 | $ 1,000.00 | $ 1,022.33 | $ 2.91 | 0.57% | ||||||
| Class F | $ 1,000.00 | $ 1,070.40 | $ 2.40 | $ 1,000.00 | $ 1,022.89 | $ 2.35 | 0.46% | ||||||
| The Hartford Small Cap Growth Fund | |||||||||||||
| Class A | $ 1,000.00 | $ 1,004.80 | $ 5.91 | $ 1,000.00 | $ 1,019.31 | $ 5.96 | 1.17% | ||||||
| Class C | $ 1,000.00 | $ 1,001.50 | $ 9.33 | $ 1,000.00 | $ 1,015.88 | $ 9.40 | 1.85% | ||||||
| Class I | $ 1,000.00 | $ 1,006.60 | $ 4.25 | $ 1,000.00 | $ 1,020.97 | $ 4.28 | 0.84% | ||||||
| Class R3 | $ 1,000.00 | $ 1,003.20 | $ 7.52 | $ 1,000.00 | $ 1,017.69 | $ 7.58 | 1.49% | ||||||
| Class R4 | $ 1,000.00 | $ 1,004.90 | $ 5.86 | $ 1,000.00 | $ 1,019.36 | $ 5.90 | 1.16% | ||||||
| Class R5 | $ 1,000.00 | $ 1,006.30 | $ 4.45 | $ 1,000.00 | $ 1,020.77 | $ 4.48 | 0.88% | ||||||
| Class R6 | $ 1,000.00 | $ 1,006.90 | $ 3.84 | $ 1,000.00 | $ 1,021.37 | $ 3.87 | 0.76% | ||||||
| Class Y | $ 1,000.00 | $ 1,006.60 | $ 4.15 | $ 1,000.00 | $ 1,021.07 | $ 4.18 | 0.82% | ||||||
| Class F | $ 1,000.00 | $ 1,007.00 | $ 3.84 | $ 1,000.00 | $ 1,021.37 | $ 3.87 | 0.76% | ||||||
| Hartford Small Cap Value Fund | |||||||||||||
| Class A | $ 1,000.00 | $ 979.50 | $ 6.44 | $ 1,000.00 | $ 1,018.70 | $ 6.56 | 1.29% | ||||||
| Class C | $ 1,000.00 | $ 976.20 | $ 10.21 | $ 1,000.00 | $ 1,014.87 | $ 10.41 | 2.05% | ||||||
| Class I | $ 1,000.00 | $ 981.00 | $ 4.89 | $ 1,000.00 | $ 1,020.27 | $ 4.99 | 0.98% | ||||||
| Class R3 | $ 1,000.00 | $ 979.60 | $ 7.19 | $ 1,000.00 | $ 1,017.95 | $ 7.32 | 1.44% | ||||||
| Class R4 | $ 1,000.00 | $ 980.60 | $ 5.99 | $ 1,000.00 | $ 1,019.16 | $ 6.11 | 1.20% | ||||||
| Class R5 | $ 1,000.00 | $ 981.90 | $ 4.50 | $ 1,000.00 | $ 1,020.67 | $ 4.58 | 0.90% | ||||||
| Class R6 | $ 1,000.00 | $ 981.90 | $ 4.00 | $ 1,000.00 | $ 1,021.17 | $ 4.08 | 0.80% | ||||||
| Class Y | $ 1,000.00 | $ 982.60 | $ 4.25 | $ 1,000.00 | $ 1,020.92 | $ 4.33 | 0.85% | ||||||
| Class F | $ 1,000.00 | $ 982.40 | $ 4.00 | $ 1,000.00 | $ 1,021.17 | $ 4.08 | 0.80% | ||||||
| The Hartford Small Company Fund | |||||||||||||
| Class A | $ 1,000.00 | $ 984.40 | $ 6.15 | $ 1,000.00 | $ 1,019.00 | $ 6.26 | 1.23% | ||||||
| Class C | $ 1,000.00 | $ 980.00 | $ 10.18 | $ 1,000.00 | $ 1,014.92 | $ 10.36 | 2.04% | ||||||
| Class I | $ 1,000.00 | $ 985.50 | $ 4.85 | $ 1,000.00 | $ 1,020.32 | $ 4.94 | 0.97% | ||||||
| Class R3 | $ 1,000.00 | $ 982.40 | $ 7.94 | $ 1,000.00 | $ 1,017.19 | $ 8.08 | 1.59% | ||||||
| Class R4 | $ 1,000.00 | $ 984.00 | $ 6.35 | $ 1,000.00 | $ 1,018.80 | $ 6.46 | 1.27% | ||||||
| Class R5 | $ 1,000.00 | $ 985.20 | $ 4.95 | $ 1,000.00 | $ 1,020.21 | $ 5.04 | 0.99% | ||||||
| Class R6 | $ 1,000.00 | $ 986.10 | $ 4.31 | $ 1,000.00 | $ 1,020.87 | $ 4.38 | 0.86% | ||||||
| Class Y | $ 1,000.00 | $ 985.80 | $ ��4.60 | $ 1,000.00 | $ 1,020.57 | $ 4.69 | 0.92% | ||||||
| Class F | $ 1,000.00 | $ 985.90 | $ 4.25 | $ 1,000.00 | $ 1,020.92 | $ 4.33 | 0.85% | ||||||
| 46 |
October 31, 2021
| Shares or Principal Amount | Market Value† | ||
| COMMON STOCKS - 96.1% | |||
| Automobiles & Components - 0.8% | |||
| 664,770 | Arrival S.A.*(1) | $ 10,988,648 | |
| 2,017,201 | Ford Motor Co.* | 34,453,793 | |
| 172,302 | Thor Industries, Inc. | 17,567,912 | |
| 63,010,353 | |||
| Banks - 2.1% | |||
| 873,529 | Bank of America Corp. | 41,737,216 | |
| 174,665 | JP Morgan Chase & Co. | 29,673,837 | |
| 395,825 | Western Alliance Bancorp | 45,951,324 | |
| 765,505 | Zions Bancorp NA | 48,219,160 | |
| 165,581,537 | |||
| Capital Goods - 7.6% | |||
| 524,137 | AerCap Holdings N.V.* | 30,945,048 | |
| 679,995 | Colfax Corp.* | 35,101,342 | |
| 377,567 | Emerson Electric Co. | 36,627,775 | |
| 258,433 | Fortive Corp. | 19,565,962 | |
| 101,646 | General Dynamics Corp. | 20,608,727 | |
| 806,800 | HF Global, Inc.*(2)(3)(4) | 16,039,184 | |
| 498,263 | Ingersoll Rand, Inc.* | 26,786,619 | |
| 890,488 | JELD-WEN Holding, Inc.* | 24,408,276 | |
| 779,388 | Johnson Controls International plc | 57,183,698 | |
| 572,018 | Kennametal, Inc. | 22,737,715 | |
| 223,263 | Lockheed Martin Corp. | 74,194,760 | |
| 267,220 | Middleby Corp.* | 48,751,617 | |
| 208,954 | Northrop Grumman Corp. | 74,642,548 | |
| 317,192 | Raytheon Technologies Corp. | 28,185,681 | |
| 321,478 | SPX FLOW, Inc. | 24,017,621 | |
| 546,415 | Westinghouse Air Brake Technologies Corp. | 49,576,233 | |
| 589,372,806 | |||
| Commercial & Professional Services - 2.3% | |||
| 277,564 | Clean Harbors, Inc.* | 31,237,053 | |
| 289,958 | Copart, Inc.* | 45,027,578 | |
| 252,370 | CoStar Group, Inc.* | 21,716,438 | |
| 486,303 | Leidos Holdings, Inc. | 48,620,574 | |
| 211,674 | Waste Management, Inc. | 33,916,525 | |
| 180,518,168 | |||
| Consumer Durables & Apparel - 3.3% | |||
| 140,936 | Garmin Ltd. | 20,238,409 | |
| 179,331 | Lennar Corp. Class A | 17,920,547 | |
| 102,361 | Lululemon Athletica, Inc.* | 47,701,250 | |
| 472,484 | NIKE, Inc. Class B | 79,041,848 | |
| 4,606 | NVR, Inc.* | 22,545,449 | |
| 509,847 | Steven Madden Ltd. | 22,994,100 | |
| 914,456 | Under Armour, Inc. Class A* | 20,081,454 | |
| 828,040 | Under Armour, Inc. Class C* | 15,633,395 | |
| 106,955 | VF Corp. | 7,794,880 | |
| 253,951,332 | |||
| Consumer Services - 4.9% | |||
| 387,949 | Airbnb, Inc. Class A* | 66,207,376 | |
| 24,566 | Booking Holdings, Inc.* | 59,468,882 | |
| 1,472,422 | Denny's Corp.* | 23,411,510 | |
| 604,928 | DraftKings, Inc. Class A* | 28,183,596 | |
| 263,148 | Las Vegas Sands Corp.* | 10,212,774 | |
| 383,161 | McDonald's Corp. | 94,085,184 | |
| 402,209 | Penn National Gaming, Inc.* | 28,798,164 | |
| 654,272 | Six Flags Entertainment Corp.* | 26,910,207 | |
| 220,781 | Wyndham Hotels & Resorts, Inc. | 18,649,371 | |
| 212,392 | Yum! Brands, Inc. | 26,536,256 | |
| 382,463,320 | |||
| Diversified Financials - 3.1% | |||
| 475,100 | American Express Co. | 82,562,878 | |
| Shares or Principal Amount | Market Value† | ||
| COMMON STOCKS - 96.1% - (continued) | |||
| Diversified Financials - 3.1% - (continued) | |||
| 629,593 | Bank of New York Mellon Corp. | $ 37,271,906 | |
| 32,045 | BlackRock, Inc. | 30,233,176 | |
| 406,987 | Charles Schwab Corp. | 33,385,144 | |
| 436,147 | Synchrony Financial | 20,259,028 | |
| 564,511 | Voya Financial, Inc. | 39,385,932 | |
| 243,098,064 | |||
| Energy - 1.0% | |||
| 829,683 | Coterra Energy, Inc. | 17,688,841 | |
| 533,020 | Diamondback Energy, Inc. | 57,134,414 | |
| 74,823,255 | |||
| Food & Staples Retailing - 0.7% | |||
| 839,259 | U.S. Foods Holding Corp.* | 29,097,109 | |
| 144,204 | Walmart, Inc. | 21,546,962 | |
| 50,644,071 | |||
| Food, Beverage & Tobacco - 4.6% | |||
| 444,353 | Altria Group, Inc. | 19,600,411 | |
| 1,156,311 | Coca-Cola Co. | 65,181,251 | |
| 184,005 | Constellation Brands, Inc. Class A | 39,894,124 | |
| 1,477,519 | Diageo plc | 73,509,066 | |
| 459,484 | General Mills, Inc. | 28,396,111 | |
| 531,044 | PepsiCo., Inc. | 85,816,710 | |
| 442,451 | Philip Morris International, Inc. | 41,829,318 | |
| 59,656 | Sovos Brands, Inc.* | 964,041 | |
| 355,191,032 | |||
| Health Care Equipment & Services - 8.5% | |||
| 82,186 | ABIOMED, Inc.* | 27,289,039 | |
| 345,312 | Acadia Healthcare Co., Inc.* | 21,409,344 | |
| 40,617 | agilon health, Inc.* | 995,117 | |
| 582,134 | Baxter International, Inc. | 45,965,301 | |
| 47,430 | Becton Dickinson and Co. | 11,363,754 | |
| 252,450 | Boston Scientific Corp.* | 10,888,168 | |
| 202,292 | Cerner Corp. | 15,028,273 | |
| 141,770 | Danaher Corp. | 44,199,633 | |
| 62,373 | DexCom, Inc.* | 38,871,477 | |
| 465,603 | Encompass Health Corp. | 29,593,727 | |
| 430,793 | GoodRx Holdings, Inc. Class A*(1) | 19,213,368 | |
| 148,363 | Insulet Corp.* | 45,995,497 | |
| 392,973 | Integra LifeSciences Holdings Corp.* | 26,116,986 | |
| 137,483 | Laboratory Corp. of America Holdings* | 39,460,371 | |
| 663,304 | Medtronic plc | 79,503,617 | |
| 120,296 | Molina Healthcare, Inc.* | 35,573,933 | |
| 285,970 | Oak Street Health, Inc.* | 13,506,363 | |
| 95,855 | Stryker Corp. | 25,504,140 | |
| 61,817 | Teleflex, Inc. | 22,064,960 | |
| 188,241 | UnitedHealth Group, Inc. | 86,679,333 | |
| 53,345 | Veeva Systems, Inc. Class A* | 16,910,898 | |
| 656,133,299 | |||
| Household & Personal Products - 2.2% | |||
| 1,160,082 | Colgate-Palmolive Co. | 88,386,648 | |
| 90,304 | Kimberly-Clark Corp. | 11,693,465 | |
| 486,459 | Procter & Gamble Co. | 69,558,772 | |
| 169,638,885 | |||
| Insurance - 4.8% | |||
| 1,047,661 | Aflac, Inc. | 56,227,966 | |
| 51,037 | Alleghany Corp.* | 33,244,481 | |
| 199,305 | Assurant, Inc. | 32,149,890 | |
| 460,827 | Chubb Ltd. | 90,036,379 | |
| 823,580 | CNO Financial Group, Inc. | 19,881,221 | |
| 132,676 | Globe Life, Inc. | 11,810,818 | |
| 187,300 | Hanover Insurance Group, Inc. | 23,599,800 | |
| 47 |
October 31, 2021
| Shares or Principal Amount | Market Value† | ||
| COMMON STOCKS - 96.1% - (continued) | |||
| Insurance - 4.8% - (continued) | |||
| 356,874 | Kemper Corp. | $ 22,654,361 | |
| 498,615 | Marsh & McLennan Cos., Inc. | 83,168,982 | |
| 372,773,898 | |||
| Materials - 3.1% | |||
| 206,624 | Celanese Corp. | 33,371,842 | |
| 321,890 | Ecolab, Inc. | 71,530,396 | |
| 473,977 | FMC Corp. | 43,136,647 | |
| 298,315 | Linde plc* | 95,222,148 | |
| 243,261,033 | |||
| Media & Entertainment - 7.7% | |||
| 620,159 | Activision Blizzard, Inc. | 48,490,232 | |
| 70,377 | Alphabet, Inc. Class A* | 208,380,667 | |
| 12,627 | Charter Communications, Inc. Class A* | 8,521,836 | |
| 287,084 | Facebook, Inc. Class A* | 92,891,770 | |
| 148,050 | Match Group, Inc.* | 22,322,979 | |
| 640,676 | Omnicom Group, Inc. | 43,617,222 | |
| 273,367 | Pinterest, Inc. Class A* | 12,203,103 | |
| 65,485 | Roku, Inc.* | 19,966,376 | |
| 631,331 | Snap, Inc. Class A* | 33,195,384 | |
| 167,956 | Spotify Technology S.A.* | 48,606,466 | |
| 290,430 | Twitter, Inc.* | 15,549,622 | |
| 144,393 | Walt Disney Co.* | 24,412,525 | |
| 260,426 | ZoomInfo Technologies, Inc.* | 17,505,836 | |
| 595,664,018 | |||
| Pharmaceuticals, Biotechnology & Life Sciences - 4.6% | |||
| 118,041 | Allakos, Inc.* | 11,872,564 | |
| 436,529 | Elanco Animal Health, Inc.* | 14,353,073 | |
| 74,928 | Eli Lilly & Co. | 19,088,657 | |
| 282,818 | Exact Sciences Corp.* | 26,929,930 | |
| 222,388 | Heron Therapeutics, Inc.* | 2,448,492 | |
| 97,522 | Illumina, Inc.* | 40,477,481 | |
| 534,026 | Johnson & Johnson | 86,982,155 | |
| 169,398 | Kodiak Sciences, Inc.* | 19,834,812 | |
| 1,879,297 | Pfizer, Inc. | 82,200,451 | |
| 442,534 | PTC Therapeutics, Inc.* | 16,785,315 | |
| 31,892 | Reata Pharmaceuticals, Inc. Class A* | 3,061,951 | |
| 92,976 | Seagen, Inc.* | 16,394,458 | |
| 89,982 | Vertex Pharmaceuticals, Inc.* | 16,640,371 | |
| 357,069,710 | |||
| Real Estate - 4.1% | |||
| 147,020 | American Tower Corp. REIT | 41,455,229 | |
| 336,254 | Americold Realty Trust REIT | 9,909,405 | |
| 169,690 | Crown Castle International Corp. REIT | 30,595,107 | |
| 720,840 | Gaming and Leisure Properties, Inc. REIT | 34,953,532 | |
| 868,149 | Invitation Homes, Inc. REIT | 35,811,146 | |
| 272,537 | Prologis, Inc. REIT | 39,506,964 | |
| 277,765 | Redfin Corp.*(1) | 14,260,455 | |
| 452,660 | Ryman Hospitality Properties, Inc. REIT* | 38,720,536 | |
| 678,935 | STORE Capital Corp. REIT | 23,307,839 | |
| 1,049,047 | VICI Properties, Inc. REIT | 30,789,530 | |
| 186,393 | Welltower, Inc. REIT | 14,985,997 | |
| 59,721 | WeWork, Inc.*(1) | 609,751 | |
| 314,905,491 | |||
| Retailing - 5.9% | |||
| 18,984 | Amazon.com, Inc.* | 64,022,211 | |
| 15,610 | AutoZone, Inc.* | 27,861,352 | |
| 656,325 | Chewy, Inc. Class A*(1) | 49,749,435 | |
| 135,953 | Dollar General Corp. | 30,116,309 | |
| 107,894 | Etsy, Inc.* | 27,047,947 | |
| 134,658 | Five Below, Inc.* | 26,568,023 | |
| Shares or Principal Amount | Market Value† | ||
| COMMON STOCKS - 96.1% - (continued) | |||
| Retailing - 5.9% - (continued) | |||
| 647,301 | Honest Co., Inc.*(2)(5) | $ 5,919,568 | |
| 90,616 | Lowe's Cos., Inc. | 21,187,833 | |
| 12,011 | MercadoLibre, Inc.* | 17,788,531 | |
| 124,289 | Ollie's Bargain Outlet Holdings, Inc.* | 8,409,394 | |
| 282,959 | Ross Stores, Inc. | 32,030,959 | |
| 1,480,520 | TJX Cos., Inc. | 96,959,255 | |
| 316,327 | Tory Burch LLC*(2)(3)(4) | 16,730,518 | |
| 86,737 | Ulta Salon Cosmetics & Fragrance, Inc.* | 31,863,704 | |
| 456,255,039 | |||
| Semiconductors & Semiconductor Equipment - 3.9% | |||
| 690,461 | Advanced Micro Devices, Inc.* | 83,014,126 | |
| 385,825 | First Solar, Inc.* | 46,140,812 | |
| 484,917 | Marvell Technology, Inc. | 33,216,814 | |
| 273,540 | MKS Instruments, Inc. | 41,044,677 | |
| 66,129 | SolarEdge Technologies, Inc.* | 23,454,634 | |
| 182,127 | Texas Instruments, Inc. | 34,145,170 | |
| 768,733 | Tower Semiconductor Ltd.* | 24,499,521 | |
| 72,200 | Universal Display Corp. | 13,227,040 | |
| 298,742,794 | |||
| Software & Services - 14.1% | |||
| 103,958 | Accenture plc Class A | 37,299,091 | |
| 239,743 | ANSYS, Inc.* | 91,001,648 | |
| 194,005 | Avalara, Inc.* | 34,851,058 | |
| 20,900 | Dynatrace, Inc.* | 1,567,500 | |
| 61,824 | Fair Isaac Corp.* | 24,618,317 | |
| 100,753 | Five9, Inc.* | 15,919,981 | |
| 190,677 | FleetCor Technologies, Inc.* | 47,175,397 | |
| 502,089 | Genpact Ltd. | 24,778,092 | |
| 204,313 | Global Payments, Inc. | 29,214,716 | |
| 203,233 | Guidewire Software, Inc.* | 25,552,485 | |
| 511,777 | International Business Machines Corp. | 64,023,303 | |
| 148,301 | Mastercard, Inc. Class A | 49,757,951 | |
| 199,732 | Microsoft Corp. | 66,235,126 | |
| 47,485 | MongoDB, Inc.* | 24,753,456 | |
| 842,986 | Oracle Corp. | 80,876,077 | |
| 81,619 | Paycom Software, Inc.* | 44,714,969 | |
| 24,184 | Q2 Holdings, Inc.* | 1,897,477 | |
| 192,836 | Rapid7, Inc.* | 24,827,635 | |
| 84,843 | RingCentral, Inc. Class A* | 20,683,027 | |
| 322,059 | salesforce.com, Inc.* | 96,517,862 | |
| 3,273,121 | Sharecare, Inc.*(2)(5) | 23,887,237 | |
| 12,640 | Sharecare, Inc. Earnout*(2)(5) | 37,515 | |
| 163,673 | Square, Inc. Class A* | 41,654,778 | |
| 428,848 | Tenable Holdings, Inc.* | 22,836,156 | |
| 246,300 | Varonis Systems, Inc.* | 15,945,462 | |
| 301,945 | Visa, Inc. Class A | 63,942,893 | |
| 1,079,168 | Western Union Co. | 19,662,441 | |
| 130,900 | WEX, Inc.* | 19,595,730 | |
| 256,827 | Workday, Inc. Class A* | 74,474,693 | |
| 1,088,302,073 | |||
| Technology Hardware & Equipment - 4.3% | |||
| 137,323 | Arista Networks, Inc.* | 56,259,860 | |
| 94,514 | Arrow Electronics, Inc.* | 10,939,996 | |
| 132,094 | CDW Corp. | 24,655,345 | |
| 1,790,802 | Cisco Systems, Inc. | 100,231,188 | |
| 160,458 | F5 Networks, Inc.* | 33,880,707 | |
| 1,397,747 | Flex Ltd.* | 23,621,924 | |
| 352,985 | II-VI, Inc.* | 21,359,122 | |
| 48 |
October 31, 2021
| Shares or Principal Amount | Market Value† | ||
| COMMON STOCKS - 96.1% - (continued) | |||
| Technology Hardware & Equipment - 4.3% - (continued) | |||
| 402,825 | Lumentum Holdings, Inc.* | $ 33,265,289 | |
| 132,495 | Rogers Corp.* | 26,647,394 | |
| 330,860,825 | |||
| Transportation - 2.3% | |||
| 130,064 | J.B. Hunt Transport Services, Inc. | 25,647,320 | |
| 53,039 | Southwest Airlines Co.* | 2,507,684 | |
| 625,957 | Uber Technologies, Inc.* | 27,429,436 | |
| 271,858 | Union Pacific Corp. | 65,626,521 | |
| 259,641 | United Parcel Service, Inc. Class B | 55,425,564 | |
| 176,636,525 | |||
| Utilities - 0.2% | |||
| 391,711 | CenterPoint Energy, Inc. | 10,200,154 | |
| 24,699 | Duke Energy Corp. | 2,519,545 | |
| 12,719,699 | |||
| Total Common Stocks (cost $5,480,324,260) | $ 7,431,617,227 | ||
| CONVERTIBLE PREFERRED STOCKS - 0.0% | |||
| Commercial & Professional Services - 0.0% | |||
| 33,739 | Rubicon Global Holdings LLC Series C*(2)(3)(4) | $ 689,861 | |
| Software & Services - 0.0% | |||
| 566,622 | Essence Group Holdings Corp. Series 3*(2)(3)(4) | 1,263,567 | |
| 77,707 | Lookout, Inc. Series F*(2)(3)(4) | 707,911 | |
| 1,971,478 | |||
| Total Convertible Preferred Stocks (cost $2,457,101) | $ 2,661,339 | ||
| EXCHANGE-TRADED FUNDS - 1.5% | |||
| Other Investment Pools & Funds - 1.5% | |||
| 374,367 | iShares Russell 1000 Growth ETF | $ 111,561,366 | |
| Total Exchange-Traded Funds (cost $104,105,756) | $ 111,561,366 | ||
| Total Long-Term Investments (Cost $5,586,887,117) | $ 7,545,839,932 | ||
| Shares or Principal Amount | Market Value† | ||
| SHORT-TERM INVESTMENTS - 3.1% | |||
| Repurchase Agreements - 2.2% | |||
| $ 168,581,979 | Fixed Income Clearing Corp. Repurchase Agreement dated 10/29/2021 at 0.010%, due on 11/01/2021 with a maturity value of $168,582,119; collateralized by U.S. Treasury Bond at 1.875%, maturing 02/15/2041, with a market value of $171,953,653 | $ 168,581,979 | |
| Securities Lending Collateral - 0.9% | |||
| 444,477 | Fidelity Investments Money Market Funds, Government Portfolio, Institutional Class, 0.01%(6) | 444,477 | |
| 68,236,565 | Goldman Sachs Financial Square Funds, Government Fund, Institutional Class, 0.03%(6) | 68,236,565 | |
| 4,898,882 | Invesco Government & Agency Portfolio, Institutional Class, 0.03%(6) | 4,898,882 | |
| 73,579,924 | |||
| Total Short-Term Investments (cost $242,161,903) | $ 242,161,903 | ||
| Total Investments (cost $5,829,049,020) | 100.7% | $ 7,788,001,835 | |
| Other Assets and Liabilities | (0.7)% | (52,815,623) | |
| Total Net Assets | 100.0% | $ 7,735,186,212 | |
| Note: | Percentage of investments as shown is the ratio of the total market value to total net assets. |
| For Fund compliance purposes, the Fund may not use the same classification system. These classifications are used for financial reporting purposes. | |
| See “Glossary” for abbreviation descriptions. |
| * | Non-income producing. |
| (1) | Represents entire or partial securities on loan. See Note 8 in the accompanying Notes to Financial Statements for securities lending information. |
| (2) | These securities are valued in good faith at fair value as determined under policies and procedures established by and under the supervision of the Board of Directors. At October 31, 2021, the aggregate fair value of these securities are $65,275,361, which represented 0.8% of total net assets. This amount excludes securities that are principally traded in certain foreign markets and whose prices are adjusted pursuant to a third party pricing service methodology approved by the Board of Directors. |
| 49 |
October 31, 2021
| (3) | Investment in securities not registered under the Securities Act of 1933 (excluding securities acquired pursuant to Rule 144A and Regulation S). At the end of the period, the value of such restricted securities amounted to $35,431,041 or 0.5% of net assets. |
| Period Acquired | Security Name | Shares/ Par Value | Total Cost | Market Value | ||||
| 05/2014 | Essence Group Holdings Corp. Series 3 Convertible Preferred | 566,622 | $ 895,999 | $ 1,263,567 | ||||
| 06/2015 | HF Global, Inc. | 806,800 | 10,846,942 | 16,039,184 | ||||
| 07/2014 | Lookout, Inc. Series F Convertible Preferred | 77,707 | 887,655 | 707,911 | ||||
| 09/2015 | Rubicon Global Holdings LLC Series C Convertible Preferred | 33,739 | 673,447 | 689,861 | ||||
| 11/2013 | Tory Burch LLC | 316,327 | 24,792,580 | 16,730,518 | ||||
| $ 38,096,623 | $ 35,431,041 |
| (4) | Investment valued using significant unobservable inputs. |
| (5) | As of October 31, 2021, investment is restricted from trading. The value of such restricted securities amounted to $29,844,320 or 0.4% of net assets. |
| Period Acquired | Security Name | Shares/ Par Value | Total Cost | Market Value | ||||
| 08/2014 | Honest Co., Inc. | 647,301 | $ 13,487,047 | $ 5,919,568 | ||||
| 03/2015 | Sharecare, Inc. | 3,273,121 | 11,759,882 | 23,887,237 | ||||
| 07/2021 | Sharecare, Inc. Earnout | 12,640 | — | 37,515 | ||||
| $ 25,246,929 | $ 29,844,320 |
| (6) | Current yield as of period end. |
| Futures Contracts Outstanding at October 31, 2021 | ||||||||
| Description | Number of Contracts | Expiration Date | Current Notional Amount | Value and Unrealized Appreciation/ (Depreciation) | ||||
| Long position contracts: | ||||||||
| Nasdaq 100 E-MINI | 596 | 12/17/2021 | $ 188,794,920 | $ 6,601,053 | ||||
| Total futures contracts | $ 6,601,053 | |||||||
| 50 |
October 31, 2021
| Description | Total | Level 1 | Level 2 | Level 3(1) | ||||
| Assets | ||||||||
| Common Stocks | ||||||||
| Automobiles & Components | $ 63,010,353 | $ 63,010,353 | $ — | $ — | ||||
| Banks | 165,581,537 | 165,581,537 | — | — | ||||
| Capital Goods | 589,372,806 | 573,333,622 | — | 16,039,184 | ||||
| Commercial & Professional Services | 180,518,168 | 180,518,168 | — | — | ||||
| Consumer Durables & Apparel | 253,951,332 | 253,951,332 | — | — | ||||
| Consumer Services | 382,463,320 | 382,463,320 | — | — | ||||
| Diversified Financials | 243,098,064 | 243,098,064 | — | — | ||||
| Energy | 74,823,255 | 74,823,255 | — | — | ||||
| Food & Staples Retailing | 50,644,071 | 50,644,071 | — | — | ||||
| Food, Beverage & Tobacco | 355,191,032 | 281,681,966 | 73,509,066 | — | ||||
| Health Care Equipment & Services | 656,133,299 | 656,133,299 | — | — | ||||
| Household & Personal Products | 169,638,885 | 169,638,885 | — | — | ||||
| Insurance | 372,773,898 | 372,773,898 | — | — | ||||
| Materials | 243,261,033 | 243,261,033 | — | — | ||||
| Media & Entertainment | 595,664,018 | 595,664,018 | — | — | ||||
| Pharmaceuticals, Biotechnology & Life Sciences | 357,069,710 | 357,069,710 | — | — | ||||
| Real Estate | 314,905,491 | 314,905,491 | — | — | ||||
| Retailing | 456,255,039 | 433,604,953 | 5,919,568 | 16,730,518 | ||||
| Semiconductors & Semiconductor Equipment | 298,742,794 | 298,742,794 | — | — | ||||
| Software & Services | 1,088,302,073 | 1,064,377,321 | 23,924,752 | — | ||||
| Technology Hardware & Equipment | 330,860,825 | 330,860,825 | — | — | ||||
| Transportation | 176,636,525 | 176,636,525 | — | — | ||||
| Utilities | 12,719,699 | 12,719,699 | — | — | ||||
| Convertible Preferred Stocks | 2,661,339 | — | — | 2,661,339 | ||||
| Exchange-Traded Funds | 111,561,366 | 111,561,366 | — | — | ||||
| Short-Term Investments | 242,161,903 | 73,579,924 | 168,581,979 | — | ||||
| Futures Contracts(2) | 6,601,053 | 6,601,053 | — | — | ||||
| Total | $ 7,794,602,888 | $ 7,487,236,482 | $ 271,935,365 | $ 35,431,041 |
| (1) | For the year ended October 31, 2021, investments valued at $24,616,180 were transferred out of Level 3 due to the initiation of a vendor providing prices that are based on market activity which has been determined to be significant observable input. There were no transfers into Level 3. |
| (2) | Derivative instruments (excluding purchased and written options, if applicable) are valued at the unrealized appreciation/(depreciation) on the investments. |
| 51 |
October 31, 2021
| Shares or Principal Amount | Market Value† | ||
| COMMON STOCKS - 99.1% | |||
| Automobiles & Components - 1.7% | |||
| 4,216,780 | Ford Motor Co. | $ 72,022,602 | |
| 130,186 | Tesla, Inc.* | 145,027,204 | |
| 217,049,806 | |||
| Banks - 6.3% | |||
| 6,540,939 | Bank of America Corp. | 312,526,066 | |
| 1,870,925 | JP Morgan Chase & Co. | 317,851,448 | |
| 785,029 | PNC Financial Services Group, Inc. | 165,664,670 | |
| 796,042,184 | |||
| Capital Goods - 5.8% | |||
| 920,873 | AMETEK, Inc. | 121,923,585 | |
| 336,942 | Deere & Co. | 115,338,616 | |
| 1,283,179 | Fortune Brands Home & Security, Inc. | 130,114,351 | |
| 493,475 | IDEX Corp. | 109,832,731 | |
| 469,622 | Illinois Tool Works, Inc. | 107,012,765 | |
| 1,628,970 | Raytheon Technologies Corp. | 144,750,274 | |
| 728,972,322 | |||
| Commercial & Professional Services - 2.6% | |||
| 509,244 | Equifax, Inc. | 141,279,563 | |
| 1,213,493 | Leidos Holdings, Inc. | 121,325,030 | |
| 530,571 | Republic Services, Inc. | 71,414,857 | |
| 334,019,450 | |||
| Consumer Durables & Apparel - 2.3% | |||
| 1,007,926 | NIKE, Inc. Class B | 168,615,941 | |
| 1,767,404 | VF Corp. | 128,808,403 | |
| 297,424,344 | |||
| Consumer Services - 2.6% | |||
| 438,692 | Airbnb, Inc. Class A* | 74,867,177 | |
| 38,316 | Booking Holdings, Inc.* | 92,754,606 | |
| 639,955 | McDonald's Corp. | 157,140,950 | |
| 324,762,733 | |||
| Diversified Financials - 5.3% | |||
| 1,043,602 | American Express Co. | 181,357,156 | |
| 161,168 | BlackRock, Inc. | 152,055,561 | |
| 1,544,009 | Charles Schwab Corp. | 126,655,058 | |
| 2,112,381 | Morgan Stanley | 217,110,519 | |
| 677,178,294 | |||
| Energy - 1.3% | |||
| 1,830,293 | EOG Resources, Inc. | 169,228,891 | |
| Food & Staples Retailing - 1.2% | |||
| 1,025,459 | Walmart, Inc. | 153,224,084 | |
| Food, Beverage & Tobacco - 1.9% | |||
| 667,944 | Constellation Brands, Inc. Class A | 144,816,939 | |
| 1,194,897 | Monster Beverage Corp.* | 101,566,245 | |
| 246,383,184 | |||
| Health Care Equipment & Services - 8.3% | |||
| 911,149 | Abbott Laboratories | 117,437,995 | |
| 1,454,354 | Baxter International, Inc. | 114,835,792 | |
| 482,675 | Becton Dickinson and Co. | 115,644,103 | |
| 553,840 | Danaher Corp. | 172,670,697 | |
| 1,478,019 | Hologic, Inc.* | 108,353,573 | |
| 369,372 | Laboratory Corp. of America Holdings* | 106,017,151 | |
| 678,234 | UnitedHealth Group, Inc. | 312,306,410 | |
| 1,047,265,721 | |||
| Shares or Principal Amount | Market Value† | ||
| COMMON STOCKS - 99.1% - (continued) | |||
| Household & Personal Products - 2.8% | |||
| 1,419,455 | Colgate-Palmolive Co. | $ 108,148,276 | |
| 1,703,919 | Procter & Gamble Co. | 243,643,378 | |
| 351,791,654 | |||
| Insurance - 1.0% | |||
| 631,912 | Chubb Ltd. | 123,462,967 | |
| Materials - 1.1% | |||
| 843,470 | PPG Industries, Inc. | 135,435,978 | |
| Media & Entertainment - 11.7% | |||
| 255,088 | Alphabet, Inc. Class A* | 755,295,161 | |
| 909,359 | Facebook, Inc. Class A* | 294,241,292 | |
| 296,130 | Netflix, Inc.* | 204,421,500 | |
| 1,343,360 | Walt Disney Co.* | 227,121,875 | |
| 1,481,079,828 | |||
| Pharmaceuticals, Biotechnology & Life Sciences - 6.1% | |||
| 764,948 | Eli Lilly & Co. | 194,878,152 | |
| 2,459,852 | Merck & Co., Inc. | 216,589,969 | |
| 227,712 | Regeneron Pharmaceuticals, Inc.* | 145,722,017 | |
| 331,672 | Thermo Fisher Scientific, Inc. | 209,971,593 | |
| 767,161,731 | |||
| Real Estate - 1.7% | |||
| 464,477 | American Tower Corp. REIT | 130,968,580 | |
| 1,677,033 | Gaming and Leisure Properties, Inc. REIT | 81,319,330 | |
| 212,287,910 | |||
| Retailing - 5.3% | |||
| 145,247 | Amazon.com, Inc.* | 489,835,340 | |
| 2,813,031 | TJX Cos., Inc. | 184,225,400 | |
| 674,060,740 | |||
| Semiconductors & Semiconductor Equipment - 4.8% | |||
| 1,031,633 | Advanced Micro Devices, Inc.* | 124,033,235 | |
| 307,018 | KLA Corp. | 114,444,030 | |
| 814,518 | QUALCOMM, Inc. | 108,363,475 | |
| 559,651 | Teradyne, Inc. | 77,366,154 | |
| 1,003,300 | Texas Instruments, Inc. | 188,098,684 | |
| 612,305,578 | |||
| Software & Services - 11.7% | |||
| 869,108 | Fidelity National Information Services, Inc. | 96,245,020 | |
| 575,418 | Global Payments, Inc. | 82,279,020 | |
| 931,438 | GoDaddy, Inc. Class A* | 64,427,566 | |
| 526,297 | Mastercard, Inc. Class A | 176,583,169 | |
| 2,195,575 | Microsoft Corp. | 728,096,582 | |
| 717,178 | salesforce.com, Inc.* | 214,931,075 | |
| 395,406 | Workday, Inc. Class A* | 114,659,832 | |
| 1,477,222,264 | |||
| Technology Hardware & Equipment - 9.6% | |||
| 3,997,148 | Apple, Inc. | 598,772,771 | |
| 648,636 | CDW Corp. | 121,067,909 | |
| 3,416,709 | Corning, Inc. | 121,532,339 | |
| 424,001 | F5 Networks, Inc.* | 89,527,811 | |
| 695,267 | Motorola Solutions, Inc. | 172,836,424 | |
| 1,265,221 | NetApp, Inc. | 112,984,235 | |
| 1,216,721,489 | |||
| Telecommunication Services - 1.0% | |||
| 2,382,342 | Verizon Communications, Inc. | 126,240,303 | |
| 52 |
October 31, 2021
| Shares or Principal Amount | Market Value† | ||
| COMMON STOCKS - 99.1% - (continued) | |||
| Transportation - 1.0% | |||
| 563,667 | FedEx Corp. | $ 132,760,488 | |
| Utilities - 2.0% | |||
| 1,535,596 | American Electric Power Co., Inc. | 130,080,337 | |
| 1,145,031 | Duke Energy Corp. | 116,804,612 | |
| 246,884,949 | |||
| Total Common Stocks (cost $7,636,774,973) | $ 12,548,966,892 | ||
| SHORT-TERM INVESTMENTS - 0.6% | |||
| Repurchase Agreements - 0.6% | |||
| $ 72,985,489 | Fixed Income Clearing Corp. Repurchase Agreement dated 10/29/2021 at 0.010%, due on 11/01/2021 with a maturity value of $72,985,550; collateralized by U.S. Treasury Bond at 1.875%, maturing 02/15/2041, with a market value of $74,445,202 | $ 72,985,489 | |
| Total Short-Term Investments (cost $72,985,489) | $ 72,985,489 | ||
| Total Investments (cost $7,709,760,462) | 99.7% | $ 12,621,952,381 | |
| Other Assets and Liabilities | 0.3% | 42,672,568 | |
| Total Net Assets | 100.0% | $ 12,664,624,949 | |
| Note: | Percentage of investments as shown is the ratio of the total market value to total net assets. |
| Equity industry classifications used in this report are the Global Industry Classification Standard, which was developed by and is the exclusive property and service mark of MSCI, Inc. and Standard & Poor’s. | |
| For Fund compliance purposes, the Fund may not use the same classification system. These classifications are used for financial reporting purposes. | |
| See “Glossary” for abbreviation descriptions. |
| * | Non-income producing. |
| † | See Significant Accounting Policies of accompanying Notes to Financial Statements regarding valuation of investments. |
| Description | Total | Level 1 | Level 2 | Level 3(1) | ||||
| Assets | ||||||||
| Common Stocks | ||||||||
| Automobiles & Components | $ 217,049,806 | $ 217,049,806 | $ — | $ — | ||||
| Banks | 796,042,184 | 796,042,184 | — | — | ||||
| Capital Goods | 728,972,322 | 728,972,322 | — | — | ||||
| Commercial & Professional Services | 334,019,450 | 334,019,450 | — | — | ||||
| Consumer Durables & Apparel | 297,424,344 | 297,424,344 | — | — | ||||
| Consumer Services | 324,762,733 | 324,762,733 | — | — | ||||
| Diversified Financials | 677,178,294 | 677,178,294 | — | — | ||||
| Energy | 169,228,891 | 169,228,891 | — | — | ||||
| Food & Staples Retailing | 153,224,084 | 153,224,084 | — | — | ||||
| Food, Beverage & Tobacco | 246,383,184 | 246,383,184 | — | — | ||||
| Health Care Equipment & Services | 1,047,265,721 | 1,047,265,721 | — | — | ||||
| Household & Personal Products | 351,791,654 | 351,791,654 | — | — | ||||
| Insurance | 123,462,967 | 123,462,967 | — | — | ||||
| Materials | 135,435,978 | 135,435,978 | — | — | ||||
| Media & Entertainment | 1,481,079,828 | 1,481,079,828 | — | — | ||||
| Pharmaceuticals, Biotechnology & Life Sciences | 767,161,731 | 767,161,731 | — | — | ||||
| Real Estate | 212,287,910 | 212,287,910 | — | — | ||||
| Retailing | 674,060,740 | 674,060,740 | — | — | ||||
| Semiconductors & Semiconductor Equipment | 612,305,578 | 612,305,578 | — | — | ||||
| Software & Services | 1,477,222,264 | 1,477,222,264 | — | — | ||||
| Technology Hardware & Equipment | 1,216,721,489 | 1,216,721,489 | — | — | ||||
| Telecommunication Services | 126,240,303 | 126,240,303 | — | — | ||||
| Transportation | 132,760,488 | 132,760,488 | — | — | ||||
| Utilities | 246,884,949 | 246,884,949 | — | — | ||||
| Short-Term Investments | 72,985,489 | — | 72,985,489 | — | ||||
| Total | $ 12,621,952,381 | $ 12,548,966,892 | $ 72,985,489 | $ — |
| (1) | For the year ended October 31, 2021, there were no transfers in and out of Level 3. |
| 53 |
October 31, 2021
| Shares or Principal Amount | Market Value† | ||
| COMMON STOCKS - 96.8% | |||
| Banks - 7.2% | |||
| 7,836,529 | Bank of America Corp. | $ 374,429,355 | |
| 2,711,967 | JP Morgan Chase & Co. | 460,736,074 | |
| 1,068,329 | PNC Financial Services Group, Inc. | 225,449,469 | |
| 1,060,614,898 | |||
| Capital Goods - 6.4% | |||
| 713,083 | General Dynamics Corp. | 144,577,578 | |
| 2,247,469 | Ingersoll Rand, Inc.* | 120,823,933 | |
| 1,638,652 | Johnson Controls International plc | 120,227,897 | |
| 476,687 | Lockheed Martin Corp. | 158,412,624 | |
| 2,121,335 | Otis Worldwide Corp. | 170,364,414 | |
| 2,502,303 | Raytheon Technologies Corp. | 222,354,645 | |
| 936,761,091 | |||
| Commercial & Professional Services - 1.1% | |||
| 1,010,769 | Waste Management, Inc. | 161,955,517 | |
| Consumer Services - 2.4% | |||
| 1,302,328 | Hilton Worldwide Holdings, Inc.* | 187,470,116 | |
| 646,590 | McDonald's Corp. | 158,770,174 | |
| 346,240,290 | |||
| Diversified Financials - 6.4% | |||
| 1,286,704 | American Express Co. | 223,603,421 | |
| 177,313 | BlackRock, Inc. | 167,287,723 | |
| 2,512,105 | Charles Schwab Corp. | 206,067,973 | |
| 1,061,074 | Northern Trust Corp. | 130,554,545 | |
| 445,150 | S&P Global, Inc. | 211,072,324 | |
| 938,585,986 | |||
| Energy - 4.2% | |||
| 1,633,139 | Chevron Corp. | 186,978,084 | |
| 2,567,884 | ConocoPhillips | 191,281,679 | |
| 1,160,273 | Marathon Petroleum Corp. | 76,496,799 | |
| 3,238,459 | TotalEnergies SE ADR | 162,279,181 | |
| 617,035,743 | |||
| Food & Staples Retailing - 2.6% | |||
| 2,193,983 | Sysco Corp. | 168,717,293 | |
| 1,469,305 | Walmart, Inc. | 219,543,553 | |
| 388,260,846 | |||
| Food, Beverage & Tobacco - 2.6% | |||
| 3,442,168 | Coca-Cola Co. | 194,035,010 | |
| 2,997,178 | Mondelez International, Inc. Class A | 182,048,592 | |
| 376,083,602 | |||
| Health Care Equipment & Services - 7.4% | |||
| 445,493 | Anthem, Inc. | 193,847,369 | |
| 744,198 | Becton Dickinson and Co. | 178,302,399 | |
| 578,914 | HCA Healthcare, Inc. | 144,994,800 | |
| 1,646,361 | Medtronic plc | 197,332,830 | |
| 804,868 | UnitedHealth Group, Inc. | 370,617,568 | |
| 1,085,094,966 | |||
| Household & Personal Products - 0.6% | |||
| 1,158,347 | Colgate-Palmolive Co. | 88,254,458 | |
| Insurance - 6.4% | |||
| 3,344,007 | American International Group, Inc. | 197,597,374 | |
| 1,659,531 | Chubb Ltd. | 324,239,167 | |
| 2,100,692 | MetLife, Inc. | 131,923,457 | |
| 1,107,110 | Principal Financial Group, Inc. | 74,276,010 | |
| 1,936,354 | Prudential Financial, Inc. | 213,095,758 | |
| 941,131,766 | |||
| Shares or Principal Amount | Market Value† | ||
| COMMON STOCKS - 96.8% - (continued) | |||
| Materials - 3.4% | |||
| 1,286,379 | Celanese Corp. | $ 207,763,072 | |
| 1,869,862 | FMC Corp. | 170,176,141 | |
| 726,769 | PPG Industries, Inc. | 116,697,298 | |
| 494,636,511 | |||
| Media & Entertainment - 6.1% | |||
| 207,234 | Alphabet, Inc. Class A* | 613,603,295 | |
| 5,420,503 | Comcast Corp. Class A | 278,776,470 | |
| 892,379,765 | |||
| Pharmaceuticals, Biotechnology & Life Sciences - 7.5% | |||
| 890,131 | Agilent Technologies, Inc. | 140,186,731 | |
| 2,567,638 | AstraZeneca plc ADR | 160,169,258 | |
| 3,094,041 | Bristol-Myers Squibb Co. | 180,691,994 | |
| 1,763,113 | Merck & Co., Inc. | 155,242,100 | |
| 1,923,766 | Novartis AG ADR | 159,210,874 | |
| 6,993,925 | Pfizer, Inc. | 305,914,280 | |
| 1,101,415,237 | |||
| Real Estate - 3.2% | |||
| 587,108 | American Tower Corp. REIT | 165,546,842 | |
| 7,154,513 | Host Hotels & Resorts, Inc. REIT* | 120,410,454 | |
| 535,577 | Public Storage REIT | 177,907,968 | |
| 463,865,264 | |||
| Retailing - 3.8% | |||
| 548,210 | Home Depot, Inc. | 203,791,586 | |
| 841,033 | Lowe's Cos., Inc. | 196,650,336 | |
| 2,369,531 | TJX Cos., Inc. | 155,180,585 | |
| 555,622,507 | |||
| Semiconductors & Semiconductor Equipment - 3.3% | |||
| 422,332 | Broadcom, Inc. | 224,541,255 | |
| 1,384,389 | Micron Technology, Inc. | 95,661,280 | |
| 857,838 | Texas Instruments, Inc. | 160,827,468 | |
| 481,030,003 | |||
| Software & Services - 8.7% | |||
| 442,948 | Accenture plc Class A | 158,925,313 | |
| 2,582,253 | Cognizant Technology Solutions Corp. Class A | 201,648,137 | |
| 1,587,342 | Fidelity National Information Services, Inc. | 175,782,253 | |
| 2,245,315 | Microsoft Corp. | 744,591,360 | |
| 1,280,947,063 | |||
| Technology Hardware & Equipment - 7.0% | |||
| 2,516,708 | Apple, Inc. | 377,002,858 | |
| 4,577,565 | Cisco Systems, Inc. | 256,206,313 | |
| 3,839,831 | Corning, Inc. | 136,582,789 | |
| 5,659,075 | HP, Inc. | 171,639,745 | |
| 353,673 | Motorola Solutions, Inc. | 87,919,571 | |
| 1,029,351,276 | |||
| Telecommunication Services - 2.1% | |||
| 5,729,658 | Verizon Communications, Inc. | 303,614,577 | |
| Transportation - 0.6% | |||
| 384,170 | Union Pacific Corp. | 92,738,638 | |
| Utilities - 3.8% | |||
| 1,954,147 | Dominion Energy, Inc. | 148,378,382 | |
| 1,305,770 | Duke Energy Corp. | 133,201,597 | |
| 54 |
October 31, 2021
| Shares or Principal Amount | Market Value† | ||
| COMMON STOCKS - 96.8% - (continued) | |||
| Utilities - 3.8% - (continued) | |||
| 2,824,728 | Exelon Corp. | $ 150,247,282 | |
| 1,028,025 | Sempra Energy | 131,206,831 | |
| 563,034,092 | |||
| Total Common Stocks (cost $8,592,575,439) | $ 14,198,654,096 | ||
| SHORT-TERM INVESTMENTS - 2.5% | |||
| Repurchase Agreements - 2.5% | |||
| $ 369,098,764 | Fixed Income Clearing Corp. Repurchase Agreement dated 10/29/2021 at 0.01%, due on 11/01/2021 with a maturity value of $ 369,099,072 ; collateralized by U.S. Treasury Bond at 1.875%, maturing 02/15/2041, with a market value of $ 376,480,787 | $ 369,098,764 | |
| Total Short-Term Investments (cost $369,098,764) | $ 369,098,764 | ||
| Total Investments (cost $8,961,674,203) | 99.3% | $ 14,567,752,860 | |
| Other Assets and Liabilities | 0.7% | 99,349,220 | |
| Total Net Assets | 100.0% | $ 14,667,102,080 | |
| Note: | Percentage of investments as shown is the ratio of the total market value to total net assets. |
| Equity industry classifications used in this report are the Global Industry Classification Standard, which was developed by and is the exclusive property and service mark of MSCI, Inc. and Standard & Poor’s. | |
| For Fund compliance purposes, the Fund may not use the same classification system. These classifications are used for financial reporting purposes. | |
| See “Glossary” for abbreviation descriptions. |
| * | Non-income producing. |
| † | See Significant Accounting Policies of accompanying Notes to Financial Statements regarding valuation of investments. |
| Description | Total | Level 1 | Level 2 | Level 3(1) | ||||
| Assets | ||||||||
| Common Stocks | ||||||||
| Banks | $ 1,060,614,898 | $ 1,060,614,898 | $ — | $ — | ||||
| Capital Goods | 936,761,091 | 936,761,091 | — | — | ||||
| Commercial & Professional Services | 161,955,517 | 161,955,517 | — | — | ||||
| Consumer Services | 346,240,290 | 346,240,290 | — | — | ||||
| Diversified Financials | 938,585,986 | 938,585,986 | — | — | ||||
| Energy | 617,035,743 | 617,035,743 | — | — | ||||
| Food & Staples Retailing | 388,260,846 | 388,260,846 | — | — | ||||
| Food, Beverage & Tobacco | 376,083,602 | 376,083,602 | — | — | ||||
| Health Care Equipment & Services | 1,085,094,966 | 1,085,094,966 | — | — | ||||
| Household & Personal Products | 88,254,458 | 88,254,458 | — | — | ||||
| Insurance | 941,131,766 | 941,131,766 | — | — | ||||
| Materials | 494,636,511 | 494,636,511 | — | — | ||||
| Media & Entertainment | 892,379,765 | 892,379,765 | — | — | ||||
| Pharmaceuticals, Biotechnology & Life Sciences | 1,101,415,237 | 1,101,415,237 | — | — | ||||
| Real Estate | 463,865,264 | 463,865,264 | — | — | ||||
| Retailing | 555,622,507 | 555,622,507 | — | — | ||||
| Semiconductors & Semiconductor Equipment | 481,030,003 | 481,030,003 | — | — | ||||
| Software & Services | 1,280,947,063 | 1,280,947,063 | — | — | ||||
| Technology Hardware & Equipment | 1,029,351,276 | 1,029,351,276 | — | — | ||||
| Telecommunication Services | 303,614,577 | 303,614,577 | — | — | ||||
| Transportation | 92,738,638 | 92,738,638 | — | — | ||||
| Utilities | 563,034,092 | 563,034,092 | — | — | ||||
| Short-Term Investments | 369,098,764 | — | 369,098,764 | — | ||||
| Total | $ 14,567,752,860 | $ 14,198,654,096 | $ 369,098,764 | $ — |
| (1) | For the year ended October 31, 2021, there were no transfers in and out of Level 3. |
| 55 |
October 31, 2021
| Shares or Principal Amount | Market Value† | ||
| COMMON STOCKS - 98.9% | |||
| Banks - 9.1% | |||
| 2,621,002 | Bank of America Corp. | $ 125,231,476 | |
| 911,172 | JP Morgan Chase & Co. | 154,799,011 | |
| 400,468 | PNC Financial Services Group, Inc. | 84,510,762 | |
| 1,265,853 | Truist Financial Corp. | 80,343,690 | |
| 444,884,939 | |||
| Capital Goods - 11.7% | |||
| 129,505 | Caterpillar, Inc. | 26,420,315 | |
| 94,362 | Deere & Co. | 32,301,056 | |
| 696,743 | Eaton Corp. plc | 114,795,377 | |
| 372,159 | General Dynamics Corp. | 75,455,237 | |
| 342,266 | Honeywell International, Inc. | 74,826,193 | |
| 915,601 | Johnson Controls International plc | 67,177,646 | |
| 208,200 | L3Harris Technologies, Inc. | 47,998,428 | |
| 161,838 | Lockheed Martin Corp. | 53,782,004 | |
| 897,315 | Raytheon Technologies Corp. | 79,735,411 | |
| 572,491,667 | |||
| Consumer Services - 0.9% | |||
| 174,758 | McDonald's Corp. | 42,911,827 | |
| Diversified Financials - 5.5% | |||
| 635,846 | Ares Management Corp. Class A | 53,881,590 | |
| 104,769 | BlackRock, Inc. | 98,845,361 | |
| 1,155,103 | Morgan Stanley | 118,721,486 | |
| 271,448,437 | |||
| Energy - 5.3% | |||
| 1,236,466 | ConocoPhillips | 92,104,352 | |
| 247,066 | Phillips 66 | 18,475,596 | |
| 506,657 | Pioneer Natural Resources Co. | 94,734,726 | |
| 1,044,916 | TC Energy Corp. | 56,526,443 | |
| 261,841,117 | |||
| Food, Beverage & Tobacco - 8.0% | |||
| 969,542 | Archer-Daniels-Midland Co. | 62,283,378 | |
| 606,241 | Kellogg Co. | 37,162,573 | |
| 1,671,319 | Mondelez International, Inc. Class A | 101,515,916 | |
| 358,563 | Nestle S.A. ADR | 47,265,775 | |
| 296,256 | PepsiCo., Inc. | 47,874,969 | |
| 1,005,131 | Philip Morris International, Inc. | 95,025,085 | |
| 391,127,696 | |||
| Health Care Equipment & Services - 9.1% | |||
| 154,078 | Anthem, Inc. | 67,043,960 | |
| 705,979 | Baxter International, Inc. | 55,744,102 | |
| 363,315 | Becton Dickinson and Co. | 87,046,641 | |
| 504,783 | Medtronic plc | 60,503,290 | |
| 379,518 | UnitedHealth Group, Inc. | 174,756,654 | |
| 445,094,647 | |||
| Household & Personal Products - 3.7% | |||
| 352,507 | Kimberly-Clark Corp. | 45,646,131 | |
| 652,839 | Procter & Gamble Co. | 93,349,449 | |
| 842,571 | Unilever plc ADR | 45,144,954 | |
| 184,140,534 | |||
| Insurance - 6.0% | |||
| 599,248 | Chubb Ltd. | 117,081,074 | |
| Shares or Principal Amount | Market Value† | ||
| COMMON STOCKS - 98.9% - (continued) | |||
| Insurance - 6.0% - (continued) | |||
| 1,634,899 | MetLife, Inc. | $ 102,671,657 | |
| 767,035 | Progressive Corp. | 72,776,281 | |
| 292,529,012 | |||
| Materials - 4.3% | |||
| 459,445 | Celanese Corp. | 74,204,962 | |
| 427,000 | LyondellBasell Industries N.V. Class A | 39,634,140 | |
| 465,421 | PPG Industries, Inc. | 74,732,650 | |
| 326,600 | Rio Tinto plc ADR(1) | 20,663,982 | |
| 209,235,734 | |||
| Media & Entertainment - 2.6% | |||
| 2,438,968 | Comcast Corp. Class A | 125,436,124 | |
| Pharmaceuticals, Biotechnology & Life Sciences - 10.0% | |||
| 1,114,778 | AstraZeneca plc ADR | 69,539,852 | |
| 247,631 | Eli Lilly & Co. | 63,086,474 | |
| 838,868 | Johnson & Johnson | 136,634,820 | |
| 903,191 | Merck & Co., Inc. | 79,525,967 | |
| 2,019,373 | Pfizer, Inc. | 88,327,375 | |
| 130,633 | Roche Holding AG | 50,606,435 | |
| 487,720,923 | |||
| Real Estate - 2.0% | |||
| 537,436 | Crown Castle International Corp. REIT | 96,899,711 | |
| Retailing - 3.7% | |||
| 161,394 | Home Depot, Inc. | 59,996,605 | |
| 340,213 | Lowe's Cos., Inc. | 79,548,604 | |
| 653,772 | TJX Cos., Inc. | 42,815,528 | |
| 182,360,737 | |||
| Semiconductors & Semiconductor Equipment - 2.5% | |||
| 431,375 | Analog Devices, Inc. | 74,839,249 | |
| 260,200 | Texas Instruments, Inc. | 48,782,296 | |
| 123,621,545 | |||
| Software & Services - 0.5% | |||
| 232,700 | Fidelity National Information Services, Inc. | 25,769,198 | |
| Technology Hardware & Equipment - 6.3% | |||
| 2,750,672 | Cisco Systems, Inc. | 153,955,112 | |
| 1,642,408 | Corning, Inc. | 58,420,452 | |
| 648,020 | TE Connectivity Ltd. | 94,610,920 | |
| 306,986,484 | |||
| Telecommunication Services - 1.0% | |||
| 930,205 | Verizon Communications, Inc. | 49,291,563 | |
| Transportation - 1.0% | |||
| 205,438 | Union Pacific Corp. | 49,592,733 | |
| Utilities - 5.7% | |||
| 557,792 | American Electric Power Co., Inc. | 47,250,560 | |
| 688,734 | Dominion Energy, Inc. | 52,295,573 | |
| 412,001 | Duke Energy Corp. | 42,028,222 | |
| 1,224,048 | Exelon Corp. | 65,107,113 | |
| 56 |
October 31, 2021
| Shares or Principal Amount | Market Value† | ||
| COMMON STOCKS - 98.9% - (continued) | |||
| Utilities - 5.7% - (continued) | |||
| 391,665 | Sempra Energy | $ 49,988,204 | |
| 485,429 | UGI Corp. | 21,072,473 | |
| 277,742,145 | |||
| Total Common Stocks (cost $3,254,434,435) | $ 4,841,126,773 | ||
| SHORT-TERM INVESTMENTS - 1.4% | |||
| Repurchase Agreements - 1.0% | |||
| $ 51,975,720 | Fixed Income Clearing Corp. Repurchase Agreement dated 10/29/2021 at 0.010%, due on 11/01/2021 with a maturity value of $51,975,763; collateralized by U.S. Treasury Bond at 1.375%, maturing 11/15/2040, with a market value of $53,015,261 | $ 51,975,720 | |
| Securities Lending Collateral - 0.4% | |||
| 110,306 | Fidelity Investments Money Market Funds, Government Portfolio, Institutional Class, 0.01%(2) | 110,306 | |
| 16,934,307 | Goldman Sachs Financial Square Funds, Government Fund, Institutional Class, 0.03%(2) | 16,934,307 | |
| 1,215,759 | Invesco Government & Agency Portfolio, Institutional Class, 0.03%(2) | 1,215,759 | |
| 18,260,372 | |||
| Total Short-Term Investments (cost $70,236,092) | $ 70,236,092 | ||
| Total Investments (cost $3,324,670,527) | 100.3% | $ 4,911,362,865 | |
| Other Assets and Liabilities | (0.3)% | (16,249,967) | |
| Total Net Assets | 100.0% | $ 4,895,112,898 | |
| Note: | Percentage of investments as shown is the ratio of the total market value to total net assets. |
| Prices of foreign equities that are principally traded on certain foreign markets will generally be adjusted daily pursuant to a fair value pricing service approved by the Board of Directors in order to reflect an adjustment for factors occurring after the close of certain foreign markets but before the close of the New York Stock Exchange. | |
| Equity industry classifications used in this report are the Global Industry Classification Standard, which was developed by and is the exclusive property and service mark of MSCI, Inc. and Standard & Poor’s. | |
| For Fund compliance purposes, the Fund may not use the same classification system. These classifications are used for financial reporting purposes. | |
| See “Glossary” for abbreviation descriptions. |
| (1) | Represents entire or partial securities on loan. See Note 8 in the accompanying Notes to Financial Statements for securities lending information. |
| (2) | Current yield as of period end. |
| † | See Significant Accounting Policies of accompanying Notes to Financial Statements regarding valuation of investments. |
| 57 |
October 31, 2021
| Description | Total | Level 1 | Level 2 | Level 3(1) | ||||
| Assets | ||||||||
| Common Stocks | ||||||||
| Banks | $ 444,884,939 | $ 444,884,939 | $ — | $ — | ||||
| Capital Goods | 572,491,667 | 572,491,667 | — | — | ||||
| Consumer Services | 42,911,827 | 42,911,827 | — | — | ||||
| Diversified Financials | 271,448,437 | 271,448,437 | — | — | ||||
| Energy | 261,841,117 | 261,841,117 | — | — | ||||
| Food, Beverage & Tobacco | 391,127,696 | 391,127,696 | — | — | ||||
| Health Care Equipment & Services | 445,094,647 | 445,094,647 | — | — | ||||
| Household & Personal Products | 184,140,534 | 184,140,534 | — | — | ||||
| Insurance | 292,529,012 | 292,529,012 | — | — | ||||
| Materials | 209,235,734 | 209,235,734 | — | — | ||||
| Media & Entertainment | 125,436,124 | 125,436,124 | — | — | ||||
| Pharmaceuticals, Biotechnology & Life Sciences | 487,720,923 | 437,114,488 | 50,606,435 | — | ||||
| Real Estate | 96,899,711 | 96,899,711 | — | — | ||||
| Retailing | 182,360,737 | 182,360,737 | — | — | ||||
| Semiconductors & Semiconductor Equipment | 123,621,545 | 123,621,545 | — | — | ||||
| Software & Services | 25,769,198 | 25,769,198 | — | — | ||||
| Technology Hardware & Equipment | 306,986,484 | 306,986,484 | — | — | ||||
| Telecommunication Services | 49,291,563 | 49,291,563 | — | — | ||||
| Transportation | 49,592,733 | 49,592,733 | — | — | ||||
| Utilities | 277,742,145 | 277,742,145 | — | — | ||||
| Short-Term Investments | 70,236,092 | 18,260,372 | 51,975,720 | — | ||||
| Total | $ 4,911,362,865 | $ 4,808,780,710 | $ 102,582,155 | $ — |
| (1) | For the year ended October 31, 2021, there were no transfers in and out of Level 3. |
| 58 |
October 31, 2021
| Shares or Principal Amount | Market Value† | ||
| COMMON STOCKS - 93.6% | |||
| Automobiles & Components - 1.0% | |||
| 778,371 | Thor Industries, Inc. | $ 79,362,707 | |
| Capital Goods - 2.5% | |||
| 1,691,230 | Johnson Controls International plc | 124,085,545 | |
| 450,322 | Middleby Corp.* | 82,156,746 | |
| 206,242,291 | |||
| Commercial & Professional Services - 3.6% | |||
| 603,830 | Copart, Inc.* | 93,768,760 | |
| 1,315,385 | CoStar Group, Inc.* | 113,188,879 | |
| 875,064 | Leidos Holdings, Inc. | 87,488,899 | |
| 294,446,538 | |||
| Consumer Durables & Apparel - 4.1% | |||
| 877,162 | Lennar Corp. Class A | 87,654,799 | |
| 518,918 | Lululemon Athletica, Inc.* | 241,820,977 | |
| 329,475,776 | |||
| Consumer Services - 6.5% | |||
| 1,206,879 | Airbnb, Inc. Class A* | 205,965,970 | |
| 49,280 | Booking Holdings, Inc.* | 119,296,039 | |
| 2,926,593 | DraftKings, Inc. Class A* | 136,349,968 | |
| 916,314 | Penn National Gaming, Inc.* | 65,608,082 | |
| 527,220,059 | |||
| Food, Beverage & Tobacco - 1.1% | |||
| 402,820 | Constellation Brands, Inc. Class A | 87,335,404 | |
| Health Care Equipment & Services - 8.7% | |||
| 365,287 | ABIOMED, Inc.* | 121,289,896 | |
| 310,753 | Danaher Corp. | 96,883,463 | |
| 293,514 | DexCom, Inc.* | 182,920,860 | |
| 2,065,194 | GoodRx Holdings, Inc. Class A*(1) | 92,107,652 | |
| 464,186 | Insulet Corp.* | 143,906,944 | |
| 1,347,906 | Oak Street Health, Inc.* | 63,661,600 | |
| 700,770,415 | |||
| Media & Entertainment - 20.2% | |||
| 206,035 | Alphabet, Inc. Class A* | 610,053,152 | |
| 816,822 | Facebook, Inc. Class A* | 264,299,094 | |
| 648,250 | Match Group, Inc.* | 97,743,135 | |
| 2,865,570 | Snap, Inc. Class A* | 150,671,671 | |
| 823,836 | Spotify Technology S.A.* | 238,418,138 | |
| 1,409,809 | Twitter, Inc.* | 75,481,174 | |
| 686,327 | Walt Disney Co.* | 116,037,306 | |
| 1,237,948 | ZoomInfo Technologies, Inc.* | 83,214,865 | |
| 1,635,918,535 | |||
| Pharmaceuticals, Biotechnology & Life Sciences - 5.6% | |||
| 209,083 | Ascendis Pharma A/S ADR* | 31,699,074 | |
| 2,093,739 | Elanco Animal Health, Inc.* | 68,842,138 | |
| 1,386,982 | Exact Sciences Corp.* | 132,068,426 | |
| 455,111 | Illumina, Inc.* | 188,898,372 | |
| 178,650 | Kodiak Sciences, Inc.* | 20,918,128 | |
| 121,360 | Reata Pharmaceuticals, Inc. Class A*(1) | 11,651,774 | |
| 454,077,912 | |||
| Real Estate - 0.1% | |||
| 448,214 | WeWork, Inc.*(1) | 4,576,265 | |
| Retailing - 9.2% | |||
| 89,268 | Amazon.com, Inc.* | 301,050,081 | |
| 644,567 | Five Below, Inc.* | 127,173,069 | |
| 575,034 | Honest Co., Inc.*(2)(3) | 5,258,686 | |
| 1,293,870 | Ross Stores, Inc. | 146,466,084 | |
| Shares or Principal Amount | Market Value† | ||
| COMMON STOCKS - 93.6% - (continued) | |||
| Retailing - 9.2% - (continued) | |||
| 171,581 | Tory Burch LLC*(2)(4)(5) | $ 9,074,918 | |
| 411,626 | Ulta Salon Cosmetics & Fragrance, Inc.* | 151,214,927 | |
| 740,237,765 | |||
| Semiconductors & Semiconductor Equipment - 7.3% | |||
| 2,162,009 | Advanced Micro Devices, Inc.* | 259,938,342 | |
| 1,317,411 | Marvell Technology, Inc. | 90,242,653 | |
| 475,971 | MKS Instruments, Inc. | 71,419,449 | |
| 308,688 | SolarEdge Technologies, Inc.* | 109,485,460 | |
| 345,750 | Universal Display Corp. | 63,341,400 | |
| 594,427,304 | |||
| Software & Services - 21.2% | |||
| 303,467 | Fair Isaac Corp.* | 120,840,559 | |
| 478,828 | Five9, Inc.* | 75,659,612 | |
| 729,119 | Guidewire Software, Inc.* | 91,672,132 | |
| 5,596,045 | ironSource Ltd.*(1) | 63,738,952 | |
| 723,037 | Mastercard, Inc. Class A | 242,593,374 | |
| 226,343 | MongoDB, Inc.* | 117,990,343 | |
| 376,462 | Paycom Software, Inc.* | 206,244,707 | |
| 685,800 | Payoneer Global, Inc.* | 5,177,790 | |
| 413,817 | RingCentral, Inc. Class A* | 100,880,308 | |
| 819,581 | salesforce.com, Inc.* | 245,620,230 | |
| 778,540 | Square, Inc. Class A* | 198,138,430 | |
| 1,165,278 | Varonis Systems, Inc.* | 75,440,098 | |
| 578,541 | Workday, Inc. Class A* | 167,765,319 | |
| 1,711,761,854 | |||
| Technology Hardware & Equipment - 2.5% | |||
| 492,886 | Arista Networks, Inc.* | 201,930,465 | |
| Total Common Stocks (cost $5,737,128,894) | $ 7,567,783,290 | ||
| CONVERTIBLE PREFERRED STOCKS - 0.4% | |||
| Commercial & Professional Services - 0.1% | |||
| 470,535 | Rubicon Global Holdings LLC Series C*(2)(4)(5) | $ 9,621,029 | |
| Software & Services - 0.3% | |||
| 5,668,755 | Essence Group Holdings Corp. Series 3*(2)(4)(5) | 12,641,324 | |
| 743,470 | Lookout, Inc. Series F*(2)(4)(5) | 6,773,012 | |
| 19,414,336 | |||
| Total Convertible Preferred Stocks (cost $26,848,848) | $ 29,035,365 | ||
| EXCHANGE-TRADED FUNDS - 4.1% | |||
| Other Investment Pools & Funds - 4.1% | |||
| 1,120,355 | iShares Russell 1000 Growth ETF (1) | $ 333,865,790 | |
| Total Exchange-Traded Funds (cost $318,621,742) | $ 333,865,790 | ||
| Total Long-Term Investments (Cost $6,082,599,484) | $ 7,930,684,445 | ||
| SHORT-TERM INVESTMENTS - 1.7% | |||
| Repurchase Agreements - 1.1% | |||
| $ 87,787,053 | Fixed Income Clearing Corp. Repurchase Agreement dated 10/29/2021 at 0.010%, due on 11/01/2021 with a maturity value of $87,787,126; collateralized by U.S. Treasury Bond at 1.875%, maturing 02/15/2041, with a market value of $89,542,843 | $ 87,787,053 | |
| 59 |
October 31, 2021
| Shares or Principal Amount | Market Value† | ||
| SHORT-TERM INVESTMENTS - 1.7% - (continued) | |||
| Securities Lending Collateral - 0.6% | |||
| 294,896 | Fidelity Investments Money Market Funds, Government Portfolio, Institutional Class, 0.01%(6) | $ 294,896 | |
| 45,272,633 | Goldman Sachs Financial Square Funds, Government Fund, Institutional Class, 0.03%(6) | 45,272,633 | |
| 3,250,241 | Invesco Government & Agency Portfolio, Institutional Class, 0.03%(6) | 3,250,241 | |
| 48,817,770 | |||
| Total Short-Term Investments (cost $136,604,823) | $ 136,604,823 | ||
| Total Investments (cost $6,219,204,307) | 99.8% | $ 8,067,289,268 | |
| Other Assets and Liabilities | 0.2% | 16,179,667 | |
| Total Net Assets | 100.0% | $ 8,083,468,935 | |
| Note: | Percentage of investments as shown is the ratio of the total market value to total net assets. |
| Prices of foreign equities that are principally traded on certain foreign markets will generally be adjusted daily pursuant to a fair value pricing service approved by the Board of Directors in order to reflect an adjustment for factors occurring after the close of certain foreign markets but before the close of the New York Stock Exchange. | |
| Equity industry classifications used in this report are the Global Industry Classification Standard, which was developed by and is the exclusive property and service mark of MSCI, Inc. and Standard & Poor’s. | |
| For Fund compliance purposes, the Fund may not use the same classification system. These classifications are used for financial reporting purposes. | |
| See “Glossary” for abbreviation descriptions. |
| * | Non-income producing. |
| (1) | Represents entire or partial securities on loan. See Note 8 in the accompanying Notes to Financial Statements for securities lending information. |
| (2) | These securities are valued in good faith at fair value as determined under policies and procedures established by and under the supervision of the Board of Directors. At October 31, 2021, the aggregate fair value of these securities are $43,368,969, which represented 0.5% of total net assets. This amount excludes securities that are principally traded in certain foreign markets and whose prices are adjusted pursuant to a third party pricing service methodology approved by the Board of Directors. |
| (3) | As of October 31, 2021, investment is restricted from trading. The value of such restricted securities amounted to $5,258,686 or 0.1% of net assets. |
| Period Acquired | Security Name | Shares/ Par Value | Total Cost | Market Value | ||||
| 08/2014 | Honest Co., Inc. | 575,034 | $ 7,360,452 | $ 5,258,686 |
| (4) | Investment in securities not registered under the Securities Act of 1933 (excluding securities acquired pursuant to Rule 144A and Regulation S). At the end of the period, the value of such restricted securities amounted to $38,110,283 or 0.5% of net assets. |
| Period Acquired | Security Name | Shares/ Par Value | Total Cost | Market Value | ||||
| 05/2014 | Essence Group Holdings Corp. Series 3 Convertible Preferred | 5,668,755 | $ 8,964,002 | $ 12,641,324 | ||||
| 07/2014 | Lookout, Inc. Series F Convertible Preferred | 743,470 | 8,492,732 | 6,773,012 | ||||
| 09/2015 | Rubicon Global Holdings LLC Series C Convertible Preferred | 470,535 | 9,392,114 | 9,621,029 | ||||
| 11/2013 | Tory Burch LLC | 171,581 | 13,447,917 | 9,074,918 | ||||
| $ 40,296,765 | $ 38,110,283 |
| (5) | Investment valued using significant unobservable inputs. |
| (6) | Current yield as of period end. |
| † | See Significant Accounting Policies of accompanying Notes to Financial Statements regarding valuation of investments. |
| 60 |
October 31, 2021
| Description | Total | Level 1 | Level 2 | Level 3(1) | ||||
| Assets | ||||||||
| Common Stocks | ||||||||
| Automobiles & Components | $ 79,362,707 | $ 79,362,707 | $ — | $ — | ||||
| Capital Goods | 206,242,291 | 206,242,291 | — | — | ||||
| Commercial & Professional Services | 294,446,538 | 294,446,538 | — | — | ||||
| Consumer Durables & Apparel | 329,475,776 | 329,475,776 | — | — | ||||
| Consumer Services | 527,220,059 | 527,220,059 | — | — | ||||
| Food, Beverage & Tobacco | 87,335,404 | 87,335,404 | — | — | ||||
| Health Care Equipment & Services | 700,770,415 | 700,770,415 | — | — | ||||
| Media & Entertainment | 1,635,918,535 | 1,635,918,535 | — | — | ||||
| Pharmaceuticals, Biotechnology & Life Sciences | 454,077,912 | 454,077,912 | — | — | ||||
| Real Estate | 4,576,265 | 4,576,265 | — | — | ||||
| Retailing | 740,237,765 | 725,904,161 | 5,258,686 | 9,074,918 | ||||
| Semiconductors & Semiconductor Equipment | 594,427,304 | 594,427,304 | — | — | ||||
| Software & Services | 1,711,761,854 | 1,711,761,854 | — | — | ||||
| Technology Hardware & Equipment | 201,930,465 | 201,930,465 | — | — | ||||
| Convertible Preferred Stocks | 29,035,365 | — | — | 29,035,365 | ||||
| Exchange-Traded Funds | 333,865,790 | 333,865,790 | — | — | ||||
| Short-Term Investments | 136,604,823 | 48,817,770 | 87,787,053 | — | ||||
| Total | $ 8,067,289,268 | $ 7,936,133,246 | $ 93,045,739 | $ 38,110,283 |
| (1) | For the year ended October 31, 2021, investments valued at $13,101,364 were transferred out of Level 3 due to the initiation of a vendor providing prices that are based on market activity which has been determined to be significant observable input. There were no transfers into Level 3. |
| 61 |
October 31, 2021
| Shares or Principal Amount | Market Value† | ||
| COMMON STOCKS - 98.7% | |||
| Biotechnology - 17.9% | |||
| 636,147 | 89bio, Inc.* | $ 11,196,187 | |
| 242,890 | Abcam plc* | 5,498,017 | |
| 67,461 | Alnylam Pharmaceuticals, Inc.* | 10,764,077 | |
| 157,714 | ALX Oncology Holdings, Inc.* | 8,838,293 | |
| 1,280,964 | Amicus Therapeutics, Inc.* | 13,450,122 | |
| 135,406 | Arena Pharmaceuticals, Inc.* | 7,770,950 | |
| 22,901 | Argenx SE ADR* | 6,915,186 | |
| 64,327 | Ascendis Pharma A/S ADR* | 9,752,617 | |
| 179,608 | BioAtla, Inc.* | 5,249,942 | |
| 101,689 | Blueprint Medicines Corp.* | 11,438,996 | |
| 186,086 | Celldex Therapeutics, Inc.* | 7,916,099 | |
| 259,682 | Connect Biopharma Holdings Ltd. ADR*(1) | 4,113,363 | |
| 1,094,800 | Everest Medicines Ltd.*(1)(2) | 6,279,813 | |
| 190,692 | Exact Sciences Corp.* | 18,157,692 | |
| 15,195 | Genmab A/S* | 6,826,376 | |
| 103,511 | Genus plc | 7,849,422 | |
| 378,118 | Gracell Biotechnologies, Inc. ADR* | 4,045,863 | |
| 1,095,843 | ImmunoGen, Inc.* | 6,607,933 | |
| 2,443,000 | InnoCare Pharma Ltd.*(1)(2) | 5,858,408 | |
| 871,000 | Innovent Biologics, Inc.*(2) | 7,795,755 | |
| 325,840 | Invitae Corp.*(1) | 8,634,760 | |
| 641,240 | Ironwood Pharmaceuticals, Inc.* | 8,188,635 | |
| 16,756 | Karuna Therapeutics, Inc.* | 2,352,207 | |
| 90,167 | Kodiak Sciences, Inc.* | 10,557,654 | |
| 156,275 | Kymera Therapeutics, Inc.* | 9,201,472 | |
| 93,379 | Madrigal Pharmaceuticals, Inc.* | 7,260,217 | |
| 316,114 | Merus N.V.* | 8,866,998 | |
| 52,367 | Mirati Therapeutics, Inc.* | 9,898,410 | |
| 195,573 | Myovant Sciences Ltd.* | 4,279,137 | |
| 252,578 | Nurix Therapeutics, Inc.* | 8,448,734 | |
| 109,837 | Sage Therapeutics, Inc.* | 4,433,021 | |
| 138,301 | Seagen, Inc.* | 24,386,615 | |
| 230,374 | Veracyte, Inc.* | 11,030,307 | |
| 122,075 | Verve Therapeutics, Inc.*(1) | 5,663,059 | |
| 16,100 | Zai Lab Ltd.* | 1,670,230 | |
| 153,427 | Zai Lab Ltd. ADR* | 16,017,779 | |
| 58,545 | Zealand Pharma A/S ADR*(1) | 1,859,975 | |
| 309,074,321 | |||
| Consumer Finance - 0.1% | |||
| 112,470 | Orion Acquisition Corp.* | 1,113,453 | |
| Health Care Distributors - 0.8% | |||
| 195,067 | AdaptHealth Corp.* | 5,315,576 | |
| 220,464 | Owens & Minor, Inc. | 7,910,248 | |
| 13,225,824 | |||
| Health Care Equipment - 23.5% | |||
| 272,548 | Baxter International, Inc. | 21,520,390 | |
| 148,590 | Becton Dickinson and Co. | 35,600,678 | |
| 1,221,571 | Boston Scientific Corp.* | 52,686,357 | |
| 221,064 | Danaher Corp. | 68,921,123 | |
| 64,009 | DiaSorin S.p.A. | 14,470,127 | |
| 437,474 | Edwards Lifesciences Corp.* | 52,418,135 | |
| 125,300 | Glaukos Corp.* | 5,727,463 | |
| 199,927 | Hologic, Inc.* | 14,656,648 | |
| 114,636 | Inari Medical, Inc.* | 10,376,851 | |
| 44,369 | Insulet Corp.* | 13,755,277 | |
| 111,528 | Integra LifeSciences Holdings Corp.* | 7,412,151 | |
| 130,270 | iRhythm Technologies, Inc.* | 9,137,138 | |
| 280,677 | Koninklijke Philips N.V. | 13,240,985 | |
| 17,349 | Masimo Corp.* | 4,919,136 | |
| 602,169 | Smith & Nephew plc | 10,399,499 | |
| Shares or Principal Amount | Market Value† | ||
| COMMON STOCKS - 98.7% - (continued) | |||
| Health Care Equipment - 23.5% - (continued) | |||
| 171,346 | Stryker Corp. | $ 45,590,030 | |
| 57,658 | Teleflex, Inc. | 20,580,447 | |
| 1,112,000 | Venus MedTech Hangzhou, Inc. Class H*(1)(2) | 5,146,335 | |
| 406,558,770 | |||
| Health Care Facilities - 2.7% | |||
| 460,563 | Cano Health, Inc.*(1) | 5,061,587 | |
| 197,431 | Encompass Health Corp. | 12,548,714 | |
| 115,493 | HCA Healthcare, Inc. | 28,926,377 | |
| 46,536,678 | |||
| Health Care Services - 2.5% | |||
| 330,168 | agilon health, Inc.* | 8,089,116 | |
| 53,248 | Amedisys, Inc.* | 9,017,016 | |
| 411,170 | Aveanna Healthcare Holdings, Inc.* | 3,174,232 | |
| 242,800 | Entrada Therapeutics, Inc. | 5,815,060 | |
| 60,275 | Laboratory Corp. of America Holdings* | 17,300,131 | |
| 43,395,555 | |||
| Health Care Supplies - 2.3% | |||
| 34,886 | Align Technology, Inc.* | 21,781,772 | |
| 73,393 | Haemonetics Corp.* | 5,042,833 | |
| 58,588 | Quidel Corp.* | 7,778,728 | |
| 2,980,000 | Shandong Weigao Group Medical Polymer Co., Ltd. Class H | 5,075,924 | |
| 39,679,257 | |||
| Integrated Telecommunication Services - 0.2% | |||
| 366,004 | MedTech Acquisition Corp.* | 3,740,561 | |
| Life & Health Insurance - 0.2% | |||
| 237,734 | Oscar Health, Inc. Class A* | 4,108,044 | |
| Life Sciences Tools & Services - 7.9% | |||
| 214,252 | Agilent Technologies, Inc. | 33,742,547 | |
| 19,886 | Bio-Techne Corp. | 10,413,304 | |
| 60,435 | Illumina, Inc.* | 25,084,151 | |
| 167,320 | NanoString Technologies, Inc.* | 8,081,556 | |
| 230,957 | NeoGenomics, Inc.* | 10,624,022 | |
| 90,700 | Oxford Industries, Inc.* | 693,252 | |
| 314,068 | Syneos Health, Inc.* | 29,315,107 | |
| 15,660 | Tecan Group AG | 9,594,916 | |
| 450,215 | WuXi AppTec Co., Ltd. Class H(2) | 9,612,614 | |
| 137,161,469 | |||
| Managed Health Care - 14.2% | |||
| 321,445 | Centene Corp.* | 22,899,742 | |
| 85,826 | Humana, Inc. | 39,751,170 | |
| 53,748 | Molina Healthcare, Inc.* | 15,894,359 | |
| 464,300 | Notre Dame Intermedica Participacoes S.A. | 5,279,913 | |
| 349,594 | UnitedHealth Group, Inc. | 160,977,549 | |
| 244,802,733 | |||
| Other Diversified Financial Services - 0.3% | |||
| 599,851 | DA32 Life Science Tech Acquisition Corp. Class A* | 5,878,540 | |
| Pharmaceuticals - 26.1% | |||
| 1,102,300 | Astellas Pharma, Inc. | 18,583,420 | |
| 664,429 | AstraZeneca plc ADR | 41,447,081 | |
| 993,748 | Bristol-Myers Squibb Co. | 58,034,883 | |
| 2,436,000 | CSPC Pharmaceutical Group Ltd. | 2,541,965 | |
| 755,625 | Daiichi Sankyo Co., Ltd. | 19,066,207 | |
| 199,195 | Eisai Co., Ltd. | 14,114,188 | |
| 182,112 | Elanco Animal Health, Inc.* | 5,987,843 | |
| 356,242 | Eli Lilly & Co. | 90,756,212 | |
| 62 |
October 31, 2021
| Shares or Principal Amount | Market Value† | ||
| COMMON STOCKS - 98.7% - (continued) | |||
| Pharmaceuticals - 26.1% - (continued) | |||
| 90,221 | Hikma Pharmaceuticals plc | $ 2,973,856 | |
| 315,547 | Hutchmed China Ltd.* | 1,867,191 | |
| 70,182 | Hutchmed China Ltd. ADR* | 2,064,755 | |
| 1,386,600 | Hypera S.A. | 6,893,936 | |
| 133,500 | Kyowa Kirin Co., Ltd. | 4,390,554 | |
| 58,900 | Nippon Shinyaku Co., Ltd. | 4,718,854 | |
| 95,995 | Novartis AG | 7,940,006 | |
| 421,845 | Ono Pharmaceutical Co., Ltd. | 8,851,036 | |
| 2,254,423 | Pfizer, Inc. | 98,608,462 | |
| 35,517 | Roche Holding AG | 13,759,071 | |
| 67,192 | UCB S.A. | 8,031,167 | |
| 190,537 | Zoetis, Inc. | 41,194,099 | |
| 451,824,786 | |||
| Total Common Stocks (cost $1,268,187,086) | $ 1,707,099,991 | ||
| SHORT-TERM INVESTMENTS - 1.7% | |||
| Repurchase Agreements - 1.1% | |||
| $ 18,664,274 | Fixed Income Clearing Corp. Repurchase Agreement dated 10/29/2021 at 0.010%, due on 11/01/2021 with a maturity value of $18,664,290; collateralized by U.S. Treasury Bond at 1.875%, maturing 02/15/2041, with a market value of $19,037,631 | $ 18,664,274 | |
| Securities Lending Collateral - 0.6% | |||
| 61,744 | Fidelity Investments Money Market Funds, Government Portfolio, Institutional Class, 0.01%(3) | 61,744 | |
| 9,479,008 | Goldman Sachs Financial Square Funds, Government Fund, Institutional Class, 0.03%(3) | 9,479,008 | |
| 680,523 | Invesco Government & Agency Portfolio, Institutional Class, 0.03%(3) | 680,523 | |
| 10,221,275 | |||
| Total Short-Term Investments (cost $28,885,549) | $ 28,885,549 | ||
| Total Investments (cost $1,297,072,635) | 100.4% | $ 1,735,985,540 | |
| Other Assets and Liabilities | (0.4)% | (7,356,096) | |
| Total Net Assets | 100.0% | $ 1,728,629,444 | |
| Note: | Percentage of investments as shown is the ratio of the total market value to total net assets. |
| Prices of foreign equities that are principally traded on certain foreign markets will generally be adjusted daily pursuant to a fair value pricing service approved by the Board of Directors in order to reflect an adjustment for factors occurring after the close of certain foreign markets but before the close of the New York Stock Exchange. | |
| Equity industry classifications used in this report are the Global Industry Classification Standard, which was developed by and is the exclusive property and service mark of MSCI, Inc. and Standard & Poor’s. | |
| For Fund compliance purposes, the Fund may not use the same classification system. These classifications are used for financial reporting purposes. | |
| See “Glossary” for abbreviation descriptions. |
| * | Non-income producing. |
| (1) | Represents entire or partial securities on loan. See Note 8 in the accompanying Notes to Financial Statements for securities lending information. |
| (2) | Security was purchased pursuant to Rule 144A under the Securities Act of 1933 and may be sold in transactions that are exempt from registration (typically only to qualified institutional buyers) or in a public offering registered under the Securities Act of 1933. At October 31, 2021, the aggregate value of these securities was $34,692,925, representing 2.0% of net assets. |
| (3) | Current yield as of period end. |
| † | See Significant Accounting Policies of accompanying Notes to Financial Statements regarding valuation of investments. |
| 63 |
October 31, 2021
| Description | Total | Level 1 | Level 2 | Level 3(1) | ||||
| Assets | ||||||||
| Common Stocks | ||||||||
| Biotechnology | $ 309,074,321 | $ 272,794,317 | $ 36,280,004 | $ — | ||||
| Consumer Finance | 1,113,453 | 1,113,453 | — | — | ||||
| Health Care Distributors | 13,225,824 | 13,225,824 | — | — | ||||
| Health Care Equipment | 406,558,770 | 363,301,824 | 43,256,946 | — | ||||
| Health Care Facilities | 46,536,678 | 46,536,678 | — | — | ||||
| Health Care Services | 43,395,555 | 43,395,555 | — | — | ||||
| Health Care Supplies | 39,679,257 | 34,603,333 | 5,075,924 | — | ||||
| Integrated Telecommunication Services | 3,740,561 | 3,740,561 | — | — | ||||
| Life & Health Insurance | 4,108,044 | 4,108,044 | — | — | ||||
| Life Sciences Tools & Services | 137,161,469 | 117,953,939 | 19,207,530 | — | ||||
| Managed Health Care | 244,802,733 | 244,802,733 | — | — | ||||
| Other Diversified Financial Services | 5,878,540 | 5,878,540 | — | — | ||||
| Pharmaceuticals | 451,824,786 | 344,987,271 | 106,837,515 | — | ||||
| Short-Term Investments | 28,885,549 | 10,221,275 | 18,664,274 | — | ||||
| Total | $ 1,735,985,540 | $ 1,506,663,347 | $ 229,322,193 | $ — |
| (1) | For the year ended October 31, 2021, there were no transfers in and out of Level 3. |
| 64 |
October 31, 2021
| Shares or Principal Amount | Market Value† | ||
| COMMON STOCKS - 99.7% | |||
| Automobiles & Components - 0.3% | |||
| 2,100,397 | Arrival S.A.*(1) | $ 34,719,562 | |
| Banks - 5.3% | |||
| 1,025,790 | Cullen/Frost Bankers, Inc. | 132,839,805 | |
| 194,966 | First Citizens BancShares, Inc. Class A | 158,682,827 | |
| 827,481 | First Republic Bank | 179,008,965 | |
| 976,668 | M&T Bank Corp. | 143,687,396 | |
| 1,577,763 | Prosperity Bancshares, Inc. | 118,821,332 | |
| 733,040,325 | |||
| Capital Goods - 9.6% | |||
| 639,425 | Axon Enterprise, Inc.* | 115,070,923 | |
| 1,355,232 | Builders FirstSource, Inc.* | 78,969,369 | |
| 997,555 | Graco, Inc. | 74,996,185 | |
| 990,618 | IDEX Corp. | 220,481,848 | |
| 5,850,149 | Ingersoll Rand, Inc.* | 314,504,010 | |
| 612,107 | Lennox International, Inc. | 183,191,383 | |
| 1,095,952 | Lincoln Electric Holdings, Inc. | 156,063,565 | |
| 471,679 | Middleby Corp.* | 86,053,117 | |
| 350,026 | Watsco, Inc. | 101,360,529 | |
| 1,330,690,929 | |||
| Commercial & Professional Services - 3.8% | |||
| 5,581,750 | Dun & Bradstreet Holdings, Inc.* | 105,160,170 | |
| 4,500,933 | GFL Environmental, Inc. | 185,213,393 | |
| 1,920,845 | IAA, Inc.* | 114,578,404 | |
| 1,431,700 | Science Applications International Corp. | 128,538,026 | |
| 533,489,993 | |||
| Consumer Durables & Apparel - 6.6% | |||
| 1,413,762 | Carter's, Inc. | 139,283,832 | |
| 47,469 | NVR, Inc.* | 232,351,261 | |
| 1,418,489 | PVH Corp.* | 155,083,403 | |
| 6,705,234 | Under Armour, Inc. Class C* | 126,594,818 | |
| 1,350,565 | Vizio Holding Corp.*(1) | 27,740,605 | |
| 2,431,366 | YETI Holdings, Inc.* | 239,076,219 | |
| 920,130,138 | |||
| Consumer Services - 2.1% | |||
| 1,576,391 | Choice Hotels International, Inc. | 221,672,102 | |
| 821,868 | Hyatt Hotels Corp. Class A* | 70,023,154 | |
| 291,695,256 | |||
| Diversified Financials - 2.4% | |||
| 436,396 | Credit Acceptance Corp.*(1) | 261,056,451 | |
| 715,501 | Hamilton Lane, Inc. Class A | 74,777,010 | |
| 335,833,461 | |||
| Energy - 0.1% | |||
| 765,797 | Coterra Energy, Inc. | 16,326,792 | |
| Food & Staples Retailing - 0.6% | |||
| 1,748,699 | Performance Food Group Co.* | 79,093,656 | |
| Food, Beverage & Tobacco - 0.9% | |||
| 2,268,536 | Lamb Weston Holdings, Inc. | 128,058,857 | |
| Health Care Equipment & Services - 5.6% | |||
| 1,789,941 | Encompass Health Corp. | 113,768,650 | |
| 467,887 | Inari Medical, Inc.* | 42,353,131 | |
| 3,010,499 | Integra LifeSciences Holdings Corp.* | 200,077,764 | |
| 212,382 | LHC Group, Inc.* | 28,584,493 | |
| 518,351 | Molina Healthcare, Inc.* | 153,286,758 | |
| 358,161 | Nevro Corp.* | 40,737,232 | |
| Shares or Principal Amount | Market Value† | ||
| COMMON STOCKS - 99.7% - (continued) | |||
| Health Care Equipment & Services - 5.6% - (continued) | |||
| 898,804 | NuVasive, Inc.* | $ 47,960,181 | |
| 441,123 | Teleflex, Inc. | 157,454,444 | |
| 784,222,653 | |||
| Insurance - 4.4% | |||
| 288,511 | Erie Indemnity Co. Class A | 59,378,449 | |
| 2,181,404 | Fidelity National Financial, Inc. | 104,511,066 | |
| 995,873 | Globe Life, Inc. | 88,652,614 | |
| 144,120 | Markel Corp.* | 189,248,296 | |
| 87,912 | White Mountains Insurance Group Ltd. | 92,746,281 | |
| 990,037 | WR Berkley Corp. | 78,806,945 | |
| 613,343,651 | |||
| Materials - 2.8% | |||
| 7,373,730 | Element Solutions, Inc. | 167,457,408 | |
| 2,543,548 | Silgan Holdings, Inc. | 102,250,630 | |
| 1,911,881 | Steel Dynamics, Inc. | 126,337,096 | |
| 396,045,134 | |||
| Media & Entertainment - 2.9% | |||
| 112,736 | Cable One, Inc. | 192,914,971 | |
| 3,243,974 | Cargurus, Inc.* | 108,802,888 | |
| 14,737,745 | Zynga, Inc. Class A* | 108,764,558 | |
| 410,482,417 | |||
| Pharmaceuticals, Biotechnology & Life Sciences - 12.6% | |||
| 1,224,567 | Allakos, Inc.* | 123,166,950 | |
| 3,395,859 | Apellis Pharmaceuticals, Inc.* | 104,388,706 | |
| 1,715,223 | Arena Pharmaceuticals, Inc.* | 98,436,648 | |
| 735,922 | Exact Sciences Corp.* | 70,074,493 | |
| 657,649 | ICON plc* | 188,594,004 | |
| 5,071,958 | Iovance Biotherapeutics, Inc.* | 123,299,299 | |
| 1,263,070 | Jazz Pharmaceuticals plc* | 168,038,833 | |
| 1,190,403 | Kodiak Sciences, Inc.* | 139,384,287 | |
| 682,899 | Mirati Therapeutics, Inc.* | 129,081,569 | |
| 901,047 | NeoGenomics, Inc.* | 41,448,162 | |
| 2,958,804 | PTC Therapeutics, Inc.* | 112,227,436 | |
| 1,161,132 | Reata Pharmaceuticals, Inc. Class A* | 111,480,283 | |
| 2,686,502 | Sage Therapeutics, Inc.* | 108,427,221 | |
| 1,398,598 | Syneos Health, Inc.* | 130,545,137 | |
| 1,324,292 | Ultragenyx Pharmaceutical, Inc.* | 111,134,584 | |
| 1,759,727,612 | |||
| Real Estate - 5.3% | |||
| 1,647,136 | Life Storage, Inc. REIT | 220,403,268 | |
| 339,934 | PS Business Parks, Inc. REIT | 60,406,272 | |
| 1,878,364 | Redfin Corp.* | 96,435,207 | |
| 2,741,859 | Rexford Industrial Realty, Inc. REIT | 184,252,925 | |
| 5,287,457 | STORE Capital Corp. REIT | 181,518,399 | |
| 743,016,071 | |||
| Retailing - 3.0% | |||
| 952,538 | CarMax, Inc.* | 130,421,503 | |
| 1,161,263 | Etsy, Inc.* | 291,117,021 | |
| 421,538,524 | |||
| Semiconductors & Semiconductor Equipment - 5.6% | |||
| 2,814,704 | First Solar, Inc.* | 336,610,451 | |
| 1,356,592 | MKS Instruments, Inc. | 203,556,630 | |
| 694,890 | Silicon Laboratories, Inc.* | 131,167,436 | |
| 566,836 | Synaptics, Inc.* | 110,289,281 | |
| 781,623,798 | |||
| Software & Services - 10.8% | |||
| 156,729 | Aspen Technology, Inc.* | 24,557,867 | |
| 708,815 | Black Knight, Inc.* | 49,695,020 | |
| 65 |
October 31, 2021
| Shares or Principal Amount | Market Value† | ||
| COMMON STOCKS - 99.7% - (continued) | |||
| Software & Services - 10.8% - (continued) | |||
| 1,823,731 | Digital Turbine, Inc.* | $ 156,950,290 | |
| 6,274,649 | Genpact Ltd. | 309,653,928 | |
| 1,237,778 | Guidewire Software, Inc.* | 155,625,828 | |
| 1,333,753 | Informatica, Inc.* | 39,559,114 | |
| 1,851,060 | LiveRamp Holdings, Inc.* | 99,050,220 | |
| 1,030,751 | Olo, Inc.* | 28,057,042 | |
| 1,341,592 | Q2 Holdings, Inc.* | 105,261,308 | |
| 1,667,905 | Shift4 Payments, Inc. Class A* | 105,294,843 | |
| 3,482,291 | Teradata Corp.* | 196,958,379 | |
| 1,528,397 | WEX, Inc.* | 228,801,031 | |
| 1,499,464,870 | |||
| Technology Hardware & Equipment - 9.4% | |||
| 777,784 | CDW Corp. | 145,173,384 | |
| 10,220,711 | CommScope Holding Co., Inc.*(2) | 109,463,815 | |
| 1,469,230 | F5 Networks, Inc.* | 310,227,914 | |
| 11,718,531 | Flex Ltd.* | 198,043,174 | |
| 4,321,301 | II-VI, Inc.* | 261,481,923 | |
| 2,555,543 | Lumentum Holdings, Inc.* | 211,036,741 | |
| 1,706,855 | National Instruments Corp. | 72,490,132 | |
| 1,307,917,083 | |||
| Transportation - 3.1% | |||
| 234,604 | AMERCO | 172,900,802 | |
| 4,443,074 | Knight-Swift Transportation Holdings, Inc. | 251,877,865 | |
| 424,778,667 | |||
| Utilities - 2.5% | |||
| 1,310,358 | Black Hills Corp. | 86,981,564 | |
| 2,085,993 | NiSource, Inc. | 51,461,447 | |
| 4,765,883 | UGI Corp. | 206,886,981 | |
| 345,329,992 | |||
| Total Common Stocks (cost $9,383,481,835) | $ 13,890,569,441 | ||
| SHORT-TERM INVESTMENTS - 2.2% | |||
| Repurchase Agreements - 0.2% | |||
| $ 27,625,042 | Fixed Income Clearing Corp. Repurchase Agreement dated 10/29/2021 at 0.01%, due on 11/01/2021 with a maturity value of $27,625,065; collateralized by U.S. Treasury Bond at 1.875%, maturing 02/15/2041, with a market value of $28,177,640 | $ 27,625,042 | |
| Securities Lending Collateral - 2.0% | |||
| 1,679,805 | Fidelity Investments Money Market Funds, Government Portfolio, Institutional Class, 0.01%(3) | 1,679,805 | |
| Shares or Principal Amount | Market Value† | ||
| SHORT-TERM INVESTMENTS - 2.2% - (continued) | |||
| Securities Lending Collateral - 2.0% - (continued) | |||
| 257,885,094 | Goldman Sachs Financial Square Funds, Government Fund, Institutional Class, 0.03%(3) | $ 257,885,094 | |
| 18,514,248 | Invesco Government & Agency Portfolio, Institutional Class, 0.03%(3) | 18,514,248 | |
| 278,079,147 | |||
| Total Short-Term Investments (cost $305,704,189) | $ 305,704,189 | ||
| Total Investments (cost $9,689,186,024) | 101.9% | $ 14,196,273,630 | |
| Other Assets and Liabilities | (1.9)% | (269,981,623) | |
| Total Net Assets | 100.0% | $ 13,926,292,007 | |
| Note: | Percentage of investments as shown is the ratio of the total market value to total net assets. |
| Prices of foreign equities that are principally traded on certain foreign markets will generally be adjusted daily pursuant to a fair value pricing service approved by the Board of Directors in order to reflect an adjustment for factors occurring after the close of certain foreign markets but before the close of the New York Stock Exchange. | |
| Equity industry classifications used in this report are the Global Industry Classification Standard, which was developed by and is the exclusive property and service mark of MSCI, Inc. and Standard & Poor’s. | |
| For Fund compliance purposes, the Fund may not use the same classification system. These classifications are used for financial reporting purposes. | |
| See “Glossary” for abbreviation descriptions. |
| * | Non-income producing. |
| (1) | Represents entire or partial securities on loan. See Note 8 in the accompanying Notes to Financial Statements for securities lending information. |
| (2) | Affiliated company – The Fund owns greater than 5% of the outstanding voting securities of this issuer. |
| (3) | Current yield as of period end. |
| † | See Significant Accounting Policies of accompanying Notes to Financial Statements regarding valuation of investments. |
| 66 |
October 31, 2021
| Description | Total | Level 1 | Level 2 | Level 3(1) | ||||
| Assets | ||||||||
| Common Stocks | ||||||||
| Automobiles & Components | $ 34,719,562 | $ 34,719,562 | $ — | $ — | ||||
| Banks | 733,040,325 | 733,040,325 | — | — | ||||
| Capital Goods | 1,330,690,929 | 1,330,690,929 | — | — | ||||
| Commercial & Professional Services | 533,489,993 | 533,489,993 | — | — | ||||
| Consumer Durables & Apparel | 920,130,138 | 920,130,138 | — | — | ||||
| Consumer Services | 291,695,256 | 291,695,256 | — | — | ||||
| Diversified Financials | 335,833,461 | 335,833,461 | — | — | ||||
| Energy | 16,326,792 | 16,326,792 | — | — | ||||
| Food & Staples Retailing | 79,093,656 | 79,093,656 | — | — | ||||
| Food, Beverage & Tobacco | 128,058,857 | 128,058,857 | — | — | ||||
| Health Care Equipment & Services | 784,222,653 | 784,222,653 | — | — | ||||
| Insurance | 613,343,651 | 613,343,651 | — | — | ||||
| Materials | 396,045,134 | 396,045,134 | — | — | ||||
| Media & Entertainment | 410,482,417 | 410,482,417 | — | — | ||||
| Pharmaceuticals, Biotechnology & Life Sciences | 1,759,727,612 | 1,759,727,612 | — | — | ||||
| Real Estate | 743,016,071 | 743,016,071 | — | — | ||||
| Retailing | 421,538,524 | 421,538,524 | — | — | ||||
| Semiconductors & Semiconductor Equipment | 781,623,798 | 781,623,798 | — | — | ||||
| Software & Services | 1,499,464,870 | 1,499,464,870 | — | — | ||||
| Technology Hardware & Equipment | 1,307,917,083 | 1,307,917,083 | — | — | ||||
| Transportation | 424,778,667 | 424,778,667 | — | — | ||||
| Utilities | 345,329,992 | 345,329,992 | — | — | ||||
| Short-Term Investments | 305,704,189 | 278,079,147 | 27,625,042 | — | ||||
| Total | $ 14,196,273,630 | $ 14,168,648,588 | $ 27,625,042 | $ — |
| (1) | For the year ended October 31, 2021, there were no transfers in and out of Level 3. |
| 67 |
October 31, 2021
| Shares or Principal Amount | Market Value† | ||
| COMMON STOCKS - 99.8% | |||
| Automobiles & Components - 2.0% | |||
| 600,328 | Ford Motor Co.* | $ 10,253,602 | |
| 212,534 | Gentex Corp. | 7,521,578 | |
| 17,775,180 | |||
| Banks - 9.5% | |||
| 359,179 | Cadence Bank* | 10,423,375 | |
| 94,661 | M&T Bank Corp. | 13,926,526 | |
| 587,012 | MGIC Investment Corp. | 9,486,114 | |
| 155,626 | South State Corp. | 12,152,834 | |
| 265,949 | Synovus Financial Corp. | 12,390,564 | |
| 98,539 | Western Alliance Bancorp | 11,439,393 | |
| 209,674 | Zions Bancorp NA | 13,207,365 | |
| 83,026,171 | |||
| Capital Goods - 18.4% | |||
| 225,703 | AerCap Holdings N.V.* | 13,325,505 | |
| 203,950 | Builders FirstSource, Inc.* | 11,884,167 | |
| 235,043 | Colfax Corp.* | 12,132,920 | |
| 313,706 | Howmet Aerospace, Inc. | 9,313,931 | |
| 303,657 | Ingersoll Rand, Inc.* | 16,324,600 | |
| 327,939 | JELD-WEN Holding, Inc.* | 8,988,808 | |
| 155,448 | Johnson Controls International plc | 11,405,220 | |
| 56,137 | L3Harris Technologies, Inc. | 12,941,824 | |
| 72,328 | Middleby Corp.* | 13,195,520 | |
| 43,785 | Regal-Beloit Corp. | 6,669,769 | |
| 259,382 | Spirit AeroSystems Holdings, Inc. | 10,709,883 | |
| 114,523 | SPX FLOW, Inc. | 8,556,013 | |
| 202,396 | Westinghouse Air Brake Technologies Corp. | 18,363,389 | |
| 196,380 | Zurn Water Solutios Corp. | 7,124,666 | |
| 160,936,215 | |||
| Commercial & Professional Services - 3.0% | |||
| 101,773 | Clean Harbors, Inc.* | 11,453,534 | |
| 146,645 | Leidos Holdings, Inc. | 14,661,567 | |
| 26,115,101 | |||
| Consumer Durables & Apparel - 2.0% | |||
| 41,298 | Columbia Sportswear Co. | 4,288,384 | |
| 121,582 | Leggett & Platt, Inc. | 5,696,117 | |
| 157,153 | Steven Madden Ltd. | 7,087,600 | |
| 17,072,101 | |||
| Consumer Services - 2.0% | |||
| 78,748 | Boyd Gaming Corp.* | 5,022,548 | |
| 225,715 | Six Flags Entertainment Corp.* | 9,283,658 | |
| 42,979 | Wyndham Hotels & Resorts, Inc. | 3,630,436 | |
| 17,936,642 | |||
| Diversified Financials - 1.7% | |||
| 211,768 | Voya Financial, Inc. | 14,775,053 | |
| Energy - 3.9% | |||
| 604,445 | Coterra Energy, Inc. | 12,886,767 | |
| 263,859 | Delek U.S. Holdings, Inc.* | 5,132,058 | |
| 151,654 | Diamondback Energy, Inc. | 16,255,792 | |
| 34,274,617 | |||
| Food & Staples Retailing - 1.5% | |||
| 369,285 | U.S. Foods Holding Corp.* | 12,803,111 | |
| Food, Beverage & Tobacco - 1.3% | |||
| 314,332 | Keurig Dr Pepper, Inc. | 11,344,242 | |
| Health Care Equipment & Services - 7.3% | |||
| 123,400 | Acadia Healthcare Co., Inc.* | 7,650,800 | |
| Shares or Principal Amount | Market Value† | ||
| COMMON STOCKS - 99.8% - (continued) | |||
| Health Care Equipment & Services - 7.3% - (continued) | |||
| 340,058 | Centene Corp.* | $ 24,225,732 | |
| 203,156 | Encompass Health Corp. | 12,912,595 | |
| 89,149 | Haemonetics Corp.* | 6,125,428 | |
| 201,630 | Integra LifeSciences Holdings Corp.* | 13,400,330 | |
| 64,314,885 | |||
| Insurance - 7.9% | |||
| 22,430 | Alleghany Corp.* | 14,610,453 | |
| 119,355 | Arthur J Gallagher & Co. | 20,012,253 | |
| 84,802 | Assurant, Inc. | 13,679,411 | |
| 88,992 | Hanover Insurance Group, Inc. | 11,212,992 | |
| 153,462 | Kemper Corp. | 9,741,768 | |
| 69,256,877 | |||
| Materials - 5.6% | |||
| 97,717 | Celanese Corp. | 15,782,273 | |
| 104,554 | Crown Holdings, Inc. | 10,872,570 | |
| 89,296 | FMC Corp. | 8,126,829 | |
| 95,857 | Reliance Steel & Aluminum Co. | 14,010,459 | |
| 48,792,131 | |||
| Media & Entertainment - 1.8% | |||
| 119,350 | Cargurus, Inc.* | 4,002,999 | |
| 81,939 | Electronic Arts, Inc. | 11,491,945 | |
| 15,494,944 | |||
| Pharmaceuticals, Biotechnology & Life Sciences - 1.7% | |||
| 163,895 | Syneos Health, Inc.* | 15,297,959 | |
| Real Estate - 11.5% | |||
| 188,907 | American Campus Communities, Inc. REIT | 10,148,084 | |
| 323,306 | Americold Realty Trust REIT | 9,527,828 | |
| 264,476 | Essential Properties Realty Trust, Inc. REIT | 7,878,740 | |
| 163,539 | First Industrial Realty Trust, Inc. REIT | 9,522,876 | |
| 295,395 | Gaming and Leisure Properties, Inc. REIT | 14,323,703 | |
| 828,254 | Host Hotels & Resorts, Inc. REIT* | 13,939,515 | |
| 54,643 | Life Storage, Inc. REIT | 7,311,780 | |
| 178,333 | Ryman Hospitality Properties, Inc. REIT* | 15,254,605 | |
| 154,878 | Welltower, Inc. REIT | 12,452,191 | |
| 100,359,322 | |||
| Retailing - 4.0% | |||
| 87,017 | CarMax, Inc.* | 11,914,368 | |
| 126,651 | Dollar Tree, Inc.* | 13,647,912 | |
| 85,596 | Ross Stores, Inc. | 9,689,467 | |
| 35,251,747 | |||
| Semiconductors & Semiconductor Equipment - 2.1% | |||
| 58,565 | MKS Instruments, Inc. | 8,787,678 | |
| 57,356 | Qorvo, Inc.* | 9,649,000 | |
| 18,436,678 | |||
| Technology Hardware & Equipment - 6.4% | |||
| 125,730 | Ciena Corp.* | 6,825,882 | |
| 73,406 | F5 Networks, Inc.* | 15,499,677 | |
| 139,971 | II-VI, Inc.* | 8,469,645 | |
| 191,269 | Lumentum Holdings, Inc.* | 15,794,994 | |
| 45,926 | Rogers Corp.* | 9,236,637 | |
| 55,826,835 | |||
| Transportation - 0.9% | |||
| 541,218 | JetBlue Airways Corp.* | 7,593,289 | |
| Utilities - 5.3% | |||
| 209,593 | Alliant Energy Corp. | 11,856,676 | |
| 68 |
October 31, 2021
| Shares or Principal Amount | Market Value† | ||
| COMMON STOCKS - 99.8% - (continued) | |||
| Utilities - 5.3% - (continued) | |||
| 175,364 | Evergy, Inc. | $ 11,179,455 | |
| 232,379 | Portland General Electric Co. | 11,458,609 | |
| 96,142 | Sempra Energy | 12,270,603 | |
| 46,765,343 | |||
| Total Common Stocks (cost $668,280,112) | $ 873,448,443 | ||
| SHORT-TERM INVESTMENTS - 0.5% | |||
| Repurchase Agreements - 0.5% | |||
| $ 4,110,683 | Fixed Income Clearing Corp. Repurchase Agreement dated 10/29/2021 at 0.010%, due on 11/01/2021 with a maturity value of $4,110,686; collateralized by U.S. Treasury Bond at 1.875%, maturing 02/15/2041, with a market value of $4,192,923 | $ 4,110,683 | |
| Total Short-Term Investments (cost $4,110,683) | $ 4,110,683 | ||
| Total Investments (cost $672,390,795) | 100.3% | $ 877,559,126 | |
| Other Assets and Liabilities | (0.3)% | (2,215,050) | |
| Total Net Assets | 100.0% | $ 875,344,076 | |
| Note: | Percentage of investments as shown is the ratio of the total market value to total net assets. |
| Prices of foreign equities that are principally traded on certain foreign markets will generally be adjusted daily pursuant to a fair value pricing service approved by the Board of Directors in order to reflect an adjustment for factors occurring after the close of certain foreign markets but before the close of the New York Stock Exchange. | |
| Equity industry classifications used in this report are the Global Industry Classification Standard, which was developed by and is the exclusive property and service mark of MSCI, Inc. and Standard & Poor’s. | |
| For Fund compliance purposes, the Fund may not use the same classification system. These classifications are used for financial reporting purposes. | |
| See “Glossary” for abbreviation descriptions. |
| * | Non-income producing. |
| † | See Significant Accounting Policies of accompanying Notes to Financial Statements regarding valuation of investments. |
| Description | Total | Level 1 | Level 2 | Level 3(1) | ||||
| Assets | ||||||||
| Common Stocks | ||||||||
| Automobiles & Components | $ 17,775,180 | $ 17,775,180 | $ — | $ — | ||||
| Banks | 83,026,171 | 83,026,171 | — | — | ||||
| Capital Goods | 160,936,215 | 160,936,215 | — | — | ||||
| Commercial & Professional Services | 26,115,101 | 26,115,101 | — | — | ||||
| Consumer Durables & Apparel | 17,072,101 | 17,072,101 | — | — | ||||
| Consumer Services | 17,936,642 | 17,936,642 | — | — | ||||
| Diversified Financials | 14,775,053 | 14,775,053 | — | — | ||||
| Energy | 34,274,617 | 34,274,617 | — | — | ||||
| Food & Staples Retailing | 12,803,111 | 12,803,111 | — | — | ||||
| Food, Beverage & Tobacco | 11,344,242 | 11,344,242 | — | — | ||||
| Health Care Equipment & Services | 64,314,885 | 64,314,885 | — | — | ||||
| Insurance | 69,256,877 | 69,256,877 | — | — | ||||
| Materials | 48,792,131 | 48,792,131 | — | — | ||||
| Media & Entertainment | 15,494,944 | 15,494,944 | — | — | ||||
| Pharmaceuticals, Biotechnology & Life Sciences | 15,297,959 | 15,297,959 | — | — | ||||
| Real Estate | 100,359,322 | 100,359,322 | — | — | ||||
| Retailing | 35,251,747 | 35,251,747 | — | — | ||||
| Semiconductors & Semiconductor Equipment | 18,436,678 | 18,436,678 | — | — | ||||
| Technology Hardware & Equipment | 55,826,835 | 55,826,835 | — | — | ||||
| Transportation | 7,593,289 | 7,593,289 | — | — | ||||
| Utilities | 46,765,343 | 46,765,343 | — | — | ||||
| Short-Term Investments | 4,110,683 | — | 4,110,683 | — | ||||
| Total | $ 877,559,126 | $ 873,448,443 | $ 4,110,683 | $ — |
| (1) | For the year ended October 31, 2021, there were no transfers in and out of Level 3. |
| 69 |
October 31, 2021
| Shares or Principal Amount | Market Value† | ||
| COMMON STOCKS - 97.9% | |||
| Banks - 11.9% | |||
| 196,066 | Bank of America Corp. | $ 9,368,033 | |
| 30,617 | Bank of Nova Scotia | 2,007,251 | |
| 63,765 | JP Morgan Chase & Co. | 10,833,036 | |
| 25,897 | PNC Financial Services Group, Inc. | 5,465,044 | |
| 27,673,364 | |||
| Capital Goods - 8.0% | |||
| 15,045 | Honeywell International, Inc. | 3,289,138 | |
| 40,406 | Johnson Controls International plc | 2,964,588 | |
| 8,052 | Lockheed Martin Corp. | 2,675,841 | |
| 57,448 | Raytheon Technologies Corp. | 5,104,829 | |
| 49,530 | Westinghouse Air Brake Technologies Corp. | 4,493,857 | |
| 18,528,253 | |||
| Commercial & Professional Services - 1.3% | |||
| 18,488 | Waste Management, Inc. | 2,962,332 | |
| Consumer Services - 3.2% | |||
| 21,372 | Hilton Worldwide Holdings, Inc.* | 3,076,500 | |
| 17,397 | McDonald's Corp. | 4,271,833 | |
| 7,348,333 | |||
| Diversified Financials - 3.1% | |||
| 27,893 | American Express Co. | 4,847,245 | |
| 1,026 | BlackRock, Inc. | 967,990 | |
| 17,025 | Charles Schwab Corp. | 1,396,561 | |
| 7,211,796 | |||
| Energy - 5.1% | |||
| 43,818 | Chevron Corp. | 5,016,723 | |
| 37,600 | EOG Resources, Inc. | 3,476,496 | |
| 65,997 | TotalEnergies SE ADR | 3,307,109 | |
| 11,800,328 | |||
| Food & Staples Retailing - 1.2% | |||
| 36,960 | Sysco Corp. | 2,842,224 | |
| Food, Beverage & Tobacco - 4.0% | |||
| 31,316 | Coca-Cola Co. | 1,765,283 | |
| 60,750 | Mondelez International, Inc. Class A | 3,689,955 | |
| 40,280 | Philip Morris International, Inc. | 3,808,071 | |
| 9,263,309 | |||
| Health Care Equipment & Services - 10.7% | |||
| 9,689 | Anthem, Inc. | 4,215,975 | |
| 17,686 | Becton Dickinson and Co. | 4,237,389 | |
| 14,551 | Hill-Rom Holdings, Inc. | 2,253,950 | |
| 49,766 | Koninklijke Philips N.V. ADR | 2,351,443 | |
| 38,315 | Medtronic plc | 4,592,436 | |
| 15,785 | UnitedHealth Group, Inc. | 7,268,519 | |
| 24,919,712 | |||
| Household & Personal Products - 1.4% | |||
| 43,315 | Colgate-Palmolive Co. | 3,300,170 | |
| Insurance - 8.9% | |||
| 60,044 | American International Group, Inc. | 3,548,000 | |
| 29,903 | Chubb Ltd. | 5,842,448 | |
| 20,149 | Marsh & McLennan Cos., Inc. | 3,360,853 | |
| 38,903 | MetLife, Inc. | 2,443,109 | |
| 37,593 | Principal Financial Group, Inc. | 2,522,114 | |
| 26,151 | Prudential Financial, Inc. | 2,877,918 | |
| 20,594,442 | |||
| Shares or Principal Amount | Market Value† | ||
| COMMON STOCKS - 97.9% - (continued) | |||
| Materials - 3.6% | |||
| 21,023 | Celanese Corp. | $ 3,395,425 | |
| 32,916 | FMC Corp. | 2,995,685 | |
| 11,795 | PPG Industries, Inc. | 1,893,923 | |
| 8,285,033 | |||
| Media & Entertainment - 2.2% | |||
| 87,579 | Comcast Corp. Class A | 4,504,188 | |
| 7,932 | Omnicom Group, Inc. | 540,010 | |
| 5,044,198 | |||
| Pharmaceuticals, Biotechnology & Life Sciences - 6.4% | |||
| 62,860 | AstraZeneca plc ADR | 3,921,207 | |
| 29,767 | Merck & Co., Inc. | 2,620,984 | |
| 30,825 | Novartis AG ADR | 2,551,077 | |
| 132,196 | Pfizer, Inc. | 5,782,253 | |
| 14,875,521 | |||
| Real Estate - 4.4% | |||
| 9,946 | American Tower Corp. REIT | 2,804,474 | |
| 134,251 | Host Hotels & Resorts, Inc. REIT* | 2,259,444 | |
| 8,109 | Public Storage REIT | 2,693,648 | |
| 83,253 | VICI Properties, Inc. REIT | 2,443,475 | |
| 10,201,041 | |||
| Retailing - 4.0% | |||
| 571,800 | Allstar Co.(1)(2)(3) | — | |
| 15,824 | Lowe's Cos., Inc. | 3,699,968 | |
| 11,900 | Target Corp. | 3,089,478 | |
| 38,645 | TJX Cos., Inc. | 2,530,861 | |
| 9,320,307 | |||
| Semiconductors & Semiconductor Equipment - 4.4% | |||
| 8,861 | Broadcom, Inc. | 4,711,128 | |
| 45,063 | Intel Corp. | 2,208,087 | |
| 17,449 | Texas Instruments, Inc. | 3,271,338 | |
| 10,190,553 | |||
| Software & Services - 4.2% | |||
| 10,782 | Accenture plc Class A | 3,868,474 | |
| 38,391 | Cognizant Technology Solutions Corp. Class A | 2,997,953 | |
| 27,305 | Fidelity National Information Services, Inc. | 3,023,756 | |
| 9,890,183 | |||
| Technology Hardware & Equipment - 1.8% | |||
| 74,461 | Cisco Systems, Inc. | 4,167,582 | |
| Telecommunication Services - 2.4% | |||
| 105,543 | Verizon Communications, Inc. | 5,592,724 | |
| Transportation - 1.1% | |||
| 8,851 | J.B. Hunt Transport Services, Inc. | 1,745,329 | |
| 18,816 | Southwest Airlines Co.* | 889,620 | |
| 2,634,949 | |||
| Utilities - 4.6% | |||
| 42,556 | Alliant Energy Corp. | 2,407,393 | |
| 39,379 | Avangrid, Inc. | 2,075,273 | |
| 27,400 | Dominion Energy, Inc. | 2,080,482 | |
| 70 |
October 31, 2021
| Shares or Principal Amount | Market Value† | ||
| COMMON STOCKS - 97.9% - (continued) | |||
| Utilities - 4.6% - (continued) | |||
| 25,906 | Eversource Energy | $ 2,199,419 | |
| 16,134 | Sempra Energy | 2,059,183 | |
| 10,821,750 | |||
| Total Common Stocks (cost $166,440,224) | $ 227,468,104 | ||
| SHORT-TERM INVESTMENTS - 2.0% | |||
| Repurchase Agreements - 2.0% | |||
| $ 4,517,432 | Fixed Income Clearing Corp. Repurchase Agreement dated 10/29/2021 at 0.010%, due on 11/01/2021 with a maturity value of 4,517,436; collateralized by U.S. Treasury Bond at 1.875%, maturing 11/01/2021, with a market value of $4,607,836 | $ 4,517,432 | |
| Total Short-Term Investments (cost $4,517,432) | $ 4,517,432 | ||
| Total Investments (cost $170,957,656) | 99.9% | $ 231,985,536 | |
| Other Assets and Liabilities | 0.1% | 293,678 | |
| Total Net Assets | 100.0% | $ 232,279,214 | |
| Note: | Percentage of investments as shown is the ratio of the total market value to total net assets. |
| Prices of foreign equities that are principally traded on certain foreign markets will generally be adjusted daily pursuant to a fair value pricing service approved by the Board of Directors in order to reflect an adjustment for factors occurring after the close of certain foreign markets but before the close of the New York Stock Exchange. |
| * | Non-income producing. |
| (1) | This security is valued in good faith at fair value as determined under policies and procedures established by and under the supervision of the Board of Directors. At October 31, 2021, the aggregate fair value of this security was $0, which represented 0.0% of total net assets. This amount excludes securities that are principally traded in certain foreign markets and whose prices are adjusted pursuant to a third party pricing service methodology approved by the Board of Directors. |
| (2) | Investment in securities not registered under the Securities Act of 1933 (excluding securities acquired pursuant to Rule 144A and Regulation S). At the end of the period, the value of such restricted securities amounted to $0 or 0.0% of net assets. |
| Period Acquired | Security Name | Shares/ Par Value | Total Cost | Market Value | ||||
| 08/2011 | Allstar Co. | 571,800 | $ — | $ — |
| (3) | Investment valued using significant unobservable inputs. |
| † | See Significant Accounting Policies of accompanying Notes to Financial Statements regarding valuation of investments. |
| 71 |
October 31, 2021
| Description | Total | Level 1 | Level 2 | Level 3(1) | ||||
| Assets | ||||||||
| Common Stocks | ||||||||
| Banks | $ 27,673,364 | $ 27,673,364 | $ — | $ — | ||||
| Capital Goods | 18,528,253 | 18,528,253 | — | — | ||||
| Commercial & Professional Services | 2,962,332 | 2,962,332 | — | — | ||||
| Consumer Services | 7,348,333 | 7,348,333 | — | — | ||||
| Diversified Financials | 7,211,796 | 7,211,796 | — | — | ||||
| Energy | 11,800,328 | 11,800,328 | — | — | ||||
| Food & Staples Retailing | 2,842,224 | 2,842,224 | — | — | ||||
| Food, Beverage & Tobacco | 9,263,309 | 9,263,309 | — | — | ||||
| Health Care Equipment & Services | 24,919,712 | 24,919,712 | — | — | ||||
| Household & Personal Products | 3,300,170 | 3,300,170 | — | — | ||||
| Insurance | 20,594,442 | 20,594,442 | — | — | ||||
| Materials | 8,285,033 | 8,285,033 | — | — | ||||
| Media & Entertainment | 5,044,198 | 5,044,198 | — | — | ||||
| Pharmaceuticals, Biotechnology & Life Sciences | 14,875,521 | 14,875,521 | — | — | ||||
| Real Estate | 10,201,041 | 10,201,041 | — | — | ||||
| Retailing | 9,320,307 | 9,320,307 | — | — | ||||
| Semiconductors & Semiconductor Equipment | 10,190,553 | 10,190,553 | — | — | ||||
| Software & Services | 9,890,183 | 9,890,183 | — | — | ||||
| Technology Hardware & Equipment | 4,167,582 | 4,167,582 | — | — | ||||
| Telecommunication Services | 5,592,724 | 5,592,724 | — | — | ||||
| Transportation | 2,634,949 | 2,634,949 | — | — | ||||
| Utilities | 10,821,750 | 10,821,750 | — | — | ||||
| Short-Term Investments | 4,517,432 | — | 4,517,432 | — | ||||
| Total | $ 231,985,536 | $ 227,468,104 | $ 4,517,432 | $ — |
| (1) | For the year ended October 31, 2021, investments valued at $480,312 were transferred into Level 3 due to the unavailability of active market pricing. There were no transfers out of Level 3. |
| 72 |
October 31, 2021
| Shares or Principal Amount | Market Value† | ||
| COMMON STOCKS - 99.1% | |||
| Automobiles & Components - 2.7% | |||
| 67,336 | Fox Factory Holding Corp.* | $ 10,837,729 | |
| 88,563 | Patrick Industries, Inc. | 6,899,943 | |
| 64,533 | Thor Industries, Inc. | 6,579,785 | |
| 24,317,457 | |||
| Banks - 2.8% | |||
| 394,794 | MGIC Investment Corp. | 6,379,871 | |
| 113,785 | Synovus Financial Corp. | 5,301,243 | |
| 69,234 | Triumph Bancorp, Inc.* | 8,121,148 | |
| 46,267 | Western Alliance Bancorp | 5,371,136 | |
| 25,173,398 | |||
| Capital Goods - 10.2% | |||
| 63,336 | Altra Industrial Motion Corp. | 3,302,972 | |
| 70,126 | Applied Industrial Technologies, Inc. | 6,835,883 | |
| 48,886 | Armstrong World Industries, Inc. | 5,164,806 | |
| 55,462 | Boise Cascade Co. | 3,140,258 | |
| 120,255 | Builders FirstSource, Inc.* | 7,007,259 | |
| 34,547 | Chart Industries, Inc.* | 6,132,783 | |
| 40,234 | Curtiss-Wright Corp. | 5,137,077 | |
| 40,988 | EnerSys | 3,280,680 | |
| 165,640 | Hydrofarm Holdings Group, Inc.* | 5,461,151 | |
| 68,345 | ITT, Inc. | 6,429,214 | |
| 63,179 | John Bean Technologies Corp. | 9,334,697 | |
| 99,266 | SPX Corp.* | 5,766,362 | |
| 75,646 | SPX FLOW, Inc. | 5,651,513 | |
| 341,081 | WillScot Mobile Mini Holdings Corp.* | 11,852,565 | |
| 172,740 | Zurn Water Solutios Corp. | 6,267,007 | |
| 90,764,227 | |||
| Commercial & Professional Services - 6.4% | |||
| 93,252 | ASGN, Inc.* | 11,158,534 | |
| 29,735 | CACI International, Inc. Class A* | 8,552,975 | |
| 37,249 | Clean Harbors, Inc.* | 4,192,003 | |
| 61,466 | Exponent, Inc. | 7,056,297 | |
| 71,100 | Insperity, Inc. | 8,887,500 | |
| 37,612 | Science Applications International Corp. | 3,376,805 | |
| 56,314 | Tetra Tech, Inc. | 9,892,117 | |
| 96,704 | Viad Corp.* | 4,290,757 | |
| 57,406,988 | |||
| Consumer Durables & Apparel - 3.8% | |||
| 16,823 | Deckers Outdoor Corp.* | 6,650,300 | |
| 59,236 | PVH Corp.* | 6,476,272 | |
| 39,253 | TopBuild Corp.* | 10,086,843 | |
| 132,428 | Traeger, Inc.*(1) | 2,501,565 | |
| 208,370 | Under Armour, Inc. Class C* | 3,934,026 | |
| 44,483 | YETI Holdings, Inc.* | 4,374,013 | |
| 34,023,019 | |||
| Consumer Services - 5.5% | |||
| 158,373 | BJ's Restaurants, Inc.* | 5,276,988 | |
| 33,277 | Churchill Downs, Inc. | 7,653,710 | |
| 321,519 | GAN Ltd.* | 4,591,291 | |
| 295,533 | Mister Car Wash, Inc.*(1) | 5,420,075 | |
| 81,636 | Penn National Gaming, Inc.* | 5,845,138 | |
| 101,195 | Texas Roadhouse, Inc. | 8,987,128 | |
| 65,874 | Wingstop, Inc. | 11,361,289 | |
| 49,135,619 | |||
| Diversified Financials - 1.5% | |||
| 125,093 | OneMain Holdings, Inc. | 6,606,161 | |
| 86,238 | Stifel Financial Corp. | 6,284,163 | |
| 12,890,324 | |||
| Shares or Principal Amount | Market Value† | ||
| COMMON STOCKS - 99.1% - (continued) | |||
| Energy - 0.5% | |||
| 229,790 | Magnolia Oil & Gas Corp. Class A | $ 4,798,015 | |
| Food & Staples Retailing - 1.0% | |||
| 202,238 | Performance Food Group Co.* | 9,147,225 | |
| Food, Beverage & Tobacco - 3.2% | |||
| 42,752 | Celsius Holdings, Inc.* | 4,126,423 | |
| 49,703 | Freshpet, Inc.* | 7,749,195 | |
| 33,637 | Lancaster Colony Corp. | 5,718,290 | |
| 146,561 | Simply Good Foods Co.* | 5,811,144 | |
| 294,813 | Sovos Brands, Inc.* | 4,764,178 | |
| 28,169,230 | |||
| Health Care Equipment & Services - 11.0% | |||
| 17,664 | Amedisys, Inc.* | 2,991,222 | |
| 65,745 | AtriCure, Inc.* | 4,934,820 | |
| 61,889 | Cardiovascular Systems, Inc.* | 2,171,066 | |
| 181,726 | Covetrus, Inc.* | 3,669,048 | |
| 66,050 | Glaukos Corp.* | 3,019,145 | |
| 91,122 | Globus Medical, Inc. Class A* | 7,031,885 | |
| 120,698 | Health Catalyst, Inc.* | 6,353,543 | |
| 72,313 | Integer Holdings Corp.* | 6,509,616 | |
| 106,793 | Integra LifeSciences Holdings Corp.* | 7,097,463 | |
| 44,160 | LHC Group, Inc.* | 5,943,494 | |
| 30,789 | ModivCare, Inc.* | 5,011,525 | |
| 41,986 | Nevro Corp.* | 4,775,488 | |
| 82,658 | Omnicell, Inc.* | 14,725,523 | |
| 156,667 | Owens & Minor, Inc. | 5,621,212 | |
| 473,748 | R1 RCM, Inc.* | 10,280,332 | |
| 56,901 | Tandem Diabetes Care, Inc.* | 7,757,313 | |
| 97,892,695 | |||
| Household & Personal Products - 0.4% | |||
| 144,264 | Beauty Health Co.* | 3,962,932 | |
| Insurance - 0.8% | |||
| 108,522 | James River Group Holdings Ltd. | 3,467,278 | |
| 53,289 | Kemper Corp. | 3,382,786 | |
| 6,850,064 | |||
| Materials - 2.1% | |||
| 247,214 | Axalta Coating Systems Ltd.* | 7,710,605 | |
| 52,975 | Ingevity Corp.* | 4,127,282 | |
| 80,860 | Louisiana-Pacific Corp. | 4,765,080 | |
| 69,378 | Ranpak Holdings Corp.* | 2,390,766 | |
| 18,993,733 | |||
| Media & Entertainment - 2.1% | |||
| 104,084 | Cardlytics, Inc.* | 8,187,247 | |
| 80,117 | Ziff Davis, Inc.* | 10,276,608 | |
| 18,463,855 | |||
| Pharmaceuticals, Biotechnology & Life Sciences - 14.6% | |||
| 202,253 | Aclaris Therapeutics, Inc.*(1) | 3,509,090 | |
| 92,737 | Akero Therapeutics, Inc.* | 1,992,918 | |
| 47,631 | Allakos, Inc.* | 4,790,726 | |
| 65,565 | ALX Oncology Holdings, Inc.* | 3,674,263 | |
| 88,276 | Apellis Pharmaceuticals, Inc.* | 2,713,604 | |
| 51,949 | Arena Pharmaceuticals, Inc.* | 2,981,353 | |
| 27,731 | Arrowhead Pharmaceuticals, Inc.* | 1,769,792 | |
| 52,999 | Arvinas, Inc.* | 4,588,654 | |
| 53,396 | BioAtla, Inc.* | 1,560,765 | |
| 17,467 | Biohaven Pharmaceutical Holding Co., Ltd.* | 2,485,904 | |
| 64,580 | Blueprint Medicines Corp.* | 7,264,604 | |
| 98,002 | Celldex Therapeutics, Inc.* | 4,169,005 | |
| 110,124 | Cytokinetics, Inc.* | 3,844,429 | |
| 73 |
October 31, 2021
| Shares or Principal Amount | Market Value† | ||
| COMMON STOCKS - 99.1% - (continued) | |||
| Pharmaceuticals, Biotechnology & Life Sciences - 14.6% - (continued) | |||
| 126,609 | Dyne Therapeutics, Inc.*(1) | $ 1,837,097 | |
| 30,333 | Fate Therapeutics, Inc.* | 1,631,915 | |
| 226,798 | Heron Therapeutics, Inc.* | 2,497,046 | |
| 524,517 | ImmunoGen, Inc.* | 3,162,838 | |
| 37,916 | Intellia Therapeutics, Inc.* | 5,042,070 | |
| 113,887 | KalVista Pharmaceuticals, Inc.* | 2,047,688 | |
| 33,200 | Karuna Therapeutics, Inc.* | 4,660,616 | |
| 43,813 | Kodiak Sciences, Inc.* | 5,130,064 | |
| 73,756 | Kymera Therapeutics, Inc.* | 4,342,753 | |
| 36,455 | Madrigal Pharmaceuticals, Inc.* | 2,834,376 | |
| 252,225 | Mersana Therapeutics, Inc.* | 2,159,046 | |
| 20,556 | Mirati Therapeutics, Inc.* | 3,885,495 | |
| 101,240 | NanoString Technologies, Inc.* | 4,889,892 | |
| 143,417 | NeoGenomics, Inc.* | 6,597,182 | |
| 110,118 | PTC Therapeutics, Inc.* | 4,176,776 | |
| 105,480 | RAPT Therapeutics, Inc.* | 3,331,058 | |
| 32,194 | Reata Pharmaceuticals, Inc. Class A* | 3,090,946 | |
| 140,810 | Revance Therapeutics, Inc.* | 1,936,138 | |
| 85,273 | Revolution Medicines, Inc.* | 2,509,584 | |
| 75,860 | Scholar Rock Holding Corp.* | 1,995,118 | |
| 162,189 | Syndax Pharmaceuticals, Inc.* | 3,154,576 | |
| 145,991 | TCR2 Therapeutics, Inc.* | 919,743 | |
| 130,515 | TG Therapeutics, Inc.* | 4,074,678 | |
| 50,897 | Turning Point Therapeutics, Inc.* | 2,116,297 | |
| 76,271 | Veracyte, Inc.* | 3,651,856 | |
| 109,120 | Y-mAbs Therapeutics, Inc.* | 2,679,987 | |
| 129,699,942 | |||
| Real Estate - 4.5% | |||
| 233,353 | Essential Properties Realty Trust, Inc. REIT | 6,951,586 | |
| 322,436 | Independence Realty Trust, Inc. REIT | 7,619,163 | |
| 46,228 | PS Business Parks, Inc. REIT | 8,214,715 | |
| 64,876 | Redfin Corp.* | 3,330,734 | |
| 110,728 | Rexford Industrial Realty, Inc. REIT | 7,440,922 | |
| 77,872 | Ryman Hospitality Properties, Inc. REIT* | 6,661,171 | |
| 40,218,291 | |||
| Retailing - 2.7% | |||
| 11,209 | Floor & Decor Holdings, Inc. Class A* | 1,523,527 | |
| 129,484 | Foot Locker, Inc. | 6,172,502 | |
| 119,069 | Ollie's Bargain Outlet Holdings, Inc.* | 8,056,209 | |
| 66,965 | Shutterstock, Inc. | 8,112,810 | |
| 23,865,048 | |||
| Semiconductors & Semiconductor Equipment - 4.7% | |||
| 110,333 | Axcelis Technologies, Inc.* | 6,060,592 | |
| 69,889 | Cirrus Logic, Inc.* | 5,647,730 | |
| 151,093 | Lattice Semiconductor Corp.* | 10,491,898 | |
| 94,430 | Power Integrations, Inc. | 9,746,120 | |
| 50,099 | Synaptics, Inc.* | 9,747,762 | |
| 41,694,102 | |||
| Software & Services - 16.1% | |||
| 79,250 | Alarm.com Holdings, Inc.* | 6,677,605 | |
| 66,866 | Blackbaud, Inc.* | 4,748,155 | |
| 57,018 | Concentrix Corp. | 10,130,958 | |
| 25,652 | Consensus Cloud Solutions, Inc.* | 1,624,541 | |
| 125,715 | Digital Turbine, Inc.* | 10,819,033 | |
| 31,525 | Everbridge, Inc.* | 5,022,248 | |
| 81,242 | ExlService Holdings, Inc.* | 9,962,706 | |
| 263,526 | Kaltura, Inc.* | 2,487,685 | |
| 88,222 | LiveRamp Holdings, Inc.* | 4,720,759 | |
| 42,026 | Manhattan Associates, Inc.* | 7,629,400 | |
| 91,165 | Mimecast Ltd.* | 6,877,488 | |
| Shares or Principal Amount | Market Value† | ||
| COMMON STOCKS - 99.1% - (continued) | |||
| Software & Services - 16.1% - (continued) | |||
| 95,723 | Momentive Global, Inc.* | $ 2,193,971 | |
| 94,693 | Perficient, Inc.* | 11,704,055 | |
| 61,255 | Q2 Holdings, Inc.* | 4,806,067 | |
| 84,031 | Rapid7, Inc.* | 10,818,991 | |
| 273,264 | Repay Holdings Corp.* | 5,741,277 | |
| 26,400 | Solo Brands, Inc.* | 484,704 | |
| 113,772 | Sprinklr, Inc.*(1) | 2,195,800 | |
| 70,592 | Sprout Social, Inc. Class A* | 9,013,186 | |
| 178,348 | Telos Corp.* | 4,620,997 | |
| 131,975 | Varonis Systems, Inc.* | 8,544,061 | |
| 506,977 | Verra Mobility Corp.* | 7,543,818 | |
| 34,683 | Workiva, Inc.* | 5,186,843 | |
| 143,554,348 | |||
| Technology Hardware & Equipment - 2.2% | |||
| 128,632 | II-VI, Inc.* | 7,783,522 | |
| 66,081 | Insight Enterprises, Inc.* | 6,257,871 | |
| 67,418 | Lumentum Holdings, Inc.* | 5,567,379 | |
| 19,608,772 | |||
| Telecommunication Services - 0.3% | |||
| 29,198 | Bandwidth, Inc. Class A* | 2,490,005 | |
| Total Common Stocks (cost $603,199,663) | $ 883,119,289 | ||
| SHORT-TERM INVESTMENTS - 0.8% | |||
| Repurchase Agreements - 0.4% | |||
| $ 3,225,177 | Fixed Income Clearing Corp. Repurchase Agreement dated 10/29/2021 at 0.010%, due on 11/01/2021 with a maturity value of $3,225,180; collateralized by U.S. Treasury Bond at 1.875%, maturing 02/15/2041, with a market value of $3,289,705 | $ 3,225,177 | |
| Securities Lending Collateral - 0.4% | |||
| 22,865 | Fidelity Investments Money Market Funds, Government Portfolio, Institutional Class, 0.01%(2) | 22,865 | |
| 3,510,319 | Goldman Sachs Financial Square Funds, Government Fund, Institutional Class, 0.03%(2) | 3,510,319 | |
| 252,015 | Invesco Government & Agency Portfolio, Institutional Class, 0.03%(2) | 252,015 | |
| 3,785,199 | |||
| Total Short-Term Investments (cost $7,010,376) | $ 7,010,376 | ||
| Total Investments (cost $610,210,039) | 99.9% | $ 890,129,665 | |
| Other Assets and Liabilities | 0.1% | 454,020 | |
| Total Net Assets | 100.0% | $ 890,583,685 | |
| Note: | Percentage of investments as shown is the ratio of the total market value to total net assets. |
| For Fund compliance purposes, the Fund may not use the same classification system. These classifications are used for financial reporting purposes. | |
| See “Glossary” for abbreviation descriptions. |
| 74 |
October 31, 2021
| * | Non-income producing. |
| (1) | Represents entire or partial securities on loan. See Note 8 in the accompanying Notes to Financial Statements for securities lending information. |
| (2) | Current yield as of period end. |
| † | See Significant Accounting Policies of accompanying Notes to Financial Statements regarding valuation of investments. |
| Description | Total | Level 1 | Level 2 | Level 3(1) | ||||
| Assets | ||||||||
| Common Stocks | ||||||||
| Automobiles & Components | $ 24,317,457 | $ 24,317,457 | $ — | $ — | ||||
| Banks | 25,173,398 | 25,173,398 | — | — | ||||
| Capital Goods | 90,764,227 | 90,764,227 | — | — | ||||
| Commercial & Professional Services | 57,406,988 | 57,406,988 | — | — | ||||
| Consumer Durables & Apparel | 34,023,019 | 34,023,019 | — | — | ||||
| Consumer Services | 49,135,619 | 49,135,619 | — | — | ||||
| Diversified Financials | 12,890,324 | 12,890,324 | — | — | ||||
| Energy | 4,798,015 | 4,798,015 | — | — | ||||
| Food & Staples Retailing | 9,147,225 | 9,147,225 | — | — | ||||
| Food, Beverage & Tobacco | 28,169,230 | 28,169,230 | — | — | ||||
| Health Care Equipment & Services | 97,892,695 | 97,892,695 | — | — | ||||
| Household & Personal Products | 3,962,932 | 3,962,932 | — | — | ||||
| Insurance | 6,850,064 | 6,850,064 | — | — | ||||
| Materials | 18,993,733 | 18,993,733 | — | — | ||||
| Media & Entertainment | 18,463,855 | 18,463,855 | — | — | ||||
| Pharmaceuticals, Biotechnology & Life Sciences | 129,699,942 | 129,699,942 | — | — | ||||
| Real Estate | 40,218,291 | 40,218,291 | — | — | ||||
| Retailing | 23,865,048 | 23,865,048 | — | — | ||||
| Semiconductors & Semiconductor Equipment | 41,694,102 | 41,694,102 | — | — | ||||
| Software & Services | 143,554,348 | 143,554,348 | — | — | ||||
| Technology Hardware & Equipment | 19,608,772 | 19,608,772 | — | — | ||||
| Telecommunication Services | 2,490,005 | 2,490,005 | — | — | ||||
| Short-Term Investments | 7,010,376 | 3,785,199 | 3,225,177 | — | ||||
| Total | $ 890,129,665 | $ 886,904,488 | $ 3,225,177 | $ — |
| (1) | For the year ended October 31, 2021, there were no transfers in and out of Level 3. |
| 75 |
October 31, 2021
| Shares or Principal Amount | Market Value† | ||
| COMMON STOCKS - 99.1% | |||
| Banks - 22.3% | |||
| 74,819 | Bank OZK | $ 3,342,165 | |
| 119,111 | Berkshire Hills Bancorp, Inc. | 3,233,864 | |
| 104,728 | Cadence Bank* | 3,039,198 | |
| 28,100 | Federal Agricultural Mortgage Corp. Class C | 3,543,129 | |
| 86,313 | First Hawaiian, Inc. | 2,381,376 | |
| 67,105 | First Interstate BancSystem, Inc. Class A | 2,789,555 | |
| 207,226 | FNB Corp. | 2,414,183 | |
| 89,172 | Great Western Bancorp, Inc. | 3,036,306 | |
| 123,074 | Home BancShares, Inc. | 2,924,238 | |
| 73,348 | Pacific Premier Bancorp, Inc. | 3,079,882 | |
| 124,039 | Radian Group, Inc. | 2,960,811 | |
| 73,458 | Sandy Spring Bancorp, Inc. | 3,486,317 | |
| 155,210 | Umpqua Holdings Corp. | 3,174,044 | |
| 39,405,068 | |||
| Capital Goods - 8.5% | |||
| 59,800 | Air Lease Corp. | 2,394,990 | |
| 39,216 | EnerSys | 3,138,849 | |
| 92,648 | Kennametal, Inc. | 3,682,758 | |
| 90,919 | nVent Electric plc | 3,223,079 | |
| 167,476 | REV Group, Inc. | 2,530,562 | |
| 14,970,238 | |||
| Commercial & Professional Services - 12.2% | |||
| 150,208 | BrightView Holdings, Inc.* | 2,382,299 | |
| 185,360 | CoreCivic, Inc. REIT* | 1,595,949 | |
| 84,363 | Deluxe Corp. | 3,009,228 | |
| 76,253 | Herman Miller, Inc. | 2,967,767 | |
| 50,655 | Kforce, Inc. | 3,280,418 | |
| 104,804 | Loomis AB | 2,830,001 | |
| 32,541 | Science Applications International Corp. | 2,921,531 | |
| 80,511 | US Ecology, Inc.* | 2,591,649 | |
| 21,578,842 | |||
| Consumer Durables & Apparel - 8.2% | |||
| 30,270 | Carter's, Inc. | 2,982,200 | |
| 50,269 | Kontoor Brands, Inc. | 2,664,257 | |
| 79,638 | Movado Group, Inc. | 2,651,945 | |
| 80,391 | Steven Madden Ltd. | 3,625,634 | |
| 32,513 | Sturm Ruger & Co., Inc. | 2,564,626 | |
| 14,488,662 | |||
| Consumer Services - 3.3% | |||
| 75,555 | Adtalem Global Education, Inc.* | 2,790,246 | |
| 131,837 | H&R Block, Inc. | 3,041,480 | |
| 5,831,726 | |||
| Diversified Financials - 6.4% | |||
| 160,139 | Greenhill & Co., Inc. | 2,517,385 | |
| 140,544 | Navient Corp. | 2,768,717 | |
| 72,741 | PRA Group, Inc.* | 3,119,134 | |
| 71,353 | PROG Holdings, Inc.* | 2,886,229 | |
| 11,291,465 | |||
| Energy - 1.7% | |||
| 71,886 | DMC Global, Inc.* | 3,003,397 | |
| Health Care Equipment & Services - 4.8% | |||
| 170,741 | NextGen Healthcare, Inc.* | 2,810,397 | |
| Shares or Principal Amount | Market Value† | ||
| COMMON STOCKS - 99.1% - (continued) | |||
| Health Care Equipment & Services - 4.8% - (continued) | |||
| 45,156 | NuVasive, Inc.* | $ 2,409,524 | |
| 82,506 | Premier, Inc. Class A | 3,213,609 | |
| 8,433,530 | |||
| Household & Personal Products - 4.3% | |||
| 89,605 | Edgewell Personal Care Co. | 3,135,279 | |
| 59,408 | Energizer Holdings, Inc. | 2,166,610 | |
| 11,806 | Medifast, Inc. | 2,317,163 | |
| 7,619,052 | |||
| Insurance - 4.6% | |||
| 392,884 | Lancashire Holdings Ltd. | 2,720,669 | |
| 125,106 | ProAssurance Corp. | 2,866,179 | |
| 273,641 | Siriuspoint Ltd.* | 2,572,225 | |
| 8,159,073 | |||
| Materials - 3.1% | |||
| 41,120 | Compass Minerals International, Inc. | 2,697,472 | |
| 78,653 | Schweitzer-Mauduit International, Inc. | 2,740,270 | |
| 5,437,742 | |||
| Media & Entertainment - 0.8% | |||
| 72,041 | TEGNA, Inc. | 1,416,326 | |
| Real Estate - 3.2% | |||
| 125,511 | Pebblebrook Hotel Trust REIT | 2,818,977 | |
| 161,426 | Piedmont Office Realty Trust, Inc. Class A, REIT | 2,866,926 | |
| 5,685,903 | |||
| Semiconductors & Semiconductor Equipment - 6.5% | |||
| 44,283 | Ichor Holdings Ltd.* | 1,936,053 | |
| 164,571 | Rambus, Inc.* | 3,829,567 | |
| 35,980 | Silicon Motion Technology Corp. ADR | 2,569,332 | |
| 95,765 | Tower Semiconductor Ltd.* | 3,052,030 | |
| 11,386,982 | |||
| Software & Services - 4.3% | |||
| 49,239 | CSG Systems International, Inc. | 2,464,412 | |
| 37,901 | InterDigital, Inc. | 2,537,472 | |
| 149,215 | Xperi Holding Corp. | 2,673,933 | |
| 7,675,817 | |||
| Technology Hardware & Equipment - 1.6% | |||
| 106,735 | Plantronics, Inc.* | 2,856,229 | |
| Utilities - 3.3% | |||
| 59,528 | Portland General Electric Co. | 2,935,326 | |
| 125,060 | South Jersey Industries, Inc. | 2,846,365 | |
| 5,781,691 | |||
| Total Common Stocks (cost $148,724,517) | $ 175,021,743 | ||
| 76 |
October 31, 2021
| Shares or Principal Amount | Market Value† | ||
| EXCHANGE-TRADED FUNDS - 0.1% | |||
| Other Investment Pools & Funds - 0.1% | |||
| 1,357 | iShares Russell 2000 Value ETF | $ 225,778 | |
| Total Exchange-Traded Funds (cost $205,314) | $ 225,778 | ||
| Total Long-Term Investments (Cost $148,929,831) | $ 175,247,521 | ||
| SHORT-TERM INVESTMENTS - 0.4% | |||
| Repurchase Agreements - 0.4% | |||
| $ 732,030 | Fixed Income Clearing Corp. Repurchase Agreement dated 10/29/2021 at 0.010%, due on 11/01/2021 with a maturity value of $732,031; collateralized by U.S. Treasury Bond at 1.875%, maturing 02/15/2041, with a market value of $746,763 | $ 732,030 | |
| Total Short-Term Investments (cost $732,030) | $ 732,030 | ||
| Total Investments (cost $149,661,861) | 99.6% | $ 175,979,551 | |
| Other Assets and Liabilities | 0.4% | 685,513 | |
| Total Net Assets | 100.0% | $ 176,665,064 | |
| Note: | Percentage of investments as shown is the ratio of the total market value to total net assets. |
| Equity industry classifications used in this report are the Global Industry Classification Standard, which was developed by and is the exclusive property and service mark of MSCI, Inc. and Standard & Poor’s. | |
| For Fund compliance purposes, the Fund may not use the same classification system. These classifications are used for financial reporting purposes. | |
| See “Glossary” for abbreviation descriptions. |
| * | Non-income producing. |
| † | See Significant Accounting Policies of accompanying Notes to Financial Statements regarding valuation of investments. |
| Description | Total | Level 1 | Level 2 | Level 3(1) | ||||
| Assets | ||||||||
| Common Stocks | ||||||||
| Banks | $ 39,405,068 | $ 39,405,068 | $ — | $ — | ||||
| Capital Goods | 14,970,238 | 14,970,238 | — | — | ||||
| Commercial & Professional Services | 21,578,842 | 21,578,842 | — | — | ||||
| Consumer Durables & Apparel | 14,488,662 | 14,488,662 | — | — | ||||
| Consumer Services | 5,831,726 | 5,831,726 | — | — | ||||
| Diversified Financials | 11,291,465 | 11,291,465 | — | — | ||||
| Energy | 3,003,397 | 3,003,397 | — | — | ||||
| Health Care Equipment & Services | 8,433,530 | 8,433,530 | — | — | ||||
| Household & Personal Products | 7,619,052 | 7,619,052 | — | — | ||||
| Insurance | 8,159,073 | 8,159,073 | — | — | ||||
| Materials | 5,437,742 | 5,437,742 | — | — | ||||
| Media & Entertainment | 1,416,326 | 1,416,326 | — | — | ||||
| Real Estate | 5,685,903 | 5,685,903 | — | — | ||||
| Semiconductors & Semiconductor Equipment | 11,386,982 | 11,386,982 | — | — | ||||
| Software & Services | 7,675,817 | 7,675,817 | — | — | ||||
| Technology Hardware & Equipment | 2,856,229 | 2,856,229 | — | — | ||||
| Utilities | 5,781,691 | 5,781,691 | — | — | ||||
| Exchange-Traded Funds | 225,778 | 225,778 | — | — | ||||
| Short-Term Investments | 732,030 | — | 732,030 | — | ||||
| Total | $ 175,979,551 | $ 175,247,521 | $ 732,030 | $ — |
| (1) | For the year ended October 31, 2021, there were no transfers in and out of Level 3. |
| 77 |
October 31, 2021
| Shares or Principal Amount | Market Value† | ||
| COMMON STOCKS - 97.5% | |||
| Banks - 4.5% | |||
| 270,343 | Ameris Bancorp | $ 14,163,270 | |
| 239,351 | Markforged, Inc. PIPE | 1,577,323 | |
| 293,985 | Sterling Bancorp | 7,481,918 | |
| 162,981 | Synovus Financial Corp. | 7,593,285 | |
| 117,625 | Western Alliance Bancorp | 13,655,086 | |
| 44,470,882 | |||
| Capital Goods - 12.0% | |||
| 36,754 | Acuity Brands, Inc. | 7,550,374 | |
| 303,137 | Altra Industrial Motion Corp. | 15,808,594 | |
| 201,070 | Applied Industrial Technologies, Inc. | 19,600,304 | |
| 181,981 | Builders FirstSource, Inc.* | 10,604,033 | |
| 299,118 | Colfax Corp.* | 15,440,471 | |
| 79,285 | Curtiss-Wright Corp. | 10,123,109 | |
| 447,954 | Fluor Corp.* | 8,708,226 | |
| 114,457 | Gibraltar Industries, Inc.* | 7,458,018 | |
| 109,800 | Hydrofarm Holdings Group, Inc.* | 3,620,106 | |
| 35,950 | Kornit Digital Ltd.* | 6,013,716 | |
| 77,543 | Middleby Corp.* | 14,146,945 | |
| 119,073,896 | |||
| Consumer Durables & Apparel - 4.2% | |||
| 25,763 | Cavco Industries, Inc.* | 6,192,910 | |
| 93,960 | Crocs, Inc.* | 15,169,842 | |
| 223,176 | Skyline Champion Corp.* | 14,131,504 | |
| 61,708 | YETI Holdings, Inc.* | 6,067,748 | |
| 41,562,004 | |||
| Consumer Services - 3.9% | |||
| 96,754 | 2U, Inc.*(1) | 2,858,113 | |
| 98,172 | Boyd Gaming Corp.* | 6,261,410 | |
| 477,750 | Mister Car Wash, Inc.* | 8,761,935 | |
| 130,609 | Planet Fitness, Inc. Class A* | 10,389,946 | |
| 62,252 | Wingstop, Inc. | 10,736,603 | |
| 39,008,007 | |||
| Diversified Financials - 0.7% | |||
| 117,424 | Hannon Armstrong Sustainable Infrastructure Capital, Inc. REIT | 7,092,410 | |
| Energy - 2.3% | |||
| 268,996 | Chesapeake Energy Corp. | 17,145,805 | |
| 272,309 | Magnolia Oil & Gas Corp. Class A | 5,685,812 | |
| 22,831,617 | |||
| Health Care Equipment & Services - 11.5% | |||
| 223,953 | Accolade, Inc.* | 8,911,090 | |
| 564,774 | Cross Country Healthcare, Inc.* | 11,707,765 | |
| 111,590 | Globus Medical, Inc. Class A* | 8,611,400 | |
| 174,294 | Health Catalyst, Inc.* | 9,174,836 | |
| 144,067 | HealthEquity, Inc.* | 9,534,354 | |
| 55,106 | Inspire Medical Systems, Inc.* | 14,855,476 | |
| 173,792 | Integra LifeSciences Holdings Corp.* | 11,550,216 | |
| 58,582 | LHC Group, Inc.* | 7,884,551 | |
| 59,353 | Oak Street Health, Inc.* | 2,803,242 | |
| 60,641 | Omnicell, Inc.* | 10,803,194 | |
| 487,311 | R1 RCM, Inc.* | 10,574,649 | |
| 58,135 | Tandem Diabetes Care, Inc.* | 7,925,545 | |
| 114,336,318 | |||
| Materials - 0.7% | |||
| 126,311 | Cabot Corp. | 6,738,692 | |
| Media & Entertainment - 3.5% | |||
| 79,357 | Cardlytics, Inc.* | 6,242,222 | |
| Shares or Principal Amount | Market Value† | ||
| COMMON STOCKS - 97.5% - (continued) | |||
| Media & Entertainment - 3.5% - (continued) | |||
| 48,100 | Cargurus, Inc.* | $ 1,613,274 | |
| 289,832 | Criteo S.A. ADR* | 9,576,049 | |
| 268,662 | Genius Sports Ltd.* | 4,980,994 | |
| 95,360 | Ziff Davis, Inc.* | 12,231,827 | |
| 34,644,366 | |||
| Pharmaceuticals, Biotechnology & Life Sciences - 13.4% | |||
| 225,754 | Aclaris Therapeutics, Inc.* | 3,916,832 | |
| 42,253 | Allakos, Inc.* | 4,249,807 | |
| 36,824 | ALX Oncology Holdings, Inc.* | 2,063,617 | |
| 358,529 | Amicus Therapeutics, Inc.* | 3,764,554 | |
| 82,601 | Arena Pharmaceuticals, Inc.* | 4,740,471 | |
| 42,428 | Ascendis Pharma A/S ADR* | 6,432,509 | |
| 58,076 | BioAtla, Inc.* | 1,697,561 | |
| 70,091 | Blueprint Medicines Corp.* | 7,884,537 | |
| 56,775 | Celldex Therapeutics, Inc.* | 2,415,208 | |
| 70,470 | Fate Therapeutics, Inc.* | 3,791,286 | |
| 494,197 | ImmunoGen, Inc.* | 2,980,008 | |
| 44,241 | Intellia Therapeutics, Inc.* | 5,883,168 | |
| 156,741 | KalVista Pharmaceuticals, Inc.* | 2,818,203 | |
| 28,309 | Karuna Therapeutics, Inc.* | 3,974,017 | |
| 56,644 | Kodiak Sciences, Inc.* | 6,632,446 | |
| 85,529 | Kymera Therapeutics, Inc.* | 5,035,948 | |
| 33,591 | Madrigal Pharmaceuticals, Inc.* | 2,611,700 | |
| 71,674 | Medpace Holdings, Inc.* | 16,237,745 | |
| 270,051 | Mersana Therapeutics, Inc.* | 2,311,637 | |
| 183,353 | Myovant Sciences Ltd.* | 4,011,764 | |
| 113,097 | NanoString Technologies, Inc.* | 5,462,585 | |
| 216,815 | NeoGenomics, Inc.* | 9,973,490 | |
| 111,492 | RAPT Therapeutics, Inc.* | 3,520,917 | |
| 30,874 | Reata Pharmaceuticals, Inc. Class A* | 2,964,213 | |
| 105,157 | Revolution Medicines, Inc.* | 3,094,770 | |
| 90,974 | Rocket Pharmaceuticals, Inc.* | 2,702,838 | |
| 115,636 | Scholar Rock Holding Corp.* | 3,041,227 | |
| 31,588 | Turning Point Therapeutics, Inc.* | 1,313,429 | |
| 117,504 | Veracyte, Inc.* | 5,626,092 | |
| 87,888 | Y-mAbs Therapeutics, Inc.* | 2,158,529 | |
| 133,311,108 | |||
| Real Estate - 2.6% | |||
| 340,259 | Essential Properties Realty Trust, Inc. REIT | 10,136,315 | |
| 103,548 | Ryman Hospitality Properties, Inc. REIT* | 8,857,496 | |
| 382,020 | Xenia Hotels & Resorts, Inc. REIT* | 6,799,956 | |
| 25,793,767 | |||
| Retailing - 8.2% | |||
| 3,136,600 | Allstar Co.(2)(3)(4)(5) | — | |
| 104,431 | Five Below, Inc.* | 20,604,236 | |
| 96,757 | Floor & Decor Holdings, Inc. Class A* | 13,151,212 | |
| 100,384 | Honest Co., Inc.(3)(6) | 918,012 | |
| 132,208 | National Vision Holdings, Inc.* | 8,149,301 | |
| 36,008 | Ollie's Bargain Outlet Holdings, Inc.* | 2,436,301 | |
| 427,738 | Porch Group, Inc.*(1) | 8,995,330 | |
| 157,828 | Revolve Group, Inc.* | 11,843,413 | |
| 120,290 | Shutterstock, Inc. | 14,573,134 | |
| 26,907 | Tory Burch LLC(3)(4)(5) | 1,423,135 | |
| 82,094,074 | |||
| Semiconductors & Semiconductor Equipment - 6.4% | |||
| 30,141 | Ambarella, Inc.* | 5,601,102 | |
| 244,080 | Maxeon Solar Technologies Ltd.*(1) | 5,499,122 | |
| 71,955 | MKS Instruments, Inc. | 10,796,848 | |
| 78 |
October 31, 2021
| Shares or Principal Amount | Market Value† | ||
| COMMON STOCKS - 97.5% - (continued) | |||
| Semiconductors & Semiconductor Equipment - 6.4% - (continued) | |||
| 109,456 | Synaptics, Inc.* | $ 21,296,854 | |
| 630,560 | Tower Semiconductor Ltd.* | 20,095,947 | |
| 63,289,873 | |||
| Software & Services - 18.2% | |||
| 52,067 | Concentrix Corp. | 9,251,265 | |
| 31,786 | Consensus Cloud Solutions, Inc.* | 2,013,007 | |
| 239,477 | Digital Turbine, Inc.* | 20,609,391 | |
| 370,741 | Jamf Holding Corp.* | 17,665,809 | |
| 759,295 | Kaltura, Inc.*(1) | 7,167,745 | |
| 561,220 | Latch, Inc. | 4,989,246 | |
| 194,027 | LiveRamp Holdings, Inc.* | 10,382,385 | |
| 50,841 | Manhattan Associates, Inc.* | 9,229,675 | |
| 97,227 | Marathon Digital Holdings, Inc.*(1) | 5,079,138 | |
| 212,185 | Mimecast Ltd.* | 16,007,236 | |
| 79,093 | New Relic, Inc.* | 6,419,188 | |
| 561,926 | Payoneer Global, Inc.* | 4,242,541 | |
| 93,156 | Perficient, Inc.* | 11,514,082 | |
| 115,178 | Rapid7, Inc.* | 14,829,167 | |
| 401,135 | Repay Holdings Corp.* | 8,427,846 | |
| 175,693 | Telos Corp.* | 4,552,206 | |
| 271,677 | Varonis Systems, Inc.* | 17,588,369 | |
| 730,289 | Verra Mobility Corp.* | 10,866,700 | |
| 180,834,996 | |||
| Technology Hardware & Equipment - 4.0% | |||
| 251,717 | Calix, Inc.* | 15,754,967 | |
| 167,921 | II-VI, Inc.* | 10,160,900 | |
| 51,719 | Novanta, Inc.* | 8,924,631 | |
| 86,508 | PAR Technology Corp.*(1) | 5,434,432 | |
| 40,274,930 | |||
| Telecommunication Services - 0.6% | |||
| 68,150 | Bandwidth, Inc. Class A* | 5,811,832 | |
| Transportation - 0.8% | |||
| 25,045 | Saia, Inc.* | 7,830,069 | |
| Total Common Stocks (cost $793,907,592) | $ 968,998,841 | ||
| EXCHANGE-TRADED FUNDS - 1.3% | |||
| Other Investment Pools & Funds - 1.3% | |||
| 42,672 | iShares Russell 2000 Growth ETF (1) | $ 13,118,226 | |
| Total Exchange-Traded Funds (cost $12,326,618) | $ 13,118,226 | ||
| Total Long-Term Investments (Cost $806,234,210) | $ 982,117,067 | ||
| SHORT-TERM INVESTMENTS - 3.2% | |||
| Repurchase Agreements - 0.6% | |||
| $ 5,237,817 | Fixed Income Clearing Corp. Repurchase Agreement dated 10/29/2021 at 0.010%, due on 11/01/2021 with a maturity value of $5,237,821; collateralized by U.S. Treasury Bond at 1.875%, maturing 02/15/2041, with a market value of $5,342,663 | $ 5,237,817 | |
| Shares or Principal Amount | Market Value† | ||
| SHORT-TERM INVESTMENTS - 3.2% - (continued) | |||
| Securities Lending Collateral - 2.6% | |||
| 156,697 | Fidelity Investments Money Market Funds, Government Portfolio, Institutional Class, 0.01%(7) | $ 156,697 | |
| 24,056,190 | Goldman Sachs Financial Square Funds, Government Fund, Institutional Class, 0.03%(7) | 24,056,190 | |
| 1,727,057 | Invesco Government & Agency Portfolio, Institutional Class, 0.03%(7) | 1,727,057 | |
| 25,939,944 | |||
| Total Short-Term Investments (cost $31,177,761) | $ 31,177,761 | ||
| Total Investments (cost $837,411,971) | 102.0% | $ 1,013,294,828 | |
| Other Assets and Liabilities | (2.0)% | (19,391,783) | |
| Total Net Assets | 100.0% | $ 993,903,045 | |
| Note: | Percentage of investments as shown is the ratio of the total market value to total net assets. |
| Prices of foreign equities that are principally traded on certain foreign markets will generally be adjusted daily pursuant to a fair value pricing service approved by the Board of Directors in order to reflect an adjustment for factors occurring after the close of certain foreign markets but before the close of the New York Stock Exchange. | |
| The Fund may refer to any one or more of the industry classifications used by one or more widely recognized market indices, ratings group and/or as defined by Fund management. Industry classifications may not be identical across all security types. | |
| Equity industry classifications used in this report are the Global Industry Classification Standard, which was developed by and is the exclusive property and service mark of MSCI, Inc. and Standard & Poor’s. | |
| For Fund compliance purposes, the Fund may not use the same classification system. These classifications are used for financial reporting purposes. | |
| See “Glossary” for abbreviation descriptions. |
| * | Non-income producing. |
| (1) | Represents entire or partial securities on loan. See Note 8 in the accompanying Notes to Financial Statements for securities lending information. |
| (2) | Affiliated company – The Fund owns greater than 5% of the outstanding voting securities of this issuer. |
| (3) | These securities are valued in good faith at fair value as determined under policies and procedures established by and under the supervision of the Board of Directors. At October 31, 2021, the aggregate fair value of these securities are $2,341,147, which represented 0.2% of total net assets. This amount excludes securities that are principally traded in certain foreign markets and whose prices are adjusted pursuant to a third party pricing service methodology approved by the Board of Directors. |
| 79 |
October 31, 2021
| (4) | Investment in securities not registered under the Securities Act of 1933 (excluding securities acquired pursuant to Rule 144A and Regulation S). At the end of the period, the value of such restricted securities amounted to $1,423,135 or 0.1% of net assets. |
| Period Acquired | Security Name | Shares/ Par Value | Total Cost | Market Value | ||||
| 08/2011 | Allstar Co. | 3,136,600 | $ — | $ — | ||||
| 11/2013 | Tory Burch LLC | 26,907 | 2,108,912 | 1,423,135 | ||||
| $ 2,108,912 | $ 1,423,135 |
| (5) | Investment valued using significant unobservable inputs. |
| (6) | As of October 31, 2021, investment is restricted from trading. The value of such restricted securities amounted to $918,012 or 0.1% of net assets. |
| Period Acquired | Security Name | Shares/ Par Value | Total Cost | Market Value | ||||
| 08/2014 | Honest Co., Inc. | 100,384 | $ 2,172,859 | $ 918,012 |
| (7) | Current yield as of period end. |
| † | See Significant Accounting Policies of accompanying Notes to Financial Statements regarding valuation of investments. |
| Description | Total | Level 1 | Level 2 | Level 3(1) | ||||
| Assets | ||||||||
| Common Stocks | ||||||||
| Banks | $ 44,470,882 | $ 44,470,882 | $ — | $ — | ||||
| Capital Goods | 119,073,896 | 119,073,896 | — | — | ||||
| Consumer Durables & Apparel | 41,562,004 | 41,562,004 | — | — | ||||
| Consumer Services | 39,008,007 | 39,008,007 | — | — | ||||
| Diversified Financials | 7,092,410 | 7,092,410 | — | — | ||||
| Energy | 22,831,617 | 22,831,617 | — | — | ||||
| Health Care Equipment & Services | 114,336,318 | 114,336,318 | — | — | ||||
| Materials | 6,738,692 | 6,738,692 | — | — | ||||
| Media & Entertainment | 34,644,366 | 34,644,366 | — | — | ||||
| Pharmaceuticals, Biotechnology & Life Sciences | 133,311,108 | 133,311,108 | — | — | ||||
| Real Estate | 25,793,767 | 25,793,767 | — | — | ||||
| Retailing | 82,094,074 | 79,752,927 | 918,012 | 1,423,135 | ||||
| Semiconductors & Semiconductor Equipment | 63,289,873 | 63,289,873 | — | — | ||||
| Software & Services | 180,834,996 | 180,834,996 | — | — | ||||
| Technology Hardware & Equipment | 40,274,930 | 40,274,930 | — | — | ||||
| Telecommunication Services | 5,811,832 | 5,811,832 | — | — | ||||
| Transportation | 7,830,069 | 7,830,069 | — | — | ||||
| Exchange-Traded Funds | 13,118,226 | 13,118,226 | — | — | ||||
| Short-Term Investments | 31,177,761 | 25,939,944 | 5,237,817 | — | ||||
| Total | $ 1,013,294,828 | $ 1,005,715,864 | $ 6,155,829 | $ 1,423,135 |
| (1) | For the year ended October 31, 2021, investments valued at $2,634,744 were transferred into Level 3 due to the unavailability of active market pricing, and investments valued at $1,956,547 were transferred out of Level 3 due to the availability of significant observable inputs. |
| 80 |
| Currency Abbreviations: | |
| USD | United States Dollar |
| Index Abbreviations: | |
| S&P | Standard & Poor's |
| Municipal Abbreviations: | |
| Rev | Revenue |
| Other Abbreviations: | |
| ADR | American Depositary Receipt |
| ETF | Exchange-Traded Fund |
| PIPE | Private Investment in Public Equity |
| REIT | Real Estate Investment Trust |
| 81 |
October 31, 2021
| The Hartford Capital Appreciation Fund | Hartford Core Equity Fund | The Hartford Dividend and Growth Fund | The Hartford Equity Income Fund | The Hartford Growth Opportunities Fund | The Hartford Healthcare Fund | ||||||
| Assets: | |||||||||||
| Investments in securities, at market value(1) | $ 7,619,419,856 | $ 12,548,966,892 | $ 14,198,654,096 | $ 4,859,387,145 | $ 7,979,502,215 | $ 1,717,321,266 | |||||
| Repurchase agreements | 168,581,979 | 72,985,489 | 369,098,764 | 51,975,720 | 87,787,053 | 18,664,274 | |||||
| Cash | 42,416,398 | 18,364,607 | 93,124,893 | 13,076,951 | 22,088,167 | 4,696,074 | |||||
| Cash collateral due from broker on futures contracts | 10,132,000 | — | — | — | — | — | |||||
| Cash collateral held for securities on loan | 3,872,628 | — | — | 961,072 | 2,569,356 | 537,962 | |||||
| Foreign currency | 1,240 | — | — | 631,954 | — | 18 | |||||
| Receivables: | |||||||||||
| Investment securities sold | 47,500,257 | 40,360,566 | 81,980,066 | 35,510,151 | 116,917,314 | 3,697,381 | |||||
| Fund shares sold | 833,438 | 19,953,368 | 30,175,536 | 3,172,146 | 5,043,995 | 908,176 | |||||
| Dividends and interest | 2,982,664 | 10,517,803 | 15,155,928 | 5,564,850 | 652,909 | 1,302,237 | |||||
| Securities lending income | 52,775 | — | — | 5,418 | 26,392 | 23,653 | |||||
| Variation margin on futures contracts | 879,127 | — | — | — | — | — | |||||
| Tax reclaims | 579,346 | — | 2,257,630 | 2,379,987 | 407,735 | 231,995 | |||||
| Other assets | 99,317 | 193,994 | 216,115 | 100,609 | 132,255 | 56,701 | |||||
| Total assets | 7,897,351,025 | 12,711,342,719 | 14,790,663,028 | 4,972,766,003 | 8,215,127,391 | 1,747,439,737 | |||||
| Liabilities: | |||||||||||
| Obligation to return securities lending collateral | 77,452,552 | — | — | 19,221,444 | 51,387,126 | 10,759,237 | |||||
| Payables: | |||||||||||
| Investment securities purchased | 74,147,178 | 31,418,407 | 104,502,202 | 51,457,804 | 60,874,462 | 5,184,372 | |||||
| Fund shares redeemed | 4,510,609 | 9,877,587 | 9,679,332 | 3,554,967 | 13,051,353 | 1,162,963 | |||||
| Investment management fees | 4,292,486 | 3,439,954 | 7,239,243 | 2,506,618 | 4,745,963 | 1,216,966 | |||||
| Transfer agent fees | 1,097,362 | 1,254,904 | 1,268,977 | 539,572 | 1,016,050 | 306,817 | |||||
| Accounting services fees | 179,735 | 280,232 | 314,358 | 114,417 | 186,302 | 45,306 | |||||
| Board of Directors' fees | 21,835 | 31,226 | 33,293 | 13,243 | 20,789 | 4,957 | |||||
| Distribution fees | 260,079 | 178,266 | 230,577 | 107,930 | 207,133 | 61,306 | |||||
| Accrued expenses | 202,977 | 237,194 | 292,966 | 137,110 | 169,278 | 68,369 | |||||
| Total liabilities | 162,164,813 | 46,717,770 | 123,560,948 | 77,653,105 | 131,658,456 | 18,810,293 | |||||
| Net assets | $ 7,735,186,212 | $ 12,664,624,949 | $ 14,667,102,080 | $ 4,895,112,898 | $ 8,083,468,935 | $ 1,728,629,444 | |||||
| Summary of Net Assets: | |||||||||||
| Capital stock and paid-in-capital | $ 4,736,174,336 | $ 7,376,870,845 | $ 8,354,194,715 | $ 2,950,234,730 | $ 4,679,255,005 | $ 1,125,189,834 | |||||
| Distributable earnings (loss) | 2,999,011,876 | 5,287,754,104 | 6,312,907,365 | 1,944,878,168 | 3,404,213,930 | 603,439,610 | |||||
| Net assets | $ 7,735,186,212 | $ 12,664,624,949 | $ 14,667,102,080 | $ 4,895,112,898 | $ 8,083,468,935 | $ 1,728,629,444 | |||||
| Shares authorized | 1,540,000,000 | 825,000,000 | 1,175,000,000 | 675,000,000 | 19,850,000,000 | 485,000,000 | |||||
| Par value | $ 0.0010 | $ 0.0010 | $ 0.0010 | $ 0.0010 | $ 0.0001 | $ 0.0010 | |||||
| Class A: Net asset value per share | $ 48.89 | $ 49.41 | $ 34.32 | $ 23.85 | $ 62.10 | $ 44.57 | |||||
| Maximum offering price per share | 51.74 | 52.29 | 36.32 | 25.24 | 65.71 | 47.16 | |||||
| Shares outstanding | 116,814,374 | 34,023,739 | 137,939,758 | 78,188,182 | 58,774,130 | 19,826,710 | |||||
| Net Assets | $ 5,710,869,050 | $ 1,681,155,050 | $ 4,733,857,918 | $ 1,864,492,491 | $ 3,650,083,238 | $ 883,718,709 | |||||
| Class C: Net asset value per share | $ 34.14 | $ 44.63 | $ 32.94 | $ 23.72 | $ 25.14 | $ 32.92 | |||||
| Shares outstanding | 4,359,759 | 13,083,074 | 5,148,348 | 6,845,561 | 12,772,504 | 4,087,885 | |||||
| Net Assets | $ 148,862,385 | $ 583,876,103 | $ 169,568,922 | $ 162,393,278 | $ 321,096,709 | $ 134,574,473 | |||||
| Class I: Net asset value per share | $ 49.25 | $ 49.59 | $ 34.12 | $ 23.68 | $ 67.29 | $ 47.93 | |||||
| Shares outstanding | 14,650,459 | 94,791,907 | 93,153,281 | 57,436,382 | 31,567,063 | 9,673,890 | |||||
| Net Assets | $ 721,608,044 | $ 4,700,781,762 | $ 3,178,644,677 | $ 1,360,338,797 | $ 2,124,159,902 | $ 463,673,377 | |||||
| Class R3: Net asset value per share | $ 55.21 | $ 50.06 | $ 34.88 | $ 23.89 | $ 61.55 | $ 45.63 | |||||
| Shares outstanding | 816,091 | 1,430,690 | 1,913,645 | 1,401,611 | 842,031 | 713,286 | |||||
| Net Assets | $ 45,054,324 | $ 71,616,850 | $ 66,751,455 | $ 33,484,951 | $ 51,823,521 | $ 32,550,492 | |||||
| Class R4: Net asset value per share | $ 57.63 | $ 51.01 | $ 35.17 | $ 23.93 | $ 67.45 | $ 49.12 | |||||
| Shares outstanding | 637,666 | 4,689,079 | 3,029,705 | 2,086,152 | 1,132,796 | 525,566 | |||||
| Net Assets | $ 36,749,920 | $ 239,198,061 | $ 106,561,016 | $ 49,922,978 | $ 76,404,459 | $ 25,817,999 |
| 82 |
October 31, 2021
| The Hartford Capital Appreciation Fund | Hartford Core Equity Fund | The Hartford Dividend and Growth Fund | The Hartford Equity Income Fund | The Hartford Growth Opportunities Fund | The Hartford Healthcare Fund | ||||||
| Class R5: Net asset value per share | $ 59.02 | $ 49.99 | $ 35.33 | $ 24.07 | $ 72.75 | $ 52.49 | |||||
| Shares outstanding | 618,882 | 4,501,062 | 7,523,865 | 3,365,253 | 343,638 | 246,408 | |||||
| Net Assets | $ 36,529,281 | $ 225,016,748 | $ 265,832,265 | $ 80,990,509 | $ 25,000,217 | $ 12,933,037 | |||||
| Class R6: Net asset value per share | $ 59.48 | $ 50.24 | $ 35.34 | $ 24.13 | $ 74.55 | $ 53.47 | |||||
| Shares outstanding | 323,851 | 20,812,277 | 13,313,236 | 3,382,927 | 971,545 | 113,909 | |||||
| Net Assets | $ 19,261,274 | $ 1,045,661,029 | $ 470,425,300 | $ 81,642,924 | $ 72,428,272 | $ 6,091,017 | |||||
| Class Y: Net asset value per share | $ 59.41 | $ 50.20 | $ 35.34 | $ 24.14 | $ 74.41 | $ 53.38 | |||||
| Shares outstanding | 2,062,435 | 18,005,370 | 26,293,570 | 4,991,997 | 7,595,580 | 2,300,490 | |||||
| Net Assets | $ 122,539,204 | $ 903,951,659 | $ 929,282,966 | $ 120,501,751 | $ 565,204,403 | $ 122,792,846 | |||||
| Class F: Net asset value per share | $ 49.26 | $ 49.65 | $ 34.10 | $ 23.68 | $ 67.69 | $ 48.18 | |||||
| Shares outstanding | 18,141,549 | 64,724,487 | 139,201,458 | 48,191,500 | 17,687,464 | 964,611 | |||||
| Net Assets | $ 893,712,730 | $ 3,213,367,687 | $ 4,746,177,561 | $ 1,141,345,219 | $ 1,197,268,214 | $ 46,477,494 | |||||
| Cost of investments | $ 5,829,049,020 | $ 7,709,760,462 | $ 8,961,674,203 | $ 3,324,670,527 | $ 6,219,204,307 | $ 1,297,072,635 | |||||
| Cost of foreign currency | $ 1,233 | $ — | $ — | $ 633,746 | $ — | $ 18 | |||||
| (1) Includes Investment in securities on loan, at market value | $ 78,297,883 | $ — | $ — | $ 18,426,375 | $ 50,802,197 | $ 12,432,635 |
| 83 |
October 31, 2021
| The Hartford MidCap Fund | The Hartford MidCap Value Fund | Hartford Quality Value Fund | The Hartford Small Cap Growth Fund | Hartford Small Cap Value Fund | The Hartford Small Company Fund | ||||||
| Assets: | |||||||||||
| Investments in securities, at market value(1) | $ 14,059,184,773 | $ 873,448,443 | $ 227,468,104 | $ 886,904,488 | $ 175,247,521 | $ 1,008,057,011 | |||||
| Repurchase agreements | 27,625,042 | 4,110,683 | 4,517,432 | 3,225,177 | 732,030 | 5,237,817 | |||||
| Investments in affiliated investments, at market value | 109,463,815 | — | — | — | — | — | |||||
| Cash | 7,056,190 | 1,034,123 | 1,155,617 | 5,539,188 | 184,186 | 465,012 | |||||
| Cash collateral held for securities on loan | 14,635,744 | — | — | 199,221 | — | 1,365,260 | |||||
| Foreign currency | — | — | 7 | — | — | — | |||||
| Receivables: | |||||||||||
| From affiliates | — | — | — | — | 5,146 | — | |||||
| Investment securities sold | 120,709,133 | 3,516,641 | 1,388,985 | — | 2,593,492 | 12,302,508 | |||||
| Fund shares sold | 9,770,736 | 1,345,842 | 11,967 | 707,382 | 458,933 | 1,080,951 | |||||
| Dividends and interest | 1,025,611 | 150,812 | 267,232 | 40,922 | 57,160 | 38,378 | |||||
| Securities lending income | 173,273 | — | — | 1,559 | 187 | 28,213 | |||||
| Tax reclaims | — | — | 56,850 | — | — | — | |||||
| Other assets | 161,724 | 49,005 | 24,822 | 49,130 | 51,486 | 81,186 | |||||
| Total assets | 14,349,806,041 | 883,655,549 | 234,891,016 | 896,667,067 | 179,330,141 | 1,028,656,336 | |||||
| Liabilities: | |||||||||||
| Obligation to return securities lending collateral | 292,714,891 | — | — | 3,984,420 | — | 27,305,204 | |||||
| Payables: | |||||||||||
| Investment securities purchased | 73,677,651 | 6,590,316 | 2,347,117 | 448,800 | 2,416,955 | 5,765,448 | |||||
| Fund shares redeemed | 45,952,899 | 976,170 | 79,555 | 869,835 | 76,455 | 764,845 | |||||
| Investment management fees | 8,282,139 | 520,756 | 87,439 | 537,449 | 104,988 | 647,427 | |||||
| Transfer agent fees | 1,759,865 | 102,231 | 51,130 | 147,646 | 26,700 | 132,574 | |||||
| Accounting services fees | 326,356 | 24,463 | 7,513 | 25,628 | 5,812 | 27,231 | |||||
| Board of Directors' fees | 48,328 | 2,356 | 624 | 2,718 | 480 | 2,826 | |||||
| Distribution fees | 219,229 | 17,294 | 8,455 | 13,148 | 2,774 | 23,552 | |||||
| Accrued expenses | 532,676 | 77,887 | 29,969 | 53,738 | 30,913 | 84,184 | |||||
| Total liabilities | 423,514,034 | 8,311,473 | 2,611,802 | 6,083,382 | 2,665,077 | 34,753,291 | |||||
| Net assets | $ 13,926,292,007 | $ 875,344,076 | $ 232,279,214 | $ 890,583,685 | $ 176,665,064 | $ 993,903,045 | |||||
| Summary of Net Assets: | |||||||||||
| Capital stock and paid-in-capital | $ 7,969,271,648 | $ 611,617,346 | $ 157,414,123 | $ 461,279,698 | $ 141,214,034 | $ 615,429,120 | |||||
| Distributable earnings (loss) | 5,957,020,359 | 263,726,730 | 74,865,091 | 429,303,987 | 35,451,030 | 378,473,925 | |||||
| Net assets | $ 13,926,292,007 | $ 875,344,076 | $ 232,279,214 | $ 890,583,685 | $ 176,665,064 | $ 993,903,045 | |||||
| Shares authorized | 1,105,000,000 | 475,000,000 | 22,110,000,000 | 22,100,000,000 | 860,000,000 | 525,000,000 | |||||
| Par value | $ 0.0010 | $ 0.0010 | $ 0.0001 | $ 0.0001 | $ 0.0010 | $ 0.0010 | |||||
| Class A: Net asset value per share | $ 37.01 | $ 18.14 | $ 26.27 | $ 64.88 | $ 13.36 | $ 30.24 | |||||
| Maximum offering price per share | 39.16 | 19.20 | 27.80 | 68.66 | 14.14 | 32.00 | |||||
| Shares outstanding | 93,132,686 | 20,066,591 | 7,168,371 | 3,946,506 | 4,453,228 | 16,633,361 | |||||
| Net Assets | $ 3,446,674,196 | $ 363,954,790 | $ 188,343,780 | $ 256,060,898 | $ 59,496,447 | $ 502,922,732 | |||||
| Class C: Net asset value per share | $ 22.89 | $ 14.28 | $ 22.22 | $ 41.34 | $ 11.48 | $ 17.65 | |||||
| Shares outstanding | 16,668,511 | 625,465 | 152,850 | 196,001 | 269,928 | 528,252 | |||||
| Net Assets | $ 381,566,370 | $ 8,930,558 | $ 3,396,750 | $ 8,102,065 | $ 3,098,190 | $ 9,324,284 | |||||
| Class I: Net asset value per share | $ 38.77 | $ 18.36 | $ 25.93 | $ 69.03 | $ 13.40 | $ 32.69 | |||||
| Shares outstanding | 102,151,916 | 1,378,009 | 777,224 | 1,740,371 | 2,455,556 | 1,817,737 | |||||
| Net Assets | $ 3,960,712,874 | $ 25,307,031 | $ 20,153,140 | $ 120,134,654 | $ 32,905,244 | $ 59,420,781 | |||||
| Class R3: Net asset value per share | $ 41.94 | $ 19.18 | $ 26.71 | $ 63.50 | $ 13.91 | $ 33.41 | |||||
| Shares outstanding | 2,387,205 | 363,519 | 41,118 | 136,011 | 66,944 | 464,762 | |||||
| Net Assets | $ 100,112,898 | $ 6,973,073 | $ 1,098,399 | $ 8,637,022 | $ 931,035 | $ 15,527,252 | |||||
| Class R4: Net asset value per share | $ 44.51 | $ 19.64 | $ 27.02 | $ 67.99 | $ 14.13 | $ 36.39 | |||||
| Shares outstanding | 4,254,090 | 534,644 | 176,691 | 310,290 | 3,745 | 421,042 | |||||
| Net Assets | $ 189,348,282 | $ 10,502,401 | $ 4,774,827 | $ 21,098,002 | $ 52,909 | $ 15,320,411 | |||||
| Class R5: Net asset value per share | $ 46.54 | $ 19.97 | $ 27.30 | $ 72.91 | $ 14.10 | $ 39.26 | |||||
| Shares outstanding | 6,864,261 | 107,248 | 11,721 | 1,190,292 | 1,717 | 172,754 | |||||
| Net Assets | $ 319,470,199 | $ 2,142,225 | $ 320,014 | $ 86,787,952 | $ 24,204 | $ 6,782,371 |
| 84 |
October 31, 2021
| The Hartford MidCap Fund | The Hartford MidCap Value Fund | Hartford Quality Value Fund | The Hartford Small Cap Growth Fund | Hartford Small Cap Value Fund | The Hartford Small Company Fund | ||||||
| Class R6: Net asset value per share | $ 47.29 | $ — | $ 27.38 | $ 74.32 | $ 14.10 | $ 40.33 | |||||
| Shares outstanding | 35,096,226 | — | 9,388 | 1,142,459 | 106,993 | 147,632 | |||||
| Net Assets | $ 1,659,581,715 | $ — | $ 257,072 | $ 84,908,124 | $ 1,508,417 | $ 5,953,999 | |||||
| Class Y: Net asset value per share | $ 47.18 | $ 20.02 | $ 27.34 | $ 74.28 | $ 14.07 | $ 40.25 | |||||
| Shares outstanding | 20,567,777 | 764,775 | 64,137 | 3,613,498 | 138,316 | 1,132,719 | |||||
| Net Assets | $ 970,296,215 | $ 15,307,456 | $ 1,753,297 | $ 268,416,456 | $ 1,946,741 | $ 45,590,067 | |||||
| Class F: Net asset value per share | $ 39.01 | $ 18.37 | $ 25.84 | $ 69.43 | $ 13.40 | $ 32.96 | |||||
| Shares outstanding | 74,310,824 | 24,077,883 | 471,493 | 524,816 | 5,724,378 | 10,106,323 | |||||
| Net Assets | $ 2,898,529,258 | $ 442,226,542 | $ 12,181,935 | $ 36,438,512 | $ 76,701,877 | $ 333,061,148 | |||||
| Cost of investments | $ 9,586,734,086 | $ 672,390,795 | $ 170,957,656 | $ 610,210,039 | $ 149,661,861 | $ 837,411,971 | |||||
| Cost of investments in affiliated investments | $ 102,451,938 | $ — | $ — | $ — | $ — | $ — | |||||
| Cost of foreign currency | $ — | $ — | $ 7 | $ — | $ — | $ — | |||||
| (1) Includes Investment in securities on loan, at market value | $ 285,537,889 | $ — | $ — | $ 4,006,025 | $ — | $ 26,917,675 |
| 85 |
For the Year Ended October 31, 2021
| The Hartford Capital Appreciation Fund | Hartford Core Equity Fund | The Hartford Dividend and Growth Fund | The Hartford Equity Income Fund | The Hartford Growth Opportunities Fund | The Hartford Healthcare Fund | ||||||
| Investment Income: | |||||||||||
| Dividends | $ 86,490,916 | $ 136,795,634 | $ 252,552,716 | $ 117,001,201 | $ 19,108,988 | $ 14,937,666 | |||||
| Interest | 65,550 | 87,235 | 141,932 | 36,912 | 44,144 | 15,034 | |||||
| Securities lending | 202,085 | 22,622 | 121,350 | 63,536 | 352,094 | 230,464 | |||||
| Less: Foreign tax withheld | (72,342) | — | (1,936,818) | (1,010,207) | — | (231,932) | |||||
| Total investment income, net | 86,686,209 | 136,905,491 | 250,879,180 | 116,091,442 | 19,505,226 | 14,951,232 | |||||
| Expenses: | |||||||||||
| Investment management fees | 49,676,683 | 37,136,213 | 74,151,966 | 27,914,942 | 53,553,149 | 14,240,330 | |||||
| Transfer agent fees | |||||||||||
| Class A | 5,618,496 | 1,337,171 | 3,867,964 | 1,420,724 | 2,973,184 | 972,857 | |||||
| Class C | 233,282 | 473,195 | 197,771 | 194,796 | 336,435 | 190,269 | |||||
| Class I | 561,597 | 3,641,597 | 2,124,231 | 1,118,898 | 1,808,294 | 437,635 | |||||
| Class R3 | 102,666 | 124,063 | 142,586 | 76,152 | 116,044 | 71,469 | |||||
| Class R4 | 58,152 | 309,598 | 144,060 | 71,423 | 123,907 | 41,440 | |||||
| Class R5 | 41,188 | 218,565 | 232,793 | 82,493 | 26,392 | 14,983 | |||||
| Class R6 | 467 | 21,916 | 14,330 | 2,935 | 2,395 | 225 | |||||
| Class Y | 129,824 | 810,008 | 1,078,791 | 103,232 | 576,983 | 129,123 | |||||
| Class F | 6,368 | 23,756 | 25,744 | 11,470 | 7,437 | 1,462 | |||||
| Distribution fees | |||||||||||
| Class A | 13,797,055 | 3,691,312 | 10,669,520 | 4,259,988 | 8,682,038 | 2,141,127 | |||||
| Class C | 1,723,108 | 5,375,759 | 1,591,467 | 1,893,578 | 3,387,379 | 1,466,784 | |||||
| Class R3 | 233,602 | 299,348 | 324,593 | 180,149 | 266,089 | 171,257 | |||||
| Class R4 | 90,159 | 529,775 | 239,606 | 116,696 | 195,851 | 66,369 | |||||
| Custodian fees | 15,440 | 35,714 | 32,206 | �� | 15,714 | 31,974 | 25,607 | ||||
| Registration and filing fees | 159,815 | 502,930 | 408,671 | 200,502 | 269,303 | 152,383 | |||||
| Accounting services fees | 1,079,266 | 1,601,426 | 1,754,140 | 659,987 | 1,094,466 | 255,936 | |||||
| Board of Directors' fees | 192,690 | 297,825 | 322,741 | 116,960 | 200,727 | 43,699 | |||||
| Audit and tax fees | 39,415 | 22,156 | 22,376 | 22,060 | 38,555 | 25,652 | |||||
| Other expenses | 614,691 | 813,780 | 953,884 | 412,099 | 562,864 | 167,975 | |||||
| Total expenses (before waivers, reimbursements and fees paid indirectly) | 74,373,964 | 57,266,107 | 98,299,440 | 38,874,798 | 74,253,466 | 20,616,582 | |||||
| Transfer agent fee waivers | (17,901) | (131,049) | (682,575) | (10,138) | (48,828) | (20,235) | |||||
| Distribution fee reimbursements | (229,280) | (101,307) | (105,853) | (16,158) | (241,569) | (28,670) | |||||
| Commission recapture | (49,870) | (9,920) | (44,995) | (11,719) | (75,072) | (5,949) | |||||
| Total waivers, reimbursements and fees paid indirectly | (297,051) | (242,276) | (833,423) | (38,015) | (365,469) | (54,854) | |||||
| Total expenses | 74,076,913 | 57,023,831 | 97,466,017 | 38,836,783 | 73,887,997 | 20,561,728 | |||||
| Net Investment Income (Loss) | 12,609,296 | 79,881,660 | 153,413,163 | 77,254,659 | (54,382,771) | (5,610,496) | |||||
| Net Realized Gain (Loss) on Investments, Other Financial Instruments and Foreign Currency Transactions on: | |||||||||||
| Investments | 1,086,100,955 | 335,569,531 | 700,954,383 | 364,674,920 | 1,724,290,896 | 183,813,447 | |||||
| Futures contracts | 31,660,302 | 31,391,264 | — | — | — | — | |||||
| Other foreign currency transactions | (17,591) | — | (2,510) | 2,657 | (10,450) | 18,863 | |||||
| Net Realized Gain (Loss) on Investments, Other Financial Instruments and Foreign Currency Transactions | 1,117,743,666 | 366,960,795 | 700,951,873 | 364,677,577 | 1,724,280,446 | 183,832,310 | |||||
| Net Changes in Unrealized Appreciation (Depreciation) of Investments, Other Financial Instruments and Foreign Currency Transactions of: | |||||||||||
| Investments | 952,494,489 | 2,961,617,485 | 3,492,438,056 | 993,084,121 | 264,839,851 | 154,309,751 | |||||
| Futures contracts | 8,707,449 | 2,034,977 | — | — | — | — | |||||
| Translation of other assets and liabilities in foreign currencies | (5,142) | — | — | 7,558 | 521 | (23,898) | |||||
| Net Changes in Unrealized Appreciation (Depreciation) of Investments, Other Financial Instruments and Foreign Currency Transactions | 961,196,796 | 2,963,652,462 | 3,492,438,056 | 993,091,679 | 264,840,372 | 154,285,853 |
| 86 |
For the Year Ended October 31, 2021
| The Hartford Capital Appreciation Fund | Hartford Core Equity Fund | The Hartford Dividend and Growth Fund | The Hartford Equity Income Fund | The Hartford Growth Opportunities Fund | The Hartford Healthcare Fund | ||||||
| Net Gain (Loss) on Investments, Other Financial Instruments and Foreign Currency Transactions | 2,078,940,462 | 3,330,613,257 | 4,193,389,929 | 1,357,769,256 | 1,989,120,818 | 338,118,163 | |||||
| Net Increase (Decrease) in Net Assets Resulting from Operations | $ 2,091,549,758 | $ 3,410,494,917 | $ 4,346,803,092 | $ 1,435,023,915 | $ 1,934,738,047 | $ 332,507,667 |
| 87 |
For the Year Ended October 31, 2021
| The Hartford MidCap Fund | The Hartford MidCap Value Fund | Hartford Quality Value Fund | The Hartford Small Cap Growth Fund | Hartford Small Cap Value Fund | The Hartford Small Company Fund | ||||||
| Investment Income: | |||||||||||
| Dividends | $ 201,741,540 | $ 9,689,704 | $ 5,142,877 | $ 4,503,518 | $ 2,918,048 | $ 1,513,669 | |||||
| Interest | 9,579 | 3,064 | 1,565 | 1,721 | 377 | 7,668 | |||||
| Securities lending | 702,498 | — | — | 159,387 | 2,639 | 346,655 | |||||
| Less: Foreign tax withheld | (34,024) | (42,560) | (63,015) | — | (11,114) | — | |||||
| Total investment income, net | 202,419,593 | 9,650,208 | 5,081,427 | 4,664,626 | 2,909,950 | 1,867,992 | |||||
| Expenses: | |||||||||||
| Investment management fees | 105,484,421 | 5,708,276 | 960,238 | 6,588,557 | 988,172 | 7,498,454 | |||||
| Transfer agent fees | |||||||||||
| Class A | 3,224,605 | 525,217 | 287,037 | 434,824 | 109,933 | 633,628 | |||||
| Class C | 466,043 | 19,328 | 9,424 | 16,511 | 7,053 | 21,265 | |||||
| Class I | 5,476,633 | 18,055 | 14,892 | 85,250 | 22,563 | 55,197 | |||||
| Class R3 | 232,025 | 15,170 | 2,299 | 21,357 | 1,603 | 36,452 | |||||
| Class R4 | 359,131 | 17,280 | 8,164 | 42,331 | 78 | 25,118 | |||||
| Class R5 | 398,704 | 2,335 | 344 | 95,217 | 37 | 6,936 | |||||
| Class R6 | 50,732 | — | 22 | 2,254 | 12 | 147 | |||||
| Class Y | 1,270,095 | 19,048 | 1,074 | 305,889 | 1,396 | 27,139 | |||||
| Class F | 39,723 | 7,768 | 213 | 517 | 234 | 5,868 | |||||
| Distribution fees | |||||||||||
| Class A | 8,471,369 | 828,375 | 436,747 | 625,134 | 132,935 | 1,232,988 | |||||
| Class C | 4,218,510 | 102,470 | 37,720 | 126,505 | 28,540 | 103,748 | |||||
| Class R3 | 527,886 | 34,514 | 5,233 | 48,579 | 3,705 | 82,922 | |||||
| Class R4 | 534,779 | 25,439 | 12,163 | 64,892 | 117 | 38,523 | |||||
| Custodian fees | 164,146 | 1,797 | 2,214 | 10,358 | 4,304 | 17,381 | |||||
| Registration and filing fees | 305,049 | 125,290 | 116,885 | 124,937 | 117,008 | 162,594 | |||||
| Accounting services fees | 2,146,175 | 129,561 | 36,768 | 146,956 | 24,971 | 150,619 | |||||
| Board of Directors' fees | 387,370 | 20,880 | 5,478 | 23,271 | 3,942 | 25,512 | |||||
| Audit and tax fees | 22,535 | 21,877 | 22,026 | 21,583 | 21,903 | 31,645 | |||||
| Other expenses | 1,432,803 | 174,542 | 37,216 | 88,724 | 30,675 | 177,502 | |||||
| Total expenses (before waivers, reimbursements and fees paid indirectly) | 135,212,734 | 7,797,222 | 1,996,157 | 8,873,646 | 1,499,181 | 10,333,638 | |||||
| Expense waivers | — | — | (55,447) | — | (37,080) | — | |||||
| Transfer agent fee waivers | (857,805) | (602) | — | (153,731) | — | — | |||||
| Distribution fee reimbursements | (117,703) | (7,915) | (9,920) | (20,310) | (5,356) | (23,248) | |||||
| Commission recapture | (46,666) | (13,118) | (362) | (10,002) | (1,043) | (20,274) | |||||
| Total waivers, reimbursements and fees paid indirectly | (1,022,174) | (21,635) | (65,729) | (184,043) | (43,479) | (43,522) | |||||
| Total expenses | 134,190,560 | 7,775,587 | 1,930,428 | 8,689,603 | 1,455,702 | 10,290,116 | |||||
| Net Investment Income (Loss) | 68,229,033 | 1,874,621 | 3,150,999 | (4,024,977) | 1,454,248 | (8,422,124) | |||||
| Net Realized Gain (Loss) on Investments, Other Financial Instruments and Foreign Currency Transactions on: | |||||||||||
| Investments | 1,762,635,518 | 100,033,121 | 13,598,690 | 174,617,463 | 17,238,965 | 218,358,576 | |||||
| Investments in affiliated investments | (55,422,395) | — | — | — | — | 1,364,479 | |||||
| Other foreign currency transactions | — | 3,431 | 215 | — | 4,312 | 184 | |||||
| Net Realized Gain (Loss) on Investments, Other Financial Instruments and Foreign Currency Transactions | 1,707,213,123 | 100,036,552 | 13,598,905 | 174,617,463 | 17,243,277 | 219,723,239 | |||||
| Net Changes in Unrealized Appreciation (Depreciation) of Investments, Other Financial Instruments and Foreign Currency Transactions of: | |||||||||||
| Investments | 2,562,166,242 | 189,407,923 | 56,452,184 | 106,905,409 | 29,174,321 | 8,069,059 | |||||
| Investments in affiliated investments | 127,853,845 | — | — | — | — | — | |||||
| Net Changes in Unrealized Appreciation (Depreciation) of Investments, Other Financial Instruments and Foreign Currency Transactions | 2,690,020,087 | 189,407,923 | 56,452,184 | 106,905,409 | 29,174,321 | 8,069,059 | |||||
| Net Gain (Loss) on Investments, Other Financial Instruments and Foreign Currency Transactions | 4,397,233,210 | 289,444,475 | 70,051,089 | 281,522,872 | 46,417,598 | 227,792,298 | |||||
| Net Increase (Decrease) in Net Assets Resulting from Operations | $ 4,465,462,243 | $ 291,319,096 | $ 73,202,088 | $ 277,497,895 | $ 47,871,846 | $ 219,370,174 |
| 88 |
For the Year Ended October 31, 2021
| The Hartford Capital Appreciation Fund | Hartford Core Equity Fund | ||||||
| For the Year Ended October 31, 2021 | For the Year Ended October 31, 2020 | For the Year Ended October 31, 2021 | For the Year Ended October 31, 2020 | ||||
| Operations: | |||||||
| Net investment income (loss) | $ 12,609,296 | $ 35,121,555 | $ 79,881,660 | $ 68,377,330 | |||
| Net realized gain (loss) on investments, other financial instruments and foreign currency transactions | 1,117,743,666 | 321,998,365 | 366,960,795 | (54,681,104) | |||
| Net changes in unrealized appreciation (depreciation) of investments, other financial instruments and foreign currency transactions | 961,196,796 | 174,640,236 | 2,963,652,462 | 762,997,999 | |||
| Net Increase (Decrease) in Net Assets Resulting from Operations | 2,091,549,758 | 531,760,156 | 3,410,494,917 | 776,694,225 | |||
| Distributions to Shareholders: | |||||||
| Class A | (256,624,217) | (233,332,626) | (7,166,565) | (22,933,276) | |||
| Class C | (12,630,524) | (16,172,531) | — | (8,130,633) | |||
| Class I | (33,651,291) | (33,414,797) | (26,510,048) | (50,034,683) | |||
| Class R3 | (1,911,571) | (1,922,241) | (145,253) | (766,121) | |||
| Class R4 | (1,459,215) | (1,528,792) | (972,045) | (3,662,366) | |||
| Class R5 | (1,629,937) | (1,654,005) | (1,462,901) | (6,433,518) | |||
| Class R6 | (638,212) | (3,567,961) | (6,940,312) | (7,619,916) | |||
| Class Y | (4,992,537) | (8,300,069) | (5,937,551) | (10,460,626) | |||
| Class F | (42,410,229) | (40,192,877) | (21,751,271) | (48,473,881) | |||
| Total distributions | (355,947,733) | (340,085,899) | (70,885,946) | (158,515,020) | |||
| Capital Share Transactions: | |||||||
| Sold | 338,608,621 | 393,860,254 | 3,592,112,670 | 4,431,360,869 | |||
| Issued on reinvestment of distributions | 343,956,936 | 327,641,306 | 67,490,064 | 151,792,918 | |||
| Redeemed | (1,039,938,487) | (1,497,856,000) | (2,927,339,187) | (2,300,491,319) | |||
| Net increase (decrease) from capital share transactions | (357,372,930) | (776,354,440) | 732,263,547 | 2,282,662,468 | |||
| Net Increase (Decrease) in Net Assets | 1,378,229,095 | (584,680,183) | 4,071,872,518 | 2,900,841,673 | |||
| Net Assets: | |||||||
| Beginning of period | 6,356,957,117 | 6,941,637,300 | 8,592,752,431 | 5,691,910,758 | |||
| End of period | $ 7,735,186,212 | $ 6,356,957,117 | $ 12,664,624,949 | $ 8,592,752,431 | |||
| 89 |
For the Year Ended October 31, 2021
| The Hartford Dividend and Growth Fund | The Hartford Equity Income Fund | ||||||
| For the Year Ended October 31, 2021 | For the Year Ended October 31, 2020 | For the Year Ended October 31, 2021 | For the Year Ended October 31, 2020 | ||||
| Operations: | |||||||
| Net investment income (loss) | $ 153,413,163 | $ 159,576,823 | $ 77,254,659 | $ 76,499,402 | |||
| Net realized gain (loss) on investments, other financial instruments and foreign currency transactions | 700,951,873 | 194,550,105 | 364,677,577 | 41,190,676 | |||
| Net changes in unrealized appreciation (depreciation) of investments, other financial instruments and foreign currency transactions | 3,492,438,056 | (496,987,234) | 993,091,679 | (294,473,186) | |||
| Net Increase (Decrease) in Net Assets Resulting from Operations | 4,346,803,092 | (142,860,306) | 1,435,023,915 | (176,783,108) | |||
| Distributions to Shareholders: | |||||||
| Class A | (124,272,767) | (160,312,321) | (41,652,685) | (123,227,802) | |||
| Class C | (3,956,164) | (7,036,533) | (3,698,845) | (20,643,364) | |||
| Class I | (71,985,276) | (56,365,416) | (33,459,498) | (79,079,559) | |||
| Class R3 | (1,696,101) | (2,526,370) | (781,704) | (3,167,178) | |||
| Class R4 | (2,690,217) | (4,441,817) | (1,147,861) | (4,104,853) | |||
| Class R5 | (6,848,052) | (8,627,986) | (2,137,950) | (6,408,419) | |||
| Class R6 | (9,408,231) | (6,208,413) | (2,007,112) | (4,420,613) | |||
| Class Y | (30,895,801) | (32,073,450) | (2,882,683) | (8,372,101) | |||
| Class F | (117,659,277) | (133,641,614) | (30,248,716) | (77,653,805) | |||
| Total distributions | (369,411,886) | (411,233,920) | (118,017,054) | (327,077,694) | |||
| Capital Share Transactions: | |||||||
| Sold | 4,029,585,831 | 2,466,834,298 | 771,725,035 | 870,782,771 | |||
| Issued on reinvestment of distributions | 354,750,045 | 395,743,447 | 113,763,031 | 313,924,345 | |||
| Redeemed | (2,883,515,258) | (2,162,912,714) | (999,427,216) | (1,064,410,832) | |||
| Net increase (decrease) from capital share transactions | 1,500,820,618 | 699,665,031 | (113,939,150) | 120,296,284 | |||
| Net Increase (Decrease) in Net Assets | 5,478,211,824 | 145,570,805 | 1,203,067,711 | (383,564,518) | |||
| Net Assets: | |||||||
| Beginning of period | 9,188,890,256 | 9,043,319,451 | 3,692,045,187 | 4,075,609,705 | |||
| End of period | $ 14,667,102,080 | $ 9,188,890,256 | $ 4,895,112,898 | $ 3,692,045,187 | |||
| 90 |
For the Year Ended October 31, 2021
| The Hartford Growth Opportunities Fund | The Hartford Healthcare Fund | ||||||
| For the Year Ended October 31, 2021 | For the Year Ended October 31, 2020 | For the Year Ended October 31, 2021 | For the Year Ended October 31, 2020 | ||||
| Operations: | |||||||
| Net investment income (loss) | $ (54,382,771) | $ (29,916,479) | $ (5,610,496) | $ (4,395,168) | |||
| Net realized gain (loss) on investments, other financial instruments and foreign currency transactions | 1,724,280,446 | 1,058,626,660 | 183,832,310 | 203,398,936 | |||
| Net changes in unrealized appreciation (depreciation) of investments, other financial instruments and foreign currency transactions | 264,840,372 | 1,003,071,867 | 154,285,853 | 73,940,755 | |||
| Net Increase (Decrease) in Net Assets Resulting from Operations | 1,934,738,047 | 2,031,782,048 | 332,507,667 | 272,944,523 | |||
| Distributions to Shareholders: | |||||||
| Class A | (423,673,541) | (132,324,071) | (93,880,300) | (43,738,879) | |||
| Class C | (94,842,287) | (33,402,683) | (22,672,232) | (11,289,417) | |||
| Class I | (234,064,363) | (86,336,894) | (44,908,247) | (18,502,650) | |||
| Class R3 | (7,102,825) | (2,788,128) | (3,747,674) | (2,132,500) | |||
| Class R4 | (9,398,654) | (3,725,988) | (2,881,694) | (1,601,341) | |||
| Class R5 | (2,988,257) | (1,419,176) | (1,201,964) | (362,224) | |||
| Class R6 | (5,296,402) | (1,357,539) | (438,736) | (138,636) | |||
| Class Y | (53,966,607) | (8,936,697) | (10,597,239) | (4,160,454) | |||
| Class F | (109,670,067) | (31,543,831) | (4,009,747) | (1,805,276) | |||
| Total distributions | (941,003,003) | (301,835,007) | (184,337,833) | (83,731,377) | |||
| Capital Share Transactions: | |||||||
| Sold | 1,412,684,010 | 1,236,652,514 | 254,406,423 | 225,456,081 | |||
| Issued on reinvestment of distributions | 867,858,722 | 276,247,055 | 175,117,607 | 79,518,799 | |||
| Redeemed | (1,585,916,069) | (1,570,077,091) | (314,733,008) | (300,020,713) | |||
| Net increase (decrease) from capital share transactions | 694,626,663 | (57,177,522) | 114,791,022 | 4,954,167 | |||
| Net Increase (Decrease) in Net Assets | 1,688,361,707 | 1,672,769,519 | 262,960,856 | 194,167,313 | |||
| Net Assets: | |||||||
| Beginning of period | 6,395,107,228 | 4,722,337,709 | 1,465,668,588 | 1,271,501,275 | |||
| End of period | $ 8,083,468,935 | $ 6,395,107,228 | $ 1,728,629,444 | $ 1,465,668,588 | |||
| 91 |
For the Year Ended October 31, 2021
| The Hartford MidCap Fund | The Hartford MidCap Value Fund | ||||||
| For the Year Ended October 31, 2021 | For the Year Ended October 31, 2020 | For the Year Ended October 31, 2021 | For the Year Ended October 31, 2020 | ||||
| Operations: | |||||||
| Net investment income (loss) | $ 68,229,033 | $ (10,215,371) | $ 1,874,621 | $ 4,875,802 | |||
| Net realized gain (loss) on investments, other financial instruments and foreign currency transactions | 1,707,213,123 | 1,702,763,140 | 100,036,552 | (39,228,979) | |||
| Net changes in unrealized appreciation (depreciation) of investments, other financial instruments and foreign currency transactions | 2,690,020,087 | (766,119,265) | 189,407,923 | (52,936,953) | |||
| Net Increase (Decrease) in Net Assets Resulting from Operations | 4,465,462,243 | 926,428,504 | 291,319,096 | (87,290,130) | |||
| Distributions to Shareholders: | |||||||
| Class A | (347,506,316) | (150,147,304) | (837,738) | (9,305,290) | |||
| Class C | (72,065,078) | (38,059,233) | — | (469,443) | |||
| Class I | (475,898,575) | (215,894,776) | (113,371) | (986,601) | |||
| Class R3 | (10,341,121) | (4,574,098) | — | (194,286) | |||
| Class R4 | (21,473,620) | (11,938,522) | (19,877) | (330,164) | |||
| Class R5 | (36,606,303) | (21,826,289) | (9,446) | (46,111) | |||
| Class R6 | (171,635,482) | (75,768,819) | — | — | |||
| Class Y | (114,448,304) | (67,701,427) | (91,721) | (388,031) | |||
| Class F | (294,576,639) | (117,154,616) | (2,424,869) | (10,736,193) | |||
| Total distributions | (1,544,551,438) | (703,065,084) | (3,497,022) | (22,456,119) | |||
| Capital Share Transactions: | |||||||
| Sold | 2,014,553,894 | 3,049,644,964 | 146,817,585 | 143,137,588 | |||
| Issued on reinvestment of distributions | 1,483,163,109 | 674,235,988 | 3,487,144 | 22,332,350 | |||
| Redeemed | (5,460,496,113) | (4,890,549,843) | (162,560,509) | (161,706,044) | |||
| Net increase (decrease) from capital share transactions | (1,962,779,110) | (1,166,668,891) | (12,255,780) | 3,763,894 | |||
| Net Increase (Decrease) in Net Assets | 958,131,695 | (943,305,471) | 275,566,294 | (105,982,355) | |||
| Net Assets: | |||||||
| Beginning of period | 12,968,160,312 | 13,911,465,783 | 599,777,782 | 705,760,137 | |||
| End of period | $ 13,926,292,007 | $ 12,968,160,312 | $ 875,344,076 | $ 599,777,782 | |||
| 92 |
For the Year Ended October 31, 2021
| Hartford Quality Value Fund | The Hartford Small Cap Growth Fund | ||||||
| For the Year Ended October 31, 2021 | For the Year Ended October 31, 2020 | For the Year Ended October 31, 2021 | For the Year Ended October 31, 2020 | ||||
| Operations: | |||||||
| Net investment income (loss) | $ 3,150,999 | $ 4,115,456 | $ (4,024,977) | $ (2,708,736) | |||
| Net realized gain (loss) on investments, other financial instruments and foreign currency transactions | 13,598,905 | (2,408,260) | 174,617,463 | 76,991,681 | |||
| Net changes in unrealized appreciation (depreciation) of investments, other financial instruments and foreign currency transactions | 56,452,184 | (16,678,797) | 106,905,409 | 50,280,658 | |||
| Net Increase (Decrease) in Net Assets Resulting from Operations | 73,202,088 | (14,971,601) | 277,497,895 | 124,563,603 | |||
| Distributions to Shareholders: | |||||||
| Class A | (3,241,327) | (8,585,823) | (16,552,797) | (3,152,385) | |||
| Class C | (63,247) | (334,835) | (1,531,478) | (371,513) | |||
| Class I | (300,872) | (704,282) | (7,507,522) | (2,950,208) | |||
| Class R3 | (17,729) | (57,990) | (683,476) | (162,662) | |||
| Class R4 | (91,734) | (303,759) | (2,012,020) | (630,158) | |||
| Class R5 | (5,775) | (12,405) | (5,481,575) | (1,205,841) | |||
| Class R6 | (13,682) | (1,828) | (6,037,686) | (971,533) | |||
| Class Y | (10,318) | (33,830) | (17,719,809) | (5,261,028) | |||
| Class F | (258,522) | (650,547) | (3,391,955) | (693,277) | |||
| Total distributions | (4,003,206) | (10,685,299) | (60,918,318) | (15,398,605) | |||
| Capital Share Transactions: | |||||||
| Sold | 21,527,878 | 14,502,495 | 158,407,323 | 261,523,570 | |||
| Issued on reinvestment of distributions | 3,936,286 | 10,505,584 | 58,369,869 | 14,907,961 | |||
| Redeemed | (31,941,068) | (38,374,320) | (342,794,035) | (601,709,062) | |||
| Net increase (decrease) from capital share transactions | (6,476,904) | (13,366,241) | (126,016,843) | (325,277,531) | |||
| Net Increase (Decrease) in Net Assets | 62,721,978 | (39,023,141) | 90,562,734 | (216,112,533) | |||
| Net Assets: | |||||||
| Beginning of period | 169,557,236 | 208,580,377 | 800,020,951 | 1,016,133,484 | |||
| End of period | $ 232,279,214 | $ 169,557,236 | $ 890,583,685 | $ 800,020,951 | |||
| 93 |
For the Year Ended October 31, 2021
| Hartford Small Cap Value Fund | The Hartford Small Company Fund | ||||||
| For the Year Ended October 31, 2021 | For the Year Ended October 31, 2020 | For the Year Ended October 31, 2021 | For the Year Ended October 31, 2020 | ||||
| Operations: | |||||||
| Net investment income (loss) | $ 1,454,248 | $ 1,079,397 | $ (8,422,124) | $ (3,224,456) | |||
| Net realized gain (loss) on investments, other financial instruments and foreign currency transactions | 17,243,277 | (8,845,626) | 219,723,239 | 80,687,603 | |||
| Net changes in unrealized appreciation (depreciation) of investments, other financial instruments and foreign currency transactions | 29,174,321 | (8,048,202) | 8,069,059 | 109,288,045 | |||
| Net Increase (Decrease) in Net Assets Resulting from Operations | 47,871,846 | (15,814,431) | 219,370,174 | 186,751,192 | |||
| Distributions to Shareholders: | |||||||
| Class A | (363,877) | (2,971,162) | (42,313,500) | (19,581,596) | |||
| Class C | (3,950) | (232,432) | (1,604,568) | (922,638) | |||
| Class I | (54,057) | (419,421) | (3,566,682) | (1,641,458) | |||
| Class R3 | (3,498) | (37,274) | (1,394,856) | (795,519) | |||
| Class R4 | (362) | (4,174) | (1,251,522) | (754,352) | |||
| Class R5 | (148) | (730) | (377,954) | (157,911) | |||
| Class R6 | (3,866) | (7,037) | (128,962) | (5,772) | |||
| Class Y | (3,913) | (28,438) | (1,778,231) | (1,571,493) | |||
| Class F | (666,330) | (3,318,166) | (24,289,826) | (11,316,929) | |||
| Total distributions | (1,100,001) | (7,018,834) | (76,706,101) | (36,747,668) | |||
| Capital Share Transactions: | |||||||
| Sold | 82,135,100 | 14,194,625 | 307,799,887 | 102,088,209 | |||
| Issued on reinvestment of distributions | 1,094,882 | 6,977,511 | 76,133,999 | 36,543,865 | |||
| Redeemed | (32,701,037) | (23,873,812) | (262,911,327) | (164,590,834) | |||
| Net increase (decrease) from capital share transactions | 50,528,945 | (2,701,676) | 121,022,559 | (25,958,760) | |||
| Net Increase (Decrease) in Net Assets | 97,300,790 | (25,534,941) | 263,686,632 | 124,044,764 | |||
| Net Assets: | |||||||
| Beginning of period | 79,364,274 | 104,899,215 | 730,216,413 | 606,171,649 | |||
| End of period | $ 176,665,064 | $ 79,364,274 | $ 993,903,045 | $ 730,216,413 | |||
| 94 |
| — Selected Per-Share Data(1) — | — Ratios and Supplemental Data — | |||||||||||||||||||||||||||
| Class | Net Asset Value at Beginning of Period | Net Investment Income (Loss) | Net Realized and Unrealized Gain (Loss) on Investments | Total from Investment Operations | Dividends from Net Investment Income | Distributions from Capital Gains | Total Dividends and Distributions | Net Asset Value at End of Period | Total Return(2) | Net Assets at End of Period (000s) | Ratio of Expenses to Average Net Assets Before Adjust- ments(3) | Ratio of Expenses to Average Net Assets After Adjust- ments(3) | Ratio of Net Investment Income (Loss) to Average Net Assets | Portfolio Turnover | ||||||||||||||
| The Hartford Capital Appreciation Fund | ||||||||||||||||||||||||||||
| For the Year Ended October 31, 2021 | ||||||||||||||||||||||||||||
| A | $ 38.39 | $ 0.05 | $ 12.59 | $ 12.64 | $ (0.15) | $ (1.99) | $ (2.14) | $ 48.89 | 33.83% | $ 5,710,869 | 1.04% | 1.04% | 0.12% | 62% | ||||||||||||||
| C | 27.45 | (0.21) | 8.89 | 8.68 | — | (1.99) | (1.99) | 34.14 | 32.74 | 148,862 | 1.83 | 1.83 | (0.66) | 62 | ||||||||||||||
| I | 38.66 | 0.18 | 12.65 | 12.83 | (0.26) | (1.99) | (2.25) | 49.25 | 34.15 | 721,608 | 0.77 | 0.77 | 0.38 | 62 | ||||||||||||||
| R3 | 43.14 | (0.13) | 14.19 | 14.06 | — | (1.99) | (1.99) | 55.21 | 33.32 | 45,054 | 1.41 | 1.41 | (0.25) | 62 | ||||||||||||||
| R4 | 44.91 | 0.03 | 14.77 | 14.80 | (0.10) | (1.99) | (2.09) | 57.63 | 33.72 | 36,750 | 1.10 | 1.10 | 0.06 | 62 | ||||||||||||||
| R5 | 45.94 | 0.20 | 15.10 | 15.30 | (0.24) | (1.99) | (2.23) | 59.02 | 34.11 | 36,529 | 0.80 | 0.80 | 0.36 | 62 | ||||||||||||||
| R6 | 46.27 | 0.26 | 15.22 | 15.48 | (0.28) | (1.99) | (2.27) | 59.48 | 34.27 | 19,261 | 0.69 | 0.69 | 0.46 | 62 | ||||||||||||||
| Y | 46.24 | 0.21 | 15.21 | 15.42 | (0.26) | (1.99) | (2.25) | 59.41 | 34.14 | 122,539 | 0.80 | 0.79 | 0.37 | 62 | ||||||||||||||
| F | 38.66 | 0.21 | 12.67 | 12.88 | (0.29) | (1.99) | (2.28) | 49.26 | 34.28 | 893,713 | 0.69 | 0.69 | 0.47 | 62 | ||||||||||||||
| For the Year Ended October 31, 2020 | ||||||||||||||||||||||||||||
| A | $ 37.12 | $ 0.18 | $ 2.90 | $ 3.08 | $ (0.17) | $ (1.64) | $ (1.81) | $ 38.39 | 8.57% | $ 4,645,677 | 1.07% | 1.07% | 0.48% | 84% | ||||||||||||||
| C | 27.08 | (0.07) | 2.08 | 2.01 | — | (1.64) | (1.64) | 27.45 | 7.78 | 177,309 | 1.85 | 1.85 | (0.27) | 84 | ||||||||||||||
| I | 37.36 | 0.28 | 2.93 | 3.21 | (0.27) | (1.64) | (1.91) | 38.66 | 8.88 | 584,048 | 0.79 | 0.79 | 0.77 | 84 | ||||||||||||||
| R3 | 41.47 | 0.06 | 3.25 | 3.31 | — | (1.64) | (1.64) | 43.14 | 8.25 | 42,449 | 1.42 | 1.42 | 0.14 | 84 | ||||||||||||||
| R4 | 43.06 | 0.20 | 3.39 | 3.59 | (0.10) | (1.64) | (1.74) | 44.91 | 8.59 | 32,732 | 1.10 | 1.10 | 0.46 | 84 | ||||||||||||||
| R5 | 44.04 | 0.33 | 3.47 | 3.80 | (0.26) | (1.64) | (1.90) | 45.94 | 8.88 | 34,188 | 0.81 | 0.81 | 0.75 | 84 | ||||||||||||||
| R6 | 44.34 | 0.43 | 3.44 | 3.87 | (0.30) | (1.64) | (1.94) | 46.27 | 9.03 | 12,531 | 0.70 | 0.70 | 1.00 | 84 | ||||||||||||||
| Y | 44.32 | 0.36 | 3.49 | 3.85 | (0.29) | (1.64) | (1.93) | 46.24 | 8.97 | 103,152 | 0.80 | 0.75 | 0.83 | 84 | ||||||||||||||
| F | 37.36 | 0.31 | 2.93 | 3.24 | (0.30) | (1.64) | (1.94) | 38.66 | 9.00 | 724,872 | 0.70 | 0.70 | 0.85 | 84 | ||||||||||||||
| For the Year Ended October 31, 2019 | ||||||||||||||||||||||||||||
| A | $ 37.88 | $ 0.15 | $ 4.81 | $ 4.96 | $ (0.11) | $ (5.61) | $ (5.72) | $ 37.12 | 16.32% | $ 4,831,749 | 1.07% | 1.07% | 0.42% | 68% | ||||||||||||||
| C | 29.30 | (0.09) | 3.48 | 3.39 | — | (5.61) | (5.61) | 27.08 | 15.45 | 278,394 | 1.83 | 1.83 | (0.33) | 68 | ||||||||||||||
| I | 38.08 | 0.25 | 4.84 | 5.09 | (0.20) | (5.61) | (5.81) | 37.36 | 16.66 | 658,302 | 0.79 | 0.79 | 0.70 | 68 | ||||||||||||||
| R3 | 41.62 | 0.03 | 5.43 | 5.46 | — | (5.61) | (5.61) | 41.47 | 15.91 | 50,957 | 1.42 | 1.42 | 0.07 | 68 | ||||||||||||||
| R4 | 42.94 | 0.16 | 5.63 | 5.79 | (0.06) | (5.61) | (5.67) | 43.06 | 16.27 | 38,634 | 1.11 | 1.11 | 0.39 | 68 | ||||||||||||||
| R5 | 43.80 | 0.28 | 5.75 | 6.03 | (0.18) | (5.61) | (5.79) | 44.04 | 16.64 | 38,808 | 0.80 | 0.80 | 0.68 | 68 | ||||||||||||||
| R6 | 44.07 | 0.33 | 5.78 | 6.11 | (0.23) | (5.61) | (5.84) | 44.34 | 16.74 | 80,535 | 0.70 | 0.70 | 0.78 | 68 | ||||||||||||||
| Y | 44.06 | 0.32 | 5.77 | 6.09 | (0.22) | (5.61) | (5.83) | 44.32 | 16.71 | 187,754 | 0.78 | 0.74 | 0.75 | 68 | ||||||||||||||
| F | 38.09 | 0.28 | 4.83 | 5.11 | (0.23) | (5.61) | (5.84) | 37.36 | 16.75 | 776,505 | 0.70 | 0.70 | 0.79 | 68 | ||||||||||||||
| For the Year Ended October 31, 2018 | ||||||||||||||||||||||||||||
| A | $ 41.86 | $ 0.15 | $ 1.45 | $ 1.60 | $ (0.26) | $ (5.32) | $ (5.58) | $ 37.88 | 3.92% | $ 4,742,846 | 1.07% | 1.06% | 0.38% | 108% | ||||||||||||||
| C | 33.62 | (0.11) | 1.16 | 1.05 | (0.05) | (5.32) | (5.37) | 29.30 | 3.15 | 426,256 | 1.81 | 1.81 | (0.34) | 108 | ||||||||||||||
| I | 42.04 | 0.26 | 1.44 | 1.70 | (0.34) | (5.32) | (5.66) | 38.08 | 4.19 | 734,580 | 0.78 | 0.78 | 0.66 | 108 | ||||||||||||||
| R3 | 45.39 | 0.02 | 1.56 | 1.58 | (0.03) | (5.32) | (5.35) | 41.62 | 3.57 | 61,882 | 1.42 | 1.41 | 0.04 | 108 | ||||||||||||||
| R4 | 46.69 | 0.15 | 1.62 | 1.77 | (0.20) | (5.32) | (5.52) | 42.94 | 3.87 | 51,635 | 1.10 | 1.10 | 0.34 | 108 | ||||||||||||||
| R5 | 47.54 | 0.30 | 1.63 | 1.93 | (0.35) | (5.32) | (5.67) | 43.80 | 4.18 | 34,288 | 0.80 | 0.80 | 0.65 | 108 | ||||||||||||||
| R6 | 47.80 | 0.35 | 1.64 | 1.99 | (0.40) | (5.32) | (5.72) | 44.07 | 4.29 | 70,935 | 0.70 | 0.70 | 0.75 | 108 | ||||||||||||||
| Y | 47.78 | 0.34 | 1.64 | 1.98 | (0.38) | (5.32) | (5.70) | 44.06 | 4.28 | 175,731 | 0.71 | 0.71 | 0.74 | 108 | ||||||||||||||
| F | 42.06 | 0.30 | 1.45 | 1.75 | (0.40) | (5.32) | (5.72) | 38.09 | 4.28 | 880,110 | 0.70 | 0.70 | 0.75 | 108 | ||||||||||||||
| 95 |
| — Selected Per-Share Data(1) — | — Ratios and Supplemental Data — | |||||||||||||||||||||||||||
| Class | Net Asset Value at Beginning of Period | Net Investment Income (Loss) | Net Realized and Unrealized Gain (Loss) on Investments | Total from Investment Operations | Dividends from Net Investment Income | Distributions from Capital Gains | Total Dividends and Distributions | Net Asset Value at End of Period | Total Return(2) | Net Assets at End of Period (000s) | Ratio of Expenses to Average Net Assets Before Adjust- ments(3) | Ratio of Expenses to Average Net Assets After Adjust- ments(3) | Ratio of Net Investment Income (Loss) to Average Net Assets | Portfolio Turnover | ||||||||||||||
| The Hartford Capital Appreciation Fund – (continued) | ||||||||||||||||||||||||||||
| For the Year Ended October 31, 2017 | ||||||||||||||||||||||||||||
| A | $ 34.49 | $ 0.13 | $ 7.39 | $ 7.52 | $ (0.15) | $ — | $ (0.15) | $ 41.86 | 21.86% | $ 4,613,982 | 1.09% (4) | 1.08% (4) | 0.34% | 123% | ||||||||||||||
| C | 27.80 | (0.12) | 5.94 | 5.82 | — | — | — | 33.62 | 20.97 | 1,241,267 | 1.82 (4) | 1.82 (4) | (0.39) | 123 | ||||||||||||||
| I | 34.65 | 0.25 | 7.40 | 7.65 | (0.26) | — | (0.26) | 42.04 | 22.20 | 846,019 | 0.81 (4) | 0.81 (4) | 0.63 | 123 | ||||||||||||||
| R3 | 37.38 | 0.01 | 8.01 | 8.02 | (0.01) | — | (0.01) | 45.39 | 21.47 | 75,201 | 1.42 (4) | 1.40 (4) | 0.03 | 123 | ||||||||||||||
| R4 | 38.39 | 0.14 | 8.23 | 8.37 | (0.07) | — | (0.07) | 46.69 | 21.82 | 74,374 | 1.11 (4) | 1.11 (4) | 0.33 | 123 | ||||||||||||||
| R5 | 39.15 | 0.28 | 8.37 | 8.65 | (0.26) | — | (0.26) | 47.54 | 22.20 | 40,582 | 0.81 (4) | 0.80 (4) | 0.63 | 123 | ||||||||||||||
| R6 | 39.36 | 0.31 | 8.42 | 8.73 | (0.29) | — | (0.29) | 47.80 | 22.33 | 70,142 | 0.71 (4) | 0.71 (4) | 0.71 | 123 | ||||||||||||||
| Y | 39.36 | 0.30 | 8.41 | 8.71 | (0.29) | — | (0.29) | 47.78 | 22.27 | 184,502 | 0.72 (4) | 0.72 (4) | 0.70 | 123 | ||||||||||||||
| F (5) | 38.15 | 0.18 | 3.73 | 3.91 | — | — | — | 42.06 | 10.28 (6) | 1,103,972 | 0.71 (4)(7) | 0.71 (4)(7) | 0.65 (7) | 123 | ||||||||||||||
| Hartford Core Equity Fund | ||||||||||||||||||||||||||||
| For the Year Ended October 31, 2021 | ||||||||||||||||||||||||||||
| A | $ 36.04 | $ 0.23 | $ 13.36 | $ 13.59 | $ (0.22) | $ — | $ (0.22) | $ 49.41 | 37.85% | $ 1,681,155 | 0.70% | 0.70% | 0.52% | 13% | ||||||||||||||
| C | 32.62 | (0.09) | 12.10 | 12.01 | — | — | — | 44.63 | 36.82 | 583,876 | 1.45 | 1.45 | (0.23) | 13 | ||||||||||||||
| I | 36.16 | 0.34 | 13.40 | 13.74 | (0.31) | — | (0.31) | 49.59 | 38.19 | 4,700,782 | 0.45 | 0.45 | 0.77 | 13 | ||||||||||||||
| R3 | 36.54 | 0.07 | 13.56 | 13.63 | (0.11) | — | (0.11) | 50.06 | 37.38 | 71,617 | 1.07 | 1.06 | 0.16 | 13 | ||||||||||||||
| R4 | 37.20 | 0.23 | 13.79 | 14.02 | (0.21) | — | (0.21) | 51.01 | 37.82 | 239,198 | 0.76 | 0.72 | 0.50 | 13 | ||||||||||||||
| R5 | 36.44 | 0.34 | 13.51 | 13.85 | (0.30) | — | (0.30) | 49.99 | 38.17 | 225,017 | 0.46 | 0.46 | 0.76 | 13 | ||||||||||||||
| R6 | 36.62 | 0.39 | 13.57 | 13.96 | (0.34) | — | (0.34) | 50.24 | 38.31 | 1,045,661 | 0.36 | 0.36 | 0.86 | 13 | ||||||||||||||
| Y | 36.60 | 0.35 | 13.56 | 13.91 | (0.31) | — | (0.31) | 50.20 | 38.20 | 903,952 | 0.46 | 0.44 | 0.78 | 13 | ||||||||||||||
| F | 36.19 | 0.38 | 13.42 | 13.80 | (0.34) | — | (0.34) | 49.65 | 38.33 | 3,213,368 | 0.36 | 0.36 | 0.86 | 13 | ||||||||||||||
| For the Year Ended October 31, 2020 | ||||||||||||||||||||||||||||
| A | $ 33.40 | $ 0.26 | $ 3.23 | $ 3.49 | $ (0.23) | $ (0.62) | $ (0.85) | $ 36.04 | 10.58% | $ 1,140,994 | 0.73% | 0.72% | 0.77% | 22% | ||||||||||||||
| C | 30.35 | 0.01 | 2.92 | 2.93 | (0.04) | (0.62) | (0.66) | 32.62 | 9.74 | 443,989 | 1.47 | 1.47 | 0.03 | 22 | ||||||||||||||
| I | 33.50 | 0.35 | 3.24 | 3.59 | (0.31) | (0.62) | (0.93) | 36.16 | 10.87 | 2,936,718 | 0.46 | 0.46 | 1.03 | 22 | ||||||||||||||
| R3 | 33.86 | 0.15 | 3.26 | 3.41 | (0.11) | (0.62) | (0.73) | 36.54 | 10.17 | 46,674 | 1.07 | 1.07 | 0.43 | 22 | ||||||||||||||
| R4 | 34.44 | 0.27 | 3.33 | 3.60 | (0.22) | (0.62) | (0.84) | 37.20 | 10.58 | 169,267 | 0.78 | 0.73 | 0.77 | 22 | ||||||||||||||
| R5 | 33.75 | 0.36 | 3.25 | 3.61 | (0.30) | (0.62) | (0.92) | 36.44 | 10.85 | 188,738 | 0.47 | 0.47 | 1.04 | 22 | ||||||||||||||
| R6 | 33.91 | 0.38 | 3.29 | 3.67 | (0.34) | (0.62) | (0.96) | 36.62 | 10.96 | 746,018 | 0.38 | 0.38 | 1.10 | 22 | ||||||||||||||
| Y | 33.90 | 0.36 | 3.28 | 3.64 | (0.32) | (0.62) | (0.94) | 36.60 | 10.89 | 668,655 | 0.47 | 0.45 | 1.05 | 22 | ||||||||||||||
| F | 33.52 | 0.38 | 3.25 | 3.63 | (0.34) | (0.62) | (0.96) | 36.19 | 10.97 | 2,251,700 | 0.38 | 0.38 | 1.12 | 22 | ||||||||||||||
| For the Year Ended October 31, 2019 | ||||||||||||||||||||||||||||
| A | $ 30.17 | $ 0.27 | $ 4.40 | $ 4.67 | $ (0.21) | $ (1.23) | $ (1.44) | $ 33.40 | 16.60% | $ 881,587 | 0.74% | 0.73% | 0.88% | 15% | ||||||||||||||
| C | 27.53 | 0.04 | 4.01 | 4.05 | — | (1.23) | (1.23) | 30.35 | 15.71 | 366,553 | 1.47 | 1.47 | 0.14 | 15 | ||||||||||||||
| I | 30.26 | 0.35 | 4.40 | 4.75 | (0.28) | (1.23) | (1.51) | 33.50 | 16.91 | 1,740,669 | 0.47 | 0.47 | 1.14 | 15 | ||||||||||||||
| R3 | 30.52 | 0.16 | 4.48 | 4.64 | (0.07) | (1.23) | (1.30) | 33.86 | 16.18 | 34,158 | 1.10 | 1.10 | 0.52 | 15 | ||||||||||||||
| R4 | 31.03 | 0.28 | 4.54 | 4.82 | (0.18) | (1.23) | (1.41) | 34.44 | 16.59 | 150,159 | 0.77 | 0.74 | 0.88 | 15 | ||||||||||||||
| R5 | 30.47 | 0.35 | 4.44 | 4.79 | (0.28) | (1.23) | (1.51) | 33.75 | 16.90 | 231,879 | 0.49 | 0.49 | 1.13 | 15 | ||||||||||||||
| R6 | 30.61 | 0.38 | 4.46 | 4.84 | (0.31) | (1.23) | (1.54) | 33.91 | 17.01 | 259,706 | 0.38 | 0.38 | 1.22 | 15 | ||||||||||||||
| Y | 30.61 | 0.37 | 4.45 | 4.82 | (0.30) | (1.23) | (1.53) | 33.90 | 16.94 | 371,580 | 0.46 | 0.43 | 1.18 | 15 | ||||||||||||||
| F | 30.28 | 0.38 | 4.40 | 4.78 | (0.31) | (1.23) | (1.54) | 33.52 | 17.00 | 1,655,619 | 0.38 | 0.38 | 1.21 | 15 | ||||||||||||||
| 96 |
| — Selected Per-Share Data(1) — | — Ratios and Supplemental Data — | |||||||||||||||||||||||||||
| Class | Net Asset Value at Beginning of Period | Net Investment Income (Loss) | Net Realized and Unrealized Gain (Loss) on Investments | Total from Investment Operations | Dividends from Net Investment Income | Distributions from Capital Gains | Total Dividends and Distributions | Net Asset Value at End of Period | Total Return(2) | Net Assets at End of Period (000s) | Ratio of Expenses to Average Net Assets Before Adjust- ments(3) | Ratio of Expenses to Average Net Assets After Adjust- ments(3) | Ratio of Net Investment Income (Loss) to Average Net Assets | Portfolio Turnover | ||||||||||||||
| Hartford Core Equity Fund – (continued) | ||||||||||||||||||||||||||||
| For the Year Ended October 31, 2018 | ||||||||||||||||||||||||||||
| A | $ 28.53 | $ 0.22 | $ 2.42 | $ 2.64 | $ (0.25) | $ (0.75) | $ (1.00) | $ 30.17 | 9.41% | $ 666,354 | 0.74% | 0.74% | 0.73% | 22% | ||||||||||||||
| C | 26.13 | — | 2.22 | 2.22 | (0.07) | (0.75) | (0.82) | 27.53 | 8.61 | 293,064 | 1.48 | 1.48 | — | 22 | ||||||||||||||
| I | 28.60 | 0.30 | 2.43 | 2.73 | (0.32) | (0.75) | (1.07) | 30.26 | 9.72 | 1,130,600 | 0.47 | 0.47 | 1.00 | 22 | ||||||||||||||
| R3 | 28.85 | 0.12 | 2.44 | 2.56 | (0.14) | (0.75) | (0.89) | 30.52 | 9.02 | 34,765 | 1.10 | 1.10 | 0.38 | 22 | ||||||||||||||
| R4 | 29.32 | 0.22 | 2.48 | 2.70 | (0.24) | (0.75) | (0.99) | 31.03 | 9.37 | 144,866 | 0.79 | 0.76 | 0.72 | 22 | ||||||||||||||
| R5 | 28.81 | 0.30 | 2.44 | 2.74 | (0.33) | (0.75) | (1.08) | 30.47 | 9.69 | 201,510 | 0.49 | 0.49 | 0.99 | 22 | ||||||||||||||
| R6 | 28.93 | 0.33 | 2.45 | 2.78 | (0.35) | (0.75) | (1.10) | 30.61 | 9.80 | 146,643 | 0.39 | 0.39 | 1.08 | 22 | ||||||||||||||
| Y | 28.93 | 0.32 | 2.45 | 2.77 | (0.34) | (0.75) | (1.09) | 30.61 | 9.77 | 216,788 | 0.42 | 0.42 | 1.06 | 22 | ||||||||||||||
| F | 28.63 | 0.33 | 2.42 | 2.75 | (0.35) | (0.75) | (1.10) | 30.28 | 9.80 | 635,245 | 0.39 | 0.39 | 1.09 | 22 | ||||||||||||||
| For the Year Ended October 31, 2017 | ||||||||||||||||||||||||||||
| A | $ 23.87 | $ 0.27 | $ 4.70 | $ 4.97 | $ (0.12) | $ (0.19) | $ (0.31) | $ 28.53 | 21.06% | $ 631,817 | 0.75% | 0.75% | 1.05% | 39% | ||||||||||||||
| C | 21.94 | 0.07 | 4.33 | 4.40 | (0.02) | (0.19) | (0.21) | 26.13 | 20.20 | 316,886 | 1.50 | 1.50 | 0.30 | 39 | ||||||||||||||
| I | 23.93 | 0.34 | 4.71 | 5.05 | (0.19) | (0.19) | (0.38) | 28.60 | 21.37 | 982,686 | 0.52 | 0.52 | 1.30 | 39 | ||||||||||||||
| R3 | 24.18 | 0.19 | 4.77 | 4.96 | (0.10) | (0.19) | (0.29) | 28.85 | 20.71 | 43,004 | 1.11 | 1.09 | 0.72 | 39 | ||||||||||||||
| R4 | 24.54 | 0.27 | 4.84 | 5.11 | (0.14) | (0.19) | (0.33) | 29.32 | 21.05 | 172,584 | 0.81 | 0.79 | 1.01 | 39 | ||||||||||||||
| R5 | 24.10 | 0.35 | 4.75 | 5.10 | (0.20) | (0.19) | (0.39) | 28.81 | 21.41 | 192,359 | 0.51 | 0.49 | 1.31 | 39 | ||||||||||||||
| R6 | 24.19 | 0.37 | 4.77 | 5.14 | (0.21) | (0.19) | (0.40) | 28.93 | 21.52 | 118,527 | 0.41 | 0.41 | 1.38 | 39 | ||||||||||||||
| Y | 24.20 | 0.35 | 4.78 | 5.13 | (0.21) | (0.19) | (0.40) | 28.93 | 21.47 | 148,542 | 0.42 | 0.42 | 1.33 | 39 | ||||||||||||||
| F (5) | 26.05 | 0.26 | 2.32 | 2.58 | — | — | — | 28.63 | 9.90 (6) | 585,057 | 0.41 (7) | 0.41 (7) | 1.39 (7) | 39 | ||||||||||||||
| The Hartford Dividend and Growth Fund | ||||||||||||||||||||||||||||
| For the Year Ended October 31, 2021 | ||||||||||||||||||||||||||||
| A | $ 24.26 | $ 0.33 | $ 10.63 | $ 10.96 | $ (0.33) | $ (0.57) | $ (0.90) | $ 34.32 | 46.01% | $ 4,733,858 | 0.97% | 0.97% | 1.07% | 18% | ||||||||||||||
| C | 23.31 | 0.09 | 10.22 | 10.31 | (0.11) | (0.57) | (0.68) | 32.94 | 44.92 | 169,569 | 1.75 | 1.75 | 0.30 | 18 | ||||||||||||||
| I | 24.12 | 0.40 | 10.58 | 10.98 | (0.41) | (0.57) | (0.98) | 34.12 | 46.39 | 3,178,645 | 0.71 | 0.71 | 1.30 | 18 | ||||||||||||||
| R3 | 24.65 | 0.22 | 10.80 | 11.02 | (0.22) | (0.57) | (0.79) | 34.88 | 45.43 | 66,751 | 1.35 | 1.35 | 0.70 | 18 | ||||||||||||||
| R4 | 24.84 | 0.32 | 10.89 | 11.21 | (0.31) | (0.57) | (0.88) | 35.17 | 45.92 | 106,561 | 1.03 | 1.03 | 1.01 | 18 | ||||||||||||||
| R5 | 24.95 | 0.41 | 10.95 | 11.36 | (0.41) | (0.57) | (0.98) | 35.33 | 46.35 | 265,832 | 0.73 | 0.73 | 1.30 | 18 | ||||||||||||||
| R6 | 24.95 | 0.44 | 10.96 | 11.40 | (0.44) | (0.57) | (1.01) | 35.34 | 46.52 | 470,425 | 0.63 | 0.63 | 1.37 | 18 | ||||||||||||||
| Y | 24.95 | 0.44 | 10.94 | 11.38 | (0.42) | (0.57) | (0.99) | 35.34 | 46.47 | 929,283 | 0.74 | 0.67 | 1.38 | 18 | ||||||||||||||
| F | 24.10 | 0.43 | 10.58 | 11.01 | (0.44) | (0.57) | (1.01) | 34.10 | 46.55 | 4,746,178 | 0.63 | 0.63 | 1.40 | 18 | ||||||||||||||
| For the Year Ended October 31, 2020 | ||||||||||||||||||||||||||||
| A | $ 25.93 | $ 0.39 | $ (0.94) | $ (0.55) | $ (0.37) | $ (0.75) | $ (1.12) | $ 24.26 | (2.20)% | $ 3,385,907 | 1.00% | 1.00% | 1.61% | 28% | ||||||||||||||
| C | 24.96 | 0.20 | (0.92) | (0.72) | (0.18) | (0.75) | (0.93) | 23.31 | (3.01) | 138,431 | 1.78 | 1.78 | 0.84 | 28 | ||||||||||||||
| I | 25.80 | 0.45 | (0.94) | (0.49) | (0.44) | (0.75) | (1.19) | 24.12 | (1.97) | 1,681,761 | 0.73 | 0.73 | 1.86 | 28 | ||||||||||||||
| R3 | 26.32 | 0.31 | (0.95) | (0.64) | (0.28) | (0.75) | (1.03) | 24.65 | (2.54) | 54,642 | 1.35 | 1.35 | 1.26 | 28 | ||||||||||||||
| R4 | 26.52 | 0.39 | (0.97) | (0.58) | (0.35) | (0.75) | (1.10) | 24.84 | (2.26) | 82,299 | 1.05 | 1.05 | 1.56 | 28 | ||||||||||||||
| R5 | 26.64 | 0.47 | (0.98) | (0.51) | (0.43) | (0.75) | (1.18) | 24.95 | (1.97) | 177,851 | 0.74 | 0.74 | 1.86 | 28 | ||||||||||||||
| R6 | 26.64 | 0.49 | (0.97) | (0.48) | (0.46) | (0.75) | (1.21) | 24.95 | (1.87) | 196,065 | 0.65 | 0.65 | 1.94 | 28 | ||||||||||||||
| Y | 26.64 | 0.48 | (0.97) | (0.49) | (0.45) | (0.75) | (1.20) | 24.95 | (1.91) | 735,618 | 0.73 | 0.68 | 1.92 | 28 | ||||||||||||||
| F | 25.78 | 0.48 | (0.95) | (0.47) | (0.46) | (0.75) | (1.21) | 24.10 | (1.89) | 2,736,317 | 0.64 | 0.64 | 1.96 | 28 | ||||||||||||||
| 97 |
| — Selected Per-Share Data(1) — | — Ratios and Supplemental Data — | |||||||||||||||||||||||||||
| Class | Net Asset Value at Beginning of Period | Net Investment Income (Loss) | Net Realized and Unrealized Gain (Loss) on Investments | Total from Investment Operations | Dividends from Net Investment Income | Distributions from Capital Gains | Total Dividends and Distributions | Net Asset Value at End of Period | Total Return(2) | Net Assets at End of Period (000s) | Ratio of Expenses to Average Net Assets Before Adjust- ments(3) | Ratio of Expenses to Average Net Assets After Adjust- ments(3) | Ratio of Net Investment Income (Loss) to Average Net Assets | Portfolio Turnover | ||||||||||||||
| The Hartford Dividend and Growth Fund – (continued) | ||||||||||||||||||||||||||||
| For the Year Ended October 31, 2019 | ||||||||||||||||||||||||||||
| A | $ 25.63 | $ 0.40 | $ 2.63 | $ 3.03 | $ (0.38) | $ (2.35) | $ (2.73) | $ 25.93 | 13.75% | $ 3,739,696 | 1.00% | 0.99% | 1.65% | 22% | ||||||||||||||
| C | 24.75 | 0.21 | 2.53 | 2.74 | (0.18) | (2.35) | (2.53) | 24.96 | 12.92 | 192,715 | 1.77 | 1.77 | 0.89 | 22 | ||||||||||||||
| I | 25.51 | 0.46 | 2.63 | 3.09 | (0.45) | (2.35) | (2.80) | 25.80 | 14.08 | 1,079,962 | 0.73 | 0.73 | 1.89 | 22 | ||||||||||||||
| R3 | 25.97 | 0.32 | 2.67 | 2.99 | (0.29) | (2.35) | (2.64) | 26.32 | 13.33 | 66,115 | 1.36 | 1.35 | 1.30 | 22 | ||||||||||||||
| R4 | 26.14 | 0.40 | 2.69 | 3.09 | (0.36) | (2.35) | (2.71) | 26.52 | 13.71 | 111,451 | 1.04 | 1.04 | 1.61 | 22 | ||||||||||||||
| R5 | 26.25 | 0.47 | 2.71 | 3.18 | (0.44) | (2.35) | (2.79) | 26.64 | 14.05 | 193,707 | 0.74 | 0.74 | 1.89 | 22 | ||||||||||||||
| R6 | 26.25 | 0.50 | 2.71 | 3.21 | (0.47) | (2.35) | (2.82) | 26.64 | 14.16 | 119,159 | 0.64 | 0.64 | 1.98 | 22 | ||||||||||||||
| Y | 26.25 | 0.49 | 2.70 | 3.19 | (0.45) | (2.35) | (2.80) | 26.64 | 14.10 | 696,309 | 0.71 | 0.68 | 1.96 | 22 | ||||||||||||||
| F | 25.50 | 0.49 | 2.61 | 3.10 | (0.47) | (2.35) | (2.82) | 25.78 | 14.15 | 2,844,206 | 0.64 | 0.64 | 2.00 | 22 | ||||||||||||||
| For the Year Ended October 31, 2018 | ||||||||||||||||||||||||||||
| A | $ 27.46 | $ 0.39 | $ 0.80 | $ 1.19 | $ (0.38) | $ (2.64) | $ (3.02) | $ 25.63 | 4.38% | $ 3,521,062 | 0.99% | 0.99% | 1.49% | 31% | ||||||||||||||
| C | 26.62 | 0.19 | 0.77 | 0.96 | (0.19) | (2.64) | (2.83) | 24.75 | 3.58 | 228,076 | 1.76 | 1.75 | 0.76 | 31 | ||||||||||||||
| I | 27.35 | 0.46 | 0.79 | 1.25 | (0.45) | (2.64) | (3.09) | 25.51 | 4.68 | 847,646 | 0.73 | 0.73 | 1.75 | 31 | ||||||||||||||
| R3 | 27.78 | 0.30 | 0.81 | 1.11 | (0.28) | (2.64) | (2.92) | 25.97 | 4.03 | 72,723 | 1.35 | 1.35 | 1.13 | 31 | ||||||||||||||
| R4 | 27.95 | 0.39 | 0.80 | 1.19 | (0.36) | (2.64) | (3.00) | 26.14 | 4.32 | 131,649 | 1.04 | 1.04 | 1.44 | 31 | ||||||||||||||
| R5 | 28.05 | 0.47 | 0.82 | 1.29 | (0.45) | (2.64) | (3.09) | 26.25 | 4.65 | 146,918 | 0.74 | 0.74 | 1.74 | 31 | ||||||||||||||
| R6 | 28.05 | 0.49 | 0.82 | 1.31 | (0.47) | (2.64) | (3.11) | 26.25 | 4.76 | 74,795 | 0.64 | 0.64 | 1.84 | 31 | ||||||||||||||
| Y | 28.05 | 0.49 | 0.81 | 1.30 | (0.46) | (2.64) | (3.10) | 26.25 | 4.72 | 616,454 | 0.68 | 0.68 | 1.80 | 31 | ||||||||||||||
| F | 27.33 | 0.48 | 0.80 | 1.28 | (0.47) | (2.64) | (3.11) | 25.50 | 4.77 | 2,591,584 | 0.64 | 0.64 | 1.84 | 31 | ||||||||||||||
| For the Year Ended October 31, 2017 | ||||||||||||||||||||||||||||
| A | $ 23.49 | $ 0.39 | $ 4.75 | $ 5.14 | $ (0.38) | $ (0.79) | $ (1.17) | $ 27.46 | 22.40% | $ 3,619,123 | 1.00% | 1.00% | 1.52% | 26% | ||||||||||||||
| C | 22.80 | 0.19 | 4.62 | 4.81 | (0.20) | (0.79) | (0.99) | 26.62 | 21.54 | 449,961 | 1.74 | 1.74 | 0.78 | 26 | ||||||||||||||
| I | 23.38 | 0.44 | 4.74 | 5.18 | (0.42) | (0.79) | (1.21) | 27.35 | 22.67 | 775,427 | 0.80 | 0.80 | 1.75 | 26 | ||||||||||||||
| R3 | 23.75 | 0.30 | 4.81 | 5.11 | (0.29) | (0.79) | (1.08) | 27.78 | 21.97 | 77,175 | 1.35 | 1.35 | 1.17 | 26 | ||||||||||||||
| R4 | 23.89 | 0.38 | 4.84 | 5.22 | (0.37) | (0.79) | (1.16) | 27.95 | 22.34 | 142,563 | 1.05 | 1.05 | 1.47 | 26 | ||||||||||||||
| R5 | 23.97 | 0.46 | 4.86 | 5.32 | (0.45) | (0.79) | (1.24) | 28.05 | 22.72 | 132,739 | 0.74 | 0.74 | 1.76 | 26 | ||||||||||||||
| R6 | 23.97 | 0.46 | 4.88 | 5.34 | (0.47) | (0.79) | (1.26) | 28.05 | 22.83 | 10,957 | 0.65 | 0.64 | 1.75 | 26 | ||||||||||||||
| Y | 23.97 | 0.50 | 4.84 | 5.34 | (0.47) | (0.79) | (1.26) | 28.05 | 22.81 | 605,049 | 0.66 | 0.66 | 1.94 | 26 | ||||||||||||||
| F (5) | 25.51 | 0.29 | 1.86 | 2.15 | (0.33) | — | (0.33) | 27.33 | 8.49 (6) | 2,570,906 | 0.64 (7) | 0.64 (7) | 1.66 (7) | 26 | ||||||||||||||
| The Hartford Equity Income Fund | ||||||||||||||||||||||||||||
| For the Year Ended October 31, 2021 | ||||||||||||||||||||||||||||
| A | $ 17.55 | $ 0.34 | $ 6.50 | $ 6.84 | $ (0.34) | $ (0.20) | $ (0.54) | $ 23.85 | 39.45% | $ 1,864,492 | 0.98% | 0.98% | 1.57% | 24% | ||||||||||||||
| C | 17.46 | 0.18 | 6.44 | 6.62 | (0.16) | (0.20) | (0.36) | 23.72 | 38.31 | 162,393 | 1.75 | 1.75 | 0.85 | 24 | ||||||||||||||
| I | 17.44 | 0.39 | 6.44 | 6.83 | (0.39) | (0.20) | (0.59) | 23.68 | 39.69 | 1,360,339 | 0.74 | 0.74 | 1.81 | 24 | ||||||||||||||
| R3 | 17.59 | 0.26 | 6.50 | 6.76 | (0.26) | (0.20) | (0.46) | 23.89 | 38.83 | 33,485 | 1.36 | 1.35 | 1.21 | 24 | ||||||||||||||
| R4 | 17.62 | 0.33 | 6.50 | 6.83 | (0.32) | (0.20) | (0.52) | 23.93 | 39.25 | 49,923 | 1.05 | 1.05 | 1.52 | 24 | ||||||||||||||
| R5 | 17.71 | 0.40 | 6.55 | 6.95 | (0.39) | (0.20) | (0.59) | 24.07 | 39.75 | 80,991 | 0.75 | 0.75 | 1.80 | 24 | ||||||||||||||
| R6 | 17.76 | 0.42 | 6.56 | 6.98 | (0.41) | (0.20) | (0.61) | 24.13 | 39.82 | 81,643 | 0.65 | 0.65 | 1.90 | 24 | ||||||||||||||
| Y | 17.76 | 0.40 | 6.57 | 6.97 | (0.39) | (0.20) | (0.59) | 24.14 | 39.77 | 120,502 | 0.74 | 0.73 | 1.81 | 24 | ||||||||||||||
| F | 17.44 | 0.41 | 6.44 | 6.85 | (0.41) | (0.20) | (0.61) | 23.68 | 39.81 | 1,141,345 | 0.65 | 0.65 | 1.92 | 24 | ||||||||||||||
| 98 |
| — Selected Per-Share Data(1) — | — Ratios and Supplemental Data — | |||||||||||||||||||||||||||
| Class | Net Asset Value at Beginning of Period | Net Investment Income (Loss) | Net Realized and Unrealized Gain (Loss) on Investments | Total from Investment Operations | Dividends from Net Investment Income | Distributions from Capital Gains | Total Dividends and Distributions | Net Asset Value at End of Period | Total Return(2) | Net Assets at End of Period (000s) | Ratio of Expenses to Average Net Assets Before Adjust- ments(3) | Ratio of Expenses to Average Net Assets After Adjust- ments(3) | Ratio of Net Investment Income (Loss) to Average Net Assets | Portfolio Turnover | ||||||||||||||
| The Hartford Equity Income Fund – (continued) | ||||||||||||||||||||||||||||
| For the Year Ended October 31, 2020 | ||||||||||||||||||||||||||||
| A | $ 19.99 | $ 0.34 | $ (1.21) | $ (0.87) | $ (0.31) | $ (1.26) | $ (1.57) | $ 17.55 | (4.68)% | $ 1,365,895 | 1.00% | 1.00% | 1.89% | 31% | ||||||||||||||
| C | 19.88 | 0.21 | (1.20) | (0.99) | (0.17) | (1.26) | (1.43) | 17.46 | (5.38) | 191,917 | 1.76 | 1.76 | 1.15 | 31 | ||||||||||||||
| I | 19.88 | 0.38 | (1.20) | (0.82) | (0.36) | (1.26) | (1.62) | 17.44 | (4.44) | 977,950 | 0.74 | 0.74 | 2.13 | 31 | ||||||||||||||
| R3 | 20.02 | 0.28 | (1.20) | (0.92) | (0.25) | (1.26) | (1.51) | 17.59 | (4.97) | 31,778 | 1.36 | 1.36 | 1.55 | 31 | ||||||||||||||
| R4 | 20.06 | 0.33 | (1.21) | (0.88) | (0.30) | (1.26) | (1.56) | 17.62 | (4.72) | 41,386 | 1.05 | 1.05 | 1.85 | 31 | ||||||||||||||
| R5 | 20.16 | 0.39 | (1.22) | (0.83) | (0.36) | (1.26) | (1.62) | 17.71 | (4.46) | 56,329 | 0.77 | 0.77 | 2.14 | 31 | ||||||||||||||
| R6 | 20.21 | 0.40 | (1.21) | (0.81) | (0.38) | (1.26) | (1.64) | 17.76 | (4.34) | 55,448 | 0.66 | 0.66 | 2.22 | 31 | ||||||||||||||
| Y | 20.22 | 0.40 | (1.23) | (0.83) | (0.37) | (1.26) | (1.63) | 17.76 | (4.40) | 81,615 | 0.76 | 0.71 | 2.20 | 31 | ||||||||||||||
| F | 19.87 | 0.40 | (1.19) | (0.79) | (0.38) | (1.26) | (1.64) | 17.44 | (4.31) | 889,727 | 0.66 | 0.66 | 2.23 | 31 | ||||||||||||||
| For the Year Ended October 31, 2019 | ||||||||||||||||||||||||||||
| A | $ 19.39 | $ 0.38 | $ 2.02 | $ 2.40 | $ (0.36) | $ (1.44) | $ (1.80) | $ 19.99 | 13.88% | $ 1,565,663 | 1.00% | 1.00% | 2.01% | 21% | ||||||||||||||
| C | 19.29 | 0.24 | 2.00 | 2.24 | (0.21) | (1.44) | (1.65) | 19.88 | 13.00 | 292,388 | 1.76 | 1.76 | 1.27 | 21 | ||||||||||||||
| I | 19.29 | 0.43 | 2.01 | 2.44 | (0.41) | (1.44) | (1.85) | 19.88 | 14.17 | 959,142 | 0.75 | 0.75 | 2.26 | 21 | ||||||||||||||
| R3 | 19.41 | 0.32 | 2.02 | 2.34 | (0.29) | (1.44) | (1.73) | 20.02 | 13.48 | 43,474 | 1.36 | 1.36 | 1.66 | 21 | ||||||||||||||
| R4 | 19.44 | 0.37 | 2.04 | 2.41 | (0.35) | (1.44) | (1.79) | 20.06 | 13.85 | 53,957 | 1.07 | 1.07 | 1.96 | 21 | ||||||||||||||
| R5 | 19.54 | 0.43 | 2.04 | 2.47 | (0.41) | (1.44) | (1.85) | 20.16 | 14.14 | 81,758 | 0.76 | 0.76 | 2.25 | 21 | ||||||||||||||
| R6 | 19.58 | 0.45 | 2.05 | 2.50 | (0.43) | (1.44) | (1.87) | 20.21 | 14.29 | 52,201 | 0.66 | 0.66 | 2.33 | 21 | ||||||||||||||
| Y | 19.58 | 0.45 | 2.05 | 2.50 | (0.42) | (1.44) | (1.86) | 20.22 | 14.21 | 105,015 | 0.73 | 0.71 | 2.34 | 21 | ||||||||||||||
| F | 19.29 | 0.44 | 2.01 | 2.45 | (0.43) | (1.44) | (1.87) | 19.87 | 14.24 | 922,012 | 0.66 | 0.66 | 2.34 | 21 | ||||||||||||||
| For the Year Ended October 31, 2018 | ||||||||||||||||||||||||||||
| A | $ 20.64 | $ 0.38 | $ (0.24) | $ 0.14 | $ (0.35) | $ (1.04) | $ (1.39) | $ 19.39 | 0.49% | $ 1,508,580 | 1.00% | 1.00% | 1.90% | 22% | ||||||||||||||
| C | 20.53 | 0.23 | (0.23) | — | (0.20) | (1.04) | (1.24) | 19.29 | (0.22) | 330,741 | 1.75 | 1.75 | 1.16 | 22 | ||||||||||||||
| I | 20.54 | 0.43 | (0.24) | 0.19 | (0.40) | (1.04) | (1.44) | 19.29 | 0.77 | 1,157,708 | 0.74 | 0.74 | 2.14 | 22 | ||||||||||||||
| R3 | 20.66 | 0.31 | (0.25) | 0.06 | (0.27) | (1.04) | (1.31) | 19.41 | 0.12 | 46,820 | 1.36 | 1.36 | 1.53 | 22 | ||||||||||||||
| R4 | 20.69 | 0.37 | (0.24) | 0.13 | (0.34) | (1.04) | (1.38) | 19.44 | 0.43 | 70,446 | 1.06 | 1.06 | 1.83 | 22 | ||||||||||||||
| R5 | 20.78 | 0.43 | (0.23) | 0.20 | (0.40) | (1.04) | (1.44) | 19.54 | 0.78 | 79,557 | 0.76 | 0.76 | 2.13 | 22 | ||||||||||||||
| R6 | 20.83 | 0.45 | (0.24) | 0.21 | (0.42) | (1.04) | (1.46) | 19.58 | 0.83 | 34,957 | 0.66 | 0.66 | 2.22 | 22 | ||||||||||||||
| Y | 20.83 | 0.45 | (0.25) | 0.20 | (0.41) | (1.04) | (1.45) | 19.58 | 0.79 | 140,057 | 0.70 | 0.70 | 2.19 | 22 | ||||||||||||||
| F | 20.54 | 0.45 | (0.24) | 0.21 | (0.42) | (1.04) | (1.46) | 19.29 | 0.85 | 774,529 | 0.65 | 0.65 | 2.23 | 22 | ||||||||||||||
| For the Year Ended October 31, 2017 | ||||||||||||||||||||||||||||
| A | $ 17.97 | $ 0.35 | $ 3.24 | $ 3.59 | $ (0.32) | $ (0.60) | $ (0.92) | $ 20.64 | 20.51% | $ 1,685,398 | 1.00% | 1.00% | 1.83% | 16% | ||||||||||||||
| C | 17.89 | 0.21 | 3.21 | 3.42 | (0.18) | (0.60) | (0.78) | 20.53 | 19.56 | 449,104 | 1.74 | 1.74 | 1.09 | 16 | ||||||||||||||
| I | 17.89 | 0.39 | 3.23 | 3.62 | (0.37) | (0.60) | (0.97) | 20.54 | 20.76 | 1,111,235 | 0.78 | 0.78 | 2.03 | 16 | ||||||||||||||
| R3 | 17.99 | 0.28 | 3.24 | 3.52 | (0.25) | (0.60) | (0.85) | 20.66 | 20.06 | 57,341 | 1.37 | 1.37 | 1.46 | 16 | ||||||||||||||
| R4 | 18.02 | 0.34 | 3.24 | 3.58 | (0.31) | (0.60) | (0.91) | 20.69 | 20.39 | 79,632 | 1.06 | 1.06 | 1.77 | 16 | ||||||||||||||
| R5 | 18.09 | 0.40 | 3.26 | 3.66 | (0.37) | (0.60) | (0.97) | 20.78 | 20.77 | 83,048 | 0.76 | 0.76 | 2.06 | 16 | ||||||||||||||
| R6 | 18.13 | 0.41 | 3.28 | 3.69 | (0.39) | (0.60) | (0.99) | 20.83 | 20.91 | 29,284 | 0.66 | 0.66 | 2.10 | 16 | ||||||||||||||
| Y | 18.13 | 0.45 | 3.23 | 3.68 | (0.38) | (0.60) | (0.98) | 20.83 | 20.88 | 141,479 | 0.67 | 0.67 | 2.35 | 16 | ||||||||||||||
| F (5) | 19.22 | 0.24 | 1.37 | 1.61 | (0.29) | — | (0.29) | 20.54 | 8.45 (6) | 674,626 | 0.66 (7) | 0.66 (7) | 1.84 (7) | 16 | ||||||||||||||
| 99 |
| — Selected Per-Share Data(1) — | — Ratios and Supplemental Data — | |||||||||||||||||||||||||||
| Class | Net Asset Value at Beginning of Period | Net Investment Income (Loss) | Net Realized and Unrealized Gain (Loss) on Investments | Total from Investment Operations | Dividends from Net Investment Income | Distributions from Capital Gains | Total Dividends and Distributions | Net Asset Value at End of Period | Total Return(2) | Net Assets at End of Period (000s) | Ratio of Expenses to Average Net Assets Before Adjust- ments(3) | Ratio of Expenses to Average Net Assets After Adjust- ments(3) | Ratio of Net Investment Income (Loss) to Average Net Assets | Portfolio Turnover | ||||||||||||||
| The Hartford Growth Opportunities Fund | ||||||||||||||||||||||||||||
| For the Year Ended October 31, 2021 | ||||||||||||||||||||||||||||
| A | $ 54.65 | $ (0.47) | $ 15.83 | $ 15.36 | $ — | $ (7.91) | $ (7.91) | $ 62.10 | 30.45% | $ 3,650,083 | 1.07% | 1.06% | (0.80)% | 87% | ||||||||||||||
| C | 26.47 | (0.38) | 6.96 | 6.58 | — | (7.91) | (7.91) | 25.14 | 29.47 | 321,097 | 1.83 | 1.83 | (1.57) | 87 | ||||||||||||||
| I | 58.51 | (0.36) | 17.05 | 16.69 | — | (7.91) | (7.91) | 67.29 | 30.75 | 2,124,160 | 0.82 | 0.82 | (0.56) | 87 | ||||||||||||||
| R3 | 54.41 | (0.68) | 15.73 | 15.05 | — | (7.91) | (7.91) | 61.55 | 29.96 | 51,824 | 1.45 | 1.44 | (1.18) | 87 | ||||||||||||||
| R4 | 58.79 | (0.56) | 17.13 | 16.57 | — | (7.91) | (7.91) | 67.45 | 30.36 | 76,404 | 1.14 | 1.14 | (0.88) | 87 | ||||||||||||||
| R5 | 62.69 | (0.39) | 18.36 | 17.97 | — | (7.91) | (7.91) | 72.75 | 30.74 | 25,000 | 0.84 | 0.84 | (0.58) | 87 | ||||||||||||||
| R6 | 64.01 | (0.34) | 18.79 | 18.45 | — | (7.91) | (7.91) | 74.55 | 30.87 | 72,428 | 0.74 | 0.74 | (0.49) | 87 | ||||||||||||||
| Y | 63.96 | (0.40) | 18.76 | 18.36 | — | (7.91) | (7.91) | 74.41 | 30.74 | 565,204 | 0.84 | 0.83 | (0.57) | 87 | ||||||||||||||
| F | 58.77 | (0.31) | 17.14 | 16.83 | — | (7.91) | (7.91) | 67.69 | 30.87 | 1,197,268 | 0.73 | 0.73 | (0.48) | 87 | ||||||||||||||
| For the Year Ended October 31, 2020 | ||||||||||||||||||||||||||||
| A | $ 39.45 | $ (0.30) | $ 18.03 | $ 17.73 | $ — | $ (2.53) | $ (2.53) | $ 54.65 | 47.69% | $ 2,939,376 | 1.10% | 1.09% | (0.66)% | 118% | ||||||||||||||
| C | 20.50 | (0.31) | 8.81 | 8.50 | — | (2.53) | (2.53) | 26.47 | 46.64 | 322,226 | 1.85 | 1.85 | (1.41) | 118 | ||||||||||||||
| I | 41.95 | (0.19) | 19.28 | 19.09 | — | (2.53) | (2.53) | 58.51 | 48.12 | 1,722,100 | 0.83 | 0.83 | (0.39) | 118 | ||||||||||||||
| R3 | 39.41 | (0.44) | 17.97 | 17.53 | — | (2.53) | (2.53) | 54.41 | 47.21 | 47,880 | 1.44 | 1.43 | (0.99) | 118 | ||||||||||||||
| R4 | 42.26 | (0.33) | 19.39 | 19.06 | — | (2.53) | (2.53) | 58.79 | 47.67 | 70,918 | 1.13 | 1.13 | (0.69) | 118 | ||||||||||||||
| R5 | 44.78 | (0.20) | 20.64 | 20.44 | — | (2.53) | (2.53) | 62.69 | 48.09 | 23,170 | 0.85 | 0.85 | (0.40) | 118 | ||||||||||||||
| R6 | 45.63 | (0.17) | 21.08 | 20.91 | — | (2.53) | (2.53) | 64.01 | 48.23 | 40,559 | 0.74 | 0.74 | (0.31) | 118 | ||||||||||||||
| Y | 45.62 | (0.20) | 21.07 | 20.87 | — | (2.53) | (2.53) | 63.96 | 48.15 | 433,672 | 0.83 | 0.78 | (0.38) | 118 | ||||||||||||||
| F | 42.09 | (0.15) | 19.36 | 19.21 | — | (2.53) | (2.53) | 58.77 | 48.25 | 795,206 | 0.74 | 0.74 | (0.31) | 118 | ||||||||||||||
| For the Year Ended October 31, 2019 | ||||||||||||||||||||||||||||
| A | $ 45.89 | $ (0.25) | $ 4.35 | $ 4.10 | $ — | $ (10.54) | $ (10.54) | $ 39.45 | 13.64% | $ 2,089,246 | 1.12% | 1.11% | (0.64)% | 66% | ||||||||||||||
| C | 29.36 | (0.29) | 1.97 | 1.68 | — | (10.54) | (10.54) | 20.50 | 12.79 | 281,545 | 1.86 | 1.86 | (1.39) | 66 | ||||||||||||||
| I | 47.99 | (0.16) | 4.66 | 4.50 | — | (10.54) | (10.54) | 41.95 | 13.94 | 1,500,756 | 0.85 | 0.85 | (0.38) | 66 | ||||||||||||||
| R3 | 45.98 | (0.39) | 4.36 | 3.97 | — | (10.54) | (10.54) | 39.41 | 13.25 | 44,757 | 1.47 | 1.46 | (1.00) | 66 | ||||||||||||||
| R4 | 48.38 | (0.29) | 4.71 | 4.42 | — | (10.54) | (10.54) | 42.26 | 13.57 | 67,104 | 1.15 | 1.15 | (0.69) | 66 | ||||||||||||||
| R5 | 50.48 | (0.17) | 5.01 | 4.84 | — | (10.54) | (10.54) | 44.78 | 13.92 | 25,396 | 0.85 | 0.85 | (0.39) | 66 | ||||||||||||||
| R6 | 51.18 | (0.13) | 5.12 | 4.99 | — | (10.54) | (10.54) | 45.63 | 14.03 | 22,765 | 0.75 | 0.75 | (0.29) | 66 | ||||||||||||||
| Y | 51.18 | (0.15) | 5.13 | 4.98 | — | (10.54) | (10.54) | 45.62 | 14.00 | 164,390 | 0.83 | 0.79 | (0.33) | 66 | ||||||||||||||
| F | 48.07 | (0.12) | 4.68 | 4.56 | — | (10.54) | (10.54) | 42.09 | 14.07 | 526,379 | 0.74 | 0.74 | (0.28) | 66 | ||||||||||||||
| For the Year Ended October 31, 2018 | ||||||||||||||||||||||||||||
| A | $ 46.20 | $ (0.29) | $ 3.86 | $ 3.57 | $ — | $ (3.88) | $ (3.88) | $ 45.89 | 8.31% | $ 2,013,200 | 1.11% | 1.11% | (0.61)% | 122% | ||||||||||||||
| C | 31.15 | (0.41) | 2.50 | 2.09 | — | (3.88) | (3.88) | 29.36 | 7.49 | 321,653 | 1.85 | 1.85 | (1.35) | 122 | ||||||||||||||
| I | 48.01 | (0.17) | 4.03 | 3.86 | — | (3.88) | (3.88) | 47.99 | 8.62 | 1,674,141 | 0.84 | 0.84 | (0.34) | 122 | ||||||||||||||
| R3 | 46.43 | (0.45) | 3.88 | 3.43 | — | (3.88) | (3.88) | 45.98 | 7.94 | 47,707 | 1.46 | 1.45 | (0.95) | 122 | ||||||||||||||
| R4 | 48.52 | (0.32) | 4.06 | 3.74 | — | (3.88) | (3.88) | 48.38 | 8.28 | 79,229 | 1.15 | 1.15 | (0.65) | 122 | ||||||||||||||
| R5 | 50.31 | (0.18) | 4.23 | 4.05 | — | (3.88) | (3.88) | 50.48 | 8.60 | 19,708 | 0.86 | 0.86 | (0.35) | 122 | ||||||||||||||
| R6 | 50.91 | (0.14) | 4.29 | 4.15 | — | (3.88) | (3.88) | 51.18 | 8.71 | 12,061 | 0.75 | 0.75 | (0.26) | 122 | ||||||||||||||
| Y | 50.92 | (0.15) | 4.29 | 4.14 | — | (3.88) | (3.88) | 51.18 | 8.68 | 127,721 | 0.78 | 0.78 | (0.28) | 122 | ||||||||||||||
| F | 48.05 | (0.12) | 4.02 | 3.90 | — | (3.88) | (3.88) | 48.07 | 8.71 | 401,565 | 0.75 | 0.75 | (0.25) | 122 | ||||||||||||||
| 100 |
| — Selected Per-Share Data(1) — | — Ratios and Supplemental Data — | |||||||||||||||||||||||||||
| Class | Net Asset Value at Beginning of Period | Net Investment Income (Loss) | Net Realized and Unrealized Gain (Loss) on Investments | Total from Investment Operations | Dividends from Net Investment Income | Distributions from Capital Gains | Total Dividends and Distributions | Net Asset Value at End of Period | Total Return(2) | Net Assets at End of Period (000s) | Ratio of Expenses to Average Net Assets Before Adjust- ments(3) | Ratio of Expenses to Average Net Assets After Adjust- ments(3) | Ratio of Net Investment Income (Loss) to Average Net Assets | Portfolio Turnover | ||||||||||||||
| The Hartford Growth Opportunities Fund – (continued) | ||||||||||||||||||||||||||||
| For the Year Ended October 31, 2017 | ||||||||||||||||||||||||||||
| A | $ 37.66 | $ (0.23) | $ 10.17 | $ 9.94 | $ — | $ (1.40) | $ (1.40) | $ 46.20 | 27.40% | $ 1,914,743 | 1.11% | 1.10% | (0.57)% | 119% | ||||||||||||||
| C | 26.03 | (0.36) | 6.88 | 6.52 | — | (1.40) | (1.40) | 31.15 | 26.46 | 412,184 | 1.86 | 1.86 | (1.32) | 119 | ||||||||||||||
| I | 39.00 | (0.15) | 10.56 | 10.41 | — | (1.40) | (1.40) | 48.01 | 27.67 | 1,546,058 | 0.89 | 0.89 | (0.35) | 119 | ||||||||||||||
| R3 | 37.96 | (0.37) | 10.24 | 9.87 | — | (1.40) | (1.40) | 46.43 | 26.95 | 48,315 | 1.46 | 1.45 | (0.92) | 119 | ||||||||||||||
| R4 | 39.50 | (0.26) | 10.68 | 10.42 | — | (1.40) | (1.40) | 48.52 | 27.33 | 81,413 | 1.15 | 1.15 | (0.62) | 119 | ||||||||||||||
| R5 | 40.78 | (0.14) | 11.07 | 10.93 | — | (1.40) | (1.40) | 50.31 | 27.74 | 16,530 | 0.86 | 0.85 | (0.32) | 119 | ||||||||||||||
| R6 | 41.21 | (0.12) | 11.22 | 11.10 | — | (1.40) | (1.40) | 50.91 | 27.86 | 4,554 | 0.76 | 0.75 | (0.26) | 119 | ||||||||||||||
| Y | 41.23 | (0.09) | 11.18 | 11.09 | — | (1.40) | (1.40) | 50.92 | 27.83 | 104,645 | 0.77 | 0.77 | (0.22) | 119 | ||||||||||||||
| F (5) | 40.07 | (0.10) | 8.08 | 7.98 | — | — | — | 48.05 | 19.92 (6) | 617,087 | 0.75 (7) | 0.75 (7) | (0.34) (7) | 119 | ||||||||||||||
| The Hartford Healthcare Fund | ||||||||||||||||||||||||||||
| For the Year Ended October 31, 2021 | ||||||||||||||||||||||||||||
| A | $ 40.91 | $ (0.15) | $ 8.98 | $ 8.83 | $ — | $ (5.17) | $ (5.17) | $ 44.57 | 22.88% | $ 883,719 | 1.25% | 1.24% | (0.36)% | 51% | ||||||||||||||
| C | 31.63 | (0.36) | 6.82 | 6.46 | — | (5.17) | (5.17) | 32.92 | 21.98 | 134,574 | 2.01 | 2.01 | (1.12) | 51 | ||||||||||||||
| I | 43.53 | (0.04) | 9.61 | 9.57 | — | (5.17) | (5.17) | 47.93 | 23.23 | 463,673 | 0.98 | 0.98 | (0.10) | 51 | ||||||||||||||
| R3 | 41.90 | (0.31) | 9.21 | 8.90 | — | (5.17) | (5.17) | 45.63 | 22.46 | 32,550 | 1.59 | 1.59 | (0.70) | 51 | ||||||||||||||
| R4 | 44.63 | (0.19) | 9.85 | 9.66 | — | (5.17) | (5.17) | 49.12 | 22.83 | 25,818 | 1.29 | 1.29 | (0.40) | 51 | ||||||||||||||
| R5 | 47.24 | (0.06) | 10.48 | 10.42 | — | (5.17) | (5.17) | 52.49 | 23.21 | 12,933 | 1.00 | 1.00 | (0.11) | 51 | ||||||||||||||
| R6 | 47.99 | — (8) | 10.65 | 10.65 | — | (5.17) | (5.17) | 53.47 | 23.33 | 6,091 | 0.89 | 0.89 | — (9) | 51 | ||||||||||||||
| Y | 47.95 | (0.05) | 10.65 | 10.60 | — | (5.17) | (5.17) | 53.38 | 23.24 | 122,793 | 0.99 | 0.98 | (0.09) | 51 | ||||||||||||||
| F | 43.70 | — (8) | 9.65 | 9.65 | — | (5.17) | (5.17) | 48.18 | 23.34 | 46,477 | 0.89 | 0.89 | — (9) | 51 | ||||||||||||||
| For the Year Ended October 31, 2020 | ||||||||||||||||||||||||||||
| A | $ 35.63 | $ (0.13) | $ 7.77 | $ 7.64 | $ — | $ (2.36) | $ (2.36) | $ 40.91 | 22.17% | $ 746,242 | 1.28% | 1.28% | (0.33)% | 49% | ||||||||||||||
| C | 28.24 | (0.33) | 6.08 | 5.75 | — | (2.36) | (2.36) | 31.63 | 21.21 | 139,847 | 2.04 | 2.04 | (1.09) | 49 | ||||||||||||||
| I | 37.68 | (0.02) | 8.23 | 8.21 | — | (2.36) | (2.36) | 43.53 | 22.49 | 376,518 | 0.99 | 0.99 | (0.05) | 49 | ||||||||||||||
| R3 | 36.56 | (0.26) | 7.96 | 7.70 | — | (2.36) | (2.36) | 41.90 | 21.74 | 31,090 | 1.61 | 1.61 | (0.65) | 49 | ||||||||||||||
| R4 | 38.69 | (0.15) | 8.45 | 8.30 | — | (2.36) | (2.36) | 44.63 | 22.12 | 25,078 | 1.30 | 1.30 | (0.35) | 49 | ||||||||||||||
| R5 | 40.71 | (0.03) | 8.92 | 8.89 | — | (2.36) | (2.36) | 47.24 | 22.48 | 10,937 | 1.01 | 1.01 | (0.07) | 49 | ||||||||||||||
| R6 | 41.28 | 0.02 | 9.05 | 9.07 | — | (2.36) | (2.36) | 47.99 | 22.61 | 3,885 | 0.90 | 0.90 | 0.04 | 49 | ||||||||||||||
| Y | 41.27 | (0.01) | 9.05 | 9.04 | — | (2.36) | (2.36) | 47.95 | 22.55 | 97,263 | 1.00 | 0.95 | (0.01) | 49 | ||||||||||||||
| F | 37.79 | 0.02 | 8.25 | 8.27 | — | (2.36) | (2.36) | 43.70 | 22.59 | 34,808 | 0.90 | 0.90 | 0.04 | 49 | ||||||||||||||
| For the Year Ended October 31, 2019 | ||||||||||||||||||||||||||||
| A | $ 34.38 | $ (0.10) | $ 3.83 | $ 3.73 | $ — | $ (2.48) | $ (2.48) | $ 35.63 | 12.02% | $ 666,181 | 1.30% | 1.30% | (0.30)% | 35% | ||||||||||||||
| C | 27.98 | (0.28) | 3.02 | 2.74 | — | (2.48) | (2.48) | 28.24 | 11.17 | 138,539 | 2.05 | 2.05 | (1.06) | 35 | ||||||||||||||
| I | 36.11 | — (8) | 4.05 | 4.05 | — | (2.48) | (2.48) | 37.68 | 12.36 | 297,000 | 1.01 | 1.01 | (0.01) | 35 | ||||||||||||||
| R3 | 35.32 | (0.21) | 3.93 | 3.72 | — | (2.48) | (2.48) | 36.56 | 11.66 | 33,948 | 1.62 | 1.62 | (0.62) | 35 | ||||||||||||||
| R4 | 37.12 | (0.12) | 4.17 | 4.05 | — | (2.48) | (2.48) | 38.69 | 12.00 | 26,699 | 1.32 | 1.32 | (0.32) | 35 | ||||||||||||||
| R5 | 38.82 | (0.01) | 4.38 | 4.37 | — | (2.48) | (2.48) | 40.71 | 12.32 | 6,170 | 1.02 | 1.02 | (0.04) | 35 | ||||||||||||||
| R6 (10) | 39.22 | 0.02 | 2.04 | 2.06 | — | — | — | 41.28 | 5.25 (6) | 1,341 | 0.91 (7) | 0.91 (7) | 0.06 (7) | 35 | ||||||||||||||
| Y | 39.29 | 0.01 | 4.45 | 4.46 | — | (2.48) | (2.48) | 41.27 | 12.40 | 72,515 | 0.97 | 0.96 | 0.03 | 35 | ||||||||||||||
| F | 36.17 | 0.02 | 4.08 | 4.10 | — | (2.48) | (2.48) | 37.79 | 12.48 | 29,108 | 0.91 | 0.91 | 0.06 | 35 | ||||||||||||||
| 101 |
| — Selected Per-Share Data(1) — | — Ratios and Supplemental Data — | |||||||||||||||||||||||||||
| Class | Net Asset Value at Beginning of Period | Net Investment Income (Loss) | Net Realized and Unrealized Gain (Loss) on Investments | Total from Investment Operations | Dividends from Net Investment Income | Distributions from Capital Gains | Total Dividends and Distributions | Net Asset Value at End of Period | Total Return(2) | Net Assets at End of Period (000s) | Ratio of Expenses to Average Net Assets Before Adjust- ments(3) | Ratio of Expenses to Average Net Assets After Adjust- ments(3) | Ratio of Net Investment Income (Loss) to Average Net Assets | Portfolio Turnover | ||||||||||||||
| The Hartford Healthcare Fund – (continued) | ||||||||||||||||||||||||||||
| For the Year Ended October 31, 2018 | ||||||||||||||||||||||||||||
| A | $ 34.86 | $ (0.14) | $ 1.45 | $ 1.31 | $ — | $ (1.79) | $ (1.79) | $ 34.38 | 3.86% | $ 682,175 | 1.28% | 1.28% | (0.40)% | 27% | ||||||||||||||
| C | 28.90 | (0.33) | 1.20 | 0.87 | — | (1.79) | (1.79) | 27.98 | 3.10 | 160,084 | 2.03 | 2.02 | (1.13) | 27 | ||||||||||||||
| I | 36.43 | (0.04) | 1.51 | 1.47 | — | (1.79) | (1.79) | 36.11 | 4.15 | 379,392 | 1.00 | 1.00 | (0.11) | 27 | ||||||||||||||
| R3 | 35.87 | (0.26) | 1.50 | 1.24 | — | (1.79) | (1.79) | 35.32 | 3.55 | 38,412 | 1.61 | 1.61 | (0.72) | 27 | ||||||||||||||
| R4 | 37.50 | (0.16) | 1.57 | 1.41 | — | (1.79) | (1.79) | 37.12 | 3.86 | 32,373 | 1.30 | 1.30 | (0.42) | 27 | ||||||||||||||
| R5 | 39.03 | (0.05) | 1.63 | 1.58 | — | (1.79) | (1.79) | 38.82 | 4.15 | 7,757 | 1.02 | 1.02 | (0.13) | 27 | ||||||||||||||
| Y | 39.45 | (0.01) | 1.64 | 1.63 | — | (1.79) | (1.79) | 39.29 | 4.24 | 52,896 | 0.92 | 0.92 | (0.03) | 27 | ||||||||||||||
| F | 36.45 | — | 1.51 | 1.51 | — | (1.79) | (1.79) | 36.17 | 4.26 | 76,003 | 0.90 | 0.90 | (0.01) | 27 | ||||||||||||||
| For the Year Ended October 31, 2017 | ||||||||||||||||||||||||||||
| A | $ 30.96 | $ (0.12) | $ 7.04 | $ 6.92 | $ — | $ (3.02) | $ (3.02) | $ 34.86 | 24.28% | $ 714,694 | 1.29% | 1.29% | (0.36)% | 23% | ||||||||||||||
| C | 26.34 | (0.30) | 5.88 | 5.58 | — | (3.02) | (3.02) | 28.90 | 23.37 | 242,421 | 2.04 | 2.03 | (1.10) | 23 | ||||||||||||||
| I | 32.15 | (0.04) | 7.34 | 7.30 | — | (3.02) | (3.02) | 36.43 | 24.59 | 351,686 | 1.03 | 1.03 | (0.11) | 23 | ||||||||||||||
| R3 | 31.87 | (0.23) | 7.25 | 7.02 | — | (3.02) | (3.02) | 35.87 | 23.87 | 45,673 | 1.61 | 1.61 | (0.68) | 23 | ||||||||||||||
| R4 | 33.10 | (0.13) | 7.55 | 7.42 | — | (3.02) | (3.02) | 37.50 | 24.22 | 35,927 | 1.31 | 1.31 | (0.38) | 23 | ||||||||||||||
| R5 | 34.23 | (0.03) | 7.85 | 7.82 | — | (3.02) | (3.02) | 39.03 | 24.62 | 6,888 | 1.01 | 1.01 | (0.08) | 23 | ||||||||||||||
| Y | 34.54 | (0.01) | 7.94 | 7.93 | — | (3.02) | (3.02) | 39.45 | 24.72 | 45,193 | 0.93 | 0.93 | (0.02) | 23 | ||||||||||||||
| F (5) | 33.96 | 0.01 | 2.48 | 2.49 | — | — | — | 36.45 | 7.33 (6) | 61,710 | 0.90 (7) | 0.90 (7) | 0.04 (7) | 23 | ||||||||||||||
| The Hartford MidCap Fund | ||||||||||||||||||||||||||||
| For the Year Ended October 31, 2021 | ||||||||||||||||||||||||||||
| A | $ 30.63 | $ 0.10 | $ 10.24 | $ 10.34 | $ — | $ (3.96) | $ (3.96) | $ 37.01 | 35.51% | $ 3,446,674 | 1.08% | 1.08% | 0.28% | 28% | ||||||||||||||
| C | 20.34 | (0.12) | 6.63 | 6.51 | — | (3.96) | (3.96) | 22.89 | 34.49 | 381,566 | 1.84 | 1.84 | (0.52) | 28 | ||||||||||||||
| I | 31.87 | 0.20 | 10.66 | 10.86 | — | (3.96) | (3.96) | 38.77 | 35.79 | 3,960,713 | 0.86 | 0.85 | 0.53 | 28 | ||||||||||||||
| R3 | 34.38 | (0.05) | 11.57 | 11.52 | — | (3.96) | (3.96) | 41.94 | 35.03 | 100,113 | 1.45 | 1.45 | (0.12) | 28 | ||||||||||||||
| R4 | 36.18 | 0.08 | 12.21 | 12.29 | — | (3.96) | (3.96) | 44.51 | 35.45 | 189,348 | 1.15 | 1.13 | 0.18 | 28 | ||||||||||||||
| R5 | 37.58 | 0.23 | 12.69 | 12.92 | — | (3.96) | (3.96) | 46.54 | 35.84 | 319,470 | 0.83 | 0.83 | 0.52 | 28 | ||||||||||||||
| R6 | 38.09 | 0.26 | 12.90 | 13.16 | — | (3.96) | (3.96) | 47.29 | 36.00 | 1,659,582 | 0.74 | 0.74 | 0.57 | 28 | ||||||||||||||
| Y | 38.02 | 0.24 | 12.88 | 13.12 | — | (3.96) | (3.96) | 47.18 | 35.96 | 970,296 | 0.84 | 0.77 | 0.52 | 28 | ||||||||||||||
| F | 32.00 | 0.23 | 10.74 | 10.97 | — | (3.96) | (3.96) | 39.01 | 36.01 | 2,898,529 | 0.74 | 0.74 | 0.61 | 28 | ||||||||||||||
| For the Year Ended October 31, 2020 | ||||||||||||||||||||||||||||
| A | $ 30.34 | $ (0.08) | $ 2.00 | $ 1.92 | $ — | $ (1.63) | $ (1.63) | $ 30.63 | 6.48% | $ 2,724,316 | 1.11% | 1.11% | (0.27)% | 45% | ||||||||||||||
| C | 20.83 | (0.20) | 1.34 | 1.14 | — | (1.63) | (1.63) | 20.34 | 5.63 | 380,033 | 1.87 | 1.87 | (1.02) | 45 | ||||||||||||||
| I | 31.43 | (0.01) | 2.08 | 2.07 | — | (1.63) | (1.63) | 31.87 | 6.74 | 3,867,925 | 0.88 | 0.87 | (0.04) | 45 | ||||||||||||||
| R3 | 33.98 | (0.21) | 2.24 | 2.03 | — | (1.63) | (1.63) | 34.38 | 6.09 | 92,023 | 1.47 | 1.47 | (0.63) | 45 | ||||||||||||||
| R4 | 35.57 | (0.10) | 2.34 | 2.24 | — | (1.63) | (1.63) | 36.18 | 6.42 | 205,114 | 1.16 | 1.14 | (0.30) | 45 | ||||||||||||||
| R5 | 36.77 | 0.00 (8) | 2.44 | 2.44 | — | (1.63) | (1.63) | 37.58 | 6.77 | 371,791 | 0.85 | 0.85 | 0.00 (9) | 45 | ||||||||||||||
| R6 | 37.22 | 0.03 | 2.47 | 2.50 | — | (1.63) | (1.63) | 38.09 | 6.85 | 1,759,581 | 0.75 | 0.75 | 0.08 | 45 | ||||||||||||||
| Y | 37.17 | 0.02 | 2.46 | 2.48 | — | (1.63) | (1.63) | 38.02 | 6.81 | 1,144,624 | 0.85 | 0.79 | 0.06 | 45 | ||||||||||||||
| F | 31.52 | 0.03 | 2.08 | 2.11 | — | (1.63) | (1.63) | 32.00 | 6.85 | 2,422,752 | 0.75 | 0.75 | 0.09 | 45 | ||||||||||||||
| For the Year Ended October 31, 2019 | ||||||||||||||||||||||||||||
| A | $ 30.03 | $ (0.09) | $ 3.80 | $ 3.71 | $ — | $ (3.40) | $ (3.40) | $ 30.34 | 14.93% | $ 2,820,971 | 1.11% | 1.10% | (0.32)% | 31% | ||||||||||||||
| C | 21.90 | (0.22) | 2.55 | 2.33 | — | (3.40) | (3.40) | 20.83 | 14.10 | 498,057 | 1.86 | 1.86 | (1.08) | 31 | ||||||||||||||
| I | 30.91 | (0.02) | 3.94 | 3.92 | — | (3.40) | (3.40) | 31.43 | 15.25 | 4,168,592 | 0.85 | 0.85 | (0.06) | 31 | ||||||||||||||
| R3 | 33.31 | (0.22) | 4.29 | 4.07 | — | (3.40) | (3.40) | 33.98 | 14.54 | 96,409 | 1.45 | 1.45 | (0.67) | 31 | ||||||||||||||
| R4 | 34.59 | (0.12) | 4.50 | 4.38 | — | (3.40) | (3.40) | 35.57 | 14.89 | 266,390 | 1.16 | 1.14 | (0.36) | 31 | ||||||||||||||
| R5 | 35.55 | (0.02) | 4.64 | 4.62 | — | (3.40) | (3.40) | 36.77 | 15.23 | 497,712 | 0.84 | 0.84 | (0.07) | 31 | ||||||||||||||
| R6 | 35.90 | 0.02 | 4.70 | 4.72 | — | (3.40) | (3.40) | 37.22 | 15.37 | 1,731,890 | 0.74 | 0.74 | 0.04 | 31 | ||||||||||||||
| Y | 35.87 | 0.00 (8) | 4.70 | 4.70 | — | (3.40) | (3.40) | 37.17 | 15.32 | 1,571,851 | 0.82 | 0.78 | 0.01 | 31 | ||||||||||||||
| F | 30.96 | 0.01 | 3.95 | 3.96 | — | (3.40) | (3.40) | 31.52 | 15.36 | 2,259,594 | 0.74 | 0.74 | 0.04 | 31 | ||||||||||||||
| 102 |
| — Selected Per-Share Data(1) — | — Ratios and Supplemental Data — | |||||||||||||||||||||||||||
| Class | Net Asset Value at Beginning of Period | Net Investment Income (Loss) | Net Realized and Unrealized Gain (Loss) on Investments | Total from Investment Operations | Dividends from Net Investment Income | Distributions from Capital Gains | Total Dividends and Distributions | Net Asset Value at End of Period | Total Return(2) | Net Assets at End of Period (000s) | Ratio of Expenses to Average Net Assets Before Adjust- ments(3) | Ratio of Expenses to Average Net Assets After Adjust- ments(3) | Ratio of Net Investment Income (Loss) to Average Net Assets | Portfolio Turnover | ||||||||||||||
| The Hartford MidCap Fund – (continued) | ||||||||||||||||||||||||||||
| For the Year Ended October 31, 2018 | ||||||||||||||||||||||||||||
| A | $ 30.36 | $ (0.12) | $ 1.20 | $ 1.08 | $ — | $ (1.41) | $ (1.41) | $ 30.03 | 3.63% | $ 2,592,610 | 1.11% | 1.10% | (0.39)% | 37% | ||||||||||||||
| C | 22.67 | (0.27) | 0.91 | 0.64 | — | (1.41) | (1.41) | 21.90 | 2.84 | 580,708 | 1.85 | 1.85 | (1.14) | 37 | ||||||||||||||
| I | 31.12 | (0.03) | 1.23 | 1.20 | — | (1.41) | (1.41) | 30.91 | 3.91 | 3,666,464 | 0.82 | 0.82 | (0.11) | 37 | ||||||||||||||
| R3 | 33.64 | (0.26) | 1.34 | 1.08 | — | (1.41) | (1.41) | 33.31 | 3.23 | 102,632 | 1.46 | 1.46 | (0.75) | 37 | ||||||||||||||
| R4 | 34.78 | (0.16) | 1.38 | 1.22 | — | (1.41) | (1.41) | 34.59 | 3.57 | 289,049 | 1.16 | 1.15 | (0.43) | 37 | ||||||||||||||
| R5 | 35.59 | (0.05) | 1.42 | 1.37 | — | (1.41) | (1.41) | 35.55 | 3.89 | 468,146 | 0.85 | 0.85 | (0.13) | 37 | ||||||||||||||
| R6 | 35.90 | (0.01) | 1.42 | 1.41 | — | (1.41) | (1.41) | 35.90 | 3.97 | 1,014,518 | 0.75 | 0.75 | (0.04) | 37 | ||||||||||||||
| Y | 35.88 | (0.02) | 1.42 | 1.40 | — | (1.41) | (1.41) | 35.87 | 3.95 | 1,934,520 | 0.78 | 0.78 | (0.06) | 37 | ||||||||||||||
| F | 31.15 | (0.01) | 1.23 | 1.22 | — | (1.41) | (1.41) | 30.96 | 3.97 | 1,648,425 | 0.75 | 0.75 | (0.03) | 37 | ||||||||||||||
| For the Year Ended October 31, 2017 | ||||||||||||||||||||||||||||
| A | $ 24.25 | $ (0.11) | $ 7.00 | $ 6.89 | $ — | $ (0.78) | $ (0.78) | $ 30.36 | 29.02% | $ 2,482,275 | 1.13% | 1.12% | (0.38)% | 30% | ||||||||||||||
| C | 18.42 | (0.23) | 5.26 | 5.03 | — | (0.78) | (0.78) | 22.67 | 28.07 | 717,521 | 1.87 | 1.87 | (1.12) | 30 | ||||||||||||||
| I | 24.79 | (0.05) | 7.16 | 7.11 | — | (0.78) | (0.78) | 31.12 | 29.28 | 2,996,705 | 1.02 | 0.89 | (0.17) | 30 | ||||||||||||||
| R3 | 26.88 | (0.22) | 7.76 | 7.54 | — | (0.78) | (0.78) | 33.64 | 28.59 | 90,582 | 1.47 | 1.47 | (0.73) | 30 | ||||||||||||||
| R4 | 27.69 | (0.14) | 8.01 | 7.87 | — | (0.78) | (0.78) | 34.78 | 28.95 | 263,236 | 1.16 | 1.16 | (0.43) | 30 | ||||||||||||||
| R5 | 28.24 | (0.04) | 8.17 | 8.13 | — | (0.78) | (0.78) | 35.59 | 29.32 | 356,166 | 0.86 | 0.86 | (0.14) | 30 | ||||||||||||||
| R6 | 28.45 | (0.05) | 8.28 | 8.23 | — | (0.78) | (0.78) | 35.90 | 29.45 | 431,183 | 0.76 | 0.76 | (0.14) | 30 | ||||||||||||||
| Y | 28.44 | (0.01) | 8.23 | 8.22 | — | (0.78) | (0.78) | 35.88 | 29.43 | 1,847,676 | 0.78 | 0.78 | (0.04) | 30 | ||||||||||||||
| F (5) | 27.52 | (0.03) | 3.66 | 3.63 | — | — | — | 31.15 | 13.19 (6) | 1,244,732 | 0.76 (7) | 0.76 (7) | (0.15) (7) | 30 | ||||||||||||||
| The Hartford MidCap Value Fund | ||||||||||||||||||||||||||||
| For the Year Ended October 31, 2021 | ||||||||||||||||||||||||||||
| A | $ 12.21 | $ —(8) | $ 5.97 | $ 5.97 | $ (0.04) | $ — | $ (0.04) | $ 18.14 | 48.99% | $ 363,955 | 1.18% | 1.18% | 0.03% | 57% | ||||||||||||||
| C | 9.66 | (0.09) | 4.71 | 4.62 | — | — | — | 14.28 | 47.83 | 8,931 | 1.96 | 1.96 | (0.73) | 57 | ||||||||||||||
| I | 12.36 | 0.06 | 6.02 | 6.08 | (0.08) | — | (0.08) | 18.36 | 49.39 | 25,307 | 0.85 | 0.85 | 0.36 | 57 | ||||||||||||||
| R3 | 12.91 | (0.05) | 6.32 | 6.27 | — | — | — | 19.18 | 48.57 | 6,973 | 1.49 | 1.49 | (0.28) | 57 | ||||||||||||||
| R4 | 13.21 | — (8) | 6.46 | 6.46 | (0.03) | — | (0.03) | 19.64 | 48.99 | 10,502 | 1.19 | 1.19 | 0.02 | 57 | ||||||||||||||
| R5 | 13.44 | 0.06 | 6.56 | 6.62 | (0.09) | — | (0.09) | 19.97 | 49.39 | 2,142 | 0.89 | 0.89 | 0.31 | 57 | ||||||||||||||
| Y | 13.47 | 0.06 | 6.58 | 6.64 | (0.09) | — | (0.09) | 20.02 | 49.49 | 15,307 | 0.88 | 0.88 | 0.32 | 57 | ||||||||||||||
| F | 12.36 | 0.07 | 6.04 | 6.11 | (0.10) | — | (0.10) | 18.37 | 49.64 | 442,227 | 0.77 | 0.77 | 0.43 | 57 | ||||||||||||||
| For the Year Ended October 31, 2020 | ||||||||||||||||||||||||||||
| A | $ 14.43 | $ 0.07 | $ (1.86) | $ (1.79) | $ (0.09) | $ (0.34) | $ (0.43) | $ 12.21 | (12.86)% | $ 245,112 | 1.25% | 1.25% | 0.56% | 61% | ||||||||||||||
| C | 11.51 | (0.02) | (1.49) | (1.51) | (0.00) (8) | (0.34) | (0.34) | 9.66 | (13.55) | 9,533 | 2.03 | 2.03 | (0.20) | 61 | ||||||||||||||
| I | 14.60 | 0.12 | (1.88) | (1.76) | (0.14) | (0.34) | (0.48) | 12.36 | (12.58) | 19,722 | 0.91 | 0.91 | 0.91 | 61 | ||||||||||||||
| R3 | 15.22 | 0.04 | (1.98) | (1.94) | (0.03) | (0.34) | (0.37) | 12.91 | (13.12) | 5,317 | 1.53 | 1.53 | 0.30 | 61 | ||||||||||||||
| R4 | 15.58 | 0.08 | (2.02) | (1.94) | (0.09) | (0.34) | (0.43) | 13.21 | (12.88) | 8,857 | 1.23 | 1.23 | 0.58 | 61 | ||||||||||||||
| R5 | 15.82 | 0.12 | (2.04) | (1.92) | (0.12) | (0.34) | (0.46) | 13.44 | (12.60) | 1,423 | 0.92 | 0.92 | 0.88 | 61 | ||||||||||||||
| Y | 15.87 | 0.13 | (2.05) | (1.92) | (0.14) | (0.34) | (0.48) | 13.47 | (12.55) | 10,009 | 0.92 | 0.88 | 0.93 | 61 | ||||||||||||||
| F | 14.60 | 0.13 | (1.88) | (1.75) | (0.15) | (0.34) | (0.49) | 12.36 | (12.51) | 299,805 | 0.82 | 0.82 | 0.98 | 61 | ||||||||||||||
| For the Year Ended October 31, 2019 | ||||||||||||||||||||||||||||
| A | $ 14.54 | $ 0.08 | $ 1.44 | $ 1.52 | $ (0.04) | $ (1.59) | $ (1.63) | $ 14.43 | 12.74% | $ 309,996 | 1.23% | 1.23% | 0.61% | 55% | ||||||||||||||
| C | 11.97 | (0.02) | 1.15 | 1.13 | — | (1.59) | (1.59) | 11.51 | 11.99 | 15,910 | 1.99 | 1.99 | (0.14) | 55 | ||||||||||||||
| I | 14.68 | 0.13 | 1.46 | 1.59 | (0.08) | (1.59) | (1.67) | 14.60 | 13.20 | 31,173 | 0.89 | 0.89 | 0.95 | 55 | ||||||||||||||
| R3 | 15.23 | 0.05 | 1.53 | 1.58 | — | (1.59) | (1.59) | 15.22 | 12.42 | 8,034 | 1.52 | 1.52 | 0.33 | 55 | ||||||||||||||
| R4 | 15.55 | 0.09 | 1.57 | 1.66 | (0.04) | (1.59) | (1.63) | 15.58 | 12.77 | 11,865 | 1.21 | 1.21 | 0.64 | 55 | ||||||||||||||
| R5 | 15.76 | 0.16 | 1.57 | 1.73 | (0.08) | (1.59) | (1.67) | 15.82 | 13.14 | 1,592 | 0.92 | 0.92 | 1.06 | 55 | ||||||||||||||
| Y | 15.80 | 0.15 | 1.60 | 1.75 | (0.09) | (1.59) | (1.68) | 15.87 | 13.23 | 12,624 | 0.89 | 0.85 | 0.98 | 55 | ||||||||||||||
| F | 14.69 | 0.14 | 1.46 | 1.60 | (0.10) | (1.59) | (1.69) | 14.60 | 13.27 | 314,566 | 0.80 | 0.80 | 1.03 | 55 | ||||||||||||||
| 103 |
| — Selected Per-Share Data(1) — | — Ratios and Supplemental Data — | |||||||||||||||||||||||||||
| Class | Net Asset Value at Beginning of Period | Net Investment Income (Loss) | Net Realized and Unrealized Gain (Loss) on Investments | Total from Investment Operations | Dividends from Net Investment Income | Distributions from Capital Gains | Total Dividends and Distributions | Net Asset Value at End of Period | Total Return(2) | Net Assets at End of Period (000s) | Ratio of Expenses to Average Net Assets Before Adjust- ments(3) | Ratio of Expenses to Average Net Assets After Adjust- ments(3) | Ratio of Net Investment Income (Loss) to Average Net Assets | Portfolio Turnover | ||||||||||||||
| The Hartford MidCap Value Fund – (continued) | ||||||||||||||||||||||||||||
| For the Year Ended October 31, 2018 | ||||||||||||||||||||||||||||
| A | $ 15.62 | $ 0.03 | $ (0.72) | $ (0.69) | $ — | $ (0.39) | $ (0.39) | $ 14.54 | (4.56)% | $ 284,646 | 1.22% | 1.22% | 0.18% | 49% | ||||||||||||||
| C | 13.03 | (0.07) | (0.60) | (0.67) | — | (0.39) | (0.39) | 11.97 | (5.26) | 17,909 | 1.98 | 1.97 | (0.57) | 49 | ||||||||||||||
| I | 15.72 | 0.08 | (0.73) | (0.65) | — | (0.39) | (0.39) | 14.68 | (4.27) | 34,656 | 0.90 | 0.90 | 0.50 | 49 | ||||||||||||||
| R3 | 16.39 | (0.02) | (0.75) | (0.77) | — | (0.39) | (0.39) | 15.23 | (4.84) | 9,555 | 1.52 | 1.52 | (0.13) | 49 | ||||||||||||||
| R4 | 16.68 | 0.03 | (0.77) | (0.74) | — | (0.39) | (0.39) | 15.55 | (4.52) | 11,639 | 1.22 | 1.22 | 0.18 | 49 | ||||||||||||||
| R5 | 16.88 | 0.08 | (0.78) | (0.70) | (0.03) | (0.39) | (0.42) | 15.76 | (4.32) | 8,087 | 0.91 | 0.91 | 0.48 | 49 | ||||||||||||||
| Y | 16.93 | 0.09 | (0.79) | (0.70) | (0.04) | (0.39) | (0.43) | 15.80 | (4.23) | 11,371 | 0.86 | 0.86 | 0.52 | 49 | ||||||||||||||
| F | 15.76 | 0.10 | (0.73) | (0.63) | (0.05) | (0.39) | (0.44) | 14.69 | (4.18) | 252,917 | 0.80 | 0.80 | 0.61 | 49 | ||||||||||||||
| For the Year Ended October 31, 2017 | ||||||||||||||||||||||||||||
| A | $ 13.98 | $ 0.01 | $ 2.65 | $ 2.66 | $ — | $ (1.02) | $ (1.02) | $ 15.62 | 19.67% | $ 291,082 | 1.23% | 1.23% | 0.06% | 40% | ||||||||||||||
| C | 11.90 | (0.08) | 2.23 | 2.15 | — | (1.02) | (1.02) | 13.03 | 18.66 | 35,520 | 1.96 | 1.96 | (0.67) | 40 | ||||||||||||||
| I | 14.09 | 0.03 | 2.67 | 2.70 | (0.05) | (1.02) | (1.07) | 15.72 | 19.81 | 43,342 | 1.20 | 1.10 | 0.20 | 40 | ||||||||||||||
| R3 | 14.67 | (0.04) | 2.78 | 2.74 | — | (1.02) | (1.02) | 16.39 | 19.26 | 11,923 | 1.52 | 1.52 | (0.23) | 40 | ||||||||||||||
| R4 | 14.87 | 0.01 | 2.82 | 2.83 | — | (1.02) | (1.02) | 16.68 | 19.58 | 12,637 | 1.21 | 1.21 | 0.08 | 40 | ||||||||||||||
| R5 | 15.03 | 0.06 | 2.86 | 2.92 | (0.05) | (1.02) | (1.07) | 16.88 | 20.06 | 11,445 | 0.91 | 0.91 | 0.38 | 40 | ||||||||||||||
| Y | 15.07 | 0.08 | 2.86 | 2.94 | (0.06) | (1.02) | (1.08) | 16.93 | 20.10 | 28,403 | 0.82 | 0.82 | 0.48 | 40 | ||||||||||||||
| F (5) | 14.97 | 0.05 | 0.74 | 0.79 | — | — | — | 15.76 | 5.28 (6) | 238,682 | 0.81 (7) | 0.81 (7) | 0.46 (7) | 40 | ||||||||||||||
| Hartford Quality Value Fund | ||||||||||||||||||||||||||||
| For the Year Ended October 31, 2021 | ||||||||||||||||||||||||||||
| A | $ 18.61 | $ 0.34 | $ 7.76 | $ 8.10 | $ (0.44) | $ — | $ (0.44) | $ 26.27 | 44.08% | $ 188,344 | 0.97% | 0.94% | 1.44% | 21% | ||||||||||||||
| C | 15.78 | 0.14 | 6.57 | 6.71 | (0.27) | — | (0.27) | 22.22 | 42.97 | 3,397 | 1.80 | 1.71 | 0.71 | 21 | ||||||||||||||
| I | 18.37 | 0.41 | 7.65 | 8.06 | (0.50) | — | (0.50) | 25.93 | 44.56 | 20,153 | 0.65 | 0.63 | 1.73 | 21 | ||||||||||||||
| R3 | 18.92 | 0.29 | 7.89 | 8.18 | (0.39) | — | (0.39) | 26.71 | 43.73 | 1,098 | 1.27 | 1.17 | 1.22 | 21 | ||||||||||||||
| R4 | 19.13 | 0.37 | 7.97 | 8.34 | (0.45) | — | (0.45) | 27.02 | 44.20 | 4,775 | 0.97 | 0.88 | 1.50 | 21 | ||||||||||||||
| R5 | 19.32 | 0.43 | 8.06 | 8.49 | (0.51) | — | (0.51) | 27.30 | 44.59 | 320 | 0.67 | 0.62 | 1.76 | 21 | ||||||||||||||
| R6 | 19.38 | 0.48 | 8.06 | 8.54 | (0.54) | — | (0.54) | 27.38 | 44.79 | 257 | 0.56 | 0.46 | 1.95 | 21 | ||||||||||||||
| Y | 19.35 | 0.44 | 8.07 | 8.51 | (0.52) | — | (0.52) | 27.34 | 44.65 | 1,753 | 0.66 | 0.57 | 1.74 | 21 | ||||||||||||||
| F | 18.31 | 0.45 | 7.62 | 8.07 | (0.54) | — | (0.54) | 25.84 | 44.84 | 12,182 | 0.56 | 0.46 | 1.92 | 21 | ||||||||||||||
| For the Year Ended October 31, 2020 | ||||||||||||||||||||||||||||
| A | $ 21.11 | $ 0.42 | $ (1.85) | $ (1.43) | $ (0.48) | $ (0.59) | $ (1.07) | $ 18.61 | (7.34)% | $ 140,154 | 1.03% | 0.91% | 2.19% | 26% | ||||||||||||||
| C | 18.05 | 0.23 | (1.59) | (1.36) | (0.32) | (0.59) | (0.91) | 15.78 | (8.09) | 3,673 | 1.82 | 1.71 | 1.38 | 26 | ||||||||||||||
| I | 20.85 | 0.48 | (1.82) | (1.34) | (0.55) | (0.59) | (1.14) | 18.37 | (7.02) | 10,927 | 0.67 | 0.56 | 2.53 | 26 | ||||||||||||||
| R3 | 21.45 | 0.38 | (1.89) | (1.51) | (0.43) | (0.59) | (1.02) | 18.92 | (7.56) | 855 | 1.29 | 1.16 | 1.91 | 26 | ||||||||||||||
| R4 | 21.68 | 0.44 | (1.91) | (1.47) | (0.49) | (0.59) | (1.08) | 19.13 | (7.34) | 3,887 | 0.98 | 0.87 | 2.21 | 26 | ||||||||||||||
| R5 | 21.87 | 0.50 | (1.92) | (1.42) | (0.54) | (0.59) | (1.13) | 19.32 | (7.05) | 220 | 0.69 | 0.58 | 2.53 | 26 | ||||||||||||||
| R6 | 21.93 | 0.50 | (1.89) | (1.39) | (0.57) | (0.59) | (1.16) | 19.38 | (6.92) | 485 | 0.58 | 0.46 | 2.53 | 26 | ||||||||||||||
| Y | 21.91 | 0.51 | (1.93) | (1.42) | (0.55) | (0.59) | (1.14) | 19.35 | (7.05) | 382 | 0.68 | 0.57 | 2.53 | 26 | ||||||||||||||
| F | 20.83 | 0.50 | (1.82) | (1.32) | (0.61) | (0.59) | (1.20) | 18.31 | (6.94) | 8,975 | 0.58 | 0.46 | 2.64 | 26 | ||||||||||||||
| For the Year Ended October 31, 2019 | ||||||||||||||||||||||||||||
| A | $ 20.00 | $ 0.38 | $ 1.99 | $ 2.37 | $ (0.28) | $ (0.98) | $ (1.26) | $ 21.11 | 13.10% | $ 169,771 | 1.00% | 0.90% | 1.95% | 23% | ||||||||||||||
| C | 17.12 | 0.20 | 1.71 | 1.91 | — | (0.98) | (0.98) | 18.05 | 12.23 | 6,834 | 1.76 | 1.67 | 1.21 | 23 | ||||||||||||||
| I | 19.78 | 0.45 | 1.94 | 2.39 | (0.34) | (0.98) | (1.32) | 20.85 | 13.49 | 12,796 | 0.65 | 0.56 | 2.30 | 23 | ||||||||||||||
| R3 | 20.29 | 0.34 | 2.01 | 2.35 | (0.21) | (0.98) | (1.19) | 21.45 | 12.78 | 1,240 | 1.27 | 1.16 | 1.69 | 23 | ||||||||||||||
| R4 | 20.49 | 0.40 | 2.04 | 2.44 | (0.27) | (0.98) | (1.25) | 21.68 | 13.17 | 6,014 | 0.95 | 0.86 | 1.99 | 23 | ||||||||||||||
| R5 | 20.67 | 0.47 | 2.04 | 2.51 | (0.33) | (0.98) | (1.31) | 21.87 | 13.46 | 230 | 0.67 | 0.58 | 2.33 | 23 | ||||||||||||||
| R6 | 20.74 | 0.47 | 2.06 | 2.53 | (0.36) | (0.98) | (1.34) | 21.93 | 13.57 | 34 | 0.56 | 0.46 | 2.26 | 23 | ||||||||||||||
| Y | 20.72 | 0.47 | 2.05 | 2.52 | (0.35) | (0.98) | (1.33) | 21.91 | 13.50 | 622 | 0.64 | 0.55 | 2.29 | 23 | ||||||||||||||
| F | 19.77 | 0.48 | 1.92 | 2.40 | (0.36) | (0.98) | (1.34) | 20.83 | 13.58 | 11,040 | 0.55 | 0.46 | 2.52 | 23 | ||||||||||||||
| 104 |
| — Selected Per-Share Data(1) — | — Ratios and Supplemental Data — | |||||||||||||||||||||||||||
| Class | Net Asset Value at Beginning of Period | Net Investment Income (Loss) | Net Realized and Unrealized Gain (Loss) on Investments | Total from Investment Operations | Dividends from Net Investment Income | Distributions from Capital Gains | Total Dividends and Distributions | Net Asset Value at End of Period | Total Return(2) | Net Assets at End of Period (000s) | Ratio of Expenses to Average Net Assets Before Adjust- ments(3) | Ratio of Expenses to Average Net Assets After Adjust- ments(3) | Ratio of Net Investment Income (Loss) to Average Net Assets | Portfolio Turnover | ||||||||||||||
| Hartford Quality Value Fund – (continued) | ||||||||||||||||||||||||||||
| For the Year Ended October 31, 2018 | ||||||||||||||||||||||||||||
| A | $ 20.49 | $ 0.31 | $ 0.16 | $ 0.47 | $ (0.20) | $ (0.76) | $ (0.96) | $ 20.00 | 2.25% | $ 164,325 | 1.06% | 1.04% | 1.52% | 85% | ||||||||||||||
| C | 17.67 | 0.14 | 0.15 | 0.29 | (0.08) | (0.76) | (0.84) | 17.12 | 1.53 | 9,082 | 1.81 | 1.79 | 0.80 | 85 | ||||||||||||||
| I | 20.25 | 0.38 | 0.16 | 0.54 | (0.25) | (0.76) | (1.01) | 19.78 | 2.60 | 12,974 | 0.71 | 0.69 | 1.87 | 85 | ||||||||||||||
| R3 | 20.70 | 0.26 | 0.17 | 0.43 | (0.08) | (0.76) | (0.84) | 20.29 | 2.03 | 1,075 | 1.34 | 1.30 | 1.26 | 85 | ||||||||||||||
| R4 | 20.95 | 0.33 | 0.16 | 0.49 | (0.19) | (0.76) | (0.95) | 20.49 | 2.29 | 6,014 | 1.04 | 1.01 | 1.55 | 85 | ||||||||||||||
| R5 | 21.13 | 0.38 | 0.17 | 0.55 | (0.25) | (0.76) | (1.01) | 20.67 | 2.57 | 504 | 0.74 | 0.72 | 1.76 | 85 | ||||||||||||||
| R6 (11) | 20.99 | 0.28 | (0.53) (12) | (0.25) | — | — | — | 20.74 | (1.19) (6) | 10 | 0.61 (7) | 0.59 (7) | 1.95 (7) | 85 | ||||||||||||||
| Y | 21.19 | 0.40 | 0.17 | 0.57 | (0.28) | (0.76) | (1.04) | 20.72 | 2.65 | 601 | 0.68 | 0.66 | 1.90 | 85 | ||||||||||||||
| F | 20.26 | 0.39 | 0.17 | 0.56 | (0.29) | (0.76) | (1.05) | 19.77 | 2.71 | 88,336 | 0.62 | 0.60 | 1.94 | 85 | ||||||||||||||
| For the Year Ended October 31, 2017 | ||||||||||||||||||||||||||||
| A | $ 17.94 | $ 0.19 | $ 2.64 | $ 2.83 | $ (0.14) | $ (0.14) | $ (0.28) | $ 20.49 | 15.89% | $ 180,059 | 1.20% | 1.20% | 0.95% | 39% | ||||||||||||||
| C | 15.52 | 0.04 | 2.28 | 2.32 | (0.03) | (0.14) | (0.17) | 17.67 | 15.05 | 20,312 | 1.93 | 1.93 | 0.22 | 39 | ||||||||||||||
| I | 17.75 | 0.24 | 2.60 | 2.84 | (0.20) | (0.14) | (0.34) | 20.25 | 16.19 | 15,561 | 0.94 | 0.94 | 1.22 | 39 | ||||||||||||||
| R3 | 18.13 | 0.13 | 2.66 | 2.79 | (0.08) | (0.14) | (0.22) | 20.70 | 15.48 | 1,448 | 1.54 | 1.53 | 0.63 | 39 | ||||||||||||||
| R4 | 18.34 | 0.19 | 2.70 | 2.89 | (0.14) | (0.14) | (0.28) | 20.95 | 15.87 | 7,550 | 1.20 | 1.20 | 0.96 | 39 | ||||||||||||||
| R5 | 18.49 | 0.23 | 2.75 | 2.98 | (0.20) | (0.14) | (0.34) | 21.13 | 16.25 | 480 | 0.91 | 0.91 | 1.17 | 39 | ||||||||||||||
| Y | 18.55 | 0.27 | 2.73 | 3.00 | (0.22) | (0.14) | (0.36) | 21.19 | 16.32 | 1,052 | 0.83 | 0.83 | 1.31 | 39 | ||||||||||||||
| F (5) | 19.58 | 0.16 | 0.52 | 0.68 | — | — | — | 20.26 | 3.47 (6) | 12,030 | 0.80 (7) | 0.80 (7) | 1.17 (7) | 39 | ||||||||||||||
| The Hartford Small Cap Growth Fund | ||||||||||||||||||||||||||||
| For the Year Ended October 31, 2021 | ||||||||||||||||||||||||||||
| A | $ 51.35 | $ (0.42) | $ 18.27 | $ 17.85 | $ — | $ (4.32) | $ (4.32) | $ 64.88 | 35.73% | $ 256,061 | 1.18% | 1.18% | (0.67)% | 48% | ||||||||||||||
| C | 34.22 | (0.55) | 11.99 | 11.44 | — | (4.32) | (4.32) | 41.34 | 34.80 | 8,102 | 1.89 | 1.89 | (1.37) | 48 | ||||||||||||||
| I | 54.23 | (0.22) | 19.34 | 19.12 | — | (4.32) | (4.32) | 69.03 | 36.21 | 120,135 | 0.83 | 0.83 | (0.33) | 48 | ||||||||||||||
| R3 | 50.47 | (0.59) | 17.94 | 17.35 | — | (4.32) | (4.32) | 63.50 | 35.34 | 8,637 | 1.48 | 1.47 | (0.97) | 48 | ||||||||||||||
| R4 | 53.64 | (0.42) | 19.09 | 18.67 | — | (4.32) | (4.32) | 67.99 | 35.74 | 21,098 | 1.17 | 1.17 | (0.64) | 48 | ||||||||||||||
| R5 | 57.10 | (0.25) | 20.38 | 20.13 | — | (4.32) | (4.32) | 72.91 | 36.15 | 86,788 | 0.87 | 0.87 | (0.36) | 48 | ||||||||||||||
| R6 | 58.07 | (0.18) | 20.75 | 20.57 | — | (4.32) | (4.32) | 74.32 | 36.31 | 84,908 | 0.76 | 0.76 | (0.25) | 48 | ||||||||||||||
| Y | 58.07 | (0.22) | 20.75 | 20.53 | — | (4.32) | (4.32) | 74.28 | 36.24 | 268,416 | 0.87 | 0.81 | (0.31) | 48 | ||||||||||||||
| F | 54.48 | (0.15) | 19.42 | 19.27 | — | (4.32) | (4.32) | 69.43 | 36.32 | 36,439 | 0.76 | 0.76 | (0.23) | 48 | ||||||||||||||
| For the Year Ended October 31, 2020 | ||||||||||||||||||||||||||||
| A | $ 45.71 | $ (0.28) | $ 6.67 | $ 6.39 | $ — | $ (0.75) | $ (0.75) | $ 51.35 | 14.06% | $ 198,430 | 1.26% | 1.25% | (0.60)% | 58% | ||||||||||||||
| C | 30.90 | (0.39) | 4.46 | 4.07 | — | (0.75) | (0.75) | 34.22 | 13.31 | 12,323 | 1.91 | 1.91 | (1.25) | 58 | ||||||||||||||
| I | 48.05 | (0.09) | 7.02 | 6.93 | — | (0.75) | (0.75) | 54.23 | 14.50 | 98,673 | 0.85 | 0.85 | (0.19) | 58 | ||||||||||||||
| R3 | 45.05 | (0.38) | 6.55 | 6.17 | — | (0.75) | (0.75) | 50.47 | 13.80 | 7,485 | 1.49 | 1.49 | (0.83) | 58 | ||||||||||||||
| R4 | 47.69 | (0.26) | 6.96 | 6.70 | — | (0.75) | (0.75) | 53.64 | 14.13 | 31,169 | 1.19 | 1.19 | (0.52) | 58 | ||||||||||||||
| R5 | 50.57 | (0.12) | 7.40 | 7.28 | — | (0.75) | (0.75) | 57.10 | 14.47 | 71,754 | 0.89 | 0.89 | (0.23) | 58 | ||||||||||||||
| R6 | 51.36 | (0.06) | 7.52 | 7.46 | — | (0.75) | (0.75) | 58.07 | 14.62 | 80,327 | 0.78 | 0.78 | (0.12) | 58 | ||||||||||||||
| Y | 51.39 | (0.08) | 7.51 | 7.43 | — | (0.75) | (0.75) | 58.07 | 14.58 | 255,484 | 0.88 | 0.81 | (0.16) | 58 | ||||||||||||||
| F | 48.23 | (0.06) | 7.06 | 7.00 | — | (0.75) | (0.75) | 54.48 | 14.62 | 44,376 | 0.78 | 0.78 | (0.13) | 58 | ||||||||||||||
| 105 |
| — Selected Per-Share Data(1) — | — Ratios and Supplemental Data — | |||||||||||||||||||||||||||
| Class | Net Asset Value at Beginning of Period | Net Investment Income (Loss) | Net Realized and Unrealized Gain (Loss) on Investments | Total from Investment Operations | Dividends from Net Investment Income | Distributions from Capital Gains | Total Dividends and Distributions | Net Asset Value at End of Period | Total Return(2) | Net Assets at End of Period (000s) | Ratio of Expenses to Average Net Assets Before Adjust- ments(3) | Ratio of Expenses to Average Net Assets After Adjust- ments(3) | Ratio of Net Investment Income (Loss) to Average Net Assets | Portfolio Turnover | ||||||||||||||
| The Hartford Small Cap Growth Fund – (continued) | ||||||||||||||||||||||||||||
| For the Year Ended October 31, 2019 | ||||||||||||||||||||||||||||
| A | $ 55.20 | $ (0.21) | $ 2.62 | $ 2.41 | $ — | $ (11.90) | $ (11.90) | $ 45.71 | 8.99% | $ 195,314 | 1.24% | 1.24% | (0.46)% | 48% | ||||||||||||||
| C | 41.81 | (0.34) | 1.33 | 0.99 | — | (11.90) | (11.90) | 30.90 | 8.27 | 15,722 | 1.89 | 1.89 | (1.11) | 48 | ||||||||||||||
| I | 57.17 | (0.02) | 2.80 | 2.78 | — | (11.90) | (11.90) | 48.05 | 9.41 | 191,482 | 0.83 | 0.83 | (0.05) | 48 | ||||||||||||||
| R3 | 54.70 | (0.31) | 2.56 | 2.25 | — | (11.90) | (11.90) | 45.05 | 8.72 | 10,036 | 1.47 | 1.47 | (0.69) | 48 | ||||||||||||||
| R4 | 56.99 | (0.18) | 2.78 | 2.60 | — | (11.90) | (11.90) | 47.69 | 9.05 | 42,296 | 1.17 | 1.17 | (0.39) | 48 | ||||||||||||||
| R5 | 59.48 | (0.03) | 3.02 | 2.99 | — | (11.90) | (11.90) | 50.57 | 9.40 | 82,624 | 0.85 | 0.85 | (0.07) | 48 | ||||||||||||||
| R6 | 60.16 | — (8) | 3.10 | 3.10 | — | (11.90) | (11.90) | 51.36 | 9.49 | 66,260 | 0.76 | 0.76 | 0.01 | 48 | ||||||||||||||
| Y | 60.20 | (0.01) | 3.10 | 3.09 | — | (11.90) | (11.90) | 51.39 | 9.44 | 365,867 | 0.82 | 0.80 | (0.01) | 48 | ||||||||||||||
| F | 57.30 | 0.01 | 2.82 | 2.83 | — | (11.90) | (11.90) | 48.23 | 9.49 | 46,533 | 0.76 | 0.76 | 0.02 | 48 | ||||||||||||||
| For the Year Ended October 31, 2018 | ||||||||||||||||||||||||||||
| A | $ 57.24 | $ (0.33) | $ 1.03 | $ 0.70 | $ — | $ (2.74) | $ (2.74) | $ 55.20 | 1.20% | $ 203,297 | 1.21% | 1.20% | (0.56)% | 66% | ||||||||||||||
| C | 44.29 | (0.55) | 0.81 | 0.26 | — | (2.74) | (2.74) | 41.81 | 0.53 | 23,212 | 1.88 | 1.88 | (1.22) | 66 | ||||||||||||||
| I | 58.97 | (0.10) | 1.04 | 0.94 | — | (2.74) | (2.74) | 57.17 | 1.59 | 243,340 | 0.82 | 0.82 | (0.16) | 66 | ||||||||||||||
| R3 | 56.89 | (0.48) | 1.03 | 0.55 | — | (2.74) | (2.74) | 54.70 | 0.94 | 13,210 | 1.47 | 1.47 | (0.82) | 66 | ||||||||||||||
| R4 | 58.98 | (0.31) | 1.06 | 0.75 | — | (2.74) | (2.74) | 56.99 | 1.26 | 69,097 | 1.15 | 1.15 | (0.50) | 66 | ||||||||||||||
| R5 | 61.26 | (0.12) | 1.08 | 0.96 | — | (2.74) | (2.74) | 59.48 | 1.56 | 94,887 | 0.85 | 0.85 | (0.20) | 66 | ||||||||||||||
| R6 | 61.87 | (0.09) | 1.12 | 1.03 | — | (2.74) | (2.74) | 60.16 | 1.66 | 44,278 | 0.75 | 0.75 | (0.14) | 66 | ||||||||||||||
| Y | 61.93 | (0.09) | 1.10 | 1.01 | — | (2.74) | (2.74) | 60.20 | 1.63 | 358,049 | 0.79 | 0.79 | (0.14) | 66 | ||||||||||||||
| F | 59.06 | (0.06) | 1.04 | 0.98 | — | (2.74) | (2.74) | 57.30 | 1.66 | 47,999 | 0.75 | 0.75 | (0.10) | 66 | ||||||||||||||
| For the Year Ended October 31, 2017 | ||||||||||||||||||||||||||||
| A | $ 44.55 | $ (0.25) | $ 13.25 | $ 13.00 | $ — | $ (0.31) | $ (0.31) | $ 57.24 | 29.28% | $ 215,743 | 1.17% | 1.16% | (0.48)% | 56% | ||||||||||||||
| C | 34.78 | (0.48) | 10.30 | 9.82 | — | (0.31) | (0.31) | 44.29 | 28.36 | 36,531 | 1.89 | 1.88 | (1.19) | 56 | ||||||||||||||
| I | 45.79 | (0.18) | 13.67 | 13.49 | — | (0.31) | (0.31) | 58.97 | 29.56 | 429,401 | 1.03 | 0.95 | (0.33) | 56 | ||||||||||||||
| R3 | 44.42 | (0.41) | 13.19 | 12.78 | — | (0.31) | (0.31) | 56.89 | 28.87 | 14,427 | 1.48 | 1.48 | (0.79) | 56 | ||||||||||||||
| R4 | 45.90 | (0.26) | 13.65 | 13.39 | — | (0.31) | (0.31) | 58.98 | 29.27 | 76,315 | 1.16 | 1.16 | (0.48) | 56 | ||||||||||||||
| R5 | 47.52 | (0.10) | 14.15 | 14.05 | — | (0.31) | (0.31) | 61.26 | 29.67 | 118,794 | 0.86 | 0.86 | (0.17) | 56 | ||||||||||||||
| R6 | 47.94 | (0.06) | 14.30 | 14.24 | — | (0.31) | (0.31) | 61.87 | 29.80 | 10,596 | 0.76 | 0.76 | (0.11) | 56 | ||||||||||||||
| Y | 48.00 | (0.05) | 14.29 | 14.24 | — | (0.31) | (0.31) | 61.93 | 29.76 | 370,006 | 0.78 | 0.78 | (0.09) | 56 | ||||||||||||||
| F | 52.62 | (0.09) | 6.53 | 6.44 | — | — | — | 59.06 | 12.24 (6) | 47,409 | 0.75 (7) | 0.75 (7) | (0.24) (7) | 56 | ||||||||||||||
| Hartford Small Cap Value Fund | ||||||||||||||||||||||||||||
| For the Year Ended October 31, 2021 | ||||||||||||||||||||||||||||
| A | $ 8.29 | $ 0.10 | $ 5.06 | $ 5.16 | $ (0.09) | $ — | $ (0.09) | $ 13.36 | 62.61% | $ 59,496 | 1.30% | 1.28% | 0.78% | 60% | ||||||||||||||
| C | 7.12 | — (8) | 4.37 | 4.37 | (0.01) | — | (0.01) | 11.48 | 61.49 | 3,098 | 2.09 | 2.04 | 0.01 | 60 | ||||||||||||||
| I | 8.31 | 0.15 | 5.06 | 5.21 | (0.12) | — | (0.12) | 13.40 | 63.20 | 32,905 | 0.97 | 0.96 | 1.12 | 60 | ||||||||||||||
| R3 | 8.62 | 0.09 | 5.27 | 5.36 | (0.07) | — | (0.07) | 13.91 | 62.45 | 931 | 1.56 | 1.39 | 0.69 | 60 | ||||||||||||||
| R4 | 8.76 | 0.12 | 5.35 | 5.47 | (0.10) | — | (0.10) | 14.13 | 62.83 | 53 | 1.26 | 1.20 | 0.88 | 60 | ||||||||||||||
| R5 | 8.74 | 0.15 | 5.34 | 5.49 | (0.13) | — | (0.13) | 14.10 | 63.34 | 24 | 0.96 | 0.90 | 1.12 | 60 | ||||||||||||||
| R6 | 8.74 | 0.16 | 5.35 | 5.51 | (0.15) | — | (0.15) | 14.10 | 63.49 | 1,508 | 0.85 | 0.80 | 1.24 | 60 | ||||||||||||||
| Y | 8.73 | 0.17 | 5.31 | 5.48 | (0.14) | — | (0.14) | 14.07 | 63.26 | 1,947 | 0.95 | 0.85 | 1.22 | 60 | ||||||||||||||
| F | 8.31 | 0.16 | 5.08 | 5.24 | (0.15) | — | (0.15) | 13.40 | 63.53 | 76,702 | 0.84 | 0.80 | 1.26 | 60 | ||||||||||||||
| 106 |
| — Selected Per-Share Data(1) — | — Ratios and Supplemental Data — | |||||||||||||||||||||||||||
| Class | Net Asset Value at Beginning of Period | Net Investment Income (Loss) | Net Realized and Unrealized Gain (Loss) on Investments | Total from Investment Operations | Dividends from Net Investment Income | Distributions from Capital Gains | Total Dividends and Distributions | Net Asset Value at End of Period | Total Return(2) | Net Assets at End of Period (000s) | Ratio of Expenses to Average Net Assets Before Adjust- ments(3) | Ratio of Expenses to Average Net Assets After Adjust- ments(3) | Ratio of Net Investment Income (Loss) to Average Net Assets | Portfolio Turnover | ||||||||||||||
| Hartford Small Cap Value Fund – (continued) | ||||||||||||||||||||||||||||
| For the Year Ended October 31, 2020 | ||||||||||||||||||||||||||||
| A | $ 10.35 | $ 0.09 | $ (1.49) | $ (1.40) | $ (0.08) | $ (0.58) | $ (0.66) | $ 8.29 | (14.57)% | $ 32,996 | 1.41% | 1.29% | 1.04% | 62% | ||||||||||||||
| C | 8.96 | 0.02 | (1.28) | (1.26) | (0.00) (8) | (0.58) | (0.58) | 7.12 | (15.15) | 2,020 | 2.15 | 2.04 | 0.29 | 62 | ||||||||||||||
| I | 10.37 | 0.12 | (1.48) | (1.36) | (0.12) | (0.58) | (0.70) | 8.31 | (14.22) | 2,915 | 1.04 | 0.93 | 1.43 | 62 | ||||||||||||||
| R3 | 10.73 | 0.08 | (1.54) | (1.46) | (0.07) | (0.58) | (0.65) | 8.62 | (14.62) | 457 | 1.63 | 1.42 | 0.92 | 62 | ||||||||||||||
| R4 | 10.89 | 0.10 | (1.56) | (1.46) | (0.09) | (0.58) | (0.67) | 8.76 | (14.46) | 30 | 1.33 | 1.20 | 1.10 | 62 | ||||||||||||||
| R5 | 10.87 | 0.13 | (1.56) | (1.43) | (0.12) | (0.58) | (0.70) | 8.74 | (14.21) | 10 | 1.03 | 0.90 | 1.51 | 62 | ||||||||||||||
| R6 | 10.87 | 0.12 | (1.54) | (1.42) | (0.13) | (0.58) | (0.71) | 8.74 | (14.17) | 240 | 0.92 | 0.80 | 1.42 | 62 | ||||||||||||||
| Y | 10.86 | 0.13 | (1.55) | (1.42) | (0.13) | (0.58) | (0.71) | 8.73 | (14.18) | 250 | 1.02 | 0.85 | 1.50 | 62 | ||||||||||||||
| F | 10.38 | 0.13 | (1.49) | (1.36) | (0.13) | (0.58) | (0.71) | 8.31 | (14.22) | 40,447 | 0.91 | 0.80 | 1.53 | 62 | ||||||||||||||
| For the Year Ended October 31, 2019 | ||||||||||||||||||||||||||||
| A | $ 13.65 | $ 0.10 | $ (0.04) | $ 0.06 | $ (0.03) | $ (3.33) | $ (3.36) | $ 10.35 | 3.46% | $ 47,037 | 1.37% | 1.27% | 0.98% | 140% | ||||||||||||||
| C | 12.35 | 0.02 | (0.08) | (0.06) | — | (3.33) | (3.33) | 8.96 | 2.60 | 3,719 | 2.14 | 2.04 | 0.26 | 140 | ||||||||||||||
| I | 13.68 | 0.14 | (0.05) | 0.09 | (0.07) | (3.33) | (3.40) | 10.37 | 3.77 | 4,354 | 1.00 | 0.90 | 1.34 | 140 | ||||||||||||||
| R3 | 14.02 | 0.09 | (0.03) | 0.06 | (0.02) | (3.33) | (3.35) | 10.73 | 3.31 | 609 | 1.62 | 1.42 | 0.82 | 140 | ||||||||||||||
| R4 | 14.16 | 0.11 | (0.03) | 0.08 | (0.02) | (3.33) | (3.35) | 10.89 | 3.52 | 69 | 1.31 | 1.20 | 1.01 | 140 | ||||||||||||||
| R5 | 14.16 | 0.16 | (0.05) | 0.11 | (0.07) | (3.33) | (3.40) | 10.87 | 3.82 | 11 | 1.01 | 0.90 | 1.44 | 140 | ||||||||||||||
| R6 | 14.15 | 0.15 | (0.02) | 0.13 | (0.08) | (3.33) | (3.41) | 10.87 | 3.99 | 103 | 0.89 | 0.80 | 1.39 | 140 | ||||||||||||||
| Y | 14.15 | 0.16 | (0.04) | 0.12 | (0.08) | (3.33) | (3.41) | 10.86 | 3.94 | 572 | 0.97 | 0.85 | 1.43 | 140 | ||||||||||||||
| F | 13.68 | 0.15 | (0.04) | 0.11 | (0.08) | (3.33) | (3.41) | 10.38 | 3.99 | 48,425 | 0.89 | 0.80 | 1.43 | 140 | ||||||||||||||
| For the Year Ended October 31, 2018 | ||||||||||||||||||||||||||||
| A | $ 14.13 | $ 0.04 | $ 0.10 | $ 0.14 | $ (0.02) | $ (0.60) | $ (0.62) | $ 13.65 | 1.00% | $ 52,406 | 1.35% | 1.29% | 0.28% | 68% | ||||||||||||||
| C | 12.91 | (0.06) | 0.10 | 0.04 | — | (0.60) | (0.60) | 12.35 | 0.27 | 6,444 | 2.13 | 2.04 | (0.44) | 68 | ||||||||||||||
| I | 14.15 | 0.09 | 0.10 | 0.19 | (0.06) | (0.60) | (0.66) | 13.68 | 1.33 | 3,756 | 1.02 | 0.95 | 0.62 | 68 | ||||||||||||||
| R3 | 14.50 | 0.03 | 0.09 | 0.12 | — | (0.60) | (0.60) | 14.02 | 0.82 | 529 | 1.62 | 1.43 | 0.18 | 68 | ||||||||||||||
| R4 | 14.61 | 0.06 | 0.10 | 0.16 | (0.01) | (0.60) | (0.61) | 14.16 | 1.07 | 48 | 1.32 | 1.20 | 0.41 | 68 | ||||||||||||||
| R5 | 14.63 | 0.10 | 0.10 | 0.20 | (0.07) | (0.60) | (0.67) | 14.16 | 1.39 | 36 | 1.02 | 0.90 | 0.71 | 68 | ||||||||||||||
| R6 | 13.99 | 0.05 | 0.11 | 0.16 | — | — | — | 14.15 | 1.14 (6) | 10 | 0.91 (7) | 0.84 (7) | 0.47 (7) | 68 | ||||||||||||||
| Y | 14.66 | 0.11 | 0.10 | 0.21 | (0.12) | (0.60) | (0.72) | 14.15 | 1.42 | 646 | 0.96 | 0.85 | 0.74 | 68 | ||||||||||||||
| F | 14.16 | 0.11 | 0.09 | 0.20 | (0.08) | (0.60) | (0.68) | 13.68 | 1.42 | 38,087 | 0.90 | 0.84 | 0.80 | 68 | ||||||||||||||
| For the Year Ended October 31, 2017 | ||||||||||||||||||||||||||||
| A | $ 11.56 | $ 0.04 | $ 2.63 | $ 2.67 | $ (0.10) | $ — | $ (0.10) | $ 14.13 | 23.19% | $ 53,057 | 1.28% | 1.27% | 0.32% | 83% | ||||||||||||||
| C | 10.58 | (0.05) | 2.40 | 2.35 | (0.02) | — | (0.02) | 12.91 | 22.24 | 11,081 | 2.03 | 2.01 | (0.41) | 83 | ||||||||||||||
| I | 11.58 | 0.08 | 2.63 | 2.71 | (0.14) | — | (0.14) | 14.15 | 23.53 | 3,225 | 1.01 | 1.00 | 0.60 | 83 | ||||||||||||||
| R3 | 11.87 | 0.01 | 2.69 | 2.70 | (0.07) | — | (0.07) | 14.50 | 22.79 | 723 | 1.63 | 1.50 | 0.09 | 83 | ||||||||||||||
| R4 | 11.94 | 0.05 | 2.70 | 2.75 | (0.08) | — | (0.08) | 14.61 | 23.11 | 113 | 1.36 | 1.20 | 0.36 | 83 | ||||||||||||||
| R5 | 11.96 | 0.10 | 2.71 | 2.81 | (0.14) | — | (0.14) | 14.63 | 23.63 | 44 | 1.01 | 0.90 | 0.74 | 83 | ||||||||||||||
| Y | 12.00 | 0.11 | 2.71 | 2.82 | (0.16) | — | (0.16) | 14.66 | 23.58 | 1,242 | 0.86 | 0.85 | 0.78 | 83 | ||||||||||||||
| F | 13.22 | 0.05 | 0.89 | 0.94 | — | — | — | 14.16 | 7.11 (6) | 86,675 | 0.88 (7) | 0.85 (7) | 0.52 (7) | 83 | ||||||||||||||
| 107 |
| — Selected Per-Share Data(1) — | — Ratios and Supplemental Data — | |||||||||||||||||||||||||||
| Class | Net Asset Value at Beginning of Period | Net Investment Income (Loss) | Net Realized and Unrealized Gain (Loss) on Investments | Total from Investment Operations | Dividends from Net Investment Income | Distributions from Capital Gains | Total Dividends and Distributions | Net Asset Value at End of Period | Total Return(2) | Net Assets at End of Period (000s) | Ratio of Expenses to Average Net Assets Before Adjust- ments(3) | Ratio of Expenses to Average Net Assets After Adjust- ments(3) | Ratio of Net Investment Income (Loss) to Average Net Assets | Portfolio Turnover | ||||||||||||||
| The Hartford Small Company Fund | ||||||||||||||||||||||||||||
| For the Year Ended October 31, 2021 | ||||||||||||||||||||||||||||
| A | $ 25.50 | $ (0.30) | $ 7.82 | $ 7.52 | $ — | $ (2.78) | $ (2.78) | $ 30.24 | 30.50% | $ 502,923 | 1.23% | 1.22% | (1.02)% | 123% | ||||||||||||||
| C | 15.97 | (0.33) | 4.79 | 4.46 | — | (2.78) | (2.78) | 17.65 | 29.39 | 9,324 | 2.05 | 2.05 | (1.85) | 123 | ||||||||||||||
| I | 27.31 | (0.25) | 8.41 | 8.16 | — | (2.78) | (2.78) | 32.69 | 30.84 | 59,421 | 0.95 | 0.95 | (0.77) | 123 | ||||||||||||||
| R3 | 28.02 | (0.45) | 8.62 | 8.17 | — | (2.78) | (2.78) | 33.41 | 30.04 | 15,527 | 1.57 | 1.57 | (1.37) | 123 | ||||||||||||||
| R4 | 30.22 | (0.38) | 9.33 | 8.95 | — | (2.78) | (2.78) | 36.39 | 30.46 | 15,320 | 1.26 | 1.26 | (1.06) | 123 | ||||||||||||||
| R5 | 32.33 | (0.30) | 10.01 | 9.71 | — | (2.78) | (2.78) | 39.26 | 30.85 | 6,782 | 0.97 | 0.97 | (0.78) | 123 | ||||||||||||||
| R6 | 33.12 | (0.28) | 10.27 | 9.99 | — | (2.78) | (2.78) | 40.33 | 30.97 | 5,954 | 0.85 | 0.85 | (0.69) | 123 | ||||||||||||||
| Y | 33.07 | (0.29) | 10.25 | 9.96 | — | (2.78) | (2.78) | 40.25 | 30.92 | 45,590 | 0.91 | 0.91 | (0.72) | 123 | ||||||||||||||
| F | 27.49 | (0.21) | 8.46 | 8.25 | — | (2.78) | (2.78) | 32.96 | 30.98 | 333,061 | 0.85 | 0.85 | (0.65) | 123 | ||||||||||||||
| For the Year Ended October 31, 2020 | ||||||||||||||||||||||||||||
| A | $ 20.35 | $ (0.14) | $ 6.57 | $ 6.43 | $ — | $ (1.28) | $ (1.28) | $ 25.50 | 33.21% | $ 389,496 | 1.32% | 1.31% | (0.66)% | 104% | ||||||||||||||
| C | 13.30 | (0.20) | 4.15 | 3.95 | — | (1.28) | (1.28) | 15.97 | 32.08 | 9,058 | 2.14 | 2.14 | (1.50) | 104 | ||||||||||||||
| I | 21.65 | (0.08) | 7.02 | 6.94 | — | (1.28) | (1.28) | 27.31 | 33.59 | 35,806 | 1.00 | 1.00 | (0.35) | 104 | ||||||||||||||
| R3 | 22.29 | (0.21) | 7.22 | 7.01 | — | (1.28) | (1.28) | 28.02 | 32.91 | 14,013 | 1.61 | 1.55 | (0.90) | 104 | ||||||||||||||
| R4 | 23.88 | (0.15) | 7.77 | 7.62 | — | (1.28) | (1.28) | 30.22 | 33.29 | 13,363 | 1.30 | 1.25 | (0.60) | 104 | ||||||||||||||
| R5 | 25.40 | (0.08) | 8.29 | 8.21 | — | (1.28) | (1.28) | 32.33 | 33.64 | 3,936 | 1.01 | 0.95 | (0.30) | 104 | ||||||||||||||
| R6 | 25.97 | (0.13) | 8.56 | 8.43 | — | (1.28) | (1.28) | 33.12 | 33.75 | 1,530 | 0.90 | 0.90 | (0.42) | 104 | ||||||||||||||
| Y | 25.95 | (0.08) | 8.48 | 8.40 | — | (1.28) | (1.28) | 33.07 | 33.65 | 19,956 | 0.96 | 0.95 | (0.29) | 104 | ||||||||||||||
| F | 21.76 | (0.06) | 7.07 | 7.01 | — | (1.28) | (1.28) | 27.49 | 33.75 | 243,057 | 0.90 | 0.90 | (0.24) | 104 | ||||||||||||||
| For the Year Ended October 31, 2019 | ||||||||||||||||||||||||||||
| A | $ 22.20 | $ (0.13) | $ 2.28 | $ 2.15 | $ — | $ (4.00) | $ (4.00) | $ 20.35 | 14.08% | $ 311,742 | 1.33% | 1.32% | (0.66)% | 91% | ||||||||||||||
| C | 16.11 | (0.19) | 1.38 | 1.19 | — | (4.00) | (4.00) | 13.30 | 13.24 | 9,929 | 2.14 | 2.13 | (1.46) | 91 | ||||||||||||||
| I | 23.28 | (0.08) | 2.45 | 2.37 | — | (4.00) | (4.00) | 21.65 | 14.48 | 26,939 | 1.04 | 1.03 | (0.37) | 91 | ||||||||||||||
| R3 | 23.95 | (0.19) | 2.53 | 2.34 | — | (4.00) | (4.00) | 22.29 | 13.84 | 14,142 | 1.62 | 1.55 | (0.89) | 91 | ||||||||||||||
| R4 | 25.28 | (0.14) | 2.74 | 2.60 | — | (4.00) | (4.00) | 23.88 | 14.20 | 14,261 | 1.32 | 1.25 | (0.59) | 91 | ||||||||||||||
| R5 | 26.53 | (0.07) | 2.94 | 2.87 | — | (4.00) | (4.00) | 25.40 | 14.56 | 3,239 | 1.02 | 0.95 | (0.29) | 91 | ||||||||||||||
| R6 | 27.02 | (0.06) | 3.01 | 2.95 | — | (4.00) | (4.00) | 25.97 | 14.60 | 206 | 0.90 | 0.90 | (0.23) | 91 | ||||||||||||||
| Y | 27.01 | (0.06) | 3.00 | 2.94 | — | (4.00) | (4.00) | 25.95 | 14.56 | 32,472 | 0.94 | 0.93 | (0.26) | 91 | ||||||||||||||
| F | 23.35 | (0.05) | 2.46 | 2.41 | — | (4.00) | (4.00) | 21.76 | 14.63 | 193,242 | 0.90 | 0.90 | (0.23) | 91 | ||||||||||||||
| For the Year Ended October 31, 2018 | ||||||||||||||||||||||||||||
| A | $ 20.34 | $ (0.20) | $ 2.06 | $ 1.86 | $ — | $ — | $ — | $ 22.20 | 9.20% | $ 283,912 | 1.34% | 1.33% | (0.87)% | 104% | ||||||||||||||
| C | 14.87 | (0.27) | 1.51 | 1.24 | — | — | — | 16.11 | 8.34 | 11,729 | 2.12 | 2.10 | (1.64) | 104 | ||||||||||||||
| I | 21.27 | (0.14) | 2.15 | 2.01 | — | — | — | 23.28 | 9.45 | 28,540 | 1.07 | 1.05 | (0.60) | 104 | ||||||||||||||
| R3 | 21.98 | (0.27) | 2.24 | 1.97 | — | — | — | 23.95 | 8.92 | 16,386 | 1.63 | 1.55 | (1.09) | 104 | ||||||||||||||
| R4 | 23.14 | (0.20) | 2.34 | 2.14 | — | — | — | 25.28 | 9.25 | 15,295 | 1.32 | 1.25 | (0.79) | 104 | ||||||||||||||
| R5 | 24.21 | (0.14) | 2.46 | 2.32 | — | — | — | 26.53 | 9.58 | 2,678 | 1.03 | 0.95 | (0.51) | 104 | ||||||||||||||
| R6 | 24.64 | (0.12) | 2.50 | 2.38 | — | — | — | 27.02 | 9.66 | 144 | 0.91 | 0.90 | (0.42) | 104 | ||||||||||||||
| Y | 24.64 | (0.12) | 2.49 | 2.37 | — | — | — | 27.01 | 9.66 | 35,351 | 0.92 | 0.90 | (0.44) | 104 | ||||||||||||||
| F | 21.30 | (0.11) | 2.16 | 2.05 | — | — | — | 23.35 | 9.63 | 115,365 | 0.91 | 0.90 | (0.45) | 104 | ||||||||||||||
| 108 |
| — Selected Per-Share Data(1) — | — Ratios and Supplemental Data — | |||||||||||||||||||||||||||
| Class | Net Asset Value at Beginning of Period | Net Investment Income (Loss) | Net Realized and Unrealized Gain (Loss) on Investments | Total from Investment Operations | Dividends from Net Investment Income | Distributions from Capital Gains | Total Dividends and Distributions | Net Asset Value at End of Period | Total Return(2) | Net Assets at End of Period (000s) | Ratio of Expenses to Average Net Assets Before Adjust- ments(3) | Ratio of Expenses to Average Net Assets After Adjust- ments(3) | Ratio of Net Investment Income (Loss) to Average Net Assets | Portfolio Turnover | ||||||||||||||
| The Hartford Small Company Fund – (continued) | ||||||||||||||||||||||||||||
| For the Year Ended October 31, 2017 | ||||||||||||||||||||||||||||
| A | $ 15.74 | $ (0.12) | $ 4.72 | $ 4.60 | $ — | $ — | $ — | $ 20.34 | 29.16% | $ 252,187 | 1.39% | 1.37% | (0.64)% | 109% | ||||||||||||||
| C | 11.60 | (0.19) | 3.46 | 3.27 | — | — | — | 14.87 | 28.19 | 26,529 | 2.12 | 2.10 | (1.40) | 109 | ||||||||||||||
| I | 16.43 | (0.10) | 4.94 | 4.84 | — | — | — | 21.27 | 29.40 | 28,052 | 1.49 | 1.15 | (0.51) | 109 | ||||||||||||||
| R3 | 17.05 | (0.17) | 5.10 | 4.93 | — | — | — | 21.98 | 28.91 | 23,932 | 1.63 | 1.55 | (0.84) | 109 | ||||||||||||||
| R4 | 17.89 | (0.11) | 5.36 | 5.25 | — | — | — | 23.14 | 29.29 | 23,080 | 1.32 | 1.25 | (0.53) | 109 | ||||||||||||||
| R5 | 18.67 | (0.04) | 5.58 | 5.54 | — | — | — | 24.21 | 29.67 | 3,263 | 1.06 | 0.95 | (0.20) | 109 | ||||||||||||||
| R6 | 18.99 | (0.09) | 5.74 | 5.65 | — | — | — | 24.64 | 29.75 | 78 | 1.07 | 0.90 | (0.38) | 109 | ||||||||||||||
| Y | 18.99 | (0.02) | 5.67 | 5.65 | — | — | — | 24.64 | 29.70 | 33,040 | 0.94 | 0.90 | (0.08) | 109 | ||||||||||||||
| F (5) | 18.76 | (0.05) | 2.59 | 2.54 | — | — | — | 21.30 | 13.49 (6) | 81,831 | 0.92 (7) | 0.90 (7) | (0.38) (7) | 109 | ||||||||||||||
| FINANCIAL HIGHLIGHTS FOOTNOTES | |
| (1) | Information presented relates to a share outstanding throughout the indicated period. Net investment income (loss) per share amounts are calculated based on average shares outstanding unless otherwise noted. |
| (2) | Assumes initial investment at net asset value at the beginning of each period, reinvestment of all distributions, the complete redemption of the investment at net asset value at the end of each period and no sales charge. Total return would be reduced if sales charges were taken into account. |
| (3) | Adjustments include waivers and reimbursements, if applicable. Ratios do not include fees paid indirectly (see Expenses in the accompanying Notes to Financial Statements). |
| (4) | Includes interest expense representing less than 0.005%. |
| (5) | Commenced operations on February 28, 2017. |
| (6) | Not annualized. |
| (7) | Annualized. |
| (8) | Amount is less than $0.01 per share. |
| (9) | Amount is less than 0.01%. |
| (10) | Commenced operations on February 28, 2019. |
| (11) | Commenced operations on February 28, 2018. |
| (12) | Per share amount was not in accord with the net realized and unrealized gain (loss) for the period because of the timing of transactions in shares of the Fund and the amount and timing of per-share net realized and unrealized gain (loss) on such shares. |
| 109 |
October 31, 2021
| 1. | Organization: |
| The Hartford Mutual Funds, Inc. and The Hartford Mutual Funds II, Inc. (each, a "Company" and collectively, the "Companies") are each an open-end registered management investment company comprised of thirty-six and thirteen series, respectively, as of October 31, 2021. Financial statements for the series of each Company listed below (each, a “Fund” and collectively, the “Funds”) are included in this report. | |
| The Hartford Mutual Funds, Inc.: |
| The Hartford Capital Appreciation Fund (the "Capital Appreciation Fund") |
| Hartford Core Equity Fund (the "Core Equity Fund") |
| The Hartford Dividend and Growth Fund (the "Dividend and Growth Fund") |
| The Hartford Equity Income Fund (the "Equity Income Fund") |
| The Hartford Healthcare Fund (the "Healthcare Fund") |
| The Hartford MidCap Fund (the "MidCap Fund") |
| The Hartford MidCap Value Fund (the "MidCap Value Fund") |
| Hartford Small Cap Value Fund (the "Small Cap Value Fund") |
| The Hartford Small Company Fund (the "Small Company Fund") |
| The Hartford Mutual Funds II, Inc.: |
| The Hartford Growth Opportunities Fund (the "Growth Opportunities Fund") |
| Hartford Quality Value Fund (the "Quality Value Fund") |
| The Hartford Small Cap Growth Fund (the "Small Cap Growth Fund") |
| 2. | Significant Accounting Policies: |
| The following is a summary of significant accounting policies of each Fund used in the preparation of its financial statements, which are in accordance with United States Generally Accepted Accounting Principles (“U.S. GAAP”). The preparation of financial statements in accordance with U.S. GAAP may require management to make estimates and assumptions that affect the reported amounts of assets and liabilities and disclosure of contingent assets and liabilities at the date of the financial statements and the reported amounts of increases and decreases in net assets from operations during the reporting period. Actual results could differ from those estimates. |
| a) | Determination of Net Asset Value – The net asset value ("NAV") of each class of each Fund’s shares is determined as of the close of regular trading on the New York Stock Exchange (the "Exchange") (normally 4:00 p.m. Eastern Time) (the “NYSE Close”) on each day that the Exchange is open ("Valuation Date"). If the Exchange is closed due to weather or other extraordinary circumstances on a day it would typically be open for business, each Fund may treat such day as a typical business day and accept purchase and redemption orders and calculate each Fund’s NAV in accordance with applicable law. The NAV of each class of each Fund's shares is determined by dividing the value of the Fund’s net assets attributable to the class of shares by the number of shares outstanding for that class. Information that becomes known to the Funds after the NAV has been calculated on a particular day will not generally be used to retroactively adjust the NAV determined earlier that day. |
| b) | Investment Valuation and Fair Value Measurements – For purposes of calculating the NAV of each class of each Fund, portfolio securities and other assets held in the Fund’s portfolio for which market prices are readily available are valued at market value. Market value is generally determined on the basis of official close price or last reported trade price. If no trades were reported, market value is based on prices obtained from a quotation reporting system, established market makers (including evaluated prices), or independent pricing services. Pricing vendors may use matrix pricing or valuation models that utilize certain inputs and assumptions to derive values, including transaction |
| 110 |
October 31, 2021
| data, credit quality information, general market conditions, news, and other factors and assumptions. | |
| If market prices are not readily available or are deemed unreliable, a Fund will use the fair value of the security or other instrument as determined in good faith under policies and procedures established by and under the supervision of the Board of Directors of the respective Company (the “Board of Directors”) (“Valuation Procedures”). Market prices are considered not readily available where there is an absence of current or reliable market-based data (e.g., trade information or broker quotes), including where events occur after the close of the relevant market, but prior to the NYSE Close, that materially affect the values of a Fund’s portfolio holdings or assets. In addition, market prices are considered not readily available when, due to extraordinary circumstances, the exchanges or markets on which the securities or other instruments trade do not open for trading for the entire day and no other market prices are available. Fair value pricing is subjective in nature and the use of fair value pricing by a Fund may cause the NAV of its shares to differ significantly from the NAV that would have been calculated using market prices at the close of the exchange on which a portfolio holding is primarily traded. There can be no assurance that a Fund could obtain the fair value assigned to an investment if the Fund were to sell the investment at approximately the time at which the Fund determines its NAV. | |
| Prices of foreign equities that are principally traded on certain foreign markets will generally be adjusted daily pursuant to a fair value pricing service in order to reflect an adjustment for the factors occurring after the close of certain foreign markets but before the NYSE Close. Securities and other instruments that are primarily traded on foreign markets may trade on days that are not business days of the Funds. The value of the foreign securities or other instruments in which a Fund invests may change on days when a shareholder will not be able to purchase, redeem or exchange shares of the Fund. | |
| Fixed income investments (other than short-term obligations) and non-exchange traded derivatives held by a Fund are normally valued at prices supplied by independent pricing services in accordance with the Valuation Procedures. Short-term investments maturing in 60 days or less are generally valued at amortized cost which approximates fair value. | |
| Exchange-traded derivatives, such as options, futures and options on futures, are valued at the last sale price determined by the exchange where such instruments principally trade as of the close of such exchange (“Exchange Close”). If a last sale price is not available, the value will be the mean of the most recently quoted bid and ask prices as of the Exchange Close. If a mean of the bid and ask prices cannot be calculated for the day, the value will be the most recently quoted bid price as of the Exchange Close. Over-the-counter derivatives are normally valued based on prices supplied by independent pricing services in accordance with the Valuation Procedures. | |
| Investments valued in currencies other than U.S. dollars are converted to U.S. dollars using the prevailing spot currency exchange rates obtained from independent pricing services for calculation of the NAV. As a result, the NAV of a Fund’s shares may be affected by changes in the value of currencies in relation to the U.S. dollar. The value of securities or other instruments traded in markets outside the United States or denominated in currencies other than the U.S. dollar may be affected significantly on a day that the Exchange is closed and the market value may change on days when an investor is not able to purchase, redeem or exchange shares of a Fund. | |
| Foreign currency contracts represent agreements to exchange currencies on specific future dates at predetermined rates. Foreign currency contracts are valued using foreign currency exchange rates and forward rates as provided by an independent pricing service on the Valuation Date. | |
| Investments in investment companies that are not listed or traded on an exchange ("Non-Traded Funds"), if any, are valued at the respective NAV of each Non-Traded Fund on the Valuation Date. Shares of investment companies listed and traded on an exchange are valued in the same manner as any exchange-listed equity security. Such Non-Traded Funds and listed investment companies may use fair value pricing as disclosed in their prospectuses. | |
| Financial instruments for which prices are not available from an independent pricing service may be valued using market quotations obtained from one or more dealers that make markets in the respective financial instrument in accordance with the Valuation Procedures. | |
| U.S. GAAP defines fair value as the price that a Fund would receive to sell an asset or pay to transfer a liability in an orderly transaction between market participants. The U.S. GAAP fair value measurement standards require disclosure of a fair value hierarchy for each major category of assets and liabilities. Various inputs are used in determining the fair value of each Fund’s investments. These inputs are summarized into three broad hierarchy levels. This hierarchy is based on whether the valuation inputs are observable or unobservable. These levels are: |
| • | Level 1 – Quoted prices in active markets for identical investments. Level 1 may include exchange traded instruments, such as domestic equities, some foreign equities, options, futures, mutual funds, exchange traded funds, rights and warrants. |
| • | Level 2 – Observable inputs other than Level 1 prices, such as quoted prices for similar investments; quoted prices in markets that are not active; or other inputs that are observable or can be corroborated by observable market data. Level 2 may include debt investments that are traded less frequently than exchange traded instruments and which are valued using independent pricing services; foreign equities, which are principally traded on certain foreign markets and are adjusted daily pursuant to a fair value pricing service in order |
| 111 |
October 31, 2021
| to reflect an adjustment for the factors occurring after the close of certain foreign markets but before the NYSE Close; senior floating rate interests, which are valued using an aggregate of dealer bids; short-term investments, which are valued at amortized cost; and swaps, which are valued based upon the terms of each swap contract. | |
| • | Level 3 – Significant unobservable inputs that are supported by limited or no market activity. Level 3 may include financial instruments whose values are determined using indicative market quotes or require significant management judgment or estimation. These unobservable valuation inputs may include estimates for current yields, maturity/duration, prepayment speed, and indicative market quotes for comparable investments along with other assumptions relating to credit quality, collateral value, complexity of the investment structure, general market conditions and liquidity. This category may include investments where trading has been halted or there are certain restrictions on trading. While these investments are priced using unobservable inputs, the valuation of these investments reflects the best available data and management believes the prices are a reasonable representation of exit price. |
| c) | Investment Transactions and Investment Income – Investment transactions are recorded as of the trade date (the date the order to buy or sell is executed) for financial reporting purposes. Investments purchased or sold on a when-issued or delayed-delivery basis may be settled a month or more after the trade date. Realized gains and losses are determined on the basis of identified cost. |
| Dividend income from domestic securities is accrued on the ex-dividend date. In general, dividend income from foreign securities is recorded on the ex-date; however, dividend notifications in certain foreign jurisdictions may not be available in a timely manner and as a result, a Fund will record the dividend as soon as the relevant details (i.e., rate per share, payment date, shareholders of record, etc.) are publicly available. | |
| Interest income, including amortization of premium, accretion of discounts and additional principal received in-kind in lieu of cash, is accrued on a daily basis. |
| d) | Taxes – A Fund may be subject to taxes imposed on realized gains on securities of certain foreign countries in which such Fund invests. A Fund may also be subject to taxes withheld on foreign dividends and interest from securities in which a Fund invests. The amount of any foreign taxes withheld and foreign tax expense is included on the accompanying Statements of Operations as a reduction to net investment income or net realized or unrealized gain (loss) on investments in these securities, if applicable. |
| e) | Foreign Currency Transactions – Assets and liabilities denominated in currencies other than U.S. dollars are translated into U.S. dollars at the exchange rates in effect on the Valuation Date. Purchases and sales of investments, income and expenses are translated into U.S. dollars at the exchange rates on the dates of such transactions. |
| A Fund does not isolate that portion of portfolio investment valuation resulting from fluctuations in the foreign currency exchange rates from the fluctuations arising from changes in the market prices of investments held. Exchange rate fluctuations are included with the net realized and unrealized gain or loss on investments in the accompanying financial statements. | |
| Net realized foreign exchange gains or losses arise from sales of foreign currencies and the difference between asset and liability amounts initially stated in foreign currencies and the U.S. dollar value of the amounts actually received or paid. Net unrealized foreign exchange gains or losses arise from changes in the value of other assets and liabilities at the end of the reporting period, resulting from changes in the exchange rates. |
| f) | Joint Trading Account – A Fund may invest cash balances into a joint trading account that may be invested in one or more repurchase agreements. |
| g) | Fund Share Valuation and Dividend Distributions to Shareholders – Orders for each class of each Fund’s shares are executed in accordance with the investment instructions of the shareholders. The NAV of each class of each Fund’s shares is determined as of the close of business on each business day of the Exchange (see Note 2(a)). The NAV is determined separately for each class of shares of a Fund by dividing the Fund's net assets attributable to that class by the number of shares of the class outstanding. Each class of shares offered by a Fund |
| 112 |
October 31, 2021
| has equal rights as to assets and voting privileges (except that shareholders of a class have exclusive voting rights regarding any matter relating solely to that class of shares). Income and non-class specific expenses are allocated daily to each class on the basis of the relative net assets of the class of the Fund. Realized and unrealized gains and losses are allocated daily based on the relative net assets of each class of shares of each Fund. | |
| Orders for the purchase of a Fund's shares received prior to the close of the Exchange on any day the Exchange is open for business are priced at the NAV determined as of the close of the Exchange. Orders received after the close of the Exchange, or on a day on which the Exchange and/or the Funds are not open for business, are priced at the next determined NAV. | |
| Dividends are declared pursuant to a policy adopted by the respective Company's Board of Directors. Dividends and/or distributions to shareholders are recorded on ex-date. The policy of each Fund, except Dividend and Growth Fund and Equity Income Fund, is to pay dividends from net investment income and realized gains, if any, at least once a year. The policy of Dividend and Growth Fund and Equity Income Fund is to pay dividends from net investment income, if any, quarterly and realized gains, if any, at least once a year. | |
| Income dividends and capital gains distributions are determined in accordance with federal income tax regulations, which may differ from U.S. GAAP with respect to character and timing (see Federal Income Taxes: Distributions and Components of Distributable Earnings and Reclassification of Capital Accounts notes). |
| 3. | Securities and Other Investments: |
| a) | Restricted Securities – Each Fund may invest in securities that are subject to legal or contractual restrictions on resale. These securities generally may be resold in transactions exempt from registration or to the public if the securities are registered. Disposal of these securities may involve time-consuming negotiations and expense, and prompt sale at an acceptable price may be difficult. Information regarding restricted securities, if applicable, is included at the end of each Fund's Schedule of Investments. |
| b) | Repurchase Agreements – A repurchase agreement is an agreement between two parties whereby one party sells the other a security at a specified price with a commitment to repurchase the security later at an agreed-upon price, date and interest payment. Each Fund is permitted to enter into fully collateralized repurchase agreements. Each Company's Board of Directors has delegated to the sub-adviser(s), as applicable, the responsibility of evaluating the creditworthiness of the banks and securities dealers with which the Funds will engage in repurchase agreements. The sub-adviser(s) will monitor such transactions to ensure that the value of underlying collateral will be at least equal to the total amount of the repurchase obligation as required by the valuation provision of the repurchase agreement, including the accrued interest. Repurchase agreements carry the risk that the market value of the securities declines below the repurchase price. A Fund could also lose money if it is unable to recover the securities and the value of any collateral held or assets segregated by the Fund to cover the transaction is less than the value of the securities. In the event the borrower commences bankruptcy proceedings, a court may characterize the transaction as a loan. If a Fund has not perfected a security interest in the underlying collateral, the Fund may be required to return the underlying collateral to the borrower’s estate and be treated as an unsecured creditor. As an unsecured creditor, the Fund could lose some or all of the principal and interest involved in the transaction. See each Fund's Schedule of Investments, if applicable, for repurchase agreements as of October 31, 2021. |
| c) | Special Purpose Acquisition Companies – A Fund may invest in special purpose acquisition companies (“SPACs”) or similar special purpose entities. SPACs are collective investment structures that pool funds in order to seek potential acquisition opportunities. SPACs and similar entities may be blank check companies with no operating history or ongoing business other than to seek a potential acquisition. Because SPACs and similar entities have no operating history or ongoing business other than seeking acquisitions, the value of their securities is particularly dependent on the ability of the entity’s management to identify and complete a profitable acquisition. Some SPACs may pursue acquisitions only within certain industries or regions, which may increase the volatility of their securities’ prices. In addition, these securities, which are typically traded in the OTC market, may be considered illiquid and/or be subject to restrictions on resale. A Fund may enter into a contingent commitment with a SPAC to purchase shares of private investments in public equity investments (“PIPE”) if and when the SPAC completes its merger or acquisition; however if the commitment expires, then no shares are purchased. Purchased PIPE shares will be restricted from trading until the registration statement for the shares is declared effective. Upon registration, the shares can be freely sold; however, in certain circumstances, the issuer may have the right to temporarily suspend trading of the shares in the first year after the merger. |
| 4. | Financial Derivative Instruments: |
| The following disclosures contain information on how and why a Fund may use derivative instruments, the credit-risk-related contingent features in certain derivative instruments, and how derivative instruments affect a Fund’s financial position and results of operations. The location and fair value amounts of these instruments on the Statements of Assets and Liabilities and the realized gains and losses and changes in unrealized gains and losses on the Statements of Operations, each categorized by type of derivative contract, are included in the following Additional |
| 113 |
October 31, 2021
| a) | Futures Contracts – A Fund may enter into futures contracts. A futures contract is an agreement between two parties to buy or sell an asset at a set price on a future date. A Fund may use futures contracts to manage risk or obtain exposure to the investment markets, commodities, or movements in interest rates and currency values. The primary risks associated with the use of futures contracts are the imperfect correlation between the change in market value of the investments held by a Fund and the prices of futures contracts and the possibility of an illiquid market. Upon entering into a futures contract, a Fund is required to deposit with a futures commission merchant (“FCM”) an amount of cash or U.S. Government or Agency Obligations in accordance with the initial margin requirements of the broker or exchange. Futures contracts are marked to market daily and an appropriate amount equal to the change in value (“variation margin”) is paid or received by a Fund. Gains or losses are recognized but not considered realized until the contracts expire or are closed. Futures contracts involve, to varying degrees, risk of loss in excess of the variation margin disclosed on the Statements of Assets and Liabilities. |
| b) | Additional Derivative Instrument Information: |
| Capital Appreciation Fund | |
| The Effect of Derivative Instruments on the Statement of Assets and Liabilities as of October 31, 2021: | |||||||||||
| Risk Exposure Category | |||||||||||
| Interest Rate Contracts | Foreign Currency Contracts | Credit Contracts | Equity Contracts | Commodity Contracts | Total | ||||||
| Assets: | |||||||||||
| Unrealized appreciation on futures contracts(1) | $ — | $ — | $ — | $ 6,601,053 | $ — | $ 6,601,053 | |||||
| Total | $ — | $ — | $ — | $ 6,601,053 | $ — | $ 6,601,053 | |||||
| (1) | Amount represents the cumulative appreciation and depreciation on futures contracts as disclosed within the Schedule of Investments under the open “Futures Contracts” section. Only current day’s variation margin, if any, is reported within the Statement of Assets and Liabilities. |
| The Effect of Derivative Instruments on the Statement of Operations for the year ended October 31, 2021: | |||||||||||
| Risk Exposure Category | |||||||||||
| Interest Rate Contracts | Foreign Currency Contracts | Credit Contracts | Equity Contracts | Commodity Contracts | Total | ||||||
| Realized Gain (Loss) on Derivatives Recognized as a Result of Operations: | |||||||||||
| Net realized gain (loss) on futures contracts | $ — | $ — | $ — | $ 31,660,302 | $ — | $ 31,660,302 | |||||
| Total | $ — | $ — | $ — | $ 31,660,302 | $ — | $ 31,660,302 | |||||
| Net Change in Unrealized Appreciation (Depreciation) on Derivatives Recognized as a Result of Operations: | |||||||||||
| Net change in unrealized appreciation (depreciation) of futures contracts | $ — | $ — | $ — | $ 8,707,449 | $ — | $ 8,707,449 | |||||
| Total | $ — | $ — | $ — | $ 8,707,449 | $ — | $ 8,707,449 | |||||
| Derivative Description | Average Notional Par, Contracts or Face Amount | |
| Futures Contracts Number of Long Contracts | 471 |
| 114 |
October 31, 2021
| The Effect of Derivative Instruments on the Statement of Operations for the year ended October 31, 2021: | |||||||||||
| Risk Exposure Category | |||||||||||
| Interest Rate Contracts | Foreign Currency Contracts | Credit Contracts | Equity Contracts | Commodity Contracts | Total | ||||||
| Realized Gain (Loss) on Derivatives Recognized as a Result of Operations: | |||||||||||
| Net realized gain (loss) on futures contracts | $ — | $ — | $ — | $ 31,391,264 | $ — | $ 31,391,264 | |||||
| Total | $ — | $ — | $ — | $ 31,391,264 | $ — | $ 31,391,264 | |||||
| Net Change in Unrealized Appreciation (Depreciation) on Derivatives Recognized as a Result of Operations: | |||||||||||
| Net change in unrealized appreciation (depreciation) of futures contracts | $ — | $ — | $ — | $ 2,034,977 | $ — | $ 2,034,977 | |||||
| Total | $ — | $ — | $ — | $ 2,034,977 | $ — | $ 2,034,977 | |||||
| Derivative Description | Average Notional Par, Contracts or Face Amount | |
| Futures Contracts Number of Long Contracts | 321 |
| c) | Balance Sheet Offsetting Information – Set forth below are tables which disclose both gross information and net information about instruments and transactions eligible for offset in the financial statements, and instruments and transactions that are subject to a master netting arrangement, as well as amounts related to margin, reflected as financial collateral (including cash collateral), held at clearing brokers, counterparties and a Fund's custodian. The master netting arrangements allow the clearing brokers to net any collateral held in or on behalf of a Fund, or liabilities or payment obligations of the clearing brokers to a Fund, against any liabilities or payment obligations of a Fund to the clearing brokers. A Fund is required to deposit financial collateral (including cash collateral) at the Fund's custodian on behalf of clearing brokers and counterparties to continually meet the original and maintenance requirements established by the clearing brokers and counterparties. Such requirements are specific to the respective clearing broker or counterparty. Certain master netting arrangements may not be enforceable in a bankruptcy. |
| The following tables present a Fund's derivative assets and liabilities, presented on a gross basis as no amounts are netted within the Statements of Assets and Liabilities, by counterparty net of amounts available for offset under a master netting agreement or similar agreement ("MNA") and net of the related collateral received/pledged by a Fund as of October 31, 2021: | |
| Capital Appreciation Fund | ||||
| Derivative Financial Instruments: | Assets | Liabilities | ||
| Futures contracts | $ 6,601,053 | $ — | ||
| Total gross amount of derivative assets and liabilities in the Statement of Assets and Liabilities | 6,601,053 | — | ||
| Derivatives not subject to a MNA | (6,601,053) | — | ||
| Total gross amount of assets and liabilities subject to MNA or similar agreements | $ — | $ — |
| 5. | Principal Risks: |
| A Fund’s investments expose it to various types of risks associated with financial instruments and the markets. A Fund may be exposed to the risks described below. Each Fund’s prospectus provides details of its principal risks. | |
| The market values of equity securities, such as common stocks and preferred stocks, or equity related derivative investments, such as futures and options, may decline due to general market conditions which are not specifically related to a particular company, such as real or perceived adverse economic conditions, changes in the general outlook for corporate earnings, changes in interest or currency rates or adverse investor sentiment generally. The market value of equity securities may also decline due to factors which affect a particular industry or industries, such as labor shortages or increased production costs and competitive conditions within an industry. Equity securities and equity related investments generally have greater market price volatility than fixed income securities. The extent of each Fund’s exposure to market risk is the market value of the investments held as shown in the Fund’s Schedule of Investments. |
| 115 |
October 31, 2021
| A widespread health crisis, such as a global pandemic, could cause substantial market volatility, exchange trading suspensions or restrictions and closures of securities exchanges and businesses, impact the ability to complete redemptions, and adversely impact Fund performance. The current ongoing outbreak of COVID-19, a respiratory disease caused by a novel coronavirus, has negatively affected the worldwide economy, created supply chain disruptions and labor shortages, and impacted the financial health of individual companies and the market in significant and unforeseen ways. The future impact of the ongoing COVID-19 pandemic remains unclear. The effects to public health, business and market conditions resulting from COVID-19 pandemic may have a significant negative impact on the performance of a Fund’s investments, including exacerbating other pre-existing political, social and economic risks. | |
| Investing in the securities of non-U.S. issuers, whether directly or indirectly, involves certain considerations and risks not typically associated with securities of U.S. issuers. Such risks include, but are not limited to: generally less liquid and less efficient securities markets; generally greater price volatility; exchange rate fluctuations; imposition of restrictions on the expatriation of funds or other protectionist measures; less publicly available information about issuers; the imposition of withholding or other taxes; higher transaction and custody costs; settlement delays and risk of loss attendant in settlement procedures; difficulties in enforcing contractual obligations; less regulation of securities markets; different accounting, disclosure and reporting requirements; more substantial governmental involvement in the economy; higher inflation rates; and greater social, economic and political uncertainties. Non-U.S. issuers may also be affected by political, social, economic or diplomatic developments in a foreign country or region or the U.S. (including the imposition of sanctions, tariffs, or other governmental restrictions). These risks are heightened for investments in issuers from countries with less developed markets. | |
| Securities lending involves the risk that a Fund may lose money because the borrower of the loaned securities fails to return the securities in a timely manner or at all. A Fund could also lose money in the event of a decline in the value of the collateral provided for the loaned securities or a decline in the value of any investments made with cash collateral. These events could also trigger adverse tax consequences for a Fund that lends its holdings. |
| 6. | Federal Income Taxes: |
| a) | Each Fund intends to continue to qualify as a Regulated Investment Company ("RIC") under Subchapter M of the Internal Revenue Code (“IRC”) by distributing substantially all of its taxable net investment income and net realized capital gains to its shareholders each year. Each Fund has distributed substantially all of its income and capital gains in prior years, if applicable, and intends to distribute substantially all of its income and capital gains during the calendar year ending December 31, 2021. Accordingly, no provision for federal income or excise taxes has been made in the accompanying financial statements. Distributions from short-term capital gains are treated as ordinary income distributions for federal income tax purposes. |
| b) | Net Investment Income (Loss), Net Realized Gains (Losses) and Distributions – Net investment income (loss) and net realized gains (losses) may differ for financial statement and tax purposes primarily because of losses deferred due to wash sale adjustments, foreign currency gains and losses, adjustments related to Passive Foreign Investment Companies ("PFICs"), Real Estate Investment Trusts ("REITs"), RICs, certain derivatives and partnerships. The character of distributions made during the year from net investment income or net realized gains may differ from their ultimate characterization for federal income tax purposes. Also, due to the timing of dividend distributions, the fiscal year in which amounts are distributed may differ from the year that the income or realized gains (losses) were recorded by each Fund. |
| c) | Distributions and Components of Distributable Earnings – The tax character of distributions paid by each Fund for the years ended October 31, 2021 and October 31, 2020 are as follows: |
| For the Year Ended October 31, 2021 | For the Year Ended October 31, 2020 | |||||||
| Fund | Ordinary Income | Long-Term Capital Gains(1) | Ordinary Income | Long-Term Capital Gains(1) | ||||
| Capital Appreciation Fund | $ 29,401,051 | $ 326,546,682 | $ 36,050,954 | $ 304,034,945 | ||||
| Core Equity Fund | 70,885,946 | — | 60,527,093 | 97,987,927 | ||||
| Dividend and Growth Fund | 154,554,069 | 214,857,817 | 150,668,454 | 260,565,466 | ||||
| Equity Income Fund | 75,881,176 | 42,135,878 | 71,168,447 | 255,909,247 | ||||
| Growth Opportunities Fund | 361,398,386 | 579,604,617 | — | 301,835,007 | ||||
| Healthcare Fund | 27,136,342 | 157,201,491 | 6,049,810 | 77,681,567 | ||||
| MidCap Fund | — | 1,544,551,438 | — | 703,065,084 | ||||
| MidCap Value Fund | 3,497,022 | — | 5,747,295 | 16,708,824 | ||||
| Quality Value Fund | 4,003,206 | — | 4,852,723 | 5,832,576 | ||||
| Small Cap Growth Fund | 14,305,053 | 46,613,265 | — | 15,398,605 | ||||
| Small Cap Value Fund | 1,100,001 | — | 1,006,381 | 6,012,453 | ||||
| Small Company Fund | 37,854,022 | 38,852,079 | — | 36,747,668 | ||||
| (1) | The Funds designate these distributions as long-term capital gains dividends pursuant to IRC Sec 852(b)(3)(c) |
| 116 |
October 31, 2021
| Fund | Undistributed Ordinary Income | Undistributed Long-Term Capital Gains | Unrealized Appreciation (Depreciation) on Investments | Total Accumulated Earnings (Deficit) | ||||
| Capital Appreciation Fund | $ 275,556,677 | $ 808,192,672 | $ 1,915,262,527 | $ 2,999,011,876 | ||||
| Core Equity Fund | 109,005,821 | 276,779,779 | 4,901,968,504 | 5,287,754,104 | ||||
| Dividend and Growth Fund | 72,768,002 | 650,563,089 | 5,589,576,274 | 6,312,907,365 | ||||
| Equity Income Fund | 23,718,521 | 327,557,472 | 1,593,602,175 | 1,944,878,168 | ||||
| Growth Opportunities Fund | 625,300,617 | 929,828,549 | 1,849,084,764 | 3,404,213,930 | ||||
| Healthcare Fund | 8,784,435 | 157,636,285 | 437,018,890 | 603,439,610 | ||||
| MidCap Fund | 82,826,769 | 1,452,195,245 | 4,421,998,345 | 5,957,020,359 | ||||
| MidCap Value Fund | 21,874,389 | 40,778,782 | 201,073,559 | 263,726,730 | ||||
| Quality Value Fund | 3,297,860 | 11,016,024 | 60,551,207 | 74,865,091 | ||||
| Small Cap Growth Fund | — | 150,799,913 | 278,504,074 | 429,303,987 | ||||
| Small Cap Value Fund | 6,278,175 | 5,362,817 | 23,810,038 | 35,451,030 | ||||
| Small Company Fund | 50,478,329 | 153,794,458 | 174,201,138 | 378,473,925 |
| d) | Reclassification of Capital Accounts – The Funds may record reclassifications in their capital accounts. These reclassifications have no impact on the total net assets of the Funds. The reclassifications are a result of permanent differences between U.S. GAAP and tax accounting for such items as earnings and profits distributed to shareholders on the redemption of shares, and adjustments to prior year accumulated balances. Adjustments are made to reflect the impact these items have on current and future earnings distributions to shareholders. Therefore, the source of the Funds’ distributions may be shown in the accompanying Statements of Changes in Net Assets as from distributable earnings or from capital depending on the type of book and tax differences that exist. For the year ended October 31, 2021, the Funds recorded reclassifications to increase (decrease) the accounts listed below: |
| Fund | Paid-in-Capital | Distributable Earnings (Loss) | ||
| Capital Appreciation Fund | $ 36,737,981 | $ (36,737,981) | ||
| Equity Income Fund | 26,760,727 | (26,760,727) | ||
| Growth Opportunities Fund | 105,922,139 | (105,922,139) | ||
| Healthcare Fund | 9,171,665 | (9,171,665) | ||
| MidCap Fund | 202,946,801 | (202,946,801) | ||
| Small Cap Growth Fund | 17,201,525 | (17,201,525) | ||
| Small Company Fund | 6,096,797 | (6,096,797) |
| e) | Capital Loss Carryforward – Under the Regulated Investment Company Modernization Act of 2010, funds are permitted to carry forward capital losses for an unlimited period. |
| The Capital Appreciation Fund, Core Equity Fund, Dividend and Growth Fund, Equity Income Fund, Growth Opportunities Fund, Healthcare Fund, MidCap Fund, MidCap Value Fund, Quality Value Fund, Small Cap Growth Fund, Small Cap Value Fund and Small Company Fund had no capital loss carryforwards for U.S. federal tax purposes as of October 31, 2021. | |
| During the year ended October 31, 2021, Core Equity Fund utilized $46,847,127, MidCap Value Fund utilized $32,679,852, Quality Value Fund utilized $2,486,494, and Small Cap Value Fund utilized $5,504,390 of prior year capital loss carryforwards. |
| f) | Tax Basis of Investments – The aggregate cost of investments for federal income tax purposes at October 31, 2021 is different from book purposes primarily due to wash sale loss deferrals, passive foreign investment company (PFIC) mark-to-market adjustments, partnership adjustments and non-taxable distributions from underlying investments. The net unrealized appreciation/(depreciation) on investments for tax purposes, which consists of gross unrealized appreciation and depreciation, was also different from book purposes primarily due to wash sale loss deferrals and mark-to-market adjustments on futures, PFICs, partnership adjustments and non-taxable distributions from |
| 117 |
October 31, 2021
| underlying investments. Both the cost and unrealized appreciation and depreciation for federal income tax purposes are disclosed below: | |
| Fund | Tax Cost | Gross Unrealized Appreciation | Gross Unrealized (Depreciation) | Net Unrealized Appreciation (Depreciation) | ||||
| Capital Appreciation Fund | $ 5,872,665,229 | $ 2,009,304,658 | $ (93,968,052) | $ 1,915,336,606 | ||||
| Core Equity Fund | 7,719,983,877 | 4,924,670,451 | (22,701,947) | 4,901,968,504 | ||||
| Dividend and Growth Fund | 8,978,176,586 | 5,650,613,698 | (61,037,424) | 5,589,576,274 | ||||
| Equity Income Fund | 3,317,882,290 | 1,622,736,076 | (29,255,501) | 1,593,480,575 | ||||
| Growth Opportunities Fund | 6,218,207,281 | 2,015,361,057 | (166,279,070) | 1,849,081,987 | ||||
| Healthcare Fund | 1,298,957,148 | 491,284,508 | (54,256,116) | 437,028,392 | ||||
| MidCap Fund | 9,774,275,285 | 4,825,023,634 | (403,025,289) | 4,421,998,345 | ||||
| MidCap Value Fund | 676,485,567 | 211,895,733 | (10,822,174) | 201,073,559 | ||||
| Quality Value Fund | 171,434,329 | 61,682,308 | (1,131,101) | 60,551,207 | ||||
| Small Cap Growth Fund | 611,625,591 | 322,908,546 | (44,404,472) | 278,504,074 | ||||
| Small Cap Value Fund | 152,169,513 | 27,886,880 | (4,076,842) | 23,810,038 | ||||
| Small Company Fund | 839,093,690 | 220,057,227 | (45,856,089) | 174,201,138 |
| g) | Accounting for Uncertainty in Income Taxes – Pursuant to provisions set forth by U.S. GAAP, Hartford Funds Management Company, LLC ("HFMC") reviews each Fund’s tax positions for all open tax years. As of October 31, 2021, HFMC had reviewed the open tax years and concluded that there was no reason to record a liability for net unrecognized tax obligations relating to uncertain income tax positions. Each Fund files U.S. tax returns. Although the statute of limitations for examining a Fund’s U.S. tax returns remains open for 3 years, no examination is currently in progress. The Funds recognize interest and penalties, if any, related to unrecognized tax benefits as income tax expense on the Statements of Operations. During the year ended October 31, 2021, the Funds did not incur any interest or penalties. HFMC is not aware of any tax positions for which it is reasonably possible that the total amounts of unrecognized tax obligations will significantly change in the next twelve months. |
| 7. | Expenses: |
| a) | Investment Management Agreement – HFMC serves as each Fund’s investment manager. Each Company, on behalf of its respective Funds, has entered into an Investment Management Agreement with HFMC. HFMC is an indirect subsidiary of The Hartford Financial Services Group, Inc. (“The Hartford”). HFMC has overall investment supervisory responsibility for each Fund. In addition, HFMC provides administrative personnel, services, equipment, facilities and office space for proper operation of each Fund. HFMC has contracted with Wellington Management Company LLP (“Wellington Management”) under a sub-advisory agreement and Wellington Management performs the daily investment of the assets of each Fund in accordance with the Fund’s investment objective and policies. Each Fund pays a fee to HFMC. HFMC pays a sub-advisory fee to Wellington Management out of its management fee. |
| The schedule below reflects the rates of compensation paid to HFMC for investment management services rendered as of October 31, 2021; the rates are accrued daily and paid monthly based on each Fund’s average daily net assets, at the following annual rates: | |
| Fund | Management Fee Rates | |
| Capital Appreciation Fund | 0.8000% on first $500 million and; | |
| 0.7000% on next $500 million and; | ||
| 0.6500% on next $4 billion and; | ||
| 0.6475% on next $5 billion and; | ||
| 0.6450% over $10 billion | ||
| Core Equity Fund | 0.4500% on first $500 million and; | |
| 0.3500% on next $500 million and; | ||
| 0.3300% on next $1.5 billion and; | ||
| 0.3250% on next $2.5 billion and; | ||
| 0.3225% over $5 billion | ||
| Dividend and Growth Fund | 0.7500% on first $500 million and; | |
| 0.6500% on next $500 million and; | ||
| 0.6000% on next $1.5 billion and; | ||
| 0.5950% on next $2.5 billion and; | ||
| 0.5900% on next $5 billion and; | ||
| 0.5850% over $10 billion |
| 118 |
October 31, 2021
| Fund | Management Fee Rates | |
| Equity Income Fund | 0.7500% on first $250 million and; | |
| 0.7000% on next $250 million and; | ||
| 0.6500% on next $500 million and; | ||
| 0.6000% on next $1.5 billion and; | ||
| 0.5900% on next $2.5 billion and; | ||
| 0.5875% over $5 billion | ||
| Growth Opportunities Fund | 0.8000% on first $250 million and; | |
| 0.7000% on next $4.75 billion and; | ||
| 0.6975% on next $5 billion and; | ||
| 0.6950% over $10 billion | ||
| Healthcare Fund | 0.9000% on first $500 million and; | |
| 0.8500% on next $500 million and; | ||
| 0.8000% on next $4 billion and; | ||
| 0.7975% on next $5 billion and; | ||
| 0.7950% over $10 billion | ||
| MidCap Fund | 0.8500% on first $500 million and; | |
| 0.7500% on next $500 million and; | ||
| 0.7000% on next $4 billion and; | ||
| 0.6975% on next $5 billion and; | ||
| 0.6950% over $10 billion | ||
| MidCap Value Fund | 0.7500% on first $500 million and; | |
| 0.6500% on next $500 million and; | ||
| 0.6000% on next $1.5 billion and; | ||
| 0.5950% on next $2.5 billion and; | ||
| 0.5900% on next $5 billion and; | ||
| 0.5850% over $10 billion | ||
| Quality Value Fund | 0.4500% on first $500 million and; | |
| 0.3500% on next $500 million and; | ||
| 0.3300% on next $4 billion and; | ||
| 0.3250% on next $5 billion and; | ||
| 0.3225% over $10 billion | ||
| Small Cap Growth Fund | 0.9000% on first $100 million and; | |
| 0.8000% on next $150 million and; | ||
| 0.7000% on next $250 million and; | ||
| 0.6500% on next $4.5 billion and; | ||
| 0.6300% on next $5 billion and; | ||
| 0.6200% over $10 billion | ||
| Small Cap Value Fund | 0.7000% on first $500 million and; | |
| 0.6500% on next $500 million and; | ||
| 0.6000% on next $2 billion and; | ||
| 0.5900% on next $2 billion and; | ||
| 0.5800% on next $5 billion and; | ||
| 0.5700% over $10 billion | ||
| Small Company Fund | 0.8500% on first $250 million and; | |
| 0.8000% on next $250 million and; | ||
| 0.7500% on next $500 million and; | ||
| 0.7000% on next $500 million and; | ||
| 0.6500% on next $3.5 billion and; | ||
| 0.6300% on next $5 billion and; | ||
| 0.6200% over $10 billion |
| b) | Accounting Services Agreement – HFMC provides the Funds with accounting services pursuant to a fund accounting agreement by and between each Company, on behalf of its respective Funds, and HFMC. HFMC has delegated certain accounting and administrative service functions to State Street Bank and Trust Company (“State Street”). In consideration of services rendered and expenses assumed pursuant to the fund accounting agreement, each Fund pays HFMC a fee. Effective May 1, 2021, the fund accounting fee schedule as set forth in the fund accounting agreement by and between each Company, on behalf of its respective Funds, and HFMC, was revised. Effective May 1, 2021, the fund accounting fee for each Fund is equal to the greater of: (A) the sum of (i) the sub-accounting fee payable by HFMC with respect to the Fund; (ii) the fee payable for tax preparation services for the Fund; and (iii) the amount of expenses that HFMC allocates for providing the fund accounting services to the Fund; plus a target profit margin; or (B) $40,000 per year; provided, however, that to the extent the annual amount of the fund accounting fee exceeds 0.02% of the Fund’s average net assets (calculated during its current fiscal year), HFMC shall waive such portion of the fund accounting fee. For the period November 1, 2020 through April 30, 2021, HFMC received the |
| 119 |
October 31, 2021
| following fee with respect to each Fund: any sub-accounting fee payable by HFMC plus the amount of expenses that HFMC allocates for providing the fund accounting services. | |
| c) | Operating Expenses – Allocable expenses incurred by each Company are allocated to each series within such Company, and allocated to classes within each such series, in proportion to the average daily net assets of such series and classes, except where allocation of certain expenses is more fairly made directly to a Fund or to specific classes within a Fund. As of October 31, 2021, HFMC contractually agreed to limit the total annual fund operating expenses (exclusive of taxes, interest expenses, brokerage commissions, acquired fund fees and expenses, and extraordinary expenses), through February 28, 2022 (unless the applicable Board of Directors approves its earlier termination) as follows for each of the following Funds: |
| Expense Limit as a Percentage of Average Daily Net Assets | ||||||||||||||||||
| Fund | Class A | Class C | Class I | Class R3 | Class R4 | Class R5 | Class R6 | Class Y | Class F | |||||||||
| Quality Value Fund | 0.96% | 1.71% | 0.66% | 1.18% | 0.88% | 0.63% | 0.46% | 0.57% | 0.46% | |||||||||
| Small Cap Value Fund | 1.30% | 2.05% | 1.00% | 1.50% | 1.20% | 0.90% | 0.80% | 0.85% | 0.80% | |||||||||
| Expense Limit as a Percentage of Average Daily Net Assets | ||||||||||||||||||
| Fund | Class A | Class C | Class I | Class R3 | Class R4 | Class R5 | Class R6 | Class Y | Class F | |||||||||
| Small Company Fund | 1.40% | 2.15% | 1.15% | 1.55% | 1.25% | 0.95% | 0.90% | 0.95% | 0.90% | |||||||||
| d) | Fees Paid Indirectly – Certain Funds have entered into agreements with State Street Global Markets, LLC and Russell Implementation Services, Inc. to partially recapture non-discounted trade commissions. Such rebates are used to pay a portion of a Fund's expenses. For the year ended October 31, 2021, these amounts, if any, are included in the Statements of Operations. |
| The ratio of expenses to average net assets in the accompanying financial highlights excludes the reduction in expenses related to fees paid indirectly. The annualized expense ratio after waivers reflecting the reduction for fees paid indirectly for the period is as follows: | |
| Fund | Class A | Class C | Class I | Class R3 | Class R4 | Class R5 | Class R6 | Class Y | Class F | |||||||||
| Capital Appreciation Fund | 1.04% | 1.83% | 0.77% | 1.41% | 1.10% | 0.80% | 0.69% | 0.78% | 0.69% | |||||||||
| Core Equity Fund | 0.70% | 1.45% | 0.45% | 1.06% | 0.72% | 0.46% | 0.36% | 0.44% | 0.36% | |||||||||
| Dividend and Growth Fund | 0.97% | 1.75% | 0.71% | 1.35% | 1.03% | 0.73% | 0.63% | 0.67% | 0.63% | |||||||||
| Equity Income Fund | 0.98% | 1.75% | 0.74% | 1.35% | 1.05% | 0.75% | 0.65% | 0.73% | 0.65% | |||||||||
| Growth Opportunities Fund | 1.06% | 1.83% | 0.82% | 1.44% | 1.14% | 0.84% | 0.73% | 0.83% | 0.73% | |||||||||
| Healthcare Fund | 1.24% | 2.01% | 0.98% | 1.59% | 1.29% | 1.00% | 0.89% | 0.98% | 0.89% | |||||||||
| MidCap Fund | 1.08% | 1.84% | 0.85% | 1.45% | 1.13% | 0.83% | 0.74% | 0.77% | 0.73% | |||||||||
| MidCap Value Fund | 1.18% | 1.95% | 0.85% | 1.49% | 1.19% | 0.89% | N/A | 0.88% | 0.77% | |||||||||
| Quality Value Fund | 0.94% | 1.71% | 0.63% | 1.17% | 0.88% | 0.62% | 0.46% | 0.57% | 0.46% | |||||||||
| Small Cap Growth Fund | 1.18% | 1.89% | 0.83% | 1.47% | 1.17% | 0.86% | 0.76% | 0.81% | 0.76% | |||||||||
| Small Cap Value Fund | 1.28% | 2.04% | 0.96% | 1.39% | 1.20% | 0.90% | 0.80% | 0.85% | 0.80% | |||||||||
| Small Company Fund | 1.22% | 2.05% | 0.95% | 1.57% | 1.26% | 0.96% | 0.85% | 0.90% | 0.85% |
| e) | Sales Charges and Distribution and Service Plan for Class A, T, C, R3 and R4 Shares – Hartford Funds Distributors, LLC (“HFD”), an indirect subsidiary of The Hartford, is the principal underwriter and distributor of each Fund. For the year ended October 31, 2021, HFD received front-end sales charges and contingent deferred sales charges for each Fund as follows: |
| Fund | Front-End Sales Charges | Contingent Deferred Sales Charges | ||
| Capital Appreciation Fund | $ 1,636,733 | $ 12,072 | ||
| Core Equity Fund | 2,921,456 | 43,366 | ||
| Dividend and Growth Fund | 3,383,956 | 24,796 | ||
| Equity Income Fund | 1,125,483 | 10,310 | ||
| Growth Opportunities Fund | 3,114,928 | 25,783 | ||
| Healthcare Fund | 1,005,689 | 6,572 | ||
| MidCap Fund | 2,254,813 | 19,506 | ||
| MidCap Value Fund | 469,398 | 428 | ||
| Quality Value Fund | 97,745 | 65 | ||
| Small Cap Growth Fund | 100,663 | 499 | ||
| Small Cap Value Fund | 106,907 | 860 | ||
| Small Company Fund | 612,308 | 2,894 |
| 120 |
October 31, 2021
| f) | Other Related Party Transactions – Certain officers of each Company are directors and/or officers of HFMC and/or The Hartford or its subsidiaries. For the year ended October 31, 2021, a portion of each Company’s Chief Compliance Officer’s (“CCO”) compensation was paid by all of the investment companies in the Hartford fund complex. The portion allocated to each Fund, as represented in other expenses on the Statements of Operations, is outlined in the table below. |
| Fund | CCO Compensation Paid by Fund | |
| Capital Appreciation Fund | $ 13,090 | |
| Core Equity Fund | 20,209 | |
| Dividend and Growth Fund | 22,565 | |
| Equity Income Fund | 8,109 | |
| Growth Opportunities Fund | 13,439 | |
| Healthcare Fund | 2,937 | |
| MidCap Fund | 24,786 | |
| MidCap Value Fund | 1,433 | |
| Quality Value Fund | 380 | |
| Small Cap Growth Fund | 1,545 | |
| Small Cap Value Fund | 280 | |
| Small Company Fund | 1,652 |
| 121 |
October 31, 2021
| Share Class | Specified Amount (as a percentage average daily net assets) | |
| Class A | 0.25% | |
| Class C | 0.25% | |
| Class I | 0.20% | |
| Class R3 | 0.22% | |
| Class R4 | 0.17% | |
| Class R5 | 0.12% | |
| Class R6 | 0.004% | |
| Class Y | 0.11% | |
| Class F | 0.004% |
| Fund | Class I | Class Y | ||
| Core Equity Fund | N/A | 0.08% | ||
| Dividend and Growth Fund | N/A | 0.04% | ||
| MidCap Fund | 0.12% | 0.04% | ||
| Small Cap Growth Fund | N/A | 0.06% |
| Fund | Class I | Class Y | ||
| Capital Appreciation Fund | N/A | 0.06% | ||
| Core Equity Fund | N/A | 0.08% | ||
| Dividend and Growth Fund | N/A | 0.04% | ||
| Equity Income Fund | N/A | 0.06% | ||
| Growth Opportunities Fund | N/A | 0.04% | ||
| Healthcare Fund | N/A | 0.05% | ||
| MidCap Fund | 0.12% | 0.04% | ||
| MidCap Value Fund | N/A | 0.07% | ||
| Small Cap Growth Fund | N/A | 0.04% |
| Fund | Class A | Class C | Class I | Class R3 | Class R4 | Class R5 | Class R6 | Class Y | Class F | |||||||||
| Capital Appreciation Fund | 0.10% | 0.14% | 0.08% | 0.22% | 0.16% | 0.11% | 0.00% * | 0.09% | 0.00%* | |||||||||
| Core Equity Fund | 0.09% | 0.09% | 0.09% | 0.21% | 0.15% | 0.10% | 0.00% * | 0.08% | 0.00%* | |||||||||
| Dividend and Growth Fund | 0.09% | 0.12% | 0.09% | 0.22% | 0.15% | 0.10% | 0.00% * | 0.04% | 0.00%* | |||||||||
| Equity Income Fund | 0.08% | 0.10% | 0.09% | 0.21% | 0.15% | 0.10% | 0.00% * | 0.09% | 0.00%* | |||||||||
| Growth Opportunities Fund | 0.09% | 0.10% | 0.09% | 0.22% | 0.16% | 0.11% | 0.00% * | 0.10% | 0.00%* | |||||||||
| Healthcare Fund | 0.11% | 0.13% | 0.10% | 0.21% | 0.16% | 0.12% | 0.00% * | 0.09% | 0.00%* | |||||||||
| MidCap Fund | 0.10% | 0.11% | 0.12% | 0.22% | 0.17% | 0.10% | 0.00% * | 0.04% | 0.00%* | |||||||||
| MidCap Value Fund | 0.16% | 0.19% | 0.08% | 0.22% | 0.17% | 0.12% | N/A | 0.11% | 0.00%* | |||||||||
| Quality Value Fund | 0.16% | 0.25% | 0.09% | 0.22% | 0.17% | 0.12% | 0.00% * | 0.11% | 0.00%* | |||||||||
| Small Cap Growth Fund | 0.17% | 0.13% | 0.07% | 0.22% | 0.16% | 0.11% | 0.00% * | 0.05% | 0.00%* | |||||||||
| Small Cap Value Fund | 0.21% | 0.25% | 0.12% | 0.22% | 0.17% | 0.12% | 0.00% * | 0.11% | 0.00%* | |||||||||
| Small Company Fund | 0.13% | 0.20% | 0.11% | 0.22% | 0.16% | 0.12% | 0.00% * | 0.06% | 0.00%* |
| * | Amount rounds to 0.00% |
| 122 |
October 31, 2021
| 8. | Securities Lending: |
| Each Company has entered into a securities lending agency agreement (“lending agreement”) with Citibank, N.A. (“Citibank”). A Fund may lend portfolio securities to certain borrowers in U.S. and non-U.S. markets in an amount not to exceed one-third (33 1/3%) of the value of its total assets. A Fund may lend portfolio securities, provided that the borrower provides collateral that is maintained in an amount at least equal to the current market value of the securities loaned. Cash collateral is invested for the benefit of a Fund by the Fund’s lending agent pursuant to collateral investment guidelines. The collateral is marked to market daily, in an amount at least equal to the current market value of the securities loaned. | |
| A Fund is subject to certain risks while its securities are on loan, including the following: (i) the risk that the borrower defaults on the loan and the collateral is inadequate to cover the Fund’s loss; (ii) the risk that the earnings on the collateral invested are not sufficient to pay fees incurred in connection with the loan; (iii) the Fund could lose money in the event of a decline in the value of the collateral provided for loaned securities or a decline in the value of any investments made with cash collateral; (iv) the risk that the borrower may use the loaned securities to cover a short sale, which may in turn place downward pressure on the market prices of the loaned securities; (v) the risk that return of loaned securities could be delayed and interfere with portfolio management decisions; and (vi) the risk that any efforts to restrict or recall the securities for purposes of voting may not be effective. These events could also trigger adverse tax consequences for the Fund. | |
| A Fund retains loan fees and the interest on cash collateral investments but is required to pay the borrower a rebate for the use of cash collateral. In cases where the lent security is of high value to borrowers, there may be a negative rebate (i.e., a net payment from the borrower to the applicable Fund). Upon termination of a loan, a Fund is required to return to the borrower an amount equal to the cash collateral, plus any rebate owed to the borrowers. | |
| The net income earned on the securities lending (after payment of rebates and Citibank’s fee) is included on the Statements of Operations as Investment Income from securities lending. A Fund also receives payments from the borrower during the period of the loan, equivalent to dividends and interest earned on the securities loaned, which are recorded as Investment Income from dividends or interest, respectively, on the Statements of Operations. | |
| The following table presents for each Fund that lends its portfolio securities the market value of the securities on loan; the collateral posted by the borrower; and the net amount, if any, due from the borrower in the event of default as of October 31, 2021. | |
| Fund | Investment Securities on Loan, at market value, Presented on the Statements of Assets and Liabilities | Collateral Posted by Borrower(1) | Net Amount(2) | |||
| Capital Appreciation Fund | $ 78,297,883 | $ (78,297,883) | $ — | |||
| Core Equity Fund | — | — | — | |||
| Dividend and Growth Fund | — | — | — | |||
| Equity Income Fund | 18,426,375 | (18,426,375) | — | |||
| Growth Opportunities Fund | 50,802,197 | (50,802,197) | — | |||
| Healthcare Fund | 12,432,635 | (12,432,635) (3) | — | |||
| MidCap Fund | 285,537,889 | (285,537,889) | — | |||
| MidCap Value Fund | — | — | — | |||
| Quality Value Fund | — | — | — | |||
| Small Cap Growth Fund | 4,006,025 | (4,006,025) | — | |||
| Small Cap Value Fund | — | — | — | |||
| Small Company Fund | 26,917,675 | (26,917,675) | — |
| (1) | It is each Fund’s policy to obtain additional collateral from, or return excess collateral to, the borrower by the end of the next business day following the valuation date of the securities loaned. Therefore, the value of the collateral held may be temporarily less than that required under the lending contract due to timing. Pursuant to the lending agreement, the borrower will provide collateral in an amount at least equal to the current market value of securities loaned. Collateral received in excess or in deficit of the market value is not presented in this table. |
| (2) | Net amount represents the net amount receivable due from the borrower in the event of default. |
| (3) | Includes non-cash collateral of $2,493,877. |
| 9. | Secured Borrowings: |
| The following tables reflect a breakdown of transactions accounted for as secured borrowings, the gross obligation by the type of collateral pledged, and the remaining contractual maturity of those transactions as of October 31, 2021. |
| 123 |
October 31, 2021
| Certain Transfers Accounted For As Secured Borrowings | |
| Remaining Contractual Maturity of the Agreements | |
| Overnight and Continuous | < 30 days | Between 30 & 90 days | > 90 days | Total | |||||
| Capital Appreciation Fund | |||||||||
| Securities Lending Transactions(1) | |||||||||
| Common Stocks | $ 77,452,552 | $ — | $ — | $ — | $ 77,452,552 | ||||
| Total Borrowings | $ 77,452,552 | $ — | $ — | $ — | $ 77,452,552 | ||||
| Gross amount of recognized liabilities for securities lending transactions | $ 77,452,552 | ||||||||
| Equity Income Fund | |||||||||
| Securities Lending Transactions(1) | |||||||||
| Common Stocks | $ 19,221,444 | $ — | $ — | $ — | $ 19,221,444 | ||||
| Total Borrowings | $ 19,221,444 | $ — | $ — | $ — | $ 19,221,444 | ||||
| Gross amount of recognized liabilities for securities lending transactions | $ 19,221,444 | ||||||||
| Growth Opportunities Fund | |||||||||
| Securities Lending Transactions(1) | |||||||||
| Common Stocks | $ 30,756,183 | $ — | $ — | $ — | $ 30,756,183 | ||||
| Exchange-Traded Funds | 20,630,943 | — | — | — | 20,630,943 | ||||
| Total Borrowings | $ 51,387,126 | $ — | $ — | $ — | $ 51,387,126 | ||||
| Gross amount of recognized liabilities for securities lending transactions | $ 51,387,126 | ||||||||
| Healthcare Fund | |||||||||
| Securities Lending Transactions(1) | |||||||||
| Common Stocks | $ 10,759,237 | $ — | $ — | $ — | $ 10,759,237 | ||||
| Total Borrowings | $ 10,759,237 | $ — | $ — | $ — | $ 10,759,237 | ||||
| Gross amount of recognized liabilities for securities lending transactions | $ 10,759,237 | ||||||||
| MidCap Fund | |||||||||
| Securities Lending Transactions(1) | |||||||||
| Common Stocks | $ 292,714,891 | $ — | $ — | $ — | $ 292,714,891 | ||||
| Total Borrowings | $ 292,714,891 | $ — | $ — | $ — | $ 292,714,891 | ||||
| Gross amount of recognized liabilities for securities lending transactions | $ 292,714,891 | ||||||||
| Small Cap Growth Fund | |||||||||
| Securities Lending Transactions(1) | |||||||||
| Common Stocks | $ 3,984,420 | $ — | $ — | $ — | $ 3,984,420 | ||||
| Total Borrowings | $ 3,984,420 | $ — | $ — | $ — | $ 3,984,420 | ||||
| Gross amount of recognized liabilities for securities lending transactions | $ 3,984,420 | ||||||||
| Small Company Fund | |||||||||
| Securities Lending Transactions(1) | |||||||||
| Common Stocks | $ 3,373,971 | $ — | $ — | $ — | $ 3,373,971 | ||||
| Exchange-Traded Funds | 23,931,233 | — | — | — | 23,931,233 | ||||
| Total Borrowings | $ 27,305,204 | $ — | $ — | $ — | $ 27,305,204 | ||||
| Gross amount of recognized liabilities for securities lending transactions | $ 27,305,204 | ||||||||
| (1) | Amount represents the payable for cash collateral received on securities on loan. This will generally be in the “Overnight and Continuous” column as the securities are typically callable on demand. |
| 124 |
October 31, 2021
| 10. | Affiliated Security Transactions: |
| If a Fund owns 5% or more of the outstanding voting securities, either directly or indirectly, of a particular issuer, the 1940 Act deems such an issuer to be an “affiliate” of the Fund. As of and during the year ended October 31, 2021, the MidCap Fund and Small Company Fund owned 5% or more of the outstanding voting securities of the issuers identified in the table below: | |
| A summary of affiliated security transactions for the year ended October 31, 2021 follows: | |
| Affliated Investments | Beginning Value as of November 1, 2020 | Purchases at Cost | Proceeds from Sales | Net Realized Gain/(Loss) on Sales | Return of Capital | Change in Unrealized Appreciation/ (Depreciation) | Ending Value as of October 31, 2021 | Shares as of October 31, 2021 | Capital Gains Distribution | |||||||||
| MidCap Fund | ||||||||||||||||||
| Coherent, Inc.* | $ 187,569,718 | $ 18,058,381 | $ 411,099,062 | $ 188,312,226 | $ — | $ 17,158,737 | $ — | — | $ — | |||||||||
| CommScope Holding Co., Inc. | 137,679,930 | 36,110,935 | 136,758,500 | (55,422,395) | — | 127,853,845 | 109,463,815 | 10,220,711 | — | |||||||||
| II-VI, Inc.* | 281,918,456 | 51,442,698 | 188,952,376 | 65,146,804 | — | 51,926,342 | 261,481,923 | 4,321,301 | — | |||||||||
| KAR Auction Services, Inc.* | 166,382,725 | 2,968,202 | 188,244,850 | (21,888,071) | — | 40,781,994 | — | — | — | |||||||||
| NuVasive, Inc.* | 122,529,543 | 44,759,373 | 145,995,683 | (7,845,007) | — | 34,511,955 | 47,960,181 | 898,804 | — | |||||||||
| PTC Therapeutics, Inc.* | 185,643,379 | 19,931,856 | 48,321,120 | (6,267,817) | — | (38,758,862) | 112,227,436 | 2,958,804 | — | |||||||||
| Teradata Corp.* | 158,390,567 | 5,640,697 | 221,630,337 | 48,810,006 | — | 113,662,125 | 196,958,379 | 3,482,291 | — | |||||||||
| Total | $ 1,240,114,318 | $ 178,912,142 | $ 1,341,001,928 | $ 210,845,746 | $ — | $ 347,136,136 | $728,091,734 | 21,881,911 | $ — | |||||||||
| Small Company Fund | ||||||||||||||||||
| Allstar Co.(1) | $ 2,634,744 | $ — | $ — | $ — | $ (1,364,479) | $ (1,270,265) | $ — | 3,136,600 | $ 5,465,767 | |||||||||
| * | Not an affiliate as of October 31, 2021. |
| (1) | Allstar Co. is a Delaware limited liability company that was created for the purpose of investing in Academy Sports & Outdoors, Inc. As a result of the Fund's holdings in Allstar Co., the Fund previously had indirect exposure to Academy Sports & Outdoors, Inc.; however, the Fund does not have direct or indirect exposure to 5% or more of the outstanding voting securities of Academy Sports & Outdoors, Inc. |
| 11. | Affiliate Holdings: |
| As of October 31, 2021, affiliates of The Hartford had ownership of shares in each Fund as follows: | |
| Percentage of a Class: | ||||||||||||||||||
| Fund | Class A | Class C | Class I | Class R3 | Class R4 | Class R5 | Class R6 | Class Y | Class F | |||||||||
| Small Cap Value Fund | — | — | — | — | — | 65% | — | — | — |
| Percentage of Fund by Class: | ||||||||||||||||||
| Fund | Class A | Class C | Class I | Class R3 | Class R4 | Class R5 | Class R6 | Class Y | Class F | |||||||||
| Small Cap Value Fund | — | — | — | — | — | 0%* | — | — | — |
| * | Percentage rounds to zero. |
| 125 |
October 31, 2021
| Fund | Percentage of Fund* | |
| Capital Appreciation Fund | 8% | |
| Core Equity Fund | 3% | |
| Dividend and Growth Fund | 6% | |
| Equity Income Fund | 6% | |
| Growth Opportunities Fund | 3% | |
| MidCap Fund | 1% | |
| MidCap Value Fund | 2% | |
| Small Cap Growth Fund | 4% | |
| Small Cap Value Fund | 34% | |
| Small Company Fund | 8% |
| * | As of October 31, 2021, affiliated funds of funds and the 529 plan were invested in Class F shares. |
| 12. | Investment Transactions: |
| For the year ended October 31, 2021, the cost of purchases and proceeds from sales of investment securities (excluding short-term investments) were as follows: | |
| Fund | Cost of Purchases Excluding U.S. Government Obligations | Sales Proceeds Excluding U.S. Government Obligations | Total Cost of Purchases | Total Sales Proceeds | ||||
| Capital Appreciation Fund | $ 4,464,956,625 | $ 5,206,803,039 | $ 4,464,956,625 | $ 5,206,803,039 | ||||
| Core Equity Fund | 2,350,534,922 | 1,430,740,283 | 2,350,534,922 | 1,430,740,283 | ||||
| Dividend and Growth Fund | 3,190,240,893 | 2,085,167,169 | 3,190,240,893 | 2,085,167,169 | ||||
| Equity Income Fund | 1,067,185,235 | 1,216,065,330 | 1,067,185,235 | 1,216,065,330 | ||||
| Growth Opportunities Fund | 6,533,782,097 | 6,816,019,926 | 6,533,782,097 | 6,816,019,926 | ||||
| Healthcare Fund | 824,641,192 | 912,535,736 | 824,641,192 | 912,535,736 | ||||
| MidCap Fund | 4,121,031,940 | 7,569,551,161 | 4,121,031,940 | 7,569,551,161 | ||||
| MidCap Value Fund | 441,899,041 | 453,360,880 | 441,899,041 | 453,360,880 | ||||
| Quality Value Fund | 42,339,156 | 51,449,852 | 42,339,156 | 51,449,852 | ||||
| Small Cap Growth Fund | 431,398,620 | 625,517,479 | 431,398,620 | 625,517,479 | ||||
| Small Cap Value Fund | 132,253,465 | 82,617,263 | 132,253,465 | 82,617,263 | ||||
| Small Company Fund | 1,185,210,655 | 1,133,575,058 | 1,185,210,655 | 1,133,575,058 |
| 13. | Capital Share Transactions: |
| The following information is for the years ended October 31, 2021 and October 31, 2020: | |
| For the Year Ended October 31, 2021 | For the Year Ended October 31, 2020 | ||||||
| Shares | Amount | Shares | Amount | ||||
| Capital Appreciation Fund | |||||||
| Class A | |||||||
| Shares Sold | 3,367,409 | $ 153,139,085 | 4,936,646 | $ 174,349,729 | |||
| Shares Issued for Reinvested Dividends | 5,909,766 | 249,118,669 | 6,205,381 | 227,070,199 | |||
| Shares Redeemed | (13,459,956) | (610,878,988) | (20,320,300) | (726,270,861) | |||
| Net Increase (Decrease) | (4,182,781) | (208,621,234) | (9,178,273) | (324,850,933) | |||
| Class C | |||||||
| Shares Sold | 420,030 | $ 13,300,659 | 646,385 | $ 16,546,122 | |||
| Shares Issued for Reinvested Dividends | 423,362 | 12,493,414 | 576,523 | 15,076,069 | |||
| Shares Redeemed | (2,943,150) | (94,205,765) | (5,045,288) | (130,502,671) | |||
| Net Increase (Decrease) | (2,099,758) | (68,411,692) | (3,822,380) | (98,880,480) | |||
| Class I | |||||||
| Shares Sold | 1,763,794 | $ 80,348,270 | 1,956,471 | $ 70,731,684 | |||
| Shares Issued for Reinvested Dividends | 692,879 | 29,440,161 | 771,728 | 28,460,949 | |||
| Shares Redeemed | (2,913,758) | (132,549,967) | (5,242,907) | (186,790,433) | |||
| Net Increase (Decrease) | (457,085) | (22,761,536) | (2,514,708) | (87,597,800) | |||
| 126 |
October 31, 2021
| For the Year Ended October 31, 2021 | For the Year Ended October 31, 2020 | ||||||
| Shares | Amount | Shares | Amount | ||||
| Class R3 | |||||||
| Shares Sold | 81,697 | $ 4,139,188 | 116,903 | $ 4,540,361 | |||
| Shares Issued for Reinvested Dividends | 40,201 | 1,911,571 | 46,694 | 1,912,115 | |||
| Shares Redeemed | (289,780) | (14,863,615) | (408,486) | (16,587,839) | |||
| Net Increase (Decrease) | (167,882) | (8,812,856) | (244,889) | (10,135,363) | |||
| Class R4 | |||||||
| Shares Sold | 75,708 | $ 4,029,701 | 102,404 | $ 4,357,340 | |||
| Shares Issued for Reinvested Dividends | 28,656 | 1,422,120 | 34,702 | 1,480,745 | |||
| Shares Redeemed | (195,566) | (10,231,712) | (305,424) | (13,165,782) | |||
| Net Increase (Decrease) | (91,202) | (4,779,891) | (168,318) | (7,327,697) | |||
| Class R5 | |||||||
| Shares Sold | 38,655 | $ 2,086,665 | 73,396 | $ 3,082,937 | |||
| Shares Issued for Reinvested Dividends | 31,983 | 1,626,764 | 37,234 | 1,629,967 | |||
| Shares Redeemed | (196,018) | (10,767,188) | (247,588) | (10,879,629) | |||
| Net Increase (Decrease) | (125,380) | (7,053,759) | (136,958) | (6,166,725) | |||
| Class R6 | |||||||
| Shares Sold | 101,705 | $ 5,729,396 | 154,746 | $ 6,189,604 | |||
| Shares Issued for Reinvested Dividends | 11,975 | 613,867 | 80,778 | 3,562,525 | |||
| Shares Redeemed | (60,680) | (3,346,501) | (1,780,995) | (77,069,137) | |||
| Net Increase (Decrease) | 53,000 | 2,996,762 | (1,545,471) | (67,317,008) | |||
| Class Y | |||||||
| Shares Sold | 418,089 | $ 23,154,624 | 406,425 | $ 17,905,774 | |||
| Shares Issued for Reinvested Dividends | 97,100 | 4,973,187 | 187,899 | 8,281,321 | |||
| Shares Redeemed | (683,536) | (37,544,012) | (2,600,260) | (116,860,535) | |||
| Net Increase (Decrease) | (168,347) | (9,416,201) | (2,005,936) | (90,673,440) | |||
| Class F | |||||||
| Shares Sold | 1,156,081 | $ 52,681,033 | 2,953,391 | $ 96,156,703 | |||
| Shares Issued for Reinvested Dividends | 996,586 | 42,357,183 | 1,088,641 | 40,167,416 | |||
| Shares Redeemed | (2,759,017) | (125,550,739) | (6,078,654) | (219,729,113) | |||
| Net Increase (Decrease) | (606,350) | (30,512,523) | (2,036,622) | (83,404,994) | |||
| Total Net Increase (Decrease) | (7,845,785) | $ (357,372,930) | (21,653,555) | $ (776,354,440) | |||
| Core Equity Fund | |||||||
| Class A | |||||||
| Shares Sold | 8,048,194 | $ 349,552,465 | 12,000,329 | $ 399,459,192 | |||
| Shares Issued for Reinvested Dividends | 170,767 | 6,957,062 | 652,243 | 22,377,578 | |||
| Shares Redeemed | (5,854,509) | (256,534,349) | (7,386,228) | (240,896,634) | |||
| Net Increase (Decrease) | 2,364,452 | 99,975,178 | 5,266,344 | 180,940,136 | |||
| Class C | |||||||
| Shares Sold | 2,433,951 | $ 95,569,941 | 4,551,296 | $ 137,663,560 | |||
| Shares Issued for Reinvested Dividends | — | — | 247,606 | 7,653,796 | |||
| Shares Redeemed | (2,963,058) | (117,542,554) | (3,263,520) | (99,295,785) | |||
| Net Increase (Decrease) | (529,107) | (21,972,613) | 1,535,382 | 46,021,571 | |||
| Class I | |||||||
| Shares Sold | 38,606,478 | $ 1,683,147,371 | 55,251,441 | $ 1,824,328,535 | |||
| Shares Issued for Reinvested Dividends | 587,802 | 23,982,316 | 1,340,855 | 46,209,109 | |||
| Shares Redeemed | (25,621,499) | (1,138,977,250) | (27,336,937) | (896,498,720) | |||
| Net Increase (Decrease) | 13,572,781 | 568,152,437 | 29,255,359 | 974,038,924 | |||
| Class R3 | |||||||
| Shares Sold | 430,551 | $ 19,338,433 | 599,499 | $ 20,904,257 | |||
| Shares Issued for Reinvested Dividends | 3,454 | 143,013 | 21,100 | 731,315 | |||
| Shares Redeemed | (280,505) | (12,331,610) | (352,314) | (11,904,251) | |||
| Net Increase (Decrease) | 153,500 | 7,149,836 | 268,285 | 9,731,321 | |||
| Class R4 | |||||||
| Shares Sold | 1,346,774 | $ 61,759,473 | 1,581,637 | $ 56,055,128 | |||
| Shares Issued for Reinvested Dividends | 22,870 | 962,136 | 100,713 | 3,564,282 | |||
| Shares Redeemed | (1,230,844) | (56,219,106) | (1,491,613) | (51,795,823) | |||
| Net Increase (Decrease) | 138,800 | 6,502,503 | 190,737 | 7,823,587 | |||
| 127 |
October 31, 2021
| For the Year Ended October 31, 2021 | For the Year Ended October 31, 2020 | ||||||
| Shares | Amount | Shares | Amount | ||||
| Class R5 | |||||||
| Shares Sold | 719,073 | $ 31,981,033 | 1,134,925 | $ 38,804,050 | |||
| Shares Issued for Reinvested Dividends | 30,689 | 1,262,537 | 159,932 | 5,552,692 | |||
| Shares Redeemed | (1,428,140) | (63,174,300) | (2,986,041) | (101,176,396) | |||
| Net Increase (Decrease) | (678,378) | (29,930,730) | (1,691,184) | (56,819,654) | |||
| Class R6 | |||||||
| Shares Sold | 5,638,764 | $ 249,691,246 | 16,027,389 | $ 553,894,759 | |||
| Shares Issued for Reinvested Dividends | 161,700 | 6,679,826 | 209,189 | 7,302,091 | |||
| Shares Redeemed | (5,359,583) | (240,460,323) | (3,524,239) | (123,476,087) | |||
| Net Increase (Decrease) | 440,881 | 15,910,749 | 12,712,339 | 437,720,763 | |||
| Class Y | |||||||
| Shares Sold | 4,083,890 | $ 178,723,495 | 11,888,408 | $ 397,928,760 | |||
| Shares Issued for Reinvested Dividends | 139,865 | 5,777,841 | 285,662 | 9,972,693 | |||
| Shares Redeemed | (4,487,602) | (204,115,939) | (4,866,025) | (165,866,944) | |||
| Net Increase (Decrease) | (263,847) | (19,614,603) | 7,308,045 | 242,034,509 | |||
| Class F | |||||||
| Shares Sold | 20,968,799 | $ 922,349,213 | 29,798,828 | $ 1,002,322,628 | |||
| Shares Issued for Reinvested Dividends | 532,223 | 21,725,333 | 1,403,840 | 48,429,362 | |||
| Shares Redeemed | (18,994,470) | (837,983,756) | (18,375,875) | (609,580,679) | |||
| Net Increase (Decrease) | 2,506,552 | 106,090,790 | 12,826,793 | 441,171,311 | |||
| Total Net Increase (Decrease) | 17,705,634 | $ 732,263,547 | 67,672,100 | $ 2,282,662,468 | |||
| Dividend and Growth Fund | |||||||
| Class A | |||||||
| Shares Sold | 11,151,010 | $ 344,976,720 | 12,878,095 | $ 307,347,699 | |||
| Shares Issued for Reinvested Dividends | 4,336,771 | 122,673,579 | 6,355,646 | 158,639,507 | |||
| Shares Redeemed | (17,131,999) | (519,287,515) | (23,863,951) | (575,703,006) | |||
| Net Increase (Decrease) | (1,644,218) | (51,637,216) | (4,630,210) | (109,715,800) | |||
| Class C | |||||||
| Shares Sold | 1,419,508 | $ 42,204,089 | 1,341,581 | $ 31,800,923 | |||
| Shares Issued for Reinvested Dividends | 145,715 | 3,852,604 | 277,274 | 6,745,974 | |||
| Shares Redeemed | (2,354,366) | (69,029,852) | (3,403,410) | (78,986,558) | |||
| Net Increase (Decrease) | (789,143) | (22,973,159) | (1,784,555) | (40,439,661) | |||
| Class I | |||||||
| Shares Sold | 36,793,322 | $ 1,137,090,014 | 44,546,101 | $ 1,034,422,781 | |||
| Shares Issued for Reinvested Dividends | 2,425,264 | 69,068,594 | 2,167,389 | 53,242,132 | |||
| Shares Redeemed | (15,783,459) | (477,606,650) | (18,862,040) | (444,869,560) | |||
| Net Increase (Decrease) | 23,435,127 | 728,551,958 | 27,851,450 | 642,795,353 | |||
| Class R3 | |||||||
| Shares Sold | 324,177 | $ 10,228,653 | 319,957 | $ 7,867,244 | |||
| Shares Issued for Reinvested Dividends | 59,719 | 1,695,081 | 98,410 | 2,513,108 | |||
| Shares Redeemed | (687,387) | (21,558,216) | (713,282) | (17,768,056) | |||
| Net Increase (Decrease) | (303,491) | (9,634,482) | (294,915) | (7,387,704) | |||
| Class R4 | |||||||
| Shares Sold | 676,475 | $ 21,736,412 | 646,555 | $ 15,896,512 | |||
| Shares Issued for Reinvested Dividends | 75,716 | 2,188,661 | 137,823 | 3,531,150 | |||
| Shares Redeemed | (1,035,619) | (31,590,923) | (1,673,250) | (42,325,963) | |||
| Net Increase (Decrease) | (283,428) | (7,665,850) | (888,872) | (22,898,301) | |||
| Class R5 | |||||||
| Shares Sold | 2,526,093 | $ 79,438,301 | 2,555,808 | $ 63,782,124 | |||
| Shares Issued for Reinvested Dividends | 96,696 | 2,843,393 | 142,472 | 3,650,977 | |||
| Shares Redeemed | (2,227,663) | (69,728,112) | (2,841,394) | (70,963,602) | |||
| Net Increase (Decrease) | 395,126 | 12,553,582 | (143,114) | (3,530,501) | |||
| Class R6 | |||||||
| Shares Sold | 7,406,904 | $ 227,713,097 | 4,880,872 | $ 113,525,683 | |||
| Shares Issued for Reinvested Dividends | 297,938 | 8,855,913 | 237,877 | 5,996,137 | |||
| Shares Redeemed | (2,250,013) | (70,681,330) | (1,733,037) | (42,798,399) | |||
| Net Increase (Decrease) | 5,454,829 | 165,887,680 | 3,385,712 | 76,723,421 | |||
| 128 |
October 31, 2021
| For the Year Ended October 31, 2021 | For the Year Ended October 31, 2020 | ||||||
| Shares | Amount | Shares | Amount | ||||
| Class Y | |||||||
| Shares Sold | 20,130,737 | $ 637,738,953 | 9,848,904 | $ 247,712,473 | |||
| Shares Issued for Reinvested Dividends | 944,058 | 27,654,509 | 1,131,629 | 28,911,339 | |||
| Shares Redeemed | (24,259,929) | (783,606,689) | (7,635,109) | (181,522,018) | |||
| Net Increase (Decrease) | (3,185,134) | (118,213,227) | 3,345,424 | 95,101,794 | |||
| Class F | |||||||
| Shares Sold | 49,096,886 | $ 1,528,459,592 | 27,526,744 | $ 644,478,859 | |||
| Shares Issued for Reinvested Dividends | 4,082,716 | 115,917,711 | 5,376,050 | 132,513,123 | |||
| Shares Redeemed | (27,500,734) | (840,425,971) | (29,713,611) | (707,975,552) | |||
| Net Increase (Decrease) | 25,678,868 | 803,951,332 | 3,189,183 | 69,016,430 | |||
| Total Net Increase (Decrease) | 48,758,536 | $ 1,500,820,618 | 30,030,103 | $ 699,665,031 | |||
| Equity Income Fund | |||||||
| Class A | |||||||
| Shares Sold | 8,289,761 | $ 180,610,904 | 7,828,556 | $ 136,913,278 | |||
| Shares Issued for Reinvested Dividends | 1,960,721 | 40,766,669 | 6,504,295 | 121,363,438 | |||
| Shares Redeemed | (9,871,460) | (212,979,569) | (14,827,638) | (260,683,783) | |||
| Net Increase (Decrease) | 379,022 | 8,398,004 | (494,787) | (2,407,067) | |||
| Class C | |||||||
| Shares Sold | 649,197 | $ 14,115,367 | 919,038 | $ 16,271,303 | |||
| Shares Issued for Reinvested Dividends | 180,050 | 3,621,924 | 1,018,170 | 19,066,339 | |||
| Shares Redeemed | (4,975,576) | (107,730,675) | (5,650,866) | (99,286,782) | |||
| Net Increase (Decrease) | (4,146,329) | (89,993,384) | (3,713,658) | (63,949,140) | |||
| Class I | |||||||
| Shares Sold | 13,408,859 | $ 286,986,093 | 24,304,724 | $ 412,538,522 | |||
| Shares Issued for Reinvested Dividends | 1,520,952 | 31,538,766 | 3,968,707 | 73,365,491 | |||
| Shares Redeemed | (13,573,736) | (290,903,554) | (20,447,146) | (354,091,319) | |||
| Net Increase (Decrease) | 1,356,075 | 27,621,305 | 7,826,285 | 131,812,694 | |||
| Class R3 | |||||||
| Shares Sold | 178,866 | $ 3,905,700 | 271,229 | $ 4,760,437 | |||
| Shares Issued for Reinvested Dividends | 37,851 | 778,951 | 167,445 | 3,145,148 | |||
| Shares Redeemed | (622,158) | (13,765,852) | (802,663) | (14,461,635) | |||
| Net Increase (Decrease) | (405,441) | (9,081,201) | (363,989) | (6,556,050) | |||
| Class R4 | |||||||
| Shares Sold | 409,910 | $ 8,975,208 | 608,869 | $ 10,607,139 | |||
| Shares Issued for Reinvested Dividends | 41,162 | 854,303 | 165,375 | 3,099,772 | |||
| Shares Redeemed | (714,299) | (15,093,697) | (1,115,129) | (20,177,582) | |||
| Net Increase (Decrease) | (263,227) | (5,264,186) | (340,885) | (6,470,671) | |||
| Class R5 | |||||||
| Shares Sold | 1,641,838 | $ 34,220,609 | 802,326 | $ 14,635,220 | |||
| Shares Issued for Reinvested Dividends | 92,807 | 1,954,636 | 278,873 | 5,250,372 | |||
| Shares Redeemed | (1,549,727) | (34,015,363) | (1,956,200) | (36,004,334) | |||
| Net Increase (Decrease) | 184,918 | 2,159,882 | (875,001) | (16,118,742) | |||
| Class R6 | |||||||
| Shares Sold | 1,024,580 | $ 22,209,707 | 1,617,179 | $ 29,511,931 | |||
| Shares Issued for Reinvested Dividends | 84,605 | 1,790,192 | 215,494 | 4,044,046 | |||
| Shares Redeemed | (848,471) | (18,624,173) | (1,293,116) | (23,556,776) | |||
| Net Increase (Decrease) | 260,714 | 5,375,726 | 539,557 | 9,999,201 | |||
| Class Y | |||||||
| Shares Sold | 1,290,931 | $ 27,947,876 | 2,226,330 | $ 40,140,301 | |||
| Shares Issued for Reinvested Dividends | 115,344 | 2,434,785 | 392,940 | 7,398,398 | |||
| Shares Redeemed | (1,008,753) | (22,141,456) | (3,219,621) | (56,256,214) | |||
| Net Increase (Decrease) | 397,522 | 8,241,205 | (600,351) | (8,717,515) | |||
| Class F | |||||||
| Shares Sold | 8,946,727 | $ 192,753,571 | 11,762,717 | $ 205,404,640 | |||
| Shares Issued for Reinvested Dividends | 1,449,703 | 30,022,805 | 4,181,434 | 77,191,341 | |||
| Shares Redeemed | (13,229,490) | (284,172,877) | (11,310,899) | (199,892,407) | |||
| Net Increase (Decrease) | (2,833,060) | (61,396,501) | 4,633,252 | 82,703,574 | |||
| Total Net Increase (Decrease) | (5,069,806) | $ (113,939,150) | 6,610,423 | $ 120,296,284 | |||
| 129 |
October 31, 2021
| For the Year Ended October 31, 2021 | For the Year Ended October 31, 2020 | ||||||
| Shares | Amount | Shares | Amount | ||||
| Growth Opportunities Fund | |||||||
| Class A | |||||||
| Shares Sold | 5,209,175 | $ 302,551,393 | 5,812,021 | $ 259,824,535 | |||
| Shares Issued for Reinvested Dividends | 7,642,117 | 408,394,711 | 3,358,472 | 128,192,872 | |||
| Shares Redeemed | (7,857,838) | (457,256,332) | (8,349,301) | (364,377,295) | |||
| Net Increase (Decrease) | 4,993,454 | 253,689,772 | 821,192 | 23,640,112 | |||
| Class C | |||||||
| Shares Sold | 1,814,685 | $ 42,859,385 | 2,155,278 | $ 46,083,147 | |||
| Shares Issued for Reinvested Dividends | 4,008,428 | 87,303,560 | 1,561,881 | 29,066,389 | |||
| Shares Redeemed | (5,222,282) | (124,561,047) | (5,277,715) | (112,869,127) | |||
| Net Increase (Decrease) | 600,831 | 5,601,898 | (1,560,556) | (37,719,591) | |||
| Class I | |||||||
| Shares Sold | 6,786,614 | $ 423,546,619 | 8,087,671 | $ 380,046,455 | |||
| Shares Issued for Reinvested Dividends | 3,207,164 | 185,309,937 | 1,712,981 | 69,821,119 | |||
| Shares Redeemed | (7,861,192) | (491,248,063) | (16,144,778) | (718,420,627) | |||
| Net Increase (Decrease) | 2,132,586 | 117,608,493 | (6,344,126) | (268,553,053) | |||
| Class R3 | |||||||
| Shares Sold | 217,459 | $ 12,458,353 | 183,888 | $ 8,139,758 | |||
| Shares Issued for Reinvested Dividends | 133,397 | 7,088,738 | 70,480 | 2,685,999 | |||
| Shares Redeemed | (388,784) | (22,241,704) | (510,198) | (22,155,084) | |||
| Net Increase (Decrease) | (37,928) | (2,694,613) | (255,830) | (11,329,327) | |||
| Class R4 | |||||||
| Shares Sold | 260,470 | $ 16,275,076 | 248,241 | $ 12,098,571 | |||
| Shares Issued for Reinvested Dividends | 149,374 | 8,675,642 | 84,663 | 3,477,115 | |||
| Shares Redeemed | (483,285) | (30,586,387) | (714,482) | (33,779,284) | |||
| Net Increase (Decrease) | (73,441) | (5,635,669) | (381,578) | (18,203,598) | |||
| Class R5 | |||||||
| Shares Sold | 88,508 | $ 5,974,431 | 145,107 | $ 7,246,281 | |||
| Shares Issued for Reinvested Dividends | 44,659 | 2,790,306 | 30,971 | 1,353,114 | |||
| Shares Redeemed | (159,100) | (10,438,793) | (373,606) | (18,780,243) | |||
| Net Increase (Decrease) | (25,933) | (1,674,056) | (197,528) | (10,180,848) | |||
| Class R6 | |||||||
| Shares Sold | 490,627 | $ 33,816,735 | 306,651 | $ 16,060,946 | |||
| Shares Issued for Reinvested Dividends | 77,962 | 4,986,464 | 28,918 | 1,288,564 | |||
| Shares Redeemed | (230,683) | (16,066,034) | (200,896) | (10,416,531) | |||
| Net Increase (Decrease) | 337,906 | 22,737,165 | 134,673 | 6,932,979 | |||
| Class Y | |||||||
| Shares Sold | 2,179,222 | $ 149,741,177 | 4,986,167 | $ 311,128,698 | |||
| Shares Issued for Reinvested Dividends | 841,194 | 53,752,317 | 199,027 | 8,864,641 | |||
| Shares Redeemed | (2,205,530) | (152,562,447) | (2,009,071) | (111,330,500) | |||
| Net Increase (Decrease) | 814,886 | 50,931,047 | 3,176,123 | 208,662,839 | |||
| Class F | |||||||
| Shares Sold | 6,728,193 | $ 425,460,841 | 3,945,706 | $ 196,024,123 | |||
| Shares Issued for Reinvested Dividends | 1,886,638 | 109,557,047 | 769,915 | 31,497,242 | |||
| Shares Redeemed | (4,459,130) | (280,955,262) | (3,691,002) | (177,948,400) | |||
| Net Increase (Decrease) | 4,155,701 | 254,062,626 | 1,024,619 | 49,572,965 | |||
| Total Net Increase (Decrease) | 12,898,062 | $ 694,626,663 | (3,583,011) | $ (57,177,522) | |||
| Healthcare Fund | |||||||
| Class A | |||||||
| Shares Sold | 1,918,507 | $ 82,032,094 | 1,358,922 | $ 51,528,734 | |||
| Shares Issued for Reinvested Dividends | 2,232,980 | 90,190,081 | 1,142,449 | 42,179,219 | |||
| Shares Redeemed | (2,567,935) | (109,917,953) | (2,954,883) | (111,468,464) | |||
| Net Increase (Decrease) | 1,583,552 | 62,304,222 | (453,512) | (17,760,511) | |||
| Class C | |||||||
| Shares Sold | 368,990 | $ 11,716,851 | 416,479 | $ 12,224,079 | |||
| Shares Issued for Reinvested Dividends | 743,990 | 22,349,458 | 382,047 | 10,983,839 | |||
| Shares Redeemed | (1,445,763) | (46,040,790) | (1,283,408) | (37,962,383) | |||
| Net Increase (Decrease) | (332,783) | (11,974,481) | (484,882) | (14,754,465) | |||
| 130 |
October 31, 2021
| For the Year Ended October 31, 2021 | For the Year Ended October 31, 2020 | ||||||
| Shares | Amount | Shares | Amount | ||||
| Class I | |||||||
| Shares Sold | 2,309,673 | $ 105,781,014 | 2,595,432 | $ 104,468,275 | |||
| Shares Issued for Reinvested Dividends | 924,714 | 40,077,121 | 416,322 | 16,319,822 | |||
| Shares Redeemed | (2,209,353) | (101,145,679) | (2,244,715) | (89,839,287) | |||
| Net Increase (Decrease) | 1,025,034 | 44,712,456 | 767,039 | 30,948,810 | |||
| Class R3 | |||||||
| Shares Sold | 151,226 | $ 6,683,795 | 197,480 | $ 7,654,724 | |||
| Shares Issued for Reinvested Dividends | 90,203 | 3,742,540 | 55,830 | 2,117,618 | |||
| Shares Redeemed | (270,146) | (11,931,278) | (439,877) | (17,102,681) | |||
| Net Increase (Decrease) | (28,717) | (1,504,943) | (186,567) | (7,330,339) | |||
| Class R4 | |||||||
| Shares Sold | 134,157 | $ 6,296,937 | 200,061 | $ 8,245,646 | |||
| Shares Issued for Reinvested Dividends | 58,738 | 2,616,195 | 36,845 | 1,484,498 | |||
| Shares Redeemed | (229,273) | (10,763,007) | (365,083) | (15,109,587) | |||
| Net Increase (Decrease) | (36,378) | (1,849,875) | (128,177) | (5,379,443) | |||
| Class R5 | |||||||
| Shares Sold | 79,162 | $ 3,961,571 | 209,035 | $ 9,163,668 | |||
| Shares Issued for Reinvested Dividends | 25,326 | 1,201,964 | 8,515 | 362,223 | |||
| Shares Redeemed | (89,603) | (4,495,885) | (137,584) | (5,877,478) | |||
| Net Increase (Decrease) | 14,885 | 667,650 | 79,966 | 3,648,413 | |||
| Class R6 | |||||||
| Shares Sold | 55,913 | $ 2,913,413 | 54,266 | $ 2,377,216 | |||
| Shares Issued for Reinvested Dividends | 9,082 | 438,736 | 3,211 | 138,636 | |||
| Shares Redeemed | (32,048) | (1,696,505) | (9,001) | (390,531) | |||
| Net Increase (Decrease) | 32,947 | 1,655,644 | 48,476 | 2,125,321 | |||
| Class Y | |||||||
| Shares Sold | 450,272 | $ 22,884,351 | 542,348 | $ 23,900,470 | |||
| Shares Issued for Reinvested Dividends | 219,387 | 10,587,619 | 96,305 | 4,156,525 | |||
| Shares Redeemed | (397,553) | (20,324,517) | (367,262) | (16,122,522) | |||
| Net Increase (Decrease) | 272,106 | 13,147,453 | 271,391 | 11,934,473 | |||
| Class F | |||||||
| Shares Sold | 262,096 | $ 12,136,397 | 135,930 | $ 5,893,269 | |||
| Shares Issued for Reinvested Dividends | 89,913 | 3,913,893 | 45,179 | 1,776,419 | |||
| Shares Redeemed | (183,888) | (8,417,394) | (154,961) | (6,147,780) | |||
| Net Increase (Decrease) | 168,121 | 7,632,896 | 26,148 | 1,521,908 | |||
| Total Net Increase (Decrease) | 2,698,767 | $ 114,791,022 | (60,118) | $ 4,954,167 | |||
| MidCap Fund | |||||||
| Class A | |||||||
| Shares Sold | 5,765,546 | $ 206,608,439 | 7,479,560 | $ 213,627,977 | |||
| Shares Issued for Reinvested Dividends | 10,539,072 | 343,679,112 | 4,994,716 | 148,592,803 | |||
| Shares Redeemed | (12,122,834) | (430,915,073) | (16,503,575) | (468,979,095) | |||
| Net Increase (Decrease) | 4,181,784 | 119,372,478 | (4,029,299) | (106,758,315) | |||
| Class C | |||||||
| Shares Sold | 997,903 | $ 22,218,396 | 1,573,527 | $ 30,282,962 | |||
| Shares Issued for Reinvested Dividends | 3,497,780 | 71,039,908 | 1,866,822 | 37,149,763 | |||
| Shares Redeemed | (6,508,579) | (145,602,161) | (8,672,532) | (165,685,884) | |||
| Net Increase (Decrease) | (2,012,896) | (52,343,857) | (5,232,183) | (98,253,159) | |||
| Class I | |||||||
| Shares Sold | 18,766,871 | $ 702,875,370 | 46,979,290 | $ 1,323,608,186 | |||
| Shares Issued for Reinvested Dividends | 13,770,100 | 469,422,719 | 6,833,413 | 211,084,130 | |||
| Shares Redeemed | (51,765,006) | (1,948,483,150) | (65,064,509) | (1,964,863,323) | |||
| Net Increase (Decrease) | (19,228,035) | (776,185,061) | (11,251,806) | (430,171,007) | |||
| Class R3 | |||||||
| Shares Sold | 328,898 | $ 13,349,542 | 732,243 | $ 22,709,563 | |||
| Shares Issued for Reinvested Dividends | 278,856 | 10,337,182 | 135,870 | 4,553,016 | |||
| Shares Redeemed | (897,014) | (36,300,678) | (1,028,675) | (33,458,482) | |||
| Net Increase (Decrease) | (289,260) | (12,613,954) | (160,562) | (6,195,903) | |||
| 131 |
October 31, 2021
| For the Year Ended October 31, 2021 | For the Year Ended October 31, 2020 | ||||||
| Shares | Amount | Shares | Amount | ||||
| Class R4 | |||||||
| Shares Sold | 616,644 | $ 26,335,205 | 1,188,661 | $ 39,805,895 | |||
| Shares Issued for Reinvested Dividends | 530,397 | 20,812,764 | 324,499 | 11,409,397 | |||
| Shares Redeemed | (2,562,147) | (109,758,970) | (3,333,796) | (113,157,709) | |||
| Net Increase (Decrease) | (1,415,106) | (62,611,001) | (1,820,636) | (61,942,417) | |||
| Class R5 | |||||||
| Shares Sold | 1,925,411 | $ 85,163,229 | 2,214,020 | $ 77,371,989 | |||
| Shares Issued for Reinvested Dividends | 805,971 | 32,980,317 | 534,352 | 19,461,090 | |||
| Shares Redeemed | (5,761,404) | (259,286,863) | (6,388,662) | (229,431,554) | |||
| Net Increase (Decrease) | (3,030,022) | (141,143,317) | (3,640,290) | (132,598,475) | |||
| Class R6 | |||||||
| Shares Sold | 7,264,767 | $ 326,578,751 | 13,129,081 | $ 470,477,844 | |||
| Shares Issued for Reinvested Dividends | 3,932,733 | 163,365,732 | 1,978,533 | 72,988,070 | |||
| Shares Redeemed | (22,294,027) | (1,010,767,875) | (15,444,055) | (551,163,077) | |||
| Net Increase (Decrease) | (11,096,527) | (520,823,392) | (336,441) | (7,697,163) | |||
| Class Y | |||||||
| Shares Sold | 4,103,182 | $ 185,837,048 | 8,081,483 | $ 279,248,651 | |||
| Shares Issued for Reinvested Dividends | 2,564,133 | 106,283,299 | 1,713,171 | 63,096,079 | |||
| Shares Redeemed | (16,202,137) | (733,248,509) | (21,978,523) | (783,693,402) | |||
| Net Increase (Decrease) | (9,534,822) | (441,128,162) | (12,183,869) | (441,348,672) | |||
| Class F | |||||||
| Shares Sold | 11,833,195 | $ 445,587,914 | 20,067,998 | $ 592,511,897 | |||
| Shares Issued for Reinvested Dividends | 7,742,034 | 265,242,076 | 3,417,284 | 105,901,640 | |||
| Shares Redeemed | (20,970,331) | (786,132,834) | (19,463,971) | (580,117,317) | |||
| Net Increase (Decrease) | (1,395,102) | (75,302,844) | 4,021,311 | 118,296,220 | |||
| Total Net Increase (Decrease) | (43,819,986) | $ (1,962,779,110) | (34,633,775) | $ (1,166,668,891) | |||
| MidCap Value Fund | |||||||
| Class A | |||||||
| Shares Sold | 2,474,862 | $ 41,495,746 | 2,480,138 | $ 30,751,925 | |||
| Shares Issued for Reinvested Dividends | 56,642 | 831,510 | 633,942 | 9,248,149 | |||
| Shares Redeemed | (2,543,440) | (41,457,915) | (4,519,018) | (55,158,666) | |||
| Net Increase (Decrease) | (11,936) | 869,341 | (1,404,938) | (15,158,592) | |||
| Class C | |||||||
| Shares Sold | 43,557 | $ 579,493 | 121,039 | $ 1,113,875 | |||
| Shares Issued for Reinvested Dividends | — | — | 40,108 | 460,945 | |||
| Shares Redeemed | (405,320) | (5,295,304) | (556,664) | (5,538,552) | |||
| Net Increase (Decrease) | (361,763) | (4,715,811) | (395,517) | (3,963,732) | |||
| Class I | |||||||
| Shares Sold | 328,086 | $ 5,572,562 | 520,034 | $ 6,756,443 | |||
| Shares Issued for Reinvested Dividends | 7,619 | 112,984 | 66,544 | 983,484 | |||
| Shares Redeemed | (553,865) | (8,619,992) | (1,126,169) | (13,885,918) | |||
| Net Increase (Decrease) | (218,160) | (2,934,446) | (539,591) | (6,145,991) | |||
| Class R3 | |||||||
| Shares Sold | 66,910 | $ 1,193,206 | 83,482 | $ 1,027,547 | |||
| Shares Issued for Reinvested Dividends | — | — | 12,474 | 191,545 | |||
| Shares Redeemed | (115,157) | (2,047,635) | (211,872) | (2,849,232) | |||
| Net Increase (Decrease) | (48,247) | (854,429) | (115,916) | (1,630,140) | |||
| Class R4 | |||||||
| Shares Sold | 71,792 | $ 1,296,064 | 112,090 | $ 1,454,297 | |||
| Shares Issued for Reinvested Dividends | 1,122 | 17,850 | 19,234 | 303,476 | |||
| Shares Redeemed | (208,564) | (3,543,019) | (222,635) | (3,007,462) | |||
| Net Increase (Decrease) | (135,650) | (2,229,105) | (91,311) | (1,249,689) | |||
| Class R5 | |||||||
| Shares Sold | 7,217 | $ 128,610 | 9,680 | $ 139,991 | |||
| Shares Issued for Reinvested Dividends | 586 | 9,446 | 2,874 | 46,111 | |||
| Shares Redeemed | (6,437) | (116,999) | (7,314) | (94,084) | |||
| Net Increase (Decrease) | 1,366 | 21,057 | 5,240 | 92,018 | |||
| 132 |
October 31, 2021
| For the Year Ended October 31, 2021 | For the Year Ended October 31, 2020 | ||||||
| Shares | Amount | Shares | Amount | ||||
| Class Y | |||||||
| Shares Sold | 473,420 | $ 8,111,667 | 126,076 | $ 1,744,448 | |||
| Shares Issued for Reinvested Dividends | 5,606 | 90,649 | 24,096 | 388,031 | |||
| Shares Redeemed | (457,356) | (8,763,398) | (202,609) | (2,806,695) | |||
| Net Increase (Decrease) | 21,670 | (561,082) | (52,437) | (674,216) | |||
| Class F | |||||||
| Shares Sold | 5,244,142 | $ 88,440,237 | 8,138,328 | $ 100,149,062 | |||
| Shares Issued for Reinvested Dividends | 163,610 | 2,424,705 | 724,542 | 10,710,609 | |||
| Shares Redeemed | (5,585,121) | (92,716,247) | (6,157,364) | (78,365,435) | |||
| Net Increase (Decrease) | (177,369) | (1,851,305) | 2,705,506 | 32,494,236 | |||
| Total Net Increase (Decrease) | (930,089) | $ (12,255,780) | 111,036 | $ 3,763,894 | |||
| Quality Value Fund | |||||||
| Class A | |||||||
| Shares Sold | 434,273 | $ 10,311,005 | 439,196 | $ 8,293,523 | |||
| Shares Issued for Reinvested Dividends | 151,354 | 3,182,978 | 399,950 | 8,456,495 | |||
| Shares Redeemed | (947,815) | (22,212,834) | (1,349,336) | (25,330,604) | |||
| Net Increase (Decrease) | (362,188) | (8,718,851) | (510,190) | (8,580,586) | |||
| Class C | |||||||
| Shares Sold | 29,926 | $ 594,579 | 27,218 | $ 445,180 | |||
| Shares Issued for Reinvested Dividends | 3,530 | 63,188 | 16,808 | 302,140 | |||
| Shares Redeemed | (113,368) | (2,261,575) | (189,929) | (3,063,775) | |||
| Net Increase (Decrease) | (79,912) | (1,603,808) | (145,903) | (2,316,455) | |||
| Class I | |||||||
| Shares Sold | 278,233 | $ 6,680,247 | 116,192 | $ 2,216,237 | |||
| Shares Issued for Reinvested Dividends | 14,220 | 294,345 | 32,925 | 686,590 | |||
| Shares Redeemed | (110,028) | (2,556,620) | (167,957) | (3,198,931) | |||
| Net Increase (Decrease) | 182,425 | 4,417,972 | (18,840) | (296,104) | |||
| Class R3 | |||||||
| Shares Sold | 4,235 | $ 100,111 | 5,088 | $ 93,854 | |||
| Shares Issued for Reinvested Dividends | 828 | 17,729 | 2,697 | 57,990 | |||
| Shares Redeemed | (9,137) | (220,510) | (20,388) | (402,055) | |||
| Net Increase (Decrease) | (4,074) | (102,670) | (12,603) | (250,211) | |||
| Class R4 | |||||||
| Shares Sold | 44,905 | $ 1,069,168 | 42,840 | $ 822,386 | |||
| Shares Issued for Reinvested Dividends | 4,243 | 91,734 | 13,979 | 303,759 | |||
| Shares Redeemed | (75,589) | (1,855,079) | (131,128) | (2,658,103) | |||
| Net Increase (Decrease) | (26,441) | (694,177) | (74,309) | (1,531,958) | |||
| Class R5 | |||||||
| Shares Sold | 123 | $ 3,003 | 510 | $ 10,672 | |||
| Shares Issued for Reinvested Dividends | 265 | 5,775 | 566 | 12,405 | |||
| Shares Redeemed | (64) | (1,603) | (173) | (3,456) | |||
| Net Increase (Decrease) | 324 | 7,175 | 903 | 19,621 | |||
| Class R6 | |||||||
| Shares Sold | 5,718 | $ 131,614 | 25,758 | $ 484,275 | |||
| Shares Issued for Reinvested Dividends | 536 | 11,697 | 83 | 1,828 | |||
| Shares Redeemed | (21,890) | (567,870) | (2,382) | (47,033) | |||
| Net Increase (Decrease) | (15,636) | (424,559) | 23,459 | 439,070 | |||
| Class Y | |||||||
| Shares Sold | 46,187 | $ 1,183,352 | 7,651 | $ 158,274 | |||
| Shares Issued for Reinvested Dividends | 473 | 10,318 | 1,541 | 33,830 | |||
| Shares Redeemed | (2,267) | (57,102) | (17,842) | (304,447) | |||
| Net Increase (Decrease) | 44,393 | 1,136,568 | (8,650) | (112,343) | |||
| Class F | |||||||
| Shares Sold | 64,383 | $ 1,454,799 | 110,798 | $ 1,978,094 | |||
| Shares Issued for Reinvested Dividends | 12,550 | 258,522 | 31,266 | 650,547 | |||
| Shares Redeemed | (95,500) | (2,207,875) | (181,962) | (3,365,916) | |||
| Net Increase (Decrease) | (18,567) | (494,554) | (39,898) | (737,275) | |||
| Total Net Increase (Decrease) | (279,676) | $ (6,476,904) | (786,031) | $ (13,366,241) | |||
| 133 |
October 31, 2021
| For the Year Ended October 31, 2021 | For the Year Ended October 31, 2020 | ||||||
| Shares | Amount | Shares | Amount | ||||
| Small Cap Growth Fund | |||||||
| Class A | |||||||
| Shares Sold | 242,684 | $ 15,163,953 | 129,404 | $ 5,969,147 | |||
| Shares Issued for Reinvested Dividends | 280,755 | 16,331,511 | 64,625 | 3,116,821 | |||
| Shares Redeemed | (441,435) | (27,592,119) | (602,309) | (27,705,360) | |||
| Net Increase (Decrease) | 82,004 | 3,903,345 | (408,280) | (18,619,392) | |||
| Class C | |||||||
| Shares Sold | 18,046 | $ 723,868 | 4,911 | $ 150,801 | |||
| Shares Issued for Reinvested Dividends | 40,883 | 1,524,921 | 10,908 | 352,646 | |||
| Shares Redeemed | (223,022) | (8,907,111) | (164,584) | (5,078,582) | |||
| Net Increase (Decrease) | (164,093) | (6,658,322) | (148,765) | (4,575,135) | |||
| Class I | |||||||
| Shares Sold | 356,881 | $ 23,938,090 | 1,191,528 | $ 51,688,394 | |||
| Shares Issued for Reinvested Dividends | 118,956 | 7,339,599 | 57,456 | 2,916,489 | |||
| Shares Redeemed | (555,069) | (36,106,911) | (3,414,260) | (171,804,734) | |||
| Net Increase (Decrease) | (79,232) | (4,829,222) | (2,165,276) | (117,199,851) | |||
| Class R3 | |||||||
| Shares Sold | 34,992 | $ 2,097,739 | 41,973 | $ 1,789,694 | |||
| Shares Issued for Reinvested Dividends | 11,592 | 661,760 | 3,087 | 146,681 | |||
| Shares Redeemed | (58,869) | (3,639,902) | (119,534) | (5,504,341) | |||
| Net Increase (Decrease) | (12,285) | (880,403) | (74,474) | (3,567,966) | |||
| Class R4 | |||||||
| Shares Sold | 89,389 | $ 5,836,584 | 138,690 | $ 6,582,259 | |||
| Shares Issued for Reinvested Dividends | 32,051 | 1,953,808 | 12,210 | 614,885 | |||
| Shares Redeemed | (392,229) | (25,488,142) | (456,656) | (20,953,685) | |||
| Net Increase (Decrease) | (270,789) | (17,697,750) | (305,756) | (13,756,541) | |||
| Class R5 | |||||||
| Shares Sold | 262,369 | $ 18,020,843 | 720,572 | $ 37,862,183 | |||
| Shares Issued for Reinvested Dividends | 80,046 | 5,219,014 | 21,655 | 1,157,694 | |||
| Shares Redeemed | (408,838) | (28,555,099) | (1,119,362) | (58,971,093) | |||
| Net Increase (Decrease) | (66,423) | (5,315,242) | (377,135) | (19,951,216) | |||
| Class R6 | |||||||
| Shares Sold | 334,847 | $ 23,790,157 | 1,797,542 | $ 98,016,701 | |||
| Shares Issued for Reinvested Dividends | 90,910 | 6,035,522 | 17,777 | 965,664 | |||
| Shares Redeemed | (666,499) | (47,474,079) | (1,722,133) | (85,535,221) | |||
| Net Increase (Decrease) | (240,742) | (17,648,400) | 93,186 | 13,447,144 | |||
| Class Y | |||||||
| Shares Sold | 710,508 | $ 50,782,835 | 1,010,537 | $ 51,567,246 | |||
| Shares Issued for Reinvested Dividends | 243,023 | 16,134,292 | 92,203 | 5,010,332 | |||
| Shares Redeemed | (1,739,428) | (123,651,652) | (3,823,424) | (209,045,933) | |||
| Net Increase (Decrease) | (785,897) | (56,734,525) | (2,720,684) | (152,468,355) | |||
| Class F | |||||||
| Shares Sold | 272,698 | $ 18,053,254 | 192,412 | $ 7,897,145 | |||
| Shares Issued for Reinvested Dividends | 51,104 | 3,169,442 | 12,299 | 626,749 | |||
| Shares Redeemed | (613,475) | (41,379,020) | (354,986) | (17,110,113) | |||
| Net Increase (Decrease) | (289,673) | (20,156,324) | (150,275) | (8,586,219) | |||
| Total Net Increase (Decrease) | (1,827,130) | $ (126,016,843) | (6,257,459) | $ (325,277,531) | |||
| Small Cap Value Fund | |||||||
| Class A | |||||||
| Shares Sold | 1,188,590 | $ 15,684,280 | 431,215 | $ 3,396,385 | |||
| Shares Issued for Reinvested Dividends | 34,939 | 359,520 | 292,505 | 2,936,036 | |||
| Shares Redeemed | (750,779) | (9,444,203) | (1,289,036) | (10,577,661) | |||
| Net Increase (Decrease) | 472,750 | 6,599,597 | (565,316) | (4,245,240) | |||
| Class C | |||||||
| Shares Sold | 108,329 | $ 1,209,656 | 31,607 | $ 222,855 | |||
| Shares Issued for Reinvested Dividends | 441 | 3,924 | 26,761 | 229,881 | |||
| Shares Redeemed | (122,556) | (1,345,622) | (189,586) | (1,389,193) | |||
| Net Increase (Decrease) | (13,786) | (132,042) | (131,218) | (936,457) | |||
| 134 |
October 31, 2021
| For the Year Ended October 31, 2021 | For the Year Ended October 31, 2020 | ||||||
| Shares | Amount | Shares | Amount | ||||
| Class I | |||||||
| Shares Sold | 2,537,268 | $ 33,866,723 | 295,467 | $ 2,831,571 | |||
| Shares Issued for Reinvested Dividends | 5,247 | 53,996 | 41,551 | 418,405 | |||
| Shares Redeemed | (437,736) | (5,819,619) | (405,903) | (3,187,749) | |||
| Net Increase (Decrease) | 2,104,779 | 28,101,100 | (68,885) | 62,227 | |||
| Class R3 | |||||||
| Shares Sold | 29,282 | $ 397,377 | 9,891 | $ 82,868 | |||
| Shares Issued for Reinvested Dividends | 326 | 3,498 | 3,512 | 36,622 | |||
| Shares Redeemed | (15,655) | (197,530) | (17,164) | (139,499) | |||
| Net Increase (Decrease) | 13,953 | 203,345 | (3,761) | (20,009) | |||
| Class R4 | |||||||
| Shares Sold | 822 | $ 11,178 | 1,313 | $ 11,330 | |||
| Shares Issued for Reinvested Dividends | 33 | 362 | 226 | 2,398 | |||
| Shares Redeemed | (584) | (8,365) | (4,441) | (42,520) | |||
| Net Increase (Decrease) | 271 | 3,175 | (2,902) | (28,792) | |||
| Class R5 | |||||||
| Shares Sold | 3,061 | $ 44,058 | 1,479 | $ 10,000 | |||
| Shares Issued for Reinvested Dividends | 14 | 148 | 69 | 730 | |||
| Shares Redeemed | (2,457) | (34,282) | (1,479) | (11,716) | |||
| Net Increase (Decrease) | 618 | 9,924 | 69 | (986) | |||
| Class R6 | |||||||
| Shares Sold | 88,436 | $ 1,245,447 | 18,071 | $ 163,710 | |||
| Shares Issued for Reinvested Dividends | 357 | 3,866 | 665 | 7,036 | |||
| Shares Redeemed | (9,262) | (115,115) | (741) | (7,349) | |||
| Net Increase (Decrease) | 79,531 | 1,134,198 | 17,995 | 163,397 | |||
| Class Y | |||||||
| Shares Sold | 124,042 | $ 1,700,660 | 842 | $ 7,711 | |||
| Shares Issued for Reinvested Dividends | 342 | 3,688 | 2,671 | 28,235 | |||
| Shares Redeemed | (14,694) | (205,546) | (27,529) | (261,033) | |||
| Net Increase (Decrease) | 109,690 | 1,498,802 | (24,016) | (225,087) | |||
| Class F | |||||||
| Shares Sold | 2,116,114 | $ 27,975,721 | 906,600 | $ 7,468,195 | |||
| Shares Issued for Reinvested Dividends | 64,774 | 665,880 | 329,545 | 3,318,168 | |||
| Shares Redeemed | (1,320,995) | (15,530,755) | (1,038,699) | (8,257,092) | |||
| Net Increase (Decrease) | 859,893 | 13,110,846 | 197,446 | 2,529,271 | |||
| Total Net Increase (Decrease) | 3,627,699 | $ 50,528,945 | (580,588) | $ (2,701,676) | |||
| Small Company Fund | |||||||
| Class A | |||||||
| Shares Sold | 1,809,812 | $ 54,140,187 | 1,886,865 | $ 39,854,997 | |||
| Shares Issued for Reinvested Dividends | 1,517,800 | 41,967,161 | 956,824 | 19,433,104 | |||
| Shares Redeemed | (1,970,509) | (58,538,530) | (2,885,202) | (59,241,409) | |||
| Net Increase (Decrease) | 1,357,103 | 37,568,818 | (41,513) | 46,692 | |||
| Class C | |||||||
| Shares Sold | 105,496 | $ 1,863,781 | 116,822 | $ 1,577,039 | |||
| Shares Issued for Reinvested Dividends | 98,681 | 1,604,546 | 70,385 | 901,628 | |||
| Shares Redeemed | (243,229) | (4,261,364) | (366,573) | (4,857,687) | |||
| Net Increase (Decrease) | (39,052) | (793,037) | (179,366) | (2,379,020) | |||
| Class I | |||||||
| Shares Sold | 722,263 | $ 23,465,518 | 296,143 | $ 6,816,692 | |||
| Shares Issued for Reinvested Dividends | 113,755 | 3,392,187 | 75,333 | 1,633,979 | |||
| Shares Redeemed | (329,416) | (10,447,336) | (304,758) | (6,628,138) | |||
| Net Increase (Decrease) | 506,602 | 16,410,369 | 66,718 | 1,822,533 | |||
| Class R3 | |||||||
| Shares Sold | 136,144 | $ 4,520,959 | 89,211 | $ 1,943,559 | |||
| Shares Issued for Reinvested Dividends | 45,509 | 1,394,856 | 35,475 | 793,230 | |||
| Shares Redeemed | (217,034) | (7,087,863) | (258,886) | (5,812,439) | |||
| Net Increase (Decrease) | (35,381) | (1,172,048) | (134,200) | (3,075,650) | |||
| 135 |
October 31, 2021
| For the Year Ended October 31, 2021 | For the Year Ended October 31, 2020 | ||||||
| Shares | Amount | Shares | Amount | ||||
| Class R4 | |||||||
| Shares Sold | 130,342 | $ 4,726,037 | 118,455 | $ 2,883,625 | |||
| Shares Issued for Reinvested Dividends | 37,589 | 1,251,351 | 31,292 | 752,892 | |||
| Shares Redeemed | (189,059) | (6,753,577) | (304,693) | (7,836,433) | |||
| Net Increase (Decrease) | (21,128) | (776,189) | (154,946) | (4,199,916) | |||
| Class R5 | |||||||
| Shares Sold | 84,862 | $ 3,272,537 | 44,314 | $ 1,187,403 | |||
| Shares Issued for Reinvested Dividends | 10,551 | 377,953 | 6,152 | 157,911 | |||
| Shares Redeemed | (44,399) | (1,705,756) | (56,252) | (1,506,697) | |||
| Net Increase (Decrease) | 51,014 | 1,944,734 | (5,786) | (161,383) | |||
| Class R6 | |||||||
| Shares Sold | 129,943 | $ 5,123,929 | 43,328 | $ 1,379,271 | |||
| Shares Issued for Reinvested Dividends | 3,508 | 128,962 | 220 | 5,772 | |||
| Shares Redeemed | (32,019) | (1,254,201) | (5,289) | (151,909) | |||
| Net Increase (Decrease) | 101,432 | 3,998,690 | 38,259 | 1,233,134 | |||
| Class Y | |||||||
| Shares Sold | 2,592,104 | $ 111,577,676 | 236,078 | $ 6,005,173 | |||
| Shares Issued for Reinvested Dividends | 47,078 | 1,728,226 | 58,965 | 1,548,420 | |||
| Shares Redeemed | (2,109,893) | (87,145,029) | (943,050) | (22,519,569) | |||
| Net Increase (Decrease) | 529,289 | 26,160,873 | (648,007) | (14,965,976) | |||
| Class F | |||||||
| Shares Sold | 3,078,986 | $ 99,109,263 | 1,838,858 | $ 40,440,450 | |||
| Shares Issued for Reinvested Dividends | 808,547 | 24,288,757 | 518,887 | 11,316,929 | |||
| Shares Redeemed | (2,624,084) | (85,717,671) | (2,396,511) | (56,036,553) | |||
| Net Increase (Decrease) | 1,263,449 | 37,680,349 | (38,766) | (4,279,174) | |||
| Total Net Increase (Decrease) | 3,713,328 | $ 121,022,559 | (1,097,607) | $ (25,958,760) | |||
| 14. | Line of Credit: |
| Each Fund participates in a committed line of credit pursuant to a credit agreement dated March 4, 2021. Each Fund may borrow under the line of credit for temporary or emergency purposes. The Funds (together with certain other Hartford Funds) may borrow up to $350 million in the aggregate, subject to asset coverage and other limitations specified in the credit agreement. The interest rate on borrowings varies depending on the nature of the loan. The facility also charges certain fees, such as an upfront fee and a commitment fee. From November 1, 2020 through March 4, 2021, the Funds (together with certain other Hartford Funds) had a similar agreement that enabled them to participate in a $350 million committed line of credit. The fees incurred by the Funds in connection with the committed lines of credit during the period appear in the Statements of Operations under “Other expenses.” During and as of the year ended October 31, 2021, none of the Funds had borrowings under this facility. |
| 15. | Indemnifications: |
| Under each Company’s organizational documents, the Company shall indemnify its officers and directors to the full extent required or permitted under Maryland General Corporation Law and federal securities laws. In addition, each Company, on behalf of its respective Funds, may enter into contracts that contain a variety of indemnifications. Each Company’s maximum exposure under these arrangements is unknown. However, as of the date of these financial statements, each Company has not had prior claims or losses pursuant to these contracts and expects the risk of loss to be remote. |
| 16. | Change in Independent Registered Public Accounting Firm: |
| On November 6, 2019, the Companies, on behalf of their respective Funds, dismissed Ernst & Young LLP (“EY”) as the Funds’ independent registered public accounting firm effective upon the issuance of EY’s report on the Funds’ financial statements as of and for the fiscal year ended October 31, 2019. EY’s report on the Funds’ financial statements for the fiscal years October 31, 2018 and October 31, 2019 contained no adverse opinion or disclaimer of opinion nor was EY’s report qualified or modified as to uncertainty, audit scope or accounting principles. During the Funds’ fiscal periods ended on October 31, 2018 and October 31, 2019 and through December 30, 2019 (the “Covered Period”), (i) there were no disagreements with EY on any matter of accounting principles or practices, financial statement disclosure or auditing scope or procedure, |
| 136 |
October 31, 2021
| which disagreements, if not resolved to the satisfaction of EY, would have caused it to make reference to the subject matter of the disagreements in connection with its reports on the Funds’ financial statements for the Covered Period, and (ii) there were no “reportable events” of the kind described in Item 304(a)(1)(v) of Regulation S-K under the Securities Exchange Act of 1934, as amended. | |
| On November 6, 2019, the Audit Committee of each Company’s Board of Directors participated in and approved the decision to engage PricewaterhouseCoopers LLP (“PwC”) as the independent registered public accounting firm for the Funds for the fiscal year ended October 31, 2020. The selection of PwC does not reflect any disagreements with or dissatisfaction by each Company or the Board of Directors with the performance of the Funds’ prior independent registered public accounting firm, EY. During the Covered Period, neither the Funds, nor anyone on their behalf, consulted with PwC on items which: (i) concerned the application of accounting principles to a specified transaction, either completed or proposed, or the type of audit opinion that might be rendered on the Funds’ financial statements; or (ii) concerned the subject of a disagreement (as defined in paragraph (a)(1)(iv) of Item 304 of Regulation S-K) or reportable events (as described in paragraph (a)(1)(v) of Item 304 of Regulation S-K). |
| 17. | Subsequent Events: |
| Management has evaluated all subsequent transactions and events through the date on which these financial statements were issued and has determined that no additional items require disclosure in these financial statements. |
| 137 |
| 138 |
| • | the operation of the LRM Program (and related policies and procedures utilized in connection with management of the Funds’ liquidity risk); |
| • | an assessment of the adequacy and effectiveness of the LRM Program’s (and related policies and procedures’) implementation; |
| • | the operation, and assessment of the adequacy and effectiveness, of each Fund’s HLIM; |
| • | whether the third-party liquidity vendor’s (“LRM Program Vendor”) processes for determining preliminary liquidity classifications, including the particular methodologies or factors used and metrics analyzed by the LRM Program Vendor, are sufficient under the Liquidity Rule and appropriate in light of each Fund’s specific circumstances; and |
| • | any material changes to the LRM Program. |
| 139 |
| NAME, YEAR OF BIRTH AND ADDRESS(1) | POSITION HELD WITH EACH COMPANY | TERM OF OFFICE(2) AND LENGTH OF TIME SERVED | PRINCIPAL OCCUPATION(S) DURING PAST 5 YEARS | NUMBER OF PORTFOLIOS IN FUND COMPLEX(3) OVERSEEN BY DIRECTOR | OTHER DIRECTORSHIPS FOR PUBLIC COMPANIES AND OTHER REGISTERED INVESTMENT COMPANIES BY DIRECTOR | |||||
| NON-INTERESTED DIRECTORS | ||||||||||
| HILARY E. ACKERMANN (1956) | Director | Since 2014 | Ms. Ackermann served as Chief Risk Officer at Goldman Sachs Bank USA from October 2008 to November 2011. | 75 | Ms. Ackermann served as a Director of Dynegy, Inc. from October 2012 until its acquisition by Vistra Energy Corporation (“Vistra”) in 2018, and since that time she has served as a Director of Vistra. Ms. Ackermann serves as a Director of Credit Suisse Holdings (USA), Inc. from January 2017 to present. | |||||
| ROBIN C. BEERY (1967) | Director | Since 2017 | Ms. Beery has served as a consultant to ArrowMark Partners (an alternative asset manager) since March of 2015 and since November 2018 has been employed by ArrowMark Partners as a Senior Advisor. Previously, she was Executive Vice President, Head of Distribution, for Janus Capital Group, and Chief Executive Officer and President of the Janus Mutual Funds (a global asset manager) from September 2009 to August 2014. | 75 | Ms. Beery serves as an independent Director of UMB Financial Corporation (January 2015 to present), has chaired the Compensation Committee since April 2017, and serves on the Audit Committee and the Risk Committee. | |||||
| LYNN S. BIRDSONG(4), (5) (1946) | Director and Chair of the Board | Director since 2003; Chair of the Board since 2019 | From January 1981 through December 2013, Mr. Birdsong was a partner in Birdsong Company, an advertising specialty firm. From 1979 to 2002, Mr. Birdsong was a Managing Director of Zurich Scudder Investments, an investment management firm. | 75 | None | |||||
| DERRICK D. CEPHAS (1952) | Director | Since 2020 | Mr. Cephas currently serves as Of Counsel to Squire Patton Boggs LLP, an international law firm with 45 offices in 20 countries. Until his retirement in October 2020, Mr. Cephas was a Partner of Weil, Gotshal & Manges LLP, an international law firm headquartered in New York, where he served as the Head of the Financial Institutions Practice (April 2011 to October 2020). | 75 | Mr. Cephas currently serves as a Director of Signature Bank, a New York-based commercial bank, and is a member of the Credit Committee, Examining Committee and Risk Committee. Mr. Cephas currently serves as a Director of Claros Mortgage Trust, Inc., a real estate investment trust. | |||||
| CHRISTINE R. DETRICK(5) (1958) | Director | Since 2016 | Ms. Detrick served as a Senior Partner/Advisor at Bain & Company (a management consulting firm) from September 2002 to December 2012. | 75 | Ms. Detrick serves as a Director and Chair of the Nominating and Governance Committee of Reinsurance Group of America (from January 2014 to present). She also serves as a Director of Charles River Associates (May 2020 to present). | |||||
| 140 |
| NAME, YEAR OF BIRTH AND ADDRESS(1) | POSITION HELD WITH EACH COMPANY | TERM OF OFFICE(2) AND LENGTH OF TIME SERVED | PRINCIPAL OCCUPATION(S) DURING PAST 5 YEARS | NUMBER OF PORTFOLIOS IN FUND COMPLEX(3) OVERSEEN BY DIRECTOR | OTHER DIRECTORSHIPS FOR PUBLIC COMPANIES AND OTHER REGISTERED INVESTMENT COMPANIES BY DIRECTOR | |||||
| ANDREW A. JOHNSON (1962) | Director | Since 2020 | Mr. Johnson currently serves as a Diversity and Inclusion Advisor at Neuberger Berman, a private, global investment management firm. Prior to his current role, Mr. Johnson served as Chief Investment Officer and Head of Global Investment Grade Fixed Income at Neuberger Berman (January 2009 to December 2018). | 75 | Mr. Johnson currently serves as a Director of AGNC Investment Corp., a real estate investment trust. | |||||
| PAUL L. ROSENBERG (1953) | Director | Since 2020 | Mr. Rosenberg is a Partner of The Bridgespan Group, a global nonprofit consulting firm that is a social impact advisor to nonprofits, non-governmental organizations, philanthropists and institutional investors (October 2007 to present). | 75 | None | |||||
| LEMMA W. SENBET(4) (1946) | Director | Since 2005 | Dr. Senbet currently serves as the William E. Mayer Chair Professor of Finance in the Robert H. Smith School of Business at the University of Maryland, where he was chair of the Finance Department from 1998 to 2006. In June 2013, he began a sabbatical from the University to serve as Executive Director of the African Economic Research Consortium which focuses on economic policy research and training, which he completed in 2018. | 75 | None | |||||
| DAVID SUNG (1953) | Director | Since 2017 | Mr. Sung was a Partner at Ernst & Young LLP from October 1995 to July 2014. | 75 | Mr. Sung serves as a Trustee of Ironwood Institutional Multi-Strategy Fund, LLC and Ironwood Multi-Strategy Fund, LLC (October 2015 to present). | |||||
| OFFICERS AND INTERESTED DIRECTORS | ||||||||||
| JAMES E. DAVEY(6) (1964) | Director, President and Chief Executive Officer | President and Chief Executive Officer since 2010; Director since 2012 | Mr. Davey serves as Executive Vice President of The Hartford Financial Services Group, Inc. Mr. Davey has served in various positions within The Hartford and its subsidiaries and joined The Hartford in 2002. Additionally, Mr. Davey serves as Director, Chairman, President, and Senior Managing Director for Hartford Funds Management Group, Inc. ("HFMG"). Mr. Davey also serves as President, Manager, Chairman of the Board, and Senior Managing Director for Hartford Funds Management Company, LLC (“HFMC”); Manager, Chairman of the Board, and President of Lattice Strategies LLC (“Lattice”); Chairman of the Board, Manager, and Senior Managing Director of Hartford Funds Distributors, LLC (“HFD”); and Chairman of the Board, President and Senior Managing Director of Hartford Administrative Services Company (“HASCO”), each of which is an affiliate of HFMG. | 75 | None | |||||
| ANDREW S. DECKER (1963) | AML Compliance Officer | Since 2015 | Mr. Decker serves as Chief Compliance Officer and AML Compliance Officer of HASCO (since April 2015) and Vice President of HASCO (since April 2018). Mr. Decker serves as AML Officer of HFD (since May 2015). Mr. Decker also serves as Vice President of HFMG (since April 2018). Prior to joining The Hartford, Mr. Decker served as Vice President and AML Officer at Janney Montgomery Scott (a broker dealer) from April 2011 to January 2015. | N/A | N/A | |||||
| AMY N. FURLONG (1979) | Vice President | Since 2018 | Ms. Furlong serves as Vice President and Assistant Treasurer of HFMC (since September 2019). From 2018 through March 15, 2021, Ms. Furlong served as the Treasurer of each Company. Ms. Furlong has served in various positions within The Hartford and its subsidiaries in connection with the operation of the Hartford funds. Ms. Furlong joined The Hartford in 2004. | N/A | N/A | |||||
| 141 |
| NAME, YEAR OF BIRTH AND ADDRESS(1) | POSITION HELD WITH EACH COMPANY | TERM OF OFFICE(2) AND LENGTH OF TIME SERVED | PRINCIPAL OCCUPATION(S) DURING PAST 5 YEARS | NUMBER OF PORTFOLIOS IN FUND COMPLEX(3) OVERSEEN BY DIRECTOR | OTHER DIRECTORSHIPS FOR PUBLIC COMPANIES AND OTHER REGISTERED INVESTMENT COMPANIES BY DIRECTOR | |||||
| WALTER F. GARGER (1965) | Vice President and Chief Legal Officer | Since 2016 | Mr. Garger serves as Secretary, Managing Director and General Counsel of HFMG, HFMC, HFD, and HASCO (since 2013). Mr. Garger also serves as Secretary and General Counsel of Lattice (since July 2016). Mr. Garger has served in various positions within The Hartford and its subsidiaries in connection with the operation of the Hartford funds. Mr. Garger joined The Hartford in 1995. | N/A | N/A | |||||
| THEODORE J. LUCAS (1966) | Vice President | Since 2017 | Mr. Lucas serves as Executive Vice President of HFMG (since July 2016) and as Executive Vice President of Lattice (since June 2017). Previously, Mr. Lucas served as Managing Partner of Lattice (2003 to 2016). | N/A | N/A | |||||
| JOSEPH G. MELCHER (1973) | Vice President and Chief Compliance Officer | Since 2013 | Mr. Melcher serves as Executive Vice President of HFMG and HASCO (since December 2013). Mr. Melcher also serves as Executive Vice President (since December 2013) and Chief Compliance Officer (since December 2012) of HFMC, serves as Executive Vice President and Chief Compliance Officer of Lattice (since July 2016), serves as Executive Vice President of HFD (since December 2013), and served as President and Chief Executive Officer of HFD (from April 2018 to June 2019). | N/A | N/A | |||||
| VERNON J. MEYER (1964) | Vice President | Since 2006 | Mr. Meyer serves as Managing Director and Chief Investment Officer of HFMC and Managing Director of HFMG (since 2013). Mr. Meyer also serves as Senior Vice President-Investments of Lattice (since March 2019). Mr. Meyer has served in various positions within The Hartford and its subsidiaries in connection with the operation of the Hartford funds. Mr. Meyer joined The Hartford in 2004. | N/A | N/A | |||||
| DAVID A. NAAB (1985) | Vice President and Treasurer | Since March 15, 2021 | Mr. Naab serves as Vice President and Assistant Treasurer of HFMC (since June 2021). Prior to joining HFMC in 2021, Mr. Naab served in various positions as an associate, senior associate, manager, senior manager, and director within the investment management, financial services, and asset & wealth management practice groups of PricewaterhouseCoopers, LLP from 2007 to 2020. | N/A | N/A | |||||
| ALICE A. PELLEGRINO (1960) | Vice President and Assistant Secretary | Since 2016 | Ms. Pellegrino serves as Vice President of HFMG (since December 2013). Ms. Pellegrino also serves as Vice President and Assistant Secretary of Lattice (since June 2017). Ms. Pellegrino is a Senior Counsel and has served in various positions within The Hartford and its subsidiaries in connection with the operation of the Hartford funds. Ms. Pellegrino joined The Hartford in 2007. | N/A | N/A | |||||
| THOMAS R. PHILLIPS (1960) | Vice President and Secretary | Since 2017 | Mr. Phillips is Deputy General Counsel for HFMG and currently serves as a Senior Vice President (since June 2021) and Assistant Secretary (since June 2017) for HFMG. Mr. Phillips also serves as Vice President of HFMC (since June 2021). Prior to joining HFMG in 2017, Mr. Phillips was a Director and Chief Legal Officer of Saturna Capital Corporation from 2014–2016. Prior to that, Mr. Phillips was a Partner and Deputy General Counsel of Lord, Abbett & Co. LLC. | N/A | N/A |
| 142 |
| (1) | The address for each officer and Director is c/o Hartford Funds 690 Lee Road, Wayne, Pennsylvania 19087. |
| (2) | Term of Office: Each Director holds an indefinite term until his or her retirement, resignation, removal, or death. Directors generally must retire no later than December 31 of the year in which the Director turns 75 years of age. Each Fund officer generally serves until his or her resignation, removal, or death. |
| (3) | The portfolios of the “Fund Complex” are operational series of The Hartford Mutual Funds, Inc., The Hartford Mutual Funds II, Inc., Hartford Series Fund, Inc., Hartford HLS Series Fund II, Inc., Lattice Strategies Trust, and Hartford Funds Exchange-Traded Trust. |
| (4) | Effective as of December 31, 2021, Messrs. Birdsong and Senbet will retire as Directors. |
| (5) | Mr. Birdsong will retire effective December 31, 2021. Anticipating Mr. Birdsong's retirement, the Board has elected Christine R. Detrick to serve as Chair of the Board effective November 4, 2021. Accordingly, effective November 4, 2021, Mr. Birdsong will no longer serve as Chair of the Board. Effective November 5, 2021, Ms. Detrick also will serve as a Director of Capital One Financial Corporation. |
| (6) | “Interested person,” as defined in the 1940 Act, of each Company because of the person’s affiliation with, or equity ownership of, HFMC, HFD or affiliated companies. |
| 143 |
| 144 |
| 145 |
| 146 |
| 147 |
| 148 |
| • | The Board noted that the Fund’s performance was in the 3rd quintile of its performance universe for the 1-year period, and the 2nd quintile for the 3- and 5-year periods. The Board also noted that the Fund’s performance was below its benchmark for the 1-, 3-, and 5-year periods. |
| • | The Board noted that the Fund’s contractual management fee and actual management fee were in the 4th quintile and its total expenses (less 12b-1 and shareholder service fees) were in the 3rd quintile. |
| • | The Board noted that the Fund’s performance was in the 4th quintile of its performance universe for the 1-year period, the 2nd quintile for the 3-year period, and the 3rd quintile for the 5-year period. The Board also noted that the Fund’s performance was below its benchmark for the 1-year period and in line with its benchmark for the 3- and 5-year periods. |
| 149 |
| • | The Board noted that the Fund’s contractual management fee, actual management fee, and total expenses (less 12b-1 and shareholder service fees) were in the 1st quintile of its expense group. The Board noted that Class Y shares of the Fund have a contractual transfer agency expense cap of 0.08% through February 28, 2022, which resulted in HFMC reimbursing the Fund for certain expenses. |
| • | The Board noted that the Fund’s performance was in the 2nd quintile of its performance universe for the 1- and 3-year periods and the 1st quintile for the 5-year period. The Board also noted that the Fund’s performance was below its benchmark for the 1-, 3- , and 5-year periods. |
| • | The Board noted that the Fund’s contractual management fee was in the 4th quintile of its expense group, while its actual management fee and its total expenses (less 12b-1 and shareholder service fees) were in the 3rd quintile. The Board noted that Class Y shares of the Fund have a contractual transfer agency expense cap of 0.04% through February 28, 2022, which resulted in HFMC reimbursing the Fund for certain expenses. |
| • | The Board noted that the Fund’s performance was in the 4th quintile of its performance universe for the 1-year period and the 3rd quintile for the 3- and 5-year periods. The Board also noted that the Fund’s performance was below its benchmark for the 1-year period and in line with its benchmark for the 3- and 5-year periods. |
| • | The Board noted that the Fund’s contractual management fee was in the 4th quintile of its expense group, while its actual management fee and its total expenses (less 12b-1 and shareholder service fees) were in the 3rd quintile. |
| • | The Board noted that the Fund’s performance was in the 1st quintile of its performance universe for the 1-, 3-, and 5-year periods. The Board also noted that the Fund’s performance was above its benchmark for the 1-, 3-, and 5-year periods. |
| • | The Board noted that the Fund’s contractual management fee and actual management fee were in the 4th quintile of its expense group, while its total expenses (less 12b-1 and shareholder service fees) were in the 3rd quintile. |
| • | The Board noted that the Fund’s performance was in the 2nd quintile of its performance universe for the 1-, 3-, and 5-year periods. The Board also noted that the Fund’s performance was above its benchmark for the 1-, 3-, and 5-year periods. The Board noted recent and upcoming changes to the Fund’s portfolio management team. |
| • | The Board noted that the Fund’s contractual management fee and actual management fee were in the 4th quintile of its expense group, while its total expenses (less 12b-1 and shareholder service fees) were in the 3rd quintile. |
| • | The Board noted that the Fund’s performance was in the 3rd quintile of its performance universe for the 1-year period, the 5th quintile for the 3-year period, and the 4th quintile for the 5-year period. The Board also noted that the Fund’s performance was below its benchmark for the 1-year period and above its benchmark for the 3- and 5-year periods. |
| • | The Board noted that the Fund’s contractual management fee was in the 4th quintile of its expense group, while its actual management fee and its total expenses (less 12b-1 and shareholder service fees) were in the 3rd quintile. The Board noted that Class I and Y shares of the Fund have contractual transfer agency expense caps of 0.12% and 0.04%, respectively, through February 28, 2022. |
| • | The Board noted that the Fund’s performance was in the 5th quintile of its performance universe for the 1-year period and the 3rd quintile for the 3- and 5-year periods. The Board also noted that the Fund’s performance was below its benchmark for the 1-, 3-, and 5-year periods. |
| 150 |
| • | The Board noted that the Fund’s contractual management fee was in the 1st quintile of its expense group, while its actual management fee was in the 3rd quintile and its total expenses (less 12b-1 and shareholder service fees) were in the 5th quintile. |
| • | The Board noted that the Fund’s performance was in the 4th quintile of its performance universe for the 1-year period and the 3rd quintile for the 3- and 5-year periods. The Board also noted that the Fund’s performance was below its benchmark for the 1-year period and in line with its benchmark for the 3- and 5-year periods. |
| • | The Board noted that the Fund’s contractual management fee and actual management fee were in the 1st quintile of its expense group, while its total expenses (less 12b-1 and shareholder service fees) were in the 2nd quintile. The Board noted that Class A shares of the Fund have a contractual expense cap of 0.96% through February 28, 2022, which resulted in HFMC reimbursing the Fund for certain expenses. |
| • | The Board noted that the Fund’s performance was in the 4th quintile of its performance universe for the 1-, 3-, and 5-year periods. The Board also noted that the Fund’s performance was below its benchmark for the 1-, 3-, and 5-year periods. |
| • | The Board noted that the Fund’s contractual management fee was in the 2nd quintile of its expense group, while its actual management fee was in the 1st quintile of its expense group and its total expenses (less 12b-1 and shareholder service fees) were in the 3rd quintile. The Board noted that Class Y shares of the Fund have a contractual transfer agency expense cap of 0.06% through February 28, 2022, which resulted in HFMC reimbursing the Fund for certain expenses. |
| • | The Board noted that the Fund’s performance was in the 2nd quintile of its performance universe for the 1-, 3-, and 5-year periods. The Board also noted that the Fund’s performance was above its benchmark for the 1- and 3-year periods and below its benchmark for the 5-year period. |
| • | The Board noted that the Fund’s contractual management fee and actual management fee were in the 1st quintile of its expense group, while its total expenses (less 12b-1 and shareholder service fees) were in the 3rd quintile. The Board noted that Class A shares of the Fund have a contractual expense cap of 1.30% through February 28, 2022, which resulted in HFMC reimbursing the Fund for certain expenses. |
| • | The Board noted that the Fund’s performance was in the 1st quintile of its performance universe for the 1- and 3-year periods and the 2nd quintile for the 5-year period. The Board also noted that the Fund’s performance was above its benchmark for the 1-, 3-, and 5-year periods. |
| • | The Board noted that the Fund’s contractual management fee was in the 2nd quintile of its expense group, while its actual management fee was in the 3rd quintile and its total expenses (less 12b-1 and shareholder service fees) were in the 4th quintile. |
| 151 |
| a) | management; |
| b) | use; and |
| c) | protection; |
| a) | service your Transactions with us; and |
| b) | support our business functions. |
| a) | You; |
| b) | your Transactions with us; and |
| c) | third parties such as a consumer-reporting agency. |
| a) | your name; |
| b) | your address; |
| c) | your income; |
| d) | your payment; or |
| e) | your credit history; |
| a) | our insurance companies; |
| b) | our employee agents; |
| c) | our brokerage firms; and |
| d) | our administrators. |
| a) | market our products; or |
| b) | market our services; |
| a) | independent agents; |
| b) | brokerage firms; |
| c) | insurance companies; |
| d) | administrators; and |
| e) | service providers; |
| a) | taking surveys; |
| b) | marketing our products or services; or |
| c) | offering financial products or services under a joint agreement |
| a) | cookies; |
| b) | pixel tagging; or |
| c) | other technologies; |
| a) | “opt-out;” or |
| b) | “opt-in;” |
| a) | your authorization; or |
| b) | as otherwise allowed or required by law. |
| a) | underwriting policies; |
| b) | paying claims; |
| c) | developing new products; or |
| d) | advising customers of our products and services. |
| a) | the confidentiality; and |
| b) | the integrity of; |
| a) | secured files; |
| b) | user authentication; |
| c) | encryption; |
| d) | firewall technology; and |
| e) | the use of detection software. |
| a) | identify information to be protected; |
| b) | provide an adequate level of protection for that data; and |
| c) | grant access to protected data only to those people who must use |
| a) | credit history; |
| b) | income; |
| c) | financial benefits; or |
| d) | policy or claim information. |
| a) | your medical records; or |
| b) | information about your illness, disability or injury. |
| a) | Personal Financial Information; and |
| b) | Personal Health Information. |
| a) | your Application; |
| b) | your request for us to pay a claim; and |
| c) | your request for us to take an action on your account. |
| a) | asking about; |
| b) | applying for; or |
| c) | obtaining; |

(b) Not applicable.
Item 2. Code of Ethics.
The registrant, as of the end of the period covered by this report, has adopted a code of ethics that applies to the registrant’s principal executive officer, principal financial officer, principal accounting officer or controller, or persons performing similar functions, regardless of whether these individuals are employed by the registrant or a third party. There have been no amendments, during the period covered by this report, to a provision of the code of ethics that applies to the registrant��s principal executive officer, principal financial officer, principal accounting officer or controller, or persons performing similar functions, regardless of whether these individuals are employed by the registrant or a third party, and that relates to any element of the code of ethics description. The registrant has not granted any waivers, including an implicit waiver, from a provision of the code of ethics that applies to the registrant’s principal executive officer, principal financial officer, principal accounting officer or controller, or persons performing similar functions, regardless of whether these individuals are employed by the registrant or a third party, that relates to one or more of the items set forth in paragraph (b) of this item’s instructions. A copy of the code of ethics is filed herewith.
Item 3. Audit Committee Financial Expert.
The Board of Directors of the registrant (the “Board”) has designated David Sung as an Audit Committee Financial Expert. Mr. Sung is considered by the Board to be an independent director.
Item 4. Principal Accountant Fees and Services.
| (a) | Audit Fees: The aggregate fees billed for each of the last two fiscal years for professional services rendered by the principal accountant for the audit of the registrant’s annual financial statements or services that are normally provided by the accountant in connection with statutory and regulatory filings or engagements for those fiscal years were: |
$261,500 for the fiscal year ended October 31, 2020; $284,690 for the fiscal year ended October 31, 2021.
| (b) | Audit Related Fees: The aggregate fees billed in each of the last two fiscal years for assurance and related services by the principal accountant that are reasonably related to the performance of the audit of the registrant’s financial statements and are not reported under paragraph (a) of this Item were: |
$0 for the fiscal year ended October 31, 2020; $0 for the fiscal year ended October 31, 2021
| (c) | Tax Fees: The aggregate fees billed in each of the last two fiscal years for professional services rendered by the principal accountant for tax compliance, tax advice, and tax planning were: |
$70,962 for the fiscal year ended October 31, 2020; $65,952 for the fiscal year ended October 31, 2021. Tax-related services were principally in connection with, but not limited to, general tax services and excise tax services.
| (d) | All Other Fees: The aggregate fees billed in each of the last two fiscal years for products and services provided by the principal accountant, other than the services reported in paragraphs (a) through (c) of this Item were: |
$0 for the fiscal year ended October 31, 2020; $11,586 for the fiscal year ended October 31, 2021. These fees were principally in connection with, but not limited to, general audit related products and services and an accounting research tool subscription.
| (e) (1) | The Pre-Approval Policies and Procedures (the “Policy”) adopted by the Audit Committee of the registrant (also, the “Fund”) sets forth the procedures pursuant to which services performed by the independent registered public accounting firm for the registrant may be pre-approved. The following summarizes the pre-approval requirements under the Policy. |
| a) | The Audit Committee must pre-approve all audit services and non-audit services that the independent registered public accounting firm provides to the Fund. |
| b) | The Audit Committee must pre-approve any engagement of the independent registered public accounting firm to provide non-audit services to any Service Affiliate (which is defined to include any entity controlling, controlled by, or under common control with the investment adviser that provides ongoing services to the Fund) during the period of the independent registered public accounting firm’s engagement to provide audit services to the Fund, if the non-audit services to the Service Affiliate directly impact the Fund’s operations and financial reporting. |
| c) | The Audit Committee, from time to time, may designate one or more of its members who are Independent Directors (each a “Designated Member”) to consider, on the Audit Committee’s behalf, any non-audit services, whether to the Fund or to any Service Affiliate, that have not been pre-approved by the Audit Committee. The Designated Member also shall review, on the Audit Committee’s behalf, any proposed material change in the nature or extent of any non-audit services previously approved. In considering any requested non-audit services or proposed material change in such services, the Designated Member shall not authorize services which would exceed $50,000 in fees for such services. |
| d) | The independent registered public accounting firm may not provide specified prohibited non-audit services set forth in the Policy to the Fund, the Fund’s investment adviser, the Service Affiliates or any other member of the investment company complex. |
| (e) (2) | One hundred percent of the services described in items 4(b) through 4(d) were approved in accordance with the Audit Committee’s Pre-Approval Policy. As a result, none of such services was approved pursuant to paragraph (c)(7)(i)(C) of Rule 2-01 of Regulation S-X. |
| (f) | None of the hours expended on the principal accountant’s engagement to audit the registrant’s financial statements for the year ended October 31, 2021, were attributed to work performed by persons other than the principal accountant’s full-time, permanent employees. |
| (g) | The aggregate non-audit fees billed by the registrant’s accountant for services rendered to the registrant, and rendered to the registrant’s investment adviser (not including any sub-adviser whose role is primarily portfolio management and is subcontracted with or overseen by another investment adviser), and any entity controlling, controlled by, or under common control with the adviser that provides ongoing services to the registrant for each of the last two fiscal years of the registrant were: |
The aggregate non-audit fees billed by the registrant’s accountant for services rendered to the registrant: $70,962 for the fiscal year ended October 31, 2020; $77,538 for the fiscal year ended October 31, 2021. |
The aggregate non-audit fees billed by the registrant’s accountant for services rendered to the registrant’s investment adviser (not including any sub-adviser whose role is primarily portfolio management and is subcontracted with or overseen by another investment adviser), and any entity controlling, controlled by, or under common control with the adviser was $0 for the fiscal year ended October 31, 2020 and $325,000 for the fiscal year ended October 31, 2021. |
| (h) | The registrant’s audit committee of the board of directors has considered whether the provision of non-audit services that were rendered to the registrant’s investment adviser (not including any sub-adviser whose role is primarily portfolio management and is subcontracted with or overseen by another investment adviser), and any entity controlling, controlled by, or under common control with the investment adviser that provides ongoing services to the registrant that were not pre-approved pursuant to paragraph (c)(7)(ii) of Rule 2-01 of Regulation S-X is compatible with maintaining the principal accountant’s independence. |
Item 5. Audit Committee of Listed Registrants.
Not applicable.
Item 6. Investments.
| (a) | The Schedule of Investments in securities of unaffiliated issuers as of the close of the reporting period is included as part of the annual report filed under Item 1 of this form. |
| (b) | Not applicable. |
Item 7. Disclosure of Proxy Voting Policies and Procedures for Closed-End Management Investment Companies.
Not applicable.
Item 8. Portfolio Managers of Closed-End Management Investment Companies.
Not applicable.
Item 9. Purchases of Equity Securities by Closed-End Management Investment Company and Affiliated Purchasers.
Not applicable.
Item 10. Submission of Matters to a Vote of Security Holders.
There have been no material changes to the procedures by which the shareholders may recommend nominees to the registrant’s board of directors, where those changes were implemented after the registrant last provided disclosure in response to the requirements of Item 407(c)(2)(iv) of Regulation S-K (17 CFR 229.407) (as required by Item 22(b)(15) of Schedule 14A (17 CFR 240.14a-101)), or this Item.
Item 11. Controls and Procedures.
| (a) | The registrant’s principal executive and principal financial officers, or persons performing similar functions, have concluded that the registrant’s disclosure controls and procedures (as defined in Rule 30a-3(c) under the Investment Company Act of 1940, as amended (the “1940 Act”) (17 CFR 270.30a-3(c))) are generally effective to provide reasonable assurance, as of a date within 90 days of the filing date of the report that includes the disclosure required by this paragraph, based on their evaluation of these controls and |
procedures required by Rule 30a-3(b) under the 1940 Act (17 CFR 270.30a-3(b)) and Rules 13a-15(b) or 15d-15(b) under the Securities Exchange Act of 1934, as amended (17 CFR 240.13a-15(b) or 240.15d-15(b)). |
| (b) | There were no changes in the registrant’s internal control over financial reporting (as defined in Rule 30a-3(d) under the 1940 Act (17 CFR 270.30a-3(d)) that occurred during the period covered by this report that have materially affected, or are reasonably likely to materially affect, the registrant’s internal control over financial reporting. |
Item 12. Disclosure of Securities Lending Activities for Closed-End Management Investment Companies.
Not applicable.
Item 13. Exhibits.
| (a)(1) |
| (a)(2) |
| (a)(3) | Not applicable. |
| (a)(4) | Not applicable. |
| (b) |
SIGNATURES
Pursuant to the requirements of the Securities Exchange Act of 1934 and the Investment Company Act of 1940, the registrant has duly caused this report to be signed on its behalf by the undersigned, thereunto duly authorized.
| THE HARTFORD MUTUAL FUNDS II, INC. | ||||||
Date: January 6, 2022 | By: | /s/ James E. Davey | ||||
James E. Davey | ||||||
President and Chief Executive Officer | ||||||
Pursuant to the requirements of the Securities Exchange Act of 1934 and the Investment Company Act of 1940, this report has been signed below by the following persons on behalf of the registrant and in the capacities and on the dates indicated.
Date: January 6, 2022 | By: | /s/ James E. Davey | ||||
James E. Davey | ||||||
President and Chief Executive Officer | ||||||
Date: January 6, 2022 | By: | /s/ David A. Naab | ||||
David A. Naab | ||||||
Treasurer | ||||||
(Principal Financial Officer and Principal Accounting Officer) | ||||||