UNITED STATES
SECURITIES AND EXCHANGE COMMISSION
Washington, D.C. 20549
FORM N-CSR
CERTIFIED SHAREHOLDER REPORT OF REGISTERED MANAGEMENT
INVESTMENT COMPANIES
Investment Company Act file number: 811-00558
THE HARTFORD MUTUAL FUNDS II, INC.
(Exact name of registrant as specified in charter)
690 Lee Road, Wayne, Pennsylvania 19087
(Address of Principal Executive Offices) (Zip Code)
Thomas R. Phillips, Esquire
Hartford Funds Management Company, LLC
690 Lee Road
Wayne, Pennsylvania 19087
(Name and Address of Agent for Service)
Copy to:
John V. O’Hanlon, Esquire
Dechert LLP
One International Place, 40th Floor
100 Oliver Street
Boston, Massachusetts 02110-2605
Registrant’s telephone number, including area code: (610) 386-4068
Date of fiscal year end: October 31
Date of reporting period: October 31, 2022
Form N-CSR is to be used by management investment companies to file reports with the Commission not later than 10 days after the transmission to stockholders of any report that is required to be transmitted to stockholders under Rule 30e-1 under the Investment Company Act of 1940 (17 CFR 270.30e-1). The Commission may use the information provided on Form N-CSR in its regulatory, disclosure review, inspection, and policymaking roles.
A registrant is required to disclose the information specified by Form N-CSR, and the Commission will make this information public. A registrant is not required to respond to the collection of information contained in Form N-CSR unless the Form displays a currently valid Office of Management and Budget (“OMB”) control number. Please direct comments concerning the accuracy of the information collection burden estimate and any suggestions for reducing the burden to Secretary, Securities and Exchange Commission, 100 F Street, NE, Washington, DC 20549. The OMB has reviewed this collection of information under the clearance requirements of 44 U.S.C. § 3507.
Item 1. Reports to Stockholders.

Hartford Schroders Funds
Annual Report
October 31, 2022
| ■ Hartford Schroders China A Fund |
| ■ Hartford Schroders Diversified Emerging Markets Fund |
| ■ Hartford Schroders Emerging Markets Equity Fund |
| ■ Hartford Schroders Emerging Markets Multi-Sector Bond Fund |
| ■ Hartford Schroders International Contrarian Value Fund |
| ■ Hartford Schroders International Multi-Cap Value Fund |
| ■ Hartford Schroders International Stock Fund |
| ■ Hartford Schroders Securitized Income Fund |
| ■ Hartford Schroders Sustainable International Core Fund |
| ■ Hartford Schroders Tax-Aware Bond Fund |
| ■ Hartford Schroders US MidCap Opportunities Fund |
| ■ Hartford Schroders US Small Cap Opportunities Fund |
A MESSAGE FROM THE PRESIDENT
Dear Shareholders:
Thank you for investing in Hartford Mutual Funds. The following is the Funds’ Annual Report covering the period from November 1, 2021 through October 31, 2022.
Market Review
During the 12 months ended October 31, 2022, U.S. stocks, as measured by the S&P 500 Index,1 lost 14.61%. The decline was an unsettling reminder that equities have experienced an exceptionally volatile period marked by persistent inflation, the U.S. Federal Reserve (Fed) interest rate increases, and, lately, growing fears of recession.
Many investors would prefer to remember the brief period from late-June to late-August in 2022 when stocks came off their June 2022 lows for the year and climbed on hopes of a pause in the Fed’s interest-rate increases. But Fed Chair Jerome Powell’s Jackson Hole speech on August 26, 2022, made it clear the Fed would not be backing off its campaign of rate hikes until it felt inflation had been brought under control. The mid-summer rally quickly faded as Powell’s words sank in and as the August 2022 Consumer Price Index (CPI)2 report of 8.3% annual inflation appeared to stiffen the Fed’s resolve. The CPI’s small retreat to 8.2% in September 2022 produced no change in Fed sentiment.
With all the volatility we’ve seen these past 12 months, it may seem hard to believe that markets at the start of the period were, in fact, on their way to setting new positive records. Even as the Fed had begun expressing concerns in late 2021 over the likely persistence of inflation, the S&P 500 Index was on a steady climb on its way to a record high as of January 3, 2022.
As inflation numbers steadily worsened, Fed policymakers acknowledged that higher prices wouldn't be as transitory as they would have hoped. Soon thereafter, the Fed embarked on a cycle of rate hikes and Treasury balance-sheet reductions designed to slow the economy and soak up the massive amounts of liquidity put in place to support a faltering economy.
Any review of the period would be incomplete without noting the impact of the February 24, 2022 invasion of Ukraine by Russia’s armed forces, a decision that continues to threaten global security and strain worldwide food and energy supplies. With the continued backdrop of geopolitical instability, the Fed kept its anti-inflationary policy stance in focus in March 2022 by enacting a quarter-percent increase in the federal funds rate.
After a surprise jump in consumer prices in May 2022, the Fed in June 2022 raised rates by three-quarters of a percent. Although declining gasoline prices offered consumers a measure of relief during the summer, core inflation, which excludes volatile food and energy prices, remained persistently high as the period came to an end. As the Fed added another three-quarter-percent rate hike in September and October 2022, markets remained highly volatile.
As we approach the winter months, recession concerns are likely to grow as a result of the impact of Fed rate hikes on labor markets, currencies, and corporate profits. With market volatility likely to persist, it’s more important than ever to maintain a strong relationship with your financial professional.
Thank you again for investing in Hartford Mutual Funds. For the most up-to-date information on our funds, please take advantage of all the resources available at hartfordfunds.com.
James Davey
President
Hartford Funds
| 1 | S&P 500 Index is a market capitalization-weighted price index composed of 500 widely held common stocks. The index is unmanaged and not available
for direct investment. Past performance does not guarantee future results. |
| 2 | The Consumer Price Index (CPI) in the United States is defined by the Bureau of Labor Statistics as a measure of the average change over time in the prices
paid by urban consumers for a market basket of consumer goods and services. |
Table of Contents
The views expressed in each Fund’s Manager Discussion contained in the Fund Overview section are views of that Fund’s portfolio manager(s) through the end of the period and are subject to change based on market and other conditions, and we disclaim any responsibility to update the views contained herein. These views may contain statements that are “forward-looking” statements. Actual results may differ materially from those projected in the “forward-looking” statements. Each Fund’s Manager Discussion is for informational purposes only and does not represent an offer, recommendation or solicitation to buy, hold or sell any security. The specific securities identified and described, if any, do not represent all of the securities purchased or sold and you should not assume that investments in the securities identified and discussed will be profitable. Holdings and characteristics are subject to change. With the exception of Hartford Schroders Diversified Emerging Markets Fund, Hartford Schroders International Contrarian Value Fund, and Hartford Schroders Sustainable International Core Fund, Fund performance reflected in each Fund’s Manager Discussion reflects the returns of such Fund’s Class A shares, before sales charges, and returns for such Fund’s other classes differ only to the extent that the classes do not have the same expenses. Fund performance reflected in the Manager Discussion for each of Hartford Schroders Diversified Emerging Markets Fund, Hartford Schroders International Contrarian Value Fund, and Hartford Schroders Sustainable International Core Fund reflect the returns of such Fund's Class SDR shares and returns for such Fund’s other classes differ only to the extent that the classes do not have the same expenses.
Hartford Schroders China A Fund
Fund Overview
October 31, 2022 (Unaudited)
Inception 03/31/2020
Sub-advised by Schroder Investment Management North America Inc. and its
sub-sub-adviser, Schroder Investment Management North America Limited | Investment objective – The Fund seeks long-term capital appreciation. |
Comparison of Change in Value of $10,000 Investment (03/31/2020 - 10/31/2022)
The chart above represents the hypothetical growth of a $10,000 investment in Class A, which includes the maximum sales charge applicable to Class A shares. Returns for the Fund’s other classes will vary from what is seen above due to differences in the expenses charged to those share classes.
| Average Annual Total Returns |
| for the Periods Ended 10/31/2022 |
| | 1 Year | Since
Inception1 |
| Class A2 | -35.01% | 4.75% |
| Class A3 | -38.58% | 2.48% |
| Class C2 | -34.97% | 4.25% |
| Class C4 | -35.61% | 4.25% |
| Class I2 | -34.86% | 4.99% |
| Class Y2 | -34.77% | 5.08% |
| Class F2 | -34.71% | 5.17% |
| Class SDR2 | -34.75% | 5.17% |
| MSCI China A Onshore Index (Net) | -34.78% | 1.51% |
| 1 | Inception: 03/31/2020 |
| 2 | Without sales charge |
| 3 | Reflects maximum sales charge of 5.50% |
| 4 | Reflects a contingent deferred sales charge of 1.00% |
PERFORMANCE DATA QUOTED REPRESENTS PAST PERFORMANCE AND DOES NOT GUARANTEE FUTURE RESULTS. The investment return and principal value of the investment will fluctuate so that investors’ shares, when redeemed, may be worth more or less than their original cost. The chart and table do not reflect the deductions of taxes that a shareholder would pay on Fund distributions or the redemption of Fund shares. Current performance may be lower or higher than the performance data quoted. To obtain performance data current to the most recent month-end, please visit our website hartfordfunds.com.
Total returns presented above were calculated using the applicable class' net asset value available to shareholders for sale or redemption of Fund shares on 10/31/2022, which may exclude investment transactions as of this date. All share class returns assume the reinvestment of all distributions at net asset value and the deduction of all fund expenses. The total returns presented in the Financial Highlights section of the report are calculated in the same manner, but also take into account certain
adjustments that are necessary under generally accepted accounting principles. As a result, the total returns in the Financial Highlights section may differ from the total returns presented above.
You cannot invest directly in an index.
See "Benchmark Glossary" for benchmark descriptions.
Performance information may reflect expense waivers/reimbursements without which performance would have been lower. For information on current expense waivers/reimbursements, please see the prospectus.
| Operating Expenses* | Gross | Net |
| Class A | 1.94% | 1.45% |
| Class C | 2.66% | 2.25% |
| Class I | 1.65% | 1.15% |
| Class Y | 1.65% | 1.11% |
| Class F | 1.54% | 0.99% |
| Class SDR | 1.54% | 0.99% |
| * | Expenses as shown in the Fund’s most recent prospectus. Gross expenses do not reflect contractual expense reimbursement arrangements. Net expenses reflect such arrangements in instances when they reduce gross expenses. These arrangements remain in effect until 02/28/2023 unless the Fund’s Board of Directors approves an earlier termination. Actual expenses may be higher or lower. Please see accompanying Financial Highlights for expense ratios for the period ended 10/31/2022. |
Hartford Schroders China A Fund
Fund Overview – (continued)
October 31, 2022 (Unaudited)
Portfolio Manager
Hartford Schroders China A Fund’s sub-adviser is Schroder Investment Management North America Inc. and its sub-sub-adviser is Schroder Investment Management North America Limited.
Jack Lee, CFA
Portfolio Manager
Manager Discussion
How did the Fund perform during the period?
The Class A shares of the Hartford Schroders China A Fund returned -35.01%, before sales charges, for the twelve-month period ended October 31, 2022, underperforming the Fund’s benchmark, the MSCI China A Onshore Index (Net), which returned -34.78% for the same period. For the same period, the Class A shares of the Fund, before sales charges, outperformed the -43.78% average return of the Lipper China Region peer group, a group of funds with investment strategies similar to those of the Fund.
Why did the Fund perform this way?
Chinese equities markets declined in the final months of 2021 amid constant regional COVID-19 outbreaks in China. China’s “zero COVID” policy continued to trigger a series of sporadic lockdowns in major cities, which put a damper on consumer confidence and domestic demand. Additionally, the ongoing liquidity concerns around Chinese property developers and the heightened U.S.-China relations also depressed market sentiment somewhat. The markets remained volatile entering into 2022, as they continued to be driven by macroeconomic factors including the outlook for U.S. interest rates, geopolitical tensions, and the outbreak of the Omicron strain of COVID-19 in China. Although the market rebounded briefly in mid-March 2022 on positive policy guidance from policymakers, overall sentiment towards the China market remained weak in the remaining months of the period given the concerns around COVID lockdowns and their longer-term impact on the economy. The closely watched Chinese Communist Party 20th Congress also concluded in October 2022, which reinforced President Xi’s authority but failed to signal any near-term easing of the country’s “zero-COVID” policy.
Outside of China, the macroeconomic backdrop continued to be increasingly challenging during the period. Global growth momentum seemed to be softening, inflation proxies remained elevated on high commodity prices and lingering supply-chain issues, and central banks and governments globally took steps to normalize monetary policy by withdrawing stimulus at a record-matching pace. The divergence in the monetary-policy trajectories between China and the U.S. during the period caused the Chinese renminbi to decline against the U.S. dollar, which was not favorable to the Chinese market.
During the period, the Fund delivered negative returns while performing broadly in line with the MSCI China A Onshore Index (Net). Sector allocation effect was positive, driven by the Fund’s underweight exposure to the Consumer Staples and Industrials sectors, as well as an overweight exposure to the Healthcare sector. Cash allocation in
the down market also had a positive impact. Stock selection was mostly neutral, as positive selection in the Technology and Healthcare sectors was offset by weak selection in the Financials sector.
At the stock level, satellite image processing software provider Piesat Information was the top contributor, thanks to the strong growth in revenue and earnings driven by the boom in China’s remote sensing satellite industry. Medical equipment manufacturer Micro-Tech advanced on expectations that the Chinese government will spend more on hospital infrastructure going forward. Real estate company Poly Development also contributed positively to Fund performance, as investors believed the company could benefit from the reshaping of the industry landscape given its strong balance sheet and state-owned background. On the negative side, bakery shop Toly Bread underperformed as its business was severely impacted by the recurring COVID lockdowns in China. New media service provider Mango Excellent underperformed because its business, especially the advertising side, was impacted by the depressing macro environment. Lastly, ceramic material producer Shandong Sinocera traded lower as demand for consumer electronic products was weak amid the downcycle in the tech industry.
During the period, the Fund used p-notes and non-standard warrants, which are types of derivatives, to gain access to the broader A-share universe. These derivatives had no material impact on the Fund's overall performance for the period.
What is the outlook as of the end of the period?
As of the end of the period, China’s markets remained depressed by the twin overhangs of the “dynamic-zero-COVID” policy and the ongoing contraction in real estate activity, both of which have negatively affected economic activity and seriously impacted earnings in many sectors of the market.
Against the weak macroeconomic backdrop, we have started to see more policy measures announced to support the real estate market, increase infrastructure investment, and encourage consumption.
Although it seems unlikely that restrictive COVID-19 policies will soften much in the near term, in the last few months markets have started to anticipate a return to normalcy in the medium term. There is some hope that the Shanghai lockdown-related weakness could represent the low point for growth in this market cycle and mark the peak of restrictions. In our view, year-on-year comparisons should also look better as we head towards 2023, and a stronger rebound in activity may occur, as the authorities may become more relaxed about the downside risks from easing controls.
Looking ahead, we expect that policy implementation in line with President Xi’s stated policy priorities should accelerate after the
Hartford Schroders China A Fund
Fund Overview – (continued)
October 31, 2022 (Unaudited)
change of leadership in China. We also expect a ramp-up of supporting policies, which may support China's domestic growth. More details of economic policy from the new leadership team will likely be available in the Central Economic Work Conference in late December 2022. Before that, the market is likely to continue to consolidate as domestic and external uncertainties continue without much clarity in sight.
China reopening and the possibility of a pivot by the Federal Reserve to slow down the pace of future interest-rate increases (or a confirmation of an inflation peak in the U.S.) remain the most visible and powerful upside catalysts for the market in early 2023, in our view.
In terms of the Fund’s portfolio strategy, as of the end of the period we have maintained our focus on sectors that we believe will see structural growth over the medium term. As of the end of the period, the Fund is most overweight in the Healthcare sector, as we believe the sector’s risk and reward profile has appeared to become more attractive after the corrections over the past year or so. The sector outlook is still well underpinned by the structural increase in government spending on healthcare equipment/products. As of the end of the period, we still favor select domestic Chinese consumer-facing businesses with strong brand value and pricing power. We also like the Technology sector as of the end of the period, believing it should benefit from the “new infrastructure” initiative, localization, and the structural increase in renewables in the medium term given carbon neutrality goals globally. Alongside these structural growth companies in the Fund’s portfolio are exposures to more cyclical businesses (petrochemical and select material names) that we believe help to balance the overall portfolio.
Important Risks
Investing involves risk, including the possible loss of principal. Security prices fluctuate in value depending on general market and economic conditions and the prospects of individual companies. ●The Fund invests in China A shares through Stock Connect, which is subject to a number of restrictions that may affect the Fund’s investments and returns. To the extent the Fund invests in China A shares listed on the Science and Technology Innovation Board of the Shanghai stock exchange and/or the ChiNext market of the Shenzhen stock exchange, the risks are heightened. • Risks associated with investments in China include currency fluctuation, political, economic, social, environmental, regulatory and other risks, including risks associated with differing legal standards. Focusing investments in China subjects the Fund to more volatility and greater risk of loss than a fund with more geographically diverse investments. • Foreign investments may be more volatile and less liquid than U.S. investments and are subject to the risk of currency fluctuations and adverse political, economic and regulatory developments. These risks may be greater, and include additional risks, for investments in emerging markets, such as China. • Integration of environmental, social, and/or governance (ESG) characteristics into the investment process may not work as intended. • Small- and mid-cap securities can have greater risks and volatility than large-cap securities. • Derivatives are generally more volatile and sensitive to changes in market or economic conditions than other securities; their risks include currency, leverage, liquidity, index, pricing, regulatory and counterparty risk. • Because the Fund is non-diversified, it may invest in a smaller number of issuers,
and may be more exposed to risks and volatility than a more broadly diversified fund. • To the extent the Fund focuses on one or more sectors, the Fund may be subject to increased volatility and risk of loss if adverse developments occur. • The Fund may have high portfolio turnover, which could increase its transaction costs and an investor's tax liability.
| Composition by Sector(1) |
| as of 10/31/2022 |
| Sector | Percentage
of Net Assets |
| Equity Securities | |
| Communication Services | 2.8% |
| Consumer Discretionary | 8.9 |
| Consumer Staples | 6.7 |
| Financials | 15.2 |
| Health Care | 10.6 |
| Industrials | 17.7 |
| Information Technology | 13.8 |
| Materials | 19.0 |
| Real Estate | 0.7 |
| Total | 95.4% |
| Short-Term Investments | 0.8 |
| Other Assets & Liabilities | 3.8 |
| Total | 100.0% |
| (1) | A sector may be comprised of several industries. For Fund compliance purposes, the Fund may not use the same classification system. These sector classifications are used for financial reporting purposes. |
Hartford Schroders Diversified Emerging Markets Fund
Fund Overview
October 31, 2022 (Unaudited)
Inception 09/30/2021
Sub-advised by Schroder Investment Management North America Inc. and its sub-sub-adviser, Schroder Investment Management North America Limited | Investment objective – The Fund seeks long-term capital appreciation. |
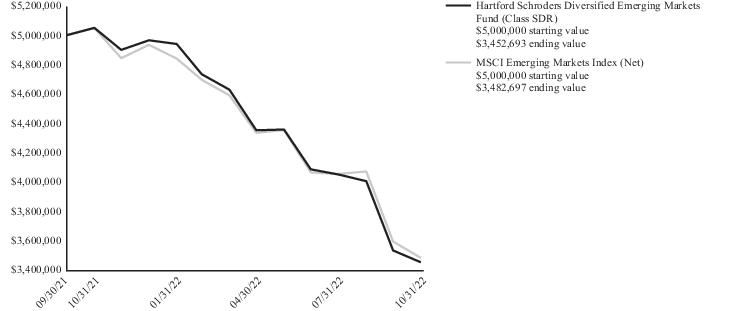
Comparison of Change in Value of $5,000,000 Investment (09/30/2021 - 10/31/2022)
The chart above represents the hypothetical growth of a $5,000,000 investment in Class SDR. Returns for the Fund’s other classes will vary from what is seen above due to differences in the expenses charged to those share classes.
| Average Annual Total Returns |
| for the Periods Ended 10/31/2022 |
| | 1 Year | Since
Inception1 |
| Class A2 | -31.63% | -28.92% |
| Class A3 | -35.39% | -32.53% |
| Class C2 | -32.03% | -29.30% |
| Class C4 | -32.71% | -29.30% |
| Class I2 | -31.43% | -28.73% |
| Class Y2 | -31.43% | -28.73% |
| Class F2 | -31.63% | -28.92% |
| Class SDR2 | -31.63% | -28.92% |
| MSCI Emerging Markets Index (Net) | -31.03% | -28.19% |
| 1 | Inception: 09/30/2021 |
| 2 | Without sales charge |
| 3 | Reflects maximum sales charge of 5.50% |
| 4 | Reflects a contingent deferred sales charge of 1.00% |
PERFORMANCE DATA QUOTED REPRESENTS PAST PERFORMANCE AND DOES NOT GUARANTEE FUTURE RESULTS. The investment return and principal value of the investment will fluctuate so that investors’ shares, when redeemed, may be worth more or less than their original cost. The chart and table do not reflect the deductions of taxes that a shareholder would pay on Fund distributions or the redemption of Fund shares. Current performance may be lower or higher than the performance data quoted. To obtain performance data current to the most recent month-end, please visit our website hartfordfunds.com.
Total returns presented above were calculated using the applicable class' net asset value available to shareholders for sale or redemption of Fund shares on 10/31/2022, which may exclude investment transactions as of this date. The share class returns assume the reinvestment of all distributions at net asset value and the deduction of all fund expenses. The total returns presented in the Financial Highlights section of the report are calculated in the same manner, but also take into account certain
adjustments that are necessary under generally accepted accounting principles. As a result, the total returns in the Financial Highlights section may differ from the total returns presented above.
Classes A, C, I, Y, and F commenced operations on 02/28/2022 and performance prior to that date is that of the Fund’s Class SDR shares. Performance prior to an inception date of a class has not been adjusted to reflect the operating expenses of such class. If the performance were adjusted, it may have been higher or lower.
You cannot invest directly in an index.
See "Benchmark Glossary" for benchmark descriptions.
Performance information may reflect expense waivers/reimbursements without which performance would have been lower. For information on current expense waivers/reimbursements, please see the prospectus.
| Operating Expenses* | Gross | Net |
| Class A | 1.40% | 1.34% |
| Class C | 2.14% | 2.14% |
| Class I | 1.15% | 1.04% |
| Class Y | 1.15% | 0.99% |
| Class F | 1.05% | 0.89% |
| Class SDR | 1.05% | 0.89% |
| * | Expenses as shown in the Fund’s most recent prospectus. Gross expenses do not reflect contractual expense reimbursement arrangements. Net expenses reflect such arrangements in instances when they reduce gross expenses. These arrangements remain in effect until 02/28/2023 unless the Fund’s Board of Directors approves an earlier termination. Please see accompanying Financial Highlights for expense ratios for the period ended 10/31/2022. |
Hartford Schroders Diversified Emerging Markets Fund
Fund Overview – (continued)
October 31, 2022 (Unaudited)
Portfolio Managers
Hartford Schroders Diversified Emerging Markets Fund’s sub-adviser is Schroder Investment Management North America Inc. and its sub-sub-adviser is Schroder Investment Management North America Limited.
Tom Wilson, CFA
Portfolio Manager
David Philpotts
Portfolio Manager
Gordon Huang
Portfolio Manager
Manager Discussion
How did the Fund perform during the period?
The Class SDR shares of the Hartford Schroders Diversified Emerging Markets Fund returned -31.63% for the twelve-month period ended October 31, 2022, modestly underperforming the Fund’s benchmark, the MSCI Emerging Markets Index (Net), which returned -31.03% for the period. Over the same period, the Class SDR shares of the Fund outperformed the -32.69% average return of the Lipper Emerging Markets Funds peer group, which is a group of funds with investment strategies similar to those of the Fund.
Why did the Fund perform this way?
Over the twelve-month period ended October 31, 2022, the emerging-markets equity asset class was under pressure along with broader global equities. Russia’s invasion of Ukraine, the ensuing energy crisis, supply-chain disruptions, China’s zero-Covid policy and regulatory crackdown, and tighter global monetary policy all weighed heavily on investor sentiment. The strength of the U.S. dollar against emerging-market currencies was also detrimental to the Fund’s performance relative to the MSCI Emerging Markets Index (Net) for the period. The sharp underperformance of China over the period chiefly benefited commodity-heavy markets in Latin America and the Middle East, while also benefitting Indian equities, which were regarded as a relative safe haven given India’s more robust economic growth during the period.
In selecting investments for the Fund, we combine both fundamental and quantitative analysis along with our sustainable investing criteria. At the portfolio level, exposure to Europe, the Middle East and Africa (EMEA) and Latin America added value over the twelve-month period. Within EMEA, a sizable underweight to Russia leading up to its unprovoked invasion of Ukraine was additive to relative performance as the market ultimately collapsed and was swiftly removed from the MSCI Emerging Markets Index (Net). Adverse signals from our country risk monitor prompted a timely de-risking of the Fund’s exposure to Russian equities. The United Arab Emirates (UAE) was a positive contributor to Fund performance, as robust oil prices underpinned a relatively upbeat domestic economy. Positions in high-quality, attractively valued banks and a select, well-capitalized diversified property investment & developer also lifted relative performance. The favorable performance outcome in Latin America was primarily driven by an overweight position in Mexico alongside
strong stock selection during the period. In particular, a mix of contributions from high-quality, attractively valued banks and defensive staples (e.g., Kimberly-Clark de Mexico) underpinned relative performance.
However, positioning in Asian emerging markets was an overall detractor from performance during the period, offsetting some of the aforementioned gains. China was a volatile market over the twelve-month period due to rising geopolitical risks related to its relationship with Russia and its intentions towards Taiwan. Moreover, concerns relating to President Xi’s consolidation of power following the Chinese Communist Party’s 20th Congress in October 2022 and his increasing focus on economic security were poorly received by investors. While we maintained a modest underweight to the market, relative performance was negatively impacted by our holdings in internet platform giants Alibaba and JD.com, as well as an insufficient exposure to the outperforming Energy sector. A modest underweight to India also weighed on relative performance during the period, as the market performed strongly despite its lofty valuation.
Brighter spots within the largest region of the MSCI Emerging Markets Index (Net) included Indonesia and South Korea. Indonesia was driven by strong stock selection within banks, benefiting from well-capitalized, quality value opportunities. Exposure to quality cyclicals within the Industrials sector and an underweight to a key internet platform laggard underpinned solid relative performance in South Korea.
Finally, at a broader sector level, the Energy sector was a notable detractor from the Fund’s performance due to a lack of exposure to Brazilian heavyweight Petrobras and an underweight to coal, as the underlying commodity rallied sharply due to supply concerns emanating from the energy crisis. We view the sub-industry as poor-quality cyclical exposure with negative environmental, social and governance (ESG) characteristics.
Derivatives were used within the Fund during the period in the form of index futures, and were only used for efficient management of fund inflows and outflows; these futures had no material impact on overall Fund performance for the period.
Hartford Schroders Diversified Emerging Markets Fund
Fund Overview – (continued)
October 31, 2022 (Unaudited)
What is the outlook as of the end of the period?
It has been another humbling year for economic forecasters, whether they be investors or central banks. Few predicted the current global backdrop even as short a time ago as the start of the year, most notably the level and persistence of inflation. There still remains an unusually high level of uncertainty about the economic outlook and what this means for global interest rates and currencies.
After having held up relatively well through the summer months, emerging markets finally capitulated in September 2022, with emerging-markets equities, fixed income, foreign currency, and credit all underperforming their developed-market counterparts. However, emerging markets are also further along in their monetary policy tightening cycle, which does provide some comfort, particularly if the dollar is close to peaking. The timing of China’s “re-opening” is also a significant “known unknown,” but this seems a pre-requisite for a firmer footing, in our view. We believe there is good value in emerging markets, but it is scarcer than simple valuation multiples suggest due to the greater risks, most notably their inherent cyclicality.
As investors wait for greater clarity, we believe the path of least resistance is probably for a range-bound market (i.e., a market that trades within a certain range) with further downside likely if earnings disappoint expectations or if inflation remains more stubborn than expected. This backdrop reinforces our defensive positioning for the Fund. Fortunately, as of the end of the period, we believe there are opportunities to find quality stocks at reasonable prices. We believe this also offers a natural hedge against such an uncertain environment. But we are also wary of the potential for a pivot by the U.S. Federal Reserve.
More broadly, we still expect stock selection to be more nuanced in the near term than we saw during the 2017-2020 thematic “growth at any price” period. We believe markets will be driven more by the progression of earnings as opposed to multiple expansion as was the case from 2017 to 2020. In our view, companies that the market favored during that period now offer better value but are still not exceptionally cheap, particularly given ongoing regulatory risks and geopolitical tensions. In contrast, in our view, stocks exhibiting both quality and value characteristics still have a way to run for valuations to normalize even before considering their recession-proofing potential.
Finally, we would stress that, given the prospect of ongoing short-term volatility, we believe it is more important than ever to stay true to our investment process. In the short term, we remain disciplined in seeking to find opportunities during periods of excess volatility by trading little but often back to target stock weights.
Important Risks
Investing involves risk, including the possible loss of principal. Security prices fluctuate in value depending on general market and economic conditions and the prospects of individual companies. • Foreign investments may be more volatile and less liquid than U.S. investments and are subject to the risk of currency fluctuations and adverse political, economic and regulatory developments. These risks may be greater, and include additional risks, for investments in emerging markets or if the Fund focuses in a particular geographic region or
country, such as China. • Risks associated with investments in China include currency fluctuation, political, economic, social, environmental, regulatory and other risks, including risks associated with differing legal standards. • Small- and mid-cap securities can have greater risks and volatility than large-cap securities. • Derivatives are generally more volatile and sensitive to changes in market or economic conditions than other securities; their risks include currency, leverage, liquidity, index, pricing, regulatory and counterparty risk. • Applying sustainability criteria to the investment process may result in foregoing certain investments and underperformance comparative to funds that do not have a similar focus. There is a risk that the securities identified by the sub-adviser as meeting its sustainable investing criteria do not operate as anticipated. • The Fund may have high portfolio turnover, which could increase its transaction costs and an investor's tax liability.
| Composition by Sector(1) |
| as of 10/31/2022 |
| Sector | Percentage
of Net Assets |
| Equity Securities | |
| Communication Services | 12.4% |
| Consumer Discretionary | 10.0 |
| Consumer Staples | 6.4 |
| Energy | 4.0 |
| Financials | 26.5 |
| Health Care | 3.8 |
| Industrials | 4.6 |
| Information Technology | 23.6 |
| Materials | 5.9 |
| Real Estate | 0.4 |
| Utilities | 0.8 |
| Total | 98.4% |
| Short-Term Investments | 1.0 |
| Other Assets & Liabilities | 0.6 |
| Total | 100.0% |
| (1) | A sector may be comprised of several industries. For Fund compliance purposes, the Fund may not use the same classification system. These sector classifications are used for financial reporting purposes. |
Hartford Schroders Emerging Markets Equity Fund
Fund Overview
October 31, 2022 (Unaudited)
Inception 03/31/2006
Sub-advised by Schroder Investment Management North America Inc. and its
sub-sub-adviser, Schroder Investment Management North America Limited | Investment objective – The Fund seeks capital appreciation. |
Comparison of Change in Value of $10,000 Investment (10/31/2012 - 10/31/2022)
The chart above represents the hypothetical growth of a $10,000 investment in Class A, which includes the maximum sales charge applicable to Class A shares. Returns for the Fund’s other classes will vary from what is seen above due to differences in the expenses charged to those share classes.
| Average Annual Total Returns |
| for the Periods Ended 10/31/2022 |
| | 1 Year | 5 Years | 10 Years |
| Class A1 | -33.86% | -3.10% | 1.06% |
| Class A2 | -37.51% | -4.19% | 0.49% |
| Class C1 | -34.26% | -3.75% | 0.75% |
| Class C3 | -34.91% | -3.75% | 0.75% |
| Class I1 | -33.63% | -2.86% | 1.31% |
| Class R31 | -33.94% | -3.29% | 1.05% |
| Class R41 | -33.81% | -2.98% | 1.21% |
| Class R51 | -33.62% | -2.82% | 1.33% |
| Class Y1 | -33.62% | -2.77% | 1.37% |
| Class F1 | -33.55% | -2.68% | 1.40% |
| Class SDR1 | -33.50% | -2.68% | 1.44% |
| MSCI Emerging Markets Index (Net) | -31.03% | -3.09% | 0.79% |
| 1 | Without sales charge |
| 2 | Reflects maximum sales charge of 5.50% |
| 3 | Reflects a contingent deferred sales charge of 1.00% |
PERFORMANCE DATA QUOTED REPRESENTS PAST PERFORMANCE AND DOES NOT GUARANTEE FUTURE RESULTS. The investment return and principal value of the investment will fluctuate so that investors’ shares, when redeemed, may be worth more or less than their original cost. The chart and table do not reflect the deductions of taxes that a shareholder would pay on Fund distributions or the redemption of Fund shares. Current performance may be lower or higher than the performance data quoted. To obtain performance data current to the most recent month-end, please visit our website hartfordfunds.com.
Total returns presented above were calculated using the applicable class' net asset value available to shareholders for sale or redemption of Fund shares on 10/31/2022, which may exclude investment transactions as of this date. All share class returns assume the reinvestment of all distributions at net asset value and the deduction of all fund expenses. The total returns presented in the Financial Highlights section of the report are calculated in the same manner, but also take into account certain
adjustments that are necessary under generally accepted accounting principles. As a result, the total returns in the Financial Highlights section may differ from the total returns presented above.
Effective immediately before the opening of business on 10/24/2016, the Schroder Emerging Market Equity Fund (the “Predecessor Fund”) was reorganized into the Fund. The performance information shown for periods prior to 10/24/2016 is that of the Predecessor Fund. Prior to 10/24/2016, Class A, Class I and Class SDR were called Advisor Shares, Investor Shares and R6 Shares, respectively. Class C, Class R3, Class R4, Class R5, and Class Y shares commenced operations on 10/24/2016 and performance prior to this date reflects the performance of the Predecessor Fund’s Investor Shares. Performance for Class SDR shares prior to 12/30/2014 (the inception date of the Predecessor Fund’s Class R6 Shares) reflects the performance of the Predecessor Fund’s Investor Shares. Class F shares commenced operations on 02/28/2017 and performance prior to that date is that of the Fund’s Class I shares. Performance prior to Class F’s inception date has not been adjusted to reflect the operating expenses of Class F. The returns would be different if the Fund’s fees and expenses were reflected for periods prior to 10/24/2016.
You cannot invest directly in an index.
See "Benchmark Glossary" for benchmark descriptions.
Performance information may reflect expense waivers/reimbursements without which performance would have been lower.
Effective as of the close of business on 04/15/2021, the Fund was closed to new investors, subject to certain exceptions. For more information, please see the Fund’s prospectus.
Hartford Schroders Emerging Markets Equity Fund
Fund Overview – (continued)
October 31, 2022 (Unaudited)
| Operating Expenses* | Gross | Net |
| Class A | 1.45% | 1.45% |
| Class C | 2.14% | 2.14% |
| Class I | 1.23% | 1.23% |
| Class R3 | 1.77% | 1.77% |
| Class R4 | 1.47% | 1.47% |
| Class R5 | 1.17% | 1.17% |
| Class Y | 1.16% | 1.16% |
| Class F | 1.05% | 1.05% |
| Class SDR | 1.05% | 1.05% |
| * | Expenses as shown in the Fund’s most recent prospectus. Actual expenses may be higher or lower. Please see accompanying Financial Highlights for expense ratios for the period ended 10/31/2022. |
Portfolio Managers
Hartford Schroders Emerging Markets Equity Fund’s sub-adviser is Schroder Investment Management North America Inc. and its sub-sub-adviser is Schroder Investment Management North America Limited.
Tom Wilson, CFA
Portfolio Manager
Robert Davy
Portfolio Manager
James Gotto
Portfolio Manager
Waj Hashmi, CFA
Portfolio Manager
Nicholas Field
Portfolio Manager
Manager Discussion
How did the Fund perform during the period?
The Class A shares of the Hartford Schroders Emerging Markets Equity Fund returned -33.86%, before sales charges, for the twelve-month period ended October 31, 2022, underperforming the Fund’s benchmark, the MSCI Emerging Markets Index (Net), which returned -31.03% for the same period. For the same period, the Class A shares of the Fund, before sales charges, underperformed the -32.69% average return of the Lipper Emerging Markets Funds peer group, a group of funds with investment strategies similar to those of the Fund.
Why did the Fund perform this way?
Global equities, as measured by the MSCI ACWI Index (Net), recorded a negative return over the twelve-month period ended October 31, 2022, against a backdrop of war in Ukraine, slowing growth, heightened inflationary pressure, and rising interest rates. The MSCI Emerging Markets Index (Net) returned -31.03% during the period, underperforming the MSCI World Index, which returned -18.48% for the same period.
Russian equities fell sharply in the run-up to and in the aftermath of the invasion of Ukraine at the end of February 2022. Russia was removed from the MSCI Emerging Markets Index on March 9, 2022. Hungary and Poland, which border Ukraine, were among the weakest index markets amid concern over the impact of the war on their domestic economies and the risk of escalation of Russia’s actions within the region.
China also lagged the MSCI Emerging Markets Index as COVID-19 lockdowns in key cities were introduced, removed, and then introduced again, hampering domestic demand. A crisis in the Real Estate sector also weighed on sentiment. Towards the end of the period, macroeconomic data began to improve, helped by Chinese authorities’ implementation of various economic support policies. Meanwhile, South Korea and Taiwan underperformed as the outlook for global growth and trade deteriorated during the period.
On the positive side, Brazil outperformed as election-related volatility ended with former President Lula winning a third term in October 2022’s presidential election. Turkey was the best-performing market despite inflation that reached over 80% as the central bank cut interest rates to low double digits over the period.
Hartford Schroders Emerging Markets Equity Fund
Fund Overview – (continued)
October 31, 2022 (Unaudited)
Over the period, the Fund’s country allocation added to performance, while stock selection detracted from performance.
Russia detracted from relative performance over the period. As mentioned earlier, MSCI removed Russia from its indices on March 9, 2022. Outside of Russia, the overweight position to Brazil was a notable contributor to Fund performance. The Fund’s underweight to China was also beneficial, while cash held in a falling market had a positive impact as well. Stock selection was negative overall, most notably in in China (where the Fund was overweight Great Wall Motors and Xpeng, and lacked an allocation to China Construction Bank) but also in Chile (where the Fund was overweight Falabella, and lacked an allocation to SQM). Conversely, stock selection was positive in Korea (where the Fund was overweight to Samsung SDI and Korea Zinc, with no exposure to Kakao Corp).
Derivatives were not used in a significant manner in the Fund during the period and did not have a material impact on performance during the period.
What is the outlook as of the end of the period?
As of the end of the period, we believe the outlook for global growth remains weak, and the inflation path is unclear as the lagged effects of interest-rate increases from major global central banks feed through. Monetary policy tightening is ongoing, leading to lower global liquidity and tighter financial conditions for emerging markets. The slowdown in global trade and the strong U.S. dollar are further challenges for emerging markets. We believe there is potential for further U.S. dollar strength in the near term, which also poses the risk of renewed financial market stress. The U.S. dollar remains expensive relative to history on a real effective exchange rate basis. Any stabilization or weakness would be beneficial for emerging markets in terms of easing pressure on currencies and financial conditions for emerging markets.
We believe there is also the prospect of a cyclical recovery in economic growth in China in 2023. This may be shallow, but Chinese policy is asynchronous relative to the rest of the world. There is potential, in our view, that COVID-related restrictions are gradually eased as we move through the first half of 2023. Early signs of change in China’s zero-COVD policy may include a marked increase in vaccinations and/or a push to encourage greater vaccination uptake, along with an easing in COVID-related border restrictions.
Emerging-markets valuations in aggregate are cheap versus the long-term median on a forward price-earnings (P/E), price-book (P/B), and dividend yield basis, in our view. That said, on a P/E and P/B basis, the margin of cheapness is not significant in our view, and earnings continue to see downgrades which we believe may persist over the coming few quarters. We believe certain growth equities are selectively interesting but in general remain richly valued. Meanwhile, several cyclical areas screen as cheap but may face further downgrades to earnings, in our view. We believe emerging markets yields and currencies in general remain at attractive levels. Most emerging markets’ external accounts are also in reasonable shape, providing greater resilience to U.S. dollar strength compared with previous episodes, in our view.
Near term, we maintain a cautious outlook but continue to look for opportunities that may present themselves as a function of market stress.
At the end of the period, the Fund was overweight to Korea, Argentina, Brazil, Chile, Mexico, Peru, Egypt, Greece, Hungary, and South Africa relative to the MSCI Emerging Markets Index (Net). The Fund was neutrally positioned in Poland and United Arab Emirates (UAE) relative to the MSCI Emerging Markets Index (Net) as of the end of the period. The Fund was underweight to China, India, Indonesia, Malaysia, Philippines, Taiwan, Thailand, Colombia, Czech Republic, Kuwait, Qatar, Saudi Arabia, and Turkey relative to the MSCI Emerging Markets Index (Net) at the end of the period.
Important Risks
Investing involves risk, including the possible loss of principal. Security prices fluctuate in value depending on general market and economic conditions and the prospects of individual companies. • Foreign investments may be more volatile and less liquid than U.S. investments and are subject to the risk of currency fluctuations and adverse political, economic and regulatory developments. These risks may be greater, and include additional risks, for investments in emerging markets or if the Fund focuses in a particular geographic region or country, such as China. • Risks associated with investments in China include currency fluctuation, political, economic, social, environmental, regulatory and other risks, including risks associated with differing legal standards. • Mid-cap securities can have greater risks and volatility than large-cap securities. • Integration of environmental, social, and/or governance (ESG) characteristics into the investment process may not work as intended. • To the extent the Fund focuses on one or more sectors, the Fund may be subject to increased volatility and risk of loss if adverse developments occur.
| Composition by Sector(1) |
| as of 10/31/2022 |
| Sector | Percentage
of Net Assets |
| Equity Securities | |
| Communication Services | 9.2% |
| Consumer Discretionary | 11.0 |
| Consumer Staples | 5.5 |
| Energy | 3.6 |
| Financials | 28.1 |
| Health Care | 2.9 |
| Industrials | 4.8 |
| Information Technology | 22.9 |
| Materials | 5.3 |
| Real Estate | 1.6 |
| Utilities | 1.4 |
| Total | 96.3% |
| Short-Term Investments | 3.6 |
| Other Assets & Liabilities | 0.1 |
| Total | 100.0% |
| (1) | A sector may be comprised of several industries. For Fund compliance purposes, the Fund may not use the same classification system. These sector classifications are used for financial reporting purposes. |
Hartford Schroders Emerging Markets Multi-Sector Bond Fund
Fund Overview
October 31, 2022 (Unaudited)
Inception 06/25/2013
Sub-advised by Schroder Investment Management North America Inc. and its sub-sub-adviser, Schroder Investment Management North America Limited | Investment objective – The Fund seeks to provide a return of long-term capital growth and income. |
Comparison of Change in Value of $10,000 Investment (06/25/2013 - 10/31/2022)
The chart above represents the hypothetical growth of a $10,000 investment in Class A, which includes the maximum sales charge applicable to Class A shares. Returns for the Fund’s other classes will vary from what is seen above due to differences in the expenses charged to those share classes.
| Average Annual Total Returns |
| for the Periods Ended 10/31/2022 |
| | 1 Year | 5 Years | Since
Inception1 |
| Class A2 | -20.83% | -3.96% | -0.13% |
| Class A3 | -24.38% | -4.84% | -0.62% |
| Class C2 | -21.38% | -4.70% | -0.56% |
| Class C4 | -22.13% | -4.70% | -0.56% |
| Class I2 | -20.56% | -3.70% | 0.11% |
| Class R32 | -21.04% | -4.03% | -0.11% |
| Class R42 | -20.83% | -3.82% | 0.02% |
| Class R52 | -20.52% | -3.67% | 0.12% |
| Class Y2 | -20.52% | -3.64% | 0.15% |
| Class F2 | -20.49% | -3.63% | 0.14% |
| Class SDR2 | -20.44% | -3.60% | 0.20% |
| JP Morgan Emerging Markets Blended Index (JEMB) – Equal Weighted | -20.83% | -2.08% | 0.92% |
| 1 | Inception: 06/25/2013 |
| 2 | Without sales charge |
| 3 | Reflects maximum sales charge of 4.50% |
| 4 | Reflects a contingent deferred sales charge of 1.00% |
PERFORMANCE DATA QUOTED REPRESENTS PAST PERFORMANCE AND DOES NOT GUARANTEE FUTURE RESULTS. The investment return and principal value of the investment will fluctuate so that investors’ shares, when redeemed, may be worth more or less than their original cost. The chart and table do not reflect the deductions of taxes that a shareholder would pay on Fund distributions or the redemption of Fund shares. Current performance may be lower or higher than the performance data quoted. To obtain performance data current to the most recent month-end, please visit our website hartfordfunds.com.
Total returns presented above were calculated using the applicable class' net asset value available to shareholders for sale or redemption of Fund shares on 10/31/2022, which may exclude investment transactions as of this date. All share class returns assume the reinvestment of all distributions at net asset value and the deduction of all
fund expenses. The total returns presented in the Financial Highlights section of the report are calculated in the same manner, but also take into account certain adjustments that are necessary under generally accepted accounting principles. As a result, the total returns in the Financial Highlights section may differ from the total returns presented above.
Effective immediately before the opening of business on 10/24/2016, the Schroder Emerging Markets Multi-Sector Bond Fund (the “Predecessor Fund”) was reorganized into the Fund. The performance information shown for periods prior to 10/24/2016 is that of the Predecessor Fund. Prior to 10/24/2016, Class A, Class I and Class SDR were called Advisor Shares, Investor Shares and R6 Shares, respectively. Class C, Class R3, Class R4, Class R5, and Class Y shares commenced operations on 10/24/2016 and performance prior to this date reflects the performance of the Predecessor Fund’s Investor Shares. Performance for Class SDR shares prior to 12/30/2014 (the inception date of the Predecessor Fund’s Class R6 Shares) reflects the performance of the Predecessor Fund’s Investor Shares. Class F shares commenced operations on 02/28/2017 and performance prior to that date is that of the Fund’s Class I shares. Performance prior to Class F’s inception date has not been adjusted to reflect the operating expenses of Class F. The returns would be different if the Fund’s fees and expenses were reflected for periods prior to 10/24/2016.
You cannot invest directly in an index.
See "Benchmark Glossary" for benchmark descriptions.
Performance information may reflect expense waivers/reimbursements without which performance would have been lower. For information on current expense waivers/reimbursements, please see the prospectus.
Hartford Schroders Emerging Markets Multi-Sector Bond Fund
Fund Overview – (continued)
October 31, 2022 (Unaudited)
| Operating Expenses* | Gross | Net |
| Class A | 1.48% | 1.15% |
| Class C | 2.32% | 1.90% |
| Class I | 1.16% | 0.90% |
| Class R3 | 1.79% | 1.45% |
| Class R4 | 1.49% | 1.15% |
| Class R5 | 1.19% | 0.85% |
| Class Y | 1.18% | 0.85% |
| Class F | 1.07% | 0.75% |
| Class SDR | 1.07% | 0.75% |
| * | Expenses as shown in the Fund’s most recent prospectus. Gross expenses do not reflect contractual expense reimbursement arrangements. Net expenses reflect such arrangements in instances when they reduce gross expenses. These arrangements remain in effect until 02/28/2023 unless the Fund’s Board of Directors approves an earlier termination. Actual expenses may be higher or lower. Please see accompanying Financial Highlights for expense ratios for the period ended 10/31/2022. |
Portfolio Managers
Hartford Schroders Emerging Markets Multi-Sector Bond Fund’s sub-adviser is Schroder Investment Management North America Inc. and its sub-sub-adviser is Schroder Investment Management North America Limited.
Fernando Grisales, CFA
Portfolio Manager
Autumn Graham
Portfolio Manager
Abdallah Guezour
Portfolio Manager
Manager Discussion
The Class A shares of the Hartford Schroders Emerging Markets Multi-Sector Bond Fund returned -20.83%, before sales charges, for the twelve-month period ended October 31, 2022, performing in line with the Fund’s benchmark, JP Morgan Emerging Markets Blended Index (JEMB) - Equal Weighted, which returned -20.83% for the same period. For the same period, the Class A shares of the Fund, before sales charges, outperformed the -22.43% average return of the Lipper International Emerging Markets Hard Currency Debt peer group, a group of funds with investment strategies similar to those of the Fund.
Why did the Fund perform this way?
Emerging-markets debt, as measured by the JP Morgan Emerging Markets Blended Index (JEMB) - Equal Weighted, returned -20.83% for the twelve-month period ended October 31, 2022. Emerging-markets bonds declined in the fourth quarter of 2021, as developed-markets’ central banks fell behind the actions of their emerging-markets counterparts in terms of monetary tightening and inflation soared across the globe. Tighter monetary policy along with a market sell-off in response to the Russian invasion of Ukraine were the main drivers of emerging markets during the period. Sanctions mounted against Russia throughout the second and third quarters of 2022, as the conflict dragged out much longer than Russia had originally anticipated. In response, Russia restricted access to energy
for parts of Europe, sending energy prices soaring and compounding the already soaring inflation caused by accommodative monetary policies that served to increase liquidity in markets. Emerging-markets bond markets saw rapid outflows throughout the year, as liquidity tightened around the globe in response to these inflationary pressures.
Positioning within local-currency bonds and foreign currency positioning was among the top contributors to the Fund’s performance relative to the JP Morgan Emerging Markets Blended Index (JEMB) - Equal Weighted for the period. Russian local bonds were among the top individual contributors to Fund performance for the period. Initially, the bonds detracted from performance given the Fund’s modest overweight. These bonds were marked to zero and subsequently removed from the JP Morgan Emerging Markets Blended Index (JEMB) - Equal Weighted in March 2022. However, we held onto our exposure due to our belief that we would be able to exit these holdings at more reasonable prices. We were able to exit the Fund’s exposure to Russian local bonds later in the period, which was additive to Fund performance. Throughout the period, the Fund’s holdings in the Corporate Bond sector detracted from performance, led by the Fund’s holdings in Chinese real estate bonds.
Hartford Schroders Emerging Markets Multi-Sector Bond Fund
Fund Overview – (continued)
October 31, 2022 (Unaudited)
Security selection in the Sovereign sector detracted from performance for the period, with significant negative impacts from Ukrainian and Russian dollar-denominated debt offsetting positive performance elsewhere. Credit default swap (CDS) protection and positions in Chilean debt were among the top contributors to Fund performance during the period. Conversely, the Quasi-Sovereign segment detracted from performance for the period, led by names such as Veb Finance, Russian debt that was sanctioned, and Petroleos Mexicanos.
The Fund’s asset allocation in the Local Currency sector was positive on the whole for the period, largely due to the Fund’s underweight to the sector throughout the second and third quarters of 2022. The Fund’s underweight to the sector contributed positively to relative performance for the period, as local-currency assets trailed the broader emerging-markets debt sector. Local currencies were hindered by a strengthening U.S. dollar and the rise in interest rates, which offset positive effects of rising energy prices.
The Fund used foreign exchange (FX) forwards, CDS, and interest-rate futures during the period. FX forwards, a type of derivative used for the purposes of adding or hedging local-currency exposure, aided performance during the period. Likewise, interest-rate futures, used for managing portfolio duration, were additive. Finally, CDS also contributed positively, led by names like South Africa and Colombia.
We have maintained the Fund’s duration overweight against the JP Morgan Emerging Markets Blended Index (JEMB) - Equal Weighted as of the end of the period.
What is the outlook as of the end of the period?
As of the end of the period, the outlook for global financial markets remains challenging in our view, as global growth expectations continue to be slashed, global financial liquidity has tightened severely, and geopolitical risks remain elevated. The sharp deceleration in global monetary aggregates has shown no signs of abating. This tightening in financial liquidity is exacerbated by a persistent contraction in global capital flows and a strong U.S. dollar. Despite this severe tightening, bank lending activity remains surprisingly strong in developed economies. We believe this positive global credit impulse and the continued strength in labor markets has continued to put a floor under the global economy, for now at least. In the absence of a major financial catalyst, the conditions remain in place for the U.S. Federal Reserve (Fed) to keep tightening until inflation is convincingly under control.
In our view, it remains to be seen how inflation in developed countries can be tamed without pushing these economies into severe recession, and without exacerbating the already unsustainable public-sector borrowing requirements. While inflation may have already peaked on a temporary basis thanks to the recent correction in energy prices and the easing dislocations in global supply chains, we believe price pressures appear to be entrenched and will be significantly in excess of central bank targets in developed economies as a result of second round effects (indirect inflationary impacts), elevated wage growth, unsustainable fiscal positions, and commodity supply constraints.
While there are signs of peaking inflation in food and energy prices, as of the end of the period the Fed appears to remain steadfast in its determination to continue its monetary tightening cycle, which has been further supported by a resilient U.S. labor market. We believe that this tightening is likely to continue until something “breaks,” such as the possibility of a global recession.
As of the end of the period, the Fund maintained a material underweight to local currencies and rates, as inflation remained persistent in many emerging markets. We remained broadly positive in our views of Brazil and Mexico given their attractive valuations, elevated commodity prices, and already advanced monetary tightening cycles. The political calendar is also starting to turn more favorable, in our view, as crucial elections in key countries have recently occurred. These observations are particularly valid for Brazil, where growth is recovering, and for Mexico, where there are no major macroeconomic imbalances. We expect high volatility to persist in Brazil and Mexico.
As of the end of the period, the Fund had an overweight to high-yield hard-currency sovereigns, as valuations looked attractive relative to corporate bonds, in our view. We have maintained the Fund’s duration overweight relative to the JP Morgan Emerging Markets Blended Index (JEMB) - Equal Weighted as of the end of the period, as rates appear to have rallied in recent months and we believe we are approaching the end of the interest-rate hiking cycle in some emerging-markets countries.
Important Risks
Investing involves risk, including the possible loss of principal. Security prices fluctuate in value depending on general market and economic conditions and the prospects of individual companies. • Fixed income security risks include credit, liquidity, call, duration, and interest-rate risk. As interest rates rise, bond prices generally fall. • Foreign investments may be more volatile and less liquid than U.S. investments and are subject to the risk of currency fluctuations and adverse political, economic and regulatory developments. These risks may be greater, and include additional risks, for investments in emerging markets or if the Fund focuses in a particular geographic region or country. • Investments in high-yield (“junk”) bonds involve greater risk of price volatility, illiquidity, and default than higher-rated debt securities. • Derivatives are generally more volatile and sensitive to changes in market or economic conditions than other securities; their risks include currency, leverage, liquidity, index, pricing, regulatory and counterparty risk. • Restricted securities may be more difficult to sell and price than other securities. • The Fund may have high portfolio turnover, which could increase its transaction costs and an investor’s tax liability. • Because the Fund is non-diversified, it may invest in a smaller number of issuers, and may be more exposed to risks and volatility than a more broadly diversified fund. • Integration of environmental, social, and/or governance (ESG) characteristics into the investment process may not work as intended.
Hartford Schroders Emerging Markets Multi-Sector Bond Fund
Fund Overview – (continued)
October 31, 2022 (Unaudited)
| Composition by Security Type(1) |
| as of 10/31/2022 |
| Category | Percentage of
Net Assets |
| Fixed Income Securities | |
| Corporate Bonds | 42.2% |
| Foreign Government Obligations | 50.3 |
| Total | 92.5% |
| Short-Term Investments | 8.6 |
| Other Assets & Liabilities | (1.1) |
| Total | 100.0% |
| (1) | For Fund compliance purposes, the Fund may not use the same classification system. These classifications are used for financial reporting purposes. |
Hartford Schroders International Contrarian Value Fund
Fund Overview
October 31, 2022 (Unaudited)
Inception 05/24/2022
Sub-advised by Schroder Investment Management North America Inc. and its
sub-sub-adviser, Schroder Investment Management North America Limited | Investment objective – The Fund seeks long-term capital appreciation. |
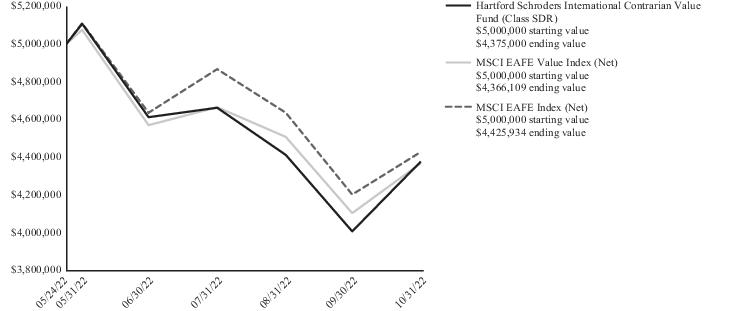
Comparison of Change in Value of $5,000,000 Investment (05/24/2022 - 10/31/2022)
The chart above represents the hypothetical growth of a $5,000,000 investment in Class SDR. Returns for Class I may vary from what is seen above due to differences in the expenses charged to Class I.
| Cumulative Total Returns |
| for the Period Ended 10/31/2022 |
| | Since
Inception1 |
| Class I | -12.50% |
| Class SDR | -12.50% |
| MSCI EAFE Value Index (Net) | -12.68% |
| MSCI EAFE Index (Net) | -11.48% |
PERFORMANCE DATA QUOTED REPRESENTS PAST PERFORMANCE AND DOES NOT GUARANTEE FUTURE RESULTS. The investment return and principal value of the investment will fluctuate so that investors’ shares, when redeemed, may be worth more or less than their original cost. The chart and table do not reflect the deductions of taxes that a shareholder would pay on Fund distributions or the redemption of Fund shares. Current performance may be lower or higher than the performance data quoted. To obtain performance data current to the most recent month-end, please visit our website hartfordfunds.com.
Total returns presented above were calculated using the applicable class' net asset value available to shareholders for sale or redemption of Fund shares on 10/31/2022, which may exclude investment transactions as of this date. All share class returns assume the reinvestment of all distributions at net asset value and the deduction of all fund expenses. The total returns presented in the Financial Highlights section of the report are calculated in the same manner, but also take into account certain adjustments that are necessary under generally accepted accounting principles. As a result, the total returns in the Financial Highlights section may differ from the total returns presented above.
You cannot invest directly in an index.
See "Benchmark Glossary" for benchmark descriptions.
Performance information may reflect expense waivers/reimbursements without which performance would have been lower. For information on current expense waivers/reimbursements, please see the prospectus.
| Operating Expenses* | Gross | Net |
| Class I | 1.20% | 0.85% |
| Class SDR | 1.11% | 0.70% |
| * | Expenses as shown in the Fund’s most recent prospectus. Gross expenses do not reflect contractual expense reimbursement arrangements. Net expenses reflect such arrangements in instances when they reduce gross expenses. These arrangements remain in effect until 02/29/2024 unless the Fund’s Board of Directors approves an earlier termination. Actual expenses may be higher or lower. Please see accompanying Financial Highlights for expense ratios for the period ended 10/31/2022. |
Hartford Schroders International Contrarian Value Fund
Fund Overview – (continued)
October 31, 2022 (Unaudited)
Portfolio Managers
Hartford Schroders International Contrarian Value Fund’s sub-adviser is Schroder Investment Management North America Inc. and its sub-sub-adviser is Schroder Investment Management North America Limited.
Nick Kirrage, CFA
Portfolio Manager
Simon Adler, CFA
Portfolio Manager
Liam Nunn, CFA
Portfolio Manager
Manager Discussion
How did the Fund perform during the period?
The Class SDR shares of the Hartford Schroders International Contrarian Value Fund returned -12.50% for the period since inception on May 24, 2022 to October 31, 2022, outperforming the Fund’s primary benchmark, the MSCI EAFE Value Index (Net), which returned -12.68% for the same period, and underperforming the Fund’s secondary benchmark, the MSCI EAFE Index (Net), which returned -11.48% for the same period. For the same period, the Class SDR shares of the Fund outperformed the -13.14% average return of the Lipper International Multi-Cap Value peer group, a group of funds with investment strategies similar to those of the Fund.
Why did the Fund perform this way?
During the period, international equities struggled as investors became increasingly concerned over rising inflation, higher interest rates, and a global economic slowdown. After a brief rally in July 2022, global equity markets fell and registered negative returns for the third quarter of 2022. Investors’ hopes for interest-rate cuts were broken as central banks reaffirmed their commitment to fighting inflation through tighter monetary policy. The U.S. Federal Reserve (Fed), European Central Bank, and Bank of England all raised interest rates over the period.
In the eurozone, the energy crisis continued to dominate markets. Nord Stream 1, the main pipeline supplying gas to Europe from Russia, was closed for maintenance in July 2022. It came back onstream temporarily before Russia shut it down again in early September 2022. This put further pressure on power generators, many of which needed to buy natural gas from higher-cost sources, and intensified worries over potential energy shortages this winter. The news also sent the euro to a 20-year low versus the U.S. dollar.
From a style perspective, markets continued to favor value over growth during the period.
The Fund outperformed its primary benchmark, the MSCI EAFE Value Index (Net), for the period. Stock selection in names within France and Italy as well as stock selection within the Consumer Discretionary sector more broadly contributed positively towards Fund performance over the period.
French car maker Renault contributed positively to Fund performance for the period. While we believe the company has some risks, not least its balance sheet, we continued to hold the company’s stock within the Fund as of the end of the period.
Educational publisher Pearson was another positive contributor to Fund performance for the period. The group has been engaged in a protracted turnaround process, which we believe is now starting to bear fruit. Pearson has focused on digital courses as well as its traditional textbook publishing. Pearson said in August 2022 that profit margins would be in the mid-teens next year, which would be two years ahead of schedule. The shares continued to perform well over the period, and as a result we progressively reduced the Fund’s position and subsequently sold the Fund’s holding towards the end of the period.
Italian bank UniCredit also contributed positively to returns over the period. The shares performed well on the back of the positive sentiment towards the Banking sector due to the rising interest-rate environment.
On the negative side of the ledger, tires and automotive parts and technology company Continental detracted from performance relative to the MSCI EAFE Value Index (Net) for the period. The cyclical nature of a number of Continental’s service lines (tires, chassis and safety, industrial rubber) have resulted in worsening sentiment towards the business during the period.
Another detractor from Fund performance was British telecommunications name BT Group. After shares approached one-year highs in July 2022, they experienced a tough period. Uncertainty around one of the company’s major shareholders being forced to sell their 18% stake following pressure from the United
Hartford Schroders International Contrarian Value Fund
Fund Overview – (continued)
October 31, 2022 (Unaudited)
Kingdom (U.K.) government (which ultimately didn’t materialize), as well as ongoing employee pay negotiations with labor unions, weighed on the shares.
Derivatives were not used in a significant manner in the Fund during the period and did not have a material impact on performance during the period.
What is the outlook as of the end of the period?
As of the end of the period, the equity market drawdown resulted in plenty of new equities appearing on our valuation screens. We continue to use a long-term time horizon, and one of our most important areas of focus is on balance-sheet strength. We believe this focus on truly understanding a company’s financial position is important at the best of times, and is even more important today. For example, when looking at cyclical businesses we seek to identify companies that trade at a substantial discount to their fair or intrinsic value, with robust capital positions to help them weather short-term downturns in the economic cycle and which have attractive long-term prospects that may be underappreciated today.
Overall, we believe the Fund remains well-diversified and retains a larger-cap bias. The majority of the companies that the Fund holds are “global” in nature (companies generating revenues from multiple different countries in multiple different currencies), which in our view may help to limit the damage from ongoing volatility in the currency markets. As of the end of the period, we are cautious, focusing on areas that stand to benefit the Fund over the coming years.
Important Risks
The Fund is new and has a limited operating history. Investing involves risk, including the possible loss of principal. Security prices fluctuate in value depending on general market and economic conditions and the prospects of individual companies. • Foreign investments may be more volatile and less liquid than U.S. investments and are subject to the risk of currency fluctuations and adverse political, economic and regulatory developments. These risks may be greater, and include additional risks, for investments in emerging markets or if the Fund focuses in a particular geographic region or country. • Mid-cap securities can have greater risks and volatility than large-cap securities. • Integration of environmental, social, and/or governance (ESG) characteristics into the investment process may not work as intended. • Different investment styles may go in and out of favor, which may cause the Fund to underperform the broader stock market. • To the extent the Fund focuses on one or more sectors, the Fund may be subject to increased volatility and risk of loss if adverse developments occur. The Fund may also hold a limited number of securities.
| Composition by Sector(1) |
| as of 10/31/2022 |
| Sector | Percentage
of Net Assets |
| Equity Securities | |
| Communication Services | 19.1% |
| Consumer Discretionary | 17.0 |
| Consumer Staples | 11.5 |
| Energy | 9.8 |
| Financials | 21.1 |
| Health Care | 9.1 |
| Industrials | 2.9 |
| Materials | 9.6 |
| Total | 100.1% |
| Short-Term Investments | 3.1 |
| Other Assets & Liabilities | (3.2) |
| Total | 100.0% |
| (1) | A sector may be comprised of several industries. For Fund compliance purposes, the Fund may not use the same classification system. These sector classifications are used for financial reporting purposes. |
Hartford Schroders International Multi-Cap Value Fund
Fund Overview
October 31, 2022 (Unaudited)
Inception 08/30/2006
Sub-advised by Schroder Investment Management North America Inc. and its
sub-sub-adviser, Schroder Investment Management North America Limited | Investment objective – The Fund seeks long-term capital appreciation. |
Comparison of Change in Value of $10,000 Investment (10/31/2012 - 10/31/2022)
The chart above represents the hypothetical growth of a $10,000 investment in Class A, which includes the maximum sales charge applicable to Class A shares. Returns for the Fund’s other classes will vary from what is seen above due to differences in the expenses charged to those share classes.
| Average Annual Total Returns |
| for the Periods Ended 10/31/2022 |
| | 1 Year | 5 Years | 10 Years |
| Class A1 | -19.57% | -1.30% | 3.27% |
| Class A2 | -23.99% | -2.40% | 2.68% |
| Class C1 | -20.16% | -2.04% | 2.91% |
| Class C3 | -20.94% | -2.04% | 2.91% |
| Class I1 | -19.29% | -1.02% | 3.56% |
| Class R31 | -19.72% | -1.58% | 3.19% |
| Class R41 | -19.59% | -1.34% | 3.36% |
| Class R51 | -19.31% | -1.05% | 3.54% |
| Class Y1 | -19.36% | -0.99% | 3.59% |
| Class F1 | -19.19% | -0.93% | 3.61% |
| Class SDR1 | -19.21% | -0.94% | 3.64% |
| MSCI ACWI ex USA Index (Net) | -24.73% | -0.60% | 3.27% |
| MSCI ACWI ex USA Value Index (Net) | -18.13% | -1.60% | 2.21% |
| 1 | Without sales charge |
| 2 | Reflects maximum sales charge of 5.50% |
| 3 | Reflects a contingent deferred sales charge of 1.00% |
PERFORMANCE DATA QUOTED REPRESENTS PAST PERFORMANCE AND DOES NOT GUARANTEE FUTURE RESULTS. The investment return and principal value of the investment will fluctuate so that investors’ shares, when redeemed, may be worth more or less than their original cost. The chart and table do not reflect the deductions of taxes that a shareholder would pay on Fund distributions or the redemption of Fund shares. Current performance may be lower or higher than the performance data quoted. To obtain performance data current to the most recent month-end, please visit our website hartfordfunds.com.
Total returns presented above were calculated using the applicable class' net asset value available to shareholders for sale or redemption of Fund shares on 10/31/2022, which may exclude investment transactions as of this date. All share class returns assume the reinvestment of all distributions at net asset value and the deduction of all fund expenses. The total returns presented in the Financial Highlights section of the report are calculated in the same manner, but also take into account certain
adjustments that are necessary under generally accepted accounting principles. As a result, the total returns in the Financial Highlights section may differ from the total returns presented above.
Effective immediately before the opening of business on 10/24/2016, the Schroder International Multi-Cap Value Fund (the “Predecessor Fund”) was reorganized into the Fund. The performance information shown for periods prior to 10/24/2016 is that of the Predecessor Fund. Prior to 10/24/2016, Class A, Class I and Class SDR were called Advisor Shares, Investor Shares and R6 Shares, respectively. Class C, Class R3, Class R4, Class R5, and Class Y shares commenced operations on 10/24/2016 and performance prior to this date reflects the performance of the Predecessor Fund’s Investor Shares. Performance for Class SDR shares prior to 12/30/2014 (the inception date of the Predecessor Fund’s Class R6 Shares) reflects the performance of the Predecessor Fund’s Investor Shares. Class F shares commenced operations on 02/28/2017 and performance prior to that date is that of the Fund’s Class I shares. Performance prior to Class F’s inception date has not been adjusted to reflect the operating expenses of Class F. The returns would be different if the Fund’s fees and expenses were reflected for periods prior to 10/24/2016.
You cannot invest directly in an index.
See "Benchmark Glossary" for benchmark descriptions.
Performance information may reflect expense waivers/reimbursements without which performance would have been lower. For information on current expense waivers/reimbursements, please see the prospectus.
Hartford Schroders International Multi-Cap Value Fund
Fund Overview – (continued)
October 31, 2022 (Unaudited)
| Operating Expenses* | Gross | Net |
| Class A | 1.11% | 1.11% |
| Class C | 1.85% | 1.85% |
| Class I | 0.86% | 0.86% |
| Class R3 | 1.47% | 1.47% |
| Class R4 | 1.17% | 1.17% |
| Class R5 | 0.85% | 0.85% |
| Class Y | 0.86% | 0.84% |
| Class F | 0.75% | 0.75% |
| Class SDR | 0.75% | 0.75% |
| * | Expenses as shown in the Fund’s most recent prospectus. Gross expenses do not reflect contractual fee waivers or expense reimbursement, if any. Net expenses reflect such arrangements only with respect to Class Y. These arrangements remain in effect until 02/28/2023 unless the Fund’s Board of Directors approves an earlier termination. Actual expenses may be higher or lower. Please see accompanying Financial Highlights for expense ratios for the period ended 10/31/2022. |
Portfolio Managers
Hartford Schroders International Multi-Cap Value Fund’s sub-adviser is Schroder Investment Management North America Inc. and its sub-sub-adviser is Schroder Investment Management North America Limited.
Stephen Langford, CFA
Portfolio Manager
David Philpotts
Portfolio Manager
Lukas Kamblevicius
Portfolio Manager
Manager Discussion
How did the Fund perform during the period?
The Class A shares of the Hartford Schroders International Multi-Cap Value Fund returned -19.57%, before sales charges, for the twelve-month period ended October 31, 2022, outperforming the Fund’s primary benchmark, the MSCI ACWI ex USA Index (Net), which returned -24.73% for the period, while underperforming the Fund’s secondary benchmark, the MSCI ACWI ex USA Value Index (Net), which returned -18.13% over the same period. For the same period, the Class A shares of the Fund, before sales charges, outperformed the -19.92% average return of the Lipper International Multi-Cap Value peer group, which is a group of funds with investment strategies similar to those of the Fund.
Why did the Fund perform this way?
Over the course of the twelve-month period ended October 31, 2022, the market environment continued to favor equities with cheaper valuations. By way of example, the MSCI ACWI ex USA Value Index (Net) outperformed the by MSCI ACWI ex USA Growth Index (Net) by 12.86% over the period. Following a strong rebound in undervalued equities as global economies reopened in late 2020, value stocks led their growth counterparts again in late November 2021 when the U.S. Federal Reserve (Fed) acknowledged inflation was not transitory
and began to telegraph tighter monetary policy in an attempt to rein in inflation. The resulting rise in global interest rates was supportive of undervalued companies, most notably in the Financials sector. Supply bottlenecks continued to push oil prices higher, which also benefited Energy equities, another traditional value sector.
Conditions began to deteriorate in global markets following Russia’s invasion of Ukraine in late February 2022, which severely dented global growth forecasts and led to elevated investor uncertainty from a geopolitical perspective. Against this backdrop, quality-oriented value equities, particularly those with robust balance sheets, held up better than the broader market, whereas poorer-quality, high-growth equities suffered a markdown in valuations during this period.
Relative to the MSCI ACWI ex USA Index (Net), the Fund benefited from its broad exposure across sectors in the MSCI ACWI ex USA Index (Net), with nine of eleven sectors adding value over the period. The Energy and Healthcare sectors were the top two contributors to Fund performance for the period, while Consumer Staples and Financials were the only two detracting sectors. An overweight allocation to the Energy sector, which was further boosted by positive stock selection, underpinned relative performance, with positioning in integrated oil & gas (Equinor, Repsol) and exploration & production companies (ARC Resources) adding the most value. Energy was the only sector that did not decline on an absolute basis over the
Hartford Schroders International Multi-Cap Value Fund
Fund Overview – (continued)
October 31, 2022 (Unaudited)
twelve-month period (albeit up just 1% at the index level). In the Healthcare sector, the Fund’s holdings in the pharmaceutical industry and an underweight to the more cyclical health equipment providers accounted for most of the relative outperformance during the period.
The Fund’s underweight in the more expensive Consumer Staples sector detracted from performance relative to the MSCI ACWI ex USA Index (Net), as the sector outperformed in a very weak market due to its defensive credentials. More specifically, the Fund’s underweight positioning within drinks, food manufacturers, and tobacco created difficulties overall. Finally, the Fund lagged very slightly within the Financials sector, primarily driven by positioning in investment banks. However, this was partially offset by strong stock selection within European insurance and investment services.
Against the MSCI ACWI ex USA Value Index (Net), Energy and Real Estate were the top two sector contributors to Fund performance for the period, although this was more than offset by lagging performance in the Technology and Communication Services sectors. Notable contributors to performance in the Energy sector were identical to those highlighted above, i.e., Equinor, Respol, and ARC Resources, among others. An underweight stance in the Real Estate sector was another positive contributor, as rapidly rising interest rates impaired the “bond proxy” characteristics of the sector (i.e., beneficiaries of low and declining rates due to more leveraged business models). Short-term financing concerns continued to negatively impact the financial strength characteristics of the group. Positive stock selection within residential and commercial was also supportive.
The Fund’s allocation to the Technology sector was the largest detractor from performance during the period, particularly the Fund’s overweight posture in semiconductors, relative to the MSCI ACWI ex USA Value Index (Net), in conjunction with challenged stock selection in the group. Trends for chip producers and semiconductor capital equipment players deteriorated over the period due to a materially weaker economic backdrop and challenging year-over-year earnings and margin comparisons. The recent U.S. ban on the export of cutting-edge chips to China inserted an additional layer of uncertainty within the group. By the end of the period, the Fund was modestly underweight in semiconductors from a mix of selective profit taking and de-risking. Finally, a modest overweight positioning in broadcasting and online services within the Communication Services sector had a negative impact. In particular, the recent market correction in China in reaction to President Xi’s consolidation of power at the Chinese Communist Party’s 20th Congress in October 2022 triggered another negative performance impact to internet platform giant Tencent.
Derivatives were not used in a significant manner in the Fund during the period and did not have a material impact on performance during the period.
What is the outlook as of the end of the period?
As of the end of the period, it has been another humbling year for economic forecasters, whether they be investors or central banks. Few predicted the current backdrop even as short a time ago as the start of 2022, most notably the level and persistence of inflation alongside the resilience of the labor market. We believe there remains an
unusually high level of uncertainty about the economic outlook and what this means for global interest rates. Without falling into the same trap of attempting to predict the future, it seems reasonable to speculate that inflation is close to peaking in most markets. However, it is still far from clear whether the Fed is close to a pivot towards less aggressive interest-rate increases. Investors may need some reassurance on this front as well as evidence of a capitulation in earnings forecasts before they feel comfortable re-entering the market in earnest once again. We believe it would also be optimistic to discount geopolitical risks, which we know from experience can have far-reaching implications, not least to currencies where the “king dollar” reigns supreme.
Despite one of the largest year-on-year de-ratings in the past half century, we believe equity valuations are still not very compelling even before the anticipated drop in earnings per share. There is also the question of what reduced multiple to apply to these earnings compared to recent years. Business prospects are more challenging outside the U.S. due to a greater reliance on imported energy and more open economies, but this is more than reflected in valuations. We believe this is particularly true for emerging markets given their higher sensitivity to global demand. After having held up relatively well through the summer months, emerging markets finally capitulated in September 2022, with emerging-markets equities, interest rates, foreign currency, and credit all underperforming their developed-markets counterparts. However, emerging markets are also further along in their monetary policy tightening cycle, which does provide some comfort, particularly if the dollar is close to peaking. The timing of China’s “re-opening” is also a significant “known unknown,” but this seems a pre-requisite for a firmer footing, in our view. We believe there is good value in emerging markets, but it is scarcer than simple valuation multiples suggest due to the greater risks, most notably their inherent cyclicality.
As investors wait for evidence that the Fed is slowing down interest-rate increases, we believe the path of least resistance is probably for a range-bound market (i.e., a market that trades within a certain range) with further downside likely if earnings disappoint expectations or the central banks continue with tighter monetary policy for longer. This backdrop reinforces the Fund’s defensive positioning and ongoing bias towards recessionary beneficiaries. Fortunately, as of the end of the period, in our view, there are opportunities to find quality stocks at a reasonable price. We believe this also offers a natural hedge against such an uncertain environment. We are also wary of the potential for a pivot by the Fed.
More broadly, we still expect stock selection to be more nuanced in the near term than what we saw during the 2017-2020 thematic “growth at any price” period. We believe markets will be driven more by the progression of earnings as opposed to multiple expansion as was the case from 2017 to 2020. We believe that the companies that the market favored during that period now offer better value but are still not cheap, particularly given their sensitivity to higher yields. In contrast, stocks exhibiting both quality and value characteristics still have a way to run for valuations to normalize even before considering their recession-proofing potential. Finally, we would stress that, given the prospect of ongoing short-term volatility, we believe it is more important than ever to stay true to our investment process. In the short
Hartford Schroders International Multi-Cap Value Fund
Fund Overview – (continued)
October 31, 2022 (Unaudited)
term, we remain disciplined in seeking to find opportunities during periods of excess volatility by trading little but often back to target stock weights.
Important Risks
Investing involves risk, including the possible loss of principal. Security prices fluctuate in value depending on general market and economic conditions and the prospects of individual companies. • Foreign investments may be more volatile and less liquid than U.S. investments and are subject to the risk of currency fluctuations and adverse political, economic and regulatory developments. These risks may be greater, and include additional risks, for investments in emerging markets or if the Fund focuses in a particular geographic region or country. • Small- and mid-cap securities can have greater risks and volatility than large-cap securities. • Different investment styles may go in and out of favor, which may cause the Fund to underperform the broader stock market. • Integration of environmental, social, and/or governance (ESG) characteristics into the investment process may not work as intended. • The exclusion of certain issuers for reasons other than performance may negatively impact the Fund’s performance. • The Fund may have high portfolio turnover, which could increase its transaction costs and an investor’s tax liability.
| Composition by Sector(1) |
| as of 10/31/2022 |
| Sector | Percentage
of Net Assets |
| Equity Securities | |
| Communication Services | 13.1% |
| Consumer Discretionary | 9.8 |
| Consumer Staples | 6.5 |
| Energy | 12.2 |
| Financials | 20.8 |
| Health Care | 9.5 |
| Industrials | 6.9 |
| Information Technology | 6.8 |
| Materials | 7.1 |
| Real Estate | 1.3 |
| Utilities | 4.3 |
| Total | 98.3% |
| Short-Term Investments | 2.2 |
| Other Assets & Liabilities | (0.5) |
| Total | 100.0% |
| (1) | A sector may be comprised of several industries. For Fund compliance purposes, the Fund may not use the same classification system. These sector classifications are used for financial reporting purposes. |
Hartford Schroders International Stock Fund
Fund Overview
October 31, 2022 (Unaudited)
Inception 12/19/1985
Sub-advised by Schroder Investment Management North America Inc. and its
sub-sub-adviser, Schroder Investment Management North America Limited | Investment objective – The Fund seeks long-term capital appreciation through investment in securities markets outside the United States. |
Comparison of Change in Value of $10,000 Investment (10/31/2012 - 10/31/2022)
The chart above represents the hypothetical growth of a $10,000 investment in Class A, which includes the maximum sales charge applicable to Class A shares. Returns for the Fund’s other classes will vary from what is seen above due to differences in the expenses charged to those share classes.
| Average Annual Total Returns |
| for the Periods Ended 10/31/2022 |
| | 1 Year | 5 Years | 10 Years |
| Class A1 | -27.22% | 2.37% | 5.35% |
| Class A2 | -31.23% | 1.22% | 4.76% |
| Class C1 | -27.71% | 1.62% | 5.01% |
| Class C3 | -28.42% | 1.62% | 5.01% |
| Class I1 | -27.04% | 2.66% | 5.64% |
| Class R31 | -27.43% | 2.19% | 5.37% |
| Class R41 | -27.26% | 2.40% | 5.50% |
| Class R51 | -26.99% | 2.65% | 5.65% |
| Class Y1 | -27.03% | 2.66% | 5.66% |
| Class F1 | -26.93% | 2.74% | 5.69% |
| Class SDR1 | -26.96% | 2.72% | 5.71% |
| MSCI ACWI ex USA Index (Net) | -24.73% | -0.60% | 3.27% |
| 1 | Without sales charge |
| 2 | Reflects maximum sales charge of 5.50% |
| 3 | Reflects a contingent deferred sales charge of 1.00% |
PERFORMANCE DATA QUOTED REPRESENTS PAST PERFORMANCE AND DOES NOT GUARANTEE FUTURE RESULTS. The investment return and principal value of the investment will fluctuate so that investors’ shares, when redeemed, may be worth more or less than their original cost. The chart and table do not reflect the deductions of taxes that a shareholder would pay on Fund distributions or the redemption of Fund shares. Current performance may be lower or higher than the performance data quoted. To obtain performance data current to the most recent month-end, please visit our website hartfordfunds.com.
Total returns presented above were calculated using the applicable class' net asset value available to shareholders for sale or redemption of Fund shares on 10/31/2022, which may exclude investment transactions as of this date. All share class returns assume the reinvestment of all distributions at net asset value and the deduction of all fund expenses. The total returns presented in the Financial Highlights section of the report are calculated in the same manner, but also take into account certain
adjustments that are necessary under generally accepted accounting principles. As a result, the total returns in the Financial Highlights section may differ from the total returns presented above.
Effective immediately before the opening of business on 10/24/2016, the Schroder International Alpha Fund (the “Predecessor Fund”) was reorganized into the Fund. The performance information shown for periods prior to 10/24/2016 is that of the Predecessor Fund. Prior to 10/24/2016, Class A, Class I and Class SDR were called Advisor Shares, Investor Shares and R6 Shares, respectively. Class C, Class R3, Class R4, Class R5, and Class Y shares commenced operations on 10/24/2016 and performance prior to this date reflects the performance of the Predecessor Fund’s Investor Shares. Performance for Class SDR shares prior to 12/30/2014 (the inception date of the Predecessor Fund’s Class R6 Shares) reflects the performance of the Predecessor Fund’s Investor Shares. Class F shares commenced operations on 02/28/2017 and performance prior to that date is that of the Fund’s Class I shares. Performance prior to Class F’s inception date has not been adjusted to reflect the operating expenses of Class F. The returns would be different if the Fund’s fees and expenses were reflected for periods prior to 10/24/2016.
You cannot invest directly in an index.
See "Benchmark Glossary" for benchmark descriptions.
Performance information may reflect expense waivers/reimbursements without which performance would have been lower.
Hartford Schroders International Stock Fund
Fund Overview – (continued)
October 31, 2022 (Unaudited)
| Operating Expenses* | Gross | Net |
| Class A | 1.06% | 1.06% |
| Class C | 1.80% | 1.80% |
| Class I | 0.79% | 0.79% |
| Class R3 | 1.42% | 1.42% |
| Class R4 | 1.12% | 1.12% |
| Class R5 | 0.81% | 0.81% |
| Class Y | 0.81% | 0.81% |
| Class F | 0.70% | 0.70% |
| Class SDR | 0.71% | 0.71% |
| * | Expenses as shown in the Fund’s most recent prospectus. Actual expenses may be higher or lower. Please see accompanying Financial Highlights for expense ratios for the period ended 10/31/2022. |
Portfolio Managers
Hartford Schroders International Stock Fund’s sub-adviser is Schroder Investment Management North America Inc. and its sub-sub-adviser is Schroder Investment Management North America Limited.
James Gautrey, CFA
Portfolio Manager
Simon Webber, CFA
Portfolio Manager
Manager Discussion
How did the Fund perform during the period?
The Class A shares of the Hartford Schroders International Stock Fund returned -27.22%, before sales charges, for the twelve-month period ended October 31, 2022, underperforming the Fund’s benchmark, the MSCI ACWI ex USA Index (Net), which returned -24.73% for the same period. For the same period, the Class A shares of the Fund, before sales charges, outperformed the -29.71% average return of the Lipper International Large Cap Growth peer group, a group of funds with investment strategies similar to those of the Fund.
Why did the Fund perform this way?
Over the twelve-month period ended October 31, 2022, international equities suffered significant declines amid elevated volatility as investors dealt with Russia’s invasion of Ukraine. The invasion caused an energy crisis and rising inflationary pressures which, alongside sharply rising interest rates, ultimately resulted in an increased risk of a global recession. All major regions faced selling pressure, with the weakest performance seen in emerging markets and the United Kingdom. North America was among the most resilient regions, helped in part by U.S. dollar strength, but still posted losses over the period. Income-driven sectors such as Utilities and Real Estate were among the weaker performers as sharp rises in bond yields offered investors other places to find yield outside of the equity market. Real estate was also impacted by signs of peaking property prices in several markets. Commodity sectors such as Energy and Materials proved to be more resilient as inflationary hedges during the period.
Amid this challenging market backdrop, both stock selection and asset allocation detracted from returns as the Fund underperformed the MSCI ACWI ex USA Index (Net) over the period. Over the period, the Fund’s industrial holdings were the largest detractors from performance. Vestas and Knorr Bremse both experienced profitability challenges from inflation and supply-chain disruption during the period. We sold the Fund’s position in these two companies during the period as a result. Within the Information Technology sector, as the COVID-19 ecommerce boom ended, Mercadolibre and Zalando were also detractors from performance, and we reduced both positions within the Fund to reflect their more challenging near-term outlooks.
Two of the largest positive contributors to returns were the Fund’s holdings in the Energy sector, Equinor and Shell. Both companies have a credible energy transition plan to steadily migrate their businesses towards more sustainable energy. The energy crisis in Europe has made it clear in our view that the energy transition will be difficult, and that until demand is migrated to alternative sources, economies will remain reliant on a steady supply of fossil fuels for some time.
By region, Continental Europe and the Pacific excluding Japan detracted from performance, while holdings in the United Kingdom and emerging markets added value during the period.
In our view, the recent exceptionally swift movement from growth to value stocks being in favor has been a more challenging environment for the Fund compared to recent years. However, we did appreciate that valuations of long-term compounders became extended in valuation terms relative to history. Towards the end of 2021 and early 2022, we sold some of these positions in the Fund where the risk and
Hartford Schroders International Stock Fund
Fund Overview – (continued)
October 31, 2022 (Unaudited)
reward became most unappealing (Xero, SEA Limited) in our view and reduced positions in others where we felt the combination of the strong long-term growth outlook and limited liquidity warranted retaining a smaller position (Sika, Lindt).
As the market then steadily downgraded growth equities, we sought to take advantage by establishing new positions in some businesses where we believed the long-term outlook was underappreciated. These businesses included Nibe, a manufacturer of heat pumps, which we believe is set to see major growth this decade as Europe decarbonizes heating.
The Fund also sold out of some equities where we believed the investment cases were broken, such as Knorr Bremse, a maker of braking systems for rail and trucks. Knorr Bremse failed to demonstrate the pricing power we thought they would have during the period and began losing share in China to domestic competitors. We also sold Adidas as the company came under pressure in China, at least in part due to a public stance on Xianjiang cotton. This undermined their reputation within China and led to very weak sales there.
Derivatives were not used in the Fund during the period.
What is the outlook as of the end of the period?
Outlook predictability was lower than usual as of the end of the period. The COVID-19 pandemic and the unprecedented global fiscal and monetary response to it created an inflationary impulse not seen in decades. Monetary policy raced to catch up, which led to much higher interest rates and a tighter set of financial conditions globally. Combined with rising geopolitical tension and war in Ukraine, risk premiums also rose during the period.
As investors wait for greater clarity, we believe there are reasons to think that inflationary pressures could begin to peak soon. The U.S. and European economies are slowing rapidly and, although labor markets have remained tight for longer than policymakers expected, the first tentative signs of a weaker job market are now starting to appear. We believe the effects of a reduction in disposable income from a major energy price shock will be intense in Europe this winter. Supply-chain disruption has also clearly peaked in our view, with shipping costs and commodity costs falling and the availability of semiconductors and other components improving.
Many companies are still facing significant margin pressure as demand weakens, making it harder for them to pass on prices to consumers. We expect the third- and fourth-quarter reporting seasons to lead to a round of estimate reductions on average, and in this context we need to be thinking about our growth gaps in relative terms as well as absolute ones – simply being able to deliver on consensus earnings estimates may be a very valuable attribute in the 12 months ahead.
Real interest rates have risen significantly to levels not seen since before the global financial crisis in 2008. This gives us optimism that the pressure on long-duration growth equities may have nearly run its course. In recent months, we found more of these types of quality growth companies showing good upside in our long-term growth and valuation models.
Currency markets have moved substantially, with relentless dollar strength being the key feature. Currencies such as the yen, euro, and pound are all now relatively cheap against the dollar as measured by various forms of purchasing power parity. Should current foreign exchange (FX) rates sustain, companies in these regions will have a major competitiveness boost, supporting employment and growth. However, once the U.S. Federal Reserve reaches the peak of its tightening cycle, we would expect to see a partial reversal of such extreme currency rates, representing a boost to international equity returns in U.S.-dollar terms. We are watching developments in Japan given the change in Bank of Japan Governor in March 2023, where a more conservative Governor is almost certain to be selected, in our view.
Our fundamental analysis process seeks to uncover companies with a strong competitive advantage that leads to pricing power and unanticipated growth. We believe there are signs that pricing power is emerging in the Energy sector and banking industry, albeit of a more transitory nature. Within the Energy sector, a lack of investment in supply after years of low prices and societal efforts to shift investment to more sustainable energy has introduced the prospect of a longer upcycle in oil and gas prices than we have seen in past years. In banking, interest rates are rising for the first time in years, reigniting the competitive funding advantage of banks with strong deposit franchises. With credit spreads beginning to normalize as well, it is also not so easy for companies that need to raise capital to bypass banks by accessing capital markets.
With such a different economic and market backdrop to recent years, many of the most powerful structural themes have faced a challenging period of performance. This goes for innovation in the Healthcare and Financial Services sectors, the climate and energy transition, the shift to digital and ecommerce, and manufacturing automation. Our conviction in these themes in the long term is undiminished, and they continue to be a focus of our investment team research and discussions. We continue to look for opportunities to build positions into those themes we feel are long-term winners, particularly as the stock market de-rates them with a short-term view.
There is growing evidence that the rising tension and rivalry between the U.S. (and to a lesser extent its European allies) and China will be a defining theme of this decade. We are working to understand this theme in more detail, but we expect to see consequences for many industries spanning higher costs, diseconomies of scale, and political intervention. The exposure of portfolio holdings to profit pools in China is of particular interest, given that these have been such a powerful source of growth historically but may be seen as vulnerable to homegrown China businesses that find it easier to compete in the future.
As of the end of the period, we have reduced the Fund’s cyclical exposure in light of slowing economic growth, while adding to stocks where we believe earnings risk is less pronounced and valuations discount strong long-term fundamentals. As of the end of the period, the Fund remained overweight in the Industrials sector as labor shortages, supply-chain issues, and higher input costs eased, and valuations began to look attractive, in our view. We also added to the Fund’s holdings in the Information Technology sector as of the end of
Hartford Schroders International Stock Fund
Fund Overview – (continued)
October 31, 2022 (Unaudited)
the period. Conversely, we have trimmed the Fund’s overweight to the Consumer Discretionary sector as of the end of the period, as we expect disposable incomes will fall as consumers struggle with rising inflation and interest rates. As of the end of the period, the Fund remained underweight in the Financials sector as we believe higher rates have dampened activity and increased recession risks, potentially testing banks’ balance-sheet strength.
Important Risks
Investing involves risk, including the possible loss of principal. Security prices fluctuate in value depending on general market and economic conditions and the prospects of individual companies. • Foreign investments may be more volatile and less liquid than U.S. investments and are subject to the risk of currency fluctuations and adverse political, economic and regulatory developments. These risks may be greater, and include additional risks, for investments in emerging markets or if the Fund focuses in a particular geographic region or country. • Small- and mid-cap securities can have greater risks and volatility than large-cap securities. • Integration of environmental, social, and/or governance (ESG) characteristics into the investment process may not work as intended. • To the extent the Fund focuses on one or more sectors, the Fund may be subject to increased volatility and risk of loss if adverse developments occur.
| Composition by Sector(1) |
| as of 10/31/2022 |
| Sector | Percentage
of Net Assets |
| Equity Securities | |
| Communication Services | 3.1% |
| Consumer Discretionary | 16.8 |
| Consumer Staples | 12.7 |
| Energy | 5.0 |
| Financials | 13.8 |
| Health Care | 11.2 |
| Industrials | 18.5 |
| Information Technology | 13.8 |
| Materials | 1.1 |
| Utilities | 3.3 |
| Total | 99.3% |
| Short-Term Investments | 1.2 |
| Other Assets & Liabilities | (0.5) |
| Total | 100.0% |
| (1) | A sector may be comprised of several industries. For Fund compliance purposes, the Fund may not use the same classification system. These sector classifications are used for financial reporting purposes. |
Hartford Schroders Securitized Income Fund
Fund Overview
October 31, 2022 (Unaudited)
Inception 02/28/2019
Sub-advised by Schroder Investment Management North America Inc. | Investment objective – The Fund seeks to provide current income and long-term total return consistent with preservation of capital. |
Comparison of Change in Value of $10,000 Investment (02/28/2019 - 10/31/2022)
The chart above represents the hypothetical growth of a $10,000 investment in Class A, which includes the maximum sales charge applicable to Class A shares. Returns for the Fund’s other classes will vary from what is seen above due to differences in the expenses charged to those share classes.
| Average Annual Total Returns |
| for the Periods Ended 10/31/2022 |
| | 1 Year | Since
Inception1 |
| Class A2 | -6.45% | -0.63% |
| Class A3 | -9.29% | -1.46% |
| Class C2 | -7.42% | -1.37% |
| Class C4 | -8.33% | -1.37% |
| Class I2 | -6.41% | -0.57% |
| Class Y2 | -6.37% | -0.54% |
| Class F2 | -6.27% | -0.47% |
| Class SDR2 | -6.28% | -0.49% |
| ICE BofA 1-3 Year US Corporate Index | -5.79% | 0.70% |
| ICE BofA US ABS & CMBS Index | -9.06% | 0.17% |
| Morningstar LSTA US Leveraged Loan Index (formerly, the S&P/LSTA Leveraged Loan Index) | -1.76% | 2.78% |
| 1 | Inception: 02/28/2019 |
| 2 | Without sales charge |
| 3 | Reflects maximum sales charge of 3.00% |
| 4 | Reflects a contingent deferred sales charge of 1.00% |
PERFORMANCE DATA QUOTED REPRESENTS PAST PERFORMANCE AND DOES NOT GUARANTEE FUTURE RESULTS. The investment return and principal value of the investment will fluctuate so that investors’ shares, when redeemed, may be worth more or less than their original cost. The chart and table do not reflect the deductions of taxes that a shareholder would pay on Fund distributions or the redemption of Fund shares. Current performance may be lower or higher than the performance data quoted. To obtain performance data current to the most recent month-end, please visit our website hartfordfunds.com.
Total returns presented above were calculated using the applicable class’ net asset value available to shareholders for sale or redemption of Fund shares on 10/31/2022, which may exclude investment transactions as of this date. All share class returns assume the reinvestment of all distributions at net asset value and the deduction of all fund expenses. The total returns presented in the Financial Highlights section of the report are calculated in the same manner, but also take into account certain
adjustments that are necessary under generally accepted accounting principles. As a result, the total returns in the Financial Highlights section may differ from the total returns presented above.
Class C shares commenced operations on 02/28/2020 and performance prior to this date reflects Class A shares (excluding sales charges). Performance prior to Class C’s inception date has not been adjusted to reflect the operating expenses of Class C. If the performance were adjusted, it would have been lower.
Effective December 31, 2021, the Fund changed its benchmark to the ICE BofA 1-3 Year US Corporate Index from the ICE BofA US ABS & CMBS Index and the Morningstar LSTA US Leveraged Loan Index (formerly, the S&P/LSTA Leveraged Loan Index). The Fund changed its benchmark because the Fund’s Investment Manager believes the new benchmark’s duration profile and credit quality profile are more representative of the Fund’s investment strategy.
You cannot invest directly in an index.
See "Benchmark Glossary" for benchmark descriptions.
Performance information may reflect expense waivers/reimbursements without which performance would have been lower. For information on current expense waivers/reimbursements, please see the prospectus.
Hartford Schroders Securitized Income Fund
Fund Overview – (continued)
October 31, 2022 (Unaudited)
| Operating Expenses* | Gross | Net |
| Class A | 0.90% | 0.85% |
| Class C | 1.68% | 1.68% |
| Class I | 0.64% | 0.60% |
| Class Y | 0.63% | 0.55% |
| Class F | 0.59% | 0.45% |
| Class SDR | 0.59% | 0.45% |
| * | Expenses as shown in the Fund’s most recent prospectus. Gross expenses do not reflect contractual expense reimbursement arrangements. Net expenses reflect such arrangements in instances when they reduce gross expenses. These arrangements remain in effect until 02/28/2023 unless the Fund’s Board of Directors approves an earlier termination. Actual expenses may be higher or lower. Please see accompanying Financial Highlights for expense ratios for the period ended 10/31/2022. |
Portfolio Managers
Hartford Schroders Securitized Income Fund’s sub-adviser is Schroder Investment Management North America Inc.
Michelle Russell-Dowe
Portfolio Manager and Head of Securitized Credit
Anthony Breaks
Portfolio Manager
Manager Discussion
How did the Fund perform during the period?
The Class A shares of the Hartford Schroders Securitized Income Fund returned -6.45%, before sales charges, for the twelve-month period ended October 31, 2022, underperforming the Fund’s benchmark, the ICE BofA 1-3 Year US Corporate Index, which returned -5.79% for the same period. For the same period, the Class A shares of the Fund, before sales charges, outperformed the -14.33% average return of the Lipper U.S. Mortgage Funds peer group, defined as funds that invest primarily in U.S. government agency and/or non-agency mortgage-backed securities. Effective December 31, 2021, the Fund changed its benchmark to the ICE BofA 1-3 Year US Corporate Index from the ICE BofA US ABS & CMBS Index and the Morningstar LSTA US Leveraged Loan Index (formerly, the S&P/LSTA Leveraged Loan Index). For the same period, Class A shares of the Fund, before sales charges, outperformed the ICE BofA US ABS & CMBS Index, which returned -9.06%, and underperformed the Morningstar LSTA US Leveraged Loan Index, which returned -1.76%.
Why did the Fund perform this way?
Over the period, interest rates generally increased for the five- and ten-year U.S. Treasury notes by 305 basis points (bps) and 250 bps, respectively.
The Fund continued to increase credit exposure in sectors that we believe have strong credit and supportive fundamental factors over the period. The Fund focused on securitized credit, where income is higher relative to corporate credit of comparable ratings. Despite the higher income and generally lower duration exposure compared to the ICE BofA 1-3 Year US Corporate Index, the Fund saw more credit
spread widening than the benchmark due to the pullback from banks, which have been material buyers in the low-duration securitized space. The main detractors from performance were the Fund’s allocations to mortgage-backed securities, collateralized loan obligations, and commercial mortgage-backed securities. During the period, the Fund continued to focus on a structural exposure to sectors that we believe have higher income, strong credit, and supportive fundamental factors. During the period, the Fund increased its exposure to senior commercial real estate (CRE) collateralized loan obligations (CLOs) securities and agency mortgage-backed securities (MBS), as both have seen their spreads widen, and both provide good high-quality income, in our view. During the period, the Fund reduced its exposure to European CLOs due to a higher probability of recession in Europe compared to the U.S. Our view during the period was that credit spreads would widen and having exposure to higher-quality income with good collateral protection would be beneficial in an environment bookended by inflation and recession.
Currency futures and forwards were used within the Fund during the period for hedging against currency fluctuations on non-U.S.-dollar bonds; these derivatives did not have a material impact on the Fund’s performance during the period.
What is the outlook as of the end of the period?
As of the end of the period, inflation remains a global challenge, and we believe the long-term economic trends in place are supportive of ongoing inflationary pressure. We believe the labor market is characterized by considerable wage pressure and little slack, while consumer strength is bifurcated. The economic pillars (corporations, banks, and consumers) began the period in a very healthy state. Given the starting point for the consumer, we are concerned about
Hartford Schroders Securitized Income Fund
Fund Overview – (continued)
October 31, 2022 (Unaudited)
“fringe” products, such as micro finance and peer-to-peer lending (which are untested through crisis), and those associated with a more leveraged, sub-prime borrower.
The U.S. Federal Reserve (Fed) will likely need to do more than the market anticipates, and the impact of the Fed and U.S. dollar strength will negatively impact other countries, in our view.
In a market characterized by uncertainty, we believe we will see more volatility, more limited liquidity, and more idiosyncratic risk. From our perspective, traditional risk premia remain too low given the uncertainty and potential for rapid change.
Within credit, securitized fixed income has been more impacted by the pull-back in demand from banks, which have been material buyers in the lower-duration space. With lower duration, shorter tenor (the length of time to maturity), and stronger fundamentals (collateralization), we believe the value proposition versus other traditional income investments is strong, particularly in AAA-rated securities.
Important Risks
Investing involves risk, including the possible loss of principal. Security prices fluctuate in value depending on general market and economic conditions and the prospects of individual companies. • Fixed income security risks include credit, liquidity, call, duration, event and interest-rate risk. As interest rates rise, bond prices generally fall. • The risks associated with mortgage-related and asset-backed securities as well as collateralized loan obligations (CLOs) include credit, interest-rate, prepayment, liquidity, default and extension risk. • Foreign investments may be more volatile and less liquid than U.S. investments and are subject to the risk of currency fluctuations and adverse political, economic and regulatory developments. • Derivatives are generally more volatile and sensitive to changes in market or economic conditions than other securities; their risks include currency, leverage, liquidity, index, pricing, regulatory and counterparty risk. • Integration of environmental, social, and/or governance (ESG) characteristics into the investment process may not work as intended. • Obligations of U.S. Government agencies are supported by varying degrees of credit but are generally not backed by the full faith and credit of the U.S. Government. • Restricted securities may be more difficult to sell and price than other securities. • The purchase of securities in the To-Be-Announced (TBA) market can result in higher portfolio turnover and related expenses as well as price and counterparty risk. • The Fund may use repurchase agreements, which can increase risk and volatility. • Investments in high-yield (“junk”) bonds involve greater risk of price volatility, illiquidity, and default than higher-rated debt securities. • Changes related to LIBOR could have an adverse impact on financial instruments that reference this rate.
| Composition by Security Type(1) |
| as of 10/31/2022 |
| Category | Percentage of
Net Assets |
| Equity Securities | |
| Common Stocks | 1.5% |
| Fixed Income Securities | |
| Asset & Commercial Mortgage-Backed Securities | 87.8% |
| Corporate Bonds | 1.4 |
| U.S. Government Agencies(2) | 4.8 |
| Total | 94.0% |
| Short-Term Investments | 8.8 |
| Other Assets & Liabilities | (4.3) |
| Total | 100.0% |
| (1) | For Fund compliance purposes, the Fund may not use the same classification system. These classifications are used for financial reporting purposes. |
| (2) | All, or a portion of the securities categorized as U.S. Government Agencies, were agency mortgage-backed securities as of October 31, 2022. |
Hartford Schroders Sustainable International Core Fund
Fund Overview
October 31, 2022 (Unaudited)
Inception 05/24/2022
Sub-advised by Schroder Investment Management North America Inc. and its
sub-sub-adviser, Schroder Investment Management North America Limited | Investment objective – The Fund seeks long-term capital appreciation while giving special consideration to certain sustainability criteria. |
Comparison of Change in Value of $5,000,000 Investment (05/24/2022 - 10/31/2022)
The chart above represents the hypothetical growth of a $5,000,000 investment in Class SDR. Returns for Class I may vary from what is seen above due to differences in the expenses charged to Class I.
| Cumulative Total Returns |
| for the Period Ended 10/31/2022 |
| | Since
Inception1 |
| Class I | -14.00% |
| Class SDR | -14.00% |
| MSCI ACWI ex USA Index (Net) | -12.31% |
PERFORMANCE DATA QUOTED REPRESENTS PAST PERFORMANCE AND DOES NOT GUARANTEE FUTURE RESULTS. The investment return and principal value of the investment will fluctuate so that investors’ shares, when redeemed, may be worth more or less than their original cost. The chart and table do not reflect the deductions of taxes that a shareholder would pay on Fund distributions or the redemption of Fund shares. Current performance may be lower or higher than the performance data quoted. To obtain performance data current to the most recent month-end, please visit our website hartfordfunds.com.
Total returns presented above were calculated using the applicable class' net asset value available to shareholders for sale or redemption of Fund shares on 10/31/2022, which may exclude investment transactions as of this date. All share class returns assume the reinvestment of all distributions at net asset value and the deduction of all fund expenses. The total returns presented in the Financial Highlights section of the report are calculated in the same manner, but also take into account certain adjustments that are necessary under generally accepted accounting principles. As a result, the total returns in the Financial Highlights section may differ from the total returns presented above.
You cannot invest directly in an index.
See "Benchmark Glossary" for benchmark descriptions.
Performance information may reflect expense waivers/reimbursements without which performance would have been lower. For information on current expense waivers/reimbursements, please see the prospectus.
| Operating Expenses* | Gross | Net |
| Class I | 1.21% | 0.85% |
| Class SDR | 1.12% | 0.70% |
| * | Expenses as shown in the Fund’s most recent prospectus. Gross expenses do not reflect contractual expense reimbursement arrangements. Net expenses reflect such arrangements in instances when they reduce gross expenses. These arrangements remain in effect until 02/29/2024 unless the Fund’s Board of Directors approves an earlier termination. Actual expenses may be higher or lower. Please see accompanying Financial Highlights for expense ratios for the period ended 10/31/2022. |
Hartford Schroders Sustainable International Core Fund
Fund Overview – (continued)
October 31, 2022 (Unaudited)
Portfolio Manager
Hartford Schroders Sustainable International Core Fund’s sub-adviser is Schroder Investment Management North America Inc. and its sub-sub-adviser is Schroder Investment Management North America Limited.
Nicholette MacDonald-Brown, CFA
Portfolio Manager
Manager Discussion
How did the Fund perform during the period?
The Class SDR shares of the Hartford Schroders Sustainable International Core Fund returned -14.00% for the period since inception on May 24, 2022 to October 31, 2022, underperforming the Fund’s benchmark, the MSCI ACWI ex USA Index (Net), which returned -12.31% for the same period. For the same period, the Class SDR shares of the Fund also underperformed the -12.02% average return of the Lipper International Multi-Cap Core peer group, a group of funds with investment strategies similar to those of the Fund.
Why did the Fund perform this way?
During the period, international equities struggled as investors became increasingly concerned over rising inflation, higher interest rates, and a global economic slowdown. Our investment approach does not rely on taking large style or factor bets, but focuses instead on individual mispriced opportunities while seeking to retain diversification. As part of our investment process, we also use our proprietary sustainability tools to evaluate investments for the Fund. Stock selection in the Consumer Staples, Industrials, and Materials sectors detracted from the Fund’s performance during the period.
Within the Consumer Staples sector, China Mengniu Dairy Company, salmon farmer Mowi, and French supermarket Carrefour were the leading detractors from Fund performance for the period. Mowi disappointed in the wake of news that Norway is proposing a new resource tax on salmon and trout farming.
Among companies in the Industrials sector, Chinese multinational manufacturer Sany Heavy Industry as well as Toyota Industries were detractors to the Fund’s relative performance during the period. Toyota Industries is a component supplier within the Toyota Group, which weakened along with most of the auto sector. Chinese equities saw sharper sell-offs compared to other Asian equities. China continued its zero-Covid policy during the period, which had negative implications for global supply chains. Investors also focused on Chinese Premier Xi Jinping’s historic third five-year term and whether that could result in fewer opportunities for foreign investment, as well as rising tensions between Taiwan and China.
The Fund’s cyclical holdings, including miners Newcrest Mining and Rio Tinto, together with stainless steelmaker Outokumpu, led the detractors from relative performance within the Materials sector for the
period. Weaker copper pricing influenced Newcrest Mining; however, Outokumpu reported strong earnings and encouraging guidance during the period.
On the positive side, the Fund’s holdings in Bank of Ireland and payments group Network International were among the largest contributors to the Fund’s relative performance during the period. Bank of Ireland benefited from rising interest rates, which had a positive impact on their net interest margins. Network International announced a good set of results and a share buyback program.
Derivatives in the form of futures were used in the Fund during the period, and they had a positive impact on relative performance.
What is the outlook as of the end of the period?
Despite the July 2022 rally, the market environment has been tough for equities as of the end of the period. As we draw near to the end of the third-quarter corporate earnings season, we expect banks to upgrade their earnings expectations due to the rising interest-rate environment, while many others, particularly cyclical sectors, we expect will be announcing downgrades to their earnings expectations.
We have observed that, while market valuations have fallen during the period, we believe the mood for many investors remains one of deep pessimism. A turning point may come if we see signs that inflation is peaking. The cost of freight and some commodities has been dropping, but we are not there yet in terms of seeing the same outcome for overall inflation.
Important Risks
The Fund is new and has a limited operating history. Investing involves risk, including the possible loss of principal. Security prices fluctuate in value depending on general market and economic conditions and the prospects of individual companies. • Foreign investments may be more volatile and less liquid than U.S. investments and are subject to the risk of currency fluctuations and adverse political, economic and regulatory developments. These risks may be greater, and include additional risks, for investments in emerging markets or if the Fund focuses in a particular geographic region or country. • Mid-cap securities can have greater risks and volatility than large-cap securities. • Applying sustainability criteria to the investment process may result in foregoing certain investments and underperformance comparative to funds that do not have a similar focus. There is a risk that the securities identified by the sub-adviser as meeting its sustainable investing criteria do not operate as anticipated. • To the extent the Fund focuses on one or more sectors, the Fund may be subject to increased volatility and risk of loss if adverse developments
Hartford Schroders Sustainable International Core Fund
Fund Overview – (continued)
October 31, 2022 (Unaudited)
occur. • Derivatives are generally more volatile and sensitive to changes in market or economic conditions than other securities; their risks include currency, leverage, liquidity, index, pricing, regulatory and counterparty risk.
| Composition by Sector(1) |
| as of 10/31/2022 |
| Sector | Percentage
of Net Assets |
| Equity Securities | |
| Communication Services | 5.6% |
| Consumer Discretionary | 9.7 |
| Consumer Staples | 9.7 |
| Energy | 2.7 |
| Financials | 21.7 |
| Health Care | 12.1 |
| Industrials | 13.7 |
| Information Technology | 12.8 |
| Materials | 6.2 |
| Real Estate | 0.4 |
| Utilities | 3.4 |
| Total | 98.0% |
| Short-Term Investments | 4.6 |
| Other Assets & Liabilities | (2.6) |
| Total | 100.0% |
| (1) | A sector may be comprised of several industries. For Fund compliance purposes, the Fund may not use the same classification system. These sector classifications are used for financial reporting purposes. |
Hartford Schroders Tax-Aware Bond Fund
Fund Overview
October 31, 2022 (Unaudited)
Inception 10/03/2011
Sub-advised by Schroder Investment Management North America Inc. and its
sub-sub-adviser, Schroder Investment Management North America Limited | Investment objective – The Fund seeks total return on an after-tax basis. |
Comparison of Change in Value of $10,000 Investment (10/31/2012 - 10/31/2022)
The chart above represents the hypothetical growth of a $10,000 investment in Class A, which includes the maximum sales charge applicable to Class A shares. Returns for the Fund’s other classes will vary from what is seen above due to differences in the expenses charged to those share classes.
| Average Annual Total Returns |
| for the Periods Ended 10/31/2022 |
| | 1 Year | 5 Years | 10 Years |
| Class A1 | -13.33% | -0.29% | 1.53% |
| Class A2 | -17.23% | -1.20% | 1.06% |
| Class C1 | -14.04% | -1.13% | 1.11% |
| Class C3 | -14.89% | -1.13% | 1.11% |
| Class I1 | -13.12% | -0.07% | 1.77% |
| Class Y1 | -13.18% | -0.13% | 1.74% |
| Class F1 | -13.09% | -0.05% | 1.78% |
| Class SDR1 | -13.10% | -0.05% | 1.77% |
| Bloomberg Municipal Bond Index | -11.98% | 0.37% | 1.68% |
| 1 | Without sales charge |
| 2 | Reflects maximum sales charge of 4.50% |
| 3 | Reflects a contingent deferred sales charge of 1.00% |
PERFORMANCE DATA QUOTED REPRESENTS PAST PERFORMANCE AND DOES NOT GUARANTEE FUTURE RESULTS. The investment return and principal value of the investment will fluctuate so that investors’ shares, when redeemed, may be worth more or less than their original cost. The chart and table do not reflect the deductions of taxes that a shareholder would pay on Fund distributions or the redemption of Fund shares. Current performance may be lower or higher than the performance data quoted. To obtain performance data current to the most recent month-end, please visit our website hartfordfunds.com.
Total returns presented above were calculated using the applicable class' net asset value available to shareholders for sale or redemption of Fund shares on 10/31/2022, which may exclude investment transactions as of this date. All share class returns assume the reinvestment of all distributions at net asset value and the deduction of all fund expenses. The total returns presented in the Financial Highlights section of the report are calculated in the same manner, but also take into account certain adjustments that are necessary under generally accepted accounting principles. As a result, the total returns in the Financial Highlights section may differ from the total returns presented above.
Effective immediately before the opening of business on 10/24/2016, the Schroder Broad Tax-Aware Value Bond Fund (the “Predecessor Fund”) was reorganized into the Fund. The performance information shown for periods prior to 10/24/2016 is that of the Predecessor Fund and the Predecessor Fund’s predecessor. Prior to 10/24/2016, Class A and Class I were called Advisor Shares and Investor Shares, respectively. Performance for Class A shares prior to 12/30/2014 (the inception date of the Predecessor Fund’s Advisor Shares) reflects the performance of the Predecessor Fund’s Investor Shares adjusted to reflect the distribution fees of the Predecessor Fund’s Advisor Shares. Class C, Class Y and Class SDR shares commenced operations on 10/24/2016 and performance prior to this date reflects the performance of the Predecessor Fund’s Investor Shares. Class F shares commenced operations on 02/28/2017 and performance prior to that date is that of the Fund’s Class I shares. Performance prior to Class F’s inception date has not been adjusted to reflect the operating expenses of Class F. The returns would be different if the Fund’s fees and expenses were reflected for periods prior to 10/24/2016. Performance for the Fund prior to 06/14/2013 reflects performance of the Predecessor Fund’s predecessor.
You cannot invest directly in an index.
See "Benchmark Glossary" for benchmark descriptions.
Performance information may reflect expense waivers/reimbursements without which performance would have been lower. For information on current expense waivers/reimbursements, please see the prospectus.
Hartford Schroders Tax-Aware Bond Fund
Fund Overview – (continued)
October 31, 2022 (Unaudited)
| Operating Expenses* | Gross | Net |
| Class A | 0.82% | 0.71% |
| Class C | 1.64% | 1.59% |
| Class I | 0.59% | 0.49% |
| Class Y | 0.62% | 0.56% |
| Class F | 0.51% | 0.46% |
| Class SDR | 0.51% | 0.46% |
| * | Expenses as shown in the Fund’s most recent prospectus. Gross expenses do not reflect contractual expense reimbursement arrangements. Net expenses reflect such arrangements in instances when they reduce gross expenses. These arrangements remain in effect until 02/28/2023 unless the Fund’s Board of Directors approves an earlier termination. Actual expenses may be higher or lower. Please see accompanying Financial Highlights for expense ratios for the period ended 10/31/2022. |
Portfolio Managers
Hartford Schroders Tax-Aware Bond Fund’s sub-adviser is Schroder Investment Management North America Inc. and its sub-sub-adviser is Schroder Investment Management North America Limited.
Lisa Hornby, CFA
Portfolio Manager
Neil G. Sutherland, CFA
Portfolio Manager
Julio C. Bonilla, CFA
Portfolio Manager
David May
Portfolio Manager
Manager Discussion
How did the Fund perform during the period?
The Class A shares of the Hartford Schroders Tax-Aware Bond Fund returned -13.33%, before sales charges, for the twelve-month period ended October 31, 2022, underperforming the Fund’s benchmark, the Bloomberg Municipal Bond Index, which returned -11.98% for the same period. For the same period, the Class A shares of the Fund, before sales charges, outperformed the -14.07% average return of the Lipper General & Insured Municipal Debt Funds peer group, a group of funds with investment strategies similar to those of the Fund.
Why did the Fund perform this way?
During the period, inflation was higher and more persistent than anticipated, driven by continuing labor-market strength, supply-side disruption related to the Russia/Ukraine war, and COVID quarantines in China. This led to a more aggressive interest-rate hiking cycle by the U.S. Federal Reserve (Fed), which has driven rates higher across the yield curve. With the 10-year Treasury yield higher by 250 basis points (bps) over the period, fixed-income markets experienced negative absolute returns, negative excess returns, and elevated volatility.
The Fund underperformed the Bloomberg Municipal Bond Index for the twelve-month period ended October 31, 2022 due to negative issuer selection. Specific tax-exempt bonds were the main factor, with tax-exempt federal agency bonds detracting the most from performance, and smaller impacts from tax-exempt housing and tax-exempt transportation bonds. Federal agency bonds saw their spreads widen materially given the material outflows for tax-exempt bonds as a result of higher Treasury yields during the period. For the tax-exempt housing bonds, the story was similar; however, the tax-exempt transportation bonds were also impacted by higher gas prices.
Although the Fund underperformed the Bloomberg Municipal Bond Index for the period, sector allocation was a materially positive factor due to the Fund’s specific underweights within tax-exempt bonds, including underweights to general-obligation bonds (GOs), transportation, utilities, and other revenue bonds (tax-exempt exposure overall was 34% lower than the benchmark on average over the period). These allocations helped offset the negative impact to Fund performance from the Fund’s out-of-benchmark allocation to corporate bonds during the period (which was 24% lower than the benchmark on average over the period). Yield curve and duration impacts were negative factors, which detracted from the Fund’s performance relative to the Bloomberg Municipal Bond Index during
Hartford Schroders Tax-Aware Bond Fund
Fund Overview – (continued)
October 31, 2022 (Unaudited)
the period. These impacts were generally the fallout from the sector allocation decisions, as the corporate bonds in the Fund were not part of the benchmark and resulted in more exposure at the shorter end of the maturity curve where rates rose the most.
During the period, the Fund used derivatives, such as futures, to manage duration within the portfolio. The use of such derivatives had no material impact on performance for the period.
What is the outlook as of the end of the period?
Fixed-income markets have undergone historic drawdowns during the period and have not provided the ballast many investors expected during these market conditions. We believe that fixed-income securities now offer a singular opportunity for longer-term investors seeking attractive absolute yields, diversification, and total returns. With Treasury yields as high as they were at the end of the period, we believe there is less need to extend out along the risk spectrum, particularly given our view that the U.S. economy is likely to enter an economic recession in the coming months. In addition, with generous short corporate break-even buffers (i.e., the yield to which bonds would have to rise for capital losses to offset the income earned over 12 months) combined with accumulated interest-rate increases that are expected to slow the economy, and inflation cresting, we believe the opportunity with fixed income is considerable.
Important Risks
Investing involves risk, including the possible loss of principal. Security prices fluctuate in value depending on general market and economic conditions and the prospects of individual companies. • Fixed income security risks include credit, liquidity, call, duration, and interest-rate risk. As interest rates rise, bond prices generally fall. • Municipal securities may be adversely impacted by state/local, political, economic, or market conditions; these risks may be magnified if the Fund focuses its assets in municipal securities of issuers in a few select states. Investors may be subject to the federal Alternative Minimum Tax as well as state and local income taxes. Capital gains, if any, are taxable. • Obligations of U.S. Government agencies are supported by varying degrees of credit but are generally not backed by the full faith and credit of the U.S. Government. • Mortgage-related and asset-backed securities’ risks include credit, interest-rate, prepayment, and extension risk. • The purchase of securities in the To-Be-Announced (TBA) market can result in higher portfolio turnover and related expenses as well as price and counterparty risk. • Derivatives are generally more volatile and sensitive to changes in market or economic conditions than other securities; their risks include currency, leverage, liquidity, index, pricing, regulatory and counterparty risk. • Foreign investments may be more volatile and less liquid than U.S. investments and are subject to the risk of currency fluctuations and adverse political, economic and regulatory developments. • Integration of environmental, social, and/or governance (ESG) characteristics into the investment process may not work as intended. • The Fund may have high portfolio turnover, which could increase its transaction costs and an investor’s tax liability.
| Composition by Security Type(1) |
| as of 10/31/2022 |
| Category | Percentage of
Net Assets |
| Fixed Income Securities | |
| Corporate Bonds | 10.0% |
| Municipal Bonds | 78.3 |
| U.S. Government Agencies(2) | 1.0 |
| U.S. Government Securities | 9.5 |
| Total | 98.8% |
| Short-Term Investments | 2.6 |
| Other Assets & Liabilities | (1.4) |
| Total | 100.0% |
| (1) | For Fund compliance purposes, the Fund may not use the same classification system. These classifications are used for financial reporting purposes. |
| (2) | All, or a portion of the securities categorized as U.S. Government Agencies, were agency mortgage-backed securities as of October 31, 2022. |
Hartford Schroders US MidCap Opportunities Fund
Fund Overview
October 31, 2022 (Unaudited)
Inception 03/31/2006
Sub-advised by Schroder Investment Management North America Inc. | Investment objective – The Fund seeks capital appreciation. |
Comparison of Change in Value of $10,000 Investment (10/31/2012 - 10/31/2022)
The chart above represents the hypothetical growth of a $10,000 investment in Class A, which includes the maximum sales charge applicable to Class A shares. Returns for the Fund’s other classes will vary from what is seen above due to differences in the expenses charged to those share classes.
| Average Annual Total Returns |
| for the Periods Ended 10/31/2022 |
| | 1 Year | 5 Years | 10 Years |
| Class A1 | -10.46% | 6.68% | 10.99% |
| Class A2 | -15.38% | 5.48% | 10.36% |
| Class C1 | -11.16% | 5.88% | 10.59% |
| Class C3 | -11.93% | 5.88% | 10.59% |
| Class I1 | -10.25% | 6.96% | 11.28% |
| Class R31 | -10.81% | 6.29% | 10.86% |
| Class R41 | -10.47% | 6.65% | 11.08% |
| Class R51 | -10.22% | 6.93% | 11.25% |
| Class Y1 | -10.29% | 6.96% | 11.28% |
| Class F1 | -10.18% | 7.05% | 11.33% |
| Class SDR1 | -10.12% | 7.05% | 11.36% |
| Russell Midcap Index | -17.17% | 7.95% | 11.36% |
| Russell 2500 Index | -17.58% | 7.07% | 10.70% |
| 1 | Without sales charge |
| 2 | Reflects maximum sales charge of 5.50% |
| 3 | Reflects a contingent deferred sales charge of 1.00% |
PERFORMANCE DATA QUOTED REPRESENTS PAST PERFORMANCE AND DOES NOT GUARANTEE FUTURE RESULTS. The investment return and principal value of the investment will fluctuate so that investors’ shares, when redeemed, may be worth more or less than their original cost. The chart and table do not reflect the deductions of taxes that a shareholder would pay on Fund distributions or the redemption of Fund shares. Current performance may be lower or higher than the performance data quoted. To obtain performance data current to the most recent month-end, please visit our website hartfordfunds.com.
Total returns presented above were calculated using the applicable class' net asset value available to shareholders for sale or redemption of Fund shares on 10/31/2022, which may exclude investment transactions as of this date. All share class returns assume the reinvestment of all distributions at net asset value and the deduction of all fund expenses. The total returns presented in the Financial Highlights section of the report are calculated in the same manner, but also take into account certain
adjustments that are necessary under generally accepted accounting principles. As a result, the total returns in the Financial Highlights section may differ from the total returns presented above.
Effective immediately before the opening of business on 10/24/2016, the Schroder U.S. Small and Mid Cap Opportunities Fund (the “Predecessor Fund”) was reorganized into the Fund. The performance information shown for periods prior to 10/24/2016 is that of the Predecessor Fund. Prior to 10/24/2016, Class A, Class I and Class SDR were called Advisor Shares, Investor Shares and R6 Shares, respectively. Class C, Class R3, Class R4, Class R5, and Class Y shares commenced operations on 10/24/2016 and performance prior to this date reflects the performance of the Predecessor Fund’s Investor Shares. Performance for Class SDR shares prior to 12/30/2014 (the inception date of the Predecessor Fund’s Class R6 Shares) reflects the performance of the Predecessor Fund’s Investor Shares. Class F shares commenced operations on 02/28/2017 and performance prior to that date is that of the Fund’s Class I shares. Performance prior to Class F’s inception date has not been adjusted to reflect the operating expenses of Class F. The returns would be different if the Fund’s fees and expenses were reflected for periods prior to 10/24/2016.
Performance information prior to 05/01/2019 reflect when the Fund invested at least 80% of its assets in securities of companies considered by Schroder Investment Management North America Inc. to be small- or mid-cap companies located in the United States.
You cannot invest directly in an index.
See "Benchmark Glossary" for benchmark descriptions.
Performance information may reflect expense waivers/reimbursements without which performance would have been lower.
Hartford Schroders US MidCap Opportunities Fund
Fund Overview – (continued)
October 31, 2022 (Unaudited)
| Operating Expenses* | Gross | Net |
| Class A | 1.16% | 1.16% |
| Class C | 1.90% | 1.90% |
| Class I | 0.89% | 0.89% |
| Class R3 | 1.52% | 1.52% |
| Class R4 | 1.22% | 1.22% |
| Class R5 | 0.92% | 0.92% |
| Class Y | 0.91% | 0.91% |
| Class F | 0.80% | 0.80% |
| Class SDR | 0.80% | 0.80% |
| * | Expenses as shown in the Fund’s most recent prospectus. Actual expenses may be higher or lower. Please see accompanying Financial Highlights for expense ratios for the period ended 10/31/2022. |
Portfolio Manager
Hartford Schroders US MidCap Opportunities Fund’s sub-adviser is Schroder Investment Management North America Inc.
Robert Kaynor, CFA
Portfolio Manager
Manager Discussion
How did the Fund perform during the period?
The Class A shares of the Hartford Schroders US MidCap Opportunities Fund returned -10.46%, before sales charges, for the twelve-month period ended October 31, 2022, outperforming both the Fund’s primary benchmark, the Russell Midcap Index, which returned -17.17% for the period, and the Fund’s secondary benchmark, the Russell 2500 Index, which returned -17.58% for the same period. For the same period, the Class A shares of the Fund, before sales charges, outperformed the -10.61% average return of the Lipper Mid-Cap Core peer group, a group of funds with investment strategies similar to those of the Fund.
Why did the Fund perform this way?
U.S. mid-capitalization equities, as measured by the Russell Midcap Index, declined over the twelve-month period ended October 31, 2022 by -17.16%. Markets started off the year on the wrong footing, giving back some of the strong gains seen in the fourth quarter of 2021. This was in response to predictions for tighter monetary policy from the U.S. Federal Reserve (Fed) due to higher inflation data. Combined with Russia’s invasion of Ukraine, existing concerns over inflation pressures increased, particularly for food and energy. The first three quarters of 2022 saw negative returns and ended with the reality that inflation was going to be harder to tame than most originally thought.
During the period, we invested the Fund’s assets in a combination of stock types that can be classified into the following three categories: “Steady Eddies” (companies we believe have recurring earnings/cash flow/revenue characteristics), “Turnarounds” (companies we believe have experienced business or operational difficulties but may potentially have a catalyst to help them return to a growth path), and “Mispriced Growth” (companies we believe have unrecognized or under-appreciated growth dynamics that will be rewarded over time).
The Fund’s holdings in the “Mispriced Growth”, “Steady Eddies” and “Turnarounds” categories contributed positively to the Fund’s relative returns for the period.
Over the period, the most significant contribution to the Fund’s outperformance relative to the Russell Midcap Index during the period was stock selection, particularly in the Technology, Financials, and Industrials sectors. Technology was the worst-performing sector in the benchmark, down -37% over the period. Within the Technology sector, stock selection within software, which the Fund was underweight, contributed positively to returns relative to the Russell Midcap Index.
The Fund was overweight to the Financials sector, and particularly to insurance brokers and life insurance, which contributed positively to performance relative to the Russell Midcap Index over the period. Specifically, the Fund’s holdings in insurance brokers performed well, and the Fund also benefited from not owning certain companies within the group that were benchmark constituents. In life insurance, the Fund’s holdings benefited from upbeat earnings results. The Fund tends to have a large weight in life insurance and insurance brokers rather than banks as we believe they are less interest-rate sensitive and more cyclical. Additionally, the Fund’s positioning in the investment services industry contributed positively over the period relative to the Russell Midcap Index due to stock selection within the industry.
Within the Industrials sector, the Fund’s stock selection contributed positively over the period, as did the Fund’s overweight in the defense industry. The start of the war in Ukraine early in 2022 boosted prospects for both defense and nuclear industries. Stock selection within electronic equipment benefited the Fund during the period.
The sectors that detracted the most from Fund performance over the period were the Basic Materials and Consumer Staples sectors. Basic Materials is the smallest weight in the Fund and lagged due to a significant underweight. The Fund holds two names within the sector,
Hartford Schroders US MidCap Opportunities Fund
Fund Overview – (continued)
October 31, 2022 (Unaudited)
and that is strictly due to stock selection and the difficulties of investing outside of the specialty chemicals space. The Consumer Staples sector also lagged due to the Fund’s underweight for the period. The Fund only had exposure in the food products industry, which benefited the Fund over the period from a stock selection perspective.
Top contributors to the Fund’s performance relative to the Russell Midcap Index during the period included Hershey Company (Consumer Staples sector), ON Semiconductor (Technology sector), and Amdocs (Technology sector). Hershey produces snack, chocolate, and non-chocolate confectionary. The company announced strong quarterly results over the period with Reese’s demand driving growth, and saw net sales rise year-over-year to over $2 billion. ON Semiconductor designs, manufactures, and markets a portfolio of semiconductor components. The company announced quarterly revenues exceeding $2 billion for the first time ever, driven by industrial and primarily automotive strength. Amdocs specializes in software and services for communications, media, and financial services providers and digital enterprises. The company announced that it acquired U.K. company MYCOM OSI for $188 million. MYCOM provides Software as a Service (SaaS) solutions, allowing Amdocs to expand its portfolio in SaaS-based cloud and service assurance offerings.
Over the period, the largest detractors from the Fund’s performance relative to the Russell Midcap Index were Match Group (Technology sector), Catalent Inc (Healthcare sector) and Masimo Corporation (Healthcare sector). Match Group is a provider of online dating products. The stock fell victim to the higher-growth names trading off later in the period coupled with poor guidance announcements throughout the year. The company also announced the CEO would be stepping down. Catalent provides delivery technologies, development, drug manufacturing, biologics, gene therapies, and consumer health products. The company’s management team issued lower-than-expected initial outlook for fiscal year 2023, which caused concern for investors, and the stock subsequently traded down. Masimo Corporation is a global medical technology company that develops, manufactures, and markets non-invasive technologies and hospital automation solutions. The stock fell in February 2022 as the company announced its biggest deal ever, the acquisition of consumer tech company Sound United for $1 billion.
Derivatives were not used in the Fund during the period.
What is the outlook as of the end of the period?
As of the end of the period, markets have been adjusting to the rise in interest rates through a revaluation of the share price multiples for different companies. An increase in interest rates generally means investors will not pay as much for longer-term growth, which is why the share prices of highly valued growth companies have fallen. At some point when there is more clarity about when interest rates might peak, we believe the focus will shift to how company profitability is being affected.
In our view, the next shoe to drop is the delayed impact of monetary policy in the form of interest-rate increases on company earnings. We believe that the impact could be felt in a number of guises. In our view, the most obvious is falling demand, and we expect that it will be felt
especially by companies that have not adjusted their inventories in anticipation of a slowing economy. We believe it will also be painful for companies that relied on pricing power to support revenues. We expect that financial strains will intensify as interest rates continue to rise and economic activity slows. In our view, other areas of caution could include margin pressure in retail from elevated inventories stemming from both inflation and economic normalization, longer cycles in technology, and some cancelling of hiring plans and even layoffs.
The next earnings season will start to indicate how companies might be faring into 2023. In our view, this is not a time to buy companies just because their share prices have fallen a long way. In this environment, we believe that very often the cheapest companies can turn out to be the most expensive.
There remains a strong case for investing in U.S. mid- and small-cap companies in the longer term. We believe valuations, in particular, are already pricing in earnings revisions, which offers support for companies who are adjusting their profitability and upside opportunities for companies who beat expectations. U.S. smaller companies are more exposed to the domestic economy, which we believe in some areas will be boosted by the reshoring benefits of U.S. manufacturers and multinationals investing in production and supply chains in the U.S.
Mid and small caps have been outperforming large caps since the end of January 2022, and this trend continued in the third quarter of 2022. This is unusual in a period of recessionary fears, but we believe this partially reflects much cheaper valuations and consequently less risk to earnings revisions. As of the end of the period, we think this outperformance should continue, but stock selection will become increasingly important.
Important Risks
Investing involves risk, including the possible loss of principal. Security prices fluctuate in value depending on general market and economic conditions and the prospects of individual companies. • Mid-cap securities can have greater risks and volatility than large-cap securities. • To the extent the Fund focuses on one or more sectors, the Fund may be subject to increased volatility and risk of loss if adverse developments occur. • Integration of environmental, social, and/or governance (ESG) characteristics into the investment process may not work as intended.
Hartford Schroders US MidCap Opportunities Fund
Fund Overview – (continued)
October 31, 2022 (Unaudited)
| Composition by Sector(1) |
| as of 10/31/2022 |
| Sector | Percentage
of Net Assets |
| Equity Securities | |
| Communication Services | 4.1% |
| Consumer Discretionary | 5.5 |
| Consumer Staples | 2.0 |
| Energy | 4.5 |
| Financials | 16.0 |
| Health Care | 8.8 |
| Industrials | 19.5 |
| Information Technology | 20.9 |
| Materials | 3.2 |
| Real Estate | 3.4 |
| Utilities | 4.8 |
| Total | 92.7% |
| Short-Term Investments | 6.9 |
| Other Assets & Liabilities | 0.4 |
| Total | 100.0% |
| (1) | A sector may be comprised of several industries. For Fund compliance purposes, the Fund may not use the same classification system. These sector classifications are used for financial reporting purposes. |
Hartford Schroders US Small Cap Opportunities Fund
Fund Overview
October 31, 2022 (Unaudited)
Inception 08/06/1993
Sub-advised by Schroder Investment Management North America Inc. | Investment objective – The Fund seeks capital appreciation. |
Comparison of Change in Value of $10,000 Investment (10/31/2012 - 10/31/2022)
The chart above represents the hypothetical growth of a $10,000 investment in Class A, which includes the maximum sales charge applicable to Class A shares. Returns for the Fund’s other classes will vary from what is seen above due to differences in the expenses charged to those share classes.
| Average Annual Total Returns |
| for the Periods Ended 10/31/2022 |
| | 1 Year | 5 Years | 10 Years |
| Class A1 | -12.56% | 5.84% | 10.06% |
| Class A2 | -17.37% | 4.65% | 9.44% |
| Class C1 | -13.24% | 5.05% | 9.69% |
| Class C3 | -14.02% | 5.05% | 9.69% |
| Class I1 | -12.35% | 6.15% | 10.39% |
| Class R31 | -12.83% | 5.55% | 10.03% |
| Class R41 | -12.57% | 5.91% | 10.23% |
| Class R51 | -12.30% | 6.17% | 10.38% |
| Class Y1 | -12.32% | 6.19% | 10.41% |
| Class F1 | -12.21% | 6.27% | 10.45% |
| Class SDR1 | -12.23% | 6.27% | 10.47% |
| Russell 2000 Index | -18.54% | 5.56% | 9.93% |
| 1 | Without sales charge |
| 2 | Reflects maximum sales charge of 5.50% |
| 3 | Reflects a contingent deferred sales charge of 1.00% |
PERFORMANCE DATA QUOTED REPRESENTS PAST PERFORMANCE AND DOES NOT GUARANTEE FUTURE RESULTS. The investment return and principal value of the investment will fluctuate so that investors’ shares, when redeemed, may be worth more or less than their original cost. The chart and table do not reflect the deductions of taxes that a shareholder would pay on Fund distributions or the redemption of Fund shares. Current performance may be lower or higher than the performance data quoted. To obtain performance data current to the most recent month-end, please visit our website hartfordfunds.com.
Total returns presented above were calculated using the applicable class' net asset value available to shareholders for sale or redemption of Fund shares on 10/31/2022, which may exclude investment transactions as of this date. All share class returns assume the reinvestment of all distributions at net asset value and the deduction of all fund expenses. The total returns presented in the Financial Highlights section of the report are calculated in the same manner, but also take into account certain
adjustments that are necessary under generally accepted accounting principles. As a result, the total returns in the Financial Highlights section may differ from the total returns presented above.
Effective immediately before the opening of business on 10/24/2016, the Schroder U.S. Opportunities Fund (the “Predecessor Fund”) was reorganized into the Fund. The performance information shown for periods prior to 10/24/2016 is that of the Predecessor Fund. Prior to 10/24/2016, Class A, Class I and Class SDR were called Advisor Shares, Investor Shares and R6 Shares, respectively. Class C, Class R3, Class R4, Class R5, and Class Y shares commenced operations on 10/24/2016 and performance prior to this date reflects the performance of the Predecessor Fund’s Investor Shares. Performance for Class SDR shares prior to 09/28/2015 (the inception date of the Predecessor Fund’s Class R6 Shares) reflects the performance of the Predecessor Fund’s Investor Shares. Class F shares commenced operations on 02/28/2017 and performance prior to that date is that of the Fund’s Class I shares. Performance prior to Class F’s inception date has not been adjusted to reflect the operating expenses of Class F. The returns would be different if the Fund’s fees and expenses were reflected for periods prior to 10/24/2016.
You cannot invest directly in an index.
See "Benchmark Glossary" for benchmark descriptions.
Performance information may reflect expense waivers/reimbursements without which performance would have been lower. For information on current expense waivers/reimbursements, please see the prospectus.
Hartford Schroders US Small Cap Opportunities Fund
Fund Overview – (continued)
October 31, 2022 (Unaudited)
| Operating Expenses* | Gross | Net |
| Class A | 1.38% | 1.35% |
| Class C | 2.12% | 2.10% |
| Class I | 1.08% | 1.08% |
| Class R3 | 1.70% | 1.65% |
| Class R4 | 1.40% | 1.35% |
| Class R5 | 1.10% | 1.05% |
| Class Y | 1.09% | 1.05% |
| Class F | 0.99% | 0.95% |
| Class SDR | 0.99% | 0.95% |
| * | Expenses as shown in the Fund’s most recent prospectus. Gross expenses do not reflect contractual expense reimbursement arrangements. Net expenses reflect such arrangements in instances when they reduce gross expenses. These arrangements remain in effect until 02/28/2023 unless the Fund’s Board of Directors approves an earlier termination. Actual expenses may be higher or lower. Please see accompanying Financial Highlights for expense ratios for the period ended 10/31/2022. |
Portfolio Manager
Hartford Schroders US Small Cap Opportunities Fund’s sub-adviser is Schroder Investment Management North America Inc.
Robert Kaynor, CFA
Portfolio Manager
Manager Discussion
How did the Fund perform during the period?
The Class A shares of the Hartford Schroders US Small Cap Opportunities Fund returned -12.56%, before sales charges, for the twelve-month period ended October 31, 2022, outperforming the Fund’s benchmark, the Russell 2000 Index, which returned -18.54% for the same period. For the same period, the Class A shares of the Fund, before sales charges, underperformed the -11.64% average return of the Lipper Small-Cap Core peer group, a group of funds with investment strategies similar to those of the Fund.
Why did the Fund perform this way?
U.S. small-capitalization equities, as measured by the Russell 2000 Index, returned -18.54% over the twelve-month period ended October 31, 2022. Markets started off the year on the wrong footing, giving back some of the strong gains seen in the fourth quarter of 2021. This was in response to predictions for tighter monetary policy from the U.S. Federal Reserve (Fed) due to higher inflation data. Combined with the war in Ukraine, existing concerns were heightened over inflation pressures, particularly through food and energy. The first three quarters of 2022 saw negative returns and ended with the reality that inflation was going to be harder to tame than most originally thought.
During the period, we invested the Fund’s assets in a combination of stock types that can be classified into the following three categories: “Steady Eddies” (companies we believe have recurring earnings/cash flow/revenue characteristics), “Turnarounds” (companies we believe have experienced business or operational difficulties but may potentially have a catalyst to help them return to a growth path), and “Mispriced Growth” (companies we believe have unrecognized or
under-appreciated growth dynamics that will be rewarded over time). The Fund’s holdings in the “Mispriced Growth”, “Steady Eddies” and “Turnarounds” categories contributed positively to the Fund’s relative returns for the period.
The most significant contribution to the Fund’s outperformance relative to the Russell 2000 Index during the twelve-month period was stock selection, particularly in the Consumer Discretionary and Financials sectors. Stock selection contributed positively within the home construction industry, particularly within the manufactured housing industry. Excluding manufactured housing, the Fund was underweight to the Consumer Discretionary sector, a shift that occurred in 2020 and has held since, as consumers have continued to feel pressure from rising prices. Within the Consumer Services sector, the Fund benefited from stock selection as well as an overweight position.
In the Financials sector, the Fund had an equal weight to the Russell 2000 Index over the period, but stock selection drove positive performance relative to the benchmark. The Fund’s exposure in banks was one of the best performers over the period due to an allocation to community banks, which in our view are traditionally higher quality with a more defensive business model type. Noteworthy contributors in the banking industry were First Bancorp, Heritage Financial Corporation, and First Merchants Corporation. The Fund’s lone holding in life insurance, Reinsurance Group of America, was one of the biggest contributors over the period as premiums grew and gave the company the ability to deploy excess capital.
The sector that detracted the most from the Fund’s performance over the period was the Energy sector. Despite having good stock selection in the sector, the Fund has historically been and remains underweight
Hartford Schroders US Small Cap Opportunities Fund
Fund Overview – (continued)
October 31, 2022 (Unaudited)
to the Energy sector. The sector dominated market performance in the first half of 2022. Due to this underweight, the Fund lagged significantly due to sector allocation specifically in crude producers.
Top contributors to the Fund’s performance relative to the Russell 2000 Index over the period included Plantronics (Telecommunications), Reinsurance Group of America (Financials), and Science Applications International (Industrials). Plantronics designs, manufactures and markets integrated communications such as headsets, video, and voice services. The company reached an agreement with HP to be purchased for $3.3 billion during the period. Reinsurance Group of America provides traditional life and health reinsurance and financial solutions. The company has seen solid premium growth across all regions of their business for the period. Science Applications International is a provider of technical, engineering and enterprise IT services primarily to the United States Government. The company announced strong earnings and guidance numbers over the period and has been executing its Army IT services renewal contracts from last year and winning new contracts and awards.
Over the period, the largest detractors from the Fund’s performance relative to the Russell 2000 Index were LiveRamp Holdings (Technology), NeoGenomics, Inc. (Healthcare), and Semtech Corporation (Technology). LiveRamp Holdings is a global technology company that provides enterprise data connectivity platform that helps organizations to leverage customer data. Despite satisfactory quarterly results during 2022, the company tapered guidance in consecutive quarters as the impending recession fears created caution among LiveRamp’s clients. NeoGenomics, Inc. is an operator of a network of cancer-focused testing laboratories. The company was caught in the growth to value rotation. Additionally, the company announced the departure of its CEO during the period. The company also suspended its annual guidance. Semtech Corporation is a supplier of analog and mixed-signal semiconductor products and advanced algorithms. The company reported a very weak fiscal third-quarter/fourth-quarter outlook with a deteriorating macroeconomic outlook, notably in China, which is driving consumer softness and supply constraints. The company also announced a deal to acquire Sierra Wireless, which received mixed reviews.
Derivatives were not used in the Fund during the period.
What is the outlook as of the end of the period?
As of the end of the period, markets have been adjusting to the rise in interest rates through a revaluation of the share price multiples for different companies. An increase in interest rates generally means investors will not pay as much for longer term growth which is why the share prices of highly valued growth companies have fallen. At some point when there is more clarity about when interest rates might peak, we believe the focus will shift to how company profitability is being affected.
In our view, the next shoe to drop is the delayed impact of monetary policy in the form of interest rate increases on company earnings. We believe that the impact could be felt in a number of guises. In our view, the most obvious is falling demand, and we expect that it will be felt especially by companies that have not adjusted their inventories in
anticipation of a slowing economy. We believe it will also be painful for companies that relied on pricing power to support revenues. We expect that financial strains will intensify as interest rates continue to rise and economic activity slows. In our view, other areas of caution could include margin pressure in retail from elevated inventories stemming from both inflation and economic normalization, longer cycles in technology and some cancelling of hiring plans and even layoffs.
The next earnings season will start to indicate how companies might be faring into 2023. In our view, this is not a time to buy companies just because their share prices have fallen a long way. In this environment, we believe that very often the cheapest companies can turn out to be the most expensive.
There remains a strong case for investing in U.S. mid- and small-cap companies in the longer term. We believe valuations, in particular, are already pricing in earnings revisions which offers support for companies who are adjusting their profitability and upside opportunities for companies who beat expectations. U.S. smaller companies are more exposed to the domestic economy, which we believe in some areas will be boosted by the reshoring benefits of U.S. manufacturers and multinationals investing in production and supply chains in the U.S.
Mid and small caps have been outperforming large caps since the end of January 2022, and this trend continued in the third quarter of 2022. This is unusual in a period of recessionary fears but we believe this partially reflects much cheaper valuations and consequently less risk to earnings revisions. As of the end of the period, we think this outperformance should continue but stock selection will become increasingly important.
Important Risks
Investing involves risk, including the possible loss of principal. Security prices fluctuate in value depending on general market and economic conditions and the prospects of individual companies. • Small-cap securities can have greater risks, including liquidity risk, and volatility than large-cap securities. • To the extent the Fund focuses on one or more sectors, the Fund may be subject to increased volatility and risk of loss if adverse developments occur. • Integration of environmental, social, and/or governance (ESG) characteristics into the investment process may not work as intended.
Hartford Schroders US Small Cap Opportunities Fund
Fund Overview – (continued)
October 31, 2022 (Unaudited)
| Composition by Sector(1) |
| as of 10/31/2022 |
| Sector | Percentage
of Net Assets |
| Equity Securities | |
| Communication Services | 2.4% |
| Consumer Discretionary | 6.5 |
| Consumer Staples | 5.0 |
| Energy | 5.0 |
| Financials | 19.1 |
| Health Care | 11.8 |
| Industrials | 17.0 |
| Information Technology | 13.3 |
| Materials | 8.3 |
| Real Estate | 2.7 |
| Utilities | 3.7 |
| Total | 94.8% |
| Short-Term Investments | 6.9 |
| Other Assets & Liabilities | (1.7) |
| Total | 100.0% |
| (1) | A sector may be comprised of several industries. For Fund compliance purposes, the Fund may not use the same classification system. These sector classifications are used for financial reporting purposes. |
Benchmark Glossary (Unaudited)
| Bloomberg Municipal Bond Index (reflects no deduction for fees, expenses or taxes) is designed to cover the USD-denominated long-term tax-exempt bond market. |
| ICE BofA US ABS & CMBS Index (reflects no deduction for fees, expenses or taxes) tracks the performance of US dollar denominated investment grade fixed and floating rate asset backed securities and fixed rate commercial mortgage backed securities publicly issued in the US domestic market. |
| ICE BofA 1-3 Year US Corporate Index (reflects no deduction for fees, expenses or taxes) is designed to measure the performance of US investment-grade corporate debt with a remaining term to maturity of less than 3 years. |
| JP Morgan Emerging Markets Blended Index (JEMB) - Equal Weighted (reflects no deduction for fees, expenses or taxes) is a blended index produced by JP Morgan that is comprised of 1/3 JP Morgan GBI Emerging Markets Global Diversified Index, 1/3 JP Morgan EMBI Global Diversified Index, and 1/3 JP Morgan CEMBI Broad Diversified Index. The JEMB - Equal Weighted is designed to blend US dollar and local currency denominated sovereign, quasi-sovereign and corporate bonds in equal proportion. |
| MSCI ACWI (All Country World) ex USA Index (Net) (reflects reinvested dividends net of withholding taxes but reflects no deduction for fees, expenses or other taxes) is designed to capture large and mid cap securities across developed markets (excluding the US) and emerging market countries. |
| MSCI ACWI (All Country World) ex USA Value Index (Net) (reflects reinvested dividends net of withholding taxes but reflects no deduction for fees, expenses or other taxes) is designed to capture large and mid cap securities exhibiting overall value style characteristics across developed (excluding the US) and emerging markets countries. The value investment style characteristics for index construction are defined using three variables: book value to price, 12-month forward earnings to price and dividend yield. |
| MSCI China A Onshore Index (Net) (reflects reinvested dividends net of withholding taxes but reflects no deduction for fees, expenses or other taxes) is designed to capture large and mid-cap securities across China securities listed on the Shanghai and Shenzhen exchanges. The index covers only those securities that are accessible through “Stock Connect”. |
| MSCI EAFE Index (Net) (reflects reinvested dividends net of withholding taxes but reflects no deduction for fees, expenses or other taxes) is designed to capture large and mid cap securities across developed market countries, excluding the US and Canada. |
| MSCI EAFE Value Index (Net) (reflects reinvested dividends net of withholding taxes but reflects no deduction for fees, expenses or other taxes) is designed to capture large and mid cap securities exhibiting overall value style characteristics across developed market countries, excluding the US and Canada. |
| MSCI Emerging Markets Index (Net) (reflects reinvested dividends net of withholding taxes but reflects no deduction for fees, expenses or other taxes) is designed to capture large and mid cap securities across emerging market countries. |
| Russell 2000 Index (reflects no deduction for fees, expenses or taxes) is an index comprised of 2,000 of the smallest US-domiciled company common stocks based on a combination of their market capitalization and current index membership. |
| Russell 2500 Index (reflects no deduction for fees, expenses or taxes) is designed to measure the performance of the small to mid-cap segment of the US equity universe, commonly referred to as “smid” cap. The Russell 2500 Index is a subset of the Russell 3000 Index and includes approximately 2,500 of the smallest US Companies based on a combination of their market capitalization and current index membership. |
| Russell Midcap Index (reflects no deduction for fees, expenses or taxes) is designed to measure the performance of the mid-cap segment of the US equity universe. The Russell Midcap Index is a subset of the Russell 1000 Index. It includes approximately 800 of the smallest securities based on a combination of their market cap and current index membership. |
| Morningstar LSTA US Leveraged Loan Index (formerly, the S&P/LSTA Leveraged Loan Index) (reflects no deduction for fees, expenses or taxes) is a market value-weighted index that is designed to measure the performance of the US leveraged loan market based upon market weightings, spreads and interest payments. |
| Additional Information Regarding Bloomberg Index(es). “Bloomberg®” and the above referenced Bloomberg index(es) are service marks of Bloomberg Finance L.P. and its affiliates, including Bloomberg Index Services Limited (“BISL”), the administrator of the index (collectively, “Bloomberg”), and have been licensed for use for certain purposes by Hartford Funds Management Company, LLC ("HFMC"). The Funds are not sponsored, endorsed, sold or promoted by Bloomberg. Bloomberg does not make any representation or warranty, express or implied, to the owners of or counterparties to the Funds or any member of the public regarding the advisability of investing in securities generally or in the Funds particularly. The only relationship of Bloomberg to HFMC is the licensing of certain trademarks, trade names and service marks and of the above referenced Bloomberg index(es), which is determined, composed and calculated by BISL without regard to HFMC or the Funds. Bloomberg has no obligation to take the needs of HFMC or the owners of the Funds into consideration in determining, composing or calculating the above referenced Bloomberg index(es). Bloomberg is not responsible for and has not participated in the determination of the timing of, prices at, or quantities of the Funds to be issued. Bloomberg shall not have any obligation or liability, including, without limitation, to the Funds' customers, in connection with the administration, marketing or trading of the Funds. |
Benchmark Glossary (Unaudited) – (continued)
| BLOOMBERG DOES NOT GUARANTEE THE ACCURACY AND/OR THE COMPLETENESS OF THE ABOVE REFERENCED BLOOMBERG INDEX(ES) OR ANY DATA RELATED THERETO AND SHALL HAVE NO LIABILITY FOR ANY ERRORS, OMISSIONS OR INTERRUPTIONS THEREIN. BLOOMBERG DOES NOT MAKE ANY WARRANTY, EXPRESS OR IMPLIED, AS TO RESULTS TO BE OBTAINED BY HFMC, OWNERS OF THE FUNDS OR ANY OTHER PERSON OR ENTITY FROM THE USE OF THE ABOVE REFERENCED BLOOMBERG INDEX(ES) OR ANY DATA RELATED THERETO. BLOOMBERG DOES NOT MAKE ANY EXPRESS OR IMPLIED WARRANTIES AND EXPRESSLY DISCLAIMS ALL WARRANTIES OF MERCHANTABILITY OR FITNESS FOR A PARTICULAR PURPOSE OR USE WITH RESPECT TO THE ABOVE REFERENCED BLOOMBERG INDEX(ES) OR ANY DATA RELATED THERETO. WITHOUT LIMITING ANY OF THE FOREGOING, TO THE MAXIMUM EXTENT ALLOWED BY LAW, BLOOMBERG, ITS LICENSORS, AND ITS AND THEIR RESPECTIVE EMPLOYEES, CONTRACTORS, AGENTS, SUPPLIERS, AND VENDORS SHALL HAVE NO LIABILITY OR RESPONSIBILITY WHATSOEVER FOR ANY INJURY OR DAMAGES --WHETHER DIRECT, INDIRECT, CONSEQUENTIAL, INCIDENTAL, PUNITIVE OR OTHERWISE --ARISING IN CONNECTION WITH THE ABOVE REFERENCED BLOOMBERG INDEX(ES) OR ANY DATA OR VALUES RELATING THERETO --WHETHER ARISING FROM THEIR NEGLIGENCE OR OTHERWISE, EVEN IF NOTIFIED OF THE POSSIBILITY THEREOF. |
| Additional Information Regarding MSCI Indices. Neither MSCI nor any other party involved in or related to compiling, computing or creating the MSCI data makes any express or implied warranties or representations with respect to such data (or the results to be obtained by the use thereof), and all such parties hereby expressly disclaim all warranties of originality, accuracy, completeness, merchantability or fitness for a particular purpose with respect to any of such data. Without limiting any of the foregoing, in no event shall MSCI, any of its affiliates or any third party involved in or related to compiling, computing or creating the data have any liability for any direct, indirect, special, punitive, consequential or any other damages (including lost profits) even if notified of the possibility of such damages. No further distribution or dissemination of the MSCI data is permitted without MSCI’s express written consent. |
Expense Examples (Unaudited)
Your Fund's Expenses
As a shareholder of a Fund, you incur two types of costs: (1) transaction costs, including sales charges (loads) on purchase payments, if any, and contingent deferred sales charges (CDSC), if any, and (2) ongoing costs, including investment management fees, distribution and/or service (12b-1) fees, if any, and other fund expenses. This example is intended to help you understand your ongoing costs (in dollars) of investing in a Fund and to compare these costs with the ongoing costs of investing in other mutual funds. The example is based on an investment of $1,000 invested at the beginning of the period and held for the entire period of May 1, 2022 through October 31, 2022, except as noted below. To the extent a Fund was subject to acquired fund fees and expenses during the period, acquired fund fees and expenses are not included in the annualized expense ratios below.
Actual Expenses
The first set of columns of the table below provides information about actual account values and actual expenses. You may use this information, together with the amount you invested, to estimate the expenses that you paid over the period. Simply divide your account value by $1,000 (for example, an $8,600 account value divided by $1,000 = 8.6), then multiply the result by the number in the line under the heading entitled “Expenses Paid During The Period” to estimate the expenses you paid on your account during this period.
Hypothetical Example for Comparison Purposes
The second set of columns of the table below provides information about hypothetical account values and hypothetical expenses based on a Fund’s actual expense ratio and an assumed rate of return of 5% per year before expenses, which is not the Fund’s actual return. The hypothetical account values and expenses may not be used to estimate the actual ending account balance or expenses you paid for the period. You may use this information to compare the ongoing costs of investing in a Fund and other funds. To do so, compare this 5% hypothetical example with the 5% hypothetical examples that appear in the shareholder reports of the other funds.
Please note that the expenses shown in the table are meant to highlight your ongoing costs only and do not reflect any transactional costs, such as sales charges (loads and CDSC). Therefore, the second set of columns of the table is useful in comparing ongoing costs only, and will not help you determine the relative total costs of owning different funds. In addition, if these transactional costs were included, your costs would be higher. Expenses for a class of a Fund are equal to the class' annualized expense ratio multiplied by average account value over the period, multiplied by 184/365 (to reflect the one-half year period).
| | Actual Return | | Hypothetical (5% return before expenses) |
| | Beginning
Account Value
May 1, 2022 | | Ending
Account Value
October 31, 2022 | | Expenses paid
during the period
May 1, 2022
through
October 31, 2022 | | Beginning
Account Value
May 1, 2022 | | Ending
Account Value
October 31, 2022 | | Expenses paid
during the period
May 1, 2022
through
October 31, 2022 | | Annualized
expense
ratio |
| Hartford Schroders China A Fund |
| Class A | $ 1,000.00 | | $ 856.40 | | $ 6.78 | | $ 1,000.00 | | $ 1,017.90 | | $ 7.38 | | 1.45% |
| Class C | $ 1,000.00 | | $ 856.30 | | $ 6.78 | | $ 1,000.00 | | $ 1,017.95 | | $ 7.38 | | 1.45% |
| Class I | $ 1,000.00 | | $ 857.50 | | $ 5.39 | | $ 1,000.00 | | $ 1,019.41 | | $ 5.85 | | 1.15% |
| Class Y(1) | $ 1,000.00 | | $ 857.70 | | $ 5.25 | | $ 1,000.00 | | $ 1,019.56 | | $ 5.70 | | 1.12% |
| Class F | $ 1,000.00 | | $ 857.90 | | $ 4.64 | | $ 1,000.00 | | $ 1,020.21 | | $ 5.04 | | 0.99% |
| Class SDR | $ 1,000.00 | | $ 857.90 | | $ 4.64 | | $ 1,000.00 | | $ 1,020.21 | | $ 5.04 | | 0.99% |
| Hartford Schroders Diversified Emerging Markets Fund |
| Class A | $ 1,000.00 | | $ 794.20 | | $ 3.66 | | $ 1,000.00 | | $ 1,020.87 | | $ 4.13 | | 0.81% |
| Class C | $ 1,000.00 | | $ 790.50 | | $ 7.35 | | $ 1,000.00 | | $ 1,017.19 | | $ 8.29 | | 1.63% |
| Class I | $ 1,000.00 | | $ 795.60 | | $ 2.31 | | $ 1,000.00 | | $ 1,022.58 | | $ 2.60 | | 0.51% |
| Class Y | $ 1,000.00 | | $ 795.60 | | $ 2.13 | | $ 1,000.00 | | $ 1,022.89 | | $ 2.40 | | 0.47% |
| Class F | $ 1,000.00 | | $ 793.30 | | $ 4.02 | | $ 1,000.00 | | $ 1,020.92 | | $ 4.53 | | 0.89% |
| Class SDR | $ 1,000.00 | | $ 793.30 | | $ 4.02 | | $ 1,000.00 | | $ 1,020.72 | | $ 4.53 | | 0.89% |
| Hartford Schroders Emerging Markets Equity Fund |
| Class A | $ 1,000.00 | | $ 813.80 | | $ 7.22 | | $ 1,000.00 | | $ 1,017.24 | | $ 8.03 | | 1.58% |
| Class C | $ 1,000.00 | | $ 811.00 | | $ 9.87 | | $ 1,000.00 | | $ 1,014.32 | | $ 10.97 | | 2.16% |
| Class I | $ 1,000.00 | | $ 814.80 | | $ 5.76 | | $ 1,000.00 | | $ 1,018.85 | | $ 6.41 | | 1.26% |
| Class R3 | $ 1,000.00 | | $ 813.30 | | $ 7.82 | | $ 1,000.00 | | $ 1,016.59 | | $ 8.69 | | 1.71% |
| Class R4 | $ 1,000.00 | | $ 813.70 | | $ 6.77 | | $ 1,000.00 | | $ 1,017.74 | | $ 7.53 | | 1.48% |
| Class R5 | $ 1,000.00 | | $ 814.80 | | $ 5.49 | | $ 1,000.00 | | $ 1,019.21 | | $ 6.11 | | 1.20% |
| Class Y | $ 1,000.00 | | $ 815.30 | | $ 5.49 | | $ 1,000.00 | | $ 1,019.16 | | $ 6.11 | | 1.20% |
| Class F | $ 1,000.00 | | $ 815.40 | | $ 4.94 | | $ 1,000.00 | | $ 1,019.76 | | $ 5.50 | | 1.08% |
| Class SDR | $ 1,000.00 | | $ 815.80 | | $ 4.90 | | $ 1,000.00 | | $ 1,019.81 | | $ 5.45 | | 1.07% |
Expense Examples (Unaudited) – (continued)
| | Actual Return | | Hypothetical (5% return before expenses) |
| | Beginning
Account Value
May 1, 2022 | | Ending
Account Value
October 31, 2022 | | Expenses paid
during the period
May 1, 2022
through
October 31, 2022 | | Beginning
Account Value
May 1, 2022 | | Ending
Account Value
October 31, 2022 | | Expenses paid
during the period
May 1, 2022
through
October 31, 2022 | | Annualized
expense
ratio |
| Hartford Schroders Emerging Markets Multi-Sector Bond Fund |
| Class A | $ 1,000.00 | | $ 926.10 | | $ 5.58 | | $ 1,000.00 | | $ 1,019.41 | | $ 5.85 | | 1.15% |
| Class C | $ 1,000.00 | | $ 922.30 | | $ 9.20 | | $ 1,000.00 | | $ 1,015.68 | | $ 9.65 | | 1.90% |
| Class I | $ 1,000.00 | | $ 927.10 | | $ 4.37 | | $ 1,000.00 | | $ 1,020.67 | | $ 4.58 | | 0.90% |
| Class R3 | $ 1,000.00 | | $ 924.80 | | $ 7.03 | | $ 1,000.00 | | $ 1,017.90 | | $ 7.38 | | 1.45% |
| Class R4 | $ 1,000.00 | | $ 926.10 | | $ 5.58 | | $ 1,000.00 | | $ 1,019.21 | | $ 5.85 | | 1.15% |
| Class R5 | $ 1,000.00 | | $ 927.40 | | $ 4.13 | | $ 1,000.00 | | $ 1,020.87 | | $ 4.33 | | 0.85% |
| Class Y | $ 1,000.00 | | $ 927.40 | | $ 4.13 | | $ 1,000.00 | | $ 1,020.92 | | $ 4.33 | | 0.85% |
| Class F | $ 1,000.00 | | $ 927.60 | | $ 3.55 | | $ 1,000.00 | | $ 1,021.68 | | $ 3.72 | | 0.73% |
| Class SDR | $ 1,000.00 | | $ 927.80 | | $ 3.64 | | $ 1,000.00 | | $ 1,021.42 | | $ 3.82 | | 0.75% |
| Hartford Schroders International Contrarian Value Fund(2) |
| Class I | $ 1,000.00 | | $ 875.00 | | $ 2.88(3) | | $ 1,000.00 | | $ 1,021.68 | | $ 3.57(4) | | 0.70% |
| Class SDR | $ 1,000.00 | | $ 875.00 | | $ 2.88(3) | | $ 1,000.00 | | $ 1,021.68 | | $ 3.57(4) | | 0.70% |
| Hartford Schroders International Multi-Cap Value Fund |
| Class A | $ 1,000.00 | | $ 853.80 | | $ 5.28 | | $ 1,000.00 | | $ 1,019.51 | | $ 5.75 | | 1.13% |
| Class C | $ 1,000.00 | | $ 850.20 | | $ 8.63 | | $ 1,000.00 | | $ 1,015.88 | | $ 9.40 | | 1.85% |
| Class I | $ 1,000.00 | | $ 855.10 | | $ 3.98 | | $ 1,000.00 | | $ 1,020.92 | | $ 4.33 | | 0.85% |
| Class R3 | $ 1,000.00 | | $ 853.00 | | $ 6.54 | | $ 1,000.00 | | $ 1,018.15 | | $ 7.12 | | 1.40% |
| Class R4 | $ 1,000.00 | | $ 853.40 | | $ 5.42 | | $ 1,000.00 | | $ 1,019.36 | | $ 5.90 | | 1.16% |
| Class R5 | $ 1,000.00 | | $ 854.90 | | $ 3.93 | | $ 1,000.00 | | $ 1,020.97 | | $ 4.28 | | 0.84% |
| Class Y | $ 1,000.00 | | $ 855.00 | | $ 3.88 | | $ 1,000.00 | | $ 1,021.02 | | $ 4.23 | | 0.83% |
| Class F | $ 1,000.00 | | $ 855.60 | | $ 3.46 | | $ 1,000.00 | | $ 1,021.48 | | $ 3.77 | | 0.74% |
| Class SDR | $ 1,000.00 | | $ 855.40 | | $ 3.46 | | $ 1,000.00 | | $ 1,021.48 | | $ 3.77 | | 0.74% |
| Hartford Schroders International Stock Fund |
| Class A | $ 1,000.00 | | $ 863.50 | | $ 5.12 | | $ 1,000.00 | | $ 1,019.71 | | $ 5.55 | | 1.09% |
| Class C | $ 1,000.00 | | $ 861.00 | | $ 8.59 | | $ 1,000.00 | | $ 1,015.98 | | $ 9.30 | | 1.83% |
| Class I | $ 1,000.00 | | $ 864.70 | | $ 3.85 | | $ 1,000.00 | | $ 1,021.07 | | $ 4.18 | | 0.82% |
| Class R3 | $ 1,000.00 | | $ 862.50 | | $ 6.66 | | $ 1,000.00 | | $ 1,018.05 | | $ 7.22 | | 1.42% |
| Class R4 | $ 1,000.00 | | $ 863.10 | | $ 5.36 | | $ 1,000.00 | | $ 1,019.46 | | $ 5.80 | | 1.14% |
| Class R5 | $ 1,000.00 | | $ 865.40 | | $ 3.90 | | $ 1,000.00 | | $ 1,021.02 | | $ 4.23 | | 0.83% |
| Class Y | $ 1,000.00 | | $ 865.10 | | $ 3.86 | | $ 1,000.00 | | $ 1,021.07 | | $ 4.18 | | 0.82% |
| Class F | $ 1,000.00 | | $ 866.10 | | $ 3.34 | | $ 1,000.00 | | $ 1,021.63 | | $ 3.62 | | 0.71% |
| Class SDR | $ 1,000.00 | | $ 865.40 | | $ 3.39 | | $ 1,000.00 | | $ 1,021.58 | | $ 3.67 | | 0.72% |
| Hartford Schroders Securitized Income Fund |
| Class A | $ 1,000.00 | | $ 962.90 | | $ 3.41 | | $ 1,000.00 | | $ 1,021.73 | | $ 3.52 | | 0.69% |
| Class C(1) | $ 1,000.00 | | $ 957.30 | | $ 8.49 | | $ 1,000.00 | | $ 1,016.53 | | $ 8.74 | | 1.72% |
| Class I | $ 1,000.00 | | $ 963.20 | | $ 2.97 | | $ 1,000.00 | | $ 1,022.18 | | $ 3.06 | | 0.60% |
| Class Y | $ 1,000.00 | | $ 962.40 | | $ 2.72 | | $ 1,000.00 | | $ 1,022.43 | | $ 2.80 | | 0.55% |
| Class F | $ 1,000.00 | | $ 963.90 | | $ 2.23 | | $ 1,000.00 | | $ 1,022.94 | | $ 2.29 | | 0.45% |
| Class SDR | $ 1,000.00 | | $ 963.90 | | $ 2.23 | | $ 1,000.00 | | $ 1,022.94 | | $ 2.29 | | 0.45% |
| Hartford Schroders Sustainable International Core Fund(2) |
| Class I | $ 1,000.00 | | $ 860.00 | | $ 2.85(3) | | $ 1,000.00 | | $ 1,021.68 | | $ 3.57(4) | | 0.70% |
| Class SDR | $ 1,000.00 | | $ 860.00 | | $ 2.85(3) | | $ 1,000.00 | | $ 1,021.68 | | $ 3.57(4) | | 0.70% |
| Hartford Schroders Tax-Aware Bond Fund |
| Class A | $ 1,000.00 | | $ 941.90 | | $ 3.48 | | $ 1,000.00 | | $ 1,021.63 | | $ 3.62 | | 0.71% |
| Class C | $ 1,000.00 | | $ 938.40 | | $ 7.77 | | $ 1,000.00 | | $ 1,017.19 | | $ 8.08 | | 1.59% |
| Class I | $ 1,000.00 | | $ 943.20 | | $ 2.40 | | $ 1,000.00 | | $ 1,022.74 | | $ 2.50 | | 0.49% |
| Class Y | $ 1,000.00 | | $ 942.80 | | $ 2.74 | | $ 1,000.00 | | $ 1,022.38 | | $ 2.85 | | 0.56% |
| Class F | $ 1,000.00 | | $ 943.30 | | $ 2.25 | | $ 1,000.00 | | $ 1,022.89 | | $ 2.35 | | 0.46% |
| Class SDR | $ 1,000.00 | | $ 943.20 | | $ 2.25 | | $ 1,000.00 | | $ 1,022.89 | | $ 2.35 | | 0.46% |
Expense Examples (Unaudited) – (continued)
| | Actual Return | | Hypothetical (5% return before expenses) |
| | Beginning
Account Value
May 1, 2022 | | Ending
Account Value
October 31, 2022 | | Expenses paid
during the period
May 1, 2022
through
October 31, 2022 | | Beginning
Account Value
May 1, 2022 | | Ending
Account Value
October 31, 2022 | | Expenses paid
during the period
May 1, 2022
through
October 31, 2022 | | Annualized
expense
ratio |
| Hartford Schroders US MidCap Opportunities Fund |
| Class A | $ 1,000.00 | | $ 973.10 | | $ 5.82 | | $ 1,000.00 | | $ 1,019.31 | | $ 5.96 | | 1.17% |
| Class C | $ 1,000.00 | | $ 969.30 | | $ 9.48 | | $ 1,000.00 | | $ 1,015.58 | | $ 9.70 | | 1.91% |
| Class I | $ 1,000.00 | | $ 974.40 | | $ 4.43 | | $ 1,000.00 | | $ 1,020.72 | | $ 4.53 | | 0.89% |
| Class R3 | $ 1,000.00 | | $ 970.70 | | $ 7.55 | | $ 1,000.00 | | $ 1,017.54 | | $ 7.73 | | 1.52% |
| Class R4 | $ 1,000.00 | | $ 973.00 | | $ 5.72 | | $ 1,000.00 | | $ 1,019.41 | | $ 5.85 | | 1.15% |
| Class R5 | $ 1,000.00 | | $ 974.30 | | $ 4.53 | | $ 1,000.00 | | $ 1,020.62 | | $ 4.63 | | 0.91% |
| Class Y | $ 1,000.00 | | $ 973.80 | | $ 4.53 | | $ 1,000.00 | | $ 1,020.62 | | $ 4.63 | | 0.91% |
| Class F | $ 1,000.00 | | $ 974.40 | | $ 3.98 | | $ 1,000.00 | | $ 1,021.17 | | $ 4.08 | | 0.80% |
| Class SDR | $ 1,000.00 | | $ 975.00 | | $ 4.03 | | $ 1,000.00 | | $ 1,021.12 | | $ 4.13 | | 0.81% |
| Hartford Schroders US Small Cap Opportunities Fund |
| Class A | $ 1,000.00 | | $ 980.00 | | $ 6.74 | | $ 1,000.00 | | $ 1,018.40 | | $ 6.87 | | 1.35% |
| Class C | $ 1,000.00 | | $ 976.40 | | $ 10.46 | | $ 1,000.00 | | $ 1,014.62 | | $ 10.66 | | 2.10% |
| Class I | $ 1,000.00 | | $ 981.30 | | $ 5.45 | | $ 1,000.00 | | $ 1,019.71 | | $ 5.55 | | 1.09% |
| Class R3 | $ 1,000.00 | | $ 978.60 | | $ 8.23 | | $ 1,000.00 | | $ 1,016.89 | | $ 8.39 | | 1.65% |
| Class R4 | $ 1,000.00 | | $ 980.00 | | $ 6.74 | | $ 1,000.00 | | $ 1,018.40 | | $ 6.87 | | 1.35% |
| Class R5 | $ 1,000.00 | | $ 981.60 | | $ 5.25 | | $ 1,000.00 | | $ 1,019.91 | | $ 5.35 | | 1.05% |
| Class Y | $ 1,000.00 | | $ 981.60 | | $ 5.25 | | $ 1,000.00 | | $ 1,019.91 | | $ 5.35 | | 1.05% |
| Class F | $ 1,000.00 | | $ 982.30 | | $ 4.75 | | $ 1,000.00 | | $ 1,020.42 | | $ 4.84 | | 0.95% |
| Class SDR | $ 1,000.00 | | $ 982.00 | | $ 4.75 | | $ 1,000.00 | | $ 1,020.42 | | $ 4.84 | | 0.95% |
| (1) | The annualized expense ratio is representative of the period from May 1, 2022 through October 31, 2022. The annualized expense ratio does not fully reflect the contractual expense limitation arrangement as this arrangement is based on the entire fiscal year and not the six-month period. As such, the annualized expense ratio exceeds the amount of the contractual expense limitation arrangement for this share class of the Fund for purposes of the hypothetical example. Please see the accompanying Financial Highlights for the expense ratio for the year ended October 31, 2022. |
| (2) | Hartford Schroders International Contrarian Value Fund and Hartford Schroders Sustainable International Core Fund commenced operations on May 24, 2022. |
| (3) | Expenses paid during the period May 24, 2022 through October 31, 2022. |
| (4) | Please note that while each of the Hartford Schroders International Contrarian Value Fund and the Hartford Schroders Sustainable International Core Fund commenced operations on May 24, 2022, the hypothetical expenses paid during the period reflect projected activity for the full six month period for purposes of comparability. This projection assumes that annualized expense ratios were in effect during period May 1, 2022 to October 31, 2022. |
Hartford Schroders China A Fund
Schedule of Investments
October 31, 2022
| Shares or Principal Amount | | Market Value† |
| COMMON STOCKS - 78.8% |
| | Automobiles & Components - 1.0% |
| 40,400 | Huizhou Desay Sv Automotive Co., Ltd. Class A | $ 573,787 |
| | Banks - 5.1% |
| 326,592 | Bank of Ningbo Co., Ltd. Class A | 1,065,938 |
| 490,233 | China Merchants Bank Co., Ltd. Class A | 1,808,679 |
| | | | 2,874,617 |
| | Capital Goods - 14.3% |
| 25,000 | Contemporary Amperex Technology Co., Ltd. Class A | 1,282,993 |
| 29,000 | Gongniu Group Co., Ltd. Class A | 476,085 |
| 161,500 | Han's Laser Technology Industry Group Co., Ltd. Class A | 562,296 |
| 309,740 | Hongfa Technology Co., Ltd. Class A | 1,460,171 |
| 168,200 | Jiangsu Hengli Hydraulic Co., Ltd. Class A | 1,271,725 |
| 61,668 | Luoyang Xinqianglian Slewing Bearing Co., Ltd. Class A | 592,052 |
| 75,800 | PNC Process Systems Co., Ltd. Class A* | 407,457 |
| 579,900 | Sany Heavy Industry Co., Ltd. Class A | 1,076,087 |
| 107,100 | Sinoseal Holding Co., Ltd. Class A | 619,609 |
| 82,400 | Zhejiang Sanhua Intelligent Controls Co., Ltd. Class A | 240,042 |
| | | | 7,988,517 |
| | Consumer Durables & Apparel - 5.1% |
| 397,646 | Hang Zhou Great Star Industrial Co., Ltd. Class A* | 1,048,642 |
| 216,800 | Midea Group Co., Ltd. Class A | 1,194,322 |
| 53,189 | Oppein Home Group, Inc. Class A | 594,113 |
| | | | 2,837,077 |
| | Diversified Financials - 1.3% |
| 60,500 | Hithink RoyalFlush Information Network Co., Ltd. Class A | 707,309 |
| | Food, Beverage & Tobacco - 6.7% |
| 170,095 | Chacha Food Co., Ltd. Class A | 1,032,690 |
| 8,145 | Kweichow Moutai Co., Ltd. Class A | 1,509,708 |
| 452,964 | Toly Bread Co., Ltd. Class A | 700,143 |
| 27,799 | Wuliangye Yibin Co., Ltd. Class A | 509,520 |
| | | | 3,752,061 |
| | Health Care Equipment & Services - 1.1% |
| 236,700 | Edan Instruments, Inc. Class A | 400,712 |
| 197,165 | Shanghai Kinetic Medical Co., Ltd. Class A | 213,088 |
| | | | 613,800 |
| | Insurance - 3.7% |
| 415,500 | Ping An Insurance Group Co. of China Ltd. Class A | 2,062,985 |
| | Materials - 18.1% |
| 270,200 | China Jushi Co., Ltd. Class A | 433,774 |
| 471,009 | Chongqing Zaisheng Technology Corp. Ltd. Class A | 336,015 |
| 324,514 | Citic Pacific Special Steel Group Co., Ltd. Class A | 715,891 |
| 275,745 | Hengli Petrochemical Co., Ltd. Class A | 581,046 |
| 587,878 | Huafon Chemical Co., Ltd. Class A | 537,325 |
| 347,900 | Hubei Dinglong Co., Ltd. Class A | 1,002,957 |
| 89,400 | Jiangsu Boqian New Materials Stock Co., Ltd. Class A | 577,410 |
| 190,800 | LB Group Co., Ltd. Class A* | 402,733 |
| 693,146 | Satellite Chemical Co., Ltd. Class A | 1,179,540 |
| 284,700 | Shandong Sinocera Functional Material Co., Ltd. Class A | 901,128 |
| 10,000 | Sunresin New Materials Co., Ltd. Class A | 104,827 |
| 119,300 | Wanhua Chemical Group Co., Ltd. Class A | 1,316,647 |
| 116,740 | Zhejiang Huayou Cobalt Co., Ltd. Class A | 873,034 |
| 1,049,257 | Zijin Mining Group Co., Ltd. Class A | 1,141,482 |
| | | | 10,103,809 |
| Shares or Principal Amount | | Market Value† |
| COMMON STOCKS - 78.8% - (continued) |
| | Media & Entertainment - 2.8% |
| 345,900 | Mango Excellent Media Co., Ltd. Class A | $ 1,042,816 |
| 324,000 | Perfect World Co., Ltd. Class A | 505,424 |
| | | | 1,548,240 |
| | Pharmaceuticals, Biotechnology & Life Sciences - 6.3% |
| 114,400 | Amoy Diagnostics Co., Ltd. Class A | 367,786 |
| 61,700 | Hangzhou Tigermed Consulting Co., Ltd. Class A | 705,081 |
| 188,176 | Jiangsu Hengrui Medicine Co., Ltd. Class A | 1,038,661 |
| 75,680 | Shenzhen Kangtai Biological Products Co., Ltd. Class A | 323,034 |
| 103,660 | WuXi AppTec Co., Ltd. Class A | 1,086,332 |
| | | | 3,520,894 |
| | Real Estate - 0.7% |
| 209,344 | Poly Developments and Holdings Group Co., Ltd. Class A | 397,770 |
| | Semiconductors & Semiconductor Equipment - 2.9% |
| 244,556 | LONGi Green Energy Technology Co., Ltd. Class A* | 1,615,089 |
| | Technology Hardware & Equipment - 7.4% |
| 227,000 | GoerTek, Inc. Class A | 673,869 |
| 75,410 | Guangzhou Shiyuan Electronic Technology Co., Ltd. Class A | 672,392 |
| 332,159 | Shenzhen Sunlord Electronics Co., Ltd. Class A | 975,754 |
| 141,000 | Suzhou Dongshan Precision Manufacturing Co., Ltd. Class A | 488,216 |
| 203,400 | Zhejiang Jiecang Linear Motion Technology Co., Ltd. Class A | 694,691 |
| 158,700 | Zhongji Innolight Co., Ltd. Class A | 637,296 |
| | | | 4,142,218 |
| | Transportation - 2.3% |
| 197,500 | SF Holding Co., Ltd. Class A | 1,308,213 |
| | Total Common Stocks
(cost $64,834,223) | | $ 44,046,386 |
| WARRANTS - 16.6%(1) |
| | Banks - 2.2% |
| 11,531 | Autobio Diagnostics Co., Ltd. Expires 10/13/2023* | $ 117,480 |
| 83,177 | Micro-Tech Nanjing Co., Ltd. Expires 10/2/2023* | 1,125,726 |
| | | | 1,243,206 |
| | Consumer Durables & Apparel - 0.4% |
| 60,058 | Shanghai Milkground Food Tech Co., Ltd. Expires 03/13/2023* | 229,087 |
| | Diversified Financials - 2.9% |
| 64,864 | Advanced Micro-Fabrication Equipment, Inc. China Expires 8/14/2023* | 986,389 |
| 21,353 | ZWSOFT Co., Ltd. Guangzhou Expires 9/22/2023* | 658,793 |
| | | | 1,645,182 |
| | Health Care Equipment & Services - 3.2% |
| 10,024 | iRay Technology Co., Ltd. Expires 6/13/2023* | 708,682 |
| 83,242 | Qingdao Haier Biomedical Co., Ltd. Expires 1/6/2023* | 879,683 |
| 19,779 | Qingdao Haier Biomedical Co., Ltd. Expires 5/29/2023* | 209,020 |
| | | | 1,797,385 |
| | Household & Personal Products - 2.4% |
| 299,798 | Ninebot Ltd. Expires 8/28/2023 Expires 08/28/2023* | 1,314,435 |
| | Semiconductors & Semiconductor Equipment - 0.9% |
| 14,358 | Beijing Huafeng Test & Control Technology Co., Ltd. Expires 12/21/2022* | 520,666 |
The accompanying notes are an integral part of these financial statements.
Hartford Schroders China A Fund
Schedule of Investments – (continued)
October 31, 2022
| Shares or Principal Amount | | Market Value† |
| WARRANTS - 16.6%(1) - (continued) |
| | Software & Services - 2.6% |
| 117,757 | Piesat Information Technology Co., Ltd. Expires 12/23/2022* | $ 1,452,884 |
| | Technology Hardware & Equipment - 2.0% |
| 30,755 | Gongniu Group Co., Ltd. Expires 2/17/2023* | 504,268 |
| 3,818 | Gongniu Group Co., Ltd. Expires 6/21/2023* | 62,601 |
| 60,734 | Shanghai Holystar Information Technology Co., Ltd. Expires 1/23/2023* | 542,134 |
| | | | 1,109,003 |
| | Total Warrants
(cost $10,664,482) | | $ 9,311,848 |
| | Total Long-Term Investments
(cost $75,498,705) | | $ 53,358,234 |
| SHORT-TERM INVESTMENTS - 0.8% |
| | Other Investment Pools & Funds - 0.8% |
| 456,396 | Morgan Stanley Institutional Liquidity Funds, Treasury Portfolio, Institutional Class, 3.02%(2) | $ 456,396 |
| | Total Short-Term Investments
(cost $456,395) | $ 456,396 |
| | Total Investments
(cost $75,955,100) | 96.2% | $ 53,814,630 |
| | Other Assets and Liabilities | 3.8% | 2,114,740 |
| | Total Net Assets | 100.0% | $ 55,929,370 |
| Note: | Percentage of investments as shown is the ratio of the total market value to total net assets. |
| | Prices of foreign equities that are principally traded on certain foreign markets will generally be adjusted daily pursuant to a fair value pricing service approved by Hartford Funds Management Company, LLC in order to reflect an adjustment for factors occurring after the close of certain foreign markets but before the close of the New York Stock Exchange. |
| | The Fund may refer to any one or more of the industry classifications used by one or more widely recognized market indices, ratings group and/or as defined by Fund management. Industry classifications may not be identical across all security types. |
| | Equity industry classifications used in this report are the Global Industry Classification Standard, which was developed by and is the exclusive property and service mark of MSCI, Inc. and Standard & Poor’s. |
| | For Fund compliance purposes, the Fund may not use the same classification system. These classifications are used for financial reporting purposes. |
| | See “Glossary” for abbreviation descriptions. |
| * | Non-income producing. |
| (1) | “Warrants” refers to non-standard warrants and participatory notes. |
| (2) | Current yield as of period end. |
| † | See Significant Accounting Policies of accompanying Notes to Financial Statements regarding valuation of investments. |
Fair Value Summary
The following is a summary of the fair valuations according to the inputs used as of October 31, 2022 in valuing the Fund’s investments.
| Description | | Total | | Level 1 | | Level 2 | | Level 3(1) |
| Assets | | | | | | | | |
| Common Stocks | | | | | | | | |
| Automobiles & Components | | $ 573,787 | | $ — | | $ 573,787 | | $ — |
| Banks | | 2,874,617 | | — | | 2,874,617 | | — |
| Capital Goods | | 7,988,517 | | — | | 7,988,517 | | — |
| Consumer Durables & Apparel | | 2,837,077 | | — | | 2,837,077 | | — |
| Diversified Financials | | 707,309 | | — | | 707,309 | | — |
| Food, Beverage & Tobacco | | 3,752,061 | | — | | 3,752,061 | | — |
| Health Care Equipment & Services | | 613,800 | | — | | 613,800 | | — |
| Insurance | | 2,062,985 | | — | | 2,062,985 | | — |
| Materials | | 10,103,809 | | — | | 10,103,809 | | — |
| Media & Entertainment | | 1,548,240 | | — | | 1,548,240 | | — |
| Pharmaceuticals, Biotechnology & Life Sciences | | 3,520,894 | | — | | 3,520,894 | | — |
| Real Estate | | 397,770 | | — | | 397,770 | | — |
| Semiconductors & Semiconductor Equipment | | 1,615,089 | | — | | 1,615,089 | | — |
| Technology Hardware & Equipment | | 4,142,218 | | — | | 4,142,218 | | — |
| Transportation | | 1,308,213 | | — | | 1,308,213 | | — |
| Warrants | | 9,311,848 | | — | | 9,311,848 | | — |
| Short-Term Investments | | 456,396 | | 456,396 | | — | | — |
| Total | | $ 53,814,630 | | $ 456,396 | | $ 53,358,234 | | $ — |
| (1) | For the year ended October 31, 2022, there were no transfers in and out of Level 3. |
The accompanying notes are an integral part of these financial statements.
Hartford Schroders Diversified Emerging Markets Fund
Schedule of Investments
October 31, 2022
| Shares or Principal Amount | | Market Value† |
| COMMON STOCKS - 94.8% |
| | Bermuda - 0.0% |
| 1,639 | Sylvania Platinum Ltd. | $ 1,732 |
| | Brazil - 3.3% |
| 2,200 | AES Brasil Energia S.A. | 4,217 |
| 5,100 | B3 S.A. - Brasil Bolsa Balcao | 14,849 |
| 3,800 | Banco BTG Pactual S.A. | 21,290 |
| 4,900 | BB Seguridade Participacoes S.A. | 28,164 |
| 1,200 | Cia de Saneamento de Minas Gerais | 3,568 |
| 2,800 | Cosan S.A. | 9,139 |
| 2,500 | Hypera S.A. | 24,591 |
| 1,400 | Localiza Rent a Car S.A. | 19,118 |
| 1,700 | M Dias Branco S.A. | 14,316 |
| 3,030 | Odontoprev S.A. | 4,857 |
| 5,100 | Santos Brasil Participacoes S.A. | 8,985 |
| 1,100 | Sao Martinho S.A. | 5,743 |
| 3,400 | Sendas Distribuidora S.A. | 13,046 |
| 800 | Tupy S.A. | 4,575 |
| 3,800 | Ultrapar Participacoes S.A. | 9,865 |
| 5,175 | WEG S.A. | 40,354 |
| | | | 226,677 |
| | Cayman Islands - 0.2% |
| 3,500 | Wuxi Biologics Cayman, Inc.*(1) | 15,749 |
| | Chile - 0.4% |
| 264 | Sociedad Quimica y Minera de Chile S.A. ADR | 24,732 |
| | China - 24.0% |
| 2,800 | 37 Interactive Entertainment Network Technology Group Co., Ltd. Class A | 5,572 |
| 81,000 | Agricultural Bank of China Ltd. Class H | 23,120 |
| 18,900 | Alibaba Group Holding Ltd.* | 146,946 |
| 4,900 | Anhui Anke Biotechnology Group Co., Ltd. Class A | 6,653 |
| 26,500 | BAIC Motor Corp. Ltd. Class H(1) | 5,871 |
| 7,500 | Baidu, Inc. Class A* | 71,902 |
| 54,000 | Bank of China Ltd. Class H | 17,392 |
| 2,100 | Beijing Easpring Material Technology Co., Ltd. Class A | 17,062 |
| 300 | Beijing United Information Technology Co., Ltd. Class A | 5,104 |
| 200 | Beijing Wantai Biological Pharmacy Enterprise Co., Ltd. Class A | 3,441 |
| 2,100 | Chengxin Lithium Group Co., Ltd. Class A | 12,497 |
| 16,000 | China Feihe Ltd.(1) | 9,217 |
| 4,700 | China Jushi Co., Ltd. Class A | 7,545 |
| 5,000 | China Medical System Holdings Ltd. | 5,465 |
| 7,000 | China Merchants Bank Co., Ltd. Class H | 22,917 |
| 3,200 | China Pacific Insurance Group Co., Ltd. Class H | 5,158 |
| 700 | China Tourism Group Duty Free Corp. Ltd. Class A | 15,381 |
| 12,000 | CMOC Group Ltd. Class H | 3,863 |
| 500 | Contemporary Amperex Technology Co., Ltd. Class A | 25,660 |
| 14,000 | CSPC Pharmaceutical Group Ltd. | 14,380 |
| 7,000 | Dali Foods Group Co. Ltd.(1) | 2,881 |
| 400 | Eastroc Beverage Group Co., Ltd. Class A | 8,497 |
| 1,600 | Foshan Haitian Flavouring & Food Co., Ltd. Class A | 13,114 |
| 9,000 | Fu Shou Yuan International Group Ltd. | 4,496 |
| 4,000 | Fuyao Glass Industry Group Co., Ltd. Class H(1) | 14,335 |
| 2,280 | Ganfeng Lithium Co., Ltd. Class H(1) | 15,421 |
| 300 | G-bits Network Technology Xiamen Co., Ltd. Class A* | 10,486 |
| 6,100 | GEM Co., Ltd. Class A | 6,220 |
| 500 | Ginlong Technologies Co., Ltd. Class A* | 12,821 |
| 200 | Gongniu Group Co., Ltd. Class A | 3,283 |
| 1,000 | Gotion High-tech Co., Ltd. Class A | 4,135 |
| 8,000 | Great Wall Motor Co., Ltd. Class H | 8,739 |
| 8,000 | Greentown Management Holdings Co., Ltd.(1) | 4,580 |
| 22,000 | Guangzhou Automobile Group Co., Ltd. Class H | 13,407 |
| 3,300 | Guangzhou Tinci Materials Technology Co., Ltd. Class A | 19,228 |
| Shares or Principal Amount | | Market Value† |
| COMMON STOCKS - 94.8% - (continued) |
| | China - 24.0% - (continued) |
| 900 | Hangzhou Tigermed Consulting Co., Ltd. Class H(1) | $ 6,112 |
| 1,840 | Hefei Meiya Optoelectronic Technology, Inc. Class A | 5,991 |
| 1,000 | Hubei Jumpcan Pharmaceutical Co., Ltd. Class A | 4,469 |
| 300 | Huizhou Desay Sv Automotive Co., Ltd. Class A | 4,261 |
| 115,000 | Industrial & Commercial Bank of China Ltd. Class H | 49,929 |
| 1,200 | Jafron Biomedical Co., Ltd. Class A | 5,215 |
| 2,750 | JD Health International, Inc.*(1) | 15,087 |
| 8,930 | JD.com, Inc. Class A | 162,620 |
| 12,000 | Jiumaojiu International Holdings Ltd.(1) | 18,860 |
| 2,100 | Livzon Pharmaceutical Group, Inc. Class H | 5,497 |
| 3,500 | LONGi Green Energy Technology Co., Ltd. Class A* | 23,115 |
| 4,200 | Maoyan Entertainment*(1) | 2,449 |
| 2,300 | Meituan Class B*(1) | 36,824 |
| 4,000 | Minth Group Ltd. | 7,887 |
| 500 | NAURA Technology Group Co., Ltd. Class A | 18,153 |
| 1,500 | NetDragon Websoft Holdings Ltd. | 2,519 |
| 4,000 | NetEase, Inc. | 44,381 |
| 9,000 | New China Life Insurance Co., Ltd. Class H | 14,293 |
| 200 | Ningbo Deye Technology Co., Ltd. Class A | 8,974 |
| 1,000 | Ningbo Orient Wires & Cables Co., Ltd. Class A | 10,556 |
| 5,100 | Ningbo Shanshan Co., Ltd. Class A | 12,561 |
| 3,600 | Nongfu Spring Co., Ltd. Class H(1) | 18,082 |
| 344 | Pinduoduo, Inc. ADR* | 18,862 |
| 9,000 | Ping An Insurance Group Co. of China Ltd. Class H | 36,031 |
| 11,000 | Postal Savings Bank of China Co., Ltd. Class H(1) | 5,101 |
| 4,600 | Qinghai Salt Lake Industry Co., Ltd. Class A* | 13,584 |
| 100 | SG Micro Corp. Class A | 2,055 |
| 2,500 | Shenzhen Capchem Technology Co., Ltd. Class A | 12,396 |
| 300 | Shenzhen Mindray Bio-Medical Electronics Co., Ltd. Class A | 13,411 |
| 5,200 | Sichuan Yahua Industrial Group Co., Ltd. Class A | 19,092 |
| 2,100 | Sinoma Science & Technology Co., Ltd. Class A | 5,159 |
| 2,200 | Skyworth Digital Co., Ltd. Class A | 4,495 |
| 200 | Suzhou Maxwell Technologies Co., Ltd. Class A | 13,160 |
| 200 | Suzhou TA&A Ultra Clean Technology Co., Ltd. Class A | 1,699 |
| 10,800 | Tencent Holdings Ltd. | 283,789 |
| 3,500 | Tianjin Zhonghuan Semiconductor Co., Ltd. Class A | 18,975 |
| 6,000 | Tianneng Power International Ltd. | 5,773 |
| 4,400 | Tianqi Lithium Corp. Class H* | 35,874 |
| 2,400 | Tongwei Co., Ltd. Class A | 14,350 |
| 17,000 | Want Want China Holdings Ltd. | 11,167 |
| 500 | WuXi AppTec Co., Ltd. Class H(1) | 4,013 |
| 500 | Wuxi Lead Intelligent Equipment Co., Ltd. Class A | 3,438 |
| 500 | Xiamen Faratronic Co., Ltd. Class A | 12,105 |
| 3,400 | Xiamen Tungsten Co., Ltd. Class A | 9,357 |
| 400 | XPeng, Inc. Class A* | 1,281 |
| 16,000 | Yadea Group Holdings Ltd.(1) | 24,430 |
| 1,600 | Yangling Metron New Material, Inc. Class A | 10,885 |
| 2,400 | Yealink Network Technology Corp. Ltd. Class A | 22,714 |
| 700 | Zhejiang Weixing New Building Materials Co., Ltd. Class A | 1,671 |
| 300 | Zhejiang Wolwo Bio-Pharmaceutical Co., Ltd. Class A | 1,933 |
| 3,400 | Zhuzhou Kibing Group Co., Ltd. Class A | 3,663 |
| | | | 1,655,087 |
| | Colombia - 0.2% |
| 498 | Geopark Ltd. | 7,361 |
| 255 | Tecnoglass, Inc. | 5,235 |
| | | | 12,596 |
| | Cyprus - 0.0% |
| 1,951 | Tharisa plc | 2,194 |
The accompanying notes are an integral part of these financial statements.
Hartford Schroders Diversified Emerging Markets Fund
Schedule of Investments – (continued)
October 31, 2022
| Shares or Principal Amount | | Market Value† |
| COMMON STOCKS - 94.8% - (continued) |
| | Greece - 0.3% |
| 1,197 | Hellenic Telecommunications Organization S.A. | $ 18,798 |
| 222 | Motor Oil Hellas Corinth Refineries S.A. | 3,816 |
| | | | 22,614 |
| | Hong Kong - 2.1% |
| 15,800 | AIA Group Ltd. | 119,682 |
| 4,000 | BOE Varitronix Ltd. | 5,931 |
| 10,000 | China Water Affairs Group Ltd. | 7,082 |
| 14,000 | Geely Automobile Holdings Ltd. | 15,067 |
| | | | 147,762 |
| | Hungary - 0.8% |
| 808 | OTP Bank Nyrt | 17,627 |
| 1,733 | Richter Gedeon Nyrt | 34,280 |
| | | | 51,907 |
| | India - 13.3% |
| 398 | ABB India Ltd. | 14,662 |
| 404 | Asian Paints Ltd. | 15,208 |
| 93 | Avenue Supermarts Ltd.*(1) | 4,857 |
| 307 | Bajaj Finance Ltd. | 26,537 |
| 754 | Bharti Airtel Ltd. | 7,583 |
| 796 | Colgate-Palmolive India Ltd. | 15,707 |
| 4,669 | Dabur India Ltd. | 31,304 |
| 5,083 | Devyani International Ltd.* | 11,905 |
| 649 | Eicher Motors Ltd. | 30,239 |
| 48 | Grindwell Norton Ltd. | 1,219 |
| 1,001 | HCL Technologies Ltd. | 12,601 |
| 7,769 | HDFC Bank Ltd. | 140,995 |
| 925 | Hindustan Unilever Ltd. | 28,540 |
| 652 | Housing Development Finance Corp. Ltd. | 19,494 |
| 15,471 | ICICI Bank Ltd. | 170,109 |
| 2,167 | Infosys Ltd. ADR | 40,588 |
| 2,244 | KPIT Technologies Ltd. | 19,250 |
| 4,569 | Marico Ltd. | 28,987 |
| 478 | Metro Brands Ltd. | 5,002 |
| 33 | Nestle India Ltd. | 8,126 |
| 1,885 | Reliance Industries Ltd. | 58,165 |
| 655 | Reliance Industries Ltd. GDR(1) | 40,012 |
| 459 | Shriram Transport Finance Co., Ltd. | 6,826 |
| 25 | SKF India Ltd. | 1,330 |
| 948 | SRF Ltd. | 29,340 |
| 2,519 | Tata Consultancy Services Ltd. | 97,214 |
| 3,860 | UPL Ltd. | 34,077 |
| 1,291 | Varun Beverages Ltd. | 16,381 |
| 237 | VRL Logistics Ltd. | 1,738 |
| | | | 917,996 |
| | Indonesia - 3.8% |
| 47,400 | Bank Central Asia Tbk PT | 26,794 |
| 67,200 | Bank Mandiri Persero Tbk PT | 45,397 |
| 51,100 | Bank Negara Indonesia Persero Tbk PT | 30,810 |
| 175,400 | Bank Rakyat Indonesia Persero Tbk PT | 52,328 |
| 97,800 | Kalbe Farma Tbk PT | 12,862 |
| 30,900 | Mitra Adiperkasa Tbk PT* | 2,387 |
| 25,200 | Mitra Keluarga Karyasehat Tbk PT | 4,464 |
| 128,800 | Perusahaan Gas Negara Persero Tbk PT | 16,320 |
| 240,000 | Telkom Indonesia Persero Tbk PT | 67,404 |
| | | | 258,766 |
| | Malaysia - 1.9% |
| 3,300 | Bursa Malaysia Bhd | 4,502 |
| 7,200 | DiGi.Com Bhd | 5,775 |
| 4,200 | Frontken Corp. Bhd | 2,186 |
| 900 | Hong Leong Bank Bhd | 4,034 |
| 6,600 | Lotte Chemical Titan Holding Bhd(1) | 1,830 |
| 21,500 | Malayan Banking Bhd | 39,056 |
| 4,900 | Mega First Corp. Bhd | 3,401 |
| 15,950 | MR DIY Group M Bhd(1) | 6,819 |
| Shares or Principal Amount | | Market Value† |
| COMMON STOCKS - 94.8% - (continued) |
| | Malaysia - 1.9% - (continued) |
| 44,000 | Public Bank Bhd | $ 41,611 |
| 5,700 | RHB Bank Bhd | 6,903 |
| 3,800 | Syarikat Takaful Malaysia Keluarga Bhd | 2,653 |
| 3,900 | TIME dotCom Bhd | 3,753 |
| 2,400 | Uchi Technologies Bhd | 1,716 |
| 4,300 | Westports Holdings Bhd | 3,050 |
| | | | 127,289 |
| | Mexico - 3.5% |
| 3,500 | Arca Continental S.A.B. de C.V. | 28,593 |
| 21,200 | Bolsa Mexicana de Valores S.A.B. de C.V. | 38,435 |
| 128 | Fomento Economico Mexicano S.A.B. de C.V. ADR | 9,167 |
| 2,200 | Gentera S.A.B. de C.V. | 2,256 |
| 2,500 | Grupo Aeroportuario del Centro Norte S.A.B. de C.V. | 19,936 |
| 54 | Grupo Aeroportuario del Pacifico S.A.B. de C.V. ADR | 8,373 |
| 32 | Grupo Aeroportuario del Sureste S.A.B. de C.V. ADR | 7,469 |
| 7,300 | Grupo Financiero Banorte S.A.B. de C.V. Class O | 59,427 |
| 7,100 | Grupo Financiero Inbursa S.A.B. de C.V. Class O* | 13,055 |
| 35,600 | Kimberly-Clark de Mexico S.A.B. de C.V. Class A | 56,096 |
| | | | 242,807 |
| | Philippines - 0.1% |
| 560 | GT Capital Holdings, Inc. | 4,004 |
| | Poland - 0.4% |
| 468 | Dino Polska S.A.*(1) | 30,547 |
| | Qatar - 0.8% |
| 754 | Qatar Islamic Bank SAQ | 5,046 |
| 9,251 | Qatar National Bank QPSC | 50,655 |
| | | | 55,701 |
| | Romania - 0.0% |
| 464 | BRD-Groupe Societe Generale S.A. | 1,055 |
| | Russia - 0.0% |
| 378 | HeadHunter Group plc ADR*(2) | — |
| 1,092 | Lukoil PJSC*(2) | — |
| 762 | Mobile TeleSystems PJSC*(2) | — |
| 92 | Novatek PJSC GDR*(2) | — |
| 235 | Polyus PJSC GDR*(2) | — |
| | | | — |
| | Saudi Arabia - 5.2% |
| 2,273 | Al Rajhi Bank* | 51,539 |
| 3,728 | Alinma Bank | 37,205 |
| 2,965 | Banque Saudi Fransi | 34,088 |
| 1,002 | Jarir Marketing Co. | 43,733 |
| 486 | Mouwasat Medical Services Co. | 28,325 |
| 4,191 | Riyad Bank | 40,097 |
| 344 | SABIC Agri-Nutrients Co. | 14,556 |
| 2,812 | Saudi British Bank | 32,554 |
| 4,474 | Saudi National Bank | 70,726 |
| 218 | Saudi Telecom Co. | 2,344 |
| | | | 355,167 |
| | South Africa - 3.2% |
| 102 | Anglo American Platinum Ltd. | 8,122 |
| 7,412 | AVI Ltd. | 29,689 |
| 1,592 | Bidvest Group Ltd. | 18,415 |
| 1,121 | Gold Fields Ltd. ADR(3) | 8,834 |
| 1,089 | Impala Platinum Holdings Ltd. | 11,150 |
| 564 | Kumba Iron Ore Ltd. | 10,610 |
| 1,075 | Mr. Price Group Ltd. | 10,347 |
| 1,284 | MultiChoice Group Ltd. | 8,390 |
| 11,620 | Sanlam Ltd. | 33,872 |
| 3,069 | Sappi Ltd.* | 9,455 |
| 7,095 | Truworths International Ltd. | 20,191 |
| 7,984 | Vodacom Group Ltd. | 54,383 |
| | | | 223,458 |
The accompanying notes are an integral part of these financial statements.
Hartford Schroders Diversified Emerging Markets Fund
Schedule of Investments – (continued)
October 31, 2022
| Shares or Principal Amount | | Market Value† |
| COMMON STOCKS - 94.8% - (continued) |
| | South Korea - 14.0% |
| 21 | CJ CheilJedang Corp. | $ 6,097 |
| 625 | Classys, Inc. | 6,740 |
| 134 | Dentium Co., Ltd. | 7,162 |
| 125 | Doosan Bobcat, Inc. | 2,934 |
| 151 | Ecopro BM Co., Ltd. | 12,162 |
| 40 | GOLFZON Co., Ltd. | 3,232 |
| 44 | Hansol Chemical Co., Ltd. | 5,715 |
| 614 | JYP Entertainment Corp. | 23,869 |
| 431 | KB Financial Group, Inc. | 14,503 |
| 1,336 | KT Corp. | 34,302 |
| 446 | KT Skylife Co., Ltd. | 2,560 |
| 142 | L&F Co., Ltd.* | 22,378 |
| 94 | LG Chem Ltd. | 41,251 |
| 132 | LG Electronics, Inc. | 7,540 |
| 79 | LG Energy Solution Ltd.* | 29,231 |
| 120 | LG Innotek Co., Ltd. | 24,896 |
| 1,571 | LG Uplus Corp. | 12,615 |
| 79 | Lotte Chemical Corp. | 8,186 |
| 199 | LOTTE Fine Chemical Co., Ltd. | 7,825 |
| 554 | Lutronic Corp. | 7,033 |
| 9,778 | Samsung Electronics Co., Ltd. | 406,959 |
| 116 | Samsung SDI Co., Ltd. | 59,846 |
| 870 | SIMMTECH Co., Ltd. | 21,515 |
| 1,515 | SK Hynix, Inc. | 87,706 |
| 222 | SK Innovation Co., Ltd.* | 26,881 |
| 1,045 | SK Telecom Co., Ltd. | 36,723 |
| 549 | S-Oil Corp. | 33,288 |
| 270 | Youngone Corp. | 8,949 |
| | | | 962,098 |
| | Taiwan - 12.9% |
| 4,000 | Accton Technology Corp. | 30,079 |
| 5,000 | Advantech Co., Ltd. | 45,298 |
| 30,000 | Cathay Financial Holding Co., Ltd. | 35,109 |
| 1,000 | Chroma ATE, Inc. | 5,460 |
| 19,000 | Chunghwa Telecom Co., Ltd. | 65,510 |
| 4,000 | E Ink Holdings, Inc. | 25,417 |
| 15,050 | Fubon Financial Holding Co., Ltd. | 23,772 |
| 12,000 | Hon Hai Precision Industry Co., Ltd. | 38,113 |
| 1,000 | KMC Kuei Meng International, Inc. | 4,325 |
| 1,000 | Lotes Co., Ltd. | 23,999 |
| 1,000 | Nien Made Enterprise Co., Ltd. | 7,711 |
| 6,000 | President Chain Store Corp. | 49,890 |
| 1,000 | Realtek Semiconductor Corp. | 7,883 |
| 2,000 | Sino-American Silicon Products, Inc. | 7,670 |
| 42,000 | Taiwan Semiconductor Manufacturing Co., Ltd. | 504,933 |
| 2,000 | Unimicron Technology Corp. | 7,685 |
| 3,000 | Vanguard International Semiconductor Corp. | 6,160 |
| | | | 889,014 |
| | Thailand - 2.0% |
| 7,500 | Advanced Info Service PCL NVDR | 37,688 |
| 6,600 | Bangchak Corp. PCL NVDR | 5,304 |
| 4,900 | Bangkok Bank PCL NVDR | 18,764 |
| 5,000 | Bangkok Dusit Medical Services PCL NVDR | 3,881 |
| 4,700 | Bumrungrad Hospital PCL NVDR | 28,017 |
| 4,600 | Kasikornbank PCL NVDR | 17,699 |
| 37,100 | Krung Thai Bank PCL NVDR | 17,095 |
| 43,600 | TTW PCL NVDR | 9,966 |
| | | | 138,414 |
| | United Arab Emirates - 2.4% |
| 5,823 | Abu Dhabi Commercial Bank PJSC | 14,989 |
| 15,480 | Emaar Properties PJSC | 25,553 |
| 11,212 | Emirates NBD Bank PJSC | 40,486 |
| Shares or Principal Amount | | Market Value† |
| COMMON STOCKS - 94.8% - (continued) |
| | United Arab Emirates - 2.4% - (continued) |
| 9,329 | Emirates Telecommunications Group Co. PJSC | $ 65,565 |
| 3,872 | First Abu Dhabi Bank PJSC | 18,883 |
| | | | 165,476 |
| | Total Common Stocks
(cost $8,642,318) | | $ 6,532,842 |
| PREFERRED STOCKS - 3.6% |
| | Brazil - 3.6% |
| 9,510 | Banco Bradesco S.A. (Preference Shares) | $ 36,564 |
| 16,500 | Cia de Saneamento do Parana (Preference Shares) | 12,298 |
| 11,400 | Itau Unibanco Holding S.A. (Preference Shares) | 67,091 |
| 19,900 | Itausa S.A. (Preference Shares) | 41,376 |
| 16,400 | Petroleo Brasileiro S.A. (Preference Shares) | 94,644 |
| | | | 251,973 |
| | Total Preferred Stocks
(cost $242,421) | | $ 251,973 |
| | Total Long-Term Investments
(cost $8,884,739) | | $ 6,784,815 |
| SHORT-TERM INVESTMENTS - 1.0% |
| | Other Investment Pools & Funds - 0.9% |
| $ 61,889 | Morgan Stanley Institutional Liquidity Funds, Treasury Portfolio, Institutional Class, 3.02%(4) | $ 61,889 |
| | Securities Lending Collateral - 0.1% |
| 1,398 | Goldman Sachs Financial Square Funds, Government Fund, Institutional Class, 3.07%(4) | 1,398 |
| 4,658 | HSBC US Government Money Market Fund, 3.09%(4) | 4,658 |
| 1,397 | Invesco Government & Agency Portfolio, Institutional Class, 3.07%(4) | 1,397 |
| 1,397 | Morgan Stanley Institutional Liquidity Funds, Government Portfolio, Institutional Class, 2.88%(4) | 1,397 |
| | | | 8,850 |
| | Total Short-Term Investments
(cost $70,739) | $ 70,739 |
| | Total Investments
(cost $8,955,478) | 99.4% | $ 6,855,554 |
| | Other Assets and Liabilities | 0.6% | 38,898 |
| | Total Net Assets | 100.0% | $ 6,894,452 |
| Note: | Percentage of investments as shown is the ratio of the total market value to total net assets. |
| | Prices of foreign equities that are principally traded on certain foreign markets will generally be adjusted daily pursuant to a fair value pricing service approved by Hartford Funds Management Company, LLC in order to reflect an adjustment for factors occurring after the close of certain foreign markets but before the close of the New York Stock Exchange. |
| | The Fund may refer to any one or more of the industry classifications used by one or more widely recognized market indices, ratings group and/or as defined by Fund management. Industry classifications may not be identical across all security types. |
| | For Fund compliance purposes, the Fund may not use the same classification system. These classifications are used for financial reporting purposes. |
| | See “Glossary” for abbreviation descriptions. |
The accompanying notes are an integral part of these financial statements.
Hartford Schroders Diversified Emerging Markets Fund
Schedule of Investments – (continued)
October 31, 2022
| * | Non-income producing. |
| (1) | Security was purchased pursuant to Rule 144A under the Securities Act of 1933 and may be sold in transactions that are exempt from registration (typically only to qualified institutional buyers) or in a public offering registered under the Securities Act of 1933. At October 31, 2022, the aggregate value of these securities was $283,077, representing 4.1% of net assets. |
| (2) | Investment valued using significant unobservable inputs. |
| (3) | Represents entire or partial securities on loan. See Note 8 in the accompanying Notes to Financial Statements for securities lending information. |
| (4) | Current yield as of period end. |
| † | See Significant Accounting Policies of accompanying Notes to Financial Statements regarding valuation of investments. |
Fair Value Summary
The following is a summary of the fair valuations according to the inputs used as of October 31, 2022 in valuing the Fund’s investments.
| Description | | Total | | Level 1 | | Level 2 | | Level 3(1) |
| Assets | | | | | | | | |
| Common Stocks | | | | | | | | |
| Bermuda | | $ 1,732 | | $ — | | $ 1,732 | | $ — |
| Brazil | | 226,677 | | 226,677 | | — | | — |
| Cayman Islands | | 15,749 | | — | | 15,749 | | — |
| Chile | | 24,732 | | 24,732 | | — | | — |
| China | | 1,655,087 | | 54,736 | | 1,600,351 | | — |
| Colombia | | 12,596 | | 12,596 | | — | | — |
| Cyprus | | 2,194 | | 2,194 | | — | | — |
| Greece | | 22,614 | | — | | 22,614 | | — |
| Hong Kong | | 147,762 | | — | | 147,762 | | — |
| Hungary | | 51,907 | | — | | 51,907 | | — |
| India | | 917,996 | | 40,588 | | 877,408 | | — |
| Indonesia | | 258,766 | | 2,387 | | 256,379 | | — |
| Malaysia | | 127,289 | | 3,753 | | 123,536 | | — |
| Mexico | | 242,807 | | 242,807 | | — | | — |
| Philippines | | 4,004 | | — | | 4,004 | | — |
| Poland | | 30,547 | | — | | 30,547 | | — |
| Qatar | | 55,701 | | — | | 55,701 | | — |
| Romania | | 1,055 | | — | | 1,055 | | — |
| Russia | | — | | — | | — | | — |
| Saudi Arabia | | 355,167 | | 355,167 | | — | | — |
| South Africa | | 223,458 | | 35,639 | | 187,819 | | — |
| South Korea | | 962,098 | | — | | 962,098 | | — |
| Taiwan | | 889,014 | | — | | 889,014 | | — |
| Thailand | | 138,414 | | 9,966 | | 128,448 | | — |
| United Arab Emirates | | 165,476 | | — | | 165,476 | | — |
| Preferred Stocks | | 251,973 | | 251,973 | | — | | — |
| Short-Term Investments | | 70,739 | | 70,739 | | — | | — |
| Total | | $ 6,855,554 | | $ 1,333,954 | | $ 5,521,600 | | $ — |
| (1) | For the year ended October 31, 2022, investments valued at $134,945 were transferred into Level 3 due the unavailability of active market pricing, and investments valued at $27,803 were transferred out of Level 3 due to the availability of significant observable inputs. |
Level 3 investments at the beginning and/or end of the period in relation to net assets were not significant and accordingly, a reconciliation of Level 3 assets for the year ended October 31, 2022 is not presented.
The accompanying notes are an integral part of these financial statements.
Hartford Schroders Emerging Markets Equity Fund
Schedule of Investments
October 31, 2022
| Shares or Principal Amount | | Market Value† |
| COMMON STOCKS - 96.3% |
| | Brazil - 10.8% |
| 1,332,742 | 3R Petroleum Oleo E Gas S.A.* | $ 11,997,387 |
| 6,399,632 | CCR S.A. | 16,056,380 |
| 3,065,437 | Centrais Eletricas Brasileiras S.A. | 29,565,400 |
| 4,755,380 | Dexco S.A. | 8,920,653 |
| 1,664,171 | Energisa S.A. | 15,622,041 |
| 16,858,547 | Itau Unibanco Holding S.A. ADR | 98,116,744 |
| 1,607,983 | Localiza Rent a Car S.A. | 21,958,595 |
| 7,058,736 | Lojas Renner S.A. | 42,225,330 |
| 3,621,729 | Petro Rio S.A.* | 24,813,278 |
| 3,570,966 | Petroleo Brasileiro S.A. ADR | 45,779,784 |
| 8,431,567 | Raia Drogasil S.A. | 42,945,412 |
| 488,092 | Telefonica Brasil S.A. | 3,903,413 |
| 6,373,487 | TIM S.A. | 16,286,909 |
| 6,752,210 | Vale S.A. ADR | 87,373,597 |
| 3,676,985 | WEG S.A. | 28,672,724 |
| 770,055 | XP, Inc. Class A* | 14,115,108 |
| 3,439,467 | YDUQS Participacoes S.A. | 10,740,219 |
| | | | 519,092,974 |
| | Cayman Islands - 0.6% |
| 6,448,500 | Wuxi Biologics Cayman, Inc.*(1) | 29,015,944 |
| | Chile - 1.0% |
| 152,095,591 | Banco de Chile | 13,910,258 |
| 1,655,056 | Banco Santander Chile ADR | 23,882,458 |
| 6,116,536 | Falabella S.A. | 11,946,198 |
| | | | 49,738,914 |
| | China - 21.1% |
| 11,167,596 | Alibaba Group Holding Ltd.* | 86,827,016 |
| 103,743 | Baidu, Inc. ADR* | 7,943,602 |
| 3,761,304 | Baidu, Inc. Class A* | 36,059,603 |
| 7,990,168 | Centre Testing International Group Co., Ltd. Class A | 20,525,176 |
| 15,277,000 | China Mengniu Dairy Co., Ltd.* | 48,903,941 |
| 14,347,200 | China Pacific Insurance Group Co., Ltd. Class H | 23,127,586 |
| 455,100 | Contemporary Amperex Technology Co., Ltd. Class A | 23,355,602 |
| 2,660,300 | ENN Energy Holdings Ltd. | 26,448,821 |
| 1,303,533 | H World Group Ltd. ADR | 35,299,674 |
| 5,894,000 | Innovent Biologics, Inc.*(1) | 20,868,647 |
| 4,956,326 | JD.com, Inc. Class A | 90,257,227 |
| 9,907,233 | LONGi Green Energy Technology Co., Ltd. Class A* | 65,429,040 |
| 1,747,700 | Meituan Class B*(1) | 27,981,612 |
| 10,674,545 | Midea Group Co., Ltd. Class A | 58,804,624 |
| 44,694,000 | PICC Property & Casualty Co., Ltd. Class H | 41,221,770 |
| 15,591,910 | Satellite Chemical Co., Ltd. Class A | 26,533,066 |
| 6,729,973 | SF Holding Co., Ltd. Class A | 44,578,429 |
| 6,296,050 | Shenzhen Inovance Technology Co., Ltd. Class A | 57,683,528 |
| 3,344,700 | Shenzhou International Group Holdings Ltd. | 23,222,242 |
| 6,668,700 | Tencent Holdings Ltd. | 175,231,916 |
| 644,200 | Wuliangye Yibin Co., Ltd. Class A | 11,807,357 |
| 1,155,968 | Yum China Holdings, Inc. | 47,532,698 |
| 2,232,256 | Zhejiang Supor Co., Ltd. Class A | 12,254,602 |
| 474,134 | ZTO Express Cayman, Inc. ADR | 8,008,123 |
| | | | 1,019,905,902 |
| | Cyprus - 0.0% |
| 278,611 | Galaxy Cosmos Mezz plc* | 44,990 |
| | Egypt - 0.2% |
| 8,092,121 | Commercial International Bank Egypt S.A.E. GDR | 10,269,395 |
| Shares or Principal Amount | | Market Value† |
| COMMON STOCKS - 96.3% - (continued) |
| | Greece - 1.1% |
| 7,522,520 | Alpha Services and Holdings S.A.* | $ 6,966,566 |
| 16,800,130 | Eurobank Ergasias Services & Holdings S.A. Class A* | 16,585,125 |
| 1,194,807 | Hellenic Telecommunications Organization S.A. | 18,763,898 |
| 3,417,107 | National Bank of Greece S.A.* | 12,381,116 |
| | | | 54,696,705 |
| | Hong Kong - 2.6% |
| 12,650,400 | AIA Group Ltd. | 95,824,126 |
| 4,248,000 | China Resources Land Ltd. | 13,291,071 |
| 14,597,000 | Hang Lung Properties Ltd. | 18,362,485 |
| | | | 127,477,682 |
| | Hungary - 0.7% |
| 343,436 | OTP Bank Nyrt | 7,492,342 |
| 1,225,772 | Richter Gedeon Nyrt | 24,246,671 |
| | | | 31,739,013 |
| | India - 12.2% |
| 2,953,032 | Axis Bank Ltd. | 32,384,358 |
| 6,628,597 | Bharti Airtel Ltd.* | 66,662,406 |
| 3,087,442 | Cipla Ltd. | 43,560,548 |
| 6,709,945 | HDFC Bank Ltd. | 121,775,050 |
| 13,555,687 | ICICI Bank Ltd. | 149,049,517 |
| 1,348,698 | Mahindra & Mahindra Ltd. | 22,012,140 |
| 2,232,955 | Reliance Industries Ltd. | 68,901,754 |
| 2,148,046 | Tata Consultancy Services Ltd. | 82,897,539 |
| | | | 587,243,312 |
| | Indonesia - 1.5% |
| 69,891,600 | Bank Mandiri Persero Tbk PT | 47,215,485 |
| 85,763,020 | Bank Rakyat Indonesia Persero Tbk PT | 25,585,947 |
| | | | 72,801,432 |
| | Malaysia - 0.6% |
| 23,852,532 | CIMB Group Holdings Bhd | 27,862,694 |
| | Mexico - 2.8% |
| 994,516 | Fomento Economico Mexicano S.A.B. de C.V. ADR | 71,227,236 |
| 7,974,686 | Grupo Financiero Banorte S.A.B. de C.V. Class O | 64,918,846 |
| | | | 136,146,082 |
| | Peru - 0.7% |
| 242,733 | Credicorp Ltd. | 35,526,402 |
| | Poland - 0.6% |
| 754,756 | Bank Polska Kasa Opieki S.A. | 12,370,043 |
| 2,810,322 | Powszechny Zaklad Ubezpieczen S.A.(2) | 15,744,301 |
| | | | 28,114,344 |
| | Qatar - 0.8% |
| 6,976,144 | Qatar National Bank QPSC | 38,198,901 |
| | Russia - 0.0% |
| 390,765 | Lukoil PJSC*(3) | — |
| 339,057 | Magnit PJSC*(3) | — |
| 366,305 | Novatek PJSC GDR*(3) | — |
| 67,747 | Polyus PJSC*(3) | — |
| 30,946 | Polyus PJSC GDR*(3) | — |
| 5,358,303 | Rosneft Oil Co. PJSC*(3) | — |
| 836,086 | Yandex N.V. Class A*(3) | — |
| | | | — |
The accompanying notes are an integral part of these financial statements.
Hartford Schroders Emerging Markets Equity Fund
Schedule of Investments – (continued)
October 31, 2022
| Shares or Principal Amount | | Market Value† |
| COMMON STOCKS - 96.3% - (continued) |
| | Saudi Arabia - 2.7% |
| 4,472,897 | Alinma Bank | $ 44,639,096 |
| 5,493,792 | Saudi National Bank | 86,846,814 |
| | | | 131,485,910 |
| | Singapore - 0.3% |
| 273,864 | Sea Ltd. ADR* | 13,605,564 |
| | South Africa - 5.6% |
| 2,755,260 | Aspen Pharmacare Holdings Ltd. | 22,664,563 |
| 3,408,058 | AVI Ltd.(2) | 13,650,947 |
| 313,799 | Capitec Bank Holdings Ltd. | 32,492,892 |
| 16,643,789 | FirstRand Ltd. | 58,186,364 |
| 1,150,861 | Foschini Group Ltd. | 7,195,426 |
| 5,029,258 | Gold Fields Ltd. | 40,288,382 |
| 4,010,492 | MTN Group Ltd. | 28,343,961 |
| 301,016 | Naspers Ltd. Class N | 31,029,272 |
| 2,814,518 | Shoprite Holdings Ltd. | 35,824,742 |
| | | | 269,676,549 |
| | South Korea - 14.0% |
| 366,934 | Kia Corp. | 17,051,712 |
| 69,163 | Korea Zinc Co., Ltd. | 31,016,316 |
| 159,135 | LG Chem Ltd. | 69,834,572 |
| 34,973 | LG H&H Co., Ltd. | 12,495,178 |
| 2,814,467 | LG Uplus Corp. | 22,600,960 |
| 7,295,077 | Samsung Electronics Co., Ltd. | 303,619,819 |
| 198,865 | Samsung Fire & Marine Insurance Co., Ltd. | 27,890,689 |
| 170,184 | Samsung SDI Co., Ltd. | 87,800,479 |
| 1,018,185 | SK Hynix, Inc. | 58,944,267 |
| 173,230 | SK Innovation Co., Ltd.* | 20,976,112 |
| 678,995 | SK Telecom Co., Ltd. | 23,861,048 |
| | | | 676,091,152 |
| | Taiwan - 12.7% |
| 3,603,000 | Accton Technology Corp. | 27,094,026 |
| 14,407,036 | ASE Technology Holding Co., Ltd. | 35,573,117 |
| 17,387,000 | Cathay Financial Holding Co., Ltd. | 20,348,132 |
| 8,687,000 | Chunghwa Telecom Co., Ltd. | 29,952,041 |
| 47,868,000 | CTBC Financial Holding Co., Ltd. | 30,239,978 |
| 26,374,000 | Hon Hai Precision Industry Co., Ltd. | 83,765,842 |
| 29,674,139 | Taiwan Semiconductor Manufacturing Co., Ltd. | 356,748,527 |
| 13,026,000 | Uni-President Enterprises Corp. | 26,452,669 |
| | | | 610,174,332 |
| | Thailand - 1.2% |
| 15,569,800 | Kasikornbank PCL NVDR | 59,908,194 |
| | Turkey - 0.2% |
| 3,251,225 | KOC Holding AS | 9,698,758 |
| | United Arab Emirates - 1.5% |
| 29,108,760 | Emaar Properties PJSC | 48,051,422 |
| 4,697,573 | First Abu Dhabi Bank PJSC | 22,908,922 |
| | | | 70,960,344 |
| | United Kingdom - 0.8% |
| 3,985,547 | Prudential plc | 37,024,371 |
| | Total Common Stocks
(cost $5,068,698,120) | | $ 4,646,499,860 |
| SHORT-TERM INVESTMENTS - 3.6% |
| | Other Investment Pools & Funds - 3.3% |
| $ 159,596,614 | Morgan Stanley Institutional Liquidity Funds, Treasury Portfolio, Institutional Class, 3.02%(4) | $ 159,596,614 |
| Shares or Principal Amount | | Market Value† |
| SHORT-TERM INVESTMENTS - 3.6% - (continued) |
| | Securities Lending Collateral - 0.3% |
| 2,065,115 | Goldman Sachs Financial Square Funds, Government Fund, Institutional Class, 3.07%(4) | $ 2,065,115 |
| 6,883,714 | HSBC US Government Money Market Fund, 3.09%(4) | 6,883,714 |
| 2,065,114 | Invesco Government & Agency Portfolio, Institutional Class, 3.07%(4) | 2,065,114 |
| 2,065,114 | Morgan Stanley Institutional Liquidity Funds, Government Portfolio, Institutional Class, 2.88%(4) | 2,065,114 |
| | | | 13,079,057 |
| | Total Short-Term Investments
(cost $172,675,671) | $ 172,675,671 |
| | Total Investments
(cost $5,241,373,791) | 99.9% | $ 4,819,175,531 |
| | Other Assets and Liabilities | 0.1% | 6,729,286 |
| | Total Net Assets | 100.0% | $ 4,825,904,817 |
| Note: | Percentage of investments as shown is the ratio of the total market value to total net assets. |
| | Prices of foreign equities that are principally traded on certain foreign markets will generally be adjusted daily pursuant to a fair value pricing service approved by Hartford Funds Management Company, LLC in order to reflect an adjustment for factors occurring after the close of certain foreign markets but before the close of the New York Stock Exchange. |
| | The Fund may refer to any one or more of the industry classifications used by one or more widely recognized market indices, ratings group and/or as defined by Fund management. Industry classifications may not be identical across all security types. |
| | For Fund compliance purposes, the Fund may not use the same classification system. These classifications are used for financial reporting purposes. |
| | See “Glossary” for abbreviation descriptions. |
| * | Non-income producing. |
| (1) | Security was purchased pursuant to Rule 144A under the Securities Act of 1933 and may be sold in transactions that are exempt from registration (typically only to qualified institutional buyers) or in a public offering registered under the Securities Act of 1933. At October 31, 2022, the aggregate value of these securities was $77,866,203, representing 1.6% of net assets. |
| (2) | Represents entire or partial securities on loan. See Note 8 in the accompanying Notes to Financial Statements for securities lending information. |
| (3) | Investment valued using significant unobservable inputs. |
| (4) | Current yield as of period end. |
| † | See Significant Accounting Policies of accompanying Notes to Financial Statements regarding valuation of investments. |
The accompanying notes are an integral part of these financial statements.
Hartford Schroders Emerging Markets Equity Fund
Schedule of Investments – (continued)
October 31, 2022
Fair Value Summary
The following is a summary of the fair valuations according to the inputs used as of October 31, 2022 in valuing the Fund’s investments.
| Description | | Total | | Level 1 | | Level 2 | | Level 3(1) |
| Assets | | | | | | | | |
| Common Stocks | | | | | | | | |
| Brazil | | $ 519,092,974 | | $ 519,092,974 | | $ — | | $ — |
| Cayman Islands | | 29,015,944 | | — | | 29,015,944 | | — |
| Chile | | 49,738,914 | | 37,792,716 | | 11,946,198 | | — |
| China | | 1,019,905,902 | | 86,397,576 | | 933,508,326 | | — |
| Cyprus | | 44,990 | | 44,990 | | — | | — |
| Egypt | | 10,269,395 | | — | | 10,269,395 | | — |
| Greece | | 54,696,705 | | — | | 54,696,705 | | — |
| Hong Kong | | 127,477,682 | | — | | 127,477,682 | | — |
| Hungary | | 31,739,013 | | — | | 31,739,013 | | — |
| India | | 587,243,312 | | — | | 587,243,312 | | — |
| Indonesia | | 72,801,432 | | — | | 72,801,432 | | — |
| Malaysia | | 27,862,694 | | — | | 27,862,694 | | — |
| Mexico | | 136,146,082 | | 136,146,082 | | — | | — |
| Peru | | 35,526,402 | | 35,526,402 | | — | | — |
| Poland | | 28,114,344 | | — | | 28,114,344 | | — |
| Qatar | | 38,198,901 | | — | | 38,198,901 | | — |
| Russia | | — | | — | | — | | — |
| Saudi Arabia | | 131,485,910 | | 131,485,910 | | — | | — |
| Singapore | | 13,605,564 | | 13,605,564 | | — | | — |
| South Africa | | 269,676,549 | | — | | 269,676,549 | | — |
| South Korea | | 676,091,152 | | — | | 676,091,152 | | — |
| Taiwan | | 610,174,332 | | — | | 610,174,332 | | — |
| Thailand | | 59,908,194 | | — | | 59,908,194 | | — |
| Turkey | | 9,698,758 | | — | | 9,698,758 | | — |
| United Arab Emirates | | 70,960,344 | | — | | 70,960,344 | | — |
| United Kingdom | | 37,024,371 | | — | | 37,024,371 | | — |
| Short-Term Investments | | 172,675,671 | | 172,675,671 | | — | | — |
| Total | | $ 4,819,175,531 | | $ 1,132,767,885 | | $ 3,686,407,646 | | $ — |
| (1) | For the year ended October 31, 2022, investments valued at $392,375,959 were transferred into Level 3 due to the unavailability of active market pricing or observable market data activity. There were no transfers out of Level 3. |
Level 3 investments at the beginning and/or end of the period in relation to net assets were not significant and accordingly, a reconciliation of Level 3 assets for the year ended October 31, 2022 is not presented.
The accompanying notes are an integral part of these financial statements.
Hartford Schroders Emerging Markets Multi-Sector Bond Fund
Schedule of Investments
October 31, 2022
| Shares or Principal Amount | | Market Value† |
| CORPORATE BONDS - 42.2% |
| | Argentina - 1.5% |
| $ 159,000 | YPF Energia Electrica S.A. 10.00%, 07/25/2026(1) | $ 126,402 |
| | YPF S.A. | |
| 160,000 | 8.50%, 07/28/2025(2) | 115,200 |
| 274,000 | 8.50%, 06/27/2029(1)(3) | 166,762 |
| | | | 408,364 |
| | Austria - 0.2% |
| 81,000 | Suzano Austria GmbH 3.13%, 01/15/2032 | 60,305 |
| | Bermuda - 0.7% |
| 200,000 | Credicorp Ltd. 2.75%, 06/17/2025(1) | 184,248 |
| | Brazil - 0.5% |
| 167,376 | Prumo Participacoes e Investimentos S/A 7.50%, 12/31/2031(2) | 148,469 |
| | British Virgin Islands - 1.0% |
| 200,000 | China Cinda 2020 I Management Ltd. 3.00%, 01/20/2031(2) | 133,964 |
| 200,000 | Elect Global Investments Ltd. 4.85%, 08/25/2023(2)(4) | 140,222 |
| | | | 274,186 |
| | Canada - 1.2% |
| 200,000 | Canacol Energy Ltd. 5.75%, 11/24/2028(1) | 149,175 |
| 200,000 | MEGlobal Canada ULC 5.88%, 05/18/2030(1) | 192,656 |
| | | | 341,831 |
| | Cayman Islands - 2.1% |
| | Alibaba Group Holding Ltd. | |
| 200,000 | 3.40%, 12/06/2027 | 171,730 |
| 200,000 | 4.20%, 12/06/2047 | 120,291 |
| 200,000 | 4.50%, 11/28/2034 | 157,181 |
| 200,000 | Tencent Holdings Ltd. 3.93%, 01/19/2038(1) | 135,837 |
| | | | 585,039 |
| | Chile - 3.3% |
| 200,000 | Celulosa Arauco y Constitucion S.A. 5.15%, 01/29/2050(1)(3) | 145,565 |
| 200,000 | Cencosud S.A. 5.15%, 02/12/2025(1) | 195,360 |
| 234,080 | Empresa Electrica Cochrane S.p.A. 5.50%, 05/14/2027(1) | 203,064 |
| 420,000 | Empresa Nacional del Petroleo 3.75%, 08/05/2026(1) | 372,591 |
| | | | 916,580 |
| | Colombia - 1.5% |
| | Ecopetrol S.A. | |
| 196,000 | 5.88%, 09/18/2023 | 192,825 |
| 210,000 | 5.88%, 05/28/2045(3) | 127,852 |
| 29,000 | 5.88%, 11/02/2051 | 17,238 |
| 79,000 | 6.88%, 04/29/2030 | 65,009 |
| | | | 402,924 |
| | Hong Kong - 1.0% |
| 240,000 | Lenovo Group Ltd. 3.42%, 11/02/2030(1) | 164,570 |
| 200,000 | Xiaomi Best Time International Ltd. 2.88%, 07/14/2031(1) | 125,562 |
| | | | 290,132 |
| | India - 1.0% |
| 200,000 | Adani Ports & Special Economic Zone Ltd. 4.38%, 07/03/2029(2) | 148,439 |
| 200,000 | Summit Digitel Infrastructure Ltd. 2.88%, 08/12/2031(1)(3) | 137,085 |
| | | | 285,524 |
| Shares or Principal Amount | | Market Value† |
| CORPORATE BONDS - 42.2% - (continued) |
| | Indonesia - 0.6% |
| $ 200,000 | Tower Bersama Infrastructure Tbk PT 2.80%, 05/02/2027(2) | $ 162,113 |
| | Jersey - 0.5% |
| 200,000 | Galaxy Pipeline Assets Bidco Ltd. 2.63%, 03/31/2036(1) | 151,895 |
| | Kazakhstan - 0.7% |
| 200,000 | Development Bank of Kazakhstan JSC 5.75%, 05/12/2025(1) | 198,083 |
| | Luxembourg - 2.4% |
| 80,000 | Atento Luxco 1 S.A. 8.00%, 02/10/2026 | 31,200 |
| 197,796 | FEL Energy S.a.r.l. 5.75%, 12/01/2040(1) | 132,328 |
| 230,000 | Kenbourne Invest S.A. 4.70%, 01/22/2028(1) | 168,301 |
| 200,000 | MC Brazil Downstream Trading S.a.r.l. 7.25%, 06/30/2031(1) | 151,820 |
| 200,000 | Puma International Financing S.A. 5.00%, 01/24/2026(1) | 177,500 |
| | | | 661,149 |
| | Mexico - 11.0% |
| 200,000 | America Movil S.A.B. de C.V. 5.38%, 04/04/2032(1) | 169,500 |
| 200,000 | Banco Mercantil del Norte S.A. 7.63%, 01/10/2028, (7.63% fixed rate until 01/10/2028; 10 year USD CMT + 5.353% thereafter)(1)(4)(5) | 163,974 |
| 200,000 | Braskem Idesa SAPI 6.99%, 02/20/2032(1) | 133,776 |
| 200,000 | Cemex S.A.B. de C.V. 7.38%, 06/05/2027(2) | 198,000 |
| 171,400 | Cometa Energia S.A. de C.V. 6.38%, 04/24/2035(2) | 148,261 |
| 200,000 | Electricidad Firme de Mexico Holdings S.A. de C.V. 4.90%, 11/20/2026(1) | 159,006 |
| MXN 16,510,000 | Grupo Televisa S.A.B. 7.25%, 05/14/2043 | 510,141 |
| $ 200,000 | Infraestructura Energetica Nova S.A.B. de C.V. 4.88%, 01/14/2048(1) | 136,006 |
| | Petroleos Mexicanos | |
| 660,000 | 5.95%, 01/28/2031(3) | 476,854 |
| 90,000 | 6.63%, 06/15/2035 | 62,505 |
| 496,000 | 6.70%, 02/16/2032 | 375,100 |
| 150,000 | 8.75%, 06/02/2029 | 134,531 |
| 250,000 | Total Play Telecomunicaciones S.A. de C.V. 6.38%, 09/20/2028(1) | 171,345 |
| 200,000 | Trust Fibra Uno 5.25%, 12/15/2024(2) | 189,200 |
| | | | 3,028,199 |
| | Netherlands - 1.4% |
| 200,000 | Braskem Netherlands Finance B.V. 8.50%, 01/23/2081, (8.50% fixed rate until 10/24/2025; 5 year USD CMT + 8.220% thereafter)(1)(5) | 190,000 |
| 200,000 | Embraer Netherlands Finance B.V. 6.95%, 01/17/2028(1) | 188,652 |
| | | | 378,652 |
| | Panama - 0.6% |
| 200,000 | AES Panama Generation Holdings 4.38%, 05/31/2030(1) | 157,576 |
| | Peru - 2.5% |
| 127,000 | Banco BBVA Peru S.A. 5.25%, 09/22/2029, (5.25% fixed rate until 09/22/2024; 5 year USD CMT + 2.750% thereafter)(1)(3)(5) | 121,060 |
The accompanying notes are an integral part of these financial statements.
Hartford Schroders Emerging Markets Multi-Sector Bond Fund
Schedule of Investments – (continued)
October 31, 2022
| Shares or Principal Amount | | Market Value† |
| CORPORATE BONDS - 42.2% - (continued) |
| | Peru - 2.5% - (continued) |
| $ 150,000 | Banco Internacional del Peru SAA Interbank 4.00%, 07/08/2030, (4.00% fixed rate until 07/08/2025; 12 mo. USD CMT + 3.711% thereafter)(1)(5) | $ 131,426 |
| 200,000 | Kallpa Generacion S.A. 4.13%, 08/16/2027(1) | 175,485 |
| 400,000 | Petroleos del Peru S.A. 5.63%, 06/19/2047(1) | 252,574 |
| 22,000 | Volcan Cia Minera SAA 4.38%, 02/11/2026(1) | 18,464 |
| | | | 699,009 |
| | Qatar - 1.4% |
| 540,000 | Qatar Energy 3.13%, 07/12/2041(1) | 382,752 |
| | Russia - 0.9% |
| 200,000 | Hacienda Investments Ltd. Via DME Airport DAC 5.35%, 02/08/2028*(1) | 40,000 |
| 200,000 | Metalloinvest Finance DAC 3.38%, 10/22/2028*(1) | 110,000 |
| 200,000 | VEON Holdings B.V. 3.38%, 11/25/2027*(1) | 100,000 |
| 200,000 | Vnesheconombank Via VEB Finance plc 6.80%, 11/22/2025*(1)(6)(7) | — |
| | | | 250,000 |
| | Saudi Arabia - 0.6% |
| 200,000 | Saudi Arabian Oil Co. 2.25%, 11/24/2030(2) | 157,727 |
| | Singapore - 0.7% |
| 200,000 | ABJA Investment Co. Pte Ltd. 5.95%, 07/31/2024(2) | 195,874 |
| | Spain - 0.8% |
| 250,000 | AI Candelaria Spain S.A. 7.50%, 12/15/2028(1) | 210,625 |
| | Turkey - 1.1% |
| 200,000 | Coca-Cola Icecek AS 4.50%, 01/20/2029(1) | 160,350 |
| 200,000 | Ulker Biskuvi Sanayi AS 6.95%, 10/30/2025(1) | 139,550 |
| | | | 299,900 |
| | United Arab Emirates - 0.7% |
| 200,000 | First Abu Dhabi Bank PJSC 4.50%, 04/05/2026, (4.50% fixed rate until 04/05/2026; 5 year USD CMT + 4.138% thereafter)(2)(4)(5) | 182,550 |
| | United Kingdom - 0.6% |
| 200,000 | Endeavour Mining plc 5.00%, 10/14/2026(1) | 155,500 |
| | United States - 1.7% |
| 200,000 | Kosmos Energy Ltd. 7.75%, 05/01/2027(1) | 161,500 |
| 200,000 | Mercury Chile Holdco LLC 6.50%, 01/24/2027(1) | 165,000 |
| 200,000 | Sasol Financing USA LLC 5.50%, 03/18/2031 | 150,432 |
| | | | 476,932 |
| | Total Corporate Bonds
(cost $14,477,865) | $ 11,646,138 |
| Shares or Principal Amount | | Market Value† |
| FOREIGN GOVERNMENT OBLIGATIONS - 50.3% |
| | Angola - 1.8% |
| | Angolan Government International Bond | |
| $ 200,000 | 8.25%, 05/09/2028(1) | $ 168,200 |
| 400,000 | 8.75%, 04/14/2032(1) | 322,200 |
| | | | 490,400 |
| | Argentina - 2.0% |
| 461,379 | Argentine Republic Government International Bond 1.50%, 07/09/2035(3)(8) | 91,561 |
| 200,000 | Ciudad Autonoma De Buenos Aires 7.50%, 06/01/2027(1) | 172,000 |
| 371,291 | Provincia de Cordoba 6.88%, 12/10/2025(1)(3)(8) | 282,181 |
| | | | 545,742 |
| | Azerbaijan - 0.8% |
| 220,000 | Republic of Azerbaijan International Bond 4.75%, 03/18/2024(1) | 215,113 |
| | Brazil - 6.0% |
| | Brazil Notas do Tesouro Nacional | |
| BRL 2,554,000 | 10.00%, 01/01/2025 | 478,108 |
| 3,272,000 | 10.00%, 01/01/2029 | 587,657 |
| 2,549,000 | 10.00%, 01/01/2031 | 449,160 |
| $ 200,000 | Brazilian Government International Bond 5.63%, 02/21/2047 | 151,664 |
| | | | 1,666,589 |
| | Cameroon - 0.3% |
| EUR 110,000 | Republic of Cameroon International Bond 5.95%, 07/07/2032(1) | 71,460 |
| | Chile - 0.4% |
| CLP 105,000,000 | Bonos de la Tesoreria de la Republica en pesos 2.50%, 03/01/2025 | 99,998 |
| | Colombia - 2.0% |
| $ 270,000 | Colombia Government International Bond 4.50%, 01/28/2026 | 242,654 |
| | Colombian TES | |
| COP 259,800,000 | 6.25%, 07/09/2036 | 28,423 |
| 1,419,400,000 | 7.00%, 06/30/2032 | 184,898 |
| 641,400,000 | 7.25%, 10/18/2034 | 80,811 |
| 241,300,000 | 7.25%, 10/26/2050 | 26,073 |
| | | | 562,859 |
| | Costa Rica - 0.7% |
| $ 200,000 | Costa Rica Government International Bond 6.13%, 02/19/2031(1)(3) | 185,490 |
| | Dominican Republic - 1.4% |
| | Dominican Republic International Bond | |
| 330,000 | 6.85%, 01/27/2045(1) | 255,152 |
| 160,000 | 7.45%, 04/30/2044(1) | 133,995 |
| | | | 389,147 |
| | Ecuador - 0.5% |
| | Ecuador Government International Bond | |
| 259,500 | 0.00%, 07/31/2030(1)(9) | 80,661 |
| 106,000 | 5.50%, 07/31/2030(1)(8) | 56,281 |
| | | | 136,942 |
| | El Salvador - 0.5% |
| | El Salvador Government International Bond | |
| 50,000 | 5.88%, 01/30/2025(1) | 27,500 |
| 310,000 | 8.63%, 02/28/2029(1) | 124,017 |
| | | | 151,517 |
The accompanying notes are an integral part of these financial statements.
Hartford Schroders Emerging Markets Multi-Sector Bond Fund
Schedule of Investments – (continued)
October 31, 2022
| Shares or Principal Amount | | Market Value† |
| FOREIGN GOVERNMENT OBLIGATIONS - 50.3% - (continued) |
| | Gabon - 0.5% |
| $ 200,000 | Gabon Government International Bond 6.63%, 02/06/2031(1) | $ 139,924 |
| | Guatemala - 0.7% |
| 200,000 | Guatemala Government Bond 5.25%, 08/10/2029(1) | 184,181 |
| | Hungary - 1.8% |
| | Hungary Government Bond | |
| HUF 34,740,000 | 2.50%, 10/24/2024 | 68,722 |
| 270,000 | 3.00%, 04/25/2041 | 294 |
| 29,130,000 | 6.00%, 11/24/2023 | 65,275 |
| 117,880,000 | 6.75%, 10/22/2028 | 231,466 |
| $ 140,000 | Hungary Government International Bond 7.63%, 03/29/2041 | 139,838 |
| | | | 505,595 |
| | Indonesia - 4.9% |
| | Indonesia Treasury Bond | |
| IDR 2,820,000,000 | 7.00%, 05/15/2027 | 178,925 |
| 877,000,000 | 7.13%, 06/15/2042 | 53,386 |
| 1,035,000,000 | 7.50%, 08/15/2032 | 65,910 |
| 401,000,000 | 8.25%, 05/15/2036 | 26,737 |
| 1,577,000,000 | 8.38%, 03/15/2034 | 106,704 |
| 1,768,000,000 | 8.75%, 05/15/2031 | 121,796 |
| 5,087,000,000 | 9.00%, 03/15/2029 | 351,425 |
| $ 470,000 | Perusahaan Penerbit SBSN Indonesia III 4.70%, 06/06/2032(1) | 439,136 |
| | | | 1,344,019 |
| | Ivory Coast - 2.3% |
| | Ivory Coast Government International Bond | |
| EUR 100,000 | 5.25%, 03/22/2030(1) | 75,396 |
| $ 200,000 | 6.38%, 03/03/2028(1) | 181,500 |
| EUR 630,000 | 6.63%, 03/22/2048(1) | 392,236 |
| | | | 649,132 |
| | Jordan - 0.7% |
| $ 200,000 | Jordan Government International Bond 5.75%, 01/31/2027(1) | 183,258 |
| | Kenya - 0.5% |
| 200,000 | Kenya Government International Bond 8.00%, 05/22/2032(2) | 139,250 |
| | Malaysia - 3.1% |
| | Malaysia Government Bond | |
| MYR 1,907,000 | 3.89%, 08/15/2029 | 390,789 |
| 2,146,000 | 3.90%, 11/30/2026 | 452,188 |
| | | | 842,977 |
| | Mexico - 4.3% |
| | Mexican Bonos | |
| MXN 1,240,000 | 7.50%, 06/03/2027 | 57,262 |
| 1,360,000 | 7.75%, 05/29/2031 | 60,416 |
| 6,368,200 | 7.75%, 11/13/2042 | 259,011 |
| 1,361,200 | 8.00%, 11/07/2047 | 56,214 |
| 13,968,500 | 10.00%, 12/05/2024 | 701,725 |
| $ 70,000 | Mexico Government International Bond 5.55%, 01/21/2045(3) | 59,371 |
| | | | 1,193,999 |
| | Nigeria - 2.1% |
| | Nigeria Government International Bond | |
| 250,000 | 6.13%, 09/28/2028(1) | 164,516 |
| 200,000 | 7.14%, 02/23/2030(1) | 130,500 |
| Shares or Principal Amount | | Market Value† |
| FOREIGN GOVERNMENT OBLIGATIONS - 50.3% - (continued) |
| | Nigeria - 2.1% - (continued) |
| $ 200,000 | 8.38%, 03/24/2029(1) | $ 144,500 |
| 200,000 | 8.75%, 01/21/2031(1) | 140,806 |
| | | | 580,322 |
| | Oman - 1.9% |
| 620,000 | Oman Government International Bond 6.75%, 01/17/2048(1) | 520,025 |
| | Peru - 2.9% |
| 150,000 | Fondo MIVIVIENDA S.A. 4.63%, 04/12/2027(1) | 138,644 |
| | Peru Government Bond | |
| PEN 1,018,000 | 5.40%, 08/12/2034 | 197,163 |
| 920,000 | 6.35%, 08/12/2028 | 214,606 |
| 538,000 | 6.95%, 08/12/2031 | 124,084 |
| $ 120,000 | Peruvian Government International Bond 6.55%, 03/14/2037 | 120,117 |
| | | | 794,614 |
| | Romania - 0.5% |
| 180,000 | Romanian Government International Bond 6.13%, 01/22/2044(1) | 143,809 |
| | Saudi Arabia - 1.7% |
| | Saudi Government International Bond | |
| 220,000 | 3.45%, 02/02/2061(2) | 140,998 |
| 400,000 | 4.50%, 10/26/2046(1) | 318,240 |
| | | | 459,238 |
| | South Africa - 3.5% |
| | Republic of South Africa Government Bond | |
| ZAR 937,200 | 6.50%, 02/28/2041 | 30,899 |
| 4,469,200 | 7.00%, 02/28/2031 | 188,415 |
| 5,541,400 | 8.50%, 01/31/2037 | 231,958 |
| 2,300,400 | 8.88%, 02/28/2035 | 102,041 |
| 3,610,000 | 9.00%, 01/31/2040 | 154,688 |
| | Republic of South Africa Government International Bond | |
| $ 200,000 | 5.00%, 10/12/2046 | 125,456 |
| 200,000 | 6.30%, 06/22/2048 | 144,670 |
| | | | 978,127 |
| | Thailand - 0.8% |
| | Thailand Government Bond | |
| THB 6,238,000 | 3.63%, 06/16/2023 | 166,098 |
| 1,760,000 | 4.88%, 06/22/2029 | 51,375 |
| | | | 217,473 |
| | Ukraine - 0.1% |
| $ 200,000 | Ukraine Government International Bond 7.38%, 09/25/2034(1)(6) | 29,975 |
| | United Arab Emirates - 1.6% |
| 640,000 | Abu Dhabi Government International Bond 3.13%, 09/30/2049(1) | 430,426 |
| | Total Foreign Government Obligations
(cost $15,960,725) | | $ 13,851,601 |
| | Total Long-Term Investments
(cost $30,438,590) | | $ 25,497,739 |
| SHORT-TERM INVESTMENTS - 8.6% |
| | Other Investment Pools & Funds - 0.2% |
| 62,947 | Morgan Stanley Institutional Liquidity Funds, Treasury Portfolio, Institutional Class, 3.02%(10) | $ 62,947 |
The accompanying notes are an integral part of these financial statements.
Hartford Schroders Emerging Markets Multi-Sector Bond Fund
Schedule of Investments – (continued)
October 31, 2022
| Shares or Principal Amount | | Market Value† |
| SHORT-TERM INVESTMENTS - 8.6% - (continued) |
| | Securities Lending Collateral - 3.5% |
| 153,520 | Goldman Sachs Financial Square Funds, Government Fund, Institutional Class, 3.07%(10) | $ 153,520 |
| 511,732 | HSBC US Government Money Market Fund, 3.09%(10) | 511,732 |
| 153,520 | Invesco Government & Agency Portfolio, Institutional Class, 3.07%(10) | 153,520 |
| 153,520 | Morgan Stanley Institutional Liquidity Funds, Government Portfolio, Institutional Class, 2.88%(10) | 153,520 |
| | | | 972,292 |
| | U.S. Treasury Securities - 4.9% |
| | U.S. Treasury Bills | |
| $ 840,000 | 2.79%, 12/01/2022(11) | 838,014 |
| 500,000 | 3.95%, 02/02/2023(11) | 495,234 |
| | | | 1,333,248 |
| | Total Short-Term Investments
(cost $2,368,594) | $ 2,368,487 |
| | Total Investments
(cost $32,807,184) | 101.1% | $ 27,866,226 |
| | Other Assets and Liabilities | (1.1)% | (300,140) |
| | Total Net Assets | 100.0% | $ 27,566,086 |
| Note: | Percentage of investments as shown is the ratio of the total market value to total net assets. |
| | Prices of foreign equities that are principally traded on certain foreign markets will generally be adjusted daily pursuant to a fair value pricing service approved by Hartford Funds Management Company, LLC in order to reflect an adjustment for factors occurring after the close of certain foreign markets but before the close of the New York Stock Exchange. |
| | The Fund may refer to any one or more of the industry classifications used by one or more widely recognized market indices, ratings group and/or as defined by Fund management. Industry classifications may not be identical across all security types. |
For Fund compliance purposes, the Fund may not use the same classification system. These classifications are used for financial reporting purposes.
See “Glossary” for abbreviation descriptions.
| * | Non-income producing. |
| (1) | Security was purchased pursuant to Rule 144A under the Securities Act of 1933 and may be sold in transactions that are exempt from registration (typically only to qualified institutional buyers) or in a public offering registered under the Securities Act of 1933. At October 31, 2022, the aggregate value of these securities was $12,924,247, representing 46.9% of net assets. |
| (2) | Security is exempt from registration under Regulation S under the Securities Act of 1933, which exempts from registration securities offered and sold outside of the United States. Security may not be offered or sold in the United States except pursuant to an exemption from, or in a transaction not subject to, the registration requirements of the Securities Act of 1933. At October 31, 2022, the aggregate value of these securities was $2,200,267, representing 8.0% of net assets. |
| (3) | Represents entire or partial securities on loan. See Note 8 in the accompanying Notes to Financial Statements for securities lending information. |
| (4) | Perpetual maturity security. Maturity date shown is the next call date or final legal maturity date, whichever comes first. |
| (5) | Fixed to variable rate investment. The rate shown reflects the fixed rate in effect at October 31, 2022. Rate will reset at a future date. Base lending rates may be subject to a floor or cap. |
| (6) | Non-income producing. For long-term debt securities, items identified are in default as to payment of interest and/or principal. |
| (7) | Investment valued using significant unobservable inputs. |
| (8) | Security is a “step-up” bond where coupon increases or steps up at a predetermined date. Rate shown is current coupon rate. |
| (9) | Security is a zero-coupon bond. |
| (10) | Current yield as of period end. |
| (11) | The rate shown represents current yield to maturity. |
| Foreign Currency Contracts Outstanding at October 31, 2022 |
Amount and Description of
Currency to be Purchased | | Amount and Description of
Currency to be Sold | | Counterparty | | Settlement
Date | | Appreciation/
(Depreciation) |
| 1,020,550 | BRL | | 191,114 | USD | | UBS | | 01/27/2023 | | $ 2,749 |
| 1,020,550 | BRL | | 192,013 | USD | | MSC | | 01/27/2023 | | 1,850 |
| 417,246,700 | CLP | | 422,528 | USD | | MSC | | 11/18/2022 | | 18,341 |
| 184,250,000 | CLP | | 196,693 | USD | | UBS | | 11/18/2022 | | (2,012) |
| 15,540,000 | CLP | | 16,300 | USD | | CBK | | 01/05/2023 | | (14) |
| 2,070,000 | CNY | | 292,476 | USD | | UBS | | 12/16/2022 | | (7,990) |
| 2,060,000 | CNY | | 292,468 | USD | | MSC | | 12/16/2022 | | (9,356) |
| 3,086,880,000 | COP | | 683,106 | USD | | CBK | | 11/18/2022 | | (59,967) |
| 1,354,940,000 | COP | | 270,537 | USD | | CBK | | 01/12/2023 | | 207 |
| 620,000 | EUR | | 620,908 | USD | | UBS | | 11/09/2022 | | (7,812) |
| 27,485,000 | HUF | | 63,621 | USD | | SSG | | 01/19/2023 | | 1,164 |
| 27,485,000 | HUF | | 63,645 | USD | | JPM | | 01/19/2023 | | 1,141 |
| 2,420,000 | PEN | | 618,135 | USD | | MSC | | 11/18/2022 | | (11,979) |
| 5,110,000 | ZAR | | 282,183 | USD | | SSG | | 12/01/2022 | | (4,673) |
| 378,479 | USD | | 2,041,100 | BRL | | MSC | | 01/27/2023 | | (9,247) |
| 204,609 | USD | | 184,250,000 | CLP | | UBS | | 11/18/2022 | | 9,927 |
| 445,119 | USD | | 417,246,700 | CLP | | CBK | | 11/18/2022 | | 4,250 |
| 414,830 | USD | | 410,060,000 | CLP | | MSC | | 01/05/2023 | | (14,895) |
| 592,284 | USD | | 4,130,000 | CNY | | JPM | | 12/16/2022 | | 24,686 |
The accompanying notes are an integral part of these financial statements.
Hartford Schroders Emerging Markets Multi-Sector Bond Fund
Schedule of Investments – (continued)
October 31, 2022
| Foreign Currency Contracts Outstanding at October 31, 2022 – (continued) |
Amount and Description of
Currency to be Purchased | | Amount and Description of
Currency to be Sold | | Counterparty | | Settlement
Date | | Appreciation/
(Depreciation) |
| 187,547 | USD | | 1,360,000 | CNY | | JPM | | 02/03/2023 | | $ (145) |
| 415,717 | USD | | 1,786,750,000 | COP | | JPM | | 11/18/2022 | | 55,031 |
| 288,277 | USD | | 1,300,130,000 | COP | | CBK | | 11/18/2022 | | 25,824 |
| 288,469 | USD | | 1,354,940,000 | COP | | JPM | | 01/12/2023 | | 17,725 |
| 166,589 | USD | | 829,000,000 | COP | | UBS | | 02/02/2023 | | 1,655 |
| 166,566 | USD | | 829,000,000 | COP | | MSC | | 02/02/2023 | | 1,633 |
| 634,074 | USD | | 620,000 | EUR | | MSC | | 11/09/2022 | | 20,979 |
| 129,219 | USD | | 54,970,000 | HUF | | SSG | | 01/19/2023 | | (353) |
| 622,268 | USD | | 2,420,000 | PEN | | CBK | | 11/18/2022 | | 16,112 |
| 293,670 | USD | | 5,110,000 | ZAR | | MSC | | 12/01/2022 | | 16,159 |
| 352,889 | USD | | 6,490,000 | ZAR | | JPM | | 01/13/2023 | | 1,561 |
| Total foreign currency contracts | | $ 92,551 |
† See Significant Accounting Policies of accompanying Notes to Financial Statements regarding valuation of investments.
Fair Value Summary
The following is a summary of the fair valuations according to the inputs used as of October 31, 2022 in valuing the Fund’s investments.
| Description | | Total | | Level 1 | | Level 2 | | Level 3(1) |
| Assets | | | | | | | | |
| Corporate Bonds | | $ 11,646,138 | | $ — | | $ 11,646,138 | | $ — |
| Foreign Government Obligations | | 13,851,601 | | — | | 13,851,601 | | — |
| Short-Term Investments | | 2,368,487 | | 1,035,239 | | 1,333,248 | | — |
| Foreign Currency Contracts(2) | | 220,994 | | — | | 220,994 | | — |
| Total | | $ 28,087,220 | | $ 1,035,239 | | $ 27,051,981 | | $ — |
| Liabilities | | | | | | | | |
| Foreign Currency Contracts(2) | | $ (128,443) | | $ — | | $ (128,443) | | $ — |
| Total | | $ (128,443) | | $ — | | $ (128,443) | | $ — |
| (1) | For the year ended October 31, 2022, there were no transfers in and out of Level 3. |
| (2) | Derivative instruments (excluding purchased and written options, if applicable) are valued at the unrealized appreciation/(depreciation) on the investments. |
Level 3 investments at the beginning and/or end of the period in relation to net assets were not significant and accordingly, a reconciliation of Level 3 assets for the year ended October 31, 2022 is not presented.
The accompanying notes are an integral part of these financial statements.
Hartford Schroders International Contrarian Value Fund
Schedule of Investments
October 31, 2022
| Shares or Principal Amount | | Market Value† |
| COMMON STOCKS - 96.5% |
| | Australia - 2.2% |
| 8,379 | South32 Ltd. | $ 19,224 |
| | Belgium - 2.2% |
| 566 | Ageas S.A. | 19,594 |
| | France - 15.9% |
| 1,015 | AXA S.A. | 25,065 |
| 1,465 | Carrefour S.A. | 23,580 |
| 2,340 | Orange S.A. | 22,295 |
| 388 | Publicis Groupe S.A. | 21,730 |
| 642 | Renault S.A.* | 19,767 |
| 312 | Sanofi | 26,850 |
| | | | 139,287 |
| | Germany - 11.2% |
| 496 | BASF SE | 22,256 |
| 466 | Bayer AG | 24,503 |
| 535 | Continental AG | 27,710 |
| 506 | HeidelbergCement AG | 23,269 |
| | | | 97,738 |
| | Italy - 7.3% |
| 2,128 | Eni S.p.A. | 27,948 |
| 7,843 | Intesa Sanpaolo S.p.A. | 14,953 |
| 1,701 | UniCredit S.p.A. | 21,095 |
| | | | 63,996 |
| | Japan - 13.7% |
| 700 | Bridgestone Corp. | 25,316 |
| 800 | Dentsu Group, Inc. | 24,883 |
| 800 | KDDI Corp. | 23,646 |
| 700 | Nippon Telegraph & Telephone Corp. | 19,306 |
| 3,700 | Panasonic Holdings Corp. | 26,354 |
| | | | 119,505 |
| | Netherlands - 1.8% |
| 1,618 | BNP Paribas Emissions- und Handelsgesellschaft mbH | 15,920 |
| | Singapore - 3.0% |
| 45,400 | Genting Singapore Ltd. | 25,818 |
| | Spain - 3.2% |
| 2,078 | Repsol S.A. | 28,270 |
| | Switzerland - 5.6% |
| 107 | Swatch Group AG | 24,044 |
| 337 | Swiss Re AG | 25,034 |
| | | | 49,078 |
| | United Kingdom - 30.4% |
| 638 | Anglo American plc | 19,111 |
| 8,880 | Barclays plc | 15,089 |
| 18,704 | BT Group plc | 27,873 |
| 1,699 | GSK plc | 27,832 |
| 2,679 | HSBC Holdings plc | 13,749 |
| 895 | Imperial Brands plc | 21,801 |
| 5,350 | NatWest Group plc | 14,409 |
| 28,323 | Rolls-Royce Holdings plc* | 25,402 |
| Shares or Principal Amount | | Market Value† |
| COMMON STOCKS - 96.5% - (continued) |
| | United Kingdom - 30.4% - (continued) |
| 1,061 | Shell plc | $ 29,391 |
| 3,436 | Standard Chartered plc | 20,529 |
| 9,649 | Tesco plc | 23,832 |
| 3,079 | WPP plc | 27,096 |
| | | | 266,114 |
| | Total Common Stocks
(cost $978,587) | | $ 844,544 |
| PREFERRED STOCKS - 3.6% |
| | Germany - 3.6% |
| 492 | Henkel AG & Co. KGaA (Preference Shares) | $ 30,995 |
| | Total Preferred Stocks
(cost $32,371) | | $ 30,995 |
| | Total Long-Term Investments
(cost $1,010,958) | | $ 875,539 |
| SHORT-TERM INVESTMENTS - 3.1% |
| | Other Investment Pools & Funds - 3.1% |
| $ 27,552 | Morgan Stanley Institutional Liquidity Funds, Treasury Portfolio, Institutional Class, 3.02%(1) | $ 27,552 |
| | Total Short-Term Investments
(cost $27,552) | $ 27,552 |
| | Total Investments
(cost $1,038,510) | 103.2% | $ 903,091 |
| | Other Assets and Liabilities | (3.2)% | (28,043) |
| | Total Net Assets | 100.0% | $ 875,048 |
| Note: | Percentage of investments as shown is the ratio of the total market value to total net assets. |
| | Prices of foreign equities that are principally traded on certain foreign markets will generally be adjusted daily pursuant to a fair value pricing service approved by Hartford Funds Management Company, LLC in order to reflect an adjustment for factors occurring after the close of certain foreign markets but before the close of the New York Stock Exchange. |
| | Equity industry classifications used in this report are the Global Industry Classification Standard, which was developed by and is the exclusive property and service mark of MSCI, Inc. and Standard & Poor’s. |
| | For Fund compliance purposes, the Fund may not use the same classification system. These classifications are used for financial reporting purposes. |
| | See “Glossary” for abbreviation descriptions. |
| * | Non-income producing. |
| (1) | Current yield as of period end. |
| † | See Significant Accounting Policies of accompanying Notes to Financial Statements regarding valuation of investments. |
The accompanying notes are an integral part of these financial statements.
Hartford Schroders International Contrarian Value Fund
Schedule of Investments – (continued)
October 31, 2022
Fair Value Summary
The following is a summary of the fair valuations according to the inputs used as of October 31, 2022 in valuing the Fund’s investments.
| Description | | Total | | Level 1 | | Level 2 | | Level 3(1) |
| Assets | | | | | | | | |
| Common Stocks | | | | | | | | |
| Australia | | $ 19,224 | | $ — | | $ 19,224 | | $ — |
| Belgium | | 19,594 | | — | | 19,594 | | — |
| France | | 139,287 | | — | | 139,287 | | — |
| Germany | | 97,738 | | — | | 97,738 | | — |
| Italy | | 63,996 | | — | | 63,996 | | — |
| Japan | | 119,505 | | — | | 119,505 | | — |
| Netherlands | | 15,920 | | — | | 15,920 | | — |
| Singapore | | 25,818 | | — | | 25,818 | | — |
| Spain | | 28,270 | | — | | 28,270 | | — |
| Switzerland | | 49,078 | | — | | 49,078 | | — |
| United Kingdom | | 266,114 | | — | | 266,114 | | — |
| Preferred Stocks | | 30,995 | | — | | 30,995 | | — |
| Short-Term Investments | | 27,552 | | 27,552 | | — | | — |
| Total | | $ 903,091 | | $ 27,552 | | $ 875,539 | | $ — |
| (1) | For the year ended October 31, 2022, there were no transfers in and out of Level 3. |
The accompanying notes are an integral part of these financial statements.
Hartford Schroders International Multi-Cap Value Fund
Schedule of Investments
October 31, 2022
| Shares or Principal Amount | | Market Value† |
| COMMON STOCKS - 97.7% |
| | Australia - 3.4% |
| 497,736 | Allkem Ltd.* | $ 4,598,911 |
| 1,599,129 | Beach Energy Ltd. | 1,635,206 |
| 308,659 | BHP Group Ltd. | 7,385,177 |
| 86,132 | Computershare Ltd. | 1,394,308 |
| 162,374 | Fortescue Metals Group Ltd. | 1,529,726 |
| 448,954 | IGO Ltd. | 4,390,745 |
| 453,174 | Iluka Resources Ltd. | 2,510,824 |
| 147,563 | Mineral Resources Ltd. | 6,918,016 |
| 63,714 | Nick Scali Ltd. | 410,333 |
| 475,648 | Perenti Global Ltd.* | 291,494 |
| 777,878 | Pilbara Minerals Ltd.* | 2,528,296 |
| 973,005 | Qantas Airways Ltd.* | 3,635,892 |
| 125,874 | Rio Tinto Ltd. | 7,143,298 |
| 1,382,809 | Santos Ltd. | 6,750,399 |
| 128,451 | SmartGroup Corp. Ltd. | 404,980 |
| 1,750,781 | Telstra Group Ltd. | 4,389,957 |
| 657,571 | Woodside Energy Group Ltd. | 15,208,113 |
| | | | 71,125,675 |
| | Austria - 1.0% |
| 22,911 | AT&S Austria Technologie & Systemtechnik AG | 707,605 |
| 77,954 | Erste Group Bank AG | 1,921,171 |
| 6,553 | Lenzing AG | 313,522 |
| 273,584 | OMV AG | 12,596,721 |
| 74,699 | Raiffeisen Bank International AG | 1,038,855 |
| 75,793 | Telekom Austria AG | 440,579 |
| 47,283 | Verbund AG | 3,703,907 |
| 44,848 | Wienerberger AG | 1,025,172 |
| | | | 21,747,532 |
| | Belgium - 1.0% |
| 127,984 | Ageas S.A. | 4,430,573 |
| 50,069 | bpost S.A. | 247,495 |
| 230,164 | KBC Group N.V. | 11,534,838 |
| 43,713 | Solvay S.A. | 3,944,698 |
| | | | 20,157,604 |
| | Brazil - 0.2% |
| 317,900 | Cia de Saneamento de Minas Gerais | 945,300 |
| 492,700 | EDP - Energias do Brasil S.A. | 2,200,482 |
| 66,400 | Sao Martinho S.A. | 346,686 |
| | | | 3,492,468 |
| | Canada - 8.6% |
| 685,754 | ARC Resources Ltd. | 9,654,466 |
| 196,651 | Bank of Montreal(1) | 18,114,093 |
| 456,235 | BCE, Inc. | 20,578,883 |
| 72,447 | BRP, Inc. | 4,843,981 |
| 52,100 | Canaccord Genuity Group, Inc. | 266,934 |
| 164,503 | Canadian Natural Resources Ltd. | 9,866,437 |
| 214,372 | Capstone Mining Corp.* | 497,240 |
| 124,197 | CI Financial Corp. | 1,243,474 |
| 1,693 | Fairfax Financial Holdings Ltd. | 831,482 |
| 64,943 | Fiera Capital Corp.(1) | 413,297 |
| 206,005 | Fortuna Silver Mines, Inc.*(1) | 573,097 |
| 15,764 | George Weston Ltd. | 1,735,099 |
| 134,097 | Gildan Activewear, Inc. | 4,231,534 |
| 107,676 | Imperial Oil Ltd. | 5,857,429 |
| 23,725 | Largo, Inc.*(1) | 149,593 |
| 170,287 | Loblaw Cos., Ltd. | 13,951,947 |
| 59,466 | Magna International, Inc. | 3,313,876 |
| 561,572 | Manulife Financial Corp. | 9,307,664 |
| 42,700 | Martinrea International, Inc. | 273,623 |
| 229,936 | Metro, Inc. | 12,045,753 |
| 211,419 | National Bank of Canada | 14,395,145 |
| 75,057 | Nutrien Ltd. | 6,341,844 |
| 228,451 | Parex Resources, Inc. | 3,484,576 |
| 111,448 | Royal Bank of Canada | 10,311,609 |
| Shares or Principal Amount | | Market Value† |
| COMMON STOCKS - 97.7% - (continued) |
| | Canada - 8.6% - (continued) |
| 42,321 | Sleep Country Canada Holdings, Inc.(2) | $ 696,471 |
| 267,069 | Suncor Energy, Inc. | 9,186,225 |
| 70,449 | Teck Resources Ltd. Class B | 2,144,471 |
| 261,687 | Toronto-Dominion Bank | 16,747,891 |
| 38,664 | Transcontinental, Inc. Class A | 441,315 |
| | | | 181,499,449 |
| | Chile - 0.4% |
| 3,946,496 | Aguas Andinas S.A. Class A | 832,382 |
| 82,269 | Sociedad Quimica y Minera de Chile S.A. ADR | 7,706,960 |
| | | | 8,539,342 |
| | China - 5.4% |
| 809,000 | 3SBio, Inc.(2) | 571,322 |
| 10,136,000 | Agricultural Bank of China Ltd. Class H | 2,893,151 |
| 1,995,000 | Alibaba Group Holding Ltd.* | 15,510,939 |
| 2,526,500 | BAIC Motor Corp. Ltd. Class H(2) | 559,733 |
| 841,000 | Baidu, Inc. Class A* | 8,062,663 |
| 2,814,000 | Bank of China Ltd. Class H | 906,325 |
| 9,356,000 | China Construction Bank Corp. Class H | 4,965,119 |
| 1,738,000 | China Longyuan Power Group Corp. Ltd. Class H | 1,985,961 |
| 1,336,000 | China Medical System Holdings Ltd. | 1,460,146 |
| 1,840,000 | China Merchants Bank Co., Ltd. Class H | 6,023,975 |
| 984,000 | China Shineway Pharmaceutical Group Ltd. | 591,345 |
| 32,662,000 | China Tower Corp. Ltd. Class H(2) | 2,955,090 |
| 795,000 | Fu Shou Yuan International Group Ltd. | 397,168 |
| 546,560 | Ganfeng Lithium Co., Ltd. Class H(2) | 3,696,723 |
| 654,000 | Greentown Management Holdings Co., Ltd.(2) | 374,403 |
| 528,000 | Haitian International Holdings Ltd. | 1,057,140 |
| 16,977,000 | Industrial & Commercial Bank of China Ltd. Class H | 7,370,825 |
| 555,350 | JD.com, Inc. Class A | 10,113,207 |
| 994,200 | Kingsoft Corp. Ltd. | 3,010,579 |
| 587,400 | Livzon Pharmaceutical Group, Inc. Class H | 1,537,495 |
| 6,369,000 | Lonking Holdings Ltd. | 876,230 |
| 129,500 | NetDragon Websoft Holdings Ltd. | 217,447 |
| 841,000 | NetEase, Inc. | 9,331,103 |
| 1,114,500 | Ping An Insurance Group Co. of China Ltd. Class H | 4,461,779 |
| 159,000 | S-Enjoy Service Group Co., Ltd.(1) | 72,877 |
| 1,754,000 | Sinotrans Ltd. Class H | 427,104 |
| 593,000 | Tencent Holdings Ltd. | 15,582,126 |
| 510,000 | Tianqi Lithium Corp. Class H* | 4,158,147 |
| 1,117,600 | Xinte Energy Co., Ltd. Class H | 2,180,318 |
| 1,124,000 | Yadea Group Holdings Ltd.(2) | 1,716,213 |
| 814,000 | Yangzijiang Shipbuilding Holdings Ltd. | 690,048 |
| 800,600 | ZTE Corp. Class H | 1,428,145 |
| | | | 115,184,846 |
| | Colombia - 0.0% |
| 7,173 | Geopark Ltd. | 106,017 |
| 26,351 | Tecnoglass, Inc.(1) | 540,986 |
| | | | 647,003 |
| | Czech Republic - 0.4% |
| 246,193 | CEZ AS | 8,051,370 |
| | Denmark - 0.7% |
| 308,884 | Danske Bank AS | 4,982,603 |
| 176,668 | Pandora A/S | 9,293,352 |
| | | | 14,275,955 |
| | Finland - 0.4% |
| 76,048 | Elisa Oyj | 3,675,119 |
| 1,030,086 | Nokia Oyj | 4,577,612 |
| 45,881 | TietoEVRY Oyj | 1,093,767 |
| | | | 9,346,498 |
The accompanying notes are an integral part of these financial statements.
Hartford Schroders International Multi-Cap Value Fund
Schedule of Investments – (continued)
October 31, 2022
| Shares or Principal Amount | | Market Value† |
| COMMON STOCKS - 97.7% - (continued) |
| | France - 6.5% |
| 22,351 | Amundi S.A.(2) | $ 1,054,518 |
| 143,785 | BNP Paribas S.A. | 6,742,636 |
| 140,022 | Bureau Veritas S.A. | 3,464,181 |
| 274,661 | Carrefour S.A. | 4,420,792 |
| 156,834 | Cie de Saint-Gobain | 6,411,520 |
| 177,541 | Cie Generale des Etablissements Michelin SCA | 4,524,463 |
| 58,767 | Coface S.A.* | 654,203 |
| 116,420 | Elis S.A. | 1,333,231 |
| 610,118 | Engie S.A. | 7,927,478 |
| 18,534 | Eramet S.A. | 1,214,191 |
| 64,379 | Eutelsat Communications S.A. | 646,246 |
| 66,985 | Ipsen S.A. | 6,883,901 |
| 43,285 | IPSOS | 2,095,305 |
| 296,019 | Metropole Television S.A. | 3,061,584 |
| 1,457,009 | Orange S.A. | 13,882,254 |
| 76,124 | Pernod Ricard S.A. | 13,360,612 |
| 51,458 | Publicis Groupe S.A. | 2,881,873 |
| 277,494 | Rexel S.A. | 4,951,962 |
| 321,736 | Sanofi | 27,687,891 |
| 231,236 | Societe Generale S.A. | 5,303,865 |
| 354,624 | TotalEnergies SE | 19,345,927 |
| 21,308 | Verallia S.A.(2) | 603,760 |
| | | | 138,452,393 |
| | Georgia - 0.1% |
| 68,559 | TBC Bank Group plc | 1,481,265 |
| | Germany - 1.7% |
| 59,420 | BASF SE | 2,666,213 |
| 90,620 | Bayer AG | 4,764,893 |
| 17,921 | Bayerische Motoren Werke AG | 1,406,653 |
| 55,136 | Brenntag SE | 3,345,448 |
| 274,987 | Deutsche Bank AG | 2,621,105 |
| 624,327 | Deutsche Telekom AG | 11,784,475 |
| 31,400 | DWS Group GmbH & Co. KGaA(2) | 848,941 |
| 80,780 | Fresenius SE & Co. KGaA | 1,859,001 |
| 52,583 | Mercedes-Benz Group AG | 3,043,586 |
| 37,960 | Porsche Automobil Holding SE | 2,120,910 |
| 251,499 | Schaeffler AG(1) | 1,292,271 |
| 19,622 | Vitesco Technologies Group AG Class A* | 1,049,945 |
| | | | 36,803,441 |
| | Greece - 0.1% |
| 169,852 | OPAP S.A. | 2,081,221 |
| | Hong Kong - 1.1% |
| 303,500 | Beijing Enterprises Holdings Ltd. | 769,949 |
| 746,500 | China Overseas Land & Investment Ltd. | 1,426,501 |
| 758,000 | China Water Affairs Group Ltd. | 536,856 |
| 656,303 | CK Asset Holdings Ltd. | 3,628,415 |
| 3,317,000 | GCL Technology Holdings Ltd.* | 840,717 |
| 99,000 | Hang Lung Properties Ltd. | 124,538 |
| 367,000 | Henderson Land Development Co., Ltd. | 898,511 |
| 394,400 | Hongkong Land Holdings Ltd. | 1,518,394 |
| 276,000 | Kerry Properties Ltd. | 436,600 |
| 720,000 | Sino Land Co., Ltd. | 768,827 |
| 1,421,000 | SITC International Holdings Co., Ltd. | 2,327,309 |
| 390,000 | Sun Hung Kai Properties Ltd. | 4,191,063 |
| 280,000 | Swire Pacific Ltd. Class A | 1,857,383 |
| 708,800 | Swire Properties Ltd. | 1,362,252 |
| 1,242,000 | Untrade Youyuan*(1)(3) | — |
| 668,000 | Wharf Real Estate Investment Co., Ltd. | 2,631,960 |
| | | | 23,319,275 |
| | Hungary - 0.3% |
| 178,355 | OTP Bank Nyrt | 3,890,962 |
| 161,929 | Richter Gedeon Nyrt | 3,203,075 |
| | | | 7,094,037 |
| Shares or Principal Amount | | Market Value† |
| COMMON STOCKS - 97.7% - (continued) |
| | India - 0.6% |
| 3,395,578 | Power Grid Corp. of India Ltd. | $ 9,368,654 |
| 75,779 | Sun TV Network Ltd. | 478,882 |
| 268,205 | UPL Ltd. | 2,367,745 |
| | | | 12,215,281 |
| | Indonesia - 1.2% |
| 12,188,900 | Bank Mandiri Persero Tbk PT | 8,234,249 |
| 19,286,700 | Bank Rakyat Indonesia Persero Tbk PT | 5,753,861 |
| 7,749,100 | Media Nusantara Citra Tbk PT | 407,802 |
| 40,877,700 | Telkom Indonesia Persero Tbk PT | 11,480,534 |
| | | | 25,876,446 |
| | Ireland - 0.4% |
| 1,218,668 | AIB Group plc | 3,525,501 |
| 215,007 | Bank of Ireland Group plc | 1,548,184 |
| 129,726 | Kenmare Resources plc | 610,700 |
| 97,845 | Smurfit Kappa Group plc | 3,238,957 |
| | | | 8,923,342 |
| | Israel - 0.8% |
| 75,768 | Check Point Software Technologies Ltd.* | 9,791,499 |
| 322,441 | ICL Group Ltd. | 2,907,644 |
| 196,883 | Plus500 Ltd. | 4,075,425 |
| | | | 16,774,568 |
| | Italy - 2.7% |
| 364,471 | Anima Holding S.p.A.(2) | 1,128,827 |
| 209,548 | Azimut Holding S.p.A. | 3,374,154 |
| 820,098 | Enel S.p.A. | 3,663,663 |
| 1,382,776 | Eni S.p.A. | 18,160,990 |
| 1,742,588 | Italgas S.p.A. | 8,978,245 |
| 368,788 | Mediobanca Banca di Credito Finanziario S.p.A. | 3,341,066 |
| 35,198 | Moncler S.p.A. | 1,518,590 |
| 309,588 | Pirelli & C. S.p.A.(2) | 1,167,784 |
| 90,142 | RAI Way S.p.A.(2) | 431,824 |
| 178,890 | Recordati Industria Chimica e Farmaceutica S.p.A. | 6,721,163 |
| 1,091,891 | Terna - Rete Elettrica Nazionale | 7,241,055 |
| 170,981 | UniCredit S.p.A. | 2,120,380 |
| | | | 57,847,741 |
| | Japan - 15.6% |
| 192,700 | AGC, Inc. | 6,038,245 |
| 80,400 | Air Water, Inc. | 897,652 |
| 188,600 | Aisin Corp. | 4,841,312 |
| 1,744,000 | Astellas Pharma, Inc. | 24,064,029 |
| 256,100 | Citizen Watch Co., Ltd. | 1,075,545 |
| 83,900 | CKD Corp. | 1,028,978 |
| 94,400 | Dexerials Corp. | 2,198,654 |
| 46,800 | Dowa Holdings Co., Ltd. | 1,485,995 |
| 1,577,000 | ENEOS Holdings, Inc. | 5,201,979 |
| 61,600 | Exedy Corp. | 722,163 |
| 104,600 | FCC Co., Ltd. | 1,017,019 |
| 205,400 | Fujikura Ltd. | 1,216,169 |
| 24,100 | Goldcrest Co., Ltd. | 282,856 |
| 64,200 | GS Yuasa Corp. | 977,387 |
| 29,400 | G-Tekt Corp. | 262,804 |
| 106,900 | Hokuetsu Corp. | 554,539 |
| 344,800 | Honda Motor Co., Ltd. | 7,862,293 |
| 57,400 | Hosiden Corp. | 605,447 |
| 2,040,400 | Inpex Corp. | 20,592,523 |
| 682,300 | Isuzu Motors Ltd. | 8,023,615 |
| 230,200 | ITOCHU Corp. | 5,949,412 |
| 52,500 | Japan Petroleum Exploration Co., Ltd. | 1,364,102 |
| 47,200 | Japan Post Insurance Co., Ltd. | 698,709 |
| 173,100 | JTEKT Corp. | 1,222,057 |
| 122,000 | Kajima Corp. | 1,148,408 |
| 349,500 | Kamigumi Co., Ltd. | 6,646,332 |
The accompanying notes are an integral part of these financial statements.
Hartford Schroders International Multi-Cap Value Fund
Schedule of Investments – (continued)
October 31, 2022
| Shares or Principal Amount | | Market Value† |
| COMMON STOCKS - 97.7% - (continued) |
| | Japan - 15.6% - (continued) |
| 77,600 | Kanamoto Co., Ltd.(1) | $ 1,120,235 |
| 63,800 | Kandenko Co., Ltd. | 358,616 |
| 61,300 | Kaneka Corp. | 1,520,072 |
| 873,300 | KDDI Corp. | 25,812,102 |
| 79,200 | Kinden Corp. | 805,888 |
| 522,300 | Kirin Holdings Co., Ltd. | 7,677,774 |
| 26,400 | Komeri Co., Ltd. | 460,573 |
| 23,500 | Kureha Corp. | 1,508,924 |
| 45,600 | Kyudenko Corp. | 967,195 |
| 36,700 | Makino Milling Machine Co., Ltd. | 1,133,977 |
| 835,700 | Marubeni Corp. | 7,315,645 |
| 947,200 | Mazda Motor Corp. | 6,377,460 |
| 25,800 | Meidensha Corp. | 343,251 |
| 691,300 | Mitsubishi Chemical Group Corp. | 3,122,845 |
| 194,700 | Mitsubishi Corp. | 5,274,205 |
| 139,400 | Mitsubishi Gas Chemical Co., Inc. | 1,771,385 |
| 280,100 | Mitsui & Co., Ltd. | 6,198,381 |
| 145,500 | Mitsui Chemicals, Inc. | 2,693,048 |
| 26,300 | Mitsui Mining & Smelting Co., Ltd. | 531,196 |
| 265,200 | Mizuho Financial Group, Inc. | 2,868,260 |
| 35,400 | Mizuno Corp. | 606,045 |
| 267,000 | NGK Spark Plug Co., Ltd. | 4,871,162 |
| 119,400 | NHK Spring Co., Ltd. | 661,487 |
| 10,868 | Nichirin Co., Ltd. | 123,200 |
| 56,200 | Nippon Electric Glass Co., Ltd. | 973,136 |
| 29,400 | Nippon Shokubai Co., Ltd. | 1,054,600 |
| 653,500 | Nippon Telegraph & Telephone Corp. | 18,023,983 |
| 24,000 | Nishio Rent All Co., Ltd. | 482,551 |
| 22,200 | Nitta Corp. | 430,762 |
| 137,100 | NOK Corp. | 1,121,505 |
| 12,400 | Noritake Co. Ltd. | 344,232 |
| 514,400 | Oji Holdings Corp. | 1,783,283 |
| 1,136,600 | Ono Pharmaceutical Co., Ltd. | 26,748,233 |
| 316,600 | Panasonic Holdings Corp. | 2,255,019 |
| 198,500 | Press Kogyo Co., Ltd. | 555,123 |
| 460,600 | Renesas Electronics Corp.* | 3,853,263 |
| 240,100 | Rengo Co., Ltd. | 1,333,903 |
| 26,800 | Rorze Corp. | 1,346,737 |
| 77,000 | Sekisui House Ltd. | 1,278,415 |
| 355,600 | Senko Group Holdings Co., Ltd. | 2,375,374 |
| 54,600 | Shin-Etsu Chemical Co., Ltd. | 5,674,574 |
| 123,400 | Shinko Electric Industries Co., Ltd. | 2,965,460 |
| 43,000 | Sintokogio Ltd. | 198,552 |
| 327,100 | SKY Perfect JSAT Holdings, Inc. | 1,145,678 |
| 320,500 | Sumco Corp. | 4,062,283 |
| 49,400 | Sumitomo Bakelite Co., Ltd. | 1,337,074 |
| 938,000 | Sumitomo Chemical Co., Ltd. | 3,158,488 |
| 125,600 | Sumitomo Corp. | 1,596,849 |
| 316,000 | Sumitomo Electric Industries Ltd. | 3,302,300 |
| 245,400 | Sumitomo Forestry Co., Ltd. | 3,838,932 |
| 87,700 | Sumitomo Heavy Industries Ltd. | 1,662,330 |
| 265,700 | Sumitomo Mitsui Financial Group, Inc. | 7,461,270 |
| 140,800 | Sumitomo Rubber Industries Ltd. | 1,207,908 |
| 33,600 | Sumitomo Seika Chemicals Co., Ltd. | 670,689 |
| 86,500 | Taisei Corp. | 2,356,313 |
| 61,500 | Takeuchi Manufacturing Co., Ltd. | 1,240,269 |
| 63,600 | TBS Holdings, Inc. | 658,825 |
| 107,100 | Toagosei Co., Ltd. | 822,875 |
| 31,900 | Toho Holdings Co., Ltd. | 433,822 |
| 41,700 | Tokai Rika Co., Ltd. | 435,160 |
| 62,200 | Tokyo Seimitsu Co., Ltd. | 1,870,639 |
| 124,700 | Tokyo Steel Manufacturing Co., Ltd. | 1,070,638 |
| 210,100 | Toppan, Inc. | 3,133,466 |
| 120,100 | Toyo Seikan Group Holdings Ltd. | 1,373,637 |
| 21,400 | Toyoda Gosei Co., Ltd. | 342,116 |
| 36,100 | Toyota Boshoku Corp. | 459,357 |
| 265,200 | Toyota Motor Corp. | 3,679,544 |
| Shares or Principal Amount | | Market Value† |
| COMMON STOCKS - 97.7% - (continued) |
| | Japan - 15.6% - (continued) |
| 196,700 | Toyota Tsusho Corp. | $ 6,602,411 |
| 44,400 | TPR Co., Ltd. | 372,706 |
| 34,400 | Tsubakimoto Chain Co. | 736,495 |
| 20,200 | Tv Tokyo Holdings Corp. | 258,306 |
| 61,500 | Ulvac, Inc. | 2,424,392 |
| 92,000 | Wakita & Co., Ltd. | 726,284 |
| 282,800 | Yamaha Motor Co., Ltd. | 5,837,714 |
| 104,500 | Yokohama Rubber Co., Ltd. | 1,634,078 |
| 54,500 | Yurtec Corp. | 260,856 |
| | | | 329,073,559 |
| | Luxembourg - 0.1% |
| 66,373 | RTL Group S.A. | 2,253,093 |
| | Malaysia - 0.2% |
| 337,797 | Lynas Rare Earths Ltd.* | 1,801,738 |
| 1,049,000 | Malayan Banking Bhd | 1,905,565 |
| 944,900 | RHB Bank Bhd | 1,144,265 |
| | | | 4,851,568 |
| | Mexico - 1.3% |
| 2,641,701 | Bolsa Mexicana de Valores S.A.B. de C.V. | 4,789,275 |
| 2,296,000 | Concentradora Fibra Danhos S.A. de C.V. REIT(1) | 2,839,146 |
| 24,440 | Fomento Economico Mexicano S.A.B. de C.V. ADR | 1,750,393 |
| 658,100 | Gentera S.A.B. de C.V. | 674,940 |
| 353,800 | Grupo Aeroportuario del Centro Norte S.A.B. de C.V. | 2,821,400 |
| 837,200 | Grupo Financiero Banorte S.A.B. de C.V. Class O | 6,815,322 |
| 5,279,399 | Kimberly-Clark de Mexico S.A.B. de C.V. Class A | 8,318,924 |
| 2 | Urbi Desarrollos Urbanos S.A.B. de C.V.* | 1 |
| | | | 28,009,401 |
| | Netherlands - 3.9% |
| 583,528 | ABN Amro Bank N.V. GDR(2) | 5,736,448 |
| 856,319 | Aegon N.V. | 3,964,035 |
| 84,464 | AMG Advanced Metallurgical Group N.V. | 2,638,900 |
| 255,475 | ASR Nederland N.V. | 11,249,298 |
| 554,471 | BNP Paribas Emissions- und Handelsgesellschaft mbH | 5,455,765 |
| 155,335 | Heineken N.V. | 12,975,784 |
| 9,052,281 | Koninklijke KPN N.V. | 25,320,184 |
| 78,093 | Koninklijke Vopak N.V. | 1,595,596 |
| 116,594 | NN Group N.V. | 4,936,874 |
| 89,196 | Signify N.V.(2) | 2,471,190 |
| 438,660 | Stellantis N.V. | 5,918,210 |
| | | | 82,262,284 |
| | New Zealand - 0.3% |
| 165,292 | Freightways Ltd. | 993,191 |
| 1,537,916 | Spark New Zealand Ltd. | 4,578,010 |
| | | | 5,571,201 |
| | Norway - 1.9% |
| 204,080 | Aker BP ASA | 6,482,877 |
| 882,952 | DNO ASA | 1,148,485 |
| 723,891 | Equinor ASA | 26,374,041 |
| 203,002 | Europris ASA(2) | 1,208,707 |
| 121,049 | Yara International ASA | 5,402,588 |
| | | | 40,616,698 |
| | Poland - 0.1% |
| 292,319 | Powszechna Kasa Oszczednosci Bank Polski S.A. | 1,592,955 |
| | Portugal - 0.6% |
| 1,009,665 | Galp Energia SGPS S.A. | 10,251,227 |
The accompanying notes are an integral part of these financial statements.
Hartford Schroders International Multi-Cap Value Fund
Schedule of Investments – (continued)
October 31, 2022
| Shares or Principal Amount | | Market Value† |
| COMMON STOCKS - 97.7% - (continued) |
| | Portugal - 0.6% - (continued) |
| 78,141 | Greenvolt-Energias Renovaveis S.A.* | $ 600,228 |
| 239,489 | Navigator Co. S.A. | 912,417 |
| | | | 11,763,872 |
| | Russia - 0.0% |
| 19,959,800 | RusHydro PJSC*(3) | — |
| | Singapore - 1.7% |
| 559,100 | DBS Group Holdings Ltd. | 13,516,971 |
| 1,899,300 | Oversea-Chinese Banking Corp. Ltd. | 16,303,748 |
| 1,084,400 | Sheng Siong Group Ltd. | 1,196,013 |
| 558,600 | Singapore Airlines Ltd.* | 2,072,019 |
| 504,900 | UMS Holdings Ltd. | 319,342 |
| 712,100 | UOL Group Ltd. | 3,110,302 |
| | | | 36,518,395 |
| | South Africa - 1.3% |
| 771,860 | AVI Ltd. | 3,091,679 |
| 74,534 | Kumba Iron Ore Ltd. | 1,402,172 |
| 470,703 | MultiChoice Group Ltd. | 3,075,793 |
| 56,454 | Naspers Ltd. Class N | 5,819,380 |
| 308,259 | Sappi Ltd.* | 949,686 |
| 681,595 | Truworths International Ltd. | 1,939,724 |
| 1,501,660 | Vodacom Group Ltd. | 10,228,570 |
| | | | 26,507,004 |
| | South Korea - 4.5% |
| 21,307 | AfreecaTV Co., Ltd. | 1,186,270 |
| 30,450 | Asia Paper Manufacturing Co., Ltd. | 781,621 |
| 70,546 | BH Co., Ltd. | 1,190,469 |
| 4,478 | CJ CheilJedang Corp. | 1,300,150 |
| 46,588 | Classys, Inc. | 502,413 |
| 36,255 | Coway Co., Ltd. | 1,405,820 |
| 91,633 | Daeduck Electronics Co., Ltd. / New | 1,577,302 |
| 19,133 | Daesang Corp. | 281,091 |
| 76,907 | DB HiTek Co., Ltd. | 2,380,582 |
| 13,109 | Dentium Co., Ltd. | 700,688 |
| 54,377 | Doosan Bobcat, Inc. | 1,276,171 |
| 5,772 | GOLFZON Co., Ltd. | 466,352 |
| 33,737 | HAESUNG DS Co., Ltd. | 897,094 |
| 110,742 | Hana Financial Group, Inc. | 3,201,703 |
| 18,238 | Handsome Co., Ltd. | 320,766 |
| 70,539 | Hankook Tire & Technology Co., Ltd. | 1,806,804 |
| 7,504 | Hansol Chemical Co., Ltd. | 974,633 |
| 1,217 | Hyosung Advanced Materials Corp. | 271,856 |
| 1,807 | Hyosung TNC Corp. | 331,095 |
| 27,797 | Hyundai Department Store Co., Ltd. | 1,054,276 |
| 20,511 | Hyundai Glovis Co., Ltd. | 2,500,029 |
| 6,416 | Hyundai Home Shopping Network Corp. | 201,565 |
| 5,365 | Hyundai Motor Co. | 618,254 |
| 11,716 | Hyundai Wia Corp. | 501,203 |
| 39,862 | Innox Advanced Materials Co., Ltd. | 762,870 |
| 30,973 | INTOPS Co., Ltd. | 604,166 |
| 46,610 | KB Financial Group, Inc. | 1,568,383 |
| 162,074 | Kia Corp. | 7,531,706 |
| 591,223 | KT Corp. | 15,179,596 |
| 59,066 | KT Skylife Co., Ltd. | 339,032 |
| 11,166 | LEENO Industrial, Inc. | 1,069,787 |
| 35,624 | LG Corp. | 1,977,595 |
| 52,159 | LG Electronics, Inc. | 2,979,334 |
| 29,201 | LG Innotek Co., Ltd. | 6,058,163 |
| 198,506 | LG Uplus Corp. | 1,594,059 |
| 21,160 | Lotte Chemical Corp. | 2,192,565 |
| 6,389 | Lotte Chilsung Beverage Co., Ltd. | 629,150 |
| 37,058 | LOTTE Fine Chemical Co., Ltd. | 1,457,250 |
| 55,463 | Lutronic Corp. | 704,108 |
| 12,783 | SFA Engineering Corp. | 341,767 |
| 29,771 | Shinhan Financial Group Co., Ltd. | 756,676 |
| 90,604 | SIMMTECH Co., Ltd. | 2,240,609 |
| Shares or Principal Amount | | Market Value† |
| COMMON STOCKS - 97.7% - (continued) |
| | South Korea - 4.5% - (continued) |
| 19,588 | SK Hynix, Inc. | $ 1,133,979 |
| 37,398 | SK Innovation Co., Ltd.* | 4,528,457 |
| 250,231 | SK Telecom Co., Ltd. | 8,793,546 |
| 80,011 | S-Oil Corp. | 4,851,431 |
| 4,748 | Soulbrain Co., Ltd. | 680,748 |
| 6,999 | Tokai Carbon Korea Co., Ltd. | 497,366 |
| 34,309 | Wonik QnC Corp. | 584,529 |
| 23,799 | Youngone Corp. | 788,827 |
| | | | 95,573,906 |
| | Spain - 2.0% |
| 276,630 | Acerinox S.A. | 2,424,397 |
| 119,821 | Atresmedia Corp. de Medios de Comunicacion S.A.(1) | 345,789 |
| 1,470,165 | Banco Bilbao Vizcaya Argentaria S.A. | 7,584,270 |
| 53,723 | CIE Automotive S.A. | 1,368,496 |
| 401,279 | Endesa S.A. | 6,704,585 |
| 16,226 | Grupo Catalana Occidente S.A. | 440,684 |
| 47,228 | Laboratorios Farmaceuticos Rovi S.A. | 2,148,034 |
| 598,023 | Red Electrica Corp. S.A. | 9,673,443 |
| 847,973 | Repsol S.A. | 11,536,219 |
| | | | 42,225,917 |
| | Sweden - 2.8% |
| 173,772 | Assa Abloy AB Class B | 3,508,817 |
| 85,151 | Boliden AB | 2,476,267 |
| 88,182 | Evolution AB(2) | 8,225,853 |
| 475,621 | Securitas AB Class B(1) | 3,886,207 |
| 1,269,109 | Skandinaviska Enskilda Banken AB Class A | 13,380,713 |
| 889,197 | Stillfront Group AB* | 1,730,690 |
| 953,107 | Swedbank AB Class A | 14,208,965 |
| 612,327 | Tele2 AB Class B | 5,018,641 |
| 993,571 | Telefonaktiebolaget LM Ericsson Class B | 5,523,603 |
| 478,979 | Truecaller AB Class B*(1) | 1,753,137 |
| | | | 59,712,893 |
| | Switzerland - 4.3% |
| 203,487 | Ferrexpo plc | 238,664 |
| 148,060 | Julius Baer Group Ltd. | 7,103,750 |
| 344,182 | Novartis AG | 27,841,126 |
| 70,692 | Roche Holding AG | 23,455,473 |
| 35,498 | Swisscom AG | 17,528,525 |
| 8,090 | Swissquote Group Holding S.A. | 958,270 |
| 884,469 | UBS Group AG | 14,022,506 |
| | | | 91,148,314 |
| | Taiwan - 3.9% |
| 1,150,000 | ASE Technology Holding Co., Ltd. | 2,839,521 |
| 129,000 | Bizlink Holding, Inc. | 983,734 |
| 702,000 | Chicony Electronics Co., Ltd. | 1,741,610 |
| 12,947 | ChipMOS Technologies, Inc. ADR | 255,833 |
| 1,730,000 | Compeq Manufacturing Co., Ltd. | 2,337,105 |
| 1,499,000 | E Ink Holdings, Inc. | 9,524,901 |
| 1,275,750 | Fubon Financial Holding Co., Ltd. | 2,015,090 |
| 167,000 | Globalwafers Co., Ltd. | 1,851,017 |
| 688,000 | Gold Circuit Electronics Ltd. | 1,820,758 |
| 749,000 | Hon Hai Precision Industry Co., Ltd. | 2,378,881 |
| 184,000 | International Games System Co., Ltd. | 2,003,301 |
| 118,000 | Lotes Co., Ltd. | 2,831,872 |
| 279,000 | MediaTek, Inc. | 5,085,666 |
| 149,000 | Nien Made Enterprise Co., Ltd. | 1,148,856 |
| 757,000 | Pegatron Corp. | 1,383,855 |
| 318,000 | Radiant Opto-Electronics Corp. | 968,904 |
| 426,000 | Realtek Semiconductor Corp. | 3,358,268 |
| 191,000 | Simplo Technology Co., Ltd. | 1,517,644 |
| 1,198,000 | Sino-American Silicon Products, Inc. | 4,594,294 |
| 1,888,000 | Taiwan Semiconductor Manufacturing Co., Ltd. | 22,697,920 |
| 218,000 | TXC Corp. | 514,513 |
The accompanying notes are an integral part of these financial statements.
Hartford Schroders International Multi-Cap Value Fund
Schedule of Investments – (continued)
October 31, 2022
| Shares or Principal Amount | | Market Value† |
| COMMON STOCKS - 97.7% - (continued) |
| | Taiwan - 3.9% - (continued) |
| 1,360,000 | Unimicron Technology Corp. | $ 5,225,623 |
| 762,000 | United Microelectronics Corp. | 916,275 |
| 1,174,000 | Vanguard International Semiconductor Corp. | 2,410,420 |
| 219,675 | Yageo Corp. | 2,490,460 |
| | | | 82,896,321 |
| | Thailand - 0.9% |
| 681,500 | Advanced Info Service PCL NVDR | 3,424,549 |
| 1,888,800 | Bangkok Bank PCL NVDR | 7,232,954 |
| 1,174,000 | Kasikornbank PCL NVDR | 4,517,221 |
| 1,932,900 | Krung Thai Bank PCL NVDR | 890,663 |
| 2,461,400 | PTT PCL NVDR | 2,329,387 |
| 3,943,700 | TTW PCL NVDR | 901,476 |
| | | | 19,296,250 |
| | Turkey - 0.1% |
| 238,731 | Tofas Turk Otomobil Fabrikasi AS | 1,259,632 |
| | United Arab Emirates - 0.0% |
| 232,950 | Network International Holdings plc*(2) | 868,228 |
| | United Kingdom - 15.2% |
| 51,587 | Anglo American plc | 1,545,247 |
| 82,252 | Ashtead Group plc | 4,284,755 |
| 242,674 | AstraZeneca plc | 28,473,454 |
| 697,963 | Auto Trader Group plc(2) | 4,177,848 |
| 248,799 | Aviva plc | 1,193,395 |
| 3,291,844 | Barclays plc | 5,593,672 |
| 736,414 | Beazley plc | 5,281,421 |
| 1,885,108 | BP plc | 10,429,551 |
| 3,644,632 | BT Group plc | 5,431,342 |
| 281,993 | Bunzl plc | 9,188,881 |
| 849,104 | Burberry Group plc | 17,692,864 |
| 325,944 | Central Asia Metals plc | 798,514 |
| 9,691,958 | Centrica plc | 8,516,431 |
| 2,050,575 | Coats Group plc | 1,422,611 |
| 669,318 | Devro plc | 1,373,663 |
| 181,354 | Diageo plc | 7,463,164 |
| 1,036,915 | Direct Line Insurance Group plc | 2,395,726 |
| 158,749 | Domino's Pizza Group plc | 410,570 |
| 829,599 | Dr. Martens plc | 2,359,293 |
| 747,213 | Drax Group plc | 4,462,070 |
| 1,068,376 | DS Smith plc | 3,562,949 |
| 147,109 | Dunelm Group plc | 1,462,668 |
| 272,849 | Forterra plc(2) | 683,693 |
| 1,059,926 | GSK plc | 17,362,732 |
| 607,606 | Harbour Energy plc | 2,636,907 |
| 287,144 | Howden Joinery Group plc | 1,691,449 |
| 1,620,800 | HSBC Holdings plc(1) | 8,318,430 |
| 1,809,924 | HSBC Holdings plc | 9,288,619 |
| 1,374,560 | IG Group Holdings plc | 12,537,715 |
| 3,598,433 | ITV plc | 2,770,637 |
| 206,508 | Kape Technologies plc* | 521,011 |
| 246,558 | Lancashire Holdings Ltd. | 1,399,250 |
| 2,290,053 | Legal & General Group plc | 6,126,486 |
| 11,543,229 | Lloyds Banking Group plc | 5,543,832 |
| 2,384,294 | Man Group plc | 5,931,185 |
| 820,443 | Moneysupermarket.com Group plc | 1,725,801 |
| 302,236 | Moonpig Group plc* | 475,112 |
| 3,206,092 | NatWest Group plc | 8,634,971 |
| 125,713 | Next Fifteen Communications Group plc | 1,265,792 |
| 51,084 | Next plc | 2,885,205 |
| 110,957 | Norcros plc | 228,676 |
| 223,812 | Pagegroup plc | 1,079,528 |
| 98,849 | Rathbones Group plc | 2,124,366 |
| 370,571 | Reckitt Benckiser Group plc | 24,592,558 |
| 351,241 | RELX plc | 9,434,503 |
| 121,519 | Rio Tinto plc | 6,350,780 |
| 1,134,415 | Shell plc | 31,426,644 |
| Shares or Principal Amount | | Market Value† |
| COMMON STOCKS - 97.7% - (continued) |
| | United Kingdom - 15.2% - (continued) |
| 1,508,672 | Standard Chartered plc | $ 9,013,917 |
| 377,581 | Subsea 7 S.A. | 3,767,085 |
| 270,404 | Synthomer plc | 349,822 |
| 242,439 | TI Fluid Systems plc(2) | 384,959 |
| 314,278 | Unilever plc | 14,285,299 |
| 105,777 | Vistry Group plc | 731,469 |
| 122,268 | WPP plc | 1,075,976 |
| | | | 322,164,498 |
| | Total Common Stocks
(cost $2,243,207,230) | | $ 2,069,102,741 |
| PREFERRED STOCKS - 0.6% |
| | Brazil - 0.5% |
| 2,102,553 | Cia de Saneamento do Parana (Preference Shares) | $ 1,567,095 |
| 3,963,900 | Itausa S.A. (Preference Shares) | 8,241,658 |
| | | | 9,808,753 |
| | Germany - 0.1% |
| 12,042 | Volkswagen AG (Preference Shares) | 1,541,392 |
| | Total Preferred Stocks
(cost $12,399,535) | | $ 11,350,145 |
| | Total Long-Term Investments
(cost $2,255,606,765) | | $ 2,080,452,886 |
| SHORT-TERM INVESTMENTS - 2.2% |
| | Other Investment Pools & Funds - 1.2% |
| $ 25,683,816 | Morgan Stanley Institutional Liquidity Funds, Treasury Portfolio, Institutional Class, 3.02%(4) | $ 25,683,816 |
| | Securities Lending Collateral - 1.0% |
| 3,428,811 | Goldman Sachs Financial Square Funds, Government Fund, Institutional Class, 3.07%(4) | 3,428,811 |
| 11,429,370 | HSBC US Government Money Market Fund, 3.09%(4) | 11,429,370 |
| 3,428,811 | Invesco Government & Agency Portfolio, Institutional Class, 3.07%(4) | 3,428,811 |
| 3,428,811 | Morgan Stanley Institutional Liquidity Funds, Government Portfolio, Institutional Class, 2.88%(4) | 3,428,811 |
| | | | 21,715,803 |
| | Total Short-Term Investments
(cost $47,399,619) | $ 47,399,619 |
| | Total Investments
(cost $2,303,006,384) | 100.5% | $ 2,127,852,505 |
| | Other Assets and Liabilities | (0.5)% | (10,574,455) |
| | Total Net Assets | 100.0% | $ 2,117,278,050 |
| Note: | Percentage of investments as shown is the ratio of the total market value to total net assets. |
| | Prices of foreign equities that are principally traded on certain foreign markets will generally be adjusted daily pursuant to a fair value pricing service approved by Hartford Funds Management Company, LLC in order to reflect an adjustment for factors occurring after the close of certain foreign markets but before the close of the New York Stock Exchange. |
| | Equity industry classifications used in this report are the Global Industry Classification Standard, which was developed by and is the exclusive property and service mark of MSCI, Inc. and Standard & Poor’s. |
The accompanying notes are an integral part of these financial statements.
Hartford Schroders International Multi-Cap Value Fund
Schedule of Investments – (continued)
October 31, 2022
For Fund compliance purposes, the Fund may not use the same classification system. These classifications are used for financial reporting purposes.
See “Glossary” for abbreviation descriptions.
| * | Non-income producing. |
| (1) | Represents entire or partial securities on loan. See Note 8 in the accompanying Notes to Financial Statements for securities lending information. |
| (2) | Security was purchased pursuant to Rule 144A under the Securities Act of 1933 and may be sold in transactions that are exempt from registration (typically only to qualified institutional buyers) or in a public offering registered under the Securities Act of 1933. At October 31, 2022, the aggregate value of these securities was $39,562,535, representing 1.9% of net assets. |
| (3) | Investment valued using significant unobservable inputs. |
| (4) | Current yield as of period end. |
| Foreign Currency Contracts Outstanding at October 31, 2022 |
Amount and Description of
Currency to be Purchased | | Amount and Description of
Currency to be Sold | | Counterparty | | Settlement
Date | | Appreciation/
(Depreciation) |
| 11,052,742 | USD | | 11,377,700 | EUR | | JPM | | 11/30/2022 | | $ (215,206) |
| 16,861,301 | USD | | 17,310,900 | EUR | | UBS | | 11/30/2022 | | (282,613) |
| 88,560,029 | USD | | 79,884,000 | GBP | | JPM | | 11/30/2022 | | (3,125,993) |
| 44,810,483 | USD | | 6,551,194,000 | JPY | | JPM | | 11/30/2022 | | 605,216 |
| Total foreign currency contracts | | $ (3,018,596) |
† See Significant Accounting Policies of accompanying Notes to Financial Statements regarding valuation of investments.
The accompanying notes are an integral part of these financial statements.
Hartford Schroders International Multi-Cap Value Fund
Schedule of Investments – (continued)
October 31, 2022
Fair Value Summary
The following is a summary of the fair valuations according to the inputs used as of October 31, 2022 in valuing the Fund’s investments.
| Description | | Total | | Level 1 | | Level 2 | | Level 3(1) |
| Assets | | | | | | | | |
| Common Stocks | | | | | | | | |
| Australia | | $ 71,125,675 | | $ 4,389,957 | | $ 66,735,718 | | $ — |
| Austria | | 21,747,532 | | — | | 21,747,532 | | — |
| Belgium | | 20,157,604 | | — | | 20,157,604 | | — |
| Brazil | | 3,492,468 | | 3,492,468 | | — | | — |
| Canada | | 181,499,449 | | 181,499,449 | | — | | — |
| Chile | | 8,539,342 | | 8,539,342 | | — | | — |
| China | | 115,184,846 | | 4,158,147 | | 111,026,699 | | — |
| Colombia | | 647,003 | | 647,003 | | — | | — |
| Czech Republic | | 8,051,370 | | 8,051,370 | | — | | — |
| Denmark | | 14,275,955 | | — | | 14,275,955 | | — |
| Finland | | 9,346,498 | | — | | 9,346,498 | | — |
| France | | 138,452,393 | | — | | 138,452,393 | | — |
| Georgia | | 1,481,265 | | 1,481,265 | | — | | — |
| Germany | | 36,803,441 | | — | | 36,803,441 | | — |
| Greece | | 2,081,221 | | — | | 2,081,221 | | — |
| Hong Kong | | 23,319,275 | | — | | 23,319,275 | | — |
| Hungary | | 7,094,037 | | — | | 7,094,037 | | — |
| India | | 12,215,281 | | — | | 12,215,281 | | — |
| Indonesia | | 25,876,446 | | — | | 25,876,446 | | — |
| Ireland | | 8,923,342 | | 610,700 | | 8,312,642 | | — |
| Israel | | 16,774,568 | | 13,866,924 | | 2,907,644 | | — |
| Italy | | 57,847,741 | | — | | 57,847,741 | | — |
| Japan | | 329,073,559 | | — | | 329,073,559 | | — |
| Luxembourg | | 2,253,093 | | — | | 2,253,093 | | — |
| Malaysia | | 4,851,568 | | — | | 4,851,568 | | — |
| Mexico | | 28,009,401 | | 28,009,400 | | 1 | | — |
| Netherlands | | 82,262,284 | | — | | 82,262,284 | | — |
| New Zealand | | 5,571,201 | | — | | 5,571,201 | | — |
| Norway | | 40,616,698 | | — | | 40,616,698 | | — |
| Poland | | 1,592,955 | | — | | 1,592,955 | | — |
| Portugal | | 11,763,872 | | — | | 11,763,872 | | — |
| Russia | | — | | — | | — | | — |
| Singapore | | 36,518,395 | | — | | 36,518,395 | | — |
| South Africa | | 26,507,004 | | 3,075,793 | | 23,431,211 | | — |
| South Korea | | 95,573,906 | | — | | 95,573,906 | | — |
| Spain | | 42,225,917 | | — | | 42,225,917 | | — |
| Sweden | | 59,712,893 | | — | | 59,712,893 | | — |
| Switzerland | | 91,148,314 | | — | | 91,148,314 | | — |
| Taiwan | | 82,896,321 | | 255,833 | | 82,640,488 | | — |
| Thailand | | 19,296,250 | | 901,476 | | 18,394,774 | | — |
| Turkey | | 1,259,632 | | — | | 1,259,632 | | — |
| United Arab Emirates | | 868,228 | | 868,228 | | — | | — |
| United Kingdom | | 322,164,498 | | 6,788,999 | | 315,375,499 | | — |
| Preferred Stocks | | 11,350,145 | | 9,808,753 | | 1,541,392 | | — |
| Short-Term Investments | | 47,399,619 | | 47,399,619 | | — | | — |
| Foreign Currency Contracts(2) | | 605,216 | | — | | 605,216 | | — |
| Total | | $ 2,128,457,721 | | $ 323,844,726 | | $ 1,804,612,995 | | $ — |
| Liabilities | | | | | | | | |
| Foreign Currency Contracts(2) | | $ (3,623,812) | | $ — | | $ (3,623,812) | | $ — |
| Total | | $ (3,623,812) | | $ — | | $ (3,623,812) | | $ — |
| (1) | For the year October 31, 2022, investments valued at $6,027,338 were transferred out of Level 3 due to the initiation of a vendor providing prices that are based on market activity which has been determined to be a significant observable input. There were no transfers into Level 3. |
| (2) | Derivative instruments (excluding purchased and written options, if applicable) are valued at the unrealized appreciation/(depreciation) on the investments. |
Level 3 investments at the beginning and/or end of the period in relation to net assets were not significant and accordingly, a reconciliation of Level 3 assets for the year ended October 31, 2022 is not presented.
The accompanying notes are an integral part of these financial statements.
Hartford Schroders International Stock Fund
Schedule of Investments
October 31, 2022
| Shares or Principal Amount | | Market Value† |
| COMMON STOCKS - 97.0% |
| | Argentina - 2.0% |
| 77,000 | MercadoLibre, Inc.* | $ 69,424,740 |
| | Austria - 1.5% |
| 2,131,094 | Erste Group Bank AG | 52,520,666 |
| | Brazil - 1.5% |
| 18,867,229 | B3 S.A. - Brasil Bolsa Balcao | 54,934,300 |
| | Canada - 6.6% |
| 637,981 | Canadian National Railway Co. | 75,582,731 |
| 261,298 | Lululemon Athletica, Inc.* | 85,977,494 |
| 1,103,791 | Toronto-Dominion Bank | 70,642,300 |
| | | | 232,202,525 |
| | China - 2.9% |
| 6,239,800 | Alibaba Group Holding Ltd.* | 48,513,862 |
| 2,120,900 | Tencent Holdings Ltd. | 55,730,408 |
| | | | 104,244,270 |
| | Denmark - 1.8% |
| 3,158,618 | Vestas Wind Systems A/S | 62,267,935 |
| | France - 7.4% |
| 3,541,471 | Carrefour S.A.(1) | 57,001,563 |
| 705,489 | Legrand S.A. | 53,761,516 |
| 760,474 | Sanofi | 65,444,715 |
| 663,640 | Schneider Electric SE | 83,921,463 |
| | | | 260,129,257 |
| | Germany - 8.6% |
| 906,075 | Bayerische Motoren Werke AG | 71,119,515 |
| 2,649,150 | Infineon Technologies AG | 64,282,856 |
| 927,775 | SAP SE | 89,300,906 |
| 730,785 | Siemens AG | 79,808,269 |
| | | | 304,511,546 |
| | Hong Kong - 2.4% |
| 11,259,200 | AIA Group Ltd. | 85,286,078 |
| | India - 2.6% |
| 5,168,398 | HDFC Bank Ltd. | 93,798,373 |
| | Italy - 1.8% |
| 4,698,955 | FinecoBank Banca Fineco S.p.A. | 63,321,178 |
| | Japan - 10.4% |
| 2,896,800 | Bridgestone Corp. | 104,766,960 |
| 1,795,500 | KDDI Corp. | 53,069,539 |
| 160,800 | Keyence Corp. | 60,632,059 |
| 2,568,000 | Recruit Holdings Co., Ltd. | 79,020,355 |
| 179,700 | SMC Corp. | 72,131,944 |
| | | | 369,620,857 |
| | Netherlands - 1.9% |
| 143,299 | ASML Holding N.V. | 67,219,641 |
| | Norway - 2.0% |
| 1,931,977 | Equinor ASA | 70,389,107 |
| | South Korea - 3.1% |
| 2,603,916 | Samsung Electronics Co., Ltd. | 108,374,525 |
| | Spain - 1.8% |
| 6,292,422 | Iberdrola S.A. | 63,989,359 |
| | Sweden - 2.3% |
| 1,585,960 | Nibe Industrier AB Class B | 12,650,841 |
| 7,465,222 | Svenska Handelsbanken AB Class A | 69,359,586 |
| | | | 82,010,427 |
| Shares or Principal Amount | | Market Value† |
| COMMON STOCKS - 97.0% - (continued) |
| | Switzerland - 11.0% |
| 6,020 | Chocoladefabriken Lindt & Spruengli AG | $ 57,774,166 |
| 136,521 | Lonza Group AG | 70,278,813 |
| 1,050,359 | Nestle S.A. | 114,340,822 |
| 324,787 | Roche Holding AG | 107,763,716 |
| 179,527 | Sika AG | 40,478,983 |
| | | | 390,636,500 |
| | Taiwan - 2.8% |
| 8,311,000 | Taiwan Semiconductor Manufacturing Co., Ltd. | 99,916,530 |
| | United Kingdom - 20.2% |
| 783,159 | AstraZeneca plc | 91,889,704 |
| 1,832,873 | Bunzl plc | 59,725,070 |
| 2,391,637 | Burberry Group plc | 49,834,775 |
| 1,934,609 | Diageo plc | 79,613,922 |
| 3,376,209 | GSK plc | 55,305,947 |
| 4,846,288 | National Grid plc | 52,800,870 |
| 1,218,617 | Reckitt Benckiser Group plc | 80,872,245 |
| 2,716,473 | RELX plc | 72,965,776 |
| 3,900,695 | Shell plc | 108,069,085 |
| 25,154,457 | Tesco plc | 62,128,502 |
| | | | 713,205,896 |
| | United States - 2.4% |
| 44,544 | Booking Holdings, Inc.* | 83,274,117 |
| | Total Common Stocks
(cost $3,887,299,920) | | $ 3,431,277,827 |
| PREFERRED STOCKS - 2.3% |
| | Germany - 2.3% |
| 781,167 | Dr Ing hc F Porsche AG (Preference Shares)* | $ 79,900,764 |
| | Total Preferred Stocks
(cost $63,133,394) | | $ 79,900,764 |
| | Total Long-Term Investments
(cost $3,950,433,314) | | $ 3,511,178,591 |
| SHORT-TERM INVESTMENTS - 1.2% |
| | Other Investment Pools & Funds - 1.1% |
| $ 39,969,384 | Morgan Stanley Institutional Liquidity Funds, Treasury Portfolio, Institutional Class, 3.02%(2) | $ 39,969,384 |
| | Securities Lending Collateral - 0.1% |
| 662,681 | Goldman Sachs Financial Square Funds, Government Fund, Institutional Class, 3.07%(2) | 662,681 |
| 2,208,934 | HSBC US Government Money Market Fund, 3.09%(2) | 2,208,934 |
| 662,680 | Invesco Government & Agency Portfolio, Institutional Class, 3.07%(2) | 662,680 |
| 662,680 | Morgan Stanley Institutional Liquidity Funds, Government Portfolio, Institutional Class, 2.88%(2) | 662,680 |
| | | | 4,196,975 |
| | Total Short-Term Investments
(cost $44,166,359) | $ 44,166,359 |
| | Total Investments
(cost $3,994,599,673) | 100.5% | $ 3,555,344,950 |
| | Other Assets and Liabilities | (0.5)% | (19,386,643) |
| | Total Net Assets | 100.0% | $ 3,535,958,307 |
The accompanying notes are an integral part of these financial statements.
Hartford Schroders International Stock Fund
Schedule of Investments – (continued)
October 31, 2022
| Note: | Percentage of investments as shown is the ratio of the total market value to total net assets. |
| | Prices of foreign equities that are principally traded on certain foreign markets will generally be adjusted daily pursuant to a fair value pricing service approved by Hartford Funds Management Company, LLC in order to reflect an adjustment for factors occurring after the close of certain foreign markets but before the close of the New York Stock Exchange. |
| | Equity industry classifications used in this report are the Global Industry Classification Standard, which was developed by and is the exclusive property and service mark of MSCI, Inc. and Standard & Poor’s. |
| | For Fund compliance purposes, the Fund may not use the same classification system. These classifications are used for financial reporting purposes. |
See “Glossary” for abbreviation descriptions.
| * | Non-income producing. |
| (1) | Represents entire or partial securities on loan. See Note 8 in the accompanying Notes to Financial Statements for securities lending information. |
| (2) | Current yield as of period end. |
| † | See Significant Accounting Policies of accompanying Notes to Financial Statements regarding valuation of investments. |
Fair Value Summary
The following is a summary of the fair valuations according to the inputs used as of October 31, 2022 in valuing the Fund’s investments.
| Description | | Total | | Level 1 | | Level 2 | | Level 3(1) |
| Assets | | | | | | | | |
| Common Stocks | | | | | | | | |
| Argentina | | $ 69,424,740 | | $ 69,424,740 | | $ — | | $ — |
| Austria | | 52,520,666 | | — | | 52,520,666 | | — |
| Brazil | | 54,934,300 | | 54,934,300 | | — | | — |
| Canada | | 232,202,525 | | 232,202,525 | | — | | — |
| China | | 104,244,270 | | — | | 104,244,270 | | — |
| Denmark | | 62,267,935 | | — | | 62,267,935 | | — |
| France | | 260,129,257 | | — | | 260,129,257 | | — |
| Germany | | 304,511,546 | | — | | 304,511,546 | | — |
| Hong Kong | | 85,286,078 | | — | | 85,286,078 | | — |
| India | | 93,798,373 | | — | | 93,798,373 | | — |
| Italy | | 63,321,178 | | — | | 63,321,178 | | — |
| Japan | | 369,620,857 | | — | | 369,620,857 | | — |
| Netherlands | | 67,219,641 | | — | | 67,219,641 | | — |
| Norway | | 70,389,107 | | — | | 70,389,107 | | — |
| South Korea | | 108,374,525 | | — | | 108,374,525 | | — |
| Spain | | 63,989,359 | | — | | 63,989,359 | | — |
| Sweden | | 82,010,427 | | — | | 82,010,427 | | — |
| Switzerland | | 390,636,500 | | — | | 390,636,500 | | — |
| Taiwan | | 99,916,530 | | — | | 99,916,530 | | — |
| United Kingdom | | 713,205,896 | | — | | 713,205,896 | | — |
| United States | | 83,274,117 | | 83,274,117 | | — | | — |
| Preferred Stocks | | 79,900,764 | | 79,900,764 | | — | | — |
| Short-Term Investments | | 44,166,359 | | 44,166,359 | | — | | — |
| Total | | $ 3,555,344,950 | | $ 563,902,805 | | $ 2,991,442,145 | | $ — |
| (1) | For the year ended October 31, 2022, there were no transfers in and out of Level 3. |
The accompanying notes are an integral part of these financial statements.
Hartford Schroders Securitized Income Fund
Schedule of Investments
October 31, 2022
| Shares or Principal Amount | | Market Value† |
| ASSET & COMMERCIAL MORTGAGE-BACKED SECURITIES - 87.8% |
| | Asset-Backed - Automobile - 2.8% |
| $ 1,000,000 | JP Morgan Chase & Co. 3.69%, 02/26/2029(1) | $ 898,769 |
| 879,675 | Santander Bank Auto Credit-Linked Notes 3.27%, 12/15/2031(1) | 844,611 |
| | | | 1,743,380 |
| | Asset-Backed - Finance & Insurance - 10.9% |
| 1,038,000 | Atlas Senior Loan Fund IX Ltd. 5.26%, 04/20/2028, 3 mo. USD LIBOR + 2.550%(1)(2) | 956,254 |
| 2,097,000 | Atrium XII 7.12%, 04/22/2027, 3 mo. USD LIBOR + 2.800%(1)(2) | 1,900,769 |
| 516,389 | Carlyle Global Market Strategies CLO Ltd. 5.08%, 01/15/2031, 3 mo. USD LIBOR + 1.000%(1)(2) | 503,772 |
| 673,000 | Carlyle US CLO Ltd. 7.04%, 10/20/2027, 3 mo. USD LIBOR + 2.800%(1)(2) | 592,297 |
| 341,953 | Countrywide Asset-Backed Certificates Trust 5.71%, 05/25/2036(3) | 321,373 |
| 774,000 | Madison Park Funding XIII Ltd. 7.08%, 04/19/2030, 3 mo. USD LIBOR + 2.850%(1)(2) | 693,478 |
| 1,036,000 | Magnetite VII Ltd. 6.13%, 01/15/2028, 3 mo. USD LIBOR + 2.050%(1)(2) | 924,802 |
| 974,000 | Tricon American Homes 4.88%, 07/17/2038(1) | 854,819 |
| | | | 6,747,564 |
| | Asset-Backed - Home Equity - 3.0% |
| 838,817 | CWHEQ Revolving Home Equity Loan Resecuritization Trust 3.60%, 11/15/2035, 1 mo. USD LIBOR + 0.190%(1)(2) | 745,714 |
| | CWHEQ Revolving Home Equity Loan Trust | |
| 442,956 | 3.55%, 07/15/2036, 1 mo. USD LIBOR + 0.140%(2) | 401,095 |
| 400,776 | 3.55%, 01/15/2037, 1 mo. USD LIBOR + 0.140%(2) | 364,855 |
| 63,415 | Home Equity Loan Trust 3.72%, 05/25/2036, 1 mo. USD LIBOR + 0.130%(2) | 62,363 |
| 294,725 | Option One Mortgage Loan Trust 5.86%, 01/25/2037(4) | 281,217 |
| | | | 1,855,244 |
| | Commercial Mortgage-Backed Securities - 16.4% |
| | BDS Ltd. | |
| 500,000 | 4.79%, 01/18/2036, 1 mo. USD LIBOR + 1.350%(1)(2) | 465,077 |
| 1,093,000 | 4.99%, 01/18/2036, 1 mo. USD LIBOR + 1.550%(1)(2) | 1,026,748 |
| 1,015,000 | BX Trust 5.18%, 05/15/2030, 1 mo. USD LIBOR + 1.770%(1)(2) | 948,813 |
| 1,000,000 | CAMB Commercial Mortgage Trust 5.96%, 12/15/2037, 1 mo. USD LIBOR + 2.550%(1)(2) | 931,554 |
| | Citigroup Commercial Mortgage Trust | |
| 1,000,000 | 3.52%, 05/10/2035(1)(3) | 904,097 |
| 500,000 | 6.21%, 12/15/2036, 1 mo. USD LIBOR + 2.800%(1)(2) | 471,380 |
| 40,237 | Commercial Mortgage Trust 5.61%, 10/15/2034, 1 mo. USD LIBOR + 2.200%(1)(2) | 38,297 |
| 668,000 | Core Mortgage Trust 5.31%, 12/15/2031, 1 mo. USD LIBOR + 1.900%(1)(2) | 624,654 |
| | Credit Suisse Mortgage Capital Certificates | |
| 1,708,000 | 5.56%, 05/15/2036, 1 mo. USD LIBOR + 2.150%(1)(2) | 1,639,562 |
| 539,000 | 6.06%, 05/15/2036, 1 mo. USD LIBOR + 2.650%(1)(2) | 516,988 |
| 765,682 | HPLY Trust 5.76%, 11/15/2036, 1 mo. USD LIBOR + 2.350%(1)(2) | 713,924 |
| 250,000 | Morgan Stanley Capital Trust 5.96%, 07/15/2035, 1 mo. USD LIBOR + 2.550%(1)(2) | 234,951 |
| Shares or Principal Amount | | Market Value† |
| ASSET & COMMERCIAL MORTGAGE-BACKED SECURITIES - 87.8% - (continued) |
| | Commercial Mortgage-Backed Securities - 16.4% - (continued) |
| $ 1,413,000 | MSSG Trust 3.74%, 09/13/2039(1)(3) | $ 1,135,084 |
| GBP 501,318 | Taurus DAC 3.61%, 05/17/2031, SONIA + 1.650%(1)(2) | 540,438 |
| | | | 10,191,567 |
| | Other Asset-Backed Securities - 14.5% |
| | Arbor Realty Commercial Real Estate Notes Ltd. | |
| $ 500,000 | 4.51%, 05/15/2036, 1 mo. USD LIBOR + 1.100%(1)(2) | 485,293 |
| 500,000 | 4.76%, 11/15/2036, 1 mo. USD LIBOR + 1.350%(1)(2) | 482,548 |
| 1,863,000 | 5.23%, 05/15/2037, 1 mo. USD SOFR + 1.850%(1)(2) | 1,817,595 |
| 500,000 | 5.36%, 05/15/2036, 1 mo. USD LIBOR + 1.950%(1)(2) | 459,743 |
| 1,750,000 | CBAM Ltd. 5.40%, 01/15/2031, 3 mo. USD LIBOR + 1.531%(1)(2) | 1,717,564 |
| 1,119,000 | FirstKey Homes Trust 3.64%, 08/17/2037(1) | 996,094 |
| 1,679,000 | HGI CRE CLO Ltd. 4.46%, 06/16/2036, 1 mo. USD LIBOR + 1.050%(1)(2) | 1,609,516 |
| 542,447 | JP Morgan Mortgage Acquisition Trust 4.62%, 11/25/2036(4) | 514,503 |
| 910,897 | LCM XXIII Ltd. 5.31%, 10/20/2029, 3 mo. USD LIBOR + 1.070%(1)(2) | 890,630 |
| | | | 8,973,486 |
| | Whole Loan Collateral CMO - 40.2% |
| 1,174,000 | Bank of America Funding Trust 3.76%, 06/26/2035(1)(3) | 1,128,612 |
| | Bellemeade Re Ltd. | |
| 2,485,000 | 6.15%, 09/25/2031, 1 mo. USD SOFR + 3.150%(1)(2) | 2,133,199 |
| 859,000 | 6.29%, 03/25/2029, 1 mo. USD LIBOR + 2.700%(1)(2) | 850,457 |
| 1,508,000 | 6.44%, 10/25/2029, 1 mo. USD LIBOR + 2.850%(1)(2) | 1,433,695 |
| 940,000 | 6.69%, 04/25/2029, 1 mo. USD LIBOR + 3.100%(1)(2) | 906,714 |
| | Eagle RE Ltd. | |
| 617,000 | 5.05%, 04/25/2034, 1 mo. USD SOFR + 2.050%(1)(2) | 600,671 |
| 510,728 | 5.39%, 04/25/2029, 1 mo. USD LIBOR + 1.800%(1)(2) | 492,026 |
| 1,450,000 | 7.59%, 11/25/2028, 1 mo. USD LIBOR + 4.000%(1)(2) | 1,433,493 |
| | Home Re Ltd. | |
| 1,199,000 | 5.80%, 01/25/2034, 1 mo. USD SOFR + 2.800%(1)(2) | 1,129,223 |
| 819,733 | 6.59%, 10/25/2028, 1 mo. USD LIBOR + 3.000%(1)(2) | 816,160 |
| 1,933,000 | 6.84%, 05/25/2029, 1 mo. USD LIBOR + 3.250%(1)(2) | 1,897,795 |
| 1,134,000 | 7.59%, 10/25/2028, 1 mo. USD LIBOR + 4.000%(1)(2) | 1,106,968 |
| 281,732 | 7.74%, 10/25/2030, 1 mo. USD LIBOR + 4.150%(1)(2) | 282,297 |
| 976,000 | Oaktown Re II Ltd. 6.44%, 07/25/2028, 1 mo. USD LIBOR + 2.850%(1)(2) | 967,354 |
| 500,000 | Oaktown Re V Ltd. 8.84%, 10/25/2030, 1 mo. USD LIBOR + 5.250%(1)(2) | 496,905 |
| | Oaktown Re VI Ltd. | |
| 1,200,000 | 5.05%, 10/25/2033, 1 mo. USD SOFR + 2.050%(1)(2) | 1,184,644 |
| 1,190,000 | 6.00%, 10/25/2033, 1 mo. USD SOFR + 3.000%(1)(2) | 1,128,321 |
| | Preston Ridge Partners Mortgage Trust LLC | |
| 1,624,363 | 1.79%, 06/25/2026(1)(4) | 1,447,348 |
The accompanying notes are an integral part of these financial statements.
Hartford Schroders Securitized Income Fund
Schedule of Investments – (continued)
October 31, 2022
| Shares or Principal Amount | | Market Value† |
| ASSET & COMMERCIAL MORTGAGE-BACKED SECURITIES - 87.8% - (continued) |
| | Whole Loan Collateral CMO - 40.2% - (continued) |
| $ 365,898 | 2.12%, 01/25/2026(1)(3) | $ 335,694 |
| 663,220 | 2.12%, 03/25/2026(1)(3) | 611,406 |
| 1,364,428 | 2.36%, 10/25/2026(1)(4) | 1,238,866 |
| 591,475 | 2.49%, 10/25/2026(1)(4) | 502,753 |
| | Radnor RE Ltd. | |
| 746,440 | 5.54%, 02/25/2029, 1 mo. USD LIBOR + 1.950%(1)(2) | 730,227 |
| 1,520,000 | 5.59%, 01/25/2030, 1 mo. USD LIBOR + 2.000%(1)(2) | 1,414,560 |
| 702,000 | 6.15%, 12/27/2033, 1 mo. USD SOFR + 3.150%(1)(2) | 639,721 |
| | | | 24,909,109 |
| | Total Asset & Commercial Mortgage-Backed Securities
(cost $58,434,930) | $ 54,420,350 |
| CORPORATE BONDS - 1.4% |
| | Insurance - 1.4% |
| 841,000 | NMI Holdings, Inc. 7.38%, 06/01/2025(1) | $ 840,193 |
| | Total Corporate Bonds
(cost $861,093) | $ 840,193 |
| U.S. GOVERNMENT AGENCIES - 4.8% |
| | Mortgage-Backed Agencies - 4.8% |
| | FNMA - 4.8% |
| 3,000,000 | 5.50%, 11/15/2052(5) | $ 2,955,938 |
| | GNMA - 0.0% |
| 20,456 | 2.00%, 11/20/2050(6) | 2,184 |
| 4,882 | 2.50%, 11/20/2050(6) | 635 |
| 2,452 | 3.00%, 02/20/2051(6) | 349 |
| | | | 3,168 |
| | Total U.S. Government Agencies
(cost $2,913,607) | | $ 2,959,106 |
| COMMON STOCKS - 1.5% |
| | Real Estate - 1.5% |
| 29,612 | Invitation Homes, Inc. REIT | $ 938,404 |
| | Total Common Stocks
(cost $1,203,774) | | $ 938,404 |
| | Total Long-Term Investments
(cost $63,413,404) | | $ 59,158,053 |
| Shares or Principal Amount | | Market Value† |
| SHORT-TERM INVESTMENTS - 8.8% |
| | Other Investment Pools & Funds - 8.8% |
| 5,487,820 | Morgan Stanley Institutional Liquidity Funds, Treasury Portfolio, Institutional Class, 3.02%(7) | $ 5,487,820 |
| | Total Short-Term Investments
(cost $5,487,820) | $ 5,487,820 |
| | Total Investments
(cost $68,901,224) | 104.3% | $ 64,645,873 |
| | Other Assets and Liabilities | (4.3)% | (2,693,194) |
| | Total Net Assets | 100.0% | $ 61,952,679 |
| Note: | Percentage of investments as shown is the ratio of the total market value to total net assets. |
| | The Fund may refer to any one or more of the industry classifications used by one or more widely recognized market indices, ratings group and/or as defined by Fund management. Industry classifications may not be identical across all security types. |
| | For Fund compliance purposes, the Fund may not use the same classification system. These classifications are used for financial reporting purposes. |
| | See “Glossary” for abbreviation descriptions. |
| (1) | Security was purchased pursuant to Rule 144A under the Securities Act of 1933 and may be sold in transactions that are exempt from registration (typically only to qualified institutional buyers) or in a public offering registered under the Securities Act of 1933. At October 31, 2022, the aggregate value of these securities was $53,315,137, representing 86.1% of net assets. |
| (2) | Variable rate securities; the rate reported is the coupon rate in effect at October 31, 2022. Base lending rates may be subject to a floor or cap. |
| (3) | Variable or floating rate security, which interest rate adjusts periodically based on changes in current interest rates and prepayments on the underlying pool of assets. Rate shown is the rate in effect as of period end. |
| (4) | Security is a “step-up” bond where coupon increases or steps up at a predetermined date. Rate shown is current coupon rate. |
| (5) | Represents or includes a TBA transaction. |
| (6) | Securities disclosed are interest-only strips. |
| (7) | Current yield as of period end. |
| Futures Contracts Outstanding at October 31, 2022 |
| Description | | Number of
Contracts | | Expiration
Date | | Current
Notional
Amount | | Value and
Unrealized
Appreciation/
(Depreciation) |
| Long position contracts: |
| U.S. Treasury 2-Year Note Future | | 182 | | 12/30/2022 | | $ 37,197,672 | | $ (763,040) |
| Short position contracts: |
| U.S. Treasury 5-Year Note Future | | 23 | | 12/30/2022 | | $ 2,451,657 | | $ (5,435) |
| U.S. Treasury 10-Year Ultra Future | | 14 | | 12/20/2022 | | 1,623,781 | | 5,441 |
| Total | | | | | | | | $ 6 |
| Total futures contracts | | $ (763,034) |
The accompanying notes are an integral part of these financial statements.
Hartford Schroders Securitized Income Fund
Schedule of Investments – (continued)
October 31, 2022
| Foreign Currency Contracts Outstanding at October 31, 2022 |
Amount and Description of
Currency to be Purchased | | Amount and Description of
Currency to be Sold | | Counterparty | | Settlement
Date | | Appreciation/
(Depreciation) |
| 3,389 | GBP | | 3,785 | USD | | BNP | | 11/29/2022 | | $ 105 |
| 539,228 | USD | | 476,904 | GBP | | BOA | | 11/29/2022 | | (8,118) |
| Total foreign currency contracts | | $ (8,013) |
† See Significant Accounting Policies of accompanying Notes to Financial Statements regarding valuation of investments.
Fair Value Summary
The following is a summary of the fair valuations according to the inputs used as of October 31, 2022 in valuing the Fund’s investments.
| Description | | Total | | Level 1 | | Level 2 | | Level 3(1) |
| Assets | | | | | | | | |
| Asset & Commercial Mortgage-Backed Securities | | $ 54,420,350 | | $ — | | $ 54,420,350 | | $ — |
| Corporate Bonds | | 840,193 | | — | | 840,193 | | — |
| U.S. Government Agencies | | 2,959,106 | | — | | 2,959,106 | | — |
| Common Stocks | | | | | | | | |
| Real Estate | | 938,404 | | 938,404 | | — | | — |
| Short-Term Investments | | 5,487,820 | | 5,487,820 | | — | | — |
| Foreign Currency Contracts(2) | | 105 | | — | | 105 | | — |
| Futures Contracts(2) | | 5,441 | | 5,441 | | — | | — |
| Total | | $ 64,651,419 | | $ 6,431,665 | | $ 58,219,754 | | $ — |
| Liabilities | | | | | | | | |
| Foreign Currency Contracts(2) | | $ (8,118) | | $ — | | $ (8,118) | | $ — |
| Futures Contracts(2) | | (768,475) | | (768,475) | | — | | — |
| Total | | $ (776,593) | | $ (768,475) | | $ (8,118) | | $ — |
| (1) | For the year ended October 31, 2022, there were no transfers in and out of Level 3. |
| (2) | Derivative instruments (excluding purchased and written options, if applicable) are valued at the unrealized appreciation/(depreciation) on the investments. |
The accompanying notes are an integral part of these financial statements.
Hartford Schroders Sustainable International Core Fund
Schedule of Investments
October 31, 2022
| Shares or Principal Amount | | Market Value† |
| COMMON STOCKS - 98.0% |
| | Australia - 6.3% |
| 115 | CSL Ltd. | $ 20,587 |
| 1,135 | Newcrest Mining Ltd. | 12,570 |
| 368 | Rio Tinto Ltd. | 20,884 |
| | | | 54,041 |
| | China - 5.9% |
| 600 | Chacha Food Co., Ltd. Class A | 3,643 |
| 4,000 | China Mengniu Dairy Co., Ltd.* | 12,805 |
| 8,200 | China Pacific Insurance Group Co., Ltd. Class H | 13,218 |
| 200 | China Tourism Group Duty Free Corp. Ltd. Class A | 4,395 |
| 1,000 | Li Ning Co., Ltd. | 5,173 |
| 2,700 | Sany Heavy Industry Co., Ltd. Class A | 5,010 |
| 800 | WuXi AppTec Co., Ltd. Class H(1) | 6,421 |
| | | | 50,665 |
| | Finland - 4.1% |
| 526 | Neste Oyj | 23,054 |
| 3,107 | Outokumpu Oyj | 12,469 |
| | | | 35,523 |
| | France - 5.8% |
| 103 | Capgemini SE | 16,881 |
| 1,025 | Carrefour S.A. | 16,498 |
| 193 | Sanofi | 16,609 |
| | | | 49,988 |
| | Germany - 5.4% |
| 148 | Beiersdorf AG | 14,207 |
| 195 | Siemens AG | 21,296 |
| 488 | Software AG | 10,676 |
| | | | 46,179 |
| | Hong Kong - 1.1% |
| 3,000 | BOC Hong Kong Holdings Ltd. | 9,322 |
| | India - 2.5% |
| 170 | HDFC Bank Ltd. ADR | 10,593 |
| 510 | ICICI Bank Ltd. ADR | 11,240 |
| | | | 21,833 |
| | Indonesia - 1.4% |
| 17,400 | Bank Mandiri Persero Tbk PT | 11,755 |
| | Ireland - 2.4% |
| 2,820 | Bank of Ireland Group plc | 20,306 |
| | Italy - 2.7% |
| 3,786 | Intesa Sanpaolo S.p.A. | 7,218 |
| 379 | Moncler S.p.A. | 16,352 |
| | | | 23,570 |
| | Japan - 19.8% |
| 400 | Asahi Intecc Co., Ltd. | 6,814 |
| 600 | Astellas Pharma, Inc. | 8,279 |
| 100 | Daikin Industries Ltd. | 14,979 |
| 1,000 | Isuzu Motors Ltd. | 11,760 |
| 300 | JCR Pharmaceuticals Co., Ltd. | 4,459 |
| 300 | MatsukiyoCocokara & Co. | 10,922 |
| 200 | Mitsui Fudosan Co., Ltd. REIT | 3,830 |
| 200 | Nippon Shinyaku Co., Ltd. | 11,073 |
| 100 | Nitori Holdings Co., Ltd. | 9,062 |
| 1,500 | NTT Data Corp. | 21,726 |
| 900 | ORIX Corp. | 13,219 |
| 600 | Park24 Co., Ltd.* | 7,997 |
| 100 | Rorze Corp. | 5,025 |
| 900 | Stanley Electric Co., Ltd. | 15,300 |
| 300 | Tokio Marine Holdings, Inc. | 5,431 |
| 400 | Toyota Industries Corp. | 20,606 |
| | | | 170,482 |
| Shares or Principal Amount | | Market Value† |
| COMMON STOCKS - 98.0% - (continued) |
| | Netherlands - 2.8% |
| 44 | ASM International N.V. | $ 9,734 |
| 1,079 | Stellantis N.V. | 14,557 |
| | | | 24,291 |
| | Norway - 0.7% |
| 378 | Mowi ASA | 5,642 |
| | Portugal - 1.6% |
| 3,166 | EDP - Energias de Portugal S.A. | 13,833 |
| | Singapore - 4.4% |
| 400 | DBS Group Holdings Ltd. | 9,671 |
| 1,300 | Oversea-Chinese Banking Corp. Ltd. | 11,159 |
| 9,900 | Singapore Telecommunications Ltd. | 17,431 |
| | | | 38,261 |
| | South Korea - 3.5% |
| 459 | Hana Financial Group, Inc. | 13,270 |
| 71 | NAVER Corp. | 8,422 |
| 211 | Samsung Electronics Co., Ltd. | 8,782 |
| | | | 30,474 |
| | Sweden - 6.7% |
| 201 | Holmen AB Class B | 7,294 |
| 1,985 | Skandinaviska Enskilda Banken AB Class A | 20,929 |
| 793 | SKF AB Class B | 11,479 |
| 1,887 | Svenska Handelsbanken AB Class A | 17,532 |
| | | | 57,234 |
| | Switzerland - 0.9% |
| 123 | Alcon, Inc. | 7,489 |
| | Taiwan - 4.0% |
| 1,000 | Giant Manufacturing Co., Ltd. | 6,364 |
| 930 | MediaTek, Inc. | 16,952 |
| 186 | Taiwan Semiconductor Manufacturing Co., Ltd. ADR | 11,448 |
| | | | 34,764 |
| | Thailand - 0.6% |
| 6,500 | Bangkok Dusit Medical Services PCL | 5,038 |
| | United Arab Emirates - 1.1% |
| 2,576 | Network International Holdings plc*(1) | 9,601 |
| | United Kingdom - 14.3% |
| 49 | AstraZeneca plc | 5,749 |
| 1,309 | CNH Industrial N.V. | 16,935 |
| 4,089 | ConvaTec Group plc(1) | 10,232 |
| 3,556 | Informa plc | 22,659 |
| 288 | Reckitt Benckiser Group plc | 19,113 |
| 732 | RELX plc | 19,662 |
| 864 | SSE plc | 15,440 |
| 2,161 | Standard Chartered plc | 12,911 |
| | | | 122,701 |
| | Total Common Stocks
(cost $982,474) | | $ 842,992 |
| SHORT-TERM INVESTMENTS - 4.6% |
| | Other Investment Pools & Funds - 4.6% |
| $ 39,399 | Morgan Stanley Institutional Liquidity Funds, Treasury Portfolio, Institutional Class, 3.02%(2) | $ 39,399 |
| | Total Short-Term Investments
(cost $39,399) | $ 39,399 |
| | Total Investments
(cost $1,021,873) | 102.6% | $ 882,391 |
| | Other Assets and Liabilities | (2.6)% | (22,104) |
| | Total Net Assets | 100.0% | $ 860,287 |
The accompanying notes are an integral part of these financial statements.
Hartford Schroders Sustainable International Core Fund
Schedule of Investments – (continued)
October 31, 2022
| Note: | Percentage of investments as shown is the ratio of the total market value to total net assets. |
| | Prices of foreign equities that are principally traded on certain foreign markets will generally be adjusted daily pursuant to a fair value pricing service approved by Hartford Funds Management Company, LLC in order to reflect an adjustment for factors occurring after the close of certain foreign markets but before the close of the New York Stock Exchange. |
| | Equity industry classifications used in this report are the Global Industry Classification Standard, which was developed by and is the exclusive property and service mark of MSCI, Inc. and Standard & Poor’s. |
| | For Fund compliance purposes, the Fund may not use the same classification system. These classifications are used for financial reporting purposes. |
See “Glossary” for abbreviation descriptions.
| * | Non-income producing. |
| (1) | Security was purchased pursuant to Rule 144A under the Securities Act of 1933 and may be sold in transactions that are exempt from registration (typically only to qualified institutional buyers) or in a public offering registered under the Securities Act of 1933. At October 31, 2022, the aggregate value of these securities was $26,254, representing 3.1% of net assets. |
| (2) | Current yield as of period end. |
| Futures Contracts Outstanding at October 31, 2022 |
| Description | | Number of
Contracts | | Expiration
Date | | Current
Notional
Amount | | Value and
Unrealized
Appreciation/
(Depreciation) |
| Long position contracts: |
| SGX Nifty 50 Index Future | | 1 | | 11/24/2022 | | $ 36,121 | | $ 437 |
| Total futures contracts | | $ 437 |
† See Significant Accounting Policies of accompanying Notes to Financial Statements regarding valuation of investments.
Fair Value Summary
The following is a summary of the fair valuations according to the inputs used as of October 31, 2022 in valuing the Fund’s investments.
| Description | | Total | | Level 1 | | Level 2 | | Level 3(1) |
| Assets | | | | | | | | |
| Common Stocks | | | | | | | | |
| Australia | | $ 54,041 | | $ — | | $ 54,041 | | $ — |
| China | | 50,665 | | — | | 50,665 | | — |
| Finland | | 35,523 | | — | | 35,523 | | — |
| France | | 49,988 | | — | | 49,988 | | — |
| Germany | | 46,179 | | — | | 46,179 | | — |
| Hong Kong | | 9,322 | | — | | 9,322 | | — |
| India | | 21,833 | | 21,833 | | — | | — |
| Indonesia | | 11,755 | | — | | 11,755 | | — |
| Ireland | | 20,306 | | — | | 20,306 | | — |
| Italy | | 23,570 | | — | | 23,570 | | — |
| Japan | | 170,482 | | — | | 170,482 | | — |
| Netherlands | | 24,291 | | — | | 24,291 | | — |
| Norway | | 5,642 | | — | | 5,642 | | — |
| Portugal | | 13,833 | | — | | 13,833 | | — |
| Singapore | | 38,261 | | — | | 38,261 | | — |
| South Korea | | 30,474 | | — | | 30,474 | | — |
| Sweden | | 57,234 | | — | | 57,234 | | — |
| Switzerland | | 7,489 | | — | | 7,489 | | — |
| Taiwan | | 34,764 | | 11,448 | | 23,316 | | — |
| Thailand | | 5,038 | | 5,038 | | — | | — |
| United Arab Emirates | | 9,601 | | 9,601 | | — | | — |
| United Kingdom | | 122,701 | | — | | 122,701 | | — |
| Short-Term Investments | | 39,399 | | 39,399 | | — | | — |
| Futures Contracts(2) | | 437 | | 437 | | — | | — |
| Total | | $ 882,828 | | $ 87,756 | | $ 795,072 | | $ — |
| (1) | For the year ended October 31, 2022, there were no transfers in and out of Level 3. |
| (2) | Derivative instruments (excluding purchased and written options, if applicable) are valued at the unrealized appreciation/(depreciation) on the investments. |
The accompanying notes are an integral part of these financial statements.
Hartford Schroders Tax-Aware Bond Fund
Schedule of Investments
October 31, 2022
| Shares or Principal Amount | | Market Value† |
| CORPORATE BONDS - 10.0% |
| | Auto Manufacturers - 1.2% |
| $ 3,109,000 | General Motors Financial Co., Inc. 2.35%, 02/26/2027 | $ 2,630,771 |
| 2,116,000 | Hyundai Capital America 0.88%, 06/14/2024(1) | 1,945,519 |
| | | | 4,576,290 |
| | Commercial Banks - 3.7% |
| 2,200,000 | Banco Santander S.A. 1.72%, 09/14/2027, 12 mo. USD CMT + 0.900%(2) | 1,789,807 |
| | Barclays plc | |
| 2,617,000 | 2.28%, 11/24/2027, 12 mo. USD CMT + 1.050%(2) | 2,160,657 |
| 1,664,000 | 7.33%, 11/02/2026, 12 mo. USD CMT + 3.050%(2) | 1,661,305 |
| | HSBC Holdings plc | |
| 1,844,000 | 3.97%, 05/22/2030, 3 mo. USD LIBOR + 1.610%(2) | 1,518,962 |
| 2,306,000 | 7.34%, 11/03/2026, 3 mo. USD SOFR + 3.030% | 2,311,505 |
| 1,421,000 | JP Morgan Chase & Co. 2.08%, 04/22/2026, (2.08% fixed rate until 04/22/2025; 3 mo. USD SOFR + 1.850% thereafter)(2) | 1,293,396 |
| 4,616,000 | UniCredit S.p.A. 1.98%, 06/03/2027, 12 mo. USD CMT + 1.200%(1)(2) | 3,776,313 |
| | | | 14,511,945 |
| | Diversified Financial Services - 1.5% |
| 6,882,000 | AerCap Ireland Capital DAC / AerCap Global Aviation Trust 2.45%, 10/29/2026 | 5,809,973 |
| | Entertainment - 1.0% |
| 4,627,000 | Magallanes, Inc. 3.76%, 03/15/2027(1) | 4,114,962 |
| | Healthcare - Services - 0.5% |
| 2,563,000 | CommonSpirit Health 3.35%, 10/01/2029 | 2,149,176 |
| | Packaging & Containers - 0.7% |
| 3,220,000 | Sealed Air Corp. 1.57%, 10/15/2026(1) | 2,694,695 |
| | REITS - 0.4% |
| 1,693,000 | Crown Castle, Inc. 1.05%, 07/15/2026 | 1,424,238 |
| | Semiconductors - 0.8% |
| | Qorvo, Inc. | |
| 800,000 | 1.75%, 12/15/2024(1) | 729,520 |
| 2,791,000 | 4.38%, 10/15/2029 | 2,378,274 |
| | | | 3,107,794 |
| | Telecommunications - 0.2% |
| 881,000 | T-Mobile USA, Inc. 2.40%, 03/15/2029 | 719,350 |
| | Total Corporate Bonds
(cost $45,671,884) | $ 39,108,423 |
| MUNICIPAL BONDS - 78.3% |
| | California - 14.9% |
| 955,000 | Alameda Corridor, CA, Transportation Auth Rev, (AGM Insured) 5.00%, 10/01/2052 | $ 952,884 |
| 700,000 | Brentwood Union School Dist, GO 5.25%, 08/01/2052 | 732,337 |
| 2,835,000 | California State Health Facs Finance Auth Rev 5.00%, 04/01/2033 | 2,929,533 |
| | City of Los Angeles, CA, Department of Airports Rev | |
| 460,000 | 1.25%, 05/15/2028 | 373,075 |
| 70,000 | 5.00%, 05/15/2029 | 76,572 |
| 355,000 | 5.00%, 05/15/2031 | 392,943 |
| | County of Sacramento, CA, Airport System Rev | |
| 550,000 | 5.00%, 07/01/2032 | 589,399 |
| 960,000 | 5.00%, 07/01/2033 | 1,017,998 |
| 600,000 | 5.00%, 07/01/2034 | 626,428 |
| Shares or Principal Amount | | Market Value† |
| MUNICIPAL BONDS - 78.3% - (continued) |
| | California - 14.9% - (continued) |
| $ 2,845,000 | Del Mar, CA, Union School Dist, GO 4.00%, 08/01/2046 | $ 2,520,294 |
| 10,055,000 | Elk Grove, CA, Unified School Dist, GO 4.00%, 08/01/2048 | 8,806,330 |
| 2,600,000 | Fresno, CA, Unified School Dist, GO 4.00%, 08/01/2052 | 2,232,115 |
| 3,325,000 | Golden State, CA, Tobacco Securitization Corp. Rev 3.00%, 06/01/2046 | 3,011,340 |
| 1,000,000 | Merced, CA, Union High School Dist, GO 0.00%, 08/01/2034(3) | 591,056 |
| 200,000 | North Orange County, CA, Community College Dist, GO, (NATL Insured) 0.00%, 08/01/2028(3) | 159,270 |
| 680,000 | Peralta Community College Dist, GO 5.50%, 08/01/2052(4) | 722,343 |
| 5,480,000 | Regents of the University of California Medical Center Pooled Rev 4.00%, 05/15/2053 | 4,582,404 |
| 300,000 | Rialto, CA, Unified School Dist, GO, (AGM Insured) 0.00%, 08/01/2029(3) | 228,739 |
| 4,335,000 | San Francisco, CA, Bay Area Rapid Transit Dist, GO 4.25%, 08/01/2052 | 3,986,139 |
| 410,000 | San Francisco, CA, Community College Dist, GO 2.02%, 06/15/2029 | 340,050 |
| 11,750,000 | Sweetwater Union High School Dist GO 5.00%, 08/01/2052 | 11,963,270 |
| 3,805,000 | Victor Valley, CA, Community College Dist, GO 4.00%, 08/01/2050 | 3,224,532 |
| 7,640,000 | Vista, CA, Unified School Dist GO, (BAM Insured) 5.25%, 08/01/2048 | 8,088,556 |
| | | | 58,147,607 |
| | Colorado - 1.0% |
| 950,000 | City & County of Denver, CO, Airport System Rev 5.00%, 11/15/2032 | 1,019,450 |
| 655,000 | Colorado Health Facs Auth Rev 5.25%, 11/01/2052 | 647,768 |
| 2,515,000 | Colorado Housing and Finance Auth Rev, (GNMA/FNMA/FHLMC Insured) 3.50%, 05/01/2050 | 2,430,723 |
| | | | 4,097,941 |
| | Connecticut - 0.5% |
| 1,770,000 | Connecticut Housing Finance Auth Rev, (GNMA/FNMA/FHLMC Insured) 4.25%, 05/15/2042 | 1,753,842 |
| 300,000 | State of Connecticut, GO 5.00%, 09/15/2030 | 328,688 |
| | | | 2,082,530 |
| | Delaware - 0.3% |
| | Delaware Transportation Auth Rev | |
| 630,000 | 5.00%, 09/01/2029 | 684,883 |
| 570,000 | 5.00%, 09/01/2033 | 614,520 |
| | | | 1,299,403 |
| | District of Columbia - 1.4% |
| 5,225,000 | Dist of Columbia Water & Sewer Auth Rev 5.00%, 10/01/2052 | 5,367,449 |
| | Florida - 3.7% |
| 11,440,000 | Broward County, FL, Convention Center Hotel Rev 4.00%, 01/01/2051 | 10,112,716 |
| 440,000 | County of Miami-Dade, FL, Rev 1.15%, 10/01/2025 | 392,811 |
| | Florida Housing Finance Corp. Rev, (GNMA/FNMA/FHLMC Insured) | |
| 295,000 | 3.00%, 07/01/2051 | 280,426 |
| 2,380,000 | 3.00%, 07/01/2052 | 2,234,115 |
The accompanying notes are an integral part of these financial statements.
Hartford Schroders Tax-Aware Bond Fund
Schedule of Investments – (continued)
October 31, 2022
| Shares or Principal Amount | | Market Value† |
| MUNICIPAL BONDS - 78.3% - (continued) |
| | Florida - 3.7% - (continued) |
| $ 650,000 | 3.50%, 07/01/2051 | $ 627,487 |
| 645,000 | 4.00%, 07/01/2049 | 636,714 |
| | | | 14,284,269 |
| | Georgia - 3.4% |
| | Georgia Municipal Association, Inc. | |
| 35,000 | 5.00%, 12/01/2027 | 37,645 |
| 25,000 | 5.00%, 12/01/2028 | 26,866 |
| 80,000 | 5.00%, 12/01/2029 | 85,699 |
| 35,000 | 5.00%, 12/01/2033 | 36,914 |
| | Main Street Natural Gas, Inc., GA, Rev | |
| 3,945,000 | 4.00%, 08/01/2048(5) | 3,934,232 |
| 8,250,000 | 4.00%, 03/01/2050(5) | 7,919,067 |
| 1,520,000 | 4.00%, 05/01/2052(5) | 1,423,324 |
| | | | 13,463,747 |
| | Illinois - 4.5% |
| 475,000 | Champaign County, IL, Community Unit School Dist No. 4 Champaign, GO 5.00%, 01/01/2029 | 496,063 |
| 695,000 | Chicago, IL, Metropolitan Water Reclamation Dist, GO 5.25%, 12/01/2032 | 781,017 |
| 7,735,000 | Chicago, IL, O'Hare International Airport Rev, 5.00%, 01/01/2033 | 8,095,116 |
| | Illinois Housing Dev Auth Rev, (GNMA/FNMA/FHLMC/COLL Insured) | |
| 915,000 | 3.00%, 04/01/2051 | 858,291 |
| 5,180,000 | 3.75%, 04/01/2050 | 5,029,778 |
| 1,270,000 | 3.75%, 04/01/2050 | 1,232,289 |
| 1,030,000 | 4.50%, 10/01/2048 | 1,024,976 |
| 90,000 | Metropolitan Pier & Exposition Auth, IL, Rev, (NATL Insured) 0.00%, 06/15/2028(3) | 68,869 |
| | | | 17,586,399 |
| | Indiana - 0.5% |
| | Indiana Housing & Community Dev Auth Rev, (GNMA/FNMA/FHLMC/COLL Insured) | |
| 1,345,000 | 3.00%, 07/01/2050 | 1,269,228 |
| 655,000 | 4.00%, 07/01/2048 | 645,666 |
| | | | 1,914,894 |
| | Iowa - 1.8% |
| | Iowa Finance Auth Rev, (GNMA/FNMA/FHLMC Insured) | |
| 6,570,000 | 3.00%, 07/01/2051 | 6,086,290 |
| 545,000 | 3.25%, 07/01/2050 | 521,281 |
| 475,000 | 4.00%, 07/01/2048 | 468,422 |
| | | | 7,075,993 |
| | Kentucky - 1.7% |
| | Kentucky Public Energy Auth Rev | |
| 6,080,000 | 4.00%, 12/01/2049(5) | 5,923,234 |
| 650,000 | 4.00%, 02/01/2050(5) | 614,367 |
| | | | 6,537,601 |
| | Louisiana - 2.4% |
| 230,000 | Louisiana Housing Corp. Rev 4.50%, 12/01/2047 | 229,057 |
| 12,250,000 | Louisiana State Local Gov't Environmental Facs & Community Dev Auth Rev 2.50%, 04/01/2036 | 9,050,762 |
| | | | 9,279,819 |
| | Maine - 0.4% |
| | Maine Municipal Bond Bank Rev | |
| 325,000 | 5.00%, 09/01/2029 | 351,265 |
| 535,000 | 5.00%, 09/01/2031 | 583,047 |
| 415,000 | 5.00%, 09/01/2032 | 450,549 |
| | | | 1,384,861 |
| Shares or Principal Amount | | Market Value† |
| MUNICIPAL BONDS - 78.3% - (continued) |
| | Maryland - 1.4% |
| $ 6,355,000 | Maryland State Transportation Auth Rev 4.00%, 07/01/2050 | $ 5,383,097 |
| | Massachusetts - 0.6% |
| | Commonwealth of Massachusetts, GO | |
| 685,000 | 3.00%, 02/01/2048 | 483,828 |
| 1,685,000 | 5.00%, 01/01/2035 | 1,774,218 |
| | | | 2,258,046 |
| | Minnesota - 0.4% |
| 2,055,000 | Minneapolis-St. Paul, MN, Metropolitan Airports Commission Rev 4.25%, 01/01/2052 | 1,724,520 |
| | Mississippi - 0.5% |
| 1,260,000 | Mississippi Home Corp. Rev, (GNMA/FNMA/FHLMC Insured) 3.25%, 12/01/2050 | 1,208,343 |
| 645,000 | State of Mississippi, GO 5.00%, 06/01/2031 | 707,056 |
| | | | 1,915,399 |
| | Missouri - 1.3% |
| | Missouri Housing Dev Commission Rev, (GNMA/FNMA/FHLMC Insured) | |
| 1,745,000 | 3.25%, 05/01/2051 | 1,664,030 |
| 955,000 | 3.50%, 11/01/2050 | 920,020 |
| 1,305,000 | 4.25%, 05/01/2049 | 1,291,823 |
| 1,135,000 | 4.75%, 05/01/2049 | 1,136,725 |
| | | | 5,012,598 |
| | Nebraska - 1.0% |
| | Nebraska Investment Finance Auth Rev, (GNMA/FNMA/FHLMC Insured) | |
| 3,415,000 | 3.00%, 09/01/2050 | 3,231,718 |
| 810,000 | 4.00%, 09/01/2048 | 796,801 |
| | | | 4,028,519 |
| | Nevada - 0.5% |
| | Nevada Housing Division Rev, (GNMA/FNMA/FHLMC Insured) | |
| 855,000 | 3.00%, 04/01/2051 | 802,182 |
| 1,080,000 | 4.00%, 10/01/2049 | 1,060,127 |
| | | | 1,862,309 |
| | New Jersey - 1.1% |
| 1,430,000 | Garden State, NJ, Preservation Trust Rev, (AGM Insured) 5.75%, 11/01/2028 | 1,525,858 |
| 565,000 | New Jersey Economic Dev Auth Rev 5.00%, 06/15/2028 | 583,314 |
| | New Jersey Transportation Trust Fund Auth Rev | |
| 140,000 | 4.00%, 06/15/2035 | 127,442 |
| 1,330,000 | 5.00%, 12/15/2028 | 1,384,732 |
| 605,000 | New Jersey Turnpike Auth Rev 5.00%, 01/01/2029 | 643,985 |
| | | | 4,265,331 |
| | New Mexico - 1.7% |
| | New Mexico Mortgage Finance Auth Rev, (GNMA/FNMA/FHLMC Insured) | |
| 3,805,000 | 3.00%, 01/01/2051 | 3,591,620 |
| 1,635,000 | 3.00%, 01/01/2052 | 1,531,231 |
| 1,640,000 | 4.00%, 01/01/2049 | 1,613,185 |
| | | | 6,736,036 |
| | New York - 7.3% |
| | City of New York, NY, GO | |
| 760,000 | 5.00%, 08/01/2032 | 840,641 |
| 4,210,000 | 5.00%, 08/01/2033 | 4,517,050 |
| | New York City, NY, Transitional Finance Auth, Future Tax Secured Rev | |
| 2,085,000 | 4.00%, 08/01/2048 | 1,769,156 |
The accompanying notes are an integral part of these financial statements.
Hartford Schroders Tax-Aware Bond Fund
Schedule of Investments – (continued)
October 31, 2022
| Shares or Principal Amount | | Market Value† |
| MUNICIPAL BONDS - 78.3% - (continued) |
| | New York - 7.3% - (continued) |
| $ 2,605,000 | 5.00%, 05/01/2033 | $ 2,805,461 |
| 6,075,000 | New York State Dormitory Auth Rev 3.00%, 03/15/2038 | 4,664,236 |
| 475,000 | New York Transportation Dev Corp. Rev 5.00%, 12/01/2028 | 482,741 |
| | Port Auth of New York & New Jersey Rev | |
| 750,000 | 5.00%, 07/15/2031 | 802,453 |
| 2,585,000 | 5.00%, 07/15/2033 | 2,769,586 |
| 4,740,000 | Triborough Bridge & Tunnel Auth Rev 5.00%, 05/15/2051 | 4,830,714 |
| 6,030,000 | Triborough, Bridge & Tunnel Auth, NY, Rev 4.13%, 05/15/2052 | 5,116,712 |
| | | | 28,598,750 |
| | Ohio - 1.6% |
| | Ohio Housing Finance Agency Rev | |
| 425,000 | 3.00%, 03/01/2052 | 400,399 |
| 2,905,000 | 3.25%, 03/01/2050 | 2,779,094 |
| 195,000 | 4.50%, 09/01/2048 | 194,138 |
| | Ohio State University Rev | |
| 5,000 | 5.00%, 12/01/2030 | 5,522 |
| 5,000 | 5.00%, 12/01/2031 | 5,548 |
| | Ohio Turnpike & Infrastructure Commission Rev | |
| 1,680,000 | 0.00%, 02/15/2038(3) | 788,626 |
| 1,395,000 | 0.00%, 02/15/2041(3) | 543,424 |
| | State of Ohio, GO | |
| 275,000 | 5.00%, 05/01/2031 | 304,343 |
| 745,000 | 5.00%, 05/01/2032 | 817,553 |
| 230,000 | 5.00%, 05/01/2033 | 253,530 |
| | | | 6,092,177 |
| | Oklahoma - 0.2% |
| 940,000 | Oklahoma Housing Finance Agency Rev, (GNMA/FNMA/FHLMC Insured) 4.00%, 03/01/2050 | 919,460 |
| | Pennsylvania - 1.5% |
| 850,000 | Allegheny County Sanitary Auth Rev 5.00%, 06/01/2053(4) | 856,780 |
| 635,000 | Commonwealth Finance Auth, PA, Rev 5.00%, 06/01/2032 | 657,339 |
| 1,295,000 | Geisinger, PA, Health System Auth Rev 5.00%, 02/15/2032 | 1,329,156 |
| | Pennsylvania Turnpike Commission Rev | |
| 300,000 | 5.00%, 12/01/2032 | 321,538 |
| 310,000 | 5.00%, 12/01/2033 | 330,429 |
| | Philadelphia, PA, Gas Works Co. Rev, (AGM Insured) | |
| 440,000 | 5.00%, 08/01/2029 | 469,518 |
| 910,000 | 5.00%, 08/01/2030 | 976,452 |
| 820,000 | 5.00%, 08/01/2033 | 868,552 |
| | | | 5,809,764 |
| | South Carolina - 1.7% |
| 6,425,000 | Patriots Energy Group Financing Agency, SC, Rev 4.00%, 10/01/2048(5) | 6,395,452 |
| 250,000 | Tobacco Settlement Rev Mgmt Auth, SC, Rev 6.38%, 05/15/2030 | 289,372 |
| | | | 6,684,824 |
| | South Dakota - 0.1% |
| | South Dakota Conservancy Dist Rev | |
| 245,000 | 5.00%, 08/01/2029 | 269,218 |
| 235,000 | 5.00%, 08/01/2030 | 260,612 |
| | | | 529,830 |
| | Tennessee - 1.8% |
| 340,000 | Jackson, TN, Health Educational & Housing Facility Board Rev 3.00%, 12/01/2026(5) | 334,259 |
| Shares or Principal Amount | | Market Value† |
| MUNICIPAL BONDS - 78.3% - (continued) |
| | Tennessee - 1.8% - (continued) |
| $ 250,000 | Metropolitan Nashville, TN, Airport Auth Rev 5.00%, 07/01/2049 | $ 244,321 |
| 6,085,000 | Tennergy Corp., TN, Rev 4.00%, 12/01/2051(5) | 5,711,296 |
| 925,000 | Tennessee Housing Dev Agency Rev 4.50%, 07/01/2049 | 920,922 |
| | | | 7,210,798 |
| | Texas - 15.0% |
| | Arlington, TX, Higher Education Finance Corp. Rev, (PSF-GTD Insured) | |
| 605,000 | 5.00%, 08/15/2030 | 654,785 |
| 455,000 | 5.00%, 08/15/2031 | 492,038 |
| 610,000 | 5.00%, 08/15/2032 | 660,227 |
| 3,770,000 | 5.00%, 08/15/2033 | 3,986,781 |
| 1,495,000 | Bexar County, TX, Hospital Dist, GO 4.25%, 02/15/2052 | 1,307,320 |
| 5,975,000 | Bullard, TX, Independent School Dist GO, (PSF-GTD Insured) 4.00%, 02/15/2052 | 5,113,629 |
| | City of Houston, TX, Airport System Rev | |
| 2,385,000 | 5.00%, 07/01/2029 | 2,546,386 |
| 1,325,000 | 5.00%, 07/01/2030 | 1,416,677 |
| 220,000 | City of McKinney, TX, Waterworks & Sewer System Rev 5.00%, 03/15/2031 | 240,811 |
| 745,000 | Cleburne Independent School Dist GO, (PSF-GTD Insured) 3.00%, 02/15/2046 | 537,212 |
| | Clifton, TX, Higher Education Finance Corp., Rev, (PSF-GTD Insured) | |
| 210,000 | 5.00%, 08/15/2028 | 223,388 |
| 810,000 | 5.00%, 08/15/2029 | 869,078 |
| 270,000 | 5.00%, 08/15/2030 | 291,651 |
| 320,000 | Crandall Independent School Dist, TX, GO 4.00%, 08/15/2052 | 275,289 |
| 1,695,000 | Cypress-Fairbanks, TX, Independent School Dist, GO, (PSF-GTD Insured) 4.00%, 02/15/2033 | 1,706,908 |
| | Harris County, TX, Cultural Education Facs Finance Corp. Rev | |
| 450,000 | 5.00%, 11/15/2028 | 479,045 |
| 430,000 | 5.00%, 11/15/2029 | 456,956 |
| 1,075,000 | Hitchcock, TX, Independent School Dist, GO 4.00%, 02/15/2048 | 930,455 |
| 1,900,000 | Lamar Consolidated Independent School Dist GO, (PSF-GTD Insured) 3.00%, 02/15/2051 | 1,301,748 |
| | Lower Colorado River, TX, Auth Rev | |
| 370,000 | 5.00%, 05/15/2029 | 396,888 |
| 140,000 | 5.00%, 05/15/2030 | 150,835 |
| 3,485,000 | Montgomery, TX, Independent School Dist GO, (PSF-GTD Insured) 4.25%, 02/15/2052 | 3,126,267 |
| | Newark, TX, Higher Education Finance Corp. Rev, (PSF-GTD Insured) | |
| 3,079,000 | 4.00%, 06/15/2047 | 2,680,956 |
| 704,000 | 4.00%, 06/15/2052 | 604,144 |
| 2,715,000 | Northwest, TX, Independent School Dist, GO, (PSF-GTD Insured) 5.00%, 02/15/2048(4) | 2,810,354 |
| 1,050,000 | Sabine-Neches Navigation Dist, GO 5.25%, 02/15/2052 | 1,085,968 |
| 3,765,000 | Temple, TX, Independent School Dist, GO, (PSF-GTD Insured) 4.25%, 02/01/2047 | 3,426,129 |
| | Texas Department of Housing & Community Affairs Rev, (GNMA Insured) | |
| 1,765,000 | 3.00%, 01/01/2052 | 1,651,371 |
| 5,430,000 | 3.00%, 03/01/2052 | 5,054,472 |
| 1,765,000 | 3.50%, 03/01/2051 | 1,685,800 |
| 1,040,000 | 4.00%, 03/01/2050 | 1,014,473 |
| 680,000 | 4.75%, 03/01/2049 | 680,381 |
| 1,245,000 | Texas Municipal Gas Acquisition & Supply Corp. Rev 5.00%, 12/15/2028 | 1,261,373 |
The accompanying notes are an integral part of these financial statements.
Hartford Schroders Tax-Aware Bond Fund
Schedule of Investments – (continued)
October 31, 2022
| Shares or Principal Amount | | Market Value† |
| MUNICIPAL BONDS - 78.3% - (continued) |
| | Texas - 15.0% - (continued) |
| $ 2,370,000 | Texas Water Dev Board Rev 4.80%, 10/15/2052 | $ 2,376,625 |
| 880,000 | University of Texas Rev 5.00%, 05/15/2035 | 921,401 |
| | White Settlement, TX, Independent School Dist GO, (PSF-GTD Insured) | |
| 4,985,000 | 4.00%, 08/15/2052 | 4,269,975 |
| 2,125,000 | 4.13%, 08/15/2052 | 1,864,751 |
| | | | 58,552,547 |
| | Utah - 0.3% |
| 1,140,000 | Intermountain, UT, Power Agency Rev 5.00%, 07/01/2032 | 1,255,291 |
| | Virginia - 2.3% |
| | Hampton Roads Transportation, VA, Accountability Commission Rev | |
| 450,000 | 5.00%, 07/01/2031 | 492,052 |
| 415,000 | 5.00%, 07/01/2032 | 455,349 |
| 5,405,000 | Loudoun County Economic Dev Auth Rev 4.00%, 10/01/2052 | 4,732,570 |
| 3,095,000 | Virginia College Building Auth Rev 5.00%, 02/01/2032 | 3,418,917 |
| | | | 9,098,888 |
| | Washington - 1.1% |
| 1,415,000 | Energy, WA, Northwest Rev 5.00%, 07/01/2032 | 1,568,285 |
| | Washington State Housing Finance Commission Rev, (GNMA/FNMA/FHLMC Insured) | |
| 1,880,000 | 4.00%, 12/01/2048 | 1,852,446 |
| 965,000 | 4.00%, 06/01/2050 | 946,312 |
| | | | 4,367,043 |
| | Wisconsin - 0.2% |
| 650,000 | Wisconsin Health & Educational Facs Auth Rev 5.00%, 04/01/2033 | 673,482 |
| | Wyoming - 0.2% |
| 865,000 | Wyoming Community Dev Auth Rev 4.00%, 06/01/2043 | 852,704 |
| | Total Municipal Bonds
(cost $340,684,191) | | $ 306,353,926 |
| U.S. GOVERNMENT AGENCIES - 1.0% |
| | Mortgage-Backed Agencies - 1.0% |
| | FHLMC - 0.5% |
| 2,018,196 | 4.50%, 09/01/2052 | $ 1,895,234 |
| | FNMA - 0.5% |
| 1,982,588 | 5.00%, 10/01/2052 | 1,911,570 |
| | Total U.S. Government Agencies
(cost $3,840,904) | | $ 3,806,804 |
| U.S. GOVERNMENT SECURITIES - 9.5% |
| | U.S. Treasury Securities - 9.5% |
| | U.S. Treasury Bonds - 5.7% |
| 25,719,000 | 3.38%, 08/15/2042 | $ 22,106,284 |
| | U.S. Treasury Notes - 3.8% |
| 9,526,000 | 3.00%, 06/30/2024 | 9,276,315 |
| 5,906,000 | 3.13%, 08/15/2025 | 5,700,674 |
| | | | 14,976,989 |
| | Total U.S. Government Securities
(cost $39,379,535) | | $ 37,083,273 |
| | Total Long-Term Investments
(cost $429,576,514) | | $ 386,352,426 |
| Shares or Principal Amount | | Market Value† |
| SHORT-TERM INVESTMENTS - 2.6% |
| | Other Investment Pools & Funds - 2.6% |
| 10,084,158 | Morgan Stanley Institutional Liquidity Funds, Treasury Portfolio, Institutional Class, 3.02%(6) | $ 10,084,158 |
| | Total Short-Term Investments
(cost $10,084,158) | $ 10,084,158 |
| | Total Investments
(cost $439,660,672) | 101.4% | $ 396,436,584 |
| | Other Assets and Liabilities | (1.4)% | (5,475,298) |
| | Total Net Assets | 100.0% | $ 390,961,286 |
| Note: | Percentage of investments as shown is the ratio of the total market value to total net assets. |
| | The Fund may refer to any one or more of the industry classifications used by one or more widely recognized market indices, ratings group and/or as defined by Fund management. Industry classifications may not be identical across all security types. |
| | For Fund compliance purposes, the Fund may not use the same classification system. These classifications are used for financial reporting purposes. |
| | See “Glossary” for abbreviation descriptions. |
| (1) | Security was purchased pursuant to Rule 144A under the Securities Act of 1933 and may be sold in transactions that are exempt from registration (typically only to qualified institutional buyers) or in a public offering registered under the Securities Act of 1933. At October 31, 2022, the aggregate value of these securities was $13,261,009, representing 3.4% of net assets. |
| (2) | Fixed to variable rate investment. The rate shown reflects the fixed rate in effect at October 31, 2022. Rate will reset at a future date. Base lending rates may be subject to a floor or cap. |
| (3) | Security is a zero-coupon bond. |
| (4) | This security, or a portion of this security, was purchased on a when-issued, delayed-delivery or delayed-draw basis. The cost of these securities was $4,338,676 at October 31, 2022. |
| (5) | Variable or floating rate security, which interest rate adjusts periodically based on changes in current interest rates and prepayments on the underlying pool of assets. Rate shown is the rate in effect as of period end. |
| (6) | Current yield as of period end. |
| † | See Significant Accounting Policies of accompanying Notes to Financial Statements regarding valuation of investments. |
The accompanying notes are an integral part of these financial statements.
Hartford Schroders Tax-Aware Bond Fund
Schedule of Investments – (continued)
October 31, 2022
Fair Value Summary
The following is a summary of the fair valuations according to the inputs used as of October 31, 2022 in valuing the Fund’s investments.
| Description | | Total | | Level 1 | | Level 2 | | Level 3(1) |
| Assets | | | | | | | | |
| Corporate Bonds | | $ 39,108,423 | | $ — | | $ 39,108,423 | | $ — |
| Municipal Bonds | | 306,353,926 | | — | | 306,353,926 | | — |
| U.S. Government Agencies | | 3,806,804 | | — | | 3,806,804 | | — |
| U.S. Government Securities | | 37,083,273 | | — | | 37,083,273 | | — |
| Short-Term Investments | | 10,084,158 | | 10,084,158 | | — | | — |
| Total | | $ 396,436,584 | | $ 10,084,158 | | $ 386,352,426 | | $ — |
| (1) | For the year ended October 31, 2022, there were no transfers in and out of Level 3. |
The accompanying notes are an integral part of these financial statements.
Hartford Schroders US MidCap Opportunities Fund
Schedule of Investments
October 31, 2022
| Shares or Principal Amount | | Market Value† |
| COMMON STOCKS - 92.7% |
| | Banks - 3.7% |
| 122,687 | Commerce Bancshares, Inc. | $ 8,691,147 |
| 173,893 | Fifth Third Bancorp | 6,206,241 |
| 35,709 | First Republic Bank | 4,288,651 |
| 139,075 | Glacier Bancorp, Inc. | 7,966,216 |
| | | | 27,152,255 |
| | Capital Goods - 11.1% |
| 237,698 | BWX Technologies, Inc. | 13,544,032 |
| 50,421 | Dover Corp. | 6,589,521 |
| 138,929 | Fortune Brands Home & Security, Inc. | 8,380,197 |
| 193,712 | Hexcel Corp. | 10,789,758 |
| 82,507 | IDEX Corp. | 18,342,131 |
| 39,724 | Nordson Corp. | 8,937,900 |
| 33,000 | Snap-on, Inc. | 7,327,650 |
| 47,761 | Trane Technologies plc | 7,624,089 |
| | | | 81,535,278 |
| | Commercial & Professional Services - 8.4% |
| 91,371 | Copart, Inc.* | 10,509,492 |
| 120,687 | Leidos Holdings, Inc. | 12,260,592 |
| 445,791 | Rentokil Initial plc ADR | 13,792,774 |
| 62,471 | Robert Half International, Inc. | 4,776,533 |
| 49,413 | Verisk Analytics, Inc. Class A | 9,034,179 |
| 82,755 | Waste Connections, Inc. | 10,916,212 |
| | | | 61,289,782 |
| | Consumer Services - 2.5% |
| 282,545 | Aramark | 10,312,893 |
| 39,643 | Churchill Downs, Inc. | 8,242,176 |
| | | | 18,555,069 |
| | Diversified Financials - 3.6% |
| 165,836 | Nasdaq, Inc. | 10,321,632 |
| 68,341 | Raymond James Financial, Inc. | 8,073,806 |
| 145,594 | SEI Investments Co. | 7,905,754 |
| | | | 26,301,192 |
| | Energy - 4.5% |
| 40,332 | Cheniere Energy, Inc. | 7,114,968 |
| 352,962 | Coterra Energy, Inc. | 10,987,707 |
| 58,789 | Diamondback Energy, Inc. | 9,236,340 |
| 23,464 | Pioneer Natural Resources Co. | 6,016,404 |
| | | | 33,355,419 |
| | Food, Beverage & Tobacco - 2.0% |
| 60,622 | Hershey Co. | 14,474,715 |
| | Health Care Equipment & Services - 6.0% |
| 26,554 | Chemed Corp. | 12,397,266 |
| 23,742 | Cooper Cos., Inc. | 6,490,825 |
| 217,719 | Encompass Health Corp. | 11,852,622 |
| 99,494 | Masimo Corp.* | 13,093,411 |
| | | | 43,834,124 |
| | Insurance - 8.7% |
| 74,003 | Arthur J Gallagher & Co. | 13,844,481 |
| 115,037 | Assurant, Inc. | 15,628,927 |
| 104,419 | Globe Life, Inc. | 12,062,483 |
| 84,778 | Reinsurance Group of America, Inc. | 12,476,778 |
| 220,192 | Ryan Specialty Group Holdings, Inc.* | 9,875,611 |
| | | | 63,888,280 |
| | Materials - 3.2% |
| 105,759 | AptarGroup, Inc. | 10,486,005 |
| 155,930 | Berry Global Group, Inc.* | 7,378,607 |
| 59,226 | International Flavors & Fragrances, Inc. | 5,781,050 |
| | | | 23,645,662 |
| | Media & Entertainment - 4.1% |
| 268,777 | Interpublic Group of Cos., Inc. | 8,006,867 |
| 144,553 | Match Group, Inc.* | 6,244,689 |
| Shares or Principal Amount | | Market Value† |
| COMMON STOCKS - 92.7% - (continued) |
| | Media & Entertainment - 4.1% - (continued) |
| 277,228 | Pinterest, Inc. Class A* | $ 6,819,809 |
| 77,013 | Take-Two Interactive Software, Inc.* | 9,124,500 |
| | | | 30,195,865 |
| | Pharmaceuticals, Biotechnology & Life Sciences - 2.8% |
| 115,863 | Catalent, Inc.* | 7,615,675 |
| 202,308 | Royalty Pharma plc Class A | 8,561,675 |
| 20,644 | West Pharmaceutical Services, Inc. | 4,750,184 |
| | | | 20,927,534 |
| | Real Estate - 3.4% |
| 68,709 | Alexandria Real Estate Equities, Inc. REIT | 9,983,418 |
| 219,576 | American Homes 4 Rent Class A, REIT | 7,013,258 |
| 376,808 | Brixmor Property Group, Inc. REIT | 8,029,779 |
| | | | 25,026,455 |
| | Retailing - 3.0% |
| 41,453 | Advance Auto Parts, Inc. | 7,872,754 |
| 40,523 | Burlington Stores, Inc.* | 5,793,168 |
| 149,166 | LKQ Corp. | 8,299,596 |
| | | | 21,965,518 |
| | Semiconductors & Semiconductor Equipment - 5.4% |
| 90,919 | Entegris, Inc. | 7,213,513 |
| 59,514 | First Solar, Inc.* | 8,663,453 |
| 141,109 | Microchip Technology, Inc. | 8,712,070 |
| 141,729 | ON Semiconductor Corp.* | 8,706,413 |
| 69,810 | Skyworks Solutions, Inc. | 6,004,358 |
| | | | 39,299,807 |
| | Software & Services - 9.7% |
| 175,007 | Amdocs Ltd. | 15,104,854 |
| 146,214 | Dolby Laboratories, Inc. Class A | 9,772,944 |
| 26,972 | EPAM Systems, Inc.* | 9,440,200 |
| 260,958 | Genpact Ltd. | 12,656,463 |
| 102,232 | PTC, Inc.* | 12,045,997 |
| 61,233 | VeriSign, Inc.* | 12,274,767 |
| | | | 71,295,225 |
| | Technology Hardware & Equipment - 5.8% |
| 52,172 | CDW Corp. | 9,015,843 |
| 197,164 | Ciena Corp.* | 9,444,156 |
| 56,957 | Motorola Solutions, Inc. | 14,222,732 |
| 24,122 | Teledyne Technologies, Inc.* | 9,600,074 |
| | | | 42,282,805 |
| | Utilities - 4.8% |
| 165,289 | Alliant Energy Corp. | 8,623,127 |
| 319,852 | CenterPoint Energy, Inc. | 9,150,966 |
| 100,114 | CMS Energy Corp. | 5,711,504 |
| 51,098 | Eversource Energy | 3,897,755 |
| 204,342 | FirstEnergy Corp. | 7,705,737 |
| | | | 35,089,089 |
| | Total Common Stocks
(cost $515,973,622) | | $ 680,114,074 |
| SHORT-TERM INVESTMENTS - 6.9% |
| | Other Investment Pools & Funds - 6.9% |
| 50,458,891 | Morgan Stanley Institutional Liquidity Funds, Treasury Portfolio, Institutional Class, 3.02%(1) | $ 50,458,891 |
| | Total Short-Term Investments
(cost $50,458,891) | $ 50,458,891 |
| | Total Investments
(cost $566,432,513) | 99.6% | $ 730,572,965 |
| | Other Assets and Liabilities | 0.4% | 2,796,011 |
| | Total Net Assets | 100.0% | $ 733,368,976 |
The accompanying notes are an integral part of these financial statements.
Hartford Schroders US MidCap Opportunities Fund
Schedule of Investments – (continued)
October 31, 2022
| Note: | Percentage of investments as shown is the ratio of the total market value to total net assets. |
| | Prices of foreign equities that are principally traded on certain foreign markets will generally be adjusted daily pursuant to a fair value pricing service approved by Hartford Funds Management Company, LLC in order to reflect an adjustment for factors occurring after the close of certain foreign markets but before the close of the New York Stock Exchange. |
| | The Fund may refer to any one or more of the industry classifications used by one or more widely recognized market indices, ratings group and/or as defined by Fund management. Industry classifications may not be identical across all security types. |
| | Equity industry classifications used in this report are the Global Industry Classification Standard, which was developed by and is the exclusive property and service mark of MSCI, Inc. and Standard & Poor’s. |
For Fund compliance purposes, the Fund may not use the same classification system. These classifications are used for financial reporting purposes.
See “Glossary” for abbreviation descriptions.
| * | Non-income producing. |
| (1) | Current yield as of period end. |
| † | See Significant Accounting Policies of accompanying Notes to Financial Statements regarding valuation of investments. |
Fair Value Summary
The following is a summary of the fair valuations according to the inputs used as of October 31, 2022 in valuing the Fund’s investments.
| Description | | Total | | Level 1 | | Level 2 | | Level 3(1) |
| Assets | | | | | | | | |
| Common Stocks | | | | | | | | |
| Banks | | $ 27,152,255 | | $ 27,152,255 | | $ — | | $ — |
| Capital Goods | | 81,535,278 | | 81,535,278 | | — | | — |
| Commercial & Professional Services | | 61,289,782 | | 61,289,782 | | — | | — |
| Consumer Services | | 18,555,069 | | 18,555,069 | | — | | — |
| Diversified Financials | | 26,301,192 | | 26,301,192 | | — | | — |
| Energy | | 33,355,419 | | 33,355,419 | | — | | — |
| Food, Beverage & Tobacco | | 14,474,715 | | 14,474,715 | | — | | — |
| Health Care Equipment & Services | | 43,834,124 | | 43,834,124 | | — | | — |
| Insurance | | 63,888,280 | | 63,888,280 | | — | | — |
| Materials | | 23,645,662 | | 23,645,662 | | — | | — |
| Media & Entertainment | | 30,195,865 | | 30,195,865 | | — | | — |
| Pharmaceuticals, Biotechnology & Life Sciences | | 20,927,534 | | 20,927,534 | | — | | — |
| Real Estate | | 25,026,455 | | 25,026,455 | | — | | — |
| Retailing | | 21,965,518 | | 21,965,518 | | — | | — |
| Semiconductors & Semiconductor Equipment | | 39,299,807 | | 39,299,807 | | — | | — |
| Software & Services | | 71,295,225 | | 71,295,225 | | — | | — |
| Technology Hardware & Equipment | | 42,282,805 | | 42,282,805 | | — | | — |
| Utilities | | 35,089,089 | | 35,089,089 | | — | | — |
| Short-Term Investments | | 50,458,891 | | 50,458,891 | | — | | — |
| Total | | $ 730,572,965 | | $ 730,572,965 | | $ — | | $ — |
| (1) | For the year ended October 31, 2022, there were no transfers in and out of Level 3. |
The accompanying notes are an integral part of these financial statements.
Hartford Schroders US Small Cap Opportunities Fund
Schedule of Investments
October 31, 2022
| Shares or Principal Amount | | Market Value† |
| COMMON STOCKS - 94.8% |
| | Automobiles & Components - 1.1% |
| 57,191 | Gentherm, Inc.* | $ 3,341,098 |
| | Banks - 10.7% |
| 22,849 | Cambridge Bancorp | 2,007,285 |
| 255,872 | First BanCorp | 4,040,219 |
| 101,218 | First Interstate BancSystem, Inc. Class A | 4,616,553 |
| 111,819 | First Merchants Corp. | 5,020,673 |
| 104,065 | Heritage Financial Corp. | 3,505,950 |
| 111,113 | Seacoast Banking Corp. of Florida | 3,433,392 |
| 48,704 | SouthState Corp. | 4,404,303 |
| 45,793 | TriCo Bancshares | 2,651,872 |
| 88,600 | United Community Banks, Inc. | 3,411,100 |
| | | | 33,091,347 |
| | Capital Goods - 13.3% |
| 40,805 | Albany International Corp. Class A | 3,738,554 |
| 262,331 | Custom Truck One Source, Inc.*(1) | 1,817,954 |
| 21,468 | EnPro Industries, Inc. | 2,286,342 |
| 37,476 | ESCO Technologies, Inc. | 3,229,307 |
| 57,155 | Gibraltar Industries, Inc.* | 2,919,477 |
| 77,745 | Hexcel Corp. | 4,330,396 |
| 134,667 | Maxar Technologies, Inc. | 3,008,461 |
| 31,484 | McGrath Rent Corp. | 2,961,070 |
| 120,019 | Primoris Services Corp. | 2,423,184 |
| 51,123 | Proto Labs, Inc.* | 1,952,387 |
| 28,644 | Simpson Manufacturing Co., Inc. | 2,448,489 |
| 27,941 | Standex International Corp. | 2,767,556 |
| 87,046 | Univar Solutions, Inc.* | 2,217,932 |
| 15,216 | Valmont Industries, Inc. | 4,857,252 |
| | | | 40,958,361 |
| | Commercial & Professional Services - 3.7% |
| 46,807 | ASGN, Inc.* | 3,968,298 |
| 213,462 | Interface, Inc. | 2,414,255 |
| 45,380 | Science Applications International Corp. | 4,916,469 |
| | | | 11,299,022 |
| | Consumer Durables & Apparel - 4.4% |
| 15,656 | Cavco Industries, Inc.* | 3,548,746 |
| 25,949 | Oxford Industries, Inc. | 2,639,792 |
| 38,481 | Skyline Champion Corp.* | 2,239,979 |
| 218,487 | Snap One Holdings Corp.*(1) | 2,604,365 |
| 86,804 | Steven Madden Ltd. | 2,592,835 |
| | | | 13,625,717 |
| | Diversified Financials - 2.9% |
| 212,955 | Compass Diversified Holdings | 4,531,682 |
| 20,802 | Houlihan Lokey, Inc. | 1,858,035 |
| 303,656 | Perella Weinberg Partners Class A | 2,392,809 |
| | | | 8,782,526 |
| | Energy - 5.0% |
| 43,609 | Cactus, Inc. Class A | 2,255,457 |
| 98,701 | Delek U.S. Holdings, Inc. | 2,927,472 |
| 69,931 | Matador Resources Co. | 4,646,915 |
| 309,320 | Permian Resources Corp. Class A* | 3,022,056 |
| 176,866 | Solaris Oilfield Infrastructure, Inc. Class A | 2,408,915 |
| | | | 15,260,815 |
| | Food & Staples Retailing - 1.5% |
| 130,017 | Chefs' Warehouse, Inc.* | 4,762,523 |
| | Food, Beverage & Tobacco - 3.5% |
| 44,845 | Darling Ingredients, Inc.* | 3,519,435 |
| 285,220 | Primo Water Corp. | 4,161,360 |
| 233,644 | Sovos Brands, Inc.* | 3,238,306 |
| | | | 10,919,101 |
| | Health Care Equipment & Services - 7.4% |
| 169,353 | Enhabit, Inc.* | 2,103,364 |
| 114,102 | Envista Holdings Corp.* | 3,766,507 |
| Shares or Principal Amount | | Market Value† |
| COMMON STOCKS - 94.8% - (continued) |
| | Health Care Equipment & Services - 7.4% - (continued) |
| 45,940 | Haemonetics Corp.* | $ 3,902,603 |
| 35,561 | ICU Medical, Inc.* | 5,277,608 |
| 14,459 | Mesa Laboratories, Inc. | 1,911,624 |
| 70,204 | Progyny, Inc.* | 3,121,972 |
| 31,311 | U.S. Physical Therapy, Inc. | 2,780,417 |
| | | | 22,864,095 |
| | Insurance - 5.5% |
| 45,533 | Axis Capital Holdings Ltd. | 2,489,289 |
| 83,602 | James River Group Holdings Ltd. | 2,112,623 |
| 79,768 | Kemper Corp. | 3,802,541 |
| 34,703 | Reinsurance Group of America, Inc. | 5,107,240 |
| 74,360 | Ryan Specialty Group Holdings, Inc.* | 3,335,046 |
| | | | 16,846,739 |
| | Materials - 8.3% |
| 39,298 | Ashland Global Holdings, Inc. | 4,123,146 |
| 38,627 | Balchem Corp. | 5,400,055 |
| 31,050 | Eagle Materials, Inc. | 3,797,725 |
| 196,723 | Element Solutions, Inc. | 3,383,636 |
| 34,271 | Materion Corp. | 2,937,367 |
| 71,039 | Mativ, Inc. | 1,686,466 |
| 73,980 | PureCycle Technologies, Inc.*(1) | 611,815 |
| 121,761 | Valvoline, Inc. | 3,574,903 |
| | | | 25,515,113 |
| | Media & Entertainment - 2.4% |
| 130,382 | Gray Television, Inc. | 1,844,905 |
| 62,692 | IAC, Inc.* | 3,051,847 |
| 346,691 | Stagwell, Inc.* | 2,631,385 |
| | | | 7,528,137 |
| | Pharmaceuticals, Biotechnology & Life Sciences - 4.4% |
| 250,884 | Evolus, Inc.*(1) | 2,147,567 |
| 134,686 | FibroGen, Inc.* | 2,192,688 |
| 49,268 | Intra-Cellular Therapies, Inc.* | 2,250,069 |
| 44,334 | Natera, Inc.* | 2,081,925 |
| 38,942 | Pacira BioSciences, Inc.* | 2,015,638 |
| 59,229 | Syneos Health, Inc.* | 2,983,957 |
| | | | 13,671,844 |
| | Real Estate - 2.7% |
| 141,022 | Douglas Emmett, Inc. REIT | 2,480,577 |
| 175,704 | Kennedy-Wilson Holdings, Inc. | 2,918,443 |
| 50,107 | Terreno Realty Corp. REIT | 2,863,114 |
| | | | 8,262,134 |
| | Retailing - 1.0% |
| 19,781 | Asbury Automotive Group, Inc.* | 3,120,453 |
| | Semiconductors & Semiconductor Equipment - 2.9% |
| 192,543 | Allegro MicroSystems, Inc.* | 4,892,518 |
| 69,954 | MACOM Technology Solutions Holdings, Inc.* | 4,048,238 |
| | | | 8,940,756 |
| | Software & Services - 7.1% |
| 150,993 | Box, Inc. Class A* | 4,386,347 |
| 50,721 | CommVault Systems, Inc.* | 3,088,402 |
| 131,535 | LiveRamp Holdings, Inc.* | 2,414,983 |
| 56,904 | Perficient, Inc.* | 3,810,861 |
| 177,343 | Sabre Corp.* | 1,030,363 |
| 56,587 | Teradata Corp.* | 1,787,583 |
| 61,494 | WNS Holdings Ltd. ADR* | 5,293,403 |
| | | | 21,811,942 |
| | Technology Hardware & Equipment - 3.3% |
| 52,009 | Ciena Corp.* | 2,491,231 |
| 43,583 | Lumentum Holdings, Inc.* | 3,244,755 |
| 295,481 | Viavi Solutions, Inc.* | 4,461,763 |
| | | | 10,197,749 |
The accompanying notes are an integral part of these financial statements.
Hartford Schroders US Small Cap Opportunities Fund
Schedule of Investments – (continued)
October 31, 2022
| Shares or Principal Amount | | Market Value† |
| COMMON STOCKS - 94.8% - (continued) |
| | Utilities - 3.7% |
| 44,732 | Avista Corp. | $ 1,835,354 |
| 19,774 | Chesapeake Utilities Corp. | 2,459,490 |
| 47,362 | ONE Gas, Inc. | 3,669,608 |
| 46,595 | SJW Group | 3,293,334 |
| | | | 11,257,786 |
| | Total Common Stocks
(cost $247,527,123) | | $ 292,057,258 |
| SHORT-TERM INVESTMENTS - 6.9% |
| | Other Investment Pools & Funds - 5.0% |
| 15,299,820 | Morgan Stanley Institutional Liquidity Funds, Treasury Portfolio, Institutional Class, 3.02%(2) | $ 15,299,820 |
| | Securities Lending Collateral - 1.9% |
| 920,577 | Goldman Sachs Financial Square Funds, Government Fund, Institutional Class, 3.07%(2) | 920,577 |
| 3,068,589 | HSBC US Government Money Market Fund, 3.09%(2) | 3,068,589 |
| 920,577 | Invesco Government & Agency Portfolio, Institutional Class, 3.07%(2) | 920,577 |
| 920,577 | Morgan Stanley Institutional Liquidity Funds, Government Portfolio, Institutional Class, 2.88%(2) | 920,577 |
| | | | 5,830,320 |
| | Total Short-Term Investments
(cost $21,130,140) | $ 21,130,140 |
| | Total Investments
(cost $268,657,263) | 101.7% | $ 313,187,398 |
| | Other Assets and Liabilities | (1.7)% | (5,243,603) |
| | Total Net Assets | 100.0% | $ 307,943,795 |
| Note: | Percentage of investments as shown is the ratio of the total market value to total net assets. |
| | Prices of foreign equities that are principally traded on certain foreign markets will generally be adjusted daily pursuant to a fair value pricing service approved by Hartford Funds Management Company, LLC in order to reflect an adjustment for factors occurring after the close of certain foreign markets but before the close of the New York Stock Exchange. |
| | The Fund may refer to any one or more of the industry classifications used by one or more widely recognized market indices, ratings group and/or as defined by Fund management. Industry classifications may not be identical across all security types. |
| | Equity industry classifications used in this report are the Global Industry Classification Standard, which was developed by and is the exclusive property and service mark of MSCI, Inc. and Standard & Poor’s. |
| | For Fund compliance purposes, the Fund may not use the same classification system. These classifications are used for financial reporting purposes. |
| | See “Glossary” for abbreviation descriptions. |
| * | Non-income producing. |
| (1) | Represents entire or partial securities on loan. See Note 8 in the accompanying Notes to Financial Statements for securities lending information. |
| (2) | Current yield as of period end. |
| † | See Significant Accounting Policies of accompanying Notes to Financial Statements regarding valuation of investments. |
The accompanying notes are an integral part of these financial statements.
Hartford Schroders US Small Cap Opportunities Fund
Schedule of Investments – (continued)
October 31, 2022
Fair Value Summary
The following is a summary of the fair valuations according to the inputs used as of October 31, 2022 in valuing the Fund’s investments.
| Description | | Total | | Level 1 | | Level 2 | | Level 3(1) |
| Assets | | | | | | | | |
| Common Stocks | | | | | | | | |
| Automobiles & Components | | $ 3,341,098 | | $ 3,341,098 | | $ — | | $ — |
| Banks | | 33,091,347 | | 33,091,347 | | — | | — |
| Capital Goods | | 40,958,361 | | 40,958,361 | | — | | — |
| Commercial & Professional Services | | 11,299,022 | | 11,299,022 | | — | | — |
| Consumer Durables & Apparel | | 13,625,717 | | 13,625,717 | | — | | — |
| Diversified Financials | | 8,782,526 | | 8,782,526 | | — | | — |
| Energy | | 15,260,815 | | 15,260,815 | | — | | — |
| Food & Staples Retailing | | 4,762,523 | | 4,762,523 | | — | | — |
| Food, Beverage & Tobacco | | 10,919,101 | | 10,919,101 | | — | | — |
| Health Care Equipment & Services | | 22,864,095 | | 22,864,095 | | — | | — |
| Insurance | | 16,846,739 | | 16,846,739 | | — | | — |
| Materials | | 25,515,113 | | 25,515,113 | | — | | — |
| Media & Entertainment | | 7,528,137 | | 7,528,137 | | — | | — |
| Pharmaceuticals, Biotechnology & Life Sciences | | 13,671,844 | | 13,671,844 | | — | | — |
| Real Estate | | 8,262,134 | | 8,262,134 | | — | | — |
| Retailing | | 3,120,453 | | 3,120,453 | | — | | — |
| Semiconductors & Semiconductor Equipment | | 8,940,756 | | 8,940,756 | | — | | — |
| Software & Services | | 21,811,942 | | 21,811,942 | | — | | — |
| Technology Hardware & Equipment | | 10,197,749 | | 10,197,749 | | — | | — |
| Utilities | | 11,257,786 | | 11,257,786 | | — | | — |
| Short-Term Investments | | 21,130,140 | | 21,130,140 | | — | | — |
| Total | | $ 313,187,398 | | $ 313,187,398 | | $ — | | $ — |
| (1) | For the year ended October 31, 2022, there were no transfers in and out of Level 3. |
The accompanying notes are an integral part of these financial statements.
GLOSSARY: (abbreviations used in preceding Schedules of Investments)
| Counterparty Abbreviations: |
| BNP | BNP Paribas Securities Services |
| BOA | Bank of America Securities LLC |
| CBK | Citibank NA |
| JPM | JP Morgan Chase & Co. |
| MSC | Morgan Stanley |
| SSG | State Street Global Markets LLC |
| UBS | UBS AG |
| Currency Abbreviations: |
| BRL | Brazil Real |
| CLP | Chile Peso |
| CNY | China Yuan Renminbi |
| COP | Colombia Peso |
| EUR | Euro Member Countries |
| GBP | British Pound |
| HUF | Hungary Forint |
| IDR | Indonesia Rupiah |
| JPY | Japan Yen |
| MXN | Mexican Peso |
| MYR | Malaysia Ringgit |
| PEN | Peru Nuevo Sol |
| THB | Thailand Baht |
| USD | United States Dollar |
| ZAR | South Africa Rand |
| Index Abbreviations: |
| CMT | Constant Maturity Treasury Index |
| SGX | Singapore Exchange |
| Municipal Abbreviations: |
| Auth | Authority |
| Dev | Development |
| Dist | District |
| Facs | Facilities |
| GO | General Obligation |
| Rev | Revenue |
| VA | Veterans Administration |
| Other Abbreviations: |
| ADR | American Depositary Receipt |
| AGM | Assured Guaranty Municipal |
| BAM | Build America Mutual Assurance Corp. |
| Bhd | Berhad |
| CLO | Collateralized Loan Obligation |
| CMO | Collateralized Mortgage Obligation |
| FHLMC | Federal Home Loan Mortgage Corp. |
| FNMA | Federal National Mortgage Association |
| GDR | Global Depositary Receipt |
| GNMA | Government National Mortgage Association |
| JSC | Joint Stock Company |
| KGaA | Kommanditgesellschaft Auf Aktien |
| LIBOR | London Interbank Offered Rate |
| NATL | National Public Finance Guarantee Corp. |
| NVDR | Non-Voting Depositary Receipt |
| Nyrt | New York REIT Inc |
| PJSC | Private Joint Stock Company |
| PSF-GTD | Permanent School Fund Guaranteed |
| PT | Perseroan Terbatas |
| REIT | Real Estate Investment Trust |
| SOFR | Secured Overnight Financing Rate |
| SONIA | Sterling Overnight Index Average |
| Tbk | Terbuka |
Statements of Assets and Liabilities
October 31, 2022
| | Hartford
Schroders
China A Fund | | Hartford
Schroders
Diversified
Emerging
Markets Fund | | Hartford
Schroders
Emerging
Markets Equity
Fund | | Hartford
Schroders
Emerging Markets
Multi-Sector
Bond Fund | | Hartford
Schroders
International
Contrarian
Value
Fund |
| Assets: | | | | | | | | | |
| Investments in securities, at market value(1) | $ 53,814,630 | | $ 6,855,554 | | $ 4,819,175,531 | | $ 27,866,226 | | $ 903,091 |
| Cash | — | | — | | — | | 4,025 | | — |
| Cash collateral due from broker on futures contracts | — | | — | | 39 | | — | | — |
| Cash collateral held for securities on loan | — | | 466 | | 688,371 | | 51,173 | | — |
| Foreign currency | 5,968 | | 21,869 | | 9,778,750 | | 30,369 | | — |
| Unrealized appreciation on foreign currency contracts | — | | — | | — | | 220,994 | | — |
| Receivables: | | | | | | | | | |
| From affiliates | 14,708 | | 22,952 | | — | | 12,442 | | 14,429 |
| Investment securities sold | 223,066 | | 50,476 | | 25,808,601 | | — | | — |
| Fund shares sold | 2,079,869 | | 48 | | 48,407,009 | | 1,346 | | — |
| Dividends and interest | 6,917 | | 6,494 | | 3,854,106 | | 558,246 | | 2,004 |
| Securities lending income | — | | — | | 82,901 | | 939 | | — |
| Tax reclaims | — | | 256 | | 80,224 | | 30,358 | | 608 |
| Other assets | 28,809 | | 42,236 | | 224,426 | | 66,529 | | — |
| Total assets | 56,173,967 | | 7,000,351 | | 4,908,099,958 | | 28,842,647 | | 920,132 |
| Liabilities: | | | | | | | | | |
| Due to custodian | — | | 15 | | — | | — | | — |
| Unrealized depreciation on foreign currency contracts | — | | — | | — | | 128,443 | | — |
| Due to custodian - foreign currency | — | | — | | — | | — | | 18 |
| Obligation to return securities lending collateral | — | | 9,316 | | 13,767,428 | | 1,023,465 | | — |
| Payables: | | | | | | | | | |
| Investment securities purchased | 160,143 | | 40,334 | | 12,987,227 | | 68,839 | | — |
| Fund shares redeemed | — | | — | | 35,304,830 | | 436 | | — |
| Investment management fees | 44,379 | | 5,039 | | 4,246,500 | | 16,519 | | 463 |
| Transfer agent fees | 2,754 | | 51 | | 652,691 | | 2,217 | | 142 |
| Accounting services fees | 1,699 | | 244 | | 140,443 | | 881 | | 29 |
| Board of Directors' fees | 238 | | 28 | | 18,743 | | 101 | | — |
| Foreign taxes | — | | 3,181 | | 13,685,621 | | 146 | | — |
| Distribution fees | 40 | | — | | 3,793 | | — | | — |
| Accrued expenses | 35,344 | | 47,691 | | 1,387,865 | | 35,514 | | 44,432 |
| Total liabilities | 244,597 | | 105,899 | | 82,195,141 | | 1,276,561 | | 45,084 |
| Net assets | $ 55,929,370 | | $ 6,894,452 | | $ 4,825,904,817 | | $ 27,566,086 | | $ 875,048 |
| Summary of Net Assets: | | | | | | | | | |
| Capital stock and paid-in-capital | $ 85,997,248 | | $ 10,034,170 | | $ 5,940,242,364 | | $ 50,416,231 | | $ 999,999 |
| Distributable earnings (loss) | (30,067,878) | | (3,139,718) | | (1,114,337,547) | | (22,850,145) | | (124,951) |
| Net assets | $ 55,929,370 | | $ 6,894,452 | | $ 4,825,904,817 | | $ 27,566,086 | | $ 875,048 |
| Shares authorized | 300,000,000 | | 650,000,000 | | 1,425,000,000 | | 500,000,000 | | 100,000,000 |
| Par value | $ 0.0001 | | $ 0.0001 | | $ 0.0001 | | $ 0.0001 | | $ — |
| Class A: Net asset value per share | $ 10.14 | | $ 6.87 | | $ 13.24 | | $ 6.21 | | $ — |
| Maximum offering price per share | 10.73 | | 7.27 | | 14.01 | | 6.50 | | — |
| Shares outstanding | 41,413 | | 1,521 | | 5,355,272 | | 163,793 | | — |
| Net Assets | $ 419,980 | | $ 10,451 | | $ 70,885,622 | | $ 1,017,901 | | $ — |
| Class C: Net asset value per share | $ 10.01 | | $ 6.83 | | $ 12.96 | | $ 6.19 | | $ — |
| Shares outstanding | 12,807 | | 1,061 | | 314,151 | | 10,564 | | — |
| Net Assets | $ 128,189 | | $ 7,251 | | $ 4,070,961 | | $ 65,424 | | $ — |
| Class I: Net asset value per share | $ 10.17 | | $ 6.89 | | $ 13.20 | | $ 6.20 | | $ 8.75 |
| Shares outstanding | 858,240 | | 1,061 | | 128,213,514 | | 1,191,775 | | 50,000 |
| Net Assets | $ 8,730,067 | | $ 7,309 | | $ 1,691,881,500 | | $ 7,394,255 | | $ 437,525 |
| Class R3: Net asset value per share | $ — | | $ — | | $ 13.11 | | $ 6.22 | | $ — |
| Shares outstanding | — | | — | | 5,770 | | 4,396 | | — |
| Net Assets | $ — | | $ — | | $ 75,618 | | $ 27,364 | | $ — |
| Class R4: Net asset value per share | $ — | | $ — | | $ 13.23 | | $ 6.21 | | $ — |
| Shares outstanding | — | | — | | 378,927 | | 1,430 | | — |
| Net Assets | $ — | | $ — | | $ 5,012,531 | | $ 8,887 | | $ — |
The accompanying notes are an integral part of these financial statements.
Statements of Assets and Liabilities – (continued)
October 31, 2022
| | Hartford
Schroders
China A Fund | | Hartford
Schroders
Diversified
Emerging
Markets Fund | | Hartford
Schroders
Emerging
Markets Equity
Fund | | Hartford
Schroders
Emerging Markets
Multi-Sector
Bond Fund | | Hartford
Schroders
International
Contrarian
Value
Fund |
| Class R5: Net asset value per share | $ — | | $ — | | $ 13.20 | | $ 6.20 | | $ — |
| Shares outstanding | — | | — | | 22,300 | | 1,446 | | — |
| Net Assets | $ — | | $ — | | $ 294,443 | | $ 8,967 | | $ — |
| Class Y: Net asset value per share | $ 10.19 | | $ 6.89 | | $ 13.24 | | $ 6.20 | | $ — |
| Shares outstanding | 130,336 | | 1,422 | | 7,347,901 | | 407,999 | | — |
| Net Assets | $ 1,327,830 | | $ 9,796 | | $ 97,257,198 | | $ 2,530,831 | | $ — |
| Class F: Net asset value per share | $ 10.20 | | $ 6.82 | | $ 13.21 | | $ 5.80 | | $ — |
| Shares outstanding | 4,192,703 | | 1,061 | | 50,065,445 | | 1,657 | | — |
| Net Assets | $ 42,772,165 | | $ 7,240 | | $ 661,402,873 | | $ 9,604 | | $ — |
| Class SDR: Net asset value per share | $ 10.20 | | $ 6.87 | | $ 13.24 | | $ 6.20 | | $ 8.75 |
| Shares outstanding | 250,000 | | 997,550 | | 173,392,371 | | 2,659,804 | | 50,000 |
| Net Assets | $ 2,551,139 | | $ 6,852,405 | | $ 2,295,024,071 | | $ 16,502,853 | | $ 437,523 |
| Cost of investments | $ 75,955,100 | | $ 8,955,478 | | $ 5,241,373,791 | | $ 32,807,184 | | $ 1,038,510 |
| Cost of foreign currency | $ 5,969 | | $ 21,904 | | $ 9,806,565 | | $ 30,063 | | $ (42) |
| (1) Includes Investment in securities on loan, at market value | $ — | | $ 8,739 | | $ 13,022,460 | | $ 973,390 | | $ — |
The accompanying notes are an integral part of these financial statements.
Statements of Assets and Liabilities – (continued)
October 31, 2022
| | Hartford
Schroders
International
Multi-Cap
Value Fund | | Hartford
Schroders
International
Stock Fund | | Hartford
Schroders
Securitized
Income Fund | | Hartford
Schroders
Sustainable
International
Core
Fund | | Hartford
Schroders
Tax-Aware
Bond Fund |
| Assets: | | | | | | | | | |
| Investments in securities, at market value(1) | $ 2,127,852,505 | | $ 3,555,344,950 | | $ 64,645,873 | | $ 882,391 | | $ 396,436,584 |
| Cash collateral due from broker on futures contracts | — | | — | | 210,233 | | 1,980 | | — |
| Cash collateral held for securities on loan | 1,142,936 | | 220,893 | | — | | — | | — |
| Foreign currency | 5,115,143 | | 543,918 | | 5,734 | | 161 | | — |
| Unrealized appreciation on foreign currency contracts | 605,216 | | — | | 105 | | — | | — |
| Receivables: | | | | | | | | | |
| From affiliates | — | | — | | 4,682 | | 14,460 | | 40,160 |
| Investment securities sold | 9,396,618 | | 15,703,030 | | — | | 4,465 | | 1,934,555 |
| Fund shares sold | 1,982,290 | | 9,171,627 | | 181 | | — | | 1,833,460 |
| Dividends and interest | 6,819,551 | | 2,601,931 | | 144,287 | | 1,433 | | 4,039,223 |
| Securities lending income | 39,589 | | 117 | | — | | — | | — |
| Variation margin on futures contracts | — | | — | | — | | 394 | | — |
| Tax reclaims | 3,194,027 | | 5,412,565 | | — | | 82 | | — |
| Other assets | 135,237 | | 159,198 | | 23,388 | | 5 | | 81,672 |
| Total assets | 2,156,283,112 | | 3,589,158,229 | | 65,034,483 | | 905,371 | | 404,365,654 |
| Liabilities: | | | | | | | | | |
| Unrealized depreciation on foreign currency contracts | 3,623,812 | | — | | 8,118 | | — | | — |
| Obligation to return securities lending collateral | 22,858,739 | | 4,417,868 | | — | | — | | — |
| Payables: | | | | | | | | | |
| Investment securities purchased | 7,230,556 | | 35,653,733 | | 2,950,313 | | — | | 11,924,695 |
| Fund shares redeemed | 3,605,410 | | 10,101,417 | | 4,534 | | — | | 1,227,891 |
| Investment management fees | 1,245,185 | | 1,917,703 | | 21,513 | | 469 | | 149,829 |
| Transfer agent fees | 206,680 | | 420,017 | | 6,045 | | 147 | | 44,432 |
| Accounting services fees | 61,843 | | 98,555 | | 2,303 | | 29 | | 14,288 |
| Board of Directors' fees | 8,133 | | 12,838 | | 263 | | — | | 1,197 |
| Variation margin on futures contracts | — | | — | | 40,069 | | — | | — |
| Foreign taxes | 7,032 | | 415,211 | | — | | — | | — |
| Distribution fees | 6,829 | | 11,447 | | 209 | | — | | 2,250 |
| Accrued expenses | 150,843 | | 151,133 | | 48,437 | | 44,439 | | 39,786 |
| Total liabilities | 39,005,062 | | 53,199,922 | | 3,081,804 | | 45,084 | | 13,404,368 |
| Net assets | $ 2,117,278,050 | | $ 3,535,958,307 | | $ 61,952,679 | | $ 860,287 | | $ 390,961,286 |
| Summary of Net Assets: | | | | | | | | | |
| Capital stock and paid-in-capital | $ 2,562,225,999 | | $ 4,217,165,767 | | $ 71,060,746 | | $ 999,999 | | $ 446,605,677 |
| Distributable earnings (loss) | (444,947,949) | | (681,207,460) | | (9,108,067) | | (139,712) | | (55,644,391) |
| Net assets | $ 2,117,278,050 | | $ 3,535,958,307 | | $ 61,952,679 | | $ 860,287 | | $ 390,961,286 |
| Shares authorized | 865,000,000 | | 900,000,000 | | 300,000,000 | | 100,000,000 | | 360,000,000 |
| Par value | $ 0.0001 | | $ 0.0001 | | $ 0.0001 | | $ — | | $ 0.0001 |
| Class A: Net asset value per share | $ 8.05 | | $ 13.66 | | $ 9.05 | | $ — | | $ 9.48 |
| Maximum offering price per share | 8.52 | | 14.46 | | 9.33 | | — | | 9.93 |
| Shares outstanding | 11,715,507 | | 15,441,414 | | 447,855 | | — | | 3,974,338 |
| Net Assets | $ 94,322,022 | | $ 210,992,295 | | $ 4,053,805 | | $ — | | $ 37,681,792 |
| Class C: Net asset value per share | $ 8.00 | | $ 12.88 | | $ 9.02 | | $ — | | $ 9.50 |
| Shares outstanding | 1,217,332 | | 1,189,264 | | 28,207 | | — | | 455,187 |
| Net Assets | $ 9,744,129 | | $ 15,312,747 | | $ 254,567 | | $ — | | $ 4,323,336 |
| Class I: Net asset value per share | $ 8.05 | | $ 13.23 | | $ 9.02 | | $ 8.60 | | $ 9.49 |
| Shares outstanding | 76,852,605 | | 143,373,752 | | 4,034,686 | | 50,000 | | 26,240,607 |
| Net Assets | $ 618,284,871 | | $ 1,897,370,720 | | $ 36,388,404 | | $ 430,144 | | $ 248,947,016 |
| Class R3: Net asset value per share | $ 8.03 | | $ 13.11 | | $ — | | $ — | | $ — |
| Shares outstanding | 1,659,266 | | 151,658 | | — | | — | | — |
| Net Assets | $ 13,320,466 | | $ 1,987,625 | | $ — | | $ — | | $ — |
| Class R4: Net asset value per share | $ 8.03 | | $ 13.18 | | $ — | | $ — | | $ — |
| Shares outstanding | 565,860 | | 274,391 | | — | | — | | — |
| Net Assets | $ 4,543,946 | | $ 3,617,547 | | $ — | | $ — | | $ — |
The accompanying notes are an integral part of these financial statements.
Statements of Assets and Liabilities – (continued)
October 31, 2022
| | Hartford
Schroders
International
Multi-Cap
Value Fund | | Hartford
Schroders
International
Stock Fund | | Hartford
Schroders
Securitized
Income Fund | | Hartford
Schroders
Sustainable
International
Core
Fund | | Hartford
Schroders
Tax-Aware
Bond Fund |
| Class R5: Net asset value per share | $ 8.04 | | $ 13.24 | | $ — | | $ — | | $ — |
| Shares outstanding | 1,658,519 | | 1,796,001 | | — | | — | | — |
| Net Assets | $ 13,333,395 | | $ 23,775,458 | | $ — | | $ — | | $ — |
| Class Y: Net asset value per share | $ 8.04 | | $ 13.27 | | $ 9.01 | | $ — | | $ 9.49 |
| Shares outstanding | 30,764,179 | | 10,321,603 | | 435,235 | | — | | 26,034 |
| Net Assets | $ 247,391,068 | | $ 136,982,489 | | $ 3,923,172 | | $ — | | $ 247,022 |
| Class F: Net asset value per share | $ 8.05 | | $ 13.26 | | $ 9.01 | | $ — | | $ 9.49 |
| Shares outstanding | 58,745,618 | | 52,210,871 | | 218,133 | | — | | 5,073,962 |
| Net Assets | $ 472,832,301 | | $ 692,063,269 | | $ 1,965,281 | | $ — | | $ 48,151,090 |
| Class SDR: Net asset value per share | $ 8.04 | | $ 13.24 | | $ 9.00 | | $ 8.60 | | $ 9.48 |
| Shares outstanding | 80,071,264 | | 41,819,590 | | 1,707,251 | | 50,000 | | 5,443,951 |
| Net Assets | $ 643,505,852 | | $ 553,856,157 | | $ 15,367,450 | | $ 430,143 | | $ 51,611,030 |
| Cost of investments | $ 2,303,006,384 | | $ 3,994,599,673 | | $ 68,901,224 | | $ 1,021,873 | | $ 439,660,672 |
| Cost of foreign currency | $ 5,149,011 | | $ 543,973 | | $ 5,802 | | $ 172 | | $ — |
| (1) Includes Investment in securities on loan, at market value | $ 21,298,659 | | $ 4,220,021 | | $ — | | $ — | | $ — |
The accompanying notes are an integral part of these financial statements.
Statements of Assets and Liabilities – (continued)
October 31, 2022
| | Hartford
Schroders US
MidCap
Opportunities
Fund | | Hartford
Schroders US
Small Cap
Opportunities
Fund |
| Assets: | | | |
| Investments in securities, at market value(1) | $ 730,572,965 | | $ 313,187,398 |
| Cash collateral held for securities on loan | — | | 306,859 |
| Receivables: | | | |
| From affiliates | — | | 4,341 |
| Investment securities sold | 2,775,854 | | 867,853 |
| Fund shares sold | 1,101,472 | | 94,453 |
| Dividends and interest | 230,701 | | 36,731 |
| Securities lending income | 354 | | 670 |
| Other assets | 64,221 | | 61,115 |
| Total assets | 734,745,567 | | 314,559,420 |
| Liabilities: | | | |
| Obligation to return securities lending collateral | — | | 6,137,179 |
| Payables: | | | |
| Fund shares redeemed | 759,028 | | 162,438 |
| Investment management fees | 440,724 | | 220,576 |
| Transfer agent fees | 97,357 | | 46,120 |
| Accounting services fees | 21,810 | | 11,106 |
| Board of Directors' fees | 2,540 | | 1,046 |
| Distribution fees | 11,161 | | 2,434 |
| Accrued expenses | 43,971 | | 34,726 |
| Total liabilities | 1,376,591 | | 6,615,625 |
| Net assets | $ 733,368,976 | | $ 307,943,795 |
| Summary of Net Assets: | | | |
| Capital stock and paid-in-capital | $ 550,365,781 | | $ 263,165,672 |
| Distributable earnings (loss) | 183,003,195 | | 44,778,123 |
| Net assets | $ 733,368,976 | | $ 307,943,795 |
| Shares authorized | 500,000,000 | | 500,000,000 |
| Par value | $ 0.0001 | | $ 0.0001 |
| Class A: Net asset value per share | $ 15.92 | | $ 26.06 |
| Maximum offering price per share | 16.85 | | 27.58 |
| Shares outstanding | 6,773,127 | | 1,243,555 |
| Net Assets | $ 107,826,330 | | $ 32,402,693 |
| Class C: Net asset value per share | $ 15.80 | | $ 26.07 |
| Shares outstanding | 2,625,487 | | 247,017 |
| Net Assets | $ 41,486,297 | | $ 6,439,767 |
| Class I: Net asset value per share | $ 16.74 | | $ 27.79 |
| Shares outstanding | 23,769,100 | | 6,461,503 |
| Net Assets | $ 397,912,344 | | $ 179,553,510 |
| Class R3: Net asset value per share | $ 16.26 | | $ 27.05 |
| Shares outstanding | 111,961 | | 36,558 |
| Net Assets | $ 1,819,967 | | $ 988,748 |
| Class R4: Net asset value per share | $ 16.58 | | $ 27.51 |
| Shares outstanding | 34,048 | | 23,106 |
| Net Assets | $ 564,489 | | $ 635,633 |
| Class R5: Net asset value per share | $ 16.71 | | $ 27.77 |
| Shares outstanding | 18,467 | | 16,403 |
| Net Assets | $ 308,509 | | $ 455,496 |
| Class Y: Net asset value per share | $ 16.72 | | $ 27.79 |
| Shares outstanding | 3,627,851 | | 1,238,000 |
| Net Assets | $ 60,674,289 | | $ 34,407,286 |
The accompanying notes are an integral part of these financial statements.
Statements of Assets and Liabilities – (continued)
October 31, 2022
| | Hartford
Schroders US
MidCap
Opportunities
Fund | | Hartford
Schroders US
Small Cap
Opportunities
Fund |
| Class F: Net asset value per share | $ 16.75 | | $ 27.87 |
| Shares outstanding | 5,279,123 | | 574,796 |
| Net Assets | $ 88,436,350 | | $ 16,017,264 |
| Class SDR: Net asset value per share | $ 16.79 | | $ 27.90 |
| Shares outstanding | 2,045,685 | | 1,327,657 |
| Net Assets | $ 34,340,401 | | $ 37,043,398 |
| Cost of investments | $ 566,432,513 | | $ 268,657,263 |
| (1) Includes Investment in securities on loan, at market value | $ — | | $ 5,871,509 |
The accompanying notes are an integral part of these financial statements.
Statements of Operations
For the Year Ended October 31, 2022
| | Hartford
Schroders
China A Fund | | Hartford
Schroders
Diversified
Emerging
Markets Fund | | Hartford
Schroders
Emerging
Markets Equity
Fund | | Hartford
Schroders
Emerging Markets
Multi-Sector
Bond Fund | | Hartford
Schroders
International
Contrarian
Value
Fund(1) |
| Investment Income: | | | | | | | | | |
| Dividends | $ 1,170,116 | | $ 281,797 | | $ 188,844,881 | | $ — | | $ 16,906 |
| Interest | 7,564 | | 4,082 | | 1,649,253 | | 2,220,261 | | 272 |
| Securities lending | — | | 63 | | 295,633 | | 6,038 | | — |
| Less: Foreign tax withheld | (110,468) | | (30,768) | | (18,202,026) | | (11,897) | | (1,361) |
| Total investment income, net | 1,067,212 | | 255,174 | | 172,587,741 | | 2,214,402 | | 15,817 |
| Expenses: | | | | | | | | | |
| Investment management fees | 684,468 | | 73,857 | | 60,759,737 | | 246,921 | | 2,577 |
| Transfer agent fees | | | | | | | | | |
| Class A | 1,195 | | 15 | | 215,814 | | 2,267 | | — |
| Class C | 255 | | 14 | | 6,034 | | 229 | | — |
| Class I | 12,990 | | 12 | | 3,920,809 | | 13,801 | | 394 |
| Class R3 | — | | — | | 188 | | 64 | | — |
| Class R4 | — | | — | | 7,969 | | 17 | | — |
| Class R5 | — | | — | | 429 | | 12 | | — |
| Class Y | 312 | | 7 | | 863,898 | | 1,791 | | — |
| Class F | 318 | | — | | 4,259 | | — | | — |
| Class SDR | 132 | | 182 | | 6,326 | | 385 | | 8 |
| Distribution fees | | | | | | | | | |
| Class A | 1,506 | | 15 | | 216,429 | | 3,005 | | — |
| Class C | 1,713 | | 58 | | 70,834 | | 919 | | — |
| Class R3 | — | | — | | 430 | | 146 | | — |
| Class R4 | — | | — | | 12,642 | | 25 | | — |
| Custodian fees | 19,075 | | 42,583 | | 1,194,414 | | 11,613 | | 3,988 |
| Registration and filing fees | 90,851 | | 91,812 | | 505,317 | | 116,896 | | 19,240 |
| Accounting services fees | 15,240 | | 1,761 | | 858,837 | | 7,059 | | 79 |
| Board of Directors' fees | 2,051 | | 234 | | 151,874 | | 867 | | 14 |
| Audit and tax fees | 27,951 | | 27,748 | | 56,313 | | 30,419 | | 26,025 |
| Legal fees | 7,206 | | 3,294 | | 83,120 | | 3,895 | | 5,553 |
| Other expenses | 7,551 | | 4,903 | | 449,175 | | 9,308 | | 1,105 |
| Total expenses (before waivers, reimbursements and fees paid indirectly) | 872,814 | | 246,495 | | 69,384,848 | | 449,639 | | 58,983 |
| Expense waivers | (94,055) | | (168,225) | | — | | (156,787) | | (56,209) |
| Distribution fee reimbursements | (1,937) | | (13) | | (123) | | (204) | | — |
| Total waivers, reimbursements and fees paid indirectly | (95,992) | | (168,238) | | (123) | | (156,991) | | (56,209) |
| Total expenses | 776,822 | | 78,257 | | 69,384,725 | | 292,648 | | 2,774 |
| Net Investment Income (Loss) | 290,390 | | 176,917 | | 103,203,016 | | 1,921,754 | | 13,043 |
| Net Realized Gain (Loss) on Investments, Other Financial Instruments and Foreign Currency Transactions on: | | | | | | | | | |
| Investments | (7,518,212) | | (1,084,206) | | (462,727,121) | | (6,178,042) | | (1,544) |
| Less: Foreign taxes paid on realized capital gains | — | | — | | (1,975,506) | | (1,452) | | — |
| Futures contracts | — | | (100,934) | | — | | 311,788 | | (164) |
| Swap contracts | — | | — | | — | | 40,387 | | — |
| Foreign currency contracts | — | | 637 | | (256) | | 84,919 | | — |
| Other foreign currency transactions | (25,434) | | (11,226) | | (3,653,303) | | (34,313) | | (851) |
| Net Realized Gain (Loss) on Investments, Other Financial Instruments and Foreign Currency Transactions | (7,543,646) | | (1,195,729) | | (468,356,186) | | (5,776,713) | | (2,559) |
| Net Changes in Unrealized Appreciation (Depreciation) of Investments, Other Financial Instruments and Foreign Currency Transactions of: | | | | | | | | | |
| Investments * | (22,880,735) | | (2,182,196) | | (2,069,675,995) | | (4,708,281) | | (135,419) |
| Futures contracts | — | | 9,512 | | — | | — | | — |
| Swap contracts | — | | — | | — | | (2,167) | | — |
| Foreign currency contracts | — | | (2,100) | | — | | 89,254 | | — |
| Translation of other assets and liabilities in foreign currencies | (522) | | 131 | | 28,616 | | (2,371) | | (16) |
| Net Changes in Unrealized Appreciation (Depreciation) of Investments, Other Financial Instruments and Foreign Currency Transactions | (22,881,257) | | (2,174,653) | | (2,069,647,379) | | (4,623,565) | | (135,435) |
| Net Gain (Loss) on Investments, Other Financial Instruments and Foreign Currency Transactions | (30,424,903) | | (3,370,382) | | (2,538,003,565) | | (10,400,278) | | (137,994) |
| Net Increase (Decrease) in Net Assets Resulting from Operations | $ (30,134,513) | | $ (3,193,465) | | $ (2,434,800,549) | | $ (8,478,524) | | $ (124,951) |
The accompanying notes are an integral part of these financial statements.
Statements of Operations – (continued)
For the Year Ended October 31, 2022
| | Hartford
Schroders
China A Fund | | Hartford
Schroders
Diversified
Emerging
Markets Fund | | Hartford
Schroders
Emerging
Markets Equity
Fund | | Hartford
Schroders
Emerging Markets
Multi-Sector
Bond Fund | | Hartford
Schroders
International
Contrarian
Value
Fund(1) |
| * Includes change in unrealized appreciation (depreciation) on deferred capital gains tax | $ — | | $ (3,181) | | $ 1,697,949 | | $ 6,164 | | $ — |
| (1) | Commenced operations on May 24, 2022. |
The accompanying notes are an integral part of these financial statements.
Statements of Operations – (continued)
For the Year Ended October 31, 2022
| | Hartford
Schroders
International
Multi-Cap
Value Fund | | Hartford
Schroders
International
Stock Fund | | Hartford
Schroders
Securitized
Income Fund | | Hartford
Schroders
Sustainable
International
Core
Fund(1) | | Hartford
Schroders
Tax-Aware
Bond Fund |
| Investment Income: | | | | | | | | | |
| Dividends | $ 113,379,452 | | $ 106,253,445 | | $ 16,985 | | $ 11,742 | | $ — |
| Interest | 675,335 | | 292 | | 2,802,570 | | 438 | | 9,850,108 |
| Securities lending | 1,147,780 | | 423,909 | | — | | — | | 4,091 |
| Less: Foreign tax withheld | (11,894,791) | | (9,209,109) | | — | | (1,131) | | — |
| Total investment income, net | 103,307,776 | | 97,468,537 | | 2,819,555 | | 11,049 | | 9,854,199 |
| Expenses: | | | | | | | | | |
| Investment management fees | 17,540,435 | | 24,665,976 | | 408,037 | | 2,635 | | 1,822,310 |
| Transfer agent fees | | | | | | | | | |
| Class A | 127,163 | | 290,781 | | 1,069 | | — | | 28,217 |
| Class C | 14,046 | | 20,291 | | 350 | | — | | 5,427 |
| Class I | 760,003 | | 2,021,018 | | 44,142 | | 404 | | 224,656 |
| Class R3 | 34,420 | | 3,436 | | — | | — | | — |
| Class R4 | 9,075 | | 6,974 | | — | | — | | — |
| Class R5 | 16,643 | | 25,957 | | — | | — | | — |
| Class Y | 324,680 | | 219,353 | | 698 | | — | | 302 |
| Class F | 6,890 | | 2,227 | | 82 | | — | | 436 |
| Class SDR | 31,551 | | 17,272 | | 303 | | 8 | | 1,047 |
| Distribution fees | | | | | | | | | |
| Class A | 262,094 | | 650,977 | | 11,814 | | — | | 125,655 |
| Class C | 132,674 | | 194,048 | | 3,761 | | — | | 56,176 |
| Class R3 | 78,332 | | 7,826 | | — | | — | | — |
| Class R4 | 13,402 | | 10,293 | | — | | — | | — |
| Custodian fees | 168,748 | | 141,078 | | 7,011 | | 3,988 | | 8,800 |
| Registration and filing fees | 230,417 | | 573,879 | | 96,131 | | 19,240 | | 115,294 |
| Accounting services fees | 370,015 | | 553,202 | | 19,260 | | 81 | | 75,172 |
| Board of Directors' fees | 64,992 | | 103,843 | | 2,400 | | 14 | | 10,258 |
| Audit and tax fees | 57,989 | | 35,392 | | 43,451 | | 26,025 | | 30,567 |
| Legal fees | 36,542 | | 53,518 | | 7,674 | | 5,573 | | 8,754 |
| Other expenses | 163,488 | | 325,495 | | 13,242 | | 1,107 | | 30,873 |
| Total expenses (before waivers, reimbursements and fees paid indirectly) | 20,443,599 | | 29,922,836 | | 659,425 | | 59,075 | | 2,543,944 |
| Expense waivers | — | | — | | (75,858) | | (56,237) | | (416,018) |
| Transfer agent fee waivers | (65,404) | | — | | — | | — | | — |
| Distribution fee reimbursements | (9,140) | | (611) | | (9,034) | | — | | (122) |
| Total waivers, reimbursements and fees paid indirectly | (74,544) | | (611) | | (84,892) | | (56,237) | | (416,140) |
| Total expenses | 20,369,055 | | 29,922,225 | | 574,533 | | 2,838 | | 2,127,804 |
| Net Investment Income (Loss) | 82,938,721 | | 67,546,312 | | 2,245,022 | | 8,211 | | 7,726,395 |
| Net Realized Gain (Loss) on Investments, Other Financial Instruments and Foreign Currency Transactions on: | | | | | | | | | |
| Investments | (214,309,392) | | (284,283,223) | | (2,323,017) | | (11,282) | | (13,451,696) |
| Futures contracts | (25,925,224) | | — | | (1,617,622) | | 3,292 | | 880,616 |
| Foreign currency contracts | 24,730,173 | | — | | 1,299,541 | | — | | — |
| Other foreign currency transactions | (3,794,523) | | (1,614,382) | | (98,270) | | (812) | | — |
| Net Realized Gain (Loss) on Investments, Other Financial Instruments and Foreign Currency Transactions | (219,298,966) | | (285,897,605) | | (2,739,368) | | (8,802) | | (12,571,080) |
| Net Changes in Unrealized Appreciation (Depreciation) of Investments, Other Financial Instruments and Foreign Currency Transactions of: | | | | | | | | | |
| Investments * | (389,818,772) | | (984,543,869) | | (4,806,423) | | (139,482) | | (51,658,079) |
| Futures contracts | (11,758) | | — | | (538,674) | | 437 | | (403,918) |
| Foreign currency contracts | (4,739,630) | | — | | (101,994) | | — | | — |
| Translation of other assets and liabilities in foreign currencies | (384,713) | | (379,189) | | 25,108 | | (76) | | — |
| Net Changes in Unrealized Appreciation (Depreciation) of Investments, Other Financial Instruments and Foreign Currency Transactions | (394,954,873) | | (984,923,058) | | (5,421,983) | | (139,121) | | (52,061,997) |
| Net Gain (Loss) on Investments, Other Financial Instruments and Foreign Currency Transactions | (614,253,839) | | (1,270,820,663) | | (8,161,351) | | (147,923) | | (64,633,077) |
| Net Increase (Decrease) in Net Assets Resulting from Operations | $ (531,315,118) | | $ (1,203,274,351) | | $ (5,916,329) | | $ (139,712) | | $ (56,906,682) |
The accompanying notes are an integral part of these financial statements.
Statements of Operations – (continued)
For the Year Ended October 31, 2022
| | Hartford
Schroders
International
Multi-Cap
Value Fund | | Hartford
Schroders
International
Stock Fund | | Hartford
Schroders
Securitized
Income Fund | | Hartford
Schroders
Sustainable
International
Core
Fund(1) | | Hartford
Schroders
Tax-Aware
Bond Fund |
| * Includes change in unrealized appreciation (depreciation) on deferred capital gains tax | $ (7,032) | | $ 750,427 | | $ — | | $ — | | $ — |
| (1) | Commenced operations on May 24, 2022. |
The accompanying notes are an integral part of these financial statements.
Statements of Operations – (continued)
For the Year Ended October 31, 2022
| | Hartford
Schroders US
MidCap
Opportunities
Fund | | Hartford
Schroders US
Small Cap
Opportunities
Fund |
| Investment Income: | | | |
| Dividends | $ 10,101,827 | | $ 3,262,307 |
| Interest | 265,753 | | 122,920 |
| Securities lending | 354 | | 28,822 |
| Less: Foreign tax withheld | (12,056) | | (23,897) |
| Total investment income, net | 10,355,878 | | 3,390,152 |
| Expenses: | | | |
| Investment management fees | 5,673,763 | | 2,900,886 |
| Transfer agent fees | | | |
| Class A | 122,054 | | 48,555 |
| Class C | 49,132 | | 10,309 |
| Class I | 377,996 | | 192,484 |
| Class R3 | 4,262 | | 2,769 |
| Class R4 | 1,219 | | 1,079 |
| Class R5 | 509 | | 570 |
| Class Y | 75,030 | | 39,639 |
| Class F | 1,129 | | 327 |
| Class SDR | 1,427 | | 1,364 |
| Distribution fees | | | |
| Class A | 264,878 | | 88,268 |
| Class C | 477,690 | | 72,833 |
| Class R3 | 9,701 | | 6,363 |
| Class R4 | 1,795 | | 1,590 |
| Custodian fees | 9,605 | | 12,747 |
| Registration and filing fees | 137,281 | | 125,705 |
| Accounting services fees | 123,303 | | 62,815 |
| Board of Directors' fees | 19,679 | | 8,277 |
| Audit and tax fees | 22,680 | | 22,704 |
| Legal fees | 13,800 | | 8,132 |
| Other expenses | 74,993 | | 38,856 |
| Total expenses (before waivers, reimbursements and fees paid indirectly) | 7,461,926 | | 3,646,272 |
| Expense waivers | — | | (47,913) |
| Distribution fee reimbursements | (1,204) | | (981) |
| Total waivers, reimbursements and fees paid indirectly | (1,204) | | (48,894) |
| Total expenses | 7,460,722 | | 3,597,378 |
| Net Investment Income (Loss) | 2,895,156 | | (207,226) |
| Net Realized Gain (Loss) on Investments, Other Financial Instruments and Foreign Currency Transactions on: | | | |
| Investments | 18,630,891 | | 1,385,585 |
| Other foreign currency transactions | 32 | | — |
| Net Realized Gain (Loss) on Investments, Other Financial Instruments and Foreign Currency Transactions | 18,630,923 | | 1,385,585 |
| Net Changes in Unrealized Appreciation (Depreciation) of Investments, Other Financial Instruments and Foreign Currency Transactions of: | | | |
| Investments * | (102,931,957) | | (44,687,496) |
| Net Changes in Unrealized Appreciation (Depreciation) of Investments, Other Financial Instruments and Foreign Currency Transactions | (102,931,957) | | (44,687,496) |
| Net Gain (Loss) on Investments, Other Financial Instruments and Foreign Currency Transactions | (84,301,034) | | (43,301,911) |
| Net Increase (Decrease) in Net Assets Resulting from Operations | $ (81,405,878) | | $ (43,509,137) |
| * Includes change in unrealized appreciation (depreciation) on deferred capital gains tax | $ — | | $ — |
The accompanying notes are an integral part of these financial statements.
Statements of Changes in Net Assets
| | Hartford Schroders
China A Fund | | Hartford Schroders Diversified
Emerging Markets Fund |
| | For the
Year Ended
October 31,
2022 | | For the
Year Ended
October 31,
2021 | | For the
Year Ended
October 31,
2022 | | For the
Period Ended
October 31,
2021(1) |
| Operations: | | | | | | | |
| Net investment income (loss) | $ 290,390 | | $ (22,780) | | $ 176,917 | | $ (2,220) |
| Net realized gain (loss) on investments, other financial instruments and foreign currency transactions | (7,543,646) | | 458,633 | | (1,195,729) | | 35,242 |
| Net changes in unrealized appreciation (depreciation) of investments, other financial instruments and foreign currency transactions | (22,881,257) | | (997,792) | | (2,174,653) | | 71,701 |
| Net Increase (Decrease) in Net Assets Resulting from Operations | (30,134,513) | | (561,939) | | (3,193,465) | | 104,723 |
| Distributions to Shareholders: | | | | | | | |
| Class A | (10,069) | | (51,074) | | — | | — |
| Class C | (2,700) | | (17,324) | | — | | — |
| Class I | (104,164) | | (23,649) | | — | | — |
| Class Y | (39,890) | | (16,158) | | — | | — |
| Class F | (899,258) | | (324,076) | | — | | — |
| Class SDR | (52,837) | | (383,976) | | (50,976) | | — |
| Total distributions | (1,108,918) | | (816,257) | | (50,976) | | — |
| Capital Share Transactions: | | | | | | | |
| Sold | 29,473,307 | | 106,251,339 | | 58,666 | | 10,000,010 |
| Issued on reinvestment of distributions | 1,053,228 | | 432,281 | | 25,504 | | — |
| Redeemed | (22,346,182) | | (34,134,687) | | (50,000) | | (10) |
| Net increase (decrease) from capital share transactions | 8,180,353 | | 72,548,933 | | 34,170 | | 10,000,000 |
| Net Increase (Decrease) in Net Assets | (23,063,078) | | 71,170,737 | | (3,210,271) | | 10,104,723 |
| Net Assets: | | | | | | | |
| Beginning of period | 78,992,448 | | 7,821,711 | | 10,104,723 | | — |
| End of period | $ 55,929,370 | | $ 78,992,448 | | $ 6,894,452 | | $ 10,104,723 |
| (1) | Commenced operations on September 30, 2021. |
The accompanying notes are an integral part of these financial statements.
Statements of Changes in Net Assets – (continued)
| | Hartford Schroders
Emerging Markets Equity Fund | | Hartford Schroders
Emerging Markets Multi-Sector
Bond Fund |
| | For the
Year Ended
October 31,
2022 | | For the
Year Ended
October 31,
2021 | | For the
Year Ended
October 31,
2022 | | For the
Year Ended
October 31,
2021 |
| Operations: | | | | | | | |
| Net investment income (loss) | $ 103,203,016 | | $ 68,766,050 | | $ 1,921,754 | | $ 2,244,030 |
| Net realized gain (loss) on investments, other financial instruments and foreign currency transactions | (468,356,186) | | 191,629,190 | | (5,776,713) | | 507,882 |
| Net changes in unrealized appreciation (depreciation) of investments, other financial instruments and foreign currency transactions | (2,069,647,379) | | 384,427,436 | | (4,623,565) | | 628,875 |
| Net Increase (Decrease) in Net Assets Resulting from Operations | (2,434,800,549) | | 644,822,676 | | (8,478,524) | | 3,380,787 |
| Distributions to Shareholders: | | | | | | | |
| From distributable earnings: | | | | | | | |
| Class A | (151,824) | | (5,312,511) | | (54,191) | | (69,629) |
| Class C | (23,946) | | — | | (3,458) | | (5,800) |
| Class I | (27,092,330) | | (13,377,299) | | (579,078) | | (808,597) |
| Class R3 | (703) | | (330) | | (1,290) | | (1,124) |
| Class R4 | (51,898) | | (37,977) | | (463) | | (447) |
| Class R5 | (5,062) | | (2,909) | | (492) | | (484) |
| Class Y | (13,184,071) | | (589,255) | | (139,376) | | (109,352) |
| Class F | (13,622,640) | | (9,554,982) | | (572) | | (563) |
| Class SDR | (31,667,545) | | (14,545,085) | | (918,507) | | (1,083,054) |
| From return of capital: | | | | | | | |
| Class A | — | | — | | (8,116) | | — |
| Class C | — | | — | | (513) | | — |
| Class I | — | | — | | (86,311) | | — |
| Class R3 | — | | — | | (194) | | — |
| Class R4 | — | | — | | (69) | | — |
| Class R5 | — | | — | | (74) | | — |
| Class Y | — | | — | | (20,978) | | — |
| Class F | — | | — | | (86) | | — |
| Class SDR | — | | — | | (138,241) | | — |
| Total distributions | (85,800,019) | | (43,420,348) | | (1,952,009) | | (2,079,050) |
| Capital Share Transactions: | | | | | | | |
| Sold | 5,086,373,116 | | 4,842,961,004 | | 5,791,384 | | 25,345,037 |
| Issued on reinvestment of distributions | 58,740,454 | | 32,176,805 | | 1,951,740 | | 2,078,786 |
| Redeemed | (4,540,386,396) | | (2,926,986,156) | | (14,227,849) | | (44,370,189) |
| Net increase (decrease) from capital share transactions | 604,727,174 | | 1,948,151,653 | | (6,484,725) | | (16,946,366) |
| Net Increase (Decrease) in Net Assets | (1,915,873,394) | | 2,549,553,981 | | (16,915,258) | | (15,644,629) |
| Net Assets: | | | | | | | |
| Beginning of period | 6,741,778,211 | | 4,192,224,230 | | 44,481,344 | | 60,125,973 |
| End of period | $ 4,825,904,817 | | $ 6,741,778,211 | | $ 27,566,086 | | $ 44,481,344 |
The accompanying notes are an integral part of these financial statements.
Statements of Changes in Net Assets – (continued)
| | Hartford
Schroders International
Contrarian Value Fund | | Hartford
Schroders International Multi-Cap
Value Fund |
| | For the
Period Ended
October 31,
2022(2) | | For the
Year Ended
October 31,
2022 | | For the
Year Ended
October 31,
2021 |
| Operations: | | | | | |
| Net investment income (loss) | $ 13,043 | | $ 82,938,721 | | $ 58,285,565 |
| Net realized gain (loss) on investments, other financial instruments and foreign currency transactions | (2,559) | | (219,298,966) | | 200,522,634 |
| Net changes in unrealized appreciation (depreciation) of investments, other financial instruments and foreign currency transactions | (135,435) | | (394,954,873) | | 379,254,167 |
| Net Increase (Decrease) in Net Assets Resulting from Operations | (124,951) | | (531,315,118) | | 638,062,366 |
| Distributions to Shareholders: | | | | | |
| Class A | — | | (3,151,213) | | (1,921,493) |
| Class C | — | | (294,121) | | (224,044) |
| Class I | — | | (23,679,132) | | (17,086,178) |
| Class R3 | — | | (416,460) | | (328,949) |
| Class R4 | — | | (158,198) | | (103,502) |
| Class R5 | — | | (503,439) | | (473,876) |
| Class Y | — | | (9,900,359) | | (6,351,823) |
| Class F | — | | (18,702,771) | | (12,981,174) |
| Class SDR | — | | (26,659,683) | | (20,557,285) |
| Total distributions | — | | (83,465,376) | | (60,028,324) |
| Capital Share Transactions: | | | | | |
| Sold | 1,000,020 | | 926,405,981 | | 1,001,256,584 |
| Issued on reinvestment of distributions | — | | 75,457,113 | | 53,767,304 |
| Redeemed | (21) | | (873,580,501) | | (778,260,331) |
| Net increase (decrease) from capital share transactions | 999,999 | | 128,282,593 | | 276,763,557 |
| Net Increase (Decrease) in Net Assets | 875,048 | | (486,497,901) | | 854,797,599 |
| Net Assets: | | | | | |
| Beginning of period | — | | 2,603,775,951 | | 1,748,978,352 |
| End of period | $ 875,048 | | $ 2,117,278,050 | | $ 2,603,775,951 |
| (2) | Commenced operations on May 24, 2022. |
The accompanying notes are an integral part of these financial statements.
Statements of Changes in Net Assets – (continued)
| | Hartford
Schroders International Stock
Fund | | Hartford
Schroders Securitized Income
Fund |
| | For the
Year Ended
October 31,
2022 | | For the
Year Ended
October 31,
2021 | | For the
Year Ended
October 31,
2022 | | For the
Year Ended
October 31,
2021 |
| Operations: | | | | | | | |
| Net investment income (loss) | $ 67,546,312 | | $ 28,141,682 | | $ 2,245,022 | | $ 1,883,904 |
| Net realized gain (loss) on investments, other financial instruments and foreign currency transactions | (285,897,605) | | 29,254,959 | | (2,739,368) | | (765,136) |
| Net changes in unrealized appreciation (depreciation) of investments, other financial instruments and foreign currency transactions | (984,923,058) | | 436,588,606 | | (5,421,983) | | 1,579,512 |
| Net Increase (Decrease) in Net Assets Resulting from Operations | (1,203,274,351) | | 493,985,247 | | (5,916,329) | | 2,698,280 |
| Distributions to Shareholders: | | | | | | | |
| Class A | (4,534,577) | | (32,727) | | (109,491) | | (84,434) |
| Class C | (184,966) | | — | | (5,018) | | (3,248) |
| Class I | (38,891,433) | | (2,419,301) | | (1,612,430) | | (1,292,341) |
| Class R3 | (16,060) | | — | | — | | — |
| Class R4 | (72,581) | | (701) | | — | | — |
| Class R5 | (502,674) | | (52,125) | | — | | — |
| Class Y | (4,809,155) | | (340,321) | | (110,676) | | (72,758) |
| Class F | (13,376,220) | | (990,397) | | (57,621) | | (39,737) |
| Class SDR | (9,695,197) | | (872,187) | | (511,605) | | (399,130) |
| Total distributions | (72,082,863) | | (4,707,759) | | (2,406,841) | | (1,891,648) |
| Capital Share Transactions: | | | | | | | |
| Sold | 2,658,324,156 | | 2,595,240,179 | | 24,268,122 | | 65,753,561 |
| Issued on reinvestment of distributions | 67,165,273 | | 4,373,503 | | 2,196,248 | | 1,653,658 |
| Redeemed | (1,545,627,305) | | (483,052,970) | | (81,797,891) | | (36,531,227) |
| Net increase (decrease) from capital share transactions | 1,179,862,124 | | 2,116,560,712 | | (55,333,521) | | 30,875,992 |
| Net Increase (Decrease) in Net Assets | (95,495,090) | | 2,605,838,200 | | (63,656,691) | | 31,682,624 |
| Net Assets: | | | | | | | |
| Beginning of period | 3,631,453,397 | | 1,025,615,197 | | 125,609,370 | | 93,926,746 |
| End of period | $ 3,535,958,307 | | $ 3,631,453,397 | | $ 61,952,679 | | $ 125,609,370 |
The accompanying notes are an integral part of these financial statements.
Statements of Changes in Net Assets – (continued)
| | Hartford
Schroders Sustainable
International Core Fund | | Hartford
Schroders Tax-Aware Bond Fund |
| | For the
Period Ended
October 31,
2022(2) | | For the
Year Ended
October 31,
2022 | | For the
Year Ended
October 31,
2021 |
| Operations: | | | | | |
| Net investment income (loss) | $ 8,211 | | $ 7,726,395 | | $ 5,775,902 |
| Net realized gain (loss) on investments, other financial instruments and foreign currency transactions | (8,802) | | (12,571,080) | | 5,653,116 |
| Net changes in unrealized appreciation (depreciation) of investments, other financial instruments and foreign currency transactions | (139,121) | | (52,061,997) | | (6,174,421) |
| Net Increase (Decrease) in Net Assets Resulting from Operations | (139,712) | | (56,906,682) | | 5,254,597 |
| Distributions to Shareholders: | | | | | |
| Class A | — | | (1,605,764) | | (1,450,548) |
| Class C | — | | (126,622) | | (129,755) |
| Class I | — | | (8,157,871) | | (7,512,352) |
| Class Y | — | | (8,866) | | (5,542) |
| Class F | — | | (1,246,693) | | (913,441) |
| Class SDR | — | | (1,969,376) | | (1,616,470) |
| Total distributions | — | | (13,115,192) | | (11,628,108) |
| Capital Share Transactions: | | | | | |
| Sold | 1,000,020 | | 245,198,906 | | 153,934,962 |
| Issued on reinvestment of distributions | — | | 10,578,397 | | 9,364,337 |
| Redeemed | (21) | | (250,656,258) | | (144,506,187) |
| Net increase (decrease) from capital share transactions | 999,999 | | 5,121,045 | | 18,793,112 |
| Net Increase (Decrease) in Net Assets | 860,287 | | (64,900,829) | | 12,419,601 |
| Net Assets: | | | | | |
| Beginning of period | — | | 455,862,115 | | 443,442,514 |
| End of period | $ 860,287 | | $ 390,961,286 | | $ 455,862,115 |
| (2) | Commenced operations on May 24, 2022. |
The accompanying notes are an integral part of these financial statements.
Statements of Changes in Net Assets – (continued)
| | Hartford
Schroders US MidCap
Opportunities Fund | | Hartford
Schroders US Small Cap
Opportunities Fund |
| | For the
Year Ended
October 31,
2022 | | For the
Year Ended
October 31,
2021 | | For the
Year Ended
October 31,
2022 | | For the
Year Ended
October 31,
2021 |
| Operations: | | | | | | | |
| Net investment income (loss) | $ 2,895,156 | | $ 623,135 | | $ (207,226) | | $ (329,984) |
| Net realized gain (loss) on investments, other financial instruments and foreign currency transactions | 18,630,923 | | 122,807,700 | | 1,385,585 | | 48,336,250 |
| Net changes in unrealized appreciation (depreciation) of investments, other financial instruments and foreign currency transactions | (102,931,957) | | 138,362,727 | | (44,687,496) | | 56,709,046 |
| Net Increase (Decrease) in Net Assets Resulting from Operations | (81,405,878) | | 261,793,562 | | (43,509,137) | | 104,715,312 |
| Distributions to Shareholders: | | | | | | | |
| Class A | (15,162,114) | | (69,958) | | (4,292,084) | | — |
| Class C | (7,632,003) | | — | | (921,789) | | — |
| Class I | (61,840,766) | | (1,312,243) | | (22,681,914) | | (89,287) |
| Class R3 | (288,955) | | — | | (148,641) | | — |
| Class R4 | (116,572) | | — | | (76,371) | | — |
| Class R5 | (101,815) | | (3,796) | | (73,241) | | (462) |
| Class Y | (10,739,172) | | (258,077) | | (4,006,301) | | (27,753) |
| Class F | (11,385,090) | | (265,270) | | (1,840,382) | | (25,755) |
| Class SDR | (5,005,028) | | (175,684) | | (3,566,355) | | (57,905) |
| Total distributions | (112,271,515) | | (2,085,028) | | (37,607,078) | | (201,162) |
| Capital Share Transactions: | | | | | | | |
| Sold | 195,719,583 | | 149,305,285 | | 82,976,378 | | 87,392,291 |
| Issued on reinvestment of distributions | 108,437,249 | | 2,008,748 | | 36,489,337 | | 197,351 |
| Redeemed | (218,180,334) | | (211,486,538) | | (89,585,740) | | (66,867,177) |
| Net increase (decrease) from capital share transactions | 85,976,498 | | (60,172,505) | | 29,879,975 | | 20,722,465 |
| Net Increase (Decrease) in Net Assets | (107,700,895) | | 199,536,029 | | (51,236,240) | | 125,236,615 |
| Net Assets: | | | | | | | |
| Beginning of period | 841,069,871 | | 641,533,842 | | 359,180,035 | | 233,943,420 |
| End of period | $ 733,368,976 | | $ 841,069,871 | | $ 307,943,795 | | $ 359,180,035 |
The accompanying notes are an integral part of these financial statements.
| | | — Selected Per-Share Data(1) — | | — Ratios and Supplemental Data — |
| Class | | Net
Asset
Value at
Beginning
of Period | | Net
Investment
Income
(Loss) | | Net
Realized
and
Unrealized
Gain (Loss)
on
Investments | | Total from
Investment
Operations | | Dividends
from Net
Investment
Income | | Distributions
from
Capital
Gains | | Returns
of
Capital | | Total
Dividends
and
Distributions | | Net
Asset
Value at
End of
Period | | Total
Return(2) | | Net
Assets
at End
of Period
(000s) | | Ratio of
Expenses
to
Average
Net
Assets
Before
Adjust-
ments(3) | | Ratio of
Expenses
to
Average
Net
Assets
After
Adjust-
ments(3) | | Ratio of
Net
Investment
Income
(Loss) to
Average
Net Assets | | Portfolio
Turnover |
| Hartford Schroders China A Fund |
| For the Year Ended October 31, 2022 |
| A | | $ 15.80 | | $ (0.02) | | $ (5.43) | | $ (5.45) | | $ — | | $ (0.21) | | $ — | | $ (0.21) | | $ 10.14 | | (35.01)% | | $ 420 | | 1.57% | | 1.45% | | (0.16)% | | 65% |
| C | | 15.59 | | (0.01) | | (5.36) | | (5.37) | | — | | (0.21) | | — | | (0.21) | | 10.01 | | (34.97) | | 128 | | 2.27 | | 1.38 | | (0.07) | | 65 |
| I | | 15.81 | | 0.04 | | (5.47) | | (5.43) | | — | | (0.21) | | — | | (0.21) | | 10.17 | | (34.86) | | 8,730 | | 1.24 | | 1.15 | | 0.34 | | 65 |
| Y | | 15.82 | | 0.03 | | (5.45) | | (5.42) | | — | | (0.21) | | — | | (0.21) | | 10.19 | | (34.77) | | 1,328 | | 1.13 | | 1.11 | | 0.22 | | 65 |
| F | | 15.82 | | 0.06 | | (5.47) | | (5.41) | | — | | (0.21) | | — | | (0.21) | | 10.20 | | (34.71) | | 42,772 | | 1.12 | | 0.99 | | 0.41 | | 65 |
| SDR | | 15.83 | | 0.04 | | (5.46) | | (5.42) | | — | | (0.21) | | — | | (0.21) | | 10.20 | | (34.75) | | 2,551 | | 1.13 | | 0.99 | | 0.32 | | 65 |
| For the Year Ended October 31, 2021 |
| A | | $ 15.06 | | $ (0.05) | | $ 2.25 | | $ 2.20 | | $ (0.00) (4) | | $ (1.46) | | $ — | | $ (1.46) | | $ 15.80 | | 15.20% | | $ 781 | | 1.94% | | 1.42% | | (0.28)% | | 73% |
| C | | 14.98 | | (0.18) | | 2.25 | | 2.07 | | — | | (1.46) | | — | | (1.46) | | 15.59 | | 14.31 | | 199 | | 2.66 | | 2.19 | | (1.14) | | 73 |
| I | | 15.08 | | (0.03) | | 2.27 | | 2.24 | | (0.05) | | (1.46) | | — | | (1.51) | | 15.81 | | 15.45 | | 7,776 | | 1.65 | | 1.15 | | (0.19) | | 73 |
| Y | | 15.08 | | 0.14 | | 2.12 | | 2.26 | | (0.06) | | (1.46) | | — | | (1.52) | | 15.82 | | 15.57 | | 2,987 | | 1.55 | | 1.11 | | 0.88 | | 73 |
| F | | 15.09 | | (0.03) | | 2.30 | | 2.27 | | (0.08) | | (1.46) | | — | | (1.54) | | 15.82 | | 15.63 | | 63,292 | | 1.54 | | 0.99 | | (0.18) | | 73 |
| SDR | | 15.09 | | 0.01 | | 2.27 | | 2.28 | | (0.08) | | (1.46) | | — | | (1.54) | | 15.83 | | 15.70 | | 3,957 | | 1.54 | | 0.99 | | 0.06 | | 73 |
| For the Period Ended October 31, 2020(5) |
| A | | $ 10.00 | | $ 0.04 | | $ 5.02 | | $ 5.06 | | $ — | | $ — | | $ — | | $ — | | $ 15.06 | | 50.60% (6) | | $ 369 | | 4.28% (7) | | 1.29% (7) | | 0.55% (7) | | 46% |
| C | | 10.00 | | 0.00 (4) | | 4.98 | | 4.98 | | — | | — | | — | | — | | 14.98 | | 49.80 (6) | | 178 | | 5.08 (7) | | 2.22 (7) | | (0.04) (7) | | 46 |
| I | | 10.00 | | 0.07 | | 5.01 | | 5.08 | | — | | — | | — | | — | | 15.08 | | 50.80 (6) | | 183 | | 4.01 (7) | | 1.15 (7) | | 0.93 (7) | | 46 |
| Y | | 10.00 | | 0.09 | | 4.99 | | 5.08 | | — | | — | | — | | — | | 15.08 | | 50.80 (6) | | 151 | | 3.95 (7) | | 1.10 (7) | | 1.14 (7) | | 46 |
| F | | 10.00 | | 0.10 | | 4.99 | | 5.09 | | — | | — | | — | | — | | 15.09 | | 50.90 (6) | | 3,169 | | 3.85 (7) | | 0.99 (7) | | 1.24 (7) | | 46 |
| SDR | | 10.00 | | 0.10 | | 4.99 | | 5.09 | | — | | — | | — | | — | | 15.09 | | 50.90 (6) | | 3,772 | | 3.85 (7) | | 0.99 (7) | | 1.24 (7) | | 46 |
| Hartford Schroders Diversified Emerging Markets Fund |
| For the Period Ended October 31, 2022 |
| A (8) | | $ 9.42 | | $ 0.14 | | $ (2.69) | | $ (2.55) | | $ — | | $ — | | $ — | | $ — | | $ 6.87 | | (27.07)% (6) | | $ 10 | | 3.81% (7) | | 0.88% (7) | | 2.63% (7) | | 98% |
| C (8) | | 9.42 | | 0.11 | | (2.70) | | (2.59) | | — | | — | | — | | — | | 6.83 | | (27.50) (6) | | 7 | | 4.55 (7) | | 1.68 (7) | | 1.92 (7) | | 98 |
| I (8) | | 9.42 | | 0.16 | | (2.69) | | (2.53) | | — | | — | | — | | — | | 6.89 | | (26.86) (6) | | 7 | | 3.50 (7) | | 0.58 (7) | | 2.96 (7) | | 98 |
| Y (8) | | 9.42 | | 0.17 | | (2.70) | | (2.53) | | — | | — | | — | | — | | 6.89 | | (26.86) (6) | | 10 | | 3.42 (7) | | 0.53 (7) | | 3.02 (7) | | 98 |
| F (8) | | 9.42 | | 0.15 | | (2.75) | | (2.60) | | — | | — | | — | | — | | 6.82 | | (27.60) (6) | | 7 | | 3.31 (7) | | 0.89 (7) | | 2.65 (7) | | 98 |
| SDR | | 10.10 | | 0.18 | | (3.36) | | (3.18) | | (0.03) | | (0.02) | | — | | (0.05) | | 6.87 | | (31.63) | | 6,852 | | 2.80 | | 0.89 | | 2.01 | | 98 |
| For the Period EndedOctober 31, 2021(9) |
| SDR | | $ 10.00 | | $ —(4) | | $ 0.10 | | $ 0.10 | | $ — | | $ — | | $ — | | $ — | | $ 10.10 | | 1.00% (6) | | $ 10,105 | | 4.69% (7) | | 0.89% (7) | | (0.26)% (7) | | 9% (10) |
| Hartford Schroders Emerging Markets Equity Fund |
| For the Year Ended October 31, 2022 |
| A | | $ 20.05 | | $ 0.22 | | $ (7.00) | | $ (6.78) | | $ (0.03) | | $ — | | $ — | | $ (0.03) | | $ 13.24 | | (33.86)% | | $ 70,886 | | 1.56% | | 1.56% | | 1.29% | | 39% |
| C | | 19.76 | | 0.11 | | (6.86) | | (6.75) | | (0.05) | | — | | — | | (0.05) | | 12.96 | | (34.23) | | 4,071 | | 2.15 | | 2.15 | | 0.68 | | 39 |
| I | | 20.13 | | 0.27 | | (6.97) | | (6.70) | | (0.23) | | — | | — | | (0.23) | | 13.20 | | (33.63) | | 1,691,881 | | 1.25 | | 1.25 | | 1.62 | | 39 |
| R3 | | 19.99 | | 0.19 | | (6.93) | | (6.74) | | (0.14) | | — | | — | | (0.14) | | 13.11 | | (33.94) | | 76 | | 1.78 | | 1.70 | | 1.14 | | 39 |
| R4 | | 20.18 | | 0.23 | | (7.00) | | (6.77) | | (0.18) | | — | | — | | (0.18) | | 13.23 | | (33.81) | | 5,013 | | 1.47 | | 1.47 | | 1.39 | | 39 |
| R5 | | 20.14 | | 0.28 | | (6.98) | | (6.70) | | (0.24) | | — | | — | | (0.24) | | 13.20 | | (33.62) | | 294 | | 1.18 | | 1.18 | | 1.66 | | 39 |
| Y | | 20.20 | | 0.31 | | (7.02) | | (6.71) | | (0.25) | | — | | — | | (0.25) | | 13.24 | | (33.58) | | 97,257 | | 1.17 | | 1.17 | | 1.82 | | 39 |
| F | | 20.15 | | 0.30 | | (6.97) | | (6.67) | | (0.27) | | — | | — | | (0.27) | | 13.21 | | (33.52) | | 661,403 | | 1.06 | | 1.06 | | 1.78 | | 39 |
| SDR | | 20.19 | | 0.29 | | (6.97) | | (6.68) | | (0.27) | | — | | — | | (0.27) | | 13.24 | | (33.50) | | 2,295,024 | | 1.06 | | 1.06 | | 1.75 | | 39 |
The accompanying notes are an integral part of these financial statements.
Financial Highlights – (continued)
| | | — Selected Per-Share Data(1) — | | — Ratios and Supplemental Data — |
| Class | | Net
Asset
Value at
Beginning
of Period | | Net
Investment
Income
(Loss) | | Net
Realized
and
Unrealized
Gain (Loss)
on
Investments | | Total from
Investment
Operations | | Dividends
from Net
Investment
Income | | Distributions
from
Capital
Gains | | Returns
of
Capital | | Total
Dividends
and
Distributions | | Net
Asset
Value at
End of
Period | | Total
Return(2) | | Net
Assets
at End
of Period
(000s) | | Ratio of
Expenses
to
Average
Net
Assets
Before
Adjust-
ments(3) | | Ratio of
Expenses
to
Average
Net
Assets
After
Adjust-
ments(3) | | Ratio of
Net
Investment
Income
(Loss) to
Average
Net Assets | | Portfolio
Turnover |
| Hartford Schroders Emerging Markets Equity Fund – (continued) |
| For the Year Ended October 31, 2021 |
| A | | $ 17.22 | | $ 0.06 | | $ 2.95 | | $ 3.01 | | $ (0.18) | | $ — | | $ — | | $ (0.18) | | $ 20.05 | | 17.47% | | $ 99,011 | | 1.44% | | 1.44% | | 0.28% | | 36% |
| C | | 16.93 | | 0.01 | | 2.82 | | 2.83 | | — | | — | | — | | — | | 19.76 | | 16.72 | | 8,835 | | 2.13 | | 2.13 | | 0.03 | | 36 |
| I | | 17.22 | | 0.21 | | 2.86 | | 3.07 | | (0.16) | | — | | — | | (0.16) | | 20.13 | | 17.82 | | 2,326,811 | | 1.23 | | 1.23 | | 1.01 | | 36 |
| R3 | | 17.11 | | 0.10 | | 2.85 | | 2.95 | | (0.07) | | — | | — | | (0.07) | | 19.99 | | 17.27 | | 100 | | 1.77 | | 1.68 | | 0.47 | | 36 |
| R4 | | 17.29 | | 0.14 | | 2.90 | | 3.04 | | (0.15) | | — | | — | | (0.15) | | 20.18 | | 17.57 | | 5,485 | | 1.47 | | 1.47 | | 0.68 | | 36 |
| R5 | | 17.22 | | 0.21 | | 2.86 | | 3.07 | | (0.15) | | — | | — | | (0.15) | | 20.14 | | 17.87 | | 412 | | 1.17 | | 1.17 | | 1.01 | | 36 |
| Y | | 17.25 | | 0.29 | | 2.78 | | 3.07 | | (0.12) | | — | | — | | (0.12) | | 20.20 | | 17.82 | | 890,765 | | 1.16 | | 1.16 | | 1.41 | | 36 |
| F | | 17.24 | | 0.24 | | 2.86 | | 3.10 | | (0.19) | | — | | — | | (0.19) | | 20.15 | | 17.99 | | 1,049,336 | | 1.05 | | 1.05 | | 1.15 | | 36 |
| SDR | | 17.27 | | 0.26 | | 2.85 | | 3.11 | | (0.19) | | — | | — | | (0.19) | | 20.19 | | 18.02 | | 2,361,023 | | 1.05 | | 1.05 | | 1.23 | | 36 |
| For the Year Ended October 31, 2020 |
| A | | $ 15.78 | | $ 0.06 | | $ 1.71 | | $ 1.77 | | $ (0.33) | | $ — | | $ — | | $ (0.33) | | $ 17.22 | | 11.28% | | $ 62,843 | | 1.53% | | 1.53% | | 0.40% | | 52% |
| C | | 15.51 | | (0.05) | | 1.67 | | 1.62 | | (0.20) | | — | | — | | (0.20) | | 16.93 | | 10.51 | | 7,127 | | 2.16 | | 2.16 | | (0.34) | | 52 |
| I | | 15.77 | | 0.10 | | 1.71 | | 1.81 | | (0.36) | | — | | — | | (0.36) | | 17.22 | | 11.56 | | 1,443,799 | | 1.25 | | 1.25 | | 0.63 | | 52 |
| R3 | | 15.66 | | 0.03 | | 1.70 | | 1.73 | | (0.28) | | — | | — | | (0.28) | | 17.11 | | 11.08 | | 88 | | 1.79 | | 1.71 | | 0.21 | | 52 |
| R4 | | 15.74 | | 0.17 | | 1.62 | | 1.79 | | (0.24) | | — | | — | | (0.24) | | 17.29 | | 11.43 | | 4,500 | | 1.43 | | 1.43 | | 1.09 | | 52 |
| R5 | | 15.78 | | 0.11 | | 1.70 | | 1.81 | | (0.37) | | — | | — | | (0.37) | | 17.22 | | 11.55 | | 322 | | 1.20 | | 1.20 | | 0.69 | | 52 |
| Y | | 15.79 | | 0.13 | | 1.70 | | 1.83 | | (0.37) | | — | | — | | (0.37) | | 17.25 | | 11.69 | | 505,338 | | 1.18 | | 1.18 | | 0.85 | | 52 |
| F | | 15.78 | | 0.14 | | 1.71 | | 1.85 | | (0.39) | | — | | — | | (0.39) | | 17.24 | | 11.79 | | 861,337 | | 1.08 | | 1.08 | | 0.85 | | 52 |
| SDR | | 15.81 | | 0.13 | | 1.72 | | 1.85 | | (0.39) | | — | | — | | (0.39) | | 17.27 | | 11.77 | | 1,306,890 | | 1.08 | | 1.08 | | 0.83 | | 52 |
| For the Year Ended October 31, 2019 |
| A | | $ 14.07 | | $ 0.29 | | $ 1.56 | | $ 1.85 | | $ (0.14) | | $ — | | $ — | | $ (0.14) | | $ 15.78 | | 13.27% | | $ 60,356 | | 1.45% | | 1.45% | | 1.95% | | 43% |
| C | | 13.86 | | 0.19 | | 1.53 | | 1.72 | | (0.07) | | — | | — | | (0.07) | | 15.51 | | 12.50 | | 10,532 | | 2.17 | | 2.17 | | 1.27 | | 43 |
| I | | 14.06 | | 0.31 | | 1.57 | | 1.88 | | (0.17) | | — | | — | | (0.17) | | 15.77 | | 13.54 | | 1,838,077 | | 1.23 | | 1.23 | | 2.07 | | 43 |
| R3 | | 13.98 | | 0.23 | | 1.57 | | 1.80 | | (0.12) | | — | | — | | (0.12) | | 15.66 | | 13.01 | | 83 | | 1.79 | | 1.72 | | 1.51 | | 43 |
| R4 | | 14.02 | | (0.05) | | 1.95 | | 1.90 | | (0.18) | | — | | — | | (0.18) | | 15.74 | | 13.78 | | 26 | | 1.43 | | 1.42 | | (0.32) | | 43 |
| R5 | | 14.07 | | 0.33 | | 1.56 | | 1.89 | | (0.18) | | — | | — | | (0.18) | | 15.78 | | 13.61 | | 600 | | 1.19 | | 1.19 | | 2.19 | | 43 |
| Y | | 14.09 | | 0.32 | | 1.57 | | 1.89 | | (0.19) | | — | | — | | (0.19) | | 15.79 | | 13.62 | | 120,308 | | 1.13 | | 1.13 | | 2.11 | | 43 |
| F | | 14.07 | | 0.42 | | 1.48 | | 1.90 | | (0.19) | | — | | — | | (0.19) | | 15.78 | | 13.73 | | 419,520 | | 1.07 | | 1.07 | | 2.77 | | 43 |
| SDR | | 14.10 | | 0.34 | | 1.56 | | 1.90 | | (0.19) | | — | | — | | (0.19) | | 15.81 | | 13.71 | | 1,129,431 | | 1.07 | | 1.07 | | 2.28 | | 43 |
| For the Year Ended October 31, 2018 |
| A | | $ 16.23 | | $ 0.16 | | $ (2.22) | | $ (2.06) | | $ (0.10) | | $ — | | $ — | | $ (0.10) | | $ 14.07 | | (12.79)% | | $ 46,162 | | 1.45% | | 1.45% | | 0.98% | | 24% |
| C | | 16.08 | | 0.07 | | (2.22) | | (2.15) | | (0.07) | | — | | — | | (0.07) | | 13.86 | | (13.44) | | 7,217 | | 2.19 | | 2.19 | | 0.45 | | 24 |
| I | | 16.23 | | 0.19 | | (2.22) | | (2.03) | | (0.14) | | — | | — | | (0.14) | | 14.06 | | (12.66) | | 1,733,270 | | 1.24 | | 1.24 | | 1.19 | | 24 |
| R3 | | 16.20 | | 0.22 | | (2.30) | | (2.08) | | (0.14) | | — | | — | | (0.14) | | 13.98 | | (12.99) | | 90 | | 1.80 | | 1.70 | | 1.36 | | 24 |
| R4 | | 16.19 | | 0.05 | | (2.11) | | (2.06) | | (0.11) | | — | | — | | (0.11) | | 14.02 | | (12.88) | | 3,710 | | 1.49 | | 1.48 | | 0.36 | | 24 |
| R5 | | 16.23 | | 0.27 | | (2.29) | | (2.02) | | (0.14) | | — | | — | | (0.14) | | 14.07 | | (12.56) | | 484 | | 1.20 | | 1.20 | | 1.69 | | 24 |
| Y | | 16.25 | | 0.23 | | (2.24) | | (2.01) | | (0.15) | | — | | — | | (0.15) | | 14.09 | | (12.48) | | 123,082 | | 1.11 | | 1.11 | | 1.43 | | 24 |
| F | | 16.23 | | 0.30 | | (2.30) | | (2.00) | | (0.16) | | — | | — | | (0.16) | | 14.07 | | (12.48) | | 154,306 | | 1.08 | | 1.08 | | 1.89 | | 24 |
| SDR | | 16.26 | | 0.23 | | (2.23) | | (2.00) | | (0.16) | | — | | — | | (0.16) | | 14.10 | | (12.46) | | 930,480 | | 1.08 | | 1.08 | | 1.43 | | 24 |
The accompanying notes are an integral part of these financial statements.
Financial Highlights – (continued)
| | | — Selected Per-Share Data(1) — | | — Ratios and Supplemental Data — |
| Class | | Net
Asset
Value at
Beginning
of Period | | Net
Investment
Income
(Loss) | | Net
Realized
and
Unrealized
Gain (Loss)
on
Investments | | Total from
Investment
Operations | | Dividends
from Net
Investment
Income | | Distributions
from
Capital
Gains | | Returns
of
Capital | | Total
Dividends
and
Distributions | | Net
Asset
Value at
End of
Period | | Total
Return(2) | | Net
Assets
at End
of Period
(000s) | | Ratio of
Expenses
to
Average
Net
Assets
Before
Adjust-
ments(3) | | Ratio of
Expenses
to
Average
Net
Assets
After
Adjust-
ments(3) | | Ratio of
Net
Investment
Income
(Loss) to
Average
Net Assets | | Portfolio
Turnover |
| Hartford Schroders Emerging Markets Multi-Sector Bond Fund |
| For the Year Ended October 31, 2022 |
| A | | $ 8.29 | | $ 0.37 | | $ (2.06) | | $ (1.69) | | $ (0.33) | | $ (0.01) | | $ (0.05) | | $ (0.39) | | $ 6.21 | | (20.83)% | | $ 1,018 | | 1.65% | | 1.15% | | 5.12% | | 118% |
| C | | 8.26 | | 0.31 | | (2.05) | | (1.74) | | (0.28) | | (0.01) | | (0.04) | | (0.33) | | 6.19 | | (21.38) | | 65 | | 2.46 | | 1.90 | | 4.32 | | 118 |
| I | | 8.28 | | 0.40 | | (2.07) | | (1.67) | | (0.35) | | (0.01) | | (0.05) | | (0.41) | | 6.20 | | (20.65) | | 7,394 | | 1.32 | | 0.90 | | 5.32 | | 118 |
| R3 | | 8.30 | | 0.36 | | (2.07) | | (1.71) | | (0.31) | | (0.01) | | (0.05) | | (0.37) | | 6.22 | | (21.04) | | 27 | | 1.93 | | 1.45 | | 4.89 | | 118 |
| R4 | | 8.29 | | 0.37 | | (2.06) | | (1.69) | | (0.33) | | (0.01) | | (0.05) | | (0.39) | | 6.21 | | (20.83) | | 9 | | 1.63 | | 1.15 | | 5.17 | | 118 |
| R5 | | 8.28 | | 0.39 | | (2.06) | | (1.67) | | (0.35) | | (0.01) | | (0.05) | | (0.41) | | 6.20 | | (20.61) | | 9 | | 1.33 | | 0.85 | | 5.48 | | 118 |
| Y | | 8.28 | | 0.39 | | (2.06) | | (1.67) | | (0.35) | | (0.01) | | (0.05) | | (0.41) | | 6.20 | | (20.61) | | 2,531 | | 1.27 | | 0.85 | | 5.47 | | 118 |
| F | | 7.77 | | 0.38 | | (1.93) | | (1.55) | | (0.36) | | (0.01) | | (0.05) | | (0.42) | | 5.80 | | (20.46) | | 10 | | 1.21 | | 0.75 | | 5.58 | | 118 |
| SDR | | 8.28 | | 0.41 | | (2.07) | | (1.66) | | (0.36) | | (0.01) | | (0.05) | | (0.42) | | 6.20 | | (20.53) | | 16,503 | | 1.21 | | 0.75 | | 5.56 | | 118 |
| For the Year Ended October 31, 2021 |
| A | | $ 8.22 | | $ 0.36 | | $ 0.05 | | $ 0.41 | | $ (0.34) | | $ — | | $ — | | $ (0.34) | | $ 8.29 | | 4.92% | | $ 1,574 | | 1.48% | | 1.15% | | 4.14% | | 168% |
| C | | 8.20 | | 0.29 | | 0.04 | | 0.33 | | (0.27) | | — | | — | | (0.27) | | 8.26 | | 4.02 | | 136 | | 2.32 | | 1.90 | | 3.41 | | 168 |
| I | | 8.21 | | 0.38 | | 0.05 | | 0.43 | | (0.36) | | — | | — | | (0.36) | | 8.28 | | 5.19 | | 18,976 | | 1.16 | | 0.88 | | 4.41 | | 168 |
| R3 | | 8.23 | | 0.33 | | 0.05 | | 0.38 | | (0.31) | | — | | — | | (0.31) | | 8.30 | | 4.60 | | 31 | | 1.79 | | 1.41 | | 3.89 | | 168 |
| R4 | | 8.22 | | 0.37 | | 0.04 | | 0.41 | | (0.34) | | — | | — | | (0.34) | | 8.29 | | 4.92 | | 11 | | 1.49 | | 1.09 | | 4.24 | | 168 |
| R5 | | 8.21 | | 0.38 | | 0.05 | | 0.43 | | (0.36) | | — | | — | | (0.36) | | 8.28 | | 5.24 | | 11 | | 1.19 | | 0.85 | | 4.45 | | 168 |
| Y | | 8.21 | | 0.38 | | 0.05 | | 0.43 | | (0.36) | | — | | — | | (0.36) | | 8.28 | | 5.24 | | 2,946 | | 1.12 | | 0.83 | | 4.46 | | 168 |
| F | | 7.72 | | 0.37 | | 0.05 | | 0.42 | | (0.37) | | — | | — | | (0.37) | | 7.77 | | 5.43 | | 12 | | 1.07 | | 0.75 | | 4.54 | | 168 |
| SDR | | 8.21 | | 0.39 | | 0.05 | | 0.44 | | (0.37) | | — | | — | | (0.37) | | 8.28 | | 5.35 | | 20,784 | | 1.07 | | 0.75 | | 4.57 | | 168 |
| For the Year Ended October 31, 2020 |
| A | | $ 9.12 | | $ 0.44 | | $ (0.90) | | $ (0.46) | | $ (0.34) | | $ — | | $ (0.10) | | $ (0.44) | | $ 8.22 | | (4.85)% | | $ 1,727 | | 1.41% | | 1.15% | | 5.22% | | 141% |
| C | | 9.08 | | 0.38 | | (0.89) | | (0.51) | | (0.29) | | — | | (0.08) | | (0.37) | | 8.20 | | (5.43) | | 215 | | 2.23 | | 1.90 | | 4.48 | | 141 |
| I | | 9.11 | | 0.47 | | (0.90) | | (0.43) | | (0.37) | | — | | (0.10) | | (0.47) | | 8.21 | | (4.50) | | 21,211 | | 1.05 | | 0.82 | | 5.56 | | 141 |
| R3 | | 9.13 | | 0.43 | | (0.89) | | (0.46) | | (0.34) | | — | | (0.10) | | (0.44) | | 8.23 | | (4.79) | | 29 | | 1.70 | | 1.24 | | 5.15 | | 141 |
| R4 | | 9.11 | | 0.46 | | (0.89) | | (0.43) | | (0.36) | | — | | (0.10) | | (0.46) | | 8.22 | | (4.45) | | 11 | | 1.40 | | 0.92 | | 5.48 | | 141 |
| R5 | | 9.10 | | 0.46 | | (0.88) | | (0.42) | | (0.37) | | — | | (0.10) | | (0.47) | | 8.21 | | (4.41) | | 11 | | 1.10 | | 0.85 | | 5.52 | | 141 |
| Y | | 9.10 | | 0.47 | | (0.89) | | (0.42) | | (0.36) | | — | | (0.11) | | (0.47) | | 8.21 | | (4.34) | | 2,376 | | 0.98 | | 0.76 | | 5.60 | | 141 |
| F | | 9.10 | | 0.51 | | (1.02) | | (0.51) | | (0.67) | | — | | (0.20) | | (0.87) | | 7.72 | | (4.66) | | 11 | | 0.98 | | 0.75 | | 5.58 | | 141 |
| SDR | | 9.11 | | 0.47 | | (0.90) | | (0.43) | | (0.36) | | — | | (0.11) | | (0.47) | | 8.21 | | (4.44) | | 34,536 | | 0.98 | | 0.75 | | 5.62 | | 141 |
| For the Year Ended October 31, 2019 |
| A | | $ 8.79 | | $ 0.55 | | $ 0.25 | | $ 0.80 | | $ (0.43) | | $ — | | $ (0.04) | | $ (0.47) | | $ 9.12 | | 9.21% | | $ 1,829 | | 1.29% | | 1.11% | | 6.12% | | 240% |
| C | | 8.74 | | 0.48 | | 0.25 | | 0.73 | | (0.36) | | — | | (0.03) | | (0.39) | | 9.08 | | 8.44 | | 266 | | 2.14 | | 1.90 | | 5.39 | | 240 |
| I | | 8.78 | | 0.58 | | 0.25 | | 0.83 | | (0.46) | | — | | (0.04) | | (0.50) | | 9.11 | | 9.65 | | 29,715 | | 1.00 | | 0.83 | | 6.37 | | 240 |
| R3 | | 8.80 | | 0.57 | | 0.25 | | 0.82 | | (0.45) | | — | | (0.04) | | (0.49) | | 9.13 | | 9.46 | | 11 | | 1.55 | | 0.88 | | 6.33 | | 240 |
| R4 | | 8.78 | | 0.57 | | 0.25 | | 0.82 | | (0.45) | | — | | (0.04) | | (0.49) | | 9.11 | | 9.45 | | 11 | | 1.28 | | 0.86 | | 6.35 | | 240 |
| R5 | | 8.78 | | 0.58 | | 0.24 | | 0.82 | | (0.46) | | — | | (0.04) | | (0.50) | | 9.10 | | 9.56 | | 11 | | 1.00 | | 0.81 | | 6.39 | | 240 |
| Y | | 8.78 | | 0.58 | | 0.24 | | 0.82 | | (0.46) | | — | | (0.04) | | (0.50) | | 9.10 | | 9.61 | | 2,046 | | 0.94 | | 0.76 | | 6.39 | | 240 |
| F | | 8.78 | | 0.58 | | 0.25 | | 0.83 | | (0.47) | | — | | (0.04) | | (0.51) | | 9.10 | | 9.66 | | 23,084 | | 0.93 | | 0.75 | | 6.45 | | 240 |
| SDR | | 8.79 | | 0.58 | | 0.25 | | 0.83 | | (0.47) | | — | | (0.04) | | (0.51) | | 9.11 | | 9.65 | | 37,109 | | 0.93 | | 0.75 | | 6.44 | | 240 |
The accompanying notes are an integral part of these financial statements.
Financial Highlights – (continued)
| | | — Selected Per-Share Data(1) — | | — Ratios and Supplemental Data — |
| Class | | Net
Asset
Value at
Beginning
of Period | | Net
Investment
Income
(Loss) | | Net
Realized
and
Unrealized
Gain (Loss)
on
Investments | | Total from
Investment
Operations | | Dividends
from Net
Investment
Income | | Distributions
from
Capital
Gains | | Returns
of
Capital | | Total
Dividends
and
Distributions | | Net
Asset
Value at
End of
Period | | Total
Return(2) | | Net
Assets
at End
of Period
(000s) | | Ratio of
Expenses
to
Average
Net
Assets
Before
Adjust-
ments(3) | | Ratio of
Expenses
to
Average
Net
Assets
After
Adjust-
ments(3) | | Ratio of
Net
Investment
Income
(Loss) to
Average
Net Assets | | Portfolio
Turnover |
| Hartford Schroders Emerging Markets Multi-Sector Bond Fund – (continued) |
| For the Year Ended October 31, 2018 |
| A | | $ 9.98 | | $ 0.50 | | $ (1.02) | | $ (0.52) | | $ (0.32) | | $ (0.13) | | $ (0.22) | | $ (0.67) | | $ 8.79 | | (5.34)% | | $ 3,389 | | 1.29% | | 1.08% | | 5.42% | | 285% |
| C | | 9.95 | | 0.41 | | (1.01) | | (0.60) | | (0.28) | | (0.13) | | (0.20) | | (0.61) | | 8.74 | | (6.27) | | 414 | | 2.16 | | 1.90 | | 4.52 | | 285 |
| I | | 9.97 | | 0.52 | | (1.02) | | (0.50) | | (0.34) | | (0.13) | | (0.22) | | (0.69) | | 8.78 | | (5.22) | | 36,557 | | 1.02 | | 0.85 | | 5.63 | | 285 |
| R3 | | 9.97 | | 0.50 | | (1.03) | | (0.53) | | (0.30) | | (0.13) | | (0.21) | | (0.64) | | 8.80 | | (5.43) | | 10 | | 1.65 | | 1.25 | | 5.23 | | 285 |
| R4 | | 9.97 | | 0.52 | | (1.03) | | (0.51) | | (0.33) | | (0.13) | | (0.22) | | (0.68) | | 8.78 | | (5.25) | | 10 | | 1.35 | | 0.92 | | 5.54 | | 285 |
| R5 | | 9.97 | | 0.53 | | (1.03) | | (0.50) | | (0.34) | | (0.13) | | (0.22) | | (0.69) | | 8.78 | | (5.23) | | 10 | | 1.06 | | 0.85 | | 5.58 | | 285 |
| Y | | 9.97 | | 0.49 | | (0.98) | | (0.49) | | (0.34) | | (0.13) | | (0.23) | | (0.70) | | 8.78 | | (5.17) | | 970 | | 0.95 | | 0.77 | | 5.29 | | 285 |
| F | | 9.96 | | 0.53 | | (1.01) | | (0.48) | | (0.34) | | (0.13) | | (0.23) | | (0.70) | | 8.78 | | (5.04) | | 28,842 | | 0.94 | | 0.75 | | 5.67 | | 285 |
| SDR | | 9.98 | | 0.56 | | (1.05) | | (0.49) | | (0.34) | | (0.13) | | (0.23) | | (0.70) | | 8.79 | | (5.11) | | 34,841 | | 0.94 | | 0.75 | | 5.89 | | 285 |
| Hartford Schroders International Contrarian Value Fund(11) |
| For the Period Ended October 31, 2022 |
| I | | $ 10.00 | | $ 0.13 | | $ (1.38) | | $ (1.25) | | $ — | | $ — | | $ — | | $ — | | $ 8.75 | | (12.50)% (6) | | $ 438 | | 14.98% (7) | | 0.70% (7) | | 3.29% (7) | | 8% (12) |
| SDR | | 10.00 | | 0.13 | | (1.38) | | (1.25) | | — | | — | | — | | — | | 8.75 | | (12.50) (6) | | 437 | | 14.78 (7) | | 0.70 (7) | | 3.29 (7) | | 8 (12) |
| Hartford Schroders International Multi-Cap Value Fund |
| For the Year Ended October 31, 2022 |
| A | | $ 10.32 | | $ 0.29 | | $ (2.27) | | $ (1.98) | | $ (0.29) | | $ — | | $ — | | $ (0.29) | | $ 8.05 | | (19.57)% | | $ 94,322 | | 1.11% | | 1.11% | | 3.03% | | 101% |
| C | | 10.25 | | 0.22 | | (2.26) | | (2.04) | | (0.21) | | — | | — | | (0.21) | | 8.00 | | (20.16) | | 9,744 | | 1.85 | | 1.85 | | 2.27 | | 101 |
| I | | 10.31 | | 0.31 | | (2.26) | | (1.95) | | (0.31) | | — | | — | | (0.31) | | 8.05 | | (19.29) | | 618,285 | | 0.84 | | 0.84 | | 3.26 | | 101 |
| R3 | | 10.28 | | 0.25 | | (2.24) | | (1.99) | | (0.26) | | — | | — | | (0.26) | | 8.03 | | (19.72) | | 13,320 | | 1.46 | | 1.40 | | 2.68 | | 101 |
| R4 | | 10.29 | | 0.28 | | (2.26) | | (1.98) | | (0.28) | | — | | — | | (0.28) | | 8.03 | | (19.59) | | 4,544 | | 1.16 | | 1.16 | | 2.91 | | 101 |
| R5 | | 10.30 | | 0.29 | | (2.24) | | (1.95) | | (0.31) | | — | | — | | (0.31) | | 8.04 | | (19.31) | | 13,333 | | 0.85 | | 0.85 | | 3.08 | | 101 |
| Y | | 10.31 | | 0.32 | | (2.27) | | (1.95) | | (0.32) | | — | | — | | (0.32) | | 8.04 | | (19.36) | | 247,391 | | 0.85 | | 0.83 | | 3.35 | | 101 |
| F | | 10.31 | | 0.32 | | (2.26) | | (1.94) | | (0.32) | | — | | — | | (0.32) | | 8.05 | | (19.19) | | 472,832 | | 0.74 | | 0.74 | | 3.33 | | 101 |
| SDR | | 10.30 | | 0.32 | | (2.26) | | (1.94) | | (0.32) | | — | | — | | (0.32) | | 8.04 | | (19.21) | | 643,506 | | 0.74 | | 0.74 | | 3.34 | | 101 |
| For the Year Ended October 31, 2021 |
| A | | $ 7.76 | | $ 0.21 | | $ 2.57 | | $ 2.78 | | $ (0.22) | | $ — | | $ — | | $ (0.22) | | $ 10.32 | | 36.00% | | $ 98,511 | | 1.11% | | 1.11% | | 2.12% | | 85% |
| C | | 7.71 | | 0.13 | | 2.56 | | 2.69 | | (0.15) | | — | | — | | (0.15) | | 10.25 | | 34.97 | | 14,700 | | 1.85 | | 1.85 | | 1.34 | | 85 |
| I | | 7.75 | | 0.24 | | 2.57 | | 2.81 | | (0.25) | | — | | — | | (0.25) | | 10.31 | | 36.41 | | 713,835 | | 0.85 | | 0.85 | | 2.39 | | 85 |
| R3 | | 7.73 | | 0.18 | | 2.56 | | 2.74 | | (0.19) | | — | | — | | (0.19) | | 10.28 | | 35.61 | | 17,169 | | 1.46 | | 1.40 | | 1.81 | | 85 |
| R4 | | 7.74 | | 0.23 | | 2.54 | | 2.77 | | (0.22) | | — | | — | | (0.22) | | 10.29 | | 35.96 | | 5,890 | | 1.16 | | 1.16 | | 2.28 | | 85 |
| R5 | | 7.75 | | 0.23 | | 2.57 | | 2.80 | | (0.25) | | — | | — | | (0.25) | | 10.30 | | 36.25 | | 18,070 | | 0.85 | | 0.85 | | 2.28 | | 85 |
| Y | | 7.75 | | 0.24 | | 2.57 | | 2.81 | | (0.25) | | — | | — | | (0.25) | | 10.31 | | 36.43 | | 285,533 | | 0.85 | | 0.82 | | 2.44 | | 85 |
| F | | 7.76 | | 0.25 | | 2.56 | | 2.81 | | (0.26) | | — | | — | | (0.26) | | 10.31 | | 36.35 | | 578,284 | | 0.75 | | 0.75 | | 2.52 | | 85 |
| SDR | | 7.74 | | 0.25 | | 2.57 | | 2.82 | | (0.26) | | — | | — | | (0.26) | | 10.30 | | 36.57 | | 871,784 | | 0.75 | | 0.75 | | 2.49 | | 85 |
| For the Year Ended October 31, 2020 |
| A | | $ 9.05 | | $ 0.17 | | $ (1.24) | | $ (1.07) | | $ (0.22) | | $ — | | $ — | | $ (0.22) | | $ 7.76 | | (12.01)% | | $ 65,123 | | 1.12% | | 1.12% | | 2.12% | | 119% |
| C | | 8.99 | | 0.11 | | (1.23) | | (1.12) | | (0.16) | | — | | — | | (0.16) | | 7.71 | | (12.69) | | 12,691 | | 1.86 | | 1.86 | | 1.32 | | 119 |
| I | | 9.05 | | 0.20 | | (1.26) | | (1.06) | | (0.24) | | — | | — | | (0.24) | | 7.75 | | (11.86) | | 538,073 | | 0.85 | | 0.85 | | 2.37 | | 119 |
| R3 | | 9.02 | | 0.14 | | (1.24) | | (1.10) | | (0.19) | | — | | — | | (0.19) | | 7.73 | | (12.42) | | 13,398 | | 1.48 | | 1.48 | | 1.71 | | 119 |
| R4 | | 9.03 | | 0.17 | | (1.24) | | (1.07) | | (0.22) | | — | | — | | (0.22) | | 7.74 | | (12.07) | | 2,328 | | 1.18 | | 1.18 | | 2.13 | | 119 |
| R5 | | 9.04 | | 0.20 | | (1.25) | | (1.05) | | (0.24) | | — | | — | | (0.24) | | 7.75 | | (11.75) | | 17,008 | | 0.86 | | 0.86 | | 2.42 | | 119 |
| Y | | 9.04 | | 0.20 | | (1.24) | | (1.04) | | (0.25) | | — | | — | | (0.25) | | 7.75 | | (11.72) | | 165,134 | | 0.86 | | 0.81 | | 2.49 | | 119 |
| F | | 9.05 | | 0.21 | | (1.25) | | (1.04) | | (0.25) | | — | | — | | (0.25) | | 7.76 | | (11.65) | | 357,583 | | 0.76 | | 0.76 | | 2.58 | | 119 |
| SDR | | 9.04 | | 0.21 | | (1.26) | | (1.05) | | (0.25) | | — | | — | | (0.25) | | 7.74 | | (11.78) | | 577,640 | | 0.76 | | 0.76 | | 2.54 | | 119 |
The accompanying notes are an integral part of these financial statements.
Financial Highlights – (continued)
| | | — Selected Per-Share Data(1) — | | — Ratios and Supplemental Data — |
| Class | | Net
Asset
Value at
Beginning
of Period | | Net
Investment
Income
(Loss) | | Net
Realized
and
Unrealized
Gain (Loss)
on
Investments | | Total from
Investment
Operations | | Dividends
from Net
Investment
Income | | Distributions
from
Capital
Gains | | Returns
of
Capital | | Total
Dividends
and
Distributions | | Net
Asset
Value at
End of
Period | | Total
Return(2) | | Net
Assets
at End
of Period
(000s) | | Ratio of
Expenses
to
Average
Net
Assets
Before
Adjust-
ments(3) | | Ratio of
Expenses
to
Average
Net
Assets
After
Adjust-
ments(3) | | Ratio of
Net
Investment
Income
(Loss) to
Average
Net Assets | | Portfolio
Turnover |
| Hartford Schroders International Multi-Cap Value Fund – (continued) |
| For the Year Ended October 31, 2019 |
| A | | $ 8.97 | | $ 0.27 | | $ 0.28 | | $ 0.55 | | $ (0.25) | | $ (0.22) | | $ — | | $ (0.47) | | $ 9.05 | | 6.61% | | $ 106,530 | | 1.12% | | 1.12% | | 3.03% | | 119% |
| C | | 8.90 | | 0.19 | | 0.30 | | 0.49 | | (0.18) | | (0.22) | | — | | (0.40) | | 8.99 | | 5.91 | | 21,500 | | 1.87 | | 1.87 | | 2.12 | | 119 |
| I | | 8.96 | | 0.28 | | 0.30 | | 0.58 | | (0.27) | | (0.22) | | — | | (0.49) | | 9.05 | | 6.98 | | 740,680 | | 0.86 | | 0.86 | | 3.13 | | 119 |
| R3 | | 8.94 | | 0.28 | | 0.25 | | 0.53 | | (0.23) | | (0.22) | | — | | (0.45) | | 9.02 | | 6.36 | | 19,748 | | 1.48 | | 1.48 | | 3.25 | | 119 |
| R4 | | 8.95 | | 0.26 | | 0.29 | | 0.55 | | (0.25) | | (0.22) | | — | | (0.47) | | 9.03 | | 6.57 | | 2,746 | | 1.18 | | 1.18 | | 3.01 | | 119 |
| R5 | | 8.95 | | 0.26 | | 0.32 | | 0.58 | | (0.27) | | (0.22) | | — | | (0.49) | | 9.04 | | 6.97 | | 21,262 | | 0.87 | | 0.87 | | 2.99 | | 119 |
| Y | | 8.96 | | 0.29 | | 0.29 | | 0.58 | | (0.28) | | (0.22) | | — | | (0.50) | | 9.04 | | 6.93 | | 146,587 | | 0.85 | | 0.80 | | 3.29 | | 119 |
| F | | 8.97 | | 0.29 | | 0.29 | | 0.58 | | (0.28) | | (0.22) | | — | | (0.50) | | 9.05 | | 6.98 | | 377,025 | | 0.76 | | 0.76 | | 3.31 | | 119 |
| SDR | | 8.96 | | 0.29 | | 0.29 | | 0.58 | | (0.28) | | (0.22) | | — | | (0.50) | | 9.04 | | 6.99 | | 636,333 | | 0.76 | | 0.76 | | 3.27 | | 119 |
| For the Year Ended October 31, 2018 |
| A | | $ 10.18 | | $ 0.23 | | $ (1.09) | | $ (0.86) | | $ (0.24) | | $ (0.11) | | $ — | | $ (0.35) | | $ 8.97 | | (8.71)% | | $ 67,252 | | 1.13% | | 1.10% | | 2.26% | | 87% |
| C | | 10.12 | | 0.17 | | (1.10) | | (0.93) | | (0.18) | | (0.11) | | — | | (0.29) | | 8.90 | | (9.47) | | 25,614 | | 1.88 | | 1.85 | | 1.71 | | 87 |
| I | | 10.17 | | 0.26 | | (1.09) | | (0.83) | | (0.27) | | (0.11) | | — | | (0.38) | | 8.96 | | (8.47) | | 875,109 | | 0.87 | | 0.84 | | 2.64 | | 87 |
| R3 | | 10.15 | | 0.22 | | (1.10) | | (0.88) | | (0.22) | | (0.11) | | — | | (0.33) | | 8.94 | | (8.96) | | 613 | | 1.50 | | 1.43 | | 2.22 | | 87 |
| R4 | | 10.16 | | 0.20 | | (1.06) | | (0.86) | | (0.24) | | (0.11) | | — | | (0.35) | | 8.95 | | (8.76) | | 1,312 | | 1.20 | | 1.16 | | 2.03 | | 87 |
| R5 | | 10.17 | | 0.27 | | (1.11) | | (0.84) | | (0.27) | | (0.11) | | — | | (0.38) | | 8.95 | | (8.58) | | 22,482 | | 0.88 | | 0.85 | | 2.68 | | 87 |
| Y | | 10.17 | | 0.25 | | (1.07) | | (0.82) | | (0.28) | | (0.11) | | — | | (0.39) | | 8.96 | | (8.42) | | 80,993 | | 0.83 | | 0.81 | | 2.57 | | 87 |
| F | | 10.18 | | 0.28 | | (1.10) | | (0.82) | | (0.28) | | (0.11) | | — | | (0.39) | | 8.97 | | (8.38) | | 251,677 | | 0.78 | | 0.75 | | 2.78 | | 87 |
| SDR | | 10.17 | | 0.27 | | (1.09) | | (0.82) | | (0.28) | | (0.11) | | — | | (0.39) | | 8.96 | | (8.38) | | 540,822 | | 0.78 | | 0.75 | | 2.69 | | 87 |
| Hartford Schroders International Stock Fund |
| For the Year Ended October 31, 2022 |
| A | | $ 19.07 | | $ 0.25 | | $ (5.36) | | $ (5.11) | | $ (0.16) | | $ (0.14) | | $ — | | $ (0.30) | | $ 13.66 | | (27.22)% | | $ 210,992 | | 1.06% | | 1.06% | | 1.56% | | 35% |
| C | | 17.97 | | 0.13 | | (5.07) | | (4.94) | | (0.01) | | (0.14) | | — | | (0.15) | | 12.88 | | (27.71) | | 15,313 | | 1.81 | | 1.81 | | 0.84 | | 35 |
| I | | 18.49 | | 0.28 | | (5.19) | | (4.91) | | (0.21) | | (0.14) | | — | | (0.35) | | 13.23 | | (27.04) | | 1,897,371 | | 0.80 | | 0.80 | | 1.79 | | 35 |
| R3 | | 18.31 | | 0.15 | | (5.11) | | (4.96) | | (0.10) | | (0.14) | | — | | (0.24) | | 13.11 | | (27.43) | | 1,988 | | 1.42 | | 1.41 | | 1.01 | | 35 |
| R4 | | 18.42 | | 0.23 | | (5.17) | | (4.94) | | (0.16) | | (0.14) | | — | | (0.30) | | 13.18 | | (27.26) | | 3,618 | | 1.12 | | 1.12 | | 1.49 | | 35 |
| R5 | | 18.49 | | 0.27 | | (5.17) | | (4.90) | | (0.21) | | (0.14) | | — | | (0.35) | | 13.24 | | (26.99) | | 23,775 | | 0.81 | | 0.81 | | 1.76 | | 35 |
| Y | | 18.54 | | 0.30 | | (5.22) | | (4.92) | | (0.21) | | (0.14) | | — | | (0.35) | | 13.27 | | (27.03) | | 136,982 | | 0.81 | | 0.81 | | 1.87 | | 35 |
| F | | 18.52 | | 0.29 | | (5.18) | | (4.89) | | (0.23) | | (0.14) | | — | | (0.37) | | 13.26 | | (26.93) | | 692,063 | | 0.70 | | 0.70 | | 1.86 | | 35 |
| SDR | | 18.50 | | 0.28 | | (5.17) | | (4.89) | | (0.23) | | (0.14) | | — | | (0.37) | | 13.24 | | (26.96) | | 553,856 | | 0.71 | | 0.71 | | 1.84 | | 35 |
| For the Year Ended October 31, 2021 |
| A | | $ 14.14 | | $ 0.16 | | $ 4.77 | | $ 4.93 | | $ (0.00) (4) | | $ — | | $ — | | $ — | | $ 19.07 | | 34.90% | | $ 285,278 | | 1.06% | | 1.06% | | 0.89% | | 28% |
| C | | 13.43 | | 0.02 | | 4.52 | | 4.54 | | — | | — | | — | | — | | 17.97 | | 33.80 | | 20,788 | | 1.80 | | 1.80 | | 0.13 | | 28 |
| I | | 13.71 | | 0.21 | | 4.62 | | 4.83 | | (0.05) | | — | | — | | (0.05) | | 18.49 | | 35.30 | | 1,981,793 | | 0.79 | | 0.79 | | 1.18 | | 28 |
| R3 | | 13.63 | | 0.10 | | 4.58 | | 4.68 | | — | | — | | — | | — | | 18.31 | | 34.34 | | 1,190 | | 1.42 | | 1.41 | | 0.55 | | 28 |
| R4 | | 13.67 | | 0.14 | | 4.61 | | 4.75 | | (0.00) (4) | | — | | — | | — | | 18.42 | | 34.78 | | 3,841 | | 1.12 | | 1.12 | | 0.79 | | 28 |
| R5 | | 13.72 | | 0.20 | | 4.62 | | 4.82 | | (0.05) | | — | | — | | (0.05) | | 18.49 | | 35.20 | | 24,588 | | 0.81 | | 0.81 | | 1.14 | | 28 |
| Y | | 13.76 | | 0.21 | | 4.62 | | 4.83 | | (0.05) | | — | | — | | (0.05) | | 18.54 | | 35.17 | | 248,058 | | 0.81 | | 0.81 | | 1.17 | | 28 |
| F | | 13.74 | | 0.22 | | 4.63 | | 4.85 | | (0.07) | | — | | — | | (0.07) | | 18.52 | | 35.36 | | 618,602 | | 0.70 | | 0.70 | | 1.25 | | 28 |
| SDR | | 13.73 | | 0.22 | | 4.62 | | 4.84 | | (0.07) | | — | | — | | (0.07) | | 18.50 | | 35.31 | | 447,317 | | 0.71 | | 0.71 | | 1.25 | | 28 |
The accompanying notes are an integral part of these financial statements.
Financial Highlights – (continued)
| | | — Selected Per-Share Data(1) — | | — Ratios and Supplemental Data — |
| Class | | Net
Asset
Value at
Beginning
of Period | | Net
Investment
Income
(Loss) | | Net
Realized
and
Unrealized
Gain (Loss)
on
Investments | | Total from
Investment
Operations | | Dividends
from Net
Investment
Income | | Distributions
from
Capital
Gains | | Returns
of
Capital | | Total
Dividends
and
Distributions | | Net
Asset
Value at
End of
Period | | Total
Return(2) | | Net
Assets
at End
of Period
(000s) | | Ratio of
Expenses
to
Average
Net
Assets
Before
Adjust-
ments(3) | | Ratio of
Expenses
to
Average
Net
Assets
After
Adjust-
ments(3) | | Ratio of
Net
Investment
Income
(Loss) to
Average
Net Assets | | Portfolio
Turnover |
| Hartford Schroders International Stock Fund – (continued) |
| For the Year Ended October 31, 2020 |
| A | | $ 12.91 | | $ 0.07 | | $ 1.30 | | $ 1.37 | | $ (0.14) | | $ — | | $ — | | $ (0.14) | | $ 14.14 | | 10.63% | | $ 114,042 | | 1.12% | | 1.11% | | 0.49% | | 34% |
| C | | 12.25 | | (0.03) | | 1.25 | | 1.22 | | (0.04) | | — | | — | | (0.04) | | 13.43 | | 9.93 | | 6,687 | | 1.85 | | 1.85 | | (0.21) | | 34 |
| I | | 12.51 | | 0.10 | | 1.26 | | 1.36 | | (0.16) | | — | | — | | (0.16) | | 13.71 | | 10.93 | | 516,721 | | 0.83 | | 0.83 | | 0.79 | | 34 |
| R3 | | 12.47 | | 0.03 | | 1.26 | | 1.29 | | (0.13) | | — | | — | | (0.13) | | 13.63 | | 10.38 | | 734 | | 1.46 | | 1.45 | | 0.25 | | 34 |
| R4 | | 12.50 | | 0.07 | | 1.25 | | 1.32 | | (0.15) | | — | | — | | (0.15) | | 13.67 | | 10.62 | | 2,536 | | 1.15 | | 1.15 | | 0.51 | | 34 |
| R5 | | 12.52 | | 0.11 | | 1.26 | | 1.37 | | (0.17) | | — | | — | | (0.17) | | 13.72 | | 10.96 | | 12,208 | | 0.83 | | 0.83 | | 0.84 | | 34 |
| Y | | 12.52 | | 0.06 | | 1.32 | | 1.38 | | (0.14) | | — | | — | | (0.14) | | 13.76 | | 11.09 | | 66,753 | | 0.82 | | 0.82 | | 0.45 | | 34 |
| F | | 12.52 | | 0.11 | | 1.28 | | 1.39 | | (0.17) | | — | | — | | (0.17) | | 13.74 | | 11.13 | | 169,576 | | 0.75 | | 0.75 | | 0.86 | | 34 |
| SDR | | 12.52 | | 0.11 | | 1.27 | | 1.38 | | (0.17) | | — | | — | | (0.17) | | 13.73 | | 11.07 | | 136,358 | | 0.75 | | 0.75 | | 0.86 | | 34 |
| For the Year Ended October 31, 2019 |
| A | | $ 12.46 | | $ 0.17 | | $ 1.18 | | $ 1.35 | | $ (0.15) | | $ (0.75) | | $ — | | $ (0.90) | | $ 12.91 | | 12.04% | | $ 46,241 | | 1.16% | | 1.14% | | 1.42% | | 37% |
| C | | 11.90 | | 0.10 | | 1.10 | | 1.20 | | (0.10) | | (0.75) | | — | | (0.85) | | 12.25 | | 11.16 | | 3,530 | | 1.90 | | 1.87 | | 0.88 | | 37 |
| I | | 12.09 | | 0.21 | | 1.13 | | 1.34 | | (0.17) | | (0.75) | | — | | (0.92) | | 12.51 | | 12.39 | | 218,391 | | 0.86 | | 0.83 | | 1.81 | | 37 |
| R3 | | 12.08 | | 0.16 | | 1.13 | | 1.29 | | (0.15) | | (0.75) | | — | | (0.90) | | 12.47 | | 11.93 | | 190 | | 1.44 | | 1.33 | | 1.35 | | 37 |
| R4 | | 12.09 | | 0.15 | | 1.17 | | 1.32 | | (0.16) | | (0.75) | | — | | (0.91) | | 12.50 | | 12.15 | | 292 | | 1.12 | | 1.05 | | 1.24 | | 37 |
| R5 | | 12.10 | | 0.15 | | 1.19 | | 1.34 | | (0.17) | | (0.75) | | — | | (0.92) | | 12.52 | | 12.33 | | 1,066 | | 0.80 | | 0.78 | | 1.21 | | 37 |
| Y | | 12.11 | | 0.21 | | 1.12 | | 1.33 | | (0.17) | | (0.75) | | — | | (0.92) | | 12.52 | | 12.38 | | 676 | | 0.87 | | 0.84 | | 1.80 | | 37 |
| F | | 12.10 | | 0.22 | | 1.12 | | 1.34 | | (0.17) | | (0.75) | | — | | (0.92) | | 12.52 | | 12.47 | | 70,305 | | 0.78 | | 0.76 | | 1.85 | | 37 |
| SDR | | 12.10 | | 0.21 | | 1.14 | | 1.35 | | (0.18) | | (0.75) | | — | | (0.93) | | 12.52 | | 12.45 | | 100,663 | | 0.80 | | 0.76 | | 1.80 | | 37 |
| For the Year Ended October 31, 2018 |
| A | | $ 13.62 | | $ 0.19 | | $ (1.22) | | $ (1.03) | | $ (0.13) | | $ — | | $ — | | $ (0.13) | | $ 12.46 | | (7.63)% | | $ 11,234 | | 1.25% | | 1.16% | | 1.40% | | 65% |
| C | | 13.11 | | 0.13 | | (1.21) | | (1.08) | | (0.13) | | — | | — | | (0.13) | | 11.90 | | (8.33) | | 1,824 | | 2.01 | | 1.92 | | 0.97 | | 65 |
| I | | 13.20 | | 0.22 | | (1.17) | | (0.95) | | (0.16) | | — | | — | | (0.16) | | 12.09 | | (7.32) | | 129,528 | | 0.93 | | 0.85 | | 1.70 | | 65 |
| R3 | | 13.19 | | 0.21 | | (1.19) | | (0.98) | | (0.13) | | — | | — | | (0.13) | | 12.08 | | (7.49) | | 12 | | 1.61 | | 1.02 | | 1.59 | | 65 |
| R4 | | 13.20 | | 0.22 | | (1.19) | | (0.97) | | (0.14) | | — | | — | | (0.14) | | 12.09 | | (7.42) | | 12 | | 1.31 | | 0.97 | | 1.64 | | 65 |
| R5 | | 13.22 | | 0.22 | | (1.18) | | (0.96) | | (0.16) | | — | | — | | (0.16) | | 12.10 | | (7.36) | | 12 | | 1.01 | | 0.90 | | 1.69 | | 65 |
| Y | | 13.23 | | 0.12 | | (1.07) | | (0.95) | | (0.17) | | — | | — | | (0.17) | | 12.11 | | (7.32) | | 5,693 | | 0.90 | | 0.81 | | 0.97 | | 65 |
| F | | 13.22 | | 0.22 | | (1.17) | | (0.95) | | (0.17) | | — | | — | | (0.17) | | 12.10 | | (7.32) | | 9,204 | | 0.89 | | 0.80 | | 1.69 | | 65 |
| SDR | | 13.23 | | 0.23 | | (1.18) | | (0.95) | | (0.18) | | — | | — | | (0.18) | | 12.10 | | (7.33) | | 67,339 | | 0.89 | | 0.80 | | 1.71 | | 65 |
| Hartford Schroders Securitized Income Fund |
| For the Year Ended October 31, 2022 |
| A | | $ 9.91 | | $ 0.22 | | $ (0.85) | | $ (0.63) | | $ (0.23) | | $ — | | $ — | | $ (0.23) | | $ 9.05 | | (6.45)% | | $ 4,054 | | 0.89% | | 0.70% (13) | | 2.35% | | 38% (14) |
| C | | 9.89 | | 0.12 | | (0.85) | | (0.73) | | (0.14) | | — | | — | | (0.14) | | 9.02 | | (7.42) | | 255 | | 1.71 | | 1.69 (13) | | 1.29 | | 38 (14) |
| I | | 9.89 | | 0.22 | | (0.84) | | (0.62) | | (0.25) | | — | | — | | (0.25) | | 9.02 | | (6.32) | | 36,388 | | 0.69 | | 0.63 (13) | | 2.29 | | 38 (14) |
| Y | | 9.89 | | 0.24 | | (0.86) | | (0.62) | | (0.26) | | — | | — | | (0.26) | | 9.01 | | (6.37) | | 3,923 | | 0.64 | | 0.57 (13) | | 2.56 | | 38 (14) |
| F | | 9.88 | | 0.25 | | (0.85) | | (0.60) | | (0.27) | | — | | — | | (0.27) | | 9.01 | | (6.17) | | 1,965 | | 0.62 | | 0.47 (13) | | 2.66 | | 38 (14) |
| SDR | | 9.88 | | 0.24 | | (0.85) | | (0.61) | | (0.27) | | — | | — | | (0.27) | | 9.00 | | (6.28) | | 15,367 | | 0.63 | | 0.48 (13) | | 2.54 | | 38 (14) |
| For the Year Ended October 31, 2021 |
| A | | $ 9.79 | | $ 0.17 | | $ 0.10 | | $ 0.27 | | $ (0.15) | | $ — | | $ — | | $ (0.15) | | $ 9.91 | | 2.77% | | $ 5,167 | | 1.26% (15) | | 1.06% (13) | | 1.66% (16) | | 71% |
| C | | 9.79 | | 0.07 | | 0.10 | | 0.17 | | (0.07) | | — | | — | | (0.07) | | 9.89 | | 1.69 | | 432 | | 2.07 (15) | | 2.06 (13) | | 0.66 (16) | | 71 |
| I | | 9.79 | | 0.17 | | 0.10 | | 0.27 | | (0.17) | | — | | — | | (0.17) | | 9.89 | | 2.82 | | 89,260 | | 1.03 (15) | | 0.97 (13) | | 1.73 (16) | | 71 |
| Y | | 9.79 | | 0.18 | | 0.10 | | 0.28 | | (0.18) | | — | | — | | (0.18) | | 9.89 | | 2.87 | | 4,187 | | 0.99 (15) | | 0.92 (13) | | 1.78 (16) | | 71 |
| F | | 9.78 | | 0.19 | | 0.10 | | 0.29 | | (0.19) | | — | | — | | (0.19) | | 9.88 | | 2.97 | | 2,096 | | 0.98 (15) | | 0.84 (13) | | 1.88 (16) | | 71 |
| SDR | | 9.78 | | 0.18 | | 0.11 | | 0.29 | | (0.19) | | — | | — | | (0.19) | | 9.88 | | 2.97 | | 24,467 | | 0.97 (15) | | 0.84 (13) | | 1.84 (16) | | 71 |
The accompanying notes are an integral part of these financial statements.
Financial Highlights – (continued)
| | | — Selected Per-Share Data(1) — | | — Ratios and Supplemental Data — |
| Class | | Net
Asset
Value at
Beginning
of Period | | Net
Investment
Income
(Loss) | | Net
Realized
and
Unrealized
Gain (Loss)
on
Investments | | Total from
Investment
Operations | | Dividends
from Net
Investment
Income | | Distributions
from
Capital
Gains | | Returns
of
Capital | | Total
Dividends
and
Distributions | | Net
Asset
Value at
End of
Period | | Total
Return(2) | | Net
Assets
at End
of Period
(000s) | | Ratio of
Expenses
to
Average
Net
Assets
Before
Adjust-
ments(3) | | Ratio of
Expenses
to
Average
Net
Assets
After
Adjust-
ments(3) | | Ratio of
Net
Investment
Income
(Loss) to
Average
Net Assets | | Portfolio
Turnover |
| Hartford Schroders Securitized Income Fund – (continued) |
| For the Year Ended October 31, 2020 |
| A | | $ 10.06 | | $ 0.21 | | $ (0.25) | | $ (0.04) | | $ (0.22) | | $ (0.01) | | $ — | | $ (0.23) | | $ 9.79 | | (0.41)% | | $ 5,553 | | 1.54% (17) | | 1.10% (18)(19) | | 2.12% (20) | | 78% |
| C (21) | | 10.12 | | 0.04 | | (0.31) | | (0.27) | | (0.06) | | 0.00 | | — | | (0.06) | | 9.79 | | (2.64) (6) | | 443 | | 2.52 (7)(17) | | 2.29 (7)(18)(19) | | 0.55 (7)(20) | | 78 |
| I | | 10.06 | | 0.19 | | (0.23) | | (0.04) | | (0.22) | | (0.01) | | — | | (0.23) | | 9.79 | | (0.42) | | 65,636 | | 1.34 (17) | | 1.12 (18)(19) | | 1.94 (20) | | 78 |
| Y | | 10.06 | | 0.21 | | (0.25) | | (0.04) | | (0.22) | | (0.01) | | — | | (0.23) | | 9.79 | | (0.36) | | 3,571 | | 1.29 (17) | | 1.07 (18)(19) | | 2.20 (20) | | 78 |
| F | | 10.05 | | 0.22 | | (0.26) | | (0.04) | | (0.22) | | (0.01) | | — | | (0.23) | | 9.78 | | (0.34) | | 2,035 | | 1.28 (17) | | 1.06 (18)(19) | | 2.25 (20) | | 78 |
| SDR | | 10.05 | | 0.23 | | (0.26) | | (0.03) | | (0.23) | | (0.01) | | — | | (0.24) | | 9.78 | | (0.31) | | 16,688 | | 1.28 (17) | | 1.07 (18)(19) | | 2.32 (20) | | 78 |
| For the Period Ended October 31, 2019(22) |
| A | | $ 10.00 | | $ 0.17 | | $ 0.03 | | $ 0.20 | | $ (0.14) | | $ — | | $ — | | $ (0.14) | | $ 10.06 | | 2.04% (6) | | $ 3,571 | | 1.58% (7)(23) | | 1.00% (7)(19)(24) | | 2.49% (7)(25) | | 35% |
| I | | 10.00 | | 0.17 | | 0.04 | | 0.21 | | (0.15) | | — | | — | | (0.15) | | 10.06 | | 2.09 (6) | | 4,633 | | 1.33 (7)(23) | | 0.96 (7)(19)(24) | | 2.52 (7)(25) | | 35 |
| Y | | 10.00 | | 0.17 | | 0.04 | | 0.21 | | (0.15) | | — | | — | | (0.15) | | 10.06 | | 2.13 (6) | | 3,583 | | 1.27 (7)(23) | | 0.91 (7)(19)(24) | | 2.58 (7)(25) | | 35 |
| F | | 10.00 | | 0.18 | | 0.03 | | 0.21 | | (0.16) | | — | | — | | (0.16) | | 10.05 | | 2.06 (6) | | 2,544 | | 1.26 (7)(23) | | 0.89 (7)(19)(24) | | 2.61 (7)(25) | | 35 |
| SDR | | 10.00 | | 0.17 | | 0.04 | | 0.21 | | (0.16) | | — | | — | | (0.16) | | 10.05 | | 2.19 (6) | | 80,616 | | 1.24 (7)(23) | | 0.86 (7)(19)(24) | | 2.55 (7)(25) | | 35 |
| Hartford Schroders Sustainable International Core Fund(11) |
| For the Period Ended October 31, 2022 |
| I | | $ 10.00 | | $ 0.08 | | $ (1.48) | | $ (1.40) | | $ — | | $ — | | $ — | | $ — | | $ 8.60 | | (14.00)% (6) | | $ 430 | | 14.67% (7) | | 0.70% (7) | | 2.03% (7) | | 17(% 12) |
| SDR | | 10.00 | | 0.08 | | (1.48) | | (1.40) | | — | | — | | — | | — | | 8.60 | | (14.00) (6) | | 430 | | 14.48 (7) | | 0.70 (7) | | 2.03 (7) | | 17 (12) |
| Hartford Schroders Tax-Aware Bond Fund |
| For the Year Ended October 31, 2022 |
| A | | $ 11.27 | | $ 0.17 | | $ (1.64) | | $ (1.47) | | $ (0.17) | | $ (0.15) | | $ — | | $ (0.32) | | $ 9.48 | | (13.33)% | | $ 37,682 | | 0.83% | | 0.71% | | 1.66% | | 143% |
| C | | 11.28 | | 0.08 | | (1.64) | | (1.56) | | (0.07) | | (0.15) | | — | | (0.22) | | 9.50 | | (14.04) | | 4,323 | | 1.62 | | 1.59 | | 0.79 | | 143 |
| I | | 11.28 | | 0.20 | | (1.64) | | (1.44) | | (0.20) | | (0.15) | | — | | (0.35) | | 9.49 | | (13.12) | | 248,947 | | 0.61 | | 0.49 | | 1.96 | | 143 |
| Y | | 11.28 | | 0.20 | | (1.65) | | (1.45) | | (0.19) | | (0.15) | | — | | (0.34) | | 9.49 | | (13.18) | | 247 | | 0.63 | | 0.56 | | 1.86 | | 143 |
| F | | 11.28 | | 0.21 | | (1.65) | | (1.44) | | (0.20) | | (0.15) | | — | | (0.35) | | 9.49 | | (13.09) | | 48,151 | | 0.52 | | 0.46 | | 1.98 | | 143 |
| SDR | | 11.27 | | 0.21 | | (1.65) | | (1.44) | | (0.20) | | (0.15) | | — | | (0.35) | | 9.48 | | (13.10) | | 51,611 | | 0.52 | | 0.46 | | 1.97 | | 143 |
| For the Year Ended October 31, 2021 |
| A | | $ 11.42 | | $ 0.12 | | $ (0.00)(4) | | $ 0.12 | | $ (0.12) | | $ (0.15) | | $ — | | $ (0.27) | | $ 11.27 | | 1.08% | | $ 63,475 | | 0.82% | | 0.71% | | 1.09% | | 109% |
| C | | 11.44 | | 0.03 | | (0.02) | | 0.01 | | (0.02) | | (0.15) | | — | | (0.17) | | 11.28 | | 0.11 | | 7,768 | | 1.64 | | 1.58 | | 0.22 | | 109 |
| I | | 11.43 | | 0.15 | | (0.01) | | 0.14 | | (0.14) | | (0.15) | | — | | (0.29) | | 11.28 | | 1.30 | | 279,048 | | 0.59 | | 0.49 | | 1.31 | | 109 |
| Y | | 11.44 | | 0.14 | | (0.01) | | 0.13 | | (0.14) | | (0.15) | | — | | (0.29) | | 11.28 | | 1.14 | | 286 | | 0.62 | | 0.56 | | 1.24 | | 109 |
| F | | 11.44 | | 0.15 | | (0.01) | | 0.14 | | (0.15) | | (0.15) | | — | | (0.30) | | 11.28 | | 1.24 | | 40,994 | | 0.51 | | 0.46 | | 1.34 | | 109 |
| SDR | | 11.43 | | 0.15 | | (0.01) | | 0.14 | | (0.15) | | (0.15) | | — | | (0.30) | | 11.27 | | 1.24 | | 64,292 | | 0.51 | | 0.46 | | 1.34 | | 109 |
| For the Year Ended October 31, 2020 |
| A | | $ 11.34 | | $ 0.16 | | $ 0.32 | | $ 0.48 | | $ (0.17) | | $ (0.23) | | $ — | | $ (0.40) | | $ 11.42 | | 4.31% | | $ 56,486 | | 0.82% | | 0.71% | | 1.39% | | 186% |
| C | | 11.34 | | 0.06 | | 0.33 | | 0.39 | | (0.06) | | (0.23) | | — | | (0.29) | | 11.44 | | 3.53 | | 8,731 | | 1.61 | | 1.55 | | 0.56 | | 186 |
| I | | 11.34 | | 0.18 | | 0.34 | | 0.52 | | (0.20) | | (0.23) | | — | | (0.43) | | 11.43 | | 4.64 | | 283,060 | | 0.60 | | 0.49 | | 1.61 | | 186 |
| Y | | 11.35 | | 0.18 | | 0.33 | | 0.51 | | (0.19) | | (0.23) | | — | | (0.42) | | 11.44 | | 4.56 | | 213 | | 0.63 | | 0.56 | | 1.56 | | 186 |
| F | | 11.35 | | 0.19 | | 0.33 | | 0.52 | | (0.20) | | (0.23) | | — | | (0.43) | | 11.44 | | 4.67 | | 33,074 | | 0.52 | | 0.46 | | 1.64 | | 186 |
| SDR | | 11.34 | | 0.19 | | 0.33 | | 0.52 | | (0.20) | | (0.23) | | — | | (0.43) | | 11.43 | | 4.68 | | 61,878 | | 0.52 | | 0.46 | | 1.66 | | 186 |
| For the Year Ended October 31, 2019 |
| A | | $ 10.66 | | $ 0.23 | | $ 0.80 | | $ 1.03 | | $ (0.23) | | $ (0.12) | | $ — | | $ (0.35) | | $ 11.34 | | 9.79% | | $ 36,158 | | 0.83% | | 0.71% | | 2.08% | | 161% |
| C | | 10.65 | | 0.14 | | 0.80 | | 0.94 | | (0.13) | | (0.12) | | — | | (0.25) | | 11.34 | | 8.91 | | 7,894 | | 1.61 | | 1.54 | | 1.26 | | 161 |
| I | | 10.67 | | 0.26 | | 0.79 | | 1.05 | | (0.26) | | (0.12) | | — | | (0.38) | | 11.34 | | 9.95 | | 209,719 | | 0.61 | | 0.48 | | 2.31 | | 161 |
| Y | | 10.67 | | 0.26 | | 0.79 | | 1.05 | | (0.25) | | (0.12) | | — | | (0.37) | | 11.35 | | 9.98 | | 204 | | 0.60 | | 0.53 | | 2.31 | | 161 |
| F | | 10.67 | | 0.26 | | 0.80 | | 1.06 | | (0.26) | | (0.12) | | — | | (0.38) | | 11.35 | | 10.06 | | 20,569 | | 0.53 | | 0.46 | | 2.33 | | 161 |
| SDR | | 10.66 | | 0.26 | | 0.80 | | 1.06 | | (0.26) | | (0.12) | | — | | (0.38) | | 11.34 | | 10.08 | | 60,005 | | 0.53 | | 0.46 | | 2.38 | | 161 |
The accompanying notes are an integral part of these financial statements.
Financial Highlights – (continued)
| | | — Selected Per-Share Data(1) — | | — Ratios and Supplemental Data — |
| Class | | Net
Asset
Value at
Beginning
of Period | | Net
Investment
Income
(Loss) | | Net
Realized
and
Unrealized
Gain (Loss)
on
Investments | | Total from
Investment
Operations | | Dividends
from Net
Investment
Income | | Distributions
from
Capital
Gains | | Returns
of
Capital | | Total
Dividends
and
Distributions | | Net
Asset
Value at
End of
Period | | Total
Return(2) | | Net
Assets
at End
of Period
(000s) | | Ratio of
Expenses
to
Average
Net
Assets
Before
Adjust-
ments(3) | | Ratio of
Expenses
to
Average
Net
Assets
After
Adjust-
ments(3) | | Ratio of
Net
Investment
Income
(Loss) to
Average
Net Assets | | Portfolio
Turnover |
| Hartford Schroders Tax-Aware Bond Fund – (continued) |
| For the Year Ended October 31, 2018 |
| A | | $ 11.08 | | $ 0.23 | | $ (0.42) | | $ (0.19) | | $ (0.22) | | $ (0.01) | | $ — | | $ (0.23) | | $ 10.66 | | (1.77)% | | $ 25,186 | | 0.86% | | 0.71% | | 2.07% | | 161% |
| C | | 11.07 | | 0.14 | | (0.43) | | (0.29) | | (0.12) | | (0.01) | | — | | (0.13) | | 10.65 | | (2.64) | | 4,819 | | 1.62 | | 1.53 | | 1.24 | | 161 |
| I | | 11.10 | | 0.25 | | (0.42) | | (0.17) | | (0.25) | | (0.01) | | — | | (0.26) | | 10.67 | | (1.59) | | 120,282 | | 0.62 | | 0.46 | | 2.31 | | 161 |
| Y | | 11.10 | | 0.25 | | (0.43) | | (0.18) | | (0.24) | | (0.01) | | — | | (0.25) | | 10.67 | | (1.63) | | 214 | | 0.57 | | 0.48 | | 2.30 | | 161 |
| F | | 11.10 | | 0.26 | | (0.44) | | (0.18) | | (0.24) | | (0.01) | | — | | (0.25) | | 10.67 | | (1.60) | | 8,689 | | 0.55 | | 0.46 | | 2.36 | | 161 |
| SDR | | 11.09 | | 0.25 | | (0.43) | | (0.18) | | (0.24) | | (0.01) | | — | | (0.25) | | 10.66 | | (1.60) | | 59,590 | | 0.55 | | 0.46 | | 2.30 | | 161 |
| Hartford Schroders US MidCap Opportunities Fund |
| For the Year Ended October 31, 2022 |
| A | | $ 20.63 | | $ 0.03 | | $ (1.84) | | $ (1.81) | | $ — | | $ (2.90) | | $ — | | $ (2.90) | | $ 15.92 | | (10.46)% | | $ 107,826 | | 1.17% | | 1.17% | | 0.20% | | 42% |
| C | | 20.64 | | (0.09) | | (1.85) | | (1.94) | | — | | (2.90) | | — | | (2.90) | | 15.80 | | (11.16) | | 41,486 | | 1.91 | | 1.91 | | (0.54) | | 42 |
| I | | 21.52 | | 0.08 | | (1.94) | | (1.86) | | (0.02) | | (2.90) | | — | | (2.92) | | 16.74 | | (10.25) | | 397,914 | | 0.89 | | 0.89 | | 0.47 | | 42 |
| R3 | | 21.07 | | (0.03) | | (1.88) | | (1.91) | | — | | (2.90) | | — | | (2.90) | | 16.26 | | (10.75) | | 1,820 | | 1.52 | | 1.52 | | (0.15) | | 42 |
| R4 | | 21.37 | | 0.04 | | (1.93) | | (1.89) | | — | | (2.90) | | — | | (2.90) | | 16.58 | | (10.47) | | 564 | | 1.22 | | 1.16 | | 0.22 | | 42 |
| R5 | | 21.47 | | 0.08 | | (1.93) | | (1.85) | | (0.01) | | (2.90) | | — | | (2.91) | | 16.71 | | (10.22) | | 309 | | 0.92 | | 0.92 | | 0.42 | | 42 |
| Y | | 21.50 | | 0.08 | | (1.95) | | (1.87) | | (0.01) | | (2.90) | | — | | (2.91) | | 16.72 | | (10.29) | | 60,674 | | 0.91 | | 0.91 | | 0.45 | | 42 |
| F | | 21.53 | | 0.10 | | (1.95) | | (1.85) | | (0.03) | | (2.90) | | — | | (2.93) | | 16.75 | | (10.18) | | 88,436 | | 0.80 | | 0.80 | | 0.57 | | 42 |
| SDR | | 21.56 | | 0.10 | | (1.94) | | (1.84) | | (0.03) | | (2.90) | | — | | (2.93) | | 16.79 | | (10.12) | | 34,340 | | 0.81 | | 0.81 | | 0.56 | | 42 |
| For the Year Ended October 31, 2021 |
| A | | $ 14.57 | | $ (0.02) | | $ 6.09 | | $ 6.07 | | $ (0.01) | | $ — | | $ — | | $ (0.01) | | $ 20.63 | | 41.71% | | $ 106,982 | | 1.16% | | 1.16% | | (0.10)% | | 47% |
| C | | 14.67 | | (0.16) | | 6.13 | | 5.97 | | — | | — | | — | | — | | 20.64 | | 40.70 | | 54,795 | | 1.90 | | 1.90 | | (0.84) | | 47 |
| I | | 15.19 | | 0.03 | | 6.36 | | 6.39 | | (0.06) | | — | | — | | (0.06) | | 21.52 | | 42.13 | | 457,621 | | 0.89 | | 0.89 | | 0.17 | | 47 |
| R3 | | 14.92 | | (0.09) | | 6.24 | | 6.15 | | — | | — | | — | | — | | 21.07 | | 41.22 | | 2,157 | | 1.52 | | 1.52 | | (0.46) | | 47 |
| R4 | | 15.08 | | (0.02) | | 6.31 | | 6.29 | | — | | — | | — | | — | | 21.37 | | 41.71 | | 856 | | 1.22 | | 1.17 | | (0.11) | | 47 |
| R5 | | 15.16 | | 0.03 | | 6.33 | | 6.36 | | (0.05) | | — | | — | | (0.05) | | 21.47 | | 42.03 | | 874 | | 0.92 | | 0.92 | | 0.17 | | 47 |
| Y | | 15.18 | | 0.03 | | 6.34 | | 6.37 | | (0.05) | | — | | — | | (0.05) | | 21.50 | | 42.05 | | 82,958 | | 0.91 | | 0.91 | | 0.15 | | 47 |
| F | | 15.20 | | 0.05 | | 6.35 | | 6.40 | | (0.07) | | — | | — | | (0.07) | | 21.53 | | 42.23 | | 83,647 | | 0.80 | | 0.80 | | 0.26 | | 47 |
| SDR | | 15.23 | | 0.05 | | 6.35 | | 6.40 | | (0.07) | | — | | — | | (0.07) | | 21.56 | | 42.14 | | 51,180 | | 0.80 | | 0.80 | | 0.26 | | 47 |
| For the Year Ended October 31, 2020 |
| A | | $ 15.01 | | $ 0.01 | | $ (0.35) | | $ (0.34) | | $ 0.00(4) | | $ (0.10) | | $ — | | $ (0.10) | | $ 14.57 | | (2.25)% | | $ 71,370 | | 1.18% | | 1.18% | | 0.06% | | 53% |
| C | | 15.21 | | (0.10) | | (0.34) | | (0.44) | | — | | (0.10) | | — | | (0.10) | | 14.67 | | (2.90) | | 43,785 | | 1.92 | | 1.92 | | (0.67) | | 53 |
| I | | 15.63 | | 0.05 | | (0.35) | | (0.30) | | (0.04) | | (0.10) | | — | | (0.14) | | 15.19 | | (1.92) | | 352,667 | | 0.90 | | 0.90 | | 0.35 | | 53 |
| R3 | | 15.41 | | (0.04) | | (0.35) | | (0.39) | | — | | (0.10) | | — | | (0.10) | | 14.92 | | (2.54) | | 975 | | 1.53 | | 1.53 | | (0.28) | | 53 |
| R4 | | 15.53 | | 0.00 (4) | | (0.35) | | (0.35) | | — | | (0.10) | | — | | (0.10) | | 15.08 | | (2.26) | | 567 | | 1.23 | | 1.23 | | 0.01 | | 53 |
| R5 | | 15.60 | | 0.05 | | (0.35) | | (0.30) | | (0.04) | | (0.10) | | — | | (0.14) | | 15.16 | | (1.96) | | 1,229 | | 0.93 | | 0.93 | | 0.31 | | 53 |
| Y | | 15.63 | | 0.05 | | (0.35) | | (0.30) | | (0.05) | | (0.10) | | — | | (0.15) | | 15.18 | | (1.93) | | 77,493 | | 0.91 | | 0.90 | | 0.34 | | 53 |
| F | | 15.64 | | 0.06 | | (0.34) | | (0.28) | | (0.06) | | (0.10) | | — | | (0.16) | | 15.20 | | (1.82) | | 55,554 | | 0.81 | | 0.81 | | 0.42 | | 53 |
| SDR | | 15.67 | | 0.07 | | (0.35) | | (0.28) | | (0.06) | | (0.10) | | — | | (0.16) | | 15.23 | | (1.81) | | 37,895 | | 0.81 | | 0.81 | | 0.45 | | 53 |
| For the Year Ended October 31, 2019 |
| A | | $ 13.68 | | $ 0.02 | | $ 1.58 | | $ 1.60 | | $ — | | $ (0.27) | | $ — | | $ (0.27) | | $ 15.01 | | 12.12% | | $ 87,831 | | 1.27% | | 1.27% | | 0.14% | | 39% |
| C | | 13.97 | | (0.09) | | 1.60 | | 1.51 | | — | | (0.27) | | — | | (0.27) | | 15.21 | | 11.29 | | 60,195 | | 2.02 | | 2.02 | | (0.61) | | 39 |
| I | | 14.24 | | 0.06 | | 1.64 | | 1.70 | | (0.04) | | (0.27) | | — | | (0.31) | | 15.63 | | 12.41 | | 496,725 | | 1.00 | | 1.00 | | 0.42 | | 39 |
| R3 | | 14.09 | | (0.04) | | 1.63 | | 1.59 | | — | | (0.27) | | — | | (0.27) | | 15.41 | | 11.69 | | 1,423 | | 1.62 | | 1.62 | | (0.25) | | 39 |
| R4 | | 14.17 | | 0.01 | | 1.64 | | 1.65 | | (0.02) | | (0.27) | | — | | (0.29) | | 15.53 | | 12.09 | | 627 | | 1.32 | | 1.32 | | 0.09 | | 39 |
| R5 | | 14.24 | | 0.06 | | 1.62 | | 1.68 | | (0.05) | | (0.27) | | — | | (0.32) | | 15.60 | | 12.32 | | 1,476 | | 1.02 | | 1.02 | | 0.39 | | 39 |
| Y | | 14.24 | | 0.07 | | 1.64 | | 1.71 | | (0.05) | | (0.27) | | — | | (0.32) | | 15.63 | | 12.50 | | 116,557 | | 0.97 | | 0.95 | | 0.44 | | 39 |
| F | | 14.25 | | 0.07 | | 1.64 | | 1.71 | | (0.05) | | (0.27) | | — | | (0.32) | | 15.64 | | 12.52 | | 54,955 | | 0.91 | | 0.91 | | 0.48 | | 39 |
| SDR | | 14.28 | | 0.07 | | 1.64 | | 1.71 | | (0.05) | | (0.27) | | — | | (0.32) | | 15.67 | | 12.49 | | 82,604 | | 0.91 | | 0.91 | | 0.48 | | 39 |
The accompanying notes are an integral part of these financial statements.
Financial Highlights – (continued)
| | | — Selected Per-Share Data(1) — | | — Ratios and Supplemental Data — |
| Class | | Net
Asset
Value at
Beginning
of Period | | Net
Investment
Income
(Loss) | | Net
Realized
and
Unrealized
Gain (Loss)
on
Investments | | Total from
Investment
Operations | | Dividends
from Net
Investment
Income | | Distributions
from
Capital
Gains | | Returns
of
Capital | | Total
Dividends
and
Distributions | | Net
Asset
Value at
End of
Period | | Total
Return(2) | | Net
Assets
at End
of Period
(000s) | | Ratio of
Expenses
to
Average
Net
Assets
Before
Adjust-
ments(3) | | Ratio of
Expenses
to
Average
Net
Assets
After
Adjust-
ments(3) | | Ratio of
Net
Investment
Income
(Loss) to
Average
Net Assets | | Portfolio
Turnover |
| Hartford Schroders US MidCap Opportunities Fund – (continued) |
| For the Year Ended October 31, 2018 |
| A | | $ 13.97 | | $ 0.01 | | $ (0.10) | | $ (0.09) | | $ — | | $ (0.20) | | $ — | | $ (0.20) | | $ 13.68 | | (0.66)% | | $ 96,491 | | 1.26% | | 1.25% | | 0.05% | | 37% |
| C | | 14.37 | | (0.11) | | (0.09) | | (0.20) | | — | | (0.20) | | — | | (0.20) | | 13.97 | | (1.49) | | 67,037 | | 2.02 | | 2.01 | | (0.72) | | 37 |
| I | | 14.52 | | 0.05 | | (0.11) | | (0.06) | | (0.02) | | (0.20) | | — | | (0.22) | | 14.24 | | (0.44) | | 648,971 | | 0.99 | | 0.98 | | 0.31 | | 37 |
| R3 | | 14.43 | | (0.05) | | (0.09) | | (0.14) | | — | | (0.20) | | — | | (0.20) | | 14.09 | | (1.06) | | 950 | | 1.63 | | 1.60 | | (0.31) | | 37 |
| R4 | | 14.48 | | — | | (0.10) | | (0.10) | | (0.01) | | (0.20) | | — | | (0.21) | | 14.17 | | (0.74) | | 775 | | 1.33 | | 1.30 | | (0.03) | | 37 |
| R5 | | 14.51 | | 0.04 | | (0.09) | | (0.05) | | (0.02) | | (0.20) | | — | | (0.22) | | 14.24 | | (0.42) | | 1,864 | | 1.03 | | 1.00 | | 0.26 | | 37 |
| Y | | 14.53 | | 0.04 | | (0.10) | | (0.06) | | (0.03) | | (0.20) | | — | | (0.23) | | 14.24 | | (0.46) | | 108,680 | | 0.96 | | 0.94 | | 0.25 | | 37 |
| F | | 14.53 | | 0.06 | | (0.11) | | (0.05) | | (0.03) | | (0.20) | | — | | (0.23) | | 14.25 | | (0.37) | | 45,449 | | 0.91 | | 0.90 | | 0.38 | | 37 |
| SDR | | 14.56 | | 0.06 | | (0.11) | | (0.05) | | (0.03) | | (0.20) | | — | | (0.23) | | 14.28 | | (0.37) | | 57,898 | | 0.91 | | 0.90 | | 0.38 | | 37 |
| Hartford Schroders US Small Cap Opportunities Fund |
| For the Year Ended October 31, 2022 |
| A | | $ 33.48 | | $ (0.08) | | $ (3.65) | | $ (3.73) | | $ — | | $ (3.69) | | $ — | | $ (3.69) | | $ 26.06 | | (12.56)% | | $ 32,403 | | 1.37% | | 1.35% | | (0.30)% | | 38% |
| C | | 33.73 | | (0.29) | | (3.68) | | (3.97) | | — | | (3.69) | | — | | (3.69) | | 26.07 | | (13.24) | | 6,440 | | 2.13 | | 2.10 | | (1.05) | | 38 |
| I | | 35.38 | | (0.01) | | (3.89) | | (3.90) | | — | | (3.69) | | — | | (3.69) | | 27.79 | | (12.35) | | 179,554 | | 1.09 | | 1.09 | | (0.04) | | 38 |
| R3 | | 34.71 | | (0.17) | | (3.80) | | (3.97) | | — | | (3.69) | | — | | (3.69) | | 27.05 | | (12.83) | | 989 | | 1.70 | | 1.65 | | (0.59) | | 38 |
| R4 | | 35.14 | | (0.09) | | (3.85) | | (3.94) | | — | | (3.69) | | — | | (3.69) | | 27.51 | | (12.57) | | 636 | | 1.41 | | 1.35 | | (0.29) | | 38 |
| R5 | | 35.34 | | — | | (3.88) | | (3.88) | | — | | (3.69) | | — | | (3.69) | | 27.77 | | (12.30) | | 455 | | 1.11 | | 1.05 | | — | | 38 |
| Y | | 35.37 | | — | | (3.89) | | (3.89) | | — | | (3.69) | | — | | (3.69) | | 27.79 | | (12.32) | | 34,407 | | 1.10 | | 1.05 | | — | | 38 |
| F | | 35.42 | | 0.03 | | (3.89) | | (3.86) | | — | | (3.69) | | — | | (3.69) | | 27.87 | | (12.21) | | 16,017 | | 0.99 | | 0.95 | | 0.10 | | 38 |
| SDR | | 35.46 | | 0.03 | | (3.90) | | (3.87) | | — | | (3.69) | | — | | (3.69) | | 27.90 | | (12.23) | | 37,043 | | 0.99 | | 0.95 | | 0.11 | | 38 |
| For the Year Ended October 31, 2021 |
| A | | $ 23.20 | | $ (0.11) | | $ 10.39 | | $ 10.28 | | $ — | | $ — | | $ — | | $ — | | $ 33.48 | | 44.31% | | $ 38,561 | | 1.38% | | 1.35% | | (0.34)% | | 56% |
| C | | 23.54 | | (0.34) | | 10.53 | | 10.19 | | — | | — | | — | | — | | 33.73 | | 43.29 | | 8,574 | | 2.12 | | 2.10 | | (1.09) | | 56 |
| I | | 24.45 | | (0.02) | | 10.97 | | 10.95 | | (0.02) | | — | | — | | (0.02) | | 35.38 | | 44.78 | | 219,197 | | 1.08 | | 1.07 | | (0.06) | | 56 |
| R3 | | 24.11 | | (0.21) | | 10.81 | | 10.60 | | — | | — | | — | | — | | 34.71 | | 43.97 | | 1,379 | | 1.70 | | 1.63 | | (0.64) | | 56 |
| R4 | | 24.35 | | (0.11) | | 10.90 | | 10.79 | | — | | — | | — | | — | | 35.14 | | 44.31 | | 739 | | 1.40 | | 1.35 | | (0.34) | | 56 |
| R5 | | 24.44 | | (0.02) | | 10.95 | | 10.93 | | (0.03) | | — | | — | | (0.03) | | 35.34 | | 44.75 | | 687 | | 1.10 | | 1.05 | | (0.06) | | 56 |
| Y | | 24.46 | | (0.01) | | 10.95 | | 10.94 | | (0.03) | | — | | — | | (0.03) | | 35.37 | | 44.75 | | 38,267 | | 1.09 | | 1.05 | | (0.05) | | 56 |
| F | | 24.49 | | 0.02 | | 10.97 | | 10.99 | | (0.06) | | — | | — | | (0.06) | | 35.42 | | 44.92 | | 17,664 | | 0.99 | | 0.95 | | 0.06 | | 56 |
| SDR | | 24.52 | | 0.02 | | 10.98 | | 11.00 | | (0.06) | | — | | — | | (0.06) | | 35.46 | | 44.91 | | 34,111 | | 0.99 | | 0.95 | | 0.06 | | 56 |
| For the Year Ended October 31, 2020 |
| A | | $ 25.69 | | $ 0.01 | | $ (1.19) | | $ (1.18) | | $ (0.02) | | $ (1.29) | | $ — | | $ (1.31) | | $ 23.20 | | (5.02)% | | $ 23,897 | | 1.42% | | 1.35% | | 0.06% | | 47% |
| C | | 26.23 | | (0.16) | | (1.24) | | (1.40) | | — | | (1.29) | | — | | (1.29) | | 23.54 | | (5.77) | | 6,957 | | 2.17 | | 2.10 | | (0.67) | | 47 |
| I | | 27.00 | | 0.09 | | (1.27) | | (1.18) | | (0.08) | | (1.29) | | — | | (1.37) | | 24.45 | | (4.78) | | 144,885 | | 1.11 | | 1.05 | | 0.38 | | 47 |
| R3 | | 26.71 | | (0.07) | | (1.24) | | (1.31) | | — | | (1.29) | | — | | (1.29) | | 24.11 | | (5.31) | | 242 | | 1.73 | | 1.64 | | (0.30) | | 47 |
| R4 | | 26.93 | | 0.02 | | (1.27) | | (1.25) | | (0.04) | | (1.29) | | — | | (1.33) | | 24.35 | | (5.04) | | 194 | | 1.43 | | 1.35 | | 0.08 | | 47 |
| R5 | | 26.98 | | 0.06 | | (1.23) | | (1.17) | | (0.08) | | (1.29) | | — | | (1.37) | | 24.44 | | (4.78) | | 293 | | 1.13 | | 1.05 | | 0.25 | | 47 |
| Y | | 27.00 | | 0.09 | | (1.26) | | (1.17) | | (0.08) | | (1.29) | | — | | (1.37) | | 24.46 | | (4.74) | | 23,531 | | 1.12 | | 1.05 | | 0.39 | | 47 |
| F | | 27.03 | | 0.10 | | (1.25) | | (1.15) | | (0.10) | | (1.29) | | — | | (1.39) | | 24.49 | | (4.68) | | 10,407 | | 1.01 | | 0.95 | | 0.41 | | 47 |
| SDR | | 27.06 | | 0.08 | | (1.23) | | (1.15) | | (0.10) | | (1.29) | | — | | (1.39) | | 24.52 | | (4.66) | | 23,538 | | 1.01 | | 0.95 | | 0.36 | | 47 |
The accompanying notes are an integral part of these financial statements.
Financial Highlights – (continued)
| | | — Selected Per-Share Data(1) — | | — Ratios and Supplemental Data — |
| Class | | Net
Asset
Value at
Beginning
of Period | | Net
Investment
Income
(Loss) | | Net
Realized
and
Unrealized
Gain (Loss)
on
Investments | | Total from
Investment
Operations | | Dividends
from Net
Investment
Income | | Distributions
from
Capital
Gains | | Returns
of
Capital | | Total
Dividends
and
Distributions | | Net
Asset
Value at
End of
Period | | Total
Return(2) | | Net
Assets
at End
of Period
(000s) | | Ratio of
Expenses
to
Average
Net
Assets
Before
Adjust-
ments(3) | | Ratio of
Expenses
to
Average
Net
Assets
After
Adjust-
ments(3) | | Ratio of
Net
Investment
Income
(Loss) to
Average
Net Assets | | Portfolio
Turnover |
| Hartford Schroders US Small Cap Opportunities Fund – (continued) |
| For the Year Ended October 31, 2019 |
| A | | $ 25.55 | | $ 0.02 | | $ 2.38 | | $ 2.40 | | $ (0.01) | | $ (2.25) | | $ — | | $ (2.26) | | $ 25.69 | | 11.21% | | $ 20,928 | | 1.43% | | 1.35% | | 0.07% | | 45% |
| C | | 26.20 | | 0.16 | | 2.44 | | 2.28 | | — | | (2.2500) | | — | | (2.25) | | 26.23 | | 10.43 | | 7,096 | | 2.18 | | 2.10 | | (0.65) | | 45 |
| I | | 26.71 | | 0.10 | | 2.50 | | 2.60 | | 0.06 | | (2.25) | | — | | (2.31) | | 27.00 | | 11.59 | | 140,024 | | 1.11 | | 1.04 | | 0.40 | | 45 |
| R3 | | 26.53 | | (0.05) | | 2.48 | | 2.43 | | — | | (2.25) | | — | | (2.25) | | 26.71 | | 10.90 | | 111 | | 1.74 | | 1.63 | | (0.21) | | 45 |
| R4 | | 26.68 | | — | | 2.54 | | 2.54 | | (0.04) | | (2.25) | | — | | (2.29) | | 26.93 | | 11.33 | | 259 | | 1.44 | | 1.31 | | (0.01) | | 45 |
| R5 | | 26.70 | | 0.08 | | 2.51 | | 2.59 | | (0.06) | | (2.25) | | — | | (2.31) | | 26.98 | | 11.56 | | 78 | | 1.12 | | 1.05 | | 0.31 | | 45 |
| Y | | 26.73 | | 0.11 | | 2.50 | | 2.61 | | (0.09) | | 2.25 | | — | | (2.34) | | 27.00 | | 11.62 | | 25,883 | | 1.08 | | 1.01 | | 0.43 | | 45 |
| F | | 26.74 | | 0.12 | | 2.51 | | 2.63 | | (0.09) | | (2.25) | | — | | (2.34) | | 27.03 | | 11.69 | | 4,483 | | 1.02 | | 0.95 | | 0.47 | | 45 |
| SDR | | 26.78 | | 0.13 | | 2.49 | | 2.62 | | (0.09) | | (2.25) | | — | | (2.34) | | 27.06 | | 11.67 | | 11,328 | | 1.02 | | 0.95 | | 0.50 | | 45 |
| For the Year Ended October 31, 2018 |
| A | | $ 27.97 | | $ (0.02) | | $ (0.04) | | $ (0.06) | | $ — | | $ (2.36) | | $ — | | $ (2.36) | | $ 25.55 | | (0.34)% | | $ 13,976 | | 1.43% | | 1.34% | | (0.08)% | | 42% |
| C | | 28.82 | | (0.23) | | (0.03) | | (0.26) | | — | | (2.36) | | — | | (2.36) | | 26.20 | | (1.08) | | 6,892 | | 2.18 | | 2.09 | | (0.84) | | 42 |
| I | | 29.14 | | 0.07 | | (0.05) | | 0.02 | | (0.09) | | (2.36) | | — | | (2.45) | | 26.71 | | (0.05) | | 109,710 | | 1.12 | | 1.04 | | 0.25 | | 42 |
| R3 | | 29.06 | | (0.08) | | (0.05) | | (0.13) | | (0.04) | | (2.36) | | — | | (2.40) | | 26.53 | | (0.58) | | 66 | | 1.75 | | 1.58 | | (0.30) | | 42 |
| R4 | | 29.08 | | 0.04 | | (0.04) | | — | | (0.04) | | (2.36) | | — | | (2.40) | | 26.68 | | (0.11) | | 11 | | 1.45 | | 1.13 | | 0.12 | | 42 |
| R5 | | 29.11 | | 0.07 | | (0.05) | | 0.02 | | (0.07) | | (2.36) | | — | | (2.43) | | 26.70 | | (0.02) | | 19 | | 1.15 | | 1.05 | | 0.23 | | 42 |
| Y | | 29.14 | | 0.09 | | (0.05) | | 0.04 | | (0.09) | | (2.36) | | — | | (2.45) | | 26.73 | | (0.03) | | 23,507 | | 1.03 | | 0.95 | | 0.33 | | 42 |
| F | | 29.15 | | 0.08 | | (0.04) | | 0.04 | | (0.09) | | (2.36) | | — | | (2.45) | | 26.74 | | 0.04 | | 2,841 | | 1.03 | | 0.95 | | 0.30 | | 42 |
| SDR | | 29.19 | | 0.13 | | (0.08) | | 0.05 | | (0.10) | | (2.36) | | — | | (2.46) | | 26.78 | | 0.07 | | 10,952 | | 1.03 | | 0.95 | | 0.44 | | 42 |
| FINANCIAL HIGHLIGHTS FOOTNOTES |
| (1) | Information presented relates to a share outstanding throughout the indicated period. Net investment income (loss) per share amounts are calculated based on average shares outstanding unless otherwise noted. |
| (2) | Assumes initial investment at net asset value at the beginning of each period, reinvestment of all distributions, the complete redemption of the investment at net asset value at the end of each period and no sales charge. Total return would be reduced if sales charges were taken into account. |
| (3) | Adjustments include waivers and reimbursements, if applicable. Ratios do not include fees paid indirectly (see Expenses in the accompanying Notes to Financial Statements). |
| (4) | Amount is less than $0.01 per share. |
| (5) | Commenced operations on March 31, 2020. |
| (6) | Not annualized. |
| (7) | Annualized. |
| (8) | Classes A, C, I, Y and F commenced operations on February 28, 2022. |
| (9) | Commenced operations on September 30, 2021. |
| (10) | Reflects the Fund's portfolio turnover for the period September 30, 2021 through October 31, 2021. |
| (11) | Commenced operations on May 24, 2022. |
| (12) | Reflects the Fund’s portfolio turnover for the period May 24, 2022 through October 31, 2022. |
| (13) | The ratio of expenses after adjustments to average net assets excluding interest expense for the year ended October 31, 2021 was 0.92%, 1.92%, 0.83%, 0.78%, 0.70% and 0.70% for Class A, Class C, Class I, Class Y, Class F and Class SDR, respectively. |
| (14) | Portfolio turnover excludes TBA roll transactions. Had TBA roll transactions been included, the portfolio turnover rate would have been 75% for the fiscal year ended October 31, 2022. |
| (15) | The ratio of expenses before adjustments to average net assets excluding interest expense for the year ended October 31, 2021 was 1.12%, 1.93%, 0.89%, 0.85%, 0.84% and 0.84% for Class A, Class C, Class I, Class Y, Class F and Class SDR, respectively. |
| (16) | The ratio of net investment income to average net assets excluding interest expense for the year ended October 31, 2021 was 1.80%, 0.80%, 1.87%, 1.92%, 2.02% and 1.98% for Class A, Class C, Class I, Class Y, Class F and Class SDR, respectively. |
| (17) | The ratio of expenses before adjustments to average net assets excluding interest expense for the year ended October 31, 2020 was 1.18%, 2.16%, 0.97%, 0.92%, 0.92% and 0.92% for Class A, Class C, Class I, Class Y, Class F and Class SDR, respectively. |
| (18) | The ratio of expenses after adjustments to average net assets excluding interest expense for the year ended October 31, 2020 was 0.74%, 1.93%, 0.76%, 0.71%, 0.70% and 0.70% for Class A, Class C, Class I, Class Y, Class F and Class SDR, respectively. |
| (19) | Includes the impact of certain non-contractual waivers. Please see the fee table in the Fund’s prospectus for the Fund’s estimated total annual fund operating expenses (before and after contractual waivers and/or reimbursements). |
| (20) | The ratio of net investment income to average net assets excluding interest expense for the year ended October 31, 2020 was 2.48%, 0.91%, 2.30%, 2.56%, 2.61% and 2.69% for Class A, Class C, Class I, Class Y, Class F and Class SDR, respectively. |
| (21) | Commenced operations on February 28, 2020. |
| (22) | Commenced operations on February 28, 2019. |
The accompanying notes are an integral part of these financial statements.
Financial Highlights – (continued)
| (23) | The ratio of expenses before adjustments to average net assets excluding interest expense for the period February 28, 2019 through October 31, 2019 was 1.39%, 1.14%, 1.09%, 1.07% and 1.07% for Class A, Class I, Class Y, Class F and Class SDR, respectively. |
| (24) | The ratio of expenses after adjustments to average net assets excluding interest expense for the period February 28, 2019 through October 31, 2019 was 0.79%, 0.76%, 0.70%, 0.68% and 0.70% for Class A, Class I, Class Y, Class F and Class SDR, respectively. This includes the impact of certain non-contractual waivers. |
| (25) | The ratio of net investment income to average net assets excluding interest expense for the period February 28, 2019 through October 31, 2019 was 2.68%, 2.71%, 2.77%, 2.81% and 2.71% for Class A, Class I, Class Y, Class F and Class SDR, respectively. |
The accompanying notes are an integral part of these financial statements.
Notes to Financial Statements
October 31, 2022
| 1. | Organization: |
| | The Hartford Mutual Funds II, Inc. (the "Company") is an open-end registered management investment company comprised of sixteen series, as of October 31, 2022. Financial statements of each series of the Company listed below (each, a "Fund" and collectively, the "Funds") are included in this report. |
| | |
| The Hartford Mutual Funds II, Inc.: |
| Hartford Schroders China A Fund (the "China A Fund") |
| Hartford Schroders Diversified Emerging Markets Fund (the "Diversified Emerging Markets Fund") |
| Hartford Schroders Emerging Markets Equity Fund (the "Emerging Markets Equity Fund") |
| Hartford Schroders Emerging Markets Multi-Sector Bond Fund (the "Emerging Markets Multi-Sector Bond Fund") |
| Hartford Schroders International Contrarian Value Fund (the "International Contrarian Value Fund") |
| Hartford Schroders International Multi-Cap Value Fund (the "International Multi-Cap Value Fund") |
| Hartford Schroders International Stock Fund (the "International Stock Fund") |
| Hartford Schroders Securitized Income Fund (the "Securitized Income Fund") |
| Hartford Schroders Sustainable International Core Fund (the "Sustainable International Core Fund") |
| Hartford Schroders Tax-Aware Bond Fund (the "Tax-Aware Bond Fund") |
| Hartford Schroders US MidCap Opportunities Fund (the "US MidCap Opportunities Fund") |
| Hartford Schroders US Small Cap Opportunities Fund (the "US Small Cap Opportunities Fund") |
The assets of each Fund are separate, and a shareholder’s interest is limited to the Fund in which shares are held. The Company is organized under the laws of the State of Maryland and is registered with the Securities and Exchange Commission (the "SEC") under the Investment Company Act of 1940, as amended (the "1940 Act"). Each Fund, except China A Fund and Emerging Markets Multi-Sector Bond Fund, is a diversified open-end management investment company. China A Fund and Emerging Markets Multi-Sector Bond Fund are each a non-diversified open-end management investment company. Each Fund applies specialized accounting and reporting standards under Accounting Standards Codification-Topic 946, "Financial Services – Investment Companies".
International Contrarian Value Fund and Sustainable International Core Fund commenced operations on May 24, 2022. Diversified Emerging Markets Fund commenced operations on September 30, 2021. Each Fund, except International Contrarian Value Fund and Sustainable International Core Fund, has registered for sale Class A, Class C, Class Y and Class F shares. Each Fund has registered for sale Class I and Class SDR shares. In addition, each Fund, except China A Fund, Diversified Emerging Markets Fund, International Contrarian Value Fund, Securitized Income Fund, Sustainable International Core Fund and Tax-Aware Bond Fund, has registered for sale Class R3, Class R4 and Class R5 shares. Class A shares of each Fund, except Emerging Markets Multi-Sector Bond Fund, Securitized Income Fund and Tax-Aware Bond Fund, are sold with a front-end sales charge of up to 5.50%. Class A shares of Emerging Markets Multi-Sector Bond Fund and Tax-Aware Bond Fund are sold with a front-end sales charge of up to 4.50%. Class A shares of Securitized Income Fund are sold with a front-end sales charge of up to 3.00%. Class C shares are sold with a contingent deferred sales charge of up to 1.00% on shares redeemed within twelve months of purchase. Class C shares automatically convert to Class A shares of the same Fund after eight years provided that the Fund or the financial intermediary has records verifying that the Class C shares have been held for at least eight years. Classes I, R3, R4, R5, Y, F and SDR shares do not have a sales charge. Effective as of the close of business on April 15, 2021, the Emerging Markets Equity Fund is closed to new investors, subject to certain exceptions set forth in the Emerging Markets Equity Fund’s prospectus.
| 2. | Significant Accounting Policies: |
| | The following is a summary of significant accounting policies of each Fund used in the preparation of its financial statements, which are in accordance with United States Generally Accepted Accounting Principles ("U.S. GAAP"). The preparation of financial statements in accordance with U.S. GAAP may require management to make estimates and assumptions that affect the reported amounts of assets and liabilities and disclosure of contingent assets and liabilities at the date of the financial statements and the reported amounts of increases and decreases in net assets from operations during the reporting period. Actual results could differ from those estimates. |
| a) | Determination of Net Asset Value – The net asset value ("NAV") of each class of each Fund’s shares is determined as of the close of regular trading on the New York Stock Exchange (the "Exchange") (normally 4:00 p.m. Eastern Time) (the "NYSE Close") on each day that the Exchange is open ("Valuation Date"). If the Exchange is closed due to weather or other extraordinary circumstances on a day it would typically be open for business, each Fund may treat such day as a typical business day and accept purchase and redemption orders and calculate each Fund’s NAV in accordance with applicable law. The NAV of each class of each Fund's shares is determined by dividing the value of the Fund’s net assets attributable to the class of shares by the number of shares outstanding for that class. Information that |
Notes to Financial Statements – (continued)
October 31, 2022
| | becomes known to the Funds after the NAV has been calculated on a particular day will not generally be used to retroactively adjust the NAV determined earlier that day. |
| b) | Investment Valuation and Fair Value Measurements – For purposes of calculating the NAV of each class of each Fund, portfolio securities and other assets held in the Fund’s portfolio for which market prices are readily available are valued at market value. Market value is generally determined on the basis of official close price or last reported trade price. If no trades were reported, market value is based on prices obtained from a quotation reporting system, established market makers (including evaluated prices), or independent pricing services. Pricing vendors may use matrix pricing or valuation models that utilize certain inputs and assumptions to derive values, including transaction data, credit quality information, general market conditions, news, and other factors and assumptions. |
| | With respect to a Fund's investments that do not have readily available market prices, the Company's Board of Directors (the "Board") has designated Hartford Funds Management Company, LLC (the "Investment Manager") as its valuation designee to perform fair valuations pursuant to Rule 2a-5 under the 1940 Act (the "Valuation Designee"). |
| | If market prices are not readily available or deemed unreliable, the Valuation Designee determines the fair value of the security or other instrument in good faith under policies and procedures approved by and under the supervision of the Board ("Valuation Procedures"). |
| | The Valuation Designee has delegated the day-to-day responsibility for implementing the Valuation Procedures to the Valuation Committee. The Valuation Committee will consider all available relevant factors in determining an investment’s fair value. The Valuation Designee reports fair value matters to the Audit Committee of the Board. |
| | Prices of foreign equities that are principally traded on certain foreign markets will generally be adjusted daily pursuant to a fair value pricing service in order to reflect an adjustment for the factors occurring after the close of certain foreign markets but before the NYSE Close. Securities and other instruments that are primarily traded on foreign markets may trade on days that are not business days of the Funds. The value of the foreign securities or other instruments in which a Fund invests may change on days when a shareholder will not be able to purchase, redeem or exchange shares of the Fund. |
| | Fixed income investments (other than short-term obligations) and non-exchange traded derivatives held by a Fund are normally valued at prices supplied by independent pricing services in accordance with the Valuation Procedures. Short-term investments maturing in 60 days or less are generally valued at amortized cost, which approximates fair value. |
| | Exchange-traded derivatives, such as options, futures and options on futures, are valued at the last sale price determined by the exchange where such instruments principally trade as of the close of such exchange ("Exchange Close"). If a last sale price is not available, the value will be the mean of the most recently quoted bid and ask prices as of the Exchange Close. If a mean of the bid and ask prices cannot be calculated for the day, the value will be the most recently quoted bid price as of the Exchange Close. Over-the-counter derivatives are normally valued based on prices supplied by independent pricing services in accordance with the Valuation Procedures. |
| | Investments valued in currencies other than U.S. dollars are converted to U.S. dollars using the prevailing spot currency exchange rates obtained from independent pricing services for calculation of the NAV. As a result, the NAV of a Fund’s shares may be affected by changes in the value of currencies in relation to the U.S. dollar. The value of securities or other instruments traded in markets outside the United States or denominated in currencies other than the U.S. dollar may be affected significantly on a day that the Exchange is closed and the market value may change on days when an investor is not able to purchase, redeem or exchange shares of a Fund. |
| | Foreign currency contracts represent agreements to exchange currencies on specific future dates at predetermined rates. Foreign currency contracts are valued using foreign currency exchange rates and forward rates as provided by an independent pricing service on the Valuation Date. |
| | Shares of investment companies listed and traded on an exchange are valued in the same manner as any exchange-listed equity security. Investments in investment companies that are not listed or traded on an exchange ("Non-Traded Funds"), if any, are valued at the respective NAV of each Non-Traded Fund on the Valuation Date. Such Non-Traded Funds and listed investment companies may use fair value pricing as disclosed in their prospectuses. |
| | Financial instruments for which prices are not available from an independent pricing service may be valued using quotations obtained from one or more dealers that make markets in the respective financial instrument in accordance with the Valuation Procedures. |
Notes to Financial Statements – (continued)
October 31, 2022
| | U.S. GAAP defines fair value as the price that a Fund would receive to sell an asset or pay to transfer a liability in an orderly transaction between market participants. The U.S. GAAP fair value measurement standards require disclosure of a fair value hierarchy for each major category of assets and liabilities. Various inputs are used in determining the fair value of each Fund’s investments. These inputs are summarized into three broad hierarchy levels. This hierarchy is based on whether the valuation inputs are observable or unobservable. These levels are: |
| • | Level 1 – Quoted prices in active markets for identical investments. Level 1 may include exchange traded instruments, such as domestic equities, some foreign equities, options, futures, mutual funds, exchange traded funds, rights and warrants. |
| • | Level 2 – Observable inputs other than Level 1 prices, such as quoted prices for similar investments; quoted prices in markets that are not active; or other inputs that are observable or can be corroborated by observable market data. Level 2 may include debt investments that are traded less frequently than exchange traded instruments and which are valued using independent pricing services; foreign equities, which are principally traded on certain foreign markets and are adjusted daily pursuant to a fair value pricing service in order to reflect an adjustment for the factors occurring after the close of certain foreign markets but before the NYSE Close; senior floating rate interests, which are valued using an aggregate of dealer bids; short-term investments, which are valued at amortized cost; and swaps, which are valued based upon the terms of each swap contract. |
| • | Level 3 – Significant unobservable inputs that are supported by limited or no market activity. Level 3 may include financial instruments whose values are determined using indicative market quotes or require significant management judgment or estimation. These unobservable valuation inputs may include estimates for current yields, maturity/duration, prepayment speed, and indicative market quotes for comparable investments along with other assumptions relating to credit quality, collateral value, complexity of the investment structure, general market conditions and liquidity. This category may include investments where trading has been halted or there are certain restrictions on trading. While these investments are priced using unobservable inputs, the valuation of these investments reflects the best available data and management believes the prices are a reasonable representation of exit price. |
Valuation levels are not necessarily indicative of the risk associated with investing in such investments. Individual investments within any of the above mentioned asset classes may be assigned a different hierarchical level than those presented above, as individual circumstances dictate.
For additional information, refer to the Fair Value Summary and the Level 3 roll-forward reconciliation, if applicable, which follows each Fund's Schedule of Investments.
| c) | Investment Transactions and Investment Income – Investment transactions are recorded as of the trade date (the date the order to buy or sell is executed) for financial reporting purposes. Investments purchased or sold on a when-issued or delayed-delivery basis may be settled a month or more after the trade date. Realized gains and losses are determined on the basis of identified cost. |
| | The trade date for senior floating rate interests purchased in the primary loan market is considered the date on which the loan allocations are determined. The trade date for senior floating rate interests purchased in the secondary loan market is the date on which the transaction is entered into. |
| | Dividend income from domestic securities is accrued on the ex-dividend date. In general, dividend income from foreign securities is recorded on the ex-date; however, dividend notifications in certain foreign jurisdictions may not be available in a timely manner and as a result, each Fund will record the dividend as soon as the relevant details (i.e., rate per share, payment date, shareholders of record, etc.) are publicly available. Interest income, including amortization of premium, accretion of discounts and additional principal received in-kind in lieu of cash, is accrued on a daily basis. Paydown gains and losses on mortgage-related and other asset-backed securities are included in interest income in the Statements of Operations, as applicable. |
Please refer to Note 8 for Securities Lending information.
| d) | Taxes – A Fund may be subject to taxes imposed on realized gains on securities of certain foreign countries in which such Fund invests. A Fund may also be subject to taxes withheld on foreign dividends and interest from securities in which each Fund invests. The amount of any foreign taxes withheld and foreign tax expense is included on the accompanying Statements of Operations as a reduction to net investment income or net realized or unrealized gain (loss) on investments in these securities, if applicable. |
| e) | Foreign Currency Transactions – Assets and liabilities denominated in currencies other than U.S. dollars are translated into U.S. dollars at the exchange rates in effect on the Valuation Date. Purchases and sales of investments, income and expenses are translated into U.S. dollars at the exchange rates on the dates of such transactions. |
| | A Fund does not isolate that portion of portfolio investment valuation resulting from fluctuations in the foreign currency exchange rates from the fluctuations arising from changes in the market prices of investments held. Exchange rate fluctuations are included with the net realized and unrealized gain or loss on investments in the accompanying financial statements. |
Notes to Financial Statements – (continued)
October 31, 2022
Net realized foreign exchange gains or losses arise from sales of foreign currencies and the difference between asset and liability amounts initially stated in foreign currencies and the U.S. dollar value of the amounts actually received or paid. Net unrealized foreign exchange gains or losses arise from changes in the value of other assets and liabilities at the end of the reporting period, resulting from changes in the exchange rates.
| f) | Joint Trading Account – A Fund may invest cash balances into a joint trading account that may be invested in one or more repurchase agreements. |
| g) | Fund Share Valuation and Dividend Distributions to Shareholders – Orders for each class of each Fund’s shares are executed in accordance with the investment instructions of the shareholders. The NAV of each class of each Fund’s shares is determined as of the close of business on each business day of the Exchange (see Note 2(a)). The NAV is determined separately for each class of shares of a Fund by dividing the Fund's net assets attributable to that class by the number of shares of the class outstanding. Each class of shares offered by a Fund has equal rights as to assets and voting privileges (except that shareholders of a class have exclusive voting rights regarding any matter relating solely to that class of shares). Income and non-class specific expenses are allocated daily to each class on the basis of the relative net assets of the class of the Fund. Realized and unrealized gains and losses are allocated daily based on the relative net assets of each class of shares of each Fund. |
| | Orders for the purchase of a Fund's shares received prior to the close of the Exchange on any day the Exchange is open for business are priced at the NAV determined as of the close of the Exchange. Orders received after the close of the Exchange, or on a day on which the Exchange and/or the Funds are not open for business, are priced at the next determined NAV. |
| | Dividends are declared pursuant to a policy adopted by the Company’s Board of Directors. Dividends and/or distributions to shareholders are recorded on ex-date. The policy of China A Fund, Diversified Emerging Markets Fund, Emerging Markets Equity Fund, International Contrarian Value Fund, International Stock Fund, Sustainable International Core Fund, US MidCap Opportunities Fund and US Small Cap Opportunities Fund is to pay dividends from net investment income and realized gains, if any, at least once a year. The policy of Securitized Income Fund and Tax-Aware Bond Fund is to pay dividends from net investment income, if any, monthly, and realized gains, if any, at least once a year. The policy of Emerging Markets Multi-Sector Bond Fund and International Multi-Cap Value Fund is to pay dividends from net investment income, if any, quarterly, and realized gains, if any, at least once a year. |
| | Income dividends and capital gains distributions are determined in accordance with federal income tax regulations, which may differ from U.S. GAAP with respect to character and timing (see Federal Income Taxes: Distributions and Components of Distributable Earnings and Reclassification of Capital Accounts notes). |
| 3. | Securities and Other Investments: |
| a) | Restricted Securities – Each Fund may invest in securities that are subject to legal or contractual restrictions on resale. These securities generally may be resold in transactions exempt from registration or to the public if the securities are registered. Disposal of these securities may involve time-consuming negotiations and expense, and prompt sale at an acceptable price may be difficult. Information regarding restricted securities, if applicable, is included at the end of each Fund's Schedule of Investments. |
| b) | Investments Purchased on a When-Issued or Delayed-Delivery Basis – Delivery and payment for investments that have been purchased by a Fund on a forward commitment, or when-issued or delayed-delivery basis, take place beyond the customary settlement period. A Fund may dispose of or renegotiate a delayed-delivery transaction after it is entered into, and may sell delayed-delivery investments before they are delivered, which may result in a realized gain or loss. During this period, such investments are subject to market fluctuations. See each Fund’s Schedule of Investments, if applicable, for when-issued or delayed-delivery investments as of October 31, 2022. |
| | A Fund may enter into to-be announced ("TBA") commitments. TBA commitments are forward agreements for the purchase or sale of mortgage-backed securities for a fixed price, with payment and delivery on an agreed-upon future settlement date. The specific securities to be delivered are not identified at the trade date; however, delivered securities must meet specified terms, including issuer, rate and mortgage terms. Although a Fund may enter into TBA commitments with the intention of acquiring or delivering securities for its portfolio, the Fund can extend the settlement date, roll the transaction, or dispose of a commitment prior to settlement if deemed appropriate to do so. If the TBA commitment is closed through the acquisition of an offsetting TBA commitment, a Fund realizes a gain or loss. In a TBA roll transaction, a Fund generally purchases or sells the initial TBA commitment prior to the agreed upon settlement date and enters into a new TBA commitment for future delivery or receipt of the mortgage-backed securities. TBA commitments involve a risk of loss if the value of the security to be purchased or sold declines or increases, respectively, prior to settlement date. See a Fund's Schedule of Investments, if applicable, for TBA commitments as of October 31, 2022. |
| c) | Mortgage-Related and Other Asset-Backed Securities – A Fund may invest in mortgage-related and other asset-backed securities. These securities include mortgage pass-through securities, collateralized mortgage obligations, commercial mortgage-backed securities, stripped |
Notes to Financial Statements – (continued)
October 31, 2022
| | mortgage-backed securities, asset-backed securities, collateralized debt obligations and other securities that directly or indirectly represent a participation in, or are secured by and payable from, mortgage loans on real property. Mortgage-related securities are created from pools of residential or commercial mortgage loans, including mortgage loans made by savings and loan institutions, mortgage bankers, commercial banks and others. Asset-backed securities are created from many types of assets, including auto loans, credit card receivables, home equity loans, and student loans. These securities provide a monthly payment that consists of both interest and principal payments. Interest payments may be determined by fixed or adjustable rates. The rate of prepayments on underlying mortgages will affect the price and volatility of a mortgage-related security, and may have the effect of shortening or extending the effective duration of the security relative to what was anticipated at the time of purchase. The timely payment of principal and interest of certain mortgage-related securities is guaranteed by the full faith and credit of the United States Government. Mortgage-related and other asset-backed securities created and guaranteed by non-governmental issuers, including government-sponsored corporations, may be supported by various forms of insurance or guarantees, but there can be no assurance that the private insurers or guarantors can meet their obligations under the insurance policies or guarantee arrangements. See each Fund's Schedule of Investments, if applicable, for mortgage-related and other asset-backed securities as of October 31, 2022. |
| d) | Inflation-Indexed Bonds – A Fund may invest in inflation-indexed bonds. Inflation-indexed bonds are fixed income investments whose principal value is periodically adjusted to the rate of inflation. The interest rate on these bonds is generally fixed at issuance at a rate lower than typical bonds. Over the life of an inflation-indexed bond, however, interest will be paid based on a principal value, which is adjusted for inflation. Any increase or decrease in the principal amount of an inflation-indexed bond will be included as interest income on the Statements of Operations, even though investors do not receive the principal amount until maturity. See each Fund's Schedule of Investments, if applicable, for inflation-indexed bonds as of October 31, 2022. |
| 4. | Financial Derivative Instruments: |
| | The following disclosures contain information on how and why a Fund may use derivative instruments, the credit-risk-related contingent features in certain derivative instruments, and how derivative instruments affect a Fund’s financial position and results of operations. The location and fair value amounts of these instruments on the Statements of Assets and Liabilities and the realized gains and losses and changes in unrealized gains and losses on the Statements of Operations, each categorized by type of derivative contract, are included in the following Additional Derivative Instrument Information footnote. The derivative instruments outstanding as of period-end are disclosed in the notes to the Schedules of Investments, if applicable. The amounts of realized gains and losses and changes in unrealized gains and losses on derivative instruments during the period are disclosed in the Statements of Operations. |
| a) | Foreign Currency Contracts – A Fund may enter into foreign currency contracts that obligate the Fund to purchase or sell currencies at specified future dates. Foreign currency contracts may be used in connection with settling purchases or sales of securities to hedge the currency exposure associated with some or all of a Fund’s investments and/or as part of an investment strategy. Foreign currency contracts are marked to market daily and the change in value is recorded by a Fund as an unrealized gain or loss. A Fund will record a realized gain or loss when the foreign currency contract is settled. |
| | Foreign currency contracts involve elements of market risk in excess of the amounts reflected in the Statements of Assets and Liabilities. In addition, risks may arise upon entering into these contracts from the potential inability of the counterparties to meet the terms of the contracts and from unanticipated movements in the value of the foreign currencies relative to the U.S. dollar. Upon entering into a foreign currency contract, a Fund may be required to post margin equal to its outstanding exposure thereunder. |
| | During the year ended October 31, 2022, each of Diversified Emerging Markets Fund, Emerging Markets Equity Fund, Emerging Markets Multi-Sector Bond Fund, International Multi-Cap Value Fund and Securitized Income Fund had used Foreign Currency Contracts. |
| b) | Futures Contracts – A Fund may enter into futures contracts. A futures contract is an agreement between two parties to buy or sell an asset at a set price on a future date. A Fund may use futures contracts to manage risk or obtain exposure to the investment markets, commodities, or movements in interest rates and currency values. The primary risks associated with the use of futures contracts are the imperfect correlation between the change in market value of the investments held by a Fund and the prices of futures contracts and the possibility of an illiquid market. Upon entering into a futures contract, a Fund is required to deposit with a futures commission merchant ("FCM") an amount of cash or U.S. Government or Agency Obligations in accordance with the initial margin requirements of the broker or exchange. Futures contracts are marked to market daily and an appropriate amount equal to the change in value ("variation margin") is paid or received by a Fund. Gains or losses are recognized but not considered realized until the contracts expire or are closed. Futures contracts involve, to varying degrees, risk of loss in excess of the variation margin disclosed on the Statements of Assets and Liabilities. |
| | During the year ended October 31, 2022, each of Diversified Emerging Markets Fund, Emerging Markets Multi-Sector Bond Fund, International Contrarian Value Fund, International Multi-Cap Value Fund, Securitized Income Fund, Sustainable International Core Fund and Tax-Aware Bond Fund had used Futures Contracts. |
Notes to Financial Statements – (continued)
October 31, 2022
| c) | Swap Contracts – A Fund may invest in swap contracts. Swap contracts are agreements to exchange or swap investment cash flows, assets, foreign currencies or market-linked returns at specified future intervals. Swap contracts are either privately negotiated in the over-the-counter market ("OTC swaps") or cleared through a central counterparty or derivatives clearing organization ("centrally cleared swaps"). A Fund may enter into credit default, total return, cross-currency, interest rate, inflation and other forms of swap contracts to manage its exposure to credit, currency, interest rate, commodity and inflation risk. Swap contracts are also used to gain exposure to certain markets. In connection with these contracts, investments or cash may be identified as collateral or margin in accordance with the terms of the respective swap contracts and/or master netting arrangement to provide assets of value and recourse in the event of default or bankruptcy/insolvency. |
| | Swaps are valued in accordance with the Valuation Procedures. Changes in market value, if any, are reflected as a component of net changes in unrealized appreciation or depreciation on the Statements of Operations. Daily changes in valuation of centrally cleared swaps, if any, are recorded as a receivable or payable for the change in value ("variation margin") on the Statements of Assets and Liabilities. Realized gains or losses on centrally cleared swaps are recorded upon the termination of the swaps. OTC swap payments received or paid at the beginning of the measurement period are reflected as such on the Statements of Assets and Liabilities and represent premiums paid or received upon entering into the swap contract to compensate for differences between the stated terms of the swap contract and prevailing market conditions (credit spreads, currency exchange rates, interest rates and other relevant factors). These upfront premiums are recorded as realized gains or losses on the Statements of Operations upon termination or maturity of the swap. A liquidation payment received or made at the termination or maturity of the swap is recorded as a realized gain or loss on the Statements of Operations. Net periodic payments received or paid by a Fund are included as part of realized gains or losses on the Statements of Operations. |
| | Entering into these contracts involves, to varying degrees, elements of liquidation, counterparty, credit and market risk in excess of the amounts recognized on the Statements of Assets and Liabilities. Such risks involve the possibility that there will be no liquid market for these contracts, that the counterparty to the contracts may default on its obligation to perform or disagree as to the meaning of contractual terms in the contracts, and that there may be unfavorable changes in market conditions (credit spreads, currency exchange rates, interest rates and other relevant factors). |
| | A Fund’s maximum risk of loss from counterparty risk for OTC swaps is the net value of the discounted cash flows to be received from the counterparty over the contract’s remaining life, and current market value, to the extent that amount is positive. The risk is mitigated by having a master netting arrangement between a Fund and the counterparty, which allows for the netting of payments made or received (although such amounts are presented on a gross basis within the Statements of Assets and Liabilities, as applicable) as well as the posting of collateral to a Fund to cover the Fund’s exposure to the counterparty. In a centrally cleared swap, while a Fund enters into an agreement with a clearing broker to execute contracts with a counterparty, the performance of the swap is guaranteed by the central clearinghouse, which reduces the Fund’s exposure to counterparty risk. However, the Fund is still exposed to a certain amount of counterparty risk through the clearing broker and clearinghouse. The clearinghouse attempts to minimize this risk to its participants through the use of mandatory margin requirements, daily cash settlements and other procedures. Likewise, the clearing broker reduces its risk through margin requirements and required segregation of customer balances. |
| | Credit Default Swap Contracts – The credit default swap market allows a Fund to manage credit risk through buying and selling credit protection on a specific issuer, asset or basket of assets. Certain credit default swaps involve the exchange of a fixed rate premium for protection against the loss in value of an underlying investment or index in the event of a credit event, such as payment default or bankruptcy. |
| | Under a credit default swap contract, one party acts as guarantor by receiving the fixed periodic payment in exchange for the commitment to purchase the underlying investment at par if the defined credit event occurs. Upon the occurrence of a defined credit event, the difference between the value of the reference obligation and the swap’s notional amount is recorded as realized gain or loss on swap transactions in the Statements of Operations. A "buyer" of credit protection agrees to pay a counterparty to assume the credit risk of an issuer upon the occurrence of certain events. The "seller" of the protection receives periodic payments and agrees to assume the credit risk of an issuer upon the occurrence of certain events. Although specified events are contract specific, credit events are generally defined as bankruptcy, failure to pay, restructuring, obligation acceleration, obligation default or repudiation/moratorium. A "seller’s" exposure is limited to the total notional amount of the credit default swap contract. These potential amounts would be partially offset by any recovery values of the respective referenced obligations or upfront payments received upon entering into the contract. |
| | Implied credit spreads, represented in absolute terms, utilized in determining the market value of credit default swap contracts on corporate issues, sovereign government issues or U.S. municipal issues as of year-end are disclosed in the notes to the Schedules of Investments, as applicable, and serve as an indicator of the current status of the payment/performance risk and represent the likelihood or risk of default for the credit derivative. The implied credit spread of a particular referenced entity reflects the cost of buying/selling protection and there may also be upfront payments required to be made to enter into the contract. Wider credit spreads represent a deterioration of the referenced entity’s credit soundness and a greater likelihood or risk of default or other credit event occurring as defined under the terms of the contract. For credit default swap contracts on credit indices, the quoted market prices and resulting values serve as the indicator of the current status |
Notes to Financial Statements – (continued)
October 31, 2022
| | of the payment/performance risk. Increasing market values, in absolute terms when compared to the notional amount of the swap, represent a deterioration of the referenced equity’s credit soundness and a greater likelihood or risk of default or other credit event occurring as defined under the terms of the contract. |
During the year ended October 31, 2022, the Emerging Markets Multi-Sector Bond Fund had used Credit Default Swaps.
| d) | Additional Derivative Instrument Information: |
| | Diversified Emerging Markets Fund |
| | |
| The Effect of Derivative Instruments on the Statement of Operations for the year ended October 31, 2022: |
| | Risk Exposure Category |
| | Interest Rate
Contracts | | Foreign
Currency
Contracts | | Credit
Contracts | | Equity
Contracts | | Commodity
Contracts | | Total |
| Realized Gain (Loss) on Derivatives Recognized as a Result of Operations: | | | | | | | | | | | |
| Net realized gain (loss) on futures contracts | $ — | | $ — | | $ — | | $ (100,934) | | $ — | | $ (100,934) |
| Net realized gain (loss) on foreign currency contracts | — | | 637 | | — | | — | | — | | 637 |
| Total | $ — | | $ 637 | | $ — | | $ (100,934) | | $ — | | $ (100,297) |
| Net Change in Unrealized Appreciation (Depreciation) on Derivatives Recognized as a Result of Operations: | | | | | | | | | | | |
| Net change in unrealized appreciation (depreciation) of futures contracts | $ — | | $ — | | $ — | | $ 9,512 | | $ — | | $ 9,512 |
| Net change in unrealized appreciation (depreciation) of foreign currency contracts | — | | (2,100) | | — | | — | | — | | (2,100) |
| Total | $ — | | $ (2,100) | | $ — | | $ 9,512 | | $ — | | $ 7,412 |
For the year ended October 31, 2022, the average monthly amount or number per contract outstanding for each derivative type was as follows:
| Derivative Description | | Average Notional
Par, Contracts
or Face Amount |
| Futures Contracts Number of Long Contracts | | 8 |
| Foreign Currency Contracts Purchased at Contract Amount | | $ 2,463 |
| Foreign Currency Contracts Sold at Contract Amount | | $ 13,834 |
Emerging Markets Equity Fund
| The Effect of Derivative Instruments on the Statement of Operations for the year ended October 31, 2022: |
| | Risk Exposure Category |
| | Interest Rate
Contracts | | Foreign
Currency
Contracts | | Credit
Contracts | | Equity
Contracts | | Commodity
Contracts | | Total |
| Realized Gain (Loss) on Derivatives Recognized as a Result of Operations: | | | | | | | | | | | |
| Net realized gain (loss) on foreign currency contracts | $ — | | $ (256) | | $ — | | $ — | | $ — | | $ (256) |
| Total | $ — | | $ (256) | | $ — | | $ — | | $ — | | $ (256) |
For the year ended October 31, 2022, the average monthly amount or number per contract outstanding for each derivative type was as follows:
| Derivative Description | | Average Notional
Par, Contracts
or Face Amount |
| Foreign Currency Contracts Sold at Contract Amount | | $ 97,323 |
Notes to Financial Statements – (continued)
October 31, 2022
Emerging Markets Multi-Sector Bond Fund
| The Effect of Derivative Instruments on the Statement of Assets and Liabilities as of October 31, 2022: |
| | Risk Exposure Category |
| | Interest Rate
Contracts | | Foreign
Currency
Contracts | | Credit
Contracts | | Equity
Contracts | | Commodity
Contracts | | Total |
| Assets: | | | | | | | | | | | |
| Unrealized appreciation on foreign currency contracts | $ — | | $ 220,994 | | $ — | | $ — | | $ — | | $ 220,994 |
| Total | $ — | | $ 220,994 | | $ — | | $ — | | $ — | | $ 220,994 |
| Liabilities: | | | | | | | | | | | |
| Unrealized depreciation on foreign currency contracts | $ — | | $ 128,443 | | $ — | | $ — | | $ — | | $ 128,443 |
| Total | $ — | | $ 128,443 | | $ — | | $ — | | $ — | | $ 128,443 |
| The Effect of Derivative Instruments on the Statement of Operations for the year ended October 31, 2022: |
| | Risk Exposure Category |
| | Interest Rate
Contracts | | Foreign
Currency
Contracts | | Credit
Contracts | | Equity
Contracts | | Commodity
Contracts | | Total |
| Realized Gain (Loss) on Derivatives Recognized as a Result of Operations: | | | | | | | | | | | |
| Net realized gain (loss) on futures contracts | $ 311,582 | | $ — | | $ — | | $ — | | $ — | | $ 311,582 |
| Net realized gain (loss) on swap contracts | — | | — | | 40,387 | | — | | — | | 40,387 |
| Net realized gain (loss) on foreign currency contracts | — | | 84,919 | | — | | — | | — | | 84,919 |
| Total | $ 311,582 | | $ 84,919 | | $ 40,387 | | $ — | | $ — | | $ 436,888 |
| Net Change in Unrealized Appreciation (Depreciation) on Derivatives Recognized as a Result of Operations: | | | | | | | | | | | |
| Net change in unrealized appreciation (depreciation) of swap contracts | $ — | | $ — | | $ (2,167) | | $ — | | $ — | | $ (2,167) |
| Net change in unrealized appreciation (depreciation) of foreign currency contracts | — | | 89,254 | | — | | — | | — | | 89,254 |
| Total | $ — | | $ 89,254 | | $ (2,167) | | $ — | | $ — | | $ 87,087 |
For the year ended October 31, 2022, the average monthly amount or number per contract outstanding for each derivative type was as follows:
| Derivative Description | | Average Notional
Par, Contracts
or Face Amount |
| Futures Contracts Number of Long Contracts | | 1 |
| Futures Contracts Number of Short Contracts | | (8) |
| Swap Contracts at Notional Amount | | $ 539,843 |
| Foreign Currency Contracts Purchased at Contract Amount | | $ 5,764,702 |
| Foreign Currency Contracts Sold at Contract Amount | | $ 5,582,192 |
International Contrarian Value Fund
| The Effect of Derivative Instruments on the Statement of Operations for the year ended October 31, 2022: |
| | Risk Exposure Category |
| | Interest Rate
Contracts | | Foreign
Currency
Contracts | | Credit
Contracts | | Equity
Contracts | | Commodity
Contracts | | Total |
| Realized Gain (Loss) on Derivatives Recognized as a Result of Operations: | | | | | | | | | | | |
| Net realized gain (loss) on futures contracts | $ — | | $ — | | $ — | | $ (164) | | $ — | | $ (164) |
| Total | $ — | | $ — | | $ — | | $ (164) | | $ — | | $ (164) |
For the year ended October 31, 2022, the average monthly amount or number per contract outstanding for each derivative type was as follows:
| Derivative Description | | Average Notional
Par, Contracts
or Face Amount |
| Futures Contracts Number of Long Contracts | | 3 |
Notes to Financial Statements – (continued)
October 31, 2022
International Multi-Cap Value Fund
| The Effect of Derivative Instruments on the Statement of Assets and Liabilities as of October 31, 2022: |
| | Risk Exposure Category |
| | Interest Rate
Contracts | | Foreign
Currency
Contracts | | Credit
Contracts | | Equity
Contracts | | Commodity
Contracts | | Total |
| Assets: | | | | | | | | | | | |
| Unrealized appreciation on foreign currency contracts | $ — | | $ 605,216 | | $ — | | $ — | | $ — | | $ 605,216 |
| Total | $ — | | $ 605,216 | | $ — | | $ — | | $ — | | $ 605,216 |
| Liabilities: | | | | | | | | | | | |
| Unrealized depreciation on foreign currency contracts | $ — | | $ 3,623,812 | | $ — | | $ — | | $ — | | $ 3,623,812 |
| Total | $ — | | $ 3,623,812 | | $ — | | $ — | | $ — | | $ 3,623,812 |
| The Effect of Derivative Instruments on the Statement of Operations for the year ended October 31, 2022: |
| | Risk Exposure Category |
| | Interest Rate
Contracts | | Foreign
Currency
Contracts | | Credit
Contracts | | Equity
Contracts | | Commodity
Contracts | | Total |
| Realized Gain (Loss) on Derivatives Recognized as a Result of Operations: | | | | | | | | | | | |
| Net realized gain (loss) on futures contracts | $ — | | $ — | | $ — | | $ (25,925,224) | | $ — | | $ (25,925,224) |
| Net realized gain (loss) on foreign currency contracts | — | | 24,730,173 | | — | | — | | — | | 24,730,173 |
| Total | $ — | | $ 24,730,173 | | $ — | | $ (25,925,224) | | $ — | | $ (1,195,051) |
| Net Change in Unrealized Appreciation (Depreciation) on Derivatives Recognized as a Result of Operations: | | | | | | | | | | | |
| Net change in unrealized appreciation (depreciation) of futures contracts | $ — | | $ — | | $ — | | $ (11,758) | | $ — | | $ (11,758) |
| Net change in unrealized appreciation (depreciation) of foreign currency contracts | — | | (4,739,630) | | — | | — | | — | | (4,739,630) |
| Total | $ — | | $ (4,739,630) | | $ — | | $ (11,758) | | $ — | | $ (4,751,388) |
For the year ended October 31, 2022, the average monthly amount or number per contract outstanding for each derivative type was as follows:
| Derivative Description | | Average Notional
Par, Contracts
or Face Amount |
| Futures Contracts Number of Long Contracts | | 652 |
| Foreign Currency Contracts Purchased at Contract Amount | | $ 24,432,749 |
| Foreign Currency Contracts Sold at Contract Amount | | $ 155,192,077 |
Securitized Income Fund
| The Effect of Derivative Instruments on the Statement of Assets and Liabilities as of October 31, 2022: |
| | Risk Exposure Category |
| | Interest Rate
Contracts | | Foreign
Currency
Contracts | | Credit
Contracts | | Equity
Contracts | | Commodity
Contracts | | Total |
| Assets: | | | | | | | | | | | |
| Unrealized appreciation on futures contracts(1) | $ 5,441 | | $ — | | $ — | | $ — | | $ — | | $ 5,441 |
| Unrealized appreciation on foreign currency contracts | — | | 105 | | — | | — | | — | | 105 |
| Total | $ 5,441 | | $ 105 | | $ — | | $ — | | $ — | | $ 5,546 |
| Liabilities: | | | | | | | | | | | |
| Unrealized depreciation on futures contracts(1) | $ 768,475 | | $ — | | $ — | | $ — | | $ — | | $ 768,475 |
| Unrealized depreciation on foreign currency contracts | — | | 8,118 | | — | | — | | — | | 8,118 |
| Total | $ 768,475 | | $ 8,118 | | $ — | | $ — | | $ — | | $ 776,593 |
| (1) | Amount represents the cumulative appreciation and depreciation on futures contracts as disclosed within the Schedule of Investments under the open “Futures Contracts” section. Only current day’s variation margin, if any, is reported within the Statement of Assets and Liabilities. |
Notes to Financial Statements – (continued)
October 31, 2022
Securitized Income Fund – (continued)
| The Effect of Derivative Instruments on the Statement of Operations for the year ended October 31, 2022: |
| | Risk Exposure Category |
| | Interest Rate
Contracts | | Foreign
Currency
Contracts | | Credit
Contracts | | Equity
Contracts | | Commodity
Contracts | | Total |
| Realized Gain (Loss) on Derivatives Recognized as a Result of Operations: | | | | | | | | | | | |
| Net realized gain (loss) on futures contracts | $ (1,617,622) | | $ — | | $ — | | $ — | | $ — | | $ (1,617,622) |
| Net realized gain (loss) on foreign currency contracts | — | | 1,299,541 | | — | | — | | — | | 1,299,541 |
| Total | $ (1,617,622) | | $ 1,299,541 | | $ — | | $ — | | $ — | | $ (318,081) |
| Net Change in Unrealized Appreciation (Depreciation) on Derivatives Recognized as a Result of Operations: | | | | | | | | | | | |
| Net change in unrealized appreciation (depreciation) of futures contracts | $ (538,674) | | $ — | | $ — | | $ — | | $ — | | $ (538,674) |
| Net change in unrealized appreciation (depreciation) of foreign currency contracts | — | | (101,994) | | — | | — | | — | | (101,994) |
| Total | $ (538,674) | | $ (101,994) | | $ — | | $ — | | $ — | | $ (640,668) |
For the year ended October 31, 2022, the average monthly amount or number per contract outstanding for each derivative type was as follows:
| Derivative Description | | Average Notional
Par, Contracts
or Face Amount |
| Futures Contracts Number of Long Contracts | | 208 |
| Futures Contracts Number of Short Contracts | | (54) |
| Foreign Currency Contracts Purchased at Contract Amount | | $ 1,024,991 |
| Foreign Currency Contracts Sold at Contract Amount | | $ 9,123,684 |
Sustainable International Core Fund
| The Effect of Derivative Instruments on the Statement of Assets and Liabilities as of October 31, 2022: |
| | Risk Exposure Category |
| | Interest Rate
Contracts | | Foreign
Currency
Contracts | | Credit
Contracts | | Equity
Contracts | | Commodity
Contracts | | Total |
| Assets: | | | | | | | | | | | |
| Unrealized appreciation on futures contracts(1) | $ — | | $ — | | $ — | | $ 437 | | $ — | | $ 437 |
| Total | $ — | | $ — | | $ — | | $ 437 | | $ — | | $ 437 |
| (1) | Amount represents the cumulative appreciation and depreciation on futures contracts as disclosed within the Schedule of Investments under the open “Futures Contracts” section. Only current day’s variation margin, if any, is reported within the Statement of Assets and Liabilities. |
| The Effect of Derivative Instruments on the Statement of Operations for the year ended October 31, 2022: |
| | Risk Exposure Category |
| | Interest Rate
Contracts | | Foreign
Currency
Contracts | | Credit
Contracts | | Equity
Contracts | | Commodity
Contracts | | Total |
| Realized Gain (Loss) on Derivatives Recognized as a Result of Operations: | | | | | | | | | | | |
| Net realized gain (loss) on futures contracts | $ — | | $ — | | $ — | | $ 3,292 | | $ — | | $ 3,292 |
| Total | $ — | | $ — | | $ — | | $ 3,292 | | $ — | | $ 3,292 |
| Net Change in Unrealized Appreciation (Depreciation) on Derivatives Recognized as a Result of Operations: | | | | | | | | | | | |
| Net change in unrealized appreciation (depreciation) of futures contracts | $ — | | $ — | | $ — | | $ 437 | | $ — | | $ 437 |
| Total | $ — | | $ — | | $ — | | $ 437 | | $ — | | $ 437 |
Notes to Financial Statements – (continued)
October 31, 2022
Sustainable International Core Fund – (continued)
For the year ended October 31, 2022, the average monthly amount or number per contract outstanding for each derivative type was as follows:
| Derivative Description | | Average Notional
Par, Contracts
or Face Amount |
| Futures Contracts Number of Long Contracts | | 1 |
Tax-Aware Bond Fund
| The Effect of Derivative Instruments on the Statement of Operations for the year ended October 31, 2022: |
| | Risk Exposure Category |
| | Interest Rate
Contracts | | Foreign
Currency
Contracts | | Credit
Contracts | | Equity
Contracts | | Commodity
Contracts | | Total |
| Realized Gain (Loss) on Derivatives Recognized as a Result of Operations: | | | | | | | | | | | |
| Net realized gain (loss) on futures contracts | $ 880,616 | | $ — | | $ — | | $ — | | $ — | | $ 880,616 |
| Total | $ 880,616 | | $ — | | $ — | | $ — | | $ — | | $ 880,616 |
| Net Change in Unrealized Appreciation (Depreciation) on Derivatives Recognized as a Result of Operations: | | | | | | | | | | | |
| Net change in unrealized appreciation (depreciation) of futures contracts | $ (403,918) | | $ — | | $ — | | $ — | | $ — | | $ (403,918) |
| Total | $ (403,918) | | $ — | | $ — | | $ — | | $ — | | $ (403,918) |
For the year ended October 31, 2022, the average monthly amount or number per contract outstanding for each derivative type was as follows:
| Derivative Description | | Average Notional
Par, Contracts
or Face Amount |
| Futures Contracts Number of Long Contracts | | 16 |
| Futures Contracts Number of Short Contracts | | (37) |
| e) | Balance Sheet Offsetting Information – Set forth below are tables which disclose both gross information and net information about instruments and transactions eligible for offset in the financial statements, and instruments and transactions that are subject to a master netting arrangement, as well as amounts related to margin, reflected as financial collateral (including cash collateral), held at clearing brokers, counterparties and a Fund's custodian. The master netting arrangements allow the clearing brokers to net any collateral held in or on behalf of a Fund, or liabilities or payment obligations of the clearing brokers to a Fund, against any liabilities or payment obligations of a Fund to the clearing brokers. A Fund is required to deposit financial collateral (including cash collateral) at the Fund's custodian on behalf of clearing brokers and counterparties to continually meet the original and maintenance requirements established by the clearing brokers and counterparties. Such requirements are specific to the respective clearing broker or counterparty. Certain master netting arrangements may not be enforceable in a bankruptcy. |
| | The following tables present a Fund's derivative assets and liabilities, presented on a gross basis as no amounts are netted within the Statements of Assets and Liabilities, by counterparty net of amounts available for offset under a master netting agreement or similar agreement ("MNA") and net of the related collateral received/pledged by a Fund as of October 31, 2022: |
| | |
| Emerging Markets Multi-Sector Bond Fund | | | | |
| Derivative Financial Instruments: | | Assets | | Liabilities |
| Foreign currency contracts | | $ 220,994 | | $ (128,443) |
| Total gross amount of derivative assets and liabilities in the Statement of Assets and Liabilities | | 220,994 | | (128,443) |
| Derivatives not subject to a MNA | | — | | — |
| Total gross amount of assets and liabilities subject to MNA or similar agreements | | $ 220,994 | | $ (128,443) |
Notes to Financial Statements – (continued)
October 31, 2022
| Counterparty | | Gross Amount
of Assets | | Financial
Instruments
and Derivatives
Available
for Offset | | Non-cash
Collateral
Received* | | Cash
Collateral
Received* | | Net Amount
of Assets |
| Citibank NA | | $ 46,393 | | $ (46,393) | | $ — | | $ — | | $ — |
| JP Morgan Chase & Co. | | 100,144 | | (145) | | — | | — | | 99,999 |
| Morgan Stanley | | 58,962 | | (45,477) | | — | | — | | 13,485 |
| State Street Global Markets LLC | | 1,164 | | (1,164) | | — | | — | | — |
| UBS AG | | 14,331 | | (14,331) | | — | | — | | — |
| Total | | $ 220,994 | | $ (107,510) | | $ — | | $ — | | $ 113,484 |
| | | | | | | | | | | |
| | | | | | | | | | | |
| Counterparty | | Gross Amount
of Liabilities | | Financial
Instruments
and Derivatives
Available
for Offset | | Non-cash
Collateral
Pledged* | | Cash
Collateral
Pledged* | | Net Amount
of Liabilities |
| Citibank NA | | $ (59,981) | | $ 46,393 | | $ — | | $ — | | $ (13,588) |
| JP Morgan Chase & Co. | | (145) | | 145 | | — | | — | | — |
| Morgan Stanley | | (45,477) | | 45,477 | | — | | — | | — |
| State Street Global Markets LLC | | (5,026) | | 1,164 | | — | | — | | (3,862) |
| UBS AG | | (17,814) | | 14,331 | | — | | — | | (3,483) |
| Total | | $ (128,443) | | $ 107,510 | | $ — | | $ — | | $ (20,933) |
| * | In some instances, the actual collateral received and/or pledged may be more than the amount shown. |
| International Multi-Cap Value Fund | | | | |
| Derivative Financial Instruments: | | Assets | | Liabilities |
| Foreign currency contracts | | $ 605,216 | | $ (3,623,812) |
| Total gross amount of derivative assets and liabilities in the Statement of Assets and Liabilities | | 605,216 | | (3,623,812) |
| Derivatives not subject to a MNA | | — | | — |
| Total gross amount of assets and liabilities subject to MNA or similar agreements | | $ 605,216 | | $ (3,623,812) |
| Counterparty | | Gross Amount
of Assets | | Financial
Instruments
and Derivatives
Available
for Offset | | Non-cash
Collateral
Received | | Cash
Collateral
Received | | Net Amount
of Assets |
| JP Morgan Chase & Co. | | $ 605,216 | | $ (605,216) | | $ — | | $ — | | $ — |
| Total | | $ 605,216 | | $ (605,216) | | $ — | | $ — | | $ — |
| | | | | | | | | | | |
| | | | | | | | | | | |
| Counterparty | | Gross Amount
of Liabilities | | Financial
Instruments
and Derivatives
Available
for Offset | | Non-cash
Collateral
Pledged | | Cash
Collateral
Pledged | | Net Amount
of Liabilities |
| JP Morgan Chase & Co. | | $ (3,341,199) | | $ 605,216 | | $ — | | $ — | | $ (2,735,983) |
| UBS AG | | (282,613) | | — | | — | | — | | (282,613) |
| Total | | $ (3,623,812) | | $ 605,216 | | $ — | | $ — | | $ (3,018,596) |
| Securitized Income Fund | | | | |
| Derivative Financial Instruments: | | Assets | | Liabilities |
| Foreign currency contracts | | $ 105 | | $ (8,118) |
| Futures contracts | | 5,441 | | (768,475) |
| Total gross amount of derivative assets and liabilities in the Statement of Assets and Liabilities | | 5,546 | | (776,593) |
| Derivatives not subject to a MNA | | (5,441) | | 768,475 |
| Total gross amount of assets and liabilities subject to MNA or similar agreements | | $ 105 | | $ (8,118) |
Notes to Financial Statements – (continued)
October 31, 2022
| Counterparty | | Gross Amount
of Assets | | Financial
Instruments
and Derivatives
Available
for Offset | | Non-cash
Collateral
Received | | Cash
Collateral
Received | | Net Amount
of Assets |
| BNP Paribas Securities Services | | $ 105 | | $ — | | $ — | | $ — | | $ 105 |
| Total | | $ 105 | | $ — | | $ — | | $ — | | $ 105 |
| | | | | | | | | | | |
| | | | | | | | | | | |
| Counterparty | | Gross Amount
of Liabilities | | Financial
Instruments
and Derivatives
Available
for Offset | | Non-cash
Collateral
Pledged | | Cash
Collateral
Pledged | | Net Amount
of Liabilities |
| Bank of America Securities LLC | | $ (8,118) | | $ — | | $ — | | $ — | | $ (8,118) |
| Total | | $ (8,118) | | $ — | | $ — | | $ — | | $ (8,118) |
| 5. | Principal Risks: |
| | A Fund’s investments expose it to various types of risks associated with financial instruments and the markets. A Fund may be exposed to the risks described below. Each Fund’s prospectus provides details of its principal risks. |
| | The market values of equity securities, such as common stocks and preferred stocks, or equity related derivative investments, such as futures and options, may decline due to general market conditions which are not specifically related to a particular company, such as real or perceived adverse economic conditions, changes in the general outlook for corporate earnings, changes in interest or currency rates or adverse investor sentiment generally. The market value of equity securities may also decline due to factors which affect a particular industry or industries, such as labor shortages or increased production costs and competitive conditions within an industry. Equity securities and equity related investments generally have greater market price volatility than fixed income securities. The extent of each Fund’s exposure to market risk is the market value of the investments held as shown in the Fund’s Schedule of Investments. |
| | A widespread health crisis, such as a global pandemic, could cause substantial market volatility, exchange trading suspensions or restrictions and closures of securities exchanges and businesses, impact the ability to complete redemptions, and adversely impact Fund performance. The outbreak of COVID-19, a respiratory disease caused by a novel coronavirus, has negatively affected the worldwide economy, created supply chain disruptions and labor shortages, and impacted the financial health of individual companies and the market in significant and unforeseen ways. The future impact of COVID-19 remains unclear. The effects to public health, business and market conditions resulting from COVID-19 pandemic may have a significant negative impact on the performance of a Fund’s investments, including exacerbating other pre-existing political, social and economic risks. |
| | Certain investments held by a Fund expose the Fund to various risks which may include, but are not limited to, interest rate, prepayment, and extension risks. Interest rate risk is the risk that fixed income securities will decline in value because of changes in interest rates. As nominal interest rates rise, the values of certain fixed income securities held by a Fund are likely to decrease. A nominal interest rate can be described as the sum of a real interest rate and an expected inflation rate. Fixed income securities with longer durations tend to be more sensitive to changes in interest rates, usually making them more volatile than securities with shorter durations. Duration is useful primarily as a measure of the sensitivity of a fixed income security’s market price to interest rate (i.e., yield) movements. Senior floating rate interests and securities subject to prepayment and extension risk generally offer less potential for gains when interest rates decline. Rising interest rates may cause prepayments to occur at a slower than expected rate, thereby effectively lengthening the maturity of the security and making the security more sensitive to interest rate changes. Prepayment and extension risk are major risks of mortgage-backed securities, senior floating rate interests and certain asset-backed securities. For certain asset-backed securities, the actual maturity may be less than the stated maturity shown in the Schedule of Investments, if applicable. As a result, the timing of income recognition relating to these securities may vary based upon the actual maturity. |
| | Investing in the securities of non-U.S. issuers, whether directly or indirectly, involves certain considerations and risks not typically associated with securities of U.S. issuers. Such risks include, but are not limited to: generally less liquid and less efficient securities markets; generally greater price volatility; exchange rate fluctuations; imposition of restrictions on the expatriation of funds or other protectionist measures; less publicly available information about issuers; the imposition of withholding or other taxes; higher transaction and custody costs; settlement delays and risk of loss attendant in settlement procedures; difficulties in enforcing contractual obligations; less regulation of securities markets; different accounting, disclosure and reporting requirements; more substantial governmental involvement in the economy; higher inflation rates; and greater social, economic and political uncertainties. Non-U.S. issuers may also be affected by political, social, economic or diplomatic developments in a foreign country or region or the U.S. (including the imposition of sanctions, tariffs, or other governmental restrictions). These risks are heightened for investments in issuers from countries with less developed markets. |
Notes to Financial Statements – (continued)
October 31, 2022
| | Securities lending involves the risk that a Fund may lose money because the borrower of the loaned securities fails to return the securities in a timely manner or at all. A Fund could also lose money in the event of a decline in the value of the collateral provided for the loaned securities or a decline in the value of any investments made with cash collateral. These events could also trigger adverse tax consequences for a Fund that lends its holdings. |
| | As a result of the China A Fund’s focus in China A shares, the China A Fund may be subject to increased currency, political, economic, social, environmental, regulatory and other risks not typically associated with investing in a larger number of countries or regions. Over the last few decades, the Chinese government has undertaken reform of economic and market practices and has expanded the sphere of private ownership of property in China. Nevertheless, China remains an emerging market and demonstrates significantly higher volatility from time to time in comparison to developed markets. China A shares are equity securities of companies located in mainland China that trade on the Shanghai Stock Exchange and the Shenzhen Stock Exchange. The China A Fund may invest in China A shares through the Shanghai-Hong Kong and Shenzhen-Hong Kong Stock Connect programs (collectively, "Stock Connect"). The Shanghai and Shenzhen stock exchanges may close for extended periods for holidays or otherwise, which impacts the China A Fund’s ability to trade in China A shares during those periods. Trading suspensions in certain stocks and extended market closures could lead to greater market execution risk, valuation risks, liquidity risks, and costs for the China A Fund. The China A Fund’s investments in China A shares are generally subject to the laws of the People’s Republic of China ("PRC"), including local securities regulations and listing rules. As a result of different legal standards, the China A Fund faces the risk of being unable to enforce its rights with respect to its China A shares holdings. Investing in China A shares is subject to trading, clearance, settlement and other procedures, which could pose risks to the China A Fund. Trading through Stock Connect is currently subject to a daily quota, which may restrict the China A Fund’s ability to invest in China A shares through Stock Connect on a timely basis and could affect the China A Fund’s ability to effectively pursue its investment strategy. Stock Connect will only operate on days when both the Chinese and Hong Kong markets are open for trading and when banking services are available in both markets on the corresponding settlement days. Therefore, an investment in China A shares through Stock Connect may subject the China A Fund to the risk of price fluctuations on days when the Chinese markets are open, but Stock Connect is not trading. If the China A Fund invests through the Qualified Foreign Institutional Investor or Renminbi Qualified Foreign Institutional Investor systems, it may be subject to additional risks, such as failure to achieve best execution, trading disruption, custody risk and credit loss. In difficult market conditions, the China A Fund may not be able to sell its investments easily or at all, which could affect Fund performance and the China A Fund’s liquidity. The risks related to investments in China A shares through Stock Connect are heightened to the extent that the China A Fund invests in China A shares listed on the Science and Technology Innovation Board on the Shanghai stock exchange ("STAR market") and/or the ChiNext market of the Shenzhen stock exchange ("ChiNext market"). Listed companies on the STAR market and ChiNext market are usually of an emerging nature with smaller operating scale. They are subject to higher fluctuation in stock prices and liquidity. It may be more common and faster for companies listed on the STAR market and ChiNext market to delist. |
| | Credit risk depends largely on the perceived financial health of bond issuers. In general, the credit rating is inversely related to the credit risk of the issuer. Higher rated bonds generally are deemed to have less credit risk, while lower or unrated bonds are deemed to have higher risk of default. The share price, yield and total return of a fund that holds securities with higher credit risk may be more volatile than those of a fund that holds bonds with lower credit risk. A Fund may be exposed to counterparty risk, or the risk that an institution or other entity with which a Fund has unsettled or open transactions will default. |
| | Recent events, including the invasion of Ukraine by Russia, have interjected uncertainty into the global financial markets. One or more of the Funds hold positions in securities or other instruments that are economically tied to Russia. Investments in Russia are subject to political, economic, legal, market and currency risks, as well as the risks related to the economic sanctions on Russia imposed by the United States and/or other countries. Such sanctions which affect companies in many sectors, including energy, financial services and defense, among others, have adversely affected and could adversely affect the global energy and financial markets and, thus, have adversely affected and could affect the value of a Fund’s investments, even beyond any direct exposure the Fund may have to Russian issuers or the adjoining geographic regions. In addition, certain transactions have or may be prohibited and/or existing investments have or may become illiquid (e.g., because transacting in certain existing investments is prohibited), which could cause a Fund to sell other portfolio holdings at a disadvantageous time or price in order to meet shareholder redemptions. |
| | The use of certain London Interbank Offered Rates (collectively, "LIBOR") was generally phased out by the end of 2021, and some regulated entities (such as banks) have ceased to enter into new LIBOR-based contracts beginning January 1, 2022. However, it is expected that the most widely used tenors of U.S. LIBOR may continue to be provided on a representative basis until mid-2023. In some instances, regulators may restrict new use of LIBOR prior to the actual cessation date.There remains uncertainty regarding the future use of LIBOR and the nature of any replacement rate (e.g., the Secured Overnight Financing Rate (“SOFR”), which is is a measure of the cost of borrowing cash overnight, collateralized by the U.S. Treasury securities and is intended to replace the U.S. dollar LIBOR). As such, the potential effect of a transition away from LIBOR on a Fund or the LIBOR-based instruments in which the Fund invests cannot yet be determined. The transition process away from LIBOR may involve, among other things, increased volatility or illiquidity in markets for instruments that currently rely on LIBOR. The transition process may also result in a reduction in the value of certain instruments held by a Fund or reduce the effectiveness of related Fund transactions, such as hedges. Volatility, the potential reduction in value, and/or the hedge effectiveness of financial instruments may be heightened for financial instruments that do not include fallback provisions that address the cessation of LIBOR. Any potential effects of the transition away from LIBOR |
Notes to Financial Statements – (continued)
October 31, 2022
on the Fund or on financial instruments in which a Fund invests, as well as other unforeseen effects, could result in losses to the Fund. Since the usefulness of LIBOR as a benchmark or reference rate could deteriorate during the transition period, these effects could occur prior to and/or subsequent to mid-2023.
| a) | Each Fund intends to continue to qualify as a Regulated Investment Company ("RIC") under Subchapter M of the Internal Revenue Code ("IRC") by distributing substantially all of its taxable net investment income and net realized capital gains to its shareholders each year. Each Fund has distributed substantially all of its income and capital gains in prior years, if applicable, and intends to distribute substantially all of its income and capital gains during the calendar year ending December 31, 2022. Accordingly, no provision for federal income or excise taxes has been made in the accompanying financial statements. Distributions from short-term capital gains are treated as ordinary income distributions for federal income tax purposes. |
| b) | Net Investment Income (Loss), Net Realized Gains (Losses) and Distributions – Net investment income (loss) and net realized gains (losses) may differ for financial statement and tax purposes primarily because of losses deferred due to wash sale adjustments, foreign currency gains and losses, adjustments related to Passive Foreign Investment Companies ("PFICs") Real Estate Investment Trusts ("REITs"),RICs, certain derivatives, partnerships, debt modifications and mark to market on certain derivatives. The character of distributions made during the year from net investment income or net realized gains may differ from their ultimate characterization for federal income tax purposes. Also, due to the timing of dividend distributions, the fiscal year in which amounts are distributed may differ from the year that the income or realized gains (losses) were recorded by each Fund. |
| c) | Distributions and Components of Distributable Earnings – The tax character of distributions paid by each Fund for the year or period ended October 31, 2022 and October 31, 2021 are as follows: |
| | |
| | | For the Year Ended
October 31, 2022 | | For the Year Ended
October 31, 2021 |
| Fund | | Tax Exempt
Income | | Ordinary
Income | | Long-Term
Capital Gains(1) | | Tax Return of
Capital | | Tax Exempt
Income | | Ordinary
Income | | Long-Term
Capital Gains(1) |
| China A Fund | | $ — | | $ 758,745 | | $ 350,173 | | $ — | | $ — | | $ 816,257 | | $ — |
| Diversified Emerging Markets Fund(2) | | — | | 41,496 | | 9,480 | | — | | — | | — | | — |
| Emerging Markets Equity Fund | | — | | 85,800,019 | | — | | — | | — | | 43,420,348 | | — |
| Emerging Markets Multi-Sector Bond Fund | | — | | 1,697,427 | | — | | 254,582 | | — | | 2,079,050 | | — |
| International Contrarian Value Fund(3) | | — | | — | | — | | — | | — | | — | | — |
| International Multi-Cap Value Fund | | — | | 83,465,376 | | — | | — | | — | | 60,028,324 | | — |
| International Stock Fund | | — | | 45,131,132 | | 26,951,731 | | — | | — | | 4,707,759 | | — |
| Securitized Income Fund | | — | | 2,406,841 | | — | | — | | — | | 1,891,648 | | — |
| Sustainable International Core Fund(3) | | — | | — | | — | | — | | — | | — | | — |
| Tax-Aware Bond Fund | | 5,352,817 | | 3,743,773 | | 4,018,602 | | — | | 3,851,447 | | 5,221,719 | | 2,554,942 |
| US MidCap Opportunities Fund | | — | | 22,369,887 | | 89,901,628 | | — | | — | | 2,085,028 | | — |
| US Small Cap Opportunities Fund | | — | | 406,200 | | 37,200,878 | | — | | — | | 201,162 | | — |
| (1) | The Funds designate these distributions as long-term capital gains dividends pursuant to IRC Sec 852(b)(3)(c). |
| (2) | Distributions for the period September 30, 2021 (commencement of operations) through October 31, 2022. |
| (3) | Distributions for the period May 24, 2022 (commencement of operations) through October 31, 2022. |
Notes to Financial Statements – (continued)
October 31, 2022
As of October 31, 2022, the components of total accumulated earnings (deficit) for each Fund on a tax basis are as follows:
| Fund | | Tax Exempt
Income | | Undistributed
Ordinary
Income | | Undistributed
Long-Term
Capital Gains | | Accumulated
Capital and
Other Losses | | Other
Temporary
Differences | | Unrealized
Appreciation
(Depreciation)
on Investments(1) | | Total
Accumulated
Earnings
(Deficit) |
| China A Fund | | $ — | | $ 264,950 | | $ — | | $ (7,015,877) | | $ — | | $ (23,316,951) | | $ (30,067,878) |
| Diversified Emerging Markets Fund | | — | | 166,401 | | — | | (1,027,973) | | (26,046) | | (2,252,100) | | (3,139,718) |
| Emerging Markets Equity Fund | | — | | 88,409,641 | | — | | (673,516,243) | | — | | (529,230,945) | | (1,114,337,547) |
| Emerging Markets Multi-Sector Bond Fund | | — | | — | | — | | (17,737,715) | | — | | (5,112,430) | | (22,850,145) |
| International Contrarian Value Fund | | — | | 14,343 | | — | | (1,708) | | (2,151) | | (135,435) | | (124,951) |
| International Multi-Cap Value Fund | | — | | 34,898,675 | | — | | (278,418,504) | | — | | (201,428,120) | | (444,947,949) |
| International Stock Fund | | — | | 49,860,829 | | — | | (270,585,615) | | — | | (460,482,674) | | (681,207,460) |
| Securitized Income Fund | | — | | 227,739 | | — | | (5,210,514) | | — | | (4,125,292) | | (9,108,067) |
| Sustainable International Core Fund | | — | | 9,550 | | — | | (7,933) | | (2,151) | | (139,178) | | (139,712) |
| Tax-Aware Bond Fund | | 295,702 | | — | | — | | (12,429,835) | | (930) | | (43,509,328) | | (55,644,391) |
| US MidCap Opportunities Fund | | — | | 2,161,518 | | 20,424,776 | | — | | — | | 160,416,901 | | 183,003,195 |
| US Small Cap Opportunities Fund | | — | | — | | 2,430,311 | | (211,596) | | — | | 42,559,408 | | 44,778,123 |
| (1) | Differences between book-basis and tax basis unrealized appreciation (depreciation) may be attributable to the losses deferred due to wash sale adjustments, foreign currency gains and losses, adjustments related to PFICs, REITS, certain derivatives and partnerships. |
| d) | Reclassification of Capital Accounts – The Funds may record reclassifications in their capital accounts. These reclassifications have no impact on the total net assets of the Funds. The reclassifications are a result of permanent differences between U.S. GAAP and tax accounting for such items as adjustments to prior year accumulated balances. Adjustments are made to reflect the impact these items have on the current and future earnings distributions to shareholders. Therefore, the source of the Funds' distributions may be shown in the accompanying Statements of Changes in Net Assets as from distributable earnings or from capital depending on the type of book and tax differences that exist. For the year ended October 31, 2022, the Funds recorded reclassifications to increase (decrease) the accounts listed below: |
| | |
| Fund | | Paid-in-Capital | | Distributable
Earnings (Loss) |
| US Small Cap Opportunities Fund | | $ 271,033 | | $ (271,033) |
| e) | Capital Loss Carryforward – Under the Regulated Investment Company Modernization Act of 2010, funds are permitted to carry forward capital losses for an unlimited period. |
| | At October 31, 2022 (tax year end), each Fund's capital loss carryforwards for U.S. federal income tax purposes were as follows: |
| | |
| Fund | | Short-Term
Capital Loss
Carryforward with
No Expiration | | Long-Term
Capital Loss
Carryforward with
No Expiration |
| China A Fund | | $ 4,875,676 | | $ 2,140,201 |
| Diversified Emerging Markets Fund | | 867,319 | | 160,654 |
| Emerging Markets Equity Fund | | 579,853,713 | | 93,662,530 |
| Emerging Markets Multi-Sector Bond Fund* | | 12,594,568 | | 5,143,147 |
| International Contrarian Value Fund | | 1,708 | | — |
| International Multi-Cap Value Fund | | 160,939,798 | | 117,478,706 |
| International Stock Fund | | 194,213,283 | | 76,372,332 |
| Securitized Income Fund | | 2,498,891 | | 2,711,623 |
| Sustainable International Core Fund | | 7,933 | | — |
| Tax-Aware Bond Fund | | 6,219,720 | | 6,210,115 |
| * | Future utilization of losses are subject to limitation under current tax laws. |
The US MidCap Opportunities Fund and US Small Cap Opportunities Fund had no capital loss carryforwards for U.S. federal tax purposes as of October 31, 2022.
The US Small Cap Opportunities Fund deferred $211,596 in late year ordinary losses.
| f) | Tax Basis of Investments – The aggregate cost of investments for federal income tax purposes at October 31, 2022 is different from book purposes primarily due to wash sale loss deferrals, passive foreign investment company (PFIC) mark to market adjustments, partnerships, debt modification adjustments and non-taxable distributions from underlying investments. The net unrealized appreciation/(depreciation) on |
Notes to Financial Statements – (continued)
October 31, 2022
| | investments for tax purposes, which consists of gross unrealized appreciation and depreciation, was also different from book purposes primarily due to wash sale loss deferrals, mark-to-market adjustments on futures, PFICs, partnership adjustments, debt modification adjustments and non-taxable distributions from underlying investments. Both the cost and unrealized appreciation and depreciation for federal income tax purposes are disclosed below: |
| | |
| Fund | | Tax Cost | | Gross Unrealized
Appreciation | | Gross Unrealized
(Depreciation) | | Net Unrealized
Appreciation
(Depreciation) |
| China A Fund | | $ 77,131,174 | | $ 819,726 | | $ (24,136,271) | | $ (23,316,545) |
| Diversified Emerging Markets Fund | | 9,104,626 | | 157,349 | | (2,406,421) | | (2,249,072) |
| Emerging Markets Equity Fund | | 5,334,694,939 | | 421,527,663 | | (937,047,071) | | (515,519,408) |
| Emerging Markets Multi-Sector Bond Fund | | 33,016,794 | | 86,626 | | (5,190,953) | | (5,104,327) |
| International Contrarian Value Fund | | 1,038,509 | | 7,992 | | (143,411) | | (135,419) |
| International Multi-Cap Value Fund | | 2,328,827,720 | | 110,211,854 | | (311,187,069) | | (200,975,215) |
| International Stock Fund | | 4,015,037,509 | | 126,515,471 | | (586,208,030) | | (459,692,559) |
| Securitized Income Fund | | 68,771,112 | | 48,224 | | (4,173,464) | | (4,125,240) |
| Sustainable International Core Fund | | 1,021,930 | | 10,607 | | (149,709) | | (139,102) |
| Tax-Aware Bond Fund | | 439,945,912 | | 456,260 | | (43,965,588) | | (43,509,328) |
| US MidCap Opportunities Fund | | 570,156,064 | | 170,414,560 | | (9,997,659) | | 160,416,901 |
| US Small Cap Opportunities Fund | | 270,627,990 | | 62,200,937 | | (19,641,529) | | 42,559,408 |
| g) | Accounting for Uncertainty in Income Taxes – Pursuant to provisions set forth by U.S. GAAP, Hartford Funds Management Company, LLC ("HFMC" or the "Investment Manager") reviews each Fund’s tax positions for all open tax years. As of October 31, 2022, HFMC had reviewed the open tax years and concluded that there was no reason to record a liability for net unrecognized tax obligations relating to uncertain income tax positions. Each Fund files U.S. tax returns. Although the statute of limitations for examining a Fund’s U.S. tax returns remains open for three years, no examination is currently in progress. The Funds recognize interest and penalties, if any, related to unrecognized tax benefits as income tax expense on the Statements of Operations. During the year ended October 31, 2022, the Funds did not incur any interest or penalties. HFMC is not aware of any tax positions for which it is reasonably possible that the total amounts of unrecognized tax obligations will significantly change in the next twelve months. |
| a) | Investment Management Agreement – HFMC serves as each Fund’s investment manager pursuant to an Investment Management Agreement with the Company. HFMC is an indirect subsidiary of The Hartford Financial Services Group, Inc. ("The Hartford"). HFMC has overall investment supervisory responsibility for each Fund. In addition, HFMC provides administrative personnel, services, equipment, facilities and office space for proper operation of each Fund. HFMC has contracted with Schroder Investment Management North America Inc. ("SIMNA") under a sub-advisory agreement and SIMNA has contracted with Schroder Investment Management North America Limited (“SIMNA Ltd.”) under a sub-sub-advisory agreement with respect to certain Funds. SIMNA performs the daily investment of the assets for each Fund, and, with respect to each of China A Fund, Diversified Emerging Markets Fund, Emerging Markets Equity Fund, Emerging Markets Multi-Sector Bond Fund, International Contrarian Value Fund, International Multi-Cap Value Fund, International Stock Fund, Sustainable International Core Fund, and Tax-Aware Bond Fund, SIMNA may allocate assets to or from SIMNA Ltd., an affiliate of SIMNA, in connection with the daily investment of the assets for each of these Funds. SIMNA pays the sub-sub-advisory fees to SIMNA Ltd. |
| b) | The schedule below reflects the rates of compensation paid to HFMC for investment management services rendered as of October 31, 2022; the rates are accrued daily and paid monthly based on each Fund’s average daily net assets, at the following annual rates: |
| | |
| Fund | | Management Fee Rates |
| China A Fund | | 0.9000% on first $1 billion and; |
| | | 0.8900% over $1 billion |
| Diversified Emerging Markets Fund | | 0.8400% on first $1 billion and; |
| | | 0.7800% over $1 billion |
| Emerging Markets Equity Fund | | 1.0500% on first $1 billion and; |
| | | 1.0000% on next $4 billion and; |
| | | 0.9900% on next $5 billion and; |
| | | 0.9850% over $10 billion |
| Emerging Markets Multi-Sector Bond Fund | | 0.7000% on first $1 billion and; |
| | | 0.6500% on next $4 billion and; |
| | | 0.6400% on next $5 billion and; |
| | | 0.6350% over $10 billion |
Notes to Financial Statements – (continued)
October 31, 2022
| Fund | | Management Fee Rates |
| International Contrarian Value Fund | | 0.6500% on first $1 billion and; |
| | | 0.6100% over $1 billion |
| International Multi-Cap Value Fund | | 0.7200% on first $1 billion and; |
| | | 0.6800% on next $4 billion and; |
| | | 0.6750% on next $5 billion and; |
| | | 0.6700% over $10 billion |
| International Stock Fund | | 0.6700% on first $1 billion and; |
| | | 0.6500% on next $4 billion and; |
| | | 0.6450% on next $5 billion and; |
| | | 0.6400% over $10 billion |
| Securitized Income Fund | | 0.4000% on first $1 billion and; |
| | | 0.3900% over $1 billion |
| Sustainable International Core Fund | | 0.6500% on first $1 billion and; |
| | | 0.6100% over $1 billion |
| Tax-Aware Bond Fund | | 0.4500% on first $1 billion and; |
| | | 0.4300% on next $4 billion and; |
| | | 0.4250% on next $5 billion and; |
| | | 0.4200% over $10 billion |
| US MidCap Opportunities Fund | | 0.7500% on first $1 billion and; |
| | | 0.7000% on next $1.5 billion and; |
| | | 0.6500% on next $2.5 billion and; |
| | | 0.6450% on next $5 billion and; |
| | | 0.6400% over $10 billion |
| US Small Cap Opportunities Fund | | 0.9000% on first $1 billion and; |
| | | 0.8900% on next $4 billion and; |
| | | 0.8800% on next $5 billion and; |
| | | 0.8700% over $10 billion |
For the period November 1, 2021 through November 30, 2021, the investment management fee rates for the Securitized Income Fund was accrued daily and paid monthly based on the Fund’s average daily net assets, at the rate below:
| Fund | | Management Fee Rates |
| Securitized Income Fund | | 0.6500% on first $1 billion and; |
| | | 0.6000% over $1 billion |
| c) | Accounting Services Agreement – HFMC provides the Funds with accounting services pursuant to a fund accounting agreement by and between the Company, on behalf of each Fund, and HFMC. HFMC has delegated certain accounting and administrative service functions to State Street Bank and Trust Company ("State Street"). In consideration of services rendered and expenses assumed pursuant to the fund accounting agreement, each Fund pays HFMC a fee. The fund accounting fee for each Fund is equal to the greater of: (A) the sum of (i) the sub-accounting fee payable by HFMC with respect to the Fund; (ii) the fee payable for tax preparation services for the Fund; and (iii) the amount of expenses that HFMC allocates for providing the fund accounting services to the Fund; plus a target profit margin; or (B) $40,000 per year; provided, however, that to the extent the annual amount of the fund accounting fee exceeds 0.02% of the Fund’s average net assets (calculated during its current fiscal year), HFMC shall waive such portion of the fund accounting fee. |
| d) | Operating Expenses – Allocable expenses incurred by the Company are allocated to each series within the Company, and allocated to classes within each such series, in proportion to the average daily net assets of such series and classes, except where allocation of certain expenses is more fairly made directly to a Fund or to specific classes within a Fund. As of October 31, 2022, HFMC contractually agreed to limit the total annual fund operating expenses (exclusive of taxes, interest expenses, brokerage commissions, acquired fund fees and |
Notes to Financial Statements – (continued)
October 31, 2022
| | expenses, and extraordinary expenses) through the date indicated below (unless the Board of Directors approves its earlier termination) as follows for each of the following Funds: |
| | |
| | | Expense Limit as a Percentage of Average Daily Net Assets |
| Fund | | Class A | | Class C | | Class I | | Class R3 | | Class R4 | | Class R5 | | Class Y | | Class F | | Class SDR |
| China A Fund(1) | | 1.45% | | 2.25% | | 1.15% | | N/A | | N/A | | N/A | | 1.11% | | 0.99% | | 0.99% |
| Diversified Emerging Markets Fund(1) | | 1.34% | | 2.14% | | 1.04% | | N/A | | N/A | | N/A | | 0.99% | | 0.89% | | 0.89% |
| Emerging Markets Multi-Sector Bond Fund(1) | | 1.15% | | 1.90% | | 0.90% | | 1.45% | | 1.15% | | 0.85% | | 0.85% | | 0.75% | | 0.75% |
| International Contrarian Value Fund(2) | | N/A | | N/A | | 0.85% | | N/A | | N/A | | N/A | | N/A | | N/A | | 0.70% |
| Securitized Income Fund(1) | | 0.85% | | 1.70% | | 0.60% | | N/A | | N/A | | N/A | | 0.55% | | 0.45% | | 0.45% |
| Sustainable International Core Fund(2) | | N/A | | N/A | | 0.85% | | N/A | | N/A | | N/A | | N/A | | N/A | | 0.70% |
| Tax-Aware Bond Fund(1) | | 0.71% | | 1.59% | | 0.49% | | N/A | | N/A | | N/A | | 0.56% | | 0.46% | | 0.46% |
| US Small Cap Opportunities Fund(1) | | 1.35% | | 2.10% | | 1.10% | | 1.65% | | 1.35% | | 1.05% | | 1.05% | | 0.95% | | 0.95% |
| (1) | February 28, 2023. |
| (2) | February 29, 2024. |
From November 1, 2021 to November 30, 2021, HFMC contractually agreed to limit the total annual fund operating expenses (exclusive of taxes, interest expenses, brokerage commissions, acquired fund fees and expenses and extraordinary expenses) as follows for the Securitized Income Fund:
| | | Expense Limit as a Percentage of Average Daily Net Assets |
| Fund | | Class A | | Class C | | Class I | | Class Y | | Class F | | Class SDR |
| Securitized Income Fund | | 1.10% | | 1.95% | | 0.85% | | 0.80% | | 0.70% | | 0.70% |
| e) | Sales Charges and Distribution and Service Plan for Class A, C, R3 and R4 Shares – Hartford Funds Distributors, LLC ("HFD"), an indirect subsidiary of The Hartford, is the principal underwriter and distributor of each Fund. For the year ended October 31, 2022, HFD received front-end sales charges and contingent deferred sales charges for each Fund as follows: |
| | |
| Fund | | Front-End
Sales Charges | | Contingent Deferred
Sales Charges |
| China A Fund | | $ 142 | | $ — |
| Diversified Emerging Markets Fund | | 2 | | — |
| Emerging Markets Equity Fund | | 7,295 | | 1,961 |
| Emerging Markets Multi-Sector Bond Fund | | 1,045 | | — |
| International Multi-Cap Value Fund | | 185,648 | | 3,900 |
| International Stock Fund | | 442,366 | | 11,261 |
| Securitized Income Fund | | 1,346 | | 7 |
| Tax-Aware Bond Fund | | 57,728 | | 10,421 |
| US MidCap Opportunities Fund | | 180,322 | | 7,415 |
| US Small Cap Opportunities Fund | | 55,711 | | 4,565 |
The Board of Directors of the Company has approved the adoption of a separate distribution plan (each a "Plan") pursuant to Rule 12b-1 under the 1940 Act for each of Class A, C, R3 and R4 shares. Under a Plan, Class A, Class C, Class R3 and Class R4 shares of a Fund, as applicable, bear distribution and/or service fees paid to HFD, some or all of which may be paid to select broker-dealers. Pursuant to the Class A Plan, a Fund may pay HFD a fee of up to 0.25% of the average daily net assets attributable to Class A shares for distribution financing activities and shareholder account servicing activities. The entire amount of the fee may be used for shareholder servicing expenses and/or distribution expenses. Pursuant to the Class C Plan, a Fund may pay HFD a fee of up to 1.00% of the average daily net assets attributable to Class C shares for distribution financing activities, and up to 0.25% may be used for shareholder account servicing activities. The Class C Plan also provides that HFD will receive all contingent deferred sales charges attributable to Class C shares. Pursuant to the Class R3 Plan, a Fund may pay HFD a fee of up to 0.50% of the average daily net assets attributable to Class R3 shares for distribution financing activities, and up to 0.25% may be used for shareholder account servicing activities. Pursuant to the Class R4 Plan, a Fund may pay HFD a fee of up to 0.25% of the average daily net assets attributable to Class R4 shares for distribution financing activities. The entire amount of the fee may be used for shareholder account servicing activities. Each Fund’s 12b-1 fees are accrued daily and paid monthly or at such other intervals as the Company’s Board of Directors may determine. Any 12b-1 fees attributable to assets held in an account held directly with the Funds’ transfer agent for which there is not a third-party listed as the broker-dealer of record (or HFD does not otherwise have a payment obligation) are generally reimbursed to the applicable Fund. Such amounts are reflected as "Distribution fee reimbursements" on the Statements of Operations.
| f) | Other Related Party Transactions – Certain officers of the Company are directors and/or officers of HFMC and/or The Hartford or its subsidiaries. For the year ended October 31, 2022, a portion of the Company’s Chief Compliance Officer’s ("CCO") compensation was paid |
Notes to Financial Statements – (continued)
October 31, 2022
| | by all of the investment companies in the Hartford fund complex. The portion allocated to each Fund, as represented in "Other expenses" on the Statements of Operations, is outlined in the table below. |
| | |
| Fund | | CCO Compensation
Paid by Fund |
| China A Fund | | $ 183 |
| Diversified Emerging Markets Fund | | 20 |
| Emerging Markets Equity Fund | | 13,566 |
| Emerging Markets Multi-Sector Bond Fund | | 72 |
| International Contrarian Value Fund | | — |
| International Multi-Cap Value Fund | | 5,698 |
| International Stock Fund | | 8,731 |
| Securitized Income Fund | | 211 |
| Sustainable International Core Fund | | — |
| Tax-Aware Bond Fund | | 920 |
| US MidCap Opportunities Fund | | 1,683 |
| US Small Cap Opportunities Fund | | 718 |
| g) | Hartford Administrative Services Company ("HASCO"), an indirect subsidiary of The Hartford, provides transfer agent services to each Fund. Each Fund pays HASCO a transfer agency fee payable monthly based on the lesser of (i) the costs of providing or overseeing transfer agency services provided to each share class of such Fund plus a target profit margin or (ii) a Specified Amount (as defined in the table below). Such fee is intended to compensate HASCO for: (i) fees payable by HASCO to DST Asset Manager Solutions, Inc. ("DST") (and any other designated sub-agent) according to the agreed-upon fee schedule under the sub-transfer agency agreement between HASCO and DST (or between HASCO and any other designated sub-agent, as applicable); (ii) sub-transfer agency fees payable by HASCO to financial intermediaries, according to the agreed-upon terms between HASCO and the financial intermediaries, provided that such payments are within certain limits approved by the Company’s Board of Directors; (iii) certain expenses that HASCO’s parent company, Hartford Funds Management Group, Inc., allocates to HASCO that relate to HASCO’s transfer agency services provided to the Fund; and (iv) a target profit margin. |
| | |
| Share Class | | Specified Amount
(as a percentage
average daily
net assets) |
| Class A | | 0.25% |
| Class C | | 0.25% |
| Class I | | 0.20% |
| Class R3 | | 0.22% |
| Class R4 | | 0.17% |
| Class R5 | | 0.12% |
| Class Y | | 0.11% |
| Class F | | 0.004% |
| Class SDR | | 0.004% |
Effective March 1, 2022, HASCO has contractually agreed to waive its transfer agency fee and/or reimburse transfer agency-related expenses to the extent necessary to limit the transfer agency fee for Class Y shares of the International Multi-Cap Value Fund as follows: 0.09%. This contractual arrangement will remain in effect until February 28, 2023, unless the Board of Directors approves its earlier termination.
From November 1, 2021 through February 28, 2022, HASCO contractually agreed to waive its transfer agency fee and/or reimburse transfer agency-related expenses to the extent necessary to limit the transfer agency fee for Class Y shares of the International Multi-Cap Value Fund to 0.08%.
Pursuant to a sub-transfer agency agreement between HASCO and DST, HASCO has delegated certain transfer agent, dividend disbursing agent and shareholder servicing agent functions to DST. Each Fund does not pay any fee directly to DST; rather, HASCO makes all such payments to DST. The accrued amount shown in the Statements of Operations reflects the amounts charged by HASCO. These fees are accrued daily and paid monthly.
Notes to Financial Statements – (continued)
October 31, 2022
For the year ended October 31, 2022, the effective rate of compensation paid to HASCO for transfer agency services as a percentage of each Class' average daily net assets is as follows:
| Fund | | Class A | | Class C | | Class I | | Class R3 | | Class R4 | | Class R5 | | Class Y | | Class F | | Class SDR |
| China A Fund | | 0.20% | | 0.15% | | 0.12% | | N/A | | N/A | | N/A | | 0.01% | | 0.00% * | | 0.00% * |
| Diversified Emerging Markets Fund | | 0.25% | | 0.25% | | 0.20% | | N/A | | N/A | | N/A | | 0.11% | | 0.00% * | | 0.00% * |
| Emerging Markets Equity Fund | | 0.25% | | 0.09% | | 0.19% | | 0.22% | | 0.16% | | 0.12% | | 0.11% | | 0.00% * | | 0.00% * |
| Emerging Markets Multi-Sector Bond Fund | | 0.19% | | 0.25% | | 0.11% | | 0.22% | | 0.17% | | 0.12% | | 0.06% | | 0.00% * | | 0.00% * |
| International Contrarian Value Fund | | N/A | | N/A | | 0.20% | | N/A | | N/A | | N/A | | N/A | | N/A | | 0.00% * |
| International Multi-Cap Value Fund | | 0.12% | | 0.11% | | 0.11% | | 0.22% | | 0.17% | | 0.11% | | 0.09% | | 0.00% * | | 0.00% * |
| International Stock Fund | | 0.11% | | 0.10% | | 0.10% | | 0.22% | | 0.17% | | 0.11% | | 0.11% | | 0.00% * | | 0.00% * |
| Securitized Income Fund | | 0.02% | | 0.09% | | 0.07% | | N/A | | N/A | | N/A | | 0.02% | | 0.00% * | | 0.00% * |
| Sustainable International Core Fund | | N/A | | N/A | | 0.20% | | N/A | | N/A | | N/A | | N/A | | N/A | | 0.00% * |
| Tax-Aware Bond Fund | | 0.06% | | 0.10% | | 0.09% | | N/A | | N/A | | N/A | | 0.11% | | 0.00% * | | 0.00% * |
| US MidCap Opportunities Fund | | 0.12% | | 0.10% | | 0.09% | | 0.22% | | 0.17% | | 0.12% | | 0.11% | | 0.00% * | | 0.00% * |
| US Small Cap Opportunities Fund | | 0.14% | | 0.14% | | 0.10% | | 0.22% | | 0.17% | | 0.12% | | 0.11% | | 0.00% * | | 0.00% * |
| 8. | Securities Lending: |
| | The Company has entered into a securities lending agency agreement ("lending agreement") with Citibank, N.A. ("Citibank"). A Fund may lend portfolio securities to certain borrowers in U.S. and non-U.S. markets in an amount not to exceed one-third (33 1/3%) of the value of its total assets. A Fund may lend portfolio securities, provided that the borrower provides collateral that is maintained in an amount at least equal to the current market value of the securities loaned. Cash collateral is invested for the benefit of a Fund by the Fund’s lending agent pursuant to collateral investment guidelines. The collateral is marked to market daily, in an amount at least equal to the current market value of the securities loaned. The contractual maturities of the securities lending transactions are considered overnight and continuous. Each of the China A Fund and the Securitized Income Fund do not currently engage in securities lending. |
| | A Fund is subject to certain risks while its securities are on loan, including the following: (i) the risk that the borrower defaults on the loan and the collateral is inadequate to cover the Fund’s loss; (ii) the risk that the earnings on the collateral invested are not sufficient to pay fees incurred in connection with the loan; (iii) the Fund could lose money in the event of a decline in the value of the collateral provided for loaned securities or a decline in the value of any investments made with cash collateral; (iv) the risk that the borrower may use the loaned securities to cover a short sale, which may in turn place downward pressure on the market prices of the loaned securities; (v) the risk that return of loaned securities could be delayed and interfere with portfolio management decisions; (vi) the risk that any efforts to restrict or recall the securities for purposes of voting may not be effective; and (vii) operational risks (i.e., the risk of losses resulting from problems in the settlement and accounting process especially so in certain international markets). These events could also trigger adverse tax consequences for the Fund. |
| | A Fund retains loan fees and the interest on cash collateral investments but is required to pay the borrower a rebate for the use of cash collateral. In cases where the lent security is of high value to borrowers, there may be a negative rebate (i.e., a net payment from the borrower to the applicable Fund). Upon termination of a loan, a Fund is required to return to the borrower an amount equal to the cash collateral, plus any rebate owed to the borrowers. |
| | The net income earned on the securities lending (after payment of rebates and Citibank’s fee) is included on the Statements of Operations as Investment Income from securities lending. A Fund also receives payments from the borrower during the period of the loan, equivalent to dividends and interest earned on the securities loaned, which are recorded as Investment Income from dividends or interest, respectively, on the Statements of Operations. |
Notes to Financial Statements – (continued)
October 31, 2022
| | The following table presents for each Fund that lends its portfolio securities the market value of the securities on loan and the cash and non-cash collateral posted by the borrower as of October 31, 2022. |
| | |
| Fund | | Investment Securities on Loan, at market value,
Presented on the Statements of Assets and Liabilities | | Cash
Collateral | | Non-Cash
Collateral(1) |
| Diversified Emerging Markets Fund | | $ 8,739 | | $ 9,316 | | $ — |
| Emerging Markets Equity Fund | | 13,022,460 | | 13,767,428 | | 183 |
| Emerging Markets Multi-Sector Bond Fund | | 973,390 | | 1,023,465 | | — |
| International Contrarian Value Fund | | — | | — | | — |
| International Multi-Cap Value Fund | | 21,298,659 | | 22,858,739 | | 949,664 |
| International Stock Fund | | 4,220,021 | | 4,417,868 | | — |
| Sustainable International Core Fund | | — | | — | | — |
| Tax-Aware Bond Fund | | — | | — | | — |
| US MidCap Opportunities Fund | | — | | — | | — |
| US Small Cap Opportunities Fund | | 5,871,509 | | 6,137,179 | | — |
| (1) | It is each Fund’s policy to obtain additional collateral from, or return excess collateral to, the borrower by the end of the next business day following the valuation date of the securities loaned. Therefore, the value of the collateral held may be temporarily less than that required under the lending contract due to timing. Pursuant to the lending agreement, the borrower will provide collateral in an amount at least equal to the current market value of securities loaned. |
| 9. | Affiliate Holdings: |
| | As of October 31, 2022, affiliates of The Hartford had ownership of shares in certain Funds as follows: |
| | |
| Percentage of a Class: | | | | | | | | | | | | | | | | | | |
| Fund | | Class A | | Class C | | Class I | | Class R3 | | Class R4 | | Class R5 | | Class Y | | Class F | | Class SDR |
| China A Fund | | 27% | | 87% | | 1% | | N/A | | N/A | | N/A | | 9% | | 6% | | — |
| Diversified Emerging Markets Fund | | 70% | | 100% | | 100% | | N/A | | N/A | | N/A | | 75% | | 100% | | 50% |
| Emerging Markets Equity Fund | | — | | — | | — | | 14% | | — | | — | | — | | — | | — |
| Emerging Markets Multi-Sector Bond Fund | | — | | — | | — | | 32% | | 100% | | 100% | | 0%* | | 100% | | — |
| International Contrarian Value Fund | | N/A | | N/A | | 100% | | N/A | | N/A | | N/A | | N/A | | N/A | | — |
| Securitized Income Fund | | 84% | | 4% | | 9% | | N/A | | N/A | | N/A | | 87% | | 100% | | — |
| Sustainable International Core Fund | | N/A | | N/A | | 100% | | N/A | | N/A | | N/A | | N/A | | N/A | | — |
| Tax-Aware Bond Fund | | — | | — | | — | | N/A | | N/A | | N/A | | 4% | | — | | — |
| * | Percentage rounds to zero. |
| Percentage of Fund by Class: | | | | | | | | | | | | | | | | | | |
| Fund | | Class A | | Class C | | Class I | | Class R3 | | Class R4 | | Class R5 | | Class Y | | Class F | | Class SDR |
| China A Fund | | 0% * | | 0%* | | 0%* | | N/A | | N/A | | N/A | | 0%* | | 4% | | — |
| Diversified Emerging Markets Fund | | 0% * | | 0%* | | 0%* | | N/A | | N/A | | N/A | | 0%* | | 0% * | | 50% |
| Emerging Markets Equity Fund | | — | | — | | — | | 0%* | | — | | — | | — | | — | | — |
| Emerging Markets Multi-Sector Bond Fund | | — | | — | | — | | 0%* | | 0% * | | 0% * | | 0%* | | 0% * | | — |
| International Contrarian Value Fund | | N/A | | N/A | | 50% | | N/A | | N/A | | N/A | | N/A | | N/A | | — |
| Securitized Income Fund | | 5% | | 0%* | | 6% | | N/A | | N/A | | N/A | | 6% | | 3% | | — |
| Sustainable International Core Fund | | N/A | | N/A | | 50% | | N/A | | N/A | | N/A | | N/A | | N/A | | — |
| Tax-Aware Bond Fund | | — | | — | | — | | N/A | | N/A | | N/A | | 0%* | | — | | — |
| * | Percentage rounds to zero. |
As of October 31, 2022, affiliated funds of funds and the 529 plan for which HFMC serves as the program manager (the "529 plan") in the aggregate owned a portion of the Funds identified below. Therefore, these Funds may experience relatively large purchases or redemptions of their shares as a result of purchase and sale activity from these affiliated funds of funds and the 529 plan. Affiliated funds of funds and the 529 plan owned shares in the Funds listed below as follows:
| Fund | | Percentage
of Fund* |
| Emerging Markets Equity Fund | | 1% |
| International Multi-Cap Value Fund | | 3% |
| * | As of October 31, 2022, affiliated funds of funds and the 529 plan were invested in Class F shares. |
Notes to Financial Statements – (continued)
October 31, 2022
| 10. | Beneficial Fund Ownership: |
| | As of October 31, 2022, to the knowledge of a Fund, the shareholders listed below beneficially held more than 25% of the shares outstanding of a Fund. |
| | |
| Fund | | Shareholder | | Percentage of Ownership |
| Diversified Emerging Markets Fund | | Schroder US Holdings, Inc | | 50% |
| Hartford Funds Management Company, LLC | | 50% |
| International Contrarian Value Fund | | Schroder US Holdings, Inc | | 50% |
| Hartford Funds Management Company, LLC | | 50% |
| Sustainable International Core Fund | | Schroder US Holdings, Inc | | 50% |
| Hartford Funds Management Company, LLC | | 50% |
| 11. | Investment Transactions: |
| | For the period ended October 31, 2022, the cost of purchases and proceeds from sales of investment securities (excluding short-term investments) were as follows: |
| | |
| Fund | | Cost of Purchases
Excluding U.S.
Government
Obligations | | Sales Proceeds
Excluding U.S.
Government
Obligations | | Cost of Purchases
For U.S. Government
Obligations | | Sales Proceeds
For U.S. Government
Obligations | | Total Cost of
Purchases | | Total Sales
Proceeds |
| China A Fund | | $ 50,460,480 | | $ 43,809,974 | | $ — | | $ — | | $ 50,460,480 | | $ 43,809,974 |
| Diversified Emerging Markets Fund | | 8,763,313 | | 7,600,855 | | — | | — | | 8,763,313 | | 7,600,855 |
| Emerging Markets Equity Fund | | 2,806,251,460 | | 2,295,196,739 | | — | | — | | 2,806,251,460 | | 2,295,196,739 |
| Emerging Markets Multi-Sector Bond Fund | | 38,503,823 | | 41,976,631 | | — | | — | | 38,503,823 | | 41,976,631 |
| International Contrarian Value Fund | | 1,081,915 | | 69,412 | | — | | — | | 1,081,915 | | 69,412 |
| International Multi-Cap Value Fund | | 2,598,116,551 | | 2,408,959,998 | | — | | — | | 2,598,116,551 | | 2,408,959,998 |
| International Stock Fund | | 2,524,068,183 | | 1,288,425,947 | | — | | — | | 2,524,068,183 | | 1,288,425,947 |
| Securitized Income Fund | | 23,754,384 | | 75,413,444 | | 10,055,328 | | 13,609,513 | | 33,809,712 | | 89,022,957 |
| Sustainable International Core Fund | | 1,148,603 | | 154,846 | | — | | — | | 1,148,603 | | 154,846 |
| Tax-Aware Bond Fund | | 207,902,285 | | 214,764,786 | | 368,800,244 | | 360,601,309 | | 576,702,529 | | 575,366,095 |
| US MidCap Opportunities Fund | | 309,799,048 | | 349,170,254 | | — | | — | | 309,799,048 | | 349,170,254 |
| US Small Cap Opportunities Fund | | 117,268,045 | | 125,149,406 | | — | | — | | 117,268,045 | | 125,149,406 |
| 12. | Capital Share Transactions: |
| | The following information is for the year or period ended October 31, 2022 and October 31, 2021: |
| | |
| | For the Year Ended
October 31, 2022 | | For the Year Ended
October 31, 2021 |
| | Shares | | Amount | | Shares | | Amount |
| China A Fund | | | | | | | |
| Class A | | | | | | | |
| Shares Sold | 9,385 | | $ 133,010 | | 79,611 | | $ 1,298,148 |
| Shares Issued for Reinvested Dividends | 496 | | 8,251 | | 3,414 | | 51,074 |
| Shares Redeemed | (17,911) | | (262,246) | | (58,087) | | (925,156) |
| Net Increase (Decrease) | (8,030) | | (120,985) | | 24,938 | | 424,066 |
| Class C | | | | | | | |
| Shares Sold | — | | $ — | | 401 | | $ 6,000 |
| Shares Issued for Reinvested Dividends | 165 | | 2,701 | | 1,166 | | 17,324 |
| Shares Redeemed | (148) | | (2,008) | | (636) | | (10,083) |
| Net Increase (Decrease) | 17 | | 693 | | 931 | | 13,241 |
| Class I | | | | | | | |
| Shares Sold | 708,416 | | $ 10,078,307 | | 559,782 | | $ 9,060,215 |
| Shares Issued for Reinvested Dividends | 6,198 | | 103,128 | | 1,578 | | 23,649 |
| Shares Redeemed | (348,354) | | (4,598,210) | | (81,523) | | (1,288,921) |
| Net Increase (Decrease) | 366,260 | | 5,583,225 | | 479,837 | | 7,794,943 |
Notes to Financial Statements – (continued)
October 31, 2022
| | For the Year Ended
October 31, 2022 | | For the Year Ended
October 31, 2021 |
| | Shares | | Amount | | Shares | | Amount |
| Class Y | | | | | | | |
| Shares Sold | 80,580 | | $ 976,699 | | 1,609,643 | | $ 26,810,000 |
| Shares Issued for Reinvested Dividends | 2,394 | | 39,890 | | 1,078 | | 16,158 |
| Shares Redeemed | (141,378) | | (1,504,424) | | (1,431,981) | | (23,642,005) |
| Net Increase (Decrease) | (58,404) | | (487,835) | | 178,740 | | 3,184,153 |
| Class F | | | | | | | |
| Shares Sold | 1,375,804 | | $ 18,285,291 | | 4,287,332 | | $ 69,076,976 |
| Shares Issued for Reinvested Dividends | 53,977 | | 899,258 | | 21,609 | | 324,076 |
| Shares Redeemed | (1,237,089) | | (15,979,294) | | (518,930) | | (8,268,522) |
| Net Increase (Decrease) | 192,692 | | 3,205,255 | | 3,790,011 | | 61,132,530 |
| Class SDR | | | | | | | |
| Shares Sold | — | | $ — | | — | | $ — |
| Shares Issued for Reinvested Dividends | — | | — | | — | | — |
| Shares Redeemed | — | | — | | — | | — |
| Net Increase (Decrease) | — | | — | | — | | — |
| Total Net Increase (Decrease) | 492,535 | | $ 8,180,353 | | 4,474,457 | | $ 72,548,933 |
| Diversified Emerging Markets Fund(1) | | | | | | | |
| Class A(2) | | | | | | | |
| Shares Sold | 1,521 | | $ 13,187 | | — | | $ — |
| Net Increase (Decrease) | 1,521 | | 13,187 | | — | | — |
| Class C(2) | | | | | | | |
| Shares Sold | 1,061 | | $ 10,000 | | — | | $ — |
| Net Increase (Decrease) | 1,061 | | 10,000 | | — | | — |
| Class I(2) | | | | | | | |
| Shares Sold | 1,061 | | $ 10,000 | | — | | $ — |
| Net Increase (Decrease) | 1,061 | | 10,000 | | — | | — |
| Class Y(2) | | | | | | | |
| Shares Sold | 1,422 | | $ 12,850 | | — | | $ — |
| Net Increase (Decrease) | 1,422 | | 12,850 | | — | | — |
| Class F(2) | | | | | | | |
| Shares Sold | 1,061 | | $ 10,000 | | — | | $ — |
| Net Increase (Decrease) | 1,061 | | 10,000 | | — | | — |
| Class SDR | | | | | | | |
| Shares Sold | 282 | | $ 2,629 | | 1,000,001 | | $ 10,000,010 |
| Shares Issued for Reinvested Dividends | 2,576 | | 25,504 | | — | | — |
| Shares Redeemed | (5,308) | | (50,000) | | (1) | | (10) |
| Net Increase (Decrease) | (2,450) | | (21,867) | | 1,000,000 | | 10,000,000 |
| Total Net Increase (Decrease) | 3,676 | | $ 34,170 | | 1,000,000 | | $ 10,000,000 |
| Emerging Markets Equity Fund | | | | | | | |
| Class A | | | | | | | |
| Shares Sold | 3,144,857 | | $ 52,286,198 | | 36,308,664 | | $ 733,571,336 |
| Shares Issued for Reinvested Dividends | 5,507 | | 104,621 | | 258,333 | | 5,148,579 |
| Shares Redeemed | (2,734,451) | | (45,124,654) | | (35,276,754) | | (754,119,916) |
| Net Increase (Decrease) | 415,913 | | 7,266,165 | | 1,290,243 | | (15,400,001) |
| Class C | | | | | | | |
| Shares Sold | 30,797 | | $ 541,901 | | 123,952 | | $ 2,605,435 |
| Shares Issued for Reinvested Dividends | 1,281 | | 23,946 | | — | | — |
| Shares Redeemed | (164,970) | | (2,418,551) | | (97,854) | | (1,992,405) |
| Net Increase (Decrease) | (132,892) | | (1,852,704) | | 26,098 | | 613,030 |
| Class I | | | | | | | |
| Shares Sold | 55,222,381 | | $ 926,254,984 | | 56,431,151 | | $ 1,193,073,411 |
| Shares Issued for Reinvested Dividends | 707,597 | | 13,366,510 | | 464,881 | | 9,279,021 |
| Shares Redeemed | (43,293,639) | | (714,803,335) | | (25,131,200) | | (525,557,724) |
| Net Increase (Decrease) | 12,636,339 | | 224,818,159 | | 31,764,832 | | 676,794,708 |
Notes to Financial Statements – (continued)
October 31, 2022
| | For the Year Ended
October 31, 2022 | | For the Year Ended
October 31, 2021 |
| | Shares | | Amount | | Shares | | Amount |
| Class R3 | | | | | | | |
| Shares Sold | 1,094 | | $ 17,136 | | 645 | | $ 13,351 |
| Shares Issued for Reinvested Dividends | 37 | | 703 | | 17 | | 330 |
| Shares Redeemed | (371) | | (6,794) | | (792) | | (14,775) |
| Net Increase (Decrease) | 760 | | 11,045 | | (130) | | (1,094) |
| Class R4 | | | | | | | |
| Shares Sold | 150,667 | | $ 2,373,387 | | 59,355 | | $ 1,241,955 |
| Shares Issued for Reinvested Dividends | 2,734 | | 51,898 | | 1,894 | | 37,977 |
| Shares Redeemed | (46,313) | | (750,969) | | (49,612) | | (1,048,202) |
| Net Increase (Decrease) | 107,088 | | 1,674,316 | | 11,637 | | 231,730 |
| Class R5 | | | | | | | |
| Shares Sold | 3,363 | | $ 56,321 | | 4,821 | | $ 105,573 |
| Shares Issued for Reinvested Dividends | 268 | | 5,061 | | 146 | | 2,909 |
| Shares Redeemed | (1,778) | | (30,591) | | (3,234) | | (66,710) |
| Net Increase (Decrease) | 1,853 | | 30,791 | | 1,733 | | 41,772 |
| Class Y | | | | | | | |
| Shares Sold | 125,556,366 | | $ 2,138,110,148 | | 56,182,329 | | $ 1,188,725,143 |
| Shares Issued for Reinvested Dividends | 691,784 | | 13,102,388 | | 27,484 | | 550,220 |
| Shares Redeemed | (162,990,961) | | (2,617,613,159) | | (41,414,742) | | (832,689,032) |
| Net Increase (Decrease) | (36,742,811) | | (466,400,623) | | 14,795,071 | | 356,586,331 |
| Class F | | | | | | | |
| Shares Sold | 13,532,858 | | $ 231,401,984 | | 22,506,430 | | $ 474,432,411 |
| Shares Issued for Reinvested Dividends | 119,590 | | 2,259,074 | | 171,016 | | 3,411,762 |
| Shares Redeemed | (15,652,329) | | (258,973,847) | | (20,567,063) | | (417,122,964) |
| Net Increase (Decrease) | (1,999,881) | | (25,312,789) | | 2,110,383 | | 60,721,209 |
| Class SDR | | | | | | | |
| Shares Sold | 115,820,251 | | $ 1,735,331,057 | | 59,760,937 | | $ 1,249,192,389 |
| Shares Issued for Reinvested Dividends | 1,576,441 | | 29,826,253 | | 687,644 | | 13,746,007 |
| Shares Redeemed | (60,935,901) | | (900,664,496) | | (19,170,448) | | (394,374,428) |
| Net Increase (Decrease) | 56,460,791 | | 864,492,814 | | 41,278,133 | | 868,563,968 |
| Total Net Increase (Decrease) | 30,747,160 | | $ 604,727,174 | | 91,278,000 | | $ 1,948,151,653 |
| Emerging Markets Multi-Sector Bond Fund | | | | | | | |
| Class A | | | | | | | |
| Shares Sold | 31,961 | | $ 214,718 | | 47,327 | | $ 412,229 |
| Shares Issued for Reinvested Dividends | 8,966 | | 62,204 | | 8,151 | | 69,539 |
| Shares Redeemed | (66,954) | | (488,297) | | (75,660) | | (659,703) |
| Net Increase (Decrease) | (26,027) | | (211,375) | | (20,182) | | (177,935) |
| Class C | | | | | | | |
| Shares Sold | — | | $ — | | 3,257 | | $ 28,142 |
| Shares Issued for Reinvested Dividends | 571 | | 3,971 | | 682 | | 5,800 |
| Shares Redeemed | (6,414) | | (47,154) | | (13,769) | | (116,669) |
| Net Increase (Decrease) | (5,843) | | (43,183) | | (9,830) | | (82,727) |
| Class I | | | | | | | |
| Shares Sold | 665,444 | | $ 4,910,224 | | 1,037,078 | | $ 8,815,527 |
| Shares Issued for Reinvested Dividends | 94,355 | | 665,223 | | 94,845 | | 808,423 |
| Shares Redeemed | (1,860,008) | | (13,232,268) | | (1,422,965) | | (12,291,788) |
| Net Increase (Decrease) | (1,100,209) | | (7,656,821) | | (291,042) | | (2,667,838) |
| Class R3 | | | | | | | |
| Shares Sold | 464 | | $ 3,490 | | 95 | | $ 814 |
| Shares Issued for Reinvested Dividends | 216 | | 1,484 | | 132 | | 1,124 |
| Shares Redeemed | (6) | | (40) | | (4) | | (35) |
| Net Increase (Decrease) | 674 | | 4,934 | | 223 | | 1,903 |
| Class R4 | | | | | | | |
| Shares Issued for Reinvested Dividends | 77 | | $ 532 | | 52 | | $ 447 |
| Net Increase (Decrease) | 77 | | 532 | | 52 | | 447 |
| Class R5 | | | | | | | |
| Shares Issued for Reinvested Dividends | 83 | | $ 566 | | 56 | | $ 484 |
| Net Increase (Decrease) | 83 | | 566 | | 56 | | 484 |
Notes to Financial Statements – (continued)
October 31, 2022
| | For the Year Ended
October 31, 2022 | | For the Year Ended
October 31, 2021 |
| | Shares | | Amount | | Shares | | Amount |
| Class Y | | | | | | | |
| Shares Sold | 32,193 | | $ 263,589 | | 53,623 | | $ 450,000 |
| Shares Issued for Reinvested Dividends | 23,257 | | 160,354 | | 12,859 | | 109,352 |
| Shares Redeemed | (3,346) | | (23,759) | | — | | — |
| Net Increase (Decrease) | 52,104 | | 400,184 | | 66,482 | | 559,352 |
| Class F | | | | | | | |
| Shares Issued for Reinvested Dividends | 102 | | $ 658 | | 71 | | $ 563 |
| Net Increase (Decrease) | 102 | | 658 | | 71 | | 563 |
| Class SDR | | | | | | | |
| Shares Sold | 53,653 | | $ 399,363 | | 1,855,889 | | $ 15,638,325 |
| Shares Issued for Reinvested Dividends | 153,241 | | 1,056,748 | | 127,085 | | 1,083,054 |
| Shares Redeemed | (57,452) | | (436,331) | | (3,676,965) | | (31,301,994) |
| Net Increase (Decrease) | 149,442 | | 1,019,780 | | (1,693,991) | | (14,580,615) |
| Total Net Increase (Decrease) | (929,597) | | $ (6,484,725) | | (1,948,161) | | $ (16,946,366) |
| International Contrarian Value Fund(3) | | | | | | | |
| Class I | | | | | | | |
| Shares Sold | 50,001 | | $ 500,010 | | | | |
| Shares Redeemed | (1) | | (11) | | | | |
| Net Increase (Decrease) | 50,000 | | 499,999 | | | | |
| Class SDR | | | | | | | |
| Shares Sold | 50,001 | | $ 500,010 | | | | |
| Shares Redeemed | (1) | | (10) | | | | |
| Net Increase (Decrease) | 50,000 | | 500,000 | | | | |
| Total Net Increase (Decrease) | 100,000 | | $ 999,999 | | | | |
| International Multi-Cap Value Fund | | | | | | | |
| Class A | | | | | | | |
| Shares Sold | 3,969,095 | | $ 38,712,258 | | 3,119,668 | | $ 31,670,732 |
| Shares Issued for Reinvested Dividends | 334,971 | | 3,126,679 | | 192,316 | | 1,906,426 |
| Shares Redeemed | (2,136,771) | | (19,814,377) | | (2,158,176) | | (21,202,027) |
| Net Increase (Decrease) | 2,167,295 | | 22,024,560 | | 1,153,808 | | 12,375,131 |
| Class C | | | | | | | |
| Shares Sold | 260,513 | | $ 2,681,470 | | 192,389 | | $ 1,951,130 |
| Shares Issued for Reinvested Dividends | 31,059 | | 292,479 | | 22,890 | | 223,413 |
| Shares Redeemed | (508,156) | | (4,774,650) | | (427,573) | | (4,192,351) |
| Net Increase (Decrease) | (216,584) | | (1,800,701) | | (212,294) | | (2,017,808) |
| Class I | | | | | | | |
| Shares Sold | 37,132,233 | | $ 357,740,863 | | 27,019,314 | | $ 273,064,831 |
| Shares Issued for Reinvested Dividends | 2,341,766 | | 21,826,880 | | 1,579,191 | | 15,688,134 |
| Shares Redeemed | (31,864,455) | | (293,182,448) | | (28,763,882) | | (283,248,146) |
| Net Increase (Decrease) | 7,609,544 | | 86,385,295 | | (165,377) | | 5,504,819 |
| Class R3 | | | | | | | |
| Shares Sold | 543,984 | | $ 5,061,125 | | 451,422 | | $ 4,539,473 |
| Shares Issued for Reinvested Dividends | 44,436 | | 416,427 | | 33,416 | | 328,548 |
| Shares Redeemed | (598,538) | | (5,581,378) | | (547,780) | | (5,546,589) |
| Net Increase (Decrease) | (10,118) | | (103,826) | | (62,942) | | (678,568) |
| Class R4 | | | | | | | |
| Shares Sold | 101,651 | | $ 961,522 | | 345,107 | | $ 3,431,953 |
| Shares Issued for Reinvested Dividends | 16,751 | | 156,516 | | 10,331 | | 103,502 |
| Shares Redeemed | (125,006) | | (1,172,011) | | (83,743) | | (835,688) |
| Net Increase (Decrease) | (6,604) | | (53,973) | | 271,695 | | 2,699,767 |
| Class R5 | | | | | | | |
| Shares Sold | 483,544 | | $ 4,467,895 | | 554,831 | | $ 5,385,186 |
| Shares Issued for Reinvested Dividends | 53,588 | | 503,439 | | 48,233 | | 473,876 |
| Shares Redeemed | (632,737) | | (6,351,772) | | (1,044,634) | | (10,154,724) |
| Net Increase (Decrease) | (95,605) | | (1,380,438) | | (441,570) | | (4,295,662) |
Notes to Financial Statements – (continued)
October 31, 2022
| | For the Year Ended
October 31, 2022 | | For the Year Ended
October 31, 2021 |
| | Shares | | Amount | | Shares | | Amount |
| Class Y | | | | | | | |
| Shares Sold | 11,500,546 | | $ 111,963,654 | | 11,839,608 | | $ 116,506,159 |
| Shares Issued for Reinvested Dividends | 1,057,829 | | 9,843,991 | | 640,600 | | 6,350,181 |
| Shares Redeemed | (9,501,430) | | (83,923,920) | | (6,086,109) | | (62,073,760) |
| Net Increase (Decrease) | 3,056,945 | | 37,883,725 | | 6,394,099 | | 60,782,580 |
| Class F | | | | | | | |
| Shares Sold | 18,214,855 | | $ 172,764,909 | | 19,714,834 | | $ 200,134,513 |
| Shares Issued for Reinvested Dividends | 1,491,960 | | 13,923,670 | | 914,358 | | 9,110,634 |
| Shares Redeemed | (17,024,072) | | (160,777,808) | | (10,673,807) | | (106,051,569) |
| Net Increase (Decrease) | 2,682,743 | | 25,910,771 | | 9,955,385 | | 103,193,578 |
| Class SDR | | | | | | | |
| Shares Sold | 24,161,009 | | $ 232,052,285 | | 36,805,961 | | $ 364,572,607 |
| Shares Issued for Reinvested Dividends | 2,709,276 | | 25,367,032 | | 1,978,197 | | 19,582,590 |
| Shares Redeemed | (31,439,433) | | (298,002,137) | | (28,732,672) | | (284,955,477) |
| Net Increase (Decrease) | (4,569,148) | | (40,582,820) | | 10,051,486 | | 99,199,720 |
| Total Net Increase (Decrease) | 10,618,468 | | $ 128,282,593 | | 26,944,290 | | $ 276,763,557 |
| International Stock Fund | | | | | | | |
| Class A | | | | | | | |
| Shares Sold | 5,420,422 | | $ 88,898,122 | | 8,837,396 | | $ 158,876,977 |
| Shares Issued for Reinvested Dividends | 241,771 | | 4,491,371 | | 1,911 | | 32,461 |
| Shares Redeemed | (5,178,862) | | (80,095,955) | | (1,944,352) | | (35,151,106) |
| Net Increase (Decrease) | 483,331 | | 13,293,538 | | 6,894,955 | | 123,758,332 |
| Class C | | | | | | | |
| Shares Sold | 323,136 | | $ 5,254,695 | | 740,492 | | $ 12,700,219 |
| Shares Issued for Reinvested Dividends | 10,583 | | 184,799 | | — | | — |
| Shares Redeemed | (300,987) | | (4,340,336) | | (82,030) | | (1,412,935) |
| Net Increase (Decrease) | 32,732 | | 1,099,158 | | 658,462 | | 11,287,284 |
| Class I | | | | | | | |
| Shares Sold | 108,872,670 | | $ 1,695,721,112 | | 87,401,083 | | $ 1,526,402,071 |
| Shares Issued for Reinvested Dividends | 1,930,718 | | 34,706,711 | | 128,684 | | 2,114,283 |
| Shares Redeemed | (74,625,554) | | (1,118,379,282) | | (18,010,716) | | (319,129,489) |
| Net Increase (Decrease) | 36,177,834 | | 612,048,541 | | 69,519,051 | | 1,209,386,865 |
| Class R3 | | | | | | | |
| Shares Sold | 117,126 | | $ 1,739,146 | | 35,715 | | $ 599,480 |
| Shares Issued for Reinvested Dividends | 900 | | 16,059 | | — | | — |
| Shares Redeemed | (31,319) | | (467,955) | | (24,649) | | (436,671) |
| Net Increase (Decrease) | 86,707 | | 1,287,250 | | 11,066 | | 162,809 |
| Class R4 | | | | | | | |
| Shares Sold | 114,159 | | $ 1,866,632 | | 55,476 | | $ 972,356 |
| Shares Issued for Reinvested Dividends | 4,048 | | 72,581 | | 43 | | 701 |
| Shares Redeemed | (52,286) | | (746,656) | | (32,578) | | (571,973) |
| Net Increase (Decrease) | 65,921 | | 1,192,557 | | 22,941 | | 401,084 |
| Class R5 | | | | | | | |
| Shares Sold | 782,962 | | $ 12,441,571 | | 610,480 | | $ 10,516,058 |
| Shares Issued for Reinvested Dividends | 27,948 | | 502,674 | | 3,171 | | 52,125 |
| Shares Redeemed | (344,424) | | (5,236,938) | | (173,831) | | (3,084,332) |
| Net Increase (Decrease) | 466,486 | | 7,707,307 | | 439,820 | | 7,483,851 |
| Class Y | | | | | | | |
| Shares Sold | 2,189,922 | | $ 36,339,650 | | 9,099,927 | | $ 157,454,989 |
| Shares Issued for Reinvested Dividends | 266,396 | | 4,802,050 | | 20,632 | | 340,017 |
| Shares Redeemed | (5,513,544) | | (82,168,396) | | (594,350) | | (10,590,133) |
| Net Increase (Decrease) | (3,057,226) | | (41,026,696) | | 8,526,209 | | 147,204,873 |
| Class F | | | | | | | |
| Shares Sold | 29,140,024 | | $ 455,053,231 | | 24,072,686 | | $ 422,064,011 |
| Shares Issued for Reinvested Dividends | 743,026 | | 13,374,470 | | 60,241 | | 990,360 |
| Shares Redeemed | (11,078,766) | | (167,216,529) | | (3,069,438) | | (53,817,085) |
| Net Increase (Decrease) | 18,804,284 | | 301,211,172 | | 21,063,489 | | 369,237,286 |
Notes to Financial Statements – (continued)
October 31, 2022
| | For the Year Ended
October 31, 2022 | | For the Year Ended
October 31, 2021 |
| | Shares | | Amount | | Shares | | Amount |
| Class SDR | | | | | | | |
| Shares Sold | 23,013,973 | | $ 361,009,997 | | 17,507,759 | | $ 305,654,018 |
| Shares Issued for Reinvested Dividends | 501,264 | | 9,014,558 | | 51,342 | | 843,556 |
| Shares Redeemed | (5,872,106) | | (86,975,258) | | (3,315,061) | | (58,859,246) |
| Net Increase (Decrease) | 17,643,131 | | 283,049,297 | | 14,244,040 | | 247,638,328 |
| Total Net Increase (Decrease) | 70,703,200 | | $ 1,179,862,124 | | 121,380,033 | | $ 2,116,560,712 |
| Securitized Income Fund | | | | | | | |
| Class A | | | | | | | |
| Shares Sold | 254,499 | | $ 2,475,452 | | 121,794 | | $ 1,209,452 |
| Shares Issued for Reinvested Dividends | 11,566 | | 109,491 | | 8,519 | | 84,434 |
| Shares Redeemed | (339,569) | | (3,274,911) | | (176,058) | | (1,751,542) |
| Net Increase (Decrease) | (73,504) | | (689,968) | | (45,745) | | (457,656) |
| Class C | | | | | | | |
| Shares Sold | 6,520 | | $ 62,429 | | 22,841 | | $ 226,983 |
| Shares Issued for Reinvested Dividends | 532 | | 5,017 | | 329 | | 3,248 |
| Shares Redeemed | (22,544) | | (211,827) | | (24,701) | | (245,738) |
| Net Increase (Decrease) | (15,492) | | (144,381) | | (1,531) | | (15,507) |
| Class I | | | | | | | |
| Shares Sold | 2,233,642 | | $ 21,730,241 | | 5,640,264 | | $ 56,021,872 |
| Shares Issued for Reinvested Dividends | 169,366 | | 1,607,745 | | 130,288 | | 1,291,127 |
| Shares Redeemed | (7,390,428) | | (70,517,666) | | (3,450,666) | | (34,224,582) |
| Net Increase (Decrease) | (4,987,420) | | (47,179,680) | | 2,319,886 | | 23,088,417 |
| Class Y | | | | | | | |
| Shares Sold | — | | $ — | | 82,467 | | $ 817,254 |
| Shares Issued for Reinvested Dividends | 11,750 | | 110,676 | | 7,346 | | 72,758 |
| Shares Redeemed | — | | — | | (31,177) | | (309,365) |
| Net Increase (Decrease) | 11,750 | | 110,676 | | 58,636 | | 580,647 |
| Class F | | | | | | | |
| Shares Issued for Reinvested Dividends | 6,118 | | $ 57,621 | | 4,014 | | $ 39,737 |
| Net Increase (Decrease) | 6,118 | | 57,621 | | 4,014 | | 39,737 |
| Class SDR | | | | | | | |
| Shares Sold | — | | $ — | | 754,606 | | $ 7,478,000 |
| Shares Issued for Reinvested Dividends | 32,436 | | 305,698 | | 16,390 | | 162,354 |
| Shares Redeemed | (802,591) | | (7,793,487) | | — | | — |
| Net Increase (Decrease) | (770,155) | | (7,487,789) | | 770,996 | | 7,640,354 |
| Total Net Increase (Decrease) | (5,828,703) | | $ (55,333,521) | | 3,106,256 | | $ 30,875,992 |
| Sustainable International Core Fund(3) | | | | | | | |
| Class I | | | | | | | |
| Shares Sold | 50,001 | | $ 500,010 | | | | |
| Shares Redeemed | (1) | | (11) | | | | |
| Net Increase (Decrease) | 50,000 | | 499,999 | | | | |
| Class SDR | | | | | | | |
| Shares Sold | 50,001 | | $ 500,010 | | | | |
| Shares Redeemed | (1) | | (10) | | | | |
| Net Increase (Decrease) | 50,000 | | 500,000 | | | | |
| Total Net Increase (Decrease) | 100,000 | | $ 999,999 | | | | |
| Tax-Aware Bond Fund | | | | | | | |
| Class A | | | | | | | |
| Shares Sold | 1,373,862 | | $ 14,067,798 | | 1,741,910 | | $ 19,878,259 |
| Shares Issued for Reinvested Dividends | 147,221 | | 1,578,008 | | 126,621 | | 1,442,775 |
| Shares Redeemed | (3,180,461) | | (32,954,090) | | (1,179,190) | | (13,432,195) |
| Net Increase (Decrease) | (1,659,378) | | (17,308,284) | | 689,341 | | 7,888,839 |
Notes to Financial Statements – (continued)
October 31, 2022
| | For the Year Ended
October 31, 2022 | | For the Year Ended
October 31, 2021 |
| | Shares | | Amount | | Shares | | Amount |
| Class C | | | | | | | |
| Shares Sold | 61,878 | | $ 627,838 | | 70,850 | | $ 808,470 |
| Shares Issued for Reinvested Dividends | 11,688 | | 126,622 | | 11,340 | | 129,366 |
| Shares Redeemed | (307,058) | | (3,255,017) | | (156,997) | | (1,790,148) |
| Net Increase (Decrease) | (233,492) | | (2,500,557) | | (74,807) | | (852,312) |
| Class I | | | | | | | |
| Shares Sold | 18,011,789 | | $ 184,657,435 | | 9,285,209 | | $ 105,989,966 |
| Shares Issued for Reinvested Dividends | 632,849 | | 6,689,376 | | 518,954 | | 5,918,013 |
| Shares Redeemed | (17,152,818) | | (177,770,396) | | (9,814,495) | | (111,991,453) |
| Net Increase (Decrease) | 1,491,820 | | 13,576,415 | | (10,332) | | (83,474) |
| Class Y | | | | | | | |
| Shares Sold | 6,178 | | $ 68,000 | | 6,206 | | $ 70,000 |
| Shares Issued for Reinvested Dividends | 834 | | 8,866 | | 486 | | 5,542 |
| Shares Redeemed | (6,307) | | (68,214) | | (6) | | (67) |
| Net Increase (Decrease) | 705 | | 8,652 | | 6,686 | | 75,475 |
| Class F | | | | | | | |
| Shares Sold | 3,811,234 | | $ 38,477,443 | | 1,578,206 | | $ 18,003,067 |
| Shares Issued for Reinvested Dividends | 107,260 | | 1,140,108 | | 79,668 | | 908,464 |
| Shares Redeemed | (2,479,185) | | (25,756,107) | | (915,304) | | (10,439,970) |
| Net Increase (Decrease) | 1,439,309 | | 13,861,444 | | 742,570 | | 8,471,561 |
| Class SDR | | | | | | | |
| Shares Sold | 721,477 | | $ 7,300,392 | | 806,356 | | $ 9,185,200 |
| Shares Issued for Reinvested Dividends | 95,950 | | 1,035,417 | | 84,192 | | 960,177 |
| Shares Redeemed | (1,079,179) | | (10,852,434) | | (600,601) | | (6,852,354) |
| Net Increase (Decrease) | (261,752) | | (2,516,625) | | 289,947 | | 3,293,023 |
| Total Net Increase (Decrease) | 777,212 | | $ 5,121,045 | | 1,643,405 | | $ 18,793,112 |
| US MidCap Opportunities Fund | | | | | | | |
| Class A | | | | | | | |
| Shares Sold | 1,868,261 | | $ 31,440,976 | | 1,210,595 | | $ 22,793,512 |
| Shares Issued for Reinvested Dividends | 829,476 | | 15,005,217 | | 4,107 | | 69,120 |
| Shares Redeemed | (1,109,382) | | (18,771,474) | | (927,065) | | (17,122,126) |
| Net Increase (Decrease) | 1,588,355 | | 27,674,719 | | 287,637 | | 5,740,506 |
| Class C | | | | | | | |
| Shares Sold | 146,816 | | $ 2,488,130 | | 288,995 | | $ 5,282,477 |
| Shares Issued for Reinvested Dividends | 422,177 | | 7,628,739 | | — | | — |
| Shares Redeemed | (598,927) | | (9,986,755) | | (618,074) | | (11,506,800) |
| Net Increase (Decrease) | (29,934) | | 130,114 | | (329,079) | | (6,224,323) |
| Class I | | | | | | | |
| Shares Sold | 6,635,474 | | $ 115,668,805 | | 4,168,468 | | $ 79,622,315 |
| Shares Issued for Reinvested Dividends | 3,062,689 | | 58,169,249 | | 70,646 | | 1,237,010 |
| Shares Redeemed | (7,197,466) | | (127,788,647) | | (6,184,627) | | (118,224,917) |
| Net Increase (Decrease) | 2,500,697 | | 46,049,407 | | (1,945,513) | | (37,365,592) |
| Class R3 | | | | | | | |
| Shares Sold | 9,451 | | $ 159,327 | | 58,182 | | $ 1,003,819 |
| Shares Issued for Reinvested Dividends | 15,594 | | 288,955 | | — | | — |
| Shares Redeemed | (15,441) | | (277,630) | | (21,164) | | (409,218) |
| Net Increase (Decrease) | 9,604 | | 170,652 | | 37,018 | | 594,601 |
| Class R4 | | | | | | | |
| Shares Sold | 11,536 | | $ 199,514 | | 5,663 | | $ 117,506 |
| Shares Issued for Reinvested Dividends | 6,187 | | 116,572 | | — | | — |
| Shares Redeemed | (23,745) | | (398,332) | | (3,200) | | (62,093) |
| Net Increase (Decrease) | (6,022) | | (82,246) | | 2,463 | | 55,413 |
| Class R5 | | | | | | | |
| Shares Sold | 20,644 | | $ 353,654 | | 9,243 | | $ 172,463 |
| Shares Issued for Reinvested Dividends | 5,372 | | 101,815 | | 217 | | 3,796 |
| Shares Redeemed | (48,245) | | (901,065) | | (49,797) | | (904,365) |
| Net Increase (Decrease) | (22,229) | | (445,596) | | (40,337) | | (728,106) |
Notes to Financial Statements – (continued)
October 31, 2022
| | For the Year Ended
October 31, 2022 | | For the Year Ended
October 31, 2021 |
| | Shares | | Amount | | Shares | | Amount |
| Class Y | | | | | | | |
| Shares Sold | 186,550 | | $ 3,334,038 | | 477,180 | | $ 9,436,657 |
| Shares Issued for Reinvested Dividends | 566,051 | | 10,739,169 | | 14,753 | | 258,023 |
| Shares Redeemed | (983,891) | | (18,205,045) | | (1,738,687) | | (34,340,663) |
| Net Increase (Decrease) | (231,290) | | (4,131,838) | | (1,246,754) | | (24,645,983) |
| Class F | | | | | | | |
| Shares Sold | 1,920,896 | | $ 33,615,395 | | 1,124,576 | | $ 22,004,533 |
| Shares Issued for Reinvested Dividends | 598,731 | | 11,385,089 | | 15,153 | | 265,184 |
| Shares Redeemed | (1,126,309) | | (20,026,642) | | (909,052) | | (17,727,319) |
| Net Increase (Decrease) | 1,393,318 | | 24,973,842 | | 230,677 | | 4,542,398 |
| Class SDR | | | | | | | |
| Shares Sold | 475,120 | | $ 8,459,744 | | 451,019 | | $ 8,872,003 |
| Shares Issued for Reinvested Dividends | 262,522 | | 5,002,444 | | 10,018 | | 175,615 |
| Shares Redeemed | (1,065,374) | | (21,824,744) | | (576,471) | | (11,189,037) |
| Net Increase (Decrease) | (327,732) | | (8,362,556) | | (115,434) | | (2,141,419) |
| Total Net Increase (Decrease) | 4,874,767 | | $ 85,976,498 | | (3,119,322) | | $ (60,172,505) |
| US Small Cap Opportunities Fund | | | | | | | |
| Class A | | | | | | | |
| Shares Sold | 254,673 | | $ 7,066,418 | | 277,286 | | $ 8,677,102 |
| Shares Issued for Reinvested Dividends | 143,030 | | 4,285,681 | | — | | — |
| Shares Redeemed | (305,848) | | (8,310,516) | | (155,738) | | (4,695,935) |
| Net Increase (Decrease) | 91,855 | | 3,041,583 | | 121,548 | | 3,981,167 |
| Class C | | | | | | | |
| Shares Sold | 15,116 | | $ 408,272 | | 35,829 | | $ 1,124,826 |
| Shares Issued for Reinvested Dividends | 30,546 | | 921,789 | | — | | — |
| Shares Redeemed | (52,878) | | (1,468,740) | | (77,129) | | (2,416,272) |
| Net Increase (Decrease) | (7,216) | | (138,679) | | (41,300) | | (1,291,446) |
| Class I | | | | | | | |
| Shares Sold | 1,699,466 | | $ 49,801,108 | | 1,618,994 | | $ 54,075,726 |
| Shares Issued for Reinvested Dividends | 679,332 | | 21,661,454 | | 2,920 | | 85,749 |
| Shares Redeemed | (2,113,118) | | (62,689,996) | | (1,350,665) | | (44,554,890) |
| Net Increase (Decrease) | 265,680 | | 8,772,566 | | 271,249 | | 9,606,585 |
| Class R3 | | | | | | | |
| Shares Sold | 7,533 | | $ 237,672 | | 41,262 | | $ 1,394,324 |
| Shares Issued for Reinvested Dividends | 4,768 | | 148,641 | | — | | — |
| Shares Redeemed | (15,473) | | (423,560) | | (11,574) | | (370,424) |
| Net Increase (Decrease) | (3,172) | | (37,247) | | 29,688 | | 1,023,900 |
| Class R4 | | | | | | | |
| Shares Sold | 4,957 | | $ 145,923 | | 17,843 | | $ 622,180 |
| Shares Issued for Reinvested Dividends | 2,414 | | 76,371 | | — | | — |
| Shares Redeemed | (5,302) | | (166,163) | | (4,761) | | (161,866) |
| Net Increase (Decrease) | 2,069 | | 56,131 | | 13,082 | | 460,314 |
| Class R5 | | | | | | | |
| Shares Sold | 8,397 | | $ 245,069 | | 11,260 | | $ 367,453 |
| Shares Issued for Reinvested Dividends | 2,298 | | 73,241 | | 16 | | 462 |
| Shares Redeemed | (13,741) | | (411,892) | | (3,825) | | (131,445) |
| Net Increase (Decrease) | (3,046) | | (93,582) | | 7,451 | | 236,470 |
| Class Y | | | | | | | |
| Shares Sold | 328,702 | | $ 9,589,112 | | 304,107 | | $ 10,256,879 |
| Shares Issued for Reinvested Dividends | 123,509 | | 3,935,921 | | 945 | | 27,753 |
| Shares Redeemed | (296,095) | | (8,431,038) | | (185,283) | | (6,074,145) |
| Net Increase (Decrease) | 156,116 | | 5,093,995 | | 119,769 | | 4,210,487 |
| Class F | | | | | | | |
| Shares Sold | 150,435 | | $ 4,436,538 | | 205,102 | | $ 6,865,644 |
| Shares Issued for Reinvested Dividends | 57,640 | | 1,840,382 | | 877 | | 25,755 |
| Shares Redeemed | (131,965) | | (3,908,901) | | (132,190) | | (4,388,595) |
| Net Increase (Decrease) | 76,110 | | 2,368,019 | | 73,789 | | 2,502,804 |
Notes to Financial Statements – (continued)
October 31, 2022
| | For the Year Ended
October 31, 2022 | | For the Year Ended
October 31, 2021 |
| | Shares | | Amount | | Shares | | Amount |
| Class SDR | | | | | | | |
| Shares Sold | 384,592 | | $ 11,046,266 | | 122,265 | | $ 4,008,157 |
| Shares Issued for Reinvested Dividends | 110,939 | | 3,545,857 | | 1,960 | | 57,632 |
| Shares Redeemed | (129,747) | | (3,774,934) | | (122,234) | | (4,073,605) |
| Net Increase (Decrease) | 365,784 | | 10,817,189 | | 1,991 | | (7,816) |
| Total Net Increase (Decrease) | 944,180 | | $ 29,879,975 | | 597,267 | | $ 20,722,465 |
| (1) | Diversified Emerging Markets Fund commenced operations on September 30, 2021. |
| (2) | Classes A, C, I, Y and F of the Diversified Emerging Markets Fund commenced operations on February 28, 2022. |
| (3) | International Contrarian Value Fund and Sustainable International Core Fund commenced operations on May 24, 2022. |
| 13. | Line of Credit: |
| | Each Fund, except International Contrarian Value Fund and Sustainable International Core Fund, participates in a committed line of credit pursuant to a credit agreement dated March 3, 2022. Each Fund that participates in the committed line of credit may borrow under the line of credit for temporary or emergency purposes. The Funds that participate in the committed line of credit (together with certain other Hartford Funds) may borrow up to $350 million in the aggregate, subject to asset coverage and other limitations specified in the credit agreement. The interest rate on borrowings varies depending on the nature of the loan. The facility also charges certain fees, such as a commitment fee. Prior to March 3, 2022, each Fund that participates in the committed line of credit (together with certain other Hartford Funds) had a similar agreement that enabled them to participate in a $350 million committed line of credit. The fees incurred by the Funds in connection with the committed lines of credit during the period appear in the Statements of Operations under “Other expenses.” During and as of the year ended October 31, 2022, none of the Funds that participate in the committed line of credit had borrowings under this facility. |
| 14. | Indemnifications: |
| | Under the Company’s organizational documents, the Company shall indemnify its officers and directors to the full extent required or permitted under Maryland General Corporation Law and federal securities laws. In addition, the Company, on behalf of each Fund, may enter into contracts that contain a variety of indemnifications. The Company’s maximum exposure under these arrangements is unknown. However, as of the date of these financial statements, the Company has not had prior claims or losses pursuant to these contracts and expects the risk of loss to be remote. |
| 15. | Recent Accounting Pronouncement: |
| | In March 2020, FASB issued Accounting Standards Update ("ASU") No. 2020-04, Reference Rate Reform (Topic 848); Facilitation of the Effects of Reference Rate Reform on Financial Reporting, which provides optional guidance for a limited period of time to ease the potential burden in accounting for (or recognizing the effects of) reference rate reform. The guidance is applicable to contracts referencing LIBOR or another reference rate that is expected to be discontinued due to reference rate reform. The ASU is effective as of March 12, 2020 and generally can be applied through December 31, 2022. Management is evaluating the underlying securities referencing LIBOR or another reference rate that is expected to be discontinued over the period of time the ASU is effective. |
| 16. | Subsequent Events: |
| | In connection with the preparation of the financial statements of the Funds as of and for the year ended October 31, 2022, events and transactions subsequent to October 31, 2022, through the date the financial statements were issued have been evaluated by the Funds’ management for possible adjustment and/or disclosure. |
| | Effective December 1, 2022, HASCO has contractually agreed to waive its transfer agency fee and/or reimburse transfer agency-related expenses to the extent necessary to limit the transfer agency fee for Class A shares of the Emerging Markets Equity Fund as follows: 0.14%. This contractual arrangement will remain in effect until February 29, 2024, unless the Board of Directors approves its earlier termination. |
Report of Independent Registered Public Accounting Firm
To the Board of Directors of The Hartford Mutual Funds II, Inc. and Shareholders of Hartford Schroders China A Fund, Hartford Schroders Diversified Emerging Markets Fund, Hartford Schroders Emerging Markets Equity Fund, Hartford Schroders Emerging Markets Multi-Sector Bond Fund, Hartford Schroders International Contrarian Value Fund, Hartford Schroders International Multi-Cap Value Fund, Hartford Schroders International Stock Fund, Hartford Schroders Securitized Income Fund, Hartford Schroders Sustainable International Core Fund, Hartford Schroders Tax-Aware Bond Fund, Hartford Schroders US MidCap Opportunities Fund and Hartford Schroders US Small Cap Opportunities Fund
Opinion on the Financial Statements
We have audited the accompanying statements of assets and liabilities, including the schedules of investments, of each of the funds indicated in the table below (twelve of the funds constituting The Hartford Mutual Funds II, Inc., hereafter collectively referred to as the "Funds") as of October 31, 2022, and the related statements of operations and changes in net assets for each of the periods indicated in the table below, including the related notes, and the financial highlights for each of the periods indicated in the table below (collectively referred to as the "financial statements"). In our opinion, the financial statements present fairly, in all material respects, the financial position of each of the Funds as of October 31, 2022, the results of each of their operations and the changes in each of their net assets, and each of the financial highlights for each of the periods indicated in the table below, in conformity with accounting principles generally accepted in the United States of America.
| Fund Name |
| Hartford Schroders China A Fund(1) |
| Hartford Schroders Diversified Emerging Markets Fund (2) |
| Hartford Schroders Emerging Markets Equity Fund(3) |
| Hartford Schroders Emerging Markets Multi-Sector Bond Fund(3) |
| Hartford Schroders International Contrarian Value Fund (4) |
| Hartford Schroders International Multi-Cap Value Fund (3) |
| Hartford Schroders International Stock Fund (3) |
| Hartford Schroders Securitized Income Fund (3) |
| Hartford Schroders Sustainable International Core Fund (4) |
| Hartford Schroders Tax-Aware Bond Fund (3) |
| Hartford Schroders US MidCap Opportunities Fund(3) |
| Hartford Schroders US Small Cap Opportunities Fund(3) |
| 1 | Statement of operations for the year ended October 31, 2022, the statements of changes in net assets for each of the two years in the period ended October 31, 2022 and financial highlights for the years ended October 31, 2022, October 31, 2021 and the period March 31, 2020 (commencement of operations) through October 31, 2020. |
| 2 | Statement of operations for the year ended October 31, 2022, statements of changes in net assets and financial highlights for the years ended October 31, 2022 and the period September 30, 2021 (commencement of operations) through October 31, 2021. |
| 3 | Statement of operations for the year ended October 31, 2022, the statements of changes in net assets for each of the two years in the period ended October 31, 2022 and financial highlights for each of the three years or periods in the period ended October 31, 2022. |
| 4 | Statement of operations, statement of changes in net assets and financial highlights for the period May 24, 2022 (commencement of operations) through October 31, 2022. |
The financial statements of Hartford Schroders Emerging Markets Equity Fund, Hartford Schroders Emerging Markets Multi-Sector Bond Fund, Hartford Schroders International Multi-Cap Value Fund, Hartford Schroders International Stock Fund, Hartford Schroders Securitized Income Fund, Hartford Schroders Tax-Aware Bond Fund, Hartford Schroders US MidCap Opportunities Fund and Hartford Schroders US Small Cap Opportunities Fund as of and for the year ended October 31, 2019 and the financial highlights for each of the periods ended on or prior to October 31, 2019 (not presented herein, other than the financial highlights) were audited by other auditors whose report dated December 30, 2019 expressed an unqualified opinion on those financial statements and financial highlights.
Basis for Opinion
These financial statements are the responsibility of the Funds' management. Our responsibility is to express an opinion on the Funds' financial statements based on our audits. We are a public accounting firm registered with the Public Company Accounting Oversight Board (United States) (PCAOB) and are required to be independent with respect to the Funds in accordance with the U.S. federal securities laws and the applicable rules and regulations of the Securities and Exchange Commission and the PCAOB.
We conducted our audits of these financial statements in accordance with the standards of the PCAOB. Those standards require that we plan and perform the audit to obtain reasonable assurance about whether the financial statements are free of material misstatement, whether due to error or fraud.
Report of Independent Registered Public Accounting Firm
Our audits included performing procedures to assess the risks of material misstatement of the financial statements, whether due to error or fraud, and performing procedures that respond to those risks. Such procedures included examining, on a test basis, evidence regarding the amounts and disclosures in the financial statements. Our audits also included evaluating the accounting principles used and significant estimates made by management, as well as evaluating the overall presentation of the financial statements. Our procedures included confirmation of securities owned as of October 31, 2022 by correspondence with the custodian, transfer agent and brokers; when replies were not received from brokers, we performed other auditing procedures. We believe that our audits provide a reasonable basis for our opinions.
/s/ PricewaterhouseCoopers LLP
Philadelphia, Pennsylvania
December 28, 2022
We have served as the auditor of one or more investment companies in the Hartford Funds group of investment companies since 2020.
Operation of the Liquidity Risk Management Program (Unaudited)
This section describes the operation and effectiveness of the Liquidity Risk Management Program (“LRM Program”) established in accordance with Rule 22e-4 under the Investment Company Act of 1940, as amended (the “Liquidity Rule”). The LRM Program seeks to assess and manage each Fund’s liquidity risk. The Liquidity Rule generally defines liquidity risk as the risk that a Fund could not meet its obligation to redeem shares without significant dilution of the non-redeeming investors’ interests in the Fund. The Board of Directors (“Board”) of The Hartford Mutual Funds II, Inc. has appointed Hartford Funds Management Company, LLC (“HFMC”) to serve as the administrator of the LRM Program with respect to each of the Funds, subject to the oversight of the Board. In order to efficiently and effectively administer the LRM Program, HFMC established a Liquidity Risk Oversight Committee.
The LRM Program is comprised of various components designed to support the assessment and/or management of liquidity risk, including: (1) the assessment and periodic review (no less frequently than annually) of certain factors that influence each Fund’s liquidity risk; (2) the classification and periodic review (no less frequently than monthly) of each Fund’s investments into one of four liquidity categories that reflect an estimate of their liquidity under current market conditions; (3) a 15% limit on the acquisition of “illiquid investments” (as defined under the Liquidity Rule); (4) the determination of a minimum percentage of each Fund’s assets that generally will be invested in highly liquid investments (“HLIM”); (5) the periodic review (no less frequently than annually) of the HLIM and the adoption and implementation of policies and procedures for responding to a shortfall of a Fund’s highly liquid investments below its HLIM; and (6) periodic reporting to the Board.
At a meeting of the Board held August 9-10, 2022, HFMC provided an annual written report to the Board covering the period from April 1, 2021 through June 30, 2022 (the “Reporting Period”). The annual report addressed important aspects of the LRM Program, including, but not limited to:
| • | the operation of the LRM Program (and related policies and procedures utilized in connection with management of the Funds’ liquidity risk); |
| • | an assessment of the adequacy and effectiveness of the LRM Program’s (and related policies and procedures’) implementation; |
| • | the operation, and assessment of the adequacy and effectiveness, of each Fund’s HLIM; |
| • | whether the third-party liquidity vendor’s (“LRM Program Vendor”) processes for determining preliminary liquidity classifications, including the particular methodologies or factors used and metrics analyzed by the LRM Program Vendor, are sufficient under the Liquidity Rule and appropriate in light of each Fund’s specific circumstances; and |
| • | any material changes to the LRM Program. |
In addition, HFMC provides a quarterly report on the LRM Program at each quarterly meeting of the Board’s Compliance and Risk Oversight Committee. The quarterly report included information regarding the Funds’ liquidity as measured by established parameters, a summary of developments within the capital markets that may impact liquidity, and other factors that may impact liquidity. Among other things, HFMC reports any changes to a Fund’s HLIM.
During the Reporting Period, HFMC did not reduce the HLIM for any Fund.
Based on its review and assessment, HFMC has concluded that the LRM Program is operating effectively to assess and manage the liquidity risk of each Fund and that the LRM Program has been and continues to be adequately and effectively implemented with respect to each Fund. Because liquidity in the capital markets in which the Funds invest is beyond the control of the Funds, there can be no assurance that the LRM Program will ensure liquidity under all circumstances and does not protect against the risk of loss.
Directors and Officers of the Company (Unaudited)
The Hartford Mutual Funds II, Inc. (the “Company”) is governed by a Board of Directors (the “Directors”). The following tables present certain information regarding the Directors and officers of the Company as of October 31, 2022. For more information regarding the Directors and officers, please refer to the Statement of Additional Information, which is available, without charge, upon request by calling 1-888-843-7824.
NAME, YEAR OF BIRTH
AND ADDRESS(1) | | POSITION
HELD WITH
THE COMPANY | | TERM OF
OFFICE(2) AND
LENGTH OF
TIME SERVED | | PRINCIPAL OCCUPATION(S)
DURING PAST 5 YEARS | | NUMBER OF
PORTFOLIOS
IN FUND
COMPLEX(3)
OVERSEEN
BY DIRECTOR | | OTHER DIRECTORSHIPS
FOR PUBLIC COMPANIES
AND OTHER REGISTERED
INVESTMENT COMPANIES HELD
BY DIRECTOR |
| NON-INTERESTED DIRECTORS |
HILARY E. ACKERMANN
(1956) | | Director | | Since 2014 | | Ms. Ackermann served as Chief Risk Officer at Goldman Sachs Bank USA from October 2008 to November 2011. | | 80 | | Ms. Ackermann served as a Director of Dynegy, Inc. from October 2012 until its acquisition by Vistra Energy Corporation ("Vistra") in 2018, and since that time she has served as a Director of Vistra. Ms. Ackermann serves as a Director of Credit Suisse Holdings (USA), Inc. from January 2017 to present. |
ROBIN C. BEERY
(1967) | | Director | | Since 2017 | | Ms. Beery has served as a consultant to ArrowMark Partners (an alternative asset manager) since March of 2015 and since November 2018 has been employed by ArrowMark Partners as a Senior Advisor. Previously, she was Executive Vice President, Head of Distribution, for Janus Capital Group, and Chief Executive Officer and President of the Janus Mutual Funds (a global asset manager) from September 2009 to August 2014. | | 80 | | Ms. Beery serves as an independent Director of UMB Financial Corporation (January 2015 to present), has chaired the Compensation Committee since April 2017, and serves on the Audit Committee and the Risk Committee. |
DERRICK D. CEPHAS
(1952) | | Director | | Since 2020 | | Mr. Cephas currently serves as Of Counsel to Squire Patton Boggs LLP, an international law firm with 45 offices in 20 countries. Until his retirement in October 2020, Mr. Cephas was a Partner of Weil, Gotshal & Manges LLP, an international law firm headquartered in New York, where he served as the Head of the Financial Institutions Practice (April 2011 to October 2020). | | 80 | | Mr. Cephas currently serves as a Director of Signature Bank, a New York-based commercial bank, and is a member of the Credit Committee, Examining Committee and Risk Committee. Mr. Cephas currently serves as a Director of Claros Mortgage Trust, Inc., a real estate investment trust. |
CHRISTINE R. DETRICK
(1958) | | Director and Chair of the Board | | Director since 2016; Chair of the Board since 2021 | | From 2002 until 2012, Ms. Detrick was a Senior Partner, Leader of the Financial Services Practice, and a Senior Advisor at Bain & Company (“Bain”). Before joining Bain, she served in various senior management roles for other financial services firms and was a consultant at McKinsey and Company. | | 80 | | Ms. Detrick currently serves as a Director of Charles River Associates (May 2020 to present); currently serves as a Director of Capital One Financial Corporation (since November 2021); and currently serves as a Director of Altus Power, Inc (since December 2021). |
JOHN J. GAUTHIER
(1961) | | Director | | Since 2022 | | Mr. Gauthier currently is the Principal Owner of JJG Advisory, LLC, an investment consulting firm, and Co-Founder and Principal Owner of Talcott Capital Partners (a placement agent for investment managers serving insurance companies). From 2008 to 2018, Mr. Gauthier served as a Senior Vice President (2008-2010), Executive Vice President (2010-2012), and President (2012-2018) of Allied World Financial Services (a global provider of property, casualty and specialty insurance and reinsurance solutions). | | 80 | | Mr. Gauthier serves as a Director of Reinsurance Group of America, Inc. (from 2018 to present) and chairs the Investment Committee and is a member of the Audit and Risk Committees. |
Directors and Officers of the Company (Unaudited) – (continued)
NAME, YEAR OF BIRTH
AND ADDRESS(1) | | POSITION
HELD WITH
THE COMPANY | | TERM OF
OFFICE(2) AND
LENGTH OF
TIME SERVED | | PRINCIPAL OCCUPATION(S)
DURING PAST 5 YEARS | | NUMBER OF
PORTFOLIOS
IN FUND
COMPLEX(3)
OVERSEEN
BY DIRECTOR | | OTHER DIRECTORSHIPS
FOR PUBLIC COMPANIES
AND OTHER REGISTERED
INVESTMENT COMPANIES HELD
BY DIRECTOR |
ANDREW A. JOHNSON
(1962) | | Director | | Since 2020 | | Mr. Johnson currently serves as a Diversity and Inclusion Advisor at Neuberger Berman, a private, global investment management firm. Prior to his current role, Mr. Johnson served as Chief Investment Officer and Head of Global Investment Grade Fixed Income at Neuberger Berman (January 2009 to December 2018). | | 80 | | Mr. Johnson currently serves as a Director of AGNC Investment Corp., a real estate investment trust. |
PAUL L. ROSENBERG
(1953) | | Director | | Since 2020 | | Mr. Rosenberg is a Partner of The Bridgespan Group, a global nonprofit consulting firm that is a social impact advisor to nonprofits, non-governmental organizations, philanthropists and institutional investors (October 2007 to present). | | 80 | | None |
DAVID SUNG
(1953) | | Director | | Since 2017 | | Mr. Sung was a Partner at Ernst & Young LLP from October 1995 to July 2014. | | 80 | | Mr. Sung serves as a Trustee of Ironwood Institutional Multi-Strategy Fund, LLC and Ironwood Multi-Strategy Fund, LLC (October 2015 to present). |
| OFFICERS AND INTERESTED DIRECTORS |
JAMES E. DAVEY(4)
(1964) | | Director, President and Chief Executive Officer | | President and Chief Executive Officer since 2010; Director since 2012 | | Mr. Davey serves as Executive Vice President of The Hartford Financial Services Group, Inc. Mr. Davey has served in various positions within The Hartford and its subsidiaries and joined The Hartford in 2002. Additionally, Mr. Davey serves as Director, Chairman, President, and Senior Managing Director for Hartford Funds Management Group, Inc. ("HFMG"). Mr. Davey also serves as President, Manager, Chairman of the Board, and Senior Managing Director for Hartford Funds Management Company, LLC (“HFMC”); Manager, Chairman of the Board, and President of Lattice Strategies LLC (“Lattice”); Chairman of the Board, Manager, and Senior Managing Director of Hartford Funds Distributors, LLC (“HFD”); and Chairman of the Board, President and Senior Managing Director of Hartford Administrative Services Company (“HASCO”), each of which is an affiliate of HFMG. | | 80 | | None |
AMY N. FURLONG
(1979) | | Vice President | | Since 2018 | | Ms. Furlong serves as Vice President and Assistant Treasurer of HFMC (since September 2019). From 2018 through March 15, 2021, Ms. Furlong served as the Treasurer of the Company. Ms. Furlong has served in various positions within The Hartford and its subsidiaries in connection with the operation of the Hartford Funds. Ms. Furlong joined The Hartford in 2004. | | N/A | | N/A |
WALTER F. GARGER
(1965) | | Vice President and Chief Legal Officer | | Since 2016 | | Mr. Garger serves as Secretary, Managing Director and General Counsel of HFMG, HFMC, HFD, and HASCO (since 2013). Mr. Garger also serves as Secretary and General Counsel of Lattice (since July 2016). Mr. Garger has served in various positions within The Hartford and its subsidiaries in connection with the operation of the Hartford Funds. Mr. Garger joined The Hartford in 1995. | | N/A | | N/A |
THEODORE J. LUCAS
(1966) | | Vice President | | Since 2017 | | Mr. Lucas serves as Executive Vice President of HFMG (since July 2016) and as Executive Vice President of Lattice (since June 2017). Previously, Mr. Lucas served as Managing Partner of Lattice (2003 to 2016). | | N/A | | N/A |
JOSEPH G. MELCHER
(1973) | | Vice President, Chief Compliance Officer and AML Compliance Officer | | Vice President and Chief Compliance Officer since 2013; AML Compliance Officer since August 1, 2022 | | Mr. Melcher serves as Executive Vice President of HFMG and HASCO (since December 2013). Mr. Melcher also serves as Executive Vice President (since December 2013) and Chief Compliance Officer (since December 2012) of HFMC, serves as Executive Vice President and Chief Compliance Officer of Lattice (since July 2016), serves as Executive Vice President of HFD (since December 2013), and has served as President and Chief Executive Officer of HFD (from April 2018 to June 2019). | | N/A | | N/A |
Directors and Officers of the Company (Unaudited) – (continued)
NAME, YEAR OF BIRTH
AND ADDRESS(1) | | POSITION
HELD WITH
THE COMPANY | | TERM OF
OFFICE(2) AND
LENGTH OF
TIME SERVED | | PRINCIPAL OCCUPATION(S)
DURING PAST 5 YEARS | | NUMBER OF
PORTFOLIOS
IN FUND
COMPLEX(3)
OVERSEEN
BY DIRECTOR | | OTHER DIRECTORSHIPS
FOR PUBLIC COMPANIES
AND OTHER REGISTERED
INVESTMENT COMPANIES HELD
BY DIRECTOR |
VERNON J. MEYER
(1964) | | Vice President | | Since 2006 | | Mr. Meyer serves as Managing Director and Chief Investment Officer of HFMC and Managing Director of HFMG (since 2013). Mr. Meyer also serves as Senior Vice President-Investments of Lattice (since March 2019). Mr. Meyer has served in various positions within The Hartford and its subsidiaries in connection with the operation of the Hartford Funds. Mr. Meyer joined The Hartford in 2004. | | N/A | | N/A |
DAVID A. NAAB
(1985) | | Vice President and Treasurer | | Since 2021 | | Mr. Naab serves as Vice President and Assistant Treasurer of HFMC (since June 2021). Prior to joining HFMC in 2021, Mr. Naab served in various positions as an associate, senior associate, manager, senior manager, and director within the investment management, financial services, and asset & wealth management practice groups of PricewaterhouseCoopers, LLP from 2007 to 2020. | | N/A | | N/A |
ALICE A. PELLEGRINO
(1960) | | Vice President and Assistant Secretary | | Since 2016 | | Ms. Pellegrino is Deputy General Counsel for HFMG (since April 2022) and currently serves as Vice President of HFMG (since December 2013). Ms. Pellegrino also serves as Vice President and Assistant Secretary of Lattice (since June 2017). Ms. Pellegrino has served in various positions within The Hartford and its subsidiaries in connection with the operation of the Hartford Funds. Ms. Pellegrino joined The Hartford in 2007. | | N/A | | N/A |
THOMAS R. PHILLIPS
(1960) | | Vice President and Secretary | | Since 2017 | | Mr. Phillips is Deputy General Counsel for HFMG and currently serves as a Senior Vice President (since June 2021) and Assistant Secretary (since June 2017) for HFMG. Mr. Phillips also serves as Vice President of HFMC (since June 2021). Prior to joining HFMG in 2017, Mr. Phillips was a Director and Chief Legal Officer of Saturna Capital Corporation from 2014–2016. Prior to that, Mr. Phillips was a Partner and Deputy General Counsel of Lord, Abbett & Co. LLC. | | N/A | | N/A |
| (1) | The address for each officer and Director is c/o Hartford Funds 690 Lee Road, Wayne, Pennsylvania 19087. |
| (2) | Term of Office: Each Director holds an indefinite term until his or her retirement, resignation, removal, or death. Directors generally must retire no later than December 31 of the year in which the Director turns 75 years of age. Each Fund officer generally serves until his or her resignation, removal, or death. |
| (3) | The portfolios of the “Fund Complex” are operational series of The Hartford Mutual Funds, Inc., The Hartford Mutual Funds II, Inc., Hartford Series Fund, Inc., Hartford HLS Series Fund II, Inc., Lattice Strategies Trust and Hartford Funds Exchange-Traded Trust. |
| (4) | “Interested person,” as defined in the 1940 Act, of the Company because of the person’s affiliation with, or equity ownership of, HFMC, HFD or affiliated companies. |
HOW TO OBTAIN A COPY OF EACH FUND’S PROXY VOTING POLICIES AND VOTING RECORDS (UNAUDITED)
A description of the policies and procedures that each Fund uses to determine how to vote proxies relating to portfolio securities and information about how each Fund voted proxies relating to portfolio securities during the most recent twelve-month period ended June 30 are available (1) without charge, upon request, by calling 888-843-7824 and (2) on the SEC’s website at http://www.sec.gov.
QUARTERLY PORTFOLIO HOLDINGS INFORMATION (UNAUDITED)
Each Fund files its complete schedule of portfolio holdings with the SEC for the first and third quarters of each fiscal year as an exhibit to its reports on Form N-PORT. Each Fund’s portfolio holdings filed as an exhibit to Form N-PORT for the most recent first and third quarter of the Fund’s fiscal year are available (1) without charge, upon request, by calling 888-843-7824, (2) on the Funds' website, hartfordfunds.com, and (3) on the SEC’s website at http://www.sec.gov.
Approval of Investment Management and Investment Sub-Advisory Agreements (Unaudited)
Approval of Investment Management and Investment Sub-Advisory Agreements for the following Funds:
The Hartford Mutual Funds II, Inc.
Hartford Schroders China A Fund
Hartford Schroders Emerging Markets Equity Fund
Hartford Schroders Emerging Markets Multi-Sector Bond Fund
Hartford Schroders International Multi-Cap Value Fund
Hartford Schroders International Stock Fund
Hartford Schroders Securitized Income Fund
Hartford Schroders Tax-Aware Bond Fund
Hartford Schroders US MidCap Opportunities Fund
Hartford Schroders US Small Cap Opportunities Fund
(each, a “Fund” and collectively, the “Funds”)
Each of the Hartford Schroders Emerging Markets Equity Fund, Hartford Schroders Emerging Markets Multi-Sector Bond Fund, Hartford Schroders International Multi-Cap Value Fund, Hartford Schroders International Stock Fund, Hartford Schroders Tax-Aware Bond Fund, Hartford Schroders US MidCap Opportunities Fund, and Hartford Schroders US Small Cap Opportunities Fund is the successor to a corresponding series of Schroder Series Trust or Schroder Capital Funds (Delaware) (each a “Predecessor Fund” and collectively, the “Predecessor Funds”), pursuant to a reorganization consummated on October 24, 2016.
Section 15(c) of the Investment Company Act of 1940, as amended (the “1940 Act”), requires that each mutual fund’s board of directors, including a majority of those directors who are not “interested persons” of the mutual fund, as defined in the 1940 Act (the “Independent Directors”), annually review and consider the continuation of the mutual fund’s investment advisory and sub-advisory agreements. At its meeting held on August 9-10, 2022, the Board of Directors (the “Board”) of The Hartford Mutual Funds II, Inc. (“HMF II”), including each of the Independent Directors, unanimously voted to approve (i) the continuation of an investment management agreement by and between Hartford Funds Management Company, LLC (“HFMC”) and each of HMF II, on behalf of each of the Funds, and The Hartford Mutual Funds, Inc. (“HMF”), on behalf of its series (the “Management Agreement”); (ii) the continuation of an investment sub-advisory agreement (the “Sub-Advisory Agreement”) by and between HFMC and each Fund’s sub-adviser, Schroder Investment Management North America Inc. (“SIMNA Inc.”); and (iii) the continuation of a separate sub-sub-advisory agreement (the “Sub-Sub-Advisory Agreement” and together with the Management Agreement and Sub-Advisory Agreement, the “Agreements”) by and between SIMNA Inc. and Schroder Investment Management North America Limited (“SIMNA Ltd.,” and together with SIMNA Inc., the “Sub-advisers,” and together with HFMC, the “Advisers”) on behalf of Hartford Schroders China A Fund, Hartford Schroders Emerging Markets Equity Fund, Hartford Schroders Emerging Markets Multi-Sector Bond Fund, Hartford Schroders International Stock Fund, Hartford Schroders Tax-Aware Bond Fund, and Hartford Schroders International Multi-Cap Value Fund (collectively, the “Sub-Sub-Advised Funds”).
In the months preceding the August 9-10, 2022 meeting, the Board requested and reviewed written responses from the Advisers to questions posed to the Advisers on behalf of the Independent Directors and supporting materials relating to those questions and responses. In addition, the Board considered such additional information as it deemed reasonably necessary to evaluate the Agreements, as applicable, with respect to each Fund, which included information furnished to the Board and its committees at their meetings throughout the year and in between regularly scheduled meetings on particular matters as the need arose, as well as information specifically prepared in connection with the approval of the continuation of the Agreements that was presented at the Board’s meetings held on June 15-16, 2022 and August 9-10, 2022. Information provided to the Board and its committees at their meetings throughout the year included, among other things, reports on Fund performance, legal, compliance and risk management matters, sales and marketing activity, shareholder services, and the other services provided to each Fund by the Advisers and their affiliates. The members of the Board also considered the materials and presentations by Fund officers and representatives of HFMC received at the Board’s meetings on June 15-16, 2022 and August 9-10, 2022 concerning the Agreements and at the special meeting of the Board’s Investment Committee on May 20, 2022 concerning Fund performance and other investment-related matters.
The Independent Directors, advised by independent legal counsel throughout the evaluation process, engaged service providers to assist them with evaluating the Agreements with respect to each Fund, as applicable. Broadridge Financial Solutions, Inc. (“Broadridge”), an independent provider of investment company data, was retained to provide the Board with reports on how each Fund’s contractual management fees, actual management fees, total expense ratios and investment performance compared to those of comparable mutual funds with similar investment objectives. The Independent Directors also engaged an independent financial services consultant (the “Consultant”) to assist them in evaluating each Fund’s contractual management fees, actual management fees, total expense ratios and investment performance. In addition, the Consultant previously reviewed the profitability methodologies utilized by HFMC in connection with the continuation of the Management Agreement.
Approval of Investment Management and Investment Sub-Advisory Agreements (Unaudited) – (continued)
In determining whether to approve the continuation of the Agreements for a Fund, the members of the Board reviewed and evaluated information and factors they believed to be relevant and appropriate through the exercise of their reasonable business judgment. While individual members of the Board may have weighed certain factors differently, the Board’s determination to approve the continuation of the Agreements was based on a comprehensive consideration of all information provided to the Board throughout the year and specifically with respect to the continuation of the Agreements. The Board was also furnished with an analysis of its fiduciary obligations in connection with its evaluation of the Agreements. Throughout the evaluation process, the Board was assisted by counsel for the Funds and the Independent Directors were also separately assisted by independent legal counsel. In connection with their deliberations, the Independent Directors met separately with independent legal counsel and the Consultant on June 10, 2022 and in executive session on several occasions to consider their responsibilities under relevant laws and regulations and to discuss the materials presented and other matters deemed relevant to their consideration of the approval of the continuation of the Agreements. As a result of the discussions that occurred during the June 10, 2022 and June 15-16, 2022 meetings, the Independent Directors presented HFMC with requests for additional information on certain topics. HFMC responded to these requests with additional information in connection with the August 9-10, 2022 meeting. A more detailed summary of the important, but not necessarily all, factors the Board considered with respect to its approval of the continuation of the Agreements is provided below.
Nature, Extent and Quality of Services Provided by the Advisers
The Board requested and considered information concerning the nature, extent and quality of the services provided to each Fund by the Advisers. The Board considered, among other things, the terms of the Agreements and the range of services provided by the Advisers. The Board considered the Advisers’ professional personnel who provide services to the Funds, including each Adviser’s ability and experience in attracting and retaining qualified personnel to service the Funds. The Board considered each Adviser’s reputation and overall financial strength, as well as each Adviser’s willingness to consider and implement organizational and operational changes designed to enhance services to the funds managed by HFMC and its affiliates (the “Hartford funds”). In addition, the Board considered the quality of each Adviser’s communications with the Board and responsiveness to Board inquiries and requests made from time to time with respect to the Funds and other Hartford funds.
The Board also requested and evaluated information concerning each Adviser’s regulatory and compliance environment. In this regard, the Board requested and reviewed information about each Adviser’s compliance policies and procedures and compliance history, and a report from the Funds’ Chief Compliance Officer about each Adviser’s compliance with applicable laws and regulations, including responses to regulatory developments and any compliance or other issues raised by regulators. The Board also noted the Advisers’ support of the Funds’ compliance control structure, as applicable, including the resources devoted by the Advisers in support of the Funds’ obligations pursuant to Rule 38a-1 under the 1940 Act and the Funds’ risk management programs, as well as the efforts of the Advisers to address cybersecurity risks. The Board also considered HFMC’s investments in business continuity planning designed to benefit the Funds, and the implementation of HFMC’s business continuity plans due to the COVID-19 pandemic. The Board also noted HFMC’s commitment to maintaining high quality systems and expending substantial resources to prepare for and respond to ongoing changes to the market, regulatory and control environments in which the Funds and their service providers operate.
With respect to HFMC, the Board noted that, under the Management Agreement, HFMC is responsible for the management of the Funds, including oversight of fund operations and service providers, and the provision of investment advisory and administrative services in connection with selecting, monitoring and supervising the Sub-advisers. In this regard, the Board evaluated information about the nature and extent of responsibilities retained and risks assumed by HFMC that were not delegated to or assumed by the Sub-advisers. The Board considered HFMC’s ongoing monitoring of people, process and performance, including its quarterly reviews of each of the Hartford funds, semi-annual meetings with the leaders of each Fund’s portfolio management team, and ongoing oversight of the Hartford funds’ portfolio managers. The Board noted that HFMC has demonstrated a record of initiating changes to the portfolio management and/or investment strategies of the Hartford funds when warranted. The Board considered HFMC’s periodic due diligence reviews of each Sub-adviser and ongoing oversight of each Sub-adviser’s investment approach and results, process for monitoring best execution of portfolio trades and other trading operations by each Sub-adviser, and approach to risk management with respect to the Funds and the service providers to the Funds. The Board considered HFMC’s oversight of the securities lending program for the Funds that engage in securities lending and noted the income earned by the Funds that participate in such program. The Board also considered HFMC’s day-to-day oversight of each Fund’s compliance with its investment objective and policies as well as with applicable laws and regulations, noting that regulatory and other developments had over time led to an increase in the scope of HFMC’s oversight in this regard. Moreover, the Board considered HFMC’s oversight of potential conflicts of interest between the Funds’ investments and those of other funds or accounts, if any, managed by the Funds’ portfolio management personnel.
In addition, the Board considered HFMC’s overall strategic plan for, and ongoing commitment to review and rationalize, the Hartford funds product line-up. The Board also considered the expenses that HFMC had incurred, as well as the risks HFMC had assumed, in connection with the launch of new funds and changes to existing Hartford funds in recent years. The Board considered that HFMC is responsible for providing the Funds’ officers.
Approval of Investment Management and Investment Sub-Advisory Agreements (Unaudited) – (continued)
With respect to SIMNA Inc., which provides certain day-to-day portfolio management services for the Funds, and SIMNA Ltd., which also provides certain day-to-day portfolio management services for the Sub-Sub-Advised Funds, each subject to oversight by HFMC, the Board considered, among other things, the Sub-adviser’s investment personnel, investment philosophy and process, investment research capabilities and resources, performance record, trade execution capabilities and experience, including with respect to sustainable and environmental, social and/or governance (ESG) investing. The Board considered the experience of each Fund’s portfolio manager(s), the number of accounts managed by the portfolio manager(s), and each Sub-adviser’s method for compensating the portfolio manager(s). The Board also considered each Sub-adviser’s succession planning practices to ensure continuity of portfolio management services provided to the Funds.
The Board considered the benefits to shareholders of being part of the family of Hartford funds, including, with respect to certain share classes, the right to exchange investments between the same class of shares without a sales charge, the ability to reinvest Fund dividends into other Hartford funds (excluding the Hartford funds that are exchange-traded funds), and the ability to combine holdings in a Fund with holdings in other Hartford funds (excluding the Hartford funds that are exchange-traded funds) and 529 plans for which HFMC serves as the program manager to obtain a reduced sales charge. The Board considered HFMC’s efforts to provide investors in the Hartford funds with a broad range of investment styles and asset classes and the assumption of entrepreneurial and other risks by HFMC in sponsoring and providing ongoing services to new funds to expand these opportunities for shareholders. In addition, the Board observed that in the marketplace there are a range of investment options available to each Fund’s shareholders and such shareholders, having had the opportunity to consider other investment options, have chosen to invest in the Fund.
Based on these considerations, the Board concluded that it was satisfied with the nature, extent and quality of the services provided to each Fund by HFMC and, as applicable, the Sub-advisers.
Performance of each Fund and the Advisers
The Board considered the investment performance of each Fund, which included the performance of any applicable Predecessor Fund. The Board noted that each Predecessor Fund had been sub-advised by SIMNA Inc., and each Sub-Sub-Advised Fund’s corresponding Predecessor Fund, if applicable, with the exception of the corresponding Predecessor Fund for the Hartford Schroders Tax-Aware Bond Fund and the Hartford Schroders Emerging Markets Multi-Sector Bond Fund, had been sub-sub-advised by SIMNA Ltd. In this regard, the Board reviewed the performance of each Fund over different time periods and evaluated HFMC’s analysis of the Fund’s performance for these time periods. The Board considered information and materials provided to the Board by the Advisers concerning Fund performance, as well as information from Broadridge comparing the investment performance of each Fund to an appropriate universe of peer funds. The Board noted that while it found the comparative data provided by Broadridge generally useful in evaluating a Hartford fund’s investment performance, the Board recognized the limitations of such data, including that notable differences may exist between a Hartford fund and its peers. For details regarding each Fund’s performance, see the Fund-by-Fund synopsis below.
The Board considered the detailed investment analytics reports provided by HFMC’s Investment Advisory Group throughout the year, including in connection with the approval of the continuation of the Agreements. These reports included, among other things, information on each Fund’s gross returns and net returns, the Fund’s investment performance compared to one or more appropriate benchmarks and relevant groups or categories of peer funds, various statistics concerning the Fund’s portfolio, a narrative summary of various factors affecting Fund performance, and commentary on the effect of market conditions. The Board considered the Advisers’ work with the Investment Committee, which assists the Board in evaluating the performance of each Fund at periodic meetings throughout the year and specifically with respect to the approval of the continuation of the Agreements. The Board considered that the Investment Committee, in its evaluation of investment performance at meetings throughout the year, focused particular attention on information indicating less favorable performance of certain Hartford funds for specific time periods and discussed with the Advisers the reasons for such performance as well as any specific actions that the Advisers had taken, or had agreed to take, to seek to enhance Fund investment performance and the results of those actions. The Board also considered the analysis provided by the Consultant relating to each Fund’s performance track record.
Based on these considerations, the Board concluded that it had continued confidence in HFMC’s and each Sub-adviser’s overall capabilities to manage the Funds, as applicable.
Costs of the Services and Profitability of the Advisers
The Board reviewed information regarding HFMC’s cost to provide investment management and related services to each Fund and HFMC’s profitability, both overall and for each Fund, on a pre-tax basis without regard to distribution expenses. The Board also requested and reviewed information about the profitability to HFMC and its affiliates from all services provided to each Fund and all aspects of their relationship with the Fund, including information regarding profitability trends over time and information provided by Broadridge analyzing the profitability of managers to other fund complexes. The Board also requested and received information relating to the operations and profitability of the Sub-advisers. The Board
Approval of Investment Management and Investment Sub-Advisory Agreements (Unaudited) – (continued)
considered representations from HFMC and SIMNA Inc. that SIMNA Inc.’s fees were negotiated at arm’s length on a Fund-by-Fund basis and that the sub-advisory fees are paid by HFMC and not the Funds. The Board also considered that SIMNA Ltd. is an affiliate of SIMNA Inc. and that SIMNA Ltd.’s sub-sub-advisory fees would be paid by SIMNA Inc., not the Sub-Sub-Advised Funds. Accordingly, the Board concluded that the profitability of the Sub-advisers is a less relevant factor with respect to the Board’s consideration of the Sub-Advisory Agreement and the Sub-Sub-Advisory Agreement.
The Board considered the Consultant’s review of the methodologies and estimates used by HFMC in calculating profitability in connection with the continuation of the Management Agreement, including a description of the methodology used to allocate certain expenses. The Board noted the Consultant’s view that HFMC’s process for calculating and reporting Fund profitability is reasonable and consistent with the process previously reviewed by the Consultant. The Board noted that the Consultant had previously performed a full review of this process and reported that such process is reasonable, sound and consistent with common industry practice.
Based on these considerations, the Board concluded that the profits realized by the Advisers and their affiliates from their relationships with each Fund were not excessive.
Comparison of Fees and Services Provided by the Advisers
The Board considered comparative information with respect to the services rendered to and the management fees to be paid by each Fund to HFMC and the total expense ratios of the Fund. The Board also considered comparative information with respect to the sub-advisory fees to be paid by HFMC to SIMNA Inc. with respect to each Fund. In this regard, the Board requested and reviewed information from HFMC and SIMNA Inc. relating to the management and sub-advisory fees, including the sub-advisory fee schedule for each Fund and the amount of the management fee retained by HFMC, and total operating expenses for each Fund. The Board also reviewed information from Broadridge comparing each Fund’s contractual management fees, actual management fees and total expense ratios relative to an appropriate group of funds selected by Broadridge. The Board considered such information from Broadridge in consultation with the Consultant. For details regarding each Fund’s expenses, see the Fund-by-Fund synopsis below.
The Board considered the methodology used by Broadridge to select the funds included in the expense groups. While the Board recognized that comparisons between a Fund and its peer funds may be imprecise given, among other differences, the different service levels and characteristics of mutual funds and the different business models and cost structures of the Advisers, the comparative information provided by Broadridge assisted the Board in evaluating the reasonableness of each Fund’s fees and total operating expenses. In addition, the Board considered the analysis and views of the Consultant relating to each Fund’s fees and total operating expenses and expense groups.
The Board received information regarding fees charged by HFMC to another Hartford fund that is an exchange-traded fund (“ETF”) with investment strategies similar to those of the Hartford Schroders Tax-Aware Bond Fund. The Board reviewed information about structural, operational and other differences between the ETF and the Hartford Schroders Tax-Aware Bond Fund, including differences in the services provided to each type of product and differences in the marketplace in which each type of product must compete. The Board also received information regarding fees charged by the Sub-advisers to any other clients with investment strategies similar to those of the Funds, including any institutional separate account clients and registered fund clients for which a Sub-adviser serves as either primary investment adviser or sub-adviser. The Board considered the explanations provided by the Sub-advisers about any differences between a Sub-adviser’s services to the Funds and the services a Sub-adviser provides to other types of clients. In this regard, the Board reviewed information about the generally broader scope of services and compliance, reporting and other legal burdens and risks of managing registered funds compared with those associated with managing assets of non-registered fund clients such as institutional separate accounts.
Based on these considerations, the Board concluded that each Fund’s fees and total operating expenses, in conjunction with the information about quality of services, profitability, economies of scale, and other matters considered, were reasonable in light of the services provided.
Economies of Scale
The Board considered information regarding economies of scale, including the extent to which economies of scale may be realized as a Fund grows and whether fee levels reflect these economies of scale for the benefit of shareholders of the Fund. The Board reviewed the breakpoints in the management fee schedule for each Fund, if any, which reduce fee rates as the Fund’s assets grow over time. The Board recognized that a Fund with assets beyond the highest breakpoint level will continue to benefit from economies of scale because additional assets are charged the lowest breakpoint fee resulting in lower effective management fee rates. The Board also recognized that a fee schedule that reaches a breakpoint at a lower asset level provides shareholders with the benefit of anticipated or potential economies of scale. The Board considered that expense limitations and fee waivers that reduce a Fund’s expenses at all asset levels can have the same effect as breakpoints in sharing economies of scale with shareholders
Approval of Investment Management and Investment Sub-Advisory Agreements (Unaudited) – (continued)
and provide protection from an increase in expenses if the Fund’s assets decline. In addition, the Board considered that initially setting competitive fee rates, pricing a Fund to scale at inception and making additional investments intended to enhance services available to shareholders are other means of sharing anticipated or potential economies of scale with shareholders. The Board also considered that HFMC has been active in managing expenses of the Hartford funds in recent years, which has resulted in benefits being realized by shareholders. The Board also noted that, for the Hartford Schroders Emerging Markets Multi-Sector Bond Fund and Hartford Schroders Securitized Income Fund, the Fund’s current low asset levels have kept the Fund from fully realizing the benefits of anticipated or potential economies of scale.
The Board reviewed and evaluated materials from Broadridge and the Consultant showing how management fee schedules of peer funds reflect economies of scale for the benefit of shareholders as a peer fund’s assets hypothetically increase over time. Based on information provided by HFMC, Broadridge, and the Consultant, the Board recognized that there is no uniform methodology for establishing breakpoints or uniform pattern in asset levels that trigger breakpoints or the amounts of breakpoints triggered.
After considering all of the information available to it, the Board concluded that it was satisfied with the extent to which economies of scale would be shared for the benefit of each Fund’s shareholders based on currently available information and the effective management fees and total expense ratios for the Fund at its current and reasonably anticipated asset levels. The Board noted, however, that it would continue to monitor any future growth in each Fund’s assets and the appropriateness of additional management fee breakpoints or other methods to share benefits from economies of scale as part of its future review of the Agreements.
Other Benefits
The Board considered other benefits to the Advisers and their affiliates from their relationships with the Funds.
The Board noted that HFMC receives fees for fund accounting and related services from the Funds, and the Board considered information on the profitability to HFMC from providing such services to the Funds. The Board also considered that each Fund pays a transfer agency fee to Hartford Administrative Services Company (“HASCO”), an affiliate of HFMC, equal to the lesser of: (i) the actual costs incurred by HASCO in connection with the provisions of transfer agency services, including payments made to sub-transfer agents, plus a reasonable target profit margin; or (ii) a specified amount as set forth in the Transfer Agency and Service Agreement by and between HMF II, on behalf of its Funds, HMF, on behalf of its series, and HASCO. The Board reviewed information about the profitability to HASCO of the Funds’ transfer agency function. The Board considered information provided by HFMC indicating that the transfer agency fees charged by HASCO to the Funds were fair and reasonable based on available industry data about fees charged by transfer agents to other mutual funds. The Board also noted that HFMC and HASCO had delegated certain fund accounting services and transfer agency services, respectively, to external service providers, subject to oversight.
The Board also considered that Hartford Funds Distributors, LLC (“HFD”), an affiliate of HFMC, serves as principal underwriter of the Funds. The Board noted that, as principal underwriter, HFD receives distribution and service fees from the Funds and receives all or a portion of the sales charges on sales or redemptions of certain classes of shares. The Board considered that HFD has entered into an agreement with SIMNA Inc. and SEI Trust Company to provide certain marketing support services in connection with four collective investment trust vehicles for which the Sub-advisers serve as investment adviser. The Board also considered that Schroder Fund Advisors LLC (“SFA”), a wholly-owned subsidiary of SIMNA Inc., has entered into an additional compensation arrangement with HFMC and HFD. The Board considered that under this arrangement, SFA is involved in the distribution of the Class SDR shares of the Funds, and HFMC compensates SFA for such services.
The Board considered the benefits, if any, to the Sub-advisers from any use of a Fund’s brokerage commissions to obtain soft dollar research. The Board also considered that SIMNA Inc. has entered into a solicitation agreement with HFMC pursuant to which HFMC provides certain marketing support services with respect to investment strategy models offered by SIMNA Inc. through its managed account platforms.
Fund-by-Fund Factors
For purposes of evaluating a Fund's performance, the Board considered the Fund's performance relative to similarly managed funds and the Fund's performance relative to its benchmark. In particular, the Board considered the Fund's performance of its Class A shares (net of all fees and expenses), as of March 31, 2022, and compared that performance to the Fund's peer universe, which includes all funds within the same classification or category, as determined by an independent firm engaged by the Board. The Board considered the Fund's performance relative to its peer universe by evaluating its quintile ranking, with the 1st quintile representing the top performing funds within a peer universe and the 5th quintile representing the lowest performing funds. For purposes of evaluating the Fund's performance relative to its benchmark, the Board considered the Fund's performance of its Class I shares (net of all fees and expenses) as of March 31, 2022. The Board considered Fund performance to be “in line with” a Fund's benchmark
Approval of Investment Management and Investment Sub-Advisory Agreements (Unaudited) – (continued)
where it was 0.5% above or below the benchmark return. With respect to fees and expenses, the Board considered the Fund's contractual and actual management fee, and total operating expenses of its Class A shares (net of all fees and expenses), as compared to the Fund's expense peer group, which includes a group of similarly sized funds selected by the independent firm engaged by the Board.
Hartford Schroders China A Fund
| • | The Board noted that the Fund’s performance was in the 1st quintile versus its peer universe for the 1-year period. The Board also noted that the Fund’s performance was below its benchmark for the 1-year period. The Board noted that certain changes had recently been made to the Fund’s principal investment strategy. |
| • | The Board noted that the Fund’s contractual management fee and actual management fee were in the 1st quintile of its expense group, while its total expenses were in the 2nd quintile. The Board noted that Class A shares of the Fund have a contractual expense cap of 1.45% through February 28, 2023, which resulted in HFMC reimbursing the Fund for certain expenses. |
Hartford Schroders Emerging Markets Equity Fund
| • | The Board noted that the Fund’s performance was in the 4th quintile versus its peer universe for the 1-year period, the 3rd quintile for the 3-year period, and the 2nd quintile for the 5-year period. The Board also noted that the Fund’s performance was below its benchmark for the 1-year period and above its benchmark for the 3- and 5-year periods. |
| • | The Board noted that the Fund’s contractual management fee and its total expenses were in the 4th quintile of its expense group, while its actual management fee was in the 5th quintile. |
Hartford Schroders Emerging Markets Multi-Sector Bond Fund
| • | The Board noted that the Fund’s performance was in the 4th quintile versus its peer universe for the 1-year period and the 5th quintile for the 3- and 5-year periods. The Board also noted that the Fund’s performance was below its custom blended benchmark for the 1-, 3-, and 5-year periods. |
| • | The Board noted that the Fund’s contractual management fee and actual management fee were in the 2nd quintile of its expense group and its total expenses were in the 3rd quintile. The Board noted that Class A shares of the Fund have a contractual expense cap of 1.15% through February 28, 2023, which resulted in HFMC reimbursing the Fund for certain expenses. |
Hartford Schroders International Multi-Cap Value Fund
| • | The Board noted that the Fund’s performance was in the 1st quintile versus its peer universe for the 1-year period and the 2nd quintile for the 3- and 5-year periods. The Board also noted that the Fund’s performance was above its benchmark for the 1-year period, in line with its benchmark for the 3-year period, and below its benchmark for the 5-year period. The Board noted recent changes to the Fund’s portfolio management team. |
| • | The Board noted that the Fund’s contractual management fee and its total expenses were in the 1st quintile of its expense group, while its actual management fee was in the 4th quintile. The Board noted that Class Y shares of the Fund have a contractual transfer agency expense cap of 0.09% through February 28, 2023, which resulted in HASCO waiving fees and/or reimbursing the Fund for certain expenses. |
Hartford Schroders International Stock Fund
| • | The Board noted that the Fund’s performance was in the 2nd quintile versus its peer universe for the 1- and 5-year periods and the 1st quintile for the 3-year period. The Board also noted that the Fund’s performance was in line with its benchmark for the 1-year period and above its benchmark for the 3- and 5-year periods. |
| • | The Board noted that the Fund’s contractual management fee and its total expenses were in the 1st quintile of its expense group, while its actual management fee was in the 3rd quintile. |
Hartford Schroders Securitized Income Fund
| • | The Board noted that the Fund’s performance was in the 1st quintile versus its peer universe for the 1-year period and the 4th quintile for the 3-year period. The Board also noted that the Fund’s performance was below its benchmark for the 1- and 3-year periods. The Board noted that certain changes had recently been made to the Fund’s principal investment strategy. |
Approval of Investment Management and Investment Sub-Advisory Agreements (Unaudited) – (continued)
| • | The Board noted that the Fund’s contractual management fee was in the 2nd quintile of its expense group, while its actual management fee and its total expenses were in the 3rd quintile. In considering the Fund’s expenses, the Board noted the shareholder savings expected to result from a management fee reduction implemented in December 2021. The Board noted that Class A shares of the Fund have a contractual expense cap of 0.85% through February 28, 2023, which resulted in HFMC reimbursing the Fund for certain expenses. |
Hartford Schroders Tax-Aware Bond Fund
| • | The Board noted that the Fund’s performance was in the 5th quintile versus its peer universe for the 1-, 3-, and 5- year periods. The Board also noted that the Fund’s performance was above its benchmark for the 1-year period and in line with its benchmark for the 3- and 5-year periods. |
| • | The Board noted that the Fund’s contractual management fee and actual management fee were in the 2nd quintile of its expense group, while its total expenses were in the 1st quintile. The Board noted that Class A shares of the Fund have a contractual expense cap of 0.71%, through February 28, 2023, which resulted in HFMC reimbursing the Fund for certain expenses. |
Hartford Schroders US MidCap Opportunities Fund
| • | The Board noted that the Fund’s performance was in the 2nd quintile versus its peer universe for the 1-year period and the 3rd quintile for the 3- and 5-year periods. The Board also noted that the Fund’s performance was above its benchmark for the 1-year period and below its benchmark for the 3- and 5-year periods. |
| • | The Board noted that the Fund’s contractual management fee was in the 2nd quintile of its expense group, while its actual management fee and its total expenses were in the 3rd quintile. |
Hartford Schroders US Small Cap Opportunities Fund
| • | The Board noted that the Fund’s performance was in the 4th quintile versus its peer universe for the 1-year period, the 3rd quintile for the 3-year period, and the 2nd quintile for the 5-year period. The Board also noted that the Fund’s performance was above its benchmark for the 1- and 3-year periods and in line with its benchmark for the 5-year period. |
| • | The Board noted that the Fund’s contractual management fee and its total expenses were in the 3rd quintile of its expense group, while its actual management fee was in the 4th quintile. The Board noted that Class A shares of the Fund have a contractual expense cap of 1.35% through February 28, 2023, which resulted in HFMC reimbursing the Fund for certain expenses. |
* * * *
Based upon the review of the factors summarized above, among others, the Board concluded that it is in the best interests of each Fund and its shareholders for the Board to approve the continuation of the Agreements for an additional year. In reaching this decision, the Board did not assign relative weights to the factors discussed above or deem any one or group of them to be controlling in and of themselves.
Approval of Investment Management and Investment Sub-Advisory Agreements for Hartford Schroders International Contrarian Value Fund and Hartford Schroders Sustainable International Core Fund
The Hartford Mutual Funds II, Inc.
Hartford Schroders International Contrarian Value Fund
Hartford Schroders Sustainable International Core Fund
Section 15(c) of the Investment Company Act of 1940, as amended (the “1940 Act”), requires that each mutual fund’s board of directors, including a majority of those directors who are not “interested persons” of the mutual fund, as defined in the 1940 Act (the “Independent Directors”), initially approve, and annually review and consider the continuation of, the mutual fund’s investment advisory and sub-advisory agreements. At its meeting held on May 10-11, 2022, the Board of Directors (the “Board”) of The Hartford Mutual Funds II, Inc. (”HMF II”), including each of the Independent Directors, unanimously voted to approve (i) an amendment to the investment management agreement (the “Management Agreement”) by and between Hartford Funds Management Company, LLC (“HFMC”) and each of HMF II and The Hartford Mutual Funds, Inc., with respect to each of Hartford Schroders International Contrarian Value Fund and Hartford Schroders Sustainable International Core Fund (each a “Fund” and collectively, the “Funds”); (ii) an amendment to the investment sub-advisory agreement (the “Sub-Advisory Agreement”) by and between HFMC and each Fund’s sub-adviser, Schroder Investment Management North America Inc. (“SIMNA Inc.” or the “Sub-adviser”), with respect to each Fund; and (iii) an
Approval of Investment Management and Investment Sub-Advisory Agreements (Unaudited) – (continued)
amendment to the sub-sub-advisory agreement (the “Sub-Sub-Advisory Agreement” and together with the Management Agreement and the Sub-Advisory Agreement, the “Agreements”) by and between SIMNA Inc. and Schroder Investment Management North America Limited (“SIMNA Ltd.,” and together with SIMNA Inc., the “Sub-advisers,” and together with HFMC, the “Advisers”) with respect to each Fund.
Prior to approving the Agreements, the Board requested and reviewed written responses from the Advisers to questions posed to the Advisers on behalf of the Independent Directors and supporting materials relating to those questions and responses. In addition, the Board and its Investment Committee considered the materials and presentations from representatives of the Advisers received at meetings held on February 9-10, 2022 and May 10-11, 2022 regarding each Fund and its investment strategy. The members of the Board also considered the materials and presentations by Fund officers and representatives of HFMC received at the Board’s meeting on May 10-11, 2022 concerning the Agreements.
In determining whether to approve the Agreements for each Fund, the members of the Board reviewed and evaluated information and factors they believed to be relevant and appropriate through the exercise of their reasonable business judgment. While individual members of the Board may have weighed certain factors differently, the Board’s determination to approve the Agreements was based on a comprehensive consideration of all information provided to the Board with respect to the approval of the Agreements. The Board was also furnished with an analysis of its fiduciary obligations in connection with its evaluation of the Agreements. Throughout the evaluation process, the Board was assisted by counsel for each Fund and the Independent Directors were also separately assisted by independent legal counsel. In connection with their deliberations, the Independent Directors met separately with independent legal counsel in executive session to consider their responsibilities under relevant laws and regulations and to discuss the materials presented and other matters deemed relevant to their consideration of the approval of the Agreements. A more detailed summary of the important, but not necessarily all, factors the Board considered with respect to its approval of the Agreements is provided below.
Nature, Extent and Quality of Services to be Provided by the Advisers
The Board requested and considered information concerning the nature, extent and quality of the services to be provided to each Fund by the Advisers. The Board considered, among other things, the terms of the Agreements and the range of services to be provided by the Advisers. The Board considered each Adviser’s organizational structure, systems and personnel. The Board also considered each Adviser’s reputation and overall financial strength, and the Board’s past experience with each Adviser with respect to the services each Adviser provides to other funds managed by HFMC and its affiliates (the “Hartford funds”). In addition, the Board considered the quality of each Adviser’s communications with the Board and responsiveness to Board inquiries and requests made from time to time with respect to the Hartford funds.
With respect to HFMC, the Board noted that, under the Management Agreement, HFMC would be responsible for the management of each Fund, including oversight of fund operations and service providers. The Board also noted that HFMC would provide investment advisory services to each Fund as well as administrative services in connection with selecting, monitoring and supervising each Fund’s Sub-advisers, and that HFMC had recommended to the Board that the Sub-advisers be appointed as the sub-adviser and sub-sub-adviser to each Fund. In this regard, the Board evaluated information about the nature and extent of responsibilities retained and risks assumed by HFMC that were not delegated to or assumed by the Sub-advisers. The Board considered the proposed services to be provided by HFMC and, in its consideration of these services, the Board noted HFMC’s ongoing monitoring of people, process and performance, including its quarterly reviews of each of the Hartford funds, semi-annual meetings with the leaders of each Hartford fund’s portfolio management team, and ongoing oversight of the Hartford funds’ portfolio managers. The Board noted that HFMC has demonstrated a record of initiating changes to the portfolio management and/or investment strategies of the Hartford funds when warranted. The Board considered that HFMC would oversee the Sub-advisers’ investment approach and results, process for monitoring best execution of portfolio trades and other trading operations by each Sub-adviser and approach to risk management with respect to each Fund and the service providers to each Fund. The Board also considered that HFMC would oversee each Fund’s compliance with its investment objective and policies as well as with applicable laws and regulations. Moreover, the Board considered that HFMC would oversee potential conflicts of interest between each Fund’s investments and those of other funds or accounts, if any, managed by such Fund’s portfolio management personnel. In addition, the Board considered that HFMC or its affiliates would be responsible for providing each Fund’s officers.
With respect to SIMNA Inc. and SIMNA Ltd., which would provide certain day-to-day portfolio management services for each Fund, subject to oversight by HFMC, the Board considered, among other things, each Sub-adviser’s investment personnel, investment philosophy and process, investment research capabilities and resources, performance record, trade execution capabilities and experience, including with respect to sustainable investing and environmental, social and/or governance (ESG) criteria. The Board considered the experience of each Fund’s proposed portfolio manager(s), the number of accounts managed by the portfolio managers, and each Sub-adviser’s method for compensating the portfolio managers. The Board also considered each Sub-adviser’s succession planning practices to ensure continuity of portfolio management services to be provided to each Fund.
Approval of Investment Management and Investment Sub-Advisory Agreements (Unaudited) – (continued)
The Board also considered information previously provided by the Advisers regarding their compliance policies and procedures and compliance history, and received a representation from the Hartford funds’ Chief Compliance Officer that the written compliance policies and procedures of each of HFMC and the Sub-advisers are reasonably designed to prevent violations of the federal securities laws. In addition, the Board considered HFMC’s representation that it did not anticipate making any material changes to HFMC’s and the Hartford funds’ compliance program as a result of the addition of each Fund.
The Board considered the benefits to each Fund’s future shareholders of being part of the family of Hartford funds, including, the right to exchange investments between the same class of shares and the ability to reinvest Fund dividends into other Hartford funds (excluding the Hartford funds that are exchange-traded funds). The Board considered HFMC’s efforts to provide investors in the Hartford funds with a broad range of investment styles and asset classes and the assumption of entrepreneurial and other risks by HFMC in sponsoring and providing ongoing services to new funds to expand these opportunities for shareholders.
In considering the foregoing information, the Board evaluated not only the information presented to the Board and the Investment Committee in connection with its consideration of the Agreements, but also the Board’s experience through past interactions with HFMC and the Sub-advisers. Based on these considerations, the Board concluded that it was satisfied with the nature, extent and quality of the services to be provided to each Fund by HFMC and the Sub-advisers.
Performance of each Fund and the Advisers
The Board considered the investment performance of the Sub-advisers and their portfolio management teams, including, for purposes of considering the investment skill and experience of each Fund’s portfolio manager(s), back-tested and model performance of each Fund’s strategy showing the portfolio management team’s expected capabilities, and with respect to the Hartford Schroders International Contrarian Value Fund, the performance of the international component of the Sub-advisers’ Global Recovery composite, a global deep value strategy, and with respect to the Hartford Sustainable International Core Fund, the performance of a blend of certain regional composites. With respect to each Fund, the Board also considered information comparing the back-tested and model performance data to the Fund’s proposed benchmark and an appropriate universe of peer funds. With respect to each Fund, HFMC also provided additional information about the broad range of the portfolio management team’s investment experience and their investment philosophy and process.
Based on these considerations, the Board concluded that it was satisfied that HFMC and the Sub-advisers have the capability of providing satisfactory investment performance for each Fund.
Costs of the Services and Profitability of the Advisers
In considering the proposed advisory and sub-advisory fee schedules for each Fund, the Board reviewed information regarding HFMC’s estimated costs to provide investment management and related services to each Fund and the estimated profitability to HFMC from the investment management and related services to be provided to each Fund. In evaluating HFMC’s estimated profitability with respect to each Fund, the Board also considered HFMC’s representation that the level of estimated profitability of the Fund, taking into consideration the revenue and expenses of each Fund, was fair and reasonable based on the nature and quality of the services to be provided to shareholders. The Board also noted that the actual profitability to HFMC of managing each Fund would depend on the growth of such Fund’s assets under management. The Board considered representations from HFMC and SIMNA Inc. that SIMNA Inc.’s fees were negotiated at arm’s length on a Fund-by-Fund basis and that the sub-advisory fees are paid by HFMC and not the Funds. The Board also considered that SIMNA Ltd. is an affiliate of SIMNA Inc. and that SIMNA Ltd.’s sub-sub-advisory fees would be paid by SIMNA Inc., not the Funds. Accordingly, the Board concluded that the profitability of the Sub-advisers is a less relevant factor with respect to the Board’s consideration of the Sub-Advisory Agreement and the Sub-Sub-Advisory Agreement.
Based on these considerations, the Board concluded that the profits anticipated to be realized by the Advisers and their affiliates from their relationships with each Fund would not be excessive.
Comparison of Fees and Services to be Provided by the Advisers
The Board considered comparative information with respect to the services to be rendered to and the management fees to be paid by each Fund to HFMC and the estimated total expense ratios of each Fund. The Board also considered the proposed sub-advisory fees to be paid by HFMC to SIMNA Inc. with respect to each Fund. The Board also considered that SIMNA Ltd. is an affiliate of SIMNA Inc. and that SIMNA Ltd.’s sub-sub-advisory fees would be paid by SIMNA Inc., not the Funds. In this regard, the Board requested and reviewed information from HFMC and SIMNA Inc. relating to the proposed management and sub-advisory fees, including the sub-advisory fee schedule for each Fund, and the amount of
Approval of Investment Management and Investment Sub-Advisory Agreements (Unaudited) – (continued)
the management fee to be retained by HFMC, and estimated total operating expenses for each Fund. With respect to each Fund, the Board also reviewed information comparing the Fund’s proposed contractual management fees, actual management fees and estimated total expense ratios relative to an appropriate group of funds (the “Peer Group”) selected from the relevant peer universe identified by Broadridge Financial Solutions, Inc., an independent provider of investment company data. As part of this review, the Board considered the composition of the Peer Group and the methodology used to select the Peer Group, which included input from an independent financial services consultant engaged by the Independent Directors to assist them in evaluating each Fund’s proposed management fees and estimated total expense ratios. The Board considered the inherent limitations of such comparisons in light of uncertainty as to how the fees of other funds in the Peer Group are set and potentially material differences between each Fund and its Peer Group. With respect to each Fund, the Board also considered that HFMC had contractually agreed to limit the expenses (exclusive of certain specified expenses) for the Fund’s Class I to 0.85% and Class SDR through 0.70% through February 29, 2024, unless the Board approves its earlier termination.
In considering the reasonableness of each Fund’s proposed management and sub-advisory fees and estimated total expense ratios, the Board considered that each Fund’s proposed contractual management fee was below the average and median of its Peer Group for all asset levels. The Board further considered that each Fund’s proposed contractual management fees fell within the 1st quintile of its Peer Group and actual management fees, taking into account any fee waivers, fell within the 1st quintile of its Peer Group. The Board also considered that each Fund’s estimated total expense ratio for Class SDR shares was within the 1st quintile of its Peer Group.
Based on these considerations, the Board concluded that each Fund’s proposed fees and estimated total operating expenses, in conjunction with the information about quality of services, profitability, economies of scale, and other matters considered, were reasonable in light of the services to be provided.
Economies of Scale
With respect to each Fund, the Board considered information regarding economies of scale, including the extent to which economies of scale may be realized as the Fund grows and whether the Fund’s corresponding fee levels reflect these economies of scale for the benefit of the Fund’s future shareholders. The Board reviewed the breakpoint in the proposed management fee schedule for each Fund, which would reduce the fee rate if and when Fund assets grow over time to more than $1 billion. The Board considered HFMC’s representation that each Fund could be expected to achieve some economies of scale as assets in such Fund grow. The Board recognized that a fund with assets beyond the highest breakpoint level would continue to benefit from economies of scale because additional assets are charged the lowest breakpoint fee resulting in lower effective management fee rates. The Board also recognized that a fee schedule that reaches a breakpoint at a lower asset level provides shareholders with the benefit of anticipated or potential economies of scale. The Board considered that expense limitations and fee waivers that reduce each Fund’s expenses at all asset levels can have the same effect as breakpoints in sharing economies of scale with shareholders and provide protection from an increase in expenses if Fund assets decline. The Board also considered that HFMC has been active in managing expenses for the Hartford funds in recent years, which has resulted in benefits being realized by shareholders. In addition, the Board considered that initially setting competitive fee rates and pricing each Fund to scale at inception are other means of sharing potential economies of scale with shareholders.
With respect to each Fund, the Board reviewed and evaluated materials from HFMC showing how management fee schedules of other funds in the Peer Group reflect economies of scale for the benefit of shareholders as a fund’s assets hypothetically increase over time. The Board recognized that there is no uniform methodology for establishing breakpoints or uniform pattern in asset levels that trigger breakpoints or the amounts of breakpoints triggered.
The Board also considered how any benefits from economies of scale would be realized by the various parties. With respect to each Fund, the Board reviewed relevant information included in the materials provided to the Board regarding comparative breakpoint information for other funds in the Peer Group. Based on these considerations, the Board concluded that it was satisfied with the extent to which economies of scale would be shared for the benefit of each Fund’s future shareholders. The Board noted, however, that it would monitor any future growth in each Fund’s assets and the appropriateness of additional management fee breakpoints or other methods to share benefits from economies of scale as part of its future review of the Agreements.
Other Benefits
The Board considered other benefits to the Advisers and their affiliates from their relationships with each Fund.
The Board noted that HFMC would receive fees for fund accounting and related services from each Fund. The Board also considered that Hartford Administrative Services Company, each Fund’s transfer agent and an affiliate of HFMC, would receive transfer agency compensation from each Fund.
Approval of Investment Management and Investment Sub-Advisory Agreements (Unaudited) – (continued)
The Board also considered that Hartford Funds Distributors, LLC (“HFD”), an affiliate of HFMC, would serve as principal underwriter of each Fund. The Board considered that HFD has entered into an agreement with SIMNA Inc. and SEI Trust Company to provide certain marketing support services in connection with four collective investment trust vehicles for which the Sub-advisers serve as investment adviser. The Board also considered that Schroder Fund Advisors LLC (“SFA”), a wholly-owned subsidiary of SIMNA Inc., has entered into an additional compensation arrangement with HFMC and HFD. The Board considered that under this arrangement, SFA would be involved in the distribution of the Class SDR shares of each Fund, and HFMC would compensate SFA for such services.
The Board also considered that SIMNA Inc. has entered into a solicitation agreement with HFMC pursuant to which HFMC provides certain marketing support services with respect to investment strategy models offered by SIMNA Inc. through its managed account platforms.
* * * *
Based upon the review of the factors summarized above, among others, the Board concluded that it is in the best interests of each Fund for the Board to approve the Agreements. In reaching this decision, the Board did not assign relative weights to the factors discussed above or deem any one or group of them to be controlling in and of themselves.
THIS PRIVACY POLICY IS NOT PART OF THIS REPORT
Customer Privacy Notice
The Hartford Financial Services Group, Inc. and Affiliates
(herein called “we, our, and us”)
This Privacy Policy applies to our United States Operations
We value your trust. We are committed to the responsible:
| a) | management; |
| b) | use; and |
| c) | protection; |
of Personal Information.
This notice describes how we collect, disclose, and protect Personal Information.
We collect Personal Information to:
| a) | service your Transactions with us; and |
| b) | support our business functions. |
We may obtain Personal Information from:
| a) | You; |
| b) | your Transactions with us; and |
| c) | third parties such as a consumer-reporting agency. |
Based on the type of product or service You apply for or get from us, Personal Information such as:
| a) | your name; |
| b) | your address; |
| c) | your income; |
| d) | your payment; or |
| e) | your credit history; |
may be gathered from sources such as applications, Transactions, and consumer reports.
To serve You and service our business, we may share certain Personal Information. We will share Personal Information, only as allowed by law, with affiliates such as:
| a) | our insurance companies; |
| b) | our employee agents; |
| c) | our brokerage firms; and |
| d) | our administrators. |
As allowed by law, we may share Personal Financial Information with our affiliates to:
| a) | market our products; or |
| b) | market our services; |
to You without providing You with an option to prevent these disclosures.
We may also share Personal Information, only as allowed by law, with unaffiliated third parties including:
| a) | independent agents; |
| b) | brokerage firms; |
| c) | insurance companies; |
| d) | administrators; and |
| e) | service providers; |
who help us serve You and service our business.
When allowed by law, we may share certain Personal Financial Information with other unaffiliated third parties who assist us by performing services or functions such as:
| a) | taking surveys; |
| b) | marketing our products or services; or |
| c) | offering financial products or services under a joint agreement |
between us and one or more financial institutions.
We, and third parties we partner with, may track some of the pages You visit through the use of:
| a) | cookies; |
| b) | pixel tagging; or |
| c) | other technologies; |
and currently do not process or comply with any web browser’s “do not track” signal or other similar mechanism that indicates a request to disable online tracking of individual users who visit our websites or use our services.
For more information, our Online Privacy Policy, which governs information we collect on our website and our affiliate websites, is available at https://www.thehartford.com/online-privacy-policy.
We will not sell or share your Personal Financial Information with anyone for purposes unrelated to our business functions without offering You the opportunity to:
| a) | “opt-out;” or |
| b) | “opt-in;” |
as required by law.
We only disclose Personal Health Information with:
| a) | your authorization; or |
| b) | as otherwise allowed or required by law. |
Our employees have access to Personal Information in the course of doing their jobs, such as:
| a) | underwriting policies; |
| b) | paying claims; |
| c) | developing new products; or |
| d) | advising customers of our products and services. |
We use manual and electronic security procedures to maintain:
| a) | the confidentiality; and |
Personal Information that we have. We use these procedures to guard against unauthorized access.
Some techniques we use to protect Personal Information include:
| d) | firewall technology; and |
| e) | the use of detection software. |
We are responsible for and must:
| a) | identify information to be protected; |
| b) | provide an adequate level of protection for that data; and |
| c) | grant access to protected data only to those people who must use |
it in the performance of their job-related duties.
Employees who violate our privacy policies and procedures may be subject to discipline, which may include termination of their employment with us.
We will continue to follow our Privacy Policy regarding Personal Information even when a business relationship no longer exists between us.
As used in this Privacy Notice:
Application means your request for our product or service.
Personal Financial Information means financial information such as:
| d) | policy or claim information. |
Personal Financial Information may include Social Security Numbers, Driver’s license numbers, or other government-issued identification numbers, or credit, debit card, or bank account numbers.
Personal Health Information means health information such as:
| a) | your medical records; or |
| b) | information about your illness, disability or injury. |
Personal Information means information that identifies You personally and is not otherwise available to the public. It includes:
| a) | Personal Financial Information; and |
| b) | Personal Health Information. |
Transaction means your business dealings with us, such as:
| b) | your request for us to pay a claim; and |
| c) | your request for us to take an action on your account. |
You means an individual who has given us Personal Information in conjunction with:
a financial product or service from us if the product or service is used mainly for personal, family, or household purposes.
If you have any questions or comments about this privacy notice, please feel free to contact us at The Hartford – Consumer Rights and Privacy Compliance Unit, One Hartford Plaza, Mail Drop: HO1-09, Hartford, CT 06155, or at ConsumerPrivacyInquiriesMailbox@thehartford.com.
This Customer Privacy Notice is being provided on behalf of The Hartford Financial Services Group, Inc. and its affiliates (including the following as of February 2022), to the extent required by the Gramm-Leach-Bliley Act and implementing regulations:
1stAGChoice, Inc.; Access CoverageCorp, Inc.; Access CoverageCorp Technologies, Inc.; Business Management Group, Inc.; Cervus Claim Solutions, LLC; First State Insurance Company; FTC Resolution Company LLC; Hart Re Group L.L.C.; Hartford Accident and Indemnity Company; Hartford Administrative Services Company; Hartford Casualty General Agency, Inc.; Hartford Casualty Insurance Company; Hartford Fire General Agency, Inc.; Hartford Fire Insurance Company; Hartford Funds Distributors, LLC; Hartford Funds Management Company, LLC; Hartford Funds Management Group, Inc.; Hartford Holdings, Inc.; Hartford Insurance Company of Illinois; Hartford Insurance Company of the Midwest; Hartford Insurance Company of the Southeast; Hartford Insurance, Ltd.; Hartford Integrated Technologies, Inc.; Hartford Investment Management Company; Hartford Life and Accident Insurance Company; Hartford Lloyd’s Corporation; Hartford Lloyd’s Insurance Company; Hartford Management, Ltd.; Hartford Productivity Services LLC; Hartford of the Southeast General Agency, Inc.; Hartford of Texas General Agency, Inc.; Hartford Residual Market, L.C.C.; Hartford Specialty Insurance Services of Texas, LLC; Hartford STAG Ventures LLC; Hartford Strategic Investments, LLC; Hartford Underwriters General Agency, Inc.; Hartford Underwriters Insurance Company; Heritage Holdings, Inc.; Heritage Reinsurance Company, Ltd.; HLA LLC; HL Investment Advisors, LLC; Horizon Management Group, LLC; HRA Brokerage Services, Inc.; Lattice Strategies LLC; Maxum Casualty Insurance Company; Maxum Indemnity Company; Maxum Specialty Services Corporation; Millennium Underwriting Limited; MPC Resolution Company LLC; Navigators (Asia) Limited; Navigators Corporate Underwriters Limited; Navigators Holdings (UK) Limited; Navigators Insurance Company; Navigators International Insurance Company Ltd.; Navigators Management Company, Inc.; Navigators Management (UK) Limited; Navigators N.V.; Navigators Specialty Insurance Company; Navigators Underwriting Agency Limited; Navigators Underwriting Limited; New England Insurance Company; New England Reinsurance Corporation; New Ocean Insurance Co., Ltd.; NIC Investments (Chile) SpA; Nutmeg Insurance Agency, Inc.; Nutmeg Insurance Company; Pacific Insurance Company, Limited; Property and Casualty Insurance Company of Hartford; Sentinel Insurance Company, Ltd.; The Navigators Group, Inc.; Trumbull Flood Management, L.L.C.; Trumbull Insurance Company; Twin City Fire Insurance Company; Y-Risk, LLC.
Revised February 2022
[This page is intentionally left blank]
This report is submitted for the general information of the shareholders of the Funds referenced in this report. It is not authorized for distribution to persons who are not shareholders of one or more Funds referenced in this report unless preceded or accompanied by a current prospectus for the relevant Funds. Nothing herein contained is to be considered an offer of sale or a solicitation of an offer to buy shares of any Fund listed in this report.
The information cannot be used or relied upon for the purpose of avoiding IRS penalties. These materials are not intended to provide tax, accounting or legal advice. As with all matters of a tax or legal nature, you should consult your own tax or legal counsel for advice.
Investors should carefully consider a Fund’s investment objectives, risks, charges and expenses. This and other important information is contained in the Fund’s prospectus and summary prospectus, which can be obtained by visiting hartfordfunds.com. Please read it carefully before investing.
The Funds are distributed by Hartford Funds Distributors, LLC.
MFAR-HSE22 12/22 Printed in the U.S.A.

Hartford Domestic
Equity Funds
Annual Report
October 31, 2022
| ■ The Hartford Capital Appreciation Fund |
| ■ Hartford Core Equity Fund |
| ■ The Hartford Dividend and Growth Fund |
| ■ The Hartford Equity Income Fund |
| ■ The Hartford Growth Opportunities Fund |
| ■ The Hartford Healthcare Fund |
| ■ The Hartford MidCap Fund |
| ■ The Hartford MidCap Value Fund |
| ■ Hartford Quality Value Fund |
| ■ The Hartford Small Cap Growth Fund |
| ■ Hartford Small Cap Value Fund |
| ■ The Hartford Small Company Fund |
A MESSAGE FROM THE PRESIDENT
Dear Shareholders:
Thank you for investing in Hartford Mutual Funds. The following is the Funds’ Annual Report covering the period from November 1, 2021 through October 31, 2022.
Market Review
During the 12 months ended October 31, 2022, U.S. stocks, as measured by the S&P 500 Index,1 lost 14.61%. The decline was an unsettling reminder that equities have experienced an exceptionally volatile period marked by persistent inflation, the U.S. Federal Reserve (Fed) interest rate increases, and, lately, growing fears of recession.
Many investors would prefer to remember the brief period from late-June to late-August in 2022 when stocks came off their June 2022 lows for the year and climbed on hopes of a pause in the Fed’s interest-rate increases. But Fed Chair Jerome Powell’s Jackson Hole speech on August 26, 2022, made it clear the Fed would not be backing off its campaign of rate hikes until it felt inflation had been brought under control. The mid-summer rally quickly faded as Powell’s words sank in and as the August 2022 Consumer Price Index (CPI)2 report of 8.3% annual inflation appeared to stiffen the Fed’s resolve. The CPI’s small retreat to 8.2% in September 2022 produced no change in Fed sentiment.
With all the volatility we’ve seen these past 12 months, it may seem hard to believe that markets at the start of the period were, in fact, on their way to setting new positive records. Even as the Fed had begun expressing concerns in late 2021 over the likely persistence of inflation, the S&P 500 Index was on a steady climb on its way to a record high as of January 3, 2022.
As inflation numbers steadily worsened, Fed policymakers acknowledged that higher prices wouldn't be as transitory as they would have hoped. Soon thereafter, the Fed embarked on a cycle of rate hikes and Treasury balance-sheet reductions designed to slow the economy and soak up the massive amounts of liquidity put in place to support a faltering economy.
Any review of the period would be incomplete without noting the impact of the February 24, 2022 invasion of Ukraine by Russia’s armed forces, a decision that continues to threaten global security and strain worldwide food and energy supplies. With the continued backdrop of geopolitical instability, the Fed kept its anti-inflationary policy stance in focus in March 2022 by enacting a quarter-percent increase in the federal funds rate.
After a surprise jump in consumer prices in May 2022, the Fed in June 2022 raised rates by three-quarters of a percent. Although declining gasoline prices offered consumers a measure of relief during the summer, core inflation, which excludes volatile food and energy prices, remained persistently high as the period came to an end. As the Fed added another three-quarter-percent rate hike in September and October 2022, markets remained highly volatile.
As we approach the winter months, recession concerns are likely to grow as a result of the impact of Fed rate hikes on labor markets, currencies, and corporate profits. With market volatility likely to persist, it’s more important than ever to maintain a strong relationship with your financial professional.
Thank you again for investing in Hartford Mutual Funds. For the most up-to-date information on our funds, please take advantage of all the resources available at hartfordfunds.com.
James Davey
President
Hartford Funds
| 1 | S&P 500 Index is a market capitalization-weighted price index composed of 500 widely held common stocks. The index is unmanaged and not available
for direct investment. Past performance does not guarantee future results. |
| 2 | The Consumer Price Index (CPI) in the United States is defined by the Bureau of Labor Statistics as a measure of the average change over time in the prices
paid by urban consumers for a market basket of consumer goods and services. |
Hartford Domestic Equity Funds
Table of Contents
The views expressed in each Fund’s Manager Discussion contained in the Fund Overview section are views of that Fund’s portfolio manager(s) through the end of the period and are subject to change based on market and other conditions, and we disclaim any responsibility to update the views contained herein. These views may contain statements that are “forward-looking” statements. Actual results may differ materially from those projected in the “forward-looking” statements. Each Fund’s Manager Discussion is for informational purposes only and does not represent an offer, recommendation or solicitation to buy, hold or sell any security. The specific securities identified and described, if any, do not represent all of the securities purchased or sold and you should not assume that investments in the securities identified and discussed will be profitable. Holdings and characteristics are subject to change. Fund performance reflected in each Fund’s Manager Discussion reflects the returns of such Fund’s Class A shares, before sales charges. Returns for such Fund’s other classes differ only to the extent that the classes do not have the same expenses.
The Hartford Capital Appreciation Fund
Fund Overview
October 31, 2022 (Unaudited)
Inception 07/22/1996
Sub-advised by Wellington Management Company LLP | Investment objective – The Fund seeks growth of capital. |
Comparison of Change in Value of $10,000 Investment (10/31/2012 - 10/31/2022)
The chart above represents the hypothetical growth of a $10,000 investment in Class A, which includes the maximum sales charge applicable to Class A shares. Returns for the Fund’s other classes will vary from what is seen above due to differences in the expenses charged to those share classes.
| Average Annual Total Returns |
| for the Periods Ended 10/31/2022 |
| | 1 Year | 5 Years | 10 Years |
| Class A1 | -17.73% | 7.64% | 11.21% |
| Class A2 | -22.25% | 6.43% | 10.58% |
| Class C1 | -18.38% | 6.82% | 10.39% |
| Class C3 | -19.03% | 6.82% | 10.39% |
| Class I1 | -17.51% | 7.93% | 11.54% |
| Class R31 | -18.03% | 7.26% | 10.85% |
| Class R41 | -17.77% | 7.59% | 11.19% |
| Class R51 | -17.53% | 7.91% | 11.52% |
| Class R61 | -17.44% | 8.02% | 11.62% |
| Class Y1 | -17.54% | 7.96% | 11.59% |
| Class F1 | -17.42% | 8.03% | 11.59% |
| Russell 3000 Index | -16.52% | 9.87% | 12.46% |
| S&P 500 Index | -14.61% | 10.44% | 12.79% |
| 1 | Without sales charge |
| 2 | Reflects maximum sales charge of 5.50% |
| 3 | Reflects a contingent deferred sales charge of 1.00% |
PERFORMANCE DATA QUOTED REPRESENTS PAST PERFORMANCE AND DOES NOT GUARANTEE FUTURE RESULTS. The investment return and principal value of the investment will fluctuate so that investors’ shares, when redeemed, may be worth more or less than their original cost. The chart and table do not reflect the deductions of taxes that a shareholder would pay on Fund distributions or the redemption of Fund shares. Current performance may be lower or higher than the performance data quoted. To obtain performance data current to the most recent month-end, please visit our website hartfordfunds.com.
Total returns presented above were calculated using the applicable class' net asset value available to shareholders for sale or redemption of Fund shares on 10/31/2022, which may exclude investment transactions as of this date. All share class returns assume the reinvestment of all distributions at net asset value and the deduction of all fund expenses. The total returns presented in the Financial Highlights section of the report are calculated in the same manner, but also take into account certain
adjustments that are necessary under generally accepted accounting principles. As a result, the total returns in the Financial Highlights section may differ from the total returns presented above.
Class R6 shares commenced operations on 11/07/2014 and performance prior to that date is that of the Fund’s Class Y shares. Class F shares commenced operations on 02/28/2017 and performance prior to that date is that of the Fund’s Class I shares. Performance prior to an inception date of a class has not been adjusted to reflect the operating expenses of such class.
You cannot invest directly in an index.
See “Benchmark Glossary” for benchmark descriptions.
Performance information may reflect expense waivers/reimbursements without which performance would have been lower.
| Operating Expenses* | Gross | Net |
| Class A | 1.04% | 1.04% |
| Class C | 1.82% | 1.82% |
| Class I | 0.77% | 0.77% |
| Class R3 | 1.41% | 1.41% |
| Class R4 | 1.10% | 1.10% |
| Class R5 | 0.80% | 0.80% |
| Class R6 | 0.69% | 0.69% |
| Class Y | 0.80% | 0.80% |
| Class F | 0.69% | 0.69% |
| * | Expenses as shown in the Fund’s most recent prospectus. Actual expenses may be higher or lower. Please see accompanying Financial Highlights for expense ratios for the period ended 10/31/2022. |
The Hartford Capital Appreciation Fund
Fund Overview – (continued)
October 31, 2022 (Unaudited)
Portfolio Managers
Gregg R. Thomas, CFA
Senior Managing Director and Director, Investment Strategy
Wellington Management Company LLP
Thomas S. Simon, CFA, FRM
Senior Managing Director and Portfolio Manager
Wellington Management Company LLP
Manager Discussion
How did the Fund perform during the period?
The Class A shares of The Hartford Capital Appreciation Fund returned -17.73%, before sales charges, for the twelve-month period ended October 31, 2022, underperforming the Fund’s benchmarks, the Russell 3000 Index, which returned -16.52% for the same period, and the S&P 500 Index, which returned -14.61% for the same period. For the same period, the Class A shares of the Fund, before sales charges, underperformed the -16.03% average return of the Lipper Multi-Cap Core Funds peer group, a group of funds with investment strategies similar to those of the Fund.
Why did the Fund perform this way?
United States (U.S.) equities fell over the trailing twelve-month period ended October 31, 2022. Markets rallied early in the period on the back of robust equity inflows, strong corporate earnings, favorable economic data, and extremely accommodative financial conditions. However, the rapid spread of the Omicron variant of the coronavirus led to the largest increase in U.S. COVID-19 cases since the onset of the pandemic, prompting a flurry of new restrictions and event cancellations. Inflation continued to surge against a backdrop of severe supply and labor shortages, rising energy prices, and high demand for goods and services, heightening scrutiny of the U.S. Federal Reserve (Fed) amid anxiety about a potential monetary policy mistake. Equity markets fell sharply in the second quarter of 2022, as rampant inflation and tighter financial conditions negatively affected risk sentiment and increased the probability of recession. Rapidly rising prices for food and energy pushed consumer inflation to its highest level in more than four decades. Growth equities significantly underperformed their value counterparts as surging Treasury yields and disappointing earnings results from some of the largest technology companies drove the Nasdaq Composite Index to its biggest quarterly loss since September 2001. Equity market weakness persisted, as risk sentiment deteriorated on fears that aggressive interest-rate increases and tighter financial conditions would constrict economic growth and drive the U.S. to recession. Despite these concerns, Fed Chair Jerome Powell made clear that the central bank is committed to raising interest rates and keeping them elevated for longer until there is clear evidence that price pressures are abating.
Returns varied by market cap during the period, as large-cap equities, as measured by the S&P 500 Index, outperformed small-cap equities and underperformed mid-cap equities, as measured by the Russell 2000 Index and S&P MidCap 400 Index, respectively.
Eight of the eleven sectors in the Russell 3000 Index posted negative returns during the period, while three sectors posted positive returns during the period. Weak performers included the Communication Services (-41%), Consumer Discretionary (-29%), and Information Technology (-24%) sectors. The Energy (+62%), Consumer Staples (+4%), and Utilities (+3%) sectors posted gains for the period.
The Fund seeks its investment objective by employing a multiple portfolio manager structure, which means the Fund has several components that are managed separately using different investment styles (each a “sleeve”).
During the period, the Fund underperformed the Russell 3000 Index primarily due to weak stock selection within the Information Technology, Healthcare, and Communication Services sectors. Conversely, stronger selection within the Industrials, Consumer Discretionary, and Financials sectors contributed positively to relative returns during the period. Sector allocation, a result of bottom-up stock selection, detracted from performance during the period primarily due to the Fund’s underweight exposures to the Energy and Utilities sectors. Underweight exposures to the Information Technology and Communication Services sectors relative to the Russell 3000 Index contributed positively to performance during the period.
Relative to the Russell 3000 Index, the Fund’s underweight exposure to Apple (Information Technology), our decision to not hold Exxon Mobil (Energy) in the Fund, and the out-of-benchmark position in Snap (Communication Services) were the top relative detractors from Fund performance during the period. Apple designs, manufactures, and markets smartphones, personal computers, tablets, wearables, and accessories worldwide. Shares of Apple ended the period lower despite reporting better-than-expected quarterly earnings and increase in personal computer (PC) sales, driven by negative impacts from supply constraints, foreign exchange challenges, and weakness in digital advertising. While shares of Apple declined during the period, they declined less than the rest of the market as measured by the Russell 3000 Index. The Fund initiated an underweight position in the stock during the period. Exxon Mobil engages in the exploration, development, and distribution of oil, gas, and petroleum products. Shares of Exxon Mobil rose as the company reported quarterly earnings that exceeded consensus estimates and benefited overall from the rise in global energy prices. As of the end of the period, the Fund continued to not hold the stock. Snap is an American camera and social media company. Shares of Snap fell during the period as the company reported lower-than-expected quarterly earnings and projected that revenue would be lower than their original expectations. The macroeconomic environment has provided challenges for the
The Hartford Capital Appreciation Fund
Fund Overview – (continued)
October 31, 2022 (Unaudited)
company as well due to rising inflation and interest rates, labor disruptions and platform policy changes. The Fund eliminated the position in this stock during the period.
Meta Platform (Communication Services), Alphabet (Communication Services), and Amazon.com (Consumer Discretionary) were among the largest detractors from Fund performance on an absolute basis over the period.
Top contributors to performance relative to the Russell 3000 Index during the period included the overweight exposure to Northrop Grumman (Industrials), our decision to eliminate the Fund’s position in Tesla (Consumer Discretionary), as well as an underweight exposure to Microsoft (Information Technology). Northrop Grumman is an American multinational aerospace and defense technology company. Shares rose over the period alongside other defense equities in response to the Ukraine-Russia conflict. Despite falling revenues hampered by labor shortages and supply chain issues, the company maintained its 2022 fiscal year earnings and revenue guidance, and announced increases to its quarterly dividend. The Fund maintained an overweight to the stock as of the end of the period. Tesla engages in the design, development, manufacture, and sale of fully electric vehicles, energy generation, and storage systems. Shares of Tesla fell during the period as the electric vehicle maker continued to grapple with supply chain issues and COVID-related shutdowns in Shanghai. The company also reported lower-than-expected third-quarter production and delivery numbers and faced growing pains from executive turnover, logistical challenges, and rising commodity prices. The Fund eliminated the position in the stock during the period. Microsoft is an American multinational technology corporation. Shares of Microsoft fell during the period as technology stocks experienced some of the biggest losses due to challenges from rising interest rates. The company also reported weaker-than-expected cloud revenue in the fiscal first quarter and issued second-quarter revenue guidance that fell short of expectations, despite the fact that the company beat earnings and revenue estimates. We increased the position to the stock within the Fund, but the Fund remains underweight relative to the benchmark.
UnitedHealth (Healthcare), Northrop Grumman (Industrials), and Lockheed Martin (Industrials) were among the largest contributors to Fund performance on an absolute basis over the period.
Our investment process includes the use of factor-based strategies, which involve targeting certain company characteristics, or factors, that we believe impact returns across asset classes. Factor impact on the Fund was negative over the period. The Fund’s underweight exposure to higher-momentum names detracted from performance, while the Fund’s slight underweight exposures to higher-volatility equities and higher growth names contributed positively to performance relative to the Russell 3000 Index.
During the period, the Fund, at times, used equity index futures to equitize cash and to efficiently manage risks. During the period, the use of equity index futures to manage risk detracted from relative performance. The use of equity index futures to equitize cash was neutral to relative performance during the period.
What is the outlook as of the end of the period?
As of the end of the period, macroeconomic and geopolitical uncertainties continued to weigh on markets, and we expect this volatility to persist through the end of 2022. As allocators, we seek to balance risk in the Fund’s portfolio across strategic investments in value, quality, and growth sleeve managers. We look to each sleeve manager's fundamental stock selection process to identify companies that they believe are best able to navigate the landscape and seek to avoid those at greatest risk.
We seek to create for the Fund a portfolio of differentiated investment styles and philosophies, and in doing so we are mindful of the evolving risks and opportunities for each sleeve manager's style. We are mindful of the potential impact that inflation could have on corporate profitability. Within the growth universe, we continue to recognize the outsized downside risk for companies that are priced with high growth expectations but have not yet realized these expectations in terms of cash flow. While we saw this reversal start to play out earlier in the year, we believe there may still be more room to fall. In the value universe, we are mindful as ever on the potential risks to mean-reversion, including the influence of macroeconomic factors like interest rates and energy prices. While we still believe that some structural impediments to mean-reversion persist, we also think that current monetary tightening conditions could provide further relief to value stocks and create attractive opportunities for fundamental investors.
At the end of the period, the Fund’s largest overweights were to the Industrials and Healthcare sectors, while the Fund’s largest underweights were to the Information Technology and Energy sectors, relative to the Russell 3000 Index.
Important Risks
Investing involves risk, including the possible loss of principal. Security prices fluctuate in value depending on general market and economic conditions and the prospects of individual companies. The Fund’s strategy for allocating assets among portfolio management teams may not work as intended. • Mid-cap securities can have greater risks and volatility than large-cap securities. • To the extent the Fund focuses on one or more sectors, the Fund may be subject to increased volatility and risk of loss if adverse developments occur.
The Hartford Capital Appreciation Fund
Fund Overview – (continued)
October 31, 2022 (Unaudited)
| Composition by Sector(1) |
| as of 10/31/2022 |
| Sector | Percentage
of Net Assets |
| Equity Securities | |
| Communication Services | 5.0% |
| Consumer Discretionary | 11.3 |
| Consumer Staples | 7.5 |
| Energy | 2.6 |
| Financials | 14.5 |
| Health Care | 17.2 |
| Industrials | 13.4 |
| Information Technology | 18.0 |
| Materials | 4.6 |
| Real Estate | 2.9 |
| Utilities | 0.8 |
| Total | 97.8% |
| Short-Term Investments | 1.4 |
| Other Assets & Liabilities | 0.8 |
| Total | 100.0% |
| (1) | A sector may be comprised of several industries. For Fund compliance purposes, the Fund may not use the same classification system. These sector classifications are used for financial reporting purposes. |
Hartford Core Equity Fund
Fund Overview
October 31, 2022 (Unaudited)
Inception 04/30/1998
Sub-advised by Wellington Management Company LLP | Investment objective – The Fund seeks growth of capital. |
Comparison of Change in Value of $10,000 Investment (10/31/2012 - 10/31/2022)
The chart above represents the hypothetical growth of a $10,000 investment in Class A, which includes the maximum sales charge applicable to Class A shares. Returns for the Fund’s other classes will vary from what is seen above due to differences in the expenses charged to those share classes.
| Average Annual Total Returns |
| for the Periods Ended 10/31/2022 |
| | 1 Year | 5 Years | 10 Years |
| Class A1 | -15.79% | 10.37% | 13.02% |
| Class A2 | -20.43% | 9.13% | 12.38% |
| Class C1 | -16.43% | 9.54% | 12.19% |
| Class C3 | -17.25% | 9.54% | 12.19% |
| Class I1 | -15.59% | 10.65% | 13.24% |
| Class R31 | -16.11% | 9.97% | 12.67% |
| Class R41 | -15.80% | 10.35% | 13.04% |
| Class R51 | -15.58% | 10.64% | 13.35% |
| Class R61 | -15.51% | 10.75% | 13.43% |
| Class Y1 | -15.56% | 10.68% | 13.40% |
| Class F1 | -15.51% | 10.75% | 13.30% |
| S&P 500 Index | -14.61% | 10.44% | 12.79% |
| 1 | Without sales charge |
| 2 | Reflects maximum sales charge of 5.50% |
| 3 | Reflects a contingent deferred sales charge of 1.00% |
PERFORMANCE DATA QUOTED REPRESENTS PAST PERFORMANCE AND DOES NOT GUARANTEE FUTURE RESULTS. The investment return and principal value of the investment will fluctuate so that investors’ shares, when redeemed, may be worth more or less than their original cost. The chart and table do not reflect the deductions of taxes that a shareholder would pay on Fund distributions or the redemption of Fund shares. Current performance may be lower or higher than the performance data quoted. To obtain performance data current to the most recent month-end, please visit our website hartfordfunds.com.
Total returns presented above were calculated using the applicable class' net asset value available to shareholders for sale or redemption of Fund shares on 10/31/2022, which may exclude investment transactions as of this date. All share class returns assume the reinvestment of all distributions at net asset value and the deduction of all fund expenses. The total returns presented in the Financial Highlights section of the report are calculated in the same manner, but also take into account certain
adjustments that are necessary under generally accepted accounting principles. As a result, the total returns in the Financial Highlights section may differ from the total returns presented above.
Class I shares commenced operations on 03/31/2015 and performance prior to that date is that of the Fund’s Class A shares (excluding sales charges). Class R6 shares commenced operations on 03/31/2015 and performance prior to that date is that of the Fund’s Class Y shares. Class F shares commenced operations on 02/28/2017. Performance for Class F shares prior to 02/28/2017 reflects the performance of Class I shares from 03/31/2015 through 02/27/2017 and Class A shares (excluding sales charges) prior to 03/31/2015. Performance prior to an inception date of a class has not been adjusted to reflect the operating expenses of such class.
You cannot invest directly in an index.
See “Benchmark Glossary” for benchmark descriptions.
Performance information may reflect expense waivers/reimbursements without which performance would have been lower.
| Operating Expenses* | Gross | Net |
| Class A | 0.70% | 0.70% |
| Class C | 1.45% | 1.45% |
| Class I | 0.45% | 0.45% |
| Class R3 | 1.07% | 1.07% |
| Class R4 | 0.76% | 0.76% |
| Class R5 | 0.46% | 0.46% |
| Class R6 | 0.36% | 0.36% |
| Class Y | 0.45% | 0.45% |
| Class F | 0.36% | 0.36% |
| * | Expenses as shown in the Fund’s most recent prospectus. Actual expenses may be higher or lower. Please see accompanying Financial Highlights for expense ratios for the period ended 10/31/2022. |
Hartford Core Equity Fund
Fund Overview – (continued)
October 31, 2022 (Unaudited)
Portfolio Managers
Mammen Chally, CFA
Senior Managing Director and Equity Portfolio Manager
Wellington Management Company LLP
David A. Siegle, CFA
Managing Director and Equity Research Analyst
Wellington Management Company LLP
Douglas W. McLane, CFA
Senior Managing Director and Equity Portfolio Manager
Wellington Management Company LLP
Manager Discussion
How did the Fund perform during the period?
The Class A shares of the Hartford Core Equity Fund returned -15.79%, before sales charges, for the twelve-month period ended October 31, 2022, underperforming the Fund’s benchmark, the S&P 500 Index, which returned -14.61% for the same period. For the same period, the Class A shares of the Fund, before sales charges, slightly outperformed the -15.82% average return of the Lipper Large-Cap Core Funds peer group, a group of funds with investment strategies similar to those of the Fund.
Why did the Fund perform this way?
United States (U.S.) equities fell over the trailing twelve-month period ended October 31, 2022. Markets rallied early in the period on the back of robust equity inflows, strong corporate earnings, favorable economic data, and extremely accommodative financial conditions. However, the rapid spread of the Omicron variant of the coronavirus led to the largest increase in U.S. COVID-19 cases since the onset of the pandemic, prompting a flurry of new restrictions and event cancellations. Inflation continued to surge against a backdrop of severe supply and labor shortages, rising energy prices, and high demand for goods and services, heightening scrutiny of the U.S. Federal Reserve (Fed) amid anxiety about a potential monetary policy mistake.
Equity markets fell sharply in the second quarter of 2022, as rampant inflation and tighter financial conditions negatively affected risk sentiment and increased the probability of recession. Rapidly rising prices for food and energy pushed consumer inflation to its highest level in more than four decades. Growth equities significantly underperformed their value counterparts as surging Treasury yields and disappointing earnings results from some of the largest technology companies drove the Nasdaq Composite Index to its biggest quarterly loss since September 2001. Equity market weakness persisted, as risk sentiment deteriorated on fears that aggressive interest-rate increases and tighter financial conditions would constrict economic growth and drive the U.S. to recession. Despite these concerns, Fed Chair Jerome Powell made clear that the central bank is committed to raising interest rates and keeping them elevated for longer until there is clear evidence that price pressures are abating.
Returns varied by market cap during the period, as large-cap equities, as measured by the S&P 500 Index, outperformed small-cap equities and underperformed mid-cap equities, as measured by the Russell 2000 Index and S&P MidCap 400 Index, respectively.
Seven out of eleven sectors in the S&P 500 Index fell during the period, with the Communication Services (-41%) and Consumer Discretionary (-29%) sectors performing the worst. The Energy (+65%) and Consumer Staples (+5%) sectors were the best performers during the period.
Overall, the Fund’s underperformance relative to the S&P 500 Index during the period was driven by weak security selection, primarily within the Communication Services, Real Estate, and Healthcare sectors. This was partially offset by stronger stock selection within the Information Technology, Consumer Discretionary, and Industrials sectors, which contributed positively to performance. Sector allocation, a result of the bottom-up stock selection process, also detracted from relative performance, primarily driven by the Fund’s underweights to the Energy and Utilities sectors. This was partially offset by the Fund’s overweight position in the Healthcare sector and underweight position in the Consumer Discretionary sector during the period, both of which contributed positively to performance.
The top contributors to relative performance over the period were overweight positions in EOG Resources (Energy), Eli Lilly (Healthcare), and UnitedHealth Group (Healthcare). Shares of the oil and gas exploration and production company EOG Resources rose during the period after the company reported second-quarter 2022 earnings. Revenue and net income came in well above expectations as the company continued to benefit from leading operational efficiencies. The company further maintained fiscal 2022 guidance and declared a special dividend of $1.50 per share during the period. Eli Lilly’s shares rose after Eisai and Biogen reported breakthrough trial results for their Alzheimer’s drug. The news bodes well for Eli Lilly’s drug Donanemab, which also targets removing the amyloid beta protein to slow disease progression. Donanemab’s readout is slated for the second quarter of 2023. The U.S. Food and Drug Administration (FDA) also approved the company's oral lung cancer drug, Retevmo, for certain adult patients with solid tumors with a specific genetic makeup. Shares of UnitedHealth Group rose during the period. Optum, a division of UnitedHealth Group, planned to launch a new program to help insurers cut down on "unnecessary lab
Hartford Core Equity Fund
Fund Overview – (continued)
October 31, 2022 (Unaudited)
testing," a move it said will save insurers $3 billion annually. The program intends to address the lack of oversight as new genetic tests enter the market. Top absolute contributors to Fund performance over the period included Eli Lilly (Healthcare) and EOG Resources (Energy).
The top detractors from the Fund’s relative performance over the period included not owning Exxon Mobil (Energy), an overweight position in Netflix (Communication Services), and not owning Chevron (Energy). Shares of Exxon Mobil rose during the period on the back of second-quarter 2022 results reported in July, where earnings per share (EPS) and revenue beat consensus estimates. Profits exceeded due to near-record high oil prices and aggressive cost controls. The share price of Netflix declined sharply after the company announced first-quarter 2022 earnings, where it saw a loss of 200,000 subscribers, the first time it had lost subscribers since 2011. The company also warned that it expected to lose two million subscribers in the second quarter of 2022 as new password-sharing restrictions are introduced. Shares of Chevron rose over the period as the company benefited from higher oil prices. Chevron produced $21.8 billion in cash flow from operations in the first half of 2022, which was nearly twice the level seen in 2021. The Fund’s top absolute detractors from performance for the period included Alphabet (Communication Services) and Amazon (Consumer Discretionary).
Derivatives were not used in the Fund during the period.
What is the outlook as of the end of the period?
The U.S. Consumer Price Index (CPI) remained elevated in its report for August 2022, albeit slightly declining from the loftier levels of July 2022. As of the end of the period, we believe some respite is possible in the near term, given the decline in oil prices. The Federal Open Market Committee (FOMC) members’ median interest-rate expectations for 2023 have gone above 4.5% from 3.75% just three months ago. With the increase in expectations for near-term interest-rate increases, the continuing strength in the U.S. dollar is likely not a surprise, but nevertheless, its strength has become an increasing focus for companies and investors. Recent commentary from companies has indicated pockets of slowing demand, and low nominal growth in 2023 remains probable given peaking inflation and tight monetary policy.
The energy crisis Europe is facing this upcoming winter highlights the dilemma policymakers are facing between supporting low-income consumers and securing longer-term energy security for the continent. Over the last few months, it has become increasingly clear to us that Russia intends to keep the pressure on Europe, and we believe the conflict with Ukraine is likely to continue into 2024 at a minimum. The road forward regarding the conflict remains unpredictable, and the range of outcomes is wide in terms of the impact to the global economy, in our view.
On the positive side, we observe that supply-chain issues appear to be improving, although not completely resolved. Employment in the U.S. remains robust for now, but we believe there may be potential weakness ahead as the Fed continues to battle inflation. The Inflation Reduction Act (IRA), the Infrastructure Investment and Jobs Act (IIJA),
and the CHIPS Act will likely serve as offsets, in our view. Margin pressure remains a focus and is somewhat unpredictable in the near term due to the variety of factors companies are facing.
At the end of the period, the Fund’s largest overweights relative to the S&P 500 Index were the Healthcare and Industrials sectors, while the Fund’s largest underweights relative to the S&P 500 Index were the Materials and Communication Services sectors.
Important Risks
Investing involves risk, including the possible loss of principal. Security prices fluctuate in value depending on general market and economic conditions and the prospects of individual companies.
| Composition by Sector(1) |
| as of 10/31/2022 |
| Sector | Percentage
of Net Assets |
| Equity Securities | |
| Communication Services | 5.9% |
| Consumer Discretionary | 9.9 |
| Consumer Staples | 7.2 |
| Energy | 4.0 |
| Financials | 11.7 |
| Health Care | 18.4 |
| Industrials | 9.8 |
| Information Technology | 26.2 |
| Materials | 1.0 |
| Real Estate | 1.7 |
| Utilities | 3.3 |
| Total | 99.1% |
| Short-Term Investments | 0.7 |
| Other Assets & Liabilities | 0.2 |
| Total | 100.0% |
| (1) | A sector may be comprised of several industries. For Fund compliance purposes, the Fund may not use the same classification system. These sector classifications are used for financial reporting purposes. |
The Hartford Dividend and Growth Fund
Fund Overview
October 31, 2022 (Unaudited)
Inception 07/22/1996
Sub-advised by Wellington Management Company LLP | Investment objective – The Fund seeks a high level of current income consistent with growth of capital. |
Comparison of Change in Value of $10,000 Investment (10/31/2012 - 10/31/2022)
The chart above represents the hypothetical growth of a $10,000 investment in Class A, which includes the maximum sales charge applicable to Class A shares. Returns for the Fund’s other classes will vary from what is seen above due to differences in the expenses charged to those share classes.
| Average Annual Total Returns |
| for the Periods Ended 10/31/2022 |
| | 1 Year | 5 Years | 10 Years |
| Class A1 | -6.11% | 9.74% | 11.68% |
| Class A2 | -11.28% | 8.51% | 11.05% |
| Class C1 | -6.86% | 8.90% | 10.83% |
| Class C3 | -7.74% | 8.90% | 10.83% |
| Class I1 | -5.86% | 10.04% | 11.95% |
| Class R31 | -6.45% | 9.35% | 11.29% |
| Class R41 | -6.16% | 9.68% | 11.64% |
| Class R51 | -5.88% | 10.02% | 11.97% |
| Class R61 | -5.80% | 10.13% | 12.07% |
| Class Y1 | -5.82% | 10.08% | 12.06% |
| Class F1 | -5.80% | 10.13% | 12.00% |
| S&P 500 Index | -14.61% | 10.44% | 12.79% |
| Russell 1000 Value Index | -7.00% | 7.21% | 10.30% |
| 1 | Without sales charge |
| 2 | Reflects maximum sales charge of 5.50% |
| 3 | Reflects a contingent deferred sales charge of 1.00% |
PERFORMANCE DATA QUOTED REPRESENTS PAST PERFORMANCE AND DOES NOT GUARANTEE FUTURE RESULTS. The investment return and principal value of the investment will fluctuate so that investors’ shares, when redeemed, may be worth more or less than their original cost. The chart and table do not reflect the deductions of taxes that a shareholder would pay on Fund distributions or the redemption of Fund shares. Current performance may be lower or higher than the performance data quoted. To obtain performance data current to the most recent month-end, please visit our website hartfordfunds.com.
Total returns presented above were calculated using the applicable class' net asset value available to shareholders for sale or redemption of Fund shares on 10/31/2022, which may exclude investment transactions as of this date. All share class returns assume the reinvestment of all distributions at net asset value and the deduction of all fund expenses. The total returns presented in the Financial Highlights section of the report are calculated in the same manner, but also take into account certain
adjustments that are necessary under generally accepted accounting principles. As a result, the total returns in the Financial Highlights section may differ from the total returns presented above.
Class R6 shares commenced operations on 11/07/2014 and performance prior to that date is that of the Fund’s Class Y shares. Class F shares commenced operations on 02/28/2017 and performance prior to that date is that of the Fund’s Class I shares. Performance prior to an inception date of a class has not been adjusted to reflect the operating expenses of such class.
You cannot invest directly in an index.
See “Benchmark Glossary” for benchmark descriptions.
Performance information may reflect expense waivers/reimbursements without which performance would have been lower. For information on current expense waivers/reimbursements, please see the prospectus.
| Operating Expenses* | Gross | Net |
| Class A | 0.97% | 0.97% |
| Class C | 1.75% | 1.75% |
| Class I | 0.71% | 0.71% |
| Class R3 | 1.35% | 1.35% |
| Class R4 | 1.03% | 1.03% |
| Class R5 | 0.73% | 0.73% |
| Class R6 | 0.63% | 0.63% |
| Class Y | 0.74% | 0.69% |
| Class F | 0.63% | 0.63% |
| * | Expenses as shown in the Fund’s most recent prospectus. Gross expenses do not reflect contractual fee waivers or expense reimbursement arrangements, if any. Net expenses reflect such arrangements only with respect to Class Y. These arrangements remain in effect until 02/28/2023 unless the Fund’s Board of Directors approves an earlier termination. Actual expenses may be higher or lower. Please see accompanying Financial Highlights for expense ratios for the period ended 10/31/2022. |
The Hartford Dividend and Growth Fund
Fund Overview – (continued)
October 31, 2022 (Unaudited)
Portfolio Managers
Matthew G. Baker
Senior Managing Director and Equity Portfolio Manager
Wellington Management Company LLP
Nataliya Kofman
Managing Director and Equity Portfolio Manager
Wellington Management Company LLP
Manager Discussion
How did the Fund perform during the period?
The Class A shares of The Hartford Dividend and Growth Fund returned -6.11%, before sales charges, for the twelve-month period ended October 31, 2022, outperforming the Fund’s primary benchmark, the S&P 500 Index, which returned -14.61% for the same period, and outperforming the Fund’s secondary benchmark, the Russell 1000 Value Index, which returned -7.00% for the same period. For the same period, the Class A shares of the Fund, before sales charges, underperformed the -5.96% average return of the Lipper Equity Income Funds peer group, a group of funds with investment strategies similar to those of the Fund.
Why did the Fund perform this way?
United States (U.S.) equities, as measured by the S&P 500 Index, fell over the trailing twelve-month period ending October 31, 2022. Markets rallied early in the period on the back of robust equity inflows, strong corporate earnings, favorable economic data, and extremely accommodative financial conditions. However, the rapid spread of the Omicron COVID-19 variant led to the largest increase in U.S. COVID-19 cases since the onset of the pandemic and prompted a flurry of new restrictions and event cancellations. Inflation continued to surge against a backdrop of severe supply and labor shortages, rising energy prices and high demand for goods and services, heightening scrutiny of the U.S. Federal Reserve (Fed) amid anxiety about a potential monetary policy mistake.
Equity markets fell sharply in the second quarter of 2022, as rampant inflation and tighter financial conditions negatively affected risk sentiment and increased the probability of recession. Rapidly rising prices for food and energy pushed consumer inflation to its highest level in more than four decades. Growth equities significantly underperformed their value counterparts as surging U.S. Treasury yields and disappointing earnings results from some of the largest technology companies drove the Nasdaq Composite Index to its biggest quarterly loss since September 2001.
Equity market weakness persisted, as risk sentiment deteriorated on fears that aggressive interest rate increases and tighter financial conditions would constrict economic growth and drive the U.S. to recession. Despite these concerns, Fed Chair Jerome Powell made clear that the central bank remained committed to raising interest rates and keeping them elevated for longer until there is clear evidence that price pressures are abating.
Returns varied by market cap during the period, as mid-cap equities measured by the S&P MidCap 400 Index outperformed both small- and large-cap equities, as measured by the Russell 2000 Index and the S&P 500 Index.
Four out of eleven sectors in the S&P 500 Index rose during the period, with the Energy (+65%), Consumer Staples (+5%), and Utilities (+3%) sectors performing the best. The Communication Services (-41%), Consumer Discretionary (-29%), and Real Estate (-21%) sectors were the worst performers during the period.
Security selection was the main driver of the Fund’s outperformance relative to the S&P 500 Index over the period. Stock selection was strongest within the Consumer Discretionary, Information Technology, and Industrials sectors. This was partially offset by weaker selection within the Energy and Materials sectors, which detracted from performance relative to the S&P 500 Index over the same period. Sector allocation, a result of the bottom-up stock selection process, also contributed positively to the Fund’s performance relative to the S&P 500 Index. An underweight allocation to the Consumer Discretionary and Information Technology sectors added the most to returns relative to the S&P 500 Index during the period.
The Fund’s top positive contributors to performance relative to the S&P 500 Index during the period were not owning Meta Platforms (Communication Services) or Amazon.com (Consumer Discretionary) and an overweight position in ConocoPhillips (Energy). The share price of Meta Platforms, a U.S.-based social networking operator, fell during the period after management released disappointing quarterly results and weak near-term guidance. The company reported quarterly revenue declined more than 4% year over year and its second straight quarterly decline in the second quarter of 2022. Overall net income fell 52% to $4.4 billion. Shares of Amazon ended the period lower after the e-commerce giant reported first and third quarter results that missed consensus estimates. The company confronted soaring inflation and rising interest rates as well as a slowdown in their core retail business as customers returned to stores. Management also issued a disappointing fourth quarter 2022 revenue forecast and stated it plans to continue implementing cost-cutting measures. Shares of ConocoPhillips, an oil and gas exploration and production company, rose over the period on increasing earnings and revenue due to rising energy prices. The company also raised capital returns, bringing the 2022 total to an estimated $15 billion.
The Fund’s top detractors from performance relative to the S&P 500 Index during the period included not owning Exxon Mobil (Energy), an underweight position to Apple (Information Technology), and an
The Hartford Dividend and Growth Fund
Fund Overview – (continued)
October 31, 2022 (Unaudited)
overweight position to Comcast (Communication Services). Shares of Exxon Mobil rose during the period along with the rest of the Energy sector on increasing earnings and revenue from rising oil prices. The company also announced a $30 billion share buyback. Shares of Apple rose over the period as the company reported consecutive strong quarterly results where revenue growth exceeded management’s expectations despite negative impacts from supply constraints, foreign exchange challenges, and weakness in digital advertising. The share price of Comcast fell over the period as the company reported a slowdown in broadband user growth and a decline in cable TV customers. The leading cable operator started to experience the fallout of pandemic-driven, heightened subscription demand beginning its descent to more normal levels. However, the company reported second quarter 2022 earnings and revenue that topped consensus estimates and announced an increase in capital returns to shareholders.
Derivatives were not used in the Fund during the period.
What is the outlook as of the end of the period?
Markets ended the period lower as investors braced for a recession; however, the timing and magnitude is still unknown. Consumer demand has been resilient despite rising rates, but we believe we are starting to see the first indicators of economic pull back despite the record strength of the labor market. We believe inflation has likely peaked in the U.S., but a change in tighter monetary policy by the Fed is unlikely, and we have not ruled out the potential for additional meaningful interest rate increases before the end of 2022. In our view, market volatility continues to be driven by a steady sate of macroeconomic cross currents ranging from supply chain bottlenecks to Russia’s invasion of Ukraine. In the current environment, we are seeking to avoid taking undue risk within the Fund by focusing on long-term value creation potential and predictable ranges of outcomes.
We continue to anticipate negative impacts from inflationary pressures and restrictive monetary policy through at least the end of 2022. As of the end of the period, the Fund remains positioned for persistent inflation and decelerating growth by focusing on companies with balance sheet strength, sustainable and growing cash flows, and high-quality management teams, in our view. We believe that opportunistically investing in out of favor growth and cyclical names with positive risk/reward skews may provide upside potential while maintaining an overweight to more defensive segments may insulate the portfolio from macroeconomic shocks and valuation-driven corrections.
At the end of the period, the Fund had its largest overweights in the Financials and Healthcare sectors, and the largest underweights in the Information Technology and Consumer Discretionary sectors, relative to the S&P 500 Index.
Important Risks
Investing involves risk, including the possible loss of principal. Security prices fluctuate in value depending on general market and economic conditions and the prospects of individual companies. • For dividend-paying stocks, dividends are not guaranteed and may decrease without notice. • Foreign investments may be more volatile
and less liquid than U.S. investments and are subject to the risk of currency fluctuations and adverse political, economic and regulatory developments. • To the extent the Fund focuses on one or more sectors, the Fund may be subject to increased volatility and risk of loss if adverse developments occur. • Integration of environmental, social, and/or governance (ESG) characteristics into the investment process may not work as intended.
| Composition by Sector(1) |
| as of 10/31/2022 |
| Sector | Percentage
of Net Assets |
| Equity Securities | |
| Communication Services | 7.4% |
| Consumer Discretionary | 5.4 |
| Consumer Staples | 6.1 |
| Energy | 5.4 |
| Financials | 17.7 |
| Health Care | 17.9 |
| Industrials | 7.9 |
| Information Technology | 18.4 |
| Materials | 3.4 |
| Real Estate | 3.3 |
| Utilities | 4.8 |
| Total | 97.7% |
| Short-Term Investments | 1.8 |
| Other Assets & Liabilities | 0.5 |
| Total | 100.0% |
| (1) | A sector may be comprised of several industries. For Fund compliance purposes, the Fund may not use the same classification system. These sector classifications are used for financial reporting purposes. |
The Hartford Equity Income Fund
Fund Overview
October 31, 2022 (Unaudited)
Inception 08/28/2003
Sub-advised by Wellington Management Company LLP | Investment objective – The Fund seeks a high level of current income consistent with growth of capital. |
Comparison of Change in Value of $10,000 Investment (10/31/2012 - 10/31/2022)
The chart above represents the hypothetical growth of a $10,000 investment in Class A, which includes the maximum sales charge applicable to Class A shares. Returns for the Fund’s other classes will vary from what is seen above due to differences in the expenses charged to those share classes.
| Average Annual Total Returns |
| for the Periods Ended 10/31/2022 |
| | 1 Year | 5 Years | 10 Years |
| Class A1 | 0.12% | 8.78% | 10.86% |
| Class A2 | -5.38% | 7.56% | 10.23% |
| Class C1 | -0.64% | 7.95% | 10.03% |
| Class C3 | -1.55% | 7.95% | 10.03% |
| Class I1 | 0.40% | 9.05% | 11.14% |
| Class R31 | -0.25% | 8.38% | 10.46% |
| Class R41 | 0.07% | 8.71% | 10.80% |
| Class R51 | 0.34% | 9.04% | 11.13% |
| Class R61 | 0.49% | 9.15% | 11.25% |
| Class Y1 | 0.36% | 9.07% | 11.21% |
| Class F1 | 0.46% | 9.14% | 11.20% |
| Russell 1000 Value Index | -7.00% | 7.21% | 10.30% |
| 1 | Without sales charge |
| 2 | Reflects maximum sales charge of 5.50% |
| 3 | Reflects a contingent deferred sales charge of 1.00% |
PERFORMANCE DATA QUOTED REPRESENTS PAST PERFORMANCE AND DOES NOT GUARANTEE FUTURE RESULTS. The investment return and principal value of the investment will fluctuate so that investors’ shares, when redeemed, may be worth more or less than their original cost. The chart and table do not reflect the deductions of taxes that a shareholder would pay on Fund distributions or the redemption of Fund shares. Current performance may be lower or higher than the performance data quoted. To obtain performance data current to the most recent month-end, please visit our website hartfordfunds.com.
Total returns presented above were calculated using the applicable class' net asset value available to shareholders for sale or redemption of Fund shares on 10/31/2022, which may exclude investment transactions as of this date. All share class returns assume the reinvestment of all distributions at net asset value and the deduction of all fund expenses. The total returns presented in the Financial Highlights section of the report are calculated in the same manner, but also take into account certain
adjustments that are necessary under generally accepted accounting principles. As a result, the total returns in the Financial Highlights section may differ from the total returns presented above.
Class R6 shares commenced operations on 11/07/2014 and performance prior to that date is that of the Fund’s Class Y shares. Class F shares commenced operations on 02/28/2017 and performance prior to that date is that of the Fund’s Class I shares. Performance prior to an inception date of a class has not been adjusted to reflect the operating expenses of such class.
You cannot invest directly in an index.
See “Benchmark Glossary” for benchmark descriptions.
Performance information may reflect expense waivers/reimbursements without which performance would have been lower.
| Operating Expenses* | Gross | Net |
| Class A | 0.97% | 0.97% |
| Class C | 1.74% | 1.74% |
| Class I | 0.73% | 0.73% |
| Class R3 | 1.35% | 1.35% |
| Class R4 | 1.04% | 1.04% |
| Class R5 | 0.74% | 0.74% |
| Class R6 | 0.65% | 0.65% |
| Class Y | 0.74% | 0.74% |
| Class F | 0.64% | 0.64% |
| * | Expenses as shown in the Fund’s most recent prospectus. Actual expenses may be higher or lower. Please see accompanying Financial Highlights for expense ratios for the period ended 10/31/2022. |
The Hartford Equity Income Fund
Fund Overview – (continued)
October 31, 2022 (Unaudited)
Portfolio Managers
Matthew C. Hand, CFA
Senior Managing Director and Equity Portfolio Manager
Wellington Management Company LLP
Adam H. Illfelder, CFA
Senior Managing Director and Equity Portfolio Manager
Wellington Management Company LLP
Manager Discussion
How did the Fund perform during the period?
The Class A shares of The Hartford Equity Income Fund returned 0.12%, before sales charges, for the twelve-month period ended October 31, 2022, outperforming the Fund’s benchmark, the Russell 1000 Value Index, which returned -7.00% for the same period. For the same period, the Class A shares of the Fund, before sales charges, also outperformed the -5.96% average return of the Lipper Equity Income Funds peer group, a group of funds with investment strategies similar to that of the Fund.
Why did the Fund perform this way?
United States (U.S.) equities fell over the trailing twelve-month period ending October 31, 2022. Markets rallied early in the period owing to robust equity inflows, strong corporate earnings, favorable economic data, and extremely accommodative financial conditions. However, the rapid spread of the Omicron variant of the coronavirus led to the largest increase in U.S. COVID-19 cases since the onset of the pandemic, and prompted a flurry of new restrictions and event cancellations. Inflation continued to surge against a backdrop of severe supply and labor shortages, rising energy prices, and high demand for goods and services, heightening scrutiny of the U.S. Federal Reserve (Fed) amid anxiety about a potential monetary policy mistake. Equity markets fell sharply in the second quarter of 2022, as rampant inflation and tighter financial conditions negatively affected risk sentiment and increased the probability of recession. Rapidly rising prices for food and energy pushed consumer inflation to its highest level in more than four decades. Growth equities significantly underperformed their value counterparts as surging U.S. Treasury yields and disappointing earnings results from some of the largest technology companies drove the Nasdaq Composite Index to its biggest quarterly loss since September 2001. Equity market weakness persisted, as risk sentiment deteriorated on fears that aggressive interest rate increases and tighter financial conditions would constrict economic growth and drive the U.S. to recession. Despite these concerns, Fed Chair Jerome Powell made clear that the central bank is committed to raising interest rates and keeping them elevated for longer until there is clear evidence that price pressures are abating.
During the period, four of the eleven sectors within the Russell 1000 Value Index posted positive absolute returns, with the Energy (+65%), Consumer Staples (+5%), and Utilities (+3%) sectors performing the best. Conversely, the Communication Services (-30%), Information Technology (-23%), and Real Estate (-20%) sectors lagged over the period.
The Fund’s outperformance relative to the Russell 1000 Value Index during the period was driven by security selection. Strong selection in the Industrials, Financials, and Healthcare sectors contributed positively to relative performance, but was partially offset by weaker selection in the Energy and Materials sectors. Sector allocation, a result of our bottom-up stock selection process, also strongly benefited relative returns. The Fund’s underweight position in the Communication Services sector and overweight to the Consumer Staples sector contributed positively to relative results. This was partially offset by the Fund’s overweight position in the Industrials sector.
Top contributors to relative returns included ConocoPhillips (Energy), Pioneer Natural Resources (Energy), and not owning Meta Platforms (Communication Services). Shares of U.S.-based exploration & production companies ConocoPhillips and Pioneer Natural Resources rose over the period. These stocks benefited from the strong momentum within the Energy sector as oil prices spiked due to a steep supply/demand imbalance. ConocoPhillips shares experienced further gains when the company announced a $5 billion increase in a proposed 2022 return of capital. As of the end of the period, the Fund continued to own ConocoPhillips, but we have eliminated the Fund’s position in Pioneer Natural Resources.
Top detractors from relative performance during the period included the Fund’s position in BlackRock (Financials) and not holding Exxon Mobil (Energy) and Chevron (Energy). The share price of asset manager BlackRock declined during the period. The down market led to lower fund flows for the company and margin compression. More recently, BlackRock reported assets under management that missed consensus estimates, further pressuring its share price. We eliminated the Fund’s position in BlackRock during the period.
Derivatives were not used in the Fund during the period.
What is the outlook as of the end of the period?
As of the end of the period, we believe the Fund’s investment universe is rich with new opportunities. We continue to focus on seeking to find high-quality businesses with strong balance sheets and sustainable dividends.
At the end of the period, the Utilities, Healthcare, and Consumer Staples sectors represented the Fund’s largest overweights relative to the Russell 1000 Value Index, while the Communication Services, Consumer Discretionary, and Financials sectors were the Fund’s largest underweights.
The Hartford Equity Income Fund
Fund Overview – (continued)
October 31, 2022 (Unaudited)
Important Risks
Investing involves risk, including the possible loss of principal. Security prices fluctuate in value depending on general market and economic conditions and the prospects of individual companies. • For dividend-paying stocks, dividends are not guaranteed and may decrease without notice. • Mid-cap securities can have greater risks and volatility than large-cap securities. • Different investment styles may go in and out of favor, which may cause the Fund to underperform the broader stock market. • Integration of environmental, social, and/or governance (ESG) characteristics into the investment process may not work as intended. • To the extent the Fund focuses on one or more sectors, the Fund may be subject to increased volatility and risk of loss if adverse developments occur. • Foreign investments may be more volatile and less liquid than U.S. investments and are subject to the risk of currency fluctuations and adverse political, economic and regulatory developments.
| Composition by Sector(1) |
| as of 10/31/2022 |
| Sector | Percentage
of Net Assets |
| Equity Securities | |
| Communication Services | 1.4% |
| Consumer Discretionary | 5.0 |
| Consumer Staples | 8.4 |
| Energy | 8.8 |
| Financials | 19.3 |
| Health Care | 18.5 |
| Industrials | 11.4 |
| Information Technology | 9.5 |
| Materials | 3.9 |
| Real Estate | 3.9 |
| Utilities | 7.4 |
| Total | 97.5% |
| Short-Term Investments | 3.4 |
| Other Assets & Liabilities | (0.9) |
| Total | 100.0% |
| (1) | A sector may be comprised of several industries. For Fund compliance purposes, the Fund may not use the same classification system. These sector classifications are used for financial reporting purposes. |
The Hartford Growth Opportunities Fund
Fund Overview
October 31, 2022 (Unaudited)
Inception 03/31/1963
Sub-advised by Wellington Management Company LLP | Investment objective – The Fund seeks capital appreciation. |
Comparison of Change in Value of $10,000 Investment (10/31/2012 - 10/31/2022)
The chart above represents the hypothetical growth of a $10,000 investment in Class A, which includes the maximum sales charge applicable to Class A shares. Returns for the Fund’s other classes will vary from what is seen above due to differences in the expenses charged to those share classes.
| Average Annual Total Returns |
| for the Periods Ended 10/31/2022 |
| | 1 Year | 5 Years | 10 Years |
| Class A1 | -38.47% | 7.85% | 12.53% |
| Class A2 | -41.85% | 6.64% | 11.89% |
| Class C1 | -38.93% | 7.05% | 11.70% |
| Class C3 | -39.24% | 7.05% | 11.70% |
| Class I1 | -38.31% | 8.14% | 12.81% |
| Class R31 | -38.69% | 7.47% | 12.15% |
| Class R41 | -38.50% | 7.80% | 12.50% |
| Class R51 | -38.33% | 8.12% | 12.83% |
| Class R61 | -38.25% | 8.23% | 12.94% |
| Class Y1 | -38.32% | 8.17% | 12.91% |
| Class F1 | -38.25% | 8.24% | 12.87% |
| Russell 3000 Growth Index | -24.67% | 12.07% | 14.37% |
| Russell 1000 Growth Index | -24.60% | 12.59% | 14.69% |
| 1 | Without sales charge |
| 2 | Reflects maximum sales charge of 5.50% |
| 3 | Reflects a contingent deferred sales charge of 1.00% |
PERFORMANCE DATA QUOTED REPRESENTS PAST PERFORMANCE AND DOES NOT GUARANTEE FUTURE RESULTS. The investment return and principal value of the investment will fluctuate so that investors’ shares, when redeemed, may be worth more or less than their original cost. The chart and table do not reflect the deductions of taxes that a shareholder would pay on Fund distributions or the redemption of Fund shares. Current performance may be lower or higher than the performance data quoted. To obtain performance data current to the most recent month-end, please visit our website hartfordfunds.com.
Total returns presented above were calculated using the applicable class' net asset value available to shareholders for sale or redemption of Fund shares on 10/31/2022, which may exclude investment transactions as of this date. All share class returns assume the reinvestment of all distributions at net asset value and the deduction of all fund expenses. The total returns presented in the Financial Highlights section of the report are calculated in the same manner, but also take into account certain
adjustments that are necessary under generally accepted accounting principles. As a result, the total returns in the Financial Highlights section may differ from the total returns presented above.
Class R6 shares commenced operations on 11/07/2014 and performance prior to that date is that of the Fund’s Class Y shares. Class F shares commenced operations on 02/28/2017 and performance prior to that date is that of the Fund’s Class I shares. Performance prior to an inception date of a class has not been adjusted to reflect the operating expenses of such class.
You cannot invest directly in an index.
See “Benchmark Glossary” for benchmark descriptions.
Performance information may reflect expense waivers/reimbursements without which performance would have been lower.
| Operating Expenses* | Gross | Net |
| Class A | 1.06% | 1.06% |
| Class C | 1.83% | 1.83% |
| Class I | 0.82% | 0.82% |
| Class R3 | 1.45% | 1.45% |
| Class R4 | 1.14% | 1.14% |
| Class R5 | 0.84% | 0.84% |
| Class R6 | 0.73% | 0.73% |
| Class Y | 0.84% | 0.84% |
| Class F | 0.73% | 0.73% |
| * | Expenses as shown in the Fund’s most recent prospectus. Actual expenses may be higher or lower. Please see accompanying Financial Highlights for expense ratios for the period ended 10/31/2022. |
The Hartford Growth Opportunities Fund
Fund Overview – (continued)
October 31, 2022 (Unaudited)
Portfolio Managers
Stephen Mortimer
Senior Managing Director and Equity Portfolio Manager
Wellington Management Company LLP
Mario E. Abularach, CFA, CMT
Senior Managing Director and Equity Research Analyst
Wellington Management Company LLP
Manager Discussion
How did the Fund perform during the period?
The Class A shares of The Hartford Growth Opportunities Fund returned -38.47%, before sales charges, for the twelve-month period ended October 31, 2022, underperforming the Fund’s primary benchmark, the Russell 3000 Growth Index, which returned -24.67% for the same period, and underperforming the Fund’s secondary benchmark, the Russell 1000 Growth Index, which returned -24.60% for the same period. For the same period, the Class A shares of the Fund, before sales charges, underperformed the -32.85% average return of the Lipper Multi-Cap Growth Funds peer group, a group of funds with investment strategies similar to those of the Fund.
Why did the Fund perform this way?
United States (U.S.) equities, as measured by the S&P 500 Index, fell over the trailing twelve-month period ending October 31, 2022. Markets rallied early in the period owing to robust equity inflows, strong corporate earnings, favorable economic data, and extremely accommodative financial conditions. However, the rapid spread of the Omicron COVID-19 variant led to the largest increase in U.S. COVID-19 cases since the onset of the pandemic, prompting a flurry of new restrictions and event cancellations. Inflation continued to surge against a backdrop of severe supply and labor shortages, rising energy prices, and high demand for goods and services, heightening scrutiny of the U.S. Federal Reserve (Fed) amid anxiety about a potential monetary policy mistake.
Equity markets fell sharply in the second quarter of 2022, as rampant inflation and tighter financial conditions negatively affected risk sentiment and increased the probability of recession. Rapidly rising prices for food and energy pushed consumer inflation to its highest level in more than four decades. Growth equities significantly underperformed their value counterparts as surging U.S. Treasury yields and disappointing earnings results from some of the largest technology companies drove the Nasdaq Composite Index to its biggest quarterly loss since September 2001. Equity market weakness persisted, as risk sentiment deteriorated on fears that aggressive interest rate increases and tighter financial conditions would constrict economic growth and drive the U.S. to recession. Despite these concerns, Fed Chair Jerome Powell made clear that the central bank remained committed to raising interest rates and keeping them elevated for longer until there is clear evidence that price pressures are abating.
Nine out of eleven sectors in the Russell 3000 Growth Index fell during the period, with the Communication Services (-47%), Consumer Discretionary (-33%), and Real Estate (-26%) sectors performing the worst. The Energy (+53%) and Consumer Staples (+2%) sectors performed the best during the period.
Security selection was the primary driver of underperformance relative to the Russell 3000 Growth Index during the period. Weak selection in the Information Technology, Healthcare, and Communication Services sectors was partially offset by strong selection within the Materials sector. Sector allocation, a result of the bottom-up stock selection process, also detracted from benchmark-relative performance during the period, due to an overweight to the Communication Services sector and underweights to the Consumer Staples and Energy sectors. This was partially offset by an overweight allocation to the Healthcare sector.
Top detractors from performance relative to the Russell 3000 Growth Index during the period included Apple (Information Technology), Snap (Communication Services), and Spotify (Communication Services). Not owning Apple detracted from relative performance as the company is perceived as a safe haven among tech equities within this uncertain environment. The Fund’s out-of-benchmark holding in Snap detracted from relative results. Shares of Snap sold off as a result of weakening trends in the digital advertising market. Due to the uncertainty of the global economy, the company did not issue financial guidance for the third quarter of 2022. We eliminated the position in the Fund during the period. The Fund’s overweight position to Spotify detracted from relative performance. Shares of Spotify fell during the period after the streaming music service reported first quarter 2022 forecasts for user growth that fell short of consensus expectations. Management blamed the forecast on its strong end to 2021, when they added 25 million users in the fourth quarter. Also weighing on shares was controversy involving podcast host Joe Rogan, whom users and artists say is spreading misinformation about COVID vaccines. The Fund reduced its position in Spotify during the period. Amazon (Consumer Discretionary) and Alphabet (Communication Services) were among the top absolute detractors during the period.
Top contributors to performance relative to the Russell 3000 Growth Index during the period included Netflix (Communication Services), Arista Networks (Information Technology), and Tesla (Consumer Discretionary). Not owning Netflix over most of the period proved beneficial. The share price of Netflix declined after the company announced first quarter 2022 earnings where it saw a loss of subscribers for the first time since 2011. The company also warned that it expects to lose two million subscribers in the second quarter of
The Hartford Growth Opportunities Fund
Fund Overview – (continued)
October 31, 2022 (Unaudited)
2023 as new passwords sharing restrictions are introduced. We reinitiated a position in Netflix at the end of September 2022 based on our differentiated view of their launch of new advertising-supported pricing tiers. The Fund’s overweight position to Arista Networks contributed positively to relative results. Arista Networks, a software and hardware provider, did well during the period and continued to take share from competitors with strong demand in their cloud and enterprise businesses. Tesla’s stock experienced significant volatility over the period and the Fund’s underweight position proved beneficial. The Fund held the stock from mid-November 2021 to June 2022. News that Tesla’s CEO, Elon Musk, proposed to purchase Twitter for $44 billion raised investor concerns. Additionally, the electric vehicle maker continued to grapple with supply chain issues and COVID-related shutdowns in their Shanghai production facility. The market has also been concerned about increased competition in the electric vehicle space. Netflix (Communication Services) and Eli Lilly (Healthcare) were among the top absolute contributors during the period.
Derivatives were not used in the Fund during the period.
What is the outlook as of the end of the period?
Looking ahead, we expect volatility and uncertainty to persist as we close out the year. We continue to try to minimize downside potential while looking for longer-term upside potential. We believe the environment is likely to remain challenging in the near term.
At the end of the period, the Fund’s largest overweights were to the Communication Services and Healthcare sectors, and the Fund was most underweight to the Information Technology and Consumer Staples sectors relative to the Russell 3000 Growth Index.
Important Risks
Investing involves risk, including the possible loss of principal. Security prices fluctuate in value depending on general market and economic conditions and the prospects of individual companies. • Mid-cap securities can have greater risks and volatility than large-cap securities. • Different investment styles may go in and out of favor, which may cause the Fund to underperform the broader stock market. • To the extent the Fund focuses on one or more sectors, the Fund may be subject to increased volatility and risk of loss if adverse developments occur. • Foreign investments may be more volatile and less liquid than U.S. investments and are subject to the risk of currency fluctuations and adverse political, economic and regulatory developments. • The Fund may have high portfolio turnover, which could increase its transaction costs and an investor’s tax liability.
| Composition by Sector(1) |
| as of 10/31/2022 |
| Sector | Percentage
of Net Assets |
| Equity Securities | |
| Communication Services | 14.8% |
| Consumer Discretionary | 18.5 |
| Consumer Staples | 1.0 |
| Energy | 2.3 |
| Financials | 5.1 |
| Health Care | 18.0 |
| Industrials | 5.4 |
| Information Technology | 28.9 |
| Materials | 3.2 |
| Real Estate | 1.0 |
| Total | 98.2% |
| Short-Term Investments | 1.9 |
| Other Assets & Liabilities | (0.1) |
| Total | 100.0% |
| (1) | A sector may be comprised of several industries. For Fund compliance purposes, the Fund may not use the same classification system. These sector classifications are used for financial reporting purposes. |
The Hartford Healthcare Fund
Fund Overview
October 31, 2022 (Unaudited)
Inception 05/01/2000
Sub-advised by Wellington Management Company LLP | Investment objective – The Fund seeks long-term capital appreciation. |
Comparison of Change in Value of $10,000 Investment (10/31/2012 - 10/31/2022)
The chart above represents the hypothetical growth of a $10,000 investment in Class A, which includes the maximum sales charge applicable to Class A shares. Returns for the Fund’s other classes will vary from what is seen above due to differences in the expenses charged to those share classes.
| Average Annual Total Returns |
| for the Periods Ended 10/31/2022 |
| | 1 Year | 5 Years | 10 Years |
| Class A1 | -13.35% | 8.63% | 13.54% |
| Class A2 | -18.12% | 7.41% | 12.90% |
| Class C1 | -13.99% | 7.81% | 12.70% |
| Class C3 | -14.74% | 7.81% | 12.70% |
| Class I1 | -13.11% | 8.93% | 13.85% |
| Class R31 | -13.63% | 8.27% | 13.18% |
| Class R41 | -13.38% | 8.60% | 13.52% |
| Class R51 | -13.13% | 8.92% | 13.86% |
| Class R61 | -13.01% | 9.03% | 13.97% |
| Class Y1 | -13.12% | 8.97% | 13.94% |
| Class F1 | -13.03% | 9.04% | 13.92% |
| S&P Composite 1500 Health Care Index | -0.76% | 12.23% | 14.89% |
| S&P 500 Index | -14.61% | 10.44% | 12.79% |
| 1 | Without sales charge |
| 2 | Reflects maximum sales charge of 5.50% |
| 3 | Reflects a contingent deferred sales charge of 1.00% |
PERFORMANCE DATA QUOTED REPRESENTS PAST PERFORMANCE AND DOES NOT GUARANTEE FUTURE RESULTS. The investment return and principal value of the investment will fluctuate so that investors’ shares, when redeemed, may be worth more or less than their original cost. The chart and table do not reflect the deductions of taxes that a shareholder would pay on Fund distributions or the redemption of Fund shares. Current performance may be lower or higher than the performance data quoted. To obtain performance data current to the most recent month-end, please visit our website hartfordfunds.com.
Total returns presented above were calculated using the applicable class' net asset value available to shareholders for sale or redemption of Fund shares on 10/31/2022, which may exclude investment transactions as of this date. All share class returns assume the reinvestment of all distributions at net asset value and the deduction of all fund expenses. The total returns presented in the Financial Highlights section of the report are calculated in the same manner, but also take into account certain
adjustments that are necessary under generally accepted accounting principles. As a result, the total returns in the Financial Highlights section may differ from the total returns presented above.
Class R6 shares commenced operations on 02/28/2019 and performance prior to that date is that of the Fund’s Class Y shares. Class F shares commenced operations on 02/28/2017 and performance prior to that date is that of the Fund’s Class I shares. Performance prior to an inception date of a class has not been adjusted to reflect the operating expenses of such class.
You cannot invest directly in an index.
See “Benchmark Glossary” for benchmark descriptions.
Performance information may reflect expense waivers/reimbursements without which performance would have been lower.
| Operating Expenses* | Gross | Net |
| Class A | 1.24% | 1.24% |
| Class C | 2.01% | 2.01% |
| Class I | 0.98% | 0.98% |
| Class R3 | 1.59% | 1.59% |
| Class R4 | 1.29% | 1.29% |
| Class R5 | 1.00% | 1.00% |
| Class R6 | 0.88% | 0.88% |
| Class Y | 0.99% | 0.99% |
| Class F | 0.88% | 0.88% |
| * | Expenses as shown in the Fund’s most recent prospectus. Actual expenses may be higher or lower. Please see accompanying Financial Highlights for expense ratios for the period ended 10/31/2022. |
The Hartford Healthcare Fund
Fund Overview – (continued)
October 31, 2022 (Unaudited)
Portfolio Managers
Ann C. Gallo*
Senior Managing Director and Global Industry Analyst
Wellington Management Company LLP
Rebecca D. Sykes, CFA
Senior Managing Director and Global Industry Analyst
Wellington Management Company LLP
Wen Shi, PhD, CFA
Managing Director and Global Industry Analyst
Wellington Management Company LLP
David M. Khtikian, CFA
Managing Director and Global Industry Analyst
Wellington Management Company LLP
Fayyaz Mujtaba
Managing Director and Global Industry Analyst
Wellington Management Company LLP
| * | Effective February 28, 2023, Ms. Gallo will no longer serve as a portfolio manager to the Fund. Ms. Gallo will transition her portfolio management responsibilities for the Fund to Messrs. Khtikian and Mujtaba. |
Manager Discussion
How did the Fund perform during the period?
The Class A shares of The Hartford Healthcare Fund returned -13.35%, before sales charges, for the twelve-month period ended October 31, 2022, underperforming the Fund’s benchmark, the S&P Composite 1500 Health Care Index, which returned -0.76% for the same period, while outperforming the S&P 500 Index, the Fund’s other benchmark, which returned -14.61% for the same period. For the same period, the Class A shares of the Fund, before sales charges, outperformed the -14.75% average return of the Lipper Global Health and Biotechnology peer group, a group of funds with investment strategies similar to those of the Fund.
Why did the Fund perform this way?
Healthcare equities (+0.9%) outperformed both the broader United States (U.S.) equity market (-14.6%) and the global equity market (-19.6%) during the period, as measured by the S&P 500 Healthcare Index, S&P 500 Index, and MSCI ACWI Index, respectively.
Within the S&P Composite 1500 Health Care Index, three of five sub-sectors posted negative absolute returns during the period. Small-cap Biopharma (-37.2%), Medical Technology (-24.9%), and mid-cap Biopharma (-5.9%) declined during the period. Large-cap Biopharma (+15.9%) and Healthcare Services (+13.9%) rose during the period.
Security selection was the primary detractor from the Fund’s performance relative to the S&P Composite 1500 Health Care Index during the period. Sector allocation also detracted from relative returns. Security selection detracted within all sectors. Selection was weakest in the mid-cap Biopharma and Health Care Services
sub-sectors. Within sector allocation, which is a by-product of the bottom-up stock selection process, an underweight allocation to large-cap Biopharma detracted most from relative performance during the period, while an underweight to Medical Technology contributed positively to relative returns.
AbbVie (large-cap Biopharma), Zai Lab (mid-cap Biopharma), and Johnson & Johnson (large-cap Biopharma) were the top detractors from performance relative to the S&P Composite 1500 Health Care Index over the period. Not owning AbbVie, a constituent of the S&P Composite 1500 Health Care Index, detracted from relative performance, as shares traded higher on news that the U.S. Food and Drug Administration (FDA) approved RINVOQ for the treatment of adults with active psoriatic arthritis who have had an inadequate response or intolerance to one or more tumor necrosis factor (TNF) inhibitors. AbbVie’s launches have done well in the marketplace, allaying some of the concerns about the upcoming biosimilar competition for its largest franchise Humira, which we still feel will be daunting. Shares of Zai Lab, a China-based biotech company with focus on in-licensing Western drugs for development and commercialization in China, declined over the period. The share price declined significantly in the past due to the pricing cut pressure in the China pharmaceutical market as well as ongoing macroeconomic and geopolitical concerns. However, we are seeing signs that government policy direction may be shifting towards encouraging innovation which we believe may drive better than anticipated sales potential for the company. The Fund’s lack of exposure to Johnson & Johnson (J&J), a constituent of the S&P Composite 1500 Health Care Index, was a detractor from relative performance during the period. Shares rose through the year due to encouraging quarterly earnings results, which showed strength in the immunology and oncology franchises, as well as the company’s announcement of a $5 billion stock repurchase
The Hartford Healthcare Fund
Fund Overview – (continued)
October 31, 2022 (Unaudited)
program. Additionally, in an environment with rising interest rates and heightened geopolitical risk, and fears around a slowing global growth rate, large cap pharma has been seen as a safe haven for investors. Edwards Lifesciences, Align Technology, and Zoetis were the top absolute detractors from the Fund’s performance.
Eli Lilly (large-cap Biopharma), Moderna (large-cap Biopharma), and Abbott Laboratories (Medical Technology) contributed positively to results relative to the S&P Composite 1500 Health Care Index over the period. Shares of Eli Lilly rose after the company reported strong first quarter 2022 earnings results, but more importantly received FDA approval for its drug, tirzepatide, for the treatment of type 2 diabetes. Compelling pivotal data in the setting of non-diabetic obesity during the second quarter of 2022 also underscored the long-term value of this drug. More recently, the stock benefited from positive results in Eisai’s Alzheimer’s phase 3 trial which raised hopes for other anti-amyloid drugs including Eli Lilly’s drug donanemab. The Fund’s underweight to Moderna was a positive contributor to relative performance during the period, as shares have been pressured by uncertainties around future COVID-19 vaccine revenues, the success of other respiratory vaccines, and the utility of the mRNA platform beyond respiratory vaccines. As of the end of the period, the Fund continued to hold a position in Moderna as we believe the COVID-19 vaccine production has given Moderna not only sales and cash flows but has significantly increased the company’s capabilities in R&D and manufacturing to capitalize on future opportunities. Not owning Abbott Laboratories for the majority of the period was a positive contributor as shares underperformed during the period. Shares of Abbott Laboratories have been pressured as the company has faced short-term challenges including declines in COVID-19 testing demand as well as a voluntarily recall of several baby powder formulas in February 2022, including various Similac, Alimentum and EleCare branded products. We initiated a position in Abbott Laboratories recently in October 2022 as we found an attractive risk/reward opportunity following the stock’s underperformance. Top absolute contributors to the Fund’s performance during the period included Eli Lilly, UnitedHealth Group, and Bristol-Myers Squibb.
Derivatives were not used in a significant manner in the Fund during the period and did not have a material impact on performance during the period.
What is the outlook as of the end of the period?
As of the end of the period, attractive valuations, strong fundamentals, and robust innovation across the Healthcare sector leave us with a positive outlook. Starting with the biopharma sub-sector, we believe the prospects for value creation in the industry are especially strong as breakthrough innovation – particularly in oncology, immunology, and certain rare diseases — is generating a rich opportunity set for specialist investors. While the long-term implications of U.S. drug reform remain to be seen, we are encouraged by the lifting of this longstanding overhang on the biopharmaceutical industry and we believe that innovation will continue to drive value in the sector.
Outside of biopharma, the opportunity set is equally compelling, and we are just as enthusiastic about the opportunities within medical technology where innovation pipelines have never been stronger in our
view, with far more attractive medical device categories poised to accelerate in this decade versus the prior decade. In the coming years, we believe many firms will grow their addressable market through geographic expansion, new technologies, and the use of existing technologies to treat new patient populations.
Lastly and importantly, the overall delivery of health care continues to evolve, and we believe health care companies are well positioned to help solve one of the greatest societal challenges we face for the future: rising health care costs. The U.S., for example, is experiencing a decades-long transition toward a fee-for-value payment system from a historic fee-for-service approach, which we expect will result in new business models that have the potential to improve outcomes and reduce costs. These tailwinds across the various Healthcare subsectors, coupled with strong valuation support, leaves us with a positive outlook for the Healthcare sector.
In selecting equities for the Fund, we favor companies that develop innovative products designed to address important unmet medical needs. Over the long term, we believe that innovation, an aging population, and the globalization of demand for cutting-edge Western-style medicines are likely to continue to drive growth of the Healthcare sector.
Important Risks
Investing involves risk, including the possible loss of principal. Security prices fluctuate in value depending on general market and economic conditions and the prospects of individual companies. • Risks of focusing investments on the healthcare related sector include regulatory and legal developments, changes in funding or subsidies, patent and intellectual property considerations, intense competitive pressures, rapid technological changes, long and costly process for obtaining product approval by government agencies, potential product obsolescence, rising cost of medical products and services, and liquidity risk. • Small- and mid-cap securities can have greater risks and volatility than large-cap securities. • Foreign investments may be more volatile and less liquid than U.S. investments and are subject to the risk of currency fluctuations and adverse political, economic and regulatory developments. These risks may be greater, and include additional risks, for investments in emerging markets.
| Composition by Subsector(1) |
| as of 10/31/2022 |
| Subsector | Percentage of
Net Assets |
| Equity Securities | |
| Biotechnology | 13.6% |
| Consumer Finance | 0.1 |
| Health Care Equipment & Supplies | 18.7 |
| Health Care Providers & Services | 24.6 |
| Life Sciences Tools & Services | 11.0 |
| Pharmaceuticals | 30.5 |
| Total | 98.5% |
| Short-Term Investments | 1.2 |
| Other Assets & Liabilities | 0.3 |
| Total | 100.0% |
| (1) | For Fund compliance purposes, the Fund may not use the same classification system. These subsector classifications are used for financial reporting purposes. |
Fund Overview
October 31, 2022 (Unaudited)
Inception 12/31/1997
Sub-advised by Wellington Management Company LLP | Investment objective – The Fund seeks long-term growth of capital. |
Comparison of Change in Value of $10,000 Investment (10/31/2012 - 10/31/2022)
The chart above represents the hypothetical growth of a $10,000 investment in Class A, which includes the maximum sales charge applicable to Class A shares. Returns for the Fund’s other classes will vary from what is seen above due to differences in the expenses charged to those share classes.
| Average Annual Total Returns |
| for the Periods Ended 10/31/2022 |
| | 1 Year | 5 Years | 10 Years |
| Class A1 | -24.83% | 5.26% | 10.65% |
| Class A2 | -28.96% | 4.07% | 10.02% |
| Class C1 | -25.38% | 4.46% | 9.83% |
| Class C3 | -25.99% | 4.46% | 9.83% |
| Class I1 | -24.63% | 5.52% | 10.91% |
| Class R31 | -25.08% | 4.88% | 10.28% |
| Class R41 | -24.86% | 5.21% | 10.62% |
| Class R51 | -24.62% | 5.53% | 10.95% |
| Class R61 | -24.56% | 5.63% | 11.07% |
| Class Y1 | -24.58% | 5.59% | 11.04% |
| Class F1 | -24.56% | 5.63% | 10.98% |
| S&P MidCap 400 Index | -11.54% | 7.47% | 11.23% |
| 1 | Without sales charge |
| 2 | Reflects maximum sales charge of 5.50% |
| 3 | Reflects a contingent deferred sales charge of 1.00% |
PERFORMANCE DATA QUOTED REPRESENTS PAST PERFORMANCE AND DOES NOT GUARANTEE FUTURE RESULTS. The investment return and principal value of the investment will fluctuate so that investors’ shares, when redeemed, may be worth more or less than their original cost. The chart and table do not reflect the deductions of taxes that a shareholder would pay on Fund distributions or the redemption of Fund shares. Current performance may be lower or higher than the performance data quoted. To obtain performance data current to the most recent month-end, please visit our website hartfordfunds.com.
Total returns presented above were calculated using the applicable class' net asset value available to shareholders for sale or redemption of Fund shares on 10/31/2022, which may exclude investment transactions as of this date. All share class returns assume the reinvestment of all distributions at net asset value and the deduction of all fund expenses. The total returns presented in the Financial Highlights section of the report are calculated in the same manner, but also take into account certain
adjustments that are necessary under generally accepted accounting principles. As a result, the total returns in the Financial Highlights section may differ from the total returns presented above.
Class R6 shares commenced operations on 11/07/2014 and performance prior to that date is that of the Fund’s Class Y shares. Class F shares commenced operations on 02/28/2017 and performance for Class F shares prior to 02/28/2017 reflects the performance of Class I shares. Performance prior to an inception date of a class has not been adjusted to reflect the operating expenses of such class.
You cannot invest directly in an index.
See “Benchmark Glossary” for benchmark descriptions.
Performance information may reflect expense waivers/reimbursements without which performance would have been lower. For information on current expense waivers/reimbursements, please see the prospectus.
| Operating Expenses* | Gross | Net |
| Class A | 1.07% | 1.07% |
| Class C | 1.84% | 1.84% |
| Class I | 0.85% | 0.85% |
| Class R3 | 1.45% | 1.45% |
| Class R4 | 1.15% | 1.15% |
| Class R5 | 0.83% | 0.83% |
| Class R6 | 0.73% | 0.73% |
| Class Y | 0.84% | 0.79% |
| Class F | 0.73% | 0.73% |
| * | Expenses as shown in the Fund’s most recent prospectus. Gross expenses do not reflect contractual fee waivers or expense reimbursement arrangements, if any. Net expenses reflect such arrangements only with respect to Classes I and Y and in instances when they reduce gross expenses. These arrangements remain in effect until 02/28/2023 unless the Fund’s Board of Directors approves an earlier termination. Actual expenses may be higher or lower. Please see accompanying Financial Highlights for expense ratios for the period ended 10/31/2022. |
Fund Overview – (continued)
October 31, 2022 (Unaudited)
Portfolio Managers
Philip W. Ruedi, CFA
Senior Managing Director and Equity Portfolio Manager
Wellington Management Company LLP
Mark A. Whitaker, CFA
Senior Managing Director and Equity Portfolio Manager
Wellington Management Company LLP
Manager Discussion
How did the Fund perform during the period?
The Class A shares of The Hartford MidCap Fund returned -24.83%, before sales charges, for the twelve-month period ended October 31, 2022, underperforming the Fund’s benchmark, the S&P MidCap 400 Index, which returned -11.54% for the same period. For the same period, the Class A shares of the Fund, before sales charges, outperformed the -29.65% average return of the Morningstar Mid-Cap Growth Funds peer group, a group of funds with investment strategies similar to that of the Fund.
Why did the Fund perform this way?
United States (U.S.) equities, as measured by the S&P 500 Index, posted negative results over the trailing twelve-month period ending October 31, 2022. Markets rallied early in the period on the back of robust equity inflows, strong corporate earnings, favorable economic data, and extremely accommodative financial conditions. However, the rapid spread of the Omicron variant of the coronavirus led to the largest increase in U.S. COVID-19 cases since the onset of the pandemic, prompting a flurry of new restrictions and event cancellations. Inflation continued to surge against a backdrop of severe supply and labor shortages, rising energy prices, and high demand for goods and services, heightening scrutiny of the U.S. Federal Reserve (Fed) amid anxiety about a potential monetary policy mistake. Equity markets fell sharply in the second quarter of 2022, as rampant inflation and tighter financial conditions negatively affected risk sentiment and increased the probability of recession. Rapidly rising prices for food and energy pushed consumer inflation to its highest level in more than four decades. Growth equities significantly underperformed their value counterparts as surging Treasury yields and disappointing earnings results from some of the largest technology companies drove the Nasdaq Composite Index to its biggest quarterly loss since September 2001. Equity market weakness persisted, as risk sentiment deteriorated on fears that aggressive interest-rate increases and tighter financial conditions would constrict economic growth and drive the U.S. to recession. Despite these concerns, Fed Chair Jerome Powell made clear that the central bank is committed to raising interest rates and keeping them elevated for longer until there is clear evidence that price pressures are abating.
Returns varied by market cap during the period. Large-cap equities, as measured by the S&P 500 Index, underperformed mid-cap equities, as measured by the S&P MidCap 400 Index. During the period, mid-cap equities, as measured by the S& P MidCap 400 Index, outperformed small-cap equities, as measured by the Russell 2000 Index.
Within the S&P MidCap 400 Index, seven out of the eleven sectors posted negative returns during the period. The Communication Services (-24%), Information Technology (-23%), and Consumer Discretionary (-23%) sectors performed the worst, while the Energy (+44%), Consumer Staples (+4%) and Utilities (+4%) sectors performed the best.
The Fund underperformed the S& P MidCap 400 Index during the twelve-month period primarily due to negative security selection. Selection effects were particularly weak within the Information Technology, Healthcare, and Consumer Discretionary sectors. This was partially offset by strong selection in the Materials, Consumer Staples, and Utilities sectors, which contributed positively to performance during the period. Sector allocation, a result of our bottom-up stock selection process, also detracted from the Fund’s performance relative to the S&P MidCap 400 Index during the period. This was primarily due to an overweight allocation to the Information Technology and Healthcare sectors and an underweight to the Energy sector. This was partially offset by underweights to the Real Estate and Consumer Discretionary sectors, which contributed positively to performance during the period.
Top detractors from the Fund’s relative performance for the period included Etsy (Consumer Discretionary), YETI (Consumer Discretionary), and First Solar (Information Technology). The share price of handmade crafts e-commerce platform Etsy fell early in the period as holiday sales data underwhelmed investors despite management releasing solid third quarter results in November 2021. Following the platform's success as a leading supplier of homemade cloth face masks during the pandemic, customer retention came under close scrutiny as new user growth abated. Shares of YETI declined after the company reported second-quarter earnings that missed estimates and lowered full-year 2022 guidance. Sales were below expectations due to slower customer acquisition and digital traffic including Amazon Marketplace. Gross margin and operating expenses were impacted by logistics and distribution cost inflation and a market shift towards wholesale, specifically coolers and equipment. Shares of First Solar, a renewable energy and solar company, declined early in the period amid uncertainty surrounding the Inflation Reduction Act, as well as California’s Public Utilities Commission weighing the possibility of reforming home rooftop solar net metering subsidies.
Top contributors to relative performance during the period included Apellis Pharmaceutical (Healthcare), Arena Pharmaceutical (Healthcare), and Wingstop (Consumer Discretionary). Shares of Apellis Pharmaceuticals rose as the company announced that the U.S. Food and Drug Administration (FDA) accepted the New Drug
Fund Overview – (continued)
October 31, 2022 (Unaudited)
Application for pegcetacoplan and assigned it Priority Review with an expected approval date of November 2022. If approved, pegcetacoplan will be the first treatment for Geotrophic Atrophy, a disease that causes vision loss. Apellis also plans to submit a marketing authorization application to the European Medicines Agency. Shares of Arena Pharmaceuticals soared during the period on news that Pfizer would acquire the company in a $6.7 billion cash deal that was expected to close in the first half of 2022. Arena’s pipeline drug Etrasimod was a key asset in the deal. Etrasimod is in development for the treatment of immuno-inflammatory diseases including ulcerative colitis. Shares of Wingstop, a franchisor and operator of restaurants, rose over the period. Share price jumped as management reported strong second-quarter 2022 results and reiterated full year guidance. The company also reported 67 net new restaurants and 7.5% growth in system-wide sales in the second quarter of 2022.
Derivatives were not used in the Fund during the period.
What is the outlook as of the end of the period?
As of the end of the period, we continue to feel that our holdings within the Energy sector look attractive within our fundamentals, valuation, and expectations (F/V/E) framework. As a result, we increased the weight in the Fund’s existing Energy positions, ending the period with a modest overweight versus the S&P MidCap 400 Index. In addition to Energy, we feel the transportation industry presents an attractive combination of valuation and business quality. Toward the end of the period, we increased the Fund’s positions in CH Robinson, a non-asset-based truck broker and air and ocean forwarder, and Expeditors International, which arranges the transportation of freight globally.
As of the end of the period, market volatility gave us opportunities to invest in several companies that had previously graduated from the mid cap opportunity set. Positions that we increased at the end of the period within this category included Bio-Techne, which sells bio-reactive proteins for cell culture development and gene therapy treatments, and Verisign, a domain name manager. These purchases were largely funded from positions within the Information Technology sector, and more specifically information technology infrastructure. In our view, earnings for these companies have been under increased pressure given the rising interest rate and inflationary environment.
At the end of the period, the Fund’s largest overweights were in the Information Technology and Healthcare sectors relative to the S&P MidCap 400 Index. The Fund was most underweight to the Financials and Real Estate sectors relative to the S&P MidCap 400 Index as of the end of the period.
Important Risks
Investing involves risk, including the possible loss of principal. Security prices fluctuate in value depending on general market and economic conditions and the prospects of individual companies. • Mid-cap securities can have greater risks and volatility than large-cap securities. • Integration of environmental, social, and/or governance (ESG) characteristics into the investment process may not work as
intended. • To the extent the Fund focuses on one or more sectors, the Fund may be subject to increased volatility and risk of loss if adverse developments occur.
| Composition by Sector(1) |
| as of 10/31/2022 |
| Sector | Percentage
of Net Assets |
| Equity Securities | |
| Communication Services | 2.2% |
| Consumer Discretionary | 12.1 |
| Energy | 6.7 |
| Financials | 8.4 |
| Health Care | 19.1 |
| Industrials | 21.5 |
| Information Technology | 23.7 |
| Materials | 4.3 |
| Real Estate | 1.3 |
| Utilities | 0.9 |
| Total | 100.2% |
| Short-Term Investments | 2.3 |
| Other Assets & Liabilities | (2.5) |
| Total | 100.0% |
| (1) | A sector may be comprised of several industries. For Fund compliance purposes, the Fund may not use the same classification system. These sector classifications are used for financial reporting purposes. |
The Hartford MidCap Value Fund
Fund Overview
October 31, 2022 (Unaudited)
Inception 04/30/2001
Sub-advised by Wellington Management Company LLP | Investment objective – The Fund seeks long-term capital appreciation. |
Comparison of Change in Value of $10,000 Investment (10/31/2012 - 10/31/2022)
The chart above represents the hypothetical growth of a $10,000 investment in Class A, which includes the maximum sales charge applicable to Class A shares. Returns for the Fund’s other classes will vary from what is seen above due to differences in the expenses charged to those share classes.
| Average Annual Total Returns |
| for the Periods Ended 10/31/2022 |
| | 1 Year | 5 Years | 10 Years |
| Class A1 | -4.34% | 5.97% | 9.28% |
| Class A2 | -9.60% | 4.78% | 8.67% |
| Class C1 | -5.07% | 5.18% | 8.48% |
| Class C3 | -5.93% | 5.18% | 8.48% |
| Class I1 | -4.06% | 6.32% | 9.62% |
| Class R31 | -4.58% | 5.67% | 8.98% |
| Class R41 | -4.31% | 5.99% | 9.31% |
| Class R51 | -4.03% | 6.29% | 9.64% |
| Class R61 | -3.92% | 6.43% | 9.70% |
| Class Y1 | -4.09% | 6.34% | 9.71% |
| Class F1 | -3.94% | 6.42% | 9.70% |
| Russell Midcap Value Index | -10.18% | 6.49% | 10.42% |
| 1 | Without sales charge |
| 2 | Reflects maximum sales charge of 5.50% |
| 3 | Reflects a contingent deferred sales charge of 1.00% |
PERFORMANCE DATA QUOTED REPRESENTS PAST PERFORMANCE AND DOES NOT GUARANTEE FUTURE RESULTS. The investment return and principal value of the investment will fluctuate so that investors’ shares, when redeemed, may be worth more or less than their original cost. The chart and table do not reflect the deductions of taxes that a shareholder would pay on Fund distributions or the redemption of Fund shares. Current performance may be lower or higher than the performance data quoted. To obtain performance data current to the most recent month-end, please visit our website hartfordfunds.com.
Total returns presented above were calculated using the applicable class' net asset value available to shareholders for sale or redemption of Fund shares on 10/31/2022, which may exclude investment transactions as of this date. All share class returns assume the reinvestment of all distributions at net asset value and the deduction of all fund expenses. The total returns presented in the Financial Highlights section of the report are calculated in the same manner, but also take into account certain
adjustments that are necessary under generally accepted accounting principles. As a result, the total returns in the Financial Highlights section may differ from the total returns presented above.
Class R6 shares commenced operations on 06/22/2022 and performance for Class R6 shares prior to 06/22/2022 reflects the performance of Class F shares from 02/28/2017 through 06/21/2022 and Class I shares prior to 02/28/2017. Class F shares commenced operations on 02/28/2017 and performance for Class F shares prior to 02/28/2017 reflects the performance of Class I shares. Performance prior to an inception date of a class has not been adjusted to reflect the operating expenses of such class.
You cannot invest directly in an index.
See “Benchmark Glossary” for benchmark descriptions.
Performance information may reflect expense waivers/reimbursements without which performance would have been lower.
| Operating Expenses* | Gross | Net |
| Class A | 1.18% | 1.18% |
| Class C | 1.96% | 1.96% |
| Class I | 0.85% | 0.85% |
| Class R3 | 1.49% | 1.49% |
| Class R4 | 1.19% | 1.19% |
| Class R5 | 0.89% | 0.89% |
| Class R6 | 0.77% | 0.77% |
| Class Y | 0.88% | 0.88% |
| Class F | 0.77% | 0.77% |
| * | Expenses as shown in the Fund’s most recent prospectus. Actual expenses may be higher or lower. Please see accompanying Financial Highlights for expense ratios for the period ended 10/31/2022. |
The Hartford MidCap Value Fund
Fund Overview – (continued)
October 31, 2022 (Unaudited)
Portfolio Manager
Gregory J. Garabedian
Senior Managing Director and Equity Portfolio Manager
Wellington Management Company LLP
Manager Discussion
How did the Fund perform during the period?
The Class A shares of The Hartford MidCap Value Fund returned -4.34%, before sales charges, for the twelve-month period ended October 31, 2022, outperforming the Fund’s benchmark, the Russell Midcap Value Index, which returned -10.18% for the same period. For the same period, the Class A shares of the Fund, before sales charges, outperformed the -10.61% average return of the Lipper MidCap Core Fund peer group, a group of funds with investment strategies similar to those of the Fund.
Why did the Fund perform this way?
United States (U.S.) equities fell over the trailing twelve-month period ended October 31, 2022. Markets rallied early in the period on the back of robust equity inflows, strong corporate earnings, favorable economic data, and extremely accommodative financial conditions. However, the rapid spread of the Omicron variant of the coronavirus led to the largest increase in U.S. COVID-19 cases since the onset of the pandemic, prompting a flurry of new restrictions and event cancellations. Inflation continued to surge against a backdrop of severe supply and labor shortages, rising energy prices, and high demand for goods and services, heightening scrutiny of the U.S. Federal Reserve (Fed) amid anxiety about a potential monetary policy mistake.
Equity markets fell sharply in the second quarter of 2022, as rampant inflation and tighter financial conditions negatively affected risk sentiment and increased the probability of recession. Rapidly rising prices for food and energy pushed consumer inflation to its highest level in more than four decades. Growth equities significantly underperformed their value counterparts as surging Treasury yields and disappointing earnings results from some of the largest technology companies drove the Nasdaq Composite Index to its biggest quarterly loss since September 2001. Equity market weakness persisted, as risk sentiment deteriorated on fears that aggressive interest-rate increases and tighter financial conditions would constrict economic growth and drive the U.S. to recession. Despite these concerns, Fed Chair Jerome Powell made clear that the central bank is committed to raising interest rates and keeping them elevated for longer until there is clear evidence that price pressures are abating.
Returns varied by market cap during the period, as mid-cap equities, measured by the S&P MidCap 400 Index, outperformed both small- and large-cap equities, as measured by the Russell 2000 Index and the S&P 500 Index, respectively. Returns within the mid-cap space varied by style, as the Russell Midcap Value Index outperformed the Russell Midcap Growth Index.
Eight out of eleven sectors in the Russell Midcap Value Index declined during the period, with the Communication Services (-32%), Consumer Discretionary (-22%), and Information Technology (-21%) sectors lagging most. Conversely, the Energy (+55%), Consumer Staples (+8%), and Utilities (+5%) sectors were the top performers and delivered positive returns during the period.
Security selection was the primary driver of the Fund’s relative outperformance versus the Russell Midcap Value Index over the period; sector allocation decisions also contributed positively, albeit more modestly. Selection within the Financials, Real Estate, and Healthcare sectors were the top drivers of relative performance. This was partially offset by weaker security selection in the Information Technology sector. Sector allocation, a result of our bottom-up stock selection process, also contributed positively to the Fund’s performance. Underweight exposure to the Real Estate and Communication Services sectors added the most to returns during the period, but was partially offset by underweight allocations to the Consumer Staples and Energy sectors.
Top security contributors to the Fund’s performance relative to the Russell Midcap Value Index over the period included an overweight position to Coterra Energy (Energy), an out-of-benchmark position in Centene (Healthcare), and an overweight position in Diamondback Energy (Energy). Shares of Coterra Energy and Diamondback Energy rose along with other oil and gas equities over the period as a supply and demand imbalance drove oil prices higher. Centene shares rose during the period as Medicaid and Medicare membership growth and recent acquisitions drove strong operational results, resulting in management raising its full-year guidance.
Top detractors from the Fund’s relative performance during the period included overweight positions in Syneos Health (Healthcare), Spirit AeroSystems (Industrials), and Six Flags Entertainment (Consumer Discretionary). Shares of Syneos Health, a clinical research organization, trended lower over the reporting period as the small- to mid-cap biotech sector came under pressure over funding concerns. The company also reported disappointing operational results due to slower decision-making from larger pharmaceutical companies, which heightened investor concerns of slowing industry growth. Shares of Spirit AeroSystems fell over the period. The company’s cash burn rate increased as Boeing’s lower production rate slowed Spirit’s reduction of inventory, exacerbated by continued inflationary pressure. Shares of Six Flags, an American amusement park corporation, fell during the period. Despite the company reporting a narrower-than-expected first-quarter loss and revenue that beat forecasts, shares declined as attendance came in below consensus estimates and concerns around a slowdown in consumer spending caused by inflation and rising interest rates posed challenges to the company’s outlook as it approached peak season.
The Hartford MidCap Value Fund
Fund Overview – (continued)
October 31, 2022 (Unaudited)
Derivatives were not used in the Fund during the period.
What is the outlook as of the end of the period?
Given what we see as a wide range of economic outcomes as of the end of the period, we have continued to emphasize quality across the Fund’s portfolio. We are stress-testing models and balance sheets, and are actively seeking to identify new opportunities created by the market turmoil during the period. Over the period, we increased the Fund’s exposures to the Energy and Information Technology sectors while reducing the Fund’s weights to the Real Estate and Materials sectors. As of the end of the period, we continue to seek opportunities that we believe offer a compelling combination of valuation, quality, and capital return.
Important Risks
Investing involves risk, including the possible loss of principal. Security prices fluctuate in value depending on general market and economic conditions and the prospects of individual companies. • Mid-cap securities can have greater risks and volatility than large-cap securities. • Different investment styles may go in and out of favor, which may cause the Fund to underperform the broader stock market. • Foreign investments may be more volatile and less liquid than U.S. investments and are subject to the risk of currency fluctuations and adverse political, economic and regulatory developments. • To the extent the Fund focuses on one or more sectors, the Fund may be subject to increased volatility and risk of loss if adverse developments occur.
| Composition by Sector(1) |
| as of 10/31/2022 |
| Sector | Percentage
of Net Assets |
| Equity Securities | |
| Communication Services | 2.5% |
| Consumer Discretionary | 11.3 |
| Consumer Staples | 2.5 |
| Energy | 6.0 |
| Financials | 20.7 |
| Health Care | 9.9 |
| Industrials | 20.8 |
| Information Technology | 10.3 |
| Materials | 3.6 |
| Real Estate | 6.4 |
| Utilities | 5.3 |
| Total | 99.3% |
| Short-Term Investments | 0.4 |
| Other Assets & Liabilities | 0.3 |
| Total | 100.0% |
| (1) | A sector may be comprised of several industries. For Fund compliance purposes, the Fund may not use the same classification system. These sector classifications are used for financial reporting purposes. |
Hartford Quality Value Fund
Fund Overview
October 31, 2022 (Unaudited)
Inception 01/02/1996
Sub-advised by Wellington Management Company LLP | Investment objective – The Fund seeks long-term capital appreciation. |
Comparison of Change in Value of $10,000 Investment (10/31/2012 - 10/31/2022)
The chart above represents the hypothetical growth of a $10,000 investment in Class A, which includes the maximum sales charge applicable to Class A shares. Returns for the Fund’s other classes will vary from what is seen above due to differences in the expenses charged to those share classes.
| Average Annual Total Returns |
| for the Periods Ended 10/31/2022 |
| | 1 Year | 5 Years | 10 Years |
| Class A1 | -4.19% | 8.15% | 10.18% |
| Class A2 | -9.46% | 6.93% | 9.56% |
| Class C1 | -4.95% | 7.31% | 9.36% |
| Class C3 | -5.84% | 7.31% | 9.36% |
| Class I1 | -3.92% | 8.50% | 10.54% |
| Class R31 | -4.41% | 7.89% | 9.90% |
| Class R41 | -4.15% | 8.19% | 10.23% |
| Class R51 | -3.92% | 8.49% | 10.54% |
| Class R61 | -3.71% | 8.65% | 10.66% |
| Class Y1 | -3.85% | 8.54% | 10.60% |
| Class F1 | -3.78% | 8.63% | 10.61% |
| Russell 1000 Value Index | -7.00% | 7.21% | 10.30% |
| 1 | Without sales charge |
| 2 | Reflects maximum sales charge of 5.50% |
| 3 | Reflects a contingent deferred sales charge of 1.00% |
PERFORMANCE DATA QUOTED REPRESENTS PAST PERFORMANCE AND DOES NOT GUARANTEE FUTURE RESULTS. The investment return and principal value of the investment will fluctuate so that investors’ shares, when redeemed, may be worth more or less than their original cost. The chart and table do not reflect the deductions of taxes that a shareholder would pay on Fund distributions or the redemption of Fund shares. Current performance may be lower or higher than the performance data quoted. To obtain performance data current to the most recent month-end, please visit our website hartfordfunds.com.
Total returns presented above were calculated using the applicable class' net asset value available to shareholders for sale or redemption of Fund shares on 10/31/2022, which may exclude investment transactions as of this date. All share class returns assume the reinvestment of all distributions at net asset value and the deduction of all fund expenses. The total returns presented in the Financial Highlights section of the report are calculated in the same manner, but also take into account certain
adjustments that are necessary under generally accepted accounting principles. As a result, the total returns in the Financial Highlights section may differ from the total returns presented above.
The returns include the Fund’s performance when the Fund pursued a different investment objective and principal investment strategy prior to 11/01/2017.
Class R6 shares commenced operations on 02/28/2018 and performance prior to that date is that of the Fund’s Class Y shares. Class F shares commenced operations on 02/28/2017 and performance prior to that date is that of the Fund’s Class I shares. Performance prior to an inception date of a class has not been adjusted to reflect the operating expenses of such class.
You cannot invest directly in an index.
See “Benchmark Glossary” for benchmark descriptions.
Performance information may reflect expense waivers/reimbursements without which performance would have been lower. For information on current expense waivers/reimbursements, please see the prospectus.
Hartford Quality Value Fund
Fund Overview – (continued)
October 31, 2022 (Unaudited)
| Operating Expenses* | Gross | Net |
| Class A | 0.97% | 0.96% |
| Class C | 1.80% | 1.71% |
| Class I | 0.65% | 0.65% |
| Class R3 | 1.27% | 1.18% |
| Class R4 | 0.97% | 0.88% |
| Class R5 | 0.67% | 0.63% |
| Class R6 | 0.56% | 0.46% |
| Class Y | 0.66% | 0.57% |
| Class F | 0.56% | 0.46% |
| * | Expenses as shown in the Fund’s most recent prospectus. Gross expenses do not reflect contractual expense reimbursement arrangements. Net expenses reflect such arrangements in instances when they reduce gross expenses. These arrangements remain in effect until 02/28/2023 unless the Fund’s Board of Directors approves an earlier termination. Actual expenses may be higher or lower. Please see accompanying Financial Highlights for expense ratios for the period ended 10/31/2022. |
Portfolio Managers
Matthew G. Baker
Senior Managing Director and Equity Portfolio Manager
Wellington Management Company LLP
Nataliya Kofman
Managing Director and Equity Portfolio Manager
Wellington Management Company LLP
Manager Discussion
How did the Fund perform during the period?
The Class A shares of the Hartford Quality Value Fund returned -4.19%, before sales charges, for the twelve-month period ended October 31, 2022, outperforming the Fund’s benchmark, the Russell 1000 Value Index, which returned -7.00% for the same period. For the same period, the Class A shares of the Fund, before sales charges, outperformed the -6.24% average return of the Lipper Large Cap Value Fund peer group, a group of funds with investment strategies similar to those of the Fund.
Why did the Fund perform this way?
United States (U.S.) equities fell over the trailing twelve-month period ended October 31, 2022. Markets rallied early in the period on the back of robust equity inflows, strong corporate earnings, favorable economic data, and extremely accommodative financial conditions. However, the rapid spread of the Omicron variant of the coronavirus led to the largest increase in U.S. COVID-19 cases since the onset of the pandemic, prompting a flurry of new restrictions and event cancellations. Inflation continued to surge against a backdrop of severe supply and labor shortages, rising energy prices, and high demand for goods and services, heightening scrutiny of the U.S. Federal Reserve (Fed) amid anxiety about a potential monetary policy mistake.
Equity markets fell sharply in the second quarter of 2022, as rampant inflation and tighter financial conditions negatively affected risk sentiment and increased the probability of recession. Rapidly rising prices for food and energy pushed consumer inflation to its highest level in more than four decades. Growth equities significantly underperformed their value counterparts as surging Treasury yields and disappointing earnings results from some of the largest technology companies drove the Nasdaq Composite Index to its biggest quarterly loss since September 2001. Equity market weakness persisted, as risk sentiment deteriorated on fears that aggressive interest-rate increases and tighter financial conditions would constrict economic growth and drive the U.S. to recession. Despite these concerns, Fed Chair Jerome Powell made clear that the central bank is committed to raising interest rates and keeping them elevated for longer until there is clear evidence that price pressures are abating.
Seven out of eleven sectors within the Russell 1000 Value Index declined over the period, with the Communication Services (-30%), Information Technology (-23%), and Real Estate (-20%) sectors lagging the most. Conversely, the Energy (+65%), Consumer Staples (+5%), and Utilities (+3%) sectors performed best over the period.
Security selection contributed positively to Fund performance relative to the Russell 1000 Value Index over the period, while sector allocation slightly detracted from the Fund’s relative performance. Strong stock selection within the Industrials, Financials, and Consumer Discretionary sectors were the top positive contributors to relative performance. This was partially offset by weaker security selection within the Healthcare, Energy, and Utilities sectors during the
Hartford Quality Value Fund
Fund Overview – (continued)
October 31, 2022 (Unaudited)
period. Sector allocation, a result of our bottom-up stock selection process, detracted from relative performance during the period due to the Fund’s underweight allocation to the Energy sector and overweight allocation to the Information Technology sector.
Top contributors to performance relative to the Russell 1000 Value Index over the period were an overweight position in Lockheed Martin (Industrials), not owning Meta Platforms (Communication Services), and an overweight position in Principal Financial Group (Financials). Shares of Lockheed Martin trended higher during the period along with other defense equities in response to the Ukraine-Russia conflict. Germany also announced plans to bolster its military strength for the first time in decades by almost doubling its military spending and announced plans to buy fighter planes made in the U.S. The share price of Meta Platforms, a U.S.-based social networking operator, fell during the period after management released disappointing quarterly results and weak near-term guidance. The company reported that quarterly revenue declined more than 4% year over year and its second straight quarterly decline in the second quarter of 2022. Shares of Principal Financial Group ended the period higher after the investment management and insurance company reported second-quarter adjusted operating earnings per share (EPS) that were above expectations, as strong customer growth and increasing investment yields helped mitigate macroeconomic challenges.
The largest detractors from the Fund’s performance relative to the Russell 1000 Value Index over the period were not owning Exxon Mobil (Energy), an out-of-benchmark position in Koninklijke Philips (Healthcare), and an overweight position in Celanese (Materials). Shares of Exxon Mobil rose during the period along with the rest of the Energy sector on increasing earnings and revenue from rising oil prices. The company also announced a $30 billion share buyback. Shares of Koninklijke Philips fell during the period as the U.S. Food and Drug Administration (FDA) reported that instances of faulty Philips ventilators and sleep apnea machines had risen. The company also lowered full-year sales guidance and announced that longtime Chief Executive Officer (CEO) Frans van Houten would be replaced by Roy Jakobs, the Philips executive heading the recall operation. Shares of Celanese, a global chemical and specialty materials company, declined over the period as the business continued to be impacted by the persistent inflationary environment and volatile supply-chain backdrop. The company reported mixed earnings throughout the period, beating EPS estimates in April 2022 and July 2022 but failing to do so in January 2022.
Derivatives were not used in the Fund during the period.
What is the outlook as of the end of the period?
Markets ended the period lower as investors braced for recession; however, the timing and magnitude is still unknown. Consumer demand has been resilient despite rising interest rates, but we believe we are starting to see the first indicators of economic pull-back despite the record strength of the labor market. Inflation has likely peaked in the U.S., but a change in tighter monetary policy by the Fed is unlikely, in our view, and we have not ruled out the potential for additional meaningful interest-rate increases before the end of 2022. Market volatility continues to be driven by a steady state of macroeconomic crosscurrents ranging from supply-chain bottlenecks
to Russia’s invasion of Ukraine. In the current environment, we are seeking to avoid taking undue risk within the Fund by focusing on long-term value creation potential and predictable ranges of outcomes.
We continue to anticipate negative impacts from inflationary pressures and restrictive monetary policy through at least the end of 2022. As of the end of the period, the Fund remains positioned for persistent inflation and decelerating growth by focusing on companies with balance-sheet strength, sustainable and growing cash flows, and high-quality management teams, in our view. We believe that opportunistically investing in out-of-favor growth and cyclical names with positive risk/reward skews may provide upside potential, while maintaining an overweight to more defensive segments may insulate the portfolio from macroeconomic shocks and valuation-driven corrections.
At the end of the period, the Fund’s largest overweights were to the Information Technology and Consumer Staples sectors, while the Fund’s largest underweights were to the Energy and Communication Services sectors, relative to the Russell 1000 Value Index.
Important Risks
Investing involves risk, including the possible loss of principal. Security prices fluctuate in value depending on general market and economic conditions and the prospects of individual companies. • Different investment styles may go in and out of favor, which may cause the Fund to underperform the broader stock market. • For dividend-paying stocks, dividends are not guaranteed and may decrease without notice. • Integration of environmental, social, and/or governance (ESG) characteristics into the investment process may not work as intended. • To the extent the Fund focuses on one or more sectors, the Fund may be subject to increased volatility and risk of loss if adverse developments occur.
| Composition by Sector(1) |
| as of 10/31/2022 |
| Sector | Percentage
of Net Assets |
| Equity Securities | |
| Communication Services | 6.0% |
| Consumer Discretionary | 5.6 |
| Consumer Staples | 8.3 |
| Energy | 6.6 |
| Financials | 20.7 |
| Health Care | 17.3 |
| Industrials | 10.8 |
| Information Technology | 10.1 |
| Materials | 3.6 |
| Real Estate | 4.2 |
| Utilities | 5.2 |
| Total | 98.4% |
| Short-Term Investments | 1.0 |
| Other Assets & Liabilities | 0.6 |
| Total | 100.0% |
| (1) | A sector may be comprised of several industries. For Fund compliance purposes, the Fund may not use the same classification system. These sector classifications are used for financial reporting purposes. |
The Hartford Small Cap Growth Fund
Fund Overview
October 31, 2022 (Unaudited)
Inception 01/04/1988
Sub-advised by Wellington Management Company LLP | Investment objective – The Fund seeks long-term capital appreciation. |
Comparison of Change in Value of $10,000 Investment (10/31/2012 - 10/31/2022)
The chart above represents the hypothetical growth of a $10,000 investment in Class A, which includes the maximum sales charge applicable to Class A shares. Returns for the Fund’s other classes will vary from what is seen above due to differences in the expenses charged to those share classes.
| Average Annual Total Returns |
| for the Periods Ended 10/31/2022 |
| | 1 Year | 5 Years | 10 Years |
| Class A1 | -28.75% | 4.00% | 9.48% |
| Class A2 | -32.67% | 2.83% | 8.86% |
| Class C1 | -29.27% | 3.29% | 8.73% |
| Class C3 | -29.76% | 3.29% | 8.73% |
| Class I1 | -28.50% | 4.39% | 9.84% |
| Class R31 | -28.93% | 3.73% | 9.20% |
| Class R41 | -28.72% | 4.05% | 9.54% |
| Class R51 | -28.51% | 4.37% | 9.87% |
| Class R61 | -28.44% | 4.47% | 9.97% |
| Class Y1 | -28.47% | 4.43% | 9.95% |
| Class F1 | -28.42% | 4.48% | 9.91% |
| Russell 2000 Growth Index | -26.02% | 5.17% | 10.15% |
| 1 | Without sales charge |
| 2 | Reflects maximum sales charge of 5.50% |
| 3 | Reflects a contingent deferred sales charge of 1.00% |
PERFORMANCE DATA QUOTED REPRESENTS PAST PERFORMANCE AND DOES NOT GUARANTEE FUTURE RESULTS. The investment return and principal value of the investment will fluctuate so that investors’ shares, when redeemed, may be worth more or less than their original cost. The chart and table do not reflect the deductions of taxes that a shareholder would pay on Fund distributions or the redemption of Fund shares. Current performance may be lower or higher than the performance data quoted. To obtain performance data current to the most recent month-end, please visit our website hartfordfunds.com.
Total returns presented above were calculated using the applicable class' net asset value available to shareholders for sale or redemption of Fund shares on 10/31/2022, which may exclude investment transactions as of this date. All share class returns assume the reinvestment of all distributions at net asset value and the deduction of all fund expenses. The total returns presented in the Financial Highlights section of the report are calculated in the same manner, but also take into account certain adjustments that are necessary under generally accepted accounting principles. As a
result, the total returns in the Financial Highlights section may differ from the total returns presented above.
Class R6 shares commenced operations on 11/07/2014 and performance prior to that date is that of the Fund’s Class Y shares. Class F shares commenced operations on 02/28/2017 and performance prior to that date is that of the Fund’s Class I shares. Performance prior to an inception date of a class has not been adjusted to reflect the operating expenses of such class.
You cannot invest directly in an index.
See “Benchmark Glossary” for benchmark descriptions.
Performance information may reflect expense waivers/reimbursements without which performance would have been lower. For information on current expense waivers/reimbursements, please see the prospectus.
| Operating Expenses* | Gross | Net |
| Class A | 1.19% | 1.19% |
| Class C | 1.90% | 1.90% |
| Class I | 0.84% | 0.84% |
| Class R3 | 1.48% | 1.48% |
| Class R4 | 1.18% | 1.18% |
| Class R5 | 0.87% | 0.87% |
| Class R6 | 0.77% | 0.77% |
| Class Y | 0.87% | 0.83% |
| Class F | 0.77% | 0.77% |
| * | Expenses as shown in the Fund’s most recent prospectus. Gross expenses do not reflect contractual fee waivers or expense reimbursement arrangements, if any. Net expenses reflect such arrangements only with respect to Class Y. These arrangements remain in effect until 02/28/2023 unless the Fund’s Board of Directors approves an earlier termination. Actual expenses may be higher or lower. Please see accompanying Financial Highlights for expense ratios for the period ended 10/31/2022. |
The Hartford Small Cap Growth Fund
Fund Overview – (continued)
October 31, 2022 (Unaudited)
Portfolio Managers
Mammen Chally, CFA
Senior Managing Director and Equity Portfolio Manager
Wellington Management Company LLP
David A. Siegle, CFA
Managing Director and Equity Research Analyst
Wellington Management Company LLP
Douglas W. McLane, CFA
Senior Managing Director and Equity Portfolio Manager
Wellington Management Company LLP
Manager Discussion
How did the Fund perform during the period?
The Class A shares of The Hartford Small Cap Growth Fund returned -28.75%, before sales charges, for the twelve-month period ended October 31, 2022, underperforming the Fund’s benchmark, the Russell 2000 Growth Index, which returned -26.02% for the same period. For the same period, the Class A shares of the Fund, before sales charges, underperformed the -26.50% average return of the Lipper Small-Cap Growth Funds peer group, a group of funds with investment strategies similar to those of the Fund.
Why did the Fund perform this way?
United States (U.S.) equities fell over the trailing twelve-month period ended October 31, 2022. Markets rallied early in the period on the back of robust equity inflows, strong corporate earnings, favorable economic data, and extremely accommodative financial conditions. However, the rapid spread of the Omicron variant of the coronavirus led to the largest increase in U.S. COVID-19 cases since the onset of the pandemic, prompting a flurry of new restrictions and event cancellations. Inflation continued to surge against a backdrop of severe supply and labor shortages, rising energy prices, and high demand for goods and services, heightening scrutiny of the U.S. Federal Reserve (Fed) amid anxiety about a potential monetary policy mistake.
Equity markets fell sharply in the second quarter of 2022, as rampant inflation and tighter financial conditions negatively affected risk sentiment and increased the probability of recession. Rapidly rising prices for food and energy pushed consumer inflation to its highest level in more than four decades. Growth equities significantly underperformed their value counterparts as surging Treasury yields and disappointing earnings results from some of the largest technology companies drove the Nasdaq Composite Index to its biggest quarterly loss since September 2001. Equity market weakness persisted, as risk sentiment deteriorated on fears that aggressive interest-rate increases and tighter financial conditions would constrict economic growth and drive the U.S. to recession. Despite these concerns, Fed Chair Jerome Powell made clear that the central bank is committed to raising interest rates and keeping them elevated for longer until there is clear evidence that price pressures are abating.
Returns varied by market cap during the period, as large-cap equities, as measured by the S&P 500 Index, outperformed small-cap equities and underperformed mid-cap equities, as measured by the Russell 2000 Index and S&P MidCap 400 Index, respectively. Small-cap equities underperformed mid-cap equities for the period, as measured by the Russell 2000 Index and S&P MidCap 400 Index, respectively.
Ten out of eleven sectors in the Russell 2000 Growth Index had negative returns during the period. The Communication Services (-41%), Real Estate (-37%), and Information Technology (-33%) sectors lagged the broader index, while the Energy (+34%) sector had positive returns.
Sector allocation, a result of the bottom-up stock selection process, was the primary driver of relative underperformance during the period. This was driven by the Fund’s underweight allocation to the Energy sector and overweight allocations to the Real Estate and Information Technology sectors. The Fund’s overweight allocation to the Industrials sector and an underweight to the Healthcare sector detracted from relative performance during the period. Security selection also weighed on relative results. Weak selection within the Information Technology, Consumer Staples, and Consumer Discretionary sectors detracted from relative performance. This was partially offset by stronger selection in the Industrials and Real Estate sectors, which contributed positively to relative performance during the period.
The top contributors to relative performance during the period were overweight positions in WillScot Mobile Mini Holdings (Industrials), ExlService Holdings (Information Technology), and Chart Industries (Industrials). Shares of WillScot Mobile Mini, a modular space and storage solutions company, rose during the period after it was announced they acquired the rental fleet and assets of Modulease. This acquisition added roughly 400 mobile offices and 100 portable storage containers to the company's New England operation. WillScot Mobile also beat second-quarter revenue expectations, driven by strong demand and the implementation of increased rental rates. Shares of ExlService, an operations management and analytics company, rose during the period. The company reported first-quarter earnings and revenue which beat consensus expectations. Revenue increased across segments on a year-over-year basis, in particular
The Hartford Small Cap Growth Fund
Fund Overview – (continued)
October 31, 2022 (Unaudited)
within the analytics segment. Shares of Chart Industries rose over the period. The company reported second-quarter results showing record orders, record backlog, record sales, and record operating income. Top absolute contributors for the period included Chart Industries (Industrials), Turning Point Therapeutics (Healthcare), and ExlService Holdings (Information Technology).
The top detractors from relative performance during the period included overweight positions in Cardlytics (Communication Services) and Hydrofarm Holdings (Industrials), and an out-of-benchmark position in Yeti Holdings (Consumer Discretionary). Shares of Cardlytics, an advertising platform partnering with financial institutions' banking reward programs, fell after the company reported earnings for the second quarter that were below consensus expectations, with operating losses that were significantly higher than a year ago. The company has faced challenges from a sharp slowdown in digital advertising demand, driven by weakening consumer spending amid the current macroeconomic backdrop. We eliminated the Fund’s position during the period. Shares of Hydrofarm fell during the period after the company announced weaker guidance for the rest of 2022. Company management attributed this decision to the challenges the overall hydroponics space continues to face, and stated that they expect the industry to grow in the future. We eliminated the Fund’s position during the period. Shares of Yeti Holdings declined after the company reported second-quarter earnings that missed estimates and lowered full-year 2022 guidance. Sales were below expectations due to slower customer acquisition and digital traffic including Amazon Marketplace. Gross margins and operating expenses were impacted by logistics and distribution cost inflation and a market shift towards wholesale, specifically coolers and equipment. Top absolute detractors from performance for the period included Cardlytics (Communication Services), Rapid7 (Information Technology), and Omnicell (Healthcare).
Derivatives were not used in the Fund during the period.
What is the outlook as of the end of the period?
The U.S. Consumer Price Index (CPI) remained elevated in its report for August 2022, albeit slightly declining from the loftier levels of July 2022. As of the end of the period, we believe some respite is possible in the near term, given the decline in oil prices. The Federal Open Market Committee (FOMC) members’ median rate expectations for 2023 have gone above 4.5% from 3.75% just three months ago. With the increase in expectations for near-term interest-rate increases, the continuing strength in the U.S. dollar is likely not a surprise, but nevertheless, its strength has become an increasing focus for companies and investors. Recent commentary from companies has indicated pockets of slowing demand, and low nominal growth in 2023 remains probable, given peaking inflation and tight policy.
The energy crisis Europe is facing this upcoming winter highlights the dilemma policymakers are facing between supporting low-income consumers and securing longer-term energy security for the continent. Over the last few months, it has become increasingly clear that Russia intends to keep the pressure on Europe, and we believe the conflict
with Ukraine is likely to continue into 2024 at a minimum. The road forward regarding the conflict remains unpredictable, and the range of outcomes is wide in terms of the impact to the global economy, in our view.
On the positive side, we observe that supply-chain issues appear to be improving, although not completely resolved. Employment in the U.S. remains robust for now, but we believe there may be potential weakness ahead as the Fed continues to battle inflation. The Inflation Reduction Act (IRA), the Infrastructure Investment and Jobs Act (IIJA), and the CHIPS Act will likely serve as offsets, in our view. Margin pressure remains a focus and is somewhat unpredictable in the near term due to the variety of factors companies are facing.
At the end of the period, the Fund’s largest overweights were to the Industrials, Consumer Staples, and Consumer Discretionary sectors, while the Fund’s largest underweights were to the Utilities, Financials, and Energy sectors, relative to the Russell 2000 Growth Index.
Important Risks
Investing involves risk, including the possible loss of principal. Security prices fluctuate in value depending on general market and economic conditions and the prospects of individual companies. • Small-cap securities can have greater risks, including liquidity risk, and volatility than large-cap securities. • Different investment styles may go in and out of favor, which may cause the Fund to underperform the broader stock market. • To the extent the Fund focuses on one or more sectors, the Fund may be subject to increased volatility and risk of loss if adverse developments occur.
| Composition by Sector(1) |
| as of 10/31/2022 |
| Sector | Percentage
of Net Assets |
| Equity Securities | |
| Communication Services | 1.4% |
| Consumer Discretionary | 11.2 |
| Consumer Staples | 5.5 |
| Energy | 6.4 |
| Financials | 6.2 |
| Health Care | 22.5 |
| Industrials | 20.5 |
| Information Technology | 19.5 |
| Materials | 3.7 |
| Real Estate | 2.2 |
| Total | 99.1% |
| Short-Term Investments | 1.4 |
| Other Assets & Liabilities | (0.5) |
| Total | 100.0% |
| (1) | A sector may be comprised of several industries. For Fund compliance purposes, the Fund may not use the same classification system. These sector classifications are used for financial reporting purposes. |
Hartford Small Cap Value Fund
Fund Overview
October 31, 2022 (Unaudited)
Inception 01/01/2005
Sub-advised by Wellington Management Company LLP | Investment objective – The Fund seeks long-term capital appreciation. |
Comparison of Change in Value of $10,000 Investment (10/31/2012 - 10/31/2022)
The chart above represents the hypothetical growth of a $10,000 investment in Class A, which includes the maximum sales charge applicable to Class A shares. Returns for the Fund’s other classes will vary from what is seen above due to differences in the expenses charged to those share classes.
| Average Annual Total Returns |
| for the Periods Ended 10/31/2022 |
| | 1 Year | 5 Years | 10 Years |
| Class A1 | -8.86% | 5.76% | 8.87% |
| Class A2 | -13.87% | 4.57% | 8.25% |
| Class C1 | -9.54% | 4.98% | 8.06% |
| Class C3 | -10.38% | 4.98% | 8.06% |
| Class I1 | -8.56% | 6.12% | 9.14% |
| Class R31 | -9.05% | 5.61% | 8.67% |
| Class R41 | -8.79% | 5.86% | 8.96% |
| Class R51 | -8.48% | 6.19% | 9.29% |
| Class R61 | -8.46% | 6.26% | 9.35% |
| Class Y1 | -8.52% | 6.22% | 9.33% |
| Class F1 | -8.46% | 6.25% | 9.22% |
| Russell 2000 Value Index | -10.73% | 5.31% | 9.37% |
| 1 | Without sales charge |
| 2 | Reflects maximum sales charge of 5.50% |
| 3 | Reflects a contingent deferred sales charge of 1.00% |
PERFORMANCE DATA QUOTED REPRESENTS PAST PERFORMANCE AND DOES NOT GUARANTEE FUTURE RESULTS. The investment return and principal value of the investment will fluctuate so that investors’ shares, when redeemed, may be worth more or less than their original cost. The chart and table do not reflect the deductions of taxes that a shareholder would pay on Fund distributions or the redemption of Fund shares. Current performance may be lower or higher than the performance data quoted. To obtain performance data current to the most recent month-end, please visit our website hartfordfunds.com.
Total returns presented above were calculated using the applicable class' net asset value available to shareholders for sale or redemption of Fund shares on 10/31/2022, which may exclude investment transactions as of this date. All share class returns assume the reinvestment of all distributions at net asset value and the deduction of all fund expenses. The total returns presented in the Financial Highlights section of the report are calculated in the same manner, but also take into account certain
adjustments that are necessary under generally accepted accounting principles. As a result, the total returns in the Financial Highlights section may differ from the total returns presented above.
Class I shares commenced operations on 03/31/2015 and performance prior to that date is that of the Fund’s Class A shares (excluding sales charges). Class R6 shares commenced operations on 02/28/2018 and performance prior to that date is that of the Fund’s Class Y shares. Class F shares commenced operations on 02/28/2017. Performance for Class F shares prior to 02/28/2017 reflects the performance of Class I shares from 03/31/2015 through 02/27/2017 and Class A shares (excluding sales charges) prior to 03/31/2015. Performance prior to an inception date of a class has not been adjusted to reflect the operating expenses of such class.
Performance prior to 11/01/2018 reflects when the Fund pursued different strategies.
You cannot invest directly in an index.
See “Benchmark Glossary” for benchmark descriptions.
Performance information may reflect expense waivers/reimbursements without which performance would have been lower. For information on current expense waivers/reimbursements, please see the prospectus.
Hartford Small Cap Value Fund
Fund Overview – (continued)
October 31, 2022 (Unaudited)
| Operating Expenses* | Gross | Net |
| Class A | 1.30% | 1.30% |
| Class C | 2.09% | 2.05% |
| Class I | 0.97% | 0.97% |
| Class R3 | 1.56% | 1.50% |
| Class R4 | 1.26% | 1.20% |
| Class R5 | 0.96% | 0.90% |
| Class R6 | 0.85% | 0.80% |
| Class Y | 0.95% | 0.85% |
| Class F | 0.84% | 0.80% |
| * | Expenses as shown in the Fund’s most recent prospectus. Gross expenses do not reflect contractual expense reimbursement arrangements. Net expenses reflect such arrangements in instances when they reduce gross expenses. These arrangements remain in effect until 02/28/2023 unless the Fund’s Board of Directors approves an earlier termination. Actual expenses may be higher or lower. Please see accompanying Financial Highlights for expense ratios for the period ended 10/31/2022. |
Portfolio Manager
Sean Kammann
Managing Director and Equity Portfolio Manager
Wellington Management Company LLP
Manager Discussion
How did the Fund perform during the period?
The Class A shares of the Hartford Small Cap Value Fund returned -8.86%, before sales charges, for the twelve-month period ended October 31, 2022, outperforming the Fund’s benchmark, the Russell 2000 Value Index, which returned -10.73% for the same period. For the same period, the Class A shares of the Fund, before sales charges, outperformed the -11.64% average return of the Lipper Small-Cap Value Funds peer group, a group of funds with investment strategies similar to those of the Fund.
Why did the Fund perform this way?
United States (U.S.) equities fell over the trailing twelve-month period ended October 31, 2022. Markets rallied early in the period on the back of robust equity inflows, strong corporate earnings, favorable economic data, and extremely accommodative financial conditions. However, the rapid spread of the Omicron variant of the coronavirus led to the largest increase in U.S. COVID-19 cases since the onset of the pandemic, prompting a flurry of new restrictions and event cancellations. Inflation continued to surge against a backdrop of severe supply and labor shortages, rising energy prices, and high demand for goods and services, heightening scrutiny of the U.S. Federal Reserve (Fed) amid anxiety about a potential monetary policy mistake. Equity markets fell sharply in the second quarter of 2022, as rampant inflation and tighter financial conditions negatively affected risk sentiment and increased the probability of recession. Rapidly rising prices for food and energy pushed consumer inflation to its highest level in more than four decades. Growth equities significantly underperformed their value counterparts as surging Treasury yields and disappointing earnings results from some of the largest technology companies drove the Nasdaq Composite Index to
its biggest quarterly loss since September 2001. Equity market weakness persisted, as risk sentiment deteriorated on fears that aggressive interest-rate increases and tighter financial conditions would constrict economic growth and drive the U.S. to recession. Despite these concerns, Fed Chair Jerome Powell made clear that the central bank is committed to raising interest rates and keeping them elevated for longer until there is clear evidence that price pressures are abating.
During the period, returns varied by market cap. Large-cap equities, as measured by the S&P 500 Index, underperformed mid- and small-cap equities, as measured by the S&P MidCap 400 Index and Russell 2000 Index, respectively. Small-cap equities underperformed mid-cap equities for the period, as measured by the Russell 2000 Index and S&P MidCap 400 Index, respectively.
Eight of the eleven sectors in the Russell 2000 Value Index declined during the period, and the Communication Services (-41%), Healthcare (-27%), and Consumer Discretionary (-26%) sectors lagged. Conversely, the Energy (+46%), Consumer Staples (+6%), and Utilities (+3%) sectors were the top performers during the period.
Security selection drove the Fund’s outperformance relative to the Russell 2000 Value Index during the period. Strong selection in the Consumer Discretionary, Information Technology, and Healthcare sectors contributed positively to relative results. This was partially offset by weaker selection in the Financials, Energy, and Consumer Staples sectors. Sector allocation, a result of our bottom-up stock selection process, also benefited relative performance. The Fund’s underweight positions in the Communication Services and Healthcare sectors contributed positively to relative performance. This was partially offset by the Fund’s underweight position in the Energy sector and overweight to the Information Technology sector during the period.
Hartford Small Cap Value Fund
Fund Overview – (continued)
October 31, 2022 (Unaudited)
The largest contributors to relative performance over the period were positions in H&R Block (Consumer Discretionary), Plantronics (Information Technology), and South Jersey Industries (Utilities). Tax preparation company H&R Block delivered strong operational results given the continued strong growth of its assisted return business. H&R Block also saw an expansion of its small-business clientele, increased adoption of its virtual tools, as well as the launch of its new mobile banking platform against a challenging macroeconomic backdrop, supporting its stock price. Plantronics is a U.S.-based headset manufacturer. Plantronics’ shares jumped after the company announced a deal in March 2022 where it would be acquired by HP. The acquisition was completed in August 2022. Shares of South Jersey Industries soared after Infrastructure Investments Fund announced the acquisition of the energy services holding company for $36 per share in cash, reflecting an enterprise value of approximately $8.1 billion. We eliminated the Fund’s positions in all three stocks during the period.
The largest detractors from relative performance during the period were positions in PROG Holdings (Financials), Greenhill (Financials), and DMC Global (Energy). PROG Holdings shares declined during the period, as the lease-to-own and financing company reported disappointing results and cut its full-year outlook, given weakened demand and increased delinquencies as inflation continued to impose significant pressure on its customers. Shares of Greenhill also ended the period lower after the company reported a continued decline in revenue and earnings as deal activities slowed against rising rates. Shares of DMC Global, a holding company with segments in explosive metalworking and perforation, declined during the period despite the company reporting strong first- and second-quarter results. Management provided lackluster guidance for the third quarter due to high inventory costs for Arcadia and anticipated lower NobelClad revenue.
Derivatives were not used in the Fund during the period.
What is the outlook as of the end of the period?
As of the end of the period, we believe we are unquestionably on the precipice of an economically challenging period globally, and the structural advantages of the U.S. may be overwhelmed by the strong U.S. dollar. But this is temporary, in our view, and we believe these economic adjustments present investment opportunities for the Fund. We continue to focus our efforts on seeking the most attractive long-term excess return opportunities while seeking to balance these opportunities against the associated risks.
At the end of the period, the Fund was most overweight to the Financials, Industrials, and Information Technology sectors, and most underweight to the Real Estate, Healthcare, and Utilities sectors, relative to the Russell 2000 Value Index.
Important Risks
Investing involves risk, including the possible loss of principal. Security prices fluctuate in value depending on general market and economic conditions and the prospects of individual companies. • Small-cap securities can have greater risks, including liquidity risk, and volatility than large-cap securities. • Different investment styles may go in and out of favor, which may cause the Fund to underperform the broader
stock market. • To the extent the Fund focuses on one or more sectors, the Fund may be subject to increased volatility and risk of loss if adverse developments occur. • Foreign investments may be more volatile and less liquid than U.S. investments and are subject to the risk of currency fluctuations and adverse political, economic and regulatory developments.
| Composition by Sector(1) |
| as of 10/31/2022 |
| Sector | Percentage
of Net Assets |
| Equity Securities | |
| Communication Services | 1.1% |
| Consumer Discretionary | 12.0 |
| Consumer Staples | 4.6 |
| Energy | 4.5 |
| Financials | 36.4 |
| Health Care | 6.4 |
| Industrials | 17.8 |
| Information Technology | 8.5 |
| Materials | 3.3 |
| Real Estate | 2.8 |
| Utilities | 1.6 |
| Total | 99.0% |
| Short-Term Investments | 1.0 |
| Other Assets & Liabilities | 0.0 * |
| Total | 100.0% |
| * | Percentage rounds to zero. |
| (1) | A sector may be comprised of several industries. For Fund compliance purposes, the Fund may not use the same classification system. These sector classifications are used for financial reporting purposes. |
The Hartford Small Company Fund
Fund Overview
October 31, 2022 (Unaudited)
Inception 07/22/1996
Sub-advised by Wellington Management Company LLP | Investment objective – The Fund seeks growth of capital. |
Comparison of Change in Value of $10,000 Investment (10/31/2012 - 10/31/2022)
The chart above represents the hypothetical growth of a $10,000 investment in Class A, which includes the maximum sales charge applicable to Class A shares. Returns for the Fund’s other classes will vary from what is seen above due to differences in the expenses charged to those share classes.
| Average Annual Total Returns |
| for the Periods Ended 10/31/2022 |
| | 1 Year | 5 Years | 10 Years |
| Class A1 | -30.24% | 8.60% | 10.24% |
| Class A2 | -34.08% | 7.38% | 9.62% |
| Class C1 | -30.76% | 7.74% | 9.41% |
| Class C3 | -31.18% | 7.74% | 9.41% |
| Class I1 | -30.01% | 8.92% | 10.54% |
| Class R31 | -30.43% | 8.32% | 9.99% |
| Class R41 | -30.25% | 8.64% | 10.32% |
| Class R51 | -30.01% | 8.97% | 10.66% |
| Class R61 | -29.95% | 9.05% | 10.75% |
| Class Y1 | -30.05% | 8.99% | 10.71% |
| Class F1 | -29.93% | 9.05% | 10.62% |
| Russell 2000 Growth Index | -26.02% | 5.17% | 10.15% |
| 1 | Without sales charge |
| 2 | Reflects maximum sales charge of 5.50% |
| 3 | Reflects a contingent deferred sales charge of 1.00% |
PERFORMANCE DATA QUOTED REPRESENTS PAST PERFORMANCE AND DOES NOT GUARANTEE FUTURE RESULTS. The investment return and principal value of the investment will fluctuate so that investors’ shares, when redeemed, may be worth more or less than their original cost. The chart and table do not reflect the deductions of taxes that a shareholder would pay on Fund distributions or the redemption of Fund shares. Current performance may be lower or higher than the performance data quoted. To obtain performance data current to the most recent month-end, please visit our website hartfordfunds.com.
Total returns presented above were calculated using the applicable class' net asset value available to shareholders for sale or redemption of Fund shares on 10/31/2022, which may exclude investment transactions as of this date. All share class returns assume the reinvestment of all distributions at net asset value and the deduction of all
fund expenses. The total returns presented in the Financial Highlights section of the report are calculated in the same manner, but also take into account certain adjustments that are necessary under generally accepted accounting principles. As a result, the total returns in the Financial Highlights section may differ from the total returns presented above.
Class R6 shares commenced operations on 11/07/2014 and performance prior to that date is that of the Fund’s Class Y shares. Class F shares commenced operations on 02/28/2017 and performance prior to that date is that of the Fund’s Class I shares. Performance prior to an inception date of a class has not been adjusted to reflect the operating expenses of such class.
You cannot invest directly in an index.
See “Benchmark Glossary” for benchmark descriptions.
Performance information may reflect expense waivers/reimbursements without which performance would have been lower.
| Operating Expenses* | Gross | Net |
| Class A | 1.23% | 1.23% |
| Class C | 2.05% | 2.05% |
| Class I | 0.96% | 0.96% |
| Class R3 | 1.57% | 1.57% |
| Class R4 | 1.26% | 1.26% |
| Class R5 | 0.97% | 0.97% |
| Class R6 | 0.85% | 0.85% |
| Class Y | 0.91% | 0.91% |
| Class F | 0.85% | 0.85% |
| * | Expenses as shown in the Fund’s most recent prospectus. Actual expenses may be higher or lower. Please see accompanying Financial Highlights for expense ratios for the period ended 10/31/2022. |
The Hartford Small Company Fund
Fund Overview – (continued)
October 31, 2022 (Unaudited)
Portfolio Managers
Steven C. Angeli, CFA*
Senior Managing Director and Equity Portfolio Manager
Wellington Management Company LLP
Ranjit Ramachandran
Managing Director and Equity Portfolio Manager
Wellington Management Company LLP
John V. Schneider, CFA
Managing Director and Equity Research Analyst
Wellington Management Company LLP
| * | Effective February 28, 2023, Mr. Angeli will no longer serve as a portfolio manager to the Fund. Mr. Angeli will transition his portfolio management responsibilities for the Fund to Mr. Ramachandran. |
Manager Discussion
How did the Fund perform during the period?
The Class A shares of The Hartford Small Company Fund returned -30.24%, before sales charges, for the twelve-month period ended October 31, 2022, underperforming the Fund’s benchmark, the Russell 2000 Growth Index, which returned -26.02% for the same period. For the same period, the Class A shares of the Fund, before sales charges, underperformed the -26.50% average return of the Lipper Small-Cap Growth Funds peer group, a group of funds with investment strategies similar to those of the Fund.
Why did the Fund perform this way?
United States (U.S.) equities fell over the trailing twelve-month period ended October 31, 2022. Markets rallied early in the period on the back of robust equity inflows, strong corporate earnings, favorable economic data, and extremely accommodative financial conditions. However, the rapid spread of the Omicron variant of the coronavirus led to the largest increase in U.S. COVID-19 cases since the onset of the pandemic, prompting a flurry of new restrictions and event cancellations. Inflation continued to surge against a backdrop of severe supply and labor shortages, rising energy prices, and high demand for goods and services, heightening scrutiny of the U.S. Federal Reserve (Fed) amid anxiety about a potential monetary policy mistake.
Equity markets fell sharply in the second quarter of 2022, as rampant inflation and tighter financial conditions negatively affected risk sentiment and increased the probability of recession. Rapidly rising prices for food and energy pushed consumer inflation to its highest level in more than four decades. Growth equities significantly underperformed their value counterparts as surging Treasury yields and disappointing earnings results from some of the largest technology companies drove the Nasdaq Composite Index to its biggest quarterly loss since September 2001. Equity market weakness persisted, as risk sentiment deteriorated on fears that aggressive interest-rate increases and tighter financial conditions would constrict economic growth and drive the U.S. to recession. Despite these
concerns, Fed Chair Jerome Powell made clear that the central bank is committed to raising interest rates and keeping them elevated for longer until there is clear evidence that price pressures are abating.
Returns varied by market capitalization during the period. Large cap equities, as measured by the Russell 1000 Index, outperformed small-cap equities, as measured by the Russell 2000 Index, and mid-cap equities, as measured by the Russell Midcap Index. Small-cap equities underperformed mid-cap equities for the period, as measured by the Russell 2000 Index and Russell Midcap Index, respectively. Narrowing the focus to small caps, value led growth by over +1500 basis points (bps) over the trailing year, as measured by the Russell 2000 Value and Growth Indices.
Ten of the eleven sectors in the Russell 2000 Growth Index had negative returns during the period. The Energy (+34%) sector was the lone positive sector over the period, while the Communication Services (-41%), Real Estate (-38%), and Information Technology (-33%) sectors lagged the broader index.
During the period, security selection was the primary driver of the Fund’s underperformance relative to the Russell 2000 Growth Index. Selection in the Information Technology, Healthcare, and Consumer Discretionary sectors detracted from relative performance, partially offset by stronger selection in the Real Estate, Industrials, and Materials sectors. Sector allocation, a result of our bottom-up stock selection process, also detracted from relative performance, primarily driven by the Fund’s overweight allocation to the Real Estate sector and underweight to the Consumer Staples sector. This was partially offset by the Fund’s underweight allocation to the Consumer Discretionary sector.
The top detractors from relative performance during the period included Digital Turbine (Information Technology), Owens & Minor (Healthcare), and Kornit Digital (Industrials). Shares of Digital Turbine, an advertising software platform, fell over the period in an environment of rising interest rates. The share price fell in February 2022 after competitive and regulatory pressures aimed to protect users’ personal information weighed on the digital advertising market. Additionally, in
The Hartford Small Company Fund
Fund Overview – (continued)
October 31, 2022 (Unaudited)
May 2022, the company lowered guidance, citing macroeconomic challenges facing the business. Due to high uncertainty surrounding the digital advertising market, we decided to eliminate the Fund’s position during the period. Shares of Owens & Minor, a Healthcare logistics company, fell during the period as the company reported disappointing preliminary third-quarter 2022 results and lowered its full-year guidance. The Products & Healthcare Services segment detracted from relative performance driven by macroeconomic challenges, decreased hospital volumes and high stocking levels. Shares of Kornit Digital, an inkjet printer manufacturer for the textile and fashion industries, traded down in the period after missing second-quarter 2022 revenue expectations. The current economic environment led to a significantly slower pace of orders than the company originally projected. The company expressed optimism about the second half of 2022; however, we chose to eliminate the Fund’s position during the period over fears that economic recovery would not materialize. Top absolute detractors from the Fund’s performance for the period included Digital Turbine (Information Technology) and Rapid7 (Information Technology).
By contrast, some of the top contributors to relative performance included Tower Semiconductor (Information Technology), Chesapeake Energy (Energy), and Applied Industrial Technologies (Industrials). The share price of Tower Semiconductor, an independent foundry and producer of semiconductor integrated circuits, rose in February 2022 after Intel offered to acquire the company at a large premium. Shortly after the announcement, Tower Semiconductor announced strong quarterly results and adjusted earnings per share (EPS) ahead of consensus. Chesapeake Energy, a producer of oil and natural gas, experienced a share price increase during the period due to higher energy prices as well as an increased stock repurchase program announced in June 2022. The Fund realized gains by selling both positions during the period. Applied Industrial Technologies is a power transmission products and services company. The company’s share price rose as management announced fundamental strength through the period and raised their 2023 EPS guidance. Top absolute contributors to the Fund’s performance for the period included e.l.f. Beauty (Consumer Staples) and Calix (Information Technology).
Derivatives were not used in the Fund during the period.
What is the outlook as of the end of the period?
The twelve-month period ended October 31, 2022 was categorized by heightened market volatility spurred on by a steady stream of macroeconomic challenges ranging from record inflation and persistent supply-chain challenges to Russia’s invasion of Ukraine. U.S. markets ended the period lower as investors braced for a recession; however, the timing and magnitude of this recession is still unknown, in our view, as market participants weigh the impacts of persistent inflation, recession, and the Fed’s reaction to these events. As a result, stocks in the Fund’s investment universe have been prone to trading on narrative recently, rather than fundamentals. Given this uncertainty, we remain disciplined within our upside/downside valuation framework, and are seeking to position the Fund to be balanced.
In this macro- and factor-driven environment, we are seeking balance by holding a mixture of high-quality capital compounders while looking for opportunities in emerging growth names with disruptive business models. While we are not aiming to create a recession-proof portfolio, we continue to anticipate weakness in sectors with high interest-rate sensitivity. As a result, we decided to eliminate a number of software names during the period that we believe lack the cash flows to remain resilient in an economic slowdown. Finally, as of the end of the period, we added to stocks that have sold off and fallen back into the small-cap universe during the period.
At the end of the period, the Fund’s largest overweights were to the Industrials, Healthcare, and Energy sectors, while the Fund’s largest underweights were to the Information Technology, Utilities, and Financials sectors, relative to the Russell 2000 Growth Index.
Important Risks
Investing involves risk, including the possible loss of principal. Security prices fluctuate in value depending on general market and economic conditions and the prospects of individual companies. • Small-cap securities can have greater risks, including liquidity risk, and volatility than large-cap securities. • Integration of environmental, social, and/or governance (ESG) characteristics into the investment process may not work as intended. • Different investment styles may go in and out of favor, which may cause the Fund to underperform the broader stock market. • Foreign investments may be more volatile and less liquid than U.S. investments and are subject to the risk of currency fluctuations and adverse political, economic and regulatory developments. • To the extent the Fund focuses on one or more sectors, the Fund may be subject to increased volatility and risk of loss if adverse developments occur. • The Fund may have high portfolio turnover, which could increase its transaction costs and an investor’s tax liability.
| Composition by Sector(1) |
| as of 10/31/2022 |
| Sector | Percentage
of Net Assets |
| Equity Securities | |
| Communication Services | 2.4% |
| Consumer Discretionary | 8.5 |
| Consumer Staples | 3.8 |
| Energy | 8.6 |
| Financials | 6.7 |
| Health Care | 23.8 |
| Industrials | 19.8 |
| Information Technology | 16.2 |
| Materials | 3.9 |
| Real Estate | 2.6 |
| Total | 96.3% |
| Short-Term Investments | 3.3 |
| Other Assets & Liabilities | 0.4 |
| Total | 100.0% |
| (1) | A sector may be comprised of several industries. For Fund compliance purposes, the Fund may not use the same classification system. These sector classifications are used for financial reporting purposes. |
Hartford Domestic Equity Funds
Benchmark Glossary (Unaudited)
| Russell 1000 Growth Index (reflects no deduction for fees, expenses or taxes) is designed to measure the performance of those Russell 1000 Index companies with higher price-to-book ratios and higher forecasted growth values. The Russell 1000 Index is designed to measure the performance of the 1,000 largest companies in the Russell 3000 Index based on their market capitalization and current index membership. |
| Russell 1000 Value Index (reflects no deduction for fees, expenses or taxes) is designed to measure the performance of those Russell 1000 Index companies with lower price-to-book ratios and lower forecasted growth values. The Russell 1000 Index is designed to measure the performance of the 1,000 largest companies in the Russell 3000 Index based on their market capitalization and current index membership. |
| Russell 2000 Growth Index (reflects no deduction for fees, expenses or taxes) is designed to measure the performance of those Russell 2000 Index companies with higher price-to-book ratios and higher forecasted growth values. The Russell 2000 Index is an index comprised of 2,000 of the smallest US-domiciled company common stocks based on a combination of their market capitalization and current index membership. |
| Russell 2000 Value Index (reflects no deduction for fees, expenses or taxes) is designed to measure the performance of those Russell 2000 Index companies with lower price-to-book ratios and lower forecasted growth values. The Russell 2000 Index is an index comprised of 2,000 of the smallest US-domiciled company common stocks based on a combination of their market capitalization and current index membership. |
| Russell 3000 Growth Index (reflects no deduction for fees, expenses or taxes) is designed to measure the performance of those Russell 3000 Index companies with higher price-to-book ratios and higher forecasted growth values. The Russell 3000 Index is designed to measure the performance of the 3,000 largest US companies based on their market capitalization. |
| Russell 3000 Index (reflects no deduction for fees, expenses or taxes) is designed to measure the performance of the 3,000 largest US companies based on total market capitalization. |
| Russell Midcap Value Index (reflects no deduction for fees, expenses or taxes) is designed to measure the performance of the mid-cap value segment of the US equity universe. It includes those Russell Midcap Index companies with lower price-to-book ratios and lower forecasted growth values. |
| S&P 500 Index (reflects no deduction for fees, expenses or taxes) is a float-adjusted market capitalization-weighted price index composed of 500 widely held common stocks. |
| S&P Composite 1500 Health Care Index (reflects no deduction for fees, expenses or taxes) is a float-adjusted market capitalization-weighted index comprised of those companies included in the S&P Composite 1500 that are classified as members of the Global Industry Classification Standard (GICS®) health care sector. |
| S&P MidCap 400 Index (reflects no deduction for fees, expenses or taxes) is a float-adjusted market capitalization-weighted index designed to measure the performance of the mid-cap segment of the market. The index is composed of 400 constituent companies. |
Hartford Domestic Equity Funds
Expense Examples (Unaudited)
Your Fund's Expenses
As a shareholder of a Fund, you incur two types of costs: (1) transaction costs, including sales charges (loads) on purchase payments, if any, and contingent deferred sales charges (CDSC), if any, and (2) ongoing costs, including investment management fees, distribution and/or service (12b-1) fees, if any, and other fund expenses. This example is intended to help you understand your ongoing costs (in dollars) of investing in a Fund and to compare these costs with the ongoing costs of investing in other mutual funds. The example is based on an investment of $1,000 invested at the beginning of the period and held for the entire period of May 1, 2022 through October 31, 2022, except as noted below. To the extent a Fund was subject to acquired fund fees and expenses during the period, acquired fund fees and expenses are not included in the annualized expense ratios below.
Actual Expenses
The first set of columns of the table below provides information about actual account values and actual expenses. You may use this information, together with the amount you invested, to estimate the expenses that you paid over the period. Simply divide your account value by $1,000 (for example, an $8,600 account value divided by $1,000 = 8.6), then multiply the result by the number in the line under the heading entitled “Expenses Paid During The Period” to estimate the expenses you paid on your account during this period.
Hypothetical Example for Comparison Purposes
The second set of columns of the table below provides information about hypothetical account values and hypothetical expenses based on a Fund’s actual expense ratio and an assumed rate of return of 5% per year before expenses, which is not the Fund’s actual return. The hypothetical account values and expenses may not be used to estimate the actual ending account balance or expenses you paid for the period. You may use this information to compare the ongoing costs of investing in a Fund and other funds. To do so, compare this 5% hypothetical example with the 5% hypothetical examples that appear in the shareholder reports of the other funds.
Please note that the expenses shown in the table are meant to highlight your ongoing costs only and do not reflect any transactional costs, such as sales charges (loads and CDSC). Therefore, the second set of columns of the table is useful in comparing ongoing costs only, and will not help you determine the relative total costs of owning different funds. In addition, if these transactional costs were included, your costs would be higher. Expenses for a class of a Fund are equal to the class' annualized expense ratio multiplied by average account value over the period, multiplied by 184/365 (to reflect the one-half year period).
| | Actual Return | | Hypothetical (5% return before expenses) |
| | Beginning
Account Value
May 1, 2022 | | Ending
Account Value
October 31, 2022 | | Expenses paid
during the period
May 1, 2022
through
October 31, 2022 | | Beginning
Account Value
May 1, 2022 | | Ending
Account Value
October 31, 2022 | | Expenses paid
during the period
May 1, 2022
through
October 31, 2022 | | Annualized
expense
ratio |
| The Hartford Capital Appreciation Fund |
| Class A | $ 1,000.00 | | $ 937.30 | | $ 5.13 | | $ 1,000.00 | | $ 1,019.91 | | $ 5.35 | | 1.05% |
| Class C | $ 1,000.00 | | $ 933.70 | | $ 8.92 | | $ 1,000.00 | | $ 1,015.98 | | $ 9.30 | | 1.83% |
| Class I | $ 1,000.00 | | $ 938.60 | | $ 3.81 | | $ 1,000.00 | | $ 1,021.27 | | $ 3.97 | | 0.78% |
| Class R3 | $ 1,000.00 | | $ 935.50 | | $ 6.88 | | $ 1,000.00 | | $ 1,018.10 | | $ 7.17 | | 1.41% |
| Class R4 | $ 1,000.00 | | $ 937.10 | | $ 5.37 | | $ 1,000.00 | | $ 1,019.66 | | $ 5.60 | | 1.10% |
| Class R5 | $ 1,000.00 | | $ 938.50 | | $ 3.86 | | $ 1,000.00 | | $ 1,021.22 | | $ 4.02 | | 0.79% |
| Class R6 | $ 1,000.00 | | $ 939.00 | | $ 3.42 | | $ 1,000.00 | | $ 1,021.68 | | $ 3.57 | | 0.70% |
| Class Y | $ 1,000.00 | | $ 938.50 | | $ 3.91 | | $ 1,000.00 | | $ 1,021.17 | | $ 4.08 | | 0.80% |
| Class F | $ 1,000.00 | | $ 939.10 | | $ 3.37 | | $ 1,000.00 | | $ 1,021.68 | | $ 3.52 | | 0.69% |
| Hartford Core Equity Fund |
| Class A | $ 1,000.00 | | $ 954.40 | | $ 3.50 | | $ 1,000.00 | | $ 1,021.63 | | $ 3.62 | | 0.71% |
| Class C | $ 1,000.00 | | $ 950.70 | | $ 7.13 | | $ 1,000.00 | | $ 1,017.90 | | $ 7.38 | | 1.45% |
| Class I | $ 1,000.00 | | $ 955.50 | | $ 2.27 | | $ 1,000.00 | | $ 1,022.89 | | $ 2.35 | | 0.46% |
| Class R3 | $ 1,000.00 | | $ 952.50 | | $ 5.36 | | $ 1,000.00 | | $ 1,019.71 | | $ 5.55 | | 1.09% |
| Class R4 | $ 1,000.00 | | $ 954.30 | | $ 3.55 | | $ 1,000.00 | | $ 1,021.58 | | $ 3.67 | | 0.72% |
| Class R5 | $ 1,000.00 | | $ 955.60 | | $ 2.27 | | $ 1,000.00 | | $ 1,022.89 | | $ 2.35 | | 0.46% |
| Class R6 | $ 1,000.00 | | $ 956.00 | | $ 1.77 | | $ 1,000.00 | | $ 1,023.39 | | $ 1.84 | | 0.36% |
| Class Y | $ 1,000.00 | | $ 955.80 | | $ 2.17 | | $ 1,000.00 | | $ 1,022.99 | | $ 2.24 | | 0.44% |
| Class F | $ 1,000.00 | | $ 956.00 | | $ 1.77 | | $ 1,000.00 | | $ 1,023.39 | | $ 1.84 | | 0.36% |
Hartford Domestic Equity Funds
Expense Examples (Unaudited) – (continued)
| | Actual Return | | Hypothetical (5% return before expenses) |
| | Beginning
Account Value
May 1, 2022 | | Ending
Account Value
October 31, 2022 | | Expenses paid
during the period
May 1, 2022
through
October 31, 2022 | | Beginning
Account Value
May 1, 2022 | | Ending
Account Value
October 31, 2022 | | Expenses paid
during the period
May 1, 2022
through
October 31, 2022 | | Annualized
expense
ratio |
| The Hartford Dividend and Growth Fund |
| Class A | $ 1,000.00 | | $ 958.80 | | $ 4.79 | | $ 1,000.00 | | $ 1,020.32 | | $ 4.94 | | 0.97% |
| Class C | $ 1,000.00 | | $ 954.80 | | $ 8.62 | | $ 1,000.00 | | $ 1,016.38 | | $ 8.89 | | 1.75% |
| Class I | $ 1,000.00 | | $ 960.20 | | $ 3.61 | | $ 1,000.00 | | $ 1,021.53 | | $ 3.72 | | 0.73% |
| Class R3 | $ 1,000.00 | | $ 956.80 | | $ 6.71 | | $ 1,000.00 | | $ 1,018.35 | | $ 6.92 | | 1.36% |
| Class R4 | $ 1,000.00 | | $ 958.50 | | $ 5.18 | | $ 1,000.00 | | $ 1,019.91 | | $ 5.35 | | 1.05% |
| Class R5 | $ 1,000.00 | | $ 959.90 | | $ 3.66 | | $ 1,000.00 | | $ 1,021.48 | | $ 3.77 | | 0.74% |
| Class R6 | $ 1,000.00 | | $ 960.50 | | $ 3.11 | | $ 1,000.00 | | $ 1,022.03 | | $ 3.21 | | 0.63% |
| Class Y | $ 1,000.00 | | $ 960.20 | | $ 3.41 | | $ 1,000.00 | | $ 1,021.73 | | $ 3.52 | | 0.69% |
| Class F | $ 1,000.00 | | $ 960.60 | | $ 3.11 | | $ 1,000.00 | | $ 1,022.03 | | $ 3.21 | | 0.63% |
| The Hartford Equity Income Fund |
| Class A | $ 1,000.00 | | $ 999.30 | | $ 4.94 | | $ 1,000.00 | | $ 1,020.27 | | $ 4.99 | | 0.98% |
| Class C | $ 1,000.00 | | $ 995.10 | | $ 8.75 | | $ 1,000.00 | | $ 1,016.43 | | $ 8.84 | | 1.74% |
| Class I | $ 1,000.00 | | $ 1,000.50 | | $ 3.73 | | $ 1,000.00 | | $ 1,021.48 | | $ 3.77 | | 0.74% |
| Class R3 | $ 1,000.00 | | $ 997.20 | | $ 6.80 | | $ 1,000.00 | | $ 1,018.40 | | $ 6.87 | | 1.35% |
| Class R4 | $ 1,000.00 | | $ 998.80 | | $ 5.39 | | $ 1,000.00 | | $ 1,019.81 | | $ 5.45 | | 1.07% |
| Class R5 | $ 1,000.00 | | $ 1,000.00 | | $ 3.73 | | $ 1,000.00 | | $ 1,021.48 | | $ 3.77 | | 0.74% |
| Class R6 | $ 1,000.00 | | $ 1,001.00 | | $ 3.28 | | $ 1,000.00 | | $ 1,021.93 | | $ 3.31 | | 0.65% |
| Class Y | $ 1,000.00 | | $ 1,000.10 | | $ 3.73 | | $ 1,000.00 | | $ 1,021.48 | | $ 3.77 | | 0.74% |
| Class F | $ 1,000.00 | | $ 1,000.60 | | $ 3.23 | | $ 1,000.00 | | $ 1,021.93 | | $ 3.26 | | 0.64% |
| The Hartford Growth Opportunities Fund |
| Class A | $ 1,000.00 | | $ 877.90 | | $ 5.16 | | $ 1,000.00 | | $ 1,019.71 | | $ 5.55 | | 1.09% |
| Class C | $ 1,000.00 | | $ 874.70 | | $ 8.74 | | $ 1,000.00 | | $ 1,015.88 | | $ 9.40 | | 1.85% |
| Class I | $ 1,000.00 | | $ 879.40 | | $ 3.89 | | $ 1,000.00 | | $ 1,021.07 | | $ 4.18 | | 0.82% |
| Class R3 | $ 1,000.00 | | $ 876.60 | | $ 6.81 | | $ 1,000.00 | | $ 1,017.95 | | $ 7.32 | | 1.44% |
| Class R4 | $ 1,000.00 | | $ 878.00 | | $ 5.30 | | $ 1,000.00 | | $ 1,019.56 | | $ 5.70 | | 1.12% |
| Class R5 | $ 1,000.00 | | $ 879.20 | | $ 3.98 | | $ 1,000.00 | | $ 1,020.97 | | $ 4.28 | | 0.84% |
| Class R6 | $ 1,000.00 | | $ 879.80 | | $ 3.51 | | $ 1,000.00 | | $ 1,021.48 | | $ 3.77 | | 0.74% |
| Class Y | $ 1,000.00 | | $ 879.30 | | $ 3.93 | | $ 1,000.00 | | $ 1,021.02 | | $ 4.23 | | 0.83% |
| Class F | $ 1,000.00 | | $ 879.60 | | $ 3.51 | | $ 1,000.00 | | $ 1,021.48 | | $ 3.77 | | 0.74% |
| The Hartford Healthcare Fund |
| Class A | $ 1,000.00 | | $ 1,005.50 | | $ 6.42 | | $ 1,000.00 | | $ 1,018.80 | | $ 6.46 | | 1.27% |
| Class C | $ 1,000.00 | | $ 1,001.60 | | $ 10.24 | | $ 1,000.00 | | $ 1,014.97 | | $ 10.31 | | 2.03% |
| Class I | $ 1,000.00 | | $ 1,006.90 | | $ 5.01 | | $ 1,000.00 | | $ 1,020.21 | | $ 5.04 | | 0.99% |
| Class R3 | $ 1,000.00 | | $ 1,004.00 | | $ 8.13 | | $ 1,000.00 | | $ 1,017.09 | | $ 8.19 | | 1.61% |
| Class R4 | $ 1,000.00 | | $ 1,005.50 | | $ 6.52 | | $ 1,000.00 | | $ 1,018.70 | | $ 6.56 | | 1.29% |
| Class R5 | $ 1,000.00 | | $ 1,006.80 | | $ 5.11 | | $ 1,000.00 | | $ 1,020.11 | | $ 5.14 | | 1.01% |
| Class R6 | $ 1,000.00 | | $ 1,007.60 | | $ 4.56 | | $ 1,000.00 | | $ 1,020.67 | | $ 4.58 | | 0.90% |
| Class Y | $ 1,000.00 | | $ 1,006.90 | | $ 5.11 | | $ 1,000.00 | | $ 1,020.11 | | $ 5.14 | | 1.01% |
| Class F | $ 1,000.00 | | $ 1,007.40 | | $ 4.56 | | $ 1,000.00 | | $ 1,020.67 | | $ 4.58 | | 0.90% |
| The Hartford MidCap Fund |
| Class A | $ 1,000.00 | | $ 926.00 | | $ 5.34 | | $ 1,000.00 | | $ 1,019.66 | | $ 5.60 | | 1.10% |
| Class C | $ 1,000.00 | | $ 922.30 | | $ 8.96 | | $ 1,000.00 | | $ 1,015.88 | | $ 9.40 | | 1.85% |
| Class I | $ 1,000.00 | | $ 927.20 | | $ 4.18 | | $ 1,000.00 | | $ 1,020.87 | | $ 4.38 | | 0.86% |
| Class R3 | $ 1,000.00 | | $ 924.40 | | $ 7.03 | | $ 1,000.00 | | $ 1,017.90 | | $ 7.38 | | 1.45% |
| Class R4 | $ 1,000.00 | | $ 925.80 | | $ 5.49 | | $ 1,000.00 | | $ 1,019.51 | | $ 5.75 | | 1.13% |
| Class R5 | $ 1,000.00 | | $ 927.20 | | $ 4.13 | | $ 1,000.00 | | $ 1,020.92 | | $ 4.33 | | 0.85% |
| Class R6 | $ 1,000.00 | | $ 927.60 | | $ 3.60 | | $ 1,000.00 | | $ 1,021.48 | | $ 3.77 | | 0.74% |
| Class Y | $ 1,000.00 | | $ 927.40 | | $ 3.89 | | $ 1,000.00 | | $ 1,021.17 | | $ 4.08 | | 0.80% |
| Class F | $ 1,000.00 | | $ 927.60 | | $ 3.60 | | $ 1,000.00 | | $ 1,021.48 | | $ 3.77 | | 0.74% |
Hartford Domestic Equity Funds
Expense Examples (Unaudited) – (continued)
| | Actual Return | | Hypothetical (5% return before expenses) |
| | Beginning
Account Value
May 1, 2022 | | Ending
Account Value
October 31, 2022 | | Expenses paid
during the period
May 1, 2022
through
October 31, 2022 | | Beginning
Account Value
May 1, 2022 | | Ending
Account Value
October 31, 2022 | | Expenses paid
during the period
May 1, 2022
through
October 31, 2022 | | Annualized
expense
ratio |
| The Hartford MidCap Value Fund |
| Class A | $ 1,000.00 | | $ 953.30 | | $ 5.76 | | $ 1,000.00 | | $ 1,019.26 | | $ 5.95 | | 1.17% |
| Class C | $ 1,000.00 | | $ 950.00 | | $ 9.63 | | $ 1,000.00 | | $ 1,015.32 | | $ 9.96 | | 1.96% |
| Class I | $ 1,000.00 | | $ 954.50 | | $ 4.33 | | $ 1,000.00 | | $ 1,020.77 | | $ 4.48 | | 0.88% |
| Class R3 | $ 1,000.00 | | $ 952.10 | | $ 7.33 | | $ 1,000.00 | | $ 1,017.69 | | $ 7.58 | | 1.49% |
| Class R4 | $ 1,000.00 | | $ 953.40 | | $ 5.86 | | $ 1,000.00 | | $ 1,019.21 | | $ 6.06 | | 1.19% |
| Class R5 | $ 1,000.00 | | $ 954.70 | | $ 4.38 | | $ 1,000.00 | | $ 1,020.72 | | $ 4.53 | | 0.89% |
| Class R6(1) | $ 1,000.00 | | $ 955.90 | | $ 2.70(2) | | $ 1,000.00 | | $ 1,021.32 | | $ 3.92(3) | | 0.77% |
| Class Y | $ 1,000.00 | | $ 954.80 | | $ 4.33 | | $ 1,000.00 | | $ 1,020.77 | | $ 4.48 | | 0.88% |
| Class F | $ 1,000.00 | | $ 955.60 | | $ 3.80 | | $ 1,000.00 | | $ 1,021.32 | | $ 3.92 | | 0.77% |
| Hartford Quality Value Fund |
| Class A | $ 1,000.00 | | $ 966.50 | | $ 4.71 | | $ 1,000.00 | | $ 1,020.42 | | $ 4.84 | | 0.95% |
| Class C | $ 1,000.00 | | $ 962.50 | | $ 8.46 | | $ 1,000.00 | | $ 1,016.59 | | $ 8.69 | | 1.71% |
| Class I | $ 1,000.00 | | $ 968.00 | | $ 3.27 | | $ 1,000.00 | | $ 1,021.88 | | $ 3.36 | | 0.66% |
| Class R3 | $ 1,000.00 | | $ 965.50 | | $ 5.85 | | $ 1,000.00 | | $ 1,019.26 | | $ 6.01 | | 1.18% |
| Class R4 | $ 1,000.00 | | $ 966.70 | | $ 4.36 | | $ 1,000.00 | | $ 1,020.77 | | $ 4.48 | | 0.88% |
| Class R5 | $ 1,000.00 | | $ 967.80 | | $ 3.13 | | $ 1,000.00 | | $ 1,022.03 | | $ 3.21 | | 0.63% |
| Class R6 | $ 1,000.00 | | $ 969.00 | | $ 2.28 | | $ 1,000.00 | | $ 1,022.89 | | $ 2.35 | | 0.46% |
| Class Y | $ 1,000.00 | | $ 968.60 | | $ 2.83 | | $ 1,000.00 | | $ 1,022.33 | | $ 2.91 | | 0.57% |
| Class F | $ 1,000.00 | | $ 968.70 | | $ 2.28 | | $ 1,000.00 | | $ 1,022.89 | | $ 2.35 | | 0.46% |
| The Hartford Small Cap Growth Fund |
| Class A | $ 1,000.00 | | $ 961.10 | | $ 6.33 | | $ 1,000.00 | | $ 1,018.75 | | $ 6.51 | | 1.28% |
| Class C | $ 1,000.00 | | $ 957.70 | | $ 9.87 | | $ 1,000.00 | | $ 1,015.12 | | $ 10.16 | | 2.00% |
| Class I | $ 1,000.00 | | $ 963.10 | | $ 4.41 | | $ 1,000.00 | | $ 1,020.72 | | $ 4.53 | | 0.89% |
| Class R3 | $ 1,000.00 | | $ 960.00 | | $ 7.51 | | $ 1,000.00 | | $ 1,017.54 | | $ 7.73 | | 1.52% |
| Class R4 | $ 1,000.00 | | $ 961.40 | | $ 6.03 | | $ 1,000.00 | | $ 1,019.06 | | $ 6.21 | | 1.22% |
| Class R5 | $ 1,000.00 | | $ 963.00 | | $ 4.60 | | $ 1,000.00 | | $ 1,020.52 | | $ 4.74 | | 0.93% |
| Class R6 | $ 1,000.00 | | $ 963.20 | | $ 4.06 | | $ 1,000.00 | | $ 1,021.07 | | $ 4.18 | | 0.82% |
| Class Y | $ 1,000.00 | | $ 963.20 | | $ 4.36 | | $ 1,000.00 | | $ 1,020.77 | | $ 4.48 | | 0.88% |
| Class F | $ 1,000.00 | | $ 963.40 | | $ 4.01 | | $ 1,000.00 | | $ 1,021.12 | | $ 4.13 | | 0.81% |
| Hartford Small Cap Value Fund |
| Class A | $ 1,000.00 | | $ 992.20 | | $ 6.63 | | $ 1,000.00 | | $ 1,018.55 | | $ 6.72 | | 1.32% (4) |
| Class C | $ 1,000.00 | | $ 989.80 | | $ 10.28 | | $ 1,000.00 | | $ 1,014.87 | | $ 10.41 | | 2.05% (4) |
| Class I | $ 1,000.00 | | $ 994.80 | | $ 5.13 | | $ 1,000.00 | | $ 1,020.06 | | $ 5.19 | | 1.02% (4) |
| Class R3 | $ 1,000.00 | | $ 991.70 | | $ 7.43 | | $ 1,000.00 | | $ 1,017.74 | | $ 7.53 | | 1.48% |
| Class R4 | $ 1,000.00 | | $ 992.60 | | $ 6.23 | | $ 1,000.00 | | $ 1,018.95 | | $ 6.31 | | 1.24% (4) |
| Class R5 | $ 1,000.00 | | $ 995.10 | | $ 4.68 | | $ 1,000.00 | | $ 1,020.52 | | $ 4.74 | | 0.93% (4) |
| Class R6 | $ 1,000.00 | | $ 995.10 | | $ 4.02 | | $ 1,000.00 | | $ 1,021.17 | | $ 4.08 | | 0.80% |
| Class Y | $ 1,000.00 | | $ 995.00 | | $ 4.28 | | $ 1,000.00 | | $ 1,020.92 | | $ 4.33 | | 0.85% |
| Class F | $ 1,000.00 | | $ 994.80 | | $ 4.02 | | $ 1,000.00 | | $ 1,021.17 | | $ 4.08 | | 0.80% |
Hartford Domestic Equity Funds
Expense Examples (Unaudited) – (continued)
| | Actual Return | | Hypothetical (5% return before expenses) |
| | Beginning
Account Value
May 1, 2022 | | Ending
Account Value
October 31, 2022 | | Expenses paid
during the period
May 1, 2022
through
October 31, 2022 | | Beginning
Account Value
May 1, 2022 | | Ending
Account Value
October 31, 2022 | | Expenses paid
during the period
May 1, 2022
through
October 31, 2022 | | Annualized
expense
ratio |
| The Hartford Small Company Fund |
| Class A | $ 1,000.00 | | $ 935.70 | | $ 6.29 | | $ 1,000.00 | | $ 1,018.70 | | $ 6.56 | | 1.29% |
| Class C | $ 1,000.00 | | $ 932.40 | | $ 10.32 | | $ 1,000.00 | | $ 1,014.52 | | $ 10.76 | | 2.12% |
| Class I | $ 1,000.00 | | $ 937.20 | | $ 4.84 | | $ 1,000.00 | | $ 1,020.16 | | $ 5.04 | | 0.99% |
| Class R3 | $ 1,000.00 | | $ 934.20 | | $ 7.80 | | $ 1,000.00 | | $ 1,017.14 | | $ 8.13 | | 1.60% |
| Class R4 | $ 1,000.00 | | $ 935.50 | | $ 6.34 | | $ 1,000.00 | | $ 1,018.65 | | $ 6.61 | | 1.30% |
| Class R5 | $ 1,000.00 | | $ 937.10 | | $ 4.88 | | $ 1,000.00 | | $ 1,020.16 | | $ 5.09 | | 1.00% |
| Class R6 | $ 1,000.00 | | $ 937.60 | | $ 4.30 | | $ 1,000.00 | | $ 1,020.77 | | $ 4.48 | | 0.88% |
| Class Y | $ 1,000.00 | | $ 936.60 | | $ 4.78 | | $ 1,000.00 | | $ 1,020.27 | | $ 4.99 | | 0.98% |
| Class F | $ 1,000.00 | | $ 937.90 | | $ 4.30 | | $ 1,000.00 | | $ 1,020.77 | | $ 4.48 | | 0.88% |
| (1) | Class R6 of The Hartford MidCap Value Fund commenced operations on June 22, 2022. |
| (2) | Expenses paid during the period June 22, 2022 through October 31, 2022. |
| (3) | Please note that while The Hartford MidCap Value Fund's Class R6 commenced operations on June 22, 2022, the hypothetical expenses paid during the period reflect projected activity for the full six month period for purposes of comparability. This projection assumes that the annualized expense ratio for Class R6 shares was in effect during the period May 1, 2022 to October 31, 2022. |
| (4) | The annualized expense ratio is representative of the period from May 1, 2022 through October 31, 2022. The annualized expense ratio does not fully reflect the contractual expense limitation arrangement as this arrangement is based on the entire fiscal year and not the six-month period. As such, the annualized expense ratio exceeds the amount of the contractual expense limitation arrangement for this share class of the Fund for purposes of the hypothetical example. Please see the accompanying Financial Highlights for the expense ratio for the year ended October 31, 2022. |
The Hartford Capital Appreciation Fund
Schedule of Investments
October 31, 2022
| Shares or Principal Amount | | Market Value† |
| COMMON STOCKS - 96.7% |
| | Automobiles & Components - 0.6% |
| 166,820 | Thor Industries, Inc. | $ 13,590,826 |
| 161,190 | Visteon Corp.* | 21,030,459 |
| | | | 34,621,285 |
| | Banks - 2.3% |
| 405,730 | Bank of Nova Scotia | 19,604,874 |
| 973,474 | Cadence Bank | 26,916,556 |
| 326,570 | JP Morgan Chase & Co. | 41,108,631 |
| 359,651 | Western Alliance Bancorp | 24,157,758 |
| 351,049 | Zions Bancorp NA | 18,233,485 |
| | | | 130,021,304 |
| | Capital Goods - 9.9% |
| 558,792 | AerCap Holdings N.V.* | 29,845,081 |
| 232,930 | AMETEK, Inc. | 30,201,704 |
| 39,779 | Axon Enterprise, Inc.* | 5,785,458 |
| 440,728 | Builders FirstSource, Inc.* | 27,175,289 |
| 147,299 | HEICO Corp. | 23,956,709 |
| 806,800 | HF Global, Inc.*(1)(2) | 15,619,648 |
| 376,637 | Honeywell International, Inc. | 76,841,481 |
| 144,230 | IDEX Corp. | 32,063,771 |
| 174,178 | John Bean Technologies Corp. | 15,885,034 |
| 1,057,109 | Johnson Controls International plc | 61,143,185 |
| 35,790 | Lockheed Martin Corp. | 17,418,277 |
| 235,843 | Middleby Corp.* | 32,985,002 |
| 113,591 | Northrop Grumman Corp. | 62,362,595 |
| 705,213 | Otis Worldwide Corp. | 49,816,246 |
| 150,929 | Snap-on, Inc. | 33,513,784 |
| 675,290 | Spirit AeroSystems Holdings, Inc. Class A | 15,639,716 |
| 361,900 | Westinghouse Air Brake Technologies Corp. | 33,758,032 |
| | | | 564,011,012 |
| | Commercial & Professional Services - 1.9% |
| 188,197 | Clean Harbors, Inc.* | 23,046,605 |
| 95,468 | Copart, Inc.* | 10,980,729 |
| 236,411 | CoStar Group, Inc.* | 19,555,918 |
| 268,308 | Leidos Holdings, Inc. | 27,257,410 |
| 160,414 | Verisk Analytics, Inc. Class A | 29,328,491 |
| | | | 110,169,153 |
| | Consumer Durables & Apparel - 3.1% |
| 440,454 | Lennar Corp. Class A | 35,544,638 |
| 133,647 | Lululemon Athletica, Inc.* | 43,975,209 |
| 739,007 | NIKE, Inc. Class B | 68,491,169 |
| 2,973 | NVR, Inc.* | 12,598,830 |
| 588,938 | Steven Madden Ltd. | 17,591,578 |
| | | | 178,201,424 |
| | Consumer Services - 2.9% |
| 203,392 | Airbnb, Inc. Class A* | 21,744,639 |
| 1,603,154 | Denny's Corp.* | 18,163,735 |
| 46,090 | Domino's Pizza, Inc. | 15,312,941 |
| 685,372 | DraftKings, Inc. Class A*(3) | 10,828,878 |
| 295,080 | Hilton Worldwide Holdings, Inc. | 39,912,521 |
| 223,587 | McDonald's Corp. | 60,963,231 |
| | | | 166,925,945 |
| | Diversified Financials - 4.4% |
| 514,041 | American Express Co. | 76,309,386 |
| 545,025 | Bank of New York Mellon Corp. | 22,951,003 |
| 37,260 | BlackRock, Inc. | 24,066,607 |
| 54,772 | CME Group, Inc. | 9,491,988 |
| 80,061 | Moody's Corp. | 21,205,757 |
| 321,684 | Morgan Stanley | 26,432,774 |
| 193,392 | T Rowe Price Group, Inc. | 20,530,495 |
| Shares or Principal Amount | | Market Value† |
| COMMON STOCKS - 96.7% - (continued) |
| | Diversified Financials - 4.4% - (continued) |
| 363,717 | Tradeweb Markets, Inc. Class A | $ 20,033,532 |
| 431,945 | Voya Financial, Inc. | 29,527,760 |
| | | | 250,549,302 |
| | Energy - 2.6% |
| 596,447 | Cenovus Energy, Inc. | 12,048,229 |
| 60,204 | Cheniere Energy, Inc. | 10,620,588 |
| 167,304 | Chevron Corp. | 30,265,294 |
| 128,722 | Diamondback Energy, Inc. | 20,223,513 |
| 89,678 | EOG Resources, Inc. | 12,242,841 |
| 833,288 | Marathon Oil Corp. | 25,373,620 |
| 655,068 | TotalEnergies SE ADR | 35,878,074 |
| | | | 146,652,159 |
| | Food & Staples Retailing - 0.8% |
| 793,124 | U.S. Foods Holding Corp.* | 23,603,370 |
| 163,326 | Walmart, Inc. | 23,246,190 |
| | | | 46,849,560 |
| | Food, Beverage & Tobacco - 4.0% |
| 1,089,541 | Coca-Cola Co. | 65,209,029 |
| 465,849 | General Mills, Inc. | 38,003,961 |
| 130,903 | Monster Beverage Corp.* | 12,268,229 |
| 396,956 | PepsiCo., Inc. | 72,079,271 |
| 418,984 | Philip Morris International, Inc. | 38,483,680 |
| | | | 226,044,170 |
| | Health Care Equipment & Services - 9.9% |
| 585,745 | Baxter International, Inc. | 31,835,241 |
| 162,925 | DexCom, Inc.* | 19,678,082 |
| 472,533 | Encompass Health Corp. | 25,724,697 |
| 35,599 | Humana, Inc. | 19,867,090 |
| 152,731 | Insulet Corp.* | 39,528,310 |
| 406,054 | Integra LifeSciences Holdings Corp.* | 20,404,213 |
| 205,771 | Intuitive Surgical, Inc.* | 50,716,378 |
| 1,082,519 | Medtronic plc | 94,547,209 |
| 77,089 | Molina Healthcare, Inc.* | 27,664,159 |
| 265,974 | Stryker Corp. | 60,971,880 |
| 38,099 | Teleflex, Inc. | 8,174,521 |
| 253,763 | UnitedHealth Group, Inc. | 140,876,529 |
| 156,714 | Veeva Systems, Inc. Class A* | 26,318,549 |
| | | | 566,306,858 |
| | Household & Personal Products - 2.7% |
| 1,321,606 | Colgate-Palmolive Co. | 97,587,387 |
| 425,266 | Procter & Gamble Co. | 57,270,572 |
| | | | 154,857,959 |
| | Insurance - 6.7% |
| 5,496,348 | Aegon N.V. | 25,338,164 |
| 424,468 | Brown & Brown, Inc. | 24,954,474 |
| 324,947 | Chubb Ltd. | 69,827,861 |
| 236,863 | Globe Life, Inc. | 27,362,414 |
| 133,188 | Hanover Insurance Group, Inc. | 19,510,710 |
| 657,094 | Kemper Corp. | 31,323,671 |
| 412,995 | Marsh & McLennan Cos., Inc. | 66,694,562 |
| 852,142 | MetLife, Inc. | 62,385,316 |
| 647,839 | Principal Financial Group, Inc. | 57,094,051 |
| | | | 384,491,223 |
| | Materials - 4.6% |
| 72,950 | Albemarle Corp. | 20,416,516 |
| 445,317 | Celanese Corp. Class A | 42,803,870 |
| 401,290 | Ecolab, Inc. | 63,030,620 |
| 534,641 | FMC Corp. | 63,568,815 |
The accompanying notes are an integral part of these financial statements.
The Hartford Capital Appreciation Fund
Schedule of Investments – (continued)
October 31, 2022
| Shares or Principal Amount | | Market Value† |
| COMMON STOCKS - 96.7% - (continued) |
| | Materials - 4.6% - (continued) |
| 210,543 | Linde plc | $ 62,604,961 |
| 111,867 | Nutrien Ltd. | 9,452,762 |
| | | | 261,877,544 |
| | Media & Entertainment - 5.0% |
| 874,986 | Alphabet, Inc. Class A* | 82,694,927 |
| 682,342 | Cargurus, Inc.* | 9,934,900 |
| 754,310 | Comcast Corp. Class A | 23,941,800 |
| 150,245 | Meta Platforms, Inc. Class A* | 13,996,824 |
| 110,081 | Netflix, Inc.* | 32,130,442 |
| 893,120 | Omnicom Group, Inc. | 64,974,480 |
| 96,735 | Roku, Inc.* | 5,372,662 |
| 103,661 | Spotify Technology S.A.* | 8,353,003 |
| 76,784 | Take-Two Interactive Software, Inc.* | 9,097,368 |
| 209,061 | Walt Disney Co.* | 22,273,359 |
| 350,451 | ZoomInfo Technologies, Inc. Class A* | 15,605,583 |
| | | | 288,375,348 |
| | Pharmaceuticals, Biotechnology & Life Sciences - 7.3% |
| 135,289 | Agilent Technologies, Inc. | 18,717,233 |
| 40,324 | Alnylam Pharmaceuticals, Inc.* | 8,357,552 |
| 134,713 | Apellis Pharmaceuticals, Inc.* | 8,148,789 |
| 792,503 | AstraZeneca plc ADR | 46,607,101 |
| 436,742 | Danaher Corp. | 109,914,859 |
| 97,495 | Eli Lilly & Co. | 35,301,965 |
| 350,713 | Exact Sciences Corp.* | 12,197,798 |
| 78,783 | Jazz Pharmaceuticals plc* | 11,328,208 |
| 294,440 | Johnson & Johnson | 51,223,727 |
| 1,628,620 | Pfizer, Inc. | 75,812,261 |
| 225,170 | PTC Therapeutics, Inc.* | 8,515,929 |
| 348,841 | Syneos Health, Inc.* | 17,574,610 |
| 186,499 | Ultragenyx Pharmaceutical, Inc.* | 7,545,750 |
| 25,762 | Vertex Pharmaceuticals, Inc.* | 8,037,744 |
| | | | 419,283,526 |
| | Real Estate - 2.9% |
| 320,125 | American Tower Corp. REIT | 66,326,699 |
| 55,197 | AvalonBay Communities, Inc. REIT | 9,666,099 |
| 592,948 | Gaming and Leisure Properties, Inc. REIT | 29,718,554 |
| 222,650 | Ryman Hospitality Properties, Inc. REIT | 19,798,038 |
| 962,925 | VICI Properties, Inc. REIT | 30,832,858 |
| 148,597 | Welltower, Inc. REIT | 9,070,361 |
| | | | 165,412,609 |
| | Retailing - 4.7% |
| 706,657 | Amazon.com, Inc.* | 72,389,943 |
| 15,275 | AutoZone, Inc.* | 38,689,742 |
| 273,282 | Chewy, Inc. Class A*(3) | 10,584,212 |
| 104,552 | Etsy, Inc.* | 9,818,478 |
| 305,689 | Monro, Inc. | 14,596,650 |
| 150,673 | Ross Stores, Inc. | 14,417,899 |
| 1,234,520 | TJX Cos., Inc. | 89,008,892 |
| 316,327 | Tory Burch LLC*(1)(2) | 9,546,739 |
| 24,667 | Ulta Beauty, Inc.* | 10,344,600 |
| | | | 269,397,155 |
| | Semiconductors & Semiconductor Equipment - 1.1% |
| 80,804 | First Solar, Inc.* | 11,762,638 |
| 173,567 | MKS Instruments, Inc. | 14,258,529 |
| 96,546 | NVIDIA Corp. | 13,030,814 |
| 38,087 | SolarEdge Technologies, Inc.* | 8,761,153 |
| 94,168 | Synaptics, Inc.* | 8,343,285 |
| 70,756 | Universal Display Corp. | 6,737,386 |
| | | | 62,893,805 |
| | Software & Services - 12.4% |
| 186,445 | Accenture plc Class A | 52,931,735 |
| Shares or Principal Amount | | Market Value† |
| COMMON STOCKS - 96.7% - (continued) |
| | Software & Services - 12.4% - (continued) |
| 315,305 | Block, Inc.* | $ 18,940,371 |
| 457,399 | Cognizant Technology Solutions Corp. Class A | 28,473,088 |
| 89,357 | Datadog, Inc. Class A* | 7,194,132 |
| 286,546 | Dynatrace, Inc.* | 10,097,881 |
| 526,811 | Fidelity National Information Services, Inc. | 43,720,045 |
| 97,548 | Five9, Inc.* | 5,878,242 |
| 267,153 | Genpact Ltd. | 12,956,921 |
| 92,054 | Guidewire Software, Inc.* | 5,468,928 |
| 57,580 | Intuit, Inc. | 24,615,450 |
| 237,046 | Mastercard, Inc. Class A | 77,793,756 |
| 568,061 | Microsoft Corp. | 131,864,000 |
| 46,238 | MongoDB, Inc. Class A* | 8,462,941 |
| 160,207 | Okta, Inc.* | 8,990,817 |
| 138,390 | Palo Alto Networks, Inc.* | 23,746,340 |
| 74,462 | Paycom Software, Inc.* | 25,763,852 |
| 11,816 | Rubicon Earnout Shares*(1)(2) | 4,514 |
| 157,544 | Rubicon Technology, Inc. Class B*(1)(2) | 270,818 |
| 157,544 | Rubicon Technology, Inc. Class V*(1)(2) | — |
| 157,544 | Rubicon TRA Placeholder(1)(2) | 56,716 |
| 62,894 | salesforce.com, Inc.* | 10,225,935 |
| 12,640 | Sharecare, Inc. Earnout Shares*(1)(2) | 2,427 |
| 151,750 | Shopify, Inc. Class A* | 5,194,403 |
| 102,994 | Synopsys, Inc.* | 30,130,895 |
| 523,551 | Visa, Inc. Class A | 108,458,825 |
| 1,366,735 | Western Union Co. | 18,464,590 |
| 82,890 | WEX, Inc.* | 13,605,565 |
| 215,867 | Workday, Inc. Class A* | 33,636,396 |
| | | | 706,949,583 |
| | Technology Hardware & Equipment - 4.5% |
| 446,972 | Apple, Inc. | 68,538,686 |
| 249,462 | Arista Networks, Inc.* | 30,149,977 |
| 239,254 | CDW Corp. | 41,345,484 |
| 618,912 | Cisco Systems, Inc. | 28,117,172 |
| 214,756 | Coherent Corp.* | 7,217,949 |
| 152,472 | F5, Inc.* | 21,789,774 |
| 575,151 | Flex Ltd.* | 11,261,457 |
| 369,206 | Lumentum Holdings, Inc.* | 27,487,387 |
| 13,600 | Mobileye Global, Inc. Class A* | 358,768 |
| 609,734 | National Instruments Corp. | 23,279,644 |
| | | | 259,546,298 |
| | Transportation - 1.6% |
| 76,156 | J.B. Hunt Transport Services, Inc. | 13,028,007 |
| 1,046,451 | Southwest Airlines Co.* | 38,038,494 |
| 201,760 | Union Pacific Corp. | 39,774,966 |
| | | | 90,841,467 |
| | Utilities - 0.8% |
| 305,543 | Dominion Energy, Inc. | 21,378,843 |
| 353,285 | Eversource Energy | 26,948,580 |
| | | | 48,327,423 |
| | Total Common Stocks
(cost $5,182,387,985) | | $ 5,532,606,112 |
| CONVERTIBLE PREFERRED STOCKS - 0.0% |
| | Software & Services - 0.0% |
| 566,622 | Essence Group Holdings Corp. Series 3*(1)(2) | $ 1,337,228 |
| 77,707 | Lookout, Inc. Series F*(1)(2) | 613,885 |
| | Total Convertible Preferred Stocks
(cost $1,783,654) | | $ 1,951,113 |
The accompanying notes are an integral part of these financial statements.
The Hartford Capital Appreciation Fund
Schedule of Investments – (continued)
October 31, 2022
| Shares or Principal Amount | | Market Value† |
| EXCHANGE-TRADED FUNDS - 1.1% |
| | Other Investment Pools & Funds - 1.1% |
| 219,998 | iShares Russell 1000 Growth ETF | $ 48,967,155 |
| 75,438 | Vanguard Mega Cap Growth ETF | 13,645,980 |
| | | | 62,613,135 |
| | Total Exchange-Traded Funds
(cost $63,673,981) | | $ 62,613,135 |
| | Total Long-Term Investments
(cost $5,247,845,620) | | $ 5,597,170,360 |
| SHORT-TERM INVESTMENTS - 1.4% |
| | Repurchase Agreements - 1.1% |
| $ 63,260,761 | Fixed Income Clearing Corp. Repurchase Agreement dated 10/31/2022 at 3.010%, due on 11/01/2022 with a maturity value of $63,266,050; collateralized by U.S. Treasury Note at 2.375%, maturing 08/15/2024, with a market value of $10,102,624 and collateralized by U.S. Treasury Note at 0.375%, maturing 08/15/2024, with a market value of $23,247,166 and collateralized by U.S. Treasury Note at 1.500%, maturing 09/30/2024, with a market value of $23,694,037 and collateralized by U.S. Treasury Infaltion Index Note at 0.125%, maturing 10/15/2024, with a market value of $7,482,159 | $ 63,260,761 |
| | Securities Lending Collateral - 0.3% |
| 2,494,319 | Goldman Sachs Financial Square Funds, Government Fund, Institutional Class, 3.07%(4) | 2,494,319 |
| 8,314,396 | HSBC US Government Money Market Fund, 3.09%(4) | 8,314,396 |
| 2,494,319 | Invesco Government & Agency Portfolio, Institutional Class, 3.07%(4) | 2,494,319 |
| 2,494,319 | Morgan Stanley Institutional Liquidity Funds, Government Portfolio, Institutional Class, 2.88%(4) | 2,494,319 |
| | | | 15,797,353 |
| | Total Short-Term Investments
(cost $79,058,114) | $ 79,058,114 |
| | Total Investments
(cost $5,326,903,734) | 99.2% | $ 5,676,228,474 |
| | Other Assets and Liabilities | 0.8% | 46,878,297 |
| | Total Net Assets | 100.0% | $ 5,723,106,771 |
| Note: | Percentage of investments as shown is the ratio of the total market value to total net assets. |
| | For Fund compliance purposes, the Fund may not use the same classification system. These classifications are used for financial reporting purposes. |
| | See “Glossary” for abbreviation descriptions. |
| * | Non-income producing. |
| (1) | Investment in securities not registered under the Securities Act of 1933 (excluding securities acquired pursuant to Rule 144A and Regulation S). At the end of the period, the value of such restricted securities amounted to $27,451,975 or 0.5% of net assets. |
Period
Acquired | | Security Name | | Shares/
Par Value | | Total Cost | | Market Value |
| 05/2014 | | Essence Group Holdings Corp. Series 3 Convertible Preferred | | 566,622 | | $ 895,999 | | $ 1,337,228 |
| 06/2015 | | HF Global, Inc. | | 806,800 | | 10,846,942 | | 15,619,648 |
| 07/2014 | | Lookout, Inc. Series F Convertible Preferred | | 77,707 | | 887,655 | | 613,885 |
| 09/2015 | | Rubicon Earnout Shares | | 11,816 | | — | | 4,514 |
| 09/2015 | | Rubicon Technology, Inc. Class V | | 157,544 | | — | | — |
| 09/2015 | | Rubicon Technology, Inc. Class B | | 157,544 | | 673,447 | | 270,818 |
| 09/2015 | | Rubicon TRA Placeholder | | 157,544 | | — | | 56,716 |
| 07/2021 | | Sharecare, Inc. Earnout Shares | | 12,640 | | — | | 2,427 |
| 11/2013 | | Tory Burch LLC | | 316,327 | | 24,792,580 | | 9,546,739 |
| | | | | | | $ 38,096,623 | | $ 27,451,975 |
| (2) | Investment valued using significant unobservable inputs. |
| (3) | Represents entire or partial securities on loan. See Note 8 in the accompanying Notes to Financial Statements for securities lending information. |
| (4) | Current yield as of period end. |
| Futures Contracts Outstanding at October 31, 2022 |
| Description | | Number of
Contracts | | Expiration
Date | | Current
Notional
Amount | | Value and
Unrealized
Appreciation/
(Depreciation) |
| Long position contracts: |
| Nasdaq 100 E-MINI Future | | 401 | | 12/16/2022 | | $ 91,806,945 | | $ (3,889,068) |
| Total futures contracts | | $ (3,889,068) |
† See Significant Accounting Policies of accompanying Notes to Financial Statements regarding valuation of investments.
The accompanying notes are an integral part of these financial statements.
The Hartford Capital Appreciation Fund
Schedule of Investments – (continued)
October 31, 2022
Fair Value Summary
The following is a summary of the fair valuations according to the inputs used as of October 31, 2022 in valuing the Fund’s investments.
| Description | | Total | | Level 1 | | Level 2 | | Level 3(1) |
| Assets | | | | | | | | |
| Common Stocks | | | | | | | | |
| Automobiles & Components | | $ 34,621,285 | | $ 34,621,285 | | $ — | | $ — |
| Banks | | 130,021,304 | | 130,021,304 | | — | | — |
| Capital Goods | | 564,011,012 | | 548,391,364 | | — | | 15,619,648 |
| Commercial & Professional Services | | 110,169,153 | | 110,169,153 | | — | | — |
| Consumer Durables & Apparel | | 178,201,424 | | 178,201,424 | | — | | — |
| Consumer Services | | 166,925,945 | | 166,925,945 | | — | | — |
| Diversified Financials | | 250,549,302 | | 250,549,302 | | — | | — |
| Energy | | 146,652,159 | | 146,652,159 | | — | | — |
| Food & Staples Retailing | | 46,849,560 | | 46,849,560 | | — | | — |
| Food, Beverage & Tobacco | | 226,044,170 | | 226,044,170 | | — | | — |
| Health Care Equipment & Services | | 566,306,858 | | 566,306,858 | | — | | — |
| Household & Personal Products | | 154,857,959 | | 154,857,959 | | — | | — |
| Insurance | | 384,491,223 | | 384,491,223 | | — | | — |
| Materials | | 261,877,544 | | 261,877,544 | | — | | — |
| Media & Entertainment | | 288,375,348 | | 288,375,348 | | — | | — |
| Pharmaceuticals, Biotechnology & Life Sciences | | 419,283,526 | | 419,283,526 | | — | | — |
| Real Estate | | 165,412,609 | | 165,412,609 | | — | | — |
| Retailing | | 269,397,155 | | 259,850,416 | | — | | 9,546,739 |
| Semiconductors & Semiconductor Equipment | | 62,893,805 | | 62,893,805 | | — | | — |
| Software & Services | | 706,949,583 | | 706,615,108 | | — | | 334,475 |
| Technology Hardware & Equipment | | 259,546,298 | | 259,546,298 | | — | | — |
| Transportation | | 90,841,467 | | 90,841,467 | | — | | — |
| Utilities | | 48,327,423 | | 48,327,423 | | — | | — |
| Convertible Preferred Stocks | | 1,951,113 | | — | | — | | 1,951,113 |
| Exchange-Traded Funds | | 62,613,135 | | 62,613,135 | | — | | — |
| Short-Term Investments | | 79,058,114 | | 15,797,353 | | 63,260,761 | | — |
| Total | | $ 5,676,228,474 | | $ 5,585,515,738 | | $ 63,260,761 | | $ 27,451,975 |
| Liabilities | | | | | | | | |
| Futures Contracts(2) | | $ (3,889,068) | | $ (3,889,068) | | $ — | | $ — |
| Total | | $ (3,889,068) | | $ (3,889,068) | | $ — | | $ — |
| (1) | For the year ended October 31, 2022, investments valued at $37,515 were transferred into Level 3 due to the unavailability of significant observable inputs. There were no transfers out of Level 3. |
| (2) | Derivative instruments (excluding purchased and written options, if applicable) are valued at the unrealized appreciation/(depreciation) on the investments. |
Level 3 investments at the beginning and/or end of the period in relation to net assets were not significant and accordingly, a reconciliation of Level 3 assets for the year ended October 31, 2022 is not presented.
The accompanying notes are an integral part of these financial statements.
Hartford Core Equity Fund
Schedule of Investments
October 31, 2022
| Shares or Principal Amount | | Market Value† |
| COMMON STOCKS - 99.1% |
| | Automobiles & Components - 1.5% |
| 5,757,252 | Ford Motor Co. | $ 76,974,459 |
| 300,845 | Tesla, Inc.* | 68,454,272 |
| | | | 145,428,731 |
| | Banks - 5.1% |
| 4,954,659 | Bank of America Corp. | 178,565,910 |
| 1,763,413 | JP Morgan Chase & Co. | 221,978,429 |
| 545,783 | PNC Financial Services Group, Inc. | 88,324,063 |
| | | | 488,868,402 |
| | Capital Goods - 8.2% |
| 900,449 | AMETEK, Inc. | 116,752,217 |
| 351,763 | Deere & Co. | 139,234,831 |
| 970,630 | Fortune Brands Home & Security, Inc. | 58,548,402 |
| 473,626 | IDEX Corp. | 105,291,796 |
| 517,951 | Illinois Tool Works, Inc. | 110,598,077 |
| 1,984,015 | Johnson Controls International plc | 114,755,428 |
| 1,525,826 | Raytheon Technologies Corp. | 144,678,821 |
| | | | 789,859,572 |
| | Commercial & Professional Services - 1.6% |
| 882,937 | Leidos Holdings, Inc. | 89,697,570 |
| 500,043 | Republic Services, Inc. | 66,315,702 |
| | | | 156,013,272 |
| | Consumer Durables & Apparel - 1.1% |
| 1,123,903 | NIKE, Inc. Class B | 104,163,330 |
| | Consumer Services - 2.1% |
| 395,531 | Airbnb, Inc. Class A* | 42,286,219 |
| 597,809 | McDonald's Corp. | 162,998,602 |
| | | | 205,284,821 |
| | Diversified Financials - 4.2% |
| 985,818 | American Express Co. | 146,344,682 |
| 1,239,646 | Charles Schwab Corp. | 98,762,597 |
| 1,990,992 | Morgan Stanley | 163,599,813 |
| | | | 408,707,092 |
| | Energy - 4.0% |
| 1,118,642 | ConocoPhillips | 141,049,570 |
| 1,796,773 | EOG Resources, Inc. | 245,295,450 |
| | | | 386,345,020 |
| | Food & Staples Retailing - 1.3% |
| 1,416,245 | Sysco Corp. | 122,590,167 |
| | Food, Beverage & Tobacco - 2.8% |
| 595,301 | Constellation Brands, Inc. Class A | 147,086,971 |
| 1,362,546 | Monster Beverage Corp.* | 127,697,811 |
| | | | 274,784,782 |
| | Health Care Equipment & Services - 8.4% |
| 946,711 | Abbott Laboratories | 93,667,586 |
| 1,532,995 | Baxter International, Inc. | 83,318,278 |
| 491,491 | Becton Dickinson and Co. | 115,977,131 |
| 1,440,042 | Hologic, Inc.* | 97,634,848 |
| 360,431 | Laboratory Corp. of America Holdings | 79,965,222 |
| 609,822 | UnitedHealth Group, Inc. | 338,542,683 |
| | | | 809,105,748 |
| | Household & Personal Products - 3.1% |
| 1,268,271 | Colgate-Palmolive Co. | 93,649,131 |
| 1,539,765 | Procter & Gamble Co. | 207,360,152 |
| | | | 301,009,283 |
| Shares or Principal Amount | | Market Value† |
| COMMON STOCKS - 99.1% - (continued) |
| | Insurance - 2.4% |
| 606,801 | Chubb Ltd. | $ 130,395,467 |
| 808,528 | Progressive Corp. | 103,814,995 |
| | | | 234,210,462 |
| | Materials - 1.0% |
| 844,147 | PPG Industries, Inc. | 96,384,704 |
| | Media & Entertainment - 5.9% |
| 4,595,561 | Alphabet, Inc. Class A* | 434,326,470 |
| 1,271,194 | Walt Disney Co.* | 135,433,009 |
| | | | 569,759,479 |
| | Pharmaceuticals, Biotechnology & Life Sciences - 10.0% |
| 497,261 | Danaher Corp. | 125,145,676 |
| 601,615 | Eli Lilly & Co. | 217,838,775 |
| 4,065,208 | Pfizer, Inc. | 189,235,432 |
| 207,798 | Regeneron Pharmaceuticals, Inc.* | 155,588,753 |
| 308,405 | Thermo Fisher Scientific, Inc. | 158,510,918 |
| 402,469 | Vertex Pharmaceuticals, Inc.* | 125,570,328 |
| | | | 971,889,882 |
| | Real Estate - 1.7% |
| 407,385 | AvalonBay Communities, Inc. REIT | 71,341,261 |
| 803,953 | Prologis, Inc. REIT | 89,037,795 |
| | | | 160,379,056 |
| | Retailing - 5.2% |
| 3,156,415 | Amazon.com, Inc.* | 323,343,153 |
| 2,438,329 | TJX Cos., Inc. | 175,803,521 |
| | | | 499,146,674 |
| | Semiconductors & Semiconductor Equipment - 4.5% |
| 980,314 | Advanced Micro Devices, Inc.* | 58,877,659 |
| 301,301 | KLA Corp. | 95,346,701 |
| 246,301 | NVIDIA Corp. | 33,243,246 |
| 801,030 | QUALCOMM, Inc. | 94,249,190 |
| 932,778 | Texas Instruments, Inc. | 149,832,130 |
| | | | 431,548,926 |
| | Software & Services - 11.4% |
| 850,810 | Fidelity National Information Services, Inc. | 70,608,722 |
| 560,422 | Global Payments, Inc. | 64,033,818 |
| 1,005,637 | GoDaddy, Inc. Class A* | 80,853,215 |
| 498,974 | Mastercard, Inc. Class A | 163,753,287 |
| 2,031,142 | Microsoft Corp. | 471,488,992 |
| 486,156 | Palo Alto Networks, Inc.* | 83,419,508 |
| 705,303 | salesforce.com, Inc.* | 114,675,215 |
| 333,218 | Workday, Inc. Class A* | 51,922,029 |
| | | | 1,100,754,786 |
| | Technology Hardware & Equipment - 10.3% |
| 3,234,143 | Apple, Inc. | 495,923,488 |
| 607,352 | CDW Corp. | 104,956,499 |
| 2,615,047 | Corning, Inc. | 84,126,062 |
| 507,932 | F5, Inc.* | 72,588,562 |
| 629,456 | Motorola Solutions, Inc. | 157,181,458 |
| 1,237,335 | NetApp, Inc. | 85,710,195 |
| | | | 1,000,486,264 |
| | Utilities - 3.3% |
| 1,547,815 | American Electric Power Co., Inc. | 136,083,895 |
| 1,193,018 | Duke Energy Corp. | 111,165,417 |
| 921,335 | Eversource Energy | 70,279,434 |
| | | | 317,528,746 |
| | Total Common Stocks
(cost $6,984,522,918) | | $ 9,574,249,199 |
The accompanying notes are an integral part of these financial statements.
Hartford Core Equity Fund
Schedule of Investments – (continued)
October 31, 2022
| Shares or Principal Amount | | Market Value† |
| SHORT-TERM INVESTMENTS - 0.7% |
| | Repurchase Agreements - 0.7% |
| $ 70,499,034 | Fixed Income Clearing Corp. Repurchase Agreement dated 10/31/2022 at 3.010%, due on 11/01/2022 with a maturity value of $70,504,928; collateralized by U.S. Treasury Inflation Index Note at 0.125%, maturing 07/15/2024, with a market value of $62,415,131 and collateralized by U.S. Treasury Note at 2.125%, maturing 07/31/2024, with a market value of $9,493,957 | $ 70,499,034 |
| | Total Short-Term Investments
(cost $70,499,034) | $ 70,499,034 |
| | Total Investments
(cost $7,055,021,952) | 99.8% | $ 9,644,748,233 |
| | Other Assets and Liabilities | 0.2% | 19,974,249 |
| | Total Net Assets | 100.0% | $ 9,664,722,482 |
| Note: | Percentage of investments as shown is the ratio of the total market value to total net assets. |
| | Equity industry classifications used in this report are the Global Industry Classification Standard, which was developed by and is the exclusive property and service mark of MSCI, Inc. and Standard & Poor’s. |
| | For Fund compliance purposes, the Fund may not use the same classification system. These classifications are used for financial reporting purposes. |
| | See “Glossary” for abbreviation descriptions. |
| * | Non-income producing. |
| † | See Significant Accounting Policies of accompanying Notes to Financial Statements regarding valuation of investments. |
Fair Value Summary
The following is a summary of the fair valuations according to the inputs used as of October 31, 2022 in valuing the Fund’s investments.
| Description | | Total | | Level 1 | | Level 2 | | Level 3(1) |
| Assets | | | | | | | | |
| Common Stocks | | | | | | | | |
| Automobiles & Components | | $ 145,428,731 | | $ 145,428,731 | | $ — | | $ — |
| Banks | | 488,868,402 | | 488,868,402 | | — | | — |
| Capital Goods | | 789,859,572 | | 789,859,572 | | — | | — |
| Commercial & Professional Services | | 156,013,272 | | 156,013,272 | | — | | — |
| Consumer Durables & Apparel | | 104,163,330 | | 104,163,330 | | — | | — |
| Consumer Services | | 205,284,821 | | 205,284,821 | | — | | — |
| Diversified Financials | | 408,707,092 | | 408,707,092 | | — | | — |
| Energy | | 386,345,020 | | 386,345,020 | | — | | — |
| Food & Staples Retailing | | 122,590,167 | | 122,590,167 | | — | | — |
| Food, Beverage & Tobacco | | 274,784,782 | | 274,784,782 | | — | | — |
| Health Care Equipment & Services | | 809,105,748 | | 809,105,748 | | — | | — |
| Household & Personal Products | | 301,009,283 | | 301,009,283 | | — | | — |
| Insurance | | 234,210,462 | | 234,210,462 | | — | | — |
| Materials | | 96,384,704 | | 96,384,704 | | — | | — |
| Media & Entertainment | | 569,759,479 | | 569,759,479 | | — | | — |
| Pharmaceuticals, Biotechnology & Life Sciences | | 971,889,882 | | 971,889,882 | | — | | — |
| Real Estate | | 160,379,056 | | 160,379,056 | | — | | — |
| Retailing | | 499,146,674 | | 499,146,674 | | — | | — |
| Semiconductors & Semiconductor Equipment | | 431,548,926 | | 431,548,926 | | — | | — |
| Software & Services | | 1,100,754,786 | | 1,100,754,786 | | — | | — |
| Technology Hardware & Equipment | | 1,000,486,264 | | 1,000,486,264 | | — | | — |
| Utilities | | 317,528,746 | | 317,528,746 | | — | | — |
| Short-Term Investments | | 70,499,034 | | — | | 70,499,034 | | — |
| Total | | $ 9,644,748,233 | | $ 9,574,249,199 | | $ 70,499,034 | | $ — |
| (1) | For the year ended October 31, 2022, there were no transfers in and out of Level 3. |
The accompanying notes are an integral part of these financial statements.
The Hartford Dividend and Growth Fund
Schedule of Investments
October 31, 2022
| Shares or Principal Amount | | Market Value† |
| COMMON STOCKS - 97.7% |
| | Banks - 4.9% |
| 4,701,286 | Bank of America Corp. | $ 169,434,348 |
| 3,496,314 | JP Morgan Chase & Co. | 440,116,006 |
| 976,711 | PNC Financial Services Group, Inc. | 158,061,141 |
| | | | 767,611,495 |
| | Capital Goods - 6.0% |
| 504,781 | General Dynamics Corp. | 126,094,294 |
| 1,520,469 | Ingersoll Rand, Inc. | 76,783,684 |
| 4,584,912 | Johnson Controls International plc | 265,191,310 |
| 477,950 | Lockheed Martin Corp. | 232,608,706 |
| 3,308,381 | Otis Worldwide Corp. | 233,704,034 |
| | | | 934,382,028 |
| | Consumer Services - 2.2% |
| 1,403,805 | Hilton Worldwide Holdings, Inc. | 189,878,664 |
| 590,356 | McDonald's Corp. | 160,966,467 |
| | | | 350,845,131 |
| | Diversified Financials - 6.5% |
| 1,419,677 | American Express Co. | 210,751,051 |
| 194,072 | BlackRock, Inc. | 125,353,046 |
| 2,785,579 | Charles Schwab Corp. | 221,927,079 |
| 2,541,602 | Morgan Stanley | 208,843,436 |
| 764,693 | S&P Global, Inc. | 245,657,626 |
| | | | 1,012,532,238 |
| | Energy - 5.4% |
| 1,560,045 | Chevron Corp. | 282,212,140 |
| 2,300,684 | ConocoPhillips | 290,093,246 |
| 4,991,576 | TotalEnergies SE ADR | 273,388,618 |
| | | | 845,694,004 |
| | Food & Staples Retailing - 2.3% |
| 1,375,484 | Sysco Corp. | 119,061,895 |
| 1,702,299 | Walmart, Inc. | 242,288,217 |
| | | | 361,350,112 |
| | Food, Beverage & Tobacco - 2.0% |
| 2,940,725 | Keurig Dr Pepper, Inc. | 114,217,759 |
| 3,306,413 | Mondelez International, Inc. Class A | 203,278,271 |
| | | | 317,496,030 |
| | Health Care Equipment & Services - 9.0% |
| 2,711,895 | Baxter International, Inc. | 147,391,493 |
| 838,976 | Becton Dickinson and Co. | 197,973,167 |
| 491,365 | Elevance Health, Inc. | 268,663,641 |
| 638,741 | HCA Healthcare, Inc. | 138,907,005 |
| 2,571,976 | Medtronic plc | 224,636,384 |
| 764,522 | UnitedHealth Group, Inc. | 424,424,388 |
| | | | 1,401,996,078 |
| | Household & Personal Products - 1.8% |
| 2,194,673 | Colgate-Palmolive Co. | 162,054,654 |
| 2,470,408 | Unilever plc ADR | 112,428,268 |
| | | | 274,482,922 |
| | Insurance - 6.3% |
| 2,806,196 | American International Group, Inc. | 159,953,172 |
| 852,952 | Chubb Ltd. | 183,290,855 |
| 2,799,202 | MetLife, Inc. | 204,929,578 |
| 2,408,065 | Principal Financial Group, Inc. | 212,222,769 |
| 2,146,595 | Prudential Financial, Inc. | 225,800,328 |
| | | | 986,196,702 |
| | Materials - 3.4% |
| 2,000,863 | Celanese Corp. Class A | 192,322,951 |
| 1,516,643 | FMC Corp. | 180,328,853 |
| 1,319,087 | PPG Industries, Inc. | 150,613,354 |
| | | | 523,265,158 |
| Shares or Principal Amount | | Market Value† |
| COMMON STOCKS - 97.7% - (continued) |
| | Media & Entertainment - 5.8% |
| 7,053,249 | Alphabet, Inc. Class A* | $ 666,602,563 |
| 7,642,519 | Comcast Corp. Class A | 242,573,553 |
| | | | 909,176,116 |
| | Pharmaceuticals, Biotechnology & Life Sciences - 8.9% |
| 1,291,900 | Agilent Technologies, Inc. | 178,734,365 |
| 3,460,573 | AstraZeneca plc ADR | 203,516,298 |
| 3,440,656 | Bristol-Myers Squibb Co. | 266,547,620 |
| 2,403,753 | Merck & Co., Inc. | 243,259,804 |
| 2,122,577 | Novartis AG ADR | 172,204,672 |
| 6,883,492 | Pfizer, Inc. | 320,426,553 |
| | | | 1,384,689,312 |
| | Real Estate - 3.3% |
| 904,992 | American Tower Corp. REIT | 187,505,292 |
| 7,893,894 | Host Hotels & Resorts, Inc. REIT | 149,036,719 |
| 591,135 | Public Storage REIT | 183,104,066 |
| | | | 519,646,077 |
| | Retailing - 3.2% |
| 523,770 | Home Depot, Inc. | 155,104,010 |
| 799,621 | Lowe's Cos., Inc. | 155,886,114 |
| 2,614,410 | TJX Cos., Inc. | 188,498,961 |
| | | | 499,489,085 |
| | Semiconductors & Semiconductor Equipment - 2.8% |
| 178,393 | Broadcom, Inc. | 83,866,117 |
| 2,939,426 | Micron Technology, Inc. | 159,022,946 |
| 1,226,147 | Texas Instruments, Inc. | 196,955,993 |
| | | | 439,845,056 |
| | Software & Services - 11.1% |
| 661,529 | Accenture plc Class A | 187,808,083 |
| 4,014,759 | Cognizant Technology Solutions Corp. Class A | 249,918,748 |
| 3,204,057 | Fidelity National Information Services, Inc. | 265,904,690 |
| 3,220,582 | Microsoft Corp. | 747,593,700 |
| 1,337,077 | Visa, Inc. Class A | 276,988,871 |
| | | | 1,728,214,092 |
| | Technology Hardware & Equipment - 4.5% |
| 2,780,074 | Apple, Inc. | 426,296,547 |
| 6,096,017 | Cisco Systems, Inc. | 276,942,053 |
| | | | 703,238,600 |
| | Telecommunication Services - 1.6% |
| 6,796,132 | Verizon Communications, Inc. | 253,971,453 |
| | Transportation - 1.9% |
| 3,070,214 | Ryanair Holdings plc ADR* | 211,507,043 |
| 423,872 | Union Pacific Corp. | 83,562,126 |
| | | | 295,069,169 |
| | Utilities - 4.8% |
| 1,253,559 | Constellation Energy Corp. | 118,511,468 |
| 2,138,861 | Dominion Energy, Inc. | 149,656,104 |
| 1,795,144 | Duke Energy Corp. | 167,271,518 |
| 3,905,308 | Exelon Corp. | 150,705,836 |
| 1,134,265 | Sempra Energy | 171,205,959 |
| | | | 757,350,885 |
| | Total Common Stocks
(cost $11,534,130,611) | | $ 15,266,541,743 |
The accompanying notes are an integral part of these financial statements.
The Hartford Dividend and Growth Fund
Schedule of Investments – (continued)
October 31, 2022
| Shares or Principal Amount | | Market Value† |
| SHORT-TERM INVESTMENTS - 1.8% |
| | Repurchase Agreements - 1.8% |
| $ 277,160,322 | Fixed Income Clearing Corp. Repurchase Agreement dated 10/31/2022 at 3.010%, due on 11/01/2022 with a maturity value of $277,183,496; collateralized by U.S. Treasury Note at 4.375%, maturing 10/31/2024, with a market value of $282,703,620 | $ 277,160,322 |
| | Total Short-Term Investments
(cost $277,160,322) | $ 277,160,322 |
| | Total Investments
(cost $11,811,290,933) | 99.5% | $ 15,543,702,065 |
| | Other Assets and Liabilities | 0.5% | 84,303,265 |
| | Total Net Assets | 100.0% | $ 15,628,005,330 |
| Note: | Percentage of investments as shown is the ratio of the total market value to total net assets. |
| | Equity industry classifications used in this report are the Global Industry Classification Standard, which was developed by and is the exclusive property and service mark of MSCI, Inc. and Standard & Poor’s. |
| | For Fund compliance purposes, the Fund may not use the same classification system. These classifications are used for financial reporting purposes. |
| | See “Glossary” for abbreviation descriptions. |
| * | Non-income producing. |
| † | See Significant Accounting Policies of accompanying Notes to Financial Statements regarding valuation of investments. |
Fair Value Summary
The following is a summary of the fair valuations according to the inputs used as of October 31, 2022 in valuing the Fund’s investments.
| Description | | Total | | Level 1 | | Level 2 | | Level 3(1) |
| Assets | | | | | | | | |
| Common Stocks | | | | | | | | |
| Banks | | $ 767,611,495 | | $ 767,611,495 | | $ — | | $ — |
| Capital Goods | | 934,382,028 | | 934,382,028 | | — | | — |
| Consumer Services | | 350,845,131 | | 350,845,131 | | — | | — |
| Diversified Financials | | 1,012,532,238 | | 1,012,532,238 | | — | | — |
| Energy | | 845,694,004 | | 845,694,004 | | — | | — |
| Food & Staples Retailing | | 361,350,112 | | 361,350,112 | | — | | — |
| Food, Beverage & Tobacco | | 317,496,030 | | 317,496,030 | | — | | — |
| Health Care Equipment & Services | | 1,401,996,078 | | 1,401,996,078 | | — | | — |
| Household & Personal Products | | 274,482,922 | | 274,482,922 | | — | | — |
| Insurance | | 986,196,702 | | 986,196,702 | | — | | — |
| Materials | | 523,265,158 | | 523,265,158 | | — | | — |
| Media & Entertainment | | 909,176,116 | | 909,176,116 | | — | | — |
| Pharmaceuticals, Biotechnology & Life Sciences | | 1,384,689,312 | | 1,384,689,312 | | — | | — |
| Real Estate | | 519,646,077 | | 519,646,077 | | — | | — |
| Retailing | | 499,489,085 | | 499,489,085 | | — | | — |
| Semiconductors & Semiconductor Equipment | | 439,845,056 | | 439,845,056 | | — | | — |
| Software & Services | | 1,728,214,092 | | 1,728,214,092 | | — | | — |
| Technology Hardware & Equipment | | 703,238,600 | | 703,238,600 | | — | | — |
| Telecommunication Services | | 253,971,453 | | 253,971,453 | | — | | — |
| Transportation | | 295,069,169 | | 295,069,169 | | — | | — |
| Utilities | | 757,350,885 | | 757,350,885 | | — | | — |
| Short-Term Investments | | 277,160,322 | | — | | 277,160,322 | | — |
| Total | | $ 15,543,702,065 | | $ 15,266,541,743 | | $ 277,160,322 | | $ — |
| (1) | For the year ended October 31, 2022, there were no transfers in and out of Level 3. |
The accompanying notes are an integral part of these financial statements.
The Hartford Equity Income Fund
Schedule of Investments
October 31, 2022
| Shares or Principal Amount | | Market Value† |
| COMMON STOCKS - 97.5% |
| | Banks - 6.7% |
| 886,463 | JP Morgan Chase & Co. | $ 111,587,962 |
| 460,222 | M&T Bank Corp. | 77,487,578 |
| 189,996 | PNC Financial Services Group, Inc. | 30,747,053 |
| 579,723 | Royal Bank of Canada(1) | 53,638,261 |
| 1,377,981 | Truist Financial Corp. | 61,719,769 |
| | | | 335,180,623 |
| | Capital Goods - 10.4% |
| 467,134 | Eaton Corp. plc | 70,102,799 |
| 574,463 | Emerson Electric Co. | 49,748,496 |
| 341,713 | General Dynamics Corp. | 85,359,907 |
| 305,474 | Honeywell International, Inc. | 62,322,805 |
| 1,498,347 | Johnson Controls International plc | 86,664,391 |
| 261,146 | L3Harris Technologies, Inc. | 64,364,655 |
| 518,592 | Raytheon Technologies Corp. | 49,172,893 |
| 496,902 | Siemens AG | 54,266,150 |
| | | | 522,002,096 |
| | Consumer Durables & Apparel - 1.0% |
| 642,299 | Lennar Corp. Class A | 51,833,529 |
| | Diversified Financials - 8.6% |
| 1,251,175 | Ares Management Corp. Class A | 94,876,600 |
| 644,895 | Blackstone, Inc. Class A | 58,775,730 |
| 1,729,628 | Equitable Holdings, Inc. | 52,961,210 |
| 147,458 | Goldman Sachs Group, Inc. | 50,800,756 |
| 1,465,543 | Morgan Stanley | 120,423,668 |
| 464,309 | Raymond James Financial, Inc. | 54,853,465 |
| | | | 432,691,429 |
| | Energy - 8.8% |
| 1,156,495 | ConocoPhillips | 145,822,455 |
| 2,922,948 | Coterra Energy, Inc. | 90,991,371 |
| 780,010 | EOG Resources, Inc. | 106,486,965 |
| 468,034 | Phillips 66 | 48,811,266 |
| 1,151,994 | TC Energy Corp. | 50,600,302 |
| | | | 442,712,359 |
| | Food, Beverage & Tobacco - 5.9% |
| 643,577 | Archer-Daniels-Midland Co. | 62,414,098 |
| 670,654 | Kellogg Co. | 51,519,640 |
| 1,281,962 | Keurig Dr Pepper, Inc. | 49,791,404 |
| 801,791 | Mondelez International, Inc. Class A | 49,294,111 |
| 900,245 | Philip Morris International, Inc. | 82,687,503 |
| | | | 295,706,756 |
| | Health Care Equipment & Services - 5.9% |
| 819,693 | Baxter International, Inc. | 44,550,314 |
| 207,739 | Becton Dickinson and Co. | 49,020,172 |
| 136,955 | Elevance Health, Inc. | 74,882,885 |
| 532,558 | Medtronic plc | 46,513,616 |
| 150,378 | UnitedHealth Group, Inc. | 83,482,347 |
| | | | 298,449,334 |
| | Household & Personal Products - 2.5% |
| 351,662 | Kimberly-Clark Corp. | 43,767,852 |
| 1,773,039 | Unilever plc ADR | 80,691,005 |
| | | | 124,458,857 |
| | Insurance - 4.0% |
| 396,098 | Chubb Ltd. | 85,117,499 |
| 1,599,779 | MetLife, Inc. | 117,119,821 |
| | | | 202,237,320 |
| | Materials - 3.9% |
| 242,197 | Celanese Corp. Class A | 23,279,976 |
| 698,532 | LyondellBasell Industries N.V. Class A | 53,402,771 |
| 584,020 | PPG Industries, Inc. | 66,683,403 |
| 954,085 | Rio Tinto plc ADR(1) | 50,900,435 |
| | | | 194,266,585 |
| Shares or Principal Amount | | Market Value† |
| COMMON STOCKS - 97.5% - (continued) |
| | Media & Entertainment - 1.4% |
| 2,167,466 | Comcast Corp. Class A | $ 68,795,371 |
| | Pharmaceuticals, Biotechnology & Life Sciences - 12.6% |
| 1,073,163 | AstraZeneca plc ADR | 63,112,716 |
| 231,085 | Eli Lilly & Co. | 83,673,568 |
| 825,101 | Johnson & Johnson | 143,542,821 |
| 1,305,859 | Merck & Co., Inc. | 132,152,931 |
| 3,292,784 | Pfizer, Inc. | 153,279,095 |
| 172,837 | Roche Holding AG | 57,346,992 |
| | | | 633,108,123 |
| | Real Estate - 3.9% |
| 549,650 | Crown Castle, Inc. REIT | 73,246,359 |
| 1,573,147 | Gaming and Leisure Properties, Inc. REIT | 78,846,128 |
| 722,447 | Welltower, Inc. REIT | 44,098,165 |
| | | | 196,190,652 |
| | Retailing - 4.0% |
| 219,625 | Home Depot, Inc. | 65,037,551 |
| 253,633 | Lowe's Cos., Inc. | 49,445,753 |
| 1,181,528 | TJX Cos., Inc. | 85,188,169 |
| | | | 199,671,473 |
| | Semiconductors & Semiconductor Equipment - 4.2% |
| 520,432 | Analog Devices, Inc. | 74,224,012 |
| 101,410 | Broadcom, Inc. | 47,674,869 |
| 297,924 | NXP Semiconductors N.V. | 43,520,738 |
| 411,382 | QUALCOMM, Inc. | 48,403,206 |
| | | | 213,822,825 |
| | Software & Services - 0.9% |
| 576,161 | Fidelity National Information Services, Inc. | 47,815,601 |
| | Technology Hardware & Equipment - 4.4% |
| 2,217,055 | Cisco Systems, Inc. | 100,720,809 |
| 1,966,482 | Corning, Inc. | 63,261,726 |
| 480,623 | TE Connectivity Ltd. | 58,746,549 |
| | | | 222,729,084 |
| | Transportation - 1.0% |
| 421,344 | Canadian National Railway Co. | 49,917,365 |
| | Utilities - 7.4% |
| 846,460 | American Electric Power Co., Inc. | 74,420,763 |
| 702,676 | Atmos Energy Corp. | 74,870,128 |
| 2,221,251 | Exelon Corp. | 85,718,076 |
| 839,608 | NextEra Energy, Inc. | 65,069,620 |
| 477,778 | Sempra Energy | 72,115,811 |
| | | | 372,194,398 |
| | Total Common Stocks
(cost $3,929,928,975) | | $ 4,903,783,780 |
| SHORT-TERM INVESTMENTS - 3.4% |
| | Repurchase Agreements - 2.2% |
| $ 111,912,401 | Fixed Income Clearing Corp. Repurchase Agreement dated 10/31/2022 at 3.010%, due on 11/01/2022 with a maturity value of $111,921,758; collateralized by U.S. Treasury Inflation Index Note at 0.125%, maturing 10/15/2024, with a market value of $114,150,728 | $ 111,912,401 |
| | Securities Lending Collateral - 1.2% |
| 9,030,336 | Goldman Sachs Financial Square Funds, Government Fund, Institutional Class, 3.07%(2) | 9,030,336 |
| 30,101,118 | HSBC US Government Money Market Fund, 3.09%(2) | 30,101,118 |
The accompanying notes are an integral part of these financial statements.
The Hartford Equity Income Fund
Schedule of Investments – (continued)
October 31, 2022
| Shares or Principal Amount | | Market Value† |
| SHORT-TERM INVESTMENTS - 3.4% - (continued) |
| | Securities Lending Collateral - 1.2% - (continued) |
| 9,030,335 | Invesco Government & Agency Portfolio, Institutional Class, 3.07%(2) | $ 9,030,335 |
| 9,030,335 | Morgan Stanley Institutional Liquidity Funds, Government Portfolio, Institutional Class, 2.88%(2) | 9,030,335 |
| | | | 57,192,124 |
| | Total Short-Term Investments
(cost $169,104,525) | $ 169,104,525 |
| | Total Investments
(cost $4,099,033,500) | 100.9% | $ 5,072,888,305 |
| | Other Assets and Liabilities | (0.9)% | (46,191,892) |
| | Total Net Assets | 100.0% | $ 5,026,696,413 |
| Note: | Percentage of investments as shown is the ratio of the total market value to total net assets. |
| | Prices of foreign equities that are principally traded on certain foreign markets will generally be adjusted daily pursuant to a fair value pricing service approved by Hartford Funds Management Company, LLC in order to reflect an adjustment for factors occurring after the close of certain foreign markets but before the close of the New York Stock Exchange. |
Equity industry classifications used in this report are the Global Industry Classification Standard, which was developed by and is the exclusive property and service mark of MSCI, Inc. and Standard & Poor’s.
For Fund compliance purposes, the Fund may not use the same classification system. These classifications are used for financial reporting purposes.
See “Glossary” for abbreviation descriptions.
| (1) | Represents entire or partial securities on loan. See Note 8 in the accompanying Notes to Financial Statements for securities lending information. |
| (2) | Current yield as of period end. |
| † | See Significant Accounting Policies of accompanying Notes to Financial Statements regarding valuation of investments. |
Fair Value Summary
The following is a summary of the fair valuations according to the inputs used as of October 31, 2022 in valuing the Fund’s investments.
| Description | | Total | | Level 1 | | Level 2 | | Level 3(1) |
| Assets | | | | | | | | |
| Common Stocks | | | | | | | | |
| Banks | | $ 335,180,623 | | $ 335,180,623 | | $ — | | $ — |
| Capital Goods | | 522,002,096 | | 467,735,946 | | 54,266,150 | | — |
| Consumer Durables & Apparel | | 51,833,529 | | 51,833,529 | | — | | — |
| Diversified Financials | | 432,691,429 | | 432,691,429 | | — | | — |
| Energy | | 442,712,359 | | 442,712,359 | | — | | — |
| Food, Beverage & Tobacco | | 295,706,756 | | 295,706,756 | | — | | — |
| Health Care Equipment & Services | | 298,449,334 | | 298,449,334 | | — | | — |
| Household & Personal Products | | 124,458,857 | | 124,458,857 | | — | | — |
| Insurance | | 202,237,320 | | 202,237,320 | | — | | — |
| Materials | | 194,266,585 | | 194,266,585 | | — | | — |
| Media & Entertainment | | 68,795,371 | | 68,795,371 | | — | | — |
| Pharmaceuticals, Biotechnology & Life Sciences | | 633,108,123 | | 575,761,131 | | 57,346,992 | | — |
| Real Estate | | 196,190,652 | | 196,190,652 | | — | | — |
| Retailing | | 199,671,473 | | 199,671,473 | | — | | — |
| Semiconductors & Semiconductor Equipment | | 213,822,825 | | 213,822,825 | | — | | — |
| Software & Services | | 47,815,601 | | 47,815,601 | | — | | — |
| Technology Hardware & Equipment | | 222,729,084 | | 222,729,084 | | — | | — |
| Transportation | | 49,917,365 | | 49,917,365 | | — | | — |
| Utilities | | 372,194,398 | | 372,194,398 | | — | | — |
| Short-Term Investments | | 169,104,525 | | 57,192,124 | | 111,912,401 | | — |
| Total | | $ 5,072,888,305 | | $ 4,849,362,762 | | $ 223,525,543 | | $ — |
| (1) | For the year ended October 31, 2022, there were no transfers in and out of Level 3. |
The accompanying notes are an integral part of these financial statements.
The Hartford Growth Opportunities Fund
Schedule of Investments
October 31, 2022
| Shares or Principal Amount | | Market Value† |
| COMMON STOCKS - 95.3% |
| | Automobiles & Components - 1.4% |
| 730,674 | Thor Industries, Inc. | $ 59,528,011 |
| | Capital Goods - 3.1% |
| 1,550,277 | Johnson Controls International plc | 89,668,022 |
| 298,879 | Middleby Corp.* | 41,801,217 |
| | | | 131,469,239 |
| | Commercial & Professional Services - 2.3% |
| 1,169,269 | CoStar Group, Inc.* | 96,721,932 |
| | Consumer Durables & Apparel - 3.4% |
| 823,411 | Lennar Corp. Class A | 66,449,268 |
| 234,017 | Lululemon Athletica, Inc.* | 77,000,953 |
| | | | 143,450,221 |
| | Consumer Services - 3.9% |
| 459,424 | Airbnb, Inc. Class A* | 49,117,020 |
| 196,400 | Domino's Pizza, Inc. | 65,251,936 |
| 3,209,115 | DraftKings, Inc. Class A*(1) | 50,704,017 |
| | | | 165,072,973 |
| | Diversified Financials - 2.7% |
| 208,956 | CME Group, Inc. | 36,212,075 |
| 1,387,659 | Tradeweb Markets, Inc. Class A | 76,432,257 |
| | | | 112,644,332 |
| | Energy - 2.3% |
| 251,698 | Cheniere Energy, Inc. | 44,402,044 |
| 371,167 | EOG Resources, Inc. | 50,671,719 |
| | | | 95,073,763 |
| | Food, Beverage & Tobacco - 1.0% |
| 451,961 | Monster Beverage Corp.* | 42,357,785 |
| | Health Care Equipment & Services - 10.6% |
| 717,887 | DexCom, Inc.* | 86,706,392 |
| 147,493 | Humana, Inc. | 82,312,893 |
| 431,294 | Insulet Corp.* | 111,623,200 |
| 368,476 | Intuitive Surgical, Inc.* | 90,818,280 |
| 455,469 | Veeva Systems, Inc. Class A* | 76,491,464 |
| | | | 447,952,229 |
| | Materials - 3.2% |
| 333,671 | Albemarle Corp. | 93,384,503 |
| 465,792 | Nutrien Ltd. | 39,359,424 |
| | | | 132,743,927 |
| | Media & Entertainment - 14.8% |
| 2,122,490 | Alphabet, Inc. Class A* | 200,596,530 |
| 622,600 | Meta Platforms, Inc. Class A* | 58,001,416 |
| 451,698 | Netflix, Inc.* | 131,841,612 |
| 433,154 | Spotify Technology S.A.* | 34,903,549 |
| 319,577 | Take-Two Interactive Software, Inc.* | 37,863,483 |
| 837,298 | Walt Disney Co.* | 89,205,729 |
| 1,571,055 | ZoomInfo Technologies, Inc. Class A* | 69,959,079 |
| | | | 622,371,398 |
| | Pharmaceuticals, Biotechnology & Life Sciences - 7.4% |
| 524,553 | Agilent Technologies, Inc. | 72,571,908 |
| 289,654 | Danaher Corp. | 72,897,222 |
| 361,062 | Eli Lilly & Co. | 130,736,940 |
| 1,043,426 | Exact Sciences Corp.* | 36,290,356 |
| | | | 312,496,426 |
| | Real Estate - 1.0% |
| 243,391 | AvalonBay Communities, Inc. REIT | 42,622,632 |
| | Retailing - 9.8% |
| 2,982,586 | Amazon.com, Inc.* | 305,536,110 |
| 624,448 | Ross Stores, Inc. | 59,753,429 |
| Shares or Principal Amount | | Market Value† |
| COMMON STOCKS - 95.3% - (continued) |
| | Retailing - 9.8% - (continued) |
| 171,581 | Tory Burch LLC*(2)(3) | $ 5,178,314 |
| 103,434 | Ulta Beauty, Inc.* | 43,377,116 |
| | | | 413,844,969 |
| | Semiconductors & Semiconductor Equipment - 4.0% |
| 275,644 | First Solar, Inc.* | 40,125,497 |
| 407,767 | NVIDIA Corp. | 55,036,312 |
| 175,944 | SolarEdge Technologies, Inc.* | 40,472,398 |
| 330,979 | Universal Display Corp. | 31,515,821 |
| | | | 167,150,028 |
| | Software & Services - 21.4% |
| 920,398 | Block, Inc.* | 55,288,308 |
| 458,372 | Five9, Inc.* | 27,621,497 |
| 584,246 | Mastercard, Inc. Class A | 191,737,852 |
| 826,241 | Microsoft Corp. | 191,795,323 |
| 686,925 | Okta, Inc.* | 38,550,231 |
| 626,969 | Palo Alto Networks, Inc.* | 107,581,611 |
| 295,044 | Paycom Software, Inc.* | 102,085,224 |
| 164,787 | Rubicon Earnout Shares*(2)(3) | 62,949 |
| 2,197,165 | Rubicon Technology, Inc. Class B*(2)(3) | 3,776,927 |
| 2,197,165 | Rubicon Technology, Inc. Class V*(2)(3) | — |
| 2,197,165 | Rubicon TRA Placeholder*(2)(3) | 790,979 |
| 258,149 | salesforce.com, Inc.* | 41,972,446 |
| 887,558 | Workday, Inc. Class A* | 138,299,287 |
| | | | 899,562,634 |
| | Technology Hardware & Equipment - 3.0% |
| 1,040,646 | Arista Networks, Inc.* | 125,772,475 |
| 55,900 | Mobileye Global, Inc. Class A* | 1,474,642 |
| | | | 127,247,117 |
| | Total Common Stocks
(cost $4,444,842,636) | | $ 4,012,309,616 |
| CONVERTIBLE PREFERRED STOCKS - 0.5% |
| | Software & Services - 0.5% |
| 5,668,755 | Essence Group Holdings Corp. Series 3*(2)(3) | $ 13,378,262 |
| 743,470 | Lookout, Inc. Series F*(2)(3) | 5,873,413 |
| | Total Convertible Preferred Stocks
(cost $17,456,734) | | $ 19,251,675 |
| EXCHANGE-TRADED FUNDS - 2.4% |
| | Other Investment Pools & Funds - 2.4% |
| 463,635 | iShares Russell 1000 Growth ETF | $ 103,195,878 |
| | Total Exchange-Traded Funds
(cost $100,656,314) | | $ 103,195,878 |
| | Total Long-Term Investments
(cost $4,562,955,684) | | $ 4,134,757,169 |
| SHORT-TERM INVESTMENTS - 1.9% |
| | Repurchase Agreements - 1.3% |
| $ 54,681,335 | Fixed Income Clearing Corp. Repurchase Agreement dated 10/31/2022 at 3.010%, due on 11/01/2022 with a maturity value of $54,685,907; collateralized by U.S. Treasury Note at 4.375%, maturing 10/31/2024, with a market value of $55,774,963 | $ 54,681,335 |
| | Securities Lending Collateral - 0.6% |
| 3,637,695 | Goldman Sachs Financial Square Funds, Government Fund, Institutional Class, 3.07%(4) | 3,637,695 |
| 12,125,650 | HSBC US Government Money Market Fund, 3.09%(4) | 12,125,650 |
The accompanying notes are an integral part of these financial statements.
The Hartford Growth Opportunities Fund
Schedule of Investments – (continued)
October 31, 2022
| Shares or Principal Amount | | Market Value† |
| SHORT-TERM INVESTMENTS - 1.9% - (continued) |
| | Securities Lending Collateral - 0.6% - (continued) |
| 3,637,695 | Invesco Government & Agency Portfolio, Institutional Class, 3.07%(4) | $ 3,637,695 |
| 3,637,695 | Morgan Stanley Institutional Liquidity Funds, Government Portfolio, Institutional Class, 2.88%(4) | 3,637,695 |
| | | | 23,038,735 |
| | Total Short-Term Investments
(cost $77,720,070) | $ 77,720,070 |
| | Total Investments
(cost $4,640,675,754) | 100.1% | $ 4,212,477,239 |
| | Other Assets and Liabilities | (0.1)% | (3,808,355) |
| | Total Net Assets | 100.0% | $ 4,208,668,884 |
| Note: | Percentage of investments as shown is the ratio of the total market value to total net assets. |
| | Prices of foreign equities that are principally traded on certain foreign markets will generally be adjusted daily pursuant to a fair value pricing service approved by Hartford Funds Management Company, LLC in order to reflect an adjustment for factors occurring after the close of certain foreign markets but before the close of the New York Stock Exchange. |
| | Equity industry classifications used in this report are the Global Industry Classification Standard, which was developed by and is the exclusive property and service mark of MSCI, Inc. and Standard & Poor’s. |
| | For Fund compliance purposes, the Fund may not use the same classification system. These classifications are used for financial reporting purposes. |
| | See “Glossary” for abbreviation descriptions. |
| * | Non-income producing. |
| (1) | Represents entire or partial securities on loan. See Note 8 in the accompanying Notes to Financial Statements for securities lending information. |
| (2) | Investment in securities not registered under the Securities Act of 1933 (excluding securities acquired pursuant to Rule 144A and Regulation S). At the end of the period, the value of such restricted securities amounted to $29,060,844 or 0.7% of net assets. |
Period
Acquired | | Security Name | | Shares/
Par Value | | Total Cost | | Market Value |
| 05/2014 | | Essence Group Holdings Corp. Series 3 Convertible Preferred | | 5,668,755 | | $ 8,964,002 | | $ 13,378,262 |
| 07/2014 | | Lookout, Inc. Series F Convertible Preferred | | 743,470 | | 8,492,732 | | 5,873,413 |
| 09/2015 | | Rubicon Earnout Shares | | 164,787 | | — | | 62,949 |
| 09/2015 | | Rubicon Technology, Inc. Class V | | 2,197,165 | | — | | — |
| 09/2015 | | Rubicon Technology, Inc. Class B | | 2,197,165 | | 9,392,114 | | 3,776,927 |
| 09/2015 | | Rubicon TRA Placeholder | | 2,197,165 | | — | | 790,979 |
| 11/2013 | | Tory Burch LLC | | 171,581 | | 13,447,917 | | 5,178,314 |
| | | | | | | $ 40,296,765 | | $ 29,060,844 |
| (3) | Investment valued using significant unobservable inputs. |
| (4) | Current yield as of period end. |
| † | See Significant Accounting Policies of accompanying Notes to Financial Statements regarding valuation of investments. |
The accompanying notes are an integral part of these financial statements.
The Hartford Growth Opportunities Fund
Schedule of Investments – (continued)
October 31, 2022
Fair Value Summary
The following is a summary of the fair valuations according to the inputs used as of October 31, 2022 in valuing the Fund’s investments.
| Description | | Total | | Level 1 | | Level 2 | | Level 3(1) |
| Assets | | | | | | | | |
| Common Stocks | | | | | | | | |
| Automobiles & Components | | $ 59,528,011 | | $ 59,528,011 | | $ — | | $ — |
| Capital Goods | | 131,469,239 | | 131,469,239 | | — | | — |
| Commercial & Professional Services | | 96,721,932 | | 96,721,932 | | — | | — |
| Consumer Durables & Apparel | | 143,450,221 | | 143,450,221 | | — | | — |
| Consumer Services | | 165,072,973 | | 165,072,973 | | — | | — |
| Diversified Financials | | 112,644,332 | | 112,644,332 | | — | | — |
| Energy | | 95,073,763 | | 95,073,763 | | — | | — |
| Food, Beverage & Tobacco | | 42,357,785 | | 42,357,785 | | — | | — |
| Health Care Equipment & Services | | 447,952,229 | | 447,952,229 | | — | | — |
| Materials | | 132,743,927 | | 132,743,927 | | — | | — |
| Media & Entertainment | | 622,371,398 | | 622,371,398 | | — | | — |
| Pharmaceuticals, Biotechnology & Life Sciences | | 312,496,426 | | 312,496,426 | | — | | — |
| Real Estate | | 42,622,632 | | 42,622,632 | | — | | — |
| Retailing | | 413,844,969 | | 408,666,655 | | — | | 5,178,314 |
| Semiconductors & Semiconductor Equipment | | 167,150,028 | | 167,150,028 | | — | | — |
| Software & Services | | 899,562,634 | | 894,931,779 | | — | | 4,630,855 |
| Technology Hardware & Equipment | | 127,247,117 | | 127,247,117 | | — | | — |
| Convertible Preferred Stocks | | 19,251,675 | | — | | — | | 19,251,675 |
| Exchange-Traded Funds | | 103,195,878 | | 103,195,878 | | — | | — |
| Short-Term Investments | | 77,720,070 | | 23,038,735 | | 54,681,335 | | — |
| Total | | $ 4,212,477,239 | | $ 4,128,735,060 | | $ 54,681,335 | | $ 29,060,844 |
| (1) | For the year ended October 31, 2022, there were no transfers in and out of Level 3. |
Level 3 investments at the beginning and/or end of the period in relation to net assets were not significant and accordingly, a reconciliation of Level 3 assets for the year ended October 31, 2022 is not presented.
The accompanying notes are an integral part of these financial statements.
The Hartford Healthcare Fund
Schedule of Investments
October 31, 2022
| Shares or Principal Amount | | Market Value† |
| COMMON STOCKS - 98.5% |
| | Biotechnology - 13.6% |
| 448,088 | Abcam plc* | $ 6,936,106 |
| 307,940 | Alkermes plc* | 6,990,238 |
| 31,283 | Alnylam Pharmaceuticals, Inc.* | 6,483,715 |
| 238,254 | Amicus Therapeutics, Inc.* | 2,382,540 |
| 71,271 | Apellis Pharmaceuticals, Inc.* | 4,311,183 |
| 14,360 | Argenx SE ADR* | 5,570,675 |
| 46,773 | Ascendis Pharma A/S ADR* | 5,378,895 |
| 37,438 | Blueprint Medicines Corp.* | 1,940,786 |
| 128,240 | Celldex Therapeutics, Inc.* | 4,505,071 |
| 1,072,300 | Everest Medicines Ltd.*(1) | 845,095 |
| 169,536 | Exact Sciences Corp.* | 5,896,462 |
| 17,240 | Genmab A/S* | 6,640,978 |
| 219,564 | Genus plc | 6,416,873 |
| 78,550 | Horizon Therapeutics plc* | 4,895,236 |
| 56,717 | Immunocore Holdings plc ADR* | 3,240,809 |
| 280,928 | ImmunoGen, Inc.* | 1,668,712 |
| 688,700 | InnoCare Pharma Ltd.*(1)(2) | 804,568 |
| 570,102 | Ironwood Pharmaceuticals, Inc. Class A* | 6,236,916 |
| 29,173 | Karuna Therapeutics, Inc.* | 6,398,806 |
| 147,234 | Merus N.V.* | 3,018,297 |
| 48,555 | Mirati Therapeutics, Inc.* | 3,268,723 |
| 48,731 | Moderna, Inc.* | 7,325,731 |
| 62,048 | Prothena Corp. plc* | 3,812,229 |
| 107,295 | PTC Therapeutics, Inc.* | 4,057,897 |
| 19,214 | Regeneron Pharmaceuticals, Inc.* | 14,386,482 |
| 97,651 | Sage Therapeutics, Inc.* | 3,677,537 |
| 34,014 | Sarepta Therapeutics, Inc.* | 3,878,276 |
| 48,921 | Seagen, Inc.* | 6,220,794 |
| 140,959 | Syndax Pharmaceuticals, Inc.* | 3,236,419 |
| 49,068 | Ultragenyx Pharmaceutical, Inc.* | 1,985,291 |
| 54,875 | Vaxcyte, Inc.* | 2,393,099 |
| 207,612 | Veracyte, Inc.* | 4,175,077 |
| 82,539 | Vertex Pharmaceuticals, Inc.* | 25,752,168 |
| 802,000 | Zai Lab Ltd.* | 1,843,601 |
| 82,534 | Zentalis Pharmaceuticals, Inc.* | 2,070,778 |
| | | | 178,646,063 |
| | Consumer Finance - 0.1% |
| 110,246 | Orion Acquisition Corp.* | 1,106,319 |
| | Health Care Distributors - 0.5% |
| 173,426 | AdaptHealth Corp. Class A* | 3,954,113 |
| 196,006 | Owens & Minor, Inc. | 3,332,102 |
| | | | 7,286,215 |
| | Health Care Equipment - 18.2% |
| 135,202 | Abbott Laboratories | 13,376,886 |
| 25,178 | ABIOMED, Inc.* | 6,346,870 |
| 242,313 | Baxter International, Inc. | 13,169,712 |
| 105,005 | Becton Dickinson and Co. | 24,778,030 |
| 714,276 | Boston Scientific Corp.* | 30,792,438 |
| 186,760 | DexCom, Inc.* | 22,556,873 |
| 58,907 | DiaSorin S.p.A. | 7,701,244 |
| 312,460 | Edwards Lifesciences Corp.* | 22,631,478 |
| 149,905 | Glaukos Corp.* | 8,405,173 |
| 161,344 | Hologic, Inc.* | 10,939,123 |
| 101,917 | Inari Medical, Inc.* | 7,840,475 |
| 57,360 | Insulet Corp.* | 14,845,342 |
| 303,954 | Koninklijke Philips N.V. | 3,855,619 |
| 47,417 | QuidelOrtho Corp.* | 4,258,995 |
| 547,263 | Smith & Nephew plc | 6,466,953 |
| 138,910 | Stryker Corp. | 31,843,728 |
| 47,129 | Teleflex, Inc. | 10,111,998 |
| | | | 239,920,937 |
| Shares or Principal Amount | | Market Value† |
| COMMON STOCKS - 98.5% - (continued) |
| | Health Care Facilities - 2.6% |
| 175,527 | Encompass Health Corp. | $ 9,555,690 |
| 111,680 | HCA Healthcare, Inc. | 24,287,049 |
| | | | 33,842,739 |
| | Health Care Services - 2.3% |
| 65,814 | Addus HomeCare Corp.* | 6,740,670 |
| 325,242 | agilon health, Inc.*(2) | 6,456,053 |
| 47,342 | Amedisys, Inc.* | 4,620,106 |
| 54,321 | Laboratory Corp. of America Holdings | 12,051,657 |
| | | | 29,868,486 |
| | Health Care Supplies - 0.5% |
| 37,193 | Align Technology, Inc.* | 7,226,600 |
| | Life Sciences Tools & Services - 11.0% |
| 190,482 | Agilent Technologies, Inc. | 26,353,185 |
| 259,388 | Avantor, Inc.* | 5,231,856 |
| 17,681 | Bio-Techne Corp. | 5,238,173 |
| 226,109 | Danaher Corp. | 56,904,852 |
| 73,446 | Illumina, Inc.* | 16,805,914 |
| 358,976 | NanoString Technologies, Inc.* | 3,754,889 |
| 251,022 | NeoGenomics, Inc.* | 1,909,022 |
| 279,225 | Syneos Health, Inc.* | 14,067,355 |
| 14,232 | Tecan Group AG* | 5,220,774 |
| 33,380 | Waters Corp.* | 9,986,295 |
| | | | 145,472,315 |
| | Managed Health Care - 19.2% |
| 374,618 | Centene Corp.* | 31,891,230 |
| 2,876,316 | Hapvida Participacoes e Investimentos S.A.(1) | 4,343,290 |
| 107,050 | Humana, Inc. | 59,742,464 |
| 60,411 | Molina Healthcare, Inc.* | 21,679,092 |
| 243,631 | UnitedHealth Group, Inc. | 135,251,750 |
| | | | 252,907,826 |
| | Pharmaceuticals - 30.5% |
| 199,028 | Aclaris Therapeutics, Inc.* | 3,106,827 |
| 183,000 | Astellas Pharma, Inc. | 2,525,067 |
| 310,796 | AstraZeneca plc ADR | 18,277,913 |
| 673,256 | Bristol-Myers Squibb Co. | 52,157,142 |
| 305,200 | Chugai Pharmaceutical Co., Ltd. | 7,072,050 |
| 2,386,000 | CSPC Pharmaceutical Group Ltd. | 2,450,807 |
| 552,725 | Daiichi Sankyo Co., Ltd. | 17,693,147 |
| 145,795 | Eisai Co., Ltd. | 8,791,897 |
| 161,909 | Elanco Animal Health, Inc.* | 2,135,580 |
| 266,014 | Eli Lilly & Co. | 96,321,009 |
| 417,635 | GSK plc | 6,841,312 |
| 278,478 | Hikma Pharmaceuticals plc | 3,997,614 |
| 193,063 | Intra-Cellular Therapies, Inc.* | 8,817,187 |
| 231,128 | Merck & Co., Inc. | 23,390,154 |
| 192,340 | Novartis AG | 15,558,519 |
| 258,245 | Ono Pharmaceutical Co., Ltd. | 6,077,422 |
| 1,654,846 | Pfizer, Inc. | 77,033,081 |
| 155,870 | UCB S.A. | 11,747,576 |
| 260,807 | Verona Pharma plc ADR* | 3,338,330 |
| 229,783 | Zoetis, Inc. | 34,646,681 |
| | | | 401,979,315 |
| | Total Common Stocks
(cost $1,092,454,308) | | $ 1,298,256,815 |
The accompanying notes are an integral part of these financial statements.
The Hartford Healthcare Fund
Schedule of Investments – (continued)
October 31, 2022
| Shares or Principal Amount | | Market Value† |
| SHORT-TERM INVESTMENTS - 1.2% |
| | Repurchase Agreements - 0.7% |
| $ 9,456,479 | Fixed Income Clearing Corp. Repurchase Agreement dated 10/31/2022 at 3.010%, due on 11/01/2022 with a maturity value of $9,457,270; collateralized by U.S. Treasury Note at 2.125%, maturing 07/31/2024, with a market value of $9,645,649 | $ 9,456,479 |
| | Securities Lending Collateral - 0.5% |
| 1,014,265 | Goldman Sachs Financial Square Funds, Government Fund, Institutional Class, 3.07%(3) | 1,014,265 |
| 3,380,885 | HSBC US Government Money Market Fund, 3.09%(3) | 3,380,885 |
| 1,014,265 | Invesco Government & Agency Portfolio, Institutional Class, 3.07%(3) | 1,014,265 |
| 1,014,265 | Morgan Stanley Institutional Liquidity Funds, Government Portfolio, Institutional Class, 2.88%(3) | 1,014,265 |
| | | | 6,423,680 |
| | Total Short-Term Investments
(cost $15,880,159) | $ 15,880,159 |
| | Total Investments
(cost $1,108,334,467) | 99.7% | $ 1,314,136,974 |
| | Other Assets and Liabilities | 0.3% | 3,961,269 |
| | Total Net Assets | 100.0% | $ 1,318,098,243 |
| Note: | Percentage of investments as shown is the ratio of the total market value to total net assets. |
| | Prices of foreign equities that are principally traded on certain foreign markets will generally be adjusted daily pursuant to a fair value pricing service approved by Hartford Funds Management Company, LLC in order to reflect an adjustment for factors occurring after the close of certain foreign markets but before the close of the New York Stock Exchange. |
| | Equity industry classifications used in this report are the Global Industry Classification Standard, which was developed by and is the exclusive property and service mark of MSCI, Inc. and Standard & Poor’s. |
| | For Fund compliance purposes, the Fund may not use the same classification system. These classifications are used for financial reporting purposes. |
| | See “Glossary” for abbreviation descriptions. |
| * | Non-income producing. |
| (1) | Security was purchased pursuant to Rule 144A under the Securities Act of 1933 and may be sold in transactions that are exempt from registration (typically only to qualified institutional buyers) or in a public offering registered under the Securities Act of 1933. At October 31, 2022, the aggregate value of these securities was $5,992,953, representing 0.5% of net assets. |
| (2) | Represents entire or partial securities on loan. See Note 8 in the accompanying Notes to Financial Statements for securities lending information. |
| (3) | Current yield as of period end. |
| † | See Significant Accounting Policies of accompanying Notes to Financial Statements regarding valuation of investments. |
Fair Value Summary
The following is a summary of the fair valuations according to the inputs used as of October 31, 2022 in valuing the Fund’s investments.
| Description | | Total | | Level 1 | | Level 2 | | Level 3(1) |
| Assets | | | | | | | | |
| Common Stocks | | | | | | | | |
| Biotechnology | | $ 178,646,063 | | $ 155,158,842 | | $ 23,487,221 | | $ — |
| Consumer Finance | | 1,106,319 | | 1,106,319 | | — | | — |
| Health Care Distributors | | 7,286,215 | | 7,286,215 | | — | | — |
| Health Care Equipment | | 239,920,937 | | 221,897,121 | | 18,023,816 | | — |
| Health Care Facilities | | 33,842,739 | | 33,842,739 | | — | | — |
| Health Care Services | | 29,868,486 | | 29,868,486 | | — | | — |
| Health Care Supplies | | 7,226,600 | | 7,226,600 | | — | | — |
| Life Sciences Tools & Services | | 145,472,315 | | 140,251,541 | | 5,220,774 | | — |
| Managed Health Care | | 252,907,826 | | 252,907,826 | | — | | — |
| Pharmaceuticals | | 401,979,315 | | 319,223,904 | | 82,755,411 | | — |
| Short-Term Investments | | 15,880,159 | | 6,423,680 | | 9,456,479 | | — |
| Total | | $ 1,314,136,974 | | $ 1,175,193,273 | | $ 138,943,701 | | $ — |
| (1) | For the year ended October 31, 2022, there were no transfers in and out of Level 3. |
The accompanying notes are an integral part of these financial statements.
Schedule of Investments
October 31, 2022
| Shares or Principal Amount | | Market Value† |
| COMMON STOCKS - 100.2% |
| | Automobiles & Components - 0.7% |
| 385,585 | Visteon Corp.* | $ 50,307,275 |
| | Banks - 2.6% |
| 701,851 | First Republic Bank | 84,292,305 |
| 692,710 | M&T Bank Corp. | 116,631,583 |
| | | | 200,923,888 |
| | Capital Goods - 13.7% |
| 1,264,789 | Axon Enterprise, Inc.* | 183,950,912 |
| 978,475 | Builders FirstSource, Inc.* | 60,332,769 |
| 990,314 | Graco, Inc. | 68,906,048 |
| 690,087 | IDEX Corp. | 153,413,241 |
| 1,947,729 | Ingersoll Rand, Inc. | 98,360,314 |
| 448,207 | Lennox International, Inc. | 104,687,709 |
| 748,385 | Lincoln Electric Holdings, Inc. | 106,270,670 |
| 332,273 | Middleby Corp.* | 46,471,702 |
| 178,587 | Nordson Corp. | 40,182,075 |
| 255,707 | Watsco, Inc. | 69,286,369 |
| 1,205,489 | Westinghouse Air Brake Technologies Corp. | 112,448,014 |
| | | | 1,044,309,823 |
| | Commercial & Professional Services - 2.1% |
| 3,449,360 | Dun & Bradstreet Holdings, Inc. | 44,324,276 |
| 1,347,210 | GFL Environmental, Inc. | 36,361,198 |
| 489,708 | Robert Half International, Inc. | 37,443,073 |
| 649,529 | TransUnion | 38,497,584 |
| | | | 156,626,131 |
| | Consumer Durables & Apparel - 4.1% |
| 467,541 | Carter's, Inc. | 31,732,008 |
| 34,678 | NVR, Inc.* | 146,956,694 |
| 5,153,620 | Vizio Holding Corp. Class A*(1) | 57,720,544 |
| 2,307,688 | YETI Holdings, Inc.* | 74,030,631 |
| | | | 310,439,877 |
| | Consumer Services - 3.6% |
| 941,073 | Choice Hotels International, Inc. | 122,188,918 |
| 625,478 | Hyatt Hotels Corp. Class A* | 58,926,283 |
| 591,418 | Wingstop, Inc. | 93,674,697 |
| | | | 274,789,898 |
| | Diversified Financials - 2.7% |
| 291,847 | Credit Acceptance Corp.*(1) | 135,889,800 |
| 576,882 | Hamilton Lane, Inc. Class A | 34,509,081 |
| 664,169 | Tradeweb Markets, Inc. Class A | 36,582,429 |
| | | | 206,981,310 |
| | Energy - 6.7% |
| 3,066,594 | Coterra Energy, Inc. | 95,463,071 |
| 3,873,659 | Marathon Oil Corp. | 117,952,917 |
| 1,729,396 | Ovintiv, Inc. | 87,593,907 |
| 1,226,242 | PDC Energy, Inc. | 88,461,098 |
| 1,771,565 | Targa Resources Corp. | 121,121,899 |
| | | | 510,592,892 |
| | Health Care Equipment & Services - 5.5% |
| 1,832,508 | Inari Medical, Inc.* | 140,974,840 |
| 529,311 | Insulet Corp.* | 136,990,980 |
| 1,304,403 | Integra LifeSciences Holdings Corp.* | 65,546,251 |
| 365,223 | Teleflex, Inc. | 78,362,247 |
| | | | 421,874,318 |
| | Insurance - 3.1% |
| 109,004 | Markel Corp.* | 131,469,725 |
| 25,929 | White Mountains Insurance Group Ltd. | 36,719,353 |
| 862,392 | WR Berkley Corp. | 64,144,717 |
| | | | 232,333,795 |
| | Materials - 4.3% |
| 6,061,309 | Element Solutions, Inc. | 104,254,515 |
| 760,695 | FMC Corp. | 90,446,635 |
| Shares or Principal Amount | | Market Value† |
| COMMON STOCKS - 100.2% - (continued) |
| | Materials - 4.3% - (continued) |
| 2,083,264 | Silgan Holdings, Inc. | $ 98,663,383 |
| 381,958 | Steel Dynamics, Inc. | 35,923,150 |
| | | | 329,287,683 |
| | Media & Entertainment - 2.2% |
| 101,824 | Cable One, Inc. | 87,510,600 |
| 2,633,528 | Cargurus, Inc.* | 38,344,168 |
| 699,601 | Roku, Inc.* | 38,855,839 |
| | | | 164,710,607 |
| | Pharmaceuticals, Biotechnology & Life Sciences - 13.6% |
| 251,150 | Alnylam Pharmaceuticals, Inc.* | 52,053,349 |
| 1,206,006 | Apellis Pharmaceuticals, Inc.* | 72,951,303 |
| 385,121 | Bio-Techne Corp. | 114,095,948 |
| 1,793,781 | Exact Sciences Corp.* | 62,387,703 |
| 379,224 | ICON plc* | 75,025,676 |
| 956,006 | Jazz Pharmaceuticals plc* | 137,464,103 |
| 572,395 | Neurocrine Biosciences, Inc.* | 65,894,112 |
| 1,534,332 | PTC Therapeutics, Inc.* | 58,028,436 |
| 599,356 | Repligen Corp.* | 109,376,477 |
| 884,849 | Sage Therapeutics, Inc.* | 33,323,413 |
| 742,532 | Syneos Health, Inc.* | 37,408,762 |
| 1,665,624 | Ultragenyx Pharmaceutical, Inc.* | 67,391,147 |
| 627,503 | United Therapeutics Corp.* | 144,658,267 |
| | | | 1,030,058,696 |
| | Real Estate - 1.3% |
| 2,655,610 | Host Hotels & Resorts, Inc. REIT | 50,137,917 |
| 893,099 | Rexford Industrial Realty, Inc. REIT | 49,370,512 |
| | | | 99,508,429 |
| | Retailing - 3.7% |
| 1,040,918 | CarMax, Inc.* | 65,588,243 |
| 2,806,469 | Chewy, Inc. Class A*(1) | 108,694,545 |
| 1,106,365 | Etsy, Inc.* | 103,898,737 |
| | | | 278,181,525 |
| | Semiconductors & Semiconductor Equipment - 2.2% |
| 21,411 | First Solar, Inc.* | 3,116,799 |
| 456,843 | MKS Instruments, Inc. | 37,529,653 |
| 54,441 | Monolithic Power Systems, Inc. | 18,479,998 |
| 358,708 | Silicon Laboratories, Inc.* | 41,222,723 |
| 736,722 | Synaptics, Inc.* | 65,273,569 |
| | | | 165,622,742 |
| | Software & Services - 16.2% |
| 691,705 | Datadog, Inc. Class A* | 55,689,170 |
| 2,628,968 | Dynatrace, Inc.* | 92,644,832 |
| 119,693 | Fair Isaac Corp.* | 57,313,796 |
| 3,461,192 | Genpact Ltd. | 167,867,812 |
| 905,085 | Guidewire Software, Inc.* | 53,771,100 |
| 4,938,362 | Informatica, Inc. Class A*(1) | 95,606,688 |
| 1,376,419 | LiveRamp Holdings, Inc.* | 25,271,053 |
| 386,446 | MongoDB, Inc. Class A* | 70,731,211 |
| 3,043,490 | Nuvei Corp.*(1)(2) | 91,517,744 |
| 3,893,639 | Olo, Inc. Class A* | 34,302,960 |
| 1,817,062 | Q2 Holdings, Inc.* | 56,401,605 |
| 2,640,572 | Shift4 Payments, Inc. Class A*(3) | 121,387,095 |
| 2,108,122 | Teradata Corp.* | 66,595,574 |
| 409,981 | VeriSign, Inc.* | 82,184,791 |
| 984,550 | WEX, Inc.* | 161,604,037 |
| | | | 1,232,889,468 |
| | Technology Hardware & Equipment - 5.3% |
| 441,341 | CDW Corp. | 76,268,138 |
| 2,297,006 | Coherent Corp.* | 77,202,372 |
| 2,780,936 | CommScope Holding Co., Inc.* | 36,819,593 |
| 585,572 | F5, Inc.* | 83,684,094 |
The accompanying notes are an integral part of these financial statements.
Schedule of Investments – (continued)
October 31, 2022
| Shares or Principal Amount | | Market Value† |
| COMMON STOCKS - 100.2% - (continued) |
| | Technology Hardware & Equipment - 5.3% - (continued) |
| 1,926,453 | Flex Ltd.* | $ 37,719,950 |
| 1,237,188 | Lumentum Holdings, Inc.* | 92,108,646 |
| | | | 403,802,793 |
| | Transportation - 5.7% |
| 190,193 | AMERCO | 109,397,112 |
| 793,836 | CH Robinson Worldwide, Inc. | 77,573,654 |
| 749,088 | Expeditors International of Washington, Inc. | 73,298,261 |
| 550,635 | J.B. Hunt Transport Services, Inc. | 94,197,129 |
| 1,656,105 | Knight-Swift Transportation Holdings, Inc. | 79,542,723 |
| | | | 434,008,879 |
| | Utilities - 0.9% |
| 576,737 | Black Hills Corp. | 37,701,298 |
| 1,275,909 | NiSource, Inc. | 32,778,102 |
| | | | 70,479,400 |
| | Total Common Stocks
(cost $6,750,049,101) | | $ 7,617,729,429 |
| SHORT-TERM INVESTMENTS - 2.3% |
| | Securities Lending Collateral - 2.3% |
| 27,353,447 | Goldman Sachs Financial Square Funds, Government Fund, Institutional Class, 3.07%(4) | $ 27,353,447 |
| 91,178,156 | HSBC US Government Money Market Fund, 3.09%(4) | 91,178,156 |
| 27,353,447 | Invesco Government & Agency Portfolio, Institutional Class, 3.07%(4) | 27,353,447 |
| 27,353,447 | Morgan Stanley Institutional Liquidity Funds, Government Portfolio, Institutional Class, 2.88%(4) | 27,353,447 |
| | Total Short-Term Investments
(cost $173,238,497) | $ 173,238,497 |
| | Total Investments
(cost $6,923,287,598) | 102.5% | $ 7,790,967,926 |
| | Other Assets and Liabilities | (2.5)% | (191,624,009) |
| | Total Net Assets | 100.0% | $ 7,599,343,917 |
| Note: | Percentage of investments as shown is the ratio of the total market value to total net assets. |
| | Prices of foreign equities that are principally traded on certain foreign markets will generally be adjusted daily pursuant to a fair value pricing service approved by Hartford Funds Management Company, LLC in order to reflect an adjustment for factors occurring after the close of certain foreign markets but before the close of the New York Stock Exchange. |
| | Equity industry classifications used in this report are the Global Industry Classification Standard, which was developed by and is the exclusive property and service mark of MSCI, Inc. and Standard & Poor’s. |
| | For Fund compliance purposes, the Fund may not use the same classification system. These classifications are used for financial reporting purposes. |
| | See “Glossary” for abbreviation descriptions. |
| * | Non-income producing. |
| (1) | Represents entire or partial securities on loan. See Note 8 in the accompanying Notes to Financial Statements for securities lending information. |
| (2) | Security was purchased pursuant to Rule 144A under the Securities Act of 1933 and may be sold in transactions that are exempt from registration (typically only to qualified institutional buyers) or in a public offering registered under the Securities Act of 1933. At October 31, 2022, the aggregate value of this security was $91,517,744, representing 1.2% of net assets. |
| (3) | Affiliated company – The Fund owns greater than 5% of the outstanding voting securities of this issuer. |
| (4) | Current yield as of period end. |
| † | See Significant Accounting Policies of accompanying Notes to Financial Statements regarding valuation of investments. |
The accompanying notes are an integral part of these financial statements.
Schedule of Investments – (continued)
October 31, 2022
Fair Value Summary
The following is a summary of the fair valuations according to the inputs used as of October 31, 2022 in valuing the Fund’s investments.
| Description | | Total | | Level 1 | | Level 2 | | Level 3(1) |
| Assets | | | | | | | | |
| Common Stocks | | | | | | | | |
| Automobiles & Components | | $ 50,307,275 | | $ 50,307,275 | | $ — | | $ — |
| Banks | | 200,923,888 | | 200,923,888 | | — | | — |
| Capital Goods | | 1,044,309,823 | | 1,044,309,823 | | — | | — |
| Commercial & Professional Services | | 156,626,131 | | 156,626,131 | | — | | — |
| Consumer Durables & Apparel | | 310,439,877 | | 310,439,877 | | — | | — |
| Consumer Services | | 274,789,898 | | 274,789,898 | | — | | — |
| Diversified Financials | | 206,981,310 | | 206,981,310 | | — | | — |
| Energy | | 510,592,892 | | 510,592,892 | | — | | — |
| Health Care Equipment & Services | | 421,874,318 | | 421,874,318 | | — | | — |
| Insurance | | 232,333,795 | | 232,333,795 | | — | | — |
| Materials | | 329,287,683 | | 329,287,683 | | — | | — |
| Media & Entertainment | | 164,710,607 | | 164,710,607 | | — | | — |
| Pharmaceuticals, Biotechnology & Life Sciences | | 1,030,058,696 | | 1,030,058,696 | | — | | — |
| Real Estate | | 99,508,429 | | 99,508,429 | | — | | — |
| Retailing | | 278,181,525 | | 278,181,525 | | — | | — |
| Semiconductors & Semiconductor Equipment | | 165,622,742 | | 165,622,742 | | — | | — |
| Software & Services | | 1,232,889,468 | | 1,232,889,468 | | — | | — |
| Technology Hardware & Equipment | | 403,802,793 | | 403,802,793 | | — | | — |
| Transportation | | 434,008,879 | | 434,008,879 | | — | | — |
| Utilities | | 70,479,400 | | 70,479,400 | | — | | — |
| Short-Term Investments | | 173,238,497 | | 173,238,497 | | — | | — |
| Total | | $ 7,790,967,926 | | $ 7,790,967,926 | | $ — | | $ — |
| (1) | For the year ended October 31, 2022, there were no transfers in and out of Level 3. |
The accompanying notes are an integral part of these financial statements.
The Hartford MidCap Value Fund
Schedule of Investments
October 31, 2022
| Shares or Principal Amount | | Market Value† |
| COMMON STOCKS - 99.3% |
| | Automobiles & Components - 2.2% |
| 380,965 | Gentex Corp. | $ 10,091,763 |
| 72,761 | Visteon Corp.* | 9,493,128 |
| | | | 19,584,891 |
| | Banks - 7.8% |
| 453,128 | Cadence Bank | 12,528,989 |
| 86,526 | M&T Bank Corp. | 14,568,383 |
| 113,057 | SouthState Corp. | 10,223,745 |
| 324,632 | Synovus Financial Corp. | 12,936,585 |
| 175,036 | Western Alliance Bancorp | 11,757,168 |
| 145,795 | Zions Bancorp NA | 7,572,592 |
| | | | 69,587,462 |
| | Capital Goods - 16.6% |
| 338,270 | AerCap Holdings N.V.* | 18,067,001 |
| 275,835 | Builders FirstSource, Inc.* | 17,007,986 |
| 74,906 | Curtiss-Wright Corp. | 12,571,474 |
| 164,870 | Esab Corp. | 6,149,651 |
| 335,354 | Howmet Aerospace, Inc. | 11,921,835 |
| 236,954 | Ingersoll Rand, Inc. | 11,966,177 |
| 175,604 | Johnson Controls International plc | 10,156,935 |
| 50,779 | L3Harris Technologies, Inc. | 12,515,500 |
| 96,118 | Middleby Corp.* | 13,443,064 |
| 406,202 | Spirit AeroSystems Holdings, Inc. Class A | 9,407,638 |
| 28,957 | United Rentals, Inc.* | 9,142,014 |
| 158,070 | Westinghouse Air Brake Technologies Corp. | 14,744,770 |
| | | | 147,094,045 |
| | Commercial & Professional Services - 2.6% |
| 70,516 | Clean Harbors, Inc.* | 8,635,389 |
| 142,138 | Leidos Holdings, Inc. | 14,439,800 |
| | | | 23,075,189 |
| | Consumer Durables & Apparel - 3.5% |
| 123,106 | Columbia Sportswear Co. | 9,171,397 |
| 186,883 | Lennar Corp. Class A | 15,081,458 |
| 230,160 | Steven Madden Ltd. | 6,874,879 |
| | | | 31,127,734 |
| | Consumer Services - 0.9% |
| 107,826 | Wyndham Hotels & Resorts, Inc. | 8,187,228 |
| | Diversified Financials - 3.1% |
| 160,732 | Ares Management Corp. Class A | 12,188,307 |
| 227,791 | Voya Financial, Inc. | 15,571,793 |
| | | | 27,760,100 |
| | Energy - 6.0% |
| 563,549 | Coterra Energy, Inc. | 17,543,280 |
| 129,603 | Delek U.S. Holdings, Inc. | 3,844,025 |
| 103,035 | Diamondback Energy, Inc. | 16,187,829 |
| 513,765 | Marathon Oil Corp. | 15,644,144 |
| | | | 53,219,278 |
| | Food & Staples Retailing - 1.4% |
| 431,393 | U.S. Foods Holding Corp.* | 12,838,256 |
| | Food, Beverage & Tobacco - 1.1% |
| 256,106 | Keurig Dr Pepper, Inc. | 9,947,157 |
| | Health Care Equipment & Services - 8.2% |
| 187,515 | Centene Corp.* | 15,963,152 |
| 167,045 | Dentsply Sirona, Inc. | 5,148,327 |
| 211,569 | Encompass Health Corp. | 11,517,816 |
| 98,629 | Haemonetics Corp.* | 8,378,534 |
| 58,687 | ICU Medical, Inc.* | 8,709,738 |
| 220,718 | Integra LifeSciences Holdings Corp.* | 11,091,079 |
| 33,107 | Molina Healthcare, Inc.* | 11,880,778 |
| | | | 72,689,424 |
| | Insurance - 9.8% |
| 3,215,872 | Aegon N.V. | 14,825,170 |
| Shares or Principal Amount | | Market Value† |
| COMMON STOCKS - 99.3% - (continued) |
| | Insurance - 9.8% - (continued) |
| 83,129 | Arthur J Gallagher & Co. | $ 15,551,773 |
| 43,231 | Everest Re Group Ltd. | 13,948,914 |
| 124,613 | Globe Life, Inc. | 14,395,294 |
| 72,640 | Hanover Insurance Group, Inc. | 10,641,034 |
| 363,766 | Kemper Corp. | 17,340,725 |
| | | | 86,702,910 |
| | Materials - 3.6% |
| 92,934 | Celanese Corp. Class A | 8,932,816 |
| 109,808 | FMC Corp. | 13,056,171 |
| 50,997 | Reliance Steel & Aluminum Co. | 10,274,876 |
| | | | 32,263,863 |
| | Media & Entertainment - 2.5% |
| 288,802 | Cargurus, Inc.* | 4,204,957 |
| 104,755 | Electronic Arts, Inc. | 13,194,940 |
| 100,571 | Match Group, Inc.* | 4,344,667 |
| | | | 21,744,564 |
| | Pharmaceuticals, Biotechnology & Life Sciences - 1.7% |
| 205,217 | Avantor, Inc.* | 4,139,227 |
| 221,368 | Syneos Health, Inc.* | 11,152,520 |
| | | | 15,291,747 |
| | Real Estate - 6.4% |
| 259,825 | Americold Realty Trust, Inc. REIT | 6,300,756 |
| 411,466 | Essential Properties Realty Trust, Inc. REIT | 8,854,748 |
| 275,697 | Gaming and Leisure Properties, Inc. REIT | 13,817,934 |
| 116,052 | Ryman Hospitality Properties, Inc. REIT | 10,319,344 |
| 282,772 | Welltower, Inc. REIT | 17,260,403 |
| | | | 56,553,185 |
| | Retailing - 4.7% |
| 75,265 | CarMax, Inc.* | 4,742,448 |
| 101,876 | Dollar Tree, Inc.* | 16,147,346 |
| 57,555 | Five Below, Inc.* | 8,423,174 |
| 124,615 | Ross Stores, Inc. | 11,924,409 |
| | | | 41,237,377 |
| | Semiconductors & Semiconductor Equipment - 3.6% |
| 347,700 | Allegro MicroSystems, Inc.* | 8,835,057 |
| 70,482 | Cirrus Logic, Inc.* | 4,730,752 |
| 78,340 | MKS Instruments, Inc. | 6,435,631 |
| 123,297 | ON Semiconductor Corp.* | 7,574,135 |
| 53,919 | Synaptics, Inc.* | 4,777,223 |
| | | | 32,352,798 |
| | Software & Services - 1.1% |
| 49,942 | FleetCor Technologies, Inc.* | 9,295,205 |
| | Technology Hardware & Equipment - 5.6% |
| 151,449 | Coherent Corp.* | 5,090,201 |
| 74,333 | F5, Inc.* | 10,622,929 |
| 484,887 | Flex Ltd.* | 9,494,088 |
| 187,545 | Lumentum Holdings, Inc.* | 13,962,725 |
| 267,828 | National Instruments Corp. | 10,225,673 |
| | | | 49,395,616 |
| | Transportation - 1.6% |
| 626,631 | JetBlue Airways Corp.* | 5,038,113 |
| 184,931 | Knight-Swift Transportation Holdings, Inc. | 8,882,236 |
| | | | 13,920,349 |
| | Utilities - 5.3% |
| 235,604 | Alliant Energy Corp. | 12,291,461 |
| 109,073 | Atmos Energy Corp. | 11,621,728 |
The accompanying notes are an integral part of these financial statements.
The Hartford MidCap Value Fund
Schedule of Investments – (continued)
October 31, 2022
| Shares or Principal Amount | | Market Value† |
| COMMON STOCKS - 99.3% - (continued) |
| | Utilities - 5.3% - (continued) |
| 213,725 | Evergy, Inc. | $ 13,065,009 |
| 68,346 | Sempra Energy | 10,316,145 |
| | | | 47,294,343 |
| | Total Common Stocks
(cost $790,414,116) | | $ 881,162,721 |
| SHORT-TERM INVESTMENTS - 0.4% |
| | Repurchase Agreements - 0.4% |
| $ 3,479,446 | Fixed Income Clearing Corp. Repurchase Agreement dated 10/31/2022 at 3.010%, due on 11/01/2022 with a maturity value of $3,479,737; collateralized by U.S. Treasury Inflation Index Note at 0.125%, maturing 07/15/2024, with a market value of $3,549,077 | $ 3,479,446 |
| | Total Short-Term Investments
(cost $3,479,446) | $ 3,479,446 |
| | Total Investments
(cost $793,893,562) | 99.7% | $ 884,642,167 |
| | Other Assets and Liabilities | 0.3% | 2,479,970 |
| | Total Net Assets | 100.0% | $ 887,122,137 |
| Note: | Percentage of investments as shown is the ratio of the total market value to total net assets. |
| | Prices of foreign equities that are principally traded on certain foreign markets will generally be adjusted daily pursuant to a fair value pricing service approved by Hartford Funds Management Company, LLC in order to reflect an adjustment for factors occurring after the close of certain foreign markets but before the close of the New York Stock Exchange. |
| | Equity industry classifications used in this report are the Global Industry Classification Standard, which was developed by and is the exclusive property and service mark of MSCI, Inc. and Standard & Poor’s. |
| | For Fund compliance purposes, the Fund may not use the same classification system. These classifications are used for financial reporting purposes. |
| | See “Glossary” for abbreviation descriptions. |
| * | Non-income producing. |
| † | See Significant Accounting Policies of accompanying Notes to Financial Statements regarding valuation of investments. |
Fair Value Summary
The following is a summary of the fair valuations according to the inputs used as of October 31, 2022 in valuing the Fund’s investments.
| Description | | Total | | Level 1 | | Level 2 | | Level 3(1) |
| Assets | | | | | | | | |
| Common Stocks | | | | | | | | |
| Automobiles & Components | | $ 19,584,891 | | $ 19,584,891 | | $ — | | $ — |
| Banks | | 69,587,462 | | 69,587,462 | | — | | — |
| Capital Goods | | 147,094,045 | | 147,094,045 | | — | | — |
| Commercial & Professional Services | | 23,075,189 | | 23,075,189 | | — | | — |
| Consumer Durables & Apparel | | 31,127,734 | | 31,127,734 | | — | | — |
| Consumer Services | | 8,187,228 | | 8,187,228 | | — | | — |
| Diversified Financials | | 27,760,100 | | 27,760,100 | | — | | — |
| Energy | | 53,219,278 | | 53,219,278 | | — | | — |
| Food & Staples Retailing | | 12,838,256 | | 12,838,256 | | — | | — |
| Food, Beverage & Tobacco | | 9,947,157 | | 9,947,157 | | — | | — |
| Health Care Equipment & Services | | 72,689,424 | | 72,689,424 | | — | | — |
| Insurance | | 86,702,910 | | 86,702,910 | | — | | — |
| Materials | | 32,263,863 | | 32,263,863 | | — | | — |
| Media & Entertainment | | 21,744,564 | | 21,744,564 | | — | | — |
| Pharmaceuticals, Biotechnology & Life Sciences | | 15,291,747 | | 15,291,747 | | — | | — |
| Real Estate | | 56,553,185 | | 56,553,185 | | — | | — |
| Retailing | | 41,237,377 | | 41,237,377 | | — | | — |
| Semiconductors & Semiconductor Equipment | | 32,352,798 | | 32,352,798 | | — | | — |
| Software & Services | | 9,295,205 | | 9,295,205 | | — | | — |
| Technology Hardware & Equipment | | 49,395,616 | | 49,395,616 | | — | | — |
| Transportation | | 13,920,349 | | 13,920,349 | | — | | — |
| Utilities | | 47,294,343 | | 47,294,343 | | — | | — |
| Short-Term Investments | | 3,479,446 | | — | | 3,479,446 | | — |
| Total | | $ 884,642,167 | | $ 881,162,721 | | $ 3,479,446 | | $ — |
| (1) | For the year ended October 31, 2022, there were no transfers in and out of Level 3. |
The accompanying notes are an integral part of these financial statements.
Hartford Quality Value Fund
Schedule of Investments
October 31, 2022
| Shares or Principal Amount | | Market Value† |
| COMMON STOCKS - 98.4% |
| | Banks - 7.8% |
| 114,274 | Bank of America Corp. | $ 4,118,435 |
| 56,956 | Bank of Nova Scotia | 2,752,114 |
| 61,277 | JP Morgan Chase & Co. | 7,713,549 |
| 27,820 | PNC Financial Services Group, Inc. | 4,502,110 |
| | | | 19,086,208 |
| | Capital Goods - 9.2% |
| 16,061 | Curtiss-Wright Corp. | 2,695,518 |
| 20,746 | Honeywell International, Inc. | 4,232,599 |
| 84,017 | Johnson Controls International plc | 4,859,543 |
| 7,534 | Lockheed Martin Corp. | 3,666,647 |
| 48,382 | Otis Worldwide Corp. | 3,417,705 |
| 39,654 | Westinghouse Air Brake Technologies Corp. | 3,698,925 |
| | | | 22,570,937 |
| | Consumer Services - 3.2% |
| 22,960 | Hilton Worldwide Holdings, Inc. | 3,105,569 |
| 17,389 | McDonald's Corp. | 4,741,285 |
| | | | 7,846,854 |
| | Diversified Financials - 4.3% |
| 29,964 | American Express Co. | 4,448,156 |
| 44,534 | Charles Schwab Corp. | 3,548,024 |
| 31,476 | Morgan Stanley | 2,586,383 |
| | | | 10,582,563 |
| | Energy - 6.6% |
| 35,447 | Chevron Corp. | 6,412,362 |
| 27,818 | EOG Resources, Inc. | 3,797,714 |
| 110,351 | TotalEnergies SE ADR | 6,043,924 |
| | | | 16,254,000 |
| | Food & Staples Retailing - 2.4% |
| 29,856 | Sysco Corp. | 2,584,335 |
| 22,406 | Walmart, Inc. | 3,189,046 |
| | | | 5,773,381 |
| | Food, Beverage & Tobacco - 3.8% |
| 30,283 | Keurig Dr Pepper, Inc. | 1,176,192 |
| 65,261 | Mondelez International, Inc. Class A | 4,012,246 |
| 46,172 | Philip Morris International, Inc. | 4,240,898 |
| | | | 9,429,336 |
| | Health Care Equipment & Services - 9.8% |
| 56,921 | Baxter International, Inc. | 3,093,656 |
| 19,000 | Becton Dickinson and Co. | 4,483,430 |
| 10,409 | Elevance Health, Inc. | 5,691,329 |
| 52,163 | Medtronic plc | 4,555,917 |
| 11,166 | UnitedHealth Group, Inc. | 6,198,805 |
| | | | 24,023,137 |
| | Household & Personal Products - 2.1% |
| 46,532 | Colgate-Palmolive Co. | 3,435,923 |
| 38,346 | Unilever plc ADR | 1,745,126 |
| | | | 5,181,049 |
| | Insurance - 8.6% |
| 48,503 | American International Group, Inc. | 2,764,671 |
| 14,037 | Chubb Ltd. | 3,016,411 |
| 19,430 | Marsh & McLennan Cos., Inc. | 3,137,751 |
| 54,592 | MetLife, Inc. | 3,996,680 |
| 60,307 | Principal Financial Group, Inc. | 5,314,856 |
| 28,093 | Prudential Financial, Inc. | 2,955,103 |
| | | | 21,185,472 |
| | Materials - 3.6% |
| 33,296 | Celanese Corp. Class A | 3,200,412 |
| 27,515 | FMC Corp. | 3,271,533 |
| 20,784 | PPG Industries, Inc. | 2,373,117 |
| | | | 8,845,062 |
| Shares or Principal Amount | | Market Value† |
| COMMON STOCKS - 98.4% - (continued) |
| | Media & Entertainment - 4.3% |
| 33,548 | Alphabet, Inc. Class A* | $ 3,170,622 |
| 114,342 | Comcast Corp. Class A | 3,629,215 |
| 49,960 | Omnicom Group, Inc. | 3,634,590 |
| | | | 10,434,427 |
| | Pharmaceuticals, Biotechnology & Life Sciences - 7.5% |
| 79,028 | AstraZeneca plc ADR | 4,647,637 |
| 49,370 | Merck & Co., Inc. | 4,996,244 |
| 33,114 | Novartis AG ADR | 2,686,539 |
| 128,386 | Pfizer, Inc. | 5,976,368 |
| | | | 18,306,788 |
| | Real Estate - 4.2% |
| 10,685 | American Tower Corp. REIT | 2,213,825 |
| 144,221 | Host Hotels & Resorts, Inc. REIT | 2,722,892 |
| 7,656 | Public Storage REIT | 2,371,446 |
| 89,436 | VICI Properties, Inc. REIT | 2,863,741 |
| | | | 10,171,904 |
| | Retailing - 2.4% |
| 12,397 | Lowe's Cos., Inc. | 2,416,795 |
| 46,439 | TJX Cos., Inc. | 3,348,252 |
| | | | 5,765,047 |
| | Semiconductors & Semiconductor Equipment - 3.3% |
| 4,193 | Broadcom, Inc. | 1,971,213 |
| 59,591 | Intel Corp. | 1,694,172 |
| 28,163 | Texas Instruments, Inc. | 4,523,823 |
| | | | 8,189,208 |
| | Software & Services - 4.9% |
| 13,494 | Accenture plc Class A | 3,830,946 |
| 65,559 | Cognizant Technology Solutions Corp. Class A | 4,081,048 |
| 48,122 | Fidelity National Information Services, Inc. | 3,993,645 |
| | | | 11,905,639 |
| | Technology Hardware & Equipment - 1.9% |
| 101,658 | Cisco Systems, Inc. | 4,618,323 |
| | Telecommunication Services - 1.7% |
| 108,518 | Verizon Communications, Inc. | 4,055,318 |
| | Transportation - 1.6% |
| 109,207 | Southwest Airlines Co.* | 3,969,674 |
| | Utilities - 5.2% |
| 43,889 | Dominion Energy, Inc. | 3,070,913 |
| 32,540 | Duke Energy Corp. | 3,032,077 |
| 34,034 | Eversource Energy | 2,596,114 |
| 26,360 | Sempra Energy | 3,978,778 |
| | | | 12,677,882 |
| | Total Common Stocks
(cost $206,259,135) | | $ 240,872,209 |
The accompanying notes are an integral part of these financial statements.
Hartford Quality Value Fund
Schedule of Investments – (continued)
October 31, 2022
| Shares or Principal Amount | | Market Value† |
| SHORT-TERM INVESTMENTS - 1.0% |
| | Repurchase Agreements - 1.0% |
| $�� 2,479,802 | Fixed Income Clearing Corp. Repurchase Agreement dated 10/31/2022 at 3.010%, due on 11/01/2022 with a maturity value of $2,480,009; collateralized by U.S. Treasury Note at 2.125%, maturing 07/31/2024, with a market value of $2,529,451 | $ 2,479,802 |
| | Total Short-Term Investments
(cost $2,479,802) | $ 2,479,802 |
| | Total Investments
(cost $208,738,937) | 99.4% | $ 243,352,011 |
| | Other Assets and Liabilities | 0.6% | 1,522,102 |
| | Total Net Assets | 100.0% | $ 244,874,113 |
| Note: | Percentage of investments as shown is the ratio of the total market value to total net assets. |
| | Prices of foreign equities that are principally traded on certain foreign markets will generally be adjusted daily pursuant to a fair value pricing service approved by Hartford Funds Management Company, LLC in order to reflect an adjustment for factors occurring after the close of certain foreign markets but before the close of the New York Stock Exchange. |
| | Equity industry classifications used in this report are the Global Industry Classification Standard, which was developed by and is the exclusive property and service mark of MSCI, Inc. and Standard & Poor’s. |
| | For Fund compliance purposes, the Fund may not use the same classification system. These classifications are used for financial reporting purposes. |
| | See “Glossary” for abbreviation descriptions. |
| * | Non-income producing. |
| † | See Significant Accounting Policies of accompanying Notes to Financial Statements regarding valuation of investments. |
Fair Value Summary
The following is a summary of the fair valuations according to the inputs used as of October 31, 2022 in valuing the Fund’s investments.
| Description | | Total | | Level 1 | | Level 2 | | Level 3(1) |
| Assets | | | | | | | | |
| Common Stocks | | | | | | | | |
| Banks | | $ 19,086,208 | | $ 19,086,208 | | $ — | | $ — |
| Capital Goods | | 22,570,937 | | 22,570,937 | | — | | — |
| Consumer Services | | 7,846,854 | | 7,846,854 | | — | | — |
| Diversified Financials | | 10,582,563 | | 10,582,563 | | — | | — |
| Energy | | 16,254,000 | | 16,254,000 | | — | | — |
| Food & Staples Retailing | | 5,773,381 | | 5,773,381 | | — | | — |
| Food, Beverage & Tobacco | | 9,429,336 | | 9,429,336 | | — | | — |
| Health Care Equipment & Services | | 24,023,137 | | 24,023,137 | | — | | — |
| Household & Personal Products | | 5,181,049 | | 5,181,049 | | — | | — |
| Insurance | | 21,185,472 | | 21,185,472 | | — | | — |
| Materials | | 8,845,062 | | 8,845,062 | | — | | — |
| Media & Entertainment | | 10,434,427 | | 10,434,427 | | — | | — |
| Pharmaceuticals, Biotechnology & Life Sciences | | 18,306,788 | | 18,306,788 | | — | | — |
| Real Estate | | 10,171,904 | | 10,171,904 | | — | | — |
| Retailing | | 5,765,047 | | 5,765,047 | | — | | — |
| Semiconductors & Semiconductor Equipment | | 8,189,208 | | 8,189,208 | | — | | — |
| Software & Services | | 11,905,639 | | 11,905,639 | | — | | — |
| Technology Hardware & Equipment | | 4,618,323 | | 4,618,323 | | — | | — |
| Telecommunication Services | | 4,055,318 | | 4,055,318 | | — | | — |
| Transportation | | 3,969,674 | | 3,969,674 | | — | | — |
| Utilities | | 12,677,882 | | 12,677,882 | | — | | — |
| Short-Term Investments | | 2,479,802 | | — | | 2,479,802 | | — |
| Total | | $ 243,352,011 | | $ 240,872,209 | | $ 2,479,802 | | $ — |
| (1) | For the year ended October 31, 2022, there were no transfers in and out of Level 3. |
The accompanying notes are an integral part of these financial statements.
The Hartford Small Cap Growth Fund
Schedule of Investments
October 31, 2022
| Shares or Principal Amount | | Market Value† |
| COMMON STOCKS - 97.1% |
| | Automobiles & Components - 2.5% |
| 58,685 | Fox Factory Holding Corp.* | $ 5,155,477 |
| 54,942 | Patrick Industries, Inc. | 2,511,399 |
| 42,304 | Thor Industries, Inc. | 3,446,507 |
| 10,200 | Visteon Corp.* | 1,330,794 |
| | | | 12,444,177 |
| | Banks - 2.9% |
| 314,890 | MGIC Investment Corp. | 4,298,248 |
| 101,694 | Synovus Financial Corp. | 4,052,506 |
| 54,325 | Triumph Bancorp, Inc.* | 2,797,738 |
| 48,005 | Western Alliance Bancorp | 3,224,496 |
| | | | 14,372,988 |
| | Capital Goods - 13.4% |
| 63,918 | Altra Industrial Motion Corp. | 3,844,029 |
| 49,572 | Ameresco, Inc. Class A* | 2,998,115 |
| 75,346 | Applied Industrial Technologies, Inc. | 9,371,535 |
| 46,563 | Armstrong World Industries, Inc. | 3,518,766 |
| 31,493 | Boise Cascade Co. | 2,102,788 |
| 38,517 | Chart Industries, Inc.* | 8,584,669 |
| 31,348 | Curtiss-Wright Corp. | 5,261,135 |
| 19,266 | Herc Holdings, Inc. | 2,265,874 |
| 49,793 | ITT, Inc. | 3,803,687 |
| 51,080 | John Bean Technologies Corp. | 4,658,496 |
| 77,469 | SPX Technologies, Inc.* | 5,100,559 |
| 185,624 | Stem, Inc.* | 2,524,486 |
| 169,897 | WillScot Mobile Mini Holdings Corp.* | 7,225,719 |
| 246,624 | Zurn Water Solutions Corp. | 5,793,198 |
| | | | 67,053,056 |
| | Commercial & Professional Services - 7.1% |
| 63,342 | ASGN, Inc.* | 5,370,135 |
| 22,102 | CACI International, Inc. Class A* | 6,719,671 |
| 49,587 | Casella Waste Systems, Inc. Class A* | 4,056,712 |
| 21,721 | Clean Harbors, Inc.* | 2,659,954 |
| 34,595 | Exponent, Inc. | 3,295,520 |
| 51,475 | Insperity, Inc. | 6,075,080 |
| 73,946 | KBR, Inc. | 3,680,292 |
| 25,044 | Tetra Tech, Inc. | 3,538,216 |
| | | | 35,395,580 |
| | Consumer Durables & Apparel - 3.0% |
| 78,838 | Crocs, Inc.* | 5,577,789 |
| 14,242 | Deckers Outdoor Corp.* | 4,983,703 |
| 6,562 | TopBuild Corp.* | 1,116,459 |
| 107,156 | YETI Holdings, Inc.* | 3,437,564 |
| | | | 15,115,515 |
| | Consumer Services - 4.5% |
| 19,245 | Churchill Downs, Inc. | 4,001,228 |
| 78,987 | Penn National Gaming, Inc.* | 2,614,469 |
| 81,880 | Texas Roadhouse, Inc. Class A | 8,102,026 |
| 51,187 | Wingstop, Inc. | 8,107,509 |
| | | | 22,825,232 |
| | Diversified Financials - 0.9% |
| 75,280 | Stifel Financial Corp. | 4,657,574 |
| | Energy - 6.4% |
| 39,124 | Chord Energy Corp. | 5,989,493 |
| 99,885 | Helmerich & Payne, Inc. | 4,945,307 |
| 248,949 | Magnolia Oil & Gas Corp. Class A | 6,393,010 |
| 71,011 | Ovintiv, Inc. | 3,596,707 |
| 70,345 | PDC Energy, Inc. | 5,074,688 |
| 130,508 | SM Energy Co. | 5,870,250 |
| | | | 31,869,455 |
| | Food & Staples Retailing - 0.8% |
| 75,408 | Performance Food Group Co.* | 3,924,232 |
| Shares or Principal Amount | | Market Value† |
| COMMON STOCKS - 97.1% - (continued) |
| | Food, Beverage & Tobacco - 4.2% |
| 6,060 | Boston Beer Co., Inc. Class A* | $ 2,262,137 |
| 42,470 | Celsius Holdings, Inc.* | 3,868,168 |
| 52,061 | Freshpet, Inc.* | 3,068,996 |
| 25,306 | Lancaster Colony Corp. | 4,562,166 |
| 93,053 | Simply Good Foods Co.* | 3,563,930 |
| 262,426 | Sovos Brands, Inc.* | 3,637,224 |
| | | | 20,962,621 |
| | Health Care Equipment & Services - 10.3% |
| 16,776 | Amedisys, Inc.* | 1,637,170 |
| 49,043 | AtriCure, Inc.* | 2,065,691 |
| 65,260 | Glaukos Corp.* | 3,659,128 |
| 79,402 | Globus Medical, Inc. Class A* | 5,319,934 |
| 76,906 | Haemonetics Corp.* | 6,533,165 |
| 100,320 | Health Catalyst, Inc.* | 884,822 |
| 51,984 | HealthEquity, Inc.* | 4,050,073 |
| 45,447 | Inari Medical, Inc.* | 3,496,238 |
| 82,490 | Integra LifeSciences Holdings Corp.* | 4,145,123 |
| 7,923 | LHC Group, Inc.* | 1,323,933 |
| 17,082 | ModivCare, Inc.* | 1,661,054 |
| 49,770 | Omnicell, Inc.* | 3,848,216 |
| 146,510 | Owens & Minor, Inc. | 2,490,670 |
| 363,137 | R1 RCM, Inc.* | 6,412,999 |
| 7,058 | Shockwave Medical, Inc.* | 2,069,053 |
| 34,879 | Tandem Diabetes Care, Inc.* | 1,958,456 |
| | | | 51,555,725 |
| | Household & Personal Products - 0.5% |
| 215,677 | Beauty Health Co.*(1) | 2,465,188 |
| | Insurance - 0.4% |
| 83,579 | James River Group Holdings Ltd. | 2,112,041 |
| | Materials - 3.7% |
| 197,980 | Axalta Coating Systems Ltd.* | 4,616,894 |
| 66,031 | Cabot Corp. | 4,851,958 |
| 33,354 | Ingevity Corp.* | 2,243,723 |
| 178,196 | Livent Corp.* | 5,625,648 |
| 21,799 | Louisiana-Pacific Corp. | 1,234,913 |
| | | | 18,573,136 |
| | Media & Entertainment - 1.4% |
| 110,061 | Bumble, Inc. Class A* | 2,795,550 |
| 56,906 | Ziff Davis, Inc.*(1) | 4,403,955 |
| | | | 7,199,505 |
| | Pharmaceuticals, Biotechnology & Life Sciences - 12.2% |
| 136,836 | Aclaris Therapeutics, Inc.* | 2,136,010 |
| 68,906 | Apellis Pharmaceuticals, Inc.* | 4,168,124 |
| 52,213 | Blueprint Medicines Corp.* | 2,706,722 |
| 65,310 | Celldex Therapeutics, Inc.* | 2,294,340 |
| 88,800 | Crinetics Pharmaceuticals, Inc.* | 1,639,248 |
| 67,288 | Cytokinetics, Inc.* | 2,937,794 |
| 84,766 | Denali Therapeutics, Inc.* | 2,431,089 |
| 27,568 | Halozyme Therapeutics, Inc.* | 1,318,026 |
| 46,087 | Harmony Biosciences Holdings, Inc.* | 2,396,524 |
| 366,255 | ImmunoGen, Inc.* | 2,175,555 |
| 73,248 | Inhibrx, Inc.* | 2,357,121 |
| 69,907 | Intra-Cellular Therapies, Inc.* | 3,192,653 |
| 18,532 | Karuna Therapeutics, Inc.* | 4,064,809 |
| 65,368 | Kymera Therapeutics, Inc.* | 1,983,265 |
| 26,939 | Mirati Therapeutics, Inc.* | 1,813,533 |
| 78,190 | Morphic Holding, Inc.* | 2,190,102 |
| 89,156 | NanoString Technologies, Inc.* | 932,572 |
| 54,496 | Pacira BioSciences, Inc.* | 2,820,713 |
| 59,673 | PTC Therapeutics, Inc.* | 2,256,833 |
| 94,345 | Revolution Medicines, Inc.* | 1,911,430 |
| 42,377 | Sage Therapeutics, Inc.* | 1,595,918 |
| 83,565 | Stoke Therapeutics, Inc.* | 1,240,940 |
| 87,736 | Syndax Pharmaceuticals, Inc.* | 2,014,418 |
The accompanying notes are an integral part of these financial statements.
The Hartford Small Cap Growth Fund
Schedule of Investments – (continued)
October 31, 2022
| Shares or Principal Amount | | Market Value† |
| COMMON STOCKS - 97.1% - (continued) |
| | Pharmaceuticals, Biotechnology & Life Sciences - 12.2% -
(continued) |
| 8,279 | United Therapeutics Corp.* | $ 1,908,558 |
| 84,534 | Vaxcyte, Inc.* | 3,686,528 |
| 67,694 | Veracyte, Inc.* | 1,361,326 |
| 66,058 | Zentalis Pharmaceuticals, Inc.* | 1,657,395 |
| | | | 61,191,546 |
| | Real Estate - 2.2% |
| 38,654 | Agree Realty Corp. REIT | 2,655,530 |
| 133,598 | Phillips Edison & Co., Inc. REIT | 4,026,644 |
| 46,533 | Ryman Hospitality Properties, Inc. REIT | 4,137,714 |
| | | | 10,819,888 |
| | Retailing - 1.2% |
| 19,887 | Burlington Stores, Inc.* | 2,843,045 |
| 55,839 | Ollie's Bargain Outlet Holdings, Inc.* | 3,126,984 |
| | | | 5,970,029 |
| | Semiconductors & Semiconductor Equipment - 4.0% |
| 46,904 | Axcelis Technologies, Inc.* | 2,720,432 |
| 37,606 | Cirrus Logic, Inc.* | 2,524,115 |
| 40,183 | Lattice Semiconductor Corp.* | 1,949,277 |
| 26,040 | MKS Instruments, Inc. | 2,139,186 |
| 62,936 | Power Integrations, Inc. | 4,198,460 |
| 29,164 | Silicon Laboratories, Inc.* | 3,351,527 |
| 37,488 | Synaptics, Inc.* | 3,321,437 |
| | | | 20,204,434 |
| | Software & Services - 12.0% |
| 66,812 | Alarm.com Holdings, Inc.* | 3,931,218 |
| 56,730 | Blackbaud, Inc.* | 3,103,131 |
| 45,622 | Ceridian HCM Holding, Inc.* | 3,019,720 |
| 35,285 | Concentrix Corp. | 4,312,886 |
| 30,882 | Consensus Cloud Solutions, Inc.* | 1,733,716 |
| 42,597 | DigitalOcean Holdings, Inc.*(1) | 1,530,084 |
| 26,927 | ExlService Holdings, Inc.* | 4,896,675 |
| 28,263 | Five9, Inc.* | 1,703,128 |
| 39,084 | Manhattan Associates, Inc.* | 4,755,350 |
| 97,033 | Olo, Inc. Class A* | 854,861 |
| 65,725 | Perficient, Inc.* | 4,401,603 |
| 56,444 | Rapid7, Inc.* | 2,555,220 |
| 170,033 | Repay Holdings Corp.* | 1,035,501 |
| 77,927 | Shift4 Payments, Inc. Class A* | 3,582,304 |
| 59,520 | Sprout Social, Inc. Class A* | 3,590,842 |
| 104,604 | Varonis Systems, Inc.* | 2,800,249 |
| 411,065 | Verra Mobility Corp. Class A* | 7,016,880 |
| 12,174 | WEX, Inc.* | 1,998,240 |
| 41,468 | Workiva, Inc.* | 3,226,625 |
| | | | 60,048,233 |
| | Technology Hardware & Equipment - 3.5% |
| 52,775 | Fabrinet * | 6,037,460 |
| 45,715 | Insight Enterprises, Inc.* | 4,320,525 |
| 42,428 | Lumentum Holdings, Inc.* | 3,158,764 |
| 28,217 | Novanta, Inc.* | 3,989,884 |
| | | | 17,506,633 |
| | Total Common Stocks
(cost $404,751,289) | | $ 486,266,788 |
| Shares or Principal Amount | | Market Value† |
| EXCHANGE-TRADED FUNDS - 2.0% |
| | Other Investment Pools & Funds - 2.0% |
| 43,860 | iShares Russell 2000 Growth ETF | $ 9,923,764 |
| | Total Exchange-Traded Funds
(cost $9,267,874) | | $ 9,923,764 |
| | Total Long-Term Investments
(cost $414,019,163) | | $ 496,190,552 |
| SHORT-TERM INVESTMENTS - 1.4% |
| | Repurchase Agreements - 1.0% |
| $ 4,704,763 | Fixed Income Clearing Corp. Repurchase Agreement dated 10/31/2022 at 3.010%, due on 11/01/2022 with a maturity value of $4,705,156; collateralized by U.S. Treasury Inflation Index Note at 0.125%, maturing 10/15/2024, with a market value of $4,798,881 | $ 4,704,763 |
| | Securities Lending Collateral - 0.4% |
| 325,682 | Goldman Sachs Financial Square Funds, Government Fund, Institutional Class, 3.07%(2) | 325,682 |
| 1,085,606 | HSBC US Government Money Market Fund, 3.09%(2) | 1,085,606 |
| 325,682 | Invesco Government & Agency Portfolio, Institutional Class, 3.07%(2) | 325,682 |
| 325,682 | Morgan Stanley Institutional Liquidity Funds, Government Portfolio, Institutional Class, 2.88%(2) | 325,682 |
| | | | 2,062,652 |
| | Total Short-Term Investments
(cost $6,767,415) | $ 6,767,415 |
| | Total Investments
(cost $420,786,578) | 100.5% | $ 502,957,967 |
| | Other Assets and Liabilities | (0.5)% | (2,520,012) |
| | Total Net Assets | 100.0% | $ 500,437,955 |
| Note: | Percentage of investments as shown is the ratio of the total market value to total net assets. |
| | For Fund compliance purposes, the Fund may not use the same classification system. These classifications are used for financial reporting purposes. |
| | See “Glossary” for abbreviation descriptions. |
| * | Non-income producing. |
| (1) | Represents entire or partial securities on loan. See Note 8 in the accompanying Notes to Financial Statements for securities lending information. |
| (2) | Current yield as of period end. |
| † | See Significant Accounting Policies of accompanying Notes to Financial Statements regarding valuation of investments. |
The accompanying notes are an integral part of these financial statements.
The Hartford Small Cap Growth Fund
Schedule of Investments – (continued)
October 31, 2022
Fair Value Summary
The following is a summary of the fair valuations according to the inputs used as of October 31, 2022 in valuing the Fund’s investments.
| Description | | Total | | Level 1 | | Level 2 | | Level 3(1) |
| Assets | | | | | | | | |
| Common Stocks | | | | | | | | |
| Automobiles & Components | | $ 12,444,177 | | $ 12,444,177 | | $ — | | $ — |
| Banks | | 14,372,988 | | 14,372,988 | | — | | — |
| Capital Goods | | 67,053,056 | | 67,053,056 | | — | | — |
| Commercial & Professional Services | | 35,395,580 | | 35,395,580 | | — | | — |
| Consumer Durables & Apparel | | 15,115,515 | | 15,115,515 | | — | | — |
| Consumer Services | | 22,825,232 | | 22,825,232 | | — | | — |
| Diversified Financials | | 4,657,574 | | 4,657,574 | | — | | — |
| Energy | | 31,869,455 | | 31,869,455 | | — | | — |
| Food & Staples Retailing | | 3,924,232 | | 3,924,232 | | — | | — |
| Food, Beverage & Tobacco | | 20,962,621 | | 20,962,621 | | — | | — |
| Health Care Equipment & Services | | 51,555,725 | | 51,555,725 | | — | | — |
| Household & Personal Products | | 2,465,188 | | 2,465,188 | | — | | — |
| Insurance | | 2,112,041 | | 2,112,041 | | — | | — |
| Materials | | 18,573,136 | | 18,573,136 | | — | | — |
| Media & Entertainment | | 7,199,505 | | 7,199,505 | | — | | — |
| Pharmaceuticals, Biotechnology & Life Sciences | | 61,191,546 | | 61,191,546 | | — | | — |
| Real Estate | | 10,819,888 | | 10,819,888 | | — | | — |
| Retailing | | 5,970,029 | | 5,970,029 | | — | | — |
| Semiconductors & Semiconductor Equipment | | 20,204,434 | | 20,204,434 | | — | | — |
| Software & Services | | 60,048,233 | | 60,048,233 | | — | | — |
| Technology Hardware & Equipment | | 17,506,633 | | 17,506,633 | | — | | — |
| Exchange-Traded Funds | | 9,923,764 | | 9,923,764 | | — | | — |
| Short-Term Investments | | 6,767,415 | | 2,062,652 | | 4,704,763 | | — |
| Total | | $ 502,957,967 | | $ 498,253,204 | | $ 4,704,763 | | $ — |
| (1) | For the year ended October 31, 2022, there were no transfers in and out of Level 3. |
The accompanying notes are an integral part of these financial statements.
Hartford Small Cap Value Fund
Schedule of Investments
October 31, 2022
| Shares or Principal Amount | | Market Value† |
| COMMON STOCKS - 97.1% |
| | Banks - 20.9% |
| 44,714 | Bank OZK | $ 1,921,808 |
| 70,401 | Berkshire Hills Bancorp, Inc. | 2,059,229 |
| 87,420 | Cadence Bank | 2,417,163 |
| 21,861 | Federal Agricultural Mortgage Corp. Class C | 2,518,387 |
| 75,462 | First Hawaiian, Inc. | 1,930,318 |
| 62,917 | First Interstate BancSystem, Inc. Class A | 2,869,644 |
| 170,282 | FNB Corp. | 2,460,575 |
| 114,145 | Home BancShares, Inc. | 2,909,556 |
| 69,972 | Pacific Premier Bancorp, Inc. | 2,547,681 |
| 127,955 | Radian Group, Inc. | 2,670,421 |
| 57,132 | Sandy Spring Bancorp, Inc. | 2,024,758 |
| | | | 26,329,540 |
| | Capital Goods - 9.4% |
| 53,326 | Air Lease Corp. | 1,881,875 |
| 30,507 | EnerSys | 2,022,309 |
| 72,057 | Kennametal, Inc. | 1,924,642 |
| 22,101 | McGrath Rent Corp. | 2,078,599 |
| 173,061 | REV Group, Inc. | 2,377,858 |
| 66,460 | Spirit AeroSystems Holdings, Inc. Class A | 1,539,214 |
| | | | 11,824,497 |
| | Commercial & Professional Services - 8.4% |
| 168,967 | BrightView Holdings, Inc.* | 1,507,186 |
| 144,151 | CoreCivic, Inc. REIT* | 1,509,261 |
| 65,615 | Deluxe Corp. | 1,206,004 |
| 81,535 | Loomis AB | 2,282,859 |
| 98,482 | MillerKnoll Inc. | 2,085,849 |
| 18,966 | Science Applications International Corp. | 2,054,776 |
| | | | 10,645,935 |
| | Consumer Durables & Apparel - 6.1% |
| 23,545 | Carter's, Inc. | 1,597,999 |
| 54,841 | Kontoor Brands, Inc. | 1,957,824 |
| 67,577 | Steven Madden Ltd. | 2,018,525 |
| 38,570 | Sturm Ruger & Co., Inc. | 2,164,934 |
| | | | 7,739,282 |
| | Consumer Services - 4.0% |
| 58,760 | Adtalem Global Education, Inc.* | 2,450,292 |
| 22,393 | Cracker Barrel Old Country Store, Inc. | 2,557,729 |
| | | | 5,008,021 |
| | Diversified Financials - 7.1% |
| 248,899 | Greenhill & Co., Inc. | 1,764,694 |
| 109,299 | Navient Corp. | 1,654,787 |
| 56,569 | PRA Group, Inc.* | 1,895,061 |
| 114,176 | PROG Holdings, Inc.* | 1,886,187 |
| 207,762 | Rithm Capital Corp. REIT | 1,751,434 |
| | | | 8,952,163 |
| | Energy - 4.5% |
| 69,124 | ChampionX Corp. | 1,978,329 |
| 80,533 | DMC Global, Inc.* | 1,742,734 |
| 180,981 | TechnipFMC plc* | 1,916,589 |
| | | | 5,637,652 |
| | Health Care Equipment & Services - 4.9% |
| 94,955 | NextGen Healthcare, Inc.* | 1,902,898 |
| 46,076 | NuVasive, Inc.* | 2,033,334 |
| 64,169 | Premier, Inc. Class A | 2,238,215 |
| | | | 6,174,447 |
| | Household & Personal Products - 4.6% |
| 54,359 | Edgewell Personal Care Co. | 2,130,329 |
| 68,463 | Energizer Holdings, Inc. | 1,977,896 |
| 14,543 | Medifast, Inc. | 1,701,386 |
| | | | 5,809,611 |
| | Insurance - 6.5% |
| 39,822 | Kemper Corp. | 1,898,315 |
| Shares or Principal Amount | | Market Value† |
| COMMON STOCKS - 97.1% - (continued) |
| | Insurance - 6.5% - (continued) |
| 305,637 | Lancashire Holdings Ltd. | $ 1,734,531 |
| 97,292 | ProAssurance Corp. | 2,160,855 |
| 371,454 | Siriuspoint Ltd.* | 2,384,735 |
| | | | 8,178,436 |
| | Materials - 3.3% |
| 45,325 | Compass Minerals International, Inc. | 1,792,150 |
| 99,608 | Mativ, Inc. | 2,364,694 |
| | | | 4,156,844 |
| | Media & Entertainment - 1.1% |
| 122,131 | MediaAlpha, Inc. Class A* | 1,340,998 |
| | Pharmaceuticals, Biotechnology & Life Sciences - 1.5% |
| 37,637 | Pacira BioSciences, Inc.* | 1,948,091 |
| | Real Estate - 2.8% |
| 136,247 | Pebblebrook Hotel Trust REIT | 2,185,402 |
| 125,539 | Piedmont Office Realty Trust, Inc. Class A, REIT | 1,311,882 |
| | | | 3,497,284 |
| | Retailing - 1.9% |
| 50,834 | Monro, Inc. | 2,427,324 |
| | Semiconductors & Semiconductor Equipment - 4.2% |
| 64,957 | Ichor Holdings Ltd.* | 1,652,506 |
| 70,480 | Rambus, Inc.* | 2,125,677 |
| 27,990 | Silicon Motion Technology Corp. ADR | 1,497,185 |
| | | | 5,275,368 |
| | Software & Services - 4.3% |
| 230,282 | Adeia, Inc. | 2,574,553 |
| 43,797 | InterDigital, Inc. | 2,184,156 |
| 46,416 | Xperi, Inc.* | 648,432 |
| | | | 5,407,141 |
| | Utilities - 1.6% |
| 46,295 | Portland General Electric Co. | 2,080,497 |
| | Total Common Stocks
(cost $118,757,220) | | $ 122,433,131 |
| EXCHANGE-TRADED FUNDS - 1.9% |
| | Other Investment Pools & Funds - 1.9% |
| 16,319 | iShares Russell 2000 Value ETF | $ 2,371,477 |
| | Total Exchange-Traded Funds
(cost $2,171,052) | | $ 2,371,477 |
| | Total Long-Term Investments
(cost $120,928,272) | | $ 124,804,608 |
| SHORT-TERM INVESTMENTS - 1.0% |
| | Repurchase Agreements - 1.0% |
| $ 1,293,076 | Fixed Income Clearing Corp. Repurchase Agreement dated 10/31/2022 at 3.010%, due on 11/01/2022 with a maturity value of $1,293,184; collateralized by U.S. Treasury Note at 2.125%, maturing 07/31/2024, with a market value of $1,319,005 | $ 1,293,076 |
| | Total Short-Term Investments
(cost $1,293,076) | $ 1,293,076 |
| | Total Investments
(cost $122,221,348) | 100.0% | $ 126,097,684 |
| | Other Assets and Liabilities | 0.0% | 20,270 |
| | Total Net Assets | 100.0% | $ 126,117,954 |
| Note: | Percentage of investments as shown is the ratio of the total market value to total net assets. |
The accompanying notes are an integral part of these financial statements.
Hartford Small Cap Value Fund
Schedule of Investments – (continued)
October 31, 2022
| | Prices of foreign equities that are principally traded on certain foreign markets will generally be adjusted daily pursuant to a fair value pricing service approved by Hartford Funds Management Company, LLC in order to reflect an adjustment for factors occurring after the close of certain foreign markets but before the close of the New York Stock Exchange. |
| | Equity industry classifications used in this report are the Global Industry Classification Standard, which was developed by and is the exclusive property and service mark of MSCI, Inc. and Standard & Poor’s. |
For Fund compliance purposes, the Fund may not use the same classification system. These classifications are used for financial reporting purposes.
See “Glossary” for abbreviation descriptions.
| * | Non-income producing. |
| † | See Significant Accounting Policies of accompanying Notes to Financial Statements regarding valuation of investments. |
Fair Value Summary
The following is a summary of the fair valuations according to the inputs used as of October 31, 2022 in valuing the Fund’s investments.
| Description | | Total | | Level 1 | | Level 2 | | Level 3(1) |
| Assets | | | | | | | | |
| Common Stocks | | | | | | | | |
| Banks | | $ 26,329,540 | | $ 26,329,540 | | $ — | | $ — |
| Capital Goods | | 11,824,497 | | 11,824,497 | | — | | — |
| Commercial & Professional Services | | 10,645,935 | | 8,363,076 | | 2,282,859 | | — |
| Consumer Durables & Apparel | | 7,739,282 | | 7,739,282 | | — | | — |
| Consumer Services | | 5,008,021 | | 5,008,021 | | — | | — |
| Diversified Financials | | 8,952,163 | | 8,952,163 | | — | | — |
| Energy | | 5,637,652 | | 5,637,652 | | — | | — |
| Health Care Equipment & Services | | 6,174,447 | | 6,174,447 | | — | | — |
| Household & Personal Products | | 5,809,611 | | 5,809,611 | | — | | — |
| Insurance | | 8,178,436 | | 6,443,905 | | 1,734,531 | | — |
| Materials | | 4,156,844 | | 4,156,844 | | — | | — |
| Media & Entertainment | | 1,340,998 | | 1,340,998 | | — | | — |
| Pharmaceuticals, Biotechnology & Life Sciences | | 1,948,091 | | 1,948,091 | | — | | — |
| Real Estate | | 3,497,284 | | 3,497,284 | | — | | — |
| Retailing | | 2,427,324 | | 2,427,324 | | — | | — |
| Semiconductors & Semiconductor Equipment | | 5,275,368 | | 5,275,368 | | — | | — |
| Software & Services | | 5,407,141 | | 5,407,141 | | — | | — |
| Utilities | | 2,080,497 | | 2,080,497 | | — | | — |
| Exchange-Traded Funds | | 2,371,477 | | 2,371,477 | | — | | — |
| Short-Term Investments | | 1,293,076 | | — | | 1,293,076 | | — |
| Total | | $ 126,097,684 | | $ 120,787,218 | | $ 5,310,466 | | $ — |
| (1) | For the year ended October 31, 2022, there were no transfers in and out of Level 3. |
The accompanying notes are an integral part of these financial statements.
The Hartford Small Company Fund
Schedule of Investments
October 31, 2022
| Shares or Principal Amount | | Market Value† |
| COMMON STOCKS - 94.3% |
| | Automobiles & Components - 0.3% |
| 17,101 | Visteon Corp.* | $ 2,231,168 |
| | Banks - 3.8% |
| 199,289 | Ameris Bancorp | 10,265,377 |
| 241,659 | Cadence Bank | 6,681,871 |
| 199,618 | Synovus Financial Corp. | 7,954,777 |
| | | | 24,902,025 |
| | Capital Goods - 16.9% |
| 57,277 | Acuity Brands, Inc. | 10,514,339 |
| 81,197 | Ameresco, Inc. Class A* | 4,910,795 |
| 164,535 | Applied Industrial Technologies, Inc. | 20,464,863 |
| 301,626 | AZEK Co., Inc. Class A* | 5,281,471 |
| 38,229 | Chart Industries, Inc.* | 8,520,480 |
| 74,775 | Comfort Systems USA, Inc. | 9,218,262 |
| 59,464 | Curtiss-Wright Corp. | 9,979,843 |
| 431,197 | Fluor Corp.* | 13,048,021 |
| 43,013 | Middleby Corp.* | 6,015,798 |
| 73,878 | WESCO International, Inc.* | 10,178,172 |
| 183,932 | WillScot Mobile Mini Holdings Corp.* | 7,822,628 |
| 275,818 | Zurn Water Solutions Corp. | 6,478,965 |
| | | | 112,433,637 |
| | Commercial & Professional Services - 2.9% |
| 223,423 | Aris Water Solution, Inc. Class A | 3,804,894 |
| 86,940 | Casella Waste Systems, Inc. Class A* | 7,112,561 |
| 130,944 | TriNet Group, Inc.* | 8,508,741 |
| | | | 19,426,196 |
| | Consumer Durables & Apparel - 2.2% |
| 90,821 | Crocs, Inc.* | 6,425,586 |
| 144,136 | Skyline Champion Corp.* | 8,390,156 |
| | | | 14,815,742 |
| | Consumer Services - 6.9% |
| 133,714 | Boyd Gaming Corp. | 7,723,321 |
| 172,791 | H&R Block, Inc. | 7,110,350 |
| 323,509 | PowerSchool Holdings, Inc. Class A* | 6,470,180 |
| 121,488 | Texas Roadhouse, Inc. Class A | 12,021,237 |
| 81,201 | Wingstop, Inc. | 12,861,426 |
| | | | 46,186,514 |
| | Diversified Financials - 0.9% |
| 219,306 | Hannon Armstrong Sustainable Infrastructure Capital, Inc. REIT | 5,960,737 |
| | Energy - 8.6% |
| 260,619 | Brigham Minerals, Inc. Class A | 8,079,189 |
| 200,551 | Cactus, Inc. Class A | 10,372,498 |
| 80,122 | Chord Energy Corp. | 12,265,877 |
| 335,951 | SM Energy Co. | 15,111,076 |
| 342,540 | Viper Energy Partners L.P. | 11,423,709 |
| | | | 57,252,349 |
| | Food, Beverage & Tobacco - 1.1% |
| 78,611 | Celsius Holdings, Inc.* | 7,159,890 |
| | Health Care Equipment & Services - 12.6% |
| 110,503 | Acadia Healthcare Co., Inc.* | 8,983,894 |
| 244,145 | Cross Country Healthcare, Inc.* | 9,055,338 |
| 59,010 | Enovis Corp.* | 2,918,045 |
| 96,870 | Globus Medical, Inc. Class A* | 6,490,290 |
| 117,996 | Haemonetics Corp.* | 10,023,760 |
| 90,165 | HealthEquity, Inc.* | 7,024,755 |
| 113,319 | Inari Medical, Inc.* | 8,717,631 |
| 63,523 | Inspire Medical Systems, Inc.* | 12,383,809 |
| 226,337 | Owens & Minor, Inc. | 3,847,729 |
| 603,500 | R1 RCM, Inc.* | 10,657,810 |
| 13,415 | Shockwave Medical, Inc.* | 3,932,607 |
| | | | 84,035,668 |
| Shares or Principal Amount | | Market Value† |
| COMMON STOCKS - 94.3% - (continued) |
| | Household & Personal Products - 2.7% |
| 406,515 | elf Beauty, Inc.* | $ 17,585,839 |
| | Materials - 3.9% |
| 197,413 | Cabot Corp. | 14,505,907 |
| 369,898 | Livent Corp.* | 11,677,680 |
| | | | 26,183,587 |
| | Media & Entertainment - 2.4% |
| 210,097 | Cargurus, Inc.* | 3,059,013 |
| 197,936 | Criteo S.A. ADR* | 5,047,368 |
| 98,270 | Ziff Davis, Inc.* | 7,605,115 |
| | | | 15,711,496 |
| | Pharmaceuticals, Biotechnology & Life Sciences - 11.2% |
| 236,997 | Aclaris Therapeutics, Inc.* | 3,699,523 |
| 84,623 | Alkermes plc* | 1,920,942 |
| 267,144 | Amicus Therapeutics, Inc.* | 2,671,440 |
| 75,896 | Apellis Pharmaceuticals, Inc.* | 4,590,949 |
| 25,515 | Ascendis Pharma A/S ADR* | 2,934,225 |
| 72,986 | Blueprint Medicines Corp.* | 3,783,594 |
| 68,105 | Celldex Therapeutics, Inc.* | 2,392,529 |
| 137,155 | Crinetics Pharmaceuticals, Inc.* | 2,531,881 |
| 134,189 | Cytokinetics, Inc.* | 5,858,692 |
| 73,284 | Fate Therapeutics, Inc.* | 1,533,101 |
| 75,759 | Halozyme Therapeutics, Inc.* | 3,622,038 |
| 254,460 | Immatics N.V.* | 2,875,398 |
| 34,738 | Immunocore Holdings plc ADR* | 1,984,929 |
| 60,609 | Intellia Therapeutics, Inc.* | 3,198,943 |
| 87,342 | Intra-Cellular Therapies, Inc.* | 3,988,909 |
| 26,398 | Karuna Therapeutics, Inc.* | 5,790,137 |
| 62,190 | Kymera Therapeutics, Inc.* | 1,886,845 |
| 24,634 | Mirati Therapeutics, Inc.* | 1,658,361 |
| 62,467 | Pacira BioSciences, Inc.* | 3,233,292 |
| 97,003 | PTC Therapeutics, Inc.* | 3,668,654 |
| 155,025 | Revolution Medicines, Inc.* | 3,140,807 |
| 170,988 | Rocket Pharmaceuticals, Inc.* | 3,190,636 |
| 84,203 | Syndax Pharmaceuticals, Inc.* | 1,933,301 |
| 54,140 | Vaxcyte, Inc.* | 2,361,045 |
| 25,844 | Verona Pharma plc ADR* | 330,803 |
| | | | 74,780,974 |
| | Real Estate - 2.6% |
| 247,438 | Phillips Edison & Co., Inc. REIT | 7,457,781 |
| 107,666 | Ryman Hospitality Properties, Inc. REIT | 9,573,661 |
| | | | 17,031,442 |
| | Retailing - 0.1% |
| 26,907 | Tory Burch LLC*(1)(2) | 812,067 |
| | Semiconductors & Semiconductor Equipment - 1.5% |
| 45,985 | MKS Instruments, Inc. | 3,777,668 |
| 72,595 | Synaptics, Inc.* | 6,431,917 |
| | | | 10,209,585 |
| | Software & Services - 9.7% |
| 58,588 | ExlService Holdings, Inc.* | 10,654,228 |
| 96,348 | Five9, Inc.* | 5,805,931 |
| 394,887 | Jamf Holding Corp.* | 9,346,975 |
| 51,726 | Manhattan Associates, Inc.* | 6,293,502 |
| 45,984 | Perficient, Inc.* | 3,079,548 |
| 150,688 | Rapid7, Inc.* | 6,821,646 |
| 211,136 | RingCentral, Inc. Class A* | 7,499,551 |
| 884,448 | Verra Mobility Corp. Class A* | 15,097,527 |
| | | | 64,598,908 |
| | Technology Hardware & Equipment - 4.0% |
| 227,808 | Calix, Inc.* | 16,775,781 |
The accompanying notes are an integral part of these financial statements.
The Hartford Small Company Fund
Schedule of Investments – (continued)
October 31, 2022
| Shares or Principal Amount | | Market Value† |
| COMMON STOCKS - 94.3% - (continued) |
| | Technology Hardware & Equipment - 4.0% - (continued) |
| 95,569 | Coherent Corp.* | $ 3,212,074 |
| 46,888 | Novanta, Inc.* | 6,629,963 |
| | | | 26,617,818 |
| | Total Common Stocks
(cost $615,489,706) | | $ 627,935,642 |
| EXCHANGE-TRADED FUNDS - 2.0% |
| | Other Investment Pools & Funds - 2.0% |
| 58,936 | iShares Russell 2000 Growth ETF | $ 13,334,859 |
| | Total Exchange-Traded Funds
(cost $12,478,676) | | $ 13,334,859 |
| | Total Long-Term Investments
(cost $627,968,382) | | $ 641,270,501 |
| SHORT-TERM INVESTMENTS - 3.3% |
| | Repurchase Agreements - 3.3% |
| $ 21,856,986 | Fixed Income Clearing Corp. Repurchase Agreement dated 10/31/2022 at 3.010%, due on 11/01/2022 with a maturity value of $21,858,813; collateralized by U.S. Treasury Inflation Index Note at 0.125%, maturing 10/15/2024, with a market value of $22,294,185 | $ 21,856,986 |
| | Total Short-Term Investments
(cost $21,856,986) | $ 21,856,986 |
| | Total Investments
(cost $649,825,368) | 99.6% | $ 663,127,487 |
| | Other Assets and Liabilities | 0.4% | 2,524,088 |
| | Total Net Assets | 100.0% | $ 665,651,575 |
| Note: | Percentage of investments as shown is the ratio of the total market value to total net assets. |
| | Prices of foreign equities that are principally traded on certain foreign markets will generally be adjusted daily pursuant to a fair value pricing service approved by Hartford Funds Management Company, LLC in order to reflect an adjustment for factors occurring after the close of certain foreign markets but before the close of the New York Stock Exchange. |
| | The Fund may refer to any one or more of the industry classifications used by one or more widely recognized market indices, ratings group and/or as defined by Fund management. Industry classifications may not be identical across all security types. |
| | Equity industry classifications used in this report are the Global Industry Classification Standard, which was developed by and is the exclusive property and service mark of MSCI, Inc. and Standard & Poor’s. |
| | For Fund compliance purposes, the Fund may not use the same classification system. These classifications are used for financial reporting purposes. |
| | See “Glossary” for abbreviation descriptions. |
| * | Non-income producing. |
| (1) | Investment in securities not registered under the Securities Act of 1933 (excluding securities acquired pursuant to Rule 144A and Regulation S). At the end of the period, the value of such restricted securities amounted to $812,067 or 0.1% of net assets. |
Period
Acquired | | Security Name | | Shares/
Par Value | | Total Cost | | Market Value |
| 11/2013 | | Tory Burch LLC | | 26,907 | | $ 2,108,912 | | $ 812,067 |
| (2) | Investment valued using significant unobservable inputs. |
| † | See Significant Accounting Policies of accompanying Notes to Financial Statements regarding valuation of investments. |
The accompanying notes are an integral part of these financial statements.
The Hartford Small Company Fund
Schedule of Investments – (continued)
October 31, 2022
Fair Value Summary
The following is a summary of the fair valuations according to the inputs used as of October 31, 2022 in valuing the Fund’s investments.
| Description | | Total | | Level 1 | | Level 2 | | Level 3(1) |
| Assets | | | | | | | | |
| Common Stocks | | | | | | | | |
| Automobiles & Components | | $ 2,231,168 | | $ 2,231,168 | | $ — | | $ — |
| Banks | | 24,902,025 | | 24,902,025 | | — | | — |
| Capital Goods | | 112,433,637 | | 112,433,637 | | — | | — |
| Commercial & Professional Services | | 19,426,196 | | 19,426,196 | | — | | — |
| Consumer Durables & Apparel | | 14,815,742 | | 14,815,742 | | — | | — |
| Consumer Services | | 46,186,514 | | 46,186,514 | | — | | — |
| Diversified Financials | | 5,960,737 | | 5,960,737 | | — | | — |
| Energy | | 57,252,349 | | 57,252,349 | | — | | — |
| Food, Beverage & Tobacco | | 7,159,890 | | 7,159,890 | | — | | — |
| Health Care Equipment & Services | | 84,035,668 | | 84,035,668 | | — | | — |
| Household & Personal Products | | 17,585,839 | | 17,585,839 | | — | | — |
| Materials | | 26,183,587 | | 26,183,587 | | — | | — |
| Media & Entertainment | | 15,711,496 | | 15,711,496 | | — | | — |
| Pharmaceuticals, Biotechnology & Life Sciences | | 74,780,974 | | 74,780,974 | | — | | — |
| Real Estate | | 17,031,442 | | 17,031,442 | | — | | — |
| Retailing | | 812,067 | | — | | — | | 812,067 |
| Semiconductors & Semiconductor Equipment | | 10,209,585 | | 10,209,585 | | — | | — |
| Software & Services | | 64,598,908 | | 64,598,908 | | — | | — |
| Technology Hardware & Equipment | | 26,617,818 | | 26,617,818 | | — | | — |
| Exchange-Traded Funds | | 13,334,859 | | 13,334,859 | | — | | — |
| Short-Term Investments | | 21,856,986 | | — | | 21,856,986 | | — |
| Total | | $ 663,127,487 | | $ 640,458,434 | | $ 21,856,986 | | $ 812,067 |
| (1) | For the year ended October 31, 2022, there were no transfers in and out of Level 3. |
Level 3 investments at the beginning and/or end of the period in relation to net assets were not significant and accordingly, a reconciliation of Level 3 assets for the year ended October 31, 2022 is not presented.
The accompanying notes are an integral part of these financial statements.
Hartford Domestic Equity Funds
GLOSSARY: (abbreviations used in preceding Schedules of Investments)
| Currency Abbreviations: |
| USD | United States Dollar |
| Other Abbreviations: |
| ADR | American Depositary Receipt |
| ETF | Exchange-Traded Fund |
| REIT | Real Estate Investment Trust |
Hartford Domestic Equity Funds
Statements of Assets and Liabilities
October 31, 2022
| | The Hartford
Capital
Appreciation
Fund | | Hartford Core
Equity Fund | | The Hartford
Dividend and
Growth Fund | | The Hartford
Equity Income
Fund | | The Hartford
Growth
Opportunities
Fund | | The Hartford
Healthcare Fund |
| Assets: | | | | | | | | | | | |
| Investments in securities, at market value(1) | $ 5,612,967,713 | | $ 9,574,249,199 | | $ 15,266,541,743 | | $ 4,960,975,904 | | $ 4,157,795,904 | | $ 1,304,680,495 |
| Repurchase agreements | 63,260,761 | | 70,499,034 | | 277,160,322 | | 111,912,401 | | 54,681,335 | | 9,456,479 |
| Cash | 14,958,966 | | 16,373,432 | | 64,318,708 | | 25,911,539 | | 12,688,873 | | 2,281,461 |
| Cash collateral held for securities on loan | 831,440 | | — | | — | | 3,010,112 | | 1,212,565 | | 338,088 |
| Foreign currency | 1,215 | | — | | — | | 647,200 | | — | | 369,233 |
| Receivables: | | | | | | | | | | | |
| Investment securities sold | 84,178,011 | | 1,147,790 | | — | | 17,728,994 | | 56,937,232 | | 18,756,606 |
| Fund shares sold | 719,840 | | 11,886,466 | | 24,689,558 | | 7,861,893 | | 3,420,104 | | 455,518 |
| Dividends and interest | 2,993,698 | | 7,139,087 | | 16,563,456 | | 3,520,026 | | 619,656 | | 885,028 |
| Securities lending income | 4,072 | | — | | 210 | | 21,283 | | 7,174 | | 583 |
| Variation margin on futures contracts | 3,670,462 | | — | | — | | — | | — | | — |
| Tax reclaims | 476,372 | | — | | 4,220,868 | | 2,535,156 | | 55,282 | | 306,637 |
| Other assets | 98,933 | | 137,311 | | 314,249 | | 167,979 | | 95,124 | | 51,517 |
| Total assets | 5,784,161,483 | | 9,681,432,319 | | 15,653,809,114 | | 5,134,292,487 | | 4,287,513,249 | | 1,337,581,645 |
| Liabilities: | | | | | | | | | | | |
| Obligation to return securities lending collateral | 16,628,793 | | — | | — | | 60,202,236 | | 24,251,300 | | 6,761,768 |
| Payables: | | | | | | | | | | | |
| Investment securities purchased | 35,323,757 | | 2,853,980 | | — | | 36,876,242 | | 45,114,947 | | 10,571,586 |
| Fund shares redeemed | 4,514,394 | | 9,481,372 | | 15,864,393 | | 7,112,677 | | 5,882,285 | | 823,171 |
| Investment management fees | 3,106,863 | | 2,635,299 | | 7,506,642 | | 2,484,837 | | 2,471,417 | | 924,135 |
| Transfer agent fees | 962,874 | | 1,113,588 | | 1,527,766 | | 570,529 | | 738,167 | | 245,054 |
| Accounting services fees | 153,533 | | 258,522 | | 387,663 | | 125,430 | | 120,954 | | 36,621 |
| Board of Directors' fees | 21,298 | | 36,099 | | 52,139 | | 16,460 | | 17,487 | | 4,653 |
| Distribution fees | 185,343 | | 139,390 | | 215,815 | | 101,071 | | 105,074 | | 44,667 |
| Accrued expenses | 157,857 | | 191,587 | | 249,366 | | 106,592 | | 142,734 | | 71,747 |
| Total liabilities | 61,054,712 | | 16,709,837 | | 25,803,784 | | 107,596,074 | | 78,844,365 | | 19,483,402 |
| Net assets | $ 5,723,106,771 | | $ 9,664,722,482 | | $ 15,628,005,330 | | $ 5,026,696,413 | | $ 4,208,668,884 | | $ 1,318,098,243 |
| Summary of Net Assets: | | | | | | | | | | | |
| Capital stock and paid-in-capital | $ 5,126,819,841 | | $ 6,737,928,244 | | $ 11,171,428,879 | | $ 3,536,445,504 | | $ 5,273,001,606 | | $ 1,104,791,354 |
| Distributable earnings (loss) | 596,286,930 | | 2,926,794,238 | | 4,456,576,451 | | 1,490,250,909 | | (1,064,332,722) | | 213,306,889 |
| Net assets | $ 5,723,106,771 | | $ 9,664,722,482 | | $ 15,628,005,330 | | $ 5,026,696,413 | | $ 4,208,668,884 | | $ 1,318,098,243 |
| Shares authorized | 1,540,000,000 | | 825,000,000 | | 1,270,000,000 | | 675,000,000 | | 19,850,000,000 | | 485,000,000 |
| Par value | $ 0.0010 | | $ 0.0010 | | $ 0.0010 | | $ 0.0010 | | $ 0.0001 | | $ 0.0010 |
| Class A: Net asset value per share | $ 34.53 | | $ 40.38 | | $ 30.41 | | $ 21.83 | | $ 30.49 | | $ 34.67 |
| Maximum offering price per share | 36.54 | | 42.73 | | 32.18 | | 23.10 | | 32.26 | | 36.69 |
| Shares outstanding | 122,729,905 | | 36,056,289 | | 144,923,149 | | 85,975,186 | | 64,987,604 | | 20,484,794 |
| Net Assets | $ 4,238,196,694 | | $ 1,456,043,738 | | $ 4,407,511,362 | | $ 1,876,671,511 | | $ 1,981,664,547 | | $ 710,176,261 |
| Class C: Net asset value per share | $ 22.26 | | $ 36.27 | | $ 29.11 | | $ 21.71 | | $ 7.68 | | $ 24.39 |
| Shares outstanding | 3,946,921 | | 11,905,039 | | 6,436,520 | | 6,160,738 | | 17,005,554 | | 3,469,084 |
| Net Assets | $ 87,852,034 | | $ 431,852,301 | | $ ��187,341,634 | | $ 133,760,615 | | $ 130,590,086 | | $ 84,595,200 |
| Class I: Net asset value per share | $ 34.84 | | $ 40.55 | | $ 30.23 | | $ 21.67 | | $ 33.77 | | $ 37.68 |
| Shares outstanding | 14,742,412 | | 87,053,611 | | 128,477,907 | | 71,371,107 | | 27,870,521 | | 8,756,194 |
| Net Assets | $ 513,601,338 | | $ 3,529,589,467 | | $ 3,883,536,378 | | $ 1,546,286,586 | | $ 941,201,983 | | $ 329,896,468 |
| Class R3: Net asset value per share | $ 39.62 | | $ 40.90 | | $ 30.95 | | $ 21.88 | | $ 30.04 | | $ 35.46 |
| Shares outstanding | 758,999 | | 1,329,879 | | 1,762,963 | | 1,294,952 | | 982,800 | | 700,723 |
| Net Assets | $ 30,073,782 | | $ 54,393,233 | | $ 54,564,826 | | $ 28,332,483 | | $ 29,520,391 | | $ 24,848,933 |
| Class R4: Net asset value per share | $ 41.74 | | $ 41.74 | | $ 31.22 | | $ 21.91 | | $ 33.76 | | $ 38.59 |
| Shares outstanding | 646,453 | | 3,775,905 | | 3,006,726 | | 1,788,334 | | 1,255,597 | | 414,723 |
| Net Assets | $ 26,983,632 | | $ 157,597,021 | | $ 93,864,015 | | $ 39,191,273 | | $ 42,391,285 | | $ 16,006,192 |
| Class R5: Net asset value per share | $ 42.91 | | $ 40.89 | | $ 31.37 | | $ 22.05 | | $ 37.13 | | $ 41.63 |
| Shares outstanding | 650,583 | | 3,587,047 | | 7,439,828 | | 3,350,500 | | 371,197 | | 242,678 |
| Net Assets | $ 27,917,270 | | $ 146,672,264 | | $ 233,376,811 | | $ 73,875,981 | | $ 13,784,243 | | $ 10,101,726 |
The accompanying notes are an integral part of these financial statements.
Hartford Domestic Equity Funds
Statements of Assets and Liabilities – (continued)
October 31, 2022
| | The Hartford
Capital
Appreciation
Fund | | Hartford Core
Equity Fund | | The Hartford
Dividend and
Growth Fund | | The Hartford
Equity Income
Fund | | The Hartford
Growth
Opportunities
Fund | | The Hartford
Healthcare Fund |
| Class R6: Net asset value per share | $ 43.28 | | $ 41.10 | | $ 31.37 | | $ 22.12 | | $ 38.28 | | $ 42.53 |
| Shares outstanding | 638,760 | | 25,781,942 | | 20,177,389 | | 4,460,626 | | 1,032,035 | | 1,302,424 |
| Net Assets | $ 27,643,975 | | $ 1,059,701,739 | | $ 632,954,176 | | $ 98,651,510 | | $ 39,511,422 | | $ 55,391,943 |
| Class Y: Net asset value per share | $ 43.22 | | $ 41.07 | | $ 31.38 | | $ 22.12 | | $ 38.16 | | $ 42.40 |
| Shares outstanding | 1,720,441 | | 12,881,593 | | 22,781,177 | | 5,589,376 | | 8,733,532 | | 1,230,417 |
| Net Assets | $ 74,365,198 | | $ 529,017,029 | | $ 714,793,422 | | $ 123,645,420 | | $ 333,298,688 | | $ 52,172,348 |
| Class F: Net asset value per share | $ 34.85 | | $ 40.60 | | $ 30.20 | | $ 21.66 | | $ 34.05 | | $ 37.93 |
| Shares outstanding | 19,986,513 | | 56,647,418 | | 179,462,742 | | 51,065,240 | | 20,460,918 | | 920,260 |
| Net Assets | $ 696,472,848 | | $ 2,299,855,690 | | $ 5,420,062,706 | | $ 1,106,281,034 | | $ 696,706,239 | | $ 34,909,172 |
| Cost of investments | $ 5,326,903,734 | | $ 7,055,021,952 | | $ 11,811,290,933 | | $ 4,099,033,500 | | $ 4,640,675,754 | | $ 1,108,334,467 |
| Cost of foreign currency | $ 1,220 | | $ — | | $ — | | $ 648,006 | | $ — | | $ 360,114 |
| (1) Includes Investment in securities on loan, at market value | $ 16,267,500 | | $ — | | $ — | | $ 60,047,216 | | $ 24,720,680 | | $ 6,393,818 |
The accompanying notes are an integral part of these financial statements.
Hartford Domestic Equity Funds
Statements of Assets and Liabilities – (continued)
October 31, 2022
| | The Hartford
MidCap Fund | | The Hartford
MidCap Value
Fund | | Hartford Quality
Value Fund | | The Hartford
Small Cap
Growth Fund | | Hartford
Small Cap
Value Fund | | The Hartford
Small Company
Fund |
| Assets: | | | | | | | | | | | |
| Investments in securities, at market value(1) | $ 7,669,580,831 | | $ 881,162,721 | | $ 240,872,209 | | $ 498,253,204 | | $ 124,804,608 | | $ 641,270,501 |
| Repurchase agreements | — | | 3,479,446 | | 2,479,802 | | 4,704,763 | | 1,293,076 | | 21,856,986 |
| Investments in affiliated investments, at market value | 121,387,095 | | — | | — | | — | | — | | — |
| Cash | — | | 728,984 | | 615,707 | | 1,109,116 | | 300,085 | | 5,058,880 |
| Cash collateral held for securities on loan | 9,117,816 | | — | | — | | 108,561 | | — | | — |
| Receivables: | | | | | | | | | | | |
| From affiliates | — | | — | | 3,452 | | — | | 4,100 | | — |
| Investment securities sold | 30,842,442 | | 19,378,952 | | — | | 2,924,255 | | — | | — |
| Fund shares sold | 6,736,517 | | 1,991,317 | | 1,211,032 | | 511,592 | | 25,112 | | 748,846 |
| Dividends and interest | 1,323,366 | | 269,128 | | 272,414 | | 70,451 | | 76,160 | | 82,752 |
| Securities lending income | 37,789 | | — | | — | | 211 | | 21 | | 248 |
| Tax reclaims | — | | — | | 53,818 | | — | | — | | — |
| Other assets | 117,915 | | 72,886 | | 40,528 | | 47,814 | | 50,480 | | 55,590 |
| Total assets | 7,839,143,771 | | 907,083,434 | | 245,548,962 | | 507,729,967 | | 126,553,642 | | 669,073,803 |
| Liabilities: | | | | | | | | | | | |
| Due to custodian | 7,099,021 | | — | | — | | — | | — | | — |
| Obligation to return securities lending collateral | 182,356,313 | | — | | — | | 2,171,213 | | — | | — |
| Payables: | | | | | | | | | | | |
| Investment securities purchased | 15,641,552 | | 18,271,886 | | — | | 3,884,407 | | — | | 2,203,073 |
| Fund shares redeemed | 28,325,914 | | 966,839 | | 486,615 | | 748,109 | | 305,696 | | 561,588 |
| Investment management fees | 4,474,980 | | 504,269 | | 87,732 | | 314,032 | | 70,738 | | 436,495 |
| Transfer agent fees | 1,199,943 | | 106,946 | | 55,976 | | 113,252 | | 25,200 | | 112,600 |
| Accounting services fees | 214,956 | | 25,601 | | 7,574 | | 16,801 | | 3,842 | | 20,219 |
| Board of Directors' fees | 32,172 | | 3,072 | | 825 | | 1,939 | | 446 | | 2,407 |
| Distribution fees | 134,128 | | 16,673 | | 7,656 | | 7,676 | | 2,193 | | 14,517 |
| Accrued expenses | 320,875 | | 66,011 | | 28,471 | | 34,583 | | 27,573 | | 71,329 |
| Total liabilities | 239,799,854 | | 19,961,297 | | 674,849 | | 7,292,012 | | 435,688 | | 3,422,228 |
| Net assets | $ 7,599,343,917 | | $ 887,122,137 | | $ 244,874,113 | | $ 500,437,955 | | $ 126,117,954 | | $ 665,651,575 |
| Summary of Net Assets: | | | | | | | | | | | |
| Capital stock and paid-in-capital | $ 6,235,676,687 | | $ 729,135,558 | | $ 195,288,714 | | $ 454,643,208 | | $ 115,905,837 | | $ 782,520,149 |
| Distributable earnings (loss) | 1,363,667,230 | | 157,986,579 | | 49,585,399 | | 45,794,747 | | 10,212,117 | | (116,868,574) |
| Net assets | $ 7,599,343,917 | | $ 887,122,137 | | $ 244,874,113 | | $ 500,437,955 | | $ 126,117,954 | | $ 665,651,575 |
| Shares authorized | 1,105,000,000 | | 485,000,000 | | 22,110,000,000 | | 22,100,000,000 | | 860,000,000 | | 525,000,000 |
| Par value | $ 0.0050 | | $ 0.0010 | | $ 0.0001 | | $ 0.0001 | | $ 0.0010 | | $ 0.0010 |
| Class A: Net asset value per share | $ 24.51 | | $ 16.14 | | $ 23.65 | | $ 37.07 | | $ 11.40 | | $ 16.30 |
| Maximum offering price per share | 25.94 | | 17.08 | | 25.03 | | 39.23 | | 12.06 | | 17.25 |
| Shares outstanding | 93,974,881 | | 22,797,597 | | 7,330,260 | | 4,404,849 | | 4,511,632 | | 19,635,266 |
| Net Assets | $ 2,303,789,688 | | $ 368,039,964 | | $ 173,357,836 | | $ 163,292,965 | | $ 51,421,656 | | $ 319,970,670 |
| Class C: Net asset value per share | $ 13.88 | | $ 12.36 | | $ 19.79 | | $ 20.14 | | $ 9.69 | | $ 7.45 |
| Shares outstanding | 15,053,771 | | 569,650 | | 173,763 | | 109,116 | | 198,471 | | 628,214 |
| Net Assets | $ 208,962,720 | | $ 7,040,809 | | $ 3,439,467 | | $ 2,197,307 | | $ 1,922,202 | | $ 4,678,095 |
| Class I: Net asset value per share | $ 25.85 | | $ 16.36 | | $ 23.32 | | $ 40.17 | | $ 11.44 | | $ 18.06 |
| Shares outstanding | 66,227,100 | | 2,296,646 | | 1,312,171 | | 1,646,670 | | 1,871,558 | | 1,761,801 |
| Net Assets | $ 1,712,200,911 | | $ 37,582,269 | | $ 30,598,002 | | $ 66,149,935 | | $ 21,401,908 | | $ 31,818,643 |
| Class R3: Net asset value per share | $ 28.24 | | $ 17.10 | | $ 24.07 | | $ 35.99 | | $ 11.90 | | $ 18.45 |
| Shares outstanding | 2,162,666 | | 357,270 | | 39,026 | | 169,709 | | 63,830 | | 555,580 |
| Net Assets | $ 61,073,222 | | $ 6,107,826 | | $ 939,175 | | $ 6,107,530 | | $ 759,532 | | $ 10,249,683 |
| Class R4: Net asset value per share | $ 30.20 | | $ 17.59 | | $ 24.36 | | $ 39.30 | | $ 12.10 | | $ 20.59 |
| Shares outstanding | 2,850,881 | | 518,575 | | 209,779 | | 297,302 | | 3,442 | | 439,126 |
| Net Assets | $ 86,083,151 | | $ 9,121,406 | | $ 5,111,196 | | $ 11,683,847 | | $ 41,643 | | $ 9,039,759 |
| Class R5: Net asset value per share | $ 31.72 | | $ 17.91 | | $ 24.64 | | $ 42.94 | | $ 12.08 | | $ 22.66 |
| Shares outstanding | 2,932,351 | | 112,740 | | 13,667 | | 479,546 | | 145,446 | | 203,158 |
| Net Assets | $ 93,004,572 | | $ 2,019,468 | | $ 336,736 | | $ 20,590,865 | | $ 1,756,280 | | $ 4,603,283 |
The accompanying notes are an integral part of these financial statements.
Hartford Domestic Equity Funds
Statements of Assets and Liabilities – (continued)
October 31, 2022
| | The Hartford
MidCap Fund | | The Hartford
MidCap Value
Fund | | Hartford Quality
Value Fund | | The Hartford
Small Cap
Growth Fund | | Hartford
Small Cap
Value Fund | | The Hartford
Small Company
Fund |
| Class R6: Net asset value per share | $ 32.27 | | $ 16.37 | | $ 24.72 | | $ 43.99 | | $ 12.07 | | $ 23.44 |
| Shares outstanding | 23,505,613 | | 650 | | 478,768 | | 1,313,975 | | 647,881 | | 280,780 |
| Net Assets | $ 758,617,322 | | $ 10,642 | | $ 11,833,627 | | $ 57,806,599 | | $ 7,821,411 | | $ 6,580,356 |
| Class Y: Net asset value per share | $ 32.19 | | $ 17.96 | | $ 24.67 | | $ 43.94 | | $ 12.05 | | $ 23.34 |
| Shares outstanding | 13,626,214 | | 435,218 | | 274,142 | | 3,300,762 | | 239,613 | | 1,676,408 |
| Net Assets | $ 438,594,894 | | $ 7,814,387 | | $ 6,762,575 | | $ 145,027,048 | | $ 2,887,342 | | $ 39,131,465 |
| Class F: Net asset value per share | $ 26.02 | | $ 16.37 | | $ 23.22 | | $ 40.50 | | $ 11.43 | | $ 18.27 |
| Shares outstanding | 74,431,076 | | 27,451,969 | | 538,025 | | 681,102 | | 3,333,210 | | 13,114,167 |
| Net Assets | $ 1,937,017,437 | | $ 449,385,366 | | $ 12,495,499 | | $ 27,581,859 | | $ 38,105,980 | | $ 239,579,621 |
| Cost of investments | $ 6,778,722,359 | | $ 793,893,562 | | $ 208,738,937 | | $ 420,786,578 | | $ 122,221,348 | | $ 649,825,368 |
| Cost of investments in affiliated investments | $ 144,565,239 | | $ — | | $ — | | $ — | | $ — | | $ — |
| Cost of foreign currency | $ — | | $ — | | $ — | | $ — | | $ — | | $ — |
| (1) Includes Investment in securities on loan, at market value | $ 179,370,461 | | $ — | | $ — | | $ 2,045,606 | | $ — | | $ — |
The accompanying notes are an integral part of these financial statements.
Hartford Domestic Equity Funds
Statements of Operations
For the Year Ended October 31, 2022
| | The Hartford
Capital
Appreciation
Fund | | Hartford Core
Equity Fund | | The Hartford
Dividend and
Growth Fund | | The Hartford
Equity Income
Fund | | The Hartford
Growth
Opportunities
Fund | | The Hartford
Healthcare Fund |
| Investment Income: | | | | | | | | | | | |
| Dividends | $ 88,151,648 | | $ 160,810,566 | | $ 327,262,765 | | $ 139,217,427 | | $ 15,377,363 | | $ 14,248,290 |
| Interest | 1,197,187 | | 487,509 | | 4,624,204 | | 1,576,297 | | 703,343 | | 197,498 |
| Securities lending | 107,188 | | 38 | | 332 | | 87,977 | | 107,622 | | 231,937 |
| Less: Foreign tax withheld | (467,436) | | — | | (2,686,659) | | (1,168,464) | | (68,571) | | (348,597) |
| Total investment income, net | 88,988,587 | | 161,298,113 | | 329,200,642 | | 139,713,237 | | 16,119,757 | | 14,329,128 |
| Expenses: | | | | | | | | | | | |
| Investment management fees | 43,744,020 | | 36,928,848 | | 91,787,234 | | 30,000,402 | | 39,918,112 | | 12,324,123 |
| Transfer agent fees | | | | | | | | | | | |
| Class A | 5,099,389 | | 1,449,512 | | 3,962,825 | | 1,485,216 | | 2,633,941 | | 900,498 |
| Class C | 161,918 | | 453,890 | | 207,896 | | 148,521 | | 231,743 | | 143,982 |
| Class I | 518,060 | | 4,023,301 | | 3,331,226 | | 1,379,446 | | 1,414,063 | | 388,778 |
| Class R3 | 80,837 | | 140,341 | | 129,979 | | 64,303 | | 81,683 | | 58,283 |
| Class R4 | 50,468 | | 292,166 | | 163,192 | | 71,117 | | 84,431 | | 32,669 |
| Class R5 | 32,608 | | 189,605 | | 268,715 | | 81,401 | | 19,866 | | 12,615 |
| Class R6 | 1,213 | | 29,322 | | 22,126 | | 3,535 | | 2,093 | | 448 |
| Class Y | 108,781 | | 659,450 | | 896,509 | | 109,922 | | 427,927 | | 107,253 |
| Class F | 3,699 | | 28,389 | | 31,185 | | 8,908 | | 6,611 | | 536 |
| Distribution fees | | | | | | | | | | | |
| Class A | 12,125,918 | | 3,916,123 | | 11,507,280 | | 4,641,967 | | 6,510,873 | | 1,898,516 |
| Class C | 1,134,779 | | 5,053,784 | | 1,845,813 | | 1,442,668 | | 1,974,061 | | 1,054,159 |
| Class R3 | 184,544 | | 319,739 | | 302,132 | | 150,630 | | 190,750 | | 134,573 |
| Class R4 | 77,901 | | 486,272 | | 249,921 | | 104,979 | | 136,293 | | 51,466 |
| Custodian fees | 25,342 | | 40,598 | | 62,782 | | 18,376 | | 65,115 | | 40,653 |
| Registration and filing fees | 183,164 | | 369,055 | | 630,750 | | 229,818 | | 306,894 | | 147,165 |
| Accounting services fees | 935,628 | | 1,577,937 | | 2,171,799 | | 697,537 | | 808,772 | | 218,016 |
| Board of Directors' fees | 167,266 | | 289,046 | | 413,867 | | 129,130 | | 140,250 | | 36,935 |
| Audit and tax fees | 54,279 | | 20,951 | | 21,109 | | 21,158 | | 36,443 | | 24,450 |
| Other expenses | 487,190 | | 794,905 | | 1,114,837 | | 377,491 | | 449,731 | | 147,909 |
| Total expenses (before waivers, reimbursements and fees paid indirectly) | 65,177,004 | | 57,063,234 | | 119,121,177 | | 41,166,525 | | 55,439,652 | | 17,723,027 |
| Transfer agent fee waivers | — | | (52,063) | | (452,170) | | — | | — | | — |
| Distribution fee reimbursements | (214,779) | | (86,054) | | (116,973) | | (16,927) | | (201,171) | | (25,691) |
| Commission recapture | (64,181) | | (8,389) | | (46,074) | | (26,552) | | (142,150) | | (6,241) |
| Total waivers, reimbursements and fees paid indirectly | (278,960) | | (146,506) | | (615,217) | | (43,479) | | (343,321) | | (31,932) |
| Total expenses | 64,898,044 | | 56,916,728 | | 118,505,960 | | 41,123,046 | | 55,096,331 | | 17,691,095 |
| Net Investment Income (Loss) | 24,090,543 | | 104,381,385 | | 210,694,682 | | 98,590,191 | | (38,976,574) | | (3,361,967) |
| Net Realized Gain (Loss) on Investments, Other Financial Instruments and Foreign Currency Transactions on: | | | | | | | | | | | |
| Investments | 323,158,296 | | 261,921,622 | | 694,901,386 | | 529,616,656 | | (609,174,897) | | 12,441,669 |
| Futures contracts | (36,942,270) | | — | | — | | — | | — | | — |
| Foreign currency contracts | — | | — | | — | | — | | — | | (123) |
| Other foreign currency transactions | (63,023) | | — | | — | | 8,745 | | (35,639) | | (66,490) |
| Net Realized Gain (Loss) on Investments, Other Financial Instruments and Foreign Currency Transactions | 286,153,003 | | 261,921,622 | | 694,901,386 | | 529,625,401 | | (609,210,536) | | 12,375,056 |
| Net Changes in Unrealized Appreciation (Depreciation) of Investments, Other Financial Instruments and Foreign Currency Transactions of: | | | | | | | | | | | |
| Investments | (1,609,628,075) | | (2,322,465,638) | | (1,873,667,525) | | (612,837,533) | | (2,276,283,476) | | (233,110,398) |
| Futures contracts | (10,490,121) | | — | | — | | — | | — | | — |
| Translation of other assets and liabilities in foreign currencies | (43,707) | | — | | — | | (202,181) | | (2,777) | | (12,261) |
| Net Changes in Unrealized Appreciation (Depreciation) of Investments, Other Financial Instruments and Foreign Currency Transactions | (1,620,161,903) | | (2,322,465,638) | | (1,873,667,525) | | (613,039,714) | | (2,276,286,253) | | (233,122,659) |
The accompanying notes are an integral part of these financial statements.
Hartford Domestic Equity Funds
Statements of Operations – (continued)
For the Year Ended October 31, 2022
| | The Hartford
Capital
Appreciation
Fund | | Hartford Core
Equity Fund | | The Hartford
Dividend and
Growth Fund | | The Hartford
Equity Income
Fund | | The Hartford
Growth
Opportunities
Fund | | The Hartford
Healthcare Fund |
| Net Gain (Loss) on Investments, Other Financial Instruments and Foreign Currency Transactions | (1,334,008,900) | | (2,060,544,016) | | (1,178,766,139) | | (83,414,313) | | (2,885,496,789) | | (220,747,603) |
| Net Increase (Decrease) in Net Assets Resulting from Operations | $ (1,309,918,357) | | $ (1,956,162,631) | | $ (968,071,457) | | $ 15,175,878 | | $ (2,924,473,363) | | $ (224,109,570) |
The accompanying notes are an integral part of these financial statements.
Hartford Domestic Equity Funds
Statements of Operations – (continued)
For the Year Ended October 31, 2022
| | The Hartford
MidCap Fund | | The Hartford
MidCap Value
Fund | | Hartford Quality
Value Fund | | The Hartford
Small Cap
Growth Fund | | Hartford
Small Cap
Value Fund | | The Hartford
Small Company
Fund |
| Investment Income: | | | | | | | | | | | |
| Dividends | $ 73,536,118 | | $ 12,820,495 | | $ 6,066,284 | | $ 3,210,156 | | $ 3,431,895 | | $ 4,107,779 |
| Interest | 69,899 | | 65,034 | | 53,735 | | 48,543 | | 5,799 | | 145,467 |
| Securities lending | 614,164 | | 7,652 | | — | | 14,357 | | 3,741 | | 55,988 |
| Less: Foreign tax withheld | (17,336) | | (96,276) | | (67,755) | | — | | (11,983) | | — |
| Total investment income, net | 74,202,845 | | 12,796,905 | | 6,052,264 | | 3,273,056 | | 3,429,452 | | 4,309,234 |
| Expenses: | | | | | | | | | | | |
| Investment management fees | 72,260,680 | | 6,271,942 | | 1,074,105 | | 4,676,358 | | 1,029,469 | | 6,030,361 |
| Transfer agent fees | | | | | | | | | | | |
| Class A | 2,940,338 | | 547,112 | | 274,405 | | 387,933 | | 108,132 | | 580,437 |
| Class C | 340,708 | | 14,863 | | 8,515 | | 7,286 | | 6,292 | | 14,520 |
| Class I | 3,512,781 | | 29,244 | | 26,130 | | 75,048 | | 39,866 | | 51,743 |
| Class R3 | 167,712 | | 14,339 | | 2,245 | | 14,842 | | 2,094 | | 26,274 |
| Class R4 | 215,166 | | 16,390 | | 7,491 | | 24,488 | | 269 | | 18,028 |
| Class R5 | 197,346 | | 2,435 | | 575 | | 50,665 | | 1,708 | | 6,377 |
| Class R6 | 29,638 | | — | | 278 | | 2,802 | | 268 | | 226 |
| Class Y | 692,537 | | 13,663 | | 3,722 | | 191,800 | | 2,915 | | 24,768 |
| Class F | 47,346 | | 5,773 | | 206 | | 398 | | 291 | | 3,810 |
| Distribution fees | | | | | | | | | | | |
| Class A | 6,964,577 | | 920,733 | | 451,044 | | 484,287 | | 139,947 | | 948,794 |
| Class C | 2,808,476 | | 80,616 | | 36,287 | | 40,925 | | 25,311 | | 62,590 |
| Class R3 | 382,494 | | 32,638 | | 5,116 | | 33,972 | | 4,760 | | 59,819 |
| Class R4 | 319,564 | | 24,397 | | 11,916 | | 37,161 | | 403 | | 26,553 |
| Custodian fees | 102,524 | | 4,225 | | 2,007 | | 6,504 | | 6,484 | | 23,034 |
| Registration and filing fees | 251,850 | | 147,000 | | 119,847 | | 127,803 | | 128,185 | | 170,609 |
| Accounting services fees | 1,435,389 | | 142,032 | | 47,581 | | 105,052 | | 29,313 | | 122,441 |
| Board of Directors' fees | 241,893 | | 23,434 | | 6,318 | | 15,110 | | 3,720 | | 18,774 |
| Audit and tax fees | 21,007 | | 25,375 | | 21,065 | | 20,996 | | 21,263 | | 29,834 |
| Other expenses | 959,870 | | 184,136 | | 35,208 | | 54,423 | | 26,982 | | 154,042 |
| Total expenses (before waivers, reimbursements and fees paid indirectly) | 93,891,896 | | 8,500,347 | | 2,134,061 | | 6,357,853 | | 1,577,672 | | 8,373,034 |
| Expense waivers | — | | — | | (26,593) | | — | | (30,962) | | — |
| Transfer agent fee waivers | (635,243) | | — | | — | | (75,079) | | — | | — |
| Distribution fee reimbursements | (89,197) | | (8,145) | | (10,227) | | (18,327) | | (5,898) | | (18,871) |
| Commission recapture | (102,352) | | (16,317) | | (560) | | (7,578) | | (1,908) | | (23,601) |
| Total waivers, reimbursements and fees paid indirectly | (826,792) | | (24,462) | | (37,380) | | (100,984) | | (38,768) | | (42,472) |
| Total expenses | 93,065,104 | | 8,475,885 | | 2,096,681 | | 6,256,869 | | 1,538,904 | | 8,330,562 |
| Net Investment Income (Loss) | (18,862,259) | | 4,321,020 | | 3,955,583 | | (2,983,813) | | 1,890,548 | | (4,021,328) |
| Net Realized Gain (Loss) on Investments, Other Financial Instruments and Foreign Currency Transactions on: | | | | | | | | | | | |
| Investments | 683,964,438 | | 73,489,920 | | 11,495,734 | | (32,221,344) | | 8,029,836 | | (125,644,852) |
| Investments in affiliated investments | (9,968,362) | | — | | — | | — | | — | | — |
| Other foreign currency transactions | — | | — | | (145) | | — | | (198) | | — |
| Net Realized Gain (Loss) on Investments, Other Financial Instruments and Foreign Currency Transactions | 673,996,076 | | 73,489,920 | | 11,495,589 | | (32,221,344) | | 8,029,638 | | (125,644,852) |
| Net Changes in Unrealized Appreciation (Depreciation) of Investments, Other Financial Instruments and Foreign Currency Transactions of: | | | | | | | | | | | |
| Investments | (3,609,217,257) | | (114,419,726) | | (26,414,806) | | (197,748,237) | | (22,441,354) | | (162,580,738) |
| Investments in affiliated investments | (30,190,021) | | — | | — | | — | | — | | — |
| Net Changes in Unrealized Appreciation (Depreciation) of Investments, Other Financial Instruments and Foreign Currency Transactions | (3,639,407,278) | | (114,419,726) | | (26,414,806) | | (197,748,237) | | (22,441,354) | | (162,580,738) |
| Net Gain (Loss) on Investments, Other Financial Instruments and Foreign Currency Transactions | (2,965,411,202) | | (40,929,806) | | (14,919,217) | | (229,969,581) | | (14,411,716) | | (288,225,590) |
| Net Increase (Decrease) in Net Assets Resulting from Operations | $ (2,984,273,461) | | $ (36,608,786) | | $ (10,963,634) | | $ (232,953,394) | | $ (12,521,168) | | $ (292,246,918) |
The accompanying notes are an integral part of these financial statements.
Hartford Domestic Equity Funds
Statements of Changes in Net Assets
| | The Hartford
Capital Appreciation Fund | | Hartford
Core Equity Fund |
| | For the
Year Ended
October 31,
2022 | | For the
Year Ended
October 31,
2021 | | For the
Year Ended
October 31,
2022 | | For the
Year Ended
October 31,
2021 |
| Operations: | | | | | | | |
| Net investment income (loss) | $ 24,090,543 | | $ 12,609,296 | | $ 104,381,385 | | $ 79,881,660 |
| Net realized gain (loss) on investments, other financial instruments and foreign currency transactions | 286,153,003 | | 1,117,743,666 | | 261,921,622 | | 366,960,795 |
| Net changes in unrealized appreciation (depreciation) of investments, other financial instruments and foreign currency transactions | (1,620,161,903) | | 961,196,796 | | (2,322,465,638) | | 2,963,652,462 |
| Net Increase (Decrease) in Net Assets Resulting from Operations | (1,309,918,357) | | 2,091,549,758 | | (1,956,162,631) | | 3,410,494,917 |
| Distributions to Shareholders: | | | | | | | |
| Class A | (796,677,684) | | (256,624,217) | | (51,017,295) | | (7,166,565) |
| Class C | (29,128,173) | | (12,630,524) | | (16,212,320) | | — |
| Class I | (102,158,238) | | (33,651,291) | | (152,148,957) | | (26,510,048) |
| Class R3 | (5,487,633) | | (1,911,571) | | (1,879,952) | | (145,253) |
| Class R4 | (4,376,163) | | (1,459,215) | | (6,771,984) | | (972,045) |
| Class R5 | (4,206,771) | | (1,629,937) | | (6,967,996) | | (1,462,901) |
| Class R6 | (4,348,041) | | (638,212) | | (34,560,184) | | (6,940,312) |
| Class Y | (14,390,368) | | (4,992,537) | | (28,782,055) | | (5,937,551) |
| Class F | (127,204,207) | | (42,410,229) | | (106,456,492) | | (21,751,271) |
| Total distributions | (1,087,977,278) | | (355,947,733) | | (404,797,235) | | (70,885,946) |
| Capital Share Transactions: | | | | | | | |
| Sold | 311,222,644 | | 338,608,621 | | 2,598,490,371 | | 3,592,112,670 |
| Issued on reinvestment of distributions | 1,052,622,491 | | 343,956,936 | | 386,652,441 | | 67,490,064 |
| Redeemed | (978,028,941) | | (1,039,938,487) | | (3,624,085,413) | | (2,927,339,187) |
| Net increase (decrease) from capital share transactions | 385,816,194 | | (357,372,930) | | (638,942,601) | | 732,263,547 |
| Net Increase (Decrease) in Net Assets | (2,012,079,441) | | 1,378,229,095 | | (2,999,902,467) | | 4,071,872,518 |
| Net Assets: | | | | | | | |
| Beginning of period | 7,735,186,212 | | 6,356,957,117 | | 12,664,624,949 | | 8,592,752,431 |
| End of period | $ 5,723,106,771 | | $ 7,735,186,212 | | $ 9,664,722,482 | | $ 12,664,624,949 |
The accompanying notes are an integral part of these financial statements.
Hartford Domestic Equity Funds
Statements of Changes in Net Assets – (continued)
| | The Hartford
Dividend and Growth Fund | | The Hartford
Equity Income Fund |
| | For the
Year Ended
October 31,
2022 | | For the
Year Ended
October 31,
2021 | | For the
Year Ended
October 31,
2022 | | For the
Year Ended
October 31,
2021 |
| Operations: | | | | | | | |
| Net investment income (loss) | $ 210,694,682 | | $ 153,413,163 | | $ 98,590,191 | | $ 77,254,659 |
| Net realized gain (loss) on investments, other financial instruments and foreign currency transactions | 694,901,386 | | 700,951,873 | | 529,625,401 | | 364,677,577 |
| Net changes in unrealized appreciation (depreciation) of investments, other financial instruments and foreign currency transactions | (1,873,667,525) | | 3,492,438,056 | | (613,039,714) | | 993,091,679 |
| Net Increase (Decrease) in Net Assets Resulting from Operations | (968,071,457) | | 4,346,803,092 | | 15,175,878 | | 1,435,023,915 |
| Distributions to Shareholders: | | | | | | | |
| Class A | (269,880,132) | | (124,272,767) | | (162,568,145) | | (41,652,685) |
| Class C | (9,041,795) | | (3,956,164) | | (12,492,883) | | (3,698,845) |
| Class I | (200,183,734) | | (71,985,276) | | (124,787,388) | | (33,459,498) |
| Class R3 | (3,403,765) | | (1,696,101) | | (2,733,877) | | (781,704) |
| Class R4 | (5,762,217) | | (2,690,217) | | (3,872,094) | | (1,147,861) |
| Class R5 | (15,325,417) | | (6,848,052) | | (7,100,587) | | (2,137,950) |
| Class R6 | (29,887,062) | | (9,408,231) | | (7,472,847) | | (2,007,112) |
| Class Y | (53,664,884) | | (30,895,801) | | (10,565,778) | | (2,882,683) |
| Class F | (301,110,451) | | (117,659,277) | | (103,493,641) | | (30,248,716) |
| Total distributions | (888,259,457) | | (369,411,886) | | (435,087,240) | | (118,017,054) |
| Capital Share Transactions: | | | | | | | |
| Sold | 5,411,538,165 | | 4,029,585,831 | | 1,130,238,868 | | 771,725,035 |
| Issued on reinvestment of distributions | 846,009,458 | | 354,750,045 | | 420,406,777 | | 113,763,031 |
| Redeemed | (3,440,313,459) | | (2,883,515,258) | | (999,150,768) | | (999,427,216) |
| Net increase (decrease) from capital share transactions | 2,817,234,164 | | 1,500,820,618 | | 551,494,877 | | (113,939,150) |
| Net Increase (Decrease) in Net Assets | 960,903,250 | | 5,478,211,824 | | 131,583,515 | | 1,203,067,711 |
| Net Assets: | | | | | | | |
| Beginning of period | 14,667,102,080 | | 9,188,890,256 | | 4,895,112,898 | | 3,692,045,187 |
| End of period | $ 15,628,005,330 | | $ 14,667,102,080 | | $ 5,026,696,413 | | $ 4,895,112,898 |
The accompanying notes are an integral part of these financial statements.
Hartford Domestic Equity Funds
Statements of Changes in Net Assets – (continued)
| | The Hartford
Growth Opportunities Fund | | The Hartford
Healthcare Fund |
| | For the
Year Ended
October 31,
2022 | | For the
Year Ended
October 31,
2021 | | For the
Year Ended
October 31,
2022 | | For the
Year Ended
October 31,
2021 |
| Operations: | | | | | | | |
| Net investment income (loss) | $ (38,976,574) | | $ (54,382,771) | | $ (3,361,967) | | $ (5,610,496) |
| Net realized gain (loss) on investments, other financial instruments and foreign currency transactions | (609,210,536) | | 1,724,280,446 | | 12,375,056 | | 183,832,310 |
| Net changes in unrealized appreciation (depreciation) of investments, other financial instruments and foreign currency transactions | (2,276,286,253) | | 264,840,372 | | (233,122,659) | | 154,285,853 |
| Net Increase (Decrease) in Net Assets Resulting from Operations | (2,924,473,363) | | 1,934,738,047 | | (224,109,570) | | 332,507,667 |
| Distributions to Shareholders: | | | | | | | |
| Class A | (697,296,082) | | (423,673,541) | | (86,099,036) | | (93,880,300) |
| Class C | (147,140,068) | | (94,842,287) | | (17,656,083) | | (22,672,232) |
| Class I | (370,501,893) | | (234,064,363) | | (41,655,813) | | (44,908,247) |
| Class R3 | (10,091,141) | | (7,102,825) | | (3,035,400) | | (3,747,674) |
| Class R4 | (13,268,156) | | (9,398,654) | | (2,247,542) | | (2,881,694) |
| Class R5 | (4,087,401) | | (2,988,257) | | (1,042,154) | | (1,201,964) |
| Class R6 | (11,501,636) | | (5,296,402) | | (497,706) | | (438,736) |
| Class Y | (90,278,847) | | (53,966,607) | | (9,938,908) | | (10,597,239) |
| Class F | (210,961,202) | | (109,670,067) | | (4,255,546) | | (4,009,747) |
| Total distributions | (1,555,126,426) | | (941,003,003) | | (166,428,188) | | (184,337,833) |
| Capital Share Transactions: | | | | | | | |
| Sold | 858,424,489 | | 1,412,684,010 | | 186,449,080 | | 254,406,423 |
| Issued on reinvestment of distributions | 1,448,388,944 | | 867,858,722 | | 157,999,398 | | 175,117,607 |
| Redeemed | (1,702,013,695) | | (1,585,916,069) | | (364,441,921) | | (314,733,008) |
| Net increase (decrease) from capital share transactions | 604,799,738 | | 694,626,663 | | (19,993,443) | | 114,791,022 |
| Net Increase (Decrease) in Net Assets | (3,874,800,051) | | 1,688,361,707 | | (410,531,201) | | 262,960,856 |
| Net Assets: | | | | | | | |
| Beginning of period | 8,083,468,935 | | 6,395,107,228 | | 1,728,629,444 | | 1,465,668,588 |
| End of period | $ 4,208,668,884 | | $ 8,083,468,935 | | $ 1,318,098,243 | | $ 1,728,629,444 |
The accompanying notes are an integral part of these financial statements.
Hartford Domestic Equity Funds
Statements of Changes in Net Assets – (continued)
| | The Hartford
MidCap Fund | | The Hartford
MidCap Value Fund |
| | For the
Year Ended
October 31,
2022 | | For the
Year Ended
October 31,
2021 | | For the
Year Ended
October 31,
2022 | | For the
Year Ended
October 31,
2021 |
| Operations: | | | | | | | |
| Net investment income (loss) | $ (18,862,259) | | $ 68,229,033 | | $ 4,321,020 | | $ 1,874,621 |
| Net realized gain (loss) on investments, other financial instruments and foreign currency transactions | 673,996,076 | | 1,707,213,123 | | 73,489,920 | | 100,036,552 |
| Net changes in unrealized appreciation (depreciation) of investments, other financial instruments and foreign currency transactions | (3,639,407,278) | | 2,690,020,087 | | (114,419,726) | | 189,407,923 |
| Net Increase (Decrease) in Net Assets Resulting from Operations | (2,984,273,461) | | 4,465,462,243 | | (36,608,786) | | 291,319,096 |
| Distributions to Shareholders: | | | | | | | |
| Class A | (400,817,525) | | (347,506,316) | | (25,970,524) | | (837,738) |
| Class C | (68,607,269) | | (72,065,078) | | (795,151) | | — |
| Class I | (448,017,894) | | (475,898,575) | | (1,896,364) | | (113,371) |
| Class R3 | (9,696,452) | | (10,341,121) | | (473,508) | | — |
| Class R4 | (17,297,892) | | (21,473,620) | | (688,694) | | (19,877) |
| Class R5 | (27,009,142) | | (36,606,303) | | (143,466) | | (9,446) |
| Class R6 | (146,841,604) | | (171,635,482) | | — | | — |
| Class Y | (87,412,620) | | (114,448,304) | | (1,035,457) | | (91,721) |
| Class F | (329,341,310) | | (294,576,639) | | (32,934,199) | | (2,424,869) |
| Total distributions | (1,535,041,708) | | (1,544,551,438) | | (63,937,363) | | (3,497,022) |
| Capital Share Transactions: | | | | | | | |
| Sold | 1,224,843,197 | | 2,014,553,894 | | 201,258,916 | | 146,817,585 |
| Issued on reinvestment of distributions | 1,475,446,801 | | 1,483,163,109 | | 63,651,091 | | 3,487,144 |
| Redeemed | (4,507,922,919) | | (5,460,496,113) | | (152,585,797) | | (162,560,509) |
| Net increase (decrease) from capital share transactions | (1,807,632,921) | | (1,962,779,110) | | 112,324,210 | | (12,255,780) |
| Net Increase (Decrease) in Net Assets | (6,326,948,090) | | 958,131,695 | | 11,778,061 | | 275,566,294 |
| Net Assets: | | | | | | | |
| Beginning of period | 13,926,292,007 | | 12,968,160,312 | | 875,344,076 | | 599,777,782 |
| End of period | $ 7,599,343,917 | | $ 13,926,292,007 | | $ 887,122,137 | | $ 875,344,076 |
The accompanying notes are an integral part of these financial statements.
Hartford Domestic Equity Funds
Statements of Changes in Net Assets – (continued)
| | Hartford
Quality Value Fund | | The Hartford
Small Cap Growth Fund |
| | For the
Year Ended
October 31,
2022 | | For the
Year Ended
October 31,
2021 | | For the
Year Ended
October 31,
2022 | | For the
Year Ended
October 31,
2021 |
| Operations: | | | | | | | |
| Net investment income (loss) | $ 3,955,583 | | $ 3,150,999 | | $ (2,983,813) | | $ (4,024,977) |
| Net realized gain (loss) on investments, other financial instruments and foreign currency transactions | 11,495,589 | | 13,598,905 | | (32,221,344) | | 174,617,463 |
| Net changes in unrealized appreciation (depreciation) of investments, other financial instruments and foreign currency transactions | (26,414,806) | | 56,452,184 | | (197,748,237) | | 106,905,409 |
| Net Increase (Decrease) in Net Assets Resulting from Operations | (10,963,634) | | 73,202,088 | | (232,953,394) | | 277,497,895 |
| Distributions to Shareholders: | | | | | | | |
| Class A | (11,405,295) | | (3,241,327) | | (47,491,758) | | (16,552,797) |
| Class C | (212,434) | | (63,247) | | (2,240,437) | | (1,531,478) |
| Class I | (1,405,148) | | (300,872) | | (21,579,489) | | (7,507,522) |
| Class R3 | (64,011) | | (17,729) | | (1,607,651) | | (683,476) |
| Class R4 | (276,389) | | (91,734) | | (3,548,265) | | (2,012,020) |
| Class R5 | (19,958) | | (5,775) | | (12,344,930) | | (5,481,575) |
| Class R6 | (16,459) | | (13,682) | | (13,516,765) | | (6,037,686) |
| Class Y | (108,987) | | (10,318) | | (42,116,476) | | (17,719,809) |
| Class F | (807,377) | | (258,522) | | (6,354,143) | | (3,391,955) |
| Total distributions | (14,316,058) | | (4,003,206) | | (150,799,914) | | (60,918,318) |
| Capital Share Transactions: | | | | | | | |
| Sold | 57,551,280 | | 21,527,878 | | 121,488,714 | | 158,407,323 |
| Issued on reinvestment of distributions | 14,094,650 | | 3,936,286 | | 143,128,875 | | 58,369,869 |
| Redeemed | (33,771,339) | | (31,941,068) | | (271,010,011) | | (342,794,035) |
| Net increase (decrease) from capital share transactions | 37,874,591 | | (6,476,904) | | (6,392,422) | | (126,016,843) |
| Net Increase (Decrease) in Net Assets | 12,594,899 | | 62,721,978 | | (390,145,730) | | 90,562,734 |
| Net Assets: | | | | | | | |
| Beginning of period | 232,279,214 | | 169,557,236 | | 890,583,685 | | 800,020,951 |
| End of period | $ 244,874,113 | | $ 232,279,214 | | $ 500,437,955 | | $ 890,583,685 |
The accompanying notes are an integral part of these financial statements.
Hartford Domestic Equity Funds
Statements of Changes in Net Assets – (continued)
| | Hartford
Small Cap Value Fund | | The Hartford
Small Company Fund |
| | For the
Year Ended
October 31,
2022 | | For the
Year Ended
October 31,
2021 | | For the
Year Ended
October 31,
2022 | | For the
Year Ended
October 31,
2021 |
| Operations: | | | | | | | |
| Net investment income (loss) | $ 1,890,548 | | $ 1,454,248 | | $ (4,021,328) | | $ (8,422,124) |
| Net realized gain (loss) on investments, other financial instruments and foreign currency transactions | 8,029,638 | | 17,243,277 | | (125,644,852) | | 219,723,239 |
| Net changes in unrealized appreciation (depreciation) of investments, other financial instruments and foreign currency transactions | (22,441,354) | | 29,174,321 | | (162,580,738) | | 8,069,059 |
| Net Increase (Decrease) in Net Assets Resulting from Operations | (12,521,168) | | 47,871,846 | | (292,246,918) | | 219,370,174 |
| Distributions to Shareholders: | | | | | | | |
| Class A | (3,964,811) | | (363,877) | | (107,539,494) | | (42,313,500) |
| Class C | (206,679) | | (3,950) | | (3,410,978) | | (1,604,568) |
| Class I | (2,259,354) | | (54,057) | | (11,875,080) | | (3,566,682) |
| Class R3 | (57,161) | | (3,498) | | (2,994,326) | | (1,394,856) |
| Class R4 | (3,408) | | (362) | | (2,607,622) | | (1,251,522) |
| Class R5 | (1,609) | | (148) | | (1,072,566) | | (377,954) |
| Class R6 | (216,927) | | (3,866) | | (945,537) | | (128,962) |
| Class Y | (122,885) | | (3,913) | | (7,555,025) | | (1,778,231) |
| Class F | (5,116,335) | | (666,330) | | (66,272,191) | | (24,289,826) |
| Total distributions | (11,949,169) | | (1,100,001) | | (204,272,819) | | (76,706,101) |
| Capital Share Transactions: | | | | | | | |
| Sold | 40,824,744 | | 82,135,100 | | 174,178,611 | | 307,799,887 |
| Issued on reinvestment of distributions | 11,837,402 | | 1,094,882 | | 202,875,469 | | 76,133,999 |
| Redeemed | (78,738,919) | | (32,701,037) | | (208,785,813) | | (262,911,327) |
| Net increase (decrease) from capital share transactions | (26,076,773) | | 50,528,945 | | 168,268,267 | | 121,022,559 |
| Net Increase (Decrease) in Net Assets | (50,547,110) | | 97,300,790 | | (328,251,470) | | 263,686,632 |
| Net Assets: | | | | | | | |
| Beginning of period | 176,665,064 | | 79,364,274 | | 993,903,045 | | 730,216,413 |
| End of period | $ 126,117,954 | | $ 176,665,064 | | $ 665,651,575 | | $ 993,903,045 |
The accompanying notes are an integral part of these financial statements.
Hartford Domestic Equity Funds
| | | — Selected Per-Share Data(1) — | | — Ratios and Supplemental Data — |
| Class | | Net
Asset
Value at
Beginning
of Period | | Net
Investment
Income
(Loss) | | Net
Realized
and
Unrealized
Gain (Loss)
on
Investments | | Total from
Investment
Operations | | Dividends
from Net
Investment
Income | | Distributions
from
Capital
Gains | | Total
Dividends
and
Distributions | | Net
Asset
Value at
End of
Period | | Total
Return(2) | | Net
Assets
at End
of Period
(000s) | | Ratio of
Expenses
to
Average
Net
Assets
Before
Adjust-
ments(3) | | Ratio of
Expenses
to
Average
Net
Assets
After
Adjust-
ments(3) | | Ratio of
Net
Investment
Income
(Loss) to
Average
Net Assets | | Portfolio
Turnover |
| The Hartford Capital Appreciation Fund |
| For the Year Ended October 31, 2022 |
| A | | $ 48.89 | | $ 0.12 | | $ (7.60) | | $ (7.48) | | $ (0.05) | | $ (6.83) | | $ (6.88) | | $ 34.53 | | (17.73)% | | $ 4,238,197 | | 1.05% | | 1.04% | | 0.31% | | 82% |
| C | | 34.14 | | (0.12) | | (4.93) | | (5.05) | | — | | (6.83) | | (6.83) | | 22.26 | | (18.35) | | 87,852 | | 1.84 | | 1.84 | | (0.49) | | 82 |
| I | | 49.25 | | 0.22 | | (7.64) | | (7.42) | | (0.16) | | (6.83) | | (6.99) | | 34.84 | | (17.49) | | 513,601 | | 0.78 | | 0.78 | | 0.57 | | 82 |
| R3 | | 55.21 | | (0.03) | | (8.73) | | (8.76) | | — | | (6.83) | | (6.83) | | 39.62 | | (18.03) | | 30,074 | | 1.41 | | 1.41 | | (0.06) | | 82 |
| R4 | | 57.63 | | 0.12 | | (9.18) | | (9.06) | | — | | (6.83) | | (6.83) | | 41.74 | | (17.77) | | 26,984 | | 1.10 | | 1.10 | | 0.25 | | 82 |
| R5 | | 59.02 | | 0.26 | | (9.41) | | (9.15) | | (0.13) | | (6.83) | | (6.96) | | 42.91 | | (17.51) | | 27,917 | | 0.80 | | 0.80 | | 0.56 | | 82 |
| R6 | | 59.48 | | 0.31 | | (9.49) | | (9.18) | | (0.19) | | (6.83) | | (7.02) | | 43.28 | | (17.44) | | 27,644 | | 0.70 | | 0.70 | | 0.66 | | 82 |
| Y | | 59.41 | | 0.26 | | (9.48) | | (9.22) | | (0.14) | | (6.83) | | (6.97) | | 43.22 | | (17.52) | | 74,365 | | 0.80 | | 0.80 | | 0.54 | | 82 |
| F | | 49.26 | | 0.25 | | (7.64) | | (7.39) | | (0.19) | | (6.83) | | (7.02) | | 34.85 | | (17.42) | | 696,473 | | 0.69 | | 0.69 | | 0.66 | | 82 |
| For the Year Ended October 31, 2021 |
| A | | $ 38.39 | | $ 0.05 | | $ 12.59 | | $ 12.64 | | $ (0.15) | | $ (1.99) | | $ (2.14) | | $ 48.89 | | 33.83% | | $ 5,710,869 | | 1.04% | | 1.04% | | 0.12% | | 62% |
| C | | 27.45 | | (0.21) | | 8.89 | | 8.68 | | — | | (1.99) | | (1.99) | | 34.14 | | 32.74 | | 148,862 | | 1.83 | | 1.83 | | (0.66) | | 62 |
| I | | 38.66 | | 0.18 | | 12.66 (4) | | 12.84 (4) | | (0.26) | | (1.99) | | (2.25) | | 49.25 | | 34.15 | | 721,608 | | 0.77 | | 0.77 | | 0.38 | | 62 |
| R3 | | 43.14 | | (0.13) | | 14.19 | | 14.06 | | — | | (1.99) | | (1.99) | | 55.21 | | 33.32 | | 45,054 | | 1.41 | | 1.41 | | (0.25) | | 62 |
| R4 | | 44.91 | | 0.03 | | 14.78 (4) | | 14.81 (4) | | (0.10) | | (1.99) | | (2.09) | | 57.63 | | 33.72 | | 36,750 | | 1.10 | | 1.10 | | 0.06 | | 62 |
| R5 | | 45.94 | | 0.20 | | 15.11 (4) | | 15.31 (4) | | (0.24) | | (1.99) | | (2.23) | | 59.02 | | 34.11 | | 36,529 | | 0.80 | | 0.80 | | 0.36 | | 62 |
| R6 | | 46.27 | | 0.26 | | 15.22 | | 15.48 | | (0.28) | | (1.99) | | (2.27) | | 59.48 | | 34.27 | | 19,261 | | 0.69 | | 0.69 | | 0.46 | | 62 |
| Y | | 46.24 | | 0.21 | | 15.21 | | 15.42 | | (0.26) | | (1.99) | | (2.25) | | 59.41 | | 34.14 | | 122,539 | | 0.80 | | 0.79 | | 0.37 | | 62 |
| F | | 38.66 | | 0.21 | | 12.67 | | 12.88 | | (0.29) | | (1.99) | | (2.28) | | 49.26 | | 34.28 | | 893,713 | | 0.69 | | 0.69 | | 0.47 | | 62 |
| For the Year Ended October 31, 2020 |
| A | | $ 37.12 | | $ 0.18 | | $ 2.90 | | $ 3.08 | | $ (0.17) | | $ (1.64) | | $ (1.81) | | $ 38.39 | | 8.57% | | $ 4,645,677 | | 1.07% | | 1.07% | | 0.48% | | 84% |
| C | | 27.08 | | (0.07) | | 2.08 | | 2.01 | | — | | (1.64) | | (1.64) | | 27.45 | | 7.78 | | 177,309 | | 1.85 | | 1.85 | | (0.27) | | 84 |
| I | | 37.36 | | 0.28 | | 2.93 | | 3.21 | | (0.27) | | (1.64) | | (1.91) | | 38.66 | | 8.88 | | 584,048 | | 0.79 | | 0.79 | | 0.77 | | 84 |
| R3 | | 41.47 | | 0.06 | | 3.25 | | 3.31 | | — | | (1.64) | | (1.64) | | 43.14 | | 8.25 | | 42,449 | | 1.42 | | 1.42 | | 0.14 | | 84 |
| R4 | | 43.06 | | 0.20 | | 3.39 | | 3.59 | | (0.10) | | (1.64) | | (1.74) | | 44.91 | | 8.59 | | 32,732 | | 1.10 | | 1.10 | | 0.46 | | 84 |
| R5 | | 44.04 | | 0.33 | | 3.47 | | 3.80 | | (0.26) | | (1.64) | | (1.90) | | 45.94 | | 8.88 | | 34,188 | | 0.81 | | 0.81 | | 0.75 | | 84 |
| R6 | | 44.34 | | 0.43 | | 3.44 | | 3.87 | | (0.30) | | (1.64) | | (1.94) | | 46.27 | | 9.03 | | 12,531 | | 0.70 | | 0.70 | | 1.00 | | 84 |
| Y | | 44.32 | | 0.36 | | 3.49 | | 3.85 | | (0.29) | | (1.64) | | (1.93) | | 46.24 | | 8.97 | | 103,152 | | 0.80 | | 0.75 | | 0.83 | | 84 |
| F | | 37.36 | | 0.31 | | 2.93 | | 3.24 | | (0.30) | | (1.64) | | (1.94) | | 38.66 | | 9.00 | | 724,872 | | 0.70 | | 0.70 | | 0.85 | | 84 |
| For the Year Ended October 31, 2019 |
| A | | $ 37.88 | | $ 0.15 | | $ 4.81 | | $ 4.96 | | $ (0.11) | | $ (5.61) | | $ (5.72) | | $ 37.12 | | 16.32% | | $ 4,831,749 | | 1.07% | | 1.07% | | 0.42% | | 68% |
| C | | 29.30 | | (0.09) | | 3.48 | | 3.39 | | — | | (5.61) | | (5.61) | | 27.08 | | 15.45 | | 278,394 | | 1.83 | | 1.83 | | (0.33) | | 68 |
| I | | 38.08 | | 0.25 | | 4.84 | | 5.09 | | (0.20) | | (5.61) | | (5.81) | | 37.36 | | 16.66 | | 658,302 | | 0.79 | | 0.79 | | 0.70 | | 68 |
| R3 | | 41.62 | | 0.03 | | 5.43 | | 5.46 | | — | | (5.61) | | (5.61) | | 41.47 | | 15.91 | | 50,957 | | 1.42 | | 1.42 | | 0.07 | | 68 |
| R4 | | 42.94 | | 0.16 | | 5.63 | | 5.79 | | (0.06) | | (5.61) | | (5.67) | | 43.06 | | 16.27 | | 38,634 | | 1.11 | | 1.11 | | 0.39 | | 68 |
| R5 | | 43.80 | | 0.28 | | 5.75 | | 6.03 | | (0.18) | | (5.61) | | (5.79) | | 44.04 | | 16.64 | | 38,808 | | 0.80 | | 0.80 | | 0.68 | | 68 |
| R6 | | 44.07 | | 0.33 | | 5.78 | | 6.11 | | (0.23) | | (5.61) | | (5.84) | | 44.34 | | 16.74 | | 80,535 | | 0.70 | | 0.70 | | 0.78 | | 68 |
| Y | | 44.06 | | 0.32 | | 5.77 | | 6.09 | | (0.22) | | (5.61) | | (5.83) | | 44.32 | | 16.71 | | 187,754 | | 0.78 | | 0.74 | | 0.75 | | 68 |
| F | | 38.09 | | 0.28 | | 4.83 | | 5.11 | | (0.23) | | (5.61) | | (5.84) | | 37.36 | | 16.75 | | 776,505 | | 0.70 | | 0.70 | | 0.79 | | 68 |
The accompanying notes are an integral part of these financial statements.
Hartford Domestic Equity Funds
Financial Highlights – (continued)
| | | — Selected Per-Share Data(1) — | | — Ratios and Supplemental Data — |
| Class | | Net
Asset
Value at
Beginning
of Period | | Net
Investment
Income
(Loss) | | Net
Realized
and
Unrealized
Gain (Loss)
on
Investments | | Total from
Investment
Operations | | Dividends
from Net
Investment
Income | | Distributions
from
Capital
Gains | | Total
Dividends
and
Distributions | | Net
Asset
Value at
End of
Period | | Total
Return(2) | | Net
Assets
at End
of Period
(000s) | | Ratio of
Expenses
to
Average
Net
Assets
Before
Adjust-
ments(3) | | Ratio of
Expenses
to
Average
Net
Assets
After
Adjust-
ments(3) | | Ratio of
Net
Investment
Income
(Loss) to
Average
Net Assets | | Portfolio
Turnover |
| The Hartford Capital Appreciation Fund – (continued) |
| For the Year Ended October 31, 2018 |
| A | | $ 41.86 | | $ 0.15 | | $ 1.45 | | $ 1.60 | | $ (0.26) | | $ (5.32) | | $ (5.58) | | $ 37.88 | | 3.92% | | $ 4,742,846 | | 1.07% | | 1.06% | | 0.38% | | 108% |
| C | | 33.62 | | (0.11) | | 1.16 | | 1.05 | | (0.05) | | (5.32) | | (5.37) | | 29.30 | | 3.15 | | 426,256 | | 1.81 | | 1.81 | | (0.34) | | 108 |
| I | | 42.04 | | 0.26 | | 1.44 | | 1.70 | | (0.34) | | (5.32) | | (5.66) | | 38.08 | | 4.19 | | 734,580 | | 0.78 | | 0.78 | | 0.66 | | 108 |
| R3 | | 45.39 | | 0.02 | | 1.56 | | 1.58 | | (0.03) | | (5.32) | | (5.35) | | 41.62 | | 3.57 | | 61,882 | | 1.42 | | 1.41 | | 0.04 | | 108 |
| R4 | | 46.69 | | 0.15 | | 1.62 | | 1.77 | | (0.20) | | (5.32) | | (5.52) | | 42.94 | | 3.87 | | 51,635 | | 1.10 | | 1.10 | | 0.34 | | 108 |
| R5 | | 47.54 | | 0.30 | | 1.63 | | 1.93 | | (0.35) | | (5.32) | | (5.67) | | 43.80 | | 4.18 | | 34,288 | | 0.80 | | 0.80 | | 0.65 | | 108 |
| R6 | | 47.80 | | 0.35 | | 1.64 | | 1.99 | | (0.40) | | (5.32) | | (5.72) | | 44.07 | | 4.29 | | 70,935 | | 0.70 | | 0.70 | | 0.75 | | 108 |
| Y | | 47.78 | | 0.34 | | 1.64 | | 1.98 | | (0.38) | | (5.32) | | (5.70) | | 44.06 | | 4.28 | | 175,731 | | 0.71 | | 0.71 | | 0.74 | | 108 |
| F | | 42.06 | | 0.30 | | 1.45 | | 1.75 | | (0.40) | | (5.32) | | (5.72) | | 38.09 | | 4.28 | | 880,110 | | 0.70 | | 0.70 | | 0.75 | | 108 |
| Hartford Core Equity Fund |
| For the Year Ended October 31, 2022 |
| A | | $ 49.41 | | $ 0.33 | | $ (7.87) | | $ (7.54) | | $ (0.24) | | $ (1.25) | | $ (1.49) | | $ 40.38 | | (15.79)% | | $ 1,456,044 | | 0.70% | | 0.70% | | 0.75% | | 15% |
| C | | 44.63 | | (0.00) (5) | | (7.11) | | (7.11) | | — | | (1.25) | | (1.25) | | 36.27 | | (16.43) | | 431,852 | | 1.45 | | 1.45 | | (0.00) (6) | | 15 |
| I | | 49.59 | | 0.45 | | (7.89) | | (7.44) | | (0.35) | | (1.25) | | (1.60) | | 40.55 | | (15.57) | | 3,529,589 | | 0.46 | | 0.46 | | 0.99 | | 15 |
| R3 | | 50.06 | | 0.17 | | (8.00) | | (7.83) | | (0.08) | | (1.25) | | (1.33) | | 40.90 | | (16.11) | | 54,393 | | 1.08 | | 1.07 | | 0.37 | | 15 |
| R4 | | 51.01 | | 0.34 | | (8.14) | | (7.80) | | (0.22) | | (1.25) | | (1.47) | | 41.74 | | (15.80) | | 157,597 | | 0.76 | | 0.73 | | 0.71 | | 15 |
| R5 | | 49.99 | | 0.44 | | (7.95) | | (7.51) | | (0.34) | | (1.25) | | (1.59) | | 40.89 | | (15.58) | | 146,672 | | 0.46 | | 0.46 | | 0.98 | | 15 |
| R6 | | 50.24 | | 0.50 | | (8.00) | | (7.50) | | (0.39) | | (1.25) | | (1.64) | | 41.10 | | (15.51) | | 1,059,702 | | 0.36 | | 0.36 | | 1.10 | | 15 |
| Y | | 50.20 | | 0.45 | | (7.98) | | (7.53) | | (0.35) | | (1.25) | | (1.60) | | 41.07 | | (15.56) | | 529,017 | | 0.45 | | 0.44 | | 1.00 | | 15 |
| F | | 49.65 | | 0.49 | | (7.90) | | (7.41) | | (0.39) | | (1.25) | | (1.64) | | 40.60 | | (15.51) | | 2,299,856 | | 0.36 | | 0.36 | | 1.08 | | 15 |
| For the Year Ended October 31, 2021 |
| A | | $ 36.04 | | $ 0.23 | | $ 13.36 | | $ 13.59 | | $ (0.22) | | $ — | | $ (0.22) | | $ 49.41 | | 37.85% | | $ 1,681,155 | | 0.70% | | 0.70% | | 0.52% | | 13% |
| C | | 32.62 | | (0.09) | | 12.10 | | 12.01 | | — | | — | | — | | 44.63 | | 36.82 | | 583,876 | | 1.45 | | 1.45 | | (0.23) | | 13 |
| I | | 36.16 | | 0.34 | | 13.40 | | 13.74 | | (0.31) | | — | | (0.31) | | 49.59 | | 38.19 | | 4,700,782 | | 0.45 | | 0.45 | | 0.77 | | 13 |
| R3 | | 36.54 | | 0.07 | | 13.56 | | 13.63 | | (0.11) | | — | | (0.11) | | 50.06 | | 37.38 | | 71,617 | | 1.07 | | 1.06 | | 0.16 | | 13 |
| R4 | | 37.20 | | 0.23 | | 13.79 | | 14.02 | | (0.21) | | — | | (0.21) | | 51.01 | | 37.82 | | 239,198 | | 0.76 | | 0.72 | | 0.50 | | 13 |
| R5 | | 36.44 | | 0.34 | | 13.51 | | 13.85 | | (0.30) | | — | | (0.30) | | 49.99 | | 38.17 | | 225,017 | | 0.46 | | 0.46 | | 0.76 | | 13 |
| R6 | | 36.62 | | 0.39 | | 13.57 | | 13.96 | | (0.34) | | — | | (0.34) | | 50.24 | | 38.31 | | 1,045,661 | | 0.36 | | 0.36 | | 0.86 | | 13 |
| Y | | 36.60 | | 0.35 | | 13.56 | | 13.91 | | (0.31) | | — | | (0.31) | | 50.20 | | 38.20 | | 903,952 | | 0.46 | | 0.44 | | 0.78 | | 13 |
| F | | 36.19 | | 0.38 | | 13.42 | | 13.80 | | (0.34) | | — | | (0.34) | | 49.65 | | 38.33 | | 3,213,368 | | 0.36 | | 0.36 | | 0.86 | | 13 |
| For the Year Ended October 31, 2020 |
| A | | $ 33.40 | | $ 0.26 | | $ 3.23 | | $ 3.49 | | $ (0.23) | | $ (0.62) | | $ (0.85) | | $ 36.04 | | 10.58% | | $ 1,140,994 | | 0.73% | | 0.72% | | 0.77% | | 22% |
| C | | 30.35 | | 0.01 | | 2.92 | | 2.93 | | (0.04) | | (0.62) | | (0.66) | | 32.62 | | 9.74 | | 443,989 | | 1.47 | | 1.47 | | 0.03 | | 22 |
| I | | 33.50 | | 0.35 | | 3.24 | | 3.59 | | (0.31) | | (0.62) | | (0.93) | | 36.16 | | 10.87 | | 2,936,718 | | 0.46 | | 0.46 | | 1.03 | | 22 |
| R3 | | 33.86 | | 0.15 | | 3.26 | | 3.41 | | (0.11) | | (0.62) | | (0.73) | | 36.54 | | 10.17 | | 46,674 | | 1.07 | | 1.07 | | 0.43 | | 22 |
| R4 | | 34.44 | | 0.27 | | 3.33 | | 3.60 | | (0.22) | | (0.62) | | (0.84) | | 37.20 | | 10.58 | | 169,267 | | 0.78 | | 0.73 | | 0.77 | | 22 |
| R5 | | 33.75 | | 0.36 | | 3.25 | | 3.61 | | (0.30) | | (0.62) | | (0.92) | | 36.44 | | 10.85 | | 188,738 | | 0.47 | | 0.47 | | 1.04 | | 22 |
| R6 | | 33.91 | | 0.38 | | 3.29 | | 3.67 | | (0.34) | | (0.62) | | (0.96) | | 36.62 | | 10.96 | | 746,018 | | 0.38 | | 0.38 | | 1.10 | | 22 |
| Y | | 33.90 | | 0.36 | | 3.28 | | 3.64 | | (0.32) | | (0.62) | | (0.94) | | 36.60 | | 10.89 | | 668,655 | | 0.47 | | 0.45 | | 1.05 | | 22 |
| F | | 33.52 | | 0.38 | | 3.25 | | 3.63 | | (0.34) | | (0.62) | | (0.96) | | 36.19 | | 10.97 | | 2,251,700 | | 0.38 | | 0.38 | | 1.12 | | 22 |
The accompanying notes are an integral part of these financial statements.
Hartford Domestic Equity Funds
Financial Highlights – (continued)
| | | — Selected Per-Share Data(1) — | | — Ratios and Supplemental Data — |
| Class | | Net
Asset
Value at
Beginning
of Period | | Net
Investment
Income
(Loss) | | Net
Realized
and
Unrealized
Gain (Loss)
on
Investments | | Total from
Investment
Operations | | Dividends
from Net
Investment
Income | | Distributions
from
Capital
Gains | | Total
Dividends
and
Distributions | | Net
Asset
Value at
End of
Period | | Total
Return(2) | | Net
Assets
at End
of Period
(000s) | | Ratio of
Expenses
to
Average
Net
Assets
Before
Adjust-
ments(3) | | Ratio of
Expenses
to
Average
Net
Assets
After
Adjust-
ments(3) | | Ratio of
Net
Investment
Income
(Loss) to
Average
Net Assets | | Portfolio
Turnover |
| Hartford Core Equity Fund – (continued) |
| For the Year Ended October 31, 2019 |
| A | | $ 30.17 | | $ 0.27 | | $ 4.40 | | $ 4.67 | | $ (0.21) | | $ (1.23) | | $ (1.44) | | $ 33.40 | | 16.60% | | $ 881,587 | | 0.74% | | 0.73% | | 0.88% | | 15% |
| C | | 27.53 | | 0.04 | | 4.01 | | 4.05 | | — | | (1.23) | | (1.23) | | 30.35 | | 15.71 | | 366,553 | | 1.47 | | 1.47 | | 0.14 | | 15 |
| I | | 30.26 | | 0.35 | | 4.40 | | 4.75 | | (0.28) | | (1.23) | | (1.51) | | 33.50 | | 16.91 | | 1,740,669 | | 0.47 | | 0.47 | | 1.14 | | 15 |
| R3 | | 30.52 | | 0.16 | | 4.48 | | 4.64 | | (0.07) | | (1.23) | | (1.30) | | 33.86 | | 16.18 | | 34,158 | | 1.10 | | 1.10 | | 0.52 | | 15 |
| R4 | | 31.03 | | 0.28 | | 4.54 | | 4.82 | | (0.18) | | (1.23) | | (1.41) | | 34.44 | | 16.59 | | 150,159 | | 0.77 | | 0.74 | | 0.88 | | 15 |
| R5 | | 30.47 | | 0.35 | | 4.44 | | 4.79 | | (0.28) | | (1.23) | | (1.51) | | 33.75 | | 16.90 | | 231,879 | | 0.49 | | 0.49 | | 1.13 | | 15 |
| R6 | | 30.61 | | 0.38 | | 4.46 | | 4.84 | | (0.31) | | (1.23) | | (1.54) | | 33.91 | | 17.01 | | 259,706 | | 0.38 | | 0.38 | | 1.22 | | 15 |
| Y | | 30.61 | | 0.37 | | 4.45 | | 4.82 | | (0.30) | | (1.23) | | (1.53) | | 33.90 | | 16.94 | | 371,580 | | 0.46 | | 0.43 | | 1.18 | | 15 |
| F | | 30.28 | | 0.38 | | 4.40 | | 4.78 | | (0.31) | | (1.23) | | (1.54) | | 33.52 | | 17.00 | | 1,655,619 | | 0.38 | | 0.38 | | 1.21 | | 15 |
| For the Year Ended October 31, 2018 |
| A | | $ 28.53 | | $ 0.22 | | $ 2.42 | | $ 2.64 | | $ (0.25) | | $ (0.75) | | $ (1.00) | | $ 30.17 | | 9.41% | | $ 666,354 | | 0.74% | | 0.74% | | 0.73% | | 22% |
| C | | 26.13 | | — | | 2.22 | | 2.22 | | (0.07) | | (0.75) | | (0.82) | | 27.53 | | 8.61 | | 293,064 | | 1.48 | | 1.48 | | — | | 22 |
| I | | 28.60 | | 0.30 | | 2.43 | | 2.73 | | (0.32) | | (0.75) | | (1.07) | | 30.26 | | 9.72 | | 1,130,600 | | 0.47 | | 0.47 | | 1.00 | | 22 |
| R3 | | 28.85 | | 0.12 | | 2.44 | | 2.56 | | (0.14) | | (0.75) | | (0.89) | | 30.52 | | 9.02 | | 34,765 | | 1.10 | | 1.10 | | 0.38 | | 22 |
| R4 | | 29.32 | | 0.22 | | 2.48 | | 2.70 | | (0.24) | | (0.75) | | (0.99) | | 31.03 | | 9.37 | | 144,866 | | 0.79 | | 0.76 | | 0.72 | | 22 |
| R5 | | 28.81 | | 0.30 | | 2.44 | | 2.74 | | (0.33) | | (0.75) | | (1.08) | | 30.47 | | 9.69 | | 201,510 | | 0.49 | | 0.49 | | 0.99 | | 22 |
| R6 | | 28.93 | | 0.33 | | 2.45 | | 2.78 | | (0.35) | | (0.75) | | (1.10) | | 30.61 | | 9.80 | | 146,643 | | 0.39 | | 0.39 | | 1.08 | | 22 |
| Y | | 28.93 | | 0.32 | | 2.45 | | 2.77 | | (0.34) | | (0.75) | | (1.09) | | 30.61 | | 9.77 | | 216,788 | | 0.42 | | 0.42 | | 1.06 | | 22 |
| F | | 28.63 | | 0.33 | | 2.42 | | 2.75 | | (0.35) | | (0.75) | | (1.10) | | 30.28 | | 9.80 | | 635,245 | | 0.39 | | 0.39 | | 1.09 | | 22 |
| The Hartford Dividend and Growth Fund |
| For the Year Ended October 31, 2022 |
| A | | $ 34.32 | | $ 0.38 | | $ (2.34) | | $ (1.96) | | $ (0.33) | | $ (1.62) | | $ (1.95) | | $ 30.41 | | (6.11)% | | $ 4,407,511 | | 0.96% | | 0.96% | | 1.18% | | 18% |
| C | | 32.94 | | 0.13 | | (2.23) | | (2.10) | | (0.11) | | (1.62) | | (1.73) | | 29.11 | | (6.82) | | 187,342 | | 1.74 | | 1.74 | | 0.41 | | 18 |
| I | | 34.12 | | 0.45 | | (2.31) | | (1.86) | | (0.41) | | (1.62) | | (2.03) | | 30.23 | | (5.86) | | 3,883,536 | | 0.72 | | 0.72 | | 1.43 | | 18 |
| R3 | | 34.88 | | 0.26 | | (2.37) | | (2.11) | | (0.20) | | (1.62) | | (1.82) | | 30.95 | | (6.45) | | 54,565 | | 1.34 | | 1.34 | | 0.79 | | 18 |
| R4 | | 35.17 | | 0.36 | | (2.39) | | (2.03) | | (0.30) | | (1.62) | | (1.92) | | 31.22 | | (6.16) | | 93,864 | | 1.04 | | 1.04 | | 1.10 | | 18 |
| R5 | | 35.33 | | 0.46 | | (2.40) | | (1.94) | | (0.40) | | (1.62) | | (2.02) | | 31.37 | | (5.88) | | 233,377 | | 0.73 | | 0.73 | | 1.40 | | 18 |
| R6 | | 35.34 | | 0.50 | | (2.41) | | (1.91) | | (0.44) | | (1.62) | | (2.06) | | 31.37 | | (5.80) | | 632,954 | | 0.63 | | 0.63 | | 1.52 | | 18 |
| Y | | 35.34 | | 0.48 | | (2.40) | | (1.92) | | (0.42) | | (1.62) | | (2.04) | | 31.38 | | (5.82) | | 714,793 | | 0.73 | | 0.68 | | 1.45 | | 18 |
| F | | 34.10 | | 0.48 | | (2.32) | | (1.84) | | (0.44) | | (1.62) | | (2.06) | | 30.20 | | (5.80) | | 5,420,063 | | 0.63 | | 0.63 | | 1.52 | | 18 |
| For the Year Ended October 31, 2021 |
| A | | $ 24.26 | | $ 0.33 | | $ 10.63 | | $ 10.96 | | $ (0.33) | | $ (0.57) | | $ (0.90) | | $ 34.32 | | 46.01% | | $ 4,733,858 | | 0.97% | | 0.97% | | 1.07% | | 18% |
| C | | 23.31 | | 0.09 | | 10.22 | | 10.31 | | (0.11) | | (0.57) | | (0.68) | | 32.94 | | 44.92 | | 169,569 | | 1.75 | | 1.75 | | 0.30 | | 18 |
| I | | 24.12 | | 0.40 | | 10.58 | | 10.98 | | (0.41) | | (0.57) | | (0.98) | | 34.12 | | 46.39 | | 3,178,645 | | 0.71 | | 0.71 | | 1.30 | | 18 |
| R3 | | 24.65 | | 0.22 | | 10.80 | | 11.02 | | (0.22) | | (0.57) | | (0.79) | | 34.88 | | 45.43 | | 66,751 | | 1.35 | | 1.35 | | 0.70 | | 18 |
| R4 | | 24.84 | | 0.32 | | 10.89 | | 11.21 | | (0.31) | | (0.57) | | (0.88) | | 35.17 | | 45.92 | | 106,561 | | 1.03 | | 1.03 | | 1.01 | | 18 |
| R5 | | 24.95 | | 0.41 | | 10.95 | | 11.36 | | (0.41) | | (0.57) | | (0.98) | | 35.33 | | 46.35 | | 265,832 | | 0.73 | | 0.73 | | 1.30 | | 18 |
| R6 | | 24.95 | | 0.44 | | 10.96 | | 11.40 | | (0.44) | | (0.57) | | (1.01) | | 35.34 | | 46.52 | | 470,425 | | 0.63 | | 0.63 | | 1.37 | | 18 |
| Y | | 24.95 | | 0.44 | | 10.94 | | 11.38 | | (0.42) | | (0.57) | | (0.99) | | 35.34 | | 46.47 | | 929,283 | | 0.74 | | 0.67 | | 1.38 | | 18 |
| F | | 24.10 | | 0.43 | | 10.58 | | 11.01 | | (0.44) | | (0.57) | | (1.01) | | 34.10 | | 46.55 | | 4,746,178 | | 0.63 | | 0.63 | | 1.40 | | 18 |
The accompanying notes are an integral part of these financial statements.
Hartford Domestic Equity Funds
Financial Highlights – (continued)
| | | — Selected Per-Share Data(1) — | | — Ratios and Supplemental Data — |
| Class | | Net
Asset
Value at
Beginning
of Period | | Net
Investment
Income
(Loss) | | Net
Realized
and
Unrealized
Gain (Loss)
on
Investments | | Total from
Investment
Operations | | Dividends
from Net
Investment
Income | | Distributions
from
Capital
Gains | | Total
Dividends
and
Distributions | | Net
Asset
Value at
End of
Period | | Total
Return(2) | | Net
Assets
at End
of Period
(000s) | | Ratio of
Expenses
to
Average
Net
Assets
Before
Adjust-
ments(3) | | Ratio of
Expenses
to
Average
Net
Assets
After
Adjust-
ments(3) | | Ratio of
Net
Investment
Income
(Loss) to
Average
Net Assets | | Portfolio
Turnover |
| The Hartford Dividend and Growth Fund – (continued) |
| For the Year Ended October 31, 2020 |
| A | | $ 25.93 | | $ 0.39 | | $ (0.94) | | $ (0.55) | | $ (0.37) | | $ (0.75) | | $ (1.12) | | $ 24.26 | | (2.20)% | | $ 3,385,907 | | 1.00% | | 1.00% | | 1.61% | | 28% |
| C | | 24.96 | | 0.20 | | (0.92) | | (0.72) | | (0.18) | | (0.75) | | (0.93) | | 23.31 | | (3.01) | | 138,431 | | 1.78 | | 1.78 | | 0.84 | | 28 |
| I | | 25.80 | | 0.45 | | (0.94) | | (0.49) | | (0.44) | | (0.75) | | (1.19) | | 24.12 | | (1.97) | | 1,681,761 | | 0.73 | | 0.73 | | 1.86 | | 28 |
| R3 | | 26.32 | | 0.31 | | (0.95) | | (0.64) | | (0.28) | | (0.75) | | (1.03) | | 24.65 | | (2.54) | | 54,642 | | 1.35 | | 1.35 | | 1.26 | | 28 |
| R4 | | 26.52 | | 0.39 | | (0.97) | | (0.58) | | (0.35) | | (0.75) | | (1.10) | | 24.84 | | (2.26) | | 82,299 | | 1.05 | | 1.05 | | 1.56 | | 28 |
| R5 | | 26.64 | | 0.47 | | (0.98) | | (0.51) | | (0.43) | | (0.75) | | (1.18) | | 24.95 | | (1.97) | | 177,851 | | 0.74 | | 0.74 | | 1.86 | | 28 |
| R6 | | 26.64 | | 0.49 | | (0.97) | | (0.48) | | (0.46) | | (0.75) | | (1.21) | | 24.95 | | (1.87) | | 196,065 | | 0.65 | | 0.65 | | 1.94 | | 28 |
| Y | | 26.64 | | 0.48 | | (0.97) | | (0.49) | | (0.45) | | (0.75) | | (1.20) | | 24.95 | | (1.91) | | 735,618 | | 0.73 | | 0.68 | | 1.92 | | 28 |
| F | | 25.78 | | 0.48 | | (0.95) | | (0.47) | | (0.46) | | (0.75) | | (1.21) | | 24.10 | | (1.89) | | 2,736,317 | | 0.64 | | 0.64 | | 1.96 | | 28 |
| For the Year Ended October 31, 2019 |
| A | | $ 25.63 | | $ 0.40 | | $ 2.63 | | $ 3.03 | | $ (0.38) | | $ (2.35) | | $ (2.73) | | $ 25.93 | | 13.75% | | $ 3,739,696 | | 1.00% | | 0.99% | | 1.65% | | 22% |
| C | | 24.75 | | 0.21 | | 2.53 | | 2.74 | | (0.18) | | (2.35) | | (2.53) | | 24.96 | | 12.92 | | 192,715 | | 1.77 | | 1.77 | | 0.89 | | 22 |
| I | | 25.51 | | 0.46 | | 2.63 | | 3.09 | | (0.45) | | (2.35) | | (2.80) | | 25.80 | | 14.08 | | 1,079,962 | | 0.73 | | 0.73 | | 1.89 | | 22 |
| R3 | | 25.97 | | 0.32 | | 2.67 | | 2.99 | | (0.29) | | (2.35) | | (2.64) | | 26.32 | | 13.33 | | 66,115 | | 1.36 | | 1.35 | | 1.30 | | 22 |
| R4 | | 26.14 | | 0.40 | | 2.69 | | 3.09 | | (0.36) | | (2.35) | | (2.71) | | 26.52 | | 13.71 | | 111,451 | | 1.04 | | 1.04 | | 1.61 | | 22 |
| R5 | | 26.25 | | 0.47 | | 2.71 | | 3.18 | | (0.44) | | (2.35) | | (2.79) | | 26.64 | | 14.05 | | 193,707 | | 0.74 | | 0.74 | | 1.89 | | 22 |
| R6 | | 26.25 | | 0.50 | | 2.71 | | 3.21 | | (0.47) | | (2.35) | | (2.82) | | 26.64 | | 14.16 | | 119,159 | | 0.64 | | 0.64 | | 1.98 | | 22 |
| Y | | 26.25 | | 0.49 | | 2.70 | | 3.19 | | (0.45) | | (2.35) | | (2.80) | | 26.64 | | 14.10 | | 696,309 | | 0.71 | | 0.68 | | 1.96 | | 22 |
| F | | 25.50 | | 0.49 | | 2.61 | | 3.10 | | (0.47) | | (2.35) | | (2.82) | | 25.78 | | 14.15 | | 2,844,206 | | 0.64 | | 0.64 | | 2.00 | | 22 |
| For the Year Ended October 31, 2018 |
| A | | $ 27.46 | | $ 0.39 | | $ 0.80 | | $ 1.19 | | $ (0.38) | | $ (2.64) | | $ (3.02) | | $ 25.63 | | 4.38% | | $ 3,521,062 | | 0.99% | | 0.99% | | 1.49% | | 31% |
| C | | 26.62 | | 0.19 | | 0.77 | | 0.96 | | (0.19) | | (2.64) | | (2.83) | | 24.75 | | 3.58 | | 228,076 | | 1.76 | | 1.75 | | 0.76 | | 31 |
| I | | 27.35 | | 0.46 | | 0.79 | | 1.25 | | (0.45) | | (2.64) | | (3.09) | | 25.51 | | 4.68 | | 847,646 | | 0.73 | | 0.73 | | 1.75 | | 31 |
| R3 | | 27.78 | | 0.30 | | 0.81 | | 1.11 | | (0.28) | | (2.64) | | (2.92) | | 25.97 | | 4.03 | | 72,723 | | 1.35 | | 1.35 | | 1.13 | | 31 |
| R4 | | 27.95 | | 0.39 | | 0.80 | | 1.19 | | (0.36) | | (2.64) | | (3.00) | | 26.14 | | 4.32 | | 131,649 | | 1.04 | | 1.04 | | 1.44 | | 31 |
| R5 | | 28.05 | | 0.47 | | 0.82 | | 1.29 | | (0.45) | | (2.64) | | (3.09) | | 26.25 | | 4.65 | | 146,918 | | 0.74 | | 0.74 | | 1.74 | | 31 |
| R6 | | 28.05 | | 0.49 | | 0.82 | | 1.31 | | (0.47) | | (2.64) | | (3.11) | | 26.25 | | 4.76 | | 74,795 | | 0.64 | | 0.64 | | 1.84 | | 31 |
| Y | | 28.05 | | 0.49 | | 0.81 | | 1.30 | | (0.46) | | (2.64) | | (3.10) | | 26.25 | | 4.72 | | 616,454 | | 0.68 | | 0.68 | | 1.80 | | 31 |
| F | | 27.33 | | 0.48 | | 0.80 | | 1.28 | | (0.47) | | (2.64) | | (3.11) | | 25.50 | | 4.77 | | 2,591,584 | | 0.64 | | 0.64 | | 1.84 | | 31 |
| The Hartford Equity Income Fund |
| For the Year Ended October 31, 2022 |
| A | | $ 23.85 | | $ 0.42 | | $ (0.38) | | $ 0.04 | | $ (0.40) | | $ (1.66) | | $ (2.06) | | $ 21.83 | | 0.12% | | $ 1,876,672 | | 0.97% | | 0.97% | | 1.88% | | 42% |
| C | | 23.72 | | 0.24 | | (0.37) | | (0.13) | | (0.22) | | (1.66) | | (1.88) | | 21.71 | | (0.64) | | 133,761 | | 1.75 | | 1.75 | | 1.10 | | 42 |
| I | | 23.68 | | 0.47 | | (0.37) | | 0.10 | | (0.45) | | (1.66) | | (2.11) | | 21.67 | | 0.40 | | 1,546,287 | | 0.74 | | 0.74 | | 2.12 | | 42 |
| R3 | | 23.89 | | 0.34 | | (0.38) | | (0.04) | | (0.31) | | (1.66) | | (1.97) | | 21.88 | | (0.25) | | 28,332 | | 1.36 | | 1.35 | | 1.50 | | 42 |
| R4 | | 23.93 | | 0.41 | | (0.39) | | 0.02 | | (0.38) | | (1.66) | | (2.04) | | 21.91 | | 0.02 | | 39,191 | | 1.06 | | 1.06 | | 1.78 | | 42 |
| R5 | | 24.07 | | 0.48 | | (0.39) | | 0.09 | | (0.45) | | (1.66) | | (2.11) | | 22.05 | | 0.34 | | 73,876 | | 0.75 | | 0.75 | | 2.10 | | 42 |
| R6 | | 24.13 | | 0.50 | | (0.38) | | 0.12 | | (0.47) | | (1.66) | | (2.13) | | 22.12 | | 0.49 | | 98,652 | | 0.65 | | 0.65 | | 2.21 | | 42 |
| Y | | 24.14 | | 0.48 | | (0.39) | | 0.09 | | (0.45) | | (1.66) | | (2.11) | | 22.12 | | 0.36 | | 123,645 | | 0.73 | | 0.73 | | 2.12 | | 42 |
| F | | 23.68 | | 0.49 | | (0.38) | | 0.11 | | (0.47) | | (1.66) | | (2.13) | | 21.66 | | 0.46 | | 1,106,281 | | 0.64 | | 0.64 | | 2.21 | | 42 |
The accompanying notes are an integral part of these financial statements.
Hartford Domestic Equity Funds
Financial Highlights – (continued)
| | | — Selected Per-Share Data(1) — | | — Ratios and Supplemental Data — |
| Class | | Net
Asset
Value at
Beginning
of Period | | Net
Investment
Income
(Loss) | | Net
Realized
and
Unrealized
Gain (Loss)
on
Investments | | Total from
Investment
Operations | | Dividends
from Net
Investment
Income | | Distributions
from
Capital
Gains | | Total
Dividends
and
Distributions | | Net
Asset
Value at
End of
Period | | Total
Return(2) | | Net
Assets
at End
of Period
(000s) | | Ratio of
Expenses
to
Average
Net
Assets
Before
Adjust-
ments(3) | | Ratio of
Expenses
to
Average
Net
Assets
After
Adjust-
ments(3) | | Ratio of
Net
Investment
Income
(Loss) to
Average
Net Assets | | Portfolio
Turnover |
| The Hartford Equity Income Fund – (continued) |
| For the Year Ended October 31, 2021 |
| A | | $ 17.55 | | $ 0.34 | | $ 6.50 | | $ 6.84 | | $ (0.34) | | $ (0.20) | | $ (0.54) | | $ 23.85 | | 39.45% | | $ 1,864,492 | | 0.98% | | 0.98% | | 1.57% | | 24% |
| C | | 17.46 | | 0.18 | | 6.44 | | 6.62 | | (0.16) | | (0.20) | | (0.36) | | 23.72 | | 38.31 | | 162,393 | | 1.75 | | 1.75 | | 0.85 | | 24 |
| I | | 17.44 | | 0.39 | | 6.44 | | 6.83 | | (0.39) | | (0.20) | | (0.59) | | 23.68 | | 39.69 | | 1,360,339 | | 0.74 | | 0.74 | | 1.81 | | 24 |
| R3 | | 17.59 | | 0.26 | | 6.50 | | 6.76 | | (0.26) | | (0.20) | | (0.46) | | 23.89 | | 38.83 | | 33,485 | | 1.36 | | 1.35 | | 1.21 | | 24 |
| R4 | | 17.62 | | 0.33 | | 6.50 | | 6.83 | | (0.32) | | (0.20) | | (0.52) | | 23.93 | | 39.25 | | 49,923 | | 1.05 | | 1.05 | | 1.52 | | 24 |
| R5 | | 17.71 | | 0.40 | | 6.55 | | 6.95 | | (0.39) | | (0.20) | | (0.59) | | 24.07 | | 39.75 | | 80,991 | | 0.75 | | 0.75 | | 1.80 | | 24 |
| R6 | | 17.76 | | 0.42 | | 6.56 | | 6.98 | | (0.41) | | (0.20) | | (0.61) | | 24.13 | | 39.82 | | 81,643 | | 0.65 | | 0.65 | | 1.90 | | 24 |
| Y | | 17.76 | | 0.40 | | 6.57 | | 6.97 | | (0.39) | | (0.20) | | (0.59) | | 24.14 | | 39.77 | | 120,502 | | 0.74 | | 0.73 | | 1.81 | | 24 |
| F | | 17.44 | | 0.41 | | 6.44 | | 6.85 | | (0.41) | | (0.20) | | (0.61) | | 23.68 | | 39.81 | | 1,141,345 | | 0.65 | | 0.65 | | 1.92 | | 24 |
| For the Year Ended October 31, 2020 |
| A | | $ 19.99 | | $ 0.34 | | $ (1.21) | | $ (0.87) | | $ (0.31) | | $ (1.26) | | $ (1.57) | | $ 17.55 | | (4.68)% | | $ 1,365,895 | | 1.00% | | 1.00% | | 1.89% | | 31% |
| C | | 19.88 | | 0.21 | | (1.20) | | (0.99) | | (0.17) | | (1.26) | | (1.43) | | 17.46 | | (5.38) | | 191,917 | | 1.76 | | 1.76 | | 1.15 | | 31 |
| I | | 19.88 | | 0.38 | | (1.20) | | (0.82) | | (0.36) | | (1.26) | | (1.62) | | 17.44 | | (4.44) | | 977,950 | | 0.74 | | 0.74 | | 2.13 | | 31 |
| R3 | | 20.02 | | 0.28 | | (1.20) | | (0.92) | | (0.25) | | (1.26) | | (1.51) | | 17.59 | | (4.97) | | 31,778 | | 1.36 | | 1.36 | | 1.55 | | 31 |
| R4 | | 20.06 | | 0.33 | | (1.21) | | (0.88) | | (0.30) | | (1.26) | | (1.56) | | 17.62 | | (4.72) | | 41,386 | | 1.05 | | 1.05 | | 1.85 | | 31 |
| R5 | | 20.16 | | 0.39 | | (1.22) | | (0.83) | | (0.36) | | (1.26) | | (1.62) | | 17.71 | | (4.46) | | 56,329 | | 0.77 | | 0.77 | | 2.14 | | 31 |
| R6 | | 20.21 | | 0.40 | | (1.21) | | (0.81) | | (0.38) | | (1.26) | | (1.64) | | 17.76 | | (4.34) | | 55,448 | | 0.66 | | 0.66 | | 2.22 | | 31 |
| Y | | 20.22 | | 0.40 | | (1.23) | | (0.83) | | (0.37) | | (1.26) | | (1.63) | | 17.76 | | (4.40) | | 81,615 | | 0.76 | | 0.71 | | 2.20 | | 31 |
| F | | 19.87 | | 0.40 | | (1.19) | | (0.79) | | (0.38) | | (1.26) | | (1.64) | | 17.44 | | (4.31) | | 889,727 | | 0.66 | | 0.66 | | 2.23 | | 31 |
| For the Year Ended October 31, 2019 |
| A | | $ 19.39 | | $ 0.38 | | $ 2.02 | | $ 2.40 | | $ (0.36) | | $ (1.44) | | $ (1.80) | | $ 19.99 | | 13.88% | | $ 1,565,663 | | 1.00% | | 1.00% | | 2.01% | | 21% |
| C | | 19.29 | | 0.24 | | 2.00 | | 2.24 | | (0.21) | | (1.44) | | (1.65) | | 19.88 | | 13.00 | | 292,388 | | 1.76 | | 1.76 | | 1.27 | | 21 |
| I | | 19.29 | | 0.43 | | 2.01 | | 2.44 | | (0.41) | | (1.44) | | (1.85) | | 19.88 | | 14.17 | | 959,142 | | 0.75 | | 0.75 | | 2.26 | | 21 |
| R3 | | 19.41 | | 0.32 | | 2.02 | | 2.34 | | (0.29) | | (1.44) | | (1.73) | | 20.02 | | 13.48 | | 43,474 | | 1.36 | | 1.36 | | 1.66 | | 21 |
| R4 | | 19.44 | | 0.37 | | 2.04 | | 2.41 | | (0.35) | | (1.44) | | (1.79) | | 20.06 | | 13.85 | | 53,957 | | 1.07 | | 1.07 | | 1.96 | | 21 |
| R5 | | 19.54 | | 0.43 | | 2.04 | | 2.47 | | (0.41) | | (1.44) | | (1.85) | | 20.16 | | 14.14 | | 81,758 | | 0.76 | | 0.76 | | 2.25 | | 21 |
| R6 | | 19.58 | | 0.45 | | 2.05 | | 2.50 | | (0.43) | | (1.44) | | (1.87) | | 20.21 | | 14.29 | | 52,201 | | 0.66 | | 0.66 | | 2.33 | | 21 |
| Y | | 19.58 | | 0.45 | | 2.05 | | 2.50 | | (0.42) | | (1.44) | | (1.86) | | 20.22 | | 14.21 | | 105,015 | | 0.73 | | 0.71 | | 2.34 | | 21 |
| F | | 19.29 | | 0.44 | | 2.01 | | 2.45 | | (0.43) | | (1.44) | | (1.87) | | 19.87 | | 14.24 | | 922,012 | | 0.66 | | 0.66 | | 2.34 | | 21 |
| For the Year Ended October 31, 2018 |
| A | | $ 20.64 | | $ 0.38 | | $ (0.24) | | $ 0.14 | | $ (0.35) | | $ (1.04) | | $ (1.39) | | $ 19.39 | | 0.49% | | $ 1,508,580 | | 1.00% | | 1.00% | | 1.90% | | 22% |
| C | | 20.53 | | 0.23 | | (0.23) | | — | | (0.20) | | (1.04) | | (1.24) | | 19.29 | | (0.22) | | 330,741 | | 1.75 | | 1.75 | | 1.16 | | 22 |
| I | | 20.54 | | 0.43 | | (0.24) | | 0.19 | | (0.40) | | (1.04) | | (1.44) | | 19.29 | | 0.77 | | 1,157,708 | | 0.74 | | 0.74 | | 2.14 | | 22 |
| R3 | | 20.66 | | 0.31 | | (0.25) | | 0.06 | | (0.27) | | (1.04) | | (1.31) | | 19.41 | | 0.12 | | 46,820 | | 1.36 | | 1.36 | | 1.53 | | 22 |
| R4 | | 20.69 | | 0.37 | | (0.24) | | 0.13 | | (0.34) | | (1.04) | | (1.38) | | 19.44 | | 0.43 | | 70,446 | | 1.06 | | 1.06 | | 1.83 | | 22 |
| R5 | | 20.78 | | 0.43 | | (0.23) | | 0.20 | | (0.40) | | (1.04) | | (1.44) | | 19.54 | | 0.78 | | 79,557 | | 0.76 | | 0.76 | | 2.13 | | 22 |
| R6 | | 20.83 | | 0.45 | | (0.24) | | 0.21 | | (0.42) | | (1.04) | | (1.46) | | 19.58 | | 0.83 | | 34,957 | | 0.66 | | 0.66 | | 2.22 | | 22 |
| Y | | 20.83 | | 0.45 | | (0.25) | | 0.20 | | (0.41) | | (1.04) | | (1.45) | | 19.58 | | 0.79 | | 140,057 | | 0.70 | | 0.70 | | 2.19 | | 22 |
| F | | 20.54 | | 0.45 | | (0.24) | | 0.21 | | (0.42) | | (1.04) | | (1.46) | | 19.29 | | 0.85 | | 774,529 | | 0.65 | | 0.65 | | 2.23 | | 22 |
The accompanying notes are an integral part of these financial statements.
Hartford Domestic Equity Funds
Financial Highlights – (continued)
| | | — Selected Per-Share Data(1) — | | — Ratios and Supplemental Data — |
| Class | | Net
Asset
Value at
Beginning
of Period | | Net
Investment
Income
(Loss) | | Net
Realized
and
Unrealized
Gain (Loss)
on
Investments | | Total from
Investment
Operations | | Dividends
from Net
Investment
Income | | Distributions
from
Capital
Gains | | Total
Dividends
and
Distributions | | Net
Asset
Value at
End of
Period | | Total
Return(2) | | Net
Assets
at End
of Period
(000s) | | Ratio of
Expenses
to
Average
Net
Assets
Before
Adjust-
ments(3) | | Ratio of
Expenses
to
Average
Net
Assets
After
Adjust-
ments(3) | | Ratio of
Net
Investment
Income
(Loss) to
Average
Net Assets | | Portfolio
Turnover |
| The Hartford Growth Opportunities Fund |
| For the Year Ended October 31, 2022 |
| A | | $ 62.10 | | $ (0.31) | | $ (19.34) | | $ (19.65) | | $ — | | $ (11.96) | | $ (11.96) | | $ 30.49 | | (38.47)% | | $ 1,981,665 | | 1.09% | | 1.08% | | (0.79)% | | 95% |
| C | | 25.14 | | (0.16) | | (5.34) | | (5.50) | | — | | (11.96) | | (11.96) | | 7.68 | | (38.93) | | 130,590 | | 1.85 | | 1.85 | | (1.58) | | 95 |
| I | | 67.29 | | (0.24) | | (21.32) | | (21.56) | | — | | (11.96) | | (11.96) | | 33.77 | | (38.31) | | 941,202 | | 0.84 | | 0.84 | | (0.56) | | 95 |
| R3 | | 61.55 | | (0.44) | | (19.11) | | (19.55) | | — | | (11.96) | | (11.96) | | 30.04 | | (38.69) | | 29,520 | | 1.45 | | 1.45 | | (1.16) | | 95 |
| R4 | | 67.45 | | (0.36) | | (21.37) | | (21.73) | | — | | (11.96) | | (11.96) | | 33.76 | | (38.50) | | 42,391 | | 1.14 | | 1.14 | | (0.85) | | 95 |
| R5 | | 72.75 | | (0.26) | | (23.40) | | (23.66) | | — | | (11.96) | | (11.96) | | 37.13 | | (38.33) | | 13,784 | | 0.85 | | 0.85 | | (0.56) | | 95 |
| R6 | | 74.55 | | (0.22) | | (24.09) | | (24.31) | | — | | (11.96) | | (11.96) | | 38.28 | | (38.26) | | 39,511 | | 0.74 | | 0.74 | | (0.45) | | 95 |
| Y | | 74.41 | | (0.26) | | (24.03) | | (24.29) | | — | | (11.96) | | (11.96) | | 38.16 | | (38.32) | | 333,299 | | 0.84 | | 0.84 | | (0.54) | | 95 |
| F | | 67.69 | | (0.19) | | (21.49) | | (21.68) | | — | | (11.96) | | (11.96) | | 34.05 | | (38.25) | | 696,706 | | 0.74 | | 0.74 | | (0.44) | | 95 |
| For the Year Ended October 31, 2021 |
| A | | $ 54.65 | | $ (0.47) | | $ 15.83 | | $ 15.36 | | $ — | | $ (7.91) | | $ (7.91) | | $ 62.10 | | 30.45% | | $ 3,650,083 | | 1.07% | | 1.06% | | (0.80)% | | 87% |
| C | | 26.47 | | (0.38) | | 6.96 | | 6.58 | | — | | (7.91) | | (7.91) | | 25.14 | | 29.47 | | 321,097 | | 1.83 | | 1.83 | | (1.57) | | 87 |
| I | | 58.51 | | (0.36) | | 17.05 | | 16.69 | | — | | (7.91) | | (7.91) | | 67.29 | | 30.75 | | 2,124,160 | | 0.82 | | 0.82 | | (0.56) | | 87 |
| R3 | | 54.41 | | (0.68) | | 15.73 | | 15.05 | | — | | (7.91) | | (7.91) | | 61.55 | | 29.96 | | 51,824 | | 1.45 | | 1.44 | | (1.18) | | 87 |
| R4 | | 58.79 | | (0.56) | | 17.13 | | 16.57 | | — | | (7.91) | | (7.91) | | 67.45 | | 30.36 | | 76,404 | | 1.14 | | 1.14 | | (0.88) | | 87 |
| R5 | | 62.69 | | (0.39) | | 18.36 | | 17.97 | | — | | (7.91) | | (7.91) | | 72.75 | | 30.74 | | 25,000 | | 0.84 | | 0.84 | | (0.58) | | 87 |
| R6 | | 64.01 | | (0.34) | | 18.79 | | 18.45 | | — | | (7.91) | | (7.91) | | 74.55 | | 30.87 | | 72,428 | | 0.74 | | 0.74 | | (0.49) | | 87 |
| Y | | 63.96 | | (0.40) | | 18.76 | | 18.36 | | — | | (7.91) | | (7.91) | | 74.41 | | 30.74 | | 565,204 | | 0.84 | | 0.83 | | (0.57) | | 87 |
| F | | 58.77 | | (0.31) | | 17.14 | | 16.83 | | — | | (7.91) | | (7.91) | | 67.69 | | 30.87 | | 1,197,268 | | 0.73 | | 0.73 | | (0.48) | | 87 |
| For the Year Ended October 31, 2020 |
| A | | $ 39.45 | | $ (0.30) | | $ 18.03 | | $ 17.73 | | $ — | | $ (2.53) | | $ (2.53) | | $ 54.65 | | 47.69% | | $ 2,939,376 | | 1.10% | | 1.09% | | (0.66)% | | 118% |
| C | | 20.50 | | (0.31) | | 8.81 | | 8.50 | | — | | (2.53) | | (2.53) | | 26.47 | | 46.64 | | 322,226 | | 1.85 | | 1.85 | | (1.41) | | 118 |
| I | | 41.95 | | (0.19) | | 19.28 | | 19.09 | | — | | (2.53) | | (2.53) | | 58.51 | | 48.12 | | 1,722,100 | | 0.83 | | 0.83 | | (0.39) | | 118 |
| R3 | | 39.41 | | (0.44) | | 17.97 | | 17.53 | | — | | (2.53) | | (2.53) | | 54.41 | | 47.21 | | 47,880 | | 1.44 | | 1.43 | | (0.99) | | 118 |
| R4 | | 42.26 | | (0.33) | | 19.39 | | 19.06 | | — | | (2.53) | | (2.53) | | 58.79 | | 47.67 | | 70,918 | | 1.13 | | 1.13 | | (0.69) | | 118 |
| R5 | | 44.78 | | (0.20) | | 20.64 | | 20.44 | | — | | (2.53) | | (2.53) | | 62.69 | | 48.09 | | 23,170 | | 0.85 | | 0.85 | | (0.40) | | 118 |
| R6 | | 45.63 | | (0.17) | | 21.08 | | 20.91 | | — | | (2.53) | | (2.53) | | 64.01 | | 48.23 | | 40,559 | | 0.74 | | 0.74 | | (0.31) | | 118 |
| Y | | 45.62 | | (0.20) | | 21.07 | | 20.87 | | — | | (2.53) | | (2.53) | | 63.96 | | 48.15 | | 433,672 | | 0.83 | | 0.78 | | (0.38) | | 118 |
| F | | 42.09 | | (0.15) | | 19.36 | | 19.21 | | — | | (2.53) | | (2.53) | | 58.77 | | 48.25 | | 795,206 | | 0.74 | | 0.74 | | (0.31) | | 118 |
| For the Year Ended October 31, 2019 |
| A | | $ 45.89 | | $ (0.25) | | $ 4.35 | | $ 4.10 | | $ — | | $ (10.54) | | $ (10.54) | | $ 39.45 | | 13.64% | | $ 2,089,246 | | 1.12% | | 1.11% | | (0.64)% | | 66% |
| C | | 29.36 | | (0.29) | | 1.97 | | 1.68 | | — | | (10.54) | | (10.54) | | 20.50 | | 12.79 | | 281,545 | | 1.86 | | 1.86 | | (1.39) | | 66 |
| I | | 47.99 | | (0.16) | | 4.66 | | 4.50 | | — | | (10.54) | | (10.54) | | 41.95 | | 13.94 | | 1,500,756 | | 0.85 | | 0.85 | | (0.38) | | 66 |
| R3 | | 45.98 | | (0.39) | | 4.36 | | 3.97 | | — | | (10.54) | | (10.54) | | 39.41 | | 13.25 | | 44,757 | | 1.47 | | 1.46 | | (1.00) | | 66 |
| R4 | | 48.38 | | (0.29) | | 4.71 | | 4.42 | | — | | (10.54) | | (10.54) | | 42.26 | | 13.57 | | 67,104 | | 1.15 | | 1.15 | | (0.69) | | 66 |
| R5 | | 50.48 | | (0.17) | | 5.01 | | 4.84 | | — | | (10.54) | | (10.54) | | 44.78 | | 13.92 | | 25,396 | | 0.85 | | 0.85 | | (0.39) | | 66 |
| R6 | | 51.18 | | (0.13) | | 5.12 | | 4.99 | | — | | (10.54) | | (10.54) | | 45.63 | | 14.03 | | 22,765 | | 0.75 | | 0.75 | | (0.29) | | 66 |
| Y | | 51.18 | | (0.15) | | 5.13 | | 4.98 | | — | | (10.54) | | (10.54) | | 45.62 | | 14.00 | | 164,390 | | 0.83 | | 0.79 | | (0.33) | | 66 |
| F | | 48.07 | | (0.12) | | 4.68 | | 4.56 | | — | | (10.54) | | (10.54) | | 42.09 | | 14.07 | | 526,379 | | 0.74 | | 0.74 | | (0.28) | | 66 |
The accompanying notes are an integral part of these financial statements.
Hartford Domestic Equity Funds
Financial Highlights – (continued)
| | | — Selected Per-Share Data(1) — | | — Ratios and Supplemental Data — |
| Class | | Net
Asset
Value at
Beginning
of Period | | Net
Investment
Income
(Loss) | | Net
Realized
and
Unrealized
Gain (Loss)
on
Investments | | Total from
Investment
Operations | | Dividends
from Net
Investment
Income | | Distributions
from
Capital
Gains | | Total
Dividends
and
Distributions | | Net
Asset
Value at
End of
Period | | Total
Return(2) | | Net
Assets
at End
of Period
(000s) | | Ratio of
Expenses
to
Average
Net
Assets
Before
Adjust-
ments(3) | | Ratio of
Expenses
to
Average
Net
Assets
After
Adjust-
ments(3) | | Ratio of
Net
Investment
Income
(Loss) to
Average
Net Assets | | Portfolio
Turnover |
| The Hartford Growth Opportunities Fund – (continued) |
| For the Year Ended October 31, 2018 |
| A | | $ 46.20 | | $ (0.29) | | $ 3.86 | | $ 3.57 | | $ — | | $ (3.88) | | $ (3.88) | | $ 45.89 | | 8.31% | | $ 2,013,200 | | 1.11% | | 1.11% | | (0.61)% | | 122% |
| C | | 31.15 | | (0.41) | | 2.50 | | 2.09 | | — | | (3.88) | | (3.88) | | 29.36 | | 7.49 | | 321,653 | | 1.85 | | 1.85 | | (1.35) | | 122 |
| I | | 48.01 | | (0.17) | | 4.03 | | 3.86 | | — | | (3.88) | | (3.88) | | 47.99 | | 8.62 | | 1,674,141 | | 0.84 | | 0.84 | | (0.34) | | 122 |
| R3 | | 46.43 | | (0.45) | | 3.88 | | 3.43 | | — | | (3.88) | | (3.88) | | 45.98 | | 7.94 | | 47,707 | | 1.46 | | 1.45 | | (0.95) | | 122 |
| R4 | | 48.52 | | (0.32) | | 4.06 | | 3.74 | | — | | (3.88) | | (3.88) | | 48.38 | | 8.28 | | 79,229 | | 1.15 | | 1.15 | | (0.65) | | 122 |
| R5 | | 50.31 | | (0.18) | | 4.23 | | 4.05 | | — | | (3.88) | | (3.88) | | 50.48 | | 8.60 | | 19,708 | | 0.86 | | 0.86 | | (0.35) | | 122 |
| R6 | | 50.91 | | (0.14) | | 4.29 | | 4.15 | | — | | (3.88) | | (3.88) | | 51.18 | | 8.71 | | 12,061 | | 0.75 | | 0.75 | | (0.26) | | 122 |
| Y | | 50.92 | | (0.15) | | 4.29 | | 4.14 | | — | | (3.88) | | (3.88) | | 51.18 | | 8.68 | | 127,721 | | 0.78 | | 0.78 | | (0.28) | | 122 |
| F | | 48.05 | | (0.12) | | 4.02 | | 3.90 | | — | | (3.88) | | (3.88) | | 48.07 | | 8.71 | | 401,565 | | 0.75 | | 0.75 | | (0.25) | | 122 |
| The Hartford Healthcare Fund |
| For the Year Ended October 31, 2022 |
| A | | $ 44.57 | | $ (0.10) | | $ (5.43) | | $ (5.53) | | $ — | | $ (4.37) | | $ (4.37) | | $ 34.67 | | (13.39)% | | $ 710,176 | | 1.26% | | 1.26% | | (0.27)% | | 33% |
| C | | 32.92 | | (0.27) | | (3.89) | | (4.16) | | — | | (4.37) | | (4.37) | | 24.39 | | (14.05) | | 84,595 | | 2.03 | | 2.03 | | (1.04) | | 33 |
| I | | 47.93 | | (0.00) (5) | | (5.88) | | (5.88) | | — | | (4.37) | | (4.37) | | 37.68 | | (13.16) | | 329,897 | | 1.00 | | 1.00 | | (0.01) | | 33 |
| R3 | | 45.63 | | (0.23) | | (5.57) | | (5.80) | | — | | (4.37) | | (4.37) | | 35.46 | | (13.70) | | 24,849 | | 1.61 | | 1.61 | | (0.62) | | 33 |
| R4 | | 49.12 | | (0.13) | | (6.03) | | (6.16) | | — | | (4.37) | | (4.37) | | 38.59 | | (13.44) | | 16,006 | | 1.30 | | 1.30 | | (0.31) | | 33 |
| R5 | | 52.49 | | (0.01) | | (6.48) | | (6.49) | | — | | (4.37) | | (4.37) | | 41.63 | | (13.18) | | 10,102 | | 1.01 | | 1.01 | | (0.02) | | 33 |
| R6 | | 53.47 | | (0.02) | | (6.55) | | (6.57) | | — | | (4.37) | | (4.37) | | 42.53 | | (13.08) | | 55,392 | | 0.90 | | 0.90 | | (0.05) | | 33 |
| Y | | 53.38 | | 0.00 (5) | | (6.61) | | (6.61) | | — | | (4.37) | | (4.37) | | 42.40 | | (13.19) | | 52,172 | | 1.00 | | 1.00 | | 0.01 | | 33 |
| F | | 48.18 | | 0.04 | | (5.92) | | (5.88) | | — | | (4.37) | | (4.37) | | 37.93 | | (13.09) | | 34,909 | | 0.90 | | 0.90 | | 0.09 | | 33 |
| For the Year Ended October 31, 2021 |
| A | | $ 40.91 | | $ (0.15) | | $ 8.98 | | $ 8.83 | | $ — | | $ (5.17) | | $ (5.17) | | $ 44.57 | | 22.88% | | $ 883,719 | | 1.25% | | 1.24% | | (0.36)% | | 51% |
| C | | 31.63 | | (0.36) | | 6.82 | | 6.46 | | — | | (5.17) | | (5.17) | | 32.92 | | 21.98 | | 134,574 | | 2.01 | | 2.01 | | (1.12) | | 51 |
| I | | 43.53 | | (0.04) | | 9.61 | | 9.57 | | — | | (5.17) | | (5.17) | | 47.93 | | 23.23 | | 463,673 | | 0.98 | | 0.98 | | (0.10) | | 51 |
| R3 | | 41.90 | | (0.31) | | 9.21 | | 8.90 | | — | | (5.17) | | (5.17) | | 45.63 | | 22.46 | | 32,550 | | 1.59 | | 1.59 | | (0.70) | | 51 |
| R4 | | 44.63 | | (0.19) | | 9.85 | | 9.66 | | — | | (5.17) | | (5.17) | | 49.12 | | 22.83 | | 25,818 | | 1.29 | | 1.29 | | (0.40) | | 51 |
| R5 | | 47.24 | | (0.06) | | 10.48 | | 10.42 | | — | | (5.17) | | (5.17) | | 52.49 | | 23.21 | | 12,933 | | 1.00 | | 1.00 | | (0.11) | | 51 |
| R6 | | 47.99 | | (0.00) (5) | | 10.65 | | 10.65 | | — | | (5.17) | | (5.17) | | 53.47 | | 23.33 | | 6,091 | | 0.89 | | 0.89 | | (0.00) (6) | | 51 |
| Y | | 47.95 | | (0.05) | | 10.65 | | 10.60 | | — | | (5.17) | | (5.17) | | 53.38 | | 23.24 | | 122,793 | | 0.99 | | 0.98 | | (0.09) | | 51 |
| F | | 43.70 | | (0.00) (5) | | 9.65 | | 9.65 | | — | | (5.17) | | (5.17) | | 48.18 | | 23.34 | | 46,477 | | 0.89 | | 0.89 | | (0.00) (6) | | 51 |
| For the Year Ended October 31, 2020 |
| A | | $ 35.63 | | $ (0.13) | | $ 7.77 | | $ 7.64 | | $ — | | $ (2.36) | | $ (2.36) | | $ 40.91 | | 22.17% | | $ 746,242 | | 1.28% | | 1.28% | | (0.33)% | | 49% |
| C | | 28.24 | | (0.33) | | 6.08 | | 5.75 | | — | | (2.36) | | (2.36) | | 31.63 | | 21.21 | | 139,847 | | 2.04 | | 2.04 | | (1.09) | | 49 |
| I | | 37.68 | | (0.02) | | 8.23 | | 8.21 | | — | | (2.36) | | (2.36) | | 43.53 | | 22.49 | | 376,518 | | 0.99 | | 0.99 | | (0.05) | | 49 |
| R3 | | 36.56 | | (0.26) | | 7.96 | | 7.70 | | — | | (2.36) | | (2.36) | | 41.90 | | 21.74 | | 31,090 | | 1.61 | | 1.61 | | (0.65) | | 49 |
| R4 | | 38.69 | | (0.15) | | 8.45 | | 8.30 | | — | | (2.36) | | (2.36) | | 44.63 | | 22.12 | | 25,078 | | 1.30 | | 1.30 | | (0.35) | | 49 |
| R5 | | 40.71 | | (0.03) | | 8.92 | | 8.89 | | — | | (2.36) | | (2.36) | | 47.24 | | 22.48 | | 10,937 | | 1.01 | | 1.01 | | (0.07) | | 49 |
| R6 | | 41.28 | | 0.02 | | 9.05 | | 9.07 | | — | | (2.36) | | (2.36) | | 47.99 | | 22.61 | | 3,885 | | 0.90 | | 0.90 | | 0.04 | | 49 |
| Y | | 41.27 | | (0.01) | | 9.05 | | 9.04 | | — | | (2.36) | | (2.36) | | 47.95 | | 22.55 | | 97,263 | | 1.00 | | 0.95 | | (0.01) | | 49 |
| F | | 37.79 | | 0.02 | | 8.25 | | 8.27 | | — | | (2.36) | | (2.36) | | 43.70 | | 22.59 | | 34,808 | | 0.90 | | 0.90 | | 0.04 | | 49 |
The accompanying notes are an integral part of these financial statements.
Hartford Domestic Equity Funds
Financial Highlights – (continued)
| | | — Selected Per-Share Data(1) — | | — Ratios and Supplemental Data — |
| Class | | Net
Asset
Value at
Beginning
of Period | | Net
Investment
Income
(Loss) | | Net
Realized
and
Unrealized
Gain (Loss)
on
Investments | | Total from
Investment
Operations | | Dividends
from Net
Investment
Income | | Distributions
from
Capital
Gains | | Total
Dividends
and
Distributions | | Net
Asset
Value at
End of
Period | | Total
Return(2) | | Net
Assets
at End
of Period
(000s) | | Ratio of
Expenses
to
Average
Net
Assets
Before
Adjust-
ments(3) | | Ratio of
Expenses
to
Average
Net
Assets
After
Adjust-
ments(3) | | Ratio of
Net
Investment
Income
(Loss) to
Average
Net Assets | | Portfolio
Turnover |
| The Hartford Healthcare Fund – (continued) |
| For the Year Ended October 31, 2019 |
| A | | $ 34.38 | | $ (0.10) | | $ 3.83 | | $ 3.73 | | $ — | | $ (2.48) | | $ (2.48) | | $ 35.63 | | 12.02% | | $ 666,181 | | 1.30% | | 1.30% | | (0.30)% | | 35% |
| C | | 27.98 | | (0.28) | | 3.02 | | 2.74 | | — | | (2.48) | | (2.48) | | 28.24 | | 11.17 | | 138,539 | | 2.05 | | 2.05 | | (1.06) | | 35 |
| I | | 36.11 | | 0.00 (5) | | 4.05 | | 4.05 | | — | | (2.48) | | (2.48) | | 37.68 | | 12.36 | | 297,000 | | 1.01 | | 1.01 | | (0.01) | | 35 |
| R3 | | 35.32 | | (0.21) | | 3.93 | | 3.72 | | — | | (2.48) | | (2.48) | | 36.56 | | 11.66 | | 33,948 | | 1.62 | | 1.62 | | (0.62) | | 35 |
| R4 | | 37.12 | | (0.12) | | 4.17 | | 4.05 | | — | | (2.48) | | (2.48) | | 38.69 | | 12.00 | | 26,699 | | 1.32 | | 1.32 | | (0.32) | | 35 |
| R5 | | 38.82 | | (0.01) | | 4.38 | | 4.37 | | — | | (2.48) | | (2.48) | | 40.71 | | 12.32 | | 6,170 | | 1.02 | | 1.02 | | (0.04) | | 35 |
| R6 (7) | | 39.22 | | 0.02 | | 2.04 | | 2.06 | | — | | — | | — | | 41.28 | | 5.25 (8) | | 1,341 | | 0.91 (9) | | 0.91 (9) | | 0.06 (9) | | 35 |
| Y | | 39.29 | | 0.01 | | 4.45 | | 4.46 | | — | | (2.48) | | (2.48) | | 41.27 | | 12.40 | | 72,515 | | 0.97 | | 0.96 | | 0.03 | | 35 |
| F | | 36.17 | | 0.02 | | 4.08 | | 4.10 | | — | | (2.48) | | (2.48) | | 37.79 | | 12.48 | | 29,108 | | 0.91 | | 0.91 | | 0.06 | | 35 |
| For the Year Ended October 31, 2018 |
| A | | $ 34.86 | | $ (0.14) | | $ 1.45 | | $ 1.31 | | $ — | | $ (1.79) | | $ (1.79) | | $ 34.38 | | 3.86% | | $ 682,175 | | 1.28% | | 1.28% | | (0.40)% | | 27% |
| C | | 28.90 | | (0.33) | | 1.20 | | 0.87 | | — | | (1.79) | | (1.79) | | 27.98 | | 3.10 | | 160,084 | | 2.03 | | 2.02 | | (1.13) | | 27 |
| I | | 36.43 | | (0.04) | | 1.51 | | 1.47 | | — | | (1.79) | | (1.79) | | 36.11 | | 4.15 | | 379,392 | | 1.00 | | 1.00 | | (0.11) | | 27 |
| R3 | | 35.87 | | (0.26) | | 1.50 | | 1.24 | | — | | (1.79) | | (1.79) | | 35.32 | | 3.55 | | 38,412 | | 1.61 | | 1.61 | | (0.72) | | 27 |
| R4 | | 37.50 | | (0.16) | | 1.57 | | 1.41 | | — | | (1.79) | | (1.79) | | 37.12 | | 3.86 | | 32,373 | | 1.30 | | 1.30 | | (0.42) | | 27 |
| R5 | | 39.03 | | (0.05) | | 1.63 | | 1.58 | | — | | (1.79) | | (1.79) | | 38.82 | | 4.15 | | 7,757 | | 1.02 | | 1.02 | | (0.13) | | 27 |
| Y | | 39.45 | | (0.01) | | 1.64 | | 1.63 | | — | | (1.79) | | (1.79) | | 39.29 | | 4.24 | | 52,896 | | 0.92 | | 0.92 | | (0.03) | | 27 |
| F | | 36.45 | | — | | 1.51 | | 1.51 | | — | | (1.79) | | (1.79) | | 36.17 | | 4.26 | | 76,003 | | 0.90 | | 0.90 | | (0.01) | | 27 |
| The Hartford MidCap Fund |
| For the Year Ended October 31, 2022 |
| A | | $ 37.01 | | $ (0.10) | | $ (8.08) | | $ (8.18) | | $ (0.16) | | $ (4.16) | | $ (4.32) | | $ 24.51 | | (24.83)% | | $ 2,303,790 | | 1.09% | | 1.09% | | (0.35)% | | 44% |
| C | | 22.89 | | (0.19) | | (4.62) | | (4.81) | | (0.04) | | (4.16) | | (4.20) | | 13.88 | | (25.38) | | 208,963 | | 1.86 | | 1.86 | | (1.14) | | 44 |
| I | | 38.77 | | (0.04) | | (8.49) | | (8.53) | | (0.23) | | (4.16) | | (4.39) | | 25.85 | | (24.63) | | 1,712,201 | | 0.87 | | 0.86 | | (0.12) | | 44 |
| R3 | | 41.94 | | (0.23) | | (9.31) | | (9.54) | | — | | (4.16) | | (4.16) | | 28.24 | | (25.08) | | 61,073 | | 1.46 | | 1.45 | | (0.71) | | 44 |
| R4 | | 44.51 | | (0.15) | | (9.91) | | (10.06) | | (0.09) | | (4.16) | | (4.25) | | 30.20 | | (24.83) | | 86,083 | | 1.16 | | 1.14 | | (0.42) | | 44 |
| R5 | | 46.54 | | (0.06) | | (10.38) | | (10.44) | | (0.22) | | (4.16) | | (4.38) | | 31.72 | | (24.62) | | 93,005 | | 0.86 | | 0.86 | | (0.15) | | 44 |
| R6 | | 47.29 | | (0.03) | | (10.55) | | (10.58) | | (0.28) | | (4.16) | | (4.44) | | 32.27 | | (24.56) | | 758,617 | | 0.74 | | 0.74 | | (0.08) | | 44 |
| Y | | 47.18 | | (0.04) | | (10.53) | | (10.57) | | (0.26) | | (4.16) | | (4.42) | | 32.19 | | (24.58) | | 438,595 | | 0.84 | | 0.79 | | (0.10) | | 44 |
| F | | 39.01 | | (0.00) (5) | | (8.55) | | (8.55) | | (0.28) | | (4.16) | | (4.44) | | 26.02 | | (24.56) | | 1,937,017 | | 0.74 | | 0.74 | | (0.00) (6) | | 44 |
| For the Year Ended October 31, 2021 |
| A | | $ 30.63 | | $ 0.10 | | $ 10.24 | | $ 10.34 | | $ — | | $ (3.96) | | $ (3.96) | | $ 37.01 | | 35.51% | | $ 3,446,674 | | 1.08% | | 1.08% | | 0.28% | | 28% |
| C | | 20.34 | | (0.12) | | 6.63 | | 6.51 | | — | | (3.96) | | (3.96) | | 22.89 | | 34.49 | | 381,566 | | 1.84 | | 1.84 | | (0.52) | | 28 |
| I | | 31.87 | | 0.20 | | 10.66 | | 10.86 | | — | | (3.96) | | (3.96) | | 38.77 | | 35.79 | | 3,960,713 | | 0.86 | | 0.85 | | 0.53 | | 28 |
| R3 | | 34.38 | | (0.05) | | 11.57 | | 11.52 | | — | | (3.96) | | (3.96) | | 41.94 | | 35.03 | | 100,113 | | 1.45 | | 1.45 | | (0.12) | | 28 |
| R4 | | 36.18 | | 0.08 | | 12.21 | | 12.29 | | — | | (3.96) | | (3.96) | | 44.51 | | 35.45 | | 189,348 | | 1.15 | | 1.13 | | 0.18 | | 28 |
| R5 | | 37.58 | | 0.23 | | 12.69 | | 12.92 | | — | | (3.96) | | (3.96) | | 46.54 | | 35.84 | | 319,470 | | 0.83 | | 0.83 | | 0.52 | | 28 |
| R6 | | 38.09 | | 0.26 | | 12.90 | | 13.16 | | — | | (3.96) | | (3.96) | | 47.29 | | 36.00 | | 1,659,582 | | 0.74 | | 0.74 | | 0.57 | | 28 |
| Y | | 38.02 | | 0.24 | | 12.88 | | 13.12 | | — | | (3.96) | | (3.96) | | 47.18 | | 35.96 | | 970,296 | | 0.84 | | 0.77 | | 0.52 | | 28 |
| F | | 32.00 | | 0.23 | | 10.74 | | 10.97 | | — | | (3.96) | | (3.96) | | 39.01 | | 36.01 | | 2,898,529 | | 0.74 | | 0.74 | | 0.61 | | 28 |
The accompanying notes are an integral part of these financial statements.
Hartford Domestic Equity Funds
Financial Highlights – (continued)
| | | — Selected Per-Share Data(1) — | | — Ratios and Supplemental Data — |
| Class | | Net
Asset
Value at
Beginning
of Period | | Net
Investment
Income
(Loss) | | Net
Realized
and
Unrealized
Gain (Loss)
on
Investments | | Total from
Investment
Operations | | Dividends
from Net
Investment
Income | | Distributions
from
Capital
Gains | | Total
Dividends
and
Distributions | | Net
Asset
Value at
End of
Period | | Total
Return(2) | | Net
Assets
at End
of Period
(000s) | | Ratio of
Expenses
to
Average
Net
Assets
Before
Adjust-
ments(3) | | Ratio of
Expenses
to
Average
Net
Assets
After
Adjust-
ments(3) | | Ratio of
Net
Investment
Income
(Loss) to
Average
Net Assets | | Portfolio
Turnover |
| The Hartford MidCap Fund – (continued) |
| For the Year Ended October 31, 2020 |
| A | | $ 30.34 | | $ (0.08) | | $ 2.00 | | $ 1.92 | | $ — | | $ (1.63) | | $ (1.63) | | $ 30.63 | | 6.48% | | $ 2,724,316 | | 1.11% | | 1.11% | | (0.27)% | | 45% |
| C | | 20.83 | | (0.20) | | 1.34 | | 1.14 | | — | | (1.63) | | (1.63) | | 20.34 | | 5.63 | | 380,033 | | 1.87 | | 1.87 | | (1.02) | | 45 |
| I | | 31.43 | | (0.01) | | 2.08 | | 2.07 | | — | | (1.63) | | (1.63) | | 31.87 | | 6.74 | | 3,867,925 | | 0.88 | | 0.87 | | (0.04) | | 45 |
| R3 | | 33.98 | | (0.21) | | 2.24 | | 2.03 | | — | | (1.63) | | (1.63) | | 34.38 | | 6.09 | | 92,023 | | 1.47 | | 1.47 | | (0.63) | | 45 |
| R4 | | 35.57 | | (0.10) | | 2.34 | | 2.24 | | — | | (1.63) | | (1.63) | | 36.18 | | 6.42 | | 205,114 | | 1.16 | | 1.14 | | (0.30) | | 45 |
| R5 | | 36.77 | | 0.00 (5) | | 2.44 | | 2.44 | | — | | (1.63) | | (1.63) | | 37.58 | | 6.77 | | 371,791 | | 0.85 | | 0.85 | | 0.00 (6) | | 45 |
| R6 | | 37.22 | | 0.03 | | 2.47 | | 2.50 | | — | | (1.63) | | (1.63) | | 38.09 | | 6.85 | | 1,759,581 | | 0.75 | | 0.75 | | 0.08 | | 45 |
| Y | | 37.17 | | 0.02 | | 2.46 | | 2.48 | | — | | (1.63) | | (1.63) | | 38.02 | | 6.81 | | 1,144,624 | | 0.85 | | 0.79 | | 0.06 | | 45 |
| F | | 31.52 | | 0.03 | | 2.08 | | 2.11 | | — | | (1.63) | | (1.63) | | 32.00 | | 6.85 | | 2,422,752 | | 0.75 | | 0.75 | | 0.09 | | 45 |
| For the Year Ended October 31, 2019 |
| A | | $ 30.03 | | $ (0.09) | | $ 3.80 | | $ 3.71 | | $ — | | $ (3.40) | | $ (3.40) | | $ 30.34 | | 14.93% | | $ 2,820,971 | | 1.11% | | 1.10% | | (0.32)% | | 31% |
| C | | 21.90 | | (0.22) | | 2.55 | | 2.33 | | — | | (3.40) | | (3.40) | | 20.83 | | 14.10 | | 498,057 | | 1.86 | | 1.86 | | (1.08) | | 31 |
| I | | 30.91 | | (0.02) | | 3.94 | | 3.92 | | — | | (3.40) | | (3.40) | | 31.43 | | 15.25 | | 4,168,592 | | 0.85 | | 0.85 | | (0.06) | | 31 |
| R3 | | 33.31 | | (0.22) | | 4.29 | | 4.07 | | — | | (3.40) | | (3.40) | | 33.98 | | 14.54 | | 96,409 | | 1.45 | | 1.45 | | (0.67) | | 31 |
| R4 | | 34.59 | | (0.12) | | 4.50 | | 4.38 | | — | | (3.40) | | (3.40) | | 35.57 | | 14.89 | | 266,390 | | 1.16 | | 1.14 | | (0.36) | | 31 |
| R5 | | 35.55 | | (0.02) | | 4.64 | | 4.62 | | — | | (3.40) | | (3.40) | | 36.77 | | 15.23 | | 497,712 | | 0.84 | | 0.84 | | (0.07) | | 31 |
| R6 | | 35.90 | | 0.02 | | 4.70 | | 4.72 | | — | | (3.40) | | (3.40) | | 37.22 | | 15.37 | | 1,731,890 | | 0.74 | | 0.74 | | 0.04 | | 31 |
| Y | | 35.87 | | 0.00 (5) | | 4.70 | | 4.70 | | — | | (3.40) | | (3.40) | | 37.17 | | 15.32 | | 1,571,851 | | 0.82 | | 0.78 | | 0.01 | | 31 |
| F | | 30.96 | | 0.01 | | 3.95 | | 3.96 | | — | | (3.40) | | (3.40) | | 31.52 | | 15.36 | | 2,259,594 | | 0.74 | | 0.74 | | 0.04 | | 31 |
| For the Year Ended October 31, 2018 |
| A | | $ 30.36 | | $ (0.12) | | $ 1.20 | | $ 1.08 | | $ — | | $ (1.41) | | $ (1.41) | | $ 30.03 | | 3.63% | | $ 2,592,610 | | 1.11% | | 1.10% | | (0.39)% | | 37% |
| C | | 22.67 | | (0.27) | | 0.91 | | 0.64 | | — | | (1.41) | | (1.41) | | 21.90 | | 2.84 | | 580,708 | | 1.85 | | 1.85 | | (1.14) | | 37 |
| I | | 31.12 | | (0.03) | | 1.23 | | 1.20 | | — | | (1.41) | | (1.41) | | 30.91 | | 3.91 | | 3,666,464 | | 0.82 | | 0.82 | | (0.11) | | 37 |
| R3 | | 33.64 | | (0.26) | | 1.34 | | 1.08 | | — | | (1.41) | | (1.41) | | 33.31 | | 3.23 | | 102,632 | | 1.46 | | 1.46 | | (0.75) | | 37 |
| R4 | | 34.78 | | (0.16) | | 1.38 | | 1.22 | | — | | (1.41) | | (1.41) | | 34.59 | | 3.57 | | 289,049 | | 1.16 | | 1.15 | | (0.43) | | 37 |
| R5 | | 35.59 | | (0.05) | | 1.42 | | 1.37 | | — | | (1.41) | | (1.41) | | 35.55 | | 3.89 | | 468,146 | | 0.85 | | 0.85 | | (0.13) | | 37 |
| R6 | | 35.90 | | (0.01) | | 1.42 | | 1.41 | | — | | (1.41) | | (1.41) | | 35.90 | | 3.97 | | 1,014,518 | | 0.75 | | 0.75 | | (0.04) | | 37 |
| Y | | 35.88 | | (0.02) | | 1.42 | | 1.40 | | — | | (1.41) | | (1.41) | | 35.87 | | 3.95 | | 1,934,520 | | 0.78 | | 0.78 | | (0.06) | | 37 |
| F | | 31.15 | | (0.01) | | 1.23 | | 1.22 | | — | | (1.41) | | (1.41) | | 30.96 | | 3.97 | | 1,648,425 | | 0.75 | | 0.75 | | (0.03) | | 37 |
| The Hartford MidCap Value Fund |
| For the Year Ended October 31, 2022 |
| A | | $ 18.14 | | $ 0.05 | | $ (0.75) | | $ (0.70) | | $ (0.01) | | $ (1.29) | | $ (1.30) | | $ 16.14 | | (4.34)% | | $ 368,040 | | 1.16% | | 1.16% | | 0.28% | | 85% |
| C | | 14.28 | | (0.07) | | (0.56) | | (0.63) | | — | | (1.29) | | (1.29) | | 12.36 | | (5.07) | | 7,041 | | 1.95 | | 1.95 | | (0.51) | | 85 |
| I | | 18.36 | | 0.10 | | (0.75) | | (0.65) | | (0.06) | | (1.29) | | (1.35) | | 16.36 | | (4.01) | | 37,582 | | 0.86 | | 0.86 | | 0.61 | | 85 |
| R3 | | 19.18 | | (0.01) | | (0.78) | | (0.79) | | — | | (1.29) | | (1.29) | | 17.10 | | (4.58) | | 6,108 | | 1.49 | | 1.48 | | (0.04) | | 85 |
| R4 | | 19.64 | | 0.05 | | (0.81) | | (0.76) | | — | | (1.29) | | (1.29) | | 17.59 | | (4.31) | | 9,121 | | 1.18 | | 1.18 | | 0.26 | | 85 |
| R5 | | 19.97 | | 0.10 | | (0.82) | | (0.72) | | (0.05) | | (1.29) | | (1.34) | | 17.91 | | (4.03) | | 2,020 | | 0.89 | | 0.89 | | 0.55 | | 85 |
| R6 (10) | | 15.38 | | 0.03 | | 0.96 (11) | | 0.99 | | — | | — | | — | | 16.37 | | 6.47 (8) | | 11 | | 0.77 (9) | | 0.77 (9) | | 0.50 (9) | | 85 |
| Y | | 20.02 | | 0.11 | | (0.83) | | (0.72) | | (0.05) | | (1.29) | | (1.34) | | 17.96 | | (4.03) | | 7,814 | | 0.87 | | 0.87 | | 0.55 | | 85 |
| F | | 18.37 | | 0.11 | | (0.75) | | (0.64) | | (0.07) | | (1.29) | | (1.36) | | 16.37 | | (3.94) | | 449,385 | | 0.77 | | 0.77 | | 0.68 | | 85 |
The accompanying notes are an integral part of these financial statements.
Hartford Domestic Equity Funds
Financial Highlights – (continued)
| | | — Selected Per-Share Data(1) — | | — Ratios and Supplemental Data — |
| Class | | Net
Asset
Value at
Beginning
of Period | | Net
Investment
Income
(Loss) | | Net
Realized
and
Unrealized
Gain (Loss)
on
Investments | | Total from
Investment
Operations | | Dividends
from Net
Investment
Income | | Distributions
from
Capital
Gains | | Total
Dividends
and
Distributions | | Net
Asset
Value at
End of
Period | | Total
Return(2) | | Net
Assets
at End
of Period
(000s) | | Ratio of
Expenses
to
Average
Net
Assets
Before
Adjust-
ments(3) | | Ratio of
Expenses
to
Average
Net
Assets
After
Adjust-
ments(3) | | Ratio of
Net
Investment
Income
(Loss) to
Average
Net Assets | | Portfolio
Turnover |
| The Hartford MidCap Value Fund – (continued) |
| For the Year Ended October 31, 2021 |
| A | | $ 12.21 | | $ (0.00) (5) | | $ 5.97 | | $ 5.97 | | $ (0.04) | | $ — | | $ (0.04) | | $ 18.14 | | 48.99% | | $ 363,955 | | 1.18% | | 1.18% | | 0.03% | | 57% |
| C | | 9.66 | | (0.09) | | 4.71 | | 4.62 | | — | | — | | — | | 14.28 | | 47.83 | | 8,931 | | 1.96 | | 1.96 | | (0.73) | | 57 |
| I | | 12.36 | | 0.06 | | 6.02 | | 6.08 | | (0.08) | | — | | (0.08) | | 18.36 | | 49.39 | | 25,307 | | 0.85 | | 0.85 | | 0.36 | | 57 |
| R3 | | 12.91 | | (0.05) | | 6.32 | | 6.27 | | — | | — | | — | | 19.18 | | 48.57 | | 6,973 | | 1.49 | | 1.49 | | (0.28) | | 57 |
| R4 | | 13.21 | | (0.00) (5) | | 6.46 | | 6.46 | | (0.03) | | — | | (0.03) | | 19.64 | | 48.99 | | 10,502 | | 1.19 | | 1.19 | | 0.02 | | 57 |
| R5 | | 13.44 | | 0.06 | | 6.56 | | 6.62 | | (0.09) | | — | | (0.09) | | 19.97 | | 49.39 | | 2,142 | | 0.89 | | 0.89 | | 0.31 | | 57 |
| Y | | 13.47 | | 0.06 | | 6.58 | | 6.64 | | (0.09) | | — | | (0.09) | | 20.02 | | 49.49 | | 15,307 | �� | 0.88 | | 0.88 | | 0.32 | | 57 |
| F | | 12.36 | | 0.07 | | 6.04 | | 6.11 | | (0.10) | | — | | (0.10) | | 18.37 | | 49.64 | | 442,227 | | 0.77 | | 0.77 | | 0.43 | | 57 |
| For the Year Ended October 31, 2020 |
| A | | $ 14.43 | | $ 0.07 | | $ (1.86) | | $ (1.79) | | $ (0.09) | | $ (0.34) | | $ (0.43) | | $ 12.21 | | (12.86)% | | $ 245,112 | | 1.25% | | 1.25% | | 0.56% | | 61% |
| C | | 11.51 | | (0.02) | | (1.49) | | (1.51) | | (0.00) (5) | | (0.34) | | (0.34) | | 9.66 | | (13.55) | | 9,533 | | 2.03 | | 2.03 | | (0.20) | | 61 |
| I | | 14.60 | | 0.12 | | (1.88) | | (1.76) | | (0.14) | | (0.34) | | (0.48) | | 12.36 | | (12.58) | | 19,722 | | 0.91 | | 0.91 | | 0.91 | | 61 |
| R3 | | 15.22 | | 0.04 | | (1.98) | | (1.94) | | (0.03) | | (0.34) | | (0.37) | | 12.91 | | (13.12) | | 5,317 | | 1.53 | | 1.53 | | 0.30 | | 61 |
| R4 | | 15.58 | | 0.08 | | (2.02) | | (1.94) | | (0.09) | | (0.34) | | (0.43) | | 13.21 | | (12.88) | | 8,857 | | 1.23 | | 1.23 | | 0.58 | | 61 |
| R5 | | 15.82 | | 0.12 | | (2.04) | | (1.92) | | (0.12) | | (0.34) | | (0.46) | | 13.44 | | (12.60) | | 1,423 | | 0.92 | | 0.92 | | 0.88 | | 61 |
| Y | | 15.87 | | 0.13 | | (2.05) | | (1.92) | | (0.14) | | (0.34) | | (0.48) | | 13.47 | | (12.55) | | 10,009 | | 0.92 | | 0.88 | | 0.93 | | 61 |
| F | | 14.60 | | 0.13 | | (1.88) | | (1.75) | | (0.15) | | (0.34) | | (0.49) | | 12.36 | | (12.51) | | 299,805 | | 0.82 | | 0.82 | | 0.98 | | 61 |
| For the Year Ended October 31, 2019 |
| A | | $ 14.54 | | $ 0.08 | | $ 1.44 | | $ 1.52 | | $ (0.04) | | $ (1.59) | | $ (1.63) | | $ 14.43 | | 12.74% | | $ 309,996 | | 1.23% | | 1.23% | | 0.61% | | 55% |
| C | | 11.97 | | (0.02) | | 1.15 | | 1.13 | | — | | (1.59) | | (1.59) | | 11.51 | | 11.99 | | 15,910 | | 1.99 | | 1.99 | | (0.14) | | 55 |
| I | | 14.68 | | 0.13 | | 1.46 | | 1.59 | | (0.08) | | (1.59) | | (1.67) | | 14.60 | | 13.20 | | 31,173 | | 0.89 | | 0.89 | | 0.95 | | 55 |
| R3 | | 15.23 | | 0.05 | | 1.53 | | 1.58 | | — | | (1.59) | | (1.59) | | 15.22 | | 12.42 | | 8,034 | | 1.52 | | 1.52 | | 0.33 | | 55 |
| R4 | | 15.55 | | 0.09 | | 1.57 | | 1.66 | | (0.04) | | (1.59) | | (1.63) | | 15.58 | | 12.77 | | 11,865 | | 1.21 | | 1.21 | | 0.64 | | 55 |
| R5 | | 15.76 | | 0.16 | | 1.57 | | 1.73 | | (0.08) | | (1.59) | | (1.67) | | 15.82 | | 13.14 | | 1,592 | | 0.92 | | 0.92 | | 1.06 | | 55 |
| Y | | 15.80 | | 0.15 | | 1.60 | | 1.75 | | (0.09) | | (1.59) | | (1.68) | | 15.87 | | 13.23 | | 12,624 | | 0.89 | | 0.85 | | 0.98 | | 55 |
| F | | 14.69 | | 0.14 | | 1.46 | | 1.60 | | (0.10) | | (1.59) | | (1.69) | | 14.60 | | 13.27 | | 314,566 | | 0.80 | | 0.80 | | 1.03 | | 55 |
| For the Year Ended October 31, 2018 |
| A | | $ 15.62 | | $ 0.03 | | $ (0.72) | | $ (0.69) | | $ — | | $ (0.39) | | $ (0.39) | | $ 14.54 | | (4.56)% | | $ 284,646 | | 1.22% | | 1.22% | | 0.18% | | 49% |
| C | | 13.03 | | (0.07) | | (0.60) | | (0.67) | | — | | (0.39) | | (0.39) | | 11.97 | | (5.26) | | 17,909 | | 1.98 | | 1.97 | | (0.57) | | 49 |
| I | | 15.72 | | 0.08 | | (0.73) | | (0.65) | | — | | (0.39) | | (0.39) | | 14.68 | | (4.27) | | 34,656 | | 0.90 | | 0.90 | | 0.50 | | 49 |
| R3 | | 16.39 | | (0.02) | | (0.75) | | (0.77) | | — | | (0.39) | | (0.39) | | 15.23 | | (4.84) | | 9,555 | | 1.52 | | 1.52 | | (0.13) | | 49 |
| R4 | | 16.68 | | 0.03 | | (0.77) | | (0.74) | | — | | (0.39) | | (0.39) | | 15.55 | | (4.52) | | 11,639 | | 1.22 | | 1.22 | | 0.18 | | 49 |
| R5 | | 16.88 | | 0.08 | | (0.78) | | (0.70) | | (0.03) | | (0.39) | | (0.42) | | 15.76 | | (4.32) | | 8,087 | | 0.91 | | 0.91 | | 0.48 | | 49 |
| Y | | 16.93 | | 0.09 | | (0.79) | | (0.70) | | (0.04) | | (0.39) | | (0.43) | | 15.80 | | (4.23) | | 11,371 | | 0.86 | | 0.86 | | 0.52 | | 49 |
| F | | 15.76 | | 0.10 | | (0.73) | | (0.63) | | (0.05) | | (0.39) | | (0.44) | | 14.69 | | (4.18) | | 252,917 | | 0.80 | | 0.80 | | 0.61 | | 49 |
| Hartford Quality Value Fund |
| For the Year Ended October 31, 2022 |
| A | | $ 26.27 | | $ 0.39 | | $ (1.41) | | $ (1.02) | | $ (0.35) | | $ (1.25) | | $ (1.60) | | $ 23.65 | | (4.19)% | | $ 173,358 | | 0.95% | | 0.94% | | 1.59% | | 24% |
| C | | 22.22 | | 0.17 | | (1.20) | | (1.03) | | (0.15) | | (1.25) | | (1.40) | | 19.79 | | (4.95) | | 3,439 | | 1.78 | | 1.71 | | 0.82 | | 24 |
| I | | 25.93 | | 0.46 | | (1.40) | | (0.94) | | (0.42) | | (1.25) | | (1.67) | | 23.32 | | (3.92) | | 30,598 | | 0.65 | | 0.65 | | 1.91 | | 24 |
| R3 | | 26.71 | | 0.34 | | (1.44) | | (1.10) | | (0.29) | | (1.25) | | (1.54) | | 24.07 | | (4.41) | | 939 | | 1.27 | | 1.18 | | 1.35 | | 24 |
| R4 | | 27.02 | | 0.42 | | (1.46) | | (1.04) | | (0.37) | | (1.25) | | (1.62) | | 24.36 | | (4.15) | | 5,111 | | 0.95 | | 0.88 | | 1.67 | | 24 |
| R5 | | 27.30 | | 0.50 | | (1.48) | | (0.98) | | (0.43) | | (1.25) | | (1.68) | | 24.64 | | (3.88) | | 337 | | 0.67 | | 0.63 | | 1.99 | | 24 |
| R6 | | 27.38 | | 0.53 | | (1.47) | | (0.94) | | (0.47) | | (1.25) | | (1.72) | | 24.72 | | (3.71) | | 11,834 | | 0.55 | | 0.46 | | 2.13 | | 24 |
| Y | | 27.34 | | 0.50 | | (1.47) | | (0.97) | | (0.45) | | (1.25) | | (1.70) | | 24.67 | | (3.85) | | 6,763 | | 0.66 | | 0.57 | | 2.03 | | 24 |
| F | | 25.84 | | 0.49 | | (1.39) | | (0.90) | | (0.47) | | (1.25) | | (1.72) | | 23.22 | | (3.78) | | 12,495 | | 0.55 | | 0.46 | | 2.07 | | 24 |
The accompanying notes are an integral part of these financial statements.
Hartford Domestic Equity Funds
Financial Highlights – (continued)
| | | — Selected Per-Share Data(1) — | | — Ratios and Supplemental Data — |
| Class | | Net
Asset
Value at
Beginning
of Period | | Net
Investment
Income
(Loss) | | Net
Realized
and
Unrealized
Gain (Loss)
on
Investments | | Total from
Investment
Operations | | Dividends
from Net
Investment
Income | | Distributions
from
Capital
Gains | | Total
Dividends
and
Distributions | | Net
Asset
Value at
End of
Period | | Total
Return(2) | | Net
Assets
at End
of Period
(000s) | | Ratio of
Expenses
to
Average
Net
Assets
Before
Adjust-
ments(3) | | Ratio of
Expenses
to
Average
Net
Assets
After
Adjust-
ments(3) | | Ratio of
Net
Investment
Income
(Loss) to
Average
Net Assets | | Portfolio
Turnover |
| Hartford Quality Value Fund – (continued) |
| For the Year Ended October 31, 2021 |
| A | | $ 18.61 | | $ 0.34 | | $ 7.76 | | $ 8.10 | | $ (0.44) | | $ — | | $ (0.44) | | $ 26.27 | | 44.08% | | $ 188,344 | | 0.97% | | 0.94% | | 1.44% | | 21% |
| C | | 15.78 | | 0.14 | | 6.57 | | 6.71 | | (0.27) | | — | | (0.27) | | 22.22 | | 42.97 | | 3,397 | | 1.80 | | 1.71 | | 0.71 | | 21 |
| I | | 18.37 | | 0.41 | | 7.65 | | 8.06 | | (0.50) | | — | | (0.50) | | 25.93 | | 44.56 | | 20,153 | | 0.65 | | 0.63 | | 1.73 | | 21 |
| R3 | | 18.92 | | 0.29 | | 7.89 | | 8.18 | | (0.39) | | — | | (0.39) | | 26.71 | | 43.73 | | 1,098 | | 1.27 | | 1.17 | | 1.22 | | 21 |
| R4 | | 19.13 | | 0.37 | | 7.97 | | 8.34 | | (0.45) | | — | | (0.45) | | 27.02 | | 44.20 | | 4,775 | | 0.97 | | 0.88 | | 1.50 | | 21 |
| R5 | | 19.32 | | 0.43 | | 8.06 | | 8.49 | | (0.51) | | — | | (0.51) | | 27.30 | | 44.59 | | 320 | | 0.67 | | 0.62 | | 1.76 | | 21 |
| R6 | | 19.38 | | 0.48 | | 8.06 | | 8.54 | | (0.54) | | — | | (0.54) | | 27.38 | | 44.79 | | 257 | | 0.56 | | 0.46 | | 1.95 | | 21 |
| Y | | 19.35 | | 0.44 | | 8.07 | | 8.51 | | (0.52) | | — | | (0.52) | | 27.34 | | 44.65 | | 1,753 | | 0.66 | | 0.57 | | 1.74 | | 21 |
| F | | 18.31 | | 0.45 | | 7.62 | | 8.07 | | (0.54) | | — | | (0.54) | | 25.84 | | 44.84 | | 12,182 | | 0.56 | | 0.46 | | 1.92 | | 21 |
| For the Year Ended October 31, 2020 |
| A | | $ 21.11 | | $ 0.42 | | $ (1.85) | | $ (1.43) | | $ (0.48) | | $ (0.59) | | $ (1.07) | | $ 18.61 | | (7.34)% | | $ 140,154 | | 1.03% | | 0.91% | | 2.19% | | 26% |
| C | | 18.05 | | 0.23 | | (1.59) | | (1.36) | | (0.32) | | (0.59) | | (0.91) | | 15.78 | | (8.09) | | 3,673 | | 1.82 | | 1.71 | | 1.38 | | 26 |
| I | | 20.85 | | 0.48 | | (1.82) | | (1.34) | | (0.55) | | (0.59) | | (1.14) | | 18.37 | | (7.02) | | 10,927 | | 0.67 | | 0.56 | | 2.53 | | 26 |
| R3 | | 21.45 | | 0.38 | | (1.89) | | (1.51) | | (0.43) | | (0.59) | | (1.02) | | 18.92 | | (7.56) | | 855 | | 1.29 | | 1.16 | | 1.91 | | 26 |
| R4 | | 21.68 | | 0.44 | | (1.91) | | (1.47) | | (0.49) | | (0.59) | | (1.08) | | 19.13 | | (7.34) | | 3,887 | | 0.98 | | 0.87 | | 2.21 | | 26 |
| R5 | | 21.87 | | 0.50 | | (1.92) | | (1.42) | | (0.54) | | (0.59) | | (1.13) | | 19.32 | | (7.05) | | 220 | | 0.69 | | 0.58 | | 2.53 | | 26 |
| R6 | | 21.93 | | 0.50 | | (1.89) | | (1.39) | | (0.57) | | (0.59) | | (1.16) | | 19.38 | | (6.92) | | 485 | | 0.58 | | 0.46 | | 2.53 | | 26 |
| Y | | 21.91 | | 0.51 | | (1.93) | | (1.42) | | (0.55) | | (0.59) | | (1.14) | | 19.35 | | (7.05) | | 382 | | 0.68 | | 0.57 | | 2.53 | | 26 |
| F | | 20.83 | | 0.50 | | (1.82) | | (1.32) | | (0.61) | | (0.59) | | (1.20) | | 18.31 | | (6.94) | | 8,975 | | 0.58 | | 0.46 | | 2.64 | | 26 |
| For the Year Ended October 31, 2019 |
| A | | $ 20.00 | | $ 0.38 | | $ 1.99 | | $ 2.37 | | $ (0.28) | | $ (0.98) | | $ (1.26) | | $ 21.11 | | 13.10% | | $ 169,771 | | 1.00% | | 0.90% | | 1.95% | | 23% |
| C | | 17.12 | | 0.20 | | 1.71 | | 1.91 | | — | | (0.98) | | (0.98) | | 18.05 | | 12.23 | | 6,834 | | 1.76 | | 1.67 | | 1.21 | | 23 |
| I | | 19.78 | | 0.45 | | 1.94 | | 2.39 | | (0.34) | | (0.98) | | (1.32) | | 20.85 | | 13.49 | | 12,796 | | 0.65 | | 0.56 | | 2.30 | | 23 |
| R3 | | 20.29 | | 0.34 | | 2.01 | | 2.35 | | (0.21) | | (0.98) | | (1.19) | | 21.45 | | 12.78 | | 1,240 | | 1.27 | | 1.16 | | 1.69 | | 23 |
| R4 | | 20.49 | | 0.40 | | 2.04 | | 2.44 | | (0.27) | | (0.98) | | (1.25) | | 21.68 | | 13.17 | | 6,014 | | 0.95 | | 0.86 | | 1.99 | | 23 |
| R5 | | 20.67 | | 0.47 | | 2.04 | | 2.51 | | (0.33) | | (0.98) | | (1.31) | | 21.87 | | 13.46 | | 230 | | 0.67 | | 0.58 | | 2.33 | | 23 |
| R6 | | 20.74 | | 0.47 | | 2.06 | | 2.53 | | (0.36) | | (0.98) | | (1.34) | | 21.93 | | 13.57 | | 34 | | 0.56 | | 0.46 | | 2.26 | | 23 |
| Y | | 20.72 | | 0.47 | | 2.05 | | 2.52 | | (0.35) | | (0.98) | | (1.33) | | 21.91 | | 13.50 | | 622 | | 0.64 | | 0.55 | | 2.29 | | 23 |
| F | | 19.77 | | 0.48 | | 1.92 | | 2.40 | | (0.36) | | (0.98) | | (1.34) | | 20.83 | | 13.58 | | 11,040 | | 0.55 | | 0.46 | | 2.52 | | 23 |
| For the Year Ended October 31, 2018 |
| A | | $ 20.49 | | $ 0.31 | | $ 0.16 | | $ 0.47 | | $ (0.20) | | $ (0.76) | | $ (0.96) | | $ 20.00 | | 2.25% | | $ 164,325 | | 1.06% | | 1.04% | | 1.52% | | 85% |
| C | | 17.67 | | 0.14 | | 0.15 | | 0.29 | | (0.08) | | (0.76) | | (0.84) | | 17.12 | | 1.53 | | 9,082 | | 1.81 | | 1.79 | | 0.80 | | 85 |
| I | | 20.25 | | 0.38 | | 0.16 | | 0.54 | | (0.25) | | (0.76) | | (1.01) | | 19.78 | | 2.60 | | 12,974 | | 0.71 | | 0.69 | | 1.87 | | 85 |
| R3 | | 20.70 | | 0.26 | | 0.17 | | 0.43 | | (0.08) | | (0.76) | | (0.84) | | 20.29 | | 2.03 | | 1,075 | | 1.34 | | 1.30 | | 1.26 | | 85 |
| R4 | | 20.95 | | 0.33 | | 0.16 | | 0.49 | | (0.19) | | (0.76) | | (0.95) | | 20.49 | | 2.29 | | 6,014 | | 1.04 | | 1.01 | | 1.55 | | 85 |
| R5 | | 21.13 | | 0.38 | | 0.17 | | 0.55 | | (0.25) | | (0.76) | | (1.01) | | 20.67 | | 2.57 | | 504 | | 0.74 | | 0.72 | | 1.76 | | 85 |
| R6 (12) | | 20.99 | | 0.28 | | (0.53) (11) | | (0.25) | | — | | — | | — | | 20.74 | | (1.19) (8) | | 10 | | 0.61 (9) | | 0.59 (9) | | 1.95 (9) | | 85 |
| Y | | 21.19 | | 0.40 | | 0.17 | | 0.57 | | (0.28) | | (0.76) | | (1.04) | | 20.72 | | 2.65 | | 601 | | 0.68 | | 0.66 | | 1.90 | | 85 |
| F | | 20.26 | | 0.39 | | 0.17 | | 0.56 | | (0.29) | | (0.76) | | (1.05) | | 19.77 | | 2.71 | | 88,336 | | 0.62 | | 0.60 | | 1.94 | | 85 |
The accompanying notes are an integral part of these financial statements.
Hartford Domestic Equity Funds
Financial Highlights – (continued)
| | | — Selected Per-Share Data(1) — | | — Ratios and Supplemental Data — |
| Class | | Net
Asset
Value at
Beginning
of Period | | Net
Investment
Income
(Loss) | | Net
Realized
and
Unrealized
Gain (Loss)
on
Investments | | Total from
Investment
Operations | | Dividends
from Net
Investment
Income | | Distributions
from
Capital
Gains | | Total
Dividends
and
Distributions | | Net
Asset
Value at
End of
Period | | Total
Return(2) | | Net
Assets
at End
of Period
(000s) | | Ratio of
Expenses
to
Average
Net
Assets
Before
Adjust-
ments(3) | | Ratio of
Expenses
to
Average
Net
Assets
After
Adjust-
ments(3) | | Ratio of
Net
Investment
Income
(Loss) to
Average
Net Assets | | Portfolio
Turnover |
| The Hartford Small Cap Growth Fund |
| For the Year Ended October 31, 2022 |
| A | | $ 64.88 | | $ (0.30) | | $ (15.38) | | $ (15.68) | | $ — | | $ (12.13) | | $ (12.13) | | $ 37.07 | | (28.75)% | | $ 163,293 | | 1.25% | | 1.24% | | (0.72)% | | 42% |
| C | | 41.34 | | (0.36) | | (8.71) | | (9.07) | | — | | (12.13) | | (12.13) | | 20.14 | | (29.27) | | 2,197 | | 1.98 | | 1.98 | | (1.44) | | 42 |
| I | | 69.03 | | (0.17) | | (16.56) | | (16.73) | | — | | (12.13) | | (12.13) | | 40.17 | | (28.50) | | 66,150 | | 0.89 | | 0.89 | | (0.36) | | 42 |
| R3 | | 63.50 | | (0.41) | | (14.97) | | (15.38) | | — | | (12.13) | | (12.13) | | 35.99 | | (28.93) | | 6,107 | | 1.52 | | 1.51 | | (0.99) | | 42 |
| R4 | | 67.99 | | (0.31) | | (16.25) | | (16.56) | | — | | (12.13) | | (12.13) | | 39.30 | | (28.72) | | 11,684 | | 1.21 | | 1.21 | | (0.69) | | 42 |
| R5 | | 72.91 | | (0.20) | | (17.64) | | (17.84) | | — | | (12.13) | | (12.13) | | 42.94 | | (28.51) | | 20,591 | | 0.91 | | 0.91 | | (0.39) | | 42 |
| R6 | | 74.32 | | (0.14) | | (18.06) | | (18.20) | | — | | (12.13) | | (12.13) | | 43.99 | | (28.44) | | 57,807 | | 0.80 | | 0.80 | | (0.28) | | 42 |
| Y | | 74.28 | | (0.17) | | (18.04) | | (18.21) | | — | | (12.13) | | (12.13) | | 43.94 | | (28.47) | | 145,027 | | 0.91 | | 0.86 | | (0.34) | | 42 |
| F | | 69.43 | | (0.13) | | (16.67) | | (16.80) | | — | | (12.13) | | (12.13) | | 40.50 | | (28.42) | | 27,582 | | 0.80 | | 0.80 | | (0.28) | | 42 |
| For the Year Ended October 31, 2021 |
| A | | $ 51.35 | | $ (0.42) | | $ 18.27 | | $ 17.85 | | $ — | | $ (4.32) | | $ (4.32) | | $ 64.88 | | 35.73% | | $ 256,061 | | 1.18% | | 1.18% | | (0.67)% | | 48% |
| C | | 34.22 | | (0.55) | | 11.99 | | 11.44 | | — | | (4.32) | | (4.32) | | 41.34 | | 34.80 | | 8,102 | | 1.89 | | 1.89 | | (1.37) | | 48 |
| I | | 54.23 | | (0.22) | | 19.34 | | 19.12 | | — | | (4.32) | | (4.32) | | 69.03 | | 36.21 | | 120,135 | | 0.83 | | 0.83 | | (0.33) | | 48 |
| R3 | | 50.47 | | (0.59) | | 17.94 | | 17.35 | | — | | (4.32) | | (4.32) | | 63.50 | | 35.34 | | 8,637 | | 1.48 | | 1.47 | | (0.97) | | 48 |
| R4 | | 53.64 | | (0.42) | | 19.09 | | 18.67 | | — | | (4.32) | | (4.32) | | 67.99 | | 35.74 | | 21,098 | | 1.17 | | 1.17 | | (0.64) | | 48 |
| R5 | | 57.10 | | (0.25) | | 20.38 | | 20.13 | | — | | (4.32) | | (4.32) | | 72.91 | | 36.15 | | 86,788 | | 0.87 | | 0.87 | | (0.36) | | 48 |
| R6 | | 58.07 | | (0.18) | | 20.75 | | 20.57 | | — | | (4.32) | | (4.32) | | 74.32 | | 36.31 | | 84,908 | | 0.76 | | 0.76 | | (0.25) | | 48 |
| Y | | 58.07 | | (0.22) | | 20.75 | | 20.53 | | — | | (4.32) | | (4.32) | | 74.28 | | 36.24 | | 268,416 | | 0.87 | | 0.81 | | (0.31) | | 48 |
| F | | 54.48 | | (0.15) | | 19.42 | | 19.27 | | — | | (4.32) | | (4.32) | | 69.43 | | 36.32 | | 36,439 | | 0.76 | | 0.76 | | (0.23) | | 48 |
| For the Year Ended October 31, 2020 |
| A | | $ 45.71 | | $ (0.28) | | $ 6.67 | | $ 6.39 | | $ — | | $ (0.75) | | $ (0.75) | | $ 51.35 | | 14.06% | | $ 198,430 | | 1.26% | | 1.25% | | (0.60)% | | 58% |
| C | | 30.90 | | (0.39) | | 4.46 | | 4.07 | | — | | (0.75) | | (0.75) | | 34.22 | | 13.31 | | 12,323 | | 1.91 | | 1.91 | | (1.25) | | 58 |
| I | | 48.05 | | (0.09) | | 7.02 | | 6.93 | | — | | (0.75) | | (0.75) | | 54.23 | | 14.50 | | 98,673 | | 0.85 | | 0.85 | | (0.19) | | 58 |
| R3 | | 45.05 | | (0.38) | | 6.55 | | 6.17 | | — | | (0.75) | | (0.75) | | 50.47 | | 13.80 | | 7,485 | | 1.49 | | 1.49 | | (0.83) | | 58 |
| R4 | | 47.69 | | (0.26) | | 6.96 | | 6.70 | | — | | (0.75) | | (0.75) | | 53.64 | | 14.13 | | 31,169 | | 1.19 | | 1.19 | | (0.52) | | 58 |
| R5 | | 50.57 | | (0.12) | | 7.40 | | 7.28 | | — | | (0.75) | | (0.75) | | 57.10 | | 14.47 | | 71,754 | | 0.89 | | 0.89 | | (0.23) | | 58 |
| R6 | | 51.36 | | (0.06) | | 7.52 | | 7.46 | | — | | (0.75) | | (0.75) | | 58.07 | | 14.62 | | 80,327 | | 0.78 | | 0.78 | | (0.12) | | 58 |
| Y | | 51.39 | | (0.08) | | 7.51 | | 7.43 | | — | | (0.75) | | (0.75) | | 58.07 | | 14.58 | | 255,484 | | 0.88 | | 0.81 | | (0.16) | | 58 |
| F | | 48.23 | | (0.06) | | 7.06 | | 7.00 | | — | | (0.75) | | (0.75) | | 54.48 | | 14.62 | | 44,376 | | 0.78 | | 0.78 | | (0.13) | | 58 |
| For the Year Ended October 31, 2019 |
| A | | $ 55.20 | | $ (0.21) | | $ 2.62 | | $ 2.41 | | $ — | | $ (11.90) | | $ (11.90) | | $ 45.71 | | 8.99% | | $ 195,314 | | 1.24% | | 1.24% | | (0.46)% | | 48% |
| C | | 41.81 | | (0.34) | | 1.33 | | 0.99 | | — | | (11.90) | | (11.90) | | 30.90 | | 8.27 | | 15,722 | | 1.89 | | 1.89 | | (1.11) | | 48 |
| I | | 57.17 | | (0.02) | | 2.80 | | 2.78 | | — | | (11.90) | | (11.90) | | 48.05 | | 9.41 | | 191,482 | | 0.83 | | 0.83 | | (0.05) | | 48 |
| R3 | | 54.70 | | (0.31) | | 2.56 | | 2.25 | | — | | (11.90) | | (11.90) | | 45.05 | | 8.72 | | 10,036 | | 1.47 | | 1.47 | | (0.69) | | 48 |
| R4 | | 56.99 | | (0.18) | | 2.78 | | 2.60 | | — | | (11.90) | | (11.90) | | 47.69 | | 9.05 | | 42,296 | | 1.17 | | 1.17 | | (0.39) | | 48 |
| R5 | | 59.48 | | (0.03) | | 3.02 | | 2.99 | | — | | (11.90) | | (11.90) | | 50.57 | | 9.40 | | 82,624 | | 0.85 | | 0.85 | | (0.07) | | 48 |
| R6 | | 60.16 | | (0.00) (5) | | 3.10 | | 3.10 | | — | | (11.90) | | (11.90) | | 51.36 | | 9.49 | | 66,260 | | 0.76 | | 0.76 | | 0.01 | | 48 |
| Y | | 60.20 | | (0.01) | | 3.10 | | 3.09 | | — | | (11.90) | | (11.90) | | 51.39 | | 9.44 | | 365,867 | | 0.82 | | 0.80 | | (0.01) | | 48 |
| F | | 57.30 | | 0.01 | | 2.82 | | 2.83 | | — | | (11.90) | | (11.90) | | 48.23 | | 9.49 | | 46,533 | | 0.76 | | 0.76 | | 0.02 | | 48 |
The accompanying notes are an integral part of these financial statements.
Hartford Domestic Equity Funds
Financial Highlights – (continued)
| | | — Selected Per-Share Data(1) — | | — Ratios and Supplemental Data — |
| Class | | Net
Asset
Value at
Beginning
of Period | | Net
Investment
Income
(Loss) | | Net
Realized
and
Unrealized
Gain (Loss)
on
Investments | | Total from
Investment
Operations | | Dividends
from Net
Investment
Income | | Distributions
from
Capital
Gains | | Total
Dividends
and
Distributions | | Net
Asset
Value at
End of
Period | | Total
Return(2) | | Net
Assets
at End
of Period
(000s) | | Ratio of
Expenses
to
Average
Net
Assets
Before
Adjust-
ments(3) | | Ratio of
Expenses
to
Average
Net
Assets
After
Adjust-
ments(3) | | Ratio of
Net
Investment
Income
(Loss) to
Average
Net Assets | | Portfolio
Turnover |
| The Hartford Small Cap Growth Fund – (continued) |
| For the Year Ended October 31, 2018 |
| A | | $ 57.24 | | $ (0.33) | | $ 1.03 | | $ 0.70 | | $ — | | $ (2.74) | | $ (2.74) | | $ 55.20 | | 1.20% | | $ 203,297 | | 1.21% | | 1.20% | | (0.56)% | | 66% |
| C | | 44.29 | | (0.55) | | 0.81 | | 0.26 | | — | | (2.74) | | (2.74) | | 41.81 | | 0.53 | | 23,212 | | 1.88 | | 1.88 | | (1.22) | | 66 |
| I | | 58.97 | | (0.10) | | 1.04 | | 0.94 | | — | | (2.74) | | (2.74) | | 57.17 | | 1.59 | | 243,340 | | 0.82 | | 0.82 | | (0.16) | | 66 |
| R3 | | 56.89 | | (0.48) | | 1.03 | | 0.55 | | — | | (2.74) | | (2.74) | | 54.70 | | 0.94 | | 13,210 | | 1.47 | | 1.47 | | (0.82) | | 66 |
| R4 | | 58.98 | | (0.31) | | 1.06 | | 0.75 | | — | | (2.74) | | (2.74) | | 56.99 | | 1.26 | | 69,097 | | 1.15 | | 1.15 | | (0.50) | | 66 |
| R5 | | 61.26 | | (0.12) | | 1.08 | | 0.96 | | — | | (2.74) | | (2.74) | | 59.48 | | 1.56 | | 94,887 | | 0.85 | | 0.85 | | (0.20) | | 66 |
| R6 | | 61.87 | | (0.09) | | 1.12 | | 1.03 | | — | | (2.74) | | (2.74) | | 60.16 | | 1.66 | | 44,278 | | 0.75 | | 0.75 | | (0.14) | | 66 |
| Y | | 61.93 | | (0.09) | | 1.10 | | 1.01 | | — | | (2.74) | | (2.74) | | 60.20 | | 1.63 | | 358,049 | | 0.79 | | 0.79 | | (0.14) | | 66 |
| F | | 59.06 | | (0.06) | | 1.04 | | 0.98 | | — | | (2.74) | | (2.74) | | 57.30 | | 1.66 | | 47,999 | | 0.75 | | 0.75 | | (0.10) | | 66 |
| Hartford Small Cap Value Fund |
| For the Year Ended October 31, 2022 |
| A | | $ 13.36 | | $ 0.13 | | $ (1.22) | | $ (1.09) | | $ (0.09) | | $ (0.78) | | $ (0.87) | | $ 11.40 | | (8.86)% | | $ 51,422 | | 1.29% | | 1.28% | | 1.05% | | 59% |
| C | | 11.48 | | 0.03 | | (1.04) | | (1.01) | | — | | (0.78) | | (0.78) | | 9.69 | | (9.54) | | 1,922 | | 2.10 | | 2.05 | | 0.29 | | 59 |
| I | | 13.40 | | 0.16 | | (1.22) | | (1.06) | | (0.12) | | (0.78) | | (0.90) | | 11.44 | | (8.56) | | 21,402 | | 0.98 | | 0.98 | | 1.35 | | 59 |
| R3 | | 13.91 | | 0.11 | | (1.28) | | (1.17) | | (0.06) | | (0.78) | | (0.84) | | 11.90 | | (9.05) | | 760 | | 1.57 | | 1.45 | | 0.90 | | 59 |
| R4 | | 14.13 | | 0.16 | | (1.31) | | (1.15) | | (0.10) | | (0.78) | | (0.88) | | 12.10 | | (8.79) | | 42 | | 1.26 | | 1.20 | | 1.29 | | 59 |
| R5 | | 14.10 | | 0.17 | | (1.27) | | (1.10) | | (0.14) | | (0.78) | | (0.92) | | 12.08 | | (8.48) | | 1,756 | | 0.97 | | 0.90 | | 1.36 | | 59 |
| R6 | | 14.10 | | 0.18 | | (1.28) | | (1.10) | | (0.15) | | (0.78) | | (0.93) | | 12.07 | | (8.46) | | 7,821 | | 0.85 | | 0.80 | | 1.48 | | 59 |
| Y | | 14.07 | | 0.18 | | (1.28) | | (1.10) | | (0.14) | | (0.78) | | (0.92) | | 12.05 | | (8.46) | | 2,887 | | 0.96 | | 0.85 | | 1.53 | | 59 |
| F | | 13.40 | | 0.19 | | (1.23) | | (1.04) | | (0.15) | | (0.78) | | (0.93) | | 11.43 | | (8.46) | | 38,106 | | 0.85 | | 0.80 | | 1.54 | | 59 |
| For the Year Ended October 31, 2021 |
| A | | $ 8.29 | | $ 0.10 | | $ 5.06 | | $ 5.16 | | $ (0.09) | | $ — | | $ (0.09) | | $ 13.36 | | 62.61% | | $ 59,496 | | 1.30% | | 1.28% | | 0.78% | | 60% |
| C | | 7.12 | | (0.00) (5) | | 4.37 | | 4.37 | | (0.01) | | — | | (0.01) | | 11.48 | | 61.49 | | 3,098 | | 2.09 | | 2.04 | | 0.01 | | 60 |
| I | | 8.31 | | 0.15 | | 5.06 | | 5.21 | | (0.12) | | — | | (0.12) | | 13.40 | | 63.20 | | 32,905 | | 0.97 | | 0.96 | | 1.12 | | 60 |
| R3 | | 8.62 | | 0.09 | | 5.27 | | 5.36 | | (0.07) | | — | | (0.07) | | 13.91 | | 62.45 | | 931 | | 1.56 | | 1.39 | | 0.69 | | 60 |
| R4 | | 8.76 | | 0.12 | | 5.35 | | 5.47 | | (0.10) | | — | | (0.10) | | 14.13 | | 62.83 | | 53 | | 1.26 | | 1.20 | | 0.88 | | 60 |
| R5 | | 8.74 | | 0.15 | | 5.34 | | 5.49 | | (0.13) | | — | | (0.13) | | 14.10 | | 63.34 | | 24 | | 0.96 | | 0.90 | | 1.12 | | 60 |
| R6 | | 8.74 | | 0.16 | | 5.35 | | 5.51 | | (0.15) | | — | | (0.15) | | 14.10 | | 63.49 | | 1,508 | | 0.85 | | 0.80 | | 1.24 | | 60 |
| Y | | 8.73 | | 0.17 | | 5.31 | | 5.48 | | (0.14) | | — | | (0.14) | | 14.07 | | 63.26 | | 1,947 | | 0.95 | | 0.85 | | 1.22 | | 60 |
| F | | 8.31 | | 0.16 | | 5.08 | | 5.24 | | (0.15) | | — | | (0.15) | | 13.40 | | 63.53 | | 76,702 | | 0.84 | | 0.80 | | 1.26 | | 60 |
| For the Year Ended October 31, 2020 |
| A | | $ 10.35 | | $ 0.09 | | $ (1.49) | | $ (1.40) | | $ (0.08) | | $ (0.58) | | $ (0.66) | | $ 8.29 | | (14.57)% | | $ 32,996 | | 1.41% | | 1.29% | | 1.04% | | 62% |
| C | | 8.96 | | 0.02 | | (1.28) | | (1.26) | | (0.00) (5) | | (0.58) | | (0.58) | | 7.12 | | (15.15) | | 2,020 | | 2.15 | | 2.04 | | 0.29 | | 62 |
| I | | 10.37 | | 0.12 | | (1.48) | | (1.36) | | (0.12) | | (0.58) | | (0.70) | | 8.31 | | (14.22) | | 2,915 | | 1.04 | | 0.93 | | 1.43 | | 62 |
| R3 | | 10.73 | | 0.08 | | (1.54) | | (1.46) | | (0.07) | | (0.58) | | (0.65) | | 8.62 | | (14.62) | | 457 | | 1.63 | | 1.42 | | 0.92 | | 62 |
| R4 | | 10.89 | | 0.10 | | (1.56) | | (1.46) | | (0.09) | | (0.58) | | (0.67) | | 8.76 | | (14.46) | | 30 | | 1.33 | | 1.20 | | 1.10 | | 62 |
| R5 | | 10.87 | | 0.13 | | (1.56) | | (1.43) | | (0.12) | | (0.58) | | (0.70) | | 8.74 | | (14.21) | | 10 | | 1.03 | | 0.90 | | 1.51 | | 62 |
| R6 | | 10.87 | | 0.12 | | (1.54) | | (1.42) | | (0.13) | | (0.58) | | (0.71) | | 8.74 | | (14.17) | | 240 | | 0.92 | | 0.80 | | 1.42 | | 62 |
| Y | | 10.86 | | 0.13 | | (1.55) | | (1.42) | | (0.13) | | (0.58) | | (0.71) | | 8.73 | | (14.18) | | 250 | | 1.02 | | 0.85 | | 1.50 | | 62 |
| F | | 10.38 | | 0.13 | | (1.49) | | (1.36) | | (0.13) | | (0.58) | | (0.71) | | 8.31 | | (14.22) | | 40,447 | | 0.91 | | 0.80 | | 1.53 | | 62 |
The accompanying notes are an integral part of these financial statements.
Hartford Domestic Equity Funds
Financial Highlights – (continued)
| | | — Selected Per-Share Data(1) — | | — Ratios and Supplemental Data — |
| Class | | Net
Asset
Value at
Beginning
of Period | | Net
Investment
Income
(Loss) | | Net
Realized
and
Unrealized
Gain (Loss)
on
Investments | | Total from
Investment
Operations | | Dividends
from Net
Investment
Income | | Distributions
from
Capital
Gains | | Total
Dividends
and
Distributions | | Net
Asset
Value at
End of
Period | | Total
Return(2) | | Net
Assets
at End
of Period
(000s) | | Ratio of
Expenses
to
Average
Net
Assets
Before
Adjust-
ments(3) | | Ratio of
Expenses
to
Average
Net
Assets
After
Adjust-
ments(3) | | Ratio of
Net
Investment
Income
(Loss) to
Average
Net Assets | | Portfolio
Turnover |
| Hartford Small Cap Value Fund – (continued) |
| For the Year Ended October 31, 2019 |
| A | | $ 13.65 | | $ 0.10 | | $ (0.04) | | $ 0.06 | | $ (0.03) | | $ (3.33) | | $ (3.36) | | $ 10.35 | | 3.46% | | $ 47,037 | | 1.37% | | 1.27% | | 0.98% | | 140% |
| C | | 12.35 | | 0.02 | | (0.08) | | (0.06) | | — | | (3.33) | | (3.33) | | 8.96 | | 2.60 | | 3,719 | | 2.14 | | 2.04 | | 0.26 | | 140 |
| I | | 13.68 | | 0.14 | | (0.05) | | 0.09 | | (0.07) | | (3.33) | | (3.40) | | 10.37 | | 3.77 | | 4,354 | | 1.00 | | 0.90 | | 1.34 | | 140 |
| R3 | | 14.02 | | 0.09 | | (0.03) | | 0.06 | | (0.02) | | (3.33) | | (3.35) | | 10.73 | | 3.31 | | 609 | | 1.62 | | 1.42 | | 0.82 | | 140 |
| R4 | | 14.16 | | 0.11 | | (0.03) | | 0.08 | | (0.02) | | (3.33) | | (3.35) | | 10.89 | | 3.52 | | 69 | | 1.31 | | 1.20 | | 1.01 | | 140 |
| R5 | | 14.16 | | 0.16 | | (0.05) | | 0.11 | | (0.07) | | (3.33) | | (3.40) | | 10.87 | | 3.82 | | 11 | | 1.01 | | 0.90 | | 1.44 | | 140 |
| R6 | | 14.15 | | 0.15 | | (0.02) | | 0.13 | | (0.08) | | (3.33) | | (3.41) | | 10.87 | | 3.99 | | 103 | | 0.89 | | 0.80 | | 1.39 | | 140 |
| Y | | 14.15 | | 0.16 | | (0.04) | | 0.12 | | (0.08) | | (3.33) | | (3.41) | | 10.86 | | 3.94 | | 572 | | 0.97 | | 0.85 | | 1.43 | | 140 |
| F | | 13.68 | | 0.15 | | (0.04) | | 0.11 | | (0.08) | | (3.33) | | (3.41) | | 10.38 | | 3.99 | | 48,425 | | 0.89 | | 0.80 | | 1.43 | | 140 |
| For the Year Ended October 31, 2018 |
| A | | $ 14.13 | | $ 0.04 | | $ 0.10 | | $ 0.14 | | $ (0.02) | | $ (0.60) | | $ (0.62) | | $ 13.65 | | 1.00% | | $ 52,406 | | 1.35% | | 1.29% | | 0.28% | | 68% |
| C | | 12.91 | | (0.06) | | 0.10 | | 0.04 | | — | | (0.60) | | (0.60) | | 12.35 | | 0.27 | | 6,444 | | 2.13 | | 2.04 | | (0.44) | | 68 |
| I | | 14.15 | | 0.09 | | 0.10 | | 0.19 | | (0.06) | | (0.60) | | (0.66) | | 13.68 | | 1.33 | | 3,756 | | 1.02 | | 0.95 | | 0.62 | | 68 |
| R3 | | 14.50 | | 0.03 | | 0.09 | | 0.12 | | — | | (0.60) | | (0.60) | | 14.02 | | 0.82 | | 529 | | 1.62 | | 1.43 | | 0.18 | | 68 |
| R4 | | 14.61 | | 0.06 | | 0.10 | | 0.16 | | (0.01) | | (0.60) | | (0.61) | | 14.16 | | 1.07 | | 48 | | 1.32 | | 1.20 | | 0.41 | | 68 |
| R5 | | 14.63 | | 0.10 | | 0.10 | | 0.20 | | (0.07) | | (0.60) | | (0.67) | | 14.16 | | 1.39 | | 36 | | 1.02 | | 0.90 | | 0.71 | | 68 |
| R6 (12) | | 13.99 | | 0.05 | | 0.11 | | 0.16 | | — | | — | | — | | 14.15 | | 1.14 (8) | | 10 | | 0.91 (9) | | 0.84 (9) | | 0.47 (9) | | 68 |
| Y | | 14.66 | | 0.11 | | 0.10 | | 0.21 | | (0.12) | | (0.60) | | (0.72) | | 14.15 | | 1.42 | | 646 | | 0.96 | | 0.85 | | 0.74 | | 68 |
| F | | 14.16 | | 0.11 | | 0.09 | | 0.20 | | (0.08) | | (0.60) | | (0.68) | | 13.68 | | 1.42 | | 38,087 | | 0.90 | | 0.84 | | 0.80 | | 68 |
| The Hartford Small Company Fund |
| For the Year Ended October 31, 2022 |
| A | | $ 30.24 | | $ (0.13) | | $ (7.28) | | $ (7.41) | | $ — | | $ (6.53) | | $ (6.53) | | $ 16.30 | | (30.20)% | | $ 319,971 | | 1.27% | | 1.26% | | (0.69)% | | 90% |
| C | | 17.65 | | (0.14) | | (3.53) | | (3.67) | | — | | (6.53) | | (6.53) | | 7.45 | | (30.76) | | 4,678 | | 2.10 | | 2.10 | | (1.54) | | 90 |
| I | | 32.69 | | (0.09) | | (8.01) | | (8.10) | | — | | (6.53) | | (6.53) | | 18.06 | | (30.01) | | 31,819 | | 0.99 | | 0.99 | | (0.42) | | 90 |
| R3 | | 33.41 | | (0.22) | | (8.21) | | (8.43) | | — | | (6.53) | | (6.53) | | 18.45 | | (30.43) | | 10,250 | | 1.59 | | 1.59 | | (1.01) | | 90 |
| R4 | | 36.39 | | (0.17) | | (9.10) | | (9.27) | | — | | (6.53) | | (6.53) | | 20.59 | | (30.21) | | 9,040 | | 1.29 | | 1.29 | | (0.72) | | 90 |
| R5 | | 39.26 | | (0.11) | | (9.96) | | (10.07) | | — | | (6.53) | | (6.53) | | 22.66 | | (30.01) | | 4,603 | | 0.99 | | 0.99 | | (0.41) | | 90 |
| R6 | | 40.33 | | (0.07) | | (10.29) | | (10.36) | | — | | (6.53) | | (6.53) | | 23.44 | | (29.92) | | 6,580 | | 0.87 | | 0.87 | | (0.27) | | 90 |
| Y | | 40.25 | | (0.10) | | (10.28) | | (10.38) | | — | | (6.53) | | (6.53) | | 23.34 | | (30.05) | | 39,131 | | 0.95 | | 0.95 | | (0.36) | | 90 |
| F | | 32.96 | | (0.06) | | (8.10) | | (8.16) | | — | | (6.53) | | (6.53) | | 18.27 | | (29.93) | | 239,580 | | 0.87 | | 0.87 | | (0.29) | | 90 |
| For the Year Ended October 31, 2021 |
| A | | $ 25.50 | | $ (0.30) | | $ 7.82 | | $ 7.52 | | $ — | | $ (2.78) | | $ (2.78) | | $ 30.24 | | 30.50% | | $ 502,923 | | 1.23% | | 1.22% | | (1.02)% | | 123% |
| C | | 15.97 | | (0.33) | | 4.79 | | 4.46 | | — | | (2.78) | | (2.78) | | 17.65 | | 29.39 | | 9,324 | | 2.05 | | 2.05 | | (1.85) | | 123 |
| I | | 27.31 | | (0.25) | | 8.41 | | 8.16 | | — | | (2.78) | | (2.78) | | 32.69 | | 30.84 | | 59,421 | | 0.95 | | 0.95 | | (0.77) | | 123 |
| R3 | | 28.02 | | (0.45) | | 8.62 | | 8.17 | | — | | (2.78) | | (2.78) | | 33.41 | | 30.04 | | 15,527 | | 1.57 | | 1.57 | | (1.37) | | 123 |
| R4 | | 30.22 | | (0.38) | | 9.33 | | 8.95 | | — | | (2.78) | | (2.78) | | 36.39 | | 30.46 | | 15,320 | | 1.26 | | 1.26 | | (1.06) | | 123 |
| R5 | | 32.33 | | (0.30) | | 10.01 | | 9.71 | | — | | (2.78) | | (2.78) | | 39.26 | | 30.85 | | 6,782 | | 0.97 | | 0.97 | | (0.78) | | 123 |
| R6 | | 33.12 | | (0.28) | | 10.27 | | 9.99 | | — | | (2.78) | | (2.78) | | 40.33 | | 30.97 | | 5,954 | | 0.85 | | 0.85 | | (0.69) | | 123 |
| Y | | 33.07 | | (0.29) | | 10.25 | | 9.96 | | — | | (2.78) | | (2.78) | | 40.25 | | 30.92 | | 45,590 | | 0.91 | | 0.91 | | (0.72) | | 123 |
| F | | 27.49 | | (0.21) | | 8.46 | | 8.25 | | — | | (2.78) | | (2.78) | | 32.96 | | 30.98 | | 333,061 | | 0.85 | | 0.85 | | (0.65) | | 123 |
The accompanying notes are an integral part of these financial statements.
Hartford Domestic Equity Funds
Financial Highlights – (continued)
| | | — Selected Per-Share Data(1) — | | — Ratios and Supplemental Data — |
| Class | | Net
Asset
Value at
Beginning
of Period | | Net
Investment
Income
(Loss) | | Net
Realized
and
Unrealized
Gain (Loss)
on
Investments | | Total from
Investment
Operations | | Dividends
from Net
Investment
Income | | Distributions
from
Capital
Gains | | Total
Dividends
and
Distributions | | Net
Asset
Value at
End of
Period | | Total
Return(2) | | Net
Assets
at End
of Period
(000s) | | Ratio of
Expenses
to
Average
Net
Assets
Before
Adjust-
ments(3) | | Ratio of
Expenses
to
Average
Net
Assets
After
Adjust-
ments(3) | | Ratio of
Net
Investment
Income
(Loss) to
Average
Net Assets | | Portfolio
Turnover |
| The Hartford Small Company Fund – (continued) |
| For the Year Ended October 31, 2020 |
| A | | $ 20.35 | | $ (0.14) | | $ 6.57 | | $ 6.43 | | $ — | | $ (1.28) | | $ (1.28) | | $ 25.50 | | 33.21% | | $ 389,496 | | 1.32% | | 1.31% | | (0.66)% | | 104% |
| C | | 13.30 | | (0.20) | | 4.15 | | 3.95 | | — | | (1.28) | | (1.28) | | 15.97 | | 32.08 | | 9,058 | | 2.14 | | 2.14 | | (1.50) | | 104 |
| I | | 21.65 | | (0.08) | | 7.02 | | 6.94 | | — | | (1.28) | | (1.28) | | 27.31 | | 33.59 | | 35,806 | | 1.00 | | 1.00 | | (0.35) | | 104 |
| R3 | | 22.29 | | (0.21) | | 7.22 | | 7.01 | | — | | (1.28) | | (1.28) | | 28.02 | | 32.91 | | 14,013 | | 1.61 | | 1.55 | | (0.90) | | 104 |
| R4 | | 23.88 | | (0.15) | | 7.77 | | 7.62 | | — | | (1.28) | | (1.28) | | 30.22 | | 33.29 | | 13,363 | | 1.30 | | 1.25 | | (0.60) | | 104 |
| R5 | | 25.40 | | (0.08) | | 8.29 | | 8.21 | | — | | (1.28) | | (1.28) | | 32.33 | | 33.64 | | 3,936 | | 1.01 | | 0.95 | | (0.30) | | 104 |
| R6 | | 25.97 | | (0.13) | | 8.56 | | 8.43 | | — | | (1.28) | | (1.28) | | 33.12 | | 33.75 | | 1,530 | | 0.90 | | 0.90 | | (0.42) | | 104 |
| Y | | 25.95 | | (0.08) | | 8.48 | | 8.40 | | — | | (1.28) | | (1.28) | | 33.07 | | 33.65 | | 19,956 | | 0.96 | | 0.95 | | (0.29) | | 104 |
| F | | 21.76 | | (0.06) | | 7.07 | | 7.01 | | — | | (1.28) | | (1.28) | | 27.49 | | 33.75 | | 243,057 | | 0.90 | | 0.90 | | (0.24) | | 104 |
| For the Year Ended October 31, 2019 |
| A | | $ 22.20 | | $ (0.13) | | $ 2.28 | | $ 2.15 | | $ — | | $ (4.00) | | $ (4.00) | | $ 20.35 | | 14.08% | | $ 311,742 | | 1.33% | | 1.32% | | (0.66)% | | 91% |
| C | | 16.11 | | (0.19) | | 1.38 | | 1.19 | | — | | (4.00) | | (4.00) | | 13.30 | | 13.24 | | 9,929 | | 2.14 | | 2.13 | | (1.46) | | 91 |
| I | | 23.28 | | (0.08) | | 2.45 | | 2.37 | | — | | (4.00) | | (4.00) | | 21.65 | | 14.48 | | 26,939 | | 1.04 | | 1.03 | | (0.37) | | 91 |
| R3 | | 23.95 | | (0.19) | | 2.53 | | 2.34 | | — | | (4.00) | | (4.00) | | 22.29 | | 13.84 | | 14,142 | | 1.62 | | 1.55 | | (0.89) | | 91 |
| R4 | | 25.28 | | (0.14) | | 2.74 | | 2.60 | | — | | (4.00) | | (4.00) | | 23.88 | | 14.20 | | 14,261 | | 1.32 | | 1.25 | | (0.59) | | 91 |
| R5 | | 26.53 | | (0.07) | | 2.94 | | 2.87 | | — | | (4.00) | | (4.00) | | 25.40 | | 14.56 | | 3,239 | | 1.02 | | 0.95 | | (0.29) | | 91 |
| R6 | | 27.02 | | (0.06) | | 3.01 | | 2.95 | | — | | (4.00) | | (4.00) | | 25.97 | | 14.60 | | 206 | | 0.90 | | 0.90 | | (0.23) | | 91 |
| Y | | 27.01 | | (0.06) | | 3.00 | | 2.94 | | — | | (4.00) | | (4.00) | | 25.95 | | 14.56 | | 32,472 | | 0.94 | | 0.93 | | (0.26) | | 91 |
| F | | 23.35 | | (0.05) | | 2.46 | | 2.41 | | — | | (4.00) | | (4.00) | | 21.76 | | 14.63 | | 193,242 | | 0.90 | | 0.90 | | (0.23) | | 91 |
| For the Year Ended October 31, 2018 |
| A | | $ 20.34 | | $ (0.20) | | $ 2.06 | | $ 1.86 | | $ — | | $ — | | $ — | | $ 22.20 | | 9.20% | | $ 283,912 | | 1.34% | | 1.33% | | (0.87)% | | 104% |
| C | | 14.87 | | (0.27) | | 1.51 | | 1.24 | | — | | — | | — | | 16.11 | | 8.34 | | 11,729 | | 2.12 | | 2.10 | | (1.64) | | 104 |
| I | | 21.27 | | (0.14) | | 2.15 | | 2.01 | | — | | — | | — | | 23.28 | | 9.45 | | 28,540 | | 1.07 | | 1.05 | | (0.60) | | 104 |
| R3 | | 21.98 | | (0.27) | | 2.24 | | 1.97 | | — | | — | | — | | 23.95 | | 8.92 | | 16,386 | | 1.63 | | 1.55 | | (1.09) | | 104 |
| R4 | | 23.14 | | (0.20) | | 2.34 | | 2.14 | | — | | — | | — | | 25.28 | | 9.25 | | 15,295 | | 1.32 | | 1.25 | | (0.79) | | 104 |
| R5 | | 24.21 | | (0.14) | | 2.46 | | 2.32 | | — | | — | | — | | 26.53 | | 9.58 | | 2,678 | | 1.03 | | 0.95 | | (0.51) | | 104 |
| R6 | | 24.64 | | (0.12) | | 2.50 | | 2.38 | | — | | — | | — | | 27.02 | | 9.66 | | 144 | | 0.91 | | 0.90 | | (0.42) | | 104 |
| Y | | 24.64 | | (0.12) | | 2.49 | | 2.37 | | — | | — | | — | | 27.01 | | 9.66 | | 35,351 | | 0.92 | | 0.90 | | (0.44) | | 104 |
| F | | 21.30 | | (0.11) | | 2.16 | | 2.05 | | — | | — | | — | | 23.35 | | 9.63 | | 115,365 | | 0.91 | | 0.90 | | (0.45) | | 104 |
| FINANCIAL HIGHLIGHTS FOOTNOTES |
| (1) | Information presented relates to a share outstanding throughout the indicated period. Net investment income (loss) per share amounts are calculated based on average shares outstanding unless otherwise noted. |
| (2) | Assumes initial investment at net asset value at the beginning of each period, reinvestment of all distributions, the complete redemption of the investment at net asset value at the end of each period and no sales charge. Total return would be reduced if sales charges were taken into account. |
| (3) | Adjustments include waivers and reimbursements, if applicable. Ratios do not include fees paid indirectly (see Expenses in the accompanying Notes to Financial Statements). |
| (4) | The “Net Realized and Unrealized Gain (Loss) on Investments” and “Total from Net Investment Income” for Classes I, R4 and R5 shares have been updated since the October 31, 2021 Annual Report to reflect a non-material change of $0.01 to these amounts. |
| (5) | Amount is less than $0.01 per share. |
| (6) | Amount is less than 0.01%. |
| (7) | Commenced operations on February 28, 2019. |
| (8) | Not annualized. |
| (9) | Annualized. |
| (10) | Commenced operations on June 22, 2022. |
| (11) | Per share amount was not in accord with the net realized and unrealized gain (loss) for the period because of the timing of transactions in shares of the Fund and the amount and timing of per-share net realized and unrealized gain (loss) on such shares. |
| (12) | Commenced operations on February 28, 2018. |
The accompanying notes are an integral part of these financial statements.
Hartford Domestic Equity Funds
Notes to Financial Statements
October 31, 2022
| 1. | Organization: |
| | The Hartford Mutual Funds, Inc. and The Hartford Mutual Funds II, Inc. (each, a "Company" and collectively, the "Companies") are each an open-end registered management investment company comprised of thirty-seven and sixteen series, respectively, as of October 31, 2022. Financial statements for the series of each Company listed below (each, a "Fund" and collectively, the "Funds") are included in this report. |
| | |
| The Hartford Mutual Funds, Inc.: |
| The Hartford Capital Appreciation Fund (the "Capital Appreciation Fund") |
| Hartford Core Equity Fund (the "Core Equity Fund") |
| The Hartford Dividend and Growth Fund (the "Dividend and Growth Fund") |
| The Hartford Equity Income Fund (the "Equity Income Fund") |
| The Hartford Healthcare Fund (the "Healthcare Fund") |
| The Hartford MidCap Fund (the "MidCap Fund") |
| The Hartford MidCap Value Fund (the "MidCap Value Fund") |
| Hartford Small Cap Value Fund (the "Small Cap Value Fund") |
| The Hartford Small Company Fund (the "Small Company Fund") |
| The Hartford Mutual Funds II, Inc.: |
| The Hartford Growth Opportunities Fund (the "Growth Opportunities Fund") |
| Hartford Quality Value Fund (the "Quality Value Fund") |
| The Hartford Small Cap Growth Fund (the "Small Cap Growth Fund") |
The assets of each Fund are separate, and a shareholder's interest is limited to the Fund in which shares are held. Each Company is organized under the laws of the State of Maryland and is registered with the U.S. Securities and Exchange Commission (the "SEC") under the Investment Company Act of 1940, as amended (the "1940 Act"). Each Fund is a diversified open-end management investment company. Each Fund applies specialized accounting and reporting standards under Accounting Standards Codification Topic 946, "Financial Services – Investment Companies".
Each Fund has registered for sale Class A, Class C, Class I, Class R3, Class R4, Class R5, Class R6, Class Y and Class F shares. Class A shares of each Fund are sold with a front-end sales charge of up to 5.50%. Class C shares of each Fund are sold with a contingent deferred sales charge of up to 1.00% on shares redeemed within twelve months of purchase. Class C shares automatically convert to Class A shares of the same Fund after eight years provided that the Fund or the financial intermediary has records verifying that the Class C shares have been held for at least eight years. Classes I, R3, R4, R5, R6, Y and F shares do not have a sales charge.
| 2. | Significant Accounting Policies: |
| | The following is a summary of significant accounting policies of each Fund used in the preparation of its financial statements, which are in accordance with United States Generally Accepted Accounting Principles ("U.S. GAAP"). The preparation of financial statements in accordance with U.S. GAAP may require management to make estimates and assumptions that affect the reported amounts of assets and liabilities and disclosure of contingent assets and liabilities at the date of the financial statements and the reported amounts of increases and decreases in net assets from operations during the reporting period. Actual results could differ from those estimates. |
| a) | Determination of Net Asset Value – The net asset value ("NAV") of each class of each Fund’s shares is determined as of the close of regular trading on the New York Stock Exchange (the "Exchange") (normally 4:00 p.m. Eastern Time) (the "NYSE Close") on each day that the Exchange is open ("Valuation Date"). If the Exchange is closed due to weather or other extraordinary circumstances on a day it would typically be open for business, each Fund may treat such day as a typical business day and accept purchase and redemption orders and calculate each Fund’s NAV in accordance with applicable law. The NAV of each class of each Fund's shares is determined by dividing the value of the Fund’s net assets attributable to the class of shares by the number of shares outstanding for that class. Information that becomes known to the Funds after the NAV has been calculated on a particular day will not generally be used to retroactively adjust the NAV determined earlier that day. |
| b) | Investment Valuation and Fair Value Measurements – For purposes of calculating the NAV of each class of each Fund, portfolio securities and other assets held in the Fund’s portfolio for which market prices are readily available are valued at market value. Market value is generally determined on the basis of official close price or last reported trade price. If no trades were reported, market value is based on prices obtained from a quotation reporting system, established market makers (including evaluated prices), or independent pricing services. |
Hartford Domestic Equity Funds
Notes to Financial Statements – (continued)
October 31, 2022
| | Pricing vendors may use matrix pricing or valuation models that utilize certain inputs and assumptions to derive values, including transaction data, credit quality information, general market conditions, news, and other factors and assumptions. |
| | With respect to a Fund's investments that do not have readily available market prices, each Company's Board of Directors (the "Board") has designated Hartford Funds Management Company, LLC (the "Investment Manager") as its valuation designee to perform fair valuations pursuant to Rule 2a-5 under the 1940 Act (the "Valuation Designee"). |
| | If market prices are not readily available or deemed unreliable, the Valuation Designee determines the fair value of the security or other instrument in good faith under policies and procedures approved by and under the supervision of the Board ("Valuation Procedures"). |
| | The Valuation Designee has delegated the day-to-day responsibility for implementing the Valuation Procedures to the Valuation Committee. The Valuation Committee will consider all available relevant factors in determining an investment’s fair value. The Valuation Designee reports fair value matters to the Audit Committee of the Board. |
| | Prices of foreign equities that are principally traded on certain foreign markets will generally be adjusted daily pursuant to a fair value pricing service in order to reflect an adjustment for the factors occurring after the close of certain foreign markets but before the NYSE Close. Securities and other instruments that are primarily traded on foreign markets may trade on days that are not business days of the Funds. The value of the foreign securities or other instruments in which a Fund invests may change on days when a shareholder will not be able to purchase, redeem or exchange shares of the Fund. |
| | Fixed income investments (other than short-term obligations) and non-exchange traded derivatives held by a Fund are normally valued at prices supplied by independent pricing services in accordance with the Valuation Procedures. Short-term investments maturing in 60 days or less are generally valued at amortized cost, which approximates fair value. |
| | Exchange-traded derivatives, such as options, futures and options on futures, are valued at the last sale price determined by the exchange where such instruments principally trade as of the close of such exchange ("Exchange Close"). If a last sale price is not available, the value will be the mean of the most recently quoted bid and ask prices as of the Exchange Close. If a mean of the bid and ask prices cannot be calculated for the day, the value will be the most recently quoted bid price as of the Exchange Close. Over-the-counter derivatives are normally valued based on prices supplied by independent pricing services in accordance with the Valuation Procedures. |
| | Investments valued in currencies other than U.S. dollars are converted to U.S. dollars using the prevailing spot currency exchange rates obtained from independent pricing services for calculation of the NAV. As a result, the NAV of a Fund’s shares may be affected by changes in the value of currencies in relation to the U.S. dollar. The value of securities or other instruments traded in markets outside the United States or denominated in currencies other than the U.S. dollar may be affected significantly on a day that the Exchange is closed and the market value may change on days when an investor is not able to purchase, redeem or exchange shares of a Fund. |
| | Foreign currency contracts represent agreements to exchange currencies on specific future dates at predetermined rates. Foreign currency contracts are valued using foreign currency exchange rates and forward rates as provided by an independent pricing service on the Valuation Date. |
| | Shares of investment companies listed and traded on an exchange are valued in the same manner as any exchange-listed equity security. Investments in investment companies that are not listed or traded on an exchange ("Non-Traded Funds"), if any, are valued at the respective NAV of each Non-Traded Fund on the Valuation Date. Such Non-Traded Funds and listed investment companies may use fair value pricing as disclosed in their prospectuses. |
| | Financial instruments for which prices are not available from an independent pricing service may be valued using quotations obtained from one or more dealers that make markets in the respective financial instrument in accordance with the Valuation Procedures. |
| | U.S. GAAP defines fair value as the price that a Fund would receive to sell an asset or pay to transfer a liability in an orderly transaction between market participants. The U.S. GAAP fair value measurement standards require disclosure of a fair value hierarchy for each major category of assets and liabilities. Various inputs are used in determining the fair value of each Fund’s investments. These inputs are summarized into three broad hierarchy levels. This hierarchy is based on whether the valuation inputs are observable or unobservable. These levels are: |
| • | Level 1 – Quoted prices in active markets for identical investments. Level 1 may include exchange traded instruments, such as domestic equities, some foreign equities, options, futures, mutual funds, exchange traded funds, rights and warrants. |
| • | Level 2 – Observable inputs other than Level 1 prices, such as quoted prices for similar investments; quoted prices in markets that are not active; or other inputs that are observable or can be corroborated by observable market data. Level 2 may include debt investments that are traded less frequently than exchange traded instruments and which are valued using independent pricing services; foreign equities, which are principally traded on certain foreign markets and are adjusted daily pursuant to a fair value pricing service in order |
Hartford Domestic Equity Funds
Notes to Financial Statements – (continued)
October 31, 2022
| | to reflect an adjustment for the factors occurring after the close of certain foreign markets but before the NYSE Close; senior floating rate interests, which are valued using an aggregate of dealer bids; short-term investments, which are valued at amortized cost; and swaps, which are valued based upon the terms of each swap contract. |
| • | Level 3 – Significant unobservable inputs that are supported by limited or no market activity. Level 3 may include financial instruments whose values are determined using indicative market quotes or require significant management judgment or estimation. These unobservable valuation inputs may include estimates for current yields, maturity/duration, prepayment speed, and indicative market quotes for comparable investments along with other assumptions relating to credit quality, collateral value, complexity of the investment structure, general market conditions and liquidity. This category may include investments where trading has been halted or there are certain restrictions on trading. While these investments are priced using unobservable inputs, the valuation of these investments reflects the best available data and management believes the prices are a reasonable representation of exit price. |
Valuation levels are not necessarily indicative of the risk associated with investing in such investments. Individual investments within any of the above mentioned asset classes may be assigned a different hierarchical level than those presented above, as individual circumstances dictate.
For additional information, refer to the Fair Value Summary and the Level 3 roll-forward reconciliation, if applicable, which follows each Fund's Schedule of Investments.
| c) | Investment Transactions and Investment Income – Investment transactions are recorded as of the trade date (the date the order to buy or sell is executed) for financial reporting purposes. Investments purchased or sold on a when-issued or delayed-delivery basis may be settled a month or more after the trade date. Realized gains and losses are determined on the basis of identified cost. |
| | Dividend income from domestic securities is accrued on the ex-dividend date. In general, dividend income from foreign securities is recorded on the ex-date; however, dividend notifications in certain foreign jurisdictions may not be available in a timely manner and as a result, a Fund will record the dividend as soon as the relevant details (i.e., rate per share, payment date, shareholders of record, etc.) are publicly available. |
| | Interest income, including amortization of premium, accretion of discounts and additional principal received in-kind in lieu of cash, is accrued on a daily basis. |
Please refer to Note 8 for Securities Lending information.
| d) | Taxes – A Fund may be subject to taxes imposed on realized gains on securities of certain foreign countries in which such Fund invests. A Fund may also be subject to taxes withheld on foreign dividends and interest from securities in which a Fund invests. The amount of any foreign taxes withheld and foreign tax expense is included on the accompanying Statements of Operations as a reduction to net investment income or net realized or unrealized gain (loss) on investments in these securities, if applicable. |
| e) | Foreign Currency Transactions – Assets and liabilities denominated in currencies other than U.S. dollars are translated into U.S. dollars at the exchange rates in effect on the Valuation Date. Purchases and sales of investments, income and expenses are translated into U.S. dollars at the exchange rates on the dates of such transactions. |
| | A Fund does not isolate that portion of portfolio investment valuation resulting from fluctuations in the foreign currency exchange rates from the fluctuations arising from changes in the market prices of investments held. Exchange rate fluctuations are included with the net realized and unrealized gain or loss on investments in the accompanying financial statements. |
| | Net realized foreign exchange gains or losses arise from sales of foreign currencies and the difference between asset and liability amounts initially stated in foreign currencies and the U.S. dollar value of the amounts actually received or paid. Net unrealized foreign exchange gains or losses arise from changes in the value of other assets and liabilities at the end of the reporting period, resulting from changes in the exchange rates. |
| f) | Joint Trading Account – A Fund may invest cash balances into a joint trading account that may be invested in one or more repurchase agreements. |
| g) | Fund Share Valuation and Dividend Distributions to Shareholders – Orders for each class of each Fund’s shares are executed in accordance with the investment instructions of the shareholders. The NAV of each class of each Fund’s shares is determined as of the close of business on each business day of the Exchange (see Note 2(a)). The NAV is determined separately for each class of shares of a Fund by dividing the Fund's net assets attributable to that class by the number of shares of the class outstanding. Each class of shares offered by a Fund has equal rights as to assets and voting privileges (except that shareholders of a class have exclusive voting rights regarding any matter relating solely to that class of shares). Income and non-class specific expenses are allocated daily to each class on the basis of the relative net assets of the class of the Fund. Realized and unrealized gains and losses are allocated daily based on the relative net assets of each class of shares of each Fund. |
Hartford Domestic Equity Funds
Notes to Financial Statements – (continued)
October 31, 2022
| | Orders for the purchase of a Fund's shares received prior to the close of the Exchange on any day the Exchange is open for business are priced at the NAV determined as of the close of the Exchange. Orders received after the close of the Exchange, or on a day on which the Exchange and/or the Funds are not open for business, are priced at the next determined NAV. |
| | Dividends are declared pursuant to a policy adopted by the respective Company's Board of Directors. Dividends and/or distributions to shareholders are recorded on ex-date. The policy of each Fund, except Dividend and Growth Fund and Equity Income Fund, is to pay dividends from net investment income and realized gains, if any, at least once a year. The policy of Dividend and Growth Fund and Equity Income Fund is to pay dividends from net investment income, if any, quarterly and realized gains, if any, at least once a year. |
| | Income dividends and capital gains distributions are determined in accordance with federal income tax regulations, which may differ from U.S. GAAP with respect to character and timing (see Federal Income Taxes: Distributions and Components of Distributable Earnings and Reclassification of Capital Accounts notes). |
| 3. | Securities and Other Investments: |
| a) | Restricted Securities – Each Fund may invest in securities that are subject to legal or contractual restrictions on resale. These securities generally may be resold in transactions exempt from registration or to the public if the securities are registered. Disposal of these securities may involve time-consuming negotiations and expense, and prompt sale at an acceptable price may be difficult. Information regarding restricted securities, if applicable, is included at the end of each Fund's Schedule of Investments. |
| b) | Repurchase Agreements – A repurchase agreement is an agreement between two parties whereby one party sells the other a security at a specified price with a commitment to repurchase the security later at an agreed-upon price, date and interest payment. Each Fund is permitted to enter into fully collateralized repurchase agreements. Each Company's Board of Directors has delegated to the sub-adviser(s), as applicable, the responsibility of evaluating the creditworthiness of the banks and securities dealers with which the Funds will engage in repurchase agreements. The sub-adviser(s) will monitor such transactions to ensure that the value of underlying collateral will be at least equal to the total amount of the repurchase obligation as required by the valuation provision of the repurchase agreement, including the accrued interest. Repurchase agreements carry the risk that the market value of the securities declines below the repurchase price. A Fund could also lose money if it is unable to recover the securities and the value of any collateral held. In the event the borrower commences bankruptcy proceedings, a court may characterize the transaction as a loan. If a Fund has not perfected a security interest in the underlying collateral, the Fund may be required to return the underlying collateral to the borrower’s estate and be treated as an unsecured creditor. As an unsecured creditor, the Fund could lose some or all of the principal and interest involved in the transaction. See each Fund's Schedule of Investments, if applicable, for repurchase agreements as of October 31, 2022. |
| 4. | Financial Derivative Instruments: |
| | The following disclosures contain information on the derivative instruments used by a Fund during the period, the credit-risk-related contingent features in certain derivative instruments, and how such derivative instruments affect the financial position and results of operations of the applicable Fund. The location and fair value amounts of these instruments on the Statements of Assets and Liabilities and the realized gains and losses and changes in unrealized gains and losses on the Statements of Operations, each categorized by type of derivative contract, are included in the following Additional Derivative Instrument Information footnote. The derivative instruments outstanding as of period-end are disclosed in the notes to the Schedules of Investments, if applicable. The amounts of realized gains and losses and changes in unrealized gains and losses on derivative instruments during the period are disclosed in the Statements of Operations. |
| a) | Futures Contracts – A Fund may enter into futures contracts. A futures contract is an agreement between two parties to buy or sell an asset at a set price on a future date. A Fund may use futures contracts to manage risk or obtain exposure to the investment markets, commodities, or movements in interest rates and currency values. The primary risks associated with the use of futures contracts are the imperfect correlation between the change in market value of the investments held by a Fund and the prices of futures contracts and the possibility of an illiquid market. Upon entering into a futures contract, a Fund is required to deposit with a futures commission merchant ("FCM") an amount of cash or U.S. Government or Agency Obligations in accordance with the initial margin requirements of the broker or exchange. Futures contracts are marked to market daily and an appropriate amount equal to the change in value ("variation margin") is paid or received by a Fund. Gains or losses are recognized but not considered realized until the contracts expire or are closed. Futures contracts involve, to varying degrees, risk of loss in excess of the variation margin disclosed on the Statements of Assets and Liabilities. |
During the year ended October 31, 2022, the Capital Appreciation Fund had used futures contracts.
| b) | Foreign Currency Contracts – A Fund may enter into foreign currency contracts that obligate the Fund to purchase or sell currencies at specified future dates. Foreign currency contracts may be used in connection with settling purchases or sales of securities to hedge the currency exposure associated with some or all of a Fund’s investments and/or as part of an investment strategy. Foreign currency contracts |
Hartford Domestic Equity Funds
Notes to Financial Statements – (continued)
October 31, 2022
| | are marked to market daily and the change in value is recorded by a Fund as an unrealized gain or loss. A Fund will record a realized gain or loss when the foreign currency contract is settled. |
| | Foreign currency contracts involve elements of market risk in excess of the amounts reflected in the Statements of Assets and Liabilities. In addition, risks may arise upon entering into these contracts from the potential inability of the counterparties to meet the terms of the contracts and from unanticipated movements in the value of the foreign currencies relative to the U.S. dollar. Upon entering into a foreign currency contract, a Fund may be required to post margin equal to its outstanding exposure thereunder. |
During the year ended October 31, 2022, the Healthcare Fund had used Foreign Currency Contracts.
| c) | Additional Derivative Instrument Information: |
| | Capital Appreciation Fund |
| | |
| The Effect of Derivative Instruments on the Statement of Assets and Liabilities as of October 31, 2022: |
| | Risk Exposure Category |
| | Interest Rate
Contracts | | Foreign
Currency
Contracts | | Credit
Contracts | | Equity
Contracts | | Commodity
Contracts | | Total |
| Liabilities: | | | | | | | | | | | |
| Unrealized depreciation on futures contracts(1) | $ — | | $ — | | $ — | | $ 3,889,068 | | $ — | | $ 3,889,068 |
| Total | $ — | | $ — | | $ — | | $ 3,889,068 | | $ — | | $ 3,889,068 |
| (1) | Amount represents the cumulative appreciation and depreciation on futures contracts as disclosed within the Schedule of Investments under the open “Futures Contracts” section. Only current day’s variation margin, if any, is reported within the Statement of Assets and Liabilities. |
| The Effect of Derivative Instruments on the Statement of Operations for the year ended October 31, 2022: |
| | Risk Exposure Category |
| | Interest Rate
Contracts | | Foreign
Currency
Contracts | | Credit
Contracts | | Equity
Contracts | | Commodity
Contracts | | Total |
| Realized Gain (Loss) on Derivatives Recognized as a Result of Operations: | | | | | | | | | | | |
| Net realized gain (loss) on futures contracts | $ — | | $ — | | $ — | | $ (36,942,270) | | $ — | | $ (36,942,270) |
| Total | $ — | | $ — | | $ — | | $ (36,942,270) | | $ — | | $ (36,942,270) |
| Net Change in Unrealized Appreciation (Depreciation) on Derivatives Recognized as a Result of Operations: | | | | | | | | | | | |
| Net change in unrealized appreciation (depreciation) of futures contracts | $ — | | $ — | | $ — | | $ (10,490,121) | | $ — | | $ (10,490,121) |
| Total | $ — | | $ — | | $ — | | $ (10,490,121) | | $ — | | $ (10,490,121) |
For the year ended October 31, 2022, the average monthly amount or number per contract outstanding for each derivative type was as follows:
| Derivative Description | | Average Notional
Par, Contracts
or Face Amount |
| Futures Contracts Number of Long Contracts | | 444 |
Healthcare Fund
| The Effect of Derivative Instruments on the Statement of Operations for the year ended October 31, 2022: |
| | Risk Exposure Category |
| | Interest Rate
Contracts | | Foreign
Currency
Contracts | | Credit
Contracts | | Equity
Contracts | | Commodity
Contracts | | Total |
| Realized Gain (Loss) on Derivatives Recognized as a Result of Operations: | | | | | | | | | | | |
| Net realized gain (loss) on foreign currency contracts | $ — | | $ (123) | | $ — | | $ — | | $ — | | $ (123) |
| Total | $ — | | $ (123) | | $ — | | $ — | | $ — | | $ (123) |
Hartford Domestic Equity Funds
Notes to Financial Statements – (continued)
October 31, 2022
Healthcare Fund – (continued)
For the year ended October 31, 2022, the average monthly amount or number per contract outstanding for each derivative type was as follows:
| Derivative Description | | Average Notional
Par, Contracts
or Face Amount |
| Foreign Currency Contracts Sold at Contract Amount | | $ 22,792 |
| d) | Balance Sheet Offsetting Information – Set forth below are tables which disclose both gross information and net information about instruments and transactions eligible for offset in the financial statements, and instruments and transactions that are subject to a master netting arrangement, as well as amounts related to margin, reflected as financial collateral (including cash collateral), held at clearing brokers, counterparties and a Fund's custodian. The master netting arrangements allow the clearing brokers to net any collateral held in or on behalf of a Fund, or liabilities or payment obligations of the clearing brokers to a Fund, against any liabilities or payment obligations of a Fund to the clearing brokers. A Fund is required to deposit financial collateral (including cash collateral) at the Fund's custodian on behalf of clearing brokers and counterparties to continually meet the original and maintenance requirements established by the clearing brokers and counterparties. Such requirements are specific to the respective clearing broker or counterparty. Certain master netting arrangements may not be enforceable in a bankruptcy. |
| | The following tables present a Fund's derivative assets and liabilities, presented on a gross basis as no amounts are netted within the Statements of Assets and Liabilities, by counterparty net of amounts available for offset under a master netting agreement or similar agreement ("MNA") and net of the related collateral received/pledged by a Fund as of October 31, 2022: |
| | |
| Capital Appreciation Fund | | | | |
| Derivative Financial Instruments: | | Assets | | Liabilities |
| Futures contracts | | $ — | | $ (3,889,068) |
| Total gross amount of derivative assets and liabilities in the Statement of Assets and Liabilities | | — | | (3,889,068) |
| Derivatives not subject to a MNA | | — | | 3,889,068 |
| Total gross amount of assets and liabilities subject to MNA or similar agreements | | $ — | | $ — |
| 5. | Principal Risks: |
| | A Fund’s investments expose it to various types of risks associated with financial instruments and the markets. A Fund may be exposed to the risks described below. Each Fund’s prospectus provides details of its principal risks. |
| | The market values of equity securities, such as common stocks and preferred stocks, or equity related derivative investments, such as futures and options, may decline due to general market conditions which are not specifically related to a particular company, such as real or perceived adverse economic conditions, changes in the general outlook for corporate earnings, changes in interest or currency rates or adverse investor sentiment generally. The market value of equity securities may also decline due to factors which affect a particular industry or industries, such as labor shortages or increased production costs and competitive conditions within an industry. Equity securities and equity related investments generally have greater market price volatility than fixed income securities. The extent of each Fund’s exposure to market risk is the market value of the investments held as shown in the Fund’s Schedule of Investments. |
| | A widespread health crisis, such as a global pandemic, could cause substantial market volatility, exchange trading suspensions or restrictions and closures of securities exchanges and businesses, impact the ability to complete redemptions, and adversely impact Fund performance. The outbreak of COVID-19, a respiratory disease caused by a novel coronavirus, has negatively affected the worldwide economy, created supply chain disruptions and labor shortages, and impacted the financial health of individual companies and the market in significant and unforeseen ways. The future impact of COVID-19 remains unclear. The effects to public health, business and market conditions resulting from COVID-19 pandemic may have a significant negative impact on the performance of a Fund’s investments, including exacerbating other pre-existing political, social and economic risks. |
| | Investing in the securities of non-U.S. issuers, whether directly or indirectly, involves certain considerations and risks not typically associated with securities of U.S. issuers. Such risks include, but are not limited to: generally less liquid and less efficient securities markets; generally greater price volatility; exchange rate fluctuations; imposition of restrictions on the expatriation of funds or other protectionist measures; less publicly available information about issuers; the imposition of withholding or other taxes; higher transaction and custody costs; settlement delays and risk of loss attendant in settlement procedures; difficulties in enforcing contractual obligations; less regulation of securities markets; different accounting, disclosure and reporting requirements; more substantial governmental involvement in the economy; higher inflation rates; and |
Hartford Domestic Equity Funds
Notes to Financial Statements – (continued)
October 31, 2022
| | greater social, economic and political uncertainties. Non-U.S. issuers may also be affected by political, social, economic or diplomatic developments in a foreign country or region or the U.S. (including the imposition of sanctions, tariffs, or other governmental restrictions). These risks are heightened for investments in issuers from countries with less developed markets. |
| | Securities lending involves the risk that a Fund may lose money because the borrower of the loaned securities fails to return the securities in a timely manner or at all. A Fund could also lose money in the event of a decline in the value of the collateral provided for the loaned securities or a decline in the value of any investments made with cash collateral. These events could also trigger adverse tax consequences for a Fund that lends its holdings. |
| a) | Each Fund intends to continue to qualify as a Regulated Investment Company ("RIC") under Subchapter M of the Internal Revenue Code ("IRC") by distributing substantially all of its taxable net investment income and net realized capital gains to its shareholders each year. Each Fund has distributed substantially all of its income and capital gains in prior years, if applicable, and intends to distribute substantially all of its income and capital gains during the calendar year ending December 31, 2022. Accordingly, no provision for federal income or excise taxes has been made in the accompanying financial statements. Distributions from short-term capital gains are treated as ordinary income distributions for federal income tax purposes. |
| b) | Net Investment Income (Loss), Net Realized Gains (Losses) and Distributions – Net investment income (loss) and net realized gains (losses) may differ for financial statement and tax purposes primarily because of losses deferred due to wash sale adjustments, foreign currency gains and losses, adjustments related to Passive Foreign Investment Companies ("PFICs"), Real Estate Investment Trusts ("REITs"), RICs, certain derivatives and partnerships. The character of distributions made during the year from net investment income or net realized gains may differ from their ultimate characterization for federal income tax purposes. Also, due to the timing of dividend distributions, the fiscal year in which amounts are distributed may differ from the year that the income or realized gains (losses) were recorded by each Fund. |
| c) | Distributions and Components of Distributable Earnings – The tax character of distributions paid by each Fund for the years ended October 31, 2022 and October 31, 2021 are as follows: |
| | |
| | | For the Year Ended
October 31, 2022 | | For the Year Ended
October 31, 2021 |
| Fund | | Ordinary
Income | | Long-Term
Capital Gains(1) | | Ordinary
Income | | Long-Term
Capital Gains(1) |
| Capital Appreciation Fund | | $ 279,895,853 | | $ 808,081,425 | | $ 29,401,051 | | $ 326,546,682 |
| Core Equity Fund | | 128,007,129 | | 276,790,106 | | 70,885,946 | | — |
| Dividend and Growth Fund | | 237,541,713 | | 650,717,744 | | 154,554,069 | | 214,857,817 |
| Equity Income Fund | | 107,328,916 | | 327,758,324 | | 75,881,176 | | 42,135,878 |
| Growth Opportunities Fund | | 625,141,034 | | 929,985,392 | | 361,398,386 | | 579,604,617 |
| Healthcare Fund | | 8,784,435 | | 157,643,753 | | 27,136,342 | | 157,201,491 |
| MidCap Fund | | 82,760,021 | | 1,452,281,687 | | — | | 1,544,551,438 |
| MidCap Value Fund | | 23,089,873 | | 40,847,490 | | 3,497,022 | | — |
| Quality Value Fund | | 3,291,556 | | 11,024,502 | | 4,003,206 | | — |
| Small Cap Growth Fund | | — | | 150,799,914 | | 14,305,053 | | 46,613,265 |
| Small Cap Value Fund | | 6,584,761 | | 5,364,408 | | 1,100,001 | | — |
| Small Company Fund | | 50,480,239 | | 153,792,580 | | 37,854,022 | | 38,852,079 |
| (1) | The Funds designate these distributions as long-term capital gains dividends pursuant to IRC Sec 852(b)(3)(c). |
Hartford Domestic Equity Funds
Notes to Financial Statements – (continued)
October 31, 2022
As of October 31, 2022, the components of total accumulated earnings (deficit) for each Fund on a tax basis are as follows:
| Fund | | Undistributed
Ordinary
Income | | Undistributed
Long-Term
Capital Gains | | Accumulated
Capital and
Other Losses | | Unrealized
Appreciation
(Depreciation)
on Investments(1) | | Total
Accumulated
Earnings
(Deficit) |
| Capital Appreciation Fund | | $ 15,126,866 | | $ 305,332,005 | | $ — | | $ 275,828,059 | | $ 596,286,930 |
| Core Equity Fund | | 85,375,175 | | 263,608,899 | | — | | 2,577,810,164 | | 2,926,794,238 |
| Dividend and Growth Fund | | 84,331,092 | | 654,558,850 | | — | | 3,717,686,509 | | 4,456,576,451 |
| Equity Income Fund | | 14,368,872 | | 497,983,403 | | — | | 977,898,634 | | 1,490,250,909 |
| Growth Opportunities Fund | | — | | — | | (624,923,076) | | (439,409,646) | | (1,064,332,722) |
| Healthcare Fund | | — | | 13,370,314 | | (2,429,134) | | 202,365,709 | | 213,306,889 |
| MidCap Fund | | — | | 639,356,531 | | (15,748,050) | | 740,058,749 | | 1,363,667,230 |
| MidCap Value Fund | | 3,954,072 | | 85,431,628 | | — | | 68,600,879 | | 157,986,579 |
| Quality Value Fund | | 3,960,355 | | 11,588,415 | | — | | 34,036,629 | | 49,585,399 |
| Small Cap Growth Fund | | — | | — | | (33,352,947) | | 79,147,694 | | 45,794,747 |
| Small Cap Value Fund | | 1,580,866 | | 9,135,933 | | — | | (504,682) | | 10,212,117 |
| Small Company Fund | | — | | — | | (123,629,269) | | 6,760,695 | | (116,868,574) |
| (1) | Differences between book-basis and tax basis unrealized appreciation (depreciation) may be attributable to the losses deferred due to wash sale adjustments, foreign currency gains and losses, adjustments related to PFICs, REITS, certain derivatives and partnerships. |
| d) | Reclassification of Capital Accounts – The Funds may record reclassifications in their capital accounts. These reclassifications have no impact on the total net assets of the Funds. The reclassifications are the result of permanent differences between U.S. GAAP and tax accounting for such items as earnings and profits distributed to shareholders on the redemption of shares, net operating loss, and adjustments to prior year accumulated balances. Adjustments are made to reflect the impact these items have on current and future earnings distributions to shareholders. Therefore, the source of the Funds' distributions may be shown in the accompanying Statements of Changes in Net Assets as from distributable earnings or from capital depending on the type of book and tax differences that exist. For the year ended October 31, 2022, the Funds recorded reclassifications to increase (decrease) the accounts listed below: |
| | |
| Fund | | Paid-in-Capital | | Distributable
Earnings (Loss) |
| Capital Appreciation Fund | | $ 4,829,311 | | $ (4,829,311) |
| Equity Income Fund | | 34,715,897 | | (34,715,897) |
| Growth Opportunities Fund | | (11,053,137) | | 11,053,137 |
| Healthcare Fund | | (405,037) | | 405,037 |
| MidCap Fund | | 74,037,960 | | (74,037,960) |
| MidCap Value Fund | | 5,194,002 | | (5,194,002) |
| Small Cap Growth Fund | | (244,068) | | 244,068 |
| Small Cap Value Fund | | 768,576 | | (768,576) |
| Small Company Fund | | (1,177,238) | | 1,177,238 |
| e) | Capital Loss Carryforward – Under the Regulated Investment Company Modernization Act of 2010, funds are permitted to carry forward capital losses for an unlimited period. |
| | At October 31, 2022 (tax year end), each Fund's capital loss carryforwards for U.S. federal income tax purposes were as follows: |
| | |
| Fund | | Short-Term
Capital Loss
Carryforward with
No Expiration | | Long-Term
Capital Loss
Carryforward with
No Expiration |
| Growth Opportunities Fund | | $ 595,028,032 | | $ — |
| Small Cap Growth Fund | | 30,958,156 | | — |
| Small Company Fund | | 120,498,544 | | — |
The Capital Appreciation Fund, Core Equity Fund, Dividend and Growth Fund, Equity Income Fund, Healthcare Fund, MidCap Fund, MidCap Value Fund, Quality Value Fund and Small Cap Value Fund had no capital loss carryforwards for U.S. federal tax purposes as of October 31, 2022.
During the year ended October 31, 2022 Growth Opportunities Fund deferred $29,895,044, Healthcare Fund deferred $2,429,134, MidCap Fund deferred $15,748,050, Small Cap Growth Fund deferred $2,394,791 and Small Company Fund deferred $3,130,725 late year ordinary losses.
| f) | Tax Basis of Investments – The aggregate cost of investments for federal income tax purposes at October 31, 2022 is different from book purposes primarily due to wash sale loss deferrals, passive foreign investment company (PFIC) mark to market adjustments, partnerships |
Hartford Domestic Equity Funds
Notes to Financial Statements – (continued)
October 31, 2022
| | and non-taxable distributions from underlying investments. The net unrealized appreciation/(depreciation) on investments for tax purposes, which consists of gross unrealized appreciation and depreciation, was also different from book purposes primarily due to wash sale loss deferrals and mark-to-market adjustments on futures, PFICs, partnership adjustments and non-taxable distributions from underlying investments. Both the cost and unrealized appreciation and depreciation for federal income tax purposes are disclosed below: |
| | |
| Fund | | Tax Cost | | Gross Unrealized
Appreciation | | Gross Unrealized
(Depreciation) | | Net Unrealized
Appreciation
(Depreciation) |
| Capital Appreciation Fund | | $ 5,400,282,629 | | $ 785,311,585 | | $ (509,365,740) | | $ 275,945,845 |
| Core Equity Fund | | 7,066,938,069 | | 2,963,528,534 | | (385,718,370) | | 2,577,810,164 |
| Dividend and Growth Fund | | 11,826,015,556 | | 4,205,126,681 | | (487,440,172) | | 3,717,686,509 |
| Equity Income Fund | | 4,094,909,090 | | 1,117,062,645 | | (139,083,430) | | 977,979,215 |
| Growth Opportunities Fund | | 4,651,886,885 | | 300,654,462 | | (740,064,108) | | (439,409,646) |
| Healthcare Fund | | 1,111,749,502 | | 370,297,443 | | (167,909,971) | | 202,387,472 |
| MidCap Fund | | 7,050,909,177 | | 1,555,302,586 | | (815,243,837) | | 740,058,749 |
| MidCap Value Fund | | 816,041,288 | | 127,699,894 | | (59,099,015) | | 68,600,879 |
| Quality Value Fund | | 209,315,382 | | 45,396,213 | | (11,359,584) | | 34,036,629 |
| Small Cap Growth Fund | | 423,810,273 | | 114,360,105 | | (35,212,411) | | 79,147,694 |
| Small Cap Value Fund | | 126,602,366 | | 15,469,770 | | (15,974,452) | | (504,682) |
| Small Company Fund | | 656,366,792 | | 81,469,282 | | (74,708,587) | | 6,760,695 |
| g) | Accounting for Uncertainty in Income Taxes – Pursuant to provisions set forth by U.S. GAAP, Hartford Funds Management Company, LLC ("HFMC" or the "Investment Manager") reviews each Fund’s tax positions for all open tax years. As of October 31, 2022, HFMC had reviewed the open tax years and concluded that there was no reason to record a liability for net unrecognized tax obligations relating to uncertain income tax positions. Each Fund files U.S. tax returns. Although the statute of limitations for examining a Fund’s U.S. tax returns remains open for three years, no examination is currently in progress. The Funds recognize interest and penalties, if any, related to unrecognized tax benefits as income tax expense on the Statements of Operations. During the year ended October 31, 2022, the Funds did not incur any interest or penalties. HFMC is not aware of any tax positions for which it is reasonably possible that the total amounts of unrecognized tax obligations will significantly change in the next twelve months. |
| a) | Investment Management Agreement – HFMC serves as each Fund’s investment manager. Each Company, on behalf of its respective Funds, has entered into an Investment Management Agreement with HFMC. HFMC is an indirect subsidiary of The Hartford Financial Services Group, Inc. ("The Hartford"). HFMC has overall investment supervisory responsibility for each Fund. In addition, HFMC provides administrative personnel, services, equipment, facilities and office space for proper operation of each Fund. HFMC has contracted with Wellington Management Company LLP ("Wellington Management") under a sub-advisory agreement and Wellington Management performs the daily investment of the assets of each Fund in accordance with the Fund’s investment objective and policies. Each Fund pays a fee to HFMC. HFMC pays a sub-advisory fee to Wellington Management out of its management fee. |
| | The schedule below reflects the rates of compensation paid to HFMC for investment management services rendered as of October 31, 2022; the rates are accrued daily and paid monthly based on each Fund’s average daily net assets, at the following annual rates: |
| | |
| Fund | | Management Fee Rates |
| Capital Appreciation Fund | | 0.8000% on first $500 million and; |
| | | 0.7000% on next $500 million and; |
| | | 0.6500% on next $4 billion and; |
| | | 0.6475% on next $5 billion and; |
| | | 0.6450% over $10 billion |
| Core Equity Fund | | 0.4500% on first $500 million and; |
| | | 0.3500% on next $500 million and; |
| | | 0.3300% on next $1.5 billion and; |
| | | 0.3250% on next $2.5 billion and; |
| | | 0.3225% over $5 billion |
| Dividend and Growth Fund | | 0.7500% on first $500 million and; |
| | | 0.6500% on next $500 million and; |
| | | 0.6000% on next $1.5 billion and; |
| | | 0.5950% on next $2.5 billion and; |
| | | 0.5900% on next $5 billion and; |
| | | 0.5850% over $10 billion |
Hartford Domestic Equity Funds
Notes to Financial Statements – (continued)
October 31, 2022
| Fund | | Management Fee Rates |
| Equity Income Fund | | 0.7500% on first $250 million and; |
| | | 0.7000% on next $250 million and; |
| | | 0.6500% on next $500 million and; |
| | | 0.6000% on next $1.5 billion and; |
| | | 0.5900% on next $2.5 billion and; |
| | | 0.5875% over $5 billion |
| Growth Opportunities Fund | | 0.8000% on first $250 million and; |
| | | 0.7000% on next $4.75 billion and; |
| | | 0.6975% on next $5 billion and; |
| | | 0.6950% over $10 billion |
| Healthcare Fund | | 0.9000% on first $500 million and; |
| | | 0.8500% on next $500 million and; |
| | | 0.8000% on next $4 billion and; |
| | | 0.7975% on next $5 billion and; |
| | | 0.7950% over $10 billion |
| MidCap Fund | | 0.8500% on first $500 million and; |
| | | 0.7500% on next $500 million and; |
| | | 0.7000% on next $4 billion and; |
| | | 0.6975% on next $5 billion and; |
| | | 0.6950% over $10 billion |
| MidCap Value Fund | | 0.7500% on first $500 million and; |
| | | 0.6500% on next $500 million and; |
| | | 0.6000% on next $1.5 billion and; |
| | | 0.5950% on next $2.5 billion and; |
| | | 0.5900% on next $5 billion and; |
| | | 0.5850% over $10 billion |
| Quality Value Fund | | 0.4500% on first $500 million and; |
| | | 0.3500% on next $500 million and; |
| | | 0.3300% on next $4 billion and; |
| | | 0.3250% on next $5 billion and; |
| | | 0.3225% over $10 billion |
| Small Cap Growth Fund | | 0.9000% on first $100 million and; |
| | | 0.8000% on next $150 million and; |
| | | 0.7000% on next $250 million and; |
| | | 0.6500% on next $4.5 billion and; |
| | | 0.6300% on next $5 billion and; |
| | | 0.6200% over $10 billion |
| Small Cap Value Fund | | 0.7000% on first $500 million and; |
| | | 0.6500% on next $500 million and; |
| | | 0.6000% on next $2 billion and; |
| | | 0.5900% on next $2 billion and; |
| | | 0.5800% on next $5 billion and; |
| | | 0.5700% over $10 billion |
| Small Company Fund | | 0.8500% on first $250 million and; |
| | | 0.8000% on next $250 million and; |
| | | 0.7500% on next $500 million and; |
| | | 0.7000% on next $500 million and; |
| | | 0.6500% on next $3.5 billion and; |
| | | 0.6300% on next $5 billion and; |
| | | 0.6200% over $10 billion |
| b) | Accounting Services Agreement – HFMC provides the Funds with accounting services pursuant to a fund accounting agreement by and between each Company, on behalf of its respective Funds, and HFMC. HFMC has delegated certain accounting and administrative service functions to State Street Bank and Trust Company ("State Street"). In consideration of services rendered and expenses assumed pursuant to the fund accounting agreement, each Fund pays HFMC a fee. The fund accounting fee for each Fund is equal to the greater of: (A) the sum of (i) the sub-accounting fee payable by HFMC with respect to the Fund; (ii) the fee payable for tax preparation services for the Fund; and (iii) the amount of expenses that HFMC allocates for providing the fund accounting services to the Fund; plus a target profit margin; or (B) $40,000 per year; provided, however, that to the extent the annual amount of the fund accounting fee exceeds 0.02% of the Fund’s average net assets (calculated during its current fiscal year), HFMC shall waive such portion of the fund accounting fee. |
Hartford Domestic Equity Funds
Notes to Financial Statements – (continued)
October 31, 2022
| c) | Operating Expenses – Allocable expenses incurred by each Company are allocated to each series within such Company, and allocated to classes within each such series, in proportion to the average daily net assets of such series and classes, except where allocation of certain expenses is more fairly made directly to a Fund or to specific classes within a Fund. As of October 31, 2022, HFMC contractually agreed to limit the total annual fund operating expenses (exclusive of taxes, interest expenses, brokerage commissions, acquired fund fees and expenses, and extraordinary expenses), through February 28, 2023 (unless the applicable Board of Directors approves its earlier termination) as follows for each of the following Funds: |
| | |
| | | Expense Limit as a Percentage of Average Daily Net Assets |
| Fund | | Class A | | Class C | | Class I | | Class R3 | | Class R4 | | Class R5 | | Class R6 | | Class Y | | Class F |
| Quality Value Fund | | 0.96% | | 1.71% | | 0.66% | | 1.18% | | 0.88% | | 0.63% | | 0.46% | | 0.57% | | 0.46% |
| Small Cap Value Fund | | 1.30% | | 2.05% | | 1.00% | | 1.50% | | 1.20% | | 0.90% | | 0.80% | | 0.85% | | 0.80% |
| d) | Fees Paid Indirectly – Certain Funds have entered into agreements with State Street Global Markets, LLC and Russell Implementation Services, Inc. to partially recapture non-discounted trade commissions. Such rebates are used to pay a portion of a Fund's expenses. For the year ended October 31, 2022, these amounts, if any, are included in the Statements of Operations. |
| | The ratio of expenses to average net assets in the accompanying financial highlights excludes the reduction in expenses related to fees paid indirectly. The annualized expense ratio after waivers reflecting the reduction for fees paid indirectly for the period is as follows: |
| | |
| Fund | | Class A | | Class C | | Class I | | Class R3 | | Class R4 | | Class R5 | | Class R6 | | Class Y | | Class F |
| Capital Appreciation Fund | | 1.04% | | 1.83% | | 0.78% | | 1.41% | | 1.10% | | 0.80% | | 0.70% | | 0.80% | | 0.69% |
| Core Equity Fund | | 0.70% | | 1.45% | | 0.46% | | 1.07% | | 0.73% | | 0.46% | | 0.36% | | 0.44% | | 0.36% |
| Dividend and Growth Fund | | 0.96% | | 1.74% | | 0.72% | | 1.34% | | 1.04% | | 0.73% | | 0.63% | | 0.68% | | 0.63% |
| Equity Income Fund | | 0.97% | | 1.74% | | 0.74% | | 1.35% | | 1.06% | | 0.75% | | 0.65% | | 0.73% | | 0.64% |
| Growth Opportunities Fund | | 1.08% | | 1.85% | | 0.83% | | 1.44% | | 1.14% | | 0.85% | | 0.74% | | 0.83% | | 0.73% |
| Healthcare Fund | | 1.26% | | 2.03% | | 1.00% | | 1.61% | | 1.30% | | 1.01% | | 0.90% | | 1.00% | | 0.90% |
| MidCap Fund | | 1.09% | | 1.86% | | 0.86% | | 1.45% | | 1.14% | | 0.85% | | 0.74% | | 0.79% | | 0.74% |
| MidCap Value Fund | | 1.16% | | 1.95% | | 0.86% | | 1.48% | | 1.18% | | 0.88% | | 0.77% | | 0.87% | | 0.77% |
| Quality Value Fund | | 0.94% | | 1.71% | | 0.65% | | 1.18% | | 0.88% | | 0.63% | | 0.46% | | 0.57% | | 0.46% |
| Small Cap Growth Fund | | 1.24% | | 1.97% | | 0.89% | | 1.51% | | 1.21% | | 0.91% | | 0.80% | | 0.86% | | 0.80% |
| Small Cap Value Fund | | 1.28% | | 2.05% | | 0.98% | | 1.44% | | 1.20% | | 0.90% | | 0.80% | | 0.85% | | 0.80% |
| Small Company Fund | | 1.26% | | 2.10% | | 0.98% | | 1.58% | | 1.28% | | 0.98% | | 0.87% | | 0.95% | | 0.87% |
| e) | Sales Charges and Distribution and Service Plan for Class A, C, R3 and R4 Shares – Hartford Funds Distributors, LLC ("HFD"), an indirect subsidiary of The Hartford, is the principal underwriter and distributor of each Fund. For the year ended October 31, 2022, HFD received front-end sales charges and contingent deferred sales charges for each Fund as follows: |
| | |
| Fund | | Front-End
Sales Charges | | Contingent Deferred
Sales Charges |
| Capital Appreciation Fund | | $ 1,336,334 | | $ 9,389 |
| Core Equity Fund | | 2,110,859 | | 47,294 |
| Dividend and Growth Fund | | 4,212,252 | | 71,242 |
| Equity Income Fund | | 1,431,620 | | 18,638 |
| Growth Opportunities Fund | | 1,754,992 | | 44,158 |
| Healthcare Fund | | 456,553 | | 5,740 |
| MidCap Fund | | 1,348,830 | | 16,004 |
| MidCap Value Fund | | 502,787 | | 3,277 |
| Quality Value Fund | | 111,711 | | 3,098 |
| Small Cap Growth Fund | | 51,469 | | 373 |
| Small Cap Value Fund | | 43,739 | | 589 |
| Small Company Fund | | 359,633 | | 3,310 |
The Board of Directors of each Company has approved the adoption of a separate distribution plan (each a "Plan") pursuant to Rule 12b-1 under the 1940 Act for each of Class A, C, R3 and R4 shares. Under a Plan, Class A, Class C, Class R3 and Class R4 shares of a Fund, as applicable, bear distribution and/or service fees paid to HFD, some or all of which may be paid to select broker-dealers. Pursuant to the Class A Plan, a Fund may pay HFD a fee of up to 0.25% of the average daily net assets attributable to Class A shares for distribution financing activities and shareholder account servicing activities. The entire amount of the fee may be used for shareholder servicing expenses and/or distribution expenses. Pursuant to the Class C Plan, a Fund may pay HFD a fee of up to 1.00% of the average daily net assets attributable to Class C shares for distribution financing activities, and up to 0.25% may be used for shareholder account servicing activities. The Class C Plan also provides that HFD will receive all contingent deferred sales charges attributable to Class C shares. Pursuant to the Class R3 Plan, a Fund may pay HFD a fee of up to 0.50% of the average daily net assets attributable to Class R3 shares for distribution financing activities, and up to 0.25% may be used for shareholder account servicing activities. Pursuant to the Class R4 Plan, a Fund may pay HFD a fee of up to 0.25% of the average daily net assets attributable to Class R4 shares for distribution financing activities.
Hartford Domestic Equity Funds
Notes to Financial Statements – (continued)
October 31, 2022
The entire amount of the fee may be used for shareholder account servicing activities. Each Fund’s 12b-1 fees are accrued daily and paid monthly or at such other intervals as the respective Company’s Board of Directors may determine. Any 12b-1 fees attributable to assets held in an account held directly with the Funds’ transfer agent for which there is not a third-party listed as the broker-dealer of record (or HFD does not otherwise have a payment obligation) are generally reimbursed to the applicable share class of the applicable Fund. Such amounts are reflected as "Distribution fee reimbursements" on the Statements of Operations.
| f) | Other Related Party Transactions – Certain officers of each Company are directors and/or officers of HFMC and/or The Hartford or its subsidiaries. For the year ended October 31, 2022, a portion of each Company’s Chief Compliance Officer’s ("CCO") compensation was paid by all of the investment companies in the Hartford fund complex. The portion allocated to each Fund, as represented in "Other expenses" on the Statements of Operations, is outlined in the table below. |
| | |
| Fund | | CCO Compensation
Paid by Fund |
| Capital Appreciation Fund | | $ 14,432 |
| Core Equity Fund | | 24,365 |
| Dividend and Growth Fund | | 35,274 |
| Equity Income Fund | | 11,190 |
| Growth Opportunities Fund | | 11,626 |
| Healthcare Fund | | 3,233 |
| MidCap Fund | | 21,283 |
| MidCap Value Fund | | 2,039 |
| Quality Value Fund | | 550 |
| Small Cap Growth Fund | | 1,317 |
| Small Cap Value Fund | | 314 |
| Small Company Fund | | 1,563 |
| g) | Hartford Administrative Services Company ("HASCO"), an indirect subsidiary of The Hartford, provides transfer agent services to each Fund. Each Fund pays HASCO a transfer agency fee payable monthly based on the lesser of (i) the costs of providing or overseeing transfer agency services provided to each share class of such Fund plus a target profit margin or (ii) a Specified Amount (as defined in the table below). Such fee is intended to compensate HASCO for: (i) fees payable by HASCO to DST Asset Manager Solutions, Inc. ("DST") (and any other designated sub-agent) according to the agreed-upon fee schedule under the sub-transfer agency agreement between HASCO and DST (or between HASCO and any other designated sub-agent, as applicable); (ii) sub-transfer agency fees payable by HASCO to financial intermediaries, according to the agreed-upon terms between HASCO and the financial intermediaries, provided that such payments are within certain limits approved by the applicable Company’s Board of Directors; (iii) certain expenses that HASCO’s parent company, Hartford Funds Management Group, Inc., allocates to HASCO that relate to HASCO’s transfer agency services provided to the Fund; and (iv) a target profit margin. |
| | |
| Share Class | | Specified Amount
(as a percentage
average daily
net assets) |
| Class A | | 0.25% |
| Class C | | 0.25% |
| Class I | | 0.20% |
| Class R3 | | 0.22% |
| Class R4 | | 0.17% |
| Class R5 | | 0.12% |
| Class R6 | | 0.004% |
| Class Y | | 0.11% |
| Class F | | 0.004% |
Effective March 1, 2022, HASCO has contractually agreed to waive its transfer agency fee and/or reimburse transfer agency-related expenses to the extent necessary to limit the transfer agency fee for the share classes of the Funds listed below through February 28, 2023, unless the Board of Directors approves its earlier termination.
| Fund | | Class I | | Class Y |
| Dividend and Growth Fund | | N/A | | 0.06% |
| MidCap Fund | | 0.12% | | 0.06% |
| Small Cap Growth Fund | | N/A | | 0.07% |
Hartford Domestic Equity Funds
Notes to Financial Statements – (continued)
October 31, 2022
From November 1, 2021 through February 28, 2022, HASCO contractually agreed to waive and/or reimburse a portion of the transfer agency fees for the share classes of the Funds listed below to the extent necessary to limit the transfer agency fees as follows:
| Fund | | Class I | | Class Y |
| Core Equity Fund | | N/A | | 0.06% |
| Dividend and Growth Fund | | N/A | | 0.04% |
| MidCap Fund | | 0.12% | | 0.04% |
| Small Cap Growth Fund | | N/A | | 0.07% |
Pursuant to a sub-transfer agency agreement between HASCO and DST, HASCO has delegated certain transfer agent, dividend disbursing agent and shareholder servicing agent functions to DST. Each Fund does not pay any fee directly to DST; rather, HASCO makes all such payments to DST. The accrued amount shown in the Statements of Operations reflects the amounts charged by HASCO. These fees are accrued daily and paid monthly.
For the year ended October 31, 2022, the effective rate of compensation paid to HASCO for transfer agency services as a percentage of each Class' average daily net assets is as follows:
| Fund | | Class A | | Class C | | Class I | | Class R3 | | Class R4 | | Class R5 | | Class R6 | | Class Y | | Class F |
| Capital Appreciation Fund | | 0.11% | | 0.14% | | 0.09% | | 0.22% | | 0.16% | | 0.10% | | 0.00% * | | 0.11% | | 0.00% * |
| Core Equity Fund | | 0.09% | | 0.09% | | 0.10% | | 0.22% | | 0.15% | | 0.10% | | 0.00% * | | 0.08% | | 0.00% * |
| Dividend and Growth Fund | | 0.09% | | 0.11% | | 0.09% | | 0.22% | | 0.16% | | 0.11% | | 0.00% * | | 0.05% | | 0.00% * |
| Equity Income Fund | | 0.08% | | 0.10% | | 0.10% | | 0.21% | | 0.17% | | 0.11% | | 0.00% * | | 0.09% | | 0.00% * |
| Growth Opportunities Fund | | 0.10% | | 0.12% | | 0.10% | | 0.21% | | 0.15% | | 0.11% | | 0.00% * | | 0.10% | | 0.00% * |
| Healthcare Fund | | 0.12% | | 0.14% | | 0.10% | | 0.22% | | 0.16% | | 0.12% | | 0.00% * | | 0.11% | | 0.00% * |
| MidCap Fund | | 0.11% | | 0.12% | | 0.12% | | 0.22% | | 0.17% | | 0.12% | | 0.00% * | | 0.05% | | 0.00% * |
| MidCap Value Fund | | 0.15% | | 0.18% | | 0.09% | | 0.22% | | 0.17% | | 0.12% | | 0.00% | | 0.11% | | 0.00% * |
| Quality Value Fund | | 0.15% | | 0.23% | | 0.10% | | 0.22% | | 0.16% | | 0.12% | | 0.00% * | | 0.11% | | 0.00% * |
| Small Cap Growth Fund | | 0.20% | | 0.18% | | 0.09% | | 0.22% | | 0.16% | | 0.11% | | 0.00% * | | 0.07% | | 0.00% * |
| Small Cap Value Fund | | 0.19% | | 0.25% | | 0.14% | | 0.22% | | 0.17% | | 0.12% | | 0.00% * | | 0.11% | | 0.00% * |
| Small Company Fund | | 0.15% | | 0.23% | | 0.12% | | 0.22% | | 0.17% | | 0.12% | | 0.00% * | | 0.08% | | 0.00% * |
| 8. | Securities Lending: |
| | Each Company has entered into a securities lending agency agreement ("lending agreement") with Citibank, N.A. ("Citibank"). A Fund may lend portfolio securities to certain borrowers in U.S. and non-U.S. markets in an amount not to exceed one-third (33 1/3%) of the value of its total assets. A Fund may lend portfolio securities, provided that the borrower provides collateral that is maintained in an amount at least equal to the current market value of the securities loaned. Cash collateral is invested for the benefit of a Fund by the Fund’s lending agent pursuant to collateral investment guidelines. The collateral is marked to market daily, in an amount at least equal to the current market value of the securities loaned. The contractual maturities of the securities lending transactions are considered overnight and continuous. |
| | A Fund is subject to certain risks while its securities are on loan, including the following: (i) the risk that the borrower defaults on the loan and the collateral is inadequate to cover the Fund’s loss; (ii) the risk that the earnings on the collateral invested are not sufficient to pay fees incurred in connection with the loan; (iii) the Fund could lose money in the event of a decline in the value of the collateral provided for loaned securities or a decline in the value of any investments made with cash collateral; (iv) the risk that the borrower may use the loaned securities to cover a short sale, which may in turn place downward pressure on the market prices of the loaned securities; (v) the risk that return of loaned securities could be delayed and interfere with portfolio management decisions; (vi) the risk that any efforts to restrict or recall the securities for purposes of voting may not be effective; and (vii) operational risks (i.e., the risk of losses resulting from problems in the settlement and accounting process especially so in certain international markets). These events could also trigger adverse tax consequences for the Fund. |
| | A Fund retains loan fees and the interest on cash collateral investments but is required to pay the borrower a rebate for the use of cash collateral. In cases where the lent security is of high value to borrowers, there may be a negative rebate (i.e., a net payment from the borrower to the applicable Fund). Upon termination of a loan, a Fund is required to return to the borrower an amount equal to the cash collateral, plus any rebate owed to the borrowers. |
| | The net income earned on the securities lending (after payment of rebates and Citibank’s fee) is included on the Statements of Operations as Investment Income from securities lending. A Fund also receives payments from the borrower during the period of the loan, equivalent to dividends and interest earned on the securities loaned, which are recorded as Investment Income from dividends or interest, respectively, on the Statements of Operations. |
Hartford Domestic Equity Funds
Notes to Financial Statements – (continued)
October 31, 2022
| | The following table presents for each Fund that lends its portfolio securities the market value of the securities on loan and the cash and non-cash collateral posted by the borrower as of October 31, 2022. |
| | |
| Fund | | Investment Securities on Loan, at market value,
Presented on the Statements of Assets and Liabilities | | Cash
Collateral(1) | | Non-Cash
Collateral(1) |
| Capital Appreciation Fund | | $ 16,267,500 | | $ 16,628,793 | | $ — |
| Core Equity Fund | | — | | — | | — |
| Dividend and Growth Fund | | — | | — | | — |
| Equity Income Fund | | 60,047,216 | | 60,202,236 | | 1,077,732 |
| Growth Opportunities Fund | | 24,720,680 | | 24,251,300 | | — |
| Healthcare Fund | | 6,393,818 | | 6,761,768 | | 2,454 |
| MidCap Fund | | 179,370,461 | | 182,356,313 | | 3,929,094 |
| MidCap Value Fund | | — | | — | | — |
| Quality Value Fund | | — | | — | | — |
| Small Cap Growth Fund | | 2,045,606 | | 2,171,213 | | — |
| Small Cap Value Fund | | — | | — | | — |
| Small Company Fund | | — | | — | | — |
| (1) | It is each Fund’s policy to obtain additional collateral from, or return excess collateral to, the borrower by the end of the next business day following the valuation date of the securities loaned. Therefore, the value of the collateral held may be temporarily less than that required under the lending contract due to timing. Pursuant to the lending agreement, the borrower will provide collateral in an amount at least equal to the current market value of securities loaned. |
| 9. | Affiliated Security Transactions: |
| | If a Fund owns 5% or more of the outstanding voting securities, either directly or indirectly, of a particular issuer, the 1940 Act deems such an issuer to be an "affiliate" of the Fund. As of and during the year ended October 31, 2022, the MidCap Fund and Small Company Fund owned 5% or more of the outstanding voting securities of the issuers identified in the table below. |
| | A summary of affiliated security transactions for the year ended October 31, 2022 follows: |
| | |
| Affiliated Investments | | Beginning
Value as of
November 1, 2021 | | Purchases
at Cost | | Proceeds
from Sales | | Net
Realized
Gain/(Loss)
on Sales | | Return of
Capital | | Change in
Unrealized
Appreciation/
(Depreciation) | | Ending
Value as of
October 31,
2022 | | Shares as of
October 31,
2022 | | Dividend
Income | | Capital Gains
Distribution |
| MidCap Fund |
| CommScope Holding Co., Inc.* | | $ 109,463,815 | | $ 16,372,504 | | $ 80,856,839 | | $ (16,122,473) | | $ — | | $ 7,962,586 | | $ 36,819,593 | | 2,780,936 | | $ — | | $ — |
| Shift4 Payments, Inc. | | 105,294,843 | | 68,226,031 | | 27,502,306 | | (9,968,362) | | — | | (14,663,111) | | 121,387,095 | | 2,640,572 | | — | | — |
| Total | | $ 214,758,658 | | $ 84,598,535 | | $ 108,359,145 | | $ (26,090,835) | | $ — | | $ (6,700,525) | | $ 158,206,688 | | 5,421,508 | | $ — | | $ — |
| Small Company Fund |
| Allstar Co.(1),* | | $ — | | $ — | | $ 8,505 | | $ 8,505 | | $ — | | $ — | | $ — | | — | | $ — | | $ — |
| * | Not an affiliate as of October 31, 2022. |
| (1) | Allstar Co. is a Delaware limited liability company that was created for the purpose of investing in Academy Sports & Outdoors, Inc. As a result of the Fund's holdings in Allstar Co., the Fund previously had indirect exposure to Academy Sports & Outdoors, Inc.; however, the Fund does not have direct or indirect exposure to 5% or more of the outstanding voting securities of Academy Sports & Outdoors, Inc. |
| 10. | Affiliate Holdings: |
| | As of October 31, 2022, affiliates of The Hartford had ownership of shares in certain Funds as follows: |
| | |
| Percentage of a Class: | | | | | | | | | | | | | | | | | | |
| Fund | | Class A | | Class C | | Class I | | Class R3 | | Class R4 | | Class R5 | | Class R6 | | Class Y | | Class F |
| Small Cap Value Fund | | — | | — | | — | | — | | — | | 1% | | — | | — | | — |
Hartford Domestic Equity Funds
Notes to Financial Statements – (continued)
October 31, 2022
| Percentage of Fund by Class: | | | | | | | | | | | | | | | | | | |
| Fund | | Class A | | Class C | | Class I | | Class R3 | | Class R4 | | Class R5 | | Class R6 | | Class Y | | Class F |
| Small Cap Value Fund | | — | | — | | — | | — | | — | | 0% * | | — | | — | | — |
| * | Percentage rounds to zero. |
As of October 31, 2022, affiliated funds of funds and the 529 plan for which HFMC serves as the program manager (the "529 plan") in the aggregate owned a portion of the Funds identified below. Therefore, these Funds may experience relatively large purchases or redemptions of their shares as a result of purchase and sale activity from these affiliated funds of funds and the 529 plan. Affiliated funds of funds and the 529 plan owned shares in the Funds listed below as follows:
| Fund | | Percentage
of Fund* |
| Capital Appreciation Fund | | 8% |
| Core Equity Fund | | 3% |
| Dividend and Growth Fund | | 5% |
| Equity Income Fund | | 3% |
| Growth Opportunities Fund | | 3% |
| MidCap Fund | | 1% |
| MidCap Value Fund | | 2% |
| Small Cap Growth Fund | | 5% |
| Small Cap Value Fund | | 22% |
| Small Company Fund | | 6% |
| * | As of October 31, 2022, affiliated funds of funds and the 529 plan were invested in Class F shares. |
| 11. | Investment Transactions: |
| | For the year ended October 31, 2022, the cost of purchases and proceeds from sales of investment securities (excluding short-term investments) were as follows: |
| | |
| Fund | | Cost of Purchases
Excluding U.S.
Government
Obligations | | Sales Proceeds
Excluding U.S.
Government
Obligations | | Total Cost of
Purchases | | Total Sales
Proceeds |
| Capital Appreciation Fund | | $ 5,296,191,977 | | $ 5,955,268,312 | | $ 5,296,191,977 | | $ 5,955,268,312 |
| Core Equity Fund | | 1,673,194,405 | | 2,586,095,622 | | 1,673,194,405 | | 2,586,095,622 |
| Dividend and Growth Fund | | 4,967,465,962 | | 2,720,051,221 | | 4,967,465,962 | | 2,720,051,221 |
| Equity Income Fund | | 2,169,059,875 | | 2,021,769,836 | | 2,169,059,875 | | 2,021,769,836 |
| Growth Opportunities Fund | | 5,368,485,443 | | 6,276,514,006 | | 5,368,485,443 | | 6,276,514,006 |
| Healthcare Fund | | 475,349,445 | | 662,942,717 | | 475,349,445 | | 662,942,717 |
| MidCap Fund | | 4,478,325,532 | | 7,783,658,012 | | 4,478,325,532 | | 7,783,658,012 |
| MidCap Value Fund | | 795,727,291 | | 746,469,346 | | 795,727,291 | | 746,469,346 |
| Quality Value Fund | | 85,068,158 | | 56,602,987 | | 85,068,158 | | 56,602,987 |
| Small Cap Growth Fund | | 265,194,385 | | 421,002,105 | | 265,194,385 | | 421,002,105 |
| Small Cap Value Fund | | 85,958,762 | | 121,908,994 | | 85,958,762 | | 121,908,994 |
| Small Company Fund | | 667,697,509 | | 719,383,108 | | 667,697,509 | | 719,383,108 |
| 12. | Capital Share Transactions: |
| | The following information is for the years ended October 31, 2022 and October 31, 2021: |
| | |
| | For the Year Ended
October 31, 2022 | | For the Year Ended
October 31, 2021 |
| | Shares | | Amount | | Shares | | Amount |
| Capital Appreciation Fund | | | | | | | |
| Class A | | | | | | | |
| Shares Sold | 3,057,113 | | $ 117,912,718 | | 3,367,409 | | $ 153,139,085 |
| Shares Issued for Reinvested Dividends | 18,530,282 | | 773,952,122 | | 5,909,766 | | 249,118,669 |
| Shares Redeemed | (15,671,864) | | (597,749,344) | | (13,459,956) | | (610,878,988) |
| Net Increase (Decrease) | 5,915,531 | | 294,115,496 | | (4,182,781) | | (208,621,234) |
Hartford Domestic Equity Funds
Notes to Financial Statements – (continued)
October 31, 2022
| | For the Year Ended
October 31, 2022 | | For the Year Ended
October 31, 2021 |
| | Shares | | Amount | | Shares | | Amount |
| Class C | | | | | | | |
| Shares Sold | 355,100 | | $ 8,956,718 | | 420,030 | | $ 13,300,659 |
| Shares Issued for Reinvested Dividends | 1,058,069 | | 28,641,921 | | 423,362 | | 12,493,414 |
| Shares Redeemed | (1,826,007) | | (45,470,387) | | (2,943,150) | | (94,205,765) |
| Net Increase (Decrease) | (412,838) | | (7,871,748) | | (2,099,758) | | (68,411,692) |
| Class I | | | | | | | |
| Shares Sold | 1,548,525 | | $ 60,994,842 | | 1,763,794 | | $ 80,348,270 |
| Shares Issued for Reinvested Dividends | 2,140,817 | | 90,255,338 | | 692,879 | | 29,440,161 |
| Shares Redeemed | (3,597,389) | | (137,417,555) | | (2,913,758) | | (132,549,967) |
| Net Increase (Decrease) | 91,953 | | 13,832,625 | | (457,085) | | (22,761,536) |
| Class R3 | | | | | | | |
| Shares Sold | 59,892 | | $ 2,569,258 | | 81,697 | | $ 4,139,188 |
| Shares Issued for Reinvested Dividends | 114,302 | | 5,487,633 | | 40,201 | | 1,911,571 |
| Shares Redeemed | (231,286) | | (10,043,979) | | (289,780) | | (14,863,615) |
| Net Increase (Decrease) | (57,092) | | (1,987,088) | | (167,882) | | (8,812,856) |
| Class R4 | | | | | | | |
| Shares Sold | 66,901 | | $ 3,145,575 | | 75,708 | | $ 4,029,701 |
| Shares Issued for Reinvested Dividends | 85,515 | | 4,313,361 | | 28,656 | | 1,422,120 |
| Shares Redeemed | (143,629) | | (6,568,277) | | (195,566) | | (10,231,712) |
| Net Increase (Decrease) | 8,787 | | 890,659 | | (91,202) | | (4,779,891) |
| Class R5 | | | | | | | |
| Shares Sold | 49,168 | | $ 2,317,024 | | 38,655 | | $ 2,086,665 |
| Shares Issued for Reinvested Dividends | 80,863 | | 4,194,444 | | 31,983 | | 1,626,764 |
| Shares Redeemed | (98,330) | | (4,824,329) | | (196,018) | | (10,767,188) |
| Net Increase (Decrease) | 31,701 | | 1,687,139 | | (125,380) | | (7,053,759) |
| Class R6 | | | | | | | |
| Shares Sold | 342,359 | | $ 19,376,487 | | 101,705 | | $ 5,729,396 |
| Shares Issued for Reinvested Dividends | 81,637 | | 4,271,968 | | 11,975 | | 613,867 |
| Shares Redeemed | (109,087) | | (5,049,188) | | (60,680) | | (3,346,501) |
| Net Increase (Decrease) | 314,909 | | 18,599,267 | | 53,000 | | 2,996,762 |
| Class Y | | | | | | | |
| Shares Sold | 112,377 | | $ 5,423,166 | | 418,089 | | $ 23,154,624 |
| Shares Issued for Reinvested Dividends | 274,840 | | 14,360,979 | | 97,100 | | 4,973,187 |
| Shares Redeemed | (729,211) | | (33,928,608) | | (683,536) | | (37,544,012) |
| Net Increase (Decrease) | (341,994) | | (14,144,463) | | (168,347) | | (9,416,201) |
| Class F | | | | | | | |
| Shares Sold | 2,468,140 | | $ 90,526,856 | | 1,156,081 | | $ 52,681,033 |
| Shares Issued for Reinvested Dividends | 3,014,822 | | 127,144,725 | | 996,586 | | 42,357,183 |
| Shares Redeemed | (3,637,998) | | (136,977,274) | | (2,759,017) | | (125,550,739) |
| Net Increase (Decrease) | 1,844,964 | | 80,694,307 | | (606,350) | | (30,512,523) |
| Total Net Increase (Decrease) | 7,395,921 | | $ 385,816,194 | | (7,845,785) | | $ (357,372,930) |
| Core Equity Fund | | | | | | | |
| Class A | | | | | | | |
| Shares Sold | 6,383,267 | | $ 283,671,328 | | 8,048,194 | | $ 349,552,465 |
| Shares Issued for Reinvested Dividends | 1,003,255 | | 49,317,221 | | 170,767 | | 6,957,062 |
| Shares Redeemed | (5,353,972) | | (234,304,903) | | (5,854,509) | | (256,534,349) |
| Net Increase (Decrease) | 2,032,550 | | 98,683,646 | | 2,364,452 | | 99,975,178 |
| Class C | | | | | | | |
| Shares Sold | 1,253,604 | | $ 50,867,962 | | 2,433,951 | | $ 95,569,941 |
| Shares Issued for Reinvested Dividends | 349,431 | | 15,420,372 | | — | | — |
| Shares Redeemed | (2,781,070) | | (109,599,804) | | (2,963,058) | | (117,542,554) |
| Net Increase (Decrease) | (1,178,035) | | (43,311,470) | | (529,107) | | (21,972,613) |
| Class I | | | | | | | |
| Shares Sold | 25,138,210 | | $ 1,118,094,707 | | 38,606,478 | | $ 1,683,147,371 |
| Shares Issued for Reinvested Dividends | 2,850,367 | | 140,716,905 | | 587,802 | | 23,982,316 |
| Shares Redeemed | (35,726,873) | | (1,550,849,816) | | (25,621,499) | | (1,138,977,250) |
| Net Increase (Decrease) | (7,738,296) | | (292,038,204) | | 13,572,781 | | 568,152,437 |
Hartford Domestic Equity Funds
Notes to Financial Statements – (continued)
October 31, 2022
| | For the Year Ended
October 31, 2022 | | For the Year Ended
October 31, 2021 |
| | Shares | | Amount | | Shares | | Amount |
| Class R3 | | | | | | | |
| Shares Sold | 298,269 | | $ 13,926,237 | | 430,551 | | $ 19,338,433 |
| Shares Issued for Reinvested Dividends | 37,639 | | 1,871,542 | | 3,454 | | 143,013 |
| Shares Redeemed | (436,719) | | (19,025,180) | | (280,505) | | (12,331,610) |
| Net Increase (Decrease) | (100,811) | | (3,227,401) | | 153,500 | | 7,149,836 |
| Class R4 | | | | | | | |
| Shares Sold | 463,087 | | $ 21,372,285 | | 1,346,774 | | $ 61,759,473 |
| Shares Issued for Reinvested Dividends | 132,063 | | 6,705,623 | | 22,870 | | 962,136 |
| Shares Redeemed | (1,508,324) | | (69,293,943) | | (1,230,844) | | (56,219,106) |
| Net Increase (Decrease) | (913,174) | | (41,216,035) | | 138,800 | | 6,502,503 |
| Class R5 | | | | | | | |
| Shares Sold | 523,441 | | $ 23,343,337 | | 719,073 | | $ 31,981,033 |
| Shares Issued for Reinvested Dividends | 118,899 | | 5,918,731 | | 30,689 | | 1,262,537 |
| Shares Redeemed | (1,556,355) | | (67,139,669) | | (1,428,140) | | (63,174,300) |
| Net Increase (Decrease) | (914,015) | | (37,877,601) | | (678,378) | | (29,930,730) |
| Class R6 | | | | | | | |
| Shares Sold | 8,959,950 | | $ 396,301,671 | | 5,638,764 | | $ 249,691,246 |
| Shares Issued for Reinvested Dividends | 647,642 | | 32,411,972 | | 161,700 | | 6,679,826 |
| Shares Redeemed | (4,637,927) | | (204,136,867) | | (5,359,583) | | (240,460,323) |
| Net Increase (Decrease) | 4,969,665 | | 224,576,776 | | 440,881 | | 15,910,749 |
| Class Y | | | | | | | |
| Shares Sold | 2,164,398 | | $ 98,845,545 | | 4,083,890 | | $ 178,723,495 |
| Shares Issued for Reinvested Dividends | 561,625 | | 28,081,046 | | 139,865 | | 5,777,841 |
| Shares Redeemed | (7,849,800) | | (348,528,440) | | (4,487,602) | | (204,115,939) |
| Net Increase (Decrease) | (5,123,777) | | (221,601,849) | | (263,847) | | (19,614,603) |
| Class F | | | | | | | |
| Shares Sold | 13,239,963 | | $ 592,067,299 | | 20,968,799 | | $ 922,349,213 |
| Shares Issued for Reinvested Dividends | 2,148,216 | | 106,209,029 | | 532,223 | | 21,725,333 |
| Shares Redeemed | (23,465,248) | | (1,021,206,791) | | (18,994,470) | | (837,983,756) |
| Net Increase (Decrease) | (8,077,069) | | (322,930,463) | | 2,506,552 | | 106,090,790 |
| Total Net Increase (Decrease) | (17,042,962) | | $ (638,942,601) | | 17,705,634 | | $ 732,263,547 |
| Dividend and Growth Fund | | | | | | | |
| Class A | | | | | | | |
| Shares Sold | 14,259,336 | | $ 456,511,173 | | 11,151,010 | | $ 344,976,720 |
| Shares Issued for Reinvested Dividends | 8,032,629 | | 265,324,992 | | 4,336,771 | | 122,673,579 |
| Shares Redeemed | (15,308,574) | | (488,931,973) | | (17,131,999) | | (519,287,515) |
| Net Increase (Decrease) | 6,983,391 | | 232,904,192 | | (1,644,218) | | (51,637,216) |
| Class C | | | | | | | |
| Shares Sold | 2,645,502 | | $ 81,671,576 | | 1,419,508 | | $ 42,204,089 |
| Shares Issued for Reinvested Dividends | 274,652 | | 8,737,329 | | 145,715 | | 3,852,604 |
| Shares Redeemed | (1,631,982) | | (49,532,829) | | (2,354,366) | | (69,029,852) |
| Net Increase (Decrease) | 1,288,172 | | 40,876,076 | | (789,143) | | (22,973,159) |
| Class I | | | | | | | |
| Shares Sold | 64,363,688 | | $ 2,058,872,583 | | 36,793,322 | | $ 1,137,090,014 |
| Shares Issued for Reinvested Dividends | 5,907,158 | | 193,113,163 | | 2,425,264 | | 69,068,594 |
| Shares Redeemed | (34,946,220) | | (1,107,019,682) | | (15,783,459) | | (477,606,650) |
| Net Increase (Decrease) | 35,324,626 | | 1,144,966,064 | | 23,435,127 | | 728,551,958 |
| Class R3 | | | | | | | |
| Shares Sold | 348,672 | | $ 11,370,145 | | 324,177 | | $ 10,228,653 |
| Shares Issued for Reinvested Dividends | 100,882 | | 3,401,827 | | 59,719 | | 1,695,081 |
| Shares Redeemed | (600,236) | | (19,626,369) | | (687,387) | | (21,558,216) |
| Net Increase (Decrease) | (150,682) | | (4,854,397) | | (303,491) | | (9,634,482) |
| Class R4 | | | | | | | |
| Shares Sold | 796,252 | | $ 26,395,247 | | 676,475 | | $ 21,736,412 |
| Shares Issued for Reinvested Dividends | 138,647 | | 4,701,649 | | 75,716 | | 2,188,661 |
| Shares Redeemed | (957,878) | | (31,739,116) | | (1,035,619) | | (31,590,923) |
| Net Increase (Decrease) | (22,979) | | (642,220) | | (283,428) | | (7,665,850) |
Hartford Domestic Equity Funds
Notes to Financial Statements – (continued)
October 31, 2022
| | For the Year Ended
October 31, 2022 | | For the Year Ended
October 31, 2021 |
| | Shares | | Amount | | Shares | | Amount |
| Class R5 | | | | | | | |
| Shares Sold | 2,795,712 | | $ 92,959,983 | | 2,526,093 | | $ 79,438,301 |
| Shares Issued for Reinvested Dividends | 205,078 | | 6,984,131 | | 96,696 | | 2,843,393 |
| Shares Redeemed | (3,084,827) | | (100,834,486) | | (2,227,663) | | (69,728,112) |
| Net Increase (Decrease) | (84,037) | | (890,372) | | 395,126 | | 12,553,582 |
| Class R6 | | | | | | | |
| Shares Sold | 9,755,875 | | $ 319,701,277 | | 7,406,904 | | $ 227,713,097 |
| Shares Issued for Reinvested Dividends | 842,357 | | 28,512,706 | | 297,938 | | 8,855,913 |
| Shares Redeemed | (3,734,079) | | (121,605,554) | | (2,250,013) | | (70,681,330) |
| Net Increase (Decrease) | 6,864,153 | | 226,608,429 | | 5,454,829 | | 165,887,680 |
| Class Y | | | | | | | |
| Shares Sold | 7,239,847 | | $ 242,709,191 | | 20,130,737 | | $ 637,738,953 |
| Shares Issued for Reinvested Dividends | 1,560,840 | | 53,170,181 | | 944,058 | | 27,654,509 |
| Shares Redeemed | (12,313,080) | | (406,017,012) | | (24,259,929) | | (783,606,689) |
| Net Increase (Decrease) | (3,512,393) | | (110,137,640) | | (3,185,134) | | (118,213,227) |
| Class F | | | | | | | |
| Shares Sold | 67,501,996 | | $ 2,121,346,990 | | 49,096,886 | | $ 1,528,459,592 |
| Shares Issued for Reinvested Dividends | 8,634,393 | | 282,063,480 | | 4,082,716 | | 115,917,711 |
| Shares Redeemed | (35,875,105) | | (1,115,006,438) | | (27,500,734) | | (840,425,971) |
| Net Increase (Decrease) | 40,261,284 | | 1,288,404,032 | | 25,678,868 | | 803,951,332 |
| Total Net Increase (Decrease) | 86,951,535 | | $ 2,817,234,164 | | 48,758,536 | | $ 1,500,820,618 |
| Equity Income Fund | | | | | | | |
| Class A | | | | | | | |
| Shares Sold | 9,596,803 | | $ 211,409,984 | | 8,289,761 | | $ 180,610,904 |
| Shares Issued for Reinvested Dividends | 7,158,278 | | 159,263,758 | | 1,960,721 | | 40,766,669 |
| Shares Redeemed | (8,968,077) | | (198,976,567) | | (9,871,460) | | (212,979,569) |
| Net Increase (Decrease) | 7,787,004 | | 171,697,175 | | 379,022 | | 8,398,004 |
| Class C | | | | | | | |
| Shares Sold | 1,379,177 | | $ 30,309,524 | | 649,197 | | $ 14,115,367 |
| Shares Issued for Reinvested Dividends | 549,220 | | 12,167,905 | | 180,050 | | 3,621,924 |
| Shares Redeemed | (2,613,220) | | (57,727,994) | | (4,975,576) | | (107,730,675) |
| Net Increase (Decrease) | (684,823) | | (15,250,565) | | (4,146,329) | | (89,993,384) |
| Class I | | | | | | | |
| Shares Sold | 23,824,979 | | $ 520,404,729 | | 13,408,859 | | $ 286,986,093 |
| Shares Issued for Reinvested Dividends | 5,346,702 | | 117,953,687 | | 1,520,952 | | 31,538,766 |
| Shares Redeemed | (15,236,956) | | (332,668,191) | | (13,573,736) | | (290,903,554) |
| Net Increase (Decrease) | 13,934,725 | | 305,690,225 | | 1,356,075 | | 27,621,305 |
| Class R3 | | | | | | | |
| Shares Sold | 241,885 | | $ 5,341,375 | | 178,866 | | $ 3,905,700 |
| Shares Issued for Reinvested Dividends | 122,508 | | 2,733,840 | | 37,851 | | 778,951 |
| Shares Redeemed | (471,052) | | (10,531,386) | | (622,158) | | (13,765,852) |
| Net Increase (Decrease) | (106,659) | | (2,456,171) | | (405,441) | | (9,081,201) |
| Class R4 | | | | | | | |
| Shares Sold | 320,134 | | $ 7,147,306 | | 409,910 | | $ 8,975,208 |
| Shares Issued for Reinvested Dividends | 134,864 | | 3,014,807 | | 41,162 | | 854,303 |
| Shares Redeemed | (752,816) | | (17,082,777) | | (714,299) | | (15,093,697) |
| Net Increase (Decrease) | (297,818) | | (6,920,664) | | (263,227) | | (5,264,186) |
| Class R5 | | | | | | | |
| Shares Sold | 713,292 | | $ 16,015,545 | | 1,641,838 | | $ 34,220,609 |
| Shares Issued for Reinvested Dividends | 284,360 | | 6,388,940 | | 92,807 | | 1,954,636 |
| Shares Redeemed | (1,012,405) | | (22,891,236) | | (1,549,727) | | (34,015,363) |
| Net Increase (Decrease) | (14,753) | | (486,751) | | 184,918 | | 2,159,882 |
| Class R6 | | | | | | | |
| Shares Sold | 1,794,564 | | $ 40,124,508 | | 1,024,580 | | $ 22,209,707 |
| Shares Issued for Reinvested Dividends | 298,677 | | 6,718,898 | | 84,605 | | 1,790,192 |
| Shares Redeemed | (1,015,542) | | (22,792,072) | | (848,471) | | (18,624,173) |
| Net Increase (Decrease) | 1,077,699 | | 24,051,334 | | 260,714 | | 5,375,726 |
Hartford Domestic Equity Funds
Notes to Financial Statements – (continued)
October 31, 2022
| | For the Year Ended
October 31, 2022 | | For the Year Ended
October 31, 2021 |
| | Shares | | Amount | | Shares | | Amount |
| Class Y | | | | | | | |
| Shares Sold | 1,581,933 | | $ 35,422,065 | | 1,290,931 | | $ 27,947,876 |
| Shares Issued for Reinvested Dividends | 391,565 | | 8,820,735 | | 115,344 | | 2,434,785 |
| Shares Redeemed | (1,376,119) | | (31,089,555) | | (1,008,753) | | (22,141,456) |
| Net Increase (Decrease) | 597,379 | | 13,153,245 | | 397,522 | | 8,241,205 |
| Class F | | | | | | | |
| Shares Sold | 12,117,460 | | $ 264,063,832 | | 8,946,727 | | $ 192,753,571 |
| Shares Issued for Reinvested Dividends | 4,681,705 | | 103,344,207 | | 1,449,703 | | 30,022,805 |
| Shares Redeemed | (13,925,425) | | (305,390,990) | | (13,229,490) | | (284,172,877) |
| Net Increase (Decrease) | 2,873,740 | | 62,017,049 | | (2,833,060) | | (61,396,501) |
| Total Net Increase (Decrease) | 25,166,494 | | $ 551,494,877 | | (5,069,806) | | $ (113,939,150) |
| Growth Opportunities Fund | | | | | | | |
| Class A | | | | | | | |
| Shares Sold | 4,840,696 | | $ 186,204,105 | | 5,209,175 | | $ 302,551,393 |
| Shares Issued for Reinvested Dividends | 14,227,245 | | 671,810,525 | | 7,642,117 | | 408,394,711 |
| Shares Redeemed | (12,854,467) | | (482,132,807) | | (7,857,838) | | (457,256,332) |
| Net Increase (Decrease) | 6,213,474 | | 375,881,823 | | 4,993,454 | | 253,689,772 |
| Class C | | | | | | | |
| Shares Sold | 2,069,076 | | $ 22,831,433 | | 1,814,685 | | $ 42,859,385 |
| Shares Issued for Reinvested Dividends | 11,422,799 | | 136,730,901 | | 4,008,428 | | 87,303,560 |
| Shares Redeemed | (9,258,825) | | (97,832,574) | | (5,222,282) | | (124,561,047) |
| Net Increase (Decrease) | 4,233,050 | | 61,729,760 | | 600,831 | | 5,601,898 |
| Class I | | | | | | | |
| Shares Sold | 7,238,788 | | $ 309,883,151 | | 6,786,614 | | $ 423,546,619 |
| Shares Issued for Reinvested Dividends | 5,786,925 | | 301,903,898 | | 3,207,164 | | 185,309,937 |
| Shares Redeemed | (16,722,255) | | (693,094,286) | | (7,861,192) | | (491,248,063) |
| Net Increase (Decrease) | (3,696,542) | | (81,307,237) | | 2,132,586 | | 117,608,493 |
| Class R3 | | | | | | | |
| Shares Sold | 203,038 | | $ 7,785,778 | | 217,459 | | $ 12,458,353 |
| Shares Issued for Reinvested Dividends | 215,984 | | 10,077,826 | | 133,397 | | 7,088,738 |
| Shares Redeemed | (278,253) | | (10,396,015) | | (388,784) | | (22,241,704) |
| Net Increase (Decrease) | 140,769 | | 7,467,589 | | (37,928) | | (2,694,613) |
| Class R4 | | | | | | | |
| Shares Sold | 193,265 | | $ 7,876,745 | | 260,470 | | $ 16,275,076 |
| Shares Issued for Reinvested Dividends | 236,765 | | 12,382,831 | | 149,374 | | 8,675,642 |
| Shares Redeemed | (307,229) | | (13,066,648) | | (483,285) | | (30,586,387) |
| Net Increase (Decrease) | 122,801 | | 7,192,928 | | (73,441) | | (5,635,669) |
| Class R5 | | | | | | | |
| Shares Sold | 58,395 | | $ 2,652,895 | | 88,508 | | $ 5,974,431 |
| Shares Issued for Reinvested Dividends | 68,446 | | 3,927,412 | | 44,659 | | 2,790,306 |
| Shares Redeemed | (99,282) | | (4,569,412) | | (159,100) | | (10,438,793) |
| Net Increase (Decrease) | 27,559 | | 2,010,895 | | (25,933) | | (1,674,056) |
| Class R6 | | | | | | | |
| Shares Sold | 229,289 | | $ 11,255,684 | | 490,627 | | $ 33,816,735 |
| Shares Issued for Reinvested Dividends | 182,245 | | 10,770,646 | | 77,962 | | 4,986,464 |
| Shares Redeemed | (351,044) | | (16,361,897) | | (230,683) | | (16,066,034) |
| Net Increase (Decrease) | 60,490 | | 5,664,433 | | 337,906 | | 22,737,165 |
| Class Y | | | | | | | |
| Shares Sold | 2,049,547 | | $ 93,311,976 | | 2,179,222 | | $ 149,741,177 |
| Shares Issued for Reinvested Dividends | 1,525,929 | | 89,968,761 | | 841,194 | | 53,752,317 |
| Shares Redeemed | (2,437,524) | | (111,382,745) | | (2,205,530) | | (152,562,447) |
| Net Increase (Decrease) | 1,137,952 | | 71,897,992 | | 814,886 | | 50,931,047 |
| Class F | | | | | | | |
| Shares Sold | 5,268,021 | | $ 216,622,722 | | 6,728,193 | | $ 425,460,841 |
| Shares Issued for Reinvested Dividends | 4,010,962 | | 210,816,144 | | 1,886,638 | | 109,557,047 |
| Shares Redeemed | (6,505,529) | | (273,177,311) | | (4,459,130) | | (280,955,262) |
| Net Increase (Decrease) | 2,773,454 | | 154,261,555 | | 4,155,701 | | 254,062,626 |
| Total Net Increase (Decrease) | 11,013,007 | | $ 604,799,738 | | 12,898,062 | | $ 694,626,663 |
Hartford Domestic Equity Funds
Notes to Financial Statements – (continued)
October 31, 2022
| | For the Year Ended
October 31, 2022 | | For the Year Ended
October 31, 2021 |
| | Shares | | Amount | | Shares | | Amount |
| Healthcare Fund | | | | | | | |
| Class A | | | | | | | |
| Shares Sold | 1,284,953 | | $ 46,400,237 | | 1,918,507 | | $ 82,032,094 |
| Shares Issued for Reinvested Dividends | 2,140,949 | | 82,554,992 | | 2,232,980 | | 90,190,081 |
| Shares Redeemed | (2,767,818) | | (99,977,711) | | (2,567,935) | | (109,917,953) |
| Net Increase (Decrease) | 658,084 | | 28,977,518 | | 1,583,552 | | 62,304,222 |
| Class C | | | | | | | |
| Shares Sold | 198,228 | | $ 5,299,174 | | 368,990 | | $ 11,716,851 |
| Shares Issued for Reinvested Dividends | 637,952 | | 17,422,458 | | 743,990 | | 22,349,458 |
| Shares Redeemed | (1,454,981) | | (36,873,194) | | (1,445,763) | | (46,040,790) |
| Net Increase (Decrease) | (618,801) | | (14,151,562) | | (332,783) | | (11,974,481) |
| Class I | | | | | | | |
| Shares Sold | 1,431,084 | | $ 56,509,411 | | 2,309,673 | | $ 105,781,014 |
| Shares Issued for Reinvested Dividends | 894,258 | | 37,379,994 | | 924,714 | | 40,077,121 |
| Shares Redeemed | (3,243,038) | | (128,586,178) | | (2,209,353) | | (101,145,679) |
| Net Increase (Decrease) | (917,696) | | (34,696,773) | | 1,025,034 | | 44,712,456 |
| Class R3 | | | | | | | |
| Shares Sold | 117,578 | | $ 4,352,251 | | 151,226 | | $ 6,683,795 |
| Shares Issued for Reinvested Dividends | 76,658 | | 3,032,585 | | 90,203 | | 3,742,540 |
| Shares Redeemed | (206,799) | | (7,790,606) | | (270,146) | | (11,931,278) |
| Net Increase (Decrease) | (12,563) | | (405,770) | | (28,717) | | (1,504,943) |
| Class R4 | | | | | | | |
| Shares Sold | 85,195 | | $ 3,489,886 | | 134,157 | | $ 6,296,937 |
| Shares Issued for Reinvested Dividends | 45,986 | | 1,974,634 | | 58,738 | | 2,616,195 |
| Shares Redeemed | (242,024) | | (9,583,409) | | (229,273) | | (10,763,007) |
| Net Increase (Decrease) | (110,843) | | (4,118,889) | | (36,378) | | (1,849,875) |
| Class R5 | | | | | | | |
| Shares Sold | 57,546 | | $ 2,435,652 | | 79,162 | | $ 3,961,571 |
| Shares Issued for Reinvested Dividends | 22,562 | | 1,042,154 | | 25,326 | | 1,201,964 |
| Shares Redeemed | (83,838) | | (3,601,385) | | (89,603) | | (4,495,885) |
| Net Increase (Decrease) | (3,730) | | (123,579) | | 14,885 | | 667,650 |
| Class R6 | | | | | | | |
| Shares Sold | 1,224,226 | | $ 53,330,855 | | 55,913 | | $ 2,913,413 |
| Shares Issued for Reinvested Dividends | 10,556 | | 497,706 | | 9,082 | | 438,736 |
| Shares Redeemed | (46,267) | | (2,004,674) | | (32,048) | | (1,696,505) |
| Net Increase (Decrease) | 1,188,515 | | 51,823,887 | | 32,947 | | 1,655,644 |
| Class Y | | | | | | | |
| Shares Sold | 206,056 | | $ 9,241,977 | | 450,272 | | $ 22,884,351 |
| Shares Issued for Reinvested Dividends | 211,002 | | 9,927,628 | | 219,387 | | 10,587,619 |
| Shares Redeemed | (1,487,131) | | (65,145,430) | | (397,553) | | (20,324,517) |
| Net Increase (Decrease) | (1,070,073) | | (45,975,825) | | 272,106 | | 13,147,453 |
| Class F | | | | | | | |
| Shares Sold | 134,871 | | $ 5,389,637 | | 262,096 | | $ 12,136,397 |
| Shares Issued for Reinvested Dividends | 99,102 | | 4,167,247 | | 89,913 | | 3,913,893 |
| Shares Redeemed | (278,324) | | (10,879,334) | | (183,888) | | (8,417,394) |
| Net Increase (Decrease) | (44,351) | | (1,322,450) | | 168,121 | | 7,632,896 |
| Total Net Increase (Decrease) | (931,458) | | $ (19,993,443) | | 2,698,767 | | $ 114,791,022 |
| MidCap Fund | | | | | | | |
| Class A | | | | | | | |
| Shares Sold | 4,396,156 | | $ 124,424,494 | | 5,765,546 | | $ 206,608,439 |
| Shares Issued for Reinvested Dividends | 12,324,154 | | 396,196,632 | | 10,539,072 | | 343,679,112 |
| Shares Redeemed | (15,878,115) | | (445,237,437) | | (12,122,834) | | (430,915,073) |
| Net Increase (Decrease) | 842,195 | | 75,383,689 | | 4,181,784 | | 119,372,478 |
| Class C | | | | | | | |
| Shares Sold | 723,474 | | $ 11,923,400 | | 997,903 | | $ 22,218,396 |
| Shares Issued for Reinvested Dividends | 3,704,020 | | 67,653,820 | | 3,497,780 | | 71,039,908 |
| Shares Redeemed | (6,042,234) | | (98,035,963) | | (6,508,579) | | (145,602,161) |
| Net Increase (Decrease) | (1,614,740) | | (18,458,743) | | (2,012,896) | | (52,343,857) |
Hartford Domestic Equity Funds
Notes to Financial Statements – (continued)
October 31, 2022
| | For the Year Ended
October 31, 2022 | | For the Year Ended
October 31, 2021 |
| | Shares | | Amount | | Shares | | Amount |
| Class I | | | | | | | |
| Shares Sold | 14,515,466 | | $ 444,089,079 | | 18,766,871 | | $ 702,875,370 |
| Shares Issued for Reinvested Dividends | 13,008,563 | | 440,965,066 | | 13,770,100 | | 469,422,719 |
| Shares Redeemed | (63,448,845) | | (1,907,224,197) | | (51,765,006) | | (1,948,483,150) |
| Net Increase (Decrease) | (35,924,816) | | (1,022,170,052) | | (19,228,035) | | (776,185,061) |
| Class R3 | | | | | | | |
| Shares Sold | 268,544 | | $ 8,594,453 | | 328,898 | | $ 13,349,542 |
| Shares Issued for Reinvested Dividends | 262,492 | | 9,696,451 | | 278,856 | | 10,337,182 |
| Shares Redeemed | (755,575) | | (24,883,540) | | (897,014) | | (36,300,678) |
| Net Increase (Decrease) | (224,539) | | (6,592,636) | | (289,260) | | (12,613,954) |
| Class R4 | | | | | | | |
| Shares Sold | 369,134 | | $ 12,932,115 | | 616,644 | | $ 26,335,205 |
| Shares Issued for Reinvested Dividends | 422,793 | | 16,696,845 | | 530,397 | | 20,812,764 |
| Shares Redeemed | (2,195,136) | | (76,584,250) | | (2,562,147) | | (109,758,970) |
| Net Increase (Decrease) | (1,403,209) | | (46,955,290) | | (1,415,106) | | (62,611,001) |
| Class R5 | | | | | | | |
| Shares Sold | 684,393 | | $ 25,511,679 | | 1,925,411 | | $ 85,163,229 |
| Shares Issued for Reinvested Dividends | 578,517 | | 24,023,911 | | 805,971 | | 32,980,317 |
| Shares Redeemed | (5,194,820) | | (197,426,765) | | (5,761,404) | | (259,286,863) |
| Net Increase (Decrease) | (3,931,910) | | (147,891,175) | | (3,030,022) | | (141,143,317) |
| Class R6 | | | | | | | |
| Shares Sold | 3,747,078 | | $ 138,619,353 | | 7,264,767 | | $ 326,578,751 |
| Shares Issued for Reinvested Dividends | 3,286,733 | | 138,940,388 | | 3,932,733 | | 163,365,732 |
| Shares Redeemed | (18,624,424) | | (721,527,773) | | (22,294,027) | | (1,010,767,875) |
| Net Increase (Decrease) | (11,590,613) | | (443,968,032) | | (11,096,527) | | (520,823,392) |
| Class Y | | | | | | | |
| Shares Sold | 3,185,757 | | $ 122,180,289 | | 4,103,182 | | $ 185,837,048 |
| Shares Issued for Reinvested Dividends | 1,893,699 | | 79,823,910 | | 2,564,133 | | 106,283,299 |
| Shares Redeemed | (12,021,019) | | (441,584,956) | | (16,202,137) | | (733,248,509) |
| Net Increase (Decrease) | (6,941,563) | | (239,580,757) | | (9,534,822) | | (441,128,162) |
| Class F | | | | | | | |
| Shares Sold | 11,256,515 | | $ 336,568,335 | | 11,833,195 | | $ 445,587,914 |
| Shares Issued for Reinvested Dividends | 8,831,655 | | 301,449,778 | | 7,742,034 | | 265,242,076 |
| Shares Redeemed | (19,967,918) | | (595,418,038) | | (20,970,331) | | (786,132,834) |
| Net Increase (Decrease) | 120,252 | | 42,600,075 | | (1,395,102) | | (75,302,844) |
| Total Net Increase (Decrease) | (60,668,943) | | $ (1,807,632,921) | | (43,819,986) | | $ (1,962,779,110) |
| MidCap Value Fund | | | | | | | |
| Class A | | | | | | | |
| Shares Sold | 3,626,881 | | $ 60,577,133 | | 2,474,862 | | $ 41,495,746 |
| Shares Issued for Reinvested Dividends | 1,489,007 | | 25,794,038 | | 56,642 | | 831,510 |
| Shares Redeemed | (2,384,882) | | (40,360,058) | | (2,543,440) | | (41,457,915) |
| Net Increase (Decrease) | 2,731,006 | | 46,011,113 | | (11,936) | | 869,341 |
| Class C | | | | | | | |
| Shares Sold | 100,059 | | $ 1,304,175 | | 43,557 | | $ 579,493 |
| Shares Issued for Reinvested Dividends | 59,365 | | 792,527 | | — | | — |
| Shares Redeemed | (215,239) | | (2,791,559) | | (405,320) | | (5,295,304) |
| Net Increase (Decrease) | (55,815) | | (694,857) | | (361,763) | | (4,715,811) |
| Class I | | | | | | | |
| Shares Sold | 1,124,320 | | $ 19,053,064 | | 328,086 | | $ 5,572,562 |
| Shares Issued for Reinvested Dividends | 107,582 | | 1,891,181 | | 7,619 | | 112,984 |
| Shares Redeemed | (313,265) | | (5,196,398) | �� | (553,865) | | (8,619,992) |
| Net Increase (Decrease) | 918,637 | | 15,747,847 | | (218,160) | | (2,934,446) |
| Class R3 | | | | | | | |
| Shares Sold | 54,448 | | $ 966,052 | | 66,910 | | $ 1,193,206 |
| Shares Issued for Reinvested Dividends | 25,748 | | 473,508 | | — | | — |
| Shares Redeemed | (86,445) | | (1,584,367) | | (115,157) | | (2,047,635) |
| Net Increase (Decrease) | (6,249) | | (144,807) | | (48,247) | | (854,429) |
Hartford Domestic Equity Funds
Notes to Financial Statements – (continued)
October 31, 2022
| | For the Year Ended
October 31, 2022 | | For the Year Ended
October 31, 2021 |
| | Shares | | Amount | | Shares | | Amount |
| Class R4 | | | | | | | |
| Shares Sold | 61,011 | | $ 1,132,238 | | 71,792 | | $ 1,296,064 |
| Shares Issued for Reinvested Dividends | 32,127 | | 606,242 | | 1,122 | | 17,850 |
| Shares Redeemed | (109,207) | | (2,061,824) | | (208,564) | | (3,543,019) |
| Net Increase (Decrease) | (16,069) | | (323,344) | | (135,650) | | (2,229,105) |
| Class R5 | | | | | | | |
| Shares Sold | 16,192 | | $ 287,737 | | 7,217 | | $ 128,610 |
| Shares Issued for Reinvested Dividends | 7,461 | | 143,466 | | 586 | | 9,446 |
| Shares Redeemed | (18,161) | | (342,378) | | (6,437) | | (116,999) |
| Net Increase (Decrease) | 5,492 | | 88,825 | | 1,366 | | 21,057 |
| Class R6(1) | | | | | | | |
| Shares Sold | 650 | | $ 10,000 | | — | | $ — |
| Net Increase (Decrease) | 650 | | 10,000 | | — | | — |
| Class Y | | | | | | | |
| Shares Sold | 211,905 | | $ 4,000,083 | | 473,420 | | $ 8,111,667 |
| Shares Issued for Reinvested Dividends | 52,960 | | 1,020,918 | | 5,606 | | 90,649 |
| Shares Redeemed | (594,422) | | (11,262,742) | | (457,356) | | (8,763,398) |
| Net Increase (Decrease) | (329,557) | | (6,241,741) | | 21,670 | | (561,082) |
| Class F | | | | | | | |
| Shares Sold | 6,704,088 | | $ 113,928,434 | | 5,244,142 | | $ 88,440,237 |
| Shares Issued for Reinvested Dividends | 1,871,906 | | 32,929,211 | | 163,610 | | 2,424,705 |
| Shares Redeemed | (5,201,908) | | (88,986,471) | | (5,585,121) | | (92,716,247) |
| Net Increase (Decrease) | 3,374,086 | | 57,871,174 | | (177,369) | | (1,851,305) |
| Total Net Increase (Decrease) | 6,622,181 | | $ 112,324,210 | | (930,089) | | $ (12,255,780) |
| Quality Value Fund | | | | | | | |
| Class A | | | | | | | |
| Shares Sold | 653,948 | | $ 15,932,127 | | 434,273 | | $ 10,311,005 |
| Shares Issued for Reinvested Dividends | 446,698 | | 11,224,276 | | 151,354 | | 3,182,978 |
| Shares Redeemed | (938,757) | | (22,808,241) | | (947,815) | | (22,212,834) |
| Net Increase (Decrease) | 161,889 | | 4,348,162 | | (362,188) | | (8,718,851) |
| Class C | | | | | | | |
| Shares Sold | 76,667 | | $ 1,602,569 | | 29,926 | | $ 594,579 |
| Shares Issued for Reinvested Dividends | 10,099 | | 212,267 | | 3,530 | | 63,188 |
| Shares Redeemed | (65,853) | | (1,348,407) | | (113,368) | | (2,261,575) |
| Net Increase (Decrease) | 20,913 | | 466,429 | | (79,912) | | (1,603,808) |
| Class I | | | | | | | |
| Shares Sold | 710,040 | | $ 16,923,232 | | 278,233 | | $ 6,680,247 |
| Shares Issued for Reinvested Dividends | 55,812 | | 1,383,295 | | 14,220 | | 294,345 |
| Shares Redeemed | (230,905) | | (5,313,610) | | (110,028) | | (2,556,620) |
| Net Increase (Decrease) | 534,947 | | 12,992,917 | | 182,425 | | 4,417,972 |
| Class R3 | | | | | | | |
| Shares Sold | 3,836 | | $ 94,890 | | 4,235 | | $ 100,111 |
| Shares Issued for Reinvested Dividends | 2,505 | | 64,011 | | 828 | | 17,729 |
| Shares Redeemed | (8,433) | | (208,983) | | (9,137) | | (220,510) |
| Net Increase (Decrease) | (2,092) | | (50,082) | | (4,074) | | (102,670) |
| Class R4 | | | | | | | |
| Shares Sold | 46,621 | | $ 1,142,022 | | 44,905 | | $ 1,069,168 |
| Shares Issued for Reinvested Dividends | 10,678 | | 276,389 | | 4,243 | | 91,734 |
| Shares Redeemed | (24,211) | | (629,358) | | (75,589) | | (1,855,079) |
| Net Increase (Decrease) | 33,088 | | 789,053 | | (26,441) | | (694,177) |
| Class R5 | | | | | | | |
| Shares Sold | 15,997 | | $ 412,528 | | 123 | | $ 3,003 |
| Shares Issued for Reinvested Dividends | 763 | | 19,958 | | 265 | | 5,775 |
| Shares Redeemed | (14,814) | | (364,859) | | (64) | | (1,603) |
| Net Increase (Decrease) | 1,946 | | 67,627 | | 324 | | 7,175 |
Hartford Domestic Equity Funds
Notes to Financial Statements – (continued)
October 31, 2022
| | For the Year Ended
October 31, 2022 | | For the Year Ended
October 31, 2021 |
| | Shares | | Amount | | Shares | | Amount |
| Class R6 | | | | | | | |
| Shares Sold | 512,657 | | $ 13,564,294 | | 5,718 | | $ 131,614 |
| Shares Issued for Reinvested Dividends | 627 | | 16,459 | | 536 | | 11,697 |
| Shares Redeemed | (43,904) | | (1,076,263) | | (21,890) | | (567,870) |
| Net Increase (Decrease) | 469,380 | | 12,504,490 | | (15,636) | | (424,559) |
| Class Y | | | | | | | |
| Shares Sold | 210,023 | | $ 5,213,675 | | 46,187 | | $ 1,183,352 |
| Shares Issued for Reinvested Dividends | 3,465 | | 90,617 | | 473 | | 10,318 |
| Shares Redeemed | (3,483) | | (89,985) | | (2,267) | | (57,102) |
| Net Increase (Decrease) | 210,005 | | 5,214,307 | | 44,393 | | 1,136,568 |
| Class F | | | | | | | |
| Shares Sold | 114,445 | | $ 2,665,943 | | 64,383 | | $ 1,454,799 |
| Shares Issued for Reinvested Dividends | 32,704 | | 807,378 | | 12,550 | | 258,522 |
| Shares Redeemed | (80,617) | | (1,931,633) | | (95,500) | | (2,207,875) |
| Net Increase (Decrease) | 66,532 | | 1,541,688 | | (18,567) | | (494,554) |
| Total Net Increase (Decrease) | 1,496,608 | | $ 37,874,591 | | (279,676) | | $ (6,476,904) |
| Small Cap Growth Fund | | | | | | | |
| Class A | | | | | | | |
| Shares Sold | 221,362 | | $ 9,569,965 | | 242,684 | | $ 15,163,953 |
| Shares Issued for Reinvested Dividends | 954,163 | | 46,858,948 | | 280,755 | | 16,331,511 |
| Shares Redeemed | (717,182) | | (29,726,296) | | (441,435) | | (27,592,119) |
| Net Increase (Decrease) | 458,343 | | 26,702,617 | | 82,004 | | 3,903,345 |
| Class C | | | | | | | |
| Shares Sold | 15,487 | | $ 359,111 | | 18,046 | | $ 723,868 |
| Shares Issued for Reinvested Dividends | 82,922 | | 2,226,460 | | 40,883 | | 1,524,921 |
| Shares Redeemed | (185,294) | | (4,427,327) | | (223,022) | | (8,907,111) |
| Net Increase (Decrease) | (86,885) | | (1,841,756) | | (164,093) | | (6,658,322) |
| Class I | | | | | | | |
| Shares Sold | 418,467 | | $ 21,023,675 | | 356,881 | | $ 23,938,090 |
| Shares Issued for Reinvested Dividends | 399,352 | | 21,181,650 | | 118,956 | | 7,339,599 |
| Shares Redeemed | (911,520) | | (42,625,231) | | (555,069) | | (36,106,911) |
| Net Increase (Decrease) | (93,701) | | (419,906) | | (79,232) | | (4,829,222) |
| Class R3 | | | | | | | |
| Shares Sold | 37,435 | | $ 1,519,137 | | 34,992 | | $ 2,097,739 |
| Shares Issued for Reinvested Dividends | 33,647 | | 1,607,651 | | 11,592 | | 661,760 |
| Shares Redeemed | (37,384) | | (1,539,821) | | (58,869) | | (3,639,902) |
| Net Increase (Decrease) | 33,698 | | 1,586,967 | | (12,285) | | (880,403) |
| Class R4 | | | | | | | |
| Shares Sold | 57,592 | | $ 2,499,410 | | 89,389 | | $ 5,836,584 |
| Shares Issued for Reinvested Dividends | 66,764 | | 3,474,411 | | 32,051 | | 1,953,808 |
| Shares Redeemed | (137,344) | | (6,212,553) | | (392,229) | | (25,488,142) |
| Net Increase (Decrease) | (12,988) | | (238,732) | | (270,789) | | (17,697,750) |
| Class R5 | | | | | | | |
| Shares Sold | 94,689 | | $ 4,878,355 | | 262,369 | | $ 18,020,843 |
| Shares Issued for Reinvested Dividends | 209,364 | | 11,873,046 | | 80,046 | | 5,219,014 |
| Shares Redeemed | (1,014,799) | | (52,060,732) | | (408,838) | | (28,555,099) |
| Net Increase (Decrease) | (710,746) | | (35,309,331) | | (66,423) | | (5,315,242) |
| Class R6 | | | | | | | |
| Shares Sold | 632,270 | | $ 31,604,252 | | 334,847 | | $ 23,790,157 |
| Shares Issued for Reinvested Dividends | 231,729 | | 13,451,895 | | 90,910 | | 6,035,522 |
| Shares Redeemed | (692,483) | | (34,088,678) | | (666,499) | | (47,474,079) |
| Net Increase (Decrease) | 171,516 | | 10,967,469 | | (240,742) | | (17,648,400) |
| Class Y | | | | | | | |
| Shares Sold | 839,505 | | $ 41,660,987 | | 710,508 | | $ 50,782,835 |
| Shares Issued for Reinvested Dividends | 629,402 | | 36,511,588 | | 243,023 | | 16,134,292 |
| Shares Redeemed | (1,781,643) | | (93,919,879) | | (1,739,428) | | (123,651,652) |
| Net Increase (Decrease) | (312,736) | | (15,747,304) | | (785,897) | | (56,734,525) |
Hartford Domestic Equity Funds
Notes to Financial Statements – (continued)
October 31, 2022
| | For the Year Ended
October 31, 2022 | | For the Year Ended
October 31, 2021 |
| | Shares | | Amount | | Shares | | Amount |
| Class F | | | | | | | |
| Shares Sold | 184,432 | | $ 8,373,822 | | 272,698 | | $ 18,053,254 |
| Shares Issued for Reinvested Dividends | 111,234 | | 5,943,226 | | 51,104 | | 3,169,442 |
| Shares Redeemed | (139,380) | | (6,409,494) | | (613,475) | | (41,379,020) |
| Net Increase (Decrease) | 156,286 | | 7,907,554 | | (289,673) | | (20,156,324) |
| Total Net Increase (Decrease) | (397,213) | | $ (6,392,422) | | (1,827,130) | | $ (126,016,843) |
| Small Cap Value Fund | | | | | | | |
| Class A | | | | | | | |
| Shares Sold | 561,031 | | $ 6,997,260 | | 1,188,590 | | $ 15,684,280 |
| Shares Issued for Reinvested Dividends | 301,029 | | 3,859,001 | | 34,939 | | 359,520 |
| Shares Redeemed | (803,656) | | (9,550,137) | | (750,779) | | (9,444,203) |
| Net Increase (Decrease) | 58,404 | | 1,306,124 | | 472,750 | | 6,599,597 |
| Class C | | | | | | | |
| Shares Sold | 37,481 | | $ 394,693 | | 108,329 | | $ 1,209,656 |
| Shares Issued for Reinvested Dividends | 18,966 | | 206,536 | | 441 | | 3,924 |
| Shares Redeemed | (127,904) | | (1,292,884) | | (122,556) | | (1,345,622) |
| Net Increase (Decrease) | (71,457) | | (691,655) | | (13,786) | | (132,042) |
| Class I | | | | | | | |
| Shares Sold | 734,453 | | $ 9,050,605 | | 2,537,268 | | $ 33,866,723 |
| Shares Issued for Reinvested Dividends | 175,561 | | 2,258,975 | | 5,247 | | 53,996 |
| Shares Redeemed | (1,494,012) | | (17,432,510) | | (437,736) | | (5,819,619) |
| Net Increase (Decrease) | (583,998) | | (6,122,930) | | 2,104,779 | | 28,101,100 |
| Class R3 | | | | | | | |
| Shares Sold | 16,293 | | $ 204,509 | | 29,282 | | $ 397,377 |
| Shares Issued for Reinvested Dividends | 4,272 | | 57,161 | | 326 | | 3,498 |
| Shares Redeemed | (23,679) | | (272,346) | | (15,655) | | (197,530) |
| Net Increase (Decrease) | (3,114) | | (10,676) | | 13,953 | | 203,345 |
| Class R4 | | | | | | | |
| Shares Sold | 14,894 | | $ 195,383 | | 822 | | $ 11,178 |
| Shares Issued for Reinvested Dividends | 250 | | 3,408 | | 33 | | 362 |
| Shares Redeemed | (15,447) | | (172,601) | | (584) | | (8,365) |
| Net Increase (Decrease) | (303) | | 26,190 | | 271 | | 3,175 |
| Class R5 | | | | | | | |
| Shares Sold | 153,133 | | $ 2,056,317 | | 3,061 | | $ 44,058 |
| Shares Issued for Reinvested Dividends | 118 | | 1,609 | | 14 | | 148 |
| Shares Redeemed | (9,522) | | (114,642) | | (2,457) | | (34,282) |
| Net Increase (Decrease) | 143,729 | | 1,943,284 | | 618 | | 9,924 |
| Class R6 | | | | | | | |
| Shares Sold | 623,330 | | $ 8,296,495 | | 88,436 | | $ 1,245,447 |
| Shares Issued for Reinvested Dividends | 15,967 | | 216,927 | | 357 | | 3,866 |
| Shares Redeemed | (98,409) | | (1,262,128) | | (9,262) | | (115,115) |
| Net Increase (Decrease) | 540,888 | | 7,251,294 | | 79,531 | | 1,134,198 |
| Class Y | | | | | | | |
| Shares Sold | 150,796 | | $ 1,967,915 | | 124,042 | | $ 1,700,660 |
| Shares Issued for Reinvested Dividends | 9,047 | | 122,651 | | 342 | | 3,688 |
| Shares Redeemed | (58,546) | | (746,528) | | (14,694) | | (205,546) |
| Net Increase (Decrease) | 101,297 | | 1,344,038 | | 109,690 | | 1,498,802 |
| Class F | | | | | | | |
| Shares Sold | 960,813 | | $ 11,661,567 | | 2,116,114 | | $ 27,975,721 |
| Shares Issued for Reinvested Dividends | 397,291 | | 5,111,134 | | 64,774 | | 665,880 |
| Shares Redeemed | (3,749,272) | | (47,895,143) | | (1,320,995) | | (15,530,755) |
| Net Increase (Decrease) | (2,391,168) | | (31,122,442) | | 859,893 | | 13,110,846 |
| Total Net Increase (Decrease) | (2,205,722) | | $ (26,076,773) | | 3,627,699 | | $ 50,528,945 |
Hartford Domestic Equity Funds
Notes to Financial Statements – (continued)
October 31, 2022
| | For the Year Ended
October 31, 2022 | | For the Year Ended
October 31, 2021 |
| | Shares | | Amount | | Shares | | Amount |
| Small Company Fund | | | | | | | |
| Class A | | | | | | | |
| Shares Sold | 1,738,532 | | $ 32,905,503 | | 1,809,812 | | $ 54,140,187 |
| Shares Issued for Reinvested Dividends | 4,820,379 | | 106,674,987 | | 1,517,800 | | 41,967,161 |
| Shares Redeemed | (3,557,006) | | (67,298,839) | | (1,970,509) | | (58,538,530) |
| Net Increase (Decrease) | 3,001,905 | | 72,281,651 | | 1,357,103 | | 37,568,818 |
| Class C | | | | | | | |
| Shares Sold | 56,836 | | $ 481,078 | | 105,496 | | $ 1,863,781 |
| Shares Issued for Reinvested Dividends | 334,733 | | 3,410,930 | | 98,681 | | 1,604,546 |
| Shares Redeemed | (291,607) | | (2,531,382) | | (243,229) | | (4,261,364) |
| Net Increase (Decrease) | 99,962 | | 1,360,626 | | (39,052) | | (793,037) |
| Class I | | | | | | | |
| Shares Sold | 660,951 | | $ 14,455,416 | | 722,263 | | $ 23,465,518 |
| Shares Issued for Reinvested Dividends | 469,224 | | 11,477,212 | | 113,755 | | 3,392,187 |
| Shares Redeemed | (1,186,111) | | (23,974,621) | | (329,416) | | (10,447,336) |
| Net Increase (Decrease) | (55,936) | | 1,958,007 | | 506,602 | | 16,410,369 |
| Class R3 | | | | | | | |
| Shares Sold | 111,679 | | $ 2,322,102 | | 136,144 | | $ 4,520,959 |
| Shares Issued for Reinvested Dividends | 119,201 | | 2,994,327 | | 45,509 | | 1,394,856 |
| Shares Redeemed | (140,062) | | (3,015,748) | | (217,034) | | (7,087,863) |
| Net Increase (Decrease) | 90,818 | | 2,300,681 | | (35,381) | | (1,172,048) |
| Class R4 | | | | | | | |
| Shares Sold | 85,121 | | $ 1,932,961 | | 130,342 | | $ 4,726,037 |
| Shares Issued for Reinvested Dividends | 93,263 | | 2,607,622 | | 37,589 | | 1,251,351 |
| Shares Redeemed | (160,300) | | (4,013,745) | | (189,059) | | (6,753,577) |
| Net Increase (Decrease) | 18,084 | | 526,838 | | (21,128) | | (776,189) |
| Class R5 | | | | | | | |
| Shares Sold | 78,431 | | $ 2,092,719 | | 84,862 | | $ 3,272,537 |
| Shares Issued for Reinvested Dividends | 34,948 | | 1,072,566 | | 10,551 | | 377,953 |
| Shares Redeemed | (82,975) | | (2,199,696) | | (44,399) | | (1,705,756) |
| Net Increase (Decrease) | 30,404 | | 965,589 | | 51,014 | | 1,944,734 |
| Class R6 | | | | | | | |
| Shares Sold | 161,484 | | $ 4,074,702 | | 129,943 | | $ 5,123,929 |
| Shares Issued for Reinvested Dividends | 29,818 | | 945,536 | | 3,508 | | 128,962 |
| Shares Redeemed | (58,154) | | (1,496,909) | | (32,019) | | (1,254,201) |
| Net Increase (Decrease) | 133,148 | | 3,523,329 | | 101,432 | | 3,998,690 |
| Class Y | | | | | | | |
| Shares Sold | 1,528,862 | | $ 39,347,667 | | 2,592,104 | | $ 111,577,676 |
| Shares Issued for Reinvested Dividends | 235,140 | | 7,437,476 | | 47,078 | | 1,728,226 |
| Shares Redeemed | (1,220,313) | | (31,378,682) | | (2,109,893) | | (87,145,029) |
| Net Increase (Decrease) | 543,689 | | 15,406,461 | | 529,289 | | 26,160,873 |
| Class F | | | | | | | |
| Shares Sold | 3,642,764 | | $ 76,566,463 | | 3,078,986 | | $ 99,109,263 |
| Shares Issued for Reinvested Dividends | 2,680,211 | | 66,254,813 | | 808,547 | | 24,288,757 |
| Shares Redeemed | (3,315,131) | | (72,876,191) | | (2,624,084) | | (85,717,671) |
| Net Increase (Decrease) | 3,007,844 | | 69,945,085 | | 1,263,449 | | 37,680,349 |
| Total Net Increase (Decrease) | 6,869,918 | | $ 168,268,267 | | 3,713,328 | | $ 121,022,559 |
| (1) | Class R6 of the MidCap Value Fund commenced operations on June 22, 2022. |
| 13. | Line of Credit: |
| | Each Fund participates in a committed line of credit pursuant to a credit agreement dated March 3, 2022. Each Fund may borrow under the line of credit for temporary or emergency purposes. The Funds (together with certain other Hartford Funds) may borrow up to $350 million in the aggregate, subject to asset coverage and other limitations specified in the credit agreement. The interest rate on borrowings varies depending on the nature of the loan. The facility also charges certain fees, such as a commitment fee. From November 1, 2021 through March 3, 2022, the |
Hartford Domestic Equity Funds
Notes to Financial Statements – (continued)
October 31, 2022
Funds (together with certain other Hartford Funds) had a similar agreement that enabled them to participate in a $350 million committed line of credit. The fees incurred by the Funds in connection with the committed lines of credit during the period appear in the Statements of Operations under "Other expenses." During and as of the year ended October 31, 2022, none of the Funds had borrowings under this facility.
| 14. | Indemnifications: |
| | Under each Company’s organizational documents, the Company shall indemnify its officers and directors to the full extent required or permitted under Maryland General Corporation Law and federal securities laws. In addition, each Company, on behalf of its respective Funds, may enter into contracts that contain a variety of indemnifications. Each Company’s maximum exposure under these arrangements is unknown. However, as of the date of these financial statements, each Company has not had prior claims or losses pursuant to these contracts and expects the risk of loss to be remote. |
| 15. | Subsequent Events: |
| | Management has evaluated all subsequent transactions and events through the date on which these financial statements were issued and has
determined that no additional items require disclosure in these financial statements. |
Report of Independent Registered Public Accounting Firm
To the Board of Directors of The Hartford Mutual Funds, Inc. and The Hartford Mutual Funds II, Inc. and Shareholders of The Hartford Capital Appreciation Fund, Hartford Core Equity Fund, The Hartford Dividend and Growth Fund, The Hartford Equity Income Fund, The Hartford Growth Opportunities Fund, The Hartford Healthcare Fund, The Hartford MidCap Fund, The Hartford MidCap Value Fund, Hartford Quality Value Fund, The Hartford Small Cap Growth Fund, Hartford Small Cap Value Fund and The Hartford Small Company Fund
Opinion on the Financial Statements
We have audited the accompanying statements of assets and liabilities, including the schedules of investments, of The Hartford Capital Appreciation Fund, Hartford Core Equity Fund, The Hartford Dividend and Growth Fund, The Hartford Equity Income Fund, The Hartford Healthcare Fund, The Hartford MidCap Fund, The Hartford MidCap Value Fund, Hartford Small Cap Value Fund and The Hartford Small Company Fund (nine of the funds constituting The Hartford Mutual Funds, Inc.) and The Hartford Growth Opportunities Fund, Hartford Quality Value Fund and The Hartford Small Cap Growth Fund (three of the funds constituting The Hartford Mutual Funds II, Inc.) (hereafter collectively referred to as the "Funds") as of October 31, 2022, the related statements of operations for the year ended October 31, 2022, the statements of changes in net assets for each of the two years in the period ended October 31, 2022, including the related notes, and the financial highlights for each of the three years in the period ended October 31, 2022 (collectively referred to as the "financial statements"). In our opinion, the financial statements present fairly, in all material respects, the financial position of each of the Funds as of October 31, 2022, the results of each of their operations for the year then ended, the changes in each of their net assets for each of the two years in the period ended October 31, 2022 and each of the financial highlights for each of the three years in the period ended October 31, 2022 in conformity with accounting principles generally accepted in the United States of America.
The financial statements of the Funds as of and for the year ended October 31, 2019 and the financial highlights for each of the periods ended on or prior to October 31, 2019 (not presented herein, other than the financial highlights) were audited by other auditors whose report dated December 30, 2019 expressed an unqualified opinion on those financial statements and financial highlights.
Basis for Opinion
These financial statements are the responsibility of the Funds’ management. Our responsibility is to express an opinion on the Funds' financial statements based on our audits. We are a public accounting firm registered with the Public Company Accounting Oversight Board (United States) (PCAOB) and are required to be independent with respect to the Funds in accordance with the U.S. federal securities laws and the applicable rules and regulations of the Securities and Exchange Commission and the PCAOB.
We conducted our audits of these financial statements in accordance with the standards of the PCAOB. Those standards require that we plan and perform the audit to obtain reasonable assurance about whether the financial statements are free of material misstatement, whether due to error or fraud.
Our audits included performing procedures to assess the risks of material misstatement of the financial statements, whether due to error or fraud, and performing procedures that respond to those risks. Such procedures included examining, on a test basis, evidence regarding the amounts and disclosures in the financial statements. Our audits also included evaluating the accounting principles used and significant estimates made by management, as well as evaluating the overall presentation of the financial statements. Our procedures included confirmation of securities owned as of October 31, 2022 by correspondence with the custodian, transfer agent and brokers; when replies were not received from brokers, we performed other auditing procedures. We believe that our audits provide a reasonable basis for our opinions.
/s/ PricewaterhouseCoopers LLP
Philadelphia, Pennsylvania
December 28, 2022
We have served as the auditor of one or more investment companies in the Hartford Funds group of investment companies since 2020.
Hartford Domestic Equity Funds
Operation of the Liquidity Risk Management Program (Unaudited)
This section describes the operation and effectiveness of the Liquidity Risk Management Program (“LRM Program”) established in accordance with Rule 22e-4 under the Investment Company Act of 1940, as amended (the “Liquidity Rule”). The LRM Program seeks to assess and manage each Fund’s liquidity risk. The Liquidity Rule generally defines liquidity risk as the risk that a Fund could not meet its obligation to redeem shares without significant dilution of the non-redeeming investors’ interests in the Fund. The Board of Directors (“Board”) of The Hartford Mutual Funds, Inc. and The Hartford Mutual Funds II, Inc. have appointed Hartford Funds Management Company, LLC (“HFMC”) to serve as the administrator of the LRM Program with respect to each of the Funds, subject to the oversight of the Board. In order to efficiently and effectively administer the LRM Program, HFMC established a Liquidity Risk Oversight Committee.
The LRM Program is comprised of various components designed to support the assessment and/or management of liquidity risk, including: (1) the assessment and periodic review (no less frequently than annually) of certain factors that influence each Fund’s liquidity risk; (2) the classification and periodic review (no less frequently than monthly) of each Fund’s investments into one of four liquidity categories that reflect an estimate of their liquidity under current market conditions; (3) a 15% limit on the acquisition of “illiquid investments” (as defined under the Liquidity Rule); (4) the determination of a minimum percentage of each Fund’s assets that generally will be invested in highly liquid investments (“HLIM”); (5) the periodic review (no less frequently than annually) of the HLIM and the adoption and implementation of policies and procedures for responding to a shortfall of a Fund’s highly liquid investments below its HLIM; and (6) periodic reporting to the Board.
At a meeting of the Board held August 9-10, 2022, HFMC provided an annual written report to the Board covering the period from April 1, 2021 through June 30, 2022 (the “Reporting Period”). The annual report addressed important aspects of the LRM Program, including, but not limited to:
| • | the operation of the LRM Program (and related policies and procedures utilized in connection with management of the Funds’ liquidity risk); |
| • | an assessment of the adequacy and effectiveness of the LRM Program’s (and related policies and procedures’) implementation; |
| • | the operation, and assessment of the adequacy and effectiveness, of each Fund’s HLIM; |
| • | whether the third-party liquidity vendor’s (“LRM Program Vendor”) processes for determining preliminary liquidity classifications, including the particular methodologies or factors used and metrics analyzed by the LRM Program Vendor, are sufficient under the Liquidity Rule and appropriate in light of each Fund’s specific circumstances; and |
| • | any material changes to the LRM Program. |
In addition, HFMC provides a quarterly report on the LRM Program at each quarterly meeting of the Board’s Compliance and Risk Oversight Committee. The quarterly report included information regarding the Funds’ liquidity as measured by established parameters, a summary of developments within the capital markets that may impact liquidity, and other factors that may impact liquidity. Among other things, HFMC reports any changes to a Fund’s HLIM.
During the Reporting Period, HFMC did not reduce the HLIM for any Fund.
Based on its review and assessment, HFMC has concluded that the LRM Program is operating effectively to assess and manage the liquidity risk of each Fund and that the LRM Program has been and continues to be adequately and effectively implemented with respect to each Fund. Because liquidity in the capital markets in which the Funds invest is beyond the control of the Funds, there can be no assurance that the LRM Program will ensure liquidity under all circumstances and does not protect against the risk of loss.
Hartford Domestic Equity Funds
Directors and Officers of each Company (Unaudited)
Each of The Hartford Mutual Funds, Inc. and The Hartford Mutual Funds II, Inc. (each, a “Company”) is governed by a Board of Directors (the “Directors”). The following tables present certain information regarding the Directors and officers of each Company as of October 31, 2022. For more information regarding the Directors and officers, please refer to the Statement of Additional Information, which is available, without charge, upon request by calling 1-888-843-7824.
NAME, YEAR OF BIRTH
AND ADDRESS(1) | | POSITION
HELD WITH
EACH COMPANY | | TERM OF
OFFICE(2) AND
LENGTH OF
TIME SERVED | | PRINCIPAL OCCUPATION(S)
DURING PAST 5 YEARS | | NUMBER OF
PORTFOLIOS
IN FUND
COMPLEX(3)
OVERSEEN
BY DIRECTOR | | OTHER DIRECTORSHIPS
FOR PUBLIC COMPANIES
AND OTHER REGISTERED
INVESTMENT COMPANIES HELD
BY DIRECTOR |
| NON-INTERESTED DIRECTORS |
HILARY E. ACKERMANN
(1956) | | Director | | Since 2014 | | Ms. Ackermann served as Chief Risk Officer at Goldman Sachs Bank USA from October 2008 to November 2011. | | 80 | | Ms. Ackermann served as a Director of Dynegy, Inc. from October 2012 until its acquisition by Vistra Energy Corporation ("Vistra") in 2018, and since that time she has served as a Director of Vistra. Ms. Ackermann serves as a Director of Credit Suisse Holdings (USA), Inc. from January 2017 to present. |
ROBIN C. BEERY
(1967) | | Director | | Since 2017 | | Ms. Beery has served as a consultant to ArrowMark Partners (an alternative asset manager) since March of 2015 and since November 2018 has been employed by ArrowMark Partners as a Senior Advisor. Previously, she was Executive Vice President, Head of Distribution, for Janus Capital Group, and Chief Executive Officer and President of the Janus Mutual Funds (a global asset manager) from September 2009 to August 2014. | | 80 | | Ms. Beery serves as an independent Director of UMB Financial Corporation (January 2015 to present), has chaired the Compensation Committee since April 2017, and serves on the Audit Committee and the Risk Committee. |
DERRICK D. CEPHAS
(1952) | | Director | | Since 2020 | | Mr. Cephas currently serves as Of Counsel to Squire Patton Boggs LLP, an international law firm with 45 offices in 20 countries. Until his retirement in October 2020, Mr. Cephas was a Partner of Weil, Gotshal & Manges LLP, an international law firm headquartered in New York, where he served as the Head of the Financial Institutions Practice (April 2011 to October 2020). | | 80 | | Mr. Cephas currently serves as a Director of Signature Bank, a New York-based commercial bank, and is a member of the Credit Committee, Examining Committee and Risk Committee. Mr. Cephas currently serves as a Director of Claros Mortgage Trust, Inc., a real estate investment trust. |
CHRISTINE R. DETRICK
(1958) | | Director and Chair of the Board | | Director since 2016; Chair of the Board since 2021 | | From 2002 until 2012, Ms. Detrick was a Senior Partner, Leader of the Financial Services Practice, and a Senior Advisor at Bain & Company (“Bain”). Before joining Bain, she served in various senior management roles for other financial services firms and was a consultant at McKinsey and Company. | | 80 | | Ms. Detrick currently serves as a Director of Charles River Associates (May 2020 to present); currently serves as a Director of Capital One Financial Corporation (since November 2021); and currently serves as a Director of Altus Power, Inc (since December 2021). |
JOHN J. GAUTHIER
(1961) | | Director | | Since 2022 | | Mr. Gauthier currently is the Principal Owner of JJG Advisory, LLC, an investment consulting firm, and Co-Founder and Principal Owner of Talcott Capital Partners (a placement agent for investment managers serving insurance companies). From 2008 to 2018, Mr. Gauthier served as a Senior Vice President (2008-2010), Executive Vice President (2010-2012), and President (2012-2018) of Allied World Financial Services (a global provider of property, casualty and specialty insurance and reinsurance solutions). | | 80 | | Mr. Gauthier serves as a Director of Reinsurance Group of America, Inc. (from 2018 to present) and chairs the Investment Committee and is a member of the Audit and Risk Committees. |
Hartford Domestic Equity Funds
Directors and Officers of each Company (Unaudited) – (continued)
NAME, YEAR OF BIRTH
AND ADDRESS(1) | | POSITION
HELD WITH
EACH COMPANY | | TERM OF
OFFICE(2) AND
LENGTH OF
TIME SERVED | | PRINCIPAL OCCUPATION(S)
DURING PAST 5 YEARS | | NUMBER OF
PORTFOLIOS
IN FUND
COMPLEX(3)
OVERSEEN
BY DIRECTOR | | OTHER DIRECTORSHIPS
FOR PUBLIC COMPANIES
AND OTHER REGISTERED
INVESTMENT COMPANIES HELD
BY DIRECTOR |
ANDREW A. JOHNSON
(1962) | | Director | | Since 2020 | | Mr. Johnson currently serves as a Diversity and Inclusion Advisor at Neuberger Berman, a private, global investment management firm. Prior to his current role, Mr. Johnson served as Chief Investment Officer and Head of Global Investment Grade Fixed Income at Neuberger Berman (January 2009 to December 2018). | | 80 | | Mr. Johnson currently serves as a Director of AGNC Investment Corp., a real estate investment trust. |
PAUL L. ROSENBERG
(1953) | | Director | | Since 2020 | | Mr. Rosenberg is a Partner of The Bridgespan Group, a global nonprofit consulting firm that is a social impact advisor to nonprofits, non-governmental organizations, philanthropists and institutional investors (October 2007 to present). | | 80 | | None |
DAVID SUNG
(1953) | | Director | | Since 2017 | | Mr. Sung was a Partner at Ernst & Young LLP from October 1995 to July 2014. | | 80 | | Mr. Sung serves as a Trustee of Ironwood Institutional Multi-Strategy Fund, LLC and Ironwood Multi-Strategy Fund, LLC (October 2015 to present). |
| OFFICERS AND INTERESTED DIRECTORS |
JAMES E. DAVEY(4)
(1964) | | Director, President and Chief Executive Officer | | President and Chief Executive Officer since 2010; Director since 2012 | | Mr. Davey serves as Executive Vice President of The Hartford Financial Services Group, Inc. Mr. Davey has served in various positions within The Hartford and its subsidiaries and joined The Hartford in 2002. Additionally, Mr. Davey serves as Director, Chairman, President, and Senior Managing Director for Hartford Funds Management Group, Inc. ("HFMG"). Mr. Davey also serves as President, Manager, Chairman of the Board, and Senior Managing Director for Hartford Funds Management Company, LLC (“HFMC”); Manager, Chairman of the Board, and President of Lattice Strategies LLC (“Lattice”); Chairman of the Board, Manager, and Senior Managing Director of Hartford Funds Distributors, LLC (“HFD”); and Chairman of the Board, President and Senior Managing Director of Hartford Administrative Services Company (“HASCO”), each of which is an affiliate of HFMG. | | 80 | | None |
AMY N. FURLONG
(1979) | | Vice President | | Since 2018 | | Ms. Furlong serves as Vice President and Assistant Treasurer of HFMC (since September 2019). From 2018 through March 15, 2021, Ms. Furlong served as the Treasurer of each Company. Ms. Furlong has served in various positions within The Hartford and its subsidiaries in connection with the operation of the Hartford Funds. Ms. Furlong joined The Hartford in 2004. | | N/A | | N/A |
WALTER F. GARGER
(1965) | | Vice President and Chief Legal Officer | | Since 2016 | | Mr. Garger serves as Secretary, Managing Director and General Counsel of HFMG, HFMC, HFD, and HASCO (since 2013). Mr. Garger also serves as Secretary and General Counsel of Lattice (since July 2016). Mr. Garger has served in various positions within The Hartford and its subsidiaries in connection with the operation of the Hartford Funds. Mr. Garger joined The Hartford in 1995. | | N/A | | N/A |
THEODORE J. LUCAS
(1966) | | Vice President | | Since 2017 | | Mr. Lucas serves as Executive Vice President of HFMG (since July 2016) and as Executive Vice President of Lattice (since June 2017). Previously, Mr. Lucas served as Managing Partner of Lattice (2003 to 2016). | | N/A | | N/A |
JOSEPH G. MELCHER
(1973) | | Vice President, Chief Compliance Officer and AML Compliance Officer | | Vice President and Chief Compliance Officer since 2013; AML Compliance Officer since August 1, 2022 | | Mr. Melcher serves as Executive Vice President of HFMG and HASCO (since December 2013). Mr. Melcher also serves as Executive Vice President (since December 2013) and Chief Compliance Officer (since December 2012) of HFMC, serves as Executive Vice President and Chief Compliance Officer of Lattice (since July 2016), serves as Executive Vice President of HFD (since December 2013), and has served as President and Chief Executive Officer of HFD (from April 2018 to June 2019). | | N/A | | N/A |
Hartford Domestic Equity Funds
Directors and Officers of each Company (Unaudited) – (continued)
NAME, YEAR OF BIRTH
AND ADDRESS(1) | | POSITION
HELD WITH
EACH COMPANY | | TERM OF
OFFICE(2) AND
LENGTH OF
TIME SERVED | | PRINCIPAL OCCUPATION(S)
DURING PAST 5 YEARS | | NUMBER OF
PORTFOLIOS
IN FUND
COMPLEX(3)
OVERSEEN
BY DIRECTOR | | OTHER DIRECTORSHIPS
FOR PUBLIC COMPANIES
AND OTHER REGISTERED
INVESTMENT COMPANIES HELD
BY DIRECTOR |
VERNON J. MEYER
(1964) | | Vice President | | Since 2006 | | Mr. Meyer serves as Managing Director and Chief Investment Officer of HFMC and Managing Director of HFMG (since 2013). Mr. Meyer also serves as Senior Vice President-Investments of Lattice (since March 2019). Mr. Meyer has served in various positions within The Hartford and its subsidiaries in connection with the operation of the Hartford Funds. Mr. Meyer joined The Hartford in 2004. | | N/A | | N/A |
DAVID A. NAAB
(1985) | | Vice President and Treasurer | | Since 2021 | | Mr. Naab serves as Vice President and Assistant Treasurer of HFMC (since June 2021). Prior to joining HFMC in 2021, Mr. Naab served in various positions as an associate, senior associate, manager, senior manager, and director within the investment management, financial services, and asset & wealth management practice groups of PricewaterhouseCoopers, LLP from 2007 to 2020. | | N/A | | N/A |
ALICE A. PELLEGRINO
(1960) | | Vice President and Assistant Secretary | | Since 2016 | | Ms. Pellegrino is Deputy General Counsel for HFMG (since April 2022) and currently serves as Vice President of HFMG (since December 2013). Ms. Pellegrino also serves as Vice President and Assistant Secretary of Lattice (since June 2017). Ms. Pellegrino has served in various positions within The Hartford and its subsidiaries in connection with the operation of the Hartford Funds. Ms. Pellegrino joined The Hartford in 2007. | | N/A | | N/A |
THOMAS R. PHILLIPS
(1960) | | Vice President and Secretary | | Since 2017 | | Mr. Phillips is Deputy General Counsel for HFMG and currently serves as a Senior Vice President (since June 2021) and Assistant Secretary (since June 2017) for HFMG. Mr. Phillips also serves as Vice President of HFMC (since June 2021). Prior to joining HFMG in 2017, Mr. Phillips was a Director and Chief Legal Officer of Saturna Capital Corporation from 2014–2016. Prior to that, Mr. Phillips was a Partner and Deputy General Counsel of Lord, Abbett & Co. LLC. | | N/A | | N/A |
| (1) | The address for each officer and Director is c/o Hartford Funds 690 Lee Road, Wayne, Pennsylvania 19087. |
| (2) | Term of Office: Each Director holds an indefinite term until his or her retirement, resignation, removal, or death. Directors generally must retire no later than December 31 of the year in which the Director turns 75 years of age. Each Fund officer generally serves until his or her resignation, removal, or death. |
| (3) | The portfolios of the “Fund Complex” are operational series of The Hartford Mutual Funds, Inc., The Hartford Mutual Funds II, Inc., Hartford Series Fund, Inc., Hartford HLS Series Fund II, Inc., Lattice Strategies Trust and Hartford Funds Exchange-Traded Trust. |
| (4) | “Interested person,” as defined in the 1940 Act, of each Company because of the person’s affiliation with, or equity ownership of, HFMC, HFD or affiliated companies. |
Hartford Domestic Equity Funds
HOW TO OBTAIN A COPY OF EACH FUND’S PROXY VOTING POLICIES AND VOTING RECORDS (UNAUDITED)
A description of the policies and procedures that each Fund uses to determine how to vote proxies relating to portfolio securities and information about how each Fund voted proxies relating to portfolio securities during the most recent twelve-month period ended June 30 are available (1) without charge, upon request, by calling 888-843-7824 and (2) on the SEC’s website at http://www.sec.gov.
QUARTERLY PORTFOLIO HOLDINGS INFORMATION (UNAUDITED)
Each Fund files its complete schedule of portfolio holdings with the SEC for the first and third quarters of each fiscal year as an exhibit to its reports on Form N-PORT. Each Fund’s portfolio holdings filed as an exhibit to Form N-PORT for the most recent first and third quarter of the Fund’s fiscal year are available (1) without charge, upon request, by calling 888-843-7824, (2) on the Funds' website, hartfordfunds.com, and (3) on the SEC’s website at http://www.sec.gov.
Hartford Domestic Equity Funds
Approval of Investment Management and Investment Sub-Advisory Agreements (Unaudited)
The Hartford Mutual Funds, Inc.
The Hartford Mutual Funds II, Inc.
The Hartford Capital Appreciation Fund
Hartford Core Equity Fund
The Hartford Dividend and Growth Fund
The Hartford Equity Income Fund
The Hartford Growth Opportunities Fund
The Hartford Healthcare Fund
The Hartford MidCap Fund
The Hartford MidCap Value Fund
Hartford Quality Value Fund
The Hartford Small Cap Growth Fund
Hartford Small Cap Value Fund
The Hartford Small Company Fund
(each, a “Fund” and collectively, the “Funds”)
Section 15(c) of the Investment Company Act of 1940, as amended (the “1940 Act”), requires that each mutual fund’s board of directors, including a majority of those directors who are not “interested persons” of the mutual fund, as defined in the 1940 Act (the “Independent Directors”), annually review and consider the continuation of the mutual fund’s investment advisory and sub-advisory agreements. At their meeting held on August 9-10, 2022, the Boards of Directors (collectively, the “Board”) of The Hartford Mutual Funds, Inc. (“HMF”) and The Hartford Mutual Funds II, Inc. (“HMF II”), including each of the Independent Directors, unanimously voted to approve (i) the continuation of an investment management agreement by and between Hartford Funds Management Company, LLC (“HFMC”) and each of HMF, on behalf of each of The Hartford Capital Appreciation Fund, Hartford Core Equity Fund, The Hartford Dividend and Growth Fund, The Hartford Equity Income Fund, The Hartford MidCap Fund, The Hartford MidCap Value Fund and Hartford Small Cap Value Fund, and HMF II, on behalf of each of The Hartford Growth Opportunities Fund, Hartford Quality Value Fund and The Hartford Small Cap Growth Fund (the “Management Agreement”); (ii) the continuation of a separate investment management agreement by and between HFMC and HMF, on behalf of each of The Hartford Healthcare Fund and The Hartford Small Company Fund (the “2013 Investment Management Agreement” and together with the Management Agreement, the “Management Agreements”); and (iii) the continuation of investment sub-advisory agreements (each, a “Sub-Advisory Agreement,” and together with the Management Agreements, the “Agreements”) between HFMC and each Fund’s sub-adviser, Wellington Management Company LLP (the “Sub-adviser” and together with HFMC, the “Advisers”), with respect to each Fund.
In the months preceding the August 9-10, 2022 meeting, the Board requested and reviewed written responses from the Advisers to questions posed to the Advisers on behalf of the Independent Directors and supporting materials relating to those questions and responses. In addition, the Board considered such additional information as it deemed reasonably necessary to evaluate the Agreements, as applicable, with respect to each Fund, which included information furnished to the Board and its committees at their meetings throughout the year and in between regularly scheduled meetings on particular matters as the need arose, as well as information specifically prepared in connection with the approval of the continuation of the Agreements that was presented at the Board’s meetings held on June 15-16, 2022 and August 9-10, 2022. Information provided to the Board and its committees at their meetings throughout the year included, among other things, reports on Fund performance, legal, compliance and risk management matters, sales and marketing activity, shareholder services, and the other services provided to each Fund by the Advisers and their affiliates. The members of the Board also considered the materials and presentations by Fund officers and representatives of HFMC received at the Board’s meetings on June 15-16, 2022 and August 9-10, 2022 concerning the Agreements and at the special meeting of the Board’s Investment Committee on May 20, 2022 concerning Fund performance and other investment-related matters.
The Independent Directors, advised by independent legal counsel throughout the evaluation process, engaged service providers to assist them with evaluating the Agreements with respect to each Fund, as applicable. Broadridge Financial Solutions, Inc. (“Broadridge”), an independent provider of investment company data, was retained to provide the Board with reports on how each Fund’s contractual management fees, actual management fees, total expense ratios and investment performance compared to those of comparable mutual funds with similar investment objectives. The Independent Directors also engaged an independent financial services consultant (the “Consultant”) to assist them in evaluating each Fund’s contractual management fees, actual management fees, total expense ratios and investment performance. In addition, the Consultant previously reviewed the profitability methodologies utilized by HFMC in connection with the continuation of the Management Agreements.
Hartford Domestic Equity Funds
Approval of Investment Management and Investment Sub-Advisory Agreements (Unaudited) – (continued)
In determining whether to approve the continuation of the Agreements for a Fund, the members of the Board reviewed and evaluated information and factors they believed to be relevant and appropriate through the exercise of their reasonable business judgment. While individual members of the Board may have weighed certain factors differently, the Board’s determination to approve the continuation of the Agreements was based on a comprehensive consideration of all information provided to the Board throughout the year and specifically with respect to the continuation of the Agreements. The Board was also furnished with an analysis of its fiduciary obligations in connection with its evaluation of the Agreements. Throughout the evaluation process, the Board was assisted by counsel for the Funds and the Independent Directors were also separately assisted by independent legal counsel. In connection with their deliberations, the Independent Directors met separately with independent legal counsel and the Consultant on June 10, 2022 and in executive session on several occasions to consider their responsibilities under relevant laws and regulations and to discuss the materials presented and other matters deemed relevant to their consideration of the approval of the continuation of the Agreements. As a result of the discussions that occurred during the June 10, 2022 and June 15-16, 2022 meetings, the Independent Directors presented HFMC with requests for additional information on certain topics. HFMC responded to these requests with additional information in connection with the August 9-10, 2022 meeting. A more detailed summary of the important, but not necessarily all, factors the Board considered with respect to its approval of the continuation of the Agreements is provided below.
Nature, Extent and Quality of Services Provided by the Advisers
The Board requested and considered information concerning the nature, extent and quality of the services provided to each Fund by the Advisers. The Board considered, among other things, the terms of the Agreements and the range of services provided by the Advisers. The Board considered the Advisers’ professional personnel who provide services to the Funds, including each Adviser’s ability and experience in attracting and retaining qualified personnel to service the Funds. The Board considered each Adviser’s reputation and overall financial strength, as well as each Adviser’s willingness to consider and implement organizational and operational changes designed to enhance services to the funds managed by HFMC and its affiliates (the “Hartford funds”). In addition, the Board considered the quality of each Adviser’s communications with the Board and responsiveness to Board inquiries and requests made from time to time with respect to the Funds and other Hartford funds.
The Board also requested and evaluated information concerning each Adviser’s regulatory and compliance environment. In this regard, the Board requested and reviewed information about each Adviser’s compliance policies and procedures and compliance history, and a report from the Funds’ Chief Compliance Officer about each Adviser’s compliance with applicable laws and regulations, including responses to regulatory developments and any compliance or other issues raised by regulators. The Board also noted the Advisers’ support of the Funds’ compliance control structure, as applicable, including the resources devoted by the Advisers in support of the Funds’ obligations pursuant to Rule 38a-1 under the 1940 Act and the Funds’ risk management programs, as well as the efforts of the Advisers to address cybersecurity risks. The Board also considered HFMC’s investments in business continuity planning designed to benefit the Funds, and the implementation of HFMC’s business continuity plans due to the COVID-19 pandemic. The Board also noted HFMC’s commitment to maintaining high quality systems and expending substantial resources to prepare for and respond to ongoing changes to the market, regulatory and control environments in which the Funds and their service providers operate.
With respect to HFMC, the Board noted that, under the Management Agreements, HFMC is responsible for the management of the Funds, including oversight of fund operations and service providers, and the provision of investment advisory and administrative services in connection with selecting, monitoring and supervising the Sub-adviser. In this regard, the Board evaluated information about the nature and extent of responsibilities retained and risks assumed by HFMC that were not delegated to or assumed by the Sub-adviser. The Board considered HFMC’s ongoing monitoring of people, process and performance, including its quarterly reviews of each of the Hartford funds, semi-annual meetings with the leaders of each Fund’s portfolio management team, and ongoing oversight of the Hartford funds’ portfolio managers. The Board noted that HFMC has demonstrated a record of initiating changes to the portfolio management and/or investment strategies of the Hartford funds when warranted. The Board considered HFMC’s periodic due diligence reviews of the Sub-adviser and ongoing oversight of the Sub-adviser’s investment approach and results, process for monitoring best execution of portfolio trades and other trading operations by the Sub-adviser, and approach to risk management with respect to the Funds and the service providers to the Funds. The Board considered HFMC’s oversight of the securities lending program for the Funds that engage in securities lending and noted the income earned by the Funds that participate in such program. The Board also considered HFMC’s day-to-day oversight of each Fund’s compliance with its investment objective and policies as well as with applicable laws and regulations, noting that regulatory and other developments had over time led to an increase in the scope of HFMC’s oversight in this regard. Moreover, the Board considered HFMC’s oversight of potential conflicts of interest between the Funds’ investments and those of other funds or accounts, if any, managed by the Funds’ portfolio management personnel.
In addition, the Board considered HFMC’s overall strategic plan for, and ongoing commitment to review and rationalize, the Hartford funds product line-up. The Board also considered the expenses that HFMC had incurred, as well as the risks HFMC had assumed, in connection with the launch of new funds and changes to existing Hartford funds in recent years. The Board considered that HFMC is responsible for providing the Funds’ officers.
Hartford Domestic Equity Funds
Approval of Investment Management and Investment Sub-Advisory Agreements (Unaudited) – (continued)
With respect to the Sub-adviser, which provides certain day-to-day portfolio management services for the Funds, subject to oversight by HFMC, the Board considered, among other things, the Sub-adviser’s investment personnel, investment philosophy and process, investment research capabilities and resources, performance record, trade execution capabilities and experience, including with respect to sustainable and environmental, social and/or governance (ESG) investing. The Board considered the experience of each Fund’s portfolio manager(s), the number of accounts managed by the portfolio manager(s), and the Sub-adviser’s method for compensating the portfolio manager(s). The Board also considered the Sub-adviser’s succession planning practices to ensure continuity of portfolio management services provided to the Funds.
The Board considered the benefits to shareholders of being part of the family of Hartford funds, including, with respect to certain share classes, the right to exchange investments between the same class of shares without a sales charge, the ability to reinvest Fund dividends into other Hartford funds (excluding the Hartford funds that are exchange-traded funds), and the ability to combine holdings in a Fund with holdings in other Hartford funds (excluding the Hartford funds that are exchange-traded funds) and 529 plans for which HFMC serves as the program manager to obtain a reduced sales charge. The Board considered HFMC’s efforts to provide investors in the Hartford funds with a broad range of investment styles and asset classes and the assumption of entrepreneurial and other risks by HFMC in sponsoring and providing ongoing services to new funds to expand these opportunities for shareholders. In addition, the Board observed that in the marketplace there are a range of investment options available to each Fund’s shareholders and such shareholders, having had the opportunity to consider other investment options, have chosen to invest in the Fund.
Based on these considerations, the Board concluded that it was satisfied with the nature, extent and quality of the services provided to each Fund by HFMC and the Sub-adviser.
Performance of each Fund and the Advisers
The Board considered the investment performance of each Fund. In this regard, the Board reviewed the performance of each Fund over different time periods and evaluated HFMC’s analysis of the Fund’s performance for these time periods. The Board considered information and materials provided to the Board by the Advisers concerning Fund performance, as well as information from Broadridge comparing the investment performance of each Fund to an appropriate universe of peer funds. The Board noted that while it found the comparative data provided by Broadridge generally useful in evaluating a Hartford fund’s investment performance, the Board recognized the limitations of such data, including that notable differences may exist between a Hartford fund and its peers. For details regarding each Fund’s performance, see the Fund-by-Fund synopsis below.
The Board considered the detailed investment analytics reports provided by HFMC’s Investment Advisory Group throughout the year, including in connection with the approval of the continuation of the Agreements. These reports included, among other things, information on each Fund’s gross returns and net returns, the Fund’s investment performance compared to one or more appropriate benchmarks and relevant groups or categories of peer funds, various statistics concerning the Fund’s portfolio, a narrative summary of various factors affecting Fund performance, and commentary on the effect of market conditions. The Board also noted that, for The Hartford Capital Appreciation Fund, the Fund utilizes a multiple sleeve structure whereby each sleeve uses a different investment style and considered the performance attributions of the underlying managers. The Board considered the Advisers’ work with the Investment Committee, which assists the Board in evaluating the performance of each Fund at periodic meetings throughout the year and specifically with respect to the approval of the continuation of the Agreements. The Board considered that the Investment Committee, in its evaluation of investment performance at meetings throughout the year, focused particular attention on information indicating less favorable performance of certain Hartford funds for specific time periods and discussed with the Advisers the reasons for such performance as well as any specific actions that the Advisers had taken, or had agreed to take, to seek to enhance Fund investment performance and the results of those actions. The Board also considered the analysis provided by the Consultant relating to each Fund’s performance track record.
Based on these considerations, the Board concluded that it had continued confidence in HFMC’s and the Sub-adviser’s overall capabilities to manage the Funds.
Costs of the Services and Profitability of the Advisers
The Board reviewed information regarding HFMC’s cost to provide investment management and related services to each Fund and HFMC’s profitability, both overall and for each Fund, on a pre-tax basis without regard to distribution expenses. The Board also requested and reviewed information about the profitability to HFMC and its affiliates from all services provided to each Fund and all aspects of their relationship with the Fund, including information regarding profitability trends over time and information provided by Broadridge analyzing the profitability of managers to other fund complexes. The Board also requested and received information relating to the operations and profitability of the Sub-adviser. The Board considered representations from HFMC and the Sub-adviser that the Sub-adviser’s fees were negotiated at arm’s length on a Fund-by-Fund basis and that the sub-advisory fees are paid by HFMC and not the Funds. Accordingly, the Board concluded that the profitability of the Sub-adviser is a less relevant factor with respect to the Board’s consideration of the Sub-Advisory Agreements.
Hartford Domestic Equity Funds
Approval of Investment Management and Investment Sub-Advisory Agreements (Unaudited) – (continued)
The Board considered the Consultant’s review of the methodologies and estimates used by HFMC in calculating profitability in connection with the continuation of the Management Agreements, including a description of the methodology used to allocate certain expenses. The Board noted the Consultant’s view that HFMC’s process for calculating and reporting Fund profitability is reasonable and consistent with the process previously reviewed by the Consultant. The Board noted that the Consultant had previously performed a full review of this process and reported that such process is reasonable, sound and consistent with common industry practice.
Based on these considerations, the Board concluded that the profits realized by the Advisers and their affiliates from their relationships with each Fund were not excessive.
Comparison of Fees and Services Provided by the Advisers
The Board considered comparative information with respect to the services rendered to and the management fees to be paid by each Fund to HFMC and the total expense ratios of the Fund. The Board also considered comparative information with respect to the sub-advisory fees to be paid by HFMC to the Sub-adviser with respect to each Fund. In this regard, the Board requested and reviewed information from HFMC and the Sub-adviser relating to the management and sub-advisory fees, including the sub-advisory fee schedule for each Fund and the amount of the management fee retained by HFMC, and total operating expenses for each Fund. The Board also reviewed information from Broadridge comparing each Fund’s contractual management fees, actual management fees and total expense ratios relative to an appropriate group of funds selected by Broadridge. The Board considered such information from Broadridge in consultation with the Consultant. For details regarding each Fund’s expenses, see the Fund-by-Fund synopsis below.
The Board considered the methodology used by Broadridge to select the funds included in the expense groups. While the Board recognized that comparisons between a Fund and its peer funds may be imprecise given, among other differences, the different service levels and characteristics of mutual funds and the different business models and cost structures of the Advisers, the comparative information provided by Broadridge assisted the Board in evaluating the reasonableness of each Fund’s fees and total operating expenses. In addition, the Board considered the analysis and views of the Consultant relating to each Fund’s fees and total operating expenses and expense groups.
The Board also considered that HFMC provides nondiscretionary investment advisory services to model portfolios that pursue investment objectives and investment strategies similar to those of the Hartford Core Equity Fund and The Hartford Dividend and Growth Fund. The Board also received information regarding fees charged by the Sub-adviser to any other clients with investment strategies similar to those of the Funds, including any institutional separate account clients and registered fund clients for which the Sub-adviser serves as either primary investment adviser or sub-adviser. The Board considered the explanations provided by the Sub-adviser about any differences between the Sub-adviser’s services to the Funds and the services the Sub-adviser provides to other types of clients. In this regard, the Board reviewed information about the generally broader scope of services and compliance, reporting and other legal burdens and risks of managing registered funds compared with those associated with managing assets of non-registered fund clients such as institutional separate accounts.
Based on these considerations, the Board concluded that each Fund’s fees and total operating expenses, in conjunction with the information about quality of services, profitability, economies of scale, and other matters considered, were reasonable in light of the services provided.
Economies of Scale
The Board considered information regarding economies of scale, including the extent to which economies of scale may be realized as a Fund grows and whether fee levels reflect these economies of scale for the benefit of shareholders of the Fund. The Board reviewed the breakpoints in the management fee schedule for each Fund, if any, which reduce fee rates as the Fund’s assets grow over time. The Board recognized that a Fund with assets beyond the highest breakpoint level will continue to benefit from economies of scale because additional assets are charged the lowest breakpoint fee resulting in lower effective management fee rates. The Board also recognized that a fee schedule that reaches a breakpoint at a lower asset level provides shareholders with the benefit of anticipated or potential economies of scale. The Board considered that expense limitations and fee waivers that reduce a Fund’s expenses at all asset levels can have the same effect as breakpoints in sharing economies of scale with shareholders and provide protection from an increase in expenses if the Fund’s assets decline. In addition, the Board considered that initially setting competitive fee rates, pricing a Fund to scale at inception and making additional investments intended to enhance services available to shareholders are other means of sharing anticipated or potential economies of scale with shareholders. The Board also considered that HFMC has been active in managing expenses of the Hartford funds in recent years, which has resulted in benefits being realized by shareholders. The Board also noted that, for the Hartford Small Cap Value Fund, the Fund’s current low asset levels have kept the Fund from fully realizing the benefits of anticipated or potential economies of scale.
Hartford Domestic Equity Funds
Approval of Investment Management and Investment Sub-Advisory Agreements (Unaudited) – (continued)
The Board reviewed and evaluated materials from Broadridge and the Consultant showing how management fee schedules of peer funds reflect economies of scale for the benefit of shareholders as a peer fund’s assets hypothetically increase over time. Based on information provided by HFMC, Broadridge, and the Consultant, the Board recognized that there is no uniform methodology for establishing breakpoints or uniform pattern in asset levels that trigger breakpoints or the amounts of breakpoints triggered.
After considering all of the information available to it, the Board concluded that it was satisfied with the extent to which economies of scale would be shared for the benefit of each Fund’s shareholders based on currently available information and the effective management fees and total expense ratios for the Fund at its current and reasonably anticipated asset levels. The Board noted, however, that it would continue to monitor any future growth in each Fund’s assets and the appropriateness of additional management fee breakpoints or other methods to share benefits from economies of scale as part of its future review of the Agreements.
Other Benefits
The Board considered other benefits to the Advisers and their affiliates from their relationships with the Funds.
The Board noted that HFMC receives fees for fund accounting and related services from the Funds, and the Board considered information on the profitability to HFMC from providing such services to the Funds. The Board also considered that each Fund pays a transfer agency fee to Hartford Administrative Services Company (“HASCO”), an affiliate of HFMC, equal to the lesser of: (i) the actual costs incurred by HASCO in connection with the provisions of transfer agency services, including payments made to sub-transfer agents, plus a reasonable target profit margin; or (ii) a specified amount as set forth in the Transfer Agency and Service Agreement by and between HMF and HMF II, on behalf of their respective Funds, and HASCO. The Board reviewed information about the profitability to HASCO of the Funds’ transfer agency function. The Board considered information provided by HFMC indicating that the transfer agency fees charged by HASCO to the Funds were fair and reasonable based on available industry data about fees charged by transfer agents to other mutual funds. The Board also noted that HFMC and HASCO had delegated certain fund accounting services and transfer agency services, respectively, to external service providers, subject to oversight.
The Board also considered that Hartford Funds Distributors, LLC (“HFD”), an affiliate of HFMC, serves as principal underwriter of the Funds. The Board noted that, as principal underwriter, HFD receives distribution and service fees from the Funds and receives all or a portion of the sales charges on sales or redemptions of certain classes of shares.
The Board considered the benefits, if any, to the Sub-adviser from any use of a Fund’s brokerage commissions to obtain soft dollar research.
Fund-by-Fund Factors
For purposes of evaluating a Fund's performance, the Board considered the Fund's performance relative to similarly managed funds and the Fund's performance relative to its benchmark. In particular, the Board considered the Fund's performance of its Class A shares (net of all fees and expenses), as of March 31, 2022, and compared that performance to the Fund's peer universe, which includes all funds within the same classification or category, as determined by an independent firm engaged by the Board. The Board considered the Fund's performance relative to its peer universe by evaluating its quintile ranking, with the 1st quintile representing the top performing funds within a peer universe and the 5th quintile representing the lowest performing funds. For purposes of evaluating the Fund's performance relative to its benchmark, the Board considered the Fund's performance of its Class I shares (net of all fees and expenses) as of March 31, 2022. The Board considered Fund performance to be “in line with” a Fund's benchmark where it was 0.5% above or below the benchmark return. With respect to fees and expenses, the Board considered the Fund's contractual and actual management fee, and total operating expenses of its Class A shares (net of all fees and expenses), as compared to the Fund's expense peer group, which includes a group of similarly sized funds selected by the independent firm engaged by the Board.
The Hartford Capital Appreciation Fund
| • | The Board noted that the Fund’s performance was in the 5th quintile versus its peer universe for the 1-year period and the 4th quintile for the 3- and 5-year periods. The Board also noted that the Fund’s performance was below its benchmark for the 1-, 3-, and 5-year periods. |
| • | The Board noted that the Fund’s contractual management fee and actual management fee were in the 4th quintile of its expense group and its total expenses were in the 3rd quintile. |
Hartford Domestic Equity Funds
Approval of Investment Management and Investment Sub-Advisory Agreements (Unaudited) – (continued)
Hartford Core Equity Fund
| • | The Board noted that the Fund’s performance was in the 4th quintile versus its peer universe for the 1- and 3-year periods and the 2nd quintile for the 5-year period. The Board also noted that the Fund’s performance was below its benchmark for the 1- and 3-year periods and in line with its benchmark for the 5-year period. |
| • | The Board noted that the Fund’s contractual management fee, actual management fee, and its total expenses were in the 1st quintile of its expense group. |
The Hartford Dividend and Growth Fund
| • | The Board noted that the Fund’s performance was in the 1st quintile versus its peer universe for the 1-, 3-, and 5-year periods. The Board also noted that the Fund’s performance was above its benchmark for the 1-year period and below its benchmark for the 3- and 5-year periods. |
| • | The Board noted that the Fund’s contractual management fee was in the 4th quintile of its expense group, while its actual management fee and total expenses were in the 3rd quintile. The Board noted that Class Y shares of the Fund have a contractual transfer agency expense cap of 0.06% through February 28, 2023, which resulted in HASCO waiving fees and/or reimbursing the Fund for certain expenses. |
The Hartford Equity Income Fund
| • | The Board noted that the Fund’s performance was in the 1st quintile versus its peer universe for the 1-year period, the 2nd quintile for the 3-year period, and the 3rd quintile for the 5-year period. The Board also noted that the Fund’s performance was above its benchmark for the 1-, 3-, and 5-year periods. The Board also noted recent changes to the Fund’s portfolio management team. |
| • | The Board noted that the Fund’s contractual management fee, actual management fee, and its total expenses were in the 4th quintile of its expense group. |
The Hartford Growth Opportunities Fund
| • | The Board noted that the Fund’s performance was in the 5th quintile versus its peer universe for the 1-year period, the 3rd quintile for the 3-year period, and the 2nd quintile for the 5-year period. The Board also noted that the Fund’s performance was below its benchmark for the 1-, 3-, and 5-year periods. |
| • | The Board noted that the Fund’s contractual management fee was in the 4th quintile of its expense group, while its actual management fee and its total expenses were in the 3rd quintile. |
The Hartford Healthcare Fund
| • | The Board noted that the Fund’s performance was in the 4th quintile versus its peer universe for the 1-year period, the 2nd quintile for the 3-year period, and the 3rd quintile for the 5-year period. The Board also noted that the Fund’s performance was below its benchmark for the 1-, 3, and 5-year periods. The Board also noted recent and upcoming changes to the Fund’s portfolio management team. |
| • | The Board noted that the Fund’s contractual management fee was in the 4th quintile of its expense group, while its actual management fee was in the 5th quintile and its total expenses were in the 2nd quintile. |
The Hartford MidCap Fund
| • | The Board noted that the Fund’s performance was in the 3rd quintile versus its peer universe for the 1-year period, the 5th quintile for the 3-year period, and the 4th quintile for the 5-year period. The Board also noted that the Fund’s performance was below its benchmark for the 1- and 3-year periods and above its benchmark for the 5-year period. |
Hartford Domestic Equity Funds
Approval of Investment Management and Investment Sub-Advisory Agreements (Unaudited) – (continued)
| • | The Board noted that the Fund’s contractual management fee and actual management fee were in the 3rd quintile of its expense group, while its total expenses were in the 1st quintile. The Board noted that Class I and Y shares of the Fund have contractual transfer agency expense caps of 0.12% and 0.06%, respectively, through February 28, 2023, which resulted in HASCO waiving fees and/or reimbursing the Fund for certain expenses. |
The Hartford MidCap Value Fund
| • | The Board noted that the Fund’s performance was in the 2nd quintile versus its peer universe for the 1-year period and the 3rd quintile for the 3- and 5-year periods. The Board also noted that the Fund’s performance was above its benchmark for the 1- and 3-year periods and in line with its benchmark for the 5-year period. |
| • | The Board noted that the Fund’s contractual management fee was in the 1st quintile of its expense group, while its actual management fee and total expenses were in the 4th quintile. |
Hartford Quality Value Fund
| • | The Board noted that the Fund’s performance was in the 1st quintile versus its peer universe for the 1-year period, the 3rd quintile for the 3-year period, and the 4th quintile for the 5-year period. The Board also noted that the Fund’s performance was above its benchmark for the 1-, 3-, and 5-year periods. |
| • | The Board noted that the Fund’s contractual management fee was in the 1st quintile of its expense group, while its actual management fee and total expenses were in the 2nd quintile. The Board noted that Class A shares of the Fund have a contractual expense cap of 0.96% through February 28, 2023, which resulted in HFMC reimbursing the Fund for certain expenses. |
The Hartford Small Cap Growth Fund
| • | The Board noted that the Fund’s performance was in the 4th quintile versus its peer universe for the 1-year period and the 5th quintile for the 3- and 5- year periods. The Board also noted that the Fund’s performance was above its benchmark for the 1-year period and in line with its benchmark for the 3- and 5-year periods. |
| • | The Board noted that the Fund’s contractual management fee and actual management fee were in the 2nd quintile of its expense group, while its total expenses were in the 1st quintile. The Board noted that Class Y shares of the Fund have a contractual transfer agency expense cap of 0.07% through February 23, 2023, which resulted in HASCO waiving fees and/or reimbursing the Fund for certain expenses. |
Hartford Small Cap Value Fund
| • | The Board noted that the Fund’s performance was in the 5th quintile versus its peer universe for the 1-year period, the 4th quintile for the 3-year period, and the 2nd quintile for the 5-year period. The Board also noted that the Fund’s performance was below its benchmark for the 1-year period, in line with its benchmark for the 3-year period, and above its benchmark for the 5-year period. |
| • | The Board noted that the Fund’s contractual management fee and actual management fee were in the 2nd quintile of its expense group, while its total expenses were in the 4th quintile. The Board noted that Class A shares of the Fund have a contractual expense cap of 1.30% through February 28, 2023. |
The Hartford Small Company Fund
| • | The Board noted that the Fund’s performance was in the 5th quintile versus its peer universe for the 1-year period and the 2nd quintile for the 3- and 5-year periods. The Board also noted that the Fund’s performance was above its benchmark for the 1-, 3-, and 5-year periods. The Board also noted upcoming changes to the Fund’s portfolio management team. |
| • | The Board noted that the Fund’s contractual management fee was in the 2nd quintile of its expense group, while its actual management fee and its total expenses were in the 3rd quintile. |
* * * *
Hartford Domestic Equity Funds
Approval of Investment Management and Investment Sub-Advisory Agreements (Unaudited) – (continued)
Based upon the review of the factors summarized above, among others, the Board concluded that it is in the best interests of each Fund and its shareholders for the Board to approve the continuation of the Agreements for an additional year. In reaching this decision, the Board did not assign relative weights to the factors discussed above or deem any one or group of them to be controlling in and of themselves.
THIS PRIVACY POLICY IS NOT PART OF THIS REPORT
Customer Privacy Notice
The Hartford Financial Services Group, Inc. and Affiliates
(herein called “we, our, and us”)
This Privacy Policy applies to our United States Operations
We value your trust. We are committed to the responsible:
| a) | management; |
| b) | use; and |
| c) | protection; |
of Personal Information.
This notice describes how we collect, disclose, and protect Personal Information.
We collect Personal Information to:
| a) | service your Transactions with us; and |
| b) | support our business functions. |
We may obtain Personal Information from:
| a) | You; |
| b) | your Transactions with us; and |
| c) | third parties such as a consumer-reporting agency. |
Based on the type of product or service You apply for or get from us, Personal Information such as:
| a) | your name; |
| b) | your address; |
| c) | your income; |
| d) | your payment; or |
| e) | your credit history; |
may be gathered from sources such as applications, Transactions, and consumer reports.
To serve You and service our business, we may share certain Personal Information. We will share Personal Information, only as allowed by law, with affiliates such as:
| a) | our insurance companies; |
| b) | our employee agents; |
| c) | our brokerage firms; and |
| d) | our administrators. |
As allowed by law, we may share Personal Financial Information with our affiliates to:
| a) | market our products; or |
| b) | market our services; |
to You without providing You with an option to prevent these disclosures.
We may also share Personal Information, only as allowed by law, with unaffiliated third parties including:
| a) | independent agents; |
| b) | brokerage firms; |
| c) | insurance companies; |
| d) | administrators; and |
| e) | service providers; |
who help us serve You and service our business.
When allowed by law, we may share certain Personal Financial Information with other unaffiliated third parties who assist us by performing services or functions such as:
| a) | taking surveys; |
| b) | marketing our products or services; or |
| c) | offering financial products or services under a joint agreement |
between us and one or more financial institutions.
We, and third parties we partner with, may track some of the pages You visit through the use of:
| a) | cookies; |
| b) | pixel tagging; or |
| c) | other technologies; |
and currently do not process or comply with any web browser’s “do not track” signal or other similar mechanism that indicates a request to disable online tracking of individual users who visit our websites or use our services.
For more information, our Online Privacy Policy, which governs information we collect on our website and our affiliate websites, is available at https://www.thehartford.com/online-privacy-policy.
We will not sell or share your Personal Financial Information with anyone for purposes unrelated to our business functions without offering You the opportunity to:
| a) | “opt-out;” or |
| b) | “opt-in;” |
as required by law.
We only disclose Personal Health Information with:
| a) | your authorization; or |
| b) | as otherwise allowed or required by law. |
Our employees have access to Personal Information in the course of doing their jobs, such as:
| a) | underwriting policies; |
| b) | paying claims; |
| c) | developing new products; or |
| d) | advising customers of our products and services. |
We use manual and electronic security procedures to maintain:
| a) | the confidentiality; and |
Personal Information that we have. We use these procedures to guard against unauthorized access.
Some techniques we use to protect Personal Information include:
| d) | firewall technology; and |
| e) | the use of detection software. |
We are responsible for and must:
| a) | identify information to be protected; |
| b) | provide an adequate level of protection for that data; and |
| c) | grant access to protected data only to those people who must use |
it in the performance of their job-related duties.
Employees who violate our privacy policies and procedures may be subject to discipline, which may include termination of their employment with us.
We will continue to follow our Privacy Policy regarding Personal Information even when a business relationship no longer exists between us.
As used in this Privacy Notice:
Application means your request for our product or service.
Personal Financial Information means financial information such as:
| d) | policy or claim information. |
Personal Financial Information may include Social Security Numbers, Driver’s license numbers, or other government-issued identification numbers, or credit, debit card, or bank account numbers.
Personal Health Information means health information such as:
| a) | your medical records; or |
| b) | information about your illness, disability or injury. |
Personal Information means information that identifies You personally and is not otherwise available to the public. It includes:
| a) | Personal Financial Information; and |
| b) | Personal Health Information. |
Transaction means your business dealings with us, such as:
| b) | your request for us to pay a claim; and |
| c) | your request for us to take an action on your account. |
You means an individual who has given us Personal Information in conjunction with:
a financial product or service from us if the product or service is used mainly for personal, family, or household purposes.
If you have any questions or comments about this privacy notice, please feel free to contact us at The Hartford – Consumer Rights and Privacy Compliance Unit, One Hartford Plaza, Mail Drop: HO1-09, Hartford, CT 06155, or at ConsumerPrivacyInquiriesMailbox@thehartford.com.
This Customer Privacy Notice is being provided on behalf of The Hartford Financial Services Group, Inc. and its affiliates (including the following as of February 2022), to the extent required by the Gramm-Leach-Bliley Act and implementing regulations:
1stAGChoice, Inc.; Access CoverageCorp, Inc.; Access CoverageCorp Technologies, Inc.; Business Management Group, Inc.; Cervus Claim Solutions, LLC; First State Insurance Company; FTC Resolution Company LLC; Hart Re Group L.L.C.; Hartford Accident and Indemnity Company; Hartford Administrative Services Company; Hartford Casualty General Agency, Inc.; Hartford Casualty Insurance Company; Hartford Fire General Agency, Inc.; Hartford Fire Insurance Company; Hartford Funds Distributors, LLC; Hartford Funds Management Company, LLC; Hartford Funds Management Group, Inc.; Hartford Holdings, Inc.; Hartford Insurance Company of Illinois; Hartford Insurance Company of the Midwest; Hartford Insurance Company of the Southeast; Hartford Insurance, Ltd.; Hartford Integrated Technologies, Inc.; Hartford Investment Management Company; Hartford Life and Accident Insurance Company; Hartford Lloyd’s Corporation; Hartford Lloyd’s Insurance Company; Hartford Management, Ltd.; Hartford Productivity Services LLC; Hartford of the Southeast General Agency, Inc.; Hartford of Texas General Agency, Inc.; Hartford Residual Market, L.C.C.; Hartford Specialty Insurance Services of Texas, LLC; Hartford STAG Ventures LLC; Hartford Strategic Investments, LLC; Hartford Underwriters General Agency, Inc.; Hartford Underwriters Insurance Company; Heritage Holdings, Inc.; Heritage Reinsurance Company, Ltd.; HLA LLC; HL Investment Advisors, LLC; Horizon Management Group, LLC; HRA Brokerage Services, Inc.; Lattice Strategies LLC; Maxum Casualty Insurance Company; Maxum Indemnity Company; Maxum Specialty Services Corporation; Millennium Underwriting Limited; MPC Resolution Company LLC; Navigators (Asia) Limited; Navigators Corporate Underwriters Limited; Navigators Holdings (UK) Limited; Navigators Insurance Company; Navigators International Insurance Company Ltd.; Navigators Management Company, Inc.; Navigators Management (UK) Limited; Navigators N.V.; Navigators Specialty Insurance Company; Navigators Underwriting Agency Limited; Navigators Underwriting Limited; New England Insurance Company; New England Reinsurance Corporation; New Ocean Insurance Co., Ltd.; NIC Investments (Chile) SpA; Nutmeg Insurance Agency, Inc.; Nutmeg Insurance Company; Pacific Insurance Company, Limited; Property and Casualty Insurance Company of Hartford; Sentinel Insurance Company, Ltd.; The Navigators Group, Inc.; Trumbull Flood Management, L.L.C.; Trumbull Insurance Company; Twin City Fire Insurance Company; Y-Risk, LLC.
Revised February 2022
This report is submitted for the general information of the shareholders of the Funds referenced in this report. It is not authorized for distribution to persons who are not shareholders of one or more Funds referenced in this report unless preceded or accompanied by a current prospectus for the relevant Funds. Nothing herein contained is to be considered an offer of sale or a solicitation of an offer to buy shares of any Fund listed in this report.
The information cannot be used or relied upon for the purpose of avoiding IRS penalties. These materials are not intended to provide tax, accounting or legal advice. As with all matters of a tax or legal nature, you should consult your own tax or legal counsel for advice.
Investors should carefully consider a Fund’s investment objectives, risks, charges and expenses. This and other important information is contained in the Fund’s prospectus and summary prospectus, which can be obtained by visiting hartfordfunds.com. Please read it carefully before investing.
The Funds are distributed by Hartford Funds Distributors, LLC.
MFAR-DE22 12/22 Printed in the U.S.A.

Hartford Schroders
Sustainable Core Bond Fund
Annual Report
October 31, 2022
A MESSAGE FROM THE PRESIDENT
Dear Shareholders:
Thank you for investing in Hartford Mutual Funds. The following is the Fund's Annual Report covering the period from November 1, 2021 through October 31, 2022.
Market Review
During the 12 months ended October 31, 2022, U.S. stocks, as measured by the S&P 500 Index,1 lost 14.61%. The decline was an unsettling reminder that equities have experienced an exceptionally volatile period marked by persistent inflation, the U.S. Federal Reserve (Fed) interest rate increases, and, lately, growing fears of recession.
Many investors would prefer to remember the brief period from late-June to late-August in 2022 when stocks came off their June 2022 lows for the year and climbed on hopes of a pause in the Fed’s interest-rate increases. But Fed Chair Jerome Powell’s Jackson Hole speech on August 26, 2022, made it clear the Fed would not be backing off its campaign of rate hikes until it felt inflation had been brought under control. The mid-summer rally quickly faded as Powell’s words sank in and as the August 2022 Consumer Price Index (CPI)2 report of 8.3% annual inflation appeared to stiffen the Fed’s resolve. The CPI’s small retreat to 8.2% in September 2022 produced no change in Fed sentiment.
With all the volatility we’ve seen these past 12 months, it may seem hard to believe that markets at the start of the period were, in fact, on their way to setting new positive records. Even as the Fed had begun expressing concerns in late 2021 over the likely persistence of inflation, the S&P 500 Index was on a steady climb on its way to a record high as of January 3, 2022.
As inflation numbers steadily worsened, Fed policymakers acknowledged that higher prices wouldn’t be as transitory as they would have hoped. Soon thereafter, the Fed embarked on a cycle of rate hikes and Treasury balance-sheet reductions designed to slow the economy and soak up the massive amounts of liquidity put in place to support a faltering economy.
Any review of the period would be incomplete without noting the impact of the February 24, 2022 invasion of Ukraine by Russia’s armed forces, a decision that continues to threaten global security and strain worldwide food and energy supplies. With the continued backdrop of geopolitical instability, the Fed kept its anti-inflationary policy stance in focus in March 2022 by enacting a quarter-percent increase in the federal funds rate.
After a surprise jump in consumer prices in May 2022, the Fed in June 2022 raised rates by three-quarters of a percent. Although declining gasoline prices offered consumers a measure of relief during the summer, core inflation, which excludes volatile food and energy prices, remained persistently high as the period came to an end. As the Fed added another three-quarter-percent rate hike in September and October 2022, markets remained highly volatile.
As we approach the winter months, recession concerns are likely to grow as a result of the impact of Fed rate hikes on labor markets, currencies, and corporate profits. With market volatility likely to persist, it’s more important than ever to maintain a strong relationship with your financial professional.
Thank you again for investing in Hartford Mutual Funds. For the most up-to-date information on our funds, please take advantage of all the resources available at hartfordfunds.com.
James Davey
President
Hartford Funds
| 1 | S&P 500 Index is a market capitalization-weighted price index composed of 500 widely held common stocks. The index is unmanaged and not available
for direct investment. Past performance does not guarantee future results. |
| 2 | The Consumer Price Index (CPI) in the United States is defined by the Bureau of Labor Statistics as a measure of the average change over time in the prices
paid by urban consumers for a market basket of consumer goods and services. |
Hartford Schroders Sustainable Core Bond Fund
Table of Contents
The views expressed in the Fund’s Manager Discussion contained in the Fund Overview section are views of the Fund’s portfolio managers through the end of the period and are subject to change based on market and other conditions, and we disclaim any responsibility to update the views contained herein. These views may contain statements that are “forward-looking” statements. Actual results may differ materially from those projected in the “forward-looking” statements. The Fund’s Manager Discussion is for informational purposes only and does not represent an offer, recommendation or solicitation to buy, hold or sell any security. The specific securities identified and described, if any, do not represent all of the securities purchased or sold and you should not assume that investments in the securities identified and discussed will be profitable. Holdings and characteristics are subject to change. Fund performance reflected in the Fund’s Manager Discussion reflects the returns of Class SDR shares. Returns for the Fund’s other classes differ only to the extent that the classes do not have the same expenses.
Hartford Schroders Sustainable Core Bond Fund
Fund Overview
October 31, 2022 (Unaudited)
Inception 01/31/2018
Sub-advised by Schroder Investment Management North America Inc. | Investment objective – The Fund seeks long-term total return consistent with the preservation of capital while giving special consideration to certain sustainability criteria. |
Comparison of Change in Value of $5,000,000 Investment (01/31/2018 - 10/31/2022)
The chart above represents the hypothetical growth of a $5,000,000 investment in Class SDR. Returns for the Fund’s other classes will vary from what is seen above due to differences in the expenses charged to those share classes.
| Average Annual Total Returns |
| for the Periods Ended 10/31/2022 |
| | 1 Year | Since
Inception1 |
| Class I | -16.91% | -0.16% |
| Class R3 | -17.02% | -0.18% |
| Class R4 | -16.96% | -0.17% |
| Class R5 | -16.89% | -0.15% |
| Class Y | -16.91% | -0.16% |
| Class F | -16.80% | -0.13% |
| Class SDR | -16.86% | -0.14% |
| Bloomberg US Aggregate Bond Index | -15.68% | -0.40% |
PERFORMANCE DATA QUOTED REPRESENTS PAST PERFORMANCE AND DOES NOT GUARANTEE FUTURE RESULTS. The investment return and principal value of the investment will fluctuate so that investors’ shares, when redeemed, may be worth more or less than their original cost. The chart and table do not reflect the deductions of taxes that a shareholder would pay on Fund distributions or the repurchase of Fund shares. Current performance may be lower or higher than the performance data quoted. To obtain performance data current to the most recent month-end, please visit our website hartfordfunds.com.
Total returns presented above were calculated using the applicable class' net asset value available to shareholders for sale or redemption of Fund shares on 10/31/2022, which may exclude investment transactions as of this date. All share class returns assume the reinvestment of all distributions at net asset value and the deduction of all fund expenses. The total returns presented in the Financial Highlights section of the report are calculated in the same manner, but also take into account certain adjustments that are necessary under generally accepted accounting principles. As a result, the total returns in the Financial Highlights section may differ from the total returns presented above.
Effective after the close of business on 11/12/2021, the Schroder Core Bond Fund (the “Predecessor Fund”) was reorganized into the Fund (the "Reorganization"). The performance information shown for periods prior to the Reorganization is that of the Predecessor Fund. Prior to the Reorganization, Class SDR shares were called R6 Shares and Class Y shares were called Investor Shares.
Class I shares commenced operations on 11/12/2021 and performance prior to this date reflects the historical performance, fees and expenses of the Predecessor Fund’s Investor Shares and, prior to 06/29/2020 (the inception date of the Predecessor Fund’s Investor Shares), the historical performance, fees and expenses of the Predecessor Fund’s R6 Shares.
Class R3, Class R4, Class R5 and Class F shares commenced operations on 11/12/2021 and performance prior to this date reflects the historical performance, fees and expenses of the Predecessor Fund’s R6 Shares.
Performance for Class Y shares prior to 06/29/2020 (the inception date of the Predecessor Fund’s Investor Shares) reflects the historical performance, fees and expenses of R6 Shares of the Predecessor Fund.
The returns would be different if the Fund’s fees and expenses were reflected for periods prior to the Reorganization.
You cannot invest directly in an index.
See "Benchmark Glossary" for benchmark descriptions.
Performance information may reflect expense waivers/reimbursements without which performance would have been lower. For information on current expense waivers/reimbursements, please see the prospectus.
Hartford Schroders Sustainable Core Bond Fund
Fund Overview – (continued)
October 31, 2022 (Unaudited)
| Operating Expenses* | Gross | Net |
| Class I | 0.61% | 0.51% |
| Class R3 | 1.22% | 1.06% |
| Class R4 | 0.92% | 0.76% |
| Class R5 | 0.61% | 0.46% |
| Class Y | 0.61% | 0.40% |
| Class F | 0.51% | 0.36% |
| Class SDR | 0.51% | 0.32% |
| * | Expenses as shown in the Fund’s most recent prospectus. Gross expenses do not reflect contractual expense reimbursement arrangements. Net expenses reflect such arrangements in instances when they reduce gross expenses. These arrangements remain in effect until 02/28/2023 for Classes I, R3, R4, R5 and F, and 11/15/2023 for Classes Y and SDR unless the Fund’s Board of Directors approves an earlier termination. Actual expenses may be higher or lower. Please see accompanying Financial Highlights for expense ratios for the period ended 10/31/2022. |
Portfolio Managers
Hartford Schroders Sustainable Core Bond Fund’s sub-adviser is Schroder Investment Management North America Inc.
Lisa Hornby, CFA
Portfolio Manager and Head of US Multi-Sector Fixed Income
Neil G. Sutherland, CFA
Portfolio Manager
Julio C. Bonilla, CFA
Portfolio Manager
Eric Lau, CFA
Portfolio Manager
Manager Discussion
How did the Fund perform during the period?
The Class SDR shares of the Hartford Schroders Sustainable Core Bond Fund returned -16.86% for the twelve-month period ended October 31, 2022, underperforming the Fund’s benchmark, the Bloomberg US Aggregate Bond Index, which returned -15.68% for the same period. For the same period, the Class SDR shares of the Fund also underperformed the -16.23% average return of the Lipper Core Bond Funds peer group, a group of funds with investment strategies similar to those of the Fund.
Why did the Fund perform this way?
The Fund underperformed its benchmark for the period ended October 31, 2022 due to sector selection and issuer selection. The overweight to corporate bonds (which was 28% higher than the benchmark on average over the period) was the main detractor from the Fund’s performance relative to the Bloomberg US Aggregate Bond Index given wider credit spreads of 77 basis points (bps) over the period, while the underweight to Treasuries (which was 12% lower than the benchmark on average over the period) also detracted from performance to a lesser degree. Negative sector selection resulted
from the Fund’s overweight to the banking industry, with smaller negative impacts to performance from overweights to the real estate investment trusts (REITs) and communications industries. The Fund’s underweight to agency mortgage-backed securities (MBS) was the only material positive contributor to relative performance for the period. The overweight to banking (which was 16% higher than the benchmark on average over the period) was the largest single industry detractor from relative returns and the largest detractor from security selection within corporate bonds.
Yield curve and duration impacts were positive contributors to performance; however, these impacts were generally the fallout from the sector allocation decisions. With interest rates rising materially higher over the period, the Fund’s underweights to agency MBS and Treasuries resulted in less exposure to rising rates and positive contributions to relative returns.
Inflation was higher and more persistent than anticipated, driven by continuing labor-market strength, supply-side disruption related to the Russian/Ukraine war, and COVID-19 quarantines in China. This led to a more aggressive interest-rate hiking cycle by the U.S. Federal Reserve (Fed), which drove interest rates higher as measured by the 10-year Treasury, which rose by 249 bps over the period.
Hartford Schroders Sustainable Core Bond Fund
Fund Overview – (continued)
October 31, 2022 (Unaudited)
While we had modestly reduced the Fund’s corporate bond allocation during the fourth quarter of 2021, we entered 2022 with a moderate overweight. The Fund’s overweight was driven by i) our view that inflation would peak during in the first half of 2022 as sharp increases to inflation during the initial months of the reopening in 2021 were expected to roll off of annual calculations due to supply-chain issues being resolved; and ii) our expectation that the economy would continue to expand at a moderate pace. However, in the months following Russia’s invasion of Ukraine, this view was revised, and we were generally building liquidity and reducing corporate risk for the last six months of the period.
Based on our proprietary sustainable scoring methodology, we maintained the positive sustainability profile of the Fund over the period, and in some areas saw a slight improvement relative to the Bloomberg US Aggregate Bond Index. We believe our sustainable investing approach has led to a natural skew towards higher-quality sustainable issuers.
Derivatives were not used in the Fund during the period.
What is the outlook as of the end of the period?
Fixed-income markets have undergone historic drawdowns over the course of 2022 and have not provided the ballast many investors expected. With Treasury yields as high as they are, we believe there is less need to extend out along the risk spectrum, particularly as we believe the U.S. economy is likely to enter an economic recession in the coming months. In addition, given the generous short corporate break-even buffers (the yield to which bonds would have to rise for capital losses to offset the income earned over 12 months) combined with accumulated rate increases, which we believe will slow the economy, and inflation cresting, we believe the opportunity within fixed income is considerable.
As of the end of the period, we have reduced exposure to investment-grade corporate bonds within the Fund relative to the benchmark. While the Fund was overweight to investment-grade corporate bonds as of the end of the period, the position was concentrated in shorter-maturity bonds. With credit curves flat, we believe there is little need to buy longer-maturity corporate bonds with high degrees of spread sensitivity, especially given our view that credit spreads will continue to widen. We believe that short-dated bonds will be relatively insulated from such moves, given their low sensitivity to price changes and the high degree of income that they generate. We believe there will be opportunities in higher-risk credit in the coming months, but from our perspective, current valuations remain too expensive. With the potential for recession as our base case, we believe we are well-positioned to seek to take advantage of these dislocations in the coming months.
Important Risks
Investing involves risk, including the possible loss of principal. Security prices fluctuate in value depending on general market and economic conditions and the prospects of individual companies. • Fixed income security risks include credit, liquidity, call, duration, and interest-rate
risk. As interest rates rise, bond prices generally fall. • Obligations of U.S. Government agencies are supported by varying degrees of credit but are generally not backed by the full faith and credit of the U.S. Government. • Mortgage-related and asset-backed securities' risks include credit, interest-rate, prepayment, and extension risk. • Municipal securities may be adversely impacted by state/local, political, economic, or market conditions; these risks may be magnified if the Fund focuses its assets in municipal securities of issuers in a few select states. • Applying sustainability criteria to the investment process may result in foregoing certain investments and underperformance comparative to funds that do not have a similar focus. There is a risk that the securities identified by the sub-adviser as meeting its sustainable investing criteria do not operate as anticipated. • Derivatives are generally more volatile and sensitive to changes in market or economic conditions than other securities; their risks include currency, leverage, liquidity, index, pricing, regulatory and counterparty risk. • The Fund may have high portfolio turnover, which could increase its transaction costs and an investor's tax liability. • The value of inflation-protected securities (IPS) generally fluctuates with changes in real interest rates, and the market for IPS may be less developed or liquid, and more volatile, than other securities markets. • Investments in high-yield ("junk") bonds involve greater risk of price volatility, illiquidity, and default than higher-rated debt securities. • The purchase of securities in the To-Be-Announced (TBA) market can result in higher portfolio turnover and related expenses as well as price and counterparty risk. • Loans can be difficult to value and less liquid than other types of debt instruments; they are also subject to nonpayment, collateral, bankruptcy, default, extension, prepayment and insolvency risks. • Foreign investments may be more volatile and less liquid than U.S. investments and are subject to the risk of currency fluctuations and adverse political, economic and regulatory developments. • Changes related to LIBOR could have an adverse impact on financial instruments that reference this rate.
| Composition by Security Type(1) |
| as of 10/31/2022 |
| Category | Percentage of
Net Assets |
| Fixed Income Securities | |
| Asset & Commercial Mortgage-Backed Securities | 2.3% |
| Corporate Bonds | 44.2 |
| Municipal Bonds | 3.5 |
| U.S. Government Agencies(2) | 19.1 |
| U.S. Government Securities | 29.8 |
| Total | 98.9% |
| Short-Term Investments | 1.1 |
| Other Assets & Liabilities | (0.0) * |
| Total | 100.0% |
| * | Percentage rounds to zero. |
| (1) | For Fund compliance purposes, the Fund may not use the same classification system. These classifications are used for financial reporting purposes. |
| (2) | All, or a portion of the securities categorized as U.S. Government Agencies, were agency mortgage-backed securities as of October 31, 2022. |
Hartford Schroders Sustainable Core Bond Fund
Benchmark Glossary (Unaudited)
| Bloomberg US Aggregate Bond Index (reflects no deduction for fees, expenses or taxes) is composed of securities that cover the US investment grade fixed rate bond market, with index components for government and corporate securities, mortgage pass-through securities, and asset-backed securities. |
| Additional Information Regarding Bloomberg Index(es). “Bloomberg®” and the above referenced Bloomberg index(es) are service marks of Bloomberg Finance L.P. and its affiliates, including Bloomberg Index Services Limited (“BISL”), the administrator of the index (collectively, “Bloomberg”), and have been licensed for use for certain purposes by Hartford Funds Management Company, LLC ("HFMC"). The Fund is not sponsored, endorsed, sold or promoted by Bloomberg. Bloomberg does not make any representation or warranty, express or implied, to the owners of or counterparties to the Fund or any member of the public regarding the advisability of investing in securities generally or in the Fund particularly. The only relationship of Bloomberg to HFMC is the licensing of certain trademarks, trade names and service marks and of the above referenced Bloomberg index(es), which is determined, composed and calculated by BISL without regard to HFMC or the Fund. Bloomberg has no obligation to take the needs of HFMC or the owners of the Fund into consideration in determining, composing or calculating the above referenced Bloomberg index(es). Bloomberg is not responsible for and has not participated in the determination of the timing of, prices at, or quantities of the Fund to be issued. Bloomberg shall not have any obligation or liability, including, without limitation, to the Fund's customers, in connection with the administration, marketing or trading of the Fund. |
| BLOOMBERG DOES NOT GUARANTEE THE ACCURACY AND/OR THE COMPLETENESS OF THE ABOVE REFERENCED BLOOMBERG INDEX(ES) OR ANY DATA RELATED THERETO AND SHALL HAVE NO LIABILITY FOR ANY ERRORS, OMISSIONS OR INTERRUPTIONS THEREIN. BLOOMBERG DOES NOT MAKE ANY WARRANTY, EXPRESS OR IMPLIED, AS TO RESULTS TO BE OBTAINED BY HFMC, OWNERS OF THE FUND OR ANY OTHER PERSON OR ENTITY FROM THE USE OF THE ABOVE REFERENCED BLOOMBERG INDEX(ES) OR ANY DATA RELATED THERETO. BLOOMBERG DOES NOT MAKE ANY EXPRESS OR IMPLIED WARRANTIES AND EXPRESSLY DISCLAIMS ALL WARRANTIES OF MERCHANTABILITY OR FITNESS FOR A PARTICULAR PURPOSE OR USE WITH RESPECT TO THE ABOVE REFERENCED BLOOMBERG INDEX(ES) OR ANY DATA RELATED THERETO. WITHOUT LIMITING ANY OF THE FOREGOING, TO THE MAXIMUM EXTENT ALLOWED BY LAW, BLOOMBERG, ITS LICENSORS, AND ITS AND THEIR RESPECTIVE EMPLOYEES, CONTRACTORS, AGENTS, SUPPLIERS, AND VENDORS SHALL HAVE NO LIABILITY OR RESPONSIBILITY WHATSOEVER FOR ANY INJURY OR DAMAGES --WHETHER DIRECT, INDIRECT, CONSEQUENTIAL, INCIDENTAL, PUNITIVE OR OTHERWISE --ARISING IN CONNECTION WITH THE ABOVE REFERENCED BLOOMBERG INDEX(ES) OR ANY DATA OR VALUES RELATING THERETO --WHETHER ARISING FROM THEIR NEGLIGENCE OR OTHERWISE, EVEN IF NOTIFIED OF THE POSSIBILITY THEREOF. |
Hartford Schroders Sustainable Core Bond Fund
Expense Examples (Unaudited)
Your Fund's Expenses
As a shareholder of the Fund, you incur two types of costs: (1) transaction costs, including sales charges (loads) on purchase payments, if any, and contingent deferred sales charges (CDSC), if any, and (2) ongoing costs, including investment management fees, distribution and/or service (12b-1) fees, if any, and other fund expenses. This example is intended to help you understand your ongoing costs (in dollars) of investing in the Fund and to compare these costs with the ongoing costs of investing in other mutual funds. The example is based on an investment of $1,000 invested at the beginning of the period and held for the entire period of May 1, 2022 through October 31, 2022. To the extent the Fund was subject to acquired fund fees and expenses during the period, acquired fund fees and expenses are not included in the annualized expense ratios below.
Actual Expenses
The first set of columns of the table below provides information about actual account values and actual expenses. You may use this information, together with the amount you invested, to estimate the expenses that you paid over the period. Simply divide your account value by $1,000 (for example, an $8,600 account value divided by $1,000 = 8.6), then multiply the result by the number in the line under the heading entitled “Expenses Paid During The Period” to estimate the expenses you paid on your account during this period.
Hypothetical Example for Comparison Purposes
The second set of columns of the table below provides information about hypothetical account values and hypothetical expenses based on the Fund’s actual expense ratio and an assumed rate of return of 5% per year before expenses, which is not the Fund’s actual return. The hypothetical account values and expenses may not be used to estimate the actual ending account balance or expenses you paid for the period. You may use this information to compare the ongoing costs of investing in the Fund and other funds. To do so, compare this 5% hypothetical example with the 5% hypothetical examples that appear in the shareholder reports of the other funds.
Please note that the expenses shown in the table are meant to highlight your ongoing costs only and do not reflect any transactional costs, such as sales charges (loads and CDSC). Therefore, the second set of columns of the table is useful in comparing ongoing costs only, and will not help you determine the relative total costs of owning different funds. In addition, if these transactional costs were included, your costs would be higher. Expenses for a class of the Fund are equal to the class' annualized expense ratio multiplied by average account value over the period, multiplied by 184/365 (to reflect the one-half year period).
| | Actual Return | | Hypothetical (5% return before expenses) |
| | Beginning
Account Value
May 1, 2022 | | Ending
Account Value
October 31, 2022 | | Expenses paid
during the period
May 1, 2022
through
October 31, 2022 | | Beginning
Account Value
May 1, 2022 | | Ending
Account Value
October 31, 2022 | | Expenses paid
during the period
May 1, 2022
through
October 31, 2022 | | Annualized
expense
ratio |
| Hartford Schroders Sustainable Core Bond Fund |
| Class I | $ 1,000.00 | | $ 924.30 | | $ 2.57 | | $ 1,000.00 | | $ 1,022.53 | | $ 2.70 | | 0.53% (1) |
| Class R3 | $ 1,000.00 | | $ 923.70 | | $ 3.01 | | $ 1,000.00 | | $ 1,022.13 | | $ 3.16 | | 0.62% |
| Class R4 | $ 1,000.00 | | $ 924.10 | | $ 2.81 | | $ 1,000.00 | | $ 1,022.23 | | $ 2.96 | | 0.58% |
| Class R5 | $ 1,000.00 | | $ 923.40 | | $ 2.23 | | $ 1,000.00 | | $ 1,022.84 | | $ 2.35 | | 0.46% |
| Class Y | $ 1,000.00 | | $ 924.70 | | $ 1.94 | | $ 1,000.00 | | $ 1,023.19 | | $ 2.04 | | 0.40% |
| Class F | $ 1,000.00 | | $ 923.90 | | $ 1.75 | | $ 1,000.00 | | $ 1,023.39 | | $ 1.84 | | 0.36% |
| Class SDR | $ 1,000.00 | | $ 924.10 | | $ 1.55 | | $ 1,000.00 | | $ 1,023.59 | | $ 1.63 | | 0.32% |
| (1) | The annualized expense ratio is representative of the period from May 1, 2022 through October 31, 2022. The annualized expense ratio does not fully reflect the contractual expense limitation arrangement as this arrangement is based on the entire fiscal year and not the six-month period. As such, the annualized expense ratio exceeds the amount of the contractual expense limitation arrangement for this share class of the Fund for purposes of the hypothetical example. Please see the accompanying Financial Highlights for the expense ratio for the year ended October 31, 2022. |
Hartford Schroders Sustainable Core Bond Fund
Schedule of Investments
October 31, 2022
| Shares or Principal Amount | | Market Value† |
| ASSET & COMMERCIAL MORTGAGE-BACKED SECURITIES - 2.3% |
| | Asset-Backed - Finance & Insurance - 1.8% |
| $ 486,000 | Cedar Funding VI CLO Ltd. 5.29%, 04/20/2034, 3 mo. USD LIBOR + 1.050%(1)(2) | $ 463,544 |
| 500,000 | Dewolf Park CLO Ltd. 5.00%, 10/15/2030, 3 mo. USD LIBOR + 0.920%(1)(2) | 489,353 |
| 800,000 | Madison Park Funding XVIII Ltd. 5.22%, 10/21/2030, 3 mo. USD LIBOR + 0.940%(1)(2) | 782,094 |
| 600,000 | Madison Park Funding XXVI Ltd. 5.61%, 07/29/2030, 3 mo. USD LIBOR + 1.200%(1)(2) | 587,633 |
| 250,000 | Octagon Investment Partners 30 Ltd. 5.24%, 03/17/2030, 3 mo. USD LIBOR + 1.000%(1)(2) | 244,151 |
| | | | 2,566,775 |
| | Other Asset-Backed Securities - 0.4% |
| 606,000 | Goldentree Loan Management U.S. CLO Ltd. 5.15%, 11/20/2030, 3 mo. USD LIBOR + 0.910%(1)(2) | 591,304 |
| | Whole Loan Collateral CMO - 0.1% |
| | Towd Point Mortgage Trust | |
| 7,326 | 2.75%, 04/25/2057(1)(3) | 7,217 |
| 44,144 | 2.75%, 06/25/2057(1)(3) | 41,725 |
| 52,884 | 2.75%, 07/25/2057(1)(3) | 51,697 |
| | | | 100,639 |
| | Total Asset & Commercial Mortgage-Backed Securities
(cost $3,346,920) | $ 3,258,718 |
| CORPORATE BONDS - 44.2% |
| | Auto Manufacturers - 2.1% |
| 223,000 | General Motors Co. 6.13%, 10/01/2025 | $ 221,919 |
| | General Motors Financial Co., Inc. | |
| 983,000 | 1.50%, 06/10/2026 | 826,763 |
| 226,000 | 3.25%, 01/05/2023 | 225,340 |
| 1,325,000 | Hyundai Capital America 1.50%, 06/15/2026(1) | 1,105,054 |
| 710,000 | Volkswagen Group of America Finance LLC 4.35%, 06/08/2027(1) | 658,200 |
| | | | 3,037,276 |
| | Auto Parts & Equipment - 0.7% |
| 292,000 | Aptiv plc / Aptiv Corp. 3.25%, 03/01/2032 | 232,691 |
| 53,000 | Magna International, Inc. 4.15%, 10/01/2025 | 51,486 |
| 967,000 | Tyco Electronics Group S.A. 2.50%, 02/04/2032 | 769,374 |
| | | | 1,053,551 |
| | Beverages - 0.6% |
| 612,000 | Anheuser-Busch Cos. LLC / Anheuser-Busch InBev Worldwide, Inc. 4.90%, 02/01/2046 | 522,934 |
| 433,000 | JDE Peet's N.V. 1.38%, 01/15/2027(1) | 355,016 |
| | | | 877,950 |
| | Commercial Banks - 16.6% |
| | Bank of America Corp. | |
| 30,000 | 2.46%, 10/22/2025, (2.46% fixed rate until 10/22/2024; 3 mo. USD LIBOR + 0.870% thereafter)(4) | 27,985 |
| 397,000 | 3.00%, 12/20/2023, (3.00% fixed rate until 12/20/2022; 3 mo. USD LIBOR + 0.790% thereafter)(4) | 395,563 |
| 422,000 | 3.25%, 10/21/2027 | 376,443 |
| 467,000 | 3.38%, 04/02/2026, (3.38% fixed rate until 04/02/2025; 3 mo. USD SOFR + 1.330% thereafter)(4) | 438,375 |
| 512,000 | 3.50%, 04/19/2026 | 477,938 |
| Shares or Principal Amount | | Market Value† |
| CORPORATE BONDS - 44.2% - (continued) |
| | Commercial Banks - 16.6% - (continued) |
| $ 550,000 | 3.85%, 03/08/2037, (3.85% fixed rate until 03/08/2032; 5 year USD CMT + 2.000% thereafter)(4) | $ 440,245 |
| | Bank of Ireland Group plc | |
| 1,672,000 | 2.03%, 09/30/2027, (2.03% fixed rate until 09/30/2026; 12 mo. USD CMT + 1.100% thereafter)(1)(4) | 1,357,971 |
| 285,000 | 4.50%, 11/25/2023(1) | 279,243 |
| | Barclays plc | |
| 1,336,000 | 3.56%, 09/23/2035, (3.56% fixed rate until 09/23/2030; 5 year USD CMT + 2.900% thereafter)(4) | 941,243 |
| 1,219,000 | 7.33%, 11/02/2026, 12 mo. USD CMT + 3.050% | 1,217,025 |
| 733,000 | BNP Paribas S.A. 2.22%, 06/09/2026, (2.22% fixed rate until 06/09/2025; 3 mo. USD SOFR + 2.074% thereafter)(1)(4) | 655,232 |
| | Citigroup, Inc. | |
| 809,000 | 0.98%, 05/01/2025, (0.98% fixed rate until 05/01/2024; 3 mo. USD SOFR + 0.669% thereafter)(4) | 748,313 |
| 734,000 | 3.20%, 10/21/2026 | 668,253 |
| 56,000 | 4.30%, 11/20/2026 | 52,736 |
| 339,000 | Credit Suisse Group AG 3.09%, 05/14/2032, (3.09% fixed rate until 05/14/2031; 3 mo. USD SOFR + 1.730% thereafter)(1)(4) | 232,313 |
| 554,000 | Danske Bank A/S 1.62%, 09/11/2026, (1.62% fixed rate until 09/11/2025; 12 mo. USD CMT + 1.350% thereafter)(1)(4) | 470,657 |
| | Goldman Sachs Group, Inc. | |
| 105,000 | 1.95%, 10/21/2027, (1.95% fixed rate until 10/21/2026; 3 mo. USD SOFR + 0.913% thereafter)(4) | 89,133 |
| 1,503,000 | 2.64%, 02/24/2028, (2.64% fixed rate until 02/24/2027; 3 mo. USD SOFR + 1.114% thereafter)(4) | 1,298,913 |
| 90,000 | 3.50%, 11/16/2026 | 82,775 |
| 1,227,000 | 4.48%, 08/23/2028, (4.48% fixed rate until 08/23/2027; 3 mo. USD SOFR + 1.725% thereafter)(4) | 1,139,308 |
| | HSBC Holdings plc | |
| 1,356,000 | 2.10%, 06/04/2026, (2.10% fixed rate until 06/04/2025; 3 mo. USD SOFR + 1.929% thereafter)(4) | 1,192,276 |
| 657,000 | 2.63%, 11/07/2025, (2.63% fixed rate until 11/07/2024; 3 mo. USD SOFR + 1.402% thereafter)(4) | 600,262 |
| | JP Morgan Chase & Co. | |
| 894,000 | 1.58%, 04/22/2027, (1.58% fixed rate until 04/22/2026; 3 mo. USD SOFR + 0.885% thereafter)(4) | 768,710 |
| 689,000 | 2.01%, 03/13/2026, (2.01% fixed rate until 03/13/2025; 3 mo. USD SOFR + 1.585% thereafter)(4) | 627,861 |
| 693,000 | 2.60%, 02/24/2026, (2.60% fixed rate until 02/24/2025; 3 mo. USD SOFR + 0.915% thereafter)(4) | 641,821 |
| | Lloyds Banking Group plc | |
| 1,205,000 | 1.63%, 05/11/2027, (1.63% fixed rate until 05/11/2026; 12 mo. USD CMT + 0.850% thereafter)(4) | 1,008,101 |
| 280,000 | 2.44%, 02/05/2026, (2.44% fixed rate until 02/05/2025; 12 mo. USD CMT + 1.000% thereafter)(4) | 254,403 |
The accompanying notes are an integral part of these financial statements.
Hartford Schroders Sustainable Core Bond Fund
Schedule of Investments – (continued)
October 31, 2022
| Shares or Principal Amount | | Market Value† |
| CORPORATE BONDS - 44.2% - (continued) |
| | Commercial Banks - 16.6% - (continued) |
| $ 555,000 | 3.75%, 03/18/2028, (3.75% fixed rate until 03/18/2027; 12 mo. USD CMT + 1.800% thereafter)(4) | $ 488,742 |
| | Morgan Stanley | |
| 1,517,000 | 2.63%, 02/18/2026, (2.63% fixed rate until 02/18/2025; 3 mo. USD SOFR + 0.940% thereafter)(4) | 1,404,075 |
| 790,000 | 3.63%, 01/20/2027 | 727,651 |
| 1,262,000 | Natwest Group plc 3.07%, 05/22/2028, (3.07% fixed rate until 05/22/2027; 12 mo. USD CMT + 2.550% thereafter)(4) | 1,071,187 |
| | Santander UK Group Holdings plc | |
| 400,000 | 1.09%, 03/15/2025, (1.09% fixed rate until 03/15/2024; 3 mo. USD SOFR + 0.787% thereafter)(4) | 366,788 |
| 1,205,000 | 1.67%, 06/14/2027, (1.67% fixed rate until 06/14/2026; 3 mo. USD SOFR + 0.989% thereafter)(4) | 984,229 |
| 218,000 | Standard Chartered plc 2.68%, 06/29/2032, (2.68% fixed rate until 06/29/2031; 12 mo. USD CMT + 1.200% thereafter)(1)(4) | 152,137 |
| 812,000 | UniCredit S.p.A. 3.13%, 06/03/2032, (3.13% fixed rate until 06/03/2031; 12 mo. USD CMT + 1.550% thereafter)(1)(4) | 571,618 |
| | Wells Fargo & Co. | |
| 1,631,000 | 2.39%, 06/02/2028, (2.39% fixed rate until 06/02/2027; 3 mo. USD SOFR + 2.100% thereafter)(4) | 1,392,771 |
| 212,000 | 3.00%, 04/22/2026 | 193,962 |
| 117,000 | 3.53%, 03/24/2028, (3.53% fixed rate until 03/24/2027; 3 mo. USD SOFR + 1.510% thereafter)(4) | 105,336 |
| | | | 23,941,594 |
| | Commercial Services - 0.3% |
| 90,000 | Moody's Corp. 4.88%, 02/15/2024 | 89,507 |
| 282,000 | Quanta Services, Inc. 0.95%, 10/01/2024 | 256,950 |
| | | | 346,457 |
| | Diversified Financial Services - 1.6% |
| 1,118,000 | AerCap Ireland Capital DAC / AerCap Global Aviation Trust 3.30%, 01/30/2032 | 835,990 |
| 1,011,000 | Ally Financial, Inc. 2.20%, 11/02/2028 | 770,660 |
| 855,000 | Capital One Financial Corp. 3.27%, 03/01/2030, (3.27% fixed rate until 03/01/2029; 3 mo. USD SOFR + 1.790% thereafter)(4) | 702,616 |
| | | | 2,309,266 |
| | Electric - 2.8% |
| 206,000 | EDP Finance BV 6.30%, 10/11/2027 | 204,878 |
| | Enel Finance International N.V. | |
| 1,643,000 | 1.88%, 07/12/2028(1) | 1,234,884 |
| 531,000 | 7.50%, 10/14/2032 | 531,359 |
| 1,827,000 | Public Service Enterprise Group, Inc. 1.60%, 08/15/2030 | 1,353,802 |
| 347,000 | Sempra Energy 3.70%, 04/01/2029 | 305,761 |
| 370,000 | Southern California Edison Co. 4.70%, 06/01/2027 | 357,066 |
| | | | 3,987,750 |
| | Entertainment - 0.8% |
| | Magallanes, Inc. | |
| 1,045,000 | 3.76%, 03/15/2027(1) | 929,357 |
| 381,000 | 5.05%, 03/15/2042(1) | 277,941 |
| | | | 1,207,298 |
| Shares or Principal Amount | | Market Value† |
| CORPORATE BONDS - 44.2% - (continued) |
| | Environmental Control - 0.7% |
| $ 1,309,000 | Republic Services, Inc. 2.38%, 03/15/2033 | $ 1,000,864 |
| | Healthcare - Products - 0.3% |
| 90,000 | Abbott Laboratories 3.40%, 11/30/2023 | 88,755 |
| 373,000 | Baxter International, Inc. 2.54%, 02/01/2032 | 284,063 |
| 39,000 | Boston Scientific Corp. 3.45%, 03/01/2024 | 38,089 |
| | | | 410,907 |
| | Healthcare - Services - 1.2% |
| 225,000 | Aetna, Inc. 2.80%, 06/15/2023 | 221,719 |
| 531,000 | CommonSpirit Health 3.35%, 10/01/2029 | 445,264 |
| 11,000 | Elevance Health, Inc. 4.10%, 03/01/2028 | 10,301 |
| 1,051,000 | HCA, Inc. 3.38%, 03/15/2029(1) | 887,969 |
| 235,000 | Humana, Inc. 3.70%, 03/23/2029 | 209,320 |
| | | | 1,774,573 |
| | Insurance - 1.5% |
| 2,000 | Aflac, Inc. 6.45%, 08/15/2040 | 1,984 |
| 126,000 | American International Group, Inc. 3.90%, 04/01/2026 | 120,020 |
| 513,000 | Corebridge Financial, Inc. 3.65%, 04/05/2027(1) | 464,481 |
| 237,000 | Equitable Financial Life Global Funding 1.40%, 08/27/2027(1) | 194,885 |
| 100,000 | Equitable Holdings, Inc. 4.35%, 04/20/2028 | 92,791 |
| 877,000 | Guardian Life Global Funding 3.25%, 03/29/2027(1) | 808,597 |
| 501,000 | Willis North America, Inc. 4.65%, 06/15/2027 | 471,240 |
| | | | 2,153,998 |
| | IT Services - 0.3% |
| 612,000 | Dell International LLC / EMC Corp. 3.38%, 12/15/2041(1) | 378,599 |
| | Media - 1.1% |
| | Charter Communications Operating LLC / Charter Communications Operating Capital | |
| 999,000 | 2.25%, 01/15/2029 | 784,771 |
| 1,038,000 | 3.50%, 06/01/2041 | 652,400 |
| | Discovery Communications LLC | |
| 93,000 | 2.95%, 03/20/2023 | 92,189 |
| 36,000 | 3.63%, 05/15/2030 | 29,039 |
| | | | 1,558,399 |
| | Mining - 0.8% |
| 831,000 | Anglo American Capital plc 2.25%, 03/17/2028(1) | 673,383 |
| 710,000 | Yamana Gold, Inc. 2.63%, 08/15/2031 | 512,856 |
| | | | 1,186,239 |
| | Oil & Gas - 0.5% |
| | Cenovus Energy, Inc. | |
| 379,000 | 2.65%, 01/15/2032 | 292,039 |
| 73,000 | 6.75%, 11/15/2039 | 71,623 |
| 380,000 | Equinor ASA 2.38%, 05/22/2030 | 313,790 |
| 102,000 | Phillips 66 Co. 3.75%, 03/01/2028(1) | 91,562 |
| | | | 769,014 |
| | Pharmaceuticals - 0.8% |
| | AbbVie, Inc. | |
| 673,000 | 3.20%, 11/21/2029 | 586,586 |
| 228,000 | 3.60%, 05/14/2025 | 218,710 |
| 105,000 | 3.80%, 03/15/2025 | 101,254 |
| 108,000 | 3.85%, 06/15/2024 | 105,695 |
| 42,000 | Becton Dickinson and Co. 3.73%, 12/15/2024 | 40,711 |
| 41,000 | CVS Health Corp. 4.30%, 03/25/2028 | 38,452 |
| | | | 1,091,408 |
The accompanying notes are an integral part of these financial statements.
Hartford Schroders Sustainable Core Bond Fund
Schedule of Investments – (continued)
October 31, 2022
| Shares or Principal Amount | | Market Value† |
| CORPORATE BONDS - 44.2% - (continued) |
| | Pipelines - 0.5% |
| $ 69,000 | Enbridge, Inc. 4.25%, 12/01/2026 | $ 65,214 |
| 90,000 | ONEOK, Inc. 6.35%, 01/15/2031 | 88,717 |
| | Plains All American Pipeline L.P. / PAA Finance Corp. | |
| 219,000 | 3.55%, 12/15/2029 | 182,351 |
| 480,000 | 3.80%, 09/15/2030 | 399,863 |
| | | | 736,145 |
| | Real Estate Investment Trusts - 4.2% |
| 174,000 | Alexandria Real Estate Equities, Inc. 2.00%, 05/18/2032 | 125,157 |
| | American Tower Corp. | |
| 489,000 | 2.40%, 03/15/2025 | 452,098 |
| 866,000 | 3.65%, 03/15/2027 | 782,833 |
| | Boston Properties L.P. | |
| 508,000 | 2.45%, 10/01/2033 | 349,780 |
| 1,057,000 | 3.40%, 06/21/2029 | 873,410 |
| | Crown Castle, Inc. | |
| 158,000 | 3.20%, 09/01/2024 | 152,216 |
| 706,000 | 3.80%, 02/15/2028 | 636,208 |
| 841,000 | Equinix, Inc. 3.90%, 04/15/2032 | 706,994 |
| 291,000 | ERP Operating L.P. 3.00%, 07/01/2029 | 247,018 |
| 144,000 | Healthcare Realty Holdings L.P. 2.40%, 03/15/2030 | 109,292 |
| 127,000 | Healthpeak Properties, Inc. 3.25%, 07/15/2026 | 116,576 |
| 527,000 | Kimco Realty Corp. 2.70%, 10/01/2030 | 414,738 |
| 1,063,000 | Sabra Health Care L.P. 3.20%, 12/01/2031 | 765,472 |
| 412,000 | VICI Properties L.P. 4.95%, 02/15/2030 | 372,366 |
| | | | 6,104,158 |
| | Retail - 0.4% |
| 441,000 | Genuine Parts Co. 2.75%, 02/01/2032 | 341,499 |
| 294,000 | Home Depot, Inc. 4.50%, 09/15/2032 | 278,353 |
| | | | 619,852 |
| | Semiconductors - 0.6% |
| | Qorvo, Inc. | |
| 261,000 | 1.75%, 12/15/2024(1) | 238,006 |
| 754,000 | 4.38%, 10/15/2029 | 642,500 |
| | | | 880,506 |
| | Software - 0.9% |
| 697,000 | S&P Global, Inc. 2.70%, 03/01/2029(1) | 598,819 |
| 166,000 | Take-Two Interactive Software, Inc. 3.70%, 04/14/2027 | 153,272 |
| | VMware, Inc. | |
| 507,000 | 1.80%, 08/15/2028 | 400,036 |
| 140,000 | 2.20%, 08/15/2031 | 101,804 |
| | | | 1,253,931 |
| | Telecommunications - 2.9% |
| | AT&T, Inc. | |
| 1,190,000 | 1.65%, 02/01/2028 | 981,556 |
| 330,000 | 2.75%, 06/01/2031 | 263,838 |
| 613,000 | Rogers Communications, Inc. 3.20%, 03/15/2027(1) | 555,720 |
| | T-Mobile USA, Inc. | |
| 92,000 | 2.40%, 03/15/2029 | 75,119 |
| 1,243,000 | 3.88%, 04/15/2030 | 1,097,088 |
| | Verizon Communications, Inc. | |
| 453,000 | 3.15%, 03/22/2030 | 382,484 |
| 120,000 | 4.02%, 12/03/2029 | 108,226 |
| 788,000 | 4.33%, 09/21/2028 | 738,460 |
| | | | 4,202,491 |
| Shares or Principal Amount | | Market Value† |
| CORPORATE BONDS - 44.2% - (continued) |
| | Water - 2.0% |
| $ 950,000 | American Water Capital Corp. 4.45%, 06/01/2032 | $ 875,142 |
| 1,880,000 | United Utilities plc 6.88%, 08/15/2028 | 1,932,915 |
| | | | 2,808,057 |
| | Total Corporate Bonds
(cost $73,997,348) | $ 63,690,283 |
| MUNICIPAL BONDS - 3.5% |
| | General - 1.0% |
| 240,000 | City of New York, NY, GO 4.50%, 05/01/2049 | $ 223,443 |
| 265,000 | Philadelphia, PA, Auth for Industrial Dev Rev 3.96%, 04/15/2026 | 256,054 |
| 1,045,000 | Triborough Bridge & Tunnel, NY, Auth Rev 4.50%, 05/15/2047 | 987,536 |
| | | | 1,467,033 |
| | Higher Education - 0.1% |
| 130,000 | California State University Rev 3.07%, 11/01/2042 | 89,021 |
| 100,000 | Clifton, TX, Higher Education Finance Corp. Rev, (PSF-GTD Insured) 4.25%, 08/15/2052 | 90,990 |
| | | | 180,011 |
| | Power - 0.8% |
| 1,175,000 | Louisiana Local Gov't Environmental Facs & Community Dev Auth Rev 4.15%, 02/01/2033 | 1,095,286 |
| | School District - 0.2% |
| 100,000 | Belton, TX, Independent School Dist, GO 4.00%, 02/15/2052 | 85,825 |
| 260,000 | Waco, TX, Independent School Dist, GO 4.25%, 08/15/2052 | 239,608 |
| | | | 325,433 |
| | Tobacco - 0.7% |
| 1,115,000 | Golden State, CA, Tobacco Securitization Corp. Rev 3.00%, 06/01/2046 | 1,009,818 |
| | Utilities - 0.3% |
| 362,000 | Oklahoma Dev Finance Auth Rev 3.88%, 05/01/2037 | 336,688 |
| | Water - 0.4% |
| 605,000 | Texas Water Dev Board Rev 4.80%, 10/15/2052 | 606,691 |
| | Total Municipal Bonds
(cost $5,274,649) | | $ 5,020,960 |
| U.S. GOVERNMENT AGENCIES - 19.1% |
| | Mortgage-Backed Agencies - 19.1% |
| | FHLMC - 9.1% |
| 2,375,018 | 2.00%, 11/01/2051 | $ 1,880,745 |
| 1,838,522 | 2.00%, 03/01/2052 | 1,452,726 |
| 1,817,984 | 2.50%, 11/01/2051 | 1,495,159 |
| 1,771,928 | 2.50%, 09/01/2052 | 1,453,380 |
| 847,321 | 3.00%, 04/01/2052 | 721,020 |
| 3,259,643 | 3.50%, 05/01/2052 | 2,873,445 |
| 1,300,726 | 4.00%, 06/01/2052 | 1,185,108 |
| 749,488 | 4.50%, 08/01/2052 | 703,833 |
| 778,671 | 4.50%, 09/01/2052 | 731,229 |
| 588,242 | 5.00%, 08/01/2052 | 567,329 |
| | | | 13,063,974 |
| | FNMA - 10.0% |
| 2,542,956 | 2.00%, 11/01/2051 | 2,010,231 |
| 3,207,110 | 2.00%, 03/01/2052 | 2,535,148 |
The accompanying notes are an integral part of these financial statements.
Hartford Schroders Sustainable Core Bond Fund
Schedule of Investments – (continued)
October 31, 2022
| Shares or Principal Amount | | Market Value† |
| U.S. GOVERNMENT AGENCIES - 19.1% - (continued) |
| | Mortgage-Backed Agencies - 19.1% - (continued) |
| | FNMA - 10.0% - (continued) |
| $ 2,248,918 | 2.50%, 11/01/2051 | $ 1,850,223 |
| 1,223,349 | 2.50%, 05/01/2052 | 1,005,803 |
| 850,780 | 3.00%, 07/01/2052 | 723,261 |
| 3,332,163 | 3.50%, 05/01/2052 | 2,937,368 |
| 1,533,958 | 4.00%, 06/01/2052 | 1,397,923 |
| 750,421 | 4.50%, 08/01/2052 | 704,785 |
| 593,395 | 5.00%, 08/01/2052 | 572,293 |
| 763,750 | 5.00%, 10/01/2052 | 736,392 |
| | | | 14,473,427 |
| | Total U.S. Government Agencies
(cost $30,355,173) | | $ 27,537,401 |
| U.S. GOVERNMENT SECURITIES - 29.8% |
| | U.S. Treasury Securities - 29.8% |
| | U.S. Treasury Bonds - 12.3% |
| 5,309,000 | 2.88%, 05/15/2052 | $ 4,098,714 |
| 6,618,000 | 3.00%, 08/15/2052 | 5,269,582 |
| 9,651,200 | 3.38%, 08/15/2042 | 8,295,508 |
| | | | 17,663,804 |
| | U.S. Treasury Notes - 17.5% |
| 347,000 | 1.38%, 09/30/2023 | 337,119 |
| 1,082,000 | 2.75%, 08/15/2032 | 967,206 |
| 2,158,000 | 3.13%, 08/31/2027 | 2,053,472 |
| 1,773,000 | 3.13%, 08/31/2029 | 1,661,356 |
| 11,801,000 | 3.25%, 08/31/2024 | 11,528,563 |
| 8,882,000 | 3.50%, 09/15/2025 | 8,655,093 |
| | | | 25,202,809 |
| | Total U.S. Government Securities
(cost $45,318,833) | | $ 42,866,613 |
| | Total Long-Term Investments
(cost $158,292,923) | | $ 142,373,975 |
| SHORT-TERM INVESTMENTS - 1.1% |
| | Other Investment Pools & Funds - 1.1% |
| 1,684,793 | Morgan Stanley Institutional Liquidity Funds, Treasury Portfolio, Institutional Class, 3.02%(5) | $ 1,684,793 |
| | Total Short-Term Investments
(cost $1,684,793) | $ 1,684,793 |
| | Total Investments
(cost $159,977,716) | 100.0% | $ 144,058,768 |
| | Other Assets and Liabilities | (0.0)% | (59,395) |
| | Total Net Assets | 100.0% | $ 143,999,373 |
| Note: | Percentage of investments as shown is the ratio of the total market value to total net assets. |
| | The Fund may refer to any one or more of the industry classifications used by one or more widely recognized market indices, ratings group and/or as defined by Fund management. Industry classifications may not be identical across all security types. |
| | For Fund compliance purposes, the Fund may not use the same classification system. These classifications are used for financial reporting purposes. |
| | See “Glossary” for abbreviation descriptions. |
| (1) | Security was purchased pursuant to Rule 144A under the Securities Act of 1933 and may be sold in transactions that are exempt from registration (typically only to qualified institutional buyers) or in a public offering registered under the Securities Act of 1933. At October 31, 2022, the aggregate value of these securities was $16,430,363, representing 11.4% of net assets. |
| (2) | Variable rate securities; the rate reported is the coupon rate in effect at October 31, 2022. Base lending rates may be subject to a floor or cap. |
| (3) | Variable or floating rate security, which interest rate adjusts periodically based on changes in current interest rates and prepayments on the underlying pool of assets. Rate shown is the rate in effect as of period end. |
| (4) | Fixed to variable rate investment. The rate shown reflects the fixed rate in effect at October 31, 2022. Rate will reset at a future date. Base lending rates may be subject to a floor or cap. |
| (5) | Current yield as of period end. |
| † | See Significant Accounting Policies of accompanying Notes to Financial Statements regarding valuation of investments. |
The accompanying notes are an integral part of these financial statements.
Hartford Schroders Sustainable Core Bond Fund
Schedule of Investments – (continued)
October 31, 2022
Fair Value Summary
The following is a summary of the fair valuations according to the inputs used as of October 31, 2022 in valuing the Fund’s investments.
| Description | | Total | | Level 1 | | Level 2 | | Level 3(1) |
| Assets | | | | | | | | |
| Asset & Commercial Mortgage-Backed Securities | | $ 3,258,718 | | $ — | | $ 3,258,718 | | $ — |
| Corporate Bonds | | 63,690,283 | | — | | 63,690,283 | | — |
| Municipal Bonds | | 5,020,960 | | — | | 5,020,960 | | — |
| U.S. Government Agencies | | 27,537,401 | | — | | 27,537,401 | | — |
| U.S. Government Securities | | 42,866,613 | | — | | 42,866,613 | | — |
| Short-Term Investments | | 1,684,793 | | 1,684,793 | | — | | — |
| Total | | $ 144,058,768 | | $ 1,684,793 | | $ 142,373,975 | | $ — |
| (1) | For the year ended October 31, 2022, there were no transfers in and out of Level 3. |
The accompanying notes are an integral part of these financial statements.
Hartford Schroders Sustainable Core Bond Fund
GLOSSARY: (abbreviations used in preceding Schedule of Investments)
| Currency Abbreviations: |
| USD | United States Dollar |
| Index Abbreviations: |
| CMT | Constant Maturity Treasury Index |
| Municipal Abbreviations: |
| GO | General Obligation |
| Auth | Authority |
| Dev | Development |
| Rev | Revenue |
| Facs | Facilities |
| Dist | District |
| Other Abbreviations: |
| CLO | Collateralized Loan Obligation |
| LIBOR | London Interbank Offered Rate |
| CMO | Collateralized Mortgage Obligation |
| SOFR | Secured Overnight Financing Rate |
| PSF-GTD | Permanent School Fund Guaranteed |
| FHLMC | Federal Home Loan Mortgage Corp. |
| FNMA | Federal National Mortgage Association |
Hartford Schroders Sustainable Core Bond Fund
Statement of Assets and Liabilities
October 31, 2022
| | Hartford
Schroders
Sustainable
Core Bond
Fund |
| Assets: | |
| Investments in securities, at market value | $��144,058,768 |
| Cash | 194 |
| Receivables: | |
| Investment securities sold | 1,075,403 |
| Fund shares sold | 6,521 |
| Dividends and interest | 977,200 |
| Other assets | 58,820 |
| Total assets | 146,176,906 |
| Liabilities: | |
| Payables: | |
| To affiliates | 4,842 |
| Investment securities purchased | 2,102,693 |
| Investment management fees | 39,777 |
| Transfer agent fees | 2,227 |
| Accounting services fees | 5,307 |
| Board of Directors' fees | 470 |
| Accrued expenses | 22,217 |
| Total liabilities | 2,177,533 |
| Net assets | $ 143,999,373 |
| Summary of Net Assets: | |
| Capital stock and paid-in-capital | $ 172,305,953 |
| Distributable earnings (loss) | (28,306,580) |
| Net assets | $ 143,999,373 |
| Shares authorized | 375,000,000 |
| Class I: Net asset value per share | $ 8.36 |
| Shares outstanding | 67,533 |
| Net Assets | $ 564,297 |
| Class R3: Net asset value per share | $ 8.39 |
| Shares outstanding | 990 |
| Net Assets | $ 8,302 |
| Class R4: Net asset value per share | $ 8.37 |
| Shares outstanding | 993 |
| Net Assets | $ 8,307 |
| Class R5: Net asset value per share | $ 8.35 |
| Shares outstanding | 996 |
| Net Assets | $ 8,318 |
| Class Y: Net asset value per share | $ 8.35 |
| Shares outstanding | 771,361 |
| Net Assets | $ 6,440,942 |
| Class F: Net asset value per share | $ 8.35 |
| Shares outstanding | 9,126,877 |
| Net Assets | $ 76,244,705 |
| Class SDR: Net asset value per share | $ 8.34 |
| Shares outstanding | 7,277,106 |
| Net Assets | $ 60,724,502 |
| Cost of investments | $ 159,977,716 |
The accompanying notes are an integral part of these financial statements.
Hartford Schroders Sustainable Core Bond Fund
Statement of Operations
For the Year Ended October 31, 2022
| | Hartford
Schroders
Sustainable
Core Bond
Fund |
| Investment Income: | |
| Interest | $ 3,659,714 |
| Total investment income, net | 3,659,714 |
| Expenses: | |
| Investment management fees | 411,080 |
| Administrative services fees | |
| Class Y(1) | 240 |
| Transfer agent fees | |
| Class I | 900 |
| Class R3 | 20 |
| Class R4 | 15 |
| Class R5 | 11 |
| Class Y(1) | 7,678 |
| Class F | 1,976 |
| Class SDR(1) | 14,525 |
| Distribution fees | |
| Class R3 | 44 |
| Class R4 | 23 |
| Custodian fees | 3,880 |
| Registration and filing fees | 42,172 |
| Accounting services fees | 25,554 |
| Fund administration fees | 4,110 |
| Board of Directors' fees | 4,200 |
| Audit and tax fees | 14,664 |
| Other expenses | 31,096 |
| Total expenses (before waivers, reimbursements and fees paid indirectly) | 562,188 |
| Expense waivers | (124,039) |
| Distribution fee reimbursements | (62) |
| Total waivers, reimbursements and fees paid indirectly | (124,101) |
| Total expenses | 438,087 |
| Net Investment Income (Loss) | 3,221,627 |
| Net Realized Gain (Loss) on Investments on: | |
| Investments | (11,068,907) |
| Net Realized Gain (Loss) on Investments | (11,068,907) |
| Net Changes in Unrealized Appreciation (Depreciation) of Investments of: | |
| Investments | (16,551,265) |
| Net Changes in Unrealized Appreciation (Depreciation) of Investments | (16,551,265) |
| Net Gain (Loss) on Investments, Other Financial Instruments and Foreign Currency Transactions | (27,620,172) |
| Net Increase (Decrease) in Net Assets Resulting from Operations | $ (24,398,545) |
| (1) | See Note 1 in the Notes to Financial Statements regarding the reorganization of the Fund and the activity of the share classes prior to the reorganization. |
The accompanying notes are an integral part of these financial statements.
Hartford Schroders Sustainable Core Bond Fund
Statements of Changes in Net Assets
| | Hartford
Schroders Sustainable
Core Bond Fund |
| | For the
Year Ended
October 31,
2022 | | For the
Year Ended
October 31,
2021 |
| Operations: | | | |
| Net investment income (loss) | $ 3,221,627 | | $ 1,919,565 |
| Net realized gain (loss) on investments | (11,068,907) | | 2,984,089 |
| Net changes in unrealized appreciation (depreciation) of investments | (16,551,265) | | (3,638,458) |
| Net Increase (Decrease) in Net Assets Resulting from Operations | (24,398,545) | | 1,265,196 |
| Distributions to Shareholders: | | | |
| Class I | (14,783) | | — |
| Class R3 | (317) | | — |
| Class R4 | (347) | | — |
| Class R5 | (378) | | — |
| Class Y | (318,097) | | (1,046,252) |
| Class F | (1,727,648) | | — |
| Class SDR | (2,952,567) | | (3,210,773) |
| Total distributions | (5,014,137) | | (4,257,025) |
| Capital Share Transactions:(1) | | | |
| Sold | 113,246,909 | | 35,910,407 |
| Issued on reinvestment of distributions | 4,489,018 | | 3,649,456 |
| Redemption-in-kind | — | | (29,217,874) |
| Redeemed | (27,300,551) | | (34,422,862) |
| Net increase (decrease) from capital share transactions | 90,435,376 | | (24,080,873) |
| Net Increase (Decrease) in Net Assets | 61,022,694 | | (27,072,702) |
| Net Assets: | | | |
| Beginning of period | 82,976,679 | | 110,049,381 |
| End of period | $ 143,999,373 | | $ 82,976,679 |
| (1) | See Note 12 in the Notes to Financial Statements for additional information on the effects of the reorganization. |
The accompanying notes are an integral part of these financial statements.
Hartford Schroders Sustainable Core Bond Fund
| | | —Selected Per-Share Data(1)— | | —Ratios and Supplemental Data — |
| Class | | Net
Asset
Value at
Beginning
of Period | | Net
Investment
Income
(Loss) | | Net
Realized
and
Unrealized
Gain (Loss)
on
Investments | | Total from
Investment
Operations | | Dividends
from Net
Investment
Income | | Distributions
from
Capital
Gains | | Total
Dividends
and
Distributions | | Net
Asset
Value at
End of
Period | | Total
Return(2) | | Net
Assets
at End
of Period
(000s) | | Ratio of
Expenses
to
Average
Net
Assets
Before
Adjust-
ments(3) | | Ratio of
Expenses
to
Average
Net
Assets
After
Adjust-
ments(3) | | Ratio of
Net
Investment
Income
(Loss) to
Average
Net Assets | | Portfolio
Turnover |
| Hartford Schroders Sustainable Core Bond Fund(4) |
| For the Period Ended October 31, 2022 |
| I (5) | | $ 10.46 | | $ 0.23 | | $ (1.94) | | $ (1.71) | | $ (0.20) | | $ (0.19) | | $ (0.39) | | $ 8.36 | | (16.83)% (6) | | $ 564 | | 0.60% (7) | | 0.51% (7) | | 2.61% (7) | | 162% |
| R3 (5) | | 10.45 | | 0.19 | | (1.92) | | (1.73) | | (0.14) | | (0.19) | | (0.33) | | 8.39 | | (16.94) (6) | | 8 | | 1.12 (7) | | 0.66 (7) | | 2.09 (7) | | 162 |
| R4 (5) | | 10.45 | | 0.20 | | (1.92) | | (1.72) | | (0.17) | | (0.19) | | (0.36) | | 8.37 | | (16.88) (6) | | 8 | | 0.82 (7) | | 0.59 (7) | | 2.13 (7) | | 162 |
| R5 (5) | | 10.45 | | 0.21 | | (1.92) | | (1.71) | | (0.20) | | (0.19) | | (0.39) | | 8.35 | | (16.81) (6) | | 8 | | 0.52 (7) | | 0.46 (7) | | 2.27 (7) | | 162 |
| Y | | 10.47 | | 0.21 | | (1.93) | | (1.72) | | (0.21) | | (0.19) | | (0.40) | | 8.35 | | (16.91) | | 6,441 | | 0.55 | | 0.40 | | 2.26 | | 162 |
| F (5) | | 10.45 | | 0.24 | | (1.94) | | (1.70) | | (0.21) | | (0.19) | | (0.40) | | 8.35 | | (16.72) (6) | | 76,245 | | 0.41 (7) | | 0.36 (7) | | 2.68 (7) | | 162 |
| SDR | | 10.46 | | 0.23 | | (1.94) | | (1.71) | | (0.22) | | (0.19) | | (0.41) | | 8.34 | | (16.86) | | 60,725 | | 0.46 | | 0.32 | | 2.39 | | 162 |
| For the Year Ended October 31, 2021 |
| Y | | $ 10.82 | | $ 0.18 | | $ (0.12) | | $ 0.06 | | $ (0.19) | | $ (0.22) | | $ (0.41) | | $ 10.47 | | 0.51% | | $ 9,051 | | 0.74% | | 0.39% | | 1.74% | | 179% |
| SDR | | 10.82 | | 0.19 | | (0.13) | | 0.06 | | (0.20) | | (0.22) | | (0.42) | | 10.46 | | 0.50 | | 73,926 | | 0.69 | | 0.32 | | 1.78 | | 179 |
| For the Period Ended October 31, 2020 |
| Y (8) | | $ 10.82 | | $ 0.06 | | $ 0.02 | | $ 0.08 | | $ (0.08) | | $ — | | $ (0.08) | | $ 10.82 | | 0.70% (6) | | $ 34,734 | | 1.04% (7) | | 0.40% (7) | | 1.72% (7) | | 144% |
| SDR | | 10.44 | | 0.23 | | 0.62 | | 0.85 | | (0.25) | | (0.22) | | (0.47) | | 10.82 | | 8.34 | | 75,315 | | 0.81 | | 0.32 | | 2.20 | | 144 |
| For the Year Ended October 31, 2019 |
| SDR | | $ 9.67 | | $ 0.29 | | $ 0.79 | | $ 1.08 | | $ (0.31) | | $ — | | $ (0.31) | | $ 10.44 | | 11.27% | | $ 62,427 | | 0.78% | | 0.32% | | 2.91% | | 134% |
| For the Period Ended October 31, 2018 |
| SDR (9) | | $ 10.00 | | $ 0.20 | | $ (0.34) | | $ (0.14) | | $ (0.14) | | $ — | | $ (0.19) | | $ 9.67 | | (1.38)% (6) | | $ 38,061 | | 1.48% (7) | | 0.32% (7) | | 2.74% (7) | | 48% |
| FINANCIAL HIGHLIGHTS FOOTNOTES |
| (1) | Information presented relates to a share outstanding throughout the indicated period. Net investment income (loss) per share amounts are calculated based on average shares outstanding unless otherwise noted. |
| (2) | Assumes initial investment at net asset value at the beginning of each period, reinvestment of all distributions, the complete redemption of the investment at net asset value at the end of each period and no sales charge. Total return would be reduced if sales charges were taken into account. |
| (3) | Adjustments include waivers and reimbursements, if applicable. Ratios do not include fees paid indirectly (see Expenses in the accompanying Notes to Financial Statements). |
| (4) | Prior to the close of business on November 12, 2021, this Fund operated as the Predecessor Fund. Effective after the close of business on November 12, 2021, the Investor and R6 share classes were redesignated as Class Y and SDR, respectively. Please see Notes 1 and 12 in the accompanying Notes to Financial Statements for additional information regarding the reorganization. |
| (5) | Commenced operations on November 12, 2021. |
| (6) | Not annualized. |
| (7) | Annualized. |
| (8) | Commenced operations on June 29, 2020. |
| (9) | Commenced operations on January 31, 2018. |
The accompanying notes are an integral part of these financial statements.
Hartford Schroders Sustainable Core Bond Fund
Notes to Financial Statements
October 31, 2022
| 1. | Organization: |
| | The Hartford Mutual Funds II, Inc. (the “Company”) is an open-end registered management investment company comprised of sixteen series, as of October 31, 2022. Financial statements of Hartford Schroders Sustainable Core Bond Fund ("Sustainable Core Bond Fund" or the "Fund"), a series of the Company, are included in this report. |
| | The Fund acquired all of the assets and liabilities of Schroder Core Bond Fund (the "Predecessor Fund") pursuant to an agreement and plan of reorganization immediately following the close of business on November 12, 2021 (the “reorganization”). Prior to the reorganization, Class SDR shares were called R6 Shares and Class Y shares were called Investor Shares. The Fund is the accounting successor to its Predecessor Fund. The financial statements of the Fund reflect the historical results of the Investor Shares and R6 Shares of the Predecessor Fund prior to the reorganization. All information and references to periods prior to the close of business on November 12, 2021 refers to the Predecessor Fund. |
| | The Company is organized under the laws of the State of Maryland and is registered with the U.S. Securities and Exchange Commission (the “SEC”) under the Investment Company Act of 1940, as amended (the “1940 Act”). The Fund is a diversified open-end management investment company. The Fund applies specialized accounting and reporting standards under Accounting Standards Codification-Topic 946, “Financial Services – Investment Companies”. |
| | The Fund has registered for sale Class I, Class R3, Class R4, Class R5, Class Y, Class F and Class SDR shares. Classes I, R3, R4, R5, Y, F and SDR shares do not have a sales charge. |
| 2. | Significant Accounting Policies: |
| | The following is a summary of significant accounting policies of the Fund used in the preparation of its financial statements, which are in accordance with United States Generally Accepted Accounting Principles ("U.S. GAAP"). The preparation of financial statements in accordance with U.S. GAAP may require management to make estimates and assumptions that affect the reported amounts of assets and liabilities and disclosure of contingent assets and liabilities at the date of the financial statements and the reported amounts of increases and decreases in net assets from operations during the reporting period. Actual results could differ from those estimates. |
| a) | Determination of Net Asset Value – The net asset value ("NAV") of each class of the Fund's shares is determined as of the close of regular trading on the New York Stock Exchange (the “Exchange”) (normally 4:00 p.m. Eastern Time) (the “NYSE Close”) on each day that the Exchange is open (“Valuation Date”). If the Exchange is closed due to weather or other extraordinary circumstances on a day it would typically be open for business, the Fund may treat such day as a typical business day and accept purchase and redemption orders and calculate the Fund’s NAV in accordance with applicable law. The NAV of each class of the Fund's shares is determined by dividing the value of the Fund’s net assets attributable to the class of shares by the number of shares outstanding for that class. Information that becomes known to the Fund after the NAV has been calculated on a particular day will not generally be used to retroactively adjust the NAV determined earlier that day. |
| b) | Investment Valuation and Fair Value Measurements – For purposes of calculating the NAV of each class of the Fund, portfolio securities and other assets held in the Fund’s portfolio for which market prices are readily available are valued at market value. Market value is generally determined on the basis of official close price or last reported trade price. If no trades were reported, market value is based on prices obtained from a quotation reporting system, established market makers (including evaluated prices), or independent pricing services. Pricing vendors may use matrix pricing or valuation models that utilize certain inputs and assumptions to derive values, including transaction data, credit quality information, general market conditions, news, and other factors and assumptions. |
| | With respect to the Fund's investments that do not have readily available market prices, the Company's Board of Directors (the "Board") has designated Hartford Funds Management Company, LLC (the "Investment Manager") as its valuation designee to perform fair valuations pursuant to Rule 2a-5 under the 1940 Act (the "Valuation Designee"). |
| | If market prices are not readily available or deemed unreliable, the Valuation Designee determines the fair value of the security or other instrument in good faith under policies and procedures approved by and under the supervision of the Board ("Valuation Procedures"). |
| | The Valuation Designee has delegated the day-to-day responsibility for implementing the Valuation Procedures to the Valuation Committee. The Valuation Committee will consider all available relevant factors in determining an investment’s fair value. The Valuation Designee reports fair value matters to the Audit Committee of the Board. |
Hartford Schroders Sustainable Core Bond Fund
Notes to Financial Statements – (continued)
October 31, 2022
| | Prices of foreign equities that are principally traded on certain foreign markets will generally be adjusted daily pursuant to a fair value pricing service in order to reflect an adjustment for the factors occurring after the close of certain foreign markets but before the NYSE Close. Securities and other instruments that are primarily traded on foreign markets may trade on days that are not business days of the Fund. The value of the foreign securities or other instruments in which the Fund invests may change on days when a shareholder will not be able to purchase, redeem or exchange shares of the Fund. |
| | Fixed income investments (other than short-term obligations) and non-exchange traded derivatives held by the Fund are normally valued at prices supplied by independent pricing services in accordance with the Valuation Procedures. Short-term investments maturing in 60 days or less are generally valued at amortized cost, which approximates fair value. |
| | Exchange-traded derivatives, such as options, futures and options on futures, are valued at the last sale price determined by the exchange where such instruments principally trade as of the close of such exchange ("Exchange Close"). If a last sale price is not available, the value will be the mean of the most recently quoted bid and ask prices as of the Exchange Close. If a mean of the bid and ask prices cannot be calculated for the day, the value will be the most recently quoted bid price as of the Exchange Close. Over-the-counter derivatives are normally valued based on prices supplied by independent pricing services in accordance with the Valuation Procedures. |
| | Investments valued in currencies other than U.S. dollars are converted to U.S. dollars using the prevailing spot currency exchange rates obtained from independent pricing services for calculation of the NAV. As a result, the NAV of the Fund’s shares may be affected by changes in the value of currencies in relation to the U.S. dollar. The value of securities or other instruments traded in markets outside the United States or denominated in currencies other than the U.S. dollar may be affected significantly on a day that the Exchange is closed and the market value may change on days when an investor is not able to purchase, redeem or exchange shares of the Fund. |
| | Foreign currency contracts represent agreements to exchange currencies on specific future dates at predetermined rates. Foreign currency contracts are valued using foreign currency exchange rates and forward rates as provided by an independent pricing service on the Valuation Date. |
| | Shares of investment companies listed and traded on an exchange are valued in the same manner as any exchange-listed equity security. Investments in investment companies that are not listed or traded on an exchange ("Non-Traded Funds"), if any, are valued at the respective NAV of each Non-Traded Fund on the Valuation Date. Such Non-Traded Funds and listed investment companies may use fair value pricing as disclosed in their prospectuses. |
| | Financial instruments for which prices are not available from an independent pricing service may be valued using quotations obtained from one or more dealers that make markets in the respective financial instrument in accordance with the Valuation Procedures. |
| | U.S. GAAP defines fair value as the price that the Fund would receive to sell an asset or pay to transfer a liability in an orderly transaction between market participants. The U.S. GAAP fair value measurement standards require disclosure of a fair value hierarchy for each major category of assets and liabilities. Various inputs are used in determining the fair value of the Fund’s investments. These inputs are summarized into three broad hierarchy levels. This hierarchy is based on whether the valuation inputs are observable or unobservable. These levels are: |
| • | Level 1 – Quoted prices in active markets for identical investments. Level 1 may include exchange traded instruments, such as domestic equities, some foreign equities, options, futures, mutual funds, exchange traded funds, rights and warrants. |
| • | Level 2 – Observable inputs other than Level 1 prices, such as quoted prices for similar investments; quoted prices in markets that are not active; or other inputs that are observable or can be corroborated by observable market data. Level 2 may include debt investments that are traded less frequently than exchange traded instruments and which are valued using independent pricing services; foreign equities, which are principally traded on certain foreign markets and are adjusted daily pursuant to a fair value pricing service in order to reflect an adjustment for the factors occurring after the close of certain foreign markets but before the NYSE Close; senior floating rate interests, which are valued using an aggregate of dealer bids; short-term investments, which are valued at amortized cost; and swaps, which are valued based upon the terms of each swap contract. |
| • | Level 3 – Significant unobservable inputs that are supported by limited or no market activity. Level 3 may include financial instruments whose values are determined using indicative market quotes or require significant management judgment or estimation. These unobservable valuation inputs may include estimates for current yields, maturity/duration, prepayment speed, and indicative market quotes for comparable investments along with other assumptions relating to credit quality, collateral value, complexity of the investment structure, general market conditions and liquidity. This category may include investments where trading has been halted or there are certain restrictions on trading. While these investments are priced using unobservable inputs, the valuation of these investments reflects the best available data and management believes the prices are a reasonable representation of exit price. |
Valuation levels are not necessarily indicative of the risk associated with investing in such investments. Individual investments within any of the above mentioned asset classes may be assigned a different hierarchical level than those presented above, as individual circumstances dictate.
Hartford Schroders Sustainable Core Bond Fund
Notes to Financial Statements – (continued)
October 31, 2022
For additional information, refer to the Fair Value Summary and the Level 3 roll-forward reconciliation, if applicable, which follows the Fund's Schedule of Investments.
| c) | Investment Transactions and Investment Income – Investment transactions are recorded as of the trade date (the date the order to buy or sell is executed) for financial reporting purposes. Investments purchased or sold on a when-issued or delayed-delivery basis may be settled a month or more after the trade date. Realized gains and losses are determined on the basis of identified cost. |
| | The trade date for senior floating rate interests purchased in the primary loan market is considered the date on which the loan allocations are determined. The trade date for senior floating rate interests purchased in the secondary loan market is the date on which the transaction is entered into. |
| | Dividend income from domestic securities is accrued on the ex-dividend date. In general, dividend income from foreign securities is recorded on the ex-date; however, dividend notifications in certain foreign jurisdictions may not be available in a timely manner and as a result, the Fund will record the dividend as soon as the relevant details (i.e., rate per share, payment date, shareholders of record, etc.) are publicly available. Interest income, including amortization of premium, accretion of discounts and additional principal received in-kind in lieu of cash, is accrued on a daily basis. Paydown gains and losses on mortgage-related and other asset-backed securities are included in interest income in the Statement of Operations, as applicable. |
| d) | Taxes – The Fund may be subject to taxes imposed on realized gains on securities of certain foreign countries in which such Fund invests. The Fund may also be subject to taxes withheld on foreign dividends and interest from securities in which the Fund invests. The amount of any foreign taxes withheld and foreign tax expense is included on the accompanying Statement of Operations as a reduction to net investment income or net realized or unrealized gain (loss) on investments in these securities, if applicable. |
| e) | Foreign Currency Transactions – Assets and liabilities denominated in currencies other than U.S. dollars are translated into U.S. dollars at the exchange rates in effect on the Valuation Date. Purchases and sales of investments, income and expenses are translated into U.S. dollars at the exchange rates on the dates of such transactions. |
| | The Fund does not isolate that portion of portfolio investment valuation resulting from fluctuations in the foreign currency exchange rates from the fluctuations arising from changes in the market prices of investments held. Exchange rate fluctuations are included with the net realized and unrealized gain or loss on investments in the accompanying financial statements. |
| | Net realized foreign exchange gains or losses arise from sales of foreign currencies and the difference between asset and liability amounts initially stated in foreign currencies and the U.S. dollar value of the amounts actually received or paid. Net unrealized foreign exchange gains or losses arise from changes in the value of other assets and liabilities at the end of the reporting period, resulting from changes in the exchange rates. |
| f) | Joint Trading Account – The Fund may invest cash balances into a joint trading account that may be invested in one or more repurchase agreements. |
| g) | Fund Share Valuation and Dividend Distributions to Shareholders – Orders for each class of the Fund’s shares are executed in accordance with the investment instructions of the shareholders. The NAV of each class of the Fund’s shares is determined as of the close of business on each business day of the Exchange (see Note 2(a)). The NAV is determined separately for each class of shares of the Fund by dividing the Fund's net assets attributable to that class by the number of shares of the class outstanding. Each class of shares offered by the Fund has equal rights as to assets and voting privileges (except that shareholders of a class have exclusive voting rights regarding any matter relating solely to that class of shares). Income and non-class specific expenses are allocated daily to each class on the basis of the relative net assets of the class of the Fund. Realized and unrealized gains and losses are allocated daily based on the relative net assets of each class of shares of the Fund. |
| | Orders for the purchase of the Fund's shares received prior to the close of the Exchange on any day the Exchange is open for business are priced at the NAV determined as of the close of the Exchange. Orders received after the close of the Exchange, or on a day on which the Exchange and/or the Fund are not open for business, are priced at the next determined NAV. |
| | Dividends are declared pursuant to a policy adopted by the Company's Board of Directors. Dividends and/or distributions to shareholders are recorded on ex-date. The policy of the Fund is to pay dividends from net investment income, if any, monthly, and realized gains, if any, at least once a year. |
| | Income dividends and capital gains distributions are determined in accordance with federal income tax regulations, which may differ from U.S. GAAP with respect to character and timing (see Federal Income Taxes: Distributions and Components of Distributable Earnings and Reclassification of Capital Accounts notes). |
Hartford Schroders Sustainable Core Bond Fund
Notes to Financial Statements – (continued)
October 31, 2022
| 3. | Securities and Other Investments: |
| a) | Restricted Securities – The Fund may invest in securities that are subject to legal or contractual restrictions on resale. These securities generally may be resold in transactions exempt from registration or to the public if the securities are registered. Disposal of these securities may involve time-consuming negotiations and expense, and prompt sale at an acceptable price may be difficult. Information regarding restricted securities is included at the end of the Fund's Schedule of Investments. |
| b) | Investments Purchased on a When-Issued or Delayed-Delivery Basis – Delivery and payment for investments that have been purchased by the Fund on a forward commitment, or when-issued or delayed-delivery basis, take place beyond the customary settlement period. The Fund may dispose of or renegotiate a delayed-delivery transaction after it is entered into, and may sell delayed-delivery investments before they are delivered, which may result in a realized gain or loss. During this period, such investments are subject to market fluctuations. See the Fund’s Schedule of Investments for when-issued or delayed-delivery investments as of October 31, 2022. |
| c) | Mortgage-Related and Other Asset-Backed Securities – The Fund may invest in mortgage-related and other asset-backed securities. These securities include mortgage pass-through securities, collateralized mortgage obligations, commercial mortgage-backed securities, stripped mortgage-backed securities, asset-backed securities, collateralized debt obligations and other securities that directly or indirectly represent a participation in, or are secured by and payable from, mortgage loans on real property. Mortgage-related securities are created from pools of residential or commercial mortgage loans, including mortgage loans made by savings and loan institutions, mortgage bankers, commercial banks and others. Asset-backed securities are created from many types of assets, including auto loans, credit card receivables, home equity loans, and student loans. These securities provide a monthly payment that consists of both interest and principal payments. Interest payments may be determined by fixed or adjustable rates. The rate of prepayments on underlying mortgages will affect the price and volatility of a mortgage-related security, and may have the effect of shortening or extending the effective duration of the security relative to what was anticipated at the time of purchase. The timely payment of principal and interest of certain mortgage-related securities is guaranteed by the full faith and credit of the United States Government. Mortgage-related and other asset-backed securities created and guaranteed by non-governmental issuers, including government-sponsored corporations, may be supported by various forms of insurance or guarantees, but there can be no assurance that the private insurers or guarantors can meet their obligations under the insurance policies or guarantee arrangements. See the Fund's Schedule of Investments for mortgage-related and other asset-backed securities as of October 31, 2022. |
| d) | Inflation-Indexed Bonds – The Fund may invest in inflation-indexed bonds. Inflation-indexed bonds are fixed income investments whose principal value is periodically adjusted to the rate of inflation. The interest rate on these bonds is generally fixed at issuance at a rate lower than typical bonds. Over the life of an inflation-indexed bond, however, interest will be paid based on a principal value, which is adjusted for inflation. Any increase or decrease in the principal amount of an inflation-indexed bond will be included as interest income on the Statement of Operations, even though investors do not receive the principal amount until maturity. See the Fund's Schedule of Investments for inflation-indexed bonds as of October 31, 2022. |
| 4. | Principal Risks: |
| | The Fund’s investments expose it to various types of risks associated with financial instruments and the markets. The Fund may be exposed to the risks described below. The Fund’s prospectus provides details of its principal risks. |
| | Certain investments held by the Fund expose the Fund to various risks which may include, but are not limited to, interest rate, prepayment, and extension risks. Interest rate risk is the risk that fixed income securities will decline in value because of changes in interest rates. As nominal interest rates rise, the values of certain fixed income securities held by the Fund are likely to decrease. A nominal interest rate can be described as the sum of a real interest rate and an expected inflation rate. Fixed income securities with longer durations tend to be more sensitive to changes in interest rates, usually making them more volatile than securities with shorter durations. Duration is useful primarily as a measure of the sensitivity of a fixed income security’s market price to interest rate (i.e., yield) movements. Senior floating rate interests and securities subject to prepayment and extension risk generally offer less potential for gains when interest rates decline. Rising interest rates may cause prepayments to occur at a slower than expected rate, thereby effectively lengthening the maturity of the security and making the security more sensitive to interest rate changes. Prepayment and extension risk are major risks of mortgage-backed securities, senior floating rate interests and certain asset-backed securities. For certain asset-backed securities, the actual maturity may be less than the stated maturity shown in the Schedule of Investments, if applicable. As a result, the timing of income recognition relating to these securities may vary based upon the actual maturity. |
| | A widespread health crisis, such as a global pandemic, could cause substantial market volatility, exchange trading suspensions or restrictions and closures of securities exchanges and businesses, impact the ability to complete redemptions, and adversely impact Fund performance. The outbreak of COVID-19, a respiratory disease caused by a novel coronavirus, has negatively affected the worldwide economy, the financial health of individual companies and the market in significant and unforeseen ways. The future impact of COVID-19 remains unclear. The effects to public health, business and market conditions resulting from the COVID-19 pandemic may have a significant negative impact on the performance of the Fund’s investments, including exacerbating other pre-existing political, social and economic risks. |
Hartford Schroders Sustainable Core Bond Fund
Notes to Financial Statements – (continued)
October 31, 2022
| | Investing in the securities of non-U.S. issuers, whether directly or indirectly, involves certain considerations and risks not typically associated with securities of U.S. issuers. Such risks include, but are not limited to: generally less liquid and less efficient securities markets; generally greater price volatility; exchange rate fluctuations; imposition of restrictions on the expatriation of funds or other protectionist measures; less publicly available information about issuers; the imposition of withholding or other taxes; higher transaction and custody costs; settlement delays and risk of loss attendant in settlement procedures; difficulties in enforcing contractual obligations; less regulation of securities markets; different accounting, disclosure and reporting requirements; more substantial governmental involvement in the economy; higher inflation rates; and greater social, economic and political uncertainties. Non-U.S. issuers may also be affected by political, social, economic or diplomatic developments in a foreign country or region or the U.S. (including the imposition of sanctions, tariffs, or other governmental restrictions). These risks are heightened for investments in issuers from countries with less developed markets. |
| | Securities lending involves the risk that the Fund may lose money because the borrower of the loaned securities fails to return the securities in a timely manner or at all. The Fund could also lose money in the event of a decline in the value of the collateral provided for the loaned securities or a decline in the value of any investments made with cash collateral. These events could also trigger adverse tax consequences for the Fund that lends its holdings. |
| | Credit risk depends largely on the perceived financial health of bond issuers. In general, the credit rating is inversely related to the credit risk of the issuer. Higher rated bonds generally are deemed to have less credit risk, while lower or unrated bonds are deemed to have higher risk of default. The share price, yield and total return of the fund that holds securities with higher credit risk may be more volatile than those of the fund that holds bonds with lower credit risk. The Fund may be exposed to counterparty risk, or the risk that an institution or other entity with which the Fund has unsettled or open transactions will default. |
| | The use of certain London Interbank Offered Rates (collectively, “LIBOR”) was generally phased out by the end of 2021, and some regulated entities (such as banks) have ceased to enter into new LIBOR-based contracts beginning January 1, 2022. However, it is expected that the most widely used tenors of U.S. LIBOR may continue to be provided on a representative basis until mid-2023. In some instances, regulators may restrict new use of LIBOR prior to the actual cessation date. There remains uncertainty regarding the future use of LIBOR and the nature of any replacement rate (e.g., the Secured Overnight Financing Rate ("SOFR"), which is is a measure of the cost of borrowing cash overnight, collateralized by the U.S. Treasury securities and is intended to replace the U.S. dollar LIBOR). As such, the potential effect of a transition away from LIBOR on the Fund or the LIBOR-based instruments in which the Fund invests cannot yet be determined. The transition process away from LIBOR may involve, among other things, increased volatility or illiquidity in markets for instruments that currently rely on LIBOR. The transition process may also result in a reduction in the value of certain instruments held by the Fund or reduce the effectiveness of related Fund transactions, such as hedges. Volatility, the potential reduction in value, and/or the hedge effectiveness of financial instruments may be heightened for financial instruments that do not include fallback provisions that address the cessation of LIBOR. Any potential effects of the transition away from LIBOR on the Fund or on financial instruments in which the Fund invests, as well as other unforeseen effects, could result in losses to the Fund. Since the usefulness of LIBOR as a benchmark or reference rate could deteriorate during the transition period, these effects could occur prior to and/or subsequent to mid-2023. |
| a) | The Fund intends to continue to qualify as a Regulated Investment Company ("RIC") under Subchapter M of the Internal Revenue Code ("IRC") by distributing substantially all of its taxable net investment income and net realized capital gains to its shareholders each year. The Fund has distributed substantially all of its income and capital gains in prior years, if applicable, and intends to distribute substantially all of its income and capital gains during the calendar year ending December 31, 2022. Accordingly, no provision for federal income or excise taxes has been made in the accompanying financial statements. Distributions from short-term capital gains are treated as ordinary income distributions for federal income tax purposes. |
| b) | Net Investment Income (Loss), Net Realized Gains (Losses) and Distributions – Net investment income (loss) and net realized gains (losses) may differ for financial statement and tax purposes primarily because of losses deferred due to wash sale adjustments and foreign currency gains and losses. The character of distributions made during the year from net investment income or net realized gains may differ from their ultimate characterization for federal income tax purposes. Also, due to the timing of dividend distributions, the fiscal year in which amounts are distributed may differ from the year that the income or realized gains (losses) were recorded by the Fund. |
Hartford Schroders Sustainable Core Bond Fund
Notes to Financial Statements – (continued)
October 31, 2022
| c) | Distributions and Components of Distributable Earnings – The tax character of distributions paid by the Fund for the years ended October 31, 2022 and October 31, 2021 are as follows: |
| | |
| | For the Year Ended
October 31, 2022 | | For the Year Ended
October 31, 2021 | |
| | Ordinary
Income | | Long-Term
Capital Gains(1) | | Ordinary
Income | | Long-Term
Capital Gains(1) |
| | $ 4,249,484 | | $ 764,653 | | $ 3,616,546 | | $ 640,479 |
| (1) | The Funds designate these distributions as long-term capital gains dividends pursuant to IRC Sec 852(b)(3)(c) |
As of October 31, 2022, the components of total accumulated earnings (deficit) for the Fund on a tax basis are as follows:
Undistributed
Ordinary
Income | | Accumulated
Capital and
Other Losses | | Other
Temporary
Differences | | Unrealized
Appreciation
(Depreciation)
on Investments | | Total
Accumulated
Earnings
(Deficit) |
| $ 372,657 | | $ (12,055,401) | | $ (3,695) | | $ (16,620,141) | | $ (28,306,580) |
| d) | Reclassification of Capital Accounts – The Fund may record reclassifications in its capital accounts. These reclassifications have no impact on the total net assets of the Fund. The reclassification is the result of permanent differences between U.S. GAAP and tax accounting for such items as adjustments to prior year accumulated balances. Adjustments are made to reflect the impact these items have on the current and future earnings distributions to shareholders. Therefore, the source of the Fund's distributions may be shown in the accompanying Statements of Changes in Net Assets as from distributable earnings or from capital depending on the type of book and tax differences that exist. For the year ended October 31, 2022, the Fund recorded reclassifications to increase (decrease) the accounts listed below: |
| | |
| Paid-in-Capital | | Distributable
Earnings (Loss) |
| $ 477,634 | | $ (477,634) |
| e) | Capital Loss Carryforward – Under the Regulated Investment Company Modernization Act of 2010, funds are permitted to carry forward capital losses for an unlimited period. |
| | |
Short-Term
Capital Loss
Carryforward with
No Expiration | | Long-Term
Capital Loss
Carryforward with
No Expiration |
| $ 8,338,994 * | | $ 3,716,407 * |
| * | Future utilization of losses are subject to limitation under current tax laws. |
| f) | Tax Basis of Investments – The aggregate cost of investments for federal income tax purposes at October 31, 2022 is different from book purposes primarily due to wash sale loss deferrals. The net unrealized appreciation/(depreciation) on investments for tax purposes, which consists of gross unrealized appreciation and depreciation was also different from book purposes primary due to wash sales deferrals, is disclosed below: |
| | |
| Tax Cost | | Gross Unrealized
Appreciation | | Gross Unrealized
(Depreciation) | | Net Unrealized
Appreciation
(Depreciation) |
| $ 160,678,909 | | $ 27,741 | | $ (16,647,882) | | $ (16,620,141) |
| g) | Accounting for Uncertainty in Income Taxes – Pursuant to provisions set forth by U.S. GAAP, Hartford Funds Management Company, LLC ("HFMC" or the "Investment Manager") reviews the Fund’s tax positions for all open tax years. As of October 31, 2022, HFMC had reviewed the open tax years and concluded that there was no reason to record a liability for net unrecognized tax obligations relating to uncertain income tax positions. The Fund files U.S. tax returns. Although the statute of limitations for examining the Fund’s U.S. tax returns remains open for three years, no examination is currently in progress. The Fund recognize interest and penalties, if any, related to unrecognized tax benefits as income tax expense on the Statements of Operations. During the year ended October 31, 2022, the Fund did not incur any interest or penalties. HFMC is not aware of any tax positions for which it is reasonably possible that the total amounts of unrecognized tax obligations will significantly change in the next twelve months. |
Hartford Schroders Sustainable Core Bond Fund
Notes to Financial Statements – (continued)
October 31, 2022
| a) | Investment Management Agreement – HFMC serves as the Fund’s investment manager pursuant to an Investment Management Agreement with the Company. HFMC is an indirect subsidiary of The Hartford Financial Services Group, Inc. ("The Hartford"). HFMC has overall investment supervisory responsibility for the Fund. In addition, HFMC provides administrative personnel, services, equipment, facilities and office space for proper operation of the Fund. HFMC has contracted with Schroder Investment Management North America Inc. ("SIMNA") under a sub-advisory agreement. SIMNA performs the daily investment of the assets for the Fund. |
| | Prior to the close of business on November 12, 2021, the Predecessor Fund had an administration agreement with SEI Investments Global Funds Services (“SEI” or the “Administrator”), under which the Administrator provided administrative services to the Fund. For these services, the Administrator was paid a fee, which varied based on the average daily net assets of the Fund, subject to certain minimums. These fees are included in the Fund administration fees in the Statement of Operations. |
| b) | The schedule below reflects the rates of compensation paid to HFMC for investment management services rendered as of October 31, 2022; the rates are accrued daily and paid monthly based on the Fund’s average daily net assets, at the following annual rates: |
| | |
| Management Fee Rates |
| 0.3200% on first $500 million and; |
| 0.3000% on next $500 million and; |
| 0.2800% over $1 billion |
Prior to the close of business on November 12, 2021, the Predecessor Fund paid a management fee in the amount of 0.25% based on the Fund’s average daily net asset to SIMNA, which served as the investment manager for the Predecessor Fund.
| c) | Accounting Services Agreement – HFMC provides the Fund with accounting services pursuant to a fund accounting agreement by and between the Company, on behalf of the Fund, and HFMC. HFMC has delegated certain accounting and administrative service functions to State Street Bank and Trust Company ("State Street"). In consideration of services rendered and expenses assumed pursuant to the fund accounting agreement, the Fund pays HFMC a fee. The fund accounting fee for the Fund is equal to the greater of: (A) the sum of (i) the sub-accounting fee payable by HFMC with respect to the Fund; (ii) the fee payable for tax preparation services for the Fund; and (iii) the amount of expenses that HFMC allocates for providing the fund accounting services to the Fund; plus a target profit margin; or (B) $40,000 per year; provided, however, that to the extent the annual amount of the fund accounting fee exceeds 0.02% of the Fund’s average net assets (calculated during its current fiscal year), HFMC shall waive such portion of the fund accounting fee. |
| d) | Operating Expenses – Allocable expenses incurred by the Company are allocated to each series within the Company, and allocated to classes within each such series, in proportion to the average daily net assets of such series and classes, except where allocation of certain expenses is more fairly made directly to the Fund or to specific classes within the Fund. As of October 31, 2022, HFMC contractually agreed to limit the total annual fund operating expenses of the Fund (exclusive of taxes, interest expenses, brokerage commissions, extraordinary expenses and acquired fund fees and expenses) through February 28, 2023 for Classes I, R3, R4, R5 and F, and through November 15, 2023 for Classes Y and SDR, unless the Board of Directors approves its earlier termination, as follows: |
| | |
| Expense Limit as a Percentage of Average Daily Net Assets |
| Class I | | Class R3 | | Class R4 | | Class R5 | | Class Y | | Class F | | Class SDR |
| 0.51% | | 1.06% | | 0.76% | | 0.46% | | 0.40% | | 0.36% | | 0.32% |
For the period November 1, 2021 through the close of business on November 12, 2021, the investment manager of the Predecessor Fund had contractually agreed to waive management fees, pay and/or reimburse the Fund for expenses to the extent that the total annual fund operating expenses (other than acquired fund fees and expenses, other indirect acquired fund expenses, interest, taxes, and extraordinary expenses) allocable to each share class that exceeded the following annual rates (based on the average daily net assets attributable to each share class): 0.32% for R6 Shares and 0.40% for Investor Shares, now presented as Class SDR shares and Class Y shares, respectively.
| e) | Distribution and Service Plan for Class R3 and Class R4 Shares – Hartford Funds Distributors, LLC ("HFD"), an indirect subsidiary of The Hartford, is the principal underwriter and distributor of the Fund. |
| | The Board of Directors of the Company has approved the adoption of a separate distribution plan (each a “Plan”) pursuant to Rule 12b-1 under the 1940 Act for each of Class R3 and R4 shares. Under a Plan, Class R3 and Class R4 shares of the Fund, as applicable, bear distribution and/or service fees paid to HFD, some or all of which may be paid to select broker-dealers. Pursuant to the Class R3 Plan, the Fund may pay HFD a fee of up to 0.50% of the average daily net assets attributable to Class R3 shares for distribution financing activities, and up to 0.25% may be used for shareholder account servicing activities. Pursuant to the Class R4 Plan, the Fund may pay HFD a fee of up to 0.25% of the average daily net assets attributable to Class R4 shares for distribution financing activities. The entire amount of the fee may be used for shareholder account servicing activities. The Fund’s 12b-1 fees are accrued daily and paid monthly or at such other |
Hartford Schroders Sustainable Core Bond Fund
Notes to Financial Statements – (continued)
October 31, 2022
intervals as the Company’s Board of Directors may determine. Any 12b-1 fees attributable to assets held in an account held directly with the Fund's transfer agent for which there is not a third-party listed as the broker-dealer of record (or HFD does not otherwise have a payment obligation) are generally reimbursed to the applicable Fund. Such amounts are reflected as “Distribution fee reimbursements” on the Statement of Operations.
| f) | Other Related Party Transactions – Certain officers of the Company are directors and/or officers of HFMC and/or The Hartford or its subsidiaries. For the period from after the close of business on November 12, 2021 through October 31, 2022, a portion of the Company’s Chief Compliance Officer’s (“CCO”) compensation was paid by all of the investment companies in the Hartford fund complex. The portion allocated to the Fund, as represented in other expenses on the Statement of Operations, is outlined in the table below. |
| | |
CCO Compensation
Paid by Fund |
| $ 344 |
| g) | Hartford Administrative Services Company ("HASCO"), an indirect subsidiary of The Hartford, provides transfer agent services to the Fund. The Fund pays HASCO a transfer agency fee payable monthly based on the lesser of (i) the costs of providing or overseeing transfer agency services provided to each share class of such Fund plus a target profit margin or (ii) a Specified Amount (as defined in the table below). Such fee is intended to compensate HASCO for: (i) fees payable by HASCO to DST Asset Manager Solutions, Inc. ("DST") (and any other designated sub-agent) according to the agreed-upon fee schedule under the sub-transfer agency agreement between HASCO and DST (or between HASCO and any other designated sub-agent, as applicable); (ii) sub-transfer agency fees payable by HASCO to financial intermediaries, according to the agreed-upon terms between HASCO and the financial intermediaries, provided that such payments are within certain limits approved by the Company’s Board of Directors; (iii) certain expenses that HASCO’s parent company, Hartford Funds Management Group, Inc., allocates to HASCO that relate to HASCO’s transfer agency services provided to the Fund; and (iv) a target profit margin. |
| | |
| Share Class | | Specified Amount
(as a percentage
average daily
net assets) |
| Class I | | 0.20% |
| Class R3 | | 0.22% |
| Class R4 | | 0.17% |
| Class R5 | | 0.12% |
| Class Y | | 0.11% |
| Class F | | 0.004% |
| Class SDR | | 0.004% |
Pursuant to a sub-transfer agency agreement between HASCO and DST, HASCO has delegated certain transfer agent, dividend disbursing agent and shareholder servicing agent functions to DST. The Fund does not pay any fee directly to DST; rather, HASCO makes all such payments to DST. The accrued amount shown in the Statement of Operations reflects the amounts charged by HASCO. These fees are accrued daily and paid monthly.
For the period from November 1, 2021 through the close of business on November 12, 2021, the effective rate of compensation paid for transfer agency services to the previous transfer agent based on the average daily net assets attributable to each share class is as follows:
| Class I | | Class R3 | | Class R4 | | Class R5 | | Class Y | | Class F | | Class SDR |
| N/A (1) | | N/A (1) | | N/A (1) | | N/A (1) | | 0.51% | | N/A (1) | | 0.51% |
| (1) | Classes I, R3, R4, R5 and F commenced operations on November 12, 2021. |
For the period from the close of business on November 12, 2021 through October 31, 2022, the effective rate of compensation paid to HASCO for transfer agency services based on the average daily net assets attributable to each share class is as follows:
| Class I | | Class R3 | | Class R4 | | Class R5 | | Class Y | | Class F | | Class SDR |
| 0.20% | | 0.22% | | 0.17% | | 0.12% | | 0.08% | | 0.00% * | | 0.00% * |
| * | Percentage rounds to zero. |
Hartford Schroders Sustainable Core Bond Fund
Notes to Financial Statements – (continued)
October 31, 2022
For the period from November 1, 2021 through October 31, 2022, the combined effective rate of total compensation for the period paid for transfer agency services to the previous transfer agent and HASCO based on the average daily net assets attributable to each share class is as follows:
| Class I | | Class R3 | | Class R4 | | Class R5 | | Class Y | | Class F | | Class SDR |
| 0.20% (1) | | 0.22% (1) | | 0.17% (1) | | 0.12% (1) | | 0.10% | | 0.00% *(1) | | 0.02% |
| * | Percentage rounds to zero. |
| (1) | Classes I, R3, R4, R5 and F commenced operations on November 12, 2021. |
Prior to the close of business on November 12, 2021, the Predecessor Fund had a shareholder servicing plan under which a shareholder servicing fee of up to 0.15%, after waivers, of average daily net assets of Investor Shares of the Predecessor Fund was paid to financial intermediaries. For the year ended October 31, 2022, these amounts, if any, are included in the Statement of Operations.
| 7. | Securities Lending: |
| | The Company has entered into a securities lending agency agreement ("lending agreement") with Citibank, N.A. ("Citibank"). The Fund may lend portfolio securities to certain borrowers in U.S. and non-U.S. markets in an amount not to exceed one-third (33 1/3%) of the value of its total assets. The Fund may lend portfolio securities, provided that the borrower provides collateral that is maintained in an amount at least equal to the current market value of the securities loaned. Cash collateral is invested for the benefit of the Fund by the Fund’s lending agent pursuant to collateral investment guidelines. The collateral is marked to market daily, in an amount at least equal to the current market value of the securities loaned. The contractual maturities of the securities lending transactions are considered overnight and continuous. |
| | The Fund is subject to certain risks while its securities are on loan, including the following: (i) the risk that the borrower defaults on the loan and the collateral is inadequate to cover the Fund’s loss; (ii) the risk that the earnings on the collateral invested are not sufficient to pay fees incurred in connection with the loan; (iii) the Fund could lose money in the event of a decline in the value of the collateral provided for loaned securities or a decline in the value of any investments made with cash collateral; (iv) the risk that the borrower may use the loaned securities to cover a short sale, which may in turn place downward pressure on the market prices of the loaned securities; (v) the risk that return of loaned securities could be delayed and interfere with portfolio management decisions; (vi) the risk that any efforts to restrict or recall the securities for purposes of voting may not be effective; and (vii) operational risks (i.e., the risk of losses resulting from problems in the settlement and accounting process especially so in certain international markets). These events could also trigger adverse tax consequences for the Fund. |
| | The Fund retains loan fees and the interest on cash collateral investments but is required to pay the borrower a rebate for the use of cash collateral. In cases where the lent security is of high value to borrowers, there may be a negative rebate (i.e., a net payment from the borrower to the Fund). Upon termination of a loan, the Fund is required to return to the borrower an amount equal to the cash collateral, plus any rebate owed to the borrowers. |
| | The net income earned on the securities lending (after payment of rebates and Citibank’s fee) is included on the Statement of Operations as Investment Income from securities lending. The Fund also receives payments from the borrower during the period of the loan, equivalent to dividends and interest earned on the securities loaned, which are recorded as Investment Income from dividends or interest, respectively, on the Statement of Operations. |
For the year ended October 31, 2022, the Fund did not engage in securities lending.
| 8. | Affiliate Holdings: |
| | As of October 31, 2022, affiliates of The Hartford had ownership of shares in the Fund as follows: |
| | Percentage of a Class: |
| | |
| Class I | | Class R3 | | Class R4 | | Class R5 | | Class Y | | Class F | | Class SDR |
| 1% | | 100% | | 100% | | 100% | | — | | 0%* | | — |
| * | Percentage rounds to zero. |
Hartford Schroders Sustainable Core Bond Fund
Notes to Financial Statements – (continued)
October 31, 2022
Percentage of Fund by Class:
| Class I | | Class R3 | | Class R4 | | Class R5 | | Class Y | | Class F | | Class SDR |
| 0%* | | 0%* | | 0% * | | 0% * | | — | | 0% * | | — |
| * | Percentage rounds to zero. |
As of October 31, 2022, affiliated funds of funds in the aggregate owned a portion of the Fund. Therefore, the Fund may experience relatively large purchases or redemptions of its shares as a result of purchase and sale activity from these affiliated funds of funds. Affiliated funds of funds owned shares in the Fund as follows:
| * | As of October 31, 2022, affiliated funds of funds were invested in Class F shares. |
| 9. | Investment Transactions: |
| | For the year ended October 31, 2022, the cost of purchases and proceeds from sales of investment securities (excluding short-term investments) were as follows: |
| | |
Cost of Purchases
Excluding U.S.
Government
Obligations | | Sales Proceeds
Excluding U.S.
Government
Obligations | | Cost of Purchases
For U.S. Government
Obligations | | Sales Proceeds
For U.S. Government
Obligations | | Total Cost of
Purchases | | Total Sales
Proceeds |
| $82,391,532 | | $43,913,542 | | $206,370,503 | | $154,836,412 | | $288,762,035 | | $198,749,954 |
| 10. | In-Kind Transfers: |
| | On August 17, 2021, the Predecessor Fund redeemed shares in exchange for securities. |
| | |
Predecessor
Fund | | Shares
Redeemed | | Value of
Securities | | Cash | | Total |
| Schroder Core Bond Fund | | 2,753,805 | | $ 26,389,283 | | $ 2,828,591 | | $ 29,217,874 |
There were realized gains of $941,227 for the in-kind transaction in 2021.
For the year ended October 31, 2022, there were no in-kind transactions.
| 11. | Capital Share Transactions: |
| | The following information is for the years ended October 31, 2022 and October 31, 2021: |
| | |
| | For the Year Ended
October 31, 2022 | | For the Year Ended
October 31, 2021 |
| | Shares | | Amount | | Shares | | Amount |
| Class I(1) | | | | | | | |
| Shares Sold | 89,834 | | $ 861,905 | | — | | $ — |
| Shares Issued for Reinvested Dividends | 1,648 | | 14,783 | | — | | — |
| Shares Redeemed | (23,949) | | (208,242) | | — | | — |
| Net Increase (Decrease) | 67,533 | | 668,446 | | — | | — |
| Class R3(1) | | | | | | | |
| Shares Sold | 957 | | $ 10,000 | | — | | $ — |
| Shares Issued for Reinvested Dividends | 33 | | 317 | | — | | — |
| Net Increase (Decrease) | 990 | | 10,317 | | — | | — |
| Class R4(1) | | | | | | | |
| Shares Sold | 957 | | $ 10,000 | | — | | $ — |
| Shares Issued for Reinvested Dividends | 36 | | 347 | | — | | — |
| Net Increase (Decrease) | 993 | | 10,347 | | — | | — |
Hartford Schroders Sustainable Core Bond Fund
Notes to Financial Statements – (continued)
October 31, 2022
| | For the Year Ended
October 31, 2022 | | For the Year Ended
October 31, 2021 |
| | Shares | | Amount | | Shares | | Amount |
| Class R5(1) | | | | | | | |
| Shares Sold | 957 | | $ 10,000 | | — | | $ — |
| Shares Issued for Reinvested Dividends | 39 | | 376 | | — | | — |
| Net Increase (Decrease) | 996 | | 10,376 | | — | | — |
| Class Y | | | | | | | |
| Shares Sold | 50,373 | | $ 480,247 | | 481,714 | | $ 5,173,308 |
| Shares Issued for Reinvested Dividends | 20,209 | | 194,707 | | 79,975 | | 857,345 |
| Shares Redeemed | (163,701) | | (1,594,345) | | (2,908,658) | | (31,039,331) |
| Net Increase (Decrease) | (93,119) | | (919,391) | | (2,346,969) | | (25,008,678) |
| Class F(1) | | | | | | | |
| Shares Sold | 10,129,806 | | $ 97,005,756 | | — | | $ — |
| Shares Issued for Reinvested Dividends | 192,860 | | 1,727,648 | | — | | — |
| Shares Redeemed | (1,195,789) | | (10,887,963) | | — | | — |
| Net Increase (Decrease) | 9,126,877 | | 87,845,441 | | — | | — |
| Class SDR | | | | | | | |
| Shares Sold | 1,527,277 | | $ 14,869,001 | | 2,913,476 | | $ 30,737,099 |
| Shares Issued for Reinvested Dividends | 266,756 | | 2,550,840 | | 261,730 | | 2,792,111 |
| Shares Redeemed | (1,581,745) | | (14,610,001) | | (320,272) | | (3,383,531) |
| Shares Redeemed-In-Kind | — | | — | | (2,753,805) | | (29,217,874) |
| Net Increase (Decrease) | 212,288 | | 2,809,840 | | 101,129 | | 927,805 |
| Total Net Increase (Decrease) | 9,316,558 | | $ 90,435,376 | | (2,245,840) | | $ (24,080,873) |
| (1) | Commenced operations on November 12, 2021. |
| 12. | Fund Reorganization: |
| | At a special meeting of shareholders of the Predecessor Fund held on October 28, 2021, and adjourned to November 3, 2021, shareholders of the Predecessor Fund approved an agreement and plan of reorganization pursuant to which the Predecessor Fund transferred all of its assets to the Fund, in exchange for shares of the designated classes of the Fund and the assumption by the Fund of all of the liabilities of the Predecessor Fund. The Predecessor Fund was determined to be the accounting survivor. The consummation of the reorganization took place immediately after the close of business on November 12, 2021 in a tax-free exchange of shares as detailed below. |
| | |
Net assets of
Predecessor Fund as of
the close of business on
November 12, 2021 | | Net assets of
Fund immediately
before Reorganization | | Net assets of
Fund immediately
after Reorganization | | Predecessor
Fund shares
exchanged | | Fund shares issued
to the Predecessor
Fund's Shareholders |
| $ 83,254,484 | | $ — | | $ 83,254,484 | | 7,963,263 | | 7,963,263 |
Assuming the acquisition had been completed on November 1, 2021, the beginning of the annual reporting period of the Fund, the Fund’s pro forma results of operations for the year ended October 31, 2022, are as follows:
| Net investment income | $ 3,221,627 |
| Net realized and unrealized gain (loss) on investments | (27,620,172) |
| Net increase (decrease) in net assets from operations | $ (24,398,545) |
| 13. | Line of Credit: |
| | The Fund participates in a committed line of credit pursuant to a credit agreement dated March 3, 2022. The Fund may borrow under the line of credit for temporary or emergency purposes. The Fund (together with certain other Hartford Funds) may borrow up to $350 million in the aggregate, subject to asset coverage and other limitations specified in the credit agreement. The interest rate on borrowings varies depending on the nature of the loan. The facility also charges certain fees, such as a commitment fee. The fees incurred by the Fund in connection with the committed line of credit during the period appear in the Statement of Operations under “Other expenses.” During and as of the period ended October 31, 2022, the Fund had no borrowings under this facility. |
Hartford Schroders Sustainable Core Bond Fund
Notes to Financial Statements – (continued)
October 31, 2022
| 14. | Indemnifications: |
| | Under the Company’s organizational documents, the Company shall indemnify its officers and directors to the full extent required or permitted under Maryland General Corporation Law and federal securities laws. In addition, the Company, on behalf of the Fund, may enter into contracts that contain a variety of indemnifications. The Company’s maximum exposure under these arrangements is unknown. However, as of the date of these financial statements, the Company has not had prior claims or losses pursuant to these contracts and expects the risk of loss to be remote. |
| 15. | Recent Accounting Pronouncement: |
| | In March 2020, FASB issued Accounting Standards Update ("ASU") No. 2020-04, Reference Rate Reform (Topic 848); Facilitation of the Effects of Reference Rate Reform on Financial Reporting, which provides optional guidance for a limited period of time to ease the potential burden in accounting for (or recognizing the effects of) reference rate reform. The guidance is applicable to contracts referencing LIBOR or another reference rate that is expected to be discontinued due to reference rate reform. The ASU is effective as of March 12, 2020 and generally can be applied through December 31, 2022. Management is evaluating the underlying securities referencing LIBOR or another reference rate that is expected to be discontinued over the period of time the ASU is effective. |
| 16. | Change in Independent Registered Public Accounting Firm: |
| | The Predecessor Fund selected BBD, LLP (“BBD”) to serve as its independent registered public accounting firm for its fiscal year ended October 31, 2021. The decision to select BBD was recommended by the Predecessor Fund’s Audit Committee and was approved by the Predecessor Fund’s Board of Trustees on September 22, 2021. During the fiscal year ended October 31, 2020 and the subsequent interim period through September 22, 2021, neither the Predecessor Fund, nor anyone on its behalf, consulted with BBD on items which: (i) concerned the application of accounting principles to a specified transaction, either completed or proposed, or the type of audit opinion that might be rendered on the Predecessor Fund’s financial statements; or (ii) concerned the subject of a disagreement (as defined in paragraph (a)(1)(iv) of Item 304 of Regulation S-K) or reportable events (as described in paragraph (a)(1)(iv) of said Item 304). The selection of BBD does not reflect any disagreements with or dissatisfaction by the Predecessor Fund or the Predecessor Fund’s Board of Trustees with the performance of the Predecessor Fund’s prior independent registered public accounting firm for the fiscal year ended October 31, 2020. On November 3, 2021, the prior auditor resigned as the Independent Registered Public Accounting Firm for the Predecessor Fund. The prior auditor's report on the Predecessor Fund’s financial statements for fiscal year ended October 31, 2020 contained no adverse opinion or disclaimer of opinion, nor were they qualified or modified as to uncertainty, audit scope, or accounting principles. During the Predecessor Fund’s fiscal year ended October 31, 2020 and the subsequent interim period through November 3, 2021 (i) there were no disagreements with the prior auditor on any matter of accounting principles or practices, financial statement disclosure, or auditing scope or procedure, which disagreements, if not resolved to the satisfaction of the prior auditor, would have caused them to make reference to the subject matter of the disagreements in connection with their reports on the Predecessor Fund’s financial statements for such years; and (ii) there were no “reportable events” of the kind described in Item 304(a)(1)(v) of Regulation S-K. |
| 17. | Subsequent Events: |
| | Management has evaluated all subsequent transactions and events through the date on which these financial statements were issued and has determined that no additional items require disclosure in these financial statements. |
Report of Independent Registered Public Accounting Firm
To the Board of Directors of The Hartford Mutual Funds II, Inc. and the Shareholders of Hartford Schroders Sustainable Core Bond Fund
Opinion on the Financial Statements
We have audited the accompanying statement of assets and liabilities of Hartford Schroders Sustainable Core Bond Fund, a series of The Hartford Mutual Funds II, Inc. (the "Fund") (previously known as Schroder Core Bond Fund, a series of shares of beneficial interest in Schroder Series Trust), including the schedule of investments, as of October 31, 2022, and the related statement of operations for the year then ended, the statements of changes in net assets for each of the years in the two-year period then ended, the financial highlights as presented in the table below and the related notes (collectively referred to as the "financial statements"). In our opinion, the financial statements present fairly, in all material respects, the financial position of the Fund as of October 31, 2022, and the results of its operations for the year then ended, the changes in its net assets for each of the years in the two-year period then ended and its financial highlights as presented in the table below, in conformity with accounting principles generally accepted in the United States of America. The financial highlights for the periods presented below and noted as "Audited by Other Auditor" were audited by other auditors whose reports dated December 28, 2019 and December 29, 2020, expressed an unqualified opinion on those financial highlights.
| Class | Financial Highlights Presented and Audited by BBD |
| Class I /R3/R4/R5/F | For the period November 12, 2021 (commencement of operations) to October 31, 2022 |
Class Y
(previously Investor) | For each of the years in the two-year period ended October 31, 2022 |
Class SDR
(previously R6) | For each of the years in the two-year period ended October 31, 2022 |
| Class | Financial Highlights Presented and Audited by Other Auditor |
Class Y
(previously Investor) | For the period June 29, 2020 (commencement of operations) to October 31, 2020 |
Class SDR
(previously R6) | For each of the years in the two-year period ended October 31, 2020 and for the period January 31, 2018 (commencement of operations) to October 31, 2018 |
Basis for Opinion
These financial statements are the responsibility of the Fund’s management. Our responsibility is to express an opinion on the Fund's financial statements based on our audits. We are a public accounting firm registered with the Public Company Accounting Oversight Board (United States) ("PCAOB") and are required to be independent with respect to the Fund in accordance with the U.S. federal securities law and the applicable rules and regulations of the Securities and Exchange Commission and the PCAOB.
We conducted our audits in accordance with the standards of the PCAOB. Those standards require that we plan and perform the audits to obtain reasonable assurance about whether the financial statements are free of material misstatement, whether due to error or fraud. The Fund is not required to have, nor were we engaged to perform, an audit of its internal control over financial reporting. As part of our audits we are required to obtain an understanding of internal control over financial reporting but not for the purpose of expressing an opinion on the effectiveness of the Fund’s internal control over financial reporting. Accordingly, we express no such opinion.
Our audits included performing procedures to assess the risk of material misstatement of the financial statements, whether due to error or fraud, and performing procedures that respond to those risks. Such procedures included examining, on a test basis, evidence regarding the amounts and disclosures in the financial statements. Our procedures included confirmation of securities owned as of October 31, 2022 by correspondence with the custodian, brokers, or by other appropriate auditing procedures where replies from brokers were not received. Our audits also included evaluating the accounting principles used and significant estimates made by management, as well as evaluating the overall presentation of the financial statements. We believe that our audits provide a reasonable basis for our opinion.
/s/ BBD, LLP
We have served as the auditor of the Fund since 2021.
Philadelphia, Pennsylvania
December 27, 2022
Hartford Schroders Sustainable Core Bond Fund
Operation of the Liquidity Risk Management Program (Unaudited)
This section describes the operation and effectiveness of the Liquidity Risk Management Program (“LRM Program”) established in accordance with Rule 22e-4 under the Investment Company Act of 1940, as amended (the “Liquidity Rule”). The LRM Program seeks to assess and manage the Fund’s liquidity risk. The Liquidity Rule generally defines liquidity risk as the risk that the Fund could not meet its obligation to redeem shares without significant dilution of the non-redeeming investors’ interests in the Fund. The Board of Directors (“Board”) of The Hartford Mutual Funds II, Inc. has appointed Hartford Funds Management Company, LLC (“HFMC”) to serve as the administrator of the LRM Program with respect to the Fund, subject to the oversight of the Board. In order to efficiently and effectively administer the LRM Program, HFMC established a Liquidity Risk Oversight Committee.
The LRM Program is comprised of various components designed to support the assessment and/or management of liquidity risk, including: (1) the assessment and periodic review (no less frequently than annually) of certain factors that influence the Fund’s liquidity risk; (2) the classification and periodic review (no less frequently than monthly) of the Fund’s investments into one of four liquidity categories that reflect an estimate of their liquidity under current market conditions; (3) a 15% limit on the acquisition of “illiquid investments” (as defined under the Liquidity Rule); (4) the determination of a minimum percentage of the Fund’s assets that generally will be invested in highly liquid investments (“HLIM”); (5) the periodic review (no less frequently than annually) of the HLIM and the adoption and implementation of policies and procedures for responding to a shortfall of the Fund’s highly liquid investments below its HLIM; and (6) periodic reporting to the Board.
At a meeting of the Board held August 9-10, 2022, HFMC provided an annual written report to the Board covering the period ended on June 30, 2022 (the “Reporting Period”). The annual report addressed important aspects of the LRM Program, including, but not limited to:
| • | the operation of the LRM Program (and related policies and procedures utilized in connection with management of the Fund’s liquidity risk); |
| • | an assessment of the adequacy and effectiveness of the LRM Program’s (and related policies and procedures’) implementation; |
| • | the operation, and assessment of the adequacy and effectiveness, of the Fund’s HLIM; |
| • | whether the third-party liquidity vendor’s (“LRM Program Vendor”) processes for determining preliminary liquidity classifications, including the particular methodologies or factors used and metrics analyzed by the LRM Program Vendor, are sufficient under the Liquidity Rule and appropriate in light of the Fund’s specific circumstances; and |
| • | any material changes to the LRM Program. |
In addition, HFMC provides a quarterly report on the LRM Program at each quarterly meeting of the Board’s Compliance and Risk Oversight Committee. The quarterly report included information regarding the Fund’s liquidity as measured by established parameters, a summary of developments within the capital markets that may impact liquidity, and other factors that may impact liquidity. Among other things, HFMC reports any changes to the Fund’s HLIM.
During the Reporting Period, HFMC did not reduce the HLIM for the Fund.
Based on its review and assessment, HFMC has concluded that the LRM Program is operating effectively to assess and manage the liquidity risk of the Fund and that the LRM Program has been and continues to be adequately and effectively implemented with respect to the Fund. Because liquidity in the capital markets in which the Fund invests is beyond the control of the Fund, there can be no assurance that the LRM Program will ensure liquidity under all circumstances and does not protect against the risk of loss.
Hartford Schroders Sustainable Core Bond Fund
Directors and Officers of the Company (Unaudited)
The Hartford Mutual Funds II, Inc. (the “Company”) is governed by a Board of Directors (the “Directors”). The following tables present certain information regarding the Directors and officers of the Company as of October 31, 2022. For more information regarding the Directors and officers, please refer to the Statement of Additional Information, which is available, without charge, upon request by calling 1-888-843-7824.
NAME, YEAR OF BIRTH
AND ADDRESS(1) | | POSITION
HELD WITH
THE COMPANY | | TERM OF
OFFICE(2) AND
LENGTH OF
TIME SERVED | | PRINCIPAL OCCUPATION(S)
DURING PAST 5 YEARS | | NUMBER OF
PORTFOLIOS
IN FUND
COMPLEX(3)
OVERSEEN
BY DIRECTOR | | OTHER DIRECTORSHIPS
FOR PUBLIC COMPANIES
AND OTHER REGISTERED
INVESTMENT COMPANIES HELD
BY DIRECTOR |
| NON-INTERESTED DIRECTORS |
HILARY E. ACKERMANN
(1956) | | Director | | Since 2014 | | Ms. Ackermann served as Chief Risk Officer at Goldman Sachs Bank USA from October 2008 to November 2011. | | 80 | | Ms. Ackermann served as a Director of Dynegy, Inc. from October 2012 until its acquisition by Vistra Energy Corporation ("Vistra") in 2018, and since that time she has served as a Director of Vistra. Ms. Ackermann serves as a Director of Credit Suisse Holdings (USA), Inc. from January 2017 to present. |
ROBIN C. BEERY
(1967) | | Director | | Since 2017 | | Ms. Beery has served as a consultant to ArrowMark Partners (an alternative asset manager) since March of 2015 and since November 2018 has been employed by ArrowMark Partners as a Senior Advisor. Previously, she was Executive Vice President, Head of Distribution, for Janus Capital Group, and Chief Executive Officer and President of the Janus Mutual Funds (a global asset manager) from September 2009 to August 2014. | | 80 | | Ms. Beery serves as an independent Director of UMB Financial Corporation (January 2015 to present), has chaired the Compensation Committee since April 2017, and serves on the Audit Committee and the Risk Committee. |
DERRICK D. CEPHAS
(1952) | | Director | | Since 2020 | | Mr. Cephas currently serves as Of Counsel to Squire Patton Boggs LLP, an international law firm with 45 offices in 20 countries. Until his retirement in October 2020, Mr. Cephas was a Partner of Weil, Gotshal & Manges LLP, an international law firm headquartered in New York, where he served as the Head of the Financial Institutions Practice (April 2011 to October 2020). | | 80 | | Mr. Cephas currently serves as a Director of Signature Bank, a New York-based commercial bank, and is a member of the Credit Committee, Examining Committee and Risk Committee. Mr. Cephas currently serves as a Director of Claros Mortgage Trust, Inc., a real estate investment trust. |
CHRISTINE R. DETRICK
(1958) | | Director and Chair of the Board | | Director since 2016; Chair of the Board since 2021 | | From 2002 until 2012, Ms. Detrick was a Senior Partner, Leader of the Financial Services Practice, and a Senior Advisor at Bain & Company (“Bain”). Before joining Bain, she served in various senior management roles for other financial services firms and was a consultant at McKinsey and Company. | | 80 | | Ms. Detrick currently serves as a Director of Charles River Associates (May 2020 to present); currently serves as a Director of Capital One Financial Corporation (since November 2021); and currently serves as a Director of Altus Power, Inc (since December 2021). |
JOHN J. GAUTHIER
(1961) | | Director | | Since 2022 | | Mr. Gauthier currently is the Principal Owner of JJG Advisory, LLC, an investment consulting firm, and Co-Founder and Principal Owner of Talcott Capital Partners (a placement agent for investment managers serving insurance companies). From 2008 to 2018, Mr. Gauthier served as a Senior Vice President (2008-2010), Executive Vice President (2010-2012), and President (2012-2018) of Allied World Financial Services (a global provider of property, casualty and specialty insurance and reinsurance solutions). | | 80 | | Mr. Gauthier serves as a Director of Reinsurance Group of America, Inc. (from 2018 to present) and chairs the Investment Committee and is a member of the Audit and Risk Committees. |
Hartford Schroders Sustainable Core Bond Fund
Directors and Officers of the Company (Unaudited) – (continued)
NAME, YEAR OF BIRTH
AND ADDRESS(1) | | POSITION
HELD WITH
THE COMPANY | | TERM OF
OFFICE(2) AND
LENGTH OF
TIME SERVED | | PRINCIPAL OCCUPATION(S)
DURING PAST 5 YEARS | | NUMBER OF
PORTFOLIOS
IN FUND
COMPLEX(3)
OVERSEEN
BY DIRECTOR | | OTHER DIRECTORSHIPS
FOR PUBLIC COMPANIES
AND OTHER REGISTERED
INVESTMENT COMPANIES HELD
BY DIRECTOR |
ANDREW A. JOHNSON
(1962) | | Director | | Since 2020 | | Mr. Johnson currently serves as a Diversity and Inclusion Advisor at Neuberger Berman, a private, global investment management firm. Prior to his current role, Mr. Johnson served as Chief Investment Officer and Head of Global Investment Grade Fixed Income at Neuberger Berman (January 2009 to December 2018). | | 80 | | Mr. Johnson currently serves as a Director of AGNC Investment Corp., a real estate investment trust. |
PAUL L. ROSENBERG
(1953) | | Director | | Since 2020 | | Mr. Rosenberg is a Partner of The Bridgespan Group, a global nonprofit consulting firm that is a social impact advisor to nonprofits, non-governmental organizations, philanthropists and institutional investors (October 2007 to present). | | 80 | | None |
DAVID SUNG
(1953) | | Director | | Since 2017 | | Mr. Sung was a Partner at Ernst & Young LLP from October 1995 to July 2014. | | 80 | | Mr. Sung serves as a Trustee of Ironwood Institutional Multi-Strategy Fund, LLC and Ironwood Multi-Strategy Fund, LLC (October 2015 to present). |
| OFFICERS AND INTERESTED DIRECTORS |
JAMES E. DAVEY(4)
(1964) | | Director, President and Chief Executive Officer | | President and Chief Executive Officer since 2010; Director since 2012 | | Mr. Davey serves as Executive Vice President of The Hartford Financial Services Group, Inc. Mr. Davey has served in various positions within The Hartford and its subsidiaries and joined The Hartford in 2002. Additionally, Mr. Davey serves as Director, Chairman, President, and Senior Managing Director for Hartford Funds Management Group, Inc. ("HFMG"). Mr. Davey also serves as President, Manager, Chairman of the Board, and Senior Managing Director for Hartford Funds Management Company, LLC (“HFMC”); Manager, Chairman of the Board, and President of Lattice Strategies LLC (“Lattice”); Chairman of the Board, Manager, and Senior Managing Director of Hartford Funds Distributors, LLC (“HFD”); and Chairman of the Board, President and Senior Managing Director of Hartford Administrative Services Company (“HASCO”), each of which is an affiliate of HFMG. | | 80 | | None |
AMY N. FURLONG
(1979) | | Vice President | | Since 2018 | | Ms. Furlong serves as Vice President and Assistant Treasurer of HFMC (since September 2019). From 2018 through March 15, 2021, Ms. Furlong served as the Treasurer of the Company. Ms. Furlong has served in various positions within The Hartford and its subsidiaries in connection with the operation of the Hartford Funds. Ms. Furlong joined The Hartford in 2004. | | N/A | | N/A |
WALTER F. GARGER
(1965) | | Vice President and Chief Legal Officer | | Since 2016 | | Mr. Garger serves as Secretary, Managing Director and General Counsel of HFMG, HFMC, HFD, and HASCO (since 2013). Mr. Garger also serves as Secretary and General Counsel of Lattice (since July 2016). Mr. Garger has served in various positions within The Hartford and its subsidiaries in connection with the operation of the Hartford Funds. Mr. Garger joined The Hartford in 1995. | | N/A | | N/A |
THEODORE J. LUCAS
(1966) | | Vice President | | Since 2017 | | Mr. Lucas serves as Executive Vice President of HFMG (since July 2016) and as Executive Vice President of Lattice (since June 2017). Previously, Mr. Lucas served as Managing Partner of Lattice (2003 to 2016). | | N/A | | N/A |
JOSEPH G. MELCHER
(1973) | | Vice President, Chief Compliance Officer and AML Compliance Officer | | Vice President and Chief Compliance Officer since 2013; AML Compliance Officer since August 1, 2022 | | Mr. Melcher serves as Executive Vice President of HFMG and HASCO (since December 2013). Mr. Melcher also serves as Executive Vice President (since December 2013) and Chief Compliance Officer (since December 2012) of HFMC, serves as Executive Vice President and Chief Compliance Officer of Lattice (since July 2016), serves as Executive Vice President of HFD (since December 2013), and has served as President and Chief Executive Officer of HFD (from April 2018 to June 2019). | | N/A | | N/A |
Hartford Schroders Sustainable Core Bond Fund
Directors and Officers of the Company (Unaudited) – (continued)
NAME, YEAR OF BIRTH
AND ADDRESS(1) | | POSITION
HELD WITH
THE COMPANY | | TERM OF
OFFICE(2) AND
LENGTH OF
TIME SERVED | | PRINCIPAL OCCUPATION(S)
DURING PAST 5 YEARS | | NUMBER OF
PORTFOLIOS
IN FUND
COMPLEX(3)
OVERSEEN
BY DIRECTOR | | OTHER DIRECTORSHIPS
FOR PUBLIC COMPANIES
AND OTHER REGISTERED
INVESTMENT COMPANIES HELD
BY DIRECTOR |
VERNON J. MEYER
(1964) | | Vice President | | Since 2006 | | Mr. Meyer serves as Managing Director and Chief Investment Officer of HFMC and Managing Director of HFMG (since 2013). Mr. Meyer also serves as Senior Vice President-Investments of Lattice (since March 2019). Mr. Meyer has served in various positions within The Hartford and its subsidiaries in connection with the operation of the Hartford Funds. Mr. Meyer joined The Hartford in 2004. | | N/A | | N/A |
DAVID A. NAAB
(1985) | | Vice President and Treasurer | | Since 2021 | | Mr. Naab serves as Vice President and Assistant Treasurer of HFMC (since June 2021). Prior to joining HFMC in 2021, Mr. Naab served in various positions as an associate, senior associate, manager, senior manager, and director within the investment management, financial services, and asset & wealth management practice groups of PricewaterhouseCoopers, LLP from 2007 to 2020. | | N/A | | N/A |
ALICE A. PELLEGRINO
(1960) | | Vice President and Assistant Secretary | | Since 2016 | | Ms. Pellegrino is Deputy General Counsel for HFMG (since April 2022) and currently serves as Vice President of HFMG (since December 2013). Ms. Pellegrino also serves as Vice President and Assistant Secretary of Lattice (since June 2017). Ms. Pellegrino has served in various positions within The Hartford and its subsidiaries in connection with the operation of the Hartford Funds. Ms. Pellegrino joined The Hartford in 2007. | | N/A | | N/A |
THOMAS R. PHILLIPS
(1960) | | Vice President and Secretary | | Since 2017 | | Mr. Phillips is Deputy General Counsel for HFMG and currently serves as a Senior Vice President (since June 2021) and Assistant Secretary (since June 2017) for HFMG. Mr. Phillips also serves as Vice President of HFMC (since June 2021). Prior to joining HFMG in 2017, Mr. Phillips was a Director and Chief Legal Officer of Saturna Capital Corporation from 2014–2016. Prior to that, Mr. Phillips was a Partner and Deputy General Counsel of Lord, Abbett & Co. LLC. | | N/A | | N/A |
| (1) | The address for each officer and Director is c/o Hartford Funds 690 Lee Road, Wayne, Pennsylvania 19087. |
| (2) | Term of Office: Each Director holds an indefinite term until his or her retirement, resignation, removal, or death. Directors generally must retire no later than December 31 of the year in which the Director turns 75 years of age. Each Fund officer generally serves until his or her resignation, removal, or death. |
| (3) | The portfolios of the “Fund Complex” are operational series of The Hartford Mutual Funds, Inc., The Hartford Mutual Funds II, Inc., Hartford Series Fund, Inc., Hartford HLS Series Fund II, Inc., Lattice Strategies Trust and Hartford Funds Exchange-Traded Trust. |
| (4) | “Interested person,” as defined in the 1940 Act, of the Company because of the person’s affiliation with, or equity ownership of, HFMC, HFD or affiliated companies. |
Hartford Schroders Sustainable Core Bond Fund
HOW TO OBTAIN A COPY OF THE FUND’S PROXY VOTING POLICIES AND VOTING RECORDS (UNAUDITED)
A description of the policies and procedures that the Fund uses to determine how to vote proxies relating to portfolio securities and information about how the Fund voted proxies relating to portfolio securities during the most recent twelve-month period ended June 30 are available (1) without charge, upon request, by calling 888-843-7824 and (2) on the SEC’s website at http://www.sec.gov.
QUARTERLY PORTFOLIO HOLDINGS INFORMATION (UNAUDITED)
The Fund files its complete schedule of portfolio holdings with the SEC for the first and third quarters of each fiscal year as an exhibit to its reports on Form N-PORT. The Fund’s portfolio holdings filed as an exhibit to Form N-PORT for the most recent first and third quarter of the Fund’s fiscal year are available (1) without charge, upon request, by calling 888-843-7824, (2) on the Fund's website, hartfordfunds.com, and (3) on the SEC’s website at http://www.sec.gov.
Hartford Schroders Sustainable Core Bond Fund
Approval of Investment Management and Investment Sub-Advisory Agreements (Unaudited)
The Hartford Mutual Funds II, Inc.
Hartford Schroders Sustainable Core Bond Fund
Hartford Schroders Sustainable Core Bond Fund (the "Fund") is a successor to a corresponding series of Schroder Series Trust (the "Predecessor Fund") pursuant to a reorganization consummated after the close of business on November 12, 2021.
Section 15(c) of the Investment Company Act of 1940, as amended (the "1940 Act"), requires that each mutual fund’s board of directors, including a majority of those directors who are not "interested persons" of the mutual fund, as defined in the 1940 Act (the "Independent Directors"), annually review and consider the continuation of the mutual fund’s investment advisory and sub-advisory agreements. At its meeting held on August 9-10, 2022, the Board of Directors (the "Board") of The Hartford Mutual Funds II, Inc. ("HMF II"), including each of the Independent Directors, unanimously voted to approve (i) the continuation of an investment management agreement by and between Hartford Funds Management Company, LLC ("HFMC") and each of The Hartford Mutual Funds, Inc. ("HMF"), on behalf of its series, and HMF II, on behalf of the Fund (the "Management Agreement"); and (ii) the continuation of an investment sub-advisory agreement (the "Sub-Advisory Agreement" and together with the Management Agreement, the "Agreements") by and between HFMC and the Fund’s sub-adviser, Schroder Investment Management North America Inc. ("SIMNA Inc." or the "Sub-adviser" and together with HFMC, the "Advisers"), with respect to the Fund.
In the months preceding the August 9-10, 2022 meeting, the Board requested and reviewed written responses from the Advisers to questions posed to the Advisers on behalf of the Independent Directors and supporting materials relating to those questions and responses. In addition, the Board considered such additional information as it deemed reasonably necessary to evaluate the Agreements, as applicable, with respect to the Fund, which included information furnished to the Board and its committees at their meetings throughout the year and in between regularly scheduled meetings on particular matters as the need arose, as well as information specifically prepared in connection with the approval of the continuation of the Agreements that was presented at the Board’s meetings held on June 15-16, 2022 and August 9-10, 2022. Information provided to the Board and its committees at their meetings throughout the year included, among other things, reports on Fund performance, legal, compliance and risk management matters, sales and marketing activity, shareholder services, and the other services provided to the Fund by the Advisers and their affiliates. The members of the Board also considered the materials and presentations by Fund officers and representatives of HFMC received at the Board’s meetings on June 15-16, 2022 and August 9-10, 2022 concerning the Agreements and at the special meeting of the Board’s Investment Committee on May 20, 2022 concerning Fund performance and other investment-related matters.
The Independent Directors, advised by independent legal counsel throughout the evaluation process, engaged service providers to assist them with evaluating the Agreements with respect to the Fund, as applicable. Broadridge Financial Solutions, Inc. ("Broadridge"), an independent provider of investment company data, was retained to provide the Board with reports on how the Fund’s contractual management fees, actual management fees, total expense ratios and investment performance compared to those of comparable mutual funds with similar investment objectives. The Independent Directors also engaged an independent financial services consultant (the "Consultant") to assist them in evaluating the Fund’s contractual management fees, actual management fees, total expense ratios and investment performance. In addition, the Consultant previously reviewed the profitability methodologies utilized by HFMC in connection with the continuation of the Management Agreement.
In determining whether to approve the continuation of the Agreements for the Fund, the members of the Board reviewed and evaluated information and factors they believed to be relevant and appropriate through the exercise of their reasonable business judgment. While individual members of the Board may have weighed certain factors differently, the Board’s determination to approve the continuation of the Agreements was based on a comprehensive consideration of all information provided to the Board throughout the year and specifically with respect to the continuation of the Agreements. The Board was also furnished with an analysis of its fiduciary obligations in connection with its evaluation of the Agreements. Throughout the evaluation process, the Board was assisted by counsel for the Fund and the Independent Directors were also separately assisted by independent legal counsel. In connection with their deliberations, the Independent Directors met separately with independent legal counsel and the Consultant on June 10, 2022 and in executive session on several occasions to consider their responsibilities under relevant laws and regulations and to discuss the materials presented and other matters deemed relevant to their consideration of the approval of the continuation of the Agreements. As a result of the discussions that occurred during the June 10, 2022 and June 15-16, 2022 meetings, the Independent Directors presented HFMC with requests for additional information on certain topics. HFMC responded to these requests with additional information in connection with the August 9-10, 2022 meeting. A more detailed summary of the important, but not necessarily all, factors the Board considered with respect to its approval of the continuation of the Agreements is provided below.
Hartford Schroders Sustainable Core Bond Fund
Approval of Investment Management and Investment Sub-Advisory Agreements (Unaudited) – (continued)
Nature, Extent and Quality of Services Provided by the Advisers
The Board requested and considered information concerning the nature, extent and quality of the services provided to the Fund by the Advisers. The Board considered, among other things, the terms of the Agreements and the range of services provided by the Advisers. The Board considered the Advisers’ professional personnel who provide services to the Fund, including each Adviser’s ability and experience in attracting and retaining qualified personnel to service the Fund. The Board considered each Adviser’s reputation and overall financial strength, as well as each Adviser’s willingness to consider and implement organizational and operational changes designed to enhance services to the funds managed by HFMC and its affiliates (the "Hartford funds"). In addition, the Board considered the quality of each Adviser’s communications with the Board and responsiveness to Board inquiries and requests made from time to time with respect to the Fund and other Hartford funds.
The Board also requested and evaluated information concerning each Adviser’s regulatory and compliance environment. In this regard, the Board requested and reviewed information about each Adviser’s compliance policies and procedures and compliance history, and a report from the Fund’s Chief Compliance Officer about each Adviser’s compliance with applicable laws and regulations, including responses to regulatory developments and any compliance or other issues raised by regulators. The Board also noted the Advisers’ support of the Fund’s compliance control structure, as applicable, including the resources devoted by the Advisers in support of the Fund’s obligations pursuant to Rule 38a-1 under the 1940 Act and the Fund’s risk management programs, as well as the efforts of the Advisers to address cybersecurity risks. The Board also considered HFMC’s investments in business continuity planning designed to benefit the Fund, and the implementation of HFMC’s business continuity plans due to the COVID-19 pandemic. The Board also noted HFMC’s commitment to maintaining high quality systems and expending substantial resources to prepare for and respond to ongoing changes to the market, regulatory and control environments in which the Fund and its service providers operate.
With respect to HFMC, the Board noted that, under the Management Agreement, HFMC is responsible for the management of the Fund, including oversight of fund operations and service providers, and the provision of investment advisory and administrative services in connection with selecting, monitoring and supervising the Sub-adviser. In this regard, the Board evaluated information about the nature and extent of responsibilities retained and risks assumed by HFMC that were not delegated to or assumed by the Sub-adviser. The Board considered HFMC’s ongoing monitoring of people, process and performance, including its quarterly reviews of each of the Hartford funds, semi-annual meetings with the leaders of the Fund’s portfolio management team, and ongoing oversight of the Hartford funds’ portfolio managers. The Board noted that HFMC has demonstrated a record of initiating changes to the portfolio management and/or investment strategies of the Hartford funds when warranted. The Board considered HFMC’s periodic due diligence reviews of the Sub-adviser and ongoing oversight of the Sub-adviser’s investment approach and results, process for monitoring best execution of portfolio trades and other trading operations by the Sub-adviser, and approach to risk management with respect to the Fund and the service providers to the Fund. The Board also considered HFMC’s day-to-day oversight of the Fund’s compliance with its investment objective and policies as well as with applicable laws and regulations, noting that regulatory and other developments had over time led to an increase in the scope of HFMC’s oversight in this regard. Moreover, the Board considered HFMC’s oversight of potential conflicts of interest between the Fund’s investments and those of other funds or accounts, if any, managed by the Fund’s portfolio management personnel.
In addition, the Board considered HFMC’s overall strategic plan for, and ongoing commitment to review and rationalize, the Hartford funds product line-up. The Board also considered the expenses that HFMC had incurred, as well as the risks HFMC had assumed, in connection with the launch of new funds and changes to existing Hartford funds in recent years. The Board considered that HFMC is responsible for providing the Fund’s officers.
With respect to the Sub-adviser, which provides certain day-to-day portfolio management services for the Fund, subject to oversight by HFMC, the Board considered, among other things, the Sub-adviser’s investment personnel, investment philosophy and process, investment research capabilities and resources, performance record, trade execution capabilities and experience, including with respect to sustainable and environmental, social and/or governance (ESG) investing. The Board considered the experience of the Fund’s portfolio managers, the number of accounts managed by the portfolio managers, and the Sub-adviser’s method for compensating the portfolio managers. The Board also considered the Sub-adviser’s succession planning practices to ensure continuity of portfolio management services provided to the Fund.
The Board considered the benefits to shareholders of being part of the family of Hartford funds, including, the right to exchange investments between the same class of shares and the ability to reinvest Fund dividends into other Hartford funds (excluding the Hartford funds that are exchange-traded funds). The Board considered HFMC’s efforts to provide investors in the Hartford funds with a broad range of investment styles and asset classes and the assumption of entrepreneurial and other risks by HFMC in sponsoring and providing ongoing services to new funds to expand these opportunities for shareholders. In addition, the Board observed that in the marketplace there are a range of investment options available to the Fund’s shareholders and such shareholders, having had the opportunity to consider other investment options, have chosen to invest in the Fund.
Based on these considerations, the Board concluded that it was satisfied with the nature, extent and quality of the services provided to the Fund by HFMC and the Sub-adviser.
Hartford Schroders Sustainable Core Bond Fund
Approval of Investment Management and Investment Sub-Advisory Agreements (Unaudited) – (continued)
Performance of the Fund and the Advisers
The Board considered the investment performance of the Fund, which included the performance of the Predecessor Fund. The Board noted that the Predecessor Fund had been managed by SIMNA Inc. In this regard, the Board reviewed the performance of the Fund over different time periods and evaluated HFMC’s analysis of the Fund’s performance for these time periods. The Board considered information and materials provided to the Board by the Advisers concerning Fund performance, as well as information from Broadridge comparing the investment performance of the Fund to an appropriate universe of peer funds. The Board noted that while it found the comparative data provided by Broadridge generally useful in evaluating a Hartford fund’s investment performance, the Board recognized the limitations of such data, including that notable differences may exist between a Hartford fund and its peers. For details regarding the Fund’s performance, see the Fund Factors synopsis below.
The Board considered the detailed investment analytics reports provided by HFMC’s Investment Advisory Group throughout the year, including in connection with the approval of the continuation of the Agreements. These reports included, among other things, information on the Fund’s gross returns and net returns, the Fund’s investment performance compared to one or more appropriate benchmarks and relevant groups or categories of peer funds, various statistics concerning the Fund’s portfolio, a narrative summary of various factors affecting Fund performance, and commentary on the effect of market conditions. The Board considered the Advisers’ work with the Investment Committee, which assists the Board in evaluating the performance of the Fund at periodic meetings throughout the year and specifically with respect to the approval of the continuation of the Agreements. The Board considered that the Investment Committee, in its evaluation of investment performance at meetings throughout the year, focused particular attention on information indicating less favorable performance of certain Hartford funds for specific time periods and discussed with the Advisers the reasons for such performance as well as any specific actions that the Advisers had taken, or had agreed to take, to seek to enhance Fund investment performance and the results of those actions. The Board also considered the analysis provided by the Consultant relating to the Fund’s performance track record.
Based on these considerations, the Board concluded that it had continued confidence in HFMC’s and the Sub-adviser’s overall capabilities to manage the Fund.
Costs of the Services and Profitability of the Advisers
The Board reviewed information regarding HFMC’s cost to provide investment management and related services to the Fund and HFMC’s profitability, both overall and for the Fund, on a pre-tax basis without regard to distribution expenses. The Board also requested and reviewed information about the profitability to HFMC and its affiliates from all services provided to the Fund and all aspects of their relationship with the Fund, including information regarding profitability trends over time and information provided by Broadridge analyzing the profitability of managers to other fund complexes. The Board also requested and received information relating to the operations and profitability of the Sub-adviser. The Board considered representations from HFMC and the Sub-adviser that the Sub-adviser’s fees were negotiated at arm’s length and that the sub-advisory fees are paid by HFMC and not the Fund. Accordingly, the Board concluded that the profitability of the Sub-adviser is a less relevant factor with respect to the Board’s consideration of the Sub-Advisory Agreement.
The Board considered the Consultant’s review of the methodologies and estimates used by HFMC in calculating profitability in connection with the continuation of the Management Agreement, including a description of the methodology used to allocate certain expenses. The Board noted the Consultant’s view that HFMC’s process for calculating and reporting Fund profitability is reasonable and consistent with the process previously reviewed by the Consultant. The Board noted that the Consultant had previously performed a full review of this process and reported that such process is reasonable, sound and consistent with common industry practice.
Based on these considerations, the Board concluded that the profits realized by the Advisers and their affiliates from their relationships with the Fund were not excessive.
Comparison of Fees and Services Provided by the Advisers
The Board considered comparative information with respect to the services rendered to and the management fees to be paid by the Fund to HFMC and the total expense ratios of the Fund. The Board also considered comparative information with respect to the sub-advisory fees to be paid by HFMC to the Sub-adviser with respect to the Fund. In this regard, the Board requested and reviewed information from HFMC and the Sub-adviser relating to the management and sub-advisory fees, including the sub-advisory fee schedule for the Fund and the amount of the management fee retained by
Hartford Schroders Sustainable Core Bond Fund
Approval of Investment Management and Investment Sub-Advisory Agreements (Unaudited) – (continued)
HFMC, and total operating expenses for the Fund. The Board also reviewed information from Broadridge comparing the Fund’s contractual management fees, actual management fees and total expense ratios relative to an appropriate group of funds selected by Broadridge. The Board considered such information from Broadridge in consultation with the Consultant. For details regarding the Fund’s expenses, see the Fund Factors synopsis below.
The Board considered the methodology used by Broadridge to select the funds included in the expense group. While the Board recognized that comparisons between the Fund and its peer funds may be imprecise given, among other differences, the different service levels and characteristics of mutual funds and the different business models and cost structures of the Advisers, the comparative information provided by Broadridge assisted the Board in evaluating the reasonableness of the Fund’s fees and total operating expenses. In addition, the Board considered the analysis and views of the Consultant relating to the Fund’s fees and total operating expenses and expense group.
The Board received information regarding fees charged by the Sub-adviser to any other clients with investment strategies similar to those of the Fund, including any institutional separate account clients and registered fund clients for which the Sub-adviser serves as either primary investment adviser or sub-adviser. The Board considered the explanations provided by the Sub-adviser about any differences between the Sub-adviser’s services to the Fund and the services the Sub-adviser provides to other types of clients. In this regard, the Board reviewed information about the generally broader scope of services and compliance, reporting and other legal burdens and risks of managing registered funds compared with those associated with managing assets of non-registered fund clients such as institutional separate accounts.
Based on these considerations, the Board concluded that the Fund’s fees and total operating expenses, in conjunction with the information about quality of services, profitability, economies of scale, and other matters considered, were reasonable in light of the services provided.
Economies of Scale
The Board considered information regarding economies of scale, including the extent to which economies of scale may be realized as the Fund grows and whether fee levels reflect these economies of scale for the benefit of shareholders of the Fund. The Board reviewed the breakpoints in the management fee schedule for the Fund, which reduce fee rates as the Fund’s assets grow over time. The Board recognized that a fund with assets beyond the highest breakpoint level will continue to benefit from economies of scale because additional assets are charged the lowest breakpoint fee resulting in lower effective management fee rates. The Board also recognized that a fee schedule that reaches a breakpoint at a lower asset level provides shareholders with the benefit of anticipated or potential economies of scale. The Board considered that expense limitations and fee waivers that reduce the Fund’s expenses at all asset levels can have the same effect as breakpoints in sharing economies of scale with shareholders and provide protection from an increase in expenses if the Fund’s assets decline. In addition, the Board considered that initially setting competitive fee rates, pricing the Fund to scale at inception and making additional investments intended to enhance services available to shareholders are other means of sharing anticipated or potential economies of scale with shareholders. The Board also considered that HFMC has been active in managing expenses of the Hartford funds in recent years, which has resulted in benefits being realized by shareholders. The Board also noted that the Fund’s current low asset levels have kept the Fund from fully realizing the benefits of anticipated or potential economies of scale.
The Board reviewed and evaluated materials from Broadridge and the Consultant showing how management fee schedules of peer funds reflect economies of scale for the benefit of shareholders as a peer fund’s assets hypothetically increase over time. Based on information provided by HFMC, Broadridge, and the Consultant, the Board recognized that there is no uniform methodology for establishing breakpoints or uniform pattern in asset levels that trigger breakpoints or the amounts of breakpoints triggered.
After considering all of the information available to it, the Board concluded that it was satisfied with the extent to which economies of scale would be shared for the benefit of the Fund’s shareholders based on currently available information and the effective management fees and total expense ratios for the Fund at its current and reasonably anticipated asset levels. The Board noted, however, that it would continue to monitor any future growth in the Fund’s assets and the appropriateness of additional management fee breakpoints or other methods to share benefits from economies of scale as part of its future review of the Agreements.
Other Benefits
The Board considered other benefits to the Advisers and their affiliates from their relationships with the Fund.
The Board noted that HFMC receives fees for fund accounting and related services from the Fund, and the Board considered information on the profitability to HFMC from providing such services to the Fund. The Board also considered that the Fund pays a transfer agency fee to Hartford Administrative Services Company ("HASCO"), an affiliate of HFMC, equal to the lesser of: (i) the actual costs incurred by HASCO in connection with
Hartford Schroders Sustainable Core Bond Fund
Approval of Investment Management and Investment Sub-Advisory Agreements (Unaudited) – (continued)
the provisions of transfer agency services, including payments made to sub-transfer agents, plus a reasonable target profit margin; or (ii) a specified amount as set forth in the Transfer Agency and Service Agreement by and between HMF II, on behalf of the Fund, and HASCO. The Board reviewed information about the profitability to HASCO of the Fund’s transfer agency function. The Board considered information provided by HFMC indicating that the transfer agency fees charged by HASCO to the Fund were fair and reasonable based on available industry data about fees charged by transfer agents to other mutual funds. The Board also noted that HFMC and HASCO had delegated certain fund accounting services and transfer agency services, respectively, to external service providers, subject to oversight.
The Board also considered that Hartford Funds Distributors, LLC ("HFD"), an affiliate of HFMC, serves as principal underwriter of the Fund. The Board noted that, as principal underwriter, HFD receives distribution and service fees from the Fund. The Board considered that HFD has entered into an agreement with SIMNA Inc. and SEI Trust Company to provide certain marketing support services in connection with four collective investment trust vehicles for which the Sub-adviser serves as investment adviser. The Board also considered that Schroder Fund Advisors LLC ("SFA"), a wholly-owned subsidiary of SIMNA Inc., has entered into an additional compensation arrangement with HFMC and HFD. The Board considered that under this arrangement, SFA is involved in the distribution of the Class SDR shares of the Fund, and HFMC compensates SFA for such services.
The Board considered the benefits, if any, to the Sub-adviser from any use of the Fund’s brokerage commissions to obtain soft dollar research. The Board also considered that SIMNA Inc. has entered into a solicitation agreement with HFMC pursuant to which HFMC provides certain marketing support services with respect to investment strategy models offered by SIMNA Inc. through its managed account platforms.
Fund Factors
For purposes of evaluating the Fund’s performance, the Board considered the Fund’s performance relative to similarly managed funds and the Fund’s performance relative to its benchmark. In particular, the Board considered the Fund’s performance of its Class I shares (net of all fees and expenses), as of March 31, 2022, and compared that performance to the Fund’s peer universe, which includes all funds within the same classification or category, as determined by an independent firm engaged by the Board. The Board considered the Fund’s performance relative to its peer universe by evaluating its quintile ranking, with the 1st quintile representing the top performing funds within a peer universe and the 5th quintile representing the lowest performing funds. For purposes of evaluating the Fund’s performance relative to its benchmark, the Board considered the Fund’s performance of its Class I shares (net of all fees and expenses) as of March 31, 2022. The Board considered Fund performance to be "in line with" the Fund’s benchmark where it was 0.5% above or below the benchmark return. With respect to fees and expenses, the Board considered the Fund’s contractual and actual management fee, and total operating expenses of its Class I shares (net of all fees and expenses), as compared to the Fund’s expense peer group, which includes a group of similarly sized funds selected by the independent firm engaged by the Board.
| • | The Board noted that the Fund’s performance was in the 2nd quintile versus its peer universe for the 1-year period and the 1st quintile for the 3-year period. The Board also noted that the Fund’s performance was in line with its benchmark for the 1-year period and above its benchmark for the 3-year period. |
| • | The Board noted that the Fund’s contractual and actual management fee were in the 1st quintile of its expense group and its total expenses were in the 3rd quintile. The Board noted that Class I Shares of the Fund have a contractual expense cap of 0.51% through February 28, 2023, which resulted in HFMC reimbursing the Fund for certain expenses. |
* * * *
Based upon the review of the factors summarized above, among others, the Board concluded that it is in the best interests of the Fund and its shareholders for the Board to approve the continuation of the Agreements for an additional year. In reaching this decision, the Board did not assign relative weights to the factors discussed above or deem any one or group of them to be controlling in and of themselves.
Hartford Schroders Sustainable Core Bond Fund
Supplemental Proxy Information (Unaudited)
A special meeting of shareholders of the Predecessor Fund was held on October 28, 2021, and adjourned to November 3, 2021 (“Shareholder Meeting”). At the Shareholder Meeting, shareholders of the Predecessor Fund voted to approve an agreement and plan of reorganization pursuant to which the Predecessor Fund would transfer all of its assets to the Fund, in exchange for shares of the designated classes of the Fund and the assumption by the Fund of all of the liabilities of the Predecessor Fund. The final results of the Shareholder Meeting are reported below:
| |
| Shares Outstanding (as of Record Date (September 2, 2021)): 8,393,022.000 |
| Total Shares Voted: 4,804,217.000 |
| Percentage of Shares Voted: 57.24% |
| Votes For: 4,804,217.000 |
| Percentage of Shares For: 100.00% |
| Votes Against: 0 |
| Percentage of Shares Against: 0.00% |
| Votes Abstained: 0 |
| Percentage of Shares Abstained: 0.00% |
THIS PRIVACY POLICY IS NOT PART OF THIS REPORT
Customer Privacy Notice
The Hartford Financial Services Group, Inc. and Affiliates
(herein called “we, our, and us”)
This Privacy Policy applies to our United States Operations
We value your trust. We are committed to the responsible:
| a) | management; |
| b) | use; and |
| c) | protection; |
of Personal Information.
This notice describes how we collect, disclose, and protect Personal Information.
We collect Personal Information to:
| a) | service your Transactions with us; and |
| b) | support our business functions. |
We may obtain Personal Information from:
| a) | You; |
| b) | your Transactions with us; and |
| c) | third parties such as a consumer-reporting agency. |
Based on the type of product or service You apply for or get from us, Personal Information such as:
| a) | your name; |
| b) | your address; |
| c) | your income; |
| d) | your payment; or |
| e) | your credit history; |
may be gathered from sources such as applications, Transactions, and consumer reports.
To serve You and service our business, we may share certain Personal Information. We will share Personal Information, only as allowed by law, with affiliates such as:
| a) | our insurance companies; |
| b) | our employee agents; |
| c) | our brokerage firms; and |
| d) | our administrators. |
As allowed by law, we may share Personal Financial Information with our affiliates to:
| a) | market our products; or |
| b) | market our services; |
to You without providing You with an option to prevent these disclosures.
We may also share Personal Information, only as allowed by law, with unaffiliated third parties including:
| a) | independent agents; |
| b) | brokerage firms; |
| c) | insurance companies; |
| d) | administrators; and |
| e) | service providers; |
who help us serve You and service our business.
When allowed by law, we may share certain Personal Financial Information with other unaffiliated third parties who assist us by performing services or functions such as:
| a) | taking surveys; |
| b) | marketing our products or services; or |
| c) | offering financial products or services under a joint agreement |
between us and one or more financial institutions.
We, and third parties we partner with, may track some of the pages You visit through the use of:
| a) | cookies; |
| b) | pixel tagging; or |
| c) | other technologies; |
and currently do not process or comply with any web browser’s “do not track” signal or other similar mechanism that indicates a request to disable online tracking of individual users who visit our websites or use our services.
For more information, our Online Privacy Policy, which governs information we collect on our website and our affiliate websites, is available at https://www.thehartford.com/online-privacy-policy.
We will not sell or share your Personal Financial Information with anyone for purposes unrelated to our business functions without offering You the opportunity to:
| a) | “opt-out;” or |
| b) | “opt-in;” |
as required by law.
We only disclose Personal Health Information with:
| a) | your authorization; or |
| b) | as otherwise allowed or required by law. |
Our employees have access to Personal Information in the course of doing their jobs, such as:
| a) | underwriting policies; |
| b) | paying claims; |
| c) | developing new products; or |
| d) | advising customers of our products and services. |
We use manual and electronic security procedures to maintain:
| a) | the confidentiality; and |
Personal Information that we have. We use these procedures to guard against unauthorized access.
Some techniques we use to protect Personal Information include:
| d) | firewall technology; and |
| e) | the use of detection software. |
We are responsible for and must:
| a) | identify information to be protected; |
| b) | provide an adequate level of protection for that data; and |
| c) | grant access to protected data only to those people who must use |
it in the performance of their job-related duties.
Employees who violate our privacy policies and procedures may be subject to discipline, which may include termination of their employment with us.
We will continue to follow our Privacy Policy regarding Personal Information even when a business relationship no longer exists between us.
As used in this Privacy Notice:
Application means your request for our product or service.
Personal Financial Information means financial information such as:
| d) | policy or claim information. |
Personal Financial Information may include Social Security Numbers, Driver’s license numbers, or other government-issued identification numbers, or credit, debit card, or bank account numbers.
Personal Health Information means health information such as:
| a) | your medical records; or |
| b) | information about your illness, disability or injury. |
Personal Information means information that identifies You personally and is not otherwise available to the public. It includes:
| a) | Personal Financial Information; and |
| b) | Personal Health Information. |
Transaction means your business dealings with us, such as:
| b) | your request for us to pay a claim; and |
| c) | your request for us to take an action on your account. |
You means an individual who has given us Personal Information in conjunction with:
a financial product or service from us if the product or service is used mainly for personal, family, or household purposes.
If you have any questions or comments about this privacy notice, please feel free to contact us at The Hartford – Consumer Rights and Privacy Compliance Unit, One Hartford Plaza, Mail Drop: HO1-09, Hartford, CT 06155, or at ConsumerPrivacyInquiriesMailbox@thehartford.com.
This Customer Privacy Notice is being provided on behalf of The Hartford Financial Services Group, Inc. and its affiliates (including the following as of February 2022), to the extent required by the Gramm-Leach-Bliley Act and implementing regulations:
1stAGChoice, Inc.; Access CoverageCorp, Inc.; Access CoverageCorp Technologies, Inc.; Business Management Group, Inc.; Cervus Claim Solutions, LLC; First State Insurance Company; FTC Resolution Company LLC; Hart Re Group L.L.C.; Hartford Accident and Indemnity Company; Hartford Administrative Services Company; Hartford Casualty General Agency, Inc.; Hartford Casualty Insurance Company; Hartford Fire General Agency, Inc.; Hartford Fire Insurance Company; Hartford Funds Distributors, LLC; Hartford Funds Management Company, LLC; Hartford Funds Management Group, Inc.; Hartford Holdings, Inc.; Hartford Insurance Company of Illinois; Hartford Insurance Company of the Midwest; Hartford Insurance Company of the Southeast; Hartford Insurance, Ltd.; Hartford Integrated Technologies, Inc.; Hartford Investment Management Company; Hartford Life and Accident Insurance Company; Hartford Lloyd’s Corporation; Hartford Lloyd’s Insurance Company; Hartford Management, Ltd.; Hartford Productivity Services LLC; Hartford of the Southeast General Agency, Inc.; Hartford of Texas General Agency, Inc.; Hartford Residual Market, L.C.C.; Hartford Specialty Insurance Services of Texas, LLC; Hartford STAG Ventures LLC; Hartford Strategic Investments, LLC; Hartford Underwriters General Agency, Inc.; Hartford Underwriters Insurance Company; Heritage Holdings, Inc.; Heritage Reinsurance Company, Ltd.; HLA LLC; HL Investment Advisors, LLC; Horizon Management Group, LLC; HRA Brokerage Services, Inc.; Lattice Strategies LLC; Maxum Casualty Insurance Company; Maxum Indemnity Company; Maxum Specialty Services Corporation; Millennium Underwriting Limited; MPC Resolution Company LLC; Navigators (Asia) Limited; Navigators Corporate Underwriters Limited; Navigators Holdings (UK) Limited; Navigators Insurance Company; Navigators International Insurance Company Ltd.; Navigators Management Company, Inc.; Navigators Management (UK) Limited; Navigators N.V.; Navigators Specialty Insurance Company; Navigators Underwriting Agency Limited; Navigators Underwriting Limited; New England Insurance Company; New England Reinsurance Corporation; New Ocean Insurance Co., Ltd.; NIC Investments (Chile) SpA; Nutmeg Insurance Agency, Inc.; Nutmeg Insurance Company; Pacific Insurance Company, Limited; Property and Casualty Insurance Company of Hartford; Sentinel Insurance Company, Ltd.; The Navigators Group, Inc.; Trumbull Flood Management, L.L.C.; Trumbull Insurance Company; Twin City Fire Insurance Company; Y-Risk, LLC.
Revised February 2022
[This page is intentionally left blank]
[This page is intentionally left blank]
This report is submitted for the general information of the shareholders of the Hartford Schroders Sustainable Core Bond Fund (the "Fund"). It is not authorized for distribution to persons who are not shareholders of the Fund unless preceded or accompanied by a current prospectus. Nothing herein contained is to be considered an offer of sale or a solicitation of an offer to buy shares of the Fund.
The information cannot be used or relied upon for the purpose of avoiding IRS penalties. These materials are not intended to provide tax, accounting or legal advice. As with all matters of a tax or legal nature, you should consult your own tax or legal counsel for advice.
Investors should carefully consider the Fund’s investment objectives, risks, charges and expenses. This and other important information is contained in the Fund’s prospectus and summary prospectus, which can be obtained by visiting hartfordfunds.com. Please read it carefully before investing.
The Fund is distributed by Hartford Funds Distributors, LLC.
MFAR-SSCB22 12/22 Printed in the U.S.A.
(b) Not applicable.
Item 2. Code of Ethics.
The registrant, as of the end of the period covered by this report, has adopted a code of ethics that applies to the registrant’s principal executive officer, principal financial officer, principal accounting officer or controller, or persons performing similar functions, regardless of whether these individuals are employed by the registrant or a third party. There have been no amendments, during the period covered by this report, to a provision of the code of ethics that applies to the registrant’s principal executive officer, principal financial officer, principal accounting officer or controller, or persons performing similar functions, regardless of whether these individuals are employed by the registrant or a third party, and that relates to any element of the code of ethics description. The registrant has not granted any waivers, including an implicit waiver, from a provision of the code of ethics that applies to the registrant’s principal executive officer, principal financial officer, principal accounting officer or controller, or persons performing similar functions, regardless of whether these individuals are employed by the registrant or a third party, that relates to one or more of the items set forth in paragraph (b) of this item’s instructions. A copy of the code of ethics is filed herewith.
Item 3. Audit Committee Financial Expert.
The Board of Directors of the registrant (the “Board”) has designated David Sung as an Audit Committee Financial Expert. Mr. Sung is considered by the Board to be an independent director.
Item 4. Principal Accountant Fees and Services.
| | (a) | Audit Fees: The aggregate fees billed for each of the last two fiscal years for professional services rendered by the principal accountant for the audit of the registrant’s annual financial statements or services that are normally provided by the accountant in connection with statutory and regulatory filings or engagements for those fiscal years were: |
$345,358 for the fiscal year ended October 31, 2022; $284,690 for the fiscal year ended October 31, 2021, as follows:
| | | | |
| | | Fiscal year ended October
31, 2022 | | Fiscal year ended October
31, 2021 |
PricewaterhouseCoopers LLP | | $324,958 | | $284,690 |
BBD, LLP | | $20,400 | | $0 |
Aggregate Fees | | $345,358 | | $284,690 |
| | (b) | Audit Related Fees: The aggregate fees billed in each of the last two fiscal years for assurance and related services by the principal accountant that are reasonably related to the performance of the audit of the registrant’s financial statements and are not reported under paragraph (a) of this Item were: |
$0 for the fiscal year ended October 31, 2022; $0 for the fiscal year ended October 31, 2021.
| | (c) | Tax Fees: The aggregate fees billed in each of the last two fiscal years for professional services rendered by the principal accountant for tax compliance, tax advice, and tax planning were: |
$73,892 for the fiscal year ended October 31, 2022; $65,952 for the fiscal year ended October 31, 2021, as follows:
| | | | |
| | | Fiscal year ended October
31, 2022 | | Fiscal year ended October
31, 2021 |
PricewaterhouseCoopers LLP | | $73,892 | | $65,952 |
BBD, LLP | | $0 | | $0 |
Aggregate Fees | | $73,892 | | $65,952 |
Tax-related services were principally in connection with, but not limited to, general tax services and excise tax services.
| | (d) | All Other Fees: The aggregate fees billed in each of the last two fiscal years for products and services provided by the principal accountant, other than the services reported in paragraphs (a) through (c) of this Item were: |
$982 for the fiscal year ended October 31, 2022; $11,586 for the fiscal year ended October 31, 2021, as follows:
| | | | |
| | | Fiscal year ended October
31, 2022 | | Fiscal year ended October
31, 2021 |
PricewaterhouseCoopers LLP | | $982 | | $11,586 |
BBD, LLP | | $0 | | $0 |
Aggregate Fees | | $982 | | $11,586 |
These fees were principally in connection with, but not limited to, general audit related products and services and an accounting research tool subscription.
(e) | (1) | The Pre-Approval Policies and Procedures (the “Policy”) adopted by the Audit Committee of the registrant (also, the “Fund”) sets forth the procedures pursuant to which services performed by the independent registered public accounting firm for the registrant may be pre-approved. The following summarizes the pre-approval requirements under the Policy. |
| | a) | The Audit Committee must pre-approve all audit services and non-audit services that the independent registered public accounting firm provides to the Fund. |
| | b) | The Audit Committee must pre-approve any engagement of the independent registered public accounting firm to provide non-audit services to any Service Affiliate (which is defined to include any entity controlling, controlled by, or under common control with the investment adviser that provides ongoing services to the Fund) during the period of the independent registered public accounting firm’s engagement to provide audit services to |
| | the Fund, if the non-audit services to the Service Affiliate directly impact the Fund’s operations and financial reporting. |
| | c) | The Audit Committee, from time to time, may designate one or more of its members who are Independent Directors (each a “Designated Member”) to consider, on the Audit Committee’s behalf, any non-audit services, whether to the Fund or to any Service Affiliate, that have not been pre-approved by the Audit Committee. The Designated Member also shall review, on the Audit Committee’s behalf, any proposed material change in the nature or extent of any non-audit services previously approved. In considering any requested non-audit services or proposed material change in such services, the Designated Member shall not authorize services which would exceed $50,000 in fees for such services. |
| | d) | The independent registered public accounting firm may not provide specified prohibited non-audit services set forth in the Policy to the Fund, the Fund’s investment adviser, the Service Affiliates or any other member of the investment company complex. |
| | (e) (2) | One hundred percent of the services described in items 4(b) through 4(d) were approved in accordance with the Audit Committee’s Pre-Approval Policy. As a result, none of such services was approved pursuant to paragraph (c)(7)(i)(C) of Rule 2-01 of Regulation S-X. |
| | (f) | None of the hours expended on the principal accountant’s engagement to audit the registrant’s financial statements for the year ended October 31, 2022, were attributed to work performed by persons other than the principal accountant’s full-time, permanent employees. |
| | (g) | The aggregate non-audit fees billed by the registrant’s accountant for services rendered to the registrant, and rendered to the registrant’s investment adviser (not including any sub-adviser whose role is primarily portfolio management and is subcontracted with or overseen by another investment adviser), and any entity controlling, controlled by, or under common control with the adviser that provides ongoing services to the registrant for each of the last two fiscal years of the registrant were: |
The aggregate non-audit fees billed by the registrant’s accountant for services rendered to the registrant: $74,874 for the fiscal year ended October 31, 2022; $77,538 for the fiscal year ended October 31, 2021, as follows:
| | | | |
| | | Fiscal year ended October
31, 2022 | | Fiscal year ended October
31, 2021 |
PricewaterhouseCoopers LLP | | $74,874 | | $77,538 |
BBD, LLP | | $0 | | $0 |
Aggregate Fees | | $74,874 | | $77,538 |
The aggregate non-audit fees billed by the registrant’s accountant for services rendered to the registrant’s investment adviser (not including any sub-adviser whose role is primarily portfolio management and is subcontracted with or overseen by another investment adviser), and any entity controlling, controlled by, or under common control with the adviser was $120,925 for the fiscal year ended October 31, 2022 and $325,000 for the fiscal year ended October 31, 2021, as follows:
| | | | |
| | | Fiscal year ended October
31, 2022 | | Fiscal year ended October
31, 2021 |
PricewaterhouseCoopers LLP | | $120,925 | | $325,000 |
BBD, LLP | | $0 | | $0 |
Aggregate Fees | | $120,925 | | $325,000 |
| | (h) | The registrant’s audit committee of the board of directors has considered whether the provision of non-audit services that were rendered to the registrant’s investment adviser (not including any sub-adviser whose role is primarily portfolio management and is subcontracted with or overseen by another investment adviser), and any entity controlling, controlled by, or under common control with the investment adviser that provides ongoing services to the registrant that were not pre-approved pursuant to paragraph (c)(7)(ii) of Rule 2-01 of Regulation S-X is compatible with maintaining the principal accountant’s independence. |
Item 5. Audit Committee of Listed Registrants.
Not applicable.
Item 6. Investments.
| | (a) | The Schedule of Investments in securities of unaffiliated issuers as of the close of the reporting period is included as part of the annual report filed under Item 1 of this form. |
Item 7. Disclosure of Proxy Voting Policies and Procedures for Closed-End Management Investment Companies.
Not applicable.
Item 8. Portfolio Managers of Closed-End Management Investment Companies.
Not applicable.
Item 9. Purchases of Equity Securities by Closed-End Management Investment Company and Affiliated Purchasers.
Not applicable.
Item 10. Submission of Matters to a Vote of Security Holders.
There have been no material changes to the procedures by which the shareholders may recommend nominees to the registrant’s board of directors, where those changes were implemented after the registrant last provided disclosure in response to the requirements of Item 407(c)(2)(iv) of Regulation S-K (17 CFR 229.407) (as required by Item 22(b)(15) of Schedule 14A (17 CFR 240.14a-101)), or this Item.
Item 11. Controls and Procedures.
| | (a) | The registrant’s principal executive and principal financial officers, or persons performing similar functions, have concluded that the registrant’s disclosure controls and procedures (as defined in Rule 30a-3(c) under the Investment Company Act of 1940, as amended (the “1940 Act”) (17 CFR 270.30a-3(c))) are generally effective to provide reasonable assurance, as of a date within 90 days of the filing date of the report that includes the disclosure required by this paragraph, based on their evaluation of these controls and procedures required by Rule 30a-3(b) under the 1940 Act (17 CFR 270.30a-3(b)) and Rules 13a-15(b) or 15d-15(b) under the Securities Exchange Act of 1934, as amended (17 CFR 240.13a-15(b) or 240.15d-15(b)). |
| | (b) | There were no changes in the registrant’s internal control over financial reporting (as defined in Rule 30a-3(d) under the 1940 Act (17 CFR 270.30a-3(d)) that occurred during the period covered by this report that have materially affected, or are reasonably likely to materially affect, the registrant’s internal control over financial reporting. |
Item 12. Disclosure of Securities Lending Activities for Closed-End Management Investment Companies.
Not applicable.
Item 13. Exhibits.
SIGNATURES
Pursuant to the requirements of the Securities Exchange Act of 1934 and the Investment Company Act of 1940, the registrant has duly caused this report to be signed on its behalf by the undersigned, thereunto duly authorized.
| | | | | | |
| | | | THE HARTFORD MUTUAL FUNDS II, INC. |
| | | |
Date: January 6, 2023 | | | | By: | | /s/ James E. Davey |
| | | | | | James E. Davey |
| | | | | | President and Chief Executive Officer |
Pursuant to the requirements of the Securities Exchange Act of 1934 and the Investment Company Act of 1940, this report has been signed below by the following persons on behalf of the registrant and in the capacities and on the dates indicated.
| | | | | | |
Date: January 6, 2023 | | | | By: | | /s/ James E. Davey |
| | | | | | James E. Davey |
| | | | | | President and Chief Executive Officer |
| | | | | | |
Date: January 6, 2023 | | | | By: | | /s/ David A. Naab |
| | | | | | David A. Naab |
| | | | | | Treasurer |
| | | | | | (Principal Financial Officer and Principal Accounting Officer) |