The Hartford Mutual Funds, Inc.
The Hartford Mutual Funds II, Inc.
The Hartford Capital Appreciation Fund
Hartford Core Equity Fund
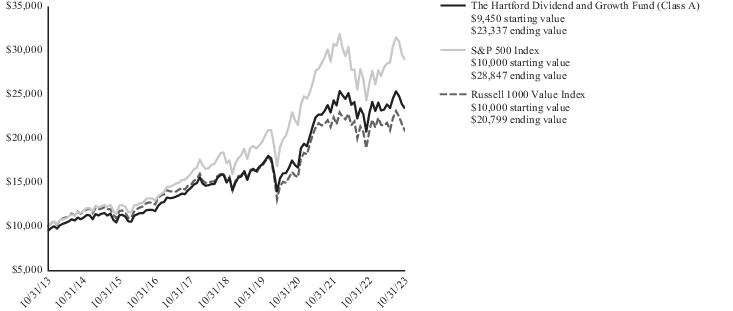
The Hartford Dividend and Growth Fund
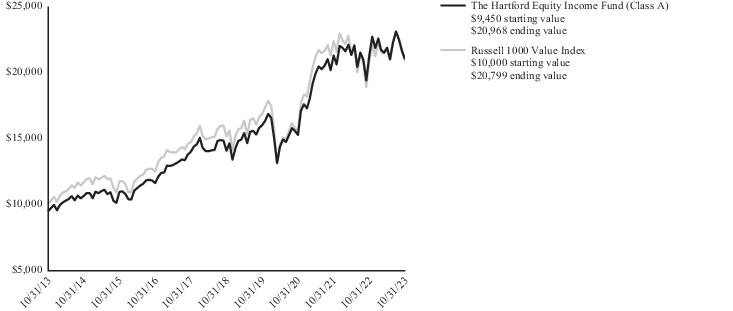
The Hartford Equity Income Fund
The Hartford Growth Opportunities Fund
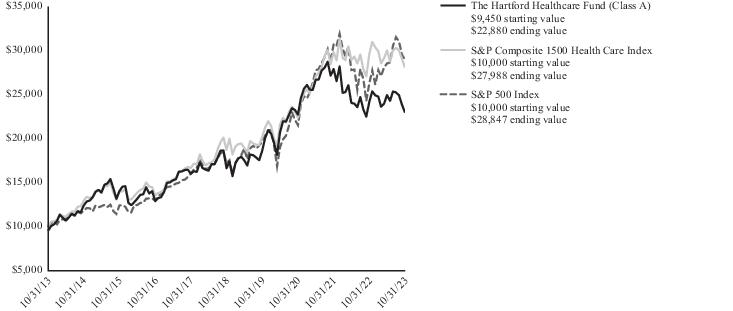
The Hartford Healthcare Fund
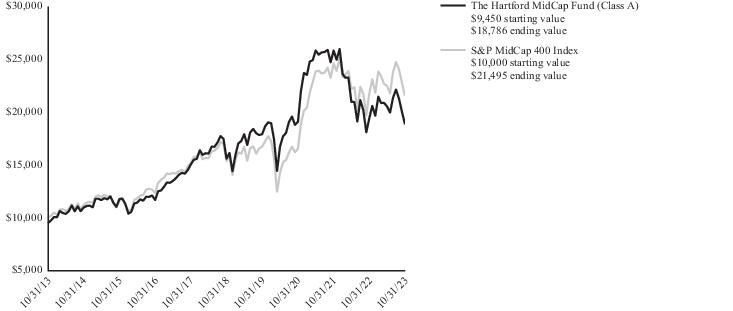
The Hartford MidCap Fund
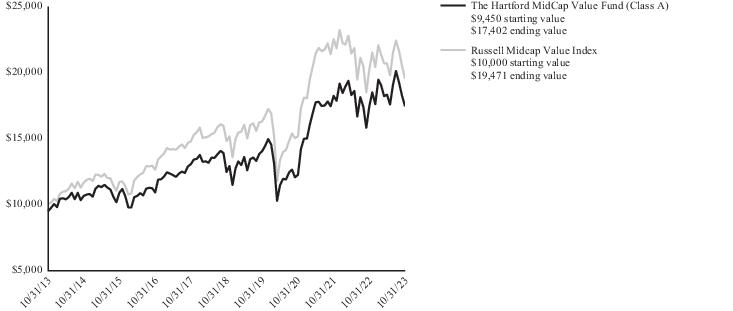
The Hartford MidCap Value Fund
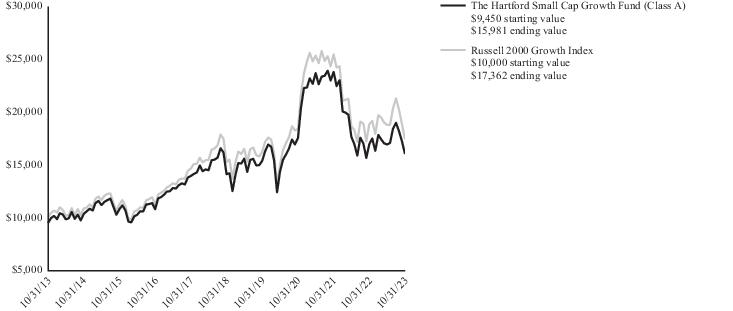
The Hartford Small Cap Growth Fund
Hartford Small Cap Value Fund
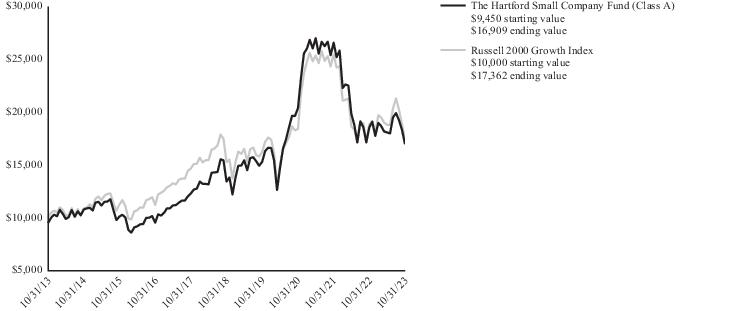
The Hartford Small Company Fund
(each, a “Fund” and collectively, the “Funds”)
Section 15(c) of the Investment Company Act of 1940, as amended (the “1940 Act”), requires that each mutual fund’s board of directors, including a majority of those directors who are not “interested persons” of the mutual fund, as defined in the 1940 Act (the “Independent Directors”), annually review and consider the continuation of the mutual fund’s investment advisory and sub-advisory agreements. At their meeting held on September 6-7, 2023, the Boards of Directors (collectively, the “Board”) of The Hartford Mutual Funds, Inc. (“HMF”) and The Hartford Mutual Funds II, Inc. (“HMF II”), including the Independent Directors, unanimously voted to approve (i) the continuation of an investment management agreement by and between Hartford Funds Management Company, LLC (“HFMC”) and each of HMF, on behalf of each of The Hartford Capital Appreciation Fund, Hartford Core Equity Fund, The Hartford Dividend and Growth Fund, The Hartford Equity Income Fund, The Hartford MidCap Fund, The Hartford MidCap Value Fund, and Hartford Small Cap Value Fund and HMF II, on behalf of each of The Hartford Growth Opportunities Fund and The Hartford Small Cap Growth Fund (the “Management Agreement”); (ii) the continuation of a separate investment management agreement by and between HFMC and HMF, on behalf of each of The Hartford Healthcare Fund and The Hartford Small Company Fund (the “2013 Investment Management Agreement” and together with the Management Agreement, the “Management Agreements”); and (iii) the continuation of investment sub-advisory agreements (each, a “Sub-Advisory Agreement,” and together with the Management Agreements, the “Agreements”) between HFMC and each Fund’s sub-adviser, Wellington Management Company LLP (the “Sub-adviser” and together with HFMC, the “Advisers”), with respect to each Fund.
In the months preceding the September 6-7, 2023 meeting, the Board requested and reviewed written responses from the Advisers to questions posed to the Advisers on behalf of the Independent Directors and supporting materials relating to those questions and responses. In addition, the Board considered such additional information as it deemed reasonably necessary to evaluate the Agreements, as applicable, with respect to each Fund, which included information furnished to the Board and its committees at their meetings throughout the year and in between regularly scheduled meetings on particular matters as the need arose, as well as information specifically prepared in connection with the approval of the continuation of the Agreements that was presented at the Board’s meetings held on June 13-14, 2023 and September 6-7, 2023. Information provided to the Board and its committees at their meetings throughout the year included, among other things, reports on Fund performance, legal, compliance and risk management matters, sales and marketing activity, shareholder services, and the other services provided to each Fund by the Advisers and their affiliates. The members of the Board also considered the materials and presentations by Fund officers and representatives of HFMC received at the Board’s meetings on June 13-14, 2023 and September 6-7, 2023 concerning the Agreements and at the special meeting of the Board’s Investment Committee on May 10-11, 2023 concerning Fund performance and other investment-related matters.
The Independent Directors, advised by independent legal counsel throughout the evaluation process, engaged service providers to assist them with evaluating the Agreements with respect to each Fund, as applicable. Broadridge Financial Solutions, Inc. (“Broadridge”), an independent provider of investment company data, was retained to provide the Board with reports on how each Fund’s contractual management fees, actual management fees, total expense ratios and investment performance compared to those of an appropriate group of investment companies selected by Broadridge. The Independent Directors also engaged an independent financial services consultant (the “Consultant”) to assist them in evaluating each Fund’s contractual management fees, actual management fees, total expense ratios and investment performance. In addition, the Consultant previously reviewed the profitability methodologies utilized by HFMC in connection with the continuation of the Management Agreements.
In determining whether to approve the continuation of the Agreements for a Fund, the members of the Board reviewed and evaluated information and factors they believed to be relevant and appropriate through the exercise of their reasonable business judgment. While individual members of the Board may have weighed certain factors differently, the Board’s determination to approve the continuation of the Agreements was based on a comprehensive consideration of all information provided to the Board throughout the year and specifically with respect to the continuation of the