Exhibit (3)
| | | |
| | | Italy's Stability Programme |
| | | |
| | | 2022 |
MINISTERO DELL'ECONOMIA E DELLE FINANZE | | Abridged version |
| | | Italy's Stability Programme |
| | | |
| | | 2022 |
| | | |
| | | |
| | | Abridged version |
| | | |
| | | |
| | | |
| | | |
| | | |
| | | |
| | | Submitted by Prime Minister |
| | | |
| | | Mario Draghi |
| | | |
| | | |
| | | and Minister of the Economy and Finance |
| | | |
| | | Daniele Franco |
| | | |
| | | |
| | | |
| | | |
| | | |
MINISTERO DELL'ECONOMIA E DELLE FINANZE | | Adopted by the Council of Ministers on 6 April 2022 and endorsed by the Parliament on 20 April 2022 |
FOREWORD
In 2021, the Italian economy posted a strong recovery, as GDP grew by 6.6 percent in real terms and the general government deficit and debt ratios to GDP fell more sharply than expected, to 7.2 percent and 150.8 percent, respectively, from 9.6 percent and 155.3 percent in 2020.
Italy’s Q4-to-Q4 GDP growth in 2021 was the highest among the large European economies, thanks also to the policies adopted by the Italian Government to support households and businesses and to the success of the anti-Covid vaccination campaign.
In the final months of the year, the economic environment deteriorated, not only because of the surge in Covid-19 infections caused by the spread of the Omicron variant, but also because of the exceptional increase in the price of natural gas, which drove up electricity tariffs and emission rights (ETS) prices. The consequent increase in the inflation rate, which has been shared by all advanced economies, albeit to a varying degree, has led the main central banks to reverse their monetary policy stance towards restriction or, in the case of the European Central Bank, to signal a future move in that direction. As a result, interest rates rose, and the spread between the yield on Italian government bonds and that on German Bunds widened. Even so, the growth outlook at the start of the year, although revised slightly downwards, remained largely favourable.
In February, following a military escalation, Russia launched its invasion of Ukraine, to which the European Union, the G7 and numerous other countries responded with a series of economic sanctions. The war led to a further increase in the prices of energy, foodstuff, metals, and other raw materials and to a further decline in business and household confidence. In Italy, consumer inflation rose to 6.7 percent in March, and core inflation (net of energy products and fresh food), albeit much more moderate, reached 2 percent.
In view of these developments, the growth outlook for the economy is now weaker and much more uncertain than at the beginning of the year. In updating the official forecast of this Document, the worsening of the economic scenario is determined by the trend of exogenous variables - from energy prices to interest rates, from the trade-weighted exchange rate of the euro to the lower expected growth of Italy’s export markets. These variables are now all less favourable than they were in September, when the previous official forecast was published in the Update of the Stability Programme and in the Draft Budgetary Plan (DBP) for 2022.
Given a fourth-quarter GDP level closer to the pre-crisis high than previously estimated and to the economic impact of the war in Ukraine, the baseline GDP growth forecast (under existing legislation) for this year is revised down compared to the DBP, from 4.7 percent to 2.9 percent. The one for 2023 is also cut from 2.8 percent to 2.3 percent, while for 2024 the forecast is revised only slightly, i.e.,
| MINISTRY OF ECONOMY AND FINANCE | III |
| | ECONOMIC AND FINANCIAL DOCUMENT 2022 |
from 1.9 percent to 1.8 percent. The forecast for 2025 is set at 1.5 percent, following the approach according to which the three-year projection converges towards the “potential” growth rate of the Italian economy, which is currently estimated at 1.4 percent. This estimate assumes the implementation of the investment and reform programme envisaged in the National Recovery and Resilience Plan (NRRP).
In light of the many unknowns of the current situation, the baseline forecast is characterised by significant downside risks, including the possible interruption of natural gas inflows from Russia, which accounted for 40 percent of Italy’s imports in 2021. Although this risk is already partly incorporated in current gas and oil prices, it is reasonable to assume that a complete shutdown of Russian gas would cause further price increases, which would negatively affect GDP and push up inflation further. In such a scenario, average annual growth in 2022 could fall below the 2.3 percent inherited from 2021.
Already last year, the Italian Government responded to the sudden increase in energy prices with measures to contain costs for gas and electricity users. Such measures - which have been implemented since the third quarter of 2021 - amounted to 5.3 billion in terms of general government net borrowing in 2021 and 14.7 billion for the first half of this year, when measures were added also in favour of large companies, including energy-intensive ones, to contain fuel costs and to support the transportation sector. As a result of these measures, the increase in energy bills paid by businesses and households in the first half of the year is estimated to be at least a quarter lower than it would have been without such interventions.
Additional measures were adopted in the early months of the year in favour of specific categories (non-repayable grants and support for business liquidity), measures to cover part of the costs of regions and local authorities, and measures for the health sector (for a total of another 4.1 billion in 2022).
The Italian Government is also working on a broader and more structural response to the energy crisis, both through actions at the national level and through active participation in the formulation of European policies. On the national front, in agreement with the companies in the sector, an effort is being made to broaden and diversify gas supplies by making greater use of Italy’s southern pipelines, as well as to increase LPG imports and regasification capacity. An increase in domestic production of natural gas and biomethane will also be promoted.
The commitment of the Italian Government and gas companies to diversify gas supply sources is accompanied by growing efforts to rapidly reduce dependence on fossil energy sources by boosting the installation of electricity generation capacity from renewable sources. This line is consistent with the European Commission’s recent REPowerEU communication, which emphasises the development of biofuel production and a concerted EU-wide policy for gas acquisition and the imposition of minimum storage levels, while also calling on Member States to curb energy consumption by increasing the energy efficiency of buildings and saving measures, for example on indoor temperatures.
The Commission also proposes, in line with the position expressed by Italy, to revise and improve the mechanisms for the functioning of gas and electricity
| IV | MINISTRY OF ECONOMY AND FINANCE |
markets, without undermining the principles of transparency and competitiveness on which they are based.
The main objective in responding to the current energy crisis is to accelerate theecological transition while securing gas supplies, which represent the bridge to a decarbonised and sustainable economy, as well as improving the structure and the transparency of the energy markets.
More generally, the difficult phase we are going through should not be a distraction, but rather reinforce the commitment of all administrations and levels of government to effectively implement the NRRP and its largest ‘mission’ in terms of investments and other outlays, namely ecological transition. The completion of the first instalment of the NRRP at the end of 2021, with the disbursement of the relevant funds by the Commission, was indeed a first important achievement.
The past year was also characterised by bottlenecks in international transport and logistics, as well as shortages of crucial products in modern industrial supply chains such as semiconductors. The automotive industry has been particularly affected, not only because of insufficient availability of electronic components and consumers’ uncertainty about the timing of the phasing out of conventional cars, but also because of difficulties in reconverting the conventional car industry.
With regard to industrial policy, new funds have been allocated to support the car industry (both in terms of sales of non-polluting vehicles and support for innovation and reconversion of the production chain) and to sustain investments in the semiconductor industry.
Further measures will be issued in April. However, before describing what the next steps will be, it is worth considering the starting point in terms of public finance.
As mentioned, the year 2021 saw a significantly lower than expected general government deficit. Data on the cash requirements of the State sector shows that public finance developments remained favourable in the first quarter of this year. The new projections show lower general government deficits than projected for 2022-2024 in the DBP policy scenario, especially for 2022. This reflects sustained and higher-than-expected tax and social security contribution revenues and lower expenditure. Recent measures to lower energy costs have been funded in a way that does not raise the deficit compared to the announced target.
The general government deficit in the baseline scenario is 5.1 percent of GDP this year and is projected to fall to 2.7 percent of GDP in 2025. Against these projections, the Government has decided to confirm the DBP nominal deficit targets for 2022-2024. This entails a deficit path starting from 5.6 percent of GDP this year and declining to 2.8 percent in 2025 and creates room for new expansionary measures amounting to 0.5 percentage points of GDP this year, 0.2 in 2023 and 0.1 in 2024 and 2025.
Using these budgetary margins, the Italian Government will prepare a new decree-law to restore some funds that were used to cover the recent Decree-Law No. 17, integrate the resources intended to compensate for the increase in the cost of public works in the face of the dynamics of the price of energy and raw materials, and intervene again to contain the cost of fuel and energy. Instruments will also be put in place to support the companies most affected by the sanctions against Russia;
| MINISTRY OF ECONOMY AND FINANCE | V |
| | ECONOMIC AND FINANCIAL DOCUMENT 2022 |
to this end, the Guarantee Fund for SMEs will also be refinanced. Finally, additional resources will be made available to provide assistance to Ukrainian refugees.
Taking into account these measures, the policy scenario is characterised by GDP growth that is slightly higher than the baseline, especially in 2022 and 2023, when GDP is expected to grow by 3.1 percent and 2.4 percent, respectively, with positive repercussions on employment growth.
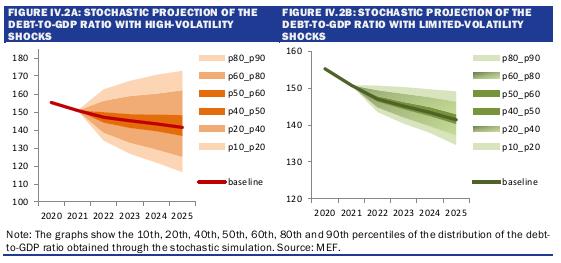
As mentioned above, in the policy scenario the general government deficit target is unchanged from the DBP for the years 2022-2024 and declines below 3 percent in 2025. The path of the structural balance is only slightly higher than that of the DBP due to a different quantification of one-off measures, but still envisages improvements in the structural balance throughout the planning horizon. The debt-to-GDP ratio will fall from 150.8 percent in 2021 to 141.4 percent in 2025.
The decision to confirm deficit targets that were set under more favourable economic circumstances testifies to the attention of the Government towards the sustainability of public finance. Even at this difficult time, when public finance is called upon to respond to multiple needs of both a cyclical and structural nature, the sustainability of public accounts is confirmed. Indeed, longer-term projections show that the gradual improvement of the budget balance in the years after 2025 and the full implementation of the reform programme outlined in the NRRP will make it possible to bring the debt-to-GDP ratio below the pre-pandemic crisis level (134.1 percent) by the end of the decade.
At the same time, it remains imperative for the Government to continue working to promote higher and sustainable economic growth. Already last year, it repeatedly laid the foundations for raising the economy’s growth potential. More than 320 billion has been allocated for public investment, adding to the resources provided for in the NRRP those of the Supplementary Fund and those earmarked by the 2022 Budget Law. Incentives for private investment and, in particular, incentives for research have been extended over time to provide greater planning certainty. New instruments have also been created to support basic and applied research.
The reform of the Personal Income Tax (IRPEF) and the cut in the Regional Tax on Production Activities (IRAP) reduce the tax burden on households and businesses, which will have positive effects on employment and the labour market. In addition, the introduction of the universal child benefit, the development of early education infrastructure, and the support for home buying in favour of young people are examples of the broader action that the Italian Government is taking in favour of families and the birth rate, also in light of adverse demographic trends.
The current situation should not make us turn our attention away from the structural policies that have already been launched in the strategic sectors of the ecological and digital transition, the competitiveness of the economic system, health and welfare, with particular regard to the structure of the pension system; for this latter, it will be necessary to find solutions that allow for flexible exits and a strengthening of supplementary pensions, while fully respecting the sustainability of public debt and of the pay-as-you-go system. Retirement prospects for younger generations will also have to be carefully analysed.
| VI | MINISTRY OF ECONOMY AND FINANCE |
In conclusion, the policy objectives of the Document are based on a scenario in which the economy is slowing down but is still registering a significant annual growth. The budgetary margins resulting from the confirmation of the targets set in the DBP will be used to further support the productive system, households and to carry out planned investments.
However, there is considerable uncertainty related to international political and economic factors. If the global scenario deteriorates further, annual growth is likely to be lower than that resulting from the carry-over of the 2021 result.
The Italian Government will not hesitate to intervene as decisively and rapidly as possible to support Italian households and businesses.
The Italian Government is committed to strongly accelerating the diversification of energy sources and the achievement of greater national energy autonomy.
The pressing problems we are currently facing must not divert our attention from medium and long-term objectives. The NRRP and all the initiatives aimed at making our economy more sustainable must be fully implemented: we must boost investment in human and physical capital and raise the employment rate and productivity growth.
Daniele Franco
Minister of Economy and Finance
| MINISTRY OF ECONOMY AND FINANCE | VII |
| | ECONOMIC AND FINANCIAL DOCUMENT 2022 |
| VIII | MINISTRY OF ECONOMY AND FINANCE |
INDEX
| I. | RECENT TRENDS IN THE ECONOMY AND THE PUBLIC FINANCES |
| | |
| II. | BASELINE MACROECONOMIC AND BUDGET FORECAST |
| II.1 | Baseline macroeconomic forecast |
| II.2 | Risks to the baseline macroeconomic forecast |
| II.3 | Budgetary outlook under existing legislation |
| | |
| III. | UPDATED POLICY SCENARIO |
| III.1 | Fiscal policy scenario |
| III.2 | Macroeconomic forecast under the policy scenario |
| III.3 | Budget balance, convergence towards the Medium-Term Objective and the expenditure rule |
| III.4 | Debt-to-GDP ratio and the debt rule |
| | |
| IV. | SUSTAINABILITY OF PUBLIC FINANCES |
| | |
| IV.1 | Risk scenarios of public finances |
| IV.2 | Sustainability analysis of public debt |
| | |
| V. | ANNEX |
| MINISTRY OF ECONOMY AND FINANCE | IX |
| | ITALY’S STABILITY PROGRAMME 2022 |
TABLES
| Table II.1 | Summary macroeconomic baseline scenario |
| Table III.1 | Public finance indicators |
| Table III.2 | Synthetic macroeconomic policy scenario |
| Table III.3 | Significant deviations |
| Table III.4 | Trends in current expenditure in relation to the expenditure benchmark |
| Table III.5 | Debt rule compliance |
| Table IV.1 | Sensitivity to growth |
FIGURES
| Figure I.1 | Gross domestic product and industrial production |
| Figure I.2 | Wholesale prices for natural gas and electricity |
| Figure I.3 | Consumer prices for the whole nation (NIC) |
| Figure I.4 | Italian business confidence indexes |
| Figure I.5 | Net borrowing and gross debt of the general government as a ratio to GDP |
| Figure II.1 | Net borrowing and primary balance under existing legislation |
| Figure III.1 | Evolution of the Debt-to-GDP ratio gross and net of European AID |
| Figure IV.1 | Dynamics of the Debt-to-GDP ratio in sensitivity scenarios |
| Figure IV.2A | Stochastic projection of the Debt-to-GDP ratio with Hight- Volatility Shocks |
| Figure IV.2B | Stochastic projection of the Debt-to-GDP ratio with Limited-Volatility Shocks |
| Figure IV.3 | Medium-Term projection of the Debt-to-GDP ratio |
| Figure IV.4 | Debt-to-GDP ratio in the reference scenario |
| Figure IV.5 | Impact of greater reform-related growth |
| Figure IV.6 | Impact of improvement in tax compliance |
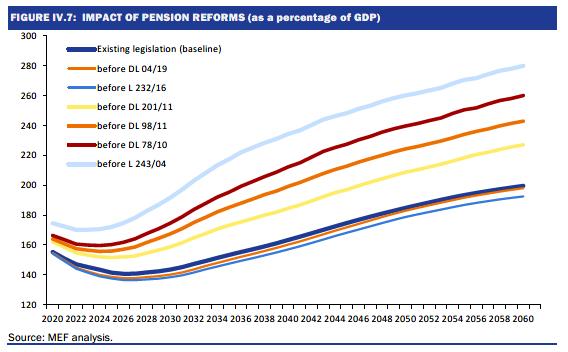
| Figure IV.7 | Impact of pension reforms |
BOX
| Chapter II | The recent evolution of trade relations between Italy and Russia |
| | Forecast errors for 2021 and revised estimates for 2022 and following years |
| | A risk analysis of the geopolitical situation and exogenous variables |
| X | MINISTRY OF ECONOMY AND FINANCE |
| I. | RECENT TRENDS IN THE ECONOMY AND THE PUBLIC FINANCES |
In 2021, Italy achieved strong recovery in gross domestic product and significant improvements in public finances. Gross domestic product (GDP) grew by 6.6 percent in real terms, after the exceptional fall of 9.0 percent recorded in 2020 in connection with the outbreak of the pandemic. General government net borrowing fell to 7.2 percent of GDP, from 9.6 percent in 2020. Thanks to sustained output growth in nominal terms (7.2 percent), the public debt-to-GDP ratio at the end of 2021 fell to 150.8 percent, from its peak of 155.3 percent in 20201.
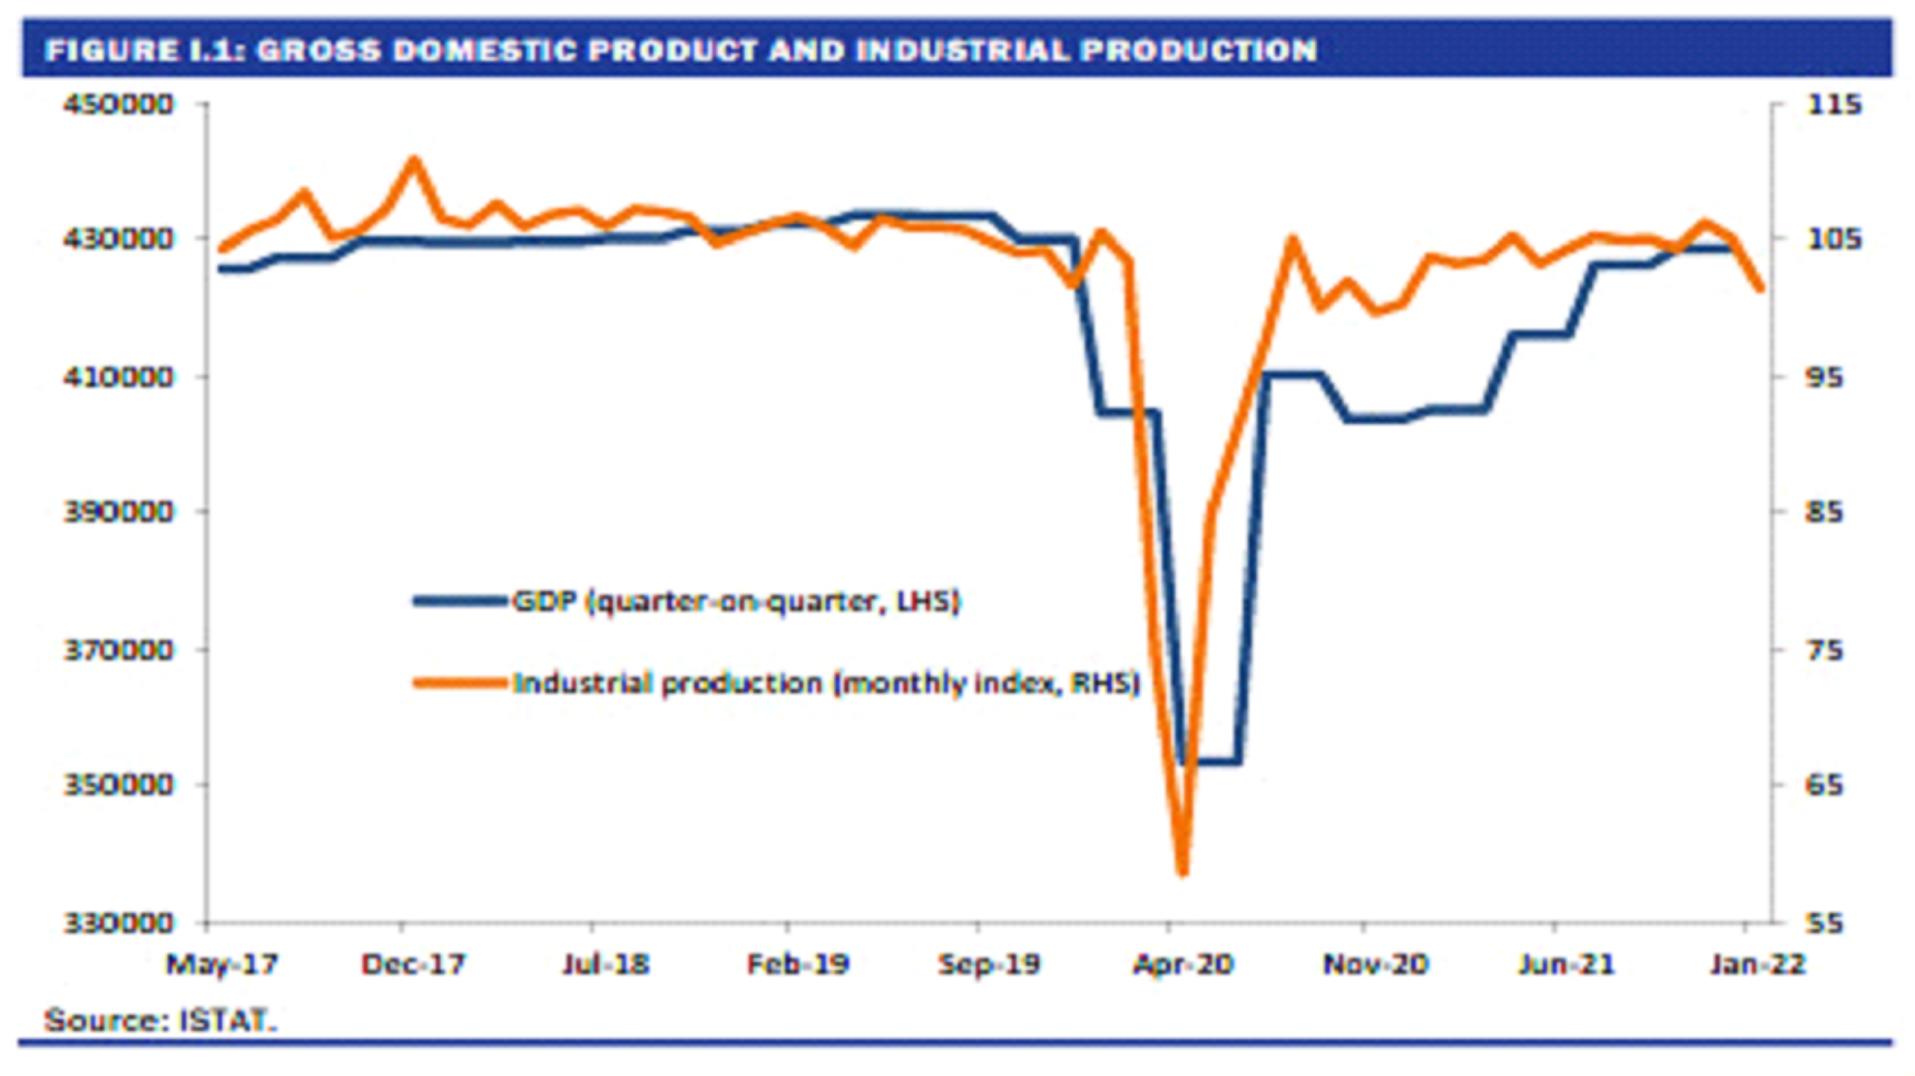
However, after the remarkable recovery in the two middle quarters of 2021, the pace of GDP growth slowed in the final months of last year due to the fourth wave of the Covid-19 outbreak, shortages of materials and components, and soaring natural gas and electricity prices, which had already risen sharply since late spring.
In the first two months of this year, indicators of the international cycle weakened, although they remained moderately positive. In Italy, the impact of the rise in energy prices on the costs of businesses and household budgets worsened, although the measures financed by the 2022 Budget Law and subsequent
________________________
1 These estimates differ from the official data published by ISTAT on 1 March 2022 following the subsequent ISTAT press release of 24 March 2022, in which ISTAT revised the nominal GDP for 2021 downwards due to a value adjustment for natural gas imports and the related import prices.
| MINISTRY OF ECONOMY AND FINANCE | 1 |
| | ITALY’S STABILITY PROGRAMME 2022 |
Government measures2 reduced it by more than a quarter for the first half of 2022. In January, production in industry and construction came to a sharp halt, while the inflation rate rose again, in Italy as well as in other European countries.
The strong inflationary impulse from energy and raw materials also caused an upward revision of market expectations on the future monetary policy of the European Central Bank (ECB). As a result, interest rates rose significantly, and the yield differential between Italian government bonds and the Bund widened.
This already complex economic situation was compounded by Russia’s military attack on Ukraine at the end of February. The aggression led to the immediate imposition of economic sanctions against Russia by the European Union (EU), the G7 and many other countries. EU sanctions were initially targeted at banks and individuals; later, they were expanded to include the export of luxury and high-tech goods and steel imports. Although gas and oil are excluded from sanctions for the time being, natural gas and oil prices rose further, reaching a new high on 8 March, which was followed by a correction, aided by the announcement of a package of EU measures, including the REPowerEU Communication, and continued normal inflows of Russian gas.
The military crisis in Ukraine has also caused a marked increase in food commodity prices, which may have further impacts on inflation in a context in which Italy’s March consumer prices, according to preliminary data from ISTAT, were up 6.7 percent year-on-year according to the consumer price index for the whole nation (NIC), from 5.7 percent in February, with the underlying component also rising to 2.0 percent, from 1.7 percent3.
________________________
2 Decree-Laws Nos. 4 of 27 January 2022, 17 of 1 March 2022 and 21 of 21 March 2022.
3 The underlying component of the NIC index excludes energy, fuel, and fresh food.
| 2 | MINISTRY OF ECONOMY AND FINANCE |
I. RECENT TRENDS IN THE ECONOMY AND THE PUBLIC FINANCES | |
In the same months, Covid-19 infections peaked on a weekly basis around 20 January and then fell rapidly until the beginning of March, when new increases were recorded, also in correspondence with an increased spread of the BA.2 sub-lineage of the Omicron variant. As at the end of March, the infection trend appears to be stabilising, and the trend in hospitalisations and intensive care occupancy rates is such that all Italian regions are now classified as low risk. Approximately 90 percent of the population aged over 12 and almost 33 percent of children aged between 5 and 11 have completed the basic vaccination cycle. Taking this overall picture into account, the Italian Government decided to end the state of emergency on 31 March and adopted a roadmap for the removal of the current anti‑Covid restrictions4.
Nevertheless, the pandemic is still ongoing and remains an obstacle to economic activity at a global level, both in terms of impact on labour supply and consumer behaviour, and adverse effects on global value chains and transport costs.
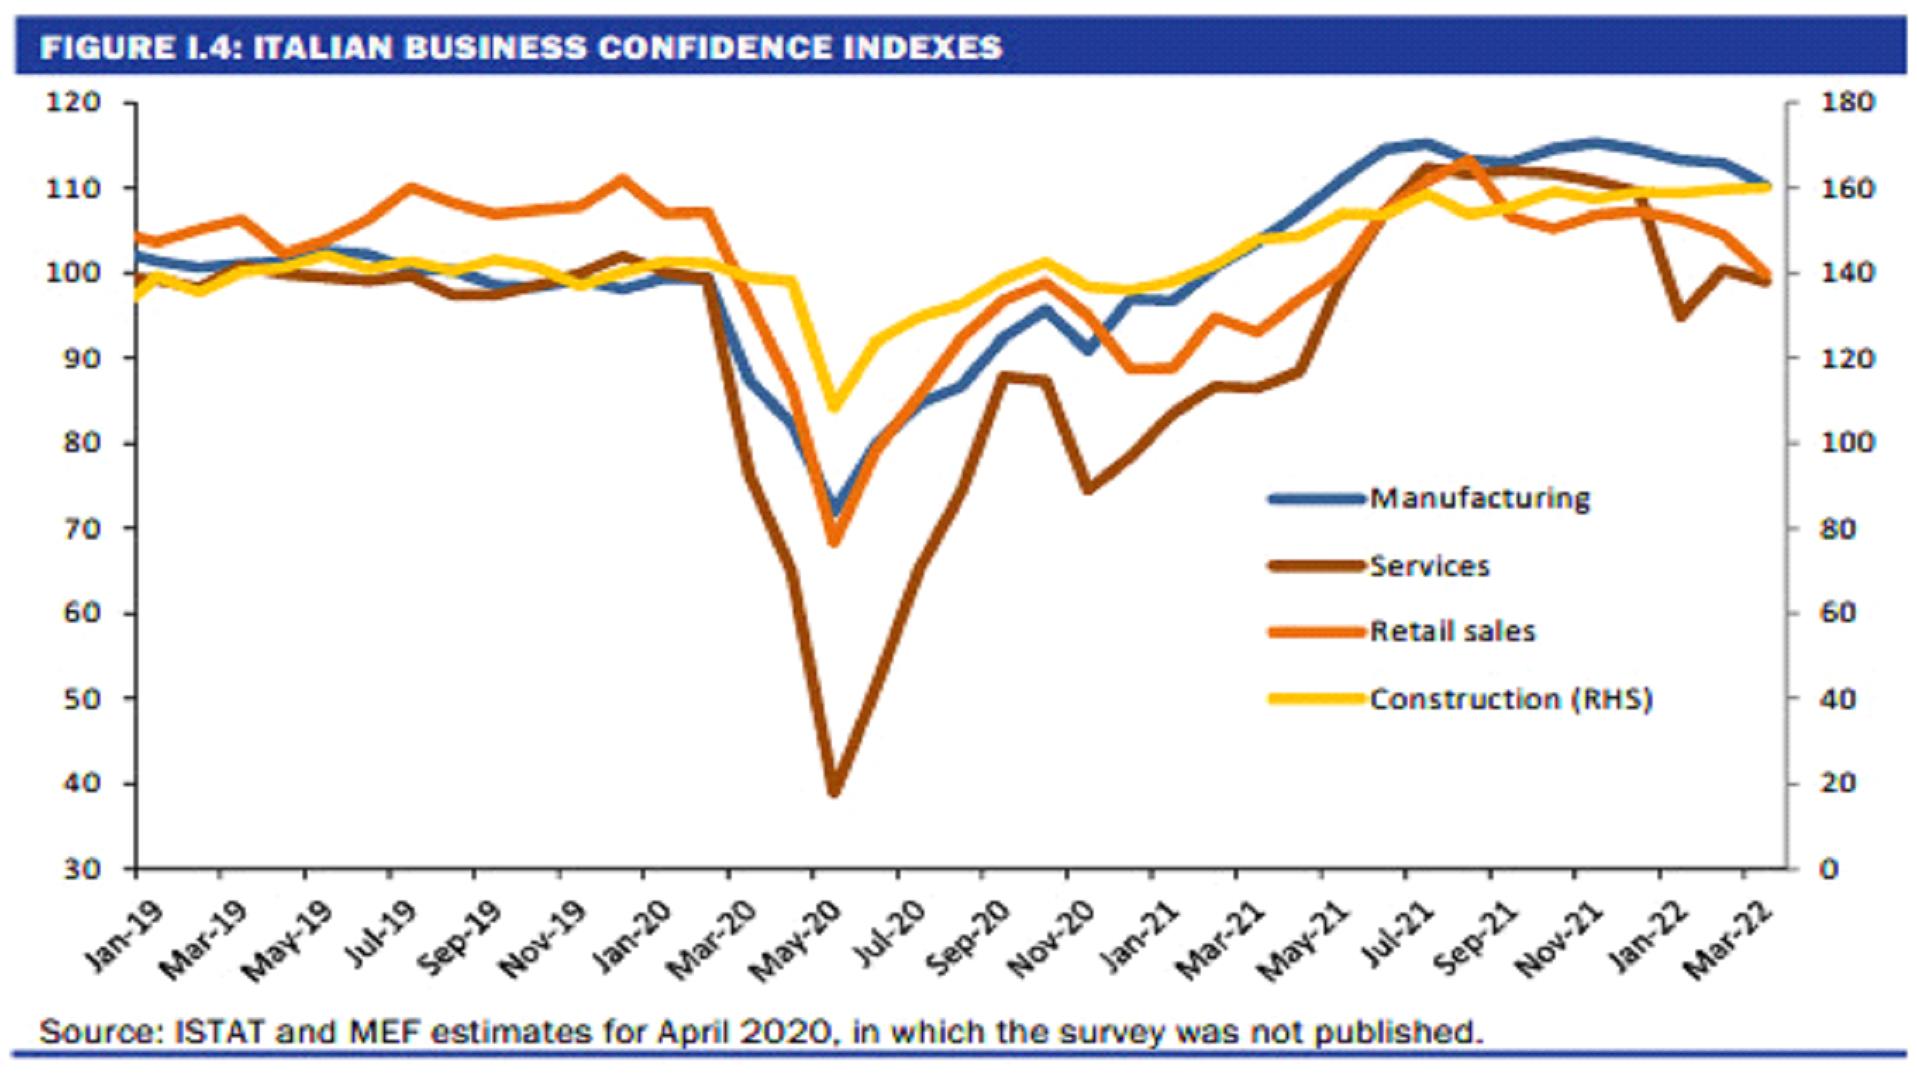
Against this backdrop of great uncertainty, Italian household confidence, which had already been on a slight downward trend since October, fell sharply in March due to the war in Ukraine. In particular, households were much more pessimistic about Italy’s economic prospects and less inclined to make purchases of durable goods, while their assessment of their own economic conditions did not worsen appreciably.
According to the ISTAT business survey, the deterioration in business confidence was more limited, with a moderate decline in manufacturing and services and a more marked deterioration in retail trade. In construction, on the other hand, the confidence index reached a new high, although a high proportion of companies reported upward pressure on prices.
________________________
4 The provisions are contained in Decree-Law No. 24/2022 of 17 March 2022.
| MINISTRY OF ECONOMY AND FINANCE | 3 |
| | ITALY’S STABILITY PROGRAMME 2022 |
Based on the latest available data, although industrial production is estimated to have rebounded in February, nowcasting models indicate that the 0.6 percent cyclical increase recorded in the fourth quarter of 2021 was followed by a 0.5 percent contraction in GDP in the first quarter of this year, which is mainly attributable to a contraction in industrial value added. Quarterly GDP growth is expected to recover moderately in the second quarter, mainly thanks to services. However, it should be noted that in the March ISTAT survey, manufacturing firms’ expectations on orders and production worsened markedly, pointing to downside risks for the second quarter.
Turning to public finance, the decline in the general government net borrowing to 7.2 percent in 2021 is a much better result than the estimate presented in last year’s Stability Programme (11.8 percent) and the one presented in the Update of the Stability Programme and the Draft Budgetary Plan (DBP) (9.4 percent). This reduction occurred despite the extraordinary amount of support measures for households, businesses, labour, health, education, universities, and research implemented during the year in response to the pandemic (totalling 71 billion) and measures to contain energy costs for households and businesses (5.3 billion).
The lower deficit in 2021 compared to the forecast is the result of a better performance of both expenditure and revenues of the general government sector. In fact, almost all components of current primary expenditure were lower than expected, especially wages, intermediate consumption, and social benefits other than pensions. Public investment was in line with forecasts (reaching almost 51 billion, or 2.9 percent of GDP), while interest payments slightly exceeded the September estimates, mainly due to the increase in Italian and European inflation, which drove up payments on inflation-indexed securities. On the revenue side, both tax revenues and social security contributions exceeded DBP estimates by a total of 26.4 billion (1.5 percent of GDP).
| 4 | MINISTRY OF ECONOMY AND FINANCE |
I. RECENT TRENDS IN THE ECONOMY AND THE PUBLIC FINANCES | |
The most recent data indicates that the positive trend of public finance continued in the first quarter of 2022, as the cash requirements of the State sector fell to 30.0 billion from 41.1 billion in the same period last year. The decline in cash requirements appears to be mainly due to the growth in tax and social security contributions revenues, which in January increased by 13.8 percent and 7.8 percent respectively compared to the same month last year.
| MINISTRY OF ECONOMY AND FINANCE | 5 |
| | ITALY’S STABILITY PROGRAMME 2022 |
| 6 | MINISTRY OF ECONOMY AND FINANCE |
II.
| BASELINE MACROECONOMIC AND BUDGET FORECAST |
II.1 BASELINE MACROECONOMIC FORECAST
Starting from an ISTAT estimate of real GDP growth in 2021 that is higher than that projected in the Update of the Stability Programme and in the Draft Budgetary Plan (DBP), 6.6 percent compared to 6.0 percent, the baseline forecast (under existing legislation) for 2022 has fallen to 2.9 percent from 4.7 percent in the DBP, although the quarterly GDP profile of 2021 has created a carry-over effect of 2.3 percent this year.
In addition to the fact that the level of quarterly real GDP inherited from 2021 is significantly higher, the downward revision of the forecast for 2022 is mainly due to the worsening of the exogenous variables of the forecast. In fact, the growth forecasts for world trade and imports of the most important countries as export markets for Italy have been revised downwards. Moreover, the expected levels of commodity and energy prices are markedly higher, and so are current and expected interest rates. The weighted exchange rate of the euro is also less competitive, although the euro remains weak against the dollar. Overall, estimates using the Treasury’s ITEM model suggest that the changes in exogenous factors since last September would cut the real growth forecast for 2022 by at least 1.4 percentage points.
The lower import growth of Italy’s trading partners, which already incorporates to some extent the onset of the Ukraine crisis, must be added to the specific impact of lower bilateral trade flows between Italy and Russia due to the war situation and the sanctions. Russia’s share of Italian exports was significantly reduced from 2013 onwards due to the sanctions that were adopted in 2014 after the annexation of Crimea and Russia’s occupation of part of Donbass. In 2021, this share amounted to 1.5 percent. The main goods exported to Russia are mechanics, furniture, clothing, footwear, foodstuffs, and transport equipment.
Exports to Russia exceed 3.0 percent of sectoral exports only for clothing and furniture, and 2.0 percent for machinery and equipment. Based on a very broad interpretation of the measures, it is estimated that the sectors subject to export bans account for about half of Italian exports to Russia. The elimination of such exports since March would cause a drop in Italian GDP of about 0.2 percentage points in 2022 and a further impact of 0.1 points in 2023.
Russia’s weight in Italy’s foreign trade is greater on the import side: in 2021, partly due to the rise in prices, it amounted to 3.0 percent and mainly included natural gas, oil, metals, and steel products. There have been no reductions in gas and oil supplies so far, while, as mentioned, imports of steel products from Russia have been banned and those from Ukraine are severely limited by the ongoing
| MINISTRY OF ECONOMY AND FINANCE | 7 |
| | ITALY’S STABILITY PROGRAMME 2022 |
conflict and the destruction of important production sites. This will cause difficulties in obtaining certain semi-finished products and an increase in their price, which will have a negative impact on GDP by an estimated amount of less than a tenth of a percentage point.
As mentioned above, the conflict in Ukraine has also had a negative impact on household and business confidence, on top of causing a sharp correction in financial markets, which has been partially reversed. The effect of these factors on GDP has been quantified at an additional 0.2 percentage points of reduced growth in 2022.
On the other hand, the update of the growth forecast for 2022 also takes into account the different time distribution of expenditure related to the National Recovery and Resilience Plan (NRRP) with respect to what was assumed in the DBP, as well as the most recent measures adopted by the Italian Government to contain the increase in gas and electricity costs in the second quarter and to support energy-intensive companies and some leading manufacturing sectors, such as automotive, components and semiconductors5. It is estimated that the different time distribution of expenditure related to the NRRP will have a positive impact on growth in 2022 of about 0.2 percentage points, while the other measures, being offset by a temporary reduction in the financing of some expenditure and increases in revenues, will have a limited impact on GDP growth in this year (in the case of the Decree-Law No. 17, they will have a delayed effect of some significance in 2023).
The new macroeconomic forecast is also characterised by a much higher inflation rate than expected in the DBP. The household consumption deflator, which grew by 1.7 percent in 2021, is projected to increase by 5.8 percent in 2022, against a forecast of 1.6 percent in the DBP. The GDP deflator growth forecast, also 1.6 percent in the DBP, has risen to 3.0 percent. This brings the new nominal GDP growth forecast to 6.0 percent, only slightly lower than the 6.4 percent forecast in the DBP.
In the face of soaring inflation, wages and labour income are expected to accelerate more moderately, although the renewal of public (and some other) contracts will cause contractual wages to accelerate. Thanks to employment growth too, which is slower than in 2021 but still significant (2.6 percent in terms of hours worked), compensation of employees would grow by 5.5 percent in nominal terms this year, up from 7.7 percent last year. The unemployment rate would fall from 9.5 percent in 2021 to 8.7 percent.
On the external side, as it was already the case in the second half of 2021, the sharp increase in import prices will lead to a narrowing of the trade and current account surplus. The latter would fall to 2.3 percent of GDP this year, from 3.7 percent of GDP in 2020 and 3.3 percent in 2021.
Regarding the coming years, the GDP growth forecast for 2023 is also lower than that of the DBP (down to 2.3 percent from 2.8 percent) due to the worsening of the exogenous variables of the forecast - in particular, higher expected levels of energy prices and interest rates and lower expected growth in world trade. The forecast for 2024 is almost unchanged (1.8 percent against 1.9 percent), while the forecast for 2025, which was not considered in the DBP horizon, is set at 1.5 percent, also on the basis of the usual approach of making the three-year forecast
________________________
5 This refers to Decree-Laws No. 17 of 1 March 2022 and No. 21 of 21 March 2022.
| 8 | MINISTRY OF ECONOMY AND FINANCE |
II. BASELINE MACROECONOMIC AND BUDGET FORECAST | |
converge towards the potential growth rate of the Italian economy. The latter, assuming the implementation of the investment and reform programme envisaged by the NRRP, is set at 1.4 percent.
| TABLE II.1: SUMMARY MACROECONOMIC BASELINE SCENARIO (1) (percentage changes, unless otherwise indicated) |
| | 2021 | 2022 | 2023 | 2024 | 2025 |
| GDP | 6.6 | 2.9 | 2.3 | 1.8 | 1.5 |
| GDP deflator | 0.5 | 3.0 | 2.1 | 1.8 | 1.8 |
| Consumption deflator | 1.7 | 5.8 | 2.0 | 1.7 | 1.8 |
| Nominal GDP | 7.2 | 6.0 | 4.4 | 3.6 | 3.3 |
| Employment (AWU) (2) | 7.6 | 2.5 | 2.2 | 1.6 | 1.3 |
| Employment (WF) (3) | 0.8 | 1.8 | 1.7 | 1.2 | 1.0 |
| Unemployment rate | 9.5 | 8.7 | 8.3 | 8.1 | 8.0 |
| Current account balance (balance in % GDP) | 3.3 | 2.3 | 2.7 | 2.8 | 2.8 |
(1) Any inaccuracies are the result of rounding (2) Employment expressed in terms of standard work units (AWU) (3) Number of employed people according to the Continuous Labour Force Survey (Rilevazione Continua delle Forze Lavoro, RCFL) sample survey. |
The forecast assumes a reduction in inflation already in 2023 after the peak expected this year. The consumption deflator would grow by around 2.0 percent in the coming years. The most important factors are the expected trends in energy prices and wages. For the former, the standard approach is to use the prices of futures contracts on gas and oil, which foresee very high levels until spring 2023 and then a gradual decline to levels that, in the case of gas, would be less than half of current prices.
As regards contractual wages, the baseline scenario assumes that, net of the components linked to corporate welfare and productivity bonuses, adjustments to contractual minimum wages will continue to be based on the inflation rate net of imported energy products. Consider, for example, that in March the national consumer price index (NIC) net of energy recorded a year/year growth of 2.5 percent, while the general index grew by 6.7 percent. Assuming that the inflation rate net of energy does not rise very significantly from the level reached in February, future wage increases should be higher than in previous years, but relatively moderate and consistent with an inflation rate of around 2.0 percent in the medium term. Wage earners will regain purchasing power when energy prices fall, and the total inflation rate falls below the energy-adjusted rate6.
Looking at the other main macroeconomic variables, the baseline forecast foresees further growth in employment over the 2023-2025 period and a decline in the unemployment rate to 8.0 percent in 2025 despite a recovery in the labour participation rate. The current account surplus of the balance of payments would widen from 2023 onwards thanks to the expected fall in energy prices and a growth in merchandise exports in line with that of the main outlet markets, as well as the recovery of foreign tourism in Italy.
The baseline macroeconomic forecast was validated by the Parliamentary Budget Office in a note dated 24 March 2022
________________________
6 Consider, for example, that in 2020 the NIC inflation rate was -0.1 percent, while the rate net of energy was +0.6 percent. With energy prices rising, in 2021 the NIC increased by 1.9 percent while the net energy rate increased by 0.8 percent. When energy prices fall, the spread will reverse again.
| MINISTRY OF ECONOMY AND FINANCE | 9 |
| | ITALY’S STABILITY PROGRAMME 2022 |
FOCUS
| The recent evolution of trade relations between Italy and Russia |
Trade relations between Italy and Russia have gone through three distinct periods in recent years. In the first period (referable to years of significant expansion of international trade), exports to Russia grew considerably (from 3.8 to 10.5 billion), doubling as a percentage of total Italian exports (from 1.4 percent in 2002 to 2.8 percent in 2008). At the same time, imports of Russian goods into Italy also grew significantly (from 8 billion to 16 billion), albeit with a less pronounced effect in terms of share of total Italian imports (from 3.0 percent to 4.2 percent). |
Subsequently, in the years of the economic and financial crisis (2008-2013), the share of Italian imports from Russia continued to grow, rising to 5.6 percent in 2013. Italian exports, on the other hand, after the sharp slowdown in 2009 (-20.9 percent globally; -38.6 percent to Russia), slowly returned to pre-crisis levels, as did the share destined for the Russian market (2.8 percent). |
Finally, the third phase (from 2013 to 2021) was characterised by Russia’s military intervention in Crimea, to which the European Union responded with a package of sanctions that grew over time and affected trade levels. Italian imports of Russian goods collapsed in the space of three years (from 20.2 to 10.6 billion in 2016), also falling in terms of incidence on total national imports (from 5.6 percent to 2.9 percent, then orbiting at values just over 3 percent in the following years). The Russian market also appeared less and less central for Italian companies, with an absorption share almost halved over the eight years, from 2.8 percent in 2013 to 1.5 percent in 2021. It is worth noting that, in 2021, the 17.6 billion of imports from Russia produced almost 10 billion of trade deficit, while exports from Italy amounted to only 7.7 billion. |
|
At a sectoral level, sanctions in response to the 2014 Crimean crisis mainly affected imports of crude oil (-3.7 billion) and refined oil products (-2.2 billion). The case of natural gas is different, as Italy has increased its supply from Russia (+1.5 billion between 2013 and 2021, an increase of 19.7 percent), in the presence of a similar increase in relative dependence (from 37.1 percent to 46.6 percent). This result is exclusively attributable to 2021, when natural gas imports from Russia increased by more than 3 billion compared to 2019 (5.3 billion compared to 2020, which is known to be characterized by a sharp slowdown in international trade due to the pandemic crisis), almost entirely to be associated with the last quarter (+2.9 billion). Looking at the 2013-2019 period, on the other hand, Russian gas imports fell by 2.3 percent, with an absolute value of just under 6 billion in both years. |
| 10 | MINISTRY OF ECONOMY AND FINANCE |
II. BASELINE MACROECONOMIC AND BUDGET FORECAST | |
| | In consideration of the objectives of diversification in gas supply, it seems useful to recall Russia’s main competitors in the Italian market. In particular, ISTAT data highlight the role of Algeria, the only country to show values comparable to those of Russia (4.5 billion, equal to 22.8 percent of Italian sector imports); this is followed by Azerbaijan, Qatar (1.8 billion each) and Libya (about 600 million), other potential markets from which to diversify supplies. |
| | |
| | TABLE R1: EVOLUTION OF ITALY’S TRADE WITH RUSSIA BY SECTOR Years 2013 and 2021 (differences in absolute values and market shares on sector total) |
| | | | EXPORTS | IMPORTS |
| | Nace | Activity description | Differences in a.v. (EUR million) | Shares % of sector total | Differences in a.v. (EUR million) | Shares % of sector total |
| | | | 2013 - 2021 | 2013 | 2021 | 2013 – 2021 | 2013 | 2021 |
| | A | AGRICULTURE | -59.9 | 1.6 | 0.4 | 32.3 | 0.9 | 0.9 |
| | B | EXTRACTION | -0.5 | 0.6 | 0.4 | -1,919.4 | 23.4 | 24.6 |
| | | of which: crude oil | 0.0 | 0.0 | 0.0 | -3,735.8 | 17.1 | 8.8 |
| | | of which: natural gas | 0.0 | 0.0 | 0.0 | 1,496.2 | 37.1 | 46.6 |
| | C | MANUFACTURING INDUSTRY | -2,998.0 | 2.8 | 1.6 | -725.2 | 2.2 | 1.4 |
| | CA | Food, beverages and tobacco | 24.5 | 2.2 | 1.4 | -71.9 | 0.7 | 0.4 |
| | CB | Textiles, clothing and footwear | -967.7 | 5.1 | 2.5 | -68.0 | 0.4 | 0.1 |
| | CC | Wood, paper and printing | -122.6 | 2.6 | 0.8 | 96.0 | 1.5 | 2.0 |
| | CD | Refined petroleum products | -1.3 | 0.1 | 0.1 | -2,231.8 | 29.2 | 15.1 |
| | CE | Chemistry | 139.8 | 2.3 | 2.0 | -438.0 | 2.2 | 0.7 |
| | CF | Pharmaceuticals | -11.5 | 1.0 | 0.6 | -1.5 | 0.0 | 0.0 |
| | CG | Rubber, plastics, metals processing | -126.6 | 2.2 | 1.3 | 71.5 | 0.2 | 0.5 |
| | CH | Metallurgy and metal products | -163.8 | 1.6 | 0.9 | 1,973.1 | 3.5 | 5.4 |
| | CI | Electronics | -9.5 | 1.3 | 0.8 | 5.4 | 0.0 | 0.0 |
| | CJ | Electrical equipment | -194.0 | 3.2 | 1.7 | 8.1 | 0.2 | 0.1 |
| | CK | Mechanics | -745.2 | 4.0 | 2.6 | 1.8 | 0.1 | 0.1 |
| | CL | Transport equipment | -412.1- | 2.2 | 0.8 | -72.1 | 0.3 | 0.0 |
| | CM | Furniture and other manufacturing activities | -408.0 | 4.2 | 1.7 | 2.2 | 0.1 | 0.1 |
| | D-V | OTHER ACTIVITIES | -17.0 | 0.3 | 0.1 | 12.9 | 0.1 | 0.1 |
| | | TOTAL | -3,075.3 | 2.8 | 1.5 | -2,599.4 | 5.6 | 3.7 |
| | Source: elaboration on ISTAT data |
| | |
| | The sanctions of past years have also reduced the presence of Italian companies on the Russian market (over 3 billion in sales in 2021 compared to 2013; -28.6 percent). Among manufacturing sectors, the fashion system has lost almost 1 million in exports during the last eight years, with the share of imports from Russia in the sector’s total cross-border sales more than halved (from 5.1 percent to 2.5 percent). Mechanics and furniture were also hard hit by the sanctions (over 400 million each), although with differing effects in terms of shares (-1.5 percentage points for mechanics and -2.5 percentage points for furniture and other manufacturing activities). On the whole, all Italian manufacturing sectors experienced a clear setback, associating a reduction in sales with a downsizing of the Russian market compared to other destination markets. The only exception was food and beverages, where the growth in exports in value (24 million) was matched by a reduction in the import share (from 2.2 percent to 1.4 percent). |
| MINISTRY OF ECONOMY AND FINANCE | 11 |
| | ITALY’S STABILITY PROGRAMME 2022 |
FOCUS
| Forecast errors for 2021 and revised estimates for 2022 and following years7 |
| |
| This box is aimed at providing an in-depth analysis of the changes introduced in the forecast update with the twofold purpose of i) assessing the forecast error for the year just ended; ii) analysing in greater detail the factors that led to a revision of the growth estimates for 2022 and the following years. In both cases the comparison is made with the forecasts made in the Update of the Stability Programme of last September and in the Draft Budgetary Plan (DBP). |
Table R1, column Delta 2021, shows the forecast error for 2021, i.e., the deviations between the September forecast and the final data published by ISTAT in March. The forecast for 2021 made in September included data from the National Accounts only up to the second quarter of last year, while the data published by ISTAT in March also include information on the second half of last year and the revision of the historical series for previous quarters. |
| With reference to GDP, the final ISTAT data were higher (0.6 percentage points) than expected, showing annual growth of 6.6 percent. The data confirms the quarterly growth profile defined in the DBP, which envisaged further expansion in the third quarter followed by a slowdown in the final quarter of the year. In fact, economic activity continued to grow at a high pace in Q3, in line with that recorded in Q2. Growth benefited from the easing of restrictions made possible by the acceleration of the vaccination campaign. In the last segment of 2021, economic activity slowed down due to higher energy prices and the effects of the fourth Covid wave. |
| |
| | TABLE R1 – MAIN VARIABLES OF THE MACROECONOMIC FRAMEWORK (average of seasonally adjusted quarterly data) |
| | | 2021 forecast | 2022 forecast | of which: Revised carry-over to 2022 compared to DBP | of which: Exogenous impact compared to DBP | of which: Revision of forecast |
| | | DBP | ISTAT | Delta 2021 | DBP | Stability Programme 2022 | Delta 2022 | (a) | (b) | (c) |
| | ITALY’S MACROS | | | | | | | | | |
| | GDP | 6.0 | 6.6 | 0.6 | 4.8 | 3.0 | -1.8 | 0.2 | -1.6 | -0.4 |
| | Household expenditure | 5.2 | 5.2 | 0.0 | 5.0 | 2.9 | -2.1 | -0.5 | -1.7 | 0.1 |
| | General Government expenditure | 0.7 | 0.6 | -0.1 | 1.7 | 1.2 | -0.5 | 0.2 | -0.1 | -0.6 |
| | Gross fixed capital formation | 15.5 | 17.0 | 1.5 | 6.8 | 7.0 | 0.2 | 1.8 | -2.4 | 0.8 |
| | Machinery, equipment and miscellaneous | 10.0 | 12.9 | 2.9 | 6.6 | 6.5 | -0.1 | 2.0 | -2.9 | 0.9 |
| | Construction | 20.9 | 22.3 | 1.4 | 6.5 | 8.7 | 2.1 | 3.0 | -1.7 | 0.9 |
| | | | | | | | | | | |
| | Exports of goods and services | 11.4 | 13.4 | 1.9 | 6.1 | 4.4 | -1.6 | 0.7 | -1.8 | -0.6 |
| | Imports of goods and services | 11.6 | 14.3 | 2.7 | 6.8 | 5.5 | -1.3 | 2.2 | -1.2 | -2.4 |
| | Deflators | | | | | | | | | |
| | GDP deflator | 1.5 | 0.5 | -1.0 | 1.6 | 3.0 | 1.4 | -1.0 | 0.2 | 2.2 |
| | Consumption deflator | 1.5 | 1.6 | 0.2 | 1.6 | 5.8 | 4.3 | 0.5 | 2.4 | 1.4 |
________________________
7 This box refers to quarterly income statement data published on 4 March 2022 that are working day adjusted.
| 12 | MINISTRY OF ECONOMY AND FINANCE |
II. BASELINE MACROECONOMIC AND BUDGET FORECAST | |
| | In terms of components, household consumption was in line with the forecast, while exports and investment, particularly in machinery and equipment, increased more than estimated; the gap is significantly positive for import growth. On the price front, there was a markedly higher than expected increase in import prices, as triggered by increases in the energy component in the second half of the year. The change in the consumption deflator was slightly higher than forecast (0.2 percent), while the actual change of the GDP deflator was 1.0 percentage point lower than estimated. |
| | In the analysis of the growth revision for 2022, the following steps have been taken: firstly, the statistical reasons for the change in the carry-over effect from 2021 have been analysed, followed by the deltas resulting from the new assumptions on the international scenario and then the revision of the forecast. |
| | Column ‘a’ shows the difference in the statistical carry-over effect from 2021 to 2022 between the value estimated in the last official update and the actual value. For GDP, the change in the carry-over effect is positive and amounts to 0.2 percentage points. The carry-over effect is affected by the higher-than-expected outcome in the second half of 2022, as noted above. |
| | The component due to the revision of the international scenario with respect to October is explained in column ‘b’, which shows the impact on the main variables estimated with the Treasury Department’s econometric model. The impact on GDP is significantly negative and reflects the deterioration of the international environment linked to the Russian-Ukrainian conflict. The latter has exacerbated critical conditions in the energy market, further increasing supply costs, and contributed to a deterioration in international trade. |
| | Column ‘c’ indicates the revision of the forecast which, for the percentage change in GDP, amounts to -0.4 percentage points. |
| | Table R2 provides a summary of the impact on GDP growth of developments in the international environment, comparing it with what was assumed in the September 2021 DBP. Such impact, estimated using the ITEM econometric model, is more unfavourable than September forecasts and amounts to -1.6 percentage points in 2022, -1.1 percentage points in 2023 and -0.4 percentage points in 2024, respectively. |
| | In detail, compared to the forecast underlying the DBP, international trade has been revised downwards sharply for 2022-23, with a more pronounced decline in the first year, before recovering in 2024. As a result, the effect of the revision of the global demand forecast on the rate of change of GDP is negative in both 2022 (-0.3 percent) and 2023 (-0.1 percent) and slightly positive in 2024 (0.1 percent). |
| | |
| | TABLE R2: EFFECTS ON GDP OF THE INTERNATIONAL SCENARIO COMPARED TO THE DBP (impact on growth rates) |
| | | 2022 | 2023 | 2024 |
| | 1. World trade | -0.3 | -0.1 | 0.1 |
| | 2. Oil and gas prices | -0.8 | -0.5 | 0.0 |
| | 3. Nominal effective exchange rate | -0.1 | -0.2 | 0.0 |
| | 4. Interest rate assumptions and financial effects | -0.2 | -0.3 | -0.6 |
| | 5. Sanctions against Russia | -0.2 | -0.1 | 0.1 |
| | Total | -1.6 | -1.1 | -0.4 |
| | Source: MEF calculations. |
| | |
| | In the first months of this year, oil prices maintained the upward trend that had emerged at the end of 2021, exacerbated by tensions arising from the Russian-Ukrainian conflict. The current projection, based on futures contracts, forecasts higher oil price levels over the entire three-year period. In particular, a peak of USD 99.8 per barrel is expected in 2022, followed
|
| MINISTRY OF ECONOMY AND FINANCE | 13 |
| | ITALY’S STABILITY PROGRAMME 2022 |
| | by a moderation in 2023 and 20248. Compared to what was projected in September, the price level is higher on average by about USD 26 over the three-year period. In the light of recent developments on the Ukrainian front, the need to consider among the exogenous variables also the price of gas has emerged, which has recorded very significant increases. The assumptions made concern the TTF gas price profile and are based on futures contracts. Specifically, the price in 2022 would reach levels four times higher than those extrapolated from contracts temporally consistent with the September Document, and then decline in subsequent years while remaining at levels much higher than those recorded in the recent past. Cumulating the effects of oil and gas price increases would result in a negative impact of 8 tenths of a point for the GDP rate of change in 2022, 5 tenths of a point in 2023 and no impact in 2024. |
| | On the exchange rate front, a technical assumption was adopted for the currency projection, which implies that the exchange rate remains unchanged over time and is equal to the average of the last 10 working days ending 10 March. The update of the nominal effective exchange rate, in comparison with September, sees an appreciation of the euro against other currencies of 0.3 percent in 2022 and 0.1 percent in 2023. The macroeconomic impact of this update of the exchange rate forecast is negative by one tenth of a percentage point on GDP growth in 2022 and two tenths in 2023. |
| | The profile of interest rates on government bonds is increasingly unfavourable over the three-year period, consistently with expectations of less accommodating policies by monetary authorities to counter inflationary pressures. In addition, higher BTP yields and a higher spread between the 10-year BTP and Bund are already expected this year, combined with higher bank credit costs. The econometric model estimates these factors to have negative effects on growth over the three-year period of -0.2 percentage points in 2022, -0.3 points in 2023 and -0.6 points in 2024, respectively. |
| | Finally, the imposition of sanctions on Russia following the outbreak of hostilities with Ukraine was also considered to be one of the revisions to the international framework that induced changes in the growth profile. Such restrictions would weaken trade by deteriorating foreign demand for domestic goods in proportion to direct export exposure to Russia. The estimated impact on the GDP rate of change is -0.2 and -0.1 percentage points in 2022 and 2023, respectively, and 0.1 in 2024. |
| | The DBP growth forecasts have been validated by the Parliamentary Budget Office. The latter in February, following the publication of ISTAT’s flash estimate for GDP in the fourth quarter, published a GDP growth forecast of 3.9 percent in 2022 and 1.9 percent in 2023. |
| | Compared to the European Commission’s most recent estimates (Winter Forecast), baseline GDP growth for 2022 is less pronounced (2.9 percent compared to 4.0 percent), while for 2023 baseline growth is 2.3 percent in both cases. In 2022, the European Commission’s estimate does not incorporate the latest international developments. In 2022, there is no mismatch between the growth estimated in the DBP and that of the European Commission and in general with those of other forecasters. |
| | |
| | TABLE R3: GROWTH FORECASTS FOR ITALY |
| | Real GDP (%y/y) | Forecast date | 2022 | 2023 |
| | Stability Programme 2022 | Mar-22 | 2.9 | 2.3 |
| | OECD | Dec-21 | 4.6 | 2.6 |
| | UPB | Feb-22 | 3.9 | 1.9 |
| | IMF (WEO) | Jan-22 | 3.8 | 2.2 |
| | European Commission | Feb-22 | 4.1 | 2.3 |
| | (*) For OECD adjusted data for working days. |
________________________
8 This refers to the average of futures over the last ten business days ending 10 March 2022..
| 14 | MINISTRY OF ECONOMY AND FINANCE |
II. BASELINE MACROECONOMIC AND BUDGET FORECAST | |
II.2 RISKS TO THE BASELINE MACROECONOMIC FORECAST
As usual, the baseline forecast was subjected to risk analysis on some key variables of the forecast (see the Focus entitled “A risk analysis on the geopolitical situation and exogenous variables”). In addition, in view of recent events, a risk scenario related to the war in Ukraine, and in particular the possibility that a further tightening of sanctions would lead to the interruption of gas and oil inflows from Russia, was explored.
The impact of a possible blockade of Russian gas and oil exports on production activities and on the prices of fossil energy sources and electricity would depend on several factors, including the timing of such an event, the level of gas stocks in Italy and Europe at the time of the interruption, and the geopolitical and military context in which it occurred.
In the simulation carried out, an export freeze was assumed to start at the end of April 2022 and last through 2023. Evaluations carried out with the contribution of experts in the sector lead to the hypothesis, with reference to the solar year rather than the thermal year, of an annual consumption in Italy of 74 billion standardised cubic metres in 2022 (against 77.1 billion in 2021) and 72.5 billion in 2023.
Based on these assessments, a first scenario assumes that companies in the sector would be able to secure the gas supplies the country needs thanks to an increase in imports from southern pipelines, an increased use of LNG (regasification capacity would increase significantly already in 2023) and an increase, initially modest, but growing over time, in domestic production of natural gas and biomethane.
However, if other European countries were to make similar efforts to diversify their supplies, this would lead to a much higher price increase than that incorporated in the exogenous components of the baseline macroeconomic framework.
The second risk scenario assumes that not all actions taken to diversify gas supplies will produce the desired results due to technical, climatic, and geopolitical issues, and that other EU countries will also face gas shortages. For Italy, gas shortages are assumed to be 18 percent of volume imports in 2022 and 15 percent of imports in 20239. As in the previous simulation, the decline in activity in the destination countries of Italian exports was also considered.
The simulation results show a fall in GDP compared to the baseline scenario of 2.3 percentage points in 2022 and 1.9 in 2023. Employment would be 1.3 percentage points lower this year and 1.2 percentage points in 2023. The consumption deflator would grow by 1.8 percentage points more this year and 2.4 percentage points in 2023. Assuming energy prices recover in the following two years and GDP returns to trend in 2025, the GDP growth rate would be 1.9 percentage points higher in 2024 and 2.3 percentage points in 2025.
________________________
9 The comparison between 2022 and 2023 is consistent with the assumption of significant progress in diversifying gas supply sources, as in 2022 Russian gas will still have been imported for four months, while in 2023 inflows from Russia would be zero. It should also be noted that, in line with the macroeconomic forecast, the analysis of gas supplies was carried out on a calendar year basis. The gas market, on the other hand, is based on the thermal year starting on 1 October. In the assumed scenario, it would be the thermal year 2022-2023 that would present the greatest supply difficulties.
| MINISTRY OF ECONOMY AND FINANCE | 15 |
| | ITALY’S STABILITY PROGRAMME 2022 |
Thus, in the worst-case scenario real GDP growth in 2022 would be 0.6 percent and 0.4 percent in 2023. As 2022 inherits 2.3 percentage points of growth from 2021, GDP growth in 2022 would be clearly negative, while the consumption deflator would grow by 7.6 percent. These assessments refer to the baseline scenario, as such a worst-case scenario would be met with a more robust economic support measure than that assumed in the policy scenario of this Document.
FOCUS
| A risk analysis of the geopolitical situation and exogenous variables |
| Using both the ITEM econometric model and the MACGEM-IT computational general equilibrium model, four different risk scenarios were considered for the baseline forecast, two of which related to the interruption of gas supplies from Russia following a tightening of sanctions, and the others to other specific macroeconomic risk factors. |
| For the two Russian gas embargo scenarios, the gas import blockade is assumed to occur from the end of April 2022 and to last through 2023. The first scenario assumes that companies in the sector manage to meet the demand by diversifying their supplies, even if the embargo causes gas, electricity, and oil prices to rise further than in the baseline scenario. In particular, the price of gas is assumed to be 37 percent higher in 2022 than in the baseline scenario (69 percent in 2023), the price of oil 9 percent higher (4.5 percent in 2023) and the price of electricity 30 percent higher (58 percent in 2023). Using the MACGEM-IT model, the impact of higher prices on output levels was determined, taking into account the use of energy materials in different sectors and inter-sectoral linkages. Moreover, as the embargo affects other European countries as well, the scenario also considers the effects of a drop in their activities due to the sharp rise in energy prices, leading to lower foreign demand. |
| In the second scenario, it is assumed that diversification efforts in supply do not have the expected results due to various difficulties. The interruption in gas supplies from Russia is therefore accompanied not only by an even more pronounced increase in gas, electricity, and oil prices (+10 percent on average compared to what was already assumed in the first scenario), but also by a shortage of gas, estimated at 18 percent and 15 percent of imports in volume in 2022 and 2023 respectively. The effects of the activity drop in European trading partners are also considered. |
| The third simulation concerns exchange rates. In the alternative scenario, they were set, over the forecast horizon, at levels corresponding to the average forward exchange rates over the most recent period (over the 10 days starting from 3 March 2021). This would result in a lower appreciation of dollars against euros in 2022 compared to the baseline scenario (by 4.8 percent instead of 6.3 percent). Moreover, while the nominal effective exchange rate remains broadly unchanged in the baseline scenario, in this simulation the euro would appreciate against other currencies by an average of about 0.3 percent in 2022 and 2.3 percent in 2023. In 2024 and 2025, the appreciation would be 3.2 and 0.8 percent, respectively. |
| The fourth and final simulation refers to risk factors related to the financial condition of the economy. Compared to the baseline scenario, the level of the 10-year BTP yield rate is assumed 100 basis points higher. These less favourable conditions for financing public debt do not affect the current year, but only the subsequent ones, due to the central bank’s ongoing programme of purchases of financial securities, which helps to limit the risk of tensions in the financial markets. In this alternative scenario, higher levels of the BTP-Bund spread starting from 2023 translate into less favourable conditions for access to credit, with higher interest rates applied to loans to households and businesses. |
| | The assessment of the impact on economic activity levels of the above risk elements is documented in Table R4. Under the first scenario hypothesis for the interruption of gas flows from Russia, the GDP growth rate would be lower than in the baseline scenario by 0.8 |
| 16 | MINISTRY OF ECONOMY AND FINANCE |
II. BASELINE MACROECONOMIC AND BUDGET FORECAST | |
| | percentage points in 2022 and 1.1 points in 2023. The recovery in the following years, with growth rates higher than in the baseline scenario (1.1 and 0.8 percent, respectively), means that the level of GDP in early 2025 is in line with the corresponding level in the baseline scenario. In the other, even more unfavourable, Russian gas embargo scenario, higher energy prices, lower gas availability for households and lower foreign demand would determine a contraction of the output growth rate relative to the baseline scenario by 2.3 percentage points in 2022 and 1.9 percentage points in 2023. In contrast, the GDP growth rate would be 1.9 percentage points higher than in the baseline in 2024 and 2.3 points higher in 2025. |
| | Regarding exchange rates, the higher appreciation of the euro relative to the baseline scenario would reduce the GDP growth rate relative to the baseline scenario by 0.4 percent in 2023, 0.8 percent in 2024 and 0.6 percent in 2025. This simulation does not include any assumptions about the partial block of Italy’s trade with Russia, therefore the effects on both exports and GDP of an appreciation of the euro (due, to a large extent, to the appreciation against the rouble) could be to some degree overestimated. Assuming worse financial conditions from 2023 onwards would determine a negative impact on the growth profile of the Italian economy. In particular, the GDP growth rate would be 0.1 percentage points lower in 2023 than in the baseline scenario and 0.4 and 0.5 points lower in 2024 and 2025, respectively. |
| | |
| | TABLE R1: EFFECTS OF RISK SCENARIOS ON GDP (impact on percentage growth rates compared to the baseline macroeconomic scenario) |
| | | 2022 | 2023 | 2024 | 2025 |
| | 1. Interruption of gas inflows from Russia: 1st scenario | -0.8 | -1.1 | 1.1 | 0.8 |
| | 2. Interruption of gas inflows from Russia: 2nd scenario | -2.3 | -1.9 | 1.9 | 2.3 |
| | 3. Nominal effective exchange rate | 0.0 | -0.4 | -0.8 | -0.6 |
| | 4. Assumption of worse financial conditions | 0.0 | -0.1 | -0.4 | -0.5 |
| | Source: MEF-TD calculations; ITEM and MACGEM-IT models. |
II.3 BUDGETARY OUTLOOK UNDER EXISTING LEGISLATION
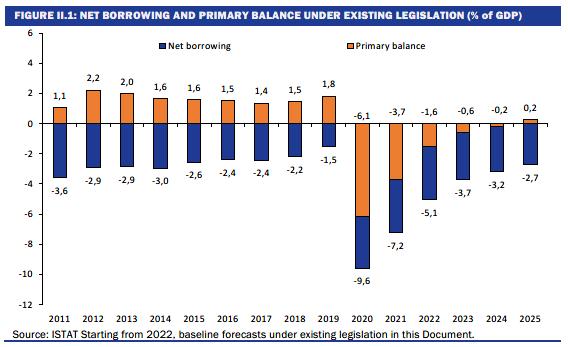
Starting from the positive public finance results achieved in 2021, the baseline forecast of the general government net borrowing for 2022 is revised downward with respect to the Update of the Stability Programme and the Draft Budgetary Plan (DBP) policy scenario, from 5.6 percent to 5.1 percent of GDP. The general government account in the baseline scenario (under existing legislation) includes the measures to lower bills for households and businesses that the Government introduced with the 2022 Budget Law and the decree-laws adopted in the past three months, to which industrial policy measures must be added. To cover the measures, inter alia, ministerial expenditure was cut by 4.5 billion and an extraordinary tax on the profits of energy companies of 3.9 billion was introduced.
Moreover, as mentioned above, GDP is now projected to grow by 6.0 percent in nominal terms in 2022, compared to 6.4 percent in the DBP. Ceteris paribus, this would result in a negative impact on general government revenues. However, while the upward revision of the inflation forecast leads to higher interest payments on government bonds indexed to consumer prices and inflation-indexed expenditures, it also pushes up revenues from indirect taxes.
Overall, the downward revision of the 2022 net borrowing estimate is mainly due to higher tax, social security contributions and other current revenues, which
| MINISTRY OF ECONOMY AND FINANCE | 17 |
| | ITALY’S STABILITY PROGRAMME 2022 |
offset to a greater extent higher estimate of current and capital expenditure compared to the DBP. However, the tax burden calculated according to national accounts criteria is expected to fall from 43.5 percent in 2021 to 43.1 percent of GDP this year. Moreover, when correcting the data to take into account the classification of various tax and social security contribution reductions as expenditure measures, the actual tax burden is lower and falls slightly more, from 41.7 last year to 41.2 this year.
As regards the next three-year period, the general government account under existing legislation benefits from a significant reduction in relation to GDP of both current primary expenditure (from 45.0 percent in 2022 to 42.0 percent in 2025) and interest expenditure (from 3.5 percent to 3.0 percent, also thanks to the expected decline in consumer inflation), while general government gross fixed capital formation is expected to rise from 3.1 percent to 3.6 percent of GDP. On the revenue side, the tax burden would fall to 42.2 percent of GDP in 2025, while final revenues would fall from 48.5 percent of GDP in 2022 to 46.9 percent in 2025.
As a result of these changes, the general government net borrowing in the baseline scenario is expected to decrease from 5.1 percent of GDP in 2022 to 3.7 percent in 2023 and then to 3.2 percent in 2024 and 2.7 percent in 2025.
| 18 | MINISTRY OF ECONOMY AND FINANCE |
| III. | UPDATED POLICY SCENARIO |
III.1 FISCAL POLICY SCENARIO
The fiscal policy for 2022 outlined a year ago in the Stability Programme, subsequently clarified in the Draft Budgetary Plan (DBP) and then implemented with the Budget Law, is based on the consideration that the revival of the Italian economy after years of slow growth and the unprecedented slump in 2020 requires a prudent but expansive fiscal policy - albeit with the expectation that the NRRP will produce a gradually increasing momentum to the country’s sustainable development.
Therefore, according to the approach adopted in the 2022 Budget Law, Italy’s fiscal policy shall remain expansionary until the GDP gap, with respect to the pre-crisis trend, is fully closed. The gradually less expansionary stance of the fiscal policy will lead to a gradual decline in the deficit, a significant reduction in the debt-to-GDP ratio, an improvement in the quality of public spending and the recovery of revenues thanks to a shrinking tax gap.
The fiscal space obtained by adopting a more gradual deficit reduction path, compared to the baseline, has been allocated to a reform of the Personal Income Tax (Imposta sui Redditi delle Persone Fisiche, IRPEF), the Regional Tax on Production Activities (Imposta regionale sulle attività produttive, IRAP), and of social benefits, funding credit guarantees and public investment, as well as raising the resources for the Citizenship Income scheme. In addition, funding for health and pandemic response has been increased and a substantial reduction in energy costs for households and businesses has been implemented. The universal child benefit has been fully implemented.
As described in detail above, higher energy prices at the beginning of the year had the hardest impact on businesses and household budgets. As a result, the Government has taken action with further price containment measures. Interventions have also been, and are being, financed to support the automotive sector, and in particular the sales of environment-friendly cars, as well as the semiconductor sector.
The recent measures implemented by the Government are in line with the guidelines issued by the European Commission, which recognise, on the one hand, the need to cushion the impact on the economy of the increases in the price of natural gas and oil caused by the war in Ukraine, and, on the other, the importance of supporting strategic industrial sectors in the face of non-European competition, which is also based on substantial State aid.
In this context, in light of the lowering of the baseline net borrowing forecast to 5.1 percent of GDP, the Government has decided to confirm the deficit-to-GDP ratio target of the DBP (5.6 percent of GDP), and to use the resulting margin of approximately 0.5 percentage points of GDP to finance a new measure, to be
| MINISTRY OF ECONOMY AND FINANCE | 19 |
| | ITALY’S STABILITY PROGRAMME 2022 |
finalised in April. First of all, the new Decree-Law will restore budgetary funds temporarily de-funded to partially cover Decree-Law No. 17/2022, amounting to 4.5 billion in terms of impact on the general government net borrowing. The remaining resources will be allocated to the following interventions:
| • | the increase in funds for credit guarantees. |
| • | the increase in resources needed to cover the rise in prices of public works. |
| • | further action to contain fuel prices and energy costs. |
| • | further measures that are necessary to assist Ukrainian refugees and to alleviate the economic impact of the ongoing conflict in Ukraine on Italian companies. |
| • | continuing to support the health system’s response to the pandemic and the sectors most affected by the pandemic emergency. |
In addition, general government net borrowing targets for 2023 and 2024, which were revised under a meliorative filter in the 2022 DBP, are confirmed: 3.9 percent of GDP in 2023 and 3.3 percent of GDP in 2024. For 2025, the new deficit target is set at 2.8 percent of GDP. Based on the baseline public finance projections under existing legislation outlined above, this creates room to finance expansionary measures of 0.2 percent of GDP in 2023 and 0.1 percent in 2024 and 2025.
The public finance baseline projection described in the previous chapter does not include the so-called unchanged policies, which include a series of expenditures that may have to be implemented in the coming years due to international commitments or legislative factors, from the refinancing of international missions to the financing of future contract renewals in the general government sector. The central State administrations will contribute to the financing of these needs and new measures that the Government will decide to adopt with the end-of-year manoeuvre, through a renewed spending review activity. This is also in view of the fact that for the 2023-2025 three-year period, the resumption of the procedure provided for by Article 22-bis of Law No. 196 of 2009 is configured as one of the enabling reforms of the NRRP (reform 1.13).
To this end, the expenditure savings to be ensured by the central State administrations for the three-year planning period are indicated, according to an increasing profile, as 800 million for the year 2023, 1,200 million for the year 2024 and 1,500 million for the year 2025. The distribution among ministries and the areas of intervention will be identified by a decree of the President of the Council of Ministers (by 31 May) on the proposal of the Minister of Economy and Finance, after deliberation by the Council of Ministers.
| 20 | MINISTRY OF ECONOMY AND FINANCE |
III. UPDATED POLICY SCENARIO | |
| TABLE III.1: PUBLIC FINANCE INDICATORS (as a percentage of GDP)(1) |
| | 2020 | 2021 | 2022 | 2023 | 2024 | 2025 |
| POLICY SCENARIO | | | | | | |
| Net borrowing | -9.6 | -7.2 | -5.6 | -3.9 | -3.3 | -2.8 |
| Primary balance | -6.1 | -3.7 | -2.1 | -0.8 | -0.3 | 0.2 |
| Interest expense | 3.5 | 3.5 | 3.5 | 3.1 | 3.0 | 3.0 |
| Structural net borrowing (2) | -5.0 | -6.1 | -5.9 | -4.5 | -4.0 | -3.6 |
| Structural variation | -3.0 | -1.1 | 0.2 | 1.4 | 0.5 | 0.4 |
| Public debt (gross of subsidies) (3) | 155.3 | 150.8 | 147.0 | 145.2 | 143.4 | 141.4 |
| Public debt (net of subsidies) (3) | 151.8 | 147.6 | 144.0 | 142.3 | 140.7 | 138.8 |
| | | | | | | |
| BASELINE SCENARIO UNDER EXISTING LEGISLATION | | | | | | |
| Net borrowing | -9.6 | -7.2 | -5.1 | -3.7 | -3.2 | -2.7 |
| Primary balance | -6.1 | -3.7 | -1.6 | -0.6 | -0.2 | 0.2 |
| Interest expense | 3.5 | 3.5 | 3.5 | 3.1 | 3.0 | 3.0 |
| Structural net borrowing (2) | -5.0 | -6.1 | -5.3 | -4.3 | -3.8 | -3.4 |
| Structural variation | -3.0 | -1.1 | 0.8 | 1.1 | 0.5 | 0.3 |
| Public debt (gross of subsidies) (3) | 155.3 | 150.8 | 146.8 | 145.0 | 143.2 | 141.2 |
| Public debt (net of subsidies) (3) | 151.8 | 147.6 | 143.8 | 142.1 | 140.5 | 138.6 |
| | | | | | | |
| MEMO: Update of the Stability Programme 2021/ DBP 2022 (POLICY SCENARIO) |
| Net borrowing | -9.6 | -9.4 | -5.6 | -3.9 | -3.3 | |
| Primary balance | -6.1 | -6.0 | -2.6 | -1.2 | -0.8 | |
| Interest expense | 3.5 | 3.4 | 2.9 | 2.7 | 2.5 | |
| Structural net borrowing (2) | -4.7 | -7.6 | -5.4 | -4.4 | -3.8 | |
| Variation in structural balance | -2.9 | -2.9 | 2.1 | 1.0 | -0.6 | |
| Public debt (gross of subsidies) | 155.6 | 153.5 | 149.4 | 147.6 | 146.1 | |
| Public debt (net of subsidies) | 152.1 | 150.3 | 146.4 | 144.8 | 143.3 | |
| Nominal baseline GDP (absolute values x 1000) | 1657.0 | 1775.4 | 1882.7 | 1966.2 | 2037.6 | 2105.7 |
| Policy nominal GDP (absolute values x 1000) | 1657.0 | 1775.4 | 1887.0 | 1974.5 | 2048.3 | 2116.8 |
(1) Any inaccuracies are the result of rounding. (2) Net of one-time measures and the cyclical component. (3) Gross or net of Italy’s share of loans to EMU Member States, bilaterally or through the EFSF, and of the contribution to the capital of the ESM. As of 2021, the amount of these shares was approximately 57.3 billion, of which 43.0 billion for bilateral loans and through the EFSF and 14.3 billion for the ESM programme (see Bank of Italy, “Statistical Bulletin Public Finance, Cash Requirements and Debt”, March 2022). It is assumed that the MEF’s cash holdings will be reduced by approximately -0.2 percent of GDP in 2022 and by approximately -0.1 percent of GDP in each subsequent year, with the aim of bringing the balance back to the level of the end of 2019. In addition, estimates take into account the repurchase of SACE, the deployment of the earmarked assets, EIB guarantees and loans under the SURE and NGEU programmes. The interest rate scenario used for the estimates is based on the implicit forecasts derived from the forward rates on Italian government bonds for the period in which this Document was completed. |
III.2 MACROECONOMIC FORECAST UNDER THE POLICY SCENARIO
The measures envisaged in the policy scenario and to be adopted in April will have an expansionary effect on the Italian economy and will increase the change in GDP projected in the policy scenario to 3.1 percent in 2022 (from 2.9 percent in the baseline scenario) and to 2.4 percent in 2023 (from 2.3 percent in the baseline scenario).
| MINISTRY OF ECONOMY AND FINANCE | 21 |
| | ITALY’S STABILITY PROGRAMME 2022 |
The higher resources allocated support households and firms and contribute to increasing (compared to the baseline scenario) investment by 0.3 percent and household consumption by about 0.1 percentage points this year. In the following year, household consumption in the macroeconomic policy framework grows by 2.1 percent (in line with the baseline scenario) and total gross fixed capital formation by 5.5 percent (0.4 percentage points higher than in the baseline scenario). The improved demand performance triggers higher imports in 2023 on the one hand and promotes labour input growth on the other.
The policy scenario expects a higher employment and lower unemployment rate than the baseline scenario, which stands at 8.1 percent in 2023, and then declines further to 8.0 percent in 2024 and 7.9 percent in 2025.
GDP growth projections for 2024 and 2025 remain broadly unchanged from those in the baseline scenario. In other aspects, the differences between the policy scenario and the baseline scenario are limited, as the deficit differential is large this year but narrows in the next three years until essentially disappearing in 2024-2025.
| TABLE III.2: SYNTHETIC MACROECONOMIC POLICY SCENARIO (1) (percentage changes, unless otherwise indicated) |
| | 2021 | 2022 | 2023 | 2024 | 2025 |
| GDP | 6.6 | 3.1 | 2.4 | 1.8 | 1.5 |
| GDP deflator | 0.5 | 3.0 | 2.2 | 1.9 | 1.8 |
| Consumption deflator | 1.7 | 5.8 | 2.1 | 1.8 | 1.8 |
| Nominal GDP | 7.2 | 6.3 | 4.6 | 3.7 | 3.3 |
| Employment (AWU) (2) | 7.6 | 2.6 | 2.3 | 1.6 | 1.3 |
| Employment (WF) (3) | 0.8 | 1.9 | 1.8 | 1.2 | 1.0 |
| Unemployment rate | 9.5 | 8.6 | 8.1 | 8.0 | 7.9 |
| Current account balance (balance in % GDP) | 3.3 | 2.3 | 2.6 | 2.7 | 2.7 |
| (1) Any inaccuracies are due to rounding. | | | | | |
| (2) Employment expressed in terms of standard work units (AWU). |
(3) Number of employed people according to the Continuous Labour Force Survey (Rilevazione Continua delle Forze Lavoro, RCFL) sample survey. |
The macroeconomic forecast based on the policy scenario was endorsed by the Parliamentary Budget Office with a note dated 14 April 2022.
III.3 BUDGET BALANCE, CONVERGENCE TOWARDS THE MEDIUM-TERM OBJECTIVE AND THE EXPENDITURE RULE
As mentioned, the Government confirms the nominal deficit targets of the DBP, with a path starting from 5.6 percent of GDP this year and going down to 2.8 percent in 2025, therefore creating room for new expansive measures worth 0.5 percentage points of GDP this year, 0.2 in 2023 and 0.1 in 2024 and 2025.
The profile of the policy balance for 2022 and future years indicates a descent below the 3 percent threshold for general government net borrowing to the GDP set by the Stability and Growth Pact.
| 22 | MINISTRY OF ECONOMY AND FINANCE |
III. UPDATED POLICY SCENARIO | |
The interpretation of the dynamics of the indicators linked to fiscal surveillance in recent years, also in the context of the activation of the General Escape Clause, is particularly complex, both because of the correction of the balance for the cyclical component (of extremely large size and subject to considerable uncertainty), and because of the presence of a considerable component of expenditure (and to a lesser extent of revenue reductions) of an emergency nature.
| TABLE III.3: SIGNIFICANT DEVIATIONS |
| Convergence of the structural balance towards the MTO | 2019 | 2020 | 2021 | 2022 | 2023 | 2024 | 2025 |
| General government net borrowing | -1.6 | -9.6 | -7.2 | -5.6 | -3.9 | -3.3 | -2.8 |
| Medium Term Objective (MTO) (*) | 0.0 | 0.5 | 0.5 | 0.5 | 0.3 | 0.3 | 0.3 |
| Structural Balance | -2.0 | -5.0 | -6.1 | -5.9 | -4.5 | -4.0 | -3.6 |
| Annual change in structural balance | 0.4 | -1.2 | -1.1 | 0.2 | 1.4 | 0.5 | 0.4 |
| Required variation in structural balance (* *) | 0.4 | -0.2 | 0.5 | 0.6 | 0.6 | 0.6 | 0.6 |
| Deviation of the structural balance from the annual required variation (<0.5 pp) | 0.8 | 4.7 | -1.6 | -0.4 | 0.8 | -0.1 | -0.2 |
| Average variation in the structural balance (over two years) | 0.1 | -0.4 | -1.1 | -0.5 | 0.8 | 1.0 | 0.5 |
| Average required variation | 0.4 | 0.1 | 0.2 | 0.6 | 0.6 | 0.6 | 0.6 |
| Deviation of the structural balance from the average required variation (<0.25 pp) | -0.2 | -0.5 | -1.3 | -1.0 | 0.2 | 0.4 | -0.1 |
| | | | | | | | |
| Expenditure rule | 2019 | 2020 | 2021 | 2022 | 2023 | 2024 | 2025 |
| Growth rate of the reference aggregate expenditure (%) | 1.5 | 10.1 | 5.1 | 3.3 | -0.2 | 1.9 | 0.4 |
| Benchmark modulated on the prevailing cyclical conditions (* * *) (%) | 0.7 | 1.9 | 0.4 | 1.8 | 1.8 | 1.5 | 1.6 |
| Deviation of the aggregate expenditure from the annual required variation (<0.5 p.p.) | -0.4 | -4.1 | -2.3 | -0.7 | 0.9 | -0.2 | 0.5 |
| Deviation of the aggregate expenditure from the average required variation over two years (<0.25 p.p.) | -0.5 | -2.2 | -3.2 | -1.5 | 0.1 | 0.4 | 0.2 |
| (*) Pending the revision of European economic governance, the Commission has updated the MTO every three years on the basis of updated data from the 2021 Autumn Forecast and the 2021 Ageing Report. |
| (* *) For 2020, flexibility is applied due to exceptional measures to safeguard and secure the territory. Please note that the activation of the general safeguard clause of the Stability and Growth Pact is considered for the 2020 – 2022 period. |
| (* * *) The benchmark takes into account the required change in the structural balance. |
According to the new estimates available in 2021, the budget balance has worsened, in structural terms, by about one percentage point of GDP compared to 2020. For 2022, the structural balance is expected to improve by less than the change indicated in the DBP10. As of 2023, the improving baseline in nominal balances is also confirmed by the annual variations in structural balances, although the cyclical correction dampens the intensity of the improvement over the policy period. This results in a different profile, especially in 2022, compared to that planned in the DBP, in terms of speed of convergence towards the medium-term objective (MTO)11. The Government, therefore, accompanies this Document with a report to Parliament pursuant to Law 243/2012.
________________________
10 The lower improvement, in addition to a different output gap profile, is partly explained by higher revenues for 2022, which are accounted as one-off measures, and therefore excluded from the calculation of the structural balance. The gap is also affected by new higher expenditures planned for extraordinary needs.
11 As Table V.9 in the Appendix shows, the output gap closes rapidly and then becomes positive from 2023 and increasing over time. This is due to the fact that throughout the Stability Programme, GDP growth exceeds potential output growth. Indeed, the commonly agreed European estimation methodology (CAM) incorporates the higher actual growth only gradually into the potential output estimates.
| MINISTRY OF ECONOMY AND FINANCE | 23 |
| | ITALY’S STABILITY PROGRAMME 2022 |
With reference to the European rule on the convergence to the medium-term budgetary objective12, as of 2023, variations in the policy structural balance are broadly in line with the corrections required by the adjustment matrix of the SGP. In 2023 a significant structural budgetary improvement is expected, while in the following years an adjustment close to 0.6 percentage points of GDP is expected, which represents full compliance with the European rule.
Regarding the expenditure rule, a conservative picture emerges from 2023 onwards, as the change in the relevant expenditure aggregate would not deviate much from the expenditure benchmark13.
In the context of the suspension of the convergence path towards the medium-term objective (MTO), the Commission focused its attention on controlling the dynamics of current expenditure financed from national resources and encouraging, instead, the expansion of public investment spending. Such an approach has already been promoted since autumn 2020; according to it, the orientation of the fiscal policy (the so-called fiscal stance) is measured by excluding both the expenditure component financed through grants from the Recovery and Resilience Facility and other European funds, and temporary emergency measures related to the pandemic crisis.
The fiscal recommendations addressed to Italy in spring 2021 were along these lines. When assessing the 2022 DBP on the basis of autumn forecasts, the Commission noted that the impact on aggregate demand of public expenditure - as measured by the current expenditure aggregate described above - would be very positive (estimated at -1.514 percent of GDP in 2022 compared to -1.9 percent of GDP in 2021)15. Consequently, the Commission invited Italy to take the necessary measures to limit the growth of current expenditure financed by national resources.
The same approach was reiterated in the above-mentioned communication on the fiscal policy guidance for 2023 of early March, where high-debt Member States were invited by the Commission to expand current expenditure at a slower pace than potential output from 2023, so as to embark on a gradual path of fiscal consolidation. Public investment, temporarily excluded from the calculation, is expected to continue supporting the economic recovery.
Before commenting on the new estimates available on the behaviour of the current expenditure aggregate, and its growth rate, it is necessary to briefly focus on emergency expenditures related to Covid-19, whose identification is crucial. The
________________________
12 Pending the revision of the European economic governance, the Commission has updated the MTO as a matter of practice on the basis of the 2021 Autumn Forecast and the 2021 Ageing Report: for Italy, the minimum value of the MTO has been lowered from 0.50 percent of GDP forecast for the 2020-2022 period to 0.25 percent of GDP for the 2023-2025 period.
13 It should be noted that the fluctuating behaviour of the expenditure aggregate between 2023 and 2025 is largely linked to the profile of EU transfers through the RRF and other EU funds.
14 A negative sign of the indicator implies a positive contribution to the economy, above the expenditure trend defined by the average nominal potential growth rate, the so-called benchmark. The Commission measures the higher growth in expenditure against the trend of potential growth as a ratio of GDP, thus treating this deviation as a contribution to growth on the aggregate demand side.
15 The current expenditure component constitutes a major part of the public expenditure aggregate contributing to the economy, but it is not the only one. Taking into account also investments financed with national and European resources and excluding measures related to the pandemic emergency, the contribution to growth of public expenditure is estimated at -2.7 percent of GDP in 2021 and -3.0 percent in 2022. For more details see COMMISSION STAFF WORKING DOCUMENT - STATISTICAL ANNEX - providing background data relevant for the assessment of the 2022 Draft Budgetary Plans, Brussels, 24.11.2021 - SWD(2021) 915 final, https://ec.europa.eu/info/sites/default/files/economy- finance/swd_2021_915_1_en_autre_document_travail_service_part1_v1_0.pdf..
| 24 | MINISTRY OF ECONOMY AND FINANCE |
III. UPDATED POLICY SCENARIO | |
identification of emergency measures and their precise quantification is particularly complex. Firstly, only some of the planned expenditures is clearly earmarked and can fully be justified by emergency reasons; secondly, the criterion of temporariness is not easily definable; finally, on an ex-post and actual basis, for some complex measures involving several levels of expenditure, it is difficult to track their actual implementation16.
With regard to a precise identification of the individual measures, as much as possible in line with the Commission’s indications, the Ministry’s structures have made some provisional estimates17 and subject to further verification and updating. According to the current evaluation, based on a first final balance assessment for 2020 and 2021, and updated projections for the following years, the higher growth of the monitored current expenditure aggregate in 2022 will be much lower than estimated by the Commission last autumn. The estimated range for this component of the fiscal stance would be between -0.5 and -1 percent of GDP (compared to an estimated -1.5 percent). It is also reiterated that current “overspending” is to a large extent linked to the introduction of particularly qualified measures from the point of view of equity, social inclusion, family, and demographic growth18. Moreover, with reference to 2023, the growth of the current expenditure aggregate would be broadly in line with the recommendation.
The behaviour of the current expenditure aggregate financed by national resources emerges more clearly in the last years of the policy scenario, where there are no temporary items that can alter the annual variations of the measure. The table below serves an illustrative purpose and shows the annual change in the current expenditure aggregate, not adjusted for temporary measures, and that of the benchmark (nominal potential GDP growth rate). In this table, the years 2020 to 2022 are heavily influenced by temporary expenditure. The figure for 2023 is marginally affected, while the final two years provide a more reliable indication.
| TABLE III.4 TRENDS IN CURRENT EXPENDITURE IN RELATION TO THE EXPENDITURE BENCHMARK |
| | 2020 | 2021 | 2022 | 2023 | 2024 | 2025 |
| Growth in current primary expenditure financed by national resources (*) | 6.8 | 2.1 | 3.2 | 0.8 | 2.2 | 1.9 |
| Variation in potential GDP | 0.1 | 0.3 | 1.0 | 1.2 | 1.3 | 1.3 |
| Real Benchmark (* *) | 0.2 | 0.4 | 0.5 | 0.7 | 0.8 | 0.8 |
| Nominal Benchmark (* * *) | 1.6 | 0.8 | 3.6 | 2.9 | 2.6 | 2.6 |
| Notes: (*) The expenditure aggregate includes the temporary component of expenditures related to the Covid-19 emergency; (* *) the real benchmark is the 10-year average of the potential GDP growth rate estimated in the 2022 Stability Programme policy scenario; (* * *) the nominal benchmark is equal to the real benchmark taking into account the inflation rate, it does not correct for the convergence to the MTO as foreseen by the SGP expenditure rule. |
________________________
16 The difficulties relate, for example, to the need of combining, for 2020 and 2021, the final balance of the requests for the measures taken under the various “emergency” decrees adopted over the two years and in the Budget Law for 2021, to be carried out on an ex-post basis, with the assessment of the effects of such measures for 2022 and 2023, to be carried out on an ex-ante basis but taking into account the aforementioned request trend.
17 According to these provisional estimates, emergency measures of a current nature taken after the DBP and during the first months of this year amount to about 0.2 percent of GDP in 2022. These measures are all considered as temporary, on the basis of the assessment criteria used by the European Commission.
18 As stated in the Update, the main allocations of a non-temporary nature were related to important reforms for families, equity and social inclusion, such as the single child allowance, the reform of personal income tax and the revision and expansion of resources allocated to the Citizenship Income (Reddito di cittadinanza).
| MINISTRY OF ECONOMY AND FINANCE | 25 |
| | ITALY’S STABILITY PROGRAMME 2022 |
In the medium term, the growth trend of current expenditure is therefore quite contained and in line with what already emerged when commenting on the indicator used for the traditional expenditure rule. This is reassuring, because the benchmark based on a moving average of the estimated potential output is particularly conservative19.
Concerning the issue of identifying and quantifying measures of an emergency nature, as a prerequisite for a proper assessment of the underlying expenditure trend, it cannot be ignored that new urgencies have emerged with 2022. Account should be taken of the expenditure, which is currently largely exceptional, linked to the need to contain the effects of rising energy prices on the economy.
III.4 DEBT-TO-GDP RATIO AND THE DEBT RULE
Public debt as a ratio of GDP: forecast under the policy scenario
In 2021, the debt-to-GDP ratio fell by about 4.4 percentage points, reaching 150.8 percent from its peak of 155.3 percent in 202020.
The improvement was driven by the economic recovery, which increased nominal GDP by 7.2 percent, while the implicit interest rate on debt remained stable at 2.4 percent. As a result, the snow-ball effect, which quantifies the automatic impact of the difference between interest expenditure and nominal GDP growth on the dynamics of the debt-to-GDP ratio, returned to contribute to the reduction of the debt-to-GDP ratio by about -6.8 percentage points.
The significant downward impulse from the snow-ball effect more than offset the opposite impulse from the primary deficit, which amounted to about 3.7 percentage points21.
The performance of the stock-flow adjustment component also contributed to a fall of about -1.3 percentage points of the debt-to-GDP ratio in 2021. The lower impact on cash requirements deriving from the legislative measures adopted in 2021, with respect to the impact on the net borrowing, together with the effect deriving from negative issue discounts due to the phase of slight decline in interest rates in the first eight months of the year, more than offset the increase of approximately 0.3 percentage points of GDP in Treasury liquidity holdings at the Bank of Italy.
________________________
19 The benchmark is very conservative for several reasons. Firstly, it is constructed using a ten-year moving average of potential output estimates: in the current phase of structural growth recovery, the estimate of potential output tends to gradually increase, but the moving average captures such an improvement with a lag. Secondly, it shall be recalled that the estimate of potential output made according to the EU commonly agreed methodology (CAM) reflects the higher economic growth with some delay and does not capture the possible impacts of structural reforms, an essential component of the National Recovery and Resilience Programme. A possible shift to fiscal rules that place more emphasis on medium-term planning could lead to a more accurate assessment of the estimate of potential output over a horizon beyond the short term.
20 As a result of the revisions to the debt stock and the level of nominal GDP, the 2020 debt-to-GDP ratio slightly declined to 155.3 percent from the previous estimate of 155.6 percent, while the 2019 debt-to-GDP ratio declined to 134.1 percent from 134.3 percent in September.
21 Although the primary balance remained in deficit in 2021, the size of the deficit was significantly reduced compared to 2020, when it had contributed to the increase in the debt-to-GDP ratio by as much as 6.1 percentage points.
| 26 | MINISTRY OF ECONOMY AND FINANCE |
III. UPDATED POLICY SCENARIO | |
The preliminary estimate for 2021 is also significantly lower (-2.7 percentage points) than the level estimated in the Update of the Stability Programme, confirmed in the 2022 DBP, which forecast a debt-to-GDP ratio of 153.5 percent.
In detail, the level of GDP in 2021 was slightly lower than that forecast in the DBP and would have resulted in an increase in the debt-to-GDP ratio of 0.3 percentage points respect to the September 2021 forecast. However, the smaller change in the debt stock contributed as much as 3.0 percentage points to the reduction in the debt-to-GDP ratio, thus largely offsetting the first effect. This mainly reflects better-than-expected cash balance performances. Indeed, the public sector’s borrowing requirement at the end of 2021 stood at 6.1 percent of GDP, instead of the 8.9 percent expected in September 202122. As a result, the growth rate of the public debt in the last year was 4.1 percent compared to the projected 6.2 percent.
Finally, it should be noted that the preliminary estimate of the debt-to-GDP ratio of 150.8 percent in 2021 is markedly lower than that projected in the previous Stability Programme, which was 159.8 percent according to the policy scenario of April 2021.
The reduction in the debt-to-GDP ratio is expected to continue in the current and the next three years.
The economic growth expected in the coming years, together with the inflationary boost linked to energy prices, which has started to intensify since the end of 2021, will continue to support the contribution of the snow-ball component to the decline in the debt-to-GDP ratio, more than offsetting the interest expenditure component. In fact, a rise in government bonds yields is expected, as a result of the ECB’s monetary policy announcements and decisions23 in response to the above-mentioned inflationary pressures, and the increased volatility of financial markets induced both by the same ECB’s decisions and by the recent international geopolitical events.
The downward trend of the debt-to-GDP ratio will mainly benefit from the expansionary impulse on GDP deriving from the budget manoeuvre for 202224, and from the implementation of the investment and reform programme of the National Recovery and Resilience Plan. The policy scenario forecasts discount the impact of the decree-law announced by the Government to mitigate the economic consequences of the current energy crisis.
However, the forecast scenario is characterised by high uncertainty due to both the war in Ukraine and the possible persistence of inflationary pressures, which are also affecting non-energy goods.
In 2022, the debt-to-GDP ratio target is revised downward to 147.0 percent. The expected reduction will come from a decrease in public sector borrowing requirement (about -1.4 percentage points with respect to 2021) and nominal GDP growth (6.3 percent).
________________________
23 It should be noted that part of the lower trend of cash requirements with respect to the Update forecasts can be attributed to the resizing or postponement of some financial transactions, such as the operation of the Patrimonio Destinato (dedicated assets) (as per Article 27 of Decree-Law No. 34/2020 converted with amendments by Law No. 77/2020), or the purchase of the company SACE (pursuant to Article 67 of Decree-Law No. 104/2020 converted with amendments by Law No. 126 of 13 October 2020).
23 Board meeting of 10 March 2022.
24 Approved in December 2021.
| MINISTRY OF ECONOMY AND FINANCE | 27 |
| | ITALY’S STABILITY PROGRAMME 2022 |
In 2023, the debt-to-GDP ratio is forecast to further decline to 145.2 percent. The pace of decline will be slower than in the previous year, due to lower nominal GDP growth of 4.6 percent and to broadly stable public sector requirement.
In 2024, the reduction of the net borrowing in the policy scenario to a level of -3.3 percent will allow the debt-to-GDP ratio to fall to 143.4 percent.
Finally, the debt-to-GDP ratio new target for 2025 is set at 141.4 percent, with an annual decrease of 2.0 percentage points.
Also contributing to this overall reduction of the ratio is the forecast of a gradual, but progressive, reduction of the Treasury’s liquidity holdings, which at the end of 2025 are expected to return to a level slightly higher than that at the end of 2019, i.e., to values prior to the start of the pandemic crisis. Net of Italy’s share of loans to EMU Member States, bilaterally or through the EFSF, and of the contribution to the capital of the ESM, the 2021 final estimate of the debt-to-GDP ratio is 147.6 percent, while the forecast stands at 138.8 percent in 2025.
Assessment of the debt rule compliance
In the current fiscal architecture defined by the Stability and Growth Pact (SGP), Member States must ensure a debt-to-GDP ratio of no more than 60 percent. If this threshold is exceeded, the SGP envisages a path for reducing the excess of public debt over the threshold at a pace deemed appropriate. In normal times, therefore, budget planning for high debt countries like Italy must respect at least one of the following criteria: (i) the portion of debt exceeding the reference value of 60 percent of GDP must be reduced on an annual basis by 1/20th of the average of the values of the three years preceding the current year (retrospective or backward-looking criterion) or in the two years following the reference year
| 28 | MINISTRY OF ECONOMY AND FINANCE |
III. UPDATED POLICY SCENARIO | |
(prospective or forward-looking criterion); (ii) the excess of debt over the backward-looking benchmark is attributable to the economic cycle25.
| TABLE III.5: DEBT RULE COMPLIANCE |
| | Scenario |
| | Policy | Unchanged legislation |
| | 2021 | 2022 | 2023 | 2021 | 2022 | 2023 |
| Debt in year t+2 (% of GDP) | 145.2 | 143.4 | 141.4 | 145.0 | 143.2 | 141.2 |
| Gap compared to backward looking benchmark (% of GDP) | 17.1 | 8.4 | 3.0 | 17.1 | 8.2 | 3.0 |
| Gap compared to forward looking benchmark (% of GDP) | 3.0 | 12.7 | 11.9 | 3.0 | 12.5 | 11.6 |
| Cyclically adjusted debt gap (% of GDP) | 7.1 | 0.0 | 15.6 | 7.2 | -0.4 | 15.2 |
The projections of the debt-to-GDP ratio in the policy scenario show a downward trend. Table III.5 shows the estimated deviations from the various reduction benchmarks envisaged by the debt rule over the time horizon set by the Commission’s fiscal surveillance.
As already illustrated in the 2021 Stability Programme, the configuration of the economy-adjusted debt-to-GDP ratio is the one with the smallest deviation. In 2022 the reduction in the debt-to-GDP ratio projected on the basis of this configuration is in line with the convergence path required by the debt rule. Essentially, if the debt-to-GDP ratio were to be adjusted for the revenue shortfalls and expenditure overruns induced by the exceptionally adverse economic conditions, based on the methodology agreed at the European level26, the value achieved would be consistent with the retrospective target set in the reduction step of 1/20 per year.
In 2023, on the other hand, the configuration based on the correction for the economic cycle is not the most favourable, as the projected reduction in the debt-to-GDP ratio based on the backward-looking configuration is closer to the path required by the debt rule. Indeed, the backward-looking benchmark takes into account estimates of the debt-to-GDP ratio for the last three years, benefiting in particular from the significant decline recorded in 2021.
In line with what stated by the Commission in its communication of 2 March, the Government confirms the path of gradual fiscal adjustment planned in the DBP to continue reducing the high public debt, aware that too sudden an adjustment could have a negative impact on growth. Despite the uncertainty of the current geopolitical situation, the Government is committed to a multi-year consolidation strategy that, combined with the investments and structural reforms defined in the NRRP, aims at sustaining the economy’s potential growth and improving the sustainability of public debt.
________________________
25 In this case, an indicator is used that expresses the debt ratio that would have been obtained if in the previous three years (i) the numerator (i.e., public debt) had been corrected for the impact of the economic cycle and (ii) the denominator (i.e., nominal GDP) had grown at the same rate as potential output.
26 See European Commission, Vade Mecum on the Stability and Growth Pact – 2019 Edition, p. 49.
| MINISTRY OF ECONOMY AND FINANCE | 29 |
| | ITALY’S STABILITY PROGRAMME 2022 |
| 30 | MINISTRY OF ECONOMY AND FINANCE |
| IV. | SUSTAINABILITY OF PUBLIC FINANCES |
IV.1 RISK SCENARIOS OF PUBLIC FINANCES
This section simulates two risk scenarios in which macroeconomic and financial shocks are reflected in public finance performance over the 2022-2025 period under standard sensitivity assumptions27.
The reference scenario (or baseline) coincides with the policy framework of this Document. The sensitivity analysis is aimed at outlining the path of the budget balance and the dynamics of the debt by assuming two alternative scenarios based on the results presented in Chapter II in the Focus “A risk analysis on the geopolitical situation and exogenous variables”.
The “financial risk” scenario (corresponding to the fourth scenario of the above-mentioned Focus) refers to risk factors related to the financial conditions of the economy, postulating an increase in the BTP-Bund spread of 100 basis points starting from 2023 and a consequent impact on economic growth.
The “gas-shortage risk” scenario (corresponding to the second scenario of the Focus) envisages a reduction in gas supplies caused by the ban on imports from Russia, combined with a further rise in gas and oil prices with a consequent impact on growth from 2022; in this second scenario no shock is expected on the interest rate curve.
| TABLE IV.1: SENSITIVITY TO GROWTH (percentage values) |
| | | 2021 | 2022 | 2023 | 2024 | 2025 |
| Nominal GDP growth rate | Baseline Financial Risk Gas-shortage risk | 7.2 7.2 7.2 | 6.3 6.3 4.4 | 4.6 4.6 3.6 | 3.7 3.3 4.7 | 3.3 2.7 5.2 |
| Real GDP growth rate | Baseline Financial Risk Gas-shortage risk | 6.6 6.6 6.6 | 3.1 3.1 0.8 | 2.4 2.3 0.4 | 1.8 1.5 3.7 | 1.5 1.0 3.8 |
| Net borrowing | Baseline Financial Risk Gas-shortage risk | -7.2 -7.2 -7.2 | -5.6 -5.6 -6.9 | -3.9 -4.0 -6.0 | -3.3 -3.9 -4.6 | -2.8 -4.1 -3.1 |
| Primary surplus | Baseline Financial Risk Gas-shortage risk | -3.7 -3.7 -3.7 | -2.1 -2.1 -3.3 | -0.8 -0.7 -2.6 | -0.3 -0.6 -1.5 | 0.2 -0.6 0.0 |
| Interest rate implicit | Baseline Financial Risk Gas-shortage risk | 2.4 2.4 2.4 | 2.5 2.5 2.5 | 2.2 2.3 2.3 | 2.1 2.4 2.1 | 2.2 2.5 2.1 |
| Public debt | Baseline Financial Risk Gas-shortage risk | 150.8 150.8 150.8 | 147.0 147.0 151.0 | 145.2 145.6 152.6 | 143.4 145.0 150.4 | 141.4 145.1 145.8 |
________________________
27 See Section III.4 of the Methodological Note on the criteria for formulating baseline forecasts attached to this Stability Programme.
| MINISTRY OF ECONOMY AND FINANCE | 31 |
| | ITALY’S STABILITY PROGRAMME 2022 |
The responses on GDP and its components (from which the potential output and the output gap are recalculated) are jointly estimated by MACGEM-IT, the general equilibrium model of the Directorate I of the Italian Department of the Treasury, and by the ITEM econometric model, as explained in the Focus. The responses on rates (for the “financial risk” scenario) and the change in interest expenditure are calculated with the Treasury’s SAPE model, which is based on the database of the current and forecasted stock of government securities.
Table IV.1 shows the estimates of the main macroeconomic and public finance variables in the different scenarios for the 2022-2025 period.
Figure IV.1 shows the change in the debt-to-GDP ratio in the three scenarios. The baseline, coinciding with the official policy forecast, shows a continuous downward trend.
Given the intensity of the shocks considered, the downward trend of the debt-to-GDP ratio is mitigated in both sensitivity scenarios. In the “gas-shortage risk” scenario, after a halt in the downward trend in the two-year period 2022-2023, the debt-to-GDP ratio falls again as growth conditions prior to the economic shock are reinstated; in the “financial risk” scenario, the different assumption on the interest rate curve, characterised by a prolonged upward trend on the long side, produces an increasing adverse effect on the dynamics of the debt-to-GDP ratio.
Stochastic simulations of debt dynamics
In order to integrate the sensitivity analysis of the trend of the debt-to-GDP ratio in the short term, stochastic simulations were carried out for the 2022-2025 period, which incorporate the historical volatility of the significant variables affecting public finances. The analyses were carried out using the Montecarlo method, applying stochastic shocks to the dynamics of the debt-to-GDP ratio
| 32 | MINISTRY OF ECONOMY AND FINANCE |
IV. SUSTAINABILITY OF PUBLIC FINANCES | |
relative to the baseline scenario underlying this Stability Programme. These shocks are modelled on the basis of the historical volatility of yields (short- and long-term), of the growth rate of nominal GDP and of the primary budget balance and are obtained by running 2000 extractions from a normal distribution with zero mean and a variance-covariance matrix observed starting from the first quarter of 1999.
Given the high volatility in the variables of interest observed from the first quarter of 2020 onwards, this Document presents two methods of simulating shocks. The first method (high-volatility shock scenario) takes into account, for the purposes of constructing the shocks, the volatility of the entire historical series available, including the values observed up to the third quarter of 2021; the second method (limited-volatility shock scenario) does not consider the volatility of the historical series after the first quarter of 2020. In both cases, the simulated shocks are symmetrical and temporary in nature28.
For each forecast year of the macroeconomic framework and for each type of shock scenario, fan charts (Figures IV.2A and IV.2B) show the distribution of the debt-to-GDP ratio.
In the simulation with high-volatility shocks, the debt is distributed around a median value that is equal to approximately 142.3 percent of GDP at the end of the time horizon, 8.2 percentage points higher than the 2019 figure (134.1), but approximately 13 percentage points lower than the 2020 value (155.3). The uncertainty surrounding the 2025 results reflects the variability of the public finance data used to construct the shocks and is therefore extremely high, as shown by a difference of about 58 percentage points between the 10th and 90th percentiles of the resulting projected debt distribution. After the decline in the debt-to-GDP ratio in 2021, which followed the sharp rise registered in 2020, the debt-to-GDP ratio continues to decline in sixty percent of the simulations.
By restricting the magnitude of the shocks to the volatility recorded in the historical series before the start of the pandemic (limited-volatility shock scenario), the results of the analysis are visibly more concentrated around the baseline debt of this Stability Programme (Figure IV.2B). In this case, uncertainty surrounding the 2025 figure is smaller, and there is a difference of about 15 percentage points between the 10th and 90th percentiles of the resulting debt distribution. In this case, in all the scenarios simulated, the dynamics of the debt-to-GDP ratio decreases at the end of the time horizon.
The “non-increasing debt cap”, i.e., the median value of public debt in 2025 that ensures, with a 90 percent probability, that even in adverse cases the debt-to-GDP ratio will not increase compared to the value projected in the policy scenario, is 143.5, 2.1 percentage points higher than the debt-to-GDP ratio projected for 2025.
The stochastic simulation shows that the downward trend in the debt-to-GDP ratio over the next few years would be facilitated by a context of renewed stability. In the event of prolonged instability, the decline in the debt-to-GDP ratio could come to a temporary halt and policies would have to react appropriately, but
________________________
28 For more details on the methodology adopted, see Berti K., (2013), “Stochastic public debt projections using the historical variance-covariance matrix approach for EU countries”, Economic Papers 480 and European Commission, 2020, Debt Sustainability Monitor 2019, Institutional Papers 120, available at: https://ec.europa.eu/info/sites/info/files/economy-finance/ip120_en.pdf.
| MINISTRY OF ECONOMY AND FINANCE | 33 |
| | ITALY’S STABILITY PROGRAMME 2022 |
further analysis in this regard is beyond the scope of the sensitivity and risk analyses carried out in this section.
IV.2 SUSTAINABILITY ANALYSIS OF PUBLIC DEBT
This section focuses on the sustainability of Italian public debt. The first part presents the results of sustainability simulations in the medium term, over a ten-year forecast period, based on the methodology currently adopted by the European Commission. The second part focuses on the long term by constructing projections of debt scenarios up to 2070. Further analyses are carried out with a twofold purpose: on the one hand, the sensitivity of public debt to the main demographic and economic scenarios that influence the behaviour of expenditure variables is verified; on the other hand, alternative scenarios are developed in order to stress the impact of government policies on the sustainability of public finances in the long term.
Medium-term projections of the debt-to-GDP ratio
In this section, the debt-to-GDP ratio is projected until 2033, following a medium-term debt sustainability analysis approach.
In scenario A, until 2025 the macroeconomic and public-finance context coincides entirely with the policy scenario; in the medium term, starting from 2026, growth is aligned with that of potential GDP, projected with the ‘t+10’ methodology developed by the Output Gap Working Group. The structural primary balance is equal to the value projected for 2025 adjusted for the change in revenues associated with the general government‘s Property Income (PI), obtained according to the methodology illustrated in the European Commission’s Ageing Report of 2021, and for Age Related Expenditures (ARE), estimated by the Italian General
| 34 | MINISTRY OF ECONOMY AND FINANCE |
IV. SUSTAINABILITY OF PUBLIC FINANCES | |
Accounting Office (Ragioneria Generale dello Stato)29. Finally, annual interests are calculated using the SAPE model of the Treasury Department, assuming, as a starting point, the composition and maturity structure of the underlying debt stock in the last forecast year (2025).
In scenario B, the macroeconomic framework and the structure of interest rates coincide with scenario A, while the nominal deficit-to-GDP ratio gradually improves in the years after 2025 due to changes in the primary balance, reaching a structural balance in 2033. The additional fiscal correction (with respect to scenario A) implies a feedback effect on real GDP in line with the methodology of the European Commission applied in the 2020 Debt Sustainability Monitor.
One should bear in mind that the assessment in terms of medium-term economic growth for scenarios A and B is conservative, as the economic effects of the vast investment and reform programme launched with the NRRP are not fully taken into account. First of all, the medium-term projection does not consider the effects of the further investments planned for 2026, since the policy framework stops at 2025; moreover, in line with the approach followed by the European Commission, the overall impact of structural reforms on the economy, which is potentially very significant, is not considered.
Scenario C takes into account the growth differential that would be obtained should the effects of the reforms undertaken, estimated through the Quest DSGE model used by Directorate I of the Italian Department of the Treasury30, be fully realised. The growth path varies as early as 2022 and it is assumed that the higher growth, being related to structural factors, is fully transferred to potential GDP. Revenue and expenditure levels are assumed equal to those of scenario A; as a result of higher growth, the ratio of the primary balance to GDP improves slightly over the planning horizon, while from 2026 it is assumed to be in line with the approach followed in scenario A, i.e., the structural primary balance to GDP remains constant at the level of 2025 (net of age-related expenditures). As in scenario B, interest rates are assumed to be equal to those of scenario A.
Figure IV.3 shows the evolution of the debt-to-GDP ratio in the three simulated scenarios. In scenario A, which does not envisage any fiscal correction beyond 2025 nor a full evaluation of the impact of the reforms, the debt-to-GDP ratio declines until 2026, before rising again to 150 percent in 2033.
In scenario B, the additional fiscal adjustment beginning in 2026 produces a downward path until 2033, when the figure reaches 130.4 percent. In scenario C, the full implementation of the reforms improves the macroeconomic framework, leading to a decline in the debt-to-GDP ratio compared to scenario A over the entire simulation period. However, the debt-to-GDP ratio rises in the final years of the decade to reach 137.5 percent in 2033.
________________________
29 These expenditures are calculated starting from the baseline macroeconomic framework underlying this document. For methodological details, see: “Le tendenze di medio-lungo periodo del sistema pensistico e socio-sanitario - Rapporto n. 22” (Medium- to long-term trends in the pension and social-health system - Report 22), drafted by the Italian General Accounting Office, available at: http://www.rgs.mef.gov.it/VERSIONE-I/attivita_istituzionali/monitoraggio/spesa_pensionistica/.
30 The National Reform Programme reviews in Chapter II and in a dedicated appendix the estimates of the effect of the expenditure measures and economic reforms contained in the National Recovery and Resilience Plan.
| MINISTRY OF ECONOMY AND FINANCE | 35 |
| | ITALY’S STABILITY PROGRAMME 2022 |
The upward trend of the debt-to-GDP ratio in scenario A is mainly linked to two factors, which respectively lead to a deterioration of the primary balance and interest expenditure. On the one hand, the projection includes an increase in ageing costs, while on the other hand, the current projections of forward rates, which reflect market expectations, imply an increase in the implicit rate paid on government debt securities from 2026 onwards.
Scenarios B and C are useful to demonstrate how, in the medium term, the full implementation of reforms and an additional fiscal effort can ensure a sustainable dynamic of the debt-to-GDP ratio. The two scenarios are simulated separately, but considering that the reforms in the coming years are likely to lead to a higher growth profile than that underlying scenario A, one can imagine that a satisfactory pace of debt reduction can be achieved even in a scenario where fiscal adjustments are slightly more gradual than in scenario B.
Long-term scenarios
This section focuses on describing the trends in the main expenditure items that are sensitive to population ageing and which influence public debt performance over the long-term.
Assumptions underlying the forecast
The estimates here presented follow the methodology and assumptions agreed within the European Economic Policy Committee-Working Group on Ageing and
| 36 | MINISTRY OF ECONOMY AND FINANCE |
IV. SUSTAINABILITY OF PUBLIC FINANCES | |
defined for the purpose of forecasting the age-related public expenditure components of the 2021 forecasting round31.
In the short term, the projections include national accounts data updated to 2021 and the baseline macroeconomic framework of this Document. In the long term, the EPC-WGA baseline scenario is used. Starting from the last year of the Stability Programme 2022 forecast, some adjustments have been made to link the data of the short-term macroeconomic framework to the medium/long-term structural values defined in the 2021 EPC-WGA baseline scenario32. Please note that the demographic assumptions adopted are based on the Eurostat central forecast with a 2019 baseline33, while the structural dynamics of the variables of the macroeconomic framework follow the assumptions agreed within the EPC WGA (hereinafter referred to as the 2021 EPC-WGA baseline scenario)34.
The age-related public expenditure forecasts shown in Table V.11 of the Appendix are updated according to the baseline scenario under existing legislation. Overall, the long-term scenario summarised in the table is characterised by high and rising levels of net indebtedness of the general government in relation to GDP, while revenues are assumed to be constant in relation to GDP. This would result in a sharp increase in general government debt and interest expenditure. The analysis therefore highlights the need to promote higher productivity, employment rate and population growth levels than those assumed in the projection and/or to raise the revenue-to-GDP ratio - issues that are analysed in the next section.
Long-term debt dynamics and indicators of fiscal sustainability
The scenarios for long-term debt dynamics presented in this section include the age-related expenditure projections modulated on the basis of demographic trends and presented in the previous section. In the projection model, economic growth is aligned with potential GDP; for baseline scenario A, the primary balance as a ratio of GDP is kept at the value projected for 2026 in the policy scenario except for the
________________________
31 For a description of the European methodology see European Commission, the 2021 Ageing Report: Underlying Assumptions and Projection Methodologies, Institutional Paper 142, November 2020.
32 In detail, for the four-year period 2022-2025, growth assumptions have been adopted, both at constant and current prices, of the short-term baseline macroeconomic framework defined for the 2022 Stability Programme. For the following period, the structural assumptions of the 2021 EPC-WGA baseline scenario have been adopted.
33 The Eurostat scenario with a 2019 baseline implies for Italy: i) a net flow of immigrants of approximately 213,000 units per year on average, increasing until 2025 and decreasing thereafter; ii) a level of life expectancy in 2070 equal to 87 years for men and 90.9 years for women; iii) a total fertility rate in 2070 equal to 1.52. ISTAT, taking into account the findings of the Permanent Census, significantly revised downward the number of residents in Italy for 2019 and 2020, mainly affecting the 15-74 age bracket. Moreover, based on the Monthly Demographic Report, ISTAT has recently updated the total population figure to 1 January 2022 (https://www.istat.it/it/files//2022/03/Dinamica-demografica_2021.pdf). Compared to the population level estimated at 1 January 2022 by Eurostat in its 2019-based demographic forecasts, the new data show a reduction of about 1,193,000 people. Taking into account these recent findings, the forecast of age-related expenditures as a share of GDP was carried out using the age reconstruction of the resident population as of 1 January 2022.
34 The structural dynamics of the variables of the macroeconomic framework, as derived from the assumptions agreed within the EPC WGA (2021 EPC-WGA baseline scenario), envisage an average annual rate of change of real productivity growing until 2038, when it reaches a value of around 1.7 percent, before falling to around 1.5 percent at the end of the forecast period. The employment rate in the 15-64 age group is expected to increase from 59.5 percent in 2022 to 64.9 percent in 2070. The interplay of the above assumptions with the demographic dynamics results in a real GDP growth rate of around 1.2 percent on average per year over the 2022¬2070 period.
| MINISTRY OF ECONOMY AND FINANCE | 37 |
| | ITALY’S STABILITY PROGRAMME 2022 |
age-related expenditure component and, in the case of revenues, for the change in property income. Debt interest expenses are calculated according to the methodology used by the European Commission in its DSA analysis35, which takes into account market interest in the short and medium term on long and short-term debt issues, and then converges to long-term values. The projections of the debt-to-GDP ratio coincide until 2033 with those produced by scenario A in the medium-term sustainability section. In this section, the main reference scenario, also called scenario A, covers the period up to 2070.
As shown in Figure IV.4, the long-term projections show a declining dynamic at first, which increases again in the final period of the simulation.
Note that the dynamic of public debt in the long run is very sensitive to the value of the primary balance in relation to the initial GDP used in the simulation. A better value can lead to very different dynamics, as shown for illustrative purposes by the second scenario considered here.
The paragraph devoted to the medium-term sustainability analysis showed a debt-to-GDP ratio profile in a context in which the budget balance gradually converged to a balanced position in structural terms (simulation B). When extending the simulation beyond the medium-term horizon (from 2034), it is assumed that, as the debt-to-GDP ratio declines significantly over the long term, the new medium-term objective (MTO) is recalculated, converging to -1 percent of GDP, with the primary balance moving accordingly. As expected, the evolution of the debt-to-GDP ratio is significantly different, and it tends to decline rapidly36. The other relevant
________________________
35 See Annex A6.2. Projecting the implicit interest rate on government debt, of the European Commission publication, Debt Sustainability Monitor 2020, Institutional Paper 143, February 2021.
36 Actually, achieving a balanced budgetary position in the medium term, without further intervention on the primary balance, would imply reaching a negative debt level at the end of the simulation period; the threshold
| 38 | MINISTRY OF ECONOMY AND FINANCE |
IV. SUSTAINABILITY OF PUBLIC FINANCES | |
dimension in the long-term projections concerns, obviously, the relative behaviour (or deviation) of the nominal GDP growth rate and the implicit interest rate paid on the public debt; this aspect is addressed through an alternative simulation within the sensitivity analysis37.
Policy impact on debt sustainability
Given the high uncertainty in long-term forecasts, the robustness of the debt-to-GDP ratio projection of the baseline scenario can be assessed by carrying out sensitivity analyses38.
Sensitivity simulations reveal, in particular, risk elements that may have an adverse impact on debt sustainability in the long-term but, at the same time, they are useful in identifying areas of intervention where policy action could have an impact. This section shows some examples of the favourable effects that policies undertaken may have on the debt-to-GDP ratio in the long-term.
Structural reforms
The first analysis concerns the impact of the structural reforms contained in the NRRP and is based on the results relative to debt sustainability in the medium term. Simulation C, which includes the effects of the reforms on GDP estimated through the QUEST model, is appropriately extended to 2070, the last year of the simulation. The increase over the baseline simulation A is equal to the total effect of the reforms on GDP estimated in the long term, amounting to 13.4 percentage points of GDP in 2070. The simulation shows that the reforms will have a significant impact on sustainability - the debt-to-GDP ratio at the end of the period is reduced by about 37 percentage points - even without considering the effects on revenues of the stronger growth, as explained in the section on the medium-term period.
________________________
of 60 percent is reached in 2056 and the debt becomes negative in 2069. In the case of simulation B shown here, considering that the level of the Medium-Term Objective is generally recalculated and revised when debt dynamics improve, the primary balance is deteriorated starting in 2040 so as to reach a deficit of 1 percent of GDP in 10 years, the most favourable threshold allowed by the rules of the Stability and Growth Pact.
37 The reference scenario, over time, presents these values:
| | 2011-2020 | 2021-2030 | 2031-2040 | 2041-2050 | 2051-2060 | 2061-2070 |
| Normal growth | -0.12 | 3.8 | 2.7 | 3.3 | 3.5 | 3.4 |
| Implicit interest rate | 3.2 | 2.3 | 2.7 | 3.2 | 3.7 | 3.8 |
38 The extended version (in Italian) of the Stability Programme contains a number of alternative scenarios that measure the response of the debt-to-GDP ratio to demographic and macroeconomic shocks following the approach usually adopted by the European Commission in its Ageing Reports. See: European Commission (2021), The 2021 Ageing Report: Economic and Budgetary Projections for the EU Member States (2019-2070), European Economy, Institutional Paper 148 (see https://ec.europa.eu/info/publications/2021-ageing-report-economic-and-budgetary-projections-eu-member-states-2019-2070_en ).
| MINISTRY OF ECONOMY AND FINANCE | 39 |
| | ITALY’S STABILITY PROGRAMME 2022 |
The fight against tax evasion
The policy scenario surrounding the fiscal policy guidelines for the next three years is mainly characterised by the implementation of the NRRP. In particular, the Mission 1 - Component 1 of the NRRP, in Axis 5 concerning ‘Structural Budgetary Measures - Taxation and Public Expenditure’, includes a series of reforms that, in terms of revenues, are aimed at improving the tax collection system, encouraging tax compliance, and combating tax evasion in order to reduce the burden on taxpayers and increase public budget revenues, thus contributing to improving the sustainability of public finances.
In the framework of this overall strategy, Reform 1.12, “Tax Administration Reform”, related to Axis 5, envisages that several measures shall be adopted to encourage tax compliance and improve the effectiveness of targeted audits and controls39; furthermore, to implement these reforms and increase the operational capacity of the Financial Administration, the personnel of the Revenue Agency shall be increased.
Therefore, the “Tax Gap Reduction” was included among the quantitative targets monitored throughout the implementation phase of the NRRP, as part of the measures related to the “Tax Administration Reform”. The target value of the indicator envisages that the “propensity to evade” calculated for all taxes, excluding
________________________
39 The planned measures include: (i) the creation of the dedicated database and IT infrastructure for issuing the pre-filled VAT return; (ii) the quality improvement of the database for voluntary compliance communications (so-called ‘compliance letters’), also with a view to reducing the incidence of false positives by gradually increasing the number of communications sent to taxpayers; (iii) the reform of the current legislation to ensure effective administrative sanctions against private businesses rejecting electronic payment; (iv) the finalisation of the process of pseudonymisation and big data analysis in order to make risk analysis and the selection of taxpayers to be audited more effective. For a brief description of the ongoing tax reform, see Chapter III of the NRRP, Paragraph ‘A fairer and more effective tax system’ and the references contained therein.
| 40 | MINISTRY OF ECONOMY AND FINANCE |
IV. SUSTAINABILITY OF PUBLIC FINANCES | |
property taxes and excise duties, should be reduced by 15 percent in 2024 compared to 2019 (Mission 1, Component 1 of the NRRP, M1C1-121). As evidence of the tax administration’s ability to increase tax compliance, this indicator has already been affected by a very significant decline in the two years prior to 2019 (from 21.2 percent to 18.5 percent). The quantitative target envisages that the propensity to evade tax - also as a result of the measures taken - shall be further reduced to at least 15.8 percent by 2024, with an intermediate target for 2023. In other words, the reforms envisaged in the NRRP should be able to reduce tax evasion by approximately 12 billion, or 0.67 percent of GDP, in 2024 with respect to 2019.
The proposed long-term simulation assumes a permanent improvement over the baseline of the budget balance by the same amount to illustrate the potential impact on long-term debt. It is clear that the simulation is for illustrative purposes and that the improvement does not necessarily have to result in a permanent increase in revenue; it is possible, for example, that the increased revenue is used to reduce distortive taxation with beneficial long-term effects on growth; the end result would still be a reduction in the debt-to-GDP ratio.
Pension expenditure
The last set of simulations reflects, in terms of different trends in the debt-to-GDP ratio, the impact of the pension reforms implemented over40. All the measures adopted over time, culminating in the 2011 reforms, with the final transition to the contribution-based system, have contributed to significantly strengthen the sustainability of the public debt.
________________________
40 The reforms are commented in the Focus “Le tendenze di medio-lungo periodo del sistema pensionistico italiano”, available on the italian version of the Document, pg. 104-109.
| MINISTRY OF ECONOMY AND FINANCE | 41 |
| | ITALY’S STABILITY PROGRAMME 2022 |
| 42 | MINISTRY OF ECONOMY AND FINANCE |
| TABLE V.1: MACROECONOMIC FORECAST |
| | 2021 | 2021 | 2022 | 2023 | 2024 | 2025 |
| | Level (1) | % var. | % var. | % var. | % var. | % var. |
| Real GDP | 1,677,568 | 6.6 | 3.1 | 2.4 | 1.8 | 1.5 |
| Nominal GDP | 1,775,436 | 7.2 | 6.3 | 4.6 | 3.7 | 3.//3 |
| COMPONENTS OF REAL GDP | | | | | | |
| Private consumption expenditure (2) | 984,117 | 5.2 | 3.0 | 2.1 | 1.6 | 1.6 |
| Government consumption expenditure (3) | 320,512 | 0.6 | 2.3 | 0.3 | 0.6 | 0.2 |
| Gross fixed capital formation | 334,086 | 17.0 | 7.3 | 5.5 | 4.0 | 2.2 |
| Changes in inventories (% of GDP) | | 0.3 | -0.2 | 0.1 | 0.0 | 0.0 |
| Exports of goods and services | 537,573 | 13.3 | 4.4 | 3.4 | 3.1 | 2.9 |
| Imports of goods and services | 502,575 | 14.2 | 5.4 | 4.0 | 3.3 | 2.9 |
| CONTRIBUTION TO REAL GDP GROWTH | | | | | | |
| Final domestic demand | | 6.3 | 3.5 | 2.5 | 1.9 | 1.5 |
| Changes in inventories | | 0.3 | -0.2 | 0.1 | 0.0 | 0.0 |
| External balance of goods and services | | 0.0 | -0.2 | -0.1 | 0.0 | 0.1 |
| (1) Millions. |
| (2) Final consumption spending of households and non-profit private social institutions serving households (NPISH). |
| (3) Public administrations. |
| Discrepancies, if any, are due to rounding. |
| TABLE V.2: PRICE DEVELOPMENTS |
| | 2021 | 2021 | 2022 | 2023 | 2024 | 2025 |
| | Level | % var. | % var. | % var. | % var. | % var. |
| GDP deflator | 105.8 | 0.5 | 3.0 | 2.2 | 1.9 | 1.8 |
| Private consumption deflator | 104.2 | 1.7 | 5.8 | 2.1 | 1.8 | 1.8 |
| HICP | 105.0 | 1.9 | 5.8 | 2.1 | 1.8 | 1.8 |
| Public consumption deflator | 109.7 | 1.6 | 4.3 | -0.8 | -1.1 | 0.1 |
| Investment deflator | 105.8 | 2.2 | 2.9 | 2.0 | 1.5 | 1.6 |
| Export price deflator (goods and services) | 108.1 | 4.9 | 4.9 | 1.3 | 1.2 | 1.1 |
| Import price deflator (goods and services) | 107.1 | 9.9 | 7.6 | 1.4 | 1.2 | 1.1 |
| TABLE V.3: LABOUR MARKET DEVELOPMENTS |
| | 2021 | 2021 | 2022 | 2023 | 2024 | 2025 |
| | Level (1) | % var. | % var. | % var. | % var. | % var. |
| Employment, persons | 25,125 | 0.6 | 1.3 | 1.7 | 1.3 | 1.1 |
| Employment, hours worked | 41,920,103 | 8.0 | 2.7 | 2.3 | 1.6 | 1.3 |
| Unemployment rate (%) | | 9.5 | 8.6 | 8.1 | 8.0 | 7.9 |
| Labour productivity, persons | 66,769 | 6.0 | 1.8 | 0.7 | 0.5 | 0.5 |
| Labour productivity, hours worked | 40 | -1.3 | 0.5 | 0.1 | 0.2 | 0.2 |
| Compensation of employees | 724,629 | 7.7 | 5.6 | 4.0 | 3.0 | 3.1 |
| Compensation per employee | 43,338 | 0.3 | 2.7 | 1.7 | 1.4 | 1.8 |
(1) Units of measurement: thousands of units for employed in national accounts and total hours worked; euro at constant values for labour productivity; euro millions at current values for compensation of employees and euro for compensation per employee (i.e., labour cost). |
| MINISTRY OF ECONOMY AND FINANCE | 43 |
| | ITALY’S STABILITY PROGRAMME 2022 |
| TABLE V.4: SECTORAL BALANCES |
| | 2021 | 2022 | 2023 | 2024 | 2025 |
| | % GDP | % GDP | % GDP | % GDP | % GDP |
| Net lending/borrowing vis-a-vis the rest of the world | 2.4 | 1.6 | 1.5 | 1.5 | 1.6 |
| - Balance on goods and services | 2.4 | 1.4 | 1.2 | 1.1 | 1.2 |
| - Balance of primary incomes and transfers | 0.4 | 0.4 | 0.4 | 0.3 | 0.3 |
| - Capital account | -0.1 | -0.1 | -0.1 | 0.0 | 0.1 |
| Net lending/borrowing of the private sector | 9.6 | 7.2 | 5.4 | 4.8 | 4.4 |
| Net lending/borrowing of general government | -7.2 | -5.6 | -3.9 | -3.3 | -2.8 |
| TABLE V.5: GENERAL GOVERNMENT BUDGETARY PROSPECTS (1) |
| | 2021 | 2022 | 2023 | 2024 | 2025 |
| | Level (2) | % of GDP | % of GDP |
| Net lending (EDP B.9) by sub-sector | | | | | |
| 1. General government | -128,327 | -7.2 | -5.6 | -3.9 | -3.3 | -2.8 |
| Difference between policy scenario and baseline scenario (3) | | | -0.5 | -0.2 | -0.1 | -0.1 |
| 2. Central government | -128,540 | -7.2 | -5.1 | -3.7 | -3.2 | -2.8 |
| 3. State government | | | | | | |
| 4. Local government | 585 | 0.0 | 0.0 | -0.1 | -0.1 | -0.1 |
| 5. Social security funds | -372 | 0.0 | 0.0 | 0.1 | 0.1 | 0.1 |
| General government | | | | | |
| 6. Total revenue | 857,634 | 48.3 | 48.5 | 48.8 | 47.3 | 46.9 |
| 7. Total expenditure | 985,961 | 55.5 | 53.6 | 52.5 | 50.5 | 49.6 |
| 8. Net lending/borrowing | -128,327 | -7.2 | -5.1 | -3.7 | -3.2 | -2.7 |
| 9. Interest expenditure | 62,863 | 3.5 | 3.5 | 3.1 | 3.0 | 3.0 |
| 10. Primary balance | -65,464 | -3.7 | -1.6 | -0.6 | -0.2 | 0.2 |
| 11. One-off and other temporary measures (4) | 7,213 | 0.4 | 0.7 | 0.3 | 0.1 | 0.1 |
| Selected components of revenue | | | | | |
| 12. Total taxes | 527,050 | 29.7 | 29.1 | 28.8 | 28.4 | 28.4 |
| 12a. Taxes on production and imports | 258,308 | 14.5 | 14.5 | 14.7 | 14.6 | 14.5 |
| 12b Current taxes on income, wealth, etc | 267,140 | 15.0 | 14.4 | 14.0 | 13.7 | 13.7 |
| 12c. Capital taxes | 1,602 | 0.1 | 0.3 | 0.1 | 0.1 | 0.1 |
| 13. Social contributions | 245,025 | 13.8 | 14.0 | 14.0 | 13.9 | 13.8 |
| 14. Property income | 17,036 | 1.0 | 0.8 | 0.8 | 0.8 | 0.8 |
| 15. Other | 68,523 | 3.9 | 4.6 | 5.2 | 4.2 | 3.9 |
| 15a. Other current revenues | 62,892 | 3.5 | 3.8 | 4.0 | 3.7 | 3.4 |
| 5b. Other capital revenues | 5,631 | 0.3 | 0.7 | 1.2 | 0.5 | 0.5 |
| 16. Total revenue | 857,634 | 48.3 | 48.5 | 48.8 | 47.3 | 46.9 |
| p.m.: Tax burden | | 43.5 | 43.1 | 42.8 | 42.3 | 42.2 |
| Selected components of expenditure | | | | | |
| 17. Compensation of employees + intermediate consumption | 286,747 | 16.2 | 16.2 | 15.4 | 14.7 | 14.3 |
| 17a. Compensation of employees | 176,309 | 9.9 | 10.0 | 9.5 | 9.1 | 8.8 |
| 17b. Intermediate consumption | 110,438 | 6.2 | 6.1 | 5.9 | 5.6 | 5.4 |
| 18. Social payments | 446,252 | 25.1 | 23.8 | 24.1 | 23.8 | 23.5 |
| of which: Unemployment benefits | 19,579 | 1.1 | 0.9 | 0.8 | 0.8 | 0.8 |
| 18a. Social transfers in kind supplied via market producers | 47,060 | 2.7 | 2.5 | 2.4 | 2.3 | 2.3 |
| 18b. Social transfers other than in kind | 399,192 | 22.5 | 21.3 | 21.7 | 21.4 | 21.2 |
| 19. Interest expenditure | 62,863 | 3.5 | 3.5 | 3.1 | 3.0 | 3.0 |
| 20. Subsidies | 35,756 | 2.0 | 2.4 | 2.1 | 1.9 | 1.9 |
| 21. Gross fixed capital formation | 50,709 | 2.9 | 3.1 | 3.6 | 3.5 | 3.6 |
| 22. Capital transfers | 55,096 | 3.1 | 2.0 | 1.7 | 1.1 | 1.1 |
| 23. Other | 48,538 | 2.7 | 2.6 | 2.5 | 2.4 | 2.4 |
| 23a. Other current expenditure | 47,511 | 2.7 | 2.6 | 2.5 | 2.4 | 2.3 |
| 23b. Other capital expenditure | 1,027 | 0.1 | 0.1 | 0.1 | 0.1 | 0.1 |
| 24. Total expenditure | 985,961 | 55.5 | 53.6 | 52.5 | 50.5 | 49.6 |
| Current primary expenditure | 816,266 | 46.0 | 45.0 | 44.1 | 42.8 | 42.0 |
| Total primary expenditure | 923,098 | 52.0 | 50.1 | 49.4 | 47.5 | 46.6 |
(1) The first line shows values under policy scenario; the other values show baseline estimates under existing legislation. Discrepancies, if any, are due to rounding. (2) Values in millions. (3) The difference is due to the effect of the decree law announced by the Government. (4) The positive sign indicates one-off measures to reduce the deficit |
| 44 | MINISTRY OF ECONOMY AND FINANCE |
| TABLE V.6: SCENARIO UNDER UNCHANGED POLICIES (1) |
| | 2021 | 2022 | 2023 | 2024 | 2025 |
| | Level (2) | % of GDP | % of GDP |
| Total revenue at unchanged policies | 857,634 | 48.3 | 48.5 | 48.9 | 47.4 | 47.0 |
| Total expenditure at unchanged policies | 985,961 | 55.5 | 53.6 | 52.8 | 50.8 | 50.0 |
| Detailed items of expenditure | | | | | | |
| Current expenditure | 879,129 | 49.5 | 48.5 | 47.5 | 46.1 | 45.2 |
| Of which: | | | | | | |
| Compensation of employees | 176,309 | 9.9 | 10.0 | 9.7 | 9.3 | 9.0 |
| Intermediate consumption | 157,498 | 8.9 | 8.6 | 8.4 | 8.0 | 7.7 |
| Capital expenditure | 106,832 | 6.0 | 5.1 | 5.3 | 4.7 | 4.8 |
| Of which: | | | | | | |
| Gross fixed capital formation | 50,709 | 2.9 | 3.1 | 3.6 | 3.6 | 3.7 |
| Investment grants | 20,829 | 1.2 | 1.3 | 1.3 | 0.9 | 0.9 |
(1) The table shows the impact of the refinancing of some measures that may be implemented in consideration of international commitments and legislative factors. (2) Values in millions. |
| TABLE V.7: EXPENDITURE TO BE EXCLUDED FROM THE EXPENDITURE RULE |
| | 2021 | 2022 | 2023 | 2024 | 2025 |
| | Level (1) | % of GDP | % of GDP |
| Expenditure on EU programs fully matched byEU funds revenue (2) | 4,093.0 | 0.2 | 1.1 | 1.8 | 0.8 | 0.6 |
| Of which investment expenditure fully matched by EU funds revenue (3) | 2,076.2 | 0.1 | 0.3 | 0.6 | 0.4 | 0.4 |
| Cyclical unemployment benefit expenditure (4) | 202.6 | 0.0 | 0.0 | -0.1 | -0.1 | -0.1 |
| Effect of discretionary revenue measures (5) | -9,395.4 | -0.5 | -0.6 | 0.1 | -0.4 | 0.8 |
| Revenues in-creased mandated by law | 0.0 | 0.0 | 0.0 | 0.0 | 0.0 | 0.0 |
(1) Values in millions. (2) The estimates include Next Generation EU grants for 0.1 percent of GDP for 2021, 1.0 percent for 2022, 1.7 percent for 2023 and 0.8 percent for 2024. (3) The estimates include Next Generation EU grants for 0.2 percent of GDP for 2022, 0.5 percent for 2023, 0.3 percent for 2024 and 0.3 percent for 2025. (4) The cyclical expenditure component for unemployment benefits was calculated using the methodology currently used by the European Commission, based on the unemployment gap. (5) Discretionary contribution revenue is included. |
| MINISTRY OF ECONOMY AND FINANCE | 45 |
| | ITALY’S STABILITY PROGRAMME 2022 |
| TABLE V.8: PUBLIC DEBT DETERMINANTS (percentage of GDP) (1) |
| | 2021 | 2022 | 2023 | 2024 | 2025 |
| Gross debt (2) | 150.8 | 147.0 | 145.2 | 143.4 | 141.4 |
| Change in gross debt ratio | -4.4 | -3.8 | -1.9 | -1.8 | -2.0 |
| Contributions to changes in gross debt: | | | | | |
| | | | | | |
| Primary balance | 3.7 | 2.1 | 0.8 | 0.3 | -0.2 |
| Snow-ball effect | -6.8 | -5.4 | -3.4 | -2.2 | -1.6 |
| Of which: Interest expenditure | 3.5 | 3.5 | 3.1 | 3.0 | 3.0 |
| | | | | | |
| Stock-flow adjustment | -1.3 | -0.5 | 0.7 | 0.1 | -0.2 |
| of which: Differences between cash and accruals | -1.1 | -1.4 | 0.0 | -0.4 | -0.5 |
| Net accumulation of financial assets (3) | 0.0 | 1.0 | 0.6 | 0.5 | 0.4 |
| of which Privatisation proceeds | 0.0 | 0.0 | 0.0 | 0.0 | 0.0 |
| Valuation effects | -0.5 | 0.2 | 0.2 | 0.1 | 0.1 |
| Others (4) | 0.3 | -0.2 | -0.1 | -0.1 | -0.1 |
| p.m.: Implicit interest rate on debt | 2.4 | 2.5 | 2.2 | 2.1 | 2.2 |
(1) Discrepancies, if any, are due to rounding. (2) Value gross of Italy's share of loans to EMU Member States, either bilaterally or through the EFSF, and of the contribution to the capital of the ESM. At the end of 2021, the amount of these shares was approximately 57.3 billion, of which 43.0 billion for bilateral loans and through the EFSF and 14.3 billion for the ESM Programme (see Bank of Italy, 'Statistical Bulletin of Public Finances, Borrowing Requirement and Debt, March 2022'). The MEF's liquidity stock is assumed to be reduced of about -0.2 percent of GDP in 2022 and -0.1 percent of GDP in each following year, with the objective to bring the stock back to the level of end 2019. In addition, the estimates take into account the repurchase of SACE, the use of ‘Patrimonio destinato’, and the EIB and SURE guarantees. The interest rate scenario used for the estimates is based on the implicit forecasts derived from the forward rates on Italian government bonds for the period in which this Document was compiled. (3) Includes the effects of contributions for GLF and the ESM Programme. (4) The item 'Other', residual compared to the preceding items, includes changes in MEF’s liquidity stock; statistical discrepancies; Eurostat reclassifications; contributions in support of the Euro Area envisaged by the EFSF Programme. |
| TABLE V.9: CYCLICALLY ADJUSTED PUBLIC FINANCES (as percentage of GDP) |
| | 2019 | 2020 | 2021 | 2022 | 2023 | 2024 | 2025 |
| 1. Real GDP growth | 0.5 | -9.0 | 6.6 | 3.1 | 2.4 | 1.8 | 1.5 |
| 2. Net Lending of general government | -1.6 | -9.6 | -7.2 | -5.6 | -3.9 | -3.3 | -2.8 |
| 3. Interest expenditure | 3.4 | 3.5 | 3.5 | 3.5 | 3.1 | 3.0 | 3.0 |
| 4. One-off and other temporary measures (2) | 0.1 | 0.1 | 0.4 | 0.7 | 0.3 | 0.1 | 0.1 |
Of which one-offs on the revenue side: general government | 0.1 | 0.2 | 0.4 | 0.6 | 0.3 | 0.1 | 0.0 |
Of which one-offs on the expenditure side: general government | -0.1 | -0.1 | 0.0 | 0.1 | 0.0 | 0.0 | 0.0 |
| 5. Potential GDP growth (%) | -0.1 | 0.1 | 0.3 | 1.0 | 1.2 | 1.3 | 1.3 |
| Contributions: | | | | | | | |
| Labour | -0.5 | -0.1 | -0.1 | 0.3 | 0.5 | 0.5 | 0.5 |
| Capital | 0.0 | -0.1 | 0.1 | 0.3 | 0.4 | 0.4 | 0.5 |
| Total Factor Productivity | 0.4 | 0.4 | 0.3 | 0.3 | 0.3 | 0.3 | 0.3 |
| 6. Output gap | 0.6 | -8.6 | -2.8 | -0.7 | 0.5 | 1.1 | 1.3 |
| 7. Cyclical budgetary component | 0.4 | -4.7 | -1.5 | -0.4 | 0.3 | 0.6 | 0.7 |
| 8. Cyclically adjusted balance | -1.9 | -4.9 | -5.7 | -5.2 | -4.2 | -3.9 | -3.5 |
| 9. Cyclically adjusted primary balance | 1.4 | -1.5 | -2.2 | -1.7 | -1.1 | -0.9 | -0.5 |
| 10. Structural balance (3) | -2.0 | -5.0 | -6.1 | -5.9 | -4.5 | -4.0 | -3.6 |
| 11. Structural primary surplus (3) | 1.3 | -1.5 | -2.6 | -2.4 | -1.4 | -1.0 | -0.6 |
| 12. Change in structural budget balance | 0.3 | -3.0 | -1.1 | 0.2 | 1.4 | 0.5 | 0.4 |
| 13. Change in structural primary surplus | 0.0 | -2.9 | -1.0 | 0.1 | 1.0 | 0.4 | 0.4 |
(1) Discrepancies, if any, are due to rounding. (2) The positive sign indicates one-off measures to reduce the deficit. (3) Cyclically adjusted net of one-off and other temporary measures. |
| 46 | MINISTRY OF ECONOMY AND FINANCE |
| TABLE V.10: DIFFERENCES COMPARED TO THE PREVIOUS STABILITY PROGRAMME (1) |
| | 2021 | 2022 | 2023 | 2024 |
| REAL GDP GROWTH (%) | | | | |
| Previous update (SP 2021) | 4.5 | 4.8 | 2.6 | 1.8 |
| Current update (SP 2022) | 6.6 | 3.1 | 2.4 | 1.8 |
| Difference | 2.1 | -1.7 | -0.2 | 0.0 |
| GENERAL GOVERNMENT NET LENDING (% of GDP) | | | | |
| Previous update (SP 2021) | -11.8 | -5.9 | -4.3 | -3.4 |
| Current update (SP 2022) | -7.2 | -5.6 | -3.9 | -3.3 |
| Difference | 4.6 | 0.3 | 0.3 | 0.1 |
| GENERAL GOVERNMENT GROSS DEBT (% of GDP) | | | | |
| Previous update (SP 2021) | 159.8 | 156.3 | 155.0 | 152.7 |
| Current update (SP 2022) | 150.8 | 147.0 | 145.2 | 143.4 |
| Difference | -9.0 | -9.2 | -9.8 | -9.3 |
| (1) Discrepancies, if any, are due to rounding. | | | | |
| MINISTRY OF ECONOMY AND FINANCE | 47 |
| | ITALY’S STABILITY PROGRAMME 2022 |
| TABLE V.11: PUBLIC EXPENDITURE FORECASTS FOR PENSIONS, HEALTHCARE, LONG-TERM CARE AND EDUCATION (% OF GDP) (1) |
| | 2010 | 2015 | 2020 | 2025 | 2030 | 2035 | 2040 | 2045 | 2050 | 2055 | 2060 | 2065 | 2070 |
| Total expenditure | 49.7 | 50.3 | 57.0 | 49.5 | 50.8 | 52.1 | 53.0 | 53.7 | 53.8 | 53.6 | 53.2 | 52.9 | 53.0 |
| Of which: | | | | | | | | | | | | | |
| Age-related expenditures | 26.6 | 26.9 | 29.6 | 26.7 | 27.6 | 28.5 | 28.8 | 28.7 | 28.0 | 27.0 | 26.2 | 25.6 | 25.5 |
| Pension expenditure (2) (3) | 14.7 | 15.6 | 17.0 | 16.1 | 16.7 | 17.4 | 17.3 | 16.8 | 15.8 | 14.6 | 13.7 | 13.3 | 13.3 |
| Health care (2) (4) | 6.9 | 6.6 | 7.4 | 6.2 | 6.4 | 6.7 | 6.9 | 7.1 | 7.3 | 7.4 | 7.4 | 7.4 | 7.3 |
| Long-term care (this was earlier included in the health care) | 0.7 | 0.7 | 0.8 | 0.7 | 0.7 | 0.7 | 0.8 | 0.9 | 0.9 | 1.0 | 1.0 | 1.0 | 1.0 |
| LTC - socio-assistance comp. (2) (4) | 1.1 | 1.1 | 1.2 | 1.0 | 1.0 | 1.1 | 1.2 | 1.2 | 1.4 | 1.5 | 1.5 | 1.5 | 1.5 |
| Education expenditure (5) | 3.9 | 3.6 | 4.0 | 3.5 | 3.4 | 3.4 | 3.4 | 3.5 | 3.6 | 3.6 | 3.5 | 3.5 | 3.4 |
| Interest expenditure | 4.3 | 4.1 | 3.5 | 3.0 | 3.4 | 3.9 | 4.5 | 5.3 | 6.1 | 6.8 | 7.3 | 7.5 | 7.8 |
| Total revenue | 45.5 | 47.8 | 47.4 | 46.6 | 46.6 | 46.6 | 46.6 | 46.6 | 46.6 | 46.6 | 46.6 | 46.6 | 46.6 |
| Of which: property income | 0.6 | 0.7 | 1.1 | 0.8 | 0.7 | 0.7 | 0.7 | 0.7 | 0.7 | 0.7 | 0.7 | 0.7 | 0.7 |
| ASSUMPTIONS (%) | | | | | | | | | | | | | |
| Labour productivity growth | 2.6 | 0.1 | 1.4 | 0.2 | 0.6 | 1.3 | 1.7 | 1.7 | 1.7 | 1.7 | 1.6 | 1.6 | 1.5 |
| Real GDP growth | 1.7 | 0.8 | -9.0 | 1.5 | 0.4 | 0.7 | 1.0 | 1.3 | 1.5 | 1.5 | 1.5 | 1.4 | 1.3 |
| Participation rate males (aged 20-64) | 72.4 | 73.7 | 72.9 | 76.1 | 76.0 | 76.5 | 76.9 | 76.9 | 76.4 | 75.8 | 75.8 | 76.1 | 76.4 |
| Participation rates females (aged 20-64) | 50.8 | 54.1 | 54.1 | 59.7 | 60.9 | 61.9 | 62.6 | 62.7 | 62.4 | 62.3 | 62.3 | 62.4 | 62.6 |
| Total participation rates (aged 20-64) | 61.6 | 63.8 | 63.5 | 68.0 | 68.6 | 69.3 | 69.9 | 70.0 | 69.6 | 69.3 | 69.3 | 69.5 | 69.8 |
| Unemployment rate | 8.5 | 12.0 | 9.3 | 7.9 | 8.1 | 7.9 | 7.7 | 7.2 | 6.7 | 6.6 | 6.6 | 6.5 | 6.5 |
| Population aged 65+ over total population | 20.4 | 21.9 | 23.2 | 24.8 | 27.2 | 29.8 | 32.2 | 33.5 | 33.7 | 33.6 | 33.2 | 33.0 | 33.1 |
Dependence index of the elderly (65 and over / [20-64]) | 31.1 | 34.0 | 36.4 | 39.3 | 44.2 | 50.6 | 57.0 | 60.9 | 61.8 | 61.1 | 60.0 | 59.3 | 59.8 |
(1) For the four-year period 2022-2025 growth assumptions are in line with the macroeconomic baseline scenario under existing legislation underlying the Stability Programme 2022. For the following period, the scenario is coherent with the EPC-WGA exercise prepared for the 2021 round of age-related expenditures projections. (2) Until 2021, expenditure on social benefits refers to National Accounting data. For the period 2022-2025, the forecast values are in line with those underlying the forecast of the public finance scenario. (3) Budget Law No. 234/2021 deleted the 'Fund for the revision of the early retirement system and to encourage the hiring of young workers', established by the Law No. 145/2018, p. 256. The resources previously earmarked in that fund have been used to finance, up to 2023, the burden resulting from the social security provisions of Decree Law No. 4/2019, through the substantial zeroing of the relative expenditure allocation. In the following years, the repeal of the above-mentioned fund deletes the expenditure allocations, that amounted to 1.8 billion for 2024; 2.8 billion for 2025; 3.8 billion for 2026-2031; 3.9 billion as of 2032. (4) Starting from 2015, the health expenditure data takes into account the revision of the time series of the national accounts, based on the ESA 2010. This revision was carried out in coordination with Eurostat and with most of the EU countries. With regard to the period 2022¬2025, the forecast reflects: charges related to the renovation of the economic treatment of dependent and contracted staff of the National Health System (NHS) for the period 2019-2021; the expenditures for the implementation of the National Recovery and Resilience Plan (NRRP) amounting to about 3.5 billion ('Mission 6: Health'); the planned commitments to strengthen the performances of the NHS, including in terms of timeliness of response to health emergencies. Starting from 2026, the forecast is made using the reference scenario methodology. (5) The aggregate includes the ISCED education levels 1-8 according to the OECD classification (ISCED 2011 level). It does not include expenditure on adult education (lifelong learning) and pre-primary school. The expenditure aggregate is built on data from UNESCO / OECD / EUROSTAT (UOE) sources. The forecast incorporates the UOE data updated to the financial year 2018. With regard to the period 2022¬2025, the projection reflects the greater expenditure for personnel necessary to face the epidemiological emergency linked to the spread of the Covid-19 (D.L. No. 18/2020, D.L. No. 34/2020, D.L. No. 104/2020, D.L. No. 137/2020, L. No. 178/2020, D.L. No. 30/2021, D.L. No. 41/2021, D.L. No. 105/2021, and L. No. 234/2021). The forecast of education expenditure in relation to GDP includes current and capital account measures financed through the Next Generation EU programme for ISCED 1-8 classes. These expenditures amount to about 22.5 billion, overall, up to 2026. |
| 48 | MINISTRY OF ECONOMY AND FINANCE |
| TABLE V.12: PUBLIC GUARANTEES IN 2020 AND 2021 (in millions) |
| | 2020 | 2021 |
| | Level | % of GDP | Level | % of GDP |
| Stock of guarantees | 215,428 | 13.0 | 282,337 | 15.9 |
| of which: financial sector (1) | 13,396 | 0.8 | 14,600 | 0.8 |
| (1) Italian banks, Cassa Depositi e Prestiti and GACS. |
| TABLE V.13: BASIC ASSUMPTIONS |
| | 2021 | 2022 | 2023 | 2024 | 2025 |
| Short-term interest rate (annual average) (1) | n. a. | -0.4 | 0.9 | 1.4 | 1.5 |
| Long-term interest rate (annual average) (2) | 0.8 | 1.8 | 2.3 | 2.4 | 2.5 |
| USD/EUR exchange rate (annual average) | 1.18 | 1.11 | 1.11 | 1.11 | 1.11 |
| Nominal effective exchange rate | 1.0 | 0.0 | 0.1 | 0.0 | 0.0 |
| World excluding EU, GDP growth | 5.1 | 3.3 | 2.9 | 2.8 | 2.8 |
| EU GDP growth | 5.2 | 3.2 | 2.8 | 2.1 | 1.5 |
| Growth of relevant foreign markets | 11.3 | 4.8 | 3.4 | 3.3 | 2.8 |
| World import volumes, excluding EU | 6.3 | 4.5 | 3.9 | 3.0 | 2.5 |
| Oil prices (Brent, USD/barrel) | 70.8 | 99.8 | 87.6 | 81.2 | 77.2 |
(1) Short-term interest rate refers to the average of the rates applied to 3-month government bonds issued during the year. (2) Long-term interest rate refers to the average of the rates applied to 10-year government bonds issued during the year. |
| TABLE V.14: IMPACT OF RECOVERY AND RESILIENCE FACILITY ON GENERAL GOVERNMENT BUDGETARY PROSPECTS – GRANTS |
| | 2020 | 2021 | 2022 | 2023 | 2024 | 2025 |
| REVENUE FROM RRF GRANTS (% GDP) | | | | | | |
| RRF GRANTS as included in the revenue projections | 0.0 | 0.1 | 0.7 | 1.1 | 0.8 | 0.5 |
| Cash disbursements of RRF GRANTS from EU | 0.0 | 0.5 | 1.1 | 0.6 | 0.4 | 0.4 |
| | | | | | | |
| EXPENDITURE FINANCED BY RRF GRANTS (% GDP) | | | | | | |
| TOTAL CURRENT EXPENDITURE | 0.0 | 0.0 | 0.1 | 0.2 | 0.2 | 0.1 |
| Gross fixed capital formation P.51g | 0.0 | 0.0 | 0.2 | 0.3 | 0.3 | 0.3 |
| Capital transfers D.9 | 0.0 | 0.1 | 0.3 | 0.5 | 0.1 | 0.0 |
| TOTAL CAPITAL ACCOUNT EXPENDITURE | 0.0 | 0.1 | 0.5 | 0.7 | 0.3 | 0.3 |
| | | | | | | |
| OTHER COSTS FINANCED BY RRF GRANTS (% GDP) (1) | | | | | | |
| Reduction in tax revenue | 0.0 | 0.0 | 0.1 | 0.2 | 0.3 | 0.1 |
| Other costs with impact on revenue | 0.0 | 0.0 | 0.0 | 0.0 | 0.0 | 0.0 |
| Financial transactions | 0.0 | 0.0 | 0.0 | 0.0 | 0.0 | 0.0 |
| (1) Reference is made to cost items not recorded as expenditure in the national accounts. |
| MINISTRY OF ECONOMY AND FINANCE | 49 |
| | ITALY’S STABILITY PROGRAMME 2022 |
| TABLE V.15: IMPACT OF RECOVERY AND RESILIENCE FACILITY ON GENERAL GOVERNMENT BUDGETARY PROSPECTS – LOANS |
| | 2020 | 2021 | 2022 | 2023 | 2024 | 2025 |
| CASH FLOW FROM RRF LOANS PROJECTED IN THE PROGRAMME (% GDP) | | | | |
| Disbursements of RRF LOANS from EU | 0.0 | 0.9 | 1.2 | 1.2 | 1.0 | 1.0 |
| Repayments of RRF LOANS to EU | 0.0 | 0.0 | 0.0 | 0.0 | 0.0 | 0.0 |
| | | | | | | |
| EXPENDITURE FINANCED BY RRF LOANS (% GDP) | | | | | | |
| TOTAL CURRENT EXPENDITURE | 0.0 | 0.0 | 0.1 | 0.1 | 0.1 | 0.1 |
| Gross fixed capital formation P.51g | 0.1 | 0.1 | 0.7 | 0.9 | 1.4 | 1.4 |
| Capital transfers D.9 | 0.0 | 0.0 | 0.0 | 0.0 | 0.0 | 0.0 |
| TOTAL CAPITAL ACCOUNT EXPENDITURE | 0.1 | 0.1 | 0.8 | 1.0 | 1.4 | 1.4 |
| | | | | | | |
| OTHER COSTS FINANCED BY RRF LOANS (% GDP) (1) | | | | | | |
| Reduction in tax revenue | 0.0 | 0.0 | 0.0 | 0.0 | 0.0 | 0.0 |
| Other costs with impact on revenue | 0.0 | 0.0 | 0.0 | 0.0 | 0.0 | 0.0 |
| Financial transactions | 0.0 | 0.0 | 0.0 | 0.0 | 0.0 | 0.0 |
| (1) Reference is made to cost items not recorded as expenditure in the national accounts. |
| TABLE V.16: STOCK OF PUBLIC GUARANTEES AT 31 DECEMBER 2021 (as percentage of GDP) |
| | Measures | Date of adoption (1) | Maximum amount of contingent liabilities (2) | Take-up (3) |
| IN RESPONSE TO COVID-19 | Central Guarantee Fund for SMEs | 17/03/2020 | | 8.3 |
| SACE- 'Garanzia Italia' | 08/04/2020 | 11.3 | 1.6 |
| Commercial credits insurance | 19/05/2020 | 0.1 | 0.1 |
| Guarantee fund for first homes | 26/05/2021 | | 0.0 |
| | SUBTOTAL | | | 10.1 |
| OTHERS | Central Guarantee Fund for SMEs | | | 1.0 |
| TAV S.p.A. | | | 0.0 |
| Guarantees provided by local authorities | | | 0.1 |
| Italian banks | | | 0.0 |
| GACS | | | 0.7 |
| Bond issues by CDP S.p.A. | | 0.3 | 0.2 |
| Guarantee fund for first homes | | | 0.6 |
| Guarantee for non-market risks in favour of SACE | 08/04/2020 | 6.8 | 3.1 |
Green New Deal Guarantees | 15/09/2020 | 0.1 | 0.1 |
| State guarantees in favour of ILVA | | | 0.0 |
| SUBTOTAL | | | 5.8 |
| | TOTAL | | | 15.9 |
(1) The date of adoption refers to the legislative provision or ministerial decree that introduced or revised the guarantee scheme. (2) Theoretical ceiling established by law (if exists). (3) Actual granted take-up. Discrepancies, if any, are due to rounding. |
| 50 | MINISTRY OF ECONOMY AND FINANCE |
| MINISTRY OF ECONOMY AND FINANCE | 51 |
The
ECONOMIC AND FINANCIAL DOCUMENT 2022
is available on-line
at the internet address listed below:
www.mef.gov.it • www.dt.mef.gov.it//it/ • www.rgs.mef.gov.it
ISSN 2239-5539