| | | |
| | | Update of the Economic and Financial Document |
| | | |
| | | 2022 |
| | Revised and integrated |
| | | Update of the Economic and Financial Document |
| | | |
| | | 2022 |
| | | |
| | | Revised and integrated |
| | | |
| | | |
| | | |
| | | |
| | | |
| | | |
| | | |
| | | Submitted by Prime Minister |
| | | Giorgia Meloni |
| | | |
| | | |
| | | and Minister of the Economy and Finance |
| | | Giancarlo Giorgetti |
| | | |
| | | |
| | | |
| | | |
| | | |
| | Approved by the Council of ministers on 4 November 2022 |
FOREWORD
This Update of the Economic and Financial Document revises and integrates the update approved by the previous government on 28 September, which contained the updated macroeconomic and public finance forecasts under existing legislation, leaving to the future government the task of developing the policy scenario.
The Italian government therefore decided to immediately draft a new version of the Update in order to enable the new Parliament to analyse and debate an integrated economic and public finance framework, complete with a new policy scenario, and adopt a resolution on the same and on the proposed budget balances. This initial step will then be followed, in quick succession, by the update of the Draft Budgetary Plan, to be sent to the European Commission, and the 2023 Budget Law.
The economic scenario has in fact changed compared to the end of September: recent trends in the economy were better than expected, with GDP increasing, against all expectations, by 0.5 percent in the third quarter compared to the previous period, bringing the growth forecast for this year (on average quarterly data) to 3.9 percent. Additionally, although consumer inflation did unfortunately rise, the wholesale price of natural gas recently fell both at the European level and, to a greater extent, in the Italian market, suggesting a temporary relief for the economy in the immediate future. On the other hand, the expectations of businesses and households, and the estimates of domestic and international forecasters on the future performance of the economy, deteriorated considerably. The risk of a cyclical downturn is increased by large rate hikes at major central banks as a response to inflation data, which have an impact on household and corporate balance sheets.
On this basis, it was inevitable to update not only the macroeconomic and public finance policy scenario for 2022-2025, but also the baseline existing legislation forecast on which it is based. The GDP growth forecast in the scenario under existing legislation was revised upward for 2022, from 3.3 percent to 3.7 percent, while the forecast for 2023 was revised downward from 0.6 percent to 0.3 percent. The forecasts for the following two years, on the other hand, remained unchanged at 1.8 percent and 1.5 percent, respectively. The recent surge in inflation, together with the update of the exogenous variables, led also to an upward revision of the GDP deflator, resulting in the projected levels of nominal GDP for 2022 and the following years being higher than in the September forecast, with a positive impact on public finance forecasts.
The new estimates of the deficit under existing legislation scenario are consistent with those of the September version of the Update for 2022 and 2023, with net borrowing projected at 5.1 percent of GDP and 3.4 percent of GDP, respectively. On the other hand, there is a slight upward revision of the deficit
| MINISTRY OF ECONOMY AND FINANCE | I |
| | UPDATE OF THE ECONOMIC AND FINANCIAL DOCUMENT 2022 |
forecasts for 2024, from 3.5 percent to 3.6 percent of GDP, and for 2025, from 3.2 percent to 3.3 percent, mainly due to higher interest charges on public debt caused by the recent rise in market yields.
Although energy prices have recently decreased, they remain at very high levels and risk spiking again during the winter months. Moreover, Italy's gas supply depends mainly on import flows subject to various risks under the current geopolitical situation.
Against this scenario, the Italian government's priority objective remained that of limiting as much as possible the impact of high energy prices on the budgets of households, especially the most fragile ones, as well as ensuring the survival and competitiveness of Italian companies both globally and in the European context, also in light of the substantial measures recently announced by other EU and non-EU countries.
This is why the Government decided to confirm the 2022 deficit target of 5.6 percent of GDP set out in the Economic and Financial Document and to use a majority share of the resulting budget margin, amounting to just over nine billion, to fund new measures to mitigate the cost of energy, such as the reintroduction of tax credits for companies and the cut in excise duties on fuels until 31 December.
With regard to the 2023-2025 manoeuvre, given the high level of uncertainty in the economic scenario and the need to continue countering high energy prices, the Italian government decided to use the Report attached to this document to request Parliament's authorisation to set a new policy course for the general government net borrowing. The new deficit-to-GDP policy levels are set at 4.5 percent for 2023, 3.7 percent for 2024 and 3.0 percent for 2025.
The resources for the net measures will be used to counter high energy prices in the first months of 2023.
The evolution of energy prices and their impact on businesses and households will be continuously monitored in early 2023. By the time the next Economic and Financial Document is drawn up, it will be assessed whether there is a need for further measures to lower energy prices and support businesses and households, and how such measures should be financed.
In the policy scenario, the real GDP growth rate is 0.6 percent in 2023, rising to 1.9 percent in 2024 and 1.3 percent in 2025.
Compared to the estimate under existing legislation, the higher growth in 2023 is mainly due to household consumption, which, boosted by an increase in nominal disposable income and the reduction in consumer inflation caused by the measures to lower prices, will increase by 1.0 percent in 2023 and 1.6 percent in 2024.
The work to prepare the budget law will proceed at a steady pace in the coming days, so that the 2023 draft budget law can be delivered to Parliament as soon as possible.
The Government's approach is based on the need to respond decisively to the energy crisis and soaring inflation and to protect the most economically fragile households and Italian businesses and the jobs they create. A strong effort will also be made to implement the Recovery and Resilience Plan, on which huge investments to relaunch the sustainable growth of the Italian economy depend.
With ambition, pragmatism, and prudence, the budget law will lay the foundations to overcome the complicated challenges faced in recent years and
| II | MINISTRY OF ECONOMY AND FINANCE |
fulfil the hopes of citizens. This, however, without losing sight of the sustainability of public finance, as confirmed by the decline in the debt-to-GDP ratio from around 150 percent in 2021 to just over 141 percent in 2025 as envisaged by this document.
Giancarlo Giorgetti
Minister of Economy and Finance
| MINISTRY OF ECONOMY AND FINANCE | III |
| | UPDATE OF THE ECONOMIC AND FINANCIAL DOCUMENT 2022 |
| IV | MINISTRY OF ECONOMY AND FINANCE |
| | UPDATE OF THE ECONOMIC AND FINANCIAL DOCUMENT 2022 |
INDEX
| I. | UPDATE OF THE MACROECONOMIC AND PUBLIC FINANCE SCENARIO UNDER EXISTING LEGISLATION |
| I.1 | Recent developments in macroeconomic and public finance variables |
| I.2 | Update of the macroeconomic scenario under existing legislation |
| I.3 | Public finance measures adopted after the publication of the 2022 Update |
| I.4 | Update of the public finance scenario under existing legislation |
| | |
| II. | PUBLIC FINANCE AND MACROECONOMIC POLICY SCENARIO |
| II.1 | Additional measures for 2022 and the 2023-25 manoeuvre |
| II.2 | Macroeconomic policy scenario |
| | |
| III. | STRUCTURAL BALANCES AND DEBT-TO-GDP RATIO |
| III.1 | Expected evolution of structural balances and the expenditure rule |
| III.2 | Evolution of the debt-to-GDP ratio |
| III.3 | The debt rule and other relevant factors |
| MINISTRY OF ECONOMY AND FINANCE | V |
| | UPDATE OF THE ECONOMIC AND FINANCIAL DOCUMENT 2022 |
| VI | MINISTRY OF ECONOMY AND FINANCE |
| I. | UPDATE OF THE MACROECONOMIC AND PUBLIC FINANCE SCENARIO UNDER EXISTING LEGISLATION |
| I.1 | RECENT DEVELOPMENTS IN MACROECONOMIC AND PUBLIC FINANCE VARIABLES |
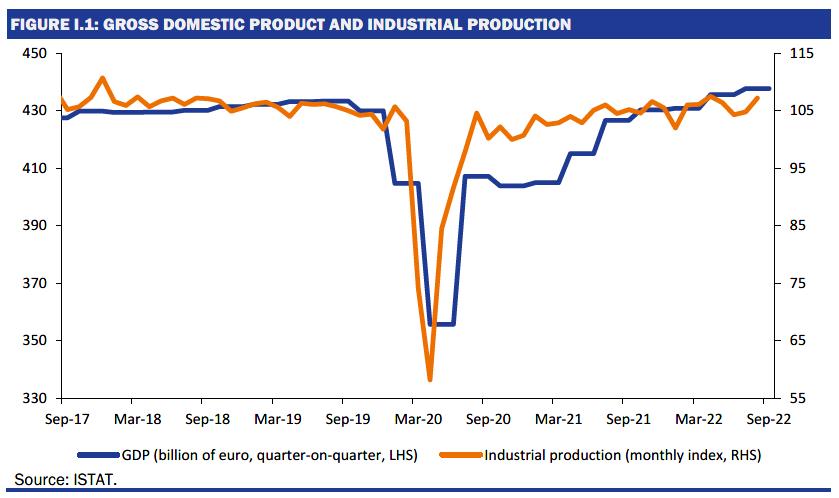
According to the latest estimates released by ISTAT, GDP growth decelerated in the third quarter of the year, but contrary to the expectations of all forecasters, it remained positive. Indeed, after the cyclical 1.1 percent increase recorded in the second quarter, GDP rose by 0.5 percent in the summer quarter compared to the previous quarter. The resilience of the economy in the summer months was the result of a strong contribution from services, while manufacturing and construction experienced a moderate contraction in value added.
Thanks to the good performance levels reached in the third quarter, the acquired growth for the current year is 3.9 percent on average quarterly data, 4 tenths of a percentage point higher than the figure available at the time of the Update of the 2022 Economic and Financial Document (Update)1. Despite the
___
1 Data adjusted for calendar effects. In detail, the acquired change was revised upwards by one tenth of percentage point with the revision of the quarterly economic accounts of 5 October 2022, to which three tenth of a percentage point were added with the preliminary estimate for the third quarter released by ISTAT on 31 October 2022.
| MINISTRY OF ECONOMY AND FINANCE | 1 |
| | UPDATE OF THE ECONOMIC AND FINANCIAL DOCUMENT 2022 |
persistence of significant downside risks for the final part of the year, which are linked to the intensification of inflationary tensions and the weakening of the international economic cycle, as already outlined in the September Update, the GDP growth forecast for 2022 has risen to 3.7 percent, from the 3.3 percent projected in the Update of 28 September2.
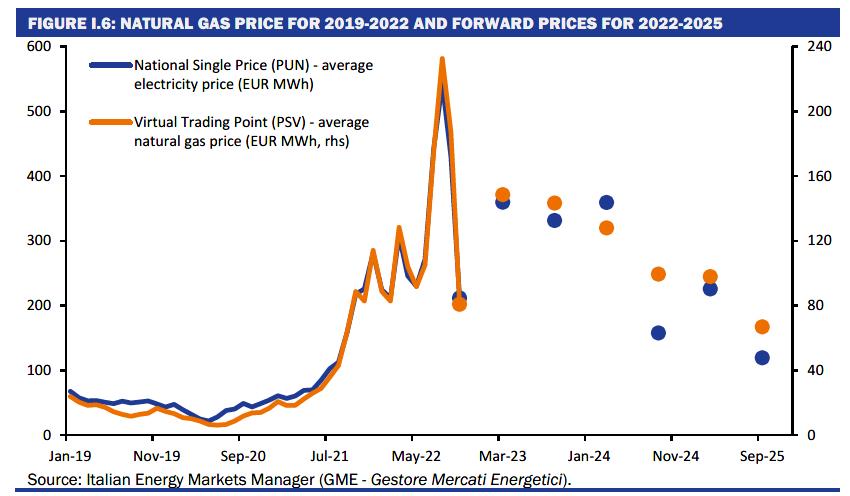
Coinciding with a phase of substantial stability in crude oil prices, the domestic price of natural gas has recently fallen sharply from its peak in August. Although it is still at historically high levels, the price at the end of October practically cancelled out the increases seen in July and August. Moreover, due to the high level of storage reached at the end of September and the above-average temperatures that contributed to reducing the demand for gas, the price on the Italian virtual market was lower than that traded on the European reference market TTF.
In this context, the increase in natural gas prices during the summer pushed up the growth in energy import prices to 111 percent over the same period last year, which was passed on to producer prices (+41.8 percent in September) and consumer inflation in October. According to the Harmonised Index of Consumer Prices, the latter reached a new peak of 12.8 percent, up from 9.4 percent in September. Both unregulated and regulated energy prices contributed significantly to this increase. In particular, for the latter, the price of the electricity component of the protected market was 59 percent higher in October than in the previous quarter.
On the other hand, the estimate of the price of natural gas in October may not include the actual reduction, as October will see ARERA begin to communicate the price for the protected market only at the beginning of the following month, since it is equal to the average of the spot prices recorded for the reference month. The
___
2 The corresponding forecasts for the average quarterly data are 3.4 percent for the September Update and 3.8 percent for the current version.
| 2 | MINISTRY OF ECONOMY AND FINANCE |
I. UPDATE OF THE MACROECONOMIC AND PUBLIC FINANCE SCENARIO UNDER EXISTING LEGISLATION |
spread of the price increase to the other index components brought core inflation (net of energy and fresh food) to 5.7 percent, again according to the harmonised index.
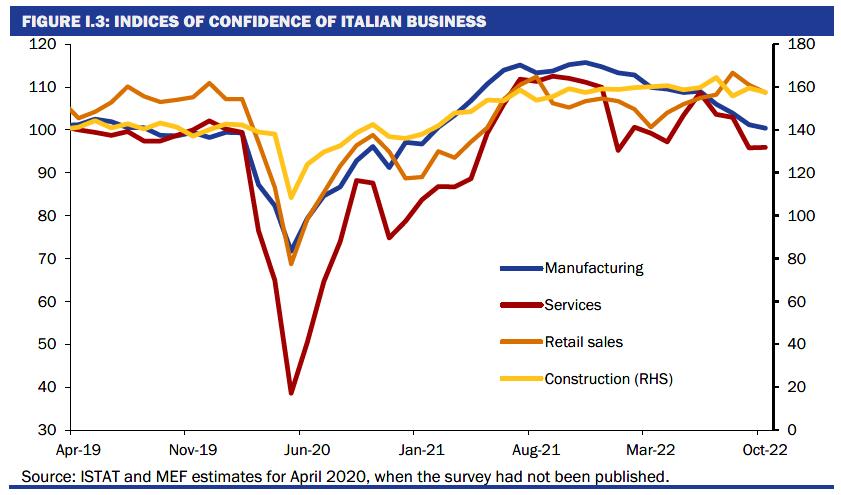
However, the surprisingly positive performance of economic activity in the third quarter was part of a macroeconomic context burdened by the worsening of qualitative indicators, as already foreshadowed in the Update at the end of September: information from the ISTAT surveys on business and consumer confidence continues to paint a picture dominated by uncertainty and deteriorating expectations, which is also reflected in the evolution of the PMI indexes, which have been below the expansion threshold since July.
Despite the fact that the qualitative information pointed to a downturn scenario for the third quarter, the dynamics of the quantitative indicators were consistent with the context of substantially stable activity: in August, the seasonally adjusted index of industrial production recorded a new, unexpected economic increase (2.3 percent m/m; up from 0.5 percent in July), accompanied by the robust recovery of construction production (2.7 percent m/m) after two months of economic decline.
However, expectations of a slowdown in the economic cycle at a global level also persisted for October, with a downward revision of the most recent forecasts of national and international bodies dictated by persistent inflationary tensions and the decisive response of central banks.
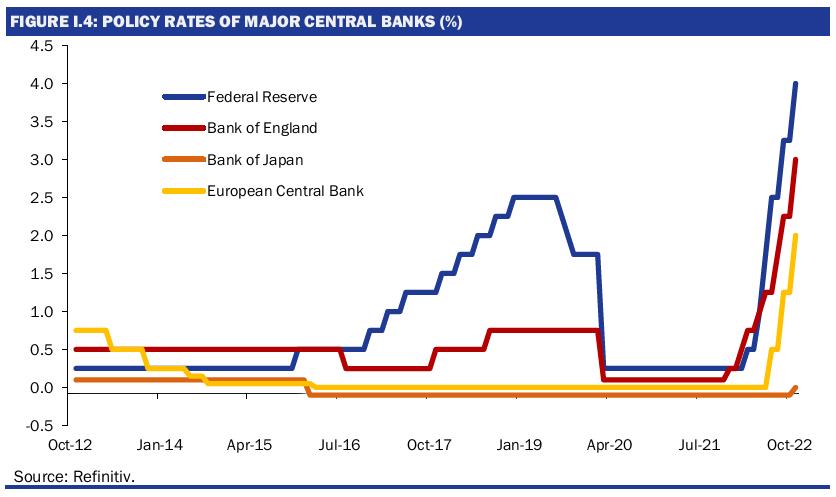
Indeed, despite the restrictive monetary policy of the Federal Reserve, which on 2 November raised reference rates by 75 basis points for the fourth time in a row, the pressure on prices in the United States is hardly diminishing, especially if we consider price trends net of the energy and food components. While the overall index has slowed in recent months, reaching a growth rate of 8.2 percent in September (from a peak of 9.1 percent in June), the core component accelerates, reaching a trend growth rate of 6.6 percent.
| MINISTRY OF ECONOMY AND FINANCE | 3 |
| | UPDATE OF THE ECONOMIC AND FINANCIAL DOCUMENT 2022 |
Although underlying inflationary pressures continued to grow, US consumer spending increased more than expected in September. Together with the acceleration in exports and the recovery in overall government spending, the consumption trend contributed to the recovery in GDP, which grew at an annualised rate of 2.6 percent in the third quarter over the previous period, rebounding from the contraction in the previous two quarters (-1.6 percent and -0.6 percent q/q, respectively). Signs of weakening came instead from private investment, which declined for the second consecutive quarter despite the increase in non-residential and machinery investment. However, in spite of the positive GDP figure, the growth profile of final demand in the US declined over the course of the year, while inventories increased.
The US labour market is starting to feel the effects of weakening domestic demand. The drop in the unemployment rate to 3.5 percent in September is the result of a stagnation in the employment rate (which has remained unchanged at 60.1 percent for two months) and a slight reduction in the participation rate; the two rates are still 1.1 percentage points below pre-pandemic levels.
The most recent qualitative surveys show a general weakening of the US economic scenario due to the impact of inflation on household purchasing power and rising interest rates.
The latest statistics on economic growth also confirm that the European economy is holding up, even though expectations for the second half of the year were pointing towards a slowdown in the cyclical phase. In the Euro Area, cyclical variation in GDP in the third quarter of the year was positive (0.2 percent) but slower than in the first two quarters of the year, with a trend variation of 2.1 percent.
The labour market continued to respond promptly to the economic cycle, with the unemployment rate standing at 6.6 percent in August - a historically low level
| 4 | MINISTRY OF ECONOMY AND FINANCE |
I. UPDATE OF THE MACROECONOMIC AND PUBLIC FINANCE SCENARIO UNDER EXISTING LEGISLATION |
since the introduction of the euro. Despite this, going forward, it is believed that the weakening economy could lead to a turnaround in the labour market.
On the supply side, the Eurozone energy crisis remains the main concern of companies and a drag on activity, especially in energy-intensive sectors. Although production indexes in the Eurozone and in the main European economies showed a good degree of resilience in August - with the exception of Germany - industrial activity appears to have been affected by a downturn in demand, also linked to the sharp rise in producer prices. Economic surveys at the beginning of the quarter report a contraction in production levels and an increase in goods in stock. This backdrop is more strongly felt in European manufacturing, particularly in the sectors most exposed to energy price volatility, and in the services sector, due to lower demand induced by the rise in the cost of living and the tightening of economic conditions.
Indeed, commodity prices, especially those of energy, still exert strong upward pressure on the entire supply chain. Producer prices in August rose by 43.3 percent year on year and contributed to the rise in consumer prices, which in October accelerated to 10.7 percent year on year due mainly to the boost of energy and fresh food prices. However, core inflation also rose to 6.4 percent from 6.0 percent in September3.
In the face of rising inflation, the tightening of monetary policy by the European Central Bank (ECB) continues. The Governing Council has raised key interest rates by 2 percentage points in the last three meetings and introduced measures to reduce excess reserves in the banking system. These ECB actions resulted in a significant increase in euro market rates, which will not fail to have a depressive effect on GDP growth in the area.
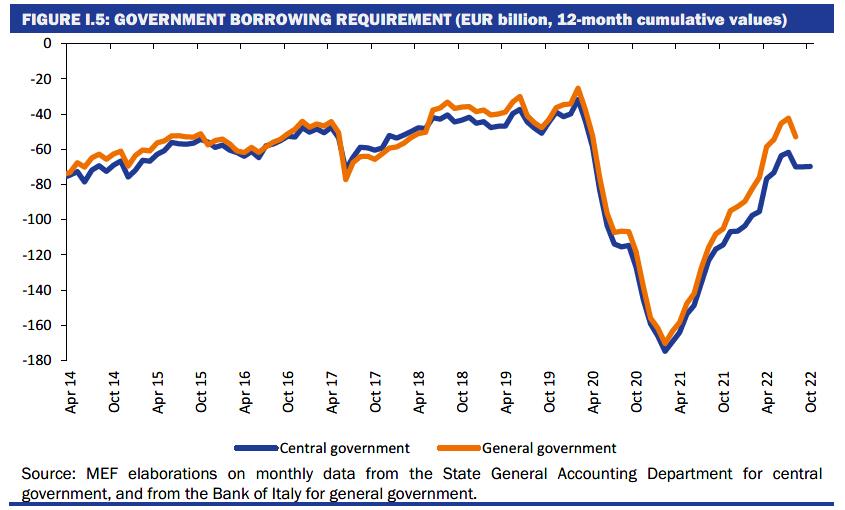
On the public finance front, the institutional sector accounts published by ISTAT indicate a sharp reduction in the general government net borrowing in the first quarter, to 9.0 percent of GDP from 12.8 percent in the corresponding period of 2021 (in non-seasonally adjusted terms)4 and 3.1 percent of GDP in the second quarter, up from 7.2 percent in the same quarter last year.
The revenue trend was particularly positive in the first eight months of the year, with tax revenues increasing by 14.7 percent and social security contributions by 7.8 percent5.
A marked improvement in public finance is also signalled by the central government cash requirement, which amounted to 56.5 billion in the first ten months of the year - an improvement of about 36.8 billion compared to 93.3 billion in the same period last year. Even excluding the grants received in August 2021 and April 2022 from the Recovery and Resilience Facility from the comparison, the reduction in cash requirement in the first ten months of the year amounted to 35.7 billion (a drop of about 35 percent). This is a very positive result also in light of the allocation of public resources for measure to lower energy prices and to aid businesses and households implemented during this period.
___
3 The data in the paragraph is from Eurostat.
4 Except for 2020 - a year out of the norm in that it was marked by the first phase of the pandemic and massive fiscal policy interventions - the first quarter normally records the highest levels of net borrowing for the whole year. As mentioned in the text, the quarterly net borrowing data are not seasonally adjusted.
5 Report on tax and social security contributions revenue, January to August 2022, of the Department of Finance and the State General Accounting Department.
| MINISTRY OF ECONOMY AND FINANCE | 5 |
| | UPDATE OF THE ECONOMIC AND FINANCIAL DOCUMENT 2022 |
| I.2 | UPDATE OF THE MACROECONOMIC SCENARIO UNDER EXISTING LEGISLATION |
The GDP growth forecast for the current year has improved from the September Update, going from 3.3 percent to 3.7 percent. For 2023, on the other hand, a loss of momentum in activity is projected, with GDP growth revised downwards to 0.3 percent - from 0.6 percent. For 2024-2025, the end-September forecast is confirmed at 1.8 percent and 1.5 percent, respectively.
Nominal GDP growth has been revised upward: for 2022, the higher nominal GDP growth rate entirely reflects the improvement in the real component, while in 2023 it reflects an upward revision of GDP deflator growth that is more pronounced than the decline in real GDP.
In detail, the improvement in the forecast for 2022 stems from a more buoyant performance of activity in the third quarter than foreshadowed in the September Update. On the other hand, the most up-to-date internal assessments project a negative change in GDP for the last quarter of the year, which would result from a cyclical retreat in the value added of industry and a slowdown in the growth of services.
Nevertheless, the dynamics of activity in the second half of the year would exert a non-negligible carryover on 2023, amounting to 0.3 percent, 0.2 percentage points higher than the September forecast. In the new existing legislation scenario, the expectation of a further cyclical downturn in activity in the first quarter of 2023 is confirmed, as driven mainly by the weakening in household consumption, also considering the fact that the existing legislation scenario takes into account the discontinuation of the measures to lower energy costs for businesses and households.
| 6 | MINISTRY OF ECONOMY AND FINANCE |
I. UPDATE OF THE MACROECONOMIC AND PUBLIC FINANCE SCENARIO UNDER EXISTING LEGISLATION |
Starting in the second quarter of next year, cyclical GDP growth is expected to pick up, as supported by the fall in the price of natural gas and a subsequent slowdown in inflation, as well as by the improved outlook for the global economy and the boost provided by the investments of the Recovery and Resilience Plan (RRP). It should be noted that the recovery profile foreshadowed from the second quarter of 2023 onwards is in any case moderate and reflects conservative assessments in light of the many energy and geopolitical uncertainty factors, primarily the average gas price level also as a reflection of temperatures and consumption during the winter.
The downgrading of GDP growth in 2023 compared to the September Update by 0.3 percentage points is consistent with changes in the main exogenous variables of the forecast.
In particular, while recent futures price levels for natural gas and oil are less unfavourable compared to September, the euro exchange rate is less competitive, interest rates and expected yields are higher and Oxford Economics' forecast of world trade developments exerts a larger negative impact on growth, such that a total of 0.3 percentage points is subtracted from the real GDP expansion rate.
| TABLE I.1: EFFECTS ON GDP OF THE UPDATE OF THE INTERNATIONAL SCENARIO IN COMPARISON WITH THE UPDATE OF 28 SEPTEMBER 2022 (impact on growth rates) |
| | 2022 | 2023 | 2024 | 2025 |
| 1. World trade | 0.0 | -0.2 | 0.0 | 0.1 |
| 2. Oil and gas prices | 0.0 | 0.1 | 0.0 | -0.1 |
| 3. Nominal effective exchange rate | 0.0 | -0.1 | 0.0 | 0.0 |
| 4. Interest rate assumptions | 0.0 | -0.1 | 0.0 | 0.0 |
| Total | 0.0 | -0.3 | 0.0 | 0.0 |
Compared to the previous forecast, the new existing legislation scenario shows differences in the dynamics and composition of domestic demand, price
| MINISTRY OF ECONOMY AND FINANCE | 7 |
| | UPDATE OF THE ECONOMIC AND FINANCIAL DOCUMENT 2022 |
developments and foreign trade. The worsening of the contribution to growth made by domestic demand in 2023 - due to the lower growth rate of consumption and investment - is accompanied by a downward revision of exports consistent with the worsening of world trade projections.
In a context in which the latest inflation data showed an unexpected acceleration in October and a significant persistence of the core component, the GDP and consumption deflators dynamics were revised upward: while the GDP deflator is unchanged in 2022 with respect to the September Update due to the combined effect of a downward revision of the quarterly economic accounts and the prospects for greater dynamics in the second half of the year, the consumption deflator is raised to 7.0 percent (from 6.6 percent).
In 2023, on the other hand, the GDP and consumption deflators are projected to rise to 4.2 percent (from 3.7 percent) and 5.9 percent (from 4.5 percent previously), respectively, and then remain essentially unchanged in the 2024-2025 period.
The inflation rate is expected to show signs of easing from the beginning of 2023, as price index levels, especially energy prices, will compare with the already very high levels in early 2022. The core inflation component is expected to be more persistent than the overall index, due to the lags in the adjustment of prices of other goods and services, albeit it embarks on a path of gradual deceleration later next year. Consistent with this inflation scenario, the trend of labour costs per full-time equivalent in the private sector in 2023 is projected to be slightly higher than in the previous forecast (3.9 percent from 3.7 percent), also as a result of the time lag between the increase in inflation and the consequent adjustment of contractual wages.
| TABLE I.2: SYNTHETIC MACROECONOMIC FRAMEWORK UNDER EXISTING LEGISLATION (1) (% changes, except where otherwise specified) |
| | 2021 | 2022 | 2023 | 2024 | 2025 |
| GDP | 6.7 | 3.7 | 0.3 | 1.8 | 1.5 |
| GDP deflator | 0.5 | 3.0 | 4.2 | 2.5 | 2.0 |
| Consumption deflator | 1.6 | 7.0 | 5.9 | 2.3 | 2.0 |
| Nominal GDP | 7.3 | 6.8 | 4.6 | 4.3 | 3.6 |
| Employment (FTEs) (2) | 7.6 | 4.5 | 0.2 | 1.1 | 1.0 |
| Employment (LF) (3) | 0.8 | 2.3 | 0.2 | 0.9 | 0.8 |
| Unemployment rate | 9.5 | 8.1 | 8.0 | 7.7 | 7.5 |
| Labour costs per FTE (4) | 0.9 | 3.4 | 3.9 | 3.4 | 2.8 |
| Current account balance (% of GDP) | 3.1 | -0.5 | -0.2 | 0.3 | 0.9 |
(1) Any inaccuracies are due to rounding. (2) Employment expressed in terms of Full-Time Equivalents (FTEs). (3) Number of employed people according to the Labour Force Survey (LFS). (4) Private sector. |
On the labour market front, employment picked up again in September, and the unemployment rate stood at 7.9 percent, unchanged from August and at its lowest level since 2009. In response to the expected loss of momentum in economic activity, employment dynamics were adjusted slightly downwards for the year 2023. Nevertheless, also due to labour force developments, the forecast of the
| 8 | MINISTRY OF ECONOMY AND FINANCE |
I. UPDATE OF THE MACROECONOMIC AND PUBLIC FINANCE SCENARIO UNDER EXISTING LEGISLATION |
unemployment rate has been revised slightly downwards compared to the September Update in 2022 (8.1 percent, -0.1 percentage points) and is confirmed at 8.0 percent in 2023, 7.7 percent in 2024 and 7.5 percent in 2025.
The current account balance of the balance of payments is projected to be in deficit in 2022 and 2023, before returning to a small surplus in the following two years mainly due to the expected decline in energy prices. Compared to the September Update, the current account deficit in 2022 has been revised in improvement (from -0.8 percent to -0.5 percent) also due to a revision of the 2021 figure (from 2.4 percent to 3.1 percent).
The new existing legislation macroeconomic forecast for 2022 and 2023 was validated by the Parliamentary Budget Office in a note dated 4 November 2022, at the end of the interlocutions provided for in the UPB-MEF Memorandum of Understanding of 13 May 2022.
| I.3 | PUBLIC FINANCE MEASURES ADOPTED AFTER THE PUBLICATION OF THE 2022 UPDATE |
The continuation of the energy crisis has made it necessary to further extend the measures concerning the reduction of excise duty rates on energy products used as fuels, including liquefied petroleum gases, the exemption from excise duty for natural gas used as motor fuel, and the reduction of the VAT rate to 5 percent for the supply of natural gas used as motor fuel, which were provided for by previous measures taken in 2022. These measures were arranged by the Ministerial Decree of 19 October 20226 for the period 1-3 November 2022 (with an effect of approximately 93 million in 2022) and by decree-law No. 153/20227 for the period 4-18 November 2022 (with burdens of approximately 465 million in 2022 and 21 million in 2024).
These extensions do not entail a worsening of the general government deficit, as the related financial effects are offset through the use of higher VAT revenues, deriving from the changes in the international price of crude oil recorded in the period from 1 September to 13 October 2022, as well as through the reduction and rationalisation of funds and expenditure in the State budget.
As a result of these measures, the gross amount of the measures to counter high energy prices adopted so far in 2022 can now be quantified at approximately 57.6 billion (3.0 percent of GDP), including the 3.8 billion originally allocated in the 2022 budget law. Temporary measures targeted at households and businesses most vulnerable to energy price increases account for about 46.1 percent of this amount. The size of the package remains stable at about 402 million in 2023, while the estimate rises slightly, from 207 million to 228 million, for 2024.
___
6 Ministerial decree No. 247 of 19 October 2022 on measures concerning the 'Reduction of taxes on certain energy products used as fuels, period 1 - 3 November 2022', published in the Official Journal on 21 October 2022.
7 Decree law No. 153 of 20 October 2022, on 'Urgent measures on excise duties and VAT on fuels'.
| MINISTRY OF ECONOMY AND FINANCE | 9 |
| | UPDATE OF THE ECONOMIC AND FINANCIAL DOCUMENT 2022 |
| I.4 | UPDATE OF THE PUBLIC FINANCE SCENARIO UNDER EXISTING LEGISLATION |
The update of the public finance scenario under existing legislation takes into account the most up-to-date information available at the time this document was prepared, including:
| • | the revision of existing legislation macroeconomic forecasts compared to the September Update; |
| • | the emergency measures to counter the economic repercussions of rising energy prices introduced by the above-mentioned decrees of 19 and 20 October. |
In 2022 and 2023, the deficit-to-GDP ratio under existing legislation is expected to be 5.1 percent and 3.4 percent, respectively, confirming the September forecast.
In the following two years, the deficit-to-GDP ratio is projected to 3.6 percent in 2024 (3.5 percent in the September Update) and 3.3 percent in 2025 (3.2 percent in the September Update).
The projections for the general government account take into account the acceleration in inflation recorded in September and October first and then the subsequent upward revision of forecasts for the coming years, which impact on social benefit expenditure and inflation-indexed debt service. In addition, the expected interest rates used for the forecast were revised upwards as a result of developments in the market environment this past month, also following the latest ECB monetary policy decisions. As a result, the forecast of interest expenditure has increased by about 2 billion in 2022, 3.6 billion in 2023, 2.6 billion in 2024 and 4.7 billion in 2025 compared to the September Update. As a result of these increases and the new expected level of nominal GDP, which is also higher than in the September forecast, the profile of interest expenditure as a ratio of GDP shows only modest increases, ranging between 0.1 and 0.2 percentage points. The ratio of interest expenditure to GDP is now expected to rise to 4.1 percent in 2022, remain constant in 2023, fall to 3.9 percent in 2024 and stand at 4.0 percent in 2025.
Beyond the upward revision of interest expenditure, public finance trends continue to be positive, due to growth in tax revenues that will offset upward revisions to primary expenditure. In the years 2023-2025, the primary balance will therefore be slightly better than in September. Specifically, a primary surplus of 0.7 percent of GDP is projected in 2023 (0.5 percent projected in September), 0.2 percent in 2024 and 0.8 percent in 2025 (0.7 percent projected in September). The improvement in the primary balance forecast compared to the September forecast offsets, entirely in 2023 and partially in 2025, the deterioration in interest expenditure, thus limiting the upward revision of the deficit forecast.
On the primary expenditure side, the forecast of pension expenditure is increased by around 0.6 billion in 2023 and by around 7.1 billion in 2024 compared to the September Update existing legislation scenario. These higher burdens are substantially related to the different pension indexation assumptions following the revision of the forecast profile of the inflation rate.
| 10 | MINISTRY OF ECONOMY AND FINANCE |
I. UPDATE OF THE MACROECONOMIC AND PUBLIC FINANCE SCENARIO UNDER EXISTING LEGISLATION |
The increases in nominal pension expenditure compared to the September forecast are about 5.6 billion in structural terms in 2025. The increase in 2025 is about 6 billion for total expenditure on cash benefits.
The combined effect of these increases and the expected new level of nominal GDP leads to a slightly higher profile of pension expenditure as a share of GDP than in September. After reaching a level of 16.6 percent of GDP in 2024, the ratio of pensions to GDP will stand at 16.5 percent in 2025, compared to the 16.4 percent projected for both years in September.
On the revenue side, the dynamics of tax revenues are stronger than expected in September, thanks to the higher nominal growth expected for the main macroeconomic aggregates8.
In 2023, indirect taxes are expected to grow at a rate that is more than one percentage point higher than the September forecast (+10.4 percent compared to +9.2 percent in September), while an average growth rate of +2.7 percent is confirmed for the following two-year period.
For direct taxes, greater dynamism is expected in the 2024-2025 period, in which this type of revenue is expected to grow at an average rate of +3.1 percent (+2.7 percent in September). The updated forecast takes into account, among other things, the new growth forecast for pension amounts, which has been updated to take into account the inflation-linked revaluation expected under the new macroeconomic scenario.
The trend in social security contributions remains broadly in line with the September Update forecast under existing legislation.
In light of the above elements, in 2022 the tax burden under existing legislation will rise to 43.8 percent of GDP, a level 0.1 percentage points lower than the September forecast. From 2023 to 2025, an average decline of about 0.4 GDP points per year is expected, to reach 42.5 percent of GDP at the end of the period.
___
8 The revenue forecast incorporates the effects of the extension of the reduction of excise duties and VAT on fuels until 18 November 2022.
| MINISTRY OF ECONOMY AND FINANCE | 11 |
| | UPDATE OF THE ECONOMIC AND FINANCIAL DOCUMENT 2022 |
TABLE I.3A: GENERAL GOVERNMENT BUDGETARY PROSPECTS UNDER EXISTING LEGISLATION
(EUR millions) |
| | 2021 | 2022 | 2023 | 2024 | 2025 |
| COMPONENTS OF EXPENDITURE | | | | | |
| Compensation of employees | 176,548 | 188,236 | 187,104 | 185,238 | 186,053 |
| Intermediate consumption | 157,228 | 166,930 | 165,593 | 162,839 | 163,506 |
| Social benefits | 397,905 | 409,220 | 428,270 | 453,610 | 464,530 |
| of which: Pensions | 286,280 | 297,350 | 321,390 | 345,380 | 355,420 |
| Other social benefits | 111,625 | 111,870 | 106,880 | 108,230 | 109,110 |
| Other current expenditure | 82,562 | 106,374 | 89,345 | 87,067 | 86,350 |
| Total current expenditure net of interest | 814,243 | 870,760 | 870,312 | 888,754 | 900,438 |
| | | | | | |
| Interest expenditure | 63,753 | 77,234 | 81,559 | 80,325 | 87,098 |
| | | | | | |
| Total current expenditure | 877,996 | 947,994 | 951,871 | 969,079 | 987,536 |
| of which: Health expenditure | 127,834 | 133,998 | 131,724 | 128,708 | 129,428 |
| | | | | | |
| Total capital expenditure | 108,172 | 81,707 | 100,753 | 94,728 | 101,617 |
| Gross fixed capital formation | 50,846 | 49,035 | 66,072 | 72,513 | 78,503 |
| Capital contributions | 21,952 | 22,629 | 26,964 | 18,002 | 18,862 |
| Other transfers | 35,374 | 10,043 | 7,718 | 4,213 | 4,252 |
| | | | | | |
| Total final expenditure net of interest | 922,415 | 952,467 | 971,065 | 983,482 | 1,002,055 |
| Total final expenditure | 986,168 | 1,029,701 | 1,052,624 | 1,063,807 | 1,089,153 |
| COMPONENTS OF REVENUE | | | | | |
| Total tax revenue | 527,629 | 568,435 | 584,079 | 596,784 | 618,150 |
| Direct Taxes | 267,492 | 284,456 | 274,445 | 280,008 | 291,663 |
| Indirect Taxes | 258,539 | 279,146 | 308,195 | 315,322 | 325,019 |
| Capital Taxes | 1,598 | 4,833 | 1,439 | 1,454 | 1,468 |
| Social contributions | 244,988 | 264,341 | 280,040 | 287,588 | 296,234 |
| Actual contributions | 240,501 | 259,560 | 275,185 | 282,659 | 291,204 |
| Imputed contributions | 4,487 | 4,781 | 4,855 | 4,929 | 5,030 |
| Other current revenue | 78,386 | 89,654 | 95,814 | 90,961 | 91,861 |
| Total current revenue | 849,405 | 917,596 | 958,494 | 973,878 | 1,004,777 |
| Non-tax capital revenue | 6,263 | 9,717 | 24,140 | 13,019 | 12,793 |
| Total final revenue | 857,266 | 932,146 | 984,073 | 988,351 | 1,019,037 |
| p.m. Tax burden | 43.4 | 43.8 | 43.4 | 42.6 | 42.5 |
| BALANCES | | | | | |
| Primary balance | -65,149 | -20,321 | 13,008 | 4,869 | 16,982 |
| % of GDP | -3.7 | -1.1 | 0.7 | 0.2 | 0.8 |
| Current balance | -28,591 | -30,398 | 6,623 | 4,800 | 17,240 |
| % of GDP | -1.6 | -1.6 | 0.3 | 0.2 | 0.8 |
| Net borrowing | -128,902 | -97,555 | -68,551 | -75,456 | -70,116 |
| % of GDP | -7.2 | -5.1 | -3.4 | -3.6 | -3.3 |
| Nominal GDP under existing legislation (x 1,000) | 1,782.1 | 1,903.3 | 1,990.2 | 2,076.5 | 2,151.0 |
| Note: Any inaccuracies are due to rounding. | | | | | |
| 12 | MINISTRY OF ECONOMY AND FINANCE |
I. UPDATE OF THE MACROECONOMIC AND PUBLIC FINANCE SCENARIO UNDER EXISTING LEGISLATION |
TABLE I.3B: GENERAL GOVERNMENT BUDGETARY PROSPECTS UNDER EXISTING LEGISLATION
(% of GDP) |
| | 2021 | 2022 | 2023 | 2024 | 2025 |
| COMPONENTS OF EXPENDITURE | | | | | |
| Compensation of employees | 9.9 | 9.9 | 9.4 | 8.9 | 8.6 |
| Intermediate consumption | 8.8 | 8.8 | 8.3 | 7.8 | 7.6 |
| Social benefits | 22.3 | 21.5 | 21.5 | 21.8 | 21.6 |
| of which: Pensions | 16.1 | 15.6 | 16.1 | 16.6 | 16.5 |
| Other social benefits | 6.3 | 5.9 | 5.4 | 5.2 | 5.1 |
| Other current expenditure | 4.6 | 5.6 | 4.5 | 4.2 | 4.0 |
| Total current expenditure net of interest | 45.7 | 45.7 | 43.7 | 42.8 | 41.9 |
| | | | | | |
| Interest expenditure | 3.6 | 4.1 | 4.1 | 3.9 | 4.0 |
| | | | | | |
| Total current expenditure | 49.3 | 49.8 | 47.8 | 46.7 | 45.9 |
| of which: Health expenditure | 7.2 | 7.0 | 6.6 | 6.2 | 6.0 |
| | | | | | |
| Total capital expenditure | 6.1 | 4.3 | 5.1 | 4.6 | 4.7 |
| Gross fixed capital formation | 2.9 | 2.6 | 3.3 | 3.5 | 3.6 |
| Capital contributions | 1.2 | 1.2 | 1.4 | 0.9 | 0.9 |
| Other transfers | 2.0 | 0.5 | 0.4 | 0.2 | 0.2 |
| | | | | | |
| Total final expenditure net of interest | 51.8 | 50.0 | 48.8 | 47.4 | 46.6 |
| Total final expenditure | 55.3 | 54.1 | 52.9 | 51.2 | 50.6 |
| | | | | | |
| COMPONENTS OF REVENUE | | | | | |
| Total tax revenue | 29.6 | 29.9 | 29.3 | 28.7 | 28.7 |
| Direct Taxes | 15.0 | 14.9 | 13.8 | 13.5 | 13.6 |
| Indirect Taxes | 14.5 | 14.7 | 15.5 | 15.2 | 15.1 |
| Capital Taxes | 0.1 | 0.3 | 0.1 | 0.1 | 0.1 |
| Social contributions | 13.7 | 13.9 | 14.1 | 13.8 | 13.8 |
| Actual contributions | 13.5 | 13.6 | 13.8 | 13.6 | 13.5 |
| Imputed contributions | 0.3 | 0.3 | 0.2 | 0.2 | 0.2 |
| Other current income | 4.4 | 4.7 | 4.8 | 4.4 | 4.3 |
| Total current revenue | 47.7 | 48.2 | 48.2 | 46.9 | 46.7 |
| | | | | | |
| Non-tax capital revenue | 0.4 | 0.5 | 1.2 | 0.6 | 0.6 |
| | | | | | |
| Total final revenue | 48.1 | 49.0 | 49.4 | 47.6 | 47.4 |
| p.m. Tax burden | 43.4 | 43.8 | 43.4 | 42.6 | 42.5 |
| BALANCES | | | | | |
| Primary balance | -3.7 | -1.1 | 0.7 | 0.2 | 0.8 |
| Current balance | -1.6 | -1.6 | 0.3 | 0.2 | 0.8 |
| Net borrowing | -7.2 | -5.1 | -3.4 | -3.6 | -3.3 |
| Note: Ratios to GDP are calculated on the existing legislation scenario forecasts. Any inaccuracies are due to rounding. |
| MINISTRY OF ECONOMY AND FINANCE | 13 |
| | UPDATE OF THE ECONOMIC AND FINANCIAL DOCUMENT 2022 |
TABLE I.3C: GENERAL GOVERNMENT BUDGETARY PROSPECTS UNDER EXISTING LEGISLATION
(percentage changes) |
| | 2022 | 2023 | 2024 | 2025 |
| COMPONENTS OF EXPENDITURE | | | | |
| Compensation of employees | 6.6 | -0.6 | -1.0 | 0.4 |
| Intermediate consumption | 6.2 | -0.8 | -1.7 | 0.4 |
| Social benefits | 2.8 | 4.7 | 5.9 | 2.4 |
| of which: Pensions | 3.9 | 8.1 | 7.5 | 2.9 |
| Other social benefits | 0.2 | -4.5 | 1.3 | 0.8 |
| Other current expenditure | 28.8 | -16.0 | -2.5 | -0.8 |
| Total current expenditure net of interest | 6.9 | -0.1 | 2.1 | 1.3 |
| | | | | |
| Interest expenditure | 21.1 | 5.6 | -1.5 | 8.4 |
| | | | | |
| Total current expenditure | 8.0 | 0.4 | 1.8 | 1.9 |
| of which: Health expenditure | 4.8 | -1.7 | -2.3 | 0.6 |
| | | | | |
| Total capital expenditure | -24.5 | 23.3 | -6.0 | 7.3 |
| | | | | |
| Gross fixed capital formation | -3.6 | 34.7 | 9.7 | 8.3 |
| | | | | |
| Capital contributions | 3.1 | 19.2 | -33.2 | 4.8 |
| Other transfers | -71.6 | -23.2 | -45.4 | 0.9 |
| | | | | |
| Total final expenditure net of interest | 3.3 | 2.0 | 1.3 | 1.9 |
| Total final expenditure | 4.4 | 2.2 | 1.1 | 2.4 |
| | | | | |
| COMPONENTS OF REVENUE | | | | |
| Total tax revenue | 7.7 | 2.8 | 2.2 | 3.6 |
| Direct Taxes | 6.3 | -3.5 | 2.0 | 4.2 |
| Indirect Taxes | 8.0 | 10.4 | 2.3 | 3.1 |
| Capital Taxes | 202.4 | -70.2 | 1.0 | 1.0 |
| Social contributions | 7.9 | 5.9 | 2.7 | 3.0 |
| Actual contributions | 7.9 | 6.0 | 2.7 | 3.0 |
| Imputed contributions | 6.5 | 1.5 | 1.5 | 2.1 |
| Other current income | 14.4 | 6.9 | -5.1 | 1.0 |
| Total current revenue | 8.0 | 4.5 | 1.6 | 3.2 |
| | | | | |
| Non-tax capital revenue | 55.1 | 148.4 | -46.1 | -1.7 |
| | | | | |
| Total final revenue | 8.7 | 5.6 | 0.4 | 3.1 |
| 14 | MINISTRY OF ECONOMY AND FINANCE |
| II. | PUBLIC FINANCE AND MACROECONOMIC POLICY SCENARIO |
| II.1 | ADDITIONAL MEASURES FOR 2022 AND THE 2023-25 MANOEUVRE |
Energy prices have recently decreased, although they remain at historically high levels and risk spiking again during the winter months. Moreover, Italy's gas supply depends mainly on import flows subject to various risks in the current geopolitical situation.
Against this scenario, the Italian government's priority objective is to limit as much as possible the impact of high energy prices on the budgets of households, especially the most vulnerable ones, and to ensure the survival and competitiveness of Italian companies both globally and in the European context, also in light of the substantial measures recently announced by other EU and non-EU countries.
The update of the general government account presented in paragraph I.4 confirms that the net borrowing level for the current year is 5.1 percent of GDP, 0.5 percentage points lower than the 5.6 percent target set in this year's Economic and Financial Document (Section I, Stability Programme).
The Italian government decided to maintain the 2022 deficit target of the Stability Programme and to use the resulting budget margin, amounting to just over nine billion, largely to fund new measures to mitigate the cost of energy, such as the reintroduction of tax credits for companies and the cut in excise duties on fuels until 31 December.
With a specific decree law currently being finalised (the so-called 'Aiuti-quarter' decree), in addition to the abovementioned measures, the financial effects of the natural gas purchases made in recent months by the Italian Energy Services Manager (Gestore dei Servizi Energetici, GSE), amounting to 4 billion, will be covered. This can be done by removing the legal provision requiring that the gas purchased by the GSE be resold by the end of 2022. Given that the recent fall in the domestic price of gas may be temporary, this will allow gas to be resold later on at prices less penalising to public finance instead of immediately crystallising the related losses. The expected proceeds based on forward gas prices will be received and recorded in 2023.
With regard to the 2023-2025 manoeuvre to be included in the next budget law, given the high level of uncertainty in the economic scenario and the need to continue countering high energy prices, the Italian government decided to use the Report attached to this document to request Parliament's authorisation to set a new policy scenario for the general government net borrowing. The new deficit-to-GDP policy levels are set at 4.5 percent for 2023, 3.7 percent for 2024 and 3.0 percent for 2025.
| MINISTRY OF ECONOMY AND FINANCE | 15 |
| | UPDATE OF THE ECONOMIC AND FINANCIAL DOCUMENT 2022 |
Table II.1 compares the new path of net borrowing with that of the updated existing legislation scenario, that estimated at end-September in the previous Update, and with the Stability Programme targets.
| TABLE II.1: PUBLIC FINANCE INDICATORS (% of GDP) (1) |
| | 2020 | 2021 | 2022 | 2023 | 2024 | 2025 |
| POLICY SCENARIO | | | | | | |
| Net borrowing | -9.5 | -7.2 | -5.6 | -4.5 | -3.7 | -3.0 |
| Primary balance | -6.0 | -3.7 | -1.5 | -0.4 | 0.2 | 1.1 |
| Interest expenditure | 3.5 | 3.6 | 4.1 | 4.1 | 3.9 | 4.1 |
| Structural net borrowing (2) | -5.0 | -6.3 | -6.1 | -4.8 | -4.2 | -3.6 |
| Structural change | -3.1 | -1.3 | 0.2 | 1.3 | 0.6 | 0.6 |
| Public debt (gross of subsidies) (3) | 154.9 | 150.3 | 145.7 | 144.6 | 142.3 | 141.2 |
| Public debt (net of subsidies) (3) | 151.5 | 147.1 | 142.7 | 141.8 | 139.6 | 138.6 |
| EXISTING LEGISLATION SCENARIO | | | | | | |
| Net borrowing | -9.5 | -7.2 | -5.1 | -3.4 | -3.6 | -3.3 |
| Primary balance | -6.0 | -3.7 | -1.1 | 0.7 | 0.2 | 0.8 |
| Interest expenditure | 3.5 | 3.6 | 4.1 | 4.1 | 3.9 | 4.0 |
| Structural net borrowing (2) | -5.0 | -6.4 | -5.6 | -3.6 | -4.0 | -3.8 |
| Structural change | -3.0 | -1.2 | 1.2 | 2.1 | -0.6 | 0.4 |
| Public debt (gross of subsidies) (3) | 154.9 | 150.3 | 145.2 | 143.3 | 141.4 | 140.2 |
| Public debt (net of subsidies) (3) | 151.5 | 147.1 | 142.2 | 140.5 | 138.7 | 137.6 |
| MEMO: September Update 2022 (EXISTING LEGISLATION SCENARIO) | | | | |
| Net borrowing | -9.5 | -7.2 | -5.1 | -3.4 | -3.5 | -3.2 |
| Primary balance | -6.0 | -3.7 | -1.1 | 0.5 | 0.2 | 0.7 |
| Interest expenditure | 3.5 | 3.6 | 4.0 | 3.9 | 3.8 | 3.9 |
| Structural net borrowing (2) | -5.0 | -6.4 | -5.5 | -3.6 | -3.9 | -3.7 |
| Variation in structural balance | -3.1 | -1.4 | 0.9 | 1.9 | -0.3 | 0.2 |
| Public debt (gross of subsidies) (3) | 154.9 | 150.3 | 145.4 | 143.2 | 140.9 | 139.3 |
| Public debt (net of subsidies) (3) | 151.4 | 147.1 | 142.5 | 140.4 | 138.2 | 136.7 |
| MEMO: DEF, Stability Programme 2022 (POLICY SCENARIO) | | | | |
| Net borrowing | -9.6 | -7.2 | -5.6 | -3.9 | -3.3 | -2.8 |
| Primary balance | -6.1 | -3.7 | -2.1 | -0.8 | -0.3 | 0.2 |
| Interest expenditure | 3.5 | 3.5 | 3.5 | 3.1 | 3.0 | 3.0 |
| Structural net borrowing (2) | -5.0 | -6.1 | -5.9 | -4.5 | -4.0 | -3.6 |
| Variation in structural balance | -3.0 | -1.1 | 0.2 | 1.4 | 0.5 | 0.4 |
| Public debt (gross of subsidies) (3) | 155.3 | 150.8 | 147.0 | 145.2 | 143.4 | 141.4 |
| Public debt (net of subsidies) (3) | 151.8 | 147.6 | 144.0 | 142.3 | 140.7 | 138.8 |
| Nominal GDP under existing legislation scenario (absolute values x 1,000) | 1660.6 | 1782.1 | 1903.3 | 1990.2 | 2076.5 | 2151.0 |
| Nominal GDP under policy scenario (absolute values x 1000) | 1660.6 | 1782.1 | 1903.3 | 1994.5 | 2088.5 | 2159.0 |
(1) Any inaccuracies are due to rounding. (2) Net of one-offs and the cyclical component. (3) Gross or net of Italy's share of loans to EMU Member States, either bilaterally or through the EFSF, and of the contribution to the capital of the ESM. |
| 16 | MINISTRY OF ECONOMY AND FINANCE |
II. PUBLIC FINANCE AND MACROECONOMIC POLICY SCENARIO | |
A comparison with the updated existing legislation scenario in this document shows that the new targets result in a fiscal room equal to 1.1 percent of GDP in 2023 and 0.1 percent of GDP in 2024, while in 2025 the net borrowing target is approximately 0.2 percentage points lower (net of rounding) than the baseline estimate.
As shown in Table II.1 and detailed in Chapter III, the new deficit targets are consistent with a gradual improvement in the primary balance (net of interest), which will turn slightly positive in 2024, before reaching a surplus of about one percent of GDP in 2025. Moreover, the structural balance (i.e., cyclically adjusted and net of temporary measures) will improve over the entire three-year period as it gradually approaches the Medium-Term Objective (MTO).
The resources of the net manoeuvre will be used to counter high energy prices in the first months of 2023.
The evolution of energy prices and their impact on businesses and households will be continuously monitored in early 2023. By the time the next Stability Programme is drawn up, it will be assessed whether there is a need for further measures to lower energy prices and support businesses and households, and how such measures should be financed.
In compliance with the requirements of the law on accounting and public finance concerning the information that must be provided in the Update, the net balance to be financed of the State budget in accrual terms may increase by up to 206 billion in 2023, 138.5 billion in 2024 and 116.5 billion in 2025. The corresponding net balance to be financed in cash terms may increase by up to 261 billion in 2023, 180.5 billion in 2024 and 152.5 billion in 2025.
| MINISTRY OF ECONOMY AND FINANCE | 17 |
| | UPDATE OF THE ECONOMIC AND FINANCIAL DOCUMENT 2022 |
| TABLE II.2: BUDGET CASH BALANCES UNDER THE POLICY SCENARIO |
| | 2021 | 2022 | 2023 | 2024 | 2025 |
| | | | % of GDP |
| Public sector | -108,984 | -6.1 | -4.0 | -4.8 | -4.2 | -3.8 |
| State sector | -106,326 | -6.0 | -3.9 | -4.9 | -4.3 | -3.8 |
| (1) Values in EUR millions. | | | | | | |
| II.2 | MACROECONOMIC POLICY SCENARIO |
The 2023 fiscal policy, aimed at ensuring support to households and businesses in order to contain the impact of high inflation on the economic activity, has a positive effect on GDP growth, which can be estimated at 0.3 percentage points of additional growth compared to the existing legislation scenario in 2023 and 0.1 percentage points in 2024. The higher level of GDP in 2024, together with the fading out of the expansionary effects of the outlined manoeuvre, would result in a less pronounced economic activity in 2025.
In particular, fiscal policy measures are aimed at tackling high energy prices and rising utility bills.
In the policy scenario, the real GDP growth rate is 0.6 percent in 2023, rising to 1.9 percent in 2024 and 1.3 percent in 2025.
Compared to the estimate under existing legislation, the higher growth in 2023 is mainly due to household consumption, which, boosted by an increase in nominal disposable income and the reduction in consumer inflation caused by the measures to lower prices, will increase by 1.0 percent in 2023 and 1.6 percent in 2024.
The measures aimed at containing the effects of higher energy prices should help mitigate the growth of consumer inflation in 2023 and consequently of domestic inflation, as measured by the GDP deflator. The discontinuation of these measures would contribute to a subsequent upturn in the price levels projected in the existing legislation scenario with an acceleration of the private consumption deflator in 2024. However, this would take place in a more favourable environment, where the prices of energy raw materials, consistent with futures prices, would decline, making a negative contribution to inflation.
The GDP deflator is projected to grow by 4.1 percent in 2023, before slowing to 2.7 percent in 2024 and 2.0 percent in 2025. The combined effect of higher real growth and the above-described price dynamics contribute to revising the nominal GDP profile upward by 0.2 percentage points in 2023 and 0.4 percentage points in 2024. In 2025, the dampening effect on real growth - equal to two-tenths of a percentage point - is also transmitted to the nominal GDP dynamics.
Gross fixed capital investments would also benefit from the measures taken, contributing positively to higher growth in economic activity and reaching around 22 percent of GDP at the end of the period.
Overall, higher domestic demand will lead to higher imports over the next two years, resulting in a marginal reduction of the current account balance and, on average, a slight decline in the contribution of net exports to growth.
| 18 | MINISTRY OF ECONOMY AND FINANCE |
II. PUBLIC FINANCE AND MACROECONOMIC POLICY SCENARIO | |
With regard to the labour market, in the two-year period 2023-2024, the higher GDP growth promotes an increase in labour input and a more pronounced growth in labour income, which help sustain household consumption. Stronger employment growth also leads to a lower unemployment rate, which is one-tenth lower in the three-year period 2023-2025 than in the baseline macroeconomic scenario, reaching 7.4 percent at the end of the period.
| TABLE II.3: SYNTHETIC MACROECONOMIC POLICY SCENARIO (1) (percentage changes, unless otherwise indicated) |
| | 2021 | 2022 | 2023 | 2024 | 2025 |
| GDP | 6.7 | 3.7 | 0.6 | 1.9 | 1.3 |
| GDP deflator | 0.5 | 3.0 | 4.1 | 2.7 | 2.0 |
| Consumption deflator | 1.6 | 7.0 | 5.5 | 2.6 | 2.0 |
| Nominal GDP | 7.3 | 6.8 | 4.8 | 4.7 | 3.4 |
| Employment (FTEs) (2) | 7.6 | 4.5 | 0.3 | 1.3 | 0.9 |
| Employment (LF) (3) | 0.8 | 2.3 | 0.3 | 1.1 | 0.7 |
| Unemployment rate | 9.5 | 8.1 | 7.9 | 7.6 | 7.4 |
| Current account balance (% of GDP) | 3.1 | -0.5 | -0.2 | 0.0 | 0.7 |
(1) Any inaccuracies are due to rounding. (2) Employment expressed in terms of Full-Time Equivalents (FTEs) (3) Number of employed people according to the Labour Force Survey (LFS). |
| MINISTRY OF ECONOMY AND FINANCE | 19 |
| | UPDATE OF THE ECONOMIC AND FINANCIAL DOCUMENT 2022 |
| 20 | MINISTRY OF ECONOMY AND FINANCE |
| III. | STRUCTURAL BALANCES AND DEBT-TO-GDP RATIO |
| III.1 | EXPECTED EVOLUTION OF STRUCTURAL BALANCES AND THE EXPENDITURE RULE |
The European context; fiscal surveillance in the coming months in view of a possible revision of governance rules
The European Commission will soon issue a Communication announcing its pro-posal to revise the rules on economic governance1. Then, based on the discussions and convergence between the positions of the Member States, the Commission will consider launching the actual legislative process. In any case, the Commission is expected to provide its fiscal policy guidelines in early 2023, in order to allow Mem-ber States to submit their Stability Programmes for the budgetary decisions to be taken for 2024 and the following years. The guidelines will be included in the Coun-try Specific Recommendations in spring 2023.
With regard to the fiscal surveillance process, the next and most immediate step will be the assessment of the Draft Budgetary Plans (DBPs) submitted by Euro-pean governments in October. This step will take place no later than December. The document sent by Italy on 10 October, which only contained information on public finance under the existing legislation scenario, will be supplemented and updated according to the policy scenario provided in this document.
The Commission will take into account the guidance given over the spring and summer months2, which also included specific recommendations for Italy. The new Communication and the attached documents, in addition to providing an overall assessment of fiscal policy in the Euro Area, will contain an opinion for each Member State on the DBPs they submitted.
The aim is to provide concrete ex ante guidance for the budget of the following year by checking consistency with the medium-term budget plans submitted in the Stability Programmes.
In December, having been given the Commission's opinion, the Eurogroup will adopt a statement on all countries' DBPs. In the statement, the Eurogroup expresses its assessment of the fiscal stance as resulting from the DBPs, including regarding the appropriateness with respect to both the indications given by the Commission and the macroeconomic scenario.
In the current environment marked by the activation of the General Escape Clause (GEC), which allows temporary deviations from the normal adjustment re-quirements of the Stability and Growth Pact (SGP), the Commission has proposed
___
1 The Commission's proposal is expected to be published on 9 November 2022.
2 See page 76 to page 78 of the Update published on 28 September.
| MINISTRY OF ECONOMY AND FINANCE | 21 |
| | UPDATE OF THE ECONOMIC AND FINANCIAL DOCUMENT 2022 |
qualitative recommendations, without specifying numerical deficit targets. How-ever, countries with high debt (Italy, France, Spain, Greece, Portugal and Belgium) are expected to have quantitative limits, i.e., in 2023, nationally financed primary current expenditure has to remain below potential GDP growth in the medium term, taking into account targeted and temporary support to households and businesses most vulnerable to the increase in energy prices as well as humanitarian assistance to people fleeing Ukraine.
This paragraph integrates the information already provided in the previous Up-date by reporting the performance of the main indicators used for fiscal surveillance under the new macroeconomic and public finance scenario.
The development of policy public finance in relation to the Commission recommendation and fiscal rules
Compared to the previous Update, the new forecasts, in addition to substantially confirming the estimates for 2022, primarily signal the political commitment to gradually bring the general government deficit-to-GDP ratio back towards the 3 percent threshold, meeting the target in 2025.
| TABLE III.1: CYCLICALLY ADJUSTED PUBLIC FINANCE (% of GDP) |
| | 2019 | 2020 | 2021 | 2022 | 2023 | 2024 | 2025 |
| 1. Growth rate of GDP at constant prices | 0.5 | -9.0 | 6.7 | 3.7 | 0.6 | 1.9 | 1.3 |
| 2. Net borrowing | -1.6 | -9.5 | -7.2 | -5.6 | -4.5 | -3.7 | -3.0 |
| 3. Interest expenditure | 3.4 | 3.5 | 3.6 | 4.1 | 4.1 | 3.9 | 4.1 |
| 4. One-off measures (2) | 0.1 | 0.1 | 0.4 | 0.4 | 0.3 | 0.1 | 0.0 |
| Of which: Revenue measures | 0.1 | 0.2 | 0.4 | 0.4 | 0.2 | 0.0 | 0.0 |
| Expenditure measures | -0.1 | -0.1 | 0.0 | 0.1 | 0.0 | 0.0 | 0.0 |
| 5. Potential GDP growth rate | 0.0 | -0.2 | 0.1 | 1.1 | 0.8 | 1.1 | 1.1 |
| Factor contribution to potential growth: | | | | | | | |
| Labour | -0.4 | -0.4 | -0.4 | 0.5 | 0.1 | 0.4 | 0.4 |
| Capital | 0.0 | -0.1 | 0.1 | 0.3 | 0.4 | 0.4 | 0.5 |
| Total factor productivity | 0.4 | 0.3 | 0.3 | 0.3 | 0.3 | 0.3 | 0.3 |
| 6. Output gap | 0.4 | -8.5 | -2.4 | 0.1 | 0.0 | 0.8 | 1.0 |
| 7. Cyclical component of budget balance | 0.2 | -4.6 | -1.3 | 0.1 | 0.0 | 0.4 | 0.6 |
| 8. Cyclically adjusted budget balance | -1.8 | -4.9 | -5.9 | -5.7 | -4.5 | -4.2 | -3.6 |
| 9. Cyclically adjusted primary balance | 1.5 | -1.5 | -2.3 | -1.6 | -0.4 | -0.3 | 0.5 |
| 10. Structural budget balance (3) | -1.9 | -5.0 | -6.3 | -6.1 | -4.8 | -4.2 | -3.6 |
| 11. Structural primary balance (3) | 1.4 | -1.5 | -2.8 | -2.0 | -0.6 | -0.3 | 0.5 |
| 12. Change in structural budget balance | 0.4 | -3.1 | -1.3 | 0.2 | 1.3 | 0.6 | 0.6 |
| 13. Change in structural primary balance | 0.1 | -3.0 | -1.2 | 0.7 | 1.4 | 0.3 | 0.8 |
(1) Any inaccuracies are due to rounding. (2) The positive sign indicates deficit reducing one-off measures. (3) Cyclically adjusted and net of one-off and other temporary measures. |
The new estimates place the structural balance in 2025 at levels very close to those projected in the September Update (from -3.7 percent to -3.6 percent). The improvement in terms of balance change over the forecast time horizon now appears to be less pronounced in 2023 and more gradual, but steady over the planning horizon and in line with the speed required to approach the Medium-Term Objective also in 2024-2025.
| 22 | MINISTRY OF ECONOMY AND FINANCE |
III. STRUCTURAL BALANCES AND DEBT-TO-GDP RATIO | |
The ratio of interest expenditure to GDP increases further, albeit marginally, compared to the projections made at the end of September. On the other hand, there is a gradual improvement in the primary surplus. The cyclical adjustment continues to be unfavourable, with the exception of the year 2023 in which, due to the strong slowdown in growth, actual GDP grows less than potential GDP. Lastly, there is a slight revision of the amounts of one-off measures for 2022 and 2023.
The table on the so-called significant deviations shows, for information purposes, all figures relating to the assessment of compliance with European fiscal rules.
Assuming full compliance with the structural balance rule from 2023, the performance on the expenditure side of the rule is also positive.
| TABLE III.2: SIGNIFICANT DEVIATIONS | | | | | | | |
| Structural balance convergence towards the MTO | 2019 | 2020 | 2021 | 2022 | 2023 | 2024 | 2025 |
| Net borrowing | -1.6 | -9.5 | -7.2 | -5.6 | -4.5 | -3.7 | -3.0 |
| Medium Term Objective (MTO) | 0.0 | 0.5 | 0.5 | 0.5 | 0.3 | 0.3 | 0.3 |
| Structural balance | -1.9 | -5.0 | -6.3 | -6.1 | -4.8 | -4.2 | -3.6 |
| Annual change in structural balance | 0.4 | -2.9 | -1.3 | 0.2 | 1.3 | 0.6 | 0.6 |
| Required change in structural balance (*) | 0.4 | -0.2 | 0.5 | 0.6 | 0.6 | 0.6 | 0.6 |
| Deviation of structural balance from required annual change (<0.5 pp) | 0.4 | -2.7 | -1.8 | -0.4 | 0.7 | 0.0 | 0.0 |
| Average change in structural balance (over two years) | 0.1 | -1.3 | -2.1 | -0.6 | 0.8 | 0.9 | 0.6 |
| Average change required | 0.4 | 0.1 | 0.2 | 0.6 | 0.6 | 0.6 | 0.6 |
| Deviation of the structural balance from the required average change (<0.25 pp) | -0.2 | -1.4 | -2.3 | -1.1 | 0.2 | 0.3 | 0.0 |
| Expenditure rule | 2019 | 2020 | 2021 | 2022 | 2023 | 2024 | 2025 |
| Growth rate of the reference expenditure aggregate (%) | 1.2 | 9.7 | 5.2 | 6.5 | 0.1 | 1.2 | 1.2 |
| Benchmark modulated on prevailing cyclical conditions (%) (**) | 0.7 | 1.9 | 0.4 | 1.8 | 3.6 | 2.3 | 1.6 |
| Deviation of expenditure aggregate from required annual change (<0,5 p.p.) | -0.4 | -4.1 | -2.4 | -2.2 | 1.6 | 0.5 | 0.2 |
| Deviation of expenditure aggregate from required 2-year average change (<0,25 p.p.) | -0.5 | -2.2 | -3.2 | -2.3 | -0.3 | 1.1 | 0.3 |
* For the 2020-2023 period, the activation of the general escape clause of the Stability and Growth Pact is considered. In addition, for 2020 the flexibility granted due to exceptional safeguard and territorial safety measures applies. ** The benchmark takes into account the required change in the structural balance. |
Until the end of 2022, the necessity to make emergency and largely extraor-dinary expenditures altered the reading of the underlying trend of public spend-ing. This occurred in the two-year period 2020-2021 due to the crisis caused by the pandemic. Then, in the course of 2022, the need to compensate households and businesses for the entirely unprecedented increases in energy prices gradually took over. The policy measures for 2023, which lead to higher expenditure com-pared to the existing legislation profile of public finance, still largely respond to this logic. However, they do not have a negative impact on the indicators for that year, while their intensity is reduced compared to 2022. It should also be noted that for 2023, part of the increase in expenditure is associated with the adjust-ment of pensions and other social benefits to the rate of inflation. Considering the fact that the expenditure rule significantly restricts the growth of the reference aggregate (the allowed value is indicated by the benchmark variable in Table III.2)
| MINISTRY OF ECONOMY AND FINANCE | 23 |
| | UPDATE OF THE ECONOMIC AND FINANCIAL DOCUMENT 2022 |
so as to determine the alignment of the budget balance towards the Medium-Term Objective, the level of compliance achieved is an excellent result.
Note that the public finance recommendation for Italy for 2023 does not concern compliance with the traditional rules of the preventive arm of the SGP but requires that the indicator used to calculate fiscal stance does not have an expansionary connotation. This essentially requires that the relevant expenditure aggregate, corresponding to the nationally financed current expenditure, should grow less than nominal potential GDP.
The Commission's request corresponds to a slightly modified configuration of the expenditure rule. The fiscal stance calculation differs from the rule mainly for three reasons: it does not include investment spending, which is regarded favourably in this phase characterised by the implementation of the RRP; it does not take into account the need to move towards the Medium-Term Objective, thus being less challenging in terms of fiscal consolidation; it requires that extraordinary and temporary expenditure items related to the need to tackle the pandemic crisis be subtracted from the expenditure aggregate.
This last subdivision of expenditure, which results in the disaggregation of emergency and temporary measures, is related to the objective of identifying a permanent expenditure component that, in order to ensure the sustainability of public finance, should not grow more than the GDP trend. The introduction from 2022 of new extraordinary measures related to energy prices further complicated the calculation of the relevant aggregate.
The Commission readily acknowledged the need for fiscal policy to address the new emergency with targeted and temporary measures and invited the Member States to provide a detailed quantification of such measures. Then, following technical discussions, it became clear that only measures that are both temporary and targeted would be deducted from the expenditure aggregate. These would not include, for example, measures for the temporary reduction of excise duties on fuels, since they are not targeted at a specific group of consumers; on the other hand, means-tested measures would be subtracted from the aggregate.
The need to make this distinction, if confirmed, would be added to the elements that complicate the calculation of the aggregate already highlighted in the Stability Programme and the September Update. These concern the correct identification within the budget of the temporary and emergency component of certain expenditure items and the difficulty of verifying in the final balance the amounts actually disbursed against the figures initially allocated.
The internal estimates under the existing legislation scenario made at the
time of the previous Update showed a positive fiscal stance for current
expenditure in 2023; the value was therefore favourable3. The increase in
___
3 For the sake of clarity, below is what has already been clarified in the September Update. The expenditure aggregate relevant for the assessment of fiscal stance is equal to total general government expenditure net of interest, unemployment benefits, temporary expenditure and emergency expenditure. The fiscal stance is then calculated as the difference between the actual expenditure aggregate and what it should have been based on the potential GDP growth rate and inflation. The higher expenditure is then adjusted for the change in discretionary revenue. If the fiscal stance indicator has a negative sign, the budget impact on the economy is expansionary: the higher expenditure is not financed by the higher discretionary revenue. By subtracting the resources received from
| 24 | MINISTRY OF ECONOMY AND FINANCE |
III. STRUCTURAL BALANCES AND DEBT-TO-GDP RATIO | |
expenditure for that year results in a slight weakening of the positive sign. However, the updated estimates indicate - until the end of 2025 - a value still close to 1. Removing, as the Commission intended, the above-mentioned temporary and targeted expenditure from the relevant aggregate would alter the value of the fiscal stance indicator within the three-year period between 2022 and 2024, although it would not change the underlying indication of an appropriate behaviour of current expenditure at the policy level.
| III.2 | EVOLUTION OF THE DEBT-TO-GDP RATIO |
As mentioned above, the target for the general government net borrowing-to-GDP ratio for 2022 is confirmed at 5.6 percent, the level set in the April Stability Programme. The new policy scenario envisages the nominal deficit to further de-cline to 4.5 percent in 2023, to 3.7 percent of GDP in 2024 and to 3.0 percent in 2025, as a result of the fiscal measures that the Government is preparing to intro-duce with the next public finance manoeuvre for the 2023-2025 period.
A decline in the gross debt-to-GDP ratio in the current year is confirmed by the updated policy scenario. The decline is more pronounced than envisaged in the Sta-bility Programme. The target for the debt-to-GDP ratio is in fact expected to fall from 150.3 percent in 2021 to 145.7 percent in 2022 (147.0 percent in the Stability Programme).
The new policy targets for the debt-to-GDP ratio for the next three years are also on average about 0.6 percentage points lower than those reported in the Sta-bility Programme. This is due to a stronger dynamic of nominal GDP under policy scenario and an improvement in the general government primary balance. These positive factors more than offset the rise in the implicit financing cost of debt re-sulting from higher yields on fixed-income government bonds and higher inflation adjustments for securities indexed to consumer prices.
In 2023 and 2024, the general government gross debt in the policy scenario is expected to stand at 144.6 percent and 142.3 percent of GDP respectively, while in 2025, the final year of the projection, it is expected to stand at 141.2 percent, slightly below the DEF target of 141.4 percent.
Net of Italy's share of loans to EMU Member States, bilateral or through the EFSF, and of the contribution to the capital of the ESM, in 2025 the policy forecast will stand at 138.6 percent.
___
the European Union, it is possible to calculate the impact deriving from public expenditure financed only with national resources. For a complete description of the expenditure aggregate under analysis and the calculation of fiscal policy stance, see the Focus on 'The fiscal policy stance and measurement proposals' on p. 78 of the Update 2021.
| MINISTRY OF ECONOMY AND FINANCE | 25 |
| | UPDATE OF THE ECONOMIC AND FINANCIAL DOCUMENT 2022 |
| TABLE III.3: GENERAL GOVERNMENT DEBT BY SUB-SECTOR (1) (EUR millions and as % of GDP) |
| | 2021 | 2022 | 2023 | 2024 | 2025 |
| Gross of Euro Area financial support (2) | | | | | |
| General government | 2,678,098 | 2,772,542 | 2,883,685 | 2,971,878 | 3,047,772 |
| % of GDP | 150.3 | 145.7 | 144.6 | 142.3 | 141.2 |
| Central government (3) | 2,601,834 | 2,694,153 | 2,805,436 | 2,893,839 | 2,970,097 |
| Local governments (3) | 119,437 | 121,561 | 121,422 | 121,211 | 120,848 |
| Social security funds (3) | 95 | 95 | 95 | 95 | 95 |
| Net of Euro Area financial support (2) | | | | | |
| General government | 2,620,773 | 2,715,717 | 2,827,361 | 2,916,054 | 2,992,681 |
| % of GDP | 147.1 | 142.7 | 141.8 | 139.6 | 138.26 |
| Central government | 2,544,509 | 2,637,329 | 2,749,112 | 2,838,015 | 2,915,007 |
| Local governments | 119,437 | 121,561 | 121,422 | 121,211 | 120,848 |
| Social security funds (3) | 95 | 95 | 95 | 95 | 95 |
(1) Note: Any inaccuracies are due to rounding. (2) Gross or net of Italy's shares of loans to EMU Member States, either bilaterally or through the EFSF, and the contribution to the capital of the ESM. At the end of 2021 the amount of these shares amounted to approximately 57.3 billion, of which 43.0 billion for bilateral loans and through the EFSF and 14.3 billion for the ESM programme (see Bank of Italy, 'Statistical Bulletin Public Finance, Borrowing Requirement and Debt' of 14 October 2022). It is assumed that the MEF's cash holdings will be reduced by approximately 0.2 percent of GDP in 2022 and by ap¬proximately 0.1 percent of GDP in each subsequent year, with the aim of taking back the stock towards the level of end of 2019. In addition, estimates take into account the repurchase of SACE, the deployment of earmarked assets, EIB guarantees and loans under the SURE and NGEU programmes. The interest rate scenario used for the estimates is based on the implicit forecasts derived from the forward rates on Italian government bonds for the period in which this document was compiled. (3) Gross of liabilities vis-à-vis other sub-sectors. |
| III.3 | THE DEBT RULE AND OTHER RELEVANT FACTORS |
The evolution of the debt-to-GDP profile over the planning horizon does not deviate significantly from the existing legislation projections of the September Update. Therefore, it remains confirmed that, prima facie, the debt rule does not appear to be met in a strict sense.
In this regard, note that in the spring months, the Commission, when assessing the Stability Programmes and defining the fiscal recommendations, argued that compliance with the rule would entail an excessive fiscal effort compared to the current economic conditions, which are conditioned by the consequences of the COVID-19 pandemic and, ultimately, by Russia's invasion of Ukraine.
Given these circumstances, the Commission did not propose to initiate new excessive deficit procedures. Table III.4 shows the gap compared to the three alternative formulations of the rule (forward-looking benchmark, backward-looking benchmark and cyclically adjusted debt). The table shows, for each configuration of the rule, the minimum fiscal adjustment required to achieve compliance over three years, i.e., the adjustment that should have been achieved in the previous year (t-1) and the adjustment to be achieved in the current year (t) and in the first forecast year (t+1), respectively. It is evident that such a result is not achievable.
| 26 | MINISTRY OF ECONOMY AND FINANCE |
III. STRUCTURAL BALANCES AND DEBT-TO-GDP RATIO | |
| TABLE III.4: COMPLIANCE WITH THE DEBT RULE: FORWARD LOOKING APPROACH AND CYCLICALLY ADJUSTED DEBT |
| | Policy | Existing legislation |
| | 2021 | 2022 | 2023 | 2021 | 2022 | 2023 |
| Debt in year t+ 2 (% of GDP) | 144.6 | 142.3 | 141.2 | 143.3 | 141.4 | 140.2 |
| Gap compared to backward-looking benchmark (% of GDP) | 16.7 | 7.3 | 3.2 | 16.7 | 6.9 | 2.1 |
| Gap compared to forward-looking benchmark (% of GDP) | 3.2 | 11.9 | 12.0 | 2.1 | 11.0 | 11.1 |
| Cyclically adjusted debt gap (% of GDP) | 7.6 | 1.1 | 15.2 | 7.6 | 0.7 | 13.6 |
The evolution of public finance and debt sustainability profiles will continue to be monitored by the Commission in the European Semester, also in light of the new autumn forecasts (currently to be published on 11 November). In this phase, non-compliance with the debt rule will, once again, not be the determining factor for the possible launch of procedures. Lastly, the Commission's intention to go beyond the debt rule, at least in its current formulation, is once again underlined.
For the sake of brevity, Chapter III does not contain the usual section on the sensitivity of public finance and the debt profile over the medium term. The sustainability profiles over a time horizon longer than the four-year planning horizon, which extends to 2033, remain essentially unchanged compared with the existing legislation projections made in September. The 10-year projections of public debt made using the same methods adopted for the three scenarios presented in the Update give similar results4. Similarly, since the publication of the September Up-date, the risks underlying the forecast have not changed.
___
4 See 'Medium-term projections of the Debt-to-GDP ratio', on pages 89 and 90 of the September Update. In the medium-term projection (starting in 2026), the slightly higher level of interest rates, which leads to higher expenditure, is offset by the improved starting level of the structural primary balance relative to 2025.
| MINISTRY OF ECONOMY AND FINANCE | 27 |
The Update of the
ECONOMIC AND FINANCIAL DOCUMENT 2022
is available on-line
at the internet address listed below:
www.mef.gov.it www.dt.tesoro.it/ www.rgs.mef.gov.it
ISSN 2240-3280