| | | |
| | | UPDATE OF THE |
| | | |
| | | Economic and Financial Document |
| | | |
| | | 2022 |
| | Abridged version |
| | | UPDATE OF THE |
| | | Economic
and Financial Document |
| | | |
| | | 2022 |
| | | |
| | | Abridged version |
| | | |
| | | |
| | | |
| | | |
| | | |
| | | |
| | | Submitted by Prime Minister |
| | | |
| | | Mario Draghi |
| | | |
| | | |
| | | and Minister of the Economy and Finance |
| | | |
| | | Daniele Franco |
| | | |
| | | |
| | | |
| | | |
| | | |
| | Approved by the Cabinet on 28 September 2022 |
FOREWORD
This Update of the Economic and Financial Document was submitted to, and approved by, the Italian Council of Ministers in compliance with national legislation on economic and financial planning1. The analysis of current trends and the fore-casts for the Italian economy and the public finances presented here are confined to the baseline scenario under existing legislation. The next government will set the public finance targets for the 2023-2025 period and subsequently draft the 2023 budget.
After the deep recession of 2020, the Italian economy experienced a strong recovery, with six quarters of higher-than-expected growth, which in the second quarter of this year took GDP 0.6 percentage points above the average level of 2019, the year before the outbreak of the pandemic. In a context in which the health emergency subsided and related restrictions were gradually lifted, the recovery was supported not only by consumption, with a strong contribution from tourist services in the most recent phase, but also by investments and exports, demonstrating the regained dynamism of the economy. In the first seven months of this year, the average level of employment rose by 3.1 percent over the same period in 2021, surpassing the pre-pandemic level.
Nevertheless, the economic outlook appears less favourable. The summer months saw a worsening of business confidence and a softening of several economic indicators, including the industrial production index.
The global and European economies are experiencing a marked slowdown that can be attributed to two main factors.
The first is the rise in energy prices, due not only to the recovery in global demand, but also, and above all, to the policy of rationing natural gas supplies to Europe that has been followed by Russia since last year and then hardened after the attack against Ukraine, also in response to EU sanctions.
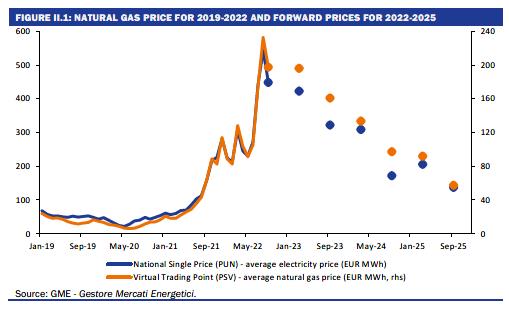
In recent months, the reduction in the supply of natural gas and fears of a complete blockage of inflows from Russia, as well as the rush of European countries to fill their storages in view of the winter season, have caused the price of natural gas to rise further. Given the key role of gas in electricity generation, its rising cost, coupled with the negative impact of the drought on hydropower production and the temporary shutdown of several French nuclear power plants, pushed Euro-pean electricity prices to new highs. Recent data on Italian industrial production shows that energy-intensive sectors have experienced the largest output falls.
The second cause of slowing global growth, which is closely linked to the first, is the rising inflation rate. Inflation has reached its highest level in forty years,
___
1 The Economic and Financial Document comprises several economic policy documents, including those that are foreseen by the European Semester, namely the Stability Programme and the National Reform Programme.
| MINISTRY OF ECONOMY AND FINANCE | 1 |
| | UPDATE OF THE ECONOMIC AND FINANCIAL DOCUMENT 2022 |
hurting households’ real incomes, and has also prompted central banks to end their expansionary policies and to embark on a series of interest rate hikes unprece-dented in recent decades, particularly in the case of the US Federal Reserve.
Rate hikes make the economic outlook more complex, not least because of the speed whereby it was implemented. It will have a downward impact on economic activity and real estate markets.
In Italy, the rise in interest rates is compounded by the widening of the spread between our government bonds and the Bund, which has risen by 150 basis points on the 10-year maturity compared with a year ago, peaking at over 250 basis points this month.
Soaring energy prices have boosted the value of our energy imports to an un-precedented extent. After almost ten years of uninterrupted surpluses, Italy’s trade balance will show a deficit in 2022. In the first seven months of the year, while the trade balance excluding energy recorded a surplus of over 46 billion, the energy balance recorded a deficit of 60 billion, more than three times higher than in the same period of 2021. This is a huge transfer of resources to energy-producing countries, including Russia, which highlights the fact that the ecological transition is crucial not only from an environmental point of view, but also for the country’s economic and social security and resilience.
At the same time, rising inflation has resulted in tax revenue dynamics that far exceeded previous official projections. The Government has monitored this trend and used the additional revenue generated to lower electricity and gas bills, support the most vulnerable households and businesses most affected by rising en-ergy prices, and mitigate fuel price increases.
As part of the numerous measures introduced in 2022 (amounting to approxi-mately 66 billion), substantial resources have been allocated to counteract the increase in energy costs, without changing the planned net borrowing target of the general government, set at 5.6 percent of GDP for 2022. This is more than 53 billion worth of interventions, including the one-off subsidies provided for the most vul-nerable households, in addition to 3.8 billion already earmarked to counter the rise in energy prices in the 2022 budget. Altogether, this amounts to around 57 billion, or 3.0 percent of GDP (up from 2021 5.5 billion interventions in 2021).
According to ISTAT estimates, the measures to lower the cost of energy for households and businesses have reduced the increase in the inflation rate by more than one percentage point, mitigating not only the loss of purchasing power of households, but also the risk of a price-wage spiral. In addition, other financial support was provided to a wide range of citizens, with contribution relief and pen-sion revaluations. Measures were implemented to support local governments and the health sector. As part of the measures planned to support the productive sys-tem, industry and innovation, industrial policy interventions were arranged, such as the introduction of support for the transformation of the automotive sector, the reintroduction of incentives for the purchase of zero- or low-polluting emission vehicles, and the provision of a fund to support the semiconductor industry.
In response to the humanitarian emergency caused by Russian aggression, fi-nancial aid was also provided to Ukraine, and resources were allocated for assis-tance to Ukrainian refugees in Italy. These interventions were conducted as part
| 2 | MINISTRY OF ECONOMY AND FINANCE |
of the international initiatives in support of Ukraine, which were coordinated at the EU and G7 level.
At the same time, in pursuit of the fundamental objectives of decarbonisation and energy security, Italy and Europe are committed to diversifying natural gas procurement and accelerating the development of renewable energy sources. These actions will rebalance the European natural gas market and lead to a nor-malisation of prices. The recovery of Italian natural gas production and the devel-opment of biofuels will further contribute to the security and resilience of our energy system.
The Recovery and Resilience Plan (RRP) has endowed the country with substan-tial resources to promote the ecological and digital transition, relaunch growth, and improve social, regional, generational and gender inclusion. The implementa-tion of the Plan is progressing in line with the stages agreed with the European Commission, which has given the go-ahead for the disbursement to Italy of the second instalment of grants and loans, amounting to 21 billion, related to the 45 objectives achieved in the first half of the year. Some of these relate to progress in implementing the important reform agenda contained in the Plan, particularly in the areas of justice, public administration and procurement. Significant progress was also made on the 55 targets to be completed by the second half of the year.
The amount of resources actually spent on RRP projects in the course of this year will be lower than the projections presented in the DEF due to the delayed start-up of some projects; in addition to the time needed to adapt to the RRP’s innovative procedures, this reflects the effects of the soaring costs of public works. On the latter front, the Government has intervened to increase the funds allocated to compensate for the higher costs, both for works in progress and for that of the Plan.
The most recent estimates indicate that, of the 191.5 billion allocated to Italy by the European Recovery and Resilience Facility, about 21 billion will actually be spent by the end of this year. This leaves approximately 170 billion to be spent in the next three and a half years, which is an impressive volume of resources. If fully utilised, they will make a significant contribution to economic growth from 2023 onwards, the year in which, according to the new assessments, the most significant increase in RRP-funded expenditure will occur.
In addition to the implementation of the RRP, growth will be supported by the resources provided by REACTEU and the national supplementary fund, and by the implementation of the strategy for energy savings, diversification of natural gas supply sources, and the development of renewables, which the Government has developed in line with the European Commission’s REPowerEU plan.
As in previous planning documents, the economic forecasts presented in this Update are based on a prudential approach and have been endorsed by the Parlia-mentary Budget Office for the 2022-23 period. Even in the current difficult con-text, we believe there is room for these forecasts to be exceeded.
The coming months will be complex in light of geopolitical risks and the likely continuation of high energy prices. However, the resources available to the country to revive public investment and promote private investment, both in new plants and in innovation, are unprecedented in recent history and will be able to generate
| MINISTRY OF ECONOMY AND FINANCE | 3 |
| | UPDATE OF THE ECONOMIC AND FINANCIAL DOCUMENT 2022 |
sustainable, high growth, thus ending the economy’s long period of substantial stagnation.
The GDP growth forecast for this year has been revised upwards, to 3.3 percent from 3.1 percent in the DEF policy scenario, thanks to the higher-than-expected growth recorded in the first half of the year and despite a slight fall in GDP in the second half of the year. On the other hand, the weakening of the international and European cycle has affected the growth forecast for 2023, which has fallen to 0.6 percent from the 2.4 percent indicated in the DEF. GDP growth forecasts for 2024 and 2025 remain unchanged from the DEF, at 1.8 and 1.5 percent respectively.
These forecasts obviously do not take into account the economic policy action that may be implemented with the next budget law and other measures.
The forecast update also shows an upward shift in the path of inflation and wage growth; however, the inflation rate is still expected to start falling by the end of this year. In contrast to the situation to date, the GDP deflator is expected to catch up with consumer inflation and slightly exceed it in 2024. Higher deflator dynamics result in nominal GDP developments that are equal to those projected in the DEF for 2023 and higher for the following two years.
In the updated projections for 2022, public finance benefits from the positive revenue performance and the moderation in primary expenditure recorded so far this year, while it is affected by the impact on debt servicing of the increase in interest rates and the revaluation of the notional amount of inflation-indexed gov-ernment bonds. Nonetheless, trend net borrowing at existing legislation falls by more than two percentage points compared with last year, from 7.2 percent to 5.1 percent of GDP (compared with the policy target of 5.6 percent), thanks to a marked improvement in the primary balance, which has fallen to -1.1 percent of GDP, from -3.7 percent in 2021.
In 2023, the adjustment to this year’s high inflation will increase pension ex-penditure, the effects of rising interest rates will persist, and public investment will accelerate, as mentioned with reference to the RRP. The remaining compo-nents of primary expenditure, on the other hand, will have a moderate dynamic; revenues will continue to grow at a good pace, albeit lower than in 2022 due to the decline in nominal growth. The net borrowing at existing legislation is projected at 3.4 percent of GDP, below the DEF policy target (3.9 percent). Interest expendi-ture will be 3.9 percent of GDP. The primary balance will show a surplus of 0.5 percent of GDP, whereas the DEF projected a deficit of -0.8 percent of GDP.
As regards 2024 and 2025, an overall moderate trend in current primary ex-penditure and a high dynamic of public investment have been confirmed, which will rise to 3.7 percent of GDP in 2025, from an average of 2.7 percent in 2021-22. Tax revenues will grow moderately in 2024 and more rapidly in 2025. All this will result in a positive primary balance in 2024 (0.2 percent of GDP) and 2025 (0.7 percent of GDP), both better than the DEF projections (-0.3 percent and 0.2 per-cent relative to GDP, respectively). However, given an interest expenditure of 3.8 percent of GDP in 2024 and 3.9 percent of GDP in 2025, net borrowing at existing legislation would rise to 3.5 percent of GDP in 2024, and then fall back to 3.2 percent of GDP in 2025.
Overall, compared to the DEF, the general government primary balance pro-jections for 2022-25 have improved, while interest expenditure has increased. This
| 4 | MINISTRY OF ECONOMY AND FINANCE |
results in lower deficit-to-GDP levels in 2022 and 2023 and slightly higher deficits in 2024 and 2025 compared to the spring forecast.
The public debt-to-GDP ratio is projected to fall sharply this year, from 150.3 percent in 2021 (as revised down by 0.5 percentage points thanks to the new ISTAT data on nominal GDP) to 145.4 percent, and then decline to 139.3 percent in the final year of the projection, 2025. These levels are lower than those projected in the DEF by about two percentage points over the 2022-25 four-year period.
In conclusion, the public finance trends presented in this document are reas-suring, although debt servicing co are rising. In 2024, the Stability and Growth Pact – in the version that will result from a consultation that the European Commission will soon open on the basis of its proposal to reform fiscal rules – will come back into force.
The Government concludes its work in a very complex geopolitical and eco-nomic phase, but with clear signs of renewed vigour of the Italian economy. Our wish is that the recovery that started after the pandemic crisis will continue and consolidate, supported by private and public investments, higher employment rates and a higher productivity dynamic – and in the context of a gradual reduction of the deficit and of the public debt ratio.
Daniele Franco
Minister of Economy and Finance
| MINISTRY OF ECONOMY AND FINANCE | 5 |
| 6 | MINISTRY OF ECONOMY AND FINANCE |
INDEX
| I. | RECENT TRENDS IN THE ECONOMY AND PUBLIC FINANCE |
| | |
| II. | MACROECONOMIC SCENARIO UNDER EXISTING LEGISLATION |
| | |
| II.1 | UPDATE OF GDP FORECAST IN LIGHT OF NEW EXOGENOUS FACTORS |
| II.2 | NATURAL GAS CONSUMPTION AND SUPPLY SCENARIO |
| II.3 | INFLATION AND OTHER MAIN VARIABLES IN THE FORECAST UNDER EXISTING LEGISLATION |
| II.4 | RISKS TO THE FORECAST |
| | |
| III. | PUBLIC FINANCE SCENARIO UNDER EXISTING LEGISLATION |
| | |
| III.1 | THE EXPECTED PERFORMANCE OF NET BORROWING |
| III.2 | STRUCTURAL BALANCE AND FISCAL STANCE INDICATORS |
| III.3 | DEBT-TO-GDP RATIO AND THE DEBT RULE |
| III.4 | SENSITIVITY ANALYSES ON PUBLIC FINANCE AND DEBT-TO-GDP RATIO PROJECTIONS IN THE MEDIUM TERM |
| | |
| IV. | REFORMS AND RECOMMENDATIONS OF THE COUNCIL OF THE EUROPEAN UNION |
| | |
| IV.1 | PURSUING A PRUDENT FISCAL POLICY (CSR 1) |
| IV.2 | IMPLEMENTATION OF RRP AND FINALISATION OF THE NEGOTIATIONS FOR THE 2021-2027 COHESION POLICY INSTRUMENTS (CSR 2) |
| IV.3 | REDUCING THE USE OF FOSSIL FUELS, DIVERSIFYING ENERGY IMPORT, DEVELOPING RENEWABLE ENERGIES (CSR 3) |
| | |
| V. | ANNEX |
| MINISTRY OF ECONOMY AND FINANCE | 7 |
| | UPDATE OF THE ECONOMIC AND FINANCIAL DOCUMENT 2022 |
| 8 | MINISTRY OF ECONOMY AND FINANCE |
I. RECENT TRENDS IN THE ECONOMY AND PUBLIC FINANCE
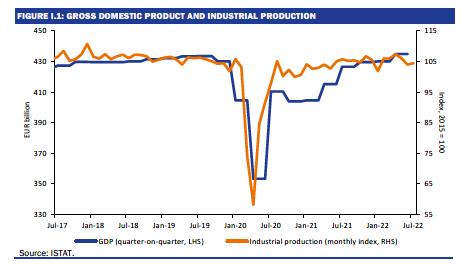
Gross domestic product (GDP) grew more than expected in the first half of the year, rising 0.6 percent above the average level of 2019, the year before the pandemic. After a cyclical slowdown to 0.1 percent in the first quarter (from 0.7 percent in the fourth quarter of 2021), a robust increase in GDP was recorded in the second quarter, up 1.1 percent over the previous period.
As a result of the good performance of the first half of the year, the GDP growth forecast for 2022 rises to 3.3 percent, up from the 3.1 percent in the Stability Programme, even though prospects for the second half are less favourable than anticipated in April2.
Indeed, amidst a weakening of global and European cyclical indicators, economic and inflation trends continue to be affected by the war in Ukraine and soaring prices of natural gas, electricity, fuels and food commodities, especially cereals.
The measures implemented this year by the government to lower energy bills and fuel prices and the aids provided to households and businesses amounted to 57.1 billion (3.0 percent of GDP) in gross terms. Despite this, energy bills for Italian
___
2 Based on data for the second quarter, the carry-over on the quarterly average figure for the current year is 3.5 percent. Including in the calculations the projection of a slight cyclical decline in GDP in the second half of the year, the average growth now expected on the quarterly data is 3.4 percent. However, due to fewer working days than in 2021, this estimate translates into a slightly lower annual GDP growth of 3.3 percent.
| MINISTRY OF ECONOMY AND FINANCE | 9 |
| | UPDATE OF THE ECONOMIC AND FINANCIAL DOCUMENT 2022 |
businesses and households continued to rise due to wholesale energy prices that in August peaked at 12 times the average for the five-year period 2016-2020 in the case of natural gas and almost 11 times in the case of electricity - an unprecedented price shock. Oil prices also followed an upward trend until June, peaking at USD 128 per barrel on the Brent benchmark in early March, only to recently fall back below USD 90 per barrel.
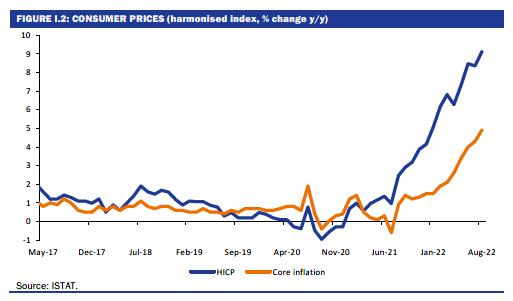
Driven by energy and food prices, inflation continued to rise, reaching 9.1 percent in August both in the euro area and in Italy, according to the Harmonised Index of Consumer Prices. The price increase progressively propagated from energy and food to the other components of the index, bringing core inflation (net of energy and fresh food) to 5.5 percent in August in the euro area and 4.9 percent in Italy.
The sudden rise in inflation prompted the major central banks to adopt restrictive monetary policy measures. The resulting rise in interest rates has been accompanied by a marked flattening of the yield curve. The markets expect the rise in inflation and the resulting monetary tightening to last no longer than two years, also based on the expected fall in energy prices and a slowdown in global growth.
The European Central Bank (ECB) was a few months late in following the restrictive moves of the US Federal Reserve and the Bank of England, however, as of 1 July it terminated its programme of purchases of fixed-income securities on the open market (quantitative easing - QE) and then raised its key interest rates by a total of 125 basis points in two stages (July and September), raising the main refinancing operations rate from zero to 1.25 percent. The ECB’s most recent macroeconomic forecast points to an inflation rate above the 2 percent target even over a two-year horizon, which would justify further increases in the key interest rates at the upcoming Governing Council meetings.
Aside from the surge in inflation, it should not be overlooked that the euro area unemployment rate fell to a new all-time low of 6.6 percent in July and the vacancy
| 10 | MINISTRY OF ECONOMY AND FINANCE |
I. RECENT TRENDS IN THE ECONOMY AND PUBLIC FINANCE | |
rate rose to 3.2 percent in the second quarter, while labour cost growth increased to 4.0 percent from 2.5 percent in the fourth quarter of 2021. In light of the stance on future monetary policy decisions communicated by the ECB itself, all this leads markets to expect further policy rate hikes. As a result, euro swap rates are currently 3.1 percentage points higher on the one-year maturity and almost 3 percentage points higher on the ten-year maturity compared to their level at the beginning of 2022.
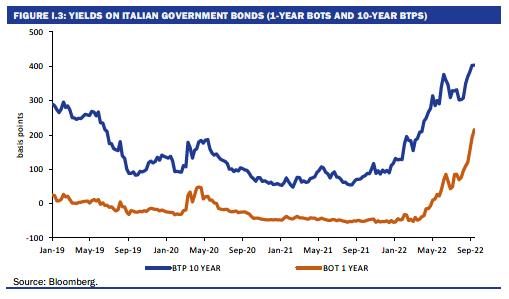
With regard to the Italian government bond market, the impact of the rise in euro rates was accompanied by the widening of the yield differential against the swap rate and the German Bund: the spread over the Bund on the ten-year maturity, which a year ago fluctuated around one percent, has recently risen to around 2.5 percent, resulting in the yield on the ten-year BTP currently standing at 4.7 percent, against 0.7 percent a year ago (while the Bund went from -0.32 percent to 2.21 percent).
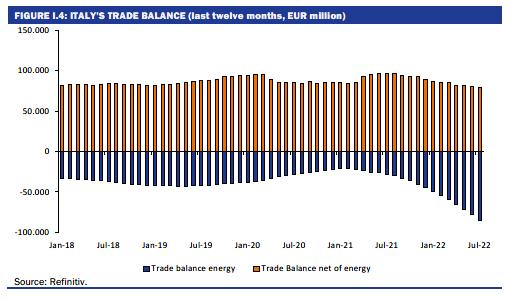
The energy shock also caused a sudden decline in Italy’s trade balance, as well as that of high surplus countries such as Germany. In the first seven months of 2022, Italy’s trade balance recorded a deficit of 13.7 billion, against a surplus of 37.5 billion in the same period last year, with the energy balance deteriorating to 60.0 billion from 19.4 billion in the first seven months of 2021. The non-energy trade balance, while remaining broadly in surplus from January to July (at 46.3 billion), also deteriorated by about 10 billion compared to the same period in 2021, due to both a decline in the terms of trade and a higher growth in import volumes than in export volumes3.
According to ISTAT data, export growth in nominal terms remained positive until the end of July. However, in terms of volumes, the performance of Italian
___
3 A decline in the terms of trade indicates a higher growth in import prices than in export prices. According to the latest ISTAT data, average unit export values in the first seven months grew by 1.1 percent on average.
| MINISTRY OF ECONOMY AND FINANCE | 11 |
| | UPDATE OF THE ECONOMIC AND FINANCIAL DOCUMENT 2022 |
goods exports was broadly positive in the first quarter, when exported volumes grew by 5.2 percent on a trend basis, only to slow down in the second quarter (-1.2 percent) and in July (-4.0 percent), mainly as a result of a slowdown in world trade.
Reflecting the decline in the trade balance, the balance of payments on current account in the first seven months of 2022 also recorded a deficit of 9.1 billion, against a surplus of 31.9 billion in the same period of 2021.
As mentioned, the unemployment rate in the euro area (and in the European Union) dropped to its lowest level in decades. The unemployment rate in Italy also dropped to 7.9 percent in July, the lowest level since 2009. According to the ISTAT labour force survey, the number of people employed in June and July exceeded 23.3 million, the highest figure since June 2019 and up 2 percent compared to the corresponding months of 2021. Due in part to the decline in the working-age population, the employment rate in June reached an all-time high of 60.4 percent, before slightly declining to 60.3 percent in July.
The results achieved so far in terms of GDP and employment growth were made possible not only by the dynamism of industry until the spring, but also by the considerable growth in the value added of the construction sector and the recovery of sectors that had previously been affected by social distancing measures. After peaking in January, new COVID-19 infections declined in the spring, only to rise again due to the spread of new sub-clusters of the Omicron variant. However, the rate of patients being hospitalised and in intensive care remained under control, allowing the process of normalisation of economic and social life to continue, with great benefits also in terms of foreign tourist arrivals.
As already mentioned, economic expectations and the performance of the manufacturing industry have worsened since the late spring. The most recent data point to a worsening of the international economic cycle during the third quarter: in August, the global PMI fell below the expansion threshold value of 50, more precisely to 49.3 from 50.8 in July and 53.5 in June, against the highest level of
| 12 | MINISTRY OF ECONOMY AND FINANCE |
I. RECENT TRENDS IN THE ECONOMY AND PUBLIC FINANCE | |
58.5 reached since the beginning of the pandemic in May last year. In the euro area, the composite PMI fell below the threshold value of 50 back in July (to 49.9), before falling further to 48.9 in August - with Germany recording the weakest figure (46.9) among the major euro area countries.
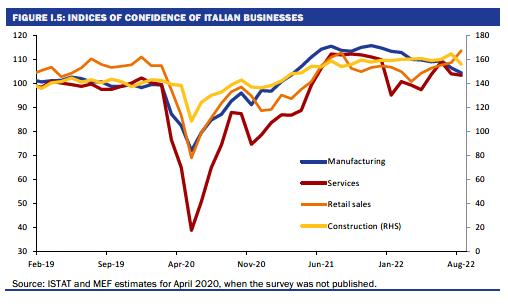
In Italy, the seasonally adjusted index of industrial production in June-July fell by 2.4 percent over the previous two months. In addition, both the ISTAT economic survey and the manufacturing PMI reported that in August companies’ assessments of current and expected levels of production and orders for the coming months declined. The indices of confidence in services and construction were also down, while the only positive note came from retail businesses, with the index recovering steadily from March onwards.
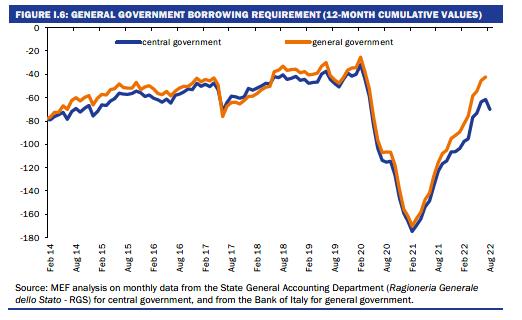
In terms of public finance, ISTAT’s institutional sector accounts indicate a sharp reduction of net borrowing of the general government in the first quarter, to 9.0 percent of GDP from 12.8 percent in the corresponding period of 2021 (in non-seasonally adjusted terms)4. The revenue trend was particularly positive in the first seven months of the year, with tax revenues increasing by 13.2 percent and contribution revenues by 6.4 percent.
A marked improvement in public finance is also reported by the borrowing requirement data, which amounted to 33.7 billion in the first eight months of the year, an improvement of about 36.4 billion compared to 70.2 billion in the corresponding period last year. Even excluding from the comparison the grants received in August 2021 and April 2022 from the Recovery and Resilience Facility, the reduction in cash requirements in the first eight months of the year amounted to 35.4 billion (a decrease of about 45 percent). This is a very positive result also in
___
4 With the exception of 2020, an anomalous year as it was marked by the first phase of the pandemic and massive fiscal policy interventions, the first quarter normally records the highest levels of net borrowing for the whole year. As mentioned in the report, quarterly debt figures are not seasonally adjusted.
| MINISTRY OF ECONOMY AND FINANCE | 13 |
| | UPDATE OF THE ECONOMIC AND FINANCIAL DOCUMENT 2022 |
light of the allocation of public resources for measures to lower energy prices and of aids to businesses and households carried out during the period in question.
| 14 | MINISTRY OF ECONOMY AND FINANCE |
II. MACROECONOMIC SCENARIO UNDER EXISTING LEGISLATION
| II.1 | UPDATE OF GDP FORECAST IN LIGHT OF NEW EXOGENOUS FACTORS |
As already mentioned, the GDP growth forecast for the current year in the new scenario under existing legislation improved from 3.1 percent to 3.3 percent compared to the Stability Programme policy scenario. On the contrary, the forecast for 2023 fell substantially, from 2.4 percent to 0.6 percent. The forecasts for 2024 and 2025 remained unchanged, at 1.8 percent and 1.5 percent, respectively.
With regard to nominal GDP - a very relevant variable for public finance projections and deficit, debt and GDP ratios - the forecasts have been revised upwards compared to the Stability Programme, with the only exception being in 2023, when the drop in projected real growth exceeds the upward revision of GDP deflator growth projections.
More specifically, based on ISTAT data for the first two quarters of the year, the most up-to-date internal evaluations suggest a slightly negative change in GDP in the third quarter as a result of a cyclical contraction in the value added of the manufacturing and construction industries, only partially offset by an increase in the services sector. As for the fourth quarter, the most up-to-date estimates point to a slight contraction of real GDP, primarily attributable to the industry sector.
The expected performance in the second half of this year results in only a slight positive carryover (0.1 percentage points) on growth in 2023. A further decline in GDP is expected in the first quarter, which would then be followed by a pick-up in economic activity from the second quarter onwards, driven by an increase in global demand, a fall in the price of natural gas (albeit still higher than under ‘normal’ conditions) and an increasing contribution of the National Recovery and Resilience Plan (RRP) to GDP growth.
The lower GDP growth forecast for 2023 compared to the Stability Programme, equal to 1.8 percentage points, is due not only to the recent decline in business and household projections, but also and above all to changes in the main exogenous variables of the scenario. The growth forecast for world trade was significantly reduced in line with the most recent projections provided by Oxford Economics; the imports of Italy’s main trading partners are now expected to grow by 1.5 percent in 2023, against the 3.4 percent forecast in the Stability Programme.
These forecasts do not, of course, take into account the economic policy measures that may be implemented with the next budget law and other actions.
With regard to energy prices, the profile outlined by the TTF natural gas futures contracts is significantly higher than the levels used for the Stability Programme
| MINISTRY OF ECONOMY AND FINANCE | 15 |
| | UPDATE OF THE ECONOMIC AND FINANCIAL DOCUMENT 2022 |
projections5. Expected Brent oil prices are also higher, albeit significantly behind the increase in gas prices.
Interest rates and yields on government bonds, as already mentioned, have risen sharply in recent months. Consequently, the forward rates and yields that are used for macroeconomic projections have also risen, with a negative impact on GDP that is marginal for this year but very significant for 2023 and relevant for the following years.
Of all the exogenous variables in the forecast, only the euro exchange rate is more competitive compared to the level used in the Stability Programme forecast and results in a more favourable impact on output growth. Overall, the impacts estimated with the ITEM model justify a downward revision of the real GDP growth forecast in 2023 by 1.9 percentage points.
Moreover, the most recent update of the public expenditure projections activated by the RRP with the resources of the Recovery and Resilience Facility (RRF) significantly lowers the estimate for 2022, while correspondingly increasing the expenditure projections in the final years of the Plan. Although the expenditure projection for 2023 is also slightly revised downward (while those for 2025-2026 go up), the expected change in 2023 expenditure tied to the RRP registers the highest upward revision compared to the data used in the Stability Programme (amounting to 12 billion). This leads to an estimated additional boost to GDP growth of 0.3 percentage points compared to the Stability Programme estimates.
| TABLE II.1: RRF RESOURCES UNDER THE FORECAST, COMPARISON THIS UPDATE – STABILITY PROGRAMME (EUR billion) |
| | 2020-2021 | 2022 | 2023 | 2024 | 2025 | 2026 |
| This Update 2022 | | | | | | |
| Total RRF | 5.5 | 15.0 | 40.9 | 46.5 | 47.7 | 35.9 |
| Annual change (levels) | 5.5 | 9.5 | 25.9 | 5.6 | 1.3 | -11.8 |
| Stability Programme 2022 | | | | | | |
| Total RRF | 4.3 | 29.4 | 43.3 | 47.4 | 41.7 | 25.5 |
| Annual change (levels) | 4.3 | 25.1 | 13.9 | 4.1 | -5.7 | -16.2 |
| This Update - Stability Programme differential |
| Total RRF | 1.2 | -14.4 | -2.4 | -0.9 | 6.1 | 10.5 |
| Annual change (levels) | 1.2 | -15.6 | 12.0 | 1.5 | 7.0 | 4.4 |
| Source: MEF. | | | | | | |
Overall, considering the change in exogenous factors and the RRP projections, the growth forecast for 2023 is expected to drop by 1.6 percentage points, from 2.4 percent in the Stability Programme policy scenario to 0.8 percent in the new scenario under existing legislation. However, it was decided to opt for a slightly more cautious forecast, i.e. the aforementioned 0.6 percent, due to two factors:
___
5 TTF stands for Title Transfer Facility, a virtual gas market operated by the Dutch company Gasunie and which is considered the main reference price for the European market. Gas traded on the TTF network must have already entered the Gasunie transport system and all trades between counterparties must be reported to the market operator. Futures on the FTT are traded via the Intercontinental Exchange (ICE) telematic market.
| 16 | MINISTRY OF ECONOMY AND FINANCE |
II. MACROECONOMIC SCENARIO UNDER EXISTING LEGISLATION | |
the first is that it is appropriate to take into account possible negative effects on the confidence of households and businesses in the complex geopolitical scenario expected for the coming months; the second is that the scenario presented is based on existing legislation and must take into account the fact that the measures to lower utility bills will only be in force until the end of 2022. A discontinuation of such measures would cause the cost of energy for businesses and households to rise at the beginning of 2023, which would have a negative impact on GDP, although simulations with the quarterly ITEM model indicate that GDP growth in 2023 will benefit from the delayed effects of the decree laws adopted in the second half of this year.
| TABLE II.2: MACROECONOMIC FRAMEWORK UNDER EXISTING LEGISLATION (% change, except where otherwise specified) |
| | 2021 | 2022 | 2023 | 2024 | 2025 |
| INTERNATIONAL EXOGENEOUS VARIABLES | | | | | |
| World Trade | 9.9 | 5.3 | 2.1 | 4.7 | 3.9 |
| Oil Price (Brent. USD/barrel. futures) | 70.8 | 101.5 | 89.9 | 83.4 | 79.0 |
| USD/EUR exchange rate | 1.183 | 1.050 | 1.002 | 1.002 | 1.002 |
| ITALY MACRO DATA (VOLUMES) | | | | | |
| GDP | 6.7 | 3.3 | 0.6 | 1.8 | 1.5 |
| Imports of goods and services | 14.7 | 14.3 | 1.9 | 4.3 | 3.4 |
| Domestic final consumption | 4.2 | 3.1 | 0.0 | 0.9 | 1.1 |
| Private consumption expenditure | 5.2 | 3.9 | 0.6 | 1.3 | 1.4 |
| Government consumption expenditure | 1.5 | 0.7 | -1.8 | -0.5 | 0.2 |
| Gross fixed capital formation | 16.5 | 9.2 | 3.0 | 4.1 | 2.7 |
| - machinery. equipment and intangible assets | 12.4 | 6.2 | 2.1 | 4.7 | 2.7 |
| - transportation means | 9.8 | 1.9 | 3.0 | 4.1 | 4.1 |
| - construction | 21.8 | 13.0 | 3.9 | 3.4 | 2.7 |
| Exports of goods and services | 13.4 | 10.4 | 1.5 | 4.2 | 3.3 |
| Memo item: Current account balance (% of GDP) | 2.4 | -0.8 | -0.2 | 0.2 | 0.9 |
| CONTRIBUTIONS TO GDP GROWTH (1) | | | | | |
| Net exports | 0.1 | -1.0 | -0.1 | 0.0 | 0.0 |
| Inventories | 0.3 | 0.2 | 0.0 | 0.1 | 0.1 |
| Domestic demand (excl. Inventories) | 6.3 | 4.1 | 0.7 | 1.6 | 1.5 |
| PRICES | | | | | |
| Imports of goods and services deflator | 9.7 | 20.9 | 4.3 | -0.2 | -0.9 |
| Exports of goods and services deflator | 5.0 | 11.2 | 4.3 | 1.3 | 0.9 |
| GDP deflator | 0.5 | 3.0 | 3.7 | 2.5 | 1.9 |
| Nominal GDP | 7.3 | 6.4 | 4.4 | 4.3 | 3.5 |
| Private consumption deflator | 1.6 | 6.6 | 4.5 | 2.3 | 1.9 |
| LABOUR | | | | | |
| Compensation of employees per FTE | 0.7 | 3.2 | 2.6 | 2.1 | 2.1 |
| Labour productivity (measured on GDP) | -0.8 | -0.9 | 0.2 | 0.7 | 0.5 |
| Unit labour cost (measured on GDP) | 1.5 | 4.2 | 2.4 | 1.4 | 1.6 |
| Employment (FTEs) | 7.6 | 4.3 | 0.4 | 1.1 | 1.0 |
| Unemployment rate | 9.5 | 8.2 | 8.0 | 7.7 | 7.5 |
| Employment rate (age 15-64) | 58.2 | 59.8 | 60.2 | 61.1 | 61.9 |
| Memo item: Nominal GDP (absolute values in EUR millions) | 1,782,050 | 1,896,182 | 1,979,197 | 2,064,350 | 2,136,555 |
(1) Any inaccuracies are due to rounding. Source: ISTAT. GDP and components in volume (chained linked values in reference year 2015), not seasonally adjusted data. |
| MINISTRY OF ECONOMY AND FINANCE | 17 |
| | UPDATE OF THE ECONOMIC AND FINANCIAL DOCUMENT 2022 |
| II.2 | NATURAL GAS CONSUMPTION AND SUPPLY SCENARIO |
As already mentioned, the scenario under existing legislation is based on natural gas prices derived from futures contracts on monthly maturities for the upcoming months of 2022 and for the years 2023-2025. With regard to Italian national consumption, which, according to data from the Italian Ministry of Economic Development (MISE), fell by 1.9 percent in the first seven months of 2022, a projection consistent with such prices, with the macro-sectoral composition of GDP growth, and with the expected trends in the composition of national electricity production has been drawn up. A sharper drop in natural gas consumption in the period from August to December is expected to bring the annual contraction in national consumption to -3.2 percent.
In 2023, a partial shift of electricity production towards other fossil fuels and biofuels and an increase in hydropower and other renewables, together with a decline in household consumption, would bring national gas consumption down by a further 4.4 percent, followed by a further slight decline of 0.3 percent in 2024. This would bring gross consumption in 2024 to a level almost 8 percent below that of 2021, which was at 76.1 billion standard cubic metres (SCM). In 2025, with the consolidation of the economic recovery, gross national consumption would increase by one percent over the previous year to a level just below 71 billion SCM.
With regard to supplies, the scenario under existing legislation predicts that imports of Russian gas will further decline, not completely cease. However, an alternative scenario based on a complete interruption of inflows from Russia starting in October was elaborated, as discussed below.
In the baseline scenario, inflows from the Tarvisio gas entry point, through which most of the import from Russia passes, would fall from 29.1 billion SMC in 2021 to 12.9 billion SMC this year and then gradually to only 3.8 billion SMC in 2025. The replacement of Russian-sourced gas would occur, besides through lower
| 18 | MINISTRY OF ECONOMY AND FINANCE |
II. MACROECONOMIC SCENARIO UNDER EXISTING LEGISLATION | |
consumption, through higher inflows from the two main southern gas pipelines (Algeria and TAP), a strong increase in liquefied gas imports (due to the gradual but significant increase in regasification capacity) and a moderate increase in domestic production. The increase in regasification capacity would take place both by increasing the production of the three main existing plants and through the acquisition of two floating units: for the former option, production is supposed to start in spring 2023, for the latter in early autumn 2024.
On 25 September, Italy’s natural gas storages were above 89.6 percent full. The 2022-2025 forecast scenario was constructed on a monthly basis for all variables of the national gas balance (production, imports, exports and consumption) by specifying volumes for all sources of supply in the national network and verifying that total storage does not fall below the level of the national strategic reserve (4.5 billion SCM) in any month of the year (the lowest level is normally reached at the end of winter). The projected import volumes for each access or regasification point are lower than the theoretical maximum capacity. However, the projection assumes that no major technical problems occur at any of the regasification plants and that a relatively high, albeit decreasing over time, gas inflow can be maintained from the Gries Pass entry point, through which gas from northern Europe arrives in Italy.
| II.3 | INFLATION AND OTHER MAIN VARIABLES IN THE FORECAST UNDER EXISTING LEGISLATION |
The main adjustments made compared to the Stability Programme concern inflation and external accounts. All these revisions are due to the sharp rise in energy and raw material prices, already extensively discussed, which has resulted in an acceleration of inflation even higher than expected and a sudden turnaround in the foreign trade balance - something that, moreover, affects Italy as well as other energy-importing countries.
The household consumption deflator and GDP deflator are revised upwards. As in the previous forecast, the average annual growth of the consumption deflator peaks in 2022, at 6.6 percent (from 5.8 percent in the Stability Programme), and then declines more slowly than previously forecast, experiencing a still high growth rate (4.5 percent) in 2023 and then falling to 1.9 percent in 2025. The deflator growth forecast for 2022 remains at 3.0 percent, up to 3.7 percent in 2023 (from 2.2 percent in the Stability Programme) and then down to 1.9 percent in 2025 (1.8 percent in the Stability Programme).
More specifically, the inflation rate under existing legislation is expected to start falling in the fourth quarter of this year, as price index levels, especially for the energy component, will compare with the already quite high levels of the last months of 2021. Core inflation should rise until the first quarter of next year, given the delayed adjustment of prices of other goods and services, before following the downward trend of the overall index. Labour costs per employee unit (private sector), which is slow to respond to the rise in inflation given contractual wage adjustment mechanisms, are expected to accelerate from 1.0 percent in 2021 to 3.5 percent this year and 3.7 percent in 2023, before slowing in the following two years down to 2.8 percent in 2025.
| MINISTRY OF ECONOMY AND FINANCE | 19 |
| | UPDATE OF THE ECONOMIC AND FINANCIAL DOCUMENT 2022 |
TABLE II.3: SYNTHETIC MACROECONOMIC FRAMEWORK UNDER EXISTING LEGISLATION (1) (percentage changes, unless otherwise indicated) |
| | | | | | |
| GDP | 6.7 | 3.3 | 0.6 | 1.8 | 1.5 |
| GDP deflator | 0.5 | 3.0 | 3.7 | 2.5 | 1.9 |
| Consumption deflator | 1.6 | 6.6 | 4.5 | 2.3 | 1.9 |
| Nominal GDP | 7.3 | 6.4 | 4.4 | 4.3 | 3.5 |
| Employment (FTEs) (2) | 7.6 | 4.3 | 0.4 | 1.1 | 1.0 |
| Employment (LF) (3) | 0.8 | 2.3 | 0.3 | 0.9 | 0.8 |
| Unemployment rate | 9.5 | 8.2 | 8.0 | 7.7 | 7.5 |
| Labour cost per FTE (4) | 1.0 | 3.5 | 3.7 | 3.3 | 2.8 |
| Current account balance (% of GDP) | 2.4 | -0.8 | -0.2 | 0.2 | 0.9 |
(1) Any inaccuracies are due to rounding. (2) Employment expressed in terms of Full-Time Equivalents (FTEs). (3) Number of employed people according to the Labour Force Survey (LFS). (4) Private sector. |
The forecasts for employment and unemployment are revised upwards, especially for this year, based on the data recorded in the first seven months of the year in terms of both growth in employment and drop in the unemployment rate. The latter is expected to fall from an average of 8.2 percent in 2022 to 7.5 percent in 2025.
The balance of current account in the balance of payments is expected to be in deficit in 2022 and 2023, before returning to a slight surplus in the following two years due mainly to falling natural gas (and to a lesser extent oil) prices.
The macroeconomic forecast under existing legislation was validated by the Parliamentary Budget Office in a note dated 23 September 2022, following the discussions provided for in the UPB-MEF Memorandum of Understanding of
13 May 2022.
| II.4 | RISKS TO THE FORECAST |
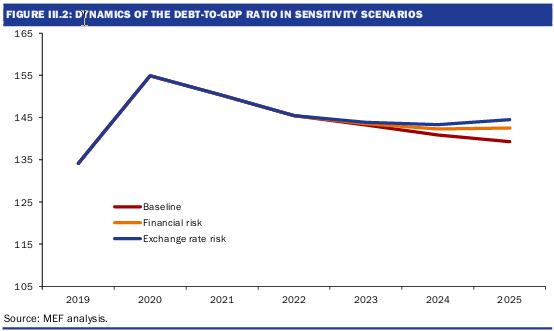
A number of risk scenarios for the main exogenous variables of the forecast are analysed, most notably a more pronounced fall in the growth of the economy and world trade (which would imply a recession in Europe), a strengthening of the weighted exchange rate of the euro in line with forward exchange rates, and a further widening of the spread between Italian government bonds and the Bund.
The results of the simulations show that if the first and third shocks mentioned (lower global growth and widening of the spread) were to occur at the same time, GDP would grow by 0.3 percentage points less than the forecast under existing legislation in 2023 (thus halving the growth forecast for that year), by 0.6 percentage points in 2024 (resulting in a lower growth rate for that year to 1.2 percent) and by 0.2 percentage points in 2025 (reducing growth to 1.3 percent). Even more unfavourable trends would occur if there were also a marked strengthening of the euro exchange rate, a scenario that could occur if, contrary to what has happened so far, the US economy and other economies outside the euro
| 20 | MINISTRY OF ECONOMY AND FINANCE |
II. MACROECONOMIC SCENARIO UNDER EXISTING LEGISLATION | |
area were to experience a more pronounced fall in inflation - and, presumably, employment - than in the euro area itself.
In addition to these standard simulations, the issue of natural gas supplies already addressed in the Stability Programme was again addressed. Compared to the end of March, when two risk scenarios centred on a price shock with or without a gas shortage were elaborated, developments in recent months have been more similar to the price shock scenario elaborated at the time: Russian gas inflows have continued but have been accompanied by sharp price rises in the face of a storage campaign by all European countries.
At present, given that storage capacity is close to the target percentage of 90 percent and that imports from Russia continued in September, albeit with much lower volumes than in the past, the highest risk scenario is that of a complete stop in supplies from October onwards. As in the scenario under existing legislation, it was assumed that the monthly level of storage would never fall below Italy’s strategic reserve.
The gap that would be created by the stop in imports from Russia could be partly filled by other sources of supply and partly by the contraction in consumption. Since in the scenario under existing legislation the volume of imports through the Tarvisio entry point will drop from an estimated 14.3 billion SCM in 2022 to 6.4 billion in 2023 and then gradually down to 3.8 billion in 2025, in order to compensate for the disappearance of these inflows, a moderate increase in the use of other supply sources combined with a reduction in consumption amounting to 4 billion SCM from October 2022 to the end of 2023 was assumed instead of the one envisaged in the scenario under existing legislation.
Since the reduction in consumption is significant but not macroscopic (about 5.4 percent of estimated annual consumption in 2022), it was decided to model it as a price shock coupled with a high degree of compliance by citizens and businesses with the recently presented Ministry of Ecological Transition (MITE) Consumption Containment Plan6. This means that further demand contraction and additional gas imports are mainly activated by a higher price level than in the scenario under existing legislation.
In the simulation performed using the MACGEM model, it was assumed that the complete stop in inflows from Russia would lead to a 20 percent increase in average natural gas, electricity and oil prices compared to the scenario under existing legislation in the fourth quarter of this year and in 2023. In 2024 and 2025, prices would be 10 percent and 5 percent higher, respectively. The simulation results indicate a cumulative contraction of 4.9 percent in 2022 and 2023 (and 7.7 percent in 2022-2025), which is only slightly lower than assumed necessary but could be supplemented by behavioural changes in response to the MITE Containment Plan.
With regard to macroeconomic impacts, the risk scenario described here yields lower GDP growth compared to the scenario under existing legislation amounting to 0.2 p.p. in 2022 and 0.5 p.p. in 2023, while it would be 0.4 p.p. higher in 2024 and 0.2 p.p. higher in 2025 due to a rebound effect. The nominal GDP growth rate would decline more moderately due to a stronger deflator, falling by 0.1 p.p. this year
___
6 Italian Ministry of Ecological Transition (Ministero della Transizione Ecologica, MITE), National Plan for the Containment of Natural Gas Consumption (Piano Nazionale di Contenimento dei Consumi di Gas Naturale), 6 September 2022.
| MINISTRY OF ECONOMY AND FINANCE | 21 |
| | UPDATE OF THE ECONOMIC AND FINANCIAL DOCUMENT 2022 |
compared to the scenario under existing legislation, by 0.3 p.p. in 2023 and rising by 0.2 pp. and 0.1 p.p. in 2024 and 2025, respectively. These impacts are much lower than those estimated in the Stability Programme risk scenarios. This reflects both the progress achieved, or expected in the next three years, in terms of alternative supplies and the inflows of natural gas from Russia in the first nine months of this year.
| 22 | MINISTRY OF ECONOMY AND FINANCE |
III. PUBLIC FINANCE SCENARIO UNDER EXISTING LEGISLATION
| III.1 | THE EXPECTED PERFORMANCE OF NET BORROWING |
As already mentioned, the trend in tax and social security revenues in the first seven months of 2022 was surprisingly upward despite the government’s impressive measures to mitigate the cost of energy, including through tax relief. The spike in imported energy prices and domestic inflation contributed significantly to the revenue growth, although the increase in GDP and employment also played their part.
The updated forecast of the general government account shows a growth in tax revenues in 2022 of 6.6 percent for direct taxes and 8.0 percent for indirect taxes. Social security contributions will rise by 7.9 percent. Due also to an increase in high current and capital revenues, total revenues will rise to 49.2 percent of GDP, up from 48.1 percent in 2021.
Regarding expenditure, contractual renewals in the public sector will lead to a 6.6 percent increase in expenditure on public wages and salaries. Intermediate consumption will increase by 6.3 percent, while social payments will rise by 2.9 percent and, among them, pension expenditure will rise by 3.9 percent. Other current expenditure (+29.3 percent) and interest payments (+17.9 percent) will increase significantly. The increase in the latter is due to both the rise in the cost of debt at issuance and the adjustment of the notional for inflation-indexed securities. Public investments are expected to contract slightly, -3.3 percent in nominal terms, after the 19.1 percent increase recorded in 2021, while private investment contributions will rise by 3.4 percent. Overall, primary expenditure (net of interest) is projected to fall to 50.3 percent of GDP, from 51.8 percent in 2021.
Given these forecasts, the primary balance in 2022 is projected to improve to -1.1 percent of GDP, from -3.7 percent in 2021, a better result than the -2.1 percent projected in the Stability Programme. On the other hand, interest expenditure is expected to increase to 4.0 percent of GDP, from 3.6 percent in 2021, significantly above the 3.5 percent estimated in the Stability Programme.
In summary, the projections show that net borrowing in 2022 will amount to 5.1 percent of GDP, half a percentage point lower than projected in the Stability Programme and certainly a very good result given the scale of the measures implemented by the government to support and help the economy and the increase in interest payments.
Looking at the trends based on existing legislation and forecast for the next three years, tax revenue growth is expected to slow in 2023 and the following years, with the exception of indirect tax revenues, which will accelerate in 2023. The total revenue to GDP ratio will rise slightly in 2023, up to 49.6 percent of GDP, and then decline in the following two years, down to 47.3 percent of GDP in 2025.
| MINISTRY OF ECONOMY AND FINANCE | 23 |
| | UPDATE OF THE ECONOMIC AND FINANCIAL DOCUMENT 2022 |
With regard to expenditure, in 2023 there will be a slight reduction in nominal terms in wages and intermediate consumption, while the adjustment for inflation this year will increase pension expenditure (+7.9 percent). Interest payments will grow, albeit less rapidly than this year (+3.7 percent). On the other hand, a strong increase in public investment is expected (+33.8 percent), mainly due to the launch of many RRP projects.
Overall, primary expenditure in 2023 will fall to 49.0 percent of GDP, below total revenues, thus bringing the primary balance to a surplus of 0.5 percent of GDP, a much better result than that projected in the Stability Programme (-0.8 percent of GDP). Although interest expenditure is projected at 3.9 percent of GDP, only slightly lower than the 2022 figure, the overall deficit will fall to 3.4 percent of GDP, half a percentage point lower than in the Stability Programme policy forecast.
With regard to the two-year period 2024-2025, the trend of primary current expenditure remains moderate overall and public investment remains high, and is expected to rise to 3.7 percent of GDP in 2025, from an average of 2.7 percent in 2021-2022. Tax revenues are expected to rise mildly in 2024 (+1.8 percent) and more decisively in 2025 (+3.6 percent).
This will result in a slightly positive primary balance in 2024 (0.2 percent of GDP) and in 2025 (0.7 percent of GDP), and both results are better than the Stability Programme projections (-0.3 percent and 0.2 percent of GDP, respectively). However, with an interest expenditure equal to 3.8 percent of GDP in 2024 and 3.9 percent of GDP in 2025, net borrowing will amount to 3.5 percent of GDP in 2024 and 3.2 percent of GDP in 2025.
The projected deficits for 2024-25 are both expected to exceed the Stability Programme projections (3.3 and 2.8 percent, respectively) and the 3 percent threshold. The latter is likely to remain the European benchmark for excessive deficits, despite the planned revision of fiscal rules. Note that the European Commission envisages the reactivation of the Stability and Growth Pact as of 2024.
| 24 | MINISTRY OF ECONOMY AND FINANCE |
III. PUBLIC FINANCE SCENARIO UNDER EXISTING LEGISLATION | |
| TABLE III.1: PUBLIC FINANCE INDICATORS (% of GDP) (1) |
| | 2020 | 2021 | 2022 | 2023 | 2024 | 2025 |
| POLICY SCENARIO | | | | | | |
| Net borrowing | | | | | | |
| Primary balance | | | | | | |
| Interest expenditure | | | | | | |
| Structural net borrowing (2) | | | | | | |
| Structural change | | | | | | |
| Public debt (gross of subsidies) (3) | | | | | | |
| Public debt (net of subsidies) (3) | | | | | | |
| TREND SCENARIO UNDER EXISTING LEGISLATION |
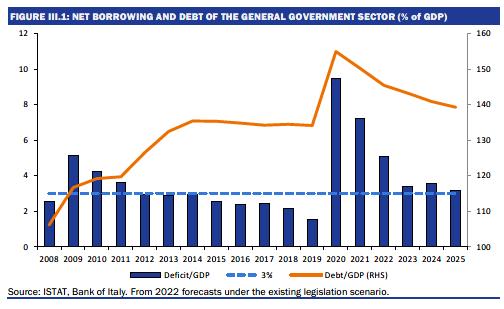
| Net borrowing | -9.5 | -7.2 | -5.1 | -3.4 | -3.5 | -3.2 |
| Primary balance | -6.0 | -3.7 | -1.1 | 0.5 | 0.2 | 0.7 |
| Interest expenditure | 3.5 | 3.6 | 4.0 | 3.9 | 3.8 | 3.9 |
| Structural net borrowing (2) | -5.0 | -6.4 | -5.5 | -3.6 | -3.9 | -3.7 |
| Structural change | -3.1 | -1.4 | 0.9 | 1.9 | -0.3 | 0.2 |
| Public debt (gross of subsidies) (3) | 154.9 | 150.3 | 145.4 | 143.2 | 140.9 | 139.3 |
| Public debt (net of subsidies) (3) | 151.4 | 147.1 | 142.5 | 140.4 | 138.2 | 136.7 |
| MEMO: POLICY SCENARIO OF THE STABILITY PROGRAMME 2022 |
| Net borrowing | -9.6 | -7.2 | -5.6 | -3.9 | -3.3 | -2.8 |
| Primary balance | -6.1 | -3.7 | -2.1 | -0.8 | -0.3 | 0.2 |
| Interest expenditure | 3.5 | 3.5 | 3.5 | 3.1 | 3.0 | 3.0 |
| Structural net borrowing (2) | -5.0 | -6.1 | -5.9 | -4.5 | -4.0 | -3.6 |
| Variation in structural balance | -3.0 | -1.1 | 0.2 | 1.4 | 0.5 | 0.4 |
| Public debt (gross of subsidies) | 155.3 | 150.8 | 147.0 | 145.2 | 143.4 | 141.4 |
| Public debt (net of subsidies) | 151.8 | 147.6 | 144.0 | 142.3 | 140.7 | 138.8 |
| Nominal GDP under existing legislation (absolute values x 1,000) | 1660.6 | 1782.1 | 1896.2 | 1979.2 | 2064.3 | 2136.6 |
(1) Any inaccuracies are due to rounding. (2) Net of one-offs and the cyclical component. (3) Gross or net of Italy’s share of loans to EMU Member States, either bilaterally or through the EFSF, and of the contribution to the capital of the ESM. As of 2021, the amount of these shares was approximately 57.3 billion, of which 43.0 billion for bilateral loans and through the EFSF and 14.3 billion for the ESM programme (see Bank of Italy, ‘Statistical Bulletin Public Finance, Borrowing Requirement and Debt’, September 2022). It is assumed that the MEF’s cash holdings will be reduced by approximately -0.2 percent of GDP in 2022 and by approximately -0.1 percent of GDP in each subsequent year, with the aim of bringing the balance back to the level of the end of 2019. In addition, estimates take into account the repurchase of SACE, the deployment of the earmarked assets, EIB guarantees and loans under the SURE and NGEU programmes. The interest rate scenario used for the estimates is based on the implicit forecasts derived from the forward rates on Italian government bonds for the period in which this document was compiled. |
| III.2 | STRUCTURAL BALANCE AND FISCAL STANCE INDICATORS |
Public finance forecasts under the scenario based on existing legislation for 2022 and 2023 show an improvement in the structural budget balance. The structural deficit, which is now estimated at 5.5 percent of GDP in 2022, is projected to decline by 0.9 percentage points of GDP in 2022 compared to 2021 and by 1.9 percentage points of GDP in 2023 compared to 2022. This result is due to
| MINISTRY OF ECONOMY AND FINANCE | 25 |
| | UPDATE OF THE ECONOMIC AND FINANCIAL DOCUMENT 2022 |
lower nominal net borrowing, as the cyclical correction is essentially zero for both years. The structural balance under the existing legislation scenario will worsen by 0.3 percentage points in 2024, while in 2025 a further slight improvement of 0.2 percentage points is projected.
The assessment to be conducted by the European Commission as part of the multilateral surveillance will only consider the years up to 2023, for which the general escape clause of the Stability and Growth Pact remains in force.
With reference to the expenditure rule, the recommendations of the Commission and the Council refer to the fiscal stance indicator linked to current expenditure financed by domestic resources, which should not exert an expansionary impact on the economy in 2023. In essence, the relevant expenditure aggregate must grow less than nominal potential GDP7. The construction of this variable assumes the quantification of expenditure measures and revenue reductions linked to COVID-19 of a temporary and emergency nature, which are excluded from net expenditure. Defining the perimeter of these measures is partly arbitrary and related to possible different assessments; moreover, their quantification may be subject to significant revisions over time.
Since the spring months, the difficulty of considering the interventions made to cushion the social and economic impact of higher energy prices had been added. These measures should be also considered temporary and emergency in nature, even if the Commission confirmed that it continues to consider only the measures related to COVID-19 within the relevant aggregate. By the way, in its recommendations for the European level and Italy, the Commission explicitly mentioned that fiscal policy should deal with the energy crisis by means of targeted and temporary interventions. It also requested the Member States to provide a precise quantification of these measures in the Draft Budgetary Plan.
That said, according to internal estimates based on the trend scenario at existing legislation and continuing to use the definition adopted in the European Commission’s Spring Forecast, the fiscal stance for 2023 would be much better than the one published by the Commission, approaching the value of -1.5.
The growth rate of expenditure for 2023 is significantly affected by financial resources earmarked to cushion the increase in energy prices and to compensate the most vulnerable households and businesses through transfers or lower taxation, which became extremely significant in 20228. The expenditure forecast based on existing legislation incorporates all the measures taken up to September, whose budgetary impact mainly refer to the current year. The end of these measures in 2023 leads to an improvement for that year, i.e., the fiscal stance becomes
___
7 The expenditure aggregate relevant for the assessment of fiscal stance is equal to total general government expenditure net of interest, unemployment benefits, temporary expenditure and emergency expenditure. The fiscal stance is then calculated as the difference between the actual expenditure aggregate and what it should have been based on the potential GDP growth rate and inflation. The higher expenditure is then adjusted for the change in discretionary revenue. By construction, if the fiscal stance indicator has a negative sign, the budget impact on the economy is expansionary: the higher expenditure is not financed by the higher discretionary revenue. By subtracting the resources received from the European Union, it is possible to calculate the impact deriving from public expenditure financed with national resources alone. For a complete description of the expenditure aggregate and the calculation of fiscal policy stance indicators, see the Focus on ‘The fiscal policy stance and measurement proposals’ on p. 78 of Update of the Stability Programme 2021.
8 These measures are described and assessed in Focus ‘Italian government initiatives in response to high energy costs’.
| 26 | MINISTRY OF ECONOMY AND FINANCE |
III. PUBLIC FINANCE SCENARIO UNDER EXISTING LEGISLATION | |
restrictive. On the other hand, if these expenditures were entirely excluded from 2022, the assessment for 2023 would worsen. An intermediate approach, where only some of the emergency-related expenditure items are considered temporary, would lead to intermediate values of the fiscal stance. A marked tendency towards moderation of current expenditure is confirmed from 2024 onwards, as indicated by positive values of this index.
Regarding the other public spending aggregates used to assess the fiscal stance, an expansionary impact on the economy is expected from public investments - judged favourably by the Commission-, including both the component financed by national resources and the funds provided by the EU in relation to the RRP.
| MINISTRY OF ECONOMY AND FINANCE | 27 |
| | UPDATE OF THE ECONOMIC AND FINANCIAL DOCUMENT 2022 |
FOCUS
| Action taken by the Italian government in response to high energy prices |
| In 2021, the Italian government began implementing a series of measures to mitigate the impact of inflation on households and businesses. Initially limited to energy prices, the growth in prices has gradually spread to other goods, leading to a sharp increase in consumer prices and in core inflation excluding energy costs and fresh food. |
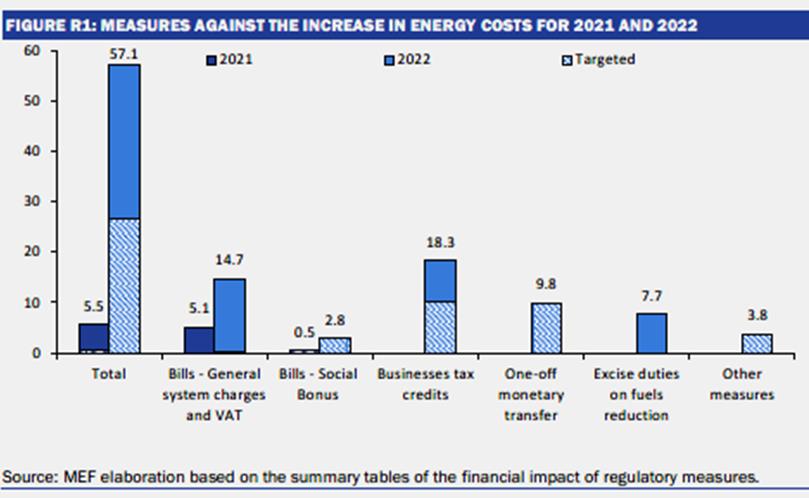
| | The package of measures adopted has a financial impact of about 62.6 billion (3.3 percent of GDP) on 2021 and 2022, of which 5.5 billion (0.3 percent of GDP) on 2021 and 57.1 billion (3.0 percent of GDP) on 2022, including 3.8 billion allocated under the 2022 budget law. |
| | This financial impact is expressed in gross terms, i.e., it is not reduced by the amount of rev-enue-raising measures or reductions in other expenditures simultaneously enacted in order not to impact the budget deficit. Furthermore, it is an ex-ante estimate, based on the financial impact included in the technical reports and summary tables of the financial effects of regu-latory measures, and does not include the indirect effects in terms of higher revenue, led by the measures. |
| | The analysis takes into account regulatory provisions adopted from March 2021 to September 20229. Consistent with the approach followed by the European Commission, temporary measures aimed at containing energy costs for households and businesses are factored in, as well as those aimed at safeguarding the purchasing power of lower incomes in order to cope with rising energy costs and the general increase in inflation. |
| | The main measures, whose primary objective is to prevent the marked increases in wholesale prices from falling entirely on the final prices borne by households and businesses, concern: |
| | • Containment of bill costs, amounting to 5.1 billion in 2021 (0.3 percent of GDP) and 14.7 billion in 2022 (0.8 percent of GDP). Such containment is implemented through the reduction to zero of the rates of general system charges on electricity and gas bills, and the reduction to 5 percent of the VAT rate on gas bills. |
| | • Social bonuses for electricity and gas users, amounting to 0.5 billion in 2021 (0.03 per-cent of GDP) and 2.8 billion in 2022 (0.15 percent of GDP). These bonuses, already in force since 2008, are intended for economically fragile families, or families with mem-bers in physical distress. They have been adjusted to minimise the impact of higher bills; moreover, the ISEE threshold for access to the bonuses has been increased from EUR 8,265 to EUR 12,000 (EUR 20,000 for large families), for the entire year 2022. |
| | • Tax credits for companies, amounting to 18.3 billion in 2022 (1,0 percent of GDP). This measure is aimed at compensating the extra costs incurred by companies for the pur-chase of energy or natural gas. The relief can only be used as an offset, it is not a tax base and cannot be combined with other tax allowances. Companies whose quarterly average costs have increased by at least 30 percent compared to the same quarter in 2019 are eligible. Initially introduced in favour of energy-intensive or natural gas-inten-sive businesses to cover 20 percent of expenses incurred in the relevant quarter, during the year these credits were extended to a wider range of businesses and increased to cover up to 40 percent of expenses incurred. Other tax credits are provided for specific sectors, such as transport, agriculture and fishing, in order to cover expenses for energy components or fuels. |
| | • Reduction in excise duties on fuels, amounting to 7.7 billion in 2022 (0.4 percent of GDP). Reductions in excise duties also include those arranged by MEF-MITE Inter-minis-terial decrees to compensate for higher VAT revenues from the rise in international crude oil prices. |
___
9 Decree law No. 41/2021 (decreto ‘Sostegni’), D.L. No. 73/2021 (decreto ‘Sostegni bis’), D.L. No. 130/2021, 2022 Budget law (law No. 234/2021), D.L. No. 4/2022 (decreto ‘Sostegni ter’), D.L. No. 17/2022, D.L. No. 21/2022, D.L. No. 38/2022, D.L. No. 50/2022 (decreto ‘Aiuti’), D.L. No. 80/2022, D.L. No. 115/2022 (decreto ‘Aiuti bis’), D.L. No. 144/2022 (decreto ‘Aiuti ter’), MEF-MITE Inter-ministerial decrees of March, April, June, July, August and September 2022.
| 28 | MINISTRY OF ECONOMY AND FINANCE |
III. PUBLIC FINANCE SCENARIO UNDER EXISTING LEGISLATION | |
| | Among the measures aimed at countering the general rise in prices, the most notable is un-doubtedly the disbursement of one-off monetary transfers (9.8 billion) to various categories of workers, pensioners and recipients of other social benefits: the first, worth EUR 200, dis-bursed in July to those with annual incomes up to EUR 35,000; the second, worth EUR 150, will be disbursed in November to those whose incomes are up to EUR 20,000. Other measures include the transport bonus, an increase in social contributions exemption for employees orig-inally introduced by the 2022 budget law, and a two-percentage point increase for pensions up to EUR 2,692 from October to December 2022. |
| | The composition of the package of measures fully responds to the EU Council recommenda-tions for 2022-2023 and the Eurogroup orientations on policy fiscal stance for 2023, as tem-porary measures targeted at families and businesses most vulnerable to energy price in-creases account for about 43.2 percent of the total amount and 46.6 percent of the amount for 2022. These include social bonuses for electricity and gas utilities, one-off monetary trans-fers, raises for lower pensions, benefits targeted at specific sectors such as transport, fishing and agriculture, and those for energy and gas-intensive businesses. In addition to these, tar-geted measures of a regulatory nature were introduced (e.g., instalment of bills). These measures, although relevant to the beneficiaries, have zero impact on public accounts and thus on the overall package. |
| | |
| | By international comparison, apart from inevitable differences in the amount and operating modalities, the rationale behind the measures adopted in Italy is similar to that of the measures introduced in the main European countries (Germany, France and Spain). |
| | Below are the most relevant measures starting with those introduced in March 2021. |
| | |
| | Decree law No. 41/202110 (‘Sostegni’ decree). The decree provides for cut in system charges on electricity bills for the second quarter of 2021. |
___
10 Converted by law No. 69 of 21 May 2021.
| MINISTRY OF ECONOMY AND FINANCE | 29 |
| | UPDATE OF THE ECONOMIC AND FINANCIAL DOCUMENT 2022 |
| | Decree law No. 73/202111 (‘Sostegni bis’ decree). The decree extends the containment of electricity prices to the third quarter of 2021. |
| | |
| | Decree law No. 130/202112. It provides for a reduction in the rates on system charges for electricity and gas utilities for the fourth quarter of 2021 and a reduction in the VAT rate on natural gas to 5 percent. It also provides for the reassessment of social bonuses on electricity rates13 and natural gas supply14 for economically disadvantaged customers or those with se-rious health conditions. |
| | |
| | 2022 budget law15. The measures provided for in D.L. No. 130/2021 are extended to the first quarter of 2022. In addition, in case domestic end customers default on bills issued from 1 January 2022 to 30 June 2022, operators are required to offer an interest-free instalment plan. |
| | |
| | Decree law No. 4/202216 (‘Sostegni ter’ decree). The decree extends the zeroing of the rates on system charges for electric utilities to the first quarter of 2022, including for utilities with available power greater than 16.5 kW, for public lighting uses, and for electric vehicle charg-ing. Tax credits are introduced for energy-intensive enterprises (20 percent), and gas-intensive enterprises (10 percent). |
| | |
| | Decree law No. 17/202217 (‘Energia’ decree). Reductions in rates on utility bills, strengthen-ing of social bonuses, and tax credits for energy and gas-intensive enterprises are extended to the second quarter of 2022. The decree provides for the extension of the granting of ex-traordinary SACE guarantees to enterprises with proven liquidity needs due to rising energy costs. |
| | |
| | Decree law No. 21/202218. The decree provides for a reduction in fuel excise taxes; it extends tax credits for energy and gas purchase expenditures incurred in the second quarter of 2022; it increases tax credits from 20 percent to 25 percent for energy-intensive businesses and from 15 percent to 20 percent for gas-intensive businesses. It raises the ISEE threshold for access to the electricity and gas social bonuses to EUR 12,000, for the entire 2022. The de-cree introduces a tax on companies in the energy, gas, or oil sectors, equal to 10 percent of the extra profits due to the increase in international reference prices. |
| | |
| | Decree Law No. 38/202219. The decree provides for the reduction of fuel excise taxes from 3 May to 8 July 2022. |
| | |
| | Decree Law No. 50/202220 (‘Aiuti’ decree). The decree increases tax credits for the second quarter of 2022: to 25 percent for the purchase of natural gas; to 15 percent for energy spending of enterprises with a power of at least 16.5 kW. In addition, an increase from 10 |
___
11 Converted by law No. 106 of 23 July 2021.
12 Converted by law No. 171 of 25 November 2021.
13 As per decree of the Minister for Economic Development of 28 December 2007.
14 As per article 3, paragraph 9 of D.L. No. 185/2008, converted by law No. 2 of 28 January 2009.
15 Law No. 234 of 30 December 2021.
16 Converted by law No. 25 of 28 March 2022.
17 Converted by law No. 34 of 27 April 2022.
18 Converted by law No. 51 of 20 May 2022.
19 Incorporated into D.L. No. 21/2022 during its conversion into law.
20 Converted by law No. 91 of 15 July 2022.
| 30 | MINISTRY OF ECONOMY AND FINANCE |
III. PUBLIC FINANCE SCENARIO UNDER EXISTING LEGISLATION | |
| | percent to 25 percent in the tax rate on extra-profits of energy enterprises is planned. A one-off monetary transfer of EUR 200 is introduced for employees, the self-employed, pensioners and social benefit recipients with an annual income below EUR 35,000, as well as a bonus for the purchase of public transport passes. |
| | |
| | Decree Law No. 80/202221. The reduction of system charges and VAT on utilities is extended to the third quarter of 2022. Retroactive access to social bonuses is granted for households now eligible due to the higher ISEE threshold. |
| | |
| | Decree Law No. 115/202222 (‘Aiuti bis’ decree). The decree extends the reduction of system charges and VAT on utilities and the restatement of social bonuses to the fourth quarter of 2022. The fuel excise tax cut is extended until 20 September 2022. Tax credits for businesses are extended through the third quarter of 2022. The EUR 200 monetary transfers are ex-tended to some previously excluded categories; the contributory cut for workers with incomes up to EUR 35,000, provided for in the 2022 budget law, is increased from 0.8 to 2 percentage points. Lastly, an increase for pensions up to EUR 2,692 is envisaged. |
| | |
| | Decree Law No. 144/202223 (‘Aiuti ter’ decree). Tax credits are extended and increased: to 40 percent for the purchase of natural gas; 40 percent for energy-intensive enterprises; 30 percent for non-energy-intensive enterprises, whose minimum available power requirement is reduced from 16.5 to 4.5 kW. The fuel excise tax reduction is extended until 31 October 2022. A new one-off monetary transfer of EUR 150 will be provided, with a reduction in annual in-come threshold to EUR 20,000. |
| | |
| | MEF-MITE Inter-ministerial decrees. In the current year, six MEF-MITE inter-ministerial decrees (21 March, 6 April, 24 June, 19 July, 31 August, 13 September) have been approved. They provide for the reduction of excise taxes on fuels to offset higher VAT revenues from the in-crease in the international price of crude oil, without further burdening the State budget24. |
___
21 Incorporated into D.L. No. 50/2022 during its conversion into law.
22 Converted by law No. 142 of 21 September 2022.
23 The decree, in effect since 23 September, has not yet entered the process of conversion into law.
24 Pursuant to law 244/2007, art. 1, paragraphs 290 - 294.
| MINISTRY OF ECONOMY AND FINANCE | 31 |
| | UPDATE OF THE ECONOMIC AND FINANCIAL DOCUMENT 2022 |
| III.3 | DEBT-TO-GDP RATIO AND THE DEBT RULE |
Public debt as a ratio of GDP: forecast based on existing legislation
The high nominal growth of the economy expected this year, the improvement in the primary balance and the favourable contribution of the so-called snow-ball and stock-flow components (also thanks to the subsidies received from the RRF) will result, according to the new projections, in a more pronounced decline in the gross debt-to-GDP ratio than that forecast in the Stability Programme, regardless of the fact that interest rates are expected to rise significantly more than what was assumed in April. Indeed, the debt-to-GDP ratio is expected to fall by 4.8 percentage points, from 150.3 percent in 202125 to 145.4 percent in 2022 (147.0 percent in the Stability Programme).
The new projections of the debt-to-GDP ratio for the next three years are also about two percentage points lower than in the Stability Programme thanks to slightly stronger nominal GDP dynamics and an improvement in the primary balance. These positive factors more than offset the rise in the implicit cost of debt financing resulting from higher yields on fixed-income government bonds and higher inflation adjustments for securities indexed to consumer prices.
On the one hand, although the forecast scenario continues to be characterised by a high level of uncertainty due to the war, nominal GDP growth is estimated at 4.4 percent in 2023 and 3.9 percent on average in 2024-2025. This dynamic is mainly due to the inflationary impulse initially linked to energy prices, which then passed on to non-energy goods, driving up domestic prices and thus the GDP deflator.
On the other hand, the increase in the cost of debt will be limited mainly because of its average maturity, which is currently particularly high (over 7 years). Indeed, although the expected interest rates are higher than those in the Stability Programme, mainly as a result of the ECB’s recent monetary policy decisions in response to the above-mentioned inflationary pressures, the average cost of debt is expected to rise by about 30 basis points in 2022 compared to 2021 and then stabilise at around 2.8 percent in the following years.
As a result of these trends, the snow-ball component will continue to exert a significant downward impulse on the debt-to-GDP ratio until at least 2025, the final year of the projection, when the gross debt of the general government sector under the existing legislation scenario is 139.3 percent of the GDP, against the 141.4 percent projected in the Stability Programme.
The reduction of the debt-to-GDP ratio also reflects a gradual reduction in the Treasury liquidity holdings which, at the end of 2025, will be brought back to a level slightly higher than at the end of 2019, i.e., to values prior the beginning of the pandemic crisis.
Net of Italy’s share of loans to EMU Member States, bilaterally or through the EFSF, and of the contribution to the capital of the ESM, forecast of the debt-to-GDP ratio stands at 136.7 percent in 2025.
___
25 The most recent estimates by the Bank of Italy and ISTAT slightly reduce the debt-to-GDP ratio for the last two years, following the upward revision of nominal GDP by about 3.7 billion and 6.6 billion in 2020 and 2021, respectively. According to the preliminary estimates in March, the debt-to-GDP ratio was 155.3 percent in 2020 and 150.8 percent in 2021. Thus, the reduction in 2021 over 2020 amounted to 4.5 percentage points.
| 32 | MINISTRY OF ECONOMY AND FINANCE |
III. PUBLIC FINANCE SCENARIO UNDER EXISTING LEGISLATION | |
TABLE III.2 GENERAL GOVERNMENT DEBT BY SUB-SECTOR (1) (EUR millions and as % of GDP) |
| | | | | | |
| Gross of Euro Area financial support (2) | | | | | |
| General government | 2,677,910 | 2,757,968 | 2,835,054 | 2,908,739 | 2,975,957 |
| % of GDP | 150.3 | 145.4 | 143.2 | 140.9 | 139.3 |
| Central government (3) | 2,601,834 | 2,679,768 | 2,756,992 | 2,830,888 | 2,898,470 |
| Local governments (3) | 119,241 | 121,365 | 121,226 | 121,015 | 120,652 |
| Social security funds (3) | 95 | 95 | 95 | 95 | 95 |
| Net of Euro Area financial support (2) | | | | | |
| General government | 2,620,585 | 2,701,144 | 2,778,730 | 2,852,915 | 2,920,866 |
| % of GDP | 147.1 | 142.5 | 140.4 | 138.2 | 136.7 |
| Central government (3) | 2,544,509 | 2,622,943 | 2,700,668 | 2,775,064 | 2,843,379 |
| Local governments (3) | 119,241 | 121,365 | 121,226 | 121,015 | 120,652 |
Social security funds (3) | | | | | |
(1) Note: Any inaccuracies result from rounding. (2) Gross or net of Italy’s shares of loans to EMU Member States, bilateral or through the EFSF, and the contribution to the capital of the ESM. At the end of 2021 the amount of these shares amounted to approximately 57.3 billion, of which 43.0 billion for bilateral loans and through the EFSF and 14.3 billion for the ESM programme (see Bank of Italy, ‘Statistical Bulletin Public Finance, Borrowing Requirement and Debt’, September 2022). The MEF’s liquidity holdings are expected to be reduced by 0.2 percent of GDP in 2022 and by 0.1 percent in each following year with the objective to take back the stock towards the level of end 2019. In addition, estimates take into account the repurchase of SACE, the use of earmarked assets, and the EIB and SURE guarantees. The interest rate scenario used for the estimates is based on the implicit forecasts arising from the forward rates on Italian government bonds during the period covered by this document. (3) Gross of liabilities vis-à-vis other sub-sectors. |

Assessment of the debt rule compliance
Among the Member States with a public debt exceeding 60 percent of GDP at the end of 2021, five of them did not comply with the reference benchmark for debt reduction as defined by the Treaty and Regulation of the European Commission (EC)
| MINISTRY OF ECONOMY AND FINANCE | 33 |
| | UPDATE OF THE ECONOMIC AND FINANCIAL DOCUMENT 2022 |
No. 1467/199726: Belgium, Finland, France, Hungary and Italy. The Commission acknowledged that complying with the adjustment path for the reduction of public debt would entail an excessive budgetary effort in the context of the present economic climate, in the aftermath of the COVID-19 crisis and with high uncertainty surrounding the developments of events in Ukraine after Russia’s aggression.
As announced, the EC has not launched new Excessive Deficit Procedures in the recent past but will reconsider the opportunity to do so after the upcoming Autumn Forecasts.
| TABLE III.3: COMPLIANCE WITH THE DEBT RULE, FORWARD LOOKING AND CYCLICALLY ADJUSTED CRITERION |
| | | | |
| Debt in year t+ 2 (% of GDP) | 143.2 | 140.9 | 139.9 |
| Gap compared to backward-looking benchmark (% of GDP) | 16.6 | 7.1 | 1.9 |
| Gap compared to forward-looking benchmark (% of GDP) | 1.9 | 10.5 | 10.1 |
Cyclically adjusted debt gap (% of GDP) | | | |
| III.4 | SENSITIVITY ANALYSES ON PUBLIC FINANCE AND DEBT-TO-GDP RATIO PROJECTIONS IN THE MEDIUM TERM |
This section presents sensitivity analyses on public finance aggregates under different financial and macroeconomic risk scenarios.
First, the effects on the budget balance and the debt-to-GDP ratio of shocks on economic growth and on the yield curve are presented; these shocks correspond to those described in section II.4. The subsequent section presents stochastic simulations of the debt-to-GDP ratio, displayed through fan charts. In the last section, the debt-to-GDP ratio is projected beyond the forecast horizon of the present document and into the medium-term (up to year 2033); two alternative projections show debt-to-GDP ratio profiles in line with ‘stylised’ paths to fiscal consolidation beyond the 2025 horizon.
Sensitivity of public finance to growth and interest rates
This section presents the simulation of two risk scenarios in which the macroeconomic shocks affect the 2022-2025 public finance aggregates, according to standard sensitivity assumptions27.
The baseline scenario corresponds to the existing legislation scenario of this document. The sensitivity analysis aims at outlining the budget balance path and the debt dynamics derived by assuming two of the alternative scenarios presented in section II.4.
___
26 The debt reduction benchmark is calculated over a three-year horizon that can be prospective (t-1 to t+ 1), retrospective (t-3 to t-1) and cyclically adjusted. If the debt ratio is below 60 percent of GDP in any of the years, the benchmark cannot be calculated in a meaningful way.
27 See section III.4 of the Methodological note on criteria for the elaboration of trend forecasts of the DEF 2022, available at:
https://www.rgs.mef.gov.it/_Documenti/VERSIONE-I/Attivit--i/Contabilit_e_finanza_pubblica/DEF/2022/Nota- Metodologica-2022.pdf.
| 34 | MINISTRY OF ECONOMY AND FINANCE |
III. PUBLIC FINANCE SCENARIO UNDER EXISTING LEGISLATION | |
The financial risk scenario considers risk elements linked to the economy’s financial conditions, incorporating a widening of 100 basis points of the BTP-Bund spread and a subsequent impact on economic growth. The exchange rate risk scenario assumes an appreciation of the euro and a consequent impact on exports and on economic growth.
The outcomes on GDP (used to estimate potential output and the output gap) are derived from the ITEM model. The figures related to interest rates (in the financial risk scenario) and to changes in interest expenditure are calculated with the Treasury’s SAPE model – based on data on current and projected government securities.
Table III.4 reports the main macroeconomic and public finance variables across the three different scenarios in the forecast horizon considered in this document (up to 2025).
| TABLE III.4: SENSITIVITY SCENARIOS (percentage values) |
| | | 2021 | 2022 | 2023 | 2024 | 2025 |
| | Baseline | -7.9 | 7.6 | 6.4 | 4.3 | 3.5 |
| Growth rate of nominal GDP | Financial risk scenario | -7.9 | 7.6 | 6.3 | 3.8 | 2.6 |
| | Exchange rate risk scenario | -7.9 | 7.5 | 5.4 | 3.3 | 2.3 |
| | Baseline | -8.9 | 6.0 | 4.7 | 2.8 | 1.9 |
| Growth rate of real GDP | Financial risk scenario | -8.9 | 6.0 | 4.6 | 2.2 | 1.1 |
| | Exchange rate risk scenario | -8.9 | 5.9 | 3.6 | 2.2 | 1.1 |
| | Baseline | -9.6 | -9.4 | -5.6 | -3.9 | -3.3 |
| Deficit/GDP | Financial risk scenario | -9.6 | -9.5 | -5.9 | -5.0 | -5.2 |
| | Exchange rate risk scenario | -9.6 | -9.5 | -6.3 | -5.1 | -5.2 |
| | Baseline | -6.1 | -6.0 | -2.7 | -1.3 | -0.8 |
| Primary balance/GDP | Financial risk scenario | -6.1 | -6.1 | -2.8 | -1.9 | -2.2 |
| | Exchange rate risk scenario | -6.1 | -6.1 | -3.3 | -2.4 | -2.6 |
| | Baseline | 2.4 | 2.4 | 2.0 | 1.9 | 1.7 |
| Implicit interest rate | Financial risk scenario | 2.4 | 2.4 | 2.1 | 2.1 | 2.1 |
| | Exchange rate risk scenario | 2.4 | 2.4 | 2.0 | 1.9 | 1.7 |
| | Baseline | 155.6 | 153.5 | 149.4 | 147.6 | 146.1 |
| Debt/GDP | Financial risk scenario | 155.6 | 153.7 | 150.4 | 150.6 | 152.4 |
| | Exchange rate risk scenario | 155.6 | 153.7 | 151.5 | 152.3 | 154.3 |
| MINISTRY OF ECONOMY AND FINANCE | 35 |
| | UPDATE OF THE ECONOMIC AND FINANCIAL DOCUMENT 2022 |
Figure III.2 illustrates the change of the debt-to-GDP ratio across the three scenarios. The existing legislation forecasts show a continuous decreasing trend. The alternative scenarios display a more contained reduction, but debt dynamics appear still steady.
Stochastic simulations of debt-to-GDP dynamics
In order to present a sensitivity analysis on the debt-to-GDP ratio trend that considers the uncertainties underlying the forecasts on the yield curve, public finances and economic growth, stochastic simulations have been implemented. These simulations consider the historical volatility of short and long-term interest rates, nominal economic growth and primary budget balances. The simulations have been carried out using the Monte Carlo method, applying stochastic shocks on the debt-to-GDP ratio dynamics in the baseline scenario at existing legislation presented in this Update. Said shocks are simulated based on the historical volatility of interest rates (short and long-term), nominal GDP growth rates and primary budget balances resulting from 2,000 draws from a normal distribution with average equal to zero and variance/covariance matrix as recorded since the first quarter of 1999.
Taking into account the extraordinary volatility of the variables of interest observed since the first quarter of 2020, in the present document two scenarios for the shocks are presented. In the first (high-volatility shocks hypothesis), the entirety of available series is taken into consideration for the construction of the shocks, including data up until the first quarter of 2022. The second scenario (limited-volatility shocks hypothesis) does not consider the volatility registered following the first quarter of 2020. In both cases, the simulated shocks are symmetrical and of temporary nature28.
In case of high-volatility shocks, the debt stands around an average value of 140.3 percent of GDP at the end of the time horizon, 6.2 percentage points higher than the figure recorded in 2019 (134.1), but 14.6 percentage points lower than the 2020 value (154.9). Great uncertainty surrounds the outcome for 2025, as shown by a gap of 53.5 percentage points between the 10th and 90th percentile of the expected debt distribution. After the sudden increase in 2020, followed by a decline in 2021 and 2022, the debt-to-GDP ratio would keep decreasing in the following three years in 60 percent of the simulated scenarios.
If the volatility of the shocks is limited to the period preceding the COVID-19 pandemic (limited-volatility shocks), the results of the simulations are visibly more concentrated around the debt-to-GDP ratio forecasted under the existing legislation scenario. In this instance, the uncertainty surrounding the 2025 results is much smaller, registering a 14.4 percentage points difference between the 10th and 90th percentile of the expected debt distribution; furthermore, the debt-to-GDP ratio keeps decreasing in all simulated scenarios.
___
28 For further information on the adopted methodology, see Berti K., (2013), ‘Stochastic public debt projections using the historical variance-covariance matrix approach for EU countries’, Economic Papers 480 and European Commission, 2020, Debt Sustainability Monitor 2019, Institutional Papers 120, available at: https://ec.europa.eu/info/sites/info/files/economy-finance/ip120_en.pdf.
| 36 | MINISTRY OF ECONOMY AND FINANCE |
III. PUBLIC FINANCE SCENARIO UNDER EXISTING LEGISLATION | |
The ‘non-increasing debt cap’, the median value of public debt in 2025 that ensures (with 90 percent probability) that even in adverse conditions the debt-to-GDP ratio will not exceed the value forecasted in the baseline scenario, is equal to 142.9 percent, 3.6 percentage points higher than the debt-to-GDP ratio projected for 2025.
Medium-term projections of the debt-to-GDP ratio
In this section, the debt-to-GDP ratio related to the macroeconomic and public finance scenario is projected beyond the forecast horizon up to 2033. The macroeconomic scenario matches the one under existing legislation up to 2025; starting from 2026, medium-term growth is in line with the estimated potential GDP growth (according with the ‘t+10’ methodology developed by the Output Gap Working Group).
Yearly interests are calculated with the Treasury’s SAPE model, by taking the composition and maturity structure of the existing debt stock underlying to the last projection year (2025).
In terms of public finance, three scenarios are simulated. In the existing legislation scenario, the structural primary balance (SPB) is set equal to the value forecasted for 2025 and adjusted in the medium term for variations in property income of the general government sector (obtained following the methodology described in the 2021 EC Ageing Report) and in age-related expenditures (calculated by the State General Accounting Department)29. In the historical SPB scenario, consistent with what is usually proposed by the EC in their Debt Sustainability
___
29 For methodological details, see: ‘Le tendenze di medio-lungo periodo del sistema pensionistico e socio-sanitario - Rapporto n. 23’, prepared by the State General Accounting Department, available on:
https://www.rgs.mef.gov.it/_Documenti/VERSIONE-I/Attivit--i/Spesa-
soci/Attivita_di_previsione_RGS/2022 /Rapporto2022.pdf.
| MINISTRY OF ECONOMY AND FINANCE | 37 |
| | UPDATE OF THE ECONOMIC AND FINANCIAL DOCUMENT 2022 |
Analysis (DSA), the structural primary balance converges in the 2026-2029 period to its 2006-2020 average (1.66 percent of GDP) and is kept constant afterwards. In the zero structural balance (SB) scenario, the SB converges to zero from 2026 with an annual correction of 0.6 percentage points, in line with the adjustment path required by the Stability and Growth Pact.
The additional fiscal adjustment under the historical SPB and the zero SB scenarios (vs. existing legislation) causes a feedback effect on real GDP growth in line with the EC methodology adopted in the 2021 Fiscal Sustainability Report.
The following Figure shows the development of the debt-to-GDP ratio across the three simulated scenarios. In the existing legislation scenario – with no additional fiscal adjustment beyond 2025 – the debt-to-GDP ratio decreases up to 2026, then increases up to 151.2 percent in 2033. In the historical SPB scenario, public debt stays essentially constant to 139 percent of GDP -beyond 2026- until 2033. Lastly, in the zero SB scenario the trajectory of the debt-to-GDP ratio declines to 127.3 percent in 2033.
The increasing trend of the debt-to-GDP ratio in the existing legislation scenario is mainly due to two factors that worsen both primary balance and interest expenditure. On the one hand, the projection includes an increase in ageing costs; on the other hand, present projections of forward rates reflect market expectations and lead to an increase of the implicit rate paid on public debt securities from 2026. It is likely that a credible planning for fiscal adjustment, as hypothesised in the alternative scenarios, would have a positive impact on market expectations, lowering interest expenditure. Said variation in expectations is not included in the simulations, whose results should therefore be interpreted as prudent.
Unlike the medium-term simulations illustrated in the Stability Programme of April, no medium-term growth projection was made based on a scenario that fully incorporates the effects of the RRP. If the latter were to produce the estimated impact on GDP growth, the fiscal adjustment necessary to reduce the debt-to-GDP ratio may be smaller than that suggested in the simulations here presented.
| 38 | MINISTRY OF ECONOMY AND FINANCE |
IV. REFORMS AND RECOMMENDATIONS OF THE
COUNCIL OF THE EUROPEAN UNION
In the closing months of the legislature, the government’s reform efforts remained focused on the implementation of the Recovery and Resilience Plan (RRP). This chapter summarises the main results achieved since the publication of the 2022 Economic and Financial Document (Documento di Economia e Finanza, DEF), which was approved by the Council of Ministers on 5 April and included the Stability Programme and the National Reform Programme.
In June, the Council of the European Union issued three Country-specific recommendations (CSRs) to Italy. Consistent with the national guidelines for official policy documents, it was deemed appropriate to structure the illustration of progress achieved in terms of reforms and economic policy around the three CSRs.
The first Recommendation concerns the public finances and invites the country to follow a prudent fiscal policy in the face of a sharp rise in energy prices, concentrating budgetary resources on supporting the most vulnerable segments of the population, as well as the ecological and digital transition and energy security, also in light of the RePowerEU initiative. From 2023 onwards, Italy is also required to orientate fiscal policy toward a credible and gradual reduction of public debt, ensuring its sustainability in the medium term through a gradual consolidation of the public finances, as well as investments and reforms aimed at improving the economy’s growth potential. To the same end, Italy is also urged to adopt and appropriately implement the enabling law on the tax reform.
The second Recommendation is to fully proceed with the implementation of the RRP and to finalise negotiations with the European Commission on the 2021-2027 cohesion policy programmes.
Finally, the third Recommendation concerns energy. The Council urges Italy to reduce its overall reliance on fossil fuels and to diversify energy imports. It also calls on Italy to overcome bottlenecks and to increase the capacity of internal gas transmission, to develop electricity interconnections, to accelerate the deployment of additional renewable energy capacity and to adopt measures to increase the energy efficiency of buildings and to promote sustainable mobility.
| MINISTRY OF ECONOMY AND FINANCE | 39 |
| | UPDATE OF THE ECONOMIC AND FINANCIAL DOCUMENT 2022 |
| IV.1 | PURSUING A PRUDENT FISCAL POLICY (CSR 1) |
With regard to the topic of public investments for the green and digital transition and for energy security referred to in the CSR 1, in recent months a number of important measures have been put in place. Recent decrees30 aim to streamline procedures to increase national regasification capacity, while the enabling law for the reform of procurement code speeds up the approval process for energy infrastructure. Simplification measures were approved for the construction of power plants using renewable energy sources, and the program for the energy conversion of buildings continued. In the RRP, the green transition is also supported by other investments such as those for reducing CO2 emissions and combating hydrogeological risks. It is crucial that investments in the green transition go hand in hand with digital transformation, and thus the RRP is giving a significant boost to Italy’s already positive performance in this sector, especially in terms of connectivity31. Through the RRP, internet access facilities and research infrastructure have become more widespread, with the next steps aiming to progressively support the growth of venture capital investment32.
With regard to the Council’s request to Italy to properly adopt and implement the enabling law on tax reform, at the end of June, the draft of such law33 was approved by the Chamber of Deputies. However, the Senate was unable to fully examine it as early general elections were called.
The draft aimed to simplify the tax system and set out principles for the revision of the personal income taxation system. It reaffirmed the goal of simplifying and streamlining the taxation of business income in addition to rationalising VAT and excise taxes and progressively abolishing the IRAP tax (regional tax on productive activities). The draft also required the government to change the discipline governing the cadastral system and implement a review of municipal and regional IRPEF (personal income tax) surcharges. Some progress has also been made outside the scope of the enabling act, with the implementation of a number of proposals contained in the ‘Report to Guide Government Actions’34 of December 2021, aimed at combating tax evasion.
Finally, the first chapter of this document reports on the debt reduction policy implemented by the outgoing government. The policy plan for 2023-2025 will be updated by the new government and illustrated in a subsequent document.
___
30 Decree law No. 21/2022 and decree law No. 50/2022.
31 In this regard, the country’s improvement in the 2022 DESI index of the European Commission is to be noted.
32 For details, see the Annual Report of the Ministry of Economic Development (MISE) on Innovative Start-ups and SMEs.33 Originally approved by the Council of Ministers on 5 October 2021,
34 Relazione-per-orientare-le-azioni-di-governo-volte-a-ridurre-l’evasione-fiscale-derivante-da-omessa-fatturazione.pdf
| 40 | MINISTRY OF ECONOMY AND FINANCE |
IV. REFORMS AND RECOMMENDATIONS OF THE COUNCIL OF THE EUROPEAN UNION | |
| IV.2 | IMPLEMENTATION OF RRP AND FINALISATION OF THE NEGOTIATIONS FOR THE 2021-2027 COHESION POLICY INSTRUMENTS (CSR 2) |
As of 30 June 2022, all 45 milestones and targets concerning the first semester had been correctly achieved, thus enabling the MEF to request the European Commission for payment of the second installment.
Following the entry into force of the enabling law reforming the Procurement Code35 and the laws to strengthen tax compliance, the commitments regarding the justice and public administration sectors and the ‘enabling reforms’ were met. The milestones achieved as of the end of June also concern other areas including: culture and tourism; ecological transition36; hydrogen; decarbonisation technologies; schools, universities and research37; construction of temporary housing, post stations and urban regeneration projects; reduction of housing shortage in the suburbs; and interventions in the health sector. Contracts have been awarded for fast internet connections projects38 and 750 million allocated39 to strengthen the competitiveness of the most innovative and/or strategic production chains.
Another 55 milestones and targets are set for December, the achievement of which determines the payment of the third installment.
Actions to reform the judicial system which were accomplished within the agreed include the completed recruitment process for the strengthening of the case management office and the approval of the reform of the tax justice system and the law reforming the judicial system40. In addition, the draft legislative decree implementing the Directive (EU) 2019/1023 on restructuring and insolvency was approved, and the related Code41 came into force on 15 July 2022.
The goals regarding the Public administration (PA) reform set for 30 June 2022 have been timely completed: the ‘PNRR bis’ decree law completed the framework for the civil service reform launched in 202142 by impacting the access mechanisms and selection procedures, modifying the simplified procedure for public hiring procedures43 and providing for an update of the related discipline44. Starting from 1 November 2022, it will be necessary to register with the InPA Portal45, which has been operational since July, to access all public competitions.
___
35 Law No. 78/2022.
36 For example, in the context of strengthening the circular economy and managing waste, the National Strategy for the Circular Economy was adopted.
37 The enactment of ‘Aiuti ter’ decree law launched the reform of technical and professional institutes.
38 These are the five interventions ‘Italia a 1 Giga’, ‘Italia 5G’, ‘Scola connessa’ (Connected School), ‘Sanità connessa’ (Connected Health) and ‘Collegamento isole minori’ (Connecting Smaller Islands).
39 For more details: https://www.mise.gov.it/index.php/it/normativa/decreti-ministeriali/decreto-ministeriale-13-gennaio-2022-attuazione-dell-investimento-5-2-competitivita-e-resilienza-delle-filiere-produttive-del-piano-nazionale-di-ripresa-e-resilienza-pnrr
40 Law No. 71/2022.
41 Introduced by legislative decree No. 14 of 2019.
42 By decree laws No. 44 and No. 80 of 2021.
43 Introduced by decree laws No. 44 del 2021.
44 Defined by Presidential decree No. 487 of 1994.
45 www.InPA.gov.it
| MINISTRY OF ECONOMY AND FINANCE | 41 |
| | UPDATE OF THE ECONOMIC AND FINANCIAL DOCUMENT 2022 |
In May, the new Technical Commission for Performance (Commissione tecnica per la performance) took office to implement the interventions included in the RRP to strengthen the public administrations. Among the investments for the training of public employees is the ‘Re-Training the PA Plan’ (‘Piano Ri-Formare la PA’), while the platform ‘Capacity Italy’ was launched to provide support to the administrations involved in the RRP. Lastly, in June, the ministerial decree defining the contents and model scheme of the integrated activity and organization plans (Piani integrati attività e organizzazione - PIAO) was signed, and the related portal became operational on 1 July.
The ‘2021 Annual Law for the Market and Competition’ (‘legge annuale per il mercato e la concorrenza’) adopted in August46, responds to the commitment made by the government in the RRP to respect the annual cadence of the law itself. One of the changes made during the parliamentary debate concerns beach concessions. It extends to 31 December 2023 - and in any case no later than 31 December 2024 - the deadline for reforming licensing for tourism, recreation and sports purposes. The regulations on state concessions are to be reviewed within six months after the law comes into force. The law also updates legislation on ports, introducing the public evidence principle in the granting of concessions of state-owned port areas, and regulates the National Fuel Registry (Anagrafe nazionale dei carburanti)47. The enabling law for the reform of local public transport was also amended. Lastly, two draft legislative decrees on the reorganisation of the regulation of local public services of economic importance and on the mapping and transparency of concessionary regimes for public assets were recently approved in preliminary examination.
The reform of the Public Procurement Code defined in June48 aims to stabilise and make structural the simplifications introduced in recent years, with particular reference to the speeding up of procedures, to alternative dispute resolution mechanisms, and to the elimination of restrictions on subcontracting. The law also affects the qualification of contracting authorities, incentivising a reduction in the number of active entities and their specialisation. Another key principle of the enabling law is the obligation for contracting authorities to use telematic platforms that are interoperable with the National Database of Public Contracts created by the National Anti-Corruption Authority (Autorità Nazionale AntiCorruzione, ANAC).
With regard to progress in the area of cohesion policy programming, it should be noted that on 15 July 2022, following the conclusion of formal negotiations initiated on 17 January 2022 by the Cohesion Policy Department, Italy’s 2021-2027 Partnership Agreement was approved49. Respectively 8 national and 38 regional
___
46 Law No. 118 of 5 August 2022.
47 Established by the 2017 Annual Law on Competition to ensure the streamlining of the fuel distribution system.
48 Enabling law No. 78/ 2022.
49 Decision C (2022) 4787. The Agreement concerns the support of the European Regional Development Fund (ERDF), the European Social Fund plus (ESF+), the Just Transition Fund (JTF), as part of the ‘Investment for Jobs and Growth’ objective49, as well as the European Maritime, Fisheries and Aquaculture Fund (EMFF), for the period from 1 January 2021 to 31 December 2027.
| 42 | MINISTRY OF ECONOMY AND FINANCE |
IV. REFORMS AND RECOMMENDATIONS OF THE COUNCIL OF THE EUROPEAN UNION | |
programs are connected to the Agreement. In order to support the process of defining and notifying the programs, the Cohesion Policy Department has implemented a monitoring and accompanying action for the administrations. At the current stage, all programs are formally notified to the European Commission and a number of them have been approved by Implementing Decision.
| IV.3 | REDUCING THE USE OF FOSSIL FUELS, DIVERSIFYING ENERGY IMPORT, DEVELOPING RENEWABLE ENERGIES (CSR 3) |
Tensions in energy markets, which began as early as 2021 and were exacerbated by the war in Ukraine and the risk of Russian gas supply disruptions, have prioritized the need to reconcile energy security, decarbonisation goals, and support for households and businesses. Regarding the latter, the measures adopted50 range from the provision of a one-time EUR 200 monetary transfer to specific categories of taxpayers to widespread interventions for households and businesses. The two decrees ‘Aiuti bis’ and ‘Aiuti ter’51 consolidated some of these actions through urgent measures regarding energy, water emergency, social and industrial policies and an additional monetary transfer to low-income households, scheduled for November.
In terms of strengthening energy availability, to increase imports via the gas pipeline network connecting Italy to Mediterranean countries, the government has entered into agreements with Algeria, signed a Memorandum for the development of energy programs in the area of renewable energy, and committed to expanding LNG supplies from Egypt.
The decree to contain energy costs52 also introduced measures to enhance domestic natural gas production and increase its supply and storage. It was established53 that works aimed at increasing national regasification capacity represent strategic public utility interventions, for which a priority route for environmental assessments is provided, and the SACE guarantee is extended to natural gas storage companies. To reduce reliance on fossil fuels, it is planned to encourage the development of electricity grids and connections and, at the same time, the green hydrogen supply chain, including through the introduction of a series of tax incentives to support its production and use.
The government has repeatedly reiterated how the development of renewable sources is the key way to reduce the country’s dependence on imported fossil fuels. To this end, it has approved the Green Transition Plan (Piano per la Transizione Ecologica, PTE), streamlined sectoral regulations and expedited the approval of projects to generate wind and photovoltaic power.
The most recent measures54 involved the production of energy from biogas and the approval of numerous simplification measures to encourage the construction of
___
50 Decree laws No. 21/2022, No. 50/2022, and No. 80/2022.
51 These are decree laws No. 115/2022 and No. 144/2022 (so-called ‘Aiuti bis’ and ‘Aiuti ter’ decrees).
52 Decree law No. 17/2022, converted with amendments by law No. 34/2022.
53 Decree law No. 50/2022, art. 5.
54 Decree law No. 21/2022 and No. 50/2022.
| MINISTRY OF ECONOMY AND FINANCE | 43 |
| | UPDATE OF THE ECONOMIC AND FINANCIAL DOCUMENT 2022 |
renewable energy production facilities and, in particular, ground-mounted photovoltaic systems.
A substantial portion of RRP resources is also devoted to improving the energy efficiency of buildings and to their requalification. The program to improve the energy performance of public buildings has been boosted and the regulations regarding the 110 percent Superbonus have been revised. In June 2022, one of the goals of the RRP aimed at simplifying and expediting procedures for the implementation of energy efficiency interventions based on four key actions including the launch of a national portal for energy efficiency in buildings55 was achieved. In addition, the operational phase of the projects financed by the Central Government Energy Upgrading Program (Programma di riqualificazione energetica della PA centrale, PREPAC) was launched, and the Service for the Design of Public Assets and Buildings (Struttura per la progettazione di beni ed edifici pubblici) was created to support central and territorial administrations in the implementation of investments.
The Annex to the DEF, ‘Infrastructure, Mobility and Logistics’, provides the planning framework for mobility development, consistent with the Sustainable Development Goals of the UN 2030 Agenda and the European Green Deal.
To reinforce modal shift policies toward more sustainable modes of transport, the ‘Aiuti’ decree law refinanced the so-called marebonus and ferrobonus subsidies for 2022, while in order to promote rail freight traffic in ports, the Port System Authorities were allowed to reduce concession fees. To promote private demand for sustainable mobility, the so-called ecobonuses for the purchase of environmentally friendly vehicles and the scrapping of the most polluting vehicles56 have been reintroduced, using the resources allocated by the ‘Aiuti bis’ decree law. The simplification of the regulations for the construction of electric vehicle charging points provided for in the ‘Aiuti ter’ decree law will also encourage the spread of electric mobility. Furthermore, a fund was also established57 by the Minister for Economic Development to encourage research and development and the technological transition of automotive companies.
___
55 Already established by legislative decree No. 48/2020: http://pnpe2.enea.it/.
56 The Prime Ministerial decree of 6 April 2022 allocates incentives for the purchase of electric, hybrid and low-emission vehicles, cars, and motorcycles, providing EUR 650 million for each of the years 2022-2023-2024.
57 Decree law No. 17/2022.
| 44 | MINISTRY OF ECONOMY AND FINANCE |
V. ANNEX
| TABLE V.1a: GENERAL GOVERNMENT BUDGETARY PROSPECTS UNDER EXISTING LEGISLATION (EUR millions) |
| | | | | | |
| COMPONENTS OF EXPENDITURE | | | | | |
| Compensation of employees | 176,548 | 188,236 | 187,104 | 185,238 | 186,053 |
| Intermediate consumption | 157,228 | 167,130 | 165,027 | 162,313 | 162,915 |
| Social benefits | 397,905 | 409,600 | 427,680 | 446,180 | 458,560 |
| of which: Pensions | 286,280 | 297,350 | 320,800 | 338,290 | 349,790 |
| Other social benefits | 111,625 | 112,250 | 106,880 | 107,890 | 108,770 |
| Other current expenditure | 82,562 | 106,774 | 89,745 | 87,477 | 86,850 |
| Total current expenditure net of interest | 814,243 | 871,740 | 869,557 | 881,209 | 894,377 |
| Interest expenditure | 63,753 | 75,177 | 77,990 | 77,743 | 82,429 |
| Total current expenditure | 877,996 | 946,917 | 947,546 | 958,951 | 976,806 |
| of which: Health expenditure | 127,834 | 133,998 | 131,724 | 128,708 | 129,428 |
| | | | | | |
| Total capital expenditure | 108,172 | 82,369 | 100,911 | 94,871 | 101,918 |
| Gross fixed capital formation | 50,846 | 49,185 | 65,830 | 72,256 | 78,204 |
| Capital contributions | 21,952 | 22,694 | 26,964 | 18,002 | 19,062 |
| Other transfers | 35,374 | 10,490 | 8,118 | 4,613 | 4,652 |
| Total final expenditure net of interest | 922,415 | 954,109 | 970,468 | 976,080 | 996,295 |
| Total final expenditure | 986,168 | 1,029,287 | 1,048,458 | 1,053,822 | 1,078,724 |
| COMPONENTS OF REVENUE | | | | | |
| Total tax revenues | 527,629 | 569,090 | 580,193 | 590,465 | 611,662 |
| Direct taxes | 267,492 | 285,033 | 273,920 | 277,140 | 288,986 |
| Indirect taxes | 258,539 | 279,243 | 304,833 | 311,870 | 321,207 |
| Capital taxes | 1,598 | 4,814 | 1,440 | 1,455 | 1,469 |
| Social contributions | 244,988 | 264,241 | 279,730 | 287,027 | 295,529 |
| Actual contributions | 240,501 | 259,460 | 274,875 | 282,098 | 290,499 |
| Imputed contributions | 4,487 | 4,781 | 4,855 | 4,929 | 5,030 |
| Other current revenues | 78,386 | 89,454 | 96,765 | 90,336 | 91,163 |
| Total current revenues | 849,405 | 917,970 | 955,248 | 966,372 | 996,885 |
| Non-tax capital revenues | 6,263 | 9,717 | 24,140 | 13,019 | 12,793 |
| Total final revenues | 857,266 | 932,501 | 980,828 | 980,846 | 1,011,146 |
| Memo: Tax burden | 43.4 | 43.9 | 43.4 | 42.5 | 42.5 |
| BALANCES | | | | . | |
| Primary balance | -65,149 | -21,608 | 10,360 | 4,766 | 14,851 |
| % of GDP | -3.7 | -1.1 | 0.5 | 0.2 | 0.7 |
| Current balance | -28,591 | -28,947 | 7,701 | 7,421 | 20,078 |
| % of GDP | -1.6 | -1.5 | 0.4 | 0.4 | 0.9 |
| Net borrowing | -128,902 | -96,786 | -67,630 | -72,976 | -67,578 |
| % of GDP | -7.2 | -5.1 | -3.4 | -3.5 | -3.2 |
| Nominal GDP under existing legislation (x 1.000) | 1,782.1 | 1,896.2 | 1,979.2 | 2,064.3 | 2,136.6 |
| Note: Any inaccuracies result from rounding. | | | | | |
| MINISTRY OF ECONOMY AND FINANCE | 45 |
| | UPDATE OF THE ECONOMIC AND FINANCIAL DOCUMENT 2022 |
| TABLE V.1b: GENERAL GOVERNMENT BUDGETARY PROSPECTS UNDER EXISTING LEGISLATION (% of GDP) |
| | | | | | |
| COMPONENTS OF EXPENDITURE | | | | | |
| Compensation of employees | 9.9 | 9.9 | 9.5 | 9.0 | 8.7 |
| Intermediate consumption | 8.8 | 8.8 | 8.3 | 7.9 | 7.6 |
| Social benefits | 22.3 | 21.6 | 21.6 | 21.6 | 21.5 |
| of which: Pensions | 16.1 | 15.7 | 16.2 | 16.4 | 16.4 |
| Other social benefits | 6.3 | 5.9 | 5.4 | 5.2 | 5.1 |
| Other current expenditure | 4.6 | 5.6 | 4.5 | 4.2 | 4.1 |
| Total current expenditure net of interest | 45.7 | 46.0 | 43.9 | 42.7 | 41.9 |
| | | | | | |
| Interest expenditure | 3.6 | 4.0 | 3.9 | 3.8 | 3.9 |
| | | | | | |
| Total current expenditure | 49.3 | 49.9 | 47.9 | 46.5 | 45.7 |
| of which: Health expenditure | 7.2 | 7.1 | 6.7 | 6.2 | 6.1 |
| | | | | | |
| Total capital expenditure | 6.1 | 4.3 | 5.1 | 4.6 | 4.8 |
| Gross fixed capital formation | 2.9 | 2.6 | 3.3 | 3.5 | 3.7 |
| Capital contributions | 1.2 | 1.2 | 1.4 | 0.9 | 0.9 |
| Other transfers | 2.0 | 0.6 | 0.4 | 0.2 | 0.2 |
| | | | | | |
| Total final expenditure net of interest | 51.8 | 50.3 | 49.0 | 47.3 | 46.6 |
| Total final expenditure | 55.3 | 54.3 | 53.0 | 51.0 | 50.5 |
| | | | | | |
| COMPONENTS OF REVENUE | | | | | |
| Total tax revenues | 29.6 | 30.0 | 29.3 | 28.6 | 28.6 |
| Direct taxes | 15.0 | 15.0 | 13.8 | 13.4 | 13.5 |
| Indirect taxes | 14.5 | 14.7 | 15.4 | 15.1 | 15.0 |
| Capital taxes | 0.1 | 0.3 | 0.1 | 0.1 | 0.1 |
| Social contributions | 13.7 | 13.9 | 14.1 | 13.9 | 13.8 |
| Actual contributions | 13.5 | 13.7 | 13.9 | 13.7 | 13.6 |
| Imputed contributions | 0.3 | 0.3 | 0.2 | 0.2 | 0.2 |
| Other current revenues | 4.4 | 4.7 | 4.9 | 4.4 | 4.3 |
| Total current revenues | 47.7 | 48.4 | 48.3 | 46.8 | 46.7 |
| | | | | | |
| Non-tax capital revenues | 0.4 | 0.5 | 1.2 | 0.6 | 0.6 |
| | | | | | |
| Total final revenues | 48.1 | 49.2 | 49.6 | 47.5 | 47.3 |
| Memo: Tax burden | 43.4 | 43.9 | 43.4 | 42.5 | 42.5 |
| BALANCES | | | | | |
| Primary balance | -3.7 | -1.1 | 0.5 | 0.2 | 0.7 |
| Current balance | -1.6 | -1.5 | 0.4 | 0.4 | 0.9 |
| Net borrowing | -7.2 | -5.1 | -3.4 | -3.5 | -3.2 |
| Note: Any inaccuracies result from rounding. | | | | | |
| 46 | MINISTRY OF ECONOMY AND FINANCE |
| TABLE V.1c: GENERAL GOVERNMENT BUDGETARY PROSPECTS UNDER EXISTING LEGISLATION (percentage changes y/y) |
| | 2022 | 2023 | 2024 | 2025 |
| COMPONENTS OF EXPENDITURE | | | | |
| Compensation of employees | 6.6 | -0.6 | -1.0 | 0.4 |
| Intermediate consumption | 6.3 | -1.3 | -1.6 | 0.4 |
| Social benefits | 2.9 | 4.4 | 4.3 | 2.8 |
| of which: Pensions | 3.9 | 7.9 | 5.5 | 3.4 |
| Other social benefits | 0.6 | -4.8 | 0.9 | 0.8 |
| Other current expenditure | 29.3 | -15.9 | -2.5 | -0.7 |
| Total current expenditure net of interest | 7.1 | -0.3 | 1.3 | 1.5 |
| | | | | |
| Interest expenditure | 17.9 | 3.7 | -0.3 | 6.0 |
| | | | | |
| Total current expenditure | 7.8 | 0.1 | 1.2 | 1.9 |
| of which: Health expenditure | 4.8 | -1.7 | -2.3 | 0.6 |
| | | | | |
| Total capital expenditure | -23.9 | 22.5 | -6.0 | 7.4 |
| Gross fixed capital formation | -3.3 | 33.8 | 9.8 | 8.2 |
| Capital contributions | 3.4 | 18.8 | -33.2 | 5.9 |
| Other transfers | -70.3 | -22.6 | -43.2 | 0.9 |
| | | | | |
| Total final expenditure net of interest | 3.4 | 1.7 | 0.6 | 2.1 |
| Total final expenditure | 4.4 | 1.9 | 0.5 | 2.4 |
| | | | | |
| COMPONENTS OF REVENUE | | | | |
| Total tax revenues | 7.9 | 2.0 | 1.8 | 3.6 |
| Direct taxes | 6.6 | -3.9 | 1.2 | 4.3 |
| Indirect taxes | 8.0 | 9.2 | 2.3 | 3.0 |
| Capital taxes | 201.3 | -70.1 | 1.0 | 1.0 |
| Social contributions | 7.9 | 5.9 | 2.6 | 3.0 |
| Actual contributions | 7.9 | 5.9 | 2.6 | 3.0 |
| Imputed contributions | 6.5 | 1.5 | 1.5 | 2.1 |
| Other current revenues | 14.1 | 8.2 | -6.6 | 0.9 |
| Total current revenues | 8.1 | 4.1 | 1.2 | 3.2 |
| | | | | |
| Non-tax capital revenues | 55.1 | 148.4 | -46.1 | -1.7 |
| | | | | |
| Total final revenues | 8.8 | 5.2 | 0.0 | 3.1 |
TABLE V.2: GENERAL GOVERNMENT CASH BALANCES (1) |
| | | 2022 | 2023 | 2024 | 2025 |
| | | | |
| General government | -108,984 | -6.1 | -3.4 | -3.3 | -3.6 | -3.5 |
| Central government | -105,754 | -5.9 | -3.3 | -3.3 | -3.7 | -3.5 |
| State sector | -106,326 | -6.0 | -3.3 | -3.4 | -3.7 | -3.5 |
| Local governments | -3,231 | -0.2 | -0.1 | 0.0 | 0.0 | 0.0 |
| Social security funds | 0 | 0.0 | 0.0 | 0.0 | 0.0 | 0.0 |
(1) From 2022 forecasts under the existing legislation scenario. (2) Values in EUR millions. |
| MINISTRY OF ECONOMY AND FINANCE | 47 |
| | UPDATE OF THE ECONOMIC AND FINANCIAL DOCUMENT 2022 |
| TABLE V.3: IMPACT OF RECOVERY AND RESILIENCE FACILITY ON GENERAL GOVERNMENT BUDGETARY PROSPECTS - GRANTS |
| | 2020 | 2021 | 2022 | 2023 | 2024 | 2025 |
| Revenues from RRF grants (% GDP) | | | | | | |
| RRF grants as included in the revenue projections | 0.0 | 0.1 | 0.5 | 1.1 | 0.8 | 0.7 |
| Cash disbursements of RRF grants from EU | 0.0 | 0.5 | 1.1 | 0.6 | 0.4 | 0.4 |
| Expenditure financed by RRF grants (% GDP) | | | | | | |
| TOTAL CURRENT EXPENDITURE | 0.0 | 0.0 | 0.0 | 0.2 | 0.2 | 0.2 |
| Gross fixed capital formation P.51g | 0.0 | 0.0 | 0.1 | 0.2 | 0.4 | 0.3 |
| Capital transfers D.9 | 0.0 | 0.1 | 0.2 | 0.5 | 0.1 | 0.1 |
| TOTAL CAPITAL ACCOUNT EXPENDITURE | 0.0 | 0.1 | 0.3 | 0.7 | 0.4 | 0.4 |
| Other costs financed by RRF grants (% GDP) (1) | | | | | | |
| Reduction in tax revenue | 0.0 | 0.0 | 0.2 | 0.2 | 0.2 | 0.2 |
| Other costs with impact on revenue | 0.0 | 0.0 | 0.0 | 0.0 | 0.0 | 0.0 |
| Financial transactions | 0.0 | 0.0 | 0.0 | 0.0 | 0.0 | 0.0 |
| (1) Reference is made to cost items not recorded as expenditure in the national accounts. Any inaccuracies result from rounding. |
| TABLE V.4: IMPACT OF RECOVERY AND RESILIENCE FACILITY ON GENERAL GOVERNMENT BUDGETARY PROSPECTS - LOANS |
| | | | | | | |
| Cash flow from RRF loans projected in the programme (% GDP) | | | | | |
| Disbursements of RRF loans from EU | 0.0 | 0.9 | 1.2 | 1.2 | 1.0 | 1.0 |
| Repayments of RRF loans to EU | 0.0 | 0.0 | 0.0 | 0.0 | 0.0 | 0.0 |
| Expenditure financed by RRF loans (% GDP) | | | | | | |
| TOTAL CURRENT EXPENDITURE | 0.0 | 0.0 | 0.0 | 0.1 | 0.1 | 0.1 |
| Gross fixed capital formation P.51g | 0.1 | 0.1 | 0.2 | 0.9 | 1.3 | 1.4 |
| Capital transfers D.9 | 0.0 | 0.0 | 0.0 | 0.0 | 0.0 | 0.0 |
| TOTAL CAPITAL ACCOUNT EXPENDITURE | 0.1 | 0.1 | 0.3 | 0.9 | 1.3 | 1.4 |
| Other costs financed by RRF loans (% GDP) (1) | | | | | | |
| Reduction in tax revenue | 0.0 | 0.0 | 0.0 | 0.0 | 0.0 | 0.0 |
| Other costs with impact on revenue | 0.0 | 0.0 | 0.0 | 0.0 | 0.0 | 0.0 |
| Financial transactions | 0.0 | 0.0 | 0.0 | 0.0 | 0.0 | 0.0 |
| (1) Reference is made to cost items not recorded as expenditure in the national accounts. Any inaccuracies result from rounding. |
| TABLE V.5: NGEU RESOURCES UNDERLYING FORECASTS (EUR billions) |
| | 2020-21 | 2022 | 2023 | 2024 | 2025 | 2026 | Total |
| RRF grants | 1.5 | 9.0 | 21.7 | 16.2 | 14.8 | 5.7 | 68.9 |
| RRF loans | 4.0 | 6.0 | 19.3 | 30.2 | 32.9 | 30.2 | 122.6 |
| TOTAL | 5.5 | 15.0 | 40.9 | 46.5 | 47.7 | 35.9 | 191.5 |
| Of which: | | | | | | | |
| Additive | 1.3 | 8.2 | 27.6 | 31.0 | 32.4 | 24.0 | 124.5 |
| Substitutive | 4.2 | 6.8 | 13.3 | 15.5 | 15.3 | 11.9 | 67.0 |
| REACT-EU | | 4.2 | 10.2 | | | | 14.4 |
| Note: Any inaccuracies result from rounding. | | | | | | | |
| 48 | MINISTRY OF ECONOMY AND FINANCE |
| TABLE V.6: CYCLICALLY ADJUSTED PUBLIC FINANCE (% of GDP) |
| | 2019 | 2020 | 2021 | 2022 | 2023 | 2024 | 2025 |
1. Growth rate of GDP at constant prices | 0.5 | -9.0 | 6.7 | 3.3 | 0.6 | 1.8 | 1.5 |
2. Net borrowing | -1.6 | -9.5 | -7.2 | -5.1 | -3.4 | -3.5 | -3.2 |
3. Interest expenditure | 3.4 | 3.5 | 3.6 | 4.0 | 3.9 | 3.8 | 3.9 |
4. One-off measures (1) | 0.1 | 0.1 | 0.4 | 0.4 | 0.2 | 0.1 | 0.0 |
| Of which: Revenue measures | 0.1 | 0.2 | 0.4 | 0.4 | 0.2 | 0.0 | 0.0 |
| Expenditure measures | -0.1 | -0.1 | 0.0 | 0.1 | 0.0 | 0.0 | 0.0 |
5. Potential GDP growth rate | 0.0 | -0.2 | 0.1 | 1.0 | 0.7 | 1.1 | 1.1 |
| Factor contribution to potential growth: | | | | | | | |
| Labour | -0.4 | -0.4 | -0.4 | 0.4 | 0.1 | 0.4 | 0.4 |
| Capital | 0.0 | -0.1 | 0.1 | 0.3 | 0.4 | 0.4 | 0.5 |
| Total factor productivity | 0.4 | 0.3 | 0.3 | 0.2 | 0.2 | 0.3 | 0.3 |
6. Output gap | 0.5 | -8.4 | -2.3 | 0.0 | -0.2 | 0.5 | 1.0 |
7. Cyclical component of budget balance | 0.3 | -4.6 | -1.3 | 0.0 | -0.1 | 0.3 | 0.5 |
8. Cyclically adjusted budget balance | -1.9 | -5.0 | -6.0 | -5.1 | -3.3 | -3.8 | -3.7 |
9. Cyclically adjusted primary balance | 1.5 | -1.5 | -2.4 | -1.1 | 0.6 | -0.1 | 0.2 |
10. Structural budget balance (2) | -1.9 | -5.0 | -6.4 | -5.5 | -3.6 | -3.9 | -3.7 |
11. Structural primary balance (2) | 1.4 | -1.6 | -2.8 | -1.5 | 0.4 | -0.1 | 0.1 |
12. Change in structural budget balance | 0.4 | -3.1 | -1.4 | 0.9 | 1.9 | -0.3 | 0.2 |
13. Change in structural primary balance | | | | | | | |
| Note: Any inaccuracies result from rounding. |
(1) The positive sign indicates deficit reducing one-off measures. (2) Cyclically adjusted and net of one-off and other temporary measures. |
| TABLE V.7: ONE-OFF MEASURES UNDER UNCHANGED LEGISLATION (EUR millions) |
| | FINAL DATA | FORECASTS |
| | 2020 | 2021 | 2022 | 2023 | 2024 | 2025 |
| Total one-off measures | 1,147 | 7,305 | 7,959 | 4,932 | 1,393 | 877 |
| % of GDP | 0.1 | 0.4 | 0.4 | 0.2 | 0.1 | 0.0 |
- a) Revenue | 2,666 | 7,350 | 6,756 | 4,407 | 924 | 408 |
| % of GDP | 0.2 | 0.4 | 0.4 | 0.2 | 0.0 | 0.0 |
| - Various substitute taxes | 1,582 | 5,637 | 5,153 | 3,524 | 516 | 0.0 |
| - Aligning of balance sheet values to IAS principles | 423 | 572 | 409 | 408 | 408 | 408 |
| - Foreign capital emersion (‘voluntary disclosure’) | 1 | 1 | 1 | 0 | 0 | 0 |
| - Tax bill scrapping (1) | 660 | 1,140 | 1,193 | 475 | 0 | 0 |
- b) Expenditure | -2,437 | -940 | -385 | -340 | -340 | -340 |
| % of GDP | -0.1 | -0.1 | 0.0 | 0.0 | 0.0 | 0.0 |
| - Interventions for natural disasters: | -962 | -940 | -385 | -340 | -340 | -340 |
| - Reclassification of MPS operation | -1,045 | 0 | 0 | 0 | 0 | 0 |
| - Reclassification of Banca Popolare di Bari loan | -430 | 0 | 0 | 0 | 0 | 0 |
- c) Real estate disposals | 918 | 895 | 1,589 | 865 | 809 | 809 |
| % of GDP | 0.1 | 0.1 | 0.1 | 0.0 | 0.0 | 0.0 |
| Breakdown by subsectors | | | | | | |
| - Central government | 308 | 6,505 | 6,403 | 4,100 | 617 | 101 |
| - Local governments | 644 | 370 | 550 | 500 | 500 | 500 |
| - Social security funds | 195 | 430 | 1,006 | 332 | 276 | 276 |
| Note: The positive sign indicates deficit reducing one-off measures. |
| (1) Including the measures of D.L. No. 193/2016. D.L. No. 148/2017. D.L. No. 119/2018. |
| MINISTRY OF ECONOMY AND FINANCE | 49 |
The Update of the
ECONOMIC AND FINANCIAL DOCUMENT 2022
is available on-line
at the internet address listed below:
www.mef.gov.it www.dt.tesoro.it/ www.rgs.mef.gov.it
ISSN 2240-3280