Exhibit (8)
|
MINISTERO DELL’ECONOMIA E DELLE FINANZE |
PUBLIC DEBT REPORT 2021 |
INDEX
| INDEX | I |
| INDEX OF TABLES | II |
| INDEX OF CHARTS AND GRAPHIC FIGURES | III |
| FOREWORD | VII |
| I. | DEBT MANAGEMENT OBJECTIVES FOR 2021 | 1 |
| I.1 | The objectives and risks of international debt management practices | 1 |
| I.2 | 2021 objectives: the institutional framework of reference | 2 |
| I.3 | Curbing the cost of debt while paying attention to the cost / risk profile | 6 |
| I.4 | Monitoring and managing the cash account to stabilise the balance | 14 |
| II. | THE ITALIAN GOVERNMENT SECURITIES MARKET: PERFORMANCE INTHE INTERNATIONAL CONTEXT | 17 |
| II.1 | Monetary policies and effects on the euro area money market | 17 |
| II.2 | Euro area bond markets | 19 |
| II.3 | Trends in the italian government securities market | 23 |
| III. | PUBLIC DEBT MANAGEMENT IN 2021 | 41 |
| III.1 | Outstanding general public debt | 41 |
| III.2 | Government bonds activities | 42 |
| III.3 | Derivatives portfolio management | 65 |
| III.4 | Debt management results in relation to objectives | 67 |
| III.5 | The Treasury’s cash management | 80 |
| MINISTRY OF ECONOMY AND FINANCE | I |
INDEX OF TABLES
| Table I.1: | Domestic government securities | 3 |
| Table I.2: | Objectives for the end of 2021: percentage composition of the debt portfolio | 4 |
| Table III.1: | Maturities and coverage of the state sector’s requirement (eur million) | 43 |
| Table III.2: | Government bonds issued net of exchange operations (eur million) | 43 |
| Table III.3: | Geographical distribution of awards in syndicated placements of nominal btp in 2021 | 49 |
| Table III.4: | Distribution by investor category of awards in syndicated placements of nominal btp in 2021 | 50 |
| Table III.5: | Summary of exchange operations (nominal amounts in eur million) | 64 |
| Table III.6: | Summary of repurchased from the cash account (nominal amounts in eur million) | 65 |
| Table III.7: | Composition of 2019-2021 issues, in absolute (EUR million) and percentage terms (including exchanges)* | 69 |
| Table III.8: | Average life of the stock of government securities | 71 |
| Table III.9: | Duration and arp trend during the 2019-2021 period, relating to the stock of government securities before derivatives (in years) | 72 |
| Table III.10: | Duration and arp trend during the 2019-2021 period, relating to the stock of government securities after derivatives (in years) | 73 |
| Table III.11: | Derivatives portfolio – years 2020-2021 (eur million) | 74 |
| Table III.12: | Duration and arp trend during the 2020-2021 period, relating to the stock of government securities before derivatives (in years) | 80 |
| Table III.13: | Duration and arp trend during the 2020-2021 period, relating to the stock of government securities after derivatives and european loans (in years) | 80 |
| Table III.14: | Cash account and investments of the Treasury’s liquidity at the end of each month - 2021 (eur million) | 84 |
| II | MINISTRY OF ECONOMY AND FINANCE |
INDEX OF CHARTS AND GRAPHIC FIGURES
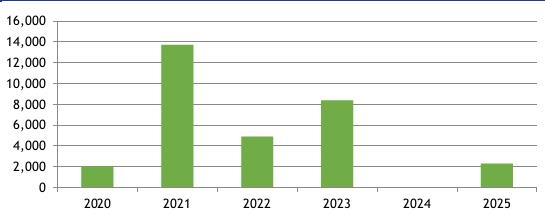
| Chart I.1 | Annual maturity profile of medium/long-term securities outstanding as at 31.12.2020 (eur million) | 7 |
| Chart I.2: | Monthly maturity profile of medium/long-term securities outstanding as at 31.12.2020 (eur million) | 8 |
| Chart I.3: | Composition of the alternative issuance portfolios analysed for 2021 (eur million) | 10 |
| Chart II.1: | Performance of the main money market rates, 2020 - 2021 (percentage values) | 18 |
| Chart II.2: | Trend of european government bond yields - 10-year maturity (percentage values) | 20 |
| Figure 1: | Monthly net purchases under the pspp and pepp programmes (eur billion) | 21 |
| Figure 2: | Volume (eur billion) and average life (years) of the stock of italian government securities purchased by the ecb under the pspp programme | 22 |
| Chart II.3: | Market yields on government securities with 2 to 50-year maturities (percentage values) | 23 |
| Chart II.4: | Government securities yield spread, 10-year vs. 2-year (basis points) | 24 |
| Chart II.5: | Government securities yield spread, 30-year vs. 10-year (basis points) | 25 |
| Chart II.6: | Yield spread: btp-bund, oat-bund bonos-bund and oat-bund, 10-year benchmark (basis points) | 25 |
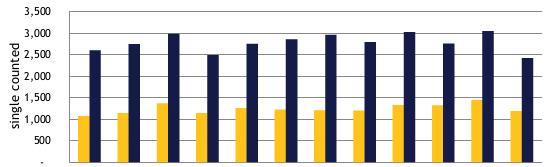
| Chart II.7: | Monthly volumes traded on the mts platform (eur million; single-counted) | 27 |
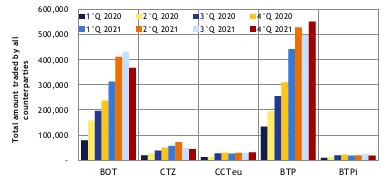
| Chart II.8: | Quarterly volumes traded on the mts platform, by segment (eur million; single- counted) | 28 |
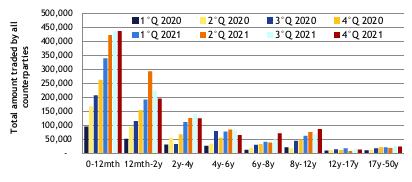
| Chart II.9: | Quarterly volumes traded on the mts platform, by maturity (eur million; single- counted) | 28 |
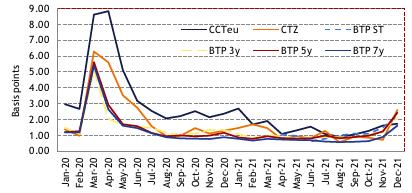
| Chart II.10a: | Bid-ask spread (in basis points) for ctzs, ccteus, 3-, 5- and 7-year benchmark btps, as recorded on the mts platform - monthly averages | 29 |
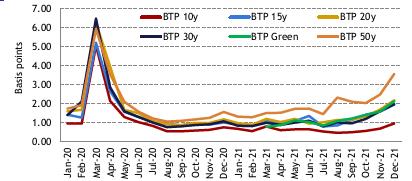
| Chart II.10b: | Bid-ask spread (in basis points) for 10-, 15-, 20-, 30- and 50-year benchmark btps, as recorded on the mts platform - monthly averages | 29 |
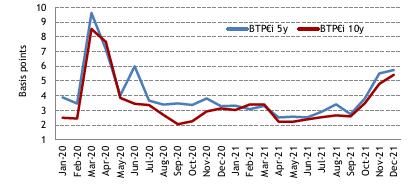
| Chart II.10c: | Bid-ask spread (in basis points) for 5- and 10-year benchmark btp€is, as recorded on the mts platform - monthly averages | 30 |
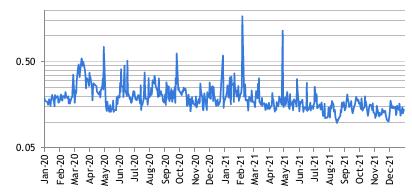
| Chart II.10d: | Daily slope on 10-year benchmark btp (logarithmic scale), as recorded on the mts platform | 31 |
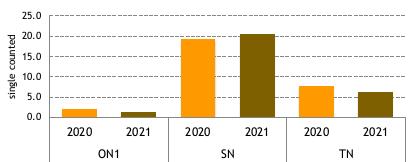
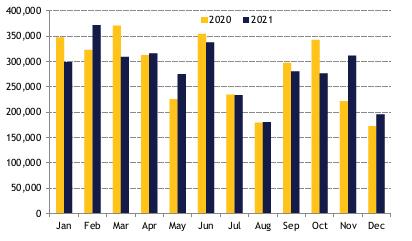
| Chart II.11: | Annual volumes traded on the mts platform in 2020 and 2021, by contract maturity (eur million) | 32 |
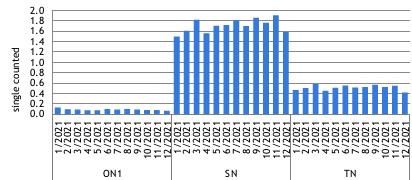
| Chart II.12: | Monthly volumes traded on the mts platform in 2021, by contract maturity (eur million) | 32 |
| Chart II.13: | Monthly special repo volumes traded on the mts platform (eur million) | 33 |
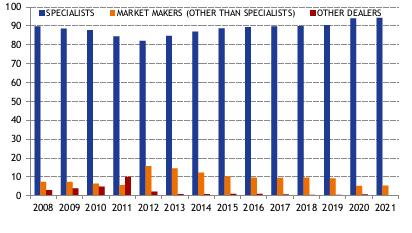
| Chart II.14: | Annual volumes traded by specialists on the mts platform (%) | 34 |
| MINISTRY OF ECONOMY AND FINANCE | III |
| Chart II.15: | Monthly volumes traded by specialists on platforms other than mts (eur million) | 35 |
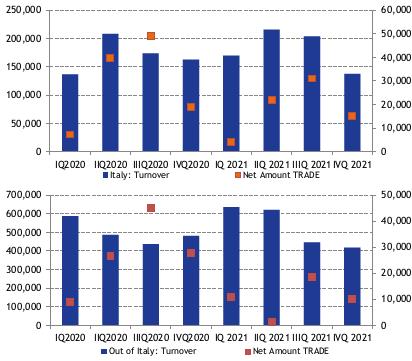
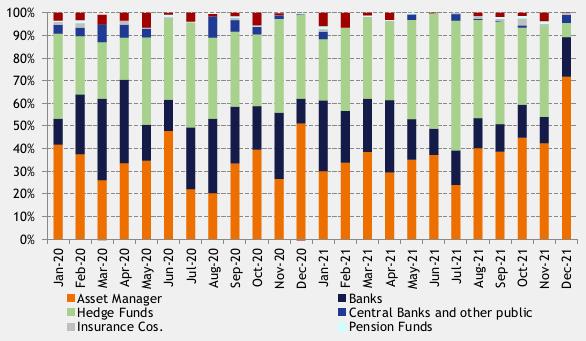
| Chart II.16: | Quarterly volumes traded by specialists by type of counterparty - fund managers, banks, pension and insurance funds, hedge funds (eur million) | 36 |
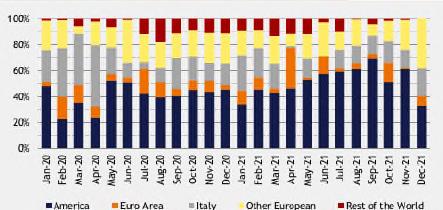
| Chart II.17: | Quarterly volumes traded by specialists according to counterparty residence (eur million) | 37 |
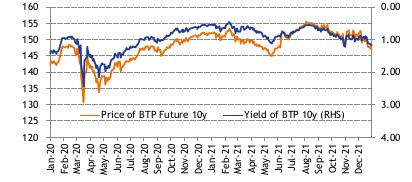
| Chart II.18: | Prices of the btp futura and yield of the 10-year benchmark btp (right-hand scale inverted, in %) | 38 |
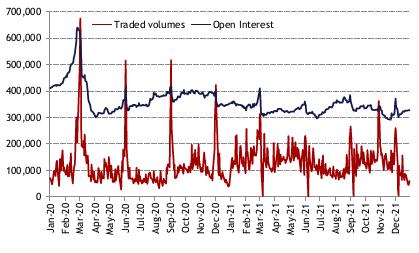
| Chart II.19: | Volumes of lots traded and open interest for the 10-year btp futura contract traded on the eurex market | 39 |
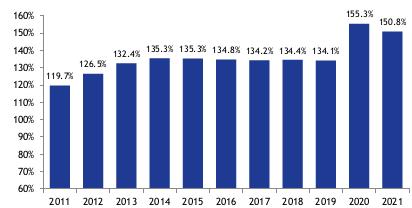
| Chart III.1: | 2011-2022 Evolution of the debt-to-gdp ratio | 41 |
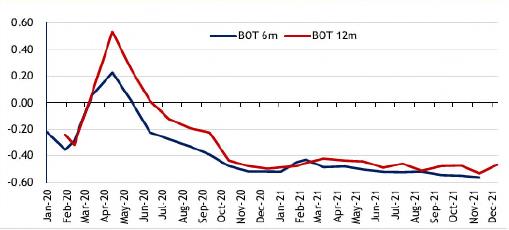
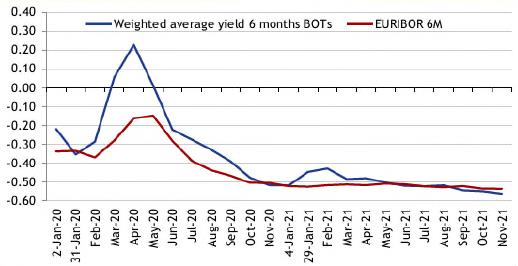
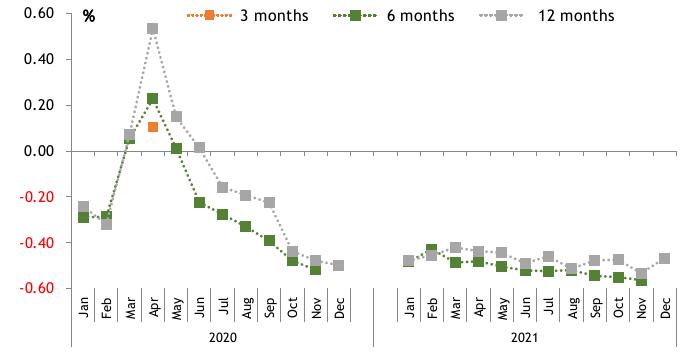
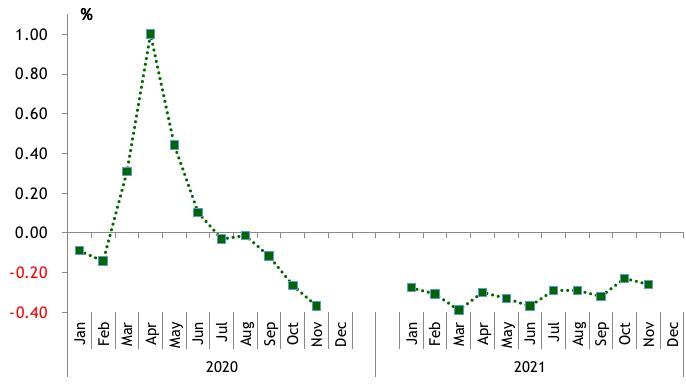
| Chart III.2: | Gross compound yields on issuance of 6- and 12-month bots, 2020-2021 (expressed in percentage points) | 46 |
| Chart III.3: | Yield at issuance of 6-month bots and comparison with euribor rate - years 2020-21 (expressed in percentage points) | 46 |
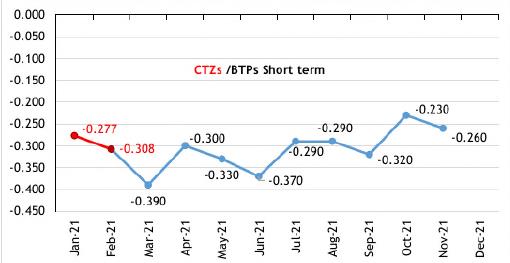
| Chart III.4: | CTZ and BTP short term yields at issuance (expressed in percentage rates) in 2021 | 48 |
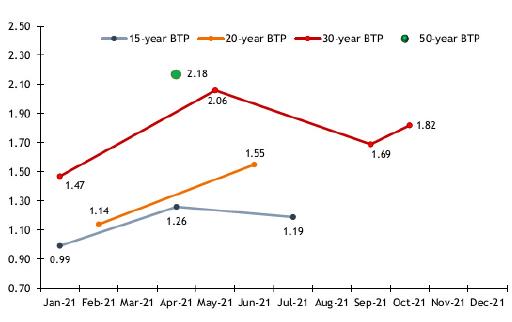
| Chart III.5: | Yields at issuance of long-term btps in 2021 (expressed in percentage points) | 51 |
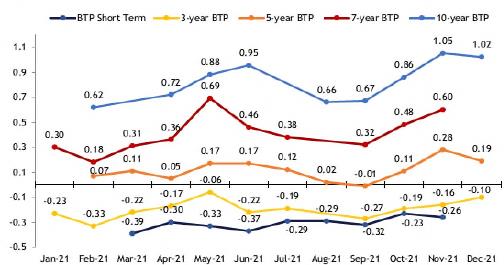
| Chart III.6: | Yields at issuance of btps with 3-10 year maturities in 2021 (in percentage points) | 54 |
| Figure 3: | Breakdown by type of counterparty of orders placed in nominal btp auctions by specialists in government bonds - year 2021 | 55 |
| Figure 4: | Breakdown by geographical area of orders placed in nominal btp auctions by specialists in government bonds - year 2021 | 55 |
| Chart III.7: | Break even inflation (bei) a 10 anni 2020-2021 (espressa in punti base) | 57 |
| Chart III.8: | 10-Year break-even inflation (bei) 2020-2021 (expressed in basis points) | 58 |
| Chart III.9: | Yields on the issue of ccteus in 2020 (expressed in percentage points) | 61 |
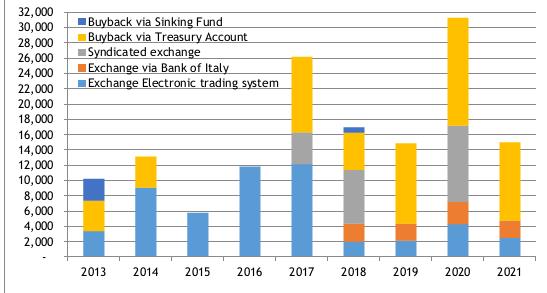
| Chart III.10: | Amount repurchased in extraordinary operations - years 2013-2021 (nominal amounts in eur million) | 63 |
| Chart III.11: | Distribution of government bonds repurchased in extraordinary operations carried out in 2021 (nominal amounts in eur million) | 65 |
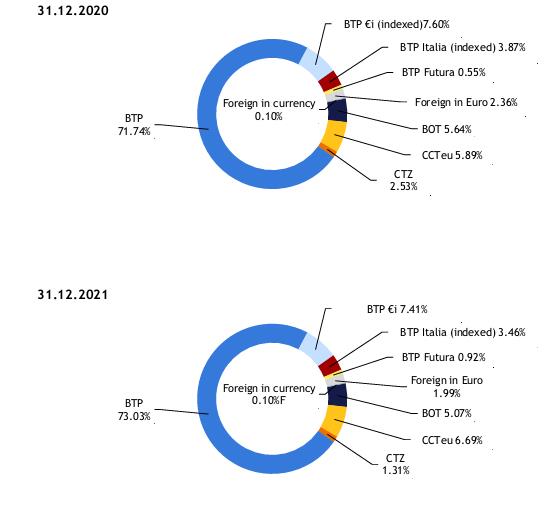
| Chart III.12: | Composition of the stock of government securities as of 31 december 2020 and 31 december 2021 | 70 |
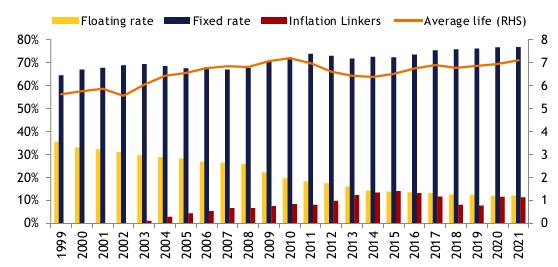
| Chart III.13: | Evolution of the structure and average life of debt (in years) | 71 |
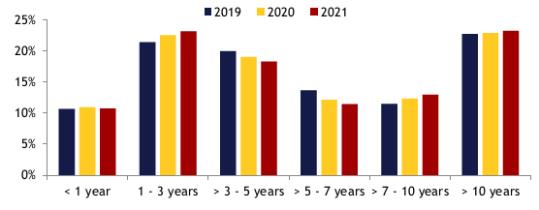
| Chart III.14: | Maturities by residual life, 2019-2021 | 72 |
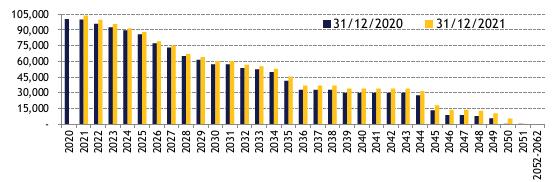
| Chart III.15: | Comparison between the prospective trend of the notional amount for the existing derivatives portfolio, as at 31/12/2020 and 31/12/2021, respectively, assuming that all swaptions are exercised (eur million) | 75 |
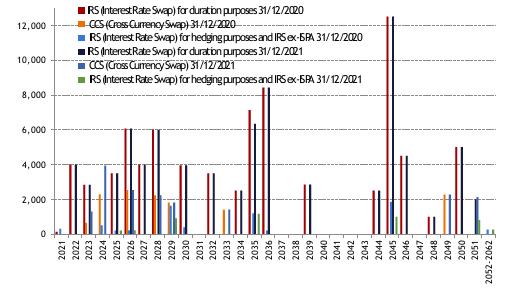
| Chart III.16: | Comparison between the maturity structure of the existing derivatives portfolio, as at 31/12/2020 and 31/12/2021, respectively, assuming that all swaptions are exercised (eur million) | 76 |
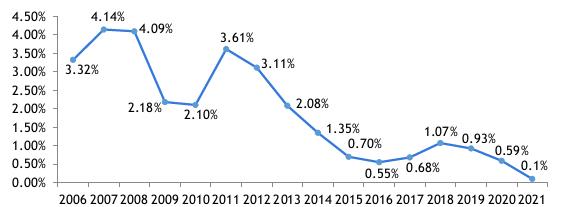
| Chart III.17: | Average cost at issuance of government securities - 2006-2021 (Percentage points) | 76 |
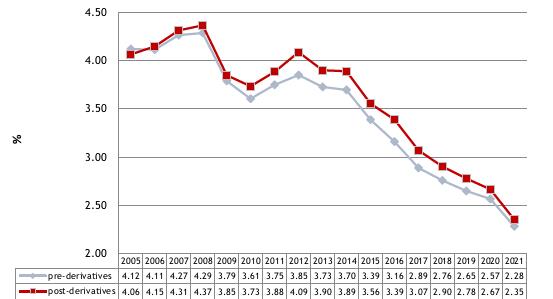
| Chart III.18: | Average cost of the stock of government securities, before and after derivatives - 2005-2021 (Percentage points) | 77 |
| IV | MINISTRY OF ECONOMY AND FINANCE |
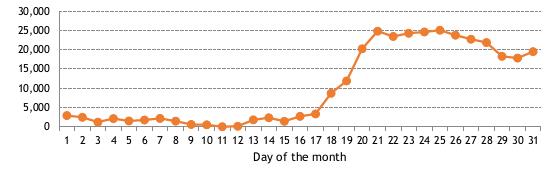
| Chart III.19: | Average intra-monthly changes in the Treasury’s available cash - differences compared with the monthly minimum - 2021 (eur million) | 82 |
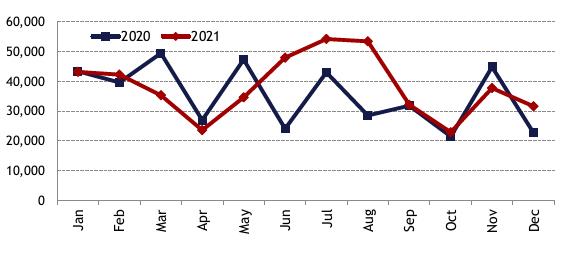
| Chart III.20: | Difference between monthly maximum and minimum Treasury’s cash account – 2020 and 2021 (eur million) | 83 |
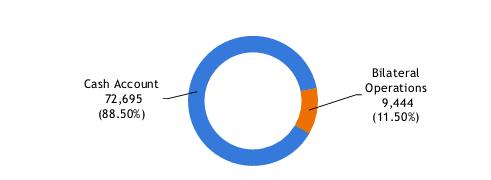
| Chart III.21: | Breakdown of the Treasury liquidity - average values for 2021 (eur million) | 84 |
| MINISTRY OF ECONOMY AND FINANCE | V |
| MINISTRY OF ECONOMY AND FINANCE | VI |
FOREWORD
The eight edition of the 2021 Annual Report on Italian Public Debt Management was slightly modified in its form and content. These changes do not alter the core structure of the Report, but merely make it easier to read. The document is also supplemented by the information available on the Public Debt section of the MEF Department of the Treasury website (www.dt.mef.gov.it/en/debito_pubblico/), which is regularly updated.
First of all, the Report was divided into two parts, leaving in-depth studies and statistical data in a separate section. The latter were primarily displayed in chart form, so that the main trends could be more immediately perceived. Please refer to the relevant pages available on the website for the underlying data.
With regard to contents, the objective was to focus on the newest and most peculiar aspects of debt management - largely determined by the absolutely exceptional market conditions experienced over the last two years - which also entailed a redefinition of the organisational structure to better meet the institutional objectives of a large issuer such as the Italian one.
Hopefully, this Report has become increasingly accessible also to less experienced readers who are rightfully interested in the evolution of Italy’s public debt management, a phenomenon that, if only due to its size, directly or indirectly has a significant influence on national economic performance.
| MINISTRY OF ECONOMY AND FINANCE | VII |
| VIII | MINISTRY OF ECONOMY AND FINANCE |
| I. | DEBT MANAGEMENT OBJECTIVES FOR 2021 |
| I.1 | THE OBJECTIVES AND RISKS OF INTERNATIONAL DEBT MANAGEMENT PRACTICES |
The Italian Treasury’s public debt management has always been in line with international best practices and fully complies with the recommendations of the main multilateral financial institutions as well as with the approaches adopted by other Debt Management Offices (DMOs) in advanced countries.
The main types of risk faced by DMOs refer to market risk, which includes interest rate risk and exchange rate risk, refinancing risk, liquidity risk and credit risk, in addition to the operational risk. Many of these risks involve, albeit in different ways, an unexpected increase in the cost of debt that could jeopardise debt sustainability.
International best practices recommend avoiding public debt portfolio structures that are too heavily weighted towards short-term and floating-rate instruments. Such structures may increase a country’s economic and financial vulnerability1.
In fact, despite reducing interest expenditure in the short term, these structures make it more volatile, while they also increase the market refinancing risk and interest rate risk inherent in the debt portfolio and, consequently, in the government budget2. On the other hand, under normal financial market conditions and regardless of the issuer’s creditworthiness, interest expenditure is higher for longer-term maturities, although longer maturities offer the benefit of effectively reducing the refinancing risk and interest rate risk.
However, DMOs are required to pursue both objectives: reducing the cost of debt at the same time as curbing market risks. Therefore, in practice, public debt managers must forego maximising both of these objectives and must instead focus on managing their relative trade-off.
__
1 Considerations in this regard can be found in the Guide to the Debt Management Performance Assessment (DeMPA) Tool, World Bank 2009
2 However, it should be noted that this risk assessment approach may only be considered optimal if focusing exclusively on government liabilities (and therefore on debt). Indeed, a different and broader point of view could also include government assets. Under this approach, debt management could thus aim to achieve a liability structure consistent with the risks inherent to assets (following a so-called “ALM”–“Asset Liability Management” approach). This may lead to choices that - in principle - could differ even quite significantly from those made by taking into account the debt composition alone. However, many countries, including Italy, have come across significant hurdles in implementing such an approach, due to both the practical difficulty of calculating the financial risk exposure of the government’s substantial assets - especially non-financial assets - and, in many cases, the fact that there is incomplete knowledge of the size and characteristics of said assets. Further information can be found in the World Bank Policy Research Working Paper How Do Countries Use an Asset and Liability Management Approach? A Survey on Sovereign Balance Sheet Management.
| MINISTRY OF ECONOMY AND FINANCE | 1 |
In other words, out of all the feasible options, they must select the cost-risk combination deemed satisfactory3 in relation to both portfolio characteristics and overall strategies. This trade-off is therefore not the same for all DMOs, and is therefore handled differently by public debt managers in each country, based on its specific characteristics, starting with its size in relation to the national economic system, its portfolio of instruments, its reference market and the fiscal policies pursued. Italy has taken a particularly prudent approach to this trade-off due to the size of its debt (among the highest in the world in absolute terms); this approach results in an idiosyncratic additional cost that does not allow for opportunistic tactics, but rather pushes for continuity, predictability and long-term strategies.
It goes without saying that the DMO’s task of minimising the cost of debt while maintaining an acceptable level of risk cannot be deemed to have been completed upon each issuance and in relation to the market conditions at the time of placement. Indeed, the structure of public debt, consisting of a wide and diversified portfolio of financial instruments with different characteristics and maturities, requires continuous, dynamic management even after issuance, conducted with suitable instruments and in line with market developments.
| I.2 | 2021 OBJECTIVES: THE INSTITUTIONAL FRAMEWORK OF REFERENCE |
Public debt is made up of the total liabilities of the general government sector, divided into the subsectors of central government, territorial entities and public social security institutions. More than 80% of public debt is constituted by government securities issued by the Treasury on both the domestic and foreign markets.
As was also the case in previous years4, this Report refers to outstanding government securities, which are subject to the special legislation represented by Italy’s “Consolidated Law on Public Debt” (TUDP)5, whose main characteristics are summarised in Table I.1.
__
3 In this regard, the International Monetary Fund and World Bank guidelines note that “Minimizing cost, while ignoring risk, should not be an objective. Operations that appear to lower debt servicing costs often embody significant risks for the government and can limit its capacity to repay lenders. Managing cost and risk therefore involves a trade-off”.
4 All editions of the Annual Public Debt Report can be found at:
www.dt.mef.gov.it/en/debito_pubblico/presentazioni_studi_relazioni/
5 Consolidated Text of Legislative and Regulatory Provisions on Public Debt (Italian Presidential Decree No.
398 of 30 December 2003).
| 2 | MINISTRY OF ECONOMY AND FINANCE |
I. DEBT MANAGEMENT OBJECTIVES FOR 2021 | |
| TABLE I.1: DOMESTIC GOVERNMENT SECURITIES |
| | BOT | CTZ | CCTeu | BTP | BTP€i | BTP Italia | BTP Futura | BTP Green |
| | Treasury Bills | Zero- Coupon Treasury Bonds | Treasury Credit Certificates | Long-term Treasury Bonds | Long-term Treasury Bonds indexed to European inflation | Long-term Treasury Bonds indexed to Italian inflation | Long-term Treasury
Bonds step-up | Long-term Treasury Bonds for financing expenditure with a positive environment al impact. |
| Maturity | 3, 6, 12 months and less than 12 months (flexible BOTs) | 24 months | 5, 7 years | Short Term, 3, 5,
7, 10, 15, 20, 30 and 50 years | 5, 10, 15 and 30 years | 4, 6, 8 years | 8, 10 and 12 years a) | Over 10
years |
| Remuneration | Issue discount | Issue discount | Half-yearly variable coupons indexed to the 6- month Euribor, possible issue discount | Half-yearly fixed coupons, possible issue discount | Half-yearly coupons indexed to European inflation (HICP index net of tobacco), possible issue discount and revaluation of principal at maturity | Half-yearly coupons indexed to Italian inflation
(“FOI” index net of tobacco), half- yearly revaluation of principal and loyalty premium b) at maturity | Half-yearly coupons with step-up mechanism with increasing yields and loyalty premium c) indexed to the average growth of Italian GDP during the life of the bond | Half-yearly fixed coupons, possible issue discount |
Issuance procedure d) | Competitive, yield- based auction | Marginal auction with discretio nary determin ation of the price and quantity issued | Marginal auction with discretiona ry determinati on of the price and quantity issued | Marginal auction
e) with discretionary determination of the price and quantity issued | Marginal auction e) with discretionary determinati on of the price and quantity issued | Through the MOT (Borsa Italiana), the electronic market dedicated to retail trading | Through the MOT (Borsa Italiana), the electronic market dedicated to retail trading | Placement syndicate (or marginal auction, with discretionary determinatio n of price and quantity issued) |
| Issuance frequency | Monthly | Monthly | Monthly | Monthly and based on market conditions for 15- and 30-year BTPs | Monthly | Once/twice a year, based on market conditions | Once/twice a year, based on market conditions | Flexible |
a) Additionally, a BTP Futura bond with a maturity at issuance of 16 years was emitted in 2021. b) For individual savers and similar investors who purchase the security at issuance during the first phase of the placement period. c) For individual savers and similar investors, to whom the BTP Futura bond is reserved, who purchased the bond during the placement period and held it until maturity. d) As of 2020, reopenings of securities destined only to Primary dealers have also been introduced. e) The first tranches of new long-term BTPs (over 10 years) or BTP€is may be offered on the market through placement syndicate. | |
The part of public debt represented by government securities was managed in accordance with: (i) the Italian Ministry of Economy and Finance’s general Directive
| MINISTRY OF ECONOMY AND FINANCE | 3 |
for administrative procedures and management for 20216, and (ii) the “Framework Decree” for 20217, which defined the reference objectives for administrative action regarding financial operations for the management of public debt. The provisions contained in these decrees were then converted into the operational “Public debt management guidelines” for 20218 (hereinafter, “Guidelines”).
The general Directive identified as a strategic objective the effective and efficient management of public debt, focusing on containing its cost and extending or stabilising its average life.
As was the case in previous years, the Framework Decree for 2021, provided guidance for the work of the Public Debt Directorate as well as a number of specific objectives. In particular, Art. 2 states that debt should be “in accordance with the limit established annually by the law approving the State budget”, equal to the amount to cover the securities maturing during the year and the Central Government’s borrowing requirements, being sure to “...reconcile the need to meet market demand with that of containing the overall borrowing cost in a medium-long term horizon, having considered the need to protect against the refinancing risk and exposure to interest rate fluctuations”.
The same article also identified the limits to be respected in terms of the percentage composition of debt at the end of 2021, broken down as follows:
| TABLE I.2: OBJECTIVES FOR THE END OF 2021: PERCENTAGE COMPOSITION OF THE DEBT PORTFOLIO |
| Type of security | Min. | Max. | Differences compared to 2020 |
| BOT (short-term) | 3% | 8% | -- |
| BTP (fixed-rate, nominal) | 65% | 78% | -- |
| CCTeu | 4% | 10% | -- |
| CTZ | -- | 4% | -- |
| BTP€i and BTP Italia (“real” securities) | -- | 15% | -- |
| Securities issued on foreign markets | -- | 5% | -- |
| Source: Framework Decree for 2021 |
In order to pursue the objectives of “curbing the overall debt cost, protecting against market risks and refinancing risks and ensuring the proper functioning of the secondary market for government securities”, Art. 3 authorises the use of public debt management operations9 also through derivative financial instruments, exchanges or repurchase of government securities.
In order to mitigate the credit risk stemming from derivatives, Art. 4 requires counterparties to have a high level of creditworthiness, according to the rating
__
6 For the Italian version of the General Directive for administrative action and management of the Italian Ministry of Economy and Finance –Year 2021, see www.mef.gov.it/ministero/oiv/direttiva_generale.html.
7 Guidelines for the implementation of financial operations (Framework Decree) for 2021: (www.dt.mef.gov.it/export/sites/sitodt/modules/documenti_en/debito_pubblico/normativa_spalla_destra/2021_Framework_Decree_-_Directives_for_conducting_financial_transactions_xD_M_30.12.2020x.pdf).
8 Guidelines for public debt management for 2021: (www.dt.mef.gov.it/export/sites/sitodt/modules/documenti_en/debito_pubblico/presentazioni_studi_relazioni/Guidelines_for_public_debt_management_2021.pdf).
9 Art. 3 of the “TUDP”(Italian Consolidated Law on Public Debt) authorises the use of operations on a consensual basis that restructure certain features of the existing debt portfolio.
| 4 | MINISTRY OF ECONOMY AND FINANCE |
I. DEBT MANAGEMENT OBJECTIVES FOR 2021 | |
given by the main rating agencies, also providing for possible agreements with the counterparties for mutual guarantees (collateralisation)10.
Lastly, Art. 6 states that the aim of cash account management11 must be “the efficient movement of cash balances, in relation to the government securities issuance, prevailing market conditions and the constraints imposed by monetary policy provisions”. To this end, this year saw the introduction of repurchase agreements (REPOs) on specifically issued tranches of government securities.
Debt management was given the objective of stabilising the structure of the government securities portfolio at the end of 2021, with no deviation from what was planned for 2020. The aim remained, therefore, to consolidate the results achieved in recent years in terms of exposure to interest rate and refinancing risk, taking advantage of a market environment which, albeit still fragile, has improved since the acute phase of the pandemic12.
Based on the outstanding securities portfolio at the end of 2020, EUR 222 billion worth of securities were scheduled to mature in 2021 (excluding BOTs), of which EUR 9.3 billion referring to the foreign programme, a slightly higher amount than the approximately EUR 202 billion worth of medium/long-term securities outstanding at the end of 2019, maturing in 2020.
In the 2021 Guidelines, the Central Government cash needs were expected to be around EUR 145 billion, a level slightly below that of 2020, to be covered not only by the national issuance programme, but also by the European resources made available by means of loans from both the SURE programme and the Recovery and Resiliency Facility package under the Next Generation EU programme. It was therefore expected that the total volume of government securities offered to the market in 2021 could be maintained at a lower level than in the previous year.
In particular, in the abovementioned document the Treasury pursued the following objectives:
| 1) | the meeting of borrowing requirements at costs as aligned as possible with market trends; |
| 2) | the consolidation of the results already achieved in terms of exposure to the main risks, in particular the interest rate risk and refinancing risk; |
| 3) | the gradual improvement in liquidity conditions on the secondary market; |
| 4) | the efficient management of the Treasury’s cash, also through a greater diversification of the instruments available. |
The Treasury’s strategy was therefore set to develop along the following lines:
| 1) | ensure predictable and regular issues for all the main segments of domestic securities; |
| 2) | adjust the volumes offered to the market in order to give greater weighting to sectors with better liquidity on the secondary market and greater depth of demand; |
__
10 For more information about these mutual guarantee agreements, please see Chap. III.3 “Derivatives portfolio management”.
11 Regulations regarding the Treasury’s cash movements and the selection of the counterparties participating in the relative operations are based on the Italian Ministerial Decree dated 10 January 2022.
12 The evolution of the average life of the stock of government securities is detailed in the following paragraphs.
| MINISTRY OF ECONOMY AND FINANCE | 5 |
| 3) | use liability management tools (such as exchanges and repurchases), in line with the approach followed in recent years, with a frequency and intensity in line with market trends, with the aim of reducing dislocations on specific securities, improving liquidity on the secondary market, managing the redemption profile for future years and managing the redemption profile of future years, and helping to reduce the average cost of outstanding debt; |
| 4) | diversify the investor base also through foreign currency issues in Global format as well as EMTNs, with particular regard to issues in US dollars; continue the dedicated offering to retail investors, aimed at expanding their direct participation in public debt financing; |
| 5) | put in place all organisational and market interventions necessary to start the issuance of “green” government securities, introduced into domestic law by the Budget Law for 2020 (Italian Law No. 160 of 27 December 2019); |
| 6) | introduce the BTP Short Term, a new nominal bond with a coupon and maturity between 18 and 30 months, replacing CTZs. |
| I.3 | CURBING THE COST OF DEBT WHILE PAYING ATTENTION TO THE COST/RISK PROFILE |
The cost-risk trade-off: Italy’s specific features
As in previous years, public debt management in Italy focuses on containing two main risks: the interest rate risk, by minimising the impact on interest expenditure13 caused by fluctuations of the interest rates at which the debt is placed; and the refinancing risk, by distributing the maturities of securities more evenly over time in order to facilitate new issues.
When it comes to these risks, the Treasury’s objectives are in line with the practices followed by other DMOs. However, in Italy’s case, the management of a particularly high debt makes it necessary to pay greater attention to the credit risk premium requested by investors, based on the perceived sustainability of the debt, which becomes a significant component of the interest rate level at the issuance for Italian government securities.
Another aspect to be considered in the management of the Italian state budget concerns the stability and predictability of interest expenditure, which allows to avoid the need to increase taxation should government-security yields be affected by possible shocks and makes it easier to manage public finance commitments stemming from European requirements, mainly based on deficit control and debt dynamics.
The two aforementioned aspects therefore significantly contribute to guiding Italy’s debt management strategy with regard to keeping refinancing and interest rate risks under control.
__
13 In order to manage public finances correctly, it is necessary, where possible, to reduce costs and to plan outgoings with as much certainty as possible. This avoids unwanted and unexpected increases in the deficit and/or fiscal pressure, perhaps also significantly and in a short amount of time, as a result of costs or expenses not being duly planned for. Correct management of public finances therefore guarantees a framework of financial stability, which in turn allows for effective debt management.
| 6 | MINISTRY OF ECONOMY AND FINANCE |
I. DEBT MANAGEMENT OBJECTIVES FOR 2021 | |
Refinancing risk metrics and management tools
The average life of the stock of government securities is the best-known benchmark metric used to measure refinancing risk: this is calculated as the average of the maturities of all outstanding securities, weighted according to the nominal value14 of each security. At the end of 2020, the average life of government securities stood at 6.95 years, up from end-2019 level.
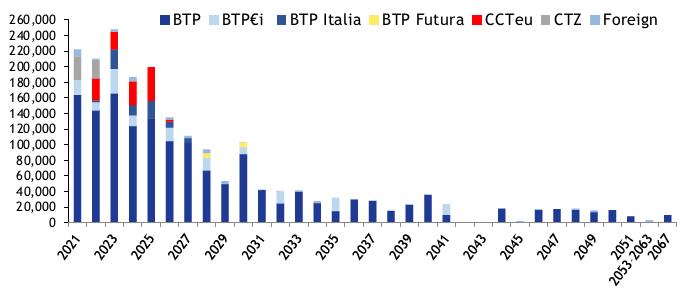
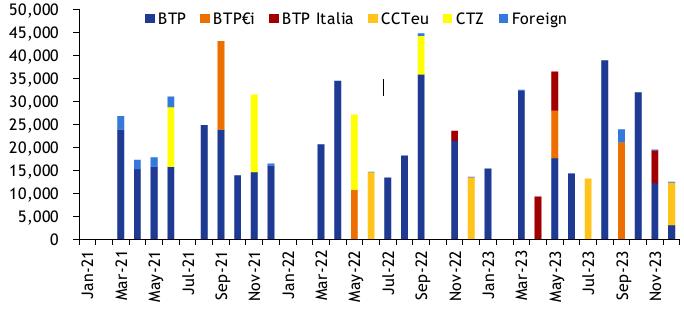
Below is the annual distribution of maturities from the end of 2020 (Chart I.1) and, in detail, the monthly distribution up to and including 2023 (Chart I.2).
In 2021, the reshaping of the maturity profile was aimed not only at guaranteeing the effective management of refinancing risk by reducing expected redemptions, especially during the course of the year and in 2022, but also at cutting the average cost paid by the Treasury on the stock of debt, by decreasing the outstanding amount of high-coupon securities. The Treasury also aimed to withdraw from the market shares of the last outstanding CTZs and variable-coupon securities, a market segment that, in recent years, had been particularly exposed to tensions in the financial markets.
| CHART I.1: ANNUAL MATURITY PROFILE OF MEDIUM/LONG-TERM SECURITIES OUTSTANDING AS AT 31.12.2020 (EUR MILLION) |
|
| Source: MEF |
__
14 For “nominal value”, the definition adopted in EC Regulation no. 479/2009 of 25 May 2009 is used: “...The nominal value of a liability outstanding at the end of the year is the face value. The nominal value of an index- linked liability corresponds to its face value adjusted by the index-related change in the value of the principal accrued to the end of the year. [...] Liabilities denominated in a foreign currency shall be converted into the national currency on the basis of the representative market exchange rate prevailing on the last working day of each year. Liabilities denominated in a foreign currency and exchanged through contractual agreements to the national currency shall be converted into the national currency at the rate agreed on in those contacts”.
| MINISTRY OF ECONOMY AND FINANCE | 7 |
| CHART I.2: MONTHLY MATURITY PROFILE OF MEDIUM/LONG-TERM SECURITIES OUTSTANDING AS AT 31.12.2020 (EUR MILLION) |
|
| Source: MEF |
Interest rate risk metrics and the SAPE model and software used by the Italian Treasury
The three main indicators used to quantify the interest rate risk are (i) financial duration, equal to the weighted average payment time for both principal and interest; (ii) the average refixing period, i.e. the average time taken by the debt portfolio to “integrate” market interest rate changes, and, lastly, (iii) Cost-at-Risk, which quantifies the maximum additional cost in terms of interest expenditure in the event of adverse interest rate scenarios, along with the probability of actually having to bear this additional cost, deriving in turn from the probability that these adverse scenarios shall occur15. Cost-at-Risk (CaR) analysis is therefore used to identify, with a given probability, an expected cost level that may not be exceeded, as well as all the compositions of the securities issuances whose cost-risk combinations are classed as being efficient, i.e. are such as to become dominant - for a given level of cost or risk - over any other hypothetical composition of the issuance portfolio.
In this way, it is possible to test the characteristics of a series of hypothetical issuance portfolios, estimating both the cost in terms of interest expenditure and the interest rate risk (measured in terms of Cost-at-Risk) for each over a given amount of time in the future, calculated with different possible scenarios as to how the interest and inflation rates will evolve.
From a technical point of view, the tool used for this analysis is an in-house developed model which the Public Debt Directorate has been using for a number of
__
15 Please see the focus point on “The main quantitative indicators of interest rate risk” on page 22 of the 2014 Annual Public Debt Report, available at the address already provided in note 8 of this Chapter.
| 8 | MINISTRY OF ECONOMY AND FINANCE |
I. DEBT MANAGEMENT OBJECTIVES FOR 2021 | |
years, called “SAPE” (Software di Analisi dei Portafogli di Emissione - Issuance Portfolio Analysis Software)16.
The outstanding debt database used by SAPE at the end of 2020 was made up of domestic securities, derivatives and securities in USD. With regard to the latter, the Treasury’s policy is to issue any securities in a foreign currency at generally better (or at least equal) cost conditions17 than those available for equivalent domestic instruments. Therefore, when estimating the refinancing costs of future redemptions for securities in USD, data on domestic securities were used, with no new derivative operations expected to manage the rate risk.
The role of the issuance strategy in managing the interest rate risk-cost trade-off in 2021
For debt management, especially of a large amount, it is essential to identify a cost-risk combination that minimises costs without increasing risk. This may also be interpreted as promoting a medium- and long-term perspective, which not only reduces present costs as much as possible, but also aims at creating the conditions for a lasting and gradual reduction in borrowing costs (which also depend on investors’ perception of credit risk).
For this reason, improvements in refinancing and interest rate risk metrics should always be evaluated by also taking into account the higher costs involved with this strategy. In fact, as already mentioned, the market demands higher remuneration for securities with longer maturities. This trade-off must therefore be taken into consideration when planning the issuance portfolio, i.e. estimating the marginal cost required by the market to improve the aforementioned risk metrics.
To do this, the Public Debt Directorate conducted an analysis of the set of hypothetical issuance portfolios for domestic securities already identified when defining the Guidelines in previous years, assessing their actual feasibility and sensitivity to certain market elements.
As a precondition, said portfolios must make it possible to fund:
| 1) | the redemptions of medium- and long-term securities scheduled for 2021 (amounting to approximately EUR 222 billion); |
| 2) | outstanding BOTs (amounting to approximately EUR 121 billion), together with the so-called “BOT rollover” during the year, i.e. the BOT issues necessary to cover the redemptions of the BOTs issued in the same year; |
| 3) | Central Government cash requirements, which, at the time, were estimated to be around EUR 145 billion18; |
| 4) | as well as ensuring that the Treasury has sufficient liquidity available to cater for all cash needs. |
__
16 Models and software are constantly being updated. A detailed description of the implications and functioning of the model can be found in the recently published study available in English at the following link: www.dt.mef.gov.it/en/debito_pubblico/Public_Debt_Management_Network/ebook/.
Furthermore, a summary of the development of the model is included in Appendix 3 of the Report.
17 Including costs to hedge against exchange rate risks.
18 This figure formed the basis for public finance forecasts included in the 2021 Draft Budgetary Plan.
| MINISTRY OF ECONOMY AND FINANCE | 9 |
The portfolio initially used for the analysis reflected the composition of domestic issues in 2020, characterised in gross terms by around 34% of BOT issuances (almost equally divided between annual and 6-months maturities), 7% of CTZs, around 3% of CCTeus and over 6% of inflation-indexed securities (including BTP€i and BTP Italia). Nominal BTPs therefore represented just under 48% of the total, of which approximately 18% were represented by securities with the shortest durations (3 and 5 years), 18.5% by 7- and 10-year maturities and, lastly, just over 11% relating to the segment with the longest duration.
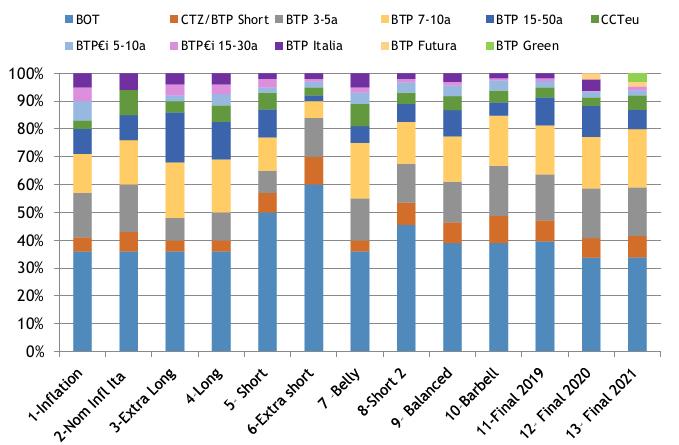
The following chart shows all the portfolios analysed:
| CHART I.3: COMPOSITION OF THE ALTERNATIVE ISSUANCE PORTFOLIOS ANALYSED FOR 2021 (EUR MILLION) |
|
| Source: MEF |
The results of the analysis confirmed the validity of a strategy in line with that of 2020 and with the portfolio implemented during the same year. Indeed, an analysis of the final 2021 portfolio shows how the Treasury opted for a composition of the issuance generally in line with that of the previous year, albeit with some differences. In particular, the issuance ratio of securities with maturities in the middle of the curve, between 7 and 10 years (equal to 21%), increased, while that of the segment with the longest duration fell to 7%. The share of indexed securities decreased, mainly due to a lack of BTP Italia issuances, while CCTeus grew to over 5%. Lastly, about 3% of the portfolio is represented by issues of the new BTP Green, the first government security connected to the sustainable finance market, launched by the Treasury in 2021.
| 10 | MINISTRY OF ECONOMY AND FINANCE |
I. DEBT MANAGEMENT OBJECTIVES FOR 2021 | |
The role of derivative operations in managing the interest rate risk-cost trade-off for 2021
The Treasury has always carefully and constantly monitored the risks underlying its debt portfolio, identifying the main factors to which it is exposed from both a qualitative and a quantitative point of view. Any change occurring to the debt as a result of both new placements and the natural maturity of the securities is not incorporated passively into the portfolio; instead, active risk management is conducted in order to improve the portfolio’s risk profile. The Treasury therefore uses liability management tools to actively manage risks, such as interest rate, refinancing and exchange rate risk, alongside new issues and possibly also following them. To this end, like many other sovereign issuers, the Treasury uses derivative financial instruments, as well as exchange and repurchase operations.
In authorising the use of derivatives, the Framework Decree states that they should contribute to achieving the general management objectives of curbing overall borrowing costs, protecting against market risks and refinancing risks, as well as ensuring the proper functioning of the secondary market for government securities.
Derivative operations therefore have a variety of objectives, such as increasing the financial duration of debt, reducing exposure to unexpected and sudden interest rate fluctuations, and improving the cost-risk profile in the medium to long term. Hence, these instruments do not have a funding objective, but rather a risk containment objective. The guidelines in derivative activities remain consistent and in line with those of previous years: changes in the policies for managing liability management instruments may only be necessary due to changes in the composition of debt, the risks underlying the portfolio or the strategic objectives pursued. Despite the pandemic crisis and the resulting increase in the notional amount of securities issued, the composition or riskiness of debt has not been substantially affected.
In line with the 2021 Guidelines, the management of the derivatives portfolio would have taken into account two main aspects: (i) the availability of collateralisation agreements for the execution of new derivative positions and the conclusion of new collateralisation agreements for past operations, consistent with the State’ s cash resources (ii) the possibility of restructuring existing positions in the portfolio.
With regard to the first point, the process of entering into19 bilateral guarantee agreements (the so-called Credit Support Annex - CSA) for the new derivative operations was completed during 2019, with all government bond specialists. Moreover, over time the legal framework had already been supplemented with a system of bilateral guarantees on selected existing contracts, thus also supporting the management of existing positions with a limited number of counterparties, characterised by significant credit exposure to the Treasury.
Although the level of swap rates was rising, albeit still contained on a historical basis, the Treasury would consider both restructuring existing positions and
__
19 On this, see the 2018 and 2019 Public Debt Reports.
| MINISTRY OF ECONOMY AND FINANCE | 11 |
executing new derivative operations to both mitigate the exposure to interest rate risk and extend the overall duration of the debt, in line with the past.
In 2021, the management of the derivatives portfolio was thus set to focus on: (i) hedging market risks, such as exchange rate risk, for possible issuances in foreign currency, and interest rate risk; (ii) restructuring and/or concluding operations already in the derivatives portfolio; and (iii) managing collateral, through the collateralisation of additional existing derivative positions (subject to the availability of funds to be allocated to this project).
Measures to achieve debt issuance and management objectives for 2021
In relation to the set objectives, the Italian Treasury’s strategy for 2021 was structured as follows, covering the two phases of debt management:
Policies at issuance of domestic and foreign securities
The Guidelines defined the issuance policy for 2021 taking into consideration the above-mentioned objectives in terms of average life, duration and the average refixing period, as well as the results of the cost-risk trade-off analysis.
In line with market conditions and given the lower volumes offered compared to the previous year, issuance choices in 2021 should therefore aim:
| 1) | to adjust BOT issuances in order to ensure an end-of-period stock which would include the renewal of maturing securities; |
| 2) | to replace CTZ issuances with the BTP Short Term, a new instrument with a fixed coupon and maturity between 18 and 30 months, aligning new securities offered with maturing CTZs; |
| 3) | for 3- and 5-year BTPs, to balance the overall amounts offered on the two segments, and to reduce the volumes offered compared to the previous year. Slightly positive net issues were expected on both segments; |
| 4) | to keep the gross issuances of 7-year BTPs in line with those of 2020, given the about EUR 32 billion worth of amounts maturing, so as to consolidate the share of 7-year BTPs within the stock of government securities at the end of the year, thereby contributing to extending the average life of the debt. In 2021, the Treasury planned to continue to offer 10-year BTPs through regular monthly auctions, albeit for a slightly lower total amount than in the previous year. Despite the amount expiring (over EUR 47 billion) largely positive net issuances were expected on this segment; |
| 5) | for longer-term nominal maturities, to provide liquidity on all available instruments (15, 20, 30 and 50 years) by resorting to both the reopening of outstanding securities and the issuance of new ones, deciding on a case-by-case basis which of the available maturities to offer depending on the conditions on the secondary market. With regard to long-term securities, the plan was to keep overall issuance levels lower to those of the previous year, while still achieving positive net issuance in the various segments, with the exception of 15-year securities, given the considerable amount maturing, at around EUR 25 billion. In the presence of favourable market conditions, it was |
| 12 | MINISTRY OF ECONOMY AND FINANCE |
I. DEBT MANAGEMENT OBJECTIVES FOR 2021 | |
also planned to use a placement syndicate for new securities on the various benchmark maturities in this segment;
| 6) | to keep the offer of CCTeus, in line with that of 2020, with positive net issuances, given the absence of expiring securities. The Treasury also planned the placement of at least one new benchmark over maturities between 3 and 7 years; |
| 7) | to continue to ensure a constant presence for the various maturities of BTP€is, with higher volumes on offer than in the previous year. However, given the significant amount of securities expiring, negative net issuance on the segment was expected. The conditions for launching a new security on the longer-term segment of the real yield curve was also to be examined; |
| 8) | to ensure at least one issuance for retail investors, keeping maximum flexibility regarding the most appropriate maturity, given that market conditions are difficult to predict. The Treasury would also have considered the possibility of carrying out exchange or repurchase operations on BTP Italia securities with a particularly high outstanding amount, in order to contribute to the management of the redemption profile for the coming years; |
| 9) | to continue issuing in USD on a regular basis, solidifying the Treasury’s presence in this sector, as announced following the 2019 multi- tranche global bond issue and in line with what was implemented in the following year. The aim was to continue to build a USD yield curve ever more complete and liquid, significantly increasing the number of institutional investors managing Italy’s Public Debt, with particular regard to strategic investors less present in the domestic securities sector, such as Asian insurance companies and pension funds, while ensuring issuance costs in line with those of outstanding securities. In line with previous years, the guidelines provided for the possibility to recourse to the MTN program, in euro/foreign currency, to meet the demand for public or private placements among primary institutional investors, subject to minimum requirements being met20 regarding the issue format; |
| 10) | to prepare all organisational and market actions for the issuance of a “green” government bond for financing projects with a positive environmental impact. |
Post-issuance debt management operations
As already mentioned, the Italian Treasury may also use extraordinary exchange and repurchase operations regarding government securities in order to achieve the aforementioned objectives for the existing debt portfolio.
The 2021 Guidelines called for a policy in line with that adopted in recent years. Extraordinary operations are in fact, by their very nature, highly flexible in terms of methods and timing of execution, and pursue a variety of purposes, such as managing refinancing risk, reshaping the maturity profile, supporting liquidity and ensuring the efficiency of the sovereign bond market, as well as reducing the average cost paid by the Treasury on outstanding securities. As was the case in
__
20 Maturity of at least three years, minimum amount of EUR 200 million and a minimum negotiable amount of EUR 500,000.
| MINISTRY OF ECONOMY AND FINANCE | 13 |
recent years, exchange and repurchase operations were also allowed to be carried out through syndication and would have been aimed, inter alia, at facilitating the process of reducing the overall maturity stock in individual years.
| I.4 | MONITORING AND MANAGING THE CASH ACCOUNT TO STABILISE THE BALANCE |
The cash account for Treasury services
The Cash Account is the account held by the Treasury with the Bank of Italy, where its incoming cash flows and payments are recorded. The balance of this account is the sum of the balances of all the accounts held by the Treasury21 and is characterised by strong volatility, due to both the large number of entities that move funds with the Treasury and to the cyclical presence, usually on a monthly basis, of certain flows that have a significant effect on daily balances. In particular, a strong impact on the payment side - mainly in the first few days of the month - is determined by the disbursement of pensions, while on the collection side, the central days of the month are marked by the collection of tax revenues. Issuances and, to an even greater extent, redemptions of government securities at maturity can also cause significant fluctuations in the Cash Account.
The Treasury, together with the Bank of Italy, manages its liquidity according to forecasts of Treasury flows and related stocks. This approach also meets the needs of the European Central Bank (ECB), which call for monetary policy to be facilitated through an efficient forecast of the liquidity held by public institutions at national central banks in the euro area.
The regulatory context for cash management in 2021
Cash management principles were established in the MEF’s general Directive for administrative procedures and management and in the Framework Decree, as well as in the 2021 Public Debt Management Guidelines. In particular, the general guidelines stated that the focus should be on improving the model to process daily cash forecasts for the Cash Account and that the monitoring and management of that Account must be geared towards stabilising the balance. The Framework Decree stated that management of the cash account must aim at efficient cash movements, in line with the government security issuance strategy and the prevailing market conditions, at the same time as complying with the constraints imposed by monetary policy provisions. Lastly, the Public Debt Management Guidelines set the objective of maintaining a constant presence in the money market through bilateral liquidity investment operations with a maturity of more than one day, for the purpose of improving its management and profitability, with a view to reducing counterparty risks.
__
21 For further details, please refer to Italian Ministerial Decree No. 51961 of 26 June 2015 concerning the identification of government deposits held with the Bank of Italy, implementing Article 5, paragraph 5, of Italian Presidential Decree No. 398/2003.
| 14 | MINISTRY OF ECONOMY AND FINANCE |
I. DEBT MANAGEMENT OBJECTIVES FOR 2021 | |
With regard to legislation governing the movement and management of the cash deposited in the Cash Account, reference continues to be made to the Framework Decree, which substantially refers to the Italian Ministerial Decree dated 25 October 201122.
At the same time, the monetary policy interventions of the European Central Bank (ECB) changed the framework under which the Treasury managed the cash deposited in the Cash Account, increasingly penalising the deposits held in the Bank of Italy. As is known, as of 1 October 2019, the procedure to pay interest on government deposits held with national central banks was reformed as a result of new provisions issued by the ECB in April 201923. More precisely, also in the year 2021, liquidity not exceeding the threshold of 0.04% of GDP (equal to EUR 671 million), was subject to the EONIA rate, while liquidity in excess of this threshold was subject to the ECB deposit rate (Deposit Facility) equal to -0.50%, which remained unchanged throughout the year.
Cash management
The cash management service was set up in 2007 and consists of monitoring Treasury balances and flows, in order to carry out daily operations on the money market to ensure an adequate level of liquidity in light of the multiple movements of the Treasury. This activity is closely linked to public debt management and constitutes the link between securities issues and the daily fluctuations of the Cash Account.
The monitoring consists of a continuous exchange of information between the Bank of Italy and the MEF (State General Accounting Department and Department of the Treasury - Public Debt Directorate), with forecast and actual data on all collections and payments involving accounts held with the Treasury and the resulting estimate of the Cash Account balance. The information exchanges are updated repeatedly during each working day, with the aim of estimating the end-of-day balance of the Account. The liquidity forecasts of the MEF and the Bank of Italy also include longer-term scenarios, shared on a weekly basis, with a time horizon consistent with monetary policy requirements.
Money market operations, on the other hand, consist of lending or borrowing surplus liquidity in order to manage possible, temporary cash shortages.
__
22 For further details on that Italian Ministerial Decree, please refer to the following link:
www.dt.mef.gov.it/export/sites/sitodt/modules/documenti_en/debito_pubblico/normativa_spalla_destra/Management-of-the-liquidity-available-on-the-Treasury-Account-25-October-2011.pdf
23 Remuneration changes include:
1) for government deposits up to a maximum balance equal to either EUR 200 million or 0.04% of GDP, whichever is higher, the EONIA (Euro Overnight Index Average) rate shall continue to be applied until 3 January 2022, which is when the new €STR (€uro short-term rate) shall come into force;
2) the previous ECB guidelines, which came into force in 2014, stated that zero interest was to be paid on any liquidity in excess of the threshold, in the case of a positive or zero deposit facility rate applied by the ECB, or at negative rates in the event of a negative DF rate. The new ECB guidelines state that, should the DF rate be higher than the rate applied to the sums within the threshold, then interest shall be paid on all government deposits at the same rate applied to said sums (i.e. EONIA or €STR).
For more information, please refer to:
ECB Guideline ECB/2019/7 (https://eur-lex.europa.eu/legal-content/EN/TXT/?uri=CELEX%3A32019O0007)
and ECB Decision ECB/2019/8 (https://eur-lex.europa.eu/legal-content/IT/TXT/?uri=CELEX:32019D0008).
| MINISTRY OF ECONOMY AND FINANCE | 15 |
Given the market scenario of the last few years, which has been characterised by a surplus of liquidity and an increased purchase of government bonds on the market by the ECB, together with the progressive shortage of collateral, the Treasury urged to accelerate the reform process of cash management and to adopt a new operational instrument, the Repo or repurchase agreement24.
LEARN MORE
| The Repo Market and Treasury’s Operations The Repo market is the market where two counterparties agree to enter into an agreement whereby one party lends a repurchase security (specific, in the case of “Special Repo”, or generic, in the case of “General Collateral”), for a fixed period of time (the duration of the agreement) in exchange for liquidity. At the end of the operation there is a reverse exchange (liquidity against securities) at a predetermined price (rate). Operators can therefore trade Repos either to meet a need for liquidity (typically in the General Collateral agreement) or for specific securities (in the Special Repo agreement) that they temporarily lack. The Treasury could thus resort to Repo operations as a cash management instrument, to use the surplus cash at more advantageous conditions than those imposed by the ECB on the balances deposited on the Cash Account. Alternatively, the Treasury could use Repo operations to collect cash in order to provide liquidity in case of temporarily limited availability and, at the same time, satisfy the needs of Primary Dealers by facilitating their market making commitments on the secondary market. The Treasury could also intervene on the secondary market in the event of tension caused by scarcity of specific securities, temporally selling Repos in order to mitigate the effect of such scarcity on the performance of Government securities. Therefore, when the Treasury borrows liquidity from the Repo market, it must in return cede to the counterparty one or more securities as a guarantee of the successful outcome of the operation. For this reason, the Treasury had to preliminarily acquire a portfolio of Government securities used in Repo operations. To this end, at the launch of the operation in May 2021, an ad hoc issuance of 15 BTPs, each worth 1,000 million (for a total of 15,000 million), issued exclusively for this specific purpose, was performed. |
__
24 For a more detailed analysis of the instruments used, see Chapter III below.
| 16 | MINISTRY OF ECONOMY AND FINANCE |
| II. | THE ITALIAN GOVERNMENT SECURITIES MARKET: PERFORMANCE IN THE INTERNATIONAL CONTEXT |
| II.1 | MONETARY POLICIES AND EFFECTS ON THE EURO AREA MONEY MARKET |
Monetary policies in the euro area
The year 2021 started under essentially the same conditions as the previous year: the second wave of Covid-19 infections in the autumn of 2020 resulted in a new and further slowdown in global economic activity - which began immediately after the outbreak of the pandemic due to prolonged lockdowns and disruptions in production chains - yet, at the same time, contributed to the implementation of large-scale vaccination campaigns. This positive outcome, together with policies supporting households and economic activity introduced by the governments of the world’s main economies, positively affected global growth prospects. The economy, despite the continuing spread of the pandemic and the restrictive measures adopted in Europe and the United States, has in fact begun to show signs of a slow recovery in consumption and investment, mainly due to the first, albeit very partial, re-openings.
With regard to inflation dynamics, some elements of tension, although still very moderate, already emerged, especially in the second half of 2021, due to both the continued presence of supply-chain disruptions - especially in Asian manufacturing areas - and the increase in energy commodity prices as a result of the rebound in production activity.
Given this underlying macroeconomic scenario, the Governing Council of the ECB repeatedly confirmed in 2021 the accommodative stance of its monetary policy as well as the extraordinary measures adopted in spring 2020: the Expanded Asset Purchase Programme (APP) and the Pandemic Emergency Purchase Programme (PEPP). During the course of 2021, however, the ECB repeatedly emphasised its intention to gradually reduce its expansive and accommodative stance, so much so that, in the last quarter of 2021, it announced a cut in the purchases of the APP programme (from EUR 40 billion to EUR 20 billion), planning to end the programme until “shortly before” the rise in key interest rates. The cut in the programme was in any case neither fast nor sharp and such as to prevent the rise in yields observed in international markets from translating into a premature tightening of financial conditions in the euro area, which would not have been justified by the economic outlook at the time. The Council reiterated on several occasions, however, that these extraordinary instruments would be adjusted if necessary, in order to ensure that inflation would continue to approach the 2% target level. In particular, at its July meeting, also as a result of its strategy review, the Council announced a
| MINISTRY OF ECONOMY AND FINANCE | 17 |
symmetrical inflation target of 2% in the medium term25. Also, while until July 2021 the intent was to confirm the PEPP in net terms at sustained and constant purchase levels until the end of March 2022, from September 2021 onwards - as the economy continued to improve - the Governing Council began to gradually change the tone and to refer to PEPP purchases being conducted in “moderately lower” volumes than in previous quarters. This trend continued to such an extent that, in December 2021, not only was it confirmed that the PEPP programme would be closed in net terms in March 2022, but it was also announced that the end of the reinvestment period for PEPP-purchased securities would be postponed from the end of 2023 to the end of 2024, so as to ensure a more gradual but certain phase-out of this emergency instrument.
Lastly, the Council left the level of the key interest rates unchanged, keeping the ECB’s Deposit Facility (DF) rate at -0.50%, the Main Refinancing Operation (MRO) rate at 0% and the Marginal Lending Facility (MLF) rate at 0.25%.
The euro area money market
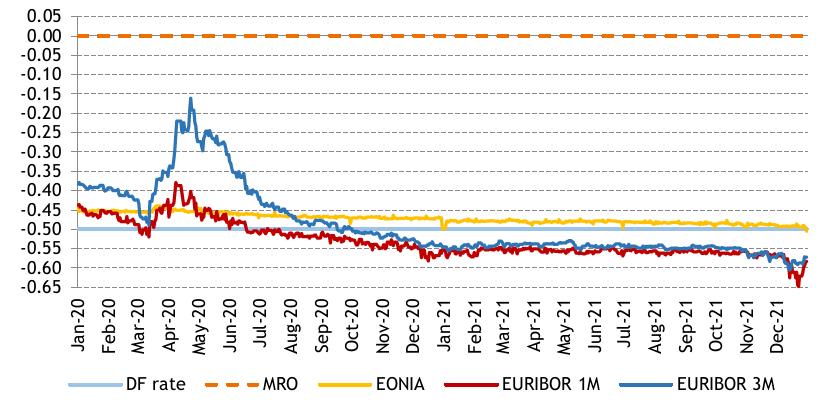
The continuation of the pandemic crisis and the confirmation of the decisions taken in the previous year, which led to further injections of liquidity into the financial market, affected the level of the main money market rates such as EURIBOR (Euro Inter Bank Offered Rate) and EONIA (Euro OverNight Index Average). Chart II.1 below compares the main money market rates with the ECB’s Deposit Facility and MRO rates over the last two years.
CHART II.1: PERFORMANCE OF THE MAIN MONEY MARKET RATES, 2020-2021 (PERCENTAGE VALUES) |
|
| Source: Based on Reuters data |
The chart shows that in the period prior to the outbreak of the pandemic, levels were substantially higher than ECB rates. However, towards the beginning of the second quarter, these levels suddenly and abruptly rose again, due to the
__
25 Replacing the inflation rate target sufficiently close but still below 2%.
| 18 | MINISTRY OF ECONOMY AND FINANCE |
II. THE ITALIAN GOVERNMENT SECURITIES MARKET: PERFORMANCE IN THE INTERNATIONAL CONTEXT |
generalised fear in the banking system of a possible and imminent liquidity crisis for the reasons described in the 2020 Public Debt Report.
The trend then changed in response to market participants’ injection of confidence in monetary policy decisions and in the instruments adopted to mitigate tensions in the financial and banking markets. Indeed, Euribor rate levels gradually and steadily began to fall, so much so that, already by the end of the previous year and for the whole of 2021, they were firmly below the Deposit Facility rate due to the abundant liquidity on the market.
With regard to the Eonia rate, the effects of the spread of Covid-19 were less sudden. The rate levels remained substantially above the Deposit Facility rate, maintaining the average spread fairly constant during the first two quarters of the year 202026 and thus in the midst of the pandemic crisis. As the second half of the year began, there was a gradual narrowing of the average spread, mainly due to the effects of the extraordinary instruments adopted by the Council. As in the case of EURIBOR rates, therefore, the EONIA rate also started to get increasingly closer to the ECB deposit rate. The downward trend then continued throughout 2021, so much so that at the end of the year it recorded its all-time low of -0.505%, reaching, for the first time, a level lower than the Deposit Facility rate.
| II.2 | EURO AREA BOND MARKETS |
During 2021, euro area financial markets continued to be affected by the uncertainty surrounding the course of the pandemic, mainly due to the spread of Covid-19 variants, which led to an increase in infections and the reintroduction of restrictive measures at various times during the year.
Financial market conditions, and in particular government bond market conditions, nevertheless remained rather relaxed throughout 2021. The economic recovery as well as the ongoing bond purchase programmes (APP and PEPP) by the Eurosystem played a decisive role in maintaining low levels of volatility, favourable funding conditions and liquidity in the government bond market. Additionally, the uptrend in economic activity, with its positive impact on the government budget, contributed to reducing the volumes being issued on the European bond markets compared to the previous year, although the average levels continued to be higher than those of the pre-Covid years, thus alleviating any tensions.
After the summer, favourable growth prospects and rising inflation - driven mainly by higher energy prices - began to raise fears about a possible withdrawal of monetary stimulus measures, pushing up government bond yields in all European countries. As shown in Chart II.2, by the end of 2021, yields on 10-year maturity bonds of the major European countries generally rose by about 50 basis points compared with the beginning of the year, although they continued to remain at low levels on average.
__
26 In the first quarter of 2020, the average spread between the Eonia and Deposit Facility rates amounted to 4.8 basis points. In the second quarter it amounted to 4.4 basis points.
| MINISTRY OF ECONOMY AND FINANCE | 19 |
CHART II.2: TREND OF EUROPEAN GOVERNMENT BOND YIELDS - 10-YEAR MATURITY (PERCENTAGE VALUES) |
|
| Source: Based on Bloomberg data |
In this framework, the yield curve of Italian government bonds contained the upward trend, also due to the substantial stability of spreads towards other issuers, both core and peripheral. The conclusion of the SURE programme and the launch of the Next Generation EU programme, on the other hand, contributed to consolidate a constructive climate in the financial markets. These factors, together with the stability of the national political framework and the strong growth of the Gross Domestic Product, made it possible to anticipate the decline in the debt-to-GDP ratio, thus positively influencing the ratings expressed by numerous Rating Agencies in recent months.
In the framework outlined above, debt management allowed the average cost at issuance to be reduced, which in 2021 was equal to 0.10% (the lowest level ever), while the average cost of debt - calculated as the ratio between the interest and the general government debt stock - remained stable at a level of about 2.4%.
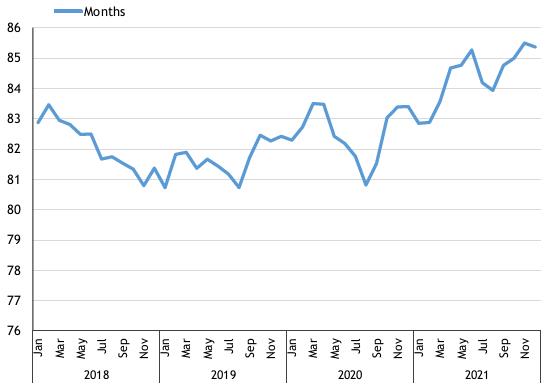
Market conditions and management decisions have also allowed to maintain the increase in the average life of the debt, which at the end of 2021, in relation to the stock of government securities, was equal to 7.11 years (7.29 years, loans under the SURE and NGEU Programmes included), which is higher than the figure at the end of 2020, equal to 6.95 years. This was thanks to the various issuances on the longer end of the yield curve, completed both through auctions and through the syndicated placements of several new nominal benchmark securities (10, 15, 20 and 50 years, plus the BTP Green maturing in 2045).
| 20 | MINISTRY OF ECONOMY AND FINANCE |
II. THE ITALIAN GOVERNMENT SECURITIES MARKET: PERFORMANCE IN THE INTERNATIONAL CONTEXT |
FOCUS
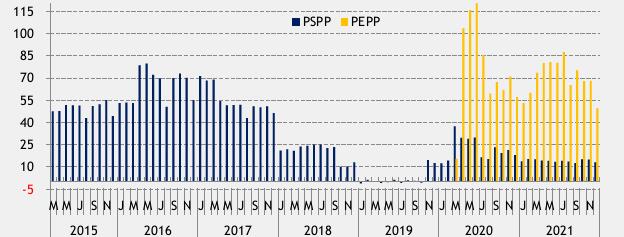
| Details on how the Public Sector Purchase Programme (PSPP) evolved and how the Pandemic Emergency Purchase Programme (PEPP) was implemented during 2021 As part of the Asset Purchase Programme (APP), the Public Sector Purchase Programme (PSPP), which began on 9 March 2015, involves net acquisitions of securities issued by central governments and public agencies of euro area countries, as well as those issued by supranational institutions. Suspended in January 2019, the APP Programme was later reactivated on 1 November of the same year in response to the deteriorating macroeconomic environment and the growing distance from the inflation target, with its duration conditional on the ECB achieving its monetary policy objectives. Following the propagation of the COVID-19 pandemic, the Governing Council decided to further strengthen the existing Asset Purchase Programme with an additional temporary endowment of EUR 120 billion27, as well as to launch a EUR 750 billion28 Pandemic Emergency Purchase Programme (PEPP) until the end of the critical phase of the pandemic29. During 2020, with the aim of providing a more durable monetary stimulus and counteracting the prolonged impact of the pandemic on the outlook for growth and inflation in the euro area, the PEPP was also further expanded both in terms of its overall envelope, which reached a total of EUR 1,850 billion, and the time horizon of purchases, extended until at least the end of March 2022, with reinvestment of maturing capital until at least the end of 2023. Lastly, in December 202130, given recovering economic growth and an improving inflation outlook, the Council announced its decision to discontinue net purchases under the PEPP at the end of March 2022, extending the reinvestment horizon until the end of 2024. Concurrently, the pace of monthly net purchases under the PPA was also revised to EUR 40 billion in Q2, EUR 30 billion in Q3 and EUR 20 billion from October 2022 onwards, in order to gradually reduce overall purchases. Figure 1 below shows the net monthly purchase trend under the PSPP from the beginning of the programme (March 2015) until December 2021, and under the PEPP from the beginning of the programme (March 2020) until the end of the year. |
FIGURE 1: MONTHLY NET PURCHASES UNDER THE PSPP AND PEPP PROGRAMMES (EUR BILLION) |
|
| Source: Based on ECB data |
__
27 www.ecb.europa.eu/press/pr/date/2020/html/ecb.mp200312~8d3aec3ff2.en.html
28 www.ecb.europa.eu/press/pr/date/2020/html/ecb.pr200318_1~3949d6f266.en.html
29 For further details on the features and changes made to the PSPP and PEPP each year, please refer to
the relative focus section in previous years’ Public Debt Reports.
30 www.ecb.europa.eu/press/pr/date/2021/html/ecb.mp211216~1b6d3a1fd8.en.html
| MINISTRY OF ECONOMY AND FINANCE | 21 |
| | As regards the ECB’s activity under the PSPP, net purchases in 2021 reached a total of EUR 840.40 billion, compared with EUR 757.166 billion at the end of 2020. Thus, since the start of the programme, net purchases totalled EUR 1,597.565 billion. Total volumes of securities purchased under the PSPP averaged EUR 70 billion per month in 2021, with a peak between April and July and a subsequent decline in the final months of the year. |
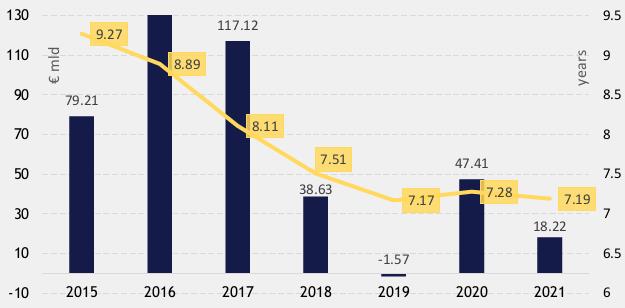
| FIGURE 2: VOLUME (EUR BILLION) AND AVERAGE LIFE (YEARS) OF THE STOCK OF ITALIAN GOVERNMENT SECURITIES PURCHASED BY THE ECB UNDER THE PSPP PROGRAMME |
|
Under the PSPP, as shown in Figure 2, the total volume of Italian Government securities purchased in 2021 was approximately EUR 18.20 billion, down from the EUR 47.40 billion purchased in the previous year. Also, the total volumes of Italian securities purchased by the ECB from the start of the programme to the end of 2021 amounted to EUR 429.415 billion31. The average life of the stock of Italian securities held by the ECB as at 31 December 2021 was 7.19 years compared to 7.28 years a year earlier. As regards the PEPP, the total volume of Italian Government securities purchased during the year was approximately EUR 132 billion, slightly higher than the EUR 126 billion purchased in 2020. Overall, at the end of 2021, the stock of Italian securities purchased through the PEPP programme came to just under EUR 260 billion, with an average life of 7.12 years, up from around 6.8 years the previous year. |
__
31 These amounts are expressed in terms of their net equivalent value.
| 22 | MINISTRY OF ECONOMY AND FINANCE |
II. THE ITALIAN GOVERNMENT SECURITIES MARKET: PERFORMANCE IN THE INTERNATIONAL CONTEXT |
| II.3 | TRENDS IN THE ITALIAN GOVERNMENT SECURITIES MARKET |
Evolution of the yield curve
As already mentioned, yield dynamics for Italian Government securities were largely influenced by the Covid-19 variants, growth and inflation trends, and the resulting expectations on monetary policy orientations.
Yields on Italian Government securities remained fairly stable in the first part of the year, in line with the ECB’s accommodative monetary policy stance, the good performance of vaccination campaigns and the improving outlook for economic growth.
The consolidation of growth prospects and the rise in inflation - which prompted the ECB to gradually reduce its monetary stimulus - led to a general steepening of the yield curve from October onwards.
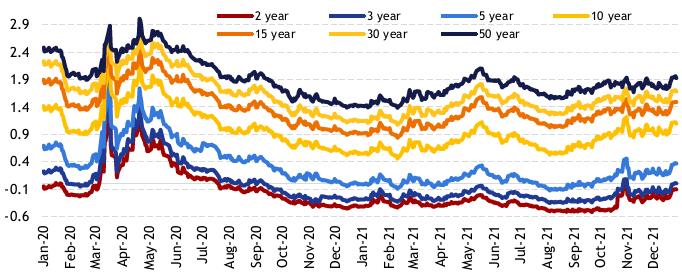
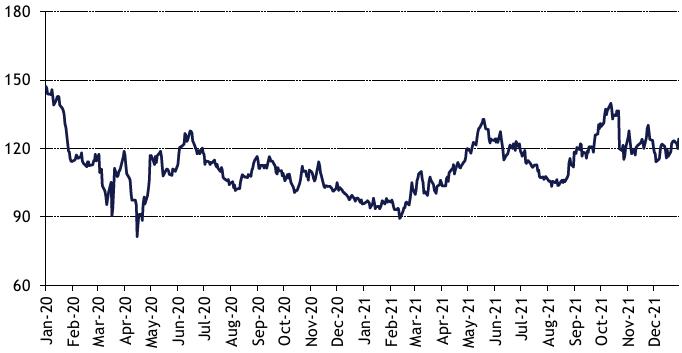
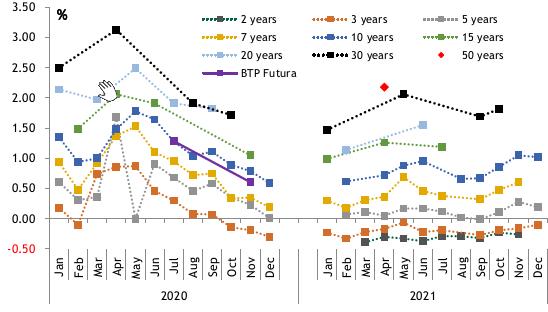
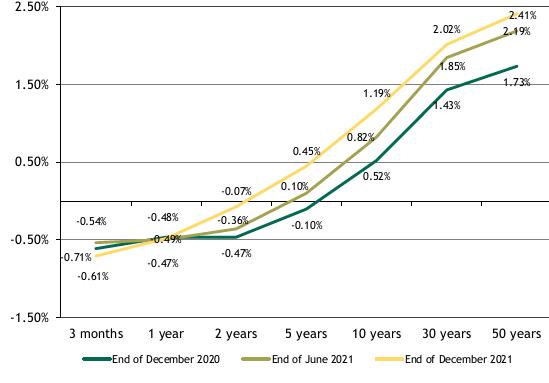
As shown in Chart II.3, the yield on Italian Government securities at the end of 2021 was higher than at the beginning of the year: while the short- and medium-term sections of the yield curve limited the upward movement (recording an increase of 34, 32 and 42 basis points, respectively, for 2-, 3- and 5-year maturities), the segment with 10-year maturities and above saw an increase above 60 basis points (63, 62 and 60 for 10-, 15- and 30-year maturities, respectively). This trend seemed to reflect a conservative stance on the part of investors who, in uncertain situations resulting - as already noted - from the evolution of the pandemic and economic policy actions, generally increase the risk premium for holding securities with longer maturities.
| CHART II.3: MARKET YIELDS ON GOVERNMENT SECURITIES WITH 2 TO 50-YEAR MATURITIES (PERCENTAGE VALUES) |
|
| Source: Based on Bloomberg data |
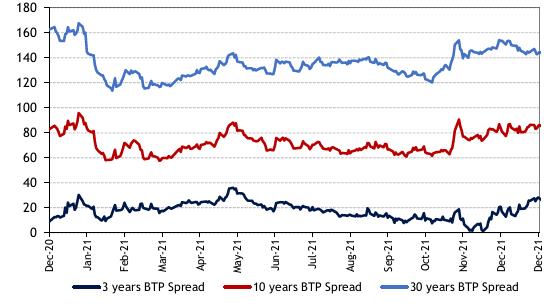
Therefore, given the trend described above, the slope of the Italy’s forward yield structure recorded an overall significant increase of about 28 basis points along the 2-10-year section (Chart II.4), passing from approximately 96 basis points at the beginning of 2021 and then closing the year at about 124 basis points. It should be noted that this trend was driven for most of the year by the movement of the 10-year BTP, against a substantial stability of the 2-year BTP.
| MINISTRY OF ECONOMY AND FINANCE | 23 |
| CHART II.4: GOVERNMENT SECURITIES YIELD SPREAD, 10-YEAR VS. 2-YEAR (BASIS POINTS) |
|
| Source: Based on Bloomberg data |
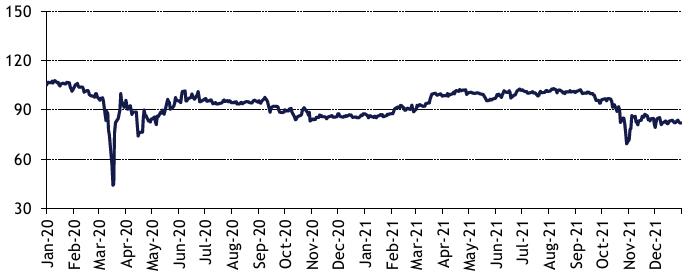
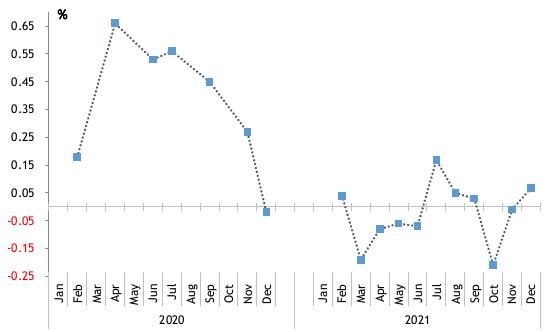
Chart II.5 shows that the slope of the 10- to 30-year section of the yield curve initially increased in the first quarter of 2021, then remained fairly stable for most of the year, and declined moderately from the end of September, only to recover in the last two months of the year. The overall impact of this movement was minimal, as the yield spread between the 30-year and 10-year maturity contracted by less than 6 basis points compared to the beginning of the year. The overall stability of the trend is related to an almost similar movement (both in direction and magnitude) of the 10-year and 30-year maturity section, except for the first part of the year in which the 10-year maturity showed greater resilience than the 30-year one, while in the last four months of the year the 10-year section seemed to be more affected than the longer-term one by the widespread rise in yields.
| CHART II.5: GOVERNMENT SECURITIES YIELD SPREAD, 30-YEAR VS. 10-YEAR (BASIS POINTS) |
|
| Source: Based on Bloomberg data |
| 24 | MINISTRY OF ECONOMY AND FINANCE |
II. THE ITALIAN GOVERNMENT SECURITIES MARKET: PERFORMANCE IN THE INTERNATIONAL CONTEXT |
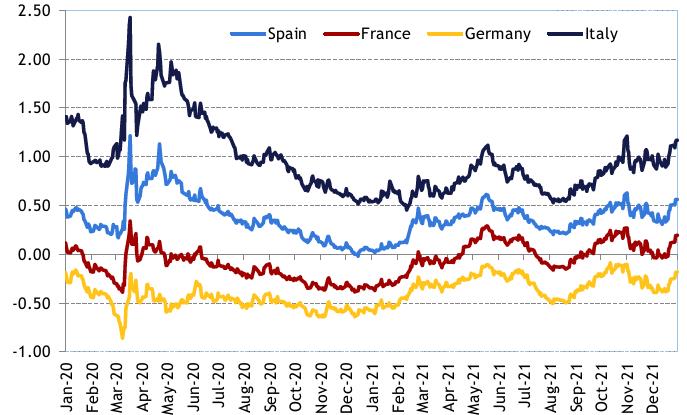
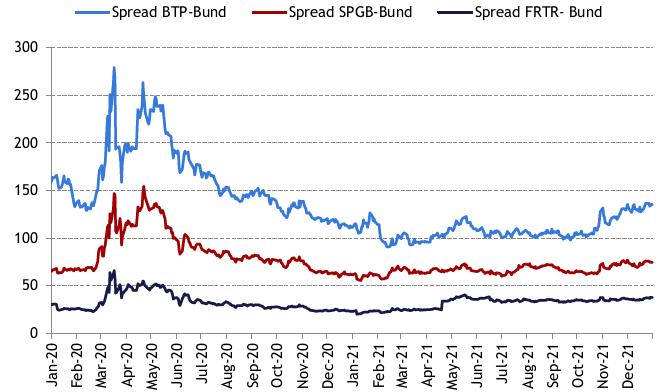
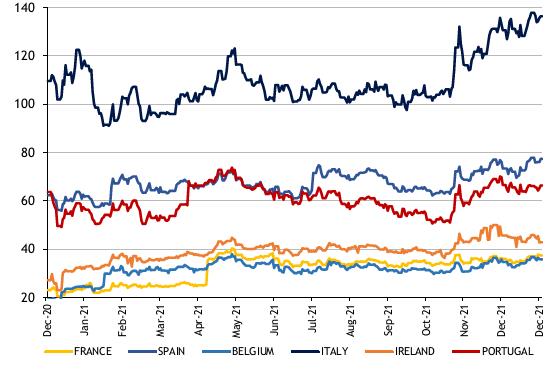
The spread between Italian and German government securities (Chart II.6) showed a rather stable trend for most of 2021, thanks to the fairly similar behaviour of Italian and German ten-year securities. Starting in September 2021, the above-mentioned prospects of a slowdown in the monetary policy stimulus and a renewed attitude towards risk aversion among investors, on the one hand favoured a reduction in the yield rates for German ten-year government securities and, on the other hand, caused an increase in the yield rates for Italian securities, thus widening the spread. All in all, the spread between Italian and German government securities increased by around 24 basis points compared to the beginning of 2021.
| CHART II.6: YIELD SPREAD: BTP-BUND, OAT-BUND BONOS-BUND AND OAT-BUND, 10-YEAR BENCHMARK (BASIS POINTS) |
|
| Source: Based on Bloomberg data |
| MINISTRY OF ECONOMY AND FINANCE | 25 |
Secondary market performance
General introduction
The secondary market for Italian government securities was affected by national and international events of a political, economic and financial nature, as Reported above. Also, the evolution of the market during 2021 was of course influenced by the features of the Italian market. The latter include (i) the role of market making; (ii) the Primary Dealership system which, in 2021, besides confirming the presence of 16 Specialists in Italian government securities, saw the arrival of three new Aspiring Specialists and the candidature of a fourth one; (iii) the functioning of the futures market which, over time, has taken on a leading role for effective market making among primary dealers; (iv) the growing contribution of the Repo and strips markets; and (v) the interrelationships with the primary market (regularity and continuity of issues compared with benchmark securities along several points of the curve).
As regards trading on the MTS platform - the reference market for Italian government bonds – in 2021 there was a significant increase in volumes traded, which reached levels well above those recorded in the previous year. On the contrary, there was a slight decrease in the volumes traded on other electronic platforms, especially business-to-customer platforms, thus continuing the downward trend already seen in the previous year. Lastly, the consistent use of operations involving alternative instruments such as futures, which are mainly used by primary dealers to “neutralise” the risks associated with long government bond positions, continued in 2021.
The interdealer wholesale market and the contribution of government bond Specialists
Only dealers and market makers operate on the “MTS Italia” regulated platform (the so-called “interdealer market”), and this is where the Treasury mainly monitors and evaluates the activities of government bond Specialists on the wholesale secondary market. This platform therefore represents a point of reference to analyse how this market segment is developing.
The cash market
The volumes traded on the MTS platform were clearly affected by general market conditions and the perceived credit risk for Italy, benefiting from the increasing liquidity in the market and from signs of recovery in economic growth. In particular, since the beginning of 2021, there has been a substantial increase in volumes traded compared to the same months of 2020, with increases averaging 250% on a monthly basis until May.
Also on a quarterly basis, the greater increase compared with 2020 was recorded in the first two quarters of the year, while it was more contained in the last quarter of the year, mainly due to the significant increase in volumes of last year, especially from the second half of the year. Furthermore, in all four quarters of 2021 except the first one, total volumes traded exceeded EUR 1 trillion in absolute terms.
| 26 | MINISTRY OF ECONOMY AND FINANCE |
II. THE ITALIAN GOVERNMENT SECURITIES MARKET: PERFORMANCE IN THE INTERNATIONAL CONTEXT |
| CHART II.7: MONTHLY VOLUMES TRADED ON THE MTS PLATFORM (EUR MILLION; SINGLE-COUNTED) |
|
| Source: Based on MTS data |
With regard to the breakdown of volumes traded by segment, the most pronounced changes between 2020 and 2021 concerned nominal BTPs, which recorded trades equal to 51% of total volumes traded compared with 48% in the previous year. The BTP€i segment further declined, representing just 2.1% of total volumes compared to 3.4% in 2020 and followed by the CCTeu segment with 2.9%. The CTZ segment also declined, with a market share of around 5.6%. On the other hand, the share of the BOT segment increased, accounting for more than 38% of total volumes, compared to 36% in 2020. In absolute terms, in line with the trend in total volumes, there was an increase in operations for all segments, which was particularly marked in the nominal BTPs and BOT segments (around 56% for both), but also involved CTZs (around 39%).
| CHART II.8: QUARTERLY VOLUMES TRADED ON THE MTS PLATFORM, BY SEGMENT (EUR MILLION; SINGLE-COUNTED) |
|
| Source: Based on MTS data |
| MINISTRY OF ECONOMY AND FINANCE | 27 |
A general increase in traded volumes was recorded on the various segments of the yield curve, with larger increases in the first two quarters of the year for the reasons already mentioned above.
As for the short-term part of the curve, the segments up to 2 years (which includes BOTs and CTZs, as well as short-term BTPs and CCTeus) saw an average increase in volumes of 120% compared to 2020.
However, the 2-4-year segment saw the strongest increase (almost 170%), followed by the 4-6-year and 8-12-year segments, which grew by an average of 120% compared to the previous year.
As for the long part of the curve, for maturities of over 12 years, volume growth was more contained and mainly observed in the first two quarters of the year, again for the reasons mentioned above.
| CHART II.9: QUARTERLY VOLUMES TRADED ON THE MTS PLATFORM, BY MATURITY (EUR MILLION; SINGLE-COUNTED) |
|
| Source: Based on MTS data |
Secondary market liquidity is also assessed using the bid-ask spread indicator, i.e. the difference between the purchase price (bid) and sale price (ask) for each security on the market. The lower the bid-ask spread, the greater the liquidity of the security.
| 28 | MINISTRY OF ECONOMY AND FINANCE |
II. THE ITALIAN GOVERNMENT SECURITIES MARKET: PERFORMANCE IN THE INTERNATIONAL CONTEXT |
The charts below show the trends recorded by this indicator for all segments and for all the benchmark points along the yield curve: after the peaks reached in the early months of the pandemic, there was a gradual return to normal liquidity levels, as shown by the compression of bid-ask spreads on all points of the curve, also favoured by the ECB’s accommodative monetary policy.
As shown by Charts II.10A, 10B and 10C, this trend continued during the first months of 2021, with bid-ask spreads even lower than pre-Covid levels, only to increase in the last two months of the year, characterised by higher volatility and uncertainty in financial markets.
| CHART II.10A: BID-ASK SPREAD (IN BASIS POINTS) FOR CTZS, CCTEUS, 3-, 5- AND 7-YEAR BENCHMARK BTPS, AS RECORDED ON THE MTS PLATFORM - MONTHLY AVERAGES |
|
| Source: Based on MTS data |
| CHART II.10B: BID-ASK SPREAD (IN BASIS POINTS) FOR 10-, 15-, 20-, 30- AND 50-YEAR BENCHMARK BTPS, AS RECORDED ON THE MTS PLATFORM - MONTHLY AVERAGES |
|
| Source: Based on MTS data |
| MINISTRY OF ECONOMY AND FINANCE | 29 |
It should be noted that the inflation-linked bond segment, despite having maintained for most of the year lower bid-ask spread levels than those recorded at the beginning of 2020, saw the largest increase in bid-ask spread levels starting in September 2021. The lower level of liquidity in the European inflation-linked BTP segment compared with Italy’s other government securities is explained by the fact that these securities not only involve an intrinsically higher credit risk than nominal securities, but they were also more affected by the uncertainty surrounding future inflation trends and the evolution of the ECB’s monetary policy which characterised the second half of the year.
| CHART II.10C: BID-ASK SPREAD (IN BASIS POINTS) FOR 5- AND 10-YEAR BENCHMARK BTP€IS, AS RECORDED ON THE MTS PLATFORM - MONTHLY AVERAGES |
|
| Source: Based on MTS data |
Liquidity in the secondary market can also be measured by less common but more sophisticated indicators, which take into account not only the size of the bid-ask spread, but also the price changes stemming from major operations or analysis of the depth of pricing on both sides of the “order book” for each security32.
One such indicator is the “slope”, which measures the ratio between the absolute difference between the best and the worst price of a given security at a given moment and the difference between the total volume of all prices in the order book for the security in question and the volume of the best price33.
When shown in a chart, this ratio generates a straight line for each side of the order book (bid and ask), highlighting buy and sell price trends depending on the quantity demanded or supplied by market makers. Therefore, this indicator measures the marginal price increase/decrease that the dealer will demand in order
__
32 The order book collects all trading orders for a given security that are present on the market at a certain moment in time, and divides them into buy and sell orders, arranged in descending and ascending order, respectively.
33 This measure is conceptually very similar to the “price impact”, although the slope calculated based on buy or sell orders, while the price impact is based on both proposed prices and trading activities. In fact, the price impact measures the relationship that exists between a buy or sell order and the corresponding change in listing price. However, literature on this subject confirms that calculating this metric is rather complex, as it not only requires an extremely large amount of intraday data, but also includes subjective assessments, including: the threshold beyond which the impact of trading on pricing is to be assess; defining the time lag during which the price change due to trading must occur; etc.
| 30 | MINISTRY OF ECONOMY AND FINANCE |
II. THE ITALIAN GOVERNMENT SECURITIES MARKET: PERFORMANCE IN THE INTERNATIONAL CONTEXT |
to trade an additional unit compared with the quantity quoted at the best price. This means that, the higher the indicator (the steeper the slope of the line), the lower the level of liquidity for the security in question. In order to get the most comprehensive picture possible and to calculate the slope for a given security on a given day of trading, the slope is calculated across many moments on the same day, and then the average is calculated and the daily slope figure created.
| CHART II.10D: DAILY SLOPE ON 10-YEAR BENCHMARK BTP (LOGARITHMIC SCALE), AS RECORDED ON THE MTS PLATFORM |
|
| Source: Based on MTS data |
This indicator reveals that liquidity deteriorated less extensively than in 2020, and that this phenomenon was more pronounced in the first few months of the year. It also shows that despite the widening of the bid-ask spread in the final part of 2021, the slope remained rather stable and at lower levels on average than in 2020. Therefore, although the greater volatility and uncertainty experienced in the final months of the year may have led operators to prudently widen bid-ask spread levels, this does not seem to have affected the depth and composition of the books.
The Repo market
The government securities Repo market plays a major role in supporting orderly trading on the cash market. In fact, an efficient Repo market allows operators (especially market makers) to ensure a continuous market presence in terms of bid and ask for all securities, even if they do not hold certain securities in their own portfolios. Furthermore, with the General Collateral contract, where the collateral security is not designated in advance, investors can trade liquidity, without counterparty risk in the case of a central counterparty contract, on a deep and liquid market.
In 2021, the Repo market showed no significant change in volumes compared to 2020. However, the trend to shift activity from the General Collateral contract (approx. 40% reduction compared to 2020) to the Special Repo contract, continued, as in previous years. This trend is due to two complementary factors: on the one hand, the abundance of liquidity in the financial system reduces the need for
| MINISTRY OF ECONOMY AND FINANCE | 31 |
funding and lending on the collateralised money market, and on the other, the ECB’s purchase programmes under the APP/PEPP programmes contributed to reducing the effective float of outstanding government securities, resulting in securities on the Repo market becoming increasingly scarce (or special in technical jargon).
| CHART II.11: ANNUAL VOLUMES TRADED ON THE MTS PLATFORM IN 2020 AND 2021, BY CONTRACT MATURITY (EUR MILLION) |
|
| Source: Based on MTS data |
| CHART II.12: MONTHLY VOLUMES TRADED ON THE MTS PLATFORM IN 2021, BY CONTRACT MATURITY (EUR MILLION) |
|
| Source: Based on MTS data |
Cases of “specialness”34, however, remained contained and limited to situations occurring during the quarterly technical maturities and when the financial markets were under greater stress due to the propagation of the pandemic, thanks also to the securities lending mechanism35 introduced as part of the Public Sector Purchase Programme (PSPP), through which the Central Bank temporarily provides
__
34 Specialness is when the repo yield for a given security falls below the “general collateral” rate.
35 For further information on securities lending, please refer to the following link on the ECB website www.ecb.europa.eu/mopo/implement/omt/lending/html/index.en.html
| 32 | MINISTRY OF ECONOMY AND FINANCE |
II. THE ITALIAN GOVERNMENT SECURITIES MARKET: PERFORMANCE IN THE INTERNATIONAL CONTEXT |
securities for which dealers hold temporary short positions. Overall, Repo market trading was therefore substantially carried out in an orderly manner, despite some moments of particularly acute stress.
The cases of specialness - as mentioned in a separate section of this Report - were also curbed by the Repo operations initiated by the Treasury during 2021.
In line with previous years, also in 2021 a significant share of the activity on the Repo market was undertaken by so-called fast money (i.e. more speculative) traders, who at the same time are very active on the BTP futures market.
| CHART II.13: MONTHLY SPECIAL REPO VOLUMES TRADED ON THE MTS PLATFORM (EUR MILLION) |
|
| | Jan-21 | Feb-21 | Mar-21 | Apr-21 | May-21 | Jun-21 | Jul-21 | Aug-21 | Sep-21 | Oct-21 | Nov-21 | Dec-21 | |
■ S.R. - Italy | 1,073 | 1,138 | 1,371 | 1,144 | 1,258 | 1,223 | 1,204 | 1,199 | 1,325 | 1,323 | 1,440 | 1,188 | |
■ S.R. - Foreign | 2,605 | 2,747 | 2,985 | 2,493 | 2,753 | 2,861 | 2,961 | 2,792 | 3,026 | 2,760 | 3,052 | 2,422 | |
| |
| Source: Based on MTS data |
Activities of government bond Specialists on the platform used to appraise them
The MTS trading platform has been selected to evaluate specialist dealers36, with the latter playing a dominant role in terms of traded volumes; in fact, in 2021, they represented more than 94% of total trades. Just over 5%, on the other hand, was traded mainly by the other market makers (“non-Specialists”)37, while a residual amount of around than 0.4% was traded by price takers (i.e., not market makers).
__
36 It should be remembered that this is an interdealer platform, meaning trades are made between intermediaries and not with end investors.
37 Pursuant to Art. 1, paragraph 5-quater, of the TUF (Italian Consolidated Law on Financial Intermediation), “Market Makers” are defined as entities that are willing to trade on their own behalf, in and/or outside of trading venues, on an ongoing basis, by buying and selling financial instruments as a direct counterparty, at the prices that they set themselves. In order to apply to be included in the “List of Specialist Operators” pursuant to Art. 23, paragraph 1, of Italian Ministerial Decree No. 216 of 2009, an entity must be classed as a Market Maker.
| MINISTRY OF ECONOMY AND FINANCE | 33 |
| CHART II.14: ANNUAL VOLUMES TRADED BY SPECIALISTS ON THE MTS PLATFORM (%) |
|
| Source: Based on MTS data |
Government bond Specialists’ trading with end investors
Traded volumes
Specialists (Primary Dealers) play an extremely important role, not only by ensuring liquidity on the interdealer market, but also by distributing the securities purchased on the primary market to end investors. This is why it becomes of crucial importance for the DMO to analyse traded volumes and purchases/sales broken down by investor type and geographic area, in order to better understand who end investors are and what they are looking for in a given market context. This monitoring is carried out using the information collected via the EMAR38, a highly standardised Reporting model shared at EU level, which is filled in by the Specialists themselves; the latter use this Report to systematically record all the activities39 they perform with any counterparty, including their end customers.
__
38 European Market Activity Report. This report replaced the previous “HRF” - “Harmonized Reporting Format”, but only in terms of its name as its content remained substantially the same.
39 This report also includes operations completed both on trading platforms and on a bilateral basis, both electronically and vocally. Since 2014, this report has included all the information on individual trades completed by Specialists (trade-by-trade report), providing indication, for each trade, of the security, the quantity, the country in which the counterparty is based, the type of counterparty and the platform or trading method used. From 1 January 2020, this report also began to include trades on Italian government securities issued under foreign legislation (MTN). Also starting from 1 January 2020, the report’s format was enhanced with information on the settlement date, allowing for analysis on certain types of operations carried out by Specialists (for example, trades with the non-standard settlement of two working days, such as simultaneous trades or trades with a settlement of over seven days, also known as forward operations).
| 34 | MINISTRY OF ECONOMY AND FINANCE |
II. THE ITALIAN GOVERNMENT SECURITIES MARKET: PERFORMANCE IN THE INTERNATIONAL CONTEXT |
In 2021, volumes traded outside the MTS - on other electronic platforms and elsewhere - were in line with the previous year’s levels.
In fact, the approximately 6% decline in trade recorded in the first quarter was fully offset by the volume growth that occurred in both the second and last quarters (Chart II.15). This stability should be framed in a context where, as illustrated, activity on the MTS has increased significantly, registering a marked increase in traded volumes.
| CHART II.15: MONTHLY VOLUMES TRADED BY SPECIALISTS ON PLATFORMS OTHER THAN MTS (EUR MILLION) |
|
| Source: Based on EMAR data |
Trades broken down by type of counterparty
As mentioned above, thanks to the information gathered through the EMARs it is possible to monitor liquidity on the various trading platforms, as well as trends on individual sectors, by geographic area and investor type.
With regard to the evolution of demand by type of investor, the charts below show the trend of absolute volumes and net amounts (purchases minus sales) traded with Specialists belonging to the main categories of investors - banks, investment funds, pension funds, insurance companies and hedge funds.
Chart II.16 shows that in 2021, investment funds and banks still represent the main investors in government securities, in terms of both absolute volumes and net purchase flows. Investment funds traded volumes of 37% of the total, down from 43% in the previous year, with a preponderant contribution to total net purchases.
As for the banking sector, volumes traded by this type of investor were up to 43%, contributing to total net purchases in line with the previous year.
| MINISTRY OF ECONOMY AND FINANCE | 35 |
| CHART II.16: QUARTERLY VOLUMES TRADED BY SPECIALISTS BY TYPE OF COUNTERPARTY - FUND MANAGERS, BANKS, PENSION AND INSURANCE FUNDS, HEDGE FUNDS (EUR MILLION) |
|
| Source: Based on EMAR data |
| 36 | MINISTRY OF ECONOMY AND FINANCE |
II. THE ITALIAN GOVERNMENT SECURITIES MARKET: PERFORMANCE IN THE INTERNATIONAL CONTEXT |
The share of volumes traded by Pension Funds and Insurances in 2021 was modest, about 2% of total trades and down slightly from the 3% recorded in the previous year, while in terms of net purchases the total amount was also 2%.
In addition, the share of hedge funds in total trading strengthened (up to 18% from 16% in 2020), although in terms of net purchases the overall share was substantially negative.
Trades broken down by counterparties’ geographical areas
The evolution of demand by geographic area, broken down between Italian and foreign investors, showed a reversal in 2021 compared to previous years: volumes traded by Italian counterparties increased by 6.7% while the share of total trades stood at 26%, returning to an upward trend after several years of contraction. However, the contribution of Italian investors in terms of net purchases has stalled, coming in at just over EUR 72 billion, after the exceptional level of EUR 115 billion reached in the previous year.
| CHART II.17: QUARTERLY VOLUMES TRADED BY SPECIALISTS ACCORDING TO COUNTERPARTY RESIDENCE (EUR MILLION) |
|
| Source: Based on EMAR data |
| MINISTRY OF ECONOMY AND FINANCE | 37 |
Foreign end investors represented the main share of total trades completed in 2021, despite a reduction of about one percentage point compared to 2020. Finally, there was a notable decline in net foreign purchases, which, after a 45% drop in the previous year, marked a further contraction of about 62% to around EUR 41 billion in total.
Evolution of the BTP Futura Market
The evolution of future40 contract prices on ten-year Italian government securities (by far more liquid compared with contracts on three-year and five-year maturities) was perfectly in line with the performance of the ten-year benchmark BTPs (Chart II.18). However, there were some discrepancies that coincided with phases of greater market volatility, particularly in the second half of the year, and the change of the benchmark BTP.
| CHART II.18: PRICES OF THE BTP FUTURA AND YIELD OF THE 10-YEAR BENCHMARK BTP (RIGHT-HAND SCALE INVERTED, IN %) |
|
| Source: Based on Bloomberg data |
In 2021, the volumes traded for the 10-year future contract increased marginally by around 16%, giving continuity to the upward trend began in 2020, when volumes rose by about six percentage points. However, a significant decrease was recorded in open interest41 levels, of around 13 percentage points (Chart II.19), in line with the previous year.
__
40 BTP Futura contracts are traded on the Eurex platform.
41 Open interest represents the number of outstanding futures contracts that are traded on the market. It can therefore be defined as the sum of all long or short positions opened on 10- year BTPs via a future contract in a certain moment in time. Steep increases normally indicate a large number of operators tending to move in the same direction.
| 38 | MINISTRY OF ECONOMY AND FINANCE |
II. THE ITALIAN GOVERNMENT SECURITIES MARKET: PERFORMANCE IN THE INTERNATIONAL CONTEXT |
| CHART II.19: VOLUMES OF LOTS TRADED AND OPEN INTEREST FOR THE 10-YEAR BTP FUTURA CONTRACT TRADED ON THE EUREX MARKET |
|
| Source: Based on Bloomberg data |
Given the increase in the traded volumes of securities, it can be assumed that part of the hedging activity, normally carried out via futures contracts, took place directly on the spot market for securities.
| MINISTRY OF ECONOMY AND FINANCE | 39 |
| MINISTRY OF ECONOMY AND FINANCE | 40 |
| III. | PUBLIC DEBT MANAGEMENT IN 2021 |
| III.1 | OUTSTANDING GENERAL PUBLIC DEBT |
The absolute level of public debt42 as of 31 December 2021 stood at nearly EUR 2,678 billion, an increase of about 105 billion compared with the end of 2020.
The same aggregate as a ratio to GDP was 150.8% in 2021, down about four percentage points from the figure measured at the end of 2020, but about 17% higher than in 2019 and 2018; the peak in 2020 had been driven by the simultaneous increase in absolute value of debt and a, relatively, more pronounced decrease in the denominator.
The debt-to-GDP ratio has evolved over the past 10 years as follows:
| CHART III.1: 2011-2022 EVOLUTION OF THE DEBT-TO-GDP RATIO |
|
| Source: based on ISTAT and Bank of Italy data |
With regard to financial instruments of which it is composed, as at 31 December 2021, debt represented by negotiable bonds of both the central government and local authorities amounted to 83.5% of total consolidated debt, in line with the same percentage measured at the end of the previous year, while both the share contracted in the form of loans and that represented by currency and deposits was just over 8%. Included in the stock of loans are liabilities related to EU programs, including the nine tranches disbursed, between 2020 and 2021 totalling EUR 27.4 billion, under the SURE (Support to mitigate Unemployment Risks in an Emergency)
__
42 Public debt or general government debt is officially calculated by the Bank of Italy (“Public Finance: requirements and debt”) based on sectoral and methodological criteria defined in Council of European Communities Regulation No. 549 of 2013, or the European System of National and Regional Accounts (ESA 2010).
| MINISTRY OF ECONOMY AND FINANCE | 41 |
program and the approximately EUR 15.9 billion from the Next Generation EU facility.
Negotiable debt basically coincides with the amount of government bonds, the management of which is discussed in more detail in the following sections.
| III.2 | GOVERNMENT BONDS ACTIVITIES |
Maturities and redemptions of government bonds
In 2021, EUR 389,452 million came due, which is approximately EUR 13.5 billion more than the EUR 376,007 million of the previous year. Taking into account the repurchases made as part of the repurchase and exchange operations carried out during the year, the total volume of redemptions reached EUR 398,395 million, just below 2020 levels.
In the short-term segment, redemptions of BOTs totalled 166,933 million in 2021, which compares with 174,461 million matured in the previous year.
In the medium to long term, maturities amounted to EUR 222,519 million, which was about 10.4% higher than the EUR 201,546 million matured in 2020. If the volumes subject to repurchase and exchange operations are also taken into account, a total of EUR 231,461 million is reached, which is in line with the EUR 232,169 million recorded in 2020. However, as usual, a lower value amounting to EUR 225,041 million was recorded in the State budget, which does not include the amount from the Government Bond Sinking Fund used to redeem maturing bonds; it amounted to EUR 6,420 million in 2021, for the purpose of redeeming maturing bonds.
Net issues and requirement coverage
In 2021, the requirement of the State Sector was EUR 106,378 million, which is EUR 52.7 billion lower than in 2020. The trend in the balance followed the marked increase in total tax revenues due, primarily, to the gradual recovery of economic activity; among the incoming sums were the tax and social security payments that had been extended in the last quarter of 2020 and the inflow of a share of EU contributions from the Recovery Fund.
The requirement was covered by the balance between net issues of bonds recorded in the State budget43 and other Treasury movements (positive 28,142 million), which provided total coverage of 110,879 million. The increase in Treasury liquidity over the balance recorded at the end of 2020 was 4,501 million, compared with the similar change of 9,543 million between 2020 and 2019. It should be noted that the EUR 27.014 billion-which is the total revenue from the SURE and NGEU
__
43 Net issues are calculated through the difference between issues and redemptions, respectively, valued as follows: issues are valued at net proceeds, with the exception of BOTs which are valued at face value (price 100) because the difference from 100 is advanced by the State Treasury; redemptions are valued at face value, with the exception of bonds repurchased in exchange which are calculated at net proceeds, as are CTZs because the interest component is already contained in the State Sector requirement.
| 42 | MINISTRY OF ECONOMY AND FINANCE |
III. PUBLIC DEBT MANAGEMENT IN 2021 |
programs in 2021-contributed to covering the requirements of the State Sector by fostering a similar reduction in net issuance of domestic government bonds.
TABLE III.1: ISSUES*, MATURITIES AND COVERAGE OF THE STATE SECTOR’S REQUIREMENT (EUR MILLION) |
| | 2021 |
| Nominal emissions | 477,295 |
| Nominal redemptions | 398,394 |
| Issues net of income (a) | 476,418 |
| Redemptions net of income (b) | 393,681 |
| Net issues (c) = (a) – (b) | 82,737 |
| Other forms of coverage held in the State Treasury (f) = - (d) + (e) – (c) | 28,142 |
| Total coverage (c) + (f) | 110,879 |
| Change in Treasury Cash Account 31-12-2021 vs 31-12-2020 (e) | 4,501 |
| Cash balance of the State Sector (d) | -106,378 |
* Calculated for the whole year using the settlement date criteria and not by auction date. |
| Source: MEF |
In 2021, requirement formation was concentrated in the first half of the year, according to its normal pattern, while in the previous year it had been steadily increasing between March and December. Due to the continuing epidemiological emergency from Covid-19, the recourse to the market has thus remained at abundant levels, albeit lower than in 2020.
| TABLE III.2: GOVERNMENT BONDS ISSUED NET OF EXCHANGE OPERATIONS (EUR MILLION) |
| | Total | I Quarter | II Quarter | III Quarter | IV Quarter | Total |
| | 2020 | 2021 | 2021 | 2021 | 2021 | 2021 |
| Short-term totals (BOTs) | 181,815 | 46,043 | 41,652 | 42,722 | 28,726 | 159,141 |
| Medium-long term totals | 353,864 | 92,034 | 107,255 | 61,233 | 52,878 | 313,399 |
| Of which: | | | | | | |
| CTZ | 37,949 | 5,951 | 0 | 0 | 0 | 5,951 |
| BTP | 241,624 | 76,497 | 89,330 | 49,809 | 41,950 | 257,587 |
| BTP€i | 12,451 | 6,586 | 4,341 | 2,150 | 2,013 | 15,089 |
| BTP ITALIA | 22,298 | 0 | 0 | 0 | 0 | 0 |
| BTP FUTURA | 11,844 | 0 | 5,477 | 0 | 3,268 | 8,745 |
| CCTeu | 16,444 | 3,000 | 5,207 | 9,274 | 4,763 | 22,244 |
| Foreign Bonds | 11,255 | 0 | 2,899 | 0 | 884 | 3,784 |
| Total | 535,679 | 138,077 | 148,906 | 103,955 | 81,603 | 472,541 |
| Source: MEF |
As a result, as can be seen in Table III.2, the time profile of the issuance activity has been parallel to that of demand, with a slight slowdown only in the last quarter of 2021. The total volume of government bonds was, for the above reasons, more than 60 billion less than that placed in 2020.
Innovations and adjustment of issuance strategy
Despite the sharp reduction in requirements in the year under review compared to 2020, as mentioned earlier, the volumes being issued continued to average higher levels than in the pre-Covid period. As a result, to meet these financing needs, the
| MINISTRY OF ECONOMY AND FINANCE | 43 |
Treasury has resorted to the instruments already used since 2020 following the outbreak of the pandemic crisis.
First, albeit to a lesser extent than in the previous year, the quantities offered in auctions on the various instruments and maturities were kept at high levels, taking into account changing market conditions and calibrating volumes in such a way as to reserve more weight for sectors with better liquidity in the secondary market.
Second, with regard to additional placements, even for a good part of 2021 the Treasury made use of the option to waive the limits of the quotas reserved to Specialists (30% for the first tranches and 15% for subsequent tranches, increasable by 5% for bonds with a residual life of more than 10 years), being able to increase them at its discretion at each auction and regardless of the residual life of the bonds.
Compared to the pre-Covid period, there is also evidence of greater use of the syndicated placement mode for the launch of new benchmarks, including on maturities outside those traditionally reserved for this type of issue and on instruments habitually placed by auction. In fact, in addition to the launch of two new benchmarks on the 10-year maturity, a new CCTeu was also placed in syndicate.
The Treasury also continued to make use of the flexibility in offering off-the-run bonds through the use of the Tap facility reserved to Government Bonds Specialists, introduced in 2020. Through this instrument, issues of one or more off-the-run bonds were made through a dedicated electronic platform of the regulated wholesale market for government bonds.
In order to increase the involvement of individual investors, the BTP Futura, the government bond dedicated to the retail market first launched in 2020, was also offered in 2021. In the two issues of the year, a mechanism was also introduced to disburse the loyalty reward44 in more instalments.
Finally, with reference to the mechanism of operation of the government bond market, during 2021 the Treasury made changes to the qualitative indicator of primary market participation (Auction Aggressivity Index, AAI) used for the evaluation of Government Bond Specialists. This indicator captures the degree of aggressiveness of each Specialist’s auction participation strategy, i.e., the combined effect of the deviation of prices submitted at a level above the market one (overbidding) coupled with requested quantities above a threshold quota set by the Treasury (overdemanding). In particular, since April, the AAI indicator has also been applied to government bonds that are no longer being issued(off-the-run), which were previously excluded from this assessment, in the same way as for on-the-run bonds. With regard to the qualitative assessment of BOT auctions, however, the indicator (BOT Auction Aggressivity Index, BAAI) has been modified in order to penalise auction participants who enter bids that are more misaligned from the weighted average yield of the auction itself.
Worth mentioning is the activity in the U.S. bond market, where the Republic of Italy continued to maintain a stable and solid presence in 2021, with two
__
44 For further details, please refer to the following section about the instrument.
| 44 | MINISTRY OF ECONOMY AND FINANCE |
III. PUBLIC DEBT MANAGEMENT IN 2021 |
syndicated issues, in continuity with what was announced when it returned to the Global market in 2019.
Domestic bonds
BOT
Gross issues of BOTs in 2021 amounted to EUR 159,141 million, down nearly EUR 23 billion from the previous year, partly due to shorter maturities (166,933 million versus 174,461 million in 2020) but mainly as a result of a negative net issuance value of about EUR 8 billion.
The latter value was due to a reduction in supply needs from the values found in 2020, when, following regulatory measures aimed at supporting the production and social sectors affected by the spread of Covid-19, they had held above-average values.
The decline in BOT issuance can be attributed to a reduction in the amounts in issuance of annual and semi-annual bonds relative to the amounts maturing and the non-recourse to the issuance of maturities of less than 6 months, such as quarterly and so-called flexible BOTs (i.e., with non-standard maturities). Unlike the previous year, in fact, no temporary cash needs emerged during 2021 that made it appropriate to use these types of securities.
During 2021, therefore, the Treasury returned to issuing only BOTs on the traditional six-month and one-year maturities. At the end of the year, the stock of outstanding BOTs amounted to EUR 113,491 million divided into about EUR 83,294 million for annual BOTs and about EUR 30,197 million for semi-annual BOTs, respectively. The total stock in 2021 was about 7.8 billion less than in the year 2020 and, in relation to the stock of all securities, was lower than in previous years: 5.07%, compared with 5.64% in 2020 and 5.68 in 2019.
As for the evolution of auction yields (Chart III.2), the year was characterised by a stable or slightly downward trend, with rates always in the negative area and basically in line with Euribor levels.
By the end of 2021, yields had fallen, reaching record lows: November saw the lowest for the six-month BOT (-0.563%) and the lowest for the one-year BOT (¬0.533%).
Overall, BOT yields in 2021 averaged lower returns than in the previous year.
| MINISTRY OF ECONOMY AND FINANCE | 45 |
| CHART III.2: GROSS COMPOUND YIELDS ON ISSUANCE OF 6- AND 12-MONTH BOTS, 2020-2021 (EXPRESSED IN PERCENTAGE POINTS) |
|
| Source: MEF |
The average allotment yield of the BOT segment for 2021 stood at -0.489%, down more than 30 basis points from that achieved in the previous year (-0.185%). Specifically, the average return on the six-month and annual bills was -0.508% and -0.47%, respectively.
The next chart (Chart III.3) compares yields at issuance of the six-month BOT with Euribor rates of the same duration. This chart shows that the decline in rates recorded in BOT auctions during 2021 was not specific to Italy but affected the entire interbank system. As can be seen, moreover, during the first months of the year BOT rates were above Euribor, and then proceeded aligned and steadily below Euribor starting in September. These levels are a clear sign of both the abundance of liquidity in the system and the perceived relative lower riskiness of Italian government bonds.
| CHART III.3: YIELDS AT ISSUANCE OF 6-MONTH BOTS AND COMPARISON WITH EUROBOR RATE – YEARS 2020-2021 (EXPRESSED IN PERCENTAGE POINTS) |
|
| Source: MEF, Bloomberg |
| 46 | MINISTRY OF ECONOMY AND FINANCE |
III. PUBLIC DEBT MANAGEMENT IN 2021 |
In terms of Primary Dealers (or Government Bond Specialists’ participation to the auction, the average bid-to-cover ratios for the year were 1.40 for the six-month BOT and 1.38 for the annual BOT, down from those in 2020, which were 1.74 and 1.70, respectively. This trend is also related to the change in the evaluation parameters of Government Bond Specialists that affected the way they participated in the BOT segment auctions starting in April 2021, as mentioned above.
In fact, during 2020, coinciding with a sharp decline in short-term yields related to the particular economic situation, a significant mismatch had emerged between the auction yields in BOT auctions and the yield levels traded on the reference secondary market (so-called overbidding). To prevent this phenomenon from generating distorting phenomena and lower participation of end investors in the auction, the Treasury has therefore made a change in the evaluation criteria that aim to better discourage overbidding behaviour and improve communication to Specialists, who can correct their strategy more immediately.
In conclusion, overall, the BOT segment has maintained satisfactory levels of efficiency both in the secondary market, in terms of liquidity and depth, and in the primary market, in terms of allotment yields in the various monthly auctions and coverage ratios.
The composition of demand at auctions, based on data collected through the Government Bond Specialists according to the harmonised model defined at European level (EMAR45), was also characterised in 2021 by a clear predominance of foreign investors, averaging 84% of total demand. During the year, foreign demand was always very high and never fell below 67%, reflecting the great confidence and interest of foreign investors in these Italian government debt instruments.
In terms of investor type, with respect to last year, the most stable component was demand from banks (41%), followed by investment funds (35%).
BTP
Consistent with what was announced in the Guidelines and in light of financing needs to cope with the evolution of the Covid-19 pandemic while containing the related financial risks, in 2021 BTPs gross issuance (net of placements in exchange operations) reached EUR 257,587 million, being 15,963 million higher than in the previous year and thus bucking the trend with respect to BOTs (whose decline in issuances was described above).
In the exchange operations, moreover, 2,500 million BTPs were issued against repurchases (in the same exchanges and buy-backs) of about 10,343 million, with the weight of nominal BTPs in total government bond circulation increasing to 73%, up from 71.7% in 2020. This increase is partly to be attributed to the introduction of a new category of BTPs, the BTPs Short Term, which gradually took the place of CTZs, whose weight on the circulating stock consequently dropped to 1.3% against 2.5% in the previous year. In fact, during 2021, in order to take into account the special characteristics of demand and to broaden the investor base, CTZ issues were replaced by the BTP Short Term, a new instrument with a fixed coupon and maturity
__
45 See supra, Ch. II, pp. 36-37.
| MINISTRY OF ECONOMY AND FINANCE | 47 |
between 18 and 30 months, which compared to traditional CTZs presented a yield and cost at issuance more aligned with the curve of the Multi-Year Treasury Bonds.
Issuances on the CTZ segment took place in the month-end auctions in January and February alone, in which the CTZ maturing 28 September 2022 was reopened for a total amount of 5.95 billion, including 450 million placed in the reopening. Thus, against a maturity volume of approximately 31,171 million (which takes into account two maturing bonds with a total volume of 28,186 million, plus 2,985 million redeemed through exchanges and repurchases46), issues on the CTZ segment were largely negative.
Issuance activity on the new BTP Short Term segment began with the launch of the first benchmark with maturity 29 September 2022 in the auction at the end of March, offered for EUR 4,000 million and with a coverage ratio of 1.42. At the end of June, with the latest tranche issued, the bond reached an outstanding amount of 15.095 billion. The second line, with a maturity date of 30 January 2024, was offered at the end of July for an amount of 3.75 billion, arriving at the end of the year with a working capital of about EUR 15.284 billion.
Coverage ratios have been fairly regular, ranging from a low of 1.37 recorded in the April and July auctions to a high of 1.65 in October, with an average of 1.49.
| CHART III.4: CZT AND BTP SHORT TERM YIELDS AT ISSUANCE (EXPRESSED IN PERCENTAGE RATES) IN 2021 |
|
| Source: MEF |
Yields at issuance of BTPs Short Term have been fairly stable and consistently in negative territory (Chart III.4), ranging from a low of -0.39% recorded in the first auction in March to a high of -0.23% in October. On average, BTPs Short Term showed less volatile yields at issuance than CTZs, as well as more aligned with the BTP curve.
__
46 See infra, Extraordinary operations, pp. 66-68.
| 48 | MINISTRY OF ECONOMY AND FINANCE |
III. PUBLIC DEBT MANAGEMENT IN 2021 |
On the other maturities of the BTP segment, issuance activity was also particularly intense and saw the opening of several new lines, often through syndicated placements that encountered exceptionally high demand47.
Placements carried out through the constitution of a syndicate of banks (in which all Government Securities Specialists participate, from which the Treasury selects the group of lead managers for the individual operation) offer the advantage of having more detailed and accurate information about the final demand, as well as allowing a selection of allocations that promotes good future performance of the bond in the secondary market. As there were as many as seven syndicated issues of nominal BTPs in the year under review, it is particularly interesting to compare their distribution both in terms of geography (Table III.3) and investor type (Table III.4).
TABLE III.3: GEOGRAPHICAL DISTRIBUTION OF AWARDS IN SYNDICATED PLACEMENTS OF NOMINAL BTP IN 2021 |
| | | | BTP Green 30/04/2045
(€ 8.5 bln) | | Tap BTP 15/03/2028
(€ 7 bln) | | Tap BTP Green 30/04/2045
(€ 5 bln) |
| | | | | | | |
| | | | | | | |
| | | | | | | |
| | | | | | | |
| | | | | | | |
| | | | | | | |
| | | | | | | |
Other Europeans countries | | | | | | | |
| | | | | | | |
| | | | | | | |
| | | | | | | |
Source: syndicated placements |
The geographical distribution of demand shows a greater presence of Italian investors in the February syndicated issues on the 10-year maturity and at the BTP Green reopening in October. Always significant was the share allocated to UK investors, with the highest percentage recorded in the June 10-year benchmark issue. On the other hand, the presence of investors in the Germanic area appears to be constant during 2021, with an average allocation quota of about 16.5%. It is also interesting to note the increased interest from non-European investors, with particular reference to North Americans in the April reopening of the seven-year bond and Asian investors in the syndicated issue of the new 50-year benchmark.
__
47 For details and more information on the syndicated issues that took place during the year, please refer to the releases posted on the Department of the Treasury's website under Public Debt (www.dt.mef.gov.it/en/debito_pubblico/).
| MINISTRY OF ECONOMY AND FINANCE | 49 |
TABLE III.4: DISTRIBUTION BY INVESTOR CATEGORY OF AWARDS IN SYNDICATED PLACEMENTS OF NOMINAL BTP IN 2021 |
| | | | BTP Green 30/04/2045
(€ 8.5 bln) | | Tap BTP 15/03/2028
(€ 7 bln) | | Tap BTP Green 30/04/2045
(€ 5 bln) |
| | | | | | | |
| | | | | | | |
Pension Funds and Insurance companies | | | | | | | |
Central banks and government institutions | | | | | | | |
| | | | | | | |
| | | | | | | |
Source: syndicated placements |
The breakdown by investor type reveals the significant presence of investors with a stable, long-term investment profile, particularly insurance companies, pension funds, central banks and government institutions, whose weight was greatest in placements on longer maturities. This development is likely due to the general environment of extremely low rates, which has prompted these individuals to increase their share of investments in long-term instruments in order to obtain a higher return.
The large number of syndicated issues of the longer-term BTPs, as well as the size of the amounts placed there, have undoubtedly contributed to the increase in the weight of the ultra-long segment in total issues, which, moreover, has been fed by regular auctions.
In particular, the 15-year maturity, after January’s syndicated issuance of a new benchmark in the amount of 10 billion, was offered at auction twice: in April in the amount of 2,000 million, with full subscription of the reopening of 400 million reserved to Government Bond Specialists; in July, with an offer of 1,750 million fully subscribed, as well as the additional amount of 350 million. Note that the April auction was held despite the dual tranche issue, which saw the reopening of the seven-year bond and the launch of the new 50-year BTP through syndication, taking advantage of the very robust demand at that time. At the end of the year, the BTP 1 March 2037 reached a circulating amount of EUR 14.5 billion, including amounts allocated in additional placements.
In the 20-year segment, the on-the-run BTP with maturity 1 March 2041 was offered in the mid-February and June auctions. Again, the amounts placed amounted to 2,000 billion and EUR 1,750 billion, respectively, bringing the circulating amount to 14.5 billion at the end of the year (including the reopening for Specialists).
With regard to the 30-year maturity, in the absence of new lines, the benchmark with maturity 1 September 2051, was auctioned several times in January, May, September and October. The issuance amounts ranged from a minimum of 1,500 million offered in October to a maximum of 2,000 million in January, and only in the two auctions in the second half of the year were the amounts offered in the reopening reserved to Specialists placed in full. At the end
| 50 | MINISTRY OF ECONOMY AND FINANCE |
III. PUBLIC DEBT MANAGEMENT IN 2021 |
of 2021, therefore, the 30-year BTP reached a circulating amount of EUR 15.72 billion.
Of note is the Treasury’s return to the ultra-long end of the BTP curve, with the issuance of a new 50-year benchmark maturing 1 March 2072. The bond was offered in April in the amount of 5 billion through a syndicated issue in combination with the reopening of the 7-year BTP on the run, as part of a dual tranche placement, registering the lowest yield at issuance ever, at 2.18%.
The evolution of yields on issues in the ultra-long segment (Chart III.5) was affected by the dynamics that characterised all maturities of Italian government bonds, with substantial stability in the first and third quarters of the year, with a rise in the second quarter and in the last months of 2021, characterised by a return of inflation and greater volatility in the markets. This upward phase has therefore led to closing the latest issues on the various maturities with rates above those of early 2021, with the most pronounced rise observable on the 20-year bond.
| CHART III.5: YIELDS AT ISSUANCE OF LONG-TERM BTPS IN 2021 (EXPRESSED IN PERCENTAGE POINTS) |
|
| Source: MEF |
BTPs with maturities of up to 10 years were issued, as usual, in regular auctions at the beginning of the month (5- and 10-year) - and in the middle of the month (3-and 7-year).
The two shorter-dated bonds (3- and 5-year) were issued in similar proportions, with a slight prevalence of the 3-year BTP (EUR 41.37 million) over the 5-year (EUR 40.4 million), in line with what was initially expected. Consistently with the expectations outlined in the Guidelines, moreover, in absolute terms gross emissions were lower than in 2020. In any case, net issues were largely positive on both maturities.
| MINISTRY OF ECONOMY AND FINANCE | 51 |
Both the 3-year and 5-year segments saw the conclusion of the issuance cycle of the previous benchmarks: respectively, the 15 January 2024 BTP, which closed in February with a final circulating volume of just under 16.85 billion; and the 1 February 2026 BTP, which reached a volume of about 18.55 billion.
Three new lines were then opened on the three-year maturity and two on the five-year maturity.
The first three-year BTP, maturing on 15 April 2024, was opened in mid-March and repeated through June, when it reached a final size of about 18.29 billion. In July, the new 15 August 2024 BTP was launched and subsequently offered through November, reaching a circulating amount of about 13.82 billion before the issuance of the new benchmark. The latter, with a maturity date of 15 December 2024, was issued in the last auction in December, ending the year with a circulating amount of 3.5 billion.
With reference to the 5-year BTP, after its launch at the end of February, the bond with maturity 1 April 2026, was reissued until the auctions at the end of June, when it reached a circulating amount of just under 19.80 billion. The new benchmark with a maturity of 1 August 2026 was first placed in late July and then offered continuously through November (considering the cancellation of the December auction), ending 2021 with a circulating amount of 14.35 billion.
An analysis of the auction coverage ratios of the two bonds shows a fairly aligned average (1.44 for the 3-year BTP versus 1.45 for the 5-year BTP), although on the 3-year maturity there is less variability: the difference between the maximum and minimum, in fact, was 0.45 compared to 0.55 for the 5-year. For both securities, however, the correlation between bid amount and bid-to-cover ratio was quite weak48.
The setting of coupons of the new bonds obviously benefited from the particularly favourable market conditions throughout the year, which allowed the new benchmarks to be placed on both maturities with coupon rates of zero at all times. All three-year BTPs, moreover, were placed at a price above par, registering a negative yield at issuance in each 2021 auction. Five-year bonds, on the other hand, were offered throughout the year with yields at issuance always close to zero, ranging from a negative minimum of 0.01% in the auction at the end of August to a maximum of 0.28% at the end of October, in both cases recorded by the BTP maturing 1 August 2026 (Chart III.6).
In the middle section of the yield curve, between 7 and 10 years, issuances were in line with those of the previous year, as projected in the Guidelines, albeit registering an increase in the volumes placed on the 7-year segment against a slight decrease in those on the 10-year.
As for the 7-year maturity, the new BTP with a maturity of March 2028 and annual coupon rate of 0.25% was launched at the beginning of the year and offered at auction regularly until the last issuance in April which took place through a syndicated reopening of 7 billion to reach a circulating amount of 19.60 billion. The May auction then saw the unveiling of the new bond with a maturity date of 15 July
__
48 A detailed analysis of the results of all issues for the year can be found in the file "Treasury Issues in 2021" on the public debt website: www.dt.mef.gov.it/export/sites/sitodt/modules/documenti_en/debito_pubblico/emissioni_del_tesoro/emissioni _tesoro/Treasury-Issue-in-2021.pdf
| 52 | MINISTRY OF ECONOMY AND FINANCE |
III. PUBLIC DEBT MANAGEMENT IN 2021 |
2028 and an annual coupon of 0.50%. This bond was offered regularly in auctions every month (except August) through October, reaching a circulating amount of just under 15.80 billion. The third new line on the seven-year maturity was opened in November (BTP February 2029, coupon 0.45%) and closed on 2021 with an outstanding amount of EUR 3.75 billion. The coverage ratio at auction on 7-year BTPs averaged 1.48, with a low of 1.35 recorded in May and a high of 1.65 in October.
Given the significance of the 10-year maturity for the market, the issuance of BTPs with this maturity was the most significant overall, perfectly in line with the intentions announced in the Guidelines.
The previous benchmark with a maturity of April 2031 was offered in the January auction and then reopened through a telematic exchange in mid-March and two issues at auction in April and June (as an off-the-run bond after the launch of the 1 August 2031 BTP), reaching a circulating amount of just under 22.43 billion. The new bond, with maturity August 2031 and a nominal rate of 0.60%, was launched in February through syndication for an amount of 10 billion and then offered regularly until the auction at the end of May, touching a circulating amount of 20.30 billion. In June, the new 1 December 2031 BTP with a coupon rate of 0.95% was unveiled, also through syndication in the amount of 10 billion. The bond then ended its issuance cycle at the end of September with a circulating amount of 18.75 billion, while in the last months of the year the new BTP 1 June 2032 (coupon rate of 0.95%) was offered at auction, ending 2021 with a circulating amount of 6 billion.
Finally, coverage ratios were on average constant, fluctuating between a minimum of 1.32 in the late May auction and a maximum of 1.73 in the late September auction.
Chart III.6 shows the auction yields of all BTPs with maturities up to 10 years, which show a clear parallelism between the trends of all bonds, although a marked mismatch in the yield at issuance of the 7-year BTP in the May auction, where it reached a yield very close to the 10-year bond placed the previous month, can be seen.
Starting in June, moreover, it is possible to see a general decline in yields across all maturities to levels in line with those at the beginning of the year, and then a phase of increase that affected the last months of 2021. Noteworthy is the yield of just below zero on the 5-year BTP in the auction that rules in early September, which was the lowest since the minimum of 0.01% touched in the auction at the end of November 2020.
| MINISTRY OF ECONOMY AND FINANCE | 53 |
| CHART III.6: YIELDS AT ISSUANCE OF BTPS WITH 3-10 YEAR MATURITIES IN 2021 (IN PERCENTAGE POINTS) |
|
| Source: MEF |
| FOCUS | Characteristics of auction demand for nominal BTPs: analysis by investor class and geographical area Among the data provided by Specialists in Government bonds in the context of communications according to the harmonised scheme adopted by the ESDM (European Sovereign Debt Markets) Subcommittee, the Treasury selects the flows observed from the day after the announcement of an auction until the day prior to the settlement of the auction itself. This data is particularly significant for nominal BTPs and is a good proxy for the demand at auction by end-investors. Normally, on the days mentioned, all these flows involve buying. However, if the market environment is particularly mixed, a prevalence of selling may emerge for certain categories of investors or in certain geographical areas. In this case, the data contained in these Specialist communications reveals a less accurate indicator of demand at auction. Therefore in cases where, in a given month, the flows of a particular category of investors or geographic area are zero or negative, the contribution in that month is considered zero for the purposes of the graphical representation of the composition of demand at auction (Figures 3 and 4). Regarding the breakdown by type of investor, Figure 3 shows how, in contrast to what happened in the previous year, the participation of banking institutions decreased in 2021, with a share in the total of just over 20% compared to 24% in 2020. On the other hand, after last year’s decline, hedge fund participation returns to growth, while investment fund participation remains essentially stable. The participation of investors with a long-term horizon, i.e., insurance companies and pension funds, is also increasing, although the share in the total remains quite negligible. The participation of official institutions and central banks declined sharply, after increasing the previous year. In this regard, it should be mentioned that the latter category does not include purchases made by the Eurosystem central banks, which are not included in the Specialists’ Reports under this harmonised Reporting framework. |
| 54 | MINISTRY OF ECONOMY AND FINANCE |
III. PUBLIC DEBT MANAGEMENT IN 2021 |
| | FIGURE 3: BREAKDOWN BY TYPE OF COUNTERPARTY OF ORDERS PLACED IN NOMINAL BTP AUCTIONS BY SPECIALISTS IN GOVERNMENT BONDS – YEAR 2021 |
| | |
| | Looking at flows by geographic region, Figure 4 shows that the largest share of demand in the auctions comes from U.S. investors, up substantially in 2021 from the previous year, at least until September. This is followed by domestic investors, albeit with a declining share compared to 2020. The participation of European investors, who represent the third most significant component of demand, also declined, both in terms of demand from the eurozone and from other European regions (among which the United Kingdom is usually the largest component). Finally, demand from the rest of the world remains fairly stable compared to 2020. |
| | FIGURE 4: BREAKDOWN BY GEOGRAPHICAL AREA OF ORDERS PLACED IN NOMINAL BTP AUCTIONS BY SPECIALISTS IN GOVERNMENT BONDS – YEAR 2021 |
| | |
| MINISTRY OF ECONOMY AND FINANCE | 55 |
BTP€i
In the year under review, the total volume of issues of BTPs indexed to European inflation49 amounted to 15,089 million, higher than the volume issued in the previous year (amounting to 12,451 million).
In contrast to 2020, when there were no maturing securities in the segment, a 10-year BTP€i in the amount of approximately EUR 19 million came due during 2021. Therefore, despite the discrete increase in the segment’s issues, the net result at the end of the year was still negative.
The performance of the inflation-indexed bond segment of all European sovereign issuers during 2021 was largely influenced by the macroeconomic environment, characterised in the first half of the year by low inflation expectations in reaction to the pandemic crisis, and then affected in the second half of the year by uncertainty about inflation trends and the attitude of central banks.
In this context, however, during 2021 the Italian Treasury confirmed its presence in the indexed bond segment through the issuance in February of a new benchmark with a 30-year maturity. This is the third 30-year benchmark issued by the Treasury on this segment: the first and second issues were in 2004 and 2009, respectively. The placement, which took place in a dual tranche together with a new 10-year BTP, was met with wide acceptance among investors, enabling EUR 4 billion to be raised. The amount issued is to be considered significant when compared to those that are placed on average on this segment, especially in light of the maturity (2051), which at the time of placement represented the longest maturity not only with respect to the Italian real yield curve but also with respect to all eurozone European inflation-indexed sovereign bonds.
The launch of the new 30-year BTP and subsequent auction reopening in April and June allowed for a more balanced issuance policy to be conducted on the various points of the real curve, unlike in 2020 when volumes were mainly concentrated on the five- and 10-year maturities, contributing to the lengthening of the average life of the debt.
Taking into account market conditions and demand, as well as the already high outstanding amount of the bond being issued (the September 2032 BTP€i), the Treasury did not consider it appropriate to issue on the 15-year maturity.
Auction amounts have always been fairly low, with bidding never exceeding EUR 1,250 million, except for the auction in April, when both the 5-year and 30-year BTP€i were issued, for a total bid of EUR 1,750 million.
Auction coverage ratios in this segment were quite high, ranging between a minimum of 1.30 in June on the 30-year BTP€i and a maximum of 1.65 on the 5-year bond in February, with the indicator’s variability lower than in 2020.
In fact, demand for European inflation-indexed bonds at auction was fairly constant throughout the year, with a greater presence in the first half of 2021 and a slight decline in the second half of the year when, moreover, there were no issues in August and December. Participation in auctions saw a significant increase in the share of domestic investors (21% compared to 15% in 2020) and a decline in the presence of U.S. investors (37% compared to 45% in the previous year). In contrast, the European presence remains stable at 38%.
__
49 More specifically to the HICP, the Harmonized Index of Consumer Prices for the Eurozone.
| 56 | MINISTRY OF ECONOMY AND FINANCE |
III. PUBLIC DEBT MANAGEMENT IN 2021 |
Regarding the type of investors, in line with previous years, the most significant component was that of hedge funds, although with a significantly declining share compared to 2020 (37% compared to 43% in the previous year). Investment funds were also significant (36%), followed by banks with a share of 11%. Demand from pension funds, central banks and other public institutions was negligible.
Unlike in 2020, where real bond yields showed a similar trend to that observed on nominal bonds, during 2021 the trend in real yields was largely influenced by inflation expectations.
Expected inflation, which together with the real rate determines the total return on issuance of indexed instruments (Chart III.7, relating to the 10-year Break Even Inflation50) has shown an upward trend throughout 2021. In particular, having already started at the beginning of the year at levels higher than those averaged during 2020, it experienced a phase of rapid and continuous growth until May. After a phase of substantial stability persisted until August, expected inflation continued its upward trend until the end of the year, ending 2021 at more than 165 basis points: such a high value has not occurred since 2013.
| CHART III.7: 10-YEAR BREAK-EVEN INFLATION (BEI) 2020-2021 (EXPRESSED IN BASIS POINTS) |
|
| Source: Bloomberg |
As anticipated, the performance of real yields at issuance of inflation-indexed bonds (Chart III.8) was closely linked to that of inflation expectations: as inflation expectations gradually increased, the yields at issuance of all maturities on the real curve saw a gradual decline, closing at well below their levels at the beginning of the year. An exception to this was the months from May to August where, against a stable inflation expectation, the yield on indexed BTPs was affected by the market environment that led to an upward movement in nominal bond yields. Thus, it can be seen that during the year the yields at issuance of all maturities moved into
__
50 The BEI (Break Even Inflation) is the measure of the inflation rate (on a European or Italian scale) that must be assumed to allow the yield at maturity of an indexed bond to equal that of a fixed coupon bond (e.g., a nominal BTP) with a similar residual life. This is to place the investor in a situation of indifference with respect to the type of bond to be subscribed. High BEIs generate bonds with low (real) coupons.
| MINISTRY OF ECONOMY AND FINANCE | 57 |
negative territory, with the exception of the 30-year maturity, which fell into negative territory only in the October auction.
| CHART III.8: REAL YIELDS AT ISSUANCE OF BTP€I IN 2021 (IN PERCENTAGE POINTS) |
|
| Source: MEF |
BTP Green
Last March 2021, the Italian state entered the green bond market for the first time by launching the 2045 BTP Green, dedicated to financing government expenditures with positive environmental impact, of which two tranches were issued with a total nominal value of 13,500 million.
The first issuance, maturing on 30 April 2045, was well received by the market, reaching a record number of applications in the inaugural sovereign Green Bond issues in Europe with participation of about 530 investors, more than half of them ESG, for a total demand of more than EUR 80 billion against an issued amount of EUR 8.5 billion.
In view of the excellent response received from the investor base and to provide adequate support for the bond’s liquidity in the secondary market, the reopening via syndicate of the first BTP Green in the amount of EUR 5 billion took place on 20 October with the participation of about 350 investors against a total demand of more than EUR 55 billion. The interest of ESG investors in the Italian green stock was also reconfirmed in this context, having subscribed to nearly half of the placement.
BTP Italia
Unlike the previous year, in which two BTPs Italia with a significant amount of EUR 22.4 billion matured, 2021 was characterised by an absence of maturities on this segment. The Treasury, taking into account the absence of maturing volumes,
| 58 | MINISTRY OF ECONOMY AND FINANCE |
III. PUBLIC DEBT MANAGEMENT IN 2021 |
after a careful assessment of market conditions, deemed it appropriate not to issue a new BTP Italia during 2021. Therefore, the year ended with negative net emissions.
BTP Futura
First introduced in 2020, the BTP Futura was reintroduced in the year under review through two issues in April and November, with total inflows of more than 8.7 billion that helped finance measures launched by the government to support the country’s economic growth.
In both 2021 issues, for the government bond reserved exclusively for the retail market, the innovative coupon structure based on the “step-up” mechanism was confirmed, with nominal semi-annual coupons calculated on the basis of a series of predetermined rates that grow over time, with guaranteed minimum yields. In addition, the Treasury has introduced a significant change with respect to the payment of the loyalty premium, again linked to the growth of the national economy during the life of the security, which will be paid at two different times: an intermediate premium at the end of an initial life of the bond, for investor holding the BTP Futura since issuance; and a final premium to investors who continue to hold the security seamlessly from issuance to maturity.
In the past year, the two issues in April and November of the BTP Futura were well received by the market, finding the product popular with a wide range of individual investors.
In detail, the first BTP Futura placed in 2021 presented a longer maturity than previous issues, which was 16 years (27 April 2037). The placement took place from 19 to 23 April and raised about EUR 5.5 billion from retail investors, against more than 132 thousand contracts signed, with an average denomination of more than EUR 41,000. Participation by “pure” retail investors amounted to 57%, while the remaining share was underwritten by private banking.
The second issue, on the other hand, took place from 8-12 November, raising more than EUR 3.2 billion, for more than 91,000 contracts concluded during the five-day placement, with an average denomination of just under EUR 36,000. The bond, with a maturity of 12 years, was largely subscribed by “pure” retail investors, with the highest participation to date on the instrument (67%), while the private banking component was allocated about one-third of the issued amount.
CCTeu
During the year under review, gross issues of CCTeus totalled about 24,499 million (including 2,255 million issued through exchange), with significant growth in volumes on offer compared to 2020 (amounting to about 16,444 million). Therefore, in the absence of maturing bonds on the segment and considering redemptions of EUR 1,407 million through exchange and repurchase operations51, net issues of CCTeus in 2021 were largely positive.
__
51 See infra, Extraordinary operations, pp. 66-68.
| MINISTRY OF ECONOMY AND FINANCE | 59 |
The floating-rate segment benefited from particularly robust demand during the year, despite the absence of maturing securities and thus the incentive to renew portfolio positions.
This allowed the Treasury to increase volumes in issuance and launch a new benchmark 7-year long CCTeu in late June through a syndicated placement, something that had not happened on this security since 2010, when the instrument was first launched. The new CCTeu, with a maturity date of 15 April 2029 and a spread over the six-month Euribor set at 0.65%, was launched in the amount of EUR 6 billion against demand of about 12.2 billion. The bond was subsequently offered again regularly in auctions at the end of the month and was offered as part of an exchange operation in December, ending 2021 with a working capital of about EUR 14.3 billion.
During the year, the CCTeu introduced at the end of November 2020, maturing on 15 April 2026, was also offered at auction in amounts ranging from EUR 1,250 to EUR 2,000 million, reaching a circulating amount of just under 11.5 billion at the end of 2021. In the auction at the end of February alone, the off-the-run bond maturing on 15 December 2023, was also reopened in the amount of 1.250 million.
The composition of demand has been quite variable, both in terms of geography and type of investors. Regarding the first aspect, the domestic component was the most significant (averaging 50%), with purchases by Italian operators being particularly significant in July and November, while they were significantly lower in the first months of the year. The European component averaged 40%, while the component from other geographical areas was around 10%, with purchases concentrated in the first half of the year.
In terms of investor type, despite some fluctuations throughout the year, banks were the most consistently present category, with ratios of more than 65%, up from 59% in the previous year. There was a marked decrease in the participation of investment funds (13.5% from 34% in 2020), while the presence of hedge funds was sporadic and insignificant, with their ratio declining to 7% from 8% in the previous year. Central bank (non-Eurozone) participation, although only episodic, was up from 2020, as was the presence of private entities (corporate and retail), whose share was just under 6%.
Yields at issuance averaged close to zero, with significantly less variability than observed in the previous year. The highest yield of 0.17% was recorded in the syndicated issue at the end of June, while the lowest of -0.21% was reached in the auction at the end of September, settled at the beginning of October, on the bond with maturity 15 April 2026 (Chart III.9).
| 60 | MINISTRY OF ECONOMY AND FINANCE |
III. PUBLIC DEBT MANAGEMENT IN 2021 |
| CHART III.9: YIELDS ON THE ISSUE OF CCTEUS IN 2020 (EXPRESSED IN IN PERCENTAGE POINTS) |
|
| Source: MEF |
The average coverage ratio at auction for CCTeus was 1.65, with a minimum of 1.46 recorded on the bond with maturity 15 April 2029 in the late August auction, where the highest amount of EUR 2,000 million was offered. By contrast, the highest ratio (1.92) was reached in the auction of late April on the CCTeu 15 April 2026, corresponding to the lowest amount offered during the year, at 1.250 million.
Foreign bonds
Global Bonds in Dollars
During 2021, the Treasury, despite the fact that the market environment continued to be characterised by the pandemic crisis and the emergence of inflation risk in the second half of the year, maintained and consolidated its presence in the international scenario through currency issuance operations.
The activity was carried out through the global bond channel, providing continuity and ensuring the stability of the Italian Treasury’s presence in the U.S. bond market through two syndicated issues, a dual tranche and a subsequent reopening of a bond issued during the year.
In the first part of the year, the Treasury issued via syndicated placement two new dollar bonds (dual tranches), maturing on 6 May 2024 and 6 May 2051, respectively. In November, as a result of sustained demand from international investors and favourable market conditions, the Treasury reopened via syndication the previously issued 30-year 2051 bond, meeting a broad market demand, but with an overwhelming focus of Asian insurance and pension funds, giving depth to a market segment characterised by many buy-and-hold investors and thus retaining holders of Italy’s foreign-currency-denominated creditworthiness.
Issues were very well received by the market, with sustained demand from multiple investors in Asia, America, and the Euro Area, who preferred to invest in Italy while at the same time being able to more easily access the offerings in dollars
| MINISTRY OF ECONOMY AND FINANCE | 61 |
rather than euros, or chose to diversify their investment portfolios in terms of currency as well.
Investors who participated in the syndicates have generally differentiated risk-return profiles depending on the maturity of the bonds purchased.
Thus the U.S. dollar curve was enriched with two new points, in the extreme and opposite segments. The bond maturing 6 May 2024, has a current balance of $2 billion, against orders of about $4.8 billion. The bond has a coupon of 1.25% and a gross yield at issuance of 0.986%.
In the first bond issue maturing 6 May 2051, $1.5 billion was issued, with total demand for more than $6.2 billion. The bond has a coupon rate of 3.875% and a gross yield at issuance of 3.938.
Certainly, the combination of the 30-year maturity, coupled with the yield and the issuer’s name, have made this bond popular with investors, particularly Asian pension funds and insurance companies, who not only secured a large share of the bond at issuance but also expressed interest in the bond in later stages after issuance.
These investors are, from a strategic point of view, an excellent means for the Treasury to broaden its target market, and therefore consideration has been given to returning to this segment at a later date to meet additional market demand. This, coupled with favourable economic conditions, allowed the Treasury to reopen the 30-year dollar bond via syndicated placement: this was the Republic’s first reopening in the dollar market.
Thus, in November, the bond maturing 6 May 2051, was reopened for $1 billion against demand of $2.2 billion, bringing the total bond outstanding to $2.5 billion.
The yield at reopening was set at 3.6%, more than thirty basis points lower than that of the first tranche, in an environment of lower rates than the initial issue but still of great interest to a large group of buyers.
As is usually the case, a cross currency swap hedge was implemented against the issue, which neutralised the exposure to foreign exchange risk (see Section III.3).
Since its return to the dollar market in 2019, the Treasury has made it one of its strategic goals to foster liquidity of its bonds in the secondary market and to ensure good trading volumes. Given the nature of investors, who keep bonds in their portfolios for strategic purposes, and also as a result of the increase with new benchmarks of the maturities on the curve, the quantities offered in the secondary market by Specialists tend to thin out quickly as time goes by: therefore, the Treasury remains active in assessing market demand and meeting the needs of its investors, while at the same time ensuring greater liquidity in different segments of the curve.
This is the case with the reopening of the bond with maturity 2051, which is widely appreciated especially by Asian investors with long-term time horizons: since its first issuance in April 2021, trades have been large and significant, and in order to meet demand and ensure adequate circulating funds for market needs, the Treasury reopened the bond via syndication.
In 2021 on the entire dollar securities segment, flows, both purchased and sold, increased overall by 25% compared to the previous year, and this was considering only the units traded with Government Bonds Specialists. It is presumable, therefore, that the total volumes were even higher.
| 62 | MINISTRY OF ECONOMY AND FINANCE |
III. PUBLIC DEBT MANAGEMENT IN 2021 |
EMTN Program Bonds
During 2021, the Treasury did not increase the plafond of private placements under the EMTN format, as requests received were not deemed to meet debt management needs or were met through public-format issuances, thus avoiding to interfere with outstanding bonds.
Extraordinary operations
As indicated in the relevant Guidelines, 2021 also saw the Treasury make use of extraordinary exchange and repurchase operations aimed at achieving multiple objectives, such as managing refinancing risk, reshaping the maturity profile, and supporting liquidity and efficiency in the government bond market. As is well known, such operations do not follow a predetermined schedule and are extremely flexible instruments, both in terms of execution and timing.
As the chart below shows, the Treasury in 2021 repurchased a volume of just under EUR 15 billion, resorting to five extraordinary operations. Comparison with previous years shows that operations have returned more in line with the years prior to 2020 (when a significant portion of these operations became necessary to compensate for the very high pace of issuance activity in the first eight months of the year, which was then no longer consistent with the trend in requirements in recent months), with the sole exception of 2017.
| CHART III.10: AMOUNT REPURCHASED IN EXTRAORDINARY OPERATIONS – YEARS 2013-2021 (NOMINAL AMOUNTS IN EUR MILLION) |
|
| Source: MEF |
Specifically, in the first half of the year, the Treasury carried out one exchange operation and one repurchase operation for the purpose of reducing very close maturities and mitigating peak redemptions. The exchange was concluded on 17 March through the electronic trading platform and involved the purchase of four
| MINISTRY OF ECONOMY AND FINANCE | 63 |
bonds, all maturing during 2021. The Treasury on this occasion issued a bond with a 10-year maturity (2031), contributing to the extension of the average life of the debt at a rate well below those of the repurchased bonds.
Given the large resources available, on 5 May a repurchase was made in the Bank of Italy of some above par bonds maturing during the year. This operation brought forward and rescheduled maturities and produced savings for the state coffers in terms of lower coupon interest.
Subsequently, the Treasury focused its repurchase activity by going easing repayments in the years immediately ahead. On 16 June, a bilateral repurchase of bonds maturing in the 2022-2023 two-year period was carried out, using the conspicuous cash balances on hand in the Cash Account. On this occasion, the Treasury repurchased two bonds with prices well above par.
Extraordinary operations resumed toward the end of 2021 when the year’s funding activity was practically over. On 4 November, an additional repurchase operation was carried out, through which the Treasury purchased six bonds maturing between 2022 and 2025. The operation focused mainly on the Cheapest to Deliver repurchase of the futures contract, which was in a tense phase at the time.
Finally, an exchange by auction at the Bank of Italy was completed on 9 December. Through this operation, the Treasury issued one CCTeu with maturity in 2029 while repurchasing four bonds, including two CCTeus and two CTZs with maturity in 2022, thus reducing the amount of bonds maturing in the following year and at the same time carrying out pre-funding activities for the following years.
See Tables III.5 and III.6 below for a summary of the exchange and repurchase operations:
| TABLE III.5: SUMMARY OF EXCHANGE OPERATIONS (NOMINAL AMOUNTS IN EUR MILLION) |
Operation
date | Settlement
date | | Amount issued | | Amount purchased | Operation
typology |
| Typology | Maturity year | Type | Maturity year |
| 17/03/2021 | 19/03/2021 | BTP | 2031 | 2,500 | BTPs,
BTP€i and CTZs | 2021 | 2,508 | Telematic
exchange |
| 09/12/2021 | 13/12/2021 | CCTeu | 2029 | 2,255 | CTZ and CCTeu | 2022 | 2,250 | Exchange at the Bank of Italy |
| | Year total | | 4,755 | | | 4,758 | |
| Source MEF | | | | | | | |
| 64 | MINISTRY OF ECONOMY AND FINANCE |
III. PUBLIC DEBT MANAGEMENT IN 2021 |
| TABLE III.6: SUMMARY OF REPURCHASED FROM THE CASH ACCOUNT (NOMINAL AMOUNTS IN EUR MILLION) |
Operation
date | Settlement date | Purchased bonds | Amount purchased | Operation typology |
| Typology | Maturity year |
| 05/05/2021 | 07/05/2021 | BTP and CTZ | 2021 | 4,725 | Competitive auction at the Bank of Italy |
| 16/06/2021 | 18/06/2021 | BTP | 2022-2023 | 490 | Bilateral repurchase |
| 04/11/2021 | 08/11/2021 | BTP and CCTeu | 2022-2023
2024-2025 | 5,000 | Competitive auction at the Bank of Italy |
| Year total | | 10,215 | |
| Source MEF | | | | | |
Finally, Chart III.11 shows the effects that the extraordinary operations executed in the year 2021 had on the reduction of the amount to be reimbursed in future years.
| CHART III.11: DISTRIBUTION OF GOVERNMENT BONDS REPURCHASED IN EXTRAORDINARY OPERATIONS CARRIED OUT IN 2021 (NOMINAL AMOUNTS IN EUR MILLION) |
|
| Year of original maturity of repurchased Government bonds |
| Source: MEF |
| III.3 | DERIVATIVES PORTFOLIO MANAGEMENT |
The management activity
In 2021, the Treasury entered into cross currency swap contracts (subject to a bilateral system of guarantees regulated by Credit Support Annex) to fully hedge the foreign exchange risk associated with U.S. dollar debt operations made during the year. The banking counterparties were selected from among the Government Bonds Specialists to pursue the dual objective of containing execution costs while ensuring competitiveness and full operation on the large notional amounts involved, without adverse repercussions in the markets.
| MINISTRY OF ECONOMY AND FINANCE | 65 |
These derivative operations were executed at the time of issue and they provide for an initial and final exchange of notional amounts, as public accounting provides for receipts and payments exclusively in euros. Through the hedging derivative, the dollar bond is synthetically transformed into a euro bond; through the initial exchange, the net proceeds of the dollar bond are converted into euros, and then accrue to the government budget; while at maturity, through the final exchange, the euros will be converted back into dollars to repay the holders of the bonds.
The syndicated bonds issued were hedged by as many cross currency swaps executed in different tranches in order to avoid any adverse impact on the fixed rate due to a temporary supply-demand imbalance and minimising the cost of hedging.
The dollar receivable rates perfectly replicate the coupon payments of the bonds, so they provide a perfect hedge and lock in a certain euro yield at issuance in the synthetic portfolio of bonds and swaps, which will therefore not be subject to future exchange rate fluctuations.
In detail, the cross currency swap covering the three-year bond has settlement on 6 May 2021 and maturity on 6 May 2024, and has a notional amount of $2 billion with a fixed receiving rate of 0.875%, while payments in euros are paid at a virtually zero rate on a notional amount of about EUR 1.6 billion.
The cross currency swaps entered into to fully hedge the new 30-year bond, issued during the first syndication, have settlement 6 May 2021 and maturity 6 May, 2051 and have a dollar notional amount of 1.5 billion and a fixed receiving rate of 3.875%, while paying on a euro notional amount of about 1.2 billion a fixed rate of 2%.
Finally, the cross currency swap entered into against the reopening of the 30-year bond, maturing on 6 May 2051, has a fixed receiving rate of 3.875% calculated on a notional amount of EUR 1 billion, compared with a fixed euro rate of less than 1.85% with a notional amount of about EUR 900 million.
In addition to the contracts just described, the Treasury in 2021 was also operating on interest rate swap contracts.
The financial environment in 2021 was characterised by market rates rising slightly from the previous year, but with still historically low levels across all segments of the swap curve. Treasury has therefore structured a liability management policy aimed at seizing market opportunities to achieve a synthetic lengthening of portfolio duration through new interest rate swaps, also with a view to containing the average rate to pay, which is lower than the rate prevailing on the stock of the corresponding segment concerned.
Thanks to favourable market conditions, new EUR 2 billion 30-year swaps were implemented with a banking counterparty, in which the Treasury pays an average annual fixed rate of just over 20 basis points and receives on the same notional amount the 6-month Euribor floating rate. These operations take the form of macro-hedge of the debt portfolio, that is, to protect against a rise in interest rates on a portion of domestic floating-rate bonds (CCTeu), without necessarily creating a point hedge between bond and derivative.
With reference to the restructuring of operations in the derivatives portfolio and in accordance with what has happened in past years, Treasury has been engaged
| 66 | MINISTRY OF ECONOMY AND FINANCE |
III. PUBLIC DEBT MANAGEMENT IN 2021 |
in its usual activity aimed at screening the opportunities available during the year in order to reduce their financial burdens and/or impact on debt.
During the year, the derivatives portfolio with a banking counterparty, consisting of uncollateralised positions that no longer met Treasury’s hedging needs, was closed. This resulted in a net simplification of the derivatives portfolio, a reduction in notional amount and, to some extent, also in interest expense, as well as a reduction in the counterparty risk to which the Treasury was exposed. The unwind of the positions brought proceeds to the state budget of about EUR 450 million, and at the same time, a cross currency swap was brought back to the market to partially hedge the exchange rate risk attached to a dollar bond maturing in September 2023.
During 2021 then, especially in the second half of the year, market risks unexpected by traders surfaced, such as the risk associated with significantly higher than expected levels of inflation.
In managing its existing debt portfolio, the Treasury is exposed to inflation risk on all those instruments offered to the market whose coupons and redemption are linked to Consumer Price Indexes (CPIs). In addition to a specific issuance policy, in very sporadic and limited cases the Treasury has also considered managing the risk arising from this type of exposure through derivatives. To this end, a path was undertaken to restructure a contract with a counterparty in order to transform an instrument already in the portfolio, with a positive mark-to-market for the Treasury, into a point hedge of an inflation-indexed bond.
| III.4 | DEBT MANAGEMENT RESULTS IN RELATION TO OBJECTIVES |
Final composition of the year’s gross issues
The performance of issuance activity during 2021 was mainly affected by two factors: the improvement of funding needs in the face of the recovery of economic activity and, in the second half of the year, the increased uncertainty about the evolution of inflation and monetary policy. Overall, there was a decline in the total volume placed on the market by about 13% compared to 2020.
Table III.7 shows details on the composition of issuances for the past three years in absolute value and percentage, including amounts from exchanges.
The distribution of issues between short- and medium- to long-term remained largely unchanged, thus confirming the decline in the portion of debt placed in BOTs recorded between 2019 and 2020 in favour of issues on the medium- to long-term segments.
On the domestic debt segment, the weight of the CTZ on total issuance plummeted from 6.89% in 2020 to 1.25% in 2021, with placements of the 24-month bond having been discontinued since March, in place of those in favour of the more recently created BTP Short-Term segment; in particular, the latter accounted for 6.36% of total issues. The relative share of 3- and 5-year BTPs remained almost stable at about 17% of total issues. In absolute terms, the Treasury was able to reduce the total volume placed on the three-year and five-year maturities by about
| MINISTRY OF ECONOMY AND FINANCE | 67 |
14 billion compared to 2020, the year during which these segments had also been affected by the exceptional growth in financing needs.
Gross issues of the 7-year BTP grew by about EUR 7 billion during 2021, consolidating the sector’s relevance within the Italian yield curve, while issues of 10-year BTPs fell by more than 5 billion in absolute terms, although the share of this maturity in total debt issued rose slightly (12.18% in 2021 versus 11.50% in 2020). The two maturities together thus accounted for 21.27% of the total, significantly higher than the 18.11% for 2020.
As predicted in the Guidelines at the beginning of the year, the supply of longer nominal BTPs was significantly lower both in absolute terms, at about EUR 29 billion, and in relative terms (6.65% versus 10.96%), in line with the decline in demand. This difference was only partially filled by BTP Green issues of EUR 13,500 million, bringing the share of debt placed on the longer-term segments to 9.47% of the total.
As for inflation-indexed bonds, total issues of BTP€is and BTPs Italia were halved in both absolute (15,089 million in 2021 versus 34,749 million in 2020) and relative terms (3.16% versus 6.31%), as no placements of BTPs Italia took place last year. BTP€i issuances alone, on the other hand, increased by about EUR 2.6 billion, with the relative weight standing at 3.16% of the issued debt compared to the previous 2.26%, in order to compensate for the significant volume of bonds maturing during the year.
The relatively new BTP Futura segment stood at 1.83% of gross issuance, down slightly from 2.15% in 2020.
In 2021, the Treasury made significant use of the CCTeu, whose issuances increased by about EUR 8 billion despite the consideration that-according to the Guidelines-the Treasury did not intend to deviate too much from the issuance policy followed the year before. Therefore, the weight of the variable rate segment increased from 2.99% in 2020 to 5.13% in 2021. However, as discussed below, this had no impact on the overall interest rate risk exposure mainly due to the concomitant rebalancing between BOT issues and those of medium- to long-term fixed-rate bonds.
Finally, foreign bonds accounted for 0.79% of gross issues, down significantly from 2.04% in 2020. However, in continuity with debt management from 2019 onward, the presence of foreign market issuance in absolute terms has continued to increase. In particular, as a result of the issuance of the dual-tranche 3- and 30-year Global Bonds and the reopening of the latter, total working capital increased to $ 20 billion.
| 68 | MINISTRY OF ECONOMY AND FINANCE |
III. PUBLIC DEBT MANAGEMENT IN 2021 |
| TABLE III.7: COMPOSITION OF 2019-2021 ISSUES, IN ABSOLUTE (EUR MILLION) AND PERCENTAGE TERMS (INCLUDING EXCHANGES)* |
| | Issuances 2019 | % of total | Issuances 2020 | % of total | Issuances 2021 | % of total |
| Flexible BOT | 0 | 0% | 0 | 0% | 0 | 0% |
| 3-month BOT | 0 | 0% | 6,500 | 1.18% | 0 | 0% |
| 6-month BOT | 86,882 | 20.98% | 82,192 | 14.93% | 75,847 | 15.89% |
| 12-month BOT | 73,957 | 17.86% | 93,123 | 16.91% | 83,294 | 17.45% |
| CP + other short term liabilities** | 0 | 0% | 0 | 0% | 654 | 0.14% |
| Total short-term securities | 160,839 | 38.83% | 181,815 | 33.02% | 159,795 | 33.48% |
| CTZ | 31,156 | 7.52% | 37,949 | 6.89% | 5,951 | 1.25% |
| CCTeu | 14,771 | 3.57% | 16,444 | 2.99% | 24,499 | 5.13% |
| BTP Short Term | 0 | 0% | 0 | 0% | 30,379 | 6.36% |
| 3-year BTP | 32,430 | 7.83% | 47,817 | 8.68% | 41,367 | 8.67% |
| 5-year BTP | 33,686 | 8.13% | 48,759 | 8.85% | 40,951 | 8.58% |
| 7-year BTP | 29,552 | 7.13% | 36,369 | 6.60% | 43,379 | 9.09% |
| 10-year BTP | 43,224 | 10.44% | 63,353 | 11.50% | 58,136 | 12.18% |
| 15-year BTP | 13,600 | 3.28% | 18,996 | 3.45% | 14,500 | 3.04% |
| 20-year BTP | 8,470 | 2.04% | 17,505 | 3.18% | 4,500 | 0.94% |
| 30-year BTP | 15,480 | 3.74% | 23,835 | 4.33% | 7,720 | 1.62% |
| 50-year BTP | 3,000 | 0.72% | 0 | 0% | 5,000 | 1.05% |
| BTP Green | 0 | 0% | 0 | 0% | 13,500 | 2.83% |
| 5-year BTP€i | 2,149 | 0.52% | 6,038 | 1.10% | 3,450 | 0.72% |
| 10-year BTP€i | 7,369 | 1.78% | 4,972 | 0.90% | 4,836 | 1.01% |
| 15-year BTP€i | 2,334 | 0.56% | 600 | 0.11% | 0 | 0.00% |
| 30-year BTP€i | 2,018 | 0.49% | 841 | 0.15% | 6,803 | 1.43% |
| BTPs Italia | 6,750 | 1.63% | 22,298 | 4.05% | 0 | 0.00% |
| BTPs Futura | - | - | 11,844 | 2.15% | 8,745 | 1.83% |
| Foreign | 7,371 | 1.78% | 11,255 | 2.04% | 3,784 | 0.79% |
| Total medium-long term securities | 253,361 | 61.17% | 368,873 | 66.98% | 317,500 | 66.52% |
| TOTAL | 414,200 | | 550,688 | | 477,295 | |
* Off-the-run bonds were placed in the closest residual life category
** Other short-term liabilities include BTP tranches maturing by 2022. |
| Source: MEF |
In 2021, the volume of off-the-run bonds issued in exchange operations was about three times lower than the amount in 2020 (4,755 million versus 15,009) thus on the similar values as in 2019 both in absolute terms and as a weight on total gross issues.
Composition of the stock of securities at the end of the year
Over the 12-month period, changes in the composition of debt were modest in size (Chart III.12).
In detail, there has been a slight downsizing of the inflation-indexed segment and in particular of the BTP€i, whose share of total debt fell from 7.60% in 2020 to 7.41% at the end of 2021, while the size of the BTP Italia stood at 3.46% from 3.58% in 2020. In contrast to this contraction, the share of debt placed through medium-or long-term nominal instruments, both fixed-rate (73.03% in 2021 versus 71.74% in 2020) and variable-rate (6.69% versus 5.89%), increased.
| MINISTRY OF ECONOMY AND FINANCE | 69 |
| CHART III.12: COMPOSITION OF THE STOCK OF GOVERNMENT SECURITIES AS OF 31 DECEMBER 2020 AND 31 DECEMBER 2021 |
|
| Source: MEF |
The percentage represented by BTP Futura also increased, rising to 0.92% of debt from the previous 0.55%.
On shorter maturities, the weight of BOTs accounted for 5.07% of the total debt stock versus a share of 5.64% in 2020, while that of CTZs (1.31% versus 2.53%) was affected by the policy of transitioning from the 24-month instrument to the new BTP Short Term.
Finally, the foreign segment also decreased from 2.46% of debt in 2020 to 2.09% at the end of 2021.
| 70 | MINISTRY OF ECONOMY AND FINANCE |
III. PUBLIC DEBT MANAGEMENT IN 2021 |
Exposure to refinancing and interest rate risks
As a result, the average life of debt increased from 6.95 years in 2020 to 7.1152 years in 2021 (Chart III.13), due to issuance activity that shifted much of the nominal bond volumes to the 10-year and higher maturity segments. Containment of market rate hikes, aided by central bank purchases and initiatives decided by the European Union to support the recovery of European countries’ economies, has thus made it possible for the issuer to make management choices aimed at extending the average life of debt.
As usual, extraordinary debt management operations were oriented in this direction, whereby both the stock of bonds with shorter residual lives was downsized and the supply of longer-term bonds was strengthened through also “Tap” reopening of off-the-run securities.
| CHART III.13: EVOLUTION OF THE STRUCTURE AND AVERAGE LIFE OF DEBT (IN YEARS) |
|
| Source: MEF |
Recent trends in average residual life are shown in Table III.8. Average residual life is only an indicator of the refinancing risk, while analysing the inherent risk in a debt portfolio also requires other aspects to be taken into consideration; it is therefore useful to adopt other types of synthetic indicators of the stock’s exposure to market risks, such as the duration and ARP (Average Refixing Period), Reported in Table III.9.
| TABLE III.8: AVERAGE LIFE OF THE STOCK OF GOVERNMENT SECURITIES | |
| | 31/12/2019 | 31/12/2020 | 31/12/2021 |
| Domestic securities | 6.74 | 6.85 | 7.00 |
| Foreign securities | 12.48 | 10.82 | 12.61 |
Stock of government securities | 6.87 | 6.95 | 7.11 |
| Source: MEF | | | |
__
52 The average residual life at the end of the year stood at 7.29 years if loans under the SURE and Next Generation EU Programs are also considered.
| MINISTRY OF ECONOMY AND FINANCE | 71 |
| TABLE III.9: DURATION AND ARP TREND DURING THE 2019-2021 PERIOD, RELATING TO THE STOCK OF GOVERNMENT SECURITIES AFTER DERIVATIVES (IN YEARS) | |
| | | Duration | | | ARP | |
| | 31/12/2019 | 31/12/2020 | 31/12/2021 | 31/12/2019 | 31/12/2020 | 31/12/2021 |
| Domestic securities before derivatives | 5.70 | 6.22 | 6.07 | 5.78 | 6.00 | 6.14 |
| Foreign securities before derivatives | 8.42 | 8.09 | 8.56 | 7.56 | 6.58 | 8.13 |
| Stock of government securities before derivatives | 5.76 | 6.26 | 6.13 | 5.82 | 6.02 | 6.19 |
| Source: MEF | | | | | | |
In particular, it is noted that the ARP, which expresses the average time in which the stock of debt comes to incorporate changes in rates, has also continued to show an upward trend in both sectors, foreign and domestic. The approximately two-month increase in the ARP of the domestic issuance segment is due to a different articulation of the medium-term segment compared to last year, with a greater weight of the stretch between the 5- and 10-year maturities. The foreign issue segment showed a rather strong increase in 2021, after a slight decline in 2020. On the one hand, the maturities that occurred during 2021 - quite significant compared to the external debt aggregate - and, on the other hand, the issuance activity concentrated on two maturities - one short term (3 years) and the other on the longer stretch of the curve (30 years) - resulted in the increase of about 1.5 years of the segment ARP. With regard to duration, which is weighted with the current values of flows and thus also affected by the changing level of market rates, on domestic bonds the trend has been downward due to the rise in the yield curve of Italian government bonds at the end of 2021 by an average of about 50 basis points compared to the previous year. In the case of foreign countries, on the other hand, the duration is higher than at the end of 2020 because the significant increase in the average time to refixing (due to the changed composition of the segment described above) has more than offset the effect of the rise in Italian government rates.
| CHART III.14: MATURITIES BY RESIDUAL LIFE, 2019-2021 |
|
| NB: the stock of inflation-linked securities takes into account the revaluation of the capital matured at the end of each year and foreign currency securities are valued after the exchange swaps |
| Source: MEF |
| 72 | MINISTRY OF ECONOMY AND FINANCE |
III. PUBLIC DEBT MANAGEMENT IN 2021 |
As illustrated by Table III.10 below, the lengthening effect exerted by derivatives portfolio is confirmed in 2021: in fact, the overall duration of debt increases from the pre-swap level of 6.13 years to post-swap 6.54 years, an increase of about five months, similar to previous years.
Consistently, the derivatives portfolio also helped lengthen the ARP of the debt: at the end of 2021, the total post-swap ARP stood at 6.57 years, almost five months higher than the corresponding pre-swap value of 6.19 years.
| TABLE III.10: DURATION AND ARP TREND DURING THE 2019-2021 PERIOD, RELATING TO THE STOCK OF GOVERNMENT SECURITIES BEFORE DERIVATIVES (IN YEARS) |
| | | Duration | | | ARP | | |
| | 31/12/2019 | 31/12/2020 | 31/12/2021 | 31/12/2019 | 31/12/2020 | 31/12/2021 | |
| Domestic securities after derivatives | 6.17 | 6.64 | 6.49 | 6.19 | 6.40 | 6.53 | |
| Foreign securities after derivatives | 8.62 | 8.30 | 8.59 | 7.90 | 6.96 | 8.34 | |
| Stock of government securities after derivatives | 6.22 | 6.68 | 6.54 | 6.22 | 6.41 | 6.57 | |
| Source: MEF | | | | | | | |
Market value trend of the derivatives portfolio
Table III.11 below shows the notional and market values of the segments into which the portfolio of derivative instruments can be divided53. Regarding debt derivatives, Cross Currency Swaps (CCSs) refer to issues denominated in foreign currencies, while hedging Interest Rate Swaps (IRSs) refer to issues denominated in euros. In addition, the “IRS duration” category includes all positions attributable to the strategy of protecting against rising interest rates. The “IRS ex-ISPA” segment includes all derivatives contracts associated with the liabilities of the company Infrastrutture S.p.A., subject to the takeover by the Treasury in accordance with the Italian Finance Law for 2007.
Finally, values for asset derivatives and the overall portfolio are shown.
__
53 For all segments of the derivatives portfolio mentioned in this section, a detailed description can be found in Annex 4 contained in the Appendix to this Report.
| MINISTRY OF ECONOMY AND FINANCE | 73 |
| TABLE III.11: DERIVATIVES PORTFOLIO – YEARS 2020-2021 (EUR MILLION) |
| Debt derivatives | | | |
| | 31/12/2020 | 31/12/2021 | |
| Instrument | Notional amount | % | MTM | in % | Notional amount | % | MTM | % | |
| ex-ISPA IRS | 3,250 | 3.24% | -1,867 | 4.89% | 1,867 | 1.80% | -791 | 2.85% | |
| CCS (Cross-Currency Swap) | 13,174 | 13.13% | -354 | 0.93% | 17,626 | 17.01% | 451 | -1.63% | |
| Hedging IRS (Interest Rate Swap) | 3,477 | 3.47% | 1,278 | -3.34% | 2,670 | 2.58% | 1,149 | -4.14% | |
| Duration IRS (Interest Rate Swap) | 80,398 | 80.16% | -37,267 | 97.53% | 81,468 | 78.61% | -28,550 | 102.92% | |
| | | | | | | | | | |
| Total debt derivatives | 100,299 | 100.00% | -38,210 | 100.00% | 103,631 | 100.00% | -27,741 | 100.00% | |
| Outstanding government securities | 2,149,584 | 2,263,303 | |
| Debt derivatives/government securities | 4.67% | 4.63% | |
Derivatives on assets (Italian financial law for 2005)
| Instrument | Notional amount | | MTM | | Notional amount | | MTM | |
| IRS (Interest Rate Swap) | 451 | | -35 | | 228 | | -13 | |
| Total derivatives portfolio | | | | | | | | |
| Instrument | Notional amount | % | MTM | % | Notional amount | % | MTM | % |
| Debt derivatives | 100,299 | 99.55% | -38,210 | 99.91% | 103,631 | 99.78% | -27,741 | 99.95% |
| Derivatives on assets | 451 | 0.45% | -35 | 0.09% | 228 | 0.22% | -13 | 0.05% |
| Total derivatives | 100,750 | 100% | -38,246 | 100% | 103,859 | 100% | -27,754 | 100% |
N.B.: The MTM Reported in this table does not include the figures published by the Bank of Italy in the “Financial Accounts Series”. |
Mutual guarantee agreements on derivative financial instruments (*) |
| The amounts indicated refer to the net amount of the guarantee posted at the end of each year |
| Cash margin | 4,313 | 4,214 |
(*) Bilateral guarantee provision pursuant to Italian Ministerial Decree No. 103382 of 20 December 2017. Please refer to the “Laws and Regulations on Government Debt - Rules on derivative transactions” section at www.dt.mef.gov.it/export/sites/sitodt/modules/documenti_en/debito_pubblico/normativa_spalla_destra/D.M._2 0.12.2017_-_Bilateral_collateral_with_reference_to_derivates.pdf |
While the notional value of the derivatives portfolio was essentially stable compared to the previous year, with a slight increase of about EUR 3 billion, the mark-to-market showed a marked improvement, being negative for EUR 27.75 billion as of 31 December 2021 compared to EUR 38.25 billion as of 31 December 2020. The component of the portfolio referring to loans receivable, under the Italian Financial Law for 2005, is increasingly small (see Table III.11). As a result, the values mentioned are essentially equivalent to those for debt derivatives alone, on which the notional increase was recorded: the market value was negative for EUR 27.74 billion at the end of 2021, compared with EUR 38.21 billion at the end of 2020. The improvement is basically attributable to the increase in swap rates in the over 5-year stretch, averaging 50 basis points.
In detail, for CCSs, the total notional amount of the foreign currency portfolio at the end of 2021 is increased by about EUR 4.5 billion compared to the previous year-end, from just under 13.2 billion to 17.6 billion at the end of 2021. In fact, during the year, as already extensively described, two bonds denominated in U.S. dollars were issued under the Global Bond program for a total amount equivalent to
| 74 | MINISTRY OF ECONOMY AND FINANCE |
III. PUBLIC DEBT MANAGEMENT IN 2021 |
approximately EUR 3.8 billion. In addition, the notional amount increased due to the early settlement of a CCS with a sinking plan and the simultaneous execution of a new CCS fully aligned with market conditions. Four IRS ex ISPAs have been repaid early, so as of 31 December 2021, the notional amount of the segment is approximately EUR 1.4 billion lower than at the end of 2020. With regard to IRSs hedging euro-denominated issues, the notional reduction of EUR 807 million is attributable to the natural maturity of one IRS and the early termination of three operations partially offset by the entry of a new point hedge operation (referring to a BTP€i with a 30-year maturity). Regarding macro-hedging IRSs for the risk of rising interest rates, as of the end of 2021, the notional amount is increased by about 1 billion. This amount is the net result of several components: new swaps were executed on the 30-year maturity for a total notional amount of EUR 2 billion, and an outstanding position was restructured, transforming it into the aforementioned point hedge; in addition, the last payment related to the instalment generated by a previous restructuring was made.
Finally, the collateralisation of the derivatives portfolio with reference to new operations continued during 2021. Specifically, two contracts were activated to enable new CCSs entered into to cover currency issuances to be subject to bilateral guarantee; in addition, new IRS and CCS operations were added to a contract already active since 2019.
At the end of 2021, the total net amount of guarantee paid to counterparties was EUR 4,214 million.
With respect to derivatives referring to debt, thus excluding the positions undertaken on loans granted, pursuant to the Italian Finance Law for 2005, the following two charts show the evolution of the notional amount year by year, as of 31 December 2020 and 31 December 2021, respectively, until the last maturity of the portfolio (2062), assuming the swaption is still exercised.
In the ten-year period after 2022, the maturities in notional amounts are equally distributed. In the 2035-2036 two-year period, a considerable notional amount will expire, as it will in 2045. Following the strategy adopted in 2021, the expiration of 2051 was added, including both IRSs and CCSs. Subsequently, only one position related to an issue under the EMTN programme will remain, with a notional amount of EUR 250 million to expire in 2062.
| CHART III.15: COMPARISON BETWEEN THE PROSPECTIVE TREND OF THE NOTIONAL AMOUNT FOR THE EXISTING DERIVATIVES PORTFOLIO, AS AT 31/12/2020 AND 31/12/2021, RESPECTIVELY, ASSUMING THAT ALL SWAPTIONS ARE EXERCISED (EUR MILLION) |
|
| Source: MEF |
| MINISTRY OF ECONOMY AND FINANCE | 75 |
| CHART III.16: COMPARISON BETWEEN THE MATURITY STRUCTURE OF THE EXISTING DERIVATIVES PORTFOLIO, AS AT 31/12/2020 AND 31/12/2021, RESPECTIVELY, ASSUMING THAT ALL SWAPTIONS ARE EXERCISED (EUR MILLION) |
|
| Source: MEF |
Debt cost
In the year under review, the weighted average rate at issuance stood at 0.10% (the lowest level ever), confirming the downward trend over the past three years, while in 2020 the average cost was 0.59%. As mentioned earlier, this was achieved while ensuring the increase in the average life of the debt.
| CHART III.17: AVERAGE COST AT ISSUANCE OF GOVERNMENT SECURITIES - 2006-2021 (PERCENTAGE POINTS) |
|
| Source: MEF |
| 76 | MINISTRY OF ECONOMY AND FINANCE |
III. PUBLIC DEBT MANAGEMENT IN 2021 |
On a cash basis, the average cost of debt, calculated as the ratio of cash interest54 paid on government bonds in year t on the stock of government bonds in year t-1, was 2.28% in 2021, which compares with 2.57% in 2020. The continuation of the historically low market rate environment has, therefore, favoured a decline in the average cost of debt, at -0.29%, which is more pronounced than in 2020.
Including also all derivative operations, the total value of the 2021 cash cost comes to 2.35%, compared to 2.67% in 2020, a reduction, therefore, of 0.32%. In line with this, the impact of the derivatives portfolio also decreased: 0.07%, compared with 0.10% in the previous year55.
Lastly, it should be noted that the public finance forecasts included in policy documents, as well as in the state budget, take into account the effect of derivatives with simulation hypotheses that are completely in line with the rest of the estimates. Similarly, all final figures also include the effects of the amounts collected or paid out as a result of derivatives operations.
| CHART III.18: AVERAGE COST OF THE STOCK OF GOVERNMENT SECURITIES, BEFORE AND AFTER DERIVATIVES - 2005-2021 (PERCENTAGE POINTS) |
|
| Source: MEF |
__
54 It is not possible to calculate a similar ratio for expenditure on an accrual basis (ESA 2010), as the latter, by definition, excludes flows from derivatives operations.
55 Please note that the difference in costs between the debt portfolio before derivatives and that after derivatives represents the marginal cost borne by the Treasury to obtain a longer duration (therefore greater hedging of the risk of rising interest rates) compared to the duration resulting from issuing bonds only.
| MINISTRY OF ECONOMY AND FINANCE | 77 |
| | The impact on debt management resulting from participation in the SURE and NGEU programs In the wake of the spread of the Covid-19 pandemic, European institutions have deployed a variety of instruments to cope with the severe health, economic and social consequences, as well as to provide support to national governments engaged in implementing measures to contain the contagions and mitigate the effects of the crisis on productive activities. Among the main lines of action proposed, the European Commission has planned two programs to support the economies of member states (SURE and Next Generation EU), to which is added the reinforcement of the European Union’s 2021-2027 multi-year budget with resources earmarked for financing aid to states. The SURE (Support to Mitigate Unemployment Risks in an Emergency) program is a temporary financial support instrument aimed at mitigating the risks of unemployment in the emergency situation related to the halt or slowdown of production activities. Approved by the European Council in May 2020, this instrument was created to provide financial assistance totalling EUR 100 billion in the form of loans granted on favourable terms by the EU to member states affected by the pandemic crisis, to cope with sudden increases in public spending and to preserve employment. Specifically, SURE loans help covering the costs directly related to the establishment or extension of national working time reduction schemes and other similar measures for self-employed workers introduced in response to the pandemic. These loans are backed by a system of voluntary guarantees from member states, whose contribution to the total guarantee amount corresponds to their respective share of the total gross national income of the European Union, based on the EU 2020 budget. The second program introduced is Next Generation EU (NGEU), a temporary financing instrument aimed at supporting the economic recovery of EU countries, with total resources of EUR 806.9 billion to be used over the 2021-2026 period. The centrepiece of NGEU is the Recovery and Resilience Facility (RRF), under which some 723.8 billion in resources in the form of loans and grants are included to support reforms and investments made by member states with the aim of mitigating the economic and social impact of the pandemic, strengthening economies, and fostering green and digital transition. The NGEU program also includes other programs, such as ReactEU, aimed at assistance, recovery and resilience for the cohesion of Europe’s territories (50.6 billion in grants), Rural development (8.1 billion in grants) and the Just transition fund (10.9 billion in grants), in addition to the already existing InvestEU program, strengthened to boost the economies of member states and support private investment (6.1 billion in grants). Furthermore, to facilitate interventions to counter the onset of future health crises and to improve mechanisms for managing them, the RescEU and Horizon Europe programs were introduced, which includes enhanced programs for research, innovation and external action. To finance the Next Generation EU program, the European Commission plans to borrow on behalf of the European Union from financial markets at more favourable rates than many member states by redistributing the amounts. The collection of the approximately planned 800 billion (equivalent to 5% of EU GDP) will be implemented at best market conditions until 2026 through a diversified financing strategy. During 2020, under the SURE program, Italy received loans totalling EUR 16.5 billion, disbursed in several tranches. The first and second tranches, with durations of 10 and 20 years respectively, were disbursed in October 2020, totalling EUR 10 billion. The fourth and fifth tranches, on the other hand, with durations of 5 and 30 years respectively, were disbursed in November 2020 for a total amount of EUR 6.5 billion. The rates applied to these loans were 0.0% for the first and third tranches, while 0.1% and 0.3% for the second and fourth tranches, respectively. |
| 78 | MINISTRY OF ECONOMY AND FINANCE |
III. PUBLIC DEBT MANAGEMENT IN 2021 |
| | Also under the SURE program, loans of about EUR 11 billion were disbursed to Italy during 2021. In fact, at the end of 2021, the total loans raised by Italy through this program stood at about EUR 27.5 billion. Disbursement also occurred in several tranches during 2021. The fifth tranche, with a term of 7 years, was disbursed in February 2021, amounting to about EUR 4.5 billion. The sixth, seventh and eighth tranches, with durations of 15, 5 and 25 years respectively, were disbursed in March, totalling about 5.7 billion. Finally, the ninth and final tranche of 2021, with a 26-year term, was transferred in May, totalling EUR 750 million. Also for loans disbursed during 2021, the rates charged were 0.0% for those with shorter terms (fifth and seventh tranches), while 0.2%, 0.45% and 0.75% for the sixth, eighth and ninth tranches, respectively. During 2021, in addition to loans from the SURE program, following the approval in July 2021 of the National Recovery and Resilience Plan by the EU Council, Italy received the first tranche of NGEU loans with a 30-year maturity on 13 August, amounting to approximately EUR 15.94 billion. The loan, with a term of 30 years, unlike SURE loans will not be repaid in a lump sum at maturity but on an annual basis, with a 10-year pre-repayment. The interest rate applied, determined based on the cost allocation methodology described in the European Commission’s Implementing Decision (EU) 2021/1095 of 2 July 2021, was 0.14%. Thus, loans that have so far been disbursed to Italy under the two programs exceed EUR 43 billion. As for the share of European loans in the stock of outstanding securities, this amounted to 1.20% at the end of 2021, composed of 0.70% of loans under the NGEU program and 1.20% of loans under the SURE program. This share is up from 0.76% in 2020, consisting as mentioned above only of the SURE component. Although the share represented by European loans is quite small compared to the total stock of Italian public debt, the high duration of loans granted to our country has nevertheless allowed the average life of the debt to be extended. In fact, at the end of 2020, relatively to the stock of government bonds, the average life was 6.95 years. If loans under the SURE Program are also considered, the average life of Italian debt rises to 7.02 years. The impact of European loans on the average life was even greater in 2021: at the end of 2021, relatively to the stock of government bonds, the average life was 7.11 years; if loans under the SURE and NGEU Programs are also taken into account, the average life rises to 7.29 years. On the other hand, with regard to the impact of the SURE and NGEU programs on the average cost of debt, it should be noted that although the weighted average term of these loans is rather high (amounting to about 20 years), the particularly favourable terms on which these loans were granted still allowed for a reduction in the average cost of debt financing. In fact, during 2020, the average cost at issuance was 0.59%. If loans under the SURE Program are also taken into account, the average cost at issuance has dropped as low as 0.57%. During 2021, the average cost at issuance was 0.11%, but if loans under the SURE and NGEU Programs are also taken into account, the average cost at issuance fell as low as 0.10%. Finally, Tables III.12 and III.13 show the impact of these loans in terms of market risk exposure expressed by duration and ARP (Average Refixing Period). |
| MINISTRY OF ECONOMY AND FINANCE | 79 |
| | |
| TABLE III.12: DURATION AND ARP TREND DURING THE 2020-2021 PERIOD, RELATING TO THE STOCK OF GOVERNMENT SECURITIES BEFORE DERIVATIVES (IN YEARS) |
| | Duration | ARP |
| | 31/12/2020 | 31/12/2021 | 31/12/2020 | 31/12/2021 |
| Domestic securities before derivatives | 6.22 | 6.07 | 6.00 | 6.14 |
| Foreign securities before derivatives | 8.09 | 8.56 | 6.58 | 8.13 |
| SURE | 14.25 | 12.32 | 15.71 | 13.77 |
| NGEU | - | 19.44 | - | 20.20 |
| Stock of government securities before derivatives | 6.31 | 6.24 | 6.09 | 6.38 |
| Source: MEF |
| |
| | |
| TABLE III.13: DURATION AND ARP TREND DURING THE 2020-2021 PERIOD, RELATING TO THE STOCK OF GOVERNMENT SECURITIES AFTER DERIVATIVES AND EUROPEAN LOANS (IN YEARS) |
| | Duration | ARP |
| | 31/12/2020 | 31/12/2021 | 31/12/2020 | 31/12/2021 |
| Domestic securities before derivatives | 6.64 | 6.49 | 6.40 | 6.53 |
| Foreign securities before derivatives | 8.30 | 8.59 | 6.96 | 8.34 |
| SURE | 14.25 | 12.32 | 15.71 | 13.77 |
| NGEU | - | 19.44 | - | 20.20 |
| Stock of government securities before derivatives | 6.73 | 6.65 | 6.48 | 6.75 |
| Source: MEF |
| |
| III.5 | THE TREASURY’S CASH MANAGEMENT |
During 2021, as described in Section II.1, the ECB adopted the same expansionary monetary policies as in recent years, strengthened as a result of the pandemic, which, while benefiting the government bond market in terms of lower yields and increased demand, also led to a tightening of the critical issues – already seen in previous years - in cash management. In fact, in an environment characterised by minimal demand for liquidity and negative returns, the Treasury has found itself having to manage cash and cash equivalents by trying to minimise the costs arising from the strong penalty applied to the stocks held at the Bank of Italy, through operations to deploy the available resources at rates, albeit very negative, higher than the rate applied to government stocks deposited with the ECB (Deposit Facility) which throughout 2021 was -0.50%.
The Treasury normally uses “OPTES” operations for part of its cash management actions, involving active management of the Treasury’s cash account. Thanks to the Bank of Italy and the MEF exchanging information on cash flows,
| 80 | MINISTRY OF ECONOMY AND FINANCE |
III. PUBLIC DEBT MANAGEMENT IN 2021 |
OPTES operations aim to improve account balance forecasts, making it easier to manage debt and monetary policy operations. As provided by law, funding and lending are carried out by selected counterparts through daily auctions and bilateral trading (OPTES operations), run directly by the Treasury or by the Bank of Italy on behalf of the MEF.
As the below analysis shows, 2021 was characterised by marginal use of OPTES operations, due to the excess liquidity in the system and, consistently, to the strong contraction in demand from market participants. Following the interruption of auctions, introduced from the second half of 2019, operations were exclusively carried out through bilateral negotiations. At the same time, money market activity was intensified, thanks to the introduction of a new liquidity management tool: Repo operations.
Monitoring the Cash account and daily and monthly cash balance trends
As previously outlined, the monitoring activity is carried out by information being continuously exchanged between the State General Accounting Department, the Department of the Treasury and the Bank of Italy. The information shared refers to all incoming and outgoing operations carried out on the State Treasury’s accounts, with data being exchanged with regard to both estimates and final balances.
The main purpose of sharing this information is to forecast the end-of-day balance, estimated on the basis of continuous updates provided by the Bank of Italy (six times a day) which are then validated by the MEF. These institutions also share longer-term forecast scenarios covering a period of between 30 and 60 days, with weekly updates being provided.
This latter exchange of information is particularly important for monetary policy purposes, as the Treasury sends its estimates regarding use of cash and government deposit balances for the period in question to the Bank of Italy, which in turn sends them to the ECB. The difficulties involved with this forecasting process stem from the large number of operators and the substantial cash flows running through the account. The average daily difference between the expected balance and the actual balance of the cash account is used as an indicator of the ability to make forecasts. In 2021, this indicator stood at around 0.64%56, down compared to 2020, whose value was 1.6%, confirming a satisfactory level of accuracy with regard to cash forecasts, despite the difficult context.
Notwithstanding the good forecasting ability in the short and medium term, the fluctuations recorded on the account are quite relevant, as shown in Chart III.19, Reporting levels and cyclicality like those recorded in previous years.
__
56 This value is calculated as the average of the percentage variations (in absolute terms) between the estimated balance of the Cash Account at 6 p.m. on day t-1 and the actual balance recorded at 9 a.m. on day t. This percentage therefore measures the average forecasting error made each day.
| MINISTRY OF ECONOMY AND FINANCE | 81 |
| CHART III.19: AVERAGE INTRA-MONTHLY CHANGES IN THE TREASURY’S AVAILABLE CASH – DIFFERENCES COMPARED WITH THE MONTHLY MINIMUM - 2021 (EUR MILLION) |
|
| Source: MEF |
As the above chart shows, balances are close to the minimum in the first part of the month and decrease to reach the lowest level towards the middle of the month, due to the substantial payments that need to be made (e.g., payment of social security allowances). This trend is then reversed in the second part of the month, with a peak in the last ten days mainly due to the collection of tax revenues.
These sudden fluctuations complicate cash management activities, as the Treasury must also hold substantial amounts of cash for significant redemptions of maturing government securities, which are not always simultaneously offset by similar issuances, especially not for medium and long-term bonds. In fact, it is market practice for securities other than BOTs to normally be distributed in several tranches over a number of months, while redemptions are made through a single payment on the maturity date. The fluctuations shown in the above chart are therefore also attributable to securities being issued and, above all, to those maturing, which may sometimes contribute to the significant decline at the beginning and half of the month. Other relevant causes connected to the account volatility are due to the misalignment between regular tax returns, usually distributed in the second half of the month, and the expenditures, mostly resulting from pensions and interest expenditure on government securities, which are instead distributed over the first days of the month.
Cash management operations and market context
As shown in Chart III.20, cash balances over the 12-month period in 2021 were always higher than the monthly averages in 2020. The trend, since the beginning of the year, has been upward to a peak in April, while in the second half of the year the descent began, bringing values back to 2020 levels in the last months of 2021. This trend is explained by the vastly different contingent situation in the first half of the two years under observation. While the first half of 2020 was particularly critical due to the outbreak of the pandemic and thus the financial effort in supporting businesses and households-with the inevitable decline in average stocks for the period-in 2021, conversely, thanks to monetary policy interventions and economic support measures adopted by the European Union and individual countries, the Treasury, given the uncertain environment it was facing anyway,
| 82 | MINISTRY OF ECONOMY AND FINANCE |
III. PUBLIC DEBT MANAGEMENT IN 2021 |
adopted an issuance policy strategy characterised by a strong acceleration in funding activity in the first months of the year. This policy, also accompanied by the inflow of funds from the SURE program, helped characterise the first half of the year with ample liquid assets. In the second half of the two years observed, on the other hand, diametrically opposite situations emerge: in 2020, average balances increased due to the excellent funding activity carried out earlier, as well as due to the positive performance of the economy and tax revenues, which were better than expected and finally due to the collection of the first tranches of the SURE program.
| CHART III.20: DIFFERENCE BETWEEN MONTHLY MAXIMUM AND MINIMUM TREASURY’S CASH ACCOUNT – 2020 AND 2021 (EUR MILLION) |
|
| Source: MEF |
During 2021, the Treasury only used medium and long-term bilateral operations to invest the liquidity of the Cash Account.
In 2021, the average stock of bilateral operations was in line with that of 2020, coming in at about 9.4 billion instead of about 9.5 billion in the previous year. Fairly predictable result given the unchanged market environment. characterised, let us recall, by an abundance of liquid assets in the market and a consequent lack of demand from banking operators, which resulted in fewer opportunities for employment and concomitantly more liquidity stored in the Treasury’s Cash Account held at the Bank of Italy.
Compared to previous years, the average duration of these operations has lengthened further, standing at 42 days in 2021 compared to 30 days in 2020 and 24 in 2019. The increase in the average maturity allowed the Treasury to obtain better opportunities to invest the excess liquidity, at more advantageous rates than the deposit facility rate.
In 2021, due to the abundance of liquidity in the account and the decidedly unattractive rate terms applied by major counterparties in the uncollateralised segment, the Treasury did not resort to OPTES funding operations.
| MINISTRY OF ECONOMY AND FINANCE | 83 |
| CHART III.21: BREAKDOWN OF THE TREASURY LIQUIDITY - AVERAGE VALUES FOR 2021 (EUR MILLION) |
|
| Source: MEF |
The liquidity share related to investments in longer-term bilateral operations was about 11.50%, while the remainder was deposited in the Cash Account, whose average balance for 2021 exceeds 88% of the total.
Table III.14 shows for all of 2021 the total amount of Treasury liquidity at the end of the month, broken down between market operations and the Cash Account.
| TABLE III.14: CASH ACCOUNT AND INVESTMENTS OF THE TREASURY'S LIQUIDITY AT THE END OF EACH MONTH - 2021 (EUR MILLION) | |
| Reference month | Balance of
the Cash account | OPTES liquidity operations | Treasury’s total available cash |
| January | 66,635 | 8,000 | 74,635 |
| February | 94,492 | 8,000 | 102,492 |
| March | 77,103 | 7,000 | 84,103 |
| April | 89,273 | 12,000 | 101,273 |
| May | 78,758 | 12,000 | 90,758 |
| June | 70,901 | 12,000 | 82,901 |
| July | 102,792 | 12,000 | 114,792 |
| August | 127,054 | 12,000 | 139,054 |
| September | 86,711 | 9,000 | 95,711 |
| October | 85,671 | 6,000 | 91,671 |
| November | 60,511 | 6,000 | 66,511 |
| December | 37,503 | 9,000 | 46,503 |
| Source: MEF |
Repo operations
In 2021, the Treasury, in order to cope with the critical issues typical of the uncollateralised money market, which is characterised by an oversupply of liquidity and interest rates stably in the negative area, expanded the tools at its disposal for a more efficient cash management.
To this end, a process of reviewing the Framework Decree was initiated during 2021 to enable the Treasury to have more flexible operational tools that adhere to market practices in order to more efficiently and effectively manage liquid assets.
| 84 | MINISTRY OF ECONOMY AND FINANCE |
III. PUBLIC DEBT MANAGEMENT IN 2021 |
Among these instruments, the one that could be implemented as early as 2021 was repurchase agreement (Repo) operations.
This operation began on 24 May 202157, with the aim of managing cash flows through funding operations, to manage any temporally limited cash needs, and lending operations, to invest surplus cash in the money market. Through an ad hoc tranche issuance, the Treasury has established a portfolio aimed at Repo market operations, consisting of 15 nominal BTPs for a total amount of EUR 15 billion, which will be updated on a periodic basis (quarterly/semi-annual) both to supplement securities that will mature over time and to adjust quantities due to specific cash management needs. Since the start of operations, there has been a steady increase in the use of the securities portfolio, with the peak reached in mid-November (over 13 billion).
Repo contracts, in addition to their main function of raising and/or deploying liquidity, bring additional benefits such as, for example, supporting market makers in the provision of liquidity in the secondary market and limiting distortions on Repo rates of specific securities due to scarcity phenomena in the market.
The goal of reducing market distortions was pursued upstream with the choice of securities to be included in the portfolio, giving preference to those with high “specialness” (Repo rate below that of the reference market). Thanks to the Treasury’s Repo operation, in fact, there has been-especially from September 2021 onward-a reduction in average market specialness in the BTP segment, relative to maturities between 2023 and 2031.
Therefore, through Repo operations, the Treasury offered, mainly to Primary Dealers, a tool by which it facilitated market making and thus supported the liquidity of securities in the secondary market.
Considering market rate levels, for the first few months of operation, the Treasury operated in the Repo market only in funding. This strategy, appropriately calibrated, has allowed a gradual easing of issuance on the money segment of BOTs, especially on six-month maturities.
In relation to the first half of operations, the volume-weighted average rate of Repo operations conducted was -0.586%, a level approximately 3 basis points lower than what would have been raised through BOT issues of the same maturity, assuming that such issues have no impact on monetary rate levels.
Finally, Repo operations helped to contain the overall average cost of liquid assets by about 1.5 basis points.
__
57 For more details on Repo operation, see the related in-depth box at the end of the Ch. I.
| MINISTRY OF ECONOMY AND FINANCE | 85 |
Conclusions
In 2021, cash management activity was particularly complex, due to all the reasons provided above. In this changed context, the Treasury had to adapt its cash management policy to ensure adequate cash availability and, where possible, use the exceeding liquidity in OPTES operations to reduce the impact of negative rates on the cash available in the Account. During the second half of the year, the Treasury continued to achieve the stabilisation of cash availability and limit the liquidity cost, by introducing Repo operations.
It should nonetheless be noted that, despite the growing difficulties involved with cash management, the effect of quantitative easing measures and the low level of interest rates along the entire yield curve were altogether favourable for Italy’s public debt management.
| 86 | MINISTRY OF ECONOMY AND FINANCE |
|
| |
Ministero dell’Economia e delle Finanze |
|
MINISTERO DELL’ECONOMIA E DELLE FINANZE |
PUBLIC DEBT REPORT 2021 |
Annex
INDEX
ANNEXES
| 1 |
| | | | |
| | | | |
| | | | |
| | Annex 1: | The Treasury’s involvement in international discussions on debt management
| 5 |
| | Annex 2: | The Department of the Treasury’s Public Debt Directorate: organisational structure
| 7 |
| | Annex 3: | SAPE (Issuance Portfolio Analysis Software)
| 11 |
| | Annex 4: | Derivatives used by the Treasury: role, types, and collateralisation system
| 13 |
| | Annex 5: | Italy and the role of Sovereign Green Bonds
| 19 |
| | | | |
| | | | |
| | | | |
| | | | |
STATISTICAL ANNEX
| 23 |
| | | | |
| | | | |
| | | | |
| | Sources of information on public dept available on the Treasury website | 23 |
| | Tables and charts
| 24 |
| | APPENDIX TO THE 2021 PUBLIC DEBT REPORT |
| 2 | MINISTRY OF ECONOMY AND FINANCE |
ANNEXES
| MINISTRY OF ECONOMY AND FINANCE | 3 |
| | APPENDIX TO THE 2021 PUBLIC DEBT REPORT |
| 4 | MINISTRY OF ECONOMY AND FINANCE |
ANNEX 1
The Treasury’s involvement in international discussions on debt management
Please find below a list of the main ways in which the Treasury is involved in international discussions on public debt management issues:
| • | Regular liaison with European DMOs is ensured as part of the special subcommittee (European Sovereign Debt Markets - ESDM) of the EU Economic and Financial Committee (EFC); the EFC has an advisory role vis-à-vis the European Commission and the Council of the European Union and is appointed to define actions for the coordination of Member States’ economic and financial policies. |
| • | Regular participation in the working groups organised by supranational institutions such as the OECD1, the IMF and the World Bank. The Treasury is also involved in the OECD’s “Working Party on Public Debt Management” (WPDM)1, which constitutes a stable platform to compare the public debt management policies and techniques of the organisation’s member countries, as well as in the “Government Borrowers’ Forum” organised annually by the World Bank for the 40 participating countries to share their practical experiences. The Treasury’s standing with regard to public debt management is implicitly recognised by the “Public Debt Management Network”, a joint initiative promoted by the OECD, the World Bank and the Italian Department of the Treasury (the only government institution alongside these two multilateral institutions), the aim of which is to share knowledge, information and research on public debt management issues. |
| • | Another key opportunity for institutional coordination is the Treasury’s participation in Eurostat statistical working groups and its contribution to drawing up the six-monthly notifications as part of the Excessive Deficit Procedure (EDP), especially in relation to entries being correctly recorded that are directly linked to public debt, in accordance with the harmonised European System of Accounts (ESA). By overseeing these accounting aspects, the Treasury is able to keep all relevant profiles under control, also moving beyond general considerations of a purely financial nature and with a direct impact on the state budget. |
| • | Finally, the Treasury attends the annual “International Retail Debt Management Conference”, made up of the DMOs of a limited number of countries; this |
__
1 The WPDM began to meet as an OECD working group of public debt management experts in 1979. Italy's Treasury has continuously contributed to the annual work of the WPDM since 1985 and is part of the Steering Group established in 2003. Currently, the DMOs of all 36 OECD countries contribute to the work of the WPDM, as do the International Monetary Fund, the World Bank and the European Commission, as observers.
| MINISTRY OF ECONOMY AND FINANCE | 5 |
| | APPENDIX TO THE 2021 PUBLIC DEBT REPORT |
conference is specifically dedicated to the operational issues involved with the placement of government securities among non-institutional investors and, every two years, it is supported by the World Bank to include emerging countries in its comparisons.
| 6 | MINISTRY OF ECONOMY AND FINANCE |
ANNEX 2
The Department of the Treasury’s Public Debt Directorate: organisational structure
The Department of the Treasury’s “Second Directorate”, dedicated to public debt management, is made up eleven offices. This Directorate carries out its tasks by working closely together with other institutional structures, such as the other directorates within the Department of the Treasury, the State General Accounting Department and the Bank of Italy. The various responsibilities of the Public Debt Directorate are shown in the chart below, grouped according to function.
| ORGANISATION OF THE PUBLIC DEBT DIRECTORATE |
|
The Directorate has a front, middle and back office, as is typically the case for financial market operators and other Debt Management Offices (DMOs) managing public debt in advanced countries.
The Front Office covers all activities in direct contact with the market. These primarily involve all issuance activities that define primary market operations, regarding both the domestic and foreign market; said issuance activities take into
| MINISTRY OF ECONOMY AND FINANCE | 7 |
| | APPENDIX TO THE 2021 PUBLIC DEBT REPORT |
account funding requirements, from market analysis to the decisions as to which type of securities to offer and the relative placement procedures and time frames.
Front Office activities also include the very short-term management of liquidity and extraordinary debt exchange and repurchase operations, as well as derivative operations.
Front Office activities also entail monitoring the various aspects of the government securities secondary market, as well as selecting and assessing dealers specialising in government securities.
The Middle Office is responsible for risk management2, carrying out all the necessary analyses, including legal and market analysis activities, to define the cost-risk profile that must drive and/or restrict Front Office operations. The various issuance portfolios identified, with their respective cost and risk combinations, (which, for many years3, have been based on a specific software that allows for “Cost-at-Risk” analysis based on a probabilistic model), are used by the Front Office to define the most appropriate issuance and hedging strategies. Risk management activities also include the monitoring of counterparty risk, determining the constraints that must be respected in terms of both derivative portfolio management and liquidity investment operations.
Middle Office activities also include multi-annual forecasts on interest expenditure and general government debt to be used for policy documents and institutional reporting purposes4.
The work carried out by the Back Office includes preparing issuance decrees and the stricter accounting activities relating to procedures to ensure timely payments.
All debt management activities are underpinned by the work to prepare the relative legal documentation for loans and derivatives, as well the drafting of prospectuses, both for international issuance programmes (Global, MTN) and for other securities placed with methods other than auctions. Likewise, since the Public Debt Directorate falls within the administrative context of the Department of the Treasury, it also carries out all the other legal-administrative and accounting tasks common to ministerial organisations.
The Public Debt Directorate also carries out other tasks of crucial importance.
These include the very important activities that may be classed under “communications”, focusing on real-time information regarding issuances, as well
__
2 For a more detailed assessment of best practices regarding Sovereign Debt Portfolio Risk Management, please refer to the International Monetary Fund's Working Paper “A Primer on Managing Sovereign Debt-Portfolio Risks”, produced in partnership with dozens of DMOs, including the Italian Treasury.
3 See the information contained in Annex 3 below.
4 In particular, the Economic and Financial Document (“DEF”) provided for by Italian Law no. 39 of 7 April 2011 (in relation to which Directorate II contributes to Section I “Italy's Stability Programme” and Section II “Analyses and Trends in Public Finances”), the DEF Update, the Draft Budgetary Plan (“DPB”) as required by EU Regulation no. 473/2013, the Annex to the so-called “Quarterly Cash Report” (referred to by Art. 14 of Italian Law no. 196/2009 as the “Report on the General Government’s Consolidated Cash Account”), the Report to Parliament on the sinking fund for government securities (an annex to the General Financial Statement of the Italian State) as referred to by Art. 44, paragraph 3, of Italian Presidential Decree no. 398/2003, and the half-yearly Report to the Court of Auditors on public debt management pursuant to the Italian Ministerial Decree dated 10/11/1995.
| 8 | MINISTRY OF ECONOMY AND FINANCE |
as statistics about the structure, dynamics and composition of debt represented by government securities and the relative market. The main channel for these
activities is the public debt website. These activities also include the statistics stemming from the monitoring of the debt and derivatives exposure of local authorities.
In addition to this monitoring, the Directorate is also responsible for any extraordinary operations relating to local authorities’ debt, as governed by specific regulations.
The role of liaising with external institutions, in particular at international level, is also of great importance; this includes: contributing to the coordination of public debt managers in Europe as part of a dedicated subcommittee (European Sovereign Debt Markets - ESDM) of the EU Economic and Financial Committee; taking part in Eurostat statistical working groups and contributing to preparing the six-monthly notifications as part of the Excessive Debt Procedure (EDP); participating in the various working groups of supranational institutions, such as the OECD and the IMF; the network between the Italian Treasury, the OECD and the World Bank regarding public debt management issues; relations with institutional investors and rating agencies5.
Finally, across-the-board IT services refer to all offices, since almost all the Directorate’s work processes are computerised; some are shared by all government departments, with the same applications for the Department of the Treasury or for the entire Ministry, and others are specific to public debt, featuring dedicated tools and applications6. The latter are structured on the basis of the Directorate’s specific needs7 and use both internal information and data flows from the Bank of Italy, from Monte Titoli S.p.A. - the company that guarantees the centralised management of government securities - or from the company that manages the electronic government securities market (MTS S.p.A.).
__
5 For more detailed information on when and how the Italian Treasury takes part in international discussions in this regard, please refer to Annex 1 of this Report.
6 Databases and applications are designed and maintained in collaboration with the Department of the Treasury's IT Coordination department and with SOGEI, the supplier of digital architecture and support services. Società Generale d’Informatica S.P.A. (“SOGEI”) is an Information Technology company that is 100% owned by the Italian Ministry of Economy and Finance.
7 For example, please refer to the particularly significant aspects involved with developing and managing “SAPE”, the Issuance Portfolio Analysis Software, as illustrated in Annex 3 below.
| MINISTRY OF ECONOMY AND FINANCE | 9 |
| | APPENDIX TO THE 2021 PUBLIC DEBT REPORT |
| 10 | MINISTRY OF ECONOMY AND FINANCE |
ANNEX 3
SAPE (Issuance Portfolio Analysis Software)
The mathematical models and corresponding software (SAPE – Issuance Portfolio Analysis Software) used by the Treasury to support its management choices regarding the public debt portfolio are the result of a research project, made possible thanks to the FIRB 2003 funding received from the Italian Ministry of Education, University and Research (D.D. 2186-Ric 12/12/2003), and issued by the Institute for Calculation Applications of the Italian National Research Council (which heads up a group that also includes other academic institutions, such as Bocconi University, the University of Milan and Tor Vergata University of Rome); this funding was granted as part of the strategic programme entitled “Humanities, economics and social sciences”, project objective “Public debt management”. In the early 2000s, this project launched the modelling and software development work that led the Department of the Treasury to adopt a tool that could support it in making decisions regarding public debt management; by using stochastic simulation techniques, this tool could analyse the cost and risk profile of government securities portfolios.
Over the years, this model underwent various development phases, managed in collaboration with the Department of the Treasury and the various bodies involved, currently made up of the “M. Picone” Institute for Calculation Applications (“IAC”) of the Italian National Research Council (“CNR”) and the Cambridge Judge Business School at the University of Cambridge, as well as SOGEI, the Italian Treasury’s IT solutions provider for the public administration.
The mathematical models and corresponding software are subject to continuous updates in order to take into account ongoing developments of the reference techniques. This allows for the various databases to be integrated in an increasingly comprehensive way, as well as taking into account the various management activities that may affect future scenarios. Since the end of 2017, the outstanding debt database used by SAPE has been made up of domestic securities, derivatives and securities in USD.
The main objective of the portfolio analysis is to measure debt servicing costs on an annual accrual basis, in accordance with ESA 2010 rules. The choice between different possible issuance portfolios must be weighted by taking into account both the cost, in terms of interest expenditure, and the interest rate risk for each individual portfolio compared with a representative sample of how interest rates may evolve.
For each possible issuance portfolio, it is possible to simulate the cost function distribution with respect to all the scenarios regarding how interest rates may evolve. This distribution simulation provides all the necessary information about costs (i.e., where the distribution is positioned) and risks (the scale of the distribution) for the portfolio in question. SAPE calculates different summary cost
| MINISTRY OF ECONOMY AND FINANCE | 11 |
| | APPENDIX TO THE 2021 PUBLIC DEBT REPORT |
indicators (average cost, CaR - Cost at Risk-, maximum cost, etc.) and risk indicators (standard cost deviation, relative CaR, ES - Expected Shortfall - etc.), allowing for the possible issuance portfolios to be studied in as much detail as possible.
After choosing the cost and risk functions, a consolidated portfolio selection technique involves building an “efficiency frontier”. This “frontier” is identified by first drawing a Cartesian graph in which each portfolio is represented by a point whose coordinates record its respective risk and cost, thereby providing a summary of their overall dynamic evolution. Portfolios are classed as “efficient” when each fixed risk value corresponds to the lowest cost. Selecting one of the best portfolios, i.e. those that can be classed as efficient, is based on (i) the debt manager’s risk aversion or risk appetite, in line with the Public Debt Management Guidelines regarding the strategy for the issuance and management of government securities (these guidelines indicate, inter alia, the approach to be adopted in order to fulfil the Treasury’s strategic requirements regarding how to manage the main risks), and (ii) how practical/feasible each individual portfolio is with respect to investors’ needs and the evolution of market conditions. The efficiency frontier is normally created by observing the cost and risk variables at the end of the prediction interval.
This model shows how the cost distribution evolves over time for each individual portfolio. This allows for accurate checks into the evolution of the selected costs and risks, making it possible for the decision maker to choose the portfolio whose temporal evolution profile best matches the policy and strategy choices in question.
The model underwent initial significant development when mutual guarantee agreements were introduced for derivative instruments8; this development allowed
for the estimate of effects in terms of Credit Value Adjustment and, as a result, in terms of the guarantees to be established/received as part of the Credit Support Annexes, to be included in the simulations.
The SAPE software’s central element is the module that generates the scenarios regarding how interest rates will evolve. This module interacts with the cost and risk calculation module in a completely transparent way and also offers the possibility to use a range of stochastic models to generate medium/long-term scenarios for interest rates and inflation rates; above all, this is useful in order to assess the expected performance, in terms of cost-risk analysis, of the various strategies relating to public debt issuance policies. More generally speaking, by generating scenarios, expected exposure can be quantified with respect to yield curve volatility. Joint estimate models for the forward interest rate structure include government and break-even inflation (BEI) curves and swap curves (Euro and USD).
A five-year forecast period is generally used for cost-risk analyses on issuance portfolios. The scenarios generated by the model’s stochastic simulation are in line with historical data in terms of the statistical properties of the yield curves, particularly in terms of the variance calculated for the different maturities and covariance between nominal rates and BEI and between nominal and swap rates.
__
8 For further information in this regard, please refer to Annex 4 below.
| 12 | MINISTRY OF ECONOMY AND FINANCE |
ANNEX 4
Derivatives used by the Treasury: role, types, and collateralisation system
Introduction
In principle, the derivatives sector is considerably vast, encompassing operations that have very different structures and purposes, used in almost all areas of finance and the economy. Sovereign issuers such as the Italian Treasury only use a few types of derivatives, for specific risk management objectives underlying its debt portfolio, with particular regard to interest rate and exchange rate risks. Please find below a description of (i) the role played by derivatives in managing Italy’s public debt; (ii) the types of operations that are used; and, (iii) the collateralisation system.
The role of derivative operations used by the Treasury
As highlighted at the beginning of this Report9, the objective of curbing debt costs at the same time as maintaining an acceptable level of risk inherent in the existing debt structure, imposed upon DMOs by international best practices, does not end upon issuance and in relation to the market conditions at the time. This objective is instead achieved in a dynamic way, through ongoing actions that regard the entire portfolio and continue even after issuance.
In addition to debt exchange and repurchase operations, DMOs may also use derivatives to mitigate these risks after issuance.
Any mismatch between the structure of the portfolio resulting from the outcome of capital market placements and the management objectives considered preferable10 can thus be rectified with the use of derivatives, increasing the DMO’s compliance with policy objectives and partly separating the achievement of these objectives from the performance recorded at the time of placement.
Furthermore, while issuance activity is managed with continuity and predictability, in order to create the technical prerequisites of the necessary
__
9 For an indispensable, more in-depth examination of the objectives pursued by public debt managers, also using derivative instruments, please refer to Chap. I.1 above, as well as the documents mentioned therein.
10 A document drawn up jointly by best practice experts from the OECD, the IMF and the World Bank in 2008 highlighted the practice adopted in this regard by many Sovereign debt managers, emphasising the fact that: “the implementation of the debt strategy may include the use of derivatives to separate funding decisions from the optimal portfolio composition decision, reduce the cost of borrowing, and manage risks in the portfolio (in particular, interest rate refixing risk and refinancing risk)”. - OECD (2008) “Use of Derivatives for Debt Management and Domestic Debt Market Development: Key Conclusions”, available at http://www.oecd.org/fr/finances/dette-publique/39354012.pdf
| MINISTRY OF ECONOMY AND FINANCE | 13 |
| | APPENDIX TO THE 2021 PUBLIC DEBT REPORT |
investment liquidity for potential buyers, derivative operations, on the other hand, do not have a pre-defined timetable. In fact, derivative contracts may be signed at any time, when market conditions allow for DMOs’ specific needs to be met; in this way, they contribute to removing a certain degree of rigidity from DMOs’ management activities.
In authorising the use of derivatives on an annual basis, the Framework Decree states that they should contribute to achieving the general management objectives of curbing overall borrowing costs and protecting against market risks and refinancing risks, based on the information available and market conditions.
From an operational point of view, management of the derivatives portfolio must also take into account two main aspects: (i) the guarantee agreements that assist these operations, and (ii) the existing constraints for certain types.
With regard to the first aspect, please refer to the specific paragraph below on the objectives and characteristics of mutual guarantee agreements (collateralisation).
With regard to the second aspect, in September 2014, Eurostat issued new rules on how to record the market value of derivatives, only applicable to swaps arising from the restructuring of pre-existing swaps or to swaptions being exercised. In fact, for these specific cases, it was established that these operations shall affect debt stock levels from an accounting point of view (despite them not entailing actual recourse to the capital market).
The types of derivative contracts used by the Treasury
The types of derivative contracts used by the Treasury Please find below the functional characteristics of the three types of derivative operations used and/or usable to manage the Treasury’s debt portfolio:
| • | Cross-currency swaps (“CCS”) are used to synthetically convert liabilities generated by bond issues denominated in a foreign currency into euro denominated liabilities, with no alterations to the foreign-currency denominated security purchased by the investor. These instruments therefore eliminate the exchange rate risk for the Treasury and make it possible to directly compare the funding costs obtained on international markets with the cost of domestic debt. As outlined in this Report, the international issuance programme allows for the institutional investor base for Italian public debt to be diversified and to obtain competitive cost conditions compared with those for domestic debt. |
| • | Interest rate swaps (“IRS”) involve an exchange of flows involving a fixed rate being paid versus a floating rate being received, usually on long-term maturities. With a view to managing the debt portfolio in a comprehensive way, this type of derivative extends the financial duration of debt and acts as a precaution against expected interest rate increases. As already mentioned, this choice is in line with the need to manage the portfolio’s cost-risk trade¬off and, in particular, with the specific characteristics of Italian public debt management, as described in Chapter I of this Report. |
| 14 | MINISTRY OF ECONOMY AND FINANCE |
| • | Finally, receiver swaptions11 are derivative contracts that act in a similar way to IRS, in that they extend the financial duration of debt and mitigate interest rate risk, but they also provide cash benefits deriving from the sale of an option. Options sold by the Treasury give the counterparty the right to enter into an interest rate swap agreement, at a future date, under pre-defined conditions, as long as a lump sum (premium) is paid to the Treasury when the contract is signed. The IRS generated by sold receiver swaptions being exercised, like those that have not been sold as an option, are generally medium/long-term swaps, whereby the Treasury pays a fixed rate and receives a floating rate starting from a given date if the counterparty exercises its option. Swaptions are exercised if the market conditions are favourable for the Treasury’s counterparty as at the date of the option being exercised (i.e., interest rates have fallen below the market expectations at the time the relative contract was signed); any IRS generated by the option being exercised shall nonetheless act as medium/long-term insurance for the Treasury. |
Collateralisation agreements - objectives and characteristics
Collateralisation agreements were introduced for the derivative operations carried out by the Italian government with two objectives in mind.
The first objective was to align with standard practices in the derivatives market. In fact, for all financial instruments, the market value of the operation (Mark to Market) may significantly vary in terms of size and whether it is positive or negative, depending on market trends. For government bonds and securities, these variations affect, inter alia, the credit risk borne by the security holder12, and therefore how they are accounted for and the relative allocations to provisions. For derivatives (for example, interest rate derivatives), on the other hand, changes in the operation value may generate potential credit exposure for the party (the government or counterparty for a derivative) for whom the instrument has a positive value at a given moment in time. This means that, over time, either of the two parties may become, alternatively, the potential creditor/debtor of a sum, which may change significantly in terms of its size and whether it has a positive or negative value; however, said sum shall only become “real” if one of the two counterparties goes bankrupt or if the operation is closed before its natural expiry (by definition, the market value at the operation date is equal to zero).
While the interbank derivatives market has always been a collateralised market, Sovereigns’ use of guarantee schemes to manage the credit exposure associated with derivative contracts has only been examined relatively recently. On the one hand, the 2008 crisis revealed the risks involved with governments being exposed vis-à-vis the banking sector without guarantees. On the other hand, the
__
11 A receiver swaption is an option that is sold/purchased to/by a counterparty that entitles the purchaser to enter into a swap contract at a future date, whereby the purchaser will pay a floating rate and receive a fixed rate on a given notional amount.
12 By contrast, the issuer, by definition, is not exposed to any credit risk.
| MINISTRY OF ECONOMY AND FINANCE | 15 |
| | APPENDIX TO THE 2021 PUBLIC DEBT REPORT |
subsequent and consequent tightening of regulatory constraints on banks gradually made it more expensive for the latter to maintain significant, unsecured exposure vis-à-vis governments, and, beyond certain limits, this even became unsustainable without capitalisation measures. Governments therefore also began using the market standard of mutual guarantee mechanisms as part of their ongoing operations.
The second objective regards the regulatory constraints on banks: given these obligations, the creation of a collateralisation system gives the Italian government the possibility to implement new hedges at sustainable costs (for example, hedges against exchange rate risk in the case of securities denominated in a foreign currency being issued).
It should also be noted that, by freeing up the resources that banking regulations require to be allocated to such exposure, the presence of collateral can indirectly allow the Italian government to strengthen the support of these counterparties for Italy’s public debt, on both the primary and secondary market.
Guarantee agreements (“Credit Support Annexes” or “CSA”) are regulated by Italian Ministerial Decree no. 103382 of 20 December 2017 (“Guarantee Decree”) and, indeed, are annexes to the ISDA Master Agreement (“ISDA MA”) in place with each counterparty.
The Public Debt Directorate has drawn up a model governed by Italian law, in line with the regulations governing each ISDA MA signed by the Italian government and all the relative confirmations. When drawing up the contracts to be signed, the Directorate in question based its choices, on the one hand, on public finance constraints, pursuant to Art. 6, paragraph 3, of the “Guarantee Decree”, and, on the other, on its own organisational requirements, which led to a bespoke CSA being drafted. The contractual specifications defined in the CSA refer to margining frequency, the minimum amount, and the rounding of margins.
The resources necessary to pay the guarantees are allocated to a specific expenditure item, established by Italy’s 2019 Budget Law and called “Expenses deriving from guarantee operations on derivatives exposure”; from this expenditure item, the guarantees are transferred to a special accounting system specifically set up for this purpose. Pursuant to Art. 5 of said Decree, the guarantee must be made up of cash in euro.
CSAs may be distinguished between those connected with previous derivative operations and those relating to new operations. The initial phase focused on pre¬existing derivative instruments with a number of counterparties, which resulted in the latter having significant credit exposure vis-à-vis the Italian government, above a threshold originally set at € 4 billion (as per the joint provision of Art. 6, paragraph 1, letter b), of the “Guarantee Decree” and Art. 4, paragraph 4, of the 2018 “Framework Decree”). As of 31 December 2017, there were only very few counterparties that met the requirements to sign a guarantee agreement for derivative positions already in the Italian government’s portfolio.
A collateral structure was therefore defined, aimed at limiting the outgoing amounts for the Italian government. For each agreement, full collateralisation is not required upon signing, as the annual guarantee amounts to be paid to the counterparty are defined within a narrow “corridor”, which tends to expand as time goes by. According to estimates, the Italian Treasury will have to pay limited and almost constant amounts over a considerable number of years; said amounts will
| 16 | MINISTRY OF ECONOMY AND FINANCE |
gradually tend to hedge the counterparty’s entire credit exposure vis-à-vis the Treasury. The expenditure commitments are therefore not only very limited compared with the overall exposure of the individual portfolios but are also set over a significant period, starting from when the agreement in question is signed. The margin to pay shall only be less than the expected amount, with a subsequent reduction in outgoing cash flows for margining purposes, if there are substantial increases in the interest rate swap curve, leading to a reduction in the overall mark-to-market of the collateralised portfolio. Time frames for the “corridor” to be applied to the cash flows is based on the need to mediate between the sustainability of the guarantee from the point of view of public finances (which makes it essential, at least in the early years, to limit said time frames) and the need to provide counterparties with a guarantee on their overall exposure vis-à-vis the Italian government within a reasonable number of years.
The work to prepare the guarantee agreement required a significant amount of time, which was necessary in order to carry out the legal analysis and the strictly financial analysis, with the latter aimed at defining, with each counterparty, the appropriate amount of the benefit to be paid to the Treasury, pursuant to Art. 6, paragraph 2, of the Guarantee Decree. All CSAs therefore only became operational in the second half of 2018 and only with regard to pre-existing operations with the banks that met the relative requirements.
The second phase, on the other hand, involved signing CSA agreements with all dealers specialising in government securities, with reference to any new operations13. This phase was completed in the second half of 2018, with a residual part being completed at the beginning of 2019. These agreements referred exclusively to derivative operations carried out after the relative agreement was signed. These agreements were signed pursuant to Art. 6, paragraph 1, let. a), of the “Guarantee Decree” with the same format being used for each individual counterparty, thereby meeting uniformity requirements with a view to treating all counterparties equally.
__
13 Primarily, derivative contracts aimed at hedging new issuances in a foreign currency.
| MINISTRY OF ECONOMY AND FINANCE | 17 |
| | APPENDIX TO THE 2021 PUBLIC DEBT REPORT |
| 18 | MINISTRY OF ECONOMY AND FINANCE |
ANNEX 5
Italy and the role of Sovereign Green Bonds
The year 2021 saw a strong rebound in GSS (Green, Social and Sustainability Bond) issuance due to increased demand from domestic and international investors and increased issuance by new and existing issuers.
According to the Debt Global State of the Market report, published by the Climate Bonds Initiative, despite continuing uncertainty related to post-pandemic inflation and dwindling central bank support, the global climate bond market attracted $1.1 trillion in new volume – 46% more than the $730.5 billion in 2020. Within that, green bonds still accounted for the largest component of issuance, with 49% of the total ($523 billion) – a 75% increase over the previous year’s volumes. Such a jump pushed the cumulative total of outstanding bonds to $1.6 billion. Europe was the most prolific region, with cumulative issuance reaching USD 758 billion by year-end.
The continued expansion of the market and the need to provide adequate information to investors on the projects financed prompted the European Commission to publish the proposed Green Bond Standards (GBS) Regulation in parallel with the new Sustainable Finance Strategy, in order to implement Action 2 of the Action Plan on the development of sustainable finance.
The European Green Bonds Regulation introduces a common framework of rules in line with the European Taxonomy - the classification of economic activities that can be defined as “sustainable” on the basis of the six objectives contained in EU Regulation 852/2020, to which all issuers can voluntarily adhere.
In this context, although some issues remain to be considered, including the difficulty of alignment with the Taxonomy for Sovereign issuers, the proposal for a European regulation has been well received by the Italian Republic, as it proposes to set a benchmark at an international level, limiting the risk of greenwashing and at the same time strengthening investors’ confidence in subscribing to green bonds, contributing to the development of the sustainable finance market.
During 2021, the Treasury completed the organisational process that enabled the Italian Republic to enter the sustainable finance market with the first issue of the BTP Green, the government bond dedicated to financing expenditure incurred by the State with a positive environmental impact, as provided for by the Budget Law for 2020 (Italian Law No. 160 of 27 December 2019).
As part of the preparatory activities for the first issuance, on 25 February, the Treasury made available the Green Bond Framework (GBF), the regulatory and organisational framework of reference for the issuance of green bonds that illustrates Italy’s environmental strategy and the four essential mechanisms that accompany the issuance of BTP Green: the criteria for selecting the expenditures in the State budget deemed eligible, the use of the proceeds, the monitoring of such expenditures, and the environmental impact of the same.
In line with the best market practices already adopted by other Sovereign issuers, the GBF received a Second Party Opinion from Vigeo Eiris, the independent evaluation body specially selected by the Treasury. This opinion constitutes an ex-
| MINISTRY OF ECONOMY AND FINANCE | 19 |
| | APPENDIX TO THE 2021 PUBLIC DEBT REPORT |
ante certification of the consistency of the approach used in the GBF with the environmental objectives and with the broader sustainability strategy of the Italian Republic, both from the point of view of resource allocation and from that of quantifying the positive effects on the climate and the environment, as well as with respect to the compliance of eligible expenses with the GBP (2018 edition) and the GBS under discussion in the European Union.
The contents of the Framework were elaborated through a complex activity of identification and collection of data and information within the Inter-Ministerial Committee for the monitoring and publication of the information necessary for the issuance of Green Bonds established with the Italian Prime Ministerial Decree of 9 October 2020, in compliance with the provisions of the Stability Law for 2020 (Italian Law No. 160 of 27 December 2019), which is responsible for coordinating the Public Administrations involved in the process of reporting on the information relevant to the use of the resources collected through Green Bonds.
The Ministries participating in the Committee collaborated with the structure of the Department of the Treasury in order to identify the eligible expenses, ensuring, through the activation of the necessary institutional collaborations, a continuous transmission of the information necessary for the traceability and monitoring of the use of the sums disbursed.
This information flow ensures the reporting of the actual utilisation of the sums, as well as the monitoring of the environmental impact of the uses indicated in the GBF.
Following the publication of the GBF and the related Second Party Opinion, the syndicated issuance of the first tranche of the BTP Green took place last 3 March, followed by the reopening of the bond in October via syndication.
In accordance with the criteria set forth in Section 4 of the GBF, last September, the Treasury disclosed the details of the green expenses for an amount similar to the net proceeds of the first issue.
The allocation of the proceeds collected in 2021 from the issuance of the BTP Green 2045 was made on the basis of the environmental objectives expressed by the European Taxonomy of Sustainable Activities14 and indicated in the Framework for BTP Green issues:
1. Climate change mitigation;
2. Climate change adaptation;
3. Sustainable use and protection of water resources and the marine environment;
4. Transition to a circular economy;
5. Pollution prevention and control;
6. Protection, enhancement and restoration of biodiversity, ecosystems and environmental services.
__
14 EU Regulation 2020/852 of 18 June 2020.
| 20 | MINISTRY OF ECONOMY AND FINANCE |
Furthermore, the use of the proceeds raised through the issuance of Green bonds contributes to the achievement by the Italian Republic of the following 2030 Sustainable Development Goals (SDGs):
| • | Goal 6: Clean Water and Sanitation |
| • | Goal 7: Clean and Affordable Energy |
| • | Goal 11: Sustainable Cities and Communities |
| • | Goal 12: Responsible Consumption and Production |
| • | Goal 13: Act for the Climate |
| • | Goal 14: Life Under Water |
The sums collected were indeed attributed to the expenditure of the State budget already made in the year the bond was issued (2021) and in the three previous years (2018-2020) with reference to the six categories indicated in the GBF:
1. Renewable sources for electricity and heat production
2. Energy efficiency
3. Transport
4. Pollution prevention and control and circular economy
5. Protection of the environment and biological diversity
6. Research
In 2022, the Treasury will make available the Report on the Allocation and Impact of the 2045 BTP Green - which was drafted in 2021 by the Department of the Treasury in collaboration with the Ministries belonging to the Committee and in line with the best market practices already adopted by other Sovereign issuers.
In particular, the Report, the publication of which is expected within one year of issuance, provides information on:
| • | the description of expenditures aimed at improving environmental conditions in line with the United Nations Sustainable Development Goals in adherence to the “Green Bond Principles” issued by the International Capital Market Association (ICMA) in June 2018 and, as far as possible, with the environmental objectives of EU Regulation No. 852 of 2020 (so-called European Taxonomy); |
| • | the detailed analysis of green programmes and projects according to their financial nature (tax breaks, capital expenditure and current expenditure), their time distribution over the 2018-2021 four-year period and their relative weight in the allocated total; |
| • | the methodology and assumptions underlying environmental impact assessments. |
| MINISTRY OF ECONOMY AND FINANCE | 21 |
| | APPENDIX TO THE 2021 PUBLIC DEBT REPORT |
| 22 | MINISTRY OF ECONOMY AND FINANCE |
STATISTICAL ANNEX
SOURCES OF INFORMATION ON PUBLIC DEBT AVAILABLE ON THE TREASURY WEBSITE
The Treasury’s website hosts a dedicated area about public Debt (www.dt.mef.gov.it/en/debito_pubblico/) featuring a wide range of both qualitative and quantitative information about each one of the operational issues included in this Report.
Information available in this area provides details about (but is not limited to) issuance timetable and official communications, auction results, securities’ features and relevant legal framework, Specialist’s assessment and extraordinary operations, available cash as well as documents of a more general nature, as the several releases of this Report or the annual Guidelines for the public Debt management.
The area also includes a data-rich statistical Section (www.dt.mef.gov.it/en/debito_pubblico/dati_statistici/) providing quantitative information about all public Debt topics, namely featured in the Quarterly Bulletin, including trends recorded in the government securities’ portfolio composition, coupons, yields at issuance and average life, risks indicators and derivatives portfolio.
The dataset is steadily updated according to operations, while also keeping past data series available.
The following pages complete the information already provided in this Report by featuring selected Charts and Tables about some of the information available in the website.
| | APPENDIX TO THE 2021 PUBLIC DEBT REPORT |
TABLES AND CHARTS
GROSS MARKET ISSUES AT NOMINAL VALUE - SECURITIES WITH A MATURITY OF UP TO 30 MONTHS (EUR MILLION) |
| | | BOT | | CTZ | BTP Short Term |
| | 3 months | 6 months | 12 months | 24 months | 18-30 months |
| Jan-18 | - | 6,500 | 7,500 | 4,501 | - |
| Feb-18 | - | 6,500 | 6,500 | 2,300 | - |
| Mar-18 | - | 6,000 | 6,500 | 3,830 | - |
| Apr-18 | - | 6,000 | 6,000 | 2,300 | - |
| May-18 | - | 6,000 | 6,500 | 1,750 | - |
| June-18 | - | 6,050 | 6,600 | 2,013 | - |
| July-18 | - | 7,150 | 6,600 | 2,051 | - |
| Aug-18 | - | 6,450 | 6,000 | 2,013 | - |
| Sept-18 | - | 6,103 | 6,600 | 2,013 | - |
| Oct-18 | - | 6,050 | 6,000 | 3,900 | - |
| Nov-18 | - | 6,000 | 5,500 | 2,500 | - |
| Dec-18 | - | 6500 | 6,050 | - | - |
| Jan-19 | - | 14,300 | 7,700 | 5,046 | - |
| Feb-19 | - | 6,000 | 6,500 | 2,588 | - |
| Mar-19 | - | 6,600 | 6,525 | 2,300 | - |
| Apr-19 | - | 6,600 | 6,102 | 4,550 | - |
| May-19 | - | 6,810 | 6,500 | 2,875 | - |
| June-19 | - | 6,600 | 6,747 | 2,588 | - |
| July-19 | - | 6,500 | 7,150 | 2,300 | - |
| Aug-19 | - | 6,600 | 7,150 | 2,300 | - |
| Sept-19 | - | 7,150 | 7,150 | 1,598 | - |
| Oct-19 | - | 7,150 | 6,600 | 3,000 | - |
| Nov-19 | - | 6,500 | 5,834 | 2,013 | - |
| Dec-19 | - | 6,072 | - | - | - |
| Jan-20 | - | 13,000 | 7,000 | 2,300 | - |
| Feb-20 | - | 6,025 | 6,000 | 2,588 | - |
| Mar-20 | - | 7,000 | 6,500 | 3,163 | - |
| Apr-20 | 6,500 | 7,700 | 7,150 | 3,163 | - |
| May-20 | - | 7,150 | 14,700 | 5,200 | - |
| June-20 | - | 7,157 | 7,431 | 4,200 | - |
| July-20 | - | 7,700 | 10,274 | 3,501 | - |
| Aug-20 | - | 7,460 | 7,035 | 3,450 | - |
| Sept-20 | - | 6,500 | 7,372 | 3,827 | - |
| Oct-20 | - | 6,500 | 7,161 | 2,500 | - |
| Nov-20 | - | 6,000 | 5,500 | 2,000 | - |
| Dec-20 | - | - | 7,000 | - | - |
| Jan-21 | - | 13,500 | 7,000 | 3,450 | - |
| Feb-21 | - | 6,500 | 7,000 | 2,501 | - |
| Mar-21 | - | 6,000 | 6,043 | - | 4,001 |
| Apr-21 | - | 7,150 | 7,000 | - | 4,500 |
| May-21 | - | 6,000 | 7,500 | - | 3,844 |
| June-21 | - | 6,500 | 7,502 | - | 2,750 |
| July-21 | - | 7,072 | 8,250 | - | 4,084 |
| Aug-21 | - | 6,500 | 7,700 | - | 3,300 |
| Sept-21 | - | 5,500 | 7,700 | - | 2,500 |
| Oct-21 | - | 6,000 | 6,000 | - | 2,700 |
| Nov-21 | - | 5,126 | 5,000 | - | 2,700 |
| Dec-21 | - | - | 6,600 | - | - |
| 24 | MINISTRY OF ECONOMY AND FINANCE |
GROSS MARKET ISSUES AT NOMINAL VALUE - SECURITIES WITH A MATURITY OF MORE THAN 30 MONTHS
(EUR MILLION) |
| | CCT eu | BTP €i | BTP | BTP Italia | BTP
Futura |
| | 5 – 7 years | 5 years | 10 years | 15 years | 30 years | 3 years | 5 years | 7 years | 10 years | 15 years | 20 years | 30 years | 50 years | 4 – 8 years | 8 – 16 years |
| Jan-18 | 2,001 | 914 | | 836 | - | 3,000 | 2,414 | 3,431 | 1,500 | - | 9,000 | - | - | - | - |
| Feb-18 | 2,300 | 1,008 | 1,292 | - | - | 2,875 | 1,798 | 3,090 | 5,463 | - | - | 2,250 | 883 | - | - |
| Mar-18 | 1,973 | 3,250 | | - | - | 2,875 | 5,200 | 5,200 | 2,300 | 1,290 | - | - | - | - | - |
| Apr-18 | 2,300 | - | 1,334 | 708 | - | 5,200 | 2,875 | 2,875 | 3,450 | - | 1,464 | 1,575 | - | - | - |
| May-18 | 3,502 | - | 604 | - | - | 3,116 | 2,750 | 2,875 | 3,000 | 1,552 | - | - | - | 7,709 | - |
| June-18 | 2,300 | 964 | 1,270 | - | 494 | 2,300 | 2,013 | 2,467 | 2,158 | - | - | 1,045 | | - | - |
| July-18 | 2,300 | - | - | - | - | 2,300 | 2,000 | 2,300 | 2,688 | 1,500 | 1,500 | - | - | - | - |
| Aug-18 | 1,725 | - | - | - | - | - | 2,300 | - | 4,999 | - | - | - | - | - | - |
| Sept-18 | 755 | - | - | 1,200 | - | 2,526 | 3,750 | 4,856 | 2,250 | - | - | 1,800 | - | - | - |
| Oct-18 | 1,250 | - | 1,146 | - | - | 4,550 | 2,000 | 1,725 | 2,000 | 1,130 | - | - | - | - | - |
| Nov-18 | 1,060 | 1,000 | - | - | - | 2,758 | 2,276 | 1,898 | 2,750 | - | 1,500 | - | - | 2,164 | - |
| Dec-18 | 702 | - | - | - | - | - | 2,300 | - | 2,588 | - | - | | - | - | - |
| | | | | | | | | | | | | | | | |
| Jan -19 | 863 | - | 845 | - | 486 | 3,450 | 2,300 | 2,588 | 1,738 | 10,000 | - | 1,500 | - | - | - |
| Feb-19 | 3,575 | 977 | - | 481 | - | 2,251 | 3,163 | 2,588 | 2,875 | - | - | 8,000 | - | - | - |
| Mar-19 | 1,250 | - | 1,070 | - | - | 5,200 | 2,000 | 2,875 | 4,000 | - | 1,500 | - | - | - | - |
| Apr-19 | 1,150 | - | - | 1,045 | - | 2,875 | 4,224 | 4,875 | 3,163 | 1,800 | - | - | - | - | - |
| May-19 | 1,150 | 728 | 709 | - | - | 2,750 | 2,875 | 2,500 | 3,450 | - | - | 1,755 | - | - | - |
| June-19 | 750 | - | 745 | - | 422 | 3,163 | 1,886 | 1,735 | 2,750 | 1,800 | 6,000 | - | - | - | - |
| July-19 | 1,150 | 444 | - | 808 | - | 3,079 | 2,588 | 2,500 | 3,163 | - | - | - | 3,000 | - | - |
| Aug-19 | 1,280 | - | - | - | - | - | 3,163 | - | 3,738 | - | - | - | - | - | - |
| Sept-19 | 1,150 | - | - | - | 450 | 4,001 | 2,588 | 2,588 | 4,000 | - | - | 1,800 | - | - | - |
| Oct-19 | 841 | - | 4,000 | - | - | 3,163 | 3,776 | 2,588 | 3,129 | - | 970 | 830 | - | 6,750 | - |
| Nov-19 | 863 | - | - | - | 660 | 2,500 | 2,875 | 3,251 | 3,450 | - | - | 957 | - | - | - |
| Dec-19 | 750 | - | - | - | - | - | 2,250 | - | 2,750 | - | - | - | - | - | - |
| | | | | | | | | | | | | | | | |
| Jan -20 | - | 1,438 | - | - | - | 3,450 | 2,155 | 2,746 | 2,501 | - | 1,250 | 7,000 | - | - | - |
| Feb-20 | 3,575 | - | 900 | 600 | - | 2,250 | 3,163 | 2,750 | 3,738 | 9,000 | - | - | - | - | - |
| Mar-20 | - | - | - | - | 841 | 3,500 | 2,500 | 795 | 4,000 | - | 1,500 | - | - | - | - |
| Apr-20 | 751 | - | 1,150 | - | - | 5,378 | 12,750 | 3,600 | 3,500 | 1,500 | - | 6,000 | - | - | - |
| May-20 | - | - | 1,150 | - | - | 5,400 | 0 | 3,000 | 4,303 | - | 1,200 | - | - | 22,298 | - |
| Jun-20 | 1,000 | 2,600 | - | - | - | 6,500 | 2,500 | 3,000 | 18,000 | 2,400 | - | - | - | - | - |
| July-20 | 1,438 | - | 1,022 | - | - | 4,200 | 3,111 | 5,302 | 2,208 | - | 2,400 | - | - | - | 6,132 |
| Aug-20 | - | - | - | - | - | 2,750 | 2,954 | 2,750 | 3,900 | - | - | 1,250 | - | - | - |
| Sept-20 | 1,331 | - | 750 | - | - | 3,293 | 5,850 | 3,448 | 3,000 | - | 10,000 | - | - | - | - |
| Oct-20 | - | 750 | - | - | - | 4,488 | 3,000 | 2,700 | 5,023 | - | - | 1,585 | - | - | - |
| Nov-20 | 1,150 | - | - | - | - | 3,600 | 3,000 | 2,100 | 3,600 | 1,500 | - | - | - | - | 5,711 |
| Dec-20 | 2,500 | - | - | - | - | 3,008 | 2,501 | 3,000 | 3,003 | - | - | - | - | - | - |
| | | | | | | | | | | | | | | | |
| Jan -21 | - | 1,150 | - | - | - | 2,750 | - | 4,500 | - | 10,000 | - | 2,000 | - | - | - |
| Feb-21 | 1,725 | - | - | - | 4,000 | 3,001 | 4,200 | 4,800 | 14,500 | - | 2,400 | - | - | - | - |
| Mar-21 | 1,275 | - | 1,436 | - | - | 6,045 | 5,000 | 3,300 | - | - | 8,500* | - | - | - | - |
| Apr-21 | 1,634 | 1,150 | - | - | 863 | 4,702 | 4,800 | 7,000 | 3,600 | 2,400 | - | - | 5,000 | - | 5,477 |
| May-21 | 1,274 | - | 1,250 | - | - | 3,344 | 2,796 | 4,695 | 2,500 | - | - | 1,820 | - | - | - |
| Jun-21 | 2,300 | - | - | - | 1,078 | 4,200 | 3,600 | 3,000 | 14,200 | - | 2,100 | - | - | - | - |
| July-21 | 6,000 | - | - | - | - | 5,850 | 3,600 | 3,300 | - | 2,100 | - | - | - | - | - |
| Aug-21 | 1,274 | 1,150 | - | - | - | - | 5,850 | - | 3,000 | - | - | - | - | - | - |
| Sept-21 | 2,000 | - | 1,000 | - | - | 2,375 | 2,500 | 2,400 | 3,250 | - | - | 2,100 | - | - | - |
| Oct-21 | 2,013 | - | - | - | 863 | 3,600 | 2,000 | 2,400 | 2,500 | - | 5,000* | 1,800 | - | - | - |
| Nov-21 | 1,250 | - | 1,150 | - | - | 2,000 | 2,000 | 3,750 | 3,750 | - | - | - | - | - | 3,268 |
| Dec-21 | 1,500 | - | - | - | - | 3,500 | 2,000 | - | 2,250 | - | - | - | - | - | - |
| | | | | | | | | | | | | | | | |
* BTP Green with a term at issue of 24 years N.B. Securities placed in connection with exchange operations are not included |
| MINISTRY OF ECONOMY AND FINANCE | 25 |
| | APPENDIX TO THE 2021 PUBLIC DEBT REPORT |
| GROSS ISSUES IN THE MARKET AT NOMINAL VALUE - OFF-THE-RUN SECURITY REOPENINGS (EUR MILLION) |
| | CCTeu | BTP€i | BTP |
| | | | |
| | 7 years | 2 – 10
years | 11 – 15
years | 16 – 30
years | 2 – 5
years | 6 – 10
years | 11 – 15
years | 16 – 30
years |
| Jan-18 | - | - | - | - | - | 1,000 | - | - |
| Feb-18 | - | - | - | - | - | - | - | - |
| Mar-18 | - | - | - | - | - | - | - | 960 |
| Apr-18 | - | - | - | - | - | - | - | - |
| May-18 | - | 647 | - | - | - | - | - | - |
| June-18 | - | - | - | - | - | - | - | 468 |
| July-18 | - | - | - | - | - | - | - | - |
| Aug-18 | - | - | - | - | - | - | - | - |
| Sept-18 | 996 | - | - | - | - | - | - | - |
| Oct-18 | - | - | - | - | - | - | - | 670 |
| Nov-18 | - | - | - | - | - | - | - | - |
| Dec-18 | 700 | - | - | - | - | - | - | - |
| Jan-19 | - | - | - | - | - | 849 | - | - |
| Feb-19 | - | - | - | - | - | - | - | - |
| Mar-19 | - | - | - | - | - | - | - | - |
| Apr-19 | - | - | - | - | - | - | - | - |
| May-19 | - | - | - | - | - | - | - | - |
| June-19 | - | - | - | - | - | 1,466 | - | - |
| July-19 | - | - | - | - | - | - | - | - |
| Aug-19 | 508 | - | - | - | - | - | - | - |
| Sept-19 | - | - | - | - | - | - | - | - |
| Oct-19 | - | - | - | - | - | - | - | - |
| Nov-19 | - | - | - | - | - | - | - | 639 |
| Dec-19 | - | - | - | - | - | - | - | - |
| Jan-20 | - | - | - | - | - | - | - | - |
| Feb-20 | - | - | - | - | - | - | - | - |
| Mar-20 | 1,000 | - | - | - | - | 1,205 | - | - |
| Apr-20 | - | - | - | - | - | 1,500 | - | 900 |
| May-20 | 858 | - | - | - | - | 2,800 | 1,200 | - |
| June-20 | 340 | - | - | - | - | 645 | 580 | - |
| July-20 | - | - | - | - | - | 1,292 | 903 | 748 |
| Aug-20 | 1,250 | - | - | - | - | - | - | - |
| Sept-20 | - | - | - | - | - | - | - | - |
| Oct-20 | 1,251 | - | - | - | - | - | - | - |
| Nov-20 | - | 1,250 | - | - | - | - | - | - |
| Dec-20 | - | - | - | - | - | - | - | - |
| Jan-21 | - | - | - | - | 505 | 995 | - | - |
| Feb-21 | - | - | - | - | - | - | - | - |
| Mar-21 | - | - | - | - | - | - | - | - |
| Apr-21 | - | - | - | - | 2,100 | - | - | - |
| May-21 | - | - | - | - | - | 2,000 | - | - |
| June-21 | - | - | - | - | 654 | 3,725 | - | - |
| July-21 | - | - | - | - | - | 3,600 | - | - |
| Aug-21 | - | - | - | - | - | - | - | - |
| Sept-21 | - | - | - | - | - | - | - | - |
| Oct-21 | - | - | - | - | - | - | - | - |
| Nov-21 | - | - | - | - | - | - | - | - |
| Dec-21 | - | - | - | - | - | - | - | - |
| N.B. Securities placed in connection with exchange operations are not included |
| 26 | MINISTRY OF ECONOMY AND FINANCE |
| GROSS COMPOUND YIELDS ON GOVERNMENT BOND ISSUES (MONTHLY WEIGHTED AVERAGES) |
| | BOT | CTZ | CCT eu | BTP€i | BTP | BTP Italia | BTP Futura |
| | | | | | | | |
| | 3 months | 6 months | 12 months | 24 months | 5-7 years | 5 years | 10 years | 15 years | 30 years | 2 years | 3 years | 5 years | 7 years | 10 years | 15 years | 20 years | 30 years | 50 years | 4-8 years | 8-16 years |
| Jan-18 | - | -0.437 | -0.420 | -0.237 | 0.48 | 0.51 | - | 1.06 | - | - | 0.04 | 0.60 | 1.35 | 1.86 | - | 2.99 | - | - | - | - |
| Feb-18 | - | -0.403 | -0.401 | -0.216 | 0.42 | -0.41 | 0.89 | - | - | - | 0.05 | 0.66 | 1.43 | 2.06 | - | - | 3.16 | 3.19 | - | - |
| Mar-18 | - | -0.430 | -0.403 | -0.225 | 0.42 | -0.43 | - | - | - | - | 0.00 | 0.89 | 1.47 | 2.06 | 2.45 | - | - | - | - | - |
| Apr-18 | - | -0.421 | -0.399 | -0.275 | 0.35 | - | 0.47 | 0.76 | - | - | 0.05 | 0.68 | 1.27 | 1.83 | - | 2.59 | 2.88 | - | - | - |
| May-18 | - | 1.213 | -0.361 | 0.350 | 0.23 | - | 1.28 | - | - | - | 0.07 | 0.56 | 1.34 | 1.70 | 2.38 | - | - | - | 1.77 | - |
| June-18 | - | 0.092 | 0.550 | 0.917 | 2.00 | 0.90 | - | - | 2.14 | - | 1.16 | 2.32 | 2.37 | 3.00 | - | - | 3.54 | - | - | - |
| July-18 | - | 0.066 | 0.337 | 0.647 | 1.67 | - | 1.55 | - | - | - | 1.10 | 1.82 | 2.31 | 2.77 | 3.04 | 3.28 | - | - | - | - |
| Aug-18 | - | 0.438 | 0.679 | 1.277 | 1.75 | - | - | - | - | - | - | 1.80 | - | 2.87 | - | - | - | - | - | - |
| Sept-18 | - | 0.206 | 0.436 | 0.715 | 2.31 | - | - | 1.65 | - | - | 1.20 | 2.44 | 2.55 | 3.25 | - | - | 3.55 | - | - | - |
| Oct-18 | - | 0.159 | 0.949 | 1.626 | 1.77 | - | 2.34 | - | - | - | 2.51 | 2.03 | 3.28 | 2.90 | 3.66 | - | - | - | - | - |
| Nov-18 | - | 0.163 | 0.630 | 0.995 | 2.32 | 1.45 | - | - | - | - | 1.98 | 2.58 | 3.12 | 3.36 | - | 3.90 | - | - | 2.55 | - |
| Dec-18 | - | - | 0.370 | - | 2.31 | - | - | - | - | - | - | 2.35 | - | 3.24 | - | - | - | - | - | - |
| Jan-19 | - | 0.095 | 0.285 | 0.518 | 1.81 | - | 2.52 | - | 3.51 | - | 1.07 | 1.79 | 2.35 | 2.70 | 3.41 | - | 3.68 | - | - | - |
| Feb-19 | - | -0.007 | 0.181 | 0.592 | 1.65 | 1.63 | - | 3.02 | - | - | 0.99 | 1.49 | 2.26 | 2.60 | - | - | 3.91 | - | - | - |
| Mar-19 | - | -0.062 | 0.060 | 0.288 | 1.83 | - | 2.37 | - | - | - | 1.06 | 1.59 | 2.05 | 2.81 | - | 3.35 | - | - | - | - |
| Apr-19 | - | -0.028 | 0.070 | 0.697 | 1.83 | - | - | 2.77 | - | - | 1.08 | 1.71 | 2.05 | 2.61 | 3.00 | - | - | - | - | - |
| May-19 | - | -0.048 | 0.122 | 0.818 | 1.77 | 1.58 | 2.43 | - | - | - | 1.24 | 1.72 | 2.23 | 2.59 | - | - | 3.65 | - | - | - |
| June-19 | - | -0.063 | 0.069 | 0.431 | 1.95 | - | 1.88 | - | 2.98 | - | 1.05 | 1.81 | 1.96 | 2.60 | 2.87 | 3.15 | - | - | - | - |
| July-19 | - | -0.210 | -0.061 | 0.041 | 1.60 | 0.53 | - | 1.65 | - | - | 0.49 | 1.34 | 1.24 | 2.09 | - | - | - | 2.88 | - | - |
| Aug-19 | - | -0.217 | 0.107 | 0.008 | 1.06 | - | - | - | - | - | - | 0.80 | - | 1.56 | - | - | - | - | - | - |
| Sept-19 | - | -0.224 | -0.226 | -0.236 | 0.77 | - | - | - | 1.67 | - | -0.01 | 0.32 | 0.56 | 0.96 | - | - | - | 2.06 | - | - |
| Oct-19 | - | -0.213 | -0.219 | -0.112 | 0.52 | - | 0.98 | - | - | - | 0.05 | 0.26 | 0.60 | 0.88 | - | 1.78 | 2.03 | - | 0.68 | - |
| Nov-19 | - | -0.215 | -0.135 | -0.033 | - | - | - | - | 2.02 | - | 0.22 | 0.42 | 0.91 | 1.06 | - | - | 2.29 | - | - | - |
| Dec-19 | - | - | -0.191 | - | 0.71 | - | - | - | - | - | - | 0.64 | - | 1.29 | - | - | - | - | - | - |
| Jan-20 | - | -0.288 | -0.242 | -0.091 | - | 0.06 | - | - | - | - | 0.18 | 0.61 | 0.94 | 1.35 | - | 2.14 | 2.50 | - | - | - |
| Feb-20 | - | -0.287 | -0.319 | -0.143 | 0.18 | - | 0.96 | 1.13 | - | - | -0.10 | 0.31 | 0.48 | 0.94 | 1.49 | - | - | - | - | - |
| Mar-20 | - | 0.055 | 0.072 | 0.307 | - | - | - | - | 2.15 | - | 0.74 | 0.36 | 0.92 | 1.00 | - | 1.97 | - | - | - | - |
| Apr-20 | 0,105 | 0.227 | 0.534 | 1.001 | 0.66 | - | 2.02 | - | - | - | 0.86 | 1.68 | 1.37 | 1.48 | 2.06 | - | 3.13 | - | - | - |
| May-20 | - | 0.012 | 0.149 | 0.441 | - | - | 1.50 | - | - | - | 0.87 | - | 1.53 | 1.78 | - | 2.49 | - | - | 1.41 | - |
| June-20 | - | -0.224 | 0.014 | 0.102 | 0.53 | 0.78 | - | - | - | - | 0.46 | 0.91 | 1.10 | 1.64 | 1.91 | - | - | - | - | - |
| July-20 | - | -0.276 | -0.159 | -0.031 | 0.56 | - | 0.97 | - | - | - | 0.30 | 0.68 | 0.95 | 1.28 | - | 1.91 | - | - | - | 1.29 |
| Aug-20 | - | -0.330 | -0.192 | -0.014 | - | - | - | - | - | - | 0.08 | 0.46 | 0.72 | 1.04 | - | - | 1.91 | - | - | - |
| Sept-20 | - | -0.392 | -0.225 | -0.118 | 0.45 | - | 0.78 | - | - | - | 0.07 | 0.58 | 0.75 | 1.11 | - | 1.82 | - | - | - | - |
| Oct-20 | - | -0.478 | -0.436 | -0.265 | - | 0.24 | - | - | - | - | -0.14 | 0.35 | 0.34 | 0.89 | - | - | - | - | - | - |
| Nov-20 | - | -0.518 | -0.478 | -0.369 | 0.27 | - | - | - | - | - | -0.19 | 0.23 | 0.35 | 0.79 | 1.05 | - | - | - | - | 0.61 |
| Dec-20 | - | - | -0.498 | - | -0.02 | - | - | - | - | - | -0.30 | 0.01 | 0.19 | 0.59 | - | - | - | - | - | - |
| Jan-21 | - | -0.483 | -0.478 | -0.277 | - | 0.11 | - | - | - | - | -0.23 | - | 0.30 | - | 0.99 | - | 1.47 | - | - | - |
| Feb-21 | - | -0.429 | -0.454 | -0.308 | 0.04 | - | - | - | 1.48 | - | -0.33 | 0.07 | 0.18 | 0.62 | - | 1.14 | - | - | - | - |
| Mar-21 | - | -0.486 | -0.421 | - | -0.19 | - | 1.56 | - | - | -0.39 | -0.22 | 0.11 | 0.31 | - | - | 1.551 | - | - | - | - |
| Apr-21 | - | -0.481 | -0.436 | - | -0.08 | 0.16 | - | - | 1.86 | -0.30 | -0.17 | 0.05 | 0.36 | 0.72 | 1.26 | - | - | 2.18 | - | 1.376 |
| May-21 | - | -0.504 | -0.443 | - | -0.06 | - | 0.76 | - | - | -0.33 | -0.06 | 0.17 | 0.69 | 0.88 | - | - | 2.06 | - | - | - |
| June-21 | - | -0.521 | -0.490 | - | -0.07 | - | - | - | 1.97 | -0.37 | -0.22 | 0.17 | 0.46 | 0.95 | - | 1.55 | - | - | - | - |
| July-21 | - | -0.524 | -0.459 | - | 0.17 | - | - | - | - | -0.29 | -0.19 | 0.12 | 0.38 | - | 1.19 | - | - | - | - | - |
| Aug-21 | - | -0.519 | -0.513 | - | 0.05 | -0.01 | - | - | - | -0.29 | - | 0.02 | - | 0.66 | - | - | - | - | - | - |
| Sept-21 | - | -0.545 | -0.477 | - | 0.03 | - | 0.59 | - | - | -0.32 | -0.27 | -0.01 | 0.32 | 0.67 | - | - | 1.69 | - | - | - |
| Oct-21 | - | -0.550 | -0.474 | - | -0.21 | - | - | - | 1.80 | -0.23 | -0.19 | 0.11 | 0.48 | 0.86 | - | 1.681 | 1.82 | - | - | - |
| Nov-21 | - | -0.563 | -0.533 | - | -0.01 | - | 0.80 | - | - | -0.26 | -0.16 | 0.28 | 0.60 | 1.05 | - | - | - | - | - | 1.255 |
| Dec-21 | - | - | -0.467 | - | 0.07 | - | - | - | - | - | -0.10 | 0.19 | - | 1.02 | - | - | - | - | - | - |
1 BTP Green issue yield N.B. Securities placed in connection with exchange operations are not included |
| MINISTRY OF ECONOMY AND FINANCE | 27 |
| | APPENDIX TO THE 2021 PUBLIC DEBT REPORT |
GROSS COMPOUND YIELDS AT GOVERNMENT BOND ISSUANCE - OFF-THE-RUN SECURITY REOPENINGS
(MONTHLY WEIGHTED AVERAGES) |
| | CCT | BTP€i | BTP |
| | 7 years | 2 – 10
years | 11 – 15
years | 16 - 30
years | 2 - 5
years | 6 - 10
years | 11 – 15
years | 16 – 30
years |
| Jan-18 | - | - | - | - | - | 1.83 | - | - |
| Feb-18 | - | - | - | - | - | - | - | - |
| Mar-18 | - | - | - | - | - | - | - | 2.92 |
| Apr-18 | - | - | - | - | - | - | - | - |
| May-18 | - | -0.05 | - | - | - | - | - | - |
| June-18 | - | - | - | - | - | - | - | 3.42 |
| July-18 | - | - | - | - | - | - | - | - |
| Aug-18 | - | - | - | - | - | - | - | - |
| Sept-18 | 2.32 | - | - | - | - | - | - | - |
| Oct-18 | - | - | - | - | - | - | - | 3.79 |
| Nov-18 | - | - | - | - | - | - | - | - |
| Dec-18 | 2.22 | - | - | - | - | - | - | - |
| | | | | | | | | |
| | - | - | - | - | - | 2.50 | - | - |
| Jan-19 | | | | | | | | |
| Feb-19 | - | - | - | - | - | - | - | - |
| Mar-19 | - | - | - | - | - | - | - | - |
| Apr-19 | - | - | - | - | - | - | - | - |
| May-19 | - | - | - | - | - | - | - | - |
| June-19 | - | - | - | - | - | 1.94 | - | - |
| July-19 | - | - | - | - | - | - | - | - |
| Aug-19 | 1.11 | - | - | - | - | - | - | - |
| Sept-19 | - | - | - | - | - | - | - | - |
| Oct-19 | - | - | - | - | - | - | - | - |
| Nov-19 | 0.40 | - | - | - | - | - | - | - |
| Dec-19 | - | - | - | - | - | - | - | - |
| | | | | | | | | |
| | - | - | - | - | - | - | - | - |
| Jan-20 | | | | | | | | |
| Feb-20 | - | - | - | - | - | - | - | - |
| Mar-20 | - | - | - | - | 2.50 | 1.29 | - | - |
| Apr-20 | - | - | - | - | - | 1.44 | - | 2.49 |
| May-20 | - | - | - | - | - | 1.43 | 2.23 | - |
| June-20 | - | - | - | - | - | 1.24 | 1.55 | - |
| July-20 | - | - | - | - | - | 1.20 | 1.36 | 1.59 |
| Aug-20 | - | - | - | - | - | - | - | - |
| Sept-20 | - | - | - | - | - | - | - | - |
| Oct-20 | - | - | - | - | - | - | - | - |
| Nov-20 | - | -0.39 | - | - | - | - | - | - |
| Dec-20 | - | - | - | - | - | - | - | - |
| | | | | | | | | |
| | - | - | - | - | 0.11 | 0.43 | - | - |
| Jan-21 | | | | | | | | |
| Feb-21 | - | - | - | - | - | - | - | - |
| Mar-21 | - | - | - | - | - | - | - | - |
| Apr-21 | - | - | - | - | 0.12 | - | - | - |
| May-21 | - | - | - | - | - | 0.83 | - | - |
| June-21 | - | - | - | - | -0.46 | 0.43 | - | - |
| July-21 | - | - | - | - | - | 0.78 | - | - |
| Aug-21 | - | - | - | - | - | - | - | - |
| Sept-21 | - | - | - | - | - | - | - | - |
| Oct-21 | - | - | - | - | - | - | - | - |
| Nov-21 | - | - | - | - | - | - | - | - |
| Dec-21 | - | - | - | - | - | - | - | - |
| | | | | | | | | |
| N.B. Securities placed in connection with exchange operations are not included |
| 28 | MINISTRY OF ECONOMY AND FINANCE |
| WEIGHTED AVERAGE RESIDUAL MATURITY OF GOVERNMENT BONDS (MONTHS) |
| | | | | BTP | | |
| BOT | CCT | CCTeu | CTZ | ordinary | indexed | Futura | Italia | Green | Foreign | TOTAL |
| Jan-18 | 5.05 | 49.20 | 12.28 | 93.01 | 96.42 | - | 51.88 | - | 144.09 | 82.88 |
| Feb-18 | 5.15 | 48.91 | 11.78 | 94.24 | 95.42 | - | 50.96 | - | 143.17 | 83.46 |
| Mar-18 | 5.14 | 48.41 | 14.88 | 93.24 | 93.71 | - | 49.95 | - | 145.36 | 82.95 |
| Apr-18 | 5.11 | 52.46 | 14.48 | 92.46 | 93.33 | - | 48.96 | - | 145.41 | 82.82 |
| May-18 | 5.11 | 52.39 | 13.80 | 92.28 | 92.23 | - | 52.90 | - | 145.34 | 82.49 |
| June-18 | 5.18 | 52.11 | 13.17 | 92.70 | 91.69 | - | 51.91 | - | 144.42 | 82.50 |
| July-18 | 5.21 | 51.67 | 12.49 | 91.82 | 90.89 | - | 50.89 | - | 143.52 | 81.67 |
| Aug-18 | 5.18 | 51.12 | 11.78 | 92.43 | 89.87 | - | 49.88 | - | 142.49 | 81.75 |
| Sept-18 | 5.20 | 50.64 | 11.07 | 91.62 | 96.53 | - | 48.89 | - | 141.83 | 81.53 |
| Oct-18 | 5.14 | 49.92 | 11.09 | 91.58 | 95.66 | - | 49.58 | - | 141.99 | 81.34 |
| Nov-18 | 5.07 | 53.14 | 10.70 | 90.63 | 94.40 | - | 48.50 | - | 141.97 | 80.80 |
| Dec-18 | 4.93 | 52.57 | 12.37 | 90.75 | 93.38 | - | 47.48 | - | 141.20 | 81.37 |
| | | | | | | | | | | |
| Jan-19 | 5.11 | 51.74 | 12.40 | 90.56 | 93.10 | - | 46.46 | - | 140.17 | 80.73 |
| Feb-19 | 5.18 | 51.35 | 11.94 | 92.53 | 92.14 | - | 45.54 | - | 139.24 | 81.83 |
| Mar-19 | 5.16 | 50.44 | 11.30 | 93.14 | 91.25 | - | 44.52 | - | 137.44 | 81.89 |
| Apr-19 | 5.13 | 49.62 | 11.50 | 92.82 | 90.74 | - | 43.54 | - | 137.00 | 81.37 |
| May-19 | 5.11 | 48.76 | 13.39 | 93.16 | 89.61 | - | 42.52 | - | 139.56 | 81.72 |
| June-19 | 5.18 | 47.78 | 12.95 | 92.87 | 89.31 | - | 41.80 | - | 138.84 | 81.44 |
| July-19 | 5.24 | 46.92 | 12.37 | 92.71 | 88.53 | - | 40.79 | - | 141.83 | 81.17 |
| Aug-19 | 5.22 | 46.09 | 11.76 | 92.63 | 87.51 | - | 39.77 | - | 144.51 | 80.73 |
| Sept-19 | 5.27 | 45.25 | 11.04 | 93.40 | 98.43 | - | 38.78 | - | 144.23 | 81.72 |
| Oct-19 | 5.22 | 44.46 | 13.47 | 93.43 | 98.20 | - | 43.27 | - | 149.82 | 82.43 |
| Nov-19 | 5.14 | 47.96 | 12.93 | 92.65 | 98.03 | - | 42.27 | - | 148.80 | 82.27 |
| Dec-19 | 5.00 | 47.04 | 11.75 | 92.74 | 97.01 | - | 41.25 | - | 149.77 | 82.42 |
| | | | | | | | | | | |
| Jan-20 | 5.09 | 46.02 | 11.61 | 93.03 | 95.44 | - | 40.23 | - | 154.29 | 82.29 |
| Feb-20 | 5.09 | 45.08 | 11.12 | 94.03 | 94.88 | - | 39.27 | - | 153.36 | 82.73 |
| Mar-20 | 5.09 | 44.18 | 14.17 | 94.71 | 94.87 | - | 38.25 | - | 152.15 | 83.50 |
| Apr-20 | 5.00 | 43.20 | 13.56 | 94.61 | 94.09 | - | 46.35 | - | 139.97 | 83.48 |
| May-20 | 5.06 | 42.25 | 13.63 | 94.61 | 93.26 | - | 49.15 | - | 129.67 | 82.42 |
| June-20 | 5.00 | 41.25 | 13.39 | 94.94 | 91.92 | - | 48.30 | - | 135.97 | 82.42 |
| July-20 | 5.19 | 40.23 | 12.91 | 94.04 | 91.07 | 119.51 | 47.28 | - | 135.15 | 81.76 |
| Aug-20 | 5.07 | 39.37 | 12.37 | 93.13 | 90.06 | 118.49 | 46.26 | - | 135.43 | 80.82 |
| Sept-20 | 5.03 | 38.43 | 12.07 | 94.56 | 89.19 | 117.50 | 45.28 | - | 134.30 | 81.52 |
| Oct-20 | 5.10 | 37.23 | 11.49 | 96.50 | 88.07 | 116.48 | 48.43 | - | 133.21 | 83.04 |
| Nov-20 | 4.95 | 36.25 | 13.87 | 96.56 | 86.79 | 105.92 | 47.48 | - | 128.96 | 83.39 |
| Dec-20 | 4.91 | 39.42 | 13.07 | 95.51 | 85.78 | 104.90 | 46.46 | - | 129.79 | 83.40 |
| | | | | | | | | | | |
| Jan-21 | 4.96 | 38.41 | 12.51 | 95.34 | 84.61 | 103.88 | 45.44 | - | 128.68 | 82.85 |
| Feb-21 | 5.16 | 37.81 | 11.90 | 94.67 | 90.32 | 102.96 | 44.52 | - | 127.81 | 82.88 |
| Mar-21 | 5.07 | 36.75 | 10.92 | 94.86 | 89.61 | 101.94 | 43.51 | 289.18 | 134.08 | 83.58 |
| Apr-21 | 5.10 | 36.06 | 9.93 | 96.23 | 89.80 | 129.76 | 42.52 | 288.20 | 139.02 | 84.68 |
| May-21 | 5.11 | 35.26 | 8.95 | 96.55 | 88.92 | 128.74 | 41.49 | 287.18 | 146.04 | 84.77 |
| June-21 | 5.17 | 34.67 | 10.24 | 96.63 | 89.62 | 127.75 | 40.51 | 286.19 | 152.63 | 85.27 |
| July-21 | 5.28 | 36.17 | 9.22 | 95.44 | 88.60 | 126.73 | 39.49 | 285.17 | 151.65 | 84.19 |
| Aug-21 | 5.29 | 35.65 | 8.20 | 95.68 | 87.37 | 125.71 | 38.47 | 284.15 | 150.66 | 83.94 |
| Sept-21 | 5.32 | 35.44 | 7.21 | 96.27 | 96.99 | 124.73 | 37.48 | 283.17 | 149.54 | 84.76 |
| Oct-21 | 5.27 | 34.69 | 6.19 | 96.21 | 97.38 | 123.71 | 36.46 | 282.15 | 148.61 | 85.00 |
| Nov-21 | 5.09 | 34.22 | 7.81 | 96.19 | 96.43 | 126.04 | 35.48 | 281.16 | 151.42 | 85.50 |
| Dec-21 | 5.02 | 34.71 | 6.76 | 95.93 | 95.42 | 125.02 | 34.46 | 280.14 | 151.51 | 85.37 |
| | | | | | | | | | | |
| N.B. Securities placed in connection with exchange operations are not included |
| MINISTRY OF ECONOMY AND FINANCE | 29 |
| | APPENDIX TO THE 2021 PUBLIC DEBT REPORT |
| BOT: COMPOUNDED GROSS YIELDS |
|
| CTZ / BTP SHORT TERM: COMPOUNDED GROSS YIELDS |
|
| 30 | MINISTRY OF ECONOMY AND FINANCE |
| BTP: COMPOUNDED GROSS YIELDS |
|
| BTP ITALIA AND BTP€I - REAL YIELDS |
|
| MINISTRY OF ECONOMY AND FINANCE | 31 |
| | APPENDIX TO THE 2021 PUBLIC DEBT REPORT |
| CCTEU: COMPOUNDED GROSS YIELDS |
|
| EURO AREA 10-YEAR BENCHMARK SPREADS OVER BUND (BASIS POINTS) |
|
| 32 | MINISTRY OF ECONOMY AND FINANCE |
| ASSET SWAP SPREAD (BASIS POINTS) |
|
| SECONDARY MARKET YIELD CURVE |
|
| MINISTRY OF ECONOMY AND FINANCE | 33 |
| | APPENDIX TO THE 2021 PUBLIC DEBT REPORT |
MONTHLY DEVELOPMENT OF THE WEIGHTED AVERAGE RESIDUAL MATURITY OF GOVERNMENT BONDS (EXPRESSED IN MONTHS) |
|
| 34 | MINISTRY OF ECONOMY AND FINANCE |
|
| |
Ministero dell’Economia e delle Finanze |