| | |
|
| | | Italy’s Stability Programme |
| | |
|
| | |
|
MINISTERO DELL’ECONOMIA E DELLE FINANZE | | Abridged version |
| | | Italy’s Stability Programme |
| | | |
| | | 2023 |
| | | |
| | | |
| | | Abridged version |
| | | |
| | | |
| | | |
| | | |
| | | |
| | | |
| | | Submitted by the Prime Minister |
| | | |
| | | Giorgia Meloni |
| | | |
| | | |
| | | and the Minister of the Economy and Finance |
| | | |
| | | Giancarlo Giorgetti |
| | | |
| | | |
| | | |
| | | |
| | | |
MINISTERO DELL’ECONOMIA E DELLE FINANZE | | Adopted by the Council of Ministers on 11 April 2023 and endorsed by the Parliament on 28 April 2023 |
FOREWORD
The Economic and Financial Document (DEF) is being published against an economic backdrop that remains uncertain and fraught with risks. Recently, the grip of the pandemic and the high energy price has loosened; however, the war in Ukraine continues to rage, geopolitical tensions remain high, and the rise in interest rates and the drain of liquidity operated by central banks have caused pockets of crisis to surface in the international banking system.
Nevertheless, despite such an uncertain situation, the Italian economy continues to show remarkable resilience and vitality. In 2022, GDP grew by 3.7 percent and gross fixed capital formation increased by 9.4 percent in real terms, reaching 21.8 percent of GDP, a level not seen in over twenty years. Although cyclical GDP growth slowed down in the second half of last year, with a slight contraction in the fourth quarter, the latest indicators suggest that economic growth already resumed in the first three months of the year. Business surveys also point to improved expectations for orders and production and an increase in investment compared to last year.
As far as public finance is concerned, 2022 was also positive in terms of the trend in public sector borrowing requirement, which fell to 3.3 percent of GDP, and in general government gross debt, which fell to 144.4 percent of GDP from 149.9 percent at the end of 2021. These results are quite remarkable if one considers the repeated fiscal policy measures adopted to support households and businesses exposed, in particular, to high energy prices, which according to the most up-to-date estimates amounted to 2.8 percent of GDP in gross terms.
The recent reclassification of tax credits related to building bonuses undertaken by ISTAT in agreement with Eurostat led to a shift from cash to accrual basis, resulting in a significant worsening of net borrowing (deficit) in 2022, which stood at 8.0 percent of GDP instead of close to the planned target of 5.6 percent. As a result of this accounting change and the recent changes in the building bonus scheme, the general government deficit based at existing legislation will however tend to improve in the coming years.
Tax credits held by the private sector will start to have a significant impact on cash borrowing requirements and will in any case make it more difficult to continue the rapid reduction in the debt ratio that has characterised the last two years, at least until 2026. In light of this framework, fiscal policy is called upon to ensure the full sustainability of public finance, while remaining ready to respond to new emergencies that may arise.
Given these premises, the Italian government’s first objective is to gradually overcome some of the extraordinary fiscal policy measures implemented over the last three years, and to identify new interventions both to support the most vulnerable and to relaunch the economy.
| MINISTRY OF ECONOMY AND FINANCE | V |
| | ECONOMIC AND FINANCIAL DOCUMENT 2023 |
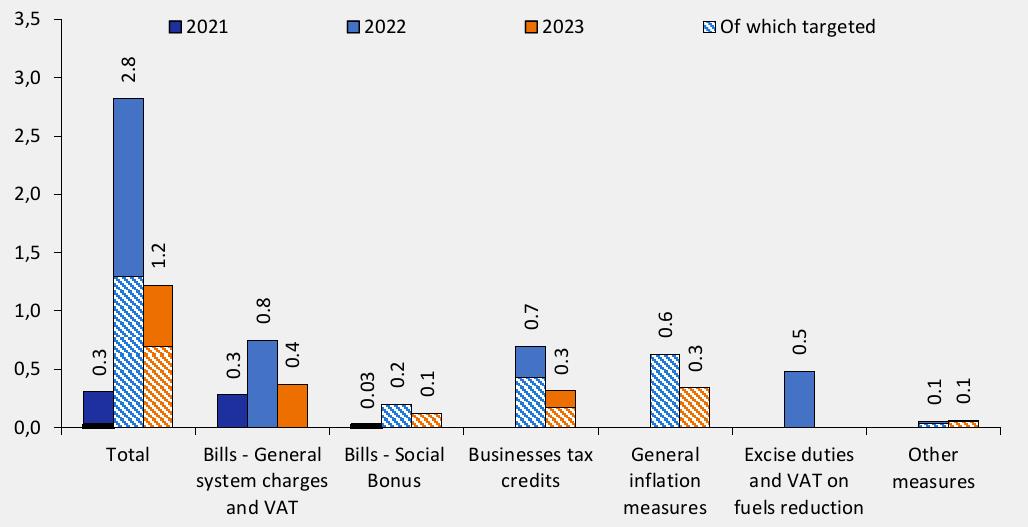
The decision made in the budget law for 2023 to put an end to some emergency measures such as the cuts in excise duties on fuels, while maintaining a high degree of support for households and businesses to curb high energy prices throughout the first quarter, has proved successful. In particular, the cost of the measures against high energy prices for businesses was lower than estimated in the budget law by about five billion.
These resources made it possible to finance new measures to support households, businesses, and the national health system and its operators. The measures contained in Decree-Law No. 34 of 30 March 2023 extended the measures to curb high energy prices for the second quarter, remodelling them. An appropriation of one billion was also provided to fund a further intervention to mitigate the cost of energy for households in the fourth quarter of the year, which will be activated if the price of natural gas is above EUR 45/MWh. In addition, the ‘social energy bonus’ for households with at least four children remains in force and has been increased for families at risk of poverty. The same Decree-Law also covers additional needs of the healthcare system.
The gross impact of measures to counter the high energy price for 2023, including the new measures, amounts to 1.2 percent of GDP. More than half of this amount is directed towards the weakest segments of the population and the companies most exposed to high energy prices, in line with the recommendation of the European Council to favour targeted measures.
The normalisation of fiscal policy relies as well on the revision of building incentives, in particular the so-called superbonus 110 for energy efficiency and earthquake-proofing and the external renovation bonus. The draught of these two measures was significantly higher than originally estimated. In view of their onerousness, the Italian government first intervened by reducing the superbonus rate to 90 percent, except in certain specific cases, for expenditure incurred in 2023.
Subsequently, Decree-Law No. 11 of 16 February 2023 eliminated the possibility of opting for the transfer of the credit or the discount on the invoice instead of the direct use of the deduction, with the exclusion of certain cases. Moreover, the progressive saturation of the purchasing capacity of the banking system had de facto slowed down the transfer of credits, leading in many cases to a lack of liquidity for companies in the construction sector. In order to restart the credit market, the Italian government developed a series of measures that were included in the law converting the abovementioned Decree.
Once this phase is over, the Italian government intends to review the entire matter of building incentives in such a way as to combine the drive for energy efficiency and earthquake-proofing of buildings with the needs of public finance sustainability and distributive equity.
The second objective of the economic-financial planning is to reduce the general government deficit and the debt as a ratio to GDP gradually, but sustainably. With unchanged consistency, the Italian government therefore confirms the net borrowing-to-GDP targets already declared in November in the
| VI | MINISTRY OF ECONOMY AND FINANCE |
Draft Budgetary Plan (DBP), namely 4.5 percent this year, 3.7 percent in 2024 and 3.0 percent in 2025. The target for 2026 is set at 2.5 percent.
The corresponding development of the primary balance (i.e., net borrowing excluding interest payments) shows a small surplus (0.3 percent of GDP) already in 2024 and then markedly positive values in the following two years, 1.2 percent of GDP in 2025 and 2.0 percent of GDP in 2026.
In terms of the structural balance (i.e., adjusted for the output gap and one-off and other temporary measures), the planned reduction is consistent with the current rules of the Stability and Growth Pact with respect to both the so-called ‘corrective arm’ (until the deficit reaches 3 percent of GDP) and the ‘preventive arm’ (once the deficit falls below 3 percent).
After several years, the European Commission decided to reactivate the Stability and Growth Pact as early as 2024. At the same time, last November it presented a proposal to revise the budgetary rules and other aspects of economic governance, including the macroeconomic imbalances procedure (MIP). On 14 March, the ECOFIN Council approved a resolution calling on the Commission to rapidly present the relevant legislative proposals so that they could be approved by the end of the year.
The Commission’s SGP reform proposal focuses on an expenditure rule whose targets are modulated according to the sustainability of each Member State’s public debt. Consistent with the parliamentary resolution of 9 March, during the debate in the ECOFIN and its subcommittees, the Italian government supported the main lines of the Commission’s proposal, while highlighting some critical points (e.g. the categorisation of Member States according to the severity of public finance ‘challenges’) and proposing the adoption of preferential treatment for public investments to fight climate change and promote digital transition (the two pillars of the NRRP), as well as defence spending resulting from commitments undertaken in international fora. The Italian government also supports the need for enhanced symmetry in the MIP and will keep supporting these positions in the negotiations that will follow the presentation of the Commission’s legislative proposals.
The third priority objective that inspires the Italian Government’s economic policy is to continue to support the recovery of the Italian economy and the achievement of higher GDP growth rates and economic well-being of its citizens than those recorded in the past two decades.
The GDP growth forecasts in this Document are extremely prudent in nature, as they are based on cautious and reliable budget projections, which earned them validation by the Parliamentary Budget Office. In the trend scenario under existing legislation, GDP is projected to grow in real terms by 0.9 percent in 2023 - a figure revised upward in comparison to November’s DBP, in which growth in 2023 was set at 0.6 percent - and then to 1.4 percent in 2024, 1.3 percent in 2025 and 1.1 percent in 2026.
The trend projection for 2024 is revised downwards (from 1.9 percent) due to a less favourable configuration of exogenous variables compared to last November. The projection for 2025, on the other hand, is in line with the DBP,
| MINISTRY OF ECONOMY AND FINANCE | VII |
| | ECONOMIC AND FINANCIAL DOCUMENT 2023 |
while the further deceleration foreseen for 2026 is due to the practice whereby as the projection goes further into the future the projected growth rate converges towards the estimate of potential GDP growth, which is estimated at just over 1 percent according to the methodology defined at EU level.
Although these forecasts are cautious, the will and the ambition of this government regarding the growth of the Italian economy is confirmed. In the short term, efforts will be made to support the resumption of growth signalled by the latest data, as well as to contain inflation. Against an estimated deficit based at existing legislation for the current year of 4.35 percent of GDP, maintaining the existing deficit target (4.5 percent) will make it possible to introduce – with a legislative measure to be adopted soon – a cut in social security contributions to be paid by employees with low to medium incomes of more than 3 billion for this year. This will support the purchasing power of households and contribute to the moderation of wage growth. Together with similar measures in the budget law, this decision testifies to the Italian government’s focus on protecting workers’ purchasing power and, at the same time, on wage moderation to prevent a dangerous wage-price spiral.
Also for 2024, public finance projections indicate that, given a trend deficit of 3.5 percent, maintaining the target of 3.7 percent of GDP will create a budget space of about 0.2 GDP points, which will be allocated to the Tax Pressure Reduction Fund. The financing of the so-called unchanged policies from 2024 onwards, as well as the continuation of the cut in the tax burden in 2025-2026, will be supported by a strengthening of the public expenditure review and increased cooperation between tax authorities and taxpayers.
Thanks to the new tax measures for 2023 and 2024 outlined here, GDP growth in the policy scenario is projected at 1.0 percent this year and 1.5 percent in 2024. Since the current deficit projections indicate the need for a more neutral stance of fiscal policy in the 2025-2026 period, the corresponding policy scenario GDP growth projections are equal to the trend ones. This point will be reconsidered if future revisions of the deficit projections indicate the existence of room for manoeuvre without jeopardising the abovementioned net borrowing targets.
A much larger contribution to raising growth in the period covered by this Document will come from the investments and reforms envisaged in the National Recovery and Resilience Plan (NRRP). The Italian government is working to obtain the third instalment of the NRRP by April and to revise or reshape some of the Plan’s projects to accelerate their implementation. The programme under the REPowerEU European initiative is also being prepared, which will include, among other things, new investments in energy transmission networks and production chains related to renewable energy sources.
The start-up of the NRRP suffered from the complexity and innovativeness of some projects, high prices and shortages of components and materials, and red tape. However, new measures have recently been implemented to reorganise the management of the NRRP and adapt procedures on the basis of the initial elements that emerged during implementation. Once the revision of some project lines has been finalised, all conditions are in place to accelerate the implementation of reforms and investments that will not only produce favourable
| VIII | MINISTRY OF ECONOMY AND FINANCE |
socioeconomic impacts, but also raise the economy’s growth potential, together with the completion of the effects of the reform of the Public Procurement Code and other planned reforms, such as that of taxation and finance for growth.
In order to make our country more dynamic, innovative and inclusive, it is not enough just to have the NRRP. Indeed, it is also necessary to invest in strengthening the country’s productive capacity and to work over a longer time horizon than that of the Plan, so as to create the right conditions to avoid new inflationary flare-ups. This is an issue that must be addressed not only in Italy, but also in Europe.
In this context, it is therefore entirely realistic to aim for an increase in the GDP growth rate and employment in the coming years that goes well beyond the forecasts in this Document, along a path of innovation and investment under the banner of ecological and digital transition and the development of infrastructure for the transmission of clean energy and sustainable mobility.
Reducing inflation and restoring the purchasing power of wages is the fourth key objective of the Italian government’s economic policy. Measures to curb high energy prices have been instrumental in slowing the rise in inflation from mid-2021 onwards. The fall in the price of natural gas since the end of last summer has also driven down the price of electricity. The price of oil fluctuated considerably, but although excise duties were brought back to pre-crisis levels in January, fuel prices returned to only slightly higher levels in the second half of 2021.
The inflation rate according to the national NIC index peaked at 11.8 percent in October and November and then dropped to 7.7 percent in March. Although food price growth remains very high (13.2 percent), the decline in energy prices points to a further decline in inflation later this year. Core inflation (excluding energy and fresh food) continued to rise to 6.4 percent in March but is also expected to decelerate in the coming months.
Regarding the consumption deflator, the forecast in this Document is for inflation to fall from an average of 7.4 percent in 2022, to 5.7 percent this year and then to 2.7 percent in 2024 and 2.0 percent in 2025-2026. The fall in inflation will be accompanied by the gradual recovery of wages in real terms, which will have to take place gradually and not mechanically, but in step with the increase in labour productivity.
The objectives summarised here and illustrated more fully in the Stability Programme and in the National Reform Programme are aimed at improving the well-being of citizens and the fairness of our society, the indicators of which are analysed and projected up to 2026 in the annex to the DEF. We are facing great challenges, from climate change to the demographic crisis of the Italian population, but also significant opportunities to open up a phase of development marked by innovation and environmental sustainability and that invests not only in the economic assets, but also in inclusion values, in order to reduce generational, geographical and gender-based gaps.
| MINISTRY OF ECONOMY AND FINANCE | IX |
| | ECONOMIC AND FINANCIAL DOCUMENT 2023 |
The reforms undertaken, starting with the tax reform, are intended to rekindle Italians’ confidence in the future, protecting families and the birth rate and, by recognising the entrepreneurial spirit as an engine of economic development, promoting work as an essential expression of human beings. Therefore, the crux of this Document is responsible ambition.
| | Giancarlo Giorgetti | |
| | Minister of Economy and Finance | |
| X | MINISTRY OF ECONOMY AND FINANCE |
INDEX
| I. | RECENT TRENDS IN THE ECONOMY AND THE PUBLIC FINANCE |
| | |
| II. | BASELINE MACROECONOMIC AND BUDGET FORECAST |
| II.1 | Baseline macroeconomic forecast |
| II.2 | Risks to the baseline macroeconomic forecast |
| II.3 | Budgetary outlook under existing legislation |
| | |
| III. | UPDATED POLICY SCENARIO |
| III.1 | Fiscal policy scenario |
| III.2 | Macroeconomic forecast under the policy scenario |
| III.3 | Budget balance, convergence towards the Medium-Term Objective and expenditure rule |
| III.4 | Debt-to-GDP ratio and the debt rule |
| | |
| IV. | SUSTAINABILITY OF PUBLIC FINANCES |
| | |
| IV.1 | Risk scenarios of public finances |
| IV.2 | Sustainability analysis of public debt |
| | |
| V. | ANNEX |
| MINISTRY OF ECONOMY AND FINANCE | XI |
| | ITALY’S STABILITY PROGRAMME 2023 |
TABLES
| Table II.1 | Summary macroeconomic under existing legislation scenario |
| Table III.1 | Public finance indicators |
| Table III.2 | Synthetic macroeconomic policy scenario |
| Table III.3 | Significant deviations |
| Table III.4 | Trends in current expenditure in relation to the expenditure benchmark |
| Table IV.1 | Sensitivity to growth |
FIGURES
| Figure I.1 | Gross domestic product and industrial production |
| Figure I.2 | Wholesale prices of natural gas and electricity |
| Figure I.3 | Harmonised index of consumer prices |
| Figure I.4 | Italian business confidence indexes |
| Figure I.5 | Net borrowing and gross debt of the general government as a ratio to GDP |
| Figure II.1 | Price indices and balances at existing legislation |
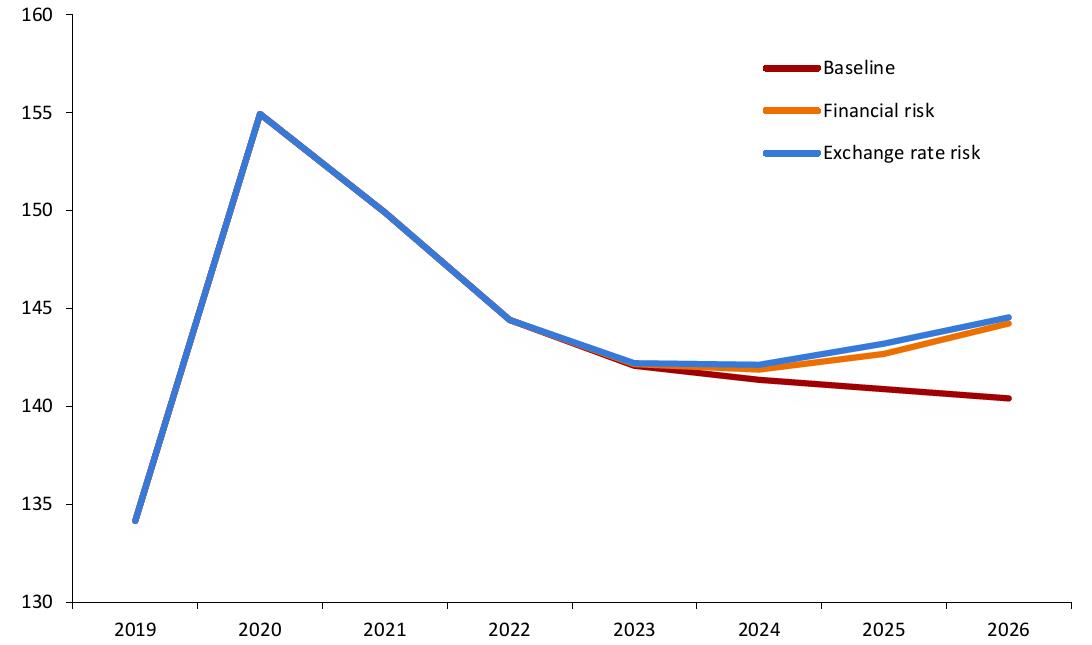
| Figure III.1 | Evolution of the debt-to-GDP ratio gross and net of European aid |
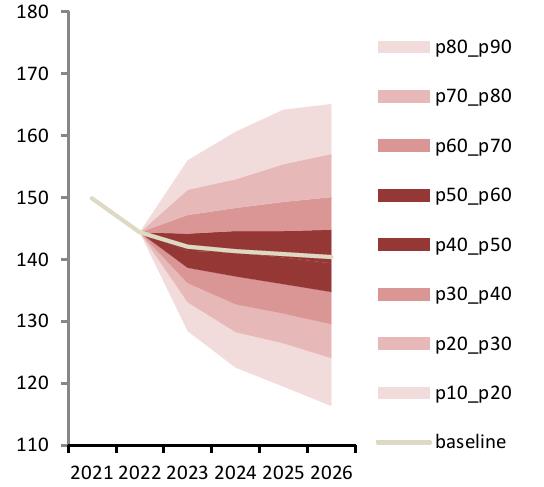
| Figure IV.1 | Dynamics of the debt-to-GDP ratio in sensitivity scenarios |
| Figure IV.2A | Stochastic simulation of the debt-to-GDP ratio under High- Volatility Shock |
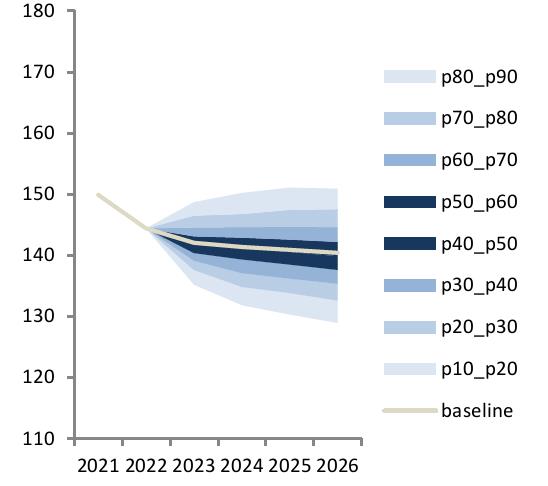
| Figure IV.2B | Stochastic simulation of the debt-to-GDP ratio under Limited Volatility Shock |
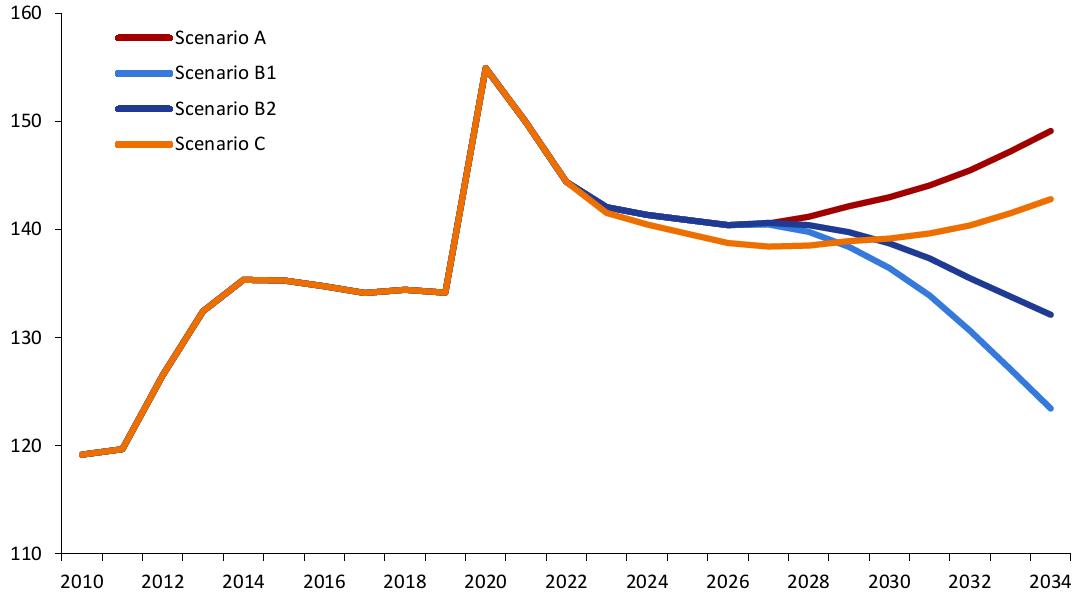
| Figure IV.3 | Medium-Term projection of the debt-to-GDP ratio |
| Figure IV.4 | Debt-to-GDP ratio in the reference scenario |
| Figure IV.5 | Impact of greater reform-related growth |
| Figure IV.6 | Impact of pension reforms |
| Figure IV.7 | Impact of a fiscal adjustment path in line with EGR. Sensitivity to adverse shocks |
FOCUS
| Chapter II | Inflation and price dynamics of energy and food |
| | Forecast errors for 2022 and revised estimates for 2023 and the following years |
| | A risk (or sensitivity) analysis on exogenous variables |
| | Superbonus 110: impact of accounting reclassification, temporary solutions and long-term perspectives |
| | Recent actions taken in response to high energy prices |
| XII | MINISTRY OF ECONOMY AND FINANCE |
| I. | RECENT TRENDS IN THE ECONOMY AND THE PUBLIC FINANCE |
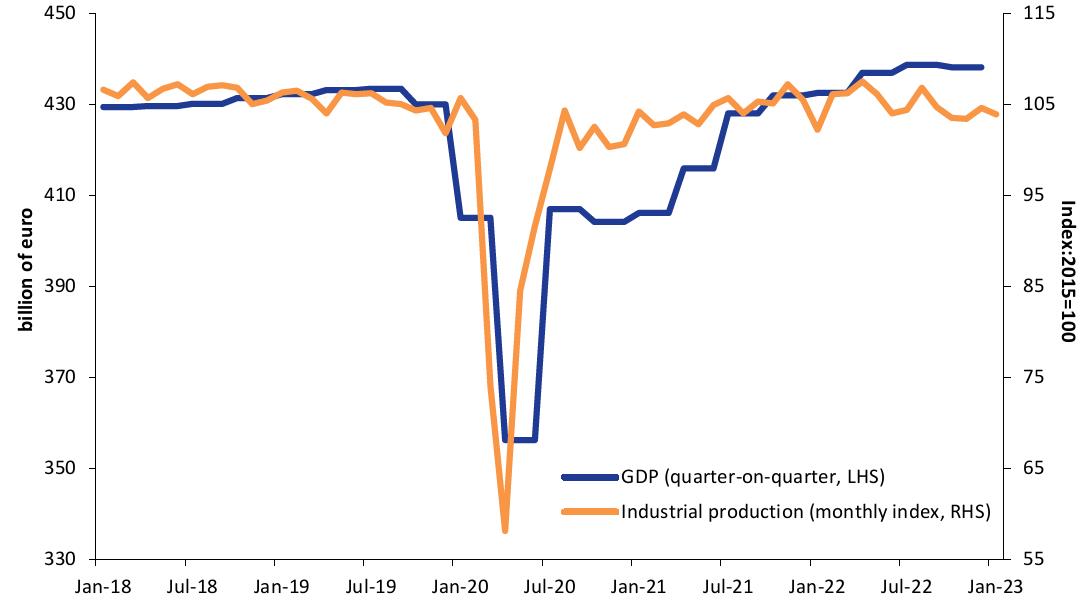
In 2022, Italy continued the recovery of economic activity and the consolidation of public finances initiated the previous year. Despite the difficult economic environment, gross domestic product (GDP) grew by 3.7 percent in real terms, thus surpassing the pre-pandemic level of 2019 in the wake of the strong recovery in 2021 (7.0 percent).
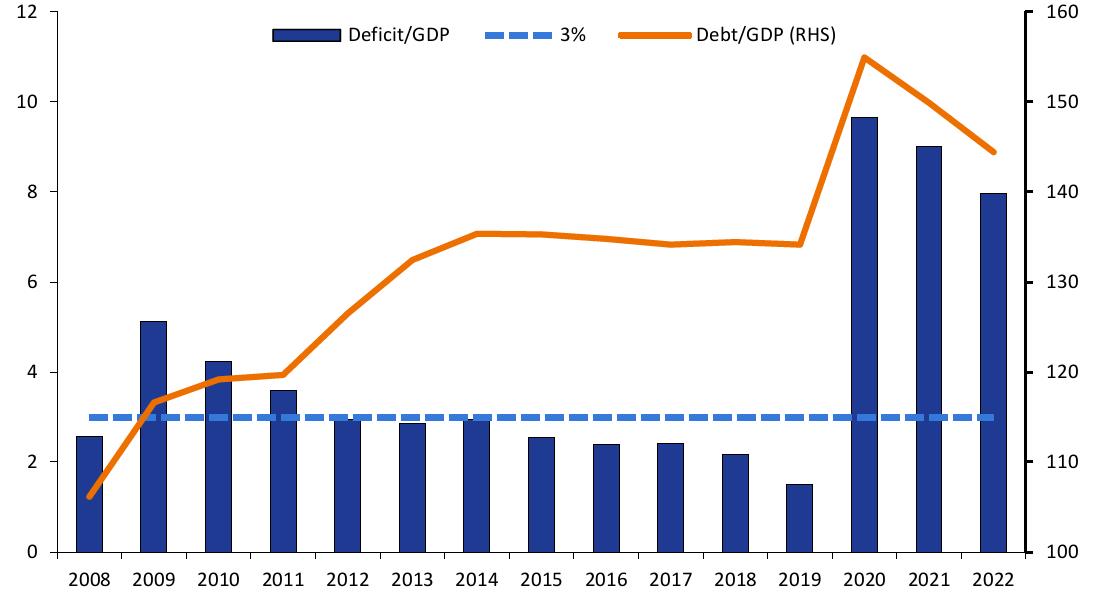
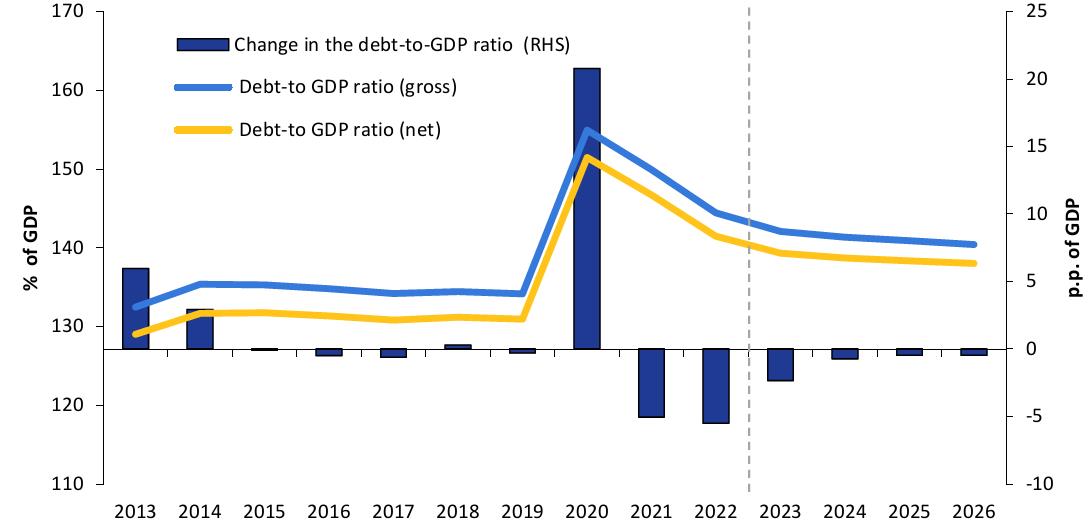
General government net borrowing decreased by about one percentage point: 8.0 percent from 9.0 percent in 2021. The high level of the deficit is attributable to the accounting reclassification of tax credits related to building bonuses, without which the figure would have been 5.4 percent, considering only the effect on expenditure, and close to the official target of 5.6 percent of GDP, also considering the effect on tax revenues. The debt-to-GDP ratio was 144.4 percent, 1.3 percentage points lower than the forecast in last November’s DBP. Sustained nominal GDP growth (6.8 percent) contributed to the sharp reduction in the debt ratio of 5.5 percentage points compared to 2021. In 2021-22 period, the decline amounted to 10.5 percentage points, absorbing more than half of the increase in debt in 2020 due to the pandemic crisis.
Overall growth during 2022 was driven mainly by the recovery in services, thanks to the loosening of anti-Covid measures, and by household spending capacity, as boosted both by the previous accumulation of savings and by government income support policies. Industrial production, on the other hand, weakened gradually, consistent with a deteriorating international macroeconomic environment due to the war in Ukraine, rising energy prices and the gradual normalisation of monetary policy.
The Italian economy remained on an expansionary path until the summer of 2022, demonstrating considerable resilience; however, the slowdown factors mentioned earlier produced a slight contraction of GDP in the closing quarter.
In the first few months of this year, the indicators of the international cycle have been moving towards a phase of moderate recovery, coinciding with the slowdown in inflation. The latter is caused by both lower energy prices and the first effects of monetary policies on the financing conditions of households and companies.
More than a year after the start of the conflict in Ukraine, the humanitarian cost of the war continues to rise. According to UN agency figures, some 17.6 million people are currently in need of protection and humanitarian assistance. To isolate and weaken Russia’s economy, a considerable part of the international community, primarily the European Union, has tightened sanctions against Russia.
| MINISTRY OF ECONOMY AND FINANCE | 1 |
| | ITALY’S STABILITY PROGRAMME 2023 |
| FIGURE I.1: GROSS DOMESTIC PRODUCT AND INDUSTRIAL PRODUCTION |
|
| Source: ISTAT. |
European countries, and Italy in particular, have coped with the energy crisis caused by the drop in Russian gas imports by significantly reducing demand and diversifying supply sources. After the peaks recorded in the summer coinciding with the filling of storages, the price of European gas fell drastically.
| FIGURE I.2: WHOLESALE PRICES OF NATURAL GAS AND ELECTRICITY |
|
| Source: GME – Gestore Mercati Energetici. |
| 2 | MINISTRY OF ECONOMY AND FINANCE |
I. RECENT TRENDS IN THE ECONOMY AND THE PUBLIC FINANCE | |
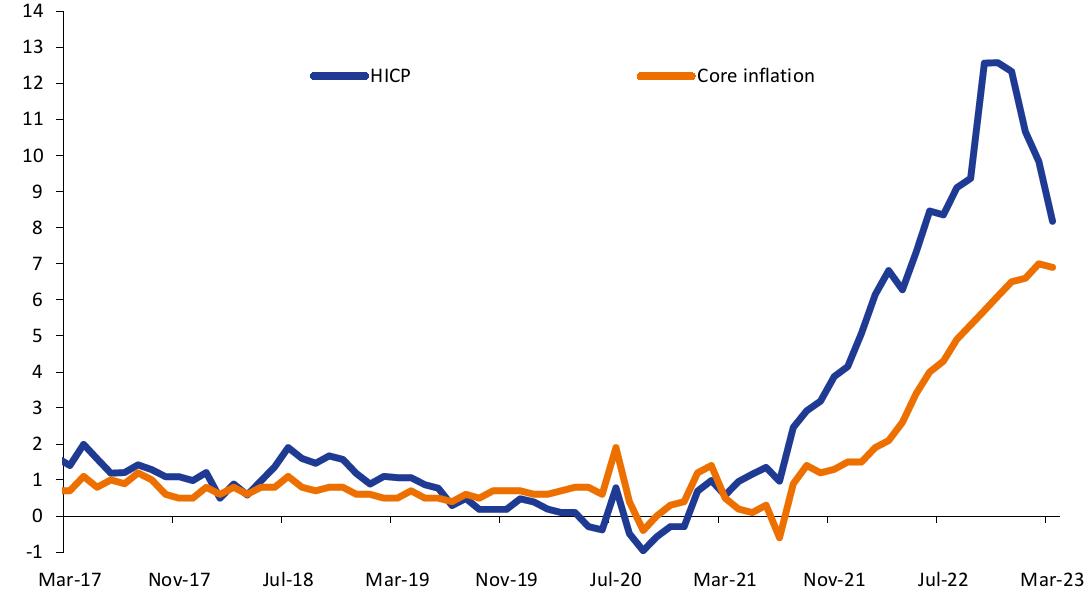
| FIGURE I.3: HARMONISED INDEX OF CONSUMER PRICES (% Y/Y) |
|
| Source: ISTAT. |
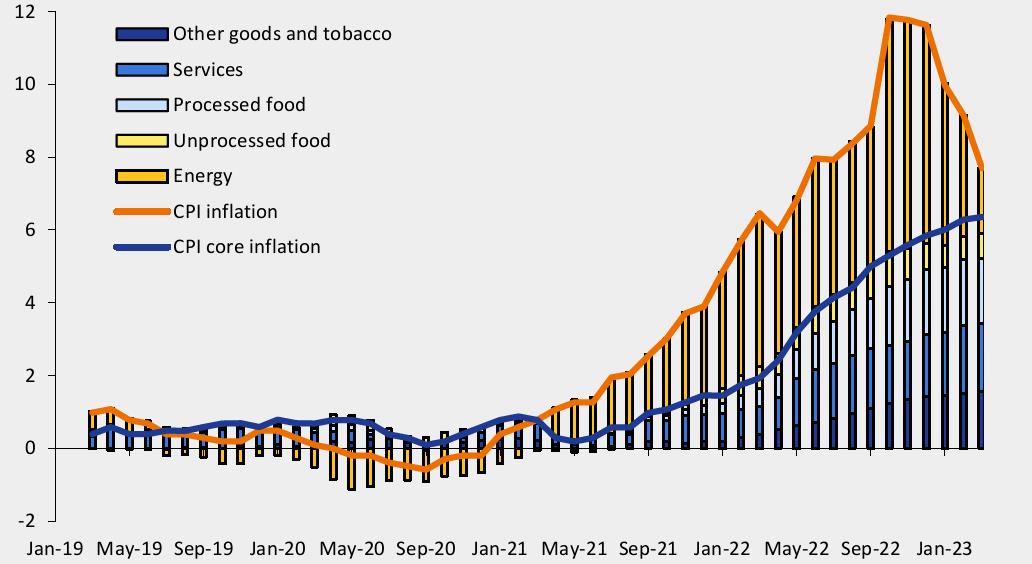
In 2022, the National Consumer Price Index for the whole nation (NIC) grew by 8.1 percent, accelerating significantly compared to 2021 (1.9 percent). Although overall inflation has been slowing since December, ISTAT’s preliminary estimates for March show the core component (which excludes unprocessed food and energy goods) still accelerating, at 6.4 percent trend. On the contrary, in March, the Harmonised Index of Consumer Prices (HICP) showed an initial, slight, decrease in the core component, to 6.9 percent from 7.0 percent in February. To counter inflationary pressures in the euro area, the European Central Bank (ECB) started a restrictive monetary policy cycle last July, which is having the first noticeable effects on the credit market and consequently on the money supply.
After some tensions on the yield spread between Italian government bonds and the Bund during last summer, the spread has decreased since October and has recently remained relatively stable. In addition, the recent financial turmoil caused a downward revision of market expectations on the ECB’s policy rates.
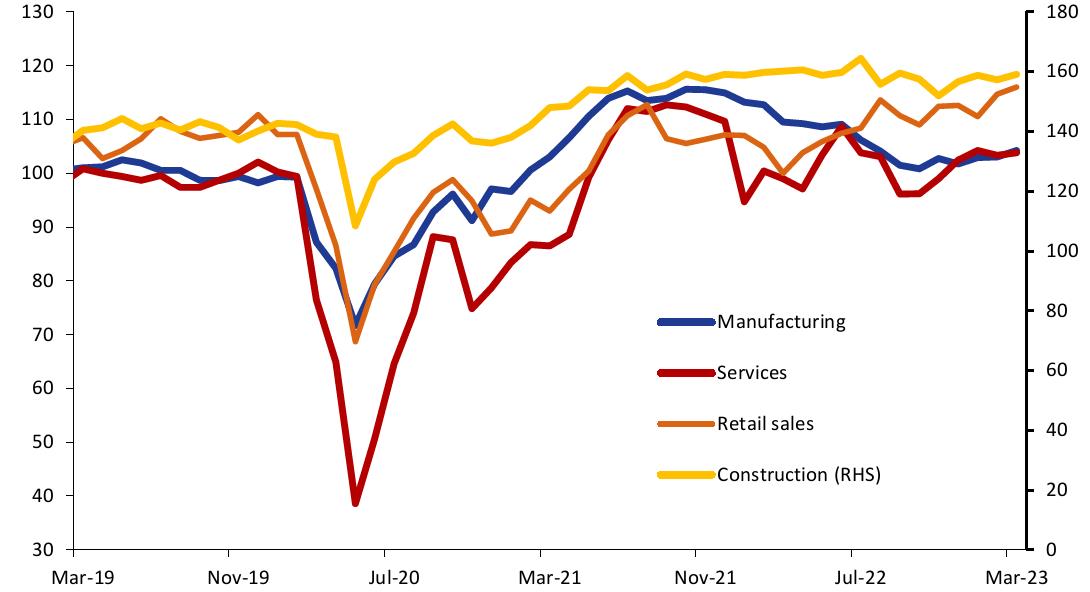
Despite the context of great uncertainty on both the geopolitical and economic fronts, the confidence of Italian households and businesses has been recovering strongly since October and consolidated in February and March. In particular, against a backdrop of a gradual improvement in assessments of price trends, households’ expectations on Italy’s economic situation and unemployment are more optimistic. The improvement in business confidence is equally significant, recording increases in all sectors in March. Notably, it reached a new high in retail trade.
Regarding public finance, the final estimate of net borrowing in 2022, at 8.0 percent of GDP, is approximately 2.4 percentage points higher than the 5.6 percent target set in last November’s DBP. As already mentioned, the gap is due to the revision of the accounting treatment of tax credits related to some building bonuses, which bring forward to the 2020-2022 period the financial effects that would instead be spread over the coming years under the previous statistical
| MINISTRY OF ECONOMY AND FINANCE | 3 |
| | ITALY’S STABILITY PROGRAMME 2023 |
treatment. For the same reason, the deficit-to-GDP ratio estimates for 2020 and 2021 were also revised upwards, by about 0.2 and 1.8 percentage points, respectively. Excluding the impact of this revision, the net borrowing in 2022 would have been close to the planned target of 5.6 percent (including the effect on tax revenues) in sharp decline from 7.2 percent of GDP in 2021, despite the increase in interest expenditure.
In fact, high inflation exerted pressure on index-linked securities, which affected the increase in interest expenditure, which amounted to 4.4 percent of GDP, a level higher than the 4.1 percent projected in the DBP and the 3.6 percent recorded in 2021. The high average duration of government bonds (around seven years) limited the impact of rising rates on the average cost of fixed-income debt.
On the other hand, rising inflation contributed to the 7.9 percent increase in final revenues, as also driven by economic growth. Together with the contained trend in primary expenditure, these allowed for an improvement in the primary balance, from -5.5 percent in 2021 to -3.6 percent of GDP in 2022, despite the considerable resources allocated to mitigate the effects of higher energy prices on households and firms.
The good performance of public finance is also reflected in the data on the cash requirements of the central government, which declined from about EUR 106.3 billion in 2021 to about EUR 66.8 billion in 2022 (a decline of 37.2 percent), contributing to the decline in the debt-to-GDP ratio. The reduction in borrowing requirements is substantial, at EUR 28.5 billion (24.7 percent), even excluding the Recovery and Resilience Facility grants received in August 2021 (almost EUR 9 billion) and April and November 2022 (a total of EUR 20 billion)1.
| FIGURE I.4: ITALIAN BUSINESS CONFIDENCE INDEXES |
|
| Source: ISTAT and MEF estimates for April 2020, when the survey was not published. |
________________________
1 Grants, unlike loans, are in fact accounted for as a reduction of borrowing requirements.
| 4 | MINISTRY OF ECONOMY AND FINANCE |
I. RECENT TRENDS IN THE ECONOMY AND THE PUBLIC FINANCE | |
| FIGURE I.5: NET BORROWING AND GROSS DEBT OF THE GENERAL GOVERNMENT AS A RATIO TO GDP |
|
| Source: ISTAT, Bank of Italy. |
| MINISTRY OF ECONOMY AND FINANCE | 5 |
| | ITALY’S STABILITY PROGRAMME 2023 |
| 6 | MINISTRY OF ECONOMY AND FINANCE |
| II. | BASELINE MACROECONOMIC AND BUDGET FORECAST |
II.1 BASELINE MACROECONOMIC FORECAST
Starting from an ISTAT estimate of real GDP growth in 2022 identical to that forecast in November in the revised and integrated Update of the Stability Programme – equal to 3.7 percent - the existing legislation scenario for 2023 is revised upward, to 0.9 percent, from 0.6 percent in the DBP. The revision considers the most recent economic indicators, which point to a faster recovery of economic activity than forecast in the Update, already starting from the first quarter. The new growth forecast for 2023 also considers the pronounced reduction in energy prices and the improved harmony of the recently observed international environment, as mentioned in the previous paragraph.
Expected GDP growth for the current year is driven by domestic demand net of inventories (0.8 percentage points) and net exports (0.3 percentage points); exports still show a substantial increase (+3.2 percent), as has been the case for several years now. Inventories, on the other hand, would make a slightly negative contribution. Projections assume that firms, with the marked drop in oil and gas prices, and also benefiting from the resources provided for in the RRP, will sustain the demand for investments, as driven by the machinery and equipment and construction components. In addition, companies might only be partially affected by the rise in interest rates due to the self-financing possibilities resulting from recent, high profit margins.
The new macroeconomic forecast is also characterised by a slightly higher inflation rate than envisaged last November. The household consumption deflator is expected to increase by 5.7 percent in 2023, against a projection of 5.5 percent in the Update of the Stability Programme, decelerating from the 7.4 percent observed in 2022. The GDP deflator growth forecast, at 4.1 percent in the Update, is revised to 4.8 percent. This brings the new nominal GDP growth forecast to 5.7 percent.
Despite the slowdown in price dynamics, consumer purchasing power will still be affected by overall high inflation. However, starting in the second half of the year, real income is expected to rise moderately thanks to the resilience of the labour market and the recovery of wages in the private sector, as well as the gradual easing of inflation. The unemployment rate would fall from 8.1 percent on average in 2022 to 7.7 in the current year.
| MINISTRY OF ECONOMY AND FINANCE | 7 |
| | ITALY’S STABILITY PROGRAMME 2023 |
| TABLE II.1: SUMMARY MACROECONOMIC UNDER EXISTING LEGISLATION SCENARIO (1) (percentage changes, unless otherwise indicated) |
| | 2022 | 2023 | 2024 | 2025 | 2026 |
| GDP | 3.7 | 0.9 | 1.4 | 1.3 | 1.1 |
| GDP deflator | 3.0 | 4.8 | 2.7 | 2.0 | 2.0 |
| Consumption deflator | 7.4 | 5.7 | 2.7 | 2.0 | 2.0 |
| Nominal GDP | 6.8 | 5.7 | 4.2 | 3.4 | 3.1 |
| Employment (FTE) (2) | 3.5 | 0.9 | 1.0 | 0.9 | 0.8 |
| Employment (LFS) (3) | 2.4 | 1.0 | 1.0 | 0.7 | 0.8 |
| Unemployment rate | 8.1 | 7.7 | 7.5 | 7.4 | 7.2 |
| Current account balance (balance in % GDP) | -0.7 | 0.8 | 1.3 | 1.6 | 1.6 |
(1) Any inaccuracies are the result of rounding. Database updated with the information available as of 5 April. (2) Employment in terms of full-time equivalent (FTE). (3) Employment (persons) based on the Labour Force Survey. |
As regards the coming years, the GDP growth forecast for 2024 is revised downward in comparison with the Update (to 1.4 percent, from 1.9 percent). The estimate for 2025 is unchanged (1.3 percent), while that for 2026, which is not considered in the Update horizon, is set at 1.1 percent; the latter value reflects the usual approach of making the forecast converge towards the potential growth rate of the Italian economy, estimated at 1.1 percent on average over the four-year planning period using the methodology agreed on at a European level.
The downward revision of the growth rate forecast for 2024 is partly explained by a less favourable international environment, which, contrary to the estimates for the current year, would push down the growth rate of the economy compared to the values projected in the Update. In this respect, the monetary policy followed by the central banks of major western countries plays a prominent role, as it has become more restrictive than foreseen last autumn when the Update was drawn up.
As is well known, an increase in interest rates transmits its full effects on the economy with some lag; therefore, especially in 2024, domestic demand would be less dynamic than last forecast due to recent restrictive interventions by the ECB. Lastly, the moderation in the international business cycle, resulting in lower international trade projections, and an appreciation of the euro exchange rate against the dollar2 contribute to the revision.
Taken as a whole, economic growth forecasts are characterised by caution and prudence, also considering reasons of expediency and prudent planning of public accounts.
Certainly, the implementation of the investment and reform plan organic to the RRP legitimately and correctly creates expectations of higher growth levels than those currently projected in official documents. These expectations are supported by estimates made both by the European Commission3 and within the national planning documents and in the NRP. For the prudential reasons mentioned above, this Document only partially incorporates the effects on productivity and labour supply associated with the implementation of the RRP in the growth estimates.
________________________
2 See the Focus ‘Forecast errors for 2022 and revised estimates for 2023 and the following years’ in this Chapter.
3 For example, according to a study by the European Commission in 2021, ‘we find that the level of real GDP in the EU-27 can be around 1.5 percent higher than without NGEU investments (in 2024). A significant part of this impact comes from spillover effects, pointing to the benefits of joint action’.
| MINISTRY OF ECONOMY AND FINANCE | 8 |
II. BASELINE MACROECONOMIC AND BUDGET FORECAST | |
However, the Stability Programme analyses the favourable impact on public finances of the higher economic growth attributable to the RRP in Chapter IV, within the paragraphs devoted to the analysis of the medium- and long-term sustainability of public debt.
Over the past few years, Italy’s economic growth has surprised on the upside several times, gradually leading the major forecasters - including the main international bodies - to revise their estimates upwards. The Italian government is confident that this will also be the case in the coming years.
The macroeconomic forecast under existing legislation was validated by the Parliamentary Budget Office (PBO) in a note of 7 April 2023.
| FOCUS | Inflation and price dynamics of energy and food |
| Exceptional price growth characterised 2022, driving the inflation rate to levels not seen in more than three decades. Last year, consumer prices, as measured by the NIC (National Consumer Price Index for the whole nation), grew by 8.1 percent, up from 1.9 percent in 2021. |
The inflationary flare-up first affected the so-called volatile component of the reference price basket, which includes energy goods and food. These items weigh about 10 and 18 percent respectively in the expenditure index4. Less affluent households have been hit harder, as a proportionally higher share of their income is spent on these types of purchases and uses. |
| This focus goes into more detail on the causes and the mechanism through which the increase in energy prices occurred, which was subsequently transmitted to core inflation, and illustrates the underlying reasons for the forecast of a gradual unwinding of the phenomenon contained within the Stability Programme. |
| |
| The shock from energy and food prices |
The first inflationary increase occurred as early as 2021; gas and electricity prices started to rise rapidly in the second half of the year, reaching considerable levels compared to the recent past. The increase became more pronounced following the war in Ukraine on 24 February 2022, peaking during the summer months; this was linked to an increasingly limited supply from Russia5 and a ‘race’ to build up stocks by European countries. |
| In August 2022, gas and energy prices exceeded their average value for the period 2015-2019 by a factor of ten, which was also reflected in energy bills. The price increase of the regulated energy goods component of electricity and gas averaged 65.6 percent over the year, three times the increase experienced in 2021 (+22.1 percent). By contrast, the non-regulated component of energy goods, which includes not only electricity and natural gas but also the fuel price, grew by +44.7 percent, four times the annual growth experienced in 2021 (+9.9 percent). In this context, the measures taken during 2022 to reduce the cost of bills and/or to contain the level of energy prices, such as the social bonus, the sterilisation of system charges and the reduction of VAT on gas and excise duties on fuels, helped to contain the increase in prices. |
| The Russian-Ukrainian conflict and adverse weather conditions also affected the food sector, for which price growth in 2022 amounted to 8.8 percent, clearly accelerating compared to |
________________________
4 In fact, one part of foodstuffs, processed goods, is part of core inflation: the latter weighs about 83 percent in the overall basket. Processed and unprocessed goods weigh 11.5 percent and 6.6 percent respectively. Overall, energy goods weigh in at about 10 percent, of which 8 percent concerns the unregulated component.
5 The supply difficulties came from unscheduled extraordinary maintenance activities of the Nord Stream 1 pipeline by Gazprom. It is also worth mentioning the episode of 26 September 2022 concerning the explosion of 3 out of 4 undersea pipes of the Nord Stream gas pipeline to Germany, which further reduced gas flows from Russia.
| MINISTRY OF ECONOMY AND FINANCE | 9 |
| | ITALY’S STABILITY PROGRAMME 2023 |
| | 2021 (0.5 percent). This provided an additional boost to inflation. More specifically, the largest price increases in 2022 were in unprocessed (fresh) food, whose index rose by 9.1 percent, while processed food prices rose by 8.5 percent6 . |
The price increase is primarily related to the impact of the conflict on exports of food commodities, such as wheat, maize, and sunflower oil, of which Ukraine and Russia themselves are important producers worldwide. On average for the year 2022, the price of food commodities on international markets rose by about 20.0 percent7. The peak was recorded between February and March 2022; after further fluctuations, we are witnessing a downward phase in wheat and maize prices, which have come back to the values of the end of 2021. |
The sector was also affected by the price of chemicals and fertilizers used in agriculture, whose production costs were pushed up by the energy shock. In addition, Russia is one of the world’s largest producers and exporters of fertilizers. The rise in prices peaked in August 2022 at 46.2 percent. The subsequent deceleration led to a year-on-year change of 21.5 percent in January 20238. |
| Regarding the production costs of food, the increase in of agricultural and forestry machinery prices, whose producer price index has recorded trend increases of just under 10 percent in recent months, must be considered. |
Finally, in 2022, the low spring temperatures, the exceptional heatwaves in the summer period, the almost total absence of rainfall and the dry climate strongly affected several traditional productions in the country. According to ISTAT, net of price changes, in 2022 Italian agricultural production decreased by 0.7 percent and crops by 2.2 percent.9 |
| This was reflected in consumer prices. Overall, the year-on-year increase in fresh food prices peaked at 12.9 percent in October. The acceleration of processed food prices was later but sharper and is still ongoing: in February 2023 the year-on-year change was 15.5 percent. |
| The rise in energy and food prices spread progressively to the main production sectors of the economy, which passed some of the higher costs on to consumers. This resulted in a continuous rise in core inflation from May 2021, whose average growth last year was 3.8 percent. The year 2022 ended with a year-on-year change of 5.8 percent, rising to 6.4 percent in March 2023, according to the latest ISTAT data. |
| |
| Inflation projections for the current year |
The inflation rate for March 2023, as estimated by ISTAT, shows the fourth consecutive decline in the change in the NIC index, which increased to 7.7 percent from its Novem-ber peak of 11.8 percent. Although consumer price tensions remain widespread in sev-eral categories of goods and services, there is a marked slowdown in energy goods pric-es (in year-on-year terms to 10.8 percent, from the peak of 71.1 percent in October 2022), which affects the regulated component to a greater extent (to -20.4 percent, from 51.6 percent in October
|
________________________
6 Among food products, the highest growth in 2022 was experienced by flour and other cereals, rice, bread, pasta and couscous, milk (especially long-life milk), butter and eggs, fresh fruit and frozen vegetables, frozen fish and poultry, olive oil and sugar.
7 With the largest increases occurring in the price of maize (28.3 percent), rough rice (23.6 percent) and wheat (19.5 percent).
8 Of lesser magnitude was the price increase for the manufacture of agrochemicals and other agricultural chemicals, which spiked more than 13 percent during 2022 to stand at 1 percent in January.
9 In particular, the production of olive oil (-17 percent), cereals (-10.4 percent), fodder plants (-5.5 percent), industrial plants (-4.5 percent), potatoes (-1.9 percent) and fresh vegetables (-1.8 percent) decreased in volume. By contrast, the production of fruit crops (+6.8 percent) and floriculture (+1.1 percent) increased in volume. In 2022, the prices of crop products grew by an average of 17.8 percent, with peaks of 40.3 percent for fodder, 39.9 percent for cereals, 21.2 percent for fresh vegetables, 14.7 percent for citrus fruits, 13.5 percent for industrial plants, 10.1 percent for wine and 6.6 percent for fresh fruit. The price of rice hit a high in February with a year-on-year increase of 41.8 percent.
| 10 | MINISTRY OF ECONOMY AND FINANCE |
II. BASELINE MACROECONOMIC AND BUDGET FORECAST | |
| | 2022) than the non-regulated component (to 18.9 percent, from 79.4 percent in October 2022). The March inflation assumption for 2023 was 5.1 percent. |
| The conditions are in place for the process of falling energy commodity prices, which started at the end of 2022 and became more pronounced in March 2023, to continue in the coming months. Indeed, gas and electricity prices in March were 62.5 percent and 54 percent lower, respectively, than in March 2022. The most recent forward price curves for gas, oil, and electricity are roughly stable throughout 2023, with only a gradual increase in the last months of the year. In recent weeks, forward prices have continued to move downwards. |
| On the protected energy goods market, ARERA has set gas tariffs down by 13.4 percent (EUR 46.58/MWh) for March, while electricity tariffs remain unchanged. The latter, which are updated quarterly, will record a 55.3 percent drop in the price on the bill in the second quarter, the result of a reduction in the cost of energy, only partially offset by the reintroduction of system charges. On the unprotected energy market, the downward trend of gas, oil and electricity is confirmed, whose forward prices in 2023 would nevertheless remain at slightly higher levels than the annual average prices recorded in 2021. |
| In light of these dynamics, it is reasonable to expect that the contraction of the energy component of the consumer price index will continue throughout 2023, both in the protected and unprotected market, although – in the case of the latter – there will be some delay in the adjustment of tariffs to the change in energy commodity prices. The run-up in food prices should also begin to slow down. However, while food commodity futures prices do not show any bullish signs over the next two years, it should not be forgotten that current and future weather conditions could adversely affect production and trigger new price tensions for some agri-food products. Overall, according to internal estimates, the core inflation component will tend to decelerate very slowly and gradually as a joint effect of a slowdown in the non-energy goods component and a stronger persistence of services. |
| The issue of inflation is constantly monitored by the government. While the comeback from the 2022 peaks in energy commodity prices is leading to a gradual loosening of some price containment measures, several measures to support households and businesses remain in place and would be reinforced in the event of new sudden price increases (see Focus ‘Recent initiatives taken in response to the high energy price’). |
| In conclusion, the inflation forecast in this Document is on a downward trend over the next three years. The estimate considers the easing of inflationary pressures already evident in the first months of 2023. This development is justified to a large extent by the well-established downward trend in energy prices. Indeed, the contribution of the energy component to the total change in the NIC index has been declining since the end of last year, giving way to the growing contribution of goods, including food, and services. Therefore, the return of core inflation is expected to be slower and more gradual, and although we are close to the peak, we may see a stabilisation phase in the dynamics before an actual drop in the second half of the year. In detail, the dynamics of the household consumption deflator is expected to be 5.7 percent in 2023, up from 7.4 percent in 2022. Thereafter, even if the deflationary momentum of the energy component is exhausted, the growth of the consumption deflator will fall to 2.7 percent in 2024, before stabilising at 2.0 in 2025 and 2026. |
| MINISTRY OF ECONOMY AND FINANCE | 11 |
| | ITALY’S STABILITY PROGRAMME 2023 |
| | FIGURE R1: INFLATION AND CONTRIBUTIONS OF MAIN AGGREGATES |
| | |
| | Source: MEF elaborations on ISTAT data. |
| FOCUS | Forecast errors for 2022 and revised estimates for 2023 and the following years 10 |
| |
This Focus provides an in-depth look at: (i) the forecast error for the year that has just ended; (ii) the factors that led to the change in growth estimates for 2023 and subsequent years. In both cases, the comparison is made with the forecasts made in the Update of the 2022 Stability Programme of last November. The main results are shown in Table R111 . |
| For 2022, the final figure was in line with the Update of the Stability Programme estimates: ISTAT certified an expansion of real GDP, in seasonally adjusted terms, of 3.8 percent. |
In terms of the components, household consumption and construction investment were more dynamic than expected, while both exports and imports underperformed; in terms of foreign trade, the contribution of net exports was better (less negative). On the price front, the growth of the GDP deflator was broadly in line with the forecast, while that of the consumption deflator exceeded expectations, being affected by stronger dynamics in the food and services components. |
The growth forecast for 2023 is revised upwards by 0.3 percentage points. A positive contribution to this revision is made by the improvement in the profile of international exogenous factors, amounting to 0.5 percentage points, and the stronger-than-expected reduction in gas prices. However, for reasons of prudence, the positive impact was only partially considered due to the high uncertainty characterising the international scenario. Finally, the differential of the carry-over effect on 2023 is nil, as the quarterly profile was also broadly in line with the November 2022 estimates. |
________________________
10 This Focus refers to the working-day adjusted quarterly economic accounts data published by ISTAT on 3 March 2023.
11 The forecasts for 2022 made in November included data from the National Accounts only up to the second quarter of last year, whereas the data published by ISTAT in March also refer to information from the second part of last year and revise the time series of previous quarters.
| 12 | MINISTRY OF ECONOMY AND FINANCE |
II. BASELINE MACROECONOMIC AND BUDGET FORECAST | |
| | TABLE R1: MAIN VARIABLES OF THE MACROECONOMIC FRAMEWORK (SEASONALLY ADJUSTED DATA) |
| | | 2022 Forecast | 2023 Forecast | of which: carry over effect on 2023 | of which: Exogenous impact | of which: other factors |
| | | Update 2022 | ISTAT | Delta 2022 | Update 2022 | SP 2023 | Delta 2023 | Delta (1) | Delta (2) | Delta (3) |
| | GDP | 3.8 | 3.8 | 0.0 | 0.7 | 1.0 | 0.3 | 0.0 | 0.5 | -0.1 |
| | Private consumption | 3.9 | 4.6 | 0.8 | 1.0 | 0.6 | -0.4 | -0.6 | 0.8 | -0.6 |
| | Government consumption | 1.4 | 0.0 | -1.3 | -2.6 | -1.3 | 1.2 | -1.4 | 0.0 | 2.6 |
| | Gross fixed capital formation | 8.7 | 9.7 | 1.0 | 3.0 | 3.7 | 0.7 | 1.9 | 0.6 | -1.8 |
| | Machinery, equipment and miscellaneous | 7.4 | 7.2 | -0.2 | 3.5 | 5.2 | 1.7 | 2.9 | 0.7 | -1.9 |
| | Constructions | 10.8 | 12.2 | 1.4 | 2.6 | 2.3 | -0.3 | 0.6 | 0.4 | -1.4 |
| | Exports of goods and services | 10.7 | 10.2 | -0.5 | 0.9 | 3.2 | 2.3 | 1.8 | -0.6 | 1.0 |
| | Imports of goods and services | 14.0 | 12.5 | -1.6 | 1.3 | 2.5 | 1.2 | -1.1 | 0.1 | 2.2 |
| | Deflators | | | | | | | | | |
| | GDP deflator | 3.0 | 3.0 | 0.1 | 4.1 | 4.8 | 0.7 | 0.4 | -0.1 | 0.4 |
| | Private consumption deflator | 7.0 | 7.4 | 0.5 | 5.5 | 5.7 | 0.2 | 1.5 | -1.0 | -0.2 |
| | Notes: Any inaccuracies result from rounding. |
| | |
| | Table R2 provides a summary of the impact on GDP growth of developments in the international environment, comparing it with what was assumed in the November 2022 Update. This impact, estimated using the ITEM econometric model, is more favourable for 2023. For the following two years, the impact is negative by -0.4 percentage points in 2024 and zero in 2025. |
| | |
| | TABLE R2: EFFECTS ON GDP OF THE INTERNATIONAL SCENARIO COMPARED TO THE UPDATE OF THE STABILITY PROGRAMME OF NOVEMBER 2022 (impact on growth rates) |
| | | 2023 | 2024 | 2025 |
| | 1. World trade | 0.0 | -0.1 | 0.1 |
| | 2. Oil and gas prices | 0.6 | 0.0 | 0.0 |
| | 3. Nominal effective exchange rate | -0.1 | -0.1 | 0.0 |
| | 4. Interest rate assumptions | 0.0 | -0.2 | 0.0 |
| | Total | 0.5 | -0.4 | 0.0 |
| | Note to the Total: any inaccuracies result from rounding. Source: MEF elaborations. |
| | |
| | In detail, compared to the forecast of the Update of the 2022 Stability Programme, international trade is slightly revised downwards for the years 2023-2024 and then recovers in 2025. As a result, the effect of the revision of the world demand forecast on the rate of change of GDP is slightly negative in 2024 (-0.1 percent) and slightly positive in 2025 (0.1 percent). In the first months of this year, oil prices were lower than in the second half of 2022, although they remained at high levels above USD 80 per barrel. The current projection, based on futures contracts, forecasts lower oil price levels over the entire three-year period. After the 2022 peak, the price is expected to follow a gradual moderation in the |
| MINISTRY OF ECONOMY AND FINANCE | 13 |
| | ITALY’S STABILITY PROGRAMME 2023 |
| | following years12. Compared to the November forecast, the price level is only marginally lower in 2023-2025. By contrast, the price of gas has fallen more than expected since December. Specifically, after peaking between August and September last year, in the first two months of 2023 the price fell to pre-Russian-Ukrainian conflict levels. For the current year, according to the futures contracts, the price would be significantly lower than the previous year and would continue to fall to EUR 33.5/MWh in 2026. The gas price in 2023 would be about one third of the level projected in the Update, falling from EUR 144.6/MWh to EUR 50.6/MWh. Overall, over the 2023-2025 three-year period, the gas price would be on average about EUR 60/MWh lower. |
| | Cumulating the effects of the oil and gas declines would result in a positive impact of 6 tenths of a point for the rate of change of GDP in 2023. The impact would be zero in subsequent years. |
| | On the exchange rate front, the usual technical assumption that the exchange rate remains unchanged over the forecast horizon at the average levels of the most recent daily quotations (last 10 working days ending 8 March) was adopted for the currency projection. The update of the nominal effective exchange rate compared to November sees an appreciation of the euro against other currencies of 1.4 percent in 2023, with a negative macroeconomic impact of one-tenth of a percentage point on GDP growth in 2023 and 2024. |
| | The three-year profile of interest rates on government bonds is broadly in line with that of the Update, as a joint effect of the less accommodative policies confirmed by the monetary authorities and the markets’ expectations regarding the first cuts in the cost of money expected as early as the end of this year, after the recent financial tensions. Indeed, bond yields have been falling in recent weeks, with that of the ten-year BTP returning to levels close to 4 percent. Compared to the November forecast: (i) the yield on the BTP is slightly lower in 2023, the same in 2024 and slightly higher in 2025; (ii) the spread between the ten-year BTP and the ten-year Bund is smaller and is projected at just below 200 basis points for the current year; (iii) short-term market rates are instead higher in both 2023 and 2024. In particular, the econometric model estimates that an increase in average lending rates to the private sector will have negative effects on growth only in 2024 and amounting to -0.2 percentage points. |
| | The baseline macroeconomic forecast of this Document was validated by the Parliamentary Budget Office. The latter in February estimated GDP growth at 0.6 percent in 2023 and 1.4 percent in 2024. |
| | In its Winter Forecast, the European Commission forecast GDP growth for 2023 substantially in line with the trend growth published in this Document (0.8 percent compared to 0.9 percent); for 2024, a greater variance emerges (1.0 percent for the European Commission and 1.4 percent for the official estimates). The reasons for this deviation are presumably to be found not only in the recent reduction in gas price futures, but also in the different growth profile for 2023 underlying the forecasts, which implies a lower carry-over to 2024 for the European Commission. |
| | |
| | TABLE R3: GROWTH FORECAST FOR ITALY |
| | Real GDP (percent y/y) | Forecast date | 2023 | 2024 |
| | SP 2023 | Mar-23 | 0.9 | 1.4 |
| | OECD | Mar-23 | 0.6 | 1.1 |
| | UPB | Feb-23 | 0.6 | 1.4 |
| | IMF (WEO) | Jan-23 | 0.6 | 0.9 |
| | European Commission | Feb-23 | 0.8 | 1.0 |
| | Note: For OECD data corrected for working days. |
________________________
12 Reference is made to the average of futures prices over the last ten business days ending 8 March 2023.
| 14 | MINISTRY OF ECONOMY AND FINANCE |
II. BASELINE MACROECONOMIC AND BUDGET FORECAST | |
II.2 RISKS TO THE BASELINE MACROECONOMIC FORECAST
This section contains an analysis of the international economic situation and related risks, as translated into precise sensitivity scenarios for the main exogenous variables of the forecast.
Although the global economy was more resilient than expected last autumn and international cyclical indicators offer an outlook for expansion, some dynamics could weaken economic activity compared to the official macroeconomic picture.
First, the effects of monetary policies are beginning to affect liquidity, especially in the US and Europe. While the slowdown in the growth of the general price index has been helped by the fall in energy commodity prices, interest rate interventions have not yet been reflected in a slowdown of core inflation. There is therefore a risk that a new rise in commodity prices, dictated by OPEC+ oil supply policies and a recovery in Chinese demand, could recreate inflationary pressures at a time when monetary policy is already restrictive.
Second, some risks for international trade come from the possible materialisation of a sharp slowdown in the US economy and a geopolitical climate in which new fronts of tension could be added to the existing ones. Moreover, the first scenario would also impact the exchange rate, while the second would add pressure on commodity prices.
In assessing the repercussions on the Italian economy of the materialisation of these risks, the trend scenario was appropriately subjected to four simulation exercises modifying the evolution of the main exogenous variables, employing the econometric models in use at the Treasury Department.
A first simulation concerns the dynamics of energy commodity prices. In addition to oil price risks, less favourable weather conditions (e.g., drought in the summer months and a colder winter ahead) could cause gas and electricity prices to rise again. Gas, electricity, and oil prices were therefore assumed to be 20 percent higher in the second half of 2023 and in 2024, declining in subsequent years but remaining higher than the base assumption. The materialisation of this risk scenario would reduce growth rates relative to the trend scenario by -0.3 percentage points in 2023 and -0.4 points in 2024.
A second simulation concerns the weakening of world trade, the result of an increased fragmentation of foreign trade and a generalised decline in international demand, which would manifest itself mainly in 2024 and 2025. In both years, the GDP growth profile would fall by 0.2 percentage points.
The exchange rate is also a key variable. A pronounced slowdown in the US economy could be followed by a reshaping of monetary policy. Lower interest rates would weaken the dollar, favouring an appreciation of the euro. As market participants have recently changed their forecasts in this direction, with a greater cut in policy rates in the current year for the Fed than for the ECB, the risk scenario makes use of forward exchange rates, which assume a greater appreciation of the euro against the dollar than in the baseline scenario. The result for Italy’s growth, working through the nominal effective exchange rate, would envisage a revision of the trend macroeconomic scenario of -0.1 percentage points in 2023, -0.3 points in 2024 and -0.6 points in 2025.
| MINISTRY OF ECONOMY AND FINANCE | 15 |
| | ITALY’S STABILITY PROGRAMME 2023 |
Lastly, with reference to risk factors linked to both global financial market conditions and idiosyncratic factors, an increase of 100 basis points in the yield rate of the 10-year BTP is assumed for all forecast years from 2024 onwards, which would cause a reduction in growth compared to trend of -0.1 percentage points in 2024 and -0.4 points in 2025.
| FOCUS | A risk (or sensitivity) analysis on exogenous variables |
| The baseline scenario of this Document incorporates the persistence of high inflation at a global level and the countervailing action of central banks, as well as the continuation of the international crisis linked to the conflict in Ukraine, albeit with the easing of tensions in gas supplies. The framework of uncertainty that characterises the international scenario suggests the advisability of considering certain risk elements in the trend scenario and assessing their repercussions on the Italian economy, should they materialise. |
| The alternative scenarios analysed concern less favourable assumptions about the profile of world demand, energy commodity prices, exchange rates and financial market conditions. To assess the effects on the trend macroeconomic framework of each of these risk factors, four different simulation exercises were conducted using both the ITEM econometric model and the MACGEM-IT computational model. |
| The first scenario concerns a weaker trend in world trade, due to various factors, including a greater fragmentation of foreign trade owing to heightened geo-political tensions and a slower-than-expected path of inflation retraction, which would push back the end of monetary policy tightening. The presence of these risk elements would not affect the current year, where the slowdown in world trade is already pronounced in the baseline scenario, but 2024 and 2025, with an annual change respectively of one and half a percentage point lower than in the baseline scenario. Foreign demand (weighted by trade with Italy) would thus grow by 2.9 percent in 2024 and 3.5 percent in 2025. In 2026, world trade performance would pick up, with growth of 4.4 percent, compared to 3.1 percent in the trend framework. World demand levels would return in line with those of the baseline scenario in the third quarter of 2026. |
| A second simulation concerns the evolution of energy commodity prices (oil, natural gas and electricity). The scenario prefigures a more sustained energy commodity price trend, due to heightened geopolitical tensions and less favourable weather conditions, characterised by drought in the summer months and a harsher winter than the one that has just passed. Gas, oil, and electricity prices in the second half of 2023 and in 2024 were assumed to be 20 percent higher than in the baseline scenario. They would gradually return to the levels outlined in the trend scenario in the following years, being still 10 percent higher in 2025 and 5 percent higher in 2026. Using the MACGEM - IT model, the impact of higher prices was determined both on production levels, considering the use of energy materials in different sectors and inter-sectoral linkages, and on household gas consumption. |
| The third scenario concerns exchange rate developments. The technical assumption underlying the trend framework is to keep exchange rates unchanged over the forecast horizon at the average levels of the most recent daily quotations (in particular, daily quotations in the ten-working-day period ending 8 March 2023 were considered). In the alternative scenario, exchange rates were set at levels corresponding to the most recently observed forward exchange rates (15 March 2023). This would result in a higher appreciation of the euro against the dollar in 2023 than in the baseline scenario (by 1.3 percent instead of 0.9 percent). In 2024, the euro would appreciate against the dollar by 0.6 percent, compared to its slight depreciation in the baseline scenario (-0.2 percent). In 2025, the euro would appreciate by 0.4 percent against the dollar, compared with no change in the baseline scenario. In 2026, the exchange rate of the euro against the dollar would remain unchanged, as in the trend scenario. As regards the nominal effective exchange rate, in 2023 the euro would appreciate more pronouncedly than in the reference scenario (by 1.8 percent versus |
| 16 | MINISTRY OF ECONOMY AND FINANCE |
II. BASELINE MACROECONOMIC AND BUDGET FORECAST | |
| | 1.4 percent). In subsequent years, with the nominal effective exchange rate unchanged in the baseline scenario, the euro would appreciate on average against other currencies by 1.5 percent in 2024, 2.4 percent in 2025 and 0.3 percent in 2026. These dynamics would be affected to a non-negligible extent by the expected depreciation against other currencies, implicit in the forward exchange rates, of the Turkish lira, the Brazilian real and the Russian rouble. |
| | The fourth scenario concerns risk factors related to financial market conditions. A level of the yield rate on the 10-year BTP was assumed to be 100 basis points higher than the trend in each year of the forecast horizon, due to the possible transmission to the sovereign debt segment of tensions generated in other segments of the financial system. These less favourable conditions for sovereign debt financing would not affect 2023, but all subsequent years of the forecast horizon. In this alternative scenario, the higher levels of the BTP-Bund spread from 2024 onwards would lead to less favourable conditions for customers in accessing credit, with the application of higher interest rates on credit to households and businesses. |
| | The assessment of the effects on economic activity levels of the risk factors outlined above is shown in Table R1. Under the assumption of weaker world trade developments starting next year, the GDP growth rate would be lower than in the trend scenario by 0.2 percentage points in both 2024 and 2025. The strong recovery in 2026, with foreign demand returning to the levels of the baseline scenario in the third quarter of the year, causes GDP to grow by 0.3 percentage points more in that year than in the baseline scenario. Less favourable developments in energy prices cause the GDP growth rate to fall by 0.3 percentage points in 2023 and 0.4 points in 2024. The adjustment path would start gradually from the following year, with GDP growth rates higher than the reference framework by 0.4 and 0.2 percentage points in 2025 and 2026, respectively. |
| | Regarding exchange rates, the higher appreciation of the euro relative to what is projected in the framework would result in a GDP growth rate that is lower by 0.1 percent in 2023, 0.3 percent in 2024, 0.6 percent in 2025 and 0.3 percent in 2026. In the scenario of a deterioration of the economy’s financial conditions, the GDP growth profile would be lower than in the trend scenario by 0.1 percentage points in 2024, 0.4 points in 2025 and 0.5 points in 2026. |
| | |
| | TABLE R1: GDP EFFECTS OF RISK SCENARIOS (impact on percentage growth rates compared to trend macroeconomic framework) |
| | | 2023 | 2024 | 2025 | 2026 |
| | 1. World trade | 0.0 | -0.2 | -0.2 | 0.3 |
| | 2. Energy commodity prices | -0.3 | -0.4 | 0.4 | 0.2 |
| | 3. Nominal effective exchange rate | -0.1 | -0.3 | -0.6 | -0.3 |
| | 4. Financial conditions of the economy | 0.0 | -0.1 | -0.4 | -0.5 |
II.3 BUDGETARY OUTLOOK UNDER EXISTING LEGISLATION
The forecasts in the existing legislation scenario of public finance take into consideration the updated baseline macroeconomic scenario and the most recent data from the monitoring of general government revenue and expenditure trends, including the accounting effects of the reclassification of tax credits made by ISTAT13. They also include the further realignment of the assumptions on the time
________________________
13 Please refer to the Focus ‘Superbonus 110: impact of accounting reclassification, temporary solutions and long-term perspectives’ for all related details.
| MINISTRY OF ECONOMY AND FINANCE | 17 |
| | ITALY’S STABILITY PROGRAMME 2023 |
profile of the expenditure financed by the Next Generation EU programme, and the measures adopted in the final months of 2022 and in the first months of the year, in particular those to contain the effects of the increase in energy prices envisaged by the 2023-2025 budget law and by the recent decree-law No. 34 of 30 March 2023.
The general government net borrowing for the current year is projected at 4.4 percent of GDP, a level slightly below the DBP target of 4.5 percent, and in sharp decline from 8.0 percent in 2022.
On the primary balance side, the upward revision of the inflation rate and GDP forecasts, compared to the DBP forecasts, leads to an increase in revenues, both from indirect and direct taxes. The downward trend of energy prices, in gradual stabilisation, allowed for a containment of public finance costs for extraordinary measures to support households and businesses in the first quarter. In fact, the recent decree-law No. 34 of 2023 envisages measures amounting to approximately EUR 3.6 billion in gross terms, entirely covered by the expenditure savings resulting for the support measures in the first quarter of 2023, thus being neutral on budget balances. The primary balance would thus improve to -0.6 percent of GDP from - 3.6 percent of GDP in 2022.
Regarding interest expenditure, the forecast for 2023 is 3.7 percent of GDP, down from 2022, due to the lower inflation rate resulting in a lower revaluation of price-indexed securities.
For the next three years, by contrast, interest expenditure is projected to increase to 4.1 percent of GDP in 2024, 4.2 percent in 2025 and 4.5 percent in 2026. This is because increasing shares of the stock of public debt will have absorbed the higher yields resulting from the ECB’s raises of reference rates.
Expenditure on social transfers is expected to grow at a sustained pace especially in 2023 and 2024, as it is affected by benefit indexation based on the previous year’s inflation rate.
In addition, the reshaping of RRF flows results in a higher concentration of public investment expenditure, particularly in 2024 and 2025.
These expenditure increases are, however, more than offset by the phasing-out of temporary measures for high energy prices, and by the complete elimination of exceptional interventions to cope with the effects of the pandemic. Primary expenditure as a ratio of GDP is projected to fall from 52.4 percent in 2022 to 45.1 percent in 2026.
As a result of these factors, in the baseline scenario under existing legislation, the general government net borrowing as a ratio of GDP is projected on a moderately better profile than in the DBP, falling to 3.5 percent in 2024, 3.0 percent in 2025 and 2.5 percent in 2026, a level that is below the 3 percent threshold indicated by the Stability and Growth Pact.
In the same scenario, the debt-to-GDP ratio is projected to continue on a downward path, albeit at a slower pace than the extraordinary reductions observed in the last two years (-5.5 percentage points recorded in 2022 relative to 2021 and -5.0 percentage points recorded in 2021 relative to 2020). The ratio is expected to fall from 144.4 percent in 2022 to 140.4 percent in 2026.
| 18 | MINISTRY OF ECONOMY AND FINANCE |
II. BASELINE MACROECONOMIC AND BUDGET FORECAST | |
| FIGURE II.1: PRICE INDICES AND BALANCES AT EXISTING LEGISLATION (y/y change and % of GDP) |
|
| Source: ISTAT. As of 2023, forecasts under the existing legislation scenario of this Document. |
| FOCUS | SUPERBONUS 110: IMPACT OF ACCOUNTING RECLASSIFICATION, TEMPORARY SOLUTIONS AND LONG-TERM PERSPECTIVES |
| |
| Accounting reclassification |
| Starting in 1998, several tax benefits have been introduced in Italy for the requalification of existing buildings, which have been extended, more recently, to include energy efficiency and seismic risk reduction interventions. These measures consist of tax deductions proportionate to the amount of expenditure incurred, with different rates depending on the type of intervention. |
| Over the last few years, significant changes have been made to the system of eligibility for building incentives, which have significantly increased the deduction rate and allowed for the possibility, as an alternative to direct use, of a discount on the invoice paid in advance by suppliers or the transfer of the deduction in the form of a tax credit. |
| Among the various incentives, the so-called sismabonus, superbonus and external redecoration bonus are particularly important. |
| The sismabonus provides for a deduction of 50 percent, 70 percent and 80 percent of the expenses incurred, which varies depending on the degree of seismic risk reduction achieved through the intervention, with further increases in the case of works carried out on the common areas of apartment buildings (75 percent or 85 percent). |
| For expenditure incurred from 1 July 2020, the superbonus was introduced, raising the deduction rate up to 110 percent for expenditure on specific works in the field of energy efficiency and anti-seismic interventions on buildings. Then, with effect from 1 January 2023, the deduction was reduced to 90 percent for interventions carried out in 2023 in apartment buildings and those carried out by individual residents on building units. The 90 percent deduction of the expenses also applies to new interventions on single-family houses, begun as from 1 January 2023, only if the owner (or the holder of the real right) has a reference income, determined on the basis of coefficients that take into account the size of the household, not exceeding EUR 15,000 and the property is used as a main residence. |
| Regarding the external redecoration bonus, the tax relief consisted in a tax deduction of 90 percent of the expenses incurred in 2020 and 2021, and 60 percent of the expenses incurred in 2022, for interventions aimed at the recovery or restoration of the external facade of existing buildings, of any cadastral category, including commercial property. |
| MINISTRY OF ECONOMY AND FINANCE | 19 |
| | ITALY’S STABILITY PROGRAMME 2023 |
| | The introduction in 2020 of the invoice discount and credit transfer options has changed, from a statistical point of view, the nature of certain benefits and, consequently, their recording in the national accounts. |
| The ESA 2010 provides for two distinct types of tax credits, ‘payable’ credits and ‘non-payable’ credits. The ‘payable’ credits are those that can be reasonably expected to be used in full by the beneficiary irrespective of the size of the beneficiary’s tax liability at the time of their accrual, either through refund or through the possibility of using them as a set-off against taxes and social security contributions due, possibly even in years after the year of accrual. Such credits give rise to a debt of a definite amount owed by the State to the beneficiary and must therefore be recognised as an expense, with an impact on net borrowing in the year in which the right to the benefit arises for the full amount due (on an accrual basis), regardless of when they are used. |
| Conversely, ‘non-payable’ credits become uncollectable once the taxpayer’s tax credit limit is exceeded. They are recorded as a reduction in tax revenues, with an impact on net borrowing in the years in which they are used by the taxpayer. |
| The measures that introduced and then extended the building incentives with the transfer option had, however, discounted the related financial effects in terms of lower tax revenues according to the time profile of the use of the benefit as offset or deduction. This accounting treatment was consistent with the classification of tax credits as ‘non-payable’ according to the ESA 2010 and in line with the provisional opinion issued by Eurostat on 8 June 2021 on the statistical treatment of the superbonus. |
The new version of the 2022 Manual on Government Deficit and Debt, published by Eurostat on 1 February 2023, provided clearer guidance for distinguishing ‘payable’ and ‘non-payable’ credits and for identifying the time of recording. The new text considers three criteria for identifying ‘payable’ credits: transferability, deferral of use to years following the year of accrual, and the possibility of offsetting credits against any type of tax or social contribution owed by the beneficiary taxpayer. These characteristics of the credit, by increasing the likelihood of actual and full utilisation of the tax benefit, determine its classification as ‘payable’. |
| |
| Impact on net borrowing and public debt |
| Based on the criteria set forth in the new version of the Manual on Government Deficit and Debt, ISTAT, in agreement with Eurostat, classified the superbonus 110 and the external redecoration bonus as ‘payable’ and, consequently, recorded in expenditure (as investment grants) the full amount of the credit accrued in the year in which the taxpayer incurred the expenditure giving rise to the tax benefit. |
| The revision of the classification, announced with the publication of the preliminary estimates for GDP and net borrowing on 1 March 2023, resulted in the effects on net borrowing being brought forward in time compared to the cash recording. Considering the accounting reclassification of the two credits, the general government net borrowing was revised upward by 0.2 pp. of GDP in 2020 and 1.8 pp. of GDP in 2021. Overall, over the three-year period 2020-2022, the impact of the reclassification can be estimated at approximately 4.6 percentage points of GDP. |
| The reclassification entails, all other things being equal, an upward revision of the general government expected tax revenues for the years to come. In this regard, note that in the forecasts contained in the Update to the 2022 Stability Programme and in the 2023 Draft Budgetary Plan of last November, the expected financial effects of the two building incentives were spread over the period of use of the deductions, consistently with the accounting of the tax deductions as a reduction of tax revenues for the portion of the credit due in the year. |
| The updated forecasts consider the effects on public finance under the new accounting rules, pending new directions from the statistical authorities, which may revise the recording |
| 20 | MINISTRY OF ECONOMY AND FINANCE |
II. BASELINE MACROECONOMIC AND BUDGET FORECAST | |
| | methods for future years in light of the most recent regulatory interventions (Italian Decree-Law No. 11/2023), which have prohibited the transfer of tax credits, save for limited exceptions. |
The updating of the forecasts of the general government account reflects these measures aimed at containing the negative effects on public finance related to the significant growth in expenditure for subsidised interventions, while still providing for a transitional regime, which allows for the exercise of the invoice discount and credit transfer options for interventions with already submitted building permits, protecting those whose interventions are at an advanced stage of planning14. |
| Lastly, again with regard to the impact on public finance, it should be noted that the accounting reclassification has not, at present, had any effect on the public debt, as the cash profile of the use of tax benefits is not affected by the different criterion used for recording accruals for ESA 2010 purposes. |
| Public debt is, in fact, driven by the development of the government sector’s borrowing requirements, which records revenues and expenditures at the time they actually occur in cash. The effect on the public debt of tax credits is therefore evident when tax offsetting and the associated reduction in revenue take place. |
| |
| Macroeconomic impact of the superbonus 110 |
| In recent years, taxpayers have benefited significantly more than expected from certain building benefits. Table R.1 shows: (i) the initial ex-ante estimates resulting from the technical reports accompanying the various building bonuses provided in the 2022 Stability Programme and referring to the overall effects over the entire time horizon of each bonus; and (ii) updated estimates that consider both the methodology and assumptions on taxpayers’ behaviour adopted in the technical reports and the most recent monitoring data on the bonuses. |
| |
| TABLE R1: ESTIMATE OF THE IMPACT OF BUILDING BONUSES ON PUBLIC FINANCE (in billions of euro) |
| | Initial estimate | Update | Differential |
| Superbonus 110 | -36.55 | -67.12 | -30.57 |
| External redecoration | -5.90 | -19.00 | -13.10 |
| Other bonuses | -29.87 | -30.01 | -0.14 |
| Total | -72.32 | -116.13 | -43.81 |
| |
| Compared to the initial estimates, the trend forecasts of the superbonus 110 and the external redecoration bonus, contained in the Update of the 2022 Stability Programme, had already been revised upward to EUR 61.2 billion and EUR 19 billion, respectively, against an initial assessment of charges to public finance of EUR 36.6 billion and EUR 5.9 billion. With the 2023 Stability Programme, the impact of the superbonus is revised to EUR 67.12 billion. |
| Considering the much higher-than-expected demand for the two bonuses, several trade associations and consulting firms have proposed macroeconomic impact assessments, with the aim of verifying the economic growth attributable to the bonuses and quantifying their effects in terms of higher contribution and tax revenues on public finance. |
| Such assessments usually suffer from several approximations that cause the estimated impact - and the resulting tax effects - to be overestimated. Several analyses take as a |
________________________
14 In particular, the transfer of credit for the superbonus 110 benefit remains possible for works whose CILA (sworn notice of work commencement) was submitted before 16 February 2023 and whose expenditure will be made before 2023.
| MINISTRY OF ECONOMY AND FINANCE | 21 |
| | ITALY’S STABILITY PROGRAMME 2023 |
| | reference the entire expenditure related to the superbonus without considering that part of the investments would have been made anyway even in the absence of the 110 percent incentive, thus distorting the evaluation of the causality effect of the policy measure. Moreover, these assessments do not consider the fact that the bonus might have led to an acceleration of investments that would have been made in any case over time, entailing a temporal reallocation of expenditure in favour of the years of validity of the bonus but to the detriment of the other years. |
| Preliminary assessments carried out within the MEF, which are currently being finalised, indicate that the superbonus 110 and the external redecoration bonus represented an important growth factor for the building sector and related activities, while their impact on the economy as a whole was more moderate. In particular, the contribution to economic growth in the two-year period 2021-2022 of the two benefits is estimated to be between 1.5 and 2.5 percentage points. Please note that these are provisional figures, which will have to be validated with future analyses. |
In this regard, please also note the considerations expressed by the Bank of Italy and the Parliamentary Budget Office during recent hearings15. In particular, the Bank of Italy has estimated that about half of the investments that benefited from the superbonus would not have occurred in the absence of the incentive and that, even considering the taxes and social security contributions paid for the increase in the sector’s activity, the burden of the measure on the public budget is still significant. Regarding the effects at the macroeconomic level, the Bank of Italy considers plausible a multiplier of building bonuses not far from unity. |
| The Parliamentary Budget Office has estimated as a first approximation that, half of the contribution to GDP growth from investment in residential construction reported by ISTAT for 2021-2022 (2 percentage points) can be attributed to the tax incentive. |
| Lastly, it should be noted that the reclassification of incentives, per se, does not change the assessments of the macroeconomic impact of the measures, which were already based on assumptions as to the timing of the actual expenditure. |
| |
| Temporary solutions and long-term prospects |
Given the high cost of the measure, the Government first intervened by bringing forward the reduction to 90 percent of the deduction rate on expenses incurred in 2023 for apartment buildings, except for those who had submitted the CILA by the end of November 202216. Then, with Italian Decree-Law No. 11 of 16 February 2023, the invoice discount and credit transfer options to the direct use of the deduction were abolished effective 17 February 2023. |
| The measures introduced over time to combat fraud phenomena and the gradual saturation of the banking system’s purchasing capacity have slowed down the transfer of credits, leading, in many cases, to a lack of liquidity for companies in the construction industry, which, having already granted the invoice discount, could no longer transfer the credit to the financial system. |
| To relaunch the credit market, the Government has drawn up a series of measures that are included in conversion law No. 38 of 11 April of the aforementioned decree-law. A number of |
________________________
15 Hearing of 29 March 2023 of the Head of the Bank of Italy’s Structural Economic Analysis Directorate and hearing of 16 March 2023 of the Chair of the Parliamentary Budget Office before Committee V of the Chamber of Deputies as part of the fact-finding inquiry on the macroeconomic and public finance effects of building tax incentives.
16 Italian Decree-Law No. 176 of 18 November 2022 (so-called ‘Aiuti quarter’ Decree), converted by Italian Law No. 6 of 13 January 2023.
| 22 | MINISTRY OF ECONOMY AND FINANCE |
II. BASELINE MACROECONOMIC AND BUDGET FORECAST | |
| | provisions are envisaged to increase the tax capacity of the transferees, either by extending the terms for using the relief, or by restoring in bonis credits subject to unfinished transfers17. |
| Concerning the credits for the superbonus, banks, financial intermediaries, and insurance companies, which have exhausted their tax capacity in the same year, are also allowed to use the aforementioned credits, in whole or in part, to purchase multi-year Treasury bonds with a maturity of not less than 10 years. The possibility of subscription is, however, only authorised within the limit of 10 percent of the annual portion that exceeds the tax credits related to the superbonus already used for offsetting purposes. |
| Lastly, to further facilitate the circulation of credits on the market, the perimeter of the several liability of the supplier applying the invoice discount or of the transferee has been limited, in the case of transfer transactions that have as their object unduly used benefits. |
| The abolition of the invoice discount or credit transfer options also has structural implications, linked to the current ecological transition, requiring the adoption of new measures. |
On the one hand, measures have been introduced to allow the transformation of deductions into tax credits for limited social categories, such as social housing and non-profit organisations, for interventions in buildings damaged by seismic or meteorological events18, or for works in areas at greater seismic risk. |
| On the other hand, also in light of the discussion at the European level of the so-called ‘Green Homes’ directive, it has become clear that there is a need to no longer intervene with extraordinary or emergency measures, but rather with programmes, funds and resources that are consistent with the public finance framework and capable of supporting the construction and building renovation market in a way that is permanent and sustainable over time. |
| Following Eurostat’s final decisions on the criteria for accounting the credits in question and on the effects of the measures introduced with Italian Decree-Law No. 11 of 2023, the Government, when updating this Document, will account for the effects of the aforementioned decisions and measures with reference to their impact on public finance balances. |
| FOCUS | RECENT ACTIONS TAKEN IN RESPONSE TO HIGH ENERGY PRICES |
| |
| Measures introduced with the public finance manoeuvre for 2023 |
| In the last months of 2022, energy goods prices, albeit decreasing, remained at high levels, making it necessary to extend some support measures for households and firms introduced in previous quarters. The impact of these extensions was included in the updated policy scenario in the Update of the 2022 Stability Programme and in the 2023 DBP of last November. |
An initial action taken by the Italian Government was the so-called ‘Aiuti quater’ decree19 of last 18 November. Among other things, the decree provided for the extension to December 2022 of tax credits in favour of companies for the purchase of electricity and gas and the extension of the reduction of excise duties and VAT on fuels until 31 December 2022. |
| With the presentation of the draft budget law for 2023, in line with the European Commission’s recommendations, the Italian Government prioritised the prolongation and the |
________________________
17 More specifically, taxpayers had to notify the Revenue Agency of the invoice discount or credit transfer options relating to 2022 expenses by 31 March 2023. Should they not have concluded the transfer contract by that date, they may resort to remission in bonis by 30 November 2023, paying a EUR 250 penalty (Article 2.1 of Italian Decree-Law No 16/2012). The possibility is limited to cases where the transferee is a qualified entity, i.e., a bank or other financial institution authorised to operate in Italy.
18 This refers to the seismic events that occurred since 2009 in municipalities for which a state of emergency was declared, and to the floods that hit the Marche region last autumn.
19 Italian Decree-Law No. 176/2022 converted by Italian Law No. 6 of 13 January 2023.
| MINISTRY OF ECONOMY AND FINANCE | 23 |
| | ITALY’S STABILITY PROGRAMME 2023 |
| | reinforcement of measures targeted at households and businesses most vulnerable to energy price increases, limiting those of a more generalised nature. |
The main measures introduced by the 2023 budget law for the first quarter of 2023 and included in the energy package concerned: (i) the extension and strengthening of measures to contain costs on energy bills for EUR 5.7 billion (0.3 percent of GDP); (ii) the prolongation of the reinforcement of social bonuses for electricity and gas utilities for EUR 2.5 billion (0.1 percent of GDP) with the simultaneous broadening of beneficiaries pool through the increase of the maximum ISEE threshold to be eligible for them; iii) the extension of tax credits for both energy-intensive and non-energy-intensive firms for EUR 10.2 billion (0.5 percent of GDP), with a strengthening of the coverage percentages of such credits; iv) the extension to the whole 2023 of the social security contribution exemption for employees with incomes up to EUR 35,000 for EUR 6.5 billion (0.3 percent of GDP)20. |
Regarding excise duties and VAT on fuels, following a drop in fuel prices, the Government decided to reduce the relief from about 30 to about 18.5 cents per litre (VAT included) in December 202221, and to not extend the relief to the first months of 2023, thus giving priority to other measures deemed more efficient. In fact, the reduction in excise duties, besides being a generalised and regressive measure in terms of distribution, tends to cause distortions both in terms of price signals of fossil fuels and in terms of incentives towards environmentally virtuous behaviour. |
Should there be a new increase in fuel prices, the ‘Transparency’22 decree has, in any case, simplified the mechanism23 whereby the MEF and the MASE24 can reduce, by inter-ministerial decree, excise duties on fuels to offset the higher VAT revenue resulting from the unexpected increase in international oil prices25. |
| The gross impact of all measures introduced by the 2023 budget law, which can be included in the energy package, as calculated according to the criteria used in the European context, amounts to approximately EUR 25.9 billion. |
In addition to the measures introduced by the 2023 budget law, the measures introduced by the ‘Transparency’ decree26 of 14 January, which extended to the whole 2023 the bonus for the purchase of public transport passes and the non-taxability of fuel bonuses granted to employees (for about EUR 0.1 billion) and the residual effects on 2023 resulting from the measures adopted in 202227 (for about EUR 0.4 billion) are also taken into account. |
| Considering the final data on actual expenditure, the cost of the energy package for 2022 is estimated at approximately EUR 53.8 billion, 2.8 percent of GDP, below the level indicated in the DBP (3.3 percent of GDP), due to savings in actual expenditure, compared to previous forecasts, mainly attributable to tax credits in favour of companies because of the more favourable trend in energy prices. |
________________________
20 Financial effect gross of induced tax effects, estimated at approximately EUR 1.9 billion. The 2-percentage point cut in the social security contribution rate for employees with annual gross income of less than EUR 35,000 has been extended to the whole 2023. For workers with annual gross income up to EUR 25,000, the cut is 3 percentage points. This measure was not included in the quantification of the package in the 2023 DBP.
21 Decree-law No. 179/2022 amending decree-law No. 176/2022, with which it was merged when converted into law.
22 Decree-law No. 5/2023.
23 Article 1, paragraphs 290-294 of law No. 244/2007.
24 Originally the responsibility lay with the MEF and the Ministry of Economic Development; in 2021 the task was transferred to the MEF and the Ministry of Ecological Transition, renamed as Ministry of Environment and Energy Security (MASE) in 2022.
25 Please note that in 2022, out of a total of approximately EUR 9.2 billion in excise duty reductions and VAT on fuels, more than EUR 3 billion were provided by these decrees and financed using increased VAT revenues on oil.
26 Decree-law No. 5/2023, converted by law No. 23 of 10 March 2023.
27 Mainly due to the one-off allowances paid in November 2022.
| 24 | MINISTRY OF ECONOMY AND FINANCE |
II. BASELINE MACROECONOMIC AND BUDGET FORECAST | |
| | The estimate for 2023, considering the measures approved up to January 2023, would amount to EUR 26.4 billion, a level corresponding to 1.3 percent of GDP (slightly higher than the 1.0 percent reported in the DBP)28. |
The budget law also provided for two discretionary revenue measures related to the surging energy prices, implemented to partially finance the support expenditure29. The first measure is a revision of the tax on windfall profits recorded by companies in the electricity, gas, and oil sectors, which delimited the tax base with a direct reference to total IRES income30 (corporate income tax), increasing the tax rate from 25 percent to 50 percent. The second measure introduced a levy on producers of electricity from renewable energy sources with revenues exceeding the 180 €/MWh cap in implementation of EU Regulation 2022/1854. Net of the expected revenues from these two measures (about EUR 4 billion; 0.2 percent of GDP), the energy package as of January 2023 amounts to about EUR 22.5 billion (1.1 percent of GDP). |
| |
| Extensions for the next quarters: towards the phasing-out of energy measures |
The dynamics of the energy prices over the last few months suggest that the most acute phase of the crisis has passed, and energy prices have begun to recover from the peaks recorded last year31. However, in the medium term they will remain at historically high levels and exposed to the risks and uncertainties also arising from the international geopolitical context. |
| In this scenario, fiscal policy should be oriented towards the gradual phasing-out of emergency measures, aimed at: i) continuing to provide support to households and businesses, especially the most vulnerable ones; ii) overcoming the emergency nature of the interventions and outlining structural instruments that are effective in contrasting any exceptional price rises in a timely manner; iii) discontinuing measures that generate distortions in terms of price signals or that are in contrast with energy saving and energy efficiency objectives; iv) relieving the pressure on public finance. |
| Urged by the European Commission, Member States are working towards a greater coordination and a common approach on support policies to ensure a level playing field for companies. The European Commission has proposed a two-tier energy pricing model, like the one recently adopted in Germany: a capped price is applied on a predefined amount of consumption, while the excess consumption is subject to the market price. |
| The mechanism can be applicable to both households and businesses and has considerable merits in terms of incentive to curb energy consumption and flexibility of application. However, the same German measure that inspired the proposal was classified by the Commission as non-targeted, which indicates that the proposed two-tier model needs to be refined to ensure adequate selectivity. Moreover, there are other relevant critical issues related to the measure’s fairness, sustainability for public finance and, above all, timing of implementation. |
| Lastly, the harmonisation of policies should consider the specific features of the individual Member States as well as the positive experiences gathered so far. |
________________________
28 This is an ex-ante estimate, based on the financial impact included in the technical reports and summary tables of the financial impacts of the regulatory measures, and does not include the indirect effects in terms of higher revenue led by the measures.
29 The European Commission, for the purpose of international comparison, also provides an estimate of the energy packages of the Member States net of the increased revenue from discretionary revenue measures related to surging energy prices.
30 In 2022, the tax base was measured as the increase in the balance of receivable and payable VAT transactions, net of VAT, in the period from October 2021 to April 2022 compared to the period from October 2020 to April 2021. The rate amounted to 25 percent, only if the increase was greater than 10 percent. For 2023, the tax applies on the portion of the IRES income that exceeds the average IRES income of the previous four years by at least 10 percent. This results in a narrowing of the tax base, partly offset by the increase in the tax rate, which more closely reflects the extraordinary increase in the company’s profitability.
31 See Focus ‘Inflation and price dynamics of energy and food goods’ in this Chapter.
| MINISTRY OF ECONOMY AND FINANCE | 25 |
| | ITALY’S STABILITY PROGRAMME 2023 |
| | The measures recently adopted by the Government (decree-law No. 34 of 30 March 2023) are still partially based on the measures already in force, in particular those effective for the second quarter of 2023, but they point to a gradual decline in subsidies accompanying the normalisation of gas and electricity prices. Looking ahead, the target over the medium-term is to remove the subsidies that have been necessary to date and reduce dependence on Russian gas in favour of electricity in line with the green transition, while still protecting the most vulnerable consumers. A measure, operational in the second half of the year (in view of possible increases in energy prices in the autumn months) and inspired by the two-tier model has already been prepared, while structural measures are being studied for companies. |
| In particular, the decree extended the measures related to the following areas: |
• Containment of bill costs: the zeroing of system charges and the reduction of VAT to 5 percent on the supply of gas for combustion, district heating and thermal energy32 (EUR 0.8 billion; 0.04 percent of GDP) are envisaged for the second quarter of 2023. Conversely, the reduction of system charges on electricity was not extended. |
• Social bonuses for electricity and gas bills: the strengthening of social bonuses for electricity and gas bills is extended to the second quarter of 2023, raising the ISEE threshold for access to bonuses for large families (EUR 0.4 billion; 0.02 percent of GDP). Given their nature of structural and extremely flexible measure with a high degree of selectivity, these bonuses have proven to be a very efficient tool to support the most fragile households. |
• Tax credits for businesses: the extraordinary subsidies to partially offset the higher costs incurred by businesses for the purchase of energy and natural gas have been extended to the second quarter of 2023, providing for a reduction in the percentages of expenditure eligible for subsidies: to 20 percent for energy-intensive businesses and for all firms for the purchase of gas, and to 10 percent for non-energy-intensive businesses (EUR 1.3 billion; 0.07 percent of GDP). Companies are eligible if their quarterly average costs have increased by at least 30 percent with respect to the same quarter in 2019. |
• Lump-sum contribution to be disbursed to home users in the fourth quarter of 2023: The decree introduces a lump-sum contribution to be disbursed to home users in the fourth quarter of 2023 if the price of gas exceeds the threshold of 45 €/MWh (EUR 1 billion; 0.05 percent of GDP), to provide support if prices will register new exceptional rises. The implementation methods, the criteria for eligibility, and the amount of the contribution will be defined in the coming months by implementing decrees issued by the MASE and the MEF, considering the average consumption of natural gas in the different climate zones, to encourage energy saving. |
As a whole, the new measures amount to about EUR 3.6 billion, and are fully covered by the expenditure savings that emerged for tax credits in the first quarter, amounting to about EUR 5 billion, and by lower costs for social bonuses33. The measures therefore do not entail any new burdens for public finance with respect to what is already provided for under existing legislation, balancing support for households with fiscal sustainability. |
Considering the savings recorded in the first quarter and the effects of the decree, the updated estimate of the energy package for 2023 is approximately EUR 24.7 billion, corresponding to 1.2 percent of GDP (1.0 percent net of discretionary revenue measures related to the tax on windfall profits and the extraordinary contribution for the energy sector34). |
________________________
32 The negative component of the system charges on natural gas, applied on consumption brackets up to 5,000 m3 per year, is only extended to April 2023, at an amount equal to 35 percent of the value applied in the previous quarter.
33 In particular, the increase in social bonuses envisaged by the decree is entirely financed with resources already in the budget of CSEA (Cassa per i servizi energetici e ambientali).
34 Decree-law No. 34/2023 also intervened on the tax on windfall profits of companies operating in the energy sector, with a reduction in the tax base and lower expected revenues equal to EUR 0.4 billion.
| 26 | MINISTRY OF ECONOMY AND FINANCE |
II. BASELINE MACROECONOMIC AND BUDGET FORECAST | |
| | From a qualitative point of view, the measures targeted to households and businesses most vulnerable to energy price increases account for about 57 percent of the total in 2023, compared to about 46 percent in 2022. The marked increase in the share of such targeted measures on the total in 2023 is attributable, to a large extent, to the non-renewal of generalised measures such as the reduction of excise duties and VAT on fuels, and the zeroing of system charges on electricity. The share of targeted measures in Italy is significantly higher than in other European countries: for 2022 the European Commission and the IMF estimated a share of targeted measures for the EU as a whole of about 30 percent; the share for the EU is estimated to fall to less than 20 percent in 2023. |
| Being temporary, the measures against high energy prices have an impact only in the year of their adoption, with some minor exceptions. The expected impact in 2024 amounts to EUR 0.4 billion (0.02 percent of GDP), largely due to indirect effects of excise cuts in 2022, while the impact in 2025 is zero. |
| FIGURE R.1: MEASURES AGAINST THE INCREASE IN ENERGY PRICES FOR 2021, 2022 AND 2023 (% of GDP) (1) |
|
| (1) For 2021 and 2022, the final estimate is based on expenditure actually incurred. For 2023, the estimate is based on ex ante forecasts of the regulatory measures, but takes into account the savings already verified and used by the decree-law No. 34/2023. |
| Source: MEF analysis on technical reports of regulatory measures. |
| MINISTRY OF ECONOMY AND FINANCE | 27 |
| | ITALY’S STABILITY PROGRAMME 2023 |
| 28 | MINISTRY OF ECONOMY AND FINANCE |
| III. | UPDATED POLICY SCENARIO |
III.1 FISCAL POLICY SCENARIO
The economic policy pursued by the Government since it took office is consistent with the guidelines expressed by the European Commission, primarily aimed at continuing to mitigate in a temporary and targeted manner the impacts on households and economic activities of the increase in energy prices caused by the war in Ukraine. In the current phase of gradual decline and stabilisation of energy prices, which started at the end of 2022, the support measures should be gradually withdrawn, maintaining a prudent fiscal policy, also in view of the deactivation of the general escape clause planned for the end of this year.
In this context and considering the improvement in the net borrowing forecast under existing legislation, the Government has decided to confirm the planned deficit targets set out in the Draft Budgetary Plan of last November, equal to 4.5 percent of GDP in 2023, 3.7 percent in 2024 and 3.0 percent in 2025. The new net borrowing target for 2026 is set at 2.5 percent of GDP, in line with the existing legislation scenario and well below the 3 percent limit set by the Stability and Growth Pact.
The budgetary margin with respect to the projections in the baseline scenario under existing legislation will be used to finance a cut in the tax wedge on subordinate employment in 2023 (by more than EUR 3 billion) and allocated to the Fund for the reduction of the fiscal pressure in 2024 (by more than EUR 4 billion).
The allocation of additional resources to the Fund for the reduction of the fiscal pressure in 2024 is consistent with the Government’s ambitious medium- to long-term programme, which includes the overall reform of the tax system, with particular focus on household taxation.
The financing of fiscal policy interventions will be carried out by identifying appropriate coverage within the public budget, to preserve the sustainability of public finances.
The public finance projection at existing legislation does not include the so-called unchanged policies, which concern recurring expenditures that are not financed by existing legislation and are normally financed annually by the budget law in consideration of international commitments, of a contractual nature or related to other needs.
| MINISTRY OF ECONOMY AND FINANCE | 29 |
| | ITALY’S STABILITY PROGRAMME 2023 |
| TABLE III.1: PUBLIC FINANCE INDICATORS (as a percentage of GDP) (1) |
| | 2021 | 2022 | 2023 | 2024 | 2025 | 2026 |
| POLICY SCENARIO | | | | | | |
| Net borrowing | -9.0 | -8.0 | -4.5 | -3.7 | -3.0 | -2.5 |
| Primary balance | -5.5 | -3.6 | -0.8 | 0.3 | 1.2 | 2.0 |
| Interest expenditure | 3.6 | 4.4 | 3.7 | 4.1 | 4.2 | 4.5 |
| Structural net borrowing (2) | -8.3 | -8.5 | -4.9 | -4.1 | -3.7 | -3.2 |
| Change in structural balance | -3.3 | -0.2 | 3.6 | 0.9 | 0.4 | 0.6 |
| Public debt (gross of European aid) (3) | 149.9 | 144.4 | 142.1 | 141.4 | 140.9 | 140.4 |
| Public debt (net of European aid) (3) | 146.7 | 141.5 | 139.3 | 138.7 | 138.3 | 138.0 |
| BASELINE SCENARIO UNDER EXISTING LEGISLATION | | | | | | |
| Net borrowing | -9.0 | -8.0 | -4.4 | -3.5 | -3.0 | -2.5 |
| Primary balance | -5.5 | -3.6 | -0.6 | 0.5 | 1.2 | 2.0 |
| Interest expenditure | 3.6 | 4.4 | 3.7 | 4.1 | 4.2 | 4.5 |
| Structural net borrowing (2) | -8.4 | -8.6 | -4.9 | -4.1 | -3.7 | -3.2 |
| Change in structural balance | -3.3 | -0.2 | 3.6 | 0.9 | 0.4 | 0.5 |
| Public debt (gross of European aid) (3) | 149.9 | 144.4 | 142.0 | 141.2 | 140.8 | 140.4 |
| Public debt (net of European aid) (3) | 146.7 | 141.5 | 139.2 | 138.5 | 138.3 | 137.9 |
| | | | | | | |
| MEMO: Update of the Stability Programme 2022/ DBP 2023 (POLICY SCENARIO) | | | |
| Net borrowing | -7.2 | -5.6 | -4.5 | -3.7 | -3.0 | |
| Primary balance | -3.7 | -1.5 | -0.4 | 0.2 | 1.1 | |
| Interest expenditure | 3.6 | 4.1 | 4.1 | 3.9 | 4.1 | |
| Structural net borrowing (2) | -6.3 | -6.1 | -4.8 | -4.2 | -3.6 | |
| Change in structural balance | -1.3 | 0.2 | 1.3 | 0.6 | 0.6 | |
| Public debt (gross of European aid) | 150.3 | 145.7 | 144.6 | 142.3 | 141.2 | |
| Public debt (net of European aid) | 147.1 | 142.7 | 141.8 | 139.6 | 138.6 | |
| Nominal baseline GDP (absolute values x 1000) | 1787.7 | 1909.2 | 2018.0 | 2102.8 | 2173.3 | 2241.2 |
| Policy nominal GDP (absolute values x 1000) | 1787.7 | 1909.2 | 2019.8 | 2105.7 | 2176.3 | 2244.2 |
(1) Any inaccuracies are the result of rounding. (2) Net of one-off measures and the cyclical component. (3) Gross or net of Italy’s share of loans to EMU Member States, bilaterally or through the EFSF, and of the contribution to the capital of the ESM. As of 2022, the amount of these interventions was approximately EUR 56.3 billion, of which EUR 43.0 billion for bilateral loans and through the EFSF and EUR 14.3 billion for the ESM programme (see Bank of Italy, ‘Statistical Bulletin Public Finance, Cash Requirements and Debt’, 15 March 2023). The policy scenario assumes revenues from privatisation proceeds amounting to 0.14 percent of GDP over the three-year period 2024-2026. It is assumed that the MEF’s cash holdings will be reduced by approximately 0.3 percent of GDP in 2023 and by approximately 0.2 percent of GDP in 2024 and 2025 and remain constant at their 2025 level in 2026. In addition, estimates consider the repurchase of SACE, the deployment of the earmarked assets, EIB guarantees and loans under the SURE and NGEU programmes. The interest rate scenario used for the estimates is based on the implicit forecasts derived from the forward rates on Italian government bonds for the period in which this Document was completed. |
The central State administrations will contribute to the financing of these needs and of new measures that the Government will decide to adopt with the end-of-year manoeuvre, following the path already started last year, namely, a renewed activity of spending review within the framework of the procedure envisaged by Article 22-bis of law No. 196 of 2009 and its profile as an enabling reform of the RRP (reform 1.13). Therefore, said administrations will contribute to the next public finance manoeuvre with expenditure savings in terms of net borrowing equal to EUR 300 million in 2024, EUR 500 million in 2025 and EUR 700 million from 2026.
| MINISTRY OF ECONOMY AND FINANCE | 30 |
III. UPDATED POLICY SCENARIO | |
The reductions in expenditure add to what was already provided for in the previous budget law, bringing the overall reduction to EUR 1.5 billion in 2024, EUR 2 billion in 2025 and EUR 2.2 billion from 2026. The distribution among ministries and the areas of intervention will be identified by a decree of the President of the Council of Ministers (to be adopted by 31 May) on the proposal of the Minister of Economy and Finance, after deliberation by the Council of Ministers.
The debt-to-GDP ratio in the policy scenario will decrease to 142.1 percent this year, to 141.4 percent in 2024, and then progressively to 140.4 percent in 2026. Since the impact of tax credits related to the building bonuses is expected to decrease from 2027 onwards, the policy scenario outlined here is consistent with the objective already stated in previous policy documents - to bring the debt-to-GDP ratio back to levels close to the pre-crisis level (134.1 percent in 2019) by the end of the decade.
Between 2023-2025, the increase in interest expenditure will be offset by economic growth and inflation dynamics, with the snow-ball component remaining negative. In 2026, on the other hand, the easing of projected economic growth and the further increase in interest expenditure, reflecting the rise in government bond yields, will cause the snow-ball component to contribute 0.2 percentage points to the increase in the debt-to-GDP ratio.
The reduction in the debt-to-GDP ratio will be driven by the growing improvement in the primary balance, which is projected to return to surplus as early as 2024, at 0.3 percent of GDP in the policy scenario, and rise to 2.0 percent of GDP in 2026. However, the reduction in the debt-to-GDP ratio that could have occurred if the superbonus had not had the impacts on public finance balances recorded so far cannot be overlooked.
| III.2 | MACROECONOMIC FORECAST UNDER THE POLICY SCENARIO |
With its planned fiscal policy measures, the Government aims to support private demand and counteract the decline in the purchasing power of salaries caused by inflation. Reducing the tax wedge may also stimulate the labour market to preserve and consolidate the progress made in recent years. In addition, supporting households’ incomes by reducing the tax wedge (by cutting their social security contributions) may limit the wage-price chase, thereby mitigating the inflation expectations of economic agents and financial markets.
As a result of the above-mentioned measures, real GDP growth rate in the policy scenario rises to 1.0 percent in 2023 and 1.5 percent in 2024.
Compared to the baseline scenario, the higher GDP growth in 2023 (+0.1 percentage points) is attributable to the tax cut. In 2024, the reduction in the tax burden will help boost GDP growth compared to the baseline projections mainly through the boost provided to household consumption.
| MINISTRY OF ECONOMY AND FINANCE | 31 |
| | ITALY’S STABILITY PROGRAMME 2023 |
TABLE III.2: SYNTHETIC MACROECONOMIC POLICY SCENARIO (1) (percentage changes, unless otherwise indicated) |
| | 2022 | 2023 | 2024 | 2025 | 2026 |
| GDP | 3.7 | 1.0 | 1.5 | 1.3 | 1.1 |
| GDP deflator | 3.0 | 4.8 | 2.7 | 2.0 | 2.0 |
| Consumption deflator | 7.4 | 5.7 | 2.7 | 2.0 | 2.0 |
| Nominal GDP | 6.8 | 5.8 | 4.3 | 3.4 | 3.1 |
| Employment (FTE) (2) | 3.5 | 1.0 | 1.1 | 0.9 | 0.8 |
| Employment (LFS) (3) | 2.4 | 1.1 | 1.1 | 0.7 | 0.8 |
| Unemployment rate | 8.1 | 7.7 | 7.5 | 7.4 | 7.2 |
| Current account balance (balance in % GDP) | -0.7 | 0.8 | 1.2 | 1.6 | 1.6 |
(1) Any inaccuracies are due to rounding. (2) Employment in terms of full-time equivalent (FTE). (3) Employment (persons) based on the Labour Force Survey. |
The macroeconomic forecast based on the policy scenario was endorsed by the Parliamentary Budget Office with a note dated 20 April 2023.
| III.3 | BUDGET BALANCE, CONVERGENCE TOWARDS THE MEDIUM-TERM OBJECTIVE AND EXPENDITURE RULE |
The budget balance and the other public finance variables in the policy framework are in line with the indications received from the European Commission and mentioned at the beginning of this section.
First, there is the commitment to bring the deficit back within the 3 percent threshold from as early as 2025 and below it in the following year. There is also a significant improvement in the structural budget balance already as of 2023, an improvement that continues in the other years of the forecast period. As highlighted in the commentary on the nominal balances to the trend public finance framework, the improvement in the current year also reflects the decrease in emergency expenditure (which in 2022 was still connected to Covid expenditure as well as to the fight against the energy crisis) as well as the effects of the statistical reclassification of some building bonuses recently carried out by ISTAT in agreement with Eurostat35. The change reported for 2024 is also significant, amounting to 0.9 percent of GDP. It should also be noted that the amount of measures to address the energy emergency goes from a level of 1.2 percent of GDP in 2023 to essentially zero in 202436.
The consolidation of public finance balances continues in 2025 and 2026. The improvement in terms of structural balance becomes slightly smaller than in previous years, but still amounts to 0.4 and 0.6 percentage points; this is mainly due to the sudden steepening of the interest rate curve, which occurred in recent months.
________________________
35 This reclassification, holding all else constant, resulted in a worsening of the 2020, 2021 and 2022 deficit, a broadly neutral impact in 2023, and an improvement in the deficit in 2024 and the following years (improvement due to an increase in general government accrued revenue). Please refer to the Focus ‘Superbonus 110: impact of accounting reclassification, temporary solutions and long-term perspectives’ for all related details.
36 Next year, in fact, the impact of the measures to address high energy prices, quantified at around EUR 0.4 billion (0.02 percent of GDP), is mainly attributable to the indirect effects of the fuel excise cuts of 2022.
| 32 | MINISTRY OF ECONOMY AND FINANCE |
III. UPDATED POLICY SCENARIO | |
Regarding the structural primary balance, the progress to be achieved over the two years is even greater. It is also noted that primary expenditure is the government budget aggregate most under government control. As is well known, the fiscal recommendations for the multi-year structural and budgetary plans envisaged by the new European economic governance and the subsequent surveillance by the European Commission will hinge on it. The Government will monitor this component of the public budget very carefully, preserving the improvements in the balances generated by the growth profile outlined in this Document.
In line with the European Commission’s request, in 2024 current primary expenditure is projected to increase at a growth rate below that of potential GDP in nominal terms (see Table III.10). Considering the metrics adopted so far to assess the fiscal stance related to current primary expenditure financed by domestic resources, it appears that there is a trend towards moderation in this category of expenditure, as requested by the Commission, indicated by a positive value of this index37. Again for 2024, and continuing to use the same criteria, it appears instead that there is an upward contribution of gross fixed investments of the general government; the incidence of this expenditure component on GDP is expected to increase by about 0.5 percentage points, to 3.8 percent from 3.3 percent in 2023. Table III.9 reports information on compliance over the planning years of the traditional expenditure rule38.
As emerged from the multi-year public finance framework, the Government will boost public investments. At the same time, in the context of the debate on the new European governance under negotiation, it will advocate for their preferential treatment, first and foremost, to fight climate change and promote the digital transition (the two pillars of the NRRP), but also for defence spending needs arising from commitments undertaken in international fora. About the latter, the issue of capital expenditure and its accounting for public finance balances will be strongly raised.
In conclusion, the public finance plan presented in this Document complies with the guidelines provided by the Commission for 2024. The projections for the last two years continue to adjust in terms of structural balance, drawing improvements in line with the preventive arm of the Stability and Growth Pact. Moreover, the changes in terms of structural primary balance are consistent and embrace the spirit of the reform proposed by the Commission. The latter aspect will be further detailed in the section on the debt rule and, later, in Chapter IV.
________________________
37 The index considers the criteria adopted by the Commission in terms of targeted energy measures and does not take into account the higher expenditure due to the accounting reclassification of tax credits related to certain construction bonuses.
38 The aggregate used for the traditional expenditure rule is very similar to the one used to calculate the fiscal stance, but the latter differs from the former in that a four-year moving average is not used to calculate public investment. For details on the methodology behind the traditional expenditure rule at present, see section III.2 of the Methodological note attached to Section II of this Document (only available in Italian).
| MINISTRY OF ECONOMY AND FINANCE | 33 |
| | ITALY’S STABILITY PROGRAMME 2023 |
| TABLE III.3: SIGNIFICANT DEVIATIONS |
| Convergence of the structural balance towards the MTO | 2020 | 2021 | 2022 | 2023 | 2024 | 2025 | 2026 |
| General government net borrowing | -9.7 | -9.0 | -8.0 | -4.5 | -3.7 | -3.0 | -2.5 |
| Medium Term Objective (MTO) (1) | 0.5 | 0.5 | 0.5 | 0.3 | 0.3 | 0.3 | 0.3 |
| Structural Balance | -5.1 | -8.3 | -8.5 | -4.9 | -4.1 | -3.7 | -3.2 |
| Annual change in the structural balance | -2.9 | -1.2 | -0.2 | 3.6 | 0.9 | 0.4 | 0.6 |
| Required change in the structural balance (2) | -0.2 | 0.5 | 0.6 | 0.6 | 0.6 | 0.6 | 0.6 |
| Deviation of the structural balance from the annual required change (<0.5 p.p.) | -2.7 | -1.7 | -0.8 | 3.0 | 0.3 | -0.2 | 0.0 |
| Average change in the structural balance (over two years) | -1.3 | -2.0 | -0.7 | 1.7 | 2.2 | 0.6 | 0.5 |
| Average required change | 0.1 | 0.2 | 0.6 | 0.6 | 0.6 | 0.6 | 0.6 |
| Deviation of the structural balance from the average required change (<0.25 p.p.) | -1.4 | -2.2 | -1.2 | 1.1 | 1.6 | 0.0 | -0.1 |
| | | | | | | | |
| Expenditure rule | 2020 | 2021 | 2022 | 2023 | 2024 | 2025 | 2026 |
| Growth rate of the reference expenditure aggregate (%) | 9.9 | 9.4 | 6.2 | -3.0 | -1.0 | 2.1 | 1.7 |
| Benchmark modulated on the prevailing cyclical conditions (3) (%) | 1.2 | 1.6 | 1.7 | 5.3 | 2.2 | 1.5 | 1.6 |
| Deviation of the expenditure aggregate from the annual required change (<0.5 p.p.) | -4.1 | -2.3 | -2.2 | 4.1 | 1.5 | -0.3 | -0.1 |
| Deviation of the expenditure aggregate from the average required change over two years (<0.25 p.p.) | -2.2 | -3.2 | -2.3 | 0.9 | 2.8 | 0.6 | -0.2 |
(1) Pending the revision of European economic governance, the Commission has updated the MTO every three years based on updated data from the 2021 Autumn Forecast and the 2021 Ageing Report. (2) The activation of the general escape clause of the Stability and Growth Pact is considered for the 2020 - 2023 period. For 2020, flexibility is applied due to exceptional measures to safeguard and secure the territory. (3) The benchmark considers the required change in the structural balance. |
TABLE III.4: TRENDS IN CURRENT EXPENDITURE IN RELATION TO THE EXPENDITURE BENCHMARK
(% change) |
| | 2021 | 2022 | 2023 | 2024 | 2025 | 2026 |
| Growth rate in current primary expenditure financed from national resources (1) | 5.2 | 10.5 | 4.5 | 0.9 | 0.8 | 2.0 |
| Change of potential GDP | -0.1 | 1.0 | 0.9 | 1.1 | 1.1 | 1.1 |
| Real Benchmark (2) | 0.3 | 0.4 | 0.5 | 0.6 | 0.7 | 0.8 |
| Nominal Benchmark (3) | 0.9 | 3.4 | 5.3 | 3.4 | 2.7 | 2.8 |
(1) The expenditure aggregate includes the temporary component of expenditures related to the Covid-19 emergency. (2) The real benchmark is the 10-year average of the potential GDP growth rate estimated in the policy scenario underlying this Document. It does not correct for the convergence to the MTO as foreseen by the SGP expenditure rule. (3) The nominal benchmark is equal to the real benchmark adjusted for the GDP deflator growth rate. |
| 34 | MINISTRY OF ECONOMY AND FINANCE |
III. UPDATED POLICY SCENARIO | |
| III.4 | DEBT-TO-GDP RATIO AND THE DEBT RULE |
Public debt as a ratio of GDP: forecast under the policy scenario
In 2022, the debt-to-GDP ratio was 144.4 percent, marking a reduction of 5.5 percentage points from the 149.9 percent recorded in 2021, and about 10.5 percentage points from the peak of 154.9 percent reached in 202039.
For the year 2021, the value of the same ratio has been revised downward from that of the Update of the Stability Programme of November 2022 and considers the upward revision of nominal GDP by about EUR 5.6 billion. The improvement is thus due to higher economic growth, equal to 7.6 percent, and to the change in the level of public debt resulting from routine updates of the sources made by the Bank of Italy of about EUR 1.5 billion40.
The final 2022 debt-to-GDP ratio was about 1.3 percentage points lower than last November’s Update of the Stability Programme forecast of 145.7 percent. The difference, in addition to the carryover effect on GDP from 2021, is mainly due to the lower debt stock compared to November estimates resulting from several factors. Specifically, the debt stock at the end of 2022 about 2.9 percent higher with respect to 2021, compared with a projected growth of 3.5 percent. The result is mainly due to a trend in public finance cash balances found to be significantly better than expected. In fact, public sector borrowing requirement at the end of 2022 stood at 3.4 percent of GDP, instead of the 4 percent expected in November 2022. Finally, the 2022 debt stock was also affected by changes in the perimeter of general government defined by ISTAT in agreement with Eurostat and accounting effects from the restructuring of some central government derivatives positions.
In terms of the equation explaining the debt dynamics, in 2021 and 2022 the trend in nominal economic growth, also helped by the rise in inflation (especially in 2022), more than offset the increase in interest expenditure, with the result that the snow-ball component, which quantifies the automatic impact of the difference between interest expenditure and nominal GDP growth on the dynamics of the debt-to-GDP ratio, remained strongly negative, amounting to 7.4 percentage points in 2021 and 5.2 percentage points in 2022, contributing to the above-described reduction in the debt-to-GDP ratio in the two years.
Inflationary pressures, through inflation-indexed securities, have driven up the average cost of debt, which in fact rose to just over 3 percent in 2022. However, debt management, which over the years has produced a particularly high average duration of debt (7.7 years at the end of 2022), has helped contain its increase, allowing it to remain well below nominal GDP growth even in 2022.
The impact of the snow-ball component was, in part, offset by the opposite impulse of the primary deficit, at 3.6 percent of GDP in 2022, which was affected by higher expenditure on pensions and social benefits due to inflation and regulatory measures taken to counter the effects of rising energy prices on households and
________________________
39 ISTAT notification on public deficit and debt sent to Eurostat on 31 March 2023 and Economic Bulletin of 7 April 2023 from the Bank of Italy. Compared with the estimates published by ISTAT on 23 September 2022 and shown in the Update of the 2022 Stability Programme, the revisions to debt levels and nominal GDP leave the debt-to-GDP ratio unchanged in 2020, while leading to a reduction in the ratio to 149.9 percent, from 150.3 percent, in 2021.
40 Bank of Italy, Economic Bulletin No. 2 - 2023, 7 April 2023.
| MINISTRY OF ECONOMY AND FINANCE | 35 |
| | ITALY’S STABILITY PROGRAMME 2023 |
businesses. The primary deficit was also affected by the revised accounting classification of tax credits related to building bonuses.
The revision involved the accounting of the financial effects arising from these bonuses only on the deficit and primary balance expressed on an accrual basis (ESA) but did not exert any impact on the level of public debt, which follows the trend in cash balances, particularly the public sector’s cash requirements.
| FIGURE III.1: EVOLUTION OF THE DEBT-TO-GDP RATIO GROSS AND NET OF EUROPEAN AID |
|
| Source: ISTAT and Bank of Italy. From 2023, forecasts of the policy scenario. |
The impact of the revision on the deficit and primary balance for ESA purposes involved a similar revision of the stock-flow adjustment component, which includes the difference between accrual- and cash-valued balances. Specifically, in 2022 this component was -3.9 percentage points, compared with the forecast of -0.6 percentage points of last November and -0.5 percentage points in the 2022 Stability Programme. The stock-flow adjustment component was also affected by the reduction compared to 2021, by about 0.2 percentage points of GDP, in total Treasury cash holdings, largely offset, however, by the effect from positive issue discounts due to the phase of sharply rising interest rate in the last months of 2022.
Finally, the preliminary estimate of the debt-to-GDP ratio in 2022 is significantly lower than the 147.0 percent projected in the 2022 Stability Programme.
The reduction in the debt-to-GDP ratio is expected to continue in the current year and the following three years. Expected economic growth, together with rising prices linked to the core inflation component, will continue to support the snow¬ball component’s contribution to the decline in the debt-to-GDP ratio, more than offsetting, until 2025, the interest expenditure component. In 2025, the snow-ball component will still be negative and equal to -0.4 percentage points of GDP.
In 2026, interest expenditure will rise to 4.5 percent of GDP, discounting the rise in government bonds yields resulting from the ECB’s monetary policy decisions41 in response to inflationary pressures. Nominal growth in the economy will not be
________________________
41 16 March 2023 Board meeting.
| 36 | MINISTRY OF ECONOMY AND FINANCE |
III. UPDATED POLICY SCENARIO | |
sufficient to offset this increase in spending, and the snow-ball component will become positive and equal to 0.2 percentage points of GDP, contributing to the increase in the debt-to-GDP ratio.
The consolidation path of the primary balance, also resulting from the removal of the extraordinary fiscal policy measures adopted to deal with the energy crisis, will contribute to the reduction of the debt-to-GDP ratio starting from 2024, the year in which a return to a policy primary surplus of 0.3 percent of GDP is expected, which will increase in the following two years up to 2 percent in 2026.
Part of the improvement in the coming years in the primary balance depends on the effects, mainly in terms of higher revenues, from the accounting reclassification of the building bonuses mentioned earlier and does not contribute to the reduction in the debt-to-GDP ratio. In fact, reclassification has a symmetrical impact on the stock-flow adjustment, which acts in the opposite direction respect to the primary balance hence neutralising the share of improvement attributable to this factor.
These trends result in a further decline in the policy debt-to-GDP ratio to 142.1 percent in 2023, a level about 2.3 percentage points lower than in 2022 (-2.5 percentage points lower than the Update of the 2022 Stability Programme target and 3.1 percentage points lower than the 2022 Stability Programme target). The value of the debt-to-GDP ratio for 2023 will also benefit from a reduction in Treasury cash holdings in the range of 0.3 percent of GDP.
In 2024, the debt-to-GDP ratio will fall an additional 0.7 percentage points to 141.4 percent, while in 2025 the ratio is expected to stand at 140.9 percent. In 2026, the planned enhancement of the primary balance will ensure a further reduction in the debt-to-GDP ratio by about 0.5 percentage points, to 140.4 percent. In the years 2024 and 2025, a marginal reduction in Treasury cash holdings in the order of 0.2 percent of GDP each year is assumed. In addition, policy estimates consider revenues from privatisation proceeds totalling about 0.14 percent of GDP over the three-year period 2024-2026.
The forecast scenario is still characterized by high uncertainty mainly due to the war in Ukraine, but also to the possibility that inflationary pressures, both on energy goods and others, particularly food goods, will show more persistence than expected.
Net of Italy’s share of loans to EMU member states, bilateral or disbursed through the EFSF, and the contribution to the capital of the ESM, the 2022 final estimate of the debt-to-GDP ratio was 141.5 percent, while the forecast stands at 138 percent in 2026.
Assessment of the debt rule compliance and the relevant factors
In the current fiscal architecture defined by the Stability and Growth Pact, Member States must ensure a debt-to-GDP ratio of no more than 60 percent. If this threshold is exceeded, the Stability and Growth Pact provides a path for reducing the excess of public debt over this threshold at a pace considered appropriate.
Under the debt rule introduced in 2011 by the so-called Sixpack, in normal times budget planning for high debt countries such as Italy had to meet at least one of the following criteria: (i) the portion of debt in excess of the 60 percent of GDP benchmark must be reduced on an annual basis by 1/20th of the average of the values in the three years prior to the current year (backward-looking criterion) or
| MINISTRY OF ECONOMY AND FINANCE | 37 |
| | ITALY’S STABILITY PROGRAMME 2023 |
in the two years following the benchmark (forward-looking criterion); (ii) the excess of debt over the backward-looking benchmark is attributable to the business cycle42.
The governance reform proposed by the Commission and described in its 9 November Communication43 plans to repeal the 1/20th per year reduction rule for public debt in excess of the 60 percent of GDP limit as it would imply excessive adjustments44. The proposal shifts the focus to the debt trend in the medium term, with the goal of ensuring its ‘plausible and continuous’ reduction. If the legislative negotiations beginning in the coming months confirm the general approach put forward by the Commission, in the coming years member states with substantial or moderate debt sustainability risks45 will have to submit national plans that ensure that debt-to-GDP ratios are also reduced in the medium term.
Debt reduction paths will be individual because they will depend on the level of general government deficit and debt at the beginning of the adjustment path. Fiscal adjustment will need to ensure that – for countries with substantial sustainability risks - the trajectory of debt over the ten years following the plan is on a plausible path of reduction. The plausibility of the trajectory will be tested by simulating the behaviour of the debt-to-GDP ratio in the ten years following the conclusion of the adjustment: this ratio must decline even in adverse or unfavourable scenarios.
The downward path of public debt is operationally guaranteed via a cap on net primary spending for a four-year horizon, with the possibility of a possible extension up to a maximum of seven years against commitments on reforms and investments.
Based on the proposal, the Excessive Deficit Procedure (EDP) would remain unchanged if the 3 percent deficit-to-GDP limit is exceeded. As for the Procedure for failure to reduce the debt-to-GDP ratio, for countries with significant or moderate risks to public debt sustainability deviation from the spending path agreed with the Commission and approved by the Council would lead to the launching of an EDP46.
As called for in the Commission’s 8 March Communication on Fiscal Policy Orientation for 2024, at this stage of transition to the new European governance rules, MS are asked to present a fiscal plan that puts public debt back on a downward path and allows it to be maintained at prudent levels over the medium term, while ensuring that the net borrowing is below 3 percent of GDP within that forecast horizon.
In line with the essence of the proposed reform of European regulations, the Government confirms the gradual fiscal adjustment path planned in the Update of the 2022 Stability Programme and in the DBP 2023 to continue reducing the high
________________________
42 In this case, an indicator is used expressing the debt-to-GDP ratio that would have been obtained if in the previous three years (i) the numerator (i.e., public debt) had been adjusted for the impact of the business cycle and (ii) the denominator (i.e., nominal GDP) had grown at the same rate as potential output.
43 Communication of the Commission, Communication on orientations for a reform of the EU economic governance framework, COM (2022) 583 final, 9/11/2022.
44 Considering the projections of the policy scenario in this Document, a gap in the debt-to-GDP ratio relative to the benchmark of 1.2 percentage points in 2023 and 4.3 percentage points in 2024 would emerge from the debt rule (based on the backward-looking configuration, which appears to be the most favourable).
45 In the November Communication, debt sustainability risk is assessed for each country using the Debt Sustainability Analysis (DSA) methodology developed by the Commission. This has received much criticism, and the Commission seems intent in its legislative proposal to advance a different methodology for categorising countries.
46 In the Commission’s original proposal, the opening of the debt procedure would be automatic for countries with substantial debt sustainability risks, while for medium-risk countries it would be conditional on the analysis of relevant factors. This was criticised by the Council in its conclusions of 14 March and will be discussed during the legislative negotiations.
| 38 | MINISTRY OF ECONOMY AND FINANCE |
III. UPDATED POLICY SCENARIO | |
public debt, aware that a too abrupt consolidation could have a negative impact on growth.
Despite the uncertainty of the current geopolitical situation, the Government is committed to a multi-year consolidation that, combined with the investments and structural reforms defined in the NRRP and other planned reforms, aims to sustain the economy’s growth potential and improve the sustainability of public debt. The government believes that it is in the country’s interest to continue this path until the debt sustainability analysis indicates that no further improvements in the structural primary balance are needed.
| MINISTRY OF ECONOMY AND FINANCE | 39 |
| | ITALY’S STABILITY PROGRAMME 2023 |
| 40 | MINISTRY OF ECONOMY AND FINANCE |
IV. SUSTAINABILITY OF PUBLIC FINANCES
IV.1 RISK SCENARIOS OF PUBLIC FINANCES
Sensitivity to growth
This section simulates two risk scenarios in which macroeconomic and financial shocks are reflected in the public finance performance over the 2023-2026 period under standard sensitivity assumptions.
The reference scenario (or baseline) coincides with the policy framework of this Document. The sensitivity analysis is aimed at outlining the path of the budget balance and the debt dynamics by assuming two alternative scenarios based on the results presented in Section II.2 in the Focus ‘A risk (or sensitivity) analysis on exogenous variables’.
| TABLE IV.1: SENSITIVITY TO GROWTH (percentage values) |
| | | 2022 | 2023 | 2024 | 2025 | 2026 |
| | Baseline | 6.8 | 5.8 | 4.3 | 3.4 | 3.1 |
| Nominal GDP growth rate | Financial risk | 6.8 | 5.8 | 4.2 | 3.0 | 2.5 |
| | Exchange rate risk | 6.8 | 5.7 | 4.0 | 2.7 | 2.5 |
| | Baseline | 3.7 | 1.0 | 1.5 | 1.3 | 1.1 |
| Real GDP growth rate | Financial risk | 3.7 | 1.0 | 1.4 | 0.9 | 0.7 |
| | Exchange rate risk | 3.7 | 0.9 | 1.2 | 0.7 | 0.8 |
| | Baseline | -8.0 | -4.5 | -3.7 | -3.0 | -2.5 |
| Net borrowing | Financial risk | -8.0 | -4.5 | -3.8 | -3.3 | -3.2 |
| | Exchange rate risk | -8.0 | -4.6 | -4.0 | -3.6 | -3.5 |
| | Baseline | -3.6 | -0.8 | 0.3 | 1.2 | 2.0 |
| Primary balance | Financial risk | -3.6 | -0.8 | 0.3 | 0.9 | 1.3 |
| | Exchange rate risk | -3.6 | -0.8 | 0.1 | 0.6 | 1.0 |
| | Baseline | 3.1 | 2.7 | 3.0 | 3.1 | 3.3 |
| Implicit interest rate | Financial risk | 3.1 | 2.8 | 3.2 | 3.4 | 3.7 |
| | Exchange rate risk | 3.1 | 2.7 | 3.0 | 3.1 | 3.3 |
| | Baseline | 144.4 | 142.1 | 141.4 | 140.9 | 140.4 |
| Public debt | Financial risk | 144.4 | 142.1 | 141.9 | 142.7 | 144.2 |
| | Exchange rate risk | 144.4 | 142.2 | 142.1 | 143.2 | 144.5 |
| Source: ISTAT and MEF elaborations up to 2022. As of 2023, policy forecasts in this Document for the baseline scenario. |
The ‘financial risk’ scenario (corresponding to the fourth scenario of the above-mentioned Focus) postulates an increase in the BTP-Bund spread of 100 basis points
| MINISTRY OF ECONOMY AND FINANCE | 41 |
| | ITALY’S STABILITY PROGRAMME 2023 |
starting from 2024. The ‘exchange rate risk’ scenario (corresponding to the third scenario in the Focus) assumes an increasing spread in the variation of the nominal effective exchange rate compared to the baseline scenario between 2023 and 2025, followed by a rapid decrease in 2026.
The effects on GDP and its components are estimated by the ITEM econometric model, as made explicit in the Focus. The economy’s response to these shocks changes the estimates of the potential output and the output gap, variables underlying the standard sensitivity assumptions. The responses on rates (for the ‘financial risk’ scenario) and the change in interest expenditure are calculated with the Treasury’s SAPE model, which is based on the database of the current and forecasted stock of government securities.
Table IV.2 shows estimates of the main macroeconomic and public finance variables in the different scenarios for the 2022-2026 period.
Figure IV.1 shows the change in the debt-to-GDP ratio in the three scenarios. The baseline, coinciding with the official policy forecast, shows a slight downward trend.
The downward trend of the debt-to-GDP ratio is reversed in both sensitivity scenarios; after a reduction of the descent in 2023, the debt-to-GDP ratio would start an increasing trend, in the case of the financial shock essentially due to the pessimistic assumption on the interest rate curve, in the case of the exchange rate shock due to the effect on economic growth.
| FIGURE IV.1: DYNAMICS OF THE DEBT-TO-GDP RATIO IN SENSITIVITY SCENARIOS |
|
| Source: MEF analysis. |
Stochastic simulations of debt dynamics
To integrate the sensitivity analysis of the trend of the debt-to-GDP ratio in the short term, stochastic simulations were carried out for the 2023-2026 period, which incorporate the historical volatility of the significant variables affecting public
| 42 | MINISTRY OF ECONOMY AND FINANCE |
IV. SUSTAINABILITY OF PUBLIC FINANCES | |
finances. The analyses were carried out using the Montecarlo method, applying stochastic shocks to the dynamics of the debt-to-GDP ratio relative to the baseline scenario underlying this Stability Programme. These shocks are modelled based on the historical volatility of yields (short- and long-term), of the growth rate of nominal GDP and of the primary budget balance and are obtained by running 2000 extractions from a normal distribution with zero mean and a variance-covariance matrix observed starting from the first quarter of 1999, at the time of the adoption of the euro as the common currency.
Given the high volatility in the variables of interest observed from the first quarter of 2020 onwards, this Document presents two methods of simulating shocks. The first method (high-volatility shock scenario) considers, for the purposes of constructing the shocks, the volatility of the entire historical series available, including the values observed up to the third quarter of 2022; the second method (limited-volatility shock scenario) operates a trimming procedure of the simulated shocks, excluding those that exceed two times the standard deviation of the series47. In both cases, the simulated shocks are symmetrical and temporary in nature48.
For each forecast year of the macroeconomic framework and for each type of shock scenario, fan charts (Figures IV.2A and IV.2B) show the distribution of the debt-to-GDP ratio.
In the simulation with high-volatility shocks, the debt is distributed around a median value that is equal to 139.4 percent of GDP at the end of the time horizon, 5.3 percentage points higher than the 2019 figure (134.1), but approximately 15.5 percentage points lower than the 2020 value (154.9). The uncertainty surrounding the 2026 results reflects the variability of the public finance data used to construct the shocks and is therefore extremely high, as shown by a difference of about 49 percentage points between the 10th and 90th percentiles of the resulting projected debt distribution. After the decline in the debt-to-GDP ratio in 2021 and 2022, the debt-to-GDP ratio would continue to decline, or remain essentially stable, in 60 percent of the simulations.
By restricting the magnitude of shocks excluding the most extreme distribution tails (limited-volatility shocks), the results of the analysis are visibly more concentrated around the baseline debt of this Stability Programme (Figure IV. 2B). In this case, the uncertainty about the 2026 results is smaller, and there is a difference of about 22 percentage points between the 10th and 90th percentiles of the resulting debt distribution. In this case, the debt-to-GDP ratio would continue to decline or remain essentially stable in 70 percent of the simulations.
________________________
47 In DEF 2022, the portion of the historical series after Q1 2020 was not considered. As three years have now elapsed, it was deemed appropriate that the methodology is changed, although the reduction in volatility is similar.
48 For more details on the methodology adopted, see Berti K., (2013), ‘Stochastic public debt projections using the historical variance-covariance matrix approach for EU countries’, Economic Papers 480 and European Commission, 2020, Debt Sustainability Monitor 2019, Institutional Papers 120, available at: https://ec.europa.eu/info/sites/info/files/economy-finance/ip120_en.pdf.
| MINISTRY OF ECONOMY AND FINANCE | 43 |
| | ITALY’S STABILITY PROGRAMME 2023 |
| FIGURE IV.2A: STOCHASTIC SIMULATION OF THE DEBT-TO-GDP RATIO UNDER HIGH-VOLATILITY SHOCK | | FIGURE IV.2B: STOCHASTIC SIMULATION OF THE DEBT-TO-GDP RATIO UNDER LIMITED VOLATILITY SHOCK |
| | |
Note: The graphs show the 10th, 20th, 40th, 50th, 60th, 80th and 90th percentiles of the distribution of the debt- to-GDP ratio obtained through the stochastic simulation. Source: MEF elaborations. |
IV.2 SUSTAINABILITY ANALYSIS OF PUBLIC DEBT
This section focuses on the sustainability of Italian public debt. The first part presents the results of sustainability simulations in the medium term, over a ten-year forecast period, based on the methodology currently adopted by the European Commission. However, innovating from the exercises presented in previous documents, a projection scenario was also prepared in line with a possible seven-year fiscal adjustment path discussed as part of the fiscal rules revision process. The second part focuses on the long run by constructing debt projection scenarios up to 2070; Further analyses are carried out with a twofold purpose: on the one hand, the sensitivity of public debt to the main demographic and economic scenarios that influence the behaviour of expenditure variables is verified; on the other hand, alternative scenarios are developed in order to stress the impact of government policies on the sustainability of public finances in the long term.
Medium-term projections of the debt-to-GDP ratio
In this section, the debt-to-GDP ratio is projected until 2034, following the standard Debt Sustainability Analysis (DSA) assumptions used by the European Commission for projecting public finance balances and macroeconomic variables49.
In scenario A, until 2026 the macroeconomic and public-finance context coincides with the policy scenario underlying this Document; in the medium term, starting from 2027, growth is aligned with that of potential GDP, projected with the ‘t+10’ methodology developed by the Output Gap Working Group, while the inflation growth rate converges towards a value determined by market
________________________
49 See Fiscal Sustainability Report 2021.
| 44 | MINISTRY OF ECONOMY AND FINANCE |
IV. SUSTAINABILITY OF PUBLIC FINANCES | |
expectations, as measured by inflation swap quotes. The structural primary balance is equal to the value projected for 2026 adjusted for the change in revenues associated with the general government Property Income (PI), obtained according to the methodology illustrated in the European Commission’s Ageing Report of 2021, and for Age Related Expenditures (ARE), estimated by the State General Accounting Department50. Finally, annual interests are calculated using the SAPE model of the Treasury Department, assuming, as a starting point, the composition and maturity structure of the underlying debt stock in the last forecast year (2026).
In scenarios B1 and B2, the macroeconomic framework and the structure of the interest rates coincide with scenario A, while the nominal deficit-to-GDP ratio gradually improves in the years after 2026.
In scenario B1, consolidation is operated directly on the structural budget balance, which converges towards the Medium-Term Objective (MTO) of 0.25 percent in steps of 0.6 p.p. per year (reaching it in 2032), in line with the adjustment required by current European fiscal rules. In scenario B2, consolidation is operated on the structural primary balance in line with a seven-year adjustment path that is broadly consistent with the proposed revision of fiscal rules currently under discussion. The proposal requires that the declining dynamics of debt must be maintained for 10 years beyond the end of the adjustment period and must prove resilient to deterministic stress tests and stochastic shocks to interest rates, growth, and the primary balance. Assuming a further adjustment plan extending from 2027 to 2031, the debt ratio is projected until 204151. The seven-year adjustment path operates from 2025 to 2031, in line with the exercises shared by the European Commission, but for 2025 and 2026 the financial planning underlying this Document is still taken into account. Given that for the 2025-2026 two-year period the average annual projected adjustment in the structural primary balance is 0.7 p.p., for the 2027-2031 period, an annual adjustment of 0.45 p.p. is sufficient to keep the debt-to-GDP ratio on a decreasing path resilient to the deterministic stress tests and stochastic shocks mentioned above52.
The additional fiscal correction in scenarios B1 and B2 (compared to scenario A) implies a feedback effect on real GDP in line with the European Commission’s methodology applied since the 2020 Debt Sustainability Monitor.
Please note that the assessment in terms of medium-term economic growth for scenarios A and B1 and B2 should be considered conservative, as the economic effects of the extensive investment and reform programme initiated with the NRRP are not fully accounted for. In fact, in line with the approach followed by the European Commission, the overall impact of structural reforms on the economy, which is potentially very significant, is not included.
________________________
50 These expenditures are calculated from the trend macroeconomic framework underlying this Document. For methodological details, see: ‘Medium- to long-term trends in the pension and social security system - Report No. 23’, prepared by the State General Accounting Department, available at: https://www.rgs.mef.gov.it/VERSIONE-I/attivita_istituzionali/monitoraggio/spesa_pensionistica/.
51 The portion of the curve that exceeds the 10-year medium-term period discussed in this section is shown in the next section on the long-term scenarios.
52 Starting from the last year of adjustment and for the next 10 years, the following deterministic stress tests are considered: a financial risk scenario, a lower structural budget balance scenario and a worsening scenario of the implicit interest rate-growth differential. These scenarios are constructed in line with the methodology outlined in the Fiscal Sustainability Report 2021. Stochastic shocks are applied starting from the last year of fiscal adjustment and verify that, with a probability of 70 percent, the debt in the next five years will be decreasing from the value obtained in the last year of the adjustment.
| MINISTRY OF ECONOMY AND FINANCE | 45 |
| | ITALY’S STABILITY PROGRAMME 2023 |
Scenario C considers the growth differential - estimated with the Treasury’s DSGE Quest model - that would be obtained should the effects of the reforms undertaken be fully realised53. Real GDP is increased as early as 2023, assuming that the higher growth, as related to structural factors, is fully transferred to potential GDP. Revenue and expenditure levels are assumed equal to those of scenario A, while from 2027 the structural primary balance as a ratio of GDP remains constant at the level of 2026 (net of age-related expenditures estimated ad hoc for this scenario), in line with the approach followed in scenario A. Interest rates are assumed unchanged from scenarios A and B.
Figure IV.3 shows the evolution of the debt-to-GDP ratio in the three simulated scenarios. In scenario A, which does not envisage any fiscal correction beyond 2026 nor a full evaluation of the impact of the reforms, the debt-to-GDP ratio declines until 2026, before rising again to 159.1 percent in 2034.
In scenarios B1 and B2, the additional fiscal adjustment initiated in 2027 produces a downward path of the debt-to-GDP ratio until 2034, when the figure reaches respectively 123.4 and 132.1 percent. The adjustment path in line with the proposed reform of the European fiscal rules (scenario B2) is less burdensome than the scenario of convergence to the OMT (scenario B1), so the curve for scenario B2 has a less decreasing trend. Specifically, in scenario B1, the structural primary balance achieved at the end of the adjustment period (2032) is 5.3 percent of GDP, while the structural budget balance is equal to the medium-term target; in scenario B2, on the other hand, in 2031 (when the seven-year consolidation path would end), a structural primary balance of 3.6 percent of GDP is achieved and a corresponding value of the structural budget balance of -1.6 percent of GDP, far from the medium-term target54. Since the assumptions underlying scenario B2 are such as to ensure a credibly decreasing debt-to-GDP ratio profile over the next ten years, the greater adjustment required by scenario B1 would be unnecessary to ensure public debt sustainability in the medium term.
In scenario C, the full implementation of the reforms improves the macroeconomic framework, leading to a decline in the debt-to-GDP ratio compared to scenario A over the entire simulation period. However, the debt-to-GDP ratio rises in the final years of the decade to reach 142.8 percent in 2034.
________________________
53 It was possible to simulate the effects of the following reform areas: taxation and transfers to households; banking system and capital market; education and research; active labour market policies; public administration; justice; tenders and contracts.
54 Both projections imply particularly grave interest expenditure. In fact, the realisation of the adjustment plans would most likely result within a reasonable timeframe in a gradual reduction in rates linked to the narrowing of the yield differential of the Italian government debt securities against those of Germany.
| 46 | MINISTRY OF ECONOMY AND FINANCE |
IV. SUSTAINABILITY OF PUBLIC FINANCES | |
| FIGURE IV.3: MEDIUM-TERM PROJECTION OF THE DEBT-TO-GDP RATIO |
|
| Source: MEF analysis. |
The upward trend of the debt-to-GDP ratio in scenario A is mainly linked to two factors, which respectively lead to a worsening of the primary balance and of interest expenditure. On the one hand, the projection includes an increase in ageing costs, while on the other hand the current projections of forward rates, which reflect market expectations, imply an increase in the implicit rate paid on government debt securities from 2026 onwards.
Scenarios B1 and B2 on the one hand, and C on the other, are useful to demonstrate how, in the medium term, a combination of the full implementation of reforms and the continuation of the virtuous path of fiscal adjustment (already envisioned in the years 2023-2026), even beyond the forecast horizon of this Document, can ensure a sustainable dynamic of the debt-to-GDP ratio. The two scenarios are simulated separately but considering that the reforms in the coming years are likely to lead to a higher growth profile than that underlying scenario A, one can imagine that a satisfactory pace of debt reduction can be achieved even in a scenario where fiscal adjustments are slightly more gradual than in scenarios B1 and B2.
Long-term scenarios
This section focuses on the long term by constructing projections of debt scenarios up to 2070. Further analyses are carried out to stress the impact of government policies on the sustainability of public finances in the long term.
Assumptions underlying the forecast
Estimates presented herein follow the methodology and assumptions agreed within the Economic Policy Committee Working Group on Ageing (EPC-WGA) as part of the 2021 long-term projection exercise contained in the Ageing Report.
| MINISTRY OF ECONOMY AND FINANCE | 47 |
| | ITALY’S STABILITY PROGRAMME 2023 |
In the short term, the forecast includes national account data updated to 2022 and the macroeconomic framework underlying this Document. Starting from the last forecast year (2026) and in the long run, the demographic and macroeconomic picture is linked to the medium- to long-term values defined within the EPC-WGA. The demographic assumptions adopted are those related to the Eurostat central forecast, with 2019 as baseline year55 (published in 2020), while the structural dynamics of the macroeconomic framework variables follow the assumptions of the EPC-WGA baseline scenario published in the 2021 Ageing Report, except for the total factor productivity convergence assumptions, for which the methodological innovations established for the purposes of the 2024 Ageing Report are adopted56.
The age-related public expenditure forecasts shown in Table V.11 of the Appendix are updated based on the current regulatory framework. With regard to pension expenditure, the projections take into account the provisions contained in the budget law for 2023 (Law No. 197/2022), which set forth: the revision for the two-year period 2023-2024 of the indexation system; the extension of early retirement for individuals who meet the requirements of 62 years of age and 41 years of contribution in 2023 (so-called ‘Quota 103’), with the related starting date regime; the extension for 2022 of the measure ‘Opzione donna’, limited exclusively to female workers who meet certain selective requirements in relation to specific conditions of need and with a partial increase in the age requirement. The forecasts also consider the overall effects of the provisions of Decree-Law No. 4 of 28 January 2019, converted into Law No. 26/2019, including those resulting from the introduction of the ‘Quota 100’ early retirement channel for those who, in the 2019¬2021 period, have accrued the joint requirement of a minimum age of 62 and a contribution period of not less than 38 years.
The projections of pension expenditure also incorporate, for the early retirement channel independent of age requirements and for the so-called precocious workers, the suspension of adjustments to life expectancy for the 2019-2026 period.
Regarding healthcare expenditure, compared with the Update of the 2022 Stability Programme, the forecast considers the effects of the 2023 budget law. Specifically, the refinancing of standard healthcare requirements increases the overall level by 2,150 million in 2023, 2,300 million in 2024 and 2,600 million from 2025. With reference to the first year of the 2023-2025 period, a portion of the increase, amounting to 1,400 million, is intended to meet the higher costs caused by the growth in energy source prices. In general, the update of the forecast values assumes a more sustained expenditure growth dynamic than expected compared to when the Update was prepared.
Based on a technical preliminary hypothesis, the Long-Term Care expenditure, incorporates costs related to the financing of certain projects funded through the
________________________
55 The projection of age-related expenditures as a ratio of GDP was carried out reconstructing the resident population as of 1 January 2023. Compared with the population level as of 1/1/2023 estimated by Eurostat in its 2019-based population forecast, the updated data show a reduction of about 1,285,000 people.
56 The structural dynamics of the variables in the macroeconomic framework, as derived from the assumptions agreed upon in the EPC WGA, predict an increasing average annual rate of change in real productivity until 2040, where it hovers around 1.7 percent, and then declines to around 1.2 percent at the end of the forecast period. The employment rate, in the 15-64 age group is expected to grow from 60.4 percent in 2023 to 64.9 percent in 2070. The interaction of the above assumptions with demographic dynamics results in a real GDP growth rate of around 1 percent per year on average over the 2023-2070 period.
| 48 | MINISTRY OF ECONOMY AND FINANCE |
IV. SUSTAINABILITY OF PUBLIC FINANCES | |
Next Generation EU programme such as those related to fostering the process of deinstitutionalisation of the elderly, strengthening home-based social services, and ensuring additional social welfare services in favour of the disabled and against marginality. These costs total 916 million over the period 2023-2026.
As for the school system, the forecast considers the charges for the renewal of contracts for the three-year periods 2019-2021, 2022-2024 and 2025-2027. Relative to the years 2020-2026, the forecast also reflects the increased personnel expenditure required to cope with the epidemiological emergency related to the spread of the Covid-19 virus. The forecast of education expenditure-to-GDP ratio includes current and capital measures financed through the Next Generation EU programme for ISCED 1-8 classes. These expenditures total about 22 billion in the 2022-2026 period.
Long-term debt dynamics and indicators of fiscal sustainability
The scenarios for long-term debt dynamics presented in this section include the age-related expenditure projections presented in the previous paragraph and follow the methodology used by the European Commission in its long-term sustainability analysis57. Economic growth is aligned with that of potential GDP, while the inflation growth rate, beyond the ‘t+10’ medium-term horizon, converges to the ECB’s policy target of 2 percent in 20 years. Regarding the assumptions on public finance, in reference scenario A, as in the related medium-term scenario, the primary balance as a ratio of GDP is kept equal to the value projected for 2026 of the policy scenario, except for the component corresponding to expenditures related to population aging and, for revenues, to the change in general government proprietary income. Interest expenditure on debt is calculated from convergence assumptions on short-and long-term market interest rates. The debt-to-GDP ratio projections coincide through 2034 with those seen in scenario A in the medium-term sustainability section and are extended in this section through 2070.
As shown in Figure IV.4, the long-term projection of scenario A appears at first decreasing, then increasing and finally decreasing again in the last fifteen years of the projection. The particularly high level of the interest rates in the short- and medium-term horizon is effectively countered by a broadly positive primary balance in the last year of the policy horizon (2 percent in 2026). In the long run, rates converge to more favourable values than at present, producing a reduction in interest expenditure and thus in the debt-to-GDP ratio.
The reference scenario (scenario A) is normally used to calculate the medium-and long-term sustainability indicators (S1 and S2)58 used by the European Commission in its analysis of member states’ debt levels. The two indicators are aimed at estimating the fiscal adjustment needed to achieve debt sustainability while also considering the impact of increased expenditure on the aging population.
________________________
57 See Debt Sustainability Monitor 2020, Institutional Paper 143, February 2021.
58 The medium-term indicator S1 measures the adjustment in the structural primary balance to be achieved in cumulative terms over the five years following the last forecast year, such that a debt/GDP level of 60 percent is achieved over the following 15 years. Indicator S2 signals the fiscal adjustment in terms of the structural primary balance that, if achieved and maintained from the last forecast year onward, would preserve the intertemporal fiscal balance over an infinite horizon. More details can be found in the report: European Commission, Debt Sustainability Monitor 2020, Institutional Papers 143. February 2021, available at:
https://ec.europa.eu/info/sites/info/files/economy-finance/ip143_en.pdf.
| MINISTRY OF ECONOMY AND FINANCE | 49 |
| | ITALY’S STABILITY PROGRAMME 2023 |
| FIGURE IV.4: DEBT-TO-GDP RATIO IN THE REFERENCE SCENARIO |
|
| Source: MEF analysis. |
Since the annual update of the Commission’s values is not available yet, the trends of the two indicators compared to values estimated in the Stability Programme 2022 are briefly highlighted. It should be remembered that the value of the indicator depends critically on the initial structural primary balance and the stock of public debt, as well as the dynamics of spending costs projected according to demographic trends.
The S1 indicator value estimated on the 2026 balance for the policy scenario shows a required fiscal adjustment of 7.2 p.p. of GDP, lower than the 8.1 p.p. estimated in the Stability Programme 2022 and the 8.6 p.p. estimated in the Stability Programme 2021, a sign that the country has embarked on a virtuous path of fiscal adjustment. This adjustment, if kept constant from 2031 onward, would allow reaching the debt-to-GDP ratio target of 60 percent in 2041. In contrast, the S2 indicator is -0.6 p.p. of GDP, which is below the 2 p.p. of GDP threshold defined by the Commission above which a country is considered at high risk of default by the Commission. As the S2 indicator is a measure of a country’s solvency, Italy is thus confirmed to be able to meet its debt obligations.
Policy impact on debt sustainability
Given the high uncertainty in long-term forecasts, the following section assesses the robustness of the debt-to-GDP ratio projection of the baseline scenario outlined in the previous section. This section shows some examples of the favourable effects that policies undertaken may have on the debt-to-GDP ratio in the long term.
Structural reforms
The first exercise concerns the long-term extension of scenario C already presented in the section on medium-term debt sustainability analysis, which incorporates the impact of structural reforms contained in the NRRP estimated through the QUEST model.
| 50 | MINISTRY OF ECONOMY AND FINANCE |
IV. SUSTAINABILITY OF PUBLIC FINANCES | |
| FIGURE IV.5: IMPACT OF GREATER REFORM-RELATED GROWTH (as a percentage of GDP) |
|
| Source: MEF analysis. |
The increase on gross domestic product estimated in the long run is 13 p.p. of GDP in 2070. The simulation shows that the reforms will have a significant impact on sustainability (the debt-to-GDP ratio at the end of the period is reduced by about 18 p.p.).
Pension expenditure
A further set of simulations shifts the impact of successive pension reforms over the past 20 years - already commented on in the Focus ‘Medium-to-long-term trends in the Italian pension system’ - in terms of different trends in the debt-to-GDP ratio.
| FIGURE IV.6: IMPACT OF PENSION REFORMS (as a percentage of GDP) |
|
| Source: MEF analysis. |
| MINISTRY OF ECONOMY AND FINANCE | 51 |
| | ITALY’S STABILITY PROGRAMME 2023 |
All the measures adopted over time, culminating in the 2011 reforms, with the final transition to the Notional Defined Contribution system, have contributed to significantly strengthen the sustainability of public debt.
The fiscal adjustment envisioned by the Economic Governance Review
The dynamics of public debt in the long run is very sensitive to the initial value of the primary balance as a ratio of GDP used in the simulation (relative, for this Document, to 2026). Figure IV.7 shows the projection to 2070 of scenario B2, already presented in the section on medium-term scenarios and assuming a seven-year fiscal adjustment path in line with the proposed European governance reform. Beyond the consolidation period, which ends in 2031, the structural primary balance is kept constant and updated by tracking the evolution of age-related expenditures and, on the revenue side, public administration proprietary income, while all remaining assumptions (macroeconomic and financial) are in line with scenario A.
Figure IV.7, in addition to showing how an improvement in government accounts in the near future would be relevant to set the debt-to-GDP ratio on a declining path in the long run as well, highlights how debt sustainability would be largely ensured even if stylised adverse shocks on fertility, TFP and migration59 were to occur.
| FIGURE IV.7: IMPACT OF A FISCAL ADJUSTMENT PATH IN LINE WITH EGR. SENSITIVITY TO ADVERSE SHOCKS (as a percentage of GDP) |
|
| Source: MEF analysis. |
________________________
59 Derived from the 2021 Ageing Report.
| 52 | MINISTRY OF ECONOMY AND FINANCE |
| TABLE V.1: MACROECONOMIC PROSPECTS |
| | 2022 | 2022 | 2023 | 2024 | 2025 | 2026 |
| | Level (1) | % var. | % var. | % var. | % var. | % var. |
| Real GDP | 1,745,403 | 3.7 | 1.0 | 1.5 | 1.3 | 1.1 |
| Nominal GDP | 1,909,154 | 6.8 | 5.8 | 4.3 | 3.4 | 3.1 |
| COMPONENTS OF REAL GDP | | | | | | |
| Private consumption expenditure (2) | 1,026,608 | 4.6 | 0.7 | 1.3 | 1.0 | 1.1 |
| Government consumption expenditure (3) | 321,545 | 0.0 | -1.3 | -1.2 | 0.9 | 0.4 |
| Gross fixed capital formation | 375,366 | 9.4 | 3.8 | 3.4 | 2.1 | 1.5 |
| Changes in inventories (% of GDP) | | -0.4 | -0.1 | 0.1 | 0.0 | 0.0 |
| Exports of goods and services | 591,384 | 9.4 | 3.2 | 3.8 | 3.7 | 2.8 |
| Imports of goods and services | 566,611 | 11.8 | 2.5 | 3.8 | 3.5 | 2.8 |
| CONTRIBUTION TO REAL GDP GROWTH | | | | | | |
| Final domestic demand | | 4.6 | 0.9 | 1.3 | 1.2 | 1.1 |
| Changes in inventories | | -0.4 | -0.1 | 0.1 | 0.0 | 0.0 |
| External balance of goods and services | | -0.5 | 0.3 | 0.1 | 0.1 | 0.0 |
| (1) Millions. |
| (2) Final consumption expenditure of households and non-profit private social institutions serving households (NPISH). |
| (3) Public administrations. |
| Discrepancies, if any, are due to rounding. |
| TABLE V.2: PRICE DEVELOPMENTS |
| | 2022 | 2022 | 2023 | 2024 | 2025 | 2026 |
| | Level | % var. | % var. | % var. | % var. | % var. |
| GDP deflator | 109.4 | 3.0 | 4.8 | 2.7 | 2.0 | 2.0 |
| Private consumption deflator | 112.2 | 7.4 | 5.7 | 2.7 | 2.0 | 2.0 |
| HICP | 114.2 | 8.7 | 5.9 | 2.8 | 2.1 | 2.0 |
| Public consumption deflator | 115.5 | 5.2 | 4.0 | -1.0 | 0.4 | 1.3 |
| Investment deflator | 110.7 | 4.1 | 2.9 | 3.0 | 2.1 | 1.9 |
| Export price deflator (goods and services) | 119.9 | 10.9 | 1.8 | 1.8 | 1.5 | 1.5 |
| Import price deflator (goods and services) | 130.4 | 21.5 | -1.9 | 0.6 | 0.7 | 1.5 |
| TABLE V.3: LABOUR MARKET DEVELOPMENTS |
| | 2022 | 2022 | 2023 | 2024 | 2025 | 2026 |
| | Level (1) | % var. | % var. | % var. | % var. | % var. |
| Employment, persons | 25,542 | 1.7 | 0.9 | 1.0 | 0.7 | 0.8 |
| Employment, hours worked | 43,279,196 | 3.9 | 1.3 | 1.1 | 0.9 | 0.8 |
| Unemployment rate (%) | | 8.1 | 7.7 | 7.5 | 7.4 | 7.2 |
| Labour productivity, persons | 68,335 | 1.9 | 0.1 | 0.5 | 0.6 | 0.3 |
| Labour productivity, hours worked | 40.3 | -0.3 | -0.3 | 0.4 | 0.3 | 0.3 |
| Compensation of employees | 782,714 | 7.0 | 4.1 | 3.4 | 2.9 | 2.6 |
| Compensation per employee | 45,470 | 3.3 | 3.1 | 2.2 | 2.0 | 1.8 |
| (1) Units of measurement: thousands of units for employed in national accounts and total hours worked; euro at constant values for labour productivity; euro millions at current values for compensation of employees and euro for compensation per employee (i.e., labour cost). |
| MINISTRY OF ECONOMY AND FINANCE | 53 |
| | ITALY’S STABILITY PROGRAMME 2023 |
| TABLE V.4: SECTORAL BALANCES |
| | 2022 | 2023 | 2024 | 2025 | 2026 |
| | % of GDP | % of GDP | % of GDP | % of GDP | % of GDP |
| Net lending/borrowing vis-a-vis the rest of the world | -0.8 | 1.2 | 1.5 | 1.9 | 1.9 |
| - Balance on goods and services | -1.5 | 0.3 | 0.7 | 1.1 | 1.1 |
| - Balance of primary incomes and transfers | 0.2 | 0.4 | 0.4 | 0.4 | 0.4 |
| - Capital account | 0.5 | 0.5 | 0.4 | 0.4 | 0.4 |
| Net lending/borrowing of the private sector | 7.2 | 5.7 | 5.2 | 4.9 | 4.4 |
| Net lending/borrowing of general government | -8.0 | -4.5 | -3.7 | -3.0 | -2.5 |
| TABLE V.5: GENERAL GOVERNMENT BUDGETARY PROSPECTS (1) |
| | 2022 | 2023 | 2024 | 2025 | 2026 |
| | Level (2) | % of GDP | % of GDP |
| Net lending (EDP B.9) by sub-sector | | | | | |
| 1. General government | -151,900 | -8.0 | -4.5 | -3.7 | -3.0 | -2.5 |
| Difference between policy scenario and baseline scenario (3) | | -0.2 | -0.2 | 0.0 | 0.0 |
| 2. Central government | -151,473 | -7.9 | -4.4 | -3.5 | -3.1 | -2.6 |
| 3. State government | | | | | | |
| 4. Local government | -1,812 | -0.1 | -0.1 | -0.1 | -0.1 | -0.1 |
| 5. Social security funds | 1,385 | 0.1 | 0.1 | 0.1 | 0.1 | 0.1 |
| General government | | | | | |
| 6. Total revenue | 931,430 | 48.8 | 48.9 | 47.7 | 47.6 | 47.1 |
| 7. Total expenditure | 1,083,330 | 56.7 | 53.2 | 51.2 | 50.7 | 49.6 |
| 8. Net lending/borrowing | -151,900 | -8.0 | -4.4 | -3.5 | -3.0 | -2.5 |
| 9. Interest expenditure | 83,206 | 4.4 | 3.7 | 4.1 | 4.2 | 4.5 |
| 10. Primary balance | -68,694 | -3.6 | -0.6 | 0.5 | 1.2 | 2.0 |
| 11. One-off and other temporary measures (4) | 5,574 | 0.3 | 0.3 | 0.1 | 0.1 | 0.1 |
| Selected components of revenue | | | | | |
| 12. Total taxes | 568,649 | 29.8 | 29.7 | 29.3 | 29.2 | 29.1 |
| 12a. Taxes on production and imports | 276,543 | 14.5 | 15.0 | 15.0 | 14.9 | 14.8 |
| 12b Current taxes on income, wealth, etc | 290,397 | 15.2 | 14.6 | 14.2 | 14.3 | 14.2 |
| 12c. Capital taxes | 1,709 | 0.1 | 0.1 | 0.1 | 0.1 | 0.1 |
| 13. Social contributions | 261,004 | 13.7 | 13.6 | 13.7 | 13.7 | 13.6 |
| 14. Property income | 16,710 | 0.9 | 0.7 | 0.6 | 0.6 | 0.6 |
| 15. Other | 85,067 | 4.5 | 4.9 | 4.1 | 4.1 | 3.8 |
| 15a. Other current revenues | 69,159 | 3.6 | 3.7 | 3.6 | 3.5 | 3.3 |
| 15b. Other capital revenues | 15,908 | 0.8 | 1.2 | 0.5 | 0.6 | 0.4 |
| 16. Total revenue | 931,430 | 48.8 | 48.9 | 47.7 | 47.6 | 47.1 |
| p.m.: Tax burden | | 43.5 | 43.3 | 43.0 | 42.9 | 42.7 |
| Selected components of expenditure | | | | | |
| 17. Compensation of employees + intermediate consumption | 302,163 | 15.8 | 15.4 | 14.5 | 14.1 | 13.9 |
| 17a. Compensation of employees | 186,916 | 9.8 | 9.4 | 8.9 | 8.6 | 8.4 |
| 17b. Intermediate consumption | 115,247 | 6.0 | 6.0 | 5.6 | 5.5 | 5.5 |
| 18. Social payments | 457,688 | 24.0 | 23.6 | 23.6 | 23.4 | 23.3 |
| of which: Unemployment benefits | 12,931 | 0.7 | 0.7 | 0.7 | 0.7 | 0.6 |
| 18a. Social transfers in kind supplied via market producers | 50,767 | 2.7 | 2.6 | 2.3 | 2.2 | 2.2 |
| 18b. Social transfers other than in kind | 406,921 | 21.3 | 21.0 | 21.4 | 21.2 | 21.1 |
| 19. Interest expenditure | 83,206 | 4.4 | 3.7 | 4.1 | 4.2 | 4.5 |
| 20. Subsidies | 49,854 | 2.6 | 2.6 | 1.8 | 1.7 | 1.5 |
| 21. Gross fixed capital formation | 51,465 | 2.7 | 3.3 | 3.8 | 3.7 | 3.4 |
| 22. Capital transfers | 87,590 | 4.6 | 2.3 | 1.4 | 1.3 | 0.9 |
| 23. Other | 51,364 | 2.7 | 2.3 | 2.1 | 2.2 | 2.2 |
| 23a. Other current expenditure | 45,708 | 2.4 | 2.3 | 2.2 | 2.2 | 2.1 |
| 23b. Other capital expenditure | 5,656 | 0.3 | -0.1 | -0.1 | 0.1 | 0.1 |
| 24. Total expenditure | 1,083,330 | 56.7 | 53.2 | 51.2 | 50.7 | 49.6 |
| Current primary expenditure | 855,413 | 44.8 | 43.9 | 42.2 | 41.4 | 40.8 |
| Total primary expenditure | 1,000,124 | 52.4 | 49.5 | 47.2 | 46.5 | 45.1 |
(1) The first line shows values under policy scenario; the other values show baseline estimates under existing legislation. Discrepancies, if any, are due to rounding. (2) Values in millions. (3) The difference is due to the effect of the public finance measures announced by the Government. (4) The positive sign indicates one-off measures to reduce the deficit |
| 54 | MINISTRY OF ECONOMY AND FINANCE |
| TABLE V.6: NO-POLICY CHANGE PROJECTIONS (1) |
| | 2022 | 2023 | 2024 | 2025 | 2026 |
| | Level (2) | % of GDP | % of GDP |
| Total expenditure at unchanged policies | 1,083,330 | 56.7 | 53.2 | 51.5 | 51.0 | 50.0 |
(1) The table shows the impact of the refinancing of some measures that may be implemented in considerationof international commitments and legislative factors. (2) Values in millions. |
| TABLE V.7: AMOUNTS TO BE EXCLUDED FROM THE EXPENDITURE BENCHMARK |
| | 2022 | 2023 | 2024 | 2025 | 2026 |
| | Level (1) | % of GDP | % of GDP |
| Expenditure on EU programs fully matched byEU funds revenue (2) | 16,473 | 0.9 | 1.5 | 0.7 | 0.8 | 0.5 |
| Of which investment expenditure fully matched by EU funds revenue (3) | 2,170 | 0.1 | 0.5 | 0.4 | 0.4 | 0.3 |
| Cyclical unemployment benefit expenditure (4) | -1,489 | -0.1 | -0.1 | -0.2 | -0.2 | -0.2 |
| Effect of discretionary revenue measures (5) | -18,969 | -1.0 | 0.5 | -0.1 | 0.1 | 0.0 |
| Revenues increased mandated by law | 0,0 | 0.0 | 0.0 | 0.0 | 0.0 | 0.0 |
(1) Values in millions. (2) The estimates include Next Generation EU grants for 0.7 percent of GDP for 2022, 1.3 percent for 2023, 0.6 percent for 2024 and 0.6 percent for 2025. (3) The estimates include Next Generation EU grants for 0.4 percent of GDP for 2023, 0.3 percent for 2024, 0.3 percent for 2025 and 0.2 percent for 2026. (4) The cyclical expenditure component for unemployment benefits was calculated using the methodology currently used by the European Commission, based on the unemployment gap. (5) Discretionary contribution revenue is included. |
| TABLE V.8: GENERAL GOVERNMENT DEBT DEVELOPMENTS (percentage of GDP) (1) |
| | 2022 | 2023 | 2024 | 2025 | 2026 |
| Gross debt (2) | 144.4 | 142.1 | 141.4 | 140.9 | 140.4 |
| Change in gross debt ratio | -5.5 | -2.3 | -0.7 | -0.5 | -0.5 |
| Contributions to changes in gross debt: | | | | | |
| Primary balance | 3.6 | 0.8 | -0.3 | -1.2 | -2.0 |
| Snow-ball effect | -5.2 | -4.2 | -1.7 | -0.4 | 0.2 |
| Of which: Interest expenditure | 4.4 | 3.7 | 4.1 | 4.2 | 4.5 |
| | | | | | |
| Stock-flow adjustment | -3.9 | 1.1 | 1.4 | 1.1 | 1.3 |
| of which: Differences between cash and accruals | -4.1 | 0.5 | 0.8 | 0.5 | 0.4 |
| Net accumulation of financial assets (3) | 0.1 | 0.5 | 0.3 | 0.4 | 0.6 |
| of which Privatisation proceeds | 0.00 | 0.00 | -0.01 | -0.09 | -0.04 |
| Valuation effects | 0.2 | 0.3 | 0.4 | 0.3 | 0.2 |
| Others (4) | -0.1 | -0.3 | -0.1 | -0.2 | 0.0 |
| p.m.: Implicit interest rate on debt | 3.1 | 2.7 | 3.0 | 3.1 | 3.3 |
(1) Discrepancies, if any, are due to rounding. (2) Value gross of Italy’s share of loans to EMU Member States, either bilaterally or through the EFSF, and of the contribution to the capital of the ESM. At the end of 2022, the amount of these shares was approximately 56.3 billion, of which 42.0 billion for bilateral loans and through the EFSF and 14.3 billion for the ESM Programme (see Bank of Italy, ‘Statistical Bulletin of Public Finances, Borrowing Requirement and Debt, March 2023’). In the policy scenario revenues from privatisation proceeds are expected around 0.14 percent of GDP in the 2024-2026 period. The MEF’s liquidity stock is assumed to be reduced of about 0.3 percent of GDP in 2023, 0.2 percent in 2024 and in 2025 and to remain to the same level of 2025 in 2026. In addition, the estimates consider the repurchase of SACE, the use of ‘Patrimonio destinato’, the EIB guarantees, and the loans of the SURE and NGEU programmes. The interest rate scenario used for the estimates is based on the implicit forecasts derived from the forward rates on Italian government bonds for the period in which this Document was compiled. (3) Including the effects of contributions for GLF and the ESM Programme. (4) The item ‘Other’, residual compared to the preceding items, includes changes in MEF’s liquidity stock; statistical discrepancies; Eurostat reclassifications; contributions in support of the Euro Area envisaged by the EFSF. |
| MINISTRY OF ECONOMY AND FINANCE | 55 |
| | ITALY’S STABILITY PROGRAMME 2023 |
| TABLE V.9: CYCLICALLY ADJUSTED PUBLIC FINANCES (as percentage of GDP) |
| | 2020 | 2021 | 2022 | 2023 | 2024 | 2025 | 2026 |
| 1. Real GDP growth | -9.0 | 7.0 | 3.7 | 1.0 | 1.5 | 1.3 | 1.1 |
| 2. Net Lending of general government | -9.7 | -9.0 | -8.0 | -4.5 | -3.7 | -3.0 | -2.5 |
| 3. Interest expenditure | 3.5 | 3.6 | 4.4 | 3.7 | 4.1 | 4.2 | 4.5 |
| 4. One-off and other temporary measures (2) | 0.1 | 0.4 | 0.3 | 0.1 | -0.1 | 0.1 | 0.1 |
Of which one-offs on the revenue side: general government | 0.2 | 0.4 | 0.3 | 0.1 | -0.2 | 0.1 | 0.0 |
Of which one-offs on the expenditure side: general government | -0.1 | 0.0 | 0.0 | 0.0 | 0.0 | 0.0 | 0.0 |
| 5. Potential GDP growth (%) | -0.1 | -0.1 | 1.0 | 0.9 | 1.1 | 1.1 | 1.1 |
| Contributions: | | | | | | | |
| Labour | -0.3 | -0.6 | 0.4 | 0.3 | 0.5 | 0.4 | 0.4 |
| Capital | -0.1 | 0.2 | 0.3 | 0.4 | 0.4 | 0.5 | 0.5 |
| Total Factor Productivity | 0.3 | 0.3 | 0.2 | 0.2 | 0.2 | 0.2 | 0.3 |
| 6. Output gap | -8.5 | -2.0 | 0.5 | 0.6 | 0.9 | 1.1 | 1.1 |
| 7. Cyclical budgetary component | -4.6 | -1.1 | 0.3 | 0.3 | 0.5 | 0.6 | 0.6 |
| 8. Cyclically adjusted balance | -5.0 | -7.9 | -8.3 | -4.8 | -4.2 | -3.6 | -3.1 |
| 9. Cyclically adjusted primary balance | -1.6 | -4.4 | -3.9 | -1.1 | -0.2 | 0.6 | 1.4 |
| 10. Structural balance (3) | -5.1 | -8.3 | -8.5 | -4.9 | -4.1 | -3.7 | -3.2 |
| 11. Structural primary surplus (3) | -1.6 | -4.8 | -4.2 | -1.2 | 0.0 | 0.5 | 1.3 |
| 12. Change in structural budget balance | -3.3 | -3.3 | -0.2 | 3.6 | 0.9 | 0.4 | 0.6 |
| 13. Change in structural primary surplus | -3.2 | -3.2 | 0.6 | 3.0 | 1.2 | 0.5 | 0.8 |
(1) Discrepancies, if any, are due to rounding. (2) The positive sign indicates one-off measures to reduce the deficit. (3) Cyclically adjusted net of one-off and other temporary measures. |
| TABLE V.10: DIVERGENCE FROM PREVIOUS UPDATE (1) |
| | 2022 | 2023 | 2024 | 2025 |
| REAL GDP GROWTH (%) | | | | |
| Previous update (SP 2022) | 3.1 | 2.4 | 1.8 | 1.5 |
| Current update (SP 2023) | 3.7 | 1.0 | 1.5 | 1.3 |
| Difference | 0.5 | -1.4 | -0.4 | -0.2 |
| GENERAL GOVERNMENT NET LENDING (% of GDP) | | | | |
| Previous update (SP 2022) | -5.6 | -3.9 | -3.3 | -2.8 |
| Current update (SP 2023) | -8.0 | -4.5 | -3.7 | -3.0 |
| Difference | -2.4 | -0.6 | -0.4 | -0.2 |
| GENERAL GOVERNMENT GROSS DEBT (% of GDP) | | | | |
| Previous update (SP 2022) | 147.0 | 145.2 | 143.4 | 141.4 |
| Current update (SP 2023) | 144.4 | 142.1 | 141.4 | 140.9 |
| Difference | -2.6 | -3.1 | -2.1 | -0.5 |
| (1) Discrepancies, if any, are due to rounding. | | | | |
| 56 | MINISTRY OF ECONOMY AND FINANCE |
| TABLE V.11: LONG-TERM SUSTAINABILITY OF PUBLIC FINANCES (% OF GDP) (1) |
| | 2010 | 2015 | 2020 | 2025 | 2030 | 2035 | 2040 | 2045 | 2050 | 2055 | 2060 | 2065 | 2070 |
| Total expenditure | 49.7 | 50.3 | 57.0 | 50.7 | 52.4 | 54.1 | 54.9 | 55.0 | 54.3 | 53.2 | 52.3 | 51.6 | 51.5 |
| Of which: | | | | | | | | | | | | | |
| Age-related expenditures | 26.6 | 26.9 | 29.5 | 27.2 | 27.6 | 28.4 | 28.7 | 28.6 | 27.8 | 26.9 | 26.2 | 25.8 | 25.8 |
| Pension expenditure (2) (3) | 14.7 | 15.6 | 16.9 | 16.1 | 16.7 | 17.3 | 17.3 | 16.8 | 15.8 | 14.7 | 13.9 | 13.6 | 13.8 |
| Health care (2) (4) | 6.9 | 6.6 | 7.4 | 6.2 | 6.4 | 6.6 | 6.9 | 7.1 | 7.2 | 7.3 | 7.3 | 7.3 | 7.2 |
| Long-term care (earlier included in the health care) | 0.7 | 0.7 | 0.7 | 0.6 | 0.7 | 0.7 | 0.8 | 0.8 | 0.9 | 1.0 | 1.0 | 1.0 | 1.0 |
| LTC - socio-assistance comp. (2) (4) | 1.1 | 1.1 | 1.1 | 1.0 | 1.0 | 1.1 | 1.1 | 1.2 | 1.3 | 1.4 | 1.5 | 1.5 | 1.4 |
| Education expenditure (5) | 3.9 | 3.6 | 4.0 | 3.8 | 3.5 | 3.4 | 3.4 | 3.5 | 3.5 | 3.5 | 3.5 | 3.4 | 3.4 |
| Interest expenditure | 4.3 | 4.1 | 3.5 | 4.2 | 5.5 | 6.4 | 6.9 | 7.1 | 7.2 | 7.0 | 6.8 | 6.6 | 6.4 |
| Total revenue | 45.5 | 47.8 | 47.3 | 47.6 | 47.6 | 47.6 | 47.6 | 47.6 | 47.6 | 47.6 | 47.6 | 47.6 | 47.6 |
| Of which: property income | 0.6 | 0.7 | 1.1 | 0.7 | 0.7 | 0.7 | 0.7 | 0.7 | 0.7 | 0.7 | 0.7 | 0.7 | 0.6 |
| ASSUMPTIONS (%) | | | | | | | | | | | | | |
| Labour productivity growth | 2.6 | 0.1 | 3.1 | 0.4 | 0.5 | 1.1 | 1.7 | 1.6 | 1.6 | 1.5 | 1.4 | 1.3 | 1.2 |
| Real GDP growth | 1.7 | 0.8 | -9.0 | 1.3 | 0.3 | 0.5 | 1.0 | 1.3 | 1.3 | 1.3 | 1.3 | 1.2 | 1.0 |
| Participation rate males (aged 20-64) | 72.5 | 73.7 | 72.9 | 74.3 | 74.8 | 75.6 | 76.4 | 76.8 | 76.4 | 75.8 | 75.8 | 76.1 | 76.4 |
| Participation rates females (aged 20-64) | 50.9 | 54.0 | 54.1 | 58.3 | 59.9 | 61.2 | 62.2 | 62.6 | 62.4 | 62.3 | 62.3 | 62.4 | 62.6 |
| Total participation rates (aged 20-64) | 61.6 | 63.8 | 63.5 | 66.3 | 67.4 | 68.5 | 69.4 | 69.9 | 69.6 | 69.3 | 69.3 | 69.5 | 69.8 |
| Unemployment rate | 8.5 | 12.0 | 9.3 | 7.4 | 7.5 | 7.6 | 7.7 | 7.2 | 6.7 | 6.6 | 6.6 | 6.5 | 6.5 |
| Population aged 65+ over total population | 20.4 | 21.9 | 23.2 | 24.8 | 27.2 | 29.8 | 32.2 | 33.5 | 33.7 | 33.6 | 33.2 | 33.0 | 33.0 |
| Dependence index of the elderly (65 and over / [20-64]) | 31.1 | 34.0 | 36.4 | 39.3 | 44.2 | 50.6 | 57.0 | 60.9 | 61.8 | 61.1 | 60.0 | 59.3 | 59.8 |
(1) For the four-year period 2023-2026 growth assumptions are in line with the macroeconomic baseline scenario under existing legislation underlying the Stability Programme 2023. For the following period, the scenario is coherent with the EPC-WGA exercise prepared for the 2021 round of age-related expenditures projections, except the hypothesis of convergence of the total factor productivity, that adopts the methodological innovations set for the Ageing Report 2024. (2) Until 2022, expenditure on social benefits refers to National Accounting data. For the period 2023-2026, the forecast values are in line with those underlying the forecast of the public finance scenario. (3) The budget law No. 197/2022 provides for a partial revision of the price indexation mechanism for pensions for 2023 and 2024 and a transitional increase for pensions that are altogether equal to or lower than the minimum INPS treatment. Regarding the access to retirement, the Law provides for the possibility of access to early retirement, in addition to the ordinary requirements, for individuals who accrue the joint requirements of 62 years of age and 41 years of contributions in 2023 (with a postponement of the starting date by three months for private employees and six months for public employees). The possibility of early retirement access is also provided for female workers who have accrued 35 years of contribution years and 60 years of age by the year 2022, with a reduction of one year for each child up to a maximum of two years, and provided that these workers meet certain selective requirements in relation to specific conditions of need. (4) Starting from 2015, the health expenditure data considers the revision of the time series of the national accounts, based on the ESA 2010. This revision was carried out in coordination with Eurostat and with most of the EU countries. Regarding the period 2022-2026, the forecast reflects: (i) expenditures for the implementation of the National Recovery and Resilience Plan (RRP), which amount to nearly 3,700 million (‘Mission 6: Health’); (ii) the effects provided for in the budget law for 2023. As of 2026, the forecast is made following the methodology of the Ageing Report 2021 reference scenario. (5) The aggregate includes the ISCED education levels 1-8 according to the OECD classification (ISCED 2011 level). It does not include expenditure on adult education (lifelong learning) and pre-primary school. The expenditure aggregate is built on data from UNESCO / OECD / EUROSTAT (UOE) sources. The forecast incorporates the UOE data updated to the financial year 2019. For 2020 and 2021, the expenditure is estimated by applying to the 2019 value the variation of education expenditure coming from COFOG data. As of 2022 the projection reflects the greater expenditure for personnel necessary to face the epidemiological emergency linked to the spread of the Covid-19. The forecast of education expenditure in relation to GDP includes current and capital account measures financed through the Next Generation EU programme for ISCED 1-8 classes. These expenditures amount to about 22 billion, overall, up to 2026. Discrepancies, if any, are due to rounding. |
| MINISTRY OF ECONOMY AND FINANCE | 57 |
| | ITALY’S STABILITY PROGRAMME 2023 |
| TABLE V.12: CONTINGENT LIABILITIES (in millions) |
| | 2021 | 2022 |
| | Level | % of GDP | Level | % of GDP |
| Stock of public guarantees | 288,446 | 16.1 | 302,538 | 15.8 |
| of which: financial sector (1) | 14,645 | 0.8 | 15,591 | 0.8 |
(1) Italian banks, Cassa Depositi e Prestiti and GACS. |
| TABLE V.13: BASIC ASSUMPTIONS |
| | 2022 | 2023 | 2024 | 2025 | 2026 |
| Short-term interest rate (annual average) (1) | n.d. | 3.1 | 3.2 | 3.5 | 3.7 |
| Long-term interest rate (annual average) (2) | 3.0 | 4.2 | 4.4 | 4.5 | 4.7 |
| USD/EUR exchange rate (annual average) | 1.05 | 1.06 | 1.06 | 1.06 | 1.06 |
| Nominal effective exchange rate | -1.1 | 1.4 | 0.0 | 0.0 | 0.0 |
| World excluding EU, GDP growth | 2.5 | 1.7 | 2.3 | 3.0 | 2.8 |
| EU GDP growth | 3.6 | 0.5 | 1.4 | 2.2 | 2.0 |
| Growth of relevant foreign markets | 5.1 | 0.6 | 3.9 | 4.0 | 3.1 |
| World import volumes, excluding EU | 3.5 | 0.3 | 3.8 | 3.4 | 2.8 |
| Oil prices (Brent, USD/barrel) | 101.0 | 82.3 | 77.9 | 73.8 | 70.5 |
(1) Short-term interest rate refers to the average of the rates applied to 3-month government bonds issued during the year. (2) Long-term interest rate refers to the average of the rates applied to 10-year government bonds issued during the year. |
| TABLE V.14: IMPACT OF RECOVERY AND RESILIENCE FACILITY ON GENERAL GOVERNMENT BUDGETARY PROSPECTS – GRANTS (% of GDP) |
| | 2020 - 2026 |
| REVENUE FROM RRF GRANTS | |
| RRF GRANTS as included in the revenue projections | 3.4 |
| Cash disbursements of RRF GRANTS from EU | 3.4 |
| | |
| EXPENDITURE FINANCED BY RRF GRANTS | |
| TOTAL CURRENT EXPENDITURE | 0.6 |
| Gross fixed capital formation P.51g | 1.2 |
| Capital transfers D.9 | 1.6 |
| TOTAL CAPITAL ACCOUNT EXPENDITURE | 2.8 |
| | |
| OTHER COSTS FINANCED BY RRF GRANTS (1) | |
| Reduction in tax revenue | 0.0 |
| Other costs with impact on revenue | 0.0 |
| Financial transactions | 0.0 |
| TABLE V.15: IMPACT OF RECOVERY AND RESILIENCE FACILITY ON GENERAL GOVERNMENT BUDGETARY PROSPECTS – LOANS (% of GDP) |
| | 2020 - 2026 |
| CASH FLOW FROM RRF LOANS PROJECTED IN THE PROGRAMME | |
| Disbursements of RRF LOANS from EU | 6.0 |
| Repayments of RRF LOANS to EU | 0.0 |
| | |
| EXPENDITURE FINANCED BY RRF LOANS | |
| TOTAL CURRENT EXPENDITURE | 0.4 |
| Gross fixed capital formation P.51g | 5.2 |
| Capital transfers D.9 | 0.1 |
| TOTAL CAPITAL ACCOUNT EXPENDITURE | 5.3 |
| | |
| OTHER COSTS FINANCED BY RRF LOANS (1) | |
| Reduction in tax revenue | 0.0 |
| Other costs with impact on revenue | 0.0 |
| Financial transactions | 0.1 |
| 58 | MINISTRY OF ECONOMY AND FINANCE |
| TABLE V.16: STOCK OF PUBLIC GUARANTEES ON 31 DECEMBER 2022 (as percentage of GDP) |
| | Measures | Date of adoption (1) | Maximum amount of contingent liabilities (2) | 2020
Take-up (3) | 2021
Take-up (3) | 2022
Take-up (3) |
| Implementation of EU instruments | SURE | 19/05/2020 | 0.2 | 0.1 | 0.2 | 0.2 |
| European Guarantee Fund | 19/05/2020 | 0.2 | 0.0 | 0.2 | 0.2 |
| Macro-Financial assistance to Ukraine | 23/09/2022 | 0.02 | 0.0 | 0.0 | 0.02 |
| Subtotal | | | 0.1 | 0.4 | 0.4 |
| In response to Covid-19 | Central Guarantee Fund for SMEs | 17/03/2020 | 12 | 5.8 | 8.3 | 7.6 |
| SACE- Garanzia Italia | 08/04/2020 | 10.5 | 1.1 | 1.6 | 1.3 |
| SACE guarantee commercial credits insurance | 19/05/2020 | 0.1 | 0.1 | 0.1 | 0.1 |
| Guarantee fund for first homes | 26/05/2021 | | 0.0 | 0.04 | 0.2 |
| Subtotal | | | 7.0 | 10.0 | 9.2 |
| Subtotal (including SURE and European Guarantee Fund) | | | 7.1 | 10.3 | 9.5 |
| In response to energetic crisis | Central Guarantee Fund for SMEs | 17/03/2020 | 12 | 0.0 | 0.0 | 0.2 |
| SACE - SupportItalia | 17/05/2022 | 10.5 | 0.0 | 0.0 | 0.2 |
| SACE guarantee commercial credits insurance | 21/03/2022 | 0.3 | 0.0 | 0.0 | 0.0 |
| Subtotal | | | 0.0 | 0.0 | 0.4 |
| Others | Central Guarantee Fund for SMEs (4) | 17/03/2020 | 12 | 1.2 | 1.0 | 0.8 |
| Bond issues by CDP S.p.A. | 24/12/2015 | 0.3 | 0.2 | 0.2 | 0.2 |
| Guarantees provided by local authorities | | | 0.2 | 0.1 | 0.1 |
| Guarantee for non-market risks in favour of SACE (5) | 08/04/2020 | 6.3 | 3.1 | 3.1 | 3.1 |
| GACS | 14/02/2016 | | 0.6 | 0.7 | 0.7 |
| Guarantee fund for first homes | 26/05/2021 | | 0.5 | 0.6 | 0.9 |
| Green New Deal Guarantees | 15/09/2020 | 0.2 | 0.0 | 0.1 | 0.1 |
| Other instruments | | | 0.1 | 0.1 | 0.1 |
| Subtotal | | | 5.9 | 5.8 | 5.8 |
| | TOTAL | | | 13.0 | 16.1 | 15.8 |
(1) The date of adoption refers to the legislative provision or ministerial decree that introduced or revised the guarantee’ scheme. (2) Theoretical ceiling established by law (if exists). The 10.5 percent of GDP ceiling refers to Garanzia Italia and Supportitalia as a whole. The overall 12 percent of GDP ceiling for the Central Guarantee Fund for SMEs refers both to the ordinary regime and to the extraordinary ones in response to pandemic and energetic crises. (3) Actual granted take-up. (4) The value refers only to the guarantees in the ordinary regime on which there exists a exposure of the State, since a share is covered by guarantee funds of the EU. (5) Including the rebalancing effect of the State’s co-insurance in favour of SACE in the export sector (Art. 2 of Decree Law No. 23/2020). The reform envisaged that commitments arising from SACE’s insurance activity in the export sector and for internationalization support would be assumed by the State and SACE in a proportion of 90 percent and 10 percent, respectively (instead of 10 percent for the State and 90 percent for SACE previously in force). Discrepancies, if any, are due to rounding. |
| MINISTRY OF ECONOMY AND FINANCE | 59 |
ECONOMIC AND FINANCIAL DOCUMENT 2023
is available online
at the internet address listed below:
www.mef.gov.it- www.dt.mef.gov.it//it/- www.rgs.mef.gov.it
ISSN 2239-5539