|
MINISTERO DELL’ECONOMIA E DELLE FINANZE |
PUBLIC DEBT REPORT 2022 |
INDEX
| INDEX | I |
| INDEX OF TABLES | II |
| INDEX OF CHARTS AND GRAPHIC FIGURES | III |
| FOREWORD | V |
| I. | DEBT MANAGEMENT OBJECTIVES FOR 2022 | 1 |
| I.1 | The objectives and risks of international debt management practices | 1 |
| I.2 | 2022 objectives: the institutional framework of reference | 2 |
| I.3 | Curbing the cost of debt while paying attention to the cost / risk profile | 6 |
| I.4 | Monitoring and managing the cash account to stabilise the balance | 13 |
| II. | THE ITALIAN GOVERNMENT SECURITIES MARKET: PERFORMANCE IN THE INTERNATIONAL CONTEXT | 17 |
| II.1 | Monetary policies and effects on the Euro area money market | 17 |
| II.2 | The Euro area bond markets | 18 |
| II.3 | Trends in the Italian government bonds market | 23 |
| III. | PUBLIC DEBT MANAGEMENT IN 2022 | 41 |
| III.1 | Outstanding general public debt | 41 |
| III.2 | Debt management results in relation to objectives | 42 |
| III.3 | Government bonds activities | 49 |
| III.4 | Derivatives portfolio management | 71 |
| III.5 | The Treasury’s cash management | 75 |
| MINISTRY OF ECONOMY AND FINANCE | I |
INDEX OF TABLES
| Table I.1: | Domestic government securities | 3 |
| Table I.2: | Objectives for the end of 2022: percentage composition of the debt portfolio | 4 |
| Table III.1: | Average life of the stock of government securities (in years) | 47 |
| Table III.2: | Duration and ARP trend in the years 2021-2022 relating to the stock of government securities, ante derivatives, and European loans (in years)
| 49 |
| Table III.3: | Duration and ARP trend in the years 2021-2022 relating to the stock of government securities, post derivatives, and European loans (in years) | 49 |
| Table III.4: | Issuances, maturities and coverage of the State sector’s requirement (EUR million) | 50 |
| Table III.5: | Government bonds issued net of exchange operations (EUR million) | 51 |
| Table III.6: | Geographic distribution awards in 2022 syndicated placements of nominal BTP | 56 |
| Table III.7: | Distribution of awards by investor category in 2022 syndicated placements of nominal BTP | 56 |
| Table III.8: | Composition of 2020-2022 issuances in absolute value (EUR million) and % (including exchanges) | 70 |
| Table III.9: | Derivatives portfolio - years 2021 and 2022 (EUR million) | 73 |
Table III.10:
| Cash account and commitments of Treasury’s liquidity at the end of the month in 2022 (EUR million) | 79 |
| II | MINISTRY OF ECONOMY AND FINANCE |
INDEX OF CHARTS AND GRAPHIC FIGURES
| Chart I.1 | Annual maturity profile of medium/long-term bonds outstanding as at 31.12.2021 (EUR million) | 7 |
| Chart I.2: | Monthly maturity profile of medium/long-term bonds outstanding as at 31.12.2021 (EUR million) | 8 |
| Chart I.3: | Composition of the alternative issuance portfolios analysed for 2022 (EUR million) | 10 |
| Chart II.1: | Development of the main money market rates in 2021-2022 (%) | 18 |
| Chart II.2: | Trend of European government bond yields – 10-year maturity (%) | 20 |
| Figure 1: | Monthly net purchases under the PSPP and PEPP programmes (EUR billion) | 22 |
| Figure 2: | Annual volume (EUR billion) and average life (in years) of the stock of Italian government bonds purchased by the ECB under the PSPP programme | 22 |
| Chart II.3: | Market yields on government bonds by maturity from 2 to 50 years (%) | 23 |
| Chart II.4: | Government bonds yield spread, 10-year vs 2-year (basis points) | 24 |
| Chart II.5: | Government bonds yield spread, 30-year vs 10-year (basis points) | 25 |
| Chart II.6: | Government bonds yield spread: BTP-Bund, OAT-Bund and Bonos-Bund, 10-year benchmark (basis points) | 26 |
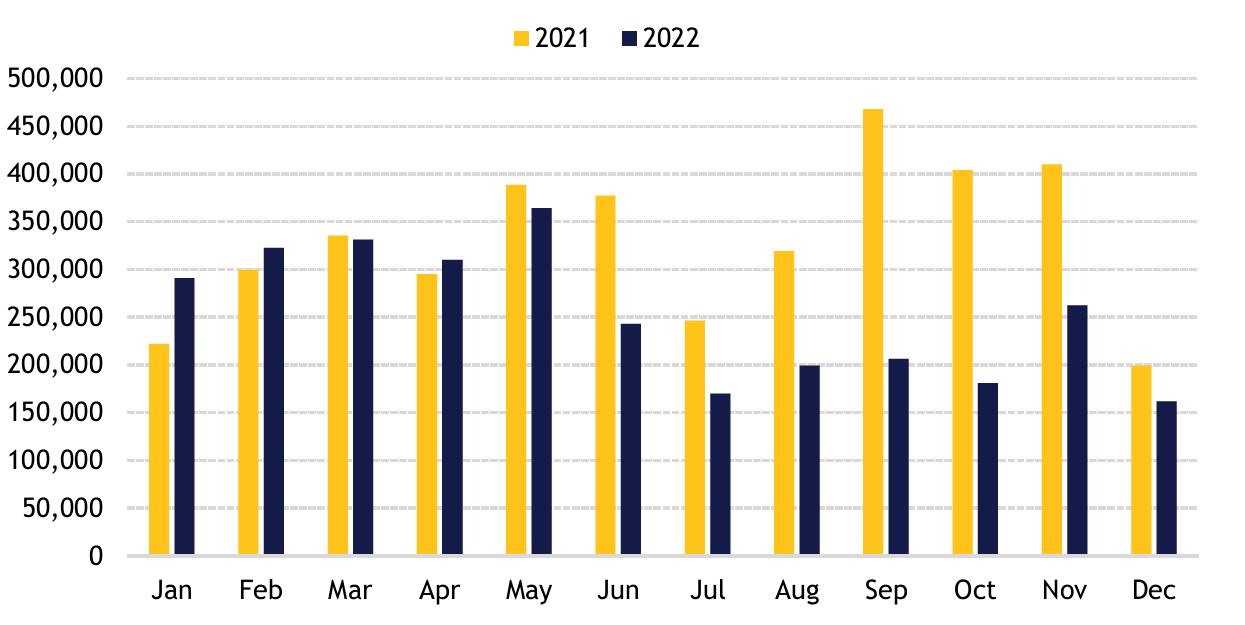
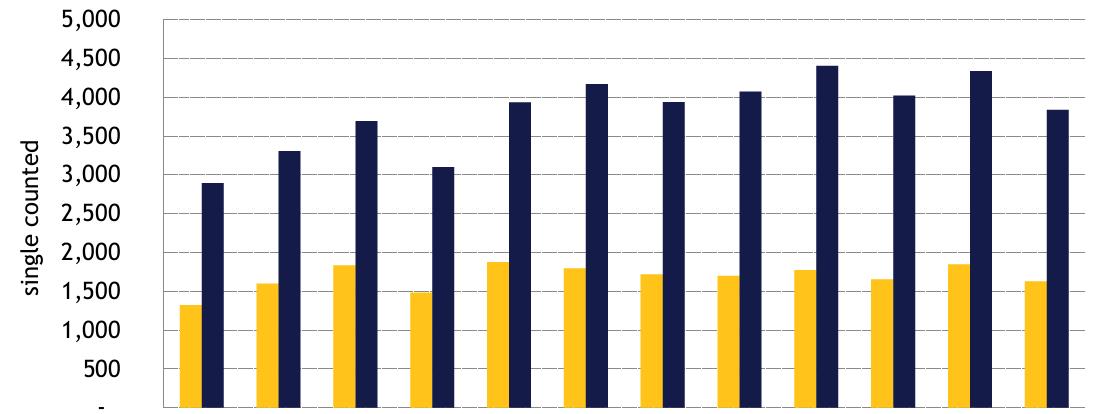
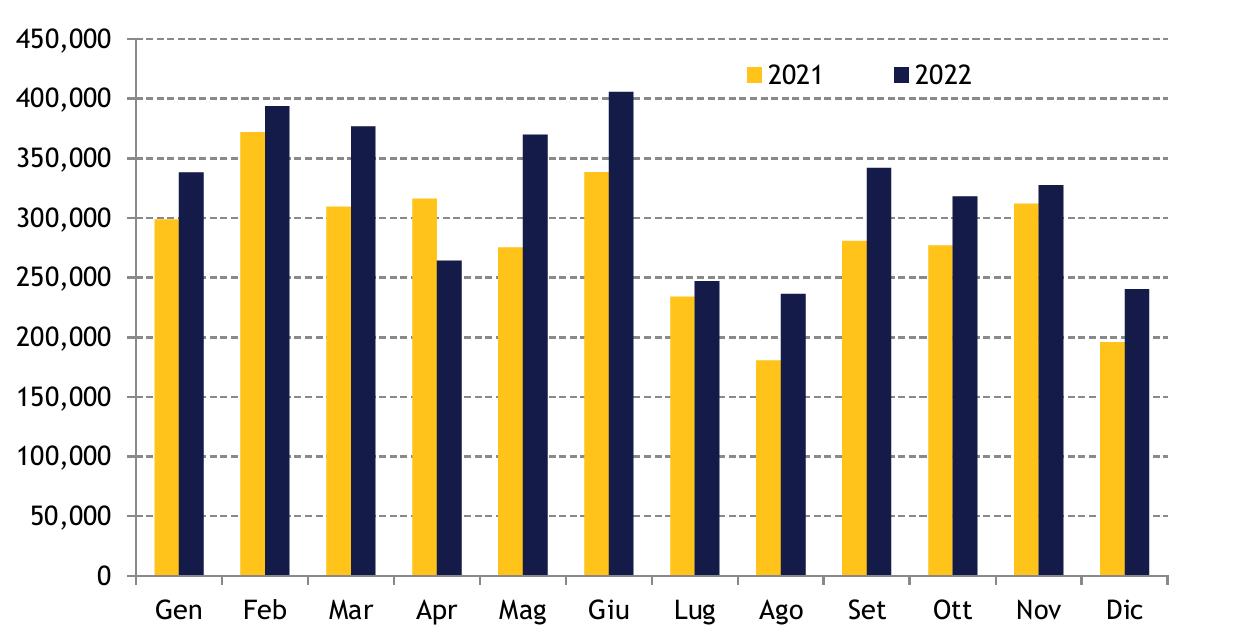
| Chart II.7: | Monthly volumes traded on the MTS platform (EUR million; single-counted) | 28 |
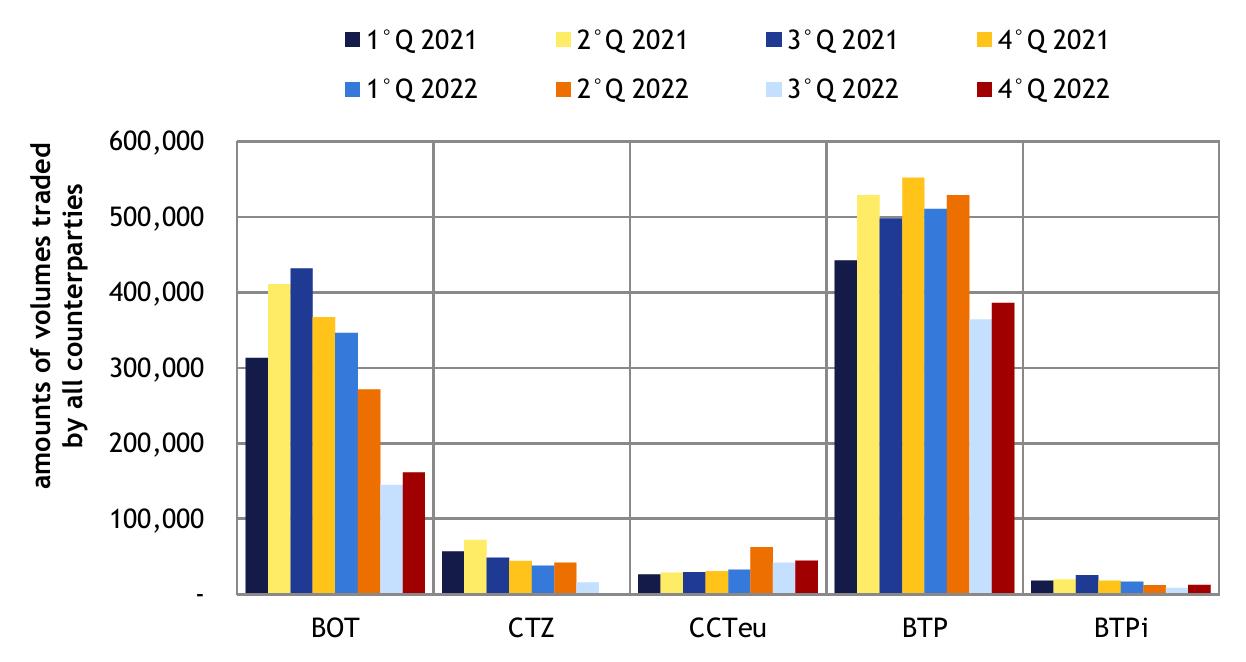
| Chart II.8: | Quarterly volumes traded on the MTS platform, by segment (EUR million; single-counted) | 28 |
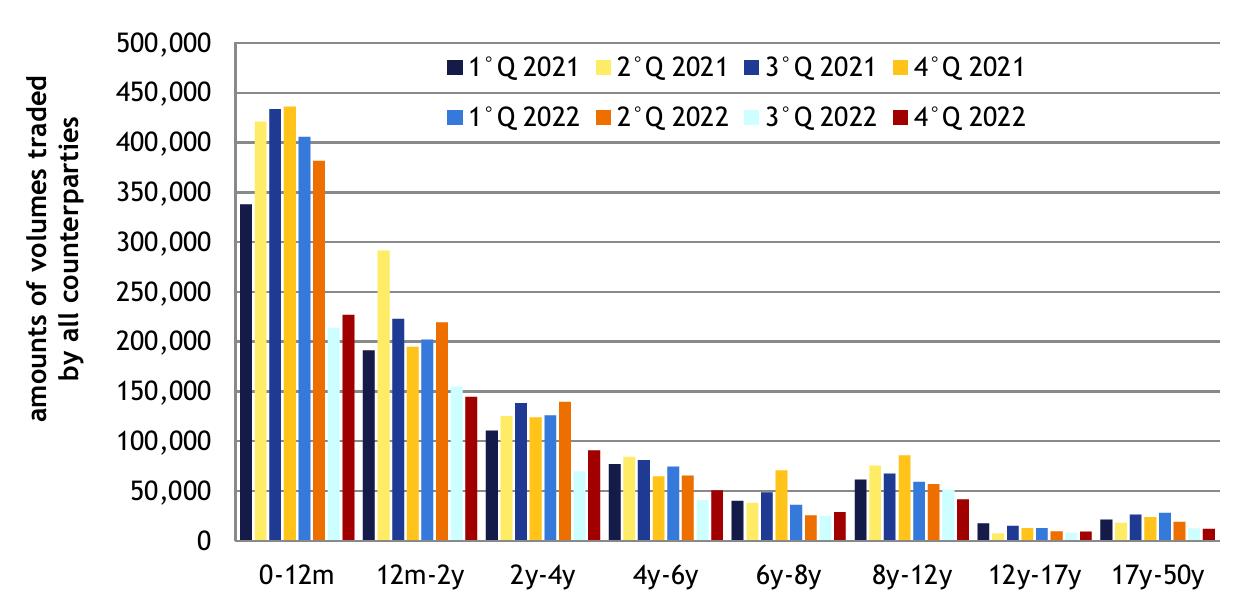
| Chart II.9: | Quarterly volumes traded on the MTS platform by maturity (EUR million; single-counted) | 29 |
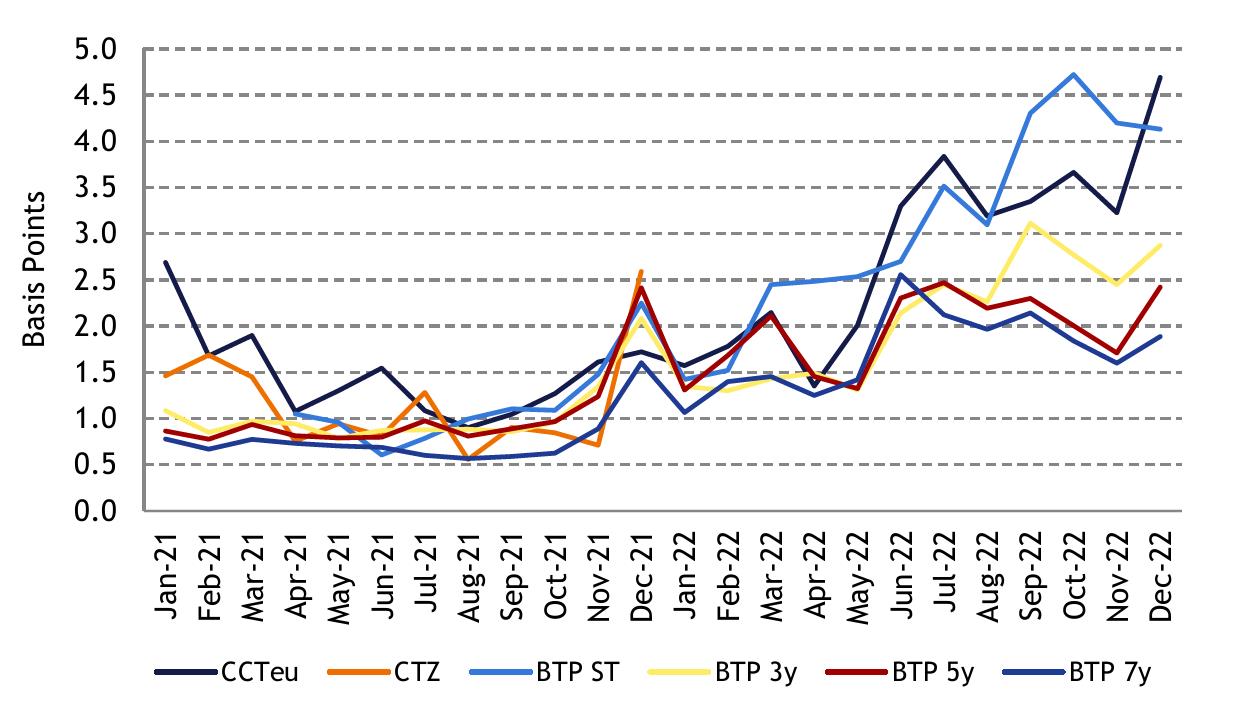
| Chart II.10a: | Bid-ask spread in basis points of CTZ, CCTeu, 3-, 5- and 7-year BTPs benchmark, recorded on the MTS platform - monthly averages | 30 |
| Chart II.10b: | Bid-ask spread in basis points of 10-, 15-, 20-, 30-, 50-year BTPs and BTP Green benchmark, recorded on the MTS platform - monthly averages | 30 |
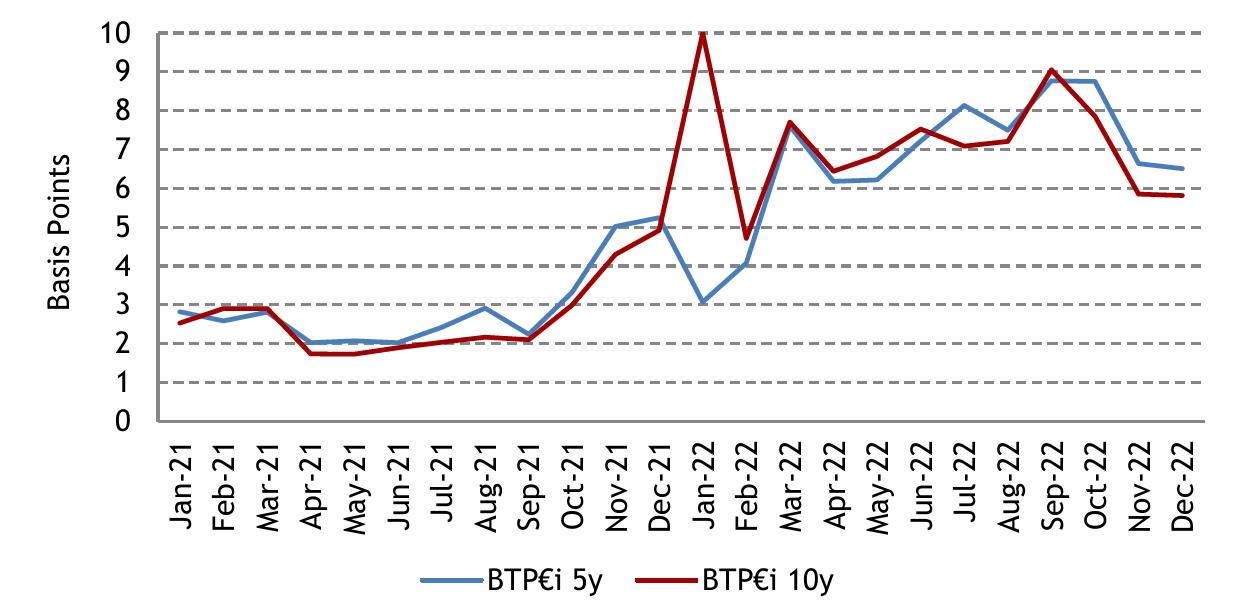
| Chart II.10c: | Bid-ask spread in basis points of 5- and 10-year BTP€is benchmark, recorded on the MTS platform - monthly averages | 31 |
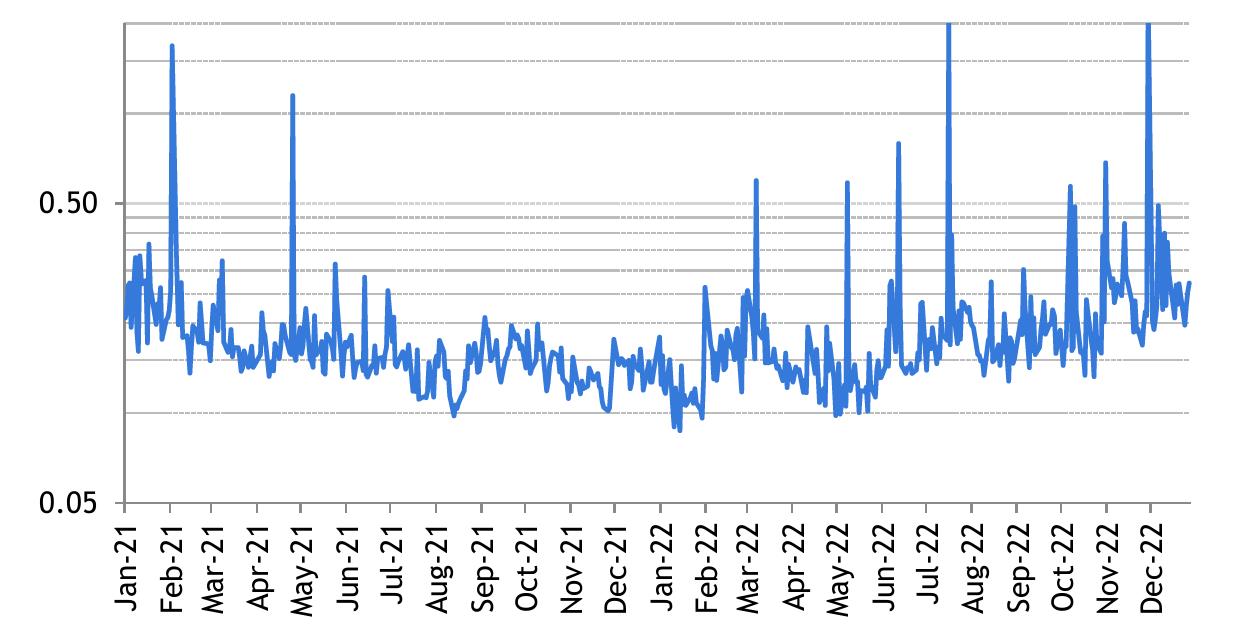
| Chart II.10d: | Daily slope on 10-year BTP benchmark (logarithmic scale) recorded on the MTS platform | 32 |
| Chart II.11: | Annual volumes traded in 2021 and 2022 on the MTS platform, by contract maturity (EUR million) | 33 |
| Chart II.12: | Monthly volumes traded in 2022 on the MTS platform, by contract maturity (EUR million) | 33 |
| Chart II.13: | Monthly Special Repo volumes traded on the MTS platform (EUR million) | 34 |
| MINISTRY OF ECONOMY AND FINANCE | III |
| Chart II.14: | Monthly volumes traded by specialists on platforms other than MTS (EUR million) | 35 |
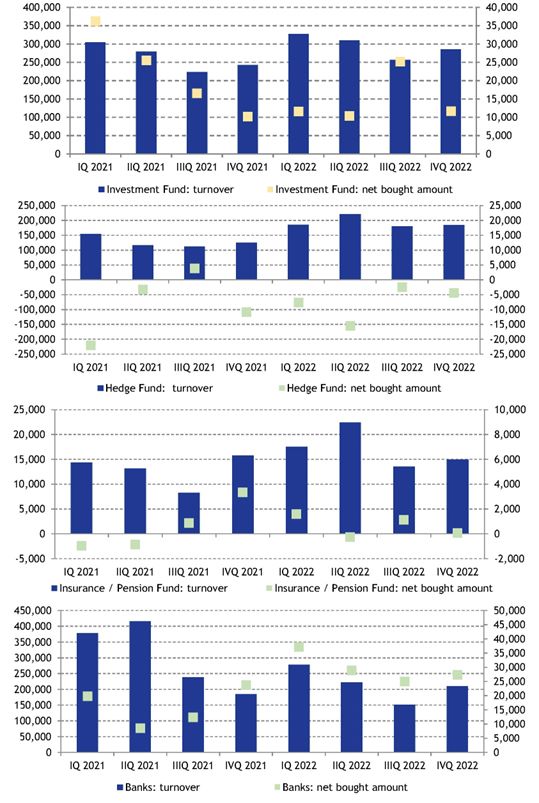
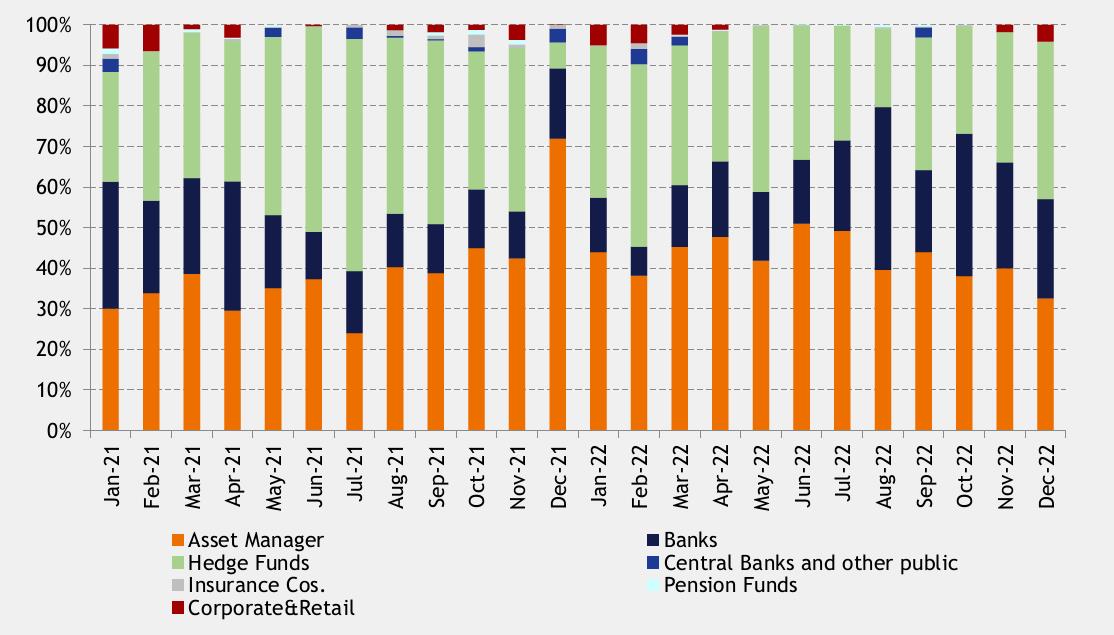
| Chart II.15: | Quarterly volumes traded by specialists by type of counterparty – fund managers, banks, pension and insurance funds, hedge funds (EUR million) | 37 |
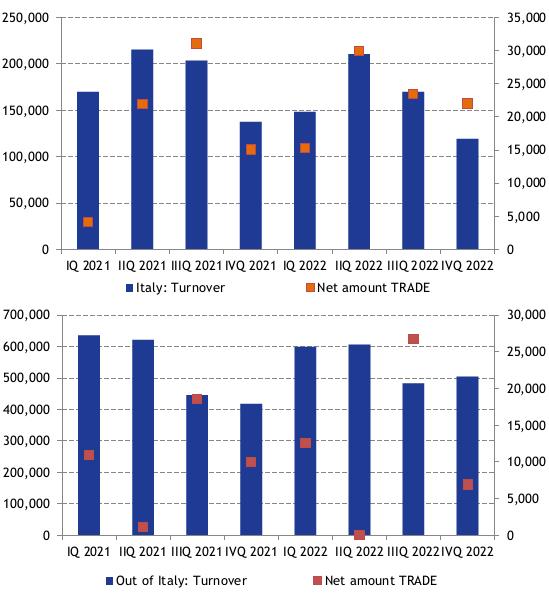
| Chart II.16: | Quarterly volumes traded by specialists by type of counterparty residence (EUR million) | 38 |
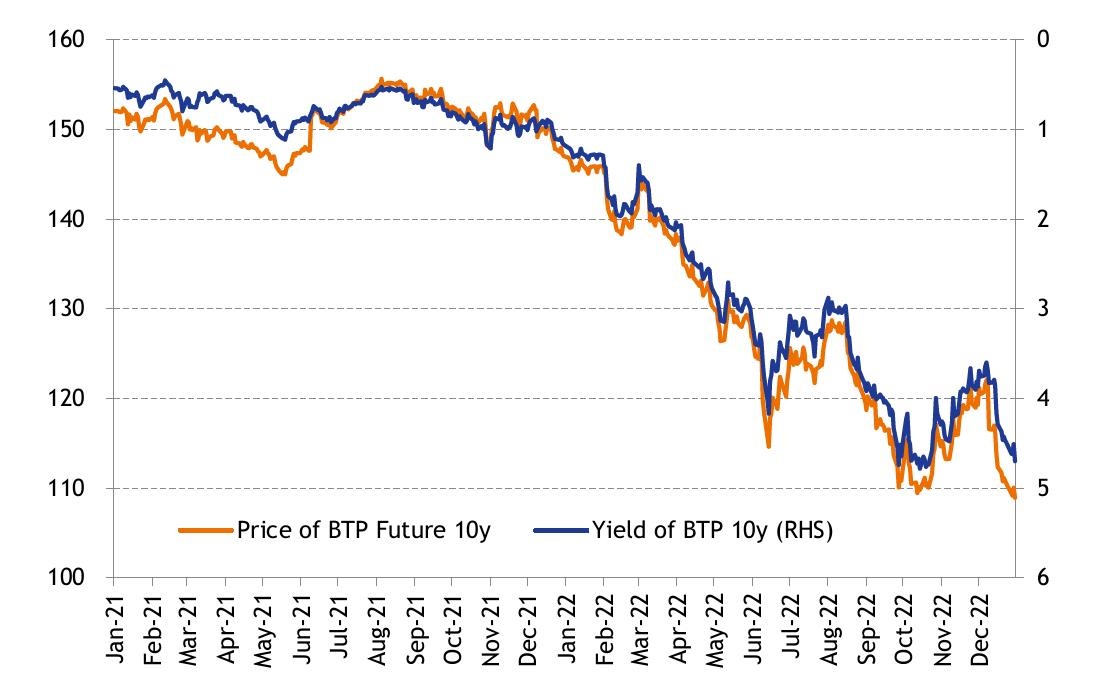
| Chart II.17: | Price of BTP Future and yield of 10-year benchmark BTP (reversed righthand scale, in %) | 39 |
| Chart II.18: | Volumes of traded lots and open interest of contracts for 10-year BTP-Future traded on the Eurex market | 40 |
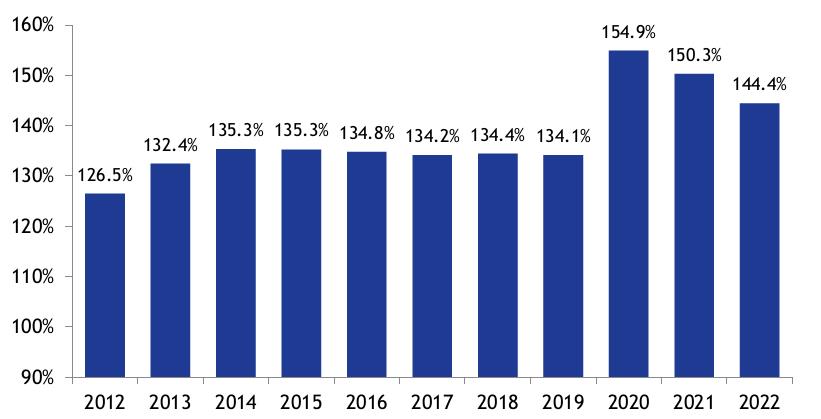
| Chart III.1: | Evolution of the debt-to-GDP ratio - 2012-2022 | 41 |
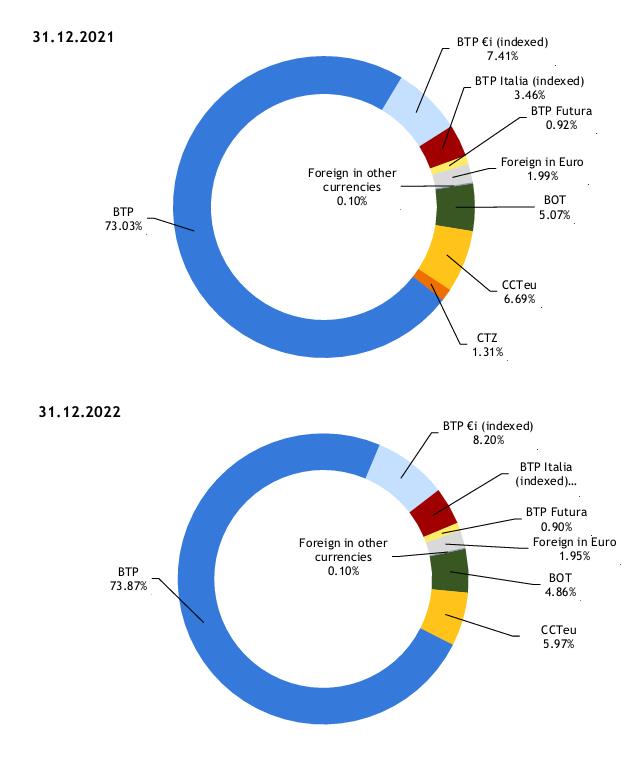
| Chart III.2: | Stock composition of government securities as of 31/12/2021 and 31/12/2022 | 43 |
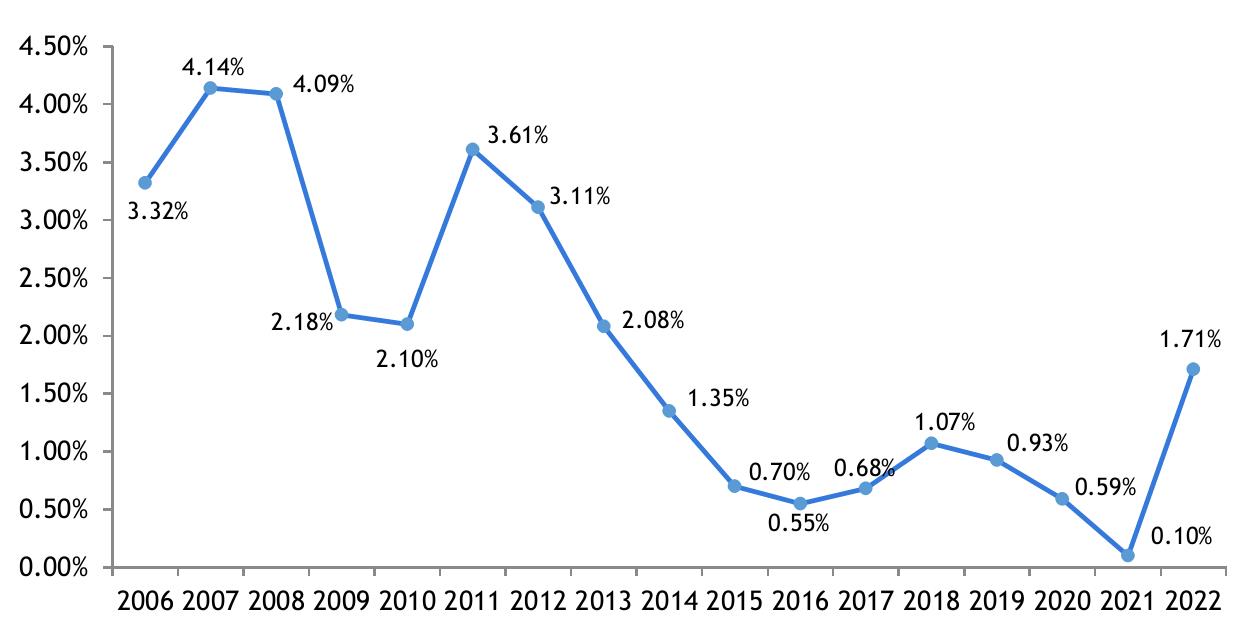
| Chart III.3: | Average cost at issuance of government securities - years 2006-2022 (%) | 44 |
| Chart III.4: | Average cash cost and ARP of government securities stock, pre and post derivatives - years 2016-2022 (%) | 45 |
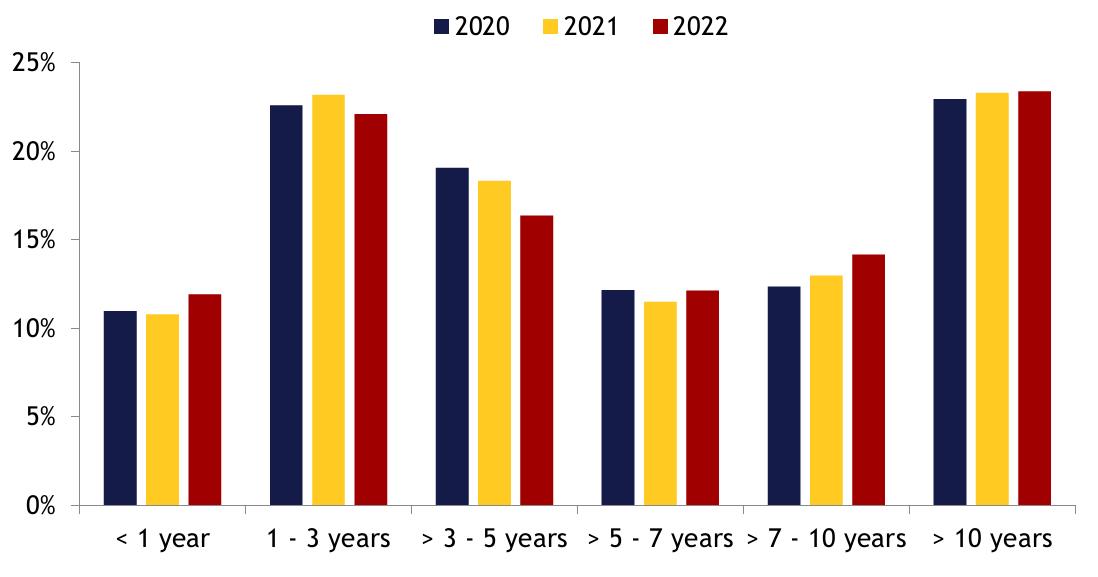
| Chart III.5: | Maturities by residual life, 2020-2022 | 46 |
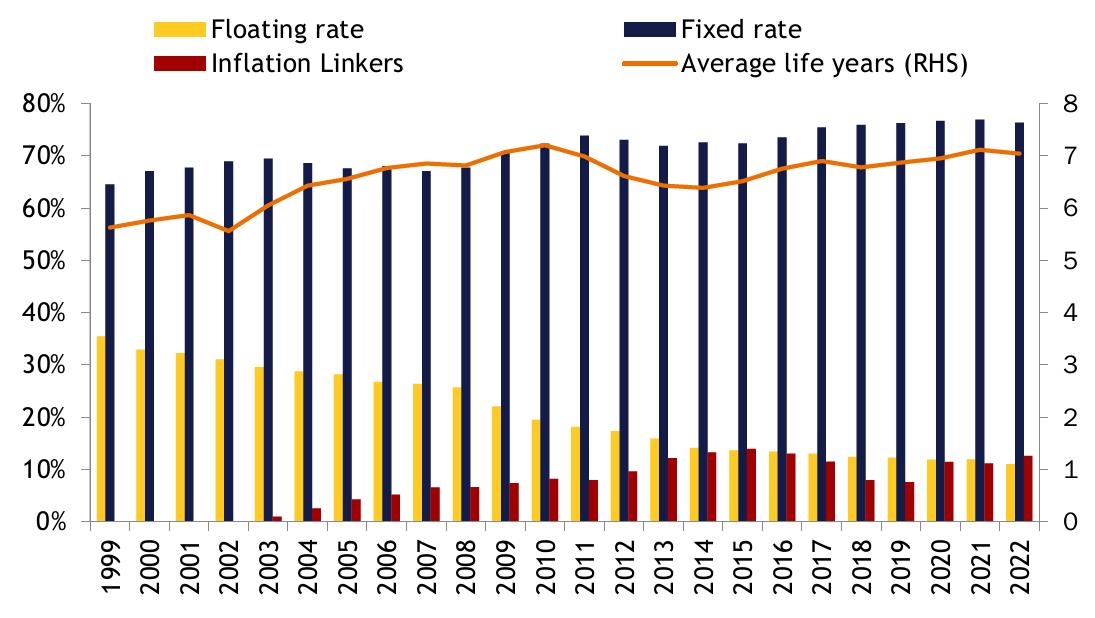
| Chart III.6: | Evolution of the debt structure and its average life (in years) | 47 |
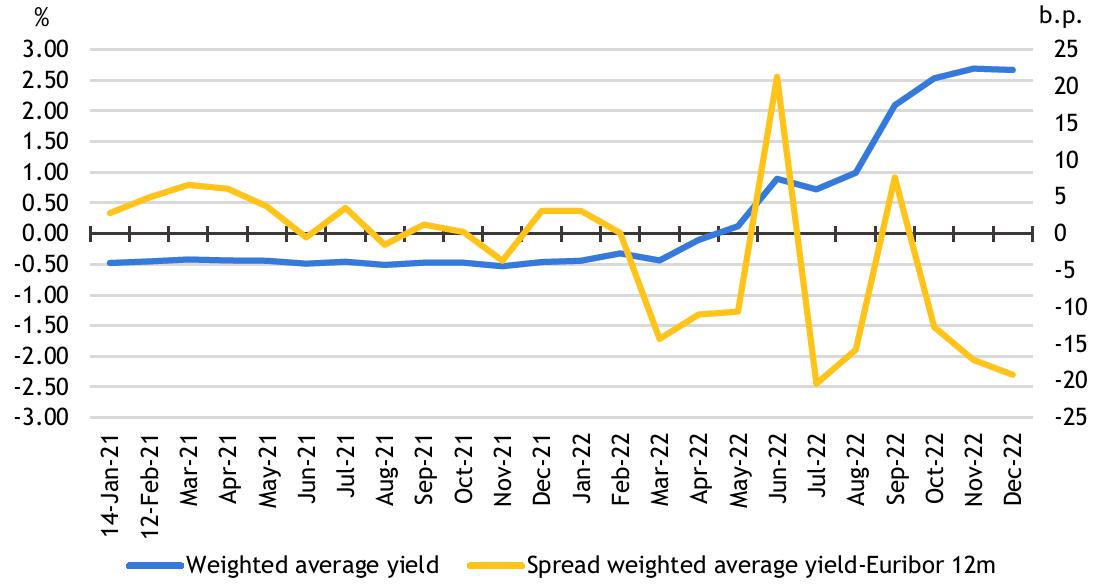
| Chart III.7: | Gross compound yield at issuance of 12-month BOT - years 2021-22 (%) and spread yield of 12-month BOT vs Euribor rate - years 2021-22 (basis points) | 53 |
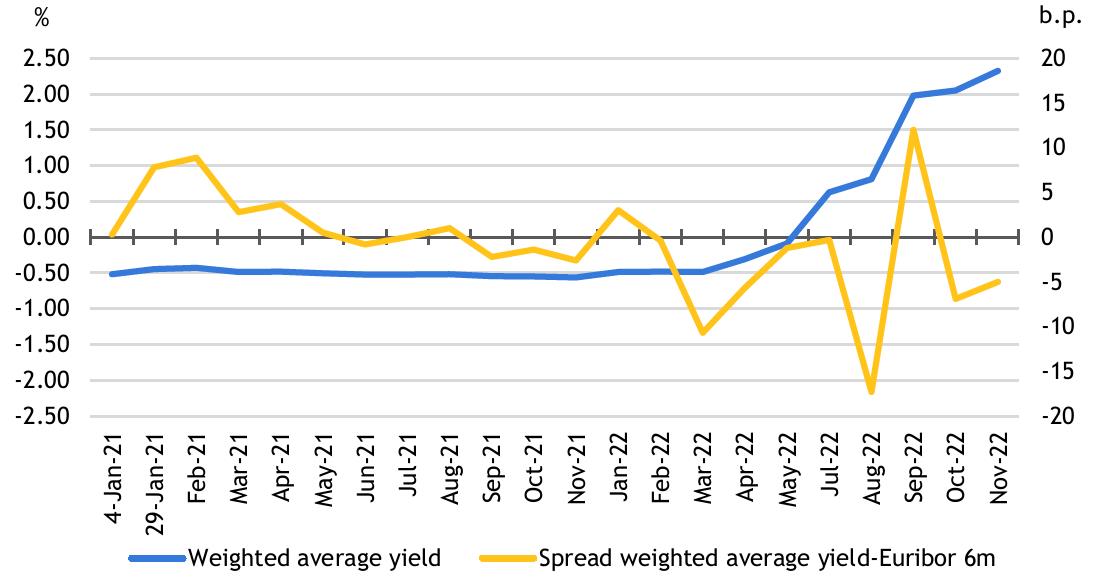
| Chart III.8: | Gross compound yield at issuance of 6-month BOT - years 2021-22 (%) and spread yield of 6-month BOT vs Euribor rate - years 2021-22 (basis points) | 53 |
| Chart III.9: | Yield at issuance of BTPs with maturity between 3 and 10 years in 2022 (%) | 59 |
| Figure 3: | Breakdown by type of counterparty of orders placed in nominal BTPs auctions by specialists in government bonds - years 2021-2022 | 60 |
| Figure 4: | Breakdown by geographical area of orders placed in nominal BTPs auctions by specialists in government bonds - years 2021-2022 | 61 |
| Chart III.10: | 10-year break even inflation (bei) 2021-2022 (basis points) | 63 |
| Chart III.11: | Yield at issuance of CCTeus in 2022 (%) | 65 |
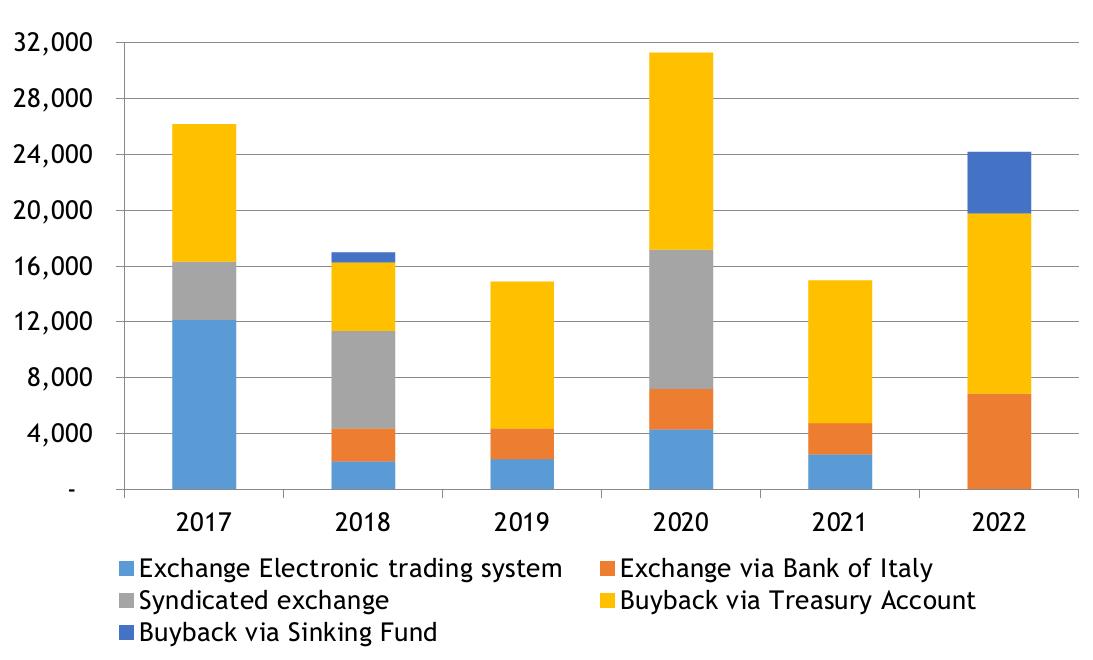
| Chart III.12: | Amount repurchased in extraordinary operations - years 2017-2022 (nominal amounts in EUR million) | 67 |
| Chart III.13: | Distribution of government bonds repurchased in extraordinary operations carried out in 2022 (nominal amounts in EUR million) | 68 |
| Chart III.14: | Comparison between the prospective trend of the notional amount for the existing derivatives portfolio, as at 31/12/2021 and 31/12/2022, respectively, assuming that all swaptions are exercised (EUR million) | 75 |
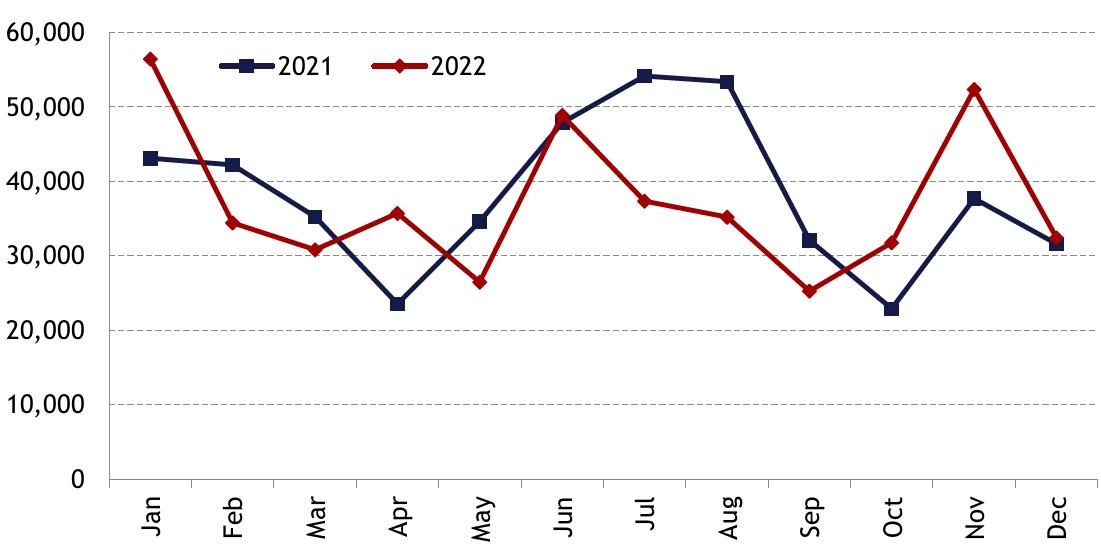
| Chart III.15: | Average infra-monthly variation in treasury cash and cash equivalents – gap with the monthly low - 2022 (EUR million) | 77 |
| Chart III.16: | Gap between low and high monthly balance of Treasury cash – 2021 and 2022 (EUR million) | 78 |
| Chart III.17: | Average breakdown of the Treasury’s liquidity – 2021 vs 2022 (EUR million) | 79 |
| IV | MINISTRY OF ECONOMY AND FINANCE |
FOREWORD
The Annual Report on Italian Public Debt Management for 2022 follows the format already introduced in the Report for the year 2021.
In terms of content, the Report covers a peculiar year for European and international financial markets, characterised by a very robust and rapid growth of interest rates decided by the monetary policy choices made by all central banks to counter the sharp rise in inflation.
These trends clearly reflected on the Italian Government Bonds Market which, as that of all the EU countries, is characterised by a sharp increase in yields at issuance and a sustained volatility of bond prices on the secondary market.
Notwithstanding the complex context and the challenges mentioned above, the public debt management has achieved to cover the State’s cash requirements and the exposure to the main market risks, by recurring to several management tools, as introduced over the last years, in terms of issuance modes, products offered on the market, management of existing tools and cash management.
As usual, the Report examines the objectives set out at the end of year 2021 and analyses the management activities realised during the year, by providing an accurate description of the reference market context.
| MINISTRY OF ECONOMY AND FINANCE | V |
| VI | MINISTRY OF ECONOMY AND FINANCE |
| I. | DEBT MANAGEMENT OBJECTIVES FOR 2022 |
| I.1 | THE OBJECTIVES AND RISKS OF INTERNATIONAL DEBT MANAGEMENT PRACTICES |
The Italian Treasury’s public debt management has always been in line with international best practices and fully complies with the recommendations of the main multilateral financial institutions as well as with the approaches adopted by other Debt Management Offices (DMOs) in advanced countries.
The main types of risk faced by DMOs refer to market risk, which includes interest rate risk and exchange rate risk, refinancing risk, liquidity risk and credit risk, in addition to the operational risk. Many of these risks involve, albeit in different ways, an unexpected increase in the cost of debt that could jeopardise debt sustainability.
International best practices recommend avoiding public debt portfolio structures that are too heavily weighted towards short-term and floating-rate instruments. Such structures may increase a country’s economic and financial vulnerability1.
In fact, despite reducing interest expenditure in the short term, these structures make it more volatile, while they also increase the market refinancing risk and interest rate risk inherent in the debt portfolio and, consequently, in the government budget2. On the other hand, under normal financial market conditions and regardless of the issuer’s creditworthiness, interest expenditure is higher for longer-term maturities, although longer maturities offer the benefit of effectively reducing the refinancing risk and interest rate risk.
However, DMOs are required to pursue both objectives: reducing the cost of debt at the same time as curbing market risks.
__
1 Considerations in this regard can be found in the Guide to the Debt Management Performance Assessment (DeMPA) Tool, World Bank 2009.
2 However, it should be noted that this risk assessment approach may only be considered optimal if focusing exclusively on government liabilities (and therefore on debt). Indeed, a different and broader point of view could also include government assets. Under this approach, debt management could thus aim to achieve a liability structure consistent with the risks inherent to assets (following a so-called “ALM” – Asset Liability Management approach). This may lead to choices that - in principle - could differ even quite significantly from those made by taking into account the debt composition alone. However, many countries, including Italy, have come across significant hurdles in implementing such an approach, due to both the practical difficulty of calculating the financial risk exposure of the government’s substantial assets - especially non-financial assets - and, in many cases, the fact that there is incomplete knowledge of the size and characteristics of said assets. Further information can be found in the World Bank Policy Research Working Paper How Do Countries Use an Asset and Liability Management Approach? A Survey on Sovereign Balance Sheet Management.
| MINISTRY OF ECONOMY AND FINANCE | 1 |
Therefore, in practice, public debt managers must forego maximising both of these objectives and must instead focus on managing their relative trade-off.
In other words, out of all the feasible options, they must select the cost-risk combination deemed satisfactory3 in relation to both portfolio characteristics and overall strategies. This trade-off is therefore not the same for all DMOs, and is therefore handled differently by public debt managers in each country, based on its specific characteristics, starting with its size in relation to the national economic system, its portfolio of instruments, its reference market and the fiscal policies pursued. Italy has taken a particularly prudent approach to this trade-off due to the size of its debt (among the highest in the world in absolute terms); this approach results in an idiosyncratic additional cost that does not allow for opportunistic tactics, but rather pushes for continuity, predictability and long-term strategies.
It goes without saying that the DMO’s task of minimising the cost of debt while maintaining an acceptable level of risk cannot be deemed to have been completed upon each issuance and in relation to the market conditions at the time of placement. Indeed, the structure of public debt, consisting of a wide and diversified portfolio of financial instruments with different characteristics and maturities, requires continuous, dynamic management even after issuance, conducted with suitable Instruments and in line with market developments.
| I.2 | 2022 OBJECTIVES: THE INSTITUTIONAL FRAMEWORK OF REFERENCE |
Public debt is made up of the total liabilities of the general government sector, divided into the sub-sectors of central government, territorial entities and public social security institutions. More than 80% of public debt is constituted by government bonds issued by the Treasury on both the domestic and foreign markets. As was also the case in previous years4, this Report refers to outstanding government bonds, which are subject to the special legislation represented by Italy’s “Consolidated Law on Public Debt” (TUDP)5 whose main characteristics are summarised in Table I.1.
__
3 In this regard, the International Monetary Fund and World Bank guidelines note that “Minimising cost, while ignoring risk, should not be an objective. Operations that appear to lower debt servicing costs often embody significant risks for the government and can limit its capacity to repay lenders Managing cost and risk therefore involves a trade-off”.
4 All editions of the Annual Public Debt Report can be found at:
https://www.dt.mef.gov.it/en/debito_pubblico/presentazioni_studi_relazioni/index.html
5 Consolidated Text of Legislative and Regulatory Provisions on Public Debt (Italian Presidential Decree No.
398 of 30 December 2003).
| 2 | MINISTRY OF ECONOMY AND FINANCE |
I. DEBT MANAGEMENT OBJECTIVES FOR 2022 | |
| TABLE I.1: DOMESTIC GOVERNMENT SECURITIES |
| | BOT 1 | CCTeu 2 | BTP 3 | BTP€i 3 | BTP Italia 4 | BTP Futura 4 | BTP Green 5 |
| | Treasury Bills | Treasury Credit Certificates | Long-term Treasury Bonds | Long-term Treasury Bonds indexed to European inflation | Long-term Treasury Bonds indexed to Italian inflation | Long-term Treasury Bonds step-up | Long-term Treasury Bonds for financing expenditure with a positive environmental impact. |
| Maturity | 3, 6, 12 months and other possible maturities lower than standard | 5, 7 years | Short Term, 3, 5, 7, 10, 15, 20, 30, 50 years | 5, 10, 15, 30 years | 4, 6, 8 years | 8, 10, 12
years a) | Over 3 years |
| Remuneration | Issue discount | Half-yearly variable coupons indexed to the 6-month Euribor, possible issue discount | Half-yearly fixed coupons, possible issue discount | Half-yearly coupons indexed to European inflation (HICP index net of tobacco) possible issue discount and revaluation of principal at maturity | Half-yearly coupons indexed to Italian inflation (“FOI” index net of tobacco), half- yearly revaluation of principal and loyalty
premium b) at maturity | Half-yearly coupons with step-up mechanism with increasing yields and loyalty premium c) indexed to the average growth of Italian GDP during the life of the bond | Half-yearly fixed coupons, possible issue discount |
Issuance Frequency(d) | Monthly | Monthly | Monthly and based on market conditions for 15- and 30-year BTPs | Monthly | Once/twice a year, based on market conditions | Once/twice a year, based on market conditions | Flexible |
1) Issuance method: competitive yield auction. 2) Issuance method: marginal auction with discretionary determination of price and quantity issued. 3) Issuance method: marginal auction with discretionary determination of price and quantity issued. The first tranches of new long-term (above 10 years) BTPs or BTP€i can be offered on the market through syndicated placements. 4) Issuance method: through the MOT (Borsa Italiana), the electronic retail market. 5) Issuance method: syndicated placement (or marginal auction, with discretionary determination of price and quantity issued). -------------- a) Additionally, a BTP Futura bond with a maturity at issuance of 16 years was emitted in 2021. b) For individual savers and similar investors who purchase the bond at issuance during the first phase of the placement period. c) For individual savers and similar investors, to whom the BTP Futura bond is reserved, who purchased the bond during the placement period and held it until maturity. d) As of 2020, reopening operations of bonds destined only to Specialists have also been introduced. |
| MINISTRY OF ECONOMY AND FINANCE | 3 |
The part of public debt represented by government bonds was managed in accordance with: (i) the Italian Ministry of Economy and Finance’s general Directive for administrative procedures and management for 20226, and (ii) the “Framework Decree” for 20227, which defined the reference objectives for administrative action regarding financial operations for the management of public debt. The provisions contained in these decrees were then converted into the operational “Public debt management guidelines” for 20228 (hereinafter, “Guidelines”).
The general Directive identified as a strategic objective the effective and efficient management of public debt, focusing on containing its cost and extending or stabilising its average life.
As was the case in previous years, the Framework Decree for 2022, provided guidance for the work of the Public Debt Directorate as well as a number of specific objectives. In particular, Art. 2 states that debt should be “in accordance with the limit established annually by the law approving the State budget”, equal to the amount to cover the bonds maturing during the year and the Central Government’s borrowing requirements, being sure to “...reconcile the need to meet market demand with that of containing the overall borrowing cost in a medium-long term horizon, having considered the need to protect against the refinancing risk and exposure to interest rate fluctuations”.
The same article also identified the limits to be respected in terms of the percentage composition of debt at the end of 2022, broken down as follows:
| TABLE I.2: OBJECTIVES FOR THE END OF 2022: PERCENTAGE COMPOSITION OF THE DEBT PORTFOLIO |
| Type of Bond | Min. | Max. | Differences compared to 2021 |
| BOT (short-term) | 3% | 8% | -- |
| BTP (fixed-rate nominal) | 65% | 80% | extended from the previous 65%-78% range |
| CCTeu | 4% | 10% | -- |
| BTP€i and BTP Italia (“real” bonds) | -- | 15% | -- |
| Bonds issued on foreign markets | -- | 5% | -- |
| Source: Framework Decrees, different years |
In order to pursue the objectives of “curbing the overall debt cost, protecting against market risks and refinancing risks and ensuring the proper functioning of the secondary market for government bonds”, Art. 3 authorises the use of public debt management operations9 also through derivative financial instruments, exchanges or repurchase of government bonds.
In order to mitigate the credit risk stemming from derivatives, Art. 4 requires counterparties to have a high level of creditworthiness, according to the rating
__
6 For the Italian version of the General Directive for Administrative Action and Management of the Italian Ministry of Economy and Finance - Year 2022 see https://www.mef.gov.it/ministero/oiv/documenti/Direttiva-generale-per-lazione-amministrativa-e-la-gestione-per-lanno-....pdf.
7 Guidelines for the implementation of financial operations (Framework Decree) for 2022: (https://www.dt.mef.gov.it/export/sites/sitodt/modules/documenti_en/debito_pubblico/normativa_spalla_dest ra/2022_Framework_Decree_-_Directives_for_conducting_financial_transactions_xMin_Decree_30.12.2021x.pdf)
8 Public debt management guidelines for 2022:
(https://www.dt.mef.gov.it/export/sites/sitodt/modules/documenti_en/debito_pubblico/presentazioni_studi_r elazioni/Guidelines_for_public_debt_management_2022.pdf).
9 Art. 3 of the “TUDP” (Italian Consolidated Law on Public Debt) authorises the use of operations on a consensual basis that restructure certain features of the existing debt portfolio.
| 4 | MINISTRY OF ECONOMY AND FINANCE |
I. DEBT MANAGEMENT OBJECTIVES FOR 2022 | |
given by the main rating agencies, also providing for possible agreements with the counter parties for mutual guarantees (collateralisation)10.
Lastly, Art. 6 states that the aim of cash account management11 must be “the efficient movement of cash balances, in relation to the government bonds issuance, prevailing market conditions and the constraints imposed by monetary policy provision”. To this end, year 2022 could have benefited from the new cash management tools introduced in 2021 (i.e., REPOs).
The 2022 aim remained that of consolidating the results achieved over the last years, in terms of exposure to interest rate and refinancing risk, taking advantage of a market environment which, albeit still fragile, has improved since the acute phase of the pandemic12.
Based on the outstanding bonds portfolio at the end of 2021, EUR 230 billion worth of bonds were scheduled to mature in 2021 (excluding BOTs), a slightly higher amount than the EUR 222 billion worth of medium-long term bonds outstanding at the end of 2020, maturing in 2021.
In the 2022 Guidelines, the Central Government cash needs were expected to be around EUR 100 billion, a level slightly below that of 2021, which might be revised downwards given the relevant improvement in cash needs recorded over the last months of the year. The cash needs could be covered not only by the national issuance programme, but also by the European resources made available by means of loans from both the SURE programme and the Recovery and Resiliency Facility package under the Next Generation EU programme.
In a macro-economic context in which there were uncertain expectations regarding the consolidation of the economic recovery, due to the evolution in European rates and the following reaction on behalf of institutional investors, the Treasury set out the following objectives in the Guidelines:
| 1) | The coverage of needs at a cost aligned, as much as possible, with the market trend; |
| 2) | the consolidation of the results already achieved in terms of exposure to the main risks, in particular the interest rate risk and refinancing risk; |
| 3) | the gradual improvement in liquidity conditions on the secondary market; |
| 4) | the efficient management of the Treasury’s cash. |
The Treasury’s strategy was therefore set to develop along the following lines:
| 1) | ensure predictable and regular issues for all the main segments of domestic bonds; |
| 2) | adjust the volumes offered to the market in order to give greater weighting to sectors with better liquidity on the secondary market and greater depth of demand; |
| 3) | use liability management tools (such as exchanges and repurchases), in line with the approach followed in recent years, with a frequency and intensity in |
__
10 For more information about these mutual guarantee agreements, please see Chap. III.4 (Derivatives portfolio management).
11 Regulations regarding the Treasury’s cash movements and the selection of the counter parties participating in the relative operations are based on the Italian Ministerial Decree dated 10/01/2022.
12 The evolution of the average life of the stock of government bonds is detailed in the following paragraphs.
| MINISTRY OF ECONOMY AND FINANCE | 5 |
line with market trends, with the aim of reducing dislocations on specific bonds, improving liquidity on the secondary market, managing the redemption profile for future years and managing the redemption profile of future years, and helping to reduce the average cost of outstanding debt;
| 4) | diversify the investor base also through foreign currency issues in Global format as well as EMTNs, with particular regard to issues in US dollars; |
| 5) | continue the dedicated offering to retail investors, aimed at expanding their direct participation in public debt financing; |
| 6) | develop the BTP Green issuance programme in line with the eligible expenses listed in the State budget. |
| I.3 | CURBING THE COST OF DEBT WHILE PAYING ATTENTION TO THE COST/RISK PROFILE |
The cost-risk trade-off: Italy’s specific features
As in previous years, public debt management in Italy focuses on containing two main risks: the interest rate risk, by minimising the impact on interest expenditure13 caused by fluctuations of the interest rates at which the debt is placed; and the refinancing risk, by distributing the maturities of bonds more evenly over time in order to facilitate new issues.
When it comes to these risks, the Treasury’s objectives are in line with the practices followed by other DMOs. However, in Italy’s case, the management of a particularly high debt makes it necessary to pay greater attention to the credit risk premium requested by investors, based on the perceived sustainability of the debt, which becomes a significant component of the interest rate level at the issuance for Italian government bonds.
Another aspect to be considered in the management of the Italian state budget concerns the stability and predictability of interest expenditure, which allows to avoid the need to increase taxation should government-bond yields be affected by possible shocks and makes it easier to manage public finance commitments stemming from European requirements, mainly based on deficit control and debt dynamics.
The two aforementioned aspects therefore significantly contribute to guiding Italy’s debt management strategy with regard to keeping refinancing and interest rate risks under control.
__
13 In order to manage public finances correctly, it is necessary, where possible, to reduce costs and to plan outgoings with as much certainty as possible. This avoids unwanted and unexpected increases in the deficit and/or fiscal pressure, perhaps also significantly and in a short amount of time, as a result of costs or expenses not being duly planned for. Correct management of public finances therefore guarantees a framework of financial stability, which in turn allows for effective debt management.
| 6 | MINISTRY OF ECONOMY AND FINANCE |
I. DEBT MANAGEMENT OBJECTIVES FOR 2022 | |
Refinancing and interest rate risks: metrics and management tools
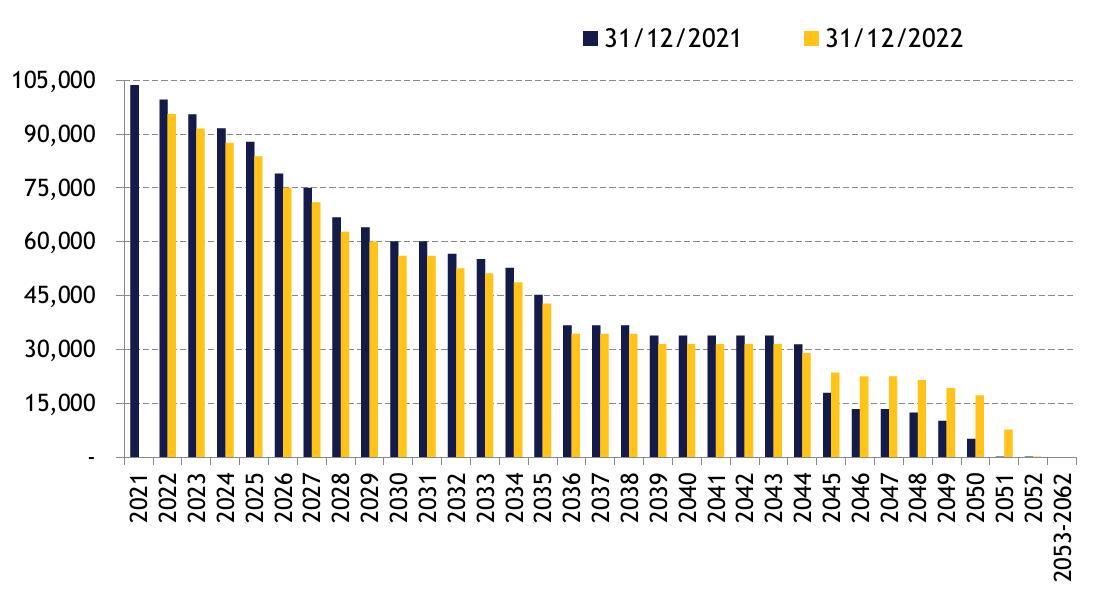
The average life of the stock of government bonds is the best-known benchmark metric used to measure refinancing risk. This is calculated as the average of the maturities of all outstanding bonds, weighted according to the nominal value14 of each bond. At the end of 2021, the average life of government bonds stood at 7.11 years, up from end-2020 level.
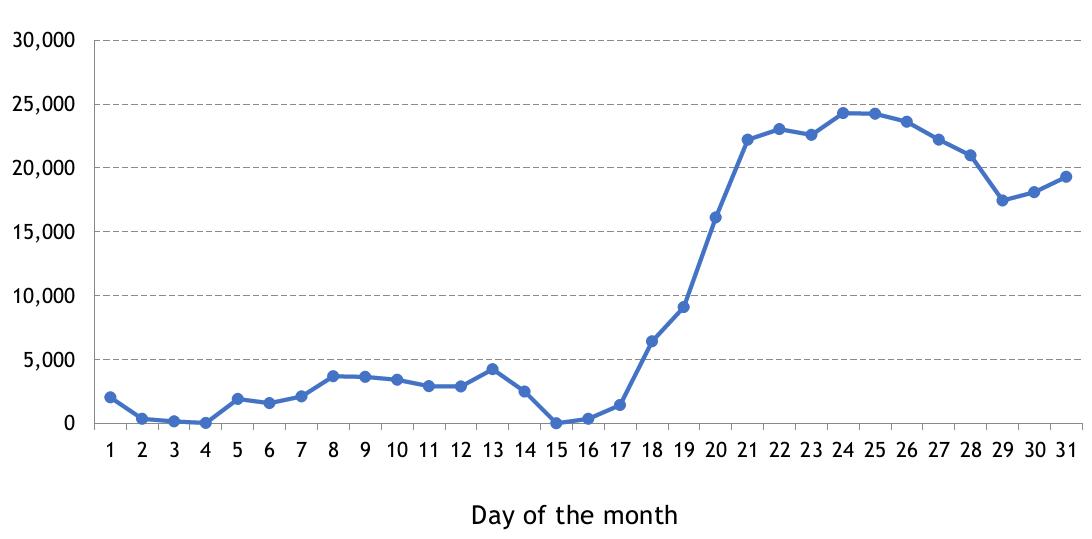
Below is the annual distribution of maturities from the end of 2021 (Chart I.1) and, in detail, the monthly distribution up to and including 2024 (Chart I.2).
| CHART I.1: ANNUAL MATURITY PROFILE OF MEDIUM/LONG-TERM BONDS OUTSTANDING AS AT 31.12.2021 (EUR MILLION) |
|
| Source: MEF |
__
14 For “nominal value”, the definition adopted in EC Regulation no. 479/2009 of 25/05/2009 is used: “...The nominal value of a liability outstanding at the end of the year is the face value. The nominal value of an index-linked liability corresponds to its face value adjusted by the index-related change in the value of the principal accrued to the end of the year. [...] Liabilities denominated in a foreign currency shall be converted into the national currency on the basis of the representative market exchange rate prevailing on the last working day of each year. Liabilities denominated in a foreign currency and exchanged through contractual agreements to the national currency shall be converted into the national currency at the rate agreed on in those contracts”.
| MINISTRY OF ECONOMY AND FINANCE | 7 |
| CHART I.2: MONTHLY MATURITY PROFILE OF MEDIUM/LONG-TERM BONDS OUTSTANDING AS AT 31.12.2021 (EUR MILLION) |
|
| Source: MEF |
In detail, by the end of 2021, the medium-term refinancing risk improved significantly compared to the previous year with a decrease in the share of bonds15 to be refinanced in the five-year period (52.80% of the total), dropping from 54.74% as of 31/12/2021.The one-year refinancing risk, instead, remained almost unchanged (16.21% at the end of 2022, compared to 15.31% at the end of 2021).
The indicators used to quantify the interest rate risk on bond issuance portfolios, instead, are as follows:
| (i) | Financial duration, equal to the weighted average payment time for both principal and interest; |
| (ii) | the average refixing period, i.e., the average time taken by the debt portfolio to “integrate” market interest rate changes; |
| (iii) | the Cost-at-Risk, which quantifies the maximum additional cost in terms of interest expenditure in the event of adverse interest rate scenarios, along with the probability of actually having to bear this additional cost, deriving in turn from the probability that these adverse scenarios shall occur16. Cost-at-Risk (CaR) analysis is therefore used to identify, with a given probability, an expected cost level that may not be exceeded, as well as all the compositions of the bonds issuances whose cost-risk combinations are classed as being efficient, i.e., are such as to become dominant - for a given level of cost or risk - over any other hypothetical composition of the issuance portfolio. |
By simulating possible development scenarios of interest rates and inflation, it is possible to assess a series of issuance portfolios in the medium-term both in terms of cost of interest expenditure, calculated according to the ESA 2010 (European
__
15 The refinancing risk is measured on the stock of domestic and international government bonds post swap.
16 Please see the focus point on “The main quantitative indicators of interest rate risk” on page 22 of the 2014 Annual Public Debt Report, available at the address already provided on page 2 of this Chapter.
| 8 | MINISTRY OF ECONOMY AND FINANCE |
I. DEBT MANAGEMENT OBJECTIVES FOR 2022 | |
System of Accounts), and of interest rate risk, also measured through the Cost-at-Risk. This identifies all potential issuance portfolios on the cost-risk efficient frontier, also called dominant portfolios, from which to elect the target portfolio for the year’s issuances.
From a technical point of view, the tool used for this analysis is an in-house developed model which the Public Debt Directorate has been using for a number of years, called “SAPE” (Issuance Portfolio Analysis Software)17.
The outstanding debt database used by SAPE at the end of 2021 was made up of domestic bonds, derivatives and bonds in USD. With regard to the latter, the Treasury’s policy is to issue any bonds in a foreign currency at generally better (or at least equal) cost conditions18 than those available for equivalent domestic instruments. Therefore, in order to estimate the refinancing costs of future maturities of USD-denominated bonds, the relevant derivative hedges were also taken into account, so that a currency exposure can be synthetically managed as if it were a Euro liability
The role of the issuance strategy in managing the rate/cost risk trade-off in 2022
In selecting the portfolio for future issuances, the trade-off between the incremental cost of the remuneration of the debt service required by the market (namely, the cost growth rate in the simulation period) and the risk, as measured by the indicators mentioned above, is fundamental. The purpose is to optimise the latter and minimise the previous one. Consequently, based on the market conditions, the investors’ needs and guaranteeing liquidity across the government bonds curve, the strategy attempts to increase the issuance of government bonds with longer maturities if economically efficient. In doing so, the Treasury’s issuance plan also considers the tools targeting retail investors (i.e., BTP Italia or Futura) and those with peculiar purposes (i.e., BTP Green).
The set of analysed portfolios can be effectively achieved, also in the presence of a different composition of the market segments, by allowing for financing:
| 1) | medium-long-term maturities expected in 2022 (equal to approx. EUR 230 billion); |
| 2) | outstanding BOTs (equal to about EUR 113 billion), with the so-called BOT roll-over during the year, i.e., the BOT issues necessary to cover the redemptions of the BOTs issued in the same year; |
| 3) | Central Government cash requirements, which, at the time, were estimated to be around EUR 100 billion19; |
| 4) | as well as ensuring that the Treasury has sufficient liquidity available to cater for all cash needs. |
__
17 Models and software are constantly being updated. A detailed description of the implications and functioning of the model can be found in the recently published study available in English at the following link: https://www.dt.mef.gov.it/en/debito_pubblico/Public_Debt_Management_Network/ebook/index.html.
A summary of the development of the model is included in Appendix 3 of the Report.
18 Including costs to hedge against exchange rate risks.
19 This figure formed the basis for public finance forecasts included in the 2021 Draft Budgetary Plan.
| MINISTRY OF ECONOMY AND FINANCE | 9 |
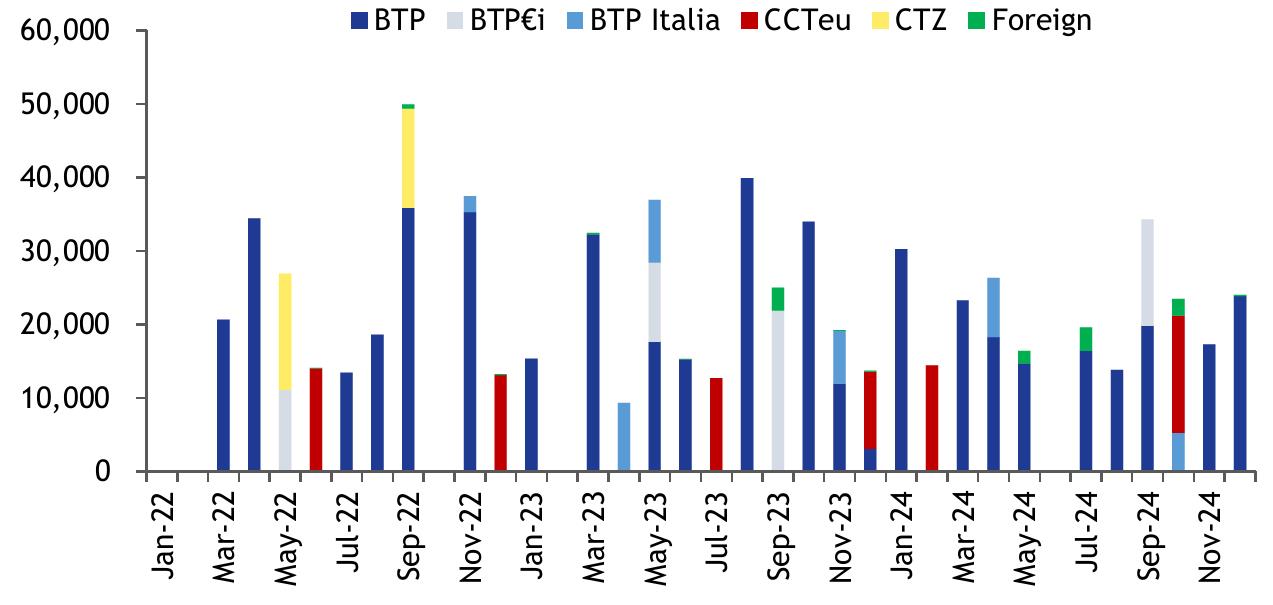
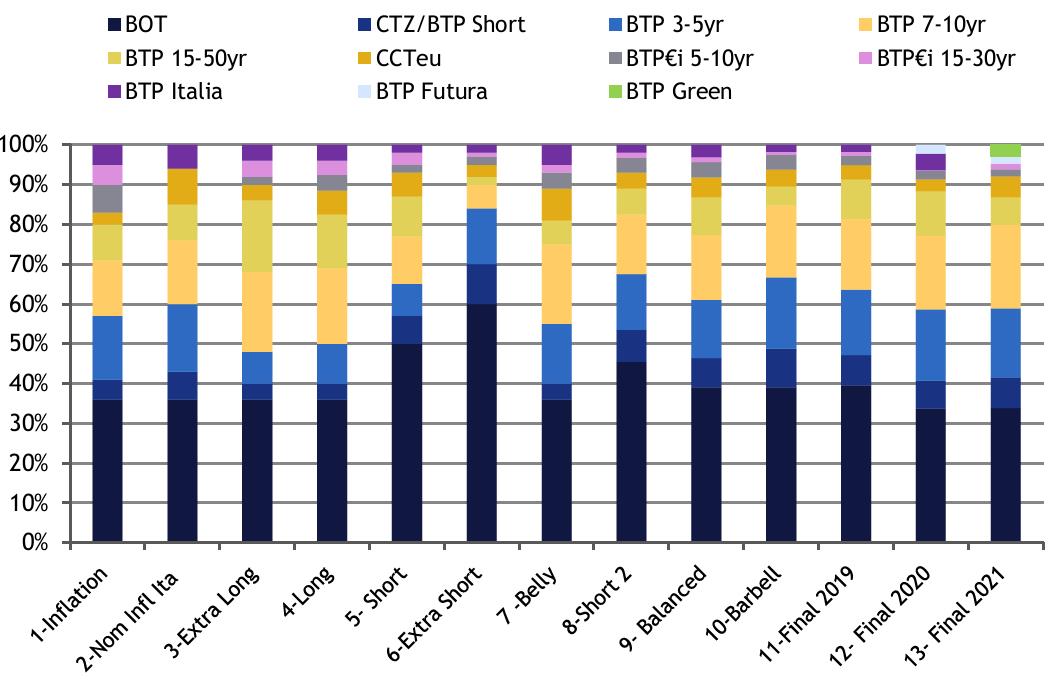
The set of portfolios analysed here reflects that of the previous year, as no considerable change was foreseen. The following chart shows the analysed portfolios:
| CHART I.3: COMPOSITION OF THE ALTERNATIVE ISSUANCE PORTFOLIOS ANALYSED FOR 2022 (EUR MILLION) |
|
| Source: MEF |
The simulation assessment led to a portfolio selection for 2022 issuances in line with what was achieved in 2021. However, in relation to the previous year, the possible reduction of BOTs - more specifically those with 6-months maturity - was taken into account, given that part of the cash needs could have been hedged with Repo operations, also used in 2022, and a slight increase in CCTeus.
The role of derivative operations in managing the rate/cost risk trade-off for 2022
The Treasury has always carefully and constantly monitored the risks underlying its debt portfolio, identifying the main factors to which it is exposed from both a qualitative and a quantitative point of view. Any change occurring to the debt due to new placements and the natural maturity of the bonds is incorporated actively into the portfolio to contain and improve the portfolio’s risk profile. The Treasury, therefore, uses financial derivatives, in line with the prescriptions laid down in the Framework Decree, to contain the total cost of debt and protect the debt portfolio from the risk of interest and exchange rate increase, both during new issuances and after.
The 2022 Guidelines are in continuity with those of the previous years: derivative operations, therefore, have a variety of objectives, such as increasing the duration of debt, including the hedging through derivatives, by reducing
| 10 | MINISTRY OF ECONOMY AND FINANCE |
I. DEBT MANAGEMENT OBJECTIVES FOR 2022 | |
exposure to unexpected and sudden interest rate fluctuations, guaranteeing good secondary market functioning of Government Bonds and improving the cost-risk profile in the medium to long term. Any change in the liability management policies might exclusively occur upon changes in the debt composition, portfolio underlying risks or risks or the strategic objectives pursued.
The pandemic crisis caused a significant burden on the state budget, reflected in an increase in the debt stock; despite this, the composition and riskiness of the debt did not change significantly. In line with the 2022 Guidelines, the management of the derivatives portfolio would have taken into account two main aspects:
(i) the evaluation and possible execution of both new Cross Currency Swaps to hedge the exchange rate risk associated with new currency operations and Interest Rate Swaps to mitigate exposure to interest rate rises and lengthen the duration if the swap curve continues to show shallow levels;
(ii) the possibility of restructuring positions in the portfolio to improve their effectiveness in terms of the objectives pursued, taking into account the changed market conditions compared to the time of their conclusion.
In 2022, the management of the derivative portfolio focused on: (i) hedging market risks, such as exchange rate risk, for possible issuances in foreign currency and interest rate risk; (ii) restructuring and/or concluding operations already in the derivatives portfolio; and (iii) managing collateral, through the collateralisation of additional existing derivative positions (subject to the availability of funds to be allocated to this project).
Measures to achieve debt issuance and management objectives for 2022
In relation to the set objectives, the Italian Treasury’s strategy for 2022 was structured as follows, covering the two phases of debt management:
Policies of domestic and foreign bonds at issuance
The Guidelines defined the issuance policy for 2022, taking into consideration the above-mentioned objectives in terms of average life, duration and the average refixing period, as well as the results of the cost-risk trade-off analysis.
In line with market conditions and given the need to ensure hedging of maturing bonds and of the Government Sector Needs, issuance choices in 2022 should therefore aim to:
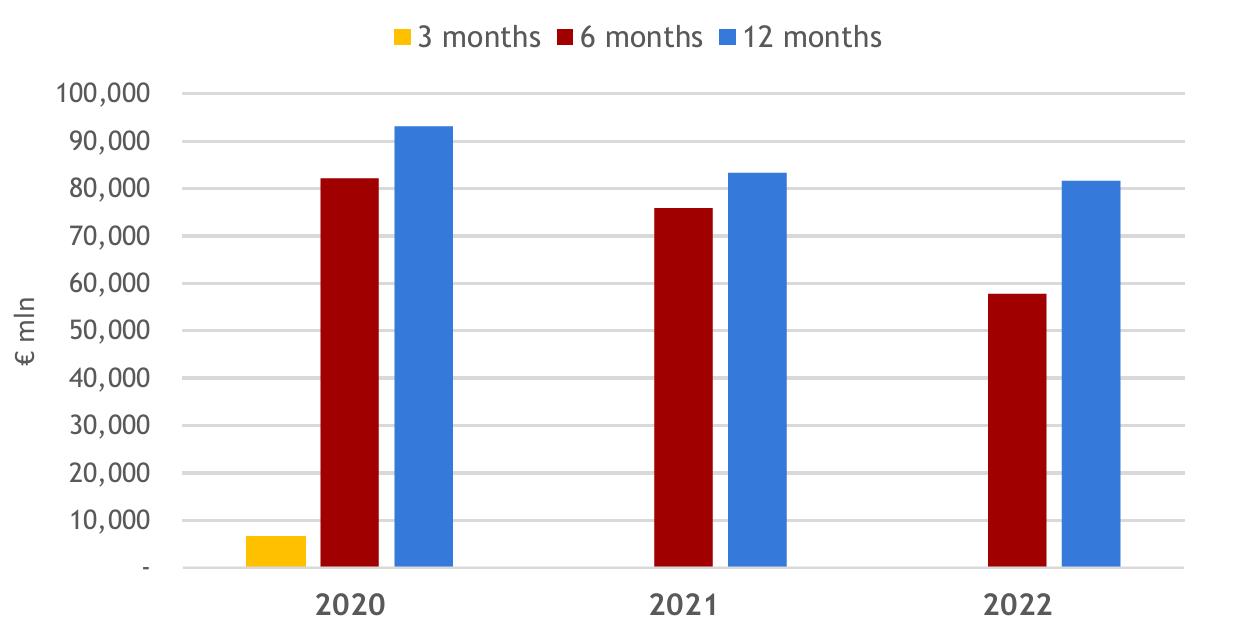
| 1) | adjust BOT issuances to ensure an end-of-period stock, which would include the renewal of maturing bonds, although a reduction in net issuances is to be achieved compared to the previous year; |
| 2) | provide continuity with BTP Short Term issuances, specifically considering maturities occurring over the year and by integrating CTZ ones. The offered amount could have been as such as to produce net negative issuances; |
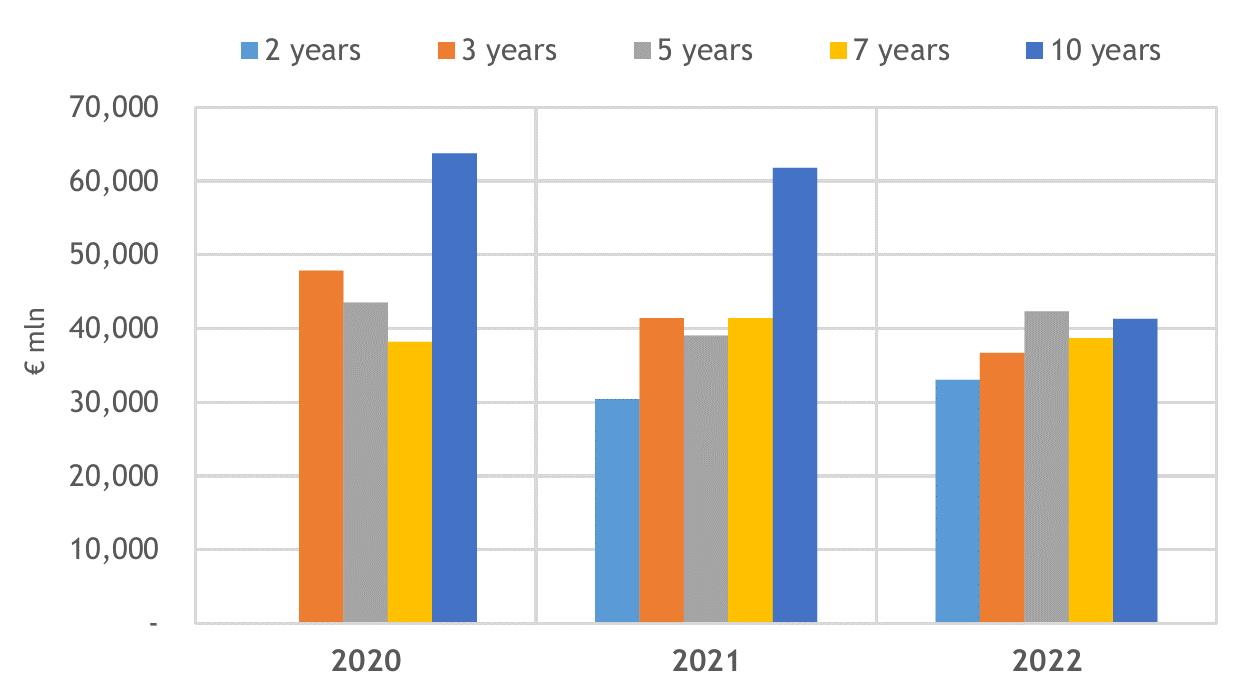
| 3) | as for 3- and 5-year BTPs, balance the overall amounts offered by reducing issuances compared to 2021. However, net issuances should be positive for both segments, although to a lesser extent for 5-yr BTPs vs. 3-yr BTPs, given the higher redemptions of the first compared to the second; |
| MINISTRY OF ECONOMY AND FINANCE | 11 |
| 4) | keep the gross issuances of 7-year BTPs in line with those of 2021, with a positive offer net of redemptions, to consolidate the 7-yr BTPs share on the stock of Government Bonds by the end of the year and contribute to extending the average life of debt. As for the 10-year BTP, in 2022, this instrument would have continued to be the benchmark for the yield curve of government bonds. Nevertheless, the issuance volume would have been lower than in 2021, and given the high maturities in the year, negative net issuance was expected. |
| 5) | allow that on the longer-term nominal maturities (15, 20, 30 and 50 years), in addition to ensuring liquidity on all instruments through regular and continuous issues, the Treasury would consider placing a new benchmark on the 15, 20 and 30-year maturities because of the float achieved by the current benchmarks. In the long-term sector, given the maturities, positive net issuance was expected; |
| 6) | increasing the supply of CCTeus compared to 2021 but not resulting in positive net issuance due to the high volume of maturing bonds. The Treasury also planned to place at least one new benchmark on maturities between 3 and 10 years; |
| 7) | ensure issuances in line with 2021 on the various maturities of BTP€is, with positive net issuances on the whole segment due to the reduced maturities during the year; |
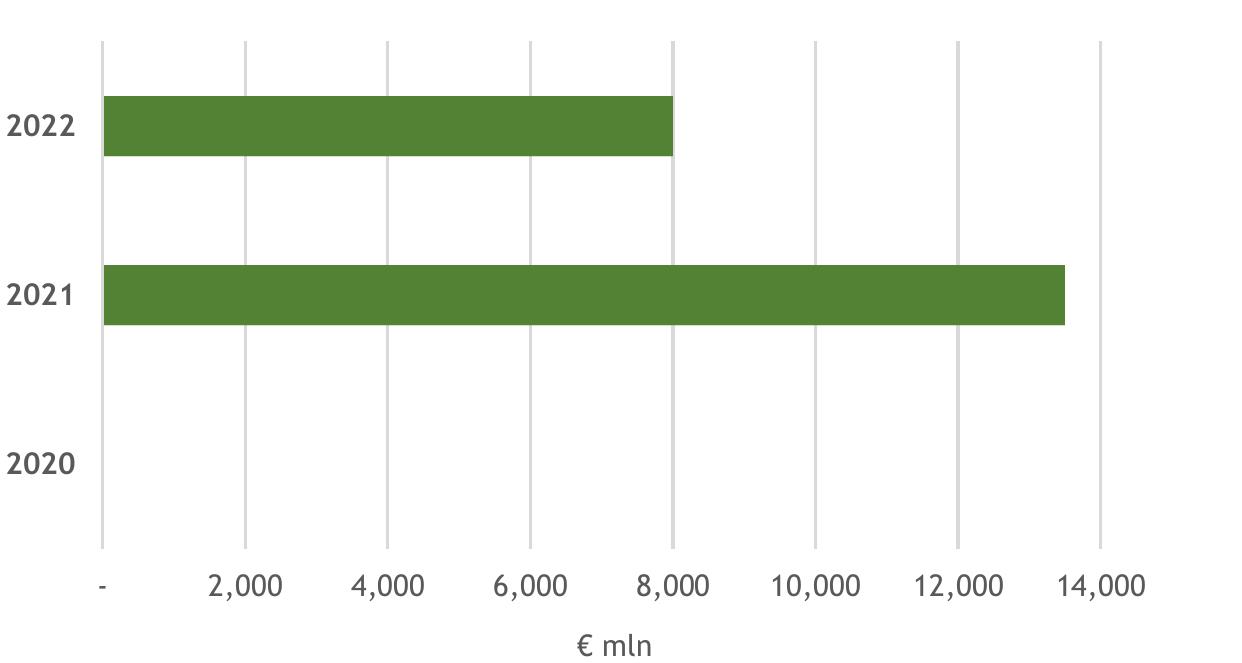
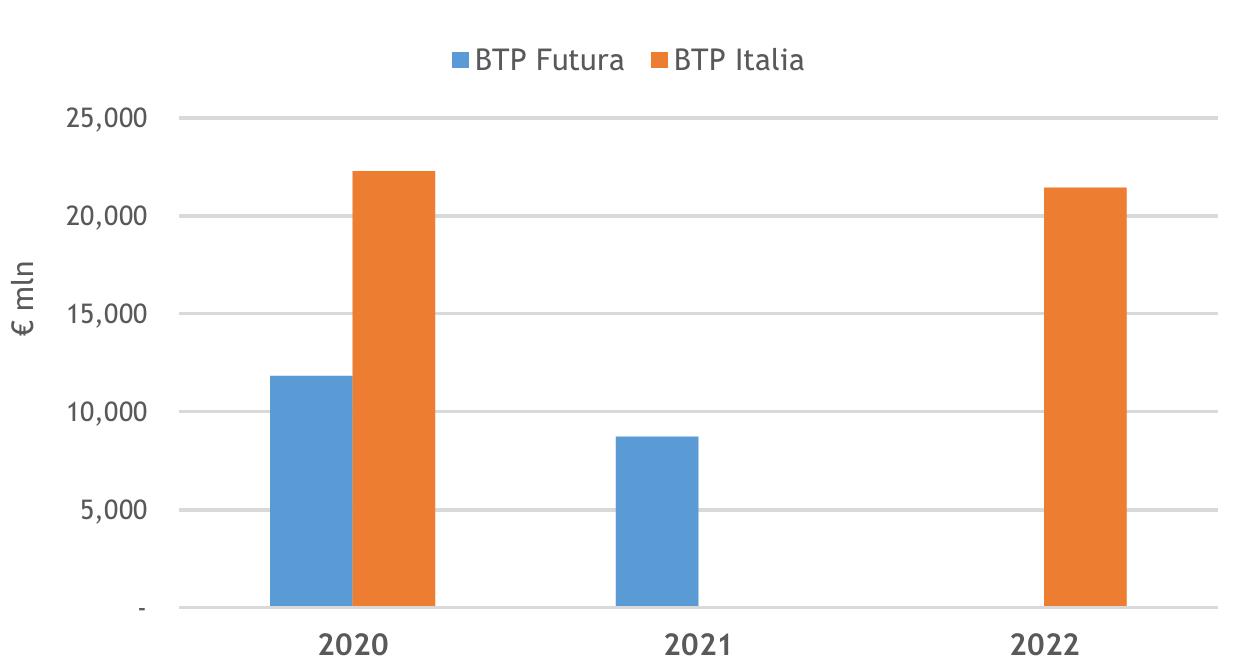
| 8) | meet the demand for instruments dedicated to retail investors, envisaging at least one issue of BTP Italia, and reserving maximum flexibility on the most appropriate maturity, given the problematic predictability of the evolution of market conditions. Positive net issues were assumed for this instrument due to its short maturities. Similarly, for the other bond intended for the retail market, the BTP Futura, at least one issue with a maturity to be defined close to the placement was also planned; |
| 9) | continue issuing in US dollars regularly, solidifying the Treasury’s presence in this segment, in continuity with what has been implemented over the last three years. The objective is further building an ever more complete and liquid yield curve in USD, significantly broadening the base of institutional investors holding Italian public debt, with particular regard to strategic investors less present in the domestic bonds segment, such as insurance companies and Asian pension funds, and at the same time ensuring issuance costs aligned with those achievable on outstanding bonds. In continuity with previous years, provision was also made for the possibility of using the MTN programme in Euro and/or in foreign currency to meet the demand for public or private placements of primary institutional investors, subject to the minimum requirements20 of the issue format; |
| 10) | examine the possibility to reopen the existing BTP Green Bond with subsequent issuance tranches and a new benchmark. |
__
20 Maturity of at least three years, minimum amount of EUR 200 million and a minimum negotiable amount of EUR 500,000.
| 12 | MINISTRY OF ECONOMY AND FINANCE |
I. DEBT MANAGEMENT OBJECTIVES FOR 2022 | |
Post-issuance debt management operations
As mentioned, the Italian Treasury may also use extraordinary exchange and repurchase operations regarding government bonds to achieve the objectives mentioned above for the existing debt portfolio.
The 2022 Guidelines called for a policy in line with that adopted in recent years. Extraordinary operations are, by their very nature, highly flexible in terms of methods and timing of execution and pursue a variety of purposes, such as managing refinancing risk, reshaping the maturity profile, supporting liquidity and ensuring the efficiency of the sovereign bond market, as well as reducing the average cost paid by the Treasury on outstanding bonds.
| I.4 | MONITORING AND MANAGING THE CASH ACCOUNT TO STABILISE THE BALANCE |
The cash account for Treasury services
The Cash Account is held by the Treasury with the Bank of Italy, where its incoming cash flows and payments are recorded. To ensure efficient handling of funds, the Account is used by all entities required to operate and consists of the sum of the balances of all accounts opened with the Treasury21. This setting is characterised by strong volatility due to the large number of entities that move funds with the Treasury and to the cyclical presence, usually on a monthly basis, of certain flows that significantly affect daily balances. In particular, a strong impact on the payment side - mainly in the first few days of the month - is determined by the disbursement of pensions, while on the collection side, the central days of the month are marked by the collection of tax revenues. Issuances and, to an even greater extent, redemptions of government bonds at maturity can also cause significant fluctuations in the Cash Account.
The Treasury and the Bank of Italy manage its liquidity according to forecasts of Treasury flows and related stocks. This approach also meets the European Central Bank’s (ECB) needs, which calls for monetary policy to be facilitated through an efficient forecast of the liquidity held by public institutions at national central banks in the Eurozone.
The regulatory context for cash management in 2022
Cash management principles were established in the MEF’s general Directive for administrative procedures and management in the recent Decree of the Ministry no. 1416 of 10/01/2022 concerning handling cash held on the Treasury Cash Account (General Decree) and in the 2022 Public Debt Management Guidelines.
In particular, the general Directive stated that the focus should be on improving the model to process daily cash forecasts for the Cash Account and that the
__
21 For further details, please refer to Italian Ministerial Decree No. 51961 of 26/06/2015 concerning the identification of government deposits held with the Bank of Italy, implementing Art. 5, paragraph 5, of Italian Presidential Decree No. 398/2003.
| MINISTRY OF ECONOMY AND FINANCE | 13 |
monitoring and management of that Account must be geared towards stabilising the balance. The Guidelines, with regard to the management of the MEF’s liquidity, emphasise how the introduction of the repurchase agreement (Repo) activity, already initiated in 2021, would have allowed the adoption of an issuance policy oriented to the continuation of the containment of short-term issues, on the one hand, and made possible further positive effects, both in terms of efficiency in the collection of very short-term liquidity, and in the management of distortions present in the market, on the other.
In 2022, the Treasury completed a process of general reform of the regulations on cash management activities, which came to fruition with the entry into force of the so-called General Decree, innovating the previous regulatory framework consisting of Decree No. 25391 of 25/10/2011.
The revision became necessary in order to update the framework for the performance of cash management operations and make it more in keeping with the trading-focused management methods most commonly used in the financial markets.
The Decree introduces essential new features. Non-collateralised liquidity-raising and liquidity-use operations may be conducted through bilateral negotiations and executed directly by the MEF both over the counter and on trading venues. At the same time, the operational activity carried out on overnight maturities through the auction mechanism is discontinued.
With regard to the counter parties eligible to participate in the operations mentioned above, the MEF simplified, for all the actors involved, the execution of liquidity collection or lending operations with the Treasury to guarantee a broader range of counter parties, including not only Specialists in Government Bonds, institutions or public entities that manage the liquidity of EU Member States but also counter parties selected by the Ministry based on structure and reliability criteria, to make the management of the MEF’s liquidity more efficient and effective.
With reference to the evolution of the monetary policy framework in the course of 2022, the European Central Bank (ECB) put in place essential measures that significantly altered the context in which the Treasury found itself managing the liquidity held in the Account, especially in the second half of the year.
In addition to having initiated a policy of normalising its reference rates22, bringing the deposit facility into positive territory after many years of negative rates, the ECB intervened in September, issuing a Decision on the remuneration of Government Deposits held with National Central Banks. Specifically, the ECB temporarily suspended the zero-remuneration regime for over-threshold government deposits where the deposit facility has a positive rate23, establishing instead the application of the lowest rate between the deposit facility and the €STR until the end of April 2023, with the removal of the 0%24.
__
22 For more details and insights, please refer to Chapter II - Monetary policies and effects on the Euro area Money Market.
23 In particular, see the address made by ECB/2019/7 (https://eur-lex.europa.eu/legal-content/EN/TXT/?uri=CELEX%3A32019O0007) and the ECB/2019/8 Decision (https://eur-lex.europa.eu/legal-content/IT/TXT/?uri=CELEX:32019D0008).
24 For more details and insights, please refer to Chapter III - Treasury Cash Management.
| 14 | MINISTRY OF ECONOMY AND FINANCE |
I. DEBT MANAGEMENT OBJECTIVES FOR 2022 | |
Cash management
Liquidity management - or cash management - was established in 2007 and consists of the activity of daily movements on the money market of the liquid assets held in the account “Treasury liquidity for the treasury service”, held at the Bank of Italy, through both the execution of repurchase agreements (Repo) and by resorting to bilateral non-collateralised lending and funding negotiations on the money market, to ensure an adequate level of liquidity, in relation to the multiple movements of the State Treasury and seeking, at the same time, to adequately remunerate cash balances, taking into account market conditions and risk levels.
This activity is closely linked to public debt management and constitutes the link between bonds issues and the daily fluctuations of the Cash Account.
To carry out efficient cash management a preliminary monitoring and accurate estimation activity on both very short-term cash provisions and annual ones is fundamental.
The monitoring consists of a continuous exchange of information between the Bank of Italy and the MEF (State General Accounting Department and Department of the Treasury - Public Debt Directorate), with forecast and actual data on all collections and payments involving accounts held with the Treasury and the resulting estimate of the Cash Account balance. The information exchanges are updated repeatedly during each working day, to estimate the end-of-day balance of the Account. The liquidity forecasts of the MEF and the Bank of Italy also include longer-term scenarios, shared weekly, with a time horizon consistent with monetary policy and issuance planning requirements.
On the other hand, money market operations consist of lending or borrowing surplus liquidity to manage temporary cash shortages.
In recent years and until the first part of 2022, the cash management business had to operate in an environment characterised by permanently negative money market rates, low volatility, and a massive ECB presence through many unconventional monetary policy measures. This context had made it very difficult to engage in market lending at better rates than those applied by the central bank on the liquidity left with it. On the other hand, Repo activity, especially in funding, was particularly effective in that a single instrument was used to meet market makers’ need for collateral, particularly on some of the most sought-after government bonds, while at the same time allowing funding operations to be carried out at particularly advantageous rates.
The ECB decision on remuneration, reported in the previous paragraph, allowed the Treasury to continue to operate on the money market with the same continuity but, at the same time, prompted the decision to keep substantial portions of liquidity with the Bank of Italy since, in the absence of the decision to suspend the application of the cap, the Treasury - as well as all other European debt managers - would have been forced to invest surplus liquidity in the market to improve its remuneration, with inevitable impacts on the money market, the repo market and the effective functioning of the spot market for government bonds.
| MINISTRY OF ECONOMY AND FINANCE | 15 |
| LEARN MORE | The Repo Market and Treasury’s Operations The Repo market is the market where two counterparties agree to enter into an agreement whereby one party lends a repurchase bond (specific, in the case of “Special Repo”, or generic, in the case of “General Collateral”) for a fixed period (the term of the agreement) in exchange for liquidity. At the end of the operation, there is a reverse exchange (liquidity against bonds) at a predetermined price (rate). Operators can, therefore, trade Repos to meet a need for liquidity (typically in the General Collateral agreement) or for specific bonds (in the Special Repo agreement) that they temporarily lack. The Treasury could thus resort to Repo operations as a cash management instrument to use the surplus cash at more advantageous conditions than those imposed by the ECB on the balances deposited on the Cash Account. Alternatively, the Treasury could use Repo operations to collect cash to provide liquidity in case of temporarily limited availability and, simultaneously, satisfy the needs of Primary Dealers by facilitating their market-making commitments on the secondary market. The Treasury could also intervene in the secondary market in the event of tension caused by scarcity of specific bonds, temporally selling Repos to mitigate the effect of such scarcity on the performance of Government bonds. Therefore, when the Treasury borrows liquidity from the Repo market, it must, in return, cede to the counterparty one or more bonds as a guarantee of the successful outcome of the operation. For this reason, the Treasury had to preliminarily acquire a portfolio of Government bonds used in Repo operations. To this end, at the launch of the operation in May 2021, an ad hoc issuance of 15 BTPs, each worth EUR 1,000 million (for a total of EUR 15,000 million), issued exclusively for this specific purpose, was performed. In the months that followed, the total amount of the portfolio was progressively increased from EUR 15,000 million in 2021 to EUR 45,000 million in 2022, divided among 45 BTPs, in order to further streamline cash management and provide broader liquidity support on the secondary market - both spot and forward - for government bonds. |
| 16 | MINISTRY OF ECONOMY AND FINANCE |
| II. | THE ITALIAN GOVERNMENT SECURITIES MARKET: PERFORMANCE IN THE INTERNATIONAL CONTEXT |
| II.1 | MONETARY POLICIES AND EFFECTS ON THE EURO AREA MONEY MARKET |
Monetary policies in the Euro area
The economic outlook for the Euro area throughout 2022 was strongly affected by post-Covid normalisation dynamics and tensions related to the invasion of Ukraine. After rebounding in 2021, growth in 2022 remained strong, albeit lower than in 2021, affected in particular by sharp increases in energy commodity prices and increased uncertainty related to the continuation of the war. Along with the repercussions on economic activity, the conflict contributed to the significant rise in the inflation rate throughout 2022, to record highs for the last two decades.
In the face of intensifying inflationary pressures and on the basis of its assessment of the outlook for the economy and prices, the ECB Governing Council adopted several measures necessary to ensure price stability and safeguard financial soundness in 2022.
In the first part of the year, it opted to maintain key interest rate levels at the previous year’s levels but signalled that the time was approaching when it would decide to raise them, and at the same time, revised the Asset Purchase Programme (APP), first by reducing the monthly net purchases and then by setting its end date as 1/07/2022. It was decided that the principal repaid on maturing bonds would continue to be reinvested beyond that date.
In the year’s second half, the ECB embarked on a phase of decisive and repeated increases in the main interest rates. In July, September, October and December, it raised the official rates by 0.50% and 0.75% on two consecutive occasions and finally by a further 0.50%, respectively, resulting in an overall increase of 2.5% of all key interest rates from July until the end of the year. At its last meeting of the year, the Governing Council also announced that these rates would still have to be raised significantly and steadily to support a timely return of inflation to the medium-term target. In addition, it decided to relax the terms applied to the targeted longer-term refinancing operations (TLTRO3) and announced the criteria according to which it will normalise the Euro system’s holdings of bonds for monetary policy purposes in December. The APP programme portfolio will be reduced at a measured and predictable pace, averaging EUR 15 billion per month from the beginning of March until the end of the second quarter of 2023. In contrast, the reinvestment of maturing bonds under the Pandemic Emergency Purchase Programme (PEPP) will continue at least until the end of 2024 and will be conducted in a flexible manner over time and across jurisdictions.
| MINISTRY OF ECONOMY AND FINANCE | 17 |
The Euro area money market
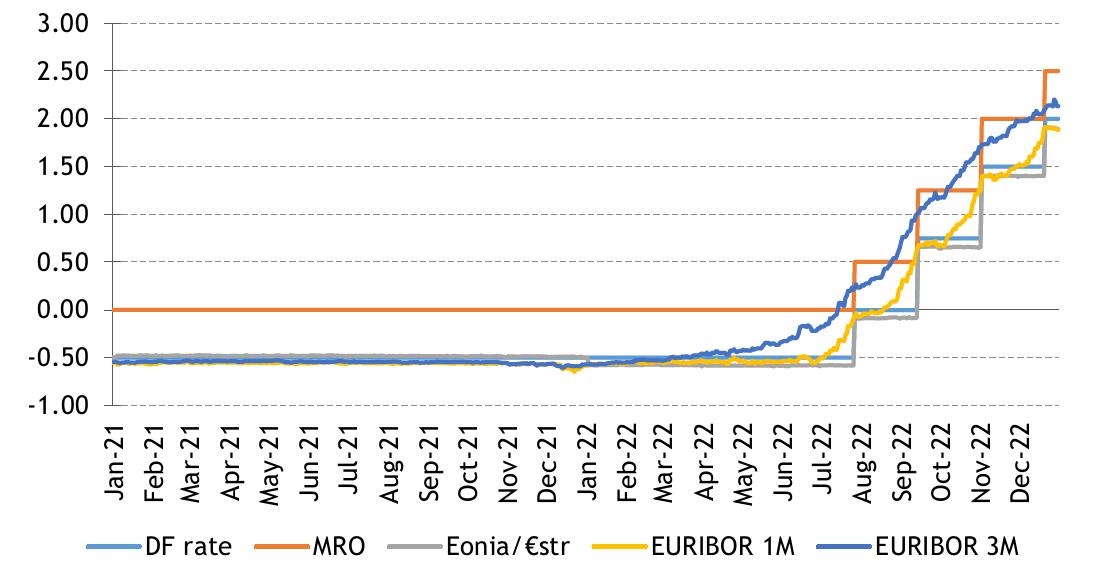
In Europe, the levels of the main ECB rates remained constant throughout the first half of 2022, confirming the ECB Deposit Facility (DF) rate at a negative 0.50%, the Main Refinancing Operation (MRO) rate at 0%, and the Marginal Lending Facility (MLF) rate at 0.25%.
However, as analysed in the previous section, the consequences brought about by the outbreak of war in Ukraine and the continuing problems in the ability of the logistics chain to supply raw materials and semi-finished products on time and in quantities to meet demand led the world’s main central banks to interrupt a long period of monetary easing to stem the sudden onset of inflationary pressures and to contain market expectations and initiate a phase of tightening monetary conditions. Therefore, in the second half of the year, the ECB raised its main reference rates, ending the year with the DF rate at 2%, the MRO at 2.5% and the MLF rate at 2.75%.
Below is a chart comparing the main money market rates with those of the ECB over the last two years.
CHART II.1: DEVELOPMENT OF THE MAIN MONEY MARKET RATES IN 2021-2022 (%) |
|
| Source: Elaboration on Reuters data |
As the chart shows, the level of the 1G money market rates (Eonia until its termination on 2/01/2022, and then €STR for the whole of 2022) remained broadly close to the level of the ECB deposit rate until the end of July, when the ECB announced the first increase in its rates and, as a result, the rest of the money market rates also adjusted to the new levels.
| II.2 | THE EURO AREA BOND MARKETS |
In 2022, multiple factors changed the reference framework of the financial markets: from the slowdown in economic activity produced by the COVID-19 pandemic to the dramatic war events in Ukraine, which caused an energy crisis with
| 18 | MINISTRY OF ECONOMY AND FINANCE |
II. THE ITALIAN GOVERNMENT SECURITIES MARKET: PERFORMANCE IN THE INTERNATIONAL CONTEXT |
negative effects on consumer price trends and economic activity. To this already complex picture added - as repeatedly mentioned - the launch of restrictive measures by Central Banks in response to the changed macroeconomic context, characterised by a marked increase in inflation.
Therefore, unlike in 2021, when, thanks to the continuation of the European Central Bank’s bond purchase programmes, conditions in the financial markets and in particular in the government bond market had remained relatively relaxed, from 2022, volatility affected all asset classes, including the government bond market.
After a January characterised by substantial stability, the Ukraine conflict outbreak fuelled global uncertainty about the economic recovery and fears about rising inflation. Higher energy prices, on the one hand, and continuing supply bottlenecks, on the other, led to a marked increase in inflation in the world’s major economies. Central banks worldwide reacted to the changed environment by accelerating the normalisation of monetary policies. After the decisions of the Federal Reserve and the Bank of England in March to make the first (by 25 basis points) and third consecutive increases in reference rates, respectively, on 14 April, it was the turn of the ECB, which confirmed the reduction in net purchases of bonds, fuelling expectations of a rise in the deposit rate by the end of the year. At its meeting in early June, in the face of a marked inflationary scenario further exacerbated by the impact on energy prices of the war in Ukraine, the ECB continued to pave the road towards normalisation by announcing the end of the APP programme on 1 July on the one hand, and the intention to make the first 25 basis points rate hike at the July meeting on the other.
In this context, starting from the end of February and steadily until mid-June, the yield curve of Italian government bonds, as well as the government yield curves of other European issuers, showed a marked upward movement accompanied by a widening, albeit to a lesser extent, of the spread towards Germany. The general rise in rates was accompanied by a marked increase in intra-day volatility, especially in conjunction with the publication of inflation data, the speeches of ECB representatives, and the actual monetary policy announcements.
Tensions eased momentarily in the aftermath of the ECB’s ad-hoc meeting in mid-June, during which the European Central Bank showed greater readiness to adopt flexibility in reinvestments within the PEPP portfolio and announced to had taken concrete steps to complete the design of a new instrument (TPI - Transmission Protection Instrument), aimed at countering situations of deteriorating financing conditions in individual Euro area countries not justified by the fundamentals of their economies.
Following this announcement, the Euro area government bond market experienced a temporary drop in yields, accompanied by a reduction in the spread of peripheral countries compared to Germany. However, market conditions deteriorated again starting in July when to cope with well above-expected inflation, the ECB opted for three consecutive hikes in its reference rates, bringing them back into positive territory after eight years: the first in July by 50 basis points (higher than the 25 announced at the previous meeting), followed by one in September by 75 basis points and one in December by another 50 basis points. These hikes and the prospects of reduced bond purchases induced a significant rise in interest rates in all markets of advanced economies, including the Eurozone sovereign bond market.
| MINISTRY OF ECONOMY AND FINANCE | 19 |
Moreover, since the end of September, the announcement of a strongly expansionary fiscal programme by the United Kingdom led to a sharp rise in UK government bond yields, with consequences on the Euro area bond markets. The situation subsequently improved thanks to the Bank of England’s interventions in the market and the government’s decision to withdraw the announced fiscal policy measures, which was accompanied by a fall in yields and volatility.
Also, in the latter part of the year, hopes of lower increases in official rates by central banks generated a favourable climate on world markets, accompanied by the closure of previously risk-averse positions, in which government bonds of high debt countries such as Italy were underweight, generating a general reduction in yields and a compression of European countries’ spreads with respect to Germany.
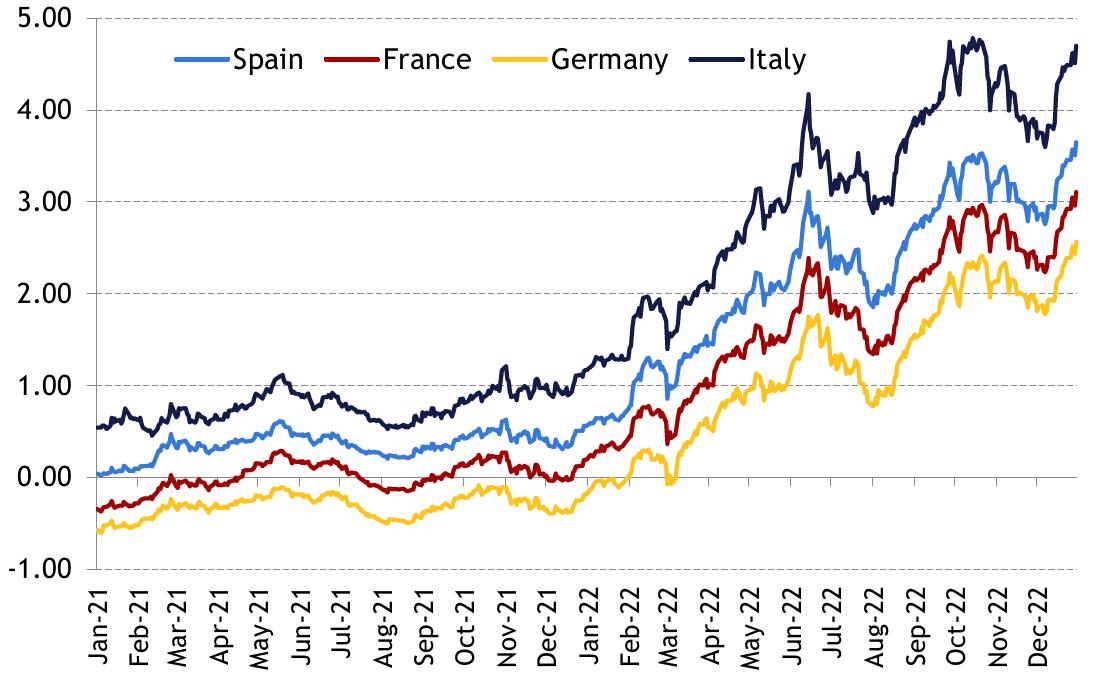
CHART II.2: TREND OF EUROPEAN GOVERNMENT BOND YIELDS - 10-YEAR MATURITY (%) |
|
| Source: Elaboration on Bloomberg data |
As shown in Chart II.2, looking at the dynamics of European government bond yields over the year as a whole, Italy recorded the most significant increase, amounting to around 349 basis points on the ten-year maturity, followed by Spain (around 305 basis points), France (around 286 basis points) and Germany (around 269 basis points). The bulk of this increase was recorded in the first half of the year, signalling that a significant part of the reduction in monetary stimulus and the progressive normalisation of monetary policy had already been incorporated into market participants’ expectations even before the actual rate hikes by the ECB.
| 20 | MINISTRY OF ECONOMY AND FINANCE |
II. THE ITALIAN GOVERNMENT SECURITIES MARKET: PERFORMANCE IN THE INTERNATIONAL CONTEXT |
| FOCUS | Details on the evolution of the Public Sector Purchase Programme (PSPP) and the implementation of the Pandemic Emergency Purchase Programme (PEPP) during 2022
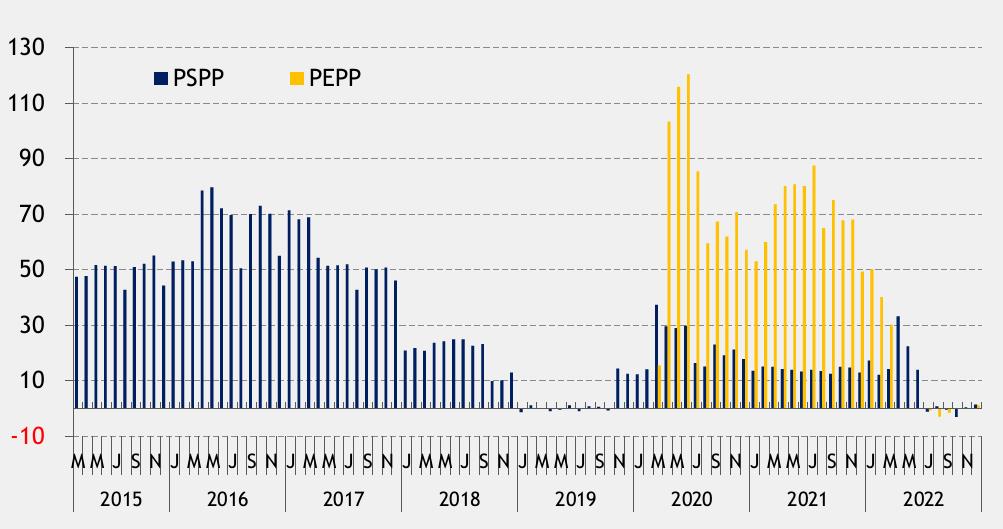
Within the Asset Purchase Programme (APP) the Public Sector Purchase Programme (PSPP) is the programme, which started on 9/03/2015, of net bonds purchases issued by central governments and public agencies of Euro area countries and supranational institutions. In 2020, following the spread of the Covid-19 pandemic, the FPA was further strengthened with an additional temporary endowment of EUR 120 billion25, as well as complemented by an extraordinary asset purchase programme (Pandemic Emergency Purchase Programme, PEPP) with a total endowment of EUR 750 billion26, later expanded to EUR 1,850 billion, and a time horizon of net purchases extended until at least the end of March 2022, with reinvestment of maturing capital until the end of 202327. In February 202228, in line with what was announced in December 2021, in the light of a significant increase in the inflation outlook, the Governing Council confirmed the discontinuation of net purchases under the PEPP at the end of March 2022 and the extension of the reinvestment horizon until the end of 2024, with flexibility in the choice of asset classes and countries to take account of possible pandemic-related market fragmentation. At the same time, to pursue the stabilisation of inflation in the medium term, the reduction in the pace of monthly net purchases under the APP was also confirmed, amounting to EUR 40 billion in Q2, EUR 30 billion in Q3 and EUR 20 billion from October 2022 onwards. However, following the Russian invasion of Ukraine and the ensuing climate of uncertainty, with its monetary policy decision of 10/03,29 the ECB revised the pace of monthly net purchases under the APP to EUR 40 billion in April, EUR 30 billion in May and EUR 20 billion in June, and then announced at the following meeting the complete discontinuation of purchases from the second half of the year, while continuing to reinvest in full the principal repaid on maturing bonds30. In addition, to cope with changing market dynamics and to safeguard the transmission mechanism of monetary policy, the Governing Council introduced a new instrument, the Transmission Protection Instrument (TPI), at its meeting on 21 July. The TPI provides for secondary market purchases of public sector bonds, with a residual maturity of between one and ten years, to counter deteriorating financing conditions in individual Euro Area countries that are not justified by fundamentals. However, unlike the other purchase programmes, the activation of this new instrument is subject to the Euro system jurisdictions’ compliance with eligibility criteria aimed at assessing the sustainability of their fiscal and macroeconomic policies31. Finally, in December 202232, taking into account the changed inflation outlook and with a view to pursuing a normalisation of the Euro system’s bonds holdings, the Governing Council announced a reduction in the APP portfolio starting in March 2023 at a pace averaging EUR 15 billion per month until the end of the second quarter, and subsequently redetermined over time. Figure 1 shows the evolution of monthly net purchases under the PSPP from the programme’s start (March 2015) until December 2022 and under the PEPP from the programme’s start (March 2020) until the end of the year. |
__
25 Monetary Policy Decisions 12/03/2020
26 Monetary Policy Decisions 18/03/2020
27 For more details on the features and changes to the PSPP and PEPP in each year, see the relevant focus in the Public Debt Report of previous years.
28 Monetary Policy Decisions 3/02/2022
29 Monetary Policy Decision 10/03/2022
30 Monetary Policy Decision 09/06/2022
31 For further details on the features of the TPI, please refer to the press release issued by the European Central Bank: The Transmission Protection Instrument 21/07/2022
32 Monetary Policy Decisions 15/12/2022
| MINISTRY OF ECONOMY AND FINANCE | 21 |
| | FIGURE 1: MONTHLY NET PURCHASES UNDER THE PSPP AND PEPP PROGRAMMES (IN EUR BILLION) |
|
| Source: Elaboration on ECB data |
Regarding the ECB’s activity under the Pandemic Emergency Purchase Programme, net purchases amounted to EUR 116.305 billion in 2022, which was down sharply from EUR 840.40 billion in 2021 due to the programme’s discontinuation at the end of March. Thus, since the start of the programme, net purchases totalled EUR 1,713.87 billion. Monthly volumes of net purchases averaged EUR 40 billion in the first quarter of the year, when the programme was still in force, and then fell to zero in the remainder of the year when only the reinvestment of the principal repaid on maturing bonds was planned. With reference to Italian government bonds, net purchases under PEPPs during the year amounted to just over EUR 29 billion, compared to EUR 132 billion in 2021. Overall, at the end of the year, the stock of Italian bonds purchased stood at just over EUR 287 billion, with an average life of around 7.20 years, up from 7.12 years the previous year. |
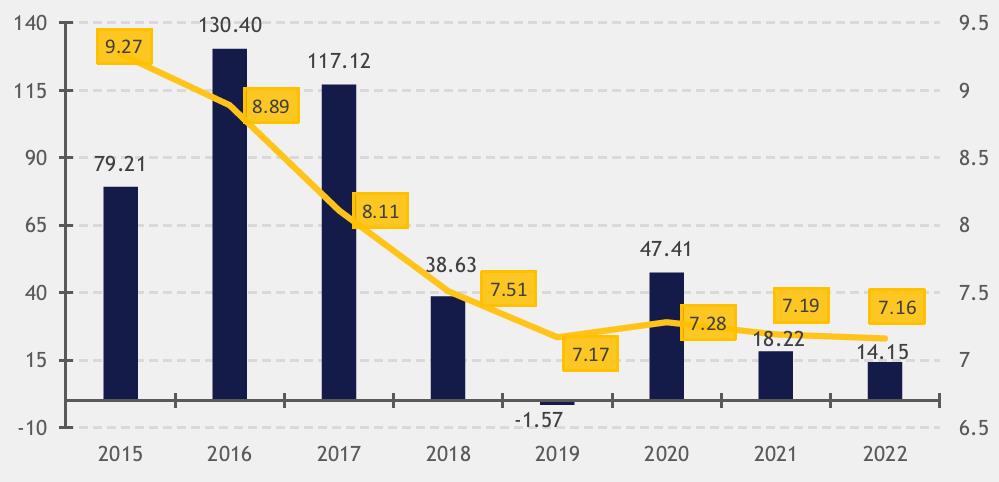
| FIGURE 2: ANNUAL VOLUME (EUR BILLION) AND AVERAGE LIFE (IN YEARS) OF THE STOCK OF ITALIAN GOVERNMENT BONDS PURCHASED BY THE ECB UNDER THE PSPP PROGRAMME |
|
| |
| 22 | MINISTRY OF ECONOMY AND FINANCE |
II. THE ITALIAN GOVERNMENT SECURITIES MARKET: PERFORMANCE IN THE INTERNATIONAL CONTEXT |
| | In the context of the Public Sector Purchase Programme (Figure 2), on the other hand, Italian government bonds amounting to approximately EUR 14.15 billion were purchased last year, down from EUR 18.20 billion in 2021. The total volume of Italian bonds repurchased by the ECB from the start of the programme to 31/12/2022 is equal to EUR 443.56 billion33, while the average life of the stock stands at 7.16 years, slightly lower than the 7.19 years recorded at the end of 2021. |
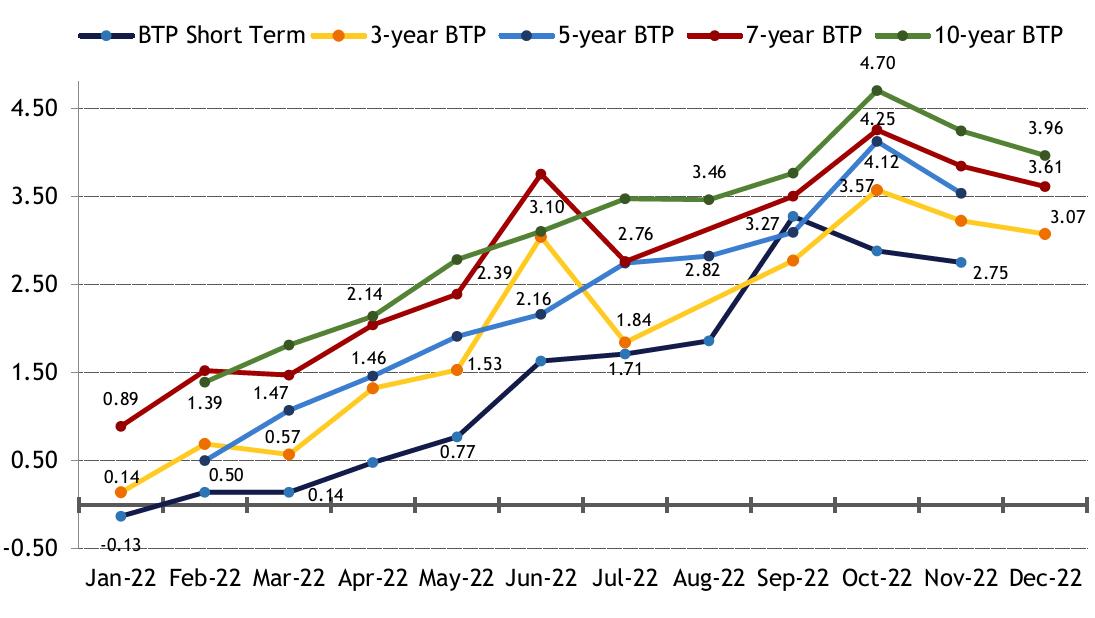
| II.3 | TRENDS IN THE ITALIAN GOVERNMENT BONDS MARKET |
Evolution of the yield curve
As illustrated above, the dynamics of Italian government bond yields during 2022 were mainly influenced by growth and inflation trends, the resulting expectations on monetary policy orientations, and the geopolitical tensions triggered by the war in Ukraine.
In line with what happened in European bond markets, except for some temporary periods of market recovery in summer and in October and November, the Italian government bond market reacted to the context outlined above with a marked upward movement of the yield curve, accompanied by an increase in episodes of volatility, which were mainly concentrated on the occasion of the publication of macroeconomic data and central bank meetings.
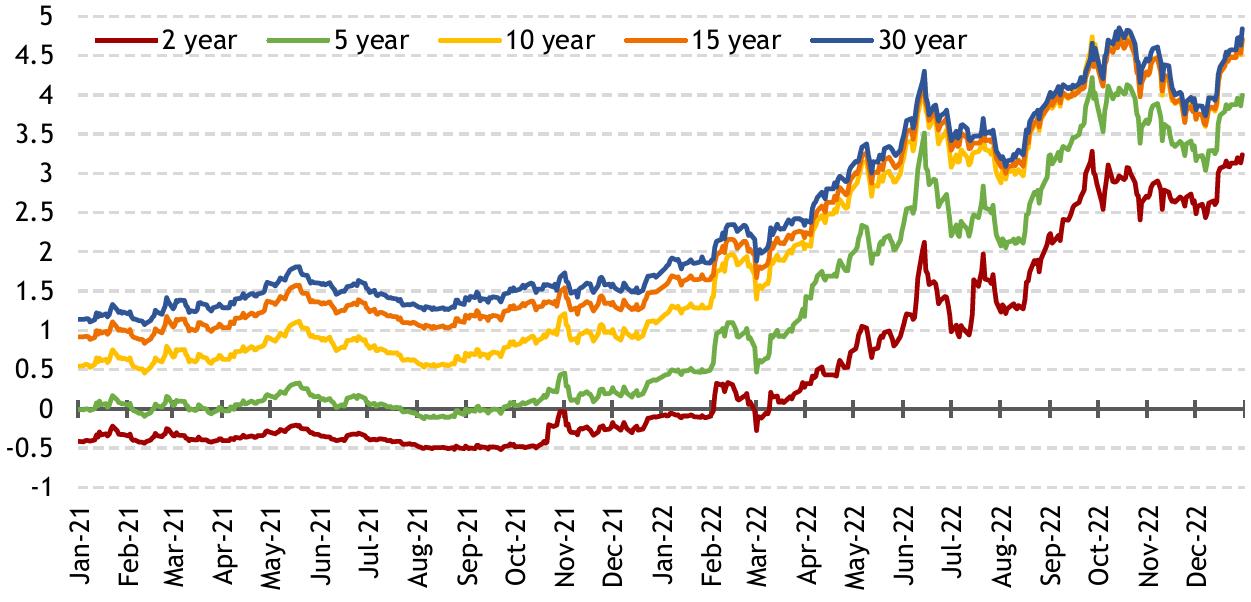
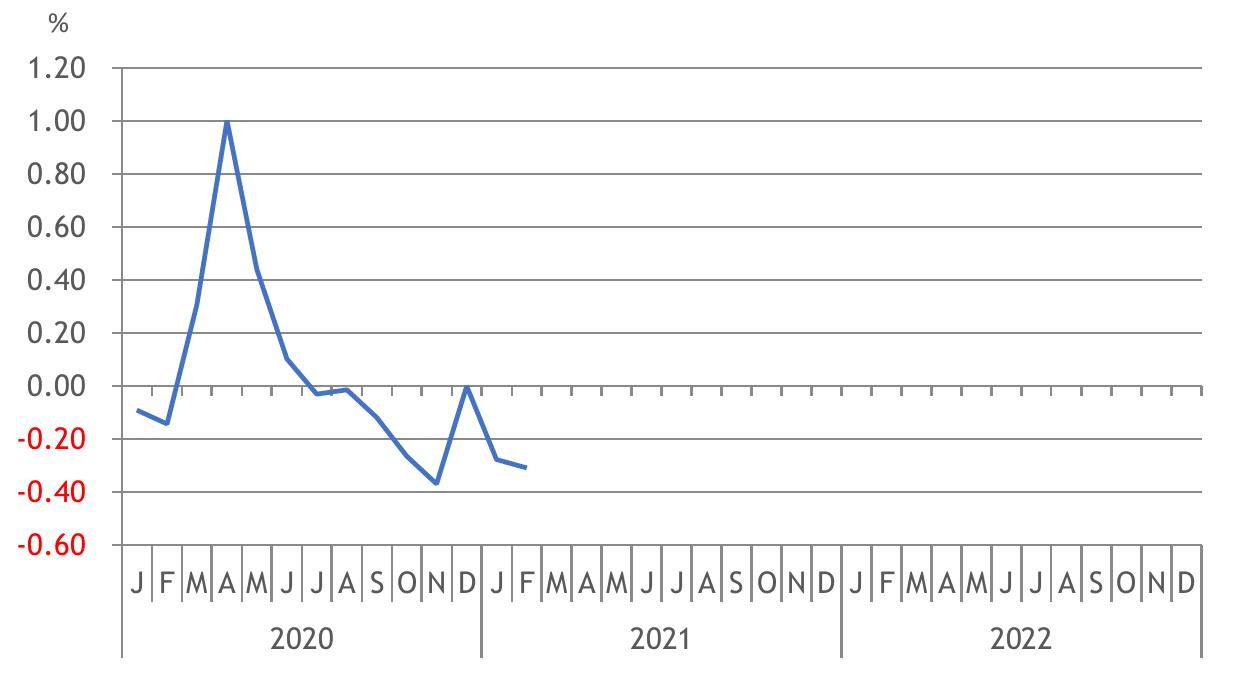
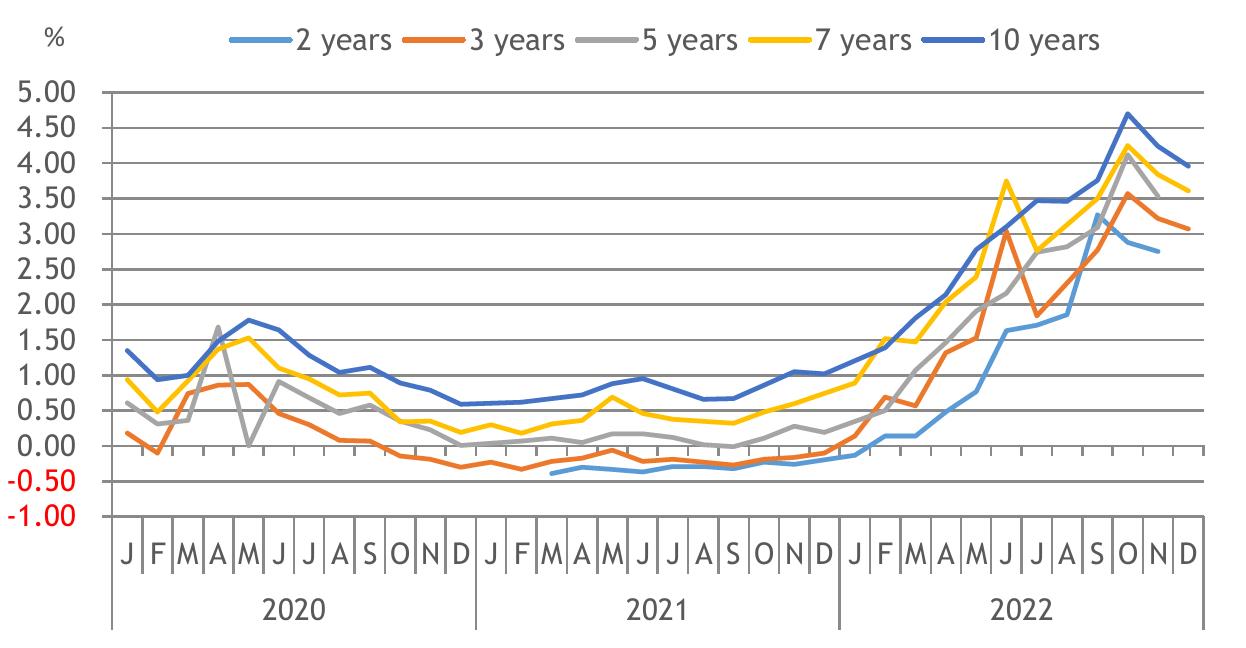
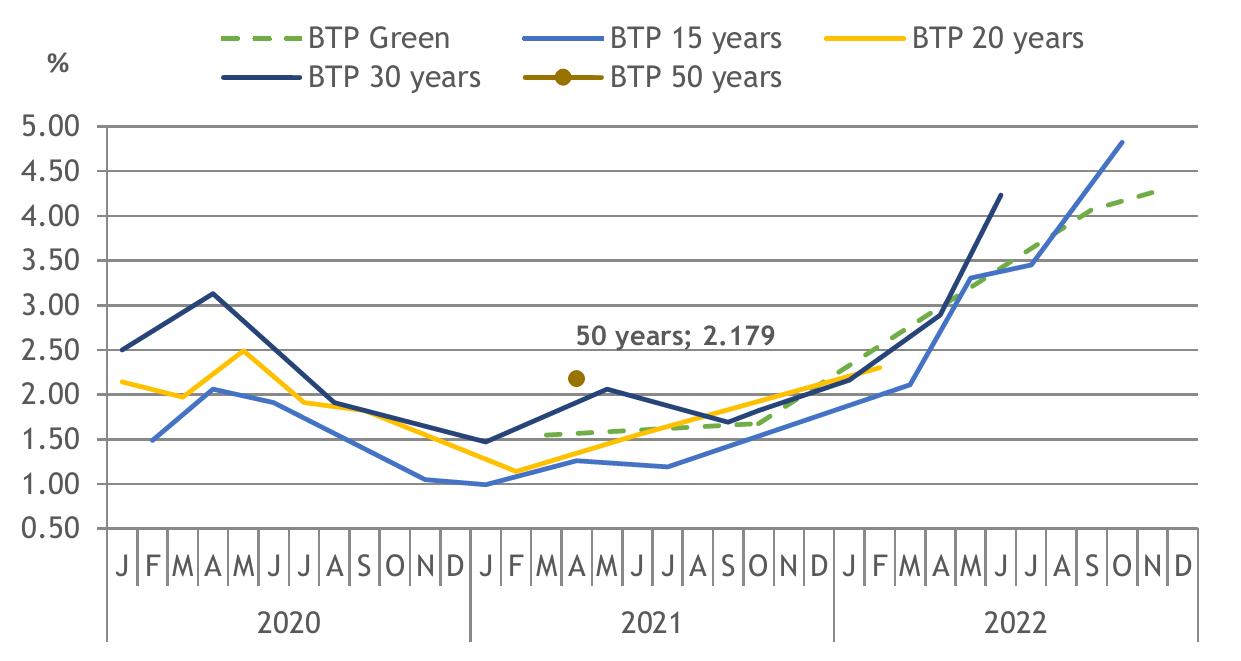
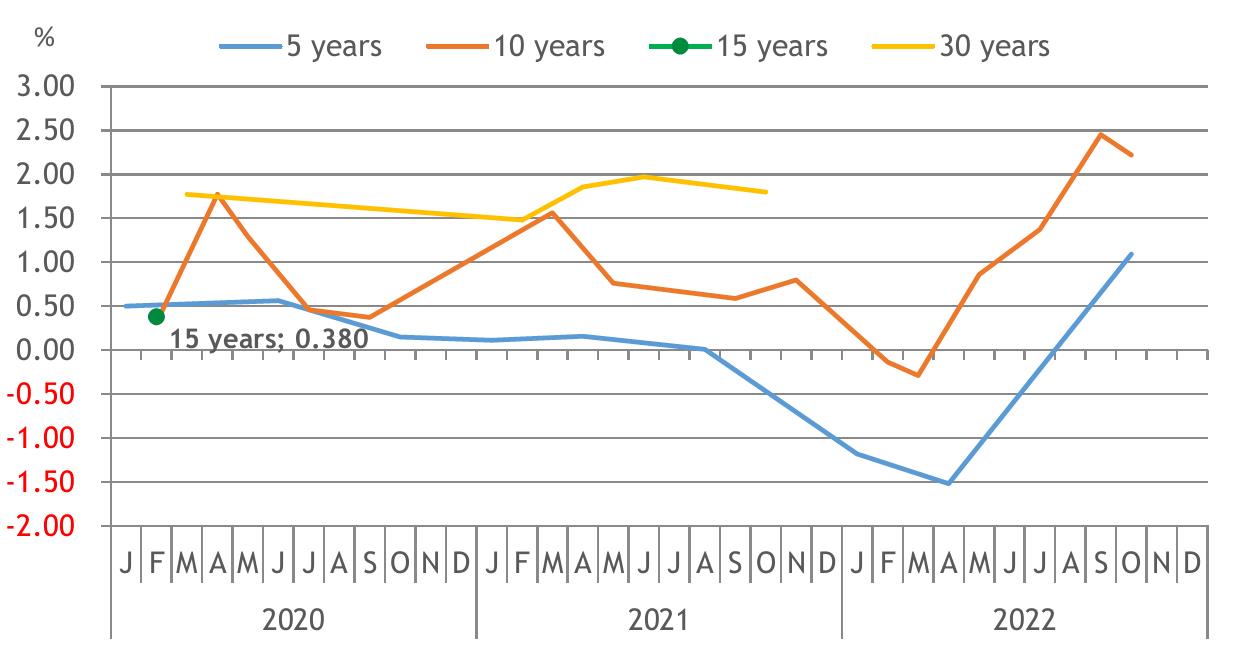
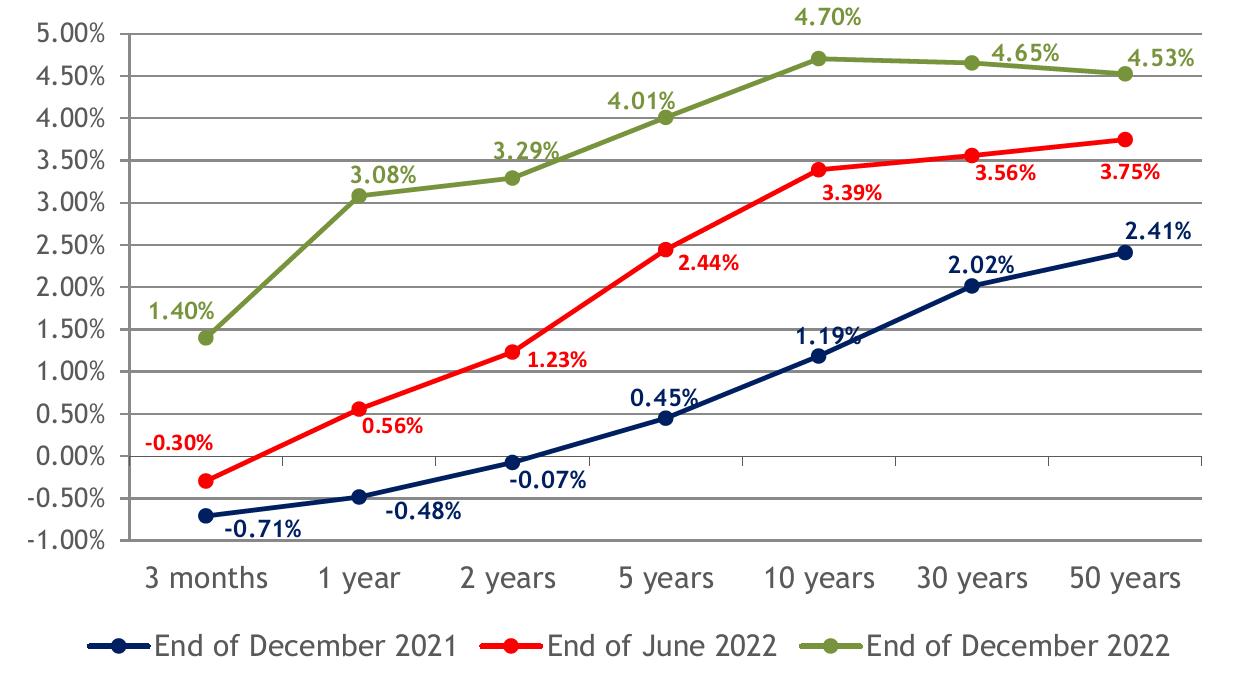
As shown in Chart II.3, all maturities of the yield curve closed sharply higher than at the beginning of the year: the increase was most pronounced on the range of the curve up to 10 years, which recorded an average increase of around 350 basis points, in contrast to the longer maturities for which the increase was more moderate and averaged 300 basis points.
| CHART II.3: MARKET YIELDS ON GOVERNMENT BONDS BY MATURITY FROM 2 TO 50 YEARS (%) |
|
| Source: Elaboration on Bloomberg data |
__
33 These amounts are expressed in countervalue terms.
| MINISTRY OF ECONOMY AND FINANCE | 23 |
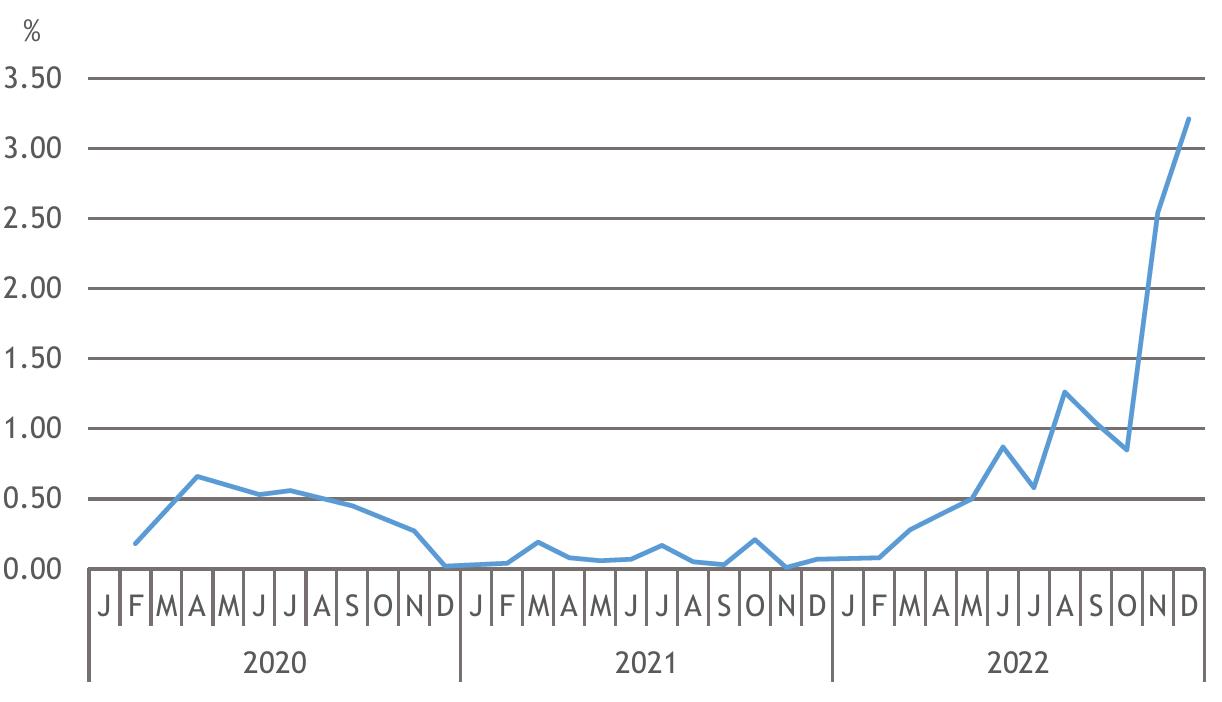
The slope of the term structure of Italian rates on the 2–10-year stretch (Chart II.4) experienced a pretty different movement in the year’s first half compared to the second half. In particular, from the beginning of the year until the first week of July, there was a significant increase in the slope, up by about 95 basis points. In the context of rising rates, the 10-year maturity of the BTP curve recorded greater increases than the short-term part. This dynamic is attributable mainly to two aspects: on the one hand, to the pressure experienced by the ten-year point of the curve (on which a large portion of the Treasury’s funding programme falls), and, on the other, to the conservative attitude of investors who, in a context of uncertainty over inflation trends and the extent of the central banks’ reduction of monetary stimulus, tend to demand a higher premium for holding bonds with a longer maturity.
However, from mid-July onwards, the slope on the 2–10-year maturity experienced an opposite dynamic, with a flattening of about 80 basis points due to the better performance of the 10-year maturity compared to the 2-year maturity. This phenomenon, coinciding with the approach of the first-rate hike by the ECB, can be traced back to the structural anchoring of short-term rates to levels close to the monetary policy reference rates, which, as mentioned above, began to rise in July.
However, during 2022, the slope increased overall, which was rather small and amounted to about 17 basis points.
| CHART II.4: GOVERNMENT BONDS YIELD SPREAD, 10-YEAR VS 2 -YEAR (BASIS POINTS) |
|
| Source: Elaboration on Bloomberg data |
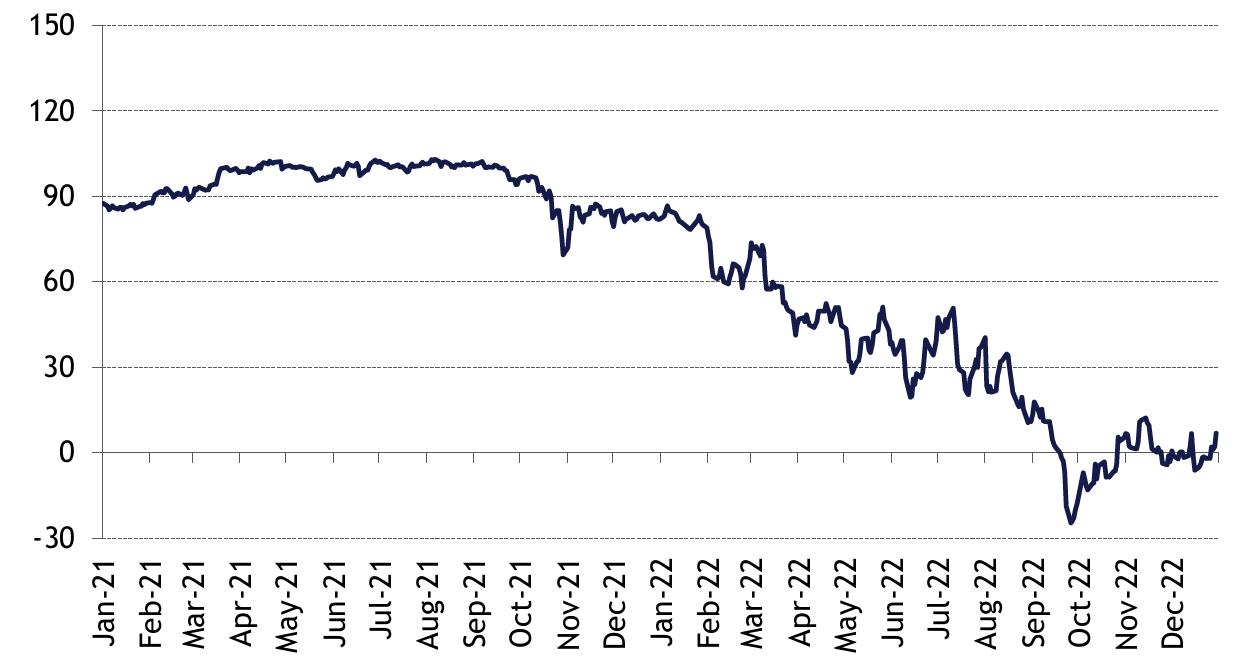
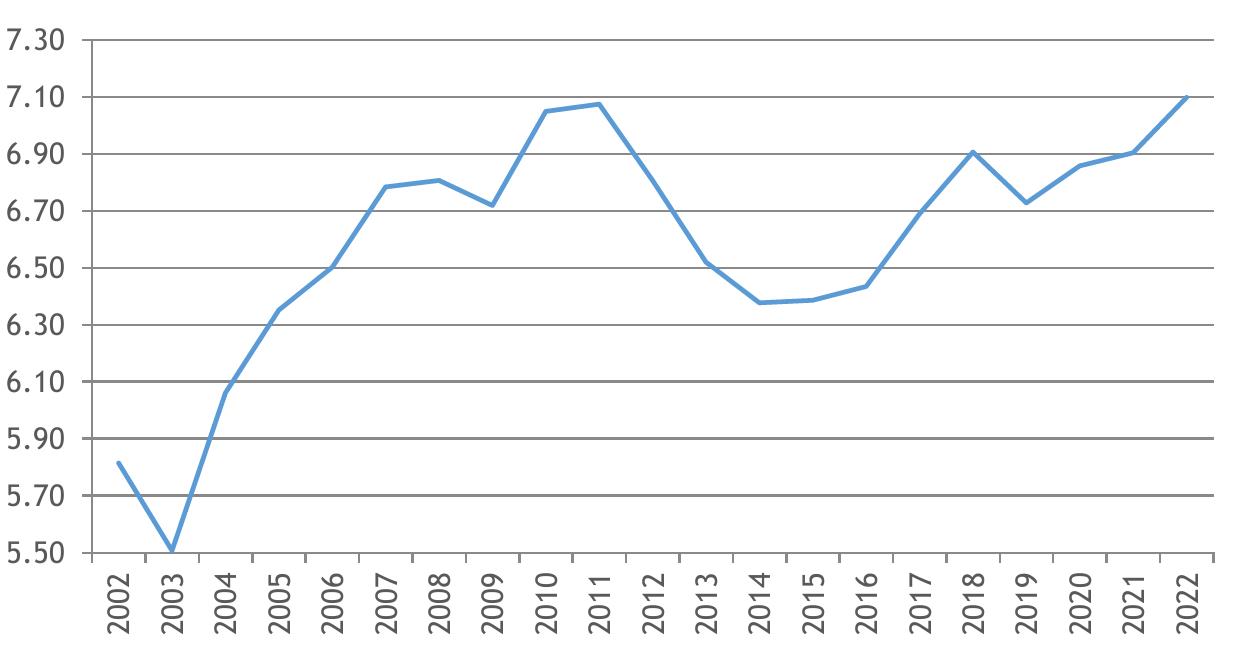
As shown in Chart II.5, the slope of the 10–30-year section of the Italian yield curve, in line with the trend of the other European curves, declined significantly, from around 83 basis points at the beginning of 2022, to fall into negative territory in September and October, and then rise again to a level that, although once again in positive territory, is still historically very low, at around 7 basis points. The
| 24 | MINISTRY OF ECONOMY AND FINANCE |
II. THE ITALIAN GOVERNMENT SECURITIES MARKET: PERFORMANCE IN THE INTERNATIONAL CONTEXT |
gradual flattening of the 10–30-year section of the curve and its momentary inversion in September and October is mainly attributable to the monetary policy cycle that began in 2022, based on a strategy of continuous rate hikes over an indefinite time horizon. Under these circumstances, on the short-term part of the yield curve, the market can only register the central bank’s decisions while, on long¬term rates, it incorporates expectations of the end of the rises and the start of a bearish phase. It is no coincidence that this phenomenon has been recorded in a much more marked way on all markets, from the USA to the main European countries, with curves widely inverted already starting from the maturities immediately following the short ones. In the Italian case, the inversion was recorded only after the 10-year maturity and is also due to the tension experienced during the year precisely by the 10-year maturity, which, in addition to absorbing, as mentioned above, a significant portion of issues, also thanks to its high liquidity tends to be used by the market to manage phases of volatility in contexts of uncertainty and general risk aversion.
The sector’s relative resilience over the long term is associated with this aspect, which can be attributed to its attractiveness in market environments characterised by uncertainty and volatility, such as those experienced during 2022. Indeed, this is a sector characterised, among other things, by a high degree of convexity34, which may be of particular interest to certain types of investors.
| CHART II.5: GOVERNMENT BONDS YIELD SPREAD, 30-YEAR VS 10-YEAR (BASIS POINTS) |
|
| Source: Elaboration on Bloomberg data |
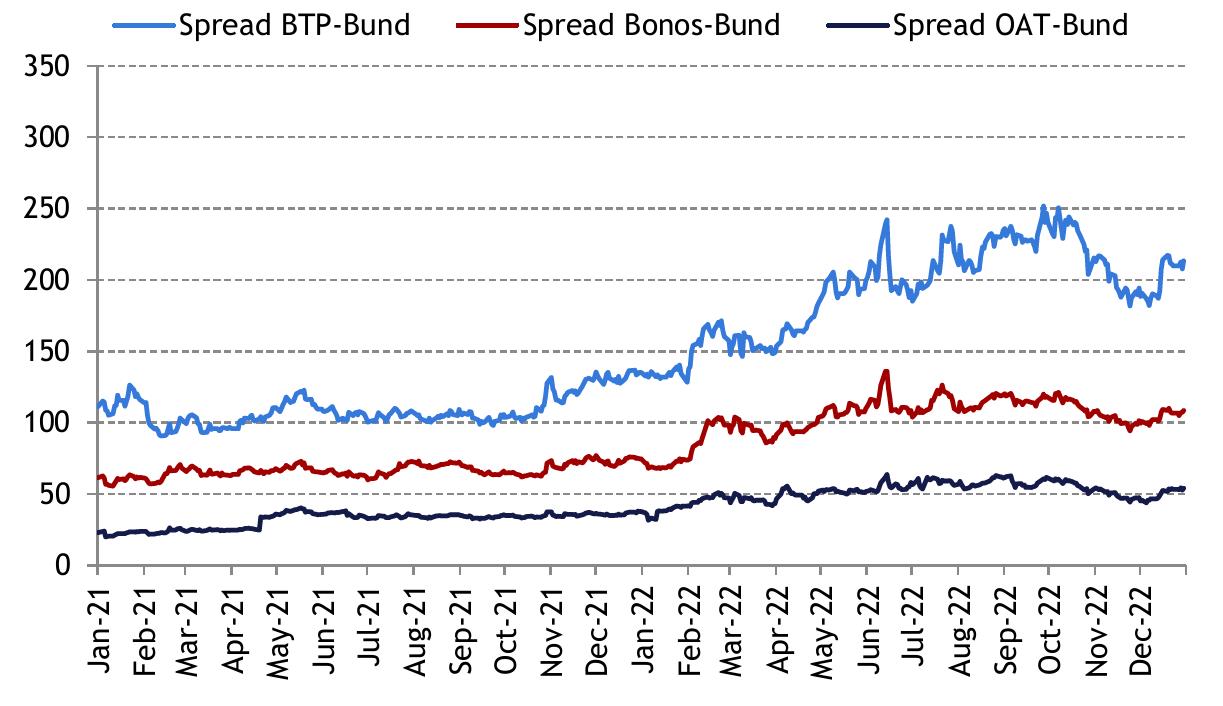
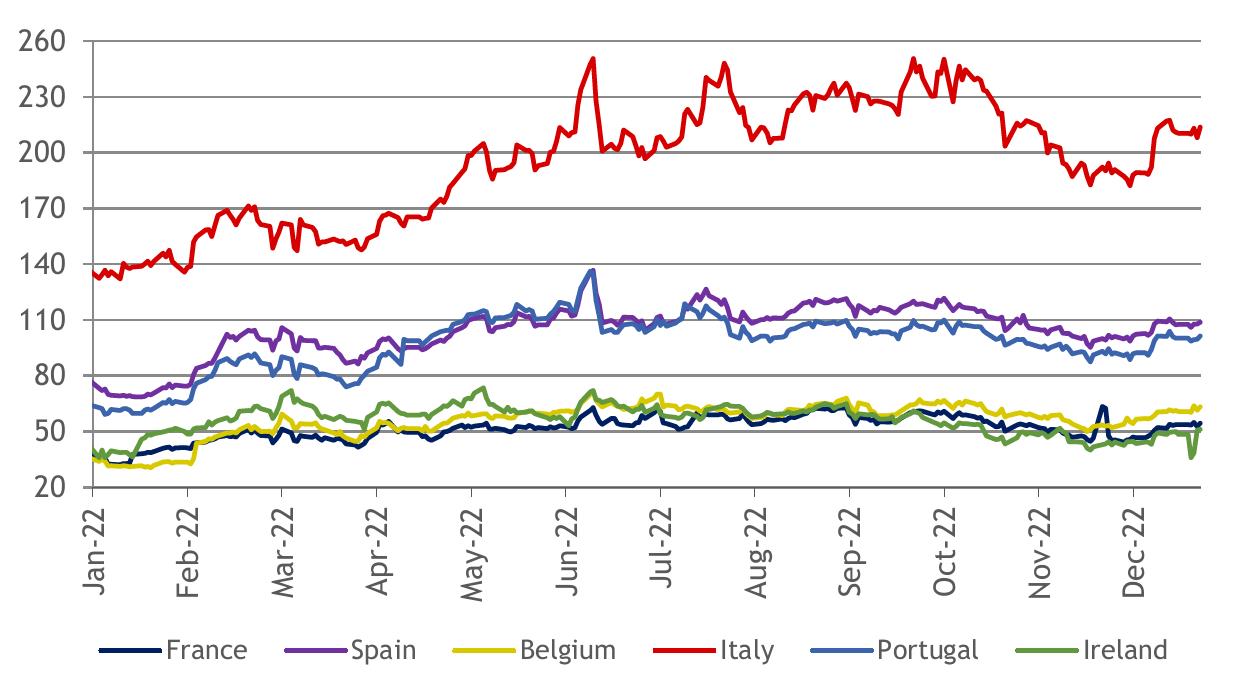
As mentioned above, the differential (spread) between Italian and German government bonds (Chart II.6) showed a profile that is partly attributable to the movement of absolute rates of return and partly has specific profiles due to the different perceptions of relative risk between the two countries.
__
34 Convexity is a measure of the curvature of the price/yield relationship function of a bond: the more positive the convexity of the bond, the greater the price increase in relation to falling yields compared to the price reduction that would occur in relation to an equivalent increase in yields.
| MINISTRY OF ECONOMY AND FINANCE | 25 |
In fact, it steadily increased for a large part of 2022: uncertainty over the future interest rate scenario and monetary policy actions led to a significant widening of the spread during the first half of the year. This is a phenomenon known as “fly-to-quality”, which typically characterises situations of tension and/or uncertainty on the markets, in response to which investors are driven to ‘take refuge’ in bonds deemed safe and risk-free, such as the Bund and sell bonds from countries perceived to be less solid. After a temporary narrowing in June and attributable to the ECB’s announcement of the TPI, the BTP-Bund spread resumed its ascent at the beginning of July, in the face of an increasingly likely rate hike that the ECB - as explained above - implemented in mid-July. Of course, the Italian political situation with the unexpected fall of the Draghi government also weighed on this spread development. Expectations of further monetary easing on the one hand, coupled with spillover effects linked to the announcement of expansionary fiscal programmes by Great Britain on the other, caused a further rise in the spread, which peaked at over 250 basis points at the end of September, only to fall again in October and November, thanks to softer tones used by central bankers and a general closure of positions of risk-averse investors who had underweight Italian government bonds in their portfolios. In these months, the evolution of the political events in our country played a role, with the early elections and the installation of a new government with a different political connotation from the previous one. The uncertainty linked to the electoral outcome and the new government’s first fiscal policy measures certainly impacted the spread’s widening phase until the end of September and its narrowing in the following months, at least until the beginning of December. Overall, the spread between the Italian ten-year bond and its German counterpart during 2022 increased by about 80 basis points, starting from about 130 basis points at the beginning of the year and closing at about 210 basis points at the end of the year.
| CHART II.6: GOVERNMENT BONDS YIELD SPREAD: BTP-BUND, OAT-BUND AND BONOS-BUND, 10-YEAR BENCHMARK (BASIS POINTS) |
|
| Source: Elaboration on Bloomberg data |
| 26 | MINISTRY OF ECONOMY AND FINANCE |
II. THE ITALIAN GOVERNMENT SECURITIES MARKET: PERFORMANCE IN THE INTERNATIONAL CONTEXT |
The performance of the secondary market
General introduction
The performance of the secondary market for Italian government bonds in 2022 was influenced by geopolitical, economic and financial events that characterised the national and international scenario, as recalled in the previous sections. In addition, the market’s evolution was also conditioned by elements peculiar to the architecture of the Italian market. These include (i) the role of Market Making; (ii) a system of Primary Dealership that in 2022 saw the entry of three new Specialists in Italian Government bonds, bringing the total number to 19, as well as the candidature of a new Aspiring Specialists; (iii) the functioning of the Futures market, which plays a key role for effective market making by Primary Dealers; (iv) the growing contribution of Repo activity; (v) interrelationships with the primary market.
With regard to trading on the MTS platform, the reference market for Italian government bonds, although in the first months of the year, trading volumes remained in line with those recorded in the same period of the previous year, with the change in the geopolitical scenario and the market environment, from the second quarter onwards, trading fell significantly, ending the year at lower levels than in 2021. By contrast, trading on the other electronic platforms rose slightly, breaking the downward trend in previous years. Finally, 2022 confirmed the growing recourse to futures as instruments mainly used by Primary Dealers to “neutralise” the risks associated with long positions in government bonds.
The interdealer wholesale market and the contribution of government bonds Specialists
The regulated platform MTS Italia, on which only dealers and market makers operate (the so-called interdealer market), is the one on which the Treasury mainly conducts its activity of monitoring and evaluating the activity of Specialists in Government Bonds on the secondary market and as such represents the point of reference for analysing the evolutions of this market segment.
The cash market
General market conditions and the perception of Italian credit risk influenced trading volumes on the MTS platform. In the first quarter of 2022, trades remained in line with, and in some months even above, the exceptionally high levels recorded in the same period of the previous year, benefiting from the ample liquidity on the market. However, starting in May and to a more accentuated extent in the second half of the year, there was a sharp contraction in trading on the secondary market and a deterioration in liquidity conditions triggered by several factors, such as the sudden change in the macroeconomic and geopolitical environment, and the gradual exit from the Central Banks’ accommodative monetary policy.
Indeed, since May, volumes traded monthly (Chart II.7) have shrunk by an average of 35% compared to the same period in 2021, with peaks in September and October when trades more than halved. Overall, in 2022, the volume reduction was about 23% compared to the previous year.
| MINISTRY OF ECONOMY AND FINANCE | 27 |
| CHART II.7: MONTHLY VOLUMES TRADED ON THE MTS PLATFORM (EUR MILLION; SINGLE-COUNTED) |
|
| Source: Elaboration on MTS data |
In the composition by segment (Chart II.8), the most pronounced changes between 2021 and 2022 concerned BOTs, which recorded trading flows amounting to 30% of total volumes traded against 38% in the previous year. The BTP€i and CTZ segments declined further, accounting respectively for 1.7% and 3.1% of total volumes. On the other hand, there was an increase in the market share of CCTeus, amounting to 6% compared to 2.9% in the previous year, and of the BTP segment, which stood at around 59% of total volumes compared to 51% in 2021.
| CHART II.8: QUARTERLY VOLUMES TRADED ON MTS, BY SEGMENT (EUR MILLION; SINGLE-COUNTED) |
|
| Source: Elaboration on MTS data |
In absolute terms, in line with the trend in total volumes, there was a reduction in operations for all segments. This contraction was exceptionally high for BTP€i
| 28 | MINISTRY OF ECONOMY AND FINANCE |
II. THE ITALIAN GOVERNMENT SECURITIES MARKET: PERFORMANCE IN THE INTERNATIONAL CONTEXT |
and BOT€i, equal to 38% and 39%, respectively, and even more significant in the CTZ segment, for which trading ceased with the maturity of the last two bonds in circulation. Bucking the trend was the CCTeu segment, which saw a 57% increase in trading compared to 2021 in the context of rising floating rates.
On the various segments of the yield curve (Chart II.9), there was a general decline in volumes, attributable primarily to the contraction in trading that occurred in the third and fourth quarters of the year.
On the short side, the segments up to 2 years (which include BOTs, CTZs, short BTPs and CCTeus) showed a drop in volumes averaging over 20% compared to 2021. The segment that recorded the sharpest decrease was the 6–8-year maturity segment (more than 40%), followed by the 8-12-year and 4–6-year segments with decreases of 28% and 24%, respectively, compared to the previous year.
On the longer end of the curve, for maturities longer than 12 years, volumes rose slightly in the first half of the year before contracting by an average of 45% in the second half of 2022.
| CHART II.9: QUARTERLY VOLUMES TRADED ON THE MTS PLATFORM BY MATURITY (EUR MILLION; SINGLE-COUNTED) |
|
| Source: Elaboration on MTS data |
A further indicator for monitoring the liquidity of the secondary market is the bid-ask spread, i.e., the price differential between the best bid and the best ask price of each bond on the market. The smaller the bid-ask spread, the greater the liquidity of the bond.
Below are graphical representations of the development of this measure for all sub-funds and all benchmark points of the yield curve. After the compression of the bid-ask spreads in early 2022, with the onset of the Russian invasion in Ukraine, spreads widened on all points of the curve and then accelerated this widening at times of increased market stress and uncertainty related to the first monetary policy rate hikes by the ECB.
Charts II.10A, 10B and 10C show the widening trend since March, with bid-ask spreads reaching levels in the second half of the year not seen since the early months of the Covid-19 pandemic.
| MINISTRY OF ECONOMY AND FINANCE | 29 |
| CHART II.10A: BID-ASK SPREAD IN BASIS POINTS OF CTZ, CCTEU, 3, 5 AND 7-YEAR BTPS BENCHMARK, RECORDED ON THE MTS PLATFORM - MONTHLY AVERAGES |
|
| Source: Elaboration on MTS data |
| CHART II.10B: BID-ASK SPREAD IN BASIS POINTS OF 10-, 15-, 20-, 30-, 50-YEAR BTPS AND BTP GREEN BENCHMARK, RECORDED ON THE MTS PLATFORM - MONTHLY AVERAGES |
|
| Source: Elaboration on MTS data |
European inflation-indexed bonds also recorded an increase in price spreads, partly related to the lower liquidity of the segment since these bonds, in addition to incorporating an inherently higher credit risk than nominal ones, were more affected by the uncertainty caused by upward pressure on inflation and the consequent evolution of monetary policy.
| 30 | MINISTRY OF ECONOMY AND FINANCE |
II. THE ITALIAN GOVERNMENT SECURITIES MARKET: PERFORMANCE IN THE INTERNATIONAL CONTEXT |
| CHART II.10C: BID-ASK SPREAD IN BASIS POINTS OF 5- AND 10-YEAR BTP€IS BENCHMARK, RECORDED ON THE MTS PLATFORM - MONTHLY AVERAGES |
|
| Source: Elaboration on MTS data |
Liquidity in the secondary market can also be measured using the slope, an indicator that takes into account not only the size of the bid-ask spreads but also the price changes induced by large operations or the analysis of the depth of prices on both sides of the order book of each bond35. It measures the ratio between the absolute difference between a given bond’s best and worst quotation at a given instant and the difference between the total volume of all quotations in the bond’s order book and the volume of the best quotation36.
Represented in the form of a chart, this ratio generates for each side of the order book - bid and ask - a straight line that shows the trend of the buy and sell price as a function of the quantity demanded or offered by market makers. The indicator, therefore, measures the marginal increase/decrease in price required by the dealer to trade an additional unit compared to the quantity quoted at the best price. Therefore, the higher the indicator (the greater the slope of the straight line), the less liquid that bond is. To get a picture as complete as possible and to calculate the slope of a bond for a trading day, the slope is calculated for single but numerous instants on the same day and then averaged to construct the daily slope data.
__
35 The order book is defined as the set of buy and sell orders relating to a specific bond, present on the market at a certain instant and subdivided into buy and sell proposals, arranged in descending and ascending order, respectively.
36 This measure is conceptually very similar to “price impact”, although slope is a measure calculated on the basis of buy or sell proposals whereas price impact is based on both price proposals and trading activity. Price impact measures, in fact, the relationship that exists between a buy or sell order and the subsequent price change in the quote. However, the literature on the subject confirms that the calculation of the latter measure is rather complex, as not only does it require an extremely large amount of intra-day data, but it is also based on subjective evaluations including: the threshold for determining the quantity above which to assess the impact of trading on price; the determination of the time lag within which the price change due to trading occurs; etc.
| MINISTRY OF ECONOMY AND FINANCE | 31 |
| CHART II.10D: DAILY SLOPE ON 10-YEAR BTP BENCHMARK (LOGARITHMIC SCALE) RECORDED ON THE MTS PLATFORM |
|
| Source: Elaboration on MTS data |
The indicator shows that the liquidity deterioration phenomena were more extensive and frequent than in 2021 and distributed over different times of the year. It also shows that the widening of the bid-ask spread in the second half of 2022 was accompanied by an increase in slope, signalling that as liquidity contracted and market volatility increased, there was also a deterioration in the depth and composition of the bonds order book.
The Repo market
The market for repurchase agreements on government bonds (also called the Repo market) plays a fundamental role in supporting the orderly conduct of trading on the spot market. In an efficient Repo market, operators (especially market makers) can guarantee the market a constant bid and ask on all bonds, even when they do not own the bonds in their portfolio. Moreover, with the General Collateral contract - i.e., one in which the bond being collateralised is not specified ex-ante - investors can trade liquidity without counterparty risk if the agreement is a central counterparty on a deep and liquid market.
In 2022, the Repo market recorded a significant volume increase compared to 2021, equal to about 40%. This increase, however, occurred in continuity with the trend of recent years, i.e., with a growth in activity on the Special Repo agreement, while activity on the General Collateral agreement remained substantially stable. These trends are the result of two complementary factors: on the one hand, the abundance of liquidity in the financial system reduces the need for funding/use on the collateralised money market (hence the relative stability of General Collateral volumes), and on the other, the ECB’s purchase programmes under the APP/PEPP have contributed to reducing the effective float of government bonds in circulation, contributing to making bonds on the Repo market increasingly scarce (or special in technical jargon), increasing Special Repo volumes. Although the ECB’s purchasing activity was much less buoyant in the second half of the year, volumes in the Special
| 32 | MINISTRY OF ECONOMY AND FINANCE |
II. THE ITALIAN GOVERNMENT SECURITIES MARKET: PERFORMANCE IN THE INTERNATIONAL CONTEXT |
segment remained strong, with average specialness rates still in line with the year’s first six months.
| CHART II.11: ANNUAL VOLUMES TRADED IN 2021 AND 2022 ON THE MTS PLATFORM BY CONTRACT MATURITY (EUR MILLION) |
|
| Source: Elaboration on MTS data |
| CHART II.12: MONTHLY VOLUMES TRADED IN 2022 ON THE MTS PLATFORM, BY CONTRACT MATURITY (EUR MILLION) |
|
| Source: Elaboration on MTS data |
Thanks in part to the security lending mechanism37 initiated as part of the PSPP purchase programme, whereby the Central Bank temporarily provides bonds on which dealers have temporary short positions, the phenomena of specialness38
__
37 For more information on bond lending, please refer to the following link on the ECB website https://www.ecb.europa.eu/mopo/implement/omt/lending/html/index.en.html
38 The term specialness refers to the phenomenon whereby the Repo yield on a particular bond falls below that of the General Collateral
| MINISTRY OF ECONOMY AND FINANCE | 33 |
nevertheless remained contained. On the whole, therefore, trading on the Repo market proceeded in an essentially orderly manner, despite some particularly acute stress phases that occurred at the September meeting when the market expected the remuneration on government deposits, with favourable DFR rates, to remain pegged at zero and thus push European Treasuries to inject liquidity into the market by withdrawing collateral.39
Repo operations, launched by the Treasury in 2021 and now fully consolidated, make a decisive contribution to the normalisation of the specialness of the BTPs in the portfolio, removing those situations of tension that can arise in the market from time to time. In line with past years, in 2022, a significant portion of the activity on the Repo market was carried out by so-called fast money investors (i.e., of a more speculative nature) who, simultaneously are very active on the BTP futures market.
| CHART II.13: MONTHLY SPECIAL REPO VOLUMES TRADED ON THE MTS PLATFORM (EUR MILLION) |
|
| | J-22 | F-22 | M-22 | A-22 | M-22 | J-22 | J-22 | A-22 | S-22 | O-22 | N-22 | D-22 | |
■ S.R. - Italy | 1,324 | 1,597 | 1,835 | 1,482 | 1,872 | 1,796 | 1,716 | 1,698 | 1,771 | 1,651 | 1,846 | 1,627 | |
■ S.R. - Foreign | 2,891 | 3,304 | 3,691 | 3,097 | 3,930 | 4,166 | 3,933 | 4,072 | 4,403 | 4,018 | 4,335 | 3,837 | |
| |
| Source: Elaboration on MTS data |
Government bonds Specialists’ trading with end investors
Traded volumes
Specialists play a crucial role in providing liquidity to the inter-dealer market and as a distribution channel to end customers of bonds purchased in the primary market. For this reason, analysing traded volumes allows the debt manager to understand who investors are and what they are looking for in a particular market environment. This monitoring is conducted through the information collected in
__
39 This risk did not materialise as a few days later, the ECB announced the temporary change - for the period from 14/09/2022 to 30/04/2023 - of the deposit remuneration criterion, removing the limit rate of 0%, in implementation of ECB Decision 2022/30 of 12/09/2022, and returning the limit to the lowest rate, even if positive, between €STR and the Deposit Facility.
| 34 | MINISTRY OF ECONOMY AND FINANCE |
II. THE ITALIAN GOVERNMENT SECURITIES MARKET: PERFORMANCE IN THE INTERNATIONAL CONTEXT |
EMAR40, a highly standardised report template shared at the European level, which the Specialists themselves compile, systematically representing all the activity41 they carry out with any counterparty, including their end clients.
In 2022 (Chart II.14), volumes traded outside MTS - on other electronic platforms and elsewhere - increased by about 14% compared to the previous year.
This increase occurred in all months of the year except April, and in particular from May onwards in a context in which, as illustrated above, activity on MTS decreased significantly (Chart II.14).
| CHART II.14: MONTHLY VOLUMES TRADED BY SPECIALISTS ON PLATFORMS OTHER THAN MTS (EUR MILLION) |
|
| Source: Elaboration on EMAR data |
Trades broken down by type of counterparty
From the information acquired through EMAR reports, it is possible to monitor liquidity on the various trading platforms and trends on individual sub-funds by geographic area and investor type.
Regarding the evolution of demand by type of investor, the charts below show the trend in absolute volumes and net quantities (purchases minus sales) exchanged with Specialists by the main categories of investors: banks, investment funds, pension funds and insurance companies, and hedge funds.
The chart below shows that, in 2022, the leading investors in government bonds remain investment funds and banks in absolute volumes and net purchase flows. Investment funds traded volumes of 41% of the total, up from 37% in the previous
__
40 European Market Activity Report. It is the report that replaces the previous HRF – “Harmonised Reporting Format” - in name, but remains unchanged in substance.
41 This reporting also includes operations concluded both through trading platforms and on a bilateral basis, both in electronic and voice format. Since 2014, this report contains all the information on individual trades made by Specialists (trade-by-trade reports), indicating, for each trade, the bond, the quantity, the country in which the counterparty is based, the type of counterparty, the platform or trading mode. From 1/01/2020, they also contain trades traded on Italian government bonds issued under foreign law (MTNs). In addition, also as of 1/01/2020, the format has been enriched with the information of the settlement date, so as to be able to carry out analyses also on certain types of trades carried out by Specialists (e.g. trades with non-standard settlement equal to 2 business days, such as contextual trades or trades with settlement greater than 7 days also known as forward operations).
| MINISTRY OF ECONOMY AND FINANCE | 35 |
year, while the share of the banking sector declined to 30% (from 43% in 2021), albeit with a predominant contribution to total net purchases.
The share of volumes traded by pension funds and insurance companies in the total amount traded was small, at just over 2%, in line with the previous year, while in terms of net purchases, the total amount was also around 2%.
Furthermore, the weight of hedge funds in total trading strengthened (up to 27% from 18% in 2021), although the overall contribution was largely negative regarding net purchases. This development is unsurprising because this type of player derives a considerable part of its profitability in high-volatility environments.
| 36 | MINISTRY OF ECONOMY AND FINANCE |
II. THE ITALIAN GOVERNMENT SECURITIES MARKET: PERFORMANCE IN THE INTERNATIONAL CONTEXT |
| CHART II.15: QUARTERLY VOLUMES TRADED BY SPECIALISTS BY TYPE OF COUNTERPARTY - FUND MANAGERS, BANKS, PENSION AND INSURANCE FUNDS, HEDGE FUNDS (EUR MILLION) |
|
| Source: Elaboration on EMAR data |
| MINISTRY OF ECONOMY AND FINANCE | 37 |
Trades broken down by counterparties’ geographical areas
The evolution of demand by geographical area, broken down between Italian and foreign investors, showed an inverse trend in 2022 compared to the previous year: volumes traded by Italian counterparties fell by around 11%, while the share of total trades stood at 23%, down by three percentage points. However, the contribution of Italian investors in terms of net purchases grew to over EUR 90 billion compared to EUR 72 billion the previous year.
| CHART II.16: QUARTERLY VOLUMES TRADED BY SPECIALISTS BY TYPE OF COUNTERPARTY RESIDENCE (EUR MILLION) |
|
| Source: Elaboration on EMAR data |
On the other hand, foreign-end investors accounted for the largest share of total trades executed in 2022, with values in line with the previous year.
Concerning net purchases, although there was an increase in absolute terms of
| 38 | MINISTRY OF ECONOMY AND FINANCE |
II. THE ITALIAN GOVERNMENT SECURITIES MARKET: PERFORMANCE IN THE INTERNATIONAL CONTEXT |
about EUR 5 billion, as a percentage of the total, the foreign share dropped to 34% compared to 36% in 2021.
The evolution of the BTP Future market
As regards the BTP Future market42, the evolution of prices on the Italian ten-year maturity (which is much more liquid than the contracts on the three- and five-year maturities) was in line with the performance of the ten-year benchmark BTPs (Chart II.17). However, some deviations were coinciding with phases of greater market volatility, particularly in the second half of the year and when the benchmark BTPs changed.
| CHART II.17: PRICE OF BTP FUTURE AND YIELD OF 10-YEAR BENCHMARK BTP (REVERSED RIGHT-HAND SCALE IN %) |
|
| Source: Elaboration on Bloomberg data |
In 2022, volumes traded on the 10-year Future contract increased by over 20%, continuing the upward trend of recent years. In contrast to the previous year, there was also a significant increase in open interest levels43, in the order of 32 percentage points (Chart II.18). Lastly, compared with 2021, there was more significant activity in terms of both volumes traded and open interest levels in the vicinity of the Future’s quarterly maturities.
In fact, although under normal market conditions, the Future is used by traders as a risk hedging instrument in contexts of high volatility and uncertainty, characterised by rarefied liquidity on the spot market, such as those experienced
__
42 Trading in BTP futures contracts takes place on the Eurex platform.
43 Open interest represents the number of Future contracts in existence - and therefore not yet closed - that are traded on the market. It can therefore be defined as the sum of all long or short positions opened on 10-year BTPs via Future contract at a specific instant. Strong upward phases normally indicate a trend in the same direction by a broad cross-section of traders.
| MINISTRY OF ECONOMY AND FINANCE | 39 |
during 2022, the Future contract can be used for speculative operations, typical of investors (so-called “fast money”) who have a short-term investment horizon.
| CHART II.18: VOLUMES OF TRADED LOTS AND OPEN INTEREST OF CONTRACTS FOR 10-YEAR BTP FUTURE TRADED ON THE EUREX MARKET |
|
| Source: Elaboration on Bloomberg data |
| MINISTRY OF ECONOMY AND FINANCE | 40 |
| III. | PUBLIC DEBT MANAGEMENT IN 2022 |
| III.1 | OUTSTANDING GENERAL PUBLIC DEBT |
The absolute level of public debt44 as of 31/12/2022 stood at almost EUR 2,762 billion, an increase of about EUR 84 billion compared to the end of 2021.
The same aggregate to GDP was 144.4% in 2022, an improvement over the previous year of about six percentage points, but still far from the levels recorded in 2019 and 2018 (+10% approximately). The peak recorded in 2020 was driven by the simultaneous increase in the absolute value of debt and a relatively more pronounced reduction in GDP. The decline in the debt-to-GDP ratio for 2022 is a consequence of solid GDP growth, which is more than proportional to the increase in debt.
The evolution of the debt-to-GDP ratio over the last decade is shown below:
| CHART III.1: EVOLUTION OF THE DEBT-TO-GDP RATIO DEVELOPMENT - 2012-2022 |
|
| Source: elaboration on data from ISTAT and Bank of Italy |
Regarding the financial instruments of which it is composed, as of 31/12/2022, negotiable bonds of the central government and local authorities together accounted for 82.7% (-0.8% compared to 2021). Loans, currency and deposits accounted for 9.4% (+1.3% compared to 2021) and 7.9% (-0.5% compared to 2021) of the aggregate, respectively. Included in the stock of loans are liabilities relating to
__
44 Public debt or general government debt is officially calculated by the Bank of Italy (“Public Finance: Requirements and Debt”) based on sectoral and methodological criteria defined in Council of European Communities Regulation No. 549 of 2013, or the European System of National and Regional Accounts (ESA 2010).
| MINISTRY OF ECONOMY AND FINANCE | 41 |
European Union programmes, of which the nine tranches disbursed between 2020 and 2021 totalling EUR 27.4 billion under the SURE (Support to Mitigate Unemployment Risks in an Emergency) programme and the approximately EUR 37.9 billion of the Next Generation EU facility.
The negotiable debt essentially coincides with the amount of government bonds, the management of which is discussed in greater detail in the following paragraphs. More specifically, the results achieved concerning the objectives defined in Chapter I and the activities implemented to that end are illustrated below.
| III.2 | DEBT MANAGEMENT RESULTS IN RELATION TO OBJECTIVES |
The composition of the stock of bonds at year-end
The issuance activity carried out over the twelve months did not significantly change the composition of the debt stock, which was in line with expectations, given the stocks’ size (Chart III. 2).
Worthy of note is the growth of the inflation segment’s share of total debt, which rose from 10.88% in 2021 to 12.35% at the end of 2022 due to the sustained rise in inflation, which influenced the revalued values of these bonds. In detail, the stock of the BTP€i stood at 8.20%, up from 7.41% in 2021, while that of the BTP Italia rose from 3.46% to 4.15%. The exposure to interest rate risk improved slightly, as the share of debt placed through floating-rate instruments contracted to 5.97% from 6.69% at the end of 2021. The weight of nominal BTPs rose slightly between 2021 and 2022 (73.03% vs. 73.87%).
The decision not to offer new BTP Futura lines in 2022 resulted in a marginal reduction of its share in total debt, from 0.92% to 0.90%.
On shorter maturities, the weight of BOTs accounted for 4.86% of the total debt stock, compared to a share of 5.07% in 2021, while that of CTZs fell to zero (from the previous 1.31%), as all outstanding bonds had expired.
Finally, the relative stock of bonds in the foreign segment was almost unchanged (2.05% in 2022 versus 2.09% in 2021).
| 42 | MINISTRY OF ECONOMY AND FINANCE |
III. PUBLIC DEBT MANAGEMENT IN 2022 |
| CHART III.2: STOCK COMPOSITION OF GOVERNMENT SECURITIES AS OF 31/12/2021 AND 31/12/2022 |
|
| Source: MEF |
| MINISTRY OF ECONOMY AND FINANCE | 43 |
The average cost and exposure to the main risks of the stock of bonds
In the year under review, the weighted average rate at issuance stood at 1.71%, up sharply from the historical low of 0.10% reached in 2021, which confirmed the downward trend of the previous three years. The value recorded in 2022 results from the rise in market rates and, in part, the price-indexation component that occurred during the year, which affects the nominal value of the stock of inflation-indexed bonds.
| CHART III.3: AVERAGE COST AT ISSUANCE OF GOVERNMENT SECURITIES - YEARS 2006-2022 (%) |
|
| Source: MEF |
In cash terms, the average cost of debt before derivatives operations, calculated as the ratio of cash 45 paid on government bonds in year t on the stock of government bonds in year t-1, was 2.14% in 2022 compared to 2.32% in 2021, thus decreasing by 0.18%.
Including all derivative operations, the total value of the cash cost in 2022 was 2.27%, compared to 2.44% in 2021, a reduction of 0.17%. The impact of the derivatives portfolio46 was stable compared to the previous year, amounting to 0.13% in 2022 against 0.12% in 2021.
This cost difference - which also follows a decreasing trend with a progressive approximation over the years between the two series of the average cost “pre” and “post” derivative operations - represents the measure of the marginal cost borne by the Treasury for greater hedging of interest rate risk, compared to the exposure resulting from the sole recourse to bonds issues.
__
45 It is not possible to calculate such a ratio on an accrual basis (ESA 2010) as this excludes by definition the flows of derivative operations.
46 It should be noted that, in drawing up the public finance forecasts contained in the planning documents as well as in the State budget, the effect produced by derivatives is taken into account with simulation assumptions that are fully consistent with the rest of the estimates. Similarly, all final figures include the effects of what has been collected or spent as a result of derivative operations.
| 44 | MINISTRY OF ECONOMY AND FINANCE |
III. PUBLIC DEBT MANAGEMENT IN 2022 |
| CHART III.4: AVERAGE CASH COST AND ARP OF GOVERNMENT SECURITIES STOCK, PRE- AND POST-DERIVATIVES - YEARS 2016-2022 (%) |
|
| Source: MEF |
Consistently, it can be observed how the management of the derivative portfolio contributed to lengthening the ARP (Average Refixing Period), a synthetic indicator of interest rate risk that expresses the average time over which the stock of debt incorporates changes in interest rates. At the end of 2022, the overall post-swap ARP stood at 6.51 years, more than five months higher than the corresponding pre-swap value of 6.06 years. The impact of derivatives on the ARP was higher than in 2021 (0.45 vs. 0.38).
In 2022, this indicator showed a decreasing trend in both segments, foreign and domestic. The slight decrease of about one and a half months in the pre-swap ARP of the domestic issuance segment (6.03 in 2022 vs. 6.14 in 2021) is due not so much to an increase in the share of short and variable bonds as to a different maturity structure compared to last year, which is also reflected in the average life performance. The segment of foreign issues showed a relatively substantial decrease in 2022 (about 8 months), as no bonds in currencies other than the Euro were issued during the year. The pre-swap ARP for foreign bonds stood at 7.42 years, compared to 8.13 years in the previous year.
| MINISTRY OF ECONOMY AND FINANCE | 45 |
| CHART III.5: MATURITIES BY RESIDUAL LIFE, 2020-2022 |
|
| Note: the stock of inflation-indexed bonds takes into account the accrued capital appreciation at the end of each year, and foreign currency bonds are valued post-exchange rate swap |
| Source: MEF |
In addition to interest rate risk, Italian public debt management focuses on containing financing risk, for which the average life of the stock of government bonds is the best-known indicator. In 2022, the average life was 7.0447 years, a value slightly lower than the 7.11 years in 2021 (Chart III.6). Despite the ECB’s reorientation of monetary policy and the consequent rise in rates from the exceptionally favourable market conditions of the previous year, the Treasury managed to remain reasonably active on the long end of the yield curve - nominal, indexed and floating rate. However, the shortening of the average life discounted smaller amounts placed in ultra-long bonds and a redemption volume on medium-to long-term maturities beyond 2021.
As usual, extraordinary debt management operations helped to reduce the stock of bonds with shorter residual maturities and to increase the supply of longer-term (off-the-run) bonds.
__
47 On the other hand, the average life at the end of the year increased to 7.31 years, from the previous 7.29 years, if loans received under the SURE and Next Generation EU programmes are also taken into account.
| 46 | MINISTRY OF ECONOMY AND FINANCE |
III. PUBLIC DEBT MANAGEMENT IN 2022 |
| CHART III.6: EVOLUTION OF THE DEBT STRUCTURE AND ITS AVERAGE LIFE (IN YEARS) |
|
| Source: MEF |
TABLE III.1: AVERAGE LIFE OF THE STOCK OF GOVERNMENT SECURITIES (IN YEARS)
|
| | 31/12/2020 | 31/12/2021 | 31/12/2022 |
| Domestic securities | 6.85 | 7.00 | 6.94 |
| Foreign securities | 10.82 | 12.61 | 11.89 |
Stock of government securities | 6.95 | 7.11 | 7.04 |
| Source: MEF | | | |
| MINISTRY OF ECONOMY AND FINANCE | 47 |
| FOCUS | The impact on debt management from participation in the SURE and NGEU programmes
Among the main lines of action proposed to cope with the post-pandemic recovery, the European Commission has envisaged two programmes to support the economies of the Member States (SURE and Next Generation EU), in addition to the reinforcement of the European Union’s 2021-2027 multi-annual budget with resources earmarked for financing aid to states. The SURE programme (Support to Mitigate Unemployment Risks in an Emergency) is a temporary financial support instrument aimed at mitigating unemployment risks in emergencies related to the freezing or the slowdown of production activities. Approved by the European Council in May 2020, this instrument is designed to provide financial assistance totalling EUR 100 billion in loans granted on favourable terms by the EU to Member States affected by the pandemic crisis to cope with sudden increases in public expenditure to preserve employment. These loans are backed by a system of voluntary guarantees from the Member States, whose contribution to the total guarantee amount corresponds to their share in the total gross national income of the EU, based on the EU 2020 budget. The second programme introduced is the Next Generation EU (NGEU), a temporary financing instrument to support the economic recovery of EU countries, with a total resource envelope of EUR 806.9 billion to be used in 2021-2026. The core of the NGEU is the Recovery and Resilience Facility (RRF), under which resources of some EUR 723.8 billion in the form of loans and grants are earmarked to support reforms and investments made by Member States to mitigate the economic and social impact of the pandemic, strengthen economies, and foster the ecological and digital transition. To finance the Next Generation EU, the European Commission plans to borrow on the financial markets on behalf of the EU at more favourable rates than many Member States by redistributing the amounts. The raising of approximately 800 billion (equivalent to 5% of the EU’s GDP) will be implemented at best market conditions until 2026 through a diversified financing strategy. In 2021, in addition to the loans of the SURE programme, following the approval of the National Recovery and Resilience Plan by the EU Council in July 2021, Italy received the first tranche of 30-year maturity NGEU loans, amounting to approximately EUR 15.94 billion, on 13 August. In addition, two new tranches of NGEU loans with 30-year maturities were disbursed in 2022: the second tranche on 13 April and the third on 8 November, for a total of EUR 22 billion. Unlike the SURE loans, this loan will not be repaid in a lump sum at maturity but annually, with a 10-year pre-amortisation. The interest rate applied is determined based on the cost allocation methodology described in the European Commission Implementing Decision (EU) 2021/1095 of 2/07/2021. Therefore, the loans that have been disbursed to Italy so far under the two programmes amount to some EUR 65.3 billion. The share of European loans in the stock of outstanding bonds amounted to 2.78% at the end of 2022 (compared to 1.90% in 2021), of which 1.61% were loans under the NGEU programme and 1.17% under SURE. Although this share is relatively small compared to the overall stock of Italian public debt, the long-term loans granted to our country has nevertheless allowed the average life of the debt to be extended to 7.31 years if these loans are considered (7.04 years if they are excluded).
Tables III.2 and III.3 show the impact of these loans in terms of exposure to interest rate risk expressed by duration and ARP (Average Refixing Period). |
| 48 | MINISTRY OF ECONOMY AND FINANCE |
III. PUBLIC DEBT MANAGEMENT IN 2022 |
| | |
| TABLE III.2: DURATION AND ARP TREND IN THE YEARS 2021-2022 RELATING TO THE STOCK OF GOVERNMENT SECURITIES, BEFORE DERIVATIVES, AND EUROPEAN LOANS (IN YEARS) |
| | Duration | ARP |
| | 31/12/2021 | 31/12/2022 | 31/12/2021 | 31/12/2022 |
| Domestic securities before derivatives | 6.07 | 5.05 | 6.14 | 6.03 |
| Foreign securities before derivatives | 8.56 | 6.38 | 8.13 | 7.42 |
| SURE | 12.32 | 9.84 | 13.77 | 12.77 |
| NGEU | 19.44 | 16.28 | 20.20 | 19.77 |
| Stock of government securities before derivatives | 6.24 | 5.21 | 6.38 | 6.36 |
| Source: MEF |
| |
| | |
| TABLE III.3: DURATION AND ARP TREND IN THE YEARS 2021-2022 RELATING TO THE STOCK OF GOVERNMENT SECURITIES, POST DERIVATIVES, AND EUROPEAN LOANS (IN YEARS) |
| | Duration | ARP |
| | 31/12/2021 | 31/12/2022 | 31/12/2021 | 31/12/2022 |
| Domestic securities before derivatives | 6.49 | 5.54 | 6.53 | 6.49 |
| Foreign securities before derivatives | 8.59 | 6.26 | 8.34 | 7.55 |
| SURE | 12.32 | 9.84 | 13.77 | 12.77 |
| NGEU | 19.44 | 16.28 | 20.20 | 19.77 |
| Stock of government securities before derivatives | 6.65 | 5.68 | 6.75 | 6.80 |
| Source: MEF |
| |
| III.3 | GOVERNMENT BONDS ACTIVITIES |
Maturities and redemptions of government bonds
Bonds maturing in 2022 amounted to EUR 370,558 million, a decrease of about EUR 18.9 billion compared to the EUR 389,452 million redeemed during the previous year. Also, considering the repurchases made as part of the buy-back and exchange operations carried out during the year, the total volume of redemptions reached EUR 393,919 million, slightly below the levels of 2021.
In the short-term segment, redemptions of BOTs amounted to EUR 141,685 million in 2022, compared to EUR 166,933 million in the previous year.
In the medium to long term, maturities amounted to EUR 228,873 million, about 3% higher than the EUR 222,519 million due in 2021. If one also considers the volumes subject to repurchase and exchange operations, one arrives at a total of EUR 252,234 million, a figure about 9% higher than the EUR 231,461 million for the previous year. However, as usual, a lower figure of EUR 247,834 million is recorded in the government balance sheet because the sums held in the Government Bond Sinking Fund used to redeem maturing bonds are not included; these amounted to EUR 4,400 million in 2022.
| MINISTRY OF ECONOMY AND FINANCE | 49 |
Net issuances and requirement coverage
In 2022, the needs of the Government Sector amounted to EUR 67,025 million, an improvement of approximately EUR 39.4 billion compared to 2021, due to a much stronger increase in final receipts than in final payments. The trend in the balance was influenced by inflation, particularly by the dynamics of energy goods prices, which supported all those tax revenues that are positively correlated with inflation; also, on the side of (capital) incoming sums were the payments of the two instalments of the NGEU loan. On the expenditure side, the contraction of transfers to enterprises decided for the pandemic emergency weighed more heavily. Finally, the management of bilateral guarantees (collateral) in the area of derivative instruments contributed to improving the financial account balance.
The requirement was covered by the balance of net issues recognised in the State48 and other treasury movements (positive to the tune of EUR 27,171 million), which together guaranteed coverage of EUR 63,038 million. In particular, in Table III.4 below, net issues are representative not only of ordinary bonds activity but also of the funding raised in the form of loans disbursed under the Next Generation EU instrument (amounting to EUR 22,000 million in 2022), while other forms of hedging include the contribution of Repo funding. For the remainder, the absorption of Treasury’s cashdecreased compared to the balance recorded at the end of 2021 and amounted to EUR 3,987 million, against the opposite change of EUR 4,501 million between 2021 and 2020.
| TABLE III.4: ISSUANCES, MATURITIES AND COVERAGE OF THE STATE SECTOR’S REQUIREMENT (EUR MILLION) |
| | 2022 |
| Nominal emissions | 424,340 |
| Nominal redemptions | 393,919 |
| Issues net of income (a) | 414,242 |
| Repayments net of income (b) | 400,374 |
| Net Issuances (including NGEU loans) (c) | 35,868 |
Other forms of coverage held by the Treasury49 (f) = – (d) + (e) – (c) | 27,171 |
| Total coverages (c) + (f) | 63,038 |
| Change in the Treasury Cash Account 31-12-2022 vs 31-12-2021 (e) | -3,987 |
| State Sector Cash Balance (d) | -67,025 |
| * Calculated for the entire year on a settlement date basis and not by auction date. |
| Source: MEF |
__
48 Net issues are calculated as the difference between issues and redemptions, respectively, valued as follows: issues are valued at net proceeds, with the exception of BOTs, which are valued at nominal value (price 100) because the difference with respect to 100 is advanced by the State Treasury; redemptions are valued at nominal value, with the exception of bonds repurchased in exchange, which are valued at net proceeds, as are CTZs because the interest component is already contained in the State Sector’s requirements.
49 This item also includes repo operations outstanding as at 31/12/2022.
| 50 | MINISTRY OF ECONOMY AND FINANCE |
III. PUBLIC DEBT MANAGEMENT IN 2022 |
| TABLE III.5: GOVERNMENT BONDS ISSUED NET OF EXCHANGE OPERATIONS (EUR MILLION) |
| | Total | I Quarter | II Quarter | III Quarter | IV Quarter | Total |
| | 2021 | 2022 | 2022 | 2022 | 2022 | 2022 |
| Short-term totals (BOTs) | 159,141 | 37,735 | 31,205 | 40,500 | 29,930 | 139,370 |
| Medium-long term totals | 313,399 | 79,602 | 75,790 | 57,118 | 65,460 | 277,970 |
| Of which: | | | | | | |
| CTZ | 5,951 | 0 | 0 | 0 | 0 | 0 |
| BTP | 257,587 | 63,790 | 60,825 | 50,778 | 48,175 | 223,568 |
| BTP€i | 15,089 | 7,650 | 2,588 | 2,503 | 1,725 | 14,465 |
| BTP ITALIA | 0 | 0 | 9,440 | 0 | 11,995 | 21,435 |
| BTP FUTURA | 8,745 | 0 | 0 | 0 | 0 | 0 |
| CCTeu | 22,244 | 8,163 | 2,938 | 3,838 | 3,565 | 18,503 |
| Foreign Bonds | 3,784 | 0 | 0 | 0 | 0 | 0 |
| Total | 472,541 | 117,337 | 106,995 | 97,618 | 95,389 | 417,340 |
| Source: MEF |
Finally, Table III.5 shows the time profile of issuance activity, which typically parallels that of demand. An early part of the year in which this activity was very strong was followed by a slowdown in the last two quarters. Overall, the volume of total government bonds was around EUR 55 billion, lower than that placed in 2021.
Innovations and adaptation of management strategy
As a result of the sharp reduction in funding needs compared to the previous two-year period, the issuance volumes in 2022 followed a gradual normalisation. Therefore, the instruments deployed by the Treasury in 2020 to cope with the Covid-19 crisis were significantly reduced.
Firstly, there was a normalisation of the quantities offered in auctions. While maintaining their usual schedule, they saw a gradual return to levels more in line with the pre-pandemic period in terms of the quantities offered on the various instruments and maturities.
Second, unlike the previous two years, the Treasury did not resort to the syndicated placement mode to launch new benchmarks on unconventional maturities. In fact, during 2022, the syndicated placement returned to being a placement modality reserved for particular sectors (such as, for example, indexed bonds) and maturities (greater than 10 years) that require an amount of the first tranches well distributed among the final investors and of a size that guarantees adequate performance on the secondary market from the outset. As discussed below, placements of this type were made for EUR 28 billion (down sharply from EUR 65 billion in 2021) on 15- and 30-year BTP maturities, on a CCTeu, on a 10-year European inflation-indexed BTP, and the 15-year BTP Green.
There was also less use of the facility reserved for Specialists in Government Bonds. This facility was introduced in 2020 to carry out issues of one or more off-the-run bonds in weeks without auctions or in addition to auctions (so-called “taps”).
As in 2021, the Treasury continued its strategy of broadening the involvement of retail investors in 2022. Consistent with the rising inflation scenario, and to continue providing retail savers with an instrument to protect their savings, two BTP Italia bonds were offered in 2022, one in June and one in November.
| MINISTRY OF ECONOMY AND FINANCE | 51 |
Finally, concerning the functioning mechanism of the Government bond market, in 2022, the Treasury made changes to the criteria for evaluating Specialists that go in the twofold direction of rewarding operators who contribute positively to the liquidity, efficiency and good functioning of the secondary market, and penalising those who instead use the market to carry out operations with opportunistic aims. In this perspective, the score of the indicator that measures the number of bonds that Specialists trade as proposers has been increased, and two new indicators have been introduced aimed at positively evaluating those who limit the activity of “auto-hedging”50 and those who refrain from engaging in trading practices that, due to the size of the trades, the breadth of the bonds involved, and the time concentration, can be detrimental to market liquidity and efficiency.
Domestic bonds
BOT
In 2022, gross issues of BOTs amounted to about EUR 139,370 million, a decrease of almost EUR 20 billion compared to the previous year and, overall, EUR 43 billion compared to the issues in 2020.
The reasons underlying the decision to make less use of the BOT instrument follow the most recent developments in Italy’s economic situation. During 2022, thanks to the consolidation of the GDP growth trend, which had already begun in 2021, and the consequent gradual reduction in demand, it was possible to continue the process of substantially reducing the level of short-term issues. This result was also facilitated by the full use of the Repo instrument, which, precisely because of its characteristics of flexibility in terms of the size of the volumes being collected and the speed of execution, made it possible to use the BOT as a proper treasury tool and not as a solution aimed at coping with very short-term criticalities.
Also, for 2022, consistent with what has just been illustrated, the non-recourse to the issuance of quarterly and flexible (i.e., with non-standard maturities) BOTs is emphasised.
Therefore, the Treasury issued only six-month and annual BOTs during the year. The stock of BOTs in circulation at the end of the year amounted to EUR 111,176 million, divided into about EUR 81,615 million for annual BOTs and about EUR 29,561 million for six-month BOTs. The 2022 total was about EUR 2.3 billion lower than in 2021 and - concerning the stock of all bonds - stood at 4.86%, a constant reduction compared to previous years.
As regards the evolution of yields at auction, the year was characterised by a trend strongly influenced by the decisions of the ECB, which implemented a restrictive monetary policy with particular reference to the second half of the year; towards the end of 2022, yields rapidly rose to entirely new and different levels compared to the average values of the previous year, reaching in November the peak of the period for the six-month BOT (2.324%) and the annual BOT (2.69%).
__
50 Auto-hedging refers to a risk-hedging strategy based on automatic algorithms that trigger each time a trader makes a sale or purchase as “proposer”, resulting in an equal and opposite trade as “originator”, which is generally executed within seconds of the initial trade.
| 52 | MINISTRY OF ECONOMY AND FINANCE |
III. PUBLIC DEBT MANAGEMENT IN 2022 |
Overall, the yields on BOTs in 2022 were much higher than in the previous year, moving from negative to positive interest rates in May and settling at over 2% on the 12-month bond as early as September. The average allotment yield on BOTs for 2022 reached 0.788%, up more than 127 basis points compared to that experienced in the previous year (-0.489%). In particular, the average yield on the six-monthly and annual bonds was 0.593% and 0.95%, respectively, albeit with such variability as to make the figure in question scarcely indicative.
| CHART III.7: GROSS COMPOUND YIELD AT ISSUANCE OF 12-MONTH BOT - YEARS 2021-22 (%) AND SPREAD YIELD OF 12-MONTH BOT VS EURIBOR RATE - YEARS 2021-22 (BASIS POINTS) |
|
| Source: MEF |
| CHART III.8: GROSS COMPOUND YIELD AT ISSUANCE OF 6-MONTH BOT - YEARS 2021-22 (%) AND SPREAD YIELDS OF 6-MONTH BOT VS EURIBOR RATE - YEARS 2021-22 (BASIS POINTS) |
|
Source: MEF, Bloomberg
|
| MINISTRY OF ECONOMY AND FINANCE | 53 |
Using the two charts (Chart III.7 and Chart III.8), it is also possible to observe the spread between the yields at the issue of the six-month and annual BOTs, respectively, and the Euribor rates of the same term. These curves show how the rapid increase in the yields recorded in BOT auctions during 2022 was not specific to Italy but concerned the entire interbank system, whose rates moved similarly. In particular, during the entire year, BOT rates were generally aligned to Euribor, constantly maintaining a negative spread with the exclusion of the June and September placements, which took place in very volatile market contexts determined respectively by the increased expectations of rate rises by the ECB51 and due to the impact on the money market of the ECB’s decision at its September meeting to revise the cap to zero on the remuneration of government deposits52. It is evident, however, how the constancy with which the rate of the two BOTs reported is linked to Euribor demonstrates the perceived reduced riskiness of Italian government bonds.
In terms of the participation of Primary Dealers (or Specialists in government bonds) in the auction, the average bid-to-cover ratios for the year were 1.47 for the six-month BOT and 1.42 for the annual, up from 1.40 and 1.38 in 2021, respectively, confirming the consolidated demand by market operators for Italian government bonds and the high level of liquidity present.
In conclusion, the BOT segment maintained, on the whole, satisfactory levels of efficiency both on the secondary market, in terms of liquidity and depth, and on the primary market, in terms of allotment yields in the various monthly auctions and coverage ratios.
The composition of demand at auctions, based on data collected through Government Bond Specialists according to the harmonised model defined at the European level (EMAR53), showed, in line with what occurred in 2021, a considerable inflow of capital invested by foreign investors; throughout 2022, demand from abroad always remained above 78% except June, in which the value stopped at 57.9%. Overall, purchases at auction by Italian investors amounted to 16.3% of the total in 2022, while demand from abroad, 83.7%, can be broken down further with a prevalence of purchases from Europe of over 61.8%. This figure further demonstrates international investors’ great confidence and interest in Italian government debt bonds.
With regard to the type of investor involved, last year saw a reversal among the counterparties most interested in buying BOTs; the share demanded by investment funds exceeded that of credit institutions (39.7% vs. 35.5%, respectively).
__
51 In addition to the announcement, after the 9 June meeting, of the end of positive net purchases of government bonds under the APP programme. This announcement, partly expected by the markets, nevertheless generated much volatility and widening of spreads for peripheral Euro area countries, and attracted such attention that the ECB met a few days later - on 16 June - and issued a communiqué announcing greater flexibility in reinvestment policy within the PEPP programme.
52 In this case, the market had already positioned itself to assume that governments had invested the enormous excess liquidity in the secured market, exacerbating the already considerable problem of collateral squeeze. The ECB removed this risk, causing the entire short end of government curves - especially the German one - to normalise, dragging the Italian one upwards as well.
53 See supra, Chap. II, pages 35-37.
| 54 | MINISTRY OF ECONOMY AND FINANCE |
III. PUBLIC DEBT MANAGEMENT IN 2022 |
BTP
In 2022, gross issues of BTPs amounted to 230,568 million54, a reduction of about 29,519 million from the previous year due to lower requirements and the resulting normalisation of funding activity after the last two-year pandemic crisis.
Overall, the weight of nominal BTPs in government bond circulation increased slightly (73.9%, compared to 73% in 2021). This increase was partly attributable to the replacement of CTZ issues with BTP Short Term issues and the redemption during the year of the last two existing CTZ lines, which led to a redistribution of weights in favour of the BTP segment.
Issuance activity on the BTP Short Term began with the launch of a new benchmark with maturity on 29/11/2023 in the auction at the end of January, placed for EUR 3.75 billion. The new bond was issued regularly in auctions until May, reaching an outstanding amount of EUR 15.4 billion. Then, in June, a new benchmark maturing on 30/05/2024 was launched for EUR 4 billion, which was subsequently issued regularly in auctions until the end of the year, closing with an outstanding amount of around EUR 16.7 billion.
The coverage ratios were fairly regular and ranged between the minimum recorded in the first auction of the year (1.41) and the maximum reached in the last auction in November (2.07), in which, however, the benchmark was offered for a relatively lower amount of EUR 1.25 billion, in combination with an off-the-run 7-year BTP.
The yields on the issue of BTP Short Term Bonds were inevitably affected by the general rise in rates during the year, fluctuating widely from a low of -0.13% in the first January auction to a high of 3.27% at the end of September.
Also, on the other maturities of the BTP segment, issuance activity was intense and saw the opening of several new lines, including through syndicated placements that met with high demand from a vast audience of investors55. Placements carried out through the establishment of a syndicate of banks (in which all Government Bond Specialists participate, among which the Treasury selects the group of lead managers of the individual transaction) offer the advantage of having more detailed and precise information on final demand, as well as allowing for a selection of allocations that favours a good future performance of the bond on the secondary market. During 2022, three syndicated issues of nominal BTPs were executed, of which it is particularly interesting to compare the distribution in geographical terms and by type of investor.
__
54 This amount includes ordinary issues and all placements made as part of exchange and tap operations. It also includes issues for the Sace reorganisation, which amount to approximately EUR 4.28 billion.
55 For further details on the syndicated issues that took place during the year, please refer to the announcements published on the website of the Department of the Treasury in the Public Debt section (https://www.dt.mef.gov.it/en/debito_pubblico/index.html).
| MINISTRY OF ECONOMY AND FINANCE | 55 |
TABLE III.6: GEOGRAPHICAL DISTRIBUTION OF AWARDS IN 2022 SYNDICATED PLACEMENTS OF NOMINAL BTP |
| | BTP 30 years 01/09/2052 (EUR 7 billion) | BTP 15 years 01/03/2038 (EUR 5 billion) | BTP Green 30/04/2035 (EUR 6 billion) |
| | | |
| | | |
Germany/Austria/Switzerland | | | |
| | | |
| | | |
| | | |
| | | |
| | | |
| | | |
Source: Syndicated placements |
The geographic distribution of demand shows a greater presence of Italian investors in the syndicated issue of the 15-year BTP in May and in the launch of the BTP Green in September. The share allocated to UK investors was always significant, averaging 25%, with the highest percentage recorded precisely in the May issue. The presence of investors in the German area averaged around 10%, with the highest share in the issue of the 30-year BTP at the beginning of the year.
TABLE III.7: DISTRIBUTION OF AWARDS BY INVESTOR CATEGORY IN 2022 SYNDICATED PLACEMENTS OF NOMINAL BTP |
| | BTP 30 years 01/09/2052 (EUR 7 billion) | BTP 15 years 01/03/2038 (EUR 5 billion) | BTP Green 30/04/2035 (EUR 6 billion) |
| | | |
| | | |
Pension Funds and Insurance | | | |
Central Banks and Government Institutions | | | |
| | | |
| | | |
Source: MEF - Syndicated placements |
The breakdown by type of investor shows that the share subscribed by investment funds remains the most significant, although it is, on average, slightly down on the previous year. It is interesting to highlight the significant and constant presence of investors with a stable and long-term investment profile, particularly insurance companies, pension funds, central banks and government institutions, with an average share of over 17%.
Over the course of the year, therefore, the Treasury used syndicated placements for the renewal of the longer maturity BTP lines, also contributing to increasing the weight of the ultra-long segment on total issues, which, moreover, was fed by regular auctions.
In particular, on the 15-year maturity, before the syndicated issuance in May of a new BTP for an amount of EUR 5 billion, the previous benchmark was offered at auction in March for an amount of EUR 2 billion, fully subscribed. Subsequently, the new 15-year bond maturing on 1/03/2038 was reopened in July with an offer of EUR 1.25 billion and in October for a further EUR 1 billion, with the EUR 200 million reopening reserved for Government Bond Specialists also fully subscribed. By the end of the year, the bond had thus reached a total outstanding amount of EUR 7.45
| 56 | MINISTRY OF ECONOMY AND FINANCE |
III. PUBLIC DEBT MANAGEMENT IN 2022 |
billion, including the amounts allocated in the additional placements. In addition, in the auction at the end of August, a further tranche of the 15-year BTP off the run on 1/03/2030 (with a residual life of 8 years) was issued for a total amount of EUR 1.25 billion.
In the 20-year segment, the benchmark BTP maturing on 1/03/2041 was offered in the single auction in mid-February for an amount of EUR 1.75 billion, bringing the outstanding amount to EUR 16.6 billion at year-end. In addition, in April, the BTP off the run on 1/03/2040 was reopened in the amount of EUR 750 million, with the EUR 150 million offered in the supplementary auction also being fully allotted.
On the 30-year maturity, the Treasury placed through a syndicated transaction at the beginning of the year a new benchmark bond maturing on 1/09/2052, for a total of EUR 7 billion. The new bond was then reopened in the mid-April auction for EUR 1 billion and, in June, as part of a joint offering with the off-the-run BTP 1/09/2049, for a total of EUR 1.5 billion. At the end of the year, the 30-year BTP thus reached a total outstanding amount of approximately EUR 9.1 billion. On several occasions, moreover, the Treasury offered to the market off-run bonds (BTP 1/03/2048, BTP 1/09/2046, and BTP 1/08/2039, for amounts ranging between EUR 1 billion and EUR 1.5 billion) intending to mitigate the distortions present on the longer end of the yield curve and, at the same time, meeting specific demand needs.
BTPs with maturities of up to 10 years were issued regularly at auctions at the beginning of the month (5- and 10-year) and mid-month (3- and 7-year).
The two shortest maturity bonds (3- and 5-year) were issued for fairly balanced amounts, with a slight prevalence of the 5-year BTP (EUR 42.8 billion) over the 3-year (EUR 36.7 billion), in view of the different profile of redemptions expected in the course of the year on the two segments. Consistent with the expectations outlined in the Guidelines, gross issues in absolute terms were slightly lower than in 2021, while net issues were largely positive on both maturities, albeit to a lesser extent on the five-year segment.
Both the 3-year and the 5-year segments saw the conclusion of the issuance cycle of the previous benchmarks: respectively, the BTP 15/12/2024, also reopened as off the run in the last auction in December when it reached a final circulating volume of around EUR 15.3 billion; and the BTP 1/08/2026, closed in January with a volume of EUR 17.56 billion.
Two new lines were opened on the three-year maturity and three on the five-year maturity.
The first three-year BTP, maturing on 15/08/2025, was placed in mid-April and reissued until September, reaching a total outstanding amount of just under EUR 15.3 billion. The new BTP 15/01/2026 was launched in October, closing the year with a circulating amount of about EUR 9.6 billion.
On the five-year maturity, after its launch at the end of February, the new bond with maturity on 1/04/2027 was offered again until the auctions at the end of May, reaching a volume of EUR 14.3 billion. The new benchmark with maturity on 1/12/2027 was placed for the first time at the end of June and was then offered continuously until October, closing with a volume of EUR 17.8 billion. The last benchmark maturing on 1/04/2028 was launched at the end of November through an exchange transaction in the Bank of Italy for a total of EUR 5 billion.
| MINISTRY OF ECONOMY AND FINANCE | 57 |
An analysis of the auction coverage ratios of the two bonds shows a higher average on the 3-year maturity (1.68) than on the 5-year BTP (1.47), although the latter shows less variability.
Yields at issuance were inevitably affected by the marked rise in market rates during the year, returning steadily to positive territory. For both sub-funds, the highs were reached at the auction cycles in late September and early October, when the 5- and 3-year benchmarks were placed with gross yields of 4.12% and 3.57% respectively (Chart III.9) 56.
In the middle section of the yield curve, between 7 and 10 years, issuance was down on the previous year, especially in the 10-year segment, whose issuance volumes returned to pre-pandemic levels.
As regards the seven-year maturity, in the first months of the year, the on-the-run 15/02/2029 bond was offered, which reached an outstanding amount of EUR 16.35 billion at the last auction in mid-April. May saw the launch of the new bond with maturity 15/06/2029 and an annual coupon of 2.80%, subsequently offered at auction every month (except August) until October, when it reached an outstanding amount of EUR 15.8 billion. The second new line, with maturity on 15/12/2029 and a coupon of 3.85%, was opened in November and closed on 2022 with an outstanding amount of EUR 7.5 billion. Finally, in the same month, a 7-year BTP off the run (with a residual maturity of two years) was reopened for EUR 1.5 billion, on the occasion of the end-month auction on the Short-Term segment.
The coverage ratio on 7-year BTPs was fairly constant, fluctuating between a low of 1.38 in December and a high of 1.69 in April, averaging 1.49.
Given the relevance of the 10-year maturity for the market, BTP issuances on this segment were among the most significant overall, although net issues on the segment were largely negative due to the large amount maturing (over EUR 60 billion) during the year.
The bond maturing in June 2032 was offered as a benchmark until March, and then reopened as an off-the-run in the July auction, reaching a circulating amount of EUR 19.8 billion. The new bond, with maturity in December 2032 and a nominal rate of 2.50%, was launched in April and reopened regularly until the auction at the end of September, reaching a circulating amount of EUR 16.55 billion. In the latter part of the year, the new benchmark with maturity on 1/05/2033 and a coupon rate of 4.40% was offered, closing the year with EUR 6.75 billion in circulation. In addition, among the bonds no longer in issue, an additional tranche of the BTP August 2029 (residual life 7 years) was placed in April for EUR 1.2 billion, including the portion allocated in the reopening reserved for Specialists.
Lastly, the 10-year sector was also the subject of extraordinary operations: a tap reopening of the BTP December 2031 conducted in January and an exchange in the Bank of Italy of the bond maturing on 1/04/2031, for a total amount of around EUR 2 billion.
Finally, coverage ratios were on average constant, fluctuating between a low of 1.30 at the end-October auction and a high of 1.73 in July.
__
56 A detailed analysis of the results of all issues of the year can be found in the file “Treasury Issues 2022” on the public debt website: Treasury Issuances 2022
| 58 | MINISTRY OF ECONOMY AND FINANCE |
III. PUBLIC DEBT MANAGEMENT IN 2022 |
Chart III.9 shows the auction yields of all BTPs with maturities of up to 10 years, showing a clear parallelism between the performance of all bonds, although a mismatch in the yields at issuance of 3- and 7-year BTPs in the June auction, which took place in a particularly volatile market environment, can be seen.
Moreover, in the auction rounds at the end of September and in October, the highest yield levels for 2022 were reached on all maturities, although a subsequent gradual decline can be seen in the last two months of the year.
| CHART III.9: YIELD AT ISSUANCE OF BTPS WITH MATURITY BETWEEN 3 AND 10 YEARS IN 2022 (%) |
|
| Source: MEF |
| MINISTRY OF ECONOMY AND FINANCE | 59 |
| FOCUS | Characteristics of auction demand for nominal BTPs: analysis by investor class and geographical area Among the data provided by Government Bond Specialists in the context of the communications according to the harmonised scheme adopted by the ESDM (European Sovereign Debt Markets) Subcommittee of the European Commission’s Economic and Financial Committee, the Treasury selects the flows observed from the day after the announcement of an auction until the day before its settlement, obtaining a good proxy of the demand at auction by final investors.
Under normal conditions, these flows on the days indicated are all buying. However, if the market environment is particularly mixed, a prevalence of selling may emerge for certain categories of investors or in certain geographical areas. In such cases, the data reported by Specialists may offer a less accurate indicator of demand at auction. Therefore, in cases where the flows for a particular category of investors or geographic area were zero or negative, the contribution in that month was considered zero for the purposes of graphical representation (Figures 3 and 4).
As regards the breakdown by type of investor, Figure 3 shows how, in line with the previous year, the participation of banking institutions decreased in 2022, with a share of just under 20% of the total. On the other hand, after last year’s decline, there was a significant increase in the share of investment funds. On the other hand, the participation of hedge funds is declining, as is the participation of investors with a long-term horizon, i.e., insurance companies, pension funds, official institutions and central banks. However, their share of the total remains reasonably negligible. In this regard, it should be noted that the “official institutions and central banks” category does not include purchases made by Euro system central banks, which are, in fact, not included in the Specialists’ reports within this harmonised reporting framework. |
| | FIGURE 3: BREAKDOWN BY TYPE OF COUNTERPARTY OF ORDERS PLACED IN NOMINAL BTP AUCTIONS BY SPECIALISTS IN GOVERNMENT BONDS - YEARS 2021-2022 |
| | |
| | |
| | Looking at flows by geographic region, Figure 4 shows that the largest share of demand in the auctions comes from US investors, with a further increase in 2022 compared to the previous year. This is followed by European investors, with a significantly increasing share in demand from the Euro area and from other European regions (of which the UK is usually the largest component). The share of domestic investors declined, representing the third most significant component of demand. Finally, demand from the rest of the world is also down compared to 2021. |
| 60 | MINISTRY OF ECONOMY AND FINANCE |
III. PUBLIC DEBT MANAGEMENT IN 2022 |
| | FIGURE 4: BREAKDOWN BY GEOGRAPHICAL AREA OF ORDERS PLACED IN NOMINAL BTP AUCTIONS BY SPECIALISTS IN GOVERNMENT BONDS - YEARS 2021-2022 |
| | |
BTP€i
In the year under review, the total volume of BTP issues indexed to European inflation57 amounted to EUR 14,465 million, slightly lower than the volume issued in the previous year (amounting to EUR 15,089 million).
Compared to the previous year, the volume of maturing bonds in the segment was lower in 2022; therefore, the year ended, as expected, with positive net issues.
In response to renewed inflation, 2022 was characterised by a growing demand for European inflation-indexed bonds. A new EUR 5 billion 10-year benchmark bond was successfully issued through syndication in February 2022, confirming the broad investor acceptance of this instrument.
In contrast to 2021, when issuance policy had been more balanced on the various points of the real curve, issuance in 2022 was mainly concentrated on the new ten-year bond, contributing to the lengthening of the average life of the debt.
This was to take into account both the demand conditions, particularly concentrated on the new bond, and the high amount in circulation reached by the other bonds of the real curve. Moreover, again taking into account demand conditions and the already high outstanding amount of the bond being issued (the BTP€i September 2032), the Treasury did not deem it appropriate to issue the 15-year maturity.
Auction amounts were always quite low, with bids never exceeding EUR 1,500 million. Auction coverage ratios in this segment were quite high, ranging between
__
57 More precisely to the HICP, the Harmonised Index of Consumer Prices of the Eurozone.
| MINISTRY OF ECONOMY AND FINANCE | 61 |
a minimum of 1.31 in September on the 10-year BTP€i and a maximum of 2.13 on the off-the-run September 2041 BTP€i issued in January, together with the 5-year BTP€i, with a higher variability of the indicator than for the 2021.
Demand for bonds indexed to European inflation at auction was fairly constant throughout the year, with a greater presence in the first half of 2022 and a slight decrease in the second half, when, moreover, as scheduled, there were no issues in August and December. Moreover, to take into account the simultaneous issuance of BTP Italia, as happened in previous years, BTP€i auctions were cancelled in June and November.
Auction participation saw a significant increase in the share of domestic investors (25% compared to 21% in 2021) and a decline in the presence of European investors (26% compared to 38% in the previous year). By contrast, the presence of US investors increased slightly (from 38% to 40%).
As regards the type of investors, in line with previous years, the most significant component was hedge funds, with a slightly higher share than in 2021 (42% compared to 37% the previous year). Also significant was the participation of investment funds (26%), followed by banks with a 20% share. Residual demand from pension funds, central banks and other public institutions.
In 2022, real yields showed a similar trend to that observed for nominal bonds but were affected, especially in the first part of the year, by expectations of inflation trends.
In fact, the expected inflation, which together with the real rate determines the overall yield at issuance of the indexed instruments (Chart III.10, relating to the 10-year Break Even Inflation58), showed an upward trend during the first months of the year, reaching its peak (equal to over 280 basis points in May), then subsequently falling to around 185 basis points at the end of July and stabilising around 210-220 basis points until the end of the year. Thus, in the generalised context of rising rates experienced in the first part of the year, inflation expectations mitigated the upward movement of real rates relative to nominal rates. As mentioned earlier, the stabilisation of inflation expectations experienced in the year’s second half brought the trend in real yields more in line with nominal yields and the general market environment.
__
58 The BEI (Break Even Inflation) is that measure of inflation rate (on a European or Italian scale) that must be assumed to allow the yield at maturity of an indexed bond to equal that of a fixed-coupon bond (e.g. a nominal BTP) of similar residual life. This is to place the investor in a situation of indifference with respect to the type of bond to be subscribed. High BEIs generate bonds with low (real) coupons.
| 62 | MINISTRY OF ECONOMY AND FINANCE |
III. PUBLIC DEBT MANAGEMENT IN 2022 |
| CHART III.10: 10-YEAR BREAK EVEN INFLATION (BEI) 2021-2022 (BASIS POINTS) |
|
| Source: Bloomberg |
BTP Green
Last May, the first BTP Green59 Allocation and Impact Report was published, containing all the information concerning the allocation of the proceeds of the two issues of the BTP Green 2045, of which two tranches were issued (the first in March 2021 via syndicate for an issued amount of EUR 8.5 billion, and a reopening of the same via syndicate in October 2021 for an issued amount of EUR 5 billion) for a total nominal value of EUR 13,500 million.
In view of the excellent response received from investors and to provide adequate support for the bond’s liquidity on the secondary market, the new BTP Green April 2035 was issued last September 2022, of which two tranches were issued for a total nominal value of EUR 8 billion: the first was issued in September for an amount of EUR 6 billion via syndicate, while the reopening was carried out last November 2022 via auction for an amount of EUR 2 billion.
All information concerning the allocation of the proceeds of the two BTP Green 2035 issues will be included in the second “BTP Green Allocation and Impact Report” to be published in June 2023.
BTP Italia
In 2022, after carefully assessing market conditions, the Treasury renewed the offer of BTP Italia through two new issuances in June and November, which both retail and institutional investors widely appreciated.
__
59 The Report is available for consultation on the Public Debt Website: Allocation and Impact Report BTP Green 2022
| MINISTRY OF ECONOMY AND FINANCE | 63 |
In the first issue, an eight-year bond was offered, with maturity on 28/06/2030 and a (real) coupon rate of 1.60%. The placement took place over four days, the first three of which were intended for retail investors and the last reserved for institutional investors, with a total funding of over EUR 9.4 billion. Of this, approximately EUR 7.26 billion flowed into the first phase against 211,432 retail orders, while institutional investors subscribed the remainder.
One of the novelties of this issue was the provision of a loyalty premium of 1% paid at different times. In detail, for those who purchased the bond during the first phase of the placement and held it until the end of the first four years, there is an intermediate premium of 0.4%, while the remaining 0.6% is paid at the final maturity.
The other typical features of this instrument remain unchanged, i.e., indexation to the FOI (national consumer price index for blue- and white-collar households, net of tobacco), the six-monthly revaluation of coupons and invested capital, and the provision of a floor in the event of deflation.
The second issue was on the 6-year maturity (BTP 22/11/2028) with a (real) coupon rate of 1.60% and a loyalty premium of 0.8% on the invested capital. Also, in this case, the placement took place over four days, and the total amount issued was just under EUR 12 billion, of which EUR 7.3 billion was placed with retail customers against several contracts concluded of 255,753, among the highest ever recorded in BTP Italia issues.
Overall, the high participation recorded in both issues by retail savers, to whom this instrument is specifically dedicated, made it possible to increase the share of debt held by this type of investor, an essential objective of the Treasury’s issuance strategy in recent years.
BTP Futura
Unlike the previous year, the Treasury, taking into account the absence of maturing volumes, after a careful assessment of market conditions, deemed it appropriate not to issue BTP Futura during 2022.
CCTeu
During the year under review, the gross issues of CCTeus amounted to approximately EUR 18,503 million, down sharply from the volumes offered in 2021 (amounting to approximately EUR 24,499 million). Therefore, taking into account the EUR 26,566 million maturing bonds in the segment and considering redemptions of EUR 4,946 million through exchange and repurchase60, net issues of CCTeus in 2022 were largely negative.
The floating rate segment benefited from particularly robust demand during the year, allowing the Treasury to launch a new CCTeu at the end of March through a syndicated placement, with maturity on 15/10/2030 and a spread over the six-month Euribor set at 0.75%. The amount issued was EUR 5 billion against demand of
__
60 See. infra, Extraordinary Operations
| 64 | MINISTRY OF ECONOMY AND FINANCE |
III. PUBLIC DEBT MANAGEMENT IN 2022 |
around EUR 10.7 billion. The bond was subsequently reissued regularly in end-month auctions, closing 2022 with a circulating amount of around EUR 12 billion.
During the year, the CCTeu introduced at the end of November 2020, with maturity on 15/04/2026, was also offered at auction in amounts between EUR 1,000 and 1,250 million, reaching a total outstanding amount of around EUR 13.8 billion at the end of 2022. In addition, in the auctions at the end of June and September, the bond maturing on 15/04/2029 was reopened for amounts between EUR 750 million and EUR 1,000 million.
The composition of demand was quite variable in terms of geography and investor type. With regard to the first aspect, the domestic component was the most significant (averaging 50%), with purchases by Italian operators particularly significant in January and October, although significantly lower in the second four months of the year. The European component averaged 20%, while that from other geographical areas was around 30%.
In terms of investor type, albeit with some fluctuations during the year, banks were the category present most consistently, with a 66% share, in line with the previous year’s 65%. The participation of investment funds declined (11% compared to 13.5% in 2021), while the presence of hedge funds increased significantly from the previous year’s share of 7%. The participation of central banks (non-Eurozone) increased compared to 2021; the presence of private entities (corporate and retail), on the other hand, decreased, with a 2% share compared to 6% last year.
Yields at issuance were positive throughout the year, with a much higher variability than in the previous year, especially in the second half of the year. The highest yield, at 3.21%, was recorded at the auction held at the end of November on the bond maturing on 15/10/2030, while the lowest of 0.08% was reached at the auction held at the end of January on the bond maturing on 15/04/2029 (Chart III.11).
| CHART III.11: YIELDS AT ISSUANCE OF CCTEUS IN 2022 (%) |
|
| Source: MEF |
The average coverage ratio at auction for CCTeus was 1.84, with a minimum of 1.63 recorded on the bond maturing on 15/04/2029 in the auction at the end of
| MINISTRY OF ECONOMY AND FINANCE | 65 |
January, in which the highest amount was offered, equal to EUR 1,500 million. The maximum ratio (2.16) was instead reached in the auction at the end of October on the CCTeu 15/04/2026, in correspondence with the lowest amount offered during the year, equal to EUR 1,000 million.
Foreign bonds
During 2022, the Treasury constantly monitored the trend of international markets and evaluated the possibility of issuing in foreign currency to broaden the audience of institutional investors and contain financing costs concerning domestic issues. However, in light of a market context characterised by high volatility of swap spreads and by a dynamic of the Euro-Dollar exchange rate that made issues on the foreign curve more expensive than domestic ones, it was deemed appropriate not to carry out financing operations in foreign currency through the Global Bond channel.
With reference to the Medium-Term Note Programme, the Treasury did not increase the ceiling of private placements under this format during the year, as the requests received were not deemed to meet debt management needs or were met through public-format issues.
Extraordinary operations (buybacks, exchanges, TAP issues)
As announced in the Guidelines, in 2022 the Treasury resorted to extraordinary swap and repurchase operations aimed at achieving multiple objectives, such as managing refinancing risk, reshaping the maturity profile, and supporting the liquidity and efficiency of the government bonds market. By their very nature, these operations do not follow a predetermined calendar and represent extremely flexible instruments in terms of execution and timing.
As shown in Chart III.12, the Treasury repurchased bonds in 2022 for about EUR 24 billion, an increase over the EUR 15 billion repurchased in the previous year. Twelve extraordinary operations were carried out, of which two exchanges with the Bank of Italy and ten repurchases, including two using the resources available on the Government Bond Sinking Fund and the remainder through recourse to the cash surpluses of the Cash Account. Seven were carried out bilaterally within the repurchase operations, two using the Bank of Italy’s auction system and one through the telematic trading system.
| 66 | MINISTRY OF ECONOMY AND FINANCE |
III. PUBLIC DEBT MANAGEMENT IN 2022 |
| CHART III.12: AMOUNT REPURCHASED IN EXTRAORDINARY OPERATIONS - YEARS 2017-2022 (NOMINAL AMOUNTS IN EUR MILLION) |
|
| Source: MEF |
In detail, the Treasury conducted the first repurchase operation in February, through the telematic trading system, on bonds maturing in the second half of 2022, intending to ease the redemption profile for the current year and, at the same time, supporting the short end of the yield curve for government bonds. The second repurchase operation, through a Bank of Italy auction, occurred in June and involved three BTP Italia bonds maturing between 2023 and 2025. Given the issuance of a new BTP Italia scheduled for the same month, the Treasury also carried out this operation to foster demand for the new instrument. In the same month, another repurchase was also carried out at the Bank of Italy on three BTPs maturing in 2025, using the resources available on the Government Bond Sinking Fund.
In the second half of the year, given the good progress of the funding programme, the Treasury conducted a series of bilateral operations to reduce the weight of maturities for the following years. The two negotiations at the end of July concerned the repurchase of two nominal BTPs maturing in 2024 and two maturing in 2028. In September, the Treasury repurchased another four BTPs on longer maturities, between 2027 and 2031, while in November, a new bilateral operation concerned five Italian BTPs with maturities between 2023 and 2027. Finally, in the last month of the year, the Treasury conducted three more bilateral repurchases (the first of which using the availability of the Sinking Fund), focusing on the repurchase of bonds with maturities between 2023.
During 2022, two exchange operations were also carried out using the Bank of Italy’s auction system. In the first operation, carried out in September, two BTPs maturing in April 2031 and August 2039 were reopened and, at the same time, two nominal BTPs with prices below par and two CCTeus with prices just above par, all maturing between the second half of 2023 and the beginning of 2024, were withdrawn. Therefore, even though the countervalue of the bonds issued in
| MINISTRY OF ECONOMY AND FINANCE | 67 |
exchange coincided with that of the bonds repurchased, the Treasury in fact also performed a pre-funding operation that reduced the concentration of the maturities of the bonds in the following years.
In the second swap, at the end of November, the Treasury issued a new nominal five-year BTP against the repurchase of five bonds (two BTPs and two CCTeus maturing in 2023, and one CCTeu maturing in 2025) with the same purpose of reducing the maturity weight for the following year and, at the same time, renewing the five-year point of the yield curve.
On the whole, the buyback activity made it possible to reduce nominal debt by EUR 17.3 billion, of which EUR 4.4 billion was repurchased through the Sinking Fund, while through the two exchange operations, bonds worth EUR 7 billion were issued and around EUR 6.9 billion repurchased. These operations, as Chart III.13 shows, made it possible to considerably lighten maturities in the following years, especially those concentrated in 2023 (around EUR 10 billion), a particularly critical year in terms of redemptions61.
| CHART III.13: DISTRIBUTION OF GOVERNMENT BONDS REPURCHASED IN EXTRAORDINARY OPERATIONS CARRIED OUT IN 2022 (NOMINAL AMOUNTS IN EUR MILLION) |
|
| Source: MEF |
Finally, during 2022, the Treasury made use on two occasions of the Tap facility reserved for Specialists in Government Bonds, an instrument introduced in 2020 for the reopening of bonds no longer in issue, with the aim of increasing their liquidity and meeting specific demand needs. On the occasion of the first Tap issue, carried out in January through the electronic trading system, two BTPs maturing in 2031 and 2036 were reopened for a total of EUR 1,750 million. In addition, at the beginning of April, the second Tap operation concerned a 10-year BTP maturing in 2028 and two 30-year BTPs maturing in 2047 and 2051, for a total maximum amount of EUR 2,500 million, fully assigned. In both cases, the bonds issued were priced both below and above par, thus balancing the Treasury’s need to satisfy market
__
61 Detailed information on all swap and buy-back operations is available on the Department of the Treasury’s website: Public Debt - Extraordinary Operations
| 68 | MINISTRY OF ECONOMY AND FINANCE |
III. PUBLIC DEBT MANAGEMENT IN 2022 |
demand for specific bonds and at the same time guaranteeing the maximum effectiveness of the transaction in terms of funding.
Final composition of the year’s gross issuances
In the course of 2022, Treasury issuance activity was mainly affected by the change in the expansionary stance of monetary policy, with the increase in reference rates and the start of the reduction of asset purchase programmes by the ECB, due to the sharp rise in inflationary pressures. At the same time, the calibration of bond issues took into account EUR 22 billion of NGEU package loans credited to Italy last year.
Overall, the downward trend in emissions continued, falling by around 11% compared to 2021.
Table III.8 details the composition of emissions over the last three years in absolute value and percentage, including amounts from exchanges.
The distribution of issues between short and medium/long-term stabilised on the quotas realised over the two-year period 2020-2021. With regard to BOTs, there was a slight contraction in activity on the six-month maturity, in favour of issues of the 12-month bond; in fact, the entry into full repurchase agreement activity, which began in 2021, allowed for the gradual relaxation of placements on this segment, particularly of the 6-month BOT.
BTPs Short-Term grew significantly, having totally absorbed the issuance of CTZs with a maturity of 24 months; in 2022, they accounted for 8.25% of total issuance compared to 6.36% in the previous year. The relative share of 3- and 5-year BTPs rose by about one percentage point (18.33% in 2022 versus 17.25% in 2021), although less was issued overall on the short-term end of the BTP curve, especially 3-year bonds, in line with lower funding needs. The weight of issues on the 5-year maturity increased to 9.57%, while those on the 3-year segment remained more or less stable at 8.77% of the total; in 2021, the distribution had been more balanced in both absolute and percentage terms.
The drop in demand also impacted the 7-year BTP segment, where issuances were down, although in relation to the total volume placed, this bond rose slightly to 9.28% compared to 9.09% in 2021. In this way, the distribution of issues, in absolute and relative terms, between the 7- and 10-year segments was more balanced; in fact, the 10-year BTP accounted for 9.21% of the total, down from 12.1% in 2021, against lower placements of around EUR 19 billion.
| MINISTRY OF ECONOMY AND FINANCE | 69 |
| TABLE III.8: COMPOSITION OF 2020-2022 ISSUANCES IN ABSOLUTE VALUE (EUR MILLION) AND % (INCLUDING EXCHANGES) |
| | Issuances 2020 | % of total | Issuances 2021 | % of total | Issuances 2022 | % of total |
| Flexible BOT | 0 | 0% | 0 | 0% | 0 | 0% |
| 3 month-BOT | 6,500 | 1.18% | 0 | 0.00% | 0 | 0.00% |
| 6 month-BOT | 82,192 | 14.93% | 75,847 | 15.89% | 57,755 | 13.61% |
| 12 month-BOT | 93,123 | 16.91% | 83,294 | 17.45% | 81,615 | 19.23% |
| CP + other short term liabilities** | 0 | 0% | 654 | 0.14% | 2,000 | 0% |
| Total short-term* | 181,815 | 33.02% | 159,795 | 33.48% | 141,370 | 33.32% |
| CTZ | 37,949 | 6.89% | 5,951 | 1.25% | 0 | 0.00% |
| CCTeu | 16,444 | 2.99% | 24,499 | 5.14% | 18,503 | 4.36% |
BTP Short Term | 0 | 0.00% | 30,379 | 6.36% | 35,028 | 8.25% |
| 3 year-BTP | 47,817 | 8.68% | 41,367 | 8.67% | 37,198 | 8.77% |
| 5 year-BTP | 48,759 | 8.85% | 40,951 | 8.58% | 40,591 | 9.57% |
| 7 year-BTP | 36,369 | 6.60% | 43,379 | 9.09% | 39,365 | 9.28% |
| 10 year-BTP | 63,353 | 11.50% | 58,136 | 12.18% | 39,089 | 9.21% |
| 15 year-BTP | 18,996 | 3.45% | 14,500 | 3.04% | 12,711 | 3.00% |
| 20 year-BTP | 17,505 | 3.18% | 4,500 | 0.94% | 4,500 | 1.06% |
| 30 year-BTP | 23,835 | 4.33% | 7,720 | 1.62% | 12,085 | 2.85% |
| 50 year-BTP | 0 | 0.00% | 5,000 | 1.05% | 0 | 0.00% |
BTP Green | 0 | 0.00% | 13,500 | 2.83% | 8,000 | 1.89% |
| 5 year-BTP€i | 6,038 | 1.10% | 3,450 | 0.72% | 2,692 | 0.63% |
| 10 year-BTP€i | 4,972 | 0.90% | 4,836 | 1.01% | 10,803 | 2.55% |
| 15 year-BTP€i | 600 | 0.11% | 0 | 0.00% | 971 | 0.23% |
| 30 year-BTP€i | 841 | 0.15% | 6,803 | 1.43% | 0 | 0.00% |
| BTP Italia | 22,298 | 4.05% | 0 | 0.00% | 21,435 | 5.05% |
| BTP Futura | 11,844 | 2.15% | 8,745 | 1.83% | 0 | 0.00% |
| Foreign | 11,255 | 2.04% | 3,784 | 0.79% | 0 | 0.00% |
| Total medium-long term* | 368,873 | 66.98% | 317,500 | 66.52% | 282,970 | 66.68% |
| TOTAL | 550,688 | | 477,295 | | 424,340 | |
* Off-the-run bonds were placed in the closest residual life category
** Other short-term liabilities include BTP tranches maturing by 2022 |
| Source: MEF |
In the long-term maturity segments of nominal BTPs, the policy aimed at limiting issuance continued, with issuance down by about EUR 8 billion (including BTP Green placements), to a total of 8.79% of the volume placed in 2022, compared to the previous 9.47%.In the inflation-indexed segment, there was a noticeable upturn in issuance activity: the absolute volume more than doubled compared to the approximately EUR 15 billion issued in 2021, while the relative share of total 2022 issuance was around 8.46% compared to 3.16% in the previous year. This increase was essentially due to the more than EUR 21 billion nominal BTP Italia subscribed in 2022, a type of bond that appeared particularly attractive to savers as a protection instrument against the strong acceleration of inflation, whereas it had not been proposed by the Treasury in 2021. As regards the bond indexed to European inflation, the growing demand was absorbed by the syndicated placement on the 10-year maturity, while the portion allocated to the other maturity stretches was less significant, compared to the total 2022 issues.
Despite the Treasury’s intention to increase its presence in the floating-rate segment, the high volatility experienced during 2022 justified a reduction in net
| 70 | MINISTRY OF ECONOMY AND FINANCE |
III. PUBLIC DEBT MANAGEMENT IN 2022 |
issuance of almost EUR 6 billion compared to 2021, CCTeus being particularly sensitive to phases of turbulence. As a result, the weight of this segment on total bonds issued fell from 5.13% in 2021 to 4.36% in 2022.
Finally, foreign bonds, which accounted for 0.79% of gross issuance in 2021, were not issued during the past year; indeed, while the Treasury had previously been particularly active in the global bond segment, the market environment in 2022 did not allow any cost advantage to be identified over the domestic yield curve.
With regard to off-the-run bonds issued through exchange operations, the volume amounted to EUR 7,000 million, higher than the EUR 4,755 million in 2021.
| III.4 | DERIVATIVES PORTFOLIO MANAGEMENT |
Management activity
In 2022, the management of the derivatives portfolio focused on assessing the functionality of individual instruments in relation to a broader debt management strategy, while at the same time assessing opportunities in the interest rate market. In particular, the upward movement of the Euro swap curves and their inversion in the medium and long term allowed for the restructuring of existing positions in the portfolio and the creation of new ones in order to synthetically lengthen the duration, simplify the portfolio, and reduce borrowing costs as well as, possibly, book debt.
In the first part of the year, a series of Interest Rate Swaps (IRS), with an overall zero mark-to-market, were restructured with a banking counterparty, simplifying the derivatives portfolio and reducing counterparty risk. The Treasury fixed, on a total notional amount of EUR 5 billion, a very low fixed rate to pay against a variable rate to receive equal to the 6-month Euribor. In addition, two new plain vanilla IRSs were stipulated with a notional value of EUR 2 billion each and a 30-year maturity, in which the Treasury pays an equally low annual fixed rate and receives the variable rate indexed to the 6-month Euribor. The Treasury has thus synthetically lengthened the duration of its debt portfolio, creating a macro-hedge to hedge the risk of a rise in market rates, which then occurred in the following months, and hedging itself against the risk of counterparty default through a system of collateralisation to which the new financial operations are subject.
The same strategy was also adopted with another banking counterparty: an IRS with a slightly positive mark-to-market for the Treasury was closed, and two 30-year swaps were opened, leaving the total notional amount unchanged at EUR 1.5 billion, in which the Treasury pays the fixed annual market rate every six months and receives variable flows whose indexation parameter is the 6-month Euribor.
Given the marked inversion of the Euro swap curve in the medium-long term, the Treasury also restructured two IRSs with a total notional amount of EUR 2 billion, extending the maturity of the contracts to a 30-year term and reducing the burden of interest expenditure by paying a lower rate than the original one. At the time of the restructuring, the accounting debt associated with these positions was also lower.
| MINISTRY OF ECONOMY AND FINANCE | 71 |
The Treasury also continued the restructuring of a positive mark-to-market portfolio transaction in order to timely hedge against long-term inflation risk, thus creating a synthetic fixed-rate hedge on a fixed notional amount.
Finally, no new Cross Currency Swaps (CCS) were entered into during 2022, as there were no new foreign currency bonds issued under the Global or EMTN programme, mainly as a result of the sharp rise in US dollar rates and the deterioration in the Euro-Dollar exchange rate.
Evolution of the market value of the derivatives portfolio
Table III.9 below shows the notional and market values of the segments into which the derivatives portfolio can be divided62. With regard to debt derivatives, “CCS” refer to issues denominated in foreign currencies, while “hedging IRS” refer to issues denominated in EUR. In addition, the “duration IRS” category includes all positions attributable to the strategy of protection against rising interest rates. The “IRS ex-ISPA” segment includes all derivative contracts associated with the liabilities of Infrastrutture S.p.A., which were subject to the Treasury’s assumption of the liabilities provided for by the 2007 Budget Law.
Finally, the values for asset derivatives and the overall portfolio are shown.
__
62 For all derivatives portfolio segments mentioned in this paragraph, a detailed description can be found in Annex 4 in the Appendix to this Report.
| 72 | MINISTRY OF ECONOMY AND FINANCE |
III. PUBLIC DEBT MANAGEMENT IN 2022 |
| TABLE III.9: DERIVATIVES PORTFOLIO - YEARS 2021 AND 2022 (EUR MILLION) |
| Debt Derivative Instrumentss | | |
| | 31/12/2021 | 31/12/2022 |
| Instrument | Notional
| % | MTM | in % | Notional
| % | MTM | % |
| IRS ex-ISPA | 1,867 | 1.80% | -791 | 2.85% | 1,833 | 1.80% | -245 | 17.25% |
| CCS | 17,626 | 17.01% | 451 | -1.63% | 17,643 | 17.01% | 1,512 | -106.48% |
| Hedging IRS | 2,670 | 2.58% | 1,149 | -4.14% | 4,270 | 2.58% | 1,448 | -101.97% |
| Duration IRS | 81,468 | 78.61% | -28,550 | 102.92% | 71,868 | 78.61% | -4,135 | 291.20% |
| | | | | | | | | |
| Total debt derivatives | 103,631 | 100.00% | -27,741 | 100.00% | 95,614 | 100.00% | -1,420 | 100.00% |
| Outstanding Government Bonds | 2,263,303 | 2,289,181 |
Debt
Derivatives/Government Bonds | 4.63% | 4.18% |
Derivatives Instruments on assets (Financial law for 2005)
| Instrument | Notional
| | MTM | | Notional
| | MTM | |
| IRS (Interest Rate Swap) | 228 | | -13 | | 77 | | -1 | |
| Overall Portfolio of Derivative Instruments |
| Instrument | Notional
| % | MTM | % | Notional
| % | MTM | % |
| Debt Derivatives | 103,631 | 99.78% | -27,741 | 99.95% | 95,614 | 99.92% | -1,420 | 99.93% |
| Asset Derivatives | 228 | 0.22% | -13 | 0.05% | 77 | 0.08% | -1 | 0.07% |
| Total Derivatives Instruments | 103,859 | 100% | -27,754 | 100% | 95,691 | 100% | -1,421 | 100% |
Please note: The market value (MTM) does not include the statistical processing performed by the Bank of Italy for the purpose of publishing financial accounts |
Bilateral guarantee contracts on derivative financial instruments (*) |
| The figures reported below refer to the net amounts of the guarantee posted at the end of each year |
| Cash margin | 4,214 | -2,177 |
(*) Bilateral guarantee performance under Ministerial Decree no. 103382 of 20/12/2017. See Public Debt Legislation - Rules on Derivative Activities. In the case of a positive sign this is a net deposit with the counterparties, in the case of a negative sign this is a net deposit with the Treasury. https://www.dt.mef.gov.it/export/sites/sitodt/modules/documenti_en/debito_pubblico/normativa_spalla_destra/D.M._ 20.12.2017_-_Bilateral_collateral_with_reference_to_derivates.pdf |
The notional amount of the derivatives portfolio decreased by about 8.2 billion from the previous year. At the same time, the mark-to-market showed a marked improvement, being negative EUR 1.4 billion as of 31/12/2022 against EUR 27.75 billion as of 31/12/2021 to debt derivatives, on which the notional reduction was recorded. The component of the portfolio referring to loans receivable under the 2005 Finance Act is increasingly small (see Table III.9); consequently, the values mentioned are substantially attributable to those relating only to debt derivatives, which recorded a reduction in notional value. The mark-to-market improvement is attributable to the more pronounced increase in swap rates in the short end of the curve, where an increase of about 410 basis points was recorded on the one-year maturity, and then subsided to 200 basis points of growth on the 30-year maturity. This trend produced an inversion of the swap curve.
In detail, about CCS, the total notional amount of the foreign currency portfolio at the end of 2022 was stable at EUR 17.6 billion compared to the end of the
| MINISTRY OF ECONOMY AND FINANCE | 73 |
previous year. No new bonds denominated in foreign currencies were issued during the year 2022.
With regard to IRSs to hedge euro-denominated issues, the increase in the notional amount of EUR 1.6 billion was due to the increase in the notional amount of an equal amount of a transaction to hedge the long-term inflation risk.
With regard to IRSs for macro-hedging the risk of rising interest rates, the notional amount was reduced by EUR 9.6 billion at the end of 2022. This amount is the result of some factors. The first is the natural maturity of two IRSs with a total notional amount of EUR 4 billion. Then, a restructuring was carried out, which involved the early extinguishment of several outstanding positions, against which four new 30-year IRSs were opened in the market. This restructuring resulted in a net notional reduction of EUR 4 billion. In addition, the partial early extinction for EUR 1.6 billion of the transaction, which had a notional amount of EUR 3.2 billion at the end of 2021, allowed for the execution of a new IRS, with the same notional amount, referring to the long-term inflation risk and mentioned above. As a result, at the end of 2022, the notional amount of the duration derivatives portfolio was around EUR 71.9 billion, compared to around EUR 81.5 billion at the end of 2021. Finally, two other restructuring operations were carried out during the year, which had no impact from the notional point of view.
Finally, in 2022, contractual activity continued to mitigate counterparty risk on the Treasury’s derivatives portfolio. Two new guarantee contracts (CSAs) were activated: one allowed a new CSA entered into in 2021 to hedge a foreign currency issue to be subject to bilateral guarantee; the second allowed two new IRS operations resulting from a restructuring to be subject to guarantee. In addition, a guarantee agreement (CSA) entered into on pre-existing operations while the restructuring of two IRSs was amended.
At the end of 2022, the total net amount of the guarantee held by the Republic of Italy was EUR 2.177 billion, which is the balance of the guarantee paid to the Treasury by some of the counterparties in derivative instruments subject to the CSA and the guarantee paid by the Treasury to other counterparties also subject to the CSA.
With regard to derivative instruments referring to debt (thus excluding positions taken under the 2005 Finance Act on loans receivable), the following chart shows the evolution of the notional amount year by year, starting respectively on 31/12/2021 and 31/12/2022 up to the last maturity of the portfolio (2062), assuming the exercise of a swaption still in place.
Although the trend of gradual reduction in the notional amount has remained unchanged since the end of 2021, the lengthening of the derivatives portfolio is evident due to the increase in maturities between 2045 and 2051, as well as the addition of the 2052 maturity for macro-hedging IRSs. Beyond this maturity, there remains only one position referring to a bond of the EMTN programme, with a notional amount of EUR 250 million, which will expire precisely in 2062.
| 74 | MINISTRY OF ECONOMY AND FINANCE |
III. PUBLIC DEBT MANAGEMENT IN 2022 |
| CHART III.14: COMPARISON BETWEEN THE PROSPECTIVE TREND OF THE NOTIONAL AMOUNT FOR THE EXISTING DERIVATIVES PORTFOLIO, AS AT 31/12/2021 AND 31/12/2022, RESPECTIVELY, ASSUMING THAT ALL SWAPTIONS ARE EXERCISED (EUR MILLION) |
|
| Source: MEF |
| III.5 | THE TREASURY’S CASH MANAGEMENT |
In recent years and up to the first part of 2022, the money market context has been characterised by permanently negative rates and a substantial abundance of liquidity, which have led the Treasury to manage its liquid assets by trying to minimise the costs deriving from the penalty imposed on the stocks deposited with the Bank of Italy, by concluding operations, albeit at negative rates, which are higher than the applied rate, imposed by the ECB.
Thanks to the update of the regulatory framework in 2022, which was commented on in Chapter One, the Treasury expanded and renewed its cash management instruments and modalities, allowing it to use the financial markets of both uncollateralised bilateral operations of short or medium term, and repurchase agreements. Both constitute easy, flexible cash management instruments used by the Treasury on the funding side (Repo) and the lending side (reverse Repo and uncollateralised deposits).
As described in Section II.1, starting in the second half of 2022, the ECB made important decisions that resulted in a reversal of the money market environment. There was a shift from an expansionary approach to monetary policy to a gradual tightening of market conditions by initiating phases of rate hikes that resulted in money rates returning to the positive area. In addition, the ECB also intervened in the remuneration conditions for government stocks deposited with central banks, agreeing to remove the 0% cap63 applied to stocks above the threshold, which was
__
63 Decision ECB/2022/30. Full text available for download at: https://eur-lex.europa.eu/legal-content/EN/TXT/?uri=uriserv:OJ.LI.2022.236.01.0001.01.ENG&toc=OJ:L:2022:236I:TOC
| MINISTRY OF ECONOMY AND FINANCE | 75 |
foreseen in the case of positive rates. Since September 2022, all deposits are remunerated at the lowest rate, even if positive, between the deposit facility and the €STR.
The monitoring of the liquidity account and daily and monthly cash flow trends
The monitoring activity is carried out through a continuous exchange of information between the State General Accounting Department, the Department of the Treasury and the Bank of Italy. The data shared refers to all incoming and outgoing operations carried out on the accounts held with the State Treasury and exchanged for forecasting and final reporting purposes.
The main objective of this activity is to forecast the end-of-day balance, estimated thanks to continuous updates (six times a day) provided by the Bank of Italy and then validated by the MEF. The institutions also share a longer-term forecast scenario, with weekly updates and a duration of between 30 and 60 days.
This last information exchange is crucial for monetary policy, as the Treasury communicates to the Bank of Italy and, through it, to the ECB, forecasts regarding the use of liquidity and government deposits in the period under consideration. The difficulties of the forecasting process arise from the large number of actors involved and the large flows transiting through the Account. The index used to measure the forecasting capacity - and thus the monitoring efficiency - is the average daily deviation between the forecast balance on the closing day and the actual balance on the following day of the Cash Account. In 2022, the value of the index stood at around 1.15%64, a deterioration compared to the value of 2021, when the index stood at around 0.64%, but a better figure than that experienced in 2020, when the value was 1.6%, confirming a satisfactory predictive capacity for the use of liquidity, despite the critical context. The variability of the figure depends on the impossibility of predicting in advance, with absolute precision, the balance of all the treasury accounts that have been moved since, for some of them, forecasts are based on the historical value and the actual amount of the change can only be identified with certainty on the day of the actual transaction.
Despite the very good short- and medium-term forecasting ability, the fluctuations in the Account are quite considerable over the month, as illustrated by Chart III.15, which shows similar levels and cyclical nature to those recorded in previous years.
__
64 This value is calculated as the average of the percentage change (in absolute value) between the estimated balance in the Cash Account at 6 p.m. on day t-1 and the actual balance recorded at 9 a.m. on day t. This percentage thus provides a measure of the average forecast error committed on a daily basis.
| 76 | MINISTRY OF ECONOMY AND FINANCE |
III. PUBLIC DEBT MANAGEMENT IN 2021 |
| CHART III.15: AVERAGE INFRA-MONTHLY VARIATION IN TREASURY CASH AND CASH EQUIVALENTS – GAP WITH THE MONTHLY LOW - 2022 (EUR MILLION) |
|
| Source: MEF |
As can be seen, in the first part of the month, balances show little variability, with values close to the minimums of the month. This means that during the first 15 days of the month, there is no predominance of inflows and/or outflows, as it is precisely the first working days of the month that have the most significant outflows due to the payment of social security cheques on the first day of the month and interest on government bonds. Period lows are generally reached around day 15 due to large payments on the demand side - mainly coupon interest. The trend is then quickly and considerably reversed in the second half of the month, with a peak generally at the beginning of the third ten days of the month due mainly to tax revenues.
These sudden fluctuations complicate the cash management task since the Treasury must also hold large amounts of liquidity to cope with the significant maturities of government bonds, which are not always simultaneously balanced by as many issues, especially for medium- and long-term bonds. In fact, according to market practice, issues of bonds other than BOTs are usually distributed in several tranches over a few months, while the related redemptions take place in a single instalment on the maturity date. Therefore, the fluctuations illustrated in the chart above can also be attributed to the issues and, above all, the maturities of bonds, which sometimes contribute to the considerable drop at the beginning and middle of the month.
Cash management operations and the market context
As can be seen from Chart III.16, the Treasury’s liquid assets, shown concerning the intra-month variation between the maximum and minimum balance for 2022 and 2021, maintained a similar trend during the first half of the year between the two years, with more marked differences in the second half of the year compared to the values for 2021.
| MINISTRY OF ECONOMY AND FINANCE | 77 |
This trend is mainly attributable to the effects arising from the profile of government bond redemptions and the possible near-term maturity of various government bonds issued in previous years. Moreover, the inter-month variability and the same comparison referred to 2021 are influenced by the different seasonality of significant inflows related to the disbursements of the various pandemic support programmes such as the SURE programme and the Italian National Recovery and Resilience Plan (NRRP), according to which, in 2021, the maximum levels of liquidity reached peaks well above 2022, in which, instead, the funding related to the plan was disbursed in April and November.
| CHART III.16: GAP BETWEEN LOW AND HIGH MONTHLY BALANCE OF TREASURY CASH - 2021 AND 2022 (EUR MILLION) |
|
| Source: MEF |
In the course of 2022, the Treasury concluded several uncollateralised bilateral trades, which constituted a vital tool for deploying excess liquidity on the availability account. As can be seen from Chart III.17, the deployment of liquidity in 2022 increased in percentage terms compared to the previous year, and this was also due to the launch of the new deposit business, which further expanded the counterparties with which the Treasury can conduct such lending operations compared to the trading mode previously used. Still, on the lending front, reverse repo activities were also launched last year, in which 105 operations were arranged for a counter-value of over EUR 9 billion.
In 2022, the average stock of bilateral operations was significantly higher than in previous years, amounting to around EUR 14.7 billion instead of EUR 9.4 billion in 2021; concerning the number of operations arranged during the calendar year, there was a significant increase in activity, which more than tripled compared to 2021, from 39 to 140.
The total of these trades allowed the Treasury to invest an average of 22% of the cash on hand in the availability account, compared to 12% in 2021. These operations allowed the Treasury to obtain a remuneration that was always better than the remuneration applied by the ECB on government balances; on average, the interest rate obtained from the operations was 0.801% compared to the 0.618% that
| 78 | MINISTRY OF ECONOMY AND FINANCE |
III. PUBLIC DEBT MANAGEMENT IN 2022 |
would have been obtained by enjoying the above-threshold rate, with a further average gain of 18.3 basis points.
Compared to 2021, the average duration of the above operations decreased to 32 days in 2022 from 42 days in the previous year but remained in line with the 30 days recorded in 2020.
In 2022, the Treasury did not resort to non-collateralised funding operations due to the abundance of liquidity in the account and the decidedly unattractive rate conditions applied by the main counterparties in the non-collateralised segment.
| CHART III.17: AVERAGE BREAKDOWN OF THE TREASURY’S LIQUIDITY – 2021 VS 2022 (EUR MILLION) |
|
| Source: MEF |
The share of liquidity deposited in the liquidity account, whose average balance for 2022 was EUR 51.765 billion, remained at around 78%, far below both in absolute terms and as a percentage of the 2021 figures of EUR 72.695 billion and 88%, respectively.
Table III.10 shows for the whole of 2022 the total amount of Treasury liquidity at the end of the month, broken down between market operations and the cash account.
| TABLE III.10: CASH ACCOUNT AND COMMITMENTS OF TREASURY’S LIQUIDITY AT THE END OF THE MONTH IN 2022 (EUR MILLION) | |
| Month of Reference | Balance of the
Cash account | OPTES Liquidity Operations | Total Treasury
Cash Available |
| January | 68,402 | 14,366 | 82,768 |
| February | 83,423 | 17,374 | 100,797 |
| March | 76,793 | 17,560 | 94,353 |
| April | 83,445 | 16,434 | 99,879 |
| May | 63,432 | 16,788 | 80,219 |
| June | 68,042 | 16,604 | 84,646 |
| July | 78,506 | 16,240 | 94,746 |
| August | 63,181 | 15,153 | 78,334 |
| September | 38,172 | 8,338 | 46,510 |
| October | 50,138 | 10,600 | 60,738 |
| November | 32,452 | 19,494 | 51,946 |
| December | 29,866 | 12,650 | 42,516 |
| Source: MEF |
| MINISTRY OF ECONOMY AND FINANCE | 79 |
Repo operations
In 2022, although operating in a decidedly changeable context, especially for the monetary segment, the Treasury had a constant presence on the markets, concluding about 1,500 operations, with an average volume traded per single contract of EUR 130 million. Compared to 2021, the year in which activity on the repo market began with about 200 operations in funding, in 2022, the Treasury consolidated its activity and presence on the market, operating on the repo market mainly in funding, given the levels of special repo rates constantly below the level of the €STR rate. This strategy, appropriately calibrated, achieved the following three main advantages: considerable savings thanks to the differential between the funding rate and the rate applied to the deposits on the Cash Account (€STR), a gradual loosening of issues on the BOT segment, and greater elasticity in adapting funding to the daily variability of requirements. By replacing part of the BOT issues, the instrument’s flexibility allowed a more efficient coverage of the balances on the Cash account, dynamically reducing the inefficiency of unnecessary cash surpluses.
During 2022, the Repo portfolio was expanded twice, on 28 March and 24 November. On 28 March, 15 new tranches of government bonds belonging to the BTP segment were added, while on 24 November, another 17 new tranches of bonds belonging to the same segment were added and, with the same effective date, 2 tranches of bonds included in the portfolio with a residual maturity of less than one year were cancelled. The nominal amount of each tranche was EUR 1 billion, while the total amount of the portfolio increased from EUR 15 billion in 2021 to EUR 45 billion after the second expansion.
Since the beginning of the year, there has been a steady increase in the use of the bonds portfolio, and activity peaked in October with 203 operations and around EUR 29 billion traded. Furthermore, with regard to the first half of the year, the volume-weighted average repo rate was -0.613%, while in the second half of the year, it rose to 0.503% due to the repeated rises in the Deposit Facility rate.
However, the variability of market conditions did not affect the strategic objectives of the Treasury, which, as for 2021, in addition to the efficient management of cash availability, contributed to reducing market distortions. Thanks to the Treasury’s Repo operations, the average specialness of the market on the BTP segment was contained relative to maturities between 2023 and 2048 (a range of dates that includes all the maturities of bonds in the portfolio), and an instrument was offered, mainly to Primary Dealers, thanks to which market making activities were facilitated, supporting their commitment to offer liquidity on the secondary market.
Final remarks
In 2022, cash management was particularly complex for all the reasons mentioned in the previous paragraphs. In this changed context, the Treasury had to adapt its cash management policy to ensure an adequate level of liquidity and, where possible, to deploy any liquidity by seeking to obtain a more favourable remuneration than that applied in the absence of operations.
| 80 | MINISTRY OF ECONOMY AND FINANCE |
|
| |
Ministero dell’Economia e delle Finanze |
|
MINISTERO DELL’ECONOMIA E DELLE FINANZE |
PUBLIC DEBT REPORT 2022 |
Annex
INDEX
| ANNEXES | 1 |
| | | | |
| | | | |
| | Annex 1: | The Treasury’s involvement in international discussions on debt management | 1 |
| | Annex 2: | The Department of the Treasury’s Public Debt Directorate: organisational structure | 3 |
| | Annex 3: | SAPE (Issuance Portfolio Analysis Software) | 7 |
| | Annex 4:
| Derivatives used by the Treasury: role, types, and collateralisation system | 9 |
| | | | |
| | | | |
| STATISTICAL ANNEX | 15 |
| | | | |
| | Sources of information on public debt available on the Treasury website | 15 |
| | Charts | 16 |
| MINISTRY OF ECONOMY AND FINANCE | I |
| | APPENDIX TO THE 2022 PUBLIC DEBT REPORT |
| II | MINISTRY OF ECONOMY AND FINANCE |
ANNEXES
ANNEX 1
The Treasury’s involvement in international discussions on debt management
Please find below a list of the main ways in which the Treasury is involved in international discussions on public debt management issues:
| • | Regular liaison with European DMOs is ensured as part of the special subcommittee (European Sovereign Debt Markets - ESDM) of the EU Economic and Financial Committee (EFC); the EFC has an advisory role vis-à-vis the European Commission and the Council of the European Union and is appointed to define actions for the coordination of Member States’ economic and financial policies. |
| • | Regular participation in the working groups organised by supranational institutions such as the OECD, the IMF and the World Bank. The Treasury is also involved in the OECD’s “Working Party on Public Debt Management” (WPDM)1, which constitutes a stable platform to compare the public debt management policies and techniques of the organisation’s member countries, as well as in the “Government Borrowers’ Forum” organised annually by the World Bank for the 40 participating countries to share their practical experiences. The Treasury’s standing with regard to public debt management is implicitly recognised by the “Public Debt Management Network”, a joint initiative promoted by the OECD, the World Bank and the Italian Department of the Treasury (the only government institution alongside these two multilateral institutions), the aim of which is to share knowledge, information and research on public debt management issues. |
| • | Another key opportunity for institutional coordination is the Treasury’s participation in Eurostat statistical working groups and its contribution to drawing up the six-monthly notifications as part of the Excessive Deficit Procedure (EDP), especially in relation to entries being correctly recorded that are directly linked to public debt, in accordance with the harmonised European System of Accounts (ESA). By overseeing these accounting aspects, the Treasury is able to keep all relevant profiles under control, also moving beyond general considerations of a purely financial nature and with a direct impact on the state budget. |
| • | Finally, the Treasury attends the annual “International Retail Debt Management Conference”, made up of the DMOs of a limited number of countries; this |
__
1 The WPDM began to meet as an OECD working group of public debt management experts in 1979. Italy’s Treasury has continuously contributed to the annual work of the WPDM since 1985 and is part of the Steering Group established in 2003. Currently, the DMOs of all 36 OECD countries contribute to the work of the WPDM, as do the International Monetary Fund, the World Bank and the European Commission, as observers.
| MINISTRY OF ECONOMY AND FINANCE | 1 |
| | APPENDIX TO THE 2022 PUBLIC DEBT REPORT |
conference is specifically dedicated to the operational issues involved with the placement of government securities among non-institutional investors and, every two years, it is supported by the World Bank to include emerging countries in its comparisons.
| 2 | MINISTRY OF ECONOMY AND FINANCE |
ANNEX 2
The Department of the Treasury’s Public Debt Directorate: organisational structure
The Department of the Treasury’s “Second Directorate”, dedicated to public debt management, is made up eleven offices. This Directorate carries out its tasks by working closely together with other institutional structures, such as the other directorates within the Department of the Treasury, the State General Accounting Department and the Bank of Italy. The various responsibilities of the Public Debt Directorate are shown in the chart below, grouped according to function.
| ORGANISATION OF THE PUBLIC DEBT DIRECTORATE |
|
The Directorate has a front, middle and back office, as is typically the case for financial market operators and other Debt Management Offices (DMOs) managing public debt in advanced countries.
The Front Office covers all activities in direct contact with the market. These primarily involve all issuance activities that define primary market operations, regarding both the domestic and foreign market; said issuance activities take into account funding requirements, from market analysis to the decisions as to which type of securities to offer and the relative placement procedures and time frames.
| MINISTRY OF ECONOMY AND FINANCE | 3 |
| | APPENDIX TO THE 2022 PUBLIC DEBT REPORT |
Front Office activities also include the very short-term management of liquidity and extraordinary debt exchange and repurchase operations, as well as derivative operations.
Front Office activities also entail monitoring the various aspects of the government securities secondary market, as well as selecting and assessing dealers specialising in government securities.
The Middle Office is responsible for risk management2, carrying out all the necessary analyses, including legal and market analysis activities, to define the cost-risk profile that must drive and/or restrict Front Office operations. The various issuance portfolios identified, with their respective cost and risk combinations, (which, for many years3, have been based on a specific software that allows for “Cost-at-Risk” analysis based on a probabilistic model), are used by the Front Office to define the most appropriate issuance and hedging strategies. Risk management activities also include the monitoring of counterparty risk, determining the constraints that must be respected in terms of both derivative portfolio management and liquidity investment operations.
Middle Office activities also include multi-annual forecasts on interest expenditure and general government debt to be used for policy documents and institutional reporting purposes4.
The work carried out by the Back Office includes preparing issuance decrees and the stricter accounting activities relating to procedures to ensure timely payments.
All debt management activities are underpinned by the work to prepare the relative legal documentation for loans and derivatives, as well the drafting of prospectuses, both for international issuance programmes (Global, MTN) and for other securities placed with methods other than auctions. Likewise, since the Public Debt Directorate falls within the administrative context of the Department of the Treasury, it also carries out all the other legal-administrative and accounting tasks common to ministerial organisations.
The Public Debt Directorate also carries out other tasks of crucial importance. These include the very important activities that may be classed under “communications”, focusing on real-time information regarding issuances, as well as statistics about the structure, dynamics and composition of debt represented by government securities and the relative market. The main channel for these activities is the public debt website. These activities also include the statistics stemming from the monitoring of the debt and derivatives exposure of local authorities.
__
2 For a more detailed assessment of best practices regarding Sovereign Debt Portfolio Risk Management, please refer to the International Monetary Fund’s Working Paper “A Primer on Managing Sovereign Debt-Portfolio Risks”, produced in partnership with dozens of DMOs, including the Italian Treasury.
3 See the information contained in Annex 3 below.
4 In particular, the Economic and Financial Document (“DEF”) provided for by Italian Law no. 39 of 7 April 2011 (in relation to which Directorate II contributes to Section I “Italy’s Stability Programme” and Section II “Analyses and Trends in Public Finances”), the DEF Update, the Draft Budgetary Plan (“DPB”) as required by EU Regulation no. 473/2013, the Annex to the so-called “Quarterly Cash Report” (referred to by Art. 14 of Italian Law no. 196/2009 as the “Report on the General Government’s Consolidated Cash Account”), the Report to Parliament on the sinking fund for government securities (an annex to the General Financial Statement of the Italian State) as referred to by Art. 44, paragraph 3, of Italian Presidential Decree no. 398/2003, and the half-yearly Report to the Court of Auditors on public debt management pursuant to the Italian Ministerial Decree dated 10/11/1995.
| 4 | MINISTRY OF ECONOMY AND FINANCE |
In addition to this monitoring, the Directorate is also responsible for any extraordinary operations relating to local authorities’ debt, as governed by specific regulations.
The role of liaising with external institutions, in particular at international level, is also of great importance; this includes: contributing to the coordination of public debt managers in Europe as part of a dedicated subcommittee (European Sovereign Debt Markets - ESDM) of the EU Economic and Financial Committee; taking part in Eurostat statistical working groups and contributing to preparing the six-monthly notifications as part of the Excessive Debt Procedure (EDP); participating in the various working groups of supranational institutions, such as the OECD and the IMF; the network between the Italian Treasury, the OECD and the World Bank regarding public debt management issues; relations with institutional investors and rating agencies5.
Finally, across-the-board IT services refer to all offices, since almost all the Directorate’s work processes are computerised; some are shared by all government departments, with the same applications for the Department of the Treasury or for the entire Ministry, and others are specific to public debt, featuring dedicated tools and applications6. The latter are structured on the basis of the Directorate’s specific needs7 and use both internal information and data flows from the Bank of Italy, from Monte Titoli S.p.A. - the company that guarantees the centralised management of government securities - or from the company that manages the electronic government securities market (MTS S.p.A.).
__
5 For more detailed information on when and how the Italian Treasury takes part in international discussions in this regard, please refer to Annex 1 of this Report.
6 Databases and applications are designed and maintained in collaboration with the Department of the Treasury’s IT Coordination department and with SOGEI, the supplier of digital architecture and support services. Società Generale d’Informatica S.P.A. (“SOGEI”) is an Information Technology company that is 100% owned by the Italian Ministry of Economy and Finance.
7 For example, please refer to the particularly significant aspects involved with developing and managing “SAPE”, the Issuance Portfolio Analysis Software, as illustrated in Annex 3 below.
| MINISTRY OF ECONOMY AND FINANCE | 5 |
| | APPENDIX TO THE 2022 PUBLIC DEBT REPORT |
| 6 | MINISTRY OF ECONOMY AND FINANCE |
ANNEX 3
SAPE (Issuance Portfolio Analysis Software)
The mathematical models and corresponding software (SAPE – Issuance Portfolio Analysis Software) used by the Treasury to support its management choices regarding the public debt portfolio are the result of a research project, made possible thanks to the FIRB 2003 funding received from the Italian Ministry of Education, University and Research (D.D. 2186-Ric 12/12/2003), and issued by the Institute for Calculation Applications of the Italian National Research Council (which heads up a group that also includes other academic institutions, such as Bocconi University, the University of Milan and Tor Vergata University of Rome); this funding was granted as part of the strategic programme entitled “Humanities, economics and social sciences”, project objective “Public debt management”. In the early 2000s, this project launched the modelling and software development work that led the Department of the Treasury to adopt a tool that could support it in making decisions regarding public debt management; by using stochastic simulation techniques, this tool could analyse the cost and risk profile of government securities portfolios.
Over the years, this model underwent various development phases, managed in collaboration with the Department of the Treasury and the various bodies involved, currently made up of the “M. Picone” Institute for Calculation Applications (“IAC”) of the Italian National Research Council (“CNR”) and the Cambridge Judge Business School at the University of Cambridge, as well as SOGEI, the Italian Treasury’s IT solutions provider for the public administration.
The mathematical models and corresponding software are subject to continuous updates in order to take into account ongoing developments of the reference techniques. This allows for the various databases to be integrated in an increasingly comprehensive way, as well as taking into account the various management activities that may affect future scenarios. Since the end of 2017, the outstanding debt database used by SAPE has been made up of domestic securities, derivatives and securities in USD.
The main objective of the portfolio analysis is to measure debt servicing costs on an annual accrual basis, in accordance with ESA 2010 rules. The choice between different possible issuance portfolios must be weighted by taking into account both the cost, in terms of interest expenditure, and the interest rate risk for each individual portfolio compared with a representative sample of how interest rates may evolve.
For each possible issuance portfolio, it is possible to simulate the cost function distribution with respect to all the scenarios regarding how interest rates may evolve. This distribution simulation provides all the necessary information about costs (i.e., where the distribution is positioned) and risks (the scale of the distribution) for the portfolio in question. SAPE calculates different summary cost indicators (average cost, CaR - Cost at Risk-, maximum cost, etc.) and risk indicators (standard cost deviation, relative CaR, ES - Expected Shortfall - etc.), allowing for the possible issuance portfolios to be studied in as much detail as possible.
After choosing the cost and risk functions, a consolidated portfolio selection technique involves building an “efficiency frontier”. This “frontier” is identified by
| MINISTRY OF ECONOMY AND FINANCE | 7 |
| | APPENDIX TO THE 2022 PUBLIC DEBT REPORT |
first drawing a Cartesian graph in which each portfolio is represented by a point whose coordinates record its respective risk and cost, thereby providing a summary of their overall dynamic evolution. Portfolios are classed as “efficient” when each fixed risk value corresponds to the lowest cost. Selecting one of the best portfolios, i.e. those that can be classed as efficient, is based on (i) the debt manager’s risk aversion or risk appetite, in line with the Public Debt Management Guidelines regarding the strategy for the issuance and management of government securities (these guidelines indicate, inter alia, the approach to be adopted in order to fulfil the Treasury’s strategic requirements regarding how to manage the main risks), and (ii) how practical/feasible each individual portfolio is with respect to investors’ needs and the evolution of market conditions. The efficiency frontier is normally created by observing the cost and risk variables at the end of the prediction interval.
This model shows how the cost distribution evolves over time for each individual portfolio. This allows for accurate checks into the evolution of the selected costs and risks, making it possible for the decision maker to choose the portfolio whose temporal evolution profile best matches the policy and strategy choices in question.
The model underwent initial significant development when mutual guarantee agreements were introduced for derivative instruments8; this development allowed for the estimate of effects in terms of Credit Value Adjustment and, as a result, in terms of the guarantees to be established/received as part of the Credit Support Annexes, to be included in the simulations.
The SAPE software’s central element is the module that generates the scenarios regarding how interest rates will evolve. This module interacts with the cost and risk calculation module in a completely transparent way and also offers the possibility to use a range of stochastic models to generate medium/long-term scenarios for interest rates and inflation rates; above all, this is useful in order to assess the expected performance, in terms of cost-risk analysis, of the various strategies relating to public debt issuance policies. More generally speaking, by generating scenarios, expected exposure can be quantified with respect to yield curve volatility. Joint estimate models for the forward interest rate structure include government and break-even inflation (BEI) curves and swap curves (Euro and USD).
A five-year forecast period is generally used for cost-risk analyses on issuance portfolios. The scenarios generated by the model’s stochastic simulation are in line with historical data in terms of the statistical properties of the yield curves, particularly in terms of the variance calculated for the different maturities and covariance between nominal rates and BEI and between nominal and swap rates.
__
8 For further information in this regard, please refer to Annex 4 below.
| 8 | MINISTRY OF ECONOMY AND FINANCE |
ANNEX 4
Derivatives used by the Treasury: role, types, and collateralisation system
Introduction
In principle, the derivatives sector is considerably vast, encompassing operations that have very different structures and purposes, used in almost all areas of finance and the economy. Sovereign issuers such as the Italian Treasury only use a few types of derivatives, for specific risk management objectives underlying its debt portfolio, with particular regard to interest rate and exchange rate risks. Please find below a description of (i) the role played by derivatives in managing Italy’s public debt; (ii) the types of operations that are used; and, (iii) the collateralisation system.
The role of derivative operations used by the Treasury
As highlighted at the beginning of this Report9, the objective of curbing debt costs at the same time as maintaining an acceptable level of risk inherent in the existing debt structure, imposed upon DMOs by international best practices, does not end upon issuance and in relation to the market conditions at the time. This objective is instead achieved in a dynamic way, through ongoing actions that regard the entire portfolio and continue even after issuance.
In addition to debt exchange and repurchase operations, DMOs may also use derivatives to mitigate these risks after issuance.
Any mismatch between the structure of the portfolio resulting from the outcome of capital market placements and the management objectives considered preferable10 can thus be rectified with the use of derivatives, increasing the DMO’s compliance with policy objectives and partly separating the achievement of these objectives from the performance recorded at the time of placement.
Furthermore, while issuance activity is managed with continuity and predictability, in order to create the technical prerequisites of the necessary investment liquidity for potential buyers, derivative operations, on the other hand, do not have a pre-defined timetable. In fact, derivative contracts may be signed at any time, when market conditions allow for DMOs’ specific needs to be met; in this way, they contribute to removing a certain degree of rigidity from DMOs’ management activities.
In authorising the use of derivatives on an annual basis, the Framework Decree states that they should contribute to achieving the general management objectives
__
9 For an indispensable, more in-depth examination of the objectives pursued by public debt managers, also using derivative instruments, please refer to Chap. I.1 above, as well as the documents mentioned therein.
10 A document drawn up jointly by best practice experts from the OECD, the IMF and the World Bank in 2008 highlighted the practice adopted in this regard by many Sovereign debt managers, emphasising the fact that: “the implementation of the debt strategy may include the use of derivatives to separate funding decisions from the optimal portfolio composition decision, reduce the cost of borrowing, and manage risks in the portfolio (in particular, interest rate refixing risk and refinancing risk)”. - OECD (2008) “Use of Derivatives for Debt Management and Domestic Debt Market Development: Key Conclusions”, available at http://www.oecd.org/fr/finances/dette-publique/39354012.pdf
| MINISTRY OF ECONOMY AND FINANCE | 9 |
| | APPENDIX TO THE 2022 PUBLIC DEBT REPORT |
of curbing overall borrowing costs and protecting against market risks and refinancing risks, based on the information available and market conditions.
From an operational point of view, management of the derivatives portfolio must also take into account two main aspects: (i) the guarantee agreements that assist these operations, and (ii) the existing constraints for certain types.
With regard to the first aspect, please refer to the specific paragraph below on the objectives and characteristics of mutual guarantee agreements (collateralisation).
With regard to the second aspect, in September 2014, Eurostat issued new rules on how to record the market value of derivatives, only applicable to swaps arising from the restructuring of pre-existing swaps or to swaptions being exercised. In fact, for these specific cases, it was established that these operations shall affect debt stock levels from an accounting point of view (despite them not entailing actual recourse to the capital market).
The types of derivative contracts used by the Treasury
The types of derivative contracts used by the Treasury Please find below the functional characteristics of the three types of derivative operations used and/or usable to manage the Treasury’s debt portfolio:
| • | Cross-currency swaps (“CCS”) are used to synthetically convert liabilities generated by bond issues denominated in a foreign currency into euro denominated liabilities, with no alterations to the foreign-currency denominated security purchased by the investor. These instruments therefore eliminate the exchange rate risk for the Treasury and make it possible to directly compare the funding costs obtained on international markets with the cost of domestic debt. As outlined in this Report, the international issuance programme allows for the institutional investor base for Italian public debt to be diversified and to obtain competitive cost conditions compared with those for domestic debt. |
| • | Interest rate swaps (“IRS”) involve an exchange of flows involving a fixed rate being paid versus a floating rate being received, usually on long-term maturities. With a view to managing the debt portfolio in a comprehensive way, this type of derivative extends the financial duration of debt and acts as a precaution against expected interest rate increases. As already mentioned, this choice is in line with the need to manage the portfolio’s cost-risk trade-off and, in particular, with the specific characteristics of Italian public debt management, as described in Chapter I of this Report. |
| • | Finally, receiver swaptions11 are derivative contracts that act in a similar way to IRS, in that they extend the financial duration of debt and mitigate interest rate risk, but they also provide cash benefits deriving from the sale of an option. Options sold by the Treasury give the counterparty the right to enter into an interest rate swap agreement, at a future date, under pre-defined |
__
11 A receiver swaption is an option that is sold/purchased to/by a counterparty that entitles the purchaser to enter into a swap contract at a future date, whereby the purchaser will pay a floating rate and receive a fixed rate on a given notional amount.
| 10 | MINISTRY OF ECONOMY AND FINANCE |
conditions, as long as a lump sum (premium) is paid to the Treasury when the contract is signed. The IRS generated by sold receiver swaptions being exercised, like those that have not been sold as an option, are generally medium/long-term swaps, whereby the Treasury pays a fixed rate and receives a floating rate starting from a given date if the counterparty exercises its option. Swaptions are exercised if the market conditions are favourable for the Treasury’s counterparty as at the date of the option being exercised (i.e., interest rates have fallen below the market expectations at the time the relative contract was signed); any IRS generated by the option being exercised shall nonetheless act as medium/long-term insurance for the Treasury.
Collateralisation agreements - objectives and characteristics
Collateralisation agreements were introduced for the derivative operations carried out by the Italian government with two objectives in mind.
The first objective was to align with standard practices in the derivatives market. In fact, for all financial instruments, the market value of the operation (Mark to Market) may significantly vary in terms of size and whether it is positive or negative, depending on market trends. For government bonds and securities, these variations affect, inter alia, the credit risk borne by the security holder12, and therefore how they are accounted for and the relative allocations to provisions. For derivatives (for example, interest rate derivatives), on the other hand, changes in the operation value may generate potential credit exposure for the party (the government or counterparty for a derivative) for whom the instrument has a positive value at a given moment in time. This means that, over time, either of the two parties may become, alternatively, the potential creditor/debtor of a sum, which may change significantly in terms of its size and whether it has a positive or negative value; however, said sum shall only become “real” if one of the two counterparties goes bankrupt or if the operation is closed before its natural expiry (by definition, the market value at the operation date is equal to zero).
While the interbank derivatives market has always been a collateralised market, Sovereigns’ use of guarantee schemes to manage the credit exposure associated with derivative contracts has only been examined relatively recently. On the one hand, the 2008 crisis revealed the risks involved with governments being exposed vis-à-vis the banking sector without guarantees. On the other hand, the subsequent and consequent tightening of regulatory constraints on banks gradually made it more expensive for the latter to maintain significant, unsecured exposure vis-à-vis governments, and, beyond certain limits, this even became unsustainable without capitalisation measures. Governments therefore also began using the market standard of mutual guarantee mechanisms as part of their ongoing operations.
The second objective regards the regulatory constraints on banks: given these obligations, the creation of a collateralisation system gives the Italian government the possibility to implement new hedges at sustainable costs (for example, hedges
__
12 By contrast, the issuer, by definition, is not exposed to any credit risk.
| MINISTRY OF ECONOMY AND FINANCE | 11 |
| | APPENDIX TO THE 2022 PUBLIC DEBT REPORT |
against exchange rate risk in the case of securities denominated in a foreign currency being issued).
It should also be noted that, by freeing up the resources that banking regulations require to be allocated to such exposure, the presence of collateral can indirectly allow the Italian government to strengthen the support of these counterparties for Italy’s public debt, on both the primary and secondary market.
Guarantee agreements (“Credit Support Annexes” or “CSA”) are regulated by Italian Ministerial Decree no. 103382 of 20 December 2017 (“Guarantee Decree”) and, indeed, are annexes to the ISDA Master Agreement (“ISDA MA”) in place with each counterparty.
The Public Debt Directorate has drawn up a model governed by Italian law, in line with the regulations governing each ISDA MA signed by the Italian government and all the relative confirmations. When drawing up the contracts to be signed, the Directorate in question based its choices, on the one hand, on public finance constraints, pursuant to Art. 6, paragraph 3, of the “Guarantee Decree”, and, on the other, on its own organisational requirements, which led to a bespoke CSA being drafted. The contractual specifications defined in the CSA refer to margining frequency, the minimum amount, and the rounding of margins.
The resources necessary to pay the guarantees are allocated to a specific expenditure item, established by Italy’s 2019 Budget Law and called “Expenses deriving from guarantee operations on derivatives exposure”; from this expenditure item, the guarantees are transferred to a special accounting system specifically set up for this purpose. Pursuant to Art. 5 of said Decree, the guarantee must be made up of cash in euro.
CSAs may be distinguished between those connected with previous derivative operations and those relating to new operations. The initial phase focused on pre-existing derivative instruments with a number of counterparties, which resulted in the latter having significant credit exposure vis-à-vis the Italian government, above a threshold originally set at € 4 billion (as per the joint provision of Art. 6, paragraph 1, letter b), of the “Guarantee Decree” and Art. 4, paragraph 4, of the 2018 “Framework Decree”). As of 31 December 2017, there were only very few counterparties that met the requirements to sign a guarantee agreement for derivative positions already in the Italian government’s portfolio.
A collateral structure was therefore defined, aimed at limiting the outgoing amounts for the Italian government. For each agreement, full collateralisation is not required upon signing, as the annual guarantee amounts to be paid to the counterparty are defined within a narrow “corridor”, which tends to expand as time goes by. According to estimates, the Italian Treasury will have to pay limited and almost constant amounts over a considerable number of years; said amounts will gradually tend to hedge the counterparty’s entire credit exposure vis-à-vis the Treasury. The expenditure commitments are therefore not only very limited compared with the overall exposure of the individual portfolios but are also set over a significant period, starting from when the agreement in question is signed. The margin to pay shall only be less than the expected amount, with a subsequent reduction in outgoing cash flows for margining purposes, if there are substantial increases in the interest rate swap curve, leading to a reduction in the overall mark-to-market of the collateralised portfolio. Time frames for the “corridor” to be applied to the cash flows is based on the need to mediate between the sustainability
| 12 | MINISTRY OF ECONOMY AND FINANCE |
of the guarantee from the point of view of public finances (which makes it essential, at least in the early years, to limit said time frames) and the need to provide counterparties with a guarantee on their overall exposure vis-à-vis the Italian government within a reasonable number of years.
The work to prepare the guarantee agreement required a significant amount of time, which was necessary in order to carry out the legal analysis and the strictly financial analysis, with the latter aimed at defining, with each counterparty, the appropriate amount of the benefit to be paid to the Treasury, pursuant to Art. 6, paragraph 2, of the Guarantee Decree. All CSAs therefore only became operational in the second half of 2018 and only with regard to pre-existing operations with the banks that met the relative requirements.
The second phase, on the other hand, involved signing CSA agreements with all dealers specialising in government securities, with reference to any new operations13. This phase was completed in the second half of 2018, with a residual part being completed at the beginning of 2019. These agreements referred exclusively to derivative operations carried out after the relative agreement was signed. These agreements were signed pursuant to Art. 6, paragraph 1, let. a), of the “Guarantee Decree” with the same format being used for each individual counterparty, thereby meeting uniformity requirements with a view to treating all counterparties equally.
__
13 Primarily, derivative contracts aimed at hedging new issuances in a foreign currency.
| MINISTRY OF ECONOMY AND FINANCE | 13 |
| | APPENDIX TO THE 2022 PUBLIC DEBT REPORT |
| 14 | MINISTRY OF ECONOMY AND FINANCE |
STATISTICAL ANNEX
SOURCES OF INFORMATION ON PUBLIC DEBT AVAILABLE ON THE TREASURY WEBSITE
The Treasury’s website hosts a dedicated area about public Debt (www.dt.mef.gov.it/en/debito_pubblico/) featuring a wide range of both qualitative and quantitative information about each one of the operational issues included in this Report.
Information available in this area provides details about (but is not limited to) issuance timetable and official communications, auction results, securities’ features and relevant legal framework, Specialist’s assessment and extraordinary operations, available cash as well as documents of a more general nature, as the several releases of this Report or the annual Guidelines for the public Debt management.
The area also includes a data-rich statistical Section (www.dt.mef.gov.it/en/debito_pubblico/dati_statistici/) providing quantitative information about all public Debt topics, namely featured in the Quarterly Bulletin, including trends recorded in the government securities’ portfolio composition, coupons, yields at issuance and average life, risks indicators and derivatives portfolio.
The dataset is constantly updated according to operations, while also keeping past data series available.
The following pages complete the information already provided in this Report by featuring selected Charts and Tables about some of the information available on the website.
| MINISTRY OF ECONOMY AND FINANCE | 15 |
| | APPENDIX TO THE 2022 PUBLIC DEBT REPORT |
CHARTS
| GROSS MARKET ISSUES AT NOMINAL VALUE – BOT (EUR MILLION) |
|
| GROSS MARKET ISSUES AT NOMINAL VALUE – CTZ (EUR MILLION) |
|
| 16 | MINISTRY OF ECONOMY AND FINANCE |
| GROSS MARKET ISSUES AT NOMINAL VALUE – BTP WITH MATURITIES UP TO 10 YEARS (EUR MILLION) |
|
| N.B. Off-the-run securities reopening are not included |
| GROSS MARKET ISSUES AT NOMINAL VALUE – BTP WITH MATURITIES EXCEEDING 10 YEARS (EUR MILLION) |
|
| N.B. Off-the-run securities reopening are not included |
| MINISTRY OF ECONOMY AND FINANCE | 17 |
| | APPENDIX TO THE 2022 PUBLIC DEBT REPORT |
| GROSS MARKET ISSUES AT NOMINAL VALUE – BTP GREEN (EUR MILLION) |
|
| GROSS MARKET ISSUES AT NOMINAL VALUE –RETAIL BONDS (EUR MILLION) |
|
| 18 | MINISTRY OF ECONOMY AND FINANCE |
| GROSS MARKET ISSUES AT NOMINAL VALUE – BTP€I (EUR MILLION) |
|
| N.B. Off-the-run securities reopening are not included |
| GROSS MARKET ISSUES AT NOMINAL VALUE – CCTEU (EUR MILLION) |
|
| MINISTRY OF ECONOMY AND FINANCE | 19 |
| | APPENDIX TO THE 2022 PUBLIC DEBT REPORT |
| GROSS COMPOUND YIELDS ON GOVERNMENT BOND ISSUES (MONTHLY WEIGHTED AVERAGES) - BOT |
|
| GROSS COMPOUND YIELDS ON GOVERNMENT BOND ISSUES (MONTHLY WEIGHTED AVERAGES) – CTZ |
|
| 20 | MINISTRY OF ECONOMY AND FINANCE |
| GROSS COMPOUND YIELDS ON GOVERNMENT BOND ISSUES (MONTHLY WEIGHTED AVERAGES) – BTP WITH MATURITIES UP TO 10 YEARS |
|
| N.B. Off-the-run securities reopening are not included |