Exhibit (7)
| | | |
| | | Update of the Economic and Financial Document |
| | | |
| | | |
| | | |
| | | 2023 |
| | Abridged version |
| | | Update of the Economic and Financial Document |
| | | |
| | | 2023 |
| | | |
| | | Abridged version |
| | | |
| | | |
| | | |
| | | |
| | | |
| | | |
| | | Submitted by the Prime Minister |
| | | |
| | | Giorgia Meloni |
| | | |
| | | |
| | | and the Minister of the Economy and Finance |
| | | |
| | | Giancarlo Giorgetti |
| | | |
| | | |
| | | |
| | | |
| | | |
| | Approved by the Council of ministers on 27 September 2023 |
FOREWORD
This Update of the 2023 Economic and Financial Document – 2023 Stability Program (henceforth, Update) was drafted in light of a more sensitive economic and public finance situation than that foreseen in Spring. After a promising start during the first months of 2023, the Italian economic growth recorded a temporary trend reversal in the second quarter of the year, showing the effects of the erosion of households purchasing power due to high inflation, the long-lasting uncertainty caused by the Ukrainian conflict, the stagnation of the European economy and the decline in world trades.
Given moderate growth in economic activities foreseen by internal estimates in the second quarter, these factors lead to a downward adjustment in 2023 GDP annual growth forecast in real terms, shifting from 1 percent (Stability Program) to 0.8 percent, and the 2024 projection at existing legislation, from 1.5 percent to 1.0 percent. The 2025 GDP growth projection under the existing legislation scenario remains basically unchanged (1.3 percent) compared to the Stability Program, while the one for 2026 shows marginal improvement, from 1.1 percent to 1.2 percent.
With regard to the public finance, the net borrowing of the general government and the borrowing requirement of the public sector trends for the current year have been strongly affected by the impact of tax credits related to the private building renovations incentives issued during the pandemic, more specifically, to the Superbonus. To this impact adds the effect of the rising interest rates on the cost of financing public debt and of the fall in import prices on indirect tax revenues. The upward revision of the estimates for the disbursement of construction incentives leads to higher tax compensation and, therefore, to a central government borrowing requirement which will remain high over the three years covered by the next budget law. In turn, higher projections of the borrowing requirement imply accumulation of the public debt, which makes a significant decline in debt-to-GDP ratio harder to achieve.
The upward revision of the budget impact of tax credits related to the Superbonus (1.1 percent of GDP) brings an upward revision of the general government net borrowing foreseen for the current year under the existing legislation scenario, shifting from 4.5 percent to 5.2 percent of GDP. However, the Government confirms its resolve to pursue a gradual but significant decline of the general government net borrowing and to restore the debt-to-GDP ratio below the level recorded before the pandemic crisis by the end of the decade.
On the other hand, the decline in the growth forecast for 2023 and 2024 and the need to protect Italian households' purchasing power move in favour of fiscal policies able to support growth and employment while containing the rise in consumer prices.
| MINISTRY OF ECONOMY AND FINANCE | I |
Based on such considerations, concurrently with the approval of this Document, the Government, after having heard the European Commission’s opinion, sent a Report to the Parliament to request authorisation to recourse to higher net borrowing, rising the deficit targets in the 2023-2026 forecast horizon, while however limiting it to a level lower than 3 percent of the GDP by 2026. The deficit targets on which the budget currently being prepared will be based are equal to 5.3 percent of GDP in 2023, 4.3 percent in 2024, 3.6 percent in 2025 and 2.9 percent in 2026.
Regarding the public debt-to-GDP ratio, the recent upward revision of the ISTAT nominal GDP estimates, equal to 1.9 percent for 2021 and 2.0 percent for 2022, led to a decline in the debt-to-GDP ratio, which equals to 141.7 percent at the end of 2022 against the previous estimate of 144.4 percent. However, in perspective, the higher levels of borrowing requirement now expected for the 2023-2026 period, given the higher take-up of the tax incentives mentioned above, negatively affect the expected dynamic of the debt-to-GDP ratio, resulting in keeping this ratio above 140 percent up to the end of 2026, in the existing legislation scenario. The updated policy scenario includes revenues from divestitures equal to at least 1 percent of GDP over the 2024-2026 period, in order to mitigate this effect and in line with a more dynamic management of public assets.
Thanks also to further revenues expected in 2024, the debt-to-GDP ratio in the policy scenario follows a slight declining path, reaching 139.6 percent in 2026. More significant decreases in the debt-to-GDP ratio are foreseen for the following years, given that the impact of tax credits will markedly decline after 2026 and that the Government will continue implementing a policy to consolidate public finances as to produce substantial improvements of the primary balance (namely, excluding payments for interests).
The Government strategy is, therefore, based on the identification of a balance between supporting growth, investments and the households’ purchasing power on the one hand and implementing a budgetary discipline and reducing the debt-to-GDP ratio on the other hand. This approach will also be possible thanks to the divestitures of companies public shareholdings, against which there are commitments towards the European Commission linked to the framework on State aid, or whose public ownership quota exceeds the quota required to maintain consistency and uniformity of strategical guidance.
Economic growth is the primary variable to ensure the sustainability of public debt and the social and economic balance of the Country. Despite the complex geographical, political, environmental and demographic context, the Country must achieve higher growth rates than the previous ten-year period. For this reason, the implementation of the National Recovery and Resilience Plan (RRP) and its effective revision, including the new chapter dedicated to the REPowerEU Plan, play a central role in the growth and innovation strategy conducted by the Government. Along with this vital pillar, the Government has planned to divest assets and acquire strategical stakes across key sectors to modernise and digitalise the economy. These include communication networks and innovative policies for infrastructure development.
| II | MINISTRY OF ECONOMY AND FINANCE |
| | UPDATE OF THE ECONOMIC AND FINANCIAL DOCUMENT 2023 |
A significant element of the growth strategy lies in innovation and scientific and applied research. The RRP finances five centres of excellence for applied research, along with further initiatives intended to replicate the achievements of the Italian Institute of Technology, which celebrated its 20th anniversary in September. Over the following weeks, the Foundation for designing semiconductor integrated circuits will open its doors in Pavia, where a previous autonomous district of semiconductor integrated circuits design has already flourished.
Moreover, thanks to European and national funds, significant investments continue to be implemented or designed in key sectors as semiconductors, next-generation photovoltaic panels and the manufacture of batteries for electric cars. At the global level, technological innovation runs faster and faster. Despite the lower budget compared to other EU Member States, Italy is called to be efficient, demanding and quick to keep pace and promote the transition of relevant industrial supply chains, such as automotive. Consequently, the budget law will keep allocating significant resources to public investments and supporting private ones by using tools such as development contracts, innovation agreements and important projects of common European interest (IPCEI). Moreover, maximum efficiency will be granted in combining public and private resources to improve the public sector's ability to provide more demanding and targeted credit guarantees.
At the end of September, the Government issued a new decree to tackle the consequences of high energy prices and the effects caused by high inflation over the last two years. Such measures are even more targeted than the previous ones, as they mainly aim to protect low-income households from rising utilities and fuel prices. Assuming that the gas price will remain relatively low during the wintertime, also thanks to the high quantities stored in the meantime, more targeted measures will be adopted in 2024 to protect the population more at risk of energy poverty and further reduce the budgetary charges caused by the measures to address the energy price hike.
Despite a sharp decline in the inflation rate foreseen over the following months, the Government's concerns focus on the price hike for goods and services included in the consumption basket, and, more specifically, food. For this reason, beside initiatives such as the agreement with production and supply categories for the ‘Anti-Inflation Quarter’, the Government confirms for 2024 the same social security contributions cuts adopted this year. In terms of public finance impacts, such cuts are the primary measure of the budget law. Its extension was decided as it protects the disposable income of low and medium-income households, limits labour costs for businesses and price increases, and keeps improving the competitiveness of our economy.
Tax reform is one of the main structural initiatives planned by the Government. The budget law will provide funds for the first phase of the reform, shifting the personal income tax (IRPEF) to a three marginal rates scheme while maintaining the flat tax for VAT holders and professionals with revenues or remuneration below EUR 85,000. The reform will reduce households’ tax burden, as it will be only partially covered by a revision of tax expenditures. Again, in order to allow a recovery of households’ disposable incomes, the budget law will also finance the contractual renewals of public employees, with specific attention on the health sector.
| MINISTRY OF ECONOMY AND FINANCE | III |
Given a significant falling birth rate, the Government wants to further support parenthood and families with more than two children. In this regard, an innovative measure is under development to favour low and medium-income households, to be financed by the budget law.
The more expansionary stance with respect to the existing legislation scenario of the budget policy in 2024 and, to a lesser extent, in 2025 will positively impact GDP growth of 0.2 percent in 2024 and 0.1 percent in 2025. Therefore, the policy scenario growth is 1.2 percent in 2024 and 1.4 percent in 2025. Instead, the need to reduce the deficit anticipates a moderate consolidation of public finance in 2026, to be implemented through spending review and measures to reduce the tax gap. A slightly negative impact on real GDP growth will follow in the final year of the forecast, estimated to be 1.0 percent.
In summary, difficult choices must be made since public finance is affected by the burden of construction incentives, the increase of interest rates, and the slow-down of the international economic cycle. The Government has decided to adopt measures to face the most urgent problems of the Country - inflation, energy and food poverty, demographic decline - while promoting investments, innovation, sustainable growth and economic responsiveness.
After having obtained a positive opinion from the Parliament on these priorities of budget policy, our efforts will focus on implementing new infrastructure, research and training initiatives to restore Italian growth in favour of workers and businesses, which, with their dedication and resourcefulness, represent the stamina of our Country and make it one of the largest European and world exporters.
| | Giancarlo Giorgetti | |
| | Minister of Economy and Finance | |
| IV | MINISTRY OF ECONOMY AND FINANCE |
INDEX
| I. | RECENT TRENDS IN THE ECONOMY AND THE PUBLIC FINANCE |
| | |
| II. | BASELINE MACROECONOMIC AND BUDGET FORECAST |
| | |
| II.1 | MACROECONOMIC SCENARIO UNDER EXISTING LEGISLATION |
| II.2 | BUDGETARY OUTLOOK UNDER EXISTING LEGISLATION |
| | |
| III. | UPDATED POLICY SCENARIO |
| | |
| III.1 | MACROECONOMIC FORECAST AND BUDGET BALANCE – POLICY SCENARIO |
| III.2 | DEBT-TO-GDP RATIO AND THE REDUCTION PATH IN THE EUROPEAN GOVERNANCE REVIEW |
| III.3 | DEBT-TO-GDP RATIO SCENARIOS IN THE MEDIUM TERM |
| | |
| IV. | STRUCTURAL REFORMS
|
| | |
| | |
| V. | ANNEX |
| MINISTRY OF ECONOMY AND FINANCE | V |
| | UPDATE OF THE ECONOMIC AND FINANCIAL DOCUMENT 2023 |
| VI | MINISTRY OF ECONOMY AND FINANCE |
I. RECENT TRENDS IN THE ECONOMY AND THE PUBLIC FINANCE
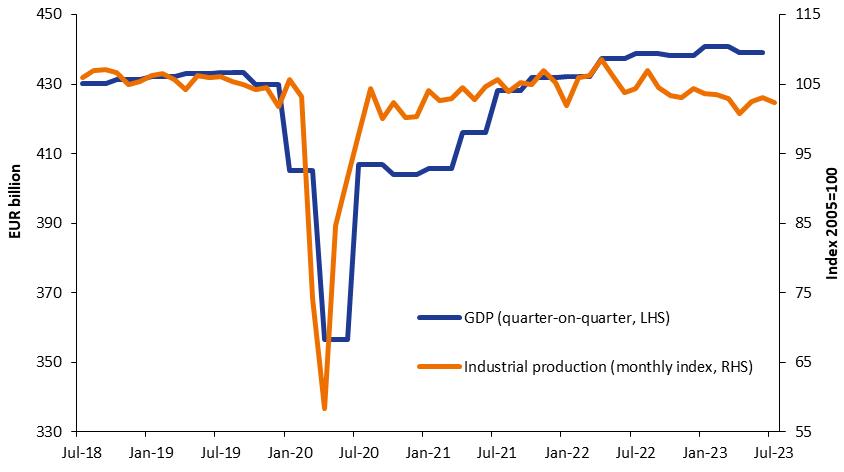
In the first half of 2023, the Italian economy was affected by the weakening in international economic cycle. The result marked in Q1, characterised by substantial increase (+0.6 percent), was followed by a GDP drop in Q2. Compared to the same quarter of the previous year, GDP grew by 0.3 percentage points. This figure shows a significant deceleration in GDP growth rate. After a sharp increase until up to the first months of the year, service slowed down, failing to compensate for the contraction in the industry that started in the second half of last year. Although temporarily, the internal demand and investment growth have stopped.
| FIGURE I.1: GDP AND INDUSTRIAL PRODUCTION |
|
| Source: ISTAT. |
The latest short-term indicators foreshadow a slight recovery starting from Q3. The manufacturing PMI is taking distance from the lows recorded in June, and rail freight traffic shows significant increases. Moreover, the electricity consumption by energy-intensive firms and energy production are recovering in recent months, also thanks to the decline in energy prices; this is consistent with the gradual deceleration in inflation and consequent recovery in the households' purchasing power. Motor vehicle registrations grew at a significant pace in summer months. Internal analyses, based on statistical models fed by high-frequency indicators, foresee gradual resumption in growth by the end of the year.
| MINISTRY OF ECONOMY AND FINANCE | 1 |
| | UPDATE OF THE ECONOMIC AND FINANCIAL DOCUMENT 2023 |
Given such elements, the GDP growth forecast for 2023 is adjusted downward, shifting from 1.0 percent as in the Stability Program to 0.8 percent.
In any case, it should be remembered that on 22 September, ISTAT revised the estimated GDP level starting from 2021 upwards for a significant amount1. This figure shows the resilience of the Italian economy and provides an encouraging growth perspective. This leads to a substantial increase in GDP level, in both nominal and real terms, provided for this year and the next three ones.
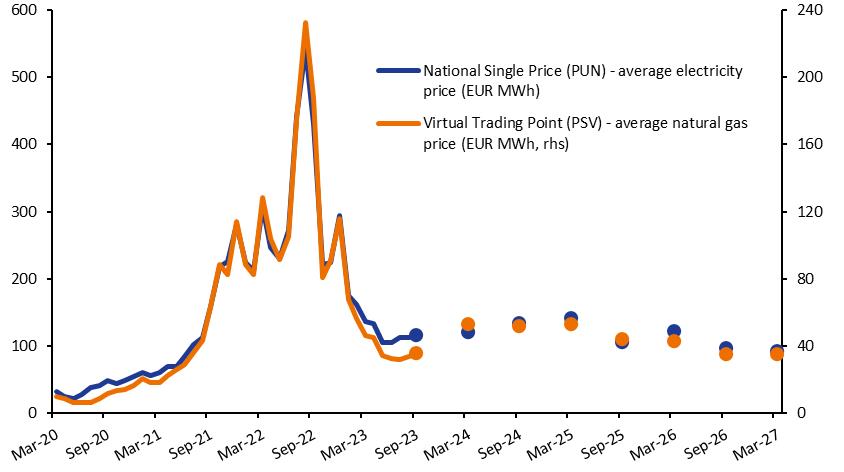
Concerning energy, the reduction in consumption2 and the diversification of supply sources allowed for easing the tensions that emerged in the summer 2022 due to the rise of natural gas prices.
| FIGURE I.2: NATURAL GAS PRICE 2020-2023 AND FORWARD PRICES 2023-2027 |
|
Source: GME - Gestore Mercati Energetici. |
Despite the share of gas imported from Russia is now representing a small part of total gas imports3, gas storage remained at high levels with a fill rate above 95 percent.
In 2023, the measures adopted to moderate bills and energy costs showed a sharp decline compared to 2022, due to the general downward trend of prices; earmarked resources amount to approximately 1.3 percent of GDP in gross terms (2.8 percent of GDP in 2022). Such measures allowed limiting the impact of price hikes on households and firms, specifically the most vulnerable ones. Despite the above, private consumption marked a slowdown.
___
1 In 2021, the nominal GDP revision amounted to 2 percentage points and exceeded one percentage point in real terms.
2 Over the first seven months of the year, national gas consumption was 15.1 percent lower than the same period in 2022.
3 Over the first seven months of the year, the gas inflow from the Tarvisio access point, where most of the imports from Russia arrive, declined from 10.5 billion of standard cubic metres (SCM) of 2022 to 2.3 billion of SCM, with a share of 6 percent out of the total (previously 24 percent). The gas imports from Russia were replaced by increased inflows from the Italy-Algeria pipeline (TransMed pipeline) and increased liquefied natural gas imports.
| 2 | MINISTRY OF ECONOMY AND FINANCE |
I. RECENT TRENDS IN THE ECONOMY AND THE PUBLIC FINANCE | |
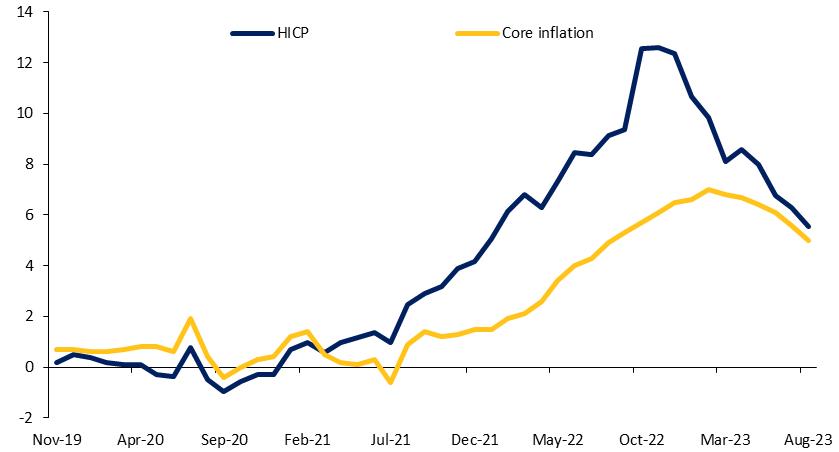
The drop in energy goods was reflected in the gradual deceleration of the harmonised index of consumer prices (HICP), which reached 5.5 percent in August, a figure in line with the Euro area that will further decrease over the last months of the year.
Core inflation (net of energy and fresh food), although with delay, followed the headline inflation dynamics: after a peak reached in February (7.0 percent), it gradually slowed down to 5.0 percent in August.
Despite the high inflation and the slowdown in business cycle, the labour market proved to be resilient. The unemployment rate reached a historically low level of 7.6 percent in July.
| FIGURE I.3: HARMONISED INDEX OF CONSUMER PRICES (% y/y) |
|
| Source: ISTAT. |
According to the Labour Force Survey (LFS), employees have exceeded 23.5 million, thus consolidating the increasing started in November 2022. Consequently, in June, the employment rate reached the maximum historical value of 61.5 percent, with a slight reduction to 61.3 percent in July.
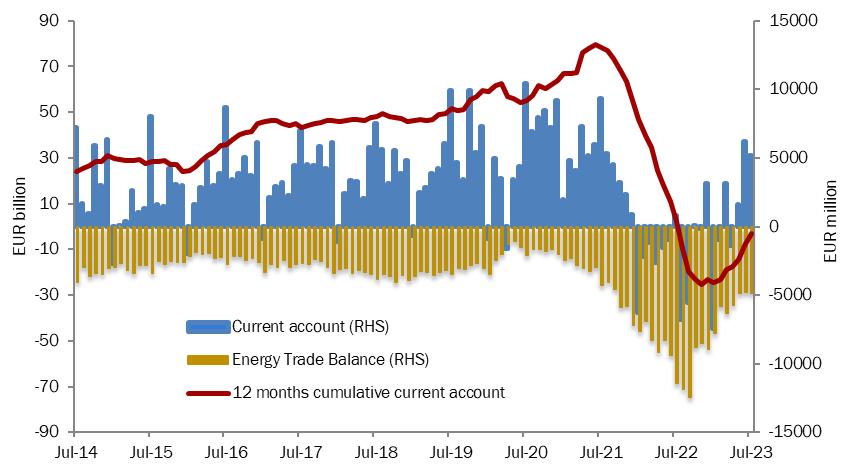
Regarding foreign trade, the combined effects of restrictive monetary policies and high inflation over the last two years are curbing global demand. Italian exports have been affected by this situation. Over the two quarters of the year, the export of goods and services experienced a cyclical fall after the strong recovery in 2021-2022 period (in which they reached a level higher than the pre-pandemic by more than 10 percentage points).
However, imports have also declined due to the slowdown of internal demand. Moreover, the mitigation of tensions in the gas market and the drop in raw materials price compared to the first half of 2022, paired with a decline in volumes, led to a marked improvement in the trade balance. Over the first seven months of the year, the Italian trade balance marked a surplus of 16.2 billion, compared to the deficit of about 15 billion in the same period of the previous year. In line with the trade balance, the current account deficit stood at -3.0 billion for the 12 months ending July, a clear improvement compared to 2022 (-23.3 billion).
| MINISTRY OF ECONOMY AND FINANCE | 3 |
| | UPDATE OF THE ECONOMIC AND FINANCIAL DOCUMENT 2023 |
| FIGURE I.4: ITALY'S BALANCE OF PAYMENTS CURRENT ACCOUNT BALANCE |
|
| Source: ISTAT. |
The internal developments of the Euro area are, among all international factors, those able to affect the Italian economy and public finance in the most relevant way. At this stage, there are dynamics like the Italian ones. Core inflation, which has marked a slowdown since March, reached 6.2 percent in August. The energy price decline and the restrictive monetary policy should favour the inflation convergence towards values consistent with price stability. The European Central Bank (ECB) foresees that the inflation rate in 2025 will decline to a level in line with the target of 2 percent.
The restrictive policies implemented by the ECB start having effects on the financial conditions and, consequently, real growth. The rise of reference interest rates is transmitting on average interest rates charged to households and companies. The credit volumes have been in contraction since the beginning of the year. Considering the current international economic framework, the consequent weakening of internal demand might not find an appropriate counterbalance in the export channel.
Despite the economy's slowdown, the Euro Area labour market conditions remain positive. The unemployment rate declined to 6.4 percent in July, a new historic low, while the increase in labour cost remains lower than consumer price increase, with a deceleration in Q2 2023 at 4.5 percent on an annual basis, from 5.3 percent on the previous quarter.
In this context, the increase of policy rates and the calm restored on financial markets after some isolated bank crises in March set the conditions for long-term interest rates to rise back to the values recorded at the beginning of the year. The market expectations for future monetary policies seem to converge towards a first cut of the ECB deposits rate, currently at 4 percent, in the next summer.
As for sovereign debts, the substantial spread stability among the Euro Area Member States suggests that yields are determined by basic common factors, firstly monetary policy.
| 4 | MINISTRY OF ECONOMY AND FINANCE |
I. RECENT TRENDS IN THE ECONOMY AND THE PUBLIC FINANCE | |
On the Italian Government bond market, in the mid-year there was a moderate reduction in the spread of 10-year BTP relative to the German Bund, which was lower than 1.7 percent on average in the June-August period. More recently, the spread upward trend led the 10-year BTP yield to above 4.5 percent, compared to an annual average of 4.2 percent (the same figures for the Bund are 2.7 and 2.4 percent).
| FIGURE I.5: YIELDS ON ITALIAN GOVERNMENT BONDS (1-YEAR BOT and 10-year BTP) |
|
Source: Bloomberg. |
As for public finance, the national accounts by institutional sector from ISTAT indicate an increase in the general government net borrowing in Q1, equal to 12.1 percent of GDP vs. 11.3 percent of the same period in 2022 (in not seasonally adjusted terms)4. However, the revenue trend was positive in the first seven months of the year, with a growth of 7.9 percent for tax revenues and 4.8 percent for social security contributions.
Moreover, according to the provisional data related to the first eight months of the year, the borrowing requirement jumped to 77 billion, with an increase of 43.3 billion vs. 33.7 billion recorded in the same period in 2022. In this comparison, it must be considered that the outcome of the previous year was favourably affected by the allocation of the first instalment of grants from the Recovery and Resilience Facility equal to 10 billion in the month of April; the payment of the third, planned for the next weeks, and of the fourth ones will help to improve the borrowing requirement.
Among the factors that negatively affect the borrowing requirement of the current year, the high amount of tax credits related to building renovations
___
4 With the exception of the last years, which should be considered out of the norm as they were marked by the pandemic, the energy crisis and the fiscal policy measures to support economy, Q1 normally records higher levels of net borrowing than the full year. As mentioned above, the net borrowing quarterly data are not seasonally adjusted.
| MINISTRY OF ECONOMY AND FINANCE | 5 |
| | UPDATE OF THE ECONOMIC AND FINANCIAL DOCUMENT 2023 |
incentives must be noted in particular; this factor also impacts the cash flow projections for future years.
| FOCUS | Inflation and price dynamic |
| The gradual reduction of inflation after the peak of 2022 |
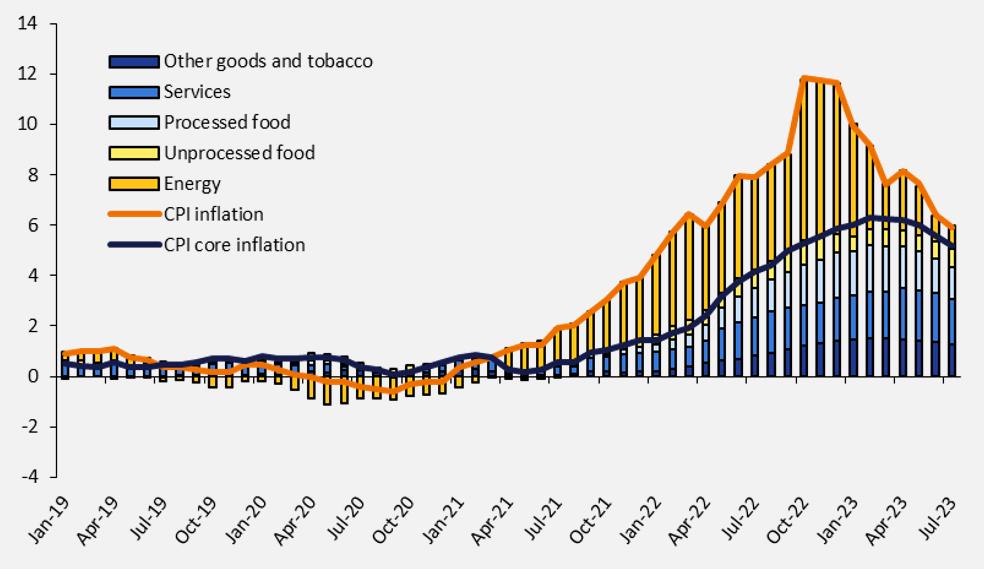
After the exceptional rise of the Italian consumer price index for the whole Nation (NIC) by 8.1 percent in 2022, inflation gradually declined to 5.4 percent in August. Core inflation (which excludes energy goods and fresh food) also declined to 4.8 percent in the same month, compared to the peak reached in 2023 (6.3 percent). In August 2023, the acquired inflation equals 5.7 percent. As is known, the inflation raises and its gradual reduction over these months reflects the decline in the price of energy raw materials, gas and oil first of all. Other elements have been added to this process. Moreover, the mitigation of the inflation dynamic in 2023 (that intensified over the last months of the year, as we will see) also benefits from the comparison with soaring prices recorded in 2022. Against this backdrop, the Government took measures to mitigate, on the first hand, the energy price and the rise of fuel prices, and, on the other hand, the exceptional impact of price growth on the households purchasing power. Starting from 2022, with the decline of gas and electricity prices, the measures extension has ever more involved those targeted to households and businesses most severely affected by economic distress, in line with the European guidelines. The measures extended over Q3 of the current year limit to the containment of bill costs, in particular through social bonuses for most vulnerable households. At the same time, targeted interventions are needed for the fourth quarter to face the rise of fuel prices observed over the last months (see the Focus ‘Recent actions taken in response to high energy prices’). After the extraordinary level reached by the price of natural gas and electricity in summer 2022, we assisted in gradually reducing gas prices, which became more significant following the EU gas price cap agreement reached in December 2022. Despite the gradual and stable price recovery, more than halved compared to 2022, the price level is still high, almost twice the average value recorded in 2015-2019 period. Such effects reflect on the trend of the consumer price index for energy goods, which, following a peak in October 2022, gradually reduced up to be slightly negative in August 20235. As for food goods, the price growth, after peaking in November 2022, recorded a slight reduction stabilising at 9.7 percent in August 2023, higher than the overall inflation. Such rises are reflected in fresh and processed food, with raises around 20 percent in the two-year period from August 2021 to August 20236. The prices of goods, net of energy and food, and services recorded more limited dynamics, however more persistent. The former accelerated in the first half of 2022 up to last February (5.5 percent) and are now gradually decelerating (4.1 percent in August). Analogously, the services, benefiting from the demand that increased after the recovery of social and recreational activities in the post-pandemic period, peaked in April 2023 (4.8 percent) and gradually declined to 3.6 percent in August. Both sectors recorded price rises of more than 7 percent in the two-year period ending in August 2023. |
___
5 Inflation reduction on energy goods was initially pushed by the decline in gas and energy prices in the regulated market which adapted to market prices more quickly. The non-regulated component, which also reflected the trend of fuel prices, contributed to inflation reduction to a lesser extent.
6 More specifically, processed food prices trend growth peaked at 15.5 percent in February 2023, and recorded a deceleration over the following months to reach 10.0 percent in August. The growth of the fresh food component, after a peak of 12.9 percent in October 2022, and several fluctuations, partly due to adverse weather conditions (draughts and floods) that negatively impacted domestic production in many Italian regions, stabilised at 9.2 percent in August.
| 6 | MINISTRY OF ECONOMY AND FINANCE |
I. RECENT TRENDS IN THE ECONOMY AND THE PUBLIC FINANCE | |
| | FIGURE R1: INFLATION AND CONTRIBUTIONS OF MAIN AGGREGATES |
| | |
| | Source: MEF elaborations on ISTAT data. |
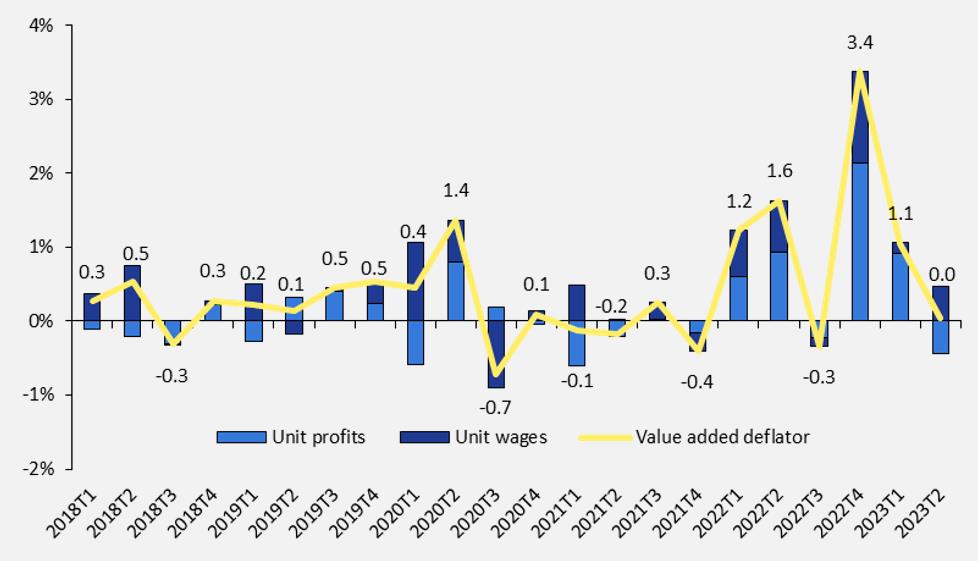
| | Regarding the single components, the higher price rise concerned reception and catering systems (6.8 percent in August, 13.9 percent in the two-year period) and, in particular, housing services (11.2 percent) and holiday packages (15.3 percent). Although in decline (-1.5 percent), transportation system prices also recorded a rise of 20.5 percent in the two-year period, while the goods and services price dynamic for ordinary house maintenance remains high (7.5 percent). Price transmission chain and inflation reduction The decline in energy prices first shifts to industrial production prices, which recorded a y/y decrease starting in April 2023 and reached -10.2 percent in July. Such a decrease also affected the price of intermediate goods, which gradually reduced from 9.9 percent in January to -4.2 percent in July 2023 also due to a minor demand. Production prices also show a slowdown in services, recording an annual growth of 2.8 percent in the second quarter, the slowest pace since the end of 2021. However, the price list adjustment following the decline of production costs occurred with some delay then, combined with the initial asymmetry in price adjustment against cost rise, drew attention to supply side analysis, in particular on the mark-up and profit share dynamics, to assess their role in internal inflationary pressures. To this end, we observe the value added deflator trend, a summary of production deflator and intermediate consumption value, which variation can be easily broken up into unit wage and profit contributions. Given such a decomposition, it is clear that in 2021 the -0.2 percent deflator decline was conditioned by lower unit profits and a slight rise in labour cost. Conversely, during 2022 the value added deflator recorded a 3.0 percent increase, and profits contributed, on average, to a greater extent to this variation, covering more than 60 percent of the overall increase. This reflects the trend of profit margins to strengthen internal pressures on prices in the period, thus actively contributing to inflation. In fact, between the first quarter of 2022 and the first quarter of 2023, the overall mark-up, after the contraction recorded over 2021, increased by 1 percent, thus favouring the 1.2 percentage points growth in the profit share, which, in turn, contributed to a variation of the output deflator (6.2 percent) higher than that of unit variable costs (5.1 percent). These dynamics suggest that the firms, following the 2021 losses and facing an inflation more |
| MINISTRY OF ECONOMY AND FINANCE | 7 |
| | UPDATE OF THE ECONOMIC AND FINANCIAL DOCUMENT 2023 |
| | persisting than expected, have modified their expectations and price strategies to hedge from further high increases in input prices and to smooth price variation over time7. It should also be noted that, in 2022, the pressure exerted by profits on prices depends on very different sectoral trends and reflects the generation of above-average profits only in few specific sectors while, for the others, the sharp rise of profits over the last year only compensated for their previous decline8. In that sense, the delay in output prices adjustment following the reduction of production costs was favoured by the businesses’ profit recovery, which, in turn, might also ensure a safeguard against partial shifting of the rise of labour cost, which usually adjusts to inflation with some delay9. |
| | FIGURE R2: VALUE ADDED DEFLATOR DECOMPOSITION (% q/q change) |
| | |
| | Source: MEF elaborations on ISTAT data. |
| | According to the latest data, a paradigm change appears to emerge in the second quarter of 2023, as the stable decline of input prices allowed the profit pressure on prices to fade, thus favouring a reduction in the output deflator. The impact on aggregate demand caused by the monetary policy tightening has also contributed to inflation reduction and will continue to do so. |
___
7 On the contrary, the initial reaction of firms to the rapid increase in input prices at the beginning of 2021 was to shift to prices only the increase in costs, reducing their mark-up to limit the effect of higher costs on demand and thus on company profits, presumably as a result of a prevailing expectation of a temporary increase in input prices. To maintain profits unchanged, and not affecting inflation, mark-up decline should compensate for the increase in costs, otherwise, the rise in costs would imply a rise in profits, although to a lesser extent (on the role of profits in internal prices pressures see, Colonna, F., Torrini, R., & Viviano, E. (2023), ‘The profit share and firm markup: how to interpret them?’, Bank of Italy Occasional Paper, (770); Hahn, E. (2023), ‘How have unit profits contributed to the recent strengthening of euro area domestic price pressures?’, Economic Bulletin Boxes, 4).
8 In detail, the sectors with the highest profit growth include the mining industry and the energy and gas supply, beside other sectors with lower increases, such as agriculture and financial and insurance services, the latter benefiting from the rise in interest rates since mid-2022. In all these sectors, the rise of unit profits contributed for more than 90 percent to the overall variation in the value added deflator in 2022; in the other economic activities, unit profits variation represented on average more than 60 percent of the deflator rise. The trade and transportation sector also showed continuous, although moderate, growth in profits over the whole period, while manufacturing sector more than made up for its initial losses as of the second half of 2022. Finally, businesses active in other services recorded a decline in margins, which on average have not yet returned to the levels prior the initial increase in costs.
9 Since the end of 2022, wages have begun to recover the losses suffered, although growing at a lower rate than prices, on average.
| 8 | MINISTRY OF ECONOMY AND FINANCE |
I. RECENT TRENDS IN THE ECONOMY AND THE PUBLIC FINANCE | |
| | Inflation projections for the current year In the following months, we expect a substantial y/y reduction in energy goods at year-end, benefiting from comparison with the prices of October 2022 when the inflation of energy goods prices peaked at 71.1 percent and recorded a growth of 26.8 percent compared to the previous month. Such comparison will result in a negative contribution of the energy component at the end of 2023 and at the beginning of 2024, with core inflation higher than overall inflation, which will stand at around 2 percent. This scenario is justified by the trend of energy raw materials prices, in sharp decline compared to the previous year (-65.2 percent of the average price of gas, -19.3 percent for oil, -58.4 percent for electricity), and it is characterised by relevant differentials in the last quarter of 2023. In contrast, in 2024, oil and electricity prices are foreseen pretty stable, while an increase of 27.3 percent is expected for gas price. Moreover, the strong fluctuations in the energy goods protected market have reduced over the last months. Regarding electricity, ARERA proclaimed stable tariffs for the third quarter of 2023 compared to the previous quarter, while the variability of gas monthly tariffs started reducing from May. The gas price on the protected market was set to 34.07 €/MWh for the August bill (down by 71 percent from the peak of 116.60 €/MWh reached in December 2022). All the above-mentioned factors suggest a sharp decline of headline inflation in the NIC index in the last quarter of 2023, probably followed by a slight increase during 2024, also due to the withdrawal of the negative contribution of the energy component. A less marked slowdown will, instead, characterise the core inflation trend due to the persistence of services component, expected to be more dynamic than overall inflation. It is worth noting that this scenario does not consider extreme weather events or unexpected international geopolitical tensions, which might affect the price, energy goods and food ones in particular. To conclude, the NIC index is expected to record an increase of 5.8 percent in 2023, to stabilise at 2.5 percent in 2024. Over the following years, 2025 and 2026, inflation is foreseen to reduce and stand at 2.0 percent. |
| FOCUS | Recent actions taken in response to high energy prices |
Over the recent months, energy goods prices have declined, though remaining at historically high levels in a context still affected by a geopolitical situation that poses several risks10. The Government has continued to support the economy with targeted interventions by prioritising the extension of measures to relieve the most vulnerable households and businesses. At the same time, it continued the phasing out of emergency measures11, thus limiting more generalised and less efficient ones which generate distortions in terms of price signals, or which are at odds with energy efficiency objectives. The set of measures extended to third quarter of 202312 is narrowed compared to those in force until the second quarter and includes the following actions:
|
| | • Containment of gas bill costs. The zeroing of system charges on gas bills and the reduction of VAT to 5 percent on the gas supply for combustion, district heating and thermal energy have been confirmed. |
| | • Social bonuses on electricity and gas bills. Their reinforcement has been extended as well as the raise of the ISEE threshold for large households to be eligible to the bonuses, from EUR 20,000 to EUR 30,000. Such bonuses, in force for years, are a structural measure of a very flexible and targeted nature. Therefore, their strengthening proved to be an essential and efficient tool for supporting the most fragile households. |
___
10 See Focus ‘Inflation and Price Dynamic’.
11 Further details on the measures adopted in the 2021-2023 period are available in the Focus of the Update of the 2022 Stability Program and in the one of the 2023 Stability Program.
12 Adopted by Decree-law No. 48/2023 and Decree-law No. 79/2023.
| MINISTRY OF ECONOMY AND FINANCE | 9 |
| | UPDATE OF THE ECONOMIC AND FINANCIAL DOCUMENT 2023 |
| | • Fringe benefits. Amounts paid or reimbursed by employers to employees with dependent children for utility payments are included among the fringe benefits which can be excluded from taxable income up to a cap of EUR 3,000. |
| | To these measures, add those valid in the whole 2023 and related to the bill instalment plans and favoured public guarantee schemes for businesses. On the other hand, in the third quarter of the current year, tax credits for businesses on expenses incurred to purchase electricity and gas were not extended. However, they were valuable during the most challenging crisis stage in 2022, while the need for these instruments has gradually diminished, as energy prices have eased. On 25 September, the Council of Ministries approved a Decree-law indicating the measures for the fourth quarter of 2023. The decree provides for the extension of containment measures on gas bills and the strengthening of social bonuses, supplemented by an extraordinary contribution; in addition to the previous, the Decree also introduces a subsidy for fuel purchases in support of disadvantaged households. This action would allow to tackle the recent hike in fuel prices in a targeted way, rather than repeat the excise duties cuts as in 2022, being a generalised and regressive measure from a distributional point of view, which may cause distortions concerning the relative prices of fossil fuels and discourage environmentally virtuous behaviours. Following updates, the energy package for 2023 amounts to about 25.7 billion13 (1.3 percent of GDP), representing less than half of the amount in 2022, equal to 53.8 billion (2.8 percent of GDP). Net of the higher revenue expected from energy related discretionary revenue measures, namely the levy on the earnings of renewable energy producers and the windfall profits tax14 of energy businesses, the energy package amounts to approximately 22.2 billion (1.1 percent of GDP). From a qualitative point of view, more than half of the resources (56 percent) allocated in 2023 are employed in targeted measures to support the most vulnerable households and businesses. The share increases significantly compared to 46 percent in 2022, although it was already exceptionally high against the European average. The Government reiterates its goal to completely wind down such temporary and emergency measures by 2024 and allocate the amounts resulting from this operation to the primary budget balance, in line with the recommendations of the European Union. |
___
13 The estimate is affected by the repeal of the so-called 'heat bonus' provided for by Decree-law No. 34/2023 in the event of a gas price increase in the fourth quarter of 2023. In addition, the cut in employee social security contributions effective in the second half of 2023 (decree-law No. 48/2023) is not included in the package, unlike other contribution reductions, of an emergency nature, adopted previously. The purpose of the measure is to protect the disposable income of workers with low and medium incomes, not in an emergency context, but at a time when the adjustment of contractual wages to inflation would place a too heavy burden on firms. The motivation for the intervention is thus the moderation of labour costs for firms, an objective that will also be pursued in the medium term, not ascribable to emergency interventions.
14 See Focus in 2023 Stability Program for further details. Decree-law No. 61/2023 repealed the change introduced by Decree-law No. 34/2023, which implied a reduction of the tax base for the tax on windfall profits.
| 10 | MINISTRY OF ECONOMY AND FINANCE |
II. BASELINE MACROECONOMIC AND BUDGET FORECAST
| II.1 | MACROECONOMIC SCENARIO UNDER EXISTING LEGISLATION |
As previously stated, with the recent update of the National Economic Accounts for 2020-2022, ISTAT revised upwards the real GDP growth in 2021 at 8.3 percent (previously 7.0 percent) and confirmed 3.7 percent for 202215, proving the strong recovery of the Italian economy after the pandemic period. Therefore, the GDP level in 2022 resulted higher. More specifically, the GDP at current prices in 2021 is 34.7 billion higher than that estimated in April, with an upward variation (+2.1 percentage points) in growth rate compared to the previous year (from 7.6 percent to 9.7 percent).
The real GDP variation rate in the same year is revised for an upward adjustment in the components of internal demand (excluding the general government expenditure), while no significant revisions were recorded in the net foreign component. In terms of supply, an improvement in the dynamic of industry and an enhancement of services were recorded in the same year; the revision of the trade, accommodation and catering sector reflected in 0.7 GDP points of the whole revision.
As mentioned, over 2023, economic growth slowed down. In the new existing legislation scenario, real GDP growth for the current year stands at 0.8 percent, from 1.0 percent previously stated in the Stability Program policy scenario. Primarily because of the carry-over effect stems for the current slowdown, the revision is wider in 2024, shifting from 1.5 percent to 1.0 percent. Projected growth remains unchanged for 2025, with marginal upward projections made in the last year. As for 2023 only, the GDP deflator variation is also revised downwards. This is connected with a much lower-than-expected economic figure in the second quarter.
In detail, having acquired GDP and component levels in the first half of the year, the projected growth profile for the current year reflects only a slight expansion in the activity of the last two quarters, mainly supported by the recovery in industry and services.
The projected GDP variation in the year's second half would allow the start of 2024 with relatively low acquired growth (0.3 percentage points). However, the recovery is expected to continue in the remaining quarters, enhanced by the boost to private investment provided by the National Recovery and Resilience Plan (RRP) and the return of inflation to the ECB's statutory target. The revision of the GDP
___
15 In line with the statistical revision policy recommended by the European Commission for EU Member States, on 22 September 2023, ISTAT issued an update of the National Economic Accounts for the three-year period 2020-2022, revising the estimates made in April after the introduction of new statistical sources related to the economic accounts of businesses. The extent of the revision resulted to be exceptional for 2021 and similar situations have occurred also in other countries. As for 2022, the level of nominal GDP has not been affected by revisions of the growth rate, although it resulted to be 37.3 billion higher than that estimated in April. Further details are available in the ISTAT press release (https://www.istat.it/it/archivio/288173).
| MINISTRY OF ECONOMY AND FINANCE | 11 |
| | UPDATE OF THE ECONOMIC AND FINANCIAL DOCUMENT 2023 |
growth estimate compared to the Stability Program is explained not only by the negative figure of the second quarter of 2023 but also by the deterioration of the international scenario.
The growth forecast for foreign trade relevant to Italy has been revised downwards for the current year, where a contraction is expected, and for 2024. In contrast, in the final two-year forecast period, the dynamic is livelier.
As far as energy prices are concerned, the profile traced by natural gas futures contracts TTF is higher than what is expected in the Stability Program16 except for 2023. The same applies to expected Brent oil prices.
Due to the ECB's monetary policy decisions, short-term interest rates are higher for this year and 2024, with no significant change in long-term yields.
Finally, the EUR exchange rate is less competitive than the levels used for the Stability Program forecasts.
At the same time, with the update of the projections on using the funds linked to the RRP, their allocation over time was reshaped, resulting in a more significant expenditure in the final years of the Plan, starting in 2024.
As for the detail of the revision, investment - although supported by RRP-related funds - will be less dynamic in the short term than projected in the Stability Program, due to worsening in credit conditions and rising prices. Household consumption is subject to a more moderate revision and will resume growing in the second half of 2023, thanks to a gradual recovery in purchasing power allowed by the deceleration in inflation. The latter is expected to fall sharply in fourth quarter of this year, as price levels for energy goods will compare with those of the last months of 2022 when they peaked. Core inflation, confirming the downward path, would show a less pronounced slowdown, due to the persistence of prices in the services sector, which will be above overall inflation in 2024.
Labour cost growth, which reflects the rise in inflation with a lag given the contractual wage adjustment mechanisms, is expected at 4.0 percent this year (3.1 percent in the Stability Program), slowing to 2.3 percent in 2024, in line with the previous forecast.
Concerning the labour market, employment is revised upwards for the current year, together with a decline in the unemployment rate. From 2024 employment growth would decelerate, affected by the broader slowdown expected for GDP. Employment growth, measured in full time equivalent, has been adjusted upwards by 0.4 percentage points, to 1.4 percent, in 2023 before falling to 0.6 percent (previously 1.1 percent) in 2024. The unemployment rate is expected to fall from an average of 7.6 percent in 2023 to 7.2 percent in 2026.
Finally, the current account is expected to be in surplus from 2023 to 2026, benefiting from the recovery of the terms of trade.
The growth outlined here is based on a prudential approach: the scenario presented takes into account the risks associated with the forecasts, in particular those related to the implications that a complex geopolitical framework, the central banks' stance and the slowdown in world trade may exert on the choices of
___
16 TTF stands for the Title Transfer Facility, a virtual gas market operated by the Dutch company Gasunie. The price determined there is considered the main reference for the European market. Gas traded on the TTF must have already entered the Gasunie transmission system and all trades between counter parties must be reported to the market operator. Futures on the TTF are traded on the Intercontinental Exchange (ICE).
| 12 | MINISTRY OF ECONOMY AND FINANCE |
II. BASELINE MACROECONOMIC AND BUDGET FORECAST | |
households and businesses. However, it should be emphasised that, since the scenario presented is at existing legislation, possible economic policy interventions may represent a factor supporting growth and mitigating the risks to which the economy is exposed.
This chapter describes risk scenarios for the main exogenous variables in the forecast, relating to world trade, Italy's competitiveness, energy commodity prices and financial market conditions (see Focus 'A risk (or sensitivity) analysis on exogenous variables').
The macroeconomic forecast under existing legislation for 2023 and 2024 was validated by the Parliamentary Budget Office in a note dated 21 September 2023, at the end of the discussions provided for in the PBO-MEF Memorandum of Understanding of 13 May 2022.
| TABLE II.1: MACROECONOMIC SCENARIO UNDER EXISTING LEGISLATION (% change, unless otherwise specified) |
| | 2022 | 2023 | 2024 | 2025 | 2026 |
| INTERNATIONAL EXOGENOUS VARIABLES | | | | | |
| World Trade | 5.6 | 0.6 | 2.7 | 4.8 | 4.0 |
| Oil price (Brent. USD/barrel. futures) | 101.0 | 81.6 | 81.4 | 77.5 | 74.4 |
| USD/EUR exchange rate | 1.053 | 1.085 | 1.085 | 1.085 | 1.085 |
| ITALY MACRO DATA (VOLUMES) | | | | | |
| GDP | 3.7 | 0.8 | 1.0 | 1.3 | 1.2 |
| Imports of goods and services | 12.4 | 0.1 | 3.1 | 4.1 | 3.7 |
| Domestic final consumption | 3.9 | 1.1 | 0.6 | 0.9 | 1.0 |
| Private consumption expenditure | 5.0 | 1.3 | 1.0 | 1.0 | 1.1 |
| Government consumption expenditure | 0.7 | 0.6 | -0.6 | 0.9 | 0.4 |
| Gross fixed capital formation | 9.7 | 1.0 | 2.8 | 2.3 | 1.9 |
| - machinery. equipment and intangible assets | 8.1 | 2.0 | 2.5 | 2.4 | 1.8 |
| - transportation means | 7.4 | 14.0 | 3.3 | 2.4 | 2.4 |
| - constructions | 11.4 | -1.3 | 2.9 | 2.2 | 2.0 |
| Exports of goods and services | 9.9 | 0.7 | 2.4 | 4.3 | 3.5 |
| | | | | | |
| Memo item: current account balance (% of GDP) | -1.2 | 0.8 | 1.3 | 1.8 | 1.9 |
| CONTRIBUTIONS TO GDP GROWTH (1) | | | | | |
| Net exports | -0.5 | 0.2 | -0.2 | 0.1 | 0.0 |
| Inventories | -0.8 | -0.3 | 0.1 | 0.0 | 0.0 |
| Domestic Demand (excl. inventories) | 5.0 | 0.9 | 1.1 | 1.2 | 1.1 |
| PRICES | | | | | |
| Imports of goods and services deflator | 21.4 | -5.4 | -0.2 | 0.7 | 1.5 |
| Exports of goods and services deflator | 11.0 | 2.5 | 1.8 | 1.5 | 1.5 |
| GDP deflator | 3.0 | 4.5 | 2.9 | 2.1 | 2.0 |
| Nominal GDP | 6.8 | 5.3 | 3.9 | 3.4 | 3.2 |
| Private consumption deflator | 7.2 | 5.6 | 2.4 | 2.0 | 2.0 |
| | | | | | |
| LABOUR MARKET | | | | | |
| Compensation of employees per FTE | 3.2 | 4.0 | 2.3 | 2.1 | 1.8 |
| Labour productivity (measured on GDP) | 0.2 | -0.5 | 0.4 | 0.3 | 0.3 |
| Unit labour cost (measured on GDP) | 3.0 | 4.6 | 1.9 | 1.8 | 1.4 |
| Employment (FTE) | 3.5 | 1.4 | 0.6 | 1.0 | 0.8 |
| Unemployment rate | 8.1 | 7.6 | 7.4 | 7.3 | 7.2 |
| Employment rate (age 15-64) | 60.1 | 61.2 | 61.9 | 62.7 | 63.6 |
| Memo item: Nominal GDP (absolute values in EUR million) | 1,946,479 | 2,050,599 | 2,130,484 | 2,203,066 | 2,274,049 |
(1) Any inaccuracies are due to rounding. (2) Source: ISTAT. GDP and components in volume (chained linked values in reference year 2015), not seasonally adjusted data. |
| MINISTRY OF ECONOMY AND FINANCE | 13 |
| | UPDATE OF THE ECONOMIC AND FINANCIAL DOCUMENT 2023 |
| FOCUS | The revision of estimates for 2023 and following years17 |
In line with the previous Documents, this Focus analyses the main factors on which the macroeconomic forecast revision for 2023-2024 was made compared to the forecasts presented in the 2023 Stability Program. First of all, the Update takes into account latest information on the Italian economic trend for the current year concerning the quarterly national accounting data now available for the first two quarters of the year and the new perspectives deriving from the international scenario. The figures in the table relate to seasonally adjusted data corrected for working days. The main factors underlying the macroeconomic forecast revision for 2023-2024 are shown in Table R.1. The first two columns compare the GDP growth estimates and their components for 2023 as stated in the Update and the Stability Program, while the third column presents the delta between the two (Delta 2023). The GDP growth forecasts for the current year are revised downwards to 0.2 percentage points compared to the Stability Program. The revision was broken down into i) economic activity trend, which is slightly worse than the average expected by the forecasts of the 2023 Stability Program; ii) substantially unchanged impact of the change of exogenous variables; iii) marginal downward revision of the estimates for the second half of 2023. Unlike what was estimated in April, in the first quarter of the year a higher increase in economic activity was recorded, though followed by a higher decline than expected, thus resulting in a lower acquired growth in the first semester. The growth profile in the second part of the year was revised downward compared to the Stability Program, given the evolution of the latest cyclical data and the uncertain evolutions of the international context. The consumption deflator growth remained broadly unchanged, while that of the GDP deflator was revised upwards due to the improvement in terms of trade. The following columns show the deviation between the current and April forecasts for 2024. In this case, the delta of the growth forecast is -0.5 percentage points. The GDP growth estimate is revised downwards, given the lower carry-over effect from 2023 and the negative impact of the update of exogenous variables. The new assumptions related to the international context are, in fact, less favourable than those assumed in the last Stability Program. The deterioration in the international environment negatively impacts growth in the next two years but makes a positive contribution in the final year of the forecast (Table R.2). Compared to the Stability Program, the estimates on the foreign demand trend (weighted by the geographical composition of Italian exports)18 for 2023 have been significantly revised downwards, and lower growth is expected also in 2024, followed by a more marked recovery in 2025-2026. Consequently, the impact of global demand on Italian exports, and therefore on GDP, is negative in the current year (-0.1) and in 2024 (-0.4) and positive in subsequent years (0.1 in 2025 and 2026). The development of the nominal effective exchange rate negatively affects the export growth forecast due to the appreciation of the euro. A technical assumption was adopted for the currency projection, which implies that the exchange rate remains fixed at the average value of the last 10 working days ending 31 August. The update of the nominal effective exchange rate compared to April sees an appreciation of the euro against other currencies of 3.0 |
___
17 This Focus refers to the data of quarterly economic accounts (adjusted for working days) issued by ISTAT on 1 September. The quarterly series in line with the annual national accounting figures revealed on 22 September will be published on 4 October. The changes made on the demand components might affect the 2023 drag-along effect.
18 Please note that projections of GDP and international trade trends at the global level are from Oxford Economics.
| 14 | MINISTRY OF ECONOMY AND FINANCE |
II. BASELINE MACROECONOMIC AND BUDGET FORECAST | |
| | percent in 2023 and 0.9 percent in 2024. The resulting macroeconomic impact is negative in both years and zero in the following two years, as the nominal effective exchange rate is unchanged. |
| | TABLE R1: MAIN VARIABLES OF THE MACROECONOMIC FORECAST (seasonally adjusted data) |
| | | 2023 Forecast | of which: revision acquired on 1 Sep 2023 | of which: Impact of Exogenous factors vs Stability Program | of which: revision of the forecas | 2024 Forecast | of which: Impact of Exogenous Factors | of which: other factors for the forecast revision |
| | | Update 2023 | Stability Program 2023 | Delta 2023 | Delta (1) | Delta (2) | Delta (3) | Update 2023 | Stability Program 2023 | Delta 2024 | Delta (1) | Delta (2) |
| | ITALY MACRO DATA | | | | | | | | | | | |
| | GDP | 0.9 | 1.1 | -0.2 | -0.1 | 0.0 | -0.1 | 0.9 | 1.4 | -0.5 | -0.6 | 0.1 |
| | Households expenditure | 1.3 | 0.7 | 0.6 | 0.8 | 0.2 | -0.4 | 1.0 | 1.3 | -0.3 | 0.0 | -0.3 |
| | Government expenditure | 0.6 | -1.3 | 1.9 | 1.1 | 0.0 | 0.8 | -0.6 | -1.2 | 0.6 | 0.0 | 0.6 |
| | Gross fixed capital formation | 1.0 | 3.8 | -2.8 | -2.8 | 0.1 | 0.0 | 2.7 | 3.4 | -0.7 | -1.3 | 0.6 |
| | Machinery, equipment and others | 2.0 | 5.3 | -3.2 | -2.9 | 0.1 | -0.4 | 2.5 | 3.5 | -1.0 | -1.7 | 0.7 |
| | Constructions | -1.3 | 2.3 | -3.6 | -3.9 | 0.0 | 0.3 | 2.9 | 3.3 | -0.4 | -0.9 | 0.5 |
| | Exports of goods and services | 0.7 | 3.2 | -2.4 | -2.0 | -0.8 | 0.4 | 2.4 | 3.7 | -1.3 | -1.8 | 0.6 |
| | Imports of goods and services | 0.1 | 2.5 | -2.4 | -2.8 | -0.2 | 0.7 | 3.1 | 3.8 | -0.7 | -0.3 | -0.4 |
| | Deflators | | | | | | | | | | | |
| | GDP deflator | 4.5 | 4.8 | -0.3 | -0.7 | -0.1 | 0.5 | 2.9 | 2.7 | 0.1 | 0.0 | 0.1 |
| | Private consumption deflator | 5.6 | 5.7 | -0.1 | -0.2 | -0.7 | 0.7 | 2.4 | 2.7 | -0.2 | 0.4 | -0.6 |
| | |
| | The current year's oil price is lower than the Stability Program projections, while the futures price rises slightly from 2024 to 2026, thus negatively affecting consumer and domestic demand prices in the last two years of the forecast19. Following what has been outlined in the latest planning Documents, the gas price20 is also considered among the exogenous variables. The latter remains at lower levels than those previously projected for the current year while exceeding the Stability Program projections for the following years. Together, the effects of oil and gas price rises result in a positive impact on GDP of 0.3 percentage points in 2023 and 0.1 percentage points in 2024, and in a cumulative negative effect of 0,4 percentage points in the 2025-2026 period. |
___
19 The current projections based on futures contracts, refers to the average of the last 10 working days, ending 31/08/2023.
20 The assumptions made concern the TTF gas price profile and are based on futures contracts. As for Brent, reference is made to the average of the last 10 working days ending 31/08/2023.
| MINISTRY OF ECONOMY AND FINANCE | 15 |
| | UPDATE OF THE ECONOMIC AND FINANCIAL DOCUMENT 2023 |
| | Finally, variations also appear in government bond yields. In line with the tighter policies adopted by monetary authorities to tackle inflationary pressures, higher short-term rates are expected as early as this year, along with higher bank credit costs for the current year and in 2024, when they are expected to peak. In contrast, the increase in long-term bonds is more modest. The econometric model estimates these factors to harm growth in 2024, to be neutral in 2025 and to have a marginally positive effect in 2026. |
| | TABLE R2: EFFECTS ON GDP OF THE INTERNATIONAL SCENARIO COMPARED TO THE 2023 STABILITY PROGRAM (impact on growth rates) |
| | | 2023 | 2024 | 2025 | 2026 |
| | 1. World trade | -0.1 | -0.4 | 0.1 | 0.1 |
| | 2. Nominal effective exchange rate | -0.2 | -0.2 | 0.0 | 0.0 |
| | 3. Oil and gas prices | 0.3 | 0.1 | -0.3 | -0.1 |
| | 4. Interest rate assumptions | 0.0 | -0.1 | 0.0 | 0.1 |
| | Total | 0.0 | -0.6 | -0.2 | 0.2 |
| | Note to the Total: any inaccuracies result from rounding. Source: MEF elaborations. |
| | |
| | The most up-to-date estimates by international institutions estimate a GDP growth of around 1 percentage point for the current year, thus above the forecast in the macroeconomic existing legislation scenario. However, some of these exclude the downward revision of GDP made by ISTAT with the release of the data relative to the second quarter of 2023. In 2024, the existing legislation forecast is marginally higher than the average of the other forecasters. |
| | TABLE R3: GROWTH FORECAST FOR ITALY |
| | Real GDP (percent y/y) | Forecast Date | 2023 | 2024 |
| | UPDATE 2023 | Sep-23 | 0.8 | 1.0 |
| | European Commission | Sep-23 | 0.9 | 0.8 |
| | OECD | Sep-23 | 0.8 | 0.8 |
| | PBO | Aug-23 | 1.0 | 1.1 |
| | IMF (WEO) | Jul-23 | 1.1 | 0.9 |
| | (*) OECD: data adjusted for working days. |
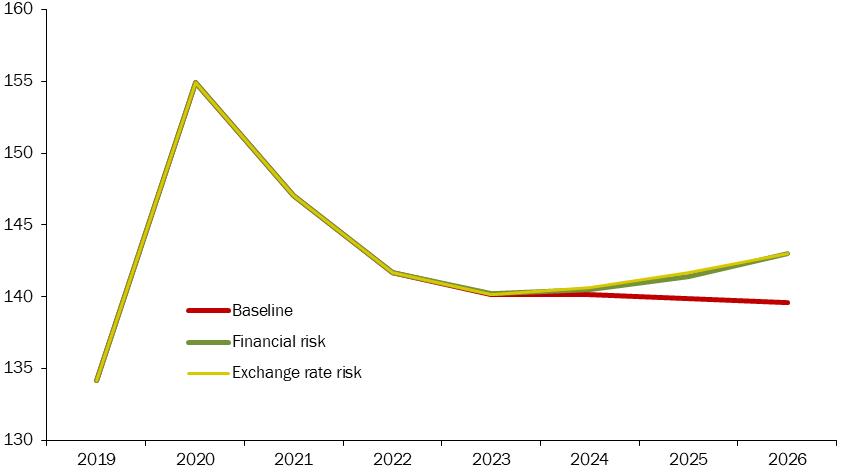
| FOCUS | A risk (or sensitivity) analysis on exogenous variables |
The previous pages describe the evolution of international exogenous variables over the forecast horizon, showing how they contribute to shaping the perspectives for the Italian economy in the existing legislation scenario. The reference international state shows further deterioration in the current year and in 2024, compared to the forecasts of the Stability Program (April 2023). Geopolitical tensions, the restrictive stance of monetary policies, the less vigorous than expected recovery in the Chinese economy, and the weak output trend in Europe contribute to shaping a weak international scenario, at least in the short-medium term. Each of these elements, as others not mentioned here, is subject to an evident uncertainty degree in intensity and persistence, thus configuring risk factors for the evolution of international scenario variables. It is, therefore, appropriate to assess their impact on the existing legislation macroeconomic scenario to capture, at least in part, the uncertainty surrounding the forecasts. Consequently, we examine certain assumptions, less favourable than those prefigured in the baseline scenario, regarding the evolution of international exogenous variables: world trade, exchange rates, oil prices and financial market conditions. |
| 16 | MINISTRY OF ECONOMY AND FINANCE |
II. BASELINE MACROECONOMIC AND BUDGET FORECAST | |
| | Simulation exercises were carried out for each risk factor using either the ITEM econometric or MACGEM-IT models. The first alternative scenario is related to the development of global demand. This would be less buoyant than in the baseline scenario as of the first quarter of 2024. It is assumed that, after the 1.5 percent drop in 2023, the rebound in global demand (weighted according to trade with Italy) in 2024 would be weaker than in the baseline, with a growth rate of 1.7 percent instead of 2.2 percent. Even in the following two years, the increase in global demand would be more contained, at 3.4 percent in 2025 and 2.5 percent in 2026, compared to 4.4 percent and 3.5 percent, respectively, in the baseline scenario. As for exchange rates, the baseline scenario adopts the usual technical assumption of keeping them unchanged over the forecast horizon at the average levels of the most recent daily quotations (in particular, the listings of the last ten working days of August 2023 were considered). In the alternative scenario, exchange rate levels are assumed to be equal to those recently observed for forward exchange rates on different maturities. This implies a smaller appreciation of the euro against the dollar in 2023 compared to the baseline scenario (2.8 percent instead of 3.0 percent) and a slight appreciation in 2024 compared to an imperceptible depreciation in 2024 in the baseline scenario (0.3 percent instead of -0.1 percent). In 2025 and 2026, the euro would appreciate against the dollar by 0.6 and 0.2 percent, respectively, against an unchanged value of the euro against the dollar in both years in the baseline scenario. Against the other currencies in this scenario, there is a more noticeable appreciation of the euro relative to the baseline scenario. In particular, while in 2023, the appreciation of the nominal effective exchange rate would be the same in the two scenarios, in 2024, it would be greater than in the baseline scenario (by 1.8 percent instead of 0.9 percent). In 2025 and 2026, the change in the effective exchange rate would be 1.9 and 1.0 percent, respectively, compared to a zero annual change in the baseline scenario. The third risk scenario contemplates increased upward pressure on oil prices as OPEC+ countries reduce crude oil supply in 2023 and early 2024. As the International Energy Agency pointed out, production cuts by OPEC+ members have so far been offset by increased supplies from other producers, particularly the US, Brazil and Iran. From September onwards, further production cuts by OPEC+ will lead to a significant drop in supply in the fourth quarter. This will increase the risk of further increases in price volatility. It was, therefore, assumed that oil prices will be 20 percent higher in 2024 than the hypotheses underlying the macroeconomic forecasts21. In 2025 and 2026, prices would be 10 percent and 5 percent higher, respectively, thus gradually returning towards the prices outlined in the baseline macroeconomic scenario. The fourth scenario refers to risk elements of the forecast associated with the financial conditions of the economy. In particular, for 2024-2026 the 10-year BTP yield rate and the BTP - Bund spread levels were assumed to be 100 basis points higher than in the baseline scenario. This alternative hypothesis aims to capture the risk of deteriorating conditions in the financial markets, which would induce banks to tighten requirements for lending to households and businesses by setting higher interest rates. Table R.1 reports the estimates of how the risk elements inherent in the reference international context may affect the levels of economic activity in the existing legislation scenario. The assumption of a weaker trend in world trade from 2024 and throughout the forecast horizon would have a limited negative impact on the GDP growth rate in 2024, which would be only 0.1 percentage points lower than in the baseline scenario and only slightly more pronounced in the years 2025 and 2026 (-0.2 compared to the baseline scenario). |
___
21 The percentage reflects the range between the average and the maximum oil price as estimated by Consensus Forecasts in September 2023.
| MINISTRY OF ECONOMY AND FINANCE | 17 |
| | UPDATE OF THE ECONOMIC AND FINANCIAL DOCUMENT 2023 |
| | The scenario with a higher appreciation of the euro against other currencies would reduce the GDP growth rate, relative to the baseline scenario, by 0.3 percentage points in 2024, 0.5 points in 2025 and 0.3 percentage points in 2026. The more unfavourable oil price trend in the risk scenario leads to a decrease in the GDP growth rate by 0.4 percentage points in 2024 compared to the baseline scenario, while, in 2025 and 2026, a reverse of the negative impact is recorded with an improvement in the output growth rate compared to the baseline scenario by 0.2 and 0.1 percentage points, respectively. Finally, in the scenario in which financial conditions are expected to be more restrictive than in the baseline scenario starting from 2024, there would be a negative effect on the growth profile of the Italian economy. The rate of change in output would be 0.1 percentage points lower than in the baseline scenario in 2024 and 0.4 and 0.5 points lower in 2025 and 2026, respectively. |
| | TABLE R1: EFFECTS OF RISK SCENARIOS ON THE GDP (% impact on growth rates) |
| | | 2023 | 2024 | 2025 | 2026 |
| | 1. World trade | 0.0 | -0.1 | -0.2 | -0.2 |
| | 2. Nominal effective exchange rate | 0.0 | -0.3 | -0.5 | -0.3 |
| | 3. Oil and gas prices | 0.0 | -0.4 | 0.2 | 0.1 |
| | 4. Interest rate assumptions | 0.0 | -0.1 | -0.4 | -0.5 |
| II.2 | BUDGETARY OUTLOOK UNDER EXISTING LEGISLATION |
The outlook of public finance presented in this Update considers the changes in the baseline macroeconomic scenario. The downward revision of economic growth, by about 2-tenths of a percentage point in 2023 and 5-tenths in 2024, implies less dynamism in the revenue profile. It should also be noted that the collection of more complete and detailed information led to a further upward revision of tax credits related to Superbonus and external redecoration scheme - so called ‘bonus facciate’ - (allowance to refurbish the façades of a building). On 22 September 2023, ISTAT revised the cost of the two incentives for 2022 upwards from 2.6 to 2.8 percent of GDP. Meanwhile, this Update also revises the existing legislation forecast of deficit in 2023 upwards by 0.7 percentage points of GDP compared to the target set in the Stability Program by including new estimates of the Superbonus cost coming from monitoring activity (+1.1 percent of GDP). In the absence of the revised Superbonus cost, the planned 2023 target would have been more than achieved.
Tax revenues at existing legislation are expected to rise in the current year to 29.3 percent of GDP and then fall in the following three years, reaching 28.3 percent in 2026. Social security contributions as a ratio to GDP will fall to 13.1 percent in the current year and remain broadly stable at an average of 13.6 percent in the following three years.
Inflation significantly affects public expenditure in the current year and in 2024, mainly due to the indexation of pensions to the previous year's inflation rate, as measured by the consumer price index. The macroeconomic scenario assumes a slowdown in price growth from 2024 onwards. Consistently, social payments under existing legislation scenario will increase by 5.9 percent in 2024 and will grow at a
| 18 | MINISTRY OF ECONOMY AND FINANCE |
II. BASELINE MACROECONOMIC AND BUDGET FORECAST | |
lower rate, 2.5 percent per year on average, in the two-year period 2025-2026; in the same period, pension growth is 7.3 percent in 2024 and is expected to slow to an average rate of 3.0 percent in 2025-2026. Against this trend, social payments as a ratio of GDP will peak at 21.1 percent in 2024 and decline to 20.7 percent in 2026.
In 2023, the level of interest expenditure at existing legislation will decrease compared to 2022 due to a lower revaluation of securities indexed to past inflation as a result of the progressive reduction in the inflation rate at national and Euro Area level. Progressive increases in interest expenditure will follow in the years 2024-2026 due to the rise in the cost of debt on new issuances, while the expenditure component linked to inflation-indexed securities will continue to shrink due to the decline in inflation.
The dynamics of public investment is affected by the new assumptions on expenditure flows financed with RRF grants and loans, revised downwards in 2023 and to a lesser extent in 2024 and then more concentrated in 2025 and 2026. The effect of the new hypotheses implies a ratio of gross fixed investments to GDP of 2.9 percent and 3.2 percent in 2023 and 2024, respectively, and then 3.4 percent in 2025 and 3.2 percent in 2026.
The capital transfers are also affected by the higher budgetary impact of the Superbonus resulting from the latest monitoring data. According to the new accounting criteria adopted by ISTAT in March, in agreement with Eurostat, the higher cost that emerged is recorded within this expenditure item in 2023 for the total amount. Furthermore, a reclassification of the tax credits related to the Superbonus from payable to non-payable is made for the following two-year period.
Given these projections and taking into account the upward revision of the level of nominal GDP in 2021 and 2022 made by ISTAT and those made to the estimates of the general government account22, the primary balance at existing legislation is projected to improve to -1.4 percent of GDP in 2023, from -3.8 percent in 2022.
In 2024, the primary balance would return to surplus at 0.6 percent of GDP, a level higher than the 0.4 percent projected in April. The primary surplus would gradually strengthen, reaching 0.9 percent of GDP in 2025 and then 1.4 percent of GDP in 2026 (compared to a target of 2.0 percent expected in April).
Interest expenditure as a ratio to GDP is projected to fall to 3.8 percent in 2023 and then rise again to 4.6 percent in 2026. In terms of the ratio to GDP, the upward revision compared with the estimates in the Stability Program is limited, amounting to one-tenth of a point of GDP per year until 2026; this confirms the fact that the long average maturity of Italy's public debt allows the impact of interest rates rises on the implicit cost of debt to be smoothed over time, including those not expected when the Stability Program was drawn up.
To summarise these projections, the general government net borrowing at existing legislation is foreseen to fall to 5.2 percent of GDP in 2023, 3.6 percent in 2024, 3.4 percent in 2025 and 3.1 percent in 2026.
These forecasts are higher than the targets set in the Stability Program over the entire forecast horizon, except for 2024, where the estimate at existing legislation is slightly below the target. As explained, the upward revision of interest
___
22 ISTAT, ‘National Economic Accounts’, 22 September 2023.
| MINISTRY OF ECONOMY AND FINANCE | 19 |
| | UPDATE OF THE ECONOMIC AND FINANCIAL DOCUMENT 2023 |
expenditure forecast, the reshaping of spending financed by RRP funds, the higher costs that emerged for building renovation bonuses and the slowdown in economic growth, expected in particular for the current year and for 2024, contribute to the revision.
In the existing legislation scenario, the debt-to-GDP ratio is expected to fall to 140.0 percent in 2023 from 141.7 percent in 2022. These levels are lower than the targets set in the Stability Program due to the improvement stemming from the revisions made by ISTAT on the preliminary estimates of the national accounts. According to recent estimates, the debt-to-GDP ratio would fall to 139.7 percent in 2024 and then stabilise at 140.1 percent in 2025-2026.
It should be noted that the projected flow of tax credits related to building renovation incentives, which will further increase due to the growth in costs revealed by the monitoring of public accounts, will contribute to raise the borrowing requirement23. Without such an impact, even in the public finance scenario at existing legislation, the projection would show a continued decline in the debt-to-GDP ratio.
| FOCUS | Superbonus 110: revision of its impact on public finances |
This Update of the Stability Program revises upwards by 0.7 percentage points of GDP the existing legislation forecast of deficit for 2023 compared to the Stability Program target by including new assessments on the cost of the Superbonus scheme for the current year based on monitoring activities outcomes (+1.1 percent of GDP). One of the main goals of this Focus is to show the dynamics which led to a progressive upward revision in calculating the costs connected to this bonus. Given that the revision does not concern only the deficit, but in future years an additional burden is expected also in terms of the cash flow, the final part of this review focuses on the consequences on public debt dynamics. |
| | Regulatory developments and the use of Superbonus scheme |
| | The measure's impact over time can be imputable to different factors affecting the changes observed regarding both the number of interventions and expenditures incurred. After establishing the Superbonus24, the subsequent regulatory interventions have affected both the propensity to request the benefit and the ability of the system to absorb the high amount of tax credits gradually generated. These measures, further extended by the 2022 budget law until 2025, although at decreasing rates over time, had led to a large number of accession requests, as reported by the monitoring carried out. The sole limitation lies in the capacity of the building sector to fulfil such requests. Already in the Update of the 2022 Stability Program, the forecasts at existing legislation were revised to consider the allowances increasing trend. However, in the absence of a ceiling for the measure, the expenditure increase did not stop. The current Government had to intervene to maintain the public finance balance. Article 9 of the Decree-law No. 176 of 2022, provided for the year 2023 to reduce from 110 to 90 percent the percentage of the Superbonus deduction for interventions carried out in 2023 by condominiums, individuals on buildings consisting of two to four housing units, even if owned by a single owner, and third-sector |
___
23 For public debt purposes, these tax credits are accounted in cash terms, according to their actual use in offsetting. Therefore, they imply an increase in the stock-flow adjustment component, which includes within it the item related to the mismatch between accruals and cash.
24 Legislative decree No. 34/2020, article 119.
| 20 | MINISTRY OF ECONOMY AND FINANCE |
II. BASELINE MACROECONOMIC AND BUDGET FORECAST | |
| | entities. At the same time, the 110 percent deduction was maintained for interventions for which the urban planning procedures were completed even in the week following the entry into force of the Decree-law (thus until 25 November 2022). The latter provision affected the number of interventions that could continue to benefit from the higher 110 percent deduction. At a later stage, with the decree-law No. 11 of 16 February 2023, the exercise of the option for invoice discount or credit transfer was prohibited. At the same time, this option was maintained for interventions for which the urban planning procedures were completed before the entry into force of the Decree-law (17 February 2023). The provision of exemptions from the immediate application of the restrictive measures mentioned above responds to the need to protect citizens who had taken concrete actions, perhaps even having incurred in initial costs, and who, therefore, had legitimate expectations. Each regulatory change has shown the difficulty of balancing the safeguard of the public finance sustainability with the need to protect the vast number of beneficiaries. The significant changes in the expenses incurred for the interventions facilitated by the Superbonus observed in particular periods can also be attributed to price increases in the activities affected by the measure, generated by factors that could not be foreseen before. These factors, mainly of an exceptional nature, include the increase in energy costs, the Russian-Ukrainian conflict, the increase in the cost of raw materials in the construction sector25 also caused by the demand peak and the absence of any price control on behalf of the contracting parties. A significant increase in the cost of interventions was recorded from April 2022, during the first months of the Russian-Ukrainian conflict, upon the entry into force of the MITE Decree (Ministry of Ecological Transition) No. 75 of 14 February 2022, which regulated the updating of the price ceilings of materials and products used for energy upgrading interventions facilitated by tax bonuses26. |
| | Implications for the sustainability of public finance |
| | Based on the criteria set out in the new version of Eurostat's Handbook on Government Deficit and Debt, last March, the statistical authorities reclassified the Superbonus and the external redecoration scheme bonus as 'payable' credits according to the ESA 2010 classification for the 2020-2022 period; as a result, the benefits were recorded in the national accounts as expenditure (capital transfers) for the total accrued amount of the credit in the year in which the taxpayer incurred the cost, determining the tax benefit. In the accounts published by ISTAT on 22 September, the expenditure estimates for the two building renovation bonuses for 2022 was revised upwards (from 2.6 to 2.8 percent of GDP) compared to last March. The regulatory changes introduced in the current year, which generally eliminated credit transferability and invoice discounting as of 18 February 2023, provided for several exceptions for expenses incurred in 2023, for which the prevailing conditions of use regarding credit transferability and invoice discounting continue to apply. The evidence indicates that the costs incurred in the current year are, to a considerable extent, referable to the above-mentioned exceptions concerning the costs already started or approved before the credit transfer was frozen. Therefore, the 2023 expenditure is also classified as a 'payable' credit, as confirmed by Eurostat’s formal opinion published on 26 September. |
___
25 According to data from the 2022 GAD Construction Cost Report-Study, in 2022, for example, the cost item cement and concrete increased by 59 percent compared to the previous year. Based on data observable in the regional price lists, the costs for scaffolding, including installation and dismantling, increased by more than 50 percent in the regions most affected by the measure..
26 Compared to the amounts stipulated in the 'Technical Requirements and Cost Ceilings' decree (Ministerial decree of 6 August 2020), the cost ceiling has been revised upwards by approximately 20 percent to take into account rising raw material prices and higher energy costs.
| MINISTRY OF ECONOMY AND FINANCE | 21 |
| | UPDATE OF THE ECONOMIC AND FINANCIAL DOCUMENT 2023 |
| | Based on the interpretation of the rules of the Handbook on Government Deficit and Debt, it is assumed, on the other hand, that the expenditure to be incurred over the 2024-2025 period should be recorded as a 'non-payable' credit since, under existing legislation, credit transferability and the invoice discount of the deductions accrued on the Superbonus interventions are no longer allowed, except for a reduced number of beneficiaries. The general government net borrowing projections over the 2023-2026 horizon, when compared with the 2023 Stability Program forecasts, are affected by the combined effects of the upward revision of expenditure for the current year and the revision of the accounting criterion for 2024-2025. In particular, there is a worsening of the impact on 2023 deficit concerning the estimated increase in the use of the Superbonus measure (from 0.7 percent to 1.8 percent of GDP) and an improvement for the deficit in 2024 and 2025 (+0.3 and +0.2 percentage points of GDP, respectively) linked to reclassification effects. Compared with the Stability Program forecasts, the impact on public debt, independent of reclassification effects, is determined by the revision of the amounts estimated for expenditure in the 2022-2023 two-year period according to the cash utilisation profile of tax benefits. The worsening is estimated at 0.1 percentage points of GDP in 2023 and 0.3 percentage points for each year of the 2024-2026 period. In general, classifying incentives as 'payable' leads to a significant misalignment between cash and accrual dynamics of public finance balances in the planning horizon years. The existence of considerable cash burdens in the coming years represents a stringent condition for the possibility of the adjustment of public finance, particularly concerning reducing the stock of debt relative to GDP. Simulations conducted by the Ministry of the Economy and Finance show that, in the absence of the disbursements associated with both schemes, the debt-to-GDP ratio would be in continuous declining already in the 2023-2026 public finance scenario at existing legislation by about 1 percentage point of GDP per year. These past and future costs, which as mentioned have been subject to significant upward revisions, are offset by positive, but difficult to quantify, impacts on GDP between 2021 and the current year. Regarding to public finance, it is considered that the stimulus exerted by the measure on economic activity and tax revenues was insufficient to offset its costs27. |
___
27 On 29 March, the Bank of Italy, in the ‘Hearing on the macroeconomic and public finance effects of tax incentives in construction’, argued that the expansive effect “was not such as to render the instrument of zero impact on the general government account”.
| 22 | MINISTRY OF ECONOMY AND FINANCE |
III. UPDATED POLICY SCENARIO
| III.1 | MACROECONOMIC FORECAST AND BUDGET OUTLOOK – POLICY SCENARIO |
The budget manoeuvre for the 2024-2026 period will continue to be oriented towards prudent principles, seeking the right balance among the objectives of providing the necessary support to the economy in the immediate term through targeted measures, of ensuring the deficit returns below the 3 percent of GDP threshold and of the achievement of a plausibly and continuously declining path of the debt-to-GDP ratio.
Given the high uncertainty in the economic outlook, the Government has requested Parliament's authorisation, with the Report accompanying this Document, to set a new planned path for the general government net borrowing. The new deficit-to-GDP targets are set at 5.3 percent in 2023, 4.3 percent in 2024, 3.6 percent in 2025 and 2.9 percent in 2026.
The economic policy set by the Government since it took office is consistent with the guidance expressed by the European Commission, aimed primarily at continuing to mitigate in a temporary and targeted manner the impacts on households and economic activities of the increase in the prices of energy goods. In the current phase of gradual decline and stabilisation of energy commodity prices, started at the end of 2022, the support measures will be gradually withdrawn by 2024, maintaining a prudent fiscal policy, also in light of the deactivation of the general escape clause of the Stability and Growth Pact scheduled for the end of this year.
The budgetary margins with respect to the existing legislation scenario forecast, subject to Parliament's authorisation28, are intended to be allocated to the public finance measures detailed in the next Draft Budgetary Plan and implemented with the public finance manoeuvre for the three-year period 2024-2026.
Continuing along the policy lines set out in the Stability Program, the Government will continue to support private demand and counter the decline in the purchasing power of wages caused by inflation through targeted interventions. A large part of the additional resources for 2024 will be used to reduce the tax wedge. Other allocations will be added to start the tax system reform and support larger households. These measures aim to reduce the tax burden, increase disposable income and support consumption.
___
28 The request for higher net borrowing is made with respect to the deficit targets set by the April Stability Program at 4.5 percent in 2023, 3.7 percent in 2024, 3.0 percent in 2025 and 2.5 percent in 2026.
| MINISTRY OF ECONOMY AND FINANCE | 23 |
| | UPDATE OF THE ECONOMIC AND FINANCIAL DOCUMENT 2023 |
| TABLE III.1: MACROECONOMIC POLICY SCENARIO (percentage changes, unless otherwise indicated) |
| | 2022 | 2023 | 2024 | 2025 | 2026 |
| INTERNATIONAL EXOGENOUS VARIABLES | | | | | |
| World Trade | 5.6 | 0.6 | 2.7 | 4.8 | 4.0 |
| Oil price (Brent. USD/barrel. futures) | 101.0 | 81.6 | 81.4 | 77.5 | 74.4 |
| USD/EUR exchange rate | 1.053 | 1.085 | 1.085 | 1.085 | 1.085 |
| ITALY MACRO DATA (VOLUMES) | | | | | |
| GDP | 3.7 | 0.8 | 1.2 | 1.4 | 1.0 |
| Imports of goods and services | 12.4 | 0.1 | 3.3 | 4.1 | 3.6 |
| Domestic final consumption | 3.9 | 1.1 | 0.8 | 1.0 | 0.8 |
| Private consumption expenditure | 5.0 | 1.3 | 1.3 | 1.1 | 1.0 |
| Government consumption expenditure | 0.7 | 0.6 | -1.0 | 0.8 | 0.0 |
| Gross fixed capital formation | 9.7 | 1.0 | 3.0 | 2.4 | 1.9 |
| - machinery. equipment and intangible assets | 8.1 | 2.0 | 2.8 | 2.6 | 1.8 |
| - transportation means | 7.4 | 14.0 | 3.3 | 2.4 | 2.4 |
| - construction | 11.4 | -1.3 | 3.1 | 2.2 | 2.0 |
| Exports of goods and services | 9.9 | 0.7 | 2.4 | 4.3 | 3.5 |
| Memo item: current account balance (% of GDP) | -1.2 | 0.8 | 1.3 | 1.8 | 1.9 |
| CONTRIBUTIONS TO GDP GROWTH (1) | | | | | |
| Net exports | -0.5 | 0.2 | -0.2 | 0.1 | 0.0 |
| Inventories | -0.8 | -0.3 | 0.1 | 0.0 | 0.0 |
| Domestic demand (excl. inventories) | 5.0 | 0.9 | 1.3 | 1.3 | 1.0 |
| PRICES | | | | | |
| Imports of goods and services deflator | 21.4 | -5.4 | -0.2 | 0.7 | 1.5 |
| Exports of goods and services deflator | 11.0 | 2.5 | 1.8 | 1.5 | 1.5 |
| GDP deflator | 3.0 | 4.5 | 2.9 | 2.1 | 2.1 |
| Nominal GDP | 6.8 | 5.3 | 4.1 | 3.6 | 3.1 |
| Private consumption deflator | 7.2 | 5.6 | 2.3 | 2.0 | 2.1 |
Planned inflation29 | 8.1 | 5.6 | 2.3 | | |
| LABOUR MARKET | | | | | |
| Compensation of employees per FTE | 3.2 | 4.0 | 2.3 | 2.1 | 1.8 |
| Labour productivity (measured on GDP) | 0.2 | -0.5 | 0.5 | 0.3 | 0.3 |
| Unit labour cost (measured on GDP) | 3.0 | 4.6 | 1.8 | 1.8 | 1.5 |
| Employment (FTEs) | 3.5 | 1.4 | 0.7 | 1.1 | 0.7 |
| Unemployment rate | 8.1 | 7.6 | 7.3 | 7.2 | 7.1 |
| Employment rate (age 15-64) | 60.1 | 61.2 | 62.0 | 62.9 | 63.7 |
| Memo item: Nominal GDP (absolute values in EUR million) | 1,946,479 | 2,050,599 | 2,135,238 | 2,212,160 | 2,281,743 |
(1) Any inaccuracies are due to rounding. Source: ISTAT. GDP and components in volume (chained linked values in reference year 2015), not seasonally adjusted data. |
Reducing the tax wedge can also give further impetus to the labour market and help preserve and consolidate the progress achieved in recent years. Moreover, supporting workers' incomes can help limit wage pressures and the consequent effects on prices, thereby mitigating inflationary expectations of both economic
___
29 The figure for 2022 refers to the FOI consumer price index net of tobacco products from ISTAT; for 2023, planned inflation has been revised upwards - compared to the forecast in the 2023 Stability Program - from 5.4 percent to 5.6 percent; for 2023 the estimate is consistent with the macroeconomic policy scenario.
| 24 | MINISTRY OF ECONOMY AND FINANCE |
III. UPDATED POLICY SCENARIO | |
agents and financial markets. As anticipated in the Stability Program, the foundations are being laid for the Government's ambitious medium- to long-term program, which includes, in particular, the comprehensive reform of the tax system, in which specific attention will be paid to revise the tax regime of the household.
The 2024 budget law will also provide allocations for the period 2024-2026 for personnel in the healthcare system and incentives for investments in Southern Italy.
Finally, resources will be allocated for so-called unchanged policies, such as those related to contractual renewals of the public employment, and other expenditures necessary to ensure the continuity of public services.
The financing of budgetary policy interventions and the so-called unchanged policies, excluded from the public finance projections at existing legislation30, will be done by identifying the appropriate coverage within the public budget to preserve the sustainability of public finances.
Activities to fight tax evasion will improve taxpayers' compliance and strengthen selective controls, targeted towards the subjects most at risk. To pursue these objectives, interoperability, full use of databases, and the financial administration's operational capacity will be enhanced through investments in data analysis tools and machine learning techniques.
In addition, the central administrations of the State will contribute to financing the measures that the Government is preparing to introduce with the budget law, continuing the path already started last year of a renewed spending review activity31. These administrations will ensure their contribution to the next public finance manoeuvre through their spending review activities.
On the side of deficit-reducing measures, budget balances will be brought back to target values through expenditure control measures, allowances revision and tax-gap reductions.
Thanks to the Government's activation of a new phase of public spending review and the further expenditure reduction measures planned in the public finance manoeuvre for the 2024-2026 period, the forecasts indicate substantial compliance with the fiscal recommendations received for 2024.
Considering the impact of these fiscal policy actions, the real GDP growth rate forecast in the policy scenario rises to 1.2 percent in 2024, to 1.4 percent in 2025 and decreases by 0.2 percentage points compared to the existing legislation scenario to 1.0 percent in 2026.
Despite the slowdown in economic growth and the worsening budgetary outlook, the sustainability of public finances remains sound in the medium term.
As previously explained, by 2026 the general government net borrowing will be adjusted to meet the 3 percent limit set by the Stability and Growth Pact. This threshold remains the European benchmark for opening an excessive deficit procedure at the European level, also in the context of the planned revision of the fiscal rules.
___
30 They relate to recurring expenditure that is not financed by existing legislation and that is normally financed from year to year by the budget law in view of international commitments of a contractual nature or relating to other needs.
31 These activities are carried out within the framework of the procedure provided for in Article 22-bis of Law No. 196 of 2009 and its enabling reform profile of the RRP (reform 1.13).
| MINISTRY OF ECONOMY AND FINANCE | 25 |
| | UPDATE OF THE ECONOMIC AND FINANCIAL DOCUMENT 2023 |
| FIGURE III.1: GENERAL GOVERNMENT NET BORROWING AND GROSS DEBT AS A RATIO OF GDP |
|
| Source: ISTAT, Bank of Italy. From 2023, policy scenario forecasts. |
Consistent with this objective, fiscal policy will become slightly restrictive in 2026 compared to the existing legislation scenario, leading to a more substantial improvement in the primary balance in that year.
In line with the plan outlined in April, in this Document, the debt-to-GDP ratio is projected to fall further in the current year, reaching 140.2 percent.
In 2024 and 2025, the debt-to-GDP ratio will fall slightly to 139.9 percent, also thanks to a partial utilisation of Treasury liquidity holdings and the launch of a plan to divest State equity investments. The slowdown in the decline derives from the various factors influencing the public finance trends at existing legislation already described and the impact on the primary balance in 2024 and 2025 resulting from the forthcoming public finance manoeuvre.
The prudent stance of fiscal policy, the management of debt by maturity and issuance, and the continuation of the public assets valorisation and disposal programme will help reinforce the decline in the debt-to-GDP ratio in 2026 when the ratio would fall further to 139.6 percent, a level lower than the 140.4 percent target indicated in the Stability Program.
The policy path outlined here aligns with the objective already stated in previous planning Documents to bring the debt-to-GDP ratio back to close to pre-crisis levels by the end of the decade.
As a whole, the public finance outlook updated in this Document appears consistent with the guidance provided by the European Commission for 2024. Net primary expenditure is below the pre-set limit, and the Government will carefully monitor public spending, preserving the improvements in budget balances outlined here. Fiscal policy will also continue to boost public investment, also in line with the European Commission's recommendations.
Finally, it should be noted that the changes in the structural primary balance are congruous and capture the spirit of the proposed reform of European economic
| 26 | MINISTRY OF ECONOMY AND FINANCE |
III. UPDATED POLICY SCENARIO | |
governance, as also highlighted in the medium-term debt-to-GDP ratio scenarios in Section III.3.
In compliance with the rules of the accounting and public finance law on the mandatory content of the Update, the net balance to be financed of the State budget in accrual terms may increase up to 202.5 billion in 2024, 168 billion in 2025 and 134 billion in 2026. The corresponding net balance to be financed in cash terms may increase to 252 billion in 2024, 212 billion in 2025 and 179 billion in 2026.
| TABLE III.2: PUBLIC FINANCE INDICATORS (% of GDP) (1) |
| | 2021 | 2022 | 2023 | 2024 | 2025 | 2026 |
| POLICY SCENARIO | | | | | | |
| Net borrowing | -8.8 | -8.0 | -5.3 | -4.3 | -3.6 | -2.9 |
| Primary balance | -5.3 | -3.8 | -1.5 | -0.2 | 0.7 | 1.6 |
| Interest expenditure | 3.5 | 4.3 | 3.8 | 4.2 | 4.3 | 4.6 |
| Structural net borrowing (2) | -8.2 | -8.7 | -5.9 | -4.8 | -4.3 | -3.5 |
| Structural change | -3.5 | -0.5 | 2.9 | 1.1 | 0.5 | 0.7 |
| Public debt (gross of subsidies) (3) | 147.1 | 141.7 | 140.2 | 140.1 | 139.9 | 139.6 |
| Public debt (net of subsidies) (3) | 143.9 | 138.8 | 137.4 | 137.5 | 137.4 | 137.2 |
| SCENARIO UNDER EXISTING LEGISLATION |
| Net borrowing | -8.8 | -8.0 | -5.2 | -3.6 | -3.4 | -3.1 |
| Primary balance | -5.3 | -3.8 | -1.4 | 0.6 | 0.9 | 1.4 |
| Interest Expenditure | 3.5 | 4.3 | 3.8 | 4.2 | 4.3 | 4.6 |
| Structural net borrowing (2) | -8.3 | -8.8 | -5.7 | -4.0 | -3.9 | -3.7 |
| Structural change | -3.5 | -0.5 | 3.0 | 1.8 | 0.0 | 0.3 |
| Public debt (gross of subsidies) (3) | 147.1 | 141.7 | 140.0 | 139.7 | 140.1 | 140.1 |
| Public debt (net of subsidies) (3) | 143.9 | 138.8 | 137.3 | 137.1 | 137.6 | 137.7 |
| MEMO: 2023 STABILITY PROGRAM (POLICY SCENARIO) |
| Net borrowing | -9.0 | -8.0 | -4.5 | -3.7 | -3.0 | -2.5 |
| Primary balance | -5.5 | -3.6 | -0.8 | 0.3 | 1.2 | 2.0 |
| Interest expenditure | 3.6 | 4.4 | 3.7 | 4.1 | 4.2 | 4.5 |
| Structural net borrowing (2) | -8.3 | -8.5 | -4.9 | -4.1 | -3.7 | -3.2 |
| Structural change | -3.3 | -0.2 | 3.6 | 0.9 | 0.4 | 0.6 |
| Public debt (gross of subsidies) | 149.9 | 144.4 | 142.1 | 141.4 | 140.9 | 140.4 |
| Public debt (net of subsidies) | 146.7 | 141.5 | 139.3 | 138.7 | 138.3 | 138.0 |
| Nominal GDP under existing legislation (EUR billion) | 1,822.3 | 1,946.5 | 2,050.6 | 2,130.5 | 2,203.1 | 2,274.0 |
| Nominal GDP under policy scenario (EUR billion) | 1,822.3 | 1,946.5 | 2,050.6 | 2,135.2 | 2,212.2 | 2,281.7 |
(1) Any inaccuracies are due to rounding. (2) Net of one-offs and the cyclical component. (3) Gross or net of Italy's shares of loans to EMU Member States, either bilateral or through the EFSF, and of the contribution to the capital of the ESM. On 2022, the amount of these shares amounted to 56.3 billion, of which 42 billion for bilateral loans and through the EFSF and 14.3 billion for the ESM programme (see Bank of Italy, ‘Statistical Bulletin Public Finance, Borrowing Requirement and Debt’ of 15 September 2023). The estimates consider the repurchase of SACE, the use of ‘Patrimonio destinato’, EIB guarantees, and loans from the SURE and NGEU programmes. The Treasury liquidity holdings are assumed in reduction from the very high level reached at the end of 2022. In addition, the policy scenario assumes proceeds from divestments of equity investments and the partial early repayment of bilateral loans by Greece are included. The interest rate scenario used for the estimates is based on the implicit forecasts derived from the forward rates on Italian government bonds for the period in which this Document was compiled. |
| MINISTRY OF ECONOMY AND FINANCE | 27 |
| | UPDATE OF THE ECONOMIC AND FINANCIAL DOCUMENT 2023 |
| III.2 | DEBT-TO-GDP RATIO AND THE REDUCTION PATH IN THE EUROPEAN GOVERNANCE REVIEW |
Public debt as a ratio of GDP: forecast under the policy scenario
The most recent estimates by the Bank of Italy and ISTAT32 provide a reduction in the debt-to-GDP ratio over the last two years. Indeed, with the upward revision of nominal GDP starting from 2021, about 2 percentage points, and some minor tweaks to the levels of public debt stock from 2019, the debt-to-GDP ratio is currently projected to be 147.1 percent in 2021 and 141.7 percent in 2022. These figures evidence a remarkable decrease in the ratio over the two years following 2020, which saw the highest point at 154.9 percent due to the impact of the pandemic, amounting to over 13 percentage points.
As already explained in the Stability Program, the reduction in the ratio in 2022 is attributable, on the one hand, to the moderate growth in the debt stock due to a positive dynamic of cash balances and, on the other hand, to nominal GDP growth, also supported by the effect of inflation. Moreover, the unprecedented rise in market interest rates in 2022 resulted in a moderate rise in the average cost of debt, even considering inflationary pressures and their direct impact on the debt burden through inflation-indexed bonds. This was possible thanks to the high average duration of total public debt of about 7.8 years33, which allowed to limit the effects of higher interest rates on overall interest expenditure.
As a result, the snowball component, which quantifies the automatic impact of the gap between the average cost of debt and the nominal GDP growth on the dynamics of the debt-to-GDP ratio, remained strongly negative, contributing about 5.1 percentage points to the ratio decrease in 2022. This component more than offset the pressure of the primary deficit, at 3.8 percent.
In line with the plan outlined in April, in this Document's policy scenario, the debt-to-GDP ratio is projected to fall further in the current year, reaching 140.2 percent.
Over the next three years, several factors will affect the pace of decline of the debt-to-GDP ratio. Prolonged uncertainties in the international context will negatively impact economic growth, which will see a slowdown; the declining inflation rate will dampen the boost to nominal GDP, although it will also reduce the interest expenditure component linked to inflation-indexed bonds; finally, an increasing share of securities will absorb the higher yields rates resulting from the increase in reference rates decided by the European Central Bank, pushing up overall interest expenditure.
Also contributing to the increase in the stock of debt will be the flow of tax credits related to building renovations incentives used as tax offsets, which are discounted, for debt accounting purposes, based on the cash profile of their actual use. The stock-flow adjustment component captures the impact of these flows within the accrual-cash difference item.
___
32 Bank of Italy, 'Statistical Bulletin Public Finance, Borrowing Requirement and Debt', 15 September 2023 and notification; ISTAT, 'National Economic Accounts', 22 September 2023.
33 By contrast, the average duration of the stock of government bonds alone is 7 years.
| 28 | MINISTRY OF ECONOMY AND FINANCE |
III. UPDATED POLICY SCENARIO | |
Therefore, this component of the stock-flow adjustment, which was already particularly unfavourable in the Stability Program, is further increased as a result of the increase in the costs related to these bonuses coming from the most recent data of public accounts monitoring activity and it is expected to reach an average annual level of around 1.1 percentage points of GDP over the 2024-2026 forecast horizon, more than offsetting the contribution to the reduction in the debt-to-GDP ratio resulting from the improvement in the primary balance.
The debt-to-GDP ratio in the policy scenario would fall slightly by 0.1 percentage points in 2024, thanks to the launch of a programme for the valorisation and divestiture of public assets and a partial utilisation of the Treasury's liquidity holdings.
In 2025, the planned strengthening of the primary surplus, together with the resources acquired through the development of the divestment program, will ensure a further reduction of the debt-to-GDP ratio by 0.2 percentage points.
The prudent stance of fiscal policy in 2026, the management of debt by maturity and issuance, as well as the disposal of public holdings, albeit at a slower pace, will contribute to limit the impact of the stock-flow adjustment, allowing the debt-to-GDP ratio to continue on its declining path, which in 2026 is expected to stand at 139.6 percent, a level lower than the Stability Program target set at 140.4 percent.
The final estimate for 2022 of the debt-to-GDP ratio net of Italy's share of loans to the EMU Member States, bilaterally or through the EFSF, and of the contribution to the capital of the ESM stands at 138.8 percent, while it is projected to fall to 137.2 percent in 2026 at the end of the forecast horizon.
| TABLE III.3: GENERAL GOVERNMENT DEBT BY SUBSECTOR (EUR million and as % of GDP) (1) |
| | 2022 | 2023 | 2024 | 2025 | 2026 |
| Gross of Euro Area financial support (2) | | | | | |
| General government | 2,757,547 | 2,874,475 | 2,991,842 | 3,094,252 | 3,184,470 |
| % of GDP | 141.7 | 140.2 | 140.1 | 139.9 | 139.6 |
| Central government (3) | 2,683,932 | 2,801,597 | 2,919,833 | 3,023,141 | 3,114,402 |
| Local government (3) | 116,552 | 115,815 | 114,946 | 114,048 | 113,005 |
| Social security funds (3) | 101.9 | 101.9 | 101.9 | 101.9 | 101.9 |
| Net of Euro Area financial support (2) | | | | | |
| General government | 2,701,257 | 2,818,185 | 2,936,053 | 3,039,195 | 3,130,069 |
| % of GDP | 138.8 | 137.4 | 137.5 | 137.4 | 137.2 |
| Central government (3) | 2,627,642 | 2,745,307 | 2,864,043 | 2,968,084 | 3,060,001 |
| Local government (3) | 116,552 | 115,815 | 114,946 | 114,048 | 113,005 |
| Social security funds (3) | 101.9 | 101.9 | 101.9 | 101.9 | 101.9 |
(1) Note: Any inaccuracies are due to rounding. (2) Gross or net of Italy's shares of loans to EMU Member States, either bilateral or through the EFSF, and of the contribution to the capital of the ESM. On 2022, the amount of these shares amounted to 56.3 billion, of which 42 billion for bilateral loans and through the EFSF and 14.3 billion for the ESM programme (see Bank of Italy, ‘Statistical Bulletin Public Finance, Borrowing Requirement and Debt’ of 15 September 2023). The estimates consider the repurchase of SACE, the use of ‘Patrimonio destinato’, EIB guarantees, and loans from the SURE and NGEU programmes. The Treasury liquidity holdings are assumed in reduction from the very high level reached at the end of 2022. In addition, the policy scenario assumes proceeds from divestments of equity investments and the partial early repayment of bilateral loans by Greece are included. The interest rate scenario used for the estimates is based on the implicit forecasts derived from the forward rates on Italian government bonds for the period in which this Document was compiled. (3) Gross of liabilities to other subsectors. |
| MINISTRY OF ECONOMY AND FINANCE | 29 |
| | UPDATE OF THE ECONOMIC AND FINANCIAL DOCUMENT 2023 |
| FIGURE III.2: EVOLUTION OF THE DEBT-TO-GDP RATIO GROSS AND NET OF EUROPEAN FINANCIAL SUPPORT |
|
| Source: ISTAT and the Bank of Italy. From 2023, forecasts of the policy scenario. |
The debt reduction path in the new European economic governance
The legislative proposal to reform the rules of economic governance advanced by the Commission34 shifts the focus to medium-term debt sustainability, intending to ensure a plausibly and continuously declining path.
If the legislative negotiation will confirm the general approach proposed by the Commission, in the next years Member States with a debt-to-GDP ratio above 60 percent would have to submit national plans that ensure the reduction of the debt-to-GDP ratio in the medium term35.
Debt reduction paths will be defined, among other things, based on each Country's levels of general government net borrowing and public debt and will, therefore, show individual characteristics able to ensure that, with appropriate fiscal adjustment, the debt trajectory in the ten years following the plan is on a plausible declining path. The adjustment trajectory will be verified by simulating the behaviour of the debt-to-GDP ratio over the ten years following the conclusion of the adjustment, which should decline even in unfavourable scenarios.
The declining path of the debt-to-GDP ratio is operationally ensured through a ceiling on the net primary expenditure to be implemented for a four-year horizon, with the possibility to eventually extend it up to a maximum of seven years against commitments on reforms and investments.
The reference expenditure aggregate should be composed of nationally financed expenditure net of discretionary revenue measures, interest expenditure and the cyclical component of unemployment expenditure. It also excludes
___
34 European Commission (2023) ‘Proposal for regulation: new economic governance rules fit for the future’ of 26.04.2023 New economic governance rules fit for the future (europa.eu).
35 The legislative proposal of 26 April 2023 eliminates the initial categorisation of the Countries based on the debt sustainability risks, outlined in the Communication from the Commission of 9 November 2022.
| 30 | MINISTRY OF ECONOMY AND FINANCE |
III. UPDATED POLICY SCENARIO | |
expenditures financed with EU structural funds and grants from the Recovery and Resilience Facility (while it includes RRF loans). Public investment would be included in its total amount.
The current debt rule, which provides for a reduction of 1/20th per year of public debt above the 60 percent of GDP limit of the Stability and Growth Pact, will be abolished, as already clarified in previous Planning Documents, because it would imply excessive budgetary adjustments36.
In the Commission's reform proposal, if the net primary expenditure path is compliant with the one set out in the medium-term plan agreed with the Commission and endorsed by the Council, the debt-to-GDP ratio reduction would be deemed sufficient to approach the 60 percent reference threshold at an appropriate pace, even in cases where it exceeds that threshold. This would exclude the initiation of an excessive debt procedure.
Conversely, in the presence of a deviation from the expenditure path, compliance with the debt reduction criterion would also be undermined, and the preconditions for the initiation of the excessive debt procedure could thus be created.
The opening of the procedure would not be automatic but would, in any case, be subject to the Commission's consideration of the so-called relevant factors, which, as provided for in the current legal framework37, significantly influence the assessment of the compliance with the debt threshold38.
In addition to the development of budgetary positions over the medium term, the extent of the actual deviation from the expenditure path, as measured by the so-called control account39, would acquire particular relevance, as would do the extent to which this deviation is due to a severe economic downturn in the Euro Area or in the entire Union (so-called 'general escape clause'), or to exceptional circumstances beyond the control of the government with significant repercussions on the public finance of the Member State concerned (so-called country-specific escape clause provided for in the proposal for the new Regulation No. 1467 of 1997).
Implementing reforms and investments, including policies to realise the common EU strategy for growth and employment, should also be considered a relevant factor when assessing the evolution of the debt-to-GDP ratio.
Finally, the Commission will consider all other factors that, in the opinion of the Member State concerned, are significant for the overall assessment of compliance with the TFEU benchmarks and that it has brought to the attention of the Council and the Commission.
In this transition phase towards the new governance, Member States were asked to present a budget plan that would put public debt-to-GDP ratio on a downward path and keep it at prudent levels in the medium term while ensuring that the general government net borrowing would be below 3 percent of GDP.
___
36 Considering the projections of the policy scenario of this Document, the debt rule (based on the backward-looking configuration, which appears to be the most favourable) would result in a debt-to-GDP ratio gap with the benchmark of 1.0 percentage point in 2023 and 5.3 percentage points in 2024.
37 Article 126, para. 3, of the Treaty on the Functioning of the EU (TFEU).
38 These factors will also continue to be relevant for compliance with the 3 percent reference threshold for the deficit-to-GDP ratio.
39 This account would record the annual deviations from the expenditure path compared to the path agreed with the European institutions, both upwards and downwards. The annual deviations would then be added up over time to track the annual trend.
| MINISTRY OF ECONOMY AND FINANCE | 31 |
| | UPDATE OF THE ECONOMIC AND FINANCIAL DOCUMENT 2023 |
In line with the spirit of the proposed reform of European rules, the Government updates the gradual adjustment budget path planned in the Stability Program to continue reducing the high public debt, aware that a too abrupt decline could harm economic growth.
Despite the uncertainty of the current geopolitical situation and pending on the approval of the European governance reform project, the Government is committed to a multi-year consolidation that, combined with the investments and structural reforms defined in the RRP and with the other planned reforms, aims at sustaining the economic growth potential and improving the sustainability of public debt. The Government believes it is in the Country's interest to continue on this path until the debt sustainability analysis indicates that no further improvement in the structural primary balance is needed.
| III.3 | DEBT-TO-GDP RATIO SCENARIOS IN THE MEDIUM-TERM |
This section presents some sensitivity analyses of the primary public finance aggregates for macroeconomic and financial risk scenarios.
First, we highlight the effects on the budget balance and on the debt-to-GDP ratio of shocks affecting economic growth and the interest rate structure. The following section contains the results of a stochastic simulation of the evolution of the debt-to-GDP ratio, represented through fan charts. The last paragraph shows the results of a scenario that extends the projection of the debt-to-GDP ratio in the medium term beyond the four-year forecast horizon of this Update (up to the year 2034); alternative projections show debt-to-GDP ratio profiles consistent with a path of fiscal consolidation beyond the 2026 horizon and with a growth profile that incorporates an impact assessment of the reforms contained in the RRP.
Sensitivity of public finance to growth and interest rates
In this section, under standard sensitivity assumptions, two risk scenarios are simulated, in which macroeconomic shocks are reflected in public finance developments over 2024-202640.
The reference scenario (or baseline) coincides with the policy macroeconomic and public finance scenario presented in previous chapters. The sensitivity analysis aims to outline the path of the budget balance and the dynamics of the debt-to-GDP ratio by assuming two alternative scenarios based on what is presented in Chapter II in the Focus 'A risk (or sensitivity) analysis on exogenous variables'.
The 'financial risk' scenario (corresponding to the fourth scenario of the Focus) assumes, starting in 2024, an increase in the BTP-Bund spread of 100 basis points. The 'exchange rate risk' scenario (corresponding to the second scenario of the Focus) assumes an appreciation of the nominal effective exchange rate with respect to the baseline.
___
40 See Section III.3 of the Methodological Note on the criteria for formulating forecasts under existing legislation scenario for the 2023 Stability Program, available at:
https://www.rgs.mef.gov.it/_Documenti/VERSIONE-I/Attivit--i/Contabilit_e_finanza_pubblica/DEF/2023/Nota-Metodologica-2023.pdf.
| 32 | MINISTRY OF ECONOMY AND FINANCE |
III. UPDATED POLICY SCENARIO | |
The effects on GDP and its components are estimated by the ITEM econometric model, as explained in the Focus. The economy's response to these shocks changes the estimates of potential output and the output gap, the variables underlying the standard sensitivity assumptions. The reactions to interest rates and the change in interest expenditure (for the 'financial risk' scenario) are calculated with the Treasury Department SAPE model, which is fed by the database of the current and forecast stock of government bonds.
The following table shows the estimates of the main macroeconomic and public finance variables in the different scenarios over the 2022-2026 horizon.
| TABLE III.4: SENSITIVITY SCENARIOS (percentage values) |
| | | 2022 | 2023 | 2024 | 2025 | 2026 |
| | Baseline | 6.8 | 5.3 | 4.1 | 3.6 | 3.1 |
| Nominal GDP growth rate | Financial Risk scenario | 6.8 | 5.3 | 4.0 | 3.2 | 2.6 |
| | Exchange Rate Risk scenario | 6.8 | 5.3 | 3.9 | 3.0 | 2.6 |
| | Baseline | 3.7 | 0.8 | 1.2 | 1.4 | 1.0 |
| Real GDP growth rate | | 3.7 | 0.8 | 1.1 | 1.1 | 0.5 |
| | Exchange Rate Risk scenario | 3.7 | 0.8 | 0.9 | 0.9 | 0.7 |
| | Baseline | -8.0 | -5.3 | -4.3 | -3.6 | -2.9 |
| Net borrowing/GDP | | -8.0 | -5.3 | -4.4 | -3.9 | -3.5 |
| | Exchange Rate Risk scenario | -8.0 | -5.3 | -4.5 | -4.1 | -3.7 |
| | Baseline | -3.8 | -1.5 | -0.2 | 0.7 | 1.6 |
| Primary balance/GDP | | -3.8 | -1.5 | -0.2 | 0.4 | 1.0 |
| | Exchange Rate Risk scenario | -3.8 | -1.5 | -0.3 | 0.2 | 0.8 |
| | Baseline | 3.1 | 2.8 | 3.1 | 3.2 | 3.4 |
| Implicit interest rate | | 3.1 | 2.8 | 3.2 | 3.5 | 3.8 |
| | Exchange Rate Risk scenario | 3.1 | 2.8 | 3.1 | 3.2 | 3.4 |
| | Baseline | 141.7 | 140.2 | 140.1 | 139.9 | 139.6 |
| Debt/GDP | | 141.7 | 140.2 | 140.5 | 141.4 | 143.0 |
| | Exchange Rate Risk scenario | 141.7 | 140.2 | 140.6 | 141.7 | 143.0 |
| Source: ISTAT and MEF elaborations for 2022. From 2023, policy scenario forecasts of this Document for the baseline scenario. |
The figure below shows the change in the debt-to-GDP ratio in the three scenarios. The baseline, coinciding with the official policy scenario forecast, indicates a slight downward trend.
| MINISTRY OF ECONOMY AND FINANCE | 33 |
| | UPDATE OF THE ECONOMIC AND FINANCIAL DOCUMENT 2023 |
| FIGURE III.3: DEBT-TO-GDP RATIO DYNAMICS IN SENSITIVITY SCENARIOS |
|
| Source: MEF elaborations. |
The decreasing dynamic of the debt-to-GDP ratio is reversed in both sensitivity scenarios; the debt-to-GDP ratio would start on an upward trend, in the case of the financial shock essentially due to the pessimistic assumption on the interest rate curve, in the case of the exchange rate shock due to the effect on economic growth. The proposed analysis confirms the findings of the 2023 Stability Program.
Stochastic simulations of debt-to-GDP ratio dynamics
In addition to the sensitivity analysis of debt-to-GDP evolution in the short term, stochastic simulations are carried out over the 2023-2026 horizon that incorporate the historical volatility of the relevant variables that affect public finance. The calculations are conducted using the Monte Carlo method, applying stochastic shocks to the dynamics of the debt-to-GDP ratio relative to the reference scenario underlying this document. These shocks are simulated based on the historical volatility of yields (short- and long-term), of the growth rate of nominal GDP and of the primary budget balance and are obtained by running 2,000 extractions from a normal distribution with zero mean and a variance-covariance matrix observed since the first quarter of 1999, when the Euro was adopted as the single currency.
Given the considerable volatility in the variables of interest observed from 2020 onwards, two methods of shock simulation are presented. The first method ('high volatility shocks') takes into account the variability of the entire available time series in constructing the shocks; the second one ('limited volatility shocks') operates a so-called trimming procedure of the simulated shocks, excluding those
| 34 | MINISTRY OF ECONOMY AND FINANCE |
III. UPDATED POLICY SCENARIO | |
that exceed twice the standard deviation of the series. In both cases, the simulated shocks are symmetrical and temporary41.
For each forecast year of the macroeconomic outlook and for each shock construction type, the debt-to-GDP ratio distribution is represented by fan charts (Figures III.4A and III.4B).
In the simulation with high-volatility shocks, the debt is distributed around a median value that is around 138.8 percent of GDP at the end of the time horizon, 0.8 percentage points below the official forecast for 2026 reported in this Document. The uncertainty of the simulations in 2026 reflects the variability of the public finance data used to construct the shocks and is, therefore, extremely large, as shown by a difference of more than 48 percentage points between the 10th and 90th percentiles of the projected public debt distribution. After the decline in the debt-to-GDP ratio in 2021 and 2022, it would continue to fall in 50 percent of the simulations.
By restricting the magnitude of the shocks by excluding the most extreme distribution tails ('volatility-limited shocks'), the results of the analysis are more concentrated around the value corresponding to the baseline scenario of this Document (Figure III.4B). In this case, the uncertainty surrounding the 2026 results is smaller, and there is a difference of about 25 percentage points between the 10th and 90th percentiles of the resulting debt distribution. In this case, the debt-to-GDP ratio would continue to fall or remain broadly stable in 60 percent of the simulations.
| FIGURE III.4A: STOCHASTIC PROJECTION OF THE DEBT-TO-GDP RATIO UNDER HIGH VOLATILITY SHOCKS | | FIGURE III.4B: STOCHASTIC PROJECTION OF THE DEBT-TO-GDP RATIO UNDER LIMITED VOLATILITY SHOCKS |
| | |
| Note: The graphs show the 10th, 20th, 30th, 40th, 50th, 60th, 70th, 80th and 90th percentile of the distribution of the debt-to-GDP ratio as obtained in stochastic simulation. Source: MEF elaborations. |
___
41 For more details on the methodology adopted, see Berti K., (2013), 'Stochastic public debt projections using the historical variance-covariance matrix approach for EU countries', Economic Papers 480 and European Commission, 2020, Debt Sustainability Monitor 2019, Institutional Papers 120, available at: https://economy-finance.ec.europa.eu/document/download/77d20f83-a86c-45b6-abee-cb657ffcc239_en?filename=ip120_en.pdf.
| MINISTRY OF ECONOMY AND FINANCE | 35 |
| | UPDATE OF THE ECONOMIC AND FINANCIAL DOCUMENT 2023 |
Projections of the debt-to-GDP ratio in the medium-term
In this section, the debt-to-GDP ratio is projected until 2034, following the standard Debt Sustainability Analysis (DSA) assumptions used by the European Commission to forecast public finance balances and macroeconomic variables42.
In the scenario A, until 2026, the macroeconomic and public-finance context coincides with the policy scenario underlying this Document; in the medium term, starting from 2027, GDP growth is aligned with that of potential GDP, projected with the 't+10' methodology developed by the Output Gap Working Group, while the inflation rate converges to a value determined by market expectations, measured based on inflation swap rates. The structural primary balance is equal to the value projected for 2026 corrected for the change in revenues associated with the general government 'Property Income' (PI), obtained consistently to the methodology illustrated in the European Commission's Ageing Report of 2021, and for Age-Related Expenditures (ARE), estimated by the State General Accounting Department43. Finally, annual interest payments are calculated using the Treasury Department SAPE model, assuming, as a starting point, the composition and maturity structure of the underlying debt stock in the last forecast year (2026).
In the 'continued adjustment' scenario, the macroeconomic outlook and the structure of interest rates coincide with scenario A, while the nominal deficit-to-GDP ratio improves in the years after 2026, assuming a constant adjustment of the structural primary balance until 2031 to ensure that net borrowing is kept below the 3 percent of GDP threshold and that the dynamics of the debt-to-GDP ratio is decreasing and resilient to deterministic stress tests on interest rates, growth and primary balance in the following ten years. To achieve the targets mentioned above, an annual adjustment in terms of the structural primary balance of 0.55 percentage points would be sufficient for the 2027-2031 period44, which is significantly lower than that envisaged in this Document for 2024-2026, equal to 1.0 percentage point per year on average45. The additional fiscal correction in the 'continued adjustment' scenario, relative to the scenario A, implies a feedback effect on real GDP in line with the European Commission's methodology applied since the 2020 Debt Sustainability Monitor.
It should be borne in mind that the assessment in terms of medium-term economic growth for scenarios A and 'continued adjustment' must be considered prudent, as the economic effects of the extensive investment and reform programme launched with the RRP are not fully taken into account. In fact, consistent with the approach followed by the European Commission, the overall impact of structural reforms on the economy, which is potentially very significant, is omitted.
___
42 See the Debt Sustainability Monitor 2022.
43 These expenditures are calculated based on the macroeconomic scenario at existing legislation underlying this Document. Methodological details can be found in: ‘Medium to long-term trends of the pension and social security system - Report No. 24’, issued by the State General Accounting Department, available at: https://www.rgs.mef.gov.it/VERSIONE-I/attivita_istituzionali/monitoraggio/spesa_pensionistica/.
44 This adjustment is less than required by current European rules, which call for an adjustment of at least 0.5 percentage points per year of the structural balance until the medium-term objective is reached.
45 Starting from the last year of adjustment and for the following 10 years, the following deterministic stress tests are considered: a financial risk scenario, a lower structural primary balance scenario and a worst-case scenario of the differential between the implicit interest rate and economic growth. These scenarios are constructed in line with the methodology presented in the Debt Sustainability Monitor 2022.
| 36 | MINISTRY OF ECONOMY AND FINANCE |
III. UPDATED POLICY SCENARIO | |
To take into account the growth differential that would be obtained if the effects of the reforms undertaken were realised, the 'continued adjustment + RRP reforms' scenario combines the fiscal adjustment path of the previously described scenario with higher growth rates that would be obtained by including the impacts on the economy of the investment and reform programme initiated with the RRP. These impacts were estimated, adopting a conservative approach, through the DSGE Quest model used by the Directorate I of the Treasury Department46. In this scenario, real GDP is increased from 2024 onwards, assuming that the higher growth related to structural factors is fully transferred to potential GDP. Revenues and expenditures are assumed unchanged compared to scenario A, and starting from 2027, the structural primary balance as a ratio of GDP, in line with the 'continued adjustment' scenario, improves annually by 0.55 percentage points until 203147. Interest rates are assumed unchanged compared to scenarios A and 'continued adjustment'.
The figure below shows the evolution of the debt-to-GDP ratio in the three simulated scenarios. In scenario A, which envisages neither fiscal correction beyond 2026, nor an assessment of the impact of reforms, the debt-to-GDP ratio falls until 2026, before rising again to 148.1 percent in 2034.
In the 'continued adjustment' scenario, further fiscal adjustment starting in 2027 produces a decreasing path for the debt-to-GDP ratio until 2034, when the forecast reaches 127.5 percent, with a structural primary balance of 3.4 percent of GDP and a corresponding value of the structural budget balance of -1.9, far from the medium-term target48. A further fiscal adjustment beyond that projected, necessary to achieve the medium-term objective, would, therefore, be unnecessary to ensure the sustainability of public debt in the medium term.
In the 'continued adjustment + RRP reforms' scenario, the full implementation of the reforms, combined with further fiscal adjustment, improves the macroeconomic perspectives, leading to a decline in the debt-to-GDP ratio, relative to the other two scenarios, over the entire simulation period; the debt-to-GDP ratio would enter a strongly declining path and reach 121.5 percent in 2034.
___
46 The chapter II of the 2023 National Reform Program revises the estimates of the effect of the reforms contained in the Recovery and Resilience Plan. For the latter, the assessment was made with reference to the long-term structural effects. The impact assessment concerned a subset of the set of reform measures contemplated in the Plan; those to which it was possible to associate measurable quantitative objectives that could be used in simulation channels within the DSGE QUEST model developed by the European Commission. In particular, it was possible to simulate the effects of the following reform areas: education and research; active labour market policies; public administration; justice; competition and procurement.
47 In the 'continued adjustment + RRP reforms' scenario, an annual adjustment of the structural primary balance of 0.45 percentage points over the period 2027-2031 would be sufficient to keep the deficit below 3 percent and to ensure that the decline in the debt-to-GDP ratio is resilient to deterministic stress tests in the ten years following the end of the fiscal adjustment.
48 Both projections imply particularly heavy interest expenditure. In reality, the realisation of the adjustment plans would in all likelihood lead to a gradual reduction in interest rates over a reasonable period of time, linked to the narrowing of the yield differential between Italian government debt securities and those of Germany.
| MINISTRY OF ECONOMY AND FINANCE | 37 |
| | UPDATE OF THE ECONOMIC AND FINANCIAL DOCUMENT 2023 |
| FIGURE III.5: MEDIUM-TERM PROJECTIONS OF THE DEBT-TO-GDP RATIO |
|
| Source: MEF elaborations. |
The upward trend in the debt-to-GDP ratio in scenario A is mainly related to two factors that induce a worsening of the primary balance and interest expenditure, respectively. On the one hand, the projection incorporates an increase in age-related expenditures (ageing costs); on the other hand, the current forecast of forward rates, which reflect market yields, implies an increase in the implicit rate paid on government debt securities starting in 2026 and throughout the forecast horizon.
The 'continuation of adjustment' scenario is helpful to show how, in the medium term, the continuation of the virtuous fiscal adjustment path (already envisaged for the years 2023-2026), even beyond the forecast horizon of this Document, can ensure a sustainable trend in the public debt-to-GDP ratio, albeit less pronounced than in the scenario in which the positive impact of reforms is also taken into account.
| 38 | MINISTRY OF ECONOMY AND FINANCE |
IV. STRUCTURAL REFORMS
Since the publication of the Economic and Financial Document, the Government action has focused on implementing, reshaping and integrating the National Recovery and Resilience Plan (RRP), as well as on preparing the tax reform.
In particular, the adjustments to the RRP were made necessary by several critical factors, mainly of an exogenous nature49, and by the approval of the REPowerEU plan50, which allows Member States to include reforms and investments to reduce dependence on Russian fossil fuels, while diversifying energy supply, and to promote ecological transition. The proposal to revise the Plan, sent to the Commission last August, will be finalised in the ongoing negotiations and then approved by the Council of the European Union.
In July, the Council of the European Union adopted the Country-Specific Recommendations for Italy51 in light of the National Reform Program, the Stability Program and the conclusions of the Country Report on Italy52 prepared by the European Commission.
The Council Recommendations aim at: strengthening policies to reduce public debt (CSR1), accelerating the implementation of the RRP, REPowerEU and cohesion policy programmes (CSR2), and supporting investments and promoting energy transition in the context of the new REPowerEU chapter of the RRP, to ensure sustainable growth (CSR3).
The tax system revision is one of the key reforms and is explicitly called for in CSR1. The enabling act on tax reform, approved last August53, sets out, among others, the following objectives: i) to stimulate economic growth and the birth rate by increasing the efficiency of the tax system and reducing the tax burden; ii) to simplify the tax system, reducing its distortions and complexity; iii) to more effectively fight tax evasion and avoidance by strengthening the use of the various available databases and creating a more efficient and transparent system to encourage voluntary compliance.
Among the main measures contained in the enabling act, there is the revision and gradual reduction of the personal income tax (IRPEF), including through the
___
49 Such as high inflation and the bottlenecks in supply chains. For details, see the documents available at https://www.politicheeuropee.gov.it/it/ministro/agenda/19-lug-23-audizione/
50 For complete information, see:
https://www.consilium.europa.eu/it/press/press-releases/2023/02/21/eu-recovery-plan-council-adopts-repowereu/
51 The Recommendations were formulated in May by the European Commission and approved in July by the European Council. For more details see:
https://eur-lex.europa.eu/legal-content/IT/TXT/?uri=CELEX:32023H0901(12)
52 For further details, see:
https://commission.europa.eu/publications/2023-european-semester-country-specific-recommendations-commission-recommendations_en
53 Law No. 111 of 9 August 2023.
| MINISTRY OF ECONOMY AND FINANCE | 39 |
| | UPDATE OF THE ECONOMIC AND FINANCIAL DOCUMENT 2023 |
reduction of marginal tax rates and related brackets, while preserving the principle of progressivity to reduce the tax burden on labour and promote horizontal equity. In order to stimulate the supply of labour, it is envisaged to reduce the corporate income tax (IRES) for companies that use in investments, new hirings or stable profit-sharing schemes of employees an amount corresponding, in whole or in part, to the income within the two tax periods following its production. The enabling law also provides for the gradual elimination of IRAP54, to reduce distortions and burdens on companies and economic operators. In any case, the intervention must guarantee the financing of the national health service and equivalent revenue for Regions with unbalanced health budgets or subject to recovery plans. Finally, the enabling law also contains specific guiding principles and criteria for the rationalisation of micro-taxes to reduce the complexity of the current system and the duties burdening on taxpayers.
Regarding excise duties and other indirect taxes on production and consumption, also in response to CSR3, the enabling act provides for the reshaping of energy taxation to encourage the reduction of climate-changing gas emissions and support the production of electricity from renewable resources.
The novelties of the enabling act also concern an improvement in the relationship between the tax authorities and taxpayers, moving from ex-post to ex-ante verification. Measures to streamline the tax structure and reduce the tax burden will also stimulate the birth rate and support families, persons with disabilities and young people.
Italy is advancing remarkably in the Country's digital transformation, allocating a large portion of the RRP resources (25 percent) to support innovative reforms and investments for the digital goal55. The design, preparation, installation and testing of four data centres, which form the core of a new cloud infrastructure, called the 'National Strategic Hub', dedicated to hosting the information systems, data and applications of all public administrations, has been completed. The Government has also adopted the 'National Digital Skills Strategy' and the 'Digital Republic' initiative, specific measures to increase the digital skills of the population and the workforce, to which are added the 'Digital Civil Service', the 'National Programme for Guaranteeing Workers' Employability' and the 'National New Skills Plan'.
The acceleration of the Country's production process also passes through the reform of public administration, an essential element for providing adequate services to citizens. The 'PNRR Ter' decree, the 'PA' decree56 and the 'PA Bis' decree57 move in this direction. In particular, the last two, in application of the CSR2, aim to increase the human capital of the public administrations involved in the implementation of the RRP and, among others, contain measures to: i) stabilise
___
54 In this process, priority will be given to partnerships and associations without legal personality formed between natural persons for the exercise in associations of arts and professions.
55 The digital target is calculated according to the methodology outlined in EU Regulation 241/2021 on the RRF: measures included in the recovery and resilience plans of individual Member States must contribute at least 20 percent of the total allocation to this target. The coefficients for individual measures are determined on the basis of the intervention areas set out in Annex VII.
56 Decree-law of 22 April 2023 No. 44, as converted with integrations by Law No. 74/2023.
57 Decree-Law of 22 June 2023 No. 75, as converted with integrations by law No. 112/2023.
| 40 | MINISTRY OF ECONOMY AND FINANCE |
fixed-term staff dedicated to environmental impact assessments; ii) strengthen the administrative structures of ministries and agencies; iii) expand the possibility of hiring non-tenured managers with specific skills; iv) speed up the conduct of public competitions to favour the recruitment of staff, especially young people, to be employed in various public administrations.
The Government has adopted several reforms to strengthen the effectiveness of the cohesion policy and ensure its complementarity with the RRP. With the 'PNRR Ter' decree, the Government has improved the national governance system of the RRP and cohesion policy, in line with the identification of a single political authority through which to represent, with a systemic vision, the choices made on both intervention instruments. In particular, the competences of the Cohesion Policies Department of the Presidency of the Council of Ministers have been strengthened to ensure strategic leadership.
The need for full integration between cohesion policy funds, both European and national, and the RRP, reiterated in the Recommendation, is thus in line with the work of the Government, which centralised the governance of the two instruments with the reform launched in April, and which, in recent months, has strengthened coordination with the Regions and Ministries, within the framework of cohesion policy. The intention is to ensure the implementation of strategic and qualifying interventions for the territories, in a perspective of integration between national, European and RRP funds, avoiding displacement effects and risks of overlap between the different investment programmes.
The third CSR, dedicated to environmental sustainability, is answered in detail by the Government's proposal to include a REPowerEU chapter in the RRP. The REPowerEU chapter amplifies the innovative scope of the RRP in the field of energy, green transition and sustainability, and includes reforms and measures to strengthen energy networks, green transition, energy efficiency and strategic industrial chains.
| MINISTRY OF ECONOMY AND FINANCE | 41 |
| | UPDATE OF THE ECONOMIC AND FINANCIAL DOCUMENT 2023 |
| 42 | MINISTRY OF ECONOMY AND FINANCE |
V. ANNEX
| TABLE V.1a: GENERAL GOVERNMENT BUDGETARY PROSPECTS UNDER EXISTING LEGISLATION (EUR millions) |
| | | | | | |
| COMPONENTS OF EXPENDITURE | | | | | |
| Compensation of employees | 187,233 | 188,709 | 186,651 | 188,604 | 188,373 |
| Intermediate consumption | 167,313 | 170,871 | 171,025 | 173,182 | 172,731 |
| Social benefits | 406,901 | 424,020 | 448,830 | 459,440 | 471,670 |
| of which: Pensions | 297,190 | 317,490 | 340,560 | 350,240 | 361,240 |
| Other social benefits | 109,711 | 106,530 | 108,270 | 109,200 | 110,430 |
| Other current expenditure | 96,678 | 96,428 | 88,572 | 85,854 | 84,394 |
| Total current expenditure net of interest | 858,125 | 880,029 | 895,078 | 907,080 | 917,168 |
| Interest expenditure | 82,888 | 78,377 | 88,970 | 94,442 | 103,561 |
| Total current expenditure | 941,013 | 958,406 | 984,047 | 1,001,522 | 1,020,729 |
| of which: Health expenditure | 131,103 | 134,734 | 132,946 | 136,701 | 138,972 |
| Total capital expenditure | 150,517 | 129,027 | 94,571 | 106,335 | 102,830 |
| Gross fixed capital formation | 52,226 | 58,730 | 69,183 | 74,102 | 72,235 |
| Capital contributions | 81,442 | 64,907 | 23,639 | 27,672 | 26,120 |
| Other transfers | 16,849 | 5,391 | 1,749 | 4,562 | 4,476 |
| Total final expenditure net of interest | 1,008,642 | 1,009,056 | 989,648 | 1,013,416 | 1,019,998 |
| Total final expenditure | 1,091,530 | 1,087,434 | 1,078,618 | 1,107,857 | 1,123,559 |
| COMPONENTS OF REVENUE | | | | | |
| Total tax revenues | 569,507 | 601,246 | 611,369 | 627,320 | 643,963 |
| Direct taxes | 291,037 | 309,236 | 305,425 | 313,634 | 322,275 |
| Indirect taxes | 276,760 | 290,388 | 304,393 | 312,120 | 320,109 |
| Capital taxes | 1,710 | 1,622 | 1,551 | 1,566 | 1,579 |
| Social contributions | 260,941 | 269,547 | 289,888 | 298,910 | 307,670 |
| Actual contributions | 256,932 | 265,300 | 285,544 | 294,471 | 303,142 |
| Imputed contributions | 4,009 | 4,247 | 4,344 | 4,439 | 4,528 |
| Other current revenues | 88,216 | 89,909 | 91,386 | 93,710 | 91,019 |
| Total current revenues | 916,954 | 959,080 | 991,092 | 1,018,374 | 1,041,073 |
| Non-tax capital revenues | 16,424 | 20,443 | 9,230 | 12,292 | 10,202 |
| Total final revenues | 935,088 | 981,145 | 1,001,873 | 1,032,232 | 1,052,854 |
| Memo: Tax burden | 42.7 | 42.5 | 42.3 | 42.0 | 41.8 |
| BALANCES | | | | | |
| Primary balance | -73,554 | -27,911 | 12,225 | 18,816 | 32,856 |
| % of GDP | -3.8 | -1.4 | 0.6 | 0.9 | 1.4 |
| Current balance | -24,059 | 674 | 7,045 | 16,852 | 20,344 |
| % of GDP | -1.2 | 0.0 | 0.3 | 0.8 | 0.9 |
| Net borrowing | -156,442 | -106,288 | -76,745 | -75,625 | -70,705 |
| % of GDP | -8.0 | -5.2 | -3.6 | -3.4 | -3.1 |
| Nominal GDP under existing legislation (x 1.000) | 1,946.5 | 2,050.6 | 2,130.5 | 2,203.1 | 2,274.0 |
| Note: Any inaccuracies result from rounding. | | | | | |
| MINISTRY OF ECONOMY AND FINANCE | 43 |
| | UPDATE OF THE ECONOMIC AND FINANCIAL DOCUMENT 2023 |
| TABLE V.1b: GENERAL GOVERNMENT BUDGETARY PROSPECTS UNDER EXISTING LEGISLATION (% of GDP) |
| | | | | | |
| COMPONENTS OF EXPENDITURE | | | | | |
| Compensation of employees | 9.6 | 9.2 | 8.8 | 8.6 | 8.3 |
| Intermediate consumption | 8.6 | 8.3 | 8.0 | 7.9 | 7.6 |
| Social benefits | 20.9 | 20.7 | 21.1 | 20.9 | 20.7 |
| of which: Pensions | 15.3 | 15.5 | 16.0 | 15.9 | 15.9 |
| Other social benefits | 5.6 | 5.2 | 5.1 | 5.0 | 4.9 |
| Other current expenditure | 5.0 | 4.7 | 4.2 | 3.9 | 3.7 |
| Total current expenditure net of interest | 44.1 | 42.9 | 42.0 | 41.2 | 40.3 |
| Interest expenditure | 4.3 | 3.8 | 4.2 | 4.3 | 4.6 |
| Total current expenditure | 48.3 | 46.7 | 46.2 | 45.5 | 44.9 |
| of which: Health expenditure | 6.7 | 6.6 | 6.2 | 6.2 | 6.1 |
| Total capital expenditure | 7.7 | 6.3 | 4.4 | 4.8 | 4.5 |
| Gross fixed capital formation | 2.7 | 2.9 | 3.2 | 3.4 | 3.2 |
| Capital contributions | 4.2 | 3.2 | 1.1 | 1.3 | 1.1 |
| Other transfers | 0.9 | 0.3 | 0.1 | 0.2 | 0.2 |
| Total final expenditure net of interest | 51.8 | 49.2 | 46.5 | 46.0 | 44.9 |
| Total final expenditure | 56.1 | 53.0 | 50.6 | 50.3 | 49.4 |
| | | | | | |
| COMPONENTS OF REVENUE | | | | | |
| Total tax revenues | 29.3 | 29.3 | 28.7 | 28.5 | 28.3 |
| Direct taxes | 15.0 | 15.1 | 14.3 | 14.2 | 14.2 |
| Indirect taxes | 14.2 | 14.2 | 14.3 | 14.2 | 14.1 |
| Capital taxes | 0.1 | 0.1 | 0.1 | 0.1 | 0.1 |
| Social contributions | 13.4 | 13.1 | 13.6 | 13.6 | 13.5 |
| Actual contributions | 13.2 | 12.9 | 13.4 | 13.4 | 13.3 |
| Imputed contributions | 0.2 | 0.2 | 0.2 | 0.2 | 0.2 |
| Other current revenues | 4.5 | 4.4 | 4.3 | 4.3 | 4.0 |
| Total current revenues | 47.1 | 46.8 | 46.5 | 46.2 | 45.8 |
| Non-tax capital revenues | 0.8 | 1.0 | 0.4 | 0.6 | 0.4 |
| Total final revenues | 48.0 | 47.8 | 47.0 | 46.9 | 46.3 |
| Memo: Tax burden | 42.7 | 42.5 | 42.3 | 42.0 | 41.8 |
| BALANCES | | | | | |
| Primary balance | -3.8 | -1.4 | 0.6 | 0.9 | 1.4 |
| Current balance | -1.2 | 0.0 | 0.3 | 0.8 | 0.9 |
| Net borrowing | -8.0 | -5.2 | -3.6 | -3.4 | -3.1 |
| Note: Any inaccuracies result from rounding. | | | | | |
| 44 | MINISTRY OF ECONOMY AND FINANCE |
| TABLE V.1c: GENERAL GOVERNMENT BUDGETARY PROSPECTS UNDER EXISTING LEGISLATION (% changes y/y) |
| | 2023 | 2024 | 2025 | 2026 |
| COMPONENTS OF EXPENDITURE | | | | |
| Compensation of employees | 0.8 | -1.1 | 1.0 | -0.1 |
| Intermediate consumption | 2.1 | 0.1 | 1.3 | -0.3 |
| Social benefits | 4.2 | 5.9 | 2.4 | 2.7 |
| of which: Pensions | 6.8 | 7.3 | 2.8 | 3.1 |
| Other social benefits | -2.9 | 1.6 | 0.9 | 1.1 |
| Other current expenditure | -0.3 | -8.1 | -3.1 | -1.7 |
| Total current expenditure net of interest | 2.6 | 1.7 | 1.3 | 1.1 |
| Interest expenditure | -5.4 | 13.5 | 6.2 | 9.7 |
| Total current expenditure | 1.8 | 2.7 | 1.8 | 1.9 |
| of which: Health expenditure | 2.8 | -1.3 | 2.8 | 1.7 |
| Total capital expenditure | -14.3 | -26.7 | 12.4 | -3.3 |
| Gross fixed capital formation | 12.5 | 17.8 | 7.1 | -2.5 |
| Capital contributions | -20.3 | -63.6 | 17.1 | -5.6 |
| Other transfers | -68.0 | -67.6 | 160.8 | -1.9 |
| Total final expenditure net of interest | 0.0 | -1.9 | 2.4 | 0.6 |
| Total final expenditure | -0.4 | -0.8 | 2.7 | 1.4 |
| | | | | |
| COMPONENTS OF REVENUE | | | | |
| Total tax revenues | 5.6 | 1.7 | 2.6 | 2.7 |
| Direct taxes | 6.3 | -1.2 | 2.7 | 2.8 |
| Indirect taxes | 4.9 | 4.8 | 2.5 | 2.6 |
| Capital taxes | -5.1 | -4.4 | 1.0 | 0.8 |
| Social contributions | 3.3 | 7.5 | 3.1 | 2.9 |
| Actual contributions | 3.3 | 7.6 | 3.1 | 2.9 |
| Imputed contributions | 5.9 | 2.3 | 2.2 | 2.0 |
| Other current revenues | 1.9 | 1.6 | 2.5 | -2.9 |
| Total current revenues | 4.6 | 3.3 | 2.8 | 2.2 |
| Non-tax capital revenues | 24.5 | -54.8 | 33.2 | -17.0 |
| Total final revenues | 4.9 | 2.1 | 3.0 | 2.0 |
| Note: Any inaccuracies result from rounding. | | | | |
| TABLE V.2: IMPACT OF RECOVERY AND RESILIENCE FACILITY ON GENERAL GOVERNMENT BUDGETARY PROSPECTS - GRANTS |
| | | 2020-2026 | |
| Revenues from RRF grants (% GDP) | | | |
| RRF grants as included in the revenue projections | | 3.3 | |
| Cash disbursements of RRF grants from EU | | 3.4 | |
| | | | |
| TOTAL CURRENT EXPENDITURE | | 0.8 | |
| Gross fixed capital formation P.51g | | 0.9 | |
| Capital transfers D.9 | | 1.5 | |
| TOTAL CAPITAL ACCOUNT EXPENDITURE | | 2.5 | |
| | | | |
| OTHER COSTS FINANCED BY RRF GRANTS (1) | | | |
| Reduction in tax revenue | | 0.0 | |
| Other costs with impact on revenue | | 0.0 | |
| Financial transactions | | 0.0 | |
| (1) Reference is made to cost items not recorded as expenditure in the national accounts. Any inaccuracies result from rounding. |
| MINISTRY OF ECONOMY AND FINANCE | 45 |
| | UPDATE OF THE ECONOMIC AND FINANCIAL DOCUMENT 2023 |
| TABLE V.3: IMPACT OF RECOVERY AND RESILIENCE FACILITY ON GENERAL GOVERNMENT BUDGETARY PROSPECTS - LOANS |
| | | 2020-2026 | |
| Cash flow from RRF loans projected in the programme (% GDP) | | | |
| Disbursement of RRF LOANS from EU | | 5.9 | |
| Repayments of RRF LOANS to EU | | 0.0 | |
| | | | |
| TOTAL CURRENT EXPENDITURE | | 0.4 | |
| Gross fixed capital formation P.51g | | 3.9 | |
| Capital transfers D.9 | | 1.2 | |
| TOTAL CAPITAL ACCOUNT EXPENDITURE | | 5.2 | |
| | | | |
| OTHER COSTS FINANCED BY RRF LOANS (1) | | | |
| Reduction in tax revenue | | 0.0 | |
| Other costs with impact on revenue | | 0.0 | |
| Financial transactions | | 0.1 | |
| (1) Reference is made to cost items not recorded as expenditure in the national accounts. Any inaccuracies result from rounding. |
| TABLE V.4: SUMMARY OF PUBLIC FINANCE UNDER POLICY SCENARIO (% of GDP) |
| | | 2022 | 2023 | 2024 | 2025 | 2026 |
| NET BORROWING | (Update) | -8.0 | -5.3 | -4.3 | -3.6 | -2.9 |
| (Stability Program) | -8.0 | -4.5 | -3.7 | -3.0 | -2.5 |
| INTEREST EXPENDITURE | (Update) | 4.3 | 3.8 | 4.2 | 4.3 | 4.6 |
| (Stability Program) | 4.4 | 3.7 | 4.1 | 4.2 | 4.5 |
| PRIMARY BALANCE | (Update) | -3.8 | -1.5 | -0.2 | 0.7 | 1.6 |
| (Stability Program) | -3.6 | -0.8 | 0.3 | 1.2 | 2.0 |
| STRUCTURAL NET BORROWING (1) | (Update) | -8.7 | -5.9 | -4.8 | -4.3 | -3.5 |
| (Stability Program) | -8.5 | -4.9 | -4.1 | -3.7 | -3.2 |
| PUBLIC DEBT (gross of subsidies) (2) | (Update) | 141.7 | 140.2 | 140.1 | 139.9 | 139.6 |
| (Stability Program) | 144.4 | 142.1 | 141.4 | 140.9 | 140.4 |
| PUBLIC DEBT (net of subsidies) (2) | (Update) | 138.8 | 137.4 | 137.5 | 137.4 | 137.2 |
| (Stability Program) | 141.5 | 139.3 | 138.7 | 138.3 | 138.0 |
| PUBLIC SECTOR CASH BALANCE | (Update) | -3.3 | -5.6 | -6.4 | -5.6 | -4.4 |
| (Stability Program) | -3.3 | -5.6 | -5.1 | -4.4 | -4.0 |
| STATE SECTOR CASH BALANCE | (Update) | -3.4 | -5.6 | -6.3 | -5.6 | -4.5 |
| | | | | | |
(1) Net of one-offs and the cyclical component. (2) Gross or net of Italy's shares of loans to EMU Member States, either bilateral or through the EFSF, and of the contribution to the capital of the ESM. On 2022, the amount of these shares amounted to 56.3 billion, of which 42 billion for bilateral loans and through the EFSF and 14.3 billion for the ESM programme. |
| 46 | MINISTRY OF ECONOMY AND FINANCE |
| TABLE V.5: CYCLICALLY ADJUSTED PUBLIC FINANCE (% of GDP) |
| | 2020 | 2021 | 2022 | 2023 | 2024 | 2025 | 2026 |
1. Growth rate of GDP at constant prices | -9.0 | 8.3 | 3.7 | 0.8 | 1.2 | 1.4 | 1,0 |
2. Net borrowing | -9.6 | -8.8 | -8.0 | -5.3 | -4.3 | -3.6 | -2,9 |
3. Interest expenditure | 3.4 | 3.5 | 4.3 | 3.8 | 4.2 | 4.3 | 4,6 |
4. One-off measures (1) | 0.1 | 0.4 | 0.3 | 0.2 | 0.0 | 0.0 | 0,0 |
| Of which: Revenue measures | 0.2 | 0.4 | 0.3 | 0.2 | 0.0 | 0.1 | 0,0 |
| Expenditure measures | -0.1 | 0.0 | 0.0 | 0.0 | 0.0 | 0.0 | 0,0 |
5. Potential GDP growth rate | 0.1 | 0.3 | 1.1 | 0.9 | 1.1 | 1.1 | 1,0 |
| Factor contribution to potential growth: | | | | | | | |
| Labour | -0.1 | -0.1 | 0.6 | 0.4 | 0.5 | 0.5 | 0,4 |
| Capital | -0.1 | 0.2 | 0.4 | 0.4 | 0.4 | 0.4 | 0,4 |
| Total factor productivity | 0.3 | 0.3 | 0.2 | 0.2 | 0.2 | 0.2 | 0,2 |
6. Output gap | -9.0 | -1.8 | 0.8 | 0.7 | 0.7 | 1.1 | 1,0 |
7. Cyclical component of budget balance | -4.9 | -1.0 | 0.4 | 0.4 | 0.4 | 0.6 | 0,6 |
8. Cyclically adjusted budget balance | -4.7 | -7.8 | -8.5 | -5.7 | -4.7 | -4.2 | -3,5 |
9. Cyclically adjusted primary balance | -1.3 | -4.3 | -4.2 | -1.9 | -0.6 | 0.1 | 1,1 |
10. Structural budget balance (2) | -4.8 | -8.2 | -8.7 | -5.9 | -4.8 | -4.3 | -3,5 |
11. Structural primary balance (2) | -1.3 | -4.7 | -4.5 | -2.1 | -0.6 | 0.0 | 1,0 |
12. Change in structural budget balance | -3.2 | -3.5 | -0.5 | 2.9 | 1.1 | 0.5 | 0,7 |
13. Change in structural primary balance | | | | | | | |
| Note: Any inaccuracies result from rounding. |
(1) The positive sign indicates deficit reducing one-off measures. (2) Cyclically adjusted and net of one-off and other temporary measures. |
| TABLE V.6: ONE-OFF MEASURES UNDER EXISTING LEGISLATION (EUR millions) |
| | FINAL DATA | FORECASTS |
| | 2021 | 2022 | 2023 | 2024 | 2025 | 2026 |
| Total one-off measures | 7,722 | 5,574 | 3,659 | 559 | 910 | 1,028 |
| % of GDP | 0.4 | 0.3 | 0.2 | 0.0 | 0.0 | 0.0 |
- a) Revenue | 7,351 | 6,145 | 4,296 | 775 | 1,223 | 512 |
| % of GDP | 0.4 | 0.3 | 0.2 | 0.0 | 0.1 | 0.0 |
| - Various substitute taxes | 5,638 | 4,454 | 4,450 | 752 | 348 | 0.0 |
| - Aligning of balance sheet values to IAS principles | 572 | 438 | 237 | 235 | 235 | 235 |
| - Foreign capital emersion (‘voluntary disclosure’) | 1 | 1 | 0 | 0 | 0 | 0 |
| - Tax bill scrapping (1) | 1,140 | 1,252 | 781 | 42 | 480 | -31 |
| | | | | | | |
| - b) Expenditure | -940 | -2,074 | -1,518 | -1,090 | -1,182 | -361 |
| % of GDP | -0.1 | -0.1 | -0.1 | -0.1 | -0.1 | 0.0 |
| - Interventions for natural disasters: | -940 | -385 | -1,518 | -1090 | -1,182 | -361 |
| - Reclassification of MPS operation | 0 | -1,689 | 0 | 0 | 0 | 0 |
| | | | | | | |
- c) Real estate disposals | 1,311 | 1,503 | 882 | 874 | 869 | 877 |
| % of GDP | 0.1 | 0.1 | 0.0 | 0.0 | 0.0 | 0.0 |
| Breakdown by subsectors | | | | | | |
| - Central government | 6,561 | 4,195 | 2,811 | -281 | 75 | 185 |
| - Local governments | 754 | 389 | 623 | 630 | 637 | 645 |
| - Social security funds | 407 | 990 | 225 | 210 | 198 | 198 |
| Note: The positive sign indicates deficit reducing one-off measures. |
| (1) Including the measures of D.L. No. 193/2016, D.L. No. 148/2017, D.L. No. 119/2018, D.L. No. 124/2019. |
| MINISTRY OF ECONOMY AND FINANCE | 47 |
The Update of the
ECONOMIC AND FINANCIAL DOCUMENT 2023
is available on-line
at the internet address listed below:
www.mef.gov.it www.dt.tesoro.it/ www.rgs.mef.gov.it
ISSN 2240-3280