Washington, D.C. 20549
As previously reported, The Merger Fund® showed a gain of 8.2% in its fiscal year ended September 30, 2007. M&A activity involving publicly traded companies in North America and Europe was strong during the period, and in the vast majority of cases, the arbitrage situations in which the Fund invested yielded positive returns. More specifically, of the 173 mergers, takeovers and other corporate reorganizations in which we held positions, 163 unfolded more or less as expected or saw topping bids. Of the remaining six deals that were subject to definitive merger agreements, two were terminated, one was renegotiated and three were left in limbo after the buyers balked at completing the transactions on their original terms. An additional four “pre-deal” situations failed to reach the definitive-agreement stage. For the first nine months of fiscal 2007, arbitrage spreads—the per-share profit to be made in any given transaction—were generally favorable relative to the risks involved but seldom compelling. During the summer, however, when turmoil in the credit markets precipitated the wholesale dumping of takeover stocks by over-leveraged hedge funds, deal spreads widened sharply, which is a bad thing if you’re forced to sell but a good thing if you’re in a position to buy. Our ability to take advantage of many of these opportunities speaks well of the Fund’s risk-management policies and the experience and judgment of its portfolio-management team.
Once again, we have included a series of charts which reflect the nature of the arbitrage situations in which the Fund has recently invested. Chart 1 shows that as of September 30, friendly transactions represented 99% of the dollar value of our long positions, while unsolicited, or hostile, takeover attempts accounted for just 1%. The latter figure, which is down from 6% a year earlier, may represent the lowest percentage of hostile deals in the Fund’s portfolio since inception 18 years ago. Corporate managements must be reading our annual reports, since we have often discussed how difficult it is to accomplish an unwelcome takeover. Poison pills, staggered boards and target-friendly state laws governing unsolicited offers have tipped the odds against all but the most committed bidders. And even when the would-be acquirer is both willing and able to stay the course, a third party acting as a white knight may end up stealing the prize. Arbitrageurs, of course, look at hostile takeovers differently than do the companies making them. Whether the original bidder or a white knight is the eventual winner is often not that important to us; we just want a deal, preferably at a nice premium to our cost basis in the target company’s shares.
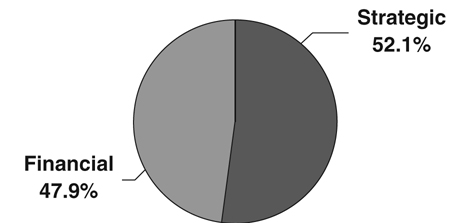
Chart 2 shows that approximately 52% of the takeovers in the Fund’s portfolio as of September 30 were strategic in nature, meaning combinations that involve a corporate buyer—typically operating in the same industry as the target—whose objective in doing the transaction is to enhance shareholder value on a longer-term basis. The rest are financial, or going-private, deals in which an investor group that normally includes the target’s management uses large amounts of borrowed money to buy out the public shareholders. In most cases, the goal in such highly leveraged transactions is to pay down debt over a few
years’ time and then either sell or IPO the company at a price that yields a sizable profit for the buyout group. Certain of the takeovers that we classify as financial transactions could be described as quasi-strategic; that is, the private equity buyer has made other acquisitions in the same industry and expects to realize synergies comparable to those available to a strategic acquirer. At the end of September financial deals represented about 48% of our arbitrage investments, up from 24% a year earlier and the highest level since we launched The Merger Fund®.
For much of the Fund’s fiscal year, the environment for going-private transactions was extremely accommodating, with lenders willing to supply large amounts of buyout financing on highly favorable terms. Taking advantage of these borrower-friendly credit markets, private-equity firms went into high gear. Multi-billion-dollar LBOs became commonplace, and a number of deals topped the $20 billion level. While the music kept playing, companies that had put themselves up for sale and had attracted interest from both private-equity and strategic bidders often ended up in the arms of buyout groups. In such cases the historical advantage enjoyed by strategic buyers—their ability to realize greater synergies when combining with another company in the same industry—was trumped by the ability of private-equity shops to amplify their investment returns with high leverage and cheap financing.
In the September quarter, however, the ascendancy of private-equity groups in deal-making came to an abrupt end. Trouble in subprime mortgages spread to a wide range of debt instruments as lenders suddenly lost their appetite for risk-taking. Although most of the going-private deals that had been announced earlier in the year survived these dislocations, new LBO activity contracted sharply. Just a month after the end of the Fund’s fiscal year, highly leveraged transactions represented a significantly smaller 36% of our investments.
Chart 3 shows the type of merger consideration to be received by the selling company’s shareholders in transactions in which the Fund held positions at the end of September. This year’s chart shows that when it comes to deal-making, cash is still king. In fact, never before in the Fund’s history have all-cash takeovers represented such a large share, 85%, of our portfolio. All-stock deals, in contrast, accounted for less than 1% of our investments, down from 14% a year ago and over 30% in 2003. Part of the explanation involves the large number of going-private transactions in the Fund’s portfolio at the end of September; these deals are always done for cash. So are most cross-border transactions, in which the sellers typically prefer to receive cash rather than shares listed in another country. In addition, corporate balance sheets have become even more cash-heavy, and borrowing costs for credit-worthy strategic buyers remain relatively low. And as we have noted before, not only are cash deals frequently more accretive to the buyer’s bottom line than stock deals, but by using their cash for acquisitions, publicly traded companies can also make themselves less of a target for activist investors demanding large cash distributions or share buybacks. Finally, many CEOs continue to regard their own shares as undervalued and are reluctant to use them as an acquisition currency.
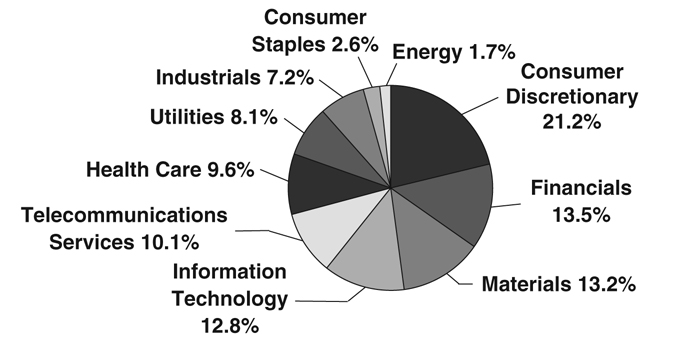
Chart 4 shows our investments grouped by economic sector. Deals involving hotels and casinos, restaurant chains, broadcasters and other companies in the consumer discretionary sector climbed to the top spot this year, representing about 21% of the dollar value of the Fund’s holdings as of September 30. The ability of these companies to generate relatively steady cash flow has attracted a significant amount of interest from private-equity buyers. Mergers and acquisitions involving financial services companies dropped to second place this year, accounting for 13% of our investments, down from 25% at the end of fiscal 2006. One reason for the dip in M&A activity in this sector is that management focus on repairing damaged balance sheets and restoring credibility with investors has taken many large banks and brokers out of the takeover game, at least for the time being. The materials sector, which includes the booming and acquisition-hungry metals and mining group, also represented about 13% of the Fund’s holdings as of September 30.
The biggest year-over-year change in the portfolio’s composition involves the energy sector, which at the end of fiscal 2006 accounted for 22% of our investments but which this year comprises only about 2%. We’re not sure why the urge to merge in this group has seemingly waned, but one possibility is that many of the obvious combinations have already taken place. Another explanation may be that buyers and sellers have divergent views regarding the sustainability of today’s record-high energy prices, making it harder to price transactions. The rest of the Fund’s positions are spread across six other economic sectors. As discussed in prior reports, we don’t target particular industry groups for investment; we go where the deals are. We wouldn’t put all of our eggs in one industry basket, of course, but the target’s industry classification is otherwise important to us only to the extent that it could potentially affect the outcome of the transaction. In most cases, it won’t.
Chart 5 shows the Fund’s arbitrage investments grouped by the geographic region in which the target company is domiciled. At the end of fiscal 2007 roughly 76% of the deals in our portfolio involved U.S.-based targets, while target companies located in Canada and Europe accounted for 11% and 13% of the Fund’s holdings, respectively. A year earlier the comparable numbers for Canada and Europe were 5% and 11%, indicating that the Fund’s investment activity has recently become somewhat more global in nature. Evaluating non-U.S. arbitrage opportunities requires an understanding of political, regulatory and corporate-governance systems that may be less shareholder-friendly than our own, and we often ask ourselves, “What do the locals know that we don’t?” We hope the answer is, “Not much.” We also take a disciplined approach to hedging currency risk, so that fluctuations in exchange rates don’t impact the Fund’s performance.
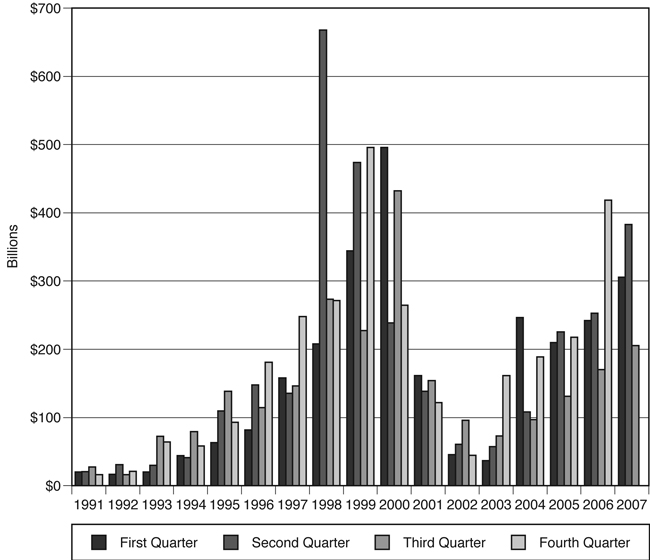
Chart 6 shows the total dollar value of mergers and acquisitions in the U.S., by quarter, since 1991. M&A volume rose nearly 50% from year-earlier levels in the 12 months ended September, although activity slowed significantly toward the end of the period as credit jitters put a damper on highly leveraged transactions. It appears unlikely that the near-perfect environment experienced by private-equity firms in the spring of 2007 will be repeated anytime soon. With fewer going-private deals in the pipeline, to what extent will strategic buyers take
up the slack over the next year or so? Much will depend on industry- and company-specific developments. At the same time, the prospect of less competition from financial players—and a corresponding reduction in takeover premiums—may be enough to entice corporate acquirers to step up their M&A activity, especially if confidence levels stay relatively high. On the other hand, a serious economic downturn or a geopolitical shock to the system could undermine confidence and cause would-be acquirers to put their plans on hold. Absent a major change in boardroom sentiment, however, global deal-making should remain at levels sufficient to provide The Merger Fund® with an ample flow of attractive investment opportunities.
Frederick W. Green
Source: Securities Data Corp.
The Standard & Poor’s 500 Index (S&P 500) is a capitalization-weighted index, representing the aggregate market value of the common equity of 500 stocks primarily traded on the New York Stock Exchange. This chart assumes an initial gross investment of $10,000 made on September 30, 1997. Returns shown include the reinvestment of all dividends. Past performance is not predictive of future performance. The graph and table do not reflect the deduction of taxes that a shareholder would pay on fund distributions or the redemption of fund shares. Investment return and principal value will fluctuate, so that your shares, when redeemed, may be worth more or less than the original cost.
As a shareholder of the Fund, you incur two types of costs: (1) redemption fees and (2) ongoing costs, including management fees; distribution and/or service fees; and other Fund expenses. This Example is intended to help you understand your ongoing costs (in dollars) of investing in the Fund and to compare these costs with the ongoing costs of investing in other mutual funds. The Example is based on an investment of $1,000 for the period 4/01/07 – 9/30/07.
The first line of the table below provides information about actual account values and actual expenses. Although the Fund charges no sales load or transaction fees, you will be assessed fees for outgoing wire transfers, returned checks and stop-payment orders at prevailing rates charged by U.S. Bancorp Fund Services, LLC, the Fund’s transfer agent. If you request that a redemption be made by wire transfer, a $15.00 fee will be charged by the Fund’s transfer agent. You will be charged a redemption fee equal to 2.00% of the net amount of the redemption if you redeem your shares less than 30 calendar days after you purchase them. IRA accounts will be charged a $15.00 annual maintenance fee. To the extent the Fund invests in shares of other investment companies as part of its investment strategy, you will indirectly bear your proportionate share of any fees and expenses charged by the underlying funds in which the Fund invests in addition to the expenses of the Fund. Actual expenses of the underlying funds are expected to vary among the various underlying funds. These expenses are not included in the example below. The example below includes, but is not limited to, management fees, shareholder servicing fees, fund accounting, custody and transfer agent fees. However, the example below does not include portfolio trading commissions and related expenses, and other extraordinary expenses as determined under generally accepted accounting principles. You may use the information in this line, together with the amount you invested, to estimate the expenses that you paid over the period. Simply divide your account value by $1,000 (for example, an $8,600 account value divided by $1,000 = 8.6), then multiply the result by the number in the first line under the heading entitled “Expenses Paid During Period” to estimate the expenses you paid on your account during this period.
The second line of the table below provides information about hypothetical account values and hypothetical expenses based on the Fund’s actual expense ratio and an assumed rate of return of 5% per year before expenses, which is not the Fund’s actual return. The hypothetical account values and expenses may not be used to estimate the actual ending account balance or expenses you paid for the period. You may use this information to compare the ongoing costs of investing in the Fund and other funds. To do so, compare this 5% hypothetical example with the 5% hypothetical examples that appear in the shareholder reports of the other funds. Please note that the expenses shown in the table are meant to highlight your ongoing costs only and do not reflect any transactional costs, such as redemption fees. Therefore, the second line of the table is useful in comparing ongoing costs only, and will not help you determine the relative total costs of owning different funds. In addition, if these transactional costs were included, your costs would have been higher.
The accompanying notes are an integral part of these financial statements.
The accompanying notes are an integral part of these financial statements.
The accompanying notes are an integral part of these financial statements.
The accompanying notes are an integral part of these financial statements.
Percentages are stated as a percent of net assets.
The accompanying notes are an integral part of these financial statements.
The Merger Fund
SCHEDULE OF SECURITIES SOLD SHORT
September 30, 2007
Shares | | | | Value | |
| | 199,308 | | Hologic, Inc. | | $ | 12,157,788 | |
| | 557,300 | | Metropcs Communications Inc. | | | 15,203,144 | |
| | 1,624,900 | | RF Micro Devices, Inc. | | | 10,935,577 | |
| | 666,622 | | The Thomson Corporation | | | 27,951,461 | |
| | 85,225 | | Vulcan Materials Company | | | 7,597,809 | |
| | 441,312 | | Wells Fargo Company | | | 15,719,533 | |
| | 315,650 | | Wesfarmers Limited | | | 11,763,876 | |
| | TOTAL SECURITIES SOLD SHORT | | | | |
| | (Proceeds $100,437,380) | | $ | 101,329,188 | |
The accompanying notes are an integral part of these financial statements.
The Merger Fund
SCHEDULE OF OPTIONS WRITTEN
September 30, 2007
Contracts (100 shares per contract) | | Value | |
| CALL OPTIONS | | | | | |
| | | Affiliated Computer Services, Inc. | | | |
| | 464 | | Expiration: October, 2007, Exercise Price: $50.00 | | $ | 46,400 | |
| | | | Applebee’s International, Inc. | | | | |
| | 470 | | Expiration: November, 2007, Exercise Price: $30.00 | | | 2,350 | |
| | | | EDO Corporation | | | | |
| | 201 | | Expiration: October, 2007, Exercise Price: $55.00 | | | 30,150 | |
| | 1,184 | | Expiration: November, 2007, Exercise Price: $55.00 | | | 260,480 | |
| | | | Harman International Industries, Inc. | | | | |
| | 1,834 | | Expiration: November, 2007, Exercise Price: $85.00 | | | 1,173,760 | |
| | 878 | | Expiration: November, 2007, Exercise Price: $90.00 | | | 368,760 | |
| | | | Mirant Corporation | | | | |
| | 2,200 | | Expiration: October, 2007, Exercise Price: $40.00 | | | 385,000 | |
| | | | Station Casinos, Inc. | | | | |
| | 4,072 | | Expiration: January, 2008, Exercise Price: $90.00 | | | 81,440 | |
| | | | TXU Corp. | | | | |
| | 4,618 | | Expiration: January, 2008, Exercise Price: $67.50 | | | 773,515 | |
| | | | Wendy’s International, Inc. | | | | |
| | 2,669 | | Expiration: November, 2007, Exercise Price: $35.00 | | | 473,747 | |
| | | | TOTAL OPTIONS WRITTEN | | | | |
| | | | (Premiums received $4,145,293) | | $ | 3,595,602 | |
The accompanying notes are an integral part of these financial statements.
The Merger Fund
STATEMENT OF ASSETS AND LIABILITIES
September 30, 2007
| ASSETS: | | | | | | |
| Investments, at value (Cost $1,923,714,924) | | | | | $ | 1,919,243,699 | |
| Cash | | | | | | 9,466,113 | |
| Receivable from brokers for proceeds on securities sold short | | | | | | 100,655,969 | |
| Receivable for investments sold | | | | | | 37,467,170 | |
| Receivable for written options | | | | | | 963,294 | |
| Receivable for swap contracts | | | | | | 24,672,018 | |
| Receivable for fund shares issued | | | | | | 5,064,287 | |
| Dividends and interest receivable | | | | | | 4,993,581 | |
| Prepaid expenses | | | | | | 75,649 | |
| Total Assets | | | | | | 2,102,601,780 | |
| LIABILITIES: | | | | | | | |
| Securities sold short, at value (proceeds of $100,437,380) | | $ | 101,329,188 | | | | | |
| Options written, at value (premiums received $4,145,293) | | | 3,595,602 | | | | | |
| Payable to brokers for short sales | | | 8,249,598 | | | | | |
| Payable for forward currency exchange contracts | | | 17,405,692 | | | | | |
| Loan payable | | | 93,676,000 | | | | | |
| Payable for securities purchased | | | 44,209,648 | | | | | |
| Payable for fund shares redeemed | | | 6,905,187 | | | | | |
| Investment advisory fee payable | | | 1,480,194 | | | | | |
| Distribution fees payable | | | 746,645 | | | | | |
| Accrued expenses and other liabilities | | | 3,289,629 | | | | | |
| Total Liabilities | | | | | | | 280,887,383 | |
| NET ASSETS | | | | | | $ | 1,821,714,397 | |
| NET ASSETS Consist Of: | | | | | | | | |
| Accumulated undistributed net investment income | | | | | | $ | 22,368,243 | |
| Accumulated undistributed net realized gain on investments | | | | | | | | |
| sold, foreign currency translation, forward currency exchange | | | | | | | | |
| contracts, securities sold short, swap contracts, | | | | | | | | |
| and written option contracts expired or closed | | | | | | | 60,348,205 | |
| Net unrealized appreciation (depreciation) on: | | | | | | | | |
| Investments | | $ | (4,471,225 | ) | | | | |
| Securities sold short | | | (891,808 | ) | | | | |
| Written option contracts | | | 549,691 | | | | | |
| Swap contracts | | | 17,357,675 | | | | | |
| Foreign currency translation | | | 16,965 | | | | | |
| Forward currency exchange contracts | | | (17,405,693 | ) | | | | |
| Net unrealized depreciation | | | | | | | (4,844,395 | ) |
| Paid-in capital | | | | | | | 1,743,842,344 | |
| Total Net Assets | | | | | | $ | 1,821,714,397 | |
| NET ASSET VALUE, offering price and redemption price per share | | | | | | | | |
| ($1,821,714,397 / 110,081,874 shares of beneficial interest outstanding) | | | | | | $ | 16.55 | |
| | | | | | | | | |
The accompanying notes are an integral part of these financial statements.
The Merger Fund
STATEMENT OF OPERATIONS
For the Year Ended September 30, 2007
| INVESTMENT INCOME: | | | | | | |
| Interest | | | | | $ | 14,618,572 | |
| Dividend income on long positions | | | | | | | |
| (net of foreign withholding taxes of $265,782) | | | | | | 36,415,104 | |
| Total investment income | | | | | | 51,033,676 | |
| EXPENSES: | | | | | | | |
| Investment advisory fee | | $ | 17,140,337 | | | | | |
| Distribution fees | | | 3,810,907 | | | | | |
| Transfer agent and shareholder servicing agent fees | | | 202,836 | | | | | |
| Federal and state registration fees | | | 88,470 | | | | | |
| Professional fees | | | 358,373 | | | | | |
| Trustees’ fees and expenses | | | 77,259 | | | | | |
| Custody fees | | | 420,630 | | | | | |
| Administration fee | | | 697,410 | | | | | |
| Fund accounting expense | | | 219,265 | | | | | |
| Reports to shareholders | | | 239,114 | | | | | |
| Proxy related expense | | | 525,000 | | | | | |
| Dividends on short positions | | | 7,849,445 | | | | | |
| Interest | | | 5,177,706 | | | | | |
| Other | | | 179,269 | | | | | |
| Total expenses before expense reimbursement by adviser | | | | | | | 36,986,021 | |
| Expense reimbursement by adviser (Note 3) | | | | | | | (214,287 | ) |
| Net Expenses | | | | | | | 36,771,734 | |
| NET INVESTMENT INCOME | | | | | | | 14,261,942 | |
| REALIZED AND UNREALIZED GAIN (LOSS) ON INVESTMENTS: | | | | | | | | |
| Realized gain (loss) on: | | | | | | | | |
| Investments | | | 99,000,486 | | | | | |
| Securities sold short | | | (22,775,070 | ) | | | | |
| Written option contracts expired or closed | | | 1,443,458 | | | | | |
| Swap contracts | | | 37,503,360 | | | | | |
| Foreign currency translation | | | 30,699,007 | | | | | |
| Forward currency exchange contracts | | | (17,381,271 | ) | | | | |
| Net realized gain | | | | | | | 128,489,970 | |
| Change in unrealized appreciation / depreciation on: | | | | | | | | |
| Investments | | | (37,884,905 | ) | | | | |
| Securities sold short | | | 24,733,007 | | | | | |
| Written option contracts | | | (2,141,867 | ) | | | | |
| Swap contracts | | | 18,787,722 | | | | | |
| Foreign currency translation | | | 17,028 | | | | | |
| Forward currency exchange contracts | | | (17,922,618 | ) | | | | |
| Net unrealized loss | | | | | | | (14,411,633 | ) |
| NET REALIZED AND UNREALIZED GAIN ON INVESTMENTS | | | | | | | 114,078,337 | |
| NET INCREASE IN NET ASSETS RESULTING FROM OPERATIONS | | | | | | $ | 128,340,279 | |
| | | | | | | | | |
The accompanying notes are an integral part of these financial statements.
The Merger Fund
STATEMENT OF CASH FLOWS
For the Year Ended September 30, 2007
| CASH FLOWS FROM OPERATING ACTIVITIES: | | | |
| Net increase in net assets resulting from operations | | $ | 128,340,279 | |
| Adjustments to reconcile net increase in net assets resulting from | | | | |
| operations to net cash provided (used) by operating activities: | | | | |
| Net realized (gain) loss on: | | | | |
| Long transactions | | | (99,000,486 | ) |
| Short transactions | | | 22,775,070 | |
| Written options | | | (1,443,458 | ) |
| Change in unrealized appreciation on long transactions, | | | | |
| short transactions, and written options | | | 15,293,765 | |
| Amortization and accretion of premium and discount | | | (2,557,129 | ) |
| Changes in assets and liabilities: | | | | |
| Deposit at broker for short sales | | | (29,060,809 | ) |
| Receivable/Payable from brokers for proceeds on securities sold short | | | 345,308,272 | |
| Receivable for investments sold | | | 28,331,986 | |
| Receivable for written options | | | (966 | ) |
| Receivable for fund shares sold | | | (289,639 | ) |
| Dividends and interest receivable | | | (3,534,169 | ) |
| Prepaid expenses | | | 17,013 | |
| Receivable/Payable for forward foreign currency exchange contracts | | | 17,922,617 | |
| Payable for swap contracts | | | (22,812,385 | ) |
| Payable for short dividends | | | (298,316 | ) |
| Investment advisory fees payable | | | 218,586 | |
| Distribution fees payable | | | 280,933 | |
| Payable for securities purchased, short positions and written options | | | (44,487,084 | ) |
| Payable for fund shares redeemed | | | 4,742,758 | |
| Accrued expenses and other liabilities | | | 1,898,339 | |
| Purchases of investments | | | (10,201,227,386 | ) |
| Proceeds from sale of investments | | | 9,899,275,999 | |
| Proceeds from short transactions | | | 987,863,475 | |
| Cover short transactions | | | (1,257,743,193 | ) |
| Premiums received on written options | | | 84,547,716 | |
| Written options closed or exercised | | | (89,137,505 | ) |
| NET CASH PROVIDED BY OPERATING ACTIVITIES | | | (214,775,717 | ) |
| CASH FLOWS FROM FINANCING ACTIVITIES: | | | | |
| Proceeds from shares issued | | | 754,043,652 | |
| Payment on shares redeemed less redemption fees | | | (620,822,606 | ) |
| Cash distributions paid | | | (2,891,996 | ) |
| Cash provided from loan | | | 93,676,000 | |
| NET CASH PROVIDED BY FINANCING ACTIVITIES | | | 224,005,050 | |
| NET CHANGE IN CASH FOR THE PERIOD | | | 9,229,333 | |
| CASH, BEGINNING OF PERIOD | | | 236,780 | |
| CASH, END OF PERIOD | | $ | 9,466,113 | |
| SUPPLEMENTAL INFORMATION: | | | | |
| Cash paid for interest on loan outstanding | | $ | 5,177,706 | |
| Noncash financing activities consisting of reinvestments of distributions | | | 59,240,023 | |
The accompanying notes are an integral part of these financial statements.
The Merger Fund
STATEMENTS OF CHANGES IN NET ASSETS
| | | Year Ended | | | Year Ended | |
| | | September 30, 2007 | | | September 30, 2006 | |
| Net investment income | | $ | 14,261,942 | | | $ | 6,021,550 | |
| Net realized gain on investments, securities sold | | | | | | | | |
| short, written option contracts, swap contracts, | | | | | | | | |
| foreign currency translation and forward | | | | | | | | |
| currency exchange contracts | | | 128,489,970 | | | | 63,035,453 | |
| Change in unrealized appreciation / depreciation on | | | | | | | | |
| investments, securities sold short, written option | | | | | | | | |
| contracts, swap contracts, foreign currency translation | | | | | | | | |
| and forward currency exchange contracts | | | (14,411,633 | ) | | | 21,559,388 | |
| Net increase in net assets resulting from operations | | | 128,340,279 | | | | 90,616,391 | |
| Distributions to shareholders from: | | | | | | | | |
| Net investment income | | | (10,472,365 | ) | | | (743,486 | ) |
| Net realized gains | | | (51,659,654 | ) | | | (69,756,711 | ) |
| Total dividends and distributions | | | (62,132,019 | ) | | | (70,500,197 | ) |
| Net increase in net assets from | | | | | | | | |
| capital share transactions (Note 4) | | | 192,461,069 | | | | 58,254,258 | |
| Net increase in net assets | | | 258,669,329 | | | | 78,370,452 | |
| | | | | | | | | |
| NET ASSETS: | | | | | | | | |
| Beginning of period | | | 1,563,045,068 | | | | 1,484,674,616 | |
| End of period (including accumulated undistributed | | | | | | | | |
| net investment income of $22,368,243 | | | | | | | | |
| and $10,940,346 respectively) | | $ | 1,821,714,397 | | | $ | 1,563,045,068 | |
The accompanying notes are an integral part of these financial statements.
The Merger Fund
FINANCIAL HIGHLIGHTS
Selected per share data is based on a share of beneficial interest outstanding throughout each period.
| | | Year | | | Year | | | Year | | | Year | | | Year | |
| | | Ended | | | Ended | | | Ended | | | Ended | | | Ended | |
| | | Sept. 30, | | | Sept. 30, | | | Sept. 30, | | | Sept. 30, | | | Sept. 30, | |
| | | 2007 | | | 2006 | | | 2005 | | | 2004 | | | 2003 | |
| | | | | | | | | | | | | | | | |
| Net Asset Value, beginning of year | | $ | 15.95 | | | $ | 15.78 | | | $ | 15.10 | | | $ | 14.84 | | | $ | 13.46 | |
| | | | | | | | | | | | | | | | | | | | | |
| Income from investment operations: | | | | | | | | | | | | | | | | | | | | |
Net investment income (loss)(1) | | | 0.13 | (2) | | | 0.06 | (2) | | | (0.06 | )(2) | | | (0.08 | )(3) | | | 0.05 | (2) |
| Net realized and unrealized | | | | | | | | | | | | | | | | | | | | |
| gain (loss) on investments | | | 1.13 | | | | 0.99 | | | | 0.94 | | | | 0.38 | | | | 1.53 | |
| Total from investment operations | | | 1.26 | | | | 1.05 | | | | 0.88 | | | | 0.30 | | | | 1.58 | |
| Redemption fees | | | 0.00 | (5) | | | 0.00 | (5) | | | 0.00 | (5) | | | 0.00 | (5) | | | — | |
| | | | | | | | | | | | | | | | | | | | | |
| Less distributions: | | | | | | | | | | | | | | | | | | | | |
| Dividends from net investment income | | | (0.11 | ) | | | (0.01 | ) | | | 0.00 | (5) | | | (0.04 | ) | | | (0.20 | ) |
| Distributions from net realized gains | | | (0.55 | ) | | | (0.87 | ) | | | (0.20 | ) | | | — | | | | — | |
| Total distributions | | | (0.66 | ) | | | (0.88 | ) | | | (0.20 | ) | | | (0.04 | ) | | | (0.20 | ) |
| Net Asset Value, end of year | | $ | 16.55 | | | $ | 15.95 | | | $ | 15.78 | | | $ | 15.10 | | | $ | 14.84 | |
| | | | | | | | | | | | | | | | | | | | | |
| Total Return | | | 8.15 | % | | | 7.10 | % | | | 5.88 | % | | | 1.99 | % | | | 11.88 | % |
| | | | | | | | | | | | | | | | | | | | | |
| Supplemental Data and Ratios: | | | | | | | | | | | | | | | | | | | | |
| Net assets, end of period (000’s) | | $ | 1,821,714 | | | $ | 1,563,045 | | | $ | 1,484,675 | | | $ | 1,681,281 | | | $ | 1,149,990 | |
| Ratio of operating expenses | | | | | | | | | | | | | | | | | | | | |
| to average net assets | | | 2.16 | % | | | 2.08 | % | | | 1.77 | % | | | 1.87 | % | | | 1.86 | % |
| Ratio of interest expense and | | | | | | | | | | | | | | | | | | | | |
| dividends on short positions to | | | | | | | | | | | | | | | | | | | | |
| average net assets | | | 0.76 | % | | | 0.71 | % | | | 0.41 | % | | | 0.50 | % | | | 0.49 | % |
| Ratio of operating expense to | | | | | | | | | | | | | | | | | | | | |
| average net assets excluding | | | | | | | | | | | | | | | | | | | | |
| interest expense and dividends | | | | | | | | | | | | | | | | | | | | |
| on short positions | | | | | | | | | | | | | | | | | | | | |
| Before expense waiver | | | 1.41 | % | | | 1.37 | % | | | 1.36 | % | | | 1.37 | % | | | 1.37 | % |
| After expense waiver | | | 1.40 | %(6) | | | 1.37 | % | | | 1.36 | % | | | 1.37 | % | | | 1.37 | % |
| Ratio of net investment income | | | | | | | | | | | | | | | | | | | | |
| to average net assets | | | 0.83 | % | | | 0.43 | % | | | (0.35 | )% | | | (0.68 | )% | | | 0.22 | % |
Portfolio turnover rate(4) | | | 334.87 | % | | | 369.47 | % | | | 312.04 | % | | | 256.88 | % | | | 309.18 | % |
_______________
Footnotes To Financial Highlights On Following Page
The accompanying notes are an integral part of these financial statements.
The Merger Fund
FINANCIAL HIGHLIGHTS (continued)
| (1) | Net investment income before interest expense and dividends on short positions for the years ended September 30, 2007, 2006, 2005, 2004 and 2003, was $0.26, $0.18, $0.01, $0.00 and $0.01, respectively. |
| (2) | Net investment income per share is calculated using ending balances prior to consideration of adjustments for permanent book and tax differences. |
| (3) | Net investment income per share represents net investment income for the respective period divided by the monthly average shares of beneficial interest outstanding throughout each period. |
| (4) | The numerator for the portfolio turnover rate includes the lesser of purchases or sales (excluding short positions). The denominator includes the average long positions throughout the period. |
| (5) | Amount less than $0.005 per share. |
| (6) | The Fund incurred proxy expenses of approximately $525,000 in 2007 related to shareholder approval of changes in the Fund’s fundamental investment policies and the election of directors. |
The accompanying notes are an integral part of these financial statements.
The Merger Fund
NOTES TO THE FINANCIAL STATEMENTS
September 30, 2007
Note 1 — ORGANIZATION
The Merger Fund (the “Fund”) is a no-load, open-end, non-diversified investment company organized as a trust under the laws of the Commonwealth of Massachusetts on April 12, 1982, and registered under the Investment Company Act of 1940, as amended (the “1940 Act”). The Fund was formerly known as the Risk Portfolio of The Ayco Fund. In January of 1989, the Fund’s fundamental policies were amended to permit the Fund to engage exclusively in merger arbitrage. At the same time, Westchester Capital Management, Inc. became the Fund’s investment adviser, and the Fund began to do business as The Merger Fund. Merger arbitrage is a highly specialized investment approach generally designed to profit from the successful completion of proposed mergers, takeovers, tender offers, leveraged buyouts, liquidations and other types of corporate reorganizations.
Note 2 — SIGNIFICANT ACCOUNTING POLICIES
The following is a summary of significant accounting policies consistently followed by the Fund in the preparation of its financial statements. These policies are in conformity with generally accepted accounting principles.
Securities listed on the NASDAQ Global Market and the NASDAQ Global Select Market are valued at the NASDAQ Official Closing Price (“NOCP”). Other listed securities are valued at the last sales price on the exchange on which such securities are primarily traded or, in the case of options, at the higher of the intrinsic value of the option or the last reported composite sales price. Securities not listed on an exchange and securities for which there are no transactions are valued at the average of the closing bid and asked prices. When pricing options, if no sales are reported or if the last sale is outside the bid and asked parameters, the higher of the intrinsic value of the option or the mean between the last reported bid and asked prices will be used. Securities for which there are no such valuations are valued at fair value as determined in good faith by management under the supervision of the Board of Trustees. The Adviser (as defined herein) reserves the right to value securities, including options, at prices other than last-sale prices, intrinsic value prices, or the average of closing bid and asked prices when such prices are believed unrepresentative of fair market value as determined in good faith by the Adviser. When fair-valued pricing is employed, the prices of securities used by the Fund to calculate its NAV may differ from quoted or published prices for the same securities. In addition, due to the subjective and variable nature of fair value pricing, it is possible that the value determined for a particular asset may be materially different from the value realized upon such asset’s sale. At September 30, 2007, fair-valued long securities represented 2.18% of investments, at value. Investments in United States government securities (other than short-term securities) are valued at the average of the quoted bid and asked prices in the over-the-counter market. Short-term investments are carried at amortized cost, which approximates market value.
The Fund may sell securities or currencies short for hedging purposes. For financial statement purposes, an amount equal to the settlement amount is included in the Statement of Assets and Liabilities as an asset and an equivalent liability. The amount of the liability is subsequently marked-to-
The Merger Fund
NOTES TO THE FINANCIAL STATEMENTS (continued)
September 30, 2007
Note 2 — SIGNIFICANT ACCOUNTING POLICIES (continued)
market to reflect the current value of the short position. Subsequent fluctuations in the market prices of securities or currencies sold, but not yet purchased, may require purchasing the securities or currencies at prices which may differ from the market value reflected on the Statement of Assets and Liabilities.
The Fund is liable for any dividends payable on securities while those securities are in a short position. As collateral for its short positions, the Fund is required under the 1940 Act to maintain assets consisting of cash, cash equivalents or liquid securities. These assets are required to be adjusted daily to reflect changes in the value of the securities or currencies sold short.
| C. | Transactions with Brokers for Short Sales |
The Fund’s receivable from brokers for proceeds on securities sold short and deposit at brokers for short sales are with three major securities dealers. The Fund does not require the brokers to maintain collateral in support of the receivable from the broker for proceeds on securities sold short.
No provision for federal income taxes has been made since the Fund has complied to date with the provisions of the Internal Revenue Code applicable to regulated investment companies and intends to continue to so comply in future years and to distribute investment company net taxable income and net capital gains to shareholders. Additionally, the Fund intends to make all required distributions to avoid federal excise tax.
| E. | Written Option Accounting |
The Fund writes (sells) covered call options to hedge portfolio investments. Uncovered put options can also be written by the Fund as part of a merger arbitrage strategy involving a pending corporate reorganization. When the Fund writes (sells) an option, an amount equal to the premium received by the Fund is included in the Statement of Assets and Liabilities as an asset and an equivalent liability. The amount of the liability is subsequently marked-to-market to reflect the current value of the option written. By writing an option, the Fund may become obligated during the term of the option to deliver or purchase the securities underlying the option at the exercise price if the option is exercised. Option contracts are valued at the higher of the intrinsic value of the option or the last sales price reported on the date of valuation. If no sale is reported or if the last sale is outside the parameters of the closing bid and asked prices, the option contract written is valued at the higher of the intrinsic value of the option or the mean between the last reported bid and asked prices on the day of valuation. When an option expires on its stipulated expiration date or the Fund enters into a closing purchase transaction, the Fund realizes a gain or loss if the cost of the closing purchase transaction differs from the premium received when the option was sold without regard to any unrealized gain or loss on the underlying security, and the liability related to such option is eliminated. When an option is exercised, the premium originally received decreases the cost basis of the security (or increases the proceeds on a sale of the security), and the Fund realizes a gain or loss from the sale of the underlying security.
| F. | Purchased Option Accounting |
The Fund purchases put options to hedge portfolio investments. Call options may be purchased only for the purpose of closing out previously written covered call options. Premiums paid for option
The Merger Fund
NOTES TO THE FINANCIAL STATEMENTS (continued)
September 30, 2007
Note 2 — SIGNIFICANT ACCOUNTING POLICIES (continued)
contracts purchased are included in the Statement of Assets and Liabilities as an asset. Option contracts are valued at the higher of the intrinsic value of the option or the last sales price reported on the date of valuation. If no sale is reported or if the last sale is outside the parameters of the closing bid and asked prices, the option contract purchased is valued at the higher of the intrinsic value of the option or the mean between the last reported bid and asked prices on the day of valuation. When option contracts expire or are closed, realized gains or losses are recognized without regard to any unrealized gains or losses on the underlying securities.
| G. | Forward Currency Exchange Contracts |
The Fund may enter into forward currency exchange contracts obligating the Fund to deliver and receive a currency at a specified future date. Forward contracts are valued daily, and unrealized appreciation or depreciation is recorded daily as the difference between the contract exchange rate and the closing forward rate applied to the face amount of the contract. A realized gain or loss is recorded at the time the forward contract is closed.
| H. | Distributions to Shareholders |
Dividends from net investment income and net realized capital gains, if any, are declared and paid at least annually. Income and capital gain distributions are determined in accordance with income tax regulations which may differ from generally accepted accounting principles. These differences are due primarily to wash-loss deferrals, constructive sales, straddle-loss deferrals, adjustments on swap contracts, and unrealized gains or losses on Section 1256 contracts, which were realized, for tax purposes, at September 30, 2007. Accordingly, reclassifications are made within the net asset accounts for such amounts, as well as amounts related to permanent differences in the character of certain income and expense items for income tax and financial reporting purposes. At September 30, 2007, the Fund increased accumulated net investment gain by $7,638,320, reduced realized accumulated gains by $7,638,319, and decreased paid-in capital by $1. The Fund may utilize earnings and profits deemed distributed to shareholders on redemption of shares as part of the dividends-paid deduction.
The preparation of financial statements in conformity with generally accepted accounting principles requires management to make estimates and assumptions that affect the reported amounts of assets and liabilities and disclosure of contingent assets and liabilities at the date of the financial statements and the reported amounts of revenues and expenses during the reporting period. Actual results could differ from those estimates.
Investing in securities of foreign companies involves special risks and considerations not typically associated with investing in U.S. companies. These risks include revaluation of currencies and adverse political and economic developments. Moreover, securities of many foreign companies and their markets may be less liquid and their prices more volatile than those of securities of comparable U.S. companies.
The Merger Fund
NOTES TO THE FINANCIAL STATEMENTS (continued)
September 30, 2007
Note 2 — SIGNIFICANT ACCOUNTING POLICIES (continued)
| K. | Foreign Currency Translations |
The books and records of the Fund are maintained in U.S. dollars. Foreign currency transactions are translated into U.S. dollars on the following basis: (i) market value of investment securities, assets and liabilities at the daily rates of exchange, and (ii) purchases and sales of investment securities, dividend and interest income and certain expenses at the rates of exchange prevailing on the respective dates of such transactions. For financial reporting purposes, the Fund does not isolate changes in the exchange rate of investment securities from the fluctuations arising from changes in the market prices of securities. However, for federal income tax purposes, the Fund does isolate and treat as ordinary income the effect of changes in foreign exchange rates on realized gain or loss from the sale of investment securities and payables and receivables arising from trade-date and settlement-date differences.
The Fund may sell securities on a when-issued or delayed-delivery basis. Although the payment and interest terms of these securities are established at the time the Fund enters into the agreement, these securities may be delivered for cash proceeds at a future date. The Fund records sales of when-issued securities and reflects the values of such securities in determining net asset value in the same manner as other open short-sale positions. The Fund segregates and maintains at all times cash, cash equivalents or other liquid securities in an amount at least equal to the market value for when-issued securities.
The Fund considers highly liquid temporary cash investments purchased with an original maturity of less than three months to be cash equivalents. Cash equivalents are included in short-term investments on the Schedule of Investments as well as in the investments on the Statement of Assets and Liabilities.
| N. | Guarantees and Indemnifications |
In the normal course of business, the Fund enters into contracts with service providers that contain general indemnification clauses. The Fund’s maximum exposure under these arrangements is unknown, as this would involve future claims that may be made against the Fund that have not yet occurred. However, based on experience, the Fund expects the risk of loss to be remote.
Investment and shareholder transactions are recorded on the trade date. Realized gains and losses from security transactions are recorded on the identified cost basis. Dividend income and distributions to shareholders are recorded on the ex-dividend date. Interest is accounted for on the accrual basis. Investment income includes $9,913,215 of interest earned on receivables from brokers for proceeds on securities sold short and deposits. The Fund may utilize derivative instruments such as options, forward currency exchange contracts and other instruments with similar characteristics to the extent that they are consistent with the Fund’s investment objectives and limitations. The use of these instruments may involve additional investment risks, including the possibility of illiquid markets or imperfect correlation between the value of the instruments and the underlying securities.
The Merger Fund
NOTES TO THE FINANCIAL STATEMENTS (continued)
September 30, 2007
Note 3 — AGREEMENTS
The Fund’s investment adviser is Westchester Capital Management, Inc. (the “Adviser”) pursuant to an investment advisory agreement dated January 31, 1989. Under the terms of this agreement, the Adviser is entitled to receive a fee, calculated daily and payable monthly, at the annual rate of 1.00% of the Fund’s average daily net assets. Effective August 1, 2004, the Adviser agreed to waive 0.10% of its fee at net asset levels between $1.5 billion through $2 billion. When net assets of the Fund exceed $2 billion, the Adviser has agreed to waive 0.20% of its fee. Investment adviser fees waived by the Adviser for the year ended September 30, 2007 were $214,287. Certain officers of the Fund are also officers of the Adviser.
U.S. Bancorp Fund Services, LLC, a subsidiary of U.S. Bancorp, a publicly held bank holding company, serves as transfer agent, administrator and accounting services agent for the Fund. U.S. Bank, N.A. serves as custodian for the Fund.
Distribution services are performed pursuant to distribution contracts with broker-dealers and other qualified institutions.
Note 4 — SHARES OF BENEFICIAL INTEREST
The Trustees have the authority to issue an unlimited amount of shares of beneficial interest without par value.
Changes in shares of beneficial interest were as follows:
| | | Year Ended | | | Year Ended | |
| | | September 30, 2007 | | | September 30, 2006 | |
| | | Shares | | | Amount | | | Shares | | | Amount | |
| Issued | | | 46,881,581 | | | $ | 754,043,652 | | | | 45,422,154 | | | $ | 697,120,869 | |
| Issued as reinvestment | | | | | | | | | | | | | | | | |
| of dividends | | | 3,795,005 | | | | 59,240,023 | | | | 4,637,847 | | | | 68,036,847 | |
| Redemption fee | | | — | | | | 90,752 | | | | — | | | | 65,213 | |
| Redeemed | | | (38,594,484 | ) | | | (620,913,358 | ) | | | (46,170,138 | ) | | | (706,968,671 | ) |
| Net increase (decrease) | | | 12,082,102 | | | $ | 192,461,069 | | | | 3,889,863 | | | $ | 58,254,258 | |
The Merger Fund
NOTES TO THE FINANCIAL STATEMENTS (continued)
September 30, 2007
Note 5 — INVESTMENT TRANSACTIONS
Purchases and sales of securities for the year ended September 30, 2007 (excluding short-term investments, options and short positions) aggregated $6,139,849,564 and $5,585,305,540, respectively. There were no purchases or sales of U.S. Government Securities.
At September, 2007 the components of accumulated earnings/losses on a tax basis were as follows:
| Cost of investments | | $ | 1,923,468,271 | |
| Gross unrealized appreciation | | | 59,352,017 | |
| Gross unrealized depreciation | | | (63,576,588 | ) |
| Net unrealized appreciation/(depreciation) | | $ | (4,224,571 | ) |
| Undistributed ordinary income | | $ | 83,449,623 | |
| Undistributed long-term capital gain | | | — | |
| Total distributable earnings | | $ | 83,449,623 | |
| Other accumulated gains/(losses) | | | (1,352,999 | ) |
| Total accumulated earnings/(losses) | | $ | 77,872,053 | |
The tax components of dividends paid during the fiscal years ended September 30, 2007 and September 30, 2006 were as follows:
| | 2007 | 2006 |
| Ordinary Income | $62,132,019 | $70,500,197 |
| Long-Term Capital Gains | $ — | $ — |
The Fund incurred a post-October currency loss of $4,151,512, which is deferred for tax purposes until the next fiscal year.
For the fiscal year ended September 30, 2007, certain dividends paid by the Fund may be subject to a maximum tax rate of 15% as provided for by the Jobs and Growth Tax Relief Reconciliation Act of 2003. The percentage of dividends declared from net investment income designated as qualified dividend income for the fiscal year ended September 30, 2007 was 12.24% for the Fund (unaudited).
For corporate shareholders, the percent of ordinary income distributions qualifying for the corporate dividends-received deduction for the fiscal year ended September 30, 2007 was 10.30% for the Fund (unaudited).
The Merger Fund
NOTES TO THE FINANCIAL STATEMENTS (continued)
September 30, 2007
Note 6 — OPTION CONTRACTS WRITTEN
The premium amount and the number of option contracts written during the year ended September 30, 2007 were as follows:
| | | Premium Amount | | | Number of Contracts | |
| Options outstanding at September 30, 2006 | | $ | 10,178,540 | | | | 42,610 | |
| Options written | | | 84,547,716 | | | | 363,384 | |
| Options closed | | | (28,941,322 | ) | | | (146,177 | ) |
| Options exercised | | | (51,964,821 | ) | | | (167,710 | ) |
| Options expired | | | (9,674,820 | ) | | | (73,517 | ) |
| Options outstanding at September 30, 2007 | | $ | 4,145,293 | | | | 18,590 | |
Note 7 — DISTRIBUTION PLAN
The Fund has adopted an Amended and Restated Plan of Distribution (the “Plan”) dated July 19, 2005, pursuant to Rule 12b-1 under the 1940 Act. Under the Plan, the Fund will compensate broker-dealers or qualified institutions with whom the Fund has entered into a contract to distribute Fund shares (“Dealers”). Under the Plan, the amount of such compensation paid in any one year shall not exceed 0.25% annually of the average daily net assets of the Fund, which may be payable as a service fee for providing recordkeeping, subaccounting, subtransfer agency and/or shareholder liaison services. For the year ended September 30, 2007, the Fund incurred $3,810,907 pursuant to the Plan.
The Plan will remain in effect from year to year provided such continuance is approved at least annually by a vote either of a majority of the Trustees, including a majority of the non-interested Trustees, or a majority of the Fund’s outstanding shares.
Note 8 — CREDIT FACILITY
Custodial Trust Company has made available to the Fund a $400 million credit facility (subject to increase under certain conditions) pursuant to a Loan and Security Agreement (“Agreement”) dated March 18, 1992 (subsequently amended) for the purpose of purchasing portfolio securities. The Agreement can be terminated by either the Fund or Custodial Trust Company with three months’ prior notice. For the year October 1, 2006 to September 30, 2007, the interest rate on the outstanding principal amount was the Federal Funds Rate plus 0.75% (weighted average rate of 6.086% was paid on the loan during the year ended September 30, 2007). Advances are collateralized by securities owned by the Fund and held separately in a special custody account pursuant to a Special Custody Agreement dated March 31, 1994. During the year ended September 30, 2007, the Fund had an outstanding average daily balance of $84,719,137. The maximum amount outstanding during the year ended September 30, 2007 was $400,000,000. At September 30, 2007, the Fund had a loan payable balance of $93,676,000. As collateral for the loan, the Fund is required under the 1940 Act to maintain assets consisting of cash, cash equivalents or liquid securities. The assets are required to be adjusted daily to reflect changes in the amount of the loan outstanding.
The Merger Fund
NOTES TO THE FINANCIAL STATEMENTS (continued)
September 30, 2007
Note 9 — FORWARD CURRENCY EXCHANGE CONTRACTS
At September 30, 2007, the Fund had entered into “position hedge” forward currency exchange contracts that obligated the Fund to deliver or receive currencies at a specified future date. The net unrealized depreciation of $17,405,693 is included in the net unrealized appreciation (depreciation) section of the Statement of Assets and Liabilities. The terms of the open contracts are as follows:
Settlement | | Currency to | | U.S. $ Value at | | | Currency to | | U.S. $ Value at | |
Date | | be Delivered | | September 30, 2007 | | | be Received | | September 30, 2007 | |
| 10/31/07 | | | 4,949,375 | | Australian Dollars | | $ | 4,384,087 | | | | 4,245,914 | | U.S. Dollars | | $ | 4,245,914 | |
| 11/29/07 | | | 100,167,525 | | Canadian Dollars | | | 100,805,491 | | | | 94,357,020 | | U.S. Dollars | | | 94,357,020 | |
| 12/14/07 | | | 40,312,250 | | Canadian Dollars | | | 40,574,752 | | | | 40,299,825 | | U.S. Dollars | | | 40,299,825 | |
| 10/10/07 | | | 53,237,101 | | Euros | | | 75,931,674 | | | | 72,221,451 | | U.S. Dollars | | | 72,221,451 | |
| 10/12/07 | | | 12,646,865 | | Euros | | | 18,039,010 | | | | 17,410,432 | | U.S. Dollars | | | 17,410,432 | |
| 10/19/07 | | | 6,250,000 | | Euros | | | 8,916,290 | | | | 8,604,125 | | U.S. Dollars | | | 8,604,125 | |
| 11/16/07 | | | 64,784,700 | | Euros | | | 92,471,020 | | | | 87,887,736 | | U.S. Dollars | | | 87,887,736 | |
| 11/30/07 | | | 920,400 | | British Pounds | | | 1,880,198 | | | | 1,850,004 | | U.S. Dollars | | | 1,850,004 | |
| 12/28/07 | | | 33,478,799 | | British Pounds | | | 68,347,131 | | | | 67,067,453 | | U.S. Dollars | | | 67,067,453 | |
| | | | | | | | $ | 411,349,653 | | | | | | | | $ | 393,943,960 | |
Note 10 — SWAP CONTRACTS
Equity Swaps
The Fund has entered into both long and short equity swap contracts with multiple broker-dealers. A long equity swap contract entitles the Fund to receive from the counterparty any appreciation and dividends paid on an individual security, while obligating the Fund to pay the counterparty any depreciation on the security as well as interest on the notional amount of the contract at a rate equal to LIBOR plus 25 to 100 basis points. A short equity swap contract obligates the Fund to pay the counterparty any appreciation and dividends paid on an individual security, while entitling the Fund to receive from the counterparty any depreciation on the security as well as interest on the notional value of the contract at a rate equal to LIBOR less 25 to 100 basis points.
The Fund may also enter into equity swap contracts whose value is determined by the spread between a long equity position and a short equity position. This type of swap contract obligates the Fund to pay the counterparty an amount tied to any increase in the spread between the two securities over the term of the contract. The Fund is also obligated to pay the counterparty any dividends paid on the short equity holding as well as any net financing costs. This type of swap contract entitles the Fund to receive from the counterparty any gains based on a decrease in the spread as well as any dividends paid on the long equity holding and any net interest income.
Fluctuations in the value of an open contract are recorded daily as a net unrealized gain or loss. The Fund will realize a gain or loss upon termination or reset of the contract. Either party, under certain conditions, may terminate the contract prior to the contract’s expiration date.
The Merger Fund
NOTES TO THE FINANCIAL STATEMENTS (continued)
September 30, 2007
Note 10 — SWAP CONTRACTS (Continued)
Credit risk may arise as a result of the failure of the counterparty to comply with the terms of the contract. The Fund considers the creditworthiness of each counterparty to a contract in evaluating potential credit risk. The counterparty risk to the Fund is limited to the net unrealized gain, if any, on the contract, along with dividends receivable on long equity contracts and interest receivable on short equity contracts. Additionally, risk may arise from unanticipated movements in interest rates or in the value of the underlying securities. At September 30, 2007, the Fund had the following open equity swap contracts:
| | | | | | | Unrealized Appreciation | |
Termination Date | Security | | Shares | | | (Depreciation) | |
| 10/18/2007 | ABN AMRO Holding | | | 1,511,000 | | | $ | 5,115,387 | |
| 10/22/2007 | ABN AMRO Holding | | | 335,500 | | | | 1,243,110 | |
| 12/15/2007 | Altadis, S.A. | | | 125,000 | | | | 590,398 | |
| 2/28/2008 | BCE Inc. | | | 1,627,800 | | | | 4,586,336 | |
| 10/9/2007 | Bodycote International Plc | | | 306,800 | | | | (247,802 | ) |
| 10/10/2007 | Endesa S.A. | | | 1,324,629 | | | | 4,067,932 | |
| 1/15/2008 | Imperial Chemical | | | 2,687,000 | | | | 1,755,052 | |
| 12/5/2007 | Prime West Energy | | | 1,507,000 | | | | 75,922 | |
| 1/31/2008 | Reuters Group Plc | | | 3,894,288 | | | | 3,484,811 | |
| 10/18/2007 and 10/22/2007 | Royal Bank of Scotland | | | (552,500 | ) | | | (166,579 | ) |
| | | | | | | | $ | 20,504,567 | |
Credit Default Swaps
The Fund may enter into credit default swaps. In a credit default swap, one party makes a stream of payments to another party in exchange for the right to receive a specified return in the event of a default by a referenced entity, typically corporate issues, on its obligation. The Fund may use the swaps as part of a merger arbitrage strategy involving pending corporate reorganizations. The Fund may purchase credit protection on the referenced entity of the credit default swap (‘‘Buy Contract’’) or provide credit protection on the referenced entity of the credit default swap (‘‘Sale Contract’’).
Swap contracts involve, to varying degrees, elements of market risk and exposure to loss in excess of the amount reflected in the Statement of Assets and Liabilities. The notional amounts reflect the extent of the total investment exposure that the Fund has under the swap contract. The primary risks associated with the use of swap agreements are imperfect correlation between movements in the notional amount and the price of the underlying securities and the inability of counterparties to perform. The Fund bears the risk of loss of the amount expected to be received under a swap contract in the event of default or bankruptcy of the swap contract counterparty.
The Merger Fund
NOTES TO THE FINANCIAL STATEMENTS (continued)
September 30, 2007
Note 10 — SWAP CONTRACTS (Continued)
| | | | | | Unrealized |
Expiration | | Buy/Sell | Pay/Receive | Notional | Appreciation |
Date | Security | Protection | Fixed Rate | Amount | (Depreciation) |
| 6/20/12 | Dow Jones CDX | Buy | 0.40% | 372,114,289 | $(3,146,892) |
| | North American | | | | |
| | Investment Grade | | | | |
Note 11 — NEW ACCOUNTING STANDARDS
On July 13, 2006, the Financial Accounting Standards Board (“FASB”) released FASB Interpretation No. 48, Accounting for Uncertainty in Income Taxes (“FIN 48”). FIN 48 provides guidance for how uncertain tax positions should be recognized, measured, presented and disclosed in the financial statements. FIN 48 requires the affirmative evaluation of tax positions taken or expected to be taken in the course of preparing the Fund’s tax returns to determine whether it is more likely than not (i.e., greater than 50%) that each tax position will be sustained upon examination by a taxing authority based on the technical merits of the position. A tax position that meets the more-likely-than-not recognition threshold is measured to determine the amount of benefit to recognize in the financial statements. Differences between tax positions taken in a tax return and amounts recognized in the financial statements will generally result in an increase in a liability for taxes payable (or a reduction of a tax refund receivable) and an increase in a deferred tax liability (or a reduction in a deferred tax asset). Adoption of FIN 48 is required as of the date of the last Net Asset Value (”NAV”) calculation in the first required financial statement reporting period for fiscal years beginning after December 15, 2006 and is to be applied to all open tax years as of the effective date. At this time, management is evaluating the implications of FIN 48. Its impact on the financial statements has not yet been determined.
In September 2006, FASB issued its new Standard No. 157, Fair Value Measurements (“FAS 157”). FAS 157 is designed to unify guidance for the measurement of fair value of all types of assets, including financial instruments, and certain liabilities, throughout a number of accounting standards. FAS 157 also establishes a hierarchy for measuring fair value in generally accepted accounting principles and expands financial statement disclosures about fair value measurements that are relevant to mutual funds. FAS 157 is effective for financial statements issued for fiscal years beginning after November 15, 2007, and earlier adoption is permitted. At this time, management is evaluating the implications of FAS 157 and its impact on the financial statements has not yet been determined.
The Merger Fund
NOTES TO THE FINANCIAL STATEMENTS (continued)
September 30, 2007
Note 12 — TRANSACTIONS WITH AFFILIATES
Pursuant to Section (2)(a)(3) of the 1940 Act, if the Fund owns 5% or more of the outstanding voting securities of an issuer, the issuer is deemed to be an affiliate of the Fund. During the period October 1, 2006 - September 30, 2007 the Fund owned the following positions in such companies for investment purposes only:
| | Share | Share | Realized | | | | |
| | Balance at | Balance at | Value at | Investment | Gains | | |
Issuer Name | Oct. 1, 2006 | Purchases | Sales | Sept. 30, 20072 | Sept. 30, 2007 | Income | (Losses) |
| Price | | | | | | | |
| Communications | | | | | | | |
Corporation1 | 4,450,698 | 22,000 | — | 4,472,698 | $1,923,260 | $4,290,560 | $4,293,790 |
1 | Issuer was not an affiliate as of September 30, 2007. |
2 | Security was converted from common stock to a tax escrow note during the period. |
Report of Independent Registered Public Accounting Firm
To the Board of Trustees and Shareholders of
The Merger Fund
In our opinion, the accompanying statement of assets and liabilities, including the schedule of investments, of securities sold short, of options written, and the related statements of operations, of cash flows and of changes in net assets and the financial highlights present fairly, in all material respects, the financial position of The Merger Fund (the “Fund”) at September 30, 2007, the results of its operations for the year then ended, the changes in its net assets for each of the two years in the period then ended and the financial highlights for each of the five years in the period then ended, in conformity with accounting principles generally accepted in the United States of America. These financial statements and financial highlights (hereafter referred to as “financial statements”) are the responsibility of the Fund's management; our responsibility is to express an opinion on these financial statements based on our audits. We conducted our audits of these financial statements in accordance with the standards of the Public Company Accounting Oversight Board (United States). Those standards require that we plan and perform the audit to obtain reasonable assurance about whether the financial statements are free of material misstatement. An audit includes examining, on a test basis, evidence supporting the amounts and disclosures in the financial statements, assessing the accounting principles used and significant estimates made by management, and evaluating the overall financial statement presentation. We believe that our audits, which included confirmation of securities at September 30, 2007 by correspondence with the custodian and brokers, provide a reasonable basis for our opinion.

PricewaterhouseCoopers LLP
November 20, 2007
VOTING RESULTS OF SPECIAL MEETING OF SHAREHOLDERS
A Special Meeting of Shareholders of the Fund was held on July 17, 2007 (adjourned from April 17, 2007). Proposal 1, to elect Messrs. Frederick W. Green, Michael J. Downey, James P. Logan, III and Barry Hamerling to the Fund’s Board of Trustees, was approved by the affirmative vote of the shareholders owning of record a plurality of the total number of Fund shares voting at the meeting. Proposal 2, to revise certain fundamental investment policies, and Proposal 3, to eliminate certain fundamental investment policies, were approved by the affirmative vote of a majority of the outstanding shares of the Fund. A description of each proposal and a summary of voting results follows:
ELECTION OF ONE NEW MEMBER AND RE-ELECTION OF THREE CURRENT MEMBERS TO THE FUND’S BOARD OF TRUSTEES
| Frederick W. Green | For | 68,615,873.655 | Withhold | 1,336,761.350 |
| Michael J. Downey | For | 68,894,507.106 | Withhold | 1,058,127.899 |
| James P. Logan, III | For | 68,823,300.130 | Withhold | 1,129,334.875 |
| Barry Hamerling | For | 68,925,041.196 | Withhold | 1,027,593.809 |
PROPOSALS TO REVISE CERTAIN FUNDAMENTAL INVESTMENT POLICIES
| | No. of Shares | % of Outstanding Shares | % of Shares Present |
2-A. To revise the fundamental investment policy relating to issuing senior securities. | | |
| For | 53,649,878.235 | | 51.199% | | 66.256% |
| Against | 2,004,317.984 | | 1.912% | | 2.475% |
| Abstain | 2,805,844.369 | | 2.678% | | 3.465% |
| Broker Non-Votes | 22,513,588.000 | | 21.485% | | 27.804% |
2-B. To revise the fundamental investment policy relating to borrowing money. | | |
| For | 53,396,482.459 | | 50.957% | | 65.943% |
| Against | 2,262,557.262 | | 2.159% | | 2.794% |
| Abstain | 2,801,000.867 | | 2.673% | | 3.459% |
| Broker Non-Votes | 22,513,588.000 | | 21.485% | | 27.804% |
2-C. To revise the fundamental investment policy relating to concentration of investments. | | |
| For | 53,511,523.258 | | 51.067% | | 66.085% |
| Against | 2,153,206.449 | | 2.054% | | 2.659% |
| Abstain | 2,795,310.881 | | 2.668% | | 3.452% |
| Broker Non-Votes | 22,513,588.000 | | 21.485% | | 27.804% |
2-D. To revise the fundamental investment policy relating to purchasing or selling real estate. | | |
| For | 53,288,902.596 | | 50.854% | | 65.810% |
| Against | 2,375,581.253 | | 2.267% | | 2.934% |
| Abstain | 2,795,556.739 | | 2.668% | | 3.452% |
| Broker Non-Votes | 22,513,588.000 | | 21.485% | | 27.804% |
VOTING RESULTS OF SPECIAL MEETING OF SHAREHOLDERS (continued)
| | No. of Shares | % of Outstanding Shares | % of Shares Present |
2-E. To revise the fundamental investment policy relating to making loans. |
| For | 52,896,446.659 | | 50.480% | | 65.326% |
| Against | 2,758,871.339 | | 2.632% | | 3.407% |
| Abstain | 2,804,722.590 | | 2.677% | | 3.464% |
| Broker Non-Votes | 22,513,588.000 | | 21.485% | | 27.804% |
PROPOSALS TO ELIMINATE CERTAIN FUNDAMENTAL INVESTMENT POLICIES |
3-A. To eliminate the fundamental investment policy relating to making short sales of securities. |
| For | 53,299,537.672 | | 50.864% | | 65.823% |
| Against | 2,312,498.549 | | 2.207% | | 2.856% |
| Abstain | 2,848,004.367 | | 2.718% | | 3.517% |
| Broker Non-Votes | 22,513,588.000 | | 21.485% | | 27.804% |
3-B. To eliminate the fundamental investment policy relating to purchasing securities on margin. |
| For | 53,153,549.913 | | 50.725% | | 65.643% |
| Against | 2,855,433.509 | | 2.725% | | 3.526% |
| Abstain | 2,451,057.166 | | 2.339% | | 3.027% |
| Broker Non-Votes | 22,513,588.000 | | 21.485% | | 27.804% |
3-C. To eliminate the fundamental investment policy relating to call options and put options. |
| For | 53,352,197.804 | | 50.915% | | 65.888% |
| Against | 2,221,383.972 | | 2.119% | | 2.744% |
| Abstain | 2,886,458.812 | | 2.755% | | 3.564% |
| Broker Non-Votes | 22,513,588.000 | | 21.485% | | 27.804% |
3-D. To eliminate the fundamental investment policy relating to pledging the Fund’s assets. | | |
| For | 53,088,851.435 | | 50.663% | | 65.563% |
| Against | 2,442,744.378 | | 2.331% | | 3.017% |
| Abstain | 2,928,444.775 | | 2.795% | | 3.616% |
| Broker Non-Votes | 22,513,588.000 | | 21.485% | | 27.804% |
3-E. To eliminate the fundamental investment policy relating to restricted securities. |
| For | 52,950,087.959 | | 50.531% | | 65.392% |
| Against | 2,577,477.927 | | 2.460% | | 3.183% |
| Abstain | 2,932,474.702 | | 2.798% | | 3.622% |
| Broker Non-Votes | 22,513,588.000 | | 21.485% | | 27.804% |
3-F. To eliminate the fundamental investment policy relating to warrants. |
| For | 53,428,777.442 | | 50.988% | | 65.983% |
| Against | 2,097,383.817 | | 2.001% | | 2.590% |
| Abstain | 2,933,879.329 | | 2.800% | | 3.623% |
| Broker Non-Votes | 22,513,588.000 | | 21.485% | | 27.804% |
VOTING RESULTS OF SPECIAL MEETING OF SHAREHOLDERS (continued)
| | | No. of Shares | % of Outstanding Shares | % of Shares Present |
| 3-G. | To eliminate the fundamental investment policy relating to oil, gas or other mineral exploration or development programs. | | | | |
| For | 53,000,192.898 | | 50.579% | | 65.454% |
| Against | 2,524,083.290 | | 2.408% | | 3.117% |
| Abstain | 2,935,764.400 | | 2.802% | | 3.626% |
| Broker Non-Votes | 22,513,588.000 | | 21.485% | | 27.804% |
3-H. | To eliminate the fundamental investment policy relating to investing for the purpose of exercising control or management. |
| For | 53,286,858.754 | | 50.852% | | 65.808% |
| Against | 2,232,045.704 | | 2.130% | | 2.756% |
| Abstain | 2,941,136.130 | | 2.807% | | 3.633% |
| Broker Non-Votes | 22,513,588.000 | | 21.485% | | 27.804% |
3-I. | To eliminate the fundamental investment policy relating to purchasing securities of any issuer if the Fund’s trustees and officers beneficially own more that 5% of the outstanding securities of such issuer. |
| For | 52,770,378.614 | | 50.359% | | 65.170% |
| Against | 2,781,729.399 | | 2.655% | | 3.435% |
| Abstain | 2,907,932.575 | | 2.775% | | 3.592% |
| Broker Non-Votes | 22,513,588.000 | | 21.485% | | 27.804% |
3-J. | To eliminate the fundamental investment policy relating to investing in issuers which have been in continuous operation for less than three years. |
| For | 53,273,552.288 | | 50.840% | | 65.791% |
| Against | 2,242,008.270 | | 2.139% | | 2.769% |
| Abstain | 2,944,480.030 | | 2.810% | | 3.636% |
| Broker Non-Votes | 22,513,588.000 | | 21.485% | | 27.804% |
3-K. | To eliminate the fundamental investment policy relating to participating on a joint and several basis in any trading account in securities. |
| For | 52,889,674.843 | | 50.473% | | 65.317% |
| Against | 2,550,304.894 | | 2.434% | | 3.150% |
| Abstain | 3,020,060.851 | | 2.882% | | 3.729% |
| Broker Non-Votes | 22,513,588.000 | | 21.485% | | 27.804% |
3-L. | To eliminate the fundamental investment policy relating to purchasing securities of other investment companies. |
| For | 53,091,011.053 | | 50.665% | | 65.566% |
| Against | 2,432,354.127 | | 2.322% | | 3.004% |
| Abstain | 2,936,675.408 | | 2.802% | | 3.627% |
| Broker Non-Votes | 22,513,588.000 | | 21.485% | | 27.804% |
VOTING RESULTS OF SPECIAL MEETING OF SHAREHOLDERS (continued)
| | | No. of Shares | % of Outstanding Shares | % of Shares Present |
| 3-M. | To eliminate the fundamental investment policy relating to investing more than 10% of the Fund’s total assets in the securities of any one issuer. |
| For | 52,627,160.268 | | 50.223% | | 64.993% |
| Against | 2,926,470.792 | | 2.792% | | 3.614% |
| Abstain | 2,906,409.528 | | 2.774% | | 3.589% |
| Broker Non-Votes | 22,513,588.000 | | 21.485% | | 27.804% |
3-N. | To eliminate the fundamental investment policy relating to purchasing securities of any one issuer if as a result more than 10% of the voting securities of such issuer would be held by the Fund. |
| For | 52,964,866.651 | | 50.545% | | 65.410% |
| Against | 2,579,798.390 | | 2.462% | | 3.186% |
| Abstain | 2,915,375.547 | | 2.782% | | 3.600% |
| Broker Non-Votes | 22,513,588.000 | | 21.485% | | 27.804% |
INFORMATION ABOUT TRUSTEES AND OFFICERS
The business and affairs of the Fund are managed under the direction of the Fund’s Board of Trustees. Information pertaining to the Officers and Trustees of the Fund is set forth below. The Statement of Additional Information includes additional information about the Fund’s Officers and Trustees and is available, without charge, upon request by calling 1-800-343-8959.
| | | Term of | | # of Portfolios | |
| | Position(s) | Office and | | in Fund Complex | Other |
| | Held with | Length of | Principal Occupation | Overseen by | Directorships |
Name, Address and Age | the Fund | Time Served | During Past Five Years | Trustee ** | Held by Trustee |
| Frederick W. Green* | President | Indefinite; | President of | 2 | None |
| Westchester Capital | and | since 1989 | Westchester Capital | | |
| Management, Inc. | Trustee | | Management, Inc., | | |
| 100 Summit Lake Drive | | | the Fund’s Adviser. | | |
| Valhalla, NY 10595 | | | | | |
Age: 60 | | | | | |
| Bonnie L. Smith | Vice | One-year | Chief Operating | N/A | N/A |
| Westchester Capital | President, | term; | Officer, Vice | | |
| Management, Inc. | Secretary | since 1989 | President and | | |
| 100 Summit Lake Drive | and | | Treasurer of | | |
| Valhalla, NY 10595 | Treasurer; | | Westchester Capital | | |
| Age: 59 | Anti-Money | | Management, Inc., the | | |
| | Laundering | | Fund’s Adviser. | | |
| | Compliance | | | | |
| | Officer | | | | |
| James P. Logan, III | Independent | Indefinite; | Chairman of J.P. | 2 | None |
| c/o Westchester Capital | Trustee | since 1989 | Logan & Company. | | |
| Management, Inc. | | | Chairman of | | |
| 100 Summit Lake Drive | | | Logan-Chace, LLC, an | | |
| Valhalla, NY 10595 | | | executive search firm. | | |
Age: 71 | | | | | |
| Michael J. Downey | Independent | Indefinite; | Private investor. | 2 | Chairman and |
| c/o Westchester Capital | Trustee | since 1995 | Managing Partner of | | Director of The |
| Management, Inc. | | | Lexington Capital | | Asia Pacific |
| 100 Summit Lake Drive | | | Investments until 2007. | | Fund, Inc.; |
| Valhalla, NY 10595 | | | Consultant and | | Director of the |
| Age: 63 | | | independent financial | | AllianceBernstein |
| | | | adviser since July 1993. | | core mutual fund |
| | | | | | group |
| Barry Hamerling | Independent | Indefinite; | Managing Partner of | 2 | Trustee of AXA |
| c/o Westchester Capital | Trustee | since 2007 | Premium Ice Cream of | | Premier VIP |
| Management, Inc. | | | America. Managing | | Trust |
| 100 Summit Lake Drive | | | Partner of Premium | | |
| Valhalla, NY 10595 | | | Salads of America. | | |
| Age: 61 | | | | | |
INFORMATION ABOUT TRUSTEES AND OFFICERS (continued)
| | | Term of | | # of Portfolios | |
| | Position (s) | Office and | | in Fund Complex | Other |
| | Held with | Length of | Principal Occupation | Overseen by | Directorships |
Name, Address and Age | the Fund | Time Served | During Past Five Years | Trustee ** | Held by Trustee |
| Roy D. Behren | Chief | One-year | Co-Portfolio Manager | N/A | N/A |
| Westchester Capital | Compliance | term; | and Chief Compliance | | |
| Management, Inc. | Officer | since 2004 | Officer of Westchester | | |
| 100 Summit Lake Drive | | | Capital Management, | | |
| Valhalla, NY 10595 | | | Inc., the Fund’s Adviser. | | |
| Age: 47 | | | | | |
| * | Denotes a trustee who is an “interested person” (as that term is defined in Section 2(a)(19) of the Investment Company Act of 1940, as amended) of the Fund or of the Fund’s Adviser. Mr. Green is deemed to be an interested person because of his affiliation with the Fund’s investment adviser, Westchester Capital Management, Inc., and because he is an officer of the Fund. |
| ** | The fund complex consists of the Fund and The Merger Fund VL |
.
The Merger Fund
AVAILABILITY OF PROXY VOTING INFORMATION
Information regarding how the Fund generally votes proxies relating to portfolio securities may be obtained without charge by calling the Fund’s Transfer Agent at 1-800-343-8959 or by visiting the SEC’s website at www.sec.gov. Information regarding how the Fund voted proxies during the most recent 12-month period ended June 30 is available on the SEC’s website or by calling the toll-free number listed above.
AVAILABILITY OF QUARTERLY PORTFOLIO SCHEDULE
The Fund files its complete schedule of portfolio holdings with the SEC for the first and third quarters of each fiscal year on Form N-Q. The Fund’s Forms N-Q are available on the SEC’s website at www.sec.gov and may be reviewed and copied at the SEC’s Public Reference Room in Washington, DC. Information on the operation of the Public Reference Room may be obtained by calling 1-800-SEC-0330.
(This Page Intentionally Left Blank.)
Investment Adviser
Westchester Capital Management, Inc.
100 Summit Lake Drive
Valhalla, NY 10595
(914) 741-5600
Administrator, Transfer Agent, Dividend Paying
Agent and Shareholder Servicing Agent
U.S. Bancorp Fund Services, LLC
615 East Michigan Street
P.O. Box 701
Milwaukee, WI 53201-0701
(800) 343-8959
Custodian
U.S. Bank, N.A.
1555 North RiverCenter Drive, Suite 302
Milwaukee, WI 53212
(800) 343-8959
Trustees
Frederick W. Green
Michael J. Downey
James P. Logan, III
Barry Hamerling
Executive Officers
Frederick W. Green, President
Bonnie L. Smith, Vice President,
Treasurer and Secretary
Roy D. Behren, Chief Compliance Officer
Counsel
Fulbright & Jaworski L.L.P.
666 Fifth Avenue
New York, NY 10103
Independent Registered Public Accounting Firm
PricewaterhouseCoopers LLP
100 East Wisconsin Avenue
Milwaukee, WI 53202
Item 2. Code of Ethics.
The registrant has adopted a code of ethics that applies to the registrant’s principal executive officer and principal financial officer. The registrant has not made any amendments to its code of ethics during the period covered by this report. The registrant has not granted any waivers from any provisions of the code of ethics during the period covered by this report. A copy of the registrant’s Code of Ethics is filed herewith.
Item 3. Audit Committee Financial Expert.
The registrant’s board of trustees has determined that there is at least one audit committee financial expert serving on its audit committee. Michael J. Downey, James P. Logan, III and Barry Hamerling are “audit committee financial experts” and are considered to be “independent” as each term is defined in Item 3 of Form N-CSR.
Item 4. Principal Accountant Fees and Services.
The registrant has engaged its principal accountant to perform audit services, audit-related services, tax services and other services during the past two fiscal years. “Audit services” refer to performing an audit of the registrant's annual financial statements or services that are normally provided by the accountant in connection with statutory and regulatory filings or engagements for those fiscal years. “Tax services” refer to professional services rendered by the principal accountant for tax compliance, tax advice, and tax planning. The following table details the aggregate fees billed or expected to be billed for each of the last two fiscal years for audit fees, audit-related fees, tax fees and other fees by the principal accountant.
| | FYE 09/30/2007 | FYE 09/30/2006 |
| Audit Fees | $66,000 | $60,097 |
| Audit-Related Fees | | |
| Tax Fees | $9,800 | $9,250 |
| All Other Fees | | |
The audit committee has adopted pre-approval policies and procedures that require the audit committee to pre-approve all audit and non-audit services of the registrant, including services provided to any entity affiliated with the registrant. The audit committee approved 100% of the tax services provided by the registrant’s principal accountant. All of the principal accountant’s hours spent on auditing the registrant’s financial statements were attributed to work performed by full-time permanent employees of the principal accountant.
There were no non-audit fees billed by the registrant's accountant for services to the registrant and to the registrant's investment adviser, and any entity controlling, controlled by, or under common control with the investment adviser that provides ongoing services to the registrant for each of the last two fiscal years of the registrant.
Item 5. Audit Committee of Listed Registrants.
Not applicable.
Item 6. Schedule of Investments.
Schedule of Investments is included as part of the report to shareholders filed under Item 1 of this Form.
Item 7. Disclosure of Proxy Voting Policies and Procedures for Closed-End Management Investment Companies.
Not applicable to open-end investment companies.
Item 8. Portfolio Managers of Closed-End Management Investment Companies.
Not applicable to open-end investment companies.
Item 9. Purchases of Equity Securities by Closed-End Management Investment Company and Affiliated Purchasers.
Not applicable to open-end investment companies.
Item 10. Submission of Matters to a Vote of Security Holders.
There have been no material changes to the procedures by which shareholders may recommend nominees to the registrant’s board of trustees.
Item 11. Controls and Procedures.
| (a) | The registrant’s President/Principal Executive Officer and Treasurer/Principal Financial Officer have reviewed the registrant's disclosure controls and procedures (as defined in Rule 30a-3(c) under the Investment Company Act of 1940 (the “Act”)) as of a date within 90 days of the filing of this report, as required by Rule 30a-3(b) under the Act and Rules 13a-15(b) or 15d-15(b) under the Securities Exchange Act of 1934. Based on their review, such officers have concluded that the disclosure controls and procedures are reasonably designed to ensure that information required to be disclosed in this report is appropriately recorded, processed, summarized and reported and made known to them by others within the registrant and by the registrant’s service provider. |
| (b) | There were no changes in the registrant's internal control over financial reporting (as defined in Rule 30a-3(d) under the Act) that occurred during the second fiscal quarter of the period covered by this report that has materially affected, or is reasonably likely to materially affect, the registrant's internal control over financial reporting. |
Item 12. Exhibits.
(a) | (1) Any code of ethics or amendment thereto, that is subject of the disclosure required by Item 2, to the extent that the registrant intends to satisfy the Item 2 requirements through filing an exhibit. Filed herewith. |
(2) Certifications pursuant to Section 302 of the Sarbanes-Oxley Act of 2002. Filed herewith.
(3) Any written solicitation to purchase securities under Rule 23c-1 under the Act sent or given during the period covered by the report by or on behalf of the registrant to 10 or more persons. Not applicable to open-end management investment companies.
(b) | Certification pursuant to Section 906 of the Sarbanes-Oxley Act of 2002. Furnished herewith. |
SIGNATURES
Pursuant to the requirements of the Securities Exchange Act of 1934 and the Investment Company Act of 1940, the registrant has duly caused this report to be signed on its behalf by the undersigned, thereunto duly authorized.
(Registrant) The Merger Fund
By (Signature and Title)* /s/ Frederick W. Green
Frederick W. Green, President
Date 11/19/2007
Pursuant to the requirements of the Securities Exchange Act of 1934 and the Investment Company Act of 1940, this report has been signed below by the following persons on behalf of the registrant and in the capacities and on the dates indicated.
By (Signature and Title)* /s/ Frederick W. Green
Frederick W. Green, President
Date 11/19/2007
By (Signature and Title)* /s/ Bonnie L. Smith
Bonnie L. Smith, Treasurer
Date 11/15/2007
* Print the name and title of each signing officer under his or her signature.