UNITED STATES
SECURITIES AND EXCHANGE COMMISSION
Washington, D.C. 20549
FORM N-CSR
CERTIFIED SHAREHOLDER REPORT
OF REGISTERED MANAGEMENT INVESTMENT COMPANIES
Investment Company Act file number 811-3462
The Flex-funds Trust
6125 Memorial Drive
Dublin, OH 43017
Bruce McKibben
c/o The Flex-funds Trust
6125 Memorial Drive
Dublin, OH 43017
Registrant’s telephone number, including area code: 800-325-3539
Date of fiscal year end: December 31, 2004
Date of reporting period: June 30, 2004
Item 1. Report to Stockholders.

The Flex-funds
The Muirfield Fund ®
The Dynamic Growth Fund
The Aggressive Growth Fund
The Total Return Utilities Fund
The Highlands Growth Fund ®
The U.S. Government Bond Fund
The Money Market Fund
2004 Semiannual Report
June 30, 2004

The Flex-funds
Managed by Meeder Asset Management, Inc.
6125 Memorial Drive, Dublin Ohio, 43017
Call Toll Free 800-325-3539 | 614-760-2159
Fax: 614-766-6669 | www.flexfunds.com
Email: flexfunds@meederfinancial.com

| | |
2004 Semiannual Report | June 30, 2004 | | The Flex-funds |
2004 Semiannual Report
Table of Contents
Page 1
| | |
The Flex-funds | | 2004 Semiannual Report | June 30, 2004 |

Robert Meeder, Jr.
President
Meeder Asset Management, Inc.
Letter to Shareholders
Stocks have trended sideways for most of the year so far, bound within a narrow trading range as investors grappled with many uncertainties, from the future direction of interest rates to political transition both at home and abroad. In the 2nd Quarter, activity in the equity market can be best described as a “whipsaw”: a short-term correction in April and May was followed by a quick rebound in June. Despite the volatility, a few leaders have emerged thus far in 2004: small- and mid-cap stock indices have outperformed the overall market, and large-cap value indices have demonstrated relative strength. Meanwhile, emerging markets and precious metals, which had performed well during last year’s rally, fell back in the first half of this year. Bond investors were hit hard in the 2nd Quarter, as the value of fixed income securities declined with the across-the-board rise in interest rates. Much of this activity in the bond market was expected, as investors anticipated the Federal Reserve’s quarter-point hike in the Fed funds target rate on June 30th.
Investment conditions have changed significantly from June 30th of last year to June 30th of this year. Last year, the liquidity-fueled equity rally was in its early stages, fired by the double-barrel effects of highly stimulative fiscal and monetary policies and growing improvement in the economy. Today, many of the conditions that energized last year’s favorable market performance remain in place. However, the market may have already discounted any future economic growth and improvement in corporate earnings. In addition, concerns over rising interest rates, rising inflation, and political uncertainty are clouding the investment horizon. These factors and others impacted the market in the first half of 2004, and will likely influence investor sentiment in the next six months of the year:
| | • | The Stock Market: Last year’s rally was supported by strong uptrends in several internal indicators of market performance. Market breadth expanded in the second half of 2003, as more stocks advanced on a daily basis than declined. Also, the trend in new 52-week highs gradually improved, while very few stocks were hitting new 52-week lows. So far this year, the uptrend in the equity market has stalled while the major indices entered a consolidation pattern. The number of stocks hitting new 52-week lows has expanded (mainly interest-rate sensitive issues such as preferred stocks, closed-end bond funds, etc.) as new 52-week highs have dropped off slightly. Advance/decline statistics have consolidated along with the major market indices, but have not corrected. Although the trends among various internal indicators have changed over the last twelve months, they continue to support a positive risk/reward relationship in the stock market. |
| | • | Interest Rates: On June 30th of last year, interest rates hovered at 45- year lows, thanks to an accommodative monetary policy by the Federal Reserve Board. The favorable interest rate environment had produced a surge of home construction and mortgage refinancing. Low interest rates also aided businesses and consumers, who benefited from reduced borrowing costs. |
On June 30th of this year, the Federal Reserve raised the Fed funds target rate by one-quarter of one percent to 1.25%. This rate hike was hardly a surprise, since investors had been anticipating the increase for some time. In January, the Fed had prompted the notion among investors that the days of an accommodative monetary policy were numbered, by omitting the words “for a considerable period” when discussing their intention to leave interest rates at their then-current level. Rates began rising across the board in March, most dramatically among bonds of longer maturities,
Page 2
| | |
2004 Semiannual Report | June 30, 2004 | | The Flex-funds |
when data began to show continued improvement in the economy, particularly in the employment markets. The market consensus at present says that the Federal Reserve is just beginning what will likely become a series of rate increases. But even if rates rise at a modest pace (as we expect,) they should remain low on an absolute basis and allow for continued economic growth and price stability.
Even if rates rise at a modest pace (as we expect,) they should remain low on an absolute basis and allow for continued economic growth and price stability.
| | • | Inflation: Inflation had been muted for most of last year, even with the effects of double-barreled fiscal and monetary stimulus pumping money into the economy. The Fed had been engaged in a 20-year war against inflation, beginning back in 1982 when Paul Volker was at the helm of the central bank. Last year, when Alan Greenspan and his band of Fed governors began worrying less about inflation and more about the threat of deflation, it essentially signaled the end of the war on inflation and the start of a new role for the Federal Reserve – that of keepers of the peace, charged with maintaining price stability consistent with solid economic growth. |
Energy prices were particularly volatile last quarter, as the price of oil climbed to more than $42 a barrel and U.S. gasoline prices rose to an average of $2.10 per gallon. Rising energy prices act like a tax on businesses and consumers, siphoning dollars that would otherwise be spent on goods and services or counted as earnings. Oil prices came down modestly from their highs as the 2nd Quarter ended. Drivers experienced some relief as well, as prices at the gas pumps declined even as the peak summer driving season approached. Increases in output from OPEC member countries, and in particular from the start-up of production in Iraq, helped ease some of the upward pressure on oil prices, although vulnerabilities in the supply chain, such as tanker shortages or sabotage on oil pipelines, may lead to continued volatility in the future.
| | • | Economic Recovery: The second half of last year saw the U.S. economic recovery accelerate at a robust pace. The GDP growth rate was clocked at 8.2% in the 3rd Quarter of 2003 – the fastest pace of economic growth in nearly 20 years – and continued to post strong numbers in subsequent quarters. Nearly all measurements of economic health indicated positive conditions for the U.S. economy over the last 12 months: gains were made in productivity, manufacturing, consumer confidence, and retail sales, among other indicators. Corporations were also doing well, registering record profits in 2003 and announcing improving quarterly earnings. The only holdout was employment, which in typical fashion lagged other economic indicators during the blossoming recovery. Improvement in the job market finally fell into place in the 2nd Quarter of 2004, with robust employment growth figures reported for March, April, and May. The economic recovery, which reportedly was on shaky ground earlier this year, now seems strong enough to roll on through the rest of this year. However, the market may have discounted most or all of the recovery already. |
| | • | U.S. Dollar: The value of the U.S. dollar relative to other currencies had declined considerably in 2003. The dollar’s depreciation rippled through many sectors of the economy, hurting foreign investors who saw the value of their U.S. investments lose value, but aiding domestic exporters who gained a degree of pricing power in overseas markets. The dollar took an upswing in the 2nd Quarter, breaking its long-term down trend. This reversal was felt in the precious metals markets, as gold prices dropped from a high of $433 per ounce on April 1st to a low of $375 per ounce on May 10th. |
Continued on Page 4
Page 3
| | |
| The Flex-funds | | 2004 Semiannual Report | June 30, 2004 |
Letter to Shareholders Continued from Page 3
The market now sees, with the emergence of Kerry, the likelihood of a more contentious campaign this November.
| | • | Taxes: On May 28th of last year, President Bush signed the Jobs & Growth Tax Relief Reconciliation Act, adding fiscal stimulus to the accommodative monetary policy of low interest rates as a means of jump-starting the economic recovery. The legislation lowered taxes for nearly all taxpayers, as well as offered benefits to investors including reduced tax rates on capital gains and qualified dividends. Some of the effects of the tax cut were felt immediately, such as the child tax credit rebate checks that were forwarded to parents with minor children last summer. The passage of tax relief sparked the strong stock market rally that ensued in the second half of 2003 and provided a boost to the economy at a critical time. Today, the markets continue to benefit from the positive results of the tax cut, although the market has largely discounted these effects already. |
| | • | Political Transition: As we have noted in previous commentaries, the third year has historically been the best year of the four-year presidential cycle for the stock market. Last year, stocks experienced strong gains consistent with this historical pattern. This year, the possibility of transition in the Oval Office creates an environment of uncertainty which could work against the markets. In fact, the stock market appeared to have entered its current trading range around the same time that John Kerry became the likely Democratic nominee for this fall’s presidential election. Where the market once saw a landslide re-election for George Bush over former Democratic front-runner Howard Dean, now it sees with the emergence of Kerry the likelihood of a more contentious campaign this November. |
Another transition that will be on the minds of many citizens over the next six months is the handover of authority in Iraq to a sovereign government of Iraqi citizens, which occurred officially on June 28th. Ongoing bloodshed and turmoil in parts of the country present substantial risks to the successful transfer of power, with the markets and the rest of the world watching the outcome closely. A worsening of the situation in Iraq, or any terrorist attacks within the U.S. or elsewhere in the world, would likely have an adverse impact on market conditions.
Looking ahead, the major events on the horizon that may sway the direction of the investment markets in the second half of the year are rising interest rates, progress in Iraq and the war on terror, and the upcoming presidential election. The market has already begun to discount future interest rate increases, but many will be watching just how far and how fast the Federal Reserve will go in raising short-term interest rates. Additionally, the developing political situations both at home and abroad, and the ever-present possibility of a terrorist attack are also likely to affect investors’ attitudes and expectations for the future. As always, we will continue to monitor market conditions on a daily basis and employ our disciplines to manage the Funds according to your expectations.
|
Sincerely, |
|

|
Robert Meeder, Jr. |
President |
Meeder Asset Management, Inc. |
August 24, 2004 |
Page 4
| | |
2004 Semiannual Report | June 30, 2004 | | The Flex-funds |
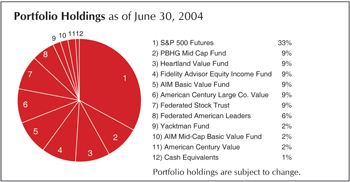
The Muirfield Fund
Performance Perspective
| | | | | | | | | | | | | | | | | | |
Period & Average Annual Total Returns as of June 30, 2004
| | 2004
YTD
| | | 1
year
| | | 3
years
| | | 5
years
| | | 10
years
| | | Since
Inception
| |
The Muirfield Fund | | 3.55 | % | | 21.87 | % | | 3.62 | % | | -2.10 | % | | 7.69 | % | | 8.98 | %1 |
S&P 500 Index3 | | 3.44 | % | | 19.10 | % | | -0.69 | % | | -2.20 | % | | 11.82 | % | | 10.96 | %2 |
Morningstar’s Average Asset Allocation Fund4 | | 1.72 | % | | 12.90 | % | | 2.18 | % | | 2.23 | % | | 8.26 | % | | 9.16 | %2 |
| 1 | Inception Date: 8/10/88. |
| 2 | Average annual total return from 8/1/88 to 6/30/04. |
Source for index and average fund data: Morningstar, Inc.
Semiannual Market Perspective

Robert S. Meeder, Sr.
Portfolio Manager

Kevin J. Kranz
Asst. Portfolio Manager
The U.S. equity markets were more volatile during the 2nd Quarter than the quarter-end performance indicates. During the three-month period, the stock market went through a corrective stage, as the S&P 500 Index, Dow Jones Industrial Average, and the Nasdaq Composite Index lost 5.5%, 5.9%, and 9.7% respectively from their quarterly highs to their low points in mid-May. Then, the major equity indices rebounded through the end of June, resulting in marginal gains for the quarter.
The Muirfield Fund reacted to the decline by holding a defensive position in cash of 35% of total assets until after the middle of May. At that point, the Fund returned to a fully-invested position in the stock market. In addition to adopting these defensive positions, the Fund was also structured to be less volatile than it was last year. This year, we hold more large-cap funds, and our holdings are tilted more toward value than growth. At quarter end, The Muirfield Fund returned 3.55% year-to-date. Over the same period, the S&P 500 Index returned 3.44%, and the average asset allocation fund returned 1.72%, according to Morningstar, Inc.
Investors had many geopolitical and economic factors to consider during the quarter. Some of the highlights include the government handover in Iraq, an expected rise in short-term interest rates thanks to the Federal Reserve, mixed economic data, the threat of inflation, expansion of terrorism into Saudi Arabia, and higher oil prices. These are challenging events for investors to navigate, but the market worked through the majority of these concerns to end the quarter on an up-note.
Nobody knows what tomorrow holds, but the market normally does a good job of discounting the future. Since the beginning of the year, the market has been trading in a narrow range and has not given clear indications of its future direction, even though on balance there has been a positive bias to the market. The uncertainty can be attributed to any combination of the aforementioned fears, but as evident in the market’s overall price action thus far this year, it is clear that the market is less optimistic now than it was last year. Plus, the market may have already discounted the recent improvement in the U.S. economy during the strong advance of the last 5 quarters. Either way, our defensive equity discipline is intended to protect investors’ assets on the down side while seeking to participate in market advances.
Past performance does not guarantee future results. All performance figures represent average annual total returns for the periods ended June 30, 2004, and assume reinvestment of all dividend and capital gain distributions. The investment return and principal value of an investment will fluctuate so that an investor’s shares, when redeemed, may be worth more or less than their original cost. Expenses were reimbursed and/or management fees were waived in order to reduce the operating expenses of The Muirfield Fund during the periods shown above.
| 3 | The S&P 500 Index is a widely recognized unmanaged index of common stock prices. The S&P 500 Index does not take into account the deduction of expenses associated with a mutual fund, such as investment management and accounting fees. One cannot invest directly in an index. |
| 4 | An index of funds such as Morningstar’s Average Asset Allocation Fund index includes a number of mutual funds grouped by investment objective. Each of those funds interprets that objective differently, and each employs a different management style and investment strategy. |
Page 5
| | |
| The Flex-funds | | 2004 Semiannual Report | June 30, 2004 |
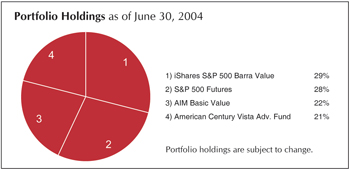
The Dynamic Growth Fund
Performance Perspective
| | | | | | | | | | | | |
Period & Average Annual Total Returns as of June 30, 2004
| | 2004
YTD
| | | 1
year
| | | 5
years
| | | Since
Inception
| |
The Dynamic Growth Fund | | -1.96 | % | | 18.99 | % | | — | | | -6.04 | %1 |
Meeder Asset Management, Inc. Growth Accounts Composite 4 | | -1.08 | % | | 20.99 | % | | 2.29 | % | | 12.47 | %2 |
S&P 500 Index 5 | | 3.44 | % | | 19.10 | % | | -2.20 | % | | -2.58 | %3 |
Morningstar’s Average Growth Fund 6 | | 3.48 | % | | 20.15 | % | | 0.15 | % | | -2.89 | %3 |
| 1 | Inception Date: 2/29/00. |
| 2 | Inception Date: 12/31/94. |
| 3 | Average annual total return from 3/1/00 to 6/30/04. |
Source for index and average fund data: Morninstar, Inc.
Semiannual Market Perspective

Robert M. Wagner, CFA
Portfolio Manager
During the stock market rally in the 12-month period from March 31, 2003 to March 31, 2004, The Dynamic Growth Fund outperformed the major equity market indices and its peer group, thanks in part to our allocation targeting the small- and mid-cap stock funds and funds closely correlated to the Nasdaq Composite Index. These areas of the market were the leaders during this rally, which was characterized by a strongly trending market that rewarded a patient approach in executing our discipline. During this period, every short-term correction resulted in a rally that surpassed the level reached prior to the correction. The best strategy in this kind of environment is to be patient and buy the market leading funds, holding them as long as the relative strength and trends exist.
However, as market conditions rapidly transitioned from one of a trending market to a sideways market this past quarter, the patient approach that worked so well over the 12-month period ending March 31, 2004 worked instead to the detriment of the Fund. Early in the 2nd Quarter, the previous leaders quickly became laggards, and rallies that used to carry the funds above previous highs failed to do so as the choppy markets became range-bound. Changes were made to the Fund to adjust to this new environment, eliminating or reducing the more volatile holdings and adding less volatile ones. In hindsight, the timing of the changes was not optimal for the market conditions that followed, and resulted in disappointing performance for the quarter. These conditions contributed to the Fund’s underperformance relative to its benchmark for the first half of 2004.
At the midpoint of the year, the Fund is targeting large-cap value funds, with some exposure to mid- and small-cap funds as well. Looking forward, we are waiting for the markets to emerge from their current trading ranges, and will adjust the portfolio accordingly. While these transitional periods can be difficult for our relative strength discipline, fortunately they are few and far between and can be overcome during periods when the market is demonstrating a clearer trend, which is typically the majority of the time. We are confident that our investment discipline will continue to allow the Fund to provide investors with returns that outpace its benchmarks over the long-term.
Past performance does not guarantee future results. All performance figures represent average annual total returns for the periods ended June 30, 2004, and assume reinvestment of all dividend and capital gain distributions. The investment return and principal value of an investment will fluctuate so that an investor’s shares, when redeemed, may be worth more or less than their original cost. Expenses were reimbursed and/or management fees were waived in order to reduce the operating expenses of The Dynamic Growth Fund during the periods shown above.
| 4 | The returns for the Meeder Asset Management, Inc. Growth Accounts Composite represent a composite of the private accounts managed by Meeder Asset Management, Inc., manager of The Flex-funds, which employ a similar investment strategy to The Dynamic Growth Fund, and are net of investment advisory fees. We have included the returns of these privately-managed accounts to present the long-term performance of the investment strategies employed by The Dynamic Growth Fund. Please refer to the disclosure on page 12 for a description of what these returns represent and what they do not represent. |
| 5 | The S&P 500 Index is a widely recognized unmanaged index of common stock prices. The S&P 500 Index does not take into account the deduction of expenses associated with a mutual fund, such as investment management and accounting fees. One cannot invest directly in an index. |
| 6 | An index of funds such as Morningstar’s Average Growth Fund index includes a number of mutual funds grouped by investment objective. Each of those funds interprets that objective differently, and each employs a different management style and investment strategy. |
Page 6
| | |
2004 Semiannual Report | June 30, 2004 | | The Flex-funds |
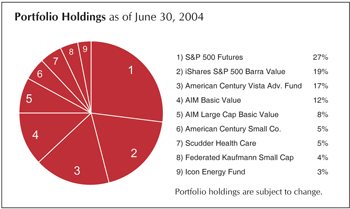
The Aggressive Growth Fund
Performance Perspective
| | | | | | | | | | | | |
Period & Average Annual Total Returns
as of June 30, 2004
| | 2004
YTD
| | | 1
year
| | | 5
years
| | | Since
Inception
| |
The Aggressive Growth Fund | | -2.41 | % | | 19.96 | % | | — | | | -9.45 | %1 |
Meeder Asset Management, Inc. | | | | | | | | | | | | |
Aggressive Growth Accounts Composite 4 | | -1.99 | % | | 20.53 | % | | 2.54 | % | | 12.80 | %2 |
Morningstar’s Average Aggressive Growth Fund5 | | 4.02 | % | | 22.02 | % | | 0.62 | % | | -10.33 | %3 |
Nasdaq Composite Index6 | | 2.22 | % | | 26.19 | % | | -5.28 | % | | -17.29 | %3 |
| 1 | Inception Date: 2/29/00. |
| 2 | Inception Date: 12/31/94. |
| 3 | Average annual total return from 3/1/00 to 6/30/04. |
Source for index and average fund data: Morningstar, Inc.
Semiannual Market Perspective
Robert M. Wagner, CFA
Portfolio Manager
During the 12-month period ending March 31, 2004, strong uptrends in the major stock market indices resulted in one of the best periods for equity investors in quite some time. Patience was rewarded throughout this rally as the market worked through minor corrections and climbed to higher ground. In particular, performance was exceptionally strong for the Nasdaq Composite Index as well as small- and mid-cap stocks, and we targeted these areas of the market for investment in The Aggressive Growth Fund. Our relative strength strategy helped the Fund significantly outperform both the major equity market indices and its peer group during this period.
The 2nd Quarter of 2004 was very much unlike the previous 12-month period, as the stock market exhibited corrective and choppy performance. The laggards of last year became the better performing groups over the last three months. The best example of this rotation is the recent strength of value stocks and the relative weakness of the high-tech stocks in the Nasdaq Composite Index.
Unfortunately, when we made our portfolio changes to adjust to the new conditions in the market, the volatility of the market accelerated and worked against our trades. The end result was a loss for the 2nd Quarter that eliminated our gains of the 1st Quarter. These conditions contributed to the Fund’s underperformance relative to its benchmark for the first six months of the year.
It is important to note that these sharp changes in market leadership occur infrequently, and we strive to overcome the underperformance that results from these periods by seeking stronger performance over the long-term. The Fund will strive to achieve competitive returns over the long-term, despite these short-term challenges to our investment discipline.
Past performance does not guarantee future results. All performance figures represent period and average annual total returns for the periods ended June 30, 2004, and assume reinvestment of all dividend and capital gain distributions. The investment return and principal value of an investment will fluctuate so that an investor’s shares, when redeemed, may be worth more or less than their original cost. Expenses were reimbursed and/or management fees were waived in order to reduce the operating expenses of The Aggressive Growth Fund during the periods shown above.
| 4 | The returns for the Meeder Asset Management, Inc. Aggressive Growth Accounts Composite represent a composite of the private accounts managed by Meeder Asset Management, Inc., manager of The Flex-funds, which employ a similar investment strategy to The Aggressive Growth Fund. We have included the returns of these privately-managed accounts to present the long-term performance of the investment strategies employed by The Aggressive Growth Fund. Please refer to the disclosure on page 12 for a description of what these returns represent and what they do not represent. |
| 5 | An index of funds such as Morningstar’s Average Aggressive Growth Fund index includes a number of mutual funds grouped by investment objective. Each of those funds interprets that objective differently, and each employs a different management style and investment strategy. |
| 6 | The Nasdaq Composite Index is a broad-based capitalization-weighted index of all Nasdaq national market and small-cap stocks. The Nasdaq Composite Index does not take into account the deduction of expenses associated with a mutual fund, such as investment management and accounting fees. One cannot invest directly in an index. |
Page 7
| | |
The Flex-funds | | 2004 Semiannual Report | June 30, 2004 |
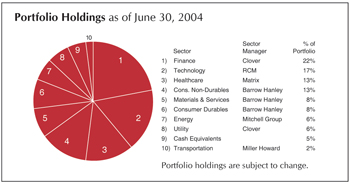
The Highlands Growth Fund
Performance Perspective
| | | | | | | | | | | | | | | |
Period & Average Annual Total
Returns as of June 30, 2004
| | 2004
YTD
| | | 1
year
| | | 5
years
| | | 10
years
| | | Since
Inception
| |
The Highlands Growth Fund | | 1.35 | % | | 15.36 | % | | -4.31 | % | | 7.39 | % | | 7.21 | %1 |
S&P 500 Index 3 | | 3.44 | % | | 19.10 | % | | -2.20 | % | | 11.82 | % | | 12.81 | %2 |
| 1 | Inception Date: 3/20/85. 2 Average annual total return from 3/29/85 to 6/30/04. Source for index data: Morningstar, Inc., Bloomberg |
Semiannual Market Perspective

William L. Gurner
Portfolio Manager
The Highlands Growth Fund gained 1.08% in the 2nd Quarter of 2004, bringing the Fund’s year-to-date return to 1.35%. In comparison, the S&P 500 Index rose 1.72% in the 2nd Quarter, for a yearto- date gain of 3.44%.
While it is good news that the stock market managed to show some progress in the first half of the year, what is amazing is that it was able to do so despite a raft of problems and uncertainties facing investors. Nearly every business and consumer had to deal with higher oil prices, higher interest rates, potentially higher inflation, and heavy debt burdens held by many Americans. On top of that, investors also had to tackle election year politics, fears of future terrorist attacks, and uncertainty regarding the length of our military’s continuing engagement in Iraq.
Thus far in 2004, we have sought to add value to investors and control their exposure to risk, by striving to reduce the number of stocks held in the Fund’s portfolio. At this midpoint of the year, we are holding approximately 115 stocks; one year ago, this number was nearly twice as much. Performance has lagged occasionally in the short term as we have cut back on the total number of our portfolio holdings. In the long run, we believe these efforts should aid shareholders, as we focus more of the Fund’s assets on the select stocks we feel are poised to grow in the future.
Our view on equities remains bullish. We believe that demand for U.S. stocks is as high as it has ever been, possibly higher. Price/earnings ratios have come down somewhat from where they were at the start of the year. And investors from around the world continue to invest their assets in U.S. equities. With higher inflation looming on the horizon, we believe equities continue to be one of the best long-term investments for producing real rates of return. We believe large-cap stocks will reap the benefits of the on-going positive economic conditions, and that our “sector neutral, style neutral” strategy will enable investors to take advantage of the opportunities that the market will present.
Past performance does not guarantee future results. All performance figures represent average annual total returns for the periods ended June 30, 2004, and assume reinvestment of all dividend and capital gain distributions. The investment return and principal value of an investment will fluctuate so that an investor’s shares, when redeemed, may be worth more or less than their original cost. Expenses were reimbursed and/or management fees were waived in order to reduce the operating expenses of The Highlands Growth Fund during the periods shown above.
| 3 | The S&P 500 Index is a widely recognized unmanaged index of common stock prices. The S&P 500 Index does not take into account the deduction of expenses associated with a mutual fund, such as investment management and accounting fees. One cannot invest directly in an index. |
Page 8
| | |
2004 Semiannual Report | June 30, 2004 | | The Flex-funds |
The Total Return Utilities Fund
Performance Perspective
| | | | | | | | | | | | |
Period & Average Annual Total Returns
as of June 30, 2004
| | 2004
YTD
| | | 1
year
| | | 5
years
| | | Since
Inception
| |
The Total Return Utilities Fund | | 2.84 | % | | 10.51 | % | | -2.02 | % | | 7.09 | %1 |
S&P 500 Utilities Index 3 | | 3.79 | % | | 11.44 | % | | -2.01 | % | | 5.22 | %2 |
Average Utility Fund 4 | | 4.27 | % | | 14.98 | % | | -1.93 | % | | 7.58 | %2 |
| 1 | Inception Date: 6/21/95. 2 Average annual total return from 6/30/95 to 6/30/04. |
Source for index data: Bloomberg. Source for average fund data: Morningstar, Inc.
Semiannual Market Perspective

Lowell G. Miller
Portfolio Manager
The Total Return Utilities Fund had a positive 2nd Quarter, even as the yield on 10-year U.S. Treasuries climbed over three-quarters of a percentage point. The Fund gained 0.66% for the 2nd Quarter, outperforming its new benchmark, the S&P 500 Utilities Index, which returned -1.31%. Year-to-date, the Fund has gained 2.84%, compared with the 3.77% year-to-date return of the S&P 500 Utilities Index.
Most of the Fund’s favorable performance for the 2nd Quarter came from our holdings among the exploration and pipeline (E&P) gas producers and from diversified utilities with natural gas production. We had been forecasting a new paradigm for natural gas prices in response to fundamental tightness in the supply and demand for gas in North America. Our early positioning of the Fund to overweight companies that stand to benefit from sustained higher natural gas prices has begun to pay off. Our more traditional electric and gas utilities lagged in the 2nd Quarter, more in line with the general utilities sector, but still were not especially problematic. Indeed, some of these companies have begun to look increasingly attractive on our valuation measures.
So far this year, it has been the lower quality or turnaround utility stocks that have led the benchmark index higher. In fact, the top ten performers in the S&P 500 Utilities Index are unavailable to the Fund to invest in, due to the fact that they either engage in nuclear power generation (which is against our socially responsible investment policy) or are of low financial quality. We did well to stay within one percentage-point of the index without holding the benchmark leaders.
We are pleased with the Fund’s balance of conservative, regulated utilities that steadily increase their dividends, as well as our diversified utility holdings that have exposure to rising gas prices. Further, our holdings in the E&P gas sector are working well, with significant upside potential if natural gas prices remain high. With earnings from our conservative utilities holdings likely to benefit from an improving economy and hotter weather in the summer forecast, we believe that steady dividend increases may insulate the Fund from any interest-rate induced malaise.
Past performance does not guarantee future results. All performance figures represent average annual total returns for the periods ended June 30, 2004, and assume reinvestment of all dividend and capital gain distributions. The investment return and principal value of an investment will fluctuate so that an investor’s shares, when redeemed, may be worth more or less than their original cost. Expenses were reimbursed and/or management fees were waived in order to reduce the operating expenses of The Total Return Utilities Fund during the periods shown above. Because The Total Return Utilities Fund concentrates its investments in public utility companies, the value of the Fund’s shares may fluctuate more than if invested in a greater number of industries. Changes in interest rates may also affect the value of utility stocks, and rising interest rates can be expected to reduce the Fund’s net asset value.
| 3 | The S&P 500 Utilities Index is an unmanaged index of 33 utility sector stocks. This index does not take into account the deduction of expenses associated with a mutual fund, such as investment management and accounting fees. One cannot invest directly in an index. The S&P 500 Utilities Index replaces the Fund’s previous benchmark, the New York Stock Exchange Utilities Index, which was discontinued at the start of this year. |
| 4 | An index of funds such as Morningstar’s Average Utility Fund index includes a number of mutual funds grouped by investment objective. Each of those funds interprets that objective differently, and each employs a different management style and investment strategy. |
Page 9
| | |
The Flex-funds | | 2004 Semiannual Report | June 30, 2004 |
The U.S. Government Bond Fund
Performance Perspective
| | | | | | | | | | | | | | | |
Period & Average Annual Total Returns
as of June 30, 2004
| | 2004
YTD
| | | 1
year
| | | 5
years
| | | 10
years
| | | Since
Inception
| |
The U.S. Government Bond Fund | | -0.47 | % | | -3.56 | % | | 3.12 | % | | 5.11 | % | | 6.01 | %1 |
Lehman Bros. Intermediate Government/Credit Index 2 | | -0.10 | % | | -0.06 | % | | 6.75 | % | | 6.89 | % | | n/a | |
Morningstar’s Average General U.S. Government Bond Fund3 | | -0.23 | % | | -0.77 | % | | 5.45 | % | | 5.82 | % | | n/a | |
| 1 | Inception Date: 5/9/85. Source for index and average fund data: Morningstar, Inc. |
Semiannual Market Perspective

Joseph A. Zarr
Co-Portfilio Manager

Christopher M. O’Daniel
Co-Portfilio Manager
For the 2nd Quarter of 2004, The Flex-funds U.S. Government Bond Fund returned –3.89%. Year-to-date, the Fund has returned –0.47%.
Our strategy for managing the Fund is to invest in longer- term securities when we believe rates are falling and bond prices are appreciating. When we believe rates are rising and prices are falling, we invest in short-term securities as a means of protecting investor capital during this high-risk market environment. We began the 2nd Quarter with an average maturity in the Fund of almost nine years, as the trend in bond prices was generally positive. Early on in the quarter, yields on 10-year notes rocketed more than one full percentage point over a 45-day period, from 3.8% on March 30th to over 4.8% in mid-May. In early April, the Fund began to transition away from the intermediate range of the market and focus on shorter-term maturities. In May, we shortened our average maturity even more, as the trend toward higher yields and lower prices persisted. Prior to and during the initial phases of the decline, the Fund’s average maturity was greater than that of its benchmark, resulting in the Fund’s underperformance relative to its benchmark for the first half of 2004. At the midpoint of the year, the average maturity of the Fund hovered around four years.
Our belief is that yields rose a bit too quickly as we entered mid-May and needed time to work off the momentum realized during the swift drop in prices for all fixed-income securities. A short-term reversal in prices to the upside would not be unexpected, as it appears as though the market moved too fast in too short a time. There may be times like these when it is advantageous to invest in longer-term securities for brief periods. But our underlying belief is that yields should continue higher for the remainder of the year. We would not be surprised to see the average maturity of the Fund reduced even more over the coming months.
Past performance does not guarantee future results. All performance figures represent average annual total returns for the periods ended June 30, 2004, and assume reinvestment of all dividend and capital gain distributions. The investment return and principal value of an investment will fluctuate so that an investor’s shares, when redeemed, may be worth more or less than their original cost. Expenses were reimbursed and/or management fees were waived in order to reduce the operating expenses of The U.S. Government Bond Fund during the periods shown above.
| 2 | The Lehman Brothers Intermediate Government/Credit Index is an unmanaged index of fixed-rate bonds issued by the U.S. Government and its agencies that are rated investment grade or higher, have one to ten years remaining until maturity, and at least $100 million outstanding. The Lehman Brothers Intermediate Government/Credit Index does not take into account the deduction of expenses associated with a mutual fund, such as investment management and accounting fees. One cannot invest directly in an index. |
| 3 | An index of funds such as Morningstar’s Average General U.S. Government Bond Fund index includes a number of mutual funds grouped by investment objective. Each of those funds interprets that objective differently, and each employs a different management style and investment strategy. |
Page 10
| | |
2004 Semiannual Report | June 30, 2004 | | The Flex-funds |
The Money Market Fund
Performance Perspective
| | | | | | | | | | | | | | | |
Period & Average Annual Total Returns as of June 30, 2004
| | 2004 YTD
| | | 1 year
| | | 5 years
| | | 10 years
| | | Since Inception
| |
The Money Market Fund | | 0.41 | % | | 0.83 | % | | 3.14 | % | | 4.22 | % | | 5.26 | %1 |
Lipper’s Average General Purpose Money Market Fund3 | | 0.17 | % | | 0.35 | % | | 2.62 | % | | 3.81 | % | | 4.84 | %2 |
Current & Effective Yields | | 7-day simple yield: 0.88% | | | 7-day compound yield: 0.88% | |
| 1 | Inception Date: 3/27/85 2 Average Annual total return from 3/31/85 to 6/30/04. Source for average money market fund data: Lipper, Inc. |
As of June 30, 2004, yield quotations more closely reflect the earnings of The Money Market Fund than total return quotations.
Semiannual Market Perspective
Joseph A. Zarr
Co-Portfilio Manager
Christopher M. O’Daniel
Co-Portfilio Manager
The Flex-funds Money Market Fund continued to provide investors with competitive yields throughout the 2nd Quarter of 2004. According to iMoneyNet, Inc., the Fund ranked among the top 10 general purpose money market funds for highest 12-month yield as of June 30, 2004.
For the year-to-date, the Fund has outperformed its peer group with a return of 0.41%, compared to the 0.17% year-to-date return of the average general purpose money market fund, according to Lipper, Inc.
Investors were finally able to see the light at the end of the interest rate tunnel during the 2nd Quarter, as short-term rates began to move upward. Economic statistics revealed rapid growth in the job market, while the new concern among investors turned to in-flation as opposed to the specter of deflation, which had held participants mesmerized for much of 2003.
In response to these and other market conditions, the Federal Reserve issued a quarter-point hike in the Fed funds target rate on the last day of the quarter, and suggested that future increases in rates would come at a “measured” pace. Federal Reserve watchers forwarded the argument that the Fed had fallen behind the curve by waiting so long to raise interest rates, highlighting the fact that short-term rates were already moving up at more than a measured pace, potentially leaving the projected incremental increases by Mr. Greenspan in the dust. Whether that happens to come about remains to be seen. For now, we expect gradual increases in the Fed funds target rate, continuing through the remainder of the year.
Our outlook calls for money market yields to increase through the end of the year, as they approach a more normal relationship with the rate of inflation. However, we are not among those money managers calling for an increase to the 3% level by year-end, since it may not be unlikely that the current pace of economic growth can be maintained over an extended period of time.
Past performance does not guarantee future results. Except for the current and effective yields, all performance figures represent average annual total returns for the periods ended June 30, 2004, and assume reinvestment of all dividend and capital gain distributions. The investment return and principal value of an investment will fluctuate so that an investor’s shares, when redeemed, may be worth more or less than their original cost. Expenses were reimbursed and/or management fees were waived in order to reduce the operating expenses of The Money Market Fund during the periods shown above. Investments in The Money Market Fund are neither insured nor guaranteed by the Federal Deposit Insurance Corporation or any other governmental agency. Although the Fund seeks to preserve the value of your investment at $1.00 per share, it is possible to lose money by investing in The Money Market Fund.
| 3 | An index of funds such as Lipper’s Average General Purpose Money Market Fund index includes a number of mutual funds grouped by investment objective. Each of those funds interprets that objective differently, and each employs a different management style and investment strategy. |
Page 11
| | |
The Flex-funds | | 2004 Semiannual Report | June 30, 2004 |
PAST PERFORMANCE OF MEEDER ASSET MANAGEMENT, INC. GROWTH AND AGGRESSIVE GROWTH ACCOUNTS COMPOSITES
Purpose of Past Performance. The performance information on Pages 6 & 7 is provided to show the past performance of the advisor in managing substantially similar accounts to The Dynamic Growth Fund and The Aggressive Growth Fund.
What Past Performance Does Not Represent. The past performance shown on Pages 6 & 7 does not represent the performance of The Dynamic Growth Fund or The Aggressive Growth Fund. You should not consider the past performance for account composites shown on Pages 6 & 7 as an indication of the future performance of The Dynamic Growth Fund or The Aggressive Growth Fund.
Similar Accounts. Robert M. Wagner, CFA serves as the advisor’s portfolio manager for privately managed accounts having investment goals, policies, strategies and risks substantially similar to those of The Dynamic Growth Fund and The Aggressive Growth Fund. Substantially all of the assets of these privately managed accounts have invested in mutual funds.
Calculation of Past Performance. All returns presented were calculated on a total return basis and include all dividends and interest, accrued income and realized and unrealized gains and losses. All returns reflect the deduction of investment advisory fees, brokerage commissions and execution costs paid by the private accounts without providing for federal or state income taxes. Custodial fees, if any, were not used to reduce performance returns. The advisor’s composite includes all actual, fee paying, discretionary, private accounts managed by the advisor that have investment objectives, policies, strategies and risks substantially similar to those of The Dynamic Growth Fund and The Aggressive Growth Fund. Cash and equivalents are included in performance returns. The returns of the advisor’s composite combine the individual accounts’ returns by asset-weighting each individual account’s asset value as of the beginning of each quarter. The yearly returns are computed by linking the returns of each quarter within the calendar year.
Differences in Regulation. The private accounts that are included in the advisor’s composite are not subject to the same types of expenses to which The Dynamic Growth Fund or The Aggressive Growth Fund are subject nor to the diversification requirements, specific tax restrictions and investment limitations imposed on The Dynamic Growth Fund or The Aggressive Growth Fund by federal securities laws.
Page 12
| | |
2004 Semiannual Report | June 30, 2004 | | The Flex-funds |
2004 Semiannual Report
Portfolio Holdings &
Financial Statements
Page 13
Schedule of Investments
June 30, 2004 (unaudited)
The Muirfield Fund
| | | | | |
Security Description
| | Shares or
Principal
Amount ($)
| | Value ($)
| |
Registered Investment Companies — 63.0% | | | |
Aim Basic Value Fund — Class A # | | 179,977 | | 5,536,099 | |
Aim Mid Cap Basic Value
Fund — Class A # | | 90,924 | | 1,115,642 | |
American Century Large Company Value Fund — Class A | | 918,452 | | 5,492,342 | |
American Century Value Fund — Class A | | 140,805 | | 1,113,766 | |
Federated American Leaders
Fund — Class A | | 154,274 | | 3,637,766 | |
Federated Stock Trust Fund | | 155,606 | | 5,450,894 | |
Fidelity Advisor Equity Income
Fund — Class A | | 206,287 | | 5,534,681 | |
Heartland Value Fund | | 103,880 | | 5,534,752 | |
PBHG Mid-Cap Fund # | | 310,325 | | 5,545,499 | |
The Yacktman Fund | | 93,268 | | 1,442,859 | |
| | | | |
|
|
Total Registered Investment Companies (Cost $35,837,643) | | | | 40,404,300 | |
| | | | |
|
|
U.S. Government Obligations — 19.8% | | | |
U.S. Treasury Bills, 0.99%, due 07/01/04 * | | 11,500,000 | | 11,499,483 | |
U.S. Treasury Bills, 1.31%, due 09/30/04 * | | 1,200,000 | | 1,196,136 | |
| | | | |
|
|
Total U.S. Government Obligations
(Cost $12,695,570) | | | | 12,695,619 | |
| | | | |
|
|
Repurchase Agreements — 19.1% | | | |
Salomon Smith Barney, Inc., 1.55%, 07/01/04, (Collateralized by $12,497,524 various Commercial Paper, at 1.41%-1.44%, due 07/13/04-08/18/04,
value — $12,479,969) | | 12,235,000 | | 12,235,000 | |
| | | | |
|
|
Total Repurchase Agreements
(Cost $12,235,000) | | | | 12,235,000 | |
| | | | |
|
|
Total Investments — 101.9%
(Cost $60,768,213) (a) | | | | 65,334,919 | |
| | | | |
|
|
Liabilities less Other Assets — (1.9%) | | | | (1,157,759 | ) |
| | | | |
|
|
Total Net Assets — 100.0% | | | | 64,177,160 | |
| | | | |
|
|
Trustee Deferred Compensation ** | | | |
The Flex-funds Dynamic Growth Fund | | 2,716 | | 20,424 | |
The Flex-funds Highlands Growth Fund | | 2,786 | | 41,846 | |
The Flex-funds Muirfield Fund | | 9,292 | | 46,088 | |
The Flex-funds Total Return Utilities Fund | | 2,033 | | 29,621 | |
| | | | |
|
|
Total Trustee Deferred Compensation (Cost $148,099) | | | | 137,979 | |
| | | | |
|
|
| | | | |
Security Description
| | Long
Contracts
| | Unrealized
Appreciation
|
Futures Contracts | | | | |
Standard & Poors 500 expiring September 2004, notional value $21,097,400 | | 74 | | 36,596 |
| | | | |
|
Total Futures Contracts | | | | 36,596 |
| | | | |
|
| | (a) | | Represents cost for financial reporting purposes and may differ for federal income tax purposes by the amount of losses recognized in excess of federal income tax reporting. Cost for federal income tax purposes differs from value by net unrealized appreciation (depreciation) of securities as follows: |
| | | | |
Unrealized appreciation | | $ | 4,615,342 | |
Unrealized depreciation | | | (48,636 | ) |
| | |
|
|
|
Net unrealized appreciation (depreciation) | | $ | 4,566,706 | |
| | |
|
|
|
| # | | Represents non-income producing securities. |
| * | | Pledged as collateral on futures contracts. |
| ** | | Assets of affiliates to The Muirfield Fund held for the benefit of the Fund’s Trustees in connection with the Trustee Deferred Compensation Plan. |
See accompanying notes to financial statements.
The Flex-funds
14
Schedule of Investments
June 30, 2004 (unaudited)
The Total Return Utilities Fund
| | | | |
Security Description
| | Shares or
Principal
Amount ($)
| | Value ($)
|
Common Stocks — 99.2% | | | | |
| Electric/Gas Utility — 15.5% | | | | |
AGL Resources, Inc. | | 27,940 | | 811,657 |
ATMOS Energy Corp. | | 20,445 | | 523,392 |
MDU Resources Group, Inc. | | 35,565 | | 854,627 |
NiSource, Inc. | | 50,360 | | 1,038,423 |
| | | | |
|
| | | | | 3,228,099 |
| | | | |
|
| Electric Utility — 21.4% | | | | |
Cinergy Corp. | | 27,270 | | 1,036,260 |
Consolidated Edison, Inc. | | 5,085 | | 202,180 |
DPL, Inc. | | 20,375 | | 395,683 |
Energy East Corp. | | 26,140 | | 633,895 |
Keyspan Corp. | | 28,245 | | 1,036,592 |
IDACORP, Inc. | | 27,900 | | 753,300 |
Pepco Holdings, Inc. | | 21,950 | | 401,246 |
| | | | |
|
| | | | | 4,459,156 |
| | | | |
|
| Natural Gas (Distributor) — 21.3% | | | | |
Gulfterra Energy Partners, L.P. | | 16,350 | | 632,745 |
National Fuel Gas Co. | | 25,890 | | 647,250 |
Nicor, Inc. | | 29,580 | | 1,004,833 |
ONEOK, Inc. | | 29,520 | | 649,145 |
Southern Union Co. # | | 23,045 | | 485,789 |
Vectren Corp. | | 28,555 | | 716,445 |
WGL Holdings, Inc. | | 11,200 | | 321,664 |
| | | | |
|
| | | | | 4,457,871 |
| | | | |
|
| Oil & Natural Gas — 30.1% | | | | |
Anadarko Petroleum Corp. | | 8,685 | | 508,941 |
Burlington Resources, Inc. | | 14,980 | | 541,976 |
Devon Energy Corp. | | 7,445 | | 491,370 |
EOG Resources, Inc. | | 9,095 | | 543,062 |
Equitable Resources, Inc. | | 19,115 | | 988,437 |
Kinder Morgan Energy Partners, L.P. | | 27,983 | | 1,138,560 |
Peoples Energy Corp. | | 13,735 | | 578,930 |
Pioneer Natural Resources Co. | | 16,480 | | 578,118 |
Questar Corp. | | 23,680 | | 914,995 |
| | | | |
|
| | | | | 6,284,389 |
| | | | |
|
| Telecommunication Services — 5.4% | | | | |
Telefonos de Mexico SA de CV ADR | | 15,210 | | 506,037 |
CenturyTel, Inc. | | 17,515 | | 526,150 |
Time Warner Telecom, Inc. # | | 25,000 | | 104,750 |
| | | | |
|
| | | | | 1,136,937 |
| | | | |
|
| Water Utility — 5.5% | | | | |
Aqua America, Inc. | | 39,402 | | 790,010 |
United Utilities PLC | | 18,350 | | 350,852 |
| | | | |
|
| | | | | 1,140,862 |
| | | | |
|
Total Common Stocks
(Cost $18,630,632) | | | | 20,707,314 |
| | | | |
|
| | | | |
Security Description
| | Shares or
Principal
Amount ($)
| | Value ($)
|
Repurchase Agreements — 0.6% | | | | |
Salomon Smith Barney, Inc., 1.55%, 07/01/04, (Collateralized by $135,854 various Commercial Paper, at 1.41%-1.44%, due 07/13/04-08/18/04,
value — $135,663) | | 133,000 | | 133,000 |
| | | | |
|
Total Repurchase Agreements
(Cost $133,000) | | | | 133,000 |
| | | | |
|
Total Investments — 99.8%
(Cost $18,763,632) (a) | | | | 20,840,314 |
| | | | |
|
| Other Assets less Liabilities — 0.2% | | | | 38,587 |
| | | | |
|
| Total Net Assets — 100.0% | | | | 20,878,901 |
| | | | |
|
Trustee Deferred Compensation * | | | | |
The Flex-funds Dynamic Growth Fund | | 929 | | 6,986 |
The Flex-funds Highlands Growth Fund | | 788 | | 11,836 |
The Flex-funds Muirfield Fund | | 2,956 | | 14,662 |
The Flex-funds Total Return Utilities Fund | | 636 | | 9,267 |
| | | | |
|
Total Trustee Deferred Compensation (Cost $42,205) | | | | 42,751 |
| | | | |
|
| ADR: | | American Depository Receipt |
| (a) | | Represents cost for financial reporting purposes and may differ for federal income tax purposes by the amount of losses recognized in excess of federal income tax reporting. Cost for federal income tax purposes differs from value by net unrealized appreciation (depreciation) of securities as follows: |
| | | | |
Unrealized appreciation | | $ | 2,857,460 | |
Unrealized depreciation | | | (780,778 | ) |
| | |
|
|
|
Net unrealized appreciation (depreciation) | | $ | 2,076,682 | |
| | |
|
|
|
| # | | Represents non-income producing securities. |
| * | | Assets of affiliates to The Total Return Utilities Fund held for the benefit of the Fund’s Trustees in connection with the Trustees Deferred Compensation Plan. |
See accompanying notes to financial statements.
The Flex-funds
15
Schedule of Investments
June 30, 2004 (unaudited)
The Highlands Growth Fund
| | | | |
Security Description
| | Shares or
Principal
Amount ($)
| | Value ($)
|
Common Stocks — 94.6% | | | | |
| Capital Goods, Materials & Services — 8.4% | | |
| (Subadvised by Barrow, Hanley, Mewhinney & Strauss, Inc.) |
3M Co. | | 2,625 | | 236,276 |
American Power Conversion Corp. | | 6,290 | | 123,599 |
Caterpillar, Inc. | | 1,995 | | 158,483 |
Cendant Corp. | | 6,490 | | 158,875 |
Ingersoll-Rand Co. — Class A | | 1,970 | | 134,570 |
Masco Corp. | | 4,235 | | 132,047 |
Praxair, Inc. | | 3,605 | | 143,876 |
Sourcecorp # | | 4,330 | | 119,162 |
Tyco International Ltd. | | 7,015 | | 232,477 |
Weyerhaeuser Co. | | 2,270 | | 143,282 |
| | | | |
|
| | | | | 1,582,647 |
| | | | |
|
| Consumer Durable Goods — 7.6% | | | | |
| (Subadvised by Barrow, Hanley, Mewhinney & Strauss, Inc.) |
Aeropostale, Inc. # | | 3,200 | | 86,112 |
Best Buy Co., Inc. | | 1,365 | | 69,260 |
Costco Wholesale Corp. # | | 1,905 | | 78,448 |
General Motors Corp. | | 1,180 | | 54,976 |
Home Depot, Inc. | | 5,355 | | 188,496 |
Lowe’s Cos., Inc. | | 2,720 | | 142,936 |
Target Corp. | | 4,260 | | 180,922 |
Wal-Mart Stores, Inc. | | 9,120 | | 481,172 |
Walgreen Co. | | 3,990 | | 144,478 |
| | | | |
|
| | | | | 1,426,800 |
| | | | |
|
| Consumer Non-durable Goods — 12.4% | | |
| (Subadvised by Barrow, Hanley, Mewhinney & Strauss, Inc.) |
Action Performance Cos., Inc. | | 10,040 | | 151,303 |
Altria Group, Inc. | | 6,420 | | 321,321 |
Bunge Ltd. | | 5,080 | | 197,815 |
Coca-Cola Co., The | | 4,070 | | 205,454 |
Comcast Corp. — Special — Class A # | | 6,640 | | 183,330 |
Haggar Corp. | | 560 | | 11,194 |
Hain Celestial Group, Inc. # | | 5,070 | | 91,767 |
JAKKS Pacific, Inc. # | | 9,000 | | 187,110 |
PepsiCo, Inc. | | 5,010 | | 269,939 |
Procter & Gamble Co. | | 4,580 | | 249,335 |
Time Warner, Inc. # | | 7,350 | | 129,213 |
Viacom, Inc. — Class B | | 4,213 | | 150,488 |
Wendy’s International, Inc. | | 5,340 | | 186,046 |
| | | | |
|
| | | | | 2,334,315 |
| | | | |
|
| Energy — 6.6% | | | | |
| (Subadvised by The Mitchell Group, Inc.) | | |
BP PLC Sponsored ADR # | | 1,348 | | 72,212 |
Chevron Texaco Corp. | | 1,056 | | 99,380 |
ConocoPhillips | | 1,800 | | 137,322 |
Devon Energy Corp. | | 1,000 | | 66,000 |
Exxon Mobil Corp. | | 6,624 | | 294,172 |
FMC Technologies, Inc. # | | 2,600 | | 74,880 |
Halliburton Co. | | 2,400 | | 72,624 |
New York Community Bancorp Inc. | | 2,550 | | 50,057 |
Pioneer Natural Resources Co. # | | 2,600 | | 91,208 |
Pride International, Inc. # | | 5,000 | | 85,550 |
| | | | |
Security Description
| | Shares or
Principal
Amount ($)
| | Value ($)
|
Common Stocks — continued | | | | |
Range Resources Corp. | | 4,700 | | 68,620 |
Schlumberger, Ltd. | | 1,100 | | 69,861 |
XTO Energy, Inc. | | 2,100 | | 62,559 |
| | | | |
|
| | | | | 1,244,445 |
| | | | |
|
| Finance — 15.4% | | | | |
| (Subadvised by Clover Partners LP) | | | | |
Bank of America Corp. | | 2,887 | | 244,298 |
Capital One Financial Corp. | | 4,220 | | 288,564 |
Citigroup, Inc. | | 11,935 | | 554,978 |
Conseco, Inc. # | | 11,120 | | 221,288 |
Crescent Real Estate Equities Co. | | 12,850 | | 207,142 |
General Electric Co. | | 22,175 | | 718,468 |
Goldman Sachs Group, Inc. | | 3,560 | | 335,210 |
Janus Capital Group, Inc. | | 23,440 | | 386,526 |
Legg Mason, Inc. | | 1,340 | | 121,953 |
Merrill Lynch & Co., Inc. | | 3,580 | | 193,248 |
NewAlliance Bancshares, Inc. # | | 15,400 | | 214,984 |
State Street Corp. | | 2,030 | | 99,551 |
Wachovia Corp. — Preferred Dividend Equalization | | 1,700 | | — |
| | | | |
|
| | | | | 3,586,210 |
| | | | |
|
| Health — 12.7% | | | | |
| (Subadvised by Matrix Asset Advisors, Inc.) | | |
AMGEN, Inc. # | | 4,225 | | 230,558 |
Baxter International, Inc. | | 6,125 | | 211,374 |
Boston Scientific Corp. # | | 1,300 | | 55,640 |
Bristol-Myers Squibb Co. | | 8,500 | | 208,250 |
Guidant Corp. | | 4,800 | | 268,224 |
Medimmune, Inc. # | | 11,200 | | 261,968 |
Merck & Co., Inc. | | 5,675 | | 269,563 |
Pfizer, Inc. | | 18,600 | | 637,608 |
Wyeth | | 6,725 | | 243,176 |
| | | | |
|
| | | | | 2,386,361 |
| | | | |
|
| Technology — 24.2% | | | | |
| (Subadvised by Dresdner RCM Global Investors, L.L.C.) |
3M Co. | | 1,290 | | 116,113 |
Analog Devices, Inc. | | 1,060 | | 49,905 |
Circuit City Stores, Inc. | | 1,815 | | 23,504 |
Cisco Systems, Inc. # | | 13,080 | | 309,995 |
Citrix Systems, Inc. # | | 4,300 | | 87,548 |
Comverse Technology, Inc. # | | 5,660 | | 112,860 |
Corning, Inc. | | 2,500 | | 32,650 |
Dell, Inc. # | | 2,235 | | 80,058 |
Telefonaktiebolaget LM Ericsson Sponsored ADR # | | 2,750 | | 82,225 |
General Dynamics Corp. | | 610 | | 60,573 |
Hewlett-Packard Co. | | 2,350 | | 49,585 |
Honeywell International, Inc. | | 2,460 | | 90,110 |
Intel Corp. | | 5,190 | | 143,244 |
JAKKS Pacific, Inc. # | | 1,080 | | 22,453 |
Lockheed Martin Corp. | | 710 | | 36,977 |
Marvell Technology Group, Ltd. # | | 3,740 | | 99,858 |
Maxim Integrated Products, Inc. | | 480 | | 25,162 |
Mercury Interactive Corp. # | | 1,230 | | 61,291 |
The Flex-funds
16
Schedule of Investments
June 30, 2004 (unaudited)
The Highlands Growth Fund
| | | | |
Security Description
| | Shares or
Principal
Amount ($)
| | Value ($)
|
Common Stocks — continued | | | | |
Microsoft Corp. | | 22,360 | | 638,602 |
Motorola, Inc. | | 7,440 | | 135,780 |
NCR Corp., Inc. # | | 2,250 | | 111,578 |
National Semiconductor Corp. # | | 4,230 | | 93,018 |
Network Appliance, Inc. # | | 1,220 | | 26,267 |
Northrop Grumman Corp. | | 1,000 | | 53,700 |
Raytheon Co. Class B | | 490 | | 17,527 |
Research in Motion, Ltd. # | | 820 | | 56,129 |
Riggs National Corp. | | 16,440 | | 347,213 |
Rockwell Collins, Inc. | | 390 | | 12,995 |
SAP AG Sponsored ADR # | | 920 | | 38,465 |
SINA Corp. # | | 2,590 | | 85,444 |
Symantec Corp. # | | 980 | | 42,902 |
Union Planters Corp. | | 5,410 | | 161,272 |
United Technologies Corp. | | 1,215 | | 111,148 |
VF Corp. | | 1,130 | | 55,031 |
Veritas Software Corp. # | | 3,290 | | 91,429 |
Yahoo! Inc. # | | 7,340 | | 267,176 |
eBay, Inc. # | | 470 | | 43,217 |
| | | | |
|
| | | | | 3,873,004 |
| | | | |
|
| Transportation — 1.6% | | | | |
| (Subadvised by Miller/Howard Investments, Inc.) | | |
Burlington Northern Santa Fe Corp. | | 655 | | 22,971 |
CNF, Inc. | | 300 | | 12,468 |
CSX Corp. | | 382 | | 12,518 |
Delta Air Lines, Inc. | | 220 | | 1,566 |
FedEx Corp. | | 455 | | 37,169 |
Norfolk Southern Corp. | | 690 | | 18,299 |
Ryder System, Inc. | | 115 | | 4,608 |
Southwest Airlines Co. | | 1,408 | | 23,612 |
Union Pacific Corp. | | 450 | | 26,753 |
United Parcel Service, Inc. — Class B | | 1,775 | | 133,427 |
| | | | |
|
| | | | | 293,391 |
| | | | |
|
| Utilities — 5.7% | | | | |
| (Subadvised by Clover Partners LP) |
AT&T Wireless Services, Inc. # | | 6,705 | | 96,016 |
FirstEnergy Corp. | | 2,614 | | 97,790 |
Nextel Communications, Inc. | | 5,270 | | 140,498 |
PG & E Corp. # | | 5,447 | | 152,189 |
TXU Corp. | | 3,910 | | 158,394 |
Verizon Communications, Inc. | | 8,761 | | 317,061 |
Western Gas Resources, Inc. | | 3,680 | | 119,526 |
| | | | |
|
| | | | | 1,081,474 |
| | | | |
|
Total Common Stocks
(Cost $16,714,694) | | | | 17,808,647 |
| | | | |
|
| | | | | |
Security Description
| | Shares or
Principal
Amount ($)
| | Value ($)
| |
U.S. Government Obligations — 0.8% | | | |
U.S. Treasury Bills,
0.99%, due 07/01/2004 | | | | | |
Total U.S. Government Obligations
(Cost $150,000) | | | | 150,000 | |
| | | | |
|
|
Repurchase Agreements — 4.7% | | | | | |
Salomon Smith Barney, Inc., 1.55%, 07/01/04, (Collateralized by $903,989 various Commercial Paper, at 1.41%-1.44%, due 07/13/04-08/18/04,
value — $902,719) | | 885,000 | | 885,000 | |
| | | | |
|
|
Total Repurchase Agreements
(Cost $885,000) | | | | 885,000 | |
| | | | |
|
|
Total Investments — 100.1%
(Cost $17,749,694) (a) | | | | 18,843,647 | |
| | | | |
|
|
Liabilities less Other Assets — (0.1%) | | | | (11,245 | ) |
| | | | |
|
|
Total Net Assets — 100.0% | | | | 18,832,402 | |
| | | | |
|
|
Trustee Deferred Compensation * | | | | | |
The Flex-funds Dynamic Growth Fund | | 1,428 | | 10,739 | |
The Flex-funds Highlands Growth Fund | | 1,285 | | 19,301 | |
The Flex-funds Muirfield Fund | | 4,670 | | 23,163 | |
The Flex-funds Total Return Utilities Fund | | 1,026 | | 14,949 | |
| | | | |
|
|
Total Trustee Deferred Compensation
(Cost $70,341) | | | | 68,152 | |
| | | | |
|
|
ADR: American Depository Receipt
| (a) | | Represents cost for financial reporting purposes and differs for federal income tax purposes by the amount of losses recognized in excess of federal income tax reporting of approximately $288,686. Cost for federal income tax purposes differs from value by net unrealized appreciation (depreciation) of securities as follows: |
| | | | |
Unrealized appreciation | | $ | 1,717,077 | |
Unrealized depreciation | | | (911,810 | ) |
| | |
|
|
|
Net unrealized appreciation (depreciation) | | $ | 805,267 | |
| | |
|
|
|
| # | | Represents non-income producing securities. |
| * | | Assets of affiliates to The Highlands Growth Fund held for the benefit of the Fund’s Trustees in connection with the Trustee Deferred Compensation Plan. |
See accompanying notes to financial statements.
The Flex-funds
17
Schedule of Investments
June 30, 2004 (unaudited)
The Dynamic Growth Fund
| | | | | |
Security Description
| | Shares or
Principal
Amount ($)
| | Value ($)
| |
Registered Investment Companies — 71.6% | | | |
Aim Basic Value Fund — Class A # | | 150,000 | | 4,614,014 | |
American Century Vista Fund — Advisor Class # | | 320,665 | | 4,354,633 | |
iShares S&P 500/BARRA Value Index Fund | | 105,800 | | 6,060,223 | |
| | | | |
|
|
Total Registered Investment Companies
(Cost $14,526,303) | | | | 15,028,870 | |
| | | | |
|
|
U.S. Government Obligations — 16.2% | | | |
U.S. Treasury Bills, 0.99%, due 07/01/04 * | | 3,100,000 | | 3,099,871 | |
U.S. Treasury Bills, 1.31%, due 09/30/04 * | | 300,000 | | 299,034 | |
| | | | |
|
|
Total U.S. Government Obligations
(Cost $3,398,893) | | | | 3,398,905 | |
| | | | |
|
|
Repurchase Agreements — 13.4% | | | | | |
Salomon Smith Barney, Inc., 1.55%, 07/01/04, (Collateralized by $2,868,251 various Commercial Paper, at 1.41%-1.44%, due 07/13/04-08/18/04,
value — $2,864,222) | | 2,808,000 | | 2,808,000 | |
| | | | |
|
|
Total Repurchase Agreements
(Cost $2,808,000) | | | | 2,808,000 | |
| | | | |
|
|
Total Investments — 101.2%
(Cost $20,733,196) | | | | 21,235,775 | |
| | | | |
|
|
Liabilities less Other Assets — (1.2%) | | | | (248,236 | ) |
| | | | |
|
|
Total Net Assets — 100.0% | | | | 20,987,539 | |
| | | | |
|
|
Trustee Deferred Compensation ** | | | | | |
The Flex-funds Dynamic Growth Fund | | 599 | | 4,504 | |
The Flex-funds Highlands Growth Fund | | 406 | | 6,098 | |
The Flex-funds Muirfield Fund | | 1,816 | | 9,007 | |
The Flex-funds Total Return Utilities Fund | | 392 | | 5,711 | |
| | | | |
|
|
Total Trustee Deferred Compensation (Cost $22,975) | | | | 25,320 | |
| | | | |
|
|
| | | | |
Security Description
| | Long
Contracts
| | Unrealized
Appreciation
|
Futures Contracts | | | | |
Standard & Poors 500 expiring September 2004, notional
value $5,131,800 | | 18 | | 26,200 |
| | | | |
|
Total Futures Contracts | | | | 26,200 |
| | | | |
|
| (a) | | Represents cost for financial reporting purposes and may differ for federal income tax purposes by the amount of losses recognized in excess of federal income tax reporting. Cost for federal income tax purposes differs from value by net unrealized appreciation (depreciation) of securities as follows: |
| | | | |
Unrealized appreciation | | $ | 529,313 | |
Unrealized depreciation | | | (26,734 | ) |
| | |
|
|
|
Net unrealized appreciation (depreciation) | | $ | 502,579 | |
| | |
|
|
|
| # | | Represents non-income producing security. |
| * | | Pledged as collateral on futures contracts. |
| ** | | Assets of affiliates to The Dynamic Growth Fund held for the benefit of the Fund’s Trustees in connection with the Trustee Deferred Compensation Plan. |
See accompanying notes to financial statements.
The Flex-funds
18
Schedule of Investments
June 30, 2004 (unaudited)
The Aggressive Growth Fund
| | | | | |
Security Description
| | Shares or
Principal
Amount ($)
| | Value ($)
| |
Registered Investment Companies — 73.1% | | | |
Aim Basic Value Fund — Class A # | | 36,167 | | 1,112,488 | |
Aim Large Cap Basic Value
Fund — Class A # | | 53,286 | | 692,190 | |
American Century Small Company
Fund — Investor Class | | 51,494 | | 469,622 | |
American Century Vista Fund — Advisor Class # | | 111,522 | | 1,514,465 | |
Federated Kaufmann Small Cap
Fund — Class A | | 19,195 | | 374,500 | |
iShares S&P 500/BARRA Value Index Fund | | 30,000 | | 1,718,400 | |
Icon Energy Fund # | | 13,163 | | 257,210 | |
Scudder Health Care Fund — Class A | | 20,360 | | 442,412 | |
| | | | |
|
|
Total Registered Investment Companies (Cost $6,279,963) | | | | 6,581,287 | |
| | | | |
|
|
U.S. Government Obligations — 14.4% | | | |
U.S. Treasury Bills, 0.99%, due 07/01/04 * | | 1,200,000 | | 1,199,948 | |
U.S. Treasury Bills, 1.31%, due 09/30/04 * | | 100,000 | | 99,678 | |
| | | | |
|
|
Total U.S. Government Obligations
(Cost $1,299,622) | | | | 1,299,626 | |
| | | | |
|
|
Repurchase Agreements — 13.3% | | | |
Salomon Smith Barney, Inc., 1.55%, 07/01/04, (Collateralized by $1,219,619 various Commercial Paper, at 1.41%-1.44%, due 07/13/04-08/18/04,
value — $1,217,906) | | 1,194,000 | | 1,194,000 | |
| | | | |
|
|
Total Repurchase Agreements
(Cost $1,194,000) | | | | 1,194,000 | |
| | | | |
|
|
Total Investments — 100.8%
(Cost $8,773,585) (a) | | | | 9,074,913 | |
| | | | |
|
|
Liabilities less Other Assets — (0.8%) | | | | (76,306 | ) |
| | | | |
|
|
Total Net Assets — 100.0% | | | | 8,998,607 | |
| | | | |
|
|
Trustee Deferred Compensation ** | | | |
The Flex-funds Dynamic Growth Fund | | 518 | | 3,895 | |
The Flex-funds Highlands Growth Fund | | 348 | | 5,227 | |
The Flex-funds Muirfield Fund | | 1,568 | | 7,777 | |
The Flex-funds Total Return Utilities Fund | | 338 | | 4,925 | |
| | | | |
|
|
Total Trustee Deferred Compensation (Cost $19,763) | | | | 21,824 | |
| | | | |
|
|
| | | | |
Security Description
| | Long
Contracts
| | Unrealized
Appreciation
|
Futures Contracts | | |
Standard & Poors 500 expiring September 2004, notional
value $1,995,700 | | 7 | | 11,375 |
| | | | |
|
Total Futures Contracts | | | | 11,375 |
| | | | |
|
| (a) | | Represents cost for financial reporting purposes and may differ for federal income tax purposes by the amount of losses recognized in excess of federal income tax reporting. Cost for federal income tax purposes differs from value by net unrealized appreciation (depreciation) of securities as follows: |
| | | | |
Unrealized appreciation | | $ | 319,063 | |
Unrealized depreciation | | | (17,735 | ) |
| | |
|
|
|
Net unrealized appreciation (depreciation) | | $ | 301,328 | |
| | |
|
|
|
| # | | Represents non-income producing securities. |
| * | | Pledged as collateral on futures contracts. |
| ** | | Assets of affiliates to The Aggressive Growth Fund held for the benefit of the Fund’s Trustees in connection with the Trustee Deferred Compensation Plan. |
See accompanying notes to financial statements.
The Flex-funds
19
Schedule of Investments
June 30, 2004 (unaudited)
The U.S. Government Bond Fund
| | | | |
Security Description
| | Principal
Amount ($)
or Shares
| | Value ($)
|
U.S. Government Obligations — 97.5% | | | | |
U.S. Treasury Bills, 0.99%, due 07/01/04 | | 190,000 | | 190,000 |
U.S. Treasury Notes, 3.38%, due 11/15/08 | | 9,500,000 | | 9,406,484 |
| | | | |
|
Total U.S. Government Obligations
(Cost $9,584,260) | | | | 9,596,484 |
| | | | |
|
Repurchase Agreements — 2.1% | | | | |
Salomon Smith Barney, Inc., 1.55%, 07/01/04, (Collateralized by $215,527 various Commercial Paper, at 1.41%-1.44%, due 07/13/04-08/18/04,
value — $215,224) | | 211,000 | | 211,000 |
| | | | |
|
Total Repurchase Agreements
(Cost $211,000) | | | | 211,000 |
| | | | |
|
Total Investments — 99.6%
(Cost $9,795,260) (a) | | | | 9,807,484 |
| | | | |
|
Other Assets less Liabilities — 0.4% | | | | 37,559 |
| | | | |
|
Total Net Assets — 100.0% | | | | 9,845,043 |
| | | | |
|
Trustee Deferred Compensation * | | | | |
The Flex-funds Dynamic Growth Fund | | 695 | | 5,226 |
The Flex-funds Highlands Growth Fund | | 626 | | 9,403 |
The Flex-funds Muirfield Fund | | 2,246 | | 11,140 |
The Flex-funds Total Return Utilities Fund | | 485 | | 7,066 |
| | | | |
|
Total Trustee Deferred Compensation
(Cost $32,815) | | | | 32,835 |
| | | | |
|
| (a) | | Represents cost for financial reporting purposes and differs for federal income tax purposes by the amount of losses recognized in excess of federal income tax reporting of approximately $7,765. Cost for federal income tax purposes differs from value by net unrealized appreciation (depreciation) of securities as follows: |
| | | | |
Unrealized appreciation | | $ | 50,319 | |
Unrealized depreciation | | | (45,860 | ) |
| | |
|
|
|
Net unrealized appreciation (depreciation) | | $ | 4,459 | |
| | |
|
|
|
| * | | Assets of affiliates to The U.S. Government Bond Fund held for the benefit of the Fund’s Trustees in connection with the Trustee Deferred Compensation Plan. |
See accompanying notes to financial statements.
The Flex-funds
20
Schedule of Investments
June 30, 2004 (unaudited)
Money Market Portfolio
| | | | | | | | | |
Security Description
| | Coupon/
Yield
| | | Maturity
| | Principal
Amount ($)
or Shares
| | Value ($)
|
Certificate of Deposit — 2.5% | | | | |
Huntington National
Bank CD | | 1.32 | % | | 08/24/04 | | 5,000,000 | | 5,000,000 |
| | | | | | | | | |
|
Total Certificate of Deposit
(Cost $5,000,000) | | | | | | | 5,000,000 |
| | | | | | | | | |
|
Corporate Obligations — 72.9% | | | | |
Abbott Laboratories | | 5.13 | % | | 07/01/04 | | 2,500,000 | | 2,500,000 |
Aquarium Holdings, KY** | | 1.31 | %* | | 07/01/04 | | 108,000 | | 108,000 |
Associates Corp. | | 6.63 | % | | 06/15/05 | | 618,000 | | 643,558 |
Austin Printing Co., Inc.** | | 1.40 | %* | | 07/01/04 | | 1,675,000 | | 1,675,000 |
Bath Technologies, Inc.** | | 1.35 | %* | | 07/01/04 | | 1,280,000 | | 1,280,000 |
Bank Of America Corp. | | 7.63 | % | | 04/15/05 | | 1,365,000 | | 1,431,778 |
Bank Of America Corp. | | 7.75 | % | | 08/15/04 | | 651,000 | | 656,092 |
Bear Stearns Co., Inc. | | 6.63 | % | | 10/01/04 | | 2,850,000 | | 2,888,011 |
Bear Stearns Co., Inc. | | 6.65 | % | | 12/01/04 | | 1,089,000 | | 1,113,552 |
Bear Stearns Co., Inc. | | 7.63 | % | | 02/01/05 | | 1,000,000 | | 1,036,997 |
Bear Stearns Co., Inc.** | | 1.95 | %* | | 07/01/04 | | 1,000,000 | | 1,000,874 |
Beaver Creek
Enterprise** | | 1.35 | %* | | 07/01/04 | | 1,990,000 | | 1,990,000 |
Cascade Plaza Project** | | 1.35 | %* | | 07/01/04 | | 8,266,000 | | 8,266,000 |
ChevronTexaco Corp. | | 6.63 | % | | 10/01/04 | | 2,500,000 | | 2,532,387 |
Citigroup, Inc. | | 7.13 | % | | 10/15/04 | | 6,000,000 | | 6,100,283 |
Citigroup, Inc. | | 7.63 | % | | 05/01/05 | | 1,440,000 | | 1,513,855 |
Clark Grave Vault Co.** | | 1.31 | %* | | 07/01/04 | | 1,050,000 | | 1,050,000 |
Commercial Credit Co. | | 7.88 | % | | 07/15/04 | | 1,430,000 | | 1,433,599 |
Countrywide Home Loans, Inc. | | 6.84 | % | | 10/22/04 | | 4,000,000 | | 4,064,072 |
Don’s Launderers-Cleaners, Inc.** | | 1.31 | %* | | 07/01/04 | | 1,000,000 | | 1,000,000 |
DuPont, E.I.,De Nemours & Co. | | 6.75 | % | | 10/15/04 | | 1,567,000 | | 1,591,474 |
Espanola/Nambe** | | 1.40 | %* | | 07/01/04 | | 915,000 | | 915,000 |
FleetBoston Financial Corp. | | 8.00 | % | | 09/15/04 | | 4,590,000 | | 4,652,482 |
FleetBoston Financial Corp. | | 8.13 | % | | 07/01/04 | | 3,000,000 | | 3,000,000 |
Gordon Flesch Co. Project** | | 1.35 | %* | | 07/01/04 | | 900,000 | | 900,000 |
International Lease Finance Corp | | 8.15 | % | | 10/01/04 | | 1,000,000 | | 1,016,994 |
Isaac Tire, Inc.** | | 1.31 | %* | | 07/01/04 | | 840,000 | | 840,000 |
J.P. Morgan & Co., Inc. | | 7.63 | % | | 09/15/04 | | 5,375,000 | | 5,444,833 |
K.L. Morris, Inc.** | | 1.31 | %* | | 07/01/04 | | 2,075,000 | | 2,075,000 |
Keycorp | | 8.00 | % | | 07/01/04 | | 3,225,000 | | 3,225,000 |
Kiser Street, Inc.** | | 1.35 | %* | | 07/01/04 | | 1,745,000 | | 1,745,000 |
Lehman Brothers Holdings, Inc. | | 7.75 | % | | 01/15/05 | | 2,500,000 | | 2,587,348 |
Martin Wheel Co, Inc.** | | 1.60 | %* | | 07/01/04 | | 2,350,000 | | 2,350,000 |
McDonald’s Corp. | | 5.15 | % | | 07/01/04 | | 1,500,000 | | 1,500,000 |
Merrill Lynch & Co., Inc. | | 6.00 | % | | 11/15/04 | | 5,000,000 | | 5,085,092 |
Merrill Lynch & Co., Inc. | | 6.55 | % | | 08/01/04 | | 7,436,000 | | 7,468,953 |
MetLife Insurance Co.*** | | 1.21 | %* | | 07/01/04 | | 12,000,000 | | 12,000,000 |
Mubea, Inc.** | | 1.35 | %* | | 07/01/04 | | 5,825,000 | | 5,825,000 |
| | | | | | | | | |
Security Description
| | Coupon/
Yield
| | | Maturity
| | Principal
Amount ($)
or Shares
| | Value ($)
|
Corporate Obligations — continued | | | | |
National Rural Utilities | | 5.25 | % | | 07/15/04 | | 4,200,000 | | 4,206,513 |
National Rural Utilities | | 6.38 | % | | 10/15/04 | | 1,104,000 | | 1,119,146 |
National Rural Utilities** | | 1.76 | %* | | 07/01/04 | | 2,000,000 | | 2,004,939 |
Osco Industries, Inc.** | | 1.40 | %* | | 07/01/04 | | 1,200,000 | | 1,200,000 |
O.K.I. Supply Co.** | | 1.31 | %* | | 07/01/04 | | 1,370,000 | | 1,370,000 |
Pfizer, Inc. | | 3.63 | % | | 11/01/04 | | 1,600,000 | | 1,611,215 |
PPG Industries, Inc. | | 6.75 | % | | 08/15/04 | | 5,920,000 | | 5,960,992 |
Pro Tire, Inc.** | | 1.31 | %* | | 07/01/04 | | 1,010,000 | | 1,010,000 |
R.I. Lampus Co.** | | 1.40 | %* | | 07/01/04 | | 460,000 | | 460,000 |
Seariver Maritime, Inc. | | 1.13 | %* | | 07/01/04 | | 4,400,000 | | 4,400,000 |
SGS Tool Co.** | | 1.38 | %* | | 07/01/04 | | 480,000 | | 480,000 |
Shawmut Bank Connecticut NA | | 8.63 | % | | 02/15/05 | | 500,000 | | 521,866 |
Springside Corp Exchange Partners I LLC** | | 1.35 | %* | | 07/01/04 | | 2,000,000 | | 2,000,000 |
Target Corp | | 7.50 | % | | 02/15/05 | | 1,250,000 | | 1,298,476 |
Taylor Brothers Properties LLC** | | 1.31 | %* | | 07/01/04 | | 1,225,000 | | 1,225,000 |
Ameren Union Electric | | 6.88 | % | | 08/01/04 | | 2,225,000 | | 2,235,489 |
United Technologies Corp | | 6.63 | % | | 11/15/04 | | 3,029,000 | | 3,089,798 |
Wachovia Corp. | | 7.20 | % | | 08/15/04 | | 788,000 | | 793,562 |
White Castle Project** | | 1.35 | %* | | 07/01/04 | | 6,250,000 | | 6,250,000 |
| | | | | | | | | |
|
Total Corporate Obligations
(Cost $145,743,230) | | | | | | | 145,743,230 |
| | | | | | | | | |
|
U.S. Government Agency Obligations — 10.9% | | |
Federal Farm Credit Bank | | 6.30 | % | | 09/23/04 | | 500,000 | | 505,477 |
Federal Home Loan Bank | | 1.40 | % | | 04/01/04 | | 2,000,000 | | 2,000,000 |
Federal Home Loan Bank | | 1.35 | % | | 04/29/04 | | 1,000,000 | | 1,000,000 |
Federal Home Loan Bank | | 3.40 | % | | 07/19/04 | | 500,000 | | 500,508 |
Federal Home Loan Bank | | 4.13 | % | | 11/15/04 | | 1,000,000 | | 1,009,702 |
Federal Home Loan Bank | | 4.00 | % | | 12/01/04 | | 250,000 | | 252,487 |
Federal Home Loan Bank | | 1.30 | % | | 02/23/05 | | 2,000,000 | | 2,000,000 |
Federal Home Loan Bank | | 1.48 | % | | 02/24/05 | | 2,000,000 | | 2,000,000 |
Federal Home Loan Bank | | 1.35 | % | | 03/23/05 | | 2,000,000 | | 2,000,000 |
Federal Home Loan Bank | | 1.23 | %* | | 07/26/04 | | 5,000,000 | | 4,998,779 |
Freddie Mac | | 6.25 | % | | 07/15/04 | | 5,017,000 | | 5,026,520 |
Federal National Mortgage Association | | 7.40 | % | | 07/01/04 | | 500,000 | | 500,000 |
| | | | | | | | | |
|
Total U.S. Government Agency Obligations
(Cost $21,793,473) | | | | 21,793,473 |
| | | | | | | | | |
|
The Flex-funds
21
Schedule of Investments
June 30, 2004 (unaudited)
Money Market Portfolio
| | | | | | | | | |
Security Description
| | Coupon/
Yield
| | | Maturity
| | Principal
Amount ($)
or Shares
| | Value ($)
|
Variable Rate Demand Notes — 5.1% | | |
Caterpillar Financial, Inc. | | 2.00 | %* | | 07/06/04 | | 10,172,632 | | 10,172,632 |
| | | | | | | | | |
|
Total Variable Rate Demand Notes
(Cost $10,172,632) | | | | 10,172,632 |
| | | | | | | | | |
|
Demand Deposits — 1.5% | | | | | | | |
National City Corp. | | 2.13 | % | | | | 3,041,974 | | 3,041,974 |
| | | | | | | | | |
|
Total Demand Deposits
(Cost $3,041,974) | | | | | | | 3,041,974 |
| | | | | | | | | |
|
Repurchase Agreements — 6.1% | | | | |
Salomon Smith Barney, Inc.,
1.55%, 07/01/04, (Collateralized by $12,436,236 various Commercial Paper, at 1.41%-1.44%, due 07/13/04-08/18/04, value —$12,418,767) | | 12,175,000 | | 12,175,000 |
| | | | | | | | | |
|
Total Repurchase Agreements
(Cost $12,175,000) | | | | | | | 12,175,000 |
| | | | | | | | | |
|
Total Investments — 99.0%
(Cost $197,926,309) (a) | | | | | | | 197,926,309 |
| | | | | | | | | |
|
Other Assets less Liabilities — 1.0 | | | | 2,086,951 |
| | | | | | | | | |
|
Total Net Assets — 100.0% | | | | | | | 200,013,260 |
| | | | | | | | | |
|
| | | | | | | | |
Security Description
| | Coupon/
Yield
| | Maturity
| | Principal
Amount ($)
or Shares
| | Value ($)
|
Trustee Deferred Compensation**** | | |
The Flex-funds Dynamic Growth Fund | | 1,229 | | 9,242 |
The Flex-funds Highlands Growth Fund | | 1,217 | | 18,279 |
The Flex-funds Muirfield Fund | | 4,288 | | 21,268 |
The Flex-funds Total Return Utilities Fund | | 1,004 | | 14,628 |
| | | | | | | | |
|
Total Trustee Deferred Compensation
(Cost $63,417) | | | | 63,417 |
| | | | | | | | |
|
| (a) | | Cost for federal income tax and financial reporting purposes are the same. |
| * | | Variable rate security. Interest rate is as of June 30, 2004. Maturity date reflects the next rate change date. |
| ** | | Represents a restricted security purchased under Rule 144A, which is exempt from registration under the Securities Act of 1933, as amended. Security is restricted as to resale to institutional investors, but has been deemed liquid in accordance with guidelines approved by the Board of Trustees. As of June 30, 2004, securities restricted as to resale to institutional investors represented 23.8% of Total Investments. |
| *** | | Illiquid security. The sale or disposition of such security would not be possible in the ordinary course of business within seven days at approximately the value at which the Fund has valued the security. As of June 30, 2004, illiquid securities represented 6.1% of Total Investments. |
| **** | | Assets of affiliates to the Money Market Portfolio held for the benefit of the Portfolio’s Trustees in connection with the Trustee Deferred Compensation Plan. |
See accompanying notes to financial statements.
The Flex-funds
22
[THIS PAGE INTENTIONALLY LEFT BLANK]
23
Statements of Assets & Liabilities
June 30, 2004 (unaudited)
| | | | | | | | |
| | | The
Muirfield
Fund
| | | The Total
Return
Utilities Fund
| |
Assets | | | | | | | | |
Investments, at value* | | $ | 53,099,919 | | | $ | 20,707,314 | |
Repurchase agreements, at value* | | | 12,235,000 | | | | 133,000 | |
Trustee deferred compensation investments, at value | | | 137,979 | | | | 42,751 | |
Cash | | | 414 | | | | 106 | |
Receivable for net variation margin on futures contracts | | | 85,100 | | | | — | |
Investments in corresponding portfolio, at value | | | | | | | | |
Receivable for capital stock issued | | | 10,533 | | | | 903 | |
Receivable from investment advisor | | | — | | | | — | |
Interest and dividend receivable | | | 527 | | | | 55,506 | |
Prepaid expenses/other assets | | | 59,814 | | | | 29,403 | |
Total Assets | | | 65,629,286 | | | | 20,968,983 | |
| | |
Liabilities | | | | | | | | |
Payable for securities purchased | | | 1,196,087 | | | | — | |
Payable for Trustee Deferred Compensation Plan | | | 137,979 | | | | 42,751 | |
Payable for capital stock redeemed | | | 29,222 | | | | 19,858 | |
Dividends payable | | | — | | | | 772 | |
Payable to investment advisor | | | 48,611 | | | | 9,295 | |
Accrued distribution plan (12b-1) fees | | | 9,976 | | | | 1,493 | |
Accrued transfer agent, fund accounting, and administrative fees | | | 12,096 | | | | 4,973 | |
Accrued trustee fees | | | 6,072 | | | | 2,870 | |
Other accrued liabilities | | | 12,083 | | | | 8,070 | |
Total Liabilities | | | 1,452,126 | | | | 90,082 | |
| | | | | | | | | |
Net Assets | | | 64,177,160 | | | | 20,878,901 | |
| | |
Net Assets | | | | | | | | |
Capital | | | 77,972,345 | | | | 30,066,697 | |
Accumulated undistributed (distributions in excess of) net investment income | | | (237,507 | ) | | | 17,843 | |
Accumulated undistributed net realized gain (loss) from investments and futures contracts | | | (18,160,980 | ) | | | (11,282,321 | ) |
Net unrealized appreciation (depreciation) of investments and futures contracts | | | 4,603,302 | | | | 2,076,682 | |
Total Net Assets | | $ | 64,177,160 | | | $ | 20,878,901 | |
| | |
Capital Stock Outstanding (indefinite number of shares authorized,
$0.10 par value) | | | 12,945,088 | | | | 1,433,387 | |
| | |
Net Asset Value, Offering and Redemption Price Per Share | | $ | 4.96 | | | $ | 14.57 | |
* Investments, at cost | | $ | 60,768,213 | | | $ | 18,763,632 | |
See accompanying notes to financial statements.
The Flex-funds
24
| | | | | | | | | | | | | | | | | |
The Highlands
Growth Fund
| | | The Dynamic
Growth Fund
| | | The Aggressive
Growth Fund
| | | The U.S.
Government
Bond Fund
| | | The Money
Market
Fund
|
| | | | | | | | | | | | | | | | | | |
| $ | 17,958,647 | | | $ | 18,427,775 | | | $ | 7,880,913 | | | $ | 9,596,484 | | | | |
| | 885,000 | | | | 2,808,000 | | | | 1,194,000 | | | | 211,000 | | | | |
| | 68,152 | | | | 25,320 | | | | 21,824 | | | | 32,835 | | | | |
| | 925 | | | | 305 | | | | 967 | | | | 744 | | | | |
| | — | | | | 20,700 | | | | 8,050 | | | | — | | | | |
| | | | | | | | | | | | | | | | | $ | 165,992,695 |
| | 254 | | | | 4,657 | | | | 2,757 | | | | 3,666 | | | | — |
| | — | | | | — | | | | — | | | | — | | | | 5,405 |
| | 19,948 | | | | 24,469 | | | | 6,955 | | | | 40,962 | | | | |
| | 28,260 | | | | 31,195 | | | | 23,662 | | | | 8,988 | | | | 32,939 |
| | 18,961,186 | | | | 21,342,421 | | | | 9,139,128 | | | | 9,894,679 | | | | 166,031,039 |
| | | | |
| | | | | | | | | | | | | | | | | | |
| | 23,411 | | | | 299,022 | | | | 99,674 | | | | — | | | | |
| | 68,152 | | | | 25,320 | | | | 21,824 | | | | 32,835 | | | | |
| | 2,650 | | | | — | | | | 300 | | | | 1,110 | | | | — |
| | — | | | | — | | | | — | | | | 1,023 | | | | 10,108 |
| | 8,131 | | | | 12,651 | | | | 5,425 | | | | 1,041 | | | | |
| | 8,347 | | | | 3,029 | | | | 2,284 | | | | 2,495 | | | | 30,296 |
| | 4,557 | | | | 4,964 | | | | 2,315 | | | | 2,087 | | | | 16,872 |
| | 3,566 | | | | 2,740 | | | | 2,326 | | | | 2,252 | | | | |
| | 9,970 | | | | 7,156 | | | | 6,373 | | | | 6,793 | | | | 18,884 |
| | 128,784 | | | | 354,882 | | | | 140,521 | | | | 49,636 | | | | 76,160 |
| | | | | | | | | | | | | | | | | | |
| | 18,832,402 | | | | 20,987,539 | | | | 8,998,607 | | | | 9,845,043 | | | | 165,954,879 |
| | | | |
| | | | | | | | | | | | | | | | | | |
| | 24,039,676 | | | | 26,542,314 | | | | 16,355,148 | | | | 10,639,491 | | | | 165,954,879 |
| | (21,132 | ) | | | (71,660 | ) | | | (40,920 | ) | | | 155,537 | | | | — |
| | (6,280,095 | ) | | | (6,011,894 | ) | | | (7,628,324 | ) | | | (962,209 | ) | | | — |
| | 1,093,953 | | | | 528,779 | | | | 312,703 | | | | 12,224 | | | | — |
| $ | 18,832,402 | | | $ | 20,987,539 | | | $ | 8,998,607 | | | $ | 9,845,043 | | | $ | 165,954,879 |
| | | | |
| | 1,253,993 | | | | 2,789,626 | | | | 1,386,470 | | | | 477,011 | | | | 165,954,879 |
| | | | |
| $ | 15.02 | | | $ | 7.52 | | | $ | 6.49 | | | $ | 20.64 | | | $ | 1.00 |
| $ | 17,749,694 | | | $ | 20,733,196 | | | $ | 8,773,585 | | | $ | 9,795,260 | | | | |
The Flex-funds
25
Statements of Operations
For the Six Months Ended June 30, 2004 (unaudited)
| | | | | | | | |
| | | The
Muirfield
Fund
| | | The Total
Return Utilities
Fund
| |
Net Investment Income (Loss) from Corresponding Portfolio | | | | | | | | |
Interest | | | | | | | | |
Expenses net of reductions | | | | | | | | |
Total Net Investment Income (Loss) from Corresponding Portfolio | | | | | | | | |
| | |
Investment Income | | | | | | | | |
Interest | | $ | 76,055 | | | $ | 2,075 | |
Dividends | | | 57,262 | | | | 398,824 | |
Total Investment Income | | | 133,317 | | | | 400,899 | |
| | |
Fund Expenses | | | | | | | | |
Investment advisor | | | 290,345 | | | | 104,869 | |
Transfer agent | | | 36,510 | | | | 12,584 | |
Fund accounting | | | 20,506 | | | | 12,973 | |
Administrative | | | 15,212 | | | | 5,244 | |
Trustee | | | 16,632 | | | | 6,916 | |
Audit | | | 5,676 | | | | 5,870 | |
Legal | | | 5,974 | | | | 5,610 | |
Custody | | | 4,536 | | | | 1,904 | |
Printing | | | 3,122 | | | | 1,320 | |
Distribution plan (12b-1) | | | 60,850 | | | | 26,217 | |
Postage | | | 4,732 | | | | 6,916 | |
Registration and filing | | | 5,404 | | | | 7,000 | |
Insurance | | | 1,492 | | | | 546 | |
Other | | | 2,856 | | | | 2,710 | |
Total Expenses Before Reductions | | | 473,847 | | | | 200,679 | |
| | |
Expenses reimbursed by investment advisor | | | — | | | | — | |
Expenses paid indirectly | | | (63,470 | ) | | | (777 | ) |
Distribution plan (12b-1) expenses waived | | | (39,553 | ) | | | — | |
Transfer agent expenses waived | | | — | | | | — | |
Net Expenses | | | 370,824 | | | | 199,902 | |
| | | | | | | | | |
Net Investment Income (Loss) | | | (237,507 | ) | | | 200,997 | |
| | |
Realized and Unrealized Gain (Loss) from Investments | | | | | | | | |
Net realized gains (losses) from investments | | | 6,745,779 | | | | 271,947 | |
Net realized gains (losses) from futures contracts | | | 198,193 | | | | — | |
Net change in unrealized appreciation (depreciation) of investments and futures contracts | | | (4,661,133 | ) | | | 98,985 | |
Net Realized and Unrealized Gain (Loss) from Investments | | | 2,282,839 | | | | 370,932 | |
| | | | | | | | | |
Net Change in Net Assets Resulting from Operations | | $ | 2,045,332 | | | $ | 571,929 | |
See accompanying notes to financial statements.
The Flex-funds
26
| | | | | | | | | | | | | | | | | | |
The Highlands
Growth Fund
| | | The Dynamic
Growth Fund
| | | The Aggressive
Growth Fund
| | | The U.S.
Government
Bond Fund
| | | The Money
Market
Fund
| |
| | | | | | | | | | | | | | | | | | | |
| | | | | | | | | | | | | | | | | $ | 1,073,745 | |
| | | | | | | | | | | | | | | | | | (177,585 | ) |
| | | | | | | | | | | | | | | | | | 896,160 | |
| | | | |
| | | | | | | | | | | | | | | | | | | |
| $ | 13,550 | | | $ | 22,740 | | | $ | 7,714 | | | $ | 185,252 | | | | | |
| | 127,290 | | | | 24,941 | | | | 21,657 | | | | — | | | | | |
| | 140,840 | | | | 47,681 | | | | 29,371 | | | | 185,252 | | | | | |
| | | | |
| | | | | | | | | | | | | | | | | | | |
| | 96,125 | | | | 80,889 | | | | 34,181 | | | | 20,352 | | | | | |
| | 11,535 | | | | 12,942 | | | | 5,469 | | | | 4,070 | | | | 67,649 | |
| | 12,099 | | | | 13,272 | | | | 6,836 | | | | 7,561 | | | | | |
| | 4,806 | | | | 5,393 | | | | 2,279 | | | | 2,544 | | | | 42,396 | |
| | 6,006 | | | | 6,916 | | | | 5,824 | | | | 5,824 | | | | | |
| | 5,858 | | | | 5,858 | | | | 5,858 | | | | 5,858 | | | | 4,292 | |
| | 5,724 | | | | 2,807 | | | | 2,807 | | | | 2,788 | | | | 4,202 | |
| | 5,163 | | | | 1,918 | | | | 1,722 | | | | 1,638 | | | | | |
| | 2,002 | | | | 819 | | | | 637 | | | | 910 | | | | 21,644 | |
| | 19,254 | | | | 26,963 | | | | 11,393 | | | | 10,182 | | | | 169,317 | |
| | 3,318 | | | | 1,047 | | | | 1,183 | | | | 1,456 | | | | 22,554 | |
| | 6,309 | | | | 5,068 | | | | 5,348 | | | | 3,318 | | | | 13,734 | |
| | 455 | | | | 546 | | | | 182 | | | | 500 | | | | 7,972 | |
| | 4,062 | | | | 2,837 | | | | 2,720 | | | | 3,657 | | | | 33,579 | |
| | 182,716 | | | | 167,275 | | | | 86,439 | | | | 70,658 | | | | 387,339 | |
| | | | |
| | (1,809 | ) | | | — | | | | — | | | | (8,992 | ) | | | (42,142 | ) |
| | (5,092 | ) | | | (25,285 | ) | | | (7,489 | ) | | | — | | | | — | |
| | (13,843 | ) | | | (22,649 | ) | | | (8,659 | ) | | | (4,528 | ) | | | (130,224 | ) |
| | — | | | | — | | | | — | | | | (1,017 | ) | | | (6,805 | ) |
| | 161,972 | | | | 119,341 | | | | 70,291 | | | | 56,121 | | | | 208,168 | |
| | | | | | | | | | | | | | | | | | | |
| | (21,132 | ) | | | (71,660 | ) | | | (40,920 | ) | | | 129,131 | | | | 687,992 | |
| | | | |
| | | | | | | | | | | | | | | | | | | |
| | 1,363,913 | | | | 1,992,692 | | | | 511,230 | | | | (169,857 | ) | | | | |
| | (11,382 | ) | | | 174,046 | | | | 189,105 | | | | (11,469 | ) | | | | |
| | (1,058,697 | ) | | | (2,503,409 | ) | | | (879,216 | ) | | | 13,849 | | | | | |
| | 293,834 | | | | (336,671 | ) | | | (178,881 | ) | | | (167,477 | ) | | | | |
| | | | | | | | | | | | | | | | | | | |
| $ | 272,702 | | | $ | (408,331 | ) | | $ | (219,801 | ) | | $ | (38,346 | ) | | $ | 687,992 | |
The Flex-funds
27
Statements of Changes in Net Assets
For the Six Months Ended June 30, 2004 (unaudited) and the Year Ended December 31, 2003
| | | | | | | | | | | | | | | | | | | | | | | | |
| | | The Muirfield Fund
| | | TheTotal Return
Utilities Fund
| | | The Highlands
Growth Fund
| |
| | | 2004
| | | 2003
| | | 2004
| | | 2003
| | | 2004
| | | 2003
| |
Operations | | | | | | | | | | | | | | | | | | | | | | | | |
Net investment income (loss) | | $ | (237,507 | ) | | $ | (546,421 | ) | | $ | 200,997 | | | $ | 431,534 | | | $ | (21,132 | ) | | $ | (19,717 | ) |
Net realized gain (loss) from investments and futures contracts | | | 6,943,972 | | | | 4,422,693 | | | | 271,947 | | | | (2,380,612 | ) | | | 1,352,531 | | | | (677,020 | ) |
Net change in unrealized appreciation (depreciation) of investments and futures contracts | | | (4,661,133 | ) | | | 9,069,931 | | | | 98,985 | | | | 4,680,888 | | | | (1,058,697 | ) | | | 5,174,405 | |
Net change in net assets resulting from operations | | | 2,045,332 | | | | 12,946,203 | | | | 571,929 | | | | 2,731,810 | | | | 272,702 | | | | 4,477,668 | |
| | | | | | |
Distributions to Shareholders | | | | | | | | | | | | | | | | | | | | | | | | |
From net investment income | | | — | | | | — | | | | (182,261 | ) | | | (431,534 | ) | | | — | | | | — | |
From net realized gain from investments and futures contracts | | | — | | | | — | | | | — | | | | — | | | | — | | | | — | |
Net change in net assets resulting from distributions | | | — | | | | — | | | | (182,261 | ) | | | (431,534 | ) | | | — | | | | — | |
| | | | | | |
Capital Transactions | | | | | | | | | | | | | | | | | | | | | | | | |
Issued | | | 7,650,726 | | | | 11,289,989 | | | | 1,784,871 | | | | 5,942,962 | | | | 597,827 | | | | 6,366,212 | |
Reinvested | | | — | | | | — | | | | 178,404 | | | | 423,057 | | | | — | | | | — | |
Redeemed | | | (4,043,096 | ) | | | (13,355,585 | ) | | | (2,512,369 | ) | | | (6,761,373 | ) | | | (2,006,625 | ) | | | (9,235,138 | ) |
Net change in net assets resulting from capital transactions | | | 3,607,630 | | | | (2,065,596 | ) | | | (549,094 | ) | | | (395,354 | ) | | | (1,408,798 | ) | | | (2,868,926 | ) |
| | | | | | | | | | | | | | | | | | | | | | | | | |
Total Change in Net Assets | | | 5,652,962 | | | | 10,880,607 | | | | (159,426 | ) | | | 1,904,922 | | | | (1,136,096 | ) | | | 1,608,742 | |
| | | | | | |
Net Assets — Beginning of Period | | | 58,524,198 | | | | 47,643,591 | | | | 21,038,327 | | | | 19,133,405 | | | | 19,968,498 | | | | 18,359,756 | |
Net Assets — End of Period | | $ | 64,177,160 | | | $ | 58,524,198 | | | $ | 20,878,901 | | | $ | 21,038,327 | | | $ | 18,832,402 | | | $ | 19,968,498 | |
| | | | | | | | | | | | | | | | | | | | | | | | | |
Accumulated undistributed (distributions in excess of) net investment income | | $ | (237,507 | ) | | $ | — | | | $ | 17,843 | | | $ | (893 | ) | | $ | (21,132 | ) | | $ | — | |
| | | | | | |
Share Transactions | | | | | | | | | | | | | | | | | | | | | | | | |
Issued | | | 1,548,500 | | | | 2,845,877 | | | | 123,725 | | | | 462,165 | | | | 40,538 | | | | 528,012 | |
Reinvested | | | — | | | | — | | | | 12,433 | | | | 32,816 | | | | — | | | | — | |
Redeemed | | | (819,579 | ) | | | (3,305,185 | ) | | | (175,318 | ) | | | (533,173 | ) | | | (134,401 | ) | | | (756,753 | ) |
Net change in shares | | | 728,921 | | | | (459,308 | ) | | | (39,160 | ) | | | (38,192 | ) | | | (93,863 | ) | | | (228,741 | ) |
See accompanying notes to financial statements.
The Flex-funds
28
| | | | | | | | | | | | | | | | | | | | | | | | | | | | | | |
The Dynamic
Growth Fund
| | | The Aggressive
Growth Fund
| | | The U.S. Government
Bond Fund
| | | The Money
Market Fund
| |
2004
| | | 2003
| | | 2004
| | | 2003
| | | 2004
| | | 2003
| | | 2004
| | | 2003
| |
| | | | | | | | | | | | | | | | | | | | | | | | | | | | | | | |
| $ | (71,660 | ) | | $ | (156,091 | ) | | $ | (40,920 | ) | | $ | (64,413 | ) | | $ | 129,131 | | | $ | 214,641 | | | $ | 687,992 | | | $ | 1,710,864 | |
| | 2,166,738 | | | | 2,746,661 | | | | 700,335 | | | | 1,215,643 | | | | (181,326 | ) | | | (764,008 | ) | | | — | | | | — | |
| | (2,503,409 | ) | | | 3,361,524 | | | | (879,216 | ) | | | 1,348,325 | | | | 13,849 | | | | (117,878 | ) | | | — | | | | — | |
| | (408,331 | ) | | | 5,952,094 | | | | (219,801 | ) | | | 2,499,555 | | | | (38,346 | ) | | | (667,245 | ) | | | 687,992 | | | | 1,710,864 | |
| | | | | | | |
| | | | | | | | | | | | | | | | | | | | | | | | | | | | | | | |
| | — | | | | — | | | | — | | | | — | | | | (129,131 | ) | | | (214,641 | ) | | | (687,992 | ) | | | (1,710,864 | ) |
| | — | | | | — | | | | — | | | | — | | | | — | | | | (224,673 | ) | | | — | | | | — | |
| | — | | | | — | | | | — | | | | — | | | | (129,131 | ) | | | (439,314 | ) | | | (687,992 | ) | | | (1,710,864 | ) |
| | | | | | | |
| | | | | | | | | | | | | | | | | | | | | | | | | | | | | | | |
| | 3,318,058 | | | | 14,439,731 | | | | 1,034,018 | | | | 1,266,436 | | | | 281,607 | | | | 20,270,426 | | | | 93,776,615 | | | | 201,399,826 | |
| | — | | | | — | | | | — | | | | — | | | | 122,442 | | | | 424,054 | | | | 683,738 | | | | 1,688,792 | |
| | (2,945,953 | ) | | | (16,462,013 | ) | | | (938,025 | ) | | | (1,689,087 | ) | | | (1,231,299 | ) | | | (22,974,430 | ) | | | (94,112,077 | ) | | | (223,761,740 | ) |
| | 372,105 | | | | (2,022,282 | ) | | | 95,993 | | | | (422,651 | ) | | | (827,250 | ) | | | (2,279,950 | ) | | | 348,276 | | | | (20,673,122 | ) |
| | | | | | | | | | | | | | | | | | | | | | | | | | | | | | | |
| | (36,226 | ) | | | 3,929,812 | | | | (123,808 | ) | | | 2,076,904 | | | | (994,727 | ) | | | (3,386,509 | ) | | | 348,276 | | | | (20,673,122 | ) |
| | | | | | | |
| | 21,023,765 | | | | 17,093,953 | | | | 9,122,415 | | | | 7,045,511 | | | | 10,839,770 | | | | 14,226,279 | | | | 165,606,603 | | | | 186,279,725 | |
| $ | 20,987,539 | | | $ | 21,023,765 | | | $ | 8,998,607 | | | $ | 9,122,415 | | | $ | 9,845,043 | | | $ | 10,839,770 | | | $ | 165,954,879 | | | $ | 165,606,603 | |
| | | | | | | | | | | | | | | | | | | | | | | | | | | | | | | |
| $ | (71,660 | ) | | $ | — | | | $ | (40,920 | ) | | $ | — | | | $ | 155,537 | | | $ | 155,537 | | | $ | — | | | $ | — | |
| | | | | | | |
| | | | | | | | | | | | | | | | | | | | | | | | | | | | | | | |
| | 425,123 | | | | 2,460,619 | | | | 153,116 | | | | 229,909 | | | | 13,326 | | | | 900,181 | | | | 93,776,615 | | | | 201,399,826 | |
| | — | | | | — | | | | — | | | | — | | | | 5,811 | | | | 19,667 | | | | 683,738 | | | | 1,688,792 | |
| | (375,824 | ) | | | (2,781,195 | ) | | | (138,868 | ) | | | (329,306 | ) | | | (58,323 | ) | | | (1,027,835 | ) | | | (94,112,077 | ) | | | (223,761,740 | ) |
| | 49,299 | | | | (320,576 | ) | | | 14,248 | | | | (99,397 | ) | | | (39,186 | ) | | | (107,987 | ) | | | 348,276 | | | | (20,673,122 | ) |
The Flex-funds
29
Financial Highlights
For a Share Outstanding Through the Period Ended June 30, 2004 (unaudited) and Each Fiscal Year Ended December 31,
The Muirfield Fund
| | | | | | | | | | | | | | | | | | | | | | | | |
| | | 2004
| | | 2003
| | | 2002
| | | 2001
| | | 2000
| | | 1999
| |
Net Asset Value, Beginning of Period | | $ | 4.79 | | | $ | 3.76 | | | $ | 4.25 | | | $ | 4.95 | | | $ | 6.32 | | | $ | 6.88 | |
| | | | | | |
Income from Investment Operations | | | | | | | | | | | | | | | | | | | | | | | | |
Net investment income (loss) | | | (0.02 | ) | | | — | | | | (0.02 | ) | | | 0.01 | | | | 0.20 | | | | 0.09 | |
Net gains (losses) on securities and futures (both realized and unrealized) | | | 0.19 | | | | 1.03 | | | | (0.47 | ) | | | (0.58 | ) | | | (1.23 | ) | | | 0.89 | |
Total from Investment Operations | | | 0.17 | | | | 1.03 | | | | (0.49 | ) | | | (0.57 | ) | | | (1.03 | ) | | | 0.98 | |
| | | | | | |
Less Distributions | | | | | | | | | | | | | | | | | | | | | | | | |
From net investment income | | | — | | | | — | | | | — | | | | (0.13 | ) | | | (0.19 | ) | | | (0.09 | ) |
From net capital gains | | | — | | | | — | | | | — | | | | — | | | | (0.15 | ) | | | (1.45 | ) |
Total Distributions | | | — | | | | — | | | | — | | | | (0.13 | ) | | | (0.34 | ) | | | (1.54 | ) |
| | | | | | | | | | | | | | | | | | | | | | | | | |
Net Asset Value, End of Period | | $ | 4.96 | | | $ | 4.79 | | | $ | 3.76 | | | $ | 4.25 | | | $ | 4.95 | | | $ | 6.32 | |
| | | | | | |
Total Return (assumes reinvestment of distributions)(4) | | | 3.55% | | | | 27.39% | | | | (11.42% | ) | | | (11.52% | ) | | | (16.50% | ) | | | 16.43% | |
| | | | | | |
Ratios/Supplemental Data | | | | | | | | | | | | | | | | | | | | | | | | |
Net assets, end of period ($000) | | $ | 64,177 | | | $ | 58,524 | | | $ | 47,644 | | | $ | 61,577 | | | $ | 97,912 | | | $ | 155,827 | |
Ratio of net expenses to average net assets(1)(2)(5) | | | 1.22% | | | | 1.39% | | | | 1.41% | | | | 1.31% | | | | 1.20% | | | | 1.21% | |
Ratio of net investment income (loss) to average net assets(1)(2)(5) | | | (0.78% | ) | | | (1.06% | ) | | | (0.43% | ) | | | 0.11% | | | | 2.97% | | | | 1.33% | |
Ratio of expenses to average net assets after reductions, excluding expenses paid indirectly(1)(2)(5) | | | 1.43% | | | | 1.47% | | | | 1.46% | | | | 1.37% | | | | 1.20% | | | | 1.21% | |
Ratio of expenses to average net assets before reductions(1)(2)(5) | | | 1.56% | | | | 1.60% | | | | 1.46% | | | | 1.37% | | | | 1.20% | | | | 1.21% | |
Portfolio turnover rate(3)(4) | | | 59.41% | | | | 252.02% | | | | 277.99% | | | | 297.81% | | | | 405.88% | | | | 787.66% | |
| (1) | | Ratio reflects reductions in corresponding portfolio, if applicable. |
| (2) | | These ratios exclude the impact of expenses of the underlying security holdings as represented in the schedule of investments. |
| (3) | | Prior to the year ended December 31, 2003, the portfolio turnover rate represented the turnover rate of the corresponding portfolio. During 2003, the funds portfolio turnover rate for the period January 1 through April 13 is equivalent to the portfolio into which the fund invested. Beginning April 14 the fund commenced calculating the portfolio turnover rate based on its own activities. Hence, the portfolio turnover rate represented for 2003 is a combination of these two periods. Subsequent to 2003 the portfolio turnover rate is specific to the Fund. |
| (4) | | Not annualized for periods of less than one full year. |
| (5) | | Annualized for periods of less than one full year. |
See accompanying notes to financial statements.
The Flex-funds
30
Financial Highlights
For a Share Outstanding Through the Period Ended June 30, 2004 (unaudited) and Each Fiscal Year Ended December 31,
The Total Return Utilities Fund
| | | | | | | | | | | | | | | | | | | | | | | | |
| | | 2004
| | | 2003
| | | 2002
| | | 2001
| | | 2000
| | | 1999
| |
Net Asset Value, Beginning of Period | | $ | 14.29 | | | $ | 12.66 | | | $ | 18.63 | | | $ | 22.17 | | | $ | 20.34 | | | $ | 19.01 | |
| | | | | | |
Income from Investment Operations | | | | | | | | | | | | | | | | | | | | | | | | |
Net investment income | | | 0.14 | | | | 0.29 | | | | 0.34 | | | | 0.35 | | | | 0.26 | | | | 0.30 | |
Net gains (losses) on securities (both realized and unrealized) | | | 0.26 | | | | 1.63 | | | | (5.97 | ) | | | (3.56 | ) | | | 3.73 | | | | 3.45 | |
Total from Investment Operations | | | 0.40 | | | | 1.92 | | | | (5.63 | ) | | | (3.21 | ) | | | 3.99 | | | | 3.75 | |
| | | | | | |
Less Distributions | | | | | | | | | | | | | | | | | | | | | | | | |
From net investment income | | | (0.12 | ) | | | (0.29 | ) | | | (0.34 | ) | | | (0.33 | ) | | | (0.28 | ) | | | (0.30 | ) |
From net capital gains | | | — | | | | — | | | | — | | | | — | | | | (1.79 | ) | | | (2.12 | ) |
Tax return of capital | | | — | | | | — | | | | — | | | | — | | | | (0.09 | ) | | | — | |
Total Distributions | | | (0.12 | ) | | | (0.29 | ) | | | (0.34 | ) | | | (0.33 | ) | | | (2.16 | ) | | | (2.42 | ) |
| | | | | | | | | | | | | | | | | | | | | | | | | |
Net Asset Value, End of Period | | $ | 14.57 | | | $ | 14.29 | | | $ | 12.66 | | | $ | 18.63 | | | $ | 22.17 | | | $ | 20.34 | |
| | | | | | |
Total Return (assumes reinvestment of distributions)(3) | | | 2.84% | | | | 15.46% | | | | (30.36% | ) | | | (14.57% | ) | | | 20.03% | | | | 20.01% | |
| | | | | | |
Ratios/Supplemental Data | | | | | | | | | | | | | | | | | | | | | | | | |
Net assets, end of period ($000) | | $ | 20,879 | | | $ | 21,038 | | | $ | 19,133 | | | $ | 31,267 | | | $ | 24,740 | | | $ | 13,893 | |
Ratio of net expenses to average net assets(1)(4) | | | 1.91% | | | | 1.92% | | | | 1.81% | | | | 1.72% | | | | 1.78% | | | | 1.80% | |
Ratio of net investment income to average
net assets(1)(4) | | | 1.92% | | | | 2.25% | | | | 2.32% | | | | 1.66% | | | | 1.22% | | | | 1.48% | |
Ratio of expenses to average net assets after reductions, excluding expenses paid indirectly(1)(4) | | | 1.92% | | | | 1.94% | | | | 1.88% | | | | 1.80% | | | | 1.79% | | | | 1.80% | |
Ratio of expenses to average net assets before reductions(1)(4) | | | 1.92% | | | | 1.94% | | | | 1.88% | | | | 1.80% | | | | 1.85% | | | | 1.99% | |
Portfolio turnover rate(2)(3) | | | 17.33% | | | | 41.12% | | | | 31.61% | | | | 22.74% | | | | 37.07% | | | | 69.20% | |
| (1) | | Ratio reflects reductions in corresponding portfolio, if applicable. |
| (2) | | Prior to the year ended December 31, 2003, the portfolio turnover rate represented the turnover rate of the corresponding portfolio. During 2003, the funds portfolio turnover rate for the period January 1 through April 13 is equivalent to the portfolio into which the fund invested. Beginning April 14 the fund commenced calculating the portfolio turnover rate based on its own activities. Hence, the portfolio turnover rate represented for 2003 is a combination of these two periods. Subsequent to 2003 the portfolio turnover rate is specific to the Fund. |
| (3) | | Not annualized for periods of less than one full year. |
| (4) | | Annualized for periods of less than one full year. |
See accompanying notes to financial statements.
The Flex-funds
31
Financial Highlights
For a Share Outstanding Through the Period Ended June 30, 2004 (unaudited) and
Each Fiscal Year Ended December 31,
The Highlands Growth Fund
| | | | | | | | | | | | | | | | | | | | | | | | |
| | | 2004
| | | 2003
| | | 2002
| | | 2001
| | | 2000
| | | 1999
| |
Net Asset Value, Beginning of Period | | $ | 14.82 | | | $ | 11.65 | | | $ | 15.47 | | | $ | 18.66 | | | $ | 22.37 | | | $ | 21.23 | |
| | | | | | |
Income from Investment Operations | | | | | | | | | | | | | | | | | | | | | | | | |
Net investment income (loss) | | | (0.02 | ) | | | — | | | | (0.03 | ) | | | — | | | | (0.01 | ) | | | (0.01 | ) |
Net gains (losses) on securities and futures (both realized and unrealized) | | | 0.22 | | | | 3.17 | | | | (3.79 | ) | | | (2.49 | ) | | | (2.17 | ) | | | 4.37 | |
Total from Investment Operations | | | 0.20 | | | | 3.17 | | | | (3.82 | ) | | | (2.49 | ) | | | (2.18 | ) | | | 4.36 | |
| | | | | | |
Less Distributions | | | | | | | | | | | | | | | | | | | | | | | | |
From net capital gains | | | — | | | | — | | | | — | | | | (0.70 | ) | | | (1.53 | ) | | | (3.22 | ) |
Total Distributions | | | — | | | | — | | | | — | | | | (0.70 | ) | | | (1.53 | ) | | | (3.22 | ) |
| | | | | | | | | | | | | | | | | | | | | | | | | |
Net Asset Value, End of Period | | $ | 15.02 | | | $ | 14.82 | | | $ | 11.65 | | | $ | 15.47 | | | $ | 18.66 | | | $ | 22.37 | |
| | | | | | |
Total Return (assumes reinvestment of distributions)(3) | | | 1.35% | | | | 27.21% | | | | (24.69% | ) | | | (13.33% | ) | | | (9.76% | ) | | | 21.16% | |
| | | | | | |
Ratios/Supplemental Data | | | | | | | | | | | | | | | | | | | | | | | | |
Net assets, end of period ($000) | | $ | 18,832 | | | $ | 19,968 | | | $ | 18,360 | | | $ | 32,248 | | | $ | 44,049 | | | $ | 53,087 | |
Ratio of net expenses to average net
assets(1)(4) | | | 1.68% | | | | 1.84% | | | | 1.76% | | | | 1.64% | | | | 1.43% | | | | 1.56% | |
Ratio of net investment income (loss) to average net assets(1)(4) | | | (0.22% | ) | | | (0.11% | ) | | | (0.20% | ) | | | (0.23% | ) | | | (0.04% | ) | | | (0.04% | ) |
Ratio of expenses to average net assets after reductions, excluding expenses paid
indirectly(1)(4) | | | 1.73% | | | | 1.84% | | | | 1.78% | | | | 1.66% | | | | 1.45% | | | | 1.57% | |
Ratio of expenses to average net assets before reductions(1)(4) | | | 1.90% | | | | 1.91% | | | | 1.79% | | | | 1.66% | | | | 1.45% | | | | 1.57% | |
Portfolio turnover rate(2)(3) | | | 120.46% | | | | 139.74% | | | | 53.61% | | | | 36.99% | | | | 58.03% | | | | 51.22% | |
| (1) | | Ratio reflects reductions in corresponding portfolio, if applicable. |
| (2) | | Prior to the year ended December 31, 2003, the portfolio turnover rate represented the turnover rate of the corresponding portfolio. During 2003, the funds portfolio turnover rate for the period January 1 through April 13 is equivalent to the portfolio into which the fund invested. Beginning April 14 the fund commenced calculating the portfolio turnover rate based on its own activities. Hence, the portfolio turnover rate represented for 2003 is a combination of these two periods. Subsequent to 2003 the portfolio turnover rate is specific to the Fund. |
| (3) | | Not annualized for periods of less than one full year. |
| (4) | | Annualized for periods of less than one full year. |
See accompanying notes to financial statements.
The Flex-funds
32
Financial Highlights
For a Share Outstanding Through the Period Ended June 30, 2004 (unaudited) and
Each Fiscal Year Ended December 31,
The Dynamic Growth Fund
| | | | | | | | | | | | | | | | | | | | |
| | | 2004
| | | 2003
| | | 2002
| | | 2001
| | | 2000*
| |
Net Asset Value, Beginning of Period | | $ | 7.67 | | | $ | 5.58 | | | $ | 7.37 | | | $ | 8.52 | | | $ | 10.00 | |
| | | | | |
Income from Investment Operations | | | | | | | | | | | | | | | | | | | | |
Net investment income (loss) | | | (0.03 | ) | | | — | | | | (0.04 | ) | | | — | | | | 0.04 | |
Net gains (losses) on securities and
futures (both realized and unrealized) | | | (0.12 | ) | | | 2.09 | | | | (1.75 | ) | | | (1.15 | ) | | | (1.39 | ) |
Total from Investment Operations | | | (0.15 | ) | | | 2.09 | | | | (1.79 | ) | | | (1.15 | ) | | | (1.35 | ) |
| | | | | |
Less Distributions | | | | | | | | | | | | | | | | | | | | |
From net investment income | | | — | | | | — | | | | — | | | | — | | | | (0.13 | ) |
Total Distributions | | | — | | | | — | | | | — | | | | — | | | | (0.13 | ) |
| | | | | | | | | | | | | | | | | | | | | |
Net Asset Value, End of Period | | $ | 7.52 | | | $ | 7.67 | | | $ | 5.58 | | | $ | 7.37 | | | $ | 8.52 | |
| | | | | |
Total Return (assumes reinvestment of distributions)(1) | | | (1.96% | ) | | | 37.46% | | | | (24.29% | ) | | | (13.47% | ) | | | (13.54% | ) |
| | | | | |
Ratios/Supplemental Data | | | | | | | | | | | | | | | | | | | | |
Net assets, end of period ($000) | | $ | 20,988 | | | $ | 21,024 | | | $ | 17,094 | | | $ | 23,126 | | | $ | 20,399 | |
Ratio of net expenses to average net assets(2)(3)(4) | | | 1.11% | | | | 1.22% | | | | 1.18% | | | | 1.03% | | | | 1.10% | |
Ratio of net investment income (loss) to average net assets(2)(3)(4) | | | (0.66% | ) | | | (0.84% | ) | | | (0.69% | ) | | | (0.62% | ) | | | 0.53% | |
Ratio of expenses to average net assets after reductions, excluding expenses paid indirectly(2)(3)(4) | | | 1.34% | | | | 1.27% | | | | 1.29% | | | | 1.19% | | | | 1.10% | |
Ratio of expenses to average net assets before reductions(2)(3)(4) | | | 1.55% | | | | 1.60% | | | | 1.35% | | | | 1.34% | | | | 1.30% | |
Portfolio turnover rate(1)(5) | | | 50.52% | | | | 249.65% | | | | 391.64% | | | | 131.21% | | | | 257.72% | |
| (1) | | Not annualized for periods of less than one full year. |
| (2) | | Annualized for periods of less than one full year. |
| (3) | | Ratio reflects reductions in corresponding portfolio, if applicable. |
| (4) | | These ratios exclude the impact of expenses of the underlying security holdings as represented in the schedule of investments. |
| (5) | | Prior to the year ended December 31, 2003, the portfolio turnover rate represented the turnover rate of the corresponding portfolio. During 2003, the funds portfolio turnover rate for the period January 1 through April 13 is equivalent to the portfolio into which the fund invested. Beginning April 14 the fund commenced calculating the portfolio turnover rate based on its own activities. Hence, the portfolio turnover rate represented for 2003 is a combination of these two periods. Subsequent to 2003 the portfolio turnover rate is specific to the Fund. |
| * | | Commenced operations on February 29, 2000. |
See accompanying notes to financial statements.
The Flex-funds
33
Financial Highlights
For a Share Outstanding Through the Period Ended June 30, 2004 (unaudited) and
Each Fiscal Year Ended December 31,
The Aggressive Growth Fund
| | | | | | | | | | | | | | | | | | | | |
| | | 2004
| | | 2003
| | | 2002
| | | 2001
| | | 2000*
| |
Net Asset Value, Beginning of Period | | $ | 6.65 | | | $ | 4.79 | | | $ | 6.52 | | | $ | 7.86 | | | $ | 10.00 | |
| | | | | |
Income from Investment Operations | | | | | | | | | | | | | | | | | | | | |
Net investment income (loss) | | | (0.03 | ) | | | — | | | | (0.06 | ) | | | — | | | | (0.01 | ) |
Net gains (losses) on securities and futures (both realized and unrealized) | | | (0.13 | ) | | | 1.86 | | | | (1.67 | ) | | | (1.34 | ) | | | (2.11 | ) |
Total from Investment Operations | | | (0.16 | ) | | | 1.86 | | | | (1.73 | ) | | | (1.34 | ) | | | (2.12 | ) |
| | | | | |
Less Distributions | | | | | | | | | | | | | | | | | | | | |
From net investment income | | | — | | | | — | | | | — | | | | — | | | | (0.02 | ) |
Total Distributions | | | — | | | | — | | | | — | | | | — | | | | (0.02 | ) |
| | | | | | | | | | | | | | | | | | | | | |
Net Asset Value, End of Period | | $ | 6.49 | | | $ | 6.65 | | | $ | 4.79 | | | $ | 6.52 | | | $ | 7.86 | |
| | | | | |
Total Return (assumes reinvestment of distributions)(1) | | | (2.41% | ) | | | 38.83% | | | | (26.53% | ) | | | (17.04% | ) | | | (21.24% | ) |
| | | | | |
Ratios/Supplemental Data | | | | | | | | | | | | | | | | | | | | |
Net assets, end of period ($000) | | $ | 8,999 | | | $ | 9,122 | | | $ | 7,046 | | | $ | 12,379 | | | $ | 12,079 | |
Ratio of net expenses to average net assets(2)(3)(4) | | | 1.54% | | | | 1.39% | | | | 1.22% | | | | 1.03% | | | | 1.10% | |
Ratio of net investment income (loss) to average net assets(2)(3)(4) | | | (0.90% | ) | | | (0.85% | ) | | | (0.95% | ) | | | (0.69% | ) | | | (0.11% | ) |
Ratio of expenses to average net assets after reductions, excluding expenses paid indirectly(2)(3)(4) | | | 1.70% | | | | 1.44% | | | | 1.32% | | | | 1.19% | | | | 1.10% | |
Ratio of expenses to average net assets before reductions(2)(3)(4) | | | 1.89% | | | | 1.99% | | | | 1.67% | | | | 1.52% | | | | 1.32% | |
Portfolio turnover rate(1)(5) | | | 142.96% | | | | 255.32% | | | | 349.42% | | | | 126.69% | | | | 302.02% | |
| (1) | | Not annualized for periods of less than one full year. |
| (2) | | Annualized for periods of less than one full year. |
| (3) | | Ratio reflects reductions in corresponding portfolio, if applicable. |
| (4) | | These ratios exclude the impact of expenses of the underlying security holdings as represented in the schedule of investments. |
| (5) | | Prior to the year ended December 31, 2003, the portfolio turnover rate represented the turnover rate of the corresponding portfolio. During 2003, the funds portfolio turnover rate for the period January 1 through April 13 is equivalent to the portfolio into which the fund invested. Beginning April 14 the fund commenced calculating the portfolio turnover rate based on its own activities. Hence, the portfolio turnover rate represented for 2003 is a combination of these two periods. Subsequent to 2003 the portfolio turnover rate is specific to the Fund. |
| * | | Commenced operations on February 29, 2000. |
See accompanying notes to financial statements.
The Flex-funds
34
Financial Highlights
For a Share Outstanding Through the Period Ended June 30, 2004 (unaudited) and Each Fiscal Year Ended December 31,
The U.S. Government Bond Fund
| | | | | | | | | | | | | | | | | | | | | | | | |
| | | 2004
| | | 2003
| | | 2002
| | | 2001
| | | 2000
| | | 1999
| |
Net Asset Value, Beginning of Period | | $ | 21.00 | | | $ | 22.79 | | | $ | 21.41 | | | $ | 21.92 | | | $ | 21.33 | | | $ | 22.14 | |
| | | | | | |
Income from Investment Operations | | | | | | | | | | | | | | | | | | | | | | | | |
Net investment income | | | 0.24 | | | | 0.35 | | | | 0.54 | | | | 0.79 | | | | 1.10 | | | | 0.88 | |
Net gains (losses) on securities and futures (both realized and unrealized) | | | (0.33 | ) | | | (1.35 | ) | | | 1.65 | | | | (0.51 | ) | | | 0.59 | | | | (0.81 | ) |
Total from Investment Operations | | | (0.09 | ) | | | (1.00 | ) | | | 2.19 | | | | 0.28 | | | | 1.69 | | | | 0.07 | |
| | | | | | |
Less Distributions | | | | | | | | | | | | | | | | | | | | | | | | |
From net investment income | | | (0.27 | ) | | | (0.35 | ) | | | (0.54 | ) | | | (0.79 | ) | | | (1.10 | ) | | | (0.88 | ) |
From net capital gains | | | — | | | | (0.44 | ) | | | (0.27 | ) | | | — | | | | — | | | | — | |
Total Distributions | | | (0.27 | ) | | | (0.79 | ) | | | (0.81 | ) | | | (0.79 | ) | | | (1.10 | ) | | | (0.88 | ) |
| | | | | | | | | | | | | | | | | | | | | | | | | |
Net Asset Value, End of Period | | $ | 20.64 | | | $ | 21.00 | | | $ | 22.79 | | | $ | 21.41 | | | $ | 21.92 | | | $ | 21.33 | |
| | | | | | |
Total Return (assumes reinvestment of distributions)(3) | | | (0.47% | ) | | | (4.43% | ) | | | 10.34% | | | | 1.23% | | | | 8.15% | | | | 0.35% | |
| | | | | | |
Ratios/Supplemental Data | | | | | | | | | | | | | | | | | | | | | | | | |
Net assets, end of period ($000) | | $ | 9,845 | | | $ | 10,840 | | | $ | 14,226 | | | $ | 13,080 | | | $ | 13,340 | | | $ | 12,422 | |
Ratio of net expenses to average
net assets(1)(4) | | | 1.10% | | | | 1.10% | | | | 1.10% | | | | 1.07% | | | | 1.00% | | | | 1.00% | |
Ratio of net investment income to average net assets(1)(4) | | | 2.54% | | | | 1.59% | | | | 2.43% | | | | 3.58% | | | | 5.12% | | | | 4.10% | |
Ratio of expenses to average net assets before reductions(1)(4) | | | 1.39% | | | | 1.24% | | | | 1.13% | | | | 1.13% | | | | 1.30% | | | | 1.18% | |
Portfolio turnover rate(2)(3) | | | 156.71% | | | | 567.68% | | | | 407.99% | | | | 503.20% | | | | 375.47% | | | | 352.23% | |
| (1) | | Ratio reflects reductions in corresponding portfolio, if applicable. |
| (2) | | Prior to the year ended December 31, 2003, the portfolio turnover rate represented the turnover rate of the corresponding portfolio. During 2003, the funds portfolio turnover rate for the period January 1 through April 13 is equivalent to the portfolio into which the fund invested. Beginning April 14 the fund commenced calculating the portfolio turnover rate based on its own activities. Hence, the portfolio turnover rate represented for 2003 is a melding of these two periods. Subsequent to 2003 the portfolio turnover rate is specific to the Fund. |
| (3) | | Not annualized for periods of less than one full year. |
| (4) | | Annualized for periods of less than one full year. |
See accompanying notes to financial statements.
The Flex-funds
35
Financial Highlights
For a Share Outstanding Through the Period Ended June 30, 2004 (unaudited) and Each Fiscal Year Ended December 31,
The Money Market Fund
| | | | | | | | | | | | | | | | | | | | | | | | |
| | | 2004
| | | 2003
| | | 2002
| | | 2001
| | | 2000
| | | 1999
| |
Net Asset Value, Beginning of Period | | $ | 1.00 | | | $ | 1.00 | | | $ | 1.00 | | | $ | 1.00 | | | $ | 1.00 | | | $ | 1.00 | |
| | | | | | |
Income from Investment Operations | | | | | | | | | | | | | | | | | | | | | | | | |
Net investment income | | | 0.004 | | | | 0.009 | | | | 0.016 | | | | 0.040 | | | | 0.060 | | | | 0.049 | |
Total from Investment Operations | | | 0.004 | | | | 0.009 | | | | 0.016 | | | | 0.040 | | | | 0.060 | | | | 0.049 | |
| | | | | | |
Less Distributions | | | | | | | | | | | | | | | | | | | | | | | | |
From net investment income | | | (0.004 | ) | | | (0.009 | ) | | | (0.016 | ) | | | (0.040 | ) | | | (0.060 | ) | | | (0.049 | ) |
Total Distributions | | | (0.004 | ) | | | (0.009 | ) | | | (0.016 | ) | | | (0.040 | ) | | | (0.060 | ) | | | (0.049 | ) |
| | | | | | | | | | | | | | | | | | | | | | | | | |
Net Asset Value, End of Period | | $ | 1.00 | | | $ | 1.00 | | | $ | 1.00 | | | $ | 1.00 | | | $ | 1.00 | | | $ | 1.00 | |
| | | | | | |
Total Return (assumes reinvestment of distributions)(1) | | | 0.41% | | | | 0.92% | | | | 1.59% | | | | 4.10% | | | | 6.20% | | | | 4.96% | |
| | | | | | |
Ratios/Supplemental Data | | | | | | | | | | | | | | | | | | | | | | | | |
Net assets, end of period ($000) | | $ | 165,955 | | | $ | 165,607 | | | $ | 186,280 | | | $ | 221,594 | | | $ | 233,227 | | | $ | 232,023 | |
Ratio of net expenses to average
net assets(2)(3) | | | 0.46% | | | | 0.43% | | | | 0.44% | | | | 0.44% | | | | 0.41% | | | | 0.41% | |
Ratio of net investment income to average
net assets(2)(3) | | | 0.81% | | | | 0.92% | | | | 1.58% | | | | 4.00% | | | | 6.01% | | | | 4.88% | |
Ratio of expenses to average net assets before reductions(2)(3) | | | 0.83% | | | | 0.82% | | | | 0.66% | | | | 0.62% | | | | 0.60% | | | | 0.54% | |
| (1) | | Not annualized for periods of less than one full year. |
| (2) | | Annualized for periods of less than one full year. |
| (3) | | Ratio reflects reduction in corresponding portfolio. |
See accompanying notes to financial statements.
The Flex-funds
36
Notes to Financial Statements
June 30, 2004 (unaudited)
1. Organization and Significant Accounting Policies
The Flex-funds Trust (the “Trust”) was organized in 1982 and is registered under the Investment Company Act of 1940, as amended (the “1940 Act”), as a diversified, open-end management investment company. The Trust offers seven separate series and is presently comprised of seven separate funds as follows: The Muirfield Fund® (“Muirfield”), The Total Return Utilities Fund (“TRUF”), The Highlands Growth Fund® (“Highlands”), The Dynamic Growth Fund (“Dynamic”), The Aggressive Growth Fund (“Aggressive”), The U.S. Government Bond Fund (“Bond”), and The Money Market Fund (“Money Market”) (each a “Fund” and collectively the “Funds”). Money Market invests all of its investable assets in a corresponding open-end management investment company, the Money Market Portfolio (“Portfolio”). As of June 30, 2004, Money Market owns 83% of the Portfolio. There is a partner in this Portfolio that owns a de minimis position.
The financial statements of the Money Market Portfolio, including the Schedule of Portfolio Investments, are included elsewhere in this report and should be read in conjunction with the financial statements of Money Market.
Use of estimates. The preparation of financial statements in conformity with accounting principles generally accepted in the United States of America (“GAAP”) requires management to make estimates and assumptions that affect the reported amounts of assets and liabilities and disclosure of contingent assets and liabilities at the date of the financial statements and the reported amounts of revenues and expenses during the reporting period. Actual results could differ from those estimates.
Security valuation. Securities that are traded on stock exchanges are valued at the last sales price as of the close of business of the New York Stock Exchange on the day of valuation or, lacking any sales, at the closing bid prices. Securities traded over-the-counter are valued at the most recent bid price or yield equivalent as obtained from one or more dealers that make markets in such securities. Mutual funds are valued at the daily redemption value as reported by the underlying fund. Bond values the securities held at 4:00 P.M. Eastern Time. The Funds obtain prices from independent pricing services, which use valuation techniques approved by the Trustees.
Money market securities held in the Funds, except Money Market, maturing more than sixty days after the valuation date are valued at the last sales price as of the close of business on the day of valuation, or, lacking any sales, at the most recent bid price or yield equivalent as obtained from dealers that make markets in such securities. When such securities are valued within sixty days or less to maturity, the difference between the valuation existing on the sixty-first day before maturity and maturity value is amortized on a straight-line basis to maturity. Securities maturing within sixty days from their date of acquisition are valued at amortized cost.
Repurchase agreements. Each Fund, except Money Market, may engage in repurchase agreement transactions whereby the Fund takes possession of an underlying debt instrument subject to an obligation of the seller to repurchase the instrument from the Fund and an obligation of the Fund to resell the instrument at an agreed upon price and term. At all times, the Fund maintains the value of collateral, including accrued interest, of at least 100% the amount of the repurchase agreement, plus accrued interest. If the seller defaults or the fair value of the collateral declines, realization of the collateral by the Funds may be delayed or limited.
Futures & options. Each Fund, except Money Market, may engage in transactions in financial futures contracts and options contracts in order to manage the risk of unanticipated changes in market values of securities held in the fund, or which it intends to purchase. The futures and options contracts are adjusted by the daily exchange rate of the underlying currency, or index, and any gains or losses are recorded for financial statement purposes as unrealized gains or losses in the statement of assets and liabilities and the statement of operations until the contract settlement date, at which time realized gains and losses are included in the statement of operations.
To the extent that the Fund enters into futures contracts on an index or group of securities, the Fund exposes itself to an indeterminate liability and will be required to pay or receive a sum of money measured by the change in the value of the index. Upon entering into a futures contract, the Fund is required to deposit an initial margin, which is either cash or securities in an amount equal to a certain percentage of the contract value. Subsequently, the variation margin, which is equal to changes in the daily settlement price or last sale price on the exchanges where they trade, is received or
The Flex-funds
37
paid and are recorded as unrealized gains or losses until the contracts are closed. When the contract is closed, the Fund records a realized gain or loss equal to the difference between the proceeds from (or cost of) the closing transaction and the Fund’s basis in the contract.
Call and put option contracts involve the payment of a premium for the right to purchase or sell an individual security or index aggregate at a specified price until the expiration of the contract. Such transactions expose the Fund to the loss of the premium paid if the Fund does not sell or exercise the contract prior to the expiration date. In the case of a call option, sufficient cash or money market instruments will be segregated to complete the purchase. Options are valued on the basis of the daily settlement price or last sale on the exchanges where they trade and the changes in value are recorded as unrealized appreciation or depreciation until closed, exercised or expired.
The Funds may write covered call or put options for which premiums received are recorded as liabilities and are subsequently adjusted to the current value of the options written. When written options are closed or exercised, premiums received are offset against the proceeds paid, and the Fund records realized gains or losses for the difference. When written options expire, the liability is eliminated, and the Fund records realized gains for the entire amount of premiums received.
Valuation of investments. Money Market records its investment in the corresponding Portfolio at value. Valuation of securities held by the Portfolio is discussed in the Portfolio’s notes to financial statements included elsewhere in this report.
Federal income taxes. It is each Fund’s policy to continue to comply with the requirements of Subchapter M of the Internal Revenue Code applicable to regulated investment companies and to distribute substantially all of its taxable income and net capital gains to its shareholders. Therefore, no federal income tax provision is required.
Distributions to shareholders. Distributions to shareholders are recorded on the ex-dividend date. Muirfield, Highlands, Dynamic, and Aggressive declare and pay dividends from net investment income, if any, on a quarterly basis. TRUF declares and pays dividends from net investment income on a monthly basis. Bond and Money Market declare dividends from net investment income on a daily basis and pay such dividends on a monthly basis. Each Fund distributes net capital gains, if any, on an annual basis.
Distributions from net investment income and from net capital gains are determined in accordance with income tax regulations, which may differ from GAAP. These differences are primarily due to deferrals of certain losses, expiring capital loss carryforwards, and differing treatments of unrealized gains and losses of futures contracts held by each Fund. Accordingly, timing differences relating to shareholder distributions are reflected in the components of net assets and permanent book and tax differences relating to shareholder distributions have been reclassified within the components of net assets. Differences identified and reclasses made for the period ended December 31, 2003 were as follows:
| | | | | | | |
| | | Capital
| | | Undistributed
Net
Investment
Income
|
The Muirfield Fund® | | $ | (546,421 | ) | | $ | 546,421 |
The Total Return Utilities Fund | | | (33 | ) | | | 33 |
The Highlands Growth Fund® | | | (19,717 | ) | | | 19,717 |
The Dynamic Growth Fund | | | (156,091 | ) | | | 156,091 |
The Aggressive Growth Fund | | | (64,413 | ) | | | 64,413 |
Investment income & expenses. Money Market records daily its proportionate share of the corresponding Portfolio’s income, expenses, and realized and unrealized gains and losses. In addition, Money Market accrues its own expenses. Expenses incurred by the Trust that do not specifically relate to an individual Fund of the Trust are allocated to the Funds based on each Fund’s relative net assets or other appropriate basis.
Other. The Funds, except Money Market, record security transactions on the trade date. Gains and losses realized from the sale of securities are determined on the specific identification basis. Dividend income is recognized on the ex-dividend date and interest income (including amortization of premium and accretion of discount) is recognized as earned.
The Flex-funds
38
Under a Deferred Compensation Plan (the “Plan”), non-interested Trustees may elect to defer receipt of a portion of their annual compensation. Under the Plan, deferred amounts are invested in shares of The Flex-funds. Deferred amounts remain in the Funds, except Money Market, until distributed in accordance with the Plan.
2. Investment Transactions
For the six months ended June 30, 2004, the cost of purchases and proceeds from sales or maturities of long-term investments for the Funds were as follows:
| | | | | | |
| | | Purchases
| | Sales
|
The Muirfield Fund® | | $ | 28,037,717 | | $ | 47,640,147 |
The Total Return Utilities Fund | | | 3,595,298 | | | 4,177,140 |
The Highlands Growth Fund® | | | 22,586,644 | | | 24,617,062 |
The Dynamic Growth Fund | | | 8,675,932 | | | 16,901,403 |
The Aggressive Growth Fund | | | 10,954,043 | | | 12,473,278 |
The U.S. Government Bond Fund | | | 15,461,797 | | | 16,377,328 |
3. Investment Advisory Fees and Other Transactions with Affiliates
Meeder Asset Management, Inc. (“MAM”), a wholly-owned subsidiary of Meeder Financial, Inc. (“Meeder”), provides each Fund, except Money Market, with investment management, research, statistical and advisory services. Under separate Investment Subadvisory Agreements with MAM, Miller/Howard Investments, Inc. (“Miller/Howard”) and Sector Capital Management, L.L.C. (“Sector Capital”) serve as subadvisors of TRUF and Highlands, respectively. Sub-subadvisors, selected by Sector Capital, subject to the review and approval of the Trustees of Highlands, are responsible for the selection of individual portfolio securities for the assets of the Fund assigned to them by Sector Capital.
For such services the Funds, except Money Market, pay a fee at the following annual rates: Muirfield, TRUF, and Highlands, 1.00% of average daily net assets up to $50 million, 0.75% of average daily net assets exceeding $50 million up to $100 million and 0.60% of average daily net assets exceeding $100 million. As subadvisor to TRUF, Miller/Howard is paid 0.00% of the 1.00% of average daily net assets up to $10 million, 0.40% of the 1.00% of average daily net assets exceeding $10 million up to $50 million, 0.40% of the 0.75% of average daily net assets exceeding $50 million up to $60 million, 0.30% of the 0.75% of average daily net assets exceeding $60 million up to $100 million and 0.25% of the 0.60% of average daily net assets exceeding $100 million. As subadvisor to Highlands, Sector Capital is paid 0.30% of the 1.00% of average daily net assets up to $25 million, 0.70% of the 1.00% of average daily net assets exceeding $25 million up to $50 million, 0.40% of the 0.75% of average daily net assets exceeding $50 million up to $100 million and 0.35% of the 0.60% of average daily net assets exceeding $100 million. Sector Capital pays all sub-subadvisors 0.25% on all average net assets; Dynamic and Aggressive, 0.75% of average daily net assets up to $200 million and 0.60% of average daily net assets exceeding $200 million; Bond, 0.40% of average daily net assets up to $100 million and 0.20% of average daily net assets exceeding $100 million. During the six months ended June 30, 2004, Sector Capital voluntarily waived $1,809 of investment advisory fees in Highlands.
Mutual Funds Service Co. (“MFSCo”), a wholly-owned subsidiary of Meeder, serves as stock transfer, dividend disbursing and shareholder services agent for each Fund. In compensation for such services, each Fund pays MFSCo an annual fee calculated as follows: For Muirfield, TRUF, Highlands, Dynamic, and Aggressive, such fee is equal to the greater of $15 per active shareholder account or 0.12% of each Fund's average daily net assets. For Bond, such fee is equal to the greater of $15 per active shareholder account or 0.08% of the Fund's average daily net assets. For Money Market, such fee is equal to the greater of $20 per active shareholder account or 0.08% of the Fund's average daily net assets. MFSCo is entitled to receive an annual minimum fee of $4,000 for each Fund. For Fund’s that are subject to an expense cap and which are above the expense cap, the basis point fee will be reduced by 0.02%.
MFSCo provides the Trust with certain administrative services. In compensation for such services, each Fund pays MFSCo an annual fee equal to 0.05% of each Fund's average daily net assets.
MFSCo serves as accounting services agent for each Fund, except Money Market. In compensation for such services, each Fund pays MFSCo an annual fee equal to the greater of:
| | a. | | 0.15% of the first $10 million of average daily net assets, |
| | 0.10% | | of the next $20 million of average daily net assets, |
| | 0.02% | | of the next $50 million of average daily net assets, and |
| | 0.01% | | in excess of $80 million of average daily net assets, or |
The Flex-funds
39
MAM has voluntarily agreed to reduce its fees and/or reimburse expenses (excluding brokerage fees and commissions, taxes, interest, and extraordinary or non-recurring expenses), to limit Bond’s total annual operating expenses to 1.10% of average daily net assets. MAM has also agreed to reduce its fees and/or reimburse expenses to the extent necessary to achieve an effective yield for Money Market that will rank in the top 10% of yields for all general-purpose money market funds in 2004. Such reduction and/or reimbursement is limited to the total of fees charged to each Fund by MAM and MFSCo. For the six months ended June 30, 2004, MAM and/or MFSCo reimbursed $8,992 and $42,142 to Bond and Money Market, respectively.
Adviser Dealer Services, Inc. (“ADS”), an affiliated broker-dealer of MAM, has an arrangement with TRUF and Highlands whereby a portion of the commissions received from security trades directed through it will be used to help pay expenses of the aforementioned Funds. For the six months ended June 30, 2004, ADS received $318 and $7,659 in commissions in connection with the purchase and sale of investments for TRUF and Highlands, respectively. For the same time period, ADS paid $777 and $5,092 of expenses under this arrangement for TRUF and Highlands, respectively.
Muirfield, Dynamic, and Aggressive have entered into an agreement with the Trust’s custodian, The Huntington National Bank (“HNB”), acting as a broker-dealer. HNB receives distribution, service, and administration fees (collectively the “fees”) from the underlying security holdings of the aforementioned Funds. HNB retains 0.03% of the fees collected and forwards the remainder to the appropriate Fund. The Funds use their portion of the fees received to reduce the gross expenses of each Fund. For the six months ended June 30, 2004, Muirfield, Dynamic, and Aggressive used $63,470, $25,285, and $7,489 of fees received, respectively, to reduce gross expenses of each Fund. It is possible that the Funds may invest in security holdings in which fees are not paid. As such, the gross expenses of a Fund would not be decreased. Also, without this agreement it is likely that the Funds would not collect any fees from underlying security holdings.
Pursuant to Rule 12b-1 of the 1940 Act, a mutual fund can adopt a written plan to pay certain expenses out of fund assets relating to the sale and distribution of its shares. Muirfield, Highlands, Bond, and Money Market have adopted a distribution plan with an annual limitation of 0.20% of average daily net assets. TRUF, Dynamic, and Aggressive have adopted a distribution plan with an annual limitation of 0.25% of average daily net assets.
4. Federal Tax Information
The tax characteristics of dividends paid by the Funds during the year ended December 31, 2003 were as follows:
| | | | | | | | | |
| | | Ordinary
Income
| | Net Short-Term
Capital Gains
| | Total Dividends
Paid(1)
|
The Total Return Utilities Fund | | $ | 431,501 | | $ | — | | $ | 431,501 |
The U.S. Government Bond Fund | | | 214,166 | | | 224,673 | | | 438,839 |
The Money Market Fund | | | 1,711,417 | | | — | | | 1,711,417 |
The tax characteristics of dividends paid by the Funds during the year ended December 31, 2002 were as follows:
| | | | | | | | | |
| | | Ordinary
Income
| | Net Short-Term
Capital Gains
| | Total Dividends
Paid(1)
|
The Muirfield Fund® | | $ | 78,095 | | $ | — | | $ | 78,095 |
The Total Return Utilities Fund | | | 557,378 | | | — | | | 557,378 |
The U.S. Government Bond Fund | | | 314,826 | | | 165,565 | | | 480,391 |
The Money Market Fund | | | 3,571,277 | | | — | | | 3,571,277 |
The Flex-funds
40
As of December 31, 2003, the components of accumulated earnings/(deficit) on a tax basis for the Funds were as follows:
| | | | | | | | | | | | | | | | | | | |
| | | Undistributed
Ordinary
Income
| | Dividends
Payable
| | | Accumulated
Capital and
Other Gains
and (Losses)
| | | Unrealized
Appreciation/
(Depreciation)(2)
| | | Total
Accumulated
Earnings/
(Deficit)
| |
The Muirfield Fund® | | $ | — | | $ | — | | | $ | (25,084,901 | ) | | $ | 9,244,385 | | | $ | (15,840,516 | ) |
The Total Return Utilities Fund | | | — | | | (893 | ) | | | (11,554,268 | ) | | | 1,977,697 | | | | (9,577,464 | ) |
The Highlands Growth Fund® | | | — | | | — | | | | (7,343,942 | ) | | | 1,863,964 | | | | (5,479,978 | ) |
The Dynamic Growth Fund | | | — | | | — | | | | (8,035,727 | ) | | | 2,889,283 | | | | (5,146,444 | ) |
The Aggressive Growth Fund | | | — | | | — | | | | (8,240,194 | ) | | | 1,103,454 | | | | (7,136,740 | ) |
The U.S. Government Bond Fund | | | 156,826 | | | (1,289 | ) | | | (773,118 | ) | | | (9,390 | ) | | | (626,971 | ) |
The Money Market Fund | | | 13,594 | | | (13,594 | ) | | | — | | | | — | | | | — | |
For federal income tax purposes, the following Funds have capital loss carryforwards as of December 31, 2003, which are available to offset future capital gains, if any. To the extent that these carryforwards are used to offset future capital gains, it is probable that the gains that are offset will not be distributed to shareholders:
| | | | | |
| | | Amount
| | Expires
|
The Muirfield Fund® | | $ | 10,358,014 | | 2008 |
The Muirfield Fund® | | | 11,066,871 | | 2009 |
The Muirfield Fund® | | | 3,660,017 | | 2010 |
The Total Return Utilities Fund | | | 612,252 | | 2009 |
The Total Return Utilities Fund | | | 8,516,444 | | 2010 |
The Total Return Utilities Fund | | | 2,043,487 | | 2011 |
The Highlands Growth Fund® | | | 869,379 | | 2009 |
The Highlands Growth Fund® | | | 5,224,895 | | 2010 |
The Highlands Growth Fund® | | | 1,249,666 | | 2011 |
The Dynamic Growth Fund | | | 300,295 | | 2008 |
The Dynamic Growth Fund | | | 726,971 | | 2009 |
The Dynamic Growth Fund | | | 7,008,461 | | 2010 |
The Aggressive Growth Fund | | | 3,583,752 | | 2008 |
The Aggressive Growth Fund | | | 618,687 | | 2009 |
The Aggressive Growth Fund | | | 4,037,755 | | 2010 |
The U.S. Government Bond Fund | | | 735,915 | | 2011 |
Under current tax laws, net capital losses incurred after October 31, within a Fund’s fiscal year, are deemed to arise on the first business day of the following fiscal year for tax purposes. For the year ended December 31, 2003, the Funds deferred post October capital losses of:
| | | |
| | | Post-October
Capital Losses
|
The Total Return Utilities Fund | | $ | 382,085 |
The U.S. Government Bond Fund | | | 37,203 |
| (1) | | Total dividends paid may differ from the amount reported in the Statement of Changes in Net Assets because for tax purposes dividends are recognized when actually paid. |
| (2) | | The differences between book- and tax-basis unrealized appreciation/(depreciation) are attributable primarily to: deferral of losses on wash sales, the realization for tax purposes of unrealized gains/(losses) on certain derivative instruments, and the difference between book and tax amortization methods for premium and market discount. |
5. Write-Off of Receivables
During December 2001, receivables which had been deemed uncollectible were written off in the following amounts: The Highlands Growth Fund — $34,816; The Muirfield Fund — $204,223; and The Total Return Utilities Fund — $59,290. An examination of the receivables has concluded that the receivables should not have been written off. As a consequence, Meeder Asset Management and Mutual Funds Service Co. have determined to pay to record shareholders of the affected Funds as of the days of the write-off in December 2001, their pro rata share amount of the receivables improperly written off, plus the amount, if any, the receivable would have earned had it been invested in the
The Flex-funds
41
Funds between 2001 and the date of the reimbursement. Because these remedial actions by Meeder Asset Management and Mutual Funds Service Co. involve payments of amounts directly to the affected shareholders, these future remedial payments are not reflected as assets on the unaudited financial statements of the Funds as of June 30, 2004.
6. Subsequent Event
The Flex-funds Money Market Fund and the Institutional Fund of the Meeder Advisor Funds Trust, which are managed by Meeder Asset Management, Inc., are organized in the master-feeder structure. Under this structure both funds, having the same investment objective, invest in the same master portfolio, the Money Market Portfolio. The Board of Trustees has approved the liquidation, on or about December 31, 2004, of the Institutional Fund. In conjunction with this liquidation, the Board of Trustees has also approved the termination, on or about December 31, 2004, of the Money Market Portfolio. The shareholders of the Institutional Fund will have the opportunity to invest their liquidation proceeds in a new class of shares of The Money Market Fund, which will have a virtually identical investment objective as the Institutional Fund. Consequently, on or about December 31, 2004, The Flex-funds Money Market Fund will be a stand-alone fund offering two classes of shares and will continue to be managed by Meeder Asset Management, Inc.
The Flex-funds
42
Statement of Assets & Liabilities
June 30, 2004 (unaudited)
| | | |
| | | Money
Market
Portfolio
|
Assets | | | |
Investments, at value* | | $ | 185,751,309 |
Repurchase agreements, at value* | | | 12,175,000 |
Trustee deferred compensation investments, at value | | | 63,417 |
Cash | | | 400 |
Interest and dividend receivable | | | 2,123,840 |
Prepaid expenses/other assets | | | 2,456 |
Total Assets | | | 200,116,422 |
| |
Liabilities | | | |
Payable for Trustee Deferred Compensation Plan | | | 63,417 |
Payable to investment advisor | | | 28,708 |
Accrued fund accounting fees | | | 4,716 |
Other accrued liabilities | | | 6,321 |
Total Liabilities | | | 103,162 |
| | | | |
Total Net Assets | | $ | 200,013,260 |
| | | | |
* Investments, at cost | | $ | 197,926,309 |
See accompanying notes to financial statements.
The Flex-funds
43
Statement of Operations
For the Six Months Ended June 30, 2004 (unaudited)
| | | | |
| | | Money
Market
Portfolio
| |
Investment Income | | | | |
Interest | | $ | 1,275,669 | |
Total Investment Income | | | 1,275,669 | |
| |
Expenses | | | | |
Investment advisor | | | 325,936 | |
Fund accounting | | | 28,453 | |
Trustee | | | 4,144 | |
Audit | | | 10,972 | |
Custodian | | | 2,940 | |
Legal | | | 1,232 | |
Total Expenses Before Reductions | | | 373,677 | |
| |
Investment advisor fees waived | | | (162,545 | ) |
Total Net Expenses | | | 211,132 | |
| | | | | |
Net Investment Income | | | 1,064,537 | |
| | | | | |
Net Change in Net Assets Resulting from Operations | | $ | 1,064,537 | |
See accompanying notes to financial statements.
The Flex-funds
44
Statements of Changes in Net Assets
For the Six Months Ended June 30, 2004 (unaudited) and the Year Ended December 31, 2003
| | | | | | | | |
| | | Money Market Portfolio
| |
| | | 2004
| | | 2003
| |
Operations | | | | | | | | |
Net investment income | | $ | 1,064,537 | | | $ | 2,417,678 | |
Net change in net assets resulting from operations | | | 1,064,537 | | | | 2,417,678 | |
| | |
Transactions of Investors’ Beneficial Interests | | | | | | | | |
Contributions | | | 125,112,095 | | | | 245,964,298 | |
Withdrawals | | | (120,509,339 | ) | | | (264,913,444 | ) |
Net change in net assets resulting from transactions of investors’ beneficial interests | | | 4,602,756 | | | | (18,949,146 | ) |
| | | | | | | | | |
Total Change in Net Assets | | | 5,667,293 | | | | (16,531,468 | ) |
| | |
Net Assets — Beginning of Period | | | 194,345,967 | | | | 210,877,435 | |
Net Assets — End of Period | | $ | 200,013,260 | | | $ | 194,345,967 | |
See accompanying notes to financial statements.
The Flex-funds
45
Financial Highlights
Ratios/Supplementary Data For the Period Ended June 30, 2004 (unaudited)
and Each Fiscal Year Ended December 31,
Money Market Portfolio
| | | | | | | | | | | | | | | | | | |
| | | 2004
| | 2003
| | 2002
| | 2001
| | 2000
| | 1999
|
Total Return(1) | | | 0.51% | | | 1.17% | | | 1.83% | | | 4.54% | | | 6.61% | | | 5.37% |
| | | | | | |
Net assets, end of period ($000) | | $ | 200,013 | | $ | 194,346 | | $ | 210,877 | | $ | 270,330 | �� | $ | 297,206 | | $ | 1,104,197 |
Ratio of net expenses to average net assets(2) | | | 0.21% | | | 0.18% | | | 0.20% | | | 0.21% | | | 0.19% | | | 0.18% |
Ratio of net investment income to average net assets(2) | | | 1.06% | | | 1.16% | | | 1.83% | | | 4.26% | | | 6.05% | | | 5.07% |
Ratio of expenses to average net assets before reductions(2) | | | 0.37% | | | 0.36% | | | 0.36% | | | 0.35% | | | 0.30% | | | 0.30% |
| (1) | | Not annualized for periods of less than one full year. |
| (2) | | Annualized for periods of less than one full year. |
See accompanying notes to financial statements.
The Flex-funds
46
Notes to Financial Statements
June 30, 2004 (unaudited)
1. Organization and Significant Accounting Policies
The Money Market Fund (the “Fund”) invests all of its investable assets in a corresponding open-end management investment company (a “Portfolio”) having the same investment objective as the Fund. The Portfolio is registered under the Investment Company Act of 1940, as amended (the “1940 Act”), as a no-load, open-ended management investment company, which was organized as a trust under the laws of the State of New York. For federal income tax purposes, the Portfolio qualifies as a partnership, and each investor in the Portfolio is treated as the owner of its proportionate share of the net assets, income, expenses, and realized and unrealized gains and losses of the Portfolio. Accordingly, as a “pass-through” entity, the Portfolio pays no income dividend or capital gain distribution.
Use of estimates. The preparation of financial statements in conformity with accounting principles generally accepted in the United States of America (“GAAP”) requires management to make estimates and assumptions that affect the reported amounts of assets and liabilities and disclosure of contingent assets and liabilities at the date of the financial statements and the reported amounts of revenues and expenses during the reporting period. Actual results could differ from those estimates.
Security valuation. Money market securities held in the Portfolio are valued at amortized cost, which approximates value. In compliance with Rule 2a-7 of the 1940 Act, the amortized values are compared to prices obtained from independent pricing services that use valuation techniques approved by the Board of Trustees (“Trustees”).
Repurchase agreements. The Portfolio may engage in repurchase agreement transactions whereby the Portfolio takes possession of an underlying debt instrument subject to an obligation of the seller to repurchase the instrument from the Portfolio and an obligation of the Portfolio to resell the instrument at an agreed upon price and term. At all times, the Portfolio maintains the value of collateral, including accrued interest, at least 100% of the amount of the repurchase agreement, plus accrued interest. If the seller defaults or the fair value of the collateral declines, realization of the collateral by the Portfolio may be delayed or limited.
Federal income taxes. The Portfolio will be treated as a partnership for federal income tax purposes. As such, each investor in the Portfolio will be subject to taxation on its share of the Portfolio’s ordinary income and capital gains. It is the Portfolio’s policy to continue to comply with the requirements of Subchapter M of the Internal Revenue Code applicable to it. Therefore, no federal income tax provision is required.
Other. The Portfolio records security transactions on the trade date. Gains and losses realized from the sale of securities are determined on the specific identification basis. Interest income (including amortization of premium and accretion of discount) is recognized as earned.
Under a Deferred Compensation Plan (the “Plan”), non-interested Trustees may elect to defer receipt of a portion of their annual compensation. Under the Plan, deferred amounts are invested in shares of The Flex-funds. Deferred amounts remain in the Portfolio until distributed in accordance with the Plan.
2. Investment Transactions
As of June 30, 2004, the aggregate cost basis of investments for federal income tax purposes was $197,926,309.
3. Investment Advisory Fees and Other Transactions with Affiliates
Meeder Asset Management, Inc. (“MAM”), a wholly-owned subsidiary of Meeder Financial, Inc. (“Meeder”), provides the Portfolio with investment management, research, statistical and advisory services. For such services the Portfolio pays a fee at the following annual rates: 0.40% of average daily net assets up to $100 million and 0.25% of average daily net assets exceeding $100 million. During the six months ended June 30, 2004, MAM agreed to reduce $162,545 of investment advisory fees in the Portfolio.
Mutual Funds Service Co. (“MFSCo”), a wholly-owned subsidiary of Meeder, serves as accounting services agent for the Portfolio. In compensation for such services, the Portfolio pays MFSCo an annual fee equal to the greater of:
| | a. | | 0.15% of the first $10 million of average daily net assets, |
| | 0.10% | | of the next $20 million of average daily net assets, |
| | 0.02% | | of the next $50 million of average daily net assets, and |
| | 0.01% | | in excess of $80 million of average daily net assets, or |
The Flex-funds
47
Trustees and Officers
Certain trustees and officers of the Funds and Portfolio are also officers or directors of Meeder, MAM and MFSCo. The Trustees oversee the management of the Trust and the Portfolio and elect their officers. The officers are responsible for the Funds’ and Portfolio’s day-to-day operations. The Trustees’ and officers’ names, addresses, years of birth, positions held with the Trust, and length of service as a Flex-funds Trustee are listed below. Also included is each Board member’s principal occupation during, at least, the past five years. Except as indicated, each individual has held the office shown or other offices in the same company for the last five years. Except as otherwise shown, all persons named as Trustees also serve in similar capacities for all other mutual funds advised by MAM, including The Flex-funds, Meeder Advisor Funds, and the corresponding portfolios of The Flex-funds and Meeder Advisor Funds (collectively, the “Fund Complex”). Those Trustees who are “interested persons”, as defined in the 1940 Act, by virtue of their affiliation with the Fund Complex are indicated by an asterisk (*).
| | | | |
Name, Address(1), and Year of Birth
| | Position, Length of Service, and Number of Funds Overseen(2)
| | Principal Occupation During Past Five Years and Other Directorships Held(3)
|
Robert S. Meeder, Sr.* Year of Birth: 1929 | | Trustee | | Chairman of Meeder Asset Management, Inc., an investment advisor; Chairman and Director of Mutual Funds Service Co., the Fund Complex’s transfer agent; Director of Adviser Dealer Services, Inc., the Fund Complex’s Distributor. |
| | |
Milton S. Bartholomew Year of Birth: 1929 | | Trustee | | Retired; formerly a practicing attorney in Columbus, Ohio; member of the Fund Complex’s Audit Committee. |
| | |
Roger D. Blackwell Year of Birth: 1940 | | Trustee | | Professor of Marketing and Consumer Behavior, The Ohio State University; President of Blackwell Associates, Inc., a strategic consulting firm. |
| | |
Robert S. Meeder, Jr.* Year of Birth: 1961 | | Trustee and President | | President of Meeder Asset Management, Inc. |
| | |
Walter L. Ogle Year of Birth: 1937 | | Trustee | | Retired; formerly Executive Vice President of Aon Consulting, an employee benefits consulting group; member of the Fund Complex’s Audit Committee. |
| | |
Charles A. Donabedian Year of Birth: 1943 | | Trustee | | CEO, Winston Advisors, Inc., an investment advisor; Chairman of the Fund Complex’s Audit Committee. |
| | |
James W. Didion Year of Birth: 1930 | | Trustee | | Retired; formerly Executive Vice President of Core Source, Inc., an employee benefit and Workers’ Compensation administration and consulting firm (1991 – 1997). |
| | |
Jack W. Nicklaus Year of Birth: 1961 | | Trustee | | Designer, Nicklaus Design, a golf course design firm and division of The Nicklaus Companies. |
| (1) | | The address of each Trustee is 6125 Memorial Drive, Dublin, OH 43017. |
| (2) | | Each Trustee serves for an indefinite term, until his or her resignation, death, or removal. Each Trustee oversees all nine Funds in the Fund Complex. |
| (3) | | Robert S. Meeder, Sr., Robert S. Meeder, Jr., and Charles A. Donabedian serve as Trustees of the Meeder Premier Portfolios, which is managed by Meeder Asset Management, Inc., the Advisor of the Trust. Roger D. Blackwell is a Director of Anthony & Sylvan, Applied Industrial Technologies, Diamond Hill, and Max & Erma’s. Walter L. Ogle is a Director of Southtrust Bank, N.A. Florida. |
| * | | Robert S. Meeder, Sr. is deemed an “interested person” of the Trust by virtue of his position as Chairman of Meeder Asset Management, Inc., the Advisor of the Portfolio. Robert S. Meeder, Jr. is deemed an “interested person” of the Trust by virtue of his position as President of Meeder Asset Management, Inc., the Advisor of the Portfolio. |
The Statement of Additional Information includes additional information about each Trustee and is available without charge. To obtain a copy of the Statement of Addition Information, please contact your financial representative or call toll free 800-325-3539.
The Flex-funds
48
Manager and Investment Advisor:
Meeder Asset Management, Inc.
6125 Memorial Drive
P.O. Box 7177
Dublin, Ohio 43017
Subadvisor/The Total Return Utilities Fund
Miller/Howard Investments, Inc.
141 Upper Byrdcliffe Road, P.O. Box 549
Woodstock, New York 12498
Subadvisor/The Highlands Growth Fund
Sector Capital Management L.L.C.
51 Germantown Court, Suite 309
Cordova, TN 38018
Board of Trustees
Milton S. Bartholomew
Dr. Roger D. Blackwell
James Didion
Charles Donabedian
Robert S. Meeder, Sr.
Robert S. Meeder, Jr.
Jack Nicklaus II
Walter L. Ogle
Custodian
The Huntington National Bank
Columbus, Ohio 43215
Transfer Agent Dividend Disbursing Agent
Mutual Funds Service Co.
6125 Memorial Drive
Dublin, Ohio 43017
Auditors
KPMG LLP
Columbus, Ohio 43215
The Flex-funds
Managed by Meeder Asset Management Inc.
6125 Memorial Drive, Dublin Ohio, 43017
Call Toll Free 800-325-3539 | 614-760-2159
Fax: 614-766-6669 | www.flexfunds.com
Email: flexfunds@meederfinancial.com

The Flex-funds
The Money Market Fund
2004 Semiannual Report
June 30, 2004

| | | | |
| | | | | The Flex-funds |
| | | | | Managed by Meeder Asset Management, Inc. 6125 Memorial Drive, Dublin Ohio, 43017 Call Toll Free 800-325-3539 | 614-760-2159 Fax: 614-766-6669 | www.flexfunds.com Email: flexfunds@meederfinancial.com |

| | |
| The Flex-funds | | 2004 Semiannual Report | June 30, 2004 |
The Money Market Fund
Performance Perspective
| | | | | | | | | | | | | | | |
Period & Average Annual Total Returns as of June 30, 2004
| | 2004
YTD
| | | 1
year
| | | 5
years
| | | 10
years
| | | Since
Inception
| |
The Money Market Fund | | 0.41 | % | | 0.83 | % | | 3.14 | % | | 4.22 | % | | 5.26 | %1 |
Lipper’s Average General Purpose Money Market Fund3 | | 0.17 | % | | 0.35 | % | | 2.62 | % | | 3.81 | % | | 4.84 | %2 |
Current & Effective Yields | | 7-day simple yield: 0.88% | | | 7-day compound yield: 0.88% | |
| 2 | Average Annual total return from 3/31/85 to 6/30/04. Source for average money market fund data: Lipper, Inc. As of June 30, 2004, yield quotations more closely reflect the earnings of The Money Market Fund than total return quotations. |
Semiannual Market Perspective

Joseph A. Zarr
Co-Portfolio Manager

Christopher M. O’Daniel
Co-Portfolio Manager
The Flex-funds Money Market Fund continued to provide investors with competitive yields throughout the 2nd Quarter of 2004. According to iMoneyNet, Inc., the Fund ranked among the top 10 general purpose money market funds for highest 12-month yield as of June 30, 2004.
For the year-to-date, the Fund has outperformed its peer group with a return of 0.41%, compared to the 0.17% year-to-date return of the average general purpose money market fund, according to Lipper, Inc.
Investors were finally able to see the light at the end of the interest rate tunnel during the 2nd Quarter, as short-term rates began to move upward. Economic statistics revealed rapid growth in the job market, while the new concern among investors turned to inflation as opposed to the specter of deflation, which had held participants mesmerized for much of 2003.
In response to these and other market conditions, the Federal Reserve issued a quarter-point hike in the Fed funds target rate on the last day of the quarter, and suggested that future increases in rates would come at a “measured” pace. Federal Reserve watchers forwarded the argument that the Fed had fallen behind the curve by waiting so long to raise interest rates, highlighting the fact that short-term rates were already moving up at more than a measured pace, potentially leaving the projected incremental increases by Mr. Greenspan in the dust. Whether that happens to come about remains to be seen. For now, we expect gradual increases in the Fed funds target rate, continuing through the remainder of the year.
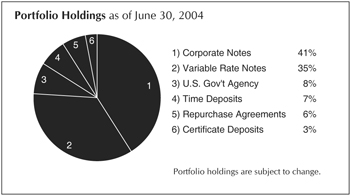
Our outlook calls for money market yields to increase through the end of the year, as they approach a more normal relationship with the rate of inflation. However, we are not among those money managers calling for an increase to the 3% level by year-end, since it may not be unlikely that the current pace of economic growth can be maintained over an extended period of time.
Past performance does not guarantee future results. Except for the current and effective yields, all performance figures represent average annual total returns for the periods ended June 30, 2004, and assume reinvestment of all dividend and capital gain distributions. The investment return and principal value of an investment will fluctuate so that an investor’s shares, when redeemed, may be worth more or less than their original cost. Expenses were reimbursed and/or management fees were waived in order to reduce the operating expenses of The Money Market Fund during the periods shown above. Investments in The Money Market Fund are neither insured nor guaranteed by the Federal Deposit Insurance Corporation or any other governmental agency. Although the Fund seeks to preserve the value of your investment at $1.00 per share, it is possible to lose money by investing in The Money Market Fund.
| 3 | An index of funds such as Lipper’s Average General Purpose Money Market Fund index includes a number of mutual funds grouped by investment objective. |
1
Schedule of Investments
June 30, 2004 (unaudited)
Money Market Portfolio
| | | | | | | | | |
Security Description
| | Coupon/
Yield
| | | Maturity
| | Principal
Amount ($)
or Shares
| | Value ($)
|
Certificate of Deposit — 2.5% | | | | |
Huntington National Bank CD | | 1.32 | % | | 08/24/04 | | 5,000,000 | | 5,000,000 |
| | | | | | | | | |
|
Total Certificate of Deposit
(Cost $5,000,000) | | | | | | | | | 5,000,000 |
| | | | | | | | | |
|
Corporate Obligations — 72.9% | | | | |
Abbott Laboratories | | 5.13 | % | | 07/01/04 | | 2,500,000 | | 2,500,000 |
Aquarium Holdings, KY** | | 1.31 | %* | | 07/01/04 | | 108,000 | | 108,000 |
Associates Corp. | | 6.63 | % | | 06/15/05 | | 618,000 | | 643,558 |
Austin Printing Co., Inc.** | | 1.40 | %* | | 07/01/04 | | 1,675,000 | | 1,675,000 |
Bath Technologies, Inc.** | | 1.35 | %* | | 07/01/04 | | 1,280,000 | | 1,280,000 |
Bank Of America Corp. | | 7.63 | % | | 04/15/05 | | 1,365,000 | | 1,431,778 |
Bank Of America Corp. | | 7.75 | % | | 08/15/04 | | 651,000 | | 656,092 |
Bear Stearns Co., Inc. | | 6.63 | % | | 10/01/04 | | 2,850,000 | | 2,888,011 |
Bear Stearns Co., Inc. | | 6.65 | % | | 12/01/04 | | 1,089,000 | | 1,113,552 |
Bear Stearns Co., Inc. | | 7.63 | % | | 02/01/05 | | 1,000,000 | | 1,036,997 |
Bear Stearns Co., Inc.** | | 1.95 | %* | | 07/01/04 | | 1,000,000 | | 1,000,874 |
Beaver Creek Enterprise** | | 1.35 | %* | | 07/01/04 | | 1,990,000 | | 1,990,000 |
Cascade Plaza Project** | | 1.35 | %* | | 07/01/04 | | 8,266,000 | | 8,266,000 |
ChevronTexaco Corp. | | 6.63 | % | | 10/01/04 | | 2,500,000 | | 2,532,387 |
Citigroup, Inc. | | 7.13 | % | | 10/15/04 | | 6,000,000 | | 6,100,283 |
Citigroup, Inc. | | 7.63 | % | | 05/01/05 | | 1,440,000 | | 1,513,855 |
Clark Grave Vault Co.** | | 1.31 | %* | | 07/01/04 | | 1,050,000 | | 1,050,000 |
Commercial Credit Co. | | 7.88 | % | | 07/15/04 | | 1,430,000 | | 1,433,599 |
Countrywide Home Loans, Inc. | | 6.84 | % | | 10/22/04 | | 4,000,000 | | 4,064,072 |
Don’s Launderers-Cleaners, Inc.** | | 1.31 | %* | | 07/01/04 | | 1,000,000 | | 1,000,000 |
DuPont, E.I.,De Nemours & Co. | | 6.75 | % | | 10/15/04 | | 1,567,000 | | 1,591,474 |
Espanola/Nambe** | | 1.40 | %* | | 07/01/04 | | 915,000 | | 915,000 |
FleetBoston Financial Corp. | | 8.00 | % | | 09/15/04 | | 4,590,000 | | 4,652,482 |
FleetBoston Financial Corp. | | 8.13 | % | | 07/01/04 | | 3,000,000 | | 3,000,000 |
Gordon Flesch Co. Project** | | 1.35 | %* | | 07/01/04 | | 900,000 | | 900,000 |
International Lease Finance Corp | | 8.15 | % | | 10/01/04 | | 1,000,000 | | 1,016,994 |
Isaac Tire, Inc.** | | 1.31 | %* | | 07/01/04 | | 840,000 | | 840,000 |
J.P. Morgan & Co., Inc. | | 7.63 | % | | 09/15/04 | | 5,375,000 | | 5,444,833 |
K.L. Morris, Inc.** | | 1.31 | %* | | 07/01/04 | | 2,075,000 | | 2,075,000 |
Keycorp | | 8.00 | % | | 07/01/04 | | 3,225,000 | | 3,225,000 |
Kiser Street, Inc.** | | 1.35 | %* | | 07/01/04 | | 1,745,000 | | 1,745,000 |
Lehman Brothers Holdings, Inc. | | 7.75 | % | | 01/15/05 | | 2,500,000 | | 2,587,348 |
Martin Wheel Co, Inc.** | | 1.60 | %* | | 07/01/04 | | 2,350,000 | | 2,350,000 |
McDonald’s Corp. | | 5.15 | % | | 07/01/04 | | 1,500,000 | | 1,500,000 |
Merrill Lynch & Co., Inc. | | 6.00 | % | | 11/15/04 | | 5,000,000 | | 5,085,092 |
Merrill Lynch & Co., Inc. | | 6.55 | % | | 08/01/04 | | 7,436,000 | | 7,468,953 |
MetLife Insurance Co.*** | | 1.21 | %* | | 07/01/04 | | 12,000,000 | | 12,000,000 |
Mubea, Inc.** | | 1.35 | %* | | 07/01/04 | | 5,825,000 | | 5,825,000 |
National Rural Utilities | | 5.25 | % | | 07/15/04 | | 4,200,000 | | 4,206,513 |
National Rural Utilities | | 6.38 | % | | 10/15/04 | | 1,104,000 | | 1,119,146 |
National Rural Utilities** | | 1.76 | %* | | 07/01/04 | | 2,000,000 | | 2,004,939 |
Osco Industries, Inc.** | | 1.40 | %* | | 07/01/04 | | 1,200,000 | | 1,200,000 |
O.K.I. Supply Co.** | | 1.31 | %* | | 07/01/04 | | 1,370,000 | | 1,370,000 |
Pfizer, Inc. | | 3.63 | % | | 11/01/04 | | 1,600,000 | | 1,611,215 |
| | | | | | | | | |
Security Description
| | Coupon/
Yield
| | | Maturity
| | Principal
Amount ($)
or Shares
| | Value ($)
|
Corporate Obligations — continued | | | | |
PPG Industries, Inc. | | 6.75 | % | | 08/15/04 | | 5,920,000 | | 5,960,992 |
Pro Tire, Inc.** | | 1.31 | %* | | 07/01/04 | | 1,010,000 | | 1,010,000 |
R.I. Lampus Co.** | | 1.40 | %* | | 07/01/04 | | 460,000 | | 460,000 |
Seariver Maritime, Inc. | | 1.13 | %* | | 07/01/04 | | 4,400,000 | | 4,400,000 |
SGS Tool Co.** | | 1.38 | %* | | 07/01/04 | | 480,000 | | 480,000 |
Shawmut Bank Connecticut NA | | 8.63 | % | | 02/15/05 | | 500,000 | | 521,866 |
Springside Corp Exchange Partners I LLC** | | 1.35 | %* | | 07/01/04 | | 2,000,000 | | 2,000,000 |
Target Corp | | 7.50 | % | | 02/15/05 | | 1,250,000 | | 1,298,476 |
Taylor Brothers Properties LLC** | | 1.31 | %* | | 07/01/04 | | 1,225,000 | | 1,225,000 |
Ameren Union Electric | | 6.88 | % | | 08/01/04 | | 2,225,000 | | 2,235,489 |
United Technologies Corp | | 6.63 | % | | 11/15/04 | | 3,029,000 | | 3,089,798 |
Wachovia Corp. | | 7.20 | % | | 08/15/04 | | 788,000 | | 793,562 |
White Castle Project** | | 1.35 | %* | | 07/01/04 | | 6,250,000 | | 6,250,000 |
| | | | | | | | | |
|
Total Corporate Obligations
(Cost $145,743,230) | | | | | | | 145,743,230 |
| | | | | | | | | |
|
U.S. Government Agency Obligations — 10.9% | | |
Federal Farm Credit Bank | | 6.30 | % | | 09/23/04 | | 500,000 | | 505,477 |
Federal Home Loan Bank | | 1.40 | % | | 04/01/04 | | 2,000,000 | | 2,000,000 |
Federal Home Loan Bank | | 1.35 | % | | 04/29/04 | | 1,000,000 | | 1,000,000 |
Federal Home Loan Bank | | 3.40 | % | | 07/19/04 | | 500,000 | | 500,508 |
Federal Home Loan Bank | | 4.13 | % | | 11/15/04 | | 1,000,000 | | 1,009,702 |
Federal Home Loan Bank | | 4.00 | % | | 12/01/04 | | 250,000 | | 252,487 |
Federal Home Loan Bank | | 1.30 | % | | 02/23/05 | | 2,000,000 | | 2,000,000 |
Federal Home Loan Bank | | 1.48 | % | | 02/24/05 | | 2,000,000 | | 2,000,000 |
Federal Home Loan Bank | | 1.35 | % | | 03/23/05 | | 2,000,000 | | 2,000,000 |
Federal Home Loan Bank | | 1.23 | %* | | 07/26/04 | | 5,000,000 | | 4,998,779 |
Freddie Mac | | 6.25 | % | | 07/15/04 | | 5,017,000 | | 5,026,520 |
Federal National Mortgage Association | | 7.40 | % | | 07/01/04 | | 500,000 | | 500,000 |
| | | | | | | | | |
|
Total U.S. Government Agency Obligations
(Cost $21,793,473) | | | | 21,793,473 |
| | | | | | | | | |
|
Variable Rate Demand Notes — 5.1% | | |
Caterpillar Financial, Inc. | | 2.00 | %* | | 07/06/04 | | 10,172,632 | | 10,172,632 |
| | | | | | | | | |
|
Total Variable Rate Demand Notes
(Cost $10,172,632) | | | | 10,172,632 |
| | | | | | | | | |
|
Demand Deposits — 1.5% | | | | |
National City Corp. | | 2.13 | % | | | | 3,041,974 | | 3,041,974 |
| | | | | | | | | |
|
Total Demand Deposits
(Cost $3,041,974) | | | | | | | | | 3,041,974 |
| | | | | | | | | |
|
Repurchase Agreements — 6.1% | | | | |
Salomon Smith Barney, Inc., 1.55%, 07/01/04, (Collateralized by $12,436,236 various Commercial Paper, at 1.41%-1.44%, due
07/13/04-08/18/04, value — $12,418,767) | | | | | 12,175,000 | | 12,175,000 |
| | | | | | | | | |
|
The Flex-funds
2
Schedule of Investments
June 30, 2004 (unaudited)
Money Market Portfolio
| | | | | | | | |
Security Description
| | Coupon/
Yield
| | Maturity
| | Principal
Amount ($)
or Shares
| | Value ($)
|
Repurchase Agreements — continued | | |
Total Repurchase Agreements (Cost $12,175,000) | | | | | | 12,175,000 |
| | | | | | | | |
|
Total Investments — 99.0%
(Cost $197,926,309) (a) | | | | | | 197,926,309 |
| | | | | | | | |
|
Other Assets less Liabilities — 1.0 | | | | | | 2,086,951 |
| | | | | | | | |
|
Total Net Assets — 100.0% | | | | | | 200,013,260 |
| | | | | | | | |
|
Trustee Deferred Compensation**** | | |
The Flex-funds Dynamic Growth Fund | | | | 1,229 | | 9,242 |
The Flex-funds Highlands Growth Fund | | | | 1,217 | | 18,279 |
The Flex-funds Muirfield Fund | | | | | | 4,288 | | 21,268 |
The Flex-funds Total Return Utilities Fund | | | | | | 1,004 | | 14,628 |
| | | | |
| | | |
|
Total Trustee Deferred Compensation
(Cost $63,417) | | | | 63,417 |
| | | | | | | | |
|
| (a) | | Cost for federal income tax and financial reporting purposes are the same. |
| * | | Variable rate security. Interest rate is as of June 30, 2004. Maturity date reflects the next rate change date. |
| ** | | Represents a restricted security purchased under Rule 144A, which is exempt from registration under the Securities Act of 1933, as amended. Security is restricted as to resale to institutional investors, but has been deemed liquid in accordance with guidelines approved by the Board of Trustees. As of June 30, 2004, securities restricted as to resale to institutional investors represented 23.8% of Total Investments. |
| *** | | Illiquid security. The sale or disposition of such security would not be possible in the ordinary course of business within seven days at approximately the value at which the Fund has valued the security. As of June 30, 2004, illiquid securities represented 6.1% of Total Investments. |
| **** | | Assets of affiliates to the Money Market Portfolio held for the benefit of the Portfolio’s Trustees in connection with the Trustee Deferred Compensation Plan. |
See accompanying notes to financial statements.
The Flex-funds
3
Statement of Assets & Liabilities
June 30, 2004 (unaudited)
| | | |
| | | The Money
Market
Fund
|
Assets | | | |
Investments in corresponding portfolio, at value | | $ | 165,992,695 |
Receivable from investment advisor | | | 5,405 |
Prepaid expenses/other assets | | | 32,939 |
Total Assets | | | 166,031,039 |
| |
Liabilities | | | |
Dividends payable | | | 10,108 |
Accrued distribution plan (12b-1) fees | | | 30,296 |
Accrued transfer agent, fund accounting, and administrative fees | | | 16,872 |
Other accrued liabilities | | | 18,884 |
Total Liabilities | | | 76,160 |
| | | | |
Net Assets | | | 165,954,879 |
| |
Net Assets | | | |
Capital | | | 165,954,879 |
Total Net Assets | | $ | 165,954,879 |
| |
Capital Stock Outstanding (indefinite number of shares authorized,
$0.10 par value) | | | 165,954,879 |
| |
Net Asset Value, Offering and Redemption Price Per Share | | $ | 1.00 |
See accompanying notes to financial statements.
The Flex-funds
4
Statement of Operations
For the Six Months Ended June 30, 2004 (unaudited)
| | | | |
| | | The Money
Market
Fund
| |
Net Investment Income (Loss) from Corresponding Portfolio | | | | |
Interest | | $ | 1,073,745 | |
Expenses net of reductions | | | (177,585 | ) |
Total Net Investment Income (Loss) from Corresponding Portfolio | | | 896,160 | |
| |
Fund Expenses | | | | |
Transfer agent | | | 67,649 | |
Administrative | | | 42,396 | |
Audit | | | 4,292 | |
Legal | | | 4,202 | |
Printing | | | 21,644 | |
Distribution plan (12b-1) | | | 169,317 | |
Postage | | | 22,554 | |
Registration and filing | | | 13,734 | |
Insurance | | | 7,972 | |
Other | | | 33,579 | |
Total Expenses Before Reductions | | | 387,339 | |
| |
Expenses reimbursed by investment advisor | | | (42,142 | ) |
Distribution plan (12b-1) expenses waived | | | (130,224 | ) |
Transfer agent expenses waived | | | (6,805 | ) |
Net Expenses | | | 208,168 | |
| | | | | |
Net Investment Income | | | 687,992 | |
| | | | | |
Net Change in Net Assets Resulting from Operations | | $ | 687,992 | |
See accompanying notes to financial statements.
The Flex-funds
5
Statements of Changes in Net Assets
For the Six Months Ended June 30, 2004 (unaudited) and the Year Ended December 31, 2003
| | | | | | | | |
| | | The Money Market Fund
| |
| | | 2004
| | | 2003
| |
Operations | | | | | | | | |
Net investment income | | $ | 687,992 | | | $ | 1,710,864 | |
Net change in net assets resulting from operations | | | 687,992 | | | | 1,710,864 | |
| | |
Distributions to Shareholders | | | | | | | | |
From net investment income | | | (687,992 | ) | | | (1,710,864 | ) |
Net change in net assets resulting from distributions | | | (687,992 | ) | | | (1,710,864 | ) |
| | |
Capital Transactions | | | | | | | | |
Issued | | | 93,776,615 | | | | 201,399,826 | |
Reinvested | | | 683,738 | | | | 1,688,792 | |
Redeemed | | | (94,112,077 | ) | | | (223,761,740 | ) |
Net change in net assets resulting from capital transactions | | | 348,276 | | | | (20,673,122 | ) |
| | | | | | | | | |
Total Change in Net Assets | | | 348,276 | | | | (20,673,122 | ) |
| | |
Net Assets — Beginning of Period | | | 165,606,603 | | | | 186,279,725 | |
Net Assets — End of Period | | $ | 165,954,879 | | | $ | 165,606,603 | |
| | | | | | | | | |
Accumulated undistributed (distributions in excess of) net investment income | | $ | — | | | $ | — | |
| | |
Share Transactions | | | | | | | | |
Issued | | | 93,776,615 | | | | 201,399,826 | |
Reinvested | | | 683,738 | | | | 1,688,792 | |
Redeemed | | | (94,112,077 | ) | | | (223,761,740 | ) |
Net change in shares | | | 348,276 | | | | (20,673,122 | ) |
See accompanying notes to financial statements.
The Flex-funds
6
Financial Highlights
For a Share Outstanding Through the Period Ended June 30, 2004 (unaudited) and
Each Fiscal Year Ended December 31,
| | | | | | | | | | | | | | | | | | | | | | | | |
The Money Market Fund | |
| | | 2004
| | | 2003
| | | 2002
| | | 2001
| | | 2000
| | | 1999
| |
Net Asset Value, Beginning of Period | | $ | 1.00 | | | $ | 1.00 | | | $ | 1.00 | | | $ | 1.00 | | | $ | 1.00 | | | $ | 1.00 | |
| | | | | | |
Income from Investment Operations | | | | | | | | | | | | | | | | | | | | | | | | |
Net investment income | | | 0.004 | | | | 0.009 | | | | 0.016 | | | | 0.040 | | | | 0.060 | | | | 0.049 | |
Total from Investment Operations | | | 0.004 | | | | 0.009 | | | | 0.016 | | | | 0.040 | | | | 0.060 | | | | 0.049 | |
| | | | | | |
Less Distributions | | | | | | | | | | | | | | | | | | | | | | | | |
From net investment income | | | (0.004 | ) | | | (0.009 | ) | | | (0.016 | ) | | | (0.040 | ) | | | (0.060 | ) | | | (0.049 | ) |
Total Distributions | | | (0.004 | ) | | | (0.009 | ) | | | (0.016 | ) | | | (0.040 | ) | | | (0.060 | ) | | | (0.049 | ) |
| | | | | | | | | | | | | | | | | | | | | | | | | |
Net Asset Value, End of Period | | $ | 1.00 | | | $ | 1.00 | | | $ | 1.00 | | | $ | 1.00 | | | $ | 1.00 | | | $ | 1.00 | |
| | | | | | |
Total Return (assumes reinvestment of distributions)(1) | | | 0.41% | | | | 0.92% | | | | 1.59% | | | | 4.10% | | | | 6.20% | | | | 4.96% | |
| | | | | | |
Ratios/Supplemental Data | | | | | | | | | | | | | | | | | | | | | | | | |
Net assets, end of period ($000) | | $ | 165,955 | | | $ | 165,607 | | | $ | 186,280 | | | $ | 221,594 | | | $ | 233,227 | | | $ | 232,023 | |
Ratio of net expenses to average
net assets (2)(3) | | | 0.46% | | | | 0.43% | | | | 0.44% | | | | 0.44% | | | | 0.41% | | | | 0.41% | |
Ratio of net investment income to average
net assets (2)(3) | | | 0.81% | | | | 0.92% | | | | 1.58% | | | | 4.00% | | | | 6.01% | | | | 4.88% | |
Ratio of expenses to average net assets before reductions (2)(3) | | | 0.83% | | | | 0.82% | | | | 0.66% | | | | 0.62% | | | | 0.60% | | | | 0.54% | |
| (1) | | Not annualized for periods of less than one full year. |
| (2) | | Annualized for periods of less than one full year. |
| (3) | | Ratio reflects reduction in corresponding portfolio. |
See accompanying notes to financial statements.
The Flex-funds
7
Notes to Financial Statements
June 30, 2004 (unaudited)
1. Organization and Significant Accounting Policies
The Flex-funds Trust (the “Trust”) was organized in 1982 and is registered under the Investment Company Act of 1940, as amended (the “1940 Act”), as a diversified, open-end management investment company. At June 30, 2004, the Trust consisted of seven separate series. The accompanying financial statements relate only to The Money Market Fund (the “Fund”). The Fund invests all of its investable assets in a corresponding open-end management investment company (the “Portfolio”). The Fund, the Portfolio into which the Fund invests and the percentage of the Portfolio owned by the Fund is as follows:
| | | | |
Fund
| | Portfolio
| | Percentage of
Portfolio Owned by
Fund as of
June 30, 2004*
|
The Money Market Fund | | Money Market Portfolio | | 83% |
| * | | There is a partner of the Portfolio that owns a de minimis position. |
The financial statements of the Portfolio, including the Schedule of Investments, are included elsewhere in this report and should be read in conjunction with the financial statements of the Fund.
Use of estimates. The preparation of financial statements in conformity with accounting principles generally accepted in the United States of America (“GAAP”) requires management to make estimates and assumptions that affect the reported amounts of assets and liabilities and disclosure of contingent assets and liabilities at the date of the financial statements and the reported amounts of revenues and expenses during the reporting period. Actual results could differ from those estimates.
Valuation of investments. The Fund records its investment in the corresponding Portfolio at value. Valuation of securities held by the Portfolio is discussed in the notes of the Portfolio’s notes to financial statements included elsewhere in this report.
Federal income taxes. It is the Fund’s policy to continue to comply with the requirements of Subchapter M of the Internal Revenue Code applicable to regulated investment companies and to distribute substantially all of its taxable income and net capital gains to its shareholders. Therefore, no federal income tax provision is required.
Distributions to shareholders. Distributions to shareholders are recorded on the ex-dividend date. The Fund declares dividends from net investment income on a daily basis and pays such dividends on a monthly basis. The Fund distributes net capital gains, if any, on an annual basis.
Distributions from net investment income and from net capital gains are determined in accordance with income tax regulations which may differ from GAAP. These differences are primarily due to deferrals of certain losses and expiring capital loss carryforwards held by the Fund’s corresponding Portfolio. Accordingly, timing differences relating to shareholder distributions are reflected in the components of net assets and permanent book and tax differences relating to shareholder distributions have been reclassified within the components of net assets.
Investment income & expenses. The Fund records daily its proportionate share of the corresponding Portfolio’s income, expenses, and realized and unrealized gains and losses. In addition, the Fund accrues its own expenses. Expenses incurred by the Trust that do not specifically relate to an individual fund of the Trust are allocated to the Fund based on the Fund’s relative net assets or other appropriate basis.
2. Agreements and Other Transactions with Affiliates
Meeder Asset Management, Inc. (“MAM”), a wholly-owned subsidiary of Meeder Financial, Inc. (“Meeder”), provides the Portfolio with investment management, research, statistical and advisory services.
Mutual Funds Service Co. (“MFSCo”), a wholly-owned subsidiary of Meeder, serves as stock transfer, dividend disbursing and shareholder services agent for the Fund. In compensation for such services, the Fund pays MFSCo an annual fee equal to the greater of $20 per active shareholder account or 0.08% of the Fund’s average daily net assets. MFSCo is entitled to receive an annual minimum fee of $4,000 from the Fund. The Fund is currently subject to an expense cap, thus the basis point fee has been reduced by 0.02%.
The Flex-funds
8
MFSCo provides the Trust with certain administrative services. In compensation for such services, the Fund pays MFSCo an annual fee equal to 0.05% of the Fund’s average daily net assets.
MAM has voluntarily agreed to reduce its fees and/or reimburse expenses, including expenses allocated from its respective Portfolio (excluding brokerage fees and commissions, taxes, interest, and extraordinary or non-recurring expenses) to the extent necessary to achieve an effective yield for the Fund that will rank in the top 10% of yields for all general purpose money market funds in 2004. Such reduction and/or reimbursement is limited to the total of fees charged to the Fund by MAM and MFSCo. For the six months ended June 30, 2004, MAM and MFSCo, collectively, reimbursed $42,142 to the Fund.
Pursuant to Rule 12b-1 of the 1940 Act, a mutual fund can adopt a written plan to pay certain expenses out of fund assets relating to the sale and distribution of its shares. The Fund has adopted a distribution plan that limits the Fund, on an annual basis, to pay 0.20% of average daily net assets for such expenses.
3. Federal Tax Information
The Fund paid dividends, characterized for tax purposes as ordinary income, of $1,711,417 and $3,571,277 during the years ended December 31, 2003 and December 31, 2002, respectively.1
As of December 31, 2003, the components of accumulated earnings/(deficit) on a tax basis for the Fund were as follows:
| | | | | | | | | | | | | | | | |
Year
| | Undistributed
Ordinary
Income
| | Dividends
Payable
| | | Accumulated
Capital and
Other Gains
and (Losses)
| | Unrealized
Appreciation/
(Depreciation)
| | Total
Accumulated
Earnings/
(Deficit)
|
| 2003 | | $ | 13,594 | | $ | (13,594 | ) | | $ | — | | $ | — | | $ | — |
| 1 | | Total dividends paid may differ from the amount reported in the Statements of Changes in Net Assets because for tax purposes dividends are recognized when actually paid. |
4. Subsequent Event
The Flex-funds Money Market Fund and the Institutional Fund of the Meeder Advisor Funds Trust, which are managed by Meeder Asset Management, Inc., are organized in the master-feeder structure. Under this structure both funds, having the same investment objective, invest in the same master portfolio, the Money Market Portfolio. The Board of Trustees has approved the liquidation, on or about December 31, 2004, of the Institutional Fund. In conjunction with this liquidation, the Board of Trustees has also approved the termination, on or about December 31, 2004, of the Money Market Portfolio. The shareholders of the Institutional Fund will have the opportunity to invest their liquidation proceeds in a new class of shares of The Money Market Fund, which will have a virtually identical investment objective as the Institutional Fund. Consequently, on or about December 31, 2004, The Flex-funds Money Market Fund will be a stand-alone fund offering two classes of shares and will continue to be managed by Meeder Asset Management, Inc.
The Flex-funds
9
Statement of Assets & Liabilities
June 30, 2004 (unaudited)
| | | |
| | | Money Market Portfolio
|
Assets | | | |
Investments, at value* | | $ | 185,751,309 |
Repurchase agreements, at value* | | | 12,175,000 |
Trustee deferred compensation investments, at value | | | 63,417 |
Cash | | | 400 |
Interest and dividend receivable | | | 2,123,840 |
Prepaid expenses/other assets | | | 2,456 |
Total Assets | | | 200,116,422 |
| |
Liabilities | | | |
Payable for Trustee Deferred Compensation Plan | | | 63,417 |
Payable to investment advisor | | | 28,708 |
Accrued fund accounting fees | | | 4,716 |
Other accrued liabilities | | | 6,321 |
Total Liabilities | | | 103,162 |
| | | | |
Total Net Assets | | $ | 200,013,260 |
| | | | |
* Investments, at cost | | $ | 197,926,309 |
See accompanying notes to financial statements.
The Flex-funds
10
Statement of Operations
For the Six Months Ended June 30, 2004 (unaudited)
| | | | |
| | | Money
Market
Portfolio
| |
Investment Income | | | | |
Interest | | $ | 1,275,669 | |
Total Investment Income | | | 1,275,669 | |
| |
Expenses | | | | |
Investment advisor | | | 325,936 | |
Fund accounting | | | 28,453 | |
Trustee | | | 4,144 | |
Audit | | | 10,972 | |
Custodian | | | 2,940 | |
Legal | | | 1,232 | |
Total Expenses Before Reductions | | | 373,677 | |
| |
Investment advisor fees waived | | | (162,545 | ) |
Total Net Expenses | | | 211,132 | |
| | | | | |
Net Investment Income | | | 1,064,537 | |
| | | | | |
Net Change in Net Assets Resulting from Operations | | $ | 1,064,537 | |
See accompanying notes to financial statements.
The Flex-funds
11
Statements of Changes in Net Assets
For the Six Months Ended June 30, 2004 (unaudited) and the Year Ended December 31, 2003
| | | | | | | | |
| | | Money Market Portfolio
| |
| | | 2004
| | | 2003
| |
Operations | | | | | | | | |
Net investment income | | $ | 1,064,537 | | | $ | 2,417,678 | |
Net change in net assets resulting from operations | | | 1,064,537 | | | | 2,417,678 | |
| | |
Transactions of Investors’ Beneficial Interests | | | | | | | | |
Contributions | | | 125,112,095 | | | | 245,964,298 | |
Withdrawals | | | (120,509,339 | ) | | | (264,913,444 | ) |
Net change in net assets resulting from transactions of investors’ beneficial interests | | | 4,602,756 | | | | (18,949,146 | ) |
| | | | | | | | | |
Total Change in Net Assets | | | 5,667,293 | | | | (16,531,468 | ) |
| | |
Net Assets — Beginning of Period | | | 194,345,967 | | | | 210,877,435 | |
Net Assets — End of Period | | $ | 200,013,260 | | | $ | 194,345,967 | |
See accompanying notes to financial statements.
The Flex-funds
12
Financial Highlights
Ratios/Supplementary Data For The Period Ended June 30, 2004 (unaudited) and Each Fiscal Year Ended December 31,
Money Market Portfolio
| | | | | | | | | | | | | | | | | | |
| | | 2004
| | 2003
| | 2002
| | 2001
| | 2000
| | 1999
|
| | | | | | |
Total Return(1) | | | 0.51% | | | 1.17% | | | 1.83% | | | 4.54% | | | 6.61% | | | 5.37% |
| | | | | | |
Net assets, end of period ($000) | | $ | 200,013 | | $ | 194,346 | | $ | 210,877 | | $ | 270,330 | | $ | 297,206 | | $ | 1,104,197 |
Ratio of net expenses to average net assets(2) | | | 0.21% | | | 0.18% | | | 0.20% | | | 0.21% | | | 0.19% | | | 0.18% |
Ratio of net investment income to average net assets(2) | | | 1.06% | | | 1.16% | | | 1.83% | | | 4.26% | | | 6.05% | | | 5.07% |
Ratio of expenses to average net assets before reductions(2) | | | 0.37% | | | 0.36% | | | 0.36% | | | 0.35% | | | 0.30% | | | 0.30% |
| (1) | | Not annualized for periods of less than one full year. |
| (2) | | Annualized for periods of less than one full year. |
See accompanying notes to financial statements.
The Flex-funds
13
Notes to Financial Statements
June 30, 2004 (unaudited)
1. Organization and Significant Accounting Policies
The Money Market Fund (the “Fund”) invests all of its investable assets in a corresponding open-end management investment company (a “Portfolio”) having the same investment objective as the Fund. The Portfolio is registered under the Investment Company Act of 1940, as amended (the “1940 Act”), as a no-load, open-ended management investment company, which was organized as a trust under the laws of the State of New York. For federal income tax purposes the Portfolio qualifies as a partnership, and each investor in the Portfolio is treated as the owner of its proportionate share of the net assets, income, expenses, and realized and unrealized gains and losses of the Portfolio. Accordingly, as a “pass-through” entity, the Portfolio pays no income dividend or capital gain distribution.
Use of estimates. The preparation of financial statements in conformity with accounting principles generally accepted in the United States of America (“GAAP”) requires management to make estimates and assumptions that affect the reported amounts of assets and liabilities and disclosure of contingent assets and liabilities at the date of the financial statements and the reported amounts of revenues and expenses during the reporting period. Actual results could differ from those estimates.
Security valuation. Money market securities held in the Portfolio are valued at amortized cost, which approximates value. In compliance with Rule 2a-7 of the 1940 Act, the amortized values are compared to prices obtained from independent pricing services that use valuation techniques approved by the Board of Trustees (“Trustees”).
Repurchase agreements. The Portfolio may engage in repurchase agreement transactions whereby the Portfolio takes possession of an underlying debt instrument subject to an obligation of the seller to repurchase the instrument from the Portfolio and an obligation of the Portfolio to resell the instrument at an agreed upon price and term. At all times, the Portfolio maintains the value of collateral, including accrued interest, at least 100% of the amount of the repurchase agreement, plus accrued interest. If the seller defaults or the fair value of the collateral declines, realization of the collateral by the Portfolio may be delayed or limited.
Federal income taxes. The Portfolio will be treated as a partnership for federal income tax purposes. As such, each investor in the Portfolio will be subject to taxation on its share of the Portfolio’s ordinary income and capital gains. It is the Portfolio’s policy to continue to comply with the requirements of Subchapter M of the Internal Revenue Code applicable to it. Therefore, no federal income tax provision is required.
Other. The Portfolio records security transactions on the trade date. Gains and losses realized from the sale of securities are determined on the specific identification basis. Interest income (including amortization of premium and accretion of discount) is recognized as earned.
Under a Deferred Compensation Plan (the “Plan”), non-interested Trustees may elect to defer receipt of a portion of their annual compensation. Under the Plan, deferred amounts are invested in shares of The Flex-funds. Deferred amounts remain in the Portfolio until distributed in accordance with the Plan.
2. Investment Transactions
As of June 30, 2004, the aggregate cost basis of investments for federal income tax purposes was $197,926,309.
3. Investment Advisory Fees and Other Transactions with Affiliates
Meeder Asset Management, Inc. (“MAM”), a wholly-owned subsidiary of Meeder Financial, Inc. (“Meeder”), provides the Portfolio with investment management, research, statistical and advisory services. For such services the Portfolio pays a fee at the following annual rates: 0.40% of average daily net assets up to $100 million and 0.25% of average daily net assets exceeding $100 million. During the six months ended June 30, 2004, MAM agreed to reduce $162,545 of investment advisory fees in the Portfolio.
Mutual Funds Service Co. (“MFSCo”), a wholly owned subsidiary of Meeder, serves as accounting services agent for the Portfolio. In compensation for such services, the Portfolio pays MFSCo an annual fee equal to the greater of:
| | a. | | 0.15% of the first $10 million of average daily net assets, 0.10% of the next $20 million of average daily net assets, 0.02% of the next $50 million of average daily net assets, and 0.01% in excess of $80 million of average daily net assets, or |
The Flex-funds
14
Trustees and Officers
Certain trustees and officers of the Portfolio are also officers or directors of Meeder, MAM and MFSCo. The Trustees oversee the management of the Trust, the Fund, and the Portfolio and elect their officers. The officers are responsible for the Fund’s and the Portfolio’s day-to-day operations. The Trustees’ and officers’ names, addresses, years of birth, positions held with the Trust, and length of service as a Flex-funds Trustee are listed below. Also included is each Board member’s principal occupation during, at least, the past five years. Except as indicated, each individual has held the office shown or other offices in the same company for the last five years. Except as otherwise shown, all persons named as Trustees also serve in similar capacities for all other mutual funds advised by MAM, including The Flex-funds, Meeder Advisor Funds, and the corresponding portfolios of The Flex-funds and Meeder Advisor Funds (collectively, the “Fund Complex”). Those Trustees who are “interested persons”, as defined in the 1940 Act, by virtue of their affiliation with the Fund Complex are indicated by an asterisk (*).
| | | | |
Name, Address(1), and Year of Birth
| | Position, Length of Service, and Number of Funds Overseen(2)
| | Principal Occupation During
Past Five Years and Other Directorships Held(3)
|
Robert S. Meeder, Sr.* Year of Birth: 1929 | | Trustee | | Chairman of Meeder Asset Management, Inc., an investment advisor; Chairman and Director of Mutual Funds Service Co., the Fund Complex’s transfer agent; Director of Adviser Dealer Services, Inc., the Fund Complex’s Distributor. |
Milton S. Bartholomew Year of Birth: 1929 | | Trustee | | Retired; formerly a practicing attorney in Columbus, Ohio; member of the Fund Complex’s Audit Committee. |
Roger D. Blackwell Year of Birth: 1940 | | Trustee | | Professor of Marketing and Consumer Behavior, The Ohio State University; President of Blackwell Associates, Inc., a strategic consulting firm. |
Robert S. Meeder, Jr.* Year of Birth: 1961 | | Trustee and President | | President of Meeder Asset Management, Inc. |
Walter L. Ogle Year of Birth: 1937 | | Trustee | | Retired; formerly Executive Vice President of Aon Consulting, an employee benefits consulting group; member of the Fund Complex’s Audit Committee. |
Charles A. Donabedian Year of Birth: 1943 | | Trustee | | CEO, Winston Advisors, Inc., an investment advisor; Chairman of the Fund Complex’s Audit Committee. |
James W. Didion Year of Birth: 1930 | | Trustee | | Retired; formerly Executive Vice President of Core Source, Inc., an employee benefit and Workers’ Compensation administration and consulting firm (1991 – 1997). |
Jack W. Nicklaus Year of Birth: 1961 | | Trustee | | Designer, Nicklaus Design, a golf course design firm and division of The Nicklaus Companies. |
| (1) | | The address of each Trustee is 6125 Memorial Drive, Dublin, OH 43017. |
| (2) | | Each Trustee serves for an indefinite term, until his or her resignation, death, or removal. Each Trustee oversees all nine Funds in the Fund Complex. |
| (3) | | Robert S. Meeder, Sr., Robert S. Meeder, Jr., and Charles A. Donabedian serve as Trustees of the Meeder Premier Portfolios, which is managed by Meeder Asset Management, Inc., the Advisor of the Trust. Roger D. Blackwell is a Director of Anthony & Sylvan, Applied Industrial Technologies, Diamond Hill, and Max & Erma’s. Walter L. Ogle is a Director of Southtrust Bank, N.A. Florida. |
| * | | Robert S. Meeder, Sr. is deemed an “interested person” of the Trust by virtue of his position as Chairman of Meeder Asset Management, Inc., the Advisor of the Portfolio. Robert S. Meeder, Jr. is deemed an “interested person” of the Trust by virtue of his position as President of Meeder Asset Management, Inc., the Advisor of the Portfolio. |
The Statement of Additional Information includes additional information about each Trustee and is available without charge. To obtain a copy of the Statement of Addition Information, please contact your financial representative or call toll free 800-325-3539.
The Flex-funds
15
Manager and Investment Advisor:
Meeder Asset Management, Inc
6125 Memorial Drive
P.O. Box 7177
Dublin, Ohio 43017
Board of Trustees
Milton S. Bartholomew
Dr. Roger D. Blackwell
James Didion
Charles Donabedian
Robert S. Meeder, Sr.
Robert S. Meeder, Jr.
Jack Nicklaus II
Walter L. Ogle
Custodian
The Huntington National Bank
Columbus, Ohio 43215
Transfer Agent Dividend Disbursing Agent
Mutual Funds Service Co.
6125 Memorial Drive
Dublin, Ohio 43017
Auditors
KPMG LLP
Columbus, Ohio 43215
The Flex-funds
Managed by Meeder Asset Management, Inc.
6125 Memorial Drive, Dublin Ohio, 43017
Call Toll Free 800-325-3539 | 614-760-2159
Fax: 614-766-6669 | www.flexfunds.com
Email: flexfunds@meederfinancial.com
Item 2. Code of Ethics.
The registrant has adopted a code of ethics that applies to the registrant’s principal executive officer, principal financial officer, comptroller or principal accounting officer, and any person who performs a similar function.
Item 3. Audit Committee Financial Expert.
Currently, The Flex-funds (the “Funds”) do not have an Audit Committee member who possesses all of the attributes required to be an “audit committee financial expert” as defined in instruction 2(b) of Item 3 of Form N-CSR. However, the Board of Trustees believes that each member of the Audit Committee has substantial experience relating to the review of financial statements and the operations of audit committees. Accordingly, the Board of Trustees believes that the members are qualified to evaluate the Funds’ financial statements, supervise the Funds’ preparation of its financial statements, and oversee the work of the Funds’ independent auditors. The Board of Trustees also believes that, although no single Audit Committee member possesses all of the attributes required to be an “audit committee financial expert”, the Audit Committee members collectively as a group possess the attributes required to be an “audit committee financial expert.”
Item 4. Principal Accountant Fees and Services.
(a) – (d) Aggregate fees billed to the registrant for the last two fiscal years for professional services rendered by the registrant’s principal accountant were as follows:
| | | | | | |
| | | 2004
| | 2003
|
Audit Fees | | $ | 51,309 | | $ | 54,196 |
Audit-Related Fees | | | — | | | — |
Tax Fees | | | 19,260 | | | 20,153 |
All Other Fees | | | 5,500 | | | 2,027 |
Audit fees include amounts related to the audit of the registrant’s annual financial statements and services normally provided by the accountant in connection with statutory and regulatory filings. Audit-related fees include amounts reasonably related to the performance of the audit of the registrant’s financial statements. Tax fees include amounts related to tax compliance, tax planning, and tax advice. All other fees include amounts related to the registrant’s annual filing of Form N1A.
(e)(1) A purpose of the Audit Committee is to approve the engagement of the registrant’s independent auditors (i) to render audit and non-audit services for the registrant in accordance with Rule 2-01(c)(7)(i) of Regulation S-X, subject to the waiver provisions set forth in Rule 2-01(c)(7)(i)(C) of Regulation S-X, and (ii) to render non-audit services for the registrant’s investment advisors (other than a sub-advisor whose role is primarily portfolio management and is subcontracted or overseen by another investment advisor) and any other entity controlling by, or under common control with the investment advisor that provides ongoing services to the registrant, in each case under (ii) if the engagement relates directly to the operations and financial reporting of the registrant, in accordance with Rule 2-01(c)(7)(ii) of Regulation S-X, subject to waiver provisions set forth in Rule 2-01(c)(7)(ii) of Regulation S-X.
(e)(2) 100% of services included in (b) – (d) above were approved pursuant to Rule 2-01(c)(7)(i)(C) of Regulation S-X.
(f) Not applicable.
(g) The aggregate fees billed for the most recent fiscal year and the preceding fiscal year by the registrant’s principal accountant for non-audit services rendered to the registrant, its investment advisor, and any entity controlling, controlled by, or under common control with the investment advisor that provides ongoing services to the registrant were $5,000 and $14,000, respectively.
(h) Not applicable.
Items 5. Audit Committee of Listed Registrants.
Not applicable.
Item 6. [Reserved]
Item 7. Disclosure of Proxy Voting Policies and Procedures for Closed-End Management Investment Companies.
Not applicable.
Item 8. [Reserved]
Item 9. Controls and Procedures.
(a) Based on our evaluation conducted within 90 days of the filing date, hereof, the design and operation of the registrant’s disclosure controls and procedures are effective to ensure that material information relating to the registrant is made known to the certifying officers by others within the appropriate entities, particularly during the period in which Forms N-CSR are being prepared, and the registrant’s disclosure controls and procedures allow timely preparation and review of the information for the registrant’s Form N-CSR and the officer certifications of such Form N-CSR.
(b) There were no significant changes in the registrant’s internal controls or in other factors that could significantly affect these controls subsequent to the date of their evaluation, including any corrective actions with regard to significant deficiencies and material weaknesses.
Item 10. Exhibits.
(a)(1) Code of Ethics filed herewith as EX-99.CODE ETH.
(a)(2) A separate certification for each principal executive and principal financial officer of the registrant as required by Rule 30a-2(a) under the Act(17 CFR270.30a-2(a)). Filed herewith as EX-99.CERT.
(b) Certifications of principal executive officer and principal financial officer, under Section 906 of the Sarbanes-Oxley Act of 2002, and 18 U.S.C. ss.1350. Filed herewith as EX-99.906 CERT.
SIGNATURES
Pursuant to the requirements of the Securities Exchange Act of 1934 and the Investment Company Act of 1940, the registrant has duly caused this report to be signed on its behalf by the undersigned, thereunto duly authorized.
The Flex-funds
| | |
| By: | | /s/ Bruce E. McKibben
|
| | | Bruce E. McKibben, Treasurer |
Date: September 1, 2004
Pursuant to the requirements of the Securities Exchange Act of 1934 and the Investment Company Act of 1940, this report has been signed below by the following persons on behalf of the registrant and in the capacities and on the dates indicated.
| | |
| By: | | /s/ Bruce E. McKibben
|
| | | Bruce E. McKibben, Treasurer |
Date: September 1, 2004
| | |
| By: | | /s/ Robert S. Meeder, Jr.
|
| | | Robert S. Meeder, Jr., President |
Date: September 1, 2004