UNITED STATES
SECURITIES AND EXCHANGE COMMISSION
Washington, D.C. 20549
FORM N-CSR
CERTIFIED SHAREHOLDER REPORT
OF REGISTERED MANAGEMENT INVESTMENT COMPANIES
Investment Company Act file number 811-3462
The Flex-funds Trust
6125 Memorial Drive
Dublin, OH 43017
Bruce McKibben
c/o The Flex-funds Trust
6125 Memorial Drive
Dublin, OH 43017
Registrant’s telephone number, including area code: 800-325-3539
Date of fiscal year end: December 31, 2006
Date of reporting period: June 30, 2006
| Item 1. | Report to Stockholders. |
The Flex-funds
2006 Semiannual Report
June 30, 2006

| | | | |
| | | | The Flex-funds |
| | |
| | | | Managed by Meeder Asset Management, Inc. |
| | | | 6125 Memorial Drive, Dublin Ohio, 43017 |
| | | | Call Toll Free 800-325-3539 | 760-2159 |
| | | | Fax: 614-766-6669 | www.flexfunds.com |
| | | | Email: flexfunds@meederfinancial.com |
Performance Review
Period & Average Annual Total Returns as of June 30, 2006
| | | | | | | | | | | | | | | | | | |
| | | Year
to-date | | | 1 year | | | 3
years | | | 5
years | | | 10
years | | | Since
inception | |
EQUITY FUNDS | | | | | | | | | | | | | | | | | | |
The Total Return Utilities Fund | | 5.47 | % | | 10.90 | % | | 16.03 | % | | 1.17 | % | | 8.05 | % | | 9.14 | %1 |
The Quantex Fund™* | | 2.93 | % | | 7.72 | % | | 10.57 | % | | 1.15 | % | | 5.91 | % | | 7.31 | %2 |
| | | | | | |
FUNDS OF FUNDS | | | | | | | | | | | | | | | | | | |
The Aggressive Growth Fund | | 2.50 | % | | 9.22 | % | | 10.98 | % | | 0.73 | % | | — | | | -4.62 | %3 |
The Dynamic Growth Fund | | 4.59 | % | | 10.74 | % | | 11.36 | % | | 2.02 | % | | — | | | -1.90 | %4 |
The Focused Growth Fund | | — | | | — | | | — | | | — | | | — | | | -2.50 | %5 |
The Muirfield Fund® | | 2.91 | % | | 8.06 | % | | 9.72 | % | | 3.82 | % | | 5.20 | % | | 8.43 | %6 |
The Defensive Growth Fund | | — | | | — | | | — | �� | | — | | | — | | | -3.30 | %7 |
| | | | | | |
FIXED INCOME FUND | | | | | | | | | | | | | | | | | | |
The U.S. Government Bond Fund | | 0.30 | % | | -0.50 | % | | -0.46 | % | | 1.50 | % | | 3.50 | % | | 5.54 | %8 |
| | | | | | |
MONEY MARKET FUNDS | | | | | | | | | | | | | | | | | | |
The Money Market Fund - Retail Class** | | 2.15 | % | | 3.87 | % | | 2.16 | % | | 2.02 | % | | 3.70 | % | | 5.03 | %9 |
Current & Effective Yields | | 7-day simple: 4.76% | | | 7-day compound: 4.87% | |
The Money Market Fund - Institutional Class ** | | 2.23 | % | | 4.01 | % | | — | | | — | | | — | | | 3.49 | %10 |
Current & Effective Yields | | 7-day simple: 4.90% | | | 7-day compound: 5.01% | |
| | | | | | |
BENCHMARK INDICES | | | | | | | | | | | | | | | | | | |
Dow Jones Industrial Average | | 5.22 | % | | 11.09 | % | | 9.86 | % | | 3.43 | % | | 9.13 | % | | | |
S&P 500 Index | | 2.71 | % | | 8.63 | % | | 11.20 | % | | 2.49 | % | | 8.31 | % | | | |
NASDAQ Composite Index | | -1.08 | % | | 6.48 | % | | 10.91 | % | | 0.66 | % | | 6.70 | % | | | |
S&P Mid-Cap 400 Index | | 4.24 | % | | 12.99 | % | | 18.11 | % | | 9.28 | % | | 13.80 | % | | | |
Russell 2000 Small-Cap Index | | 8.27 | % | | 14.67 | % | | 18.75 | % | | 8.58 | % | | 9.11 | % | | | |
S&P 500 Utilities Index | | 4.47 | % | | 5.92 | % | | 17.61 | % | | 1.23 | % | | 6.92 | % | | | |
Lehman Bros. Intermediate-Term Government/Credit Index | | -0.18 | % | | -0.19 | % | | 1.49 | % | | 4.61 | % | | 5.80 | % | | | |
To obtain a prospectus containing more complete information about The Flex-funds, including fees and other expenses that apply to a continued investment in the Funds, you may call The Flex-funds at Toll Free (800)325-3539, visit us online at www.flexfunds.com, or write P.O. Box 7177, Dublin OH 43017. Please read the prospectus carefully before investing.
Past performance does not guarantee future results. All performance figures represent total returns and average annual total returns for the periods ended June 30, 2006, and assumes reinvestment of all dividend and capital gain distributions. The investment return and principal value of an investment will fluctuate so that an investor’s shares, when redeemed, may be worth more or less than their original cost. Management fees were waived and/or expenses reimbursed in order to reduce the operating expenses of the Funds during all periods shown above. Source for index data: Bloomberg.
| * | Average annual total returns for The Quantex Fund™ for the periods prior to April 1, 2005 reflect a combination of the Fund’s current quantitative investment strategy and the Fund’s previous investment strategy. |
| ** | An investment in The Money Market Fund is not insured or guaranteed by the Federal Deposit Insurance Corporation or any other governmental agency. Although The Money Market Fund seeks to preserve the value of your investment at $1.00 per share, it is possible to lose money by investing in the Fund. Yield quotations more closely reflect the current earnings of The Money Market Fund than do total return quotations. |
| 1 | Inception Date: 6/21/95. |
| 3 | Inception Date: 2/29/00. |
| 4 | Inception Date: 2/29/00. |
| 5 | Inception Date: 1/31/06. |
| 6 | Inception Date: 8/10/88. |
| 7 | Inception Date: 1/31/06. |
| 9 | Inception Date: 3/27/85. |
| 10 | Inception Date: 12/28/04. |
| | |
| The Flex-funds | | 2006 Semiannual Report | June 30, 2006 |
Letter to Shareholders
In our previous semiannual report to the shareholders of The Flex-funds, dated June 30, 2005, I discussed a company-wide initiative our firm had undertaken to improve our investment processes, our management team, and our operational procedures. The goal of this initiative was to enhance the overall performance of The Flex-funds for our shareholders.
I am pleased to report that with these improvements in place, a majority of our funds outperformed their benchmarks over the last six-month and one-year periods.
For example, The Dynamic Growth Fund outperformed its benchmark, the S&P 500 Index, for the six-month and one-year periods ended of June 30, 2006. The Fund returned 4.59% for the semiannual period, compared with the 2.71% six-month return of the S&P 500 Index. Over the last year, the Fund gained 10.74%, significantly outpacing the 8.63% 12-month return of the S&P 500 Index.
The Aggressive Growth Fund also outperformed its benchmark index, the NASDAQ Composite Index, over the last six-month and one-year periods ended June 30, 2006. The Fund returned 2.50% for the semiannual period, compared with the -1.08% six-month return for the NASDAQ Composite Index. Over the last year, the Fund returned 9.22%, significantly outpacing the 6.48% 12-month return of the NASDAQ Composite Index.
I am also pleased to report that both The Dynamic Growth Fund and The Aggressive Growth Fund have either performed better than or in line with their respective benchmark indices over the 3-year and 5-year periods ended June 30, 2006. The Performance Review table at right includes the longer-term returns of these funds along with the returns of their benchmark indicies for the same periods.
The Total Return Utilities Fund bested its benchmark index, the S&P 500 Utilities Index, for the six-month and one-year periods ended June 30, 2006. For the semiannual period, the Fund returned 5.47%, compared with the 4.47% return of its benchmark. For the one year period, the Fund returned 10.90%, significantly outpacing its benchmark’s 5.92% return for the same period.
The Muirfield Fund performed in line with its benchmark index, the S&P 500 Index, over the last six-month and one-year periods ended June 30, 2006. The Fund returned 2.91% for the semiannual period, compared with the 2.71% six-month return of the S&P 500 Index. Because the Fund sometimes is either partially or fully invested in cash equivalents, we believe a more appropriate comparison of performance is a blended index consisting of 60% of the S&P 500 Index and 40% of the 90-day U.S. Treasury Bill. For the first six months of this year, The Muirfield Fund outperformed this blended index, which returned 2.61% for the six-month period.
The Muirfield Fund continues to perform well relative to its benchmarks over longer-term periods as well. For the 5-year period ended June 30, 2006, the Fund returned 3.82% on an annualized basis, compared with the 2.49% annualized return of the S&P 500 Index and the 2.76% annualized return of the blended index over the same period.
Finally, The Flex-funds Money Market Fund has extended its track record as one of the leading general-purpose money market funds in its peer group. The Fund continued to rank among the top 10% of all general-purpose money market funds monitored by iMoneyNet, Inc. for total return for all 12-month periods since the Fund’s inception. That is a 21-year track record of success. For the six-month period, the Fund has outperformed its peer group with a 2.15% total return, compared with the 1.89% total return for the average general purpose money market fund, according to Lipper, Inc.
A performance review for each of The Flex-funds, along with a commentary on the decisions we made with your investments in our portfolios, is included on the following pages of this Semiannual Report. In addition, we have included a financial market review to provide some background on the investing conditions that we and other investment managers faced during the first half of 2006.
Semiannual Financial Market Review
“Most [Federal Reserve Board] members thought that the end of the tightening process was likely to be near, and some expressed concerns about the dangers of tightening too much, given the lags in the effects of the policy.”
So read the minutes of the March 27-28, 2006 Federal Open Market Committee (FOMC) meeting – the first under new Federal Reserve Chairman Ben Bernanke - during which the Fed raised its target rate for the 15th
Continued on Page 2.
| | |
| The Flex-funds 2006 Semiannual Report | June 30, 2006 | | Page 1 |
| | |
| The Flex-funds | | 2006 Semiannual Report | June 30, 2006 |
Letter to Shareholders Continued from Page 1.
consecutive time since June 2004 to 4.75%. The release of the meeting minutes on April 18th sparked a strong one-day rally in the stock market. Perhaps more importantly, this message from the country’s high priests of monetary policy gave credence to the belief among investors that the Fed’s current rate-tightening cycle may draw to a close after the next FOMC meeting. In fact, upon release of the March meeting minutes, the Fed funds futures market pegged the likelihood of a June rate hike to less than 30%.
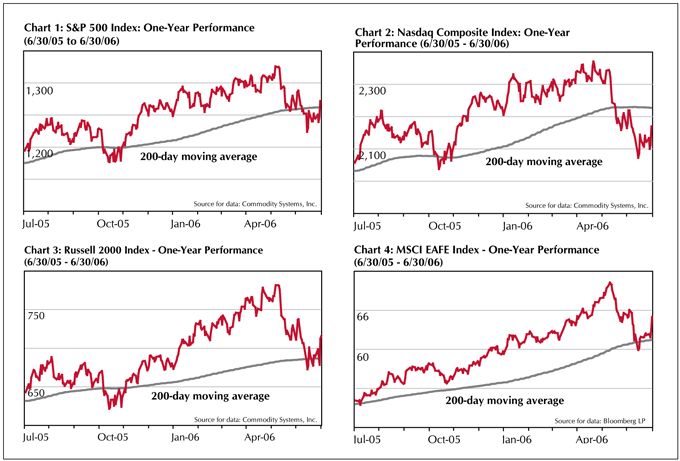
For much of the first six months of the year, speculation swirled about future Federal Reserve decisions on interest rates. As the apparent likelihood of a pause in the cycle grew, so did investors’ appetite for risk and, by extension, the on-going bull market for stocks. Building on the gains achieved in the first three months of 2006, the stock market surged to multi-year highs in April and early May. The venerable Dow Jones Industrial Average even closed in on its all-time record, climbing to within 80 points of its peak in 2000, a height last seen in the days of the tech-stock mania before the bursting of the dot-com bubble. The broader S&P 500 and Nasdaq Composite indices also performed strongly in the first half of the 2nd Quarter and eclipsed their respective four-year highs (see Charts 1 & 2 above.) although both market averages were still well below their bubble-era records.
Small-cap stocks continued to push the record bar higher and outpace their large-cap brethren in the early weeks of the 2nd Quarter. The Russell 2000 Index of small-cap stocks reached an all-time high of 781 on May 5th. Stocks on the international stage also performed well, with the MSCI EAFE Index rising 8.5% from the end of the 1st Quarter to its year-to-date peak on May 9. (See Charts 3 & 4 above.)
Investor demand for stocks was fed not only by the Federal Reserve but also by reports of robust economic growth, strong corporate profits, and relatively tame inflation. The U.S gross domestic product (GDP), a measure of economic growth, rose 5.6% in the 1st Quarter. This surge in growth reflected much of the economic activity of the post-Hurricane Katrina recovery efforts, but still was the strongest rate of growth since 2003. The 1st Quarter also saw an average 14% increase in profits for large U.S. corporations according to Thomson Financial, marking the 11th straight
| | |
| Page 2 | | The Flex-funds 2006 Semiannual Report | June 30, 2006 |
| | |
| The Flex-funds | | 2006 Semiannual Report | June 30, 2006 |
quarter of double-digit corporate profit increases. Even higher energy prices and geopolitical uncertainty did little to curb investors’ hunger for stocks.
But midway through the 2nd Quarter, the feast ended. Across the board, the major equity market indices fell, leaving stock investors with few places to hide. The S&P 500 Index tumbled nearly 4% from its peak through the end of the quarter, while the Nasdaq Composite Index slumped over 8%. The small-cap Russell 2000 Index outpaced its larger-cap siblings on the way down, falling more than 7% from its record high to the end of the quarter. The MSCI EAFE Index of international stocks lost over 7% from its year-to-date peak as well. By quarter-end, the decline erased a significant portion of the year-to-date gains achieved by the major stock indices and left many investors with the prospect of looking at their first quarterly losses since the 1st Quarter of 2005.
What happened? Naturally, there was a confluence of factors at work that impacted market performance in the 2nd Quarter. The shift in expectations about future Fed rate hikes clearly was one of them. Other factors included a surge in inflation, a mixed economic outlook, a slightly inverted yield curve, and an aging bull market.
Inflation surges: With reports of strong economic growth, healthy corporate profits, and vigorous consumer spending – and not to forget higher energy prices – investors feared that a likely uptick in inflation was just around the corner. Was it wise, some wondered, for the Fed to consider a pause in interest rate hikes when inflationary pressures were threatening to boil over? These fears and doubts were manifested in June with the release of the May Consumer Price Index (CPI). This report revealed a jump in the annual pace of inflation to 4.2%, surpassing the market’s own dire expectation of a 3.9% increase. (See Chart 5 below.)
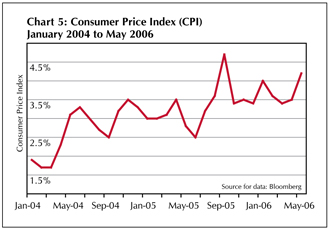
The rise in CPI took the guesswork out of the Fed’s decision to raise interest rates for the 17th consecutive time on June 29th. In fact, the strong jump in inflation also raised the probability of more rate hikes at future Federal Open Market Committee meetings in the coming months.
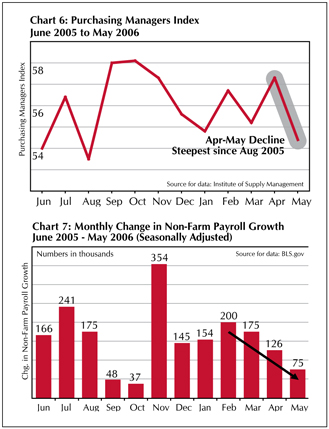
Mixed economic outlook: While corporate profits, consumer spending, and strong GDP figures stood out as bright spots, other indicators portrayed a different view for the U.S. economy. A host of market analysts – us included – have been keeping a careful watch for signs of decelerating growth in the economy, noting that the current expansion has become long in the tooth. This past quarter, several economic barometers pointed toward the possibility of a pending economic slowdown. Manufacturing activity, as measured by the Institute for Supply Management’s Purchasing Managers Index (PMI), slid dramatically from April to May. (See Chart 6 above.) Moreover, employment growth has been on a gradual decline since February and was significantly weak in May, with the number of new jobs created coming in well below market expectations. (See Chart 7 above.)
Continued on Page 4.
| | |
| The Flex-funds 2006 Semiannual Report | June 30, 2006 | | Page 3 |
| | |
| The Flex-funds | | 2006 Semiannual Report | June 30, 2006 |
Letter to Shareholders Continued from Page 3.
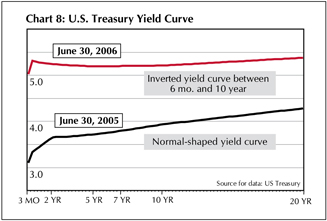
Inverted yield curve: The yield curve presents a picture of current interest rates for U.S. Treasury securities from a duration of 3-month bills to 30-year bonds. A normal yield curve will slope upward, with rates on short-term securities falling below rates on long-term securities. An inverted yield curve presents the opposite view; short-term rates higher than long-term rates, meaning that investors receive less reward for assuming the higher risks of longer-term bonds. Chart 8 above illustrates the difference between a more normal yield curve from June 30, 2005 and a slightly inverted yield curve from June 30, 2006.
What’s the significance of an inverted yield curve? Historically, inverted yield curves have often coincided with economic slowdowns, which typically result in a decline in the stock market. Chart 9 below illustrates the yield curve in a different way, marking the spread (or difference) between short-term and long-term rates over the last 45 years. The shaded areas identify periods during which economic recessions have occurred in the U.S. The percentage change figures for the S&P 500 Index represent the period from the close of the S&P 500 Index on the last day of the month that the yield curve became inverted (when the spread between the 10-year Treasury note yield and the Fed funds rate became negative) to the lowest close of the S&P 500 Index during the ensuing market correction.
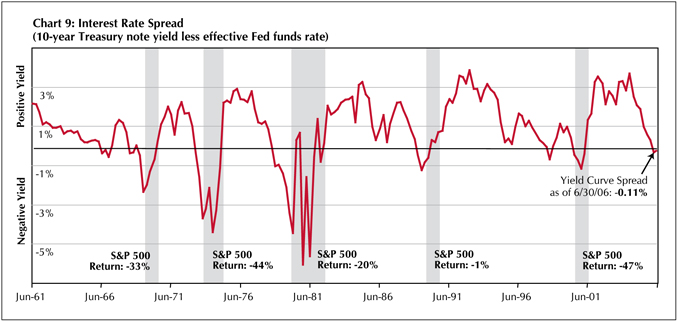
The yield curve has inverted once already this year, for a week back in February. At the time, many market analysts crowed about the dire consequences for stocks, obviously to little effect. Less crowing has been heard about the current inversion. It is a significant development in the current market environment and contributed to our decision to reduce equity exposure in our defensively-managed portfolios. (For more information on this decision, please review the commentary for The Muirfield and Defensive Growth Funds on Page 6 of this Semiannual Report.)
Aging bull market: Based on an analysis of historical market data by InvesTech Research, the length of the average bull market over the last 75 years has been 3.7 years. From the start of the current bull market in October 2002, the average point was passed sometime this past May. That in itself does not mean the end of the rally is at hand. In fact, there have been several bull markets that have lasted longer than 3.7 years, and this one may resume its charge in the quarters to come. But when taken into consideration with the factors
| | |
| Page 4 | | The Flex-funds 2006 Semiannual Report | June 30, 2006 |
| | |
| The Flex-funds | | 2006 Semiannual Report | June 30, 2006 |
mentioned above and our quantitative equity asset allocation model (which as of this writing indicates a deteriorating risk/reward relationship in the stock market), it could present a precarious environment for investors in the months to come.
Looking Ahead
While hopes for an end to the Federal Reserve’s rate hiking cycle may have been spoiled, they certainly were not without merit. What can investors expect when the Fed finally decides to stop raising rates?
If history repeats itself, investors should be prepared for changes in the market environment when the Fed finally does decide that enough rate hikes are enough. The Federal Reserve historically has gone too far in their “tightening” mode, which ultimately results in an economic slowdown. The stock market, which typically anticipates future economic conditions, often recognizes this pattern, resulting in generally weak market conditions in the months following the end of the interest rate cycle. Of course, no one can predict when the final interest rate hike of this cycle will take place or where stocks will go from that point. Our discipline is not predictive. Instead, we adhere to the quantitative disciplines in our investment process and analyze interest rate and monetary policy and other market statistics to evaluate the risk/reward relationship of the stock and bond markets.
For its part, the Fed seems to have altered its tune somewhat under new chairman Ben Bernanke. After more than 20 years of the Alan Greenspan “trust me” era, we now have a Federal Reserve Board that appears more data-dependent than its predecessor. In the words of Bernanke himself, taken from his testimony on the economy before Congress on April 27, 2006: “Future policy actions will be increasingly dependent on the evolution of the economic outlook, as reflected in the incoming data.”
That means, instead of trying to decipher the Alan Greenspan’s cryptic comments for clues on the direction of interest rates, investors can now scrutinize every report about inflation, employment, productivity, housing, and any other economic indicator that can be fathomed for signals on the Federal Reserve’s next interest rate move. More tinder to fuel the fire of emotional investors, to be sure. All the more reason to employ our highly quantitative investment disciplines for your investments.
As always, our Shareholder Services team is available for you to contact with questions about a specific investment strategy or your individual account. On behalf of all of the associates at Meeder Asset Management, Inc. and The Flex-funds, I thank you for your trust and confidence in our investment management services.
|
| Sincerely, |
|
 |
Robert S. Meeder, Jr. President Meeder Asset Management, Inc. & The Flex-funds August 3, 2006 |
| | |
| The Flex-funds 2006 Semiannual Report | June 30, 2006 | | Page 5 |
| | |
| The Flex-funds | | 2006 Semiannual Report | June 30, 2006 |
The Muirfield Fund®
The Defensive Growth Fund
Performance Perspective
| | | | | | | | | | | | | | | | | | |
Period & Average Annual Total Returns as of June 30, 2006 | | Year
to date | | | One
Year | | | Three
Years | | | Five
Years | | | Ten
Years | | | Since
Inception | |
The Muirfield Fund | | 2.91 | % | | 8.06 | % | | 9.72 | % | | 3.82 | % | | 5.20 | % | | 8.43 | %1 |
Blended Index4 | | 2.61 | % | | 6.92 | % | | 7.77 | % | | 2.76 | % | | 6.85 | % | | 8.95 | %2 |
S&P 500 Index5 | | 2.71 | % | | 8.63 | % | | 11.20 | % | | 2.49 | % | | 8.31 | % | | 11.44 | %2 |
The Defensive Growth Fund | | — | | | — | | | — | | | — | | | — | | | -3.30 | %3 |
| 1 | Inception Date: 8/10/88. |
| 2 | Average annual total return from 8/1/88 to 6/30/06. |
| 3 | Inception Date: 1/31/06 Source for index data: Morningstar, Inc. |
Past performance does not guarantee future results. All performance figures represent average annual total returns for the periods ended June 30, 2006 and assume reinvestment of all dividend and capital gain distributions. The investment return and principal value of an investment will fluctuate so that an investor’s shares, when redeemed, may be worth more or less than their original cost. Management fees were waived and/or expenses were reimbursed in order to reduce the operating expenses of the Funds during the periods shown above.
| 4 | The blended index consists of 60% of the S&P 500 Index and 40% of the average 90-day U.S. Treasury bill. |
| 5 | The S&P 500 Index is a widely recognized unmanaged index of common stock prices. The S&P 500 Index does not take into account the deduction of expenses associated with a mutual fund, such as investment management and accounting fees. One cannot invest directly in an index. |
Semiannual Market Perspective
For the first half of 2006, The Muirfield Fund performed in line with its benchmark with a total return of 2.91% for the period. In comparison, the S&P 500 Index returned 2.71% for the semiannual period.
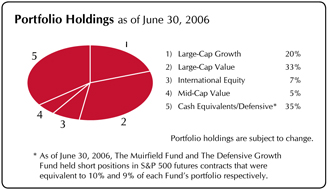
Given that, as conditions warrant, both The Muirfield Fund and The Defensive Growth Fund are sometimes partially or fully invested “defensively” in cash equivalent securities, therefore we believe the most appropriate comparison of performance is a blended index consisting of 60% of the S&P 500 Index and 40% of the 90-day U.S. Treasury Bill. With that said, we are pleased to report that The Muirfield Fund has outperformed this custom benchmark for the 6-month, 1-year, 3-year, and 5-years periods ended June 30, 2006.
Stocks rallied strongly from the beginning of 2006 through early May, with many market indices reaching multiyear highs. During this time, our tactical asset allocation model indicated that the risk/reward relationship of the stock market remained on balance positive. Therefore, we maintained a fully-invested equity position for this period. Early in the year, the Funds were primarily invested in mid- and small-cap funds with some exposure to the international equity markets. Our international positions contributed positively to fund performance during the semiannual period.
Also during this six-month period, several economic indicators began to point toward a possible slowdown. Based on this analysis and our evaluation of relative strength in the equity market, we decided in March to rotate our portfolio emphasis toward large-cap value funds, which tend to come into favor during periods of slower economic growth. This shift toward large-cap value funds continued in the 2nd Quarter, as we limited our mid-cap and international exposure and eliminated our small-cap positions. By mid-June, the Portfolio was overweighted in large-cap stock funds, with smaller allocations to mid-cap value and international equity funds.
Also in June, the risk/reward relationship in the equity market began to change. As a result of a variety of factors in our model, including the continuing trend of Federal Reserve rate hikes, the extremely flat yield curve with periodic inversions, and the lack of price support in several of our trend indicators, we concluded the risk/reward relationship of the stock market had changed to the extent that we no longer believed that 100% equity exposure to the stock market was warranted. As a result, in mid-June we established a 35% “defensive” position in both funds. Further adjustments to this position may be made in the coming months as our model warrants.
| | |
| Page 6 | | The Flex-funds 2006 Semiannual Report | June 30, 2006 |
| | |
| The Flex-funds | | 2006 Semiannual Report | June 30, 2006 |
The Dynamic Growth Fund
The Focused Growth Fund
Performance Perspective
| | | | | | | | | | | | | | | |
Period & Average Annual Total Returns as of June 30, 2006 | | Year
to date | | | One
Year | | | Three
Years | | | Five
Years | | | Since
Inception | |
The Dynamic Growth Fund | | 4.59 | % | | 10.74 | % | | 11.36 | % | | 2.02 | % | | -1.90 | %1 |
S&P 500 Index4 | | 2.71 | % | | 8.63 | % | | 11.20 | % | | 2.49 | % | | 0.46 | %2 |
The Focused Growth Fund | | — | | | — | | | — | | | — | | | 2.50 | %3 |
| 1 | Inception Date: 2/29/2000. |
| 2 | Average annual total return from 2/29/2000 to 6/30/06. |
| 3 | Inception Date: 1/31/06. |
Source for index data: Bloomberg LP
Past performance does not guarantee future results. All performance figures represent average annual total returns for the periods ended June 30, 2006 and assume reinvestment of all dividend and capital gain distributions. The investment return and principal value of an investment will fluctuate so that an investor’s shares, when redeemed, may be worth more or less than their original cost. Management fees were waived and/or expenses were reimbursed in order to reduce the operating expenses of the Funds during the periods shown above.
| 4 | The S&P 500 Index is a widely recognized unmanaged index of common stock prices. The S&P 500 Index does not take into account the deduction of expenses associated with a mutual fund, such as investment management and accounting fees. One cannot invest directly in an index. |
Semiannual Market Perspective
For the first six months of 2006, The Dynamic Growth Fund outperformed the benchmark S&P 500 Index with a total return of 4.59%. In comparison, the S&P 500 Index returned 2.71% for the same period. More importantly, over the past 1-, 3-, and 5-year periods The Dynamic Growth Fund has also either exceeded or performed in line with the S&P 500 Index.

At the start of the year, the Funds were allocated primarily to large- and mid-cap funds with some exposure to small-cap and international equity funds. Our international holdings contributed positively to fund performance during the semiannual period, as global stock markets performed well along with U.S. stock markets. After reaching multi-year highs in early May, most major equity indices declined sharply through the latter half of the 2nd Quarter. The market’s revolving fixation on inflation concerns, the overall health of the economy, and the Federal Reserve’s next rate decision all weighed heavily on investors’ risk appetite. By June 30, 2006, many major equity market indices were close to both price and moving average support levels.
Our analysis continued to indicate that the U.S. economy is in the later stages of the current economic cycle and that domestic growth might slow in the months ahead. Typically at this point in the economic cycle, as growth begins to slow down, large-cap companies tend to come into favor while performance for small-cap companies wanes. Moreover, our measure of investor sentiment recently reached its highest level of volatility since March 2004, indicating increased fear among equity investors. This was also a key factor in the flight to quality witnessed in June.
Our equity asset allocation was adjusted halfway through the 2nd Quarter to emphasize stock funds with significant weightings in large-cap companies and to limit our mid-cap exposure. With small-cap stocks declining more than large-cap stocks, we believed that large-cap stocks presented more attractive prospects for growth than small-cap stocks. Therefore, we eliminated our remaining small-cap positions during the 2nd Quarter. We also reduced our exposure to international stocks in both funds. The European Central Bank’s bias of a tighter monetary policy contributed to our decision to trim our international exposure.
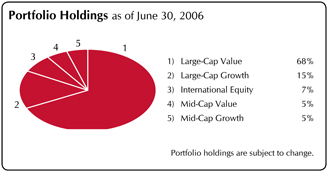
As of June 30, 2006, our target allocation for both funds was 83% in large-cap stock funds, 10% in mid-cap stock funds, and 7% in international stock funds.
| | |
| The Flex-funds 2006 Semiannual Report | June 30, 2006 | | Page 7 |
| | |
| The Flex-funds | | 2006 Semiannual Report | June 30, 2006 |
The Aggressive Growth Fund
Performance Perspective
| | | | | | | | | | | | | | | |
Period & Average Annual Total Returns as of June 30, 2006 | | Year
to date | | | One
Year | | | Three
Years | | | Five
Years | | | Since
Inception | |
The Aggressive Growth Fund | | 2.50 | % | | 9.22 | % | | 10.98 | % | | 0.73 | % | | -4.62 | %1 |
NASDAQ Composite Index3 | | -1.08 | % | | 6.48 | % | | 10.91 | % | | 0.66 | % | | -11.02 | %2 |
| 1 | Inception Date: 2/29/2000. |
| 2 | Average annual total return from 2/29/2000 to 6/30/06. |
Source for index data: Bloomberg LP.
Past performance does not guarantee future results. All performance figures represent average annual total returns for the periods ended June 30, 2006 and assume reinvestment of all dividend and capital gain distributions. The investment return and principal value of an investment will fluctuate so that an investor’s shares, when redeemed, may be worth more or less than their original cost. Management fees were waived and/or expenses were reimbursed in order to reduce the operating expenses of The Aggressive Growth Fund during the periods shown above.
| 3 | The NASDAQ Composite Index is a broad-based capitalization-weighted index of all NASDAQ National Market and Small Cap stocks. The NASDAQ Composite Index does not take into account the deduction of expenses associated with a mutual fund, such as investment management and accounting fees. One cannot invest directly in an index. |
Semiannual Market Perspective
The Aggressive Growth Fund outperformed its benchmark index for the six month period ending June 30, 2006. The Fund returned 2.50% for the period, while the NASDAQ Composite Index declined 1.08%. We are most pleased that the returns of the Fund over the past 1-, 3-, and 5-year periods as well as since inception have also outperformed their benchmark.
Performance for the Fund was aided by our allocation to international equity markets, specifically emerging market funds. Both U.S. and global equity markets performed well in the rally that lasted for much of the six-month period. But after reaching multi-year highs in early May, most major equity indices declined sharply through the latter half of the 2nd Quarter. The market’s revolving fixation on inflation concerns, the overall health of the economy, and the Federal Reserve’s next rate decision all weighed heavily on investors’ risk appetite. By June 30, 2006, many major equity market indices were close to both price and moving average support levels.
Our analysis continued to indicate that the U.S. economy is in the later stages of the current economic cycle and that domestic growth might slow in the months ahead. The supportive valuation and earnings growth environment may become vulnerable to the pressures of higher inflation and potential slower growth. Our equity asset allocation was adjusted halfway through the 2nd Quarter to emphasize stocks with significant weightings in large-cap companies and limit our mid-cap exposure. As we are entering a historically unfavorable time of the year, we also eliminated our more volatile positions such as small-cap stock funds. While some near-term strength remains a possibility given the bearish sentiment and oversold technical conditions, overall our indicators do not support the likelihood of a sustainable small-cap rally.
We also reduced our exposure to international stocks during the period. With many central banks around the world adopting a rate-tightening stance, we feel the reduction of liquidity by various central banks (European, China, and potentially Japan) poses as a headwind to global equity markets. We took the bounce from recent lows as an opportunity to reduce our international stock exposure. As we saw speculative inflows into the emerging markets countries continue to increase, we trimmed our emerging markets position, and eventually exited in Mid June.
As of June 30, 2006, our target allocation in The Aggressive Growth Fund was 83% in large-cap stock funds, 10% in mid-cap stock funds, and 7% in international stock funds.
| | |
| Page 8 | | The Flex-funds 2006 Semiannual Report | June 30, 2006 |
| | |
| The Flex-funds | | 2006 Semiannual Report | June 30, 2006 |
The Quantex Fund™
Performance Perspective
| | | | | | | | | | | | | | | | | | |
Period & Average Annual Total Returns as of June 30, 2006 | | Year
to date | | | One
Year | | | Three
Years | | | Five
Years | | | Ten
Years | | | Since
Inception | |
The Quantex Fund™ | | 2.93 | % | | 7.72 | % | | 10.57 | % | | 1.15 | % | | 5.91 | % | | 7.31 | %1 |
S&P Mid-Cap 400 Index3 | | 4.24 | % | | 12.99 | % | | 18.11 | % | | 9.28 | % | | 13.80 | % | | 13.15 | %2 |
Russell 2000 Small-Cap Index4 | | 8.27 | % | | 14.67 | % | | 18.75 | % | | 8.58 | % | | 9.11 | % | | 9.04 | %2 |
| 1 | Inception Date: 3/20/85. |
| 2 | Average annual total return from 3/31/85 to 6/30/06. |
Source for index data: Bloomberg LP.
Past performance does not guarantee future results. All performance figures represent average annual total returns for the periods ended June 30, 2006 and assume reinvestment of all dividend and capital gain distributions. The investment return and principal value of an investment will fluctuate so that an investor’s shares, when redeemed, may be worth more or less than their original cost. Management fees were waived and/or expenses were reimbursed in order to reduce the operating expenses of The Quantex Fund during the periods shown above.
| 3 | The S&P Mid-Cap 400 Index is a widely recognized unmanaged index of common stock prices of mid-sized companies. The S&P Mid-Cap 400 Index does not take into account the deduction of expenses associated with a mutual fund, such as investment management and accounting fees. One cannot invest directly in an index. |
| 4 | The Russell 2000 Index is a widely recognized unmanaged index of common stock prices of small-sized companies. The Russell 2000 Index does not take into account the deduction of expenses associated with a mutual fund, such as investment management and accounting fees. One cannot invest directly in an index. |
Semiannual Market Perspective
For the six-month period ended June 30, 2006, The Quantex Fund returned 2.93%. In comparison, the S&P Mid-Cap 400 Index returned 4.24% and the small-cap Russell 2000 Index returned 8.27%.
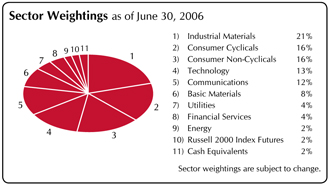
The Quantex Fund typically consists of approximately 100 equally-weighted securities selected using a quantitative screening process that has been consistently used since 1989. The Fund is rebalanced annually during the month of January.
Typically, a few of the companies whose stock is owned by the Fund are acquired every year. When this occurs, new stocks are added to the Fund to maintain a diverse selection of equity securities. The first half of 2006 has been no exception. During the 2nd Quarter alone, four companies in the Fund’s portfolio were acquired, including May-tag, Chiron, Engelhard and Knight Ridder. These securities were replaced with the appropriate securities selected in a manner consistent with how our investment strategy has dealt with acquisitions for over 15 years.
During the first half of 2006, an underweighted position in energy and financial services hurt fund performance relative to its benchmarks. These sectors have been among the equity market’s strongest performers over the last six months and contributed to the outperformance of the Fund’s benchmark indices for the semiannual period. The best performing holdings of the Fund included Allegheny Technologies (ATI, up over 92%), OfficeMax (OMX, up over 62%) and Ciena Corp.(CIEN, up over 61%). The two largest individual drags on performance were well-known names Radio Shack (RSH, down 33%) and Goodyear Tire & Rubber (GT, down 36%).
While the current investment environment has been challenging for investors, we believe that the quantitative strategy used by the Fund will continue to add value for investors over the long-term.
| | |
| The Flex-funds 2006 Semiannual Report | June 30, 2006 | | Page 9 |
| | |
| The Flex-funds | | 2006 Semiannual Report | June 30, 2006 |
The Total Return Utilities Fund
Performance Perspective
| | | | | | | | | | | | | | | | | | |
Period & Average Annual Total Returns as of June 30, 2006 | | Year
to date | | | One
Year | | | Three
Years | | | Five
Years | | | Ten
Years | | | Since Inception | |
The Total Return Utilities Fund | | 5.47 | % | | 10.90 | % | | 16.03 | % | | 1.17 | % | | 8.05 | % | | 9.14 | %1 |
S&P 500 Utilities Index3 | | 4.47 | % | | 5.92 | % | | 17.61 | % | | 1.23 | % | | 6.92 | % | | 7.90 | %2 |
| 1 | Inception Date: 6/21/1995. |
| 2 | Average annual total return from 6/30/95 to 6/30/06. |
Source for index data: Bloomberg LP.
Past performance does not guarantee future results. All performance figures represent average annual total returns for the periods ended June 30, 2006 and assume reinvestment of all dividend and capital gain distributions. The investment return and principal value of an investment will fluctuate so that an investor’s shares, when redeemed, may be worth more or less than their original cost. Management fees were waived and/or expenses were reimbursed in order to reduce the operating expenses of The Total Return Utilities Fund during the periods shown above. Because The Total Return Utilities Fund concentrates its investments in public utility companies, the value of the Fund’s shares may fluctuate more than if invested in a greater number of industries. Changes in interest rates may also affect the value of utility stocks, and rising interest rates can be expected to reduce the Fund’s net asset value.
| 3 | The S&P 500 Utilities Index is an unmanaged index of 33 utility sector stocks. This index does not take into account the deduction of expenses associated with a mutual fund, such as investment management and accounting fees. One cannot invest directly in an index. |
Semiannual Market Perspective
The Total Return Utilities Fund outperformed its benchmark index for the first half of 2006 with a total return of 5.47%. In comparison, the S&P 500 Utilities Index returned 4.47% over the same six-month period.
We are also pleased to report that for the 1-, 5- and 10- year periods as well as since inception, the performance of the Fund has either exceeded or been in line with its benchmark.
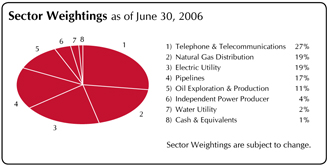
Performance for the stocks in our portfolio was quite volatile over the six month period, although our returns for the period were still positive. We have emphasized foreign telecommunications companies and natural gas producers in our portfolio, along with an allocation to the more conventional distribution and integrated utilities.
Natural gas and the growth of foreign economies seem to be two of the most fundamentally solid investable trends in the world at present. Though gas storage is nearly at full capacity as a consequence of a record warm winter, we believe that the weather may normalize and that the supply and demand for gas may favor firm or higher prices in the future. A number of major buyout deals for gas companies indicates that the valuations investors have placed in these firms is substantially lower than the estimations of those who are actually in the business, giving us a margin of safety in maintaining our positions.
As for the foreign telecoms, some traditional European companies are selling at lower valuations than their American counterparts. But the more interesting stories are coming from developing areas. We consider these emerging market telecoms to be a proxy for economic growth worldwide. It is true that there are technological challenges for these companies just as our domestics are faced with problems. But regulation is far more congenial to these enterprises, which are often the sole meaningful supplier of phone services in countries whose growth potential dwarfs our own right now.
We considered making changes to our portfolio in the 2nd Quarter, but found ourselves content with the stocks that we currently hold. A few of our supporting positions in utility service companies might change shape over the next quarter, but as of this writing we are basically confident in the stocks that we own. Investor interest in large electric companies should help support our traditional utilities, and the recent revival of our more aggressive holdings should add value to shareholders’ return as well.
| | |
| Page 10 | | The Flex-funds 2006 Semiannual Report | June 30, 2006 |
| | |
| The Flex-funds | | 2006 Semiannual Report | June 30, 2006 |
The U.S. Government Bond Fund
Performance Perspective
| | | | | | | | | | | | | | | | | | |
Period & Average Annual Total Returns as of June 30, 2006 | | Year
to date | | | One
Year | | | Three
Years | | | Five
Years | | | Ten
Years | | | Since
Inception | |
The U.S. Government Bond Fund | | 0.30 | % | | -0.50 | % | | -0.46 | % | | 1.50 | % | | 3.50 | % | | 5.54 | %1 |
Lehman Bros. Intermediate-Term Government/Credit Index2 | | -0.18 | % | | -0.19 | % | | 1.49 | % | | 4.61 | % | | 5.80 | % | | 7.50 | %2 |
| 2 | Average annual total return from 4/30/85 to 6/30/06. |
Source for index data: Morningstar, Inc.
Past performance does not guarantee future results. All performance figures represent average annual total returns for the periods ended June 30, 2006 and assume reinvestment of all dividend and capital gain distributions. The investment return and principal value of an investment will fluctuate so that an investor’s shares, when redeemed, may be worth more or less than their original cost. Management fees were waived and/or expenses were reimbursed in order to reduce the operating expenses of The U.S. Government Bond Fund during the periods shown above.
| 2 | The Lehman Brothers Intermediate-Term Government/Credit Index is an unmanaged index of fixed-rate bonds issued by the U.S. Government and its agencies that are rated investment grade or higher, have one to ten years remaining until maturity, and at least $100 million outstanding. The Lehman Brothers Intermediate-Term Government/Credit Index does not take into account the deduction of expenses associated with a mutual fund, such as investment management and accounting fees. One cannot invest directly in an index. |
Semiannual Market Perspective
The Flex-funds U.S. Government Bond Fund outperformed its benchmark for the six-month period ended June 30, 2006. Year to date, the Fund returned 0.30% while its benchmark index, the Lehman Brothers Intermediate-Term Government/Credit Index, returned -0.18% for the same period.
The Federal Reserve raised the Fed funds target rate four times during the first half of 2006. These rate hikes extended the Fed’s current rate-hiking streak to 17 consecutive increases, which has added 4.25% to the Fed funds target rate since the start of its tightening campaign in 2004 when the rate was only 1 percent. Recent Consumer Price Index readings at 4.2% suggest that inflation may still be a persistent concern and support the likelihood of further Fed rate increases in the months to come.
Interest rates rose across the spectrum of fixed income securities during the semiannual period. Our overall assessment of a rising rate environment for intermediate-term bonds aided performance, as we maintained a lower average maturity for the Fund. In this rising rate environment, we continued to seek alternative sources of additional yield through U.S. Government Agency bonds.
As of June 30th, our fixed income investment model continues to indicate that rates will likely be on the rise in the coming months. All interest rate trend components increased during the last quarter. These indicators, coupled with our fundamental factors of consumption, inflation, and unemployment, suggest that intermediate-term rates may still have room to increase in the near future. The balance of our trend and fundamental indicators suggest that a shorter maturity structure is appropriate at this time.
However, we are seeing a signal of what would imply the beginning of a more stable interest rate environment. Should our model indicate that intermediate-term interest rates may stabilize, we will begin to extend the average maturity of the Fund.
| | |
| The Flex-funds 2006 Semiannual Report | June 30, 2006 | | Page 11 |
| | |
| The Flex-funds | | 2006 Semiannual Report | June 30, 2006 |
The Money Market Fund
Performance Perspective
| | | | | | | | | | | | | | | | | | |
Period & Average Annual Total Returns as of June 30, 2006 | | Year
to date | | | One
Year | | | Three
Years | | | Five
Years | | | Ten
Years | | | Since
Inception | |
The Money Market Fund - Retail Class | | 2.15 | % | | 3.87 | % | | 2.16 | % | | 2.02 | % | | 3.70 | % | | 5.03 | %1 |
Current & Effective Yields5 | | 7-day Simple: 4.76% | | | 7-day Compound: 4.87% | |
Lipper’s Average General Purpose Money Market Fund6 | | 1.89 | % | | 3.35 | % | | 1.68 | % | | 1.51 | % | | 3.26 | % | | 4.64 | %2 |
The Money Market Fund - Institutional Class | | 2.23 | % | | 4.01 | % | | — | | | — | | | — | | | -3.49 | %3 |
Current & Effective Yields5 | | 7-day Simple: 4.90% | | | 7-day Compound: 5.01% | |
iMoneyNet, Inc. Average First-Tier Institutional Money Market Fund6 | | 2.17 | % | | 3.88 | % | | — | | | — | | | — | | | -3.42 | %4 |
| 1 | Inception Date: 3/27/85. |
| 2 | Average annual total return from 3/31/85 to 6/30/06. |
| 3 | Inception date: 12/28/04. |
| 4 | Average annual total return from 12/31/04 to 6/30/06. Source for average general purpose money market fund data: Lipper, Inc. Source for average first-tier institutional money market fund data: iMoneyNet, Inc. |
| 5 | For the period ended 6/30/06, yield quotations more closely reflect the current earnings of The Money Market Fund than do total return quotations. |
Past performance does not guarantee future results. Except for the current and effective yields, all performance figures represent average annual total returns for the periods ended June 30, 2006, and assume reinvestment of all dividend and capital gain distributions. The investment return and principal value of an investment will fluctuate so that an investor’s shares, when redeemed, may be worth more or less than their original cost. Management fees were waived and/or expenses were reimbursed in order to reduce the operating expenses of The Money Market Fund during the periods shown above. Investments in The Money Market Fund are neither insured nor guaranteed by the Federal Deposit Insurance Corporation or any other governmental agency. Although the Funds seek to preserve the value of your investment at $1.00 per share, it is possible to lose money by investing in The Money Market Fund.
| 6 | An index of funds such as Lipper’s Average General Purpose Money Market Fund Index and iMoneyNet, Inc.’s Average First Tier Institutional Money Market Fund Index includes a number of mutual funds grouped by investment objective. |
Semiannual Market Perspective
The retail class of The Money Market Fund continued to rank among the top general-purpose money market funds monitored by iMoneyNet, Inc. for the 12-month period ended June 30, 2006. More impressively, the retail class of The Money Market Fund has ranked in the top 10% of all general-purpose money market funds monitored by iMoneyNet, Inc. for every 12-month period since the Fund’s inception in 1985.
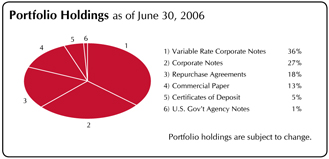
The Money Market Fund continued to maintain a high exposure to floating-rate instruments, as well as to corporate securities. This strategy enabled the Fund to earn a higher yield than what would have been realized had the Fund instead targeted a larger exposure to commercial paper. Corporate securities have consistently paid higher yields than commercial paper since the Federal Reserve began raising short-term interest rates on June 30, 2004.
During the past several months, we intentionally allowed the Fund’s weighted average maturity (WAM) to shorten so that we could more quickly invest the proceeds from maturing securities into higher-yielding instruments. At the end of the 1st Quarter, the Fund’s WAM was just under 30 days. By the end of the 2nd Quarter, we allowed the WAM to decline further to 25 days. This has worked to the Fund’s advantage, as the money market yield curve shifted higher by 30-40 basis points during the 2nd Quarter.
Our analysis of both money market rates and the Fed fund futures suggests that yields on maturities beyond the 60- 90 day range do not currently offer the proper additional yield to extend at this time. Our primary strategic focus revolves around Federal Reserve activities. Until the Fed indicates that it plans to stop raising short-term interest rates, we will continue to invest available cash in securities that have relatively short maturities.
| | |
| Page 12 | | The Flex-funds 2006 Semiannual Report | June 30, 2006 |
| | |
| The Flex-funds | | 2006 Semiannual Report | June 30, 2006 |
Shareholder Expense Analysis (Unaudited)
Shareholders of mutual funds pay ongoing expenses, such as advisory fees, distribution and service fees (12b-1 fees) and other fund expenses. The following examples are intended to help you understand your ongoing costs (in dollars) of investing in the Funds and to compare these costs with the ongoing costs of investing in other mutual funds.
The examples below are based on an investment of $1,000 invested at the beginning of the period and held for the six-month period from December 31, 2005 to June 30, 2006.
ACTUAL EXPENSES: The first table below provides information about actual account values and actual expenses. You may use the information in this table, together with the amount you invested, to estimate the expenses that you paid over the period. Simply divide your account value by $1,000 (e.g.: an $8,600 account value divided by $1,000 = 8.6), then multiply the result by the number in the line under the heading “Expenses Paid During the Period” to estimate the expenses you paid on your account during this period.
ACTUAL EXPENSES
| | | | | | | | | | | | |
| | | Beginning
Account Value
(12/31/2005) | | Ending
Account Value
(6/30/06) | | Expenses Paid
During Period1
(12/31/2005
- 6/30/06) | | Expense Ratio
(Annualized) | |
The Muirfield Fund | | $ | 1,000.00 | | $ | 1,029.10 | | $ | 7.30 | | 1.45 | % |
The Total Return Utilities Fund | | | 1,000.00 | | | 1,054.70 | | | 9.99 | | 1.96 | % |
The Quantex Fund | | | 1,000.00 | | | 1,029.30 | | | 7.90 | | 1.57 | % |
The Dynamic Growth Fund | | | 1,000.00 | | | 1,045.90 | | | 7.46 | | 1.47 | % |
The Aggressive Growth Fund | | | 1,000.00 | | | 1,025.00 | | | 8.69 | | 1.73 | % |
The Defensive Growth Fund2 | | | 1,000.00 | | | 967.00 | | | 8.73 | | 1.79 | % |
The Focused Growth Fund2 | | | 1,000.00 | | | 975.00 | | | 8.86 | | 1.81 | % |
The U.S. Government Bond Fund | | | 1,000.00 | | | 1,003.00 | | | 5.46 | | 1.10 | % |
The Money Market Fund - Retail Class | | | 1,000.00 | | | 1,021.50 | | | 2.41 | | 0.48 | % |
The Money Market Fund - Institutional Class | | | 1,000.00 | | | 1,022.30 | | | 1.70 | | 0.34 | % |
HYPOTHETICAL EXAMPLE FOR COMPARISON PURPOSES: The second table below provides information about hypothetical account values and hypothetical expenses based on the Funds’ actual expense ratios and assumed rates of return of 5% per year before expenses, which are not the Funds’ actual returns. The hypothetical account values and expenses may not be used to estimate the actual ending account balance or expenses you paid for the period. You may use this information to compare the ongoing costs of investing in the Funds to other funds. To do so, compare this 5% hypothetical example with the 5% hypothetical examples that appear in the shareholder reports of the other funds.
HYPOTHETICAL EXAMPLE
(5% return before expenses)
| | | | | | | | | | | | |
| | | Beginning
Account Value
(12/31/2005) | | Ending
Account Value
(6/30/06) | | Expenses Paid
During Period1
(12/31/2005
- 6/30/06) | | Expense Ratio
(Annualized) | |
The Muirfield Fund | | $ | 1,000.00 | | $ | 1,017.60 | | $ | 7.25 | | 1.45 | % |
The Total Return Utilities Fund | | | 1,000.00 | | | 1,015.08 | | | 9.79 | | 1.96 | % |
The Quantex Fund | | | 1,000.00 | | | 1,017.01 | | | 7.85 | | 1.57 | % |
The Dynamic Growth Fund | | | 1,000.00 | | | 1,017.50 | | | 7.35 | | 1.47 | % |
The Aggressive Growth Fund | | | 1,000.00 | | | 1,016.22 | | | 8.65 | | 1.73 | % |
The Defensive Growth Fund2 | | | 1,000.00 | | | 1,015.92 | | | 8.95 | | 1.79 | % |
The Focused Growth Fund2 | | | 1,000.00 | | | 1,015.82 | | | 9.05 | | 1.81 | % |
The U.S. Government Bond Fund | | | 1,000.00 | | | 1,019.34 | | | 5.51 | | 1.10 | % |
The Money Market Fund - Retail Class | | | 1,000.00 | | | 1,022.41 | | | 2.41 | | 0.48 | % |
The Money Market Fund - Institutional Class | | | 1,000.00 | | | 1,023.11 | | | 1.71 | | 0.34 | % |
Please note that the expenses shown in the tables are meant to highlight your ongoing costs only and do not reflect any transactional costs, such as redemption fees or exchange fees. Therefore, the second table is useful in comparing ongoing costs only, and will not help you determine the relative total costs of owning different funds. In addition, if any transactional costs were included, your costs would have been higher.
| 1 | Expenses are equal to the Funds’ annualized expense ratios, multiplied by the average account value over the period, multiplied by 181/365 (to reflect the total number of days in the six-month period). |
| 2 | The Defensive Growth and Focused Growth Funds commenced operations on January 31, 2006. |
| | |
| The Flex-funds 2006 Semiannual Report | June 30, 2006 | | Page 13 |
| | |
| The Flex-funds | | 2006 Semiannual Report | June 30, 2006 |
2006 Semiannual Report
Portfolio Holdings & Financial Statements
| | |
| Page 14 | | The Flex-funds 2006 Semiannual Report | June 30, 2006 |
Schedule of Investments
June 30, 2006 (unaudited)
The Muirfield Fund
| | | | | |
Security Description
| | Shares or
Principal
Amount ($)
| | Value ($)
| |
Registered Investment Companies — 76.0% | |
Allianz NACM International Fund — I | | 75,143 | | 1,653,887 | |
Allianz NFJ Dividend Value Fund — D | | 241,298 | | 3,711,163 | |
American Growth Fund of America — A | | 189,593 | | 6,010,107 | |
Artisan Mid Cap Value Fund | | 122,209 | | 2,361,075 | |
Goldman Sachs Structured Large Cap Value Fund — I | | 884,186 | | 11,963,043 | |
MFS Value Fund — A | | 285,627 | | 6,972,163 | |
SSgA International Stock Selection Fund | | 170,106 | | 2,100,805 | |
Transamerica Premier Equity Fund — I | | 93,073 | | 2,090,425 | |
| | | | |
|
|
Total Registered Investment Companies (Cost $36,537,716) | | | | 36,862,668 | |
| | | | |
|
|
U.S. Government Obligations — 1.0% | |
U.S. Treasury Bill,
4.854%, due 09/07/2006* | | 500,000 | | 495,371 | |
| | | | |
|
|
Total U.S. Government Obligations
(Cost $495,533) | | | | 495,371 | |
| | | | |
|
|
Repurchase Agreements — 23.1% | |
Morgan Stanley DW, Inc., 5.3725%, 07/03/2006, (Collateralized by $11,183,004 various Commercial Papers, Certificates of Deposit, Agency Strips, FNMAs, Treasury Notes, and SLMA, at 4.00% — 10.00%, due 07/05/2006 — 01/01/2036, value — $11,401,626) purchase date 06/30/2006 | | 11,178,000 | | 11,178,000 | |
| | | | |
|
|
Total Repurchase Agreements (Cost $11,178,000) | | | | 11,178,000 | |
| | | | |
|
|
Total Investments — 100.1%
(Cost $48,211,249)(a) | | | | 48,536,039 | |
| | | | |
|
|
Liabilities less Other Assets — (0.1%) | | | | (68,254 | ) |
| | | | |
|
|
Total Net Assets — 100.0% | | | | 48,467,785 | |
| | | | |
|
|
Trustee Deferred Compensation** | |
The Flex-funds Dynamic Growth Fund | | 2,390 | | 20,697 | |
The Flex-funds Quantex Fund | | 1,718 | | 30,220 | |
The Flex-funds Muirfield Fund | | 5,591 | | 29,632 | |
The Flex-funds Total Return Utilities Fund | | 435 | | 8,696 | |
| | | | |
|
|
Total Trustee Deferred Compensation (Cost $72,530) | | | | 89,245 | |
| | | | |
|
|
The Muirfield Fund
| | | | | | |
Security Description
| | Short
Contracts
| | | Unrealized
Appreciation
(Depreciation) ($)
| |
Futures Contracts | |
Standard & Poors 500 expiring September 2006, notional value $4,797,750 | | (15 | ) | | (109,585 | ) |
| | | | | |
|
|
Total Futures Contracts | | | | | (109,585 | ) |
| | | | | |
|
|
| (a) | Represents cost for financial reporting purposes and differs for federal income tax purposes by the amount of losses recognized in excess of federal income tax reporting of approximately $161,921. Cost for federal income tax purposes of $48,373,170 differs from value by net unrealized appreciation (depreciation) of securities as follows: |
| | | | |
Unrealized appreciation | | $ | 671,618 | |
Unrealized depreciation | | | (508,749 | ) |
| | |
|
|
|
Net unrealized appreciation (depreciation) | | $ | 162,869 | |
| | |
|
|
|
| # | Represents non-income producing securities. |
| * | Pledged as collateral on futures contracts. |
| ** | Assets of affiliates to The Muirfield Fund held for the benefit of the Fund’s Trustees in connection with the Trustee Deferred Compensation Plan. |
The accompanying notes are an integral part of these financial statements.
Schedule of Investments
June 30, 2006 (unaudited)
The Total Return Utilities Fund
| | | | |
Security Description
| | Shares or
Principal
Amount ($)
| | Value ($)
|
Common Stocks — 99.2% | | | | |
Electric Utility — 18.5% | | | | |
Energy East Corp. | | 33,830 | | 809,552 |
IDACORP, Inc. | | 17,495 | | 599,904 |
MDU Resources Group, Inc. | | 17,445 | | 638,662 |
Northeast Utilities | | 22,805 | | 471,379 |
Pepco Holdings, Inc. | | 16,140 | | 380,581 |
Sierra Pacific Resources | | 87,280 | | 1,221,852 |
| | | | |
|
(Cost 3,571,793) | | | | 4,121,930 |
| | | | |
|
Independent Power Producer — 3.9% | | | | |
Dynegy, Inc. | | 72,075 | | 394,250 |
NRG Energy, Inc. | | 10,010 | | 482,282 |
| | | | |
|
(Cost 774,843) | | | | 876,532 |
| | | | |
|
Natural Gas Distribution — 19.3% | | | | |
AGL Resources, Inc. | | 20,665 | | 787,750 |
ATMOS Energy Corp. | | 15,145 | | 422,697 |
NiSource, Inc. | | 37,065 | | 809,499 |
ONEOK, Inc. | | 21,460 | | 730,498 |
Peoples Energy Corp. | | 6,015 | | 215,999 |
Southern Union Co. | | 18,635 | | 504,263 |
Vectren Corp. | | 21,155 | | 576,474 |
WGL Holdings, Inc. | | 8,125 | | 235,219 |
| | | | |
|
(Cost 3,548,818) | | | | 4,282,399 |
| | | | |
|
Oil Exploration & Production — 11.4% | | | | |
Anadarko Petroleum Corp. | | 12,730 | | 607,094 |
Pioneer Natural Resources Co. | | 20,435 | | 948,388 |
Ultra Petroleum Corp.# | | 16,285 | | 965,212 |
| | | | |
|
(Cost 1,493,415) | | | | 2,520,694 |
| | | | |
|
Pipelines — 17.2% | | | | |
Enterprise Products Partners, L.P. | | 22,396 | | 557,660 |
Equitable Resources, Inc. | | 18,265 | | 611,878 |
Kinder Morgan Energy Partners, L.P. | | 18,918 | | 869,471 |
National Fuel Gas Co. | | 19,315 | | 678,729 |
Questar Corp. | | 14,185 | | 1,141,751 |
| | | | |
|
(Cost 2,680,473) | | | | 3,859,489 |
| | | | |
|
Telephone & Telecommunications — 27.4% | | |
AT&T, Inc. | | 23,995 | | 669,221 |
Brasil Telecom — ADR | | 11,855 | | 386,117 |
China Mobile Limited — ADR | | 21,505 | | 615,258 |
Cypress Semiconductor Corp.# | | 16,110 | | 234,240 |
Deutsche Telekom AG | | 26,535 | | 425,621 |
ESCO Technologies, Inc.# | | 9,115 | | 487,196 |
Nokia Corp. — ADR | | 26,455 | | 535,978 |
Powerwave Technologies, Inc. | | 21,430 | | 195,442 |
PT Telekomunikasi Indonesia — ADR | | 10,800 | | 346,680 |
Sprint Nextel Corp. | | 34,905 | | 697,751 |
Telefonos de Mexico SA de CV — ADR | | 10,285 | | 214,237 |
Telstra Corp., Ltd. — ADR | | 28,325 | | 388,053 |
Verizon Communications, Inc. | | 17,190 | | 575,693 |
Vimpel-Communications OAO — ADR# | | 7,410 | | 339,526 |
| | | | |
|
(Cost 5,684,699) | | | | 6,111,013 |
| | | | |
|
Water Utility — 1.5% | | | | |
United Utilities PLC — ADR | | 13,940 | | 330,517 |
| | | | |
|
(Cost 248,078) | | | | 330,517 |
| | | | |
|
Total Common Stocks
(Cost $18,002,119) | | | | 22,102,574 |
| | | | |
|
The Total Return Utilities Fund
| | | | | |
Security Description
| | Shares or
Principal
Amount ($)
| | Value ($)
| |
Repurchase Agreements — 0.9% | | | | | |
Morgan Stanley DW, Inc., 5.3725%, 07/03/2006, (Collateralized by $201,090 various Commercial Papers, Certificates of Deposit, Agency Strips, FNMAs, Treasury Notes, and SLMA, at 4.00% — 10.00%, due 07/05/2006 — 01/01/2036, value — $205,021) purchase date 06/30/2006 | | 201,000 | | 201,000 | |
| | | | |
|
|
Total Repurchase Agreements
(Cost $201,000) | | | | 201,000 | |
| | | | |
|
|
Total Investments — 100.1%
(Cost $18,203,119)(a) | | | | 22,303,574 | |
| | | | |
|
|
Liabilities less Other Assets — (0.1%) | | | | (32,823 | ) |
| | | | |
|
|
Total Net Assets — 100.0% | | | | 22,270,751 | |
| | | | |
|
|
Trustee Deferred Compensation* | | | | | |
The Flex-funds Dynamic Growth Fund | | 840 | | 7,274 | |
The Flex-funds Quantex Fund | | 599 | | 10,536 | |
The Flex-funds Muirfield Fund | | 1,966 | | 10,420 | |
The Flex-funds Total Return Utilities Fund | | 137 | | 2,739 | |
| | | | |
|
|
Total Trustee Deferred Compensation (Cost $25,014) | | | | 30,969 | |
| | | | |
|
|
| (a) | Cost for financial reporting purposes and federal income tax purposes are the same. Cost for federal income tax purposes differs from value by net unrealized appreciation (depreciation) of securities as follows: |
| | | | |
Unrealized appreciation | | $ | 4,560,971 | |
Unrealized depreciation | | | (460,516 | ) |
| | |
|
|
|
Net unrealized appreciation (depreciation) | | $ | 4,100,455 | |
| | |
|
|
|
ADR American Depositary Receipt
| # | Represents non-income producing securities. |
| * | Assets of affiliates to The Total Return Utilities Fund held for the benefit of the Fund’s Trustees in connection with the Trustees Deferred Compensation Plan. |
The accompanying notes are an integral part of these financial statements.
Schedule of Investments
June 30, 2006 (unaudited)
The Quantex Fund
| | | | |
Security Description
| | Shares or
Principal
Amount ($)
| | Value ($)
|
Common Stocks — 95.6% |
Basic Materials — 8.1% | | | | |
Allegheny Technologies, Inc. | | 4,000 | | 276,960 |
Ashland, Inc. | | 2,600 | | 173,420 |
Eastman Chemical Co. | | 3,000 | | 162,000 |
Hercules, Inc.# | | 13,900 | | 212,114 |
Int’l Flavors & Fragrances, Inc. | | 4,700 | | 165,628 |
Louisiana Pacific Corp. | | 5,700 | | 124,830 |
Sigma — Aldrich Corp. | | 2,400 | | 174,336 |
| | | | |
|
(Cost 1,032,473) | | | | 1,289,288 |
| | | | |
|
Communications — 12.0% | | | | |
ADC Telecommunications, Inc.# | | 6,814 | | 114,884 |
Andrew Corp.# | | 15,000 | | 132,900 |
Avaya, Inc.# | | 14,300 | | 163,306 |
CenturyTel, Inc. | | 4,700 | | 174,605 |
Ciena Corp.# | | 51,200 | | 246,272 |
Citizens Communications Co. | | 13,000 | | 169,650 |
Dow Jones & Co., Inc. | | 4,000 | | 140,040 |
EW Scripps Co. | | 3,100 | | 133,734 |
Interpublic Group of Cos., Inc. | | 15,800 | | 131,930 |
JDS Uniphase Corp.# | | 66,100 | | 167,233 |
Meredith Corp. | | 3,000 | | 148,620 |
New York Times Co. | | 5,700 | | 139,878 |
The McClatchy Co. | | 1,228 | | 49,280 |
| | | | |
|
(Cost 1,779,841) | | | | 1,912,332 |
| | | | |
|
Consumer Cyclical — 15.6% | | | | |
Autonation, Inc.# | | 7,000 | | 150,080 |
Big Lots, Inc.# | | 12,600 | | 215,208 |
Brunswick Corp. | | 3,800 | | 126,350 |
Circuit City Stores, Inc. | | 6,400 | | 174,208 |
Cooper Tire & Rubber Co. | | 10,200 | | 113,628 |
Dana Corp. | | 22,900 | | 62,288 |
Dillards, Inc. | | 6,100 | | 194,285 |
Family Dollar Stores, Inc. | | 6,100 | | 149,023 |
Hasbro, Inc. | | 7,600 | | 137,636 |
Jones Apparel Group, Inc. | | 5,200 | | 165,308 |
Liz Claiborne, Inc. | | 4,400 | | 163,064 |
Navistar International Corp.# | | 5,600 | | 137,816 |
OfficeMax, lnc. | | 6,400 | | 260,800 |
RadioShack Corp. | | 7,200 | | 100,800 |
Sabre Holdings Corp. | | 6,700 | | 147,400 |
The Goodyear Tire & Rubber Co.# | | 8,600 | | 95,460 |
Whirlpool Corp. | | 980 | | 80,997 |
| | | | |
|
(Cost 2,429,369) | | | | 2,474,351 |
| | | | |
|
Consumer Noncyclical — 15.3% | | | | |
Alberto — Culver Co. | | 3,400 | | 165,648 |
Bausch & Lomb, Inc. | | 2,300 | | 112,792 |
Convergys Corp.# | | 9,800 | | 191,100 |
Estee Lauder Cos. Inc. / The | | 4,100 | | 158,547 |
King Pharmaceuticals, Inc.# | | 8,800 | | 149,600 |
Manor Care, Inc. | | 3,900 | | 182,988 |
McCormick & Co., Inc. | | 4,900 | | 164,395 |
Millipore Corp.# | | 2,300 | | 144,877 |
Molson Coors Brewing Co. | | 2,300 | | 156,124 |
Mylan Laboratories, Inc. | | 7,700 | | 154,000 |
Patterson Cos., Inc.# | | 4,500 | | 157,185 |
Pepsi Bottling Group, Inc. | | 5,300 | | 170,395 |
The Quantex Fund
| | | | |
Security Description
| | Shares or
Principal
Amount ($)
| | Value ($)
|
Common Stocks — continued |
Supervalu, Inc. | | 4,900 | | 150,430 |
Tenet Healthcare Corp.# | | 19,900 | | 138,902 |
Tyson Foods, Inc. | | 8,900 | | 132,254 |
Watson Pharmaceuticals, lnc.# | | 4,600 | | 107,088 |
| | | | |
|
(Cost 2,243,377) | | | | 2,436,325 |
| | | | |
|
Energy — 1.9% | | | | |
Dynegy, Inc. | | 31,600 | | 172,852 |
Rowan Cos., Inc. | | 3,900 | | 138,801 |
| | | | |
|
(Cost 214,465) | | | | 311,653 |
| | | | |
|
Financial — 3.8% | | | | |
Apartment Investment & Management Co. | | 3,900 | | 169,455 |
Federated Investors, Inc. | | 4,200 | | 132,300 |
First Horizon National Corp. | | 3,900 | | 156,780 |
Janus Capital Group, Inc. | | 8,200 | | 146,780 |
Wachovia Corp. Pref. Dividend Equalization | | 1,700 | | — |
| | | | |
|
(Cost 523,918) | | | | 605,315 |
| | | | |
|
Industrial — 20.9% | | | | |
Allied Waste Industries, Inc. | | 17,500 | | 198,800 |
American Power Conversion Corp. | | 7,000 | | 136,430 |
Ball Corp. | | 3,800 | | 140,752 |
Bemis Co. | | 5,200 | | 159,224 |
Cummins, Inc. | | 1,800 | | 220,050 |
Leggett & Platt, Inc. | | 6,600 | | 164,868 |
Molex, Inc. | | 5,900 | | 198,063 |
Pactiv Corp.# | | 7,200 | | 178,200 |
Pall Corp. | | 5,800 | | 162,400 |
PerkinElmer, lnc. | | 6,800 | | 142,120 |
Ryder System, Inc. | | 3,800 | | 222,034 |
Sanmina — SCI Corp.# | | 37,400 | | 172,040 |
Sealed Air Corp. | | 2,700 | | 140,616 |
Snap — On, Inc. | | 4,300 | | 173,806 |
Solectron Corp.# | | 41,800 | | 142,956 |
Stanley Works / The | | 3,000 | | 141,660 |
Symbol Technologies, Inc. | | 12,400 | | 133,796 |
Tektronix, Inc. | | 5,000 | | 147,100 |
Thermo Electron Corp.# | | 5,000 | | 181,200 |
Waters Corp.# | | 4,000 | | 177,600 |
| | | | |
|
(Cost 2,876,067) | | | | 3,333,715 |
| | | | |
|
Technology — 12.5% | | | | |
Applied Micro Circuits Corp.# | | 59,900 | | 163,527 |
BMC Software, Inc.# | | 7,400 | | 176,860 |
Compuware Corp.# | | 15,900 | | 106,530 |
Gateway, Inc.# | | 58,600 | | 111,340 |
LSI Logic Corp.# | | 18,300 | | 163,785 |
Mercury Interactive Corp.# | | 5,800 | | 202,826 |
Novell, Inc. | | 17,100 | | 113,373 |
Novellus Systems, Inc.# | | 6,400 | | 158,080 |
Parametric Technology Corp.# | | 9,840 | | 125,066 |
PMC — Sierra, Inc.# | | 20,000 | | 188,000 |
QLogic Corp.# | | 9,600 | | 165,504 |
Teradyne, Inc.# | | 10,600 | | 147,658 |
Unisys Corp.# | | 28,100 | | 176,468 |
| | | | |
|
(Cost 1,865,904) | | | | 1,999,017 |
| | | | |
|
Schedule of Investments
June 30, 2006 (unaudited)
The Quantex Fund
| | | | |
Security Description
| | Shares or
Principal
Amount ($)
| | Value ($)
|
Common Stocks — continued |
Utilities — 5.5% | | | | |
Centrepoint Energy, Inc. | | 11,800 | | 147,500 |
CMS Energy Corp. | | 10,300 | | 133,282 |
Nicor, Inc. | | 3,900 | | 161,850 |
Peoples Energy Corp. | | 4,400 | | 158,004 |
Pinnacle West Capital Corp. | | 3,700 | | 147,667 |
TECO Energy, Inc. | | 8,800 | | 131,472 |
| | | | |
|
(Cost 895,262) | | | | 879,775 |
| | | | |
|
Total Common Stocks
(Cost $13,860,676) | | | | 15,241,771 |
| | | | |
|
U.S. Government Obligations — 1.9% |
U.S. Treasury Bill,
4.854%, due 09/07/2006* | | 300,000 | | 297,223 |
| | | | |
|
Total U.S. Government Obligations
(Cost $297,320) | | | | 297,223 |
| | | | |
|
Repurchase Agreements — 1.5% |
Morgan Stanley DW, Inc., 5.3725%, 07/03/2006, (Collateralized by $245,110 various Commercial Papers, Certificates of Deposit, Agency Strips, FNMAs, Treasury Notes, and SLMA, at 4.00% — 10.00%, due 07/05/2006 — 01/01/2036, value — $249,902) purchase date 06/30/2006 | | 245,000 | | 245,000 |
| | | | |
|
Total Repurchase Agreements
(Cost $245,000) | | | | 245,000 |
| | | | |
|
Total Investments — 99.0%
(Cost $14,402,996)(a) | | | | 15,783,994 |
| | | | |
|
Other Assets less Liabilities — 1.0% | | | | 167,144 |
| | | | |
|
Total Net Assets — 100.0% | | | | 15,951,138 |
| | | | |
|
Trustee Deferred Compensation** |
The Flex-funds Dynamic Growth Fund | | 1,235 | | 10,695 |
The Flex-funds Quantex Fund | | 802 | | 14,107 |
The Flex-funds Muirfield Fund | | 2,809 | | 14,888 |
The Flex-funds Total Return Utilities Fund | | 218 | | 4,358 |
| | | | |
|
Total Trustee Deferred Compensation (Cost $35,175) | | | | 44,048 |
| | | | |
|
The Quantex Fund
| | | | |
Security Description
| | Long
Contracts
| | Unrealized
Appreciation
(Depreciation) ($)
|
Futures Contracts |
Russell 2000 expiring September 2006, notional value $365,750 | | 1 | | 20,900 |
| | | | |
|
Total Futures Contracts | | | | 20,900 |
| | | | |
|
| (a) | Cost for financial reporting purposes and federal income tax purposes are the same. Cost for federal income tax purposes differs from value by net unrealized appreciation (depreciation) of securities as follows: |
| | | | |
Unrealized appreciation | | $ | 2,130,817 | |
Unrealized depreciation | | | (749,819 | ) |
| | |
|
|
|
Net unrealized appreciation (depreciation) | | $ | 1,380,998 | |
| | |
|
|
|
ADR American Depositary Receipt
| # | Represents non-income producing securities. |
| * | Pledged as collateral on Futures Contracts. |
| ** | Assets of affiliates to The Flex-funds Quantex Fund held for the benefit of the Fund’s Trustees in connection with the Trustee Deferred Compensation Plan. |
The accompanying notes are an integral part of these financial statements.
Schedule of Investments
June 30, 2006 (unaudited)
The Dynamic Growth Fund
| | | | | |
Security Description
| | Shares or
Principal
Amount ($)
| | Value ($)
| |
Registered Investment Companies — 92.7% | | | |
Allianz NACM International Fund — I | | 60,597 | | 1,333,734 | |
Allianz NFJ Dividend Value Fund — D | | 116,484 | | 1,791,517 | |
American Growth Fund of America — A | | 66,729 | | 2,115,297 | |
Goldman Sachs Structured Large Cap Value Fund — I | | 293,652 | | 3,973,114 | |
Goldman Sachs Mid Cap Value Fund | | 23,216 | | 849,022 | |
MFS Value Fund — A | | 83,344 | | 2,034,430 | |
Rydex Large Cap Value Fund — H | | 65,115 | | 1,929,354 | |
Rydex Mid Cap Value Fund — H | | 26,557 | | 847,432 | |
Transamerica Premier Equity Fund — I | | 38,631 | | 867,653 | |
| | | | |
|
|
Total Registered Investment Companies (Cost $15,634,263) | | | | 15,741,553 | |
| | | | |
|
|
U.S. Government Obligations — 2.3% | | | | | |
U.S. Treasury Bill,
4.854%, due 09/07/2006* | | 400,000 | | 396,297 | |
| | | | |
|
|
Total U.S. Government Obligations
(Cost $396,426) | | | | 396,297 | |
| | | | |
|
|
Repurchase Agreements — 5.2% | | | | | |
Morgan Stanley DW, Inc., 5.3725%, 07/03/2006, (Collateralized by $883,395 various Commercial Papers, Certificates of Deposit, Agency Strips, FNMAs, Treasury Notes, and SLMA, at 4.00% — 10.00%, due 07/05/2006 — 01/01/2036, value — $900,665) purchase date 06/30/2006 | | 883,000 | | 883,000 | |
| | | | |
|
|
Total Repurchase Agreements
(Cost $883,000) | | | | 883,000 | |
| | | | |
|
|
Total Investments — 100.2%
(Cost $16,913,689)(a) | | | | 17,020,850 | |
| | | | |
|
|
Liabilities less Other Assets — (0.2%) | | | | (26,084 | ) |
| | | | |
|
|
Total Net Assets — 100.0% | | | | 16,994,766 | |
| | | | |
|
|
Trustee Deferred Compensation** | | | | | |
The Flex-funds Dynamic Growth Fund | | 574 | | 4,971 | |
The Flex-funds Muirfield Fund | | 1,406 | | 7,452 | |
The Flex-funds Quantex Fund | | 460 | | 8,091 | |
The Flex-funds Total Return Utilities Fund | | 77 | | 1,539 | |
| | | | |
|
|
Total Trustee Deferred Compensation
(Cost $18,698) | | | | 22,053 | |
| | | | |
|
|
The Dynamic Growth Fund
| | | | |
Security Description
| | Long
Contracts
| | Unrealized
Appreciation
(Depreciation) ($)
|
Futures Contracts | | | | |
Standard & Poors 500 expiring September 2006, notional value $1,279,400 | | 4 | | 27,750 |
| | | | |
|
Total Futures Contracts | | | | 27,750 |
| | | | |
|
| (a) | Cost for financial reporting purposes and federal income tax purposes are the same. Cost for federal income tax purposes differs from value by net unrealized appreciation (depreciation) of securities as follows: |
| | | | |
Unrealized appreciation | | $ | 200,431 | |
Unrealized depreciation | | | (93,270 | ) |
| | |
|
|
|
Net unrealized appreciation (depreciation) | | $ | 107,161 | |
| | |
|
|
|
| # | Represents non-income producing security. |
| * | Pledged as collateral on futures contracts. |
| ** | Assets of affiliates to The Dynamic Growth Fund held for the benefit of the Fund’s Trustees in connection with the Trustee Deferred Compensation Plan. |
The accompanying notes are an integral part of these financial statements.
Schedule of Investments
June 30, 2006 (unaudited)
The Aggressive Growth Fund
| | | | | |
Security Description
| | Shares or
Principal
Amount ($)
| | Value ($)
| |
Registered Investment Companies — 90.1% | |
iShares Dow Jones U.S. Industrial Sector Index Fund | | 15,000 | | 931,500 | |
iShares MSCI EMU Index Fund | | 15,180 | | 1,336,751 | |
iShares Russell Midcap Value Index Fund | | 6,740 | | 890,826 | |
iShares Russell 1000 Value Index Fund | | 122,050 | | 8,924,296 | |
iShares S&P MidCap 400 Growth Index Fund | | 11,500 | | 882,280 | |
PowerShares Dynamic Insurance Portfolio | | 60,000 | | 1,008,000 | |
PowerShares Dynamic Large Cap Growth Portfolio | | 74,955 | | 1,159,554 | |
streetTRACKS KBW Bank ETF | | 12,010 | | 645,297 | |
| | | | |
|
|
Total Registered Investment Companies (Cost $15,768,868) | | | | 15,778,504 | |
| | | | |
|
|
U.S. Government Obligations — 1.1% | |
U.S. Treasury Bill,
4.854%, due 09/07/2006* | | 200,000 | | 198,148 | |
| | | | |
|
|
Total U.S. Government Obligations
(Cost $198,213) | | | | 198,148 | |
| | | | |
|
|
Repurchase Agreements — 9.0% | |
Morgan Stanley DW, Inc., 5.3725%, 07/03/2006, (Collateralized by $1,580,707 various Commercial Papers, Certificates of Deposit, Agency Strips, FNMAs, Treasury Notes, and SLMA, at 4.00% — 10.00%, due 07/05/2006 — 01/01/2036, value — $1,611,609) purchase date 06/30/2006 | | 1,580,000 | | 1,580,000 | |
| | | | |
|
|
Total Repurchase Agreements
(Cost $1,580,000) | | | | 1,580,000 | |
| | | | |
|
|
Total Investments — 100.2%
(Cost $17,547,081)(a) | | | | 17,556,652 | |
| | | | |
|
|
Liabilities less Other Assets — (0.2%) | | | | (41,052 | ) |
| | | | |
|
|
Total Net Assets — 100.0% | | | | 17,515,600 | |
| | | | |
|
|
Trustee Deferred Compensation** | |
The Flex-funds Dynamic Growth Fund | | 491 | | 4,252 | |
The Flex-funds Quantex Fund | | 364 | | 6,403 | |
The Flex-funds Muirfield Fund | | 1,173 | | 6,217 | |
The Flex-funds Total Return Utilities Fund | | 67 | | 1,339 | |
| | | | |
|
|
Total Trustee Deferred Compensation (Cost $15,330) | | | | 18,211 | |
| | | | |
|
|
The Aggressive Growth Fund
| | | | |
Security Description
| | Long
Contracts
| | Unrealized
Appreciation
(Depreciation) ($)
|
Futures Contracts |
Standard & Poors 500 expiring September 2006, notional value $1,599,250 | | 5 | | 40,625 |
| | | | |
|
Total Futures Contracts | | | | 40,625 |
| | | | |
|
| (a) | Cost for financial reporting purposes and federal income tax purposes are the same. Cost for federal income tax purposes differs from value by net unrealized appreciation (depreciation) of securities as follows: |
| | | | |
Unrealized appreciation | | $ | 170,901 | |
Unrealized depreciation | | | (161,330 | ) |
| | |
|
|
|
Net unrealized appreciation (depreciation) | | $ | 9,571 | |
| | |
|
|
|
| # | Represents non-income producing securities. |
| * | Pledged as collateral on futures contracts. |
| ** | Assets of affiliates to The Aggressive Growth Fund held for the benefit of the Fund’s Trustees in connection with the Trustee Deferred Compensation Plan. |
The accompanying notes are an integral part of these financial statements.
Schedule of Investments
June 30, 2006 (unaudited)
The Defensive Growth Fund
| | | | | |
Security Description
| | Shares or
Principal
Amount ($)
| | Value ($)
| |
Registered Investment Companies — 71.6% | | | |
iShares Dow Jones U.S. Industrial Sector Index Fund | | 42,990 | | 2,669,679 | |
iShares MSCI EMU Index Fund | | 24,311 | | 2,140,827 | |
iShares Russell Midcap Value Index Fund | | 10,528 | | 1,391,486 | |
iShares Russell 1000 Value Index Fund | | 130,451 | | 9,538,577 | |
PowerShares Dynamic Insurance Portfolio | | 71,867 | | 1,207,365 | |
PowerShares Dynamic Large Cap Growth Portfolio | | 186,918 | | 2,891,621 | |
streetTRACKS KBW Bank ETF | | 16,600 | | 891,918 | |
| | | | |
|
|
Total Registered Investment Companies (Cost $20,976,237) | | | | 20,731,473 | |
| | | | |
|
|
U.S. Government Obligations — 4.5% | | | | | |
U.S. Treasury Bill,
4.17%, due 07/06/06 | | 1,000,000 | | 999,421 | |
U.S. Treasury Bill,
4.71%, due 09/14/2006* | | 110,000 | | 108,885 | |
U.S. Treasury Bill,
4.99%, due 09/28/2006* | | 190,000 | | 187,691 | |
| | | | |
|
|
Total U.S. Government Obligations
(Cost $1,296,086) | | | | 1,295,997 | |
| | | | |
|
|
Repurchase Agreements — 24.0% | | | | | |
Morgan Stanley DW, Inc., 5.3725%, 07/03/2006, (Collateralized by $6,952,111 various Commercial Papers, Certificates of Deposit, Agency Strips, FNMAs, Treasury Notes, and SLMA, at 4.00% — 10.00%, due 07/05/2006 — 01/01/2036, value — $7,088,021) purchase date 06/30/2006 | | 6,949,000 | | 6,949,000 | |
| | | | |
|
|
Total Repurchase Agreements
(Cost $6,949,000) | | | | 6,949,000 | |
| | | | |
|
|
Total Investments — 100.1%
(Cost $29,221,323)(a) | | | | 28,976,470 | |
| | | | |
|
|
Liabilities less Other Assets — (0.1%) | | | | (36,305 | ) |
| | | | |
|
|
Total Net Assets — 100.0% | | | | 28,940,165 | |
| | | | |
|
|
The Defensive Growth Fund
| | | | | | |
Security Description
| | Short
Contracts
| | | Unrealized
Appreciation
(Depreciation) ($)
| |
Futures Contracts | | | | | | |
Standard & Poors 500 expiring September 2006, notional value $2,558,800 | | (8 | ) | | (58,445 | ) |
| | | | | |
|
|
Total Futures Contracts | | | | | (58,445 | ) |
| | | | | |
|
|
| (a) | Cost for financial reporting purposes and federal income tax purposes are the same. Cost for federal income tax purposes differs from value by net unrealized appreciation (depreciation) of securities as follows: |
| | | | |
Unrealized appreciation | | $ | 83,797 | |
Unrealized depreciation | | | (328,650 | ) |
| | |
|
|
|
Net unrealized appreciation (depreciation) | | $ | (244,853 | ) |
| | |
|
|
|
| # | Represents non-income producing securities. |
| * | Pledged as collateral on futures contracts. |
The accompanying notes are an integral part of these financial statements.
Schedule of Investments
June 30, 2006 (unaudited)
The Focused Growth Fund
| | | | | |
Security Description
| | Shares or
Principal
Amount ($)
| | Value ($)
| |
Registered Investment Companies — 93.7% | |
iShares Dow Jones U.S. Industrial Sector Index Fund | | 42,104 | | 2,614,658 | |
iShares MSCI EMU Index Fund | | 22,294 | | 1,963,210 | |
iShares Russell Midcap Value Index Fund | | 18,752 | | 2,478,452 | |
iShares Russell 1000 Value Index Fund | | 176,445 | | 12,901,658 | |
PowerShares Dynamic Insurance Portfolio | | 71,890 | | 1,207,752 | |
PowerShares Dynamic Large Cap Growth Portfolio | | 129,220 | | 1,999,033 | |
streetTRACKS KBW Bank ETF | | 22,450 | | 1,206,239 | |
| | | | |
|
|
Total Registered Investment Companies (Cost $24,467,049) | | | | 24,371,002 | |
| | | | |
|
|
U.S. Government Obligations — 1.8% | |
U.S. Treasury Bill,
4.99%, due 09/28/2006* | | 475,000 | | 469,229 | |
| | | | |
|
|
Total U.S. Government Obligations
(Cost $469,289) | | | | 469,229 | |
| | | | |
|
|
Repurchase Agreements — 4.5% | |
Morgan Stanley DW, Inc., 5.3725%, 07/03/2006, (Collateralized by $1,183,530 various Commercial Papers, Certificates of Deposit, Agency Strips, FNMAs, Treasury Notes, and SLMA, at 4.00% — 10.00%, due 07/05/2006 — 01/01/2036, value — $1,206,667) purchase date 06/30/2006 | | 1,183,000 | | 1,183,000 | |
| | | | |
|
|
Total Repurchase Agreements (Cost $1,183,000) | | | | 1,183,000 | |
| | | | |
|
|
Total Investments — 100.0% (Cost $26,119,338)(a) | | | | 26,023,231 | |
| | | | |
|
|
Liabilities less Other Assets — (0.0%) | | | | (10,120 | ) |
| | | | |
|
|
Total Net Assets — 100.0% | | | | 26,013,111 | |
| | | | |
|
|
The Focused Growth Fund
| | | | |
Security Description
| | Long
Contracts
| | Unrealized
Appreciation
(Depreciation) ($)
|
Futures Contracts |
Standard & Poors 500 expiring September 2006, notional value $1,279,400 | | 4 | | 29,571 |
| | | | |
|
Total Futures Contracts | | | | 29,571 |
| | | | |
|
| (a) | Cost for financial reporting purposes and federal income tax purposes are the same. Cost for federal income tax purposes differs from value by net unrealized appreciation (depreciation) of securities as follows: |
| | | | |
Unrealized appreciation | | $ | 161,429 | |
Unrealized depreciation | | | (257,536 | ) |
| | |
|
|
|
Net unrealized appreciation (depreciation) | | $ | (96,107 | ) |
| | |
|
|
|
| # | Represents non-income producing securities. |
| * | Pledged as collateral on futures contracts. |
The accompanying notes are an integral part of these financial statements.
Schedule of Investments
June 30, 2006 (unaudited)
The U.S. Government Bond Fund
| | | | |
Security Description
| | Principal
Amount ($)
or Shares
| | Value ($)
|
Registered Investment Companies — 11.6% |
iShares GS$ InvesTop Corporate Bond Fund | | 5,800 | | 600,126 |
| | | | |
|
Total Registered Investment Companies (Cost $642,176) | | | | 600,126 |
| | | | |
|
U.S. Government Obligations — 79.7% |
Federal Farm Credit, 2.32%, due 12/26/06 | | 500,000 | | 492,356 |
Federal Farm Credit, 2.25%, due 06/28/07 | | 500,000 | | 484,492 |
Federal Home Loan Bank,
5.04%, due 07/06/06 | | 600,000 | | 599,587 |
Federal Home Loan Bank,
3.125%, due 05/21/07 | | 400,000 | | 391,785 |
Federal Home Loan Bank,
3.00%, due 12/28/07 | | 400,000 | | 385,903 |
U.S. Treasury Inflation Protected Security, 3.375%, due 01/15/07 | | 508,580 | | 509,851 |
U.S. Treasury Note, 6.50%, due 10/15/06 | | 500,000 | | 501,563 |
U.S. Treasury Note, 4.00%, due 06/15/09 | | 200,000 | | 193,813 |
U.S. Treasury Note, 4.375%, due 08/15/12 | | 300,000 | | 288,469 |
U.S. Treasury Note, 4.00%, due 11/15/12 | | 300,000 | | 281,953 |
| | | | |
|
Total U.S. Government Obligations (Cost $4,173,537) | | | | 4,129,772 |
| | | | |
|
Repurchase Agreements — 8.2% |
Morgan Stanley DW, Inc., 5.3725%, 07/03/2006, (Collateralized by $427,191 various Commercial Papers, Certificates of Deposit, Agency Strips, FNMAs, Treasury Notes, and SLMA, at 4.00% — 10.00%, due 07/05/2006 — 01/01/2036, value — $435,542) purchase date 06/30/2006 | | 427,000 | | 427,000 |
| | | | |
|
Total Repurchase Agreements (Cost $427,000) | | | | 427,000 |
| | | | |
|
Total Investments — 99.5% (Cost $5,242,713)(a) | | | | 5,156,898 |
| | | | |
|
Other Assets less Liabilities — 0.5% | | | | 24,777 |
| | | | |
|
Total Net Assets — 100.0% | | | | 5,181,675 |
| | | | |
|
The U.S. Government Bond Fund
| | | | |
Security Description
| | Principal
Amount ($)
or Shares
| | Value ($)
|
Trustee Deferred Compensation* |
The Flex-funds Dynamic Growth Fund | | 634 | | 5,490 |
The Flex-funds Quantex Fund | | 452 | | 7,951 |
The Flex-funds Muirfield Fund | | 1,477 | | 7,828 |
The Flex-funds Total Return Utilities Fund | | 107 | | 2,139 |
| | | | |
|
Total Trustee Deferred Compensation (Cost $19,123) | | | | 23,408 |
| | | | |
|
| (a) | Represents cost for financial reporting purposes and differs for federal income tax purposes by the amount of losses recognized in excess of federal income tax reporting of approximately $48,816. Cost for federal income tax purposes of $5,291,529 differs from value by net unrealized appreciation (depreciation) of securities as follows: |
| | | | |
Unrealized appreciation | | $ | — | |
Unrealized depreciation | | | (134,624 | ) |
| | |
|
|
|
Net unrealized appreciation (depreciation) | | $ | (134,624 | ) |
| | |
|
|
|
| * | Assets of affiliates to The U.S. Government Bond Fund held for the benefit of the Fund’s Trustees in connection with the Trustee Deferred Compensation Plan. |
The accompanying notes are an integral part of these financial statements.
Schedule of Investments
June 30, 2006 (unaudited)
The Money Market Fund
| | | | | | | | | |
Security Description
| | Coupon/
Yield
| | | Maturity
| | Principal
Amount ($)
or Shares
| | Value ($)
|
Certificates of Deposit — 4.7% | | | | |
Huntington National Bank CD | | 5.24% | | | 07/24/06 | | 7,000,000 | | 7,000,000 |
Huntington National Bank CD | | 5.35% | | | 07/21/06 | | 1,000,000 | | 1,000,000 |
| | | | | | | | | |
|
Total Certificates of Deposit
(Cost $8,000,000) | | | | | | | | | 8,000,000 |
| | | | | | | | | |
|
Commercial Paper — 13.3% | | | | | | | |
BASF AG** | | 5.25% | | | 07/21/06 | | 6,000,000 | | 5,982,500 |
BHP Billiton | | 5.27% | | | 08/02/06 | | 6,000,000 | | 5,971,893 |
Citigroup FDG | | 5.10% | | | 08/07/06 | | 5,000,000 | | 4,974,151 |
GE Capital Corp | | 5.20% | | | 07/10/06 | | 6,000,000 | | 5,992,200 |
| | | | | | | | | |
|
Total Commercial Paper
(Cost $22,920,745) | | | | | | | | | 22,920,745 |
| | | | | | | | | |
|
Corporate Obligations — 62.5% | | | | |
Abbott Laboratories | | 5.63% | | | 07/01/06 | | 2,000,000 | | 2,000,050 |
Alliance Capital Management | | 5.63% | | | 08/15/06 | | 3,000,000 | | 3,001,035 |
Allstate Life** | | 5.45% | * | | 09/22/06 | | 3,000,000 | | 3,000,263 |
American Express | | 5.50% | | | 09/12/06 | | 4,024,000 | | 4,025,119 |
American General Finance | | 5.88% | | | 07/14/06 | | 4,841,000 | | 4,842,331 |
Aquarium Holdings, KY** | | 5.35% | * | | 07/06/06 | | 108,000 | | 108,000 |
Bank One Corp. | | 6.88% | | | 08/01/06 | | 1,000,000 | | 1,001,372 |
Bath Technologies, Inc.** | | 5.47% | * | | 07/06/06 | | 1,160,000 | | 1,160,000 |
Beaver Creek Enterprise** | | 5.42% | * | | 07/06/06 | | 1,875,000 | | 1,875,000 |
Cascade Plaza Project** | | 5.42% | * | | 07/06/06 | | 7,788,000 | | 7,788,000 |
CIT Group Inc.** | | 5.20% | * | | 08/18/06 | | 2,250,000 | | 2,250,201 |
CIT Group Inc. | | 2.88% | | | 09/29/06 | | 1,000,000 | | 994,042 |
Clark Grave Vault Co.** | | 5.35% | * | | 07/06/06 | | 450,000 | | 450,000 |
Don’s Launderers-Cleaners, Inc.** | | 5.35% | * | | 07/06/06 | | 900,000 | | 900,000 |
Espanola/Nambe** | | 5.52% | * | | 07/06/06 | | 325,000 | | 325,000 |
FPL Group Capital | | 7.63% | | | 09/15/06 | | 6,415,000 | | 6,445,498 |
Gordon Flesch Co. Project** | | 5.42% | * | | 07/06/06 | | 700,000 | | 700,000 |
HSBC Finance Corp. | | 7.20% | | | 07/15/06 | | 2,500,000 | | 2,502,205 |
Intl Lease Finance Corp. | | 5.65% | | | 08/15/06 | | 3,000,000 | | 3,001,045 |
Isaac Tire, Inc.** | | 5.35% | * | | 07/06/06 | | 770,000 | | 770,000 |
Jim White Co.** | | 5.45% | * | | 07/06/06 | | 715,000 | | 715,000 |
JPMorgan Chase & Co. | | 5.63% | | | 08/15/06 | | 5,000,000 | | 5,001,966 |
J2T LLC** | | 5.45% | * | | 07/06/06 | | 2,080,000 | | 2,080,000 |
K.L. Morris, Inc.** | | 5.35% | * | | 07/06/06 | | 2,015,000 | | 2,015,000 |
Keiser Street, Inc.** | | 5.42% | * | | 07/06/06 | | 1,545,000 | | 1,545,000 |
Martin Wheel Co, Inc.** | | 5.65% | * | | 07/06/06 | | 2,195,000 | | 2,195,000 |
Mega Star Arbor LLC** | | 5.45% | * | | 07/06/06 | | 4,270,000 | | 4,270,000 |
MetLife Insurance Co.*** | | 5.02% | * | | 07/03/06 | | 7,500,000 | | 7,500,000 |
Mubea, Inc.** | | 5.40% | * | | 07/06/06 | | 2,800,000 | | 2,800,000 |
Nationwide Fin Fund** | | 5.77% | * | | 08/18/06 | | 6,000,000 | | 6,004,899 |
Nike, Inc. | | 5.50% | | | 08/15/06 | | 1,000,000 | | 1,000,601 |
O.K.I. Supply Co.** | | 5.35% | * | | 07/06/06 | | 1,005,000 | | 1,005,000 |
Osco Industries, Inc.** | | 5.52% | * | | 07/06/06 | | 600,000 | | 600,000 |
PNC Funding Corp. | | 5.75% | | | 08/01/06 | | 7,350,000 | | 7,353,859 |
Pro Tire, Inc.** | | 5.35% | * | | 07/06/06 | | 920,000 | | 920,000 |
Protective Life | | 5.88% | | | 08/15/06 | | 4,410,000 | | 4,413,828 |
Seariver Maritime, Inc. | | 5.06% | * | | 07/03/06 | | 3,500,000 | | 3,500,000 |
The Money Market Fund
| | | | | | | | | |
Security Description
| | Coupon/
Yield
| | | Maturity
| | Principal
Amount ($)
or Shares
| | Value ($)
|
Corporate Obligations — continued | | | | |
Springside Corp Exchange Partners LLC** | | 5.42% | * | | 07/06/06 | | 2,000,000 | | 2,000,000 |
Taylor Brothers Properties LLC** | | 5.35% | * | | 07/06/06 | | 1,115,000 | | 1,115,000 |
White Castle Project** | | 5.42% | * | | 07/06/06 | | 4,500,000 | | 4,500,000 |
| | | | | | | | | |
|
Total Corporate Obligations
(Cost $107,674,316) | | | | | | | 107,674,316 |
| | | | | | | | | |
|
U.S. Government Agency Obligations — 1.2% | | |
Federal Home Loan Bank | | 5.00% | * | | 08/04/06 | | 400,000 | | 399,880 |
Federal Home Loan Bank | | 2.75% | | | 08/07/06 | | 1,000,000 | | 997,825 |
Federal Home Loan Bank | | 3.00% | | | 08/30/06 | | 500,000 | | 498,273 |
Freddie Mac | | 2.00% | | | 07/14/06 | | 250,000 | | 249,713 |
| | | | | | | | | |
|
Total U.S. Government Agency Obligations
(Cost $2,145,691) | | | | 2,145,691 |
| | | | | | | | | |
|
Repurchase Agreements — 17.6% | | | | |
Morgan Stanley DW, Inc., 5.3725%, 07/03/2006, (Collateralized by $30,232,529 various Commercial Papers, Certificates of Deposit, Agency Strips, FNMAs, Treasury Notes, and SLMA, at 4.00% — 10.00%, due 07/05/2006 — 01/01/2036, value — $30,823,559) purchase date 06/30/2006 | | | | | 30,219,000 | | 30,219,000 |
| | | | | | | | | |
|
Total Repurchase Agreements
(Cost $30,219,000) | | | | | | | 30,219,000 |
| | | | | | | | | |
|
Total Investments — 99.3%
(Cost $170,959,752)(a) | | | | | | | 170,959,752 |
| | | | | | | | | |
|
Other Assets less
Liabilities — 0.7% | | | | | | | 1,275,668 |
| | | | | | | | | |
|
Total Net Assets — 100.0% | | | | | | | 172,235,420 |
| | | | | | | | | |
|
Schedule of Investments
June 30, 2006 (unaudited)
The Money Market Fund
| | | | | | | | |
Security Description
| | Coupon/
Yield
| | Maturity
| | Principal
Amount ($)
or Shares
| | Value ($)
|
Trustee Deferred Compensation**** | | | | |
The Flex-funds Dynamic Growth Fund | | | | | | 1,065 | | 9,223 |
The Flex-funds Quantex Fund | | | | | | 715 | | 12,577 |
The Flex-funds Muirfield Fund | | | | | | 2,444 | | 12,953 |
The Flex-funds Total Return Utilities Fund | | | | | | 196 | | 3,918 |
| | | | | | | | |
|
Total Trustee Deferred Compensation
(Cost $35,716) | | | | | | | | 38,671 |
| | | | | | | | |
|
| (a) | Cost for federal income tax and financial reporting purposes are the same. |
| * | Variable rate security. Interest rate is as of June 30, 2006. Maturity date reflects the next rate change date. |
| ** | Represents a restricted security purchased under Rule 144A, which is exempt from registration under the Securities Act of 1933, as amended. Security is restricted as to resale to institutional investors, but has been deemed liquid in accordance with guidelines approved by the Board of Trustees. As of June 30, 2006, securities restricted as to resale to institutional investors represented 37.8% of Total Investments. |
| *** | Illiquid security. The sale or disposition of such security would not be possible in the ordinary course of business within seven days at approximately the value at which the Fund has valued the security. As of June 30, 2006, illiquid securities represented 4.4% of Total Investments. |
| **** | Assets of affiliates to The Money Market Fund held for the benefit of the Fund’s Trustees in connection with the Trustee Deferred Compensation Plan. |
Statements of Assets & Liabilities
June 30, 2006 (unaudited)
| | | | | | | | |
| | | The
Muirfield
Fund
| | | The Total
Return
Utilities Fund
| |
Assets | | | | | | | | |
Investments, at value* | | $ | 37,358,039 | | | $ | 22,102,574 | |
Repurchase agreements, at value* | | | 11,178,000 | | | | 201,000 | |
Trustee deferred compensation investments, at value | | | 89,245 | | | | 30,969 | |
Cash | | | 9 | | | | 204 | |
Receivable for securities sold | | | — | | | | — | |
Receivable for net variation margin on futures contracts | | | 12,000 | | | | — | |
Receivable for capital stock issued | | | 2,872 | | | | 4,938 | |
Receivable from investment advisor | | | — | | | | — | |
Interest and dividend receivable | | | 1,668 | | | | 29,461 | |
Prepaid expenses/other assets | | | 24,598 | | | | 16,031 | |
Total Assets | | | 48,666,431 | | | | 22,385,177 | |
| | |
Liabilities | | | | | | | | |
Payable for Trustee Deferred Compensation Plan | | | 89,245 | | | | 30,969 | |
Payable for net variation margin on futures contracts | | | — | | | | — | |
Payable for capital stock redeemed | | | 22,692 | | | | 41,886 | |
Dividends payable | | | — | | | | 306 | |
Dividends payable — The Money Market Fund — Retail Class | | | | | | | | |
Dividends payable — The Money Market Fund — Institutional Class | | | | | | | | |
Payable to investment advisor | | | 39,604 | | | | 17,844 | |
Accrued distribution plan (12b-1) and administrative service plan fees | | | 16,036 | | | | 7,424 | |
Accrued transfer agent, fund accounting, CCO, and administrative fees | | | 11,889 | | | | 6,423 | |
Accrued trustee fees | | | 8,269 | | | | 3,935 | |
Other accrued liabilities | | | 10,911 | | | | 5,639 | |
Total Liabilities | | | 198,646 | | | | 114,426 | |
| | | | | | | | | |
Net Assets | | | 48,467,785 | | | | 22,270,751 | |
| | |
Net Assets | | | | | | | | |
Capital | | | 56,293,941 | | | | 24,106,608 | |
Accumulated undistributed (distributions in excess of) net investment income | | | (185,290 | ) | | | 10,070 | |
Accumulated undistributed net realized gain (loss) from investments and futures contracts | | | (7,856,071 | ) | | | (5,946,382 | ) |
Net unrealized appreciation (depreciation) of investments and futures contracts | | | 215,205 | | | | 4,100,455 | |
Total Net Assets | | $ | 48,467,785 | | | $ | 22,270,751 | |
| | |
Net Assets | | | | | | | | |
The Money Market Fund — Retail Class | | | | | | | | |
The Money Market Fund — Institutional Class | | | | | | | | |
Total Net Assets | | | | | | | | |
| | |
Capital Stock Outstanding (indefinite number of shares authorized,
$0.10 par value) | | | 9,145,762 | | | | 1,114,169 | |
The Money Market Fund — Retail Class | | | | | | | | |
The Money Market Fund — Institutional Class | | | | | | | | |
Total Capital Stock Outstanding | | | | | | | | |
| | |
Net Asset Value, Offering and Redemption Price Per Share | | $ | 5.30 | | | $ | 19.99 | |
The Money Market Fund — Retail Class | | | | | | | | |
The Money Market Fund — Institutional Class | | | | | | | | |
* Investments and repurchase agreements, at cost | | $ | 48,211,249 | | | $ | 18,203,119 | |
The accompanying notes are an integral part of these financial statements.
| | | | | | | | | | | | | | | | | | | | | | | | | |
The
Quantex
Fund
| | | The Dynamic
Growth Fund
| | | The Aggressive
Growth Fund
| | | The Defensive
Growth Fund
| | | The Focused
Growth Fund
| | | The U.S.
Government
Bond Fund
| | | The Money
Market Fund
|
| | | | | | | | | | | | | | | | | | | | | | | | | | |
| $ | 15,538,994 | | | $ | 16,137,850 | | | $ | 15,976,652 | | | $ | 22,027,470 | | | $ | 24,840,231 | | | $ | 4,729,898 | | | $ | 140,740,752 |
| | 245,000 | | | | 883,000 | | | | 1,580,000 | | | | 6,949,000 | | | | 1,183,000 | | | | 427,000 | | | | 30,219,000 |
| | 44,048 | | | | 22,053 | | | | 18,211 | | | | — | | | | — | | | | 23,408 | | | | 38,671 |
| | 894 | | | | 783 | | | | 790 | | | | 809 | | | | 517 | | | | 399 | | | | 758 |
| | 156,000 | | | | 940 | | | | 790 | | | | — | | | | — | | | | — | | | | — |
| | 5,050 | | | | — | | | | — | | | | 6,400 | | | | — | | | | — | | | | — |
| | 792 | | | | — | | | | — | | | | — | | | | 32,830 | | | | 99 | | | | — |
| | — | | | | — | | | | — | | | | — | | | | — | | | | 1,912 | | | | 18,608 |
| | 12,475 | | | | 132 | | | | 236 | | | | 1,037 | | | | 177 | | | | 29,504 | | | | 1,373,581 |
| | 23,411 | | | | 10,499 | | | | 16,312 | | | | 13,322 | | | | 14,089 | | | | 9,443 | | | | 34,714 |
| | 16,026,664 | | | | 17,055,257 | | | | 17,592,991 | | | | 28,998,038 | | | | 26,070,844 | | | | 5,221,663 | | | | 172,426,084 |
| | | | | | |
| | | | | | | | | | | | | | | | | | | | | | | | | | |
| | 44,048 | | | | 22,053 | | | | 18,211 | | | | — | | | | — | | | | 23,408 | | | | 38,671 |
| | — | | | | 3,200 | | | | 4,000 | | | | — | | | | 3,200 | | | | — | | | | — |
| | 3,000 | | | | 24 | | | | 18,282 | | | | — | | | | — | | | | 1,076 | | | | — |
| | — | | | | — | | | | — | | | | — | | | | — | | | | 1,753 | | | | |
| | | | | | | | | | | | | | | | | | | | | | | | | | 5,090 |
| | | | | | | | | | | | | | | | | | | | | | | | | | 41,294 |
| | 9,773 | | | | 10,285 | | | | 10,600 | | | | 17,242 | | | | 15,656 | | | | 1,705 | | | | 36,380 |
| | 1,949 | | | | 9,627 | | | | 11,418 | | | | 26,272 | | | | 23,378 | | | | 1,335 | | | | 16,591 |
| | 4,885 | | | | 5,102 | | | | 5,236 | | | | 6,454 | | | | 5,925 | | | | 1,697 | | | | 10,036 |
| | 3,453 | | | | 3,743 | | | | 3,155 | | | | 1,524 | | | | 1,169 | | | | 3,347 | | | | 3,283 |
| | 8,418 | | | | 6,457 | | | | 6,489 | | | | 6,381 | | | | 8,405 | | | | 5,667 | | | | 39,319 |
| | 75,526 | | | | 60,491 | | | | 77,391 | | | | 57,873 | | | | 57,733 | | | | 39,988 | | | | 190,664 |
| | | | | | | | | | | | | | | | | | | | | | | | | | |
| | 15,951,138 | | | | 16,994,766 | | | | 17,515,600 | | | | 28,940,165 | | | | 26,013,111 | | | | 5,181,675 | | | | 172,235,420 |
| | | | | | |
| | | | | | | | | | | | | | | | | | | | | | | | | | |
| | 18,359,359 | | | | 18,134,735 | | | | 23,608,405 | | | | 29,849,650 | | | | 26,624,771 | | | | 6,183,260 | | | | 172,235,420 |
| | (16,316 | ) | | | (84,343 | ) | | | (19,130 | ) | | | (14,646 | ) | | | 6,259 | | | | 155,105 | | | | — |
| | (3,793,804 | ) | | | (1,190,537 | ) | | | (6,123,871 | ) | | | (591,541 | ) | | | (551,383 | ) | | | (1,070,875 | ) | | | — |
| | 1,401,899 | | | | 134,911 | | | | 50,196 | | | | (303,298 | ) | | | (66,536 | ) | | | (85,815 | ) | | | — |
| $ | 15,951,138 | | | $ | 16,994,766 | | | $ | 17,515,600 | | | $ | 28,940,165 | | | $ | 26,013,111 | | | $ | 5,181,675 | | | $ | 172,235,420 |
| | | | | | |
| | | | | | | | | | | | | | | | | | | | | | | | | | |
| | | | | | | | | | | | | | | | | | | | | | | | | $ | 148,075,609 |
| | | | | | | | | | | | | | | | | | | | | | | | | | 24,159,811 |
| | | | | | | | | | | | | | | | | | | | | | | | | $ | 172,235,420 |
| | | | | | |
| | 906,871 | | | | 1,961,430 | | | | 2,377,068 | | | | 2,991,852 | | | | 2,668,013 | | | | 259,756 | | | | |
| | | | | | | | | | | | | | | | | | | | | | | | | | 148,075,609 |
| | | | | | | | | | | | | | | | | | | | | | | | | | 24,159,811 |
| | | | | | | | | | | | | | | | | | | | | | | | | | 172,235,420 |
| | | | | | |
| $ | 17.59 | | | $ | 8.66 | | | $ | 7.37 | | | $ | 9.67 | | | $ | 9.75 | | | $ | 19.95 | | | | |
| | | | | | | | | | | | | | | | | | | | | | | | | $ | 1.00 |
| | | | | | | | | | | | | | | | | | | | | | | | | $ | 1.00 |
| $ | 14,402,996 | | | $ | 16,913,689 | | | $ | 17,547,081 | | | $ | 29,221,323 | | | $ | 26,119,338 | | | $ | 5,242,713 | | | $ | 170,959,752 |
Statements of Operations
For the Period Ended June 30, 2006 (unaudited)
| | | | | | | | |
| | | The Muirfield
Fund
| | | The Total
Return
Utilities Fund
| |
Investment Income | | | | | | | | |
Interest | | $ | 145,974 | | | $ | 5,648 | |
Dividends | | | 144,115 | | | | 317,571 | |
Total Investment Income | | | 290,089 | | | | 323,219 | |
| | |
Fund Expenses | | | | | | | | |
Investment advisor | | | 307,170 | | | | 112,258 | |
Transfer agent | | | 39,300 | | | | 13,471 | |
Transfer agent — The Money Market Fund — Retail Class | | | | | | | | |
Transfer agent — The Money Market Fund — Institutional Class | | | | | | | | |
Fund accounting | | | 20,857 | | | | 13,705 | |
Administrative | | | 31,124 | | | | 11,226 | |
Trustee | | | 15,710 | | | | 6,523 | |
Audit | | | 2,871 | | | | 2,764 | |
Legal | | | 2,995 | | | | 2,888 | |
Custody | | | 4,565 | | | | 2,172 | |
Printing | | | 2,797 | | | | 1,489 | |
Distribution plan (12b-1) | | | 65,475 | | | | 28,103 | |
Distribution plan (12b-1) — The Money Market Fund — Retail Class | | | | | | | | |
Distribution plan (12b-1) — The Money Market Fund — Institutional Class | | | | | | | | |
Administrative service plan | | | 65,527 | | | | 22,452 | |
Postage | | | 4,714 | | | | 3,916 | |
Registration and filing | | | 9,474 | | | | 7,981 | |
Insurance | | | 3,530 | | | | 923 | |
Chief Compliance Officer | | | 2,191 | | | | 2,191 | |
Other | | | 4,656 | | | | 4,465 | |
Total Expenses Before Reductions | | | 582,956 | | | | 236,527 | |
| | |
Expenses reimbursed/waived by investment advisor | | | — | | | | — | |
Expenses paid indirectly | | | (36,056 | ) | | | (579 | ) |
Distribution plan (12b-1) expenses waived | | | (25,879 | ) | | | (1,908 | ) |
Administrative service plan expenses waived | | | (45,206 | ) | | | (13,471 | ) |
Transfer agent expenses waived | | | — | | | | — | |
Net Expenses | | | 475,815 | | | | 220,569 | |
| | | | | | | | | |
Net Investment Income (Loss) | | | (185,726 | ) | | | 102,650 | |
| | |
Realized and Unrealized Gain (Loss) from Investments | | | | | | | | |
Net realized gains (losses) from investments | | | (45,091 | ) | | | 882,169 | |
Net realized gains (losses) from futures contracts | | | 141,399 | | | | — | |
Distributions of realized gains by other investment companies | | | — | | | | — | |
Net Realized Gains (Losses) from Investment Transactions, Futures Contracts, Options Contracts, and Distributions of Realized Gains by Other Investment
Companies. | | | 96,308 | | | | 882,169 | |
| | |
Net change in unrealized appreciation (depreciation) of investments, futures contracts, and options contracts | | | 3,132,328 | | | | 216,391 | |
Net Realized and Unrealized Gain (Loss) from Investments | | | 3,228,636 | | | | 1,098,560 | |
| | | | | | | | | |
Net Change in Net Assets Resulting from Operations | | $ | 3,042,910 | | | $ | 1,201,210 | |
| * | Commenced operations January 31, 2006 |
The accompanying notes are an integral part of these financial statements.
| | | | | | | | | | | | | | | | | | | | | | | | | | |
The
Quantex
Fund
| | | The Dynamic
Growth Fund
| | | The Aggressive
Growth Fund
| | | The Defensive
Growth Fund*
| | | The Focused
Growth Fund*
| | | The U.S.
Government
Bond Fund
| | | The Money
Market Fund
| |
| | | | | | | | | | | | | | | | | | | | | | | | | | | |
| $ | 22,320 | | | $ | 47,952 | | | $ | 39,972 | | | $ | 44,465 | | | $ | 32,451 | | | $ | 111,843 | | | $ | 3,763,606 | |
| | 93,593 | | | | 52,704 | | | | 71,278 | | | | 67,769 | | | | 91,845 | | | | 12,625 | | | | — | |
| | 115,913 | | | | 100,656 | | | | 111,250 | | | | 112,234 | | | | 124,296 | | | | 124,468 | | | | 3,763,606 | |
| | | | | | |
| | | | | | | | | | | | | | | | | | | | | | | | | | | |
| | 84,341 | | | | 94,519 | | | | 56,520 | | | | 53,657 | | | | 48,549 | | | | 11,594 | | | | 270,285 | |
| | 10,121 | | | | 15,123 | | | | 9,043 | | | | 8,642 | | | | 7,819 | | | | 4,000 | | | | | |
| | | | | | | | | | | | | | | | | | | | | | | | | | 55,022 | |
| | | | | | | | | | | | | | | | | | | | | | | | | | 9,838 | |
| | 10,914 | | | | 14,302 | | | | 10,016 | | | | 8,256 | | | | 7,569 | | | | 4,348 | | | | 26,184 | |
| | 8,434 | | | | 12,603 | | | | 7,536 | | | | 7,154 | | | | 6,473 | | | | 2,899 | | | | 67,647 | |
| | 5,470 | | | | 6,580 | | | | 5,100 | | | | 4,999 | | | | 4,526 | | | | 5,141 | | | | 5,519 | |
| | 2,764 | | | | 2,764 | | | | 2,764 | | | | 2,655 | | | | 2,645 | | | | 2,764 | | | | 3,446 | |
| | 2,995 | | | | 2,995 | | | | 2,962 | | | | 2,659 | | | | 2,647 | | | | 2,995 | | | | 2,781 | |
| | 4,680 | | | | 2,402 | | | | 2,172 | | | | 1,325 | | | | 1,509 | | | | 1,562 | | | | 5,529 | |
| | 1,209 | | | | 1,012 | | | | 757 | | | | 1,410 | | | | 1,504 | | | | 383 | | | | 9,090 | |
| | 16,892 | | | | 31,502 | | | | 18,852 | | | | 18,015 | | | | 16,270 | | | | 5,809 | | | | | |
| | | | | | | | | | | | | | | | | | | | | | | | | | 131,954 | |
| | | | | | | | | | | | | | | | | | | | | | | | | | 3,646 | |
| | 16,893 | | | | 25,200 | | | | 15,038 | | | | 14,370 | | | | 13,032 | | | | 5,797 | | | | — | |
| | 2,040 | | | | 1,333 | | | | 1,119 | | | | 1,410 | | | | 1,692 | | | | 798 | | | | 16,518 | |
| | 8,546 | | | | 7,427 | | | | 7,496 | | | | 7,870 | | | | 7,121 | | | | 3,793 | | | | 16,595 | |
| | 787 | | | | 1,466 | | | | 760 | | | | 479 | | | | 1,859 | | | | 426 | | | | 5,395 | |
| | 2,191 | | | | 2,191 | | | | 2,191 | | | | 940 | | | | 940 | | | | 2,191 | | | | 2,191 | |
| | 4,729 | | | | 3,730 | | | | 3,455 | | | | 1,344 | | | | 1,331 | | | | 3,414 | | | | 23,965 | |
| | 183,006 | | | | 225,149 | | | | 145,781 | | | | 135,185 | | | | 125,486 | | | | 57,914 | | | | 655,605 | |
| | | | | | |
| | (21,085 | ) | | | — | | | | — | | | | — | | | | — | | | | (14,275 | ) | | | (198,572 | ) |
| | — | | | | (15,319 | ) | | | (1,383 | ) | | | — | | | | — | | | | — | | | | — | |
| | (12,906 | ) | | | (8,697 | ) | | | (4,522 | ) | | | (2,376 | ) | | | (2,085 | ) | | | (3,942 | ) | | | (95,145 | ) |
| | (16,786 | ) | | | (16,134 | ) | | | (9,496 | ) | | | (864 | ) | | | (782 | ) | | | (5,797 | ) | | | — | |
| | — | | | | — | | | | — | | | | (5,065 | ) | | | (4,582 | ) | | | (2,016 | ) | | | (2,445 | ) |
| | 132,229 | | | | 184,999 | | | | 130,380 | | | | 126,880 | | | | 118,037 | | | | 31,884 | | | | 359,443 | |
| | | | | | | | | | | | | | | | | | | | | | | | | | | |
| | (16,316 | ) | | | (84,343 | ) | | | (19,130 | ) | | | (14,646 | ) | | | 6,259 | | | | 92,584 | | | | 3,404,163 | |
| | | | | | |
| | | | | | | | | | | | | | | | | | | | | | | | | | | |
| | 912,929 | | | | 1,149,005 | | | | 380,128 | | | | (488,981 | ) | | | (470,878 | ) | | | (18,619 | ) | | | | |
| | 82,816 | | | | 14,581 | | | | (49,969 | ) | | | (102,560 | ) | | | (80,505 | ) | | | — | | | | | |
| | — | | | | — | | | | 608 | | | | — | | | | — | | | | — | | | | | |
| | 995,745 | | | | 1,163,586 | | | | 330,767 | | | | (591,541 | ) | | | (551,383 | ) | | | (18,619 | ) | | | | |
| | | | | | |
| | (422,676 | ) | | | 616,398 | | | | (156,715 | ) | | | (303,298 | ) | | | (66,536 | ) | | | (59,642 | ) | | | | |
| | 573,069 | | | | 1,779,984 | | | | 174,052 | | | | (894,839 | ) | | | (617,919 | ) | | | (78,261 | ) | | | | |
| | | | | | | | | | | | | | | | | | | | | | | | | | | |
| $ | 556,753 | | | $ | 1,695,641 | | | $ | 154,922 | | | $ | (909,485 | ) | | $ | (611,660 | ) | | $ | 14,323 | | | $ | 3,404,163 | |
Statements of Changes in Net Assets
For the Period Ended June 30, 2006 (unaudited) and the Year Ended December 31, 2005
| | | | | | | | | | | | | | | | |
| | | The Muirfield Fund
| | | The Total Return
Utilities Fund
| |
| | | 2006
| | | 2005
| | | 2006
| | | 2005
| |
Operations | | | | | | | | | | | | | | | | |
Net investment income (loss) | | $ | (185,726 | ) | | $ | 1,012,922 | | | $ | 102,650 | | | $ | 303,378 | |
Net realized gain (loss) from investments, futures contracts, options contracts, and distributions by other investment companies | | | 96,308 | | | | 9,190,197 | | | | 882,169 | | | | 3,978,333 | |
Net change in unrealized appreciation (depreciation) of investments, futures contracts, and options contracts | | | 3,132,328 | | | | (8,346,668 | ) | | | 216,391 | | | | (910,310 | ) |
Net change in net assets resulting from operations | | | 3,042,910 | | | | 1,856,451 | | | | 1,201,210 | | | | 3,371,401 | |
| | | | |
Distributions to Shareholders | | | | | | | | | | | | | | | | |
From net investment income | | | — | | | | (1,012,922 | ) | | | (92,580 | ) | | | (303,378 | ) |
Net change in net assets resulting from distributions | | | — | | | | (1,012,922 | ) | | | (92,580 | ) | | | (303,378 | ) |
| | | | |
Capital Transactions | | | | | | | | | | | | | | | | |
Issued | | | 16,002,343 | | | | 29,413,006 | | | | 2,070,829 | | | | 6,411,954 | |
Reinvested | | | — | | | | 1,006,943 | | | | 90,898 | | | | 294,783 | |
Redeemed | | | (48,758,584 | ) | | | (22,738,425 | ) | | | (3,643,584 | ) | | | (15,578,080 | ) |
Net change in net assets resulting from capital transactions | | | (32,756,241 | ) | | | 7,681,524 | | | | (1,481,857 | ) | | | (8,871,343 | ) |
| | | | | | | | | | | | | | | | | |
Total Change in Net Assets | | | (29,713,331 | ) | | | 8,525,053 | | | | (373,227 | ) | | | (5,803,320 | ) |
| | | | |
Net Assets — Beginning of Period | | | 78,181,116 | | | | 69,656,063 | | | | 22,643,978 | | | | 28,447,298 | |
Net Assets — End of Period | | $ | 48,467,785 | | | $ | 78,181,116 | | | $ | 22,270,751 | | | $ | 22,643,978 | |
Accumulated undistributed (distributions in excess of) net investment income | | $ | (185,290 | ) | | $ | 436 | | | $ | 10,070 | | | $ | — | |
| | | | |
Share Transactions | | | | | | | | | | | | | | | | |
Issued | | | 2,990,632 | | | | 5,869,136 | | | | 104,579 | | | | 350,433 | |
Reinvested | | | — | | | | 195,523 | | | | 4,577 | | | | 16,132 | |
Redeemed | | | (9,016,883 | ) | | | (4,521,772 | ) | | | (184,602 | ) | | | (900,250 | ) |
Net change in shares | | | (6,026,251 | ) | | | 1,542,887 | | | | (75,446 | ) | | | (533,685 | ) |
The accompanying notes are an integral part of these financial statements.
| | | | | | | | | | | | | | | | | | | | | | |
The Quantex Fund
| | | The Dynamic
Growth Fund
| | | The Aggressive
Growth Fund
| |
2006
| | | 2005
| | | 2006
| | | 2005
| | | 2006
| | | 2005
| |
| | | | | | | | | | | | | | | | | | | | | | | |
| $ | (16,316 | ) | | $ | 10,696 | | | $ | (84,343 | ) | | $ | 246,570 | | | $ | (19,130 | ) | | $ | 38,156 | |
| | 995,745 | | | | 930,790 | | | | 1,163,586 | | | | 2,969,502 | | | | 330,767 | | | | 695,274 | |
| | (422,676 | ) | | | 216,650 | | | | 616,398 | | | | (1,532,538 | ) | | | (156,715 | ) | | | (184,177 | ) |
| | 556,753 | | | | 1,158,136 | | | | 1,695,641 | | | | 1,683,534 | | | | 154,922 | | | | 549,253 | |
| | | | | |
| | | | | | | | | | | | | | | | | | | | | | | |
| | — | | | | (10,696 | ) | | | — | | | | (246,570 | ) | | | — | | | | (38,156 | ) |
| | — | | | | (10,696 | ) | | | — | | | | (246,570 | ) | | | — | | | | (38,156 | ) |
| | | | | |
| | | | | | | | | | | | | | | | | | | | | | | |
| | 836,092 | | | | 2,633,034 | | | | 3,631,463 | | | | 11,727,152 | | | | 8,109,059 | | | | 3,505,018 | |
| | — | | | | 10,604 | | | | — | | | | 246,363 | | | | — | | | | 37,953 | |
| | (2,556,150 | ) | | | (5,529,545 | ) | | | (20,275,322 | ) | | | (6,329,274 | ) | | | (2,387,668 | ) | | | (3,188,136 | ) |
| | (1,720,058 | ) | | | (2,885,907 | ) | | | (16,643,859 | ) | | | 5,644,241 | | | | 5,721,391 | | | | 354,835 | |
| | | | | | | | | | | | | | | | | | | | | | | |
| | (1,163,305 | ) | | | (1,738,467 | ) | | | (14,948,218 | ) | | | 7,081,205 | | | | 5,876,313 | | | | 865,932 | |
| | | | | |
| | 17,114,443 | | | | 18,852,910 | | | | 31,942,984 | | | | 24,861,779 | | | | 11,639,287 | | | | 10,773,355 | |
| $ | 15,951,138 | | | $ | 17,114,443 | | | $ | 16,994,766 | | | $ | 31,942,984 | | | $ | 17,515,600 | | | $ | 11,639,287 | |
| $ | (16,316 | ) | | $ | — | | | $ | (84,343 | ) | | $ | — | | | $ | (19,130 | ) | | $ | — | |
| | | | | |
| | | | | | | | | | | | | | | | | | | | | | | |
| | 46,313 | | | | 161,114 | | | | 420,787 | | | | 1,496,180 | | | | 1,072,892 | | | | 509,855 | |
| | — | | | | 620 | | | | — | | | | 29,754 | | | | — | | | | 5,279 | |
| | (140,620 | ) | | | (342,385 | ) | | | (2,318,098 | ) | | | (798,045 | ) | | | (314,940 | ) | | | (473,804 | ) |
| | (94,307 | ) | | | (180,651 | ) | | | (1,897,311 | ) | | | 727,889 | | | | 757,952 | | | | 41,330 | |
Statements of Changes in Net Assets
For the Period Ended June 30, 2006 (unaudited) and the Year Ended December 31, 2005
| | | | | | | | |
| | | The Defensive Growth Fund
| | | The Focused Growth Fund
| |
| | | 2006*
| | | 2006*
| |
Operations | | | | | | | | |
Net investment income (loss) | | $ | (14,646 | ) | | $ | 6,259 | |
Net realized gain (loss) from investments, futures contracts, options contracts,
and distributions by other investment companies | | | (591,541 | ) | | | (551,383 | ) |
Net change in unrealized appreciation (depreciation) of investments, futures contracts, and options contracts | | | (303,298 | ) | | | (66,536 | ) |
Net change in net assets resulting from operations | | | (909,485 | ) | | | (611,660 | ) |
| | |
Distributions to Shareholders | | | | | | | | |
From net investment income | | | — | | | | — | |
Net change in net assets resulting from distributions | | | — | | | | — | |
| | |
Distributions to Shareholders
— The Money Market Fund
— Retail Class | | | | | | | | |
From net investment income | | | | | | | | |
Net change in net assets resulting from distributions | | | | | | | | |
| | |
Distributions to Shareholders
— The Money Market Fund
— Institutional Class | | | | | | | | |
From net investment income | | | | | | | | |
Net change in net assets resulting from distributions | | | | | | | | |
| | |
Capital Transactions | | | | | | | | |
Issued | | | 30,456,416 | | | | 26,969,050 | |
Reinvested | | | — | | | | — | |
Redeemed | | | (606,766 | ) | | | (344,279 | ) |
Net change in net assets resulting from capital transactions | | | 29,849,650 | | | | 26,624,771 | |
| | | | | | | | | |
Total Change in Net Assets | | | 28,940,165 | | | | 26,013,111 | |
| | |
Net Assets — Beginning of Period | | | | | | | | |
Net Assets — End of Period | | $ | 28,940,165 | | | $ | 26,013,111 | |
Accumulated undistributed (distributions in excess of) net investment income | | $ | (14,646 | ) | | $ | 6,259 | |
| | |
Share Transactions | | | | | | | | |
Issued | | | 3,053,961 | | | | 2,703,451 | |
Reinvested | | | — | | | | — | |
Redeemed | | | (62,109 | ) | | | (35,438 | ) |
Net change in shares | | | 2,991,852 | | | | 2,668,013 | |
| * | Commenced Operations January 31, 2006 |
The accompanying notes are an integral part of these financial statements.
| | | | | | | | | | | | | | |
The U.S. Government Bond Fund
| | | The Money Market Fund
| |
2006
| | | 2005
| | | 2006
| | | 2005
| |
| | | | | | | | | | | | | | | |
| $ | 92,584 | | | $ | 209,153 | | | $ | 3,404,163 | | | $ | 4,544,611 | |
| | | |
| | (18,619 | ) | | | (169,070 | ) | | | — | | | | — | |
| | | |
| | (59,642 | ) | | | (48,081 | ) | | | — | | | | — | |
| | 14,323 | | | | (7,998 | ) | | | 3,404,163 | | | | 4,544,611 | |
| | | |
| | | | | | | | | | | | | | | |
| | (95,012 | ) | | | (207,143 | ) | | | | | | | | |
| | (95,012 | ) | | | (207,143 | ) | | | | | | | | |
| | | |
| | | | | | | | | | | | | | | |
| | | | | | | | | | (2,857,425 | ) | | | (3,685,130 | ) |
| | | | | | | | | | (2,857,425 | ) | | | (3,685,130 | ) |
| | | |
| | | | | | | | | | | | | | | |
| | | | | | | | | | (546,738 | ) | | | (859,481 | ) |
| | | | | | | | | | (546,738 | ) | | | (859,481 | ) |
| | | |
| | | | | | | | | | | | | | | |
| | 293,515 | | | | 1,202,042 | | | | 130,114,971 | | | | 228,409,933 | |
| | 86,233 | | | | 192,482 | | | | 3,109,984 | | | | 4,140,721 | |
| | (1,441,612 | ) | | | (4,170,973 | ) | | | (111,272,425 | ) | | | (261,227,686 | ) |
| | (1,061,864 | ) | | | (2,776,449 | ) | | | 21,952,530 | | | | (28,677,032 | ) |
| | | | | | | | | | | | | | | |
| | (1,142,553 | ) | | | (2,991,590 | ) | | | 21,952,530 | | | | (28,677,032 | ) |
| | | |
| | 6,324,228 | | | | 9,315,818 | | | | 150,282,890 | | | | 178,959,922 | |
| $ | 5,181,675 | | | $ | 6,324,228 | | | $ | 172,235,420 | | | $ | 150,282,890 | |
| $ | 155,105 | | | $ | 157,533 | | | $ | — | | | $ | — | |
| | | |
| | | | | | | | | | | | | | | |
| | 14,669 | | | | 58,904 | | | | 130,114,971 | | | | 228,409,933 | |
| | 4,303 | | | | 9,401 | | | | 3,109,984 | | | | 4,140,721 | |
| | (72,027 | ) | | | (202,863 | ) | | | (111,272,425 | ) | | | (261,227,686 | ) |
| | (53,055 | ) | | | (134,558 | ) | | | 21,952,530 | | | | (28,677,032 | ) |
Financial Highlights
For a Share Outstanding Through the Period Ended June 30, 2006 (unaudited) and Each Fiscal Year Ended December 31,
The Muirfield Fund
| | | | | | | | | | | | | | | | | | | | | | | | |
| | | 2006
| | | 2005
| | | 2004
| | | 2003
| | | 2002
| | | 2001
| |
Net Asset Value, Beginning of Period | | $ | 5.15 | | | $ | 5.11 | | | $ | 4.79 | | | $ | 3.76 | | | $ | 4.25 | | | $ | 4.95 | |
| | | | | | |
Income from Investment Operations | | | | | | | | | | | | | | | | | | | | | | | | |
Net investment income (loss) | | | (0.02 | ) | | | 0.07 | | | | 0.01 | | | | (0.04 | ) | | | (0.02 | ) | | | 0.01 | |
Net gains (losses) on investments, futures, options, and distributions by other investment companies (both realized and unrealized) | | | 0.17 | | | | 0.04 | | | | 0.32 | | | | 1.07 | | | | (0.47 | ) | | | (0.58 | ) |
Total from Investment Operations | | | 0.15 | | | | 0.11 | | | | 0.33 | | | | 1.03 | | | | (0.49 | ) | | | (0.57 | ) |
| | | | | | |
Less Distributions | | | | | | | | | | | | | | | | | | | | | | | | |
From net investment income | | | — | | | | (0.07 | ) | | | (0.01 | ) | | | — | | | | — | | | | (0.13 | ) |
Total Distributions | | | 0.00 | | | | (0.07 | ) | | | (0.01 | ) | | | 0.00 | | | | 0.00 | | | | (0.13 | ) |
| | | | | | | | | | | | | | | | | | | | | | | | | |
Net Asset Value, End of Period | | $ | 5.30 | | | $ | 5.15 | | | $ | 5.11 | | | $ | 4.79 | | | $ | 3.76 | | | $ | 4.25 | |
| | | | | | |
Total Return (assumes reinvestment of distributions)(5)(7) | | | 2.91% | | | | 2.13% | | | | 6.80% | | | | 27.39% | | | | (11.42% | ) | | | (11.52% | ) |
| | | | | | |
Ratios/Supplemental Data | | | | | | | | | | | | | | | | | | | | | | | | |
Net assets, end of period ($000) | | $ | 48,468 | | | $ | 78,181 | | | $ | 69,656 | | | $ | 58,524 | | | $ | 47,644 | | | $ | 61,577 | |
Ratio of net expenses to average net
assets(1)(2)(6) | | | 1.45% | | | | 1.42% | | | | 1.26% | | | | 1.39% | | | | 1.41% | | | | 1.31% | |
Ratio of net investment income (loss) to average
net assets(1)(2)(4)(6) | | | (0.57% | ) | | | 1.36% | | | | 0.12% | | | | (1.06% | ) | | | (0.43% | ) | | | 0.11% | |
Ratio of expenses to average net assets after reductions, excluding expenses paid indirectly(1)(2)(6) | | | 1.56% | | | | 1.53% | | | | 1.45% | | | | 1.47% | | | | 1.46% | | | | 1.37% | |
Ratio of expenses to average net assets before reductions(1)(2)(6) | | | 1.78% | | | | 1.76% | | | | 1.70% | | | | 1.60% | | | | 1.46% | | | | 1.37% | |
Portfolio turnover rate(3)(5) | | | 90% | | | | 145% | | | | 145% | | | | 252% | | | | 278% | | | | 298% | |
| (1) | Ratio reflects reductions in corresponding portfolio, if applicable. |
| (2) | These ratios exclude the impact of expenses of the underlying security holdings as represented in the schedule of investments. |
| (3) | Prior to the year ended December 31, 2003, the portfolio turnover rate represented the turnover rate of the corresponding portfolio. During 2003, the Fund’s portfolio turnover rate for the period January 1 through April 13 is equivalent to the portfolio into which the Fund invested. Beginning April 14 the Fund commenced calculating the portfolio turnover rate based on its own activities. Hence, the portfolio turnover rate represented for 2003 is a combination of these two periods. Subsequent to 2003 the portfolio turnover rate is specific to the Fund. |
| (4) | Recognition of net investment income by the Fund is affected by the timing of the declaration of dividends by the underlying investment companies in which the Fund invests. |
| (5) | Not annualized for periods of less than one full year. |
| (6) | Annualized for periods of less than one full year. |
| (7) | In 2005, the advisor voluntarily reimbursed the Fund for a realized investment loss, which had no impact to total return. |
The accompanying notes are an integral part of these financial statements.
Financial Highlights
For a Share Outstanding Through the Period Ended June 30, 2006 (unaudited) and Each Fiscal Year Ended December 31,
The Total Return Utilities Fund
| | | | | | | | | | | | | | | | | | | | | | | | |
| | | 2006
| | | 2005
| | | 2004
| | | 2003
| | | 2002
| | | 2001
| |
Net Asset Value, Beginning of Period | | $ | 19.03 | | | $ | 16.51 | | | $ | 14.29 | | | $ | 12.66 | | | $ | 18.63 | | | $ | 22.17 | |
| | | | | | |
Income from Investment Operations | | | | | | | | | | | | | | | | | | | | | | | | |
Net investment income | | | 0.09 | | | | 0.21 | | | | 0.32 | | | | 0.29 | | | | 0.34 | | | | 0.35 | |
Net gains (losses) on securities, futures, and options (both realized and unrealized) | | | 0.95 | | | | 2.55 | | | | 2.22 | | | | 1.63 | | | | (5.97 | ) | | | (3.56 | ) |
Total from Investment Operations | | | 1.04 | | | | 2.76 | | | | 2.54 | | | | 1.92 | | | | (5.63 | ) | | | (3.21 | ) |
| | | | | | |
Less Distributions | | | | | | | | | | | | | | | | | | | | | | | | |
From net investment income | | | (0.08 | ) | | | (0.24 | ) | | | (0.32 | ) | | | (0.29 | ) | | | (0.34 | ) | | | (0.33 | ) |
Total Distributions | | | (0.08 | ) | | | (0.24 | ) | | | (0.32 | ) | | | (0.29 | ) | | | (0.34 | ) | | | (0.33 | ) |
| | | | | | | | | | | | | | | | | | | | | | | | | |
Net Asset Value, End of Period | | $ | 19.99 | | | $ | 19.03 | | | $ | 16.51 | | | $ | 14.29 | | | $ | 12.66 | | | $ | 18.63 | |
| | | | | | |
Total Return (assumes reinvestment of distributions)(3) | | | 5.47% | | | | 16.80% | | | | 18.01% | | | | 15.46% | | | | (30.36% | ) | | | (14.57% | ) |
| | | | | | |
Ratios/Supplemental Data | | | | | | | | | | | | | | | | | | | | | | | | |
Net assets, end of period ($000) | | $ | 22,271 | | | $ | 22,644 | | | $ | 28,447 | | | $ | 21,038 | | | $ | 19,133 | | | $ | 31,267 | |
Ratio of net expenses to average net assets(1)(4) | | | 1.96% | | | | 2.03% | | | | 1.91% | | | | 1.92% | | | | 1.81% | | | | 1.72% | |
Ratio of net investment income to average
net assets(1)(4) | | | 0.91% | | | | 1.32% | | | | 2.21% | | | | 2.25% | | | | 2.32% | | | | 1.66% | |
Ratio of expenses to average net assets after reductions, excluding expenses paid indirectly(1)(4) | | | 1.97% | | | | 2.05% | | | | 1.91% | | | | 1.94% | | | | 1.88% | | | | 1.80% | |
Ratio of expenses to average net assets before reductions(1)(4) | | | 2.11% | | | | 2.19% | | | | 1.99% | | | | 1.94% | | | | 1.88% | | | | 1.80% | |
Portfolio turnover rate(2)(3) | | | 13% | | | | 28% | | | | 38% | | | | 41% | | | | 32% | | | | 23% | |
| (1) | Ratio reflects reductions in corresponding portfolio, if applicable. |
| (2) | Prior to the year ended December 31, 2003, the portfolio turnover rate represented the turnover rate of the corresponding portfolio. During 2003, the Fund’s portfolio turnover rate for the period January 1 through April 13 is equivalent to the portfolio into which the Fund invested. Beginning April 14 the Fund commenced calculating the portfolio turnover rate based on its own activities. Hence, the portfolio turnover rate represented for 2003 is a combination of these two periods. Subsequent to 2003 the portfolio turnover rate is specific to the Fund. |
| (3) | Not annualized for periods of less than one full year. |
| (4) | Annualized for periods of less than one full year. |
The accompanying notes are an integral part of these financial statements.
Financial Highlights
For a Share Outstanding Through the Period Ended June 30, 2006 (unaudited) and Each Fiscal Year Ended December 31,
The Quantex Fund
| | | | | | | | | | | | | | | | | | | | | | | |
| | | 2006
| | | 2005
| | | 2004
| | 2003
| | | 2002
| | | 2001
| |
Net Asset Value, Beginning of Period | | $ | 17.09 | | | $ | 15.95 | | | $ | 14.82 | | $ | 11.65 | | | $ | 15.47 | | | $ | 18.66 | |
| | | | | | |
Income from Investment Operations | | | | | | | | | | | | | | | | | | | | | | | |
Net investment income (loss) | | | (0.02 | ) | | | 0.01 | | | | — | | | (0.01 | ) | | | (0.03 | ) | | | — | |
Net gains (losses) on securities, futures, and
options (both realized and unrealized) | | | 0.52 | | | | 1.14 | | | | 1.13 | | | 3.18 | | | | (3.79 | ) | | | (2.49 | ) |
Total from Investment Operations | | | 0.50 | | | | 1.15 | | | | 1.13 | | | 3.17 | | | | (3.82 | ) | | | (2.49 | ) |
| | | | | | |
Less Distributions | | | | | | | | | | | | | | | | | | | | | | | |
From net investment income | | | — | | | | (0.01 | ) | | | — | | | — | | | | — | | | | — | |
From net capital gains | | | — | | | | — | | | | — | | | — | | | | — | | | | (0.70 | ) |
Total Distributions | | | 0.00 | | | | (0.01 | ) | | | 0.00 | | | 0.00 | | | | 0.00 | | | | (0.70 | ) |
| | | | | | | | | | | | | | | | | | | | | | | | |
Net Asset Value, End of Period | | $ | 17.59 | | | $ | 17.09 | | | $ | 15.95 | | $ | 14.82 | | | $ | 11.65 | | | $ | 15.47 | |
| | | | | | |
Total Return (assumes reinvestment of distributions)(3) | | | 2.93% | | | | 7.21% | | | | 7.62% | | | 27.21% | | | | (24.69% | ) | | | (13.33% | ) |
| | | | | | |
Ratios/Supplemental Data | | | | | | | | | | | | | | | | | | | | | | | |
Net assets, end of period ($000) | | $ | 15,951 | | | $ | 17,114 | | | $ | 18,853 | | $ | 19,968 | | | $ | 18,360 | | | $ | 32,248 | |
Ratio of net expenses to average net assets(1)(4) | | | 1.57% | | | | 1.75% | | | | 1.73% | | | 1.84% | | | | 1.76% | | | | 1.64% | |
Ratio of net investment income (loss) to average
net assets(1)(4) | | | (0.19% | ) | | | 0.06% | | | | 0.00% | | | (0.11% | ) | | | (0.20% | ) | | | (0.23% | ) |
Ratio of expenses to average net assets after reductions, excluding expenses paid indirectly(1)(4) | | | 1.57% | | | | 1.78% | | | | 1.77% | | | 1.84% | | | | 1.78% | | | | 1.66% | |
Ratio of expenses to average net assets before reductions(1)(4) | | | 2.17% | | | | 2.19% | | | | 2.06% | | | 1.91% | | | | 1.79% | | | | 1.66% | |
Portfolio turnover rate(2)(3) | | | 30% | | | | 171% | | | | 253% | | | 140% | | | | 54% | | | | 37% | |
| (1) | Ratio reflects reductions in corresponding portfolio, if applicable. |
| (2) | Prior to the year ended December 31, 2003, the portfolio turnover rate represented the turnover rate of the corresponding portfolio. During 2003, the Fund’s portfolio turnover rate for the period January 1 through April 13 is equivalent to the portfolio into which the Fund invested. Beginning April 14 the Fund commenced calculating the portfolio turnover rate based on its own activities. Hence, the portfolio turnover rate represented for 2003 is a combination of these two periods. Subsequent to 2003 the portfolio turnover rate is specific to the Fund. |
| (3) | Not annualized for periods of less than one full year. |
| (4) | Annualized for periods of less than one full year. |
The accompanying notes are an integral part of these financial statements.
Financial Highlights
For a Share Outstanding Through the Period Ended June 30, 2006 (unaudited) and Each Fiscal Year Ended December 31,
The Dynamic Growth Fund
| | | | | | | | | | | | | | | | | | | | | | | | |
| | | 2006
| | | 2005
| | | 2004
| | | 2003
| | | 2002
| | | 2001
| |
Net Asset Value, Beginning of Period | | $ | 8.28 | | | $ | 7.94 | | | $ | 7.67 | | | $ | 5.58 | | | $ | 7.37 | | | $ | 8.52 | |
| | | | | | |
Income from Investment Operations | | | | | | | | | | | | | | | | | | | | | | | | |
Net investment income (loss) | | | (0.03 | ) | | | 0.07 | | | | (0.04 | ) | | | (0.06 | ) | | | (0.04 | ) | | | — | |
Net gains (losses) on investments, futures, options, and distributions by other investment companies (both realized and unrealized) | | | 0.41 | | | | 0.33 | | | | 0.31 | | | | 2.15 | | | | (1.75 | ) | | | (1.15 | ) |
Total from Investment Operations | | | 0.38 | | | | 0.40 | | | | 0.27 | | | | 2.09 | | | | (1.79 | ) | | | (1.15 | ) |
| | | | | | |
Less Distributions | | | | | | | | | | | | | | | | | | | | | | | | |
From net investment income | | | — | | | | (0.06 | ) | | | — | | | | — | | | | — | | | | — | |
Total Distributions | | | 0.00 | | | | (0.06 | ) | | | 0.00 | | | | 0.00 | | | | 0.00 | | | | 0.00 | |
| | | | | | | | | | | | | | | | | | | | | | | | | |
Net Asset Value, End of Period | | $ | 8.66 | | | $ | 8.28 | | | $ | 7.94 | | | $ | 7.67 | | | $ | 5.58 | | | $ | 7.37 | |
| | | | | | |
Total Return (assumes reinvestment of distributions)(1)(7) | | | 4.59% | | | | 5.08% | | | | 3.52% | | | | 37.46% | | | | (24.29% | ) | | | (13.47% | ) |
| | | | | | |
Ratios/Supplemental Data | | | | | | | | | | | | | | | | | | | | | | | | |
Net assets, end of period ($000) | | $ | 16,995 | | | $ | 31,943 | | | $ | 24,862 | | | $ | 21,024 | | | $ | 17,094 | | | $ | 23,126 | |
Ratio of net expenses to average net
assets(2)(3)(4) | | | 1.47% | | | | 1.41% | | | | 1.20% | | | | 1.22% | | | | 1.18% | | | | 1.03% | |
Ratio of net investment income (loss) to average
net assets(2)(3)(4)(6) | | | (0.67% | ) | | | 0.87% | | | | (0.48% | ) | | | (0.84% | ) | | | (0.69% | ) | | | (0.62% | ) |
Ratio of expenses to average net assets after reductions, excluding expenses paid indirectly(2)(3)(4) | | | 1.59% | | | | 1.58% | | | | 1.41% | | | | 1.27% | | | | 1.29% | | | | 1.19% | |
Ratio of expenses to average net assets before reductions(2)(3)(4) | | | 1.79% | | | | 1.84% | | | | 1.70% | | | | 1.60% | | | | 1.35% | | | | 1.34% | |
Portfolio turnover rate(1)(5) | | | 83% | | | | 202% | | | | 174% | | | | 250% | | | | 392% | | | | 131% | |
| (1) | Not annualized for periods of less than one full year. |
| (2) | Annualized for periods of less than one full year. |
| (3) | Ratio reflects reductions in corresponding portfolio, if applicable. |
| (4) | These ratios exclude the impact of expenses of the underlying security holdings as represented in the schedule of investments. |
| (5) | Prior to the year ended December 31, 2003, the portfolio turnover rate represented the turnover rate of the corresponding portfolio. During 2003, the Fund’s portfolio turnover rate for the period January 1 through April 13 is equivalent to the portfolio into which the Fund invested. Beginning April 14 the Fund commenced calculating the portfolio turnover rate based on its own activities. Hence, the portfolio turnover rate represented for 2003 is a combination of these two periods. Subsequent to 2003 the portfolio turnover rate is specific to the Fund. |
| (6) | Recognition of net investment income by the Fund is affected by the timing of the declaration of dividends by the underlying investment companies in which the Fund invests. |
| (7) | In 2005, the advisor voluntarily reimbursed the Fund for a realized investment loss, which had no impact to total return. |
The accompanying notes are an integral part of these financial statements.
Financial Highlights
For a Share Outstanding Through the Period Ended June 30, 2006 (unaudited) and Each Fiscal Year Ended December 31,
The Aggressive Growth Fund
| | | | | | | | | | | | | | | | | | | | | | | | |
| | | 2006
| | | 2005
| | | 2004
| | | 2003
| | | 2002
| | | 2001
| |
Net Asset Value, Beginning of Period | | $ | 7.19 | | | $ | 6.83 | | | $ | 6.65 | | | $ | 4.79 | | | $ | 6.52 | | | $ | 7.86 | |
| | | | | | |
Income from Investment Operations | | | | | | | | | | | | | | | | | | | | | | | | |
Net investment income (loss) | | | (0.01 | ) | | | 0.02 | | | | (0.03 | ) | | | (0.05 | ) | | | (0.06 | ) | | | — | |
Net gains (losses) on investments, futures, options, and distributions by other investment companies (both realized and unrealized) | | | 0.19 | | | | 0.36 | | | | 0.21 | | | | 1.91 | | | | (1.67 | ) | | | (1.34 | ) |
Total from Investment Operations | | | 0.18 | | | | 0.38 | | | | 0.18 | | | | 1.86 | | | | (1.73 | ) | | | (1.34 | ) |
| | | | | | |
Less Distributions | | | | | | | | | | | | | | | | | | | | | | | | |
From net investment income | | | — | | | | (0.02 | ) | | | — | | | | — | | | | — | | | | — | |
Total Distributions | | | 0.00 | | | | (0.02 | ) | | | 0.00 | | | | 0.00 | | | | 0.00 | | | | 0.00 | |
| | | | | | | | | | | | | | | | | | | | | | | | | |
Net Asset Value, End of Period | | $ | 7.37 | | | $ | 7.19 | | | $ | 6.83 | | | $ | 6.65 | | | $ | 4.79 | | | $ | 6.52 | |
| | | | | | |
Total Return (assumes reinvestment of distributions)(1)(7) | | | 2.50% | | | | 5.62% | | | | 2.71% | | | | 38.83% | | | | (26.53% | ) | | | (17.04% | ) |
| | | | | | |
Ratios/Supplemental Data | | | | | | | | | | | | | | | | | | | | | | | | |
Net assets, end of period ($000) | | $ | 17,516 | | | $ | 11,639 | | | $ | 10,773 | | | $ | 9,122 | | | $ | 7,046 | | | $ | 12,379 | |
Ratio of net expenses to average net
assets(2)(3)(4) | | | 1.73% | | | | 1.88% | | | | 1.64% | | | | 1.39% | | | | 1.22% | | | | 1.03% | |
Ratio of net investment income (loss) to average
net assets(2)(3)(4)(6) | | | (0.25% | ) | | | 0.35% | | | | (0.41% | ) | | | (0.85% | ) | | | (0.95% | ) | | | (0.69% | ) |
Ratio of expenses to average net assets after reductions, excluding expenses paid indirectly(2)(3)(4) | | | 1.75% | | | | 2.03% | | | | 1.80% | | | | 1.44% | | | | 1.32% | | | | 1.19% | |
Ratio of expenses to average net assets before reductions(2)(3)(4) | | | 1.93% | | | | 2.30% | | | | 2.07% | | | | 1.99% | | | | 1.67% | | | | 1.52% | |
Portfolio turnover rate(1)(5) | | | 187% | | | | 181% | | | | 264% | | | | 255% | | | | 349% | | | | 127% | |
| (1) | Not annualized for periods of less than one full year. |
| (2) | Annualized for periods of less than one full year. |
| (3) | Ratio reflects reductions in corresponding portfolio, if applicable. |
| (4) | These ratios exclude the impact of expenses of the underlying security holdings as represented in the schedule of investments. |
| (5) | Prior to the year ended December 31, 2003, the portfolio turnover rate represented the turnover rate of the corresponding portfolio. During 2003, the Fund’s portfolio turnover rate for the period January 1 through April 13 is equivalent to the portfolio into which the Fund invested. Beginning April 14 the Fund commenced calculating the portfolio turnover rate based on its own activities. Hence, the portfolio turnover rate represented for 2003 is a combination of these two periods. Subsequent to 2003 the portfolio turnover rate is specific to the Fund. |
| (6) | Recognition of net investment income by the Fund is affected by the timing of the declaration of dividends by the underlying exchange traded funds in which the Fund invests. |
| (7) | In 2005, the advisor voluntarily reimbursed the Fund for a realized investment loss, which had no impact to total return. |
The accompanying notes are an integral part of these financial statements.
Financial Highlights
For a Share Outstanding Through the Period Ended June 30, 2006 (unaudited)
The Defensive Growth Fund
| | | | |
| | | 2006*
| |
Net Asset Value, Beginning of Period | | $ | 10.00 | |
| |
Income from Investment Operations | | | | |
Net investment income (loss) | | | (0.01 | ) |
Net gains (losses) on investments, futures, options, and distributions by other investment companies (both realized and unrealized) | | | (0.32 | ) |
Total from Investment Operations | | | (0.33 | ) |
| |
Less Distributions | | | | |
From net investment income | | | — | |
Total Distributions | | | 0.00 | |
| | | | | |
Net Asset Value, End of Period | | $ | 9.67 | |
| |
Total Return (assumes reinvestment of distributions)(1) | | | (3.30% | ) |
| |
Ratios/Supplemental Data | | | | |
Net assets, end of period ($000) | | $ | 28,940 | |
Ratio of net expenses to average net assets(2)(3) | | | 1.76% | |
Ratio of net investment income (loss) to average net assets(2)(3)(4) | | | (0.20% | ) |
Ratio of expenses to average net assets after reductions, excluding expenses paid indirectly(2)(3) | | | 1.76% | |
Ratio of expenses to average net assets before reductions(2)(3) | | | 1.88% | |
Portfolio turnover rate(1) | | | 102% | |
| (1) | Not annualized for periods of less than one full year. |
| (2) | Annualized for periods of less than one full year. |
| (3) | These ratios exclude the impact of expenses of the underlying security holdings as represented in the schedule of investments. |
| (4) | Recognition of net investment income by the Fund is affected by the timing of the declaration of dividends by the underlying exchange traded funds in which the Fund invests. |
| * | Commenced operations January 31, 2006 |
The accompanying notes are an integral part of these financial statements.
Financial Highlights
For a Share Outstanding Through the Period Ended June 30, 2006 (unaudited)
The Focused Growth Fund
| | | | |
| | | 2006*
| |
Net Asset Value, Beginning of Period | | $ | 10.00 | |
| |
Income from Investment Operations | | | | |
Net investment income (loss) | | | — | |
Net gains (losses) on investments, futures, options, and distributions by other investment companies (both realized and unrealized) | | | (0.25 | ) |
Total from Investment Operations | | | (0.25 | ) |
| |
Less Distributions | | | | |
From net investment income | | | — | |
Total Distributions | | | 0.00 | |
| | | | | |
Net Asset Value, End of Period | | $ | 9.75 | |
| |
Total Return (assumes reinvestment of distributions)(1) | | | (2.50% | ) |
| |
Ratios/Supplemental Data | | | | |
Net assets, end of period ($000) | | $ | 26,013 | |
Ratio of net expenses to average net assets(2)(3) | | | 1.81% | |
Ratio of net investment income (loss) to average net assets(2)(3)(4) | | | 0.10% | |
Ratio of expenses to average net assets after reductions, excluding expenses paid indirectly(2)(3) | | | 1.81% | |
Ratio of expenses to average net assets before reductions(2)(3) | | | 1.93% | |
Portfolio turnover rate(1) | | | 95% | |
| (1) | Not annualized for periods of less than one full year. |
| (2) | Annualized for periods of less than one full year. |
| (3) | These ratios exclude the impact of expenses of the underlying security holdings as represented in the schedule of investments. |
| (4) | Recognition of net investment income by the Fund is affected by the timing of the declaration of dividends by the underlying exchange traded funds in which the Fund invests. |
| * | Commenced operations January 31, 2006 |
The accompanying notes are an integral part of these financial statements.
Financial Highlights
For a Share Outstanding Through the Period Ended June 30, 2006 (unaudited) and Each Fiscal Year Ended December 31,
The U.S. Government Bond Fund
| | | | | | | | | | | | | | | | | | | | | | | | |
| | | 2006
| | | 2005
| | | 2004
| | | 2003
| | | 2002
| | | 2001
| |
Net Asset Value, Beginning of Period | | $ | 20.22 | | | $ | 20.82 | | | $ | 21.00 | | | $ | 22.79 | | | $ | 21.41 | | | $ | 21.92 | |
| | | | | | |
Income from Investment Operations | | | | | | | | | | | | | | | | | | | | | | | | |
Net investment income | | | 0.32 | | | | 0.55 | | | | 0.52 | | | | 0.35 | | | | 0.54 | | | | 0.79 | |
Net gains (losses) on securities, futures, and options (both realized and unrealized) | | | (0.26 | ) | | | (0.58 | ) | | | (0.18 | ) | | | (1.35 | ) | | | 1.65 | | | | (0.51 | ) |
Total from Investment Operations | | | 0.06 | | | | (0.03 | ) | | | 0.34 | | | | (1.00 | ) | | | 2.19 | | | | 0.28 | |
| | | | | | |
Less Distributions | | | | | | | | | | | | | | | | | | | | | | | | |
From net investment income | | | (0.33 | ) | | | (0.57 | ) | | | (0.52 | ) | | | (0.35 | ) | | | (0.54 | ) | | | (0.79 | ) |
From net capital gains | | | — | | | | — | | | | — | | | | (0.44 | ) | | | (0.27 | ) | | | — | |
Total Distributions | | | (0.33 | ) | | | (0.57 | ) | | | (0.52 | ) | | | (0.79 | ) | | | (0.81 | ) | | | (0.79 | ) |
| | | | | | | | | | | | | | | | | | | | | | | | | |
Net Asset Value, End of Period | | $ | 19.95 | | | $ | 20.22 | | | $ | 20.82 | | | $ | 21.00 | | | $ | 22.79 | | | $ | 21.41 | |
| | | | | | |
Total Return (assumes reinvestment of
distributions)(3) | | | 0.30% | | | | (0.14% | ) | | | 1.64% | | | | (4.43% | ) | | | 10.34% | | | | 1.23% | |
| | | | | | |
Ratios/Supplemental Data | | | | | | | | | | | | | | | | | | | | | | | | |
Net assets, end of period ($000) | | $ | 5,182 | | | $ | 6,324 | | | $ | 9,316 | | | $ | 10,840 | | | $ | 14,226 | | | $ | 13,080 | |
Ratio of net expenses to average net assets(1)(4) | | | 1.10% | | | | 1.10% | | | | 1.10% | | | | 1.10% | | | | 1.10% | | | | 1.07% | |
Ratio of net investment income to average
net assets(1)(4) | | | 3.19% | | | | 2.75% | | | | 2.49% | | | | 1.59% | | | | 2.43% | | | | 3.58% | |
Ratio of expenses to average net assets before reductions(1)(4) | | | 2.00% | | | | 2.02% | | | | 1.58% | | | | 1.24% | | | | 1.13% | | | | 1.13% | |
Portfolio turnover rate(2)(3) | | | 11% | | | | 159% | | | | 352% | | | | 568% | | | | 408% | | | | 503% | |
| (1) | Ratio reflects reductions in corresponding portfolio, if applicable. |
| (2) | Prior to the year ended December 31, 2003, the portfolio turnover rate represented the turnover rate of the corresponding portfolio. During 2003, the Fund’s portfolio turnover rate for the period January 1 through April 13 is equivalent to the portfolio into which the Fund invested. Beginning April 14 the Fund commenced calculating the portfolio turnover rate based on its own activities. Hence, the portfolio turnover rate represented for 2003 is a combination of these two periods. Subsequent to 2003 the portfolio turnover rate is specific to the Fund. |
| (3) | Not annualized for periods of less than one full year. |
| (4) | Annualized for periods of less than one full year. |
The accompanying notes are an integral part of these financial statements.
Financial Highlights
For a Share Outstanding Through the Period Ended June 30, 2006 (unaudited) and Each Fiscal Year Ended December 31,
The Money Market Fund — Retail Class
| | | | | | | | | | | | | | | | | | | | | | | | |
| | | 2006
| | | 2005
| | | 2004
| | | 2003
| | | 2002
| | | 2001
| |
Net Asset Value, Beginning of Period | | $ | 1.00 | | | $ | 1.00 | | | $ | 1.00 | | | $ | 1.00 | | | $ | 1.00 | | | $ | 1.00 | |
| | | | | | |
Income from Investment Operations | | | | | | | | | | | | | | | | | | | | | | | | |
Net investment income | | | 0.021 | | | | 0.028 | | | | 0.011 | | | | 0.009 | | | | 0.016 | | | | 0.040 | |
Total from Investment Operations | | | 0.021 | | | | 0.028 | | | | 0.011 | | | | 0.009 | | | | 0.016 | | | | 0.040 | |
| | | | | | |
Less Distributions | | | | | | | | | | | | | | | | | | | | | | | | |
From net investment income | | | (0.021 | ) | | | (0.028 | ) | | | (0.011 | ) | | | (0.009 | ) | | | (0.016 | ) | | | (0.040 | ) |
Total Distributions | | | (0.021 | ) | | | (0.028 | ) | | | (0.011 | ) | | | (0.009 | ) | | | (0.016 | ) | | | (0.040 | ) |
| | | | | | | | | | | | | | | | | | | | | | | | | |
Net Asset Value, End of Period | | $ | 1.00 | | | $ | 1.00 | | | $ | 1.00 | | | $ | 1.00 | | | $ | 1.00 | | | $ | 1.00 | |
| | | | | | |
Total Return (assumes reinvestment of distributions)(2) | | | 2.15% | | | | 2.85% | | | | 1.06% | | | | 0.92% | | | | 1.59% | | | | 4.10% | |
| | | | | | |
Ratios/Supplemental Data | | | | | | | | | | | | | | | | | | | | | | | | |
Net assets, end of period ($000) | | $ | 148,076 | | | $ | 129,200 | | | $ | 148,650 | | | $ | 165,607 | | | $ | 186,280 | | | $ | 221,594 | |
Ratio of net expenses to average net assets(1)(3) | | | 0.48% | | | | 0.47% | | | | 0.46% | | | | 0.43% | | | | 0.44% | | | | 0.44% | |
Ratio of net investment income to average
net assets(1)(3) | | | 4.32% | | | | 2.79% | | | | 1.04% | | | | 0.92% | | | | 1.58% | | | | 4.00% | |
Ratio of expenses to average net assets before reductions(1)(3) | | | 0.86% | | | | 0.89% | | | | 0.84% | | | | 0.82% | | | | 0.66% | | | | 0.62% | |
| (1) | Ratio reflects reduction in corresponding portfolio, if applicable. |
| (2) | Not annualized for periods of less than one full year. |
| (3) | Annualized for periods of less than one full year. |
The accompanying notes are an integral part of these financial statements.
Financial Highlights
For a Share Outstanding Through the Period Ended June 30, 2006 (unaudited) and Each Fiscal Year Ended December 31,
The Money Market Fund — Institutional Class
| | | | | | | | | | | | |
| | | 2006
| | | 2005
| | | 2004*
| |
Net Asset Value, Beginning of Period | | $ | 1.00 | | | $ | 1.00 | | | $ | 1.00 | |
| | | |
Income from Investment Operations | | | | | | | | | | | | |
Net investment income | | | 0.022 | | | | 0.030 | | | | — | ** |
Total from Investment Operations | | | 0.022 | | | | 0.030 | | | | 0.000 | |
| | | |
Less Distributions | | | | | | | | | | | | |
From net investment income | | | (0.022 | ) | | | (0.030 | ) | | | — | ** |
Total Distributions | | | (0.022 | ) | | | (0.030 | ) | | | 0.000 | |
| | | | | | | | | | | | | |
Net Asset Value, End of Period | | $ | 1.00 | | | $ | 1.00 | | | $ | 1.00 | |
| | | |
Total Return (assumes reinvestment of distributions)(1) | | | 2.23% | | | | 2.99% | | | | 0.02% | |
| | | |
Ratios/Supplemental Data | | | | | | | | | | | | |
Net assets, end of period ($000) | | $ | 24,160 | | | $ | 21,083 | | | $ | 30,310 | |
Ratio of net expenses to average net assets(2) | | | 0.34% | | | | 0.33% | | | | 0.33% | |
Ratio of net investment income to average net assets(2) | | | 4.45% | | | | 2.93% | | | | 1.96% | |
Ratio of expenses to average net assets before reductions(2) | | | 0.69% | | | | 0.71% | | | | 0.67% | |
| (1) | Not annualized for periods of less than one full year. |
| (2) | Annualized for periods of less than one full year. |
| * | Commenced operations on December 28, 2004. |
| ** | Actual amounts were less than one-tenth of one cent. |
The accompanying notes are an integral part of these financial statements.
Notes to Financial Statements
June 30, 2006 (unaudited)
1. Organization and Significant Accounting Policies
The Flex-funds Trust (the “Trust”) was organized in 1982 and is registered under the Investment Company Act of 1940, as amended (the “1940 Act”), as a diversified, open-end management investment company. The Trust offers nine separate series and is presently comprised of nine separate funds as follows: The Muirfield Fund® (“Muirfield”), The Total Return Utilities Fund (“TRUF”), The Quantex Fund™ (“Quantex”), The Dynamic Growth Fund (“Dynamic”), The Aggressive Growth Fund (“Aggressive”), The Defensive Growth Fund (“Defensive”)(please see second paragraph of note #1 for more information), The Focused Growth Fund (“Focused”)(please see second paragraph of note #1 for more information), The U.S. Government Bond Fund (“Bond”), and The Money Market Fund (“Money Market”) (each a “Fund” and collectively the “Funds”). Money Market offers two classes of shares (the Retail Class (“Retail Class”) and the Institutional Class (“Institutional Class”)). Each class of shares has equal rights as to earnings and assets except that each class bears different distribution and transfer agent expenses. The investment objective of Muirfield, Quantex, Dynamic, Aggressive, Defensive, and Focused is growth of capital. The investment objective of TRUF is current income and growth of income. The investment objective of Bond is maximum current income. The investment objective of Money Market is current income while maintaining a stable share price of $1.00.
On January 31, 2006, Meeder Asset Management, Inc.(“MAM”), the investment advisor to the Funds, offered two new funds to the Trust. The Defensive Growth Fund seeks growth of capital by investing its assets primarily in exchange traded funds (“ETF’s”), following a disciplined strategy of “Defensive Investing.” The Defensive Investing discipline, developed by MAM in 1974, seeks to maximize shareholder returns through investing in equity securities when MAM believes the risk/reward relationship is favorable. When MAM believes the risk/reward relationship is unfavorable, Defensive Investing seeks to preserve gains, and protect against losses by shifting assets to investment grade bonds, money market instruments and/or underlying ETF’s that invest in fixed income securities. The Focused Growth Fund seeks growth of capital by investing its assets primarily in ETF’s that invest in equity securities, following a “Strategic Fund Selection” discipline. The Focused Growth Fund employs a “fund of funds” approach to investing in the equity market and offers investors the opportunity to invest in areas that MAM believes have the greatest relative strength in the stock market, with the ability to diversify a long-term portfolio.
Use of estimates. The preparation of financial statements in conformity with accounting principles generally accepted in the United States of America (“GAAP”) requires management to make estimates and assumptions that affect the reported amounts of assets and liabilities and disclosure of contingent assets and liabilities at the date of the financial statements and the reported amounts of increases and decreases in net assets from operations during the reporting period. Actual results could differ from those estimates.
Security valuation. Securities that are traded on stock exchanges are valued at the last sales price as of the close of business of the New York Stock Exchange on the day of valuation or, lacking any sales, are valued using fair value procedures approved by the Board of Trustees (“Trustees”). Securities traded over-the-counter are valued at the most recent bid price or yield equivalent as obtained from one or more dealers that make markets in such securities. Registered investment companies are valued at the daily redemption value as reported by the underlying fund. Bond values the securities held at 4:00 P.M. Eastern Time. Money market securities held in Money Market are valued at amortized cost, which approximates value. The Funds obtain prices from independent pricing services, which use valuation techniques approved by the Trustees. Money Market, in compliance with Rule 2a-7 of the 1940 Act, compares its amortized values, including illiquid and restricted securities, to the prices obtained from the independent pricing services. The ability of issuers of debt securities held by the Funds to meet their obligations may be affected by economic and political developments in a specific country or region.
Money market securities held in the Funds, except Money Market, maturing more than sixty days after the valuation date are valued at the last sales price as of the close of business on the day of valuation, or, lacking any sales, at the most recent bid price or yield equivalent as obtained from dealers that make markets in such securities. When such securities are valued within sixty days or less to maturity, the difference between the valuation existing on the sixty-first day before maturity and maturity value is amortized on a straight-line basis to maturity. Securities maturing within sixty days from their date of acquisition are valued at amortized cost.
Repurchase agreements. Each Fund may engage in repurchase agreement transactions whereby the Fund takes possession of an underlying debt instrument subject to an obligation of the seller to repurchase the instrument from the Fund and an obligation of the Fund to resell the instrument at an agreed upon price and term. At all times, the Fund
maintains the value of collateral, including accrued interest, of at least 100% of the amount of the repurchase agreement, plus accrued interest. If the seller defaults or the fair value of the collateral declines, realization of the collateral by the Funds may be delayed or limited.
Futures & options. Each Fund, except Money Market, may engage in transactions in financial futures contracts and options contracts in order to manage the risk of unanticipated changes in market values of securities held in the fund, or which it intends to purchase. The futures and options contracts are adjusted by the daily exchange rate of the underlying currency, or index, and any gains or losses are recorded for financial statement purposes as unrealized gains or losses in the statement of assets and liabilities and the statement of operations until the contract settlement date, at which time realized gains and losses are included in the statement of operations.
To the extent that the Fund enters into futures contracts on an index or group of securities, the Fund exposes itself to an indeterminate liability and will be required to pay or receive a sum of money measured by the change in the value of the index. Upon entering into a futures contract, the Fund is required to deposit an initial margin, which is either cash or securities in an amount equal to a certain percentage of the contract value. Subsequently, the variation margin, which is equal to changes in the daily settlement price or last sale price on the exchanges where futures contracts trade, is received or paid and is recorded as an unrealized gain or loss until the contract is closed. When the contract is closed, the Fund records a realized gain or loss equal to the difference between the proceeds from (or cost of) the closing transaction and the Fund’s basis in the contract. Should market conditions move unexpectedly, the Fund may not achieve the anticipated benefits of the futures contract and may realize a loss. The use of futures transactions involves the risk of imperfect correlation in movements in the price of futures contracts, interest rates, and the underlying hedged assets.
Call and put option contracts involve the payment of a premium for the right to purchase or sell an individual security or index aggregate at a specified price until the expiration of the contract. Such transactions expose the Fund to the loss of the premium paid if the Fund does not sell or exercise the contract prior to the expiration date. In the case of a call option, sufficient cash or money market instruments will be segregated to complete the purchase. Options are valued on the basis of the daily settlement price or last sale on the exchanges where they trade and the changes in value are recorded as unrealized appreciation or depreciation until closed, exercised or expired.
The Funds may write covered call or put options for which premiums received are recorded as liabilities and are subsequently adjusted to the current value of the options written. When written options are closed or exercised, premiums received are offset against the proceeds paid, and the Fund records realized gains or losses for the difference. When written options expire, the liability is eliminated, and the Fund records realized gains for the entire amount of premiums received.
Federal income taxes. It is each Fund’s policy to continue to comply with the requirements of Subchapter M of the Internal Revenue Code applicable to regulated investment companies and to distribute substantially all of its taxable income and net capital gains to its shareholders. Therefore, no federal income tax provision is required.
Distributions to shareholders. Distributions to shareholders are recorded on the ex-dividend date. Muirfield, Quantex, Dynamic, Aggressive, Defensive, and Focused declare and pay dividends from net investment income, if any, on a quarterly basis. TRUF declares and pays dividends from net investment income on a monthly basis. Bond and Money Market declare dividends from net investment income on a daily basis and pay such dividends on a monthly basis. Each Fund distributes net capital gains, if any, on an annual basis.
Distributions from net investment income and from net capital gains are determined in accordance with income tax regulations, which may differ from GAAP. These differences are primarily due to deferrals of certain losses, expiring capital loss carryforwards, and differing treatments of unrealized gains and losses of futures contracts held by each Fund. Accordingly, timing differences relating to shareholder distributions are reflected in the components of net assets and permanent book and tax differences relating to shareholder distributions have been reclassified within the components of net assets. Differences identified and reclasses made for the period ended December 31, 2005 were as follows:
| | | | | | | |
| | | Capital
| | | Undistributed
Net Investment
Income
|
The Total Return Utilities Fund | | $ | (27,624 | ) | | $ | 27,624 |
The Quantex Fund™ | | | (2,873 | ) | | | 2,873 |
Investment income & expenses. For Money Market, income and expenses (other than expenses attributable to a specific class) are allocated to each class of shares based on its relative net assets. Expenses incurred by the Trust that do not specifically relate to an individual Fund of the Trust are allocated to the Funds based on each Fund’s relative net assets or other appropriate basis.
Capital Share Transactions. Money Market is authorized to issue an indefinite number of shares in the Retail Class and the Institutional Class. Transactions in the capital shares of the Fund for the six months ended June 30, 2006 and the year ended December 31, 2005 were as follows:
| | | | | | | | | | | | | | |
| | | 2006
| | | 2005
| |
| | | Amount
| | | Shares
| | | Amount
| | | Shares
| |
Retail Class | | | | | | | | | | | | | | |
Issued | | $ | 101,474,096 | | | 101,474,096 | | | $ | 155,320,448 | | | 155,320,448 | |
Reinvested | | | 2,807,569 | | | 2,807,569 | | | | 3,629,377 | | | 3,629,377 | |
Redeemed | | | (85,405,859 | ) | | (85,405,859 | ) | | | (178,399,813 | ) | | (178,399,813 | ) |
Net increase (decrease) | | $ | 18,875,806 | | | 18,875,806 | | | $ | (19,449,988 | ) | | (19,449,988 | ) |
Institutional Class | | | | | | | | | | | | | | |
Issued | | $ | 28,640,875 | | | 28,640,875 | | | $ | 73,089,485 | | | 73,089,485 | |
Reinvested | | | 302,415 | | | 302,415 | | | | 511,344 | | | 511,344 | |
Redeemed | | | (25,866,566 | ) | | (25,866,566 | ) | | | (82,827,873 | ) | | (82,827,873 | ) |
Net increase (decrease) | | $ | 3,076,724 | | | 3,076,724 | | | $ | (9,227,044 | ) | | (9,227,044 | ) |
Other. The Funds record security transactions on the trade date. Gains and losses realized from the sale of securities are determined on the specific identification basis. Dividend income is recognized on the ex-dividend date and interest income (including amortization of premium and accretion of discount) is recognized as earned.
Under a Deferred Compensation Plan (the “Plan”), non-interested Trustees may elect to defer receipt of a portion of their annual compensation. Under the Plan, deferred amounts are invested in shares of The Flex-funds. Deferred amounts remain in the Funds until distributed in accordance with the Plan.
2. Investment Transactions
For the six months ended June 30, 2006, the cost of purchases and proceeds from sales or maturities of long-term investments for the Funds were as follows:
| | | | | | |
| | | Purchases
| | Sales
|
The Muirfield Fund® | | $ | 51,130,069 | | $ | 89,313,447 |
The Total Return Utilities Fund | | | 3,006,128 | | | 4,270,862 |
The Quantex Fund™ | | | 4,796,696 | | | 4,800,357 |
The Dynamic Growth Fund | | | 17,955,452 | | | 33,576,298 |
The Aggressive Growth Fund | | | 30,714,174 | | | 25,849,457 |
The Defensive Growth Fund | | | 38,100,319 | | | 16,635,101 |
The Focused Growth Fund | | | 39,896,583 | | | 14,958,656 |
The U.S. Government Bond Fund | | | 598,656 | | | 1,596,108 |
3. Investment Advisory Fees and Other Transactions with Affiliates
Meeder Asset Management, Inc. (“MAM”), a wholly-owned subsidiary of Meeder Financial, Inc. (“Meeder”), provides each Fund, under a separate Investment Advisory Contract, with investment management, research, statistical and advisory services. The services of MAM will terminate automatically if assigned and may be terminated without penalty at any time upon 60 days prior written notice by majority vote of the Fund, by the Trustees of the Fund, or by MAM. Under a separate Investment Subadvisory Agreement with MAM, Miller/Howard Investments, Inc. (“Miller/Howard”) serves as subadvisor of TRUF. The Investment Subadvisory Agreement provides that it will terminate automatically if assigned, and that it may be terminated by MAM without penalty to the Fund by MAM, the Trustees of the Fund, or by the vote of a majority of the outstanding voting securities of the Fund upon not less than 30 days written notice.
For such services the Funds pay a fee at the following annual rates: Muirfield, TRUF, and Quantex, 1.00% of average daily net assets up to $50 million, 0.75% of average daily net assets exceeding $50 million up to $100 million and 0.60% of average daily net assets exceeding $100 million. As subadvisor to TRUF, Miller/Howard is paid 0.00% of the
1.00% of average daily net assets up to $10 million, 0.40% of the 1.00% of average daily net assets exceeding $10 million up to $50 million, 0.40% of the 0.75% of average daily net assets exceeding $50 million up to $60 million, 0.30% of the 0.75% of average daily net assets exceeding $60 million up to $100 million and 0.25% of the 0.60% of average daily net assets exceeding $100 million; Dynamic, Aggressive, Defensive, and Focused, 0.75% of average daily net assets up to $200 million and 0.60% of average daily net assets exceeding $200 million; Bond, 0.40% of average daily net assets up to $100 million and 0.20% of average daily net assets exceeding $100 million; and Money Market, 0.40% of average daily net assets up to $100 million and 0.25% of average daily net assets exceeding $100 million. MAM has contractually agreed to reduce its investment advisory fee by 0.25% for Quantex. During the six months ended June 30, 2006, $21,085 of investment advisory fees were waived in Quantex. During the six months ended June 30, 2006, MAM voluntarily agreed to reduce $121,371 of investment advisory fees in Money Market.
The Chief Compliance Officer (“CCO”) of the Trust provides the Trust with certain compliance services. In compensation for such services, the Trust pays the CCO 70% of an annual fee of $50,000. The remaining 30% is paid by another mutual fund trust managed by MAM. The CCO was an affiliate of the Trust and MAM through March 8, 2006. From March 9, 2006 through July 12, 2006, an interim, unaffiliated CCO resumed the CCO responsibilities for the Trust and MAM. Effective July 13, 2006, a permanent, unaffiliated CCO was appointed for the Trust. With the exception of Defensive and Focused, for the period from January 1, 2006 through March 8, 2006, the affiliated CCO received $918 from each Fund. For the same period of time, the CCO did not receive any fees from Defensive and Focused.
Mutual Funds Service Co. (“MFSCo”), a wholly-owned subsidiary of Meeder, serves as stock transfer, dividend disbursing and shareholder services agent for each Fund. In compensation for such services, each Fund pays MFSCo an annual fee calculated as follows: For Muirfield, TRUF, Quantex, Dynamic, Aggressive, Defensive, and Focused, such fee is equal to the greater of $15 per active shareholder account or 0.12% of each Fund’s average daily net assets. For Bond, such fee is equal to the greater of $15 per active shareholder account or 0.08% of the Fund’s average daily net assets. For The Money Market Fund and the Institutional Fund, such fee is equal to the greater of $20 per active shareholder account or 0.08% of the Fund’s average daily net assets. MFSCo is entitled to receive an annual minimum fee of $4,000 for each Fund or class. For Funds that are subject to an expense cap and which are above the expense cap, the basis point fee will be reduced by 0.02%. During the six months ended June 30, 2006, MFSCo waived $2,016 and $2,445 of transfer agent fees for Bond and Money Market, respectively. MFSCo also voluntarily waived $5,065 and $4,582 of transfer agent fees for Defensive and Focused, respectively, during the period January 31, 2006 (commencement of the funds) through June 30, 2006.
MFSCo provides the Trust with certain administrative services. In compensation for such services, each Fund pays MFSCo an annual fee equal to 0.10% of each Fund’s average daily net assets up to $50 million and 0.08% of each Fund’s average daily net assets exceeding $50 million.
MFSCo serves as accounting services agent for each Fund. In compensation for such services, each Fund pays MFSCo an annual fee equal to the greater of:
| | a. | 0.15% of the first $10 million of average daily net assets, 0.10% of the next $20 million of average daily net assets, 0.02% of the next $50 million of average daily net assets, and 0.01% in excess of $80 million of average daily net assets, or |
| | b. | $7,500 for non-Money Market Funds and $30,000 for Money Market. |
MAM has voluntarily agreed to reduce its fees and/or reimburse expenses (excluding brokerage fees and commissions, taxes, interest, and extraordinary or non-recurring expenses), to limit Bond’s total annual operating expenses to 1.10% of average daily net assets. MAM has also agreed to reduce its fees and/or reimburse expenses to the extent necessary to achieve an effective yield for the Retail Class that will rank in the top 10% of yields for all general-purpose money market funds in 2006. Lastly, MAM limited the Institutional Class’ total annual operating expenses to 0.34% of average daily net assets. Such reduction and/or reimbursement is limited to the total of fees charged to each Fund or Class by MAM and MFSCo. For the six months ended June 30, 2006, MAM and/or MFSCo reimbursed $14,275, $58,065, and $19,136 to Bond, the Retail Class, and the Institutional Class, respectively.
Adviser Dealer Services, Inc. (“ADS”), an affiliated broker-dealer of MAM, has an arrangement with TRUF whereby a portion of the commissions received from security trades directed through it will be used to help pay expenses of the aforementioned Fund. For the six months ended June 30, 2006, ADS did not receive any net commissions in connection with the purchase and sale of investments for TRUF and paid $579 of expenses under this arrangement for the aforementioned Fund.
Muirfield, Dynamic, and Aggressive have entered into a custody agreement with the Trust’s custodian, The Huntington National Bank (“HNB”). HNB receives distribution, service, and administration fees (collectively the “fees”) from the underlying security holdings of the aforementioned Funds and executes trade orders received on behalf of the Trust as Trust custodian. HNB retains 0.03% of the fees collected and forwards the remainder to the appropriate Fund. The Funds use their portion of the fees received to reduce the gross expenses of each Fund. For the six months ended June 30, 2006, Muirfield, Dynamic, and Aggressive used $36,056, $15,319, and $1,383 of fees received, respectively, to reduce gross expenses of each Fund. It is possible that the Funds may invest in security holdings in which fees are not paid. As such, the gross expenses of a Fund would not be decreased. Also, without this agreement it is likely that the Funds would not collect any fees from underlying security holdings.
Pursuant to Rule 12b-1 of the 1940 Act, a mutual fund can adopt a written plan to pay certain expenses out of fund assets relating to the sale and distribution of its shares. Muirfield, Quantex, Bond, and the Retail Class have adopted a distribution plan with an annual limitation of 0.20% of average daily net assets. TRUF, Dynamic, Aggressive, Defensive, and Focused have adopted a distribution plan with an annual limitation of 0.25% of average daily net assets. The Institutional Class has adopted a distribution plan with an annual limitation of 0.03% of average daily net assets. For the six months ended June 30, 2006, Muirfield, TRUF, Quantex, Dynamic, Aggressive, Defensive, Focused, and Bond waived $25,879, $1,908, $12,906, $8,697, $4,522, $2,376, $2,085, and $3,942 of distribution plan (12b-1) expenses, respectively. The Retail Class and the Institutional Class waived $92,562 and $2,583, respectively, for a total of $95,145.
An Administrative Services Plan has been adopted for each Fund of the Trust except Money Market. The Administrative Services Plan allows for each eligible Fund to pay a maximum annual amount of 0.20% of average daily net assets to Service Organizations that provide administrative support services to their customers who own Shares of record or benefically. For the six months ended June 30, 2006, Muirfield, TRUF, Quantex, Dynamic, Aggressive, Defensive, Focused, and Bond waived $45,206, $13,471, $16,786, $16,134, $9,496, $864, $782, and $5,797 of administrative service plan expenses, respectively.
The Funds have adopted a Deferred Compensation Plan (the “Plan”) for the independent Trustees. Under the Plan, each eligible Trustee is permitted to defer all or a portion of the trustees fees payable by any of the Funds as an investment into any combination of Funds until a specified point of time. The investment into the Funds is recorded as an asset, however an offsetting liability is also recorded for the deferred payment. Once the eligible Trustees’ deferral amounts can be distributed, a lump sum or generally equal annual installments over a period of up to ten (10) years can be made to the eligible Trustee(s). The Funds may terminate this Plan at any time.
Certain trustees and officers of the Funds are also officers or directors of Meeder, MAM, MFSCo, and ADS.
4. Federal Tax Information
The tax characteristics of dividends paid by the Funds during the year ended December 31, 2005 were as follows:
| | | | | | | | | |
| | | Ordinary
Income
| | Net
Short-Term
Capital Gains
| | Total
Dividends
Paid(1)
|
The Muirfield Fund® | | $ | 1,007,736 | | $ | — | | $ | 1,007,736 |
The Total Return Utilities Fund | | | 303,370 | | | — | | | 303,370 |
The Quantex Fund™ | | | 10,604 | | | — | | | 10,604 |
The Dynamic Growth Fund | | | 246,363 | | | — | | | 246,363 |
The Aggressive Growth Fund | | | 37,952 | | | — | | | 37,952 |
The U.S. Government Bond Fund | | | 206,740 | | | — | | | 206,740 |
The Money Market Fund | | | 4,515,922 | | | — | | | 4,515,922 |
The tax characteristics of dividends paid by the Funds during the year ended December 31, 2004 were as follows:
| | | | | | | | | |
| | | Ordinary
Income
| | Net
Short-Term
Capital Gains
| | Total
Dividends
Paid(1)
|
The Muirfield Fund® | | $ | 73,953 | | $ | — | | $ | 73,953 |
The Total Return Utilities Fund | | | 511,965 | | | — | | | 511,965 |
The U.S. Government Bond Fund | | | 248,065 | | | — | | | 248,065 |
The Money Market Fund | | | 1,734,319 | | | — | | | 1,734,319 |
As of December 31, 2005, the components of accumulated earnings/(deficit) on a tax basis for the Funds were as follows:
| | | | | | | | | | | | | | | | | | | |
| | | Undistributed
Ordinary
Income
| | Dividends
Payable
| | | Accumulated
Capital and
Other Gains
and (Losses)
| | | Unrealized
Appreciation/
(Depreciation)(2)
| | | Total
Accumulated
Earnings/
(Deficit)
| |
The Muirfield Fund® | | $ | 6,418 | | $ | (5,982 | ) | | $ | (8,027,390 | ) | | $ | (2,842,112 | ) | | $ | (10,869,066 | ) |
The Total Return Utilities Fund | | | 2,197 | | | (2,197 | ) | | | (6,828,551 | ) | | | 3,884,064 | | | | (2,944,487 | ) |
The Quantex Fund™ | | | 92 | | | (92 | ) | | | (4,837,849 | ) | | | 1,872,875 | | | | (2,964,974 | ) |
The Dynamic Growth Fund | | | 207 | | | (207 | ) | | | (2,398,573 | ) | | | (437,037 | ) | | | (2,835,610 | ) |
The Aggressive Growth Fund | | | 204 | | | (204 | ) | | | (6,467,938 | ) | | | 220,211 | | | | (6,247,727 | ) |
The U.S. Government Bond Fund | | | 158,948 | | | (1,415 | ) | | | (1,003,440 | ) | | | (74,989 | ) | | | (920,896 | ) |
The Money Market Fund | | | 34,328 | | | (34,328 | ) | | | — | | | | — | | | | — | |
For federal income tax purposes, the following Funds have capital loss carryforwards as of December 31, 2005, which are available to offset future capital gains, if any. To the extent that these carryforwards are used to offset future capital gains, it is probable that the gains that are offset will not be distributed to shareholders:
| | | | | |
| | | Amount
| | Expires
|
The Muirfield Fund® | | $ | 4,367,373 | | 2009 |
The Muirfield Fund® | | | 3,660,017 | | 2010 |
The Total Return Utilities Fund | | | 4,785,064 | | 2010 |
The Total Return Utilities Fund | | | 2,043,487 | | 2011 |
The QuantexFund™ | | | 3,588,183 | | 2010 |
The QuantexFund™ | | | 1,249,666 | | 2011 |
The Dynamic Growth Fund | | | 2,398,573 | | 2010 |
The Aggressive Growth Fund | | | 1,811,496 | | 2008 |
The Aggressive Growth Fund | | | 618,687 | | 2009 |
The Aggressive Growth Fund | | | 4,037,755 | | 2010 |
The U.S. Government Bond Fund | | | 735,915 | | 2011 |
The U.S. Government Bond Fund | | | 125,708 | | 2012 |
The U.S. Government Bond Fund | | | 141,817 | | 2013 |
Under current tax laws, net capital losses incurred after October 31, within a Fund’s fiscal year, are deemed to arise on the first business day of the following fiscal year for tax purposes. For the year ended December 31, 2005, the Funds deferred post October capital losses of:
| | | |
| | | Post-October
Capital Losses
|
The U.S. Government Bond Fund | | $ | 48,816 |
| (1) | Total dividends paid may differ from the amount reported in the Statement of Changes in Net Assets because for tax purposes dividends are recognized when actually paid. |
| (2) | The differences between book- and tax-basis unrealized appreciation/(depreciation) are attributable primarily to: deferral of losses on wash sales and the realization for tax purposes of unrealized gains/(losses) on certain derivative instruments. |
5. Control Ownership
The beneficial ownership, either directly or indirectly, of more than 25% of the voting securities of a fund creates a presumption of control of the fund under Section 2(a)(9) of the 1940 Act. As of June 30, 2006, Charles Schwab & Co., Inc. held for the benefit of others, in aggregate, 51% of TRUF; Nationwide Trust Company, FSB held for the benefit of others, in aggregate, 98% of Defensive; Nationwide Trust Company, FSB held for the benefit of others, in aggregate, 98% of Focused; Consolidated Stores Corp. held 42% of Dynamic; Nationwide Trust Company, FSB held for the benefit of others, in aggregate, 60% of Aggressive; and Carey & Company held 37% of Money Market — Institutional Class and therefore may be deemed to control the Funds.
6. Board Review of Investment Advisory and Subadvisory Agreements
At a meeting held June 6, 2006, the Board of Trustees (the “Board”), including a majority of non-interested or independent Trustees, approved the renewal of the investment advisory agreements for seven of the nine separate funds comprising The Flex-funds (the “Funds”) and the investment sub-advisory agreement relating to The Total Return Utilities Fund (individually, an “Agreement” and collectively, the “Agreements”). There were two new funds added to The Flex-funds as of January 31, 2006, The Defensive Growth Fund and The Focused Growth Fund. These two new funds are not discussed below because their investment advisory agreements were not up for renewal at the June 6, 2006 Board meeting.
The Board reviewed materials sent to each Trustee in advance of the meeting for consideration in determining whether to approve the renewal of each Fund’s Agreement. Management reviewed with the Trustees the materials prepared by them in response to Funds’ legal counsel’s written request pursuant to Section 15(c) of the Investment Company Act of 1940 for the provision to the Trustees of information necessary or appropriate to assist the Trustees in their deliberations concerning renewal of the Agreements. In reaching the decision to renew the Agreements, the Board also took into account information furnished throughout the year at regular Board meetings. Such information included investment performance reports, related financial information for each Fund, periodic reports on shareholder services, legal compliance, pricing, brokerage commissions and execution and other services provided by the investment manager, Meeder Asset Management, Inc. (“Manager”) and its affiliates, or by or on behalf of the Total Return Utilities Fund’s subadviser, Miller/Howard Investments, Inc. Information furnished specifically in connection with the renewal process included a report for the Funds prepared by Lipper Financial Services (“Lipper”), an independent organization, as well as a Funds’ profitability analysis prepared by the Manager. The Lipper report compared each Fund’s management fees and expenses with those of other mutual funds deemed comparable to the Fund. The Funds’ profitability analysis discussed the profitability to the Manager and Mutual Funds Service Co., an affiliate of the Manager, from the overall Funds’ operations utilizing expense allocation methodologies deemed reasonable by the Manager.
In considering such materials, the independent Trustees received assistance and advice from and met separately with Fund counsel. While the Agreements were all approved at the same Board meeting, the Board dealt with each Fund separately. In approving continuance of the Agreement for each Fund, the Board, including a majority of independent Trustees, determined that the existing management fee structure was fair and reasonable and that continuance of the Agreement was in the best interests of each Fund and its shareholders. While attention was given to all information furnished, the following discusses the primary factors relevant to the Board’s decision.
Nature, Extent and Quality of Services. The Board was satisfied with the nature and quality of the overall services provided by the Manager, its affiliates and the subadviser to the Funds and their shareholders. In addition to investment performance and expenses discussed earlier in that meeting, the Board’s opinion was based, in part, upon periodic reports showing that the investment policies and restrictions for each Fund were consistently complied with as well as other reports periodically given to the Board covering matters such as the compliance of portfolio managers and other management personnel with the Code of Ethics adopted throughout the Manager’s organization, the adherence to fair value pricing procedures established by the Board, and the accuracy of net asset value calculations. Other factors taken into account by the Board were the Manager’s compliance procedures and qualifications of its Chief Compliance Officer. Consideration was also given to the experience of each Fund’s portfolio management team. The Board also took into account the transfer agent, fund accounting agent and administrative services provided to Fund shareholders by an affiliate of the Manager, noting continuing expenditures by management to increase and improve the scope of such services. Similar considerations were applied to the subadviser to the Total Return Utilities Fund’s investment advisory agreement.
Investment Performance. The Board placed emphasis on the investment performance of each Fund in view of its importance to shareholders. While consideration was given to performance reports and discussions with portfolio managers at Board meetings during the year, particular attention in assessing performance was given to the Morningstar reports furnished for the Agreement renewals. The Morningstar report prepared for each Fund showed the investment performance of the Fund for the three-month and one-, three-, and five-year (or period since inception if shorter) periods, as applicable, ended March 31, 2006 (the “relevant periods”) in comparison with a performance universe similar to each Fund’s investment objectives. There was an extensive discussion of the sources and methodology used in determining each Fund’s performance universe. The performance results for each Fund are summarized in the section below.
The Dynamic Growth and Total Return Utilities Fund outperformed their comparison benchmarks during three of the four periods, and The Money Market Fund outperformed its benchmarks during all of the relevant periods. During the three-year period ended March 31, 2006, the following Funds underperformed their respective benchmarks: The Muirfield Fund®, The Quantex Fund™, The Aggressive Growth Fund, and The U.S. Government Bond Fund. The comparison benchmarks for each of the Funds are outlined below:
| | |
Fund
| | Performance Benchmark
|
The Muirfield Fund® | | Blended Benchmark of 60% S&P 500 Index and 40% T-bill, S&P 500 Index, Morningstar’s Average Asset Allocation Fund Index |
| |
The Quantex Fund™ | | Russell 2000 Index, S&P 400 Mid-Cap Index, Morningstar’s Average Growth Fund Index |
| |
The Dynamic Growth Fund | | S&P 500 Index, Morningstar’s Average Growth Fund Index |
| |
The Total Return Utilities Funds | | S&P 500 Utilities Index, Morningstar’s Average Utility Fund Index |
| |
The U.S. Government Bond Fund | | Lehman Brothers Intermediate Government/Credit Index, Morningstar Average General Government Bond Fund Index |
| |
The Aggressive Growth Fund | | NASDAQ Composite Index, Morningstar’s Average Aggressive Growth Fund Index |
The Money Market Fund | | |
| |
Retail Class | | Lipper Average Money Market Fund Index |
| |
Institutional Class | | iMoneyNet’s Average First-Tier Institutional Money Market Fund Index |
The Board noted the excellent investment performance of The Money Market Fund, the moderate performance of The Dynamic Growth and Total Return Utilities Funds, and the underperformance of the other Funds. The Board also discussed with management the factors contributing to such performance and the actions being taken to improve the Funds’ investment results. The Board recognized that the Manager has made changes in its investment personnel and improvements in its investment processes in an effort to improve results. The portfolio managers went into detail regarding the factors taken into account when selecting investments and enhancements of their investment selection models and the Trustees acknowledged an overall trend of improvement in fund performance.
The Board noted that as of January 31, 2006, The Aggressive Growth Fund’s investment objective of growth of capital remained the same, but it accomplishes this goal by investing primarily in exchange traded funds rather than primarily investing in underlying mutual funds.
The Board recognized that with regard to The U.S. Government Bond Fund it has changed its investment strategy to pursue its unchanged investment objective of maximizing current income by allowing the Fund to invest up to 20% of its net assets in investment grade or non-investment grade corporate debt obligations, and mutual funds, exchange traded funds, index-based investments and unit investment trusts that invest in investment grade or non-investment grade corporate debt obligations rated B or higher by Moody’s or S&P 500, or if unrated, determined by the Manager to be comparable quality.
The Board indicated its intention to continue to monitor investment performance to assess the effectiveness of these changes and to evaluate whether additional steps to improve performance are necessary or appropriate. The Board concluded that continued dialogue between the Board and the Manager is the most effective method of addressing investment results.
Comparative Expenses. Consideration was given to a comparative analysis of the management fees and total expense ratios of each Fund compared with those of a group of other comparable funds. In reviewing comparative costs, emphasis was given to each Fund’s gross and net management fee in comparison with the gross and net management fee charged by a group of comparable funds, as well as the actual total expenses of the Fund in comparison with those of its peer group. The Trustees and management reviewed in detail the particulars of peer group
identification and selection. The Funds’ net management fees were also compared to each Fund’s peer group average net management fees per Lipper, Inc. The results of such expense comparisons showed that the effective management fee rate for each of The U.S. Government Bond and The Money Market Funds’ net management fees were lower than the peer groups’ fees. Conversely, The Total Return Utilities, The Aggressive Growth, The Dynamic Growth, The Quantex™, and The Muirfield® Funds’ net management fees were higher than the peer groups’ fees. In addition, the Funds’ net expense ratios were compared to each Fund’s peer group average net expense ratios per Lipper, Inc. The Aggressive Growth, The Money Market, and The Muirfield® Funds’ net expense ratios were slightly lower than the peer groups’ ratios. The Dynamic Growth Fund’s net expense ratio was substantially lower than its peer group’s ratio. The U.S. Government Bond, The Total Return Utilities, and The Quantex™ Funds’ net expense ratios were slightly higher than the peer groups’ ratios. The Board commended the Manager’s facilitation of a trading platform whereby The Muirfield Fund®, The Dynamic Growth Fund and The Aggressive Growth Fund recapture 12b-1, service and administrative fees paid by the underlying funds. While realizing that other factors such as the Manager’s profitability and economies of scale bear on the reasonableness of fees, the Board was satisfied with the management fees and total expenses of each Fund in comparison to its peer group as shown in the Lipper reports.
Management Profitability. The Board also considered the level of profits realized by the Manager and its affiliates in connection with the operation of the Funds. In this respect, the Board reviewed the Funds’ profitability analysis that addresses the overall profitability of The Flex-funds’ business. The Board also considered the extent to which the Manager and its affiliates might derive ancillary benefits from fund operations, including potential benefits resulting from allocation of fund brokerage and the declining use of “soft” commission dollars to pay for research. Specific attention was given to the method of calculating the Manager’s profitability from the Funds and the allocation of the Manager’s costs to each Fund, it being recognized that allocations are inherently subjective and various allocation methods may each be reasonable while producing different results. In reviewing and discussing such analysis, management discussed with the Board its belief that costs incurred in establishing the infrastructure necessary to the type of mutual fund operations conducted by the Manager and its corporate affiliates may not be fully reflected in the expenses allocated to each Fund in determining its profitability, as well as the fact that the level of profits, to a certain extent, reflected operational cost savings and efficiencies initiated by management. The Board also took into account management’s expenditures in improving shareholder services provided the Funds, as well as the need to meet additional regulatory and compliance requirements resulting from the Sarbanes-Oxley Act and SEC requirements. Based upon their consideration of all these factors, the Board determined that the level of profits realized by the Manager under its Agreements with the Funds was not excessive in view of the nature, quality and extent of services provided.
Economies of Scale. The Board also considered whether economies of scale are realized by the Manager as the Funds grow larger and the extent to which this is reflected in the level of management fees charged. While recognizing that any precise determination is inherently subjective, the Board noted that based upon the Funds’ profitability analysis, it appears that as some Funds get larger, at some point economies of scale do result in the Manager realizing a larger profit margin on management services provided to such a Fund. The Board also noted that economies of scale are shared with each Fund and its shareholders through management fee breakpoints so that as a Fund grows in size, its effective management fee rate declines and benefits the Funds’ shareholders.
The fee structure under the Agreement with each Fund provides an initial annual fee of 1% of the first $50 million, 0.75% of the next $50 million and 0.60% in excess of $100 million for the Muirfield Fund® and Total Return Utilities Fund; 1% of the first $50 million, 0.75% of the next $50 million and 0.60% in excess of $100 million for the Quantex Fund™, which the investment adviser voluntarily reduced on April 20, 2005 by 0.25% so that the total advisory fee would not exceed 0.75% of average daily net assets and this contractual reduction in advisory fee was renewed on April 30, 2006 for a continuous annual basis until terminated by the Manager; 0.40% of the first $100 million and 0.20% in excess of $100 million for the U.S. Government Bond Fund; 0.75% of the first $200 million and 0.60% in excess of $200 million for the Aggressive Growth and Dynamic Growth Funds and 0.40% of the first $100 million and 0.25% in excess of $100 million for the Money Market Fund. The Board expressed their satisfaction with such fees.
The Board also considered the fee applicable to the subadviser for the Total Return Utilities Fund which provides for 0.00% for the first $10 million, 0.40% for the next $50 million, 0.30% for the next $40 million and 0.25% over $100 million. The Board expressed their satisfaction with such fees.
Trustees and Officers (unaudited)
Certain trustees and officers of the Funds are also officers or directors of Meeder, MAM, MFSCo, and ADS. The Trustees oversee the management of the Trust and elect their officers. The officers are responsible for the Funds’ day-to-day operations. The Trustees’ and officers’ names, addresses, years of birth, positions held with the Trust, and length of service as a Flex-funds Trustee are listed below. Also included is each Board member’s principal occupation during, at least, the past five years. Except as indicated, each individual has held the office shown or other offices in the same company for the last five years. Those Trustees who are “interested persons”, as defined in the 1940 Act, by virtue of their affiliation with the Trust, are indicated by an asterisk (*).
| | | | | | |
Name, Address(1), and
Year of Birth
| | Year First Elected a
Director or Officer of Trust
| | Position and
Number of Funds
Overseen(2)
| | Principal
Occupation During
Past Five Years and
Other Directorships Held(3)
|
Robert S. Meeder, Jr.* Year of Birth: 1961 | | 1992 | | Trustee and President | | President of Meeder Asset Management, Inc. |
| | | |
Walter L. Ogle Year of Birth: 1937 | | 1982 | | Trustee | | Retired; formerly Executive Vice President of Aon Consulting, an employee benefits consulting group; member of the Trust’s Audit Committee. |
| | | |
James W. Didion Year of Birth: 1930 | | 1982, 1998 | | Trustee | | Retired; formerly Executive Vice President of Core Source, Inc., an employee benefit and Workers’ Compensation administration and consulting firm (1991 – 1997); Chairman of the Trust’s Audit Committee. |
| | | |
Jack W. Nicklaus Year of Birth: 1961 | | 1998 | | Trustee | | Designer, Nicklaus Design, a golf course design firm and division of The Nicklaus Companies; member of the Trust’s Audit Committee. |
| | | |
Stuart M. Allen Year of Birth: 1961 | | 2006 | | Trustee | | President of Gardiner Allen DeRoberts Insurance LLC, an insurance agency; member of the Trust’s Audit Committee. |
| | | |
Anthony D’Angelo Year of Birth: 1959 | | 2006 | | Trustee | | Director of Sales, WSYX ABC 6/WTTE Fox 28, television stations owned and operated by Sinclair Broadcast Group; member of the Trust’s Audit Committee. |
| | | |
Dale W. Smith Year of Birth: 1959 | | 2006 | | Vice President | | Chief Operating Officer & Chief Financial Officer of Meeder Asset Management, Inc. (2005 – present); formerly Senior Vice President of Financial Services of BISYS Fund Services (1996 – 2004). |
| | | | | | |
Name, Address(1), and
Year of Birth
| | Year First Elected a
Director or Officer of Trust
| | Position and
Number of Funds
Overseen(2)
| | Principal
Occupation During
Past Five Years and
Other Directorships Held(3)
|
Terra D. Case Year of Birth: 1971 | | 2006 | | Vice President and Secretary | | Associate General Counsel of Meeder Asset Management, Inc. and Mutual Funds Service Co., the Trust’s transfer agent (2005 – present); formerly attended Capital University School of Law (2002 – 2005). |
| | | |
David R. Carson Year of Birth: 1958 | | 2006 | | Chief Compliance Officer | | Chief Compliance Officer and Anti-Money Laundering Officer of the Huntington Funds and Huntington VA Funds (2005 – present); Treasurer and Assistant Treasurer of the Huntington Funds, Huntington Asset Advisors, Inc. (2002 – 2005). |
| | | |
Bruce E. McKibben Year of Birth: 1969 | | 2002 | | Treasurer | | Director of Fund Accounting of Mutual Funds Service Co., the Trust’s transfer agent. |
| (1) | The address of each Trustee is 6125 Memorial Drive, Dublin, OH 43017. |
| (2) | Each Trustee serves for an indefinite term, until his or her resignation, death, or removal. Each Trustee oversees all nine Funds in the Trust. |
| (3) | Robert S. Meeder, Jr., Stuart M. Allen, and Anthony D’Angelo serve as Trustees of the Meeder Premier Portfolios, which is managed by Meeder Asset Management, Inc., the Advisor of the Trust. |
| * | Robert S. Meeder, Jr. is deemed an “interested person” of the Trust by virtue of his position as President of Meeder Asset Management, Inc., the Advisor of the Trust. |
The Statement of Addition Information includes additional information about each Trustee and is available without charge. To obtain a copy of the Statement of Additional Information, please contact your financial representative or call toll free 1-800-325-3539.
Other Information
The Funds file their complete schedules of portfolios holdings with the Securities and Exchange Commission (“SEC”) for the first and third quarters of each fiscal year on Form N-Q. The Funds’ Forms N-Q are available on the SEC’s website at http://www.sec.gov and may be reviewed and copied at the SEC’s Public Reference Room in Washington, DC. Information on the operation of the Public Reference Room may be obtained by calling 1-800-SEC-0330. The Funds’ schedules of positions are also available on the Funds’ website at www.flexfunds.com.
A description of the policies and procedures that the Funds use to determine how to vote proxies relating to portfolio securities, and information regarding how the Funds voted these proxies for the 12-month period ended December 31, 2005, is available on the SEC’s website at http://www/sec.gov, or, without charge, upon request by calling toll-free 1-800-325-3539.
Manager and Investment Advisor:
Meeder Asset Management
6125 Memorial Drive
P.O. Box 7177
Dublin, Ohio 43017
Subadvisor/The Total Return Utilities Fund
Miller/Howard Investments, Inc.
141 Upper Byrdcliffe Road, P.O. Box 549
Woodstock, New York 12498
Board of Trustees
James Didion
Robert S. Meeder, Jr.
Jack Nicklaus II
Walter L. Ogle
Stuart M. Allen
Anthony D’Angelo
Custodian
The Huntington National Bank
Columbus, Ohio 43215
Transfer Agent Dividend Disbursing Agent
Mutual Funds Service Co.
6125 Memorial Drive
Dublin, Ohio 43017
Auditors
Cohen Fund Audit Services, Ltd.
800 Westpoint Parkway, Suite 1100
Westlake, Ohio 44145
The Flex-funds
Managed by Meeder Asset Management, Inc.
6125 Memorial Drive, Dublin Ohio, 43017
Call Toll Free 800-325-3539 | 760-2159
Fax: 614-766-6669 | www.flexfunds.com
Email: flexfunds@meederfinancial.com
The registrant has adopted a code of ethics that applies to the registrant’s principal executive officer, principal financial officer, comptroller or principal accounting officer, and any person who performs a similar function.
| Item 3. | Audit Committee Financial Expert. |
Currently, The Flex-funds (the “Funds”) do not have an Audit Committee member who possesses all of the attributes required to be an “audit committee financial expert” as defined in instruction 2(b) of Item 3 of Form N-CSR. However, the Board of Trustees believes that each member of the Audit Committee has substantial experience relating to the review of financial statements and the operations of audit committees. Accordingly, the Board of Trustees believes that the members are qualified to evaluate the Funds’ financial statements, supervise the Funds’ preparation of its financial statements, and oversee the work of the Funds’ independent auditors. The Board of Trustees also believes that, although no single Audit Committee member possesses all of the attributes required to be an “audit committee financial expert”, the Audit Committee members collectively as a group possess the attributes required to be an “audit committee financial expert.”
| Item 4. | Principal Accountant Fees and Services. |
(a) – (d) Aggregate fees billed to the registrant for the last two fiscal years for professional services rendered by the registrant’s principal accountant were as follows:
| | | | | | |
| | | 2006 | | 2005 |
Audit Fees | | $ | 48,500 | | $ | 48,400 |
Audit-Related Fees | | | 1,850 | | | 1,595 |
Tax Fees | | | 11,590 | | | 15,620 |
All Other Fees | | | 5,690 | | | 4,250 |
Audit fees include amounts related to the audit of the registrant’s annual financial statements and services normally provided by the accountant in connection with statutory and regulatory filings. Audit-related fees include amounts
reasonably related to the performance of the audit of the registrant’s financial statements. Tax fees include amounts related to tax compliance, tax planning, and tax advice. All other fees include amounts related to the registrant’s annual filing of Form N1A.
(e)(1) A purpose of the Audit Committee is to approve the engagement of the registrant’s independent auditors (i) to render audit and non-audit services for the registrant in accordance with Rule 2-01(c)(7)(i) of Regulation S-X, subject to the waiver provisions set forth in Rule 2-01(c)(7)(i)(C) of Regulation S-X, and (ii) to render non-audit services for the registrant’s investment advisors (other than a sub-advisor whose role is primarily portfolio management and is subcontracted or overseen by another investment advisor) and any other entity controlling by, or under common control with the investment advisor that provides ongoing services to the registrant, in each case under (ii) if the engagement relates directly to the operations and financial reporting of the registrant, in accordance with Rule 2-01(c)(7)(ii) of Regulation S-X, subject to waiver provisions set forth in Rule 2-01(c)(7)(ii) of Regulation S-X.
(e)(2) 100% of services included in (b) – (d) above were approved pursuant to Rule 2-01(c)(7)(i)(C) of Regulation S-X.
(f) Not applicable.
(g) The aggregate fees billed for the most recent fiscal year and the preceding fiscal year by the registrant’s principal accountant for non-audit services rendered to the registrant, its investment advisor, and any entity controlling, controlled by, or under common control with the investment advisor that provides ongoing services to the registrant were $14,080 and $21,410 respectively.
(h) Not applicable.
| Items 5. | Audit Committee of Listed Registrants. |
Not applicable.
| Item 6. | Schedule of Investments. |
Not applicable.
| Item 7. | Disclosure of Proxy Voting Policies and Procedures for Closed-End Management Investment Companies. |
Not applicable.
| Item 8. | Portfolio Managers of Closed-End Management Investment Companies. |
Not applicable.
| Item 9. | Purchases of Equity Securities by Closed-End Management Investment Company and Affiliated Purchasers. |
Not applicable.
| Item 10. | Submission of Matters to a Vote of Security Holders. |
Not applicable.
| Item 11. | Controls and Procedures. |
(a) Based on our evaluation conducted within 90 days of the filing date, hereof, the design and operation of the registrant’s disclosure controls and procedures are effective to ensure that material information relating to the registrant is made known to the certifying officers by others within the appropriate entities, particularly during the period in which Forms N-CSR are being prepared, and the registrant’s disclosure controls and procedures allow timely
preparation and review of the information for the registrant’s Form N-CSR and the officer certifications of such Form N-CSR.
(b) There were no significant changes in the registrant’s internal controls or in other factors that could significantly affect these controls subsequent to the date of their evaluation, including any corrective actions with regard to significant deficiencies and material weaknesses.
(a)(1) Code of Ethics filed herewith as EX-99.CODE ETH.
(a)(2) A separate certification for each principal executive and principal financial officer of the registrant as required by Rule 30a-2(a) under the Act (17 CFR270.30a-2(a)). Filed herewith as EX-99.CERT.
(b) Certifications of principal executive officer and principal financial officer, under Section 906 of the Sarbanes-Oxley Act of 2002, and 18 U.S.C. ss.1350. Filed herewith as EX-99.906 CERT.
SIGNATURES
Pursuant to the requirements of the Securities Exchange Act of 1934 and the Investment Company Act of 1940, the registrant has duly caused this report to be signed on its behalf by the undersigned, thereunto duly authorized.
| | |
| The Flex-funds |
| |
By: | | /s/ Bruce E. McKibben |
| | Bruce E. McKibben, Treasurer |
Date: August 21, 2006
Pursuant to the requirements of the Securities Exchange Act of 1934 and the Investment Company Act of 1940, this report has been signed below by the following persons on behalf of the registrant and in the capacities and on the dates indicated.
| | |
| |
By: | | /s/ Bruce E. McKibben |
| | Bruce E. McKibben, Treasurer |
Date: August 21, 2006
| | |
| |
By: | | /s/ Robert S. Meeder, Jr. |
| | Robert S. Meeder, Jr., President |
Date: August 21, 2006