UNITED STATES
SECURITIES AND EXCHANGE COMMISSION
Washington, D.C. 20549
FORM N-CSR
CERTIFIED SHAREHOLDER REPORT OF REGISTERED
MANAGEMENT INVESTMENT COMPANIES
Investment Company Act file number 811-3462
The Flex-funds Trust
6125 Memorial Drive
Dublin, OH 43017
Bruce McKibben
c/o The Flex-funds Trust
6125 Memorial Drive
Dublin, OH 43017
Registrant’s telephone number, including area code: 800-325-3539
Date of fiscal year end: December 31, 2007
Date of reporting period: June 30, 2007
| Item 1. | Report to Stockholders. |
The Flex-funds
2007 Semiannual Report
June 30, 2007

| | |
| | The Flex-funds Managed by Meeder Asset Management, Inc. 6125 Memorial Drive, Dublin Ohio, 43017 Call Toll Free 800-325-3539 | 614-760-2159 Fax: 614-766-6669 | www.flexfunds.com Email: flexfunds@meederfinancial.com |
Performance Review
| | | | | | | | | | | | | | | | | | | | | | | | |
Period & Average Annual Total Returns as of June 30, 2007 | | Year-to-date | | | 1 year | | | 3
years | | | 5
years | | | 10
years | | | Since
inception | | | Net
Expense
Ratio** | | | Gross
Expense
Ratio** | |
FUNDS OF FUNDS | | | | | | | | | | | | | | | | | | | | | | | | |
The Aggressive Growth Fund | | 7.13 | % | | 18.67 | % | | 10.58 | % | | 8.86 | % | | — | | | -1.74 | %1 | | 1.80 | % | | 1.98 | % |
The Dynamic Growth Fund | | 7.64 | % | | 19.33 | % | | 11.46 | % | | 9.55 | % | | — | | | 0.76 | %2 | | 1.42 | % | | 1.86 | % |
The Focused Growth Fund | | 6.71 | % | | 18.11 | % | | — | | | — | | | — | | | 10.52 | %3 | | 1.75 | % | | 1.84 | % |
The Muirfield Fund® | | 7.75 | % | | 18.95 | % | | 8.84 | % | | 9.27 | % | | 5.67 | % | | 8.96 | %4 | | 1.45 | % | | 1.85 | % |
The Defensive Growth Fund | | 6.66 | % | | 16.74 | % | | — | | | — | | | — | | | 8.98 | %5 | | 1.72 | % | | 1.81 | % |
| | | | | | | | |
EQUITY FUNDS | | | | | | | | | | | | | | | | | | | | | | | | |
The Socially Responsible Utilities Fund (formerly The Total Return Utilities Fund) | | 12.70 | % | | 25.75 | % | | 21.14 | % | | 13.60 | % | | 9.15 | % | | 10.44 | %6 | | 2.05 | % | | 2.18 | % |
The Quantex Fund™ | | 9.47 | % | | 24.09 | % | | 13.29 | % | | 10.36 | % | | 6.29 | % | | 8.01 | %7 | | 1.66 | % | | 2.25 | % |
| | | | | | | | |
MONEY MARKET FUNDS | | | | | | | | | | | | | | | | | | | | | | | | |
The Money Market Fund - Retail* | | 2.47 | % | | 5.04 | % | | 3.56 | % | | 2.55 | % | | 3.68 | % | | 5.03 | %8 | | 0.48 | % | | 0.87 | % |
Current & Effective Yields | | 7-day Compound: 5.04% | | | 7-day Simple: 4.93% | |
The Money Market Fund - Institutional* | | 2.54 | % | | 5.18 | % | | — | | | — | | | — | | | 4.17 | %9 | | 0.34 | % | | 0.71 | % |
Current & Effective Yields | | 7-day Compound: 5.19% | | | 7-day Simple: 5.07% | |
| | | | | | | | |
FIXED INCOME FUND | | | | | | | | | | | | | | | | | | | | | | | | |
The U.S. Government Bond Fund | | 0.70 | % | | 4.54 | % | | 2.26 | % | | 1.69 | % | | 3.77 | % | | 5.49 | %10 | | 1.10 | % | | 2.22 | % |
| | | | | | | | |
BENCHMARK INDICES | | | | | | | | | | | | | | | | | | | | | | | | |
Lehman Brothers Intermediate-Term Gov’t/Credit Index | | 1.45 | % | | 5.76 | % | | 3.42 | % | | 4.14 | % | | 5.66 | % | | — | | | — | | | — | |
S&P 500 Index | | 6.96 | % | | 20.59 | % | | 11.68 | % | | 10.70 | % | | 7.12 | % | | — | | | — | | | — | |
NASDAQ Composite Index | | 8.17 | % | | 20.72 | % | | 9.13 | % | | 12.91 | % | | 6.59 | % | | — | | | — | | | — | |
S&P 400 Midcap Index | | 11.98 | % | | 18.51 | % | | 15.17 | % | | 14.16 | % | | 13.36 | % | | — | | | — | | | — | |
Russell 2000 Index | | 6.45 | % | | 16.45 | % | | 13.53 | % | | 13.92 | % | | 9.14 | % | | — | | | — | | | — | |
Russell 3000 Utilities Index | | 10.26 | % | | 29.35 | % | | 20.51 | % | | 13.20 | % | | 5.74 | % | | — | | | — | | | — | |
Blended Index*** | | 5.22 | % | | 14.26 | % | | 8.59 | % | | 7.66 | % | | 6.06 | % | | — | | | — | | | — | |
To obtain a prospectus containing more complete information about The Flex-funds, including fees and other expenses that apply to a continued investment in the Funds, you may call The Flex-funds at Toll Free (800)325-3539, visit us online at www.flexfunds.com, or write P.O. Box 7177, Dublin OH 43017. Please read the prospectus carefully for investment objectives, risk & expense information before investing.
Past performance does not guarantee future results. All performance figures represent total returns and average annual total returns for the periods ended June 30, 2007, and assumes reinvestment of all dividend and capital gain distributions. The investment return and principal value of an investment will fluctuate so that an investor’s shares, when redeemed, may be worth more or less than their original cost. Management fees were waived and/or expenses reimbursed in order to reduce the operating expenses of the Funds during all periods shown above. All expense waivers for the Funds are voluntary and may be terminated at any time, except for The Quantex Fund. Source for index data: Bloomberg.
| * | An investment in The Money Market Fund is not insured or guaranteed by the Federal Deposit Insurance Corporation or any other governmental agency. Although The Money Market Fund seeks to preserve the value of your investment at $1.00 per share, it is possible to lose money by investing in the Fund. Yield quotations more closely reflect the current earnings of The Money Market Fund than do total return quotations. The current performance may be lower or higher than the performance data quoted. |
| ** | The Net and Cross Expense Ratios are percentages of the Funds’ average net assets as they are shown in the most current Funds’ Prospectus. The Net Expense Ratio includes all waivers, reimbursements and expenses paid indirectly. |
| *** | The blended index is comprised of 60% of the S&P 500 index and 40% of the average 90-day U.S. Treasury bill. |
1 | inception Date: 2/29/00. |
3 | inception Date: 1/31/06. |
4 | inception Date: 8/10/88. |
5 | inception Date: 1/31/06. |
6 | inception Date: 6/21/95. |
7 | inception Date: 3/20/85. |
8 | inception Date: 3/27/85. |
9 | inception Date: 12/28/04. |
10 | inception Date: 5/9/85. |
| | |
| The Flex-funds | | 2007 Semiannual Report | June 30, 2007 |
Letter to Shareholders
The past twelve months have been a period of above average returns for the stock markets, as large-cap stocks, as represented by the S&P 500 Index, returned 20.59%, and small-cap stocks, as represented by the Russell 2000 Index, returned 16.45%. We are quite pleased that our seven equity mutual funds had returns ranging from 16.74% to 25.75% over the same period.*
Another accomplishment this year is the “new and improved” shareholder statements. These include such items as a consolidated account balance, house holding of statement delivery and an asset allocation summary. The overall response to these statements from our shareholders has been tremendously positive.
A performance review for each of The Flex-funds, along with a commentary on the decisions we made in our funds, is included on the following pages of this Semiannual Report. In addition, we have included a financial market review to provide some background on the investing conditions that we and other investment managers faced during the first half of 2007.
Semiannual Financial Market Review
After a relatively flat first quarter, stocks performed well during the second quarter of 2007. Factors such as growth of corporate profits and continued corporate deal-making activity helped push prices higher. However, those gains were accompanied by increased volatility toward the end of the quarter as investors became increasingly concerned about inflation and the future direction of interest rates.
Despite that volatility, the major stock market indices hit several new record highs during the quarter. For example in late May, the Standard & Poor’s 500 Index surpassed its previous record close, which occurred more than seven years ago in March 2000. Though the S&P 500 Index declined 1.7% for the month of June, it was up 6.3% for the quarter. The Dow Jones Industrial Average also continued its upward trend, rising 9.11% for the quarter.
Those gains helped propel the Dow Jones Industrial Average and the S&P 500 Index to year-to-date returns of 8.75% and 6.96%, respectively (see Charts 1 and 2).
Small-cap stocks, as represented by the Russell 2000 Index, lagged behind their larger-cap brethren. Small-caps returned 4.42% for the quarter and 6.45% year-to-date.
Chart 1: Dow Jones Industrial Average Year-to-Date Performance through 6.29.07
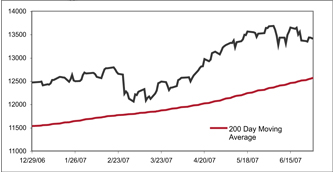
Source: ILX
Chart 2: S&P 500 Index Year-to-Date Performance through 6.29.07
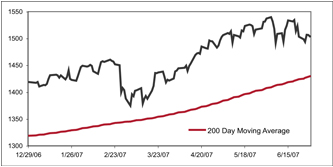
Source: ILX
Chart 3: NASDAQ Performance for the past 10 Years
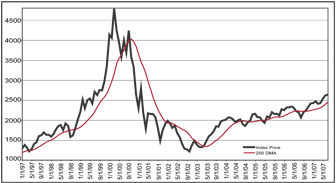
Source: ILX
The NASDAQ Composite Index also gained ground—returning 7.70% during the quarter and 8.17% for the year thus far—but remains nearly 50% below its all-time closing high back in March 2000 (see Chart 3).
Continued on Page 2.
| * | For a complete listing of all funds returns for various time periods, please see pages 6 - 12. |
| | |
| The Flex-funds 2007 Semiannual Report | June 30, 2007 | | Page 1 |
| | |
| The Flex-funds | | 2007 Semiannual Report | June 30, 2007 |
Letter to Shareholders Continued from Page 1.
A mixed economic landscape
Over the past year, the stock market has rewarded investors with impressive returns. However it is interesting to note that the more recent gains have occurred against a backdrop of sub-par economic activity, concerns about the subprime mortgage market, sharply higher gas prices and rising anxiety about the outlook for inflation.
Consider data released during the second quarter revealing that the U.S. economy grew by just 0.6% during the first three months of the year—lower than the initial estimate of 1.3%, and down significantly from the 2.5% growth rate recorded in the fourth quarter of last year (see Chart 4). In fact, the economy’s recent performance was its worst quarterly showing in more than four years. The primary factors behind this anemic growth rate: a larger than expected trade deficit and a sharp reduction by businesses on inventory spending.
That said, recent economic data suggests that the economy may be starting to reaccelerate. Economic activity in the manufacturing sector expanded in June to its highest level in twelve months (see Chart 5).
Chart 4: Economic Growth Slows to a Crawl
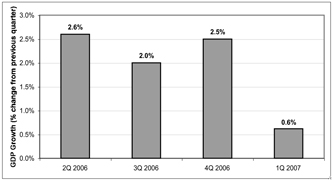
Source: Bloomberg
Chart 5: Manufacturing Activity has Reaccelerated
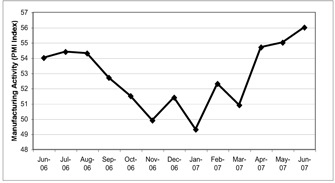
Source: Bloomberg
The subprime market’s woes
One of the biggest and most complex developments during the first half of 2007 was the deepening problems in the subprime mortgage lending market.
The problems stem from the fact that some mortgage lenders in the past few years have issued an increasing number of loans with very lax standards and low “teaser” rates to borrowers with shaky finances. Now, the rates on many of these loans have increased and subprime borrowers are struggling to make their new, higher payments. According to a recent study, 60% of all adjustable rate mortgages made since 2004 will reset and monthly payments will increase at least 25%. Compounding the problem is the fact that continued weakness in the housing market has pushed down home prices, making it impossible for many subprime borrowers to refinance.
The result: delinquent payments on subprime loans recently reached multi-year highs, causing lenders to greatly tighten their standards for issuing home loans. Additionally, some lenders have gone bankrupt or exited the subprime lending business.
These negative developments in the subprime market have created concerns about the potential effects on the beleaguered housing market. In May, not only were sales of existing homes down over 10% from the prior year, the average sales price was down 2.4% compared to May 2006.
The larger concern is the subprime market’s potential impact on the consumer and the economy. For example, it’s possible that continued weakness in housing could hurt corporate profits for firms that deal both directly and indirectly in the housing industry. That, in turn, could result in a higher level of layoffs and a reduction in consumer spending, which accounts for approximately two-thirds of all U.S. economic activity. Additionally, many homeowners have felt a “wealth effect” in recent years from real estate appreciation, and it’s possible that these problems coupled with weaker home prices could cause them to cut back their spending.
| | |
| Page 2 | | The Flex-funds 2007 Semiannual Report | June 30, 2007 |
| | |
| The Flex-funds | | 2007 Semiannual Report | June 30, 2007 |
For now, however, it remains unclear the extent to which the subprime market’s problems will spread to the overall economy. In addition, while the situation certainly requires continued vigilance, it also must be noted that the subprime segment represents just 14% of the overall outstanding mortgage market. Thus, the problem could be largely contained.
Inflationary pressures persist
Meanwhile, the possibility of higher inflation has become a significant concern among investors. Several signs pointed to persistent inflationary pressures during the quarter, including:
| * | Surging gas prices. As of late June, gas prices had risen 28% in 2007 (see Chart 6), with the average price of gas in May reaching $3.22 per gallon—just seven cents less on an inflation-adjusted basis than the previous record set during the oil shock of 1981. This sharp increase is the result of continued strong demand for oil along with a series of shutdowns at oil refineries that has cut production and reduced supply. |
The spike in the price of gas may be beginning to have an effect on the economy as evidenced by recent economic confidence surveys showing that overall consumer confidence in June dropped to its lowest level in nearly a year. Consumers could start to tighten their budgets and reduce spending if gas prices remain around their current levels for a sustained period of time. If this occurs, economic growth could stall. Additionally, the higher cost of fuel that companies must now pay to transport their goods could be passed along to consumers in the form of higher prices.
| * | Wage pressures. The U.S. unemployment rate currently stands at 4.5%, very close to its six-year low. While low unemployment is good news for workers and consumers, it strengthens the risk that excessive wage inflation will spread to the economy and cause inflation to rise. In addition, a recent report showed that wages (as measured by unit labor costs) in the first quarter of 2007 rose by a higher than expected rate of 1.8% while worker productivity rose by just 1%. When wage increases outpace productivity growth, higher inflation can occur if companies raise the cost of their products to offset their higher payrolls. |
Chart 6: Gas Prices Spike
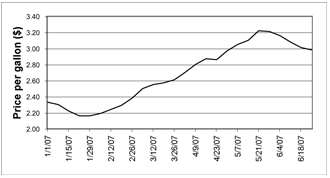
Source: Energy Information Association
Chart 7: Inflation Remains a Concern
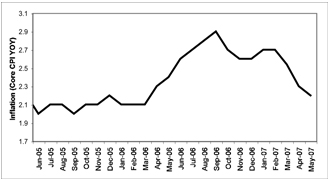
Source: Bloomberg
As a result of these and other factors, inflation remains at relatively high levels (see Chart 7). Consider that core inflation, which excludes the volatile food and energy sectors, grew by 2.2% during the 12 months through May. When those two sectors are included, overall inflation rose 2.7% during that time. Both rates are higher than the Federal Reserve Board’s target inflation rate of 1% to 2%.
Shifting Views on the Fed’s Next Move
Interest rates also were a key driver of the market’s recent behavior. The stock market’s gains this year have been driven in part by investors’ expectation that the Federal Reserve Board would cut short-term interest rates to help fuel economic growth. Currently, the federal funds rate (a key lending rate that helps set rates on various loans) is 5.25%, where it has stood since mid-2006.
Continued on Page 4
| | |
| The Flex-funds 2007 Semiannual Report | June 30, 2007 | | Page 3 |
| | |
| The Flex-funds | | 2007 Semiannual Report | June 30, 2007 |
Letter to Shareholders Continued from Page 3.
As discussed in previous reports, we have not shared the overall market’s belief that a rate cut was imminent, due to risk factors such as persistently high inflation. As the second quarter progressed, a growing number of investors came to realize that the Fed is unlikely to cut rates anytime soon. Some investors have even suggested that the Fed may raise interest rates by the end of the year in order to reduce inflation. This shift in outlook generated volatility and dampened stock market performance toward the end of the period.
Investors seem to be accepting the idea that the outlook for inflation is too uncertain to justify a reduction in interest rates. This view point has been helped, no doubt, by the Fed’s comments during the second quarter such as “the apparent tightness in the labor market remained a significant source of upside risk to inflation.” The Fed has stated more than once that its primary focus is on fighting inflation and a rate cut now could help fuel rising prices by encouraging the economy to grow too rapidly.
Mixed performance in the markets
Shares of large companies outperformed mid-cap and small-cap stocks during the quarter, as investors favored large-cap stocks’ overall earnings stability in the slow economic environment as well as large-cap stocks’ attractive valuations relative to small-caps (see Chart 8). Larger firms, which tend to have much greater exposure to international markets than do smaller firms, also benefited from strong growth in many foreign economies.
Throughout the quarter, in all of our equity fund-of-funds, we remained fully invested and maintained our strategy of overweighting high-quality large-cap stocks. We also continued to focus on value stocks over growth shares. Value stocks typically offer greater downside protection, should the economy and markets stumble, than do pricier growth stocks. Although value stocks lagged behind growth-oriented shares during the recent quarter, our overweight toward large-cap and value stocks have been primary drivers of our funds’ performance during the past twelve months.
Meanwhile, concerns about inflation and the direction of the Fed’s monetary policy caused bond prices to fall, pushing up their yields (see Chart 9). The yield on the 10-year Treasury note recently climbed above 5% for the first time since last summer. This created fears that higher rates could slow the pace of corporate deal-making by making access to capital more expensive, and hurt the stock market’s performance in the process.
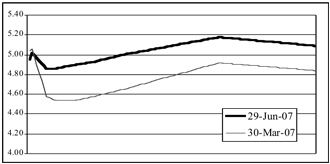
Chart 8: Large-caps Outperform 3/31/07 through 6/29/07
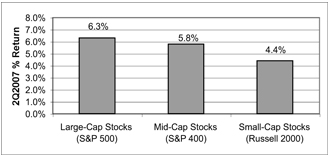
Chart 9: Bond Yields Rise Sharply
Looking Ahead
The Dow Jones Industrial Average and the S&P 500 Index continued their major uptrend, making all time or multi-year highs in late May. Our near-term momentum indicators are overextended and registering bearish divergence, suggesting that the markets may be due for a breather. Our intermediate and long-term indicators, however, are confirming the new highs, suggesting that near-term pullbacks may be followed by resumption of the major uptrend.
| | |
| Page 4 | | The Flex-funds 2007 Semiannual Report | June 30, 2007 |
| | |
| The Flex-funds | | 2007 Semiannual Report | June 30, 2007 |
Our quantitative investment models indicate that the relationship between risk and reward in the stock market is positive overall. Until conditions warrant a change, we will continue to position our equity funds to participate fully in the markets, while carefully monitoring economic and market developments.
We also intend to maintain our current focus on investing in shares of large, high-quality companies with relatively stable revenues and earnings. Such firms are well positioned to deliver strong relative returns in the type of slow-growth economic environment we may experience during the coming months.
As always, our Shareholder Services team is available for you to contact with questions about a specific investment strategy or your individual account. On behalf of all of the associates at Meeder Asset Management, Inc. and The Flex-funds, I thank you for your trust and confidence in our investment management services.
Sincerely,

Robert S. Meeder, Jr.
President
Meeder Asset Management, Inc. & The Flex-funds
June 30, 2007
| | |
| The Flex-funds 2007 Semiannual Report | June 30, 2007 | | Page 5 |
| | |
| The Flex-funds | | 2007 Semiannual Report | June 30, 2007 |
The Muirfield Fund®
The Defensive Growth Fund
| | | | | | | | | | | | | | | | | | | | | | | | |
Performance Perspective Period & Average Annual Total Returns as of June 30, 2007 | | Year
to date | | | One
Year | | | Three
Years | | | Five
Years | | | Ten
Years | | | Since
Inception | | | Net
Expense
Ratio | | | Gross
Expense
Ratio | |
The Muirfield Fund® | | 7.75 | % | | 18.95 | % | | 8.84 | % | | 9.27 | % | | 5.67 | % | | 8.96 | %1 | | 1.45 | %7 | | 1.85 | %7 |
The Defensive Growth Fund | | 6.66 | % | | 16.74 | % | | — | | | — | | | — | | | 8.98 | %2 | | 1.72 | %7 | | 1.81 | %7 |
Blended Index5 | | 5.22 | % | | 14.26 | % | | 8.59 | % | | 7.66 | % | | 6.06 | % | | 9.29 | %3 | | — | | | — | |
| | | | | | | | | | | | | | | | | 12.86 | %4 | | | | | | |
S&P 500 Index6 | | 6.96 | % | | 20.59 | % | | 11.68 | % | | 10.70 | % | | 7.12 | % | | 11.90 | %3 | | — | | | — | |
| | | | | | | | | | | | | | | | | 14.25 | %4 | | | | | | |
Past performance is not a guarantee of future results. All performance figures represent total returns and average annual total returns for the periods ended June 30, 2007. Investment performance assumes reinvestment of all dividend and capital gain distributions. The investment return and principal value of an investment will fluctuate so that an investor’s shares, when redeemed, may be worth more or less than their original cost. Management fees and/or expenses were waived and/or reimbursed in The Flex-funds during the periods shown in the table above to reduce expenses. All expenses, management fees, reimbursements or waivers for the Funds are voluntary and may be terminated at any time.
1 | Inception Date: 8/10/88. |
2 | Inception Date: 1/31/06. |
3 | Average annual total return from 8/1/88 to 6/30/07. |
4 | Average annual total return from 1/31/06 to 6/30/07. Source for index data: Morningstar, Inc. |
5 | The blended index consists of 60% of the S&P 500 Index and 40% of the average 90-day U.S. Treasury bill. |
6 | The S&P 500 Index is a widely recognized unmanaged index of common stock prices. The S&P 500 Index does not take into account the deduction of expenses associated with a mutual fund, such as investment management and accounting fees. One cannot invest directly in an index. |
7 | The Net and Gross Expense Ratios are percentages of the Funds’ net assets as they are shown in the most recent Prospectus. The Net Expense Ratio includes all waivers, reimbursements and expenses paid directly. |
Semiannual Market Perspective
For the first half of 2007, The Muirfield Fund® returned 7.75% and The Defensive Growth Fund returned 6.66%. In comparison, their benchmark, the S&P 500 Index, returned 6.96% for the same six-month period.
As conditions warrant, these Funds are sometimes invested “defensively,” meaning they are either partially or fully invested in cash equivalent securities. Due to their defensive strategy, we believe the most appropriate comparison of performance is a blended index consisting of 60% of the S&P 500 Index and 40% of the 90-day U.S. Treasury Bill. For the six months ending June 30, 2007, as well as the 1, 3, and 5 year periods, The Muirfield Fund® has outperformed this blended index.
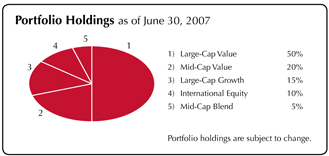
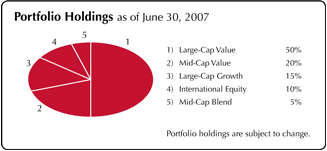
As market conditions improved last fall, we increased our equity exposure back to a fully invested position. We have maintained this 100% equity position throughout the first six months of 2007. While we continue to be 100% invested, we continue with our conservative allocation tilted toward large- and mid-cap value funds and exchange traded funds (ETFs). As was discussed in much more detail in the Chairman’s letter, we continue to believe large-cap stocks not only hold the best opportunities for return in the market over the near-term, but could also act as a buffer if the markets begin to falter. Our highly quantitative models identified mid-cap value as an area demonstrating relative value. As a result, we increased our exposure to mid-cap value funds and ETFs during the first quarter of 2007. We continue to significantly underweight small-caps due to two primary factors: 1) their valuations are unattractive relative to large-caps, and 2) we believe we are in the latter stages of an economic cycle. Typically, when the economy is in this stage of the cycle, small-caps historically have tended to underperform large-caps.
We maintained our international exposure at 10%. Our evaluation continues to favor international exposure and indicates that large-cap value foreign names appear more attractive than smaller international growth stocks or emerging markets exposure.
| | |
| Page 6 | | The Flex-funds 2007 Semiannual Report | June 30, 2007 |
| | |
| The Flex-funds | | 2007 Semiannual Report | June 30, 2007 |
The Dynamic Growth Fund
The Focused Growth Fund
| | | | | | | | | | | | | | | | | | | | | |
Performance Perspective Period & Average Annual Total Returns as of June 30, 2007 | | Year
to date | | | One
Year | | | Three
Years | | | Five
Years | | | Since
Inception | | | Net
Expense
Ratio | | | Gross
Expense
Ratio | |
The Dynamic Growth Fund | | 7.64 | % | | 19.33 | % | | 11.46 | % | | 9.55 | % | | 0.76 | %1 | | 1.42 | %5 | | 1.86 | %6 |
The Focused Growth Fund | | 6.71 | % | | 18.11 | % | | — | | | — | | | 10.52 | %2 | | 1.75 | %5 | | 1.84 | %6 |
S&P 500 Index5 | | 6.96 | % | | 20.59 | % | | 11.68 | % | | 10.70 | % | | 2.00 | %3 | | — | | | — | |
| | | | | | | | | | | | | | 14.25 | %4 | | | | | | |
Past performance is not a guarantee of future results. All performance figures represent total returns and average annual total returns for the periods ended June 30, 2007. Investment performance assumes reinvestment of all dividend and capital gain distributions. The investment return and principal value of an investment will fluctuate so that an investor’s shares, when redeemed, may be worth more or less than their original cost. Management fees and/or expenses were waived and/or reimbursed in The Flex-funds during the periods shown in the table above to reduce expenses. All expenses, management fees, reimbursements or waivers for the Funds are voluntary and may be terminated at any time.
1 | Inception Date: 2/29/00. |
2 | Inception Date: 1/31/06. |
3 | Average annual total return from 2/29/00 to 6/30/07. |
4 | Average annual total return from 1/31/06 to 6/30/07. Source for index data: Morningstar, Inc. |
5 | The S&P 500 Index is a widely recognized unmanaged index of common stock prices. The S&P 500 Index does not take into account the deduction of expenses associated with a mutual fund, such as investment management and accounting fees. One cannot invest directly in an index. |
6 | The Net and Gross Expense Ratios are percentages of the Funds’ net assets as they are shown in the most recent Prospectus. The Net Expense Ratio includes all waivers, reimbursements and expenses paid directly. |
Semiannual Market Perspective
For the first six months of 2007, The Dynamic Growth Fund returned 7.64%, and The Focused Growth Fund returned 6.71%. In comparison, the Funds’ benchmark, the S&P 500 Index, returned 6.96% for the same period.
We have seen a gradual slowing in the economy and a dramatic downward revision of the fourth quarter 2006 GDP (Gross Domestic Product) growth to 2.5%, followed by the economy registering its first quarter 2007 GDP growth at 0.6%. This is below the historical average, and well under the 3 to 3.5% that is seen as a healthy level of economic growth.
It has become clear that we have entered an environment of slowing earnings growth from an aging economic expansion. However, the second quarter was marked by some positive economic news. Since March of 2007, manufacturing activity as measured by the Institute for Supply Management (ISM) survey has moved to a level of 56, which is seen as expansionary. Manufacturing activity coupled with a low unemployment rate of 4.5% has fueled the speculation that the worst could be behind us.
In evaluating the relative value of different sections of the domestic economy, we have favored large-cap stocks and the positive Fund performance can be attributed to this emphasis. We believe the relative strength in smaller company stocks may be contingent on the Federal Reserve Board’s (Fed’s) next move on short-term interest rates. Based on this analysis, we chose not to overweight the smaller cap area of the market and maintain our existing large-cap bias.
Our allocation to ‘value’ oriented stocks versus ‘growth’ oriented stocks detracted from performance, however our strategic fund selection as a whole added value throughout the first half of 2007. The majority of our large-cap value and all mid-cap value mutual fund holdings in The Dynamic Growth Fund outperformed their respective benchmarks. Our U.S. sector analysis also yielded gains. Our utilities and U.S. industrial sector positions in The Focused Growth Fund outperformed their benchmark, the S&P 500 Index, for the first six months of the year.
By quarter-end, our target allocation for these Funds is 65% in large-cap stock funds, 25% in mid-cap stock funds, and 10% in international stock funds.
| | |
| The Flex-funds 2007 Semiannual Report | June 30, 2007 | | Page 7 |
| | |
| The Flex-funds | | 2007 Semiannual Report | June 30, 2007 |
The Aggressive Growth Fund
Performance Perspective
| | | | | | | | | | | | | | | | | | | | | |
Period & Average Annual Total Returns as of June 30, 2007 | | Year
to date | | | One
Year | | | Three
Years | | | Five
Years | | | Since
Inception | | | Net
Expense
Ratio | | | Gross
Expense
Ratio | |
The Aggressive Growth Fund | | 7.13 | % | | 18.67 | % | | 10.58 | % | | 8.86 | % | | -1.74 | %1 | | 1.80 | %4 | | 1.98 | %4 |
NASDAQ Composite Index3 | | 8.17 | % | | 20.72 | % | | 9.13 | % | | 12.91 | % | | -7.25 | %2 | | — | | | — | |
Past performance is not a guarantee of future results. All performance figures represent total returns and average annual total returns for the periods ended June 30, 2007. Investment performance assumes reinvestment of all dividend and capital gain distributions. The investment return and principal value of an investment will fluctuate so that an investor’s shares, when redeemed, may be worth more or less than their original cost. Management fees and/or expenses were waived and/or reimbursed in The Flex-funds during the periods shown in the table above to reduce expenses. All expenses, management fees, reimbursements or waivers for the Funds are voluntary and may be terminated at any time.
1 | Inception Date: 2/29/2000. |
2 | Average annual total return from 2/29/2000 to 6/30/07. Source for index data: Bloomberg LP. |
3 | The NASDAQ Composite Index is a broad-based capitalization-weighted index of all NASDAQ National Market and Small Cap stocks. The NASDAQ Composite Index does not take into account the deduction of expenses associated with a mutual fund, such as investment management and accounting fees. One cannot invest directly in an index. |
4 | The Net and Gross Expense Ratios are percentages of the Fund’s net assets as they are shown in the most recent Prospectus. The Net Expense Ratio includes all waivers, reimbursements and expenses paid directly. |
Semiannual Market Perspective
For the first six months of 2007, The Aggressive Growth Fund returned 7.13% in comparison to its benchmark, the NASDAQ Composite Index, which returned 8.17% for the same period.

Inflation pressures continue to be of concern throughout 2007. There has been a gradual increase in risk that an upward bias in interest rates may be emerging as evidenced by the bond market. The 10-Year U.S. Treasury Yield crossed the psychological barrier of 5% annual yield in early June, bringing heightened volatility to what was shaping out to be an extremely strong quarter for the markets. The Fed still views inflation as a concern as they stated on June 15, 2007, “As expected, we have also seen a gradual ebbing of core inflation, although its level remains somewhat elevated.” Based on the latest round of economic data, we suspect the economic soft landing theory may not come from an accommodative monetary policy.
We added to our position in the U.S. Industrial Sector ETF in the second quarter. These stocks benefited from a manufacturing recovery and robust exports fueled by a weak U.S. dollar. Our position in the utilities sector detracted from performance during the second quarter, but outperformed the NASDAQ Composite Index for the first six months of 2007. The spike in interest rates hurt all interest rate sensitive sectors including utilities, and financial services. We believe utility stocks represent an attractive combination of valuations and dividend yield, and have maintained our position.
In the second quarter, we adjusted our international exposure upward to 15% from 10%. Our evaluation of the international universe indicates that large value foreign companies appear more attractive than smaller growth, or emerging markets exposure. We maintained our European exposure overweight as these companies are less dependent on U.S. consumer demand. We view the European consumer as less leveraged, and domestic demand more stable due to an elaborate social safety net. The decline in the U.S. Dollar versus the Euro and the British Pound for the year aided our non-dollar denominated investments.
At the end of the second quarter 2007, our target allocation for the fund was 60% in large-cap stock funds, 25% in mid-cap stock funds, and 15% in international stock funds.
| | |
| Page 8 | | The Flex-funds 2007 Semiannual Report | June 30, 2007 |
| | |
| The Flex-funds | | 2007 Semiannual Report | June 30, 2007 |
The Quantex Fund™
| | | | | | | | | | | | | | | | | | | | | | | | |
Performance Perspective Period & Average Annual Total Returns as of June 30, 2007 | | Year
to date | | | One
Year | | | Three
Years | | | Five
Years | | | Ten
Years | | | Since
Inception | | | Net
Expense
Ratio | | | Gross
Expense
Ratio | |
The Quantex Fund™ | | 9.47 | % | | 24.09 | % | | 13.29 | % | | 10.36 | % | | 6.29 | % | | 8.01 | %1 | | 1.66 | %5 | | 2.25 | %5 |
Russell 2000 Index3 | | 6.45 | % | | 16.45 | % | | 13.53 | % | | 13.92 | % | | 9.14 | % | | 9.31 | %2 | | — | | | — | |
S&P Mid-Cap 400 Index4 | | 11.98 | % | | 18.51 | % | | 15.17 | % | | 14.16 | % | | 13.36 | % | | 13.32 | %2 | | — | | | — | |
Past performance is not a guarantee of future results. All performance figures represent total returns and average annual total returns for the periods ended June 30, 2007. Investment performance assumes reinvestment of all dividend and capital gain distributions. The investment return and principal value of an investment will fluctuate so that an investor’s shares, when redeemed, may be worth more or less than their original cost. Management fees and/or expenses were waived and/or reimbursed in The Flex-funds during the periods shown in the table above to reduce expenses. The Fund’s management fee waiver is contractual and may be terminated annually by the Advisor on its renewal date.
1 | Inception Date: 3/20/85. |
2 | Average annual total return from 3/31/85 to 6/30/07. Source for index data: Bloomberg LP. |
3 | The Russell 2000 Index is a widely recognized unmanaged index of common stock prices of small-sized companies. The Russell 2000 Index does not take into account the deduction of expenses associated with a mutual fund, such as investment management and accounting fees. One cannot invest directly in an index. |
4 | The S&P Mid-Cap 400 Index is a widely recognized unmanaged index of common stock prices of mid-sized companies. The S&P Mid-Cap 400 Index does not take into account the deduction of expenses associated with a mutual fund, such as investment management and accounting fees. One cannot invest directly in an index. |
5 | The Net and Gross Expense Ratios are percentages of the Fund’s net assets as they are shown in the most recent Prospectus. The Net Expense Ratio includes all waivers, reimbursements and expenses paid directly. |
Semiannual Market Perspective
For the six-month and one year periods ended June 30, 2007, The Quantex Fund™ returned 9.47% and 24.09%, respectively. By comparison, the Russell 2000 returned 6.45% and 16.45%, while the S&P 400 Mid-Cap Index returned 11.98% and 18.51% for the same periods.
The Quantex Fund™ typically consists of approximately 100 equally weighted securities which are selected using a quantitative screening process that focuses on small- and mid-cap stocks. This strategy, which we refer to as our Small to Mid-Cap (SMID) discipline, identifies a capitalization range from which to select stocks on an annual basis. These stocks are typically those of large companies that have declined in price prior to being included in the Fund (referred to as “fallen angels”) or stocks of small, up-and-coming companies (“rising stars”). Those stocks that fall within this predetermined market capitalization range are the stocks in which the Fund owns. We have employed this strategy since 1989 for our individually managed accounts for high net-worth individual investors and institutional investors with considerable success. The Fund is rebalanced annually during the month of January.
In 2007, a relative underweight in the financial sector and a relative overweight in technology have aided performance. Meanwhile, the Fund’s relative underweight in energy stocks have detracted from performance.
Year-to-date, the best performing stocks include Radio Shack (up 97%), GoodyearTire & Rubber (up 65%) and Dow Jones and Co. (up 53%). The two biggest detractors of performance year-to-date include Privatebancorp Inc. (down 30%) and Centex (down 28%).
| | |
| The Flex-funds 2007 Semiannual Report | June 30, 2007 | | Page 9 |
| | |
| The Flex-funds | | 2007 Semiannual Report | June 30, 2007 |
The Socially Responsible Utilities Fund
(Formerly known as The Total Return Utilities Fund)6
| | | | | | | | | | | | | | | | | | | | | | | | |
Performance Perspective Period & Average Annual Total Returns as of June 30, 2007 | | Year
to date | | | One
Year | | | Three
Years | | | Five
Years | | | Ten
Years | | | Since
Inception | | | Net
Expense
Ratio | | | Gross
Expense
Ratio | |
The Socially Responsible Utilities Fund | | 12.70 | % | | 25.75 | % | | 21.14 | % | | 13.60 | % | | 9.15 | % | | 10.44 | %1 | | 2.05 | %5 | | 2.18 | %5 |
Russell 3000 Utilities Index3 | | 10.26 | % | | 29.35 | % | | 20.51 | % | | 13.20 | % | | 5.74 | % | | 6.81 | %2 | | — | | | — | |
S&P 500 Utilities Index4 | | 8.87 | % | | 26.09 | % | | 22.62 | % | | 14.49 | % | | 8.91 | % | | 9.31 | %2 | | — | | | — | |
Past performance is not a guarantee of future results. All performance figures represent total returns and average annual total returns for the periods ended June 30, 2007. Investment performance assumes reinvestment of all dividend and capital gain distributions. The investment return and principal value of an investment will fluctuate so that an investor’s shares, when redeemed, may be worth more or less than their original cost. Management fees and/or expenses were waived and/or reimbursed in The Flex-funds during the periods shown in the table above to reduce expenses. All expenses, management fees, reimbursements or waivers for the Funds are voluntary and may be terminated at any time.
1 | Inception Date: 6/21/1995. |
2 | Average annual total return from 6/30/95 to 6/30/07. Source for index data: Bloomberg LP. |
3 | The Russell 3000 Utilities Index is a market capitalization-weighted index that is comprised of utility stocks that are included in the Russell 3000 Index. This index does not take into account the deduction of expenses associated with a mutual fund, such as investment management and accounting fees. One cannot invest directly in an index. |
4 | The S&P 500 Utilities Index is an unmanaged index of 33 utility sector stocks. This index does not take into account the deduction of expenses associated with a mutual fund, such as investment management and accounting fees. One cannot invest directly in an index. |
5 | The Net and Gross Expense Ratios are percentages of the Fund’s net assets as they are shown in the most recent Prospectus. The Net Expense Ratio includes all waivers, reimbursements and expenses paid directly. |
6 | While the name of the fund has changed, the investment objective has remained the same. |
Semiannual Market Perspective
We’ve been waggling our finger for some time now about rather full valuations in the large-cap electrics, despite fundamental improvements that reduce the comparability of these equities to those of the 1980’s and 90’s. In utter defiance of our admonitions this group (which we generally don’t own but which does set a tone for the sector) raced yet higher on into May. Then nervousness in the bond market, which would not normally have much effect on this sector but for stretched valuations, proved a spark to ignite profit-taking and a quick fall of about 10% in a few weeks. That’s normally not what you’d expect from this historically lower-volatility segment, but that’s what you get when valuations get out of hand and many holders are “generalists.” So most electrics, whether large-caps or not, finished the quarter in negative territory, and in our view enough technical and sentimental damage has been done to set them on the sidelines for a while.
However, this did not affect our fund very much, and we had a positive 6 months in yet another example of the lack of correlation our fund shows to the general utilities sector, and, frankly, the difficulty of benchmarking it. We display the major indices in our performance tables to provide a picture of the general environment, but our returns are often unrelated. It would not be off the mark to think of our strategy as an “uncorrelated asset,” in which investment considerations far overrule index representation or weight in evaluating the individual securities.
We had very few transactions; existing foreign phone holdings and gas-related companies were the drivers. We’ve been favoring foreign phones in recent years since, while they offer the substance and local economic dominance of our domestic companies, service penetration is significantly lower and therefore growth opportunities are substantially better. Obviously this comes with some risks—political, currency, and regulatory, to name three—but we think the appreciation potentials here are sufficient compensation.
| | |
| Page 10 | | The Flex-funds 2007 Semiannual Report | June 30, 2007 |
| | |
| The Flex-funds | | 2007 Semiannual Report | June 30, 2007 |
The U.S. Government Bond Fund
Performance Perspective
| | | | | | | | | | | | | | | | | | | | | | | | |
Period & Average Annual Total Returns as of June 30, 2007 | | Year
to date | | | One
Year | | | Three
Years | | | Five
Years | | | Ten
Years | | | Since
Inception | | | Net
Expense
Ratio | | | Gross
Expense
Ratio | |
The U.S. Government Bond Fund | | 0.70 | % | | 4.54 | % | | 2.26 | % | | 1.69 | % | | 3.77 | % | | 5.49 | %1 | | 1.10 | %4 | | 2.22 | %4 |
Lehman Bros. Intermediate-Term Government/Credit Index3 | | 1.45 | % | | 5.76 | % | | 3.42 | % | | 4.14 | % | | 5.66 | % | | 7.42 | %2 | | — | | | — | |
Past performance is not a guarantee of future results. All performance figures represent total returns and average annual total returns for the periods ended June 30, 2007. Investment performance assumes reinvestment of all dividend and capital gain distributions. The investment return and principal value of an investment will fluctuate so that an investor’s shares, when redeemed, may be worth more or less than their original cost. Management fees and/or expenses were waived and/or reimbursed in The Flex-funds during the periods shown in the table above to reduce expenses. All expenses, management fees, reimbursements or waivers for the Funds are voluntary and may be terminated at any time.
1 | Inception Date: 5/7/85.2 Average annual total return from 4/30/85 to 6/30/07. Source for index data: Morningstar, Inc. |
3 | The Lehman Brothers Intermediate-Term Government/Credit Index is an unmanaged index of fixed-rate bonds issued by the U.S. Government and its agencies that are rated investment grade or higher, have one to ten years remaining until maturity, and at least $100 million outstanding. The Lehman Brothers Intermediate-Term Government/Credit Index does not take into account the deduction of expenses associated with a mutual fund, such as investment management and accounting fees. One cannot invest directly in an index. |
4 | The Net and Gross Expense Ratios are percentages of the Fund’s net assets as they are shown in the most recent Prospectus. The Net Expense Ratio includes all waivers, reimbursements and expenses paid directly. |
Semiannual Market Perspective
The Flex-funds U.S. Government Bond has returned 0.70% for the six-month period ended June 30, 2007, while its benchmark, the Lehman Brothers Intermediate-Term Government/Credit Index, returned 1.45% for the same period. Interest rates fluctuated across the spectrum of fixed-income securities during the semiannual period, most notably in the second quarter. Our overall assessment of a stable to potentially rising interest rate environment for intermediate-term bonds has the Fund maintaining an average maturity similar to the benchmark.
The Federal Reserve chose to leave short-term interest rates unchanged at 5.25% during the Federal Open Market Committee meetings thus far this year. The slowing economy (0.7% GDP final for the first quarter) and growing inflation fears began to weigh on the consumer as consumer confidence fell in June to 103.9, down from 108.5 in May, according to The Conference Board. The PCE deflator, year-over-year (an indicator that the Fed monitors for inflation), stood at 2.3% in May, slightly higher than the 2.2% April reading and still above the 2.0% Fed comfort zone. Current Fed Fund Futures readings suggest a stable Fed for the balance of 2007, as the slowing economy and rising inflation continue to be a tug-of-war. The ISM non-manufacturing index may show hope for the third quarter, rising to 60.7 in June from 59.7 in May. For the quarter overall, the non-manufacturing index averaged 58.8 versus 55.2 in the first quarter, making the highest reading since the second quarter 2006. According to the ISM, construction, real estate, rental and leasing all reported growth in June. No industry reported decreased activity between May and June. This report is on the heels of the ISM manufacturing index data released on July 2, indicating that the manufacturing sector expanded in June, making it the fifth consecutive month. Much of the strength came from new orders and production, which could bode well for the remainder of the year.
As of June 30th, our fixed-income investment models continue to suggest a stable to rising interest rate environment. Should our models indicate that rates might further stabilize, we will begin to extend the average maturity of the Fund.
| | |
| The Flex-funds 2007 Semiannual Report | June 30, 2007 | | Page 11 |
| | |
| The Flex-funds | | 2007 Semiannual Report | June 30, 2007 |
The Money Market Fund
Performance Perspective
| | | | | | | | | | | | | | | | | | | | | | | | |
Period & Average Annual Total Returns as of June 30, 2007 | | Year
to date | | | One
Year | | | Three
Years | | | Five
Years | | | Ten
Years | | | Since
Inception | | | Net
Expense
Ratio | | | Gross
Expense
Ratio | |
The Money Market Fund - Retail Class | | 2.47 | % | | 5.04 | % | | 3.56 | % | | 2.55 | % | | 3.68 | % | | 5.03 | %1 | | 0.48 | %7 | | 0.87 | %7 |
Current Yields5 | | 7-day Compound: 5.04% | | | 7-day Simple: 4.93% | |
Lipper’s Average General Purpose Money Market Fund6 | | 2.23 | % | | 4.54 | % | | 3.08 | % | | 2.06 | % | | 3.23 | % | | 4.65 | %2 | | — | | | — | |
The Money Market Fund - Institutional Class | | 2.54 | % | | 5.18 | % | | — | | | — | | | — | | | 4.17 | %3 | | 0.34 | %7 | | 0.71 | %7 |
Current Yields5 | | 7-day Compound: 5.19% | | | 7-day Simple: 5.07% | |
iMoneyNet, Inc. Average First-Tier Institutional Money Market Fund6 | | 2.50 | % | | 5.11 | % | | — | | | — | | | — | | | 4.09 | %4 | | — | | | — | |
Past performance does not guarantee future results. Except for the current and effective yields, all performance figures represent average annual total returns for the periods ended June 30, 2007, and assume reinvestment of all dividend and capital gain distributions. The investment return and principal value of an investment will fluctuate so that an investor’s shares, when redeemed, may be worth more or less than their original cost. Management fees were waived and/or expenses were reimbursed in order to reduce the operating expenses of The Money Market Fund during the periods shown above. Investments in The Money Market Fund are neither insured nor guaranteed by the Federal Deposit Insurance Corporation or any other governmental agency. Although the Funds seek to preserve the value of your investment at $1.00 per share, it is possible to lose money by investing in The Money Market Fund.
1 | Inception Date: 3/27/85. |
2 | Average annual total return from 3/31/85 to 6/30/07. |
3 | Inception date: 12/28/04. |
4 | Average annual total return from 12/31/04 to 6/30/07. Source for average general purpose money market fund data: Lipper, Inc. Source for average first-tier institutional money market fund data: iMoneyNet, Inc. |
5 | For the period ended 6/30/07, yield quotations more closely reflect the current earnings of The Money Market Fund than do total return quotations. |
6 | An index of funds such as Lipper’s Average General Purpose Money Market Fund Index and iMoneyNet, Inc.’s Average First-Tier Institutional Money Market Fund Index includes a number of mutual funds grouped by investment objective. |
7 | The Net and Gross Expense Ratios are percentages of the Funds’ net assets as they are shown in the most recent Prospectus. The Net Expense Ratio includes all waivers, reimbursements and expenses paid directly. |
Semiannual Market Perspective
The retail class of The Flex-funds Money Market Fund continued to rank among the top 10% of all general-purpose money market funds in the country during the six-month period ended June 30, 2007, according to iMoneyNet, Inc. More impressively, the Fund has ranked in the top 10% of all general-purpose money market funds monitored by iMoneyNet, Inc. for every twelve-month period since its inception in 1985.
The first half of 2007 was highlighted by a generally flat to inverted U.S. Treasury market yield curve, which traded within a range between 4.75% and 5.25% for a majority of the period. Generally, this type of curve would tend to indicate lower interest rates in the future. However, the ebb and flow of economic data throughout this period kept the general consensus of market observers split on the direction of future interest rates. Even the Federal Open Market Committee (FOMC) maintained a consistent message that did not lend to any alteration in the level of its target for interest rates, the Federal Funds rate. The Federal Funds rate, pegged at 5.25%, was last changed one year ago.
With this market environment in place, the investment strategy employed in the Fund was to maneuver the weighted average maturity (WAM) to take advantage of the peaks and troughs of interest rates. As yields on products trended toward the top of the range, we increased the WAM by purchasing longer dated, fixed rate corporate debt securities. As interest rates dipped to the bottom of the range, we reduced the WAM by purchasing shorter dated commercial paper securities. At the end of the first half of 2007 the WAM was reported at 62 days.
| | |
| Page 12 | | The Flex-funds 2007 Semiannual Report | June 30, 2007 |
| | |
| The Flex-funds | | 2007 Semiannual Report | June 30, 2007 |
Shareholder Expense Analysis (Unaudited)
Shareholders of mutual funds pay ongoing expenses, such as advisory fees, distribution and service fees (12b-1 fees) and other fund expenses. The following examples are intended to help you understand your ongoing costs (in dollars) of investing in the Funds and to compare these costs with the ongoing costs of investing in other mutual funds.
The examples below are based on an investment of $1,000 invested at the beginning of the period and held for the six-month period from December 31, 2006 to June 30, 2007.
ACTUAL EXPENSES: The first table below provides information about actual account values and actual expenses. You may use the information in this table, together with the amount you invested, to estimate the expenses that you paid over the period. Simply divide your account value by $1,000 (e.g.: an $8,600 account value divided by $1,000 = 8.6), then multiply the result by the number in the line under the heading “Expenses Paid During the Period” to estimate the expenses you paid on your account during this period.
| | | | | | | | | | | | |
ACTUAL EXPENSES | | Beginning
Account Value
(12/31/2006) | | Ending
Account Value
(6/30/07) | | Expenses Paid
During Period1
(12/31/2006 -
6/30/07) | | Expense Ratio
(Annualized) | |
The Muirfield Fund® | | $ | 1,000.00 | | $ | 1,077.50 | | $ | 7.21 | | 1.40 | % |
The Socially Responsible Utilities Fund | | | 1,000.00 | | | 1,127.00 | | | 10.07 | | 1.91 | % |
The Quantex Fund™ | | | 1,000.00 | | | 1,094.70 | | | 8.05 | | 1.55 | % |
The Dynamic Growth Fund | | | 1,000.00 | | | 1,076.40 | | | 6.85 | | 1.33 | % |
The Aggressive Growth Fund | | | 1,000.00 | | | 1,071.30 | | | 8.73 | | 1.70 | % |
The Defensive Growth Fund | | | 1,000.00 | | | 1,066.60 | | | 8.15 | | 1.59 | % |
The Focused Growth Fund | | | 1,000.00 | | | 1,067.10 | | | 8.30 | | 1.62 | % |
The U.S. Government Bond Fund | | | 1,000.00 | | | 1,007.00 | | | 5.18 | | 1.04 | % |
The Money Market Fund - Retail Class | | | 1,000.00 | | | 1,024.70 | | | 2.41 | | 0.48 | % |
The Money Market Fund - Institutional Class | | | 1,000.00 | | | 1,025.40 | | | 1.71 | | 0.34 | % |
HYPOTHETICAL EXAMPLE FOR COMPARISON PURPOSES: The second table below provides information about hypothetical account values and hypothetical expenses based on the Funds’ actual expense ratios and assumed rates of return of 5% per year before expenses, which are not the Funds’ actual returns. The hypothetical account values and expenses may not be used to estimate the actual ending account balance or expenses you paid for the period. You may use this information to compare the ongoing costs of investing in the Funds to other funds. To do so, compare this 5% hypothetical example with the 5% hypothetical examples that appear in the shareholder reports of the other funds.
| | | | | | | | | | | | |
HYPOTHETICAL EXAMPLE (5% return before expenses) | | Beginning
Account Value
(12/31/2006) | | Ending
Account Value
(6/30/07) | | Expenses Paid
During Period1
(12/31/2006 -
6/30/07) | | Expense Ratio
(Annualized) | |
The Muirfield Fund® | | $ | 1,000.00 | | $ | 1,017.85 | | $ | 7.00 | | 1.40 | % |
The Socially Responsible Utilities Fund | | | 1,000.00 | | | 1,015.32 | | | 9.54 | | 1.91 | % |
The Quantex Fund™ | | | 1,000.00 | | | 1,017.11 | | | 7.75 | | 1.55 | % |
The Dynamic Growth Fund | | | 1,000.00 | | | 1,018.20 | | | 6.66 | | 1.33 | % |
The Aggressive Growth Fund | | | 1,000.00 | | | 1,016.36 | | | 8.50 | | 1.70 | % |
The Defensive Growth Fund | | | 1,000.00 | | | 1,016.91 | | | 7.95 | | 1.59 | % |
The Focused Growth Fund | | | 1,000.00 | | | 1,016.76 | | | 8.10 | | 1.62 | % |
The U.S. Government Bond Fund | | | 1,000.00 | | | 1,019.64 | | | 5.21 | | 1.04 | % |
The Money Market Fund - Retail Class | | | 1,000.00 | | | 1,022.41 | | | 2.41 | | 0.48 | % |
The Money Market Fund - Institutional Class | | | 1,000.00 | | | 1,023.11 | | | 1.71 | | 0.34 | % |
Please note that the expenses shown in the tables are meant to highlight your ongoing costs only and do not reflect any transactional costs, such as redemption fees or exchange fees. Therefore, the second table is useful in comparing ongoing costs only, and will not help you determine the relative total costs of owning different funds. In addition, if any transactional costs were included, your costs would have been higher.
1 | Expenses are equal to the Funds’ annualized expense ratios, multiplied by the average account value over the period, multiplied by 181/365 (to reflect the total number of days in the six-month period). |
| | |
| The Flex-funds 2007 Semiannual Report | June 30, 2007 | | Page 13 |
| | |
| The Flex-funds | | 2007 Semiannual Report | June 30, 2007 |
2007 Semiannual Report
Portfolio Holdings & Financial Statements
| | |
| Page 14 | | The Flex-funds 2007 Semiannual Report | June 30, 2007 |
Schedule of Investments
June 30, 2007 (unaudited)
The Muirfield Fund
| | | | | |
Security Description | | Shares or
Principal
Amount ($) | | Value ($) | |
Registered Investment Companies — 95.4% | |
Allegiant Mid Cap Value Fund — Class A | | 496,686 | | 8,046,312 | |
Allianz NFJ Dividend Value Fund — Class D | | 404,803 | | 7,424,087 | |
Artisan Mid Cap Value Fund | | 129,674 | | 2,943,590 | |
Dodge & Cox International Stock Fund | | 72,371 | | 3,538,953 | |
Goldman Sachs Structured Large Cap Value Fund — Class I | | 175,492 | | 2,676,251 | |
iShares Russell Midcap Index Fund | | 23,900 | | 2,602,710 | |
iShares Russell 1000 Growth Index Fund | | 108,000 | | 6,394,680 | |
MFS Value Fund — Class A | | 298,116 | | 8,579,767 | |
Pioneer Equity Income Fund — Class A | | 77,274 | | 2,607,214 | |
Rydex Large Cap Value Fund — Class H | | 78,292 | | 2,726,924 | |
SSgA International Stock Selection Fund | | 177,353 | | 2,692,215 | |
| | | | | |
Total Registered Investment Companies (Cost $45,157,824) | | | | 50,232,703 | |
| | | | | |
U.S. Government Obligations — 1.1% | |
U.S. Treasury Bill, 4.76%, due 08/09/2007* | | 100,000 | | 99,497 | |
U.S. Treasury Bill, 4.71%, due 09/06/2007* | | 500,000 | | 495,525 | |
| | | | | |
Total U.S. Government Obligations (Cost $595,180) | | | | 595,022 | |
| | | | | |
Repurchase Agreements — 3.7% | |
Morgan Stanley DW, Inc., 5.4350%, 07/02/2007, (Collateralized by $2,041,302 various Certificates of Deposit, Government Agencies, Agency Strips, Commercial Papers at 3.25% - 8.875%, due 07/02/2007 - 10/15/2029, value — $1,999,329) purchase date 06/29/2007 | | 1,960,000 | | 1,960,000 | |
| | | | | |
Total Repurchase Agreements (Cost $1,960,000) | | | | 1,960,000 | |
| | | | | |
Total Investments — 100.2% (Cost $47,713,004)(a) | | | | 52,787,725 | |
| | | | | |
Liabilities less Other Assets — (0.2%) | | | | (115,054 | ) |
| | | | | |
Total Net Assets — 100.0% | | | | 52,672,671 | |
| | | | | |
Trustee Deferred Compensation** | |
The Flex-funds Aggressive Growth Fund | | 294 | | 2,561 | |
The Flex-funds Defensive Growth Fund | | 152 | | 1,701 | |
The Flex-funds Dynamic Growth Fund | | 1,884 | | 19,386 | |
The Flex-funds Muirfield Fund | | 4,948 | | 30,974 | |
The Flex-funds Quantex Fund | | 1,838 | | 39,848 | |
The Flex-funds Socially Responsible Utilities Fund | | 363 | | 9,086 | |
| | | | | |
Total Trustee Deferred Compensation (Cost $73,362) | | | | 103,556 | |
| | | | | |
The Muirfield Fund
| | | | |
Security Description | | Long
Contracts | | Unrealized
Appreciation
(Depreciation) ($) |
Futures Contracts |
Standard & Poors 500 expiring September 2007, notional value $2,651,950 | | 7 | | 20,475 |
| | | | |
Total Futures Contracts | | | | 20,475 |
| | | | |
| (a) | Represents cost for financial reporting purposes and differs for federal income tax purposes by the amount of losses recognized in excess of federal income tax reporting of approximately $16,510. Cost for federal income tax purposes of $47,729,514 differs from value by net unrealized appreciation (depreciation) of securities as follows: |
| | | | |
Unrealized appreciation | | $ | 5,116,501 | |
Unrealized depreciation | | | (58,290 | ) |
| | | | |
Net unrealized appreciation (depreciation) | | $ | 5,058,211 | |
| | | | |
| * | Pledged as collateral on futures contracts. |
| ** | Assets of affiliates to The Muirfield Fund held for the benefit of the Fund’s Trustees in connection with the Trustee Deferred Compensation Plan. |
The accompanying notes are an integral part of these financial statements.
Schedule of Investments
June 30, 2007 (unaudited)
The Dynamic Growth Fund
| | | | | |
Security Description | | Shares or
Principal
Amount ($) | | Value ($) | |
Registered Investment Companies — 94.2% | | | |
Allegiant Mid Cap Value Fund — Class A | | 189,820 | | 3,075,090 | |
Allianz NFJ Dividend Value Fund — Class D | | 164,784 | | 3,022,137 | |
Dodge & Cox International Stock Fund | | 42,240 | | 2,065,532 | |
Goldman Sachs Mid Cap Value Fund — Class A | | 24,319 | | 1,029,654 | |
Goldman Sachs Structured Large Cap Value Fund — Class I | | 66,820 | | 1,019,000 | |
iShares Russell Midcap Index Fund | | 9,075 | | 988,268 | |
iShares Russell 1000 Growth Index Fund | | 39,850 | | 2,359,518 | |
MFS Value Fund — Class A | | 105,005 | | 3,022,052 | |
Pioneer Equity Income Fund — Class A | | 29,473 | | 994,402 | |
Rydex Large Cap Value Fund — Class H | | 23,565 | | 820,766 | |
| | | | | |
Total Registered Investment Companies (Cost $16,819,573) | | | | 18,396,419 | |
| | | | | |
U.S. Government Obligations — 2.0% | | | |
U.S. Treasury Bill, 4.71%, due 09/06/2007* | | 400,000 | | 396,420 | |
| | | | | |
Total U.S. Government Obligations (Cost $396,546) | | | | 396,420 | |
| | | | | |
Repurchase Agreements — 3.8% | | | |
Morgan Stanley DW, Inc., 5.4350%, 07/02/2007, (Collateralized by $779,028 various Certificates of Deposit, Government Agencies, Agency Strips, Commercial Papers at 3.25% - 8.875%, due 07/02/2007 - 10/15/2029, value — $763,010) purchase date 06/29/2007 | | 748,000 | | 748,000 | |
| | | | | |
Total Repurchase Agreements (Cost $748,000) | | | | 748,000 | |
| | | | | |
Total Investments — 100.0% (Cost $17,964,119)(a) | | | | 19,540,839 | |
| | | | | |
Liabilities less Other Assets — (0.0%) | | | | (5,440 | ) |
| | | | | |
Total Net Assets — 100.0% | | | | 19,535,399 | |
| | | | | |
Trustee Deferred Compensation** | | | |
The Flex-funds Aggressive Growth Fund | | 144 | | 1,254 | |
The Flex-funds Defensive Growth Fund | | 75 | | 839 | |
The Flex-funds Dynamic Growth Fund | | 473 | | 4,867 | |
The Flex-funds Muirfield Fund | | 1,318 | | 8,251 | |
The Flex-funds Quantex Fund | | 516 | | 11,187 | |
The Flex-funds Socially Responsible Utilities Fund | | 76 | | 1,902 | |
| | | | | |
Total Trustee Deferred Compensation (Cost $21,320) | | | | 28,300 | |
| | | | | |
The Dynamic Growth Fund
| | | | |
Security Description | | Long
Contracts | | Unrealized
Appreciation
(Depreciation) ($) |
Futures Contracts | | |
Standard & Poors 500 expiring September 2007, notional value $1,136,550 | | 3 | | 8,650 |
| | | | |
Total Futures Contracts | | | | 8,650 |
| | | | |
| (a) | Cost for financial reporting purposes and federal income tax purposes are the same. Cost for federal income tax purposes differs from value by net unrealized appreciation (depreciation) of securities as follows: |
| | | | |
Unrealized appreciation | | $ | 1,592,721 | |
Unrealized depreciation | | | (16,001 | ) |
| | | | |
Net unrealized appreciation (depreciation) | | $ | 1,576,720 | |
| | | | |
| * | Pledged as collateral on futures contracts. |
| ** | Assets of affiliates to The Dynamic Growth Fund held for the benefit of the Fund’s Trustees in connection with the Trustee Deferred Compensation Plan. |
The accompanying notes are an integral part of these financial statements.
Schedule of Investments
June 30, 2007 (unaudited)
The Aggressive Growth Fund
| | | | |
Security Description | | Shares or
Principal
Amount ($) | | Value ($) |
Registered Investment Companies — 88.1% |
iShares MSCI EAFE Index Fund | | 17,190 | | 1,388,436 |
iShares MSCI EMU Index Fund | | 24,705 | | 2,915,190 |
iShares Russell Midcap Index Fund | | 12,590 | | 1,371,051 |
iShares Russell Midcap Value Index Fund | | 25,810 | | 4,064,043 |
iShares Russell 1000 Growth Index Fund | | 26,950 | | 1,595,710 |
iShares Russell 1000 Value Index Fund | | 113,710 | | 9,863,206 |
iShares S&P MidCap 400 Growth Index Fund | | 13,900 | | 1,252,946 |
Utilities Select Sector SPDR Fund | | 54,900 | | 2,172,942 |
| | | | |
Total Registered Investment Companies (Cost $22,164,214) | | | | 24,623,524 |
| | | | |
U.S. Government Obligations — 0.7% |
U.S. Treasury Bill, 4.71%, due 09/06/07* | | 200,000 | | 198,210 |
| | | | |
Total U.S. Government Obligations (Cost $198,273) | | | | 198,210 |
| | | | |
Repurchase Agreements — 10.9% |
Morgan Stanley DW, Inc., 5.4350%, 07/02/2007, (Collateralized by $3,170,267 various Certificates of Deposit, Government Agencies, Agency Strips, Commercial Papers at 3.25% - 8.875%, due 07/02/2007 - 10/15/2029, value — $3,105,081) purchase date 06/29/2007 | | 3,044,000 | | 3,044,000 |
| | | | |
Total Repurchase Agreements (Cost $3,044,000) | | | | 3,044,000 |
| | | | |
Total Investments — 99.7% (Cost $25,406,487)(a) | | | | 27,865,734 |
| | | | |
Other Assets less Liabilities — 0.3% | | | | 88,624 |
| | | | |
Total Net Assets — 100.0% | | | | 27,954,358 |
| | | | |
Trustee Deferred Compensation** |
The Flex-funds Aggressive Growth Fund | | 150 | | 1,307 |
The Flex-funds Defensive Growth Fund | | 78 | | 873 |
The Flex-funds Dynamic Growth Fund | | 413 | | 4,250 |
The Flex-funds Muirfield Fund | | 1,121 | | 7,017 |
The Flex-funds Quantex Fund | | 422 | | 9,149 |
The Flex-funds Socially Responsible Utilities Fund | | 69 | | 1,727 |
| | | | |
Total Trustee Deferred Compensation (Cost $18,444) | | | | 24,323 |
| | | | |
The Aggressive Growth Fund
| | | | |
Security Description | | Long
Contracts | | Unrealized
Appreciation
(Depreciation) ($) |
Futures Contracts |
Standard & Poors 500 expiring September 2007, notional value $3,030,800 | | 8 | | 16,375 |
| | | | |
Total Futures Contracts | | | | 16,375 |
| | | | |
| (a) | Cost for financial reporting purposes and federal income tax purposes are the same. Cost for federal income tax purposes differs from value by net unrealized appreciation (depreciation) of securities as follows: |
| | | | |
Unrealized appreciation | | $ | 2,459,310 | |
Unrealized depreciation | | | (63 | ) |
| | | | |
Net unrealized appreciation (depreciation) | | $ | 2,459,247 | |
| | | | |
| * | Pledged as collateral on futures contracts. |
| ** | Assets of affiliates to The Aggressive Growth Fund held for the benefit of the Fund’s Trustees in connection with the Trustee Deferred Compensation Plan. |
The accompanying notes are an integral part of these financial statements.
Schedule of Investments
June 30, 2007 (unaudited)
The Defensive Growth Fund
| | | | | |
Security Description | | Shares or
Principal
Amount ($) | | Value ($) | |
Registered Investment Companies — 87.2% | |
iShares Dow Jones U.S. Industrial Sector Index Fund | | 34,740 | | 2,553,043 | |
iShares MSCI EAFE Index Fund | | 31,400 | | 2,536,178 | |
iShares MSCI EMU Index Fund | | 35,125 | | 4,144,750 | |
iShares Russell Midcap Index Fund | | 27,970 | | 3,045,933 | |
iShares Russell Midcap Value Index Fund | | 77,418 | | 12,190,238 | |
iShares Russell 1000 Growth Index Fund | | 50,185 | | 2,971,454 | |
iShares Russell 1000 Value Index Fund | | 255,781 | | 22,186,444 | |
Utilities Select Sector SPDR Fund | | 93,800 | | 3,712,604 | |
| | | | | |
Total Registered Investment Companies (Cost $48,588,826) | | | | 53,340,644 | |
| | | | | |
U.S. Government Obligations — 0.6% | |
U.S. Treasury Bill, 5.02%, due 07/05/2007* | | 100,000 | | 99,959 | |
U.S. Treasury Bill, 4.71%, due 09/06/2007* | | 110,000 | | 109,015 | |
U.S. Treasury Bill, 4.68%, due 09/27/2007* | | 190,000 | | 187,777 | |
| | | | | |
Total U.S. Government Obligations (Cost $396,858) | | | | 396,751 | |
| | | | | |
Repurchase Agreements — 12.3% | |
Morgan Stanley DW, Inc., 5.4350%, 07/02/2007, (Collateralized by $7,820,478 various Certificates of Deposit, Government Agencies, Agency Strips, Commercial Papers at 3.25% - 8.875%, due 07/02/2007 - 10/15/2029, value — $7,659,675) purchase date 06/29/2007 | | 7,509,000 | | 7,509,000 | |
| | | | | |
Total Repurchase Agreements (Cost $7,509,000) | | | | 7,509,000 | |
| | | | | |
Total Investments — 100.1% (Cost $56,494,684)(a) | | | | 61,246,395 | |
| | | | | |
Liabilities less Other Assets — (0.1%) | | | | (48,953 | ) |
| | | | | |
Total Net Assets — 100.0% | | | | 61,197,442 | |
| | | | | |
Trustee Deferred Compensation** | |
The Flex-funds Aggressive Growth Fund | | 234 | | 2,038 | |
The Flex-funds Defensive Growth Fund | | 121 | | 1,354 | |
The Flex-funds Dynamic Growth Fund | | 66 | | 679 | |
The Flex-funds Muirfield Fund | | 231 | | 1,446 | |
The Flex-funds Quantex Fund | | 108 | | 2,341 | |
The Flex-funds Socially Responsible Utilities Fund | | 28 | | 701 | |
| | | | | |
Total Trustee Deferred Compensation (Cost $8,054) | | | | 8,559 | |
| | | | | |
The Defensive Growth Fund
| | | | |
Security Description | | Long
Contracts | | Unrealized
Appreciation
(Depreciation) ($) |
Futures Contracts | | | | |
Standard & Poors 500 expiring September 2007, notional value $7,955,850 | | 21 | | 34,475 |
| | | | |
Total Futures Contracts | | | | 34,475 |
| | | | |
| (a) | Cost for financial reporting purposes and federal income tax purposes are the same. Cost for federal income tax purposes differs from value by net unrealized appreciation (depreciation) of securities as follows: |
| | | | |
Unrealized appreciation | | $ | 4,751,818 | |
Unrealized depreciation | | | (107 | ) |
| | | | |
Net unrealized appreciation (depreciation) | | $ | 4,751,711 | |
| | | | |
| * | Pledged as collateral on futures contracts. |
| ** | Assets of affiliates to The Defensive Growth Fund held for the benefit of the Fund’s Trustees in connection with the Trustee Deferred Compensation Plan. |
The accompanying notes are an integral part of these financial statements.
Schedule of Investments
June 30, 2007 (unaudited)
The Focused Growth Fund
| | | | |
Security Description | | Shares or
Principal
Amount ($) | | Value ($) |
Registered Investment Companies — 85.5% |
iShares Dow Jones U.S. Industrial Sector Index Fund | | 29,729 | | 2,184,784 |
iShares MSCI EAFE Index Fund | | 25,745 | | 2,079,424 |
iShares MSCI EMU Index Fund | | 31,839 | | 3,757,002 |
iShares Russell Midcap Index Fund | | 24,605 | | 2,679,485 |
iShares Russell Midcap Value Index Fund | | 67,342 | | 10,603,671 |
iShares Russell 1000 Growth Index Fund | | 50,770 | | 3,006,092 |
iShares Russell 1000 Value Index Fund | | 228,455 | | 19,816,187 |
Utilities Select Sector SPDR Fund | | 83,800 | | 3,316,804 |
| | | | |
Total Registered Investment Companies (Cost $42,848,359) | | | | 47,443,449 |
| | | | |
U.S. Government Obligations — 0.8% |
U.S. Treasury Bill, 4.68%, due 09/27/2007* | | 475,000 | | 469,442 |
| | | | |
Total U.S. Government Obligations (Cost $469,622) | | | | 469,442 |
| | | | |
Repurchase Agreements — 13.6% |
Morgan Stanley DW, Inc., 5.4350%, 07/02/2007, (Collateralized by $7,870,469 various Certificates of Deposit, Government Agencies, Agency Strips, Commercial Papers at 3.25% - 8.875%, due 07/02/2007 - 10/15/2029, value — $7,708,638) purchase date 06/29/2007 | | 7,557,000 | | 7,557,000 |
| | | | |
Total Repurchase Agreements (Cost $7,557,000) | | | | 7,557,000 |
| | | | |
Total Investments — 99.9% (Cost $50,874,981)(a) | | | | 55,469,891 |
| | | | |
Other Assets less Liabilities — 0.1% | | | | 43,396 |
| | | | |
Total Net Assets — 100.0% | | | | 55,513,287 |
| | | | |
Trustee Deferred Compensation** |
The Flex-funds Aggressive Growth Fund | | 213 | | 1,855 |
The Flex-funds Defensive Growth Fund | | 110 | | 1,231 |
The Flex-funds Dynamic Growth Fund | | 60 | | 617 |
The Flex-funds Muirfield Fund | | 211 | | 1,321 |
The Flex-funds Quantex Fund | | 99 | | 2,146 |
The Flex-funds Socially Responsible Utilities Fund | | 25 | | 626 |
| | | | |
Total Trustee Deferred Compensation (Cost $7,346) | | | | 7,796 |
| | | | |
The Focused Growth Fund
| | | | |
Security Description | | Long
Contracts | | Unrealized
Appreciation
(Depreciation) ($) |
Futures Contracts |
Standard & Poors 500 expiring September 2007, notional value $7,955,850 | | 21 | | 21,150 |
| | | | |
Total Futures Contracts | | | | 21,150 |
| | | | |
| (a) | Cost for financial reporting purposes and federal income tax purposes are the same. Cost for federal income tax purposes differs from value by net unrealized appreciation (depreciation) of securities as follows: |
| | | | |
Unrealized appreciation | | $ | 4,595,089 | |
Unrealized depreciation | | | (179 | ) |
| | | | |
Net unrealized appreciation (depreciation) | | $ | 4,594,910 | |
| | | | |
| * | Pledged as collateral on futures contracts. |
| ** | Assets of affiliates to The Focused Growth Fund held for the benefit of the Fund’s Trustees in connection with the Trustee Deferred Compensation Plan. |
The accompanying notes are an integral part of these financial statements.
Schedule of Investments
June 30, 2007 (unaudited)
The Quantex Fund
| | | | |
Security Description | | Shares or
Principal
Amount ($) | | Value ($) |
Common Stocks — 89.1% |
Basic Materials — 6.3% | | | | |
Ashland, Inc. | | 3,015 | | 192,809 |
Eastman Chemical Co. | | 3,475 | | 223,547 |
Hercules, Inc. | | 10,230 | | 201,020 |
Int’l Flavors & Fragrances, Inc. | | 4,065 | | 211,949 |
MeadWestvaco Corp. | | 6,620 | | 233,818 |
Sigma — Aldrich Corp. | | 5,115 | | 218,257 |
Temple — Inland, Inc. | | 4,305 | | 264,887 |
| | | | |
(Cost 1,237,239) | | | | 1,546,287 |
| | | | |
Communications — 10.9% | | | | |
ADC Telecommunications, Inc.# | | 13,609 | | 249,453 |
CenturyTel, Inc. | | 4,520 | | 221,706 |
Ciena Corp.# | | 7,149 | | 258,293 |
Citizens Communications Co. | | 13,755 | | 210,039 |
Comverse Technology, Inc.# | | 8,720 | | 181,812 |
Dow Jones & Co., Inc. | | 6,220 | | 357,339 |
EW Scripps Co. | | 4,655 | | 212,687 |
Interpublic Group of Cos., Inc. | | 16,155 | | 184,167 |
JDS Uniphase Corp.# | | 13,552 | | 182,003 |
Meredith Corp. | | 3,475 | | 214,060 |
New York Times Co. | | 8,290 | | 210,566 |
Tellabs, Inc.# | | 19,275 | | 207,399 |
| | | | |
(Cost 2,268,609) | | | | 2,689,524 |
| | | | |
Consumer Cyclical — 17.2% | | | | |
Autonation, Inc.# | | 9,285 | | 208,355 |
Big Lots, Inc.# | | 8,585 | | 252,571 |
Brunswick Corp. | | 6,165 | | 201,164 |
Centex Corp. | | 5,060 | | 202,906 |
Cintas Corp. | | 4,980 | | 196,361 |
Circuit City Stores, Inc. | | 10,445 | | 157,511 |
Dillards, Inc. | | 5,680 | | 204,082 |
Dollar General Corp. | | 12,305 | | 269,726 |
Family Dollar Stores, Inc. | | 7,080 | | 242,986 |
Hasbro, Inc. | | 7,185 | | 225,681 |
Jones Apparel Group, Inc. | | 6,030 | | 170,347 |
KB Home | | 3,820 | | 150,393 |
Liz Claiborne, Inc. | | 4,470 | | 166,731 |
OfficeMax, lnc. | | 3,955 | | 155,432 |
RadioShack Corp. | | 11,605 | | 384,590 |
The Goodyear Tire & Rubber Co.# | | 8,640 | | 300,326 |
Tiffany & Co. | | 4,980 | | 264,239 |
W.W. Grainger, Inc. | | 2,800 | | 260,540 |
Wendy’s International, Inc. | | 5,920 | | 217,560 |
| | | | |
(Cost 3,483,484) | | | | 4,231,501 |
| | | | |
Consumer Noncyclical — 19.0% | | | | |
Barr Pharmaceuticals, Inc.# | | 3,955 | | 198,660 |
Bausch & Lomb, Inc. | | 3,820 | | 265,261 |
Brown-Forman Corp. | | 3,015 | | 220,336 |
Constellation Brands, Inc.# | | 9,640 | | 234,059 |
Convergys Corp.# | | 8,240 | | 199,738 |
Equifax, Inc. | | 5,760 | | 255,859 |
Estee Lauder Cos. Inc./The | | 4,765 | | 216,855 |
Health Management Associates, Inc. | | 9,395 | | 106,727 |
Hospira, Inc.# | | 5,920 | | 231,117 |
IMS Health, Inc. | | 7,375 | | 236,959 |
The Quantex Fund
| | | | |
Security Description | | Shares or
Principal
Amount ($) | | Value ($) |
Common Stocks — continued |
King Pharmaceuticals, Inc.# | | 12,305 | | 251,760 |
Manor Care, Inc. | | 4,225 | | 275,850 |
McCormick & Co., Inc. | | 5,140 | | 196,245 |
Millipore Corp.# | | 2,960 | | 222,266 |
Molson Coors Brewing Co. | | 2,665 | | 246,406 |
Mylan Laboratories, Inc. | | 9,825 | | 178,717 |
Patterson Cos., Inc.# | | 5,575 | | 207,780 |
Pepsi Bottling Group, Inc. | | 6,865 | | 231,213 |
Tenet Healthcare Corp.# | | 27,755 | | 180,685 |
Tyson Foods, Inc. | | 12,085 | | 278,439 |
Watson Pharmaceuticals, lnc.# | | 7,540 | | 245,276 |
| | | | |
(Cost 4,019,276) | | | | 4,680,208 |
| | | | |
Energy — 3.0% | | | | |
Dynegy, Inc.# | | 27,300 | | 257,712 |
Integrys Energy Group, Inc. | | 3,645 | | 184,911 |
Rowan Cos., Inc. | | 7,430 | | 304,481 |
| | | | |
(Cost 516,433) | | | | 747,104 |
| | | | |
Financial — 4.2% | | | | |
Apartment Investment & Management Co. | | 3,470 | | 174,958 |
Federated Investors, Inc. | | 5,760 | | 220,781 |
First Horizon National Corp. | | 5,060 | | 197,340 |
Janus Capital Group, Inc. | | 9,530 | | 265,315 |
MGIC Investment Corp. | | 3,120 | | 177,403 |
Wachovia Corp. Pref. Dividend Equalization# | | 1,700 | | — |
| | | | |
(Cost 852,250) | | | | 1,035,797 |
| | | | |
Industrial — 14.9% | | | | |
Allied Waste Industries, Inc. | | 16,020 | | 215,629 |
Ball Corp. | | 4,415 | | 234,746 |
Bemis Co. | | 6,030 | | 200,075 |
Black & Decker Corp. | | 2,450 | | 216,360 |
Leggett & Platt, Inc. | | 8,375 | | 184,669 |
Molex, Inc. | | 6,275 | | 188,313 |
Pactiv Corp.# | | 5,575 | | 177,787 |
Pall Corp. | | 5,680 | | 261,223 |
PerkinElmer, lnc. | | 9,020 | | 235,061 |
Ryder System, Inc. | | 3,740 | | 201,212 |
Sanmina — SCI Corp.# | | 57,265 | | 179,239 |
Sealed Air Corp. | | 6,275 | | 194,651 |
Snap — On, Inc. | | 4,120 | | 208,101 |
Solectron Corp.# | | 61,330 | | 225,694 |
Stanley Works / The | | 3,905 | | 237,034 |
Tektronix, Inc. | | 7,620 | | 257,099 |
Waters Corp.# | | 4,065 | | 241,298 |
| | | | |
(Cost 2,971,009) | | | | 3,658,191 |
| | | | |
Technology — 9.7% | | | | |
Citrix Systems, Inc.# | | 7,320 | | 246,464 |
Compuware Corp.# | | 23,690 | | 280,964 |
Jabil Circuit, Inc. | | 8,020 | | 177,001 |
LSI Logic Corp.# | | 24,340 | | 182,793 |
Novell, Inc. # | | 31,825 | | 247,917 |
Novellus Systems, Inc.# | | 5,680 | | 161,142 |
Parametric Technology Corp.# | | 11,430 | | 247,002 |
Schedule of Investments
June 30, 2007 (unaudited)
The Quantex Fund
| | | | | |
Security Description | | Shares or
Principal
Amount ($) | | Value ($) | |
Common Stocks — continued | |
PMC — Sierra, Inc.# | | 29,375 | | 227,069 | |
QLogic Corp.# | | 9,045 | | 150,599 | |
Teradyne, Inc.# | | 13,190 | | 231,880 | |
Unisys Corp.# | | 25,200 | | 230,328 | |
| | | | | |
(Cost 1,933,325) | | | | 2,383,159 | |
| | | | | |
Utilities — 3.9% | |
Centrepoint Energy, Inc. | | 11,605 | | 201,927 | |
CMS Energy Corp. | | 11,955 | | 205,626 | |
Nicor, Inc. | | 4,225 | | 181,337 | |
Pinnacle West Capital Corp. | | 3,820 | | 152,227 | |
TECO Energy, Inc. | | 13,460 | | 231,243 | |
| | | | | |
(Cost 871,560) | | | | 972,360 | |
| | | | | |
Total Common Stocks
(Cost $18,153,185) | | | | 21,944,131 | |
| | | | | |
U.S. Government Obligations — 1.2% | |
U.S. Treasury Bill, 4.71%, due 09/06/2007* | | 300,000 | | 297,315 | |
| | | | | |
Total U.S. Government Obligations (Cost $297,410) | | | | 297,315 | |
| | | | | |
Repurchase Agreements — 9.9% | |
Morgan Stanley DW, Inc., 5.4350%, 07/02/2007, (Collateralized by $2,552,669 various Certificates of Deposit, Government Agencies, Agency Strips, Commercial Papers at 3.25% - 8.875%, due 07/02/2007 - 10/15/2029, value — $2,500,182) purchase date 06/29/2007 | | 2,451,000 | | 2,451,000 | |
| | | | | |
Total Repurchase Agreements (Cost $2,451,000) | | | | 2,451,000 | |
| | | | | |
Total Investments — 100.2% (Cost $20,901,595)(a) | | | | 24,692,446 | |
| | | | | |
Liabilities less Other Assets — (0.2%) | | | | (44,557 | ) |
| | | | | |
Total Net Assets — 100.0% | | | | 24,647,889 | |
| | | | | |
Trustee Deferred Compensation** | |
The Flex-funds Aggressive Growth Fund | | 143 | | 1,246 | |
The Flex-funds Defensive Growth Fund | | 74 | | 828 | |
The Flex-funds Dynamic Growth Fund | | 971 | | 9,992 | |
The Flex-funds Muirfield Fund | | 2,469 | | 15,456 | |
The Flex-funds Quantex Fund | | 861 | | 18,666 | |
The Flex-funds Socially Responsible Utilities Fund | | 182 | | 4,555 | |
| | | | | |
Total Trustee Deferred Compensation (Cost $35,426) | | | | 50,743 | |
| | | | | |
The Quantex Fund
| | | | |
Security Description | | Long
Contracts | | Unrealized
Appreciation
(Depreciation) ($) |
Futures Contracts |
Standard & Poors MidCap 400 expiring September 2007, notional value $2,712,600 | | 6 | | 12,225 |
| | | | |
Total Futures Contracts | | | | 12,225 |
| | | | |
| (a) | Cost for financial reporting purposes and federal income tax purposes are the same. Cost for federal income tax purposes differs from value by net unrealized appreciation (depreciation) of securities as follows: |
| | | | |
Unrealized appreciation | | $ | 4,185,172 | |
Unrealized depreciation | | | (394,321 | ) |
| | | | |
Net unrealized appreciation (depreciation) | | $ | 3,790,851 | |
| | | | |
| ADR | American Depositary Receipt |
| # | Represents non-income producing securities. |
| * | Pledged as collateral on Futures Contracts. |
| ** | Assets of affiliates to The Flex-funds Quantex Fund held for the benefit of the Fund’s Trustees in connection with the Trustee Deferred Compensation Plan. |
The accompanying notes are an integral part of these financial statements.
Schedule of Investments
June 30, 2007 (unaudited)
The Socially Responsible Utilities Fund
| | | | |
Security Description | | Shares or
Principal
Amount ($) | | Value ($) |
Common Stocks — 97.1% |
Electric Utility — 15.0% | | | | |
AES Corp.# | | 22,385 | | 489,784 |
Energy East Corp. | | 32,590 | | 850,273 |
MDU Resources Group, Inc. | | 23,237 | | 651,565 |
Northeast Utilities | | 16,755 | | 475,172 |
Pepco Holdings, Inc. | | 15,215 | | 429,063 |
Sierra Pacific Resources | | 56,125 | | 985,555 |
| | | | |
(Cost 2,936,439) | | | | 3,881,412 |
| | | | |
Independent Power Producer — 4.3% |
Dynegy, Inc.# | | 40,390 | | 381,282 |
NRG Energy, Inc.# | | 17,390 | | 722,902 |
| | | | |
(Cost 569,507) | | | | 1,104,184 |
| | | | |
Natural Gas Distribution — 15.6% |
AGL Resources, Inc. | | 14,865 | | 601,735 |
ATMOS Energy Corp. | | 14,755 | | 443,535 |
NiSource, Inc. | | 35,605 | | 737,380 |
ONEOK, Inc. | | 16,145 | | 813,870 |
Southern Union Co. | | 30,960 | | 1,008,986 |
Vectren Corp. | | 16,330 | | 439,767 |
| | | | |
(Cost 3,075,529) | | | | 4,045,273 |
| | | | |
Oil Exploration & Production — 9.7% |
GMX Resources, Inc.# | | 11,185 | | 387,001 |
Goodrich Petroleum Corp.# | | 10,340 | | 358,074 |
Pioneer Natural Resources Co. | | 18,115 | | 882,382 |
Ultra Petroleum Corp.# | | 15,555 | | 859,258 |
| | | | |
(Cost 1,817,536) | | | | 2,486,715 |
| | | | |
Pipelines — 19.5% |
El Paso Corp. | | 33,375 | | 575,051 |
Enterprise Products Partners, L.P. | | 21,646 | | 688,559 |
Equitable Resources, Inc. | | 10,905 | | 540,452 |
Kinder Morgan Energy Partners, L.P. | | 17,818 | | 983,376 |
National Fuel Gas Co. | | 12,300 | | 532,713 |
Questar Corp. | | 20,800 | | 1,099,213 |
Spectra Energy Corp. | | 25,825 | | 670,417 |
| | | | |
(Cost 3,399,265) | | | | 5,089,781 |
| | | | |
Telephone & Telecommunications — 32.0% |
America Movil SA de CV — ADR | | 11,770 | | 728,916 |
AT&T, Inc. | | 21,640 | | 898,060 |
Brasil Telecom — ADR | | 10,370 | | 626,970 |
China Mobile Limited — ADR | | 10,955 | | 590,474 |
Corning, Inc. | | 31,980 | | 817,089 |
Cypress Semiconductor Corp.# | | 14,610 | | 340,267 |
MEMC Electronic Materials, Inc.# | | 8,965 | | 547,941 |
Philippine Long Distance Telephone Company — ADR | | 9,350 | | 534,820 |
PT Telekomunikasi Indonesia — ADR | | 9,405 | | 405,355 |
Qualcom, Inc. | | 12,125 | | 526,104 |
Sprint Nextel Corp. | | 34,745 | | 719,569 |
Telefonos de Mexico SA de CV — ADR | | 10,285 | | 389,699 |
The Socially Responsible Utilities Fund
| | | | | |
Security Description | | Shares or
Principal
Amount ($) | | Value ($) | |
Common Stocks — continued | |
Turkcell Iletisim Hizmetleri AS — ADR | | 32,595 | | 542,707 | |
Verizon Communications, Inc. | | 15,420 | | 634,841 | |
| | | | | |
(Cost 5,885,635) | | | | 8,302,812 | |
| | | | | |
Water Utility — 1.0% | |
Mueller Water Products, Inc. | | 15,170 | | 258,800 | |
| | | | | |
(Cost 244,620) | | | | 258,800 | |
| | | | | |
Total Common Stocks
(Cost $17,928,531) | | | | 25,168,977 | |
| | | | | |
Repurchase Agreements — 3.0% | |
Morgan Stanley DW, Inc., 5.4350%, 07/02/2007, (Collateralized by $817,562 various Certificates of Deposit, Government Agencies, Agency Strips, Commercial Papers at 3.25% - 8.875%, due 07/02/2007 - 10/15/2029, value — $800,751) purchase date 06/29/2007 | | 785,000 | | 785,000 | |
| | | | | |
Total Repurchase Agreements (Cost $785,000) | | | | 785,000 | |
| | | | | |
Total Investments — 100.1% (Cost $18,713,531)(a) | | | | 25,953,977 | |
| | | | | |
Liabilities less Other Assets — (0.1%) | | | | (23,530 | ) |
| | | | | |
Total Net Assets — 100.0% | | | | 25,930,447 | |
| | | | | |
Trustee Deferred Compensation* | |
The Flex-funds Aggressive Growth Fund | | 165 | | 1,437 | |
The Flex-funds Defensive Growth Fund | | 85 | | 951 | |
The Flex-funds Dynamic Growth Fund | | 679 | | 6,987 | |
The Flex-funds Muirfield Fund | | 1,795 | | 11,237 | |
The Flex-funds Quantex Fund | | 664 | | 14,396 | |
The Flex-funds Socially Responsible Utilities Fund | | 123 | | 3,079 | |
| | | | | |
Total Trustee Deferred Compensation (Cost $27,280) | | | | 38,087 | |
| | | | | |
| (a) | Cost for financial reporting purposes and federal income tax purposes are the same. Cost for federal income tax purposes differs from value by net unrealized appreciation (depreciation) of securities as follows: |
| | | | |
Unrealized appreciation | | $ | 7,513,924 | |
Unrealized depreciation | | | (273,478 | ) |
| | | | |
Net unrealized appreciation (depreciation) | | $ | 7,240,446 | |
| | | | |
| ADR | American Depositary Receipt |
| # | Represents non-income producing securities. |
| * | Assets of affiliates to The Socially Responsible Utilities Fund held for the benefit of the Fund’s Trustees in connection with the Trustees Deferred Compensation Plan. |
The accompanying notes are an integral part of these financial statements.
Schedule of Investments
June 30, 2007 (unaudited)
The U.S. Government Bond Fund
| | | | |
Security Description | | Principal
Amount ($)
or Shares | | Value ($) |
U.S. Government Obligations — 80.6% |
Federal Farm Credit,
5.125%, due 06/06/2011 | | 800,000 | | 796,988 |
Federal Farm Credit,
4.875%, due 04/12/2012 | | 2,000,000 | | 1,966,473 |
Federal Home Loan Bank,
3.00%, due 12/28/2007 | | 400,000 | | 395,570 |
Federal Home Loan Bank,
5.00%, due 03/09/2012 | | 2,000,000 | | 1,977,635 |
Federal Home Loan Bank,
5.00%, due 03/14/2014 | | 2,000,000 | | 1,960,105 |
Federal Home Loan Bank,
5.375%, due 09/09/2016 | | 600,000 | | 597,376 |
Federal Home Loan Mortgage Corporation, 4.375%, due 07/17/2015 | | 1,400,000 | | 1,305,080 |
U.S. Treasury Note,
4.00%, due 06/15/2009 | | 200,000 | | 196,719 |
U.S. Treasury Note,
4.00%, due 11/15/2012 | | 300,000 | | 287,531 |
| | | | |
Total U.S. Government Obligations (Cost $9,629,443) | | | | 9,483,477 |
| | | | |
Repurchase Agreements — 18.5% |
Morgan Stanley DW, Inc., 5.4350%, 07/02/2007, (Collateralized by $2,261,055 various Certificates of Deposit, Government Agencies, Agency Strips, Commercial Papers at 3.25% - 8.875%, due 07/02/2007 - 10/15/2029, value — $2,214,564) purchase date 06/29/2007 | | 2,171,000 | | 2,171,000 |
| | | | |
Total Repurchase Agreements
(Cost $2,171,000) | | | | 2,171,000 |
| | | | |
Total Investments — 99.1%
(Cost $11,800,443)(a) | | | | 11,654,477 |
| | | | |
Other Assets less Liabilities — 0.9% | | | | 108,999 |
| | | | |
Total Net Assets — 100.0% | | | | 11,763,476 |
| | | | |
The U.S. Government Bond Fund
| | | | |
Security Description | | Principal
Amount ($)
or Shares | | Value ($) |
Trustee Deferred Compensation* |
The Flex-funds Aggressive Growth Fund | | 123 | | 1,071 |
The Flex-funds Defensive Growth Fund | | 64 | | 716 |
The Flex-funds Dynamic Growth Fund | | 513 | | 5,279 |
The Flex-funds Muirfield Fund | | 1,347 | | 8,432 |
The Flex-funds Quantex Fund | | 501 | | 10,862 |
The Flex-funds Socially Responsible Utilities Fund | | 95 | | 2,378 |
| | | | |
Total Trustee Deferred Compensation
(Cost $20,768) | | | | 28,738 |
| | | | |
| (a) | Cost for financial reporting purposes and federal income tax purposes are the same. Cost for federal income tax purposes differs from value by net unrealized appreciation (depreciation) of securities as follows: |
| | | | |
Unrealized appreciation | | $ | 1,646 | |
Unrealized depreciation | | | (147,612 | ) |
| | | | |
Net unrealized appreciation (depreciation) | | $ | (145,966 | ) |
| | | | |
| * | Assets of affiliates to The U.S. Government Bond Fund held for the benefit of the Fund’s Trustees in connection with the Trustee Deferred Compensation Plan. |
The accompanying notes are an integral part of these financial statements.
Schedule of Investments
June 30, 2007 (unaudited)
The Money Market Fund
| | | | | | | | | |
Security Description | | Coupon/
Yield | | | Maturity | | Principal
Amount ($)
or Shares | | Value ($) |
Certificates of Deposit — 6.4% |
Deutsche Bank CD | | 5.43% | | | 01/28/08 | | 5,000,000 | | 5,000,000 |
Huntington National Bank CD | | 5.36% | | | 07/03/07 | | 4,000,000 | | 4,000,000 |
Huntington National Bank CD | | 5.40% | | | 07/23/07 | | 4,000,000 | | 4,000,000 |
| | | | | | | | | |
Total Certificates of Deposit (Cost $13,000,000) | | | | | | | 13,000,000 |
| | | | | | | | | |
Commercial Paper — 18.3% |
Abbey National | | 5.24% | | | 08/07/07 | | 5,000,000 | | 4,973,800 |
Bank of America | | 5.26% | | | 09/25/07 | | 1,450,000 | | 1,431,992 |
Citigroup Funding | | 5.22% | | | 07/10/07 | | 4,000,000 | | 3,995,360 |
Citigroup Funding | | 5.22% | | | 08/30/07 | | 2,000,000 | | 1,982,890 |
Dexia Delaware | | 5.20% | | | 08/10/07 | | 3,000,000 | | 2,983,117 |
HSBC Finance | | 5.21% | | | 07/11/07 | | 3,000,000 | | 2,996,093 |
Mitsubishi International | | 5.25% | | | 09/20/07 | | 4,000,000 | | 3,953,333 |
Mitsubishi International | | 5.19% | | | 11/19/07 | | 5,000,000 | | 4,899,181 |
Societe Generale | | 5.18% | | | 11/01/07 | | 2,000,000 | | 1,964,891 |
UBS Finance Delaware | | 5.23% | | | 07/11/07 | | 2,700,000 | | 2,696,473 |
UBS Finance Delaware | | 5.20% | | | 08/10/07 | | 5,000,000 | | 4,971,861 |
| | | | | | | | | |
Total Commercial Paper (Cost $36,848,991) | | | | | | | | | 36,848,991 |
| | | | | | | | | |
Corporate Obligations — 51.8% |
American General Finance | | 2.75% | | | 06/15/08 | | 985,000 | | 960,375 |
Aquarium Holdings Ky** | | 5.37% | * | | 07/05/07 | | 108,000 | | 108,000 |
Bank of America | | 5.63% | | | 11/30/07 | | 863,000 | | 864,011 |
Bath Technologies** | | 5.43% | * | | 07/05/07 | | 1,100,000 | | 1,100,000 |
Bear Stearns Co., Inc. | | 5.96% | * | | 09/27/07 | | 2,149,000 | | 2,152,066 |
Bear Stearns Co., Inc. | | 4.00% | | | 01/31/08 | | 250,000 | | 247,855 |
Beaver Creek Enterprise** | | 5.38% | * | | 07/05/07 | | 1,815,000 | | 1,815,000 |
Cascade Plaza Project** | | 5.38% | * | | 07/05/07 | | 7,489,000 | | 7,489,000 |
CIT Group Inc. | | 4.00% | | | 05/08/08 | | 1,381,000 | | 1,364,519 |
CIT Group Inc. | | 5.43% | * | | 09/19/07 | | 700,000 | | 700,224 |
CIT Group Inc. | | 5.59% | * | | 09/20/07 | | 3,000,000 | | 3,001,457 |
CIT Group Inc. | | 5.75% | | | 09/25/07 | | 4,250,000 | | 4,252,061 |
Clark Grave Vault Co.** | | 5.37% | * | | 07/05/07 | | 150,000 | | 150,000 |
Credit Suisse First Boston | | 5.40% | | | 12/21/07 | | 8,500,000 | | 8,500,000 |
Credit Suisse First Boston | | 6.50% | | | 06/01/08 | | 750,000 | | 756,607 |
Deutsche Bank | | 5.40% | * | | 07/02/07 | | 4,000,000 | | 4,000,000 |
Don’s Launderers-Cleaners, Inc.** | | 5.37% | * | | 07/05/07 | | 900,000 | | 900,000 |
General Dynamics | | 3.00% | | | 05/15/08 | | 3,090,000 | | 3,028,186 |
Goldman Sachs | | 5.48% | * | | 07/05/07 | | 2,200,000 | | 2,200,971 |
Goldman Sachs | | 5.47% | * | | 07/02/07 | | 3,000,000 | | 3,000,000 |
Gordon Flesch Co. Project** | | 5.38% | * | | 07/05/07 | | 700,000 | | 700,000 |
Hartford Financial | | 4.70% | | | 09/01/07 | | 500,000 | | 499,272 |
HSBC Finance | | 5.50% | * | | 08/09/07 | | 3,110,000 | | 3,114,398 |
HSBC Finance | | 5.36% | * | | 08/21/07 | | 500,000 | | 500,129 |
International Lease | | 4.50% | | | 05/01/08 | | 3,785,000 | | 3,756,569 |
International Lease | | 4.63% | | | 06/02/08 | | 1,000,000 | | 993,169 |
Isaac Tire, Inc.** | | 5.37% | * | | 07/05/07 | | 725,000 | | 725,000 |
Jim White Co.** | | 5.42% | * | | 07/05/07 | | 675,000 | | 675,000 |
The Money Market Fund
| | | | | | | | | |
Security Description | | Coupon/
Yield | | | Maturity | | Principal
Amount ($)
or Shares | | Value ($) |
Corporate Obligations — continued |
J2T LLC** | | 5.42% | * | | 07/05/07 | | 2,040,000 | | 2,040,000 |
K.L. Morris, Inc.** | | 5.37% | * | | 07/05/07 | | 2,015,000 | | 2,015,000 |
Keiser Street, Inc.** | | 5.38% | * | | 07/05/07 | | 1,445,000 | | 1,445,000 |
Lehman Holdings | | 4.00% | | | 01/22/08 | | 950,000 | | 942,484 |
Lehman Holdings | | 5.38% | * | | 07/03/07 | | 200,000 | | 200,064 |
Lehman Holdings | | 5.39% | * | | 08/29/07 | | 1,760,000 | | 1,760,690 |
Martin Wheel Co, Inc.** | | 5.62% | * | | 07/05/07 | | 2,110,000 | | 2,110,000 |
Mega Star Arbor LLC** | | 5.42% | * | | 07/05/07 | | 4,090,000 | | 4,090,000 |
Merrill Lynch | | 5.48% | * | | 07/27/07 | | 1,000,000 | | 1,000,100 |
Merrill Lynch | | 4.00% | | | 11/15/07 | | 1,000,000 | | 995,968 |
MetLife Insurance Co.*** | | 5.38% | * | | 07/02/07 | | 7,500,000 | | 7,500,000 |
Mubea, Inc.** | | 5.37% | * | | 07/05/07 | | 1,400,000 | | 1,400,000 |
O.K.I. Supply Co.** | | 5.37% | * | | 07/05/07 | | 825,000 | | 825,000 |
Osco Industries, Inc.** | | 5.48% | * | | 07/05/07 | | 300,000 | | 300,000 |
Pro Tire, Inc.** | | 5.37% | * | | 07/05/07 | | 870,000 | | 870,000 |
Prudential Financial | | 3.75% | | | 05/01/08 | | 3,105,000 | | 3,062,810 |
Seariver Maritime, Inc. | | 5.32% | * | | 07/02/07 | | 3,000,000 | | 3,000,000 |
Springside Corp Exchange Partners LLC** | | 5.38% | * | | 07/05/07 | | 2,000,000 | | 2,000,000 |
Taylor Brothers Properties LLC** | | 5.37% | * | | 07/05/07 | | 1,055,000 | | 1,055,000 |
US Bank, N.A. | | 5.32% | * | | 07/03/07 | | 1,500,000 | | 1,499,846 |
US Bank, N.A. | | 5.38% | * | | 07/02/07 | | 5,000,000 | | 5,000,847 |
White Castle Project** | | 5.38% | * | | 07/05/07 | | 3,500,000 | | 3,500,000 |
| | | | | | | | | |
Total Corporate Obligations (Cost $104,166,678) | | | | | | | 104,166,678 |
| | | | | | | | | |
U.S. Government Agency Obligations — 1.3% |
Federal Farm Credit Bank | | 4.20% | | | 01/07/08 | | 750,000 | | 745,803 |
Federal Home Loan Bank | | 3.15% | | | 09/17/07 | | 1,200,000 | | 1,194,867 |
Federal Home Loan Bank | | 4.30% | | | 01/30/08 | | 500,000 | | 497,191 |
Federal National Mortgage Association | | 2.50% | | | 07/16/07 | | 200,000 | | 199,785 |
| | | | | | | | | |
Total U.S. Government Agency Obligations (Cost $2,637,646) | | | | 2,637,646 |
| | | | | | | | | |
Repurchase Agreements — 21.6% |
Morgan Stanley DW, Inc., 5.4350%, 07/02/2007, (Collateralized by $45,248,169 various Certificates of Deposit, Government Agencies, Agency Strips, Commercial Papers at 3.25% - 8.875%, due 07/02/2007 - 10/15/2029, value — $44,317,788) purchase date 06/29/2007 | | | | | 43,446,000 | | 43,446,000 |
| | | | | | | | | |
Total Repurchase Agreements (Cost $43,446,000) | | | | | | | 43,446,000 |
| | | | | | | | | |
Total Investments — 99.4% (Cost $200,099,315)(a) | | | | | | | 200,099,315 |
| | | | | | | | | |
Other Assets less Liabilities — 0.6% | | | | 1,108,515 |
| | | | | | | | | |
Total Net Assets — 100.0% | | | | | | | 201,207,830 |
| | | | | | | | | |
The accompanying notes are an integral part of these financial statements.
Schedule of Investments
June 30, 2007 (unaudited)
The Money Market Fund
| | | | | | | | |
Security Description | | Coupon/
Yield | | Maturity | | Principal
Amount ($)
or Shares | | Value ($) |
Trustee Deferred Compensation**** |
The Flex-funds Aggressive Growth Fund | | | | | | 123 | | 1,071 |
The Flex-funds Defensive Growth Fund | | | | | | 64 | | 716 |
The Flex-funds Dynamic Growth Fund | | | | | | 837 | | 8,613 |
The Flex-funds Muirfield Fund | | | | | | 2,151 | | 13,465 |
The Flex-funds Quantex Fund | | | | | | 765 | | 16,585 |
The Flex-funds Socially Responsible Utilities Fund | | | | | | 163 | | 4,080 |
| | | | | | | | |
Total Trustee Deferred Compensation (Cost $35,229) | | | | | | | | 44,530 |
| | | | | | | | |
| (a) | Cost for federal income tax and financial reporting purposes are the same. |
| * | Variable rate security. Securities payable on demand at par including accrued interest (usually within seven days notice) and unconditionally secured as to principal and interest by letters of credit or other credit support agreements from major banks. The interest rates are adjustable and are based on bank prime rates or other interest rate adjustment indices. The rate shown represents the rate in effect at June 30, 2007. The maturity date shown reflects next rate change date. |
| ** | Represents a restricted security purchased under Rule 144A, which is exempt from registration under the Securities Act of 1933, as amended. Security is restricted as to resale to institutional investors, but has been deemed liquid in accordance with guidelines approved by the Board of Trustees. As of June 30, 2007, securities restricted as to resale to institutional investors represented 21.4% of Total Investments. |
| *** | Illiquid security. The sale or disposition of such security would not be possible in the ordinary course of business within seven days at approximately the value at which the Fund has valued the security. As of June 30, 2007, illiquid securities represented 3.7% of Total Investments. |
| **** | Assets of affiliates to The Money Market Fund held for the benefit of the Fund’s Trustees in connection with the Trustee Deferred Compensation Plan. |
The accompanying notes are an integral part of these financial statements.
Statements of Assets & Liabilities
June 30, 2007 (unaudited)
| | | | | | | | |
| | | The
Muirfield
Fund | | | The Dynamic
Growth Fund | |
Assets | | | | | | | | |
Investments, at value* | | $ | 50,827,725 | | | $ | 18,792,839 | |
Repurchase agreements, at value* | | | 1,960,000 | | | | 748,000 | |
Trustee deferred compensation investments, at value | | | 103,556 | | | | 28,300 | |
Cash | | | 580 | | | | 23 | |
Receivable for capital stock issued | | | 1,651 | | | | 100 | |
Receivable from investment advisor | | | — | | | | — | |
Interest and dividend receivable | | | 24,451 | | | | 9,117 | |
Prepaid expenses/other assets | | | 41,816 | | | | 18,260 | |
Total Assets | | | 52,959,779 | | | | 19,596,639 | |
| | |
Liabilities | | | | | | | | |
Payable for Trustee Deferred Compensation Plan | | | 103,556 | | | | 28,300 | |
Payable for net variation margin on futures contracts | | | 3,150 | | | | 1,350 | |
Payable for capital stock redeemed | | | 102,726 | | | | 27 | |
Dividends payable | | | — | | | | — | |
Dividends payable — The Money Market Fund — Retail Class | | | | | | | | |
Dividends payable — The Money Market Fund — Institutional Class | | | | | | | | |
Payable to investment advisor | | | 42,824 | | | | 12,375 | |
Accrued distribution plan (12b-1) and administrative service plan fees | | | 6,205 | | | | 2,966 | |
Accrued transfer agent, fund accounting, CCO, and administrative fees | | | 13,101 | | | | 6,021 | |
Accrued trustee fees | | | 5,050 | | | | 2,298 | |
Other accrued liabilities | | | 10,496 | | | | 7,903 | |
Total Liabilities | | | 287,108 | | | | 61,240 | |
| | | | | | | | | |
Net Assets | | $ | 52,672,671 | | | $ | 19,535,399 | |
| | |
Net Assets | | | | | | | | |
Capital | | $ | 52,141,877 | | | $ | 17,404,668 | |
Accumulated undistributed (distributions in excess of) net investment income | | | (56,287 | ) | | | (10,234 | ) |
Accumulated undistributed net realized gain (loss) from investments and futures contracts | | | (4,508,115 | ) | | | 555,595 | |
Net unrealized appreciation (depreciation) of investments and futures contracts | | | 5,095,196 | | | | 1,585,370 | |
Total Net Assets | | $ | 52,672,671 | | | $ | 19,535,399 | |
| | |
Net Assets | | | | | | | | |
The Money Market Fund — Retail Class | | | | | | | | |
The Money Market Fund — Institutional Class | | | | | | | | |
Total Net Assets | | | | | | | | |
| | |
Capital Stock Outstanding (indefinite number of shares authorized, $0.10 par value) | | | 8,420,287 | | | | 1,898,184 | |
The Money Market Fund — Retail Class | | | | | | | | |
The Money Market Fund — Institutional Class | | | | | | | | |
Total Capital Stock Outstanding | | | | | | | | |
| | |
Net Asset Value, Offering and Redemption Price Per Share | | $ | 6.26 | | | $ | 10.29 | |
The Money Market Fund — Retail Class | | | | | | | | |
The Money Market Fund — Institutional Class | | | | | | | | |
* Investments and repurchase agreements, at cost | | $ | 47,713,004 | | | $ | 17,964,119 | |
The accompanying notes are an integral part of these financial statements.
| | | | | | | | | | | | | | | | | | | | | | | |
The Aggressive
Growth Fund | | | The Defensive
Growth Fund | | The Focused
Growth Fund | | The
Quantex
Fund | | | The Socially
Responsible
Utilities Fund | | | The U.S.
Government
Bond Fund | | | The Money
Market Fund |
| | | | | | | | | | | | | | | | | | | | | | | |
| $ | 24,821,734 | | | $ | 53,737,395 | | $ | 47,912,891 | | $ | 22,241,446 | | | $ | 25,168,977 | | | $ | 9,483,477 | | | $ | 156,653,315 |
| | 3,044,000 | | | | 7,509,000 | | | 7,557,000 | | | 2,451,000 | | | | 785,000 | | | | 2,171,000 | | | | 43,446,000 |
| | 24,323 | | | | 8,559 | | | 7,796 | | | 50,743 | | | | 38,087 | | | | 28,738 | | | | 44,530 |
| | 546 | | | | 852 | | | 522 | | | 875 | | | | 559 | | | | 217 | | | | 110 |
| | 49,771 | | | | — | | | 504 | | | 200 | | | | 7,996 | | | | 338 | | | | — |
| | — | | | | — | | | — | | | — | | | | — | | | | 5,361 | | | | 15,366 |
| | 83,592 | | | | 206,893 | | | 184,207 | | | 14,361 | | | | 22,405 | | | | 149,654 | | | | 1,205,908 |
| | 11,922 | | | | 11,095 | | | 10,906 | | | 9,452 | | | | 10,007 | | | | 13,182 | | | | 26,560 |
| | 28,035,888 | | | | 61,473,794 | | | 55,673,826 | | | 24,768,077 | | | | 26,033,031 | | | | 11,851,967 | | | | 201,391,789 |
| | | | | | |
| | | | | | | | | | | | | | | | | | | | | | | |
| | 24,323 | | | | 8,559 | | | 7,796 | | | 50,743 | | | | 38,087 | | | | 28,738 | | | | 44,530 |
| | 4,725 | | | | 13,950 | | | 15,075 | | | 5,400 | | | | — | | | | — | | | | — |
| | — | | | | 131,511 | | | 29,619 | | | 27,019 | | | | 11,519 | | | | 36,773 | | | | — |
| | — | | | | — | | | — | | | 259 | | | | 86 | | | | 2,415 | | | | |
| | | | | | | | | | | | | | | | | | | | | | | 6,950 |
| | | | | | | | | | | | | | | | | | | | | | | 33,563 |
| | 16,961 | | | | 37,052 | | | 33,257 | | | 15,209 | | | | 21,531 | | | | 3,812 | | | | 30,906 |
| | 17,268 | | | | 61,911 | | | 53,051 | | | 4,209 | | | | 11,315 | | | | 4,857 | | | | 16,314 |
| | 7,978 | | | | 10,938 | | | 10,186 | | | 7,231 | | | | 7,300 | | | | 3,002 | | | | 27,290 |
| | 2,484 | | | | 4,809 | | | 4,115 | | | 2,354 | | | | 2,593 | | | | 2,072 | | | | 1,161 |
| | 7,791 | | | | 7,622 | | | 7,440 | | | 7,764 | | | | 10,153 | | | | 6,822 | | | | 23,245 |
| | 81,530 | | | | 276,352 | | | 160,539 | | | 120,188 | | | | 102,584 | | | | 88,491 | | | | 183,959 |
| | | | | | | | | | | | | | | | | | | | | | | | |
| $ | 27,954,358 | | | $ | 61,197,442 | | $ | 55,513,287 | | $ | 24,647,889 | | | $ | 25,930,447 | | | $ | 11,763,476 | | | $ | 201,207,830 |
| | | | | | |
| | | | | | | | | | | | | | | | | | | | | | | |
| $ | 30,524,706 | | | $ | 55,853,263 | | $ | 50,338,072 | | $ | 23,061,254 | | | $ | 22,382,098 | | | $ | 12,941,683 | | | $ | 201,207,830 |
| | 40,695 | | | | 62,282 | | | 39,592 | | | 33,267 | | | | 29,557 | | | | 83,531 | | | | — |
| | (5,086,665 | ) | | | 495,711 | | | 519,563 | | | (2,249,708 | ) | | | (3,721,654 | ) | | | (1,115,772 | ) | | | — |
| | 2,475,622 | | | | 4,786,186 | | | 4,616,060 | | | 3,803,076 | | | | 7,240,446 | | | | (145,966 | ) | | | — |
| $ | 27,954,358 | | | $ | 61,197,442 | | $ | 55,513,287 | | $ | 24,647,889 | | | $ | 25,930,447 | | | $ | 11,763,476 | | | $ | 201,207,830 |
| | | | | | |
| | | | | | | | | | | | | | | | | | | | | | | |
| | | | | | | | | | | | | | | | | | | | | | $ | 180,238,228 |
| | | | | | | | | | | | | | | | | | | | | | | | 20,969,602 |
| | | | | | | | | | | | | | | | | | | | | | | $ | 201,207,830 |
| | | | | | |
| | 3,209,850 | | | | 5,468,840 | | | 4,856,706 | | | 1,136,903 | | | | 1,036,049 | | | | 594,434 | | | | |
| | | | | | | | | | | | | | | | | | | | | | | 180,238,228 |
| | | | | | | | | | | | | | | | | | | | | | | | 20,969,602 |
| | | | | | | | | | | | | | | | | | | | | | | | 201,207,830 |
| | | | | | |
| $ | 8.71 | | | $ | 11.19 | | $ | 11.43 | | $ | 21.68 | | | $ | 25.03 | | | $ | 19.79 | | | | |
| | | | | | | | | | | | | | | | | | | | | | $ | 1.00 |
| | | | | | | | | | | | | | | | | | | | | | | $ | 1.00 |
| $ | 25,406,487 | | | $ | 56,494,684 | | $ | 50,874,981 | | $ | 20,901,595 | | | $ | 18,713,531 | | | $ | 11,800,443 | | | $ | 200,099,315 |
Statements of Operations
For the Period Ended June 30, 2007 (unaudited)
| | | | | | | | |
| | | The
Muirfield
Fund | | | The Dynamic
Growth Fund | |
Investment Income | | | | | | | | |
Interest | | $ | 87,963 | | | $ | 40,124 | |
Dividends | | | 217,517 | | | | 81,052 | |
Total Investment Income | | | 305,480 | | | | 121,176 | |
| | |
Fund Expenses | | | | | | | | |
Investment advisor | | | 256,194 | | | | 74,109 | |
Transfer agent | | | 31,031 | | | | 11,857 | |
Transfer agent — The Money Market Fund — Retail Class | | | | | | | | |
Transfer agent — The Money Market Fund — Institutional Class | | | | | | | | |
Fund accounting | | | 19,632 | | | | 12,374 | |
Administrative | | | 25,667 | | | | 9,881 | |
Trustee | | | 9,685 | | | | 4,932 | |
Audit | | | 4,642 | | | | 4,653 | |
Legal | | | 5,523 | | | | 5,523 | |
Custody | | | 4,029 | | | | 2,053 | |
Printing | | | 4,310 | | | | 1,713 | |
Distribution plan (12b-1) | | | 51,795 | | | | 24,755 | |
Distribution plan (12b-1) — The Money Market Fund — Retail Class | | | | | | | | |
Distribution plan (12b-1) — The Money Market Fund — Institutional Class | | | | | | | | |
Administrative service plan | | | 51,720 | | | | 19,765 | |
Postage | | | 4,404 | | | | 1,431 | |
Registration and filing | | | 7,847 | | | | 3,996 | |
Insurance | | | 1,880 | | | | 524 | |
Chief Compliance Officer | | | 2,533 | | | | 2,533 | |
Other | | | 6,259 | | | | 3,778 | |
Total Expenses Before Reductions | | | 487,151 | | | | 183,877 | |
| | |
Expenses reimbursed/waived by investment advisor | | | — | | | | — | |
Expenses paid indirectly | | | (35,472 | ) | | | (13,135 | ) |
Distribution plan (12b-1) expenses waived | | | (40,342 | ) | | | (20,555 | ) |
Administrative service plan expenses waived | | | (49,134 | ) | | | (18,777 | ) |
Transfer agent expenses waived | | | — | | | | — | |
Net Expenses | | | 362,203 | | | | 131,410 | |
| | | | | | | | | |
Net Investment Income (Loss) | | | (56,723 | ) | | | (10,234 | ) |
| | |
Realized and Unrealized Gain (Loss) from Investments | | | | | | | | |
Net realized gains (losses) from investments | | | 1,774,634 | | | | 935,985 | |
Net realized gains (losses) from futures contracts | | | 133,585 | | | | 58,956 | |
Net Realized Gains (Losses) from Investment Transactions, Futures Contracts, and Distributions of Realized Gains by Other Investment Companies | | | 1,908,219 | | | | 994,941 | |
| | |
Net change in unrealized appreciation (depreciation) of investments and futures contracts | | | 1,930,029 | | | | 449,783 | |
Net Realized and Unrealized Gain (Loss) from Investments | | | 3,838,248 | | | | 1,444,724 | |
| | | | | | | | | |
Net Change in Net Assets Resulting from Operations | | $ | 3,781,525 | | | $ | 1,434,490 | |
The accompanying notes are an integral part of these financial statements.
| | | | | | | | | | | | | | | | | | | | | | | | | | |
The Aggressive
Growth Fund | | | The Defensive
Growth Fund | | | The Focused
Growth Fund | | | The
Quantex
Fund | | | The Socially
Responsible
Utilities Fund | | | The U.S.
Government
Bond Fund | | | The Money
Market Fund | |
| | | | | | | | | | | | | | | | | | | | | | | | | | |
| $ | 62,393 | | | $ | 156,631 | | | $ | 133,883 | | | $ | 82,496 | | | $ | 10,784 | | | $ | 175,281 | | | $ | 5,139,568 | |
| | 183,924 | | | | 434,368 | | | | 372,222 | | | | 190,694 | | | | 278,963 | | | | — | | | | — | |
| | 246,317 | | | | 590,999 | | | | 506,105 | | | | 273,190 | | | | 289,747 | | | | 175,281 | | | | 5,139,568 | |
| | | | | | |
| | | | | | | | | | | | | | | | | | | | | | | | | | |
| | 90,778 | | | | 197,404 | | | | 171,134 | | | | 110,815 | | | | 123,760 | | | | 13,924 | | | | 312,991 | |
| | 14,524 | | | | 31,585 | | | | 27,382 | | | | 13,298 | | | | 14,851 | | | | 4,000 | | | | | |
| | | | | | | | | | | | | | | | | | | | | | | | | 66,915 | |
| | | | | | | | | | | | | | | | | | | | | | | | | 9,324 | |
| | 14,597 | | | | 19,724 | | | | 19,024 | | | | 13,575 | | | | 14,869 | | | | 5,110 | | | | 27,977 | |
| | 12,104 | | | | 25,909 | | | | 22,717 | | | | 11,082 | | | | 12,376 | | | | 3,481 | | | | 81,209 | |
| | 5,522 | | | | 9,755 | | | | 8,667 | | | | 5,238 | | | | 5,625 | | | | 4,161 | | | | 4,632 | |
| | 4,653 | | | | 4,631 | | | | 4,631 | | | | 4,631 | | | | 4,653 | | | | 4,631 | | | | 5,016 | |
| | 5,523 | | | | 5,523 | | | | 5,523 | | | | 5,523 | | | | 5,523 | | | | 5,523 | | | | 5,743 | |
| | 2,133 | | | | 3,782 | | | | 3,332 | | | | 4,905 | | | | 2,004 | | | | 1,496 | | | | 7,587 | |
| | 1,896 | | | | 4,114 | | | | 3,555 | | | | 1,751 | | | | 2,031 | | | | 649 | | | | 17,572 | |
| | 30,276 | | | | 65,801 | | | | 57,045 | | | | 22,192 | | | | 30,947 | | | | 6,954 | | | | | |
| | | | | | | | | | | | | | | | | | | | | | | | | 167,374 | |
| | | | | | | | | | | | | | | | | | | | | | | | | 3,449 | |
| | 24,180 | | | | 52,879 | | | | 45,816 | | | | 22,124 | | | | 24,754 | | | | 6,962 | | | | — | |
| | 1,595 | | | | 2,774 | | | | 2,377 | | | | 2,175 | | | | 3,689 | | | | 689 | | | | 18,634 | |
| | 9,153 | | | | 12,355 | | | | 12,221 | | | | 9,754 | | | | 6,939 | | | | 5,503 | | | | 20,036 | |
| | 957 | | | | 1,467 | | | | 1,325 | | | | 823 | | | | 1,214 | | | | 195 | | | | 12,756 | |
| | 2,533 | | | | 2,524 | | | | 2,524 | | | | 2,533 | | | | 2,741 | | | | 2,533 | | | | 2,533 | |
| | 3,355 | | | | 3,001 | | | | 2,942 | | | | 4,453 | | | | 4,955 | | | | 2,930 | | | | 29,239 | |
| | 223,779 | | | | 443,228 | | | | 390,215 | | | | 234,872 | | | | 260,931 | | | | 68,741 | | | | 792,987 | |
| | | | | | |
| | — | | | | — | | | | — | | | | (27,702 | ) | | | — | | | | (23,662 | ) | | | (219,228 | ) |
| | — | | | | — | | | | — | | | | — | | | | — | | | | — | | | | — | |
| | (7,384 | ) | | | (5,264 | ) | | | (4,564 | ) | | | (16,843 | ) | | | (8,664 | ) | | | (3,446 | ) | | | (115,016 | ) |
| | (10,773 | ) | | | (238 | ) | | | (180 | ) | | | (18,505 | ) | | | (16,091 | ) | | | (3,899 | ) | | | — | |
| | — | | | | (18,425 | ) | | | (15,973 | ) | | | — | | | | — | | | | (1,541 | ) | | | (17,354 | ) |
| | 205,622 | | | | 419,301 | | | | 369,498 | | | | 171,822 | | | | 236,176 | | | | 36,193 | | | | 441,389 | |
| | | | | | | | | | | | | | | | | | | | | | | | | | | |
| | 40,695 | | | | 171,698 | | | | 136,607 | | | | 101,368 | | | | 53,571 | | | | 139,088 | | | | 4,698,179 | |
| | | | | | |
| | | | | | | | | | | | | | | | | | | | | | | | | | |
| | 507,781 | | | | 772,681 | | | | 679,222 | | | | 1,099,060 | | | | 1,489,626 | | | | 902 | | | | | |
| | 57,417 | | | | 209,099 | | | | 192,535 | | | | 191,332 | | | | — | | | | — | | | | | |
|
565,198 |
| | | 981,780 | | | | 871,757 | | | | 1,290,392 | | | | 1,489,626 | | | | 902 | | | | | |
| | | | | | |
| | 970,355 | | | | 2,252,904 | | | | 1,856,687 | | | | 561,421 | | | | 1,401,084 | | | | (182,442 | ) | | | | |
| | 1,535,553 | | | | 3,234,684 | | | | 2,728,444 | | | | 1,851,813 | | | | 2,890,710 | | | | (181,540 | ) | | | | |
| | | | | | | | | | | | | | | | | | | | | | | | | | | |
| $ | 1,576,248 | | | $ | 3,406,382 | | | $ | 2,865,051 | | | $ | 1,953,181 | | | $ | 2,944,281 | | | $ | (42,452 | ) | | $ | 4,698,179 | |
Statements of Changes in Net Assets
For the Period Ended June 30, 2007 (unaudited) and the Year Ended December 31, 2006
| | | | | | | | |
| | |
The Muirfield Fund | |
| | | 2007 | | | 2006 | |
Operations | | | | | | | | |
Net investment income (loss) | | $ | (56,723 | ) | | $ | 374,043 | |
Net realized gain (loss) from investments, futures contracts, options contracts, and distributions by other investment companies | | | 1,908,219 | | | | 1,536,045 | |
Net change in unrealized appreciation (depreciation) of investments, futures contracts, and options contracts | | | 1,930,029 | | | | 6,082,290 | |
Net change in net assets resulting from operations | | | 3,781,525 | | | | 7,992,378 | |
| | |
Distributions to Shareholders | | | | | | | | |
From net investment income | | | — | | | | (374,043 | ) |
Net change in net assets resulting from distributions | | | — | | | | (374,043 | ) |
| | |
Capital Transactions | | | | | | | | |
Issued | | | 2,239,534 | | | | 19,627,011 | |
Reinvested | | | — | | | | 371,082 | |
Redeemed | | | (6,575,414 | ) | | | (52,570,518 | ) |
Net change in net assets resulting from capital transactions | | | (4,335,880 | ) | | | (32,572,425 | ) |
| | | | | | | | | |
Total Change in Net Assets | | | (554,355 | ) | | | (24,954,090 | ) |
| | |
Net Assets — Beginning of Period | | | 53,227,026 | | | | 78,181,116 | |
Net Assets — End of Period | | $ | 52,672,671 | | | $ | 53,227,026 | |
Accumulated undistributed (distributions in excess of) net investment income | | $ | (56,287 | ) | | $ | 436 | |
| | |
Share Transactions | | | | | | | | |
Issued | | | 375,800 | | | | 3,627,119 | |
Reinvested | | | — | | | | 63,870 | |
Redeemed | | | (1,110,430 | ) | | | (9,708,084 | ) |
Net change in shares | | | (734,630 | ) | | | (6,017,095 | ) |
| * | Commenced Operations January 31, 2006 |
The accompanying notes are an integral part of these financial statements.
| | | | | | | | | | | | | | | | | | | | | | |
The Dynamic
Growth Fund | | | The Aggressive
Growth Fund | | | The Defensive
Growth Fund | |
| 2007 | | | 2006 | | | 2007 | | | 2006 | | | 2007 | | | 2006* | |
| | | | | | | | | | | | | | | | | | | | | | |
| $ | (10,234 | ) | | $ | 92,486 | | | $ | 40,695 | | | $ | 88,397 | | | $ | 171,698 | | | $ | 295,633 | |
|
994,941 |
| | | 1,914,777 | | | | 565,198 | | | | 802,775 | | | | 981,780 | | | | (486,069 | ) |
|
449,783 |
| | | 1,617,074 | | | | 970,355 | | | | 1,298,356 | | | | 2,252,904 | | | | 2,533,282 | |
| | 1,434,490 | | | | 3,624,337 | | | | 1,576,248 | | | | 2,189,528 | | | | 3,406,382 | | | | 2,342,846 | |
| | | | | |
| | | | | | | | | | | | | | | | | | | | | | |
| | — | | | | (92,486 | ) | | | — | | | | (88,397 | ) | | | (109,416 | ) | | | (295,633 | ) |
| | — | | | | (92,486 | ) | | | — | | | | (88,397 | ) | | | (109,416 | ) | | | (295,633 | ) |
| | | | | |
| | | | | | | | | | | | | | | | | | | | | | |
| | 885,915 | | | | 7,144,136 | | | | 8,203,911 | | | | 11,265,260 | | | | 18,040,873 | | | | 42,079,796 | |
| | — | | | | 92,487 | | | | — | | | | 87,562 | | | | 109,419 | | | | 295,634 | |
| | (4,350,975 | ) | | | (21,145,489 | ) | | | (3,380,166 | ) | | | (3,538,875 | ) | | | (2,738,590 | ) | | | (1,933,869 | ) |
| | (3,465,060 | ) | | | (13,908,866 | ) | | | 4,823,745 | | | | 7,813,947 | | | | 15,411,702 | | | | 40,441,561 | |
| | | | | | | | | | | | | | | | | | | | | | | |
| | (2,030,570 | ) | | | (10,377,015 | ) | | | 6,399,993 | | | | 9,915,078 | | | | 18,708,668 | | | | 42,488,774 | |
| | | | | |
| | 21,565,969 | | | | 31,942,984 | | | | 21,554,365 | | | | 11,639,287 | | | | 42,488,774 | | | | | |
| $ | 19,535,399 | | | $ | 21,565,969 | | | $ | 27,954,358 | | | $ | 21,554,365 | | | $ | 61,197,442 | | | $ | 42,488,774 | |
| $ | (10,234 | ) | | $ | — | | | $ | 40,695 | | | $ | — | | | $ | 62,282 | | | $ | — | |
| | | | | |
| | | | | | | | | | | | | | | | | | | | | | |
| | 88,792 | | | | 800,334 | | | | 967,778 | | | | 1,486,767 | | | | 1,666,149 | | | | 4,211,363 | |
| | — | | | | 9,674 | | | | — | | | | 10,770 | | | | 9,778 | | | | 28,129 | |
| | (446,124 | ) | | | (2,413,233 | ) | | | (409,935 | ) | | | (464,646 | ) | | | (250,299 | ) | | | (196,279 | ) |
| | (357,332 | ) | | | (1,603,225 | ) | | | 557,843 | | | | 1,032,891 | | | | 1,425,628 | | | | 4,043,213 | |
Statements of Changes in Net Assets
For the Period Ended June 30, 2007 (unaudited) and the Year Ended December 31, 2006
| | | | | | | | | | | | | | | | |
| | | The Focused
Growth Fund | | | The Quantex Fund | |
| | | 2007 | | | 2006* | | | 2007 | | | 2006 | |
Operations | | | | | | | | | | | | | | | | |
Net investment income (loss) | | $ | 136,607 | | | $ | 207,143 | | | $ | 101,368 | | | $ | 79,757 | |
Net realized gain (loss) from investments, futures contracts, options contracts, and distributions by other investment companies | | | 871,757 | | | | (352,194 | ) | | | 1,290,392 | | | | 1,249,449 | |
Net change in unrealized appreciation (depreciation) of investments, futures contracts, and options contracts | | | 1,856,687 | | | | 2,759,373 | | | | 561,421 | | | | 1,417,080 | |
Net change in net assets resulting from operations | | | 2,865,051 | | | | 2,614,322 | | | | 1,953,181 | | | | 2,746,286 | |
| | | | |
Distributions to Shareholders | | | | | | | | | | | | | | | | |
From net investment income | | | (97,015 | ) | | | (207,143 | ) | | | (68,101 | ) | | | (79,757 | ) |
Net change in net assets resulting from distributions | | | (97,015 | ) | | | (207,143 | ) | | | (68,101 | ) | | | (79,757 | ) |
| | | | |
Distributions to Shareholders | | | | | | | | | | | | | | | | |
— The Money Market Fund | | | | | | | | | | | | | | | | |
— Retail Class | | | | | | | | | | | | | | | | |
From net investment income | | | | | | | | | | | | | | | | |
Net change in net assets resulting from distributions | | | | | | | | | | | | | | | | |
| | | | |
Distributions to Shareholders | | | | | | | | | | | | | | | | |
— The Money Market Fund | | | | | | | | | | | | | | | | |
— Institutional Class | | | | | | | | | | | | | | | | |
From net investment income | | | | | | | | | | | | | | | | |
Net change in net assets resulting from distributions | | | | | | | | | | | | | | | | |
| | | | |
Capital Transactions | | | | | | | | | | | | | | | | |
Issued | | | 18,269,584 | | | | 35,057,589 | | | | 6,379,578 | | | | 3,868,932 | |
Reinvested | | | 97,015 | | | | 207,140 | | | | 67,842 | | | | 78,941 | |
Redeemed | | | (2,154,834 | ) | | | (1,138,422 | ) | | | (3,758,213 | ) | | | (3,655,243 | ) |
Net change in net assets resulting from capital transactions | | | 16,211,765 | | | | 34,126,307 | | | | 2,689,207 | | | | 292,630 | |
| | | | | | | | | | | | | | | | | |
Total Change in Net Assets | | | 18,979,801 | | | | 36,533,486 | | | | 4,574,287 | | | | 2,959,159 | |
| | | | |
Net Assets — Beginning of Period | | | 36,533,486 | | | | | | | | 20,073,602 | | | | 17,114,443 | |
Net Assets — End of Period | | $ | 55,513,287 | | | $ | 36,533,486 | | | $ | 24,647,889 | | | $ | 20,073,602 | |
Accumulated undistributed (distributions in excess of) net investment income | | $ | 39,592 | | | $ | — | | | $ | 33,267 | | | $ | — | |
| | | | |
Share Transactions | | | | | | | | | | | | | | | | |
Issued | | | 1,639,335 | | | | 3,499,231 | | | | 306,427 | | | | 206,066 | |
Reinvested | | | 8,488 | | | | 19,305 | | | | 3,129 | | | | 3,975 | |
Redeemed | | | (194,905 | ) | | | (114,748 | ) | | | (183,606 | ) | | | (200,266 | ) |
Net change in shares | | | 1,452,918 | | | | 3,403,788 | | | | 125,950 | | | | 9,775 | |
| * | Commenced Operations January 31, 2006 |
The accompanying notes are an integral part of these financial statements.
| | | | | | | | | | | | | | | | | | | | | | |
The Socially Responsible
Utilities Fund | | | The U.S. Government
Bond Fund | | | The Money Market Fund | |
| 2007 | | | 2006 | | | 2007 | | | 2006 | | | 2007 | | | 2006 | |
| | | | | | | | | | | | | | | | | | | | | | |
| $ | 53,571 | | | $ | 169,419 | | | $ | 139,088 | | | $ | 196,016 | | | $ | 4,698,179 | | | $ | 7,867,928 | |
|
1,489,626 |
| | | 1,617,271 | | | | 902 | | | | (64,418 | ) | | | — | | | | — | |
|
1,401,084 |
| | | 1,955,298 | | | | (182,442 | ) | | | 62,649 | | | | — | | | | — | |
| | 2,944,281 | | | | 3,741,988 | | | | (42,452 | ) | | | 194,247 | | | | 4,698,179 | | | | 7,867,928 | |
| | | | | |
| | | | | | | | | | | | | | | | | | | | | | |
| | (24,014 | ) | | | (169,419 | ) | | | (211,077 | ) | | | (198,029 | ) | | | | | | | | |
| | (24,014 | ) | | | (169,419 | ) | | | (211,077 | ) | | | (198,029 | ) | | | | | | | | |
| | | | | |
| | | | | | | | | | | | | | | | | | | | | | |
| | | | | | | | | | | | | | | | | | | | | | |
| | | | | | | | | | | | | | | | | | | | | | |
| | | | | | | | | | | | | | | | | | (4,110,200 | ) | | | (6,642,167 | ) |
| | | | | | | | | | | | | | | | | | (4,110,200 | ) | | | (6,642,167 | ) |
| | | | | |
| | | | | | | | | | | | | | | | | | | | | | |
| | | | | | | | | | | | | | | | | | | | | | |
| | | | | | | | | | | | | | | | | | | | | | |
| | | | | | | | | | | | | | | | | | (587,979 | ) | | | (1,225,761 | ) |
| | | | | | | | | | | | | | | | | | (587,979 | ) | | | (1,225,761 | ) |
| | | | | |
| | | | | | | | | | | | | | | | | | | | | | |
| | 2,446,147 | | | | 4,477,094 | | | | 8,609,271 | | | | 3,225,017 | | | | 116,900,471 | | | | 240,918,986 | |
| | 23,599 | | | | 166,370 | | | | 191,038 | | | | 178,780 | | | | 4,433,455 | | | | 7,284,810 | |
| | (3,428,415 | ) | | | (6,891,162 | ) | | | (3,901,218 | ) | | | (2,606,329 | ) | | | (103,884,674 | ) | | | (214,728,108 | ) |
| | (958,669 | ) | | | (2,247,698 | ) | | | 4,899,091 | | | | 797,468 | | | | 17,449,252 | | | | 33,475,688 | |
| | | | | | | | | | | | | | | | | | | | | | | |
| | 1,961,598 | | | | 1,324,871 | | | | 4,645,562 | | | | 793,686 | | | | 17,449,252 | | | | 33,475,688 | |
| | | | | |
| | 23,968,849 | | | | 22,643,978 | | | | 7,117,914 | | | | 6,324,228 | | | | 183,758,578 | | | | 150,282,890 | |
| $ | 25,930,447 | | | $ | 23,968,849 | | | $ | 11,763,476 | | | $ | 7,117,914 | | | $ | 201,207,830 | | | $ | 183,758,578 | |
| | | | | |
| $ | 29,557 | | | $ | — | | | $ | 83,531 | | | $ | 155,520 | | | $ | — | | | $ | — | |
| | | | | |
| | | | | | | | | | | | | | | | | | | | | | |
| | 103,325 | | | | 219,810 | | | | 427,169 | | | | 158,721 | | | | 116,900,471 | | | | 240,918,986 | |
| | 987 | | | | 8,186 | | | | 9,538 | | | | 8,871 | | | | 4,433,455 | | | | 7,284,810 | |
| | (146,685 | ) | | | (339,189 | ) | | | (192,849 | ) | | | (129,827 | ) | | | (103,884,674 | ) | | | (214,728,108 | ) |
| | (42,373 | ) | | | (111,193 | ) | | | 243,858 | | | | 37,765 | | | | 17,449,252 | | | | 33,475,688 | |
Financial Highlights
For a Share Outstanding Through the Period Ended June 30, 2007 (unaudited) and
Each Fiscal Year Ended December 31,
| | | | | | | | | | | | | | | | | | | | |
| | | | | Income from Investment Operations | | | Less Distributions | |
| | | Net Asset
Value,
Beginning
of Period | | Net
Investment
Income | | |
Net gains (losses) on
securities, futures, and
options (both realized
and unrealized) | | | Total from
Investment
Operations | | | From Net
Investment
Income | | | From Net
Capital
Gains | | Total
Distributions | |
The Muirfield Fund(1)(2)(3)(4)(5)(6)(7) | | | | | | | | | | | | | | | |
2007 | | $ | 5.81 | | (0.01 | ) | | 0.46 | | | 0.45 | | | — | | | — | | 0.00 | |
2006 | | $ | 5.15 | | 0.04 | | | 0.66 | | | 0.70 | | | (0.04 | ) | | — | | (0.04 | ) |
2005 | | $ | 5.11 | | 0.07 | | | 0.04 | | | 0.11 | | | (0.07 | ) | | — | | (0.07 | ) |
2004 | | $ | 4.79 | | 0.01 | | | 0.32 | | | 0.33 | | | (0.01 | ) | | — | | (0.01 | ) |
2003 | | $ | 3.76 | | (0.04 | ) | | 1.07 | | | 1.03 | | | — | | | — | | 0.00 | |
2002 | | $ | 4.25 | | (0.02 | ) | | (0.47 | ) | | (0.49 | ) | | — | | | — | | 0.00 | |
The Dynamic Growth Fund(1)(2)(3)(4)(5)(6)(7) | | | | | | | | | |
2007 | | $ | 9.56 | | — | | | 0.73 | | | 0.73 | | | — | | | — | | 0.00 | |
2006 | | $ | 8.28 | | 0.04 | | | 1.28 | | | 1.32 | | | (0.04 | ) | | — | | (0.04 | ) |
2005 | | $ | 7.94 | | 0.06 | | | 0.34 | | | 0.40 | | | (0.06 | ) | | — | | (0.06 | ) |
2004 | | $ | 7.67 | | (0.04 | ) | | 0.31 | | | 0.27 | | | — | | | — | | 0.00 | |
2003 | | $ | 5.58 | | (0.06 | ) | | 2.15 | | | 2.09 | | | — | | | — | | 0.00 | |
2002 | | $ | 7.37 | | (0.04 | ) | | (1.75 | ) | | (1.79 | ) | | — | | | — | | 0.00 | |
The Aggressive Growth Fund(1)(2)(3)(4)(5)(6)(7) | | | | | | | | | |
2007 | | $ | 8.13 | | 0.01 | | | 0.57 | | | 0.58 | | | — | | | — | | 0.00 | |
2006 | | $ | 7.19 | | 0.03 | | | 0.94 | | | 0.97 | | | (0.03 | ) | | — | | (0.03 | ) |
2005 | | $ | 6.83 | | 0.02 | | | 0.36 | | | 0.38 | | | (0.02 | ) | | — | | (0.02 | ) |
2004 | | $ | 6.65 | | (0.03 | ) | | 0.21 | | | 0.18 | | | — | | | — | | 0.00 | |
2003 | | $ | 4.79 | | (0.05 | ) | | 1.91 | | | 1.86 | | | — | | | — | | 0.00 | |
2002 | | $ | 6.52 | | (0.06 | ) | | (1.67 | ) | | (1.73 | ) | | — | | | — | | 0.00 | |
The Defensive Growth Fund(2)(4)(5)(6) | | | | | | | | | |
2007 | | $ | 10.51 | | 0.04 | | | 0.66 | | | 0.70 | | | (0.02 | ) | | — | | (0.02 | ) |
2006* | | $ | 10.00 | | 0.07 | | | 0.51 | | | 0.58 | | | (0.07 | ) | | — | | (0.07 | ) |
The Focused Growth Fund(2)(4)(5)(6) | | | | | | | | | |
2007 | | $ | 10.73 | | 0.03 | | | 0.69 | | | 0.72 | | | (0.02 | ) | | — | | (0.02 | ) |
2006* | | $ | 10.00 | | 0.06 | | | 0.73 | | | 0.79 | | | (0.06 | ) | | — | | (0.06 | ) |
| 1 | Ratio of net expenses to average net assets, ratio of net investment income (loss) to average net assets, and ratio of expenses to average net assets after reductions, excluding expenses paid indirectly, reflect reductions in corresponding portfolio, if applicable. |
| 2 | Ratio of net expenses to average net assets, ratio of net investment income (loss) to average net assets, ratio of expenses to average net assets after reductions, excluding expenses paid indirectly, and ratio of expenses to average net assets before reductions do not include impact of expenses of the underlying security holdings as represented in the schedule of investments. |
| 3 | Prior to the year ended December 31, 2003, the portfolio turnover rate represented the turnover rate of the corresponding portfolio. During 2003, the Fund’s portfolio turnover rate for the period January 1 through April 13 is equivalent to the portfolio into which the fund invested. Beginning April 14 the Fund commenced calculating the portfolio turnover rate based on its own activities. Hence, the portfolio turnover rate represented for 2003 is a combination of these two periods. Subsequent to 2003 the portfolio turnover rate is specific to the Fund. |
| 4 | Recognition of net investment income by the Fund is affected by the timing of the declaration of dividends by the underlying investment companies in which the Fund invests. |
The accompanying notes are an integral part of these financial statements.
| | | | | | | | | | | | | | | | | | | | | | |
| | | | | | Ratios/Supplemental Data | |
Net Asset
Value,
End of
Period | | Total Return
(Assumes
Reinvestment
of Distributions) | | | Net Assets,
End of
Period
($000) | | Ratio of Net
Expenses to
Average
Net Assets | | | Ratio of Net
Investment
Income (Loss)
to Average
Net Assets | | | Ratio of Expenses to
Average Net Assets
after Reductions,
Excluding Expenses
Paid Indirectly | | | Ratio of Expenses
to Average Net
Assets Before
Reductions | | | Portfolio
Turnover
Rate | |
| | | | | | | | | | | | | | | | | | | | | | |
| $ | 6.26 | | 7.75 | % | | $ | 52,673 | | 1.40 | % | | (0.22 | %) | | 1.54 | % | | 1.88 | % | | 41 | % |
| $ | 5.81 | | 13.62 | % | | $ | 53,227 | | 1.45 | % | | 0.65 | % | | 1.56 | % | | 1.85 | % | | 131 | % |
| $ | 5.15 | | 2.13 | % | | $ | 78,181 | | 1.42 | % | | 1.36 | % | | 1.53 | % | | 1.76 | % | | 145 | % |
| $ | 5.11 | | 6.80 | % | | $ | 69,656 | | 1.26 | % | | 0.12 | % | | 1.45 | % | | 1.70 | % | | 145 | % |
| $ | 4.79 | | 27.39 | % | | $ | 58,524 | | 1.39 | % | | (1.06 | %) | | 1.47 | % | | 1.60 | % | | 252 | % |
| $ | 3.76 | | (11.42 | %) | | $ | 47,644 | | 1.41 | % | | (0.43 | %) | | 1.46 | % | | 1.46 | % | | 278 | % |
| | | | | | | | | | | | | | | | | | | | | | |
| $ | 10.29 | | 7.64 | % | | $ | 19,535 | | 1.33 | % | | (0.10 | %) | | 1.46 | % | | 1.86 | % | | 47 | % |
| $ | 9.56 | | 15.96 | % | | $ | 21,566 | | 1.42 | % | | 0.42 | % | | 1.55 | % | | 1.86 | % | | 123 | % |
| $ | 8.28 | | 5.08 | % | | $ | 31,943 | | 1.41 | % | | 0.87 | % | | 1.58 | % | | 1.84 | % | | 202 | % |
| $ | 7.94 | | 3.52 | % | | $ | 24,862 | | 1.20 | % | | (0.48 | %) | | 1.41 | % | | 1.70 | % | | 174 | % |
| $ | 7.67 | | 37.46 | % | | $ | 21,024 | | 1.22 | % | | (0.84 | %) | | 1.27 | % | | 1.60 | % | | 250 | % |
| $ | 5.58 | | (24.29 | %) | | $ | 17,094 | | 1.18 | % | | (0.69 | %) | | 1.29 | % | | 1.35 | % | | 392 | % |
| | | | | | | | | | | | | | | | | | | | | | |
| $ | 8.71 | | 7.13 | % | | $ | 27,954 | | 1.70 | % | | 0.34 | % | | 1.70 | % | | 1.85 | % | | 33 | % |
| $ | 8.13 | | 13.54 | % | | $ | 21,554 | | 1.80 | % | | 0.51 | % | | 1.81 | % | | 1.98 | % | | 200 | % |
| $ | 7.19 | | 5.62 | % | | $ | 11,639 | | 1.88 | % | | 0.35 | % | | 2.03 | % | | 2.30 | % | | 181 | % |
| $ | 6.83 | | 2.71 | % | | $ | 10,773 | | 1.64 | % | | (0.41 | %) | | 1.80 | % | | 2.07 | % | | 264 | % |
| $ | 6.65 | | 38.83 | % | | $ | 9,122 | | 1.39 | % | | (0.85 | %) | | 1.44 | % | | 1.99 | % | | 255 | % |
| $ | 4.79 | | (26.53 | %) | | $ | 7,046 | | 1.22 | % | | (0.95 | %) | | 1.32 | % | | 1.67 | % | | 349 | % |
| | | | | | | | | | | | | | | | | | | | | | |
| $ | 11.19 | | 6.66 | % | | $ | 61,197 | | 1.59 | % | | 0.65 | % | | 1.59 | % | | 1.68 | % | | 22 | % |
| $ | 10.51 | | 5.84 | % | | $ | 42,489 | | 1.72 | % | | 1.20 | % | | 1.72 | % | | 1.81 | % | | 105 | % |
| | | | | | | | | | | | | | | | | | | | | | |
| $ | 11.43 | | 6.71 | % | | $ | 55,513 | | 1.62 | % | | 0.60 | % | | 1.62 | % | | 1.71 | % | | 22 | % |
| $ | 10.73 | | 7.91 | % | | $ | 36,533 | | 1.75 | % | | 0.94 | % | | 1.75 | % | | 1.84 | % | | 92 | % |
| 5 | Total return and portfolio turnover rate are not annualized for periods of less than one full year. |
| 6 | Ratio of net expenses to average net assets, ratio of net investment income (loss) to average net assets, ratio of expenses to average net assets after reductions, excluding expenses paid indirectly, and ratio of expenses to average net assets before reductions are annualized for periods of less than one full year. |
| 7 | In 2005, the advisor voluntarily reimbursed the Fund for a realized investment loss, which had no impact to total return. |
| * | Commenced Operations January 31, 2006 |
Financial Highlights
For a Share Outstanding Through the Period Ended June 30, 2007 (unaudited) and
Each Fiscal Year Ended December 31,
| | | | | | | | | | | | | | | | | | | | | |
| | | | | Income from Investment Operations | | | Less Distributions | |
| | | Net Asset
Value,
Beginning
of Period | | Net
Investment
Income | | |
Net gains (losses) on
securities, futures, and
options (both realized
and unrealized) | | | Total from
Investment
Operations | | | From Net
Investment
Income | | | From Net
Capital
Gains | | | Total
Distributions | |
The Quantex Fund(1)(2)(3)(4) | | | | | | | | | | | | | | | | |
2007 | | $ | 19.86 | | 0.09 | | | 1.79 | | | 1.88 | | | (0.06 | ) | | — | | | (0.06 | ) |
2006 | | $ | 17.09 | | 0.08 | | | 2.77 | | | 2.85 | | | (0.08 | ) | | — | | | (0.08 | ) |
2005 | | $ | 15.95 | | 0.01 | | | 1.14 | | | 1.15 | | | (0.01 | ) | | — | | | (0.01 | ) |
2004 | | $ | 14.82 | | — | | | 1.13 | | | 1.13 | | | — | | | — | | | 0.00 | |
2003 | | $ | 11.65 | | (0.01 | ) | | 3.18 | | | 3.17 | | | — | | | — | | | 0.00 | |
2002 | | $ | 15.47 | | (0.03 | ) | | (3.79 | ) | | (3.82 | ) | | — | | | — | | | 0.00 | |
The Socially Responsible Utilities Fund(1)(2)(3)(4) | | | | | | | | | | | | | |
2007 | | $ | 22.23 | | 0.05 | | | 2.77 | | | 2.82 | | | (0.02 | ) | | — | | | (0.02 | ) |
2006 | | $ | 19.03 | | 0.15 | | | 3.20 | | | 3.35 | | | (0.15 | ) | | — | | | (0.15 | ) |
2005 | | $ | 16.51 | | 0.24 | | | 2.52 | | | 2.76 | | | (0.24 | ) | | — | | | (0.24 | ) |
2004 | | $ | 14.29 | | 0.32 | | | 2.22 | | | 2.54 | | | (0.32 | ) | | — | | | (0.32 | ) |
2003 | | $ | 12.66 | | 0.29 | | | 1.63 | | | 1.92 | | | (0.29 | ) | | — | | | (0.29 | ) |
2002 | | $ | 18.63 | | 0.34 | | | (5.97 | ) | | (5.63 | ) | | (0.34 | ) | | — | | | (0.34 | ) |
The U.S. Government Bond Fund(1)(2)(3)(4) | | | | | | | | | | | | | |
2007 | | $ | 20.30 | | 0.29 | | | (0.15 | ) | | 0.14 | | | (0.65 | ) | | — | | | (0.65 | ) |
2006 | | $ | 20.22 | | 0.68 | | | 0.14 | | | 0.82 | | | (0.74 | ) | | — | | | (0.74 | ) |
2005 | | $ | 20.82 | | 0.73 | | | (0.76 | ) | | (0.03 | ) | | (0.57 | ) | | — | | | (0.57 | ) |
2004 | | $ | 21.00 | | 0.52 | | | (0.18 | ) | | 0.34 | | | (0.52 | ) | | — | | | (0.52 | ) |
2003 | | $ | 22.79 | | 0.35 | | | (1.35 | ) | | (1.00 | ) | | (0.35 | ) | | (0.44 | ) | | (0.79 | ) |
2002 | | $ | 21.41 | | 0.54 | | | 1.65 | | | 2.19 | | | (0.54 | ) | | (0.27 | ) | | (0.81 | ) |
The Money Market Fund — Retail Class(1)(3)(4) | | | | | | | | | | | | | |
2007 | | $ | 1.00 | | 0.024 | | | N/A | | | 0.024 | | | (0.024 | ) | | — | | | (0.024 | ) |
2006 | | $ | 1.00 | | 0.046 | | | N/A | | | 0.046 | | | (0.046 | ) | | — | | | (0.046 | ) |
2005 | | $ | 1.00 | | 0.028 | | | N/A | | | 0.028 | | | (0.028 | ) | | — | | | (0.028 | ) |
2004 | | $ | 1.00 | | 0.011 | | | N/A | | | 0.011 | | | (0.011 | ) | | — | | | (0.011 | ) |
2003 | | $ | 1.00 | | 0.009 | | | N/A | | | 0.009 | | | (0.009 | ) | | — | | | (0.009 | ) |
2002 | | $ | 1.00 | | 0.016 | | | N/A | | | 0.016 | | | (0.016 | ) | | — | | | (0.016 | ) |
The Money Market Fund — Institutional Class(3)(4) | | | | | | | | | | | | | |
2007 | | $ | 1.00 | | 0.025 | | | N/A | | | 0.025 | | | (0.025 | ) | | — | | | (0.025 | ) |
2006 | | $ | 1.00 | | 0.048 | | | N/A | | | 0.048 | | | (0.048 | ) | | — | | | (0.048 | ) |
2005 | | $ | 1.00 | | 0.030 | | | N/A | | | 0.030 | | | (0.030 | ) | | — | | | (0.030 | ) |
2004* | | $ | 1.00 | | — | ** | | N/A | | | — | | | — | | | — | | | 0.00 | ** |
| 1 | Ratio of net expenses to average net assets, ratio of net investment income (loss) to average net assets, and ratio of expenses to average net assets after reductions, excluding expenses paid indirectly, reflect reductions in corresponding portfolio, if applicable. |
| 2 | Prior to the year ended December 31, 2003, the portfolio turnover rate represented the turnover rate of the corresponding portfolio. During 2003, the Fund’s portfolio turnover rate for the period January 1 through April 13 is equivalent to the portfolio into which the fund invested. Beginning April 14 the Fund commenced calculating the portfolio turnover rate based on its own activities. Hence, the portfolio turnover rate represented for 2003 is a combination of these two periods. Subsequent to 2003 the portfolio turnover rate is specific to the Fund. |
| 3 | Total return and portfolio turnover rate are not annualized for periods of less than one full year. |
| 4 | Ratio of net expenses to average net assets, ratio of net investment income (loss) to average net assets, ratio of expenses to average net assets after reductions, excluding expenses paid indirectly, and ratio of expenses to average net assets before reductions are annualized for periods of less than one full year. |
| * | Commenced Operations on December 28, 2004 |
| ** | Actual amounts were less than one-tenth of a cent |
The accompanying notes are an integral part of these financial statements.
| | | | | | | | | | | | | | | | | | | | | | |
| | | | | | Ratios/Supplemental Data | |
Net Asset
Value,
End of
Period | | Total Return
(Assumes
Reinvestment
of Distributions) | | | Net Assets,
End of
Period
($000) | | Ratio of Net
Expenses to
Average
Net Assets | | | Ratio of Net
Investment
Income (Loss)
to Average
Net Assets | | | Ratio of Expenses to
Average Net Assets
after Reductions,
Excluding Expenses
Paid Indirectly | | | Ratio of Expenses
to Average Net
Assets Before
Reductions | | | Portfolio
Turnover
Rate | |
| | | | | | | | | | | | | | | | | | | | | | |
| $ | 21.68 | | 9.47 | % | | $ | 24,648 | | 1.55 | % | | 0.91 | % | | 1.55 | % | | 2.12 | % | | 24 | % |
| $ | 19.86 | | 16.67 | % | | $ | 20,074 | | 1.66 | % | | 0.47 | % | | 1.66 | % | | 2.25 | % | | 30 | % |
| $ | 17.09 | | 7.21 | % | | $ | 17,114 | | 1.75 | % | | 0.06 | % | | 1.78 | % | | 2.19 | % | | 171 | % |
| $ | 15.95 | | 7.62 | % | | $ | 18,853 | | 1.73 | % | | 0.00 | % | | 1.77 | % | | 2.06 | % | | 253 | % |
| $ | 14.82 | | 27.21 | % | | $ | 19,968 | | 1.84 | % | | (0.11 | %) | | 1.84 | % | | 1.91 | % | | 140 | % |
| $ | 11.65 | | (24.69 | %) | | $ | 18,360 | | 1.76 | % | | (0.20 | %) | | 1.78 | % | | 1.79 | % | | 54 | % |
| | | | | | | | | | | | | | | | | | | | | | |
| $ | 25.03 | | 12.70 | % | | $ | 25,930 | | 1.91 | % | | 0.43 | % | | 1.91 | % | | 2.11 | % | | 14 | % |
| $ | 22.23 | | 17.68 | % | | $ | 23,969 | | 2.05 | % | | 0.74 | % | | 2.05 | % | | 2.18 | % | | 27 | % |
| $ | 19.03 | | 16.80 | % | | $ | 22,644 | | 2.03 | % | | 1.32 | % | | 2.05 | % | | 2.19 | % | | 28 | % |
| $ | 16.51 | | 18.01 | % | | $ | 28,447 | | 1.91 | % | | 2.21 | % | | 1.91 | % | | 1.99 | % | | 38 | % |
| $ | 14.29 | | 15.46 | % | | $ | 21,038 | | 1.92 | % | | 2.25 | % | | 1.94 | % | | 1.94 | % | | 41 | % |
| $ | 12.66 | | (30.36 | %) | | $ | 19,133 | | 1.81 | % | | 2.32 | % | | 1.88 | % | | 1.88 | % | | 32 | % |
| | | | | | | | | | | | | | | | | | | | | | |
| $ | 19.79 | | 0.70 | % | | $ | 11,763 | | 1.04 | % | | 4.00 | % | | 1.04 | % | | 1.97 | % | | 47 | % |
| $ | 20.30 | | 4.13 | % | | $ | 7,118 | | 1.10 | % | | 3.59 | % | | 1.10 | % | | 2.22 | % | | 106 | % |
| $ | 20.22 | | (0.14 | %) | | $ | 6,324 | | 1.10 | % | | 2.75 | % | | 1.10 | % | | 2.02 | % | | 159 | % |
| $ | 20.82 | | 1.64 | % | | $ | 9,316 | | 1.10 | % | | 2.49 | % | | 1.10 | % | | 1.58 | % | | 352 | % |
| $ | 21.00 | | (4.43 | %) | | $ | 10,840 | | 1.10 | % | | 1.59 | % | | 1.10 | % | | 1.24 | % | | 568 | % |
| $ | 22.79 | | 10.34 | % | | $ | 14,226 | | 1.10 | % | | 2.43 | % | | 1.10 | % | | 1.13 | % | | 408 | % |
| | | | | | | | | | | | | | | | | | | | | | |
| $ | 1.00 | | 2.47 | % | | $ | 180,238 | | 0.48 | % | | 4.91 | % | | 0.48 | % | | 0.85 | % | | N/A | |
| $ | 1.00 | | 4.71 | % | | $ | 159,641 | | 0.48 | % | | 4.64 | % | | 0.48 | % | | 0.87 | % | | N/A | |
| $ | 1.00 | | 2.85 | % | | $ | 129,200 | | 0.47 | % | | 2.79 | % | | 0.47 | % | | 0.89 | % | | N/A | |
| $ | 1.00 | | 1.06 | % | | $ | 148,650 | | 0.46 | % | | 1.04 | % | | 0.46 | % | | 0.84 | % | | N/A | |
| $ | 1.00 | | 0.92 | % | | $ | 165,607 | | 0.43 | % | | 0.92 | % | | 0.43 | % | | 0.82 | % | | N/A | |
| $ | 1.00 | | 1.59 | % | | $ | 186,280 | | 0.44 | % | | 1.58 | % | | 0.44 | % | | 0.66 | % | | N/A | |
| | | | | | | | | | | | | | | | | | | | | | |
| $ | 1.00 | | 2.54 | % | | $ | 20,970 | | 0.34 | % | | 5.05 | % | | 0.34 | % | | 0.68 | % | | N/A | |
| $ | 1.00 | | 4.86 | % | | $ | 24,118 | | 0.34 | % | | 4.76 | % | | 0.34 | % | | 0.71 | % | | N/A | |
| $ | 1.00 | | 2.99 | % | | $ | 21,083 | | 0.33 | % | | 2.93 | % | | 0.33 | % | | 0.71 | % | | N/A | |
| $ | 1.00 | | 0.02 | % | | $ | 30,310 | | 0.33 | % | | 1.96 | % | | 0.33 | % | | 0.67 | % | | N/A | |
Notes to Financial Statements
June 30, 2007 (unaudited)
1. Organization and Significant Accounting Policies
The Flex-funds Trust (the “Trust”) was organized in 1982 and is registered under the Investment Company Act of 1940, as amended (the “1940 Act”), as a diversified, open-end management investment company. The Trust offers nine separate series and is presently comprised of nine separate funds as follows: The Muirfield Fund® (“Muirfield”), The Socially Responsible Utilities Fund (f.k.a. The Total Return Utilities Fund) (“Utilities”) (please see second paragraph of note #1 for more information), The Quantex Fund™ (“Quantex”), The Dynamic Growth Fund (“Dynamic”), The Aggressive Growth Fund (“Aggressive”), The Defensive Growth Fund (“Defensive”), The Focused Growth Fund (“Focused”), The U.S. Government Bond Fund (“Bond”), and The Money Market Fund (“Money Market”) (each a “Fund” and collectively the “Funds”). Money Market offers two classes of shares (the Retail Class (“Retail Class”) and the Institutional Class (“Institutional Class”)). Each class of shares has equal rights as to earnings and assets except that each class bears different distribution and transfer agent expenses. The investment objective of Muirfield, Quantex, Dynamic, Aggressive, Defensive, and Focused is growth of capital. The investment objective of Utilities is current income and growth of income. The investment objective of Bond is maximum current income. The investment objective of Money Market is current income while maintaining a stable share price of $1.00.
On April 13, 2007, the Board of Trustees of The Total Return Utilities Fund approved to change the name of the Fund to The Socially Responsible Utilities Fund to specifically identify it as a socially responsible fund. The change in name more accurately reflects the Fund’s environmental philosophy of prohibiting fund investments in the nuclear energy sector. The investment objective remains current income and growth of income.
Use of estimates. The preparation of financial statements in conformity with accounting principles generally accepted in the United States of America (“GAAP”) requires management to make estimates and assumptions that affect the reported amounts of assets and liabilities and disclosure of contingent assets and liabilities at the date of the financial statements and the reported amounts of increases and decreases in net assets from operations during the reporting period. Actual results could differ from those estimates.
Security valuation. Securities that are traded on stock exchanges are valued at the last sales price as of the close of business of the New York Stock Exchange on the day of valuation or, lacking any sales, are valued using fair value procedures approved by the Board of Trustees (“Trustees”). Securities traded over-the-counter are valued at the most recent bid price or yield equivalent as obtained from one or more dealers that make markets in such securities. Registered investment companies are valued at the daily redemption value as reported by the underlying fund. Bond values the securities held at 4:00 P.M. Eastern Time. Money market securities held in Money Market are valued at amortized cost, which approximates value. The Funds obtain prices from independent pricing services, which use valuation techniques approved by the Trustees. Money Market, in compliance with Rule 2a-7 of the 1940 Act, compares its amortized values, including illiquid and restricted securities, to the prices obtained from the independent pricing services. The ability of issuers of debt securities held by the Funds to meet their obligations may be affected by economic and political developments in a specific country or region.
Fixed income securities held in the Funds, except Money Market, maturing more than sixty days after the valuation date are valued at the last sales price as of the close of business on the day of valuation, or, lacking any sales, at the most recent bid price or yield equivalent as obtained from dealers that make markets in such securities. When such securities are valued within sixty days or less to maturity, the difference between the valuation existing on the sixty-first day before maturity and maturity value is amortized on a straight-line basis to maturity. Securities maturing within sixty days from their date of acquisition are valued at amortized cost.
In September 2006, the Financial Accounting Standards Board issued Statement on Financial Accounting Standard (“SFAS”) No. 157 “Fair Value Measurements.” This standard establishes a single authoritative definition of fair value, sets out a framework for measuring fair value and requires additional disclosure about fair value measurements. SFAS No. 157 applies to fair value measurements already required or permitted by existing standards. SFAS No. 157 is effective for financial statements issued for fiscal years beginning after November 15, 2007. The changes to current generally accepted accounting principles from the application of this Statement relate to the definition of fair value, the methods used to measure fair value, and the expanded disclosures about fair value measurements. Management does not believe the adoption of SFAS No. 157 will materially impact the financial statement amounts, however, additional disclosures may be required about the inputs used to develop the measurements and the effect of certain of the measurements on changes in net assets for the period.
Repurchase agreements. Each Fund may engage in repurchase agreement transactions whereby the Fund takes possession of an underlying debt instrument subject to an obligation of the seller to repurchase the instrument from the Fund and an obligation of the Fund to resell the instrument at an agreed upon price and term. At all times, the Fund maintains the value of collateral, including accrued interest, of at least 100% of the amount of the repurchase agreement, plus accrued interest. If the seller defaults or the fair value of the collateral declines, realization of the collateral by the Funds may be delayed or limited.
Futures & options. Each Fund, except Money Market, may engage in transactions in financial futures contracts and options contracts in order to manage the risk of unanticipated changes in market values of securities held in the fund, or which it intends to purchase. The futures and options contracts are adjusted by the daily exchange rate of the underlying currency, or index, and any gains or losses are recorded for financial statement purposes as unrealized gains or losses in the statement of assets and liabilities and the statement of operations until the contract settlement date, at which time realized gains and losses are included in the statement of operations.
To the extent that the Fund enters into futures contracts on an index or group of securities, the Fund exposes itself to an indeterminate liability and will be required to pay or receive a sum of money measured by the change in the value of the index. Upon entering into a futures contract, the Fund is required to deposit an initial margin, which is either cash or securities in an amount equal to a certain percentage of the contract value. Subsequently, the variation margin, which is equal to changes in the daily settlement price or last sale price on the exchanges where futures contracts trade, is received or paid and is recorded as an unrealized gain or loss until the contract is closed. When the contract is closed, the Fund records a realized gain or loss equal to the difference between the proceeds from (or cost of) the closing transaction and the Fund’s basis in the contract. Should market conditions move unexpectedly, the Fund may not achieve the anticipated benefits of the futures contract and may realize a loss. The use of futures transactions involves the risk of imperfect correlation in movements in the price of futures contracts, interest rates, and the underlying hedged assets.
Call and put option contracts involve the payment of a premium for the right to purchase or sell an individual security or index aggregate at a specified price until the expiration of the contract. Such transactions expose the Fund to the loss of the premium paid if the Fund does not sell or exercise the contract prior to the expiration date. In the case of a call option, sufficient cash or money market instruments will be segregated to complete the purchase. Options are valued on the basis of the daily settlement price or last sale on the exchanges where they trade and the changes in value are recorded as unrealized appreciation or depreciation until closed, exercised or expired.
The Funds may write covered call or put options for which premiums received are recorded as liabilities and are subsequently adjusted to the current value of the options written. When written options are closed or exercised, premiums received are offset against the proceeds paid, and the Fund records realized gains or losses for the difference. When written options expire, the liability is eliminated, and the Fund records realized gains for the entire amount of premiums received.
Federal income taxes. It is each Fund’s policy to continue to comply with the requirements of Subchapter M of the Internal Revenue Code applicable to regulated investment companies and to distribute substantially all of its taxable income and net capital gains to its shareholders. Therefore, no federal income tax provision is required.
In June 2006, the Financial Accounting Standards Board (“FASB”) issued FASB Interpretation No. 48 — Accounting for Uncertainty in Income Taxes, that requires the tax effects of certain tax positions to be recognized. These tax positions must meet a “more likely than not” standard that based on their technical merits, have a more than 50 percent likelihood of being sustained upon examination. FASB Interpretation No. 48 is effective for fiscal periods beginning after December 15, 2006. At adoption, the financial statements must be adjusted to reflect only those tax positions that are more likely than not of being sustained. As of June 30, 2007, Management of the Funds has determined that there is no impact to the Funds’ financial statements as a result of the issuance of FASB Interpretation No. 48.
Distributions to shareholders. Distributions to shareholders are recorded on the ex-dividend date. Muirfield, Quantex, Dynamic, Aggressive, Defensive, and Focused declare and pay dividends from net investment income, if any, on a quarterly basis. Utilities declares and pays dividends from net investment income on a monthly basis. Bond and Money Market declare dividends from net investment income on a daily basis and pay such dividends on a monthly basis. Each Fund distributes net capital gains, if any, on an annual basis.
Distributions from net investment income and from net capital gains are determined in accordance with income tax regulations, which may differ from GAAP. These differences are primarily due to deferrals of certain losses, expiring
capital loss carryforwards, and differing treatments of unrealized gains and losses of futures contracts held by each Fund. Accordingly, timing differences relating to shareholder distributions are reflected in the components of net assets and permanent book and tax differences relating to shareholder distributions have been reclassified within the components of net assets. There were no such reclassifications during the year ended December 31, 2006.
Investment income & expenses. For Money Market, income and expenses (other than expenses attributable to a specific class) are allocated to each class of shares based on its relative net assets. Expenses incurred by the Trust that do not specifically relate to an individual Fund of the Trust are allocated to the Funds based on each Fund’s relative net assets or other appropriate basis.
Capital Share Transactions. Money Market is authorized to issue an indefinite number of shares in the Retail Class and the Institutional Class. Transactions in the capital shares of the Fund for the six months ended June 30, 2007 and the year ended December 31, 2006 were as follows:
| | | | | | | | | | | | | | |
| | | 2007 | | | 2006 | |
| | | Amount | | | Shares | | | Amount | | | Shares | |
Retail Class | | | | | | | | | | | | | | |
Issued | | $ | 99,426,854 | | | 99,426,854 | | | $ | 187,692,091 | | | 187,692,091 | |
Reinvested | | | 4,072,735 | | | 4,072,735 | | | | 6,552,436 | | | 6,552,436 | |
Redeemed | | | (82,902,383 | ) | | (82,902,383 | ) | | | (163,803,310 | ) | | (163,803,310 | ) |
Net increase (decrease) | | $ | 20,597,206 | | | 20,597,206 | | | $ | 30,441,217 | | | 30,441,217 | |
Institutional Class | | | | | | | | | | | | | | |
Issued | | $ | 17,473,617 | | | 17,473,617 | | | $ | 53,226,895 | | | 53,226,895 | |
Reinvested | | | 360,720 | | | 360,720 | | | | 732,374 | | | 732,374 | |
Redeemed | | | (20,982,291 | ) | | (20,982,291 | ) | | | (50,924,798 | ) | | (50,924,798 | ) |
Net increase (decrease) | | $ | (3,147,954 | ) | | (3,147,954 | ) | | $ | 3,034,471 | | | 3,034,471 | |
Other. The Funds record security transactions on the trade date. Gains and losses realized from the sale of securities are determined on the specific identification basis. Dividend income is recognized on the ex-dividend date and interest income (including amortization of premium and accretion of discount) is recognized as earned.
2. Investment Transactions
For the six months ended June 30, 2007, the cost of purchases and proceeds from sales or maturities of long-term investments for the Funds were as follows:
| | | | | | |
| | | Purchases | | Sales |
The Muirfield Fund® | | $ | 19,970,555 | | $ | 20,439,323 |
The Dynamic Growth Fund | | | 8,556,630 | | | 9,939,074 |
The Aggressive Growth Fund | | | 10,708,551 | | | 7,217,848 |
The Defensive Growth Fund | | | 21,018,521 | | | 10,279,096 |
The Focused Growth Fund | | | 18,711,491 | | | 9,033,106 |
The Quantex Fund™ | | | 8,063,933 | | | 4,656,470 |
The Socially Responsible Utilities Fund | | | 3,443,720 | | | 4,768,867 |
The U.S. Government Bond Fund | | | 6,819,992 | | | 3,061,250 |
3. Investment Advisory Fees and Other Transactions with Affiliates
Meeder Asset Management, Inc. (“MAM”), a wholly-owned subsidiary of Meeder Financial, Inc. (“Meeder”), provides each Fund, under a separate Investment Advisory Contract, with investment management, research, statistical and advisory services. The services of MAM will terminate automatically if assigned and may be terminated without penalty at any time upon 60 days prior written notice by majority vote of the Fund, by the Trustees of the Fund, or by MAM. Under a separate Investment Subadvisory Agreement with MAM, Miller/Howard Investments, Inc. (“Miller/Howard”) serves as subadvisor of Utilities. The Investment Subadvisory Agreement provides that it will terminate automatically if assigned, and that it may be terminated by MAM without penalty to the Fund by MAM, the Trustees of the Fund, or by the vote of a majority of the outstanding voting securities of the Fund upon not less than 30 days written notice.
For such services the Funds pay a fee at the following annual rates: Muirfield, Utilities, and Quantex, 1.00% of average daily net assets up to $50 million, 0.75% of average daily net assets exceeding $50 million up to $100 million and
0.60% of average daily net assets exceeding $100 million. As subadvisor to Utilities, Miller/Howard is paid 0.00% of the 1.00% of average daily net assets up to $10 million, 0.40% of the 1.00% of average daily net assets exceeding $10 million up to $50 million, 0.40% of the 0.75% of average daily net assets exceeding $50 million up to $60 million, 0.30% of the 0.75% of average daily net assets exceeding $60 million up to $100 million and 0.25% of the 0.60% of average daily net assets exceeding $100 million; Dynamic, Aggressive, Defensive, and Focused, 0.75% of average daily net assets up to $200 million and 0.60% of average daily net assets exceeding $200 million; Bond, 0.40% of average daily net assets up to $100 million and 0.20% of average daily net assets exceeding $100 million; and Money Market, 0.40% of average daily net assets up to $100 million and 0.25% of average daily net assets exceeding $100 million. MAM has contractually agreed to reduce its investment advisory fee by 0.25% for Quantex. During the six months ended June 30, 2007, $27,702 of investment advisory fees were waived in Quantex. During the six months ended June 30, 2007, MAM voluntarily agreed to reduce $131,951 of investment advisory fees in Money Market.
The Chief Compliance Officer (“CCO”) of the Trust provides the Trust with certain compliance services. In compensation for such services, the Trust pays the CCO an annual fee of $45,000. Prior to November 1, 2006, 30% of the annual fee was paid by another mutual fund trust managed by MAM. The CCO was an affiliate of the Trust and MAM through March 8, 2006. From March 9, 2006 through July 12, 2006, an interim, unaffiliated CCO assumed the CCO responsibilities for the Trust and MAM. Effective July 13, 2006, a permanent, unaffiliated CCO was appointed for the Trust. With the exception of Defensive and Focused, for the period from January 1, 2006 through March 8, 2006, the affiliated CCO received $918 from each Fund. For the same period of time, the CCO did not receive any fees from Defensive and Focused.
Mutual Funds Service Co. (“MFSCo”), a wholly-owned subsidiary of Meeder, serves as stock transfer, dividend disbursing and shareholder services agent for each Fund. In compensation for such services, each Fund pays MFSCo an annual fee calculated as follows: For Muirfield, Utilities, Quantex, Dynamic, Aggressive, Defensive, and Focused, such fee is equal to the greater of $15 per active shareholder account or 0.12% of each Fund's average daily net assets. For Bond, such fee is equal to the greater of $15 per active shareholder account or 0.08% of the Fund's average daily net assets. For Money Market Retail Class and Money Market Institutional Class, such fee is equal to the greater of $20 per active shareholder account or 0.08% of the Fund's average daily net assets. MFSCo is entitled to receive an annual minimum fee of $4,000 for each Fund or class. For Funds that are subject to an expense cap and which are above the expense cap, the basis point fee will be reduced by 0.02%. During the six months ended June 30, 2007, MFSCo waived $1,541 and $17,354 of transfer agent fees for Bond and Money Market, respectively. MFSCo also voluntarily waived $18,425 and $15,973 of transfer agent fees for Defensive and Focused, respectively, during the six months ended June 30, 2007.
MFSCo provides the Trust with certain administrative services. In compensation for such services, each Fund pays MFSCo an annual fee equal to 0.10% of each Fund’s average daily net assets up to $50 million and 0.08% of each Fund’s average daily net assets exceeding $50 million.
MFSCo serves as accounting services agent for each Fund. In compensation for such services, each Fund pays MFSCo an annual fee equal to the greater of:
| | a. | 0.15% of the first $10 million of average daily net assets, 0.10% of the next $20 million of average daily net assets, 0.02% of the next $50 million of average daily net assets, and 0.01% in excess of $80 million of average daily net assets, or |
| | b. | $7,500 for non-Money Market Funds and $30,000 for Money Market. |
For the period January 1, 2007 through April 30, 2007, MAM voluntarily agreed to reduce its fees and/or reimburse expenses (excluding brokerage fees and commissions, taxes, interest, and extraordinary or non-recurring expenses), to limit Bond’s total annual operating expenses to 1.10% of average daily net assets. For the period May 1, 2007 through June 30, 2007, MAM voluntarily decreased that limit to 0.99% of average daily net assets. MAM has also agreed to reduce its fees and/or reimburse expenses to the extent necessary to achieve an effective yield for the Retail Class that will rank in the top 10% of yields for all general-purpose money market funds in 2007. Lastly, MAM limited the Institutional Class’ total annual operating expenses to 0.34% of average daily net assets. Such reduction and/or reimbursement is limited to the total of fees charged to each Fund or Class by MAM and MFSCo. For the six months ended June 30, 2007, MAM and/or MFSCo reimbursed $23,662, $67,956, and $19,321 to Bond, the Retail Class, and the Institutional Class, respectively.
Muirfield and Dynamic have entered into an agreement with the Trust’s custodian, The Huntington National Bank (“HNB”), whereby HNB receives distribution, service, and administration fees (collectively the “fees”) from the underlying security holdings of the aforementioned Funds. HNB retains 0.03% of the fees collected and forwards the remainder to the appropriate Fund. The Funds use their portion of the fees received to reduce the gross expenses of each Fund. For the six months ended June 30, 2007, Muirfield and Dynamic used $35,472 and $13,135 of fees received, respectively, to reduce gross expenses of each Fund. It is possible that the Funds may invest in security holdings in which fees are not paid. As such, the gross expenses of a Fund would not be decreased. Also, without this agreement it is likely that the Funds would not collect any fees from underlying security holdings.
Pursuant to Rule 12b-1 of the 1940 Act, a mutual fund can adopt a written plan to pay certain expenses out of fund assets relating to the sale and distribution of its shares. Muirfield, Quantex, Bond, and the Retail Class have adopted a distribution plan with an annual limitation of 0.20% of average daily net assets. Utilities, Dynamic, Aggressive, Defensive, and Focused have adopted a distribution plan with an annual limitation of 0.25% of average daily net assets. The Institutional Class has adopted a distribution plan with an annual limitation of 0.03% of average daily net assets. For the six months ended June 30, 2007, Muirfield, Utilities, Quantex, Dynamic, Aggressive, Defensive, Focused, and Bond waived $40,342, $8,664, $16,843, $20,555, $7,384, $5,264, $4,564, and $3,446 of distribution plan (12b-1) expenses, respectively. The Retail Class and the Institutional Class waived $112,918 and $2,098, respectively, for a total of $115,016.
An Administrative Services Plan has been adopted for each Fund of the Trust except Money Market. The Administrative Services Plan allows for each eligible Fund to pay a maximum annual amount of 0.20% of average daily net assets to Service Organizations that provide administrative support services to their customers who own Shares of record or beneficially. For the six months ended June 30, 2007, Muirfield, Utilities, Quantex, Dynamic, Aggressive, Defensive, Focused, and Bond waived $49,134, $16,091, $18,505, $18,777, $10,773, $238, $180, and $3,899 of administrative service plan expenses, respectively.
The Funds have adopted a Deferred Compensation Plan (the “Plan”) for the independent Trustees. Under the Plan, each eligible Trustee is permitted to defer all or a portion of the trustees fees payable by any of the Funds as an investment into any combination of Funds until a specified point of time. The investment into the Funds is recorded as an asset, however an offsetting liability is also recorded for the deferred payment. Once the eligible Trustees’ deferral amounts can be distributed, a lump sum or generally equal annual installments over a period of up to ten (10) years can be made to the eligible Trustee(s). The Funds may terminate this Plan at any time.
Certain trustees and officers of the Funds are also officers or directors of Meeder, MAM, and MFSCo.
4. Federal Tax Information
The tax characteristics of dividends paid by the Funds during the year ended December 31, 2006 were as follows:
| | | | | | | | | |
| | | Ordinary
Income | | Net
Short-Term
Capital Gains | | Total
Dividends
Paid(1) |
The Muirfield Fund® | | $ | 377,059 | | $ | — | | $ | 377,059 |
The Dynamic Growth Fund | | | 92,692 | | | — | | | 92,692 |
The Aggressive Growth Fund | | | 87,765 | | | — | | | 87,765 |
The Defensive Growth Fund | | | 295,633 | | | — | | | 295,633 |
The Focused Growth Fund | | | 207,143 | | | — | | | 207,143 |
The Quantex Fund™ | | | 79,033 | | | — | | | 79,033 |
The Socially Responsible Utilities Fund | | | 171,433 | | | — | | | 171,433 |
The U.S. Government Bond Fund | | | 197,693 | | | — | | | 197,693 |
The Money Market Fund | | | 7,871,702 | | | — | | | 7,871,702 |
| (1) | Total dividends paid may differ from the amount reported in the Statement of Changes in Net Assets because for tax purposes dividends are recognized when actually paid. |
The tax characteristics of dividends paid by the Funds during the year ended December 31, 2005 were as follows:
| | | | | | | | | |
| | | Ordinary
Income | | Net
Short-Term
Capital Gains | | Total
Dividends
Paid(1) |
The Muirfield Fund® | | $ | 1,007,736 | | $ | — | | $ | 1,007,736 |
The Dynamic Growth Fund | | | 246,363 | | | — | | | 246,363 |
The Aggressive Growth Fund | | | 37,952 | | | — | | | 37,952 |
The Quantex Fund™ | | | 10,604 | | | — | | | 10,604 |
The Socially Responsible Utilities Fund | | | 303,370 | | | — | | | 303,370 |
The U.S. Government Bond Fund | | | 206,740 | | | — | | | 206,740 |
The Money Market Fund | | | 4,515,922 | | | — | | | 4,515,922 |
As of December 31, 2006, the components of accumulated earnings/(deficit) on a tax basis for the Funds were as follows:
| | | | | | | | | | | | | | | | | | |
| | | Undistributed
Ordinary
Income | | Dividends
Payable | | | Accumulated
Capital and
Other Gains
and (Losses) | | | Unrealized
Appreciation/
(Depreciation)(2) | | Total
Accumulated
Earnings/
(Deficit) | |
The Muirfield Fund® | | $ | 3,402 | | $ | (2,966 | ) | | $ | (6,390,424 | ) | | $ | 3,139,257 | | $ | (3,250,731 | ) |
The Dynamic Growth Fund | | | 1 | | | (1 | ) | | | (442,346 | ) | | | 1,138,587 | | | 696,241 | |
The Aggressive Growth Fund | | | 836 | | | (836 | ) | | | (5,649,663 | ) | | | 1,503,067 | | | (4,146,596 | ) |
The Defensive Growth Fund | | | — | | | — | | | | (482,969 | ) | | | 2,530,182 | | | 2,047,213 | |
The Focused Growth Fund | | | — | | | — | | | | (346,494 | ) | | | 2,753,673 | | | 2,407,179 | |
The Quantex Fund™ | | | 816 | | | (816 | ) | | | (3,579,500 | ) | | | 3,281,055 | | | (298,445 | ) |
The Socially Responsible Utilities Fund | | | 183 | | | (183 | ) | | | (5,211,280 | ) | | | 5,839,362 | | | 628,082 | |
The U.S. Government Bond Fund | | | 157,271 | | | (1,751 | ) | | | (1,116,674 | ) | | | 36,476 | | | (924,678 | ) |
The Money Market Fund | | | 30,554 | | | (30,554 | ) | | | — | | | | — | | | — | |
For federal income tax purposes, the following Funds have capital loss carryforwards as of December 31, 2006, which are available to offset future capital gains, if any. To the extent that these carryforwards are used to offset future capital gains, it is probable that the gains that are offset will not be distributed to shareholders:
| | | | | |
| | | Amount | | Expires |
The Muirfield Fund® | | $ | 2,730,407 | | 2009 |
The Muirfield Fund® | | | 3,660,017 | | 2010 |
The Dynamic Growth Fund | | | 442,346 | | 2010 |
The Aggressive Growth Fund | | | 993,221 | | 2008 |
The Aggressive Growth Fund | | | 618,687 | | 2009 |
The Aggressive Growth Fund | | | 4,037,755 | | 2010 |
The Defensive Growth Fund | | | 482,969 | | 2014 |
The Focused Growth Fund | | | 346,494 | | 2014 |
The Quantex Fund™ | | | 2,329,834 | | 2010 |
The Quantex Fund™ | | | 1,249,666 | | 2011 |
The Socially Responsible Utilities Fund | | | 3,167,793 | | 2010 |
The Socially Responsible Utilities Fund | | | 2,043,487 | | 2011 |
The U.S. Government Bond Fund | | | 735,915 | | 2011 |
The U.S. Government Bond Fund | | | 125,708 | | 2012 |
The U.S. Government Bond Fund | | | 141,817 | | 2013 |
The U.S. Government Bond Fund | | | 113,234 | | 2014 |
Under current tax laws, net capital losses incurred after October 31, within a Fund’s fiscal year, are deemed to arise on the first business day of the following fiscal year for tax purposes. For the year ended December 31, 2006, the Funds did not defer any post October capital losses.
| (1) | Total dividends paid may differ from the amount reported in the Statement of Changes in Net Assets because for tax purposes dividends are recognized when actually paid. |
| (2) | The differences between book- and tax-basis unrealized appreciation/(depreciation) are attributable primarily to: deferral of losses on wash sales and the realization for tax purposes of unrealized gains/(losses) on certain derivative instruments. |
5. Control Ownership
The beneficial ownership, either directly or indirectly, of more than 25% of the voting securities of a fund creates a presumption of control of the fund under Section 2(a)(9) of the 1940 Act. As of June 30, 2007, Charles Schwab & Co., Inc. held for the benefit of others, in aggregate, 49% of Utilities; Nationwide Trust Company, FSB held for the benefit of others, in aggregate, 95% of Defensive; Nationwide Trust Company, FSB held for the benefit of others, in aggregate, 95% of Focused; Saxon &Co. held 39% of Dynamic; Nationwide Trust Company, FSB held for the benefit of others, in aggregate, 73% of Aggressive; Nationwide Trust Company, FSB held for the benefit of others, in aggregate, 64% of Bond; and Carey & Company held 34% of Money Market — Institutional Class and therefore may be deemed to control the Funds.
6. Board Review of Investment Advisory and Subadvisory Agreements
At a meeting held June 5, 2007, the Board of Trustees (the “Board”), including a majority of non-interested or independent Trustees, approved the renewal of the investment advisory agreements for all nine funds comprising The Flex-funds (the “Funds”) and the investment sub-advisory agreement relating to The Socially Responsible Utilities Fund (individually, an “Agreement” and collectively, the “Agreements”).
The Board reviewed materials sent to each Trustee in advance of the meeting for consideration in determining whether to approve the renewal of each Fund’s Agreement. Management reviewed with the Trustees the materials prepared by them in response to Funds’ legal counsel’s written request pursuant to Section 15(c) of the Investment Company Act of 1940 for the provision to the Trustees of information necessary or appropriate to assist the Trustees in their deliberations concerning renewal of the Agreements. In reaching the decision to renew the Agreements, the Board also took into account information furnished throughout the year at regular Board meetings. Such information included investment performance reports, related financial information for each Fund, periodic reports on shareholder services, legal compliance, pricing, brokerage commissions and execution and other services provided by the investment manager, Meeder Asset Management, Inc. ("Manager") and its affiliates, or by or on behalf of The Socially Responsible Utilities Fund’s subadviser, Miller/Howard Investments, Inc. Information furnished specifically in connection with the renewal process included a report for the Funds prepared by Lipper Financial Services ("Lipper"), an independent organization, as well as a Funds’ profitability analysis prepared by the Manager. The Lipper report compared each Fund's management fees and expenses with those of other mutual funds deemed comparable to the Fund. The Funds’ profitability analysis discussed the profitability to the Manager and Mutual Funds Service Co., an affiliate of the Manager, from the overall Funds’ operations utilizing expense allocation methodologies deemed reasonable by the Manager.
In considering such materials, the independent Trustees received assistance and advice from and met separately with Fund counsel. While the Agreements were all approved at the same Board meeting, the Board dealt with each Fund separately. In approving continuance of the Agreement for each Fund, the Board, including a majority of independent Trustees, determined that the existing management fee structure was fair and reasonable and that continuance of the Agreement was in the best interests of each Fund and its shareholders. While attention was given to all information furnished, the following discusses the primary factors relevant to the Board's decision.
Nature, Extent and Quality of Services. The Board was satisfied with the nature and quality of the overall services provided by the Manager, its affiliates and the subadviser to the Funds and their shareholders. In addition to investment performance and expenses discussed earlier in that meeting, the Board's opinion was based, in part, upon periodic reports showing that the investment policies and restrictions for each Fund were consistently complied with as well as other reports periodically given to the Board covering matters such as the compliance of portfolio managers and the overall compliance of other management personnel with the Code of Ethics adopted throughout the Manager’s organization, the adherence to fair value pricing procedures established by the Board, and the accuracy of net asset value calculations. Other factors taken into account by the Board were the Manager's compliance procedures and qualifications of its Chief Compliance Officer. Consideration was also given to the experience of each Fund's portfolio management team. The Board also took into account the transfer agent, fund accounting agent and administrative services provided to Fund shareholders by an affiliate of the Manager, noting continuing expenditures by management to increase and improve the scope of such services. Similar considerations were applied to the subadviser to The Socially Responsible Utilities Fund’s investment sub-advisory agreement.
Investment Performance. The Board placed emphasis on the investment performance of each Fund in view of its importance to shareholders. While consideration was given to performance reports and discussions with portfolio managers at Board meetings during the year, particular attention in assessing performance was given to the
Morningstar reports furnished for the Agreement renewals. The Morningstar report prepared for each Fund showed the investment performance of the Fund for the three-month and one-, three-, and five-year (or period since inception if shorter) periods, as applicable, ended March 31, 2007 (the “relevant periods”) in comparison with a performance universe similar to each Fund’s investment objectives. There was an extensive discussion of the sources and methodology used in determining each Fund’s performance universe. The performance results for each Fund are summarized in the section below.
For the 3-month period, The Muirfield Fund® outperformed three of its benchmarks and underperformed one other; The Quantex Fund™ outperformed two of its benchmarks and underperformed one other; The Dynamic Growth Fund outperformed one of its benchmarks and underperformed one other; The Socially Responsible Utilities Fund outperformed one of its benchmarks and underperformed three others; The U.S. Government Bond Fund underperformed both of its benchmarks; The Aggressive Growth Fund outperformed one of its benchmarks and underperformed one other; The Defensive Growth Fund outperformed all four of its benchmarks; The Focused Growth Fund outperformed one of its benchmarks and underperformed one other; and The Money Market Fund outperformed all of its benchmarks. For the 1-year period, The Muirfield Fund® underperformed all four of its benchmarks; The Quantex Fund™ outperformed all three of its benchmarks; The Dynamic Growth Fund outperformed one of its benchmarks and underperformed one other; The Socially Responsible Utilities Fund outperformed one of its benchmarks and underperformed three others; The U.S. Government Bond Fund outperformed one of its benchmarks and underperformed one other; The Aggressive Growth Fund outperformed both of its benchmarks; The Defensive Growth Fund outperformed its benchmark; The Focused Growth Fund underperformed its benchmark; and The Money Market Fund outperformed all of its benchmarks. For the 3-year period, The Muirfield Fund® underperformed all four of its benchmarks; The Quantex Fund™ outperformed one of its benchmarks and underperformed two others; The Dynamic Growth Fund underperformed both of its benchmarks; The Socially Responsible Utilities Fund outperformed two of its benchmarks and underperformed two others; The U.S. Government Bond Fund underperformed both of its benchmarks; The Aggressive Growth Fund underperformed both of its benchmarks; and The Money Market Fund outperformed all of its benchmarks. For the 5-year period, The Muirfield Fund® outperformed three of its benchmarks and underperformed one other; The Quantex Fund™ underperformed all three of its benchmarks; The Dynamic Growth Fund underperformed both of its benchmarks; The Socially Responsible Utilities Fund outperformed one of its benchmarks and underperformed three others; The U.S. Government Bond Fund underperformed both of its benchmarks; The Aggressive Growth Fund underperformed both of its benchmarks; and The Money Market Fund outperformed all of its benchmarks. The comparison benchmarks for each of the Funds are outlined below:
| | |
Fund | | Performance Benchmark |
The Muirfield Fund® | | Blended Benchmark of 60% S&P 500 Index and
40% T-bill, S&P 500 Index, Morningstar Average
Asset Allocation Fund, Morningstar Average
Balance Fund |
| |
The Quantex Fund™ | | Russell 2000 Index, S&P 400 Mid-Cap Index,
Morningstar Average Growth Fund |
| |
The Dynamic Growth Fund | | S&P 500 Index, Morningstar Average Growth Fund |
| |
The Socially Responsible Utilities Fund | | Russell 3000 Utilities Index, Blended Index of 60%
Russell 3000 Utilities Index and 40% Lehman
Brothers Long Credit Index, S&P 500 Utilities
Index, Morningstar Average Utility Fund |
| |
The U.S. Government Bond Fund | | Lehman Brothers Intermediate Government/Credit
Index, Morningstar Average General U.S.
Government Bond Fund |
| |
The Aggressive Growth Fund | | NASDAQ Composite Index, Morningstar Average
Aggressive Growth Fund |
| |
The Defensive Growth Fund | | S&P 500 Index, Blended Benchmark of 60% S&P
500 Index and 40% 90-day T-Bills, Morningstar
Average Asset Allocation Fund, Morningstar
Average Balance Fund |
| |
The Focused Growth Fund | | S&P 500 Index, Morningstar Average Growth Fund |
| | |
Fund | | Performance Benchmark |
The Money Market Fund | | |
| |
Retail Class | | Lipper Average General Purpose Money Market
Fund |
| |
Institutional Class | | iMoneyNet’s Average General Purpose Institutional
Money Market Fund |
The Board noted that they are encouraged by the improved performance of the Funds and congratulated Management. The Board recognized that the Manager has made changes in its investment personnel and improvements in its investment processes in an effort to improve results.
Comparative Expenses. Consideration was given to a comparative analysis of the management fees and total expense ratios of each Fund compared with those of a group of other comparable funds. In reviewing comparative costs, emphasis was given to each Fund's gross and net management fee in comparison with the gross and net management fee charged by a group of comparable funds, as well as the actual total expenses of the Fund in comparison with those of its peer group. The Trustees and management reviewed in detail the particulars of peer group identification and selection. The Funds’ net management fees were also compared to each Fund’s peer group average net management fees per Lipper, Inc. The results of such expense comparisons showed that the effective management fee rate for each of The U.S. Government Bond and The Money Market Funds’ net management fees were lower than the peer groups’ fees. Conversely, The Socially Responsible Utilities, The Aggressive Growth, The Dynamic Growth, The Defensive Growth, The Focused Growth, The Quantex™, and The Muirfield® Funds’ net management fees were higher than the peer groups’ fees.
In addition, the Funds’ net expense ratios were compared to each Fund’s peer group average net expense ratios per Lipper, Inc. The U.S. Government Bond, The Dynamic Growth, The Money Market, and The Muirfield® Funds’ net expense ratios were slightly lower than the peer groups’ ratios. The Socially Responsible Utilities, The Aggressive Growth, The Defensive Growth, The Focused Growth and The Quantex Funds’ net expense ratios were higher than the peer groups’ ratios. The Board commended the Manager’s facilitation of a trading platform whereby The Muirfield Fund®, The Dynamic Growth Fund and The Aggressive Growth Fund recapture 12b-1, service and administrative fees paid by the underlying funds. While realizing that other factors such as the Manager's profitability and economies of scale bear on the reasonableness of fees, the Board was satisfied with the management fee and total expenses of each Fund, both on a stand-alone basis and in comparison to its peer group as shown in the Lipper reports.
Management Profitability. The Board also considered the level of profits realized by the Manager and its affiliates in connection with the operation of the Funds. In this respect, the Board reviewed the Funds’ profitability analysis that addresses the overall profitability of The Flex-funds’ business. The Board also considered the extent to which the Manager and its affiliates might derive ancillary benefits from fund operations, including potential benefits resulting from allocation of fund brokerage and the declining use of "soft" commission dollars to pay for research. Specific attention was given to the method of calculating the Manager’s profitability from the Funds and the allocation of the Manager’s costs to each Fund, it being recognized that allocations are inherently subjective and various allocation methods may each be reasonable while producing different results. In reviewing and discussing such analysis, management discussed with the Board its belief that costs incurred in establishing the infrastructure necessary to the type of mutual fund operations conducted by the Manager and its corporate affiliates may not be fully reflected in the expenses allocated to each Fund in determining its profitability, as well as the fact that the level of profits, to a certain extent, reflected operational cost savings and efficiencies initiated by management. The Board also took into account management's expenditures in improving shareholder services provided to the Funds, as well as the need to meet additional regulatory and compliance requirements resulting from the Sarbanes-Oxley Act and recent SEC requirements. Based upon their consideration of all these factors, the Board determined that the level of profits realized by the Manager under its Agreements with the Funds was not excessive in view of the nature, quality and extent of services provided.
Economies of Scale. The Board also considered whether economies of scale are realized by the Manager as the Funds grow larger and the extent to which this is reflected in the level of management fees charged. While recognizing that any precise determination is inherently subjective, the Board noted that based upon the Funds’ profitability analysis, it appears that as some Funds get larger, at some point economies of scale do result in the Manager realizing a larger profit margin on management services provided to such a Fund. The Board also noted that economies of scale are shared with each Fund and its shareholders through management fee breakpoints so that as a Fund grows in size,
its effective management fee rate declines. The fee structure under the Agreement with each Fund provides an initial annual fee of 1% of the first $50 million, 0.75% of the next $50 million and 0.60% in excess of $100 million for The Quantex Fund™, The Muirfield Fund® and The Socially Responsible Utilities Fund; 0.40% of the first $100 million and 0.20% in excess of $100 million for The U.S. Government Bond Fund; 0.75% of the first $200 million and 0.60% in excess of $200 million for The Aggressive Growth Fund, The Dynamic Growth Fund, The Defensive Growth Fund, and The Focused Growth Fund; and 0.40% of the first $100 million and 0.25% in excess of $100 million for The Money Market Fund. The Board expressed their satisfaction with such fees.
The Board also considered the fee structure under the investment subadvisory agreement with Miller/Howard Investments, Inc., the subadviser for The Socially Responsible Utilities Fund, which provides for 0.00% for the first $10 million, 0.40% for the next $50 million, 0.30% for the next $40 million and 0.25% over $100 million. The Board expressed their satisfaction with such fees.
Trustees and Officers (unaudited)
Certain trustees and officers of the Funds are also officers or directors of Meeder, MAM, and MFSCo. The Trustees oversee the management of the Trust and elect their officers. The officers are responsible for the Funds’ day-to-day operations. The Trustees’ and officers’ names, addresses, years of birth, positions held with the Trust, and length of service as a Flex-funds Trustee are listed below. Also included is each Board member’s principal occupation during, at least, the past five years. Except as indicated, each individual has held the office shown or other offices in the same company for the last five years. Those Trustees who are “interested persons”, as defined in the 1940 Act, by virtue of their affiliation with the Trust, are indicated by an asterisk (*).
| | | | | | |
Name, Address(1), and
Year of Birth | | Year First Elected a
Director or Officer of Trust | | Position and
Number of Funds
Overseen(2) | | Principal
Occupation During
Past Five Years and
Other Directorships Held |
Robert S. Meeder, Jr.* Year of Birth: 1961 | | 1992 | | Trustee and President | | President of Meeder Asset Management, Inc. |
| | | |
Walter L. Ogle Year of Birth: 1937 | | 1982 | | Trustee | | Retired; formerly Executive Vice President of Aon Consulting, an employee benefits consulting group; member of the Trust’s Audit Committee. |
| | | |
James W. Didion Year of Birth: 1930 | | 1982, 1998 | | Trustee | | Retired; formerly Executive Vice President of Core Source, Inc., an employee benefit and Workers’ Compensation administration and consulting firm (1991 – 1997); Chairman of the Trust’s Audit Committee. |
| | | |
Jack W. Nicklaus Year of Birth: 1961 | | 1998 | | Trustee | | Designer, Nicklaus Design, a golf course design firm and division of The Nicklaus Companies; member of the Trust’s Audit Committee. |
| | | |
Stuart M. Allen Year of Birth: 1961 | | 2006 | | Trustee | | President of Gardiner Allen DeRoberts Insurance LLC, an insurance agency; member of the Trust’s Audit Committee. |
| | | |
Anthony D’Angelo Year of Birth: 1959 | | 2006 | | Trustee | | Director of Sales, WSYX ABC 6/WTTE Fox 28, television stations owned and operated by Sinclair Broadcast Group; member of the Trust’s Audit Committee. |
| | | |
Dale W. Smith Year of Birth: 1959 | | 2006 | | Vice President | | Chief Financial Officer of Meeder Asset Management, Inc. (2005 - present); formerly Senior Vice President of Financial Services of BISYS Fund Services (1996 – 2004). |
| | | | | | |
Name, Address(1), and
Year of Birth | | Year First Elected a
Director or Officer of Trust | | Position and
Number of Funds
Overseen(2) | | Principal
Occupation During
Past Five Years and
Other Directorships Held |
Terra D. Case Year of Birth: 1971 | | 2006 | | Vice President and Secretary | | Associate General Counsel of Meeder Asset Management, Inc. and Mutual Funds Service Co., the Trust’s transfer agent (2005 - present); formerly attended Capital University School of Law (2002 – 2005). |
| | | |
David R. Carson Year of Birth: 1958 | | 2006 | | Chief Compliance Officer | | Chief Compliance Officer and Anti-Money Laundering Officer of the Huntington Funds and Huntington VA Funds (2005 – present); Treasurer and Assistant Treasurer of the Huntington Funds, Huntington Asset Advisors, Inc. (2002 – 2005). |
| | | |
Bruce E. McKibben Year of Birth: 1969 | | 2002 | | Treasurer | | Director of Fund Accounting of Mutual Funds Service Co., the Trust’s transfer agent. |
| (1) | The address of each Trustee is 6125 Memorial Drive, Dublin, OH 43017. |
| (2) | Each Trustee serves for an indefinite term, until his or her resignation, death, or removal. Each Trustee oversees all nine Funds in the Trust. |
| * | Robert S. Meeder, Jr. is deemed an “interested person” of the Trust by virtue of his position as President of Meeder Asset Management, Inc., the Advisor of the Trust. |
The Statement of Additional Information includes additional information about each Trustee and is available without charge. To obtain a copy of the Statement of Additional Information, please contact your financial representative or call toll free 1-800-325-3539.
Other Information
The Funds file their complete schedules of portfolios holdings with the Securities and Exchange Commission (“SEC”) for the first and third quarters of each fiscal year on Form N-Q. The Funds’ Forms N-Q are available on the SEC’s website at http://www.sec.gov and may be reviewed and copied at the SEC’s Public Reference Room in Washington, DC. Information on the operation of the Public Reference Room may be obtained by calling 1-800-SEC-0330. The Funds’ schedules of positions are also available on the Funds’ website at www.flexfunds.com.
A description of the policies and procedures that the Funds use to determine how to vote proxies relating to portfolio securities, and information regarding how the Funds voted these proxies for the 12-month period ended June 30, 2007, is available on the SEC’s website at http://www/sec.gov, or, without charge, upon request by calling toll-free 1-800-325-3539.
Manager and Investment Advisor:
Meeder Asset Management, Inc.
6125 Memorial Drive
P.O. Box 7177
Dublin, Ohio 43017
Subadvisor/The Socially Responsible Utilities Fund
Miller/Howard Investments, Inc.
141 Upper Byrdcliffe Road, P.O. Box 549
Woodstock, New York 12498
Board of Trustees
James Didion
Robert S. Meeder, Jr.
Jack Nicklaus II
Walter L. Ogle
Stuart M. Allen
Anthony D’Angelo
Custodian
The Huntington National Bank
Columbus, Ohio 43215
Transfer Agent Dividend Disbursing Agent
Mutual Funds Service Co.
6125 Memorial Drive
Dublin, Ohio 43017
Auditors
Cohen Fund Audit Services, Ltd.
800 Westpoint Parkway, Suite 1100
Westlake, Ohio 44145
The Flex-funds
Managed by Meeder Asset Management, Inc.
6125 Memorial Drive, Dublin Ohio, 43017
Call Toll Free 800-325-3539 | 614-760-2159
Fax: 614-766-6669 | www.flexfunds.com
Email: flexfunds@meederfinancial.com
The registrant has adopted a code of ethics that applies to the registrant’s principal executive officer, principal financial officer, comptroller or principal accounting officer, and any person who performs a similar function.
| Item 3. | Audit Committee Financial Expert. |
Currently, The Flex-funds (the “Funds”) do not have an Audit Committee member who possesses all of the attributes required to be an “audit committee financial expert” as defined in instruction 2(b) of Item 3 of Form N-CSR. However, the Board of Trustees believes that each member of the Audit Committee has substantial experience relating to the review of financial statements and the operations of audit committees. Accordingly, the Board of Trustees believes that the members are qualified to evaluate the Funds’ financial statements, supervise the Funds’ preparation of its financial statements, and oversee the work of the Funds’ independent auditors. The Board of Trustees also believes that, although no single Audit Committee member possesses all of the attributes required to be an “audit committee financial expert”, the Audit Committee members collectively as a group possess the attributes required to be an “audit committee financial expert.”
| Item 4. | Principal Accountant Fees and Services. |
(a) – (d) Aggregate fees billed to the registrant for the last two fiscal years for professional services rendered by the registrant’s principal accountant were as follows:
| | | | | | |
| | | 2007 | | 2006 |
Audit Fees | | $ | 59,500 | | $ | 48,500 |
Audit-Related Fees | | | 2,200 | | | 1,850 |
Tax Fees | | | 18,900 | | | 11,590 |
All Other Fees | | | 3,000 | | | 5,690 |
Audit fees include amounts related to the audit of the registrant’s annual financial statements and services normally provided by the accountant in connection with statutory and regulatory filings. Audit-related fees include amounts reasonably related to the performance of the audit of the registrant’s financial statements. Tax fees include amounts related to tax compliance, tax planning, and tax advice. All other fees include amounts related to the registrant’s annual filing of Form N1A.
(e)(1) A purpose of the Audit Committee is to approve the engagement of the registrant’s independent auditors (i) to render audit and non-audit services for the registrant in accordance with Rule 2-01(c)(7)(i) of Regulation S-X, subject to the waiver provisions set forth in Rule 2-01(c)(7)(i)(C) of Regulation S-X, and (ii) to render non-audit services for the registrant’s investment advisors (other than a sub-advisor whose role is primarily portfolio management and is subcontracted or overseen by another investment advisor) and any other entity controlling by, or under common control with the investment advisor that provides ongoing services to the registrant, in each case under (ii) if the engagement relates directly to the operations and financial reporting of the registrant, in accordance with Rule 2-01(c)(7)(ii) of Regulation S-X, subject to waiver provisions set forth in Rule 2-01(c)(7)(ii) of Regulation S-X.
(e)(2) 100% of services included in (b) – (d) above were approved pursuant to Rule 2-01(c)(7)(i)(C) of Regulation S-X.
(f) Not applicable.
(g) The aggregate fees billed for the most recent fiscal year and the preceding fiscal year by the registrant’s principal accountant for non-audit services rendered to the registrant, its investment advisor, and any entity controlling, controlled by, or under common control with the investment advisor that provides ongoing services to the registrant were $12,825 and $19,080 respectively.
(h) Not applicable.
| Items 5. | Audit Committee of Listed Registrants. |
Not applicable.
| Item 6. | Schedule of Investments. |
Not applicable.
| Item 7. | Disclosure of Proxy Voting Policies and Procedures for Closed-End Management Investment Companies. |
Not applicable.
| Item 8. | Portfolio Managers of Closed-End Management Investment Companies. |
Not applicable.
| Item 9. | Purchases of Equity Securities by Closed-End Management Investment Company and Affiliated Purchasers. |
Not applicable.
| Item 10. | Submission of Matters to a Vote of Security Holders. |
Not applicable.
| Item 11. | Controls and Procedures. |
(a) Based on our evaluation conducted within 90 days of the filing date, hereof, the design and operation of the registrant’s disclosure controls and procedures are effective to ensure that material information relating to the registrant is made known to the certifying officers by others within the appropriate entities, particularly during the period in which Forms N-CSR are being prepared, and the registrant’s disclosure controls and procedures allow timely preparation and review of the information for the registrant’s Form N-CSR and the officer certifications of such Form N-CSR.
(b) There were no significant changes in the registrant’s internal controls or in other factors that could significantly affect these controls subsequent to the date of their evaluation, including any corrective actions with regard to significant deficiencies and material weaknesses.
| | |
| |
| (a)(1) | | Code of Ethics filed herewith as EX-99.CODE ETH. |
| |
| (a)(2) | | A separate certification for each principal executive and principal financial officer of the registrant as required by Rule 30a-2(a) under the Act(17 CFR270.30a-2(a)). Filed herewith as EX-99.CERT. |
| |
| (b) | | Certifications of principal executive officer and principal financial officer, under Section 906 of the Sarbanes-Oxley Act of 2002, and 18 U.S.C. ss.1350. Filed herewith as EX-99.906 CERT. |
SIGNATURES
Pursuant to the requirements of the Securities Exchange Act of 1934 and the Investment Company Act of 1940, the registrant has duly caused this report to be signed on its behalf by the undersigned, thereunto duly authorized.
| | |
| The Flex-funds |
| |
| By: | | /s/ Bruce E. McKibben |
| | Bruce E. McKibben, Treasurer |
Date: August 27, 2007
Pursuant to the requirements of the Securities Exchange Act of 1934 and the Investment Company Act of 1940, this report has been signed below by the following persons on behalf of the registrant and in the capacities and on the dates indicated.
| | |
| By: | | /s/ Bruce E. McKibben |
| | Bruce E. McKibben, Treasurer |
Date: August 27, 2007
| | |
| By: | | /s/ Robert S. Meeder, Jr. |
| | Robert S. Meeder, Jr., President |
Date: August 27, 2007