Performance Review
June 30, 2010
| | YTD | 1 year | 5 years | 10 years | Since Inception | Current Expense Ratio** | Gross Expense Ratio*** |
The Money Market Fund - Retail*1 | 0.11% | 0.31% | 2.93% | 2.66% | 4.65% | 0.37% | 0.84% |
| Current & Effective Yields | | 7-day Compound: 0.20%; 7-day Simple: 0.20% |
The Money Market Fund - Institutional* 2 | 0.15% | 0.41% | 3.07% | - | 3.01% | 0.29% | 0.67% |
| Current & Effective Yields | | 7-day Compound: 0.28%; 7-day Simple: 0.28% |
The U.S. Government Bond Fund3 | 4.05% | 7.04% | 4.39% | 3.63% | 5.56% | 0.99% | 1.49% |
The Defensive Balanced Fund 4 | -3.01% | 8.71% | - | - | -1.45% | 1.53% | 1.72% |
The Muirfield Fund® 5 | -5.01% | 10.63% | 0.18% | -0.14% | 6.50% | 1.38% | 1.66% |
The Total Return Utilities Fund 6 | -6.14% | 13.68% | 2.27% | 1.42% | 6.69% | 1.94% | 2.20% |
The Dynamic Growth Fund 7 | -6.23% | 12.43% | -0.88% | -1.14% | -2.56% | 1.42% | 1.63% |
The Strategic Growth Fund 8 | -4.80% | 19.29% | - | - | -3.99% | 1.57% | 1.80% |
The Aggressive Growth Fund 9 | -6.24% | 14.34% | -0.50% | -1.83% | -3.92% | 1.60% | 1.82% |
The Quantex Fund™ 10 | -2.54% | 38.98% | 2.23% | -0.72% | 6.27% | 1.62% | 2.39% |
Disclosure
To obtain a prospectus containing more complete information about The Flex-funds®, including fees and other expenses that apply to a continued investment in the Funds, you may call The Flex-funds® at Toll Free (800)325-3539, visit us online at www.flexfunds.com, or write P.O. Box 7177, Dublin OH 43017. Please read the prospectus carefully for investment objectives, risk & expense information before investing. Past performance does not guarantee future results. All performance figures represent total returns and average annual total returns for the periods ended July 30, 2010, and assumes reinvestment of all di vidend and capital gain distributions. The investment return and principal value of an investment will fluctuate so that an investor’s shares, when redeemed, may be worth more or less than their original cost. Management fees were waived and/or expenses reimbursed in order to reduce the operating expenses of the Funds during all periods shown above. All expense waivers for the Funds are voluntary and may be terminated at any time, except for The Quantex Fund TM. The management fee waiver for The Quantex Fund TM is contractual and may be terminated annually by the adviser on its renewal date. Source for index data: Bloomberg. *An investment in The Money Market Fund is not insured or guaranteed by the Federal Deposit Insurance Corporation or any other governmental agency. Although The Money Market Fund seeks to preserve the value of your investment at $1.00 per share, it is possible to lose money by investing in the Fund. Yield quotations more closely reflect the current earnings of The Money Market Fund than do total return quotations. The current performance may be lower or higher than the performance data quoted. ** Current expense ratio based on net assets as of 6/30/10. This ratio may increase or decrease depending on fluctuations in fund net assets. *** The Gross Expense Ratios are percentages of the Funds’ average net assets as they are shown in the most current Funds’ Prospectus. ****The Blended Index is comprised of 60% of the S&P 500 Index and 40% of the average 90-day U.S. Treasury bill. 1Inception Date: 3/27/85. 2Inception Date: 12/28/04. 3Inc eption Date: 5/7/85. 4Inception Date 1/31/06. 5Inception Date: 8/10/88. 6Inception Date: 6/21/95. 7Inception Date: 2/29/00. 8Inception Date: 1/31/06. 9Inception Date: 2/29/00. 10Inception Date: 3/20/85.
 | 2010 Semiannual Report | June 30, 2010 |
Letter to Shareholders
During the first half of 2010, the economic resurgence in the U.S. led to recovery highs for the major stock market indices through April. However, concerns regarding sovereign debt and the sustainability of the economic recovery following the expiration and fade of numerous stimulus programs weighed heavily on the financial markets during the remainder of the second quarter. As a result, major market indices posted losses during the first half of 2010. The Dow Jones Industrial Average ended the first half of 2010 down 5.00% while the S&P 500 Index declined 6.65%. However, smaller companies performed slightly better as evidenced by the S&P 400 Midcap Index and the Russell 2000 Index which lost 1.36% and 1.94%, respectively. As investor fears returned to the market, tr aditional safe haven assets such as U.S. Treasury securities and gold benefited from the renewed market turbulence. Despite the difficult conditions and volatility encountered in the equity markets, we are pleased with the relative performance of The Flex-funds® through the first half of the year, as the majority of our Funds outperformed their respective benchmarks.
The first half of 2010 witnessed an abundance of events and news headlines which contributed to the stock market volatility. During the first quarter, continued federal government stimulus programs, better than expected corporate profits, and improving employment data provided positive catalysts for the continued advance in the domestic stock market. However, investor anxiety over fiscal deficits and high debt levels in the European region coupled with emerging concerns regarding the sustainability of the economic recovery led to steep and swift market losses. Given the presence of significant challenges, some economists have even concluded that a ‘double-dip’ recession is quite possible. However, despite the numerous negative catalysts, many indicators show that the economic reco very is still intact. Companies have continued to report better than expected profits, which has also been coupled with solid sales growth in recent quarters. Subdued inflation reports should also allow the Federal Reserve to maintain its commitment to keeping interest rates low for an “extended period”.
Because of the recent deterioration of trend and technical factors in our investment models, we believe extra caution is warranted to monitor potential downside risks. Additionally, we believe that the stock market is currently in a cyclical bull market within a long-term secular bear market. As such, we believe an active management approach to risk exposure is critical in this market environment. The following pages will provide an overview of how we managed our risk exposures and the strategies we employed during the first half of 2010. We will also provide a brief summary on the economic and financial events that punctuated the first half of 2010, update our expectations for the balance of the year, and review the performance of our Funds.
The First Half of 2010 in Review
The first half of 2010 brought much uncertainty to the stock market. Following a positive start to the year, the sustainability of the economic recovery was called into question and the European debt crisis escalated as contagion fears gripped investors. In an effort to allay concerns, a bailout loan package was created by eurozone countries in conjunction with the International Monetary Fund (IMF) and the European Central Bank. Domestically, investor fears were stoked by unfavorable economic data in the housing market, renewed weakness on the job front, and the unwinding of various stimulus programs. The following is a brief overview of significant events and developments that influenced investors during the first half of 2010.
* Sovereign debt concerns emerge. The intensifying sovereign debt crisis in Europe has led to stock market declines around the globe. A $1 trillion bailout package was provided by the eurozone members and the International Monetary Fund, but investors remain concerned about the potential for defaults within the European community. Furthermore, as countries implement austerity measures to reign in spending, many economists fear such measures could push some countries back into recession. As European nations work through their debt problems, sovereign debt yields for these countries will likely remain elevated. The efficiency and expediency with which these problems are resolved could affect the progression of the global economi c rebound.
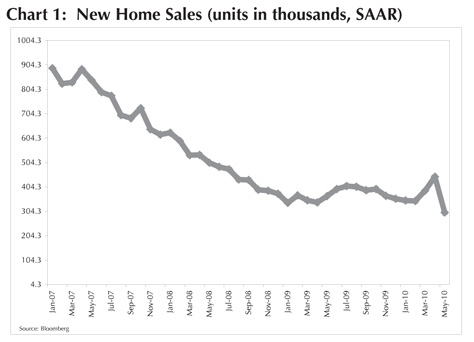
* Home sales stall following tax credit expiration. The expiration of the homebuyer tax credit at the end of April gave way to the lowest level of new home sales on
The Flex-funds® 2010 Semiannual Report | June 30, 2010 | Page 1 |
| | 2010 Semiannual Report | June 30, 2010 |
record during the month of May. New home sales declined to an annual rate of 300,000 from the revised April figure of 446,000, a 32.7% decrease (see chart 1). Although the number may be exaggerated due to the expiration of the tax credit, the exceptionally low number of new home sales raises questions whether buying will continue without government incentives. However, mortgage rates recently fell to record low levels, which may help attract buyers into the market. Investors will continue to closely monitor the housing market for signs of recovery, which could be extrapolated to the health of the overall economy.
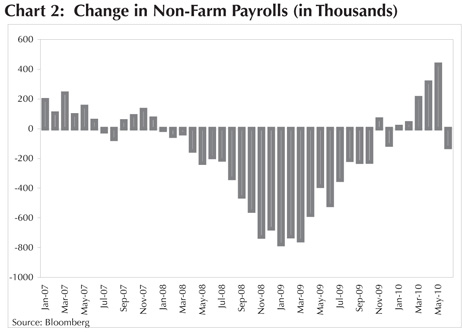
* Mixed employment data. The unemployment rate fell to 9.5% for the month of June from 9.7% during the previous month. Although this is the lowest rate experienced since July of 2009, the reduction was driven by a drop in the labor force participation rate. For the first time since December, nonfarm payrolls declined in June due to the reduction of 225,000 temporary employees hired to conduct the 2010 census (see chart 2). Additionally, private sector payrolls only increased 83,000 while analysts expected a gain of 110,000. Job growth is essential for the economy to maintain the path toward recovery. Without improvement in the labor market, the outlook for consumer spending, which is a primary driver of GDP growth, could becom e uncertain. The strength of the employment market will be continually monitored by investors as a way to gauge the economic recovery.
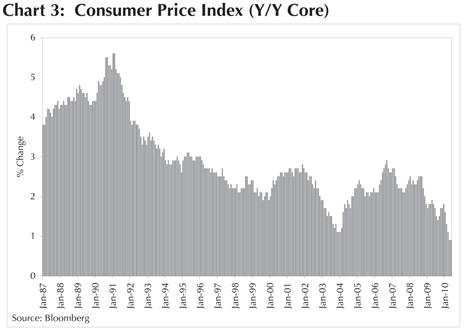
* Inflation remains low. The Consumer Price Index, a broad based gauge of inflation, remains extremely low. The core index reading, which excludes food and energy prices, was reported at 0.9% year-over-year during April and May (see chart 3). This is the lowest year-over-year increase in prices since 1966. As the year began, inflation concerns were elevated as the Federal Reserve maintained a low interest rate policy and economic growth appeared strong. However, given the fragile state of the economy, inflation concerns have become somewhat muted for the immediate future. If the economic recovery persists and employment outlook improves, inflation worries will likely return and scrutiny will surround the Federal Res erve’s interest rate policy.
* Congress approves healthcare overhaul. Congress passed the much debated and controversial healthcare bill that will extend coverage to over 32 million uninsured citizens, with major coverage expansion set to begin in 2014. Despite the marginal passage of The Patient Protection and Affordable Care Act by the House of Representatives, Democrats and Republicans continue to debate over the imminent changes to the healthcare system. Investors initially reacted favorably to the news
| Page 2 | The Flex-funds® 2010 Semiannual Report | June 30, 2010 |
| | 2010 Semiannual Report | June 30, 2010 |
as a key source of uncertainty was eliminated. However, the long-term effects of healthcare reform on the financial markets will require time to determine since most of the major policy provisions will not begin to take effect until 2014.
* Largest oil spill ever in U.S. waters. On April 20, an explosion caused a deepwater oil rig to sink in the Gulf of Mexico, and has subsequently led to the largest oil spill in U.S. history. As of the time of this writing, oil continues to leak into the gulf with containment efforts still being developed and debated by scientists and government officials. The full environmental and economic ramifications of this disaster are yet to be completely understood and quantified. As a result, there is great uncertainty surrounding the future of offshore drilling both in the U.S. and abroad, and the potential effects that regulatory changes could have on the supply of oil worldwide.
* Sales growth continues to boost corporate profits. For the first quarter of 2010, companies were able to post strong earnings results due in part to strong sales growth. Over 80% of companies in the S&P 500 reported earnings ahead of analyst expectations. Further, more than 67% of companies reported better than expected growth in sales. Because positive earnings in the first quarter were driven by sales growth, the gains may be more sustainable compared to profits driven by cost-cutting measures, which occurred throughout 2009. Close attention will be levied toward the quality of corporate earnings through the remainder of the year as investors look for evidence of sustained long-term corporate earnings growth.
* Economic indicators remain positive. Numerous indicators signal that the economic rebound remains on track. The Institute for Supply Management Manufacturing Index (ISM) was reported at 56.2 during the month of May and has been reported above 50 for the past eleven consecutive months. An ISM reading above 50 indicates expansion while a reading below 50 indicates contraction. Retail sales have increased 6.1% year-over-year during May, which marks the seventh consecutive monthly increase. Additionally, industrial production increased 8.0% year-over-year during May, which is the largest monthly increase since the economic recovery commenced. Also, capacity utilization rose to 74.7 in May from 73.1 in April, sugg esting that demand is spurring higher production activity.
The events that took place during the first half of 2010 raise questions regarding the continued recovery of the U.S. economy. Sovereign debt concerns in Europe, slow domestic job growth, the struggling housing market, and the subsequent impact on consumer confidence all raise concerns for investors. However, continued low interest rates, rising corporate profits, and increases in industrial production provide evidence that the recovery is on track.
Our Investment Approach
Equity Funds
Following new recovery highs for the major stock market indices during April, concerns regarding sovereign debt and the sustainability of the economic recovery weighed on the financial markets during the second quarter. As market conditions evolved, we employed various tactics and strategies throughout the quarter in response to the uncertain economic and stock market environment. In The Muirfield Fund® and the equity portion of The Defensive Balanced Fund, we began 2010 with an approximate 90% allocation to the stock market and a 10% defensive position in bond funds. As the year progressed and stock market conditions worsened, our investment models indicated a deteriorating risk/reward market environment. More specifically, we noted weakening in many of the trend and technical component s of our investment model. As a result, we began decreasing our stock market exposure and increasing our defensive position. We ended the first half of 2010 approximately 75% invested in the stock market and 25% invested in bond funds in The Muirfield Fund® and the equity portion of The Defensive Balanced Fund.
We also utilize investment models as an integral part of the decision making process regarding our exposure to growth versus value investments and market capitalization in our fund-of-funds based mutual funds. At the beginning of the year, our investment models maintained preference for value investments versus growth investments, which has remained a consistent theme since early 2009. This positioning contributed to positive relative performance during the first half of the year as
The Flex-funds® 2010 Semiannual Report | June 30, 2010 | Page 3 |
| | 2010 Semiannual Report | June 30, 2010 |
economically-sensitive value sectors outperformed growth investments and the broader market for the six months ended June 30, 2010. We also entered 2010 with an overweight to small-cap stocks, and subsequently increased our small-cap exposure as the first quarter progressed. However, we pared our small-cap exposure during the second quarter due to indications from our investment models, which occurred as the market conditions deteriorated. Despite the challenges facing the stock market during the second quarter, small-cap stocks delivered favorable performance compared to the broader markets for the first half of 2010, which benefited our relative performance.
We managed our industry and sector exposure throughout the first half of 2010 and initiated changes in sector allocations as the year progressed. In order to capitalize on the persistence of the stock market rally at the beginning of the year, we started with an overweight position in the industrial materials and energy sectors, as well as a position in emerging market securities. We have continued to avoid direct exposure to the developed international markets since the end of 2009. Additionally, we maintained our overweight positions in the consumer staples and healthcare sectors due to attractive valuations and as a partial hedge against potential market corrections. Our overweight positions were accomplished by underweighting the technology and utilities sectors as also indicated by our models. As the year progressed and market con ditions deteriorated, our models began to indicate preference for domestic securities and conservative sectors with defensive characteristics. As a result, we reduced our emerging markets position, and maintained exposure to the consumer staples and healthcare sectors. We are also maintaining our overweight position in the energy sector, and continue to avoid direct exposure to developed international investments.
Fixed-Income Funds
In the first quarter of 2010, market participants continued their shift into fixed-income investments. Despite the enormous ascent of equities from the March 2009 lows, tightening of yield spreads toward pre-credit crisis levels, global recovery concerns, political overhang, and sovereign debt worries, investors upheld their confidence in fixed-income securities. Discussions surrounding healthcare and financial reform created uncertainty among investors, which provided a boost to fixed-income investments in most sectors. Rumblings in the eurozone over fiscally stressed governments also created ambiguity. Throughout the financial crisis, central banks around the world rushed to aid their domestic financial systems. As a consequence, deficits in some countries have ballooned to uncomfortable levels. Rating agencies, including Moody’ ;s and Standard & Poor’s, would ultimately respond by lowering or downgrading the long-term credit ratings of some sovereign debt.
Fundamentally, we continued to see an interesting market environment for most of the first quarter. First, the steepness of the U.S. Treasury yield curve (traditionally measured as the difference between the yield of the 2-year and 10-year securities) eclipsed its previous high by reaching more than 2.90% toward the end of February. Conventional wisdom interprets a steep yield curve to mean the economy is expected to improve in the future. Second, yield spreads of investment grade and high-yield debt instruments to U.S. Treasuries have tightened to levels below historical averages. While yield spreads have not realized the low levels of the previous business cycle, it has been a dramatic move to regain these levels. Finally, despite the efforts of the Federal Reserve to make outrig ht purchases of mortgage-backed securities as part of its quantitative easing program, mortgage-backed yield spreads remained elevated compared to historical averages during this time period.
Throughout the second quarter, the market environment remained highly erratic. Volatility continued to be fueled by an array of global news, political interference, unstable sovereign fiscal budgets, economic factors, and technical trends. Despite the instability, many trends remained supportive of corporate debt investments, driven primarily by historically low interest rates. Borrowers from all sectors, including consumers, corporations, and governments, were able to benefit from low interest rates due to the ability to improve financial health, refinance existing debt, and solve liquidity issues. Overall, this is expected to offer additional support to the ongoing recovery.
For the first half of 2010, our fixed-income portfolios remained overweight in investment grade corporate debt securities. Based on economic conditions as well as output from our investment models, we continue to believe this supports our investment allocation. Any changes in
| Page 4 | The Flex-funds® 2010 Semiannual Report | June 30, 2010 |
| | 2010 Semiannual Report | June 30, 2010 |
the portfolio were accomplished by maintaining this posture without adding credit or interest rate risk. Investment grade holdings were slanted toward higher quality diversified financial companies. In the agency sector, we maintained positions in high quality senior debt and mortgage-backed securities.
Since equity markets have recovered from March 2009 lows, yield spreads versus U.S. Treasury securities have compressed aggressively. While yield spreads have not achieved previous cycle lows, a reprieve was imminent. During the second quarter, yield spreads have become more attractive, which supports a continued overweight allocation to investment grade corporate bonds. Higher quality corporations with conservative management styles were able to take advantage of favorable market conditions to secure financing and improve productivity. As financial flexibility improved, default prospects among corporate sectors continued to decline. In an effort to balance our investment grade corporate bond position, the remainder of our portfolios were allocated to U.S. Government securities.
Finally, the retail and institutional classes of The Flex-funds® Money Market Fund remain among the top performers in the iMoneyNet universe of first tier retail and institutional money market funds. Our core investment strategies for this Fund remained unchanged throughout the second quarter and the Fund’s strong performance was accomplished by maintaining its focus on high-quality money market securities and expense controls.
Outlook for the Remainder of 2010
The events that occurred during the first half of 2010 illustrate that the economic recovery in the U.S. has arrived at a crossroads. While the Federal Reserve is able to maintain its accomodative stance with low interest rates, the fade and removal of key sources of economic stimulus will present significant challenges for the durability of the ongoing economic recovery. More specifically, private sources of demand will be necessary to supplant government-induced sources of demand.
Attention will also be dedicated to the progress of European nations regarding the resolution of debt issues and implementation of austerity measures. If austerity programs and the eurozone bailout package restore investor confidence, contagion fears may be quelled and a key source of uncertainty will be removed. Regardless, investors will continue to search for improvement in the employment outlook and other evidence that economic growth is sustainable without government aid.
As we monitor the stock market and our investment models, we will continuously evaluate our defensive position in The Muirfield Fund® and the equity portion of The Defensive Balanced Fund. We will look for opportunities to adjust portfolio weights among growth and value stocks, large-, mid-, and small-caps, and domestic and international investments in order to enhance returns and manage risk for our clients. We will also continue to proactively manage our sector exposures and will make adjustments as we modify our outlook for the economy and financial markets. On the following pages you will find a review of how The Flex-funds® have performed. Please read the commentaries to learn more about the investment decisions we made during the past six months.
These are definitely challenging times in the financial services industry. Since 1974, Meeder Financial has navigated through many periods of difficult market environments. On behalf of all of the associates at Meeder Asset Management and The Flex-funds®, I thank you for the continued trust and confidence you have placed in our investment management services. Be assured we are 100% committed to working with you and helping you achieve your most important financial goals.
Sincerely,
Robert S. Meeder, Jr.
President
The Flex-funds®
June 30, 2010
The Flex-funds® 2010 Semiannual Report | June 30, 2010 | Page 5 |
| | 2010 Semiannual Report | June 30, 2010 |
The Money Market Fund
| Period & Average Annual Total Returns as of June 30, 2010 | YTD | 1 Year | 5 Years | 10 Years | Since Inception | Inception Date |
The Flex-funds® Money Market Fund (Retail Class) | 0.11% | 0.31% | 2.93% | 2.66% | 4.65% | 3/27/85 |
| | | | | | | |
Current & Effective Yields1 | 7-day Compound: 0.20% 7-day Simple: 0.20% |
| | |
Lipper Average General-Purpose Money Market Fund2 | 0.01% | 0.04% | 2.48% | 2.21% | 4.39% | 3/31/85 |
The Flex-funds® Money Market Fund (Institutional Class) | 0.15% | 0.41% | 3.07% | - | 3.01% | 12/28/04 |
| | | | | | | |
Current & Effective Yields1 | 7-day Compound: 0.28% 7-day Simple: 0.28% |
| | |
iMoneyNet, Inc. Average First-Tier Institutional Money Market Fund2 | 0.03% | 0.09% | 2.87% | - | 2.87% | 12/31/04 |
Past performance does not guarantee future results. Except for the current and effective yields, all performance figures represent average annual total returns for the periods ended June 30, 2010, and assume reinvestment of all dividend and capital gain distributions. The investment return and principal value of an investment will fluctuate so that an investor’s shares, when redeemed, may be worth more or less than their original cost. Management fees were waived and/or expenses were reimbursed in order to reduce the operating expenses of The Money Market Fund during the periods shown above. Investments in The Money Market Fund are neither insured nor guaranteed by the Federal Deposit Insurance Corporation or any other governmental agency. Although the Funds seek to preserve the value of your investment at $1.00 per sh are, it is possible to lose money by investing in The Money Market Fund.1 For the period ended June 30, 2010, yield quotations more closely reflect the current earnings of The Money Market Fund than do total return quotations. 2 An index of funds such as Lipper’s Average General Purpose Money Market Fund Index and iMoneyNet, Inc.’s Average First-Tier Institutional Money Market Fund Index includes a number of mutual funds grouped by investment objective. One cannot invest directly in an index.
Semiannual Market Perspective
The retail and institutional classes of The Flex-funds® Money Market Fund ranked as the top general purpose money market funds in the country for the six months ended June 30, 2010, according to iMoneyNet, Inc. The retail and institutional classes of The Flex-funds® Money Market Fund closed the first half with a 7-day simple yield of 0.20% and 0.28%, respectively. By comparison, the median first tier retail and institutional money market fund finished the first half with a yield of 0.01% and 0.05%, respectively. As a result, the retail and institutional classes of The Flex-funds® Money Market Fund continue to offer superior yields. Based on year-to-date performance data as of June 30th, the retail class was ranked 1st out of 228 first tier retail funds, and the institutional class was ranked 1st out of 285 first tier institutional funds according to iMoneyNet.
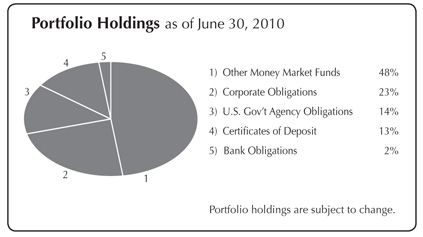
We entered 2010 with the cautious stance we have employed for a majority of the past year. Investors debating the prospects for movements in interest rates and the growth trajectory of the economy contributed to a volatile market environment. Despite the unstable backdrop, corporate financial positions continued to improve throughout the first half of the year, which created more opportunities within the money market arena. Yield spread differentials are returning to historical average spread comparisons versus U.S. Treasury bill or Government agency securities. In order to take advantage of the improving environment, we increased our allocation to investments with above average credit quality and maintained a high liquidity position.Throughout the first half of 2010, we maintained a weighted average maturity (WAM) which was greater than the average or our peers. Currently, we are adjusting our WAM lower to comply with new money market regulations and to be more in line with the category average.
| Page 6 | The Flex-funds® 2010 Semiannual Report | June 30, 2010 |
| | 2010 Semiannual Report | June 30, 2010 |
The U.S. Government Bond Fund
| Period & Average Annual Total Returns as of June 30, 2010 | YTD | 1 Year | 5 Years | 10 Years | Since Inception | Inception Date |
The Flex-funds® U.S. Government Bond Fund | 4.05% | 7.04% | 4.39% | 3.63% | 5.56% | 5/7/85 |
| | | | | | | |
Expense Ratios*: Current 0.99% Gross 1.49% | | | | | | |
| | | | | | | |
Barclays Capital Intermediate Government Index1 | 4.41% | 5.67% | 5.31% | 5.74% | 7.16% | 4/30/85 |
| | | | | | | |
Barclays Capital Intermediate-Term Government/Credit Index2 | 4.55% | 8.28% | 5.26% | 6.06% | 7.36% | 4/30/85 |
Past performance is not a guarantee of future results. All performance figures represent total returns and average annual total returns for the periods ended June 30, 2010. Investment performance assumes reinvestment of all dividend and capital gain distributions. The investment return and principal value of an investment will fluctuate so that an investor’s shares, when redeemed, may be worth more or less than their original cost. Management fees and/or expenses were waived and/or reimbursed in The Flex-funds® during the periods shown in the table above to reduce expenses. All expenses, management fees, reimbursements or waivers for the Funds are voluntary and may be terminated at any time. 1 The Barclays Capital Intermediate Government Index is an unmanaged index of dollar-denominated non-convertible fixed-rate bonds issued by the U.S. Government that are rated investment-grade or higher, have a maturity of one to ten years, and at least $250 million outstanding. The Index does not take into account the deduction of expenses associated with a mutual fund, such as investment management and accounting fees. One cannot invest directly in an index. 2Barclays Capital Intermediate-Term Government/Credit Index is an unmanaged index of fixed-rate bonds issued by the U.S. Government and its agencies that are rated investment grade or higher, have one to ten years remaining until maturity, and at least $100 million outstanding. Barclays Capital Intermediate-Term Government/Credit Index does not take int o account the deduction of expenses associated with a mutual fund, such as investment management and accounting fees. One cannot invest directly in an index. *Current expense ratio based on net assets in effect as of 6/30/10. This ratio may increase or decrease depending on fluctuations in fund net assets. The Gross Expense Ratio is a percentage of the Fund’s assets as shown in the most recent Prospectus.
Semiannual Market Perspective
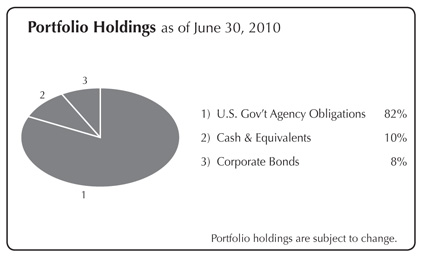
The Flex-funds® U.S. Government Bond Fund returned 4.05% year-to-date through June 30, 2010. The Fund is currently positioned with a mix of holdings issued by U.S. Government agencies and investment grade corporations. We believe both sectors should continue to benefit as investors attempt to diversify their portfolios into fixed-income investments. Currently, our models favor investment grade corporate holdings. As opportunities become present within economic cycles which support this sector, we may invest in high quality corporate obligations. The Fund’s current allocation in investment grade corporate bonds is approximately 8%. The fund is permitted to invest to a maximum allocation of 20% in investment grade corporate bonds.
Throughout the first half of the year, interest rate projections based on our models and investor sentiment in the fixed-income markets offered mixed signals. Traditionally, the current environment of historically low interest rate policy would promote a portfolio strategy incorporating shorter average maturity. However, uncertainty of economic stability has generated above average interest for fixed-income obligations. This would suggest a greater need for a portfolio adopting a longer average maturity. To combat the variability of this environment, we positioned the Fund with an average maturity level less than that of the benchmark.
The Flex-funds® 2010 Semiannual Report | June 30, 2010 | Page 7 |
| | 2010 Semiannual Report | June 30, 2010 |
The Defensive Balanced Fund
| Period & Average Annual Total Returns as of June 30, 2010 | YTD | 1 Year | 8/31/08 to 6/30/103 | Since Inception | Inception Date |
The Flex-funds® Defensive Balanced Fund | -3.01% | 8.71% | -2.67% | -1.45% | 1/31/06 |
| | | | | | |
Expense Ratios*: Current 1.53% Gross 1.72% | | | | | |
| | | | | | |
S&P 500 Index1 | -6.65% | 14.43% | -9.10% | -2.72% | 1/31/06 |
| | | | | | |
Blended Index2 | -1.32% | 8.79% | -1.21% | 1.69% | 1/31/06 |
Past performance is not a guarantee of future results. All performance figures represent total returns and average annual total returns for the periods ended June 30, 2010. Investment performance assumes reinvestment of all dividend and capital gain distributions. The investment return and principal value of an investment will fluctuate so that an investor’s shares, when redeemed, may be worth more or less than their original cost. Management fees and/or expenses were waived and/or reimbursed in The Flex-funds® during the periods shown in the table above to reduce expenses. All expenses, management fees, reimbursements or waivers for the Funds are voluntary and may be terminated at any time. 1The S&P 500 Index is a widely recognized unmanaged index of common stock prices. The S&P 500 Index does not take into account the deduction of expenses associated with a mutual fund, such as investment management and accounting fees. One cannot invest directly in an index. 2 The Blended Index consists of 42% of the S&P 500 Index, 28% of the average 90-day U.S. Treasury bill and 30% Barclays Intermediate-Term Government/Credit Index. 3 On August 25, 2008, the name and investment strategy of the Fund was changed. *Current expense ratio based on net assets in effect as of 6/30/10. This ratio may increase or decrease depending on fluctuations in fund net assets. The Gross Expense R atio is a percentage of the Fund’s assets as shown in the most recent Prospectus.
Semiannual Market Perspective
The Defensive Balanced Fund will always invest at least 30%, and up to 70%, of its assets in the stock market. The Fund will also invest at least 30%, and up to 70%, of its assets in fixed-income securities. We began 2010 with an approximate 60% allocation to the stock market. As the year progressed and stock market conditions worsened, our investment models indicated a deteriorating risk/reward market environment. As a result, we began decreasing our stock market exposure and increasing our defensive position during the second quarter. As a result, we ended the first half of 2010 approximately 55% invested in the stock market in The Defensive Balanced Fund.
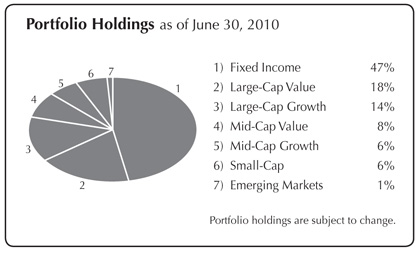
Regarding equity exposure, we entered 2010 with an overweight to value investments versus growth investments. We have also remained overweight in small-cap stocks to a varying degree throughout the first half of 2010 due to indications from our investment models. Overall, our positioning contributed to positive relative performance during the first half of the year as economically-sensitive small-cap and value sectors outperformed the broader market for the six months ended June 30, 2010. Regarding industry and sector exposure, we began the year with an overweight position in the healthcare, consumer staples, energy, and industrial materials sectors. We also maintained a position in emerging market securities, while continuing to avoid direct exposure to developed international markets. As the year progressed and market conditions dete riorated, our models began to indicate incremental preference for domestic securities and conservative sectors with defensive characteristics. As a result, we reduced our emerging markets position, and maintained exposure to the consumer staples and healthcare sectors. We also ended the first half of 2010 with an overweight to the energy sector.
In the fixed-income portion of the Fund, the target allocation has been overweight in the investment grade bond sector during the first half of 2010. While our positioning benefited performance during the first quarter, the corporate sector underperformed U.S. Treasury securities during the second quarter. Overall, our overweight to the corporate sector has benefited fixed-income returns for the first half of 2010. Additionally, the duration of the fixed-income portion of the Fund was maintained slightly below that of our benchmark during the first half, which is consistent with readings from our fixed-income models.
| Page 8 | The Flex-funds® 2010 Semiannual Report | June 30, 2010 |
| | 2010 Semiannual Report | June 30, 2010 |
The Muirfield Fund®
| Period & Average Annual Total Returns as of June 30, 2010 | YTD | 1 Year | 5 Years | 10 Years | Since Inception | Inception Date |
The Flex-funds Muirfield Fund® | -5.01% | 10.63% | 0.18% | -0.14% | 6.50% | 8/10/88 |
| | | | | | | |
Expense Ratios*: Current 1.38% Gross 1.66% | | | | | | |
| | | | | | | |
S&P 500 Index1 | -6.65% | 14.43% | -0.79% | -1.59% | 8.65% | 7/31/88 |
| | | | | | | |
Blended Index2 | -3.85% | 8.83% | 0.93% | 0.38% | 7.13% | 7/31/88 |
Past performance is not a guarantee of future results. All performance figures represent total returns and average annual total returns for the periods ended June 30, 2010. Investment performance assumes reinvestment of all dividend and capital gain distributions. The investment return and principal value of an investment will fluctuate so that an investor’s shares, when redeemed, may be worth more or less than their original cost. Management fees and/or expenses were waived and/or reimbursed in The Flex-funds® during the periods shown in the table above to reduce expenses. All expenses, management fees, reimbursements or waivers for the Funds are voluntary and may be terminated at any time.� 0; 1The S&P 500 Index is a widely recognized unmanaged index of common stock prices. The S&P 500 Index does not take into account the deduction of expenses associated with a mutual fund, such as investment management and accounting fees. One cannot invest directly in an index. 2 The Blended Index consists of 60% of the S&P 500 Index and 40% of the average 90-day U.S. Treasury bill. *Current expense ratio based on net assets in effect as of 6/30/10. This ratio may increase or decrease depending on fluctuations in fund net assets. The Gross Expense Ratio is a percentage of the Fund’s assets as shown in the most recent Prospectus.
Semiannual Market Perspective
The Muirfield Fund® began 2010 with an approximate 90% allocation to the stock market and a 10% defensive position in bond funds. As the year progressed and stock market conditions worsened, our investment models indicated a deteriorating risk/reward market environment. More specifically, we noted weakening in many of the trend and technical components of our investment model. As a result, we began decreasing our stock market exposure and increasing our defensive position. We ended the first half of 2010 approximately 75% invested in the stock market and 25% invested in bond funds in The Muirfield Fund®. While the Fund’s invested position benefited performance during the first quarter, the stock market decline during the second quarter detracted from performance relative to the blended index. However, the Fund’s defensive position contributed to relative outperformance of the broader market as measured by the S&P 500 Index.
In addition to altering our defensive position in order to protect against downside market risk, we also managed our industry and sector exposure in the Fund. We began 2010 with an overweight position in the industrial materials, energy, consumer staples, and healthcare sectors due to indications from our investment models. Our overweight positions were accomplished by underweighting the technology and utilities sectors. As the year progressed and market conditions deteriorated, our models began to indicate incremental preference for domestic securities and conservative sectors with defensive characteristics. As a result, we reduced our emerging markets position, and maintained exposure to the consumer staples and healthcare sectors. We are also maintaining our overweight pos ition in the energy sector, and continue to avoid direct exposure to developed international investments.
Regarding our stock market exposure, we utilized our investment models to manage our exposure to growth versus value investments and across the range of market capitalization. We began the year with an overweight toward value investments due to indications from our investment models. We also maintained our overweight position in small-cap stocks; however, we pared our small-cap exposure during the second quarter due to indications from our investment models which followed deterioration of market conditions. Despite the challenges facing the stock market during the second quarter, small-cap stocks delivered favorable performance compared to the broader markets for the first half of 2010, which benefited our relative performance.
The Flex-funds® 2010 Semiannual Report | June 30, 2010 | Page 9 |
| | 2010 Semiannual Report | June 30, 2010 |
The Total Return Utilities Fund
| Period & Average Annual Total Returns as of June 30, 2010 | YTD | 1 Year | 5 Years | 10 Years | Since Inception | Inception Date |
The Flex-funds® Total Return Utilities Fund | -6.14% | 13.68% | 2.27% | 1.42% | 6.69% | 6/21/95 |
| | | | | | | |
Expense Ratios*: Current 1.94% Gross 2.20% | | | | | | |
| | | | | | | |
Russell 3000 Utilities Index1 | -7.36% | 5.13% | -2.93% | -3.39% | 3.22% | 6/30/95 |
Past performance is not a guarantee of future results. All performance figures represent total returns and average annual total returns for the periods ended June 30, 2010. Investment performance assumes reinvestment of all dividend and capital gain distributions. The investment return and principal value of an investment will fluctuate so that an investor’s shares, when redeemed, may be worth more or less than their original cost. Management fees and/or expenses were waived and/or reimbursed in The Flex-funds® during the periods shown in the table above to reduce expenses. All expenses, management fees, reimbursements or waivers for the Funds are voluntary and may be terminated at any time. 1The Russell 3000 Utilities Index is a market capitalization-weighted index that is comprised of utility stocks that are included in the Russell 3000 Index. This index does not take into account the deduction of expenses associated with a mutual fund, such as investment management and accounting fees. One cannot invest directly in an index. *Current expense ratio based on net assets in effect as of 6/30/10. This ratio may increase or decrease depending on fluctuations in fund net assets. The Gross Expense Ratio is a percentage of the Fund’s assets as shown in the most recent Prospectus.
Semiannual Market Perspective
The Flex-funds® Total Return Utilities Fund returned -6.14% for the six months ended June 30, 2010, compared to the benchmark Russell 3000 Utilities Index return of -7.36%. On a year-to-date basis, the Fund is also outperforming the broader market as measured by the S&P 500 Index, while the aforementioned utility index is lagging the broader market.
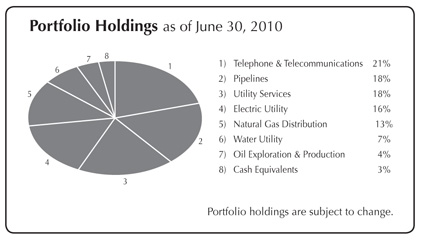
During the first quarter, we bought and sold Telmex with little result in terms of performance. We anticipated more upside for the stock as a player in Carlos Slim’s Helu’s consolidation and restructuring, but as the story unfolded we decided that gains were limited. We trimmed NII Holdings for cash needs, though it remains our largest position by virtue of its persistent and outstanding gains. We added American Tower, which is a major beneficiary of the wireless infrastructure build-out, and additional infrastructure appears necessary since smart phones use a multiple of the bandwidth used by regular voice phones. As a result, that translates to more antennas on AMT’s towers and more revenue per tower.
During the second quarter, our best performers included a mix of infrastructure companies and master limited partnerships. Akamai, whose technology and services make high speed delivery of information on the internet possible, increased nearly 30% during the second quarter. The company reported results that were much better than expected, increased its share buy-back program, and raised future guidance. Questar was strong following the company’s announcement that it would split their E&P operations from the utility and pipeline operations. On the downside, NIHD Holdings was the worst performer, but this was primarily a result of market volatility, which we believe is tolerable since the stock has been a portfolio leader over the past year. Veolia lost ground, though we continue to t hink this diversified water and infrastructure company is a long-term winner, which is a view that other investors may come to embrace as the company decreases debt through asset sales.
We believe that our stocks do not depend on the same kind of economic shifts that analysts often employ in determining which stocks will outperform or underperform. Our companies provide the essential services and infrastructure that enable the pursuit of our daily lives. We believe that investor interest in stability versus strong near-term growth tends to favor our group, although that generalization is subject to contradiction at various periods in past history. We will continue to seek holdings that can benefit from economic tailwinds and in service-provision, while being mindful of valuations.
| Page 10 | The Flex-funds® 2010 Semiannual Report | June 30, 2010 |
| | 2010 Semiannual Report | June 30, 2010 |
The Dynamic Growth Fund
| Period & Average Annual Total Returnsas of June 30, 2010 | YTD | 1 Year | 5 Years | 10 Years | Inception Date |
The Flex-funds® Dynamic Growth Fund | -6.23% | 12.43% | -0.88% | -1.14% | 2/29/00 |
| | | | | | |
Expense Ratios*: Current 1.42% Gross 1.63% | | | | | |
| | | | | | |
S&P 500 Index1 | -6.65% | 14.43% | -0.79% | -1.59% | 2/29/00 |
Past performance is not a guarantee of future results. All performance figures represent total returns and average annual total returns for the periods ended June 30, 2010. Investment performance assumes reinvestment of all dividend and capital gain distributions. The investment return and principal value of an investment will fluctuate so that an investor’s shares, when redeemed, may be worth more or less than their original cost. Management fees and/or expenses were waived and/or reimbursed in The Flex-funds® during the periods shown in the table above to reduce expenses. All expenses, management fees, reimbursements or waivers for the Funds are voluntary and may be terminated at any time. 1The S&P 500 Index is a widely recognized unmanaged index of common stock prices. The S&P 500 Index does not take into account the deduction of expenses associated with a mutual fund, such as investment management and accounting fees. One cannot invest directly in an index. * Current expense ratio based on net assets in effect as of 6/30/10. This ratio may increase or decrease depending on fluctuations in fund net assets. The Gross Expense Ratio is a percentage of the Fund’s assets as shown in the most recent Prospectus.
Semiannual Market Perspective
The Flex-funds® Dynamic Growth Fund returned -6.23% during the first half of 2010 compared to the S&P 500 Index return of -6.65% for the same time period. The second quarter of 2010 encountered significant challenges presented by a slowing economic recovery and concerns regarding heightened government debt levels and deficits. Following an 84% rally from the March 2009 low, the stock market succumbed to selling pressure and posted its first quarterly decline since the first quarter of 2009, as measured by the S&P 500 Index. However, many economic indicators show that the economic recovery is still intact.
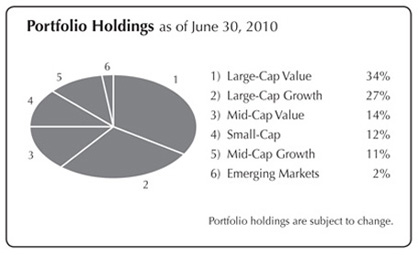
In The Flex-funds® Dynamic Growth Fund, we utilize investment models as an integral part of the decision making process regarding our exposure to growth versus value investments and market capitalization. At the beginning of the year, our investment models maintained preference for value investments versus growth investments, which has remained a consistent theme since early 2009. This positioning contributed to positive relative performance during the first half of the year as economically-sensitive value sectors outperformed growth investments and the broader market for the six months ended June 30, 2010. We also entered 2010 with an overweight to small-cap stocks, and subsequently increased our sma ll-cap exposure as the first quarter progressed. However, we pared our small-cap exposure during the second quarter due to indications from our investment models, which followed deterioration of market conditions. Despite the challenges facing the stock market during the second quarter, small-cap stocks delivered favorable performance compared to the broader markets for the first half of 2010, which benefited our relative performance.
We also managed our industry and sector exposure throughout the first half of 2010. In order to capitalize on the persistence of the stock market rally at the beginning of the year, we started with an overweight position in the industrial materials and energy sector, as well as a position in emerging market securities. Additionally, we maintained our overweight positions in the consumer staples and healthcare sectors due to attractive valuations and as a partial hedge against potential market corrections. Our overweight positions were accomplished by underweighting the technology and utilities sectors as also indicated by our models. As the year progressed and market conditions deteriorated, our models began to indicate incremental preference for domestic securities and conservative sectors w ith defensive characteristics. As a result, we reduced our emerging markets position, and maintained exposure to the consumer staples and healthcare sectors. We are also maintaining our overweight position in the energy sector, and continue to avoid direct exposure to developed international investments.
The Flex-funds® 2010 Semiannual Report | June 30, 2010 | Page 11 |
| | 2010 Semiannual Report | June 30, 2010 |
The Strategic Growth Fund
| Period & Average Annual Total Returns as of June 30, 2010 | YTD | 1 Year | 8/31/08 to 6/30/103 | Since Inception | Inception Date |
The Flex-funds® Strategic Growth Fund | -4.80% | 19.29% | -9.65% | -3.99% | 1/31/06 |
| | | | | | |
Expense Ratios*: Current 1.57% Gross 1.80% | | | | | |
| | | | | | |
S&P 500 Index1 | -6.65% | 14.43% | -9.10% | -2.72% | 1/31/06 |
| | | | | | |
Blended Index2 | -5.11% | 18.57% | -11.35% | -2.58% | 1/31/06 |
Past performance is not a guarantee of future results. All performance figures represent total returns and average annual total returns for the periods ended June 30, 2010. Investment performance assumes reinvestment of all dividend and capital gain distributions. The investment return and principal value of an investment will fluctuate so that an investor’s shares, when redeemed, may be worth more or less than their original cost. Management fees and/or expenses were waived and/or reimbursed in The Flex-funds® during the periods shown in the table above to reduce expenses. All expenses, management fees, reimbursements or waivers for the Funds are voluntary and may be terminated at any time. 1The S&P 500 Index is a widely recognized unmanaged index of common stock prices. The S&P 500 Index does not take into account the deduction of expenses associated with a mutual fund, such as investment management and accounting fees. One cannot invest directly in an index. 2The Custom Blended Index is comprised of 25% S&P 500, 20% S&P Midcap 400, 12.5% Russell 2000, 12.5% Dow Jones Wilshire Real Estate Investment Trust, 12.5% Goldman Sachs Commodity Index, 12% Morgan Stanley Capital International Europe, Australasia, and Far East, and 5.5% Morgan Stanley Capital International Europe Emerging Markets Index. These indices do not take into account the deduction of expenses associated with a mutual fund such as investment management and accounting fees. An investor cannot invest directly in an index. 3 On August 25, 2008, the name and investment strategy of the Fund was changed.* Current expense ratio based on net assets in effect as of 6/30/10. This ratio may increase or decrease depending on fluctuations in fund net assets. The Gross Expense Ratio is a percentage of the Fund’s assets as shown in the most recent Prospectus.
Semiannual Market Perspective
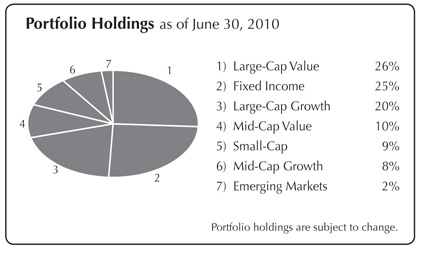
For the six months ended June 30, 2010, The Strategic Growth Fund returned -4.80%, compared to the S&P 500 Index return of -6.65% and the custom benchmark return of -5.11%. The Strategic Growth Fund is fully invested in the equity market at all times and holds a fixed allocation across six distinct investment categories. The mix of investments selected to represent each investment category is variable and actively managed by using our strategic fund selection process. The current target allocation is comprised of the following: 25% large-cap holdings, 20% mid-cap holdings, 17.5% international holdings, 12.5% small-cap holdings, 12.5% real estate holdings, and 12.5% commodities holdings. Within each respective category, we seek to identify funds that will outperform their peers through an evaluation process based on valuation factors, measures of volatility, and risk-adjusted returns. Funds that fall out of favor within our models are sold and replaced with higher ranking funds. Due to this allocation, we believe it is most appropriate to compare the Fund’s performance to a custom benchmark that reflects the target allocations previously specified. For the first half of 2010, the Fund outperformed the custom benchmark, which is attributable to favorable fund selection in various categories, particularly in our small-cap and real-estate holdings. Fund selection detracted from our performance in the commodity category through our holding of Van Eck Global Hard Assets.
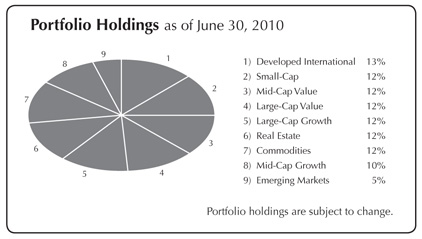
The Fund’s favorable performance during the first half of 2010 versus the S&P 500 can be directly attributed to several of the asset allocation categories. While the S&P 500 declined by 6.65% during the first half of 2010, the Russell 2000 Index of small-cap stocks decreased by 1.94% and the S&P 400 Index of mid-cap stocks decreased by 1.36% during the same time period (be advised one cannot invest directly in an index). Additionally, an index tracking real estate-related stocks increased by 5.28% during the six months ended June 30, 2010. Market segments that detracted from performance for the first half include developed international and emerging market holdings.
The custom benchmark for the Strategic Growth Fund is comprised of 25% of the S&P 500 Index, 20% of the S&P 400 Index, 12.5% of the Russell 2000 Index, 12.5% of the Dow Jones US Select REIT Index, 12.5% of the S&P GSCI Index, 12% of the MSCI EAFE Index, and 5.5% of the MSCI Emerging Markets Index.
| Page 12 | The Flex-funds® 2010 Semiannual Report | June 30, 2010 |
| | 2010 Semiannual Report | June 30, 2010 |
The Aggressive Growth Fund
| Period & Average Annual Total Returns as of June 30, 2010 | YTD | 1 Year | 5 Years | 10 Years | Inception Date |
The Flex-funds® Aggressive Growth Fund | -6.24% | 14.34% | -0.50% | -1.83% | 2/29/00 |
| | | | | | |
Expense Ratios*: Current 1.60% Gross 1.82% | | | | | |
| | | | | | |
S&P 500 Index1 | -6.65% | 14.43% | -0.79% | -1.59% | 2/29/00 |
| | | | | | |
NASDAQ Composite Index2 | -6.62% | 16.04% | 1.38% | -5.50% | 2/29/00 |
Past performance is not a guarantee of future results. All performance figures represent total returns and average annual total returns for the periods ended June 30, 2010. Investment performance assumes reinvestment of all dividend and capital gain distributions. The investment return and principal value of an investment will fluctuate so that an investor’s shares, when redeemed, may be worth more or less than their original cost. Management fees and/or expenses were waived and/or reimbursed in The Flex-funds® during the periods shown in the table above to reduce expenses. All expenses, management fees, reimbursements or waivers for the Funds are voluntary and may be terminated at any time. 1The S&P 500 Index is a widely recognized unmanaged index of common stock prices. The S&P 500 Index does not take into account the deduction of expenses associated with a mutual fund, such as investment management and accounting fees. One cannot invest directly in an index. 2The NASDAQ Composite Index is a broad-based capitalization-weighted index of all NASDAQ National Market and Small Cap stocks. The NASDAQ Composite Index does not take into account the deduction of expenses associated with a mutual fund, such as investment management and accounting fees. One cannot invest directly in an index. *Current expense ratio based on net assets in effect as of 6/30/10. This ratio may increase or decrease d epending on fluctuations in fund net assets. The Gross Expense Ratio is a percentage of the Fund’s assets as shown in the most recent Prospectus.
Semiannual Market Perspective
The Flex-funds® Aggressive Growth Fund returned -6.24% for the first half of 2010 compared to the NASDAQ Composite Index return of -6.62% and the S&P 500 Index return of -6.65%. During the first quarter, continued federal government stimulus programs, better than expected corporate profits, and improving employment data provided positive catalysts for the continued advance in the domestic stock market. However, the stock market succumbed to pressures in the second quarter as a result of decelerating economic activity and sovereign debt woes.
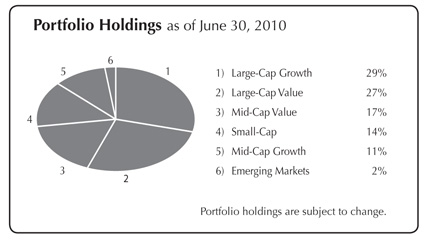
In The Aggressive Growth Fund, we entered 2010 with an overweight to value investments, mid-cap stocks, and small-cap stocks. Regarding small-cap stocks, we have maintained an overweight to a varying degree for over a year due to favorable readings from our investment models and favorable historical performance surrounding economic troughs. Following an incremental allocation to small-cap investments during the first quarter, our investment models pared preference for small-cap stocks during the second quarter as market declines intensified, which led us to decrease our position. Despite the adjustment, we remained overweight to small-cap stocks, which benefited our performance. As of the end of the first half of 2010, we are also maintaining our overweight to value investments and mid-cap st ocks.
We also managed our industry and sector exposure in the Fund, and began the year with an overweight position in the energy and industrial materials sectors, as well as a position in emerging market stocks. Given the ongoing stock market rally and economic recovery, we believed these sectors offered greater potential for capital appreciation. As the first quarter progressed our investment models increased preference for domestic securities, which led us to reduce our emerging market position while continuing to avoid direct exposure to developed international markets. We also increased our exposure to the healthcare sector due to indications from our investment models, which was largely driven by attractive valuations. We achieved our overweight positions by being underweight the technology an d utilities sectors. As the year progressed and stock market declines materialized, our investment models increased preference for defensive sectors, which led us to increase our healthcare position and establish an overweight position in the consumer staples sector. We ended the first half with an overweight position in the healthcare, consumer staples, and energy sectors.
The Flex-funds® 2010 Semiannual Report | June 30, 2010 | Page 13 |
| | 2010 Semiannual Report | June 30, 2010 |
The Quantex Fund™
| Period & Average Annual Total Returns as of June 30, 2010 | YTD | 1 Year | 5 Years | 10 Years | Since Inception | Inception Date |
The Flex-funds® Quantex Fund™ | -2.54% | 38.98% | 2.23% | -0.72% | 6.27% | 3/20/85 |
| | | | | | | |
Expense Ratios*: Current 1.62% Gross 2.39% | | | | | | |
| | | | | | | |
Russell 2000 Index1 | -1.94% | 21.49% | 0.39% | 3.04% | 6.82% | 3/31/85 |
| | | | | | | |
Blended Index2 | -1.65% | 23.22% | 1.33% | 4.22% | 9.77% | 3/31/85 |
| | | | | | | |
S&P 400 Mid-cap Index3 | -1.36% | 24.92% | 2.21% | 5.30% | 11.71% | 3/31/85 |
Past performance is not a guarantee of future results. All performance figures represent total returns and average annual total returns for the periods ended June 30, 2010. Investment performance assumes reinvestment of all dividend and capital gain distributions. The investment return and principal value of an investment will fluctuate so that an investor’s shares, when redeemed, may be worth more or less than their original cost. Management fees and/or expenses were waived and/or reimbursed in The Flex-funds® during the periods shown in the table above to reduce expenses. The Fund’s management fee waiver is contractual and may be terminated annually by the Advisor on its renewal date. 1The Russell 2000 Index is a widely recognized unmanaged index of common stock prices of small-sized companies. The Russell 2000 Index does not take into account the deduction of expenses associated with a mutual fund, such as investment management and accounting fees. One cannot invest directly in an index. 2The Blended Index consists of 50% Russell 2000 Index and 50% S&P 400 Mid-Cap Index. 3The S&P 400 Mid-Cap Index is a widely recognized unmanaged index of common stock prices of mid-sized companies. The S&P 400 Mid-Cap Index does not take into account the deduction of expenses associated with a mutual fund, such as investment management and accounting fees. One cannot invest directly in an index. * Current expense ratio based on net assets in effect as of 6/30/10. This ratio may increase or decrease depending on fluctuations in fund net assets. The Gross Expense Ratio is a percentage of the Fund’s assets as shown in the most recent Prospectus.
Semiannual Market Perspective
The Quantex Fund™ returned -2.54% for the six months ended June 30, 2010 compared to the Russell 2000 Index return of -1.94% and the S&P 400 Mid-Cap Index return of -1.36% for the same period. For the one-year period ended June 30, 2010, The Quantex Fund™ returned 38.98% compared to the Russell 2000 Index return of 21.49% and the S&P 400 Mid-Cap Index return of 24.92% for the same time period. As a result of its impressive one-year performance, the Wall Street Journal recently recognized The Quantex Fund™ as the 3rd best performing mid-cap value fund (out of 190 funds) in the country for the year ended June 30, 2010.
We have consistently employed our quantitative stock selection process since April 30, 2005 for The Quantex Fund™. We utilize rankings from our quantitative financial model to determine which securities are to be held in the Fund on an annual basis. As a result, the Fund is restructured once each year in January. From a broad standpoint for 2010, the Fund began the year with a 37% allocation to the service sector, 40% to the manufacturing sector and a 23% allocation to information technology. In the Fund’s composition for 2010 there is a strong preference for value holdings, with mid-cap value companies comprising 39% of the Fund, followed by mid-cap core with 35%, and mid-cap growth with 14%. Small-cap holdings of 12% comprise the remainder of the Fund.
For the first half of the year, Zions Bancorporation was the best performing stock in the Fund, with an increase of 68%. Akamai Technologies, Inc. also experienced significant returns through the first half of 2010 with an increase of approximately 60%. The worst performing stocks during the first half include Dean Foods Company, which is down 44%, and AK Steel Holding Corporation, which also declined by approximately 44%.
| Page 14 | The Flex-funds® 2010 Semiannual Report | June 30, 2010 |
| | 2010 Semiannual Report | June 30, 2010 |
Shareholder Expense Analysis (Unaudited)
Shareholders of mutual funds pay ongoing expenses, such as advisory fees, distribution and service fees (12b-1 fees) and other fund expenses. The following examples are intended to help you understand your ongoing costs (in dollars) of investing in the Funds and to compare these costs with the ongoing costs of investing in other mutual funds.
The examples below are based on an investment of $1,000 invested at the beginning of the period and held for the six-month period from December 31, 2009 to June 30, 2010.
ACTUAL EXPENSES: The first table below provides information about actual account values and actual expenses. You may use the information in this table, together with the amount you invested, to estimate the expenses that you paid over the period. Simply divide your account value by $1,000 (e.g.: an $8,600 account value divided by $1,000 = 8.6), then multiply the result by the number in the line under the heading “Expenses Paid During the Period” to estimate the expenses you paid on your account during this period.
| ACTUAL EXPENSES | Beginning Account Value (12/31/2009) | Ending Account Value (6/30/2010) | Expenses Paid During Period1 (12/31/2009 - 6/30/2010) | Expense Ratio (Annualized) |
| The Money Market Fund - Retail Class | $1,000.00 | $1,001.10 | $2.08 | 0.42% |
| The Money Market Fund - Institutional Class | 1,000.00 | 1,001.50 | 1.69 | 0.34% |
| The U.S. Government Bond Fund | 1,000.00 | 1,040.50 | 5.01 | 0.99% |
| The Defensive Balanced Fund | 1,000.00 | 969.90 | 7.38 | 1.51% |
The Muirfield Fund® | 1,000.00 | 949.90 | 6.67 | 1.38% |
| The Total Return Utilities Fund | 1,000.00 | 938.60 | 9.13 | 1.90% |
| The Dynamic Growth Fund | 1,000.00 | 937.70 | 6.68 | 1.39% |
| The Strategic Growth Fund | 1,000.00 | 952.00 | 7.21 | 1.49% |
| The Aggressive Growth Fund | 1,000.00 | 937.60 | 7.64 | 1.59% |
The Quantex Fund™ | 1,000.00 | 974.60 | 7.59 | 1.55% |
HYPOTHETICAL EXAMPLE FOR COMPARISON PURPOSES: The second table below provides information about hypothetical account values and hypothetical expenses based on the Funds’ actual expense ratios and assumed rates of return of 5% per year before expenses, which are not the Funds’ actual returns. The hypothetical account values and expenses may not be used to estimate the actual ending account balance or expenses you paid for the period. You may use this information to compare the ongoing costs of investing in the Funds to other funds. To do so, compare this 5% hypothetical example with the 5% hypothetical examples that appear in the shareholder reports of the other funds.
HYPOTHETICAL EXAMPLE (5% return before expenses) | Beginning Account Value (12/31/2009) | Ending Account Value (6/30/2010) | Expenses Paid During Period1 (12/31/2009 - 6/30/2010) | Expense Ratio (Annualized) |
| The Money Market Fund - Retail Class | $1,000.00 | $1,022.71 | $2.11 | 0.42% |
| The Money Market Fund - Institutional Class | 1,000.00 | 1,023.11 | 1.71 | 0.34% |
| The U.S. Government Bond Fund | 1,000.00 | 1,019.89 | 4.96 | 0.99% |
| The Defensive Balanced Fund | 1,000.00 | 1,017.31 | 7.55 | 1.51% |
The Muirfield Fund® | 1,000.00 | 1,017.95 | 6.90 | 1.38% |
| The Total Return Utilities Fund | 1,000.00 | 1,015.37 | 9.49 | 1.90% |
| The Dynamic Growth Fund | 1,000.00 | 1,017.90 | 6.95 | 1.39% |
| The Strategic Growth Fund | 1,000.00 | 1,017.41 | 7.45 | 1.49% |
| The Aggressive Growth Fund | 1,000.00 | 1,016.91 | 7.95 | 1.59% |
The Quantex Fund™ | 1,000.00 | 1,017.11 | 7.75 | 1.55% |
Please note that the expenses shown in the tables are meant to highlight your ongoing costs only and do not reflect any transactional costs, such as redemption fees or exchange fees. Therefore, the second table is useful in comparing ongoing costs only, and will not help you determine the relative total costs of owning different funds. In addition, if any transactional costs were included, your costs would have been higher.
| 1 | Expenses are equal to the Funds’ annualized expense ratios, multiplied by the average account value over the period, multiplied by 181/365 (to reflect the total number of days in the six-month period). |
The Flex-funds® 2010 Semiannual Report | June 30, 2010 | Page 15 |
| | 2010 Semiannual Report | June 30, 2010 |
2010 Semiannual Report
Portfolio Holdings & Financial Statements
| Page 16 | The Flex-funds® 2010 Semiannual Report | June 30, 2010 |
| | 2010 Semiannual Report | June 30, 2010 |
Schedule of Investments
June 30, 2010 (unaudited)
| The Muirfield Fund | |
| | Shares or Principal Amount ($) | | | | |
| Registered Investment Companies — 96.0% | |
BB&T Equity Income Fund | | | 182,117 | | | | 2,118,021 | |
| Calvert Short Duration Income Fund | | | 87,063 | | | | 1,430,442 | |
| Consumer Staples Select Sector SPDR Fund | | | 224,800 | | | | 5,732,400 | |
| Delaware Diversified Income Fund | | | 381,857 | | | | 3,612,366 | |
Energy Select Sector SPDR Fund | | | 88,325 | | | | 4,387,986 | |
Fairholme Fund | | | 320,099 | | | | 9,698,989 | |
| Fidelity Advisor Leveraged Company Stock Fund | | | 162,734 | | | | 4,356,392 | |
Harbor Bond Fund | | | 284,564 | | | | 3,613,966 | |
| Hartford Capital Appreciation Fund | | | 153,485 | | | | 4,240,803 | |
| Health Care Select Sector SPDR Fund | | | 161,325 | | | | 4,549,365 | |
Heartland Value Plus Fund | | | 127,721 | | | | 3,034,655 | |
| Invesco Diversified Dividend Fund | | | 508,823 | | | | 5,291,754 | |
| iShares Russell 2000 Value Index Fund | | | 31,400 | | | | 1,791,056 | |
Janus Short-Term Bond Fund | | | 464,031 | | | | 1,433,855 | |
| Natixis Loomis Sayles Investment Grade Bond Fund | | | 119,604 | | | | 1,437,635 | |
| Nuveen Tradewinds Value Opportunities Fund # | | | 266,822 | | | | 7,940,620 | |
PowerShares QQQ | | | 127,955 | | | | 5,464,958 | |
Putnam Equity Income Fund | | | 177,063 | | | | 2,170,793 | |
Putnam Voyager Fund | | | 262,812 | | | | 5,014,453 | |
| RidgeWorth Mid Cap Value Equity Fund | | | 594,410 | | | | 5,890,603 | |
| RidgeWorth Small Cap Value Equity Fund | | | 378,988 | | | | 4,115,809 | |
RS Emerging Markets Fund | | | 81,310 | | | | 1,756,300 | |
| Sentinel Government Securities Fund | | | 130,682 | | | | 1,446,646 | |
| Sentinel Short Maturity Government Fund | | | 153,456 | | | | 1,431,740 | |
| T. Rowe Price Equity Income Fund | | | 200,828 | | | | 3,940,248 | |
| Wells Fargo Advantage Growth Fund # | | | 222,656 | | | | 5,508,497 | |
| Total Registered Investment Companies (Cost $101,904,813) | | | | | | | 101,410,352 | |
| | | | | | | | | |
| Money Market Registered Investment Companies — 2.1% | |
| The Flex-funds Money Market Fund — Institutional Class, 0.276%* | | | 2,164,956 | | | | 2,164,956 | |
Total Money Market Registered Investment Companies (Cost $2,164,956) | | | | | | | 2,164,956 | |
| | | | | | | | | |
| Floating Rate Demand Notes — 1.2% | |
Caterpillar Financial Power Investment Floating Rate Demand Note, 1.30%, 7/1/2010** | | | 1,226,056 | | | | 1,226,056 | |
Total Floating Rate Demand Notes (Cost $1,226,056) | | | | | | | 1,226,056 | |
| | | | | | | | | |
| U.S. Government Obligations — 0.8% | |
U.S. Treasury Bill, 0.132%, due 9/23/2010*** | | | 800,000 | | | | 799,692 | |
Total U.S. Government Obligations (Cost $799,757) | | | | | | | 799,692 | |
Total Investments — 100.1% (Cost $106,095,582)(a) | | | | | | | 105,601,056 | |
| Liabilities less Other Assets - (0.1%) | | | | | | | (76,875 | ) |
Total Net Assets — 100.0% | | | | | | | 105,524,181 | |
| The Muirfield Fund | |
| | Shares or Principal Amount ($) | | | | |
| | | | | | | |
| Trustee Deferred Compensation**** | |
| The Flex-funds Aggressive Growth Fund | | | 1,660 | | | | 10,724 | |
| The Flex-funds Defensive Balanced Fund | | | 829 | | | | 7,221 | |
| The Flex-funds Dynamic Growth Fund | | | 515 | | | | 3,409 | |
The Flex-funds Muirfield Fund | | | 3,308 | | | | 15,680 | |
The Flex-funds Quantex Fund | | | 2,379 | | | | 42,846 | |
| The Flex-funds Total Return Utilities Fund | | | 184 | | | | 3,573 | |
Total Trustee Deferred Compensation (Cost $78,103) | | | | | | | 83,453 | |
| | | | | | | |
| | | | | | Unrealized Appreciation (Depreciation) ($) | |
| | | | | | | |
| Futures Contracts | |
| Standard & Poors 500 expiring September 2010, notional value $7,956,150 | | | (31 | ) | | | 104,568 | |
Total Futures Contracts | | | | | | | 104,568 | |
| (a) | Represents cost for financial reporting purposes and differs for federal income tax purposes by the amount of losses deferred for federal income tax reporting in the amount of $1,001,685. Cost for federal income tax purposes of $107,097,267 differs from value by net unrealized appreciation (depreciation) of securities as follows: |
| | | | | |
Unrealized appreciation | | $ | 3,860,923 | |
| | | | | |
Unrealized depreciation | | | (5,357,134 | ) |
| | | | | |
| Net unrealized appreciation (depreciation) | | $ | (1,496,211 | ) |
| # | Represents non-income producing securities. |
| * | Investment in affiliate. The yield shown represents the 7-day yield in effect at June 30, 2010. |
| ** | Floating rate security. The rate shown represents the rate in effect at June 30, 2010. |
| *** | Pledged as collateral on futures contracts. |
| **** | Assets of affiliates to The Muirfield Fund held for the benefit of the Fund’s Trustees in connection with the Trustee Deferred Compensation Plan. |
| The accompanying notes are an integral part of these financial statements. |
The Flex-funds® 2010 Semiannual Report | June 30, 2010 | Page 17 |
| | 2010 Semiannual Report | June 30, 2010 |
Schedule of Investments
June 30, 2010 (unaudited)
| The Dynamic Growth Fund | |
| | Shares or Principal Amount ($) | | | | |
| | | | | | | |
| Registered Investment Companies — 95.2% | |
BB&T Equity Income Fund | | | 146,248 | | | | 1,700,868 | |
| Consumer Staples Select Sector SPDR Fund | | | 171,525 | | | | 4,373,887 | |
Energy Select Sector SPDR Fund | | | 79,950 | | | | 3,971,916 | |
Fairholme Fund | | | 290,329 | | | | 8,796,957 | |
| Fidelity Advisor Leveraged Company Stock Fund | | | 143,510 | | | | 3,841,765 | |
| Hartford Capital Appreciation Fund | | | 118,690 | | | | 3,279,416 | |
| Health Care Select Sector SPDR Fund | | | 140,475 | | | | 3,961,395 | |
Heartland Value Plus Fund | | | 110,473 | | | | 2,624,839 | |
| Invesco Diversified Dividend Fund | | | 520,110 | | | | 5,409,139 | |
| iShares Russell 2000 Value Index Fund | | | 25,890 | | | | 1,476,766 | |
| Nuveen Tradewinds Value Opportunities Fund # | | | 213,501 | | | | 6,353,778 | |
PowerShares QQQ | | | 109,225 | | | | 4,665,000 | |
Putnam Equity Income Fund | | | 140,906 | | | | 1,727,510 | |
Putnam Voyager Fund | | | 229,216 | | | | 4,373,445 | |
| RidgeWorth Mid Cap Value Equity Fund | | | 568,694 | | | | 5,635,755 | |
| RidgeWorth Small Cap Value Equity Fund | | | 380,304 | | | | 4,130,106 | |
RS Emerging Markets Fund | | | 72,814 | | | | 1,572,784 | |
| T. Rowe Price Equity Income Fund | | | 210,675 | | | | 4,133,442 | |
| Wells Fargo Advantage Growth Fund # | | | 216,326 | | | | 5,351,907 | |
| Total Registered Investment Companies (Cost $78,413,329) | | | | | | | 77,380,675 | |
| | | | | | | | | |
| Money Market Registered Investment Companies — 4.0% | |
| The Flex-funds Money Market Fund — Institutional Class, 0.276%* | | | 3,276,351 | | | | 3,276,351 | |
Total Money Market Registered Investment Companies (Cost $3,276,351) | | | | | | | 3,276,351 | |
| | | | | | | | | |
| U.S. Government Obligations — 1.0% | |
U.S. Treasury Bill, 0.132%, due 9/23/2010** | | | 800,000 | | | | 799,692 | |
| Total U.S. Government Obligations (Cost $799,757) | | | | | | | 799,692 | |
Total Investments — 100.2% (Cost $82,489,437)(a) | | | | | | | 81,456,718 | |
| Liabilities less Other Assets - (0.2%) | | | | | | | (125,417 | ) |
Total Net Assets — 100.0% | | | | | | | 81,331,301 | |
| The Dynamic Growth Fund | |
| | Shares or Principal Amount ($) | | | | |
| Trustee Deferred Compensation*** | |
| The Flex-funds Aggressive Growth Fund | | | 1,161 | | | | 7,500 | |
| The Flex-funds Defensive Balanced Fund | | | 570 | | | | 4,965 | |
| The Flex-funds Dynamic Growth Fund | | | 362 | | | | 2,396 | |
The Flex-funds Muirfield Fund | | | 1,490 | | | | 7,063 | |
The Flex-funds Quantex Fund | | | 916 | | | | 16,497 | |
| The Flex-funds Total Return Utilities Fund | | | 128 | | | | 2,486 | |
Total Trustee Deferred Compensation (Cost $38,516) | | | | | | | 40,907 | |
| | | | | | Unrealized Appreciation (Depreciation) ($) | |
| Futures Contracts | |
| Standard & Poors 500 expiring September 2010, notional value $4,363,050 | | | 17 | | | | (205,628 | ) |
| Total Futures Contracts | | | | | | | (205,628 | ) |
| (a) | Represents cost for financial reporting purposes and differs for federal income tax purposes by the amount of losses deferred for federal income tax reporting in the amount of $569,701. Cost for federal income tax purposes of $83,059,138 differs from value by net unrealized appreciation (depreciation) of securities as follows: |
| | | | | |
Unrealized appreciation | | $ | 2,715,732 | |
| | | | | |
Unrealized depreciation | | | (4,318,152 | ) |
| | | | | |
| Net unrealized appreciation (depreciation) | | $ | (1,602,420 | ) |
| # | Represents non-income producing securities. |
| * | Investment in affiliate. The yield shown represents the 7-day yield in effect at June 30, 2010. |
| ** | Pledged as collateral on futures contracts. |
| *** | Assets of affiliates to The Dynamic Growth Fund held for the benefit of the Fund’s Trustees in connection with the Trustee Deferred Compensation Plan. |
| The accompanying notes are an integral part of these financial statements. |
| Page 18 | The Flex-funds® 2010 Semiannual Report | June 30, 2010 |
| | 2010 Semiannual Report | June 30, 2010 |
Schedule of Investments
June 30, 2010 (unaudited)
The Aggressive Growth Fund | |
| | Shares or Principal Amount ($) | | | | |
| | | | | | | |
| Registered Investment Companies — 94.8% | |
| Consumer Staples Select Sector SPDR Fund | | | 53,700 | | | | 1,369,350 | |
Energy Select Sector SPDR Fund | | | 25,350 | | | | 1,259,388 | |
Fairholme Fund | | | 85,725 | | | | 2,597,476 | |
| Fidelity Advisor Leveraged Company Stock Fund | | | 47,801 | | | | 1,279,628 | |
| Hartford Capital Appreciation Fund | | | 30,602 | | | | 845,541 | |
| Health Care Select Sector SPDR Fund | | | 54,650 | | | | 1,541,130 | |
| Invesco Diversified Dividend Fund | | | 147,324 | | | | 1,532,170 | |
| iShares Russell 2000 Value Index Fund | | | 15,800 | | | | 901,232 | |
| Nuveen Tradewinds Value Opportunities Fund # | | | 75,972 | | | | 2,260,921 | |
PowerShares QQQ | | | 48,410 | | | | 2,067,591 | |
Putnam Voyager Fund | | | 73,745 | | | | 1,407,045 | |
| RidgeWorth Mid Cap Value Equity Fund | | | 223,353 | | | | 2,213,424 | |
| RidgeWorth Small Cap Value Equity Fund | | | 186,242 | | | | 2,022,589 | |
RS Emerging Markets Fund | | | 23,023 | | | | 497,304 | |
| T. Rowe Price Mid Cap Growth Fund | | | 36,745 | | | | 1,735,845 | |
TCW Small Cap Growth Fund # | | | 33,802 | | | | 776,098 | |
| Wells Fargo Advantage Growth Fund # | | | 68,407 | | | | 1,692,393 | |
Total Registered Investment Companies (Cost $25,535,533) | | | | | | | 25,999,125 | |
| | | | | | | | | |
| Money Market Registered Investment Companies — 4.3% | |
| The Flex-funds Money Market Fund — Institutional Class, 0.276%* | | | 1,180,309 | | | | 1,180,309 | |
Total Money Market Registered Investment Companies (Cost $1,180,309) | | | | | | | 1,180,309 | |
| | | | | | | | | |
| Floating Rate Demand Notes - 0.0% | |
| Caterpillar Financial Power Investment Floating Rate Demand Note, 1.30%, 7/1/2010** | | | 1,996 | | | | 1,996 | |
| Total Floating Rate Demand Notes (Cost $1,996) | | | | | | | 1,996 | |
| | | | | | | | | |
| U.S. Government Obligations — 1.1% | |
U.S. Treasury Bill, 0.132%, due 9/23/2010*** | | | 300,000 | | | | 299,885 | |
Total U.S. Government Obligations (Cost $299,909) | | | | | | | 299,885 | |
Total Investments — 100.2% (Cost $27,017,747)(a) | | | | | | | 27,481,315 | |
| Liabilities less Other Assets - (0.2%) | | | | | | | (46,940 | ) |
Total Net Assets — 100.0% | | | | | | | 27,434,375 | |
| The Aggressive Growth Fund | |
| | Shares or Principal Amount ($) | | | | |
| | |
| Trustee Deferred Compensation**** | |
| The Flex-funds Aggressive Growth Fund | | | 680 | | | | 4,393 | |
| The Flex-funds Defensive Balanced Fund | | | 347 | | | | 3,022 | |
| The Flex-funds Dynamic Growth Fund | | | 209 | | | | 1,384 | |
The Flex-funds Muirfield Fund | | | 991 | | | | 4,697 | |
The Flex-funds Quantex Fund | | | 630 | | | | 11,346 | |
| The Flex-funds Total Return Utilities Fund | | | 75 | | | | 1,457 | |
Total Trustee Deferred Compensation (Cost $25,884) | | | | | | | 26,299 | |
| | | | | | Unrealized Appreciation (Depreciation) ($) | |
| | |
| Futures Contracts | |
| Standard & Poors 500 expiring September 2010, notional value $1,539,900 | | | 6 | | | | (97,058 | ) |
Total Futures Contracts | | | | | | | (97,058 | ) |
| (a) | Represents cost for financial reporting purposes and differs for federal income tax purposes by the amount of losses deferred for federal income tax reporting in the amount of $131,785. Cost for federal income tax purposes of $27,149,532 differs from value by net unrealized appreciation (depreciation) of securities as follows: |
| | | | |
Unrealized appreciation | | $ | 1,542,858 | |
| | | | | |
Unrealized depreciation | | | (1,211,075 | ) |
| | | | | |
| Net unrealized appreciation (depreciation) | | $ | 331,783 | |
| # | Represents non-income producing securities. |
| * | Investment in affiliate. The yield shown represents the 7-day yield in effect at June 30, 2010. |
| ** | Floating rate security. The rate shown represents the rate in effect at June 30, 2010. |
| *** | Pledged as collateral on futures contracts. |
| **** | Assets of affiliates to The Aggressive Growth Fund held for the benefit of the Fund’s Trustees in connection with the Trustee Deferred Compensation Plan. |
| The accompanying notes are an integral part of these financial statements. |
The Flex-funds® 2010 Semiannual Report | June 30, 2010 | Page 19 |
| | 2010 Semiannual Report | June 30, 2010 |
Schedule of Investments
June 30, 2010 (unaudited)
The Defensive Balanced Fund | |
| | Shares or Principal Amount ($) | | | | |
| | |
| Registered Investment Companies — 89.7% | |
BB&T Equity Income Fund | | | 87,472 | | | | 1,017,301 | |
| Calvert Short Duration Income Fund | | | 178,971 | | | | 2,940,500 | |
| Consumer Staples Select Sector SPDR Fund | | | 66,900 | | | | 1,705,950 | |
| Delaware Diversified Income Fund | | | 310,088 | | | | 2,933,434 | |
Energy Select Sector SPDR Fund | | | 24,425 | | | | 1,213,434 | |
Fairholme Fund | | | 106,306 | | | | 3,221,078 | |
| Fidelity Advisor Leveraged Company Stock Fund | | | 53,545 | | | | 1,433,384 | |
Harbor Bond Fund | | | 232,365 | | | | 2,951,028 | |
| Hartford Capital Appreciation Fund | | | 49,189 | | | | 1,359,098 | |
| Health Care Select Sector SPDR Fund | | | 48,550 | | | | 1,369,110 | |
Heartland Value Plus Fund | | | 40,934 | | | | 972,598 | |
| Invesco Diversified Dividend Fund | | | 172,704 | | | | 1,796,125 | |
| iShares iBoxx $ Investment Grade Corporate Bond Fund | | | 22,350 | | | | 2,424,081 | |
| iShares Russell 2000 Value Index Fund | | | 9,310 | | | | 531,043 | |
Janus Short-Term Bond Fund | | | 991,393 | | | | 3,063,404 | |
| Natixis Loomis Sayles Investment Grade Bond Fund | | | 94,902 | | | | 1,140,718 | |
| Nuveen Tradewinds Value Opportunities Fund # | | | 80,146 | | | | 2,385,141 | |
PowerShares QQQ | | | 38,825 | | | | 1,658,216 | |
Putnam Equity Income Fund | | | 56,967 | | | | 698,409 | |
Putnam Voyager Fund | | | 84,071 | | | | 1,604,071 | |
| RidgeWorth Mid Cap Value Equity Fund | | | 185,607 | | | | 1,839,366 | |
| RidgeWorth Small Cap Value Equity Fund | | | 117,344 | | | | 1,274,356 | |
RS Emerging Markets Fund | | | 26,535 | | | | 573,164 | |
| Sentinel Government Securities Fund | | | 34,765 | | | | 384,851 | |
| Sentinel Short Maturity Government Fund | | | 40,873 | | | | 381,344 | |
| T. Rowe Price Equity Income Fund | | | 80,300 | | | | 1,575,478 | |
| Wells Fargo Advantage Growth Fund # | | | 70,620 | | | | 1,747,134 | |
| Total Registered Investment Companies (Cost $44,209,746) | | | | | | | 44,193,816 | |
| | |
| Money Market Registered Investment Companies — 5.2% | |
| The Flex-funds Money Market Fund - Institutional Class, 0.276%* | | | 2,574,965 | | | | 2,574,965 | |
Total Money Market Registered Investment Companies (Cost $2,574,965) | | | | | | | 2,574,965 | |
| | |
| Floating Rate Demand Notes — 2.1% | |
| Caterpillar Financial Power Investment Floating Rate Demand Note, 1.30%, 7/1/2010** | | | 1,019,475 | | | | 1,019,475 | |
| Total Floating Rate Demand Notes (Cost $1,019,475) | | | | | | | 1,019,475 | |
| The Defensive Balanced Fund | |
| | Shares or Principal Amount ($) | | | | |
| | |
| U.S. Government Obligations — 3.1% | |
| Federal Farm Credit Bank, 0.347%, due 11/27/2012*** | | | 250,000 | | | | 250,643 | |
| Federal Home Loan Mortgage Corporation, 4.00%, due 12/15/2022 | | | 1,000,000 | | | | 1,000,000 | |
U.S. Treasury Bill, 0.132%, due 9/23/2010**** | | | 300,000 | | | | 299,885 | |
Total U.S. Government Obligations (Cost $1,542,950) | | | | | | | 1,550,528 | |
Total Investments — 100.1% (Cost $49,347,136)(a) | | | | | | | 49,338,784 | |
| Liabilities less Other Assets - (0.1%) | | | | | | | (33,174 | ) |
Total Net Assets — 100.0% | | | | | | | 49,305,610 | |
| | |
| Trustee Deferred Compensation***** | |
| The Flex-funds Aggressive Growth Fund | | | 1,068 | | | | 6,899 | |
| The Flex-funds Defensive Balanced Fund | | | 551 | | | | 4,799 | |
| The Flex-funds Dynamic Growth Fund | | | 327 | | | | 2,165 | |
The Flex-funds Muirfield Fund | | | 922 | | | | 4,370 | |
The Flex-funds Quantex Fund | | | 432 | | | | 7,780 | |
| The Flex-funds Total Return Utilities Fund | | | 118 | | | | 2,292 | |
Total Trustee Deferred Compensation (Cost $29,682) | | | | | | | 28,305 | |
| | | | | | | |
| | | | | | Unrealized Appreciation (Depreciation) ($) | |
| | |
| Futures Contracts | |
| Standard & Poors 500 expiring September 2010, notional value $513,300 | | | (2 | ) | | | (1,315 | ) |
Total Futures Contracts | | | | | | | (1,315 | ) |
| (a) | Represents cost for financial reporting purposes and differs for federal income tax purposes by the amount of losses deferred for federal income tax reporting in the amount of $105,795. Cost for federal income tax purposes of $49,452,931 differs from value by net unrealized appreciation (depreciation) of securities as follows: |
| | | | |
Unrealized appreciation | | $ | 1,366,980 | |
| | | | | |
Unrealized depreciation | | | (1,481,127 | ) |
| | | | | |
| Net unrealized appreciation (depreciation) | | $ | (114,147 | ) |
| # | Represents non-income producing securities. |
| * | Investment in affiliate. The yield shown represents the 7-day yield in effect at June 30, 2010. |
| ** | Floating rate security. The rate shown represents the rate in effect at June 30, 2010. |
| *** | Variable rate security. The rate shown represents the rate in effect at June 30, 2010. |
| **** | Pledged as collateral on futures contracts. |
| ***** | Assets of affiliates to The Defensive Balanced Fund held for the benefit of the Fund’s Trustees in connection with the Trustee Deferred Compensation Plan. |
| The accompanying notes are an integral part of these financial statements. |
| Page 20 | The Flex-funds® 2010 Semiannual Report | June 30, 2010 |
| | 2010 Semiannual Report | June 30, 2010 |
Schedule of Investments
June 30, 2010 (unaudited)
The Strategic Growth Fund | |
| | Shares or Principal Amount ($) | | | | |
| | |
| Registered Investment Companies — 93.8% | |
| Allianz NFJ International Value Fund | | | 289,763 | | | | 4,917,275 | |
Fairholme Fund | | | 102,273 | | | | 3,098,883 | |
| Fidelity Advisor Leveraged Company Stock Fund | | | 55,820 | | | | 1,494,304 | |
| First American Real Estate Securities Fund | | | 223,548 | | | | 3,348,750 | |
Heartland Value Plus Fund | | | 77,997 | | | | 1,853,208 | |
| Invesco Diversified Dividend Fund | | | 269,713 | | | | 2,805,011 | |
| Materials Select Sector SPDR Trust | | | 43,025 | | | | 1,220,619 | |
| Nuveen Tradewinds Value Opportunities Fund # | | | 78,511 | | | | 2,336,483 | |
| Oppenheimer Real Estate Fund (The) | | | 92,089 | | | | 1,441,197 | |
Putnam Voyager Fund | | | 101,306 | | | | 1,932,918 | |
| RidgeWorth Mid Cap Value Equity Fund | | | 263,725 | | | | 2,613,513 | |
| RidgeWorth Small Cap Value Equity Fund | | | 177,302 | | | | 1,925,503 | |
RS Emerging Markets Fund | | | 96,789 | | | | 2,090,653 | |
TCW Small Cap Growth Fund # | | | 33,501 | | | | 769,190 | |
| Van Eck Global Hard Assets Fund # | | | 95,280 | | | | 3,432,927 | |
| Wells Fargo Advantage Growth Fund # | | | 42,529 | | | | 1,052,161 | |
| Total Registered Investment Companies (Cost $36,105,465) | | | | | | | 36,332,595 | |
| | |
| Money Market Registered Investment Companies — 5.6% | |
| The Flex-funds Money Market Fund - Institutional Class, 0.276%* | | | 2,151,144 | | | | 2,151,144 | |
Total Money Market Registered Investment Companies (Cost $2,151,144) | | | | | | | 2,151,144 | |
| | |
| U.S. Government Obligations — 0.8% | |
| U.S. Treasury Bill, 0.132%, due 9/23/2010** | | | 300,000 | | | | 299,885 | |
| Total U.S. Government Obligations (Cost $299,909) | | | | | | | 299,885 | |
Total Investments — 100.2% (Cost $38,556,518)(a) | | | | | | | 38,783,624 | |
| Liabilities less Other Assets - (0.2%) | | | | | | | (60,427 | ) |
Total Net Assets — 100.0% | | | | | | | 38,723,197 | |
| The Strategic Growth Fund | |
| | Shares or Principal Amount ($) | | | | |
| | |
| Trustee Deferred Compensation*** | |
| The Flex-funds Aggressive Growth Fund | | | 867 | | | | 5,601 | |
| The Flex-funds Defensive Balanced Fund | | | 452 | | | | 3,937 | |
| The Flex-funds Dynamic Growth Fund | | | 264 | | | | 1,748 | |
The Flex-funds Muirfield Fund | | | 754 | | | | 3,574 | |
The Flex-funds Quantex Fund | | | 352 | | | | 6,340 | |
| The Flex-funds Total Return Utilities Fund | | | 96 | | | | 1,864 | |
Total Trustee Deferred Compensation (Cost $24,598) | | | | | | | 23,064 | |
| | | | | | | |
| | | | | | Unrealized Appreciation (Depreciation) ($) | |
| | |
| Futures Contracts | |
| Standard & Poors Mid Cap 400 expiring September 2010, notional value $2,130,000 | | | 6 | | | | (158,670 | ) |
Total Futures Contracts | | | | | | | (158,670 | ) |
| (a) | Represents cost for financial reporting purposes and differs for federal income tax purposes by the amount of losses deferred for federal income tax reporting in the amount of $112,373. Cost for federal income tax purposes of $38,668,891 differs from value by net unrealized appreciation (depreciation) of securities as follows: |
| | | | |
Unrealized appreciation | | $ | 1,359,390 | |
| | | | | |
Unrealized depreciation | | | (1,244,657 | ) |
| | | | | |
| Net unrealized appreciation (depreciation) | | $ | 114,733 | |
| # | Represents non-income producing securities. |
| * | Investment in affiliate. The yield shown represents the 7-day yield in effect at June 30, 2010. |
| ** | Pledged as collateral on futures contracts. |
| *** | Assets of affiliates to The Strategic Growth Fund held for the benefit of the Fund’s Trustees in connection with the Trustee Deferred Compensation Plan. |
| The accompanying notes are an integral part of these financial statements. |
The Flex-funds® 2010 Semiannual Report | June 30, 2010 | Page 21 |
| | 2010 Semiannual Report | June 30, 2010 |
Schedule of Investments
June 30, 2010 (unaudited)
| | Shares or Principal Amount ($) | | | | |
| | |
| Common Stocks — 87.1% | |
| Business Services — 5.5% | | | | | | |
Cintas Corporation | | | 5,130 | | | | 122,966 | |
DeVry, Inc. | | | 2,360 | | | | 123,876 | |
| Interpublic Group of Companies, Inc./The # | | | 18,115 | | | | 129,160 | |
Monster Worldwide, Inc. # | | | 7,690 | | | | 89,589 | |
Robert Half International, Inc. | | | 5,000 | | | | 117,750 | |
Ryder System, Inc. | | | 3,250 | | | | 130,747 | |
Total System Services, Inc. | | | 7,750 | | | | 105,400 | |
(Cost $999,536) | | | | | | | 819,488 | |
| Consumer Goods — 9.5% | | | | | | | | |
Avery Dennison Corp. | | | 3,660 | | | | 117,596 | |
Bemis Co., Inc. | | | 4,520 | | | | 122,040 | |
Constellation Brands, Inc. # | | | 8,390 | | | | 131,052 | |
Dean Foods Company # | | | 7,420 | | | | 74,719 | |
Eastman Kodak Company # | | | 31,640 | | | | 137,318 | |
| Harman International Industries, Inc. # | | | 3,780 | | | | 112,984 | |
Hasbro, Inc. | | | 4,170 | | | | 171,387 | |
| International Flavors & Fragrances, Inc. | | | 3,255 | | | | 138,077 | |
Newell Rubbermaid, Inc. | | | 8,910 | | | | 130,442 | |
Pactiv Corp. # | | | 5,540 | | | | 154,289 | |
Sealed Air Corp. | | | 6,115 | | | | 120,588 | |
(Cost $1,520,843) | | | | | | | 1,410,492 | |
| Consumer Services — 12.8% | | | | | | | | |
Abercrombie and Fitch Co. | | | 3,840 | | | | 117,850 | |
Airgas, Inc. | | | 2,800 | | | | 174,160 | |
AutoNation, Inc. # | | | 6,975 | | | | 136,012 | |
Big Lots, Inc. # | | | 4,625 | | | | 148,416 | |
D.R. Horton, Inc. | | | 12,290 | | | | 120,811 | |
Family Dollar Stores, Inc. | | | 4,810 | | | | 181,289 | |
GameStop Corp. # | | | 6,080 | | | | 114,243 | |
Lennar Corp. | | | 10,460 | | | | 145,499 | |
Office Depot, Inc. # | | | 20,710 | | | | 83,668 | |
Pulte Group, Inc. # | | | 13,373 | | | | 110,728 | |
RadioShack Corp. | | | 6,835 | | | | 133,351 | |
SUPERVALU, Inc. | | | 10,530 | | | | 114,145 | |
Whole Foods Market, Inc. # | | | 4,880 | | | | 175,778 | |
Wyndham Worldwide Corp. | | | 6,620 | | | | 133,327 | |
(Cost $1,885,255) | | | | | | | 1,889,277 | |
| Energy — 4.3% | | | | | | | | |
Denbury Resources, Inc. # | | | 9,000 | | | | 131,760 | |
Massey Energy Company | | | 3,170 | | | | 86,699 | |
Rowan Companies, Inc. # | | | 5,890 | | | | 129,227 | |
Sunoco, Inc. | | | 5,100 | | | | 177,327 | |
Tesoro Corp. | | | 9,810 | | | | 114,483 | |
(Cost $661,296) | | | | | | | 639,496 | |
| Financial Services — 13.4% | | | | | | | | |
| Apartment Investment & Management Company @ | | | 8,395 | | | | 162,611 | |
Assurant, Inc. | | | 4,530 | | | | 157,191 | |
CB Richard Ellis Group, Inc. # | | | 9,860 | | | | 134,195 | |
Cincinnati Financial Corporation | | | 5,100 | | | | 131,937 | |
E*TRADE Financial Corp. # | | | 7,632 | | | | 90,210 | |
Equifax, Inc. | | | 4,330 | | | | 121,500 | |
Federated Investors, Inc. | | | 4,870 | | | | 100,858 | |
First Horizon National Corp. # | | | 10,259 | | | | 117,461 | |
| The Quantex Fund | |
| | Shares or Principal Amount ($) | | | | |
| | |
| Common Stocks — continued | |
Huntington Bancshares, Inc. | | | 36,630 | | | | 202,930 | |
Janus Capital Group, Inc. | | | 9,920 | | | | 88,090 | |
Marshall & Ilsley Corp. | | | 24,490 | | | | 175,838 | |
| NASDAQ OMX Group, Inc./The # | | | 6,740 | | | | 119,837 | |
Torchmark Corp. | | | 3,040 | | | | 150,510 | |
| Wachovia Corp. Preferred Dividend Equalization # | | | 1,700 | | | | 0 | |
Zions Bancorporation | | | 10,400 | | | | 224,328 | |
(Cost $2,007,624) | | | | | | | 1,977,496 | |
| Hardware — 10.7% | | | | | | | | |
Jabil Circuit, Inc. | | | 7,700 | | | | 102,410 | |
JDS Uniphase Corp. # | | | 16,222 | | | | 159,624 | |
Lexmark International, Inc. # | | | 5,140 | | | | 169,774 | |
LSI Logic Corp. # | | | 22,250 | | | | 102,350 | |
| MEMC Electronic Materials, Inc. # | | | 9,800 | | | | 96,824 | |
Millipore Corp. # | | | 1,850 | | | | 197,303 | |
Molex, Inc. | | | 6,215 | | | | 113,362 | |
National Semiconductor Corp. | | | 8,720 | | | | 117,371 | |
Novellus Systems, Inc. # | | | 5,720 | | | | 145,059 | |
QLogic Corp. # | | | 7,085 | | | | 117,753 | |
Tellabs, Inc. | | | 23,535 | | | | 150,389 | |
Teradyne, Inc. # | | | 12,450 | | | | 121,387 | |
(Cost $1,631,091) | | | | | | | 1,593,606 | |
| Healthcare — 3.8% | | | | | | | | |
Coventry Health Care, Inc. # | | | 5,490 | | | | 97,063 | |
King Pharmaceuticals, Inc. # | | | 10,895 | | | | 82,693 | |
Patterson Companies, Inc. | | | 4,775 | | | | 136,231 | |
PerkinElmer, Inc. | | | 6,500 | | | | 134,355 | |
Tenet Healthcare Corp. # | | | 24,675 | | | | 107,090 | |
(Cost $591,025) | | | | | | | 557,432 | |
| Industrial Materials — 10.0% | | | | | | | | |
AK Steel Holding Corp. | | | 6,240 | | | | 74,381 | |
Allegheny Technologies, Inc. | | | 2,970 | | | | 131,244 | |
CF Industries Holdings, Inc. | | | 1,470 | | | | 93,271 | |
Eastman Chemical Company | | | 2,225 | | | | 118,726 | |
FMC Corp. | | | 2,390 | | | | 137,258 | |
| Goodyear Tire & Rubber Company/The # | | | 9,440 | | | | 93,834 | |
Leggett & Platt, Inc. | | | 6,565 | | | | 131,694 | |
Pall Corp. | | | 3,690 | | | | 126,825 | |
Snap-on, Inc. | | | 3,160 | | | | 129,276 | |
Stanley Black & Decker, Inc. | | | 5,208 | | | | 263,108 | |
Titanium Metals Corp. # | | | 10,630 | | | | 186,982 | |
(Cost $1,487,238) | | | | | | | 1,486,599 | |
| Media — 3.2% | | | | | | | | |
Gannett Co., Inc. | | | 8,980 | | | | 120,871 | |
Meredith Corp. | | | 4,335 | | | | 134,949 | |
New York Times Co./The # | | | 10,780 | | | | 93,247 | |
Washington Post Company/The | | | 315 | | | | 129,301 | |
(Cost $580,300) | | | | | | | 478,368 | |
| Software — 2.9% | | | | | | | | |
Compuware Corp. # | | | 18,460 | | | | 147,311 | |
Dun & Bradstreet Corp./The | | | 1,590 | | | | 106,721 | |
Novell, Inc. # | | | 32,175 | | | | 182,754 | |
(Cost $463,588) | | | | | | | 436,786 | |
| Page 22 | The Flex-funds® 2010 Semiannual Report | June 30, 2010 |
| | 2010 Semiannual Report | June 30, 2010 |
Schedule of Investments
June 30, 2010 (unaudited)
| | Shares or Principal Amount ($) | | | | |
| | |
| Common Stocks — continued | |
| Utilities — 11.0% | | | | | | |
Akamai Technologies, Inc. # | | | 5,270 | | | | 213,803 | |
Allegheny Energy, Inc. | | | 5,700 | | | | 117,876 | |
CMS Energy Corp. | | | 8,535 | | | | 125,038 | |
Frontier Communications Corp. | | | 17,135 | | | | 121,830 | |
Integrys Energy Group, Inc. | | | 3,190 | | | | 139,531 | |
| MetroPCS Communications, Inc. # | | | 17,510 | | | | 143,407 | |
Nicor, Inc. | | | 3,185 | | | | 128,991 | |
NiSource, Inc. | | | 8,690 | | | | 126,005 | |
Pepco Holdings, Inc. | | | 7,940 | | | | 124,499 | |
Pinnacle West Capital Corp. | | | 3,660 | | | | 133,078 | |
Quanta Services, Inc. # | | | 6,420 | | | | 132,573 | |
TECO Energy, Inc. | | | 8,260 | | | | 124,478 | |
(Cost $1,621,911) | | | | | | | 1,631,109 | |
Total Common Stocks (Cost $13,449,707) | | | | | | | 12,920,149 | |
| | |
| Money Market Registered Investment Companies — 10.8% | |
| The Flex-funds Money Market Fund - Institutional Class, 0.276%* | | | 1,605,578 | | | | 1,605,578 | |
Total Money Market Registered Investment Companies (Cost $1,605,578) | | | | | | | 1,605,578 | |
| | |
| Floating Rate Demand Notes — 0.7% | |
| Caterpillar Financial Power Investment Floating Rate Demand Note, 1.30%, 7/1/2010** | | | 101,569 | | | | 101,569 | |
| Total Floating Rate Demand Notes (Cost $101,569) | | | | | | | 101,569 | |
| | |
| U.S. Government Obligations — 1.3% | |
| U.S. Treasury Bill, 0.132%, due 9/23/2010*** | | | 200,000 | | | | 199,923 | |
| Total U.S. Government Obligations (Cost $199,939) | | | | | | | 199,923 | |
Total Investments — 99.9% (Cost $15,356,793)(a) | | | | | | | 14,827,219 | |
| Other Assets less Liabilities — 0.1% | | | | | | | 12,823 | |
Total Net Assets — 100.0% | | | | | | | 14,840,042 | |
| | |
| Trustee Deferred Compensation**** | |
| The Flex-funds Aggressive Growth Fund | | | 540 | | | | 3,488 | |
| The Flex-funds Defensive Balanced Fund | | | 277 | | | | 2,413 | |
| The Flex-funds Dynamic Growth Fund | | | 166 | | | | 1,099 | |
The Flex-funds Muirfield Fund | | | 1,365 | | | | 6,470 | |
The Flex-funds Quantex Fund | | | 1,020 | | | | 18,370 | |
| The Flex-funds Total Return Utilities Fund | | | 60 | | | | 1,165 | |
Total Trustee Deferred Compensation (Cost $30,999) | | | | | | | 33,005 | |
| The Quantex Fund | |
| | | | | | Unrealized Appreciation (Depreciation) ($) | |
| | |
| Futures Contracts | |
| Standard & Poors Mid Cap 400 expiring September 2010, notional value $1,775,000 | | | 5 | | | | (87,163 | ) |
Total Futures Contracts | | | | | | | (87,163 | ) |
| (a) | Represents cost for financial reporting purposes and differs for federal income tax purposes by the amount of losses deferred for federal income tax reporting in the amount of $20,540. Cost for federal income tax purposes of $15,377,333 differs from value by net unrealized appreciation (depreciation) of securities as follows: |
| | | | |
Unrealized appreciation | | $ | 1,046,496 | |
| | | | | |
Unrealized depreciation | | | (1,596,610 | ) |
| | | | | |
| Net unrealized appreciation (depreciation) | | $ | (550,114 | ) |
| ADR | American Depositary Receipt |
| # | Represents non-income producing securities. |
| @ | Real estate investment trust. |
| * | Investment in affiliate. The yield shown represents the 7-day yield in effect at June 30, 2010. |
| ** | Floating rate security. The rate shown represents the rate in effect at June 30, 2010. |
| *** | Pledged as collateral on Futures Contracts. |
| **** | Assets of affiliates to The Flex-funds Quantex Fund held for the benefit of the Fund’s Trustees in connection with the Trustee Deferred Compensation Plan. |
| The accompanying notes are an integral part of these financial statements. |
The Flex-funds® 2010 Semiannual Report | June 30, 2010 | Page 23 |
| | 2010 Semiannual Report | June 30, 2010 |
Schedule of Investments
June 30, 2010 (unaudited)
The Total Return Utilities Fund | |
| | Shares or Principal Amount ($) | | | | |
| | |
| Common Stocks — 97.3% | |
| Electric Utility 14.9% | | | | | | |
AES Corp. # | | | 43,656 | | | | 403,381 | |
| American Superconductor Corp. # | | | 11,697 | | | | 312,193 | |
ITC Holdings Corp. | | | 11,404 | | | | 603,386 | |
MDU Resources Group, Inc. | | | 28,617 | | | | 515,965 | |
Northeast Utilities | | | 30,665 | | | | 781,344 | |
NV Energy, Inc. | | | 30,498 | | | | 360,181 | |
(Cost $3,716,378) | | | | | | | 2,976,450 | |
| Natural Gas Distribution 8.6% | | | | | | | | |
National Grid PLC - ADR | | | 7,311 | | | | 269,264 | |
ONEOK, Inc. | | | 7,521 | | | | 325,283 | |
Southern Union Co. | | | 26,738 | | | | 584,493 | |
Williams Cos, Inc. | | | 30,624 | | | | 559,807 | |
(Cost $1,775,235) | | | | | | | 1,738,847 | |
| Oil Exploration & Production 4.0% | | | | | | | | |
EQT Corp. | | | 13,995 | | | | 505,779 | |
Ultra Petroleum Corp. # | | | 6,058 | | | | 268,067 | |
(Cost $847,117) | | | | | | | 773,846 | |
| Pipelines 18.5% | | | | | | | | |
El Paso Corp. | | | 45,329 | | | | 503,605 | |
| Enterprise Products Partners, L.P. | | | 31,123 | | | | 1,100,753 | |
| Kinder Morgan Energy Partners, L.P. | | | 13,786 | | | | 896,917 | |
Questar Corp. | | | 12,324 | | | | 560,619 | |
Spectra Energy Corp. | | | 30,707 | | | | 616,289 | |
(Cost $3,003,178) | | | | | | | 3,678,183 | |
| Telephone & Telecommunications 20.6% | | | | | | | | |
American Tower Corp. # | | | 9,609 | | | | 427,600 | |
AT&T, Inc. | | | 31,124 | | | | 752,890 | |
BCE, Inc. | | | 8,355 | | | | 244,551 | |
| Millicom International Cellular S.A. | | | 7,103 | | | | 575,840 | |
NII Holdings, Inc. # | | | 24,441 | | | | 794,821 | |
| Philippine Long Distance Telephone Company - ADR | | | 3,552 | | | | 181,045 | |
| Telephone and Data Systems, Inc. | | | 10,654 | | | | 323,775 | |
Verizon Communications, Inc. | | | 28,827 | | | | 807,733 | |
(Cost $4,912,529) | | | | | | | 4,108,255 | |
| Utility Services — 23.4% | | | | | | | | |
A123 Systems, Inc. # | | | 22,768 | | | | 214,702 | |
ABB Limited - ADR # | | | 26,529 | | | | 458,421 | |
Akamai Technologies, Inc. # | | | 26,319 | | | | 1,067,762 | |
Calgon Carbon Corp. # | | | 32,168 | | | | 425,904 | |
Chicago Bridge & Iron Co. # | | | 32,586 | | | | 612,943 | |
Fluor Corp. | | | 8,146 | | | | 346,205 | |
NiSource, Inc. | | | 51,177 | | | | 742,066 | |
Pepco Holdings, Inc. | | | 14,623 | | | | 229,289 | |
Quanta Services, Inc. # | | | 21,934 | | | | 452,937 | |
Willbros Group, Inc. # | | | 13,579 | | | | 100,485 | |
(Cost $4,597,660) | | | | | | | 4,650,714 | |
| Water Utility — 7.3% | | | | | | | | |
American Water Works Co., Inc. | | | 46,373 | | | | 955,284 | |
Veolia Environnement - ADR | | | 21,056 | | | | 492,079 | |
(Cost $1,630,691) | | | | | | | 1,447,363 | |
Total Common Stocks (Cost $20,482,788) | | | | | | | 19,373,658 | |
| The Total Return Utilities Fund | |
| | Shares or Principal Amount ($) | | | | |
| | |
| Money Market Registered Investment Companies — 2.8% | |
| The Flex-funds Money Market Fund - Institutional Class, 0.276%* | | | 554,454 | | | | 554,454 | |
Total Money Market Registered Investment Companies (Cost $554,454) | | | | | | | 554,454 | |
Total Investments — 100.1% (Cost $21,037,242)(a) | | | | | | | 19,928,112 | |
| Liabilities less Other Assets - (0.1%) | | | | | | | (17,905 | ) |
| | | | | | | | | |
Total Net Assets — 100.0% | | | | | | | 19,910,207 | |
| Trustee Deferred Compensation** | |
| The Flex-funds Aggressive Growth Fund | | | 623 | | | | 4,025 | |
| The Flex-funds Defensive Balanced Fund | | | 321 | | | | 2,796 | |
| The Flex-funds Dynamic Growth Fund | | | 191 | | | | 1,264 | |
The Flex-funds Muirfield Fund | | | 1,203 | | | | 5,702 | |
The Flex-funds Quantex Fund | | | 846 | | | | 15,236 | |
| The Flex-funds Total Return Utilities Fund | | | 69 | | | | 1,340 | |
Total Trustee Deferred Compensation (Cost $28,921) | | | | | | | 30,363 | |
| (a) | Represents cost for financial reporting purposes and differs for federal income tax purposes by the amount of losses deferred for federal income tax reporting in the amount of $72,658. Cost for federal income tax purposes of $21,109,900 differs from value by net unrealized appreciation (depreciation) of securities as follows: |
| | | | |
Unrealized appreciation | | $ | 2,133,283 | |
| | | | | |
Unrealized depreciation | | | (3,315,071 | ) |
| | | | | |
| Net unrealized appreciation (depreciation) | | $ | (1,181,788 | ) |
| ADR | American Depositary Receipt |
| # | Represents non-income producing securities. |
| * | Investment in affiliate. The yield shown represents the 7-day yield in effect at June 30, 2010. |
| ** | Assets of affiliates to The Total Return Utilities Fund held for the benefit of the Fund’s Trustees in connection with the Trustees Deferred Compensation Plan. |
| The accompanying notes are an integral part of these financial statements. |
| Page 24 | The Flex-funds® 2010 Semiannual Report | June 30, 2010 |
| | 2010 Semiannual Report | June 30, 2010 |
Schedule of Investments
June 30, 2010 (unaudited)
The U.S. Government Bond Fund | |
| | Principal Amount ($) or Shares | | | | |
| | |
| U.S. Government Obligations — 81.7% | |
| Fannie Mae, 1.00%, due 03/29/2013* | | | 500,000 | | | | 501,070 | |
| Fannie Mae, 2.25%, due 03/30/2015* | | | 500,000 | | | | 501,750 | |
| Fannie Mae, 4.125%, due 11/10/2017 | | | 500,000 | | | | 501,860 | |
| Fannie Mae, 4.40%, due 05/28/2019 | | | 1,000,000 | | | | 1,005,400 | |
| Fannie Mae, 5.25%, due 11/19/2024 | | | 1,000,000 | | | | 1,006,390 | |
| Federal Farm Credit Bank, 0.24%, due 08/23/2011* | | | 500,000 | | | | 499,925 | |
| Federal Farm Credit Bank, 0.35%, due 11/27/2012* | | | 250,000 | | | | 250,663 | |
| Federal Farm Credit Bank, 3.62%, due 03/08/2017 | | | 500,000 | | | | 509,595 | |
| Federal Farm Credit Bank, 5.25%, due 03/02/2021 | | | 500,000 | | | | 574,915 | |
| Federal Farm Credit Bank, 5.25%, due 10/25/2022 | | | 500,000 | | | | 571,515 | |
| Federal Farm Credit Bank, 4.79%, due 06/03/2024 | | | 1,000,000 | | | | 1,002,570 | |
| Federal Farm Credit Bank, 5.20%, due 02/06/2026 | | | 1,600,000 | | | | 1,803,046 | |
| Federal Farm Credit Bank, 5.77%, due 01/05/2027 | | | 500,000 | | | | 592,915 | |
| Federal Farm Credit Bank, 5.25%, due 04/21/2028 | | | 1,502,000 | | | | 1,678,380 | |
| Federal Home Loan Bank, 3.00%, due 03/02/2015 | | | 500,000 | | | | 501,825 | |
| Federal Home Loan Bank, 4.50%, due 09/13/2019 | | | 295,000 | | | | 320,585 | |
| Federal Home Loan Mortgage Corporation, 4.05%, due 01/29/2018 | | | 500,000 | | | | 501,440 | |
| Federal Home Loan Mortgage Corporation, 4.50%, due 02/18/2020 | | | 500,000 | | | | 502,240 | |
| Federal Home Loan Mortgage Corporation, 4.00%, due 12/15/2022 | | | 1,000,000 | | | | 986,140 | |
| Government National Mortgage Association, 6.50%, due 07/20/2038 | | | 27,596 | | | | 30,343 | |
| U.S. Treasury Note, 3.50%, due 05/15/2020 | | | 1,000,000 | | | | 1,047,813 | |
Total U.S. Government Obligations (Cost $14,571,728) | | | | | | | 14,890,380 | |
| Corporate Bonds — 8.5% | |
| Paccar Financial Corp., 3.79%, due 01/12/2011* | | | 500,000 | | | | 508,825 | |
| Partnerre Finance, 6.875%, due 06/01/2018 | | | 500,000 | | | | 532,260 | |
| Royal Bank of Canada, 0.47%, 01/28/2013* | | | 500,000 | | | | 501,924 | |
Total Corporate Bonds (Cost $1,536,371) | | | | | | | 1,543,009 | |
| Money Market Registered Investment Companies — 8.8% | |
| The Flex-funds Money Market Fund - Institutional Class, 0.276%** | | | 1,606,307 | | | | 1,606,307 | |
Total Money Market Registered Investment Companies (Cost $1,606,307) | | | | | | | 1,606,307 | |
| The U.S. Government Bond Fund | |
| | Principal Amount ($) or Shares | | | | |
| | |
| Floating Rate Demand Notes — 0.3% | |
| Caterpillar Financial Power Investment Floating Rate Demand Note, 1.30%, 7/1/2010*** | | | 51,601 | | | | 51,601 | |
Total Floating Rate Demand Notes (Cost $51,601) | | | | | | | 51,601 | |
Total Investments — 99.3% (Cost $17,766,007)(a) | | | | | | | 18,091,297 | |
| Other Assets less Liabilities — 0.7% | | | | | | | 121,604 | |
Total Net Assets — 100.0% | | | | | | | 18,212,901 | |
| | |
| Trustee Deferred Compensation**** | |
| The Flex-funds Aggressive Growth Fund | | | 505 | | | | 3,262 | |
| The Flex-funds Defensive Balanced Fund | | | 257 | | | | 2,238 | |
| The Flex-funds Dynamic Growth Fund | | | 155 | | | | 1,026 | |
The Flex-funds Muirfield Fund | | | 928 | | | | 4,399 | |
The Flex-funds Quantex Fund | | | 653 | | | | 11,761 | |
| The Flex-funds Total Return Utilities Fund | | | 56 | | | | 1,088 | |
Total Trustee Deferred Compensation (Cost $22,610) | | | | | | | 23,774 | |
| (a) | Represents cost for financial reporting purposes and differs for federal income tax purposes by the amount of losses deferred for federal income tax reporting in the amount of $1,067. Cost for federal income tax purposes of $17,767,074 differs from value by net unrealized appreciation (depreciation) of securities as follows: |
| | | | |
Unrealized appreciation | | $ | 335,368 | |
| | | | | |
Unrealized depreciation | | | (11,145 | ) |
| | | | | |
| Net unrealized appreciation (depreciation) | | $ | 324,223 | |
| * | Variable rate security. The rate shown represents the rate in effect at June 30, 2010. |
| ** | Investment in affiliate. The yield shown represents the 7-day yield in effect at June 30, 2010. |
| *** | Floating rate security. The rate shown represents the rate in effect at June 30, 2010. |
| **** | Assets of affiliates to The U.S. Government Bond Fund held for the benefit of the Fund’s Trustees in connection with the Trustee Deferred Compensation Plan. |
| The accompanying notes are an integral part of these financial statements. |
The Flex-funds® 2010 Semiannual Report | June 30, 2010 | Page 25 |
| | 2010 Semiannual Report | June 30, 2010 |
Schedule of Investments
June 30, 2010 (unaudited)
| | | | | | Principal Amount ($) or Shares | | | | |
| | |
| Bank Obligations — 0.6% | |
| Commerce National Bank Demand Deposit Account | | | 0.40 | %* | 07/01/10 | | | 249,000 | | | | 249,000 | |
| EverBank Money Market Account | | | 1.25 | %* | 07/01/10 | | | 150,834 | | | | 150,834 | |
| Excel Bank Demand Deposit Account | | | 0.75 | %* | 07/01/10 | | | 249,000 | | | | 249,000 | |
| Huntington National Bank Conservative Deposit Account | | | 0.50 | %* | 07/01/10 | | | 250,000 | | | | 250,000 | |
Total Bank Obligations (Cost $898,834) | | | | | | | | | | | | 898,834 | |
| Certificates of Deposit — 3.4% | |
| | | | | | | | | | | | | | |
Dexia Credit Local | | | 1.02 | % | 08/13/10 | | | 5,000,000 | | | | 5,000,118 | |
| Total Certificates of Deposit (Cost $5,000,118) | | | | | | | | | | | | 5,000,118 | |
| | |
| Commercial Paper — 3.4% | |
Toyota Motor Credit Corp. | | | 0.51 | % | 08/05/10 | | | 2,000,000 | | | | 1,999,028 | |
Toyota Motor Credit Corp. | | | 0.58 | % | 09/24/10 | | | 1,000,000 | | | | 998,654 | |
Toyota Motor Credit Corp. | | | 0.65 | % | 11/04/10 | | | 1,000,000 | | | | 997,760 | |
Toyota Motor Credit Corp. | | | 0.74 | % | 12/06/10 | | | 1,000,000 | | | | 996,796 | |
Total Commercial Paper (Cost $4,992,238) | | | | | | | | | | | | 4,992,238 | |
| | |
| Corporate Obligations — 30.8% | |
Barclays Bank | | | 0.55 | %* | 07/11/10 | | | 5,000,000 | | | | 5,000,000 | |
Barclays Bank | | | 1.05 | %* | 07/20/10 | | | 600,000 | | | | 600,957 | |
Barclays Bank | | | 0.85 | %* | 08/18/10 | | | 1,000,000 | | | | 1,000,000 | |
Bath Technologies*** | | | 0.45 | %* | 07/01/10 | | | 895,000 | | | | 895,000 | |
Cascade Plaza Project*** | | | 0.37 | %* | 07/01/10 | | | 6,564,000 | | | | 6,564,000 | |
| Caterpillar Financial Power Investment Floating Rate Demand Note | | | 1.30 | %** | 07/01/10 | | | 9,612,348 | | | | 9,612,348 | |
| General Electric Interest Plus Variable Rate Demand Note | | | 1.20 | %* | 07/01/10 | | | 9,083,618 | | | | 9,083,618 | |
HSBC Finance | | | 6.38 | % | 08/01/10 | | | 25,000 | | | | 25,121 | |
JP Morgan Chase | | | 4.50 | % | 11/15/10 | | | 1,263,000 | | | | 1,281,874 | |
Martin Wheel Co, Inc.*** | | | 3.10 | %* | 07/01/10 | | | 1,815,000 | | | | 1,815,000 | |
| Nationwide Floating Rate Demand Note | | | 0.86 | %** | 07/01/10 | | | 249,567 | | | | 249,567 | |
Rabobank | | | 0.35 | %* | 07/15/10 | | | 5,000,000 | | | | 5,000,000 | |
Seariver Maritime | | | 0.60 | %* | 07/01/10 | | | 1,200,000 | | | | 1,200,000 | |
| Springside Corp Exchange Partners LLC*** | | | 0.37 | %* | 07/01/10 | | | 2,000,000 | | | | 2,000,000 | |
White Castle Project*** | | | 0.50 | %* | 07/01/10 | | | 500,000 | | | | 500,000 | |
| Total Corporate Obligations (Cost $44,827,485) | | | | | | | | | | | | 44,827,485 | |
| The Money Market Fund | |
| | | | | | Principal Amount ($) or Shares | | | | |
| | |
| U.S. Government Agency Obligations — 14.1% | |
Federal Home Loan Bank | | | 4.55 | % | 08/06/10 | | | 35,000 | | | | 35,136 | |
Federal Home Loan Bank | | | 0.50 | % | 01/05/11 | | | 2,500,000 | | | | 2,500,000 | |
Federal Home Loan Bank | | | 0.50 | % | 03/07/11 | | | 1,000,000 | | | | 1,000,000 | |
Federal Home Loan Bank | | | 0.55 | % | 03/23/11 | | | 5,000,000 | | | | 5,000,000 | |
Federal Home Loan Bank | | | 0.57 | % | 04/13/11 | | | 2,000,000 | | | | 2,000,000 | |
Federal Home Loan Bank | | | 0.60 | % | 04/18/11 | | | 1,000,000 | | | | 1,000,000 | |
Federal Home Loan Bank | | | 0.63 | % | 04/21/11 | | | 1,000,000 | | | | 1,000,000 | |
Federal Home Loan Bank | | | 0.61 | % | 05/16/11 | | | 3,000,000 | | | | 3,000,000 | |
Federal Home Loan Bank | | | 0.70 | % | 05/27/11 | | | 2,000,000 | | | | 2,000,000 | |
Federal Home Loan Bank | | | 0.75 | % | 06/07/11 | | | 1,000,000 | | | | 1,000,000 | |
Federal Home Loan Bank | | | 0.75 | % | 06/21/11 | | | 1,000,000 | | | | 1,000,000 | |
Federal Home Loan Bank | | | 0.75 | % | 06/24/11 | | | 1,000,000 | | | | 1,000,000 | |
Total U.S. Government Agency Obligations (Cost $20,535,136) | | | | | | | | | | | | 20,535,136 | |
| | |
| Money Market Registered Investment Companies — 47.7% | |
| Federated Prime Value Obligations Fund, 0.28% # | | | | | | | | 10,853,965 | | | | 10,853,965 | |
| Fidelity Institutional Money Market Portfolio, 0.29% # | | | | | | | | 58,536,602 | | | | 58,536,602 | |
| Total Money Market Registered Investment Companies (Cost $69,390,567) | | | | | | | | | | | | 69,390,567 | |
Total Investments — 100.0% (Cost $145,644,378) (a) | | | | | | | | | | | | 145,644,378 | |
Other Assets less Liabilities — 0.0% | | | | | | | | | | | | 46,095 | |
Total Net Assets — 100.0% | | | | | | | | | | | | 145,690,473 | |
| Page 26 | The Flex-funds® 2010 Semiannual Report | June 30, 2010 |
| | 2010 Semiannual Report | June 30, 2010 |
| The Money Market Fund | |
| | Principal Amount ($) or Shares | | | | |
| | |
| Trustee Deferred Compensation**** | |
| The Flex-funds Aggressive Growth Fund | | | 497 | | | | 3,211 | |
| The Flex-funds Defensive Balanced Fund | | | 253 | | | | 2,204 | |
| The Flex-funds Dynamic Growth Fund | | | 153 | | | | 1,013 | |
The Flex-funds Muirfield Fund | | | 1,226 | | | | 5,811 | |
The Flex-funds Quantex Fund | | | 916 | | | | 16,497 | |
| The Flex-funds Total Return Utilities Fund | | | 55 | | | | 1,068 | |
Total Trustee Deferred Compensation (Cost $30,746) | | | | | | | 29,804 | |
| (a) | Cost for federal income tax and financial reporting purposes are the same. |
| # | 7-day yield as of June 30, 2010. |
| * | Variable rate security. Securities payable on demand at par including accrued interest (usually within seven days notice) and unconditionally secured as to principal and interest by letters of credit or other credit support agreements from major banks. The interest rates are adjustable and are based on bank prime rates or other interest rate adjustment indices. The rate shown represents the rate in effect at June 30, 2010. The maturity date shown reflects next rate change date. |
| ** | Floating rate security. The rate shown represents the rate in effect at June 30, 2010. |
| *** | Represents a restricted security purchased under Rule 144A, which is exempt from registration under the Securities Act of 1933, as amended. Security is restricted as to resale to institutional investors, but has been deemed liquid in accordance with guidelines approved by the Board of Trustees. As of June 30, 2010, securities restricted as to resale to institutional investors represented 8.1% of Total Investments. |
| **** | Assets of affiliates to The Money Market Fund held for the benefit of the Fund’s Trustees in connection with the Trustee Deferred Compensation Plan. |
| The accompanying notes are an integral part of these financial statements. |
The Flex-funds® 2010 Semiannual Report | June 30, 2010 | Page 27 |
| | 2010 Semiannual Report | June 30, 2010 |
Statements of Assets & Liabilities June 30, 2010 (unaudited) | |
| | | | | | | |
| Assets | | | | | | |
| Investments, at value* | | $ | 103,436,100 | | | $ | 78,180,367 | |
| Investments in affiliates, at amortized cost and value* | | | 2,164,956 | | | | 3,276,351 | |
| Trustee deferred compensation investments, at value | | | 83,453 | | | | 40,907 | |
| Receivable for net variation margin on futures contracts | | | 41,613 | | | | 0 | |
| Receivable for capital stock issued | | | 63,414 | | | | 46,301 | |
| Receivable from investment advisor | | | 0 | | | | 0 | |
| Interest and dividend receivable | | | 12,616 | | | | 10,453 | |
Prepaid expenses/other assets | | | 28,096 | | | | 23,350 | |
| | | 105,830,248 | | | | 81,577,729 | |
| Liabilities | | | | | | | | |
| Payable for Trustee Deferred Compensation Plan | | | 83,453 | | | | 40,907 | |
| Payable for net variation margin on futures contracts | | | 0 | | | | 30,875 | |
| Payable for capital stock redeemed | | | 20,476 | | | | 1,981 | |
| Dividends payable | | | 0 | | | | 0 | |
| Dividends payable — The Money Market Fund — Retail Class | | | | | | | | |
| Dividends payable — The Money Market Fund — Institutional Class | | | | | | | | |
| Payable to investment advisor | | | 73,082 | | | | 48,597 | |
| Accrued distribution plan (12b-1) and administrative service plan fees | | | 73,683 | | | | 78,919 | |
| Accrued transfer agent, fund accounting, CCO, and administrative fees | | | 18,574 | | | | 14,414 | |
| Accrued trustee fees | | | 8,140 | | | | 6,461 | |
Other accrued liabilities | | | 28,659 | | | | 24,274 | |
| | | 306,067 | | | | 246,428 | |
| | | | | | | | |
| | $ | 105,524,181 | | | $ | 81,331,301 | |
| Net Assets | | | | | | | | |
| Capital | | $ | 125,471,977 | | | $ | 103,799,075 | |
| Accumulated undistributed (distributions in excess of) net investment income | | | (21,114 | ) | | | (248,500 | ) |
| Accumulated undistributed net realized gain (loss) from investments and futures contracts | | | (19,536,724 | ) | | | (20,980,927 | ) |
Net unrealized appreciation (depreciation) of investments and futures contracts | | | (389,958 | ) | | | (1,238,347 | ) |
| | $ | 105,524,181 | | | $ | 81,331,301 | |
| Net Assets | | | | | | | | |
| The Money Market Fund — Retail Class | | | | | | | | |
The Money Market Fund — Institutional Class | | | | | | | | |
| | | | | | | | |
| Capital Stock Outstanding (indefinite number of shares authorized, $0.10 par value) | | | 22,245,277 | | | | 12,280,197 | |
| The Money Market Fund — Retail Class | | | | | | | | |
The Money Market Fund — Institutional Class | | | | | | | | |
Total Capital Stock Outstanding | | | | | | | | |
| Net Asset Value, Offering and Redemption Price Per Share | | $ | 4.74 | | | $ | 6.62 | |
| The Money Market Fund — Retail Class | | | | | | | | |
The Money Market Fund — Institutional Class | | | | | | | | |
* Investments and affiliated investments at cost | | $ | 106,095,582 | | | $ | 82,489,437 | |
| The accompanying notes are an integral part of these financial statements. |
| Page 28 | The Flex-funds® 2010 Semiannual Report | June 30, 2010 |
| | 2010 Semiannual Report | June 30, 2010 |
The Aggressive Growth Fund | | | The Defensive Balanced Fund | | | | | | | | | The Total Return Utilities Fund | | | The U.S. Government Bond Fund | | | | |
| | | | | | | | | | | | | | | | | | | | |
| $ | 26,301,006 | | | $ | 46,763,819 | | | $ | 36,632,480 | | | $ | 13,221,641 | | | $ | 19,373,658 | | | $ | 16,484,990 | | | $ | 145,644,378 | |
| | 1,180,309 | | | | 2,574,965 | | | | 2,151,144 | | | | 1,605,578 | | | | 554,454 | | | | 1,606,307 | | | | 0 | |
| | 26,299 | | | | 28,305 | | | | 23,064 | | | | 33,005 | | | | 30,363 | | | | 23,774 | | | | 29,804 | |
| | 0 | | | | 1,438 | | | | 0 | | | | 0 | | | | 0 | | | | 0 | | | | 0 | |
| | 12,767 | | | | 53,187 | | | | 18,629 | | | | 31,263 | | | | 34,238 | | | | 22,256 | | | | 0 | |
| | 0 | | | | 0 | | | | 0 | | | | 0 | | | | 0 | | | | 0 | | | | 2,822 | |
| | 4,537 | | | | 7,433 | | | | 385 | | | | 11,853 | | | | 18,236 | | | | 144,512 | | | | 126,187 | |
| | 15,512 | | | | 16,742 | | | | 19,091 | | | | 15,855 | | | | 10,640 | �� | | | 14,532 | | | | 22,668 | |
| | 27,540,430 | | | | 49,445,889 | | | | 38,844,793 | | | | 14,919,195 | | | | 20,021,589 | | | | 18,296,371 | | | | 145,825,859 | |
| | | | | | | | | | | | | | | | | | | | | | | | | | | |
| | 26,299 | | | | 28,305 | | | | 23,064 | | | | 33,005 | | | | 30,363 | | | | 23,774 | | | | 29,804 | |
| | 13,050 | | | | 0 | | | | 10,800 | | | | 7,500 | | | | 0 | | | | 0 | | | | 0 | |
| | 42 | | | | 0 | | | | 0 | | | | 12,364 | | | | 38,141 | | | | 29,470 | | | | 0 | |
| | 0 | | | | 0 | | | | 0 | | | | 0 | | | | 378 | | | | 1,191 | | | | | |
| | | | | | | | | | | | | | | | | | | | | | | | | | 937 | |
| | | | | | | | | | | | | | | | | | | | | | | | | | 5,019 | |
| | 15,242 | | | | 29,115 | | | | 23,955 | | | | 8,898 | | | | 15,863 | | | | 567 | | | | 0 | |
| | 26,897 | | | | 51,943 | | | | 40,198 | | | | 0 | | | | 5,225 | | | | 11,149 | | | | 16,705 | |
| | 7,666 | | | | 9,212 | | | | 8,051 | | | | 4,514 | | | | 5,799 | | | | 4,409 | | | | 25,306 | |
| | 2,448 | | | | 3,431 | | | | 2,377 | | | | 1,358 | | | | 1,640 | | | | 1,647 | | | | 1,540 | |
| | 14,411 | | | | 18,273 | | | | 13,151 | | | | 11,514 | | | | 13,973 | | | | 11,263 | | | | 56,075 | |
| | 106,055 | | | | 140,279 | | | | 121,596 | | | | 79,153 | | | | 111,382 | | | | 83,470 | | | | 135,386 | |
| | | | | | | | | | | | | | | | | | | | | | | | | | | |
| $ | 27,434,375 | | | $ | 49,305,610 | | | $ | 38,723,197 | | | $ | 14,840,042 | | | $ | 19,910,207 | | | $ | 18,212,901 | | | $ | 145,690,473 | |
| | | | | | | | | | | | | | | | | | | | | | | | | | | |
| $ | 38,377,772 | | | $ | 56,827,683 | | | $ | 45,437,976 | | | $ | 17,889,746 | | | $ | 22,128,842 | | | $ | 18,260,910 | | | $ | 145,690,473 | |
| | (137,146 | ) | | | 25,054 | | | | (83,254 | ) | | | (9,235 | ) | | | 125,471 | | | | 1,851 | | | | 0 | |
| | (11,172,761 | ) | | | (7,537,460 | ) | | | (6,699,961 | ) | | | (2,423,732 | ) | | | (1,234,976 | ) | | | (375,150 | ) | | | 0 | |
| | 366,510 | | | | (9,667 | ) | | | 68,436 | | | | (616,737 | ) | | | (1,109,130 | ) | | | 325,290 | | | | 0 | |
| $ | 27,434,375 | | | $ | 49,305,610 | | | $ | 38,723,197 | | | $ | 14,840,042 | | | $ | 19,910,207 | | | $ | 18,212,901 | | | $ | 145,690,473 | |
| | | | | | | | | | | | | | | | | | | | | | | | | | | |
| | | | | | | | | | | | | | | | | | | | | | | | | $ | 107,217,644 | |
| | | | | | | | | | | | | | | | | | | | | | | | | | 38,472,829 | |
| | | | | | | | | | | | | | | | | | | | | | | | | $ | 145,690,473 | |
| | 4,246,522 | | | | 5,657,991 | | | | 5,006,914 | | | | 824,113 | | | | 1,025,191 | | | | 852,108 | | | | | |
| | | | | | | | | | | | | | | | | | | | | | | | | | 107,217,644 | |
| | | | | | | | | | | | | | | | | | | | | | | | | | 38,472,829 | |
| | | | | | | | | | | | | | | | | | | | | | | | | | 145,690,473 | |
| $ | 6.46 | | | $ | 8.71 | | | $ | 7.73 | | | $ | 18.01 | | | $ | 19.42 | | | $ | 21.37 | | | | | |
| | | | | | | | | | | | | | | | | | | | | | | | | $ | 1.00 | |
| | | | | | | | | | | | | | | | | | | | | | | | | $ | 1.00 | |
| $ | 27,017,747 | | | $ | 49,347,136 | | | $ | 38,556,518 | | | $ | 15,356,793 | | | $ | 21,037,242 | | | $ | 17,766,007 | | | $ | 145,644,378 | |
The Flex-funds® 2010 Semiannual Report | June 30, 2010 | Page 29 |
| | 2010 Semiannual Report | June 30, 2010 |
Statements of Operations For the Period Ended June 30, 2010 (unaudited) | |
| | | | | | | |
| Investment Income | | | | | | |
| Interest | | $ | 14,240 | | | $ | 8,955 | |
| Interest from affiliates | | | 2,495 | | | | 2,911 | |
| | | 571,863 | | | | 324,941 | |
| | | 588,598 | | | | 336,807 | |
| Fund Expenses | | | | | | | | |
| Investment advisor | | | 477,299 | | | | 316,601 | |
| Transfer agent | | | 68,186 | | | | 50,656 | |
| Transfer agent — The Money Market Fund — Retail Class | | | | | | | | |
| Transfer agent — The Money Market Fund — Institutional Class | | | | | | | | |
| Fund accounting | | | 24,030 | | | | 22,565 | |
| Administrative | | | 50,416 | | | | 38,730 | |
| Trustee | | | 14,073 | | | | 10,554 | |
| Audit | | | 5,220 | | | | 5,220 | |
| Legal | | | 3,687 | | | | 3,687 | |
| Custody | | | 9,369 | | | | 7,645 | |
| Printing | | | 10,198 | | | | 7,383 | |
| Distribution plan (12b-1) | | | 113,643 | | | | 105,534 | |
| Distribution plan (12b-1) — The Money Market Fund - Retail Class | | | | | | | | |
| Distribution plan (12b-1) — The Money Market Fund - Institutional Class | | | | | | | | |
| Administrative service plan | | | 113,643 | | | | 84,427 | |
| Postage | | | 4,959 | | | | 3,267 | |
| Registration and filing | | | 9,874 | | | | 10,328 | |
| Insurance | | | 5,522 | | | | 4,221 | |
| Chief Compliance Officer | | | 1,504 | | | | 1,504 | |
| | | 4,759 | | | | 3,741 | |
Total Expenses Before Reductions | | | 916,382 | | | | 676,063 | |
| Expenses reimbursed/waived by investment advisor | | | 0 | | | | 0 | |
| Expenses paid indirectly | | | (44,050 | ) | | | (35,878 | ) |
| Distribution plan (12b-1) expenses waived | | | (34,093 | ) | | | (8,443 | ) |
| Administrative service plan expenses waived | | | (34,093 | ) | | | (25,328 | ) |
Transfer agent expenses waived | | | (22,729 | ) | | | (21,107 | ) |
| | | 781,417 | | | | 585,307 | |
| | | | | | | | |
Net Investment Income (Loss) | | | (192,819 | ) | | | (248,500 | ) |
| Realized and Unrealized Gain (Loss) from Investments | | | | | | | | |
| Net realized gains (losses) from investments | | | 3,958,436 | | | | 2,961,300 | |
Net realized gains (losses) from futures contracts | | | (173,948 | ) | | | 371,217 | |
Net Realized Gains (Losses) from Investment Transactions and Futures Contracts | | | 3,784,488 | | | | 3,332,517 | |
Net change in unrealized appreciation (depreciation) of investments and futures contracts | | | (8,736,825 | ) | | | (7,898,451 | ) |
Net Realized and Unrealized Gain (Loss) from Investments | | | (4,952,337 | ) | | | (4,565,934 | ) |
| | | | | | | | |
Net Change in Net Assets Resulting from Operations | | $ | (5,145,156 | ) | | $ | (4,814,434 | ) |
| The accompanying notes are an integral part of these financial statements. |
| Page 30 | The Flex-funds® 2010 Semiannual Report | June 30, 2010 |
| | 2010 Semiannual Report | June 30, 2010 |
The Aggressive Growth Fund | | | The Defensive Balanced Fund | | | The Strategic Growth Fund | | | | | | The Total Return Utilities Fund | | | The U.S. Government Bond Fund | | | | |
| | | | | | | | | | | | | | | | | | | | |
| $ | 2,137 | | | $ | 67,146 | | | $ | 7,252 | | | $ | 1,021 | | | $ | 0 | | | $ | 307,538 | | | $ | 486,078 | |
| | 1,126 | | | | 2,663 | | | | 2,252 | | | | 966 | | | | 597 | | | | 1,487 | | | | 0 | |
| | 92,231 | | | | 337,704 | | | | 186,575 | | | | 102,495 | | | | 359,008 | | | | 0 | | | | 0 | |
| | 95,494 | | | | 407,513 | | | | 196,079 | | | | 104,482 | | | | 359,605 | | | | 309,025 | | | | 486,078 | |
| | | | | | | | | | | | | | | | | | | | | | | | | | | |
| | 109,980 | | | | 190,004 | | | | 141,036 | | | | 73,440 | | | | 102,859 | | | | 35,851 | | | | 264,621 | |
| | 17,597 | | | | 30,401 | | | | 22,566 | | | | 8,813 | | | | 12,343 | | | | 7,170 | | | | | |
| | | | | | | | | | | | | | | | | | | | | | | | | | 50,310 | |
| | | | | | | | | | | | | | | | | | | | | | | | | | 14,517 | |
| | 16,945 | | | | 19,448 | | | | 18,142 | | | | 9,823 | | | | 12,765 | | | | 11,442 | | | | 25,957 | |
| | 14,664 | | | | 25,195 | | | | 18,805 | | | | 7,344 | | | | 10,286 | | | | 8,963 | | | | 65,835 | |
| | 4,592 | | | | 6,795 | | | | 5,068 | | | | 3,005 | | | | 3,522 | | | | 3,260 | | | | 3,005 | |
| | 5,220 | | | | 5,220 | | | | 5,220 | | | | 5,220 | | | | 5,220 | | | | 5,220 | | | | 5,220 | |
| | 3,687 | | | | 3,687 | | | | 3,687 | | | | 3,687 | | | | 3,879 | | | | 3,687 | | | | 3,687 | |
| | 3,388 | | | | 6,502 | | | | 3,276 | | | | 2,981 | | | | 1,955 | | | | 1,720 | | | | 7,736 | |
| | 2,612 | | | | 4,373 | | | | 2,990 | | | | 1,079 | | | | 1,754 | | | | 1,544 | | | | 17,702 | |
| | 36,660 | | | | 63,335 | | | | 47,012 | | | | 14,658 | | | | 25,715 | | | | 17,925 | | | | | |
| | | | | | | | | | | | | | | | | | | | | | | | | | 115,392 | |
| | | | | | | | | | | | | | | | | | | | | | | | | | 5,462 | |
| | 29,328 | | | | 50,668 | | | | 37,609 | | | | 14,687 | | | | 20,572 | | | | 17,926 | | | | 0 | |
| | 1,267 | | | | 1,891 | | | | 1,319 | | | | 894 | | | | 2,748 | | | | 865 | | | | 10,637 | |
| | 9,762 | | | | 10,560 | | | | 10,557 | | | | 7,798 | | | | 8,026 | | | | 9,805 | | | | 16,356 | |
| | 1,386 | | | | 2,284 | | | | 1,557 | | | | 503 | | | | 927 | | | | 869 | | | | 11,200 | |
| | 1,504 | | | | 1,504 | | | | 1,504 | | | | 1,504 | | | | 1,504 | | | | 1,504 | | | | 1,504 | |
| | 2,892 | | | | 3,012 | | | | 2,806 | | | | 3,005 | | | | 3,387 | | | | 2,757 | | | | 22,543 | |
| | 261,484 | | | | 424,879 | | | | 323,154 | | | | 158,441 | | | | 217,462 | | | | 130,508 | | | | 641,684 | |
| | (2,504 | ) | | | 0 | | | | 0 | | | | (18,360 | ) | | | 0 | | | | (30,125 | ) | | | (240,900 | ) |
| | (11,676 | ) | | | (14,552 | ) | | | (19,375 | ) | | | 0 | | | | 0 | | | | 0 | | | | 0 | |
| | (4,399 | ) | | | (10,134 | ) | | | (9,402 | ) | | | (12,411 | ) | | | (8,229 | ) | | | (4,481 | ) | | | (92,524 | ) |
| | (10,265 | ) | | | 0 | | | | (1,880 | ) | | | (13,953 | ) | | | (13,372 | ) | | | (5,378 | ) | | | 0 | |
| | 0 | | | | (17,734 | ) | | | (13,164 | ) | | | 0 | | | | 0 | | | | (1,792 | ) | | | (3,463 | ) |
| | 232,640 | | | | 382,459 | | | | 279,333 | | | | 113,717 | | | | 195,861 | | | | 88,732 | | | | 304,797 | |
| | | | | | | | | | | | | | | | | | | | | | | | | | | |
| | (137,146 | ) | | | 25,054 | | | | (83,254 | ) | | | (9,235 | ) | | | 163,744 | | | | 220,293 | | | | 181,281 | |
| | | | | | | | | | | | | | | | | | | | | | | | | | | |
| | 2,369,071 | | | | 1,509,123 | | | | 1,422,440 | | | | 1,391,964 | | | | (84,971 | ) | | | 237,411 | | | | | |
| | 17,671 | | | | (66,433 | ) | | | 465,555 | | | | (22,475 | ) | | | 0 | | | | 0 | | | | | |
| | 2,386,742 | | | | 1,442,690 | | | | 1,887,995 | | | | 1,369,489 | | | | (84,971 | ) | | | 237,411 | | | | | |
| | (3,835,829 | ) | | | (2,858,747 | ) | | | (3,826,507 | ) | | | (1,904,542 | ) | | | (1,402,653 | ) | | | 259,321 | | | | | |
| | (1,449,087 | ) | | | (1,416,057 | ) | | | (1,938,512 | ) | | | (535,053 | ) | | | (1,487,624 | ) | | | 496,732 | | | | | |
| | | | | | | | | | | | | | | | | | | | | | | | | | | |
| $ | (1,586,233 | ) | | $ | (1,391,003 | ) | | $ | (2,021,766 | ) | | $ | (544,288 | ) | | $ | (1,323,880 | ) | | $ | 717,025 | | | $ | 181,281 | |
The Flex-funds® 2010 Semiannual Report | June 30, 2010 | Page 31 |
| | 2010 Semiannual Report | June 30, 2010 |
Statements of Changes in Net Assets For the Period Ended June 30, 2010 (unaudited) and the Year Ended December 31, 2009 | |
| | | | | | | |
| | | | | | | |
| | | | | | | | | | | | | |
| Operations | | | | | | | | | | | | |
| Net investment income (loss) | | $ | (192,819 | ) | | $ | 171,769 | | | $ | (248,500 | ) | | $ | (28,671 | ) |
| Net realized gain (loss) from investment transactions and futures contracts | | | 3,784,488 | | | | (3,114,982 | ) | | | 3,332,517 | | | | (5,412,561 | ) |
Net change in unrealized appreciation (depreciation) of investments and futures contracts | | | (8,736,825 | ) | | | 21,711,512 | | | | (7,898,451 | ) | | | 24,472,483 | |
Net change in net assets resulting from operations | | | (5,145,156 | ) | | | 18,768,299 | | | | (4,814,434 | ) | | | 19,031,251 | |
| | | | | | | | | | | | | | | | | |
| Distributions to Shareholders | | | | | | | | | | | | | | | | |
| From net investment income | | | 0 | | | | (414,472 | ) | | | 0 | | | | (25,950 | ) |
From tax return of capital | | | 0 | | | | 0 | | | | 0 | | | | 0 | |
Net change in net assets resulting from distributions | | | 0 | | | | (414,472 | ) | | | 0 | | | | (25,950 | ) |
| | | | | | | | | | | | | | | | | |
| Capital Transactions | | | | | | | | | | | | | | | | |
| Issued | | | 15,039,015 | | | | 25,393,304 | | | | 19,331,815 | | | | 18,550,561 | |
| Reinvested | | | 0 | | | | 413,001 | | | | 0 | | | | 25,931 | |
| | | (19,507,834 | ) | | | (15,332,338 | ) | | | (17,544,161 | ) | | | (20,521,732 | ) |
Net change in net assets resulting from capital transactions | | | (4,468,819 | ) | | | 10,473,967 | | | | 1,787,654 | | | | (1,945,240 | ) |
| | | | | | | | | | | | | | | | |
Total Change in Net Assets | | | (9,613,975 | ) | | | 28,827,794 | | | | (3,026,780 | ) | | | 17,060,061 | |
| | | | | | | | | | | | | | | | | |
Net Assets - Beginning of Year | | | 115,138,156 | | | | 86,310,362 | | | | 84,358,081 | | | | 67,298,020 | |
| | | | | | | | | | | | | | | | | |
| | $ | 105,524,181 | | | $ | 115,138,156 | | | $ | 81,331,301 | | | $ | 84,358,081 | |
| | | | | | | | | | | | | | | | | |
Accumulated undistributed (distributions in excess of) net investment income | | $ | (21,114 | ) | | $ | 171,705 | | | $ | (248,500 | ) | | $ | 0 | |
| | | | | | | | | | | | | | | | | |
| Share Transactions | | | | | | | | | | | | | | | | |
| Issued | | | 2,988,717 | | | | 5,941,024 | | | | 2,726,203 | | | | 3,216,909 | |
| Reinvested | | | 0 | | | | 82,766 | | | | 0 | | | | 3,673 | |
| | | (3,794,201 | ) | | | (3,493,767 | ) | | | (2,388,917 | ) | | | (3,566,560 | ) |
| | | (805,484 | ) | | | 2,530,023 | | | | 337,286 | | | | (345,978 | ) |
| The accompanying notes are an integral part of these financial statements. |
| Page 32 | The Flex-funds® 2010 Semiannual Report | June 30, 2010 |
| | 2010 Semiannual Report | June 30, 2010 |
The Aggressive Growth Fund | | | The Defensive Balanced Fund | | | The Strategic Growth Fund | |
| | | | | | | | | | | | | | | | |
| | | | | | | | | | | | | | | | | |
| $ | (137,146 | ) | | $ | (61,565 | ) | | $ | 25,054 | | | $ | 172,076 | | | $ | (83,254 | ) | | $ | (35,998 | ) |
| | 2,386,742 | | | | (2,031,983 | ) | | | 1,442,690 | | | | 590,479 | | | | 1,887,995 | | | | (1,451,360 | ) |
| | (3,835,829 | ) | | | 9,413,372 | | | | (2,858,747 | ) | | | 5,319,008 | | | | (3,826,507 | ) | | | 10,598,970 | |
| | (1,586,233 | ) | | | 7,319,824 | | | | (1,391,003 | ) | | | 6,081,563 | | | | (2,021,766 | ) | | | 9,111,612 | |
| | | | | | | | | | | | | | | | | | | | | | | |
| | 0 | | | | 0 | | | | 0 | | | | (172,076 | ) | | | 0 | | | | 0 | |
| | 0 | | | | 0 | | | | 0 | | | | 0 | | | | 0 | | | | 0 | |
| | 0 | | | | 0 | | | | 0 | | | | (172,076 | ) | | | 0 | | | | 0 | |
| | | | | | | | | | | | | | | | | | | | | | | |
| | 5,496,222 | | | | 6,009,484 | | | | 10,289,597 | | | | 14,079,147 | | | | 13,699,378 | | | | 10,087,974 | |
| | 0 | | | | 0 | | | | 0 | | | | 172,076 | | | | 0 | | | | 0 | |
| | (6,370,604 | ) | | | (4,149,362 | ) | | | (8,981,418 | ) | | | (5,537,909 | ) | | | (7,006,296 | ) | | | (6,221,991 | ) |
| | (874,382 | ) | | | 1,860,122 | | | | 1,308,179 | | | | 8,713,314 | | | | 6,693,082 | | | | 3,865,983 | |
| | | | | | | | | | | | | | | | | | | | | | | |
| | (2,460,615 | ) | | | 9,179,946 | | | | (82,824 | ) | | | 14,622,801 | | | | 4,671,316 | | | | 12,977,595 | |
| | 29,894,990 | | | | 20,715,044 | | | | 49,388,434 | | | | 34,765,633 | | | | 34,051,881 | | | | 21,074,286 | |
| $ | 27,434,375 | | | $ | 29,894,990 | | | $ | 49,305,610 | | | $ | 49,388,434 | | | $ | 38,723,197 | | | $ | 34,051,881 | |
| $ | (137,146 | ) | | $ | 0 | | | $ | 25,054 | | | $ | 0 | | | $ | (83,254 | ) | | $ | 0 | |
| | | | | | | | | | | | | | | | | | | | | | | |
| | 790,881 | | | | 1,079,928 | | | | 1,130,315 | | | | 1,738,105 | | | | 1,641,940 | | | | 1,612,620 | |
| | 0 | | | | 0 | | | | 0 | | | | 19,162 | | | | 0 | | | | 0 | |
| | (884,690 | ) | | | (731,065 | ) | | | (974,552 | ) | | | (677,563 | ) | | | (827,023 | ) | | | (942,395 | ) |
| | (93,809 | ) | | | 348,863 | | | | 155,763 | | | | 1,079,704 | | | | 814,917 | | | | 670,225 | |
The Flex-funds® 2010 Semiannual Report | June 30, 2010 | Page 33 |
| | 2010 Semiannual Report | June 30, 2010 |
Statements of Changes in Net Assets For the Period Ended June 30, 2010 (unaudited) and the Year Ended December 31, 2009 | |
| | | | |
| | | | | | | |
| Operations | | | | | | |
| Net investment income (loss) | | $ | (9,235 | ) | | $ | (4,452 | ) |
| Net realized gain (loss) from investment transactions and futures contracts | | | 1,369,489 | | | | (1,551,576 | ) |
Net change in unrealized appreciation (depreciation) of investments and futures contracts | | | (1,904,542 | ) | | | 6,664,258 | |
Net change in net assets resulting from operations | | | (544,288 | ) | | | 5,108,230 | |
| Distributions to Shareholders | | | | | | | | |
| From net investment income | | | 0 | | | | (1,536 | ) |
From tax return of capital | | | 0 | | | | 0 | |
Net change in net assets resulting from distributions | | | 0 | | | | (1,536 | ) |
| Distributions to Shareholders - The Money Market Fund | | | | | | | | |
| From net investment income (Retail Class) | | | | | | | | |
From net investment income (Institutional Class) | | | | | | | | |
Net change in net assets resulting from distributions | | | | | | | | |
| Capital Transactions | | | | | | | | |
| Issued | | | 6,539,493 | | | | 3,088,875 | |
| Reinvested | | | 0 | | | | 1,511 | |
| | | (3,822,638 | ) | | | (2,272,834 | ) |
Net change in net assets resulting from capital transactions | | | 2,716,855 | | | | 817,552 | |
| | | | | | | | |
Total Change in Net Assets | | | 2,172,567 | | | | 5,924,246 | |
Net Assets - Beginning of Year | | | 12,667,475 | | | | 6,743,229 | |
| | $ | 14,840,042 | | | $ | 12,667,475 | |
Accumulated undistributed (distributions in excess of) net investment income | | $ | (9,235 | ) | | $ | 0 | |
| Share Transactions | | | | | | | | |
| Issued | | | 333,404 | | | | 218,531 | |
| Reinvested | | | 0 | | | | 82 | |
| | | (194,749 | ) | | | (180,496 | ) |
| | | 138,655 | | | | 38,117 | |
| The accompanying notes are an integral part of these financial statements. |
| Page 34 | The Flex-funds® 2010 Semiannual Report | June 30, 2010 |
| | 2010 Semiannual Report | June 30, 2010 |
The Total Return Utilities Fund | | | The U.S. Government Bond Fund | | | | |
| | | | | | | | | | | | | | | | |
| | | | | | | | | | | | | | | | | |
| $ | 163,744 | | | $ | 152,483 | | | $ | 220,293 | | | $ | 450,124 | | | $ | 181,281 | | | $ | 1,476,836 | |
| | (84,971 | ) | | | (570,777 | ) | | | 237,411 | | | | 109,775 | | | | 0 | | | | 0 | |
| | (1,402,653 | ) | | | 4,992,276 | | | | 259,321 | | | | (225,024 | ) | | | 0 | | | | 0 | |
| | (1,323,880 | ) | | | 4,573,982 | | | | 717,025 | | | | 334,875 | | | | 181,281 | | | | 1,476,836 | |
| | | | | | | | | | | | | | | | | | | | | | | |
| | (38,273 | ) | | | (152,483 | ) | | | (220,293 | ) | | | (450,124 | ) | | | | | | | | |
| | 0 | | | | (123,774 | ) | | | 0 | | �� | | 0 | | | | | | | | | |
| | (38,273 | ) | | | (276,257 | ) | | | (220,293 | ) | | | (450,124 | ) | | | | | | | | |
| | | | | | | | | | | | | | | | | | | | | | | |
| | | | | | | | | | | | | | | | | | (125,299 | ) | | | (977,452 | ) |
| | | | | | | | | | | | | | | | | | (55,982 | ) | | | (499,384 | ) |
| | | | | | | | | | | | | | | | | | (181,281 | ) | | | (1,476,836 | ) |
| | | | | | | | | | | | | | | | | | | | | | | |
| | 2,566,810 | | | | 3,397,816 | | | | 3,241,781 | | | | 6,327,512 | | | | 203,398,231 | | | | 303,809,610 | |
| | 37,084 | | | | 265,690 | | | | 212,928 | | | | 433,301 | | | | 138,133 | | | | 1,011,767 | |
| | (2,062,764 | ) | | | (3,089,127 | ) | | | (2,929,107 | ) | | | (3,491,220 | ) | | | (226,237,197 | ) | | | (374,956,022 | ) |
| | 541,130 | | | | 574,379 | | | | 525,602 | | | | 3,269,593 | | | | (22,700,833 | ) | | | (70,134,645 | ) |
| | | | | | | | | | | | | | | | | | | | | | | |
| | (821,023 | ) | | | 4,872,104 | | | | 1,022,334 | | | | 3,154,344 | | | | (22,700,833 | ) | | | (70,134,645 | ) |
| | 20,731,230 | | | | 15,859,126 | | | | 17,190,567 | | | | 14,036,223 | | | | 168,391,306 | | | | 238,525,951 | |
| $ | 19,910,207 | | | $ | 20,731,230 | | | $ | 18,212,901 | | | $ | 17,190,567 | | | $ | 145,690,473 | | | $ | 168,391,306 | |
| $ | 125,471 | | | $ | 0 | | | $ | 1,851 | | | $ | 1,851 | | | $ | 0 | | | $ | 0 | |
| | | | | | | | | | | | | | | | | | | | | | | |
| | 124,804 | | | | 185,225 | | | | 154,433 | | | | 304,454 | | | | 203,398,231 | | | | 303,809,610 | |
| | 1,854 | | | | 15,135 | | | | 10,115 | | | | 20,819 | | | | 138,133 | | | | 1,011,767 | |
| | (101,534 | ) | | | (183,535 | ) | | | (139,442 | ) | | | (167,871 | ) | | | (226,237,197 | ) | | | (374,956,022 | ) |
| | 25,124 | | | | 16,825 | | | | 25,106 | | | | 157,402 | | | | (22,700,833 | ) | | | (70,134,645 | ) |
The Flex-funds® 2010 Semiannual Report | June 30, 2010 | Page 35 |
| | 2010 Semiannual Report | June 30, 2010 |
Financial Highlights For a Share Outstanding Through the Period Ended June 30, 2010 (unaudited) and Each Fiscal Year Ended December 31, | |
| | | | | | Income from Investment Operations | | | |
| | | Net Asset Value, Beginning of Period | | | | Net gains (losses) on securities, futures, and options (both realized and unrealized) | | Total from Investment Operations | | | | | | | | |
| The Muirfield Fund (1)(2)(3)(4)(5) | |
| 2010 | | | $ | 4.99 | | (0.01 | ) | (0.24 | ) | (0.25 | ) | 0.00 | | 0.00 | | 0.00 | 0.00 | |
| 2009 | | | $ | 4.21 | | 0.01 | | 0.79 | | 0.80 | | (0.02 | ) | 0.00 | | 0.00 | (0.02 | ) |
| 2008 | | | $ | 6.02 | | 0.02 | | (1.83 | ) | (1.81 | ) | 0.00 | | 0.00 | | 0.00 | 0.00 | |
| 2007 | | | $ | 5.81 | | 0.18 | | 0.23 | | 0.41 | | (0.20 | ) | 0.00 | | 0.00 | (0.20 | ) |
| 2006 | | | $ | 5.15 | | 0.04 | | 0.66 | | 0.70 | | (0.04 | ) | 0.00 | | 0.00 | (0.04 | ) |
| 2005 | | | $ | 5.11 | | 0.07 | | 0.04 | | 0.11 | | (0.07 | ) | 0.00 | | 0.00 | (0.07 | ) |
The Dynamic Growth Fund (1)(2)(3)(4)(5) | |
| 2010 | | | $ | 7.06 | | (0.02 | ) | (0.42 | ) | (0.44 | ) | 0.00 | | 0.00 | | 0.00 | 0.00 | |
| 2009 | | | $ | 5.48 | | 0.00 | | 1.58 | | 1.58 | | 0.00 | ** | 0.00 | | 0.00 | 0.00 | ** |
| 2008 | | | $ | 9.24 | | 0.04 | | (3.71 | ) | (3.67 | ) | (0.04 | ) | (0.05 | ) | 0.00 | (0.09 | ) |
| 2007 | | | $ | 9.56 | | 0.29 | | 0.38 | | 0.67 | | (0.30 | ) | (0.69 | ) | 0.00 | (0.99 | ) |
| 2006 | | | $ | 8.28 | | 0.04 | | 1.28 | | 1.32 | | (0.04 | ) | 0.00 | | 0.00 | (0.04 | ) |
| 2005 | | | $ | 7.94 | | 0.06 | | 0.34 | | 0.40 | | (0.06 | ) | 0.00 | | 0.00 | (0.06 | ) |
The Aggressive Growth Fund (1)(2)(3)(4)(5) | |
| 2010 | | | $ | 6.89 | | (0.03 | ) | (0.40 | ) | (0.43 | ) | 0.00 | | 0.00 | | 0.00 | 0.00 | |
| 2009 | | | $ | 5.19 | | (0.01 | ) | 1.71 | | 1.70 | | 0.00 | | 0.00 | | 0.00 | 0.00 | |
| 2008 | | | $ | 8.59 | | 0.05 | | (3.40 | ) | (3.35 | ) | (0.05 | ) | 0.00 | | 0.00 | (0.05 | ) |
| 2007 | | | $ | 8.13 | | 0.04 | | 0.46 | | 0.50 | | (0.04 | ) | 0.00 | | 0.00 | (0.04 | ) |
| 2006 | | | $ | 7.19 | | 0.03 | | 0.94 | | 0.97 | | (0.03 | ) | 0.00 | | 0.00 | (0.03 | ) |
| 2005 | | | $ | 6.83 | | 0.02 | | 0.36 | | 0.38 | | (0.02 | ) | 0.00 | | 0.00 | (0.02 | ) |
The Defensive Balanced Fund (1)(2)(3)(4) | |
| 2010 | | | $ | 8.98 | | 0.00 | | (0.27 | ) | (0.27 | ) | 0.00 | | 0.00 | | 0.00 | 0.00 | |
| 2009 | | | $ | 7.86 | | 0.03 | | 1.12 | | 1.15 | | (0.03 | ) | 0.00 | | 0.00 | (0.03 | ) |
| 2008 | | | $ | 10.46 | | 0.07 | | (2.60 | ) | (2.53 | ) | (0.07 | ) | 0.00 | | 0.00 | (0.07 | ) |
| 2007 | | | $ | 10.51 | | 0.07 | | 0.45 | | 0.52 | | (0.07 | ) | (0.50 | ) | 0.00 | (0.57 | ) |
| 2006* | | | $ | 10.00 | | 0.07 | | 0.51 | | 0.58 | | (0.07 | ) | 0.00 | | 0.00 | (0.07 | ) |
The Strategic Growth Fund (1)(2)(3)(4) | |
| 2010 | | | $ | 8.12 | | (0.02 | ) | (0.37 | ) | (0.39 | ) | 0.00 | | 0.00 | | 0.00 | 0.00 | |
| 2009 | | | $ | 5.98 | | (0.01 | ) | 2.15 | | 2.14 | | 0.00 | | 0.00 | | 0.00 | 0.00 | |
| 2008 | | | $ | 10.58 | | 0.05 | | (4.60 | ) | (4.55 | ) | (0.05 | ) | 0.00 | | 0.00 | (0.05 | ) |
| 2007 | | | $ | 10.73 | | 0.08 | | 0.46 | | 0.54 | | (0.07 | ) | (0.62 | ) | 0.00 | (0.69 | ) |
| 2006* | | | $ | 10.00 | | 0.06 | | 0.73 | | 0.79 | | (0.06 | ) | 0.00 | | 0.00 | (0.06 | ) |
| 1 | Ratio of net expenses to average net assets, ratio of net investment income (loss) to average net assets, ratio of expenses to average net assets after reductions, excluding expenses paid indirectly, and ratio of expenses to average net assets before reductions do not include impact of expenses of the underlying security holdings as represented in the schedule of investments. |
| 2 | Recognition of net investment income by the Fund is affected by the timing of the declaration of dividends by the underlying investment companies in which the Fund invests. |
| 3 | Total return and portfolio turnover rate are not annualized for periods of less than one full year. |
| 4 | Ratio of net expenses to average net assets, ratio of net investment income (loss) to average net assets, ratio of average net assets after reductions, excluding expenses paid indirectly, and ratio of expenses to average net assets before reductions are annualized for periods of less than one full year. |
| Page 36 | The Flex-funds® 2010 Semiannual Report | June 30, 2010 |
| | 2010 Semiannual Report | June 30, 2010 |
| |
| | | | | | | | |
Net Asset Value, End of Period | | | Total Return (Assumes Reinvestment of Distributions) | | | Net Assets, End of Period ($000) | | | Ratio of Net Expenses to Average Net Assets | | | Ratio of Net Investment Income (Loss) to Average Net Assets | | | Ratio of Expenses to Average Net Assets after Reductions, Excluding Expenses Paid Indirectly | | | Ratio of Expenses to Average Net Assets Before Reductions | | | | |
| | |
| $ | 4.74 | | | | (5.01 | %) | | $ | 105,524 | | | | 1.38 | % | | | (0.34 | %) | | | 1.45 | % | | | 1.61 | % | | | 42 | % |
| $ | 4.99 | | | | 18.95 | % | | $ | 115,138 | | | | 1.43 | % | | | 0.17 | % | | | 1.51 | % | | | 1.66 | % | | | 166 | % |
| $ | 4.21 | | | | (30.07 | %) | | $ | 86,310 | | | | 1.39 | % | | | 0.54 | % | | | 1.48 | % | | | 1.75 | % | | | 173 | % |
| $ | 6.02 | | | | 7.02 | % | | $ | 50,374 | | | | 1.38 | % | | | 3.01 | % | | | 1.52 | % | | | 1.88 | % | | | 144 | % |
| $ | 5.81 | | | | 13.62 | % | | $ | 53,227 | | | | 1.45 | % | | | 0.65 | % | | | 1.56 | % | | | 1.85 | % | | | 131 | % |
| $ | 5.15 | | | | 2.13 | % | | $ | 78,181 | | | | 1.42 | % | | | 1.36 | % | | | 1.53 | % | | | 1.76 | % | | | 145 | % |
| |
| $ | 6.62 | | | | (6.23 | %) | | $ | 81,331 | | | | 1.39 | % | | | (0.59 | %) | | | 1.47 | % | | | 1.60 | % | | | 44 | % |
| $ | 7.06 | | | | 28.87 | % | | $ | 84,358 | | | | 1.37 | % | | | (0.04 | %) | | | 1.48 | % | | | 1.63 | % | | | 148 | % |
| $ | 5.48 | | | | (39.77 | %) | | $ | 67,298 | | | | 1.34 | % | | | 0.95 | % | | | 1.46 | % | | | 1.69 | % | | | 122 | % |
| $ | 9.24 | | | | 7.06 | % | | $ | 19,115 | | | | 1.32 | % | | | 2.94 | % | | | 1.46 | % | | | 1.86 | % | | | 150 | % |
| $ | 9.56 | | | | 15.96 | % | | $ | 21,566 | | | | 1.42 | % | | | 0.42 | % | | | 1.55 | % | | | 1.86 | % | | | 123 | % |
| $ | 8.28 | | | | 5.08 | % | | $ | 31,943 | | | | 1.41 | % | | | 0.87 | % | | | 1.58 | % | | | 1.84 | % | | | 202 | % |
| |
| $ | 6.46 | | | | (6.24 | %) | | $ | 27,434 | | | | 1.59 | % | | | (0.94 | %) | | | 1.67 | % | | | 1.78 | % | | | 43 | % |
| $ | 6.89 | | | | 32.76 | % | | $ | 29,895 | | | | 1.54 | % | | | (0.25 | %) | | | 1.63 | % | | | 1.82 | % | | | 156 | % |
| $ | 5.19 | | | | (38.98 | %) | | $ | 20,715 | | | | 1.62 | % | | | 0.77 | % | | | 1.65 | % | | | 1.84 | % | | | 213 | % |
| $ | 8.59 | | | | 6.14 | % | | $ | 28,841 | | | | 1.70 | % | | | 0.49 | % | | | 1.70 | % | | | 1.83 | % | | | 170 | % |
| $ | 8.13 | | | | 13.54 | % | | $ | 21,554 | | | | 1.80 | % | | | 0.51 | % | | | 1.81 | % | | | 1.98 | % | | | 200 | % |
| $ | 7.19 | | | | 5.62 | % | | $ | 11,639 | | | | 1.88 | % | | | 0.35 | % | | | 2.03 | % | | | 2.30 | % | | | 181 | % |
| |
| $ | 8.71 | | | | (3.01 | %) | | $ | 49,306 | | | | 1.51 | % | | | 0.10 | % | | | 1.57 | % | | | 1.68 | % | | | 45 | % |
| $ | 8.98 | | | | 14.65 | % | | $ | 49,388 | | | | 1.54 | % | | | 0.41 | % | | | 1.59 | % | | | 1.72 | % | | | 182 | % |
| $ | 7.86 | | | | (24.16 | %) | | $ | 34,766 | | | | 1.54 | % | | | 0.67 | % | | | 1.55 | % | | | 1.70 | % | | | 204 | % |
| $ | 10.46 | | | | 5.03 | % | | $ | 74,290 | | | | 1.56 | % | | | 0.79 | % | | | 1.56 | % | | | 1.66 | % | | | 137 | % |
| $ | 10.51 | | | | 5.84 | % | | $ | 42,489 | | | | 1.72 | % | | | 1.20 | % | | | 1.72 | % | | | 1.81 | % | | | 105 | % |
| |
| $ | 7.73 | | | | (4.80 | %) | | $ | 38,723 | | | | 1.49 | % | | | (0.44 | %) | | | 1.59 | % | | | 1.72 | % | | | 35 | % |
| $ | 8.12 | | | | 35.79 | % | | $ | 34,052 | | | | 1.54 | % | | | (0.13 | %) | | | 1.65 | % | | | 1.80 | % | | | 75 | % |
| $ | 5.98 | | | | (43.00 | %) | | $ | 21,074 | | | | 1.57 | % | | | 0.47 | % | | | 1.59 | % | | | 1.74 | % | | | 178 | % |
| $ | 10.58 | | | | 5.08 | % | | $ | 63,785 | | | | 1.58 | % | | | 0.75 | % | | | 1.58 | % | | | 1.68 | % | | | 134 | % |
| $ | 10.73 | | | | 7.91 | % | | $ | 36,533 | | | | 1.75 | % | | | 0.94 | % | | | 1.75 | % | | | 1.84 | % | | | 92 | % |
| 5 | In 2005, the advisor voluntarily reimbursed the Fund for a realized investment loss, which had no impact to total return. |
| 6 | Except for The Money Market Fund, net investment income per share is based on average shares outstanding during the period. |
| * | Commenced Operations January 31, 2006 |
| ** | Actual amounts were less than one-half of a cent per share |
| The accompanying notes are integral part of these financial statements. |
The Flex-funds® 2010 Semiannual Report | June 30, 2010 | Page 37 |
| | 2010 Semiannual Report | June 30, 2010 |
Financial Highlights For a Share Outstanding Through the Period Ended June 30, 2010 (unaudited) and Each Fiscal Year Ended December 31, | |
| | | | | Income from Investment Operations | | | | |
| Net Asset Value, Beginning of Period | | | | | | Net gains (losses) on securities, futures, and options (both realized and unrealized) | | | Total from Investment Operations | | | | | | | | | | | | | |
| The Quantex Fund (3)(4) | |
| 2010 | $ | 18.48 | | | (0.01 | ) | | (0.46 | ) | | (0.47 | ) | | 0.00 | | | 0.00 | | | 0.00 | | | 0.00 | |
| 2009 | $ | 10.42 | | | (0.01 | ) | | 8.07 | | | 8.06 | | | 0.00 | ** | | 0.00 | | | 0.00 | | | 0.00 | ** |
| 2008 | $ | 18.32 | | | 0.00 | | | (7.90 | ) | | (7.90 | ) | | 0.00 | | | 0.00 | | | 0.00 | | | 0.00 | |
| 2007 | $ | 19.86 | | | 0.16 | | | (1.54 | ) | | (1.38 | ) | | (0.16 | ) | | 0.00 | | | 0.00 | | | (0.16 | ) |
| 2006 | $ | 17.09 | | | 0.08 | | | 2.77 | | | 2.85 | | | (0.08 | ) | | 0.00 | | | 0.00 | | | (0.08 | ) |
| 2005 | $ | 15.95 | | | 0.01 | | | 1.14 | | | 1.15 | | | (0.01 | ) | | 0.00 | | | 0.00 | | | (0.01 | ) |
The Total Return Utilities Fund (3)(4) | |
| 2010 | $ | 20.73 | | | 0.16 | | | (1.43 | ) | | (1.27 | ) | | (0.04 | ) | | 0.00 | | | 0.00 | | | (0.04 | ) |
| 2009 | $ | 16.13 | | | 0.15 | | | 4.74 | | | 4.89 | | | (0.16 | ) | | 0.00 | | | (0.13 | ) | | (0.29 | ) |
| 2008 | $ | 26.14 | | | 0.09 | | | (9.90 | ) | | (9.81 | ) | | (0.14 | ) | | 0.00 | | | (0.06 | ) | | (0.20 | ) |
| 2007 | $ | 22.23 | | | 0.14 | | | 3.91 | | | 4.05 | | | (0.14 | ) | | 0.00 | | | 0.00 | | | (0.14 | ) |
| 2006 | $ | 19.03 | | | 0.15 | | | 3.20 | | | 3.35 | | | (0.15 | ) | | 0.00 | | | 0.00 | | | (0.15 | ) |
| 2005 | $ | 16.51 | | | 0.24 | | | 2.52 | | | 2.76 | | | (0.24 | ) | | 0.00 | | | 0.00 | | | (0.24 | ) |
The U.S. Government Bond Fund (3)(4) | |
| 2010 | $ | 20.79 | | | 0.26 | | | 0.58 | | | 0.84 | | | (0.26 | ) | | 0.00 | | | 0.00 | | | (0.26 | ) |
| 2009 | $ | 20.96 | | | 0.60 | | | (0.17 | ) | | 0.43 | | | (0.60 | ) | | 0.00 | | | 0.00 | | | (0.60 | ) |
| 2008 | $ | 20.58 | | | 0.66 | | | 0.38 | | | 1.04 | | | (0.66 | ) | | 0.00 | | | 0.00 | | | (0.66 | ) |
| 2007 | $ | 20.30 | | | 0.73 | | | 0.72 | | | 1.45 | | | (1.17 | ) | | 0.00 | | | 0.00 | | | (1.17 | ) |
| 2006 | $ | 20.22 | | | 0.68 | | | 0.14 | | | 0.82 | | | (0.74 | ) | | 0.00 | | | 0.00 | | | (0.74 | ) |
| 2005 | $ | 20.82 | | | 0.73 | | | (0.76 | ) | | (0.03 | ) | | (0.57 | ) | | 0.00 | | | 0.00 | | | (0.57 | ) |
The Money Market Fund - Retail Class (3)(4) | |
| 2010 | $ | 1.00 | | | 0.001 | | | N/A | | | 0.001 | | | (0.001 | ) | | 0.000 | | | 0.000 | | | (0.001 | ) |
| 2009 | $ | 1.00 | | | 0.006 | | | N/A | | | 0.006 | | | (0.006 | ) | | 0.000 | | | 0.000 | | | (0.006 | ) |
| 2008 | $ | 1.00 | | | 0.026 | | | N/A | | | 0.026 | | | (0.026 | ) | | 0.000 | | | 0.000 | | | (0.026 | ) |
| 2007 | $ | 1.00 | | | 0.048 | | | N/A | | | 0.048 | | | (0.048 | ) | | 0.000 | | | 0.000 | | | (0.048 | ) |
| 2006 | $ | 1.00 | | | 0.046 | | | N/A | | | 0.046 | | | (0.046 | ) | | 0.000 | | | 0.000 | | | (0.046 | ) |
| 2005 | $ | 1.00 | | | 0.028 | | | N/A | | | 0.028 | | | (0.028 | ) | | 0.000 | | | 0.000 | | | (0.028 | ) |
The Money Market Fund - Institutional Class (3)(4) | |
| 2010 | $ | 1.00 | | | 0.001 | | | N/A | | | 0.001 | | | (0.001 | ) | | 0.000 | | | 0.000 | | | (0.001 | ) |
| 2009 | $ | 1.00 | | | 0.008 | | | N/A | | | 0.008 | | | (0.008 | ) | | 0.000 | | | 0.000 | | | (0.008 | ) |
| 2008 | $ | 1.00 | | | 0.028 | | | N/A | | | 0.028 | | | (0.028 | ) | | 0.000 | | | 0.000 | | | (0.028 | ) |
| 2007 | $ | 1.00 | | | 0.050 | | | N/A | | | 0.050 | | | (0.050 | ) | | 0.000 | | | 0.000 | | | (0.050 | ) |
| 2006 | $ | 1.00 | | | 0.048 | | | N/A | | | 0.048 | | | (0.048 | ) | | 0.000 | | | 0.000 | | | (0.048 | ) |
| 2005 | $ | 1.00 | | | 0.030 | | | N/A | | | 0.030 | | | (0.030 | ) | | 0.000 | | | 0.000 | | | (0.030 | ) |
| 1 | Ratio of net expenses to average net assets, ratio of net investment income (loss) to average net assets, ratio of expenses to average net assets after reductions, excluding expenses paid indirectly, and ratio of expenses to average net assets before reductions do not include impact of expenses of the underlying security holdings as represented in the schedule of investments. |
| 2 | Recognition of net investment income by the Fund is affected by the timing of the declaration of dividends by the underlying investment companies in which the Fund invests. |
| 3 | Total return and portfolio turnover rate are not annualized for periods of less than one full year. |
| 4 | Ratio of net expenses to average net assets, ratio of net investment income (loss) to average net assets, ratio of average net assets after reductions, excluding expenses paid indirectly, and ratio of expenses to average net assets before reductions are annualized for periods of less than one full year. |
| Page 38 | The Flex-funds® 2010 Semiannual Report | June 30, 2010 |
| | 2010 Semiannual Report | June 30, 2010 |
| | | | | | | | |
Net Asset Value, End of Period | | | Total Return (Assumes Reinvestment of Distributions) | | | Net Assets, End of Period ($000) | | | Ratio of Net Expenses to Average Net Assets | | | Ratio of Net Investment Income (Loss) to Average Net Assets | | | Ratio of Expenses to Average Net Assets after Reductions, Excluding Expenses Paid Indirectly | | | Ratio of Expenses to Average Net A ssets Before Reductions | | | | |
| | |
| $ | 18.01 | | | (2.54 | %) | | $ | 14,840 | | | 1.55 | % | | (0.13 | %) | | 1.55 | % | | 2.16 | % | | 49 | % |
| $ | 18.48 | | | 77.37 | % | | $ | 12,667 | | | 1.79 | % | | (0.05 | %) | | 1.79 | % | | 2.39 | % | | 34 | % |
| $ | 10.42 | | | (43.12 | %) | | $ | 6,743 | | | 1.73 | % | | 0.01 | % | | 1.73 | % | | 2.26 | % | | 49 | % |
| $ | 18.32 | | | (7.00 | %) | | $ | 17,450 | | | 1.56 | % | | 0.76 | % | | 1.56 | % | | 2.09 | % | | 56 | % |
| $ | 19.86 | | | 16.67 | % | | $ | 20,074 | | | 1.66 | % | | 0.47 | % | | 1.66 | % | | 2.25 | % | | 30 | % |
| $ | 17.09 | | | 7.21 | % | | $ | 17,114 | | | 1.75 | % | | 0.06 | % | | 1.78 | % | | 2.19 | % | | 171 | % |
| |
| $ | 19.42 | | | (6.14 | %) | | $ | 19,910 | | | 1.90 | % | | 1.59 | % | | 1.90 | % | | 2.11 | % | | 19 | % |
| $ | 20.73 | | | 30.63 | % | | $ | 20,731 | | | 2.00 | % | | 0.90 | % | | 2.00 | % | | 2.20 | % | | 35 | % |
| $ | 16.13 | | | (37.63 | %) | | $ | 15,859 | | | 1.96 | % | | 0.42 | % | | 1.96 | % | | 2.14 | % | | 48 | % |
| $ | 26.14 | | | 18.24 | % | | $ | 27,333 | | | 1.90 | % | | 0.57 | % | | 1.90 | % | | 2.10 | % | | 50 | % |
| $ | 22.23 | | | 17.68 | % | | $ | 23,969 | | | 2.05 | % | | 0.74 | % | | 2.05 | % | | 2.18 | % | | 27 | % |
| $ | 19.03 | | | 16.80 | % | | $ | 22,644 | | | 2.03 | % | | 1.32 | % | | 2.05 | % | | 2.19 | % | | 28 | % |
| |
| $ | 21.37 | | | 4.05 | % | | $ | 18,213 | | | 0.99 | % | | 2.46 | % | | 0.99 | % | | 1.46 | % | | 111 | % |
| $ | 20.79 | | | 2.10 | % | | $ | 17,191 | | | 0.99 | % | | 2.90 | % | | 0.99 | % | | 1.49 | % | | 138 | % |
| $ | 20.96 | | | 5.16 | % | | $ | 14,036 | | | 0.99 | % | | 3.20 | % | | 0.99 | % | | 1.58 | % | | 118 | % |
| $ | 20.58 | | | 7.44 | % | | $ | 13,769 | | | 1.01 | % | | 3.92 | % | | 1.01 | % | | 1.72 | % | | 88 | % |
| $ | 20.30 | | | 4.13 | % | | $ | 7,118 | | | 1.10 | % | | 3.59 | % | | 1.10 | % | | 2.22 | % | | 106 | % |
| $ | 20.22 | | | (0.14 | %) | | $ | 6,324 | | | 1.10 | % | | 2.75 | % | | 1.10 | % | | 2.02 | % | | 159 | % |
| |
| $ | 1.00 | | | 0.11 | % | | $ | 107,218 | | | 0.42 | % | | 0.22 | % | | 0.42 | % | | 0.89 | % | | N/A | |
| $ | 1.00 | | | 0.64 | % | | $ | 122,142 | | | 0.55 | % | | 0.66 | % | | 0.55 | % | | 0.84 | % | | N/A | |
| $ | 1.00 | | | 2.65 | % | | $ | 161,232 | | | 0.49 | % | | 2.64 | % | | 0.49 | % | | 0.83 | % | | N/A | |
| $ | 1.00 | | | 4.95 | % | | $ | 195,479 | | | 0.48 | % | | 4.83 | % | | 0.48 | % | | 0.84 | % | | N/A | |
| $ | 1.00 | | | 4.71 | % | | $ | 159,641 | | | 0.48 | % | | 4.64 | % | | 0.48 | % | | 0.87 | % | | N/A | |
| $ | 1.00 | | | 2.85 | % | | $ | 129,200 | | | 0.47 | % | | 2.79 | % | | 0.47 | % | | 0.89 | % | | N/A | |
| |
| $ | 1.00 | | | 0.15 | % | | $ | 38,473 | | | 0.34 | % | | 0.31 | % | | 0.34 | % | | 0.71 | % | | N/A | |
| $ | 1.00 | | | 0.75 | % | | $ | 46,249 | | | 0.43 | % | | 0.83 | % | | 0.43 | % | | 0.67 | % | | N/A | |
| $ | 1.00 | | | 2.79 | % | | $ | 77,294 | | | 0.37 | % | | 2.55 | % | | 0.37 | % | | 0.68 | % | | N/A | |
| $ | 1.00 | | | 5.09 | % | | $ | 20,333 | | | 0.34 | % | | 4.98 | % | | 0.34 | % | | 0.67 | % | | N/A | |
| $ | 1.00 | | | 4.86 | % | | $ | 24,118 | | | 0.34 | % | | 4.76 | % | | 0.34 | % | | 0.71 | % | | N/A | |
| $ | 1.00 | | | 2.99 | % | | $ | 21,083 | | | 0.33 | % | | 2.93 | % | | 0.33 | % | | 0.71 | % | | N/A | |
| 5 | In 2005, the advisor voluntarily reimbursed the Fund for a realized investment loss, which had no impact to total return. |
| 6 | Except for The Money Market Fund, net investment income per share is based on average shares outstanding during the period. |
| * | Commenced Operations January 31, 2006 |
| ** | Actual amounts were less than one-half of a cent per share |
| The accompanying notes are integral part of these financial statements. |
The Flex-funds® 2010 Semiannual Report | June 30, 2010 | Page 39 |
| | 2010 Semiannual Report | June 30, 2010 |
Notes to Financial Statements June 30, 2010 (unaudited) |
1. Organization and Significant Accounting Policies
The Flex-funds® Trust (the “Trust”) was organized in 1982 and is registered under the Investment Company Act of 1940, as amended (the “1940 Act”), as a diversified, open-end management investment company. The Trust offers nine separate series and is presently comprised of nine separate funds as follows: The Muirfield Fund® (“Muirfield”), The Dynamic Growth Fund (“Dynamic”), The Aggressive Growth Fund (“Aggressive”), The Defensive Balanced Fund (“Defensive”), The Strategic Growth Fund (“Strategic”), The Quantex Fund™ (“Quantex”), The Total Return Utilities Fund (“Utilities”), The U.S. Government Bond Fund (“Bond”), and The Money Market Fund (“Money Market”) (each a “Fund” and col lectively the “Funds”). Money Market offers two classes of shares (the Retail Class (“Retail Class”) and the Institutional Class (“Institutional Class”)). Each class of shares has equal rights as to earnings and assets except that each class bears different distribution and transfer agent expenses. The investment objective of Muirfield, Dynamic, Aggressive, and Strategic is growth of capital. The investment objective of Defensive is growth of capital, with current income usually of secondary importance. The investment objective of Quantex is long term capital appreciation. The investment objective of Utilities is total returns, including current income and growth of income. The investment objective of Bond is maximum current income. The investment objective of Money Market is current income while maintaining a stable share price of $1.00.
Use of estimates. The preparation of financial statements in conformity with accounting principles generally accepted in the United States of America (“GAAP”) requires management to make estimates and assumptions that affect the reported amounts of assets and liabilities and disclosure of contingent assets and liabilities at the date of the financial statements and the reported amounts of increases and decreases in net assets from operations during the reporting period. Actual results could differ from those estimates.
Security valuation. All investments in securities are recorded at their estimated fair value, as described in Note #2.
Repurchase agreements. Each Fund may engage in repurchase agreement transactions whereby the Fund takes possession of an underlying debt instrument subject to an obligation of the seller to repurchase the instrument from the Fund and an obligation of the Fund to resell the instrument at an agreed upon price and term. At all times, the Fund maintains the value of collateral, including accrued interest, of at least 100% of the amount of the repurchase agreement, plus accrued interest. If the seller defaults or if the fair value of the collateral declines, realization of the collateral by the Funds may be delayed or limited.
Futures & options. Each Fund, except Money Market, may engage in transactions in financial futures contracts and options contracts in order to manage the risk of unanticipated changes in market values of securities held in the Fund, or which it intends to purchase. The futures and options contracts are adjusted by the daily exchange rate of the underlying currency, or index, and any gains or losses are recorded for financial statement purposes as unrealized gains or losses in the statement of assets and liabilities and the statement of operations until the contract settlement date, at which time realized gains and losses are included in the statement of operations.
To the extent that the Fund enters into futures contracts on an index or group of securities, the Fund exposes itself to an indeterminate liability and will be required to pay or receive a sum of money measured by the change in the value of the index. Upon entering into a futures contract, the Fund is required to deposit an initial margin, which is either cash or securities in an amount equal to a certain percentage of the contract value. Subsequently, the variation margin, which is equal to changes in the daily settlement price or last sale price on the exchanges where futures contracts trade, is received or paid and is recorded as an unrealized gain or loss until the contract is closed. When the contract is closed, the Fund records a realized gain or loss equal to the difference between the proceeds from (or cost of) the closing tran saction and the Fund’s basis in the contract. Should market conditions move unexpectedly, the Fund may not achieve the anticipated benefits of the futures contract and may realize a loss. The use of futures transactions involves the risk of imperfect correlation in movements in the price of futures contracts, interest rates, and the underlying hedged assets. With futures, there is minimal counterparty credit risk to the Fund since futures are exchange traded and the exchange’s clearinghouse, as counterparty to all exchange traded futures, guarantees the futures against default. Except for Money Market and Utilities, it is normal practice for each Fund to invest in futures contracts on a daily basis. Although Utilities is permitted to invest in futures contracts, it typically does not.
| Page 40 | The Flex-funds® 2010 Semiannual Report | June 30, 2010 |
| | 2010 Semiannual Report | June 30, 2010 |
Call and put option contracts involve the payment of a premium for the right to purchase or sell an individual security or index aggregate at a specified price until the expiration of the contract. Such transactions expose the Fund to the loss of the premium paid if the Fund does not sell or exercise the contract prior to the expiration date. In the case of a call option, sufficient cash or money market instruments will be segregated to complete the purchase. Options are valued on the basis of the daily settlement price or last sale on the exchanges where they trade and the changes in value are recorded as unrealized appreciation or depreciation until closed, exercised or expired. For the six months ended June 30, 2010, there were no call or put options transacted for any of the Funds.
The Funds may write covered call or put options for which premiums received are recorded as liabilities and are subsequently adjusted to the current value of the options written. When written options are closed or exercised, premiums received are offset against the proceeds paid, and the Fund records realized gains or losses for the difference. When written options expire, the liability is eliminated, and the Fund records realized gains for the entire amount of premiums received. Although permitted, it is currently not normal practice for the Funds to invest in call and put options.
The fair value of derivative instruments as reported within the Statements of Assets and Liabilities as of June 30, 2010 was as follows:
| Amount of Net Variation Margin on Derivatives |
| | | | |
| The Muirfield Fund® | Equity contracts | Assets, Receivable for net variation margin on futures contracts | $ 41,613 |
| The Dynamic Growth Fund | Equity contracts | Liabilities, Payable for net variation margin on futures contracts | 30,875 |
| The Aggressive Growth Fund | Equity contracts | Liabilities, Payable for net variation margin on futures contracts | 13,050 |
| The Defensive Balanced Fund | Equity contracts | Assets, Receivable for net variation margin on futures contracts | 1,438 |
| The Strategic Growth Fund | Equity contracts | Liabilities, Payable for net variation margin on futures contracts | 10,800 |
| The Quantex Fund™ | Equity contracts | Liabilities, Payable for net variation margin on futures contracts | 7,500 |
The effect of derivative instruments on the Statements of Operations for the period January 1, 2010 through June 30, 2010 was as follows:
| Amount of Realized Gain or (Loss) on Derivatives Recognized in Income |
| | | Contracts Opened Year-to- Date | Contracts Closed Year-to- Date | Statement of Operations Location | For the Six Months Ended June 30, 2010 |
| The Muirfield Fund® | Equity contracts | 126 | 111 | Net realized gains (losses) from futures contracts | $ (173,948) |
| The Dynamic Growth Fund | Equity contracts | 103 | 98 | Net realized gains (losses) from futures contracts | 371,217 |
| The Aggressive Growth Fund | Equity contracts | 30 | 27 | Net realized gains (losses) from futures contracts | 17,671 |
| The Defensive Balanced Fund | Equity contracts | 35 | 41 | Net realized gains (losses) from futures contracts | (66,433) |
| The Strategic Growth Fund | Equity contracts | 33 | 33 | Net realized gains (losses) from futures contracts | 465,555 |
| The Quantex Fund™ | Equity contracts | 19 | 15 | Net realized gains (losses) from futures contracts | (22,475) |
The Flex-funds® 2010 Semiannual Report | June 30, 2010 | Page 41 |
| | 2010 Semiannual Report | June 30, 2010 |
| Change in Unrealized Gain or (Loss) on Derivatives Recognized in Income |
| | | Statement of Operations Location | For the Six Months Ended June 30, 2010 |
| The Muirfield Fund® | Equity contracts | Net change in unrealized appreciation (depreciation) of investments and futures contracts | $ 49,938 |
| The Dynamic Growth Fund | Equity contracts | Net change in unrealized appreciation (depreciation) of investments and futures contracts | (246,638) |
| The Aggressive Growth Fund | Equity contracts | Net change in unrealized appreciation (depreciation) of investments and futures contracts | (107,311) |
| The Defensive Balanced Fund | Equity contracts | Net change in unrealized appreciation (depreciation) of investments and futures contracts | (28,555) |
| The Strategic Growth Fund | Equity contracts | Net change in unrealized appreciation (depreciation) of investments and futures contracts | (194,325) |
| The Quantex Fund™ | Equity contracts | Net change in unrealized appreciation (depreciation) of investments and futures contracts | (93,106) |
Federal income taxes. It is each Fund’s policy to continue to comply with the requirements of Subchapter M of the Internal Revenue Code applicable to regulated investment companies and to distribute substantially all of its taxable income and net capital gains to its shareholders. Therefore, no federal income tax provision is required.
As of and during the six months ended June 30, 2010, the Funds did not have a liability for any unrecognized tax benefits. The Funds recognize interest and penalties, if any, related to unrecognized tax benefits as income tax expense in the statements of operations. During the six months ended June 30, 2010, the Funds did not incur any interest or penalties.
The Funds are not subject to examination by U.S. federal and state tax authorities for tax years before 2006.
Distributions to shareholders. Distributions to shareholders are recorded on the ex-dividend date. Muirfield, Quantex, Dynamic, Aggressive, Defensive, and Strategic declare and pay dividends from net investment income, if any, on a quarterly basis. Utilities declares and pays dividends from net investment income on a monthly basis. Bond and Money Market declare dividends from net investment income on a daily basis and pay such dividends on a monthly basis. Each Fund distributes net capital gains, if any, on an annual basis.
Distributions from net investment income and from net capital gains are determined in accordance with income tax regulations, which may differ from GAAP. These differences are primarily due to deferrals of certain losses, expiring capital loss carryforwards, and differing treatments of unrealized gains and losses of futures contracts held by each Fund. Accordingly, timing differences relating to shareholder distributions are reflected in the components of net assets and permanent book and tax differences have been reclassified within the components of net assets based on their ultimate characterization for federal income tax purposes. For the year ended December 31, 2009, net investment loss was reclassified to paid-in-capital in the amount of $28,673, $61,565, $35,998, and $4,448 for Dynamic, Aggressive, Strategic, and Quantex, respec tively. For Muirfield, net investment income was reclassified to paid-in-capital in the amount of $64. For Utilities, $123,774 of over-distributions from net investment income was re-designated as return of paid-in-capital.
Investment income & expenses. For Money Market, income and expenses (other than expenses attributable to a specific class) are allocated to each class of shares based on its relative net assets. Expenses incurred by the Trust that do not specifically relate to an individual Fund of the Trust are allocated to the Funds based on each Fund’s relative net assets or other appropriate basis.
Capital Share Transactions. Money Market is authorized to issue an indefinite number of shares in the Retail Class and the Institutional Class. Transactions in the capital shares of the Fund for the six months ended June 30, 2010 and the year ended December 31, 2009 were as follows:
| Page 42 | The Flex-funds® 2010 Semiannual Report | June 30, 2010 |
| | 2010 Semiannual Report | June 30, 2010 |
| | | | | | | |
| | | | | | | | | | | | | |
| Retail Class | | | | | | | | | | | | |
| Issued | | $ | 59,665,020 | | | | 59,665,020 | | | $ | 111,881,231 | | | | 111,881,231 | |
| Reinvested | | | 119,166 | | | | 119,166 | | | | 902,521 | | | | 902,521 | |
| Redeemed | | | (74,708,731 | ) | | | (74,708,731 | ) | | | (151,873,802 | ) | | | (151,873,802 | ) |
| Net increase (decrease) | | $ | (14,924,545 | ) | | | (14,924,545 | ) | | $ | (39,090,050 | ) | | | (39,090,050 | ) |
| | | | | | | | | | | | | | | | | |
| Institutional Class | | | | | | | | | | | | | | | | |
| Issued | | $ | 143,733,211 | | | | 143,733,211 | | | $ | 191,928,379 | | | | 191,928,379 | |
| Reinvested | | | 18,967 | | | | 18,967 | | | | 109,246 | | | | 109,246 | |
| Redeemed | | | (151,528,466 | ) | | | (151,528,466 | ) | | | (223,082,220 | ) | | | (223,082,220 | ) |
| Net increase (decrease) | | $ | (7,776,288 | ) | | | (7,776,288 | ) | | $ | (31,044,595 | ) | | | (31,044,595 | ) |
Other. The Funds record security transactions on the trade date. Gains and losses realized from the sale of securities are determined on the specific identification basis. Dividend income is recognized on the ex-dividend date and interest income (including amortization of premium and accretion of discount) is recognized as earned. Discounts and premiums are amortized over the lives of the respective securities.
Subsequent Events. Management has evaluated subsequent events through August 27, 2010, the date the financial statements were issued.
2. Securities Valuations
As described in Note #1, the Funds utilize various methods to measure the fair value of most of their investments on a recurring basis. Generally Accepted Accounting Principles (“GAAP”) establishes a hierarchy that prioritizes inputs to valuation methods. The three levels of inputs are as follows:
Level 1 – Unadjusted quoted prices in active markets for identical assets or liabilities that the Funds have the ability to access.
Level 2 – Observable inputs other than quoted prices included in level 1 that are observable for the asset or liability, either directly or indirectly. These inputs may include quoted prices for the identical instrument on an inactive market, prices for similar instruments, interest rates, prepayment speeds, credit risk, yield curves, default rates and similar data.
Level 3 – Unobservable inputs for the asset or liability, to the extent relevant observable inputs are not available, representing the Funds’ own assumptions about the assumptions a market participant would use in valuing the asset or liability, and would be based on the best information available.
The availability of observable inputs can vary from security to security and is affected by a wide variety of factors, including, for example, the type of security, whether the security is new and not yet established in the marketplace, the liquidity of markets, and other characteristics particular to the security. To the extent that valuation is based on models or inputs that are less observable or unobservable in the market, the determination of fair value requires more judgment. Accordingly, the degree of judgment exercised in determining fair value is greatest for instruments categorized in level 3.
The inputs used to measure fair value may fall into different levels of the fair value hierarchy. In such cases, for disclosure purposes, the level in the fair value hierarchy within which the fair value measurement falls in its entirety, is determined based on the lowest level input that is significant to the fair value measurement in its entirety.
A description of the valuation techniques applied to the Funds’ major categories of assets and liabilities measured at fair value on a recurring basis follows.
Equity securities (including publicly traded partnerships and common stock). Securities traded on a national securities exchange (or reported on the NASDAQ national market) are stated at the last reported sales price on the day of valuation or, lacking any sales, are valued using fair value procedures approved by the Trustees.
The Flex-funds® 2010 Semiannual Report | June 30, 2010 | Page 43 |
| | 2010 Semiannual Report | June 30, 2010 |
Investments in registered investment companies, including money market funds, are valued at the daily redemption value as reported by the underlying fund. The Funds obtain prices from independent pricing services, which use valuation techniques approved by the Trustees. To the extent these securities are actively traded and valuation adjustments are not applied, they are categorized in level 1 of the fair value hierarchy.
Corporate bonds. The fair value of corporate bonds is estimated using various techniques, which may consider recently executed transactions in securities of the issuer or comparable issuers, market price quotations (where observable), bond spreads, fundamental data relating to the issuer, and credit default swap spreads adjusted for any basis difference between cash and derivative instruments. While most corporate bonds are categorized in level 2 of the fair value hierarchy, in instances where lower relative weight is placed on transaction prices, quotations, or similar observable inputs, they are categorized in level 3.
Short-term notes (including bank obligations, certificates of deposit, commercial paper, corporate obligations, U.S. government agency obligations, and floating rate demand notes). Short-term notes held in the Funds, except Money Market, maturing more than sixty days after the valuation date, are valued at the last sales price as of the close of business on the day of valuation, or, lacking any sales, at the most recent bid price or yield equivalent as obtained from dealers that make markets in such securities. When valued at last sales price, the securities will be categorized as level 1. When using bid prices or yield equivalents, they will be categorized as level 2. When such securities are valued within sixty days or less to maturity, the difference between the valuation exis ting on the sixty-first day before maturity and maturity value is amortized on a straight-line basis to maturity and will be categorized as level 2.
All short-term notes held in Money Market, including illiquid and restricted securities, are valued at amortized cost, which approximates fair value, and will be categorized as level 2.
U.S. government obligations. U.S. government obligations are normally valued using a model that incorporates market observable data such as reported sales of similar securities, broker quotes, yields, bids, offers, and reference data. Certain securities are valued principally using dealer quotations. In either case, these securities will be categorized as level 2.
Restricted securities (equity and debt). Restricted securities for which quotations are not readily available are valued at fair value as determined by the Trustees. Depending on the relative significance of valuation inputs, these instruments may be classified in either level 2 or level 3 of the fair value hierarchy.
Derivative instruments (futures contracts). Listed derivative instruments that are actively traded, including futures contracts, are valued based on quoted prices from the exchange and are categorized in level 1 of the fair value hierarchy.
For the six months ended June 30, 2010, the Funds did not hold any assets at any time in which significant unobservable inputs were used in determining fair value. Therefore, no reconciliation of Level 3 securities is provided. The following table summarizes the inputs used to value the Funds’ assets and liabilities measured at fair value as of June 30, 2010.
Muirfield – Assets/(Liabilities) | | | | | | | | | | | | |
Registered investment companies | | $ | 101,410,352 | | | $ | — | | | $ | — | | | $ | 101,410,352 | |
Money market registered investment companies | | | 2,164,956 | | | | — | | | | — | | | | 2,164,956 | |
Floating rate demand notes | | | — | | | | 1,226,056 | | | | — | | | | 1,226,056 | |
U.S. government obligations | | | — | | | | 799,692 | | | | — | | | | 799,692 | |
Total | | $ | 103,575,308 | | | $ | 2,025,748 | | | $ | — | | | $ | 105,601,056 | |
| Trustee deferred compensation | | $ | 83,453 | | | $ | — | | | $ | — | | | $ | 83,453 | |
| Futures contracts* | | $ | 104,568 | | | $ | — | | | $ | — | | | $ | 104,568 | |
Dynamic – Assets/(Liabilities) | | | | | | | | | | | | |
Registered investment companies | | $ | 77,380,675 | | | $ | — | | | $ | — | | | $ | 77,380,675 | |
Money market registered investment companies | | | 3,276,351 | | | | — | | | | — | | | | 3,276,351 | |
U.S. government obligations | | | — | | | | 799,692 | | | | — | | | | 799,692 | |
Total | | $ | 80,657,026 | | | $ | 799,692 | | | $ | — | | | $ | 81,456,718 | |
Trustee deferred compensation | | $ | 40,907 | | | $ | — | | | $ | — | | | $ | 40,907 | |
Futures contracts* | | $ | (205,628 | ) | | $ | — | | | $ | — | | | $ | (205,628 | ) |
| Page 44 | The Flex-funds® 2010 Semiannual Report | June 30, 2010 |
| | 2010 Semiannual Report | June 30, 2010 |
Aggressive – Assets/(Liabilities) | | | | | | | | | | | | |
Registered investment companies | | $ | 25,999,125 | | | $ | — | | | $ | — | | | $ | 25,199,125 | |
Money market registered investment companies | | | 1,180,309 | | | | — | | | | — | | | | 1,180,309 | |
Floating rate demand notes | | | — | | | | 1,996 | | | | — | | | | 1,996 | |
U.S. government obligations | | | — | | | | 299,885 | | | | — | | | | 299,885 | |
Total | | $ | 27,179,434 | | | $ | 301,881 | | | $ | — | | | $ | 27,481,315 | |
Trustee deferred compensation | | $ | 26,299 | | | $ | — | | | $ | — | | | $ | 26,299 | |
Futures contracts* | | $ | (97,058 | ) | | $ | — | | | $ | — | | | $ | (97,058 | ) |
Defensive – Assets/(Liabilities) | | | | | | | | | | | | |
Registered investment companies | | $ | 44,193,816 | | | $ | — | | | $ | — | | | $ | 44,193,816 | |
Money market registered investment companies | | | 2,574,965 | | | | — | | | | — | | | | 2,574,965 | |
Floating rate demand notes | | | — | | | | 1,019,475 | | | | — | | | | 1,019,475 | |
U.S. government obligations | | | — | | | | 1,550,528 | | | | — | | | | 1,550,528 | |
Total | | $ | 46,768,781 | | | $ | 2,570,003 | | | $ | — | | | $ | 49,338,784 | |
Trustee deferred compensation | | $ | 28,305 | | | $ | — | | | $ | — | | | $ | 28,305 | |
Futures contracts* | | $ | (1,315 | ) | | $ | — | | | $ | — | | | $ | (1,315 | ) |
Strategic – Assets/(Liabilities) | | | | | | | | | | | | |
Registered investment companies | | $ | 36,332,595 | | | $ | — | | | $ | — | | | $ | 36,332,595 | |
Money market registered investment companies | | | 2,151,144 | | | | — | | | | — | | | | 2,151,144 | |
U.S. government obligations | | | — | | | | 299,885 | | | | — | | | | 299,885 | |
Total | | $ | 38,483,739 | | | $ | 299,885 | | | $ | — | | | $ | 38,783,624 | |
Trustee deferred compensation | | $ | 23,064 | | | $ | — | | | $ | — | | | $ | 23,064 | |
Futures contracts* | | $ | (158,670 | ) | | $ | — | | | $ | — | | | $ | (158,670 | ) |
Quantex – Assets/(Liabilities) | | | | | | | | | | | | |
Common stocks** | | $ | 12,920,149 | | | $ | — | | | $ | — | | | $ | 12,920,149 | |
Money market registered investment companies | | | 1,605,578 | | | | — | | | | — | | | | 1,605,578 | |
Floating rate demand notes | | | — | | | | 101,569 | | | | — | | | | 101,569 | |
U.S. government obligations | | | — | | | | 199,923 | | | | — | | | | 199,923 | |
Total | | $ | 14,525,727 | | | $ | 301,492 | | | $ | — | | | $ | 14,827,219 | |
Trustee deferred compensation | | $ | 33,005 | | | $ | — | | | $ | — | | | $ | 33,005 | |
Futures contracts* | | $ | (87,163 | ) | | $ | — | | | $ | — | | | $ | (87,163 | ) |
Utilities – Assets/(Liabilities) | | | | | | | | | | | | |
Common stocks** | | $ | 19,373,658 | | | $ | — | | | $ | — | | | $ | 19,373,658 | |
Money market registered investment companies | | | 554,454 | | | | — | | | | — | | | | 554,454 | |
Total | | $ | 19,928,112 | | | $ | — | | | $ | — | | | $ | 19,928,112 | |
Trustee deferred compensation | | $ | 30,363 | | | $ | — | | | $ | — | | | $ | 30,363 | |
Bond – Assets/(Liabilities) | | | | | | | | | | | | |
U.S. government obligations | | $ | — | | | $ | 14,890,380 | | | $ | — | | | $ | 14,890,380 | |
Corporate bonds | | | — | | | | 1,543,009 | | | | — | | | | 1,543,009 | |
Investments in affiliates | | | 1,606,307 | | | | — | | | | — | | | | 1,606,307 | |
Floating rate demand notes | | | — | | | | 51,601 | | | | — | | | | 51,601 | |
Total | | $ | 1,606,307 | | | $ | 16,484,990 | | | $ | — | | | $ | 18,091,297 | |
Trustee deferred compensation | | $ | 23,774 | | | $ | — | | | $ | — | | | $ | 23,774 | |
The Flex-funds® 2010 Semiannual Report | June 30, 2010 | Page 45 |
| | 2010 Semiannual Report | June 30, 2010 |
Money Market – Assets/(Liabilities) | | | | | | | | | | | | |
Bank obligations | | $ | — | | | $ | 898,834 | | | $ | — | | | $ | 898,834 | |
Certificates of deposit | | | — | | | | 5,000,118 | | | | — | | | | 5,000,118 | |
Commercial paper | | | — | | | | 4,992,238 | | | | — | | | | 4,992,238 | |
Corporate obligations | | | — | | | | 44,827,485 | | | | — | | | | 44,827,485 | |
U.S. government agency obligations | | | — | | | | 20,535,136 | | | | — | | | | 20,535,136 | |
Money Market registered investment companies | | | 69,390,567 | | | | — | | | | — | | | | 69,390,567 | |
Total | | $ | 69,390,567 | | | $ | 76,253,811 | | | $ | — | | | $ | 145,644,378 | |
Trustee deferred compensation | | $ | 29,804 | | | $ | — | | | $ | — | | | $ | 29,804 | |
| * | Futures contracts include cumulative gain/loss on contracts open at June 30, 2010. |
| ** | See schedule of investments for industry classifications. |
3. Investment Transactions
For the six months ended June 30, 2010, the cost of purchases and proceeds from sales or maturities of long-term investments for the Funds were as follows:
| | | | | | | |
The Muirfield Fund® | | $ | 45,652,338 | | | $ | 48,398,842 | |
The Dynamic Growth Fund | | | 36,977,891 | | | | 35,834,056 | |
The Aggressive Growth Fund | | | 11,921,604 | | | | 13,490,983 | |
The Defensive Balanced Fund | | | 24,692,407 | | | | 20,696,002 | |
The Strategic Growth Fund | | | 18,737,250 | | | | 11,950,407 | |
The Quantex Fund™ | | | 7,662,964 | | | | 6,566,785 | |
The Total Return Utilities Fund | | | 4,671,321 | | | | 3,894,087 | |
The U.S. Government Bond Fund | | | 17,305,414 | | | | 18,274,847 | |
For the six months ended June 30, 2010, included above are the cost of purchases and proceeds from sales or maturities of long-term U.S. Government investments for the Funds as follows:
| | | | | | | |
The Defensive Balanced Fund | | $ | 993,000 | | | $ | 6,017,160 | |
The U.S. Government Bond Fund | | | 15,806,244 | | | | 15,236,502 | |
4. Investment Advisory Fees and Other Transactions with Affiliates
Meeder Asset Management, Inc. (“MAM”), a wholly-owned subsidiary of Meeder Financial, Inc. (“Meeder”), provides each Fund, under a separate Investment Advisory Contract, with investment management, research, statistical and advisory services. The services of MAM will terminate automatically if assigned and may be terminated without penalty at any time upon 60 days prior written notice by majority vote of the Fund, by the Trustees of the Fund, or by MAM. Under a separate Investment Subadvisory Agreement with MAM, Miller/Howard Investments, Inc. (“Miller/Howard”) serves as subadvisor of Utilities. The Investment Subadvisory Agreement provides that it will terminate automatically if assigned, and that it may be terminated by MAM without penalty to the Fund by MAM, the Trustees of the Fund, or by the vot e of a majority of the outstanding voting securities of the Fund upon not less than 30 days written notice.
For such services the Funds pay a fee at the following annual rates: Muirfield, Utilities, and Quantex, 1.00% of average daily net assets up to $50 million, 0.75% of average daily net assets exceeding $50 million up to $100 million and 0.60% of average daily net assets exceeding $100 million. As subadvisor to Utilities, Miller/Howard is paid 0.00% of the 1.00% of average daily net assets up to $10 million, 0.40% of the 1.00% of average daily net assets exceeding $10 million up to $50 million, 0.40% of the 0.75% of average daily net assets exceeding $50 million up to $60 million, 0.30% of the 0.75% of average daily net assets exceeding $60 million up to $100 million and 0.25% of the 0.60% of average daily net assets exceeding $100 million; Dynamic, Aggressive, Defensive, and Strategic, 0.75% of average daily net assets up to $200 million and 0.60% of average daily net assets exceeding $200 million; Bond, 0.40% of average daily net assets up to $100 million and 0.20% of average daily net assets exceeding $100 million; and Money
| Page 46 | The Flex-funds® 2010 Semiannual Report | June 30, 2010 |
| | 2010 Semiannual Report | June 30, 2010 |
Market, 0.40% of average daily net assets up to $100 million and 0.25% of average daily net assets exceeding $100 million. MAM has contractually agreed to reduce its investment advisory fee by 0.25% for Quantex. During the six months ended June 30, 2010, $18,360 of investment advisory fees was waived in Quantex. During the six months ended June 30, 2010, MAM voluntarily agreed to reduce $28,727 of investment advisory fees in Money Market.
Mutual Funds Service Co. (“MFSCo”), a wholly-owned subsidiary of Meeder, serves as stock transfer, dividend disbursing and shareholder services agent for each Fund. In compensation for such services, each Fund pays MFSCo an annual fee calculated as follows: For Muirfield, Utilities, Quantex, Dynamic, Aggressive, Defensive, and Strategic, such fee is equal to the greater of $15 per active shareholder account or 0.12% of each Fund’s average daily net assets. For Bond, such fee is equal to the greater of $15 per active shareholder account or 0.08% of the Fund’s average daily net assets. For Money Market Retail Class and Money Market Institutional Class, such fee is equal to the greater of $20 per active shareholder account or 0.08% of the Fund’s average daily net assets. MFSCo is entitled to receiv e an annual minimum fee of $4,000 for each Fund or class. For fixed income Funds that are subject to an expense cap and which are above the voluntary expense cap, the basis point fee will be reduced by 0.02%. During the six months ended June 30, 2010, MFSCo waived $1,792 and $3,463 of transfer agent fees for Bond and the Institutional Class, respectively. MFSCo also voluntarily waived $22,729, $21,107, $17,734, and $13,164 of transfer agent fees for Muirfield, Dynamic, Defensive, and Strategic, respectively, during the six months ended June 30, 2010.
MFSCo provides the Trust with certain administrative services. In compensation for such services, each Fund pays MFSCo an annual fee equal to 0.10% of each Fund’s average daily net assets up to $50 million and 0.08% of each Fund’s average daily net assets exceeding $50 million.
MFSCo serves as accounting services agent for each Fund. In compensation for such services, each Fund pays MFSCo an annual fee equal to the greater of:
| | a. | 0.15% of the first $10 million of average daily net assets, 0.10% of the next $20 million of average daily net assets, 0.02% of the next $50 million of average daily net assets, and 0.01% in excess of $80 million of average daily net assets, |
| | b. | $7,500 for non-Money Market Funds and $30,000 for Money Market. |
For the six months ended June 30, 2010, MAM voluntarily agreed to reduce its fees and/or reimburse expenses (excluding brokerage fees and commissions, taxes, interest, and extraordinary or non-recurring expenses), to limit total annual operating expenses to 0.99% and 1.60% of average daily net assets for Bond and Aggressive, respectively. MAM has also voluntarily agreed to reduce its fees and/or reimburse expenses to limit the Retail Class’ and the Institutional Class’ total annual operating expenses to 0.20% and 0.28% of average daily net assets, respectively. Such reductions and/or reimbursements are limited to the total of fees charged to each Fund or Class by MAM and MFSCo. For the six months ended June 30, 2010, MAM and/or MFSCo reimbursed $2,504, $30,125, and $212,173 to Aggressive, Bond, and Money Market, respectivel y.
Muirfield, Dynamic, Aggressive, Defensive, and Strategic have entered into an agreement with the Trust’s custodian, The Huntington National Bank (“HNB”), whereby HNB receives distribution, service, and administration fees (collectively the “fees”) from the underlying security holdings of the aforementioned Funds, and forwards those fees to the appropriate Funds. The Funds use the fees received to reduce the gross expenses of each Fund. For the six months ended June 30, 2010, Muirfield, Dynamic, Aggressive, Defensive, and Strategic used $44,050, $35,878, $11,676, $14,552, and $19,375 of fees received, respectively, to reduce gross expenses of each Fund. It is possible that the Funds may invest in security holdings in which fees are not paid. As such, the gross expenses of a Fund would not be decreased. Also , without this agreement it is likely that the Funds would not collect any fees from underlying security holdings.
Pursuant to Rule 12b-1 of the 1940 Act, a mutual fund can adopt a written plan to pay certain expenses out of fund assets relating to the sale and distribution of its shares. Muirfield, Quantex, Bond, and the Retail Class have adopted a distribution plan with an annual limitation of 0.20% of average daily net assets. Utilities, Dynamic, Aggressive, Defensive, and Strategic have adopted a distribution plan with an annual limitation of 0.25% of average daily net assets. The Institutional Class has adopted a distribution plan with an annual limitation of 0.03% of average daily net assets. For the six months ended June 30, 2010, Muirfield, Dynamic, Aggressive, Defensive, Strategic, Quantex, Utilities, and Bond waived $34,093, $8,443, $4,399, $10,134, $9,402, $12,411, $8,229, and $4,481 of distribution plan (12b-1) expenses, respectively. T he Retail Class and the Institutional Class waived $87,080 and $5,444, respectively, for a total of $92,524.
The Flex-funds® 2010 Semiannual Report | June 30, 2010 | Page 47 |
| | 2010 Semiannual Report | June 30, 2010 |
An Administrative Services Plan has been adopted for each Fund of the Trust except Money Market. The Administrative Services Plan allows for each eligible Fund to pay a maximum annual amount of 0.20% of average daily net assets to Service Organizations that provide administrative support services to their customers who own Shares of record or beneficially. For the six months ended June 30, 2010, Muirfield, Dynamic, Aggressive, Strategic, Quantex, Utilities, and Bond waived $34,093, $25,328, $10,265, $1,880, $13,953, $13,372, and $5,378 of administrative service plan expenses, respectively.
The Funds have adopted a Deferred Compensation Plan (the “Plan”) for the independent Trustees. Under the Plan, each eligible Trustee is permitted to defer all or a portion of the trustees fees payable by any of the Funds as an investment into any combination of Funds until a specified point of time. The investment into the Funds is recorded as an asset however an offsetting liability is also recorded for the deferred payment. Once the eligible Trustees’ deferral amounts can be distributed, a lump sum or generally equal annual installments over a period of up to ten (10) years can be made to the eligible Trustee(s). The Funds may terminate this Plan at any time.
Certain trustees and officers of the Funds are also officers or directors of Meeder, MAM, and MFSCo.
During the six months ended June 30, 2010, several of the Funds invested in The Money Market Fund, an affiliate, as described in Section 2(a)(3) of the Investment Company Act of 1940. As of June 30, 2010, the 7-day yield of the Institutional Class was 0.28%. A summary of the Funds’ investments in this affiliate during the year is noted below:
| | | | | | | | | | | | | | |
The Muirfield Fund® | | $ | 2,521,062 | | $ | 19,530,952 | | $ | (19,887,058 | ) | $ | 2,164,956 | | $ | 2,495 | | $ | 2,164,956 | |
The Dynamic Growth Fund | | | 2,660,901 | | | 23,062,859 | | | (22,447,409 | ) | | 3,276,351 | | | 2,911 | | | 3,276,351 | |
The Aggressive Growth Fund | | | 779,984 | | | 5,331,488 | | | (4,931,163 | ) | | 1,180,309 | | | 1,126 | | | 1,180,309 | |
The Defensive Balanced Fund | | | 2,449,157 | | | 16,641,346 | | | (16,515,538 | ) | | 2,574,965 | | | 2,663 | | | 2,574,965 | |
The Strategic Growth Fund | | | 1,858,964 | | | 12,165,810 | | | (11,873,630 | ) | | 2,151,144 | | | 2,252 | | | 2,151,144 | |
The Quantex Fund™ | | | 126,786 | | | 5,987,946 | | | (4,509,154 | ) | | 1,605,578 | | | 966 | | | 1,605,578 | |
The Total Return Utilities Fund | | | 257,874 | | | 3,693,472 | | | (3,396,892 | ) | | 554,454 | | | 597 | | | 554,454 | |
The U.S. Government Bond Fund | | | 88,306 | | | 18,322,812 | | | (16,804,811 | ) | | 1,606,307 | | | 1,487 | | | 1,606,307 | |
| Page 48 | The Flex-funds® 2010 Semiannual Report | June 30, 2010 |
| | 2010 Semiannual Report | June 30, 2010 |
5. Federal Tax Information
The tax characteristics of dividends paid by the Funds during the year ended December 31, 2009 were as follows:
| | | | | | Net Short- Term Capital Gains | | | Net Long- Term Capital Gains | | | | | | | |
The Muirfield Fund® | | $ | 413,069 | | | $ | — | | | $ | — | | | $ | — | | | $ | 413,069 | |
The Dynamic Growth Fund | | | 29,265 | | | | — | | | | — | | | | — | | | | 29,265 | |
The Aggressive Growth Fund | | | 5 | | | | — | | | | — | | | | — | | | | 5 | |
The Defensive Balanced Fund | | | 172,199 | | | | — | | | | — | | | | — | | | | 172,199 | |
The Strategic Growth Fund | | | — | | | | — | | | | — | | | | — | | | | — | |
The Quantex Fund™ | | | 1,515 | | | | — | | | | — | | | | — | | | | 1,515 | |
The Total Return Utilities Fund | | | 152,723 | | | | — | | | | — | | | | 123,774 | | | | 276,497 | |
The U.S. Government Bond Fund | | | 450,396 | | | | — | | | | — | | | | — | | | | 450,396 | |
The Money Market Fund | | | 1,592,107 | | | | — | | | | — | | | | — | | | | 1,592,107 | |
The tax characteristics of dividends paid by the Funds during the year ended December 31, 2008 were as follows:
| | | | | | Net Short- Term Capital Gains | | | Net Long-Term Capital Gains | | | | | | | |
The Muirfield Fund® | | $ | 11,273 | | | $ | — | | | $ | — | | | $ | — | | | $ | 11,273 | |
The Dynamic Growth Fund | | | 448,435 | | | | — | | | | 570,693 | | | | — | | | | 1,019,128 | |
The Aggressive Growth Fund | | | 203,657 | | | | — | | | | — | | | | — | | | | 203,657 | |
The Defensive Balanced Fund | | | 318,559 | | | | — | | | | — | | | | — | | | | 318,559 | |
The Strategic Growth Fund | | | 175,093 | | | | — | | | | — | | | | — | | | | 175,093 | |
The Quantex Fund™ | | | 320 | | | | — | | | | — | | | | — | | | | 320 | |
The Total Return Utilities Fund | | | 146,913 | | | | — | | | | — | | | | 59,813 | | | | 206,726 | |
The U.S. Government Bond Fund | | | 469,374 | | | | — | | | | — | | | | — | | | | 469,374 | |
The Money Market Fund | | | 5,992,069 | | | | — | | | | — | | | | — | | | | 5,992,069 | |
As of December 31, 2009, the components of accumulated earnings/(deficit) on a tax basis for the Funds were as follows:
| | | Undistributed Ordinary Income | | | | | | Accumulated Capital and Other Gains and (Losses) | | | Unrealized Appreciation/(Depreciation)2 | | | Total Accumulated Earnings/ (Deficit) | |
The Muirfield Fund® | | $ | 173,172 | | | $ | (1,467 | ) | | $ | (22,264,897 | ) | | $ | 7,290,552 | | | $ | (14,802,640 | ) |
The Dynamic Growth Fund | | | 20 | | | | (20 | ) | | | (23,702,733 | ) | | | 6,049,393 | | | | (17,653,340 | ) |
The Aggressive Growth Fund | | | — | | | | — | | | | (13,417,465 | ) | | | 4,060,301 | | | | (9,357,164 | ) |
The Defensive Balanced Fund | | | — | | | | — | | | | (8,847,115 | ) | | | 2,716,045 | | | | (6,131,070 | ) |
The Strategic Growth Fund | | | — | | | | — | | | | (8,439,928 | ) | | | 3,746,915 | | | | (4,693,013 | ) |
The Quantex Fund™ | | | 25 | | | | (25 | ) | | | (3,766,738 | ) | | | 1,261,322 | | | | (2,505,416 | ) |
The Total Return Utilities Fund | | | 1,550 | | | | (1,550 | ) | | | (1,077,347 | ) | | | 220,865 | | | | (856,482 | ) |
The U.S. Government Bond Fund | | | 3,331 | | | | (1,480 | ) | | | (611,494 | ) | | | 64,902 | | | | (544,741 | ) |
The Money Market Fund | | | 13,236 | | | | (13,236 | ) | | | — | | | | — | | | | — | |
| 1 | Total dividends paid may differ from the amount reported in the Statement of Changes in Net Assets because for tax purposes dividends are recognized when actually paid. |
| 2 | The differences between book- and tax-basis unrealized appreciation/(depreciation) are attributable primarily to: deferral of post October losses, wash sales, and the realization for tax purposes of unrealized gains/(losses) on certain derivative instruments. |
The Flex-funds® 2010 Semiannual Report | June 30, 2010 | Page 49 |
| | 2010 Semiannual Report | June 30, 2010 |
For federal income tax purposes, the following Funds have capital loss carryforwards as of December 31, 2009, which are available to offset future capital gains, if any. To the extent that these carryforwards are used to offset future capital gains, it is probable that the gains that are offset will not be distributed to shareholders:
| | | | | | | |
The Muirfield Fund® | | $ | 387,760 | | | | 2010 | |
The Muirfield Fund® | | | 16,393,752 | | | | 2016 | |
The Muirfield Fund® | | | 5,483,385 | | | | 2017 | |
The Dynamic Growth Fund | | | 12,564,846 | | | | 2016 | |
The Dynamic Growth Fund | | | 11,137,887 | | | | 2017 | |
The Aggressive Growth Fund | | | 3,287,233 | | | | 2010 | |
The Aggressive Growth Fund | | | 6,775,690 | | | | 2016 | |
The Aggressive Growth Fund | | | 3,354,542 | | | | 2017 | |
The Defensive Balanced Fund | | | 7,933,274 | | | | 2016 | |
The Defensive Balanced Fund | | | 913,841 | | | | 2017 | |
The Strategic Growth Fund | | | 6,478,990 | | | | 2016 | |
The Strategic Growth Fund | | | 1,960,938 | | | | 2017 | |
The Quantex Fund™ | | | 234,839 | | | | 2010 | |
The Quantex Fund™ | | | 1,249,666 | | | | 2011 | |
The Quantex Fund™ | | | 731,427 | | | | 2016 | |
The Quantex Fund™ | | | 1,550,806 | | | | 2017 | |
The Total Return Utilities Fund | | | 343,105 | | | | 2011 | |
The Total Return Utilities Fund | | | 734,242 | | | | 2017 | |
The U.S. Government Bond Fund | | | 230,735 | | | | 2011 | |
The U.S. Government Bond Fund | | | 125,708 | | | | 2012 | |
The U.S. Government Bond Fund | | | 141,817 | | | | 2013 | |
The U.S. Government Bond Fund | | | 113,234 | | | | 2014 | |
Under current tax laws, net capital losses incurred after October 31, within a Fund’s fiscal year, are deemed to arise on the first business day of the following fiscal year for tax purposes. For the year ended December 31, 2009, Dynamic, Aggressive, Strategic, Quantex, Utilities, and Bond deferred post October losses in the amounts of $185,860, $28,997, $79,592, $19,859, $60,792, and $1,067, respectively.
6. Control Ownership
The beneficial ownership, either directly or indirectly, of more than 25% of the voting securities of a fund creates a presumption of control of the fund under Section 2(a)(9) of the 1940 Act. As of June 30, 2010, Charles Schwab & Co., Inc. held for the benefit of others, in aggregate, 41% of Utilities; Nationwide Trust Company, FSB held for the benefit of others, in aggregate, 90% of Defensive; Nationwide Trust Company, FSB held for the benefit of others, in aggregate, 86% of Strategic; Nationwide Trust Company, FSB held for the benefit of others, in aggregate, 81% of Dynamic; Nationwide Trust Company, FSB held for the benefit of others, in aggregate, 75% of Aggressive; Nationwide Trust Company, FSB held for the benefit of others, in aggregate, 61% of Muirfield; Nationwide Trust Company, FSB held for the benefit of others, in aggr egate, 67% of Bond; Carey & Co. held for the benefit of others, in aggregate, 66% of Institutional Class; and IBEW 683 Health & Welfare Plan held 26% of Institutional Class, and therefore may be deemed to control the Funds.
| Page 50 | The Flex-funds® 2010 Semiannual Report | June 30, 2010 |
Trustees and Officers (unaudited)
Certain trustees and officers of the Funds are also officers or directors of Meeder, MAM, and MFSCo. The Trustees oversee the management of the Trust and elect its officers. The officers are responsible for the Funds’ day-to-day operations. The Trustees’ and officers’ names, addresses, years of birth, positions held with the Trust, and length of service with The Flex-funds are listed below. Also included is each Board member’s principal occupation during, at least, the past five years. Except as indicated, each individual has held the office shown or other offices in the same company for the last five years. Those Trustees who are “interested persons”, as defined in the 1940 Act, by virtue of their affiliation with the Trust, are indicated by an asterisk (*).
Name, Address1, and Year of Birth | Year First Elected a Trustee or Officer of the Trust | Position and Number of Funds Overseen2 | Principal Occupation During Past Five Years and Other Directorships Held |
Robert S. Meeder, Jr.* Year of Birth: 1961 | 1992 | Trustee and President | President of Meeder Asset Management, Inc. |
Walter L. Ogle** Year of Birth: 1937 | 1982 | Trustee | Retired; formerly Executive Vice President of Aon Consulting, an employee benefits consulting group; Lead Trustee of the Trust. |
James W. Didion** Year of Birth: 1930 | 1982, 1998 | Trustee | Retired; formerly Executive Vice President of Core Source, Inc., an employee benefit and Workers’ Compensation administration and consulting firm (1991 – 1997); Chairman of the Trust’s Audit Committee. |
Jack W. Nicklaus** Year of Birth: 1961 | 1998 | Trustee | Designer, Nicklaus Design, a golf course design firm and division of The Nicklaus Companies; Chairman of the Trust’s Nominating Committee. |
Stuart M. Allen** Year of Birth: 1961 | 2006 | Trustee | President of Gardiner Allen DeRoberts Insurance LLC, an insurance agency; Chairman of the Trust’s Performance Committee. |
Anthony D’Angelo** Year of Birth: 1959 | 2006 | Trustee | Director of Sales, WSYX ABC 6/WTTE Fox 28, television stations owned and operated by Sinclair Broadcast Group; Chairman of the Trust’s Compensation Committee. |
Dale W. Smith Year of Birth: 1959 | 2006 | Vice President | Chief Financial Officer of Meeder Asset Management, Inc. (2005 - present); formerly Senior Vice President of Financial Services of BISYS Fund Services (1996 – 2004). |
The Flex-funds® 2010 Semiannual Report | June 30, 2010 | Page 51 |
| | 2010 Semiannual Report | June 30, 2010 |
Name, Address1, and Year of Birth | Year First Elected a Trustee or Officer of the Trust | Position and Number of Funds Overseen2 | Principal Occupation During Past Five Years and Other Directorships Held |
David R. Carson Year of Birth: 1958 | 2006 | Chief Compliance Officer | Chief Compliance Officer and Anti-Money Laundering Officer of the Huntington Funds and Huntington VA Funds (2005 – present); Treasurer and Assistant Treasurer of the Huntington Funds, Huntington Asset Advisors, Inc. (2002 – 2005). |
James B. Craver Year of Birth: 1943 | 2009 | Assistant Chief Compliance Officer | President, James B. Craver & Associates, P.C., law firm (2009 – present); Counsel, K&L Gates, law firm (2007 – 2009); Of Counsel, Seyfarth Shaw, law firm (2005 – 2007). |
Bruce E. McKibben Year of Birth: 1969 | 2002 | Treasurer | Director of Fund Accounting of Mutual Funds Service Co., the Trust’s transfer agent (1997 – present). Interim Chief Operating Officer of Meeder Asset Management, Inc. (June 2008 – October 2008). |
| Ruth Kirkpatrick | 2009 | Secretary, pro tempore | Senior Legal Specialist of Meeder Asset Management, Inc. |
| | 1 | The address of each Trustee is 6125 Memorial Drive, Dublin, OH 43017. |
| | 2 | Each Trustee serves for an indefinite term, until his or her resignation, death, or removal. Each Trustee oversees all nine Funds in the Trust. |
| | * | Robert S. Meeder, Jr. is deemed an “interested person” of the Trust by virtue of his position as President of Meeder Asset Management, Inc., the Advisor of the Trust. |
| | ** | Each independent Trustee is a member of the Trust’s Audit Committee, Performance Committee, Compensation Committee, and Nominating Committee. |
The Statement of Additional Information includes additional information about each Trustee and is available without charge. To obtain a copy of the Statement of Additional Information, please contact your financial representative or call toll free 1-800-325-3539.
The Funds file their complete schedules of portfolios holdings with the Securities and Exchange Commission (“SEC”) for the first and third quarters of each fiscal year on Form N-Q. The Funds’ Forms N-Q are available on the SEC’s website at http://www.sec.gov and may be reviewed and copied at the SEC’s Public Reference Room in Washington, DC. Information on the operation of the Public Reference Room may be obtained by calling 1-800-SEC-0330. The Funds’ schedules of positions are also available on the Funds’ website at www.flexfunds.com.
A description of the policies and procedures that the Funds use to determine how to vote proxies relating to portfolio securities, and information regarding how the Funds voted these proxies for the 12-month period ended June 30, 2010, is available on the SEC’s website at http://www.sec.gov, or, without charge, upon request by calling toll-free 1-800-325-3539.
| Page 52 | The Flex-funds® 2010 Semiannual Report | June 30, 2010 |
Investment Adviser and Administrator
Meeder Asset Management, Inc.
6125 Memorial Drive
P.O. Box 7177
Dublin, Ohio 43017
Subadvisor / The Total Return Utilities Fund
Miller/Howard Investments, Inc.
141 Upper Byrdcliffe Road, P.O. Box 549
Woodstock, New York 12498
Board of Trustees
Stuart Allen
Anthony D’Angelo
James Didion
Robert S. Meeder, Jr.
Jack Nicklaus II
Walter L. Ogle
Custodian
The Huntington National Bank
Columbus, Ohio 43215
Transfer Agent & Dividend Disbursing Agent
Mutual Funds Service Co.
6125 Memorial Drive
Dublin, Ohio 43017
Independent Registered Public Accounting Firm
Cohen Fund Audit Services, LTD
800 Westpoint Parkway, Suite 1100
Westlake, Ohio 44145