UNITED STATES SECURITIES AND EXCHANGE COMMISSION
Washington, D.C. 20549
FORM N-CSR
CERTIFIED SHAREHOLDER REPORT
OF REGISTERED MANAGEMENT INVESTMENT COMPANIES
Investment Company Act file number 811-3462
The Flex-funds Trust
6125 Memorial Drive
Dublin, OH 43017
Bruce McKibben
c/o The Flex-funds Trust
6125 Memorial Drive
Dublin, OH 43017
Registrant’s telephone number, including area code: 800-325-3539
Date of fiscal year end: December 31, 2011
Date of reporting period: June 30, 2011
Item 1. Report to Stockholders.
Semiannual Report
The Money Market Fund The U.S. Government Bond Fund The Total Return Bond Fund The Defensive Balanced Fund The Muirfield Fund® | The Utilities and Infrastructure Fund The Dynamic Growth Fund The Strategic Growth Fund The Aggressive Growth Fund The Quantex FundTM |
TABLE OF CONTENTS
| Letter to Shareholders | 1 |
| The Money Market Fund | 4 |
| The U.S. Government Bond Fund | 5 |
| The Defensive Balanced Fund | 6 |
The Muirfield Fund® | 7 |
| The Utilities and Infrastructure Fund | 8 |
| The Dynamic Growth Fund | 9 |
| The Strategic Growth Fund | 10 |
| The Aggressive Growth Fund | 11 |
The Quantex FundTM | 12 |
| Disclosure | 13 |
| Shareholder Expense Analysis | 14 |
| Fund Holdings & Financial Statements | 16 |
Our Mission Statement
Every day, our mission is to exceed, with integrity, passion, and discipline, the expectations of our shareholders’ and clients’ overall investment experience.
Core Values
The Client/Shareholder Is Our #1 Priority Always remember whom we are serving. Our livelihood depends on providing a superior overall investment experience that exceeds the expectations of our shareholders and clients. Clarity Of Purpose Our organization has a clear, well-defined vision. All of our associates are committed to and understand how they will contribute to that vision. Communication We expect open and effective communication, full reporting, including good and bad news, and constructive feedback. Integrity We insist upon honesty and adhere to the highest ethical standards. Excellence/ Innovation Our associates strive each day for excellence in the work they perform, seek innovative ways to solve problems and introduce new ideas to take advantage of opportunities. We are a “Think Outside The Box” company. Associate Well-Being We value the success and well-being of our associates. We recognize and reward our associates’ contributions. Respect For Others Respect all people, value the differences among them and treat them as you would like to be treated. Seek First To Understand When interacting with others, place curiosity and understanding of their perspective FIRST, setting aside preconceived opinions and quick judgment. Teamwork We are a synergistic organization that works as a team to exceed our objectives. Profit We are profitable. Profitability enhances our services and capabilities, and affords everyone the opportunity to further their financial well-being. |
 | 2011 Semiannual Report | June 30, 2011 |
Letter to Shareholders
In the first half of 2011, investor concerns were heightened as the resiliency of the economic recovery was tested, geopolitical unrest emerged in the Middle East, and devastating natural disasters struck Japan. Additionally, ongoing financial instability among several European nations has further contributed to capital market volatility. Despite the presence of many negative catalysts, the domestic stock market has continued to advance, and is up 6.02% year-to-date through June 30, 2011 as measured by the S&P 500 Index. Although the pace of economic growth in the U.S. has tempered in recent months, evidence is not compelling that a return to recession is imminent. Recall that the economy experienced a similar soft patch in 2010, yet it rebounded, and the stock market ended the year at new recovery highs. Additionally, stock valuations continue to appear reasonable, especially as the S&P 500 earnings approach the prior peak set back in 2007, while the Index is trading approximately 15% lower than that time.
The following pages will provide an overview of how we managed our risk exposure and the strategies we employed during the first half of 2011. We will also provide a brief summary of the economic and financial events that took place throughout the first six months of 2011, discuss our expectations for the remainder of the year, and review the performance of The Flex-funds® Mutual Funds.
The First Half of 2011 in Review
As 2011 began, expectations were high for the ongoing recovery of the domestic economy. However, attention was quickly diverted to new concerns, including geopolitical unrest in the Middle East region and the natural disasters in Japan. In the wake of those events, investor attention returned to the sovereign debt problems in Europe and economic indicators in the U.S., such as gross domestic product (GDP) and unemployment. The Federal Reserve maintained its position to wind down scheduled purchases of U.S. Treasury securities, signaling that the economy may be ready to sustain itself with less extensive governmental aid, despite a moderated pace of growth.
Capital market volatility heightened. Following the debt ceiling debate and subsequent downgrade of the U.S. credit rating by Standard & Poor’s, as well as recent evidence of economic weakness and ongoing issues with European sovereign debt, the financial markets have experienced significant declines into the third quarter. While there has been deterioration in the trend and technical aspects of the stock market, valuations remain quite attractive and there is recent evidence that economic activity is stabilizing.
Many economic indicators remain positive. Despite the first quarter GDP report, several economic indicators signal that the ongoing recovery remains intact, and may in fact be accelerating. Orders for durable goods have been positive for the last 16 months and industrial production continues to grow. Additionally, a
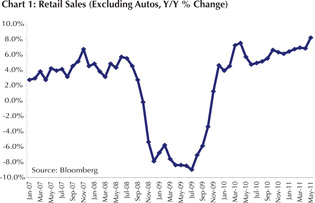 | Retail sales excluding autos increased 8.2% during May |
| 2011 Semiannual Report | June 30, 2011 |
key concern for many economists during the economic recovery has been the consumer’s propensity to spend. Retail sales excluding autos increased 8.2% during May compared to last year, which is faster than the 6.8% pace seen in the previous month (see Chart 1). This provides evidence that personal consumption may be improving, which is crucial since it comprises approximately two thirds of GDP.
Geopolitical unrest engulfs Middle East and North Africa. The Middle East and North Africa (MENA) region is comprised of many countries with authoritarian regimes, including dictatorships. Recently, civilians of many countries in the region have arranged protests to demand government change. The most prominent demonstrations include those in Egypt and Libya. As protests and uprisings continue in the MENA region, investors will examine the effects of these conflicts on oil production and prices. Crude oil has traded near $100 per barrel, which could hinder consumer confidence and dampen consumer demand for other discretionary items. Close attention will be paid to the conflicts in the MENA region and the resulting effects on oil prices and the equity markets.
Natural disasters strike Japan. On March 11, a 9.0 magnitude earthquake struck Japan and triggered a devastating tsunami. To make matters worse, a nuclear plant in Fukishima was destroyed and four out of the six nuclear reactors were damaged. Authorities have worked tirelessly in an attempt to control the radiation seeping from the reactors. Japan is the third largest economy in the world and produces 8.7% of global output. The destructive force of the disaster and nuclear radiation has had a negative effect on the world economy.
European debt problems linger. The European debt crisis continues to weigh heavily on investors as the extent of sovereign debt problems continue to unfold. At the end of June, the Greek parliament accepted an austerity package in order to secure additional rescue funds approved by the European Union (EU) and the International Monetary Fund (IMF). As a result of the severe cutbacks contained in the austerity package, many civilian protests occurred throughout Greece while parliament voted on the package’s approval. Many countries face tough budget decisions to address their fiscal imbalances, and the process of unwinding such budget issues has proven to be a long and arduous task. However, the rescue package pledged by the EU and IMF have served as a safety net for troubled nations.
GDP growth slower than expected. The rate of economic growth slowed in the first quarter of 2011 as consumer spending was hampered by rising gas prices and a struggling labor market. First quarter GDP was reported at an annualized growth rate of 1.9%, much lower than the 3.1% seen in the last quarter of 2010. Furthermore, the Federal Reserve revised their growth expectations for 2011 downward from a range of 3.1% to 3.3% to a range of 2.7% to 2.9%. Also, the Institute for Supply Management (ISM) Manufacturing Index fell for 3 consecutive months from 61.4 in February to 53.5 in May. However, the indicator rebounded in June and was reported at 55.3 (see Chart 2), which was much higher than expected. Recall that an ISM reading above 50 is consistent with economic expansion while a reading below 50 is consistent with a shrinking economy, and June’s reading marks the 23rd consecutive month above this important level.
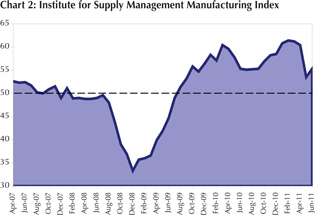 | The ISM indicator rebounded in June to 55.3 |
| 2011 Semiannual Report | June 30, 2011 |
Job growth remains sluggish. Unemployment has been a key drag on the economy since the recession began in 2007. In the first three months of 2011, there were significant improvements in the employment market, yet the jobs report for May and June showed a setback. In May, nonfarm payrolls increased only 25,000, while June posted a gain of only 18,000. In addition, the rate of unemployment has risen from 8.8% in March to 9.2% in June. However, despite the lower than expected gains, there have been positive additions to nonfarm payrolls in each of the last eight months, resulting in approximately 1.2 million jobs. The Obama administration has identified job growth as a major initiative vital to the ongoing growth of the economy. Thus, as the 2012 presidential election campaigns begin, much media attention will be placed on this important barometer of economic health.
Outlook for Remainder of 2011
Despite the negative headwinds from European debt problems and the seemingly slow rate of economic growth, there is strong evidence that suggests the economic recovery remains intact. Corporate profits continue to be strong and retail sales have accelerated despite the ongoing struggles in the labor market. Although the Federal Reserve has lowered its Treasury bond purchases, it has maintained its commitment to keeping interest rates low for “an extended period”. This will provide aid to the struggling housing market, as well as support a source of inexpensive funds for business expansion. The recent decline in oil prices should provide relief to consumers during the peak driving summer months, and allow for further expansion in consumer spending, which is needed to foster an increase in the rate of GDP growth.
As we monitor the stock market and our investment models, we will continuously evaluate our defensive position in The Muirfield Fund® and the equity portion of The Defensive Balanced Fund. We will look for opportunities to adjust portfolio weights among growth and value stocks, large-, mid-, and small-caps, and domestic and international investments in order to enhance returns and manage risk for our clients. We will also continue to proactively manage our sector exposures and will make adjustments as our investment models evolve. On the following pages you will find a review of how The Flex-funds® Mutual Funds have performed. Please read the commentaries to learn more about the investment decisions we made during the first half of 2011.
Finally, we are pleased to announce that The Total Return Bond Fund was added to The Flex-funds® investment offerings on June 30, 2011. The Fund was launched in order to offer shareholders added diversification to their fixed-income allocations, and will be managed in an effort to capitalize on a broader range of sectors in the fixed-income markets.
Although these are challenging times in the financial services industry, we believe opportunities continue to exist. Meeder celebrated its 37th anniversary this March, and we are proud to have assisted investors in meeting their financial goals through many different market environments. On behalf of all of the associates at Meeder Asset Management and The Flex-funds®, I thank you for the continued trust and confidence you have placed in our investment management services.
| | Robert S. Meeder President Meeder Asset Management, Inc. August 15, 2011 |
Please see disclosures on Page 13.
| 2011 Semiannual Report | June 30, 2011 |
Performance Perspective
| Period & Average Annual Total Returns as of June 30, 2011 | YTD | 1 Year | 5 Years | 10 Years | Since Inception | Inception Date |
The Flex-funds® Money Market Fund (Retail Class) | 0.06% | 0.15% | 2.19% | 2.10% | 4.48% | 3/27/85 |
Current & Effective Yields1 | 7-day Compound: 0.11% 7-day Simple: 0.11% |
Lipper Average General-Purpose Money Market Fund2 | 0.01% | 0.03% | 1.82% | 1.68% | 4.24% | 3/31/85 |
The Flex-funds® Money Market Fund (Institutional Class) | 0.11% | 0.25% | 2.31% | - | 2.58% | 12/28/04 |
Current & Effective Yields1 | 7-day Compound: 0.21% 7-day Simple: 0.21% |
Lipper Average General-Purpose Money Market Fund2 | 0.01% | 0.03% | 1.82% | - | 2.05% | 12/31/04 |
Management fees were waived and/or expenses were reimbursed in order to reduce the operating expenses of The Money Market Fund during the periods shown above. Investments in The Money Market Fund are neither insured nor guaranteed by the Federal Deposit Insurance Corporation or any other governmental agency. Although the Funds seek to preserve the value of your investment at $1.00 per share, it is possible to lose money by investing in The Money Market Fund.
Please see Page 13 for additional disclosures.
Semiannual Market Perspective
The retail and institutional classes of The Flex-funds® Money Market Fund ranked among the top general purpose money market funds in the country on June 30, 2011. Based on second quarter 2011 results, the retail class ranked second out of 277 general purpose money market funds that it was measured against according to Lipper. For the year-to-date period ending June 30, 2011, the retail and institutional class reported a return of 0.06% and 0.11%, respectively. The average general purpose money market fund finished the same period with a return of 0.01%, according to Lipper. The retail and institutional classes of The Flex-funds® Money Market Fund closed the quarter with a 7-day simple yield of 0.11% and 0.21%, respectively.
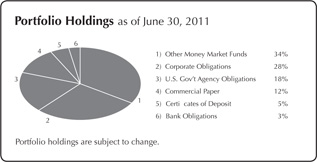
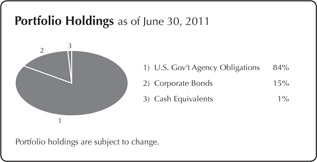
We entered 2011 in a similar market environment which has faced the Fund over the past couple of years. Investors debated the prospects for higher short-term interest rates while the Federal Reserve policy setting committee showed no signs of deviating from its current position. Throughout the first half of 2011, we maintained a weighted average maturity that was in line or slightly below that of our peers. Holdings in the Fund remained allocated toward investments with superior credit quality, as we believed the risk and reward relationship favored this position. Our sector allocation favored an overweight in high quality liquid investments and short-term investment grade corporate debt. We also maintained our exposure to U.S. Government agency securities and products backed by the FDIC. As of June 30, 2011, the Fund’s composition was as follows: 34% in other money market funds, 28% corporate obligations, 18% U.S. Government agency securities, 12% in commercial paper, 5% certificates of deposit, and 3% in bank obligations.
Although we expect available investment options that meet our credit standards may be limited for the next several months, we believe the Fund is positioned to maintain its strong performance during a difficult environment.
| 2011 Semiannual Report | June 30, 2011 |
The U.S. Government Bond Fund
Performance Perspective
| Period & Average Annual Total Returns as of June 30, 2011 | YTD | 1 Year | 5 Years | 10 Years | Since Inception | Inception Date |
The Flex-funds® U.S. Government Bond Fund | 0.64% | 0.35% | 4.57% | 3.02% | 5.35% | 5/8/85 |
Expense Ratios*: Current Net 0.99% Gross 1.42% | | | | | | |
Barclays Capital Intermediate Government Index3 | 2.10% | 2.64% | 5.84% | 4.98% | 6.90% | 4/30/85 |
Barclays Capital Intermediate-Term Government/Credit Index4 | 2.47% | 3.77% | 6.08% | 5.35% | 7.23% | 4/30/85 |
Management fees and/or expenses were waived and/or reimbursed in The U.S. Government Bond Fund during the periods shown in the table above to reduce expenses. All expenses, management fees, reimbursements or waivers for the Fund are voluntary and may be terminated at any time. *Current expense ratio based on net assets in effect as of 6/30/11. This ratio may increase or decrease depending on fluctuations in Fund net assets. The Gross Expense Ratio is a percentage of the Fund’s assets as shown in the most recent Prospectus.
Please see Page 13 for additional disclosures.
Semiannual Market Perspective
The U.S. Government Bond Fund reported a gain of 0.64% through the first half of the year, and returned 0.35% for the one year period.
In the first quarter, the main driver behind sector performance was the ongoing bearish sentiment toward U.S. Government and agency securities. The negative tone toward the sector coincided with the second round of quantitative easing by the Federal Reserve in the fourth quarter of 2010. Consequently, bonds in the government agency sector realized price declines, which pushed yields higher. However, corporate bonds remained popular during this period as companies with improved financial stability enticed investors seeking higher expected returns. This investment strategy also helped the Fund mitigate some of its underperformance as we maintained an allocation toward investment grade corporate bonds throughout the quarter.
During the second quarter, the Fund benefited from its exposure to U.S. Treasury and government agency securities. U.S. Treasury securities posted strong gains in the quarter as investor sentiment shifted away from equity positions in favor of bonds, which are perceived to carry greater safety. The Fund also obtained gains during the quarter from its allocation in high quality corporate bonds. Corporate bonds continue to advance as investors perceive that historically low default probabilities should remain at or near current levels over the near-term.
Finally, the Fund maintained an average maturity that was equal or below that of the Fund’s benchmark throughout the first half of 2011. Based on our fixed-income models, we anticipated expectations of higher interest rates in the near-term. By adopting this position, the Fund was less sensitive to interest rate movements.
| 2011 Semiannual Report | June 30, 2011 |
The Defensive Balanced Fund
Performance Perspective
| Period & Average Annual Total Returns as of June 30, 2011 | YTD | 1 Year | 8/31/08 to 6/30/11† | 5 year | Since Inception | Inception Date |
The Flex-funds® Defensive Balanced Fund† | 2.47% | 15.95% | 3.53% | 2.37% | 1.55% | 1/31/06 |
Expense Ratios*: Current Net 1.49% Gross 1.62% | | | | | | |
Blended Index5 | 3.28% | 13.49% | 3.76% | 3.97% | 3.77% | 1/31/06 |
S&P 500 Index6 | 6.02% | 30.69% | 3.32% | 2.94% | 2.72% | 1/31/06 |
Management fees and/or expenses were waived and/or reimbursed in The Defensive Balanced Fund during the periods shown in the table above to reduce expenses. All expenses, management fees, reimbursements or waivers for the Fund are voluntary and may be terminated at any time. †On August 25, 2008, the name and investment strategy of the Fund was changed. *Current expense ratio based on net assets in effect as of 6/30/11. This ratio may increase or decrease depending on fluctuations in Fund net assets. The Gross Expense Ratio is a percentage of the Fund’s assets as shown in the most recent Prospectus.
Please see Page 13 for additional disclosures.
Semiannual Market Perspective
The Flex-funds® Defensive Balanced Fund returned 2.47% for the year-to-date period ended June 30, 2011, and returned 15.95% for the one year period. The Defensive Balanced Fund will always invest at least 30% of its assets in fixed-income securities. The Fund will also hold a minimum 30% allocation in equity securities, with additional investments determined by our defensive equity discipline.
In the equity portion of The Defensive Balanced Fund we entered the first quarter essentially fully-invested in the stock market. We carefully monitored our investment models during the first half of 2011 for any indications of a deteriorating market environment. However, our models continued to prefer a fully invested position amidst the stock market volatility that has punctuated 2011 thus far. As a result, we ended the first half of 2011 with a fully-invested position in the equity portion of The Defensive Balanced Fund.
In the equity portion of the Fund, we were overweight to growth investments compared to value, and remained overweight to mid- and small-cap investments throughout the first half of 2011. In terms of sector exposure, we were overweight in the industrial materials and energy sector, while being underweight in consumer staples and healthcare during the first quarter. During the second quarter, we remained overweight in the industrial materials and established an overweight to the healthcare sector, while becoming underweight in the energy sector. Finally, throughout the first half of 2011, we maintained a modest position in emerging markets, and have continued to avoid direct exposure to the developed international markets since December of 2009.
In the fixed-income portion of the Fund, the target allocation remained overweight in intermediate-term investment grade bond funds during the first half of 2011. During the first half, the yield on investments in this sector relative to U.S. Treasury securities settled in a range close to average historical levels. We continued to believe there was still value in the sector, and capitalized on favorable investment opportunities during the year. In addition, we believe fundamental data remains supportive of stronger credit quality among issuers in this segment for the rest of the year. Due to indications in our investment models, we expect to maintain an overweight to intermediate-term investment grade credit for the near-term. The average maturity of the fixed-income portion of the Fund was maintained in line or slightly below that of our benchmark.
| 2011 Semiannual Report | June 30, 2011 |
Performance Perspective
| Period & Average Annual Total Returns as of June 30, 2011 | YTD | 1 Year | 5 Years | 10 Years | Since Inception | Inception Date |
The Flex-funds Muirfield Fund® | 2.68% | 21.77% | 2.60% | 3.21% | 7.13% | 8/10/88 |
Expense Ratios*: Current Net 1.39% Gross 1.58% | | | | | | |
Blended Index7 | 3.62% | 17.78% | 2.89% | 2.76% | 7.58% | 7/31/88 |
S&P 500 Index6 | 6.02% | 30.69% | 2.94% | 2.72% | 9.54% | 7/31/88 |
Management fees and/or expenses were waived and/or reimbursed in The Muirfield Fund® during the periods shown in the table above to reduce expenses. All expenses, management fees, reimbursements or waivers for the Fund are voluntary and may be terminated at any time. *Current expense ratio based on net assets in effect as of 6/30/11. This ratio may increase or decrease depending on fluctuations in Fund net assets. The Gross Expense Ratio is a percentage of the Fund’s assets as shown in the most recent Prospectus.
Please see Page 13 for additional disclosures.
Semiannual Market Perspective
The Flex-funds Muirfield Fund® returned 2.68% for the year-to-date period ended June 30, 2011, and returned 21.77% for the one year period.
In The Muirfield Fund®, we entered the first quarter essentially fully-invested in the stock market. We have maintained a fully-invested position since the fourth quarter of 2010 as a result of our investment models, which continue to indicate a favorable risk/reward relationship in the stock market. We carefully monitored our investment models during the first half of 2011 for any indications of a deteriorating market environment, especially as volatility emerged surrounding geopolitical events, the disaster in Japan, and slowing economic activity. However, our models continued to prefer a fully-invested position amidst the stock market volatility that has punctuated 2011 thus far. As a result, we ended the first half of 2011 with a fully-invested position in The Muirfield Fund®.
In addition to the changes in our defensive posture previously discussed, we also managed our exposure to large-, mid-, and small-cap companies, as well as growth versus value investments. During the first quarter, we maintained an overweight allocation to growth investments across the spectrum of market capitalizations. However, we reduced this overweight as the quarter progressed due to indications from our investment models. We also maintained our overweight exposure to mid- and small-cap investments. During the second quarter, we continued to maintain an overweight allocation in growth investments across the spectrum of market capitalizations, as well as our overweight exposure to mid- and small-cap investments.
We also managed our industry and sector exposure in the Fund. During the first quarter, we continued to add to our energy position, which resulted in an overweight exposure to the sector and benefited our performance. We also remained overweight to the industrial materials sector, while being underweight in the consumer staples and healthcare sectors. During the second quarter, we eliminated our energy overweight and subsequently established an overweight to the healthcare sector. Finally, throughout the first half of 2011 we maintained a modest position in emerging markets, and have continued to avoid direct exposure to the developed international markets, including Japan and Europe, since December of 2009.
| 2011 Semiannual Report | June 30, 2011 |
The Utilities and Infrastructure Fund (formerly The Total Return Utilities Fund)
Performance Perspective
| Period & Average Annual Total Returns as of June 30, 2011 | YTD | 1 Year | 5 Years | 10 Years | Since Inception | Inception Date |
The Flex-funds® Utilities and Infrastructure Fund | 5.83% | 28.66% | 5.35% | 3.24% | 7.95% | 6/21/95 |
Expense Ratios*: Current Net 1.54% Gross 1.79% | | | | | | |
Russell 3000 Utilities Index8 | 8.96% | 31.42% | 4.37% | 1.81% | 4.79% | 6/30/95 |
Management fees and/or expenses were waived and/or reimbursed in The Utilities and Infrastructure Fund during the periods shown in the table above to reduce expenses. All expenses, management fees, reimbursements or waivers for the Fund are voluntary and may be terminated at any time. *Current expense ratio based on net assets in effect as of 6/30/11. This ratio may increase or decrease depending on fluctuations in Fund net assets. The Gross Expense Ratio is a percentage of the Fund’s assets as shown in the most recent Prospectus.
Please see Page 13 for additional disclosures.
Semiannual Market Perspective
The Flex-funds® Utilities and Infrastructure Fund returned 5.83% for the year-to-date period ended June 30, 2011, and has returned 28.66% for the one year period. In addition, the Fund has outperformed the Russell 3000 Utilities benchmark for the 5-, 10-year, and since inception periods.
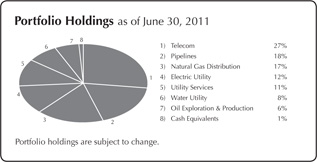
We experienced many opportunities across different industries during the first quarter. Natural gas companies with both production and delivery exposure performed well, despite ongoing low natural gas pricing. El Paso led our list, and was joined by Southern Union, National Fuel Gas, ONEOK, and MDU Resources. Battery and power management newcomer EnerSys hit a succession of new highs after beating expectations with a 61% earnings advance. Communications chip maker Qualcomm rose, as its chips have become extremely popular in new cellphones and tablets. Telecommunications companies were among our underperformers, despite big final-week runs in AT&T and Verizon. American Tower was hit by AT&T’s offer for T-Mobile, as investors assumed it would mean less need for towers, and less customers.
During a volatile second quarter for equities, the utilities sector was one of the stronger performing segments of the stock market. Our best performers comprised a mix of various industries. Southern Union rose about 40% following a pair of offers, while American Water Works exceeded earnings expectations once again and raised its dividend by 4.5%. We experienced a gain from Millicom International Cellular on a rally to fair value, and received a boost from dominant Canadian telecom BCE, which beat earnings expectations and raised its financial forecast. On the downside, many of our infrastructure enablers declined as a result of the poor broad market conditions that prevailed during the quarter, and included stocks like American Superconductor, GE, Cisco, driller Ensco, global engineering and construction firm Fluor, battery company EnerSys, and Veolia Environnement.
In our opinion, the stocks in our Fund are inexpensive, and have historically provided income and opportunity. Going forward, we see no reason for that to change.
| 2011 Semiannual Report | June 30, 2011 |
Performance Perspective
| Period & Average Annual Total Returns as of June 30, 2011 | YTD | 1 Year | 5 Years | 10 Years | Since Inception | Inception Date |
The Flex-funds® Dynamic Growth Fund | 2.83% | 26.70% | 1.82% | 1.92% | -0.27% | 2/29/00 |
Expense Ratios*: Current Net 1.39% Gross 1.57% | | | | | | |
S&P 500 Index6 | 6.02% | 30.69% | 2.94% | 2.72% | 1.54% | 2/29/00 |
Management fees and/or expenses were waived and/or reimbursed in The Dynamic Growth Fund during the periods shown in the table above to reduce expenses. All expenses, management fees, reimbursements or waivers for the Fund are voluntary and may be terminated at any time. * Current expense ratio based on net assets in effect as of 6/30/11. This ratio may increase or decrease depending on fluctuations in Fund net assets. The Gross Expense Ratio is a percentage of the Fund’s assets as shown in the most recent Prospectus.
Please see Page 13 for additional disclosures.
Semiannual Market Perspective
The Flex-funds® Dynamic Growth Fund returned 2.83% for the year-to-date period ended June 30, 2011. For the one year period, the Fund has returned 26.70%.

During the first quarter, we maintained our overweight allocation to growth investments versus value; however, we reduced this overweight later in the first quarter as our investment models began to shift toward a neutral position. Additionally, our investment models have continued to maintain preference for mid- and small-cap companies, which has led us to maintain our overweight allocation to these investments. During the second quarter, we maintained the overweight allocation to growth investments versus value due to indications from our investment models. Additionally, our investment models have continued to maintain preference for mid- and small-cap companies, which has led us to maintain our overweight allocation to these investments. On an international basis, we have avoided direct exposure to developed international markets since December of 2009, and have maintained modest exposure to emerging markets during the first half of 2011.
The performance of the Fund relative to the S&P 500 during the first quarter was driven by numerous factors. In the Fund, we established an overweight position in the energy sector early in the first quarter, while also maintaining our overweight in the industrial materials sector. We remained underweight in the consumer staples and healthcare sector. Our modest position in emerging market securities detracted from performance during the quarter since these investments underperformed domestic securities. Additionally, our positions in two individual holdings, the Fairholme Fund and the Nuveen Tradewinds Value Opportunities Fund substantially trailed their respective benchmarks. We have responded by reducing and/or eliminating these holdings within the Fund. Our performance during the second quarter was driven by multiple factors as well. In the Fund, we had established an overweight position in the energy sector early in the first quarter while also maintaining our overweight in the industrial materials sector, which detracted from our performance during the second quarter. Our modest position in emerging market securities also negatively impacted performance during the quarter since these investments underperformed domestic securities. Additionally, our overweight position in mid- and small-cap investments detracted from performance in the second quarter. While we have eliminated our direct exposure to the energy sector, we are maintaining our overweight exposure to mid- and small-cap investments due to indications from our investment models.
| 2011 Semiannual Report | June 30, 2011 |
The Strategic Growth Fund
Performance Perspective
| Period & Average Annual Total Returns as of June 30, 2011 | YTD | 1 Year | 8/31/08 to 6/30/11† | 5 Year | Since Inception | Inception Date |
The Flex-funds® Strategic Growth Fund† | 3.60% | 30.56% | 2.88% | 2.27% | 1.62% | 1/31/06 |
Expense Ratios*: Current Net 1.42% Gross 1.58% | | | | | | |
S&P 500 Index6 | 6.02% | 30.69% | 3.32% | 2.94% | 2.72% | 1/31/06 |
Blended Index9 | 6.39% | 33.10% | 2.41% | 3.34% | 3.24% | 1/31/06 |
Management fees and/or expenses were waived and/or reimbursed in The Strategic Growth Fund during the periods shown in the table above to reduce expenses. All expenses, management fees, reimbursements or waivers for the Fund are voluntary and may be terminated at any time. * Current expense ratio based on net assets in effect as of 6/30/11. This ratio may increase or decrease depending on fluctuations in Fund net assets. The Gross Expense Ratio is a percentage of the Fund’s assets as shown in the most recent Prospectus. †On August 25, 2008, the name and investment strategy of the Fund was changed.
Please see Page 13 for additional disclosures.
Semiannual Market Perspective
The Flex-funds® Strategic Growth Fund returned 3.60% for the year-to-date period ended June 30, 2011, and has returned 30.56% for the one year period.
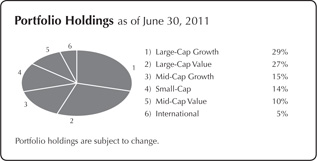
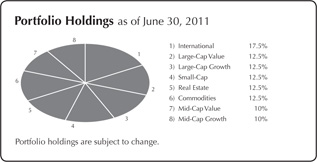
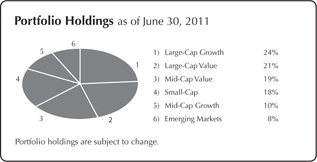
The Strategic Growth Fund is fully invested in the equity market at all times, and holds a fixed allocation across six distinct investment categories. The mix of investments selected to represent each investment category is variable and actively managed by using our strategic fund selection process. The current target allocation is comprised of the following: 25% large-cap, 20% mid-cap, 17.5% international, 12.5% small-cap, 12.5% real estate, and 12.5% commodities.
Within each respective category, we seek to identify funds that we believe will outperform their peers through an evaluation process based on valuation factors, measures of volatility, and risk-adjusted returns. Funds that fall out of favor within our models are sold and replaced with funds ranked higher by our evaluation process.
The Fund underperformed its custom benchmark and the broader market as measured by the S&P 500 Index during the first quarter. This is mostly attributable to unfavorable fund selection in the large-cap, commodity, and international categories. For instance, the Putnam Voyager Fund returned 3.60% during the first quarter compared to the S&P 500 Index return of 5.92%. However, we experienced favorable results among other funds, such as the Wells Fargo Advantage Growth Fund that returned 12.89% in the first quarter.
The Fund also underperformed its custom benchmark and the broader market as measured by the S&P 500 Index during the second quarter, and was primarily attributable to unfavorable fund selection in the mid-cap and international categories. For example, our mid-cap holding of the Ridgeworth Mid-cap Value Fund returned -1.46% during the second quarter versus the S&P 400 Mid-Cap Index return of -0.73%. Several of the asset allocation categories also underperformed the S&P 500 Index during the second quarter, such as the Russell 2000 Index of small-cap stocks that returned -1.61% in the second quarter compared to the S&P 500 Index return of 0.10%.
| 2011 Semiannual Report | June 30, 2011 |
The Aggressive Growth Fund
Performance Perspective
| Period & Average Annual Total Returns as of June 30, 2011 | YTD | 1 Year | 5 Years | 10 Years | Since Inception | Inception Date |
The Flex-funds® Aggressive Growth Fund | 3.39% | 27.55% | 2.64% | 1.68% | -1.49% | 2/29/00 |
Expense Ratios*: Current Net 1.55% Gross 1.67% | | | | | | |
S&P 500 Index6 | 6.02% | 30.69% | 2.94% | 2.72% | 1.54% | 2/29/00 |
Management fees and/or expenses were waived and/or reimbursed in The Aggressive Growth Fund during the periods shown in the table above to reduce expenses. All expenses, management fees, reimbursements or waivers for the Fund are voluntary and may be terminated at any time. *Current expense ratio based on net assets in effect as of 6/30/11. This ratio may increase or decrease depending on fluctuations in Fund net assets. The Gross Expense Ratio is a percentage of the Fund’s assets as shown in the most recent Prospectus.
Please see Page 13 for additional disclosures.
Semiannual Market Perspective
The Flex-funds® Aggressive Growth Fund returned 3.39% for the year-to-date period ended June 30, 2011, and returned 27.55% for the one year period.
The year began with major stock market indices rallying to new recovery highs, with the S&P 500 trading at levels approximately two times greater than the March 2009 lows. However, volatility quickly emerged following heightened geopolitical unrest in the Middle East and the devastating natural disasters in Japan. In the second quarter, investor concerns were heightened as the resiliency of the economic recovery was tested. Financial instability amongst several European nations continued, while some signs of slowing economic growth emerged domestically. Furthermore, a disappointing employment report in May and June emphasized the continuing struggle to add jobs in the U.S.
We entered the first quarter with an overweight position among growth versus value investments, but reduced our growth overweight as the first quarter progressed due to indications from our investment models. We also maintained our overweight in mid- and small-cap stocks, which has been a key component of our investment allocation since the stock market recovery commenced. In the Fund, our sector exposure was concentrated among the energy and industrial materials sector throughout the first quarter, and our growth exposure also resulted in an overweight to the technology sector. We were underweight in the consumer staples and healthcare sector.
During the second quarter, we maintained our overweight position among growth versus value investments, and also maintained our overweight in mid- and small-cap stocks. In the Fund, our sector exposure remained consistent with the first quarter, which was characterized by an overweight position among the energy and industrial materials sector. Additionally, our growth exposure resulted in an overweight to the technology sector, and we were underweight in the consumer staples and healthcare sector during the second quarter.
Throughout the first half of 2011, we maintained a modest direct position in emerging market securities, while we have avoided direct exposure to developed international markets since December 2009.
| 2011 Semiannual Report | June 30, 2011 |
Performance Perspective
| Period & Average Annual Total Returns as of June 30, 2011 | YTD | 1 Year | 5 Years | 10 Years | Since Inception | Inception Date |
The Flex-funds® Quantex Fund™ | 6.46% | 34.59% | 6.89% | 3.98% | 7.23% | 3/20/85 |
Expense Ratios*: Current Net 1.54% Gross 1.79% | | | | | | |
Russell 2000 Index10 | 6.21% | 37.41% | 4.08% | 6.30% | 9.48% | 3/31/85 |
Blended Index11 | 7.38% | 38.41% | 5.38% | 7.15% | 11.20% | 3/31/85 |
S&P 400 Mid-Cap Index12 | 8.56% | 39.38% | 6.59% | 7.92% | 12.79% | 3/31/85 |
Management fees and/or expenses were waived and/or reimbursed in The Quantex Fund™ during the periods shown in the table above to reduce expenses. The Fund’s management fee waiver is contractual and may be terminated annually by the Advisor on its renewal date. * Current expense ratio based on net assets in effect as of 6/30/11. This ratio may increase or decrease depending on fluctuations in Fund net assets. The Gross Expense Ratio is a percentage of the Fund’s assets as shown in the most recent Prospectus.
Please see Page 13 for additional disclosures.
Semiannual Market Perspective
The Flex-funds® Quantex Fund™ returned 6.46% for the year-to-date period ended June 30, 2011. In addition, the Fund has returned 34.59% for the one year time period. The Quantex Fund™ was recently recognized by Lipper as the best mid-cap value fund for the 3-year period ended December 31, 2010.
We have consistently employed our quantitative stock selection process since April 30, 2005 for The Quantex Fund™. We utilize rankings from our quantitative financial model to determine which securities are to be held in the Fund on an annual basis. As a result, the Fund is rebalanced annually in January. In the 2011 Fund, there is a strong preference for value holdings, with mid-cap value companies comprising 44% of the Fund, followed by mid-cap core with 26%, and mid-cap growth with 19%. Small-cap holdings of 11% comprise the remainder according to our allocation analysis at the beginning of the year.
Relative to the S&P 400 Mid-Cap Index, stock selection within the energy sector provided the greatest benefit to the Fund. The largest detractor from performance was stock selection within the financial sector, although the Fund’s underweight to the sector partially offset the negative selection impact. Stock selection in the healthcare sector also contributed to performance, while selection in the consumer discretionary sector detracted from returns. The Fund also benefited from other sector allocation decisions, including an overweight to the consumer staples during the first half of 2011.
During the year-to-date period of 2011, many stocks contributed positively to the performance of the Fund. The top performing stock for the period was National Semiconductor Corporation, which was up 80%. Other top performers for the period include Cabot Oil and Gas Corporation (up 75%) and Goodyear Tire & Rubber (up 42%). The largest detractors from performance during the period were Monster Worldwide Incorporated (down 38%) and Tellabs Incorporated (down 31%).
| 2011 Semiannual Report | June 30, 2011 |
Disclosures
Investors are advised to consider the investment objectives, risks, charges and expenses of The Flex-funds® carefully before investing. The Flex-funds® prospectus contains this and other information about the Funds and should be read carefully before investing. To request or receive a copy of The Flex-funds® prospectus, contact Shareholder Services at 800.325.3539 or visit www.flexfunds.com.
To obtain a prospectus containing more information about The Flex-funds®, including other fees and expenses that apply to a continued investment in the Funds, you may call (800)325-3539, or write to P.O. Box 7177, Dublin, OH 43017. Please read the prospectus carefully before investing.
Opinions and forecasts regarding sectors, industries, companies, countries and/or themes, and portfolio composition and holdings, are all subject to change at any time, based on market and other conditions, and should not be construed as a recommendation of any specific security, industry, or sector.
Past performance is not a guarantee of future results. All performance figures represent total returns and average annual total returns or current and effective yields for the periods ended June 30, 2011. Investment performance assumes reinvestment of all dividend and capital gain distributions. The investment return and principal value of an investment will fluctuate so an investor’s shares or units, when redeemed, may be worth more or less than their original cost. Management fees and/or expenses were waived and/or reimbursed in The Flex-funds® during the periods shown in these tables to reduce expenses. All expenses, management fees, reimbursements or waivers for the Funds are voluntary and may be terminated at any time, except for The Quantex Fund TM. The Quantex Fund TM management fee waiver is contractual and can be terminated annually by the Adviser on its renewal date, April 29, 2012.
1For the period ended June 30, 2011, yield quotations more closely reflect the current earnings of The Money Market Fund than do total return quotations.
2An index of funds such as Lipper’s Average General Purpose Money Market Fund Index includes a number of mutual funds grouped by investment objective. One cannot invest directly in an index.
3The Barclays Capital Intermediate Government Index is an unmanaged index of dollar-denominated non-convertible fixed-rate bonds issued by the U.S. Government that are rated investment-grade or higher, have a maturity of one to ten years, and at least $250 million outstanding. The Index does not take into account the deduction of expenses associated with a mutual fund, such as investment management and accounting fees. One cannot invest directly in an index.
4Barclays Capital Intermediate-Term Government/Credit Index is an unmanaged index of fixed-rate bonds issued by the U.S. Government and its agencies that are rated investment grade or higher, have one to ten years remaining until maturity, and at least $100 million outstanding. Barclays Capital Intermediate-Term Government/Credit Index does not take into account the deduction of expenses associated with a mutual fund, such as investment management and accounting fees. One cannot invest directly in an index.
5The Blended Index consists of 42% of the S&P 500 Index, 28% of the average 90-day U.S. Treasury bill and 30% Barclays Intermediate-Term Government/Credit Index.
6The S&P 500 Index is a widely recognized unmanaged index of common stock prices. The S&P 500 Index does not take into account the deduction of expenses associated with a mutual fund, such as investment management and accounting fees. One cannot invest directly in an index.
7The Blended Index consists of 60% of the S&P 500 Index and 40% of the average 90-day U.S. Treasury bill.
8The Russell 3000 Utilities Index is a market capitalization-weighted index that is comprised of utility stocks that are included in the Russell 3000 Index. This index does not take into account the deduction of expenses associated with a mutual fund, such as investment management and accounting fees. One cannot invest directly in an index.
9The Blended Index is comprised of 25% S&P 500, 20% S&P Midcap 400, 12.5% Russell 2000, 12.5% Dow Jones Wilshire Real Estate Investment Trust, 12.5% Goldman Sachs Commodity Index, 12% Morgan Stanley Capital International Europe, Australasia, and Far East, and 5.5% Morgan Stanley Capital International Europe Emerging Markets Index. These indices do not take into account the deduction of expenses associated with a mutual fund such as investment management and accounting fees. An investor cannot invest directly in an index.
10The Russell 2000 Index is a widely recognized unmanaged index of common stock prices of small-sized companies. The Russell 2000 Index does not take into account the deduction of expenses associated with a mutual fund, such as investment management and accounting fees. One cannot invest directly in an index.
11The Blended Index consists of 50% Russell 2000 Index and 50% S&P 400 Mid-Cap Index.
12The S&P 400 Mid-Cap Index is a widely recognized unmanaged index of common stock prices of mid-sized companies. The S&P 400 Mid-Cap Index does not take into account the deduction of expenses associated with a mutual fund, such as investment management and accounting fees. One cannot invest directly in an index.
| 2011 Semiannual Report | June 30, 2011 |
Shareholder Expense Analysis (Unaudited)
Shareholders of mutual funds pay ongoing expenses, such as advisory fees, distribution and service fees (12b-1 fees) and other fund expenses. The following examples are intended to help you understand your ongoing costs (in dollars) of investing in the Funds and to compare these costs with the ongoing costs of investing in other mutual funds.
The following examples are based on an investment of $1,000 invested at the beginning of the period and held for the six-month period from December 31, 2010 to June 30, 2011.
ACTUAL EXPENSES: The first table provides information about actual account values and actual expenses. You may use the information in this table, together with the amount you invested, to estimate the expenses that you paid over the period. Simply divide your account value by $1,000 (e.g.: an $8,600 account value divided by $1,000 = 8.6), then multiply the result by the number in the line under the heading “Expenses Paid During the Period” to estimate the expenses you paid on your account during this period.
| ACTUAL EXPENSES | Beginning Account Value (12/31/2010) | Ending Account Value (6/30/2011) | Expenses Paid During Period1 (12/31/2010 - 6/30/2011) | Expense Ratio (Annualized) |
| The Money Market Fund - Institutional Class | $1,000.00 | $1,001.10 | $1.09 | 0.22% |
| The Money Market Fund - Retail Class | $1,000.00 | $1,000.60 | $1.59 | 0.32% |
| The U.S. Government Bond Fund | $1,000.00 | $1,006.40 | $4.93 | 0.99% |
The Muirfield Fund® | $1,000.00 | $1,026.80 | $6.99 | 1.39% |
| The Dynamic Growth Fund | $1,000.00 | $1,028.30 | $6.99 | 1.39% |
| The Strategic Growth Fund | $1,000.00 | $1,036.00 | $7.17 | 1.42% |
| The Defensive Balanced Fund | $1,000.00 | $1,024.70 | $7.48 | 1.49% |
The Quantex Fund™ | $1,000.00 | $1,064.60 | $7.88 | 1.54% |
| The Aggressive Growth Fund | $1,000.00 | $1,033.90 | $7.82 | 1.55% |
| The Utilities and Infrastructure Fund | $1,000.00 | $1,058.30 | $9.54 | 1.87% |
| 2011 Semiannual Report | June 30, 2011 |
HYPOTHETICAL EXAMPLE FOR COMPARISON PURPOSES: The second table provides information about hypothetical account values and hypothetical expenses based on the Funds’ actual expense ratios and assumed rates of return of 5% per year before expenses, which are not the Funds’ actual returns. The hypothetical account values and expenses may not be used to estimate the actual ending account balance or expenses you paid for the period. You may use this information to compare the ongoing costs of investing in the Funds to other funds. To do so, compare this 5% hypothetical example with the 5% hypothetical examples that appear in the shareholder reports of the other funds.
HYPOTHETICAL EXAMPLE (5% return before expenses) | Beginning Account Value (12/31/2010) | Ending Account Value (6/30/2011) | Expenses Paid During Period1 (12/31/2010 - 6/30/2011) | Expense Ratio (Annualized) |
| The Money Market Fund - Institutional Class | $1,000.00 | $1,023.70 | $1.10 | 0.22% |
| The Money Market Fund - Retail Class | $1,000.00 | $1,023.21 | $1.61 | 0.32% |
| The U.S. Government Bond Fund | $1,000.00 | $1,019.89 | $4.96 | 0.99% |
The Muirfield Fund® | $1,000.00 | $1,017.90 | $6.95 | 1.39% |
| The Dynamic Growth Fund | $1,000.00 | $1,017.90 | $6.95 | 1.39% |
| The Strategic Growth Fund | $1,000.00 | $1,017.75 | $7.10 | 1.42% |
| The Defensive Balanced Fund | $1,000.00 | $1,017.41 | $7.45 | 1.49% |
The Quantex Fund™ | $1,000.00 | $1,017.16 | $7.70 | 1.54% |
| The Aggressive Growth Fund | $1,000.00 | $1,017.11 | $7.75 | 1.55% |
| The Utilities and Infrastructure Fund | $1,000.00 | $1,015.52 | $9.35 | 1.87% |
Please note that the expenses shown in the tables are meant to highlight your ongoing costs only and do not reflect any transactional costs, such as redemption fees or exchange fees. Therefore, the second table is useful in comparing ongoing costs only, and will not help you determine the relative total costs of owning different funds. In addition, if any transactional costs were included, your costs would have been higher.
| 1 | Expenses are equal to the Funds’ annualized expense ratios, multiplied by the average account value over the period, multiplied by 181/365 (to reflect the total number of days in the six-month period). |
| 2011 Semiannual Report | June 30, 2011 |
Schedule of Investments
June 30, 2011 (unaudited)
| The Muirfield Fund | |
| | Shares or Principal Amount ($) | | | | |
| Registered Investment Companies — 95.3% | |
| Allianz NFJ Dividend Value Fund | | | 969,674 | | | | 11,723,358 | |
| Delaware Emerging Markets Fund | | | 302,516 | | | | 4,846,305 | |
| Health Care Select Sector SPDR Fund | | | 148,400 | | | | 5,272,652 | |
| iShares MSCI Emerging Markets Index Fund | | | 55,625 | | | | 2,647,750 | |
iShares Russell 2000 Index Fund | | | 87,525 | | | | 7,247,070 | |
Ivy Mid Cap Growth Fund # | | | 211,699 | | | | 4,047,680 | |
| Lord Abbett Fundamental Equity Fund | | | 810,578 | | | | 11,104,919 | |
| Nuveen Tradewinds Value Opportunities Fund | | | 219,406 | | | | 7,806,482 | |
PowerShares QQQ Trust | | | 97,830 | | | | 5,581,201 | |
Putnam Voyager Fund | | | 266,709 | | | | 6,526,360 | |
| RidgeWorth Mid Cap Value Equity Fund | | | 656,034 | | | | 8,180,747 | |
| RidgeWorth Small Cap Value Equity Fund | | | 519,247 | | | | 7,643,316 | |
| T. Rowe Price Mid-Cap Growth Fund | | | 64,635 | | | | 4,062,956 | |
T. Rowe Price Value Fund | | | 447,911 | | | | 11,041,000 | |
| Wells Fargo Advantage Growth Fund # | | | 359,538 | | | | 13,177,049 | |
| Total Registered Investment Companies (Cost $102,286,476) | | | | | | | 110,908,845 | |
| Money Market Registered Investment Companies — 1.7% | |
| The Flex-funds Money Market Fund - Institutional Class, 0.21%* | | | 1,964,199 | | | | 1,964,199 | |
Total Money Market Registered Investment Companies (Cost $1,964,199) | | | | | | | 1,964,199 | |
| Floating Rate Demand Notes — 2.3% | |
Caterpillar Financial Power Investment Floating Rate Demand Note, 0.65%, 7/1/2011** | | | 2,632,955 | | | | 2,632,955 | |
Total Floating Rate Demand Notes (Cost $2,632,955) | | | | | | | 2,632,955 | |
| U.S. Government Obligations — 0.7% | |
U.S. Treasury Bill, 0.102%, due 3/8/2012*** | | | 800,000 | | | | 799,470 | |
| Total U.S. Government Obligations (Cost $799,442) | | | | | | | 799,470 | |
Total Investments — 100.0% (Cost $107,683,072)(a) | | | | | | | 116,305,469 | |
| Liabilities less Other Assets — (0.0%) | | | | | | | (36,380 | ) |
Total Net Assets — 100.0% | | | | | | | 116,269,089 | |
| The Muirfield Fund | |
| | Shares or Principal Amount ($) | | | | |
| Trustee Deferred Compensation**** | |
| The Flex-funds Aggressive Growth Fund | | | 2,082 | | | | 17,156 | |
| The Flex-funds Defensive Balanced Fund | | | 1,063 | | | | 10,587 | |
| The Flex-funds Dynamic Growth Fund | | | 660 | | | | 5,524 | |
The Flex-funds Muirfield Fund | | | 3,698 | | | | 21,264 | |
The Flex-funds Quantex Fund | | | 2,504 | | | | 60,697 | |
| The Flex-funds Utilities and Infrastructure Fund | | | 234 | | | | 5,806 | |
Total Trustee Deferred Compensation (Cost $90,845) | | | | | | | 121,034 | |
| | | | | | Unrealized Appreciation (Depreciation) ($) | |
| Futures Contracts | |
| Standard & Poors 500 expiring September 2011, notional value $5,262,000 | | | 16 | | | | 108,230 | |
Total Futures Contracts | | | | | | | 108,230 | |
| (a) | Represents cost for financial reporting purposes and differs for federal income tax purposes by the amount of losses deferred for federal income tax reporting in the amount of $312,180. Cost for federal income tax purposes of $107,995,252 differs from value by net unrealized appreciation (depreciation) of securities as follows: |
Unrealized appreciation | | $ | 8,525,900 | |
Unrealized depreciation | | | (215,683 | ) |
| Net unrealized appreciation (depreciation) | | $ | 8,310,217 | |
| # | Represents non-income producing securities. |
| * | Investment in affiliate. The yield shown represents the 7-day yield in effect at June 30, 2011. |
| ** | Floating rate security. The rate shown represents the rate in effect at June 30, 2011. |
| *** | Pledged as collateral on futures contracts. |
| **** | Assets of affiliates to The Muirfield Fund held for the benefit of the Fund’s Trustees in connection with the Trustee Deferred Compensation Plan. |
| The accompanying notes are an integral part of these financial statements. |
| 2011 Semiannual Report | June 30, 2011 |
Schedule of Investments
June 30, 2011 (unaudited)
| The Dynamic Growth Fund | |
| | Shares or Principal Amount ($) | | | | |
| Registered Investment Companies — 96.0% | |
| Allianz NFJ Dividend Value Fund | | | 848,275 | | | | 10,255,648 | |
| Delaware Emerging Markets Fund | | | 266,869 | | | | 4,275,243 | |
| Health Care Select Sector SPDR Fund | | | 134,725 | | | | 4,786,779 | |
| iShares MSCI Emerging Markets Index Fund | | | 49,800 | | | | 2,370,480 | |
iShares Russell 2000 Index Fund | | | 76,900 | | | | 6,367,320 | |
Ivy Mid Cap Growth Fund # | | | 158,774 | | | | 3,035,760 | |
| Lord Abbett Fundamental Equity Fund | | | 704,109 | | | | 9,646,292 | |
| Nuveen Tradewinds Value Opportunities Fund | | | 179,898 | | | | 6,400,785 | |
PowerShares QQQ Trust | | | 84,700 | | | | 4,832,135 | |
Putnam Voyager Fund | | | 229,598 | | | | 5,618,264 | |
| RidgeWorth Mid Cap Value Equity Fund | | | 582,632 | | | | 7,265,420 | |
| RidgeWorth Small Cap Value Equity Fund | | | 453,749 | | | | 6,679,184 | |
| T. Rowe Price Mid-Cap Growth Fund | | | 65,637 | | | | 4,125,918 | |
T. Rowe Price Value Fund | | | 388,211 | | | | 9,569,407 | |
| Wells Fargo Advantage Growth Fund # | | | 312,659 | | | | 11,458,963 | |
| Total Registered Investment Companies (Cost $87,731,925) | | | | | | | 96,687,598 | |
| Money Market Registered Investment Companies — 2.5% | |
| The Flex-funds Money Market Fund - Institutional Class, 0.21%* | | | 2,508,027 | | | | 2,508,027 | |
Total Money Market Registered Investment Companies (Cost $2,508,027) | | | | | | | 2,508,027 | |
| Floating Rate Demand Notes — 0.7% | |
Caterpillar Financial Power Investment Floating Rate Demand Note, 0.65%, 7/1/2011** | | | 752,888 | | | | 752,888 | |
| Total Floating Rate Demand Notes (Cost $752,888) | | | | | | | 752,888 | |
| U.S. Government Obligations — 0.8% | |
U.S. Treasury Bill, 0.102%, due 3/8/2012*** | | | 800,000 | | | | 799,470 | |
| Total U.S. Government Obligations (Cost $799,442) | | | | | | | 799,470 | |
Total Investments — 100.0% (Cost $91,792,282)(a) | | | | | | | 100,747,983 | |
| Liabilities less Other Assets — (0.0%) | | | | | | | (34,375 | ) |
Total Net Assets — 100.0% | | | | | | | 100,713,608 | |
| The Dynamic Growth Fund | |
| | Shares or Principal Amount ($) | | | | |
| Trustee Deferred Compensation**** | |
| The Flex-funds Aggressive Growth Fund | | | 1,495 | | | | 12,319 | |
| The Flex-funds Defensive Balanced Fund | | | 755 | | | | 7,520 | |
| The Flex-funds Dynamic Growth Fund | | | 475 | | | | 3,976 | |
The Flex-funds Muirfield Fund | | | 1,788 | | | | 10,281 | |
The Flex-funds Quantex Fund | | | 1,012 | | | | 24,531 | |
| The Flex-funds Utilities and Infrastructure Fund | | | 168 | | | | 4,168 | |
Total Trustee Deferred Compensation (Cost $39,474) | | | | | | | 62,795 | |
| | | | | | Unrealized Appreciation (Depreciation) ($) | |
| Futures Contracts | |
| Standard & Poors 500 expiring September 2011, notional value $3,946,500 | | | 12 | | | | 91,860 | |
Total Futures Contracts | | | | | | | 91,860 | |
| (a) | Represents cost for financial reporting purposes and differs for federal income tax purposes by the amount of losses deferred for federal income tax reporting in the amount of $104,957. Cost for federal income tax purposes of $91,897,239 differs from value by net unrealized appreciation (depreciation) of securities as follows: |
Unrealized appreciation | | $ | 9,047,012 | |
Unrealized depreciation | | | (196,268 | ) |
| Net unrealized appreciation (depreciation) | | $ | 8,850,744 | |
| # | Represents non-income producing securities. |
| * | Investment in affiliate. The yield shown represents the 7-day yield in effect at June 30, 2011. |
| ** | Floating rate security. The rate shown represents the rate in effect at June 30, 2011. |
| *** | Pledged as collateral on futures contracts. |
| **** | Assets of affiliates to The Dynamic Growth Fund held for the benefit of the Fund’s Trustees in connection with the Trustee Deferred Compensation Plan. |
| The accompanying notes are an integral part of these financial statements. |
| 2011 Semiannual Report | June 30, 2011 |
Schedule of Investments
June 30, 2011 (unaudited)
| The Aggressive Growth Fund | |
| | Shares or Principal Amount ($) | | | | |
| Registered Investment Companies — 96.9% | |
| Allianz NFJ Dividend Value Fund | | | 259,122 | | | | 3,132,783 | |
| BlackRock Energy & Resources Portfolio | | | 41,279 | | | | 1,883,568 | |
| Delaware Emerging Markets Fund | | | 111,609 | | | | 1,787,982 | |
| iShares MSCI Emerging Markets Index Fund | | | 32,425 | | | | 1,543,430 | |
iShares Russell 2000 Index Fund | | | 35,100 | | | | 2,906,280 | |
Ivy Mid Cap Growth Fund # | | | 52,925 | | | | 1,011,920 | |
| Lord Abbett Developing Growth Fund, Inc. # | | | 86,735 | | | | 2,195,272 | |
| Lord Abbett Fundamental Equity Fund | | | 275,126 | | | | 3,769,229 | |
Putnam Voyager Fund | | | 96,250 | | | | 2,355,231 | |
| RidgeWorth Mid Cap Value Equity Fund | | | 224,485 | | | | 2,799,325 | |
| RidgeWorth Small Cap Value Equity Fund | | | 133,349 | | | | 1,962,899 | |
RS Technology Fund | | | 100,611 | | | | 2,117,870 | |
| T. Rowe Price Mid-Cap Growth Fund | | | 24,516 | | | | 1,541,048 | |
T. Rowe Price Value Fund | | | 138,920 | | | | 3,424,385 | |
| Wells Fargo Advantage Growth Fund # | | | 143,407 | | | | 5,255,883 | |
| Total Registered Investment Companies (Cost $36,587,199) | | | | | | | 37,687,105 | |
| Money Market Registered Investment Companies — 2.3% | |
| The Flex-funds Money Market Fund - Institutional Class, 0.21%* | | | 890,714 | | | | 890,714 | |
Total Money Market Registered Investment Companies (Cost $890,714) | | | | | | | 890,714 | |
| U.S. Government Obligations — 0.8% | |
U.S. Treasury Bill, 0.102%, due 3/8/2012** | | | 300,000 | | | | 299,801 | |
| Total U.S. Government Obligations (Cost $299,791) | | | | | | | 299,801 | |
Total Investments — 100.0% (Cost $37,777,704)(a) | | | | | | | 38,877,620 | |
| Liabilities less Other Assets — (0.0%) | | | | | | | (8,453 | ) |
Total Net Assets — 100.0% | | | | | | | 38,869,167 | |
| The Aggressive Growth Fund | |
| | Shares or Principal Amount ($) | | | | |
| Trustee Deferred Compensation*** | |
| The Flex-funds Aggressive Growth Fund | | | 844 | | | | 6,955 | |
| The Flex-funds Defensive Balanced Fund | | | 439 | | | | 4,372 | |
| The Flex-funds Dynamic Growth Fund | | | 265 | | | | 2,218 | |
The Flex-funds Muirfield Fund | | | 1,137 | | | | 6,538 | |
The Flex-funds Quantex Fund | | | 676 | | | | 16,386 | |
| The Flex-funds Utilities and Infrastructure Fund | | | 95 | | | | 2,357 | |
Total Trustee Deferred Compensation (Cost $30,776) | | | | | | | 38,826 | |
| | | | | | Unrealized Appreciation (Depreciation) ($) | |
| Futures Contracts | |
| Standard & Poors 500 expiring September 2011, notional value $1,315,500 | | | 4 | | | | 55,770 | |
Total Futures Contracts | | | | | | | 55,770 | |
| (a) | Represents cost for financial reporting purposes and income tax purposes. Net unrealized appreciation (depreciation) of securities is as follows: |
Unrealized appreciation | | $ | 1,394,614 | |
Unrealized depreciation | | | (294,698 | ) |
| Net unrealized appreciation (depreciation) | | $ | 1,099,916 | |
| # | Represents non-income producing securities. |
| * | Investment in affiliate. The yield shown represents the 7-day yield in effect at June 30, 2011. |
| ** | Pledged as collateral on futures contracts. |
| *** | Assets of affiliates to The Aggressive Growth Fund held for the benefit of the Fund’s Trustees in connection with the Trustee Deferred Compensation Plan. |
| The accompanying notes are an integral part of these financial statements. |
| 2011 Semiannual Report | June 30, 2011 |
Schedule of Investments
June 30, 2011 (unaudited)
| The Defensive Balanced Fund | |
| | Shares or Principal Amount ($) | | | | |
| Registered Investment Companies — 95.0% | |
| Alliance Bernstein High Income Fund | | | 233,882 | | | | 2,140,024 | |
| Allianz NFJ Dividend Value Fund | | | 455,119 | | | | 5,502,386 | |
| Delaware Emerging Markets Fund | | | 139,516 | | | | 2,235,047 | |
| Eaton Vance Floating-Rate Advantage Fund | | | 194,942 | | | | 2,132,669 | |
Federated Bond Fund | | | 464,201 | | | | 4,279,934 | |
| Health Care Select Sector SPDR Fund | | | 49,575 | | | | 1,761,400 | |
| iShares MSCI Emerging Markets Index Fund | | | 24,750 | | | | 1,178,100 | |
iShares Russell 2000 Index Fund | | | 39,800 | | | | 3,295,440 | |
Ivy Mid Cap Growth Fund # | | | 105,849 | | | | 2,023,840 | |
| Legg Mason Western Asset Government Securities Fund | | | 338,688 | | | | 3,607,022 | |
| Lord Abbett Fundamental Equity Fund | | | 360,154 | | | | 4,934,115 | |
| Nuveen Tradewinds Value Opportunities Fund | | | 75,278 | | | | 2,678,375 | |
PowerShares QQQ Trust | | | 40,250 | | | | 2,296,263 | |
| Prudential Total Return Bond Fund | | | 305,907 | | | | 4,319,409 | |
Putnam Income Fund | | | 623,298 | | | | 4,319,456 | |
Putnam Voyager Fund | | | 114,569 | | | | 2,803,493 | |
| RidgeWorth Mid Cap Value Equity Fund | | | 299,618 | | | | 3,736,235 | |
| RidgeWorth Small Cap Value Equity Fund | | | 233,536 | | | | 3,437,649 | |
| T. Rowe Price Mid-Cap Growth Fund | | | 26,697 | | | | 1,678,175 | |
T. Rowe Price Value Fund | | | 195,667 | | | | 4,823,193 | |
| Wells Fargo Advantage Growth Fund # | | | 171,151 | | | | 6,272,688 | |
| Total Registered Investment Companies (Cost $66,267,542) | | | | | | | 69,454,913 | |
| Money Market Registered Investment Companies — 0.9% | |
| The Flex-funds Money Market Fund - Institutional Class, 0.21%* | | | 662,574 | | | | 662,574 | |
Total Money Market Registered Investment Companies (Cost $662,574) | | | | | | | 662,574 | |
| Floating Rate Demand Notes — 2.4% | |
Caterpillar Financial Power Investment Floating Rate Demand Note, 0.65%, 7/1/2011** | | | 1,759,244 | | | | 1,759,244 | |
| Total Floating Rate Demand Notes (Cost $1,759,244) | | | | | | | 1,759,244 | |
| U.S. Government Obligations — 1.8% | |
| Federal Home Loan Mortgage Corporation, 4.00%, due 12/15/2022 | | | 1,000,000 | | | | 1,001,532 | |
| U.S. Treasury Bill, 0.102%, due 3/8/2012*** | | | 300,000 | | | | 299,801 | |
| Total U.S. Government Obligations (Cost $1,293,391) | | | | | | | 1,301,333 | |
Total Investments — 100.1% (Cost $69,982,751)(a) | | | | | | | 73,178,064 | |
| Liabilities less Other Assets — (0.1%) | | | | | | | (89,170 | ) |
Total Net Assets — 100.0% | | | | | | | 73,088,894 | |
| The Defensive Balanced Fund | |
| | Shares or Principal Amount ($) | | | | |
| Trustee Deferred Compensation**** | |
| The Flex-funds Aggressive Growth Fund | | | 1,300 | | | | 10,712 | |
| The Flex-funds Defensive Balanced Fund | | | 682 | | | | 6,793 | |
| The Flex-funds Dynamic Growth Fund | | | 406 | | | | 3,398 | |
The Flex-funds Muirfield Fund | | | 1,129 | | | | 6,492 | |
The Flex-funds Quantex Fund | | | 498 | | | | 12,072 | |
| The Flex-funds Utilities and Infrastructure Fund | | | 145 | | | | 3,597 | |
Total Trustee Deferred Compensation (Cost $36,621) | | | | | | | 43,064 | |
| | | | | | Unrealized Appreciation (Depreciation) ($) | |
| Futures Contracts | |
| Standard & Poors 500 expiring September 2011, notional value $2,302,125 | | | 7 | | | | 58,573 | |
Total Futures Contracts | | | | | | | 58,573 | |
| (a) | Represents cost for financial reporting purposes and differs for federal income tax purposes by the amount of losses deferred for federal income tax reporting in the amount of $15,532. Cost for federal income tax purposes of $69,998,283 differs from value by net unrealized appreciation (depreciation) of securities as follows: |
Unrealized appreciation | | $ | 3,381,633 | |
Unrealized depreciation | | | (201,852 | ) |
| Net unrealized appreciation (depreciation) | | $ | 3,179,781 | |
| # | Represents non-income producing securities. |
| * | Investment in affiliate. The yield shown represents the 7-day yield in effect at June 30, 2011. |
| ** | Floating rate security. The rate shown represents the rate in effect at June 30, 2011. |
| *** | Pledged as collateral on futures contracts. |
| **** | Assets of affiliates to The Defensive Balanced Fund held for the benefit of the Fund’s Trustees in connection with the Trustee Deferred Compensation Plan. |
| The accompanying notes are an integral part of these financial statements. |
| 2011 Semiannual Report | June 30, 2011 |
Schedule of Investments
June 30, 2011 (unaudited)
| The Strategic Growth Fund | |
| | Shares or Principal Amount ($) | | | | |
| Registered Investment Companies — 96.4% | |
| Allianz NFJ Dividend Value Fund | | | 396,110 | | | | 4,788,965 | |
| Delaware Emerging Markets Fund | | | 443,982 | | | | 7,112,597 | |
| Dodge and Cox International Stock Fund | | | 33,544 | | | | 1,233,765 | |
Invesco Energy Fund | | | 98,718 | | | | 4,407,774 | |
Ivy Mid Cap Growth Fund # | | | 211,699 | | | | 4,047,680 | |
| Lord Abbett Developing Growth Fund, Inc. # | | | 216,628 | | | | 5,482,844 | |
| Nuveen Real Estate Securities Fund | | | 509,584 | | | | 10,173,388 | |
Oakmark International Fund | | | 297,011 | | | | 6,020,416 | |
| RidgeWorth Mid Cap Value Equity Fund | | | 633,060 | | | | 7,894,252 | |
Royce Low-Priced Stock Fund | | | 276,264 | | | | 5,235,203 | |
| T. Rowe Price Mid-Cap Growth Fund | | | 56,701 | | | | 3,564,233 | |
T. Rowe Price Value Fund | | | 205,355 | | | | 5,061,990 | |
| Van Eck Global Hard Assets Fund | | | 118,060 | | | | 6,274,875 | |
| Wells Fargo Advantage Growth Fund # | | | 309,515 | | | | 11,343,728 | |
| Total Registered Investment Companies (Cost $80,570,755) | | | | | | | 82,641,710 | |
| Money Market Registered Investment Companies — 2.7% | |
| The Flex-funds Money Market Fund - Institutional Class, 0.21%* | | | 2,350,887 | | | | 2,350,887 | |
Total Money Market Registered Investment Companies (Cost $2,350,887) | | | | | | | 2,350,887 | |
| Floating Rate Demand Notes — 0.6% | |
Caterpillar Financial Power Investment Floating Rate Demand Note, 0.65%, 7/1/2011** | | | 502,104 | | | | 502,104 | |
| Total Floating Rate Demand Notes (Cost $502,104) | | | | | | | 502,104 | |
| U.S. Government Obligations — 0.4% | |
| U.S. Treasury Bill, 0.102%, due 3/8/2012*** | | | 300,000 | | | | 299,801 | |
| Total U.S. Government Obligations (Cost $299,791) | | | | | | | 299,801 | |
Total Investments — 100.1% (Cost $83,723,537)(a) | | | | | | | 85,794,502 | |
| Liabilities less Other Assets — (0.1%) | | | | | | | (56,288 | ) |
Total Net Assets — 100.0% | | | | | | | 85,738,214 | |
| The Strategic Growth Fund | |
| | Shares or Principal Amount ($) | | | | |
| Trustee Deferred Compensation**** | |
| The Flex-funds Aggressive Growth Fund | | | 1,104 | | | | 9,097 | |
| The Flex-funds Defensive Balanced Fund | | | 583 | | | | 5,807 | |
| The Flex-funds Dynamic Growth Fund | | | 346 | | | | 2,896 | |
The Flex-funds Muirfield Fund | | | 960 | | | | 5,520 | |
The Flex-funds Quantex Fund | | | 415 | | | | 10,060 | |
| The Flex-funds Utilities and Infrastructure Fund | | | 124 | | | | 3,076 | |
Total Trustee Deferred Compensation (Cost $31,590) | | | | | | | 36,456 | |
| | | | | | Unrealized Appreciation (Depreciation) ($) | |
| Futures Contracts | |
| Standard & Poors Mid Cap 400 expiring September 2011, notional value $2,929,500 | | | 6 | | | | 74,255 | |
Total Futures Contracts | | | | | | | 74,255 | |
| (a) | Represents cost for financial reporting purposes and differs for federal income tax purposes by the amount of losses deferred for federal income tax reporting in the amount of $87,322. Cost for federal income tax purposes of $83,810,859 differs from value by net unrealized appreciation (depreciation) of securities as follows: |
Unrealized appreciation | | $ | 2,516,428 | |
Unrealized depreciation | | | (532,785 | ) |
| Net unrealized appreciation (depreciation) | | $ | 1,983,643 | |
| # | Represents non-income producing securities. |
| * | Investment in affiliate. The yield shown represents the 7-day yield in effect at June 30, 2011. |
| ** | Floating rate security. The rate shown represents the rate in effect at June 30, 2011. |
| *** | Pledged as collateral on futures contracts. |
| **** | Assets of affiliates to The Strategic Growth Fund held for the benefit of the Fund’s Trustees in connection with the Trustee Deferred Compensation Plan. |
| The accompanying notes are an integral part of these financial statements. |
| 2011 Semiannual Report | June 30, 2011 |
Schedule of Investments
June 30, 2011 (unaudited)
| The Quantex Fund | |
| | Shares or Principal Amount ($) | | | | |
| Common Stocks — 97.7% | |
| Business Services — 10.2% | | | | | | |
Apollo Group, Inc. # | | | 6,050 | | | | 264,264 | |
Cintas Corporation | | | 8,550 | | | | 282,407 | |
DeVry, Inc. | | | 4,970 | | | | 293,876 | |
H&R Block, Inc. | | | 20,090 | | | | 322,244 | |
| Interpublic Group of Companies, Inc./The | | | 22,535 | | | | 281,687 | |
Monster Worldwide, Inc. # | | | 10,130 | | | | 148,506 | |
Robert Half International, Inc. | | | 7,810 | | | | 211,104 | |
R.R. Donnelly & Sons Company | | | 13,700 | | | | 268,657 | |
Ryder System, Inc. | | | 4,550 | | | | 258,667 | |
Total System Services, Inc. | | | 15,540 | | | | 288,733 | |
(Cost $2,371,392) | | | | | | | 2,620,145 | |
| Consumer Goods — 12.7% | | | | | | | | |
Avery Dennison Corp. | | | 5,640 | | | | 217,873 | |
Bemis Company, Inc. | | | 7,320 | | | | 247,270 | |
Constellation Brands, Inc. # | | | 10,810 | | | | 225,064 | |
Dean Foods Company # | | | 27,060 | | | | 332,026 | |
| Harman International Industries, Inc. | | | 5,170 | | | | 235,597 | |
Hormel Food Corp. | | | 9,330 | | | | 278,127 | |
| International Flavors & Fragrances, Inc. | | | 4,305 | | | | 276,553 | |
Masco Corp. | | | 18,890 | | | | 227,247 | |
MeadWestvaco Corp. | | | 9,150 | | | | 304,786 | |
Owens-Illinois, Inc. # | | | 7,790 | | | | 201,060 | |
Pitney Bowes, Inc. | | | 9,890 | | | | 227,371 | |
Sealed Air Corp. | | | 9,395 | | | | 223,507 | |
Tyson Foods, Inc. | | | 13,890 | | | | 269,744 | |
(Cost $3,087,286) | | | | | | | 3,266,225 | |
| Consumer Services — 12.4% | | | | | | | | |
Abercrombie and Fitch Co. | | | 4,150 | | | | 277,718 | |
Airgas, Inc. | | | 3,820 | | | | 267,553 | |
AutoNation, Inc. # | | | 8,485 | | | | 310,636 | |
Big Lots, Inc. # | | | 7,845 | | | | 260,062 | |
D.R. Horton, Inc. | | | 20,050 | | | | 230,976 | |
Expedia, Inc. | | | 9,540 | | | | 276,565 | |
GameStop Corp. # | | | 10,450 | | | | 278,701 | |
Lennar Corp. | | | 12,750 | | | | 231,412 | |
PulteGroup, Inc. # | | | 31,803 | | | | 243,611 | |
RadioShack Corp. | | | 12,935 | | | | 172,165 | |
Sears Holding Corp. # | | | 3,250 | | | | 232,180 | |
SUPERVALU, Inc. | | | 24,830 | | | | 233,650 | |
Urban Outfitters, Inc. # | | | 6,690 | | | | 188,323 | |
(Cost $3,072,062) | | | | | | | 3,203,552 | |
| Energy — 7.0% | | | | | | | | |
Cabot Oil & Gas Corp. | | | 6,320 | | | | 419,079 | |
Diamond Offshore Drilling, Inc. | | | 3,570 | | | | 251,364 | |
Helmerich & Payne, Inc. | | | 4,930 | | | | 325,972 | |
Rowan Companies, Inc. # | | | 6,850 | | | | 265,848 | |
Sunoco, Inc. | | | 5,930 | | | | 247,340 | |
Tesoro Corp. # | | | 12,900 | | | | 295,539 | |
(Cost $1,458,328) | | | | | | | 1,805,142 | |
| Financial Services — 11.5% | | | | | | | | |
| Apartment Investment & Management Company @ | | | 9,265 | | | | 236,535 | |
Assurant, Inc. | | | 6,210 | | | | 225,237 | |
Cincinnati Financial Corporation | | | 7,540 | | | | 220,017 | |
| The Quantex Fund | |
| | Shares or Principal Amount ($) | | | | |
| Common Stocks — continued | |
E*TRADE Financial Corp. # | | | 14,942 | | | | 206,200 | |
Equifax, Inc. | | | 6,720 | | | | 233,318 | |
Federated Investors, Inc. | | | 9,140 | | | | 217,898 | |
First Horizon National Corp. | | | 20,302 | | | | 193,681 | |
Janus Capital Group, Inc. | | | 18,440 | | | | 174,074 | |
Marshall & Ilsley Corp. | | | 34,570 | | | | 275,523 | |
| NASDAQ OMX Group, Inc./The # | | | 10,080 | | | | 255,024 | |
People's United Financial, Inc. | | | 17,080 | | | | 229,555 | |
Torchmark Corp. | | | 4,000 | | | | 256,560 | |
Wells Fargo & Co. Preferred # | | | 1,700 | | | | 0 | |
Zions Bancorporation | | | 9,880 | | | | 237,219 | |
(Cost $2,936,597) | | | | | | | 2,960,841 | |
| Hardware — 11.6% | | | | | | | | |
Advanced Micro Devices, Inc. # | | | 29,240 | | | | 204,388 | |
Jabil Circuit, Inc. | | | 11,900 | | | | 240,380 | |
JDS Uniphase Corp. # | | | 16,522 | | | | 275,257 | |
Lexmark International, Inc. # | | | 6,860 | | | | 200,724 | |
LSI Corp. # | | | 39,930 | | | | 284,301 | |
| MEMC Electronic Materials, Inc. # | | | 21,240 | | | | 181,177 | |
Molex, Inc. | | | 10,515 | | | | 270,971 | |
National Semiconductor Corp. | | | 17,370 | | | | 427,476 | |
Novellus Systems, Inc. # | | | 7,400 | | | | 267,436 | |
QLogic Corp. # | | | 14,045 | | | | 223,596 | |
Tellabs, Inc. | | | 35,285 | | | | 162,664 | |
Teradyne, Inc. # | | | 17,030 | | | | 252,044 | |
(Cost $2,716,818) | | | | | | | 2,990,414 | |
| Healthcare — 6.3% | | | | | | | | |
Cephalon, Inc. # | | | 3,880 | | | | 310,012 | |
Coventry Health Care, Inc. # | | | 9,050 | | | | 330,053 | |
DENTSPLY International, Inc. | | | 7,000 | | | | 266,560 | |
Patterson Companies, Inc. | | | 7,805 | | | | 256,706 | |
PerkinElmer, Inc. | | | 9,270 | | | | 249,456 | |
Tenet Healthcare Corp. # | | | 35,755 | | | | 223,111 | |
(Cost $1,353,710) | | | | | | | 1,635,898 | |
| Industrial Materials — 7.2% | | | | | | | | |
AK Steel Holding Corp. | | | 14,610 | | | | 230,254 | |
FLIR Systems, Inc. | | | 8,040 | | | | 271,028 | |
| Goodyear Tire & Rubber Company/The # | | | 20,180 | | | | 338,419 | |
Leggett & Platt, Inc. | | | 10,505 | | | | 256,112 | |
SAIC, Inc. # | | | 15,090 | | | | 253,814 | |
Snap-on, Inc. | | | 4,220 | | | | 263,666 | |
Titanium Metals Corp. | | | 13,920 | | | | 255,014 | |
(Cost $1,601,050) | | | | | | | 1,868,307 | |
| Media — 3.5% | | | | | | | | |
Gannett Company, Inc. | | | 15,850 | | | | 226,972 | |
Meredith Corp. | | | 6,905 | | | | 214,953 | |
Scripps Networks Interactive | | | 4,620 | | | | 225,826 | |
Washington Post Company/The | | | 535 | | | | 224,138 | |
(Cost $926,058) | | | | | | | 891,889 | |
| Software — 2.9% | | | | | | | | |
Compuware Corp. # | | | 20,500 | | | | 200,080 | |
Dun & Bradstreet Corp./The | | | 2,910 | | | | 219,822 | |
Iron Mountain, Inc. | | | 9,570 | | | | 326,241 | |
(Cost $684,775) | | | | | | | 746,143 | |
| 2011 Semiannual Report | June 30, 2011 |
Schedule of Investments
June 30, 2011 (unaudited)
| The Quantex Fund | |
| | Shares or Principal Amount ($) | | | | |
| Common Stocks — continued | |
| Utilities — 12.4% | | | | | | |
CMS Energy Corp. | | | 12,845 | | | | 252,918 | |
FirstEnergy Corp. | | | 6,575 | | | | 290,286 | |
Integrys Energy Group, Inc. | | | 4,930 | | | | 255,571 | |
| MetroPCS Communications, Inc. # | | | 18,940 | | | | 325,958 | |
Nicor, Inc. | | | 4,785 | | | | 261,931 | |
NiSource, Inc. | | | 13,570 | | | | 274,792 | |
NRG Energy, Inc. # | | | 12,240 | | | | 300,859 | |
Pepco Holdings, Inc. | | | 13,110 | | | | 257,349 | |
Pinnacle West Capital Corp. | | | 5,760 | | | | 256,781 | |
Quanta Services, Inc. # | | | 12,000 | | | | 242,400 | |
SCANA Corp. | | | 5,890 | | | | 231,889 | |
TECO Energy, Inc. | | | 13,430 | | | | 253,693 | |
(Cost $2,766,261) | | | | | | | 3,204,427 | |
Total Common Stocks (Cost $22,974,337) | | | | | | | 25,192,983 | |
| Money Market Registered Investment Companies — 1.9% | |
| The Flex-funds Money Market Fund - Institutional Class, 0.21%* | | | 499,184 | | | | 499,184 | |
Total Money Market Registered Investment Companies (Cost $499,184) | | | | | | | 499,184 | |
| U.S. Government Obligations — 0.8% | |
U.S. Treasury Bill, 0.102%, due 3/8/2012*** | | | 200,000 | | | | 199,868 | |
| Total U.S. Government Obligations (Cost $199,861) | | | | | | | 199,868 | |
Total Investments — 100.4% (Cost $23,673,382)(a) | | | | | | | 25,892,035 | |
| Liabilities less Other Assets — (0.4%) | | | | | | | (108,448 | ) |
Total Net Assets — 100.0% | | | | | | | 25,783,587 | |
| Trustee Deferred Compensation*** | |
| The Flex-funds Aggressive Growth Fund | | | 643 | | | | 5,298 | |
| The Flex-funds Defensive Balanced Fund | | | 335 | | | | 3,337 | |
| The Flex-funds Dynamic Growth Fund | | | 202 | | | | 1,691 | |
The Flex-funds Muirfield Fund | | | 1,463 | | | | 8,412 | |
The Flex-funds Quantex Fund | | | 1,050 | | | | 25,452 | |
| The Flex-funds Utilities and Infrastructure Fund | | | 73 | | | | 1,811 | |
Total Trustee Deferred Compensation (Cost $34,133) | | | | | | | 46,001 | |
| The Quantex Fund | |
| | | | | | Unrealized Appreciation (Depreciation) ($) | |
| Futures Contracts | |
| Standard & Poors Mid Cap 400 expiring September 2011, notional value $488,250 | | | 1 | | | | 17,343 | |
Total Futures Contracts | | | | | | | 17,343 | |
| (a) | Represents cost for financial reporting purposes and differs for federal income tax purposes by the amount of losses deferred for federal income tax reporting in the amount of $214,388. Cost for federal income tax purposes of $23,887,770 differs from value by net unrealized appreciation (depreciation) of securities as follows: |
Unrealized appreciation | | $ | 3,023,362 | |
Unrealized depreciation | | | (1,019,097 | ) |
| Net unrealized appreciation (depreciation) | | $ | 2,004,265 | |
| # | Represents non-income producing securities. |
| @ | Real estate investment trust. |
| * | Investment in affiliate. The yield shown represents the 7-day yield in effect at June 30, 2011. |
| ** | Pledged as collateral on Futures Contracts. |
| *** | Assets of affiliates to The Flex-funds Quantex Fund held for the benefit of the Fund’s Trustees in connection with the Trustee Deferred Compensation Plan. |
| The accompanying notes are an integral part of these financial statements. |
| 2011 Semiannual Report | June 30, 2011 |
Schedule of Investments
June 30, 2011 (unaudited)
| The Utilities and Infrastructure Fund | |
| | Shares or Principal Amount ($) | | | | |
| Common Stocks — 99.0% | |
| Electric Utility — 12.0% | | | | | | |
| American Superconductor Corp. # | | | 41,471 | | | | 374,898 | |
General Electric Co. | | | 44,589 | | | | 840,949 | |
ITC Holdings Corp. | | | 9,275 | | | | 665,667 | |
MDU Resources Group, Inc. | | | 68,372 | | | | 1,538,370 | |
Northeast Utilities | | | 20,377 | | | | 716,659 | |
(Cost $4,684,844) | | | | | | | 4,136,543 | |
| Natural Gas Distribution — 16.8% | | | | | | | | |
Energy Transfer Equity, L.P. | | | 18,205 | | | | 818,497 | |
MarkWest Energy Partners, L.P. | | | 19,741 | | | | 952,306 | |
National Grid PLC - ADR | | | 27,797 | | | | 1,374,006 | |
ONEOK, Inc. | | | 7,393 | | | | 547,156 | |
Southern Union Co. | | | 24,718 | | | | 992,428 | |
Williams Companies, Inc./The | | | 37,373 | | | | 1,130,533 | |
(Cost $5,016,101) | | | | | | | 5,814,926 | |
| Oil Exploration & Production — 6.2% | | | | | | | | |
Ensco PLC - ADR | | | 12,667 | | | | 675,151 | |
EQT Corp. | | | 13,759 | | | | 722,623 | |
Ultra Petroleum Corp. # | | | 16,324 | | | | 747,639 | |
(Cost $1,943,742) | | | | | | | 2,145,413 | |
| Pipelines — 18.5% | | | | | | | | |
El Paso Corp. | | | 69,234 | | | | 1,398,527 | |
| Enterprise Products Partners, L.P. | | | 25,507 | | | | 1,102,158 | |
| Kinder Morgan Energy Partners, L.P. | | | 12,444 | | | | 903,434 | |
National Fuel Gas Co. | | | 13,183 | | | | 959,722 | |
Questar Corp. | | | 63,026 | | | | 1,116,191 | |
Spectra Energy Corp. | | | 31,074 | | | | 851,738 | |
(Cost $4,971,193) | | | | | | | 6,331,770 | |
| Telephone & Telecommunications — 27.1% | | | | | |
American Tower Corp. # | | | 9,800 | | | | 512,834 | |
AT&T, Inc. | | | 42,439 | | | | 1,333,009 | |
BCE, Inc. | | | 8,215 | | | | 322,767 | |
Cisco Systems, Inc. | | | 30,214 | | | | 471,641 | |
NII Holdings, Inc. # | | | 33,894 | | | | 1,436,428 | |
Nokia Corp. - ADR | | | 71,198 | | | | 457,091 | |
QUALCOMM, Inc. | | | 23,736 | | | | 1,347,968 | |
Telephone and Data Systems | | | 19,589 | | | | 608,826 | |
| Turkcell Iletisim Hizmetleri - ADR # | | | 58,244 | | | | 789,206 | |
Verizon Communications, Inc. | | | 29,162 | | | | 1,085,701 | |
Vodafone Group PLC - ADR | | | 35,972 | | | | 961,172 | |
(Cost $9,417,900) | | | | | | | 9,326,643 | |
| Utility Services — 10.7% | | | | | | | | |
ABB Limited - ADR | | | 36,362 | | | | 943,594 | |
EnerSys # | | | 16,493 | | | | 567,689 | |
Fluor Corp. | | | 8,366 | | | | 540,946 | |
NiSource, Inc. | | | 79,918 | | | | 1,618,339 | |
(Cost $3,294,931) | | | | | | | 3,670,568 | |
| Water Utility — 7.7% | | | | | | | | |
American Water Works Co., Inc. | | | 60,391 | | | | 1,778,445 | |
Veolia Environnement - ADR | | | 31,287 | | | | 886,674 | |
(Cost $2,361,689) | | | | | | | 2,665,119 | |
Total Common Stocks (Cost $31,690,400) | | | | | | | 34,090,982 | |
| The Utilities and Infrastructure Fund | |
| | Shares or Principal Amount ($) | | | | |
| Money Market Registered Investment Companies — 0.9% | |
| The Flex-funds Money Market Fund - Institutional Class, 0.21%* | | | 301,043 | | | | 301,043 | |
Total Money Market Registered Investment Companies (Cost $301,043) | | | | | | | 301,043 | |
Total Investments — 99.9% (Cost $31,991,443)(a) | | | | | | | 34,392,025 | |
| Other Assets less Liabilities — 0.1% | | | | | | | 48,310 | |
Total Net Assets — 100.0% | | | | | | | 34,440,335 | |
| Trustee Deferred Compensation** | |
| The Flex-funds Aggressive Growth Fund | | | 748 | | | | 6,164 | |
| The Flex-funds Defensive Balanced Fund | | | 391 | | | | 3,894 | |
| The Flex-funds Dynamic Growth Fund | | | 234 | | | | 1,959 | |
The Flex-funds Muirfield Fund | | | 1,318 | | | | 7,579 | |
The Flex-funds Quantex Fund | | | 881 | | | | 21,355 | |
| The Flex-funds Utilities and Infrastructure Fund | | | 84 | | | | 2,084 | |
Total Trustee Deferred Compensation (Cost $32,672) | | | | | | | 43,035 | |
| (a) | Represents cost for financial reporting purposes and differs for federal income tax purposes by the amount of losses deferred for federal income tax reporting in the amount of $56,746. Cost for federal income tax purposes of $32,048,189 differs from value by net unrealized appreciation (depreciation) of securities as follows: |
Unrealized appreciation | | $ | 4,133,991 | |
Unrealized depreciation | | | (1,790,155 | ) |
| Net unrealized appreciation (depreciation) | | $ | 2,343,836 | |
| ADR | American Depositary Receipt |
| # | Represents non-income producing securities. |
| * | Investment in affiliate. The yield shown represents the 7-day yield in effect at June 30, 2011. |
| ** | Assets of affiliates to The Utilities and Infrastructure Fund held for the benefit of the Fund’s Trustees in connection with the Trustees Deferred Compensation Plan. |
| The accompanying notes are an integral part of these financial statements. |
| 2011 Semiannual Report | June 30, 2011 |
Schedule of Investments
June 30, 2011 (unaudited)
| The U.S. Government Bond Fund | |
| | Principal Amount ($) or Shares | | | | |
| U.S. Government Obligations — 83.6% | |
| Fannie Mae, 1.75%, due 8/25/2020 | | | 917,960 | | | | 919,754 | |
| Fannie Mae, 2.50%, due 9/25/2040 | | | 974,876 | | | | 983,883 | |
| Federal Farm Credit Bank, 2.875%, due 04/14/2015 | | | 1,000,000 | | | | 1,052,587 | |
| Federal Farm Credit Bank, 3.15%, due 01/12/2018 | | | 1,000,000 | | | | 1,029,436 | |
| Federal Home Loan Bank, 3.125%, due 03/11/2016 | | | 1,000,000 | | | | 1,051,286 | |
| Federal Home Loan Bank, 3.75%, due 09/09/2016 | | | 1,000,000 | | | | 1,071,285 | |
| Federal Home Loan Bank, 3.125%, due 12/08/2017 | | | 2,000,000 | | | | 2,047,495 | |
| Federal Home Loan Bank, 2.875%, due 09/11/2020 | | | 1,000,000 | | | | 956,793 | |
| Federal Home Loan Mortgage Corporation, 4.00%, due 12/15/2022 | | | 1,000,000 | | | | 1,001,532 | |
| Government National Mortgage Association, 4.00%, due 02/20/2018 | | | 938,956 | | | | 996,396 | |
| Government National Mortgage Association, 6.50%, due 07/20/2038 | | | 29,445 | | | | 33,602 | |
| Government National Mortgage Association, 3.00%, due 09/16/2039 | | | 967,220 | | | | 991,023 | |
| Government National Mortgage Association, 3.146%, due 05/16/2040 | | | 1,000,000 | | | | 1,016,349 | |
| Government National Mortgage Association, 3.62406%, due 02/16/2043 | | | 1,000,000 | | | | 1,025,126 | |
| U.S. Treasury Note, 3.00%, due 02/28/2017 | | | 1,000,000 | | | | 1,052,188 | |
| Total U.S. Government Obligations (Cost $15,070,742) | | | | | | | 15,228,735 | |
| Corporate Bonds — 14.6% | |
| Abbott Laboratories, 5.875%, due 05/15/2016 | | | 500,000 | | | | 582,255 | |
| Anheuser Busch, 2.875% 02/15/2016 | | | 500,000 | | | | 509,460 | |
| Aspen Insurance Holding, Ltd., 6.00%, due 12/15/2020 | | | 500,000 | | | | 516,787 | |
| General Electric Capital Corp., 4.375%, due 09/16/2020 | | | 500,000 | | | | 494,269 | |
| Partnerre Finance, LLC, 6.875%, due 06/01/2018 | | | 500,000 | | | | 555,422 | |
Total Corporate Bonds (Cost $2,602,578) | | | | | | | 2,658,193 | |
| Money Market Registered Investment Companies — 0.6% | |
| The Flex-funds Money Market Fund - Institutional Class, 0.21%* | | | 110,324 | | | | 110,324 | |
Total Money Market Registered Investment Companies (Cost $110,324) | | | | | | | 110,324 | |
| The U.S. Government Bond Fund | |
| | Principal Amount ($) or Shares | | | | |
| Floating Rate Demand Notes — 0.0% | |
| Caterpillar Financial Power Investment Floating Rate Demand Note, 0.65%, 7/1/2011** | | | 117 | | | | 117 | |
| Total Floating Rate Demand Notes (Cost $117) | | | | | | | 117 | |
Total Investments — 98.8% (Cost $17,783,761)(a) | | | | | | | 17,997,369 | |
| Other Assets less Liabilities — 1.2% | | | | | | | 225,264 | |
Total Net Assets — 100.0% | | | | | | | 18,222,633 | |
| | | | | | Unrealized Appreciation (Depreciation) ($) | |
| Futures Contracts | |
| U.S. Treasury 2-Year Note Futures expiring September 2011, notional value $1,096,719 | | | 5 | | | | 197 | |
| U.S. Treasury 5-Year Note Futures expiring September 2011, notional value $1,787,930 | | | 15 | | | | 5,786 | |
| U.S. Treasury 10-Year Note Futures expiring September 2011, notional value $1,834,922 | | | 15 | | | | 14,263 | |
| U.S. Treasury 30-Year Note Futures expiring September 2011, notional value $1,230,313 | | | 10 | | | | 26,488 | |
Total Futures Contracts | | | | | | | 46,734 | |
| Trustee Deferred Compensation*** | |
| The Flex-funds Aggressive Growth Fund | | | 606 | | | | 4,993 | |
| The Flex-funds Defensive Balanced Fund | | | 314 | | | | 3,127 | |
| The Flex-funds Dynamic Growth Fund | | | 190 | | | | 1,590 | |
The Flex-funds Muirfield Fund | | | 1,021 | | | | 5,871 | |
The Flex-funds Quantex Fund | | | 682 | | | | 16,532 | |
| The Flex-funds Utilities and Infrastructure Fund | | | 68 | | | | 1,687 | |
Total Trustee Deferred Compensation (Cost $25,662) | | | | | | | 33,800 | |
| (a) | Represents cost for financial reporting purposes and differs for federal income tax purposes by the amount of losses deferred for federal income tax reporting in the amount of $78,987. Cost for federal income tax purposes of $17,862,748 differs from value by net unrealized appreciation (depreciation) of securities as follows: |
Unrealized appreciation | | $ | 154,021 | |
Unrealized depreciation | | | (19,400 | ) |
| Net unrealized appreciation (depreciation) | | $ | 134,621 | |
| * | Investment in affiliate. The yield shown represents the 7-day yield in effect at June 30, 2011. |
| ** | Floating rate security. The rate shown represents the rate in effect at June 30, 2011. |
| *** | Assets of affiliates to The U.S. Government Bond Fund held for the benefit of the Fund’s Trustees in connection with the Trustee Deferred Compensation Plan. |
| The accompanying notes are an integral part of these financial statements. |
| 2011 Semiannual Report | June 30, 2011 |
Schedule of Investments
June 30, 2011 (unaudited)
| The Total Return Bond Fund | |
| | Shares or Principal Amount ($) | | | | |
| Registered Investment Companies — 100.0% | |
| Alliance Bernstein High Income Fund | | | 219 | | | | 2,000 | |
Federated Bond Fund | | | 434 | | | | 4,000 | |
| Legg Mason Western Asset Government Securities Fund | | | 188 | | | | 2,000 | |
| Prudential Total Return Bond Fund | | | 283 | | | | 4,000 | |
Putnam Income Fund | | | 866 | | | | 6,000 | |
| TCW Emerging Markets Income Fund | | | 225 | | | | 2,000 | |
Total Registered Investment Companies (Cost $20,000) | | | | | | | 20,000 | |
Total Investments — 100.0% (Cost $20,000)(a) | | | | | | | 20,000 | |
| Other Assets less Liabilities — 0.0% | | | | | | | 0 | |
Total Net Assets — 100.0% | | | | | | | 20,000 | |
| (a) | Cost for financial reporting purposes and income tax purposes are the same. Since the Fund commenced operations on June 30, 2011, net unrealized appreciation (depreciation) of securities is zero. |
| The accompanying notes are an integral part of these financial statements. |
| 2011 Semiannual Report | June 30, 2011 |
Schedule of Investments
June 30, 2011 (unaudited)
| The Money Market Fund | |
| | | | | Principal Amount ($) or Shares | | | | |
| Bank Obligations — 2.9% | |
| Bank of Internet Demand Deposit Account | | | 0.50 | %* | 07/01/11 | | | 249,000 | | | | 249,000 | |
| Brand Banking Company Demand Deposit Account | | | 0.50 | %* | 07/01/11 | | | 249,000 | | | | 249,000 | |
| Columbus First Bank Demand Deposit Account | | | 0.65 | %* | 07/01/11 | | | 249,000 | | | | 249,000 | |
| Commerce National Bank Demand Deposit Account | | | 0.40 | %* | 07/01/11 | | | 249,940 | | | | 249,940 | |
| EverBank Money Market Account | | | 1.00 | %* | 07/01/11 | | | 249,629 | | | | 249,629 | |
| Excel Bank Demand Deposit Account | | | 0.75 | %* | 07/01/11 | | | 249,472 | | | | 249,472 | |
| First National Bank of Sonora Demand Deposit Account | | | 0.50 | %* | 07/01/11 | | | 249,000 | | | | 249,000 | |
Hillcrest Bank Demand Deposit Account | | | 0.85 | %* | 07/01/11 | | | 249,121 | | | | 249,121 | |
| Huntington National Bank Conservative Deposit Account | | | 0.15 | %* | 07/01/11 | | | 250,000 | | | | 250,000 | |
| Nationwide Bank Deposit Account | | | 0.74 | %* | 07/01/11 | | | 249,483 | | | | 249,483 | |
| Synovus Bank of North Georgia Demand Deposit Account | | | 0.35 | %* | 07/01/11 | | | 249,000 | | | | 249,000 | |
| TD Bank Demand Deposit Account | | | 0.40 | %* | 07/01/11 | | | 249,756 | | | | 249,756 | |
| United Community Bank Demand Deposit Account | | | 0.65 | %* | 07/01/11 | | | 249,000 | | | | 249,000 | |
Total Bank Obligations (Cost $3,241,401) | | | | | | | | | | | | 3,241,401 | |
| Certificates of Deposit — 5.4% | |
Amalgamated Bank | | | 0.75 | % | 09/15/11 | | | 238,500 | | | | 238,500 | |
Banco Popular de PR | | | 0.70 | % | 10/13/11 | | | 241,000 | | | | 241,000 | |
Citizens Business Bank | | | 0.75 | % | 09/15/11 | | | 238,500 | | | | 238,500 | |
Community Bank | | | 0.75 | % | 09/15/11 | | | 238,500 | | | | 238,500 | |
Community Mutual Savings | | | 0.70 | % | 10/13/11 | | | 241,000 | | | | 241,000 | |
Cross Keys Bank | | | 0.70 | % | 10/13/11 | | | 241,000 | | | | 241,000 | |
East West Bank | | | 0.75 | % | 09/15/11 | | | 105,814 | | | | 105,814 | |
Farmers' and Traders' State Bank | | | 0.75 | % | 09/15/11 | | | 238,500 | | | | 238,500 | |
Flagstar Bank, FSB | | | 0.75 | % | 09/15/11 | | | 238,500 | | | | 238,500 | |
Greenville Federal Bank | | | 0.70 | % | 10/13/11 | | | 189,611 | | | | 189,611 | |
Happy State Bank | | | 0.70 | % | 10/13/11 | | | 146,155 | | | | 146,155 | |
MB Financial Bank, NA | | | 0.75 | % | 09/15/11 | | | 238,500 | | | | 238,500 | |
Mechanics and Farmers | | | 0.70 | % | 10/13/11 | | | 241,000 | | | | 241,000 | |
Missouri Bank and Trust | | | 0.70 | % | 10/13/11 | | | 23,723 | | | | 23,723 | |
Morton Community Bank | | | 0.75 | % | 09/15/11 | | | 238,500 | | | | 238,500 | |
Mutual of Omaha Bank | | | 0.75 | % | 09/15/11 | | | 238,500 | | | | 238,500 | |
Northfield Bank | | | 0.70 | % | 10/13/11 | | | 241,000 | | | | 241,000 | |
| PrivateBank and Trust Company (The) | | | 0.75 | % | 09/15/11 | | | 238,500 | | | | 238,500 | |
Rockland Trust Co. | | | 0.70 | % | 10/13/11 | | | 241,000 | | | | 241,000 | |
Sovereign Bank | | | 0.70 | % | 10/13/11 | | | 241,000 | | | | 241,000 | |
State Bank Countryside | | | 0.70 | % | 10/13/11 | | | 241,000 | | | | 241,000 | |
TriState Capital Bank | | | 0.70 | % | 10/13/11 | | | 241,000 | | | | 241,000 | |
Union Bank & Trust Co. | | | 0.75 | % | 09/15/11 | | | 32,186 | | | | 32,186 | |
| The Money Market Fund | |
| | | | | Principal Amount ($) or Shares | | | | |
| Certificates of Deposit — continued | |
United Bank | | | 0.75 | % | 09/15/11 | | | 238,500 | | | | 238,500 | |
Valley Bank | | | 0.70 | % | 10/13/11 | | | 241,000 | | | | 241,000 | |
Washington Trust Bank | | | 0.75 | % | 09/15/11 | | | 238,500 | | | | 238,500 | |
WashingtonFirst Bank | | | 0.75 | % | 09/15/11 | | | 238,500 | | | | 238,500 | |
Waterford Bank, NA | | | 0.70 | % | 10/13/11 | | | 241,000 | | | | 241,000 | |
| Total Certificates of Deposit (Cost $6,010,489) | | | | | | | | | | | | 6,010,489 | |
| Commercial Paper — 12.3% | |
Abbey National | | | 0.43 | % | 07/05/11 | | | 1,000,000 | | | | 999,953 | |
Abbey National | | | 0.45 | % | 07/13/11 | | | 1,000,000 | | | | 999,853 | |
Abbey National | | | 0.40 | % | 07/28/11 | | | 1,000,000 | | | | 999,704 | |
Credit Agricole | | | 0.35 | % | 08/17/11 | | | 1,000,000 | | | | 999,556 | |
HSBC Financial Corp. | | | 0.33 | % | 09/12/11 | | | 2,000,000 | | | | 1,998,703 | |
ING Funding | | | 0.30 | % | 07/14/11 | | | 1,000,000 | | | | 999,892 | |
Nordea North America | | | 0.23 | % | 10/12/11 | | | 700,000 | | | | 699,557 | |
Nordea North America | | | 0.23 | % | 10/24/11 | | | 1,000,000 | | | | 999,265 | |
Rabobank USA Finance Corp. | | | 0.24 | % | 11/14/11 | | | 1,000,000 | | | | 999,093 | |
Societe Generale | | | 0.31 | % | 10/27/11 | | | 1,010,000 | | | | 1,009,091 | |
Toyota Motor Credit | | | 0.32 | % | 08/26/11 | | | 1,000,000 | | | | 999,518 | |
Toyota Motor Credit | | | 0.33 | % | 10/11/11 | | | 1,000,000 | | | | 999,093 | |
Toyota Motor Credit | | | 0.36 | % | 12/05/11 | | | 1,000,000 | | | | 998,474 | |
Total Commercial Paper (Cost $13,701,752) | | | | | | | | | | | | 13,701,752 | |
| Corporate Obligations — 29.7% | |
Bath Technologies*** | | | 0.26 | %* | 07/07/11 | | | 815,000 | | | | 815,000 | |
Cascade Plaza Project*** | | | 0.22 | %* | 07/07/11 | | | 6,577,000 | | | | 6,577,000 | |
| Caterpillar Financial Power Investment Floating Rate Demand Note | | | 0.65 | %** | 07/01/11 | | | 9,707,542 | | | | 9,707,542 | |
Credit Suisse Yankee CD | | | 0.28 | %* | 07/22/11 | | | 1,600,000 | | | | 1,600,129 | |
| General Electric Interest Plus Variable Rate Demand Note | | | 0.95 | %* | 07/01/11 | | | 9,177,258 | | | | 9,177,258 | |
Martin Wheel Co, Inc.*** | | | 2.94 | %* | 07/07/11 | | | 1,700,000 | | | | 1,700,000 | |
| Royal Bank of Canada Yankee CD | | | 0.29 | %* | 07/27/11 | | | 1,000,000 | | | | 1,000,409 | |
Seariver Maritime | | | 0.37 | %* | 07/01/11 | | | 600,000 | | | | 600,000 | |
| Springside Corp. Exchange Partners LLC*** | | | 0.22 | %* | 07/07/11 | | | 2,000,000 | | | | 2,000,000 | |
| Total Corporate Obligations (Cost $33,177,338) | | | | | | | | | | | | 33,177,338 | |
| 2011 Semiannual Report | June 30, 2011 |
Schedule of Investments
June 30, 2011 (unaudited)
| The Money Market Fund | |
| | | | | Principal Amount ($) or Shares | | | | |
| U.S. Government Agency Obligations — 18.4% | |
Federal Farm Credit | | | 0.50 | %** | 05/02/12 | | | 3,500,000 | | | | 3,508,399 | |
Federal Farm Credit | | | 0.20 | %** | 06/04/12 | | | 5,000,000 | | | | 5,000,423 | |
Federal Home Loan Bank | | | 0.22 | %** | 02/28/12 | | | 5,000,000 | | | | 5,004,340 | |
Federal Home Loan Bank | | | 0.40 | % | 04/27/12 | | | 2,000,000 | | | | 2,000,000 | |
Federal Home Loan Bank | | | 0.35 | % | 07/17/12 | | | 2,000,000 | | | | 2,000,000 | |
Federal Home Loan Bank | | | 0.35 | % | 07/20/12 | | | 1,000,000 | | | | 1,000,000 | |
Federal Home Loan Bank | | | 0.38 | % | 07/27/12 | | | 2,000,000 | | | | 2,000,000 | |
Total U.S. Government Agency Obligations (Cost $20,513,162) | | | | | | | | | | | | 20,513,162 | |
| The Money Market Fund | |
| | Principal Amount ($) or Shares | | | | |
| Money Market Registered Investment Companies — 33.9% | |
| Federated Prime Value Obligations Fund, 0.12% # | | | 10,161,124 | | | | 10,161,124 | |
| Fidelity Institutional Money Market Portfolio, 0.17% # | | | 27,636,546 | | | | 27,636,546 | |
Total Money Market Registered Investment Companies (Cost $37,797,670) | | | | | | | 37,797,670 | |
Total Investments — 102.6% (Cost $114,441,812) (a) | | | | | | | 114,441,812 | |
| Liabilities less Other Assets — (2.6%) | | | | | | | (2,937,608 | ) |
Total Net Assets — 100.0% | | | | | | | 111,504,204 | |
| Trustee Deferred Compensation**** | |
| The Flex-funds Aggressive Growth Fund | | | 583 | | | | 4,804 | |
| The Flex-funds Defensive Balanced Fund | | | 302 | | | | 3,008 | |
| The Flex-funds Dynamic Growth Fund | | | 182 | | | | 1,523 | |
The Flex-funds Muirfield Fund | | | 1,306 | | | | 7,510 | |
The Flex-funds Quantex Fund | | | 941 | | | | 22,810 | |
| The Flex-funds Utilities and Infrastructure Fund | | | 66 | | | | 1,637 | |
Total Trustee Deferred Compensation (Cost $33,342) | | | | | | | 41,292 | |
| (a) | Cost for federal income tax and financial reporting purposes are the same. |
| # | 7-day yield as of June 30, 2011. |
| * | Variable rate security. Securities payable at par including accrued interest (usually within seven days notice) and unconditionally secured as to principal and interest by letters of credit or other credit support agreements from major banks. The interest rates are adjustable and are based on bank prime rates or other interest rate adjustment indices. The rate shown represents the rate in effect at June 30, 2011. The maturity date shown reflects the earlier of the next demand date or stated maturity date. |
| ** | Floating rate security. The rate shown represents the rate in effect at June 30, 2011. |
| *** | Represents a restricted security purchased under Rule 144A, which is exempt from registration under the Securities Act of 1933, as amended. Security is restricted as to resale to institutional investors, but has been deemed liquid in accordance with guidelines approved by the Board of Trustees. Bath Technologies was acquired on 10/18/1999. Cascade Plaza Project was acquired on 2/28/2002. Martin Wheel Co., Inc. was acquired on 1/26/2001. Springside Corp. Exchange Partners LLC was acquired on 2/5/2004. As of June 30, 2011, securities restricted as to resale to institutional investors represented 9.7% of Total Investments. The fair value noted approximates amortized cost. |
| **** | Assets of affiliates to The Money Market Fund held for the benefit of the Fund’s Trustees in connection with the Trustee Deferred Compensation Plan. |
| The accompanying notes are an integral part of these financial statements. |
| 2011 Semiannual Report | June 30, 2011 |
Statements of Assets & Liabilities June 30, 2011 (unaudited) | |
| | | | | | | | | The Aggressive Growth Fund | |
| Assets | | | | | | | | | |
| Investments, at fair value* | | $ | 114,341,270 | | | $ | 98,239,956 | | | $ | 37,986,906 | |
| Investments in affiliates, at fair value* | | | 1,964,199 | | | | 2,508,027 | | | | 890,714 | |
| Trustee deferred compensation investments, at fair value | | | 121,034 | | | | 62,795 | | | | 38,826 | |
| Cash | | | — | | | | — | | | | — | |
| Cash held at broker | | | — | | | | — | | | | — | |
| Receivable for net variation margin on futures contracts | | | 35,853 | | | | 30,618 | | | | 11,200 | |
| Receivable for capital stock issued | | | 13,854 | | | | 31,767 | | | | 20,254 | |
| Receivable from investment advisor | | | — | | | | — | | | | — | |
| Interest and dividend receivable | | | 12,914 | | | | 11,079 | | | | 146 | |
Prepaid expenses/other assets | | | 55,927 | | | | 46,533 | | | | 28,481 | |
| | | 116,545,051 | | | | 100,930,775 | | | | 38,976,527 | |
| Liabilities | | | | | | | | | | | | |
| Payable for securities purchased | | | — | | | | — | | | | — | |
| Payable for Trustee Deferred Compensation Plan | | | 121,034 | | | | 62,795 | | | | 38,826 | |
| Payable for capital stock redeemed | | | 13,121 | | | | 14,892 | | | | 2,985 | |
| Dividends payable | | | — | | | | — | | | | — | |
| Dividends payable - The Money Market Fund - Retail Class | | | | | | | | | | | | |
| Dividends payable - The Money Market Fund - Institutional Class | | | | | | | | | | | | |
| Payable to investment advisor | | | 10,126 | | | | 7,670 | | | | 2,889 | |
| Accrued distribution plan (12b-1) and administrative service plan fees | | | 103,674 | | | | 106,997 | | | | 47,307 | |
| Accrued transfer agent, fund accounting, CCO, and administrative fees | | | 4,234 | | | | 3,962 | | | | 3,062 | |
| Accrued trustee fees | | | 4,588 | | | | 3,914 | | | | 1,455 | |
Other accrued liabilities | | | 19,185 | | | | 16,937 | | | | 10,836 | |
| | | 275,962 | | | | 217,167 | | | | 107,360 | |
| | $ | 116,269,089 | | | $ | 100,713,608 | | | $ | 38,869,167 | |
| Net Assets | | | | | | | | | | | | |
| Capital | | $ | 113,829,230 | | | $ | 102,131,378 | | | $ | 42,528,744 | |
| Accumulated undistributed (distributions in excess of) net investment income | | | (325,136 | ) | | | (404,922 | ) | | | (282,799 | ) |
| Accumulated undistributed net realized gain (loss) from investments and futures contracts | | | (5,965,632 | ) | | | (10,060,409 | ) | | | (4,532,464 | ) |
Net unrealized appreciation (depreciation) of investments and futures contracts | | | 8,730,627 | | | | 9,047,561 | | | | 1,155,686 | |
| | $ | 116,269,089 | | | $ | 100,713,608 | | | $ | 38,869,167 | |
| Net Assets | | | | | | | | | | | | |
| The Money Market Fund - Retail Class | | | | | | | | | | | | |
The Money Market Fund - Institutional Class | | | | | | | | | | | | |
| | | | | | | | | | | | |
| Capital Stock Outstanding (indefinite number of shares authorized, $0.10 par value) | | | 20,224,014 | | | | 12,029,768 | | | | 4,719,461 | |
| The Money Market Fund - Retail Class | | | | | | | | | | | | |
The Money Market Fund - Institutional Class | | | | | | | | | | | | |
Total Capital Stock Outstanding | | | | | | | | | | | | |
| Net Asset Value, Offering and Redemption Price Per Share | | $ | 5.75 | | | $ | 8.37 | | | $ | 8.24 | |
| The Money Market Fund - Retail Class | | | | | | | | | | | | |
The Money Market Fund - Institutional Class | | | | | | | | | | | | |
* Investments and affiliated investments at cost | | $ | 107,683,072 | | | $ | 91,792,282 | | | $ | 37,777,704 | |
| The accompanying notes are an integral part of these financial statements. |
| 2011 Semiannual Report | June 30, 2011 |
| |
The Defensive Balanced Fund | | | | | | | | | The Utilities and Infrastructure Fund | | | The U.S. Government Bond Fund | | | The Total Return Bond Fund | | | | |
| | | | | | | | | | | | | | | | | | | | |
| $ | 72,515,490 | | | $ | 83,443,615 | | | $ | 25,392,851 | | | $ | 34,090,982 | | | $ | 17,887,045 | | | $ | 20,000 | | | $ | 114,441,812 | |
| | 662,574 | | | | 2,350,887 | | | | 499,184 | | | | 301,043 | | | | 110,324 | | | | — | | | | — | |
| | 43,064 | | | | 36,456 | | | | 46,001 | | | | 43,035 | | | | 33,800 | | | | — | | | | 41,292 | |
| | — | | | | — | | | | — | | | | — | | | | — | | | | 10,000 | | | | — | |
| | — | | | | — | | | | — | | | | — | | | | 75,000 | | | | — | | | | — | |
| | 19,600 | | | | 9,285 | | | | 2,700 | | | | — | | | | 17,695 | | | | — | | | | — | |
| | 2,466 | | | | 35,425 | | | | 1,106 | | | | 1,238 | | | | 50,347 | | | | 10,000 | | | | — | |
| | — | | | | — | | | | — | | | | — | | | | 351 | | | | — | | | | 26,439 | |
| | 7,218 | | | | 519 | | | | 23,219 | | | | 85,068 | | | | 101,954 | | | | — | | | | 52,501 | |
| | 28,731 | | | | 45,599 | | | | 12,725 | | | | 14,460 | | | | 13,954 | | | | — | | | | 25,532 | |
| | 73,279,143 | | | | 85,921,786 | | | | 25,977,786 | | | | 34,535,826 | | | | 18,290,470 | | | | 40,000 | | | | 114,587,576 | |
| | | | | | | | | | | | | | | | | | | | | | | | | | | |
| | — | | | | — | | | | — | | | | — | | | | — | | | | 20,000 | | | | 3,000,000 | |
| | 43,064 | | | | 36,456 | | | | 46,001 | | | | 43,035 | | | | 33,800 | | | | — | | | | 41,292 | |
| | 41,966 | | | | 6,032 | | | | 123,771 | | | | 7,205 | | | | 5,349 | | | | — | | | | — | |
| | — | | | | — | | | | — | | | | 193 | | | | 764 | | | | — | | | | | |
| | | | | | | | | | | | | | | | | | | | | | | | | | 225 | |
| | | | | | | | | | | | | | | | | | | | | | | | | | 2,680 | |
| | 5,918 | | | | 6,858 | | | | 1,675 | | | | 13,005 | | | | — | | | | — | | | | — | |
| | 80,600 | | | | 115,232 | | | | 8,615 | | | | 16,103 | | | | 15,762 | | | | — | | | | 9,443 | |
| | 3,252 | | | | 3,162 | | | | 2,717 | | | | 2,971 | | | | 2,307 | | | | — | | | | 4,351 | |
| | 2,418 | | | | 3,030 | | | | 942 | | | | 1,145 | | | | 1,059 | | | | — | | | | 939 | |
| | 13,031 | | | | 12,802 | | | | 10,478 | | | | 11,834 | | | | 8,796 | | | | — | | | | 24,442 | |
| | 190,249 | | | | 183,572 | | | | 194,199 | | | | 95,491 | | | | 67,837 | | | | 20,000 | | | | 3,083,372 | |
| $ | 73,088,894 | | | $ | 85,738,214 | | | $ | 25,783,587 | | | $ | 34,440,335 | | | $ | 18,222,633 | | | $ | 20,000 | | | $ | 111,504,204 | |
| | | | | | | | | | | | | | | | | | | | | | | | | | | |
| $ | 73,416,973 | | | $ | 81,273,703 | | | $ | 24,168,104 | | | $ | 31,293,005 | | | $ | 18,573,032 | | | $ | 20,000 | | | $ | 111,504,204 | |
| | 108,497 | | | | (447,875 | ) | | | (5,935 | ) | | | 119,716 | | | | 1,852 | | | | — | | | | — | |
| | (3,690,462 | ) | | | 2,767,166 | | | | (614,578 | ) | | | 627,032 | | | | (612,593 | ) | | | — | | | | — | |
| | 3,253,886 | | | | 2,145,220 | | | | 2,235,996 | | | | 2,400,582 | | | | 260,342 | | | | — | | | | — | |
| $ | 73,088,894 | | | $ | 85,738,214 | | | $ | 25,783,587 | | | $ | 34,440,335 | | | $ | 18,222,633 | | | $ | 20,000 | | | $ | 111,504,204 | |
| | | | | | | | | | | | | | | | | | | | | | | | | | | |
| | | | | | | | | | | | | | | | | | | | | | | | | $ | 85,722,482 | |
| | | | | | | | | | | | | | | | | | | | | | | | | | 25,781,722 | |
| | | | | | | | | | | | | | | | | | | | | | | | | $ | 111,504,204 | |
| | 7,339,968 | | | | 8,526,642 | | | | 1,063,830 | | | | 1,388,265 | | | | 874,236 | | | | 2,000 | | | | | |
| | | | | | | | | | | | | | | | | | | | | | | | | | 85,722,482 | |
| | | | | | | | | | | | | | | | | | | | | | | | | | 25,781,722 | |
| | | | | | | | | | | | | | | | | | | | | | | | | | 111,504,204 | |
| $ | 9.96 | | | $ | 10.06 | | | $ | 24.24 | | | $ | 24.81 | | | $ | 20.84 | | | $ | 10.00 | | | | | |
| | | | | | | | | | | | | | | | | | | | | | | | | $ | 1.00 | |
| | | | | | | | | | | | | | | | | | | | | | | | | $ | 1.00 | |
| $ | 69,982,751 | | | $ | 83,723,537 | | | $ | 23,673,382 | | | $ | 31,991,443 | | | $ | 17,783,761 | | | $ | 20,000 | | | $ | 114,441,812 | |
| 2011 Semiannual Report | June 30, 2011 |
Statements of Operations For the Period Ended June 30, 2011 (unaudited) | |
| | | | | | | | | The Aggressive Growth Fund | |
| Investment Income | | | | | | | | | |
| Interest | | $ | 15,298 | | | $ | 3,580 | | | $ | 179 | |
| Interest from affiliates | | | 2,400 | | | | 2,332 | | | | 1,546 | |
| | | 315,417 | | | | 263,886 | | | | 77,646 | |
| | | 333,115 | | | | 269,798 | | | | 79,371 | |
| Fund Expenses | | | | | | | | | | | | |
| Investment advisor | | | 494,395 | | | | 364,013 | | | | 174,682 | |
| Transfer agent | | | 71,618 | | | | 58,252 | | | | 27,949 | |
| Transfer agent - The Money Market Fund - Retail Class | | | | | | | | | | | | |
| Transfer agent - The Money Market Fund - Institutional Class | | | | | | | | | | | | |
| Fund accounting | | | 24,315 | | | | 23,202 | | | | 19,039 | |
| Administrative | | | 52,696 | | | | 43,787 | | | | 23,228 | |
| Trustee | | | 7,447 | | | | 6,080 | | | | 3,205 | |
| Audit | | | 5,163 | | | | 5,163 | | | | 5,163 | |
| Legal | | | 2,905 | | | | 2,905 | | | | 2,905 | |
| Custody | | | 8,734 | | | | 7,698 | | | | 3,515 | |
| Printing | | | 5,228 | | | | 4,280 | | | | 1,976 | |
| Distribution plan (12b-1) | | | 119,344 | | | | 121,305 | | | | 58,135 | |
| Distribution plan (12b-1) - The Money Market Fund - Retail Class | | | | | | | | | | | | |
| Distribution plan (12b-1) - The Money Market Fund - Institutional Class | | | | | | | | | | | | |
| Administrative service plan | | | 119,218 | | | | 97,032 | | | | 46,547 | |
| Postage | | | 4,047 | | | | 3,265 | | | | 1,673 | |
| Registration and filing | | | 12,148 | | | | 12,255 | | | | 10,714 | |
| Insurance | | | 5,763 | | | | 4,360 | | | | 1,521 | |
| Chief Compliance Officer | | | 2,506 | | | | 2,504 | | | | 2,504 | |
| | | 7,114 | | | | 6,533 | | | | 5,136 | |
Total Expenses Before Reductions | | | 942,641 | | | | 762,634 | | | | 387,892 | |
| Expenses reimbursed/waived by investment advisor | | | (16,222 | ) | | | (18,233 | ) | | | (721 | ) |
| Expenses paid indirectly | | | (42,146 | ) | | | (35,210 | ) | | | (14,286 | ) |
| Distribution plan (12b-1) expenses waived | | | (17,904 | ) | | | (10,194 | ) | | | (10,715 | ) |
| Administrative service plan expenses waived | | | (12,533 | ) | | | — | | | | — | |
Transfer agent expenses waived | | | (23,881 | ) | | | (24,277 | ) | | | — | |
| | | 829,955 | | | | 674,720 | | | | 362,170 | |
| | | | | | | | | | | | |
Net Investment Income (Loss) | | | (496,840 | ) | | | (404,922 | ) | | | (282,799 | ) |
| Realized and Unrealized Gain (Loss) from Investments | | | | | | | | | | | | |
| Net realized gains (losses) from investments | | | 9,958,581 | | | | 6,946,170 | | | | 5,100,278 | |
Net realized gains (losses) from futures contracts | | | 310,569 | | | | 186,520 | | | | 107,379 | |
Net Realized Gains (Losses) from Investment Transactions, Futures Contracts, and Distributions of Long-term Realized Gains by Other Investment Companies | | | 10,269,150 | | | | 7,132,690 | | | | 5,207,657 | |
Net change in unrealized appreciation (depreciation) of investments and futures contracts | | | (6,218,338 | ) | | | (4,021,749 | ) | | | (4,101,411 | ) |
Net Realized and Unrealized Gain (Loss) from Investments | | | 4,050,812 | | | | 3,110,941 | | | | 1,106,246 | |
| | | | | | | | | | | | |
Net Change in Net Assets Resulting from Operations | | $ | 3,553,972 | | | $ | 2,706,019 | | | $ | 823,447 | |
| The accompanying notes are an integral part of these financial statements. |
| 2011 Semiannual Report | June 30, 2011 |
The Defensive Balanced Fund | | | | | | | | | The Utilities and Infrastructure Fund | | | The U.S. Government Bond Fund | | | The Total Return Bond Fund | | | | |
| | | | | | | | | | | | | | | | | | | | |
| $ | 25,702 | | | $ | 2,416 | | | $ | 119 | | | $ | — | | | $ | 241,732 | | | $ | — | | | $ | 275,119 | |
| | 2,044 | | | | 1,560 | | | | 994 | | | | 1,228 | | | | 1,029 | | | | — | | | | — | |
| | 561,834 | | | | 134,666 | | | | 161,031 | | | | 480,850 | | | | — | | | | — | | | | — | |
| | 589,580 | | | | 138,642 | | | | 162,144 | | | | 482,078 | | | | 242,761 | | | | — | | | | 275,119 | |
| | | | | | | | | | | | | | | | | | | | | | | | | | | |
| | 242,778 | | | | 309,061 | | | | 108,860 | | | | 146,434 | | | | 38,122 | | | | — | | | | 227,531 | |
| | 38,855 | | | | 49,456 | | | | 13,063 | | | | 17,572 | | | | 7,624 | | | | — | | | | | |
| | | | | | | | | | | | | | | | | | | | | | | | | | 42,435 | |
| | | | | | | | | | | | | | | | | | | | | | | | | | 12,026 | |
| | 20,855 | | | | 22,148 | | | | 13,365 | | | | 16,296 | | | | 12,010 | | | | — | | | | 24,474 | |
| | 30,855 | | | | 37,925 | | | | 10,886 | | | | 14,643 | | | | 9,530 | | | | — | | | | 53,966 | |
| | 4,405 | | | | 5,319 | | | | 1,963 | | | | 2,374 | | | | 1,767 | | | | — | | | | 1,542 | |
| | 5,163 | | | | 5,163 | | | | 5,163 | | | | 5,163 | | | | 5,163 | | | | — | | | | 5,163 | |
| | 2,905 | | | | 2,904 | | | | 2,905 | | | | 2,905 | | | | 2,905 | | | | — | | | | 2,905 | |
| | 5,737 | | | | 5,595 | | | | 2,725 | | | | 2,269 | | | | 1,844 | | | | — | | | | 4,594 | |
| | 2,906 | | | | 3,674 | | | | 988 | | | | 1,311 | | | | 787 | | | | — | | | | 7,115 | |
| | 80,911 | | | | 102,996 | | | | 21,773 | | | | 36,636 | | | | 19,061 | | | | — | | | | | |
| | | | | | | | | | | | | | | | | | | | | | | | | | 92,494 | |
| | | | | | | | | | | | | | | | | | | | | | | | | | 4,528 | |
| | 64,755 | | | | 82,408 | | | | 21,777 | | | | 29,262 | | | | 19,038 | | | | — | | | | — | |
| | 2,218 | | | | 2,656 | | | | 1,058 | | | | 2,981 | | | | 833 | | | | — | | | | 5,014 | |
| | 10,141 | | | | 10,282 | | | | 9,764 | | | | 8,937 | | | | 10,198 | | | | — | | | | 14,914 | |
| | 2,726 | | | | 2,410 | | | | 836 | | | | 1,102 | | | | 990 | | | | — | | | | 7,318 | |
| | 2,504 | | | | 2,504 | | | | 2,504 | | | | 2,504 | | | | 2,506 | | | | — | | | | 2,505 | |
| | 5,377 | | | | 5,083 | | | | 4,992 | | | | 5,282 | | | | 5,056 | | | | — | | | | 15,534 | |
| | 523,091 | | | | 649,584 | | | | 222,622 | | | | 295,671 | | | | 137,434 | | | | — | | | | 524,058 | |
| | (3,169 | ) | | | — | | | | (27,217 | ) | | | — | | | | (36,317 | ) | | | — | | | | (257,528 | ) |
| | (16,167 | ) | | | (34,215 | ) | | | — | | | | — | | | | — | | | | — | | | | — | |
| | — | | | | — | | | | (14,153 | ) | | | (13,180 | ) | | | (2,859 | ) | | | — | | | | (77,094 | ) |
| | — | | | | — | | | | (13,173 | ) | | | (8,933 | ) | | | (2,001 | ) | | | — | | | | — | |
| | (22,670 | ) | | | (28,852 | ) | | | — | | | | — | | | | (1,906 | ) | | | — | | | | (6,725 | ) |
| | 481,085 | | | | 586,517 | | | | 168,079 | | | | 273,558 | | | | 94,351 | | | | — | | | | 182,711 | |
| | | | | | | | | | | | | | | | | | | | | | | | | | | |
| | 108,495 | | | | (447,875 | ) | | | (5,935 | ) | | | 208,520 | | | | 148,410 | | | | — | | | | 92,408 | |
| | | | | | | | | | | | | | | | | | | | | | | | | | | |
| | 1,957,934 | | | | 4,529,408 | | | | 1,617,200 | | | | 813,547 | | | | (254,744 | ) | | | — | | | | | |
| | 43,555 | | | | 192,944 | | | | 34,930 | | | | — | | | | (140,995 | ) | | | — | | | | | |
| | 2,001,489 | | | | 4,722,352 | | | | 1,652,130 | | | | 813,547 | | | | (395,739 | ) | | | — | | | | | |
| | (827,002 | ) | | | (3,207,960 | ) | | | (707,092 | ) | | | 276,146 | | | | 343,206 | | | | — | | | | | |
| | 1,174,487 | | | | 1,514,392 | | | | 945,038 | | | | 1,089,693 | | | | (52,533 | ) | | | — | | | | | |
| | | | | | | | | | | | | | | | | | | | | | | | | | | |
| $ | 1,282,982 | | | $ | 1,066,517 | | | $ | 939,103 | | | $ | 1,298,213 | | | $ | 95,877 | | | $ | — | | | $ | 92,408 | |
| 2011 Semiannual Report | June 30, 2011 |
Statements of Changes in Net Assets For the Period Ended June 30, 2011 (unaudited) and the Year Ended December 31, 2010 | |
| | | | | | | |
| | | | | | | | | | | | | |
| Operations | | | | | | | | | | | | |
| Net investment income (loss) | | $ | (496,840 | ) | | $ | 459,246 | | | $ | (404,922 | ) | | $ | 198,731 | |
| Net realized gain (loss) from investment transactions, futures contracts, and distributions of long-term realized gains by other investment companies | | | 10,269,150 | | | | 7,086,430 | | | | 7,132,690 | | | | 7,120,345 | |
Net change in unrealized appreciation (depreciation) of investments and futures contracts | | | (6,218,338 | ) | | | 6,602,098 | | | | (4,021,749 | ) | | | 6,409,206 | |
Net change in net assets resulting from operations | | | 3,553,972 | | | | 14,147,774 | | | | 2,706,019 | | | | 13,728,282 | |
| Distributions to Shareholders | | | | | | | | | | | | | | | | |
| From net investment income | | | — | | | | (459,247 | ) | | | — | | | | (198,736 | ) |
From net realized gain from investment transactions | | | — | | | | — | | | | — | | | | — | |
Net change in net assets resulting from distributions | | | — | | | | (459,247 | ) | | | — | | | | (198,736 | ) |
| Capital Transactions | | | | | | | | | | | | | | | | |
| Issued | | | 18,398,801 | | | | 24,058,379 | | | | 14,769,742 | | | | 25,201,324 | |
| Reinvested | | | 46 | | | | 457,414 | | | | 6 | | | | 198,546 | |
| | | (27,950,200 | ) | | | (31,076,006 | ) | | | (12,001,582 | ) | | | (28,048,074 | ) |
Net change in net assets resulting from capital transactions | | | (9,551,353 | ) | | | (6,560,213 | ) | | | 2,768,166 | | | | (2,648,204 | ) |
| | | | | | | | | | | | | | | | |
Total Change in Net Assets | | | (5,997,381 | ) | | | 7,128,314 | | | | 5,474,185 | | | | 10,881,342 | |
Net Assets - Beginning of Year | | | 122,266,470 | | | | 115,138,156 | | | | 95,239,423 | | | | 84,358,081 | |
| | $ | 116,269,089 | | | $ | 122,266,470 | | | $ | 100,713,608 | | | $ | 95,239,423 | |
Accumulated undistributed (distributions in excess of) net investment income | | $ | (325,136 | ) | | $ | 171,704 | | | $ | (404,922 | ) | | $ | — | |
| Share Transactions | | | | | | | | | | | | | | | | |
| Issued | | | 3,201,605 | | | | 4,734,508 | | | | 1,769,446 | | | | 3,526,238 | |
| Reinvested | | | 8 | | | | 81,680 | | | | — | | | | 24,392 | |
| | | (4,802,248 | ) | | | (6,042,300 | ) | | | (1,433,362 | ) | | | (3,799,857 | ) |
| | | (1,600,635 | ) | | | (1,226,112 | ) | | | 336,084 | | | | (249,227 | ) |
| The accompanying notes are an integral part of these financial statements. |
| 2011 Semiannual Report | June 30, 2011 |
The Aggressive Growth Fund | | | The Defensive Balanced Fund | | | The Strategic Growth Fund | |
| | | | | | | | | | | | | | | | |
| | | | | | | | | | | | | | | | | |
| $ | (282,799 | ) | | $ | (21,654 | ) | | $ | 108,495 | | | $ | 796,697 | | | $ | (447,875 | ) | | $ | 198,423 | |
| | 5,207,657 | | | | 3,819,382 | | | | 2,001,489 | | | | 3,288,199 | | | | 4,722,352 | | | | 6,632,770 | |
| | (4,101,411 | ) | | | 1,054,758 | | | | (827,002 | ) | | | 1,231,808 | | | | (3,207,960 | ) | | | 1,458,237 | |
| | 823,447 | | | | 4,852,486 | | | | 1,282,982 | | | | 5,316,704 | | | | 1,066,517 | | | | 8,289,430 | |
| | | | | | | | | | | | | | | | | | | | | | | |
| | — | | | | — | | | | — | | | | (796,695 | ) | | | — | | | | (198,423 | ) |
| | — | | | | — | | | | — | | | | — | | | | — | | | | — | |
| | — | | | | — | | | | — | | | | (796,695 | ) | | | — | | | | (198,423 | ) |
| | | | | | | | | | | | | | | | | | | | | | | |
| | 20,899,726 | | | | 8,752,427 | | | | 19,934,345 | | | | 17,820,187 | | | | 49,560,756 | | | | 32,446,042 | |
| | — | | | | — | | | | — | | | | 792,255 | | | | 7 | | | | 198,274 | |
| | (16,762,321 | ) | | | (9,591,588 | ) | | | (5,907,066 | ) | | | (14,742,252 | ) | | | (27,319,907 | ) | | | (12,356,363 | ) |
| | 4,137,405 | | | | (839,161 | ) | | | 14,027,279 | | | | 3,870,190 | | | | 22,240,856 | | | | 20,287,953 | |
| | | | | | | | | | | | | | | | | | | | | | | |
| | 4,960,852 | | | | 4,013,325 | | | | 15,310,261 | | | | 8,390,199 | | | | 23,307,373 | | | | 28,378,960 | |
| | 33,908,315 | | | | 29,894,990 | | | | 57,778,633 | | | | 49,388,434 | | | | 62,430,841 | | | | 34,051,881 | |
| $ | 38,869,167 | | | $ | 33,908,315 | | | $ | 73,088,894 | | | $ | 57,778,633 | | | $ | 85,738,214 | | | $ | 62,430,841 | |
| $ | (282,799 | ) | | $ | — | | | $ | 108,497 | | | $ | 2 | | | $ | (447,875 | ) | | $ | — | |
| | | | | | | | | | | | | | | | | | | | | | | |
| | 2,564,060 | | | | 1,240,188 | | | | 1,993,162 | | | | 1,948,394 | | | | 4,890,032 | | | | 3,648,465 | |
| | — | | | | — | | | | — | | | | 81,508 | | | | — | | | | 20,420 | |
| | (2,100,285 | ) | | | (1,324,833 | ) | | | (595,983 | ) | | | (1,589,341 | ) | | | (2,792,590 | ) | | | (1,431,682 | ) |
| | 463,775 | | | | (84,645 | ) | | | 1,397,179 | | | | 440,561 | | | | 2,097,442 | | | | 2,237,203 | |
| 2011 Semiannual Report | June 30, 2011 |
Statements of Changes in Net Assets For the Period Ended June 30, 2011 (unaudited) and the Year Ended December 31, 2010 | |
| | | | | | The Utilities and Infrastructure Fund | |
| | | | | | | | | | | | | |
| Operations | | | | | | | | | | | | |
| Net investment income (loss) | | $ | (5,935 | ) | | $ | (39,827 | ) | | $ | 208,520 | | | $ | 150,010 | |
| Net realized gain (loss) from investment transactions, futures contracts, and distributions of long-term realized gains by other investment companies | | | 1,652,130 | | | | 1,526,513 | | | | 813,547 | | | | 959,028 | |
Net change in unrealized appreciation (depreciation) of investments and futures contracts | | | (707,092 | ) | | | 1,655,283 | | | | 276,146 | | | | 1,830,913 | |
Net change in net assets resulting from operations | | | 939,103 | | | | 3,141,969 | | | | 1,298,213 | | | | 2,939,951 | |
| Distributions to Shareholders | | | | | | | | | | | | | | | | |
| From net investment income | | | — | | | | — | | | | (88,016 | ) | | | (132,339 | ) |
From net realized gain from investment transactions | | | — | | | | — | | | | — | | | | — | |
Net change in net assets resulting from distributions | | | — | | | | — | | | | (88,016 | ) | | | (132,339 | ) |
| Distributions to Shareholders - The Money Market Fund | | | | | | | | | | | | | | | | |
| From net investment income (Retail Class) | | | | | | | | | | | | | | | | |
From net investment income (Institutional Class) | | | | | | | | | | | | | | | | |
Net change in net assets resulting from distributions | | | | | | | | | | | | | | | | |
| Capital Transactions | | | | | | | | | | | | | | | | |
| Issued | | | 11,348,858 | | | | 8,147,706 | | | | 12,569,888 | | | | 5,387,988 | |
| Reinvested | | | — | | | | — | | | | 85,677 | | | | 120,242 | |
| | | (3,528,015 | ) | | | (6,933,509 | ) | | | (3,569,254 | ) | | | (4,903,245 | ) |
Net change in net assets resulting from capital transactions | | | 7,820,843 | | | | 1,214,197 | | | | 9,086,311 | | | | 604,985 | |
| | | | | | | | | | | | | | | | |
Total Change in Net Assets | | | 8,759,946 | | | | 4,356,166 | | | | 10,296,508 | | | | 3,412,597 | |
Net Assets - Beginning of Year | | | 17,023,641 | | | | 12,667,475 | | | | 24,143,827 | | | | 20,731,230 | |
| | $ | 25,783,587 | | | $ | 17,023,641 | | | $ | 34,440,335 | | | $ | 24,143,827 | |
Accumulated undistributed (distributions in excess of) net investment income | | $ | (5,935 | ) | | $ | — | | | $ | 119,716 | | | $ | (788 | ) |
| Share Transactions | | | | | | | | | | | | | | | | |
| Issued | | | 462,910 | | | | 413,282 | | | | 503,578 | | | | 252,216 | |
| Reinvested | | | — | | | | — | | | | 3,423 | | | | 5,611 | |
| | | (146,818 | ) | | | (351,002 | ) | | | (145,791 | ) | | | (230,839 | ) |
| | | 316,092 | | | | 62,280 | | | | 361,210 | | | | 26,988 | |
| The accompanying notes are an integral part of these financial statements. |
| 2011 Semiannual Report | June 30, 2011 |
The U.S. Government Bond Fund | | | The Total Return Bond Fund | | | | |
| | | | | | | | | | | | | | | | |
| | | | | | | | | | | | | | | | | |
| $ | 148,410 | | | $ | 385,264 | | | $ | — | | | $ | — | | | $ | 92,408 | | | $ | 323,084 | |
| | (395,739 | ) | | | 395,707 | | | | — | | | | — | | | | — | | | | — | |
| | 343,206 | | | | (148,833 | ) | | | — | | | | — | | | | — | | | | — | |
| | 95,877 | | | | 632,138 | | | | — | | | | — | | | | 92,408 | | | | 323,084 | |
| | | | | | | | | | | | | | | | | | | | | | | |
| | (148,409 | ) | | | (385,264 | ) | | | — | | | | — | | | | | | | | | |
| | — | | | | (232,564 | ) | | | — | | | | — | | | | | | | | | |
| | (148,409 | ) | | | (617,828 | ) | | | — | | | | — | | | | | | | | | |
| | | | | | | | | | | | | | | | | | | | | | | |
| | | | | | | | | | | | | | | | | | (58,467 | ) | | | (219,387 | ) |
| | | | | | | | | | | | | | | | | | (33,941 | ) | | | (103,697 | ) |
| | | | | | | | | | | | | | | | | | (92,408 | ) | | | (323,084 | ) |
| | | | | | | | | | | | | | | | | | | | | | | |
| | 4,376,240 | | | | 6,707,688 | | | | 20,000 | | | | — | | | | 174,661,114 | | | | 362,248,902 | |
| | 144,829 | | | | 601,490 | | | | — | | | | — | | | | 67,671 | | | | 246,254 | |
| | (5,968,637 | ) | | | (4,791,322 | ) | | | — | | | | — | | | | (192,896,177 | ) | | | (401,214,866 | ) |
| | (1,447,568 | ) | | | 2,517,856 | | | | 20,000 | | | | — | | | | (18,167,392 | ) | | | (38,719,710 | ) |
| | | | | | | | | | | | | | | | | | | | | | | |
| | (1,500,100 | ) | | | 2,532,166 | | | | 20,000 | | | | — | | | | (18,167,392 | ) | | | (38,719,710 | ) |
| | 19,722,733 | | | | 17,190,567 | | | | — | | | | — | | | | 129,671,596 | | | | 168,391,306 | |
| $ | 18,222,633 | | | $ | 19,722,733 | | | $ | 20,000 | | | $ | — | | | $ | 111,504,204 | | | $ | 129,671,596 | |
| $ | 1,852 | | | $ | 1,851 | | | $ | — | | | $ | — | | | $ | — | | | $ | — | |
| | | | | | | | | | | | | | | | | | | | | | | |
| | 211,544 | | | | 315,030 | | | | 2,000 | | | | — | | | | 174,661,114 | | | | 362,248,902 | |
| | 6,978 | | | | 28,502 | | | | — | | | | — | | | | 67,671 | | | | 246,254 | |
| | (289,118 | ) | | | (225,702 | ) | | | — | | | | — | | | | (192,896,177 | ) | | | (401,214,866 | ) |
| | (70,596 | ) | | | 117,830 | | | | 2,000 | | | | — | | | | (18,167,392 | ) | | | (38,719,710 | ) |
| 2011 Semiannual Report | June 30, 2011 |
Financial Highlights For a Share Outstanding Through the Period Ended June 30, 2011 (unaudited) and Each Fiscal Year Ended December 31, | |
| | | | | | | Income from Investment Operations | | | | |
| | | Net Asset Value, Beginning of Period | | | Net Investment Income (Loss) (5) | | | Net gains (losses) on securities, futures, and options (both realized and unrealized) | | | Total from Investment Operations | | | From Net Investment Income | | | | | | From Tax Return of Capital | | | | |
| The Muirfield Fund (1)(2)(3)(4) | |
| 2011 | | | $ | 5.60 | | | | (0.02 | ) | | | 0.17 | | | | 0.15 | | | | 0.00 | | | | 0.00 | | | | 0.00 | | | | 0.00 | |
| 2010 | | | $ | 4.99 | | | | 0.02 | | | | 0.61 | | | | 0.63 | | | | (0.02 | ) | | | 0.00 | | | | 0.00 | | | | (0.02 | ) |
| 2009 | | | $ | 4.21 | | | | 0.01 | | | | 0.79 | | | | 0.80 | | | | (0.02 | ) | | | 0.00 | | | | 0.00 | | | | (0.02 | ) |
| 2008 | | | $ | 6.02 | | | | 0.02 | | | | (1.83 | ) | | | (1.81 | ) | | | 0.00 | | | | 0.00 | | | | 0.00 | | | | 0.00 | |
| 2007 | | | $ | 5.81 | | | | 0.18 | | | | 0.23 | | | | 0.41 | | | | (0.20 | ) | | | 0.00 | | | | 0.00 | | | | (0.20 | ) |
| 2006 | | | $ | 5.15 | | | | 0.04 | | | | 0.66 | | | | 0.70 | | | | (0.04 | ) | | | 0.00 | | | | 0.00 | | | | (0.04 | ) |
The Dynamic Growth Fund (1)(2)(3)(4) | |
| 2011 | | | $ | 8.14 | | | | (0.03 | ) | | | 0.26 | | | | 0.23 | | | | 0.00 | | | | 0.00 | | | | 0.00 | | | | 0.00 | |
| 2010 | | | $ | 7.06 | | | | 0.02 | | | | 1.08 | | | | 1.10 | | | | (0.02 | ) | | | 0.00 | | | | 0.00 | | | | (0.02 | ) |
| 2009 | | | $ | 5.48 | | | | 0.00 | | | | 1.58 | | | | 1.58 | | | | 0.00 | ** | | | 0.00 | | | | 0.00 | | | | 0.00 | ** |
| 2008 | | | $ | 9.24 | | | | 0.04 | | | | (3.71 | ) | | | (3.67 | ) | | | (0.04 | ) | | | (0.05 | ) | | | 0.00 | | | | (0.09 | ) |
| 2007 | | | $ | 9.56 | | | | 0.29 | | | | 0.38 | | | | 0.67 | | | | (0.30 | ) | | | (0.69 | ) | | | 0.00 | | | | (0.99 | ) |
| 2006 | | | $ | 8.28 | | | | 0.04 | | | | 1.28 | | | | 1.32 | | | | (0.04 | ) | | | 0.00 | | | | 0.00 | | | | (0.04 | ) |
The Aggressive Growth Fund (1)(2)(3)(4) | |
| 2011 | | | $ | 7.97 | | | | (0.06 | ) | | | 0.33 | | | | 0.27 | | | | 0.00 | | | | 0.00 | | | | 0.00 | | | | 0.00 | |
| 2010 | | | $ | 6.89 | | | | (0.01 | ) | | | 1.09 | | | | 1.08 | | | | 0.00 | | | | 0.00 | | | | 0.00 | | | | 0.00 | |
| 2009 | | | $ | 5.19 | | | | (0.01 | ) | | | 1.71 | | | | 1.70 | | | | 0.00 | | | | 0.00 | | | | 0.00 | | | | 0.00 | |
| 2008 | | | $ | 8.59 | | | | 0.05 | | | | (3.40 | ) | | | (3.35 | ) | | | (0.05 | ) | | | 0.00 | | | | 0.00 | | | | (0.05 | ) |
| 2007 | | | $ | 8.13 | | | | 0.04 | | | | 0.46 | | | | 0.50 | | | | (0.04 | ) | | | 0.00 | | | | 0.00 | | | | (0.04 | ) |
| 2006 | | | $ | 7.19 | | | | 0.03 | | | | 0.94 | | | | 0.97 | | | | (0.03 | ) | | | 0.00 | | | | 0.00 | | | | (0.03 | ) |
The Defensive Balanced Fund (1)(2)(3)(4) | |
| 2011 | | | $ | 9.72 | | | | 0.02 | | | | 0.22 | | | | 0.24 | | | | 0.00 | | | | 0.00 | | | | 0.00 | | | | 0.00 | |
| 2010 | | | $ | 8.98 | | | | 0.14 | | | | 0.74 | | | | 0.88 | | | | (0.14 | ) | | | 0.00 | | | | 0.00 | | | | (0.14 | ) |
| 2009 | | | $ | 7.86 | | | | 0.03 | | | | 1.12 | | | | 1.15 | | | | (0.03 | ) | | | 0.00 | | | | 0.00 | | | | (0.03 | ) |
| 2008 | | | $ | 10.46 | | | | 0.07 | | | | (2.60 | ) | | | (2.53 | ) | | | (0.07 | ) | | | 0.00 | | | | 0.00 | | | | (0.07 | ) |
| 2007 | | | $ | 10.51 | | | | 0.07 | | | | 0.45 | | | | 0.52 | | | | (0.07 | ) | | | (0.50 | ) | | | 0.00 | | | | (0.57 | ) |
| 2006* | | $ | 10.00 | | | | 0.07 | | | | 0.51 | | | | 0.58 | | | | (0.07 | ) | | | 0.00 | | | | 0.00 | | | | (0.07 | ) |
The Strategic Growth Fund (1)(2)(3)(4) | |
| 2011 | | | $ | 9.71 | | | | (0.06 | ) | | | 0.41 | | | | 0.35 | | | | 0.00 | | | | 0.00 | | | | 0.00 | | | | 0.00 | |
| 2010 | | | $ | 8.12 | | | | 0.04 | | | | 1.58 | | | | 1.62 | | | | (0.03 | ) | | | 0.00 | | | | 0.00 | | | | (0.03 | ) |
| 2009 | | | $ | 5.98 | | | | (0.01 | ) | | | 2.15 | | | | 2.14 | | | | 0.00 | | | | 0.00 | | | | 0.00 | | | | 0.00 | |
| 2008 | | | $ | 10.58 | | | | 0.05 | | | | (4.60 | ) | | | (4.55 | ) | | | (0.05 | ) | | | 0.00 | | | | 0.00 | | | | (0.05 | ) |
| 2007 | | | $ | 10.73 | | | | 0.08 | | | | 0.46 | | | | 0.54 | | | | (0.07 | ) | | | (0.62 | ) | | | 0.00 | | | | (0.69 | ) |
| 2006* | | $ | 10.00 | | | | 0.06 | | | | 0.73 | | | | 0.79 | | | | (0.06 | ) | | | 0.00 | | | | 0.00 | | | | (0.06 | ) |
| 1 | Ratio of net expenses to average net assets, ratio of net investment income (loss) to average net assets, ratio of expenses to average net assets after reductions, excluding expenses paid indirectly, and ratio of expenses to average net assets before reductions do not include impact of expenses of the underlying security holdings as represented in the schedule of investments. |
| 2 | Recognition of net investment income by the Fund is affected by the timing of the declaration of dividends by the underlying investment companies in which the Fund invests. |
| 3 | Total return and portfolio turnover rate are not annualized for periods of less than one full year. |
| 4 | Ratio of net expenses to average net assets, ratio of net investment income (loss) to average net assets, ratio of average net assets after reductions, excluding expenses paid indirectly, and ratio of expenses to average net assets before reductions are annualized for periods of less than one full year. |
| 2011 Semiannual Report | June 30, 2011 |
| | | | | | | | |
Net Asset Value, End of Period | | | Total Return (Assumes Reinvestment of Distributions) | | | Net Assets, End of Period ($000) | | | Ratio of Net Expenses to Average Net Assets | | | Ratio of Net Investment Income (Loss) to Average Net Assets | | | Ratio of Expenses to Average Net Assets after Reductions, Excluding Expenses Paid Indirectly | | | Ratio of Expenses to Average Net Assets Before Reductions | | | | |
| | |
| $ | 5.75 | | | | 2.68 | % | | $ | 116,269 | | | | 1.39 | % | | | (0.83 | %) | | | 1.46 | % | | | 1.58 | % | | | 94 | % |
| $ | 5.60 | | | | 12.65 | % | | $ | 122,266 | | | | 1.39 | % | | | 0.40 | % | | | 1.47 | % | | | 1.60 | % | | | 128 | % |
| $ | 4.99 | | | | 18.95 | % | | $ | 115,138 | | | | 1.43 | % | | | 0.17 | % | | | 1.51 | % | | | 1.66 | % | | | 166 | % |
| $ | 4.21 | | | | (30.07 | %) | | $ | 86,310 | | | | 1.39 | % | | | 0.54 | % | | | 1.48 | % | | | 1.75 | % | | | 173 | % |
| $ | 6.02 | | | | 7.02 | % | | $ | 50,374 | | | | 1.38 | % | | | 3.01 | % | | | 1.52 | % | | | 1.88 | % | | | 144 | % |
| $ | 5.81 | | | | 13.62 | % | | $ | 53,227 | | | | 1.45 | % | | | 0.65 | % | | | 1.56 | % | | | 1.85 | % | | | 131 | % |
| |
| $ | 8.37 | | | | 2.83 | % | | $ | 100,714 | | | | 1.39 | % | | | (0.83 | %) | | | 1.46 | % | | | 1.57 | % | | | 91 | % |
| $ | 8.14 | | | | 15.54 | % | | $ | 95,239 | | | | 1.39 | % | | | 0.23 | % | | | 1.47 | % | | | 1.59 | % | | | 119 | % |
| $ | 7.06 | | | | 28.87 | % | | $ | 84,358 | | | | 1.37 | % | | | (0.04 | %) | | | 1.48 | % | | | 1.63 | % | | | 148 | % |
| $ | 5.48 | | | | (39.77 | %) | | $ | 67,298 | | | | 1.34 | % | | | 0.95 | % | | | 1.46 | % | | | 1.69 | % | | | 122 | % |
| $ | 9.24 | | | | 7.06 | % | | $ | 19,115 | | | | 1.32 | % | | | 2.94 | % | | | 1.46 | % | | | 1.86 | % | | | 150 | % |
| $ | 9.56 | | | | 15.96 | % | | $ | 21,566 | | | | 1.42 | % | | | 0.42 | % | | | 1.55 | % | | | 1.86 | % | | | 123 | % |
| |
| $ | 8.24 | | | | 3.39 | % | | $ | 38,869 | | | | 1.55 | % | | | (1.21 | %) | | | 1.61 | % | | | 1.67 | % | | | 110 | % |
| $ | 7.97 | | | | 15.67 | % | | $ | 33,908 | | | | 1.59 | % | | | (0.07 | %) | | | 1.66 | % | | | 1.77 | % | | | 124 | % |
| $ | 6.89 | | | | 32.76 | % | | $ | 29,895 | | | | 1.54 | % | | | (0.25 | %) | | | 1.63 | % | | | 1.82 | % | | | 156 | % |
| $ | 5.19 | | | | (38.98 | %) | | $ | 20,715 | | | | 1.62 | % | | | 0.77 | % | | | 1.65 | % | | | 1.84 | % | | | 213 | % |
| $ | 8.59 | | | | 6.14 | % | | $ | 28,841 | | | | 1.70 | % | | | 0.49 | % | | | 1.70 | % | | | 1.83 | % | | | 170 | % |
| $ | 8.13 | | | | 13.54 | % | | $ | 21,554 | | | | 1.80 | % | | | 0.51 | % | | | 1.81 | % | | | 1.98 | % | | | 200 | % |
| |
| $ | 9.96 | | | | 2.47 | % | | $ | 73,089 | | | | 1.49 | % | | | 0.34 | % | | | 1.54 | % | | | 1.62 | % | | | 95 | % |
| $ | 9.72 | | | | 9.76 | % | | $ | 57,779 | | | | 1.52 | % | | | 1.51 | % | | | 1.57 | % | | | 1.66 | % | | | 161 | % |
| $ | 8.98 | | | | 14.65 | % | | $ | 49,388 | | | | 1.54 | % | | | 0.41 | % | | | 1.59 | % | | | 1.72 | % | | | 182 | % |
| $ | 7.86 | | | | (24.16 | %) | | $ | 34,766 | | | | 1.54 | % | | | 0.67 | % | | | 1.55 | % | | | 1.70 | % | | | 204 | % |
| $ | 10.46 | | | | 5.03 | % | | $ | 74,290 | | | | 1.56 | % | | | 0.79 | % | | | 1.56 | % | | | 1.66 | % | | | 137 | % |
| $ | 10.51 | | | | 5.84 | % | | $ | 42,489 | | | | 1.72 | % | | | 1.20 | % | | | 1.72 | % | | | 1.81 | % | | | 105 | % |
| |
| $ | 10.06 | | | | 3.60 | % | | $ | 85,738 | | | | 1.42 | % | | | (1.09 | %) | | | 1.51 | % | | | 1.58 | % | | | 89 | % |
| $ | 9.71 | | | | 19.96 | % | | $ | 62,431 | | | | 1.49 | % | | | 0.48 | % | | | 1.59 | % | | | 1.70 | % | | | 115 | % |
| $ | 8.12 | | | | 35.79 | % | | $ | 34,052 | | | | 1.54 | % | | | (0.13 | %) | | | 1.65 | % | | | 1.80 | % | | | 75 | % |
| $ | 5.98 | | | | (43.00 | %) | | $ | 21,074 | | | | 1.57 | % | | | 0.47 | % | | | 1.59 | % | | | 1.74 | % | | | 178 | % |
| $ | 10.58 | | | | 5.08 | % | | $ | 63,785 | | | | 1.58 | % | | | 0.75 | % | | | 1.58 | % | | | 1.68 | % | | | 134 | % |
| $ | 10.73 | | | | 7.91 | % | | $ | 36,533 | | | | 1.75 | % | | | 0.94 | % | | | 1.75 | % | | | 1.84 | % | | | 92 | % |
| 5 | Except for The Money Market Fund, net investment income per share is based on average shares outstanding during the period. |
| * | Commenced Operations January 31, 2006 |
| ** | Actual amounts were less than one-half of a cent per share |
| The accompanying notes are integral part of these financial statements. |
| 2011 Semiannual Report | June 30, 2011 |
Financial Highlights For a Share Outstanding Through the Period Ended June 30, 2011 (unaudited) and Each Fiscal Year Ended December 31, | |
| | | | | | | Income from Investment Operations | | | | |
| | | Net Asset Value, Beginning of Period | | | Net Investment Income (Loss) (5) | | | Net gains (losses) on securities, futures, and options (both realized and unrealized) | | | Total from Investment Operations | | | From Net Investment Income | | | | | | From Tax Return of Capital | | | | |
| The Quantex Fund (3)(4) | |
| 2011 | | | $ | 22.77 | | | | (0.01 | ) | | | 1.48 | | | | 1.47 | | | | 0.00 | | | | 0.00 | | | | 0.00 | | | | 0.00 | |
| 2010 | | | $ | 18.48 | | | | (0.06 | ) | | | 4.35 | | | | 4.29 | | | | 0.00 | | | | 0.00 | | | | 0.00 | | | | 0.00 | |
| 2009 | | | $ | 10.42 | | | | (0.01 | ) | | | 8.07 | | | | 8.06 | | | | 0.00 | ** | | | 0.00 | | | | 0.00 | | | | 0.00 | ** |
| 2008 | | | $ | 18.32 | | | | 0.00 | | | | (7.90 | ) | | | (7.90 | ) | | | 0.00 | | | | 0.00 | | | | 0.00 | | | | 0.00 | |
| 2007 | | | $ | 19.86 | | | | 0.16 | | | | (1.54 | ) | | | (1.38 | ) | | | (0.16 | ) | | | 0.00 | | | | 0.00 | | | | (0.16 | ) |
| 2006 | | | $ | 17.09 | | | | 0.08 | | | | 2.77 | | | | 2.85 | | | | (0.08 | ) | | | 0.00 | | | | 0.00 | | | | (0.08 | ) |
The Utilities and Infrastructure Fund (3)(4) | |
| 2011 | | | $ | 23.51 | | | | 0.17 | | | | 1.20 | | | | 1.37 | | | | (0.07 | ) | | | 0.00 | | | | 0.00 | | | | (0.07 | ) |
| 2010 | | | $ | 20.73 | | | | 0.15 | | | | 2.76 | | | | 2.91 | | | | (0.13 | ) | | | 0.00 | | | | 0.00 | | | | (0.13 | ) |
| 2009 | | | $ | 16.13 | | | | 0.15 | | | | 4.74 | | | | 4.89 | | | | (0.16 | ) | | | 0.00 | | | | (0.13 | ) | | | (0.29 | ) |
| 2008 | | | $ | 26.14 | | | | 0.09 | | | | (9.90 | ) | | | (9.81 | ) | | | (0.14 | ) | | | 0.00 | | | | (0.06 | ) | | | (0.20 | ) |
| 2007 | | | $ | 22.23 | | | | 0.14 | | | | 3.91 | | | | 4.05 | | | | (0.14 | ) | | | 0.00 | | | | 0.00 | | | | (0.14 | ) |
| 2006 | | | $ | 19.03 | | | | 0.15 | | | | 3.20 | | | | 3.35 | | | | (0.15 | ) | | | 0.00 | | | | 0.00 | | | | (0.15 | ) |
The U.S. Government Bond Fund (3)(4) | |
| 2011 | | | $ | 20.87 | | | | 0.16 | | | | (0.03 | ) | | | 0.13 | | | | (0.16 | ) | | | 0.00 | | | | 0.00 | | | | (0.16 | ) |
| 2010 | | | $ | 20.79 | | | | 0.43 | | | | 0.34 | | | | 0.77 | | | | (0.44 | ) | | | (0.25 | ) | | | 0.00 | | | | (0.69 | ) |
| 2009 | | | $ | 20.96 | | | | 0.60 | | | | (0.17 | ) | | | 0.43 | | | | (0.60 | ) | | | 0.00 | | | | 0.00 | | | | (0.60 | ) |
| 2008 | | | $ | 20.58 | | | | 0.66 | | | | 0.38 | | | | 1.04 | | | | (0.66 | ) | | | 0.00 | | | | 0.00 | | | | (0.66 | ) |
| 2007 | | | $ | 20.30 | | | | 0.73 | | | | 0.72 | | | | 1.45 | | | | (1.17 | ) | | | 0.00 | | | | 0.00 | | | | (1.17 | ) |
| 2006 | | | $ | 20.22 | | | | 0.68 | | | | 0.14 | | | | 0.82 | | | | (0.74 | ) | | | 0.00 | | | | 0.00 | | | | (0.74 | ) |
The Total Return Bond Fund | |
| 2011* | | $ | 10.00 | | | | 0.00 | | | | 0.00 | | | | 0.00 | | | | 0.00 | | | | 0.00 | | | | 0.00 | | | | 0.00 | |
The Money Market Fund - Retail Class (3)(4) | |
| 2011 | | | $ | 1.00 | | | | 0.001 | | | | N/A | | | | 0.001 | | | | (0.001 | ) | | | 0.000 | | | | 0.000 | | | | (0.001 | ) |
| 2010 | | | $ | 1.00 | | | | 0.002 | | | | N/A | | | | 0.002 | | | | (0.002 | ) | | | 0.000 | | | | 0.000 | | | | (0.002 | ) |
| 2009 | | | $ | 1.00 | | | | 0.006 | | | | N/A | | | | 0.006 | | | | (0.006 | ) | | | 0.000 | | | | 0.000 | | | | (0.006 | ) |
| 2008 | | | $ | 1.00 | | | | 0.026 | | | | N/A | | | | 0.026 | | | | (0.026 | ) | | | 0.000 | | | | 0.000 | | | | (0.026 | ) |
| 2007 | | | $ | 1.00 | | | | 0.048 | | | | N/A | | | | 0.048 | | | | (0.048 | ) | | | 0.000 | | | | 0.000 | | | | (0.048 | ) |
| 2006 | | | $ | 1.00 | | | | 0.046 | | | | N/A | | | | 0.046 | | | | (0.046 | ) | | | 0.000 | | | | 0.000 | | | | (0.046 | ) |
The Money Market Fund - Institutional Class (3)(4) | |
| 2011 | | | $ | 1.00 | | | | 0.001 | | | | N/A | | | | 0.001 | | | | (0.001 | ) | | | 0.000 | | | | 0.000 | | | | (0.001 | ) |
| 2010 | | | $ | 1.00 | | | | 0.003 | | | | N/A | | | | 0.003 | | | | (0.003 | ) | | | 0.000 | | | | 0.000 | | | | (0.003 | ) |
| 2009 | | | $ | 1.00 | | | | 0.008 | | | | N/A | | | | 0.008 | | | | (0.008 | ) | | | 0.000 | | | | 0.000 | | | | (0.008 | ) |
| 2008 | | | $ | 1.00 | | | | 0.028 | | | | N/A | | | | 0.028 | | | | (0.028 | ) | | | 0.000 | | | | 0.000 | | | | (0.028 | ) |
| 2007 | | | $ | 1.00 | | | | 0.050 | | | | N/A | | | | 0.050 | | | | (0.050 | ) | | | 0.000 | | | | 0.000 | | | | (0.050 | ) |
| 2006 | | | $ | 1.00 | | | | 0.048 | | | | N/A | | | | 0.048 | | | | (0.048 | ) | | | 0.000 | | | | 0.000 | | | | (0.048 | ) |
| 1 | Ratio of net expenses to average net assets, ratio of net investment income (loss) to average net assets, ratio of expenses to average net assets after reductions, excluding expenses paid indirectly, and ratio of expenses to average net assets before reductions do not include impact of expenses of the underlying security holdings as represented in the schedule of investments. |
| 2 | Recognition of net investment income by the Fund is affected by the timing of the declaration of dividends by the underlying investment companies in which the Fund invests. |
| 3 | Total return and portfolio turnover rate are not annualized for periods of less than one full year. |
| 2011 Semiannual Report | June 30, 2011 |
| | | | | | | | |
Net Asset Value, End of Period | | | Total Return (Assumes Reinvestment of Distributions) | | | Net Assets, End of Period ($000) | | | Ratio of Net Expenses to Average Net Assets | | | Ratio of Net Investment Income (Loss) to Average Net Assets | | | Ratio of Expenses to Average Net Assets after Reductions, Excluding Expenses Paid Indirectly | | | Ratio of Expenses to Average Net Assets Before Reductions | | | | |
| | |
| $ | 24.24 | | | | 6.46 | % | | $ | 25,784 | | | | 1.54 | % | | | (0.05 | %) | | | 1.54 | % | | | 2.04 | % | | | 26 | % |
| $ | 22.77 | | | | 23.21 | % | | $ | 17,024 | | | | 1.65 | % | | | (0.26 | %) | | | 1.65 | % | | | 2.17 | % | | | 55 | % |
| $ | 18.48 | | | | 77.37 | % | | $ | 12,667 | | | | 1.79 | % | | | (0.05 | %) | | | 1.79 | % | | | 2.39 | % | | | 34 | % |
| $ | 10.42 | | | | (43.12 | %) | | $ | 6,743 | | | | 1.73 | % | | | 0.01 | % | | | 1.73 | % | | | 2.26 | % | | | 49 | % |
| $ | 18.32 | | | | (7.00 | %) | | $ | 17,450 | | | | 1.56 | % | | | 0.76 | % | | | 1.56 | % | | | 2.09 | % | | | 56 | % |
| $ | 19.86 | | | | 16.67 | % | | $ | 20,074 | | | | 1.66 | % | | | 0.47 | % | | | 1.66 | % | | | 2.25 | % | | | 30 | % |
| |
| $ | 24.81 | | | | 5.83 | % | | $ | 34,440 | | | | 1.87 | % | | | 1.42 | % | | | 1.87 | % | | | 2.02 | % | | | 15 | % |
| $ | 23.51 | | | | 14.10 | % | | $ | 24,144 | | | | 1.92 | % | | | 0.70 | % | | | 1.92 | % | | | 2.11 | % | | | 53 | % |
| $ | 20.73 | | | | 30.63 | % | | $ | 20,731 | | | | 2.00 | % | | | 0.90 | % | | | 2.00 | % | | | 2.20 | % | | | 35 | % |
| $ | 16.13 | | | | (37.63 | %) | | $ | 15,859 | | | | 1.96 | % | | | 0.42 | % | | | 1.96 | % | | | 2.14 | % | | | 48 | % |
| $ | 26.14 | | | | 18.24 | % | | $ | 27,333 | | | | 1.90 | % | | | 0.57 | % | | | 1.90 | % | | | 2.10 | % | | | 50 | % |
| $ | 22.23 | | | | 17.68 | % | | $ | 23,969 | | | | 2.05 | % | | | 0.74 | % | | | 2.05 | % | | | 2.18 | % | | | 27 | % |
| |
| $ | 20.84 | | | | 0.64 | % | | $ | 18,223 | | | | 0.99 | % | | | 1.56 | % | | | 0.99 | % | | | 1.44 | % | | | 145 | % |
| $ | 20.87 | | | | 3.75 | % | | $ | 19,723 | | | | 0.99 | % | | | 2.08 | % | | | 0.99 | % | | | 1.45 | % | | | 215 | % |
| $ | 20.79 | | | | 2.10 | % | | $ | 17,191 | | | | 0.99 | % | | | 2.90 | % | | | 0.99 | % | | | 1.49 | % | | | 138 | % |
| $ | 20.96 | | | | 5.16 | % | | $ | 14,036 | | | | 0.99 | % | | | 3.20 | % | | | 0.99 | % | | | 1.58 | % | | | 118 | % |
| $ | 20.58 | | | | 7.44 | % | | $ | 13,769 | | | | 1.01 | % | | | 3.92 | % | | | 1.01 | % | | | 1.72 | % | | | 88 | % |
| $ | 20.30 | | | | 4.13 | % | | $ | 7,118 | | | | 1.10 | % | | | 3.59 | % | | | 1.10 | % | | | 2.22 | % | | | 106 | % |
| |
| $ | 10.00 | | | | N/A | | | $ | 20 | | | | N/A | | | | N/A | | | | N/A | | | | N/A | | | | N/A | |
| |
| $ | 1.00 | | | | 0.06 | % | | $ | 85,722 | | | | 0.32 | % | | | 0.13 | % | | | 0.32 | % | | | 0.90 | % | | | N/A | |
| $ | 1.00 | | | | 0.20 | % | | $ | 96,087 | | | | 0.38 | % | | | 0.20 | % | | | 0.38 | % | | | 0.86 | % | | | N/A | |
| $ | 1.00 | | | | 0.64 | % | | $ | 122,142 | | | | 0.55 | % | | | 0.66 | % | | | 0.55 | % | | | 0.84 | % | | | N/A | |
| $ | 1.00 | | | | 2.65 | % | | $ | 161,232 | | | | 0.49 | % | | | 2.64 | % | | | 0.49 | % | | | 0.83 | % | | | N/A | |
| $ | 1.00 | | | | 4.95 | % | | $ | 195,479 | | | | 0.48 | % | | | 4.83 | % | | | 0.48 | % | | | 0.84 | % | | | N/A | |
| $ | 1.00 | | | | 4.71 | % | | $ | 159,641 | | | | 0.48 | % | | | 4.64 | % | | | 0.48 | % | | | 0.87 | % | | | N/A | |
| |
| $ | 1.00 | | | | 0.11 | % | | $ | 25,782 | | | | 0.22 | % | | | 0.23 | % | | | 0.22 | % | | | 0.72 | % | | | N/A | |
| $ | 1.00 | | | | 0.28 | % | | $ | 33,584 | | | | 0.29 | % | | | 0.29 | % | | | 0.29 | % | | | 0.68 | % | | | N/A | |
| $ | 1.00 | | | | 0.75 | % | | $ | 46,249 | | | | 0.43 | % | | | 0.83 | % | | | 0.43 | % | | | 0.67 | % | | | N/A | |
| $ | 1.00 | | | | 2.79 | % | | $ | 77,294 | | | | 0.37 | % | | | 2.55 | % | | | 0.37 | % | | | 0.68 | % | | | N/A | |
| $ | 1.00 | | | | 5.09 | % | | $ | 20,333 | | | | 0.34 | % | | | 4.98 | % | | | 0.34 | % | | | 0.67 | % | | | N/A | |
| $ | 1.00 | | | | 4.86 | % | | $ | 24,118 | | | | 0.34 | % | | | 4.76 | % | | | 0.34 | % | | | 0.71 | % | | | N/A | |
| 4 | Ratio of net expenses to average net assets, ratio of net investment income (loss) to average net assets, ratio of average net assets after reductions, excluding expenses paid indirectly, and ratio of expenses to average net assets before reductions are annualized for periods of less than one full year. |
| 5 | Except for The Money Market Fund, net investment income per share is based on average shares outstanding during the period. |
| * | Commenced Operations June 30, 2011 |
| ** | Actual amounts were less than one-half of a cent per share |
| The accompanying notes are integral part of these financial statements. |
| 2011 Semiannual Report | June 30, 2011 |
Notes to Financial Statements June 30, 2011 (unaudited) |
| 1. | Organization and Significant Accounting Policies |
The Flex-funds® Trust (the “Trust”) was organized in 1982 and is registered under the Investment Company Act of 1940, as amended (the “1940 Act”), as a diversified, open-end management investment company. The Trust offers ten separate series and is presently comprised of ten separate funds as follows: The Muirfield Fund® (“Muirfield”), The Dynamic Growth Fund (“Dynamic”), The Aggressive Growth Fund (“Aggressive”), The Defensive Balanced Fund (“Defensive”), The Strategic Growth Fund (“Strategic”), The Quantex Fund™ (“Quantex”), The Utilities and Infrastructure Fund (f.k.a. The Total Return Utilities Fund)(“Utilities”)(please see second paragraph of Note #1 for more information), The U.S. Government Bond Fund (“US Bond”), The Total Return Bond Fund (“Total Bond”)(please see third paragraph of Note #1 for more information), and The Money Market Fund (“Money Market”) (each a “Fund” and collectively the “Funds”). Money Market offers two classes of shares (the Retail Class (“Retail Class”) and the Institutional Class (“Institutional Class”)). Each class of shares has equal rights as to earnings and assets except that each class bears different distribution and transfer agent expenses. The investment objective of Muirfield, Dynamic, Aggressive, and Strategic is growth of capital. The investment objective of Defensive is growth of capital, with current income usually of secondary importance. The investment objective of Quantex is long term capital appreciation. The investment objective of Utilities is total returns, including current income and growth of income. The investment objective of US Bond is maximum current income. The investment objective of Total Bond is total returns, including current income and capital growth. The investment objective of Money Market is current income while maintaining a stable share price of $1.00.
Effective April 29, 2011, the Board of Trustees (“Trustees”), including a majority of non-interested or independent Trustees, approved the change of name of The Total Return Utilities Fund to The Utilities and Infrastructure Fund. The investment strategy remains the same with an investment objective seeking total returns through income and capital appreciation. The Fund does not and will not invest in electric utilities that generate power from nuclear reactors.
On June 30, 2011, Meeder Asset Management, Inc. (“MAM”), the investment advisor to the Funds, offered a new fund to the Trust. The Total Return Bond Fund seeks total return, consisting of income and capital growth, consistent with preservation of capital by investing at least 80% of its assets in bonds which include fixed income securities and/or investments that provide exposure to fixed income securities. MAM uses a combination of quantitative models that seek to measure the relative risks and opportunities of each market segment based upon economic, market, political, currency and technical data, and its own assessment of economic and market conditions, to create an optimal risk/return allocation of the Fund’s assets among various segments of the fixed income market. After sector allocations are made, MAM uses traditional credit analysis to identify individual securities for the Fund’s portfolio.
Use of estimates. The preparation of financial statements in conformity with accounting principles generally accepted in the United States of America (“GAAP”) requires management to make estimates and assumptions that affect the reported amounts of assets and liabilities and disclosure of contingent assets and liabilities at the date of the financial statements and the reported amounts of increases and decreases in net assets from operations during the reporting period. Actual results could differ from those estimates.
Security valuation. All investments in securities are recorded at their estimated fair value, as described in Note #2.
Repurchase agreements. Each Fund may engage in repurchase agreement transactions whereby the Fund takes possession of an underlying debt instrument subject to an obligation of the seller to repurchase the instrument from the Fund and an obligation of the Fund to resell the instrument at an agreed upon price and term. At all times, the Fund maintains the value of collateral, including accrued interest, of at least 100% of the amount of the repurchase agreement, plus accrued interest. If the seller defaults or if the fair value of the collateral declines, realization of the collateral by the Funds may be delayed or limited.
Futures & options. Each Fund, except Money Market, may engage in transactions in financial futures contracts and options contracts in order to manage the risk of unanticipated changes in market values of securities held in the Fund, or which it intends to purchase. The futures and options contracts are adjusted by the daily exchange rate of the underlying currency, or index, and any gains or losses are recorded for financial statement purposes as unrealized gains or losses in the statement of assets and liabilities and the statement of operations until the contract settlement date, at which time realized gains and losses are included in the statement of operations.
| 2011 Semiannual Report | June 30, 2011 |
To the extent that the Fund enters into futures contracts on an index or group of securities, the Fund exposes itself to an indeterminate liability and will be required to pay or receive a sum of money measured by the change in the value of the index. Upon entering into a futures contract, the Fund is required to deposit an initial margin, which is either cash or securities in an amount equal to a certain percentage of the contract value. Subsequently, the variation margin, which is equal to changes in the daily settlement price or last sale price on the exchanges where futures contracts trade, is received or paid and is recorded as an unrealized gain or loss until the contract is closed. When the contract is closed, the Fund records a realized gain or loss equal to the difference between the proceeds from (or cost of) the closing transaction and the Fund’s basis in the contract. Should market conditions move unexpectedly, the Fund may not achieve the anticipated benefits of the futures contract and may realize a loss. The use of futures transactions involves the risk of imperfect correlation in movements in the price of futures contracts, interest rates, and the underlying hedged assets. With futures, there is minimal counterparty credit risk to the Fund since futures are exchange traded and the exchange’s clearinghouse, as counterparty to all exchange traded futures, guarantees the futures against default. Except for Money Market and Utilities, it is normal practice for each Fund to invest in futures contracts on a daily basis. Although Utilities is permitted to invest in futures contracts, it typically does not.
Call and put option contracts involve the payment of a premium for the right to purchase or sell an individual security or index aggregate at a specified price until the expiration of the contract. Such transactions expose the Fund to the loss of the premium paid if the Fund does not sell or exercise the contract prior to the expiration date. In the case of a call option, sufficient cash or money market instruments will be segregated to complete the purchase. Options are valued on the basis of the daily settlement price or last sale on the exchanges where they trade and the changes in value are recorded as unrealized appreciation or depreciation until closed, exercised or expired. For the six months ended June 30, 2011, there were no call or put options transacted for any of the Funds.
The Funds may write covered call or put options for which premiums received are recorded as liabilities and are subsequently adjusted to the current value of the options written. When written options are closed or exercised, premiums received are offset against the proceeds paid, and the Fund records realized gains or losses for the difference. When written options expire, the liability is eliminated, and the Fund records realized gains for the entire amount of premiums received. Although permitted, it is currently not normal practice for the Funds to invest in call and put options.
The fair value of derivative instruments as reported within the Statements of Assets and Liabilities as of June 30, 2011 was as follows:
| Amount of Net Variation Margin on Derivatives | |
| | | | | | |
The Muirfield Fund® | Equity contracts | Assets, Receivable for net variation margin on futures contracts | | $ | 35,853 | |
| The Dynamic Growth Fund | Equity contracts | Assets, Receivable for net variation margin on futures contracts | | | 30,618 | |
| The Aggressive Growth Fund | Equity contracts | Assets, Receivable for net variation margin on futures contracts | | | 11,200 | |
| The Defensive Balanced Fund | Equity contracts | Assets, Receivable for net variation margin on futures contracts | | | 19,600 | |
| The Strategic Growth Fund | Equity contracts | Assets, Receivable for net variation margin on futures contracts | | | 9,285 | |
| The Quantex Fund™ | Equity contracts | Assets, Receivable for net variation margin on futures contracts | | | 2,700 | |
| The U.S. Government Bond Fund | US Treasury Bond contracts | Assets, Receivable for net variation margin on futures contracts | | | 17,695 | |
| 2011 Semiannual Report | June 30, 2011 |
The effect of derivative instruments on the Statements of Operations for the period January 1, 2011 through June 30, 2011 was as follows:
Amount of Realized Gain on Derivatives Recognized in Income | |
| | | | Contracts Opened During the Year | | | Contracts Closed During the Year | | Statement of Operations Location | | For the Six Months Ended June 30, 2011 | |
The Muirfield Fund® | Equity contracts | | | 87 | | | | 87 | | Net realized gains from futures contracts | | $ | 310,569 | |
| The Dynamic Growth Fund | Equity contracts | | | 45 | | | | 42 | | Net realized gains from futures contracts | | | 186,520 | |
| The Aggressive Growth Fund | Equity contracts | | | 54 | | | | 53 | | Net realized gains from futures contracts | | | 107,379 | |
| The Defensive Balanced Fund | Equity contracts | | | 46 | | | | 43 | | Net realized gains from futures contracts | | | 43,555 | |
| The Strategic Growth Fund | Equity contracts | | | 32 | | | | 32 | | Net realized gains from futures contracts | | | 192,944 | |
| The Quantex Fund™ | Equity contracts | | | 22 | | | | 23 | | Net realized gains from futures contracts | | | 34,930 | |
| The U.S. Government Bond Fund | US Treasury Bond contracts | | | 140 | | | | 95 | | Net realized gains (losses) from futures contracts | | | (140,995 | ) |
| Change in Unrealized Gain or (Loss) on Derivatives Recognized in Income | |
| | | Statement of Operations Location | | For the Six Months Ended June 30, 2011 | |
The Muirfield Fund® | Equity contracts | Net change in unrealized appreciation (depreciation) of investments and futures contracts | | $ | 41,350 | |
| The Dynamic Growth Fund | Equity contracts | Net change in unrealized appreciation (depreciation) of investments and futures contracts | | | 62,415 | |
| The Aggressive Growth Fund | Equity contracts | Net change in unrealized appreciation (depreciation) of investments and futures contracts | | | 43,230 | |
| The Defensive Balanced Fund | Equity contracts | Net change in unrealized appreciation (depreciation) of investments and futures contracts | | | 41,853 | |
| The Strategic Growth Fund | Equity contracts | Net change in unrealized appreciation (depreciation) of investments and futures contracts | | | 43,550 | |
| The Quantex Fund™ | Equity contracts | Net change in unrealized appreciation (depreciation) of investments and futures contracts | | | 7,108 | |
The U.S. Government Bond Fund | US Treasury Bond contracts | Net change in unrealized appreciation (depreciation) of investments and futures contracts | | | 46,733 | |
Federal income taxes. It is each Fund’s policy to continue to comply with the requirements of Subchapter M of the Internal Revenue Code applicable to regulated investment companies and to distribute substantially all of its taxable income and net capital gains to its shareholders. Therefore, no federal income tax provision is required.
As of and during the six months ended June 30, 2011, the Funds did not have a liability for any unrecognized tax benefits. The Funds recognize interest and penalties, if any, related to unrecognized tax benefits as income tax expense in the statements of operations. During the six months ended June 30, 2011, the Funds did not incur any interest or penalties.
The Funds are not subject to examination by U.S. federal and state tax authorities for tax years before 2007.
| 2011 Semiannual Report | June 30, 2011 |
Distributions to shareholders. Distributions to shareholders are recorded on the ex-dividend date. Muirfield, Quantex, Dynamic, Aggressive, Defensive, and Strategic declare and pay dividends from net investment income, if any, on a quarterly basis. Utilities and Total Bond declare and pay dividends from net investment income on a monthly basis. US Bond and Money Market declare dividends from net investment income on a daily basis and pay such dividends on a monthly basis. Each Fund distributes net capital gains, if any, on an annual basis.
Distributions from net investment income and from net capital gains are determined in accordance with income tax regulations, which may differ from GAAP. These differences are primarily due to deferrals of certain losses, expiring capital loss carryforwards, and differing treatments of unrealized gains and losses of futures contracts held by each Fund. Accordingly, timing differences relating to shareholder distributions are reflected in the components of net assets and permanent book and tax differences have been reclassified within the components of net assets based on their ultimate characterization for federal income tax purposes. For the year ended December 31, 2010, the Funds made the following reclassifications to increase/(decrease) the components of net assets:
| | | | | | Undistributed Net Investment Income | | | Accumulated Net Realized Gain (Loss) | |
| The Dynamic Growth Fund | | $ | (5 | ) | | $ | 5 | | | $ | — | |
| The Aggressive Growth Fund | | | (21,654 | ) | | | 21,654 | | | | — | |
| The Quantex Fund™ | | | (39,827 | ) | | | 39,827 | | | | — | |
| The Utilities and Infrastructure Fund | | | 13,997 | | | | (18,459 | ) | | | 4,462 | |
| The U.S. Government Bond Fund | | | (232,564 | ) | | | — | | | | 232,564 | |
Investment income & expenses. For Money Market, income and expenses (other than expenses attributable to a specific class) are allocated to each class of shares based on its relative net assets. Expenses incurred by the Trust that do not specifically relate to an individual Fund of the Trust are allocated to the Funds based on each Fund’s relative net assets or other appropriate basis.
Capital Share Transactions. Money Market is authorized to issue an indefinite number of shares in the Retail Class and the Institutional Class. Transactions in the capital shares of the Fund for the six months ended June 30, 2011 and the year ended December 31, 2010 were as follows:
| | | | | | | |
| | | | | | | | | | | | | |
| Retail Class | | | | | | | | | | | | |
| Issued | | $ | 53,399,870 | | | | 53,399,870 | | | $ | 107,339,519 | | | | 107,339,519 | |
| Reinvested | | | 56,861 | | | | 56,861 | | | | 210,200 | | | | 210,200 | |
| Redeemed | | | (63,821,694 | ) | | | (63,821,694 | ) | | | (133,604,462 | ) | | | (133,604,462 | ) |
| Net increase (decrease) | | $ | (10,364,963 | ) | | | (10,364,963 | ) | | $ | (26,054,743 | ) | | | (26,054,743 | ) |
| | | | | | | | | | | | | | | | | |
| Institutional Class | | | | | | | | | | | | | | | | |
| Issued | | $ | 121,261,244 | | | | 121,261,244 | | | $ | 254,909,383 | | | | 254,909,383 | |
| Reinvested | | | 10,810 | | | | 10,810 | | | | 36,054 | | | | 36,054 | |
| Redeemed | | | (129,074,483 | ) | | | (129,074,483 | ) | | | (267,610,404 | ) | | | (267,610,404 | ) |
| Net increase (decrease) | | $ | (7,802,429 | ) | | | (7,802,429 | ) | | $ | (12,664,967 | ) | | | (12,664,967 | ) |
Other. The Funds record security transactions on the trade date. Gains and losses realized from the sale of securities are determined on the specific identification basis. Dividend income is recognized on the ex-dividend date and interest income (including amortization of premium and accretion of discount) is recognized as earned. Short-term capital gain distributions from underlying funds are classified as dividend income for financial reporting purposes. Long-term capital gains are broken out as such. Discounts and premiums are amortized over the lives of the respective securities. Distributions received from partnerships are recorded as return of capital distributions. Withholding taxes on foreign dividends have been provided for in accordance with the Funds’ understanding of the applicable country’s tax rules and rates.
| 2011 Semiannual Report | June 30, 2011 |
As described in Note #1, the Funds utilize various methods to measure the fair value of their investments on a recurring basis. GAAP establishes a hierarchy that prioritizes inputs to valuation methods. The three levels of inputs are as follows:
Level 1 – Unadjusted quoted prices in active markets for identical assets or liabilities that the Funds have the ability to access.
Level 2 – Observable inputs other than quoted prices included in level 1 that are observable for the asset or liability, either directly or indirectly. These inputs may include quoted prices for the identical instrument on an inactive market, prices for similar instruments, interest rates, prepayment speeds, credit risk, yield curves, default rates and similar data.
Level 3 – Significant unobservable inputs for the asset or liability, to the extent relevant observable inputs are not available, representing the Funds’ own assumptions about the assumptions a market participant would use in valuing the asset or liability, and would be based on the best information available.
The availability of observable inputs can vary from security to security and is affected by a wide variety of factors, including, for example, the type of security, whether the security is new and not yet established in the marketplace, the liquidity of markets, and other characteristics particular to the security. To the extent that valuation is based on models or inputs that are less observable or unobservable in the market, the determination of fair value requires more judgment. Accordingly, the degree of judgment exercised in determining fair value is greatest for instruments categorized in level 3.
The inputs used to measure fair value may fall into different levels of the fair value hierarchy. In such cases, for disclosure purposes, the level in the fair value hierarchy within which the fair value measurement falls in its entirety, is determined based on the lowest level input that is significant to the fair value measurement in its entirety.
A description of the valuation techniques applied to the Funds’ major categories of assets and liabilities measured at fair value on a recurring basis follows.
Equity securities (including publicly traded partnerships, real estate investment trusts, american depositary receipts, exchange traded funds, and common stock). Securities traded on a national securities exchange (or reported on the NASDAQ national market) are stated at the last reported sales price on the day of valuation and are categorized in level 1 of the fair value hierarchy.
Investments in registered open-end investment companies, including money market funds, are valued at the daily redemption value as reported by the underlying fund and are categorized in level 1 of the fair value hierarchy.
Corporate bonds. The fair value of corporate bonds is estimated using various techniques, which may consider recently executed transactions in securities of the issuer or comparable issuers, market price quotations (where observable), bond spreads, fundamental data relating to the issuer, and credit default swap spreads adjusted for any basis difference between cash and derivative instruments. While most corporate bonds are categorized in level 2 of the fair value hierarchy, in instances where lower relative weight is placed on transaction prices, quotations, or similar observable inputs, they are categorized in level 3.
Short-term notes (including bank obligations, commercial paper, corporate obligations, U.S. government agency obligations, and floating rate demand notes). Short-term notes held in the Funds, except Money Market, maturing more than sixty days after the valuation date, are valued at the last sales price as of the close of business on the day of valuation, or, lacking any sales, at the most recent bid price or yield equivalent as obtained from dealers that make markets in such securities. When valued at last sales price, the securities will be categorized as level 1. When using bid prices or yield equivalents, they will be categorized as level 2. When such securities are valued within sixty days or less to maturity, the difference between the valuation existing on the sixty-first day before maturity and maturity value is amortized on a straight-line basis to maturity and will be categorized as level 2.
All securities held in Money Market, other than money market funds, are valued at amortized cost, which approximates fair value, and will be categorized as level 2.
Certificates of deposit. Certificates of deposit are valued at acquisition cost and will be categorized as level 2.
U.S. government obligations. U.S. government obligations are normally valued using a model that incorporates market observable data such as reported sales of similar securities, broker quotes, yields, bids, offers, and reference data. Certain securities are valued principally using dealer quotations. In either case, these securities will be categorized as level 2.
| 2011 Semiannual Report | June 30, 2011 |
Restricted securities (equity and debt). Restricted securities for which quotations are not readily available are valued at fair value as determined by the Trustees. Depending on the relative significance of valuation inputs, these instruments may be classified in either level 2 or level 3 of the fair value hierarchy.
Derivative instruments (futures contracts). Listed derivative instruments that are actively traded, including futures contracts, are valued based on quoted prices from the exchange and are categorized in level 1 of the fair value hierarchy.
For the six months ended June 30, 2011, the Funds did not hold any assets at any time in which significant unobservable inputs were used in determining fair value. Therefore, no reconciliation of level 3 securities is provided. Also, there were no significant transfers between level 1 and level 2 securities. The following table summarizes the inputs used to value the Funds’ assets and liabilities measured at fair value as of June 30, 2011.
Muirfield – Assets/(Liabilities) | | | | | | | | | | | | |
Registered investment companies | | $ | 110,908,845 | | | $ | — | | | $ | — | | | $ | 110,908,845 | |
Money market registered investment companies | | | 1,964,199 | | | | — | | | | — | | | | 1,964,199 | |
Floating rate demand notes | | | — | | | | 2,632,955 | | | | — | | | | 2,632,955 | |
U.S. government obligations | | | — | | | | 799,470 | | | | — | | | | 799,470 | |
Total | | $ | 112,873,044 | | | $ | 3,432,425 | | | $ | — | | | $ | 116,305,469 | |
Trustee deferred compensation | | $ | 121,034 | | | $ | — | | | $ | — | | | $ | 121,034 | |
Futures contracts* | | $ | 108,230 | | | $ | — | | | $ | — | | | $ | 108,230 | |
Dynamic – Assets/(Liabilities) | | | | | | | | | | | | |
Registered investment companies | | $ | 96,687,598 | | | $ | — | | | $ | — | | | $ | 96,687,598 | |
Money market registered investment companies | | | 2,508,027 | | | | — | | | | — | | | | 2,508,027 | |
Floating rate demand notes | | | — | | | | 752,888 | | | | — | | | | 752,888 | |
U.S. government obligations | | | — | | | | 799,470 | | | | — | | | | 799,470 | |
Total | | $ | 99,195,625 | | | $ | 1,552,358 | | | $ | — | | | $ | 100,747,983 | |
Trustee deferred compensation | | $ | 62,795 | | | $ | — | | | $ | — | | | $ | 62,795 | |
Futures contracts* | | $ | 91,860 | | | $ | — | | | $ | — | | | $ | 91,860 | |
Aggressive – Assets/(Liabilities) | | | | | | | | | | | | |
Registered investment companies | | $ | 37,687,105 | | | $ | — | | | $ | — | | | $ | 37,687,105 | |
Money market registered investment companies | | | 890,714 | | | | — | | | | — | | | | 890,714 | |
U.S. government obligations | | | — | | | | 299,801 | | | | — | | | | 299,801 | |
Total | | $ | 38,577,819 | | | $ | 299,801 | | | $ | — | | | $ | 38,877,620 | |
Trustee deferred compensation | | $ | 38,826 | | | $ | — | | | $ | — | | | $ | 38,826 | |
Futures contracts* | | $ | 55,770 | | | $ | — | | | $ | — | | | $ | 55,770 | |
Defensive – Assets/(Liabilities) | | | | | | | | | | | | |
Registered investment companies | | $ | 69,454,913 | | | $ | — | | | $ | — | | | $ | 69,454,913 | |
Money market registered investment companies | | | 662,574 | | | | — | | | | — | | | | 662,574 | |
Floating rate demand notes | | | — | | | | 1,759,244 | | | | — | | | | 1,759,244 | |
U.S. government obligations | | | — | | | | 1,301,333 | | | | — | | | | 1,301,333 | |
Total | | $ | 70,117,487 | | | $ | 3,060,577 | | | $ | — | | | $ | 73,178,064 | |
Trustee deferred compensation | | $ | 43,064 | | | $ | — | | | $ | — | | | $ | 43,064 | |
Futures contracts* | | $ | 58,573 | | | $ | — | | | $ | — | | | $ | 58,573 | |
| 2011 Semiannual Report | June 30, 2011 |
Strategic – Assets/(Liabilities) | | | | | | | | | | | | |
Registered investment companies | | $ | 82,641,710 | | | $ | — | | | $ | — | | | $ | 82,641,710 | |
Money market registered investment companies | | | 2,350,887 | | | | — | | | | — | | | | 2,350,887 | |
Floating rate demand notes | | | — | | | | 502,104 | | | | — | | | | 502,104 | |
U.S. government obligations | | | — | | | | 299,801 | | | | — | | | | 299,801 | |
Total | | $ | 84,992,597 | | | $ | 801,905 | | | $ | — | | | $ | 85,794,502 | |
Trustee deferred compensation | | $ | 36,456 | | | $ | — | | | $ | — | | | $ | 36,456 | |
Futures contracts* | | $ | 74,255 | | | $ | — | | | $ | — | | | $ | 74,255 | |
Quantex – Assets/(Liabilities) | | | | | | | | | | | | |
Common stocks** | | $ | 25,192,983 | | | $ | — | | | $ | — | | | $ | 25,192,983 | |
Money market registered investment companies | | | 499,184 | | | | — | | | | — | | | | 499,184 | |
U.S. government obligations | | | — | | | | 199,868 | | | | — | | | | 199,868 | |
Total | | $ | 25,692,167 | | | $ | 199,868 | | | $ | — | | | $ | 25,892,035 | |
Trustee deferred compensation | | $ | 46,001 | | | $ | — | | | $ | — | | | $ | 46,001 | |
Futures contracts* | | $ | 17,343 | | | $ | — | | | $ | — | | | $ | 17,343 | |
Utilities – Assets/(Liabilities) | | | | | | | | | | | | |
Common stocks** | | $ | 34,090,982 | | | $ | — | | | $ | — | | | $ | 34,090,982 | |
Money market registered investment companies | | | 301,043 | | | | — | | | | — | | | | 301,043 | |
Total | | $ | 34,392,025 | | | $ | — | | | $ | — | | | $ | 34,392,025 | |
Trustee deferred compensation | | $ | 43,035 | | | $ | — | | | $ | — | | | $ | 43,035 | |
U.S. Bond – Assets/(Liabilities) | | | | | | | | | | | | |
U.S. government obligations | | $ | — | | | $ | 15,228,735 | | | $ | — | | | $ | 15,228,735 | |
Corporate bonds | | | — | | | | 2,658,193 | | | | — | | | | 2,658,193 | |
Money market registered investment companies | | | 110,324 | | | | — | | | | — | | | | 110,324 | |
Floating rate demand notes | | | — | | | | 117 | | | | — | | | | 117 | |
Total | | $ | 110,324 | | | $ | 17,887,045 | | | $ | — | | | $ | 17,997,369 | |
Futures contracts* | | $ | 46,734 | | | $ | — | | | $ | — | | | $ | 46,734 | |
Trustee deferred compensation | | $ | 33,800 | | | $ | — | | | $ | — | | | $ | 33,800 | |
Total Bond – Assets/(Liabilities) | | | | | | | | | | | | |
Registered investment companies | | $ | 20,000 | | | $ | — | | | $ | — | | | $ | 20,000 | |
Total | | $ | 20,000 | | | $ | — | | | $ | — | | | $ | 20,000 | |
Money Market – Assets/(Liabilities) | | | | | | | | | | | | |
Bank obligations | | $ | — | | | $ | 3,241,401 | | | $ | — | | | $ | 3,241,401 | |
Certificates of deposit | | | — | | | | 6,010,489 | | | | — | | | | 6,010,489 | |
Commercial paper | | | — | | | | 13,701,752 | | | | — | | | | 13,701,752 | |
Corporate obligations | | | — | | | | 33,177,338 | | | | — | | | | 33,177,338 | |
U.S. government agency obligations | | | — | | | | 20,513,162 | | | | — | | | | 20,513,162 | |
Money Market registered investment companies | | | 37,797,670 | | | | — | | | | — | | | | 37,797,670 | |
Total | | $ | 37,797,670 | | | $ | 76,644,142 | | | $ | — | | | $ | 114,441,812 | |
Trustee deferred compensation | | $ | 41,292 | | | $ | — | | | $ | — | | | $ | 41,292 | |
| * | Futures contracts include cumulative unrealized gain/loss on contracts open at June 30, 2011. |
| ** | See schedule of investments for industry classifications. |
| 2011 Semiannual Report | June 30, 2011 |
| 3. | Investment Transactions |
For the six months ended June 30, 2011, the cost of purchases and proceeds from sales or maturities of long-term investments for the Funds, including U.S. Government investments, were as follows:
| | | | | | | |
The Muirfield Fund® | | $ | 106,253,944 | | | $ | 110,009,399 | |
The Dynamic Growth Fund | | | 87,712,529 | | | | 86,408,092 | |
The Aggressive Growth Fund | | | 52,762,866 | | | | 49,097,006 | |
The Defensive Balanced Fund | | | 72,472,284 | | | | 58,619,486 | |
The Strategic Growth Fund | | | 91,084,404 | | | | 70,367,460 | |
The Quantex Fund™ | | | 13,520,075 | | | | 5,431,808 | |
The Utilities and Infrastructure Fund | | | 14,423,101 | | | | 4,428,821 | |
The U.S. Government Bond Fund | | | 26,862,472 | | | | 27,794,088 | |
The Total Return Bond Fund | | | 20,000 | | | | N/A | |
For the six months ended June 30, 2011, the cost of purchases and proceeds from sales or maturities of long-term U.S. Government investments for the Funds are as follows:
| | | | | | | |
The U.S. Government Bond Fund | | $ | 26,360,392 | | | $ | 27,794,088 | |
| 4. | Investment Advisory Fees and Other Transactions with Affiliates |
Meeder Asset Management, Inc. (“MAM”), a wholly-owned subsidiary of Meeder Financial, Inc. (“Meeder”), provides each Fund, under a separate Investment Advisory Contract, with investment management, research, statistical and advisory services. The services of MAM will terminate automatically if assigned and may be terminated without penalty at any time upon 60 days prior written notice by majority vote of the Fund, by the Trustees of the Fund, or by MAM. For such services the Funds pay a fee at the following annual rates: Muirfield and Quantex, 1.00% of average daily net assets up to $50 million, 0.75% of average daily net assets exceeding $50 million up to $100 million and 0.60% of average daily net assets exceeding $100 million; Dynamic, Aggressive, Defensive, and Strategic, 0.75% of average daily net assets up to $200 million and 0.60% of average daily net assets exceeding $200 million; US Bond and Total Bond, 0.40% of average daily net assets up to $100 million and 0.20% of average daily net assets exceeding $100 million; and Money Market, 0.40% of average daily net assets up to $100 million and 0.25% of average daily net assets exceeding $100 million. MAM has contractually agreed to reduce its investment advisory fee by 0.25% for Quantex for average daily net assets up to $50 million. The foregoing reduction in investment advisory fees shall automatically renew annually on or about April 30th, unless MAM elects to terminate this reduction. During the six months ended June 30, 2011, $27,217 of investment advisory fees was waived in Quantex. During the six months ended June 30, 2011, MAM voluntarily agreed to reduce $37,628 of investment advisory fees in Money Market.
Under a separate Investment Subadvisory Agreement with MAM, Miller/Howard Investments, Inc. (“Miller/Howard”) serves as subadvisor of Utilities. The Investment Subadvisory Agreement provides that it will terminate automatically if assigned, and that it may be terminated by MAM without penalty to the Fund by MAM, the Trustees of the Fund, or by the vote of a majority of the outstanding voting securities of the Fund upon not less than 30 days written notice. For its services, Utilities pays MAM a fee of 1.00% of average daily net assets up to $50 million, 0.75% of average daily net assets exceeding $50 million up to $100 million and 0.60% of average daily net assets exceeding $100 million. As subadvisor to Utilities, Miller/Howard receives a fee paid by MAM.
Mutual Funds Service Co. (“MFSCo”), a wholly-owned subsidiary of Meeder, serves as stock transfer, dividend disbursing and shareholder services agent for each Fund. In compensation for such services, each Fund pays MFSCo an annual fee calculated as follows: For Muirfield, Utilities, Quantex, Dynamic, Aggressive, Defensive, and Strategic, such fee is equal to the greater of $15 per active shareholder account or 0.12% of each Fund’s average daily net assets. For US Bond and Total Bond, such fee is equal to the greater of $15 per active shareholder account or 0.08% of each Fund’s average daily net assets. For Money Market Retail Class and Money Market Institutional Class, such fee is equal to the greater of $20 per active shareholder account or 0.08% of the Fund’s average daily net assets. MFSCo is entitled to receive an annual minimum fee of $4,000 for each Fund or class. For fixed income Funds that are subject to an expense cap and which are above the voluntary expense cap, the basis point fee will be reduced by 0.02%. During the six months ended June 30, 2011, MFSCo waived $1,906 and $6,725 of transfer agent fees for US Bond and the Institutional Class, respectively. MFSCo also voluntarily waived $23,881, $24,277, $22,670, and $28,852 of transfer agent fees for Muirfield, Dynamic, Defensive, and Strategic, respectively, during the six months ended June 30, 2011.
| 2011 Semiannual Report | June 30, 2011 |
MFSCo provides the Trust with certain administrative services. In compensation for such services, each Fund pays MFSCo an annual fee equal to 0.10% of each Fund’s average daily net assets up to $50 million and 0.08% of each Fund’s average daily net assets exceeding $50 million.
MFSCo serves as accounting services agent for each Fund. In compensation for such services, each Fund pays MFSCo an annual fee equal to the greater of:
| | a. | 0.15% of the first $10 million of average daily net assets, 0.10% of the next $20 million of average daily net assets, 0.02% of the next $50 million of average daily net assets, and 0.01% in excess of $80 million of average daily net assets, |
| | b. | $7,500 for non-Money Market Funds and $30,000 for Money Market. |
For the six months ended June 30, 2011, MAM voluntarily agreed to reduce its fees and/or reimburse expenses (excluding brokerage fees and commissions, taxes, interest, and extraordinary or non-recurring expenses), to limit total annual operating expenses to 1.39%, 1.39%, 1.59%, 1.49%, and 0.99% of average daily net assets for Muirfield, Dynamic, Aggressive, Defensive, and US Bond, respectively. MAM has also voluntarily agreed to reduce its fees and/or reimburse expenses to limit the Retail Class’ and the Institutional Class’ total annual operating expenses to 0.32% and 0.22% of average daily net assets, respectively. Such reductions and/or reimbursements are limited to the total of fees charged to each Fund or Class by MAM and MFSCo. For the six months ended June 30, 2011, MAM and/or MFSCo reimbursed $16,222, $18,233, $721, $3,169, $36,317, and $219,900 to Muirfield, Dynamic, Aggressive, Defensive, US Bond, and Money Market, respectively.
Muirfield, Dynamic, Aggressive, Defensive, Strategic, and Total Bond have entered into an agreement with the Trust’s custodian, The Huntington National Bank (“HNB”), whereby HNB receives distribution, service, and administration fees (collectively the “fees”) from the underlying security holdings of the aforementioned Funds, and forwards those fees to the appropriate Funds. The Funds use the fees received to reduce the gross expenses of each Fund. For the six months ended June 30, 2011, Muirfield, Dynamic, Aggressive, Defensive, Strategic, and Total Bond used $42,146, $35,210, $14,286, $16,167, $34,215, and $0 of fees received, respectively, to reduce gross expenses of each Fund. It is possible that the Funds may invest in security holdings in which fees are not paid. As such, the gross expenses of a Fund would not be decreased. Also, without this agreement it is likely that the Funds would not collect any fees from underlying security holdings.
Pursuant to Rule 12b-1 of the 1940 Act, a mutual fund can adopt a written plan to pay certain expenses out of fund assets relating to the sale and distribution of its shares. Muirfield, Quantex, US Bond, and the Retail Class have adopted a distribution plan with an annual limitation of 0.20% of average daily net assets. Utilities, Dynamic, Aggressive, Defensive, Strategic, and Total Bond have adopted a distribution plan with an annual limitation of 0.25% of average daily net assets. The Institutional Class has adopted a distribution plan with an annual limitation of 0.03% of average daily net assets. For the six months ended June 30, 2011, Muirfield, Dynamic, Aggressive, Quantex, Utilities, and US Bond elected to charge less than the maximum annual amount, effectively waiving $17,904, $10,194, $10,715, $14,153, $13,180, and $2,859 of distribution plan (12b-1) expenses, respectively. The Retail Class and the Institutional Class waived $72,584 and $4,510, respectively, for a total of $77,094.
An Administrative Services Plan has been adopted for each Fund of the Trust except Money Market. The Administrative Services Plan allows for each eligible Fund to pay a maximum annual amount of 0.20% of average daily net assets to Service Organizations that provide administrative support services to their customers who own Shares of record or beneficially. For the six months ended June 30, 2011, Muirfield, Quantex, Utilities, and US Bond elected to charge less than the maximum annual amount, effectively waiving $12,533, $13,173, $8,933, and $2,001 of administrative service plan expenses, respectively.
The Funds have adopted a Deferred Compensation Plan (the “Plan”) for the independent Trustees. Under the Plan, each eligible Trustee is permitted to defer all or a portion of the trustees fees payable by any of the Funds as an investment into any combination of Funds until a specified point of time. The investment into the Funds is recorded as an asset however an offsetting liability is also recorded for the deferred payment. Once the eligible Trustees’ deferral amounts can be distributed, a lump sum or generally equal annual installments over a period of up to ten (10) years can be made to the eligible Trustee(s). The Funds may terminate this Plan at any time.
Certain trustees and officers of the Funds are also officers or directors of Meeder, MAM, and MFSCo.
During the six months ended June 30, 2011, several of the Funds invested in The Money Market Fund, an affiliate, as described in Section 2(a)(3) of the Investment Company Act of 1940. As of June 30, 2011, the 7-day yield of the Institutional Class was 0.21%. A summary of the Funds’ investments in this affiliate during the year is noted below:
| 2011 Semiannual Report | June 30, 2011 |
| | | | | | | | | | | | | | | | | | | |
The Muirfield Fund® | | $ | 1,186,440 | | | $ | 29,572,067 | | | $ | (28,794,308 | ) | | $ | 1,964,199 | | | $ | 2,400 | | | $ | 1,964,199 | |
The Dynamic Growth Fund | | | 1,901,691 | | | | 18,472,572 | | | | (17,866,236 | ) | | | 2,508,027 | | | | 2,332 | | | | 2,508,027 | |
The Aggressive Growth Fund | | | 604,959 | | | | 21,227,626 | | | | (20,941,871 | ) | | | 890,714 | | | | 1,546 | | | | 890,714 | |
The Defensive Balanced Fund | | | 981,486 | | | | 20,465,228 | | | | (20,784,140 | ) | | | 662,574 | | | | 2,044 | | | | 662,574 | |
The Strategic Growth Fund | | | 1,553,744 | | | | 20,874,047 | | | | (20,076,904 | ) | | | 2,350,887 | | | | 1,560 | | | | 2,350,887 | |
The Quantex Fund™ | | | 635,526 | | | | 10,919,940 | | | | (11,056,282 | ) | | | 499,184 | | | | 994 | | | | 499,184 | |
The Utilities and Infrastructure Fund | | | 1,091,819 | | | | 11,789,874 | | | | (12,580,650 | ) | | | 301,043 | | | | 1,228 | | | | 301,043 | |
The U.S. Government Bond Fund | | | 197,989 | | | | 17,618,685 | | | | (17,706,350 | ) | | | 110,324 | | | | 1,029 | | | | 110,324 | |
| 5. | Federal Tax Information |
The tax characteristics of dividends paid by the Funds during the year ended December 31, 2010 were as follows:
| | | | | | Net Short- Term Capital Gains | | | Net Long- Term Capital Gains | | | | | | | |
The Muirfield Fund® | | $ | 458,892 | | | $ | — | | | $ | — | | | $ | — | | | $ | 458,892 | |
The Dynamic Growth Fund | | | 198,567 | | | | — | | | | — | | | | — | | | | 198,567 | |
The Aggressive Growth Fund | | | — | | | | — | | | | — | | | | — | | | | — | |
The Defensive Balanced Fund | | | 792,255 | | | | — | | | | — | | | | — | | | | 792,255 | |
The Strategic Growth Fund | | | 198,274 | | | | — | | | | — | | | | — | | | | 198,274 | |
The Quantex Fund™ | | | 25 | | | | — | | | | — | | | | — | | | | 25 | |
The Utilities and Infrastructure Fund | | | 133,540 | | | | — | | | | — | | | | — | | | | 133,540 | |
The U.S. Government Bond Fund | | | 386,192 | | | | 232,564 | | | | — | | | | — | | | | 618,756 | |
The Money Market Fund | | | 330,246 | | | | — | | | | — | | | | — | | | | 330,246 | |
The tax characteristics of dividends paid by the Funds during the year ended December 31, 2009 were as follows:
| | | | | | Net Short- Term Capital Gains | | | Net Long- Term Capital Gains | | | | | | | |
The Muirfield Fund® | | $ | 413,069 | | | $ | — | | | $ | — | | | $ | — | | | $ | 413,069 | |
The Dynamic Growth Fund | | | 29,265 | | | | — | | | | — | | | | — | | | | 29,265 | |
The Aggressive Growth Fund | | | 5 | | | | — | | | | — | | | | — | | | | 5 | |
The Defensive Balanced Fund | | | 172,199 | | | | — | | | | — | | | | — | | | | 172,199 | |
The Strategic Growth Fund | | | — | | | | — | | | | — | | | | — | | | | — | |
The Quantex Fund™ | | | 1,515 | | | | — | | | | — | | | | — | | | | 1,515 | |
The Utilities and Infrastructure Fund | | | 152,723 | | | | — | | | | — | | | | 123,774 | | | | 276,497 | |
The U.S. Government Bond Fund | | | 450,396 | | | | — | | | | — | | | | — | | | | 450,396 | |
The Money Market Fund | | | 1,592,107 | | | | — | | | | — | | | | — | | | | 1,592,107 | |
| * | Total dividends paid may differ from the amount reported in the Statement of Changes in Net Assets because for tax purposes dividends are recognized when actually paid. |
| 2011 Semiannual Report | June 30, 2011 |
As of December 31, 2010, the components of accumulated earnings/(deficit) on a tax basis for the Funds were as follows:
| | | Undistributed Ordinary Income | | | | | | Accumulated Capital and Other Gains and (Losses) | | | Unrealized Appreciation/ (Depreciation)** | | | Total Accumulated Earnings/ (Deficit) | |
The Muirfield Fund® | | $ | 173,526 | | | $ | (1,822 | ) | | $ | (15,855,722 | ) | | $ | 14,569,905 | | | $ | (1,114,113 | ) |
The Dynamic Growth Fund | | | 189 | | | | (189 | ) | | | (17,058,697 | ) | | | 12,934,908 | | | | (4,123,789 | ) |
The Aggressive Growth Fund | | | — | | | | — | | | | (9,727,581 | ) | | | 5,244,557 | | | | (4,483,024 | ) |
The Defensive Balanced Fund | | | 4,442 | | | | (4,440 | ) | | | (5,659,699 | ) | | | 4,048,636 | | | | (1,611,061 | ) |
The Strategic Growth Fund | | | 149 | | | | (149 | ) | | | (1,837,159 | ) | | | 5,235,153 | | | | 3,397,994 | |
The Quantex Fund™ | | | — | | | | — | | | | (2,042,085 | ) | | | 2,718,465 | | | | 676,380 | |
The Utilities and Infrastructure Fund | | | 349 | | | | (349 | ) | | | (130,557 | ) | | | 2,067,690 | | | | 1,937,133 | |
The U.S. Government Bond Fund | | | 2,403 | | | | (552 | ) | | | (137,867 | ) | | | (161,851 | ) | | | (297,867 | ) |
The Money Market Fund | | | 6,074 | | | | (6,074 | ) | | | — | | | | — | | | | — | |
| ** | The differences between book- and tax-basis unrealized appreciation/(depreciation) are attributable primarily to: deferral of post October losses, wash sales, and the realization for tax purposes of unrealized gains/(losses) on certain derivative instruments. |
For federal income tax purposes, the following Funds have capital loss carryforwards as of December 31, 2010, which are available to offset future capital gains, if any. To the extent that these carryforwards are used to offset future capital gains, it is probable that the gains that are offset will not be distributed to shareholders:
| | | | | | | |
The Muirfield Fund® | | $ | 10,372,337 | | | | 2016 | |
The Muirfield Fund® | | | 5,483,385 | | | | 2017 | |
The Dynamic Growth Fund | | | 5,920,810 | | | | 2016 | |
The Dynamic Growth Fund | | | 11,137,887 | | | | 2017 | |
The Aggressive Growth Fund | | | 6,373,039 | | | | 2016 | |
The Aggressive Growth Fund | | | 3,354,542 | | | | 2017 | |
The Defensive Balanced Fund | | | 4,745,858 | | | | 2016 | |
The Defensive Balanced Fund | | | 913,841 | | | | 2017 | |
The Strategic Growth Fund | | | 1,837,159 | | | | 2017 | |
The Quantex Fund™ | | | 491,279 | | | | 2016 | |
The Quantex Fund™ | | | 1,550,806 | | | | 2017 | |
The Utilities and Infrastructure Fund | | | 130,557 | | | | 2017 | |
The U.S. Government Bond Fund | | | 24,633 | | | | 2013 | |
The U.S. Government Bond Fund | | | 113,234 | | | | 2014 | |
Under current tax laws, net capital losses incurred after October 31, within a Fund’s fiscal year, are deemed to arise on the first business day of the following fiscal year for tax purposes. For the year ended December 31, 2010, US Bond deferred post October losses in the amount of $78,987.
The beneficial ownership, either directly or indirectly, of more than 25% of the voting securities of a fund creates a presumption of control of the fund under Section 2(a)(9) of the 1940 Act. As of June 30, 2011, Charles Schwab & Co., Inc. held for the benefit of others, in aggregate, 27% of Utilities; Nationwide Trust Company, FSB held for the benefit of others, in aggregate, 82% of Defensive; Nationwide Trust Company, FSB held for the benefit of others, in aggregate, 85% of Strategic; Nationwide Trust Company, FSB held for the benefit of others, in aggregate, 76% of Dynamic; Nationwide Trust Company, FSB held for the benefit of others, in aggregate, 71% of Aggressive; Nationwide Trust Company, FSB held for the benefit of others, in aggregate, 54% of Muirfield; Nationwide Trust Company, FSB held for the benefit of others, in aggregate, 29% of Quantex; Nationwide Trust Company, FSB held for the benefit of others, in aggregate, 56% of US Bond; Meeder Asset Management, Inc. held 100% of Total Bond; Carey & Co. held for the benefit of others, in aggregate, 65% of Institutional Class; and IBEW 683 Health & Welfare Plan held 29% of Institutional Class, and therefore may be deemed to control the Funds.
| 2011 Semiannual Report | June 30, 2011 |
Trustees and Officers (unaudited)
Certain trustees and officers of the Funds are also officers or directors of Meeder, MAM, and MFSCo. The Trustees oversee the management of the Trust and elect its officers. The officers are responsible for the Funds’ day-to-day operations. The Trustees’ and officers’ names, addresses, years of birth, positions held with the Trust, and length of service with The Flex-funds are listed below. Also included is each Board member’s principal occupation during, at least, the past five years. Except as indicated, each individual has held the office shown or other offices in the same company for the last five years. Those Trustees who are “interested persons”, as defined in the 1940 Act, by virtue of their affiliation with the Trust, are indicated by an asterisk (*).
Name, Address1, and Year of Birth | Year First Elected a Trustee or Officer of the Trust | Position and Number of Funds Overseen2 | Principal Occupation During Past Five Years and Other Directorships Held |
Robert S. Meeder, Jr.* Year of Birth: 1961 | 1992 | Trustee and President | President of Meeder Asset Management, Inc. |
Jack W. Nicklaus** Year of Birth: 1961 | 1998 | Trustee | Designer, Nicklaus Design, a golf course design firm and division of The Nicklaus Companies. |
Stuart M. Allen** Year of Birth: 1961 | 2006 | Trustee | President of Gardiner Allen DeRoberts Insurance LLC, an insurance agency; Chairman of the Trust’s Audit Committee. |
Anthony D’Angelo** Year of Birth: 1959 | 2006 | Trustee | Director of Sales, WSYX ABC 6/WTTE Fox 28, television stations owned and operated by Sinclair Broadcast Group; Lead Trustee of the Trust. |
Dale W. Smith Year of Birth: 1959 | 2006 | Vice President | Chief Financial Officer of Meeder Asset Management, Inc. (2005 - present); formerly Senior Vice President of Financial Services of BISYS Fund Services (1996 – 2004). |
Mary “Maggie” Bull Year of Birth: 1966 | 2011 | Chief Compliance Officer | Chief Compliance Officer, Legal Counsel and Anti-Money Laundering Officer of the Funds (2011 – present); Independent Legal Consultant (2007 – 2010); Assistant General Counsel of Nationwide (2006 – 2007). |
Stephen E. Hoffman Year of Birth: 1964 | 2011 | Assistant Chief Compliance Officer | Director of Human Resources, Meeder Asset Management, Inc. (2011 – present); Chief Compliance Officer, Meeder Asset Management, Inc. (2011 – present); Financial Consultant for Beacon Hill Fund Services (2009 – present); Chief Financial Officer for Sanese Services (2006 – 2008). |
| 2011 Semiannual Report | June 30, 2011 |
Name, Address1, and Year of Birth | Year First Elected a Trustee or Officer of the Trust | Position and Number of Funds Overseen2 | Principal Occupation During Past Five Years and Other Directorships Held |
Bruce E. McKibben Year of Birth: 1969 | 2002 | Treasurer | Director of Fund Accounting of Mutual Funds Service Co., the Trust’s transfer agent (1997 – present). Interim Chief Operating Officer of Meeder Asset Management, Inc. (June 2008 – October 2008). |
Ruth Kirkpatrick Year of Birth: 1951 | 2009 | Secretary, pro tempore | Senior Legal Specialist of Meeder Asset Management, Inc. |
| 1 | The address of each Trustee is 6125 Memorial Drive, Dublin, OH 43017. |
| 2 | Each Trustee serves for an indefinite term, until his or her resignation, death, or removal. Each Trustee oversees all ten Funds in the Trust. |
| * | Robert S. Meeder, Jr. is deemed an “interested person” of the Trust by virtue of his position as President of Meeder Asset Management, Inc., the Advisor of the Trust. |
| ** | Each independent Trustee is a member of the Trust’s Audit Committee, Compensation Committee, and Nominating Committee. |
The Statement of Additional Information includes additional information about each Trustee and is available without charge. To obtain a copy of the Statement of Additional Information, please contact your financial representative or call toll free 1-800-325-3539.
The Funds file their complete schedules of portfolios holdings with the Securities and Exchange Commission (“SEC”) for the first and third quarters of each fiscal year on Form N-Q. In addition, The Money Market Fund files its complete schedule of portfolio holdings with the SEC each month on Form N-MFP. The Funds’ Forms N-Q and N-MFP are available on the SEC’s website at http://www.sec.gov and may be reviewed and copied at the SEC’s Public Reference Room in Washington, DC. Information on the operation of the Public Reference Room may be obtained by calling 1-800-SEC-0330. The Funds’ schedules of positions are also available on the Funds’ website at www.flexfunds.com.
A description of the policies and procedures that the Funds use to determine how to vote proxies relating to portfolio securities, and information regarding how the Funds voted these proxies for the 12-month period ended June 30, 2011, is available on the SEC’s website at http://www/sec.gov, or, without charge, upon request by calling toll-free 1-800-325-3539.
| 2011 Semiannual Report | June 30, 2011 |
Manager and Investment Advisor
Meeder Asset Management, Inc.
6125 Memorial Drive
P.O. Box 7177
Dublin, Ohio 43017
Subadvisor / The Utilities and Infrastructure Fund
Miller/Howard Investments, Inc.
141 Upper Byrdcliffe Road, P.O. Box 549
Woodstock, New York 12498
Board of Trustees
Stuart Allen
Anthony D’Angelo
Robert S. Meeder, Jr.
Jack Nicklaus II
Custodian
The Huntington National Bank
Columbus, Ohio 43215
Transfer Agent & Dividend Disbursing Agent
Mutual Funds Service Co.
6125 Memorial Drive
Dublin, Ohio 43017
Independent Registered Public Accounting Firm
Cohen Fund Audit Services, Ltd.
800 Westpoint Parkway, Suite 1100
Westlake, Ohio 44145
| | | |
| | Semiannual Report June 30, 2011 | |
| | Mutual funds can be a quick, efficient, cost-effective way to achieve investment diversification. The investment options available through The Flex-funds® are suitable for a wide range of investors, from the conservative-minded to the growth-oriented, to help investors achieve their individual financial goals. We provide professional management, ongoing supervision of clients’ holdings, automatic diversification and e-Delivery of statements and fund mailings: all important elements of a well-rounded investment plan. No matter what your objectives may be, The Flex-funds® can help you make the most of your personal investment plan and help you achieve your individual financial goals. | |
 | Go Paperless. Looking for ways to help the environment? Sign up to view reports online atwww.flexfunds.com | |
| | Managed by Meeder Asset Management, Inc. 6125 Memorial Drive, Dublin, Ohio 43017 Call Toll Free: 800-325-3539 Local: 614-760-2159 Fax: 614-766-6669 www.flexfunds.com flexfunds@meederfinancial.com |  |
Item 2. Code of Ethics.
The registrant has adopted a code of ethics that applies to the registrant’s principal executive officer, principal financial officer, comptroller or principal accounting officer, and any person who performs a similar function.
Item 3. Audit Committee Financial Expert.
Currently, The Flex-funds (the “Funds”) do not have an Audit Committee member who possesses all of the attributes required to be an "audit committee financial expert" as defined in instruction 2(b) of Item 3 of Form N-CSR. However, the Board of Trustees believes that each member of the Audit Committee has substantial experience relating to the review of financial statements and the operations of audit committees. Accordingly, the Board of Trustees believes that the members are qualified to evaluate the Funds’ financial statements, supervise the Funds’ preparation of its financial statements, and oversee the work of the Funds’ independent auditors. The Board of Trustees also believes that, although no single Audit Committee member possesses all of the attributes required to be an “audit committee financial expert”, the Audit Committee members collectively as a group possess the attributes required to be an “audit committee financial expert.”
Item 4. Principal Accountant Fees and Services.
(a) – (d) Aggregate fees billed to the registrant for the last two fiscal years for professional services rendered by the registrant’s principal accountant were as follows:
| | | 2011 | | | 2010 | |
| Audit Fees | | $ | 67,500 | | | $ | 63,000 | |
| Audit-Related Fees | | | 1,050 | | | | 800 | |
| Tax Fees | | | 11,250 | | | | 20,250 | |
| All Other Fees | | | 2,500 | | | | 3,425 | |
Audit fees include amounts related to the audit of the registrant’s annual financial statements and services normally provided by the accountant in connection with statutory and regulatory filings. Audit-related fees include amounts reasonably related to the performance of the audit of the registrant’s financial statements. Tax fees include amounts related to tax compliance, tax planning, and tax advice. All other fees include amounts related to the registrant’s annual filing of Form N1A.
(e)(1) A purpose of the Audit Committee is to approve the engagement of the registrant’s independent auditors (i) to render audit and non-audit services for the registrant in accordance with Rule 2-01(c)(7)(i) of Regulation S-X, subject to the waiver provisions set forth in Rule 2-01(c)(7)(i)(C) of Regulation S-X, and (ii) to render non-audit services for the registrant’s investment advisors (other than a sub-advisor whose role is primarily portfolio management and is subcontracted or overseen by another investment advisor) and any other entity controlling by, or under common control with the investment advisor that provides ongoing services to the registrant, in each case under (ii) if the engagement relates directly to the operations and financial reporting of the registrant, in accordance with Rule 2-01(c)(7)(ii) of Regulation S-X, subject to waiver provisions set forth in Rule 2-01(c)(7)(ii) of Regulation S-X.
(e)(2) 100% of services included in (b) – (d) above were approved pursuant to Rule 2-01(c)(7)(i)(C) of Regulation S-X.
(f) Not applicable.
(g) The aggregate fees billed for the most recent fiscal year and the preceding fiscal year by the registrant’s principal accountant for non-audit services rendered to the registrant, its investment advisor, and any entity controlling, controlled by, or under common control with the investment advisor that provides ongoing services to the registrant were $25,285 and $25,460 respectively.
(h) Not applicable.
Items 5. Audit Committee of Listed Registrants.
Not applicable.
Item 6. Schedule of Investments.
Not applicable.
Item 7. Disclosure of Proxy Voting Policies and Procedures for Closed-End Management Investment Companies.
Not applicable.
Item 8. Portfolio Managers of Closed-End Management Investment Companies.
Not applicable.
Item 9. Purchases of Equity Securities by Closed-End Management Investment Company and Affiliated Purchasers.
Not applicable.
Item 10. Submission of Matters to a Vote of Security Holders.
Not applicable.
Item 11. Controls and Procedures.
(a) Based on our evaluation conducted within 90 days of the filing date, hereof, the design and operation of the registrant's disclosure controls and procedures are effective to ensure that material information relating to the registrant is made known to the certifying officers by others within the appropriate entities, particularly during the period in which Forms N-CSR are being prepared, and the registrant's disclosure controls and procedures allow timely preparation and review of the information for the registrant's Form N-CSR and the officer certifications of such Form N-CSR.
(b) There were no significant changes in the registrant's internal controls or in other factors that could significantly affect these controls subsequent to the date of their evaluation, including any corrective actions with regard to significant deficiencies and material weaknesses.
Item 12. Exhibits.
(a)(1) Code of Ethics filed herewith as EX-99.CODE ETH.
(a)(2) A separate certification for each principal executive and principal financial officer of the registrant as required by Rule 30a-2(a) under the Act(17 CFR270.30a-2(a)). Filed herewith as EX-99.CERT.
(b) Certifications of principal executive officer and principal financial officer, under Section 906 of the Sarbanes-Oxley Act of 2002, and 18 U.S.C. ss.1350. Filed herewith as EX-99.906 CERT.
SIGNATURES
Pursuant to the requirements of the Securities Exchange Act of 1934 and the Investment Company Act of 1940, the registrant has duly caused this report to be signed on its behalf by the undersigned, thereunto duly authorized.
The Flex-funds
Bruce E. McKibben, Treasurer
Pursuant to the requirements of the Securities Exchange Act of 1934 and the Investment Company Act of 1940, this report has been signed below by the following persons on behalf of the registrant and in the capacities and on the dates indicated.
Bruce E. McKibben, Treasurer
| By: | /s/ Robert S. Meeder, Jr. |
Robert S. Meeder, Jr., President