UNITED STATES
SECURITIES AND EXCHANGE COMMISSION
Washington, D.C. 20549
FORM N-CSR
CERTIFIED SHAREHOLDER REPORT OF REGISTERED
MANAGEMENT INVESTMENT COMPANIES
Investment Company Act file number 811-3462
The Flex-funds Trust
|
6125 Memorial Drive Dublin, OH 43017 |
Bruce McKibben
c/o The Flex-funds Trust
6125 Memorial Drive
Dublin, OH 43017
Registrant’s telephone number, including area code: 800-325-3539
Date of fiscal year end: December 31, 2008
Date of reporting period: June 30, 2008
| Item 1. | Report to Stockholders. |
The Flex-funds®
2008 Semiannual Report
June 30, 2008
| | |
| | The Flex-funds® Managed by Meeder Asset Management, Inc. 6125 Memorial Drive, Dublin Ohio, 43017 Call Toll Free 800-325-3539 | 614-760-2159 Fax: 614-766-6669 | www.flexfunds.com Email: flexfunds@meederfinancial.com |
Performance Review
| | | | | | | | | | | | | | | | | | | | | | | | | | | |
Period & Average Total Returns as of June 30, 2008 | | 3
Months | | | YTD | | | 1
year | | | 3
years | | | 5
years | | | 10
years | | | Since
Inception | | | Net Expense
Ratio** | | | Gross Expense
Ratio*** | |
FUND OF FUNDS | | | | | | | | | | | | | | | | | | | | | | | | | | | |
The Dynamic Growth Fund | | 3.05 | % | | -8.55 | % | | -9.04 | % | | 6.33 | % | | 8.43 | % | | — | | | -0.47 | %1 | | 1.32 | % | | 1.86 | % |
The Muirfield Fund® | | 1.67 | % | | -9.14 | % | | -9.75 | % | | 5.08 | % | | 7.24 | % | | 3.58 | % | | 7.93 | %2 | | 1.38 | % | | 1.88 | % |
The Focused Growth Fund | | -0.42 | % | | -10.02 | % | | -11.39 | % | | — | | | — | | | — | | | 0.84 | %3 | | 1.58 | % | | 1.68 | % |
The Aggressive Growth Fund | | -0.52 | % | | -10.24 | % | | -11.08 | % | | 4.85 | % | | 7.60 | % | | — | | | -2.91 | %4 | | 1.70 | % | | 1.83 | % |
The Defensive Growth Fund | | -1.37 | % | | -10.33 | % | | -11.70 | % | | — | | | — | | | — | | | -0.13 | %5 | | 1.56 | % | | 1.66 | % |
EQUITY FUNDS | | | | | | | | | | | | | | | | | | | | | | | | | | | |
The Socially Responsible Utilities Fund (formerly The Total Return Utilities Fund) | | 7.01 | % | | -2.51 | % | | 2.27 | % | | 12.56 | % | | 14.97 | % | | 6.54 | % | | 9.79 | %6 | | 1.90 | % | | 2.10 | % |
The Quantex Fund™ | | -4.73 | % | | -13.16 | % | | -26.22 | % | | -0.46 | % | | 4.36 | % | | 0.52 | % | | 6.26 | %7 | | 1.56 | % | | 2.09 | % |
MONEY MARKET FUNDS | | | | | | | | | | | | | | | | | | | | | | | | | | | |
The Money Market Fund - Retail* | | 0.61 | % | | 1.53 | % | | 3.98 | % | | 4.29 | % | | 3.09 | % | | 3.54 | % | | 4.98 | %8 | | 0.48 | % | | 0.84 | % |
Current & Effective Yields | | 7-day Compound: 2.21%; 7-day Simple: 2.19% | |
The Money Market Fund - Institutional* | | 0.65 | % | | 1.60 | % | | 4.13 | % | | 4.44 | % | | — | | | — | | | 4.15 | %9 | | 0.34 | % | | 0.67 | % |
Current & Effective Yields | | 7-day Compound: 2.36%; 7-day Simple: 2.33% | |
FIXED INCOME FUND | | | | | | | | | | | | | | | | | | | | | | | | | | | |
The U.S. Government Bond Fund | | -2.01 | % | | 0.64 | % | | 7.38 | % | | 3.76 | % | | 2.06 | % | | 3.49 | % | | 5.57 | %10 | | 1.01 | % | | 1.72 | % |
BENCHMARK INDICES | | | | | | | | | | | | | | | | | | | | | | | | | | | |
S&P 500 Index | | -2.72 | % | | -11.91 | % | | -13.11 | % | | 4.40 | % | | 7.57 | % | | 2.88 | % | | — | | | — | | | — | |
Blended Index**** | | -1.49 | % | | -6.79 | % | | -6.59 | % | | 4.34 | % | | 5.83 | % | | 3.15 | % | | — | | | — | | | — | |
NASDAQ Composite Index | | 0.82 | % | | -13.18 | % | | -11.18 | % | | 4.51 | % | | 7.90 | % | | 2.45 | % | | — | | | — | | | — | |
Russell 2000 Index | | 0.59 | % | | -9.37 | % | | -16.18 | % | | 3.82 | % | | 10.32 | % | | 5.58 | % | | — | | | — | | | — | |
S&P 400 Midcap Index | | 5.43 | % | | -3.90 | % | | -7.34 | % | | 7.44 | % | | 12.59 | % | | 9.82 | % | | — | | | — | | | — | |
Russell 3000 Utilities | | 2.87 | % | | -8.80 | % | | -9.71 | % | | 8.64 | % | | 11.24 | % | | 1.43 | % | | — | | | — | | | — | |
Lehman Brothers Intermediate-Term Gov’t/Credit Index | | -1.53 | % | | 1.43 | % | | 7.37 | % | | 4.27 | % | | 3.49 | % | | 5.55 | % | | — | | | — | | | — | |
iMoneyNet, Inc. Average First-Tier Institutional Money Market Fund | | 0.62 | % | | 1.55 | % | | 4.06 | % | | 4.56 | % | | 3.31 | % | | 4.20 | % | | — | | | — | | | — | |
Lipper Average General-Purpose Money Market Fund | | 0.50 | % | | 1.30 | % | | 3.55 | % | | 3.84 | % | | 2.60 | % | | 3.03 | % | | — | | | — | | | — | |
To obtain a prospectus containing more complete information about The Flex-funds®, including fees and other expenses that apply to a continued investment in the Funds, you may call The Flex-funds® at Toll Free (800)325-3539, visit us online at www.flexfunds.com, or write P.O. Box 7177, Dublin OH 43017. Please read the prospectus carefully for investment objectives, risk & expense information before investing.
Past performance does not guarantee future results. All performance figures represent total returns and average annual total returns for the periods ended June 30, 2008, and assumes reinvestment of all dividend and capital gain distributions. The investment return and principal value of an investment will fluctuate so that an investor’s shares, when redeemed, may be worth more or less than their original cost. Management fees were waived and/or expenses reimbursed in order to reduce the operating expenses of the Funds during all periods shown above. All expense waivers for the Funds are voluntary and may be terminated at any time, except for The Quantex Fund ™. The management fee waiver for The Quantex Fund ™ is contractual and may be terminated annually by the adviser on its renewal date. Source for index data: Bloomberg.
| * | An investment in The Money Market Fund is not insured or guaranteed by the Federal Deposit Insurance Corporation or any other governmental agency. Although The Money Market Fund seeks to preserve the value of your investment at $1.00 per share, it is possible to lose money by investing in the Fund. Yield quotations more closely reflect the current earnings of The Money Market Fund than do total return quotations. The current performance may be lower or higher than the performance data quoted. |
| ** | The Net Expense Ratios are percentages of the Funds’ average net assets as of December 31, 2007. The Net Expense Ratio includes all waivers, reimbursements and expenses paid indirectly. |
| *** | The Gross Expense Ratios are percentages of the Funds’ average net assets as they are shown in the most current Funds’ Prospectus. |
| **** | The Blended Index is comprised of 60% of the S&P 500 Index and 40% of the average 90-day U.S. Treasury bill. |
1 | Inception Date: 2/29/00. |
3 | Inception Date: 1/31/06. |
4 | Inception Date: 2/29/00. |
5 | Inception Date: 1/31/06. |
6 | Inception Date: 6/21/95. |
7 | Inception Date: 3/20/85. |
8 | Inception Date: 3/27/85. |
9 | Inception Date: 12/28/04. |
10 | Inception Date: 5/7/85. |
| | |
| The Flex-funds® | | 2008 Semiannual Report | June 30, 2008 |
Letter to Shareholders
The first half of 2008 has been characterized by volatility and challenging conditions on several fronts among the capital markets and the overall economy. For example, in the first six months of the year we witnessed continued deterioration in the housing market, the collapse of a major Wall Street investment bank, and the threat of escalating inflation in the wake of surging energy and food prices despite a slowing economy.
While the equity markets staged a brief rally in early March through mid-May, uncertainty surrounding the aforementioned events drove the markets lower by the end of the second quarter. As of June 30, 2008, the year-to-date return for the Dow Jones Industrial Average was -13.36%, while the S&P 500 returned -11.91% (see Charts 1 and 2).
Despite the tough conditions, we employed a variety of strategies that enabled the majority of our Funds to outperform their benchmarks during the first half of 2008. In the following pages, you will find a performance review for each of The Flex-funds® as well as commentary regarding the investment decisions executed in the Funds. We will begin with an economic and financial market review in order to provide a background on the events that influenced our investment strategies.
Economic weakness combined with rising prices
During the first half of 2008, the markets were confronted with a number of challenging developments, including:
| • | | Sluggish economic growth. Data suggests that the economy grew at a pace of just 1.0% on an annualized basis during the first three months of the year (see Chart 3). Although this was slightly higher than the previous quarter’s growth rate, it shows that the economy is still extremely sluggish. In addition, most of the economic growth during the quarter was driven by exports to foreign countries (not domestic sales). Other indicators provide a more concise assessment, such as industrial production, which fell by 0.1% over the 12 months ended May 31st —the first time since June 2003 industrial output has declined on a year-over-year basis. |
| • | | Soaring energy prices. The first half of 2008 saw the price of oil jump from around $93 a barrel at the beginning of January to more than $140 in late June due to factors such as rising demand for oil from emerging economies, supply constraints and speculation on the part of investors. The spike in oil prices caused gas prices to rise as well. As seen in Chart 4, the average price per gallon of gasoline was $4.10 on June 30th, up from $3.11 in early January. |
Chart 1: S&P 500 Index Year-to-Date Performance
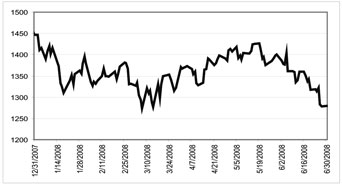
Source: ILX
Chart 2: Dow Jones Industrial Average Year-to-Date Performance
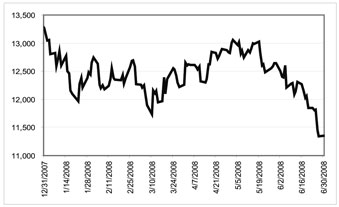
Source: ILX
Chart 3: U.S. Gross Domestic Product (GDP)
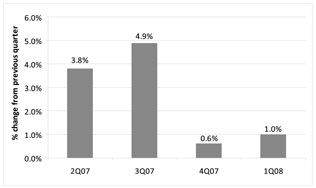
Source: U.S. Commerce Department
| | |
| The Flex-funds® 2008 Semiannual Report | June 30, 2008 | | Page 1 |
| | |
| The Flex-funds® | | 2008 Semiannual Report | June 30, 2008 |
Letter to Shareholders
Chart 4: Retail Gasoline Price (per gallon)
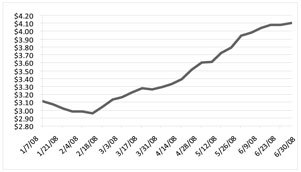
Source: Energy Information Administration
| • | | Rising inflation. Rising prices for oil and food are spurring an unwanted increase in inflation. For example, inflation as measured by the Consumer Price Index (CPI) rose at a higher than expected rate in May and was up 4.2% over the previous 12 months. |
So far, higher inflation has not spread throughout the economy as a whole. Consider that core CPI inflation (which excludes the volatile food and energy sectors) was up only 2.3% during the past year through May. Meanwhile, the Core Personal Consumption Expenditures Price Index (Core PCE), the Federal Reserve’s preferred gauge of inflation, rose by 2.1% over the 12 months ending May 31st —just outside of its target range of 1% to 2%. That said, if oil and food prices remain at their highly elevated levels, those costs could eventually be passed on to consumers in the form of higher prices in many areas. We are beginning to see this occur to some extent. For example, Dow Chemical (the nation’s largest chemical company) recently announced two major price increases to offset rising energy costs.
| • | | Rising unemployment. The sluggish economy continued to hurt the job market during the first half of 2008. The unemployment rate jumped significantly, from 5.0% in April to 5.5% in May, as employers cut jobs for the fifth consecutive month (see Chart 5). The 0.5% increase was the largest monthly percentage point rise in unemployment since 1986, and pushed the jobless rate to its highest level since October 2004. In total, some 324,000 jobs were lost from January through May. |
| • | | Housing weakness. Home prices in major U.S. cities plummeted by a record 15.3% during the 12 months through April, bringing prices back down to their 2004 levels. As home values decline further and further, the wealth effect many homeowners feel also diminishes—resulting in less overall spending. Compounding this problem is the fact that the number of homes going into foreclosure soared by 48% on a year-over-year basis in May. |
| • | | Nervous consumers. The powerful combination of rising unemployment, higher prices and weak housing is having an exceptionally negative impact on consumers, whose spending accounts for approximately two-thirds of economic activity. For example, consumer spending rose by just 1.1% from January through March—the slowest pace since the recession of 2001—while consumers’ personal incomes declined by 0.1 % from their peak last December through April. It is not especially surprising, then, that consumer confidence in June fell to its lowest level in 28 years. |
| • | | Weak manufacturing. As seen in Chart 6, manufacturing activity contracted for four consecutive months (a reading above 50 indicates expansion; below 50 indicates contraction). Although the latest reading for June shows a very slight expansion, it is clear manufacturers are facing significant headwinds in the current environment. |
Chart 5: U.S. Unemployment Rate
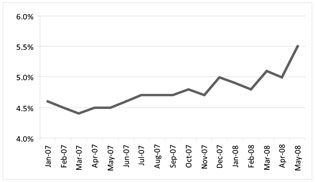
Source: Bureau of Labor Statistics
Chart 6: U.S. Manufacturing Activity
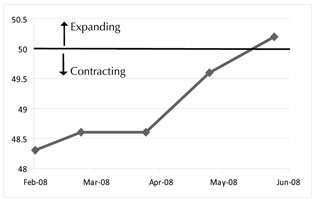
Source: Institute for Supply Management
| | |
| Page 2 | | The Flex-funds® 2008 Semiannual Report | June 30, 2008 |
| | |
| The Flex-funds® | | 2008 Semiannual Report | June 30, 2008 |
The Fed shifts its focus
The Federal Reserve Board reacted to new data, which emerged during this year, by shifting its primary focus from resparking the flagging economy to containing rising inflationary pressures.
In early April, for example, Fed chairman Ben Bernanke suggested the economy could enter into recession, while notes from a previous Fed meeting showed some Fed members worried about a “prolonged and severe” downturn. Later in April, the Fed cut short-term interest rates for the seventh time since last September (to 2%) in an effort to encourage greater consumer and business spending, and boost economic growth (see Chart 7).
Chart 7: Fed Funds Rate
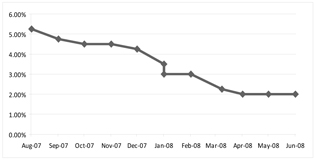
Source: Federal Reserve
By the end of May, however, the Fed started to indicate further rate cuts were unlikely. Then in June, Bernanke commented that the risk of a substantial economic downturn had diminished, but that inflation—driven by rising energy prices and a weak dollar—was becoming a growing threat the Fed would “strongly resist.” The Fed therefore held rates steady at 2% at its meeting in late June, as further rate cuts could generate an unwanted increase in inflation. It was the first time in more than nine months the Fed did not cut interest rates, while also opening the possibility to future rate hikes to combat inflation. According to the most recent Fed statement, “Although downside risks to growth remain, they appear to have diminished somewhat, and the upside risks to inflation and inflation expectations have increased.”
A somewhat cautious investment approach
The equity markets have performed poorly during the first half of 2008, driven by the factors explained above and because of the Fed’s rapid shift in focus from stimulating economic growth to fighting inflation. While large-company stocks suffered the largest losses during the time period, mid- and small-cap shares performed well in comparison (see Chart 8).
Chart 8: Asset-Class Performance (2nd Quarter 2008)
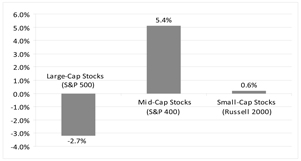
Source: Standard & Poor’s, WSJ Market Data Group
Since January, our quantitative investment models have indicated a somewhat high-risk stock market environment based on several trend and technical indicators. As a result, we established and have maintained a partially defensive position in The Muirfield Fund® and The Defensive Growth Fund. As of June 30, 2008, these Funds had an approximate 75% equity allocation and 25% allocation to money market securities. This position benefited performance as large-cap stock prices fell.
We also emphasized shares of large- and mid-cap companies in our fund-of-funds based mutual funds. This strategy included an overweight position in mid-cap stocks, which helped us deliver strong returns for the first half compared to the S&P 500 Index, the Dow Jones Industrial Average and the NASDAQ Composite Index. In addition, we continued to focus on growth stocks and underweight value shares. This approach also strongly benefited the Funds’ returns in recent months, especially since growth often performs well on a relative basis during periods of market volatility. Also, the value stock universe consists largely of financial services firms, which performed poorly during the first half and dragged down value shares as a group.
Our international investments dampened performance somewhat, as markets in Europe and elsewhere experienced negative returns. We gradually reduced our exposure to developed international markets during the second quarter. We also established a modest position in emerging markets stocks. Many economies in emerging markets such as Latin America are commodity-based, and therefore offer attractive growth prospects as well as a hedge against rising inflation. As a result of these actions, our total targeted international exposure remained unchanged at 18-20%.
| | |
| The Flex-funds® 2008 Semiannual Report | June 30, 2008 | | Page 3 |
| | |
| The Flex-funds® | | 2008 Semiannual Report | June 30, 2008 |
Letter to Shareholders
The fixed-income markets experienced significant volatility as well during the first half of 2008. During the first quarter, a flight to quality and declining interest rate environment translated to favorable exposure in long duration government Treasury securities. We maintained our position in relatively long weighted average maturities, which allowed us to lock in higher yields on longer-term issues. However, as inflation became the prevalent concern during the second quarter, Treasury bond yields rose (and prices fell), and investors favored corporate and government agency bonds, which offered attractive yields relative to Treasuries. As a result, we reduced the durations of The U.S. Government Bond Fund, which helped protect against some of the losses that occurred in the bond market in the second quarter. The Money Market Fund delivered strong performance and outperformed the average money market fund by maintaining its focus on high-quality money market securities.
Challenges ahead
It appears there will be a number of challenges during the coming months that could negatively affect the economy—including the possibility of higher inflation, reduced consumer spending, high gas prices and continued weakness in the housing market.
Indeed, the Fed now expects the economy to grow by just 0.3% to 1.2% in 2008, down from an earlier prediction of 1.3% to 2.0%. The Fed also raised its core inflation expectations for 2008, from an estimate of 2.0% to 2.2% in January to 2.2% to 2.4%, and expects unemployment to range between 5.5% and 5.7%. Additionally, a report by the Department of Energy predicts gas prices will hover around $4 per gallon and oil prices will remain well above $100 a barrel over the next year. In addition, it seems corporate earnings growth estimates are too high and will likely need to be reduced in the future.
This environment creates a significant challenge for the Federal Reserve. Further rate cuts to boost the economy could push inflation even higher, while raising rates to rein in inflation increases the risk of putting the brakes on the economy before it recovers from its current weakness. Until conditions become more clear, it is likely the Fed will hold interest rates steady.
For now, significant risks remain in the economy and the financial markets. Therefore, we are maintaining our partially defensive position in The Muirfield Fund® and The Defensive Growth Fund. We also continue to favor growth-oriented shares of large- and mid-cap domestic companies, and selective international exposures. Going forward, we will continue to monitor conditions carefully and look for shifts in the relationship between growth and value stocks, large-, mid-, and small-caps, and domestic and international shares that provide opportunities to enhance returns and manage risk for our shareholders.
On the following pages you will find a review of how our Mutual Funds have performed. Please read the commentaries and performance tables to learn more about the investment decisions that were made during the past six months.
On behalf of all of the associates at Meeder Asset Management, Inc. and The Flex-funds®, I thank you for the continued trust and confidence you have placed in our investment management services. We look forward to working with you and helping you achieve your most important financial goals.
Sincerely,
|
 |
| Robert S. Meeder, Jr. |
| President |
| Meeder Asset Management, Inc. & The Flex-funds® |
| June 30, 2008 |
| | |
| Page 4 | | The Flex-funds® 2008 Semiannual Report | June 30, 2008 |
| | |
| The Flex-funds® | | 2008 Semiannual Report | June 30, 2008 |
The Muirfield Fund®
The Defensive Growth Fund
Performance Perspective
| | | | | | | | | | | | | | | | | | | | | | | |
Period & Average Annual Total Returns as of June 30, 2008 | | 3
Months | | | YTD | | | 1
Year | | | 3
Years | | | 5
Years | | | 10
Years | | | Since
Inception | | | Inception
Date |
The Muirfield Fund® | | 1.67 | % | | -9.14 | % | | -9.75 | % | | 5.08 | % | | 7.24 | % | | 3.58 | % | | 7.93 | % | | 8/10/88 |
Expense Ratios*: Net 1.38% Gross 1.88% | | | | | | | | | | | | | | | | | | | | | | | |
The Defensive Growth Fund | | -1.37 | % | | -10.33 | % | | -11.70 | % | | — | | | — | | | — | | | -0.13 | % | | 1/31/06 |
Expense Ratios*: Net 1.56% Gross 1.66% | | | | | | | | | | | | | | | | | | | | | | | |
S&P 500 Index1 | | -2.72 | % | | -11.91 | % | | -13.11 | % | | 4.40 | % | | 7.57 | % | | 2.88 | % | | 10.49 | % | | 7/31/88 |
| | | | | | | | | | | | | | | | | | | | 1.97 | % | | 1/31/06 |
Blended Index2 | | -1.49 | % | | -6.79 | % | | -6.59 | % | | 4.34 | % | | 5.83 | % | | 3.15 | % | | 8.12 | % | | 7/31/88 |
| | | | | | | | | | | | | | | | | | | | 2.91 | % | | 1/31/06 |
Past performance is not a guarantee of future results. All performance figures represent total returns and average annual total returns for the periods ended June 30, 2008. Investment performance assumes reinvestment of all dividend and capital gain distributions. The investment return and principal value of an investment will fluctuate so that an investor’s shares, when redeemed, may be worth more or less than their original cost. Management fees and/or expenses were waived and/or reimbursed in The Flex-funds® during the periods shown in the table above to reduce expenses. All expenses, management fees, reimbursements or waivers for the Funds are voluntary and may be terminated at any time.
1 | The S&P 500 Index is a widely recognized unmanaged index of common stock prices. The S&P 500 Index does not take into account the deduction of expenses associated with a mutual fund, such as investment management and accounting fees. One cannot invest directly in an index. |
2 | The Blended Index consists of 60% of the S&P 500 Index and 40% of the average 90-day U.S. Treasury bill. |
| * | The Net Expense Ratios are percentages of the Funds’ net assets as of December 31, 2007. Gross Expense Ratios are percentages of the Funds’ assets as they are shown in the most recent Prospectus. The Net Expense Ratio includes all waivers, reimbursements and expenses paid indirectly. |
Semiannual Market Perspective
The Flex-funds Muirfield Fund® returned -9.14% for the six months ended June 30, 2008 while the The Flex-funds® Defensive Growth Fund returned -10.33% for the same period. By comparison, the S&P 500 Index declined 11.91% for the same period. That said, as conditions warrant, the Funds are sometimes invested “defensively” either partially or fully invested in cash equivalent securities. As a result, we believe another appropriate comparison of performance is a blended index consisting of 60% of the S&P 500 Index and 40% of the 90-day U.S. Treasury Bill. The Muirfield Fund® has outperformed this blended index for the 3 month, 3-, 5- and 10-year periods.
Portfolio Holdings as of June 30, 2008
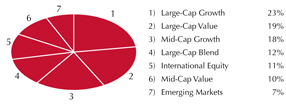
Portfolio holdings are subject to change.
Since mid-January of this year, The Muirfield Fund® and The Defensive Growth Fund have been invested in a partially defensive position. We initially established a 25% defensive position and have maintained a cash position of approximately 25-45% as a result of deterioration in the trend and technical factors in our quantitative models.
We have also been selective with our equity positions. As was discussed in the President’s letter on pages 1 through 4, the prevailing macroeconomic theme continues to focus on the impact from a slowing economy coupled with the prospect of inflationary pressures, and we believe our view necessitates an allocation to large-and mid-cap shares as opposed to small-cap shares. As such, we continue to believe large-and mid-cap stocks not only provide the best opportunities for superior relative returns over the near-term, but also act as a buffer if the markets continue to stumble.
Aside from our emphasis on large-and mid-cap shares, we continued to overweight growth stocks, as our models favored growth over value across all asset size ranges. Our strategic fund selection process identified the potential for gains through the Janus Adviser Forty Fund, which returned–0.31% during the first half. We also experienced success with the Fidelity Independence Growth Fund that returned 6.41% in the first half of 2008. In addition, we maintained our international holdings at approximately 13% as our evaluation continues to favor selective international exposures, including a modest weighting in emerging markets. Our position in the Allianz NFJ International Value Fund returned–4.96%, compared to its benchmark, the MSCI EAFE Index, which returned–10.50% in the first half of 2008.
| | |
| The Flex-funds® 2008 Semiannual Report | June 30, 2008 | | Page 5 |
| | |
| The Flex-funds® | | 2008 Semiannual Report | June 30, 2008 |
The Dynamic Growth Fund
The Focused Growth Fund
Performance Perspective
| | | | | | | | | | | | | | | | | | | | | | |
Period & Average Annual Total Returns as of June 30, 2008 | | 3
Months | | | YTD | | | 1
Year | | | 3
Years | | | 5
Years | | | 10
Years | | Since
Inception | | | Inception
Date |
The Dynamic Growth Fund | | 3.05 | % | | -8.55 | % | | -9.04 | % | | 6.33 | % | | 8.43 | % | | — | | -0.47 | % | | 2/29/00 |
Expense Ratios*: Net 1.32% Gross 1.86% | | | | | | | | | | | | | | | | | | | | | | |
The Focused Growth Fund | | -0.42 | % | | -10.02 | % | | -11.39 | % | | — | | | — | | | — | | 0.84 | % | | 1/31/06 |
Expense Ratios*: Net 1.58% Gross 1.68% | | | | | | | | | | | | | | | | | | | | | | |
S&P 500 Index1 | | -2.72 | % | | -11.91 | % | | -13.11 | % | | 4.40 | % | | 7.57 | % | | — | | 0.91 | % | | 2/29/00 |
| | | | | | | | | | | | | | | | | | | 1.97 | % | | 1/31/06 |
Past performance is not a guarantee of future results. All performance figures represent total returns and average annual total returns for the periods ended June 30, 2008. Investment performance assumes reinvestment of all dividend and capital gain distributions. The investment return and principal value of an investment will fluctuate so that an investor’s shares, when redeemed, may be worth more or less than their original cost. Management fees and/or expenses were waived and/or reimbursed in The Flex-funds® during the periods shown in the table above to reduce expenses. All expenses, management fees, reimbursements or waivers for the Funds are voluntary and may be terminated at any time.
1 | The S&P 500 Index is a widely recognized unmanaged index of common stock prices. The S&P 500 Index does not take into account the deduction of expenses associated with a mutual fund, such as investment management and accounting fees. One cannot invest directly in an index. |
| * | The Net Expense Ratios are percentages of the Funds’ net assets as of December 31, 2007. Gross Expense Ratios are percentages of the Funds’ assets as they are shown in the most recent Prospectus. The Net Expense Ratio includes all waivers, reimbursements and expenses paid indirectly. |
Semiannual Market Perspective
The Flex-funds® Dynamic Growth Fund and The Focused Growth Fund returned -8.55% and -10.02%, respectively, for the six months ended June 30, 2008, while the S&P 500 Index returned -11.91% for the same period. The Dynamic Growth Fund has also outperformed its benchmark index for the 3 month, year-to-date, 1-, 3-, and 5-year periods. Similarly, The Focused Growth Fund outperformed its benchmark index for the 3 month, year-to-date and 1-year periods.
Portfolio Holdings as of June 30, 2008
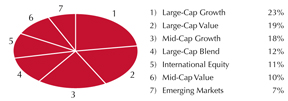
Portfolio holdings are subject to change.
The economy faced numerous challenges during the first half of 2008 as consumer confidence reached a 28-year low, inflationary pressures persisted from rising energy and food prices, and payrolls continued to decline. The unwinding of the credit bubble continued, as evidenced by the prolonged downturn in the domestic housing market and the struggling financial services sector.
Our emphasis on large-and mid-cap stock funds aided performance in the first half of the year. During the first quarter, we favored the shares of large-cap companies; however, our internal models indicated an attractive risk-return profile for mid-caps in the second quarter. Given our assessment of the economic environment, we believe it remains prudent to be invested in the shares of large-and mid-cap companies as opposed to small-cap shares. Our internal models also began shifting to growth across all market cap ranges in the third quarter of 2007. We made a series of adjustments accordingly throughout the fourth quarter of 2007 and have subsequently maintained those positions.
While value stocks outperformed in the first quarter due to weakness in the technology sector, growth stocks regained their 2007 form and significantly outperformed value stocks in the second quarter, especially as the financial services sector suffered another wave of losses. Additionally, our models continued to favor an international position so we maintained our international exposure at approximately 18-20%. Our international positions of Harbor International and Allianz NFJ International Value Fund outperformed their benchmark the MSCI EAFE Index for the first half of 2008.
As of this writing, our target allocation for the Funds is 54% in large-cap stock funds, 28% in mid-cap stock funds, and 18% in international stock funds.
| | |
| Page 6 | | The Flex-funds® 2008 Semiannual Report | June 30, 2008 |
| | |
| The Flex-funds® | | 2008 Semiannual Report | June 30, 2008 |
The Aggressive Growth Fund
Performance Perspective
| | | | | | | | | | | | | | | | | | | | | | |
Period & Average Annual Total Returns as of June 30, 2008 | | 3
Months | | | YTD | | | 1
Year | | | 3
Years | | | 5
Years | | | 10
Years | | Since
Inception | | | Inception
Date |
The Aggressive Growth Fund | | -0.52 | % | | -10.24 | % | | -11.08 | % | | 4.85 | % | | 7.60 | % | | — | | -2.91 | % | | 2/29/00 |
Expense Ratios*: Net 1.70% Gross 1.83% | | | | | | | | | | | | | | | | | | | | | | |
NASDAQ Composite Index1 | | 0.82 | % | | -13.18 | % | | -11.18 | % | | 4.51 | % | | 7.90 | % | | — | | -7.73 | % | | 2/29/00 |
Past performance is not a guarantee of future results. All performance figures represent total returns and average annual total returns for the periods ended June 30, 2008. Investment performance assumes reinvestment of all dividend and capital gain distributions. The investment return and principal value of an investment will fluctuate so that an investor’s shares, when redeemed, may be worth more or less than their original cost. Management fees and/or expenses were waived and/or reimbursed in The Flex-funds® during the periods shown in the table above to reduce expenses. All expenses, management fees, reimbursements or waivers for the Funds are voluntary and may be terminated at any time.
1 | The NASDAQ Composite Index is a broad-based capitalization-weighted index of all NASDAQ National Market and Small Cap stocks. The NASDAQ Composite Index does not take into account the deduction of expenses associated with a mutual fund, such as investment management and accounting fees. One cannot invest directly in an index. |
| * | The Net Expense Ratio is a percentage of the Fund’s net assets as of December 31, 2007. The Gross Expense Ratio is a percentage of the Fund’s assets as it is shown in the most recent Prospectus. The Net Expense Ratio includes all waivers, reimbursements and expenses paid indirectly. |
Semiannual Market Perspective
The Flex-funds® Aggressive Growth Fund returned -10.24% for the six months ended June 30, 2008. In comparison, the NASDAQ Composite Index returned -13.18% for the same period. Even with the market declines over the past nine months, The Aggressive Growth Fund has provided an average annual rate of return of 7.60%, for the 5-year period ending June 30, 2008 while the NASDAQ Composite Index returned 7.90% over the same 5-year period. The Fund exceeded its benchmark for the year-to-date, 1-, 3-and since inception periods.
Portfolio Holdings as of June 30, 2008
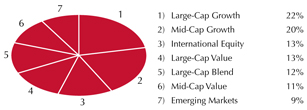
Portfolio holdings are subject to change.
The economy faced numerous challenges during the first half of 2008 as consumer confidence reached a 28-year low, inflationary pressures persisted from rising energy and food prices, and payrolls continued to decline. Due to the economic environment and a result of our quantitative model, we focused our holdings on large-and mid-cap stock positions, which aided performance in the first half of the year. Given our assessment of the economic environment, we believe it remains prudent to be invested in the shares of large-and mid-cap companies as opposed to small-cap shares. Our internal models also began shifting to growth across all market cap ranges in the third quarter of 2007. We made a series of adjustments accordingly throughout the fourth quarter of 2007 and have subsequently maintained those positions.
In The Flex-funds® Aggressive Growth Fund, our position in the Utilities sector as well as exposure to Latin America benefited the Fund, while geographic exposure to Europe detracted from value. Overall, international exposure ranged from approximately 20% to 30%, including a 9% stake in emerging markets as of the end of the first half. Downward pressure on the U.S. Dollar relative to the Euro continued to aid performance throughout the time period, and widening interest rate differentials between the U.S. and other countries may place more downside pressure on the Dollar in the months ahead.
As of this writing, our target allocation for the Fund is 47% in large-cap stock funds, 31% in mid-cap stock funds, and 22% in international stock funds.
| | |
| The Flex-funds® 2008 Semiannual Report | June 30, 2008 | | Page 7 |
| | |
| The Flex-funds® | | 2008 Semiannual Report | June 30, 2008 |
The Quantex Fund™
Performance Perspective
| | | | | | | | | | | | | | | | | | | | | | | |
Period & Average Annual Total Returns as of June 30, 2008 | | 3
Months | | | YTD | | | 1
Year | | | 3
Years | | | 5
Years | | | 10
Years | | | Since
Inception | | | Inception
Date |
The Quantex Fund™ | | -4.73 | % | | -13.16 | % | | -26.22 | % | | -0.46 | % | | 4.36 | % | | 0.52 | % | | 6.26 | % | | 3/20/85 |
Expense Ratios*: Net 1.56% Gross 2.09% | | | | | | | | | | | | | | | | | | | | | | | |
Russell 2000 Index1 | | 0.59 | % | | -9.37 | % | | -16.18 | % | | 3.82 | % | | 10.32 | % | | 5.58 | % | | 8.00 | % | | 3/31/85 |
S&P 400 Mid-Cap Index2 | | 5.43 | % | | -3.90 | % | | -7.34 | % | | 7.44 | % | | 12.59 | % | | 9.82 | % | | 12.28 | % | | 3/31/85 |
Past performance is not a guarantee of future results. All performance figures represent total returns and average annual total returns for the periods ended June 30, 2008. Investment performance assumes reinvestment of all dividend and capital gain distributions. The investment return and principal value of an investment will fluctuate so that an investor’s shares, when redeemed, may be worth more or less than their original cost. Management fees and/or expenses were waived and/or reimbursed in The Flex-funds® during the periods shown in the table above to reduce expenses. The Fund’s management fee waiver is contractual and may be terminated annually by the Advisor on its renewal date.
1 | The Russell 2000 Index is a widely recognized unmanaged index of common stock prices of small-sized companies. The Russell 2000 Index does not take into account the deduction of expenses associated with a mutual fund, such as investment management and accounting fees. One cannot invest directly in an index. |
2 | The S&P 400 Mid-Cap Index is a widely recognized unmanaged index of common stock prices of mid-sized companies. The S&P 400 Mid-Cap Index does not take into account the deduction of expenses associated with a mutual fund, such as investment management and accounting fees. One cannot invest directly in an index. |
| * | The Net Expense Ratio is a percentage of the Fund’s net assets as of December 31, 2007. The Gross Expense Ratio is a percentage of the Fund’s assets as it is shown in the most recent Prospectus. The Net Expense Ratio includes all waivers, reimbursements and expenses paid indirectly. |
Semiannual Market Perspective
The Flex-funds® Quantex Fund™ returned -13.16% for the six months ended June 30, 2008. By comparison, the Russell 2000 Index returned -9.37%, while the S&P 400 Mid-Cap Index returned -3.90% for the same period.
We have employed our quantitative stock selection process for The Quantex Fund™ since April 30, 2005. We utilize rankings from our financial model to determine which 100 securities are to be held in the Fund on an annual basis, which focuses on small-and mid-cap stocks. These stocks are typically those of large companies that have declined in price prior to being included in the Fund (referred to as “fallen angels”) or stocks of small, up-and-coming companies (“rising stars”).
Sector Weightings as of June 30, 2008
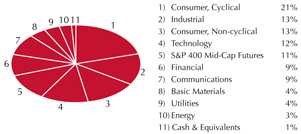
Sector weightings are subject to change.
The Fund is rebalanced once each year in January, and for 2008 the composition of the Fund is once again overweighted in Consumer Goods and underweighted in Energy, with an overall tilt to value. For the first half of 2008, the single best performing stock was Big Lots (up 95%). Energy stocks benefited performance as Teco Energy gained nearly 28% and Dynegy gained approximately 20% during the first half. The Fund also benefited from chemical companies, with Eastman Chemical Company gaining 14% during the first half of the year. The Fund experienced mixed performance with consumer-oriented companies, as evidenced by a 17% increase with Darden Restaurants compared to a 27% decrease in Radioshack. As expected, financial stocks were the worst performers, including Ambac Financial Group, Inc and MBIA.
The Fund has encountered similar rough patches in the past, particularly during transitional periods in the market. For example, in the fourth quarter of 1999 and the first quarter of 2000, the Fund returned 13.46% and 3.80%, respectively, while the S&P 400 Mid-Cap Index returned 17.20% and 12.70%.
| | |
| Page 8 | | The Flex-funds® 2008 Semiannual Report | June 30, 2008 |
| | |
| The Flex-funds® | | 2008 Semiannual Report | June 30, 2008 |
The Socially Responsible Utilities Fund
(Formerly known as The Total Return Utilities Fund)3
Performance Perspective
| | | | | | | | | | | | | | | | | | | | | | | |
Period & Average Annual Total Returns as of June 30, 2008 | | 3
Months | | | YTD | | | 1
Year | | | 3
Years | | | 5
Years | | | 10
Years | | | Since
Inception | | | Inception
Date |
The Socially Responsible Utilities Fund | | 7.01 | % | | - 2.51 | % | | 2.27 | % | | 12.56 | % | | 14.97 | % | | 6.54 | % | | 9.79 | % | | 6/21/95 |
Expense Ratios*: Net 1.90% Gross 2.10% | | | | | | | | | | | | | | | | | | | | | | | |
Russell 3000 Utilities Index1 | | 2.87 | % | | -8.80 | % | | -9.71 | % | | 8.64 | % | | 11.24 | % | | 1.43 | % | | 5.43 | % | | 6/30/95 |
Blended Index2 | | 1.48 | % | | -6.33 | % | | -5.15 | % | | 5.52 | % | | 8.11 | % | | 3.18 | % | | 5.96 | % | | 6/30/95 |
Past performance is not a guarantee of future results. All performance figures represent total returns and average annual total returns for the periods ended June 30, 2008. Investment performance assumes reinvestment of all dividend and capital gain distributions. The investment return and principal value of an investment will fluctuate so that an investor’s shares, when redeemed, may be worth more or less than their original cost. Management fees and/or expenses were waived and/or reimbursed in The Flex-funds® during the periods shown in the table above to reduce expenses. All expenses, management fees, reimbursements or waivers for the Funds are voluntary and may be terminated at any time.
1 | The Russell 3000 Utilities Index is a market capitalization-weighted index that is comprised of utility stocks that are included in the Russell 3000 Index. This index does not take into account the deduction of expenses associated with a mutual fund, such as investment management and accounting fees. One cannot invest directly in an index. |
2 | The Blended Index consists of 60% of the Russell 3000 Utilities Index and 40% of the Lehman Brothers Long Credit Index. |
3 | While the name of the fund has changed, the investment objective has remained the same. |
| * | The Net Expense Ratio is a percentage of the Fund’s net assets as of December 31, 2007. The Gross Expense Ratio is a percentage of the Fund’s assets as it is shown in the most recent Prospectus. The Net Expense Ratio includes all waivers, reimbursements and expenses paid indirectly. |
Semiannual Market Perspective
For the six months ended June 30, 2008, The Flex-funds® Socially Responsible Utilities Fund returned -2.51%, while the Russell 3000 Utilities Index returned -8.80%, and a blended index consisting of 60% of the Russell 3000 Utilities Index and 40% of The Lehman Brothers Long Credit Index returned -6.33%. We are very pleased the Fund has outperformed both of these benchmarks for the 3 month, year-to-date, 1-, 3-, 5-, 10-year and since inception periods.
Absent the problems plaguing the financial sector, utilities generally had favorable first half performance, and so did the Fund. Lower performance in the Russell 3000 Utilities generally indicates poor telecom performance, since the index is over half telecom; however, our representatives in the group had mixed performance, with some doing quite well.
Sector Weightings as of June 30, 2008
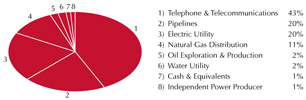
Sector weightings are subject to change.
Telecom shares proved volatile and produced mixed returns throughout the first half. A well-timed entry into the very cheap Brazilian phone company Tele Norte Leste helped the Fund in the first quarter while AT&T negatively impacted performance. During the second quarter, we took profits of about 100% in Brasil Telecom as it had fully priced its impending deal, and took profits of 65% in Leap Wireless, a fourth quarter trading purchase, replacing it with deal speculation Telephone & Data Systems. Canadian telecom TELUS, China Mobile, AT&T, America Movil and Philippine Long Distance were the weaker performers in the Fund during the second quarter.
During the first quarter we thought there had been “enough correction” in share prices. Right now we do not see excesses that need correction in this sector. Some of the weak will become strong, some of the strong will become booked profits, and there are ample new opportunities presenting themselves in many corners. We continue to like what we see, both short-term and long-term, and in this sector the term “write-down” is rarely if ever heard.
| | |
| The Flex-funds® 2008 Semiannual Report | June 30, 2008 | | Page 9 |
| | |
| The Flex-funds® | | 2008 Semiannual Report | June 30, 2008 |
The U.S. Government Bond Fund
Performance Perspective
| | | | | | | | | | | | | | | | | | | | | | | |
Period & Average Annual Total Returns as of June 30, 2008 | | 3
Months | | | YTD | | | 1
Year | | | 3
Years | | | 5
Years | | | 10
Years | | | Since
Inception | | | Inception
Date |
The U.S. Government Bond Fund | | -2.01 | % | | 0.64 | % | | 7.38 | % | | 3.76 | % | | 2.06 | % | | 3.49 | % | | 5.57 | % | | 5/7/85 |
Expense Ratios*: Net 1.01% Gross 1.72% | | | | | | | | | | | | | | | | | | | | | | | |
Lehman Brothers Intermediate-Term Government/Credit Index1 | | -1.53 | % | | 1.43 | % | | 7.37 | % | | 4.27 | % | | 3.49 | % | | 5.55 | % | | 7.43 | % | | 4/30/85 |
Past performance is not a guarantee of future results. All performance figures represent total returns and average annual total returns for the periods ended June 30, 2008. Investment performance assumes reinvestment of all dividend and capital gain distributions. The investment return and principal value of an investment will fluctuate so that an investor’s shares, when redeemed, may be worth more or less than their original cost. Management fees and/or expenses were waived and/or reimbursed in The Flex-funds® during the periods shown in the table above to reduce expenses. All expenses, management fees, reimbursements or waivers for the Funds are voluntary and may be terminated at any time.
1 | The Lehman Brothers Intermediate-Term Government/Credit Index is an unmanaged index of fixed-rate bonds issued by the U.S. Government and its agencies that are rated investment grade or higher, have one to ten years remaining until maturity, and at least $100 million outstanding. The Lehman Brothers Intermediate-Term Government/Credit Index does not take into account the deduction of expenses associated with a mutual fund, such as investment management and accounting fees. One cannot invest directly in an index. |
| * | The Net Expense Ratio is a percentage of the Fund’s net assets as of December 31, 2007. The Gross Expense Ratio is a percentages of the Fund’s assets as it is shown in the most recent Prospectus. The Net Expense Ratio includes all waivers, reimbursements and expenses paid indirectly. |
Semiannual Market Perspective
The Flex-funds® U.S. Government Bond Fund returned 0.64% year-to-date through June 30, 2008. After a positive first quarter when bond prices consistently rallied and yields declined, the second quarter realized the opposite with bond prices declining and yields increasing. The average yield on a 2-year U.S. Treasury security increased approximately 1.45% during the second quarter. This was due to the anticipation the Fed would move away from cutting its benchmark interest rate and focus more on inflation expectations. Throughout the first half of the year inflation expectations elevated with accelerated increases in many commodity and food prices. As these data sets changed our fixed-income model inputs also changed to indicate we should move our average duration lower. As a result, our target average duration moved lower from approximately 5 to 3.75.
Portfolio Holdings as of June 30, 2008
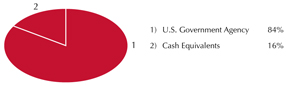
Portfolio holdings are subject to change.
As yields in the fixed-income markets started pricing in the changes in the market environment, opportunities were generated to purchase higher yielding products. Recognizing this opportunity, we invested a portion of the Fund in callable government agency bonds. This offered the opportunity for additional yield pick-up over other more traditional non-callable government investments.
As we move into the third quarter of 2008, we anticipate interest rates to rise slightly. With no relief from inflated commodity and food prices in sight, we believe our model will remain in favor of a lower average duration. Depending on the economic environment, we may continue to lower the average duration of the Fund. Investments in the Fund remain in U.S. Government Agency securities as we believe they offer an attractive spread over U.S. Treasury Securities. As the third quarter evolves we will remain vigilant to anticipate changes in the market and alter investments accordingly. At this time we believe the Fund structure is consistent with our philosophy and fixed-income model.
| | |
| Page 10 | | The Flex-funds® 2008 Semiannual Report | June 30, 2008 |
| | |
| The Flex-funds® | | 2008 Semiannual Report | June 30, 2008 |
The Money Market Fund
Performance Perspective
| | | | | | | | | | | | | | | | | | | | | | | |
Period & Average Annual Total Returns as of June 30, 2008 | | 3
Months | | | YTD | | | 1
Year | | | 3
Years | | | 5
Years | | | 10
Years | | | Since
Inception | | | Inception
Date |
The Flex-funds® Money Market Fund (Retail Class) | | 0.61 | % | | 1.53 | % | | 3.98 | % | | 4.29 | % | | 3.09 | % | | 3.54 | % | | 4.98 | % | | 3/27/85 |
Expense Ratios*: Net 0.48% Gross 0.84% | | | | | | | | | | | | | | | | | | | | | | | |
Current & Effective Yields1 | | 7-day Compound: 2.21% | | | 7-day Simple: 2.19% |
Lipper Average General-Purpose | | 0.50 | % | | 1.30 | % | | 3.55 | % | | 3.84 | % | | 2.60 | % | | 3.03 | % | | 4.45 | % | | 3/31/85 |
Money Market Fund2 | | | | | | | | | | | | | | | | | | | | | | | |
The Flex-funds® Money Market Fund (Institutional Class) | | 0.65 | % | | 1.60 | % | | 4.13 | % | | 4.44 | % | | — | | | — | | | 4.15 | % | | 12/28/04 |
Expense Ratios*: Net 0.34% Gross 0.67% | | | | | | | | | | | | | | | | | | | | | | | |
Current & Effective Yields1 | | 7-day Compound: 2.36% | | | 7-day Simple: 2.33% |
iMoneyNet, Inc. Average First-Tier | | 0.62 | % | | 1.55 | % | | 4.06 | % | | 4.56 | % | | — | | | — | | | 4.09 | % | | 12/31/04 |
Institutional Money Market Fund2 | | | | | | | | | | | | | | | | | | | | | | | |
Past performance does not guarantee future results. Except for the current and effective yields, all performance figures represent average annual total returns for the periods ended June 30, 2008, and assume reinvestment of all dividend and capital gain distributions. The investment return and principal value of an investment will fluctuate so that an investor’s shares, when redeemed, may be worth more or less than their original cost. Management fees were waived and/or expenses were reimbursed in order to reduce the operating expenses of The Money Market Fund during the periods shown above. Investments in The Money Market Fund are neither insured nor guaranteed by the Federal Deposit Insurance Corporation or any other governmental agency. Although the Funds seek to preserve the value of your investment at $1.00 per share, it is possible to lose money by investing in The Money Market Fund.
1 | For the period ended June 30, 2008, yield quotations more closely reflect the current earnings of The Money Market Fund than do total return quotations. |
2 | An index of funds such as Lipper’s Average General Purpose Money Market Fund Index and iMoneyNet, Inc.’s Average First-Tier Institutional Money Market Fund Index includes a number of mutual funds grouped by investment objective. |
| * | The Net Expense Ratios are percentages of the Funds’ net assets as of December 31, 2007. Gross Expense Ratios are percentages of the Funds’ assets as they are shown in the most recent Prospectus. The Net Expense Ratio includes all waivers, reimbursements and expenses paid indirectly. |
Semiannual Market Perspective
The Retail Class of The Flex-funds® Money Market Fund continues to rank among the top general-purpose money market funds in the country as of June 30, 2008, according to iMoneyNet, Inc. The Retail Class of the Fund closed the first half of 2008 with a 2.21% 7-day compound yield. The average general-purpose money market fund finished the quarter with a 1.89% 7-day compound yield.
Portfolio Holdings as of June 30, 2008
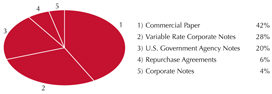
Portfolio holdings are subject to change.
The first quarter was characterized by volatility as the Fed cut the federal funds rate from 4.25% to 2.25% in response to disruptions in the credit markets. Fixed-income securities across all money market sectors rallied in price and reached a peak near the end of March. In the second quarter, investors seemed to shift focus to the potential onset of inflation despite lingering credit concerns. However, debt of financial intermediaries continued to be priced for higher yields as risk associated with these investments remained elevated. With events in place, the second quarter also realized a steeper yield curve. Traditional commercial paper with the highest credit ratings maturing in 90 days increased only 0.14% while yields at the maximum maturity for commercial paper (270 days) increased nearly 0.50%.
Corporate debt issued by financial institutions (including asset-backed commercial paper) traded at a greater spread over U.S Treasury securities compared to other money market instruments. Asset-backed commercial paper also maintained an above average spread over traditional commercial paper by approximately 0.50%. This is mainly due to higher risk associated with these investments. We continue to avoid holding any asset-backed commercial paper due to the ongoing concerns over the creditworthiness of these investments.
As we move into the third quarter of 2008, we continue to watch the developments taking place in the credit markets closely. Credit markets still show signs of instability, which is apparent in excessive spreads in certain areas of the money market arena. With the possibility of prolonged economic weakness coupled with the credit crisis it is important to remain patient at this juncture. As for the weighted average maturity (WAM) of the fund, we will move to position ourselves for flat to increasing interest rates. With this in mind, our strategy over the next quarter will be to lower our WAM closer to the industry average. We believe this philosophy will be suitable to position ourselves for the potential increase in interest rates over the next several quarters.
| | |
| The Flex-funds® 2008 Semiannual Report | June 30, 2008 | | Page 11 |
| | |
| The Flex-funds® | | 2008 Semiannual Report | June 30, 2008 |
Shareholder Expense Analysis (Unaudited)
Shareholders of mutual funds pay ongoing expenses, such as advisory fees, distribution and service fees (12b-1 fees) and other fund expenses. The following examples are intended to help you understand your ongoing costs (in dollars) of investing in the Funds and to compare these costs with the ongoing costs of investing in other mutual funds.
The examples below are based on an investment of $1,000 invested at the beginning of the period and held for the six-month period from December 31, 2007 to June 30, 2008.
ACTUAL EXPENSES: The first table below provides information about actual account values and actual expenses. You may use the information in this table, together with the amount you invested, to estimate the expenses that you paid over the period. Simply divide your account value by $1,000 (e.g.: an $8,600 account value divided by $1,000 = 8.6), then multiply the result by the number in the line under the heading “Expenses Paid During the Period” to estimate the expenses you paid on your account during this period.
| | | | | | | | | | | | |
ACTUAL EXPENSES | | Beginning
Account Value
(12/31/2007) | | Ending
Account Value
(6/30/08) | | Expenses Paid
During Period1
(12/31/2007-
6/30/08) | | Expense Ratio
(Annualized) | |
The Muirfield Fund® | | $ | 1,000.00 | | $ | 908.60 | | $ | 6.64 | | 1.40 | % |
The Socially Responsible Utilities Fund | | | 1,000.00 | | | 974.90 | | | 9.33 | | 1.90 | % |
The Quantex Fund™ | | | 1,000.00 | | | 868.40 | | | 7.67 | | 1.65 | % |
The Dynamic Growth Fund | | | 1,000.00 | | | 914.50 | | | 6.28 | | 1.32 | % |
The Aggressive Growth Fund | | | 1,000.00 | | | 897.60 | | | 8.02 | | 1.70 | % |
The Defensive Growth Fund | | | 1,000.00 | | | 896.70 | | | 7.31 | | 1.55 | % |
The Focused Growth Fund | | | 1,000.00 | | | 899.80 | | | 7.42 | | 1.57 | % |
The U.S. Government Bond Fund | | | 1,000.00 | | | 1,006.40 | | | 4.94 | | 0.99 | % |
The Money Market Fund - Retail Class | | | 1,000.00 | | | 1,015.30 | | | 2.41 | | 0.48 | % |
The Money Market Fund - Institutional Class | | | 1,000.00 | | | 1,016.00 | | | 1.70 | | 0.34 | % |
HYPOTHETICAL EXAMPLE FOR COMPARISON PURPOSES: The second table below provides information about hypothetical account values and hypothetical expenses based on the Funds’ actual expense ratios and assumed rates of return of 5% per year before expenses, which are not the Funds’ actual returns. The hypothetical account values and expenses may not be used to estimate the actual ending account balance or expenses you paid for the period. You may use this information to compare the ongoing costs of investing in the Funds to other funds. To do so, compare this 5% hypothetical example with the 5% hypothetical examples that appear in the shareholder reports of the other funds.
| | | | | | | | | | | | |
HYPOTHETICAL EXAMPLE (5% return before expenses) | | Beginning
Account Value
(12/31/2007) | | Ending
Account Value
(6/30/08) | | Expenses Paid
During Period1
(12/31/2007-
6/30/08) | | Expense Ratio
(Annualized) | |
The Muirfield Fund® | | $ | 1,000.00 | | $ | 1,017.90 | | $ | 7.02 | | 1.40 | % |
The Socially Responsible Utilities Fund | | | 1,000.00 | | | 1,015.42 | | | 9.52 | | 1.90 | % |
The Quantex Fund™ | | | 1,000.00 | | | 1,016.66 | | | 8.27 | | 1.65 | % |
The Dynamic Growth Fund | | | 1,000.00 | | | 1,018.30 | | | 6.62 | | 1.32 | % |
The Aggressive Growth Fund | | | 1,000.00 | | | 1,016.41 | | | 8.52 | | 1.70 | % |
The Defensive Growth Fund | | | 1,000.00 | | | 1,017.16 | | | 7.77 | | 1.55 | % |
The Focused Growth Fund | | | 1,000.00 | | | 1,017.06 | | | 7.87 | | 1.57 | % |
The U.S. Government Bond Fund | | | 1,000.00 | | | 1,019.94 | | | 4.97 | | 0.99 | % |
The Money Market Fund - Retail Class | | | 1,000.00 | | | 1,022.48 | | | 2.41 | | 0.48 | % |
The Money Market Fund - Institutional Class | | | 1,000.00 | | | 1,023.17 | | | 1.71 | | 0.34 | % |
Please note that the expenses shown in the tables are meant to highlight your ongoing costs only and do not reflect any transactional costs, such as redemption fees or exchange fees. Therefore, the second table is useful in comparing ongoing costs only, and will not help you determine the relative total costs of owning different funds. In addition, if any transactional costs were included, your costs would have been higher.
1 | Expenses are equal to the Funds’ annualized expense ratios, multiplied by the average account value over the period, multiplied by 182/366 (to reflect the total number of days in the six-month period). |
| | |
| Page 12 | | The Flex-funds® 2008 Semiannual Report | June 30, 2008 |
| | |
| The Flex-funds® | | 2008 Semiannual Report | June 30, 2008 |
2008 Semiannual Report
Portfolio Holdings & Financial Statements
| | |
| The Flex-funds® 2008 Semiannual Report | June 30, 2008 | | Page 13 |
Schedule of Investments
June 30, 2008 (unaudited)
The Muirfield Fund
| | | | | |
Security Description | | Shares or
Principal
Amount ($) | | Value ($)(a) | |
Registered Investment Companies — 70.9% | | | |
Allianz NFJ Dividend Value Fund — Class D | | 203,321 | | 2,980,679 | |
Allianz NFJ International Value Fund —Class A | | 156,343 | | 3,878,882 | |
CGM Focus Fund | | 54,832 | | 3,369,990 | |
DWS Large Cap Value Fund — Class A | | 69,478 | | 1,381,224 | |
Fairholme Fund | | 76,614 | | 2,296,902 | |
Fidelity Advisor Leveraged Company Stock Fund — A | | 134,409 | | 5,438,183 | |
Fidelity Independence Fund | | 144,510 | | 4,252,943 | |
Harbor International Fund — Inst. Class | | 58,263 | | 3,852,349 | |
Hartford Capital Appreciation Fund —Class A | | 176,105 | | 6,487,709 | |
iShares S&P Latin American 40 Index Fund | | 2,150 | | 591,250 | |
iShares S&P Midcap 400 Index Fund | | 25,200 | | 2,055,816 | |
Janus Adviser Forty Fund — Class S | | 160,516 | | 6,634,119 | |
Janus Adviser Mid Cap Growth Fund —Class S# | | 82,401 | | 2,974,676 | |
Janus Adviser Mid Cap Value Fund —Class S | | 215,069 | | 3,811,022 | |
Janus Enterprise Fund# | | 96,377 | | 5,264,102 | |
Lazard Emerging Markets Portfolio | | 124,939 | | 2,776,152 | |
MFS Value Fund — Class A | | 132,101 | | 3,108,344 | |
Nuveen Tradewinds Value Opportunities Fund — Class A | | 127,273 | | 3,767,295 | |
Pioneer Cullen Value Fund — Class A | | 67,034 | | 1,271,637 | |
PowerShares QQQ | | 38,250 | | 1,727,752 | |
| | | | | |
Total Registered Investment Companies (Cost $70,702,592) | | | | 67,921,026 | |
| | | | | |
Money Market Registered Investment Companies — 4.1% | |
Federated Prime Obligations Fund —Class I | | 3,891,672 | | 3,891,672 | |
| | | | | |
Total Money Market Registered Investment Companies
(Cost $3,891,672) | | | | 3,891,672 | |
| | | | | |
U.S. Government Obligations — 0.4% | | | |
U.S. Treasury Bill, 1.61%, due 08/07/2008* | | 100,000 | | 99,822 | |
U.S. Treasury Bill, 1.79%, due 09/04/2008* | | 300,000 | | 299,054 | |
| | | | | |
Total U.S. Government Obligations
(Cost $398,854) | | | | 398,876 | |
| | | | | |
Repurchase Agreements — 25.0% | | | | | |
Morgan Stanley DW, Inc., 2.56%, 07/01/2008, (Collateralized by $24,991,548 various Government Agencies, Agency Strips, Treasury Notes, and Treasury Strips at 5.125% — 8.625%, due 07/15/2008 —04/15/2030, value — $24,477,015) purchase date 06/30/2008 | | 23,997,000 | | 23,997,000 | |
| | | | | |
Total Repurchase Agreements
(Cost $23,997,000) | | | | 23,997,000 | |
| | | | | |
Total Investments — 100.4%
(Cost $98,990,118)(b) | | | | 96,208,574 | |
| | | | | |
Liabilities less Other Assets — (0.4%) | | (392,284 | ) |
| | | | | |
Total Net Assets — 100.0% | | | | 95,816,290 | |
| | | | | |
The Muirfield Fund
| | | | | |
Security Description | | Shares or
Principal
Amount ($) | | Value ($)(a) | |
Trustee Deferred Compensation** | | | |
The Flex-funds Aggressive Growth Fund | | 528 | | 4,071 | |
The Flex-funds Defensive Growth Fund | | 303 | | 2,842 | |
The Flex-funds Dynamic Growth Fund | | 1,490 | | 12,591 | |
The Flex-funds Muirfield Fund | | 4,349 | | 23,789 | |
The Flex-funds Quantex Fund | | 1,959 | | 31,168 | |
The Flex-funds Socially Responsible Utilities Fund | | 280 | | 7,123 | |
| | | | | |
Total Trustee Deferred Compensation
(Cost $74,579) | | 81,584 | |
| | | | | |
| | | Long
Contracts | | Unrealized
Appreciation
(Depreciation) ($) | |
Futures Contracts | | | | | |
Standard & Poors MidCap 400 expiring September 2008, notional value $1,642,400 | | 4 | | (105,600 | ) |
| | | | | |
Total Futures Contracts | | | | (105,600 | ) |
| | | | | |
| (a) | Statement on Financial Accounting Standard No. 157 “Fair Value Measurements” — Various inputs are used in determining the value of the Fund’s investments. These inputs are summarized in the three broad levels listed below. |
| | • | | Level 1 — quoted prices in active markets for identical securities |
| | • | | Level 2 — other significant observable inputs (including quoted prices for similar securities, interest rates, prepayment speeds, credit risk, etc.) |
| | • | | Level 3 — significant unobservable inputs (including the Fund’s own assumptions in determining the fair value of investments) |
The following is a summary of the inputs used as of June 30, 2008 in valuing the Fund’s assets carried at fair value:
| | | | | | | |
Valuation Inputs | | Investments in
Securities | | Other Financial
Instruments*** | |
Level 1 — Quoted Prices | | $ | 72,111,752 | | $ | (105,600 | ) |
Level 2 — Other Significant Observable Inputs | | | 24,096,822 | | | — | |
Level 3 — Significant Unobservable Inputs | | | — | | | — | |
| | | | | | | |
Total | | $ | 96,208,574 | | $ | (105,600 | ) |
| | | | | | | |
The inputs or methodology used for valuing securities are not necessarily an indication of the risk associated with investing in those securities. For example, short-term debt instruments and repurchase agreements with a maturity of less than 60 days are valued using amortized cost, in accordance with rules under the Investment Company Act of 1940. Generally, amortized cost approximates the current fair value of a security, but since the value is not obtained from a quoted price in an active market, such securities are reflected as Level 2.
The accompanying notes are an integral part of these financial statements.
Schedule of Investments
June 30, 2008 (unaudited)
The Muirfield Fund
| (b) | Cost for financial reporting purposes and federal income tax purposes are the same. Cost for federal income tax purposes differs from value by net unrealized appreciation (depreciation) of securities as follows: |
| | | | |
Unrealized appreciation | | $ | 588,651 | |
Unrealized depreciation | | | (3,370,195 | ) |
| | | | |
Net unrealized appreciation (depreciation) | | $ | (2,781,544 | ) |
| | | | |
| # | Represents non-income producing securities. |
| * | Pledged as collateral on futures contracts. |
| ** | Assets of affiliates to The Muirfield Fund held for the benefit of the Fund’s Trustees in connection with the Trustee Deferred Compensation Plan. |
| *** | Other financial instruments are derivative instruments not reflected in the Schedule of Investments, such as futures contracts, which are valued at the unrealized appreciation/depreciation on the instrument. |
The accompanying notes are an integral part of these financial statements.
Schedule of Investments
June 30, 2008 (unaudited)
The Dynamic Growth Fund
| | | | | |
Security Description | | Shares or
Principal
Amount ($) | | Value ($)(a) | |
Registered Investment Companies — 92.8% | | | |
Allegiant Mid Cap Value Fund — Class A | | 27,512 | | 330,696 | |
Allianz NFJ Dividend Value Fund — Class D | | 143,363 | | 2,101,700 | |
Allianz NFJ International Value Fund — Class A | | 140,873 | | 3,495,067 | |
CGM Focus Fund | | 46,260 | | 2,843,117 | |
DWS Large Cap Value Fund — Class A | | 69,144 | | 1,374,588 | |
Fairholme Fund | | 73,126 | | 2,192,305 | |
Fidelity Advisor Leveraged Company Stock Fund — A | | 101,018 | | 4,087,190 | |
Fidelity Independence Fund | | 131,980 | | 3,884,159 | |
Harbor International Fund — Inst. Class | | 52,261 | | 3,455,465 | |
Hartford Capital Appreciation Fund — Class A | | 132,713 | | 4,889,159 | |
iShares S&P Midcap 400 Index Fund | | 23,000 | | 1,876,340 | |
Ivy Large Cap Growth Fund — Class A | | 82,775 | | 1,086,838 | |
Janus Adviser Forty Fund — Class S | | 120,948 | | 4,998,774 | |
Janus Adviser Mid Cap Growth Fund — Class S# | | 64,607 | | 2,332,314 | |
Janus Adviser Mid Cap Value Fund — Class S | | 131,526 | | 2,330,624 | |
Janus Enterprise Fund | | 71,028 | | 3,879,554 | |
Lazard Emerging Markets Portfolio | | 140,925 | | 3,131,352 | |
MFS Value Fund — Class A | | 68,016 | | 1,600,408 | |
Nuveen Tradewinds Value Opportunities Fund — Class A | | 104,558 | | 3,094,923 | |
Pioneer Cullen Value Fund — Class A | | 113,652 | | 2,155,975 | |
PowerShares QQQ | | 42,450 | | 1,917,466 | |
| | | | | |
Total Registered Investment Companies
(Cost $59,632,202) | | | | 57,058,014 | |
| | | | | |
U.S. Government Obligations — 0.6% | |
U.S. Treasury Bill,
1.79%, due 09/04/2008* | | 400,000 | | 398,739 | |
| | | | | |
Total U.S. Government Obligations
(Cost $398,693) | | | | 398,739 | |
| | | | | |
Repurchase Agreements — 7.0% | |
Morgan Stanley DW, Inc., 2.56%, 07/01/2008, (Collateralized by $4,471,963 various Government Agencies, Agency Strips, Treasury Notes, and Treasury Strips at 5.125% — 8.625%, due 07/15/2008 — 04/15/2030, value — $4,379,893) purchase date 06/30/2008 | | 4,294,000 | | 4,294,000 | |
| | | | | |
Total Repurchase Agreements
(Cost $4,294,000) | | | | 4,294,000 | |
| | | | | |
Total Investments — 100.4%
(Cost $64,324,895)(b) | | | | 61,750,753 | |
| | | | | |
Liabilities less Other Assets — (0.4%) | | | | (251,019 | ) |
| | | | | |
Total Net Assets — 100.0% | | | | 61,499,734 | |
| | | | | |
The Dynamic Growth Fund
| | | | | |
Security Description | | Shares or
Principal
Amount ($) | | Value ($)(a) | |
Trustee Deferred Compensation** | |
The Flex-funds Aggressive Growth Fund | | 266 | | 2,051 | |
The Flex-funds Defensive Growth Fund | | 155 | | 1,454 | |
The Flex-funds Dynamic Growth Fund | | 400 | | 3,380 | |
The Flex-funds Muirfield Fund | | 1,240 | | 6,783 | |
The Flex-funds Quantex Fund | | 580 | | 9,228 | |
The Flex-funds Socially Responsible Utilities Fund | | 69 | | 1,755 | |
| | | | | |
Total Trustee Deferred Compensation
(Cost $24,018) | | 24,651 | |
| | | | | |
| | | Long
Contracts | | Unrealized
Appreciation
(Depreciation) ($) | |
Futures Contracts | | | | | |
Standard & Poors Mid Cap 400 expiring September 2008, notional value $4,516,600 | | 11 | | (287,400 | ) |
| | | | | |
Total Futures Contracts | | | | (287,400 | ) |
| | | | | |
| (a) | Statement on Financial Accounting Standard No. 157 “Fair Value Measurements” — Various inputs are used in determining the value of the Fund’s investments. These inputs are summarized in the three broad levels listed below. |
| | • | | Level 1 — quoted prices in active markets for identical securities |
| | • | | Level 2 — other significant observable inputs (including quoted prices for similar securities, interest rates, prepayment speeds, credit risk, etc.) |
| | • | | Level 3 — significant unobservable inputs (including the Fund’s own assumptions in determining the fair value of investments) |
The following is a summary of the inputs used as of June 30, 2008 in valuing the Fund’s assets carried at fair value:
| | | | | | | |
Valuation Inputs | | Investments in
Securities | | Other Financial
Instruments*** | |
Level 1 — Quoted Prices | | $ | 57,456,753 | | $ | (287,400 | ) |
Level 2 — Other Significant Observable Inputs | | | 4,294,000 | | | — | |
Level 3 — Significant Unobservable Inputs | | | — | | | — | |
| | | | | | | |
Total | | $ | 61,750,753 | | $ | (287,400 | ) |
| | | | | | | |
The inputs or methodology used for valuing securities are not necessarily an indication of the risk associated with investing in those securities. For example, short-term debt instruments and repurchase agreements with a maturity of less than 60 days are valued using amortized cost, in accordance with rules under the Investment Company Act of 1940. Generally, amortized cost approximates the current fair value of a security, but since the value is not obtained from a quoted price in an active market, such securities are reflected as Level 2.
The accompanying notes are an integral part of these financial statements.
Schedule of Investments
June 30, 2008 (unaudited)
The Dynamic Growth Fund
| (b) | Cost for financial reporting purposes and federal income tax purposes are the same. Cost for federal income tax purposes differs from value by net unrealized appreciation (depreciation) of securities as follows: |
| | | | |
Unrealized appreciation | | $ | 562,513 | |
Unrealized depreciation | | | (3,136,655 | ) |
| | | | |
Net unrealized appreciation (depreciation) | | $ | (2,574,142 | ) |
| | | | |
| # | Represents non-income producing securities. |
| * | Pledged as collateral on futures contracts. |
| ** | Assets of affiliates to The Dynamic Growth Fund held for the benefit of the Fund’s Trustees in connection with the Trustee Deferred Compensation Plan. |
| *** | Other financial instruments are derivative instruments not reflected in the Schedule of Investments, such as futures contracts, which are valued at the unrealized appreciation/depreciation on the instrument. |
The accompanying notes are an integral part of these financial statements.
Schedule of Investments
June 30, 2008 (unaudited)
The Aggressive Growth Fund
| | | | | |
Security Description | | Shares or
Principal
Amount ($) | | Value ($)(a) | |
Registered Investment Companies — 93.0% | | | |
Consumer Staples Select Sector SPDR Fund | | 35,675 | | 954,306 | |
DIAMONDS Trust, Series I | | 32,750 | | 3,714,505 | |
iShares Dow Jones U.S Industrial Sector Index Fund | | 13,850 | | 892,771 | |
iShares MSCI EAFE Growth Index Fund | | 14,700 | | 1,038,114 | |
iShares MSCI EAFE Index Fund | | 20,790 | | 1,427,649 | |
iShares MSCI Emerging Markets Index Fund | | 4,250 | | 576,810 | |
iShares MSCI EMU Index Fund | | 8,855 | | 867,702 | |
iShares MSCI Singapore Index Fund | | 36,900 | | 457,929 | |
iShares MSCI Taiwan Index Fund | | 29,400 | | 415,422 | |
iShares Russell Midcap Growth Index Fund | | 20,325 | | 2,151,198 | |
iShares Russell Midcap Value Index Fund | | 17,650 | | 2,270,496 | |
iShares S&P 500 Growth Index Fund | | 10,250 | | 654,258 | |
iShares S&P Latin American 40 Index Fund | | 10,450 | | 2,873,750 | |
iShares S&P MidCap 400 Growth Index Fund | | 14,800 | | 1,309,948 | |
iShares S&P MidCap 400 Index Fund | | 27,350 | | 2,231,213 | |
PowerShares Dynamic Mid Cap Growth Portfolio | | 126,275 | | 2,752,795 | |
PowerShares QQQ | | 80,760 | | 3,647,929 | |
Utilities Select Sector SPDR Fund | | 20,750 | | 844,525 | |
| | | | | |
Total Registered Investment Companies (Cost $31,362,782) | | | | 29,081,320 | |
| | | | | |
U.S. Government Obligations — 0.9% | | | |
U.S. Treasury Bill, 1.79%, due 09/04/08* | | 300,000 | | 299,054 | |
| | | | | |
Total U.S. Government Obligations
(Cost $299,020) | | | | 299,054 | |
| | | | | |
Repurchase Agreements — 6.3% | | | |
Morgan Stanley DW, Inc., 2.56%, 07/01/2008, (Collateralized by $2,064,143 various Government Agencies, Agency Strips, Treasury Notes, and Treasury Strips at 5.125% — 8.625%, due 07/15/2008 —04/15/2030, value — $2,021,646) purchase date 06/30/2008 | | 1,982,000 | | 1,982,000 | |
| | | | | |
Total Repurchase Agreements
(Cost $1,982,000) | | | | 1,982,000 | |
| | | | | |
Total Investments — 100.2%
(Cost $33,643,802)(b) | | | | 31,362,374 | |
| | | | | |
Liabilities less Other Assets — (0.2%) | | | | (75,785 | ) |
| | | | | |
Total Net Assets — 100.0% | | | | 31,286,589 | |
| | | | | |
Trustee Deferred Compensation** | | | |
The Flex-funds Aggressive Growth Fund | | 294 | | 2,267 | |
The Flex-funds Defensive Growth Fund | | 169 | | 1,585 | |
The Flex-funds Dynamic Growth Fund | | 362 | | 3,059 | |
The Flex-funds Muirfield Fund | | 1,086 | | 5,940 | |
The Flex-funds Quantex Fund | | 491 | | 7,812 | |
The Flex-funds Socially Responsible Utilities Fund | | 67 | | 1,704 | |
| | | | | |
Total Trustee Deferred Compensation (Cost $22,003) | | | | 22,367 | |
| | | | | |
The Aggressive Growth Fund
| | | | | |
Security Description | | Long
Contracts | | Unrealized
Appreciation
(Depreciation) ($) | |
Futures Contracts | | | |
Standard & Poors Mid Cap 400 expiring September 2008, notional value $2,053,000 | | 5 | | (120,900 | ) |
| | | | | |
Total Futures Contracts | | | | (120,900 | ) |
| | | | | |
| (a) | Statement on Financial Accounting Standard No. 157 “Fair Value Measurements” — Various inputs are used in determining the value of the Fund’s investments. These inputs are summarized in the three broad levels listed below. |
| | • | | Level 1 — quoted prices in active markets for identical securities |
| | • | | Level 2 — other significant observable inputs (including quoted prices for similar securities, interest rates, prepayment speeds, credit risk, etc.) |
| | • | | Level 3 — significant unobservable inputs (including the Fund’s own assumptions in determining the fair value of investments) |
The following is a summary of the inputs used as of June 30, 2008 in valuing the Fund’s assets carried at fair value:
| | | | | | | |
Valuation Inputs | | Investments in
Securities | | Other Financial
Instruments*** | |
Level 1 — Quoted Prices | | $ | 29,380,374 | | $ | (120,900 | ) |
Level 2 — Other Significant Observable Inputs | | | 1,982,000 | | | — | |
Level 3 — Significant Unobservable Inputs | | | — | | | — | |
| | | | | | | |
Total | | $ | 31,362,374 | | $ | (120,900 | ) |
| | | | | | | |
The inputs or methodology used for valuing securities are not necessarily an indication of the risk associated with investing in those securities. For example, short-term debt instruments and repurchase agreements with a maturity of less than 60 days are valued using amortized cost, in accordance with rules under the Investment Company Act of 1940. Generally, amortized cost approximates the current fair value of a security, but since the value is not obtained from a quoted price in an active market, such securities are reflected as Level 2.
| (b) | Cost for financial reporting purposes and federal income tax purposes are the same. Cost for federal income tax purposes differs from value by net unrealized appreciation (depreciation) of securities as follows: |
| | | | |
Unrealized appreciation | | $ | 32,802 | |
Unrealized depreciation | | | (2,314,230 | ) |
| | | | |
Net unrealized appreciation (depreciation) | | $ | (2,281,428 | ) |
| | | | |
| * | Pledged as collateral on futures contracts. |
| ** | Assets of affiliates to The Aggressive Growth Fund held for the benefit of the Fund’s Trustees in connection with the Trustee Deferred Compensation Plan. |
| *** | Other financial instruments are derivative instruments not reflected in the Schedule of Investments, such as futures contracts, which are valued at the unrealized appreciation/depreciation on the instrument. |
Schedule of Investments
June 30, 2008 (unaudited)
The Defensive Growth Fund
| | | | |
Security Description | | Shares or
Principal
Amount ($) | | Value ($)(a) |
Registered Investment Companies — 71.8% | | |
Consumer Staples Select Sector SPDR Fund | | 34,000 | | 909,500 |
DIAMONDS Trust, Series I | | 29,850 | | 3,385,587 |
iShares Dow Jones U.S. Energy Sector Index Fund | | 2,725 | | 412,810 |
iShares Dow Jones U.S Industrial Sector Index Fund | | 17,850 | | 1,150,611 |
iShares MSCI EAFE Growth Index Fund | | 18,775 | | 1,325,891 |
iShares MSCI EAFE Index Fund | | 26,290 | | 1,805,334 |
iShares MSCI Emerging Markets Index Fund | | 3,550 | | 481,806 |
iShares MSCI EMU Index Fund | | 5,575 | | 546,294 |
iShares Russell Midcap Growth Index Fund | | 6,960 | | 736,646 |
iShares Russell Midcap Value Index Fund | | 13,050 | | 1,678,752 |
iShares S&P 500 Value Index Fund | | 14,875 | | 943,075 |
iShares S&P Latin American 40 Index Fund | | 4,425 | | 1,216,875 |
iShares S&P MidCap 400 Growth Index Fund | | 36,300 | | 3,212,913 |
iShares S&P MidCap 400 Index Fund | | 29,425 | | 2,400,492 |
PowerShares Dynamic Mid Cap Growth Portfolio | | 94,050 | | 2,050,290 |
PowerShares QQQ | | 59,650 | | 2,694,390 |
Utilities Select Sector SPDR Fund | | 25,125 | | 1,022,588 |
| | | | |
Total Registered Investment Companies
(Cost $28,203,826) | | | | 25,973,854 |
| | | | |
U.S. Government Obligations — 1.1% |
U.S. Treasury Bill,
1.22%, due 07/24/2008* | | 400,000 | | 399,592 |
| | | | |
Total U.S. Government Obligations
(Cost $399,693) | | | | 399,592 |
| | | | |
Repurchase Agreements — 25.1% |
Morgan Stanley DW, Inc., 2.56%, 07/01/2008, (Collateralized by $9,436,530 various Government Agencies, Agency Strips, Treasury Notes, and Treasury Strips at 5.125% — 8.625%, due 07/15/2008 — 04/15/2030, value — $9,242,248) purchase date 06/30/2008 | | 9,061,000 | | 9,061,000 |
| | | | |
Total Repurchase Agreements
(Cost $9,061,000) | | | | 9,061,000 |
| | | | |
Total Investments — 98.0%
(Cost $37,664,519)(b) | | | | 35,434,446 |
| | | | |
Other Assets less Liabilities — 2.0% | | | | 709,170 |
| | | | |
Total Net Assets — 100.0% | | | | 36,143,616 |
| | | | |
Trustee Deferred Compensation** |
The Flex-funds Aggressive Growth Fund | | 519 | | 4,001 |
The Flex-funds Defensive Growth Fund | | 297 | | 2,786 |
The Flex-funds Dynamic Growth Fund | | 156 | | 1,318 |
The Flex-funds Muirfield Fund | | 492 | | 2,691 |
The Defensive Growth Fund
| | | | | |
Security Description | | Shares or
Principal
Amount ($) | | Value ($)(a) | |
Trustee Deferred Compensation** — continued | |
The Flex-funds Quantex Fund | | 236 | | 3,755 | |
The Flex-funds Socially Responsible Utilities Fund | | 58 | | 1,476 | |
| | | | | |
Total Trustee Deferred Compensation
(Cost $17,612) | | | | 16,027 | |
| | | | | |
| | | Long
Contracts | | Unrealized
Appreciation
(Depreciation) ($) | |
Futures Contracts | | | | | |
Standard & Poors Mid Cap 400 expiring September 2008, notional value $821,200 | | 2 | | (52,800 | ) |
| | | | | |
Total Futures Contracts | | | | (52,800 | ) |
| | | | | |
| (a) | Statement on Financial Accounting Standard No. 157 “Fair Value Measurements” — Various inputs are used in determining the value of the Fund’s investments. These inputs are summarized in the three broad levels listed below. |
| | • | | Level 1 — quoted prices in active markets for identical securities |
| | • | | Level 2 — other significant observable inputs (including quoted prices for similar securities, interest rates, prepayment speeds, credit risk, etc.) |
| | • | | Level 3 — significant unobservable inputs (including the Fund’s own assumptions in determining the fair value of investments) |
The following is a summary of the inputs used as of June 30, 2008 in valuing the Fund’s assets carried at fair value:
| | | | | | | |
Valuation Inputs | | Investments in
Securities | | Other Financial
Instruments*** | |
Level 1 — Quoted Prices | | $ | 25,973,854 | | $ | (52,800 | ) |
Level 2 — Other Significant Observable Inputs | | | 9,460,592 | | | — | |
Level 3 — Significant Unobservable Inputs | | | — | | | — | |
| | | | | | | |
Total | | $ | 35,434,446 | | $ | (52,800 | ) |
| | | | | | | |
The inputs or methodology used for valuing securities are not necessarily an indication of the risk associated with investing in those securities. For example, short-term debt instruments and repurchase agreements with a maturity of less than 60 days are valued using amortized cost, in accordance with rules under the Investment Company Act of 1940. Generally, amortized cost approximates the current fair value of a security, but since the value is not obtained from a quoted price in an active market, such securities are reflected as Level 2.
| (b) | Represents cost for financial reporting purposes and differs for federal income tax purposes by the amount of losses deferred for federal income tax reporting in the amount of $212,868. Cost for federal income tax purposes of $37,877,387 differs from value by net unrealized appreciation (depreciation) of securities as follows: |
| | | | |
Unrealized appreciation | | $ | 15,530 | |
Unrealized depreciation | | | (2,458,471 | ) |
| | | | |
Net unrealized appreciation (depreciation) | | $ | (2,442,941 | ) |
| | | | |
The accompanying notes are an integral part of these financial statements.
Schedule of Investments
June 30, 2008 (unaudited)
The Defensive Growth Fund
| * | Pledged as collateral on futures contracts. |
| ** | Assets of affiliates to The Defensive Growth Fund held for the benefit of the Fund’s Trustees in connection with the Trustee Deferred Compensation Plan. |
| *** | Other financial instruments are derivative instruments not reflected in the Schedule of Investments, such as futures contracts, which are valued at the unrealized appreciation/depreciation on the instrument. |
The accompanying notes are an integral part of these financial statements.
Schedule of Investments
June 30, 2008 (unaudited)
The Focused Growth Fund
| | | | | |
Security Description | | Shares or
Principal
Amount ($) | | Value ($)(a) | |
Registered Investment Companies — 91.4% | | | |
Consumer Staples Select Sector SPDR Fund | | 46,475 | | 1,243,206 | |
DIAMONDS Trust, Series I | | 26,700 | | 3,028,314 | |
iShares Dow Jones U.S. Energy Sector Index Fund | | 2,975 | | 450,683 | |
iShares Dow Jones U.S Industrial Sector Index Fund | | 21,674 | | 1,397,106 | |
iShares MSCI EAFE Growth Index Fund | | 10,600 | | 748,572 | |
iShares MSCI EAFE Index Fund | | 37,820 | | 2,597,099 | |
iShares MSCI Emerging Markets Index Fund | | 4,250 | | 576,810 | |
iShares MSCI EMU Index Fund | | 1,664 | | 163,055 | |
iShares Russell Midcap Growth Index Fund | | 6,000 | | 635,040 | |
iShares Russell Midcap Value Index Fund | | 17,387 | | 2,236,664 | |
iShares S&P 500 Value Index Fund | | 5,950 | | 377,230 | |
iShares S&P Latin American 40 Index Fund | | 8,150 | | 2,241,250 | |
iShares S&P MidCap 400 Growth Index Fund | | 48,900 | | 4,328,140 | |
iShares S&P MidCap 400 Index Fund | | 33,675 | | 2,747,207 | |
PowerShares Dynamic Mid Cap Growth Portfolio | | 79,550 | | 1,734,190 | |
PowerShares QQQ | | 52,000 | | 2,348,840 | |
Utilities Select Sector SPDR Fund | | 32,850 | | 1,336,995 | |
| | | | | |
Total Registered Investment Companies (Cost $30,327,309) | | | | 28,190,401 | |
| | | | | |
Repurchase Agreements — 9.1% | | | | | |
Morgan Stanley DW, Inc., 2.56%, 07/01/2008, (Collateralized by $2,933,750 various Government Agencies, Agency Strips, Treasury Notes, and Treasury Strips at 5.125% — 8.625%, due 07/15/2008 —04/15/2030, value — $2,873,349) purchase date 06/30/2008 | | 2,817,000 | | 2,817,000 | |
| | | | | |
Total Repurchase Agreements
(Cost $2,817,000) | | | | 2,817,000 | |
| | | | | |
Total Investments — 100.5%
(Cost $33,144,309)(b) | | | | 31,007,401 | |
| | | | | |
Liabilities less Other Assets — (0.5%) | | | | (148,906 | ) |
| | | | | |
Total Net Assets — 100.0% | | | | 30,858,495 | |
| | | | | |
Trustee Deferred Compensation* | | | |
The Flex-funds Aggressive Growth Fund | | 464 | | 3,577 | |
The Flex-funds Defensive Growth Fund | | 265 | | 2,486 | |
The Flex-funds Dynamic Growth Fund | | 140 | | 1,183 | |
The Flex-funds Muirfield Fund | | 440 | | 2,407 | |
The Flex-funds Quantex Fund | | 211 | | 3,357 | |
The Flex-funds Socially Responsible Utilities Fund | | 52 | | 1,323 | |
| | | | | |
Total Trustee Deferred Compensation (Cost $15,756) | | | | 14,333 | |
| | | | | |
The Focused Growth Fund
| | | | | |
Security Description | | Long
Contracts | | Unrealized
Appreciation
(Depreciation) ($) | |
Futures Contracts | | | | | |
Standard & Poors Mid Cap 400 expiring September 2008, notional value $2,463,600 | | 6 | | (158,400 | ) |
| | | | | |
Total Futures Contracts | | | | (158,400 | ) |
| | | | | |
| (a) | Statement on Financial Accounting Standard No. 157 “Fair Value Measurements” — Various inputs are used in determining the value of the Fund’s investments. These inputs are summarized in the three broad levels listed below. |
| | • | | Level 1 — quoted prices in active markets for identical securities |
| | • | | Level 2 — other significant observable inputs (including quoted prices for similar securities, interest rates, prepayment speeds, credit risk, etc.) |
| | • | | Level 3 — significant unobservable inputs (including the Fund’s own assumptions in determining the fair value of investments) |
The following is a summary of the inputs used as of June 30, 2008 in valuing the Fund’s assets carried at fair value:
| | | | | | | |
Valuation Inputs | | Investments in
Securities | | Other Financial
Instruments** | |
Level 1 — Quoted Prices | | $ | 28,190,401 | | $ | (158,400 | ) |
Level 2 — Other Significant Observable Inputs | | | 2,817,000 | | | — | |
Level 3 — Significant Unobservable Inputs | | | — | | | — | |
| | | | | | | |
Total | | $ | 31,007,401 | | $ | (158,400 | ) |
| | | | | | | |
The inputs or methodology used for valuing securities are not necessarily an indication of the risk associated with investing in those securities. For example, short-term debt instruments and repurchase agreements with a maturity of less than 60 days are valued using amortized cost, in accordance with rules under the Investment Company Act of 1940. Generally, amortized cost approximates the current fair value of a security, but since the value is not obtained from a quoted price in an active market, such securities are reflected as Level 2.
| (b) | Represents cost for financial reporting purposes and differs for federal income tax purposes by the amount of losses deferred for federal income tax reporting in the amount of $230,383. Cost for federal income tax purposes of $33,374,692 differs from value by net unrealized appreciation (depreciation) of securities as follows: |
| | | | |
Unrealized appreciation | | $ | 77,715 | |
Unrealized depreciation | | | (2,445,006 | ) |
| | | | |
Net unrealized appreciation (depreciation) | | $ | (2,367,291 | ) |
| | | | |
| * | Assets of affiliates to The Focused Growth Fund held for the benefit of the Fund’s Trustees in connection with the Trustee Deferred Compensation Plan. |
| ** | Other financial instruments are derivative instruments not reflected in the Schedule of Investments, such as futures contracts, which are valued at the unrealized appreciation/depreciation on the instrument. |
Schedule of Investments
June 30, 2008 (unaudited)
The Quantex Fund
| | | | |
Security Description | | Shares or
Principal
Amount ($) | | Value ($)(a) |
Common Stocks — 87.9% | | | | |
Basic Materials — 4.4% | | | | |
Ashland, Inc. | | 3,255 | | 156,891 |
Eastman Chemical Co. | | 2,535 | | 174,560 |
Hercules, Inc. | | 7,990 | | 135,271 |
Int’l Flavors & Fragrances, Inc. | | 3,215 | | 125,578 |
Titanium Metals Corp. | | 5,840 | | 81,701 |
| | | | |
(Cost 728,069) | | | | 674,001 |
| | | | |
Communications — 8.8% | | | | |
CenturyTel, Inc. | | 3,730 | | 132,751 |
Ciena Corp. | | 4,539 | | 105,168 |
Citizens Communications Co. | | 12,135 | | 137,611 |
EW Scripps Co. | | 3,435 | | 142,690 |
Interpublic Group of Cos., Inc. | | 19,055 | | 163,873 |
JDS Uniphase Corp.# | | 11,622 | | 132,026 |
Meredith Corp. | | 2,815 | | 79,636 |
Monster Worldwide, Inc.# | | 4,770 | | 98,310 |
New York Times Co. | | 8,810 | | 135,586 |
Tellabs, Inc.# | | 23,635 | | 109,903 |
Washington Post Co./The | | 195 | | 114,445 |
| | | | |
(Cost 1,815,748) | | | | 1,351,999 |
| | | | |
Consumer Cyclical — 21.0% | | | | |
Autonation, Inc.# | | 9,865 | | 98,847 |
Big Lots, Inc.# | | 9,665 | | 301,935 |
Brunswick Corp. | | 9,065 | | 96,089 |
Centex Corp. | | 6,110 | | 81,691 |
Cintas Corp. | | 4,590 | | 121,681 |
Circuit City Stores, Inc. | | 36,795 | | 106,338 |
Darden Restaurants, Inc. | | 5,570 | | 177,906 |
Dean Foods Co. | | 5,970 | | 117,131 |
Dillards, Inc. | | 8,230 | | 95,221 |
D.R. Horton, Inc. | | 11,730 | | 127,271 |
Family Dollar Stores, Inc. | | 8,030 | | 160,118 |
Hasbro, Inc. | | 6,035 | | 215,570 |
IAC/InterActiveCorp# | | 5,740 | | 110,667 |
Jones Apparel Group, Inc. | | 9,660 | | 132,825 |
KB Home | | 7,150 | | 121,049 |
Liz Claiborne, Inc. | | 7,590 | | 107,398 |
Office Depot, Inc.# | | 11,110 | | 121,543 |
OfficeMax, lnc. | | 7,475 | | 103,902 |
Polo Ralph Lauren Corp. | | 2,500 | | 156,950 |
Pulte Homes, Inc. | | 14,660 | | 141,176 |
RadioShack Corp. | | 9,175 | | 112,577 |
Robert Half International, Inc. | | 5,710 | | 136,869 |
Wendy’s International, Inc. | | 5,980 | | 162,776 |
Wyndham Worldwide Corp. | | 6,560 | | 117,490 |
| | | | |
(Cost 4,461,179) | | | | 3,225,020 |
| | | | |
Consumer Noncyclical — 12.5% | | | | |
Constellation Brands, Inc.# | | 6,540 | | 129,884 |
Convergys Corp.# | | 9,390 | | 139,535 |
Equifax, Inc. | | 4,260 | | 143,221 |
Estee Lauder Cos., Inc./The | | 3,545 | | 164,665 |
IMS Health, Inc. | | 6,705 | | 156,227 |
King Pharmaceuticals, Inc.# | | 15,095 | | 158,045 |
McCormick & Co., Inc. | | 4,080 | | 145,493 |
Millipore Corp. | | 2,120 | | 143,863 |
Mylan Laboratories, Inc. | | 10,985 | | 132,589 |
Patterson Cos., Inc.# | | 4,555 | | 133,872 |
Tenet Healthcare Corp.# | | 30,425 | | 169,163 |
The Quantex Fund
| | | | |
Security Description | | Shares or
Principal
Amount ($) | | Value ($)(a) |
Common Stocks — continued | | | | |
Tyson Foods, Inc. | | 10,085 | | 150,670 |
Watson Pharmaceuticals, lnc.# | | 5,700 | | 154,869 |
| | | | |
(Cost 2,151,794) | | | | 1,922,096 |
| | | | |
Energy — 3.4% | | | | |
Dynegy, Inc.# | | 21,650 | | 185,107 |
Integrys Energy Group, Inc. | | 2,995 | | 152,236 |
Rowan Cos., Inc. | | 3,920 | | 183,260 |
| | | | |
(Cost 395,848) | | | | 520,603 |
| | | | |
Financial — 8.7% | | | | |
Ambac Financial Group, Inc. | | 5,990 | | 8,027 |
Apartment Investment & Management Co. | | 4,593 | | 156,437 |
CB Richard Ellis Group, Inc.# | | 7,170 | | 137,664 |
CIT Group, Inc. | | 6,430 | | 43,788 |
Developers Diversified Realty Corp. | | 4,030 | | 139,881 |
E*TRADE Financial Corp.# | | 43,540 | | 136,716 |
Federated Investors, Inc. | | 3,760 | | 129,419 |
First Horizon National Corp. | | 8,510 | | 63,229 |
Janus Capital Group, Inc. | | 4,710 | | 124,674 |
Lennar Corp. | | 8,640 | | 106,618 |
MBIA, Inc. | | 8,290 | | 36,393 |
MGIC Investment Corp. | | 6,890 | | 42,098 |
Sovereign Bancorp, Inc. | | 13,550 | | 99,728 |
Wachovia Corp. Pref. Dividend Equalization | | 1,700 | | 0 |
Zions Bancorporation | | 3,310 | | 104,232 |
| | | | |
(Cost 2,281,244) | | | | 1,328,904 |
| | | | |
Industrial — 12.9% | | | | |
Allied Waste Industries, Inc.# | | 14,020 | | 176,932 |
Ball Corp. | | 3,445 | | 164,464 |
Bemis Co. | | 5,640 | | 126,449 |
Black & Decker Corp. | | 2,210 | | 127,097 |
Leggett & Platt, Inc. | | 8,855 | | 148,498 |
Molex, Inc. | | 5,655 | | 138,039 |
Pactiv Corp.# | | 5,795 | | 123,028 |
Pall Corp. | | 3,840 | | 152,371 |
PerkinElmer, lnc. | | 5,950 | | 165,708 |
Ryder System, Inc. | | 3,280 | | 225,926 |
Sealed Air Corp. | | 6,675 | | 126,892 |
Snap — On, Inc. | | 3,210 | | 166,952 |
Stanley Works/The | | 3,195 | | 143,232 |
| | | | |
(Cost 1,968,223) | | | | 1,985,588 |
| | | | |
Technology — 12.3% | | | | |
Advanced Micro Devices, Inc.# | | 20,610 | | 120,156 |
Affiliated Computer Services, Inc.# | | 3,420 | | 182,936 |
Compuware Corp.# | | 17,410 | | 166,092 |
Harman International Industries, Inc. | | 2,090 | | 86,505 |
Jabil Circuit, Inc. | | 10,120 | | 166,069 |
Lexmark International, Inc.# | | 4,430 | | 148,095 |
LSI Logic Corp.# | | 29,110 | | 178,735 |
Novell, Inc.# | | 22,505 | | 132,555 |
Novellus Systems, Inc.# | | 5,600 | | 118,664 |
QLogic Corp.# | | 10,885 | | 158,812 |
Teradata Corp.# | | 5,630 | | 130,278 |
Teradyne, Inc.# | | 14,940 | | 165,386 |
Unisys Corp.# | | 32,680 | | 129,086 |
| | | | |
(Cost 2,151,409) | | | | 1,883,369 |
| | | | |
The accompanying notes are an integral part of these financial statements.
Schedule of Investments
June 30, 2008 (unaudited)
The Quantex Fund
| | | | | |
Security Description | | Shares or
Principal
Amount ($) | | Value ($)(a) | |
Common Stocks — continued | | | | | |
Utilities — 3.9% | | | | | |
CMS Energy Corp. | | 8,895 | | 132,536 | |
Nicor, Inc. | | 3,645 | | 155,241 | |
Pinnacle West Capital Corp. | | 3,640 | | 112,003 | |
TECO Energy, Inc. | | 8,990 | | 193,195 | |
| | | | | |
(Cost 584,729) | | | | 592,975 | |
| | | | | |
Total Common Stocks
(Cost $16,538,243) | | | | 13,484,555 | |
| | | | | |
U.S. Government Obligations — 2.0% | | | |
U.S. Treasury Bill,
1.79%, due 09/04/2008* | | 300,000 | | 299,054 | |
| | | | | |
Total U.S. Government Obligations
(Cost $299,020) | | | | 299,054 | |
| | | | | |
Repurchase Agreements — 10.4% | | | |
Morgan Stanley DW, Inc., 2.56%, 07/01/2008, (Collateralized by $1,671,519 various Government Agencies, Agency Strips, Treasury Notes, and Treasury Strips at 5.125% — 8.625%, due 07/15/2008 — 04/15/2030, value — $1,637,105) purchase date 06/30/2008 | | 1,605,000 | | 1,605,000 | |
| | | | | |
Total Repurchase Agreements
(Cost $1,605,000) | | | | 1,605,000 | |
| | | | | |
Total Investments — 100.3%
(Cost $18,442,263)(b) | | | | 15,388,609 | |
| | | | | |
Liabilities less Other Assets — (0.3%) | | | | (53,358 | ) |
| | | | | |
Total Net Assets — 100.0% | | | | 15,335,251 | |
| | | | | |
Trustee Deferred Compensation** | | | |
The Flex-funds Aggressive Growth Fund | | 257 | | 1,981 | |
The Flex-funds Defensive Growth Fund | | 146 | | 1,369 | |
The Flex-funds Dynamic Growth Fund | | 765 | | 6,464 | |
The Flex-funds Muirfield Fund | | 2,148 | | 11,750 | |
The Flex-funds Quantex Fund | | 917 | | 14,589 | |
The Flex-funds Socially Responsible Utilities Fund | | 139 | | 3,536 | |
| | | | | |
Total Trustee Deferred Compensation (Cost $35,784) | | | | 39,689 | |
| | | | | |
The Quantex Fund
| | | | | |
Security Description | | Long
Contracts | | Unrealized
Appreciation
(Depreciation) ($) | |
Futures Contracts | | | | | |
Standard & Poors Mid Cap 400 expiring September 2008, notional value $1,642,400 | | 4 | | (105,600 | ) |
| | | | | |
Total Futures Contracts | | | | (105,600 | ) |
| | | | | |
| (a) | Statement on Financial Accounting Standard No. 157 “Fair Value Measurements” — Various inputs are used in determining the value of the Fund’s investments. These inputs are summarized in the three broad levels listed below. |
| | • | | Level 1 — quoted prices in active markets for identical securities |
| | • | | Level 2 — other significant observable inputs (including quoted prices for similar securities, interest rates, prepayment speeds, credit risk, etc.) |
| | • | | Level 3 — significant unobservable inputs (including the Fund’s own assumptions in determining the fair value of investments) |
The following is a summary of the inputs used as of June 30, 2008 in valuing the Fund’s assets carried at fair value:
| | | | | | | |
Valuation Inputs | | Investments in
Securities | | Other Financial
Instruments*** | |
Level 1 — Quoted Prices | | $ | 13,783,609 | | $ | (105,600 | ) |
Level 2 — Other Significant Observable Inputs | | | 1,605,000 | | | — | |
Level 3 — Significant Unobservable Inputs | | | — | | | — | |
| | | | | | | |
Total | | $ | 15,388,609 | | $ | (105,600 | ) |
| | | | | | | |
The inputs or methodology used for valuing securities are not necessarily an indication of the risk associated with investing in those securities. For example, short-term debt instruments and repurchase agreements with a maturity of less than 60 days are valued using amortized cost, in accordance with rules under the Investment Company Act of 1940. Generally, amortized cost approximates the current fair value of a security, but since the value is not obtained from a quoted price in an active market, such securities are reflected as Level 2.
| (b) | Cost for financial reporting purposes and federal income tax purposes are the same. Cost for federal income tax purposes differs from value by net unrealized appreciation (depreciation) of securities as follows: |
| | | | |
Unrealized appreciation | | $ | 873,759 | |
Unrealized depreciation | | | (3,927,413 | ) |
| | | | |
Net unrealized appreciation (depreciation) | | $ | (3,053,654 | ) |
| | | | |
| ADR | American Depositary Receipt |
| # | Represents non-income producing securities. |
| * | Pledged as collateral on Futures Contracts. |
| ** | Assets of affiliates to The Flex-funds Quantex Fund held for the benefit of the Fund’s Trustees in connection with the Trustee Deferred Compensation Plan. |
| *** | Other financial instruments are derivative instruments not reflected in the Schedule of Investments, such as futures contracts, which are valued at the unrealized appreciation/depreciation on the instrument. |
The accompanying notes are an integral part of these financial statements.
Schedule of Investments
June 30, 2008 (unaudited)
The Socially Responsible Utilities Fund
| | | | |
Security Description | | Shares or
Principal
Amount ($) | | Value ($)(a) |
Common Stocks — 99.3% | | | | |
Electric Utility — 19.7% | | | | |
AES Corp.# | | 63,580 | | 1,221,372 |
Covanta Holding Corp.# | | 33,610 | | 897,051 |
Itron, Inc# | | 5,840 | | 574,364 |
MDU Resources Group, Inc. | | 24,322 | | 847,865 |
Northeast Utilities | | 21,705 | | 554,129 |
Pepco Holdings, Inc. | | 15,750 | | 403,987 |
Sierra Pacific Resources | | 63,130 | | 802,382 |
| | | | |
(Cost 4,662,555) | | | | 5,301,150 |
| | | | |
Independent Power Producer — 1.1% | | |
Dynegy, Inc.# | | 33,485 | | 286,297 |
| | | | |
(Cost 163,747) | | | | 286,297 |
| | | | |
Natural Gas Distribution — 10.9% | | |
AGL Resources, Inc. | | 15,115 | | 522,677 |
Atmos Energy Corp. | | 9,645 | | 265,913 |
NiSource, Inc. | | 54,630 | | 978,969 |
ONEOK, Inc. | | 8,625 | | 421,159 |
Southern Union Co. | | 28,730 | | 776,285 |
| | | | |
(Cost 2,716,651) | | | | 2,965,003 |
| | | | |
Oil Exploration & Production — 2.5% | | |
Ultra Petroleum Corp.# | | 6,620 | | 650,084 |
| | | | |
(Cost 181,704) | | | | 650,084 |
| | | | |
Pipelines — 19.6% | | | | |
El Paso Corp. | | 48,495 | | 1,054,281 |
Enterprise Products Partners, L.P. | | 21,646 | | 639,423 |
Equitable Resources, Inc# | | 9,965 | | 688,183 |
Kinder Morgan Energy Partners, L.P. | | 17,873 | | 996,062 |
Questar Corp. | | 13,305 | | 945,187 |
Spectra Energy Corp. | | 33,050 | | 949,857 |
| | | | |
(Cost 3,695,003) | | | | 5,272,993 |
| | | | |
Telephone & Telecommunications — 43.3% | | |
America Movil SAB de CV — ADR# | | 11,270 | | 594,492 |
AT&T, Inc. | | 34,500 | | 1,162,305 |
BCE, Inc. | | 14,980 | | 521,454 |
China Mobile Limited — ADR# | | 6,605 | | 442,205 |
Corning, Inc. | | 40,090 | | 924,074 |
Cypress Semiconductor Corp. | | 15,625 | | 386,719 |
Fairpoint Communications Inc | | 592 | | 4,268 |
NII Holdings, Inc. # | | 35,715 | | 1,696,037 |
Nokia Corp. — ADR | | 22,515 | | 551,618 |
Philippine Long Distance Telephone Company — ADR | | 9,850 | | 526,187 |
PT Telekomunikasi Indonesia — ADR | | 16,400 | | 528,900 |
Tele Norte Leste Participacoes SA — ADR | | 31,785 | | 791,764 |
Telefonica S.A. — ADR | | 10,020 | | 797,392 |
Telephone and Data Systems, Inc. | | 11,630 | | 549,750 |
Telus Corp. | | 13,280 | | 535,582 |
Verizon Communications, Inc. | | 31,370 | | 1,110,498 |
Vivo Participacoes SA — ADR | | 88,380 | | 562,097 |
| | | | |
(Cost 11,047,042) | | | | 11,685,342 |
| | | | |
Water Utility — 2.2% | | | | |
American Water Works Co., Inc.# | | 26,260 | | 582,447 |
| | | | |
(Cost 566,045) | | | | 582,447 |
| | | | |
Total Common Stocks
(Cost $23,032,747) | | | | 26,743,316 |
| | | | |
The Socially Responsible Utilities Fund
| | | | |
Security Description | | Shares or
Principal
Amount ($) | | Value ($)(a) |
Repurchase Agreements — 0.4% | | | | |
Morgan Stanley DW, Inc., 2.56%, 07/01/2008, (Collateralized by $115,600 various Government Agencies, Agency Strips, Treasury Notes, and Treasury Strips at 5.125% — 8.625%, due 07/15/2008 — 04/15/2030, value — $113,220) purchase date 06/30/2008 | | 111,000 | | 111,000 |
| | | | |
Total Repurchase Agreements
(Cost $111,000) | | | | 111,000 |
| | | | |
Total Investments — 99.7%
(Cost $23,143,747)(b) | | | | 26,854,316 |
| | | | |
Other Assets less Liabilities — 0.3% | | | | 89,666 |
| | | | |
Total Net Assets — 100.0% | | | | 26,943,982 |
| | | | |
Trustee Deferred Compensation* | | | | |
The Flex-funds Aggressive Growth Fund | | 304 | | 2,344 |
The Flex-funds Defensive Growth Fund | | 174 | | 1,632 |
The Flex-funds Dynamic Growth Fund | | 559 | | 4,724 |
The Flex-funds Muirfield Fund | | 1,636 | | 8,949 |
The Flex-funds Quantex Fund | | 732 | | 11,646 |
The Flex-funds Socially Responsible Utilities Fund | | 104 | | 2,646 |
| | | | |
Total Trustee Deferred Compensation
(Cost $29,667) | | | | 31,941 |
| | | | |
| (a) | Statement on Financial Accounting Standard No. 157 “Fair Value Measurements” — Various inputs are used in determining the value of the Fund’s investments. These inputs are summarized in the three broad levels listed below. |
| | • | | Level 1 — quoted prices in active markets for identical securities |
| | • | | Level 2 — other significant observable inputs (including quoted prices for similar securities, interest rates, prepayment speeds, credit risk, etc.) |
| | • | | Level 3 — significant unobservable inputs (including the Fund’s own assumptions in determining the fair value of investments) |
The following is a summary of the inputs used as of June 30, 2008 in valuing the Fund’s assets carried at fair value:
| | | | | | |
Valuation Inputs | | Investments in
Securities | | Other Financial
Instruments** |
Level 1 — Quoted Prices | | $ | 26,743,316 | | $ | — |
Level 2 — Other Significant Observable Inputs | | | 111,000 | | | — |
Level 3 — Significant Unobservable Inputs | | | — | | | — |
| | | | | | |
Total | | $ | 26,854,316 | | $ | — |
| | | | | | |
The inputs or methodology used for valuing securities are not necessarily an indication of the risk associated with investing in those securities. For example, short-term debt instruments and repurchase agreements with a maturity of less than 60 days are valued using amortized cost, in accordance with rules under the Investment Company Act of 1940. Generally, amortized cost approximates the current fair value of a security, but since the value is not obtained from a quoted price in an active market, such securities are reflected as Level 2.
The accompanying notes are an integral part of these financial statements.
Schedule of Investments
June 30, 2008 (unaudited)
The Socially Responsible Utilities Fund
| (b) | Cost for financial reporting purposes and federal income tax purposes are the same. Cost for federal income tax purposes differs from value by net unrealized appreciation (depreciation) of securities as follows: |
| | | | |
Unrealized appreciation | | $ | 4,477,556 | |
Unrealized depreciation | | | (766,987 | ) |
| | | | |
Net unrealized appreciation (depreciation) | | $ | 3,710,569 | |
| | | | |
ADR American Depositary Receipt
| # | Represents non-income producing securities. |
| * | Assets of affiliates to The Socially Responsible Utilities Fund held for the benefit of the Fund’s Trustees in connection with the Trustees Deferred Compensation Plan. |
| ** | Other financial instruments are derivative instruments not reflected in the Schedule of Investments, such as futures contracts, which are valued at the unrealized appreciation/depreciation on the instrument. |
The accompanying notes are an integral part of these financial statements.
Schedule of Investments
June 30, 2008 (unaudited)
The U.S. Government Bond Fund
| | | | | |
Security Description | | Principal
Amount ($)
or Shares | | Value ($)(a) | |
U.S. Government Obligations — 84.3% | | | |
Fannie Mae, 3.00%, due 01/14/2011 | | 1,000,000 | | 988,937 | |
Fannie Mae, 4.00%, due 04/29/2013 | | 1,000,000 | | 991,632 | |
Fannie Mae, 4.60%, due 06/05/2018 | | 1,000,000 | | 980,265 | |
Federal Home Loan Bank, 3.125%, due 10/21/2011 | | 1,000,000 | | 981,266 | |
Federal Home Loan Bank, 4.25%, due 06/14/2013 | | 1,000,000 | | 996,289 | |
Federal Home Loan Bank, 5.625%, due 06/09/2017 | | 1,000,000 | | 1,066,538 | |
Federal Home Loan Bank, 5.50%, due 05/12/2023 | | 1,000,000 | | 989,420 | |
Federal Home Loan Mortgage Corporation, 4.25%, due 03/11/2013 | | 1,000,000 | | 996,299 | |
Federal Home Loan Mortgage Corporation, 4.32%, due 04/29/2013 | | 1,000,000 | | 997,324 | |
Federal Home Loan Mortgage Corporation, 4.05%, due 05/01/2013 | | 1,000,000 | | 989,527 | |
Federal Home Loan Mortgage Corporation, 4.60%, due 06/05/2018 | | 1,000,000 | | 979,205 | |
Federal Home Loan Mortgage Corporation, 5.30%, due 05/12/2020 | | 1,000,000 | | 993,462 | |
Freddie Mac, 4.375%, due 07/17/2015 | | 1,000,000 | | 995,000 | |
| | | �� | | |
Total U.S. Government Obligations
(Cost $12,957,952) | | | | 12,945,164 | |
| | | | | |
Repurchase Agreements — 15.8% | |
Morgan Stanley DW, Inc., 2.56%, 07/01/2008, (Collateralized by $2,524,462 various Government Agencies, Agency Strips, Treasury Notes, and Treasury Strips at 5.125% — 8.625%, due 07/15/2008 — 04/15/2030, value — $2,472,488) purchase date 06/30/2008 | | 2,424,000 | | 2,424,000 | |
| | | | | |
Total Repurchase Agreements
(Cost $2,424,000) | | | | 2,424,000 | |
| | | | | |
Total Investments — 100.1%
(Cost $15,381,952)(b) | | | | 15,369,164 | |
| | | | | |
Liabilities less Other Assets — (0.1%) | | | | (12,344 | ) |
| | | | | |
Total Net Assets — 100.0% | | | | 15,356,820 | |
| | | | | |
Trustee Deferred Compensation* | | | | | |
The Flex-funds Aggressive Growth Fund | | 220 | | 1,696 | |
The Flex-funds Defensive Growth Fund | | 126 | | 1,182 | |
The Flex-funds Dynamic Growth Fund | | 420 | | 3,549 | |
The Flex-funds Muirfield Fund | | 1,219 | | 6,668 | |
The Flex-funds Quantex Fund | | 548 | | 8,719 | |
The Flex-funds Socially Responsible Utilities Fund | | 79 | | 2,010 | |
| | | | | |
Total Trustee Deferred Compensation
(Cost $22,300) | | | | 23,824 | |
| | | | | |
The U.S. Government Bond Fund
| (a) | Statement on Financial Accounting Standard No. 157 “Fair Value Measurements” — Various inputs are used in determining the value of the Fund’s investments. These inputs are summarized in the three broad levels listed below. |
| | • | | Level 1 — quoted prices in active markets for identical securities |
| | • | | Level 2 — other significant observable inputs (including quoted prices for similar securities, interest rates, prepayment speeds, credit risk, etc.) |
| | • | | Level 3 — significant unobservable inputs (including the Fund’s own assumptions in determining the fair value of investments) |
The following is a summary of the inputs used as of June 30, 2008 in valuing the Fund’s assets carried at fair value:
| | | | | | |
Valuation Inputs | | Investments in
Securities | | Other Financial
Instruments** |
Level 1 — Quoted Prices | | $ | — | | $ | — |
Level 2 — Other Significant Observable Inputs | | | 15,369,164 | | | — |
Level 3 — Significant Unobservable Inputs | | | — | | | — |
| | | | | | |
Total | | $ | 15,369,164 | | $ | — |
| | | | | | |
The inputs or methodology used for valuing securities are not necessarily an indication of the risk associated with investing in those securities. For example, short-term debt instruments and repurchase agreements with a maturity of less than 60 days are valued using amortized cost, in accordance with rules under the Investment Company Act of 1940. Generally, amortized cost approximates the current fair value of a security, but since the value is not obtained from a quoted price in an active market, such securities are reflected as Level 2.
| (b) | Cost for financial reporting purposes and federal income tax purposes are the same. Cost for federal income tax purposes differs from value by net unrealized appreciation (depreciation) of securities as follows: |
| | | | |
Unrealized appreciation | | $ | 68,469 | |
Unrealized depreciation | | | (81,257 | ) |
| | | | |
Net unrealized appreciation (depreciation) | | $ | (12,788 | ) |
| | | | |
| * | Assets of affiliates to The U.S. Government Bond Fund held for the benefit of the Fund’s Trustees in connection with the Trustee Deferred Compensation Plan. |
| ** | Other financial instruments are derivative instruments not reflected in the Schedule of Investments, such as futures contracts, which are valued at the unrealized appreciation/depreciation on the instrument. |
Schedule of Investments
June 30, 2008 (unaudited)
The Money Market Fund
| | | | | | | | | |
Security Description | | Coupon/
Yield | | | Maturity | | Principal
Amount ($)
or Shares | | Value ($)(a) |
Commercial Paper — 42.1% | | | | |
ABN-AMRO NA | | 2.38% | | | 07/03/08 | | 2,000,000 | | 1,999,739 |
ABN-AMRO NA | | 2.76% | | | 07/10/08 | | 3,000,000 | | 2,997,963 |
ABN-AMRO NA | | 2.49% | | | 07/14/08 | | 2,000,000 | | 1,998,231 |
ABN-AMRO NA | | 2.65% | | | 08/12/08 | | 2,000,000 | | 1,993,933 |
ABN-AMRO NA | | 2.60% | | | 08/21/08 | | 2,000,000 | | 1,992,775 |
Bank of America | | 2.42% | | | 07/16/08 | | 1,000,000 | | 999,008 |
Bank of America | | 2.88% | | | 08/01/08 | | 1,000,000 | | 997,563 |
Bank of America | | 2.46% | | | 08/05/08 | | 1,700,000 | | 1,696,000 |
BNP PARIBAS | | 2.44% | | | 07/08/08 | | 3,800,000 | | 3,798,227 |
BNP PARIBAS | | 2.91% | | | 07/29/08 | | 1,755,000 | | 1,751,096 |
BNP PARIBAS | | 2.70% | | | 08/01/08 | | 2,000,000 | | 1,995,436 |
CBA Delaware Finance | | 2.79% | | | 07/07/08 | | 1,080,000 | | 1,079,505 |
CBA Delaware Finance | | 2.69% | | | 07/11/08 | | 2,000,000 | | 1,998,528 |
CBA Delaware Finance | | 2.39% | | | 07/30/08 | | 3,400,000 | | 3,393,563 |
CBA Delaware Finance | | 2.67% | | | 08/05/08 | | 2,000,000 | | 1,994,906 |
CBA Delaware Finance | | 2.58% | | | 08/06/08 | | 2,000,000 | | 1,994,920 |
Chevron Funding | | 2.16% | | | 07/18/08 | | 2,000,000 | | 1,997,988 |
Deutsche Bank | | 2.43% | | | 08/11/08 | | 2,000,000 | | 1,994,556 |
Dexia Delaware | | 2.64% | | | 07/09/08 | | 2,000,000 | | 1,998,844 |
Dexia Delaware | | 2.77% | | | 07/11/08 | | 2,000,000 | | 1,998,486 |
Dexia Delaware | | 2.59% | | | 08/06/08 | | 2,000,000 | | 1,994,900 |
Dexia Delaware | | 2.69% | | | 08/08/08 | | 2,000,000 | | 1,994,427 |
Dexia Delaware | | 2.67% | | | 08/19/08 | | 2,150,000 | | 2,142,333 |
GE Capital Corp | | 2.59% | | | 08/01/08 | | 2,500,000 | | 2,494,510 |
GE Capital Corp | | 2.44% | | | 08/04/08 | | 2,000,000 | | 1,995,467 |
GE Capital Corp | | 2.65% | | | 08/22/08 | | 2,500,000 | | 2,490,611 |
GE Capital Corp | | 3.00% | | | 12/15/08 | | 2,000,000 | | 1,972,909 |
ING Funding | | 2.87% | | | 07/22/08 | | 2,000,000 | | 1,996,710 |
ING Funding | | 2.59% | | | 08/04/08 | | 2,000,000 | | 1,995,183 |
ING Funding | | 2.64% | | | 08/07/08 | | 2,000,000 | | 1,994,666 |
ING Funding | | 2.60% | | | 08/08/08 | | 2,000,000 | | 1,994,595 |
ING Funding | | 2.80% | | | 08/14/08 | | 2,296,000 | | 2,288,283 |
Prudential Funding | | 2.37% | | | 08/13/08 | | 2,000,000 | | 1,994,434 |
Prudential Funding | | 2.42% | | | 08/19/08 | | 2,000,000 | | 1,993,521 |
Prudential Funding | | 2.47% | | | 08/29/08 | | 2,000,000 | | 1,992,068 |
Prudential Funding | | 2.36% | | | 09/03/08 | | 2,000,000 | | 1,991,751 |
Societe Generale | | 2.72% | | | 08/06/08 | | 2,000,000 | | 1,994,660 |
Svenska Handelsbanke | | 2.54% | | | 07/07/08 | | 2,000,000 | | 1,999,167 |
Svenska Handelsbanke | | 2.48% | | | 07/15/08 | | 1,000,000 | | 999,051 |
Svenska Handelsbanke | | 2.59% | | | 08/11/08 | | 2,000,000 | | 1,994,214 |
Svenska Handelsbanke | | 2.60% | | | 08/25/08 | | 2,000,000 | | 1,992,208 |
Toyota Motor Credit | | 2.55% | | | 07/01/08 | | 2,000,000 | | 2,000,000 |
Toyota Motor Credit | | 2.62% | | | 07/15/08 | | 2,000,000 | | 1,997,993 |
Toyota Motor Credit | | 2.43% | | | 08/14/08 | | 2,000,000 | | 1,994,158 |
Toyota Motor Credit | | 2.45% | | | 09/05/08 | | 2,000,000 | | 1,991,200 |
Toyota Motor Credit | | 2.71% | | | 10/23/08 | | 2,000,000 | | 1,983,217 |
UBS Finance Delaware | | 2.64% | | | 07/16/08 | | 2,600,000 | | 2,597,183 |
| | | | | | | | | |
Total Commercial Paper
(Cost $95,540,687) | | | | | | | 95,540,687 |
| | | | | | | | | |
Corporate Obligations — 27.9% | | | | |
Bank of America | | 3.25% | | | 08/15/08 | | 1,075,000 | | 1,074,079 |
Bank of America | | 2.48% | * | | 07/18/08 | | 5,000,000 | | 4,997,777 |
Bath Technologies** | | 2.86% | * | | 07/03/08 | | 1,040,000 | | 1,040,000 |
Canadian Imperial Bank | | 2.76% | * | | 08/12/08 | | 5,000,000 | | 4,997,910 |
Cascade Plaza Project** | | 2.71% | * | | 07/03/08 | | 7,248,000 | | 7,248,000 |
Credit Suisse | | 2.85% | * | | 07/01/08 | | 1,500,000 | | 1,490,524 |
Credit Suisse | | 2.95% | * | | 09/03/08 | | 5,000,000 | | 5,000,000 |
The Money Market Fund
| | | | | | | | | |
Security Description | | Coupon/
Yield | | | Maturity | | Principal
Amount ($)
or Shares | | Value ($)(a) |
Corporate Obligations — continued | | | | |
Don’s Launderers-Cleaners, Inc.** | | 3.25% | * | | 07/03/08 | | 900,000 | | 900,000 |
GE Capital Corp | | 2.91% | * | | 07/24/08 | | 500,000 | | 499,832 |
Goldman Sachs | | 3.88% | | | 01/15/09 | | 4,000,000 | | 4,011,098 |
Goldman Sachs | | 2.94% | | | 07/01/08 | | 2,559,000 | | 2,545,118 |
Isaac Tire, Inc.** | | 3.25% | * | | 07/03/08 | | 685,000 | | 685,000 |
JP Morgan Chase | | 6.75% | | | 08/15/08 | | 1,405,000 | | 1,408,839 |
Martin Wheel Co, Inc.** | | 2.78% | * | | 07/03/08 | | 2,020,000 | | 2,020,000 |
Merrill Lynch | | 4.83% | | | 10/27/08 | | 2,500,000 | | 2,498,975 |
MetLife Insurance
Co.**/*** | | 2.73% | * | | 07/01/08 | | 7,500,000 | | 7,500,000 |
O.K.I. Supply Co.** | | 3.25% | * | | 07/03/08 | | 645,000 | | 645,000 |
Pro Tire, Inc.** | | 3.25% | * | | 07/03/08 | | 820,000 | | 820,000 |
Seariver Maritime | | 2.70% | * | | 07/01/08 | | 2,400,000 | | 2,400,000 |
Springside Corp Exchange Partners LLC** | | 2.81% | * | | 07/03/08 | | 2,000,000 | | 2,000,000 |
Taylor Brothers Properties LLC** | | 3.25% | * | | 07/03/08 | | 995,000 | | 995,000 |
US Bank NA | | 2.40% | * | | 07/01/08 | | 5,000,000 | | 4,998,023 |
Wachovia Bank | | 2.65% | * | | 07/03/08 | | 1,200,000 | | 1,199,527 |
White Castle Project** | | 2.81% | * | | 07/03/08 | | 2,500,000 | | 2,500,000 |
| | | | | | | | | |
Total Corporate Obligations
(Cost $63,474,702) | | | | | | | 63,474,702 |
| | | | | | | | | |
U.S. Government Agency Obligations — 24.2% | | |
Fannie Mae Discount | | 2.36% | | | 09/10/08 | | 5,000,000 | | 4,976,728 |
Fannie Mae Discount | | 2.25% | | | 09/30/08 | | 5,000,000 | | 4,971,563 |
Fannie Mae Discount | | 2.52% | | | 12/10/08 | | 5,000,000 | | 4,943,233 |
Fannie Mae Discount | | 2.50% | | | 12/22/08 | | 5,000,000 | | 4,939,583 |
Federal Home Loan Bank** | | 2.25% | * | | 07/01/08 | | 5,000,000 | | 5,000,000 |
Federal Home Loan Bank** | | 2.31% | * | | 07/12/08 | | 5,000,000 | | 5,000,000 |
Federal Home Loan Bank | | 2.40% | | | 04/17/09 | | 5,000,000 | | 5,000,000 |
Freddie Mac | | 2.23% | | | 09/08/08 | | 5,000,000 | | 4,978,629 |
Freddie Mac | | 2.45% | | | 04/09/09 | | 5,000,000 | | 5,000,000 |
Freddie Mac | | 2.45% | | | 05/08/09 | | 5,000,000 | | 5,000,000 |
Freddie Mac | | 2.50% | | | 05/13/09 | | 5,000,000 | | 5,000,000 |
| | | | | | | | | |
Total U.S. Government Agency Obligations
(Cost $54,809,735) | | | | 54,809,735 |
| | | | | | | | | |
The accompanying notes are an integral part of these financial statements.
Schedule of Investments
June 30, 2008 (unaudited)
The Money Market Fund
| | | | | | | | |
Security Description | | Coupon/
Yield | | Maturity | | Principal
Amount ($)
or Shares | | Value ($)(a) |
Repurchase Agreements — 5.7% | | |
Morgan Stanley DW, Inc., 2.56%, 07/01/2008, (Collateralized by $13,556,485 various Government Agencies, Agency Strips, Treasury Notes, and Treasury Strips at 5.125% — 8.625%, due 07/15/2008 — 04/15/2030, value —$13,277,380) purchase date 06/30/2008 | | | | | | 13,017,000 | | 13,017,000 |
| | | | | | | | |
Total Repurchase Agreements
(Cost $13,017,000) | | | | | | 13,017,000 |
| | | | | | | | |
Total Investments — 99.9%
(Cost $226,842,125)(b) | | | | | | 226,842,125 |
| | | | | | | | |
Other Assets less Liabilities — 0.1% | | | | 326,142 |
| | | | | | | | |
Total Net Assets — 100.0% | | | | | | 227,168,267 |
| | | | | | | | |
Trustee Deferred Compensation**** | | |
The Flex-funds Aggressive Growth Fund | | | | 220 | | 1,696 |
The Flex-funds Defensive Growth Fund | | | | 126 | | 1,182 |
The Flex-funds Dynamic Growth Fund | | | | 659 | | 5,569 |
The Flex-funds Muirfield Fund | | | | 1,874 | | 10,251 |
The Flex-funds Quantex Fund | | | | 814 | | 12,951 |
The Flex-funds Socially Responsible Utilities Fund | | | | 156 | | 3,969 |
| | | | | | | | |
Total Trustee Deferred Compensation
(Cost $35,474) | | | | 35,618 |
| | | | | | | | |
| (a) | Statement on Financial Accounting Standard No. 157 “Fair Value Measurements” — Various inputs are used in determining the value of the Fund’s investments. These inputs are summarized in the three broad levels listed below. |
| | • | | Level 1 — quoted prices in active markets for identical securities |
| | • | | Level 2 — other significant observable inputs (including quoted prices for similar securities, interest rates, prepayment speeds, credit risk, etc.) |
| | • | | Level 3 — significant unobservable inputs (including the Fund’s own assumptions in determining the fair value of investments) |
The following is a summary of the inputs used as of June 30, 2008 in valuing the Fund’s assets carried at fair value:
| | | | | | |
Valuation Inputs | | Investments in
Securities | | Other Financial
Instruments***** |
Level 1 — Quoted Prices | | $ | — | | $ | — |
Level 2 — Other Significant Observable Inputs | | | 226,842,125 | | | — |
Level 3 — Significant Unobservable Inputs | | | — | | | — |
| | | | | | |
Total | | $ | 226,842,125 | | $ | — |
| | | | | | |
The Money Market Fund
The inputs or methodology used for valuing securities are not necessarily an indication of the risk associated with investing in those securities. For example, short-term debt instruments and repurchase agreements with a maturity of less than 60 days are valued using amortized cost, in accordance with rules under the Investment Company Act of 1940. Generally, amortized cost approximates the current fair value of a security, but since the value is not obtained from a quoted price in an active market, such securities are reflected as Level 2.
| (b) | Cost for federal income tax and financial reporting purposes are the same. |
| * | Variable rate security. Securities payable on demand at par including accrued interest (usually within seven days notice) and unconditionally secured as to principal and interest by letters of credit or other credit support agreements from major banks. The interest rates are adjustable and are based on bank prime rates or other interest rate adjustment indices. The rate shown represents the rate in effect at June 30, 2008. The maturity date shown reflects next rate change date. |
| ** | Represents a restricted security purchased under Rule 144A, which is exempt from registration under the Securities Act of 1933, as amended. Security is restricted as to resale to institutional investors, but has been deemed liquid in accordance with guidelines approved by the Board of Trustees. As of June 30, 2008, securities restricted as to resale to institutional investors represented 11.6% of Total Investments. |
| *** | Illiquid security. The sale or disposition of such security would not be possible in the ordinary course of business within seven days at approximately the value at which the Fund has valued the security. As of June 30, 2008, illiquid securities represented 3.3% of Total Investments. |
| **** | Assets of affiliates to The Money Market Fund held for the benefit of the Fund’s Trustees in connection with the Trustee Deferred Compensation Plan. |
| ***** | Other financial instruments are derivative instruments not reflected in the Schedule of Investments, such as futures contracts, which are valued at the unrealized appreciation/depreciation on the instrument. |
The accompanying notes are an integral part of these financial statements.
[THIS PAGE INTENTIONALLY LEFT BLANK]
Statements of Assets & Liabilities
June 30, 2008 (unaudited)
| | | | | | | | |
| | | The
Muirfield
Fund | | | The Dynamic
Growth Fund | |
Assets | | | | | | | | |
Investments, at value* | | $ | 72,211,574 | | | $ | 57,456,753 | |
Repurchase agreements, at value* | | | 23,997,000 | | | | 4,294,000 | |
Trustee deferred compensation investments, at value | | | 81,584 | | | | 24,651 | |
Cash | | | — | | | | 864 | |
Cash held at broker | | | — | | | | — | |
Receivable for securities sold | | | — | | | | — | |
Receivable for capital stock issued | | | 1,444 | | | | 731 | |
Receivable from investment advisor | | | — | | | | — | |
Interest and dividend receivable | | | 3,995 | | | | 1,765 | |
Prepaid expenses/other assets | | | 21,788 | | | | 14,221 | |
Total Assets | | | 96,317,385 | | | | 61,792,985 | |
| | |
Liabilities | | | | | | | | |
Payable for securities purchased | | | — | | | | — | |
Payable for Trustee Deferred Compensation Plan | | | 81,584 | | | | 24,651 | |
Payable for net variation margin on futures contracts | | | 3,600 | | | | 9,900 | |
Payable for capital stock redeemed | | | 280,598 | | | | 169,241 | |
Dividends payable | | | — | | | | — | |
Dividends payable — The Money Market Fund — Retail Class | | | | | | | | |
Dividends payable — The Money Market Fund — Institutional Class | | | | | | | | |
Payable to investment advisor | | | 68,869 | | | | 38,386 | |
Accrued distribution plan (12b-1) and administrative service plan fees | | | 30,887 | | | | 25,289 | |
Accrued transfer agent, fund accounting, CCO, and administrative fees | | | 18,873 | | | | 13,155 | |
Accrued trustee fees | | | 4,265 | | | | 2,213 | |
Other accrued liabilities | | | 12,419 | | | | 10,416 | |
Total Liabilities | | | 501,095 | | | | 293,251 | |
| | | | | | | | | |
Net Assets | | $ | 95,816,290 | | | $ | 61,499,734 | |
| | |
Net Assets | | | | | | | | |
Capital | | $ | 103,555,450 | | | $ | 65,311,086 | |
Accumulated undistributed (distributions in excess of) net investment income | | | (86,039 | ) | | | (88,879 | ) |
Accumulated undistributed net realized gain (loss) from investments and futures contracts | | | (4,765,975 | ) | | | (860,931 | ) |
Net unrealized appreciation (depreciation) of investments and futures contracts | | | (2,887,146 | ) | | | (2,861,542 | ) |
Total Net Assets | | $ | 95,816,290 | | | $ | 61,499,734 | |
| | |
Net Assets | | | | | | | | |
The Money Market Fund — Retail Class | | | | | | | | |
The Money Market Fund — Institutional Class | | | | | | | | |
Total Net Assets | | | | | | | | |
| | |
Capital Stock Outstanding (indefinite number of shares authorized,
$0.10 par value) | | | 17,501,314 | | | | 7,276,753 | |
The Money Market Fund — Retail Class | | | | | | | | |
The Money Market Fund — Institutional Class | | | | | | | | |
Total Capital Stock Outstanding | | | | | | | | |
| | |
Net Asset Value, Offering and Redemption Price Per Share | | $ | 5.47 | | | $ | 8.45 | |
The Money Market Fund — Retail Class | | | | | | | | |
The Money Market Fund — Institutional Class | | | | | | | | |
* Investments and repurchase agreements, at cost | | $ | 98,990,118 | | | $ | 64,324,895 | |
The accompanying notes are an integral part of these financial statements.
| | | | | | | | | | | | | | | | | | | | | | | | |
The Aggressive
Growth Fund | | | The Defensive
Growth Fund | | | The Focused
Growth Fund | | | The
Quantex Fund | | | The Socially
Responsible
Utilities Fund | | The U.S.
Government
Bond Fund | | | The Money
Market Fund |
| | | | | | | | | | | | | | | | | | | | | | | | |
| $ | 29,380,374 | | | $ | 26,373,446 | | | $ | 28,190,401 | | | $ | 13,783,609 | | | $ | 26,743,316 | | $ | 12,945,164 | | | $ | 213,825,125 |
| | 1,982,000 | | | | 9,061,000 | | | | 2,817,000 | | | | 1,605,000 | | | | 111,000 | | | 2,424,000 | | | | 13,017,000 |
| | 22,367 | | | | 16,027 | | | | 14,333 | | | | 39,689 | | | | 31,941 | | | 23,824 | | | | 35,618 |
| | 735 | | | | 1,341,843 | | | | 682 | | | | 358 | | | | 931 | | | 680 | | | | 581 |
| | — | | | | — | | | | 475,000 | | | | — | | | | — | | | — | | | | — |
| | — | | | | — | | | | — | | | | — | | | | 156,783 | | | — | | | | — |
| | 11,373 | | | | 597 | | | | 485 | | | | 1,741 | | | | 7,730 | | | 375 | | | | — |
| | — | | | | — | | | | — | | | | — | | | | — | | | 4,943 | | | | 11,763 |
| | 22,305 | | | | 22,437 | | | | 24,724 | | | | 14,562 | | | | 20,114 | | | 94,672 | | | | 421,304 |
| | 11,164 | | | | 12,430 | | | | 12,458 | | | | 11,632 | | | | 10,603 | | | 13,111 | | | | 31,432 |
| | 31,430,318 | | | | 36,827,780 | | | | 31,535,083 | | | | 15,456,591 | | | | 27,082,418 | | | 15,506,769 | | | | 227,342,823 |
| | | | | | |
| | | | | | | | | | | | | | | | | | | | | | | | |
| | — | | | | 397,617 | | | | 497,577 | | | | — | | | | — | | | — | | | | — |
| | 22,367 | | | | 16,027 | | | | 14,333 | | | | 39,689 | | | | 31,941 | | | 23,824 | | | | 35,618 |
| | 4,500 | | | | 1,800 | | | | 3,665 | | | | 3,600 | | | | — | | | — | | | | — |
| | 50,893 | | | | 160,520 | | | | 68,670 | | | | 44,838 | | | | 47,933 | | | 93,566 | | | | — |
| | — | | | | — | | | | — | | | | — | | | | 421 | | | 1,210 | | | | |
| | | | | | | | | | | | | | | | | | | | | | | | 6,259 |
| | | | | | | | | | | | | | | | | | | | | | | | 9,156 |
| | 19,635 | | | | 22,131 | | | | 19,049 | | | | 9,929 | | | | 22,571 | | | 4,906 | | | | 35,508 |
| | 22,887 | | | | 57,867 | | | | 47,531 | | | | 4,616 | | | | 12,117 | | | 11,051 | | | | 26,892 |
| | 9,032 | | | | 7,757 | | | | 7,027 | | | | 5,059 | | | | 8,342 | | | 4,068 | | | | 31,805 |
| | 2,745 | | | | 5,698 | | | | 4,965 | | | | 1,991 | | | | 2,605 | | | 1,724 | | | | 1,810 |
| | 11,670 | | | | 14,747 | | | | 13,771 | | | | 11,618 | | | | 12,506 | | | 9,600 | | | | 27,508 |
| | 143,729 | | | | 684,164 | | | | 676,588 | | | | 121,340 | | | | 138,436 | | | 149,949 | | | | 174,556 |
| | | | | | | | | | | | | | | | | | | | | | | | | |
| $ | 31,286,589 | | | $ | 36,143,616 | | | $ | 30,858,495 | | | $ | 15,335,251 | | | $ | 26,943,982 | | $ | 15,356,820 | | | $ | 227,168,267 |
| | | | | | |
| | | | | | | | | | | | | | | | | | | | | | | | |
| $ | 37,521,965 | | | $ | 41,433,120 | | | $ | 34,591,585 | | | $ | 19,443,098 | | | $ | 22,807,700 | | $ | 16,163,592 | | | $ | 227,168,267 |
| | 8,128 | | | | 69,915 | | | | (27,407 | ) | | | 3,998 | | | | 45,418 | | | 2,009 | | | | — |
| | | | | | |
| | (3,841,176 | ) | | | (3,076,547 | ) | | | (1,410,375 | ) | | | (952,591 | ) | | | 380,295 | | | (795,993 | ) | | | — |
| | (2,402,328 | ) | | | (2,282,872 | ) | | | (2,295,308 | ) | | | (3,159,254 | ) | | | 3,710,569 | | | (12,788 | ) | | | — |
| $ | 31,286,589 | | | $ | 36,143,616 | | | $ | 30,858,495 | | | $ | 15,335,251 | | | $ | 26,943,982 | | $ | 15,356,820 | | | $ | 227,168,267 |
| | | | | | |
| | | | | | | | | | | | | | | | | | | | | | | | |
| | | | | | | | | | | | | | | | | | | | | | | $ | 201,562,436 |
| | | | | | | | | | | | | | | | | | | | | | | | | 25,605,831 |
| | | | | | | | | | | | | | | | | | | | | | | | $ | 227,168,267 |
| | | | | | |
| | 4,057,600 | | | | 3,854,312 | | | | 3,241,136 | | | | 963,836 | | | | 1,059,040 | | | 752,997 | | | | |
| | | | | | | | | | | | | | | | | | | | | | | | 201,562,436 |
| | | | | | | | | | | | | | | | | | | | | | | | | 25,605,831 |
| | | | | | | | | | | | | | | | | | | | | | | | | 227,168,267 |
| | | | | | |
| $ | 7.71 | | | $ | 9.38 | | | $ | 9.52 | | | $ | 15.91 | | | $ | 25.44 | | $ | 20.39 | | | | |
| | | | | | | | | | | | | | | | | | | | | | | $ | 1.00 |
| | | | | | | | | | | | | | | | | | | | | | | | $ | 1.00 |
| $ | 33,643,802 | | | $ | 37,664,519 | | | $ | 33,144,309 | | | $ | 18,442,263 | | | $ | 23,143,747 | | $ | 15,381,952 | | | $ | 226,842,125 |
Statements of Operations
For the Period Ended June 30, 2008 (unaudited)
| | | | | | | | |
| | | The
Muirfield
Fund | | | The Dynamic
Growth Fund | |
Investment Income | | | | | | | | |
Interest | | $ | 226,448 | | | $ | 38,360 | |
Dividends | | | 105,249 | | | | 68,658 | |
Total Investment Income | | | 331,697 | | | | 107,018 | |
| | |
Fund Expenses | | | | | | | | |
Investment advisor | | | 282,492 | | | | 111,623 | |
Transfer agent | | | 35,788 | | | | 17,861 | |
Transfer agent — The Money Market Fund — Retail Class | | | | | | | | |
Transfer agent — The Money Market Fund — Institutional Class | | | | | | | | |
Fund accounting | | | 20,234 | | | | 14,328 | |
Administrative | | | 28,564 | | | | 14,664 | |
Trustee | | | 9,643 | | | | 5,513 | |
Audit | | | 4,962 | | | | 4,962 | |
Legal | | | 4,305 | | | | 4,305 | |
Custody | | | 4,689 | | | | 2,787 | |
Printing | | | 5,785 | | | | 2,811 | |
Distribution plan (12b-1) | | | 59,595 | | | | 37,143 | |
Distribution plan (12b-1) — The Money Market Fund — Retail Class | | | | | | | | |
Distribution plan (12b-1) — The Money Market Fund — Institutional Class | | | | | | | | |
Administrative service plan | | | 59,677 | | | | 29,802 | |
Postage | | | 2,852 | | | | 1,144 | |
Registration and filing | | | 7,649 | | | | 4,403 | |
Insurance | | | 2,417 | | | | 968 | |
Chief Compliance Officer | | | 2,583 | | | | 2,583 | |
Other | | | 5,654 | | | | 3,679 | |
Total Expenses Before Reductions | | | 536,889 | | | | 258,576 | |
| | |
Expenses reimbursed/waived by investment advisor | | | — | | | | — | |
Expenses paid indirectly | | | (34,026 | ) | | | (21,841 | ) |
Distribution plan (12b-1) expenses waived | | | (38,174 | ) | | | (21,879 | ) |
Administrative service plan expenses waived | | | (45,033 | ) | | | (17,414 | ) |
Transfer agent expenses waived | | | (1,920 | ) | | | (1,545 | ) |
Net Expenses | | | 417,736 | | | | 195,897 | |
| | | | | | | | | |
Net Investment Income (Loss) | | | (86,039 | ) | | | (88,879 | ) |
| | |
Realized and Unrealized Gain (Loss) from Investments | | | | | | | | |
Net realized gains (losses) from investments | | | (3,664,532 | ) | | | (1,123,812 | ) |
Net realized gains (losses) from futures contracts | | | (707,383 | ) | | | (312,575 | ) |
Net Realized Gains (Losses) from Investment Transactions, Futures Contracts, and Distributions of Realized Gains by Other Investment Companies | | | (4,371,915 | ) | | | (1,436,387 | ) |
| | |
Net change in unrealized appreciation (depreciation) of investments and futures contracts | | | (1,953,011 | ) | | | (2,429,601 | ) |
Net Realized and Unrealized Gain (Loss) from Investments | | | (6,324,926 | ) | | | (3,865,988 | ) |
| | | | | | | | | |
Net Change in Net Assets Resulting from Operations | | $ | (6,410,965 | ) | | $ | (3,954,867 | ) |
The accompanying notes are an integral part of these financial statements.
| | | | | | | | | | | | | | | | | | | | | | | | | | |
The Aggressive
Growth Fund | | | The
Defensive
Growth Fund | | | The Focused
Growth Fund | | | The
Quantex
Fund | | | The Socially
Responsible
Utilities Fund | | | The U.S.
Government
Bond Fund | | | The Money
Market Fund | |
| | | | | | | | | | | | | | | | | | | | | | | | | | |
| $ | 44,754 | | | $ | 279,051 | | | $ | 100,976 | | | $ | 31,611 | | | $ | 9,061 | | | $ | 296,984 | | | $ | 3,972,936 | |
| | 200,631 | | | | 262,563 | | | | 278,978 | | | | 111,342 | | | | 332,783 | | | | 2,843 | | | | — | |
| | 245,385 | | | | 541,614 | | | | 379,954 | | | | 142,953 | | | | 341,844 | | | | 299,827 | | | | 3,972,936 | |
| | | | | | |
| | | | | | | | | | | | | | | | | | | | | | | | | | |
| | 104,816 | | | | 228,405 | | | | 194,365 | | | | 84,119 | | | | 132,210 | | | | 28,901 | | | | 355,732 | |
| | 16,770 | | | | 36,549 | | | | 31,102 | | | | 10,093 | | | | 15,865 | | | | 5,780 | | | | | |
| | | | | | | | | | | | | | | | | | | | | | | | | 81,399 | |
| | | | | | | | | | | | | | | | | | | | | | | | | 8,590 | |
| | 16,298 | | | | 20,512 | | | | 19,582 | | | | 10,898 | | | | 15,707 | | | | 9,712 | | | | 29,645 | |
| | 13,975 | | | | 29,104 | | | | 25,262 | | | | 8,411 | | | | 13,221 | | | | 7,225 | | | | 94,938 | |
| | 5,472 | | | | 10,497 | | | | 8,881 | | | | 3,957 | | | | 5,301 | | | | 3,723 | | | | 3,695 | |
| | 4,962 | | | | 4,962 | | | | 4,962 | | | | 4,962 | | | | 4,962 | | | | 4,962 | | | | 4,987 | |
| | 4,305 | | | | 4,305 | | | | 4,305 | | | | 4,305 | | | | 4,336 | | | | 4,290 | | | | 4,314 | |
| | 2,581 | | | | 5,040 | | | | 4,192 | | | | 3,310 | | | | 2,208 | | | | 1,492 | | | | 8,498 | |
| | 2,709 | | | | 6,144 | | | | 5,051 | | | | 1,794 | | | | 2,633 | | | | 1,312 | | | | 23,429 | |
| | 34,985 | | | | 76,018 | | | | 64,702 | | | | 16,807 | | | | 33,022 | | | | 14,424 | | | | | |
| | | | | | | | | | | | | | | | | | | | | | | | | 203,096 | |
| | | | | | | | | | | | | | | | | | | | | | | | | 3,225 | |
| | 27,896 | | | | 60,908 | | | | 51,831 | | | | 16,848 | | | | 26,444 | | | | 14,418 | | | | — | |
| | 1,130 | | | | 2,195 | | | | 1,793 | | | | 1,097 | | | | 3,258 | | | | 673 | | | | 12,131 | |
| | 10,805 | | | | 10,822 | | | | 10,603 | | | | 8,286 | | | | 8,316 | | | | 9,926 | | | | 21,933 | |
| | 1,254 | | | | 2,905 | | | | 2,597 | | | | 1,134 | | | | 1,117 | | | | 562 | | | | 7,555 | |
| | 2,583 | | | | 2,583 | | | | 2,583 | | | | 2,583 | | | | 2,882 | | | | 2,583 | | | | 2,575 | |
| | 3,768 | | | | 3,950 | | | | 3,802 | | | | 4,358 | | | | 4,496 | | | | 3,230 | | | | 29,554 | |
| | 254,309 | | | | 504,899 | | | | 435,613 | | | | 182,962 | | | | 275,978 | | | | 113,213 | | | | 895,296 | |
| | | | | | |
| | — | | | | — | | | | — | | | | (21,036 | ) | | | — | | | | (32,745 | ) | | | (204,763 | ) |
| | — | | | | — | | | | — | | | | — | | | | — | | | | — | | | | — | |
| | (5,451 | ) | | | (11,878 | ) | | | (10,108 | ) | | | (9,845 | ) | | | (8,198 | ) | | | (3,323 | ) | | | (141,543 | ) |
| | (11,601 | ) | | | — | | | | — | | | | (13,126 | ) | | | (17,189 | ) | | | (3,974 | ) | | | — | |
| | — | | | | (21,322 | ) | | | (18,144 | ) | | | — | | | | — | | | | (1,445 | ) | | | (22,515 | ) |
| | 237,257 | | | | 471,699 | | | | 407,361 | | | | 138,955 | | | | 250,591 | | | | 71,726 | | | | 526,475 | |
| | | | | | | | | | | | | | | | | | | | | | | | | | | |
| | 8,128 | | | | 69,915 | | | | (27,407 | ) | | | 3,998 | | | | 91,253 | | | | 228,101 | | | | 3,446,461 | |
| | | | | | |
| | | | | | | | | | | | | | | | | | | | | | | | | | |
| | (291,245 | ) | | | (1,824,332 | ) | | | (765,651 | ) | | | 425,237 | | | | 1,784,066 | | | | 242,518 | | | | | |
| | (275,711 | ) | | | (1,030,473 | ) | | | (419,966 | ) | | | 100,602 | | | | — | | | | — | | | | | |
| | | | | | |
| | (566,956 | ) | | | (2,854,805 | ) | | | (1,185,617 | ) | | | 525,839 | | | | 1,784,066 | | | | 242,518 | | | | | |
| | | | | | |
| | (2,748,973 | ) | | | (3,164,265 | ) | | | (3,110,377 | ) | | | (2,509,173 | ) | | | (2,576,993 | ) | | | (380,873 | ) | | | | |
| | (3,315,929 | ) | | | (6,019,070 | ) | | | (4,295,994 | ) | | | (1,983,334 | ) | | | (792,927 | ) | | | (138,355 | ) | | | | |
| | | | | | | | | | | | | | | | | | | | | | | | | | | |
| $ | (3,307,801 | ) | | $ | (5,949,155 | ) | | $ | (4,323,401 | ) | | $ | (1,979,336 | ) | | $ | (701,674 | ) | | $ | 89,746 | | | $ | 3,446,461 | |
Statements of Changes in Net Assets
For the Period Ended June 30, 2008 (unaudited) and the Year Ended December 31, 2007
| | | | | | | | |
| |
| | | The Muirfield Fund | |
| | | 2008 | | | 2007 | |
Operations | | | | | | | | |
Net investment income (loss) | | $ | (86,039 | ) | | $ | 1,547,376 | |
Net realized gain (loss) from investments, futures contracts, options contracts, and distributions by other investment companies | | | (4,371,915 | ) | | | 6,022,274 | |
Net change in unrealized appreciation (depreciation) of investments, futures contracts, and options contracts | | | (1,953,011 | ) | | | (4,099,302 | ) |
Net change in net assets resulting from operations | | | (6,410,965 | ) | | | 3,470,348 | |
| | |
Distributions to Shareholders | | | | | | | | |
From net investment income | | | — | | | | (1,605,522 | ) |
From net realized gain from investments, futures contracts, options contracts, and distributions by other investment companies | | | — | | | | — | |
Net change in net assets resulting from distributions | | | — | | | | (1,605,522 | ) |
| | |
Distributions to Shareholders
— The Money Market Fund | | | | | | | | |
From net investment income (Retail Class) | | | | | | | | |
From net investment income (Institutional Class) | | | | | | | | |
Net change in net assets resulting from distributions | | | | | | | | |
| | |
Capital Transactions | | | | | | | | |
Issued | | | 56,278,207 | | | | 3,848,671 | |
Reinvested | | | — | | | | 1,594,194 | |
Redeemed | | | (4,425,043 | ) | | | (10,160,626 | ) |
Net change in net assets resulting from capital transactions | | | 51,853,164 | | | | (4,717,761 | ) |
| | | | | | | | | |
Total Change in Net Assets | | | 45,442,199 | | | | (2,852,935 | ) |
| | |
Net Assets — Beginning of Period | | | 50,374,091 | | | | 53,227,026 | |
Net Assets — End of Period | | $ | 95,816,290 | | | $ | 50,374,091 | |
Accumulated undistributed (distributions in
excess of) net investment income | | $ | (86,039 | ) | | $ | — | |
| | |
Share Transactions | | | | | | | | |
Issued | | | 9,934,461 | | | | 636,390 | |
Reinvested | | | — | | | | 264,816 | |
Redeemed | | | (802,010 | ) | | | (1,687,261 | ) |
Net change in shares | | | 9,132,451 | | | | (786,055 | ) |
The accompanying notes are an integral part of these financial statements.
| | | | | | | | | | | | | | | | | | | | | | |
The Dynamic
Growth Fund | | | The Aggressive
Growth Fund | | | The Defensive
Growth Fund | |
| 2008 | | | 2007 | | | 2008 | | | 2007 | | | 2008 | | | 2007 | |
| | | | | | | | | | | | | | | | | | | | | | |
| $ | (88,879 | ) | | $ | 570,000 | | | $ | 8,128 | | | $ | 131,376 | | | $ | 69,915 | | | $ | 482,437 | |
| | | | | |
| | (1,436,387 | ) | | | 2,295,081 | | | | (566,956 | ) | | | 2,377,643 | | | | (2,854,805 | ) | | | 3,617,605 | |
| | | | | |
| | (2,429,601 | ) | | | (1,567,528 | ) | | | (2,748,973 | ) | | | (1,158,622 | ) | | | (3,164,265 | ) | | | (1,651,889 | ) |
| | (3,954,867 | ) | | | 1,297,553 | | | | (3,307,801 | ) | | | 1,350,397 | | | | (5,949,155 | ) | | | 2,448,153 | |
| | | | | |
| | | | | | | | | | | | | | | | | | | | | | |
| | — | | | | (595,949 | ) | | | — | | | | (131,376 | ) | | | — | | | | (482,437 | ) |
| | | | | |
| | — | | | | (1,280,280 | ) | | | — | | | | — | | | | — | | | | (3,353,278 | ) |
| | — | | | | (1,876,229 | ) | | | — | | | | (131,376 | ) | | | — | | | | (3,835,715 | ) |
| | | | | |
| | | | | | | | | | | | | | | | | | | | | | |
| | | | | | | | | | | | | | | | | | | | | | |
| | | | | | | | | | | | | | | | | | | | | | | |
| | | | | | | | | | | | | | | | | | | | | | | |
| | | | | |
| | | | | | | | | | | | | | | | | | | | | | |
| | 48,171,843 | | | | 2,106,628 | | | | 11,963,910 | | | | 12,049,990 | | | | 16,318,533 | | | | 34,599,984 | |
| | — | | | | 1,873,772 | | | | — | | | | 131,376 | | | | — | | | | 3,835,713 | |
| | (1,831,891 | ) | | | (5,853,044 | ) | | | (6,210,237 | ) | | | (6,114,035 | ) | | | (48,516,209 | ) | | | (5,246,462 | ) |
| | 46,339,952 | | | | (1,872,644 | ) | | | 5,753,673 | | | | 6,067,331 | | | | (32,197,676 | ) | | | 33,189,235 | |
| | | | | | | | | | | | | | | | | | | | | | | |
| | 42,385,085 | | | | (2,451,320 | ) | | | 2,445,872 | | | | 7,286,352 | | | | (38,146,831 | ) | | | 31,801,673 | |
| | | | | |
| | 19,114,649 | | | | 21,565,969 | | | | 28,840,717 | | | | 21,554,365 | | | | 74,290,447 | | | | 42,488,774 | |
| $ | 61,499,734 | | | $ | 19,114,649 | | | $ | 31,286,589 | | | $ | 28,840,717 | | | $ | 36,143,616 | | | $ | 74,290,447 | |
| | | | | |
| $ | (88,879 | ) | | $ | — | | | $ | 8,128 | | | $ | — | | | $ | 69,915 | | | $ | — | |
| | | | | |
| | | | | | | | | | | | | | | | | | | | | | |
| | 5,419,543 | | | | 212,451 | | | | 1,472,294 | | | | 1,417,233 | | | | 1,672,745 | | | | 3,168,990 | |
| | — | | | | 200,434 | | | | — | | | | 15,294 | | | | — | | | | 366,328 | |
| | (212,211 | ) | | | (598,981 | ) | | | (774,003 | ) | | | (725,226 | ) | | | (4,921,938 | ) | | | (475,026 | ) |
| | 5,207,332 | | | | (186,096 | ) | | | 698,291 | | | | 707,301 | | | | (3,249,193 | ) | | | 3,060,292 | |
Statements of Changes in Net Assets
For the Period Ended June 30, 2008 (unaudited) and the Year Ended December 31, 2007
| | | | | | | | | | | | | | | | |
| | | The Focused
Growth Fund | | | The Quantex Fund | |
| | | 2008 | | | 2007 | | | 2008 | | | 2007 | |
Operations | | | | | | | | | | | | | | | | |
Net investment income (loss) | | $ | (27,407 | ) | | $ | 400,726 | | | $ | 3,998 | | | $ | 173,871 | |
Net realized gain (loss) from investments, futures contracts, options contracts, and distributions by other investment companies | | | (1,185,617 | ) | | | 3,626,617 | | | | 525,839 | | | | 2,061,670 | |
Net change in unrealized appreciation (depreciation) of investments, futures contracts, and options contracts | | | (3,110,377 | ) | | | (1,944,304 | ) | | | (2,509,173 | ) | | | (3,891,736 | ) |
Net change in net assets resulting from operations | | | (4,323,401 | ) | | | 2,083,039 | | | | (1,979,336 | ) | | | (1,656,195 | ) |
| | | | |
Distributions to Shareholders | | | | | | | | | | | | | | | | |
From net investment income | | | — | | | | (400,726 | ) | | | — | | | | (173,871 | ) |
From net realized gain from investments, futures contracts, options contracts, and distributions by other investment companies | | | — | | | | (3,499,181 | ) | | | — | | | | — | |
Net change in net assets resulting from distributions | | | — | | | | (3,899,907 | ) | | | — | | | | (173,871 | ) |
| | | | |
Distributions to Shareholders
— The Money Market Fund | | | | | | | | | | | | | | | | |
From net investment income (Retail Class) | | | | | | | | | | | | | | | | |
From net investment income (Institutional Class) | | | | | | | | | | | | | | | | |
Net change in net assets resulting from distributions | | | | | | | | | | | | | | | | |
| | | | |
Capital Transactions | | | | | | | | | | | | | | | | |
Issued | | | 27,823,927 | | | | 30,283,775 | | | | 6,955,728 | | | | 12,925,921 | |
Reinvested | | | — | | | | 3,900,118 | | | | — | | | | 173,206 | |
Redeemed | | | (56,427,517 | ) | | | (5,115,025 | ) | | | (7,091,528 | ) | | | (13,892,276 | ) |
Net change in net assets resulting from capital transactions | | | (28,603,590 | ) | | | 29,068,868 | | | | (135,800 | ) | | | (793,149 | ) |
| | | | | | | | | | | | | | | | | |
Total Change in Net Assets | | | (32,926,991 | ) | | | 27,252,000 | | | | (2,115,136 | ) | | | (2,623,215 | ) |
| | | | |
Net Assets — Beginning of Period | | | 63,785,486 | | | | 36,533,486 | | | | 17,450,387 | | | | 20,073,602 | |
Net Assets — End of Period | | $ | 30,858,495 | | | $ | 63,785,486 | | | $ | 15,335,251 | | | $ | 17,450,387 | |
Accumulated undistributed (distributions in excess of) net investment income | | $ | (27,407 | ) | | $ | — | | | $ | 3,998 | | | $ | — | |
| | | | |
Share Transactions | | | | | | | | | | | | | | | | |
Issued | | | 2,820,026 | | | | 2,709,639 | | | | 416,384 | | | | 633,860 | |
Reinvested | | | — | | | | 368,262 | | | | — | | | | 8,768 | |
Redeemed | | | (5,606,432 | ) | | | (454,147 | ) | | | (405,267 | ) | | | (700,862 | ) |
Net change in shares | | | (2,786,406 | ) | | | 2,623,754 | | | | 11,117 | | | | (58,234 | ) |
The accompanying notes are an integral part of these financial statements.
| | | | | | | | | | | | | | | | | | | | | | |
The Socially Responsible
Utilities Fund | | | The U.S. Government
Bond Fund | | | The Money
Market Fund | |
| 2008 | | | 2007 | | | 2008 | | | 2007 | | | 2008 | | | 2007 | |
| | | | | | | | | | | | | | | | | | | | | | |
| $ | 91,253 | | | $ | 147,631 | | | $ | 228,101 | | | $ | 388,962 | | | $ | 3,446,461 | | | $ | 9,798,785 | |
| | | | | |
| | 1,784,066 | | | | 3,807,509 | | | | 242,518 | | | | 78,163 | | | | — | | | | — | |
| | | | | |
| | (2,576,993 | ) | | | 448,200 | | | | (380,873 | ) | | | 331,609 | | | | — | | | | — | |
| | (701,674 | ) | | | 4,403,340 | | | | 89,746 | | | | 798,734 | | | | 3,446,461 | | | | 9,798,785 | |
| | | | | |
| | | | | | | | | | | | | | | | | | | | | | |
| | (45,835 | ) | | | (147,631 | ) | | | (228,102 | ) | | | (542,472 | ) | | | | | | | | |
| | | | | |
| | — | | | | — | | | | — | | | | — | | | | | | | | | |
| | (45,835 | ) | | | (147,631 | ) | | | (228,102 | ) | | | (542,472 | ) | | | | | | | | |
| | | | | |
| | | | | | | | | | | | | | | | | | | | | | |
| | | | | | | | | | | | | | | | | (3,112,032 | ) | | | (8,686,515 | ) |
| | | | | | | | | | | | | | | | | | (334,429 | ) | | | (1,112,270 | ) |
| | | | | | | | | | | | | | | | | | (3,446,461 | ) | | | (9,798,785 | ) |
| | | | | |
| | | | | | | | | | | | | | | | | | | | | | |
| | 3,499,103 | | | | 7,190,576 | | | | 5,352,195 | | | | 11,723,184 | | | | 158,990,188 | | | | 229,384,675 | |
| | 44,431 | | | | 143,876 | | | | 219,755 | | | | 509,089 | | | | 3,256,538 | | | | 9,336,911 | |
| | (3,184,560 | ) | | | (8,226,493 | ) | | | (3,845,369 | ) | | | (5,837,854 | ) | | | (150,890,910 | ) | | | (206,667,713 | ) |
| | | | | |
| | 358,974 | | | | (892,041 | ) | | | 1,726,581 | | | | 6,394,419 | | | | 11,355,816 | | | | 32,053,873 | |
| | | | | | | | | | | | | | | | | | | | | | | |
| | (388,535 | ) | | | 3,363,668 | | | | 1,588,225 | | | | 6,650,681 | | | | 11,355,816 | | | | 32,053,873 | |
| | | | | |
| | 27,332,517 | | | | 23,968,849 | | | | 13,768,595 | | | | 7,117,914 | | | | 215,812,451 | | | | 183,758,578 | |
| $ | 26,943,982 | | | $ | 27,332,517 | | | $ | 15,356,820 | | | $ | 13,768,595 | | | $ | 227,168,267 | | | $ | 215,812,451 | |
| | | | | |
| $ | 45,418 | | | $ | — | | | $ | 2,009 | | | $ | 2,010 | | | $ | — | | | $ | — | |
| | | | | |
| | | | | | | | | | | | | | | | | | | | | | |
| | 139,715 | | | | 295,788 | | | | 258,336 | | | | 581,998 | | | | 158,990,188 | | | | 229,384,675 | |
| | 1,770 | | | | 5,678 | | | | 10,587 | | | | 25,266 | | | | 3,256,538 | | | | 9,336,911 | |
| | (128,136 | ) | | | (334,197 | ) | | | (185,015 | ) | | | (288,752 | ) | | | (150,890,910 | ) | | | (206,667,713 | ) |
| | 13,349 | | | | (32,731 | ) | | | 83,908 | | | | 318,512 | | | | 11,355,816 | | | | 32,053,873 | |
Financial Highlights
For a Share Outstanding Through the Period Ended June 30, 2008 (unaudited) and Each Fiscal Year Ended December 31,
| | | | | | | | | | | | | | | | | | | | | |
| | | | | Income from Investment Operations | | | Less Distributions | |
| | | Net Asset
Value,
Beginning
of Period | | Net
Investment
Income | | |
Net gains (losses) on
securities, futures, and
options (both realized
and unrealized) | | | Total from
Investment
Operations | | | From Net
Investment
Income | | | From Net
Capital
Gains | | | Total
Distributions | |
The Muirfield Fund(1)(2)(3)(4)(5)(6)(7) | |
2008 | | $ | 6.02 | | (0.01 | ) | | (0.54 | ) | | (0.55 | ) | | 0.00 | | | 0.00 | | | 0.00 | |
2007 | | $ | 5.81 | | 0.18 | | | 0.23 | | | 0.41 | | | (0.20 | ) | | 0.00 | | | (0.20 | ) |
2006 | | $ | 5.15 | | 0.04 | | | 0.66 | | | 0.70 | | | (0.04 | ) | | 0.00 | | | (0.04 | ) |
2005 | | $ | 5.11 | | 0.07 | | | 0.04 | | | 0.11 | | | (0.07 | ) | | 0.00 | | | (0.07 | ) |
2004 | | $ | 4.79 | | 0.01 | | | 0.32 | | | 0.33 | | | (0.01 | ) | | 0.00 | | | (0.01 | ) |
2003 | | $ | 3.76 | | (0.04 | ) | | 1.07 | | | 1.03 | | | 0.00 | | | 0.00 | | | 0.00 | |
The Dynamic Growth Fund(1)(2)(3)(4)(5)(6)(7) | |
2008 | | $ | 9.24 | | (0.02 | ) | | (0.77 | ) | | (0.79 | ) | | 0.00 | | | 0.00 | | | 0.00 | |
2007 | | $ | 9.56 | | 0.29 | | | 0.38 | | | 0.67 | | | (0.30 | ) | | (0.69 | ) | | (0.99 | ) |
2006 | | $ | 8.28 | | 0.04 | | | 1.28 | | | 1.32 | | | (0.04 | ) | | 0.00 | | | (0.04 | ) |
2005 | | $ | 7.94 | | 0.06 | | | 0.34 | | | 0.40 | | | (0.06 | ) | | 0.00 | | | (0.06 | ) |
2004 | | $ | 7.67 | | (0.04 | ) | | 0.31 | | | 0.27 | | | 0.00 | | | 0.00 | | | 0.00 | |
2003 | | $ | 5.58 | | (0.06 | ) | | 2.15 | | | 2.09 | | | 0.00 | | | 0.00 | | | 0.00 | |
The Aggressive Growth Fund(1)(2)(3)(4)(5)(6)(7) | |
2008 | | $ | 8.59 | | 0.00 | | | (0.88 | ) | | (0.88 | ) | | 0.00 | | | 0.00 | | | 0.00 | |
2007 | | $ | 8.13 | | 0.04 | | | 0.46 | | | 0.50 | | | (0.04 | ) | | 0.00 | | | (0.04 | ) |
2006 | | $ | 7.19 | | 0.03 | | | 0.94 | | | 0.97 | | | (0.03 | ) | | 0.00 | | | (0.03 | ) |
2005 | | $ | 6.83 | | 0.02 | | | 0.36 | | | 0.38 | | | (0.02 | ) | | 0.00 | | | (0.02 | ) |
2004 | | $ | 6.65 | | (0.03 | ) | | 0.21 | | | 0.18 | | | 0.00 | | | 0.00 | | | 0.00 | |
2003 | | $ | 4.79 | | (0.05 | ) | | 1.91 | | | 1.86 | | | 0.00 | | | 0.00 | | | 0.00 | |
The Defensive Growth Fund(2)(4)(5)(6) | |
2008 | | $ | 10.46 | | 0.01 | | | (1.09 | ) | | (1.08 | ) | | 0.00 | | | 0.00 | | | 0.00 | |
2007 | | $ | 10.51 | | 0.07 | | | 0.45 | | | 0.52 | | | (0.07 | ) | | (0.50 | ) | | (0.57 | ) |
2006* | | $ | 10.00 | | 0.07 | | | 0.51 | | | 0.58 | | | (0.07 | ) | | 0.00 | | | (0.07 | ) |
The Focused Growth Fund(2)(4)(5)(6) | |
2008 | | $ | 10.58 | | (0.01 | ) | | (1.05 | ) | | (1.06 | ) | | 0.00 | | | 0.00 | | | 0.00 | |
2007 | | $ | 10.73 | | 0.08 | | | 0.46 | | | 0.54 | | | (0.07 | ) | | (0.62 | ) | | (0.69 | ) |
2006* | | $ | 10.00 | | 0.06 | | | 0.73 | | | 0.79 | | | (0.06 | ) | | 0.00 | | | (0.06 | ) |
| 1 | Ratio of net expenses to average net assets, ratio of net investment income (loss) to average net assets, and ratio of average net assets after reductions, excluding expenses paid indirectly, reflect reductions in corresponding portfolio, if applicable. |
| 2 | Ratio of net expenses to average net assets, ratio of net investment income (loss) to average net assets, ratio of average net assets after reductions, excluding expenses paid indirectly, and ratio of expenses to average net assets before reductions do not include impact of expenses of the underlying security holdings as represented in the schedule of investments. |
| 3 | Prior to the year ended December 31, 2003, the portfolio turnover rate represented the turnover rate of the corresponding portfolio. During 2003, the Fund’s portfolio turnover rate for the period January 1 through April 13 is equivalent to the portfolio into which the fund invested. Beginning April 14 the Fund commenced calculating the portfolio turnover rate based on its own activities. Hence, the portfolio turnover rate represented for 2003 is a combination of these two periods. Subsequent to 2003 the portfolio turnover rate is specific to the Fund. |
The accompanying notes are integral part of these financial statements.
| | | | | | | | | | | | | | | | | | | | | | |
| | | | | | Ratios/Supplemental Data | |
Net Asset
Value,
End of
Period | | Total Return
(Assumes
Reinvestment
of Distributions) | | | Net Assets,
End of
Period
($000) | | Ratio of Net
Expenses to
Average Net
Assets | | | Ratio of Net
Investment
Income (Loss)
to Average
Net Assets | | | Ratio of Expenses to
Average Net Assets
after Reductions,
Excluding Expenses
Paid Indirectly | | | Ratio of Expenses
to Average Net
Assets Before
Reductions | | | Portfolio
Turnover
Rate | |
| | | | | | | | | | | | | | | | | | | | | | |
| $ | 5.47 | | (9.14 | %) | | $ | 95,816 | | 1.40 | % | | (0.29 | %) | | 1.51 | % | | 1.80 | % | | 67 | % |
| $ | 6.02 | | 7.02 | % | | $ | 50,374 | | 1.38 | % | | 3.01 | % | | 1.52 | % | | 1.88 | % | | 144 | % |
| $ | 5.81 | | 13.62 | % | | $ | 53,227 | | 1.45 | % | | 0.65 | % | | 1.56 | % | | 1.85 | % | | 131 | % |
| $ | 5.15 | | 2.13 | % | | $ | 78,181 | | 1.42 | % | | 1.36 | % | | 1.53 | % | | 1.76 | % | | 145 | % |
| $ | 5.11 | | 6.80 | % | | $ | 69,656 | | 1.26 | % | | 0.12 | % | | 1.45 | % | | 1.70 | % | | 145 | % |
| $ | 4.79 | | 27.39 | % | | $ | 58,524 | | 1.39 | % | | (1.06 | %) | | 1.47 | % | | 1.60 | % | | 252 | % |
| | | | | | | | | | | | | | | | | | | | | | |
| $ | 8.45 | | (8.55 | %) | | $ | 61,500 | | 1.32 | % | | (0.60 | %) | | 1.47 | % | | 1.74 | % | | 30 | % |
| $ | 9.24 | | 7.06 | % | | $ | 19,115 | | 1.32 | % | | 2.94 | % | | 1.46 | % | | 1.86 | % | | 150 | % |
| $ | 9.56 | | 15.96 | % | | $ | 21,566 | | 1.42 | % | | 0.42 | % | | 1.55 | % | | 1.86 | % | | 123 | % |
| $ | 8.28 | | 5.08 | % | | $ | 31,943 | | 1.41 | % | | 0.87 | % | | 1.58 | % | | 1.84 | % | | 202 | % |
| $ | 7.94 | | 3.52 | % | | $ | 24,862 | | 1.20 | % | | (0.48 | %) | | 1.41 | % | | 1.70 | % | | 174 | % |
| $ | 7.67 | | 37.46 | % | | $ | 21,024 | | 1.22 | % | | (0.84 | %) | | 1.27 | % | | 1.60 | % | | 250 | % |
| | | | | | | | | | | | | | | | | | | | | | |
| $ | 7.71 | | (10.24 | %) | | $ | 31,287 | | 1.70 | % | | 0.06 | % | | 1.70 | % | | 1.82 | % | | 54 | % |
| $ | 8.59 | | 6.14 | % | | $ | 28,841 | | 1.70 | % | | 0.49 | % | | 1.70 | % | | 1.83 | % | | 170 | % |
| $ | 8.13 | | 13.54 | % | | $ | 21,554 | | 1.80 | % | | 0.51 | % | | 1.81 | % | | 1.98 | % | | 200 | % |
| $ | 7.19 | | 5.62 | % | | $ | 11,639 | | 1.88 | % | | 0.35 | % | | 2.03 | % | | 2.30 | % | | 181 | % |
| $ | 6.83 | | 2.71 | % | | $ | 10,773 | | 1.64 | % | | (0.41 | %) | | 1.80 | % | | 2.07 | % | | 264 | % |
| $ | 6.65 | | 38.83 | % | | $ | 9,122 | | 1.39 | % | | (0.85 | %) | | 1.44 | % | | 1.99 | % | | 255 | % |
| | | | | | | | | | | | | | | | | | | | | | |
| $ | 9.38 | | (10.33 | %) | | $ | 36,144 | | 1.55 | % | | 0.23 | % | | 1.55 | % | | 1.66 | % | | 65 | % |
| $ | 10.46 | | 5.03 | % | | $ | 74,290 | | 1.56 | % | | 0.79 | % | | 1.56 | % | | 1.66 | % | | 137 | % |
| $ | 10.51 | | 5.84 | % | | $ | 42,489 | | 1.72 | % | | 1.20 | % | | 1.72 | % | | 1.81 | % | | 105 | % |
| | | | | | | | | | | | | | | | | | | | | | |
| $ | 9.52 | | (10.02 | %) | | $ | 30,858 | | 1.57 | % | | (0.11 | %) | | 1.57 | % | | 1.68 | % | | 51 | % |
| $ | 10.58 | | 5.08 | % | | $ | 63,785 | | 1.58 | % | | 0.75 | % | | 1.58 | % | | 1.68 | % | | 134 | % |
| $ | 10.73 | | 7.91 | % | | $ | 36,533 | | 1.75 | % | | 0.94 | % | | 1.75 | % | | 1.84 | % | | 92 | % |
| 4 | Recognition of net investment income by the Fund is affected by the timing of the declaration of dividends by the underlying investment companies in which the Fund invests. |
| 5 | Total return and portfolio turnover rate are not annualized for periods of less than one full year. |
| 6 | Ratio of net expenses to average net assets, ratio of net investment income (loss) to average net assets, ratio of average net assets after reductions, excluding expenses paid indirectly, and ratio of expenses to average net assets after before reductions are annualized for periods of less than one full year. |
| 7 | In 2005, the advisor voluntarily reimbursed the Fund for a realized investment loss, which had no impact to total return. |
| * | Commenced Operations January 31, 2006 |
| ** | Commenced Operations on December 28, 2004 |
| *** | Actual amounts were less than one-tenth of a cent |
Financial Highlights
For a Share Outstanding Through the Period Ended June 30, 2008 (unaudited) and Each Fiscal Year Ended December 31,
| | | | | | | | | | | | | | | | | | | | | |
| | | | | Income from Investment Operations | | | Less Distributions | |
| | | Net Asset
Value,
Beginning
of Period | | Net
Investment
Income | | |
Net gains (losses) on securities, futures, and
options (both realized
and unrealized) | | | Total from
Investment
Operations | | | From Net
Investment
Income | | | From Net
Capital
Gains | | | Total
Distributions | |
The Quantex Fund(1)(3)(5)(6) | |
2008 | | $ | 18.32 | | 0.00 | | | (2.41 | ) | | (2.41 | ) | | 0.00 | | | 0.00 | | | 0.00 | |
2007 | | $ | 19.86 | | 0.16 | | | (1.54 | ) | | (1.38 | ) | | (0.16 | ) | | 0.00 | | | (0.16 | ) |
2006 | | $ | 17.09 | | 0.08 | | | 2.77 | | | 2.85 | | | (0.08 | ) | | 0.00 | | | (0.08 | ) |
2005 | | $ | 15.95 | | 0.01 | | | 1.14 | | | 1.15 | | | (0.01 | ) | | 0.00 | | | (0.01 | ) |
2004 | | $ | 14.82 | | 0.00 | | | 1.13 | | | 1.13 | | | 0.00 | | | 0.00 | | | 0.00 | |
2003 | | $ | 11.65 | | (0.01 | ) | | 3.18 | | | 3.17 | | | 0.00 | | | 0.00 | | | 0.00 | |
The Socially Responsible Utilities Fund(1)(3)(5)(6) | |
2008 | | $ | 26.14 | | 0.09 | | | (0.75 | ) | | (0.66 | ) | | (0.04 | ) | | 0.00 | | | (0.04 | ) |
2007 | | $ | 22.23 | | 0.14 | | | 3.91 | | | 4.05 | | | (0.14 | ) | | 0.00 | | | (0.14 | ) |
2006 | | $ | 19.03 | | 0.15 | | | 3.20 | | | 3.35 | | | (0.15 | ) | | 0.00 | | | (0.15 | ) |
2005 | | $ | 16.51 | | 0.24 | | | 2.52 | | | 2.76 | | | (0.24 | ) | | 0.00 | | | (0.24 | ) |
2004 | | $ | 14.29 | | 0.32 | | | 2.22 | | | 2.54 | | | (0.32 | ) | | 0.00 | | | (0.32 | ) |
2003 | | $ | 12.66 | | 0.29 | | | 1.63 | | | 1.92 | | | (0.29 | ) | | 0.00 | | | (0.29 | ) |
The U.S. Government Bond Fund(1)(3)(5)(6) | |
2008 | | $ | 20.58 | | 0.32 | | | (0.18 | ) | | 0.14 | | | (0.33 | ) | | 0.00 | | | (0.33 | ) |
2007 | | $ | 20.30 | | 0.73 | | | 0.72 | | | 1.45 | | | (1.17 | ) | | 0.00 | | | (1.17 | ) |
2006 | | $ | 20.22 | | 0.68 | | | 0.14 | | | 0.82 | | | (0.74 | ) | | 0.00 | | | (0.74 | ) |
2005 | | $ | 20.82 | | 0.73 | | | (0.76 | ) | | (0.03 | ) | | (0.57 | ) | | 0.00 | | | (0.57 | ) |
2004 | | $ | 21.00 | | 0.52 | | | (0.18 | ) | | 0.34 | | | (0.52 | ) | | 0.00 | | | (0.52 | ) |
2003 | | $ | 22.79 | | 0.35 | | | (1.35 | ) | | (1.00 | ) | | (0.35 | ) | | (0.44 | ) | | (0.79 | ) |
The Money Market Fund — Retail Class(1)(5)(6) | |
2008 | | $ | 1.00 | | 0.015 | | | N/A | | | 0.015 | | | (0.015 | ) | | 0.000 | | | (0.015 | ) |
2007 | | $ | 1.00 | | 0.048 | | | N/A | | | 0.048 | | | (0.048 | ) | | 0.000 | | | (0.048 | ) |
2006 | | $ | 1.00 | | 0.046 | | | N/A | | | 0.046 | | | (0.046 | ) | | 0.000 | | | (0.046 | ) |
2005 | | $ | 1.00 | | 0.028 | | | N/A | | | 0.028 | | | (0.028 | ) | | 0.000 | | | (0.028 | ) |
2004 | | $ | 1.00 | | 0.011 | | | N/A | | | 0.011 | | | (0.011 | ) | | 0.000 | | | (0.011 | ) |
2003 | | $ | 1.00 | | 0.009 | | | N/A | | | 0.009 | | | (0.009 | ) | | 0.000 | | | (0.009 | ) |
The Money Market Fund — Institutional Class(5)(6) | |
2008 | | $ | 1.00 | | 0.016 | | | N/A | | | 0.016 | | | (0.016 | ) | | 0.000 | | | (0.016 | ) |
2007 | | $ | 1.00 | | 0.050 | | | N/A | | | 0.050 | | | (0.050 | ) | | 0.000 | | | (0.050 | ) |
2006 | | $ | 1.00 | | 0.048 | | | N/A | | | 0.048 | | | (0.048 | ) | | 0.000 | | | (0.048 | ) |
2005 | | $ | 1.00 | | 0.030 | | | N/A | | | 0.030 | | | (0.030 | ) | | 0.000 | | | (0.030 | ) |
2004** | | $ | 1.00 | | 0.000 | *** | | N/A | | | 0.000 | | | 0.000 | | | 0.000 | | | 0.000 | *** |
| 1 | Ratio of net expenses to average net assets, ratio of net investment income (loss) to average net assets, and ratio of average net assets after reductions, excluding expenses paid indirectly, reflect reductions in corresponding portfolio, if applicable. |
| 2 | Ratio of net expenses to average net assets, ratio of net investment income (loss) to average net assets, ratio of average net assets after reductions, excluding expenses paid indirectly, and ratio of expenses to average net assets before reductions do not include impact of expenses of the underlying security holdings as represented in the schedule of investments. |
| 3 | Prior to the year ended December 31, 2003, the portfolio turnover rate represented the turnover rate of the corresponding portfolio. During 2003, the Fund’s portfolio turnover rate for the period January 1 through April 13 is equivalent to the portfolio into which the fund invested. Beginning April 14 the Fund commenced calculating the portfolio turnover rate based on its own activities. Hence, the portfolio turnover rate represented for 2003 is a combination of these two periods. Subsequent to 2003 the portfolio turnover rate is specific to the Fund. |
The accompanying notes are integral part of these financial statements.
| | | | | | | | | | | | | | | | | | | | | | |
| | | | | | Ratios/Supplemental Data | |
Net Asset
Value,
End of
Period | | Total Return
(Assumes
Reinvestment
of Distributions) | | | Net Assets,
End of
Period
($000) | | Ratio of Net
Expenses to
Average Net
Assets | | | Ratio of Net
Investment
Income (Loss)
to Average
Net Assets | | | Ratio of Expenses to
Average Net Assets
after Reductions,
Excluding Expenses
Paid Indirectly | | | Ratio of Expenses
to Average Net
Assets Before
Reductions | | | Portfolio
Turnover
Rate | |
| | | | | | | | | | | | | | | | | | | | | | |
| $ | 15.91 | | (13.16 | %) | | $ | 15,335 | | 1.65 | % | | 0.05 | % | | 1.65 | % | | 2.17 | % | | 29 | % |
| $ | 18.32 | | (7.00 | %) | | $ | 17,450 | | 1.56 | % | | 0.76 | % | | 1.56 | % | | 2.09 | % | | 56 | % |
| $ | 19.86 | | 16.67 | % | | $ | 20,074 | | 1.66 | % | | 0.47 | % | | 1.66 | % | | 2.25 | % | | 30 | % |
| $ | 17.09 | | 7.21 | % | | $ | 17,114 | | 1.75 | % | | 0.06 | % | | 1.78 | % | | 2.19 | % | | 171 | % |
| $ | 15.95 | | 7.62 | % | | $ | 18,853 | | 1.73 | % | | 0.00 | % | | 1.77 | % | | 2.06 | % | | 253 | % |
| $ | 14.82 | | 27.21 | % | | $ | 19,968 | | 1.84 | % | | (0.11 | %) | | 1.84 | % | | 1.91 | % | | 140 | % |
| | | | | | | | | | | | | | | | | | | | | | |
| $ | 25.44 | | (2.51 | %) | | $ | 26,944 | | 1.90 | % | | 0.69 | % | | 1.90 | % | | 2.09 | % | | 23 | % |
| $ | 26.14 | | 18.24 | % | | $ | 27,333 | | 1.90 | % | | 0.57 | % | | 1.90 | % | | 2.10 | % | | 50 | % |
| $ | 22.23 | | 17.68 | % | | $ | 23,969 | | 2.05 | % | | 0.74 | % | | 2.05 | % | | 2.18 | % | | 27 | % |
| $ | 19.03 | | 16.80 | % | | $ | 22,644 | | 2.03 | % | | 1.32 | % | | 2.05 | % | | 2.19 | % | | 28 | % |
| $ | 16.51 | | 18.01 | % | | $ | 28,447 | | 1.91 | % | | 2.21 | % | | 1.91 | % | | 1.99 | % | | 38 | % |
| $ | 14.29 | | 15.46 | % | | $ | 21,038 | | 1.92 | % | | 2.25 | % | | 1.94 | % | | 1.94 | % | | 41 | % |
| | | | | | | | | | | | | | | | | | | | | | |
| $ | 20.39 | | 0.64 | % | | $ | 15,357 | | 0.99 | % | | 3.16 | % | | 0.99 | % | | 1.57 | % | | 88 | % |
| $ | 20.58 | | 7.44 | % | | $ | 13,769 | | 1.01 | % | | 3.92 | % | | 1.01 | % | | 1.72 | % | | 88 | % |
| $ | 20.30 | | 4.13 | % | | $ | 7,118 | | 1.10 | % | | 3.59 | % | | 1.10 | % | | 2.22 | % | | 106 | % |
| $ | 20.22 | | (0.14 | %) | | $ | 6,324 | | 1.10 | % | | 2.75 | % | | 1.10 | % | | 2.02 | % | | 159 | % |
| $ | 20.82 | | 1.64 | % | | $ | 9,316 | | 1.10 | % | | 2.49 | % | | 1.10 | % | | 1.58 | % | | 352 | % |
| $ | 21.00 | | (4.43 | %) | | $ | 10,840 | | 1.10 | % | | 1.59 | % | | 1.10 | % | | 1.24 | % | | 568 | % |
| | | | | | | | | | | | | | | | | | | | | | |
| $ | 1.00 | | 1.53 | % | | $ | 201,562 | | 0.48 | % | | 3.06 | % | | 0.48 | % | | 0.81 | % | | N/A | |
| $ | 1.00 | | 4.95 | % | | $ | 195,479 | | 0.48 | % | | 4.83 | % | | 0.48 | % | | 0.84 | % | | N/A | |
| $ | 1.00 | | 4.71 | % | | $ | 159,641 | | 0.48 | % | | 4.64 | % | | 0.48 | % | | 0.87 | % | | N/A | |
| $ | 1.00 | | 2.85 | % | | $ | 129,200 | | 0.47 | % | | 2.79 | % | | 0.47 | % | | 0.89 | % | | N/A | |
| $ | 1.00 | | 1.06 | % | | $ | 148,650 | | 0.46 | % | | 1.04 | % | | 0.46 | % | | 0.84 | % | | N/A | |
| $ | 1.00 | | 0.92 | % | | $ | 165,607 | | 0.43 | % | | 0.92 | % | | 0.43 | % | | 0.82 | % | | N/A | |
| | | | | | | | | | | | | | | | | | | | | | |
| $ | 1.00 | | 1.60 | % | | $ | 25,606 | | 0.34 | % | | 3.11 | % | | 0.34 | % | | 0.64 | % | | N/A | |
| $ | 1.00 | | 5.09 | % | | $ | 20,333 | | 0.34 | % | | 4.98 | % | | 0.34 | % | | 0.67 | % | | N/A | |
| $ | 1.00 | | 4.86 | % | | $ | 24,118 | | 0.34 | % | | 4.76 | % | | 0.34 | % | | 0.71 | % | | N/A | |
| $ | 1.00 | | 2.99 | % | | $ | 21,083 | | 0.33 | % | | 2.93 | % | | 0.33 | % | | 0.71 | % | | N/A | |
| $ | 1.00 | | 0.02 | % | | $ | 30,310 | | 0.33 | % | | 1.96 | % | | 0.33 | % | | 0.67 | % | | N/A | |
| 4 | Recognition of net investment income by the Fund is affected by the timing of the declaration of dividends by the underlying investment companies in which the Fund invests. |
| 5 | Total return and portfolio turnover rate are not annualized for periods of less than one full year. |
| 6 | Ratio of net expenses to average net assets, ratio of net investment income (loss) to average net assets, ratio of average net assets after reductions, excluding expenses paid indirectly, and ratio of expenses to average net assets after before reductions are annualized for periods of less than one full year. |
| 7 | In 2005, the advisor voluntarily reimbursed the Fund for a realized investment loss, which had no impact to total return. |
| * | Commenced Operations January 31, 2006 |
| ** | Commenced Operations on December 28, 2004 |
| *** | Actual amounts were less than one-tenth of a cent |
Notes to Financial Statements
June 30, 2008 (unaudited)
1. Organization and Significant Accounting Policies
The Flex-funds® Trust (the “Trust”) was organized in 1982 and is registered under the Investment Company Act of 1940, as amended (the “1940 Act”), as a diversified, open-end management investment company. The Trust offers nine separate series and is presently comprised of nine separate funds as follows: The Muirfield Fund® (“Muirfield”), The Socially Responsible Utilities Fund (f.k.a. The Total Return Utilities Fund)(“Utilities”)(please see Note #6 “Subsequent Events” for more information), The Quantex Fund™ (f.k.a. The Highlands Growth Fund)(“Quantex”), The Dynamic Growth Fund (“Dynamic”), The Aggressive Growth Fund (“Aggressive”)(please see Note #6 “Subsequent Events” for more information), The Defensive Growth Fund (“Defensive”)(please see Note #6 “Subsequent Events” for more information), The Focused Growth Fund (“Focused”)(please see Note #6 “Subsequent Events” for more information), The U.S. Government Bond Fund (“Bond”), and The Money Market Fund (“Money Market”) (each a “Fund” and collectively the “Funds”). Money Market offers two classes of shares (the Retail Class (“Retail Class”) and the Institutional Class (“Institutional Class”)). Each class of shares has equal rights as to earnings and assets except that each class bears different distribution and transfer agent expenses. The investment objective of Muirfield, Quantex, Dynamic, Aggressive, Defensive, and Focused is growth of capital. The investment objective of Utilities is current income and growth of income. The investment objective of Bond is maximum current income. The investment objective of Money Market is current income while maintaining a stable share price of $1.00.
Use of estimates. The preparation of financial statements in conformity with accounting principles generally accepted in the United States of America (“GAAP”) requires management to make estimates and assumptions that affect the reported amounts of assets and liabilities and disclosure of contingent assets and liabilities at the date of the financial statements and the reported amounts of increases and decreases in net assets from operations during the reporting period. Actual results could differ from those estimates.
Security valuation. Securities and exchange traded funds that are traded on stock exchanges are valued at the last sales price as of the close of business of the New York Stock Exchange on the day of valuation or, lacking any sales, are valued using fair value procedures approved by the Board of Trustees (“Trustees”). Securities traded over-the-counter are valued at the most recent bid price or yield equivalent as obtained from one or more dealers that make markets in such securities. Registered investment companies are valued at the daily redemption value as reported by the underlying fund. Bond values the securities held at 4:00 P.M. Eastern Time. Securities held in Money Market are valued at amortized cost, which approximates value. The Funds obtain prices from independent pricing services, which use valuation techniques approved by the Trustees. Money Market, in compliance with Rule 2a-7 of the 1940 Act, compares its amortized values, including illiquid and restricted securities, to the prices obtained from the independent pricing services. The ability of issuers of debt securities held by the Funds to meet their obligations may be affected by economic and political developments in a specific country or region.
Fixed income securities held in the Funds, except Money Market, maturing more than sixty days after the valuation date, are valued at the last sales price as of the close of business on the day of valuation, or, lacking any sales, at the most recent bid price or yield equivalent as obtained from dealers that make markets in such securities. When such securities are valued within sixty days or less to maturity, the difference between the valuation existing on the sixty-first day before maturity and maturity value is amortized on a straight-line basis to maturity. Securities maturing within sixty days from their date of acquisition are valued at amortized cost.
In September 2006, the Financial Accounting Standards Board issued Statement on Financial Accounting Standard (“SFAS”) No. 157 “Fair Value Measurements.” This standard establishes a single authoritative definition of fair value, sets out a framework for measuring fair value and requires additional disclosure about fair value measurements. SFAS No. 157 applies to fair value measurements already required or permitted by existing standards. SFAS No. 157 is effective for financial statements issued for fiscal years beginning after November 15, 2007. The changes to current generally accepted accounting principles from the application of this Statement relate to the definition of fair value, the methods used to measure fair value, and the expanded disclosures about fair value measurements. Management has determined that the adoption of SFAS No. 157 will have no material impact to any financial statement amounts, however, additional disclosures will be required about the inputs used to develop the measurements and the effect of certain measurements on changes in net assets for the period.
In March 2008, the Financial Accounting Standards Board issued Statement of Financial Accounting Standards (“SFAS”) No. 161 “Disclosures about Derivative Instruments and Hedging Activities.” SFAS No. 161 was issued and is
effective for fiscal years and interim periods beginning after November 15, 2008. SFAS No. 161 is intended to improve financial reporting for derivative instruments by requiring enhanced disclosure that enables investors to understand how and why an entity used derivatives, how the entity accounts for derivatives, and how derivative instruments affect an entity’s results of operations and financial position. Management is currently evaluating the implications of SFAS No. 161 and the impact on the Funds’ financial statement disclosures.
Repurchase agreements. Each Fund may engage in repurchase agreement transactions whereby the Fund takes possession of an underlying debt instrument subject to an obligation of the seller to repurchase the instrument from the Fund and an obligation of the Fund to resell the instrument at an agreed upon price and term. At all times, the Fund maintains the value of collateral, including accrued interest, of at least 100% of the amount of the repurchase agreement, plus accrued interest. If the seller defaults or the fair value of the collateral declines, realization of the collateral by the Funds may be delayed or limited.
Futures & options. Each Fund, except Money Market, may engage in transactions in financial futures contracts and options contracts in order to manage the risk of unanticipated changes in market values of securities held in the fund, or which it intends to purchase. The futures and options contracts are adjusted by the daily exchange rate of the underlying currency, or index, and any gains or losses are recorded for financial statement purposes as unrealized gains or losses in the statement of assets and liabilities and the statement of operations until the contract settlement date, at which time realized gains and losses are included in the statement of operations.
To the extent that the Fund enters into futures contracts on an index or group of securities, the Fund exposes itself to an indeterminate liability and will be required to pay or receive a sum of money measured by the change in the value of the index. Upon entering into a futures contract, the Fund is required to deposit an initial margin, which is either cash or securities in an amount equal to a certain percentage of the contract value. Subsequently, the variation margin, which is equal to changes in the daily settlement price or last sale price on the exchanges where futures contracts trade, is received or paid and is recorded as an unrealized gain or loss until the contract is closed. When the contract is closed, the Fund records a realized gain or loss equal to the difference between the proceeds from (or cost of) the closing transaction and the Fund’s basis in the contract. Should market conditions move unexpectedly, the Fund may not achieve the anticipated benefits of the futures contract and may realize a loss. The use of futures transactions involves the risk of imperfect correlation in movements in the price of futures contracts, interest rates, and the underlying hedged assets.
Call and put option contracts involve the payment of a premium for the right to purchase or sell an individual security or index aggregate at a specified price until the expiration of the contract. Such transactions expose the Fund to the loss of the premium paid if the Fund does not sell or exercise the contract prior to the expiration date. In the case of a call option, sufficient cash or money market instruments will be segregated to complete the purchase. Options are valued on the basis of the daily settlement price or last sale on the exchanges where they trade and the changes in value are recorded as unrealized appreciation or depreciation until closed, exercised or expired.
The Funds may write covered call or put options for which premiums received are recorded as liabilities and are subsequently adjusted to the current value of the options written. When written options are closed or exercised, premiums received are offset against the proceeds paid, and the Fund records realized gains or losses for the difference. When written options expire, the liability is eliminated, and the Fund records realized gains for the entire amount of premiums received.
Federal income taxes. It is each Fund’s policy to continue to comply with the requirements of Subchapter M of the Internal Revenue Code applicable to regulated investment companies and to distribute substantially all of its taxable income and net capital gains to its shareholders. Therefore, no federal income tax provision is required.
The Funds adopted the provisions of Financial Accounting Standards Board Interpretation No. 48 (“FIN 48”), Accounting for Uncertainty in Income Taxes, in 2007. The implementation of FIN 48 resulted in no material liability for unrecognized tax benefits and no material changes to the beginning net asset values of the Funds.
As of and during the six months ended June 30, 2008, the Funds did not have a liability for any unrecognized tax benefits. The Funds recognize interest and penalties, if any, related to unrecognized tax benefits as income tax expense in the statements of operations. During the six months ended June 30, 2008, the Funds did not incur any interest or penalties.
The Funds are not subject to examination by U.S. federal and state tax authorities for tax years before 2009.
Distributions to shareholders. Distributions to shareholders are recorded on the ex-dividend date. Muirfield, Quantex, Dynamic, Aggressive, Defensive, and Focused declare and pay dividends from net investment income, if any, on a quarterly basis. Utilities declares and pays dividends from net investment income on a monthly basis. Bond and Money Market declare dividends from net investment income on a daily basis and pay such dividends on a monthly basis. Each Fund distributes net capital gains, if any, on an annual basis.
Distributions from net investment income and from net capital gains are determined in accordance with income tax regulations, which may differ from GAAP. These differences are primarily due to deferrals of certain losses, expiring capital loss carryforwards, and differing treatments of unrealized gains and losses of futures contracts held by each Fund. Accordingly, timing differences relating to shareholder distributions are reflected in the components of net assets and permanent book and tax differences have been reclassified within the components of net assets based on their ultimate characterization for federal income tax purposes. For the year ended December 31, 2007, over-distributions of net investment income were reclassified to paid-in-capital in the amounts of $57,710 and $25,949, for Muirfield and Dynamic, respectively.
Investment income & expenses. For Money Market, income and expenses (other than expenses attributable to a specific class) are allocated to each class of shares based on its relative net assets. Expenses incurred by the Trust that do not specifically relate to an individual Fund of the Trust are allocated to the Funds based on each Fund’s relative net assets or other appropriate basis.
Capital Share Transactions. Money Market is authorized to issue an indefinite number of shares in the Retail Class and the Institutional Class. Transactions in the capital shares of the Fund for the six months ended June 30, 2008 and the year ended December 31, 2007 were as follows:
| | | | | | | | | | | | | | |
| | | 2008 | | | 2007 | |
| | | Amount | | | Shares | | | Amount | | | Shares | |
Retail Class | | | | | | | | | | | | | | |
Issued | | $ | 129,673,916 | | | 129,673,916 | | | $ | 196,554,206 | | | 196,554,206 | |
Reinvested | | | 3,003,146 | | | 3,003,146 | | | | 8,603,255 | | | 8,603,255 | |
Redeemed | | | (126,593,843 | ) | | (126,593,843 | ) | | | (169,319,266 | ) | | (169,319,266 | ) |
Net increase (decrease) | | $ | 6,083,219 | | | 6,083,219 | | | $ | 35,838,195 | | | 35,838,195 | |
Institutional Class | | | | | | | | | | | | | | |
Issued | | $ | 29,316,272 | | | 29,316,272 | | | $ | 32,830,469 | | | 32,830,469 | |
Reinvested | | | 253,392 | | | 253,392 | | | | 733,656 | | | 733,656 | |
Redeemed | | | (24,297,067 | ) | | (24,297,067 | ) | | | (37,348,447 | ) | | (37,348,447 | ) |
Net increase (decrease) | | $ | 5,272,597 | | | 5,272,597 | | | $ | (3,784,322 | ) | | (3,784,322 | ) |
Other. The Funds record security transactions on the trade date. Gains and losses realized from the sale of securities are determined on the specific identification basis. Dividend income is recognized on the ex-dividend date and interest income (including amortization of premium and accretion of discount) is recognized as earned.
2. Investment Transactions
For the six months ended June 30, 2008, the cost of purchases and proceeds from sales or maturities of long-term investments for the Funds were as follows:
| | | | | | |
| | | Purchases | | Sales |
The Muirfield Fund® | | $ | 57,240,758 | | $ | 30,754,527 |
The Dynamic Growth Fund | | | 52,188,912 | | | 8,990,153 |
The Aggressive Growth Fund | | | 19,993,015 | | | 13,488,731 |
The Defensive Growth Fund | | | 26,558,910 | | | 61,027,205 |
The Focused Growth Fund | | | 21,744,058 | | | 45,699,404 |
The Quantex Fund™ | | | 5,726,450 | | | 4,283,919 |
The Socially Responsible Utilities Fund | | | 6,803,946 | | | 5,986,920 |
The U.S. Government Bond Fund | | | 12,495,401 | | | 10,896,920 |
3. Investment Advisory Fees and Other Transactions with Affiliates
Meeder Asset Management, Inc. (“MAM”), a wholly-owned subsidiary of Meeder Financial, Inc. (“Meeder”), provides each Fund, under a separate Investment Advisory Contract, with investment management, research, statistical and
advisory services. The services of MAM will terminate automatically if assigned and may be terminated without penalty at any time upon 60 days prior written notice by majority vote of the Fund, by the Trustees of the Fund, or by MAM. Under a separate Investment Subadvisory Agreement with MAM, Miller/Howard Investments, Inc. (“Miller/Howard”) serves as subadvisor of Utilities. The Investment Subadvisory Agreement provides that it will terminate automatically if assigned, and that it may be terminated by MAM without penalty to the Fund by MAM, the Trustees of the Fund, or by the vote of a majority of the outstanding voting securities of the Fund upon not less than 30 days written notice.
For such services the Funds pay a fee at the following annual rates: Muirfield, Utilities, and Quantex, 1.00% of average daily net assets up to $50 million, 0.75% of average daily net assets exceeding $50 million up to $100 million and 0.60% of average daily net assets exceeding $100 million. As subadvisor to Utilities, Miller/Howard is paid 0.00% of the 1.00% of average daily net assets up to $10 million, 0.40% of the 1.00% of average daily net assets exceeding $10 million up to $50 million, 0.40% of the 0.75% of average daily net assets exceeding $50 million up to $60 million, 0.30% of the 0.75% of average daily net assets exceeding $60 million up to $100 million and 0.25% of the 0.60% of average daily net assets exceeding $100 million; Dynamic, Aggressive, Defensive, and Focused, 0.75% of average daily net assets up to $200 million and 0.60% of average daily net assets exceeding $200 million; Bond, 0.40% of average daily net assets up to $100 million and 0.20% of average daily net assets exceeding $100 million; and Money Market, 0.40% of average daily net assets up to $100 million and 0.25% of average daily net assets exceeding $100 million. MAM has contractually agreed to reduce its investment advisory fee by 0.25% for Quantex. During the six months ended June 30, 2008, $21,036 of investment advisory fees were waived in Quantex. During the six months ended June 30, 2008, MAM voluntarily agreed to reduce $141,578 of investment advisory fees in Money Market.
The Chief Compliance Officer (“CCO”) of the Trust, who is unaffiliated with the Trust, provides the Trust with certain compliance services. In compensation for such services, the Trust pays the CCO an annual fee of $46,350, plus out-of-pocket expenses. Prior to September 1, 2007, the CCO was paid an annual fee of $45,000, plus out-of-pocket expenses.
Mutual Funds Service Co. (“MFSCo”), a wholly-owned subsidiary of Meeder, serves as stock transfer, dividend disbursing and shareholder services agent for each Fund. In compensation for such services, each Fund pays MFSCo an annual fee calculated as follows: For Muirfield, Utilities, Quantex, Dynamic, Aggressive, Defensive, and Focused, such fee is equal to the greater of $15 per active shareholder account or 0.12% of each Fund’s average daily net assets. For Bond, such fee is equal to the greater of $15 per active shareholder account or 0.08% of the Fund’s average daily net assets. For Money Market Retail Class and Money Market Institutional Class, such fee is equal to the greater of $20 per active shareholder account or 0.08% of the Fund’s average daily net assets. MFSCo is entitled to receive an annual minimum fee of $4,000 for each Fund or class. For Funds that are subject to an expense cap and which are above the expense cap, the basis point fee will be reduced by 0.02%. During the six months ended June 30, 2008, MFSCo waived $1,445 and $22,515 of transfer agent fees for Bond and Money Market, respectively. MFSCo also voluntarily waived $21,322 and $18,144 of transfer agent fees for Defensive and Focused, respectively, during the six months ended June 30, 2008, and voluntarily waived $1,920 and $1,545 of transfer agent fees for Muirfield and Dynamic, respectively, during the period June 13, 2008 through June 30, 2008.
MFSCo provides the Trust with certain administrative services. In compensation for such services, each Fund pays MFSCo an annual fee equal to 0.10% of each Fund’s average daily net assets up to $50 million and 0.08% of each Fund’s average daily net assets exceeding $50 million.
MFSCo serves as accounting services agent for each Fund. In compensation for such services, each Fund pays MFSCo an annual fee equal to the greater of:
| | a. | 0.15% of the first $10 million of average daily net assets, 0.10% of the next $20 million of average daily net assets, 0.02% of the next $50 million of average daily net assets, and 0.01% in excess of $80 million of average daily net assets, or |
| | b. | $7,500 for non-Money Market Funds and $30,000 for Money Market. |
For the six months ended June 30, 2008, MAM voluntarily agreed to reduce its fees and/or reimburse expenses (excluding brokerage fees and commissions, taxes, interest, and extraordinary or non-recurring expenses), to limit Bond’s total annual operating expenses to 0.99% of average daily net assets. MAM has also voluntarily agreed to reduce its fees and/or reimburse expenses to limit the Retail Class’ and the Institutional Class’ total annual operating expenses to 0.48% and 0.34%, respectively, of average daily net assets for the six months ended June 30, 2008. Such reductions and/or reimbursements are limited to the total of fees charged to each Fund or Class by MAM and MFSCo. For the six months ended June 30, 2008, MAM and/or MFSCo reimbursed $32,745, $48,613, and $14,572 to Bond, the Retail Class, and the Institutional Class, respectively.
Muirfield and Dynamic have entered into an agreement with the Trust’s custodian, The Huntington National Bank (“HNB”), whereby HNB receives distribution, service, and administration fees (collectively the “fees”) from the underlying security holdings of the aforementioned Funds. Prior to June 1, 2008, HNB retained 0.03% of the fees collected and forwarded the remainder to the appropriate Funds. From June 1, 2008 through June 30, 2008, HNB forwarded all fees collected to the appropriate Funds. The Funds use their portion of the fees received to reduce the gross expenses of each Fund. For the six months ended June 30, 2008, Muirfield and Dynamic used $34,026 and $21,841 of fees received, respectively, to reduce gross expenses of each Fund. It is possible that the Funds may invest in security holdings in which fees are not paid. As such, the gross expenses of a Fund would not be decreased. Also, without this agreement it is likely that the Funds would not collect any fees from underlying security holdings.
Pursuant to Rule 12b-1 of the 1940 Act, a mutual fund can adopt a written plan to pay certain expenses out of fund assets relating to the sale and distribution of its shares. Muirfield, Quantex, Bond, and the Retail Class have adopted a distribution plan with an annual limitation of 0.20% of average daily net assets. Utilities, Dynamic, Aggressive, Defensive, and Focused have adopted a distribution plan with an annual limitation of 0.25% of average daily net assets. The Institutional Class has adopted a distribution plan with an annual limitation of 0.03% of average daily net assets. For the six months ended June 30, 2008, Muirfield, Utilities, Quantex, Dynamic, Aggressive, Defensive, Focused, and Bond waived $38,174, $8,198, $9,845, $21,879, $5,451, $11,878, $10,108, and $3,323 of distribution plan (12b-1) expenses, respectively. The Retail Class and the Institutional Class waived $139,396 and $2,147, respectively, for a total of $141,543.
An Administrative Services Plan has been adopted for each Fund of the Trust except Money Market. The Administrative Services Plan allows for each eligible Fund to pay a maximum annual amount of 0.20% of average daily net assets to Service Organizations that provide administrative support services to their customers who own Shares of record or beneficially. For the six months ended June 30, 2008, Muirfield, Utilities, Quantex, Dynamic, Aggressive, and Bond waived $45,033, $17,189, $13,126, $17,414, $11,601, and $3,974 of administrative service plan expenses, respectively.
The Funds have adopted a Deferred Compensation Plan (the “Plan”) for the independent Trustees. Under the Plan, each eligible Trustee is permitted to defer all or a portion of the trustees fees payable by any of the Funds as an investment into any combination of Funds until a specified point of time. The investment into the Funds is recorded as an asset, however an offsetting liability is also recorded for the deferred payment. Once the eligible Trustees’ deferral amounts can be distributed, a lump sum or generally equal annual installments over a period of up to ten (10) years can be made to the eligible Trustee(s). The Funds may terminate this Plan at any time.
Certain trustees and officers of the Funds are also officers or directors of Meeder, MAM, and MFSCo.
4. Federal Tax Information
The tax characteristics of dividends paid by the Funds during the year ended December 31, 2007 were as follows:
| | | | | | | | | | | | |
| | | Ordinary
Income | | Net
Short-Term
Capital Gains | | Net
Long-Term
Capital Gains | | Total
Dividends
Paid(1) |
The Muirfield Fund® | | $ | 1,597,151 | | $ | — | | $ | — | | $ | 1,597,151 |
The Dynamic Growth Fund | | | 595,277 | | | 238,705 | | | 1,041,578 | | | 1,875,560 |
The Aggressive Growth Fund | | | 132,213 | | | — | | | — | | | 132,213 |
The Defensive Growth Fund | | | 482,437 | | | 1,399,872 | | | 1,953,406 | | | 3,835,715 |
The Focused Growth Fund | | | 400,727 | | | 749,648 | | | 2,749,532 | | | 3,899,907 |
The Quantex Fund™ | | | 174,362 | | | — | | | — | | | 174,362 |
The Socially Responsible Utilities Fund | | | 146,532 | | | — | | | — | | | 146,532 |
The U.S. Government Bond Fund | | | 542,339 | | | — | | | — | | | 542,339 |
The Money Market Fund | | | 9,829,339 | | | — | | | — | | | 9,829,339 |
| (1) | Total dividends paid may differ from the amount reported in the Statement of Changes in Net Assets because for tax purposes dividends are recognized when actually paid. |
The tax characteristics of dividends paid by the Funds during the year ended December 31, 2006 were as follows:
| | | | | | | | | |
| | | Ordinary
Income | | Net
Short-Term
Capital Gains | | Total
Dividends
Paid(1) |
The Muirfield Fund® | | $ | 377,059 | | $ | — | | $ | 377,059 |
The Dynamic Growth Fund | | | 92,692 | | | — | | | 92,692 |
The Aggressive Growth Fund | | | 87,765 | | | — | | | 87,765 |
The Defensive Growth Fund | | | 295,633 | | | — | | | 295,633 |
The Focused Growth Fund | | | 207,143 | | | — | | | 207,143 |
The Quantex Fund™ | | | 79,033 | | | — | | | 79,033 |
The Socially Responsible Utilities Fund | | | 171,433 | | | — | | | 171,433 |
The U.S. Government Bond Fund | | | 197,693 | | | — | | | 197,693 |
The Money Market Fund | | | 7,871,702 | | | — | | | 7,871,702 |
As of December 31, 2007, the components of accumulated earnings/(deficit) on a tax basis for the Funds were as follows:
| | | | | | | | | | | | | | | | | | | |
| | | Undistributed
Ordinary
Income | | Dividends
Payable | | | Accumulated
Capital and
Other Gains
and (Losses) | | | Unrealized
Appreciation/
(Depreciation)(2) | | | Total
Accumulated
Earnings/
(Deficit) | |
The Muirfield Fund® | | $ | — | | $ | — | | | $ | (387,760 | ) | | $ | (940,435 | ) | | $ | (1,328,195 | ) |
The Dynamic Growth Fund | | | — | | | — | | | | 570,693 | | | | (427,178 | ) | | | 143,515 | |
The Aggressive Growth Fund | | | — | | | — | | | | (3,287,233 | ) | | | 359,658 | | | | (2,927,575 | ) |
The Defensive Growth Fund | | | — | | | — | | | | — | | | | 659,651 | | | | 659,651 | |
The Focused Growth Fund | | | — | | | — | | | | — | | | | 590,311 | | | | 590,311 | |
The Quantex Fund™ | | | 324 | | | (324 | ) | | | (1,484,505 | ) | | | (644,006 | ) | | | (2,128,511 | ) |
The Socially Responsible Utilities Fund | | | — | | | — | | | | (1,403,771 | ) | | | 6,287,562 | | | | 4,883,791 | |
The U.S. Government Bond Fund | | | 3,893 | | | (1,883 | ) | | | (1,038,511 | ) | | | 368,085 | | | | (668,416 | ) |
The Money Market Fund | | | — | | | — | | | | — | | | | — | | | | — | |
For federal income tax purposes, the following Funds have capital loss carryforwards as of December 31, 2007, which are available to offset future capital gains, if any. To the extent that these carryforwards are used to offset future capital gains, it is probable that the gains that are offset will not be distributed to shareholders:
| | | | | |
| | | Amount | | Expires |
The Muirfield Fund® | | $ | 387,760 | | 2010 |
The Aggressive Growth Fund | | | 3,287,233 | | 2010 |
The Quantex Fund™ | | | 234,839 | | 2010 |
The Quantex Fund™ | | | 1,249,666 | | 2011 |
The Socially Responsible Utilities Fund | | | 1,403,772 | | 2011 |
The U.S. Government Bond Fund | | | 657,752 | | 2011 |
The U.S. Government Bond Fund | | | 125,708 | | 2012 |
The U.S. Government Bond Fund | | | 141,817 | | 2013 |
The U.S. Government Bond Fund | | | 113,234 | | 2014 |
Under current tax laws, net capital losses incurred after October 31, within a Fund’s fiscal year, are deemed to arise on the first business day of the following fiscal year for tax purposes. For the year ended December 31, 2007, Defensive and Focused deferred post October losses in the amounts of $212,868 and $230,383, respectively.
| (1) | Total dividends paid may differ from the amount reported in the Statement of Changes in Net Assets because for tax purposes dividends are recognized when actually paid. |
| (2) | The differences between book- and tax-basis unrealized appreciation/(depreciation) are attributable primarily to: deferral of post October losses and the realization for tax purposes of unrealized gains/(losses) on certain derivative instruments. |
5. Control Ownership
The beneficial ownership, either directly or indirectly, of more than 25% of the voting securities of a fund creates a presumption of control of the fund under Section 2(a)(9) of the 1940 Act. As of June 30, 2008, Charles Schwab & Co.,
Inc. held for the benefit of others, in aggregate, 45% of Utilities; Nationwide Trust Company, FSB held for the benefit of others, in aggregate, 94% of Defensive; Nationwide Trust Company, FSB held for the benefit of others, in aggregate, 95% of Focused; Nationwide Trust Company, FSB held for the benefit of others, in aggregate, 70% of Dynamic; Nationwide Trust Company, FSB held for the benefit of others, in aggregate, 80% of Aggressive; Nationwide Trust Company, FSB held for the benefit of others, in aggregate, 52% of Muirfield; Nationwide Trust Company, FSB held for the benefit of others, in aggregate, 26% of Quantex; Nationwide Trust Company, FSB held for the benefit of others, in aggregate, 73% of Bond; and International Brotherhood of Electrical Workers Local 683 Health & Welfare Plan held for the benefit of others, in aggregate, 38% of Institutional Class and therefore may be deemed to control the Funds.
6. Subsequent Events
At a meeting held April 30, 2008, the Board of Trustees (the “Board”), including a majority of non-interested or independent Trustees, approved the restructuring of The Defensive Growth Fund and The Focused Growth Fund, and also approved a change in investment strategy for The Aggressive Growth Fund, all of which will be effective on or around August 25, 2008.
The Aggressive Growth Fund will be able to hold investments in both actively managed mutual funds and exchange traded funds, rather than exchange traded funds only. This will give the Fund access to a greater number of investment options and additional opportunity for potential gains. The investment objective will remain growth of capital.
The Defensive Growth Fund will be changing its name to The Defensive Balanced Fund. The Fund will normally invest at least 30% and may invest up to 70% of its assets primarily in equity mutual funds. In addition, the Fund will normally invest at least 30% and may invest up to 70% of its assets primarily in investment grade bonds or money market instruments. The investment objective will be growth of capital, with current income usually of secondary importance. The Fund places a high degree of importance on maintaining and protecting portfolio values from adverse market conditions.
The Focused Growth Fund will be changing its name to The Strategic Growth Fund. The Fund will pursue its goal by investing primarily in open-end or closed-end investment companies that seek capital growth or appreciation without regard to current income. In addition, this Fund will normally have set allocations to U.S. large-cap equities, U.S. mid-cap equities, U.S. small-cap equities, non-U.S./International (including emerging markets) equities, real estate equities, and commodity-based equities.
At a meeting held August 13, 2008, the Board of Trustees (the “Board”), including a majority of non-interested or independent Trustees, approved the change of name of The Socially Responsible Utilities Fund. Effective August 25, 2008, The Socially Responsible Utilities Fund will be changing its name to The Total Return Utilities Fund. The investment strategy will remain the same with an investment objective seeking total returns through income and capital appreciation. The Fund does not and will not invest in electric utilities that generate power from nuclear reactors.
Trustees and Officers (unaudited)
Certain trustees and officers of the Funds are also officers or directors of Meeder, MAM, and MFSCo. The Trustees oversee the management of the Trust and elect its officers. The officers are responsible for the Funds’ day-to-day operations. The Trustees’ and officers’ names, addresses, years of birth, positions held with the Trust, and length of service with The Flex-funds are listed below. Also included is each Board member’s principal occupation during, at least, the past five years. Except as indicated, each individual has held the office shown or other offices in the same company for the last five years. Those Trustees who are “interested persons”, as defined in the 1940 Act, by virtue of their affiliation with the Trust, are indicated by an asterisk (*).
| | | | | | |
Name, Address(1), and
Year of Birth | | Year First Elected a
Trustee or Officer of the Trust | | Position and
Number of Funds
Overseen(2) | | Principal
Occupation During
Past Five Years and
Other Directorships Held |
Robert S. Meeder, Jr.* Year of Birth: 1961 | | 1992 | | Trustee and President | | President of Meeder Asset Management, Inc. |
| | | |
Walter L. Ogle** Year of Birth: 1937 | | 1982 | | Trustee | | Retired; formerly Executive Vice President of Aon Consulting, an employee benefits consulting group; Lead Trustee of the Trust. |
| | | |
James W. Didion** Year of Birth: 1930 | | 1982, 1998 | | Trustee | | Retired; formerly Executive Vice President of Core Source, Inc., an employee benefit and Workers’ Compensation administration and consulting firm (1991 – 1997); Chairman of the Trust’s Audit Committee. |
| | | |
Jack W. Nicklaus** Year of Birth: 1961 | | 1998 | | Trustee | | Designer, Nicklaus Design, a golf course design firm and division of The Nicklaus Companies; Chairman of the Trust’s Nominating Committee. |
| | | |
Stuart M. Allen** Year of Birth: 1961 | | 2006 | | Trustee | | President of Gardiner Allen DeRoberts Insurance LLC, an insurance agency; Chairman of the Trust’s Performance Committee. |
| | | |
Anthony D’Angelo** Year of Birth: 1959 | | 2006 | | Trustee | | Director of Sales, WSYX ABC 6/WTTE Fox 28, television stations owned and operated by Sinclair Broadcast Group; Chairman of the Trust’s Compensation Committee. |
| (1) | The address of each Trustee is 6125 Memorial Drive, Dublin, OH 43017. |
| (2) | Each Trustee serves for an indefinite term, until his or her resignation, death, or removal. Each Trustee oversees all nine Funds in the Trust. |
| * | Robert S. Meeder, Jr. is deemed an “interested person” of the Trust by virtue of his position as President of Meeder Asset Management, Inc., the Advisor of the Trust. |
| ** | Each independent Trustee is a member of the Trust’s Audit Committee, Performance Committee, Compensation Committee, and Nominating Committee. |
| | | | | | |
Name, Address(1), and
Year of Birth | | Year First Elected a
Trustee or Officer of the Trust | | Position and
Number of Funds
Overseen(2) | | Principal
Occupation During
Past Five Years and
Other Directorships Held |
Dale W. Smith Year of Birth: 1959 | | 2006 | | Vice President | | Chief Financial Officer of Meeder Asset Management, Inc. (2005 – present); formerly Senior Vice President of Financial Services of BISYS Fund Services (1996 – 2004). |
| | | |
David R. Carson Year of Birth: 1958 | | 2006 | | Chief Compliance Officer | | Chief Compliance Officer and Anti-Money Laundering Officer of the Huntington Funds and Huntington VA Funds (2005 – present); Treasurer and Assistant Treasurer of the Huntington Funds, Huntington Asset Advisors, Inc. (2002 – 2005). |
| | | |
Bruce E. McKibben Year of Birth: 1969 | | 2002 | | Treasurer | | Chief Operating Officer of Meeder Asset Management, Inc. (June 2008 – present); Director of Fund Accounting of Mutual Funds Service Co., the Trust’s transfer agent (1997 – 2008). |
| (1) | The address of each Trustee is 6125 Memorial Drive, Dublin, OH 43017. |
| (2) | Each Trustee serves for an indefinite term, until his or her resignation, death, or removal. Each Trustee oversees all nine Funds in the Trust. |
The Statement of Additional Information includes additional information about each Trustee and is available without charge. To obtain a copy of the Statement of Additional Information, please contact your financial representative or call toll free 1-800-325-3539.
Other Information
The Funds file their complete schedules of portfolios holdings with the Securities and Exchange Commission (“SEC”) for the first and third quarters of each fiscal year on Form N-Q. The Funds’ Forms N-Q are available on the SEC’s website at http://www.sec.gov and may be reviewed and copied at the SEC’s Public Reference Room in Washington, DC. Information on the operation of the Public Reference Room may be obtained by calling 1-800-SEC-0330. The Funds’ schedules of positions are also available on the Funds’ website at www.flexfunds.com.
A description of the policies and procedures that the Funds use to determine how to vote proxies relating to portfolio securities, and information regarding how the Funds voted these proxies for the 12-month period ended June 30, 2008, is available on the SEC’s website at http://www/sec.gov, or, without charge, upon request by calling toll-free 1-800-325-3539.
Manager and Investment Advisor
Meeder Asset Management, Inc.
6125 Memorial Drive
P.O. Box 7177
Dublin, Ohio 43017
Subadvisor/The Socially Responsible Utilities Fund
Miller/Howard Investments, Inc.
141 Upper Byrdcliffe Road, P.O. Box 549
Woodstock, New York 12498
Board of Trustees
James Didion
Robert S. Meeder, Jr.
Jack Nicklaus II
Walter L. Ogle
Stuart M. Allen
Anthony D’Angelo
Custodian
The Huntington National Bank
Columbus, Ohio 43215
Transfer Agent & Dividend Disbursing Agent
Mutual Funds Service Co.
6125 Memorial Drive
Dublin, Ohio 43017
Auditors
Cohen Fund Audit Services, Ltd.
800 Westpoint Parkway, Suite 1100
Westlake, Ohio 44145
The Flex-funds®
Managed by Meeder Asset Management, Inc.
6125 Memorial Drive, Dublin Ohio, 43017
Call Toll Free 800-325-3539 | 614-760-2159
Fax: 614-766-6669 | www.flexfunds.com
Email: flexfunds@meederfinancial.com
The registrant has adopted a code of ethics that applies to the registrant’s principal executive officer, principal financial officer, comptroller or principal accounting officer, and any person who performs a similar function.
| Item 3. | Audit Committee Financial Expert. |
Currently, The Flex-funds (the “Funds”) do not have an Audit Committee member who possesses all of the attributes required to be an “audit committee financial expert” as defined in instruction 2(b) of Item 3 of Form N-CSR. However, the Board of Trustees believes that each member of the Audit Committee has substantial experience relating to the review of financial statements and the operations of audit committees. Accordingly, the Board of Trustees believes that the members are qualified to evaluate the Funds’ financial statements, supervise the Funds’ preparation of its financial statements, and oversee the work of the Funds’ independent auditors. The Board of Trustees also believes that, although no single Audit Committee member possesses all of the attributes required to be an “audit committee financial expert”, the Audit Committee members collectively as a group possess the attributes required to be an “audit committee financial expert.”
| Item 4. | Principal Accountant Fees and Services. |
(a) – (d) Aggregate fees billed to the registrant for the last two fiscal years for professional services rendered by the registrant’s principal accountant were as follows:
| | | | | | |
| | | 2008 | | 2007 |
Audit Fees | | $ | 61,000 | | $ | 59,500 |
Audit-Related Fees | | | 2,525 | | | 2,200 |
Tax Fees | | | 19,800 | | | 18,900 |
All Other Fees | | | 2,750 | | | 3,000 |
Audit fees include amounts related to the audit of the registrant’s annual financial statements and services normally provided by the accountant in connection with statutory and regulatory filings. Audit-related fees include amounts reasonably related to the performance of the audit of the registrant’s financial statements. Tax fees include amounts related to tax compliance, tax planning, and tax advice. All other fees include amounts related to the registrant’s annual filing of Form N1A.
(e)(1) A purpose of the Audit Committee is to approve the engagement of the registrant’s independent auditors (i) to render audit and non-audit services for the registrant in accordance with Rule 2-01(c)(7)(i) of Regulation S-X, subject to the waiver provisions set forth in Rule 2-01(c)(7)(i)(C) of Regulation S-X, and (ii) to render non-audit services for the registrant’s investment advisors (other than a sub-advisor whose role is primarily portfolio management and is subcontracted or overseen by another investment advisor) and any other entity controlling by, or under common control with the investment advisor that provides ongoing services to the registrant, in each case under (ii) if the engagement relates directly to the operations and financial reporting of the registrant, in accordance with Rule 2-01(c)(7)(ii) of Regulation S-X, subject to waiver provisions set forth in Rule 2-01(c)(7)(ii) of Regulation S-X.
(e)(2) 100% of services included in (b) – (d) above were approved pursuant to Rule 2-01(c)(7)(i)(C) of Regulation S-X.
(f) Not applicable.
(g) The aggregate fees billed for the most recent fiscal year and the preceding fiscal year by the registrant’s principal accountant for non-audit services rendered to the registrant, its investment advisor, and any entity controlling, controlled by, or under common control with the investment advisor that provides ongoing services to the registrant were $12,675 and $25,525 respectively.
(h) Not applicable.
| Item 5. | Audit Committee of Listed Registrants. |
Not applicable.
| Item 6. | Schedule of Investments. |
Not applicable.
| Item 7. | Disclosure of Proxy Voting Policies and Procedures for Closed-End Management Investment Companies. |
Not applicable.
| Item 8. | Portfolio Managers of Closed-End Management Investment Companies. |
Not applicable.
| Item 9. | Purchases of Equity Securities by Closed-End Management Investment Company and Affiliated Purchasers. |
Not applicable.
| Item 10. | Submission of Matters to a Vote of Security Holders. |
Not applicable.
| Item 11. | Controls and Procedures. |
(a) Based on our evaluation conducted within 90 days of the filing date, hereof, the design and operation of the registrant’s disclosure controls and procedures are effective to ensure that material information relating to the registrant is made known to the certifying officers by others within the appropriate entities, particularly during the period in which Forms N-CSR are being prepared, and the registrant’s disclosure controls and procedures allow timely preparation and review of the information for the registrant’s Form N-CSR and the officer certifications of such Form N-CSR.
(b) There were no significant changes in the registrant’s internal controls or in other factors that could significantly affect these controls subsequent to the date of their evaluation, including any corrective actions with regard to significant deficiencies and material weaknesses.
(a)(1) Code of Ethics filed herewith as EX-99.CODE ETH.
(a)(2) A separate certification for each principal executive and principal financial officer of the registrant as required by Rule 30a-2(a) under the Act(17 CFR270.30a-2(a)). Filed herewith as EX-99.CERT.
(b) Certifications of principal executive officer and principal financial officer, under Section 906 of the Sarbanes-Oxley Act of 2002, and 18 U.S.C. ss.1350. Filed herewith as EX-99.906 CERT.
SIGNATURES
Pursuant to the requirements of the Securities Exchange Act of 1934 and the Investment Company Act of 1940, the registrant has duly caused this report to be signed on its behalf by the undersigned, thereunto duly authorized.
| | |
| The Flex-funds |
| |
| By: | | /s/ Bruce E. McKibben |
| | Bruce E. McKibben, Treasurer |
Date: August 27, 2008
Pursuant to the requirements of the Securities Exchange Act of 1934 and the Investment Company Act of 1940, this report has been signed below by the following persons on behalf of the registrant and in the capacities and on the dates indicated.
| | |
| By: | | /s/ Bruce E. McKibben |
| | Bruce E. McKibben, Treasurer |
Date: August 27, 2008
| | |
| By: | | /s/ Robert S. Meeder, Jr. |
| | Robert S. Meeder, Jr., President |
Date: August 27, 2008