UNITED STATES SECURITIES AND EXCHANGE COMMISSION
Washington, D.C. 20549
FORM N-CSR
CERTIFIED SHAREHOLDER REPORT
OF REGISTERED MANAGEMENT INVESTMENT COMPANIES
Investment Company Act file number 811-3462
The Flex-funds Trust
6125 Memorial Drive
Dublin, OH 43017
Bruce McKibben
c/o The Flex-funds Trust
6125 Memorial Drive
Dublin, OH 43017
Registrant’s telephone number, including area code: 800-325-3539
Date of fiscal year end: December 31, 2012
Date of reporting period: June 30, 2012
Item 1. Report to Stockholders.
| Letter to Shareholders | 1 |
| Money Market Fund | 4 |
| Total Return Bond Fund | 5 |
| Balanced Fund | 6 |
Muirfield Fund® | 7 |
| Utilities and Infrastructure Fund | 8 |
| Dynamic Growth Fund | 9 |
| Strategic Growth Fund | 10 |
| Aggressive Growth Fund | 11 |
Quantex FundTM | 12 |
| Shareholder Expense Analysis | 13 |
| Disclosures | 14 |
| Fund Holdings & Financial Statements | 15 |
Our Mission Statement Every day, our mission is to exceed, with integrity, passion, and discipline, the expectations of our shareholders’ and clients’ overall investment experience. Core Values The Client/Shareholder Is Our #1 Priority Always remember whom we are serving. Our livelihood depends on providing a superior overall investment experience that exceeds the expectations of our shareholders and clients. Clarity Of Purpose Our organization has a clear, well-defined vision. All of our associates are committed to and understand how they will contribute to that vision. Communication We expect open and effective communication, full reporting, including good and bad news, and constructive feedback. Integrity We insist upon honesty and adhere to the highest ethical standards. Excellence/ Innovation Our associates strive each day for excellence in the work they perform, seek innovative ways to solve problems and introduce new ideas to take advantage of opportunities. We are a “Think Outside The Box” company. Associate Well-Being We value the success and well-being of our associates. We recognize and reward our associates’ contributions. Respect For Others Respect all people, value the differences among them and treat them as you would like to be treated. Seek First To Understand When interacting with others, place curiosity and understanding of their perspective FIRST, setting aside preconceived opinions and quick judgment. Teamwork We are a synergistic organization that works as a team to exceed our objectives. Profit We are profitable. Profitability enhances our services and capabilities, and affords everyone the opportunity to further their financial well-being. |
 | 2012 Semi-Annual Report | June 30, 2012 |
Letter to Shareholders
Following a strong start to the year, stock market declines materialized during the second quarter as Europe once again dominated news headlines. In particular, the recurrence of investor concerns has focused on Spain and the need to recapitalize its banking system, as well as the recent election outcomes in Greece and France. Above all, an expansive solution that creates greater fiscal, political, and financial integration of the euro zone has remained elusive. Softening economic data domestically is also contributing to increased volatility in the stock market. The deceleration in economic growth is reminiscent of the experiences in 2010 and 2011, which were characterized by a strong first quarter followed by a mid-year lull in growth. Currently, a number of gauges are exhibiting signs of fatigue, including the recent payroll figures. For the month of June, only 80,000 jobs were created and the unemployment rate remained elevated at 8.2%. Other gauges of economic activity have also shown signs of deceleration, such as the Institute for Supply Management Manufacturing Index that currently stands at 49.7 in June from a peak 2012 reading of 54.8 in April. Finally, attention is starting to turn toward the federal government spending cuts and tax hikes set to occur in 2013, which likely will not be addressed until after the November elections but could begin to impact consumer confidence much sooner.
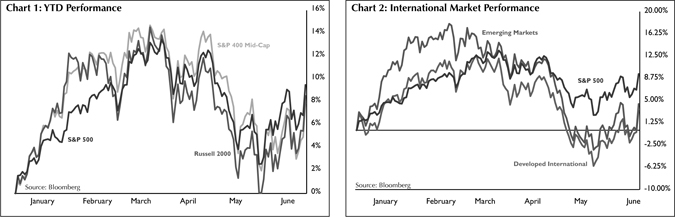
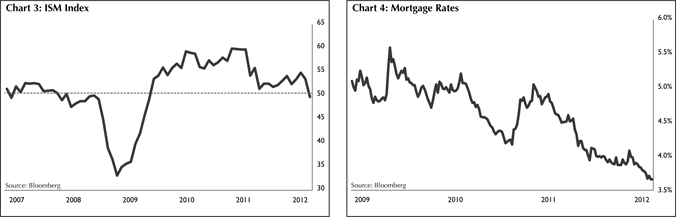
Following strong gains in the first quarter, domestic stock markets posted modest declines during the second quarter. For the year-to-date period through June 30, 2012, the S&P 500 Index has returned 9.48% while the Russell 2000 Index of small capitalization stocks is up 8.53% (see Chart 1). Additionally, international markets have continued to lag the U.S. as many European countries face recession following the implementation of harsh austerity measures and slowing growth in emerging markets. Reflecting these concerns, the MSCI EAFE Index of developed international markets and the MSCI Emerging Markets Index have posted year-to-date gains of 2.96% and 3.94%, respectively, which have trailed the S&P 500 Index for the same period (see Chart 2). Fixed-income markets posted gains amidst the ongoing uncertainty, with the Barclays Aggregate Bond Index up 2.37% through the second quarter.
The following pages will provide an overview of how we managed our risk exposure and the strategies we employed during the first half of 2012. We will also provide a brief summary of the economic and financial events that took place throughout the first six months of 2012, discuss our expectations for the remainder of the year, and review the performance of The Flex-funds® Mutual Funds.
Europe Concerns Return
Actions by the European Central Bank eased fears regarding the European financial markets in the first quarter; however, the presence of calm was extremely brief. In the second quarter, investor concerns focused on national election outcomes as well as the deterioration of Spain’s banking system. In France, a socialist candidate won the country’s presidency, and campaigned on a platform to unwind austerity measures and pursue a pro-growth agenda. Additionally, Greece nearly saw an anti-austerity party gain control of the government, which could have jeopardized Greece’s financial rescue.
| | 2012 Semi-Annual Report | June 30, 2012 |
The results of the aforementioned elections have raised concerns that coordinating actions with Germany could become even more difficult, further hampering efforts to stem the sovereign debt crisis. Attention also turned to Spain’s financial system during the second quarter, and the need to inject capital into Spanish banks as loan losses increase. As a result, Spain was forced to seek up to $125 billion in aid from the European Central Bank. While new developments and volatile market reactions seem to occur daily, one constant has remained: a comprehensive solution to stem Europe’s sovereign debt crisis and ensure the survival of the euro currency has remained elusive.
U.S. Political Uncertainty
While the debt crisis has impeded Europe’s economic recovery, political gridlock and inaction has cast a similar impact on the U.S. economy. The debt ceiling will likely be an issue again at the end of 2012, and over $600 billion of fiscal tightening is set to occur at the start of 2013 as a result of scheduled government spending cuts and a variety of tax increases. Furthermore, the issue will likely not be addressed until after the November elections, leaving only a small window of opportunity for action. While these events are months away, business surveys reveal that the uncertainty over taxes is already weighing heavily, which may lead companies to postpone investment and hiring until a resolution becomes more transparent. For instance, for the first time in nearly four years, taxes emerged as the top problem for small businesses according to a survey conducted by the National Federation of Independent Business.
U.S. Banks Returning to Health
A key driver of the stock market’s progress in 2012 has been alleviation of investor concerns regarding domestic banks. Financial sector stocks were among the best performing segments of the stock market in the first half of 2012. While part of the rally relates to easing concerns over the risks posed by European banks, lending conditions domestically have also improved and stress tests conducted by the Federal Reserve in the first quarter show progress in the health of the U.S. banking sector. The stress tests implemented by the Federal Reserve were rigorous, applying a hypothetical scenario of 13% unemployment, a 50% drop in the stock market, and a 20% drop in housing prices. Even under these conditions, 16 of the largest 19 banks tested had enough capital to meet the Federal Reserve’s minimum requirements. Two of the three that failed only did so marginally. As a result of this outcome, many of the healthiest banks have begun to return capital to their shareholders, a positive sign for the banking sector and the economy as a whole.
Decelerating Economic Data
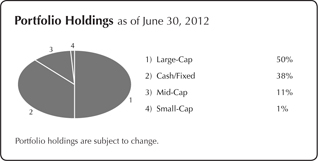
As we progress through 2012, investors are encountering an economic backdrop eerily similar to 2010 and 2011, which were characterized by strong economic data at the beginning of the year, a mid-year lull in growth, and a subsequent acceleration through year-end. Thus far, 2012 is exhibiting a similar pattern. For instance, the Institute for Supply Management Manufacturing Index, which is a broad gauge of manufacturing activity, fell to 49.7 in June from its 2012 peak of 54.8 in April (see Chart 3). A similar gauge of the service economy fell to 52.1 in June from a peak reading of 57.3 in February. For these measures, a reading above 50 indicates expansion while a reading below 50 indicates contraction. As another key measure of economic activity, job creation has slowed considerably from the first quarter. Nonfarm payrolls for the month of June increased by 80,000
| | 2012 Semi-Annual Report | June 30, 2012 |
compared to a monthly average of 225,000 in the first quarter, while the unemployment rate remained steady at 8.2% compared to May.
Housing Market
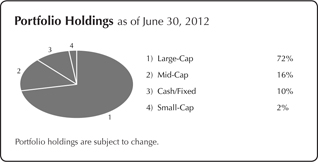
While it is still too early to be declared a recovery, the U.S. housing market is generating some positive signs. Housing starts, new home sales, and existing home sales have all risen off the extremely low levels experienced during the past three years. Additionally, other indicators that tend to lead changes in the housing sector are posting strong increases. An index of company stocks with strong ties to the housing sector posted substantial gains for the year-to-date period through June 30, increasing 25.72% compared to the S&P 500 Index gain of 9.48%. In June, homebuilder confidence reported by the National Association of Home Builders reached its highest level since May 2007. Finally, as U.S. Treasury yields have continued to decline to record low levels, mortgage rates have followed suit. The average 30-year fixed mortgage rate reported by Freddie Mac fell to 3.66% in the last week of June, which is the lowest level on record (see Chart 4). However, it is important to note that headwinds do remain in place, especially the inventory of homes in foreclosure that could continue to place downward pressure on home prices.
Outlook for the Remainder of 2012
The situation in Europe has remained a key obstacle to the ongoing U.S. economic recovery. Not only have new developments in Europe reinforced this notion, but the prospect of more political gridlock in the U.S. has added another layer of uncertainty. These impediments are inhibiting growth and clouding the outlook. We once again find that the direction of the economy is heavily dependent on the actions of policymakers.
However, if actions by policymakers do succeed in resolving the challenges previously discussed, there are a variety of existing catalysts that could propel the recovery forward. More specifically, the Fed remains extremely accommodative, interest rates are hovering near record low levels, the housing market is showing signs of recovery, and the recent plunge in commodity prices should at least temporarily aid household income.
As we monitor the stock market and our investment models, we will continuously evaluate our defensive position in the Muirfield Fund® and the equity portion of the Balanced Fund. We will look for opportunities to adjust portfolio weights among growth and value stocks, large-, mid-, and small-caps, and domestic and international investments in order to enhance returns and manage risk for our clients. We will also continue to proactively manage our sector exposures and will make adjustments as our investment models evolve. On the following pages you will find a review of how The Flex-funds® Mutual Funds have performed. Please read the commentaries to learn more about the investment decisions we made during the first half of 2012.
On behalf of all of the associates at The Flex-funds®, we thank you for the trust and confidence you have placed in our investment management services.
| |  |
| | Robert S. Meeder President Meeder Asset Management, Inc. June 30, 2012 |
Please see diclosures on Page 14.
| | 2012 Semi-Annual Report | June 30, 2012 |
Performance Perspective
| Period & Average Annual Total Returns as of June 30, 2012 | YTD | 1 Year | 3 Years | 5 Years | 10 Years | Since Inception | Inception Date |
The Flex-funds® Money Market Fund (Retail Class) | 0.05% | 0.10% | 0.19% | 1.21% | 1.87% | 4.32% | 3/27/85 |
Current & Effective Yields1 | 7-day Compound: 0.11% 7-day Simple: 0.11% |
Lipper Average General-Purpose Money Market Fund2 | 0.01% | 0.01% | 0.03% | 1.00% | 1.65% | 4.04% | 3/31/85 |
The Flex-funds® Money Market Fund (Institutional Class) | 0.08% | 0.17% | 0.27% | 1.31% | - | 2.26% | 12/28/04 |
Current & Effective Yields1 | 7-day Compound: 0.17% 7-day Simple: 0.17% |
Lipper Average General-Purpose Money Market Fund2 | 0.01% | 0.01% | 0.03% | 1.00% | - | 1.93% | 12/31/04 |
Management fees were waived and/or expenses were reimbursed in order to reduce the operating expenses of the Money Market Fund during the periods shown above. Investments in the Money Market Fund are neither insured nor guaranteed by the Federal Deposit Insurance Corporation or any other governmental agency. Although the Fund seeks to preserve the value of your investment at $1.00 per share, it is possible to lose money by investing in the Money Market Fund.
Please see Page 13 for additional disclosures.
Semiannual Market Perspective
The retail and institutional classes of The Flex-funds® Money Market Fund ranked among the top general purpose money market funds in the country on June 30, 2012. Based on second quarter 2012 results, the retail class ranked 5th out of 250 (2nd percentile) general purpose money market funds that it was measured against according to Lipper. The average general purpose money market fund finished the same period with a return of 0.01%, according to Lipper. The retail and institutional classes of The Flex-funds® Money Market Fund closed the quarter with a 7-day simple yield of 0.11% and 0.17%, respectively.
Over the past couple of years, the money market industry has been besieged by historically low interest rates, limited investment options, and the prospect of additional regulatory reform. Short-term interest rates are expected to be little changed over the remainder of the year. Money market investment options will be void of European issuers, as many funds have completely curbed their exposure to the respective region. Finally, various regulatory groups, including some members of the Securities And Exchange Commission, continue to lobby for risk reduction in the money market industry.
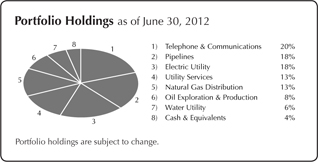
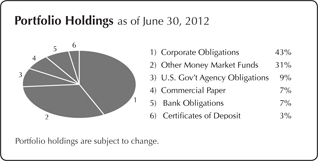
In order to manage around these obstacles, we maintained our focus on providing a high quality portfolio of investments cognizant of maturity and credit risk. Throughout the first half of the year, we maintained a weighted average maturity that was in line or slightly below that of our peers. In this time of uncertainty, we believe positioning the portfolio to take advantage of opportunities is paramount. Holdings in the Fund remained allocated toward investments with superior credit quality, as we believed the risk and reward relationship favored this position. We maintained our exposure to U.S. Government agency securities and products backed by the FDIC. As of June 30, 2012, the Fund’s composition was as follows: 43% corporate obligations, 31% in other money market funds, 9% U.S. Government agency securities, 7% in commercial paper, 7% in bank obligations, and 3% in certificates of deposit. Although we expect available investment options that meet our credit standards may be limited for the next several months, we believe the Fund is positioned to maintain its strong performance during a difficult environment.
| | 2012 Semi-Annual Report | June 30, 2012 |
Performance Perspective
| Period & Average Annual Total Returns as of June 30, 2012 | YTD | 1 Year | Since Inception | Inception Date |
The Flex-funds® Total Return Bond Fund | 2.85% | 2.27% | 2.27% | 6/30/11 |
Expense Ratios*: Current Net 0.99% Gross 1.36% | | | | |
Barclays Aggregate Bond Index3 | 2.37% | 7.48% | 7.48% | 6/30/11 |
Management fees and/or expenses were waived and/or reimbursed in the Total Return Bond Fund during the periods shown in the table above to reduce expenses. All expenses, management fees, reimbursements or waivers for the Fund are voluntary and may be terminated at any time. *Current expense ratio based on net assets in effect as of 6/30/12. This ratio may increase or decrease depending on fluctuations in Fund net assets. The Gross Expense Ratio is a percentage of the Fund’s assets as shown in the most recent Prospectus.
Please see Page 13 for additional disclosures.
Semiannual Market Perspective
As of June 30, 2012, the Flex-funds® Total Return Bond Fund returned 2.27% since the Fund’s inception on June 30, 2011. Also, the Fund returned 2.85% on a year-to-date basis. The Fund’s benchmark, the Barclays Aggregate Bond Index, returned 2.37% over the aforementioned year-to-date period.
During the first half of 2012, fixed-income investments remained susceptible to the volatility associated with headline risk. Political events, economic sustainability, and banking system risks dominated the news headlines, creating above average volatility across all fixed-income sectors. For the first six months of the year, our models provided consistent output favoring investments in U.S. corporate, high yield, and emerging market bonds. This theme provided excess returns versus our benchmark through March. In the second quarter, a move to more risk aversion became a dominant theme as some of the aforementioned risks began to resurface. As a result, U.S. Treasury securities rallied for a significant portion of the second quarter. This undermined the Fund’s performance for the quarter since we were underweight assets that carry less credit risk due to indications from our investment models.
As of this report, our allocation toward high yield and emerging market bonds has been reduced in favor of investment grade corporate bonds. Risks from Europe and lackluster global growth prospects are our immediate concerns. Our model continues to favor investments in corporate bonds as fundamentals remain relatively strong for participating issuers. We continue to believe current market fundamentals will drive favorable financing for corporate bond issuers and consequently drive adequate supply. We believe demand for corporate bonds will remain steady as default probabilities are expected to remain subdued.
| | 2012 Semi-Annual Report | June 30, 2012 |
Balanced Fund
Performance Perspective
| Period & Average Annual Total Returns as of June 30, 2012 | YTD | 1 Year | 3 Years | 8/31/08 to 6/30/12† | 5 years | Since Inception | Inception Date |
The Flex-funds® Balanced Fund† | 5.77% | -1.41% | 7.51% | 2.22% | -1.03% | 1.09% | 1/31/06 |
Expense Ratios*: Current Net 1.49% Gross 1.60% | | | | | | | |
Blended Index4 | 4.67% | 4.29% | 8.79% | 3.89% | 2.56% | 3.85% | 1/31/06 |
S&P 500 Index5 | 9.48% | 5.44% | 16.39% | 3.87% | 0.21% | 3.14% | 1/31/06 |
Management fees and/or expenses were waived and/or reimbursed in the Balanced Fund during the periods shown in the table above to reduce expenses. All expenses, management fees, reimbursements or waivers for the Fund are voluntary and may be terminated at any time. †On August 25, 2008, the name and investment strategy of the Fund was changed. *Current expense ratio based on net assets in effect as of 6/30/12. This ratio may increase or decrease depending on fluctuations in Fund net assets. The Gross Expense Ratio is a percentage of the Fund’s assets as shown in the most recent Prospectus.
Please see Page 13 for additional disclosures.
Semiannual Market Perspective
The Flex-funds® Balanced Fund returned 5.77% for the year-to-date period ended June 30, 2012, compared to its blended index return of 4.67%. The Balanced Fund will always invest at least 30% of its assets in fixed-income securities. The Fund will also hold a minimum 30% allocation in equity securities, with additional investments determined by our defensive equity discipline.
In the equity portion of the Fund, we entered the first quarter with a 10% defensive position in fixed-income investments. However, we increased our stock market exposure as the first quarter progressed following improvements in the trend and technical components of our quantitative investment model. During the second quarter, we noticed some deterioration in technical factors that we monitor as stock market declines materialized. As a result, we ended the first half of 2012 90% invested in the stock market and 10% invested in fixed-income investments for the equity portion of the fund.
In the equity portion of the Fund, we were overweight to growth investments compared to value, and maintained exposure to mid- and small-cap investments throughout the first half of 2012. In terms of sector exposure, we were overweight the technology and healthcare sector, while being underweight in financials and utilities during the first and second quarter. Finally, throughout the first half of 2012 we avoided direct exposure to emerging markets, while we held a tactical short-term position in developed international markets at the end of the first quarter. As of June 30, we did not hold direct exposure to any international market.
In the fixed-income portion of the Fund, the target allocation remained overweight in intermediate-term investment grade bond funds during the first half of 2012. During the first half, the yield on investments in this sector relative to U.S. Treasury securities settled in a range close to average historical levels. In addition, we believe fundamental data remains supportive of stronger credit quality among issuers in this segment for the rest of the year. Due to indications in our investment models, we expect to maintain an overweight to intermediate-term investment grade credit for the near-term. The average maturity of the fixed-income portion of the Fund was maintained in line to slightly above that of our benchmark.
| | 2012 Semi-Annual Report | June 30, 2012 |
Performance Perspective
| Period & Average Annual Total Returns as of June 30, 2012 | YTD | 1 Year | 3 Years | 5 Years | 10 Years | Since Inception | Inception Date |
The Flex-funds Muirfield Fund® | 7.35% | -3.34% | 9.20% | -1.57% | 3.71% | 6.67% | 8/10/88 |
Expense Ratios*: Current Net 1.39% Gross 1.58% | | | | | | | |
Blended Index6 | 5.74% | 3.62% | 9.92% | 0.90% | 4.23% | 7.41% | 8/10/88 |
S&P 500 Index5 | 9.48% | 5.44% | 16.39% | 0.21% | 5.33% | 9.36% | 8/10/88 |
Management fees and/or expenses were waived and/or reimbursed in the Muirfield Fund® during the periods shown in the table above to reduce expenses. All expenses, management fees, reimbursements or waivers for the Fund are voluntary and may be terminated at any time. *Current expense ratio based on net assets in effect as of 6/30/12. This ratio may increase or decrease depending on fluctuations in Fund net assets. The Gross Expense Ratio is a percentage of the Fund’s assets as shown in the most recent Prospectus.
Please see Page 13 for additional disclosures.
Semiannual Market Perspective
The Flex-funds Muirfield Fund® returned 7.35% for the year-to-date period ended June 30, 2012.
In the Muirfield Fund®, we entered the first quarter with a 10% defensive position in fixed-income investments following output from our investment model that indicated some elements of risk in the stock market. However, we increased our stock market exposure as the first quarter progressed following improvements in the trend and technical components of our quantitative investment model, which caused us to end the quarter essentially fully invested in the stock market. During the second quarter, we noticed some deterioration in technical factors that we monitor following declines in the stock market, which led us to adopt a partially defensive position in fixed-income investments. As a result, we ended the second quarter 90% invested in the stock market and 10% invested in fixed-income investments in the Muirfield Fund®.
In addition to the changes in our defensive posture previously discussed, we also managed our exposure to large-, mid-, and small-cap companies, as well as growth versus value investments. During the first quarter, we maintained an overweight allocation to growth investments across the spectrum of market capitalizations. We also maintained our overweight exposure to mid- and small-cap investments. However, we reduced this overweight as the quarter progressed due to indications from our investment models. During the second quarter, we continued to maintain an overweight allocation in growth investments across all market capitalizations, but continued to reduce exposure to mid- and small-cap investments.
We also managed our industry and sector exposure in the Fund. During the first quarter, we were overweight sectors with growth characteristics, such as the technology sector. We were also overweight to the healthcare sector, while being underweight in the financial and utilities sectors. We maintained similar sector exposure throughout the second quarter as well. Finally, throughout the first half of 2012 we avoided direct exposure to emerging markets, while we held a tactical short-term position in developed international markets at the end of the first quarter. As of June 30, we did not hold direct exposure to any international market.
| | 2012 Semi-Annual Report | June 30, 2012 |
Utilities and Infrastructure Fund
Performance Perspective
| Period & Average Annual Total Returns as of June 30, 2012 | YTD | 1 Year | 3 Years | 5 Years | 10 Years | Since Inception | Inception Date |
The Flex-funds® Utilities and Infrastructure Fund | -1.61% | -3.39% | 12.21% | -0.06% | 6.55% | 7.25% | 6/21/95 |
Expense Ratios*: Current Net 1.91% Gross 2.02% | | | | | | | |
Russell 3000 Utilities Index7 | 8.54% | 12.01% | 15.67% | 1.41% | 7.15% | 5.20% | 6/30/95 |
Management fees and/or expenses were waived and/or reimbursed in the Utilities and Infrastructure Fund during the periods shown in the table above to reduce expenses. All expenses, management fees, reimbursements or waivers for the Fund are voluntary and may be terminated at any time. *Current expense ratio based on net assets in effect as of 6/30/12. This ratio may increase or decrease depending on fluctuations in Fund net assets. The Gross Expense Ratio is a percentage of the Fund’s assets as shown in the most recent Prospectus.
Please see Page 13 for additional disclosures.
Semiannual Market Perspective
The Flex-funds® Utilities and Infrastructure Fund fell 1.61% for the year-to-date period ended June 30, 2012. The Fund has outperformed the Russell 3000 Utilities benchmark since its inception.
The Utilities and Infrastructure Fund was able to post a gain for the first quarter despite poor performance from large cap utilities and a weakened natural gas market. Veolia Environnement returned 49% in the first quarter, aided by plans to divest assets and reduce debt. EnerSys was up 33% following strong revenue growth and plans for an Indian joint venture. CARBO Ceramics declined 14% in spite of strong revenue for the quarter, after the manufacturer missed earnings targets. NII Holdings fell by 14% in the face of strong competition and lower earnings guidance.
The Fund trailed the broader utilities index during the second quarter due primarily to strong performance among conventional large-cap utilities, which we are underweight. Qualcomm was a detractor from performance with a second quarter decline of 17%, despite the company’s better than expected revenue and net income. Verizon, which gained 18% during the quarter, was a leading contributor to our returns as a result of the company’s strong earnings report stemming from its smartphone business. Finally, we raised our weight in ITC after a complaint about transmission rates prompted nervous investors to exit the stock. We would note that the company projects an increasing compound annual growth rate as a result of its merger with Entergy’s transmission business.
The sharp decline in natural gas prices have hurt many portfolio stocks for a few quarters; however, it appeared that natural gas prices were searching for a bottom during the second quarter. If that obstacle is removed, we believe substantial absolute and relative progress could be experienced in the Fund.
| | 2012 Semi-Annual Report | June 30, 2012 |
Performance Perspective
| Period & Average Annual Total Returns as of June 30, 2012 | YTD | 1 Year | 3 Years | 5 Years | 10 Years | Since Inception | Inception Date |
The Flex-funds® Dynamic Growth Fund | 8.20% | -0.72% | 12.25% | -1.86% | 3.69% | -0.31% | 2/29/00 |
Expense Ratios*: Current Net 1.39% Gross 1.57% | | | | | | | |
S&P 500 Index5 | 9.48% | 5.44% | 16.39% | 0.21% | 5.33% | 1.85% | 2/29/00 |
Management fees and/or expenses were waived and/or reimbursed in the Dynamic Growth Fund during the periods shown in the table above to reduce expenses. All expenses, management fees, reimbursements or waivers for the Fund are voluntary and may be terminated at any time. * Current expense ratio based on net assets in effect as of 6/30/12. This ratio may increase or decrease depending on fluctuations in Fund net assets. The Gross Expense Ratio is a percentage of the Fund’s assets as shown in the most recent Prospectus.
Please see Page 13 for additional disclosures.
Semiannual Market Perspective
The Flex-funds® Dynamic Growth Fund returned 8.20% for the year-to-date period ended June 30, 2012.

During the first quarter, we maintained our overweight allocation to growth investments versus value following indications from our investment models. Additionally, our investment models have continued to maintain preference for mid- and small-cap companies, although to a lesser extent relative to the end of 2011. As a result, we reduced our exposure to these capitalization ranges. During the second quarter, we continued to maintain an overweight allocation to growth investments versus value, while our investment models continued to pare preference for mid- and small-cap companies, which led us to further reduce our allocation to these investments. Finally, throughout the first half of 2012, we were overweight the technology and healthcare sectors, while being underweight the financial and utilities sector. Throughout the first half of 2012, we avoided direct exposure to emerging markets, while we held a tactical short-term position in developed international markets at the end of the first quarter. As of June 30, we did not hold direct exposure to any international market.
The performance of the Fund was in line with the S&P 500 during the first quarter, and was driven by numerous factors. In the Fund, our overweight to growth investments benefited performance, while our modest position among mid- and small-cap investments benefited performance overall. Additionally, our underlying fund holdings also benefited performance, which was mostly driven by the Wells Fargo Advantage Growth Fund. However, our sector positions detracted from performance, with our overweight position in technology benefiting the Fund while the overweight to healthcare and underweight to financials detracted from returns. Our performance during the second quarter lagged the S&P 500 Index, which was driven by multiple factors as well. Our overweight to growth investments detracted from the Fund’s return, while our exposure to mid- and small-cap companies also detracted from performance. In the Fund, our overweight to technology detracted from performance, while our overweight to healthcare and underweight to financials provided a benefit. Finally, our underlying fund holdings generally underperformed their respective benchmarks.
| | 2012 Semi-Annual Report | June 30, 2012 |
Performance Perspective
| Period & Average Annual Total Returns as of June 30, 2012 | YTD | 1 Year | 3 Years | 8/31/08 to 6/30/12† | 5 Year | Since Inception | Inception Date |
The Flex-funds® Strategic Growth Fund† | 5.51% | -6.66% | 13.28% | 0.30% | -2.43% | 0.28% | 1/31/06 |
Expense Ratios*: Current Net 1.39% Gross 1.58% | | | | | | | |
S&P 500 Index5 | 9.48% | 5.44% | 16.39% | 3.87% | 0.21% | 3.14% | 1/31/06 |
Blended Index8 | 6.52% | -1.76% | 15.80% | 1.29% | -0.02% | 2.43% | 1/31/06 |
Management fees and/or expenses were waived and/or reimbursed in the Strategic Growth Fund during the periods shown in the table above to reduce expenses. All expenses, management fees, reimbursements or waivers for the Fund are voluntary and may be terminated at any time. * Current expense ratio based on net assets in effect as of 6/30/12. This ratio may increase or decrease depending on fluctuations in Fund net assets. The Gross Expense Ratio is a percentage of the Fund’s assets as shown in the most recent Prospectus. †On August 25, 2008, the name and investment strategy of the Fund was changed.
Please see Page 13 for additional disclosures.
Semiannual Market Perspective
The Flex-funds® Strategic Growth Fund returned 5.51% for the year-to-date period ended June 30, 2012.
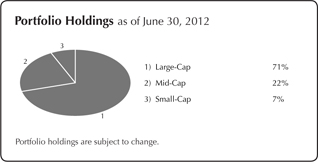
The Strategic Growth Fund is fully invested in the equity market at all times, and holds a fixed allocation across six distinct investment categories. The mix of investments selected to represent each investment category is variable and actively managed by using our strategic fund selection process. The current target allocation is comprised of the following: 25% large-cap, 20% mid-cap, 17.5% international, 12.5% small-cap, 12.5% real estate, and 12.5% commodities.
Within each respective category, we seek to identify investments that we believe will outperform the index or peers through an evaluation process based on valuation factors, measures of volatility, and risk-adjusted returns. Investments that fall out of favor within our models are sold and replaced with investments ranked higher by our evaluation process.
The Fund slightly underperformed its custom benchmark, and also underperformed the broader market as measured by the S&P 500 Index during the first quarter. We experienced unfavorable fund selection in the small-cap, emerging market, and commodities categories, while fund selection in the large-cap and developed international categories outperformed their respective benchmarks. Relative to the S&P 500 Index, the Fund’s allocation to real estate, developed international, and commodities detracted from performance while emerging market and mid-cap benefited performance.
The Fund also underperformed its custom benchmark and the broader market as measured by the S&P 500 Index during the second quarter. Fund selection in the large-cap, mid-cap, and small-cap categories detracted from performance, while selections in the commodity and developed international categories outperformed their respective benchmarks. The Fund’s allocation to real estate investments benefited performance relative to the S&P 500, but all other asset allocation categories detracted from performance.
| | 2012 Semi-Annual Report | June 30, 2012 |
Performance Perspective
| Period & Average Annual Total Returns as of June 30, 2012 | YTD | 1 Year | 3 Years | 5 Years | 10 Years | Since Inception | Inception Date |
The Flex-funds® Aggressive Growth Fund | 7.30% | -3.64% | 12.01% | -1.55% | 3.52% | -1.66% | 2/29/00 |
Expense Ratios*: Current Net 1.70% Gross 1.70% | | | | | | | |
S&P 500 Index5 | 9.48% | 5.44% | 16.39% | 0.21% | 5.33% | 1.85% | 2/29/00 |
Management fees and/or expenses were waived and/or reimbursed in the Aggressive Growth Fund during the periods shown in the table above to reduce expenses. All expenses, management fees, reimbursements or waivers for the Fund are voluntary and may be terminated at any time. *Current expense ratio based on net assets in effect as of 6/30/12. This ratio may increase or decrease depending on fluctuations in Fund net assets. The Gross Expense Ratio is a percentage of the Fund’s assets as shown in the most recent Prospectus.
Please see Page 13 for additional disclosures.
Semiannual Market Perspective
The Flex-funds® Aggressive Growth Fund returned 7.30% for the year-to-date period ended June 30, 2012.
Following a strong start to the year, stock market declines materialized during the second quarter as Europe once again dominated news headlines. Softening economic data domestically is also contributing to increased volatility in the stock market. The deceleration in economic growth is reminiscent of the experiences in 2010 and 2011, which were characterized by a strong first quarter followed by a mid-year lull in growth. Finally, attention is starting to turn toward the federal government spending cuts and tax hikes set to occur in 2013, which likely will not be addressed until after the November elections but could begin to impact consumer confidence much sooner.
We entered the first quarter with an overweight position among growth versus value investments due to indications from our investment models. We also maintained our overweight in mid- and small-cap stocks, which has been a key component of our investment allocation since the stock market recovery commenced. In the Fund, our sector exposure was concentrated among the technology and healthcare sector throughout the first quarter, and our growth exposure also resulted in an overweight to the consumer discretionary sector. We were underweight in the financial and utilities sector.
During the second quarter, we maintained our overweight position among growth versus value investments, and also maintained our overweight in mid- and small-cap stocks. In the Fund, our sector exposure remained mostly consistent with the first quarter, which was characterized by an overweight position among the technology and healthcare sector. Additionally, our growth exposure resulted in an overweight to the consumer discretionary sector, and we were underweight in the financial and utilities sector during the second quarter.
Throughout the first half of 2012, we avoided direct exposure to emerging markets, while we held a tactical short-term position in developed international markets at the end of the first quarter. As of June 30, we did not hold direct exposure to any international market.
| | 2012 Semi-Annual Report | June 30, 2012 |
Performance Perspective
| Period & Average Annual Total Returns as of June 30, 2012 | YTD | 1 Year | 3 Years | 5 Years | 10 Years | Since Inception | Inception Date |
The Flex-funds® Quantex Fund™ | 3.94% | -6.32% | 20.56% | 1.04% | 5.60% | 6.70% | 3/20/85 |
Expense Ratios*: Current Net 1.61% Gross 1.81% | | | | | | | |
Russell 2000 Index9 | 8.53% | -2.06% | 17.80% | 0.54% | 7.00% | 9.03% | 3/31/85 |
Blended Index10 | 8.24% | -2.16% | 18.61% | 1.59% | 7.65% | 10.68% | 3/31/85 |
S&P 400 Mid-Cap Index11 | 7.90% | -2.32% | 19.37% | 2.56% | 8.21% | 12.19% | 3/31/85 |
Management fees and/or expenses were waived and/or reimbursed in the Quantex Fund™ during the periods shown in the table above to reduce expenses. The Fund’s management fee waiver is contractual and may be terminated annually by the Advisor on its renewal date. * Current expense ratio based on net assets in effect as of 6/30/12. This ratio may increase or decrease depending on fluctuations in Fund net assets. The Gross Expense Ratio is a percentage of the Fund’s assets as shown in the most recent Prospectus.
Please see Page 13 for additional disclosures.
Semiannual Market Perspective
The Flex-funds® Quantex Fund™ returned 3.94% for the year-to-date period ended June 30, 2012. Also, the Quantex Fund™ was recently recognized by Lipper as the best mid-cap value fund for the 3-year period ended December 31, 2011.
We have consistently employed our quantitative stock selection process since April 30, 2005 for the Quantex Fund™. We utilize rankings from our quantitative financial model to determine which securities are to be held in the Fund on an annual basis. As a result, the Fund is rebalanced annually in January. In the 2012 Fund, there is a strong preference for value holdings, with mid-cap value companies comprising 45% of the Fund, followed by mid-cap core with 27%, and mid-cap growth with 12%. Small-cap holdings of 16% comprise the remainder according to our allocation analysis at the beginning of the year.
Relative to the S&P 400 Mid-Cap Index, stock selection within the energy and consumer staples sector provided the greatest benefit to the Fund. The largest detractor from performance was stock selection within the materials and technology sector. Additionally, the Fund’s underweight to the healthcare and financial sector detracted from performance. However, other sector allocations benefited performance, such as the Fund’s overweight to the consumer discretionary sector and underweight to the industrial sector during the first half of 2012.
During the year-to-date period of 2012, many stocks contributed positively to the performance of the Fund. The top performing stock for the period was Sears Holdings, which was up 88%. Other top performers for the period include TripAdvisor (up 77%) and Pulte Homes (up 70%). The largest detractors from performance during the period were Alpha Natural Resources (down 57%) and First Solar (down 55%).
| | 2012 Semi-Annual Report | June 30, 2012 |
Shareholder Expense Analysis (Unaudited)
Shareholders of mutual funds pay ongoing expenses, such as advisory fees, distribution and service fees (12b-1 fees) and other fund expenses. The following example is intended to help you understand your ongoing costs (in dollars) of investing in the Funds and to compare these costs with the ongoing costs of investing in other mutual funds.
The following example is based on an investment of $1,000 invested at the beginning of the period and held for the six-month period from December 31, 2011 to June 30, 2012.
ACTUAL EXPENSES: The first line of the table below provides information about actual account values and actual expenses. You may use the information in this line, together with the amount you invested, to estimate the expenses that you paid over the period. Simply divide your account value by $1,000 (e.g.: an $8,600 account value divided by $1,000 = 8.6), then multiply the result by the number in the first line under the heading “Expenses Paid During the Period” to estimate the expenses you paid on your account during this period.
HYPOTHETICAL EXAMPLE FOR COMPARISON PURPOSES: The second line provides information about hypothetical account values and hypothetical expenses based on the Funds’ actual expense ratios and assumed rates of return of 5% per year before expenses, which are not the Funds’ actual returns. The hypothetical account values and expenses may not be used to estimate the actual ending account balance or expenses you paid for the period. You may use this information to compare the ongoing costs of investing in the Funds with the ongoing costs of investing in other funds. To do so, compare this 5% hypothetical example with the 5% hypothetical examples that appear in the shareholder reports of the other funds.
| | Beginning Account Value (12/31/2011) | Ending Account Value (6/30/2012) | Expenses Paid During Period1 (12/31/2011 - 6/30/2012) | Expense Ratio (Annualized) |
| The Muirfield Fund | Actual | $1,000.00 | $1,073.50 | $7.21 | 1.39% |
| | Hypothetical* | $1,000.00 | $1,018.05 | $7.01 | 1.39% |
| The Utilities & Infrastructure Fund | Actual | $1,000.00 | $983.90 | $9.47 | 1.91% |
| | Hypothetical* | $1,000.00 | $1,015.45 | $9.62 | 1.91% |
The Quantex FundTM | Actual | $1,000.00 | $1,039.40 | $8.21 | 1.61% |
| | Hypothetical* | $1,000.00 | $1,016.95 | $8.12 | 1.61% |
| The Dynamic Growth Fund | Actual | $1,000.00 | $1,082.00 | $7.23 | 1.39% |
| | Hypothetical* | $1,000.00 | $1,018.05 | $7.01 | 1.39% |
| The Aggressive Growth Fund | Actual | $1,000.00 | $1,073.00 | $8.24 | 1.59% |
| | Hypothetical* | $1,000.00 | $1,017.05 | $8.02 | 1.59% |
| The Balanced Fund | Actual | $1,000.00 | $1,057.70 | $7.66 | 1.49% |
| | Hypothetical* | $1,000.00 | $1,017.55 | $7.52 | 1.49% |
| The Strategic Growth Fund | Actual | $1,000.00 | $1,055.10 | $7.14 | 1.39% |
| | Hypothetical* | $1,000.00 | $1,018.05 | $7.01 | 1.39% |
| The Total Return Bond Fund | Actual | $1,000.00 | $1,028.50 | $5.02 | 0.99% |
| | Hypothetical* | $1,000.00 | $1,020.05 | $5.00 | 0.99% |
| The Money Market Fund - Retail Class | Actual | $1,000.00 | $1,000.50 | $1.45 | 0.29% |
| | Hypothetical* | $1,000.00 | $1,023.55 | $1.47 | 0.29% |
| The Money Market Fund - Institutional Class | Actual | $1,000.00 | $1,000.80 | $1.10 | 0.22% |
| | Hypothetical* | $1,000.00 | $1,023.90 | $1.11 | 0.22% |
| * | Represents the hypothetical 5% return before expenses. |
Please note that the expenses shown in the table are meant to highlight your ongoing costs only and do not reflect any transactional costs, such as redemption fees or exchange fees. Therefore, the second line of the table is useful in comparing ongoing costs only, and will not help you determine the relative total costs of owning different funds. In addition, if any transactional costs were included, your costs would have been higher.
| 1 | Expenses are equal to the Funds’ annualized expense ratios, multiplied by the average account value over the period, multiplied by 183/366 (to reflect the total number of days in the six-month period). |
| | 2012 Semi-Annual Report | June 30, 2012 |
Disclosures
Investors are advised to consider the investment objectives, risks, charges and expenses of The Flex-funds® carefully before investing. The Flex-funds® prospectus contains this and other information about the Funds and should be read carefully before investing. To request or receive a copy of The Flex-funds® prospectus, contact Shareholder Services at 800.325.3539 or visit www.flexfunds.com.
To obtain a prospectus containing more information about The Flex-funds®, including other fees and expenses that apply to a continued investment in the Funds, you may call (800)325-3539, or write to P.O. Box 7177, Dublin, OH 43017. Please read the prospectus carefully before investing.
Opinions and forecasts regarding sectors, industries, companies, countries and/or themes, and portfolio composition and holdings, are all subject to change at any time, based on market and other conditions, and should not be construed as a recommendation of any specific security, industry, or sector.
Past performance is not a guarantee of future results. All performance figures represent total returns and average annual total returns or current and effective yields for the periods ended June 30, 2012. Investment performance assumes reinvestment of all dividend and capital gain distributions. The investment return and principal value of an investment will fluctuate so an investor’s shares or units, when redeemed, may be worth more or less than their original cost. Management fees and/or expenses were waived and/or reimbursed in The Flex-funds® during the periods shown in these tables to reduce expenses. All expenses, management fees, reimbursements or waivers for the Funds are voluntary and may be terminated at any time, except for the Quantex Fund TM. The Quantex Fund TM management fee waiver is contractual and can be terminated annually by the Adviser on its renewal date, April 30, 2013.
| 1 | For the period ended June 30, 2012, yield quotations more closely reflect the current earnings of The Money Market Fund than do total return quotations. |
| 2 | An index of funds such as Lipper’s Average General Purpose Money Market Fund Index includes a number of mutual funds grouped by investment objective. One cannot invest directly in an index. |
| 3 | The Barclays Aggregate Bond Index provides a measure of the performance of the U.S. investment grade bond market, which includes investment grade U.S. Government bonds, investment grade corporate bonds, mortgage pass-through securities and asset-backed securities that are publicly offered for sale in the United States. The securities index must have at least 1 year remaining to maturity. In addition, the securities must be denominated in US dollars and must be fixed rate, non convertible and taxable. |
| 4 | The Blended Index consists of 42% of the S&P 500 Index, 28% of the average 90-day U.S. Treasury bill and 30% Barclays Intermediate-Term Government/Credit Index. |
| 5 | The S&P 500 Index is a widely recognized unmanaged index of common stock prices. The S&P 500 Index does not take into account the deduction of expenses associated with a mutual fund, such as investment management and accounting fees. One cannot invest directly in an index. |
| 6 | The Blended Index consists of 60% of the S&P 500 Index and 40% of the average 90-day U.S. Treasury bill. |
| 7 | The Russell 3000 Utilities Index is a market capitalization-weighted index that is comprised of utility stocks that are included in the Russell 3000 Index. This index does not take into account the deduction of expenses associated with a mutual fund, such as investment management and accounting fees. One cannot invest directly in an index. |
| 8 | The Blended Index is comprised of 25% S&P 500, 20% S&P Midcap 400, 12.5% Russell 2000, 12.5% Dow Jones Wilshire Real Estate Investment Trust, 12.5% Goldman Sachs Commodity Index, 12% Morgan Stanley Capital International Europe, Australasia, and Far East, and 5.5% Morgan Stanley Capital International Europe Emerging Markets Index. These indices do not take into account the deduction of expenses associated with a mutual fund such as investment management and accounting fees. An investor cannot invest directly in an index. |
| 9 | The Russell 2000 Index is a widely recognized unmanaged index of common stock prices of small-sized companies. The Russell 2000 Index does not take into account the deduction of expenses associated with a mutual fund, such as investment management and accounting fees. One cannot invest directly in an index. |
| 10 | The Blended Index consists of 50% Russell 2000 Index and 50% S&P 400 Mid-Cap Index. |
| 11 | The S&P 400 Mid-Cap Index is a widely recognized unmanaged index of common stock prices of mid-sized companies. The S&P 400 Mid-Cap Index does not take into account the deduction of expenses associated with a mutual fund, such as investment management and accounting fees. One cannot invest directly in an index. |
| | 2012 Semi-Annual Report | June 30, 2012 |
2012 Semiannual Report
Portfolio Holdings & Financial Statements
| | 2012 Semi-Annual Report | June 30, 2012 |
Schedule of Investments
June 30, 2012 (unaudited)
| The Muirfield Fund | |
| | | Shares or Principal Amount ($) | | | | | |
| | | | | | | | | |
| Registered Investment Companies — 59.8% | |
| Consumer Staples Select Sector SPDR Fund | | | 68,100 | | | | 2,367,837 | |
Energy Select Sector SPDR Fund | | | 55,375 | | | | 3,675,239 | |
| Health Care Select Sector SPDR Fund | | | 145,675 | | | | 5,536,378 | |
| iShares Russell 1000 Growth Index Fund | | | 89,800 | | | | 5,678,054 | |
| iShares Russell 1000 Value Index Fund | | | 110,550 | | | | 7,541,721 | |
Ivy Mid Cap Growth Fund | | | 130,682 | | | | 2,313,078 | |
| JPMorgan Disciplined Equity Fund | | | 554,470 | | | | 9,692,138 | |
PowerShares QQQ Trust | | | 109,905 | | | | 7,051,505 | |
| SPDR Dow Jones Industrial Average ETF Trust | | | 47,750 | | | | 6,133,488 | |
Vanguard Equity Income Fund | | | 130,023 | | | | 6,321,694 | |
| Wells Fargo Advantage Growth Fund | | | 297,879 | | | | 12,221,987 | |
Total Registered Investment Companies (Cost $66,484,418) | | | | | | | 68,533,119 | |
| Money Market Registered Investment Companies — 20.8% | |
The Flex-funds Money Market Fund - Institutional Class, 0.17% (2) | | | 23,827,920 | | | | 23,827,920 | |
Total Money Market Registered Investment Companies (Cost $23,827,920) | | | | | | | 23,827,920 | |
| Bank Obligations — 4.4% | | | | | | | | |
Access National Bank, 0.30%, 7/5/2012 (3) | | | 987 | | | | 987 | |
Allied Bank, 0.30%, 7/5/2012 (3) | | | 434 | | | | 434 | |
Alma Bank, 0.30%, 7/5/2012 (3) | | | 4,804 | | | | 4,804 | |
AloStar Bank of Commerce, 0.30%, 7/5/2012 (3) | | | 3,797 | | | | 3,797 | |
Alpine Bank, 0.30%, 7/5/2012 (3) | | | 3,060 | | | | 3,060 | |
Ameriana Bank, 0.30%, 7/5/2012 (3) | | | 19 | | | | 19 | |
American Enterprise Bank of Florida, 0.30%, 7/5/2012 (3) | | | 492 | | | | 492 | |
American Momentum Bank, 0.30%, 7/5/2012 (3) | | | 5,694 | | | | 5,694 | |
American National Bank, 0.30%, 7/5/2012 (3) | | | 2,277 | | | | 2,277 | |
American National Bank-Fox Cities, 0.30%, 7/5/2012 (3) | | | 215 | | | | 215 | |
American Savings Bank F.S.B., 0.30%, 7/5/2012 (3) | | | 16 | | | | 16 | |
American Savings Bank FSB, 0.30%, 7/5/2012 (3) | | | 155 | | | | 155 | |
Americas United Bank, 0.30%, 7/5/2012 (3) | | | 1,306 | | | | 1,306 | |
AmFirst Bank N.A., 0.30%, 7/5/2012 (3) | | | 38 | | | | 38 | |
Anthem Bank & Trust, 0.30%, 7/5/2012 (3) | | | 873 | | | | 873 | |
Arizona Bank & Trust, 0.30%, 7/5/2012 (3) | | | 4,192 | | | | 4,192 | |
Arvest Bank, 0.30%, 7/5/2012 (3) | | | 220 | | | | 220 | |
Austin Bank of Chicago, 0.30%, 7/5/2012 (3) | | | 869 | | | | 869 | |
Avidia Bank, 0.30%, 7/5/2012 (3) | | | 4,192 | | | | 4,192 | |
Bancorp Bank, 0.30%, 7/5/2012 (3) | | | 10,749 | | | | 10,749 | |
Bank Hapoalim B.M., 0.30%, 7/5/2012 (3) | | | 1,511 | | | | 1,511 | |
Bank Leumi USA, 0.30%, 7/5/2012 (3) | | | 240,000 | | | | 240,000 | |
Bank of America National Association, 0.30%, 7/5/2012 (3) | | | 448 | | | | 448 | |
Bank of Augusta, 0.30%, 7/5/2012 (3) | | | 917 | | | | 917 | |
| The Muirfield Fund | |
| | | Shares or Principal Amount ($) | | | | | |
| Bank Obligations — continued | | | | | | | | |
Bank of Cadiz and Trust Company, 0.30%, 7/5/2012 (3) | | | 1,055 | | | | 1,055 | |
Bank of Cave City, 0.30%, 7/5/2012 (3) | | | 437 | | | | 437 | |
Bank of England, 0.30%, 7/5/2012 (3) | | | 1,867 | | | | 1,867 | |
Bank of Fayetteville, 0.30%, 7/5/2012 (3) | | | 436 | | | | 436 | |
Bank of Hawaii, 0.30%, 7/5/2012 (3) | | | 4,983 | | | | 4,983 | |
Bank of Houston, 0.30%, 7/5/2012 (3) | | | 2,661 | | | | 2,661 | |
Bank of Jackson Hole, 0.30%, 7/5/2012 (3) | | | 442 | | | | 442 | |
Bank of Manhattan N.A., 0.30%, 7/5/2012 (3) | | | 1,665 | | | | 1,665 | |
Bank of Marin, 0.30%, 7/5/2012 (3) | | | 218 | | | | 218 | |
Bank of Missouri, 0.30%, 7/5/2012 (3) | | | 4,968 | | | | 4,968 | |
Bank of Princeton, 0.30%, 7/5/2012 (3) | | | 651 | | | | 651 | |
Bank of the Ozarks, 0.30%, 7/5/2012 (3) | | | 108 | | | | 108 | |
Bank of the Panhandle, 0.30%, 7/5/2012 (3) | | | 1,062 | | | | 1,062 | |
Bank of the West, 0.30%, 7/5/2012 (3) | | | 13,559 | | | | 13,559 | |
Bar Harbor Bank & Trust, 0.30%, 7/5/2012 (3) | | | 869 | | | | 869 | |
Belmont Savings Bank, 0.30%, 7/5/2012 (3) | | | 4,601 | | | | 4,601 | |
Benchmark Bank, 0.30%, 7/5/2012 (3) | | | 3 | | | | 3 | |
Benefit Bank, 0.30%, 7/5/2012 (3) | | | 1,345 | | | | 1,345 | |
Berkshire Bank, 0.30%, 7/5/2012 (3) | | | 6,256 | | | | 6,256 | |
Beverly Bank & Trust Company National Associa, 0.30%, 7/5/2012 (3) | | | 30 | | | | 30 | |
Biltmore Bank of Arizona, 0.30%, 7/5/2012 (3) | | | 2,408 | | | | 2,408 | |
BMO Harris Bank National Association, 0.30%, 7/5/2012 (3) | | | 2,493 | | | | 2,493 | |
BOKF National Association, 0.30%, 7/5/2012 (3) | | | 5,969 | | | | 5,969 | |
Boone Bank & Trust Co., 0.30%, 7/5/2012 (3) | | | 1,220 | | | | 1,220 | |
Boston Private Bank & Trust Company, 0.30%, 7/5/2012 (3) | | | 2,184 | | | | 2,184 | |
Branch Banking and Trust Company, 0.30%, 7/5/2012 (3) | | | 1,980 | | | | 1,980 | |
Brookhaven Bank, 0.30%, 7/5/2012 (3) | | | 250 | | | | 250 | |
Business Bank, 0.30%, 7/5/2012 (3) | | | 1,431 | | | | 1,431 | |
Business Bank, 0.30%, 7/5/2012 (3) | | | 462 | | | | 462 | |
Business Bank of Saint Louis, 0.30%, 7/5/2012 (3) | | | 2,094 | | | | 2,094 | |
Business First Bank, 0.30%, 7/5/2012 (3) | | | 2,092 | | | | 2,092 | |
Cache Valley Bank, 0.30%, 7/5/2012 (3) | | | 3,057 | | | | 3,057 | |
Cadence Bank N.A., 0.30%, 7/5/2012 (3) | | | 209,741 | | | | 209,741 | |
California Bank & Trust, 0.30%, 7/5/2012 (3) | | | 87 | | | | 87 | |
Capital Bank, 0.30%, 7/5/2012 (3) | | | 1,156 | | | | 1,156 | |
Capital One National Association, 0.30%, 7/5/2012 (3) | | | 157,954 | | | | 157,954 | |
CapitalMark Bank & Trust, 0.30%, 7/5/2012 (3) | | | 2,903 | | | | 2,903 | |
CapStar Bank, 0.30%, 7/5/2012 (3) | | | 11,181 | | | | 11,181 | |
CapStone Bank, 0.30%, 7/5/2012 (3) | | | 2,126 | | | | 2,126 | |
Cardinal Bank, 0.30%, 7/5/2012 (3) | | | 4,028 | | | | 4,028 | |
Carolina Alliance Bank, 0.30%, 7/5/2012 (3) | | | 115 | | | | 115 | |
Carver Federal Savings Bank, 0.30%, 7/5/2012 (3) | | | 46,382 | | | | 46,382 | |
Cathay Bank, 0.30%, 7/5/2012 (3) | | | 240,000 | | | | 240,000 | |
The accompanying notes are an integral part of these financial statements.
| | 2012 Semi-Annual Report | June 30, 2012 |
Schedule of Investments
June 30, 2012 (unaudited)
| The Muirfield Fund | |
| | | Shares or Principal Amount ($) | | | | | |
| | | | | | | | | |
| Bank Obligations — continued | | | | | | | | |
Celtic Bank, 0.30%, 7/5/2012 (3) | | | 2,441 | | | | 2,441 | |
Centennial Bank, 0.30%, 7/5/2012 (3) | | | 466 | | | | 466 | |
Centra Bank Inc., 0.30%, 7/5/2012 (3) | | | 2,084 | | | | 2,084 | |
Central Bank, 0.30%, 7/5/2012 (3) | | | 695 | | | | 695 | |
Central Bank Illinois, 0.30%, 7/5/2012 (3) | | | 32 | | | | 32 | |
Central Bank of Kansas City, 0.30%, 7/5/2012 (3) | | | 38 | | | | 38 | |
CheckSpring Bank, 0.30%, 7/5/2012 (3) | | | 23 | | | | 23 | |
Chemical Bank, 0.30%, 7/5/2012 (3) | | | 399 | | | | 399 | |
Chickasha Bank & Trust Company, 0.30%, 7/5/2012 (3) | | | 442 | | | | 442 | |
Citizens Bank & Trust Company, 0.30%, 7/5/2012 (3) | | | 3,770 | | | | 3,770 | |
Citizens Bank of Pennsylvania, 0.30%, 7/5/2012 (3) | | | 133 | | | | 133 | |
Citizens National Bank, 0.30%, 7/5/2012 (3) | | | 212 | | | | 212 | |
Citizens National Bank of Bluffton, 0.30%, 7/5/2012 (3) | | | 446 | | | | 446 | |
City First Bank of D.C. National Association, 0.30%, 7/5/2012 (3) | | | 1,597 | | | | 1,597 | |
City National Bank, 0.30%, 7/5/2012 (3) | | | 271 | | | | 271 | |
City National Bank of Sulphur Springs, 0.30%, 7/5/2012 (3) | | | 146 | | | | 146 | |
City National Bank of Taylor, 0.30%, 7/5/2012 (3) | | | 970 | | | | 970 | |
Cole Taylor Bank, 0.30%, 7/5/2012 (3) | | | 79,682 | | | | 79,682 | |
Collin Bank, 0.30%, 7/5/2012 (3) | | | 1,135 | | | | 1,135 | |
Columbia State Bank, 0.30%, 7/5/2012 (3) | | | 3,884 | | | | 3,884 | |
Comerica Bank, 0.30%, 7/5/2012 (3) | | | 4,837 | | | | 4,837 | |
Commencement Bank, 0.30%, 7/5/2012 (3) | | | 1,327 | | | | 1,327 | |
Commerce Bank & Trust Company, 0.30%, 7/5/2012 (3) | | | 6,820 | | | | 6,820 | |
Commerce National Bank, 0.30%, 7/5/2012 (3) | | | 81 | | | | 81 | |
Community Bank & Trust, 0.30%, 7/5/2012 (3) | | | 2,970 | | | | 2,970 | |
Community Bank of Oelwein, 0.30%, 7/5/2012 (3) | | | 907 | | | | 907 | |
Community Bank of Santa Maria, 0.30%, 7/5/2012 (3) | | | 103 | | | | 103 | |
Community Bank of the Bay, 0.30%, 7/5/2012 (3) | | | 167 | | | | 167 | |
Community Mutual Savings Bank, 0.30%, 7/5/2012 (3) | | | 1,168 | | | | 1,168 | |
Community Trust Bank, 0.30%, 7/5/2012 (3) | | | 240,000 | | | | 240,000 | |
Compass Bank, 0.30%, 7/5/2012 (3) | | | 240,000 | | | | 240,000 | |
Congaree State Bank, 0.30%, 7/5/2012 (3) | | | 1,252 | | | | 1,252 | |
Congressional Bank, 0.30%, 7/5/2012 (3) | | | 1,356 | | | | 1,356 | |
Cooper State Bank, 0.30%, 7/5/2012 (3) | | | 431 | | | | 431 | |
Crescent State Bank, 0.30%, 7/5/2012 (3) | | | 2,140 | | | | 2,140 | |
Crystal Lake Bank and Trust Company N.A., 0.30%, 7/5/2012 (3) | | | 1 | | | | 1 | |
Delta Trust & Bank, 0.30%, 7/5/2012 (3) | | | 4,330 | | | | 4,330 | |
DeWitt Bank & Trust Company, 0.30%, 7/5/2012 (3) | | | 322 | | | | 322 | |
Diamond Bank, 0.30%, 7/5/2012 (3) | | | 3,222 | | | | 3,222 | |
| The Muirfield Fund | |
| | | Shares or Principal Amount ($) | | | | | |
| |
| Bank Obligations — continued | | | | | | | | |
DMB Community Bank, 0.30%, 7/5/2012 (3) | | | 3,070 | | | | 3,070 | |
Dollar Bank Federal Savings Bank, 0.30%, 7/5/2012 (3) | | | 1,095 | | | | 1,095 | |
Dubuque Bank & Trust Company, 0.30%, 7/5/2012 (3) | | | 431 | | | | 431 | |
Eagle Bank and Trust Company, 0.30%, 7/5/2012 (3) | | | 1,118 | | | | 1,118 | |
EagleBank, 0.30%, 7/5/2012 (3) | | | 240,000 | | | | 240,000 | |
East River Bank, 0.30%, 7/5/2012 (3) | | | 115 | | | | 115 | |
East West Bank, 0.30%, 7/5/2012 (3) | | | 240,511 | | | | 240,511 | |
Empire National Bank, 0.30%, 7/5/2012 (3) | | | 434 | | | | 434 | |
Encore Bank National Association, 0.30%, 7/5/2012 (3) | | | 319 | | | | 319 | |
Encore National Bank, 0.30%, 7/5/2012 (3) | | | 125 | | | | 125 | |
Enterprise Bank & Trust, 0.30%, 7/5/2012 (3) | | | 7,692 | | | | 7,692 | |
Equity Bank A National Association, 0.30%, 7/5/2012 (3) | | | 994 | | | | 994 | |
Exchange Bank & Trust Company, 0.30%, 7/5/2012 (3) | | | 2,303 | | | | 2,303 | |
Exchange State Bank, 0.30%, 7/5/2012 (3) | | | 433 | | | | 433 | |
Fannin Bank, 0.30%, 7/5/2012 (3) | | | 1 | | | | 1 | |
Farmers & Merchants Bank of Long Beach, 0.30%, 7/5/2012 (3) | | | 69 | | | | 69 | |
Farmers & Merchants State Bank, 0.30%, 7/5/2012 (3) | | | 124 | | | | 124 | |
Farmers and Merchants State Bank of Blooming , 0.30%, 7/5/2012 (3) | | | 839 | | | | 839 | |
Farmers Bank, 0.30%, 7/5/2012 (3) | | | 135 | | | | 135 | |
Farmers Exchange Bank, 0.30%, 7/5/2012 (3) | | | 1,580 | | | | 1,580 | |
Farmers State Bank, 0.30%, 7/5/2012 (3) | | | 1 | | | | 1 | |
Fidelity Bank, 0.30%, 7/5/2012 (3) | | | 2,975 | | | | 2,975 | |
Fifth Third Bank, 0.30%, 7/5/2012 (3) | | | 240,000 | | | | 240,000 | |
First Bank & Trust, 0.30%, 7/5/2012 (3) | | | 2 | | | | 2 | |
First Bank Financial Centre, 0.30%, 7/5/2012 (3) | | | 103 | | | | 103 | |
First Choice Bank, 0.30%, 7/5/2012 (3) | | | 1,929 | | | | 1,929 | |
First Commercial Bank, 0.30%, 7/5/2012 (3) | | | 102 | | | | 102 | |
First Commercial Bank, 0.30%, 7/5/2012 (3) | | | 853 | | | | 853 | |
First Community Bank, 0.30%, 7/5/2012 (3) | | | 2,057 | | | | 2,057 | |
First County Bank, 0.30%, 7/5/2012 (3) | | | 5,903 | | | | 5,903 | |
First Federal Bank, 0.30%, 7/5/2012 (3) | | | 1,589 | | | | 1,589 | |
First Foundation Bank, 0.30%, 7/5/2012 (3) | | | 11,657 | | | | 11,657 | |
First International Bank & Trust, 0.30%, 7/5/2012 (3) | | | 136 | | | | 136 | |
First Internet Bank of Indiana, 0.30%, 7/5/2012 (3) | | | 4,820 | | | | 4,820 | |
First Interstate Bank, 0.30%, 7/5/2012 (3) | | | 80 | | | | 80 | |
First N.A., 0.30%, 7/5/2012 (3) | | | 1,858 | | | | 1,858 | |
First National Bank, 0.30%, 7/5/2012 (3) | | | 4,171 | | | | 4,171 | |
First National Bank, 0.30%, 7/5/2012 (3) | | | 104 | | | | 104 | |
First National Bank - Fox Valley, 0.30%, 7/5/2012 (3) | | | 147 | | | | 147 | |
First National Bank in Green Forest, 0.30%, 7/5/2012 (3) | | | 221 | | | | 221 | |
First National Bank in Sioux Falls, 0.30%, 7/5/2012 (3) | | | 102 | | | | 102 | |
The accompanying notes are an integral part of these financial statements.
| | 2012 Semi-Annual Report | June 30, 2012 |
Schedule of Investments
June 30, 2012 (unaudited)
| The Muirfield Fund | |
| | | Shares or Principal Amount ($) | | | | | |
| |
| Bank Obligations — continued | | | | | | | | |
First National Bank of America, 0.30%, 7/5/2012 (3) | | | 111 | | | | 111 | |
First National Bank of Fort Smith, 0.30%, 7/5/2012 (3) | | | 164 | | | | 164 | |
First National Bank of Long Island, 0.30%, 7/5/2012 (3) | | | 10,706 | | | | 10,706 | |
First National Bank of Omaha, 0.30%, 7/5/2012 (3) | | | 70 | | | | 70 | |
First National Bank of Santa Fe, 0.30%, 7/5/2012 (3) | | | 2,406 | | | | 2,406 | |
First Premier Bank, 0.30%, 7/5/2012 (3) | | | 3,221 | | | | 3,221 | |
First Security Bank, 0.30%, 7/5/2012 (3) | | | 8,935 | | | | 8,935 | |
First Security Bank & Trust Company, 0.30%, 7/5/2012 (3) | | | 11 | | | | 11 | |
First State Bank, 0.30%, 7/5/2012 (3) | | | 875 | | | | 875 | |
First State Bank, 0.30%, 7/5/2012 (3) | | | 40 | | | | 40 | |
First State Bank of DeQueen, 0.30%, 7/5/2012 (3) | | | 924 | | | | 924 | |
First State Bank of Northwest Arkansas, 0.30%, 7/5/2012 (3) | | | 626 | | | | 626 | |
First Trade Union Bank, 0.30%, 7/5/2012 (3) | | | 167 | | | | 167 | |
First Utah Bank, 0.30%, 7/5/2012 (3) | | | 107 | | | | 107 | |
First Virginia Community Bank, 0.30%, 7/5/2012 (3) | | | 892 | | | | 892 | |
First Western Bank, 0.30%, 7/5/2012 (3) | | | 9 | | | | 9 | |
First-Citizens Bank & Trust Company, 0.30%, 7/5/2012 (3) | | | 10,582 | | | | 10,582 | |
FirstAtlantic Bank, 0.30%, 7/5/2012 (3) | | | 104 | | | | 104 | |
FirstBank, 0.30%, 7/5/2012 (3) | | | 1,326 | | | | 1,326 | |
FirstBank Puerto Rico, 0.30%, 7/5/2012 (3) | | | 240,000 | | | | 240,000 | |
FirstMerit Bank National Association, 0.30%, 7/5/2012 (3) | | | 218 | | | | 218 | |
Flagship Community Bank, 0.30%, 7/5/2012 (3) | | | 102 | | | | 102 | |
Flatirons Bank, 0.30%, 7/5/2012 (3) | | | 1,327 | | | | 1,327 | |
Florida Business Bank, 0.30%, 7/5/2012 (3) | | | 434 | | | | 434 | |
Florida Parishes Bank, 0.30%, 7/5/2012 (3) | | | 87 | | | | 87 | |
Forrest City Bank NA, 0.30%, 7/5/2012 (3) | | | 213 | | | | 213 | |
Fortune Bank, 0.30%, 7/5/2012 (3) | | | 1,402 | | | | 1,402 | |
Fox Chase Bank, 0.30%, 7/5/2012 (3) | | | 893 | | | | 893 | |
Franklin Synergy Bank, 0.30%, 7/5/2012 (3) | | | 3,885 | | | | 3,885 | |
Frost National Bank, 0.30%, 7/5/2012 (3) | | | 131 | | | | 131 | |
Genesee Regional Bank, 0.30%, 7/5/2012 (3) | | | 3,091 | | | | 3,091 | |
Georgia Bank & Trust Company of Augusta, 0.30%, 7/5/2012 (3) | | | 2,347 | | | | 2,347 | |
Georgia Banking Company, 0.30%, 7/5/2012 (3) | | | 1,407 | | | | 1,407 | |
German American Bancorp, 0.30%, 7/5/2012 (3) | | | 651 | | | | 651 | |
Glacier Bank, 0.30%, 7/5/2012 (3) | | | 7,385 | | | | 7,385 | |
Glens Falls National Bank and Trust Company, 0.30%, 7/5/2012 (3) | | | 32 | | | | 32 | |
Golden Pacific Bank National Association, 0.30%, 7/5/2012 (3) | | | 102 | | | | 102 | |
Gotham Bank of New York, 0.30%, 7/5/2012 (3) | | | 1,903 | | | | 1,903 | |
| The Muirfield Fund | |
| | | Shares or Principal Amount ($) | | | | | |
| |
| Bank Obligations — continued | | | | | | | | |
Grand Savings Bank, 0.30%, 7/5/2012 (3) | | | 1,095 | | | | 1,095 | |
Grand Valley Bank, 0.30%, 7/5/2012 (3) | | | 431 | | | | 431 | |
Green Bank National Association, 0.30%, 7/5/2012 (3) | | | 2,381 | | | | 2,381 | |
Guaranty Bank, 0.30%, 7/5/2012 (3) | | | 1,335 | | | | 1,335 | |
Guaranty Bond Bank, 0.30%, 7/5/2012 (3) | | | 18,610 | | | | 18,610 | |
GulfShore Bank, 0.30%, 7/5/2012 (3) | | | 1,327 | | | | 1,327 | |
Happy State Bank, 0.30%, 7/5/2012 (3) | | | 136 | | | | 136 | |
Heartland Bank, 0.30%, 7/5/2012 (3) | | | 16 | | | | 16 | |
Heartland Bank, 0.30%, 7/5/2012 (3) | | | 8 | | | | 8 | |
Helena National Bank, 0.30%, 7/5/2012 (3) | | | 776 | | | | 776 | |
Heritage Oaks Bank, 0.30%, 7/5/2012 (3) | | | 4,623 | | | | 4,623 | |
Hingham Institution for Savings, 0.30%, 7/5/2012 (3) | | | 4,192 | | | | 4,192 | |
Home Federal Bank, 0.30%, 7/5/2012 (3) | | | 1,409 | | | | 1,409 | |
Horizon Bank National Association, 0.30%, 7/5/2012 (3) | | | 143 | | | | 143 | |
Hyperion Bank, 0.30%, 7/5/2012 (3) | | | 221 | | | | 221 | |
IBERIABANK, 0.30%, 7/5/2012 (3) | | | 240,000 | | | | 240,000 | |
Icon Bank of Texas National Association, 0.30%, 7/5/2012 (3) | | | 300 | | | | 300 | |
Independence Bank, 0.30%, 7/5/2012 (3) | | | 69 | | | | 69 | |
Independent Bank of Texas, 0.30%, 7/5/2012 (3) | | | 104 | | | | 104 | |
Inland Bank and Trust, 0.30%, 7/5/2012 (3) | | | 19 | | | | 19 | |
Integrity Bank, 0.30%, 7/5/2012 (3) | | | 888 | | | | 888 | |
Investors Community Bank, 0.30%, 7/5/2012 (3) | | | 434 | | | | 434 | |
Isabella Bank, 0.30%, 7/5/2012 (3) | | | 113 | | | | 113 | |
Israel Discount Bank of New York, 0.30%, 7/5/2012 (3) | | | 240,000 | | | | 240,000 | |
JPMorgan Chase Bank National Association, 0.30%, 7/5/2012 (3) | | | 68 | | | | 68 | |
Kaiser Federal Bank, 0.30%, 7/5/2012 (3) | | | 433 | | | | 433 | |
Katahdin Trust Company, 0.30%, 7/5/2012 (3) | | | 2,338 | | | | 2,338 | |
KeyBank National Association, 0.30%, 7/5/2012 (3) | | | 1,679 | | | | 1,679 | |
KeySource Commercial Bank, 0.30%, 7/5/2012 (3) | | | 150 | | | | 150 | |
Lake Forest Bank & Trust Company, 0.30%, 7/5/2012 (3) | | | 1 | | | | 1 | |
Lake National Bank, 0.30%, 7/5/2012 (3) | | | 8 | | | | 8 | |
Landmark Community Bank, 0.30%, 7/5/2012 (3) | | | 873 | | | | 873 | |
Landmark National Bank, 0.30%, 7/5/2012 (3) | | | 228 | | | | 228 | |
Leader Bank National Association, 0.30%, 7/5/2012 (3) | | | 1,031 | | | | 1,031 | |
Legacy Bank, 0.30%, 7/5/2012 (3) | | | 103 | | | | 103 | |
Legacy National Bank, 0.30%, 7/5/2012 (3) | | | 438 | | | | 438 | |
LegacyTexas Bank, 0.30%, 7/5/2012 (3) | | | 8 | | | | 8 | |
Level One Bank, 0.30%, 7/5/2012 (3) | | | 2,638 | | | | 2,638 | |
Lewis & Clark Bank, 0.30%, 7/5/2012 (3) | | | 432 | | | | 432 | |
Libertad Bank SSB, 0.30%, 7/5/2012 (3) | | | 400 | | | | 400 | |
Liberty Bank, 0.30%, 7/5/2012 (3) | | | 3,419 | | | | 3,419 | |
The accompanying notes are an integral part of these financial statements.
| | 2012 Semi-Annual Report | June 30, 2012 |
Schedule of Investments
June 30, 2012 (unaudited)
| The Muirfield Fund | |
| | | Shares or Principal Amount ($) | | | | | |
| |
| Bank Obligations — continued | | | | | | | | |
Liberty Bank, 0.30%, 7/5/2012 (3) | | | 430 | | | | 430 | |
Liberty Bank National Association, 0.30%, 7/5/2012 (3) | | | 1 | | | | 1 | |
Liberty Bank of Arkansas, 0.30%, 7/5/2012 (3) | | | 3,955 | | | | 3,955 | |
Libertyville Bank & Trust Company, 0.30%, 7/5/2012 (3) | | | 1 | | | | 1 | |
Lifestore Bank, 0.30%, 7/5/2012 (3) | | | 104 | | | | 104 | |
Lone Star National Bank, 0.30%, 7/5/2012 (3) | | | 4,878 | | | | 4,878 | |
MainStreet Bank, 0.30%, 7/5/2012 (3) | | | 2,352 | | | | 2,352 | |
Manufacturers Bank, 0.30%, 7/5/2012 (3) | | | 46,382 | | | | 46,382 | |
MB Financial Bank N.A., 0.30%, 7/5/2012 (3) | | | 137 | | | | 137 | |
mBank, 0.30%, 7/5/2012 (3) | | | 984 | | | | 984 | |
Mercantil Commercebank National Association, 0.30%, 7/5/2012 (3) | | | 542 | | | | 542 | |
Mercantile Bank & Trust Company, 0.30%, 7/5/2012 (3) | | | 1,840 | | | | 1,840 | |
Mercantile Bank of Michigan, 0.30%, 7/5/2012 (3) | | | 5,175 | | | | 5,175 | |
Merchants & Farmers Bank, 0.30%, 7/5/2012 (3) | | | 213 | | | | 213 | |
Merchants Bank, 0.30%, 7/5/2012 (3) | | | 53 | | | | 53 | |
Meridian Bank, 0.30%, 7/5/2012 (3) | | | 272 | | | | 272 | |
Metropolitan Capital Bank & Trust, 0.30%, 7/5/2012 (3) | | | 1,911 | | | | 1,911 | |
Metropolitan National Bank, 0.30%, 7/5/2012 (3) | | | 12,123 | | | | 12,123 | |
Midwest Regional Bank, 0.30%, 7/5/2012 (3) | | | 51 | | | | 51 | |
Mifflin County Savings Bank, 0.30%, 7/5/2012 (3) | | | 212 | | | | 212 | |
MileStone Bank, 0.30%, 7/5/2012 (3) | | | 651 | | | | 651 | |
Miners Bank, 0.30%, 7/5/2012 (3) | | | 873 | | | | 873 | |
Minnesota Bank & Trust, 0.30%, 7/5/2012 (3) | | | 1,838 | | | | 1,838 | |
Morris Bank, 0.30%, 7/5/2012 (3) | | | 161 | | | | 161 | |
National Bank & Trust Company, 0.30%, 7/5/2012 (3) | | | 1,134 | | | | 1,134 | |
National Bank of California, 0.30%, 7/5/2012 (3) | | | 41 | | | | 41 | |
Needham Bank, 0.30%, 7/5/2012 (3) | | | 3,036 | | | | 3,036 | |
New Mexico Bank & Trust, 0.30%, 7/5/2012 (3) | | | 1,506 | | | | 1,506 | |
Newburyport Five Cents Savings Bank, 0.30%, 7/5/2012 (3) | | | 19 | | | | 19 | |
NOA Bank, 0.30%, 7/5/2012 (3) | | | 130 | | | | 130 | |
Noah Bank, 0.30%, 7/5/2012 (3) | | | 774 | | | | 774 | |
North Jersey Community Bank, 0.30%, 7/5/2012 (3) | | | 2,188 | | | | 2,188 | |
North Shore Community Bank & Trust Company, 0.30%, 7/5/2012 (3) | | | 1 | | | | 1 | |
Northbrook Bank & Trust Company, 0.30%, 7/5/2012 (3) | | | 9 | | | | 9 | |
Northern Bank & Trust Company, 0.30%, 7/5/2012 (3) | | | 4,789 | | | | 4,789 | |
Nuvo Bank & Trust Company, 0.30%, 7/5/2012 (3) | | | 1,356 | | | | 1,356 | |
| The Muirfield Fund | |
| | | Shares or Principal Amount ($) | | | | | |
| Bank Obligations — continued | | | | | | | | |
Oak View National Bank, 0.30%, 7/5/2012 (3) | | | 211 | | | | 211 | |
Oasis Bank SSB, 0.30%, 7/5/2012 (3) | | | 28 | | | | 28 | |
OceanFirst Bank, 0.30%, 7/5/2012 (3) | | | 103 | | | | 103 | |
Ohio Commerce Bank, 0.30%, 7/5/2012 (3) | | | 473 | | | | 473 | |
Old Plank Trail Community Bank National Assoc, 0.30%, 7/5/2012 (3) | | | 46 | | | | 46 | |
One Bank & Trust National Association, 0.30%, 7/5/2012 (3) | | | 212 | | | | 212 | |
OneWest Bank FSB, 0.30%, 7/5/2012 (3) | | | 3,047 | | | | 3,047 | |
Ossian State Bank, 0.30%, 7/5/2012 (3) | | | 81 | | | | 81 | |
Pacific Commerce Bank, 0.30%, 7/5/2012 (3) | | | 2,502 | | | | 2,502 | |
Pacific Enterprise Bank, 0.30%, 7/5/2012 (3) | | | 2,855 | | | | 2,855 | |
Paragon Commercial Bank, 0.30%, 7/5/2012 (3) | | | 9,584 | | | | 9,584 | |
Parkside Financial Bank & Trust, 0.30%, 7/5/2012 (3) | | | 1,326 | | | | 1,326 | |
Peapack-Gladstone Bank, 0.30%, 7/5/2012 (3) | | | 1 | | | | 1 | |
Pegasus Bank, 0.30%, 7/5/2012 (3) | | | 318 | | | | 318 | |
Peoples Bank National Association, 0.30%, 7/5/2012 (3) | | | 116 | | | | 116 | |
Peoples Bank of Commerce, 0.30%, 7/5/2012 (3) | | | 870 | | | | 870 | |
Peoples Community Bank, 0.30%, 7/5/2012 (3) | | | 1,287 | | | | 1,287 | |
Peoples United Bank, 0.30%, 7/5/2012 (3) | | | 240,000 | | | | 240,000 | |
Petit Jean State Bank, 0.30%, 7/5/2012 (3) | | | 766 | | | | 766 | |
Pine Bluff National Bank, 0.30%, 7/5/2012 (3) | | | 547 | | | | 547 | |
Plaza Bank, 0.30%, 7/5/2012 (3) | | | 104 | | | | 104 | |
PNC Bank National Association, 0.30%, 7/5/2012 (3) | | | 2,029 | | | | 2,029 | |
Post Oak Bank N.A., 0.30%, 7/5/2012 (3) | | | 434 | | | | 434 | |
Premier Bank, 0.30%, 7/5/2012 (3) | | | 2,347 | | | | 2,347 | |
Premier Bank, 0.30%, 7/5/2012 (3) | | | 1,127 | | | | 1,127 | |
PrinsBank, 0.30%, 7/5/2012 (3) | | | 542 | | | | 542 | |
Private Bank Minnesota, 0.30%, 7/5/2012 (3) | | | 1,330 | | | | 1,330 | |
ProAmérica Bank, 0.30%, 7/5/2012 (3) | | | 2,343 | | | | 2,343 | |
Professional Business Bank, 0.30%, 7/5/2012 (3) | | | 434 | | | | 434 | |
Progress Bank and Trust, 0.30%, 7/5/2012 (3) | | | 441 | | | | 441 | |
Quad City Bank and Trust Company, 0.30%, 7/5/2012 (3) | | | 4,938 | | | | 4,938 | |
Quontic Bank, 0.30%, 7/5/2012 (3) | | | 102 | | | | 102 | |
RBS Citizens National Association, 0.30%, 7/5/2012 (3) | | | 147 | | | | 147 | |
Regent Bank, 0.30%, 7/5/2012 (3) | | | 107 | | | | 107 | |
Regions Bank, 0.30%, 7/5/2012 (3) | | | 11,552 | | | | 11,552 | |
Renasant Bank, 0.30%, 7/5/2012 (3) | | | 4,106 | | | | 4,106 | |
Republic Bank, 0.30%, 7/5/2012 (3) | | | 435 | | | | 435 | |
Republic Bank & Trust, 0.30%, 7/5/2012 (3) | | | 257 | | | | 257 | |
Republic Bank & Trust Company, 0.30%, 7/5/2012 (3) | | | 103 | | | | 103 | |
River Community Bank N.A., 0.30%, 7/5/2012 (3) | | | 1,020 | | | | 1,020 | |
The accompanying notes are an integral part of these financial statements.
| | 2012 Semi-Annual Report | June 30, 2012 |
Schedule of Investments
June 30, 2012 (unaudited)
| The Muirfield Fund | |
| | | Shares or Principal Amount ($) | | | | | |
| |
| Bank Obligations — continued | | | | | | | | |
RiverBend Bank, 0.30%, 7/5/2012 (3) | | | 21 | | | | 21 | |
Riverside Bank, 0.30%, 7/5/2012 (3) | | | 132 | | | | 132 | |
Riverview Bank, 0.30%, 7/5/2012 (3) | | | 869 | | | | 869 | |
Rockland Trust Company, 0.30%, 7/5/2012 (3) | | | 5,732 | | | | 5,732 | |
RSNB Bank, 0.30%, 7/5/2012 (3) | | | 1,628 | | | | 1,628 | |
Saratoga National Bank & Trust Company, 0.30%, 7/5/2012 (3) | | | 32 | | | | 32 | |
Sauk Valley Bank & Trust Company, 0.30%, 7/5/2012 (3) | | | 4 | | | | 4 | |
Savings Institute Bank and Trust Company, 0.30%, 7/5/2012 (3) | | | 651 | | | | 651 | |
Schaumburg Bank & Trust Company National Asso, 0.30%, 7/5/2012 (3) | | | 1 | | | | 1 | |
Seaside National Bank & Trust, 0.30%, 7/5/2012 (3) | | | 9,132 | | | | 9,132 | |
Seaway Bank and Trust Company, 0.30%, 7/5/2012 (3) | | | 2,334 | | | | 2,334 | |
Security First Bank, 0.30%, 7/5/2012 (3) | | | 16 | | | | 16 | |
SharePlus Federal Bank, 0.30%, 7/5/2012 (3) | | | 176 | | | | 176 | |
Signature Bank, 0.30%, 7/5/2012 (3) | | | 1,014 | | | | 1,014 | |
Signature Bank, 0.30%, 7/5/2012 (3) | | | 199,340 | | | | 199,340 | |
Signature Bank National Association, 0.30%, 7/5/2012 (3) | | | 112 | | | | 112 | |
Solera National Bank, 0.30%, 7/5/2012 (3) | | | 476 | | | | 476 | |
Southern Bancorp Bank, 0.30%, 7/5/2012 (3) | | | 75 | | | | 75 | |
Southern Bank, 0.30%, 7/5/2012 (3) | | | 10 | | | | 10 | |
Southwest Bank, 0.30%, 7/5/2012 (3) | | | 2,434 | | | | 2,434 | |
Sovereign Bank National Association, 0.30%, 7/5/2012 (3) | | | 240,000 | | | | 240,000 | |
St. Charles Bank & Trust Company, 0.30%, 7/5/2012 (3) | | | 146 | | | | 146 | |
State Bank and Trust Company, 0.30%, 7/5/2012 (3) | | | 265 | | | | 265 | |
State Bank of the Lakes, 0.30%, 7/5/2012 (3) | | | 1 | | | | 1 | |
Sterling National Bank, 0.30%, 7/5/2012 (3) | | | 34,411 | | | | 34,411 | |
Sturdy Savings Bank, 0.30%, 7/5/2012 (3) | | | 103 | | | | 103 | |
Summit Bank, 0.30%, 7/5/2012 (3) | | | 393 | | | | 393 | |
Summit Bank & Trust, 0.30%, 7/5/2012 (3) | | | 1,904 | | | | 1,904 | |
Summit Community Bank Inc., 0.30%, 7/5/2012 (3) | | | 448 | | | | 448 | |
TD Bank N.A., 0.30%, 7/5/2012 (3) | | | 240,000 | | | | 240,000 | |
Team Capital Bank, 0.30%, 7/5/2012 (3) | | | 11,180 | | | | 11,180 | |
Texas Capital Bank National Association, 0.30%, 7/5/2012 (3) | | | 240,000 | | | | 240,000 | |
Touchmark National Bank, 0.30%, 7/5/2012 (3) | | | 1,389 | | | | 1,389 | |
Town Bank, 0.30%, 7/5/2012 (3) | | | 3 | | | | 3 | |
Transportation Alliance Bank Inc., 0.30%, 7/5/2012 (3) | | | 8 | | | | 8 | |
Treynor State Bank, 0.30%, 7/5/2012 (3) | | | 2,373 | | | | 2,373 | |
TriSummit Bank, 0.30%, 7/5/2012 (3) | | | 2,280 | | | | 2,280 | |
U.S. Bank National Association, 0.30%, 7/5/2012 (3) | | | 165 | | | | 165 | |
Uinta Bank, 0.30%, 7/5/2012 (3) | | | 1,442 | | | | 1,442 | |
| The Muirfield Fund | |
| | | Shares or Principal Amount ($) | | | | | |
| |
| Bank Obligations — continued | | | | | | | | |
UMB Bank Arizona National Association, 0.30%, 7/5/2012 (3) | | | 107 | | | | 107 | |
UMB Bank Colorado National Association, 0.30%, 7/5/2012 (3) | | | 16 | | | | 16 | |
UMB Bank National Association, 0.30%, 7/5/2012 (3) | | | 134 | | | | 134 | |
Umpqua Bank, 0.30%, 7/5/2012 (3) | | | 81 | | | | 81 | |
Union Bank National Association, 0.30%, 7/5/2012 (3) | | | 135 | | | | 135 | |
Union Bank of Mena, 0.30%, 7/5/2012 (3) | | | 16 | | | | 16 | |
Union Center National Bank, 0.30%, 7/5/2012 (3) | | | 46,382 | | | | 46,382 | |
United Bank, 0.30%, 7/5/2012 (3) | | | 2,152 | | | | 2,152 | |
United Bank, 0.30%, 7/5/2012 (3) | | | 105 | | | | 105 | |
United Bank Inc., 0.30%, 7/5/2012 (3) | | | 1,967 | | | | 1,967 | |
USNY Bank, 0.30%, 7/5/2012 (3) | | | 666 | | | | 666 | |
Valley Bank, 0.30%, 7/5/2012 (3) | | | 759 | | | | 759 | |
Valley National Bank, 0.30%, 7/5/2012 (3) | | | 220,141 | | | | 220,141 | |
Valliance Bank, 0.30%, 7/5/2012 (3) | | | 126 | | | | 126 | |
Veritex Community Bank National Association, 0.30%, 7/5/2012 (3) | | | 43 | | | | 43 | |
Verus Bank of Commerce, 0.30%, 7/5/2012 (3) | | | 3,444 | | | | 3,444 | |
Victory Bank, 0.30%, 7/5/2012 (3) | | | 217 | | | | 217 | |
ViewPoint Bank National Association, 0.30%, 7/5/2012 (3) | | | 5,278 | | | | 5,278 | |
Village Bank & Trust, 0.30%, 7/5/2012 (3) | | | 8 | | | | 8 | |
Virginia Heritage Bank, 0.30%, 7/5/2012 (3) | | | 3,297 | | | | 3,297 | |
Warren Bank & Trust Company, 0.30%, 7/5/2012 (3) | | | 1,088 | | | | 1,088 | |
Washington Trust Bank, 0.30%, 7/5/2012 (3) | | | 1,405 | | | | 1,405 | |
Washington Trust Company of Westerly, 0.30%, 7/5/2012 (3) | | | 152 | | | | 152 | |
Webster Bank National Association, 0.30%, 7/5/2012 (3) | | | 104 | | | | 104 | |
Wells Fargo Bank National Association, 0.30%, 7/5/2012 (3) | | | 238 | | | | 238 | |
West Town Savings Bank, 0.30%, 7/5/2012 (3) | | | 16 | | | | 16 | |
Western Alliance Bank, 0.30%, 7/5/2012 (3) | | | 53 | | | | 53 | |
Western National Bank, 0.30%, 7/5/2012 (3) | | | 197 | | | | 197 | |
Wheaton Bank & Trust Company, 0.30%, 7/5/2012 (3) | | | 1 | | | | 1 | |
Whidbey Island Bank, 0.30%, 7/5/2012 (3) | | | 74 | | | | 74 | |
Wilmington Savings Fund Society FSB, 0.30%, 7/5/2012 (3) | | | 4,324 | | | | 4,324 | |
Wilmington Trust National Association, 0.30%, 7/5/2012 (3) | | | 108 | | | | 108 | |
Wisconsin Community Bank, 0.30%, 7/5/2012 (3) | | | 42,621 | | | | 42,621 | |
Wolverine Bank Federal Savings Bank, 0.30%, 7/5/2012 (3) | | | 4 | | | | 4 | |
Xenith Bank, 0.30%, 7/5/2012 (3) | | | 3,914 | | | | 3,914 | |
Total Bank Obligations (Cost $5,004,521) | | | | | | | 5,004,521 | |
The accompanying notes are an integral part of these financial statements.
| | 2012 Semi-Annual Report | June 30, 2012 |
Schedule of Investments
June 30, 2012 (unaudited)
| The Muirfield Fund | |
| | | Shares or Principal Amount ($) | | | | | |
| |
| Floating Rate Demand Notes — 11.0% | | | | | | | | |
Caterpillar Financial Power Investment Floating Rate Demand Note, 0.60%, 7/1/2012 (4) | | | 12,621,905 | | | | 12,621,905 | |
Total Floating Rate Demand Notes (Cost $12,621,905) | | | | | | | 12,621,905 | |
| | | | | | | | | |
| U.S. Government Obligations — 3.1% | | | | | | | | |
U.S. Treasury Bill, 0.12%, due 9/6/2012 (5) | | | 3,500,000 | | | | 3,499,566 | |
Total U.S. Government Obligations (Cost $3,499,230) | | | | | | | 3,499,566 | |
Total Investments — 99.2% (Cost $111,437,994 )(1) | | | | | | | 113,487,031 | |
| Other Assets less Liabilities — 0.8% | | | | | | | 932,880 | |
Total Net Assets — 100.0% | | | | | | | 114,419,911 | |
| | | | | | | | | |
Trustee Deferred Compensation (6) | | | | | | | | |
| The Flex-funds Aggressive Growth Fund | | | 2,520 | | | | 20,009 | |
The Flex-funds Balanced Fund | | | 1,300 | | | | 12,623 | |
| The Flex-funds Dynamic Growth Fund | | | 810 | | | | 6,731 | |
The Flex-funds Muirfield Fund | | | 4,205 | | | | 23,338 | |
The Flex-funds Quantex Fund | | | 2,736 | | | | 62,107 | |
| The Flex-funds Utilities & Infrastructure Fund | | | 290 | | | | 6,847 | |
Total Trustee Deferred Compensation (Cost $106,435) | | | | | | | 131,655 | |
| The Muirfield Fund | |
| | | | | Unrealized Appreciation (Depreciation) ($) | |
| | | | | | | |
| Futures Contracts | |
| Standard & Poors 500 expiring September 2012, notional value $31,875,400 | | | 94 | | | | 891,120 | |
| Standard & Poors Mid Cap 400 E-Mini expiring September 2012, notional value $2,630,600 | | | 28 | | | | 65,030 | |
Total Futures Contracts | | | 122 | | | | 956,150 | |
| (1) | Represents cost for financial reporting purposes and differs for federal income tax purposes by the amount of losses deferred for federal income tax reporting in the amount of $792,550. Cost for federal income tax purposes of $112,230,544 differs from value by net unrealized appreciation (depreciation) of securities as follows: |
Unrealized appreciation | | $ | 2,603,277 | |
Unrealized depreciation | | | (1,346,790 | ) |
| Net unrealized appreciation (depreciation) | | $ | 1,256,487 | |
| (2) | Investment in affiliate. The yield shown represents the 7-day yield in effect at June 30, 2012. |
| (3) | Illiquid security. The sale or disposition of such security would not be possible in the ordinary course of business within seven days at approximately the value at which the Fund has valued the security. These securities were purchased through StoneCastle Partners, LLC, an independent, privately held asset management and investment services company, and are insured through the Federal Deposit Insurance Corporation (FDIC). The interest rate varies monthly and any accrued interest is reinvested into the program on a monthly basis. The securities are classified as illiquid because if the Fund were to redeem its investment in the program, the proceeds are delivered only once per week; on the Wednesday of the next week following the redemption request. The maximum number of days from a redemption request to receiving the proceeds is nine days. Hence the Fund may not be able to receive its proceeds within seven days. As of June 30, 2012, illiquid securities represented 4.4% of Total Investments. |
| (4) | Floating rate security. The rate shown represents the rate in effect at June 30, 2012. |
| (5) | Pledged as collateral on futures contracts. |
| (6) | Assets of affiliates to The Muirfield Fund held for the benefit of the Fund’s Trustees in connection with the Trustee Deferred Compensation Plan. |
The accompanying notes are an integral part of these financial statements.
| | 2012 Semi-Annual Report | June 30, 2012 |
Schedule of Investments
June 30, 2012 (unaudited)
| The Dynamic Growth Fund | |
| | | Shares or Principal Amount ($) | | | | | |
| Registered Investment Companies — 63.1% | |
| Consumer Staples Select Sector SPDR Fund | | | 66,850 | | | | 2,324,375 | |
Energy Select Sector SPDR Fund | | | 49,825 | | | | 3,306,885 | |
| Health Care Select Sector SPDR Fund | | | 119,450 | | | | 4,539,697 | |
| iShares Russell 1000 Growth Index Fund | | | 73,725 | | | | 4,661,632 | |
| iShares Russell 1000 Value Index Fund | | | 95,800 | | | | 6,535,476 | |
Ivy Mid Cap Growth Fund | | | 109,239 | | | | 1,933,524 | |
| JPMorgan Disciplined Equity Fund | | | 468,463 | | | | 8,188,731 | |
PowerShares QQQ Trust | | | 89,700 | | | | 5,755,152 | |
| SPDR Dow Jones Industrial Average ETF Trust | | | 39,050 | | | | 5,015,973 | |
Vanguard Equity Income Fund | | | 109,233 | | | | 5,310,891 | |
| Wells Fargo Advantage Growth Fund | | | 242,870 | | | | 9,964,952 | |
Total Registered Investment Companies (Cost $55,877,353) | | | | | | | 57,537,288 | |
| Money Market Registered Investment Companies — 25.1% | |
The Flex-funds Money Market Fund - Institutional Class, 0.17% (2) | | | 22,861,445 | | | | 22,861,445 | |
Total Money Market Registered Investment Companies (Cost $22,861,445) | | | | | | | 22,861,445 | |
| Bank Obligations — 5.5% | | | | | | | | |
Access National Bank, 0.30%, 7/5/2012 (3) | | | 987 | | | | 987 | |
Allied Bank, 0.30%, 7/5/2012 (3) | | | 434 | | | | 434 | |
Alma Bank, 0.30%, 7/5/2012 (3) | | | 4,804 | | | | 4,804 | |
AloStar Bank of Commerce, 0.30%, 7/5/2012 (3) | | | 3,797 | | | | 3,797 | |
Alpine Bank, 0.30%, 7/5/2012 (3) | | | 3,060 | | | | 3,060 | |
Ameriana Bank, 0.30%, 7/5/2012 (3) | | | 19 | | | | 19 | |
American Enterprise Bank of Florida, 0.30%, 7/5/2012 (3) | | | 492 | | | | 492 | |
American Momentum Bank, 0.30%, 7/5/2012 (3) | | | 5,694 | | | | 5,694 | |
American National Bank, 0.30%, 7/5/2012 (3) | | | 2,277 | | | | 2,277 | |
American National Bank-Fox Cities, 0.30%, 7/5/2012 (3) | | | 215 | | | | 215 | |
American Savings Bank F.S.B., 0.30%, 7/5/2012 (3) | | | 16 | | | | 16 | |
American Savings Bank FSB, 0.30%, 7/5/2012 (3) | | | 155 | | | | 155 | |
Americas United Bank, 0.30%, 7/5/2012 (3) | | | 1,306 | | | | 1,306 | |
AmFirst Bank N.A., 0.30%, 7/5/2012 (3) | | | 38 | | | | 38 | |
Anthem Bank & Trust, 0.30%, 7/5/2012 (3) | | | 873 | | | | 873 | |
Arizona Bank & Trust, 0.30%, 7/5/2012 (3) | | | 4,192 | | | | 4,192 | |
Arvest Bank, 0.30%, 7/5/2012 (3) | | | 220 | | | | 220 | |
Austin Bank of Chicago, 0.30%, 7/5/2012 (3) | | | 869 | | | | 869 | |
Avidia Bank, 0.30%, 7/5/2012 (3) | | | 4,192 | | | | 4,192 | |
Bancorp Bank, 0.30%, 7/5/2012 (3) | | | 10,749 | | | | 10,749 | |
Bank Hapoalim B.M., 0.30%, 7/5/2012 (3) | | | 1,511 | | | | 1,511 | |
Bank Leumi USA, 0.30%, 7/5/2012 (3) | | | 240,000 | | | | 240,000 | |
Bank of America National Association, 0.30%, 7/5/2012 (3) | | | 448 | | | | 448 | |
Bank of Augusta, 0.30%, 7/5/2012 (3) | | | 917 | | | | 917 | |
| The Dynamic Growth Fund | |
| | | Shares or Principal Amount ($) | | | | | |
| | | | | | | | | |
| Bank Obligations — continued | | | | | | | | |
Bank of Cadiz and Trust Company, 0.30%, 7/5/2012 (3) | | | 1,055 | | | | 1,055 | |
Bank of Cave City, 0.30%, 7/5/2012 (3) | | | 437 | | | | 437 | |
Bank of England, 0.30%, 7/5/2012 (3) | | | 1,867 | | | | 1,867 | |
Bank of Fayetteville, 0.30%, 7/5/2012 (3) | | | 436 | | | | 436 | |
Bank of Hawaii, 0.30%, 7/5/2012 (3) | | | 4,983 | | | | 4,983 | |
Bank of Houston, 0.30%, 7/5/2012 (3) | | | 2,661 | | | | 2,661 | |
Bank of Jackson Hole, 0.30%, 7/5/2012 (3) | | | 442 | | | | 442 | |
Bank of Manhattan N.A., 0.30%, 7/5/2012 (3) | | | 1,665 | | | | 1,665 | |
Bank of Marin, 0.30%, 7/5/2012 (3) | | | 218 | | | | 218 | |
Bank of Missouri, 0.30%, 7/5/2012 (3) | | | 4,968 | | | | 4,968 | |
Bank of Princeton, 0.30%, 7/5/2012 (3) | | | 651 | | | | 651 | |
Bank of the Ozarks, 0.30%, 7/5/2012 (3) | | | 108 | | | | 108 | |
Bank of the Panhandle, 0.30%, 7/5/2012 (3) | | | 1,062 | | | | 1,062 | |
Bank of the West, 0.30%, 7/5/2012 (3) | | | 13,559 | | | | 13,559 | |
Bar Harbor Bank & Trust, 0.30%, 7/5/2012 (3) | | | 869 | | | | 869 | |
Belmont Savings Bank, 0.30%, 7/5/2012 (3) | | | 4,601 | | | | 4,601 | |
Benchmark Bank, 0.30%, 7/5/2012 (3) | | | 3 | | | | 3 | |
Benefit Bank, 0.30%, 7/5/2012 (3) | | | 1,345 | | | | 1,345 | |
Berkshire Bank, 0.30%, 7/5/2012 (3) | | | 6,256 | | | | 6,256 | |
Beverly Bank & Trust Company National Associa, 0.30%, 7/5/2012 (3) | | | 30 | | | | 30 | |
Biltmore Bank of Arizona, 0.30%, 7/5/2012 (3) | | | 2,408 | | | | 2,408 | |
BMO Harris Bank National Association, 0.30%, 7/5/2012 (3) | | | 2,493 | | | | 2,493 | |
BOKF National Association, 0.30%, 7/5/2012 (3) | | | 5,969 | | | | 5,969 | |
Boone Bank & Trust Co., 0.30%, 7/5/2012 (3) | | | 1,220 | | | | 1,220 | |
Boston Private Bank & Trust Company, 0.30%, 7/5/2012 (3) | | | 2,184 | | | | 2,184 | |
Branch Banking and Trust Company, 0.30%, 7/5/2012 (3) | | | 1,980 | | | | 1,980 | |
Brookhaven Bank, 0.30%, 7/5/2012 (3) | | | 250 | | | | 250 | |
Business Bank, 0.30%, 7/5/2012 (3) | | | 1,431 | | | | 1,431 | |
Business Bank, 0.30%, 7/5/2012 (3) | | | 462 | | | | 462 | |
Business Bank of Saint Louis, 0.30%, 7/5/2012 (3) | | | 2,094 | | | | 2,094 | |
Business First Bank, 0.30%, 7/5/2012 (3) | | | 2,092 | | | | 2,092 | |
Cache Valley Bank, 0.30%, 7/5/2012 (3) | | | 3,057 | | | | 3,057 | |
Cadence Bank N.A., 0.30%, 7/5/2012 (3) | | | 209,741 | | | | 209,741 | |
California Bank & Trust, 0.30%, 7/5/2012 (3) | | | 87 | | | | 87 | |
Capital Bank, 0.30%, 7/5/2012 (3) | | | 1,156 | | | | 1,156 | |
Capital One National Association, 0.30%, 7/5/2012 (3) | | | 157,954 | | | | 157,954 | |
CapitalMark Bank & Trust, 0.30%, 7/5/2012 (3) | | | 2,903 | | | | 2,903 | |
CapStar Bank, 0.30%, 7/5/2012 (3) | | | 11,181 | | | | 11,181 | |
CapStone Bank, 0.30%, 7/5/2012 (3) | | | 2,126 | | | | 2,126 | |
Cardinal Bank, 0.30%, 7/5/2012 (3) | | | 4,028 | | | | 4,028 | |
Carolina Alliance Bank, 0.30%, 7/5/2012 (3) | | | 115 | | | | 115 | |
Carver Federal Savings Bank, 0.30%, 7/5/2012 (3) | | | 46,382 | | | | 46,382 | |
Cathay Bank, 0.30%, 7/5/2012 (3) | | | 240,000 | | | | 240,000 | |
The accompanying notes are an integral part of these financial statements.
| | 2012 Semi-Annual Report | June 30, 2012 |
Schedule of Investments
June 30, 2012 (unaudited)
| The Dynamic Growth Fund | |
| | | Shares or Principal Amount ($) | | | | | |
| | | | | | | | | |
| Bank Obligations — continued | | | | | | | | |
Celtic Bank, 0.30%, 7/5/2012 (3) | | | 2,441 | | | | 2,441 | |
Centennial Bank, 0.30%, 7/5/2012 (3) | | | 466 | | | | 466 | |
Centra Bank Inc., 0.30%, 7/5/2012 (3) | | | 2,084 | | | | 2,084 | |
Central Bank, 0.30%, 7/5/2012 (3) | | | 695 | | | | 695 | |
Central Bank Illinois, 0.30%, 7/5/2012 (3) | | | 32 | | | | 32 | |
Central Bank of Kansas City, 0.30%, 7/5/2012 (3) | | | 38 | | | | 38 | |
CheckSpring Bank, 0.30%, 7/5/2012 (3) | | | 23 | | | | 23 | |
Chemical Bank, 0.30%, 7/5/2012 (3) | | | 399 | | | | 399 | |
Chickasha Bank & Trust Company, 0.30%, 7/5/2012 (3) | | | 442 | | | | 442 | |
Citizens Bank & Trust Company, 0.30%, 7/5/2012 (3) | | | 3,770 | | | | 3,770 | |
Citizens Bank of Pennsylvania, 0.30%, 7/5/2012 (3) | | | 133 | | | | 133 | |
Citizens National Bank, 0.30%, 7/5/2012 (3) | | | 212 | | | | 212 | |
Citizens National Bank of Bluffton, 0.30%, 7/5/2012 (3) | | | 446 | | | | 446 | |
City First Bank of D.C. National Association, 0.30%, 7/5/2012 (3) | | | 1,597 | | | | 1,597 | |
City National Bank, 0.30%, 7/5/2012 (3) | | | 271 | | | | 271 | |
City National Bank of Sulphur Springs, 0.30%, 7/5/2012 (3) | | | 146 | | | | 146 | |
City National Bank of Taylor, 0.30%, 7/5/2012 (3) | | | 970 | | | | 970 | |
Cole Taylor Bank, 0.30%, 7/5/2012 (3) | | | 79,682 | | | | 79,682 | |
Collin Bank, 0.30%, 7/5/2012 (3) | | | 1,135 | | | | 1,135 | |
Columbia State Bank, 0.30%, 7/5/2012 (3) | | | 3,884 | | | | 3,884 | |
Comerica Bank, 0.30%, 7/5/2012 (3) | | | 4,837 | | | | 4,837 | |
Commencement Bank, 0.30%, 7/5/2012 (3) | | | 1,327 | | | | 1,327 | |
Commerce Bank & Trust Company, 0.30%, 7/5/2012 (3) | | | 6,820 | | | | 6,820 | |
Commerce National Bank, 0.30%, 7/5/2012 (3) | | | 81 | | | | 81 | |
Community Bank & Trust, 0.30%, 7/5/2012 (3) | | | 2,970 | | | | 2,970 | |
Community Bank of Oelwein, 0.30%, 7/5/2012 (3) | | | 907 | | | | 907 | |
Community Bank of Santa Maria, 0.30%, 7/5/2012 (3) | | | 103 | | | | 103 | |
Community Bank of the Bay, 0.30%, 7/5/2012 (3) | | | 167 | | | | 167 | |
Community Mutual Savings Bank, 0.30%, 7/5/2012 (3) | | | 1,168 | | | | 1,168 | |
Community Trust Bank, 0.30%, 7/5/2012 (3) | | | 240,000 | | | | 240,000 | |
Compass Bank, 0.30%, 7/5/2012 (3) | | | 240,000 | | | | 240,000 | |
Congaree State Bank, 0.30%, 7/5/2012 (3) | | | 1,252 | | | | 1,252 | |
Congressional Bank, 0.30%, 7/5/2012 (3) | | | 1,356 | | | | 1,356 | |
Cooper State Bank, 0.30%, 7/5/2012 (3) | | | 431 | | | | 431 | |
Crescent State Bank, 0.30%, 7/5/2012 (3) | | | 2,140 | | | | 2,140 | |
Crystal Lake Bank and Trust Company N.A., 0.30%, 7/5/2012 (3) | | | 1 | | | | 1 | |
Delta Trust & Bank, 0.30%, 7/5/2012 (3) | | | 4,330 | | | | 4,330 | |
DeWitt Bank & Trust Company, 0.30%, 7/5/2012 (3) | | | 322 | | | | 322 | |
Diamond Bank, 0.30%, 7/5/2012 (3) | | | 3,222 | | | | 3,222 | |
| The Dynamic Growth Fund | |
| | | Shares or Principal Amount ($) | | | | | |
| | | | | | | | | |
| Bank Obligations — continued | | | | | | | | |
DMB Community Bank, 0.30%, 7/5/2012 (3) | | | 3,070 | | | | 3,070 | |
Dollar Bank Federal Savings Bank, 0.30%, 7/5/2012 (3) | | | 1,095 | | | | 1,095 | |
Dubuque Bank & Trust Company, 0.30%, 7/5/2012 (3) | | | 431 | | | | 431 | |
Eagle Bank and Trust Company, 0.30%, 7/5/2012 (3) | | | 1,118 | | | | 1,118 | |
EagleBank, 0.30%, 7/5/2012 (3) | | | 240,000 | | | | 240,000 | |
East River Bank, 0.30%, 7/5/2012 (3) | | | 115 | | | | 115 | |
East West Bank, 0.30%, 7/5/2012 (3) | | | 240,511 | | | | 240,511 | |
Empire National Bank, 0.30%, 7/5/2012 (3) | | | 434 | | | | 434 | |
Encore Bank National Association, 0.30%, 7/5/2012 (3) | | | 319 | | | | 319 | |
Encore National Bank, 0.30%, 7/5/2012 (3) | | | 125 | | | | 125 | |
Enterprise Bank & Trust, 0.30%, 7/5/2012 (3) | | | 7,692 | | | | 7,692 | |
Equity Bank A National Association, 0.30%, 7/5/2012 (3) | | | 994 | | | | 994 | |
Exchange Bank & Trust Company, 0.30%, 7/5/2012 (3) | | | 2,303 | | | | 2,303 | |
Exchange State Bank, 0.30%, 7/5/2012 (3) | | | 433 | | | | 433 | |
Fannin Bank, 0.30%, 7/5/2012 (3) | | | 1 | | | | 1 | |
Farmers & Merchants Bank of Long Beach, 0.30%, 7/5/2012 (3) | | | 69 | | | | 69 | |
Farmers & Merchants State Bank, 0.30%, 7/5/2012 (3) | | | 124 | | | | 124 | |
Farmers and Merchants State Bank of Blooming , 0.30%, 7/5/2012 (3) | | | 839 | | | | 839 | |
Farmers Bank, 0.30%, 7/5/2012 (3) | | | 135 | | | | 135 | |
Farmers Exchange Bank, 0.30%, 7/5/2012 (3) | | | 1,580 | | | | 1,580 | |
Farmers State Bank, 0.30%, 7/5/2012 (3) | | | 1 | | | | 1 | |
Fidelity Bank, 0.30%, 7/5/2012 (3) | | | 2,975 | | | | 2,975 | |
Fifth Third Bank, 0.30%, 7/5/2012 (3) | | | 240,000 | | | | 240,000 | |
First Bank & Trust, 0.30%, 7/5/2012 (3) | | | 2 | | | | 2 | |
First Bank Financial Centre, 0.30%, 7/5/2012 (3) | | | 103 | | | | 103 | |
First Choice Bank, 0.30%, 7/5/2012 (3) | | | 1,929 | | | | 1,929 | |
First Commercial Bank, 0.30%, 7/5/2012 (3) | | | 102 | | | | 102 | |
First Commercial Bank, 0.30%, 7/5/2012 (3) | | | 853 | | | | 853 | |
First Community Bank, 0.30%, 7/5/2012 (3) | | | 2,057 | | | | 2,057 | |
First County Bank, 0.30%, 7/5/2012 (3) | | | 5,903 | | | | 5,903 | |
First Federal Bank, 0.30%, 7/5/2012 (3) | | | 1,589 | | | | 1,589 | |
First Foundation Bank, 0.30%, 7/5/2012 (3) | | | 11,657 | | | | 11,657 | |
First International Bank & Trust, 0.30%, 7/5/2012 (3) | | | 136 | | | | 136 | |
First Internet Bank of Indiana, 0.30%, 7/5/2012 (3) | | | 4,820 | | | | 4,820 | |
First Interstate Bank, 0.30%, 7/5/2012 (3) | | | 80 | | | | 80 | |
First N.A., 0.30%, 7/5/2012 (3) | | | 1,858 | | | | 1,858 | |
First National Bank, 0.30%, 7/5/2012 (3) | | | 4,171 | | | | 4,171 | |
First National Bank, 0.30%, 7/5/2012 (3) | | | 104 | | | | 104 | |
First National Bank - Fox Valley, 0.30%, 7/5/2012 (3) | | | 147 | | | | 147 | |
First National Bank in Green Forest, 0.30%, 7/5/2012 (3) | | | 221 | | | | 221 | |
First National Bank in Sioux Falls, 0.30%, 7/5/2012 (3) | | | 102 | | | | 102 | |
The accompanying notes are an integral part of these financial statements.
| | 2012 Semi-Annual Report | June 30, 2012 |
Schedule of Investments
June 30, 2012 (unaudited)
| The Dynamic Growth Fund | |
| | | Shares or Principal Amount ($) | | | | | |
| |
| Bank Obligations — continued | | | | | | | | |
First National Bank of America, 0.30%, 7/5/2012 (3) | | | 111 | | | | 111 | |
First National Bank of Fort Smith, 0.30%, 7/5/2012 (3) | | | 164 | | | | 164 | |
First National Bank of Long Island, 0.30%, 7/5/2012 (3) | | | 10,706 | | | | 10,706 | |
First National Bank of Omaha, 0.30%, 7/5/2012 (3) | | | 70 | | | | 70 | |
First National Bank of Santa Fe, 0.30%, 7/5/2012 (3) | | | 2,406 | | | | 2,406 | |
First Premier Bank, 0.30%, 7/5/2012 (3) | | | 3,221 | | | | 3,221 | |
First Security Bank, 0.30%, 7/5/2012 (3) | | | 8,935 | | | | 8,935 | |
First Security Bank & Trust Company, 0.30%, 7/5/2012 (3) | | | 11 | | | | 11 | |
First State Bank, 0.30%, 7/5/2012 (3) | | | 875 | | | | 875 | |
First State Bank, 0.30%, 7/5/2012 (3) | | | 40 | | | | 40 | |
First State Bank of DeQueen, 0.30%, 7/5/2012 (3) | | | 924 | | | | 924 | |
First State Bank of Northwest Arkansas, 0.30%, 7/5/2012 (3) | | | 626 | | | | 626 | |
First Trade Union Bank, 0.30%, 7/5/2012 (3) | | | 167 | | | | 167 | |
First Utah Bank, 0.30%, 7/5/2012 (3) | | | 107 | | | | 107 | |
First Virginia Community Bank, 0.30%, 7/5/2012 (3) | | | 892 | | | | 892 | |
First Western Bank, 0.30%, 7/5/2012 (3) | | | 9 | | | | 9 | |
First-Citizens Bank & Trust Company, 0.30%, 7/5/2012 (3) | | | 10,582 | | | | 10,582 | |
FirstAtlantic Bank, 0.30%, 7/5/2012 (3) | | | 104 | | | | 104 | |
FirstBank, 0.30%, 7/5/2012 (3) | | | 1,326 | | | | 1,326 | |
FirstBank Puerto Rico, 0.30%, 7/5/2012 (3) | | | 240,000 | | | | 240,000 | |
FirstMerit Bank National Association, 0.30%, 7/5/2012 (3) | | | 218 | | | | 218 | |
Flagship Community Bank, 0.30%, 7/5/2012 (3) | | | 102 | | | | 102 | |
Flatirons Bank, 0.30%, 7/5/2012 (3) | | | 1,327 | | | | 1,327 | |
Florida Business Bank, 0.30%, 7/5/2012 (3) | | | 434 | | | | 434 | |
Florida Parishes Bank, 0.30%, 7/5/2012 (3) | | | 87 | | | | 87 | |
Forrest City Bank NA, 0.30%, 7/5/2012 (3) | | | 213 | | | | 213 | |
Fortune Bank, 0.30%, 7/5/2012 (3) | | | 1,402 | | | | 1,402 | |
Fox Chase Bank, 0.30%, 7/5/2012 (3) | | | 893 | | | | 893 | |
Franklin Synergy Bank, 0.30%, 7/5/2012 (3) | | | 3,885 | | | | 3,885 | |
Frost National Bank, 0.30%, 7/5/2012 (3) | | | 131 | | | | 131 | |
Genesee Regional Bank, 0.30%, 7/5/2012 (3) | | | 3,091 | | | | 3,091 | |
Georgia Bank & Trust Company of Augusta, 0.30%, 7/5/2012 (3) | | | 2,347 | | | | 2,347 | |
Georgia Banking Company, 0.30%, 7/5/2012 (3) | | | 1,407 | | | | 1,407 | |
German American Bancorp, 0.30%, 7/5/2012 (3) | | | 651 | | | | 651 | |
Glacier Bank, 0.30%, 7/5/2012 (3) | | | 7,385 | | | | 7,385 | |
Glens Falls National Bank and Trust Company, 0.30%, 7/5/2012 (3) | | | 32 | | | | 32 | |
Golden Pacific Bank National Association, 0.30%, 7/5/2012 (3) | | | 102 | | | | 102 | |
Gotham Bank of New York, 0.30%, 7/5/2012 (3) | | | 1,903 | | | | 1,903 | |
| The Dynamic Growth Fund | |
| | | Shares or Principal Amount ($) | | | | | |
| Bank Obligations — continued | | | | | | | | |
Grand Savings Bank, 0.30%, 7/5/2012 (3) | | | 1,095 | | | | 1,095 | |
Grand Valley Bank, 0.30%, 7/5/2012 (3) | | | 431 | | | | 431 | |
Green Bank National Association, 0.30%, 7/5/2012 (3) | | | 2,381 | | | | 2,381 | |
Guaranty Bank, 0.30%, 7/5/2012 (3) | | | 1,335 | | | | 1,335 | |
Guaranty Bond Bank, 0.30%, 7/5/2012 (3) | | | 18,610 | | | | 18,610 | |
GulfShore Bank, 0.30%, 7/5/2012 (3) | | | 1,327 | | | | 1,327 | |
Happy State Bank, 0.30%, 7/5/2012 (3) | | | 136 | | | | 136 | |
Heartland Bank, 0.30%, 7/5/2012 (3) | | | 16 | | | | 16 | |
Heartland Bank, 0.30%, 7/5/2012 (3) | | | 8 | | | | 8 | |
Helena National Bank, 0.30%, 7/5/2012 (3) | | | 776 | | | | 776 | |
Heritage Oaks Bank, 0.30%, 7/5/2012 (3) | | | 4,623 | | | | 4,623 | |
Hingham Institution for Savings, 0.30%, 7/5/2012 (3) | | | 4,192 | | | | 4,192 | |
Home Federal Bank, 0.30%, 7/5/2012 (3) | | | 1,409 | | | | 1,409 | |
Horizon Bank National Association, 0.30%, 7/5/2012 (3) | | | 143 | | | | 143 | |
Hyperion Bank, 0.30%, 7/5/2012 (3) | | | 221 | | | | 221 | |
IBERIABANK, 0.30%, 7/5/2012 (3) | | | 240,000 | | | | 240,000 | |
Icon Bank of Texas National Association, 0.30%, 7/5/2012 (3) | | | 300 | | | | 300 | |
Independence Bank, 0.30%, 7/5/2012 (3) | | | 69 | | | | 69 | |
Independent Bank of Texas, 0.30%, 7/5/2012 (3) | | | 104 | | | | 104 | |
Inland Bank and Trust, 0.30%, 7/5/2012 (3) | | | 19 | | | | 19 | |
Integrity Bank, 0.30%, 7/5/2012 (3) | | | 888 | | | | 888 | |
Investors Community Bank, 0.30%, 7/5/2012 (3) | | | 434 | | | | 434 | |
Isabella Bank, 0.30%, 7/5/2012 (3) | | | 113 | | | | 113 | |
Israel Discount Bank of New York, 0.30%, 7/5/2012 (3) | | | 240,000 | | | | 240,000 | |
JPMorgan Chase Bank National Association, 0.30%, 7/5/2012 (3) | | | 68 | | | | 68 | |
Kaiser Federal Bank, 0.30%, 7/5/2012 (3) | | | 433 | | | | 433 | |
Katahdin Trust Company, 0.30%, 7/5/2012 (3) | | | 2,338 | | | | 2,338 | |
KeyBank National Association, 0.30%, 7/5/2012 (3) | | | 1,679 | | | | 1,679 | |
KeySource Commercial Bank, 0.30%, 7/5/2012 (3) | | | 150 | | | | 150 | |
Lake Forest Bank & Trust Company, 0.30%, 7/5/2012 (3) | | | 1 | | | | 1 | |
Lake National Bank, 0.30%, 7/5/2012 (3) | | | 8 | | | | 8 | |
Landmark Community Bank, 0.30%, 7/5/2012 (3) | | | 873 | | | | 873 | |
Landmark National Bank, 0.30%, 7/5/2012 (3) | | | 228 | | | | 228 | |
Leader Bank National Association, 0.30%, 7/5/2012 (3) | | | 1,031 | | | | 1,031 | |
Legacy Bank, 0.30%, 7/5/2012 (3) | | | 103 | | | | 103 | |
Legacy National Bank, 0.30%, 7/5/2012 (3) | | | 438 | | | | 438 | |
LegacyTexas Bank, 0.30%, 7/5/2012 (3) | | | 8 | | | | 8 | |
Level One Bank, 0.30%, 7/5/2012 (3) | | | 2,638 | | | | 2,638 | |
Lewis & Clark Bank, 0.30%, 7/5/2012 (3) | | | 432 | | | | 432 | |
Libertad Bank SSB, 0.30%, 7/5/2012 (3) | | | 400 | | | | 400 | |
Liberty Bank, 0.30%, 7/5/2012 (3) | | | 3,419 | | | | 3,419 | |
The accompanying notes are an integral part of these financial statements.
| | 2012 Semi-Annual Report | June 30, 2012 |
Schedule of Investments
June 30, 2012 (unaudited)
| The Dynamic Growth Fund | |
| | | Shares or Principal Amount ($) | | | | | |
| Bank Obligations — continued | | | | | | | | |
Liberty Bank, 0.30%, 7/5/2012 (3) | | | 430 | | | | 430 | |
Liberty Bank National Association, 0.30%, 7/5/2012 (3) | | | 1 | | | | 1 | |
Liberty Bank of Arkansas, 0.30%, 7/5/2012 (3) | | | 3,955 | | | | 3,955 | |
Libertyville Bank & Trust Company, 0.30%, 7/5/2012 (3) | | | 1 | | | | 1 | |
Lifestore Bank, 0.30%, 7/5/2012 (3) | | | 104 | | | | 104 | |
Lone Star National Bank, 0.30%, 7/5/2012 (3) | | | 4,878 | | | | 4,878 | |
MainStreet Bank, 0.30%, 7/5/2012 (3) | | | 2,352 | | | | 2,352 | |
Manufacturers Bank, 0.30%, 7/5/2012 (3) | | | 46,382 | | | | 46,382 | |
MB Financial Bank N.A., 0.30%, 7/5/2012 (3) | | | 137 | | | | 137 | |
mBank, 0.30%, 7/5/2012 (3) | | | 984 | | | | 984 | |
Mercantil Commercebank National Association, 0.30%, 7/5/2012 (3) | | | 542 | | | | 542 | |
Mercantile Bank & Trust Company, 0.30%, 7/5/2012 (3) | | | 1,840 | | | | 1,840 | |
Mercantile Bank of Michigan, 0.30%, 7/5/2012 (3) | | | 5,175 | | | | 5,175 | |
Merchants & Farmers Bank, 0.30%, 7/5/2012 (3) | | | 213 | | | | 213 | |
Merchants Bank, 0.30%, 7/5/2012 (3) | | | 53 | | | | 53 | |
Meridian Bank, 0.30%, 7/5/2012 (3) | | | 272 | | | | 272 | |
Metropolitan Capital Bank & Trust, 0.30%, 7/5/2012 (3) | | | 1,911 | | | | 1,911 | |
Metropolitan National Bank, 0.30%, 7/5/2012 (3) | | | 12,123 | | | | 12,123 | |
Midwest Regional Bank, 0.30%, 7/5/2012 (3) | | | 51 | | | | 51 | |
Mifflin County Savings Bank, 0.30%, 7/5/2012 (3) | | | 212 | | | | 212 | |
MileStone Bank, 0.30%, 7/5/2012 (3) | | | 651 | | | | 651 | |
Miners Bank, 0.30%, 7/5/2012 (3) | | | 873 | | | | 873 | |
Minnesota Bank & Trust, 0.30%, 7/5/2012 (3) | | | 1,838 | | | | 1,838 | |
Morris Bank, 0.30%, 7/5/2012 (3) | | | 161 | | | | 161 | |
National Bank & Trust Company, 0.30%, 7/5/2012 (3) | | | 1,134 | | | | 1,134 | |
National Bank of California, 0.30%, 7/5/2012 (3) | | | 41 | | | | 41 | |
Needham Bank, 0.30%, 7/5/2012 (3) | | | 3,036 | | | | 3,036 | |
New Mexico Bank & Trust, 0.30%, 7/5/2012 (3) | | | 1,506 | | | | 1,506 | |
Newburyport Five Cents Savings Bank, 0.30%, 7/5/2012 (3) | | | 19 | | | | 19 | |
NOA Bank, 0.30%, 7/5/2012 (3) | | | 130 | | | | 130 | |
Noah Bank, 0.30%, 7/5/2012 (3) | | | 774 | | | | 774 | |
North Jersey Community Bank, 0.30%, 7/5/2012 (3) | | | 2,188 | | | | 2,188 | |
North Shore Community Bank & Trust Company, 0.30%, 7/5/2012 (3) | | | 1 | | | | 1 | |
Northbrook Bank & Trust Company, 0.30%, 7/5/2012 (3) | | | 9 | | | | 9 | |
Northern Bank & Trust Company, 0.30%, 7/5/2012 (3) | | | 4,789 | | | | 4,789 | |
Nuvo Bank & Trust Company, 0.30%, 7/5/2012 (3) | | | 1,356 | | | | 1,356 | |
| The Dynamic Growth Fund | |
| | | Shares or Principal Amount ($) | | | | | |
| Bank Obligations — continued | | | | | | | | |
Oak View National Bank, 0.30%, 7/5/2012 (3) | | | 211 | | | | 211 | |
Oasis Bank SSB, 0.30%, 7/5/2012 (3) | | | 28 | | | | 28 | |
OceanFirst Bank, 0.30%, 7/5/2012 (3) | | | 103 | | | | 103 | |
Ohio Commerce Bank, 0.30%, 7/5/2012 (3) | | | 473 | | | | 473 | |
Old Plank Trail Community Bank National Assoc, 0.30%, 7/5/2012 (3) | | | 46 | | | | 46 | |
One Bank & Trust National Association, 0.30%, 7/5/2012 (3) | | | 212 | | | | 212 | |
OneWest Bank FSB, 0.30%, 7/5/2012 (3) | | | 3,047 | | | | 3,047 | |
Ossian State Bank, 0.30%, 7/5/2012 (3) | | | 81 | | | | 81 | |
Pacific Commerce Bank, 0.30%, 7/5/2012 (3) | | | 2,502 | | | | 2,502 | |
Pacific Enterprise Bank, 0.30%, 7/5/2012 (3) | | | 2,855 | | | | 2,855 | |
Paragon Commercial Bank, 0.30%, 7/5/2012 (3) | | | 9,584 | | | | 9,584 | |
Parkside Financial Bank & Trust, 0.30%, 7/5/2012 (3) | | | 1,326 | | | | 1,326 | |
Peapack-Gladstone Bank, 0.30%, 7/5/2012 (3) | | | 1 | | | | 1 | |
Pegasus Bank, 0.30%, 7/5/2012 (3) | | | 318 | | | | 318 | |
Peoples Bank National Association, 0.30%, 7/5/2012 (3) | | | 116 | | | | 116 | |
Peoples Bank of Commerce, 0.30%, 7/5/2012 (3) | | | 870 | | | | 870 | |
Peoples Community Bank, 0.30%, 7/5/2012 (3) | | | 1,287 | | | | 1,287 | |
Peoples United Bank, 0.30%, 7/5/2012 (3) | | | 240,000 | | | | 240,000 | |
Petit Jean State Bank, 0.30%, 7/5/2012 (3) | | | 766 | | | | 766 | |
Pine Bluff National Bank, 0.30%, 7/5/2012 (3) | | | 547 | | | | 547 | |
Plaza Bank, 0.30%, 7/5/2012 (3) | | | 104 | | | | 104 | |
PNC Bank National Association, 0.30%, 7/5/2012 (3) | | | 2,029 | | | | 2,029 | |
Post Oak Bank N.A., 0.30%, 7/5/2012 (3) | | | 434 | | | | 434 | |
Premier Bank, 0.30%, 7/5/2012 (3) | | | 2,347 | | | | 2,347 | |
Premier Bank, 0.30%, 7/5/2012 (3) | | | 1,127 | | | | 1,127 | |
PrinsBank, 0.30%, 7/5/2012 (3) | | | 542 | | | | 542 | |
Private Bank Minnesota, 0.30%, 7/5/2012 (3) | | | 1,330 | | | | 1,330 | |
ProAmérica Bank, 0.30%, 7/5/2012 (3) | | | 2,343 | | | | 2,343 | |
Professional Business Bank, 0.30%, 7/5/2012 (3) | | | 434 | | | | 434 | |
Progress Bank and Trust, 0.30%, 7/5/2012 (3) | | | 441 | | | | 441 | |
Quad City Bank and Trust Company, 0.30%, 7/5/2012 (3) | | | 4,938 | | | | 4,938 | |
Quontic Bank, 0.30%, 7/5/2012 (3) | | | 102 | | | | 102 | |
RBS Citizens National Association, 0.30%, 7/5/2012 (3) | | | 147 | | | | 147 | |
Regent Bank, 0.30%, 7/5/2012 (3) | | | 107 | | | | 107 | |
Regions Bank, 0.30%, 7/5/2012 (3) | | | 11,552 | | | | 11,552 | |
Renasant Bank, 0.30%, 7/5/2012 (3) | | | 4,106 | | | | 4,106 | |
Republic Bank, 0.30%, 7/5/2012 (3) | | | 435 | | | | 435 | |
Republic Bank & Trust, 0.30%, 7/5/2012 (3) | | | 257 | | | | 257 | |
Republic Bank & Trust Company, 0.30%, 7/5/2012 (3) | | | 103 | | | | 103 | |
River Community Bank N.A., 0.30%, 7/5/2012 (3) | | | 1,020 | | | | 1,020 | |
The accompanying notes are an integral part of these financial statements.
| | 2012 Semi-Annual Report | June 30, 2012 |
Schedule of Investments
June 30, 2012 (unaudited)
| The Dynamic Growth Fund | |
| | | Shares or Principal Amount ($) | | | | | |
| Bank Obligations — continued | | | | | | | | |
RiverBend Bank, 0.30%, 7/5/2012 (3) | | | 21 | | | | 21 | |
Riverside Bank, 0.30%, 7/5/2012 (3) | | | 132 | | | | 132 | |
Riverview Bank, 0.30%, 7/5/2012 (3) | | | 869 | | | | 869 | |
Rockland Trust Company, 0.30%, 7/5/2012 (3) | | | 5,732 | | | | 5,732 | |
RSNB Bank, 0.30%, 7/5/2012 (3) | | | 1,628 | | | | 1,628 | |
Saratoga National Bank & Trust Company, 0.30%, 7/5/2012 (3) | | | 32 | | | | 32 | |
Sauk Valley Bank & Trust Company, 0.30%, 7/5/2012 (3) | | | 4 | | | | 4 | |
Savings Institute Bank and Trust Company, 0.30%, 7/5/2012 (3) | | | 651 | | | | 651 | |
Schaumburg Bank & Trust Company National Asso, 0.30%, 7/5/2012 (3) | | | 1 | | | | 1 | |
Seaside National Bank & Trust, 0.30%, 7/5/2012 (3) | | | 9,132 | | | | 9,132 | |
Seaway Bank and Trust Company, 0.30%, 7/5/2012 (3) | | | 2,334 | | | | 2,334 | |
Security First Bank, 0.30%, 7/5/2012 (3) | | | 16 | | | | 16 | |
SharePlus Federal Bank, 0.30%, 7/5/2012 (3) | | | 176 | | | | 176 | |
Signature Bank, 0.30%, 7/5/2012 (3) | | | 1,014 | | | | 1,014 | |
Signature Bank, 0.30%, 7/5/2012 (3) | | | 199,340 | | | | 199,340 | |
Signature Bank National Association, 0.30%, 7/5/2012 (3) | | | 112 | | | | 112 | |
Solera National Bank, 0.30%, 7/5/2012 (3) | | | 476 | | | | 476 | |
Southern Bancorp Bank, 0.30%, 7/5/2012 (3) | | | 75 | | | | 75 | |
Southern Bank, 0.30%, 7/5/2012 (3) | | | 10 | | | | 10 | |
Southwest Bank, 0.30%, 7/5/2012 (3) | | | 2,434 | | | | 2,434 | |
Sovereign Bank National Association, 0.30%, 7/5/2012 (3) | | | 240,000 | | | | 240,000 | |
St. Charles Bank & Trust Company, 0.30%, 7/5/2012 (3) | | | 146 | | | | 146 | |
State Bank and Trust Company, 0.30%, 7/5/2012 (3) | | | 265 | | | | 265 | |
State Bank of the Lakes, 0.30%, 7/5/2012 (3) | | | 1 | | | | 1 | |
Sterling National Bank, 0.30%, 7/5/2012 (3) | | | 34,411 | | | | 34,411 | |
Sturdy Savings Bank, 0.30%, 7/5/2012 (3) | | | 103 | | | | 103 | |
Summit Bank, 0.30%, 7/5/2012 (3) | | | 393 | | | | 393 | |
Summit Bank & Trust, 0.30%, 7/5/2012 (3) | | | 1,904 | | | | 1,904 | |
Summit Community Bank Inc., 0.30%, 7/5/2012 (3) | | | 448 | | | | 448 | |
TD Bank N.A., 0.30%, 7/5/2012 (3) | | | 240,000 | | | | 240,000 | |
Team Capital Bank, 0.30%, 7/5/2012 (3) | | | 11,180 | | | | 11,180 | |
Texas Capital Bank National Association, 0.30%, 7/5/2012 (3) | | | 240,000 | | | | 240,000 | |
Touchmark National Bank, 0.30%, 7/5/2012 (3) | | | 1,389 | | | | 1,389 | |
Town Bank, 0.30%, 7/5/2012 (3) | | | 3 | | | | 3 | |
Transportation Alliance Bank Inc., 0.30%, 7/5/2012 (3) | | | 8 | | | | 8 | |
Treynor State Bank, 0.30%, 7/5/2012 (3) | | | 2,373 | | | | 2,373 | |
TriSummit Bank, 0.30%, 7/5/2012 (3) | | | 2,280 | | | | 2,280 | |
U.S. Bank National Association, 0.30%, 7/5/2012 (3) | | | 165 | | | | 165 | |
Uinta Bank, 0.30%, 7/5/2012 (3) | | | 1,442 | | | | 1,442 | |
| The Dynamic Growth Fund | |
| | | Shares or Principal Amount ($) | | | | | |
| Bank Obligations — continued | | | | | | | | |
UMB Bank Arizona National Association, 0.30%, 7/5/2012 (3) | | | 107 | | | | 107 | |
UMB Bank Colorado National Association, 0.30%, 7/5/2012 (3) | | | 16 | | | | 16 | |
UMB Bank National Association, 0.30%, 7/5/2012 (3) | | | 134 | | | | 134 | |
Umpqua Bank, 0.30%, 7/5/2012 (3) | | | 81 | | | | 81 | |
Union Bank National Association, 0.30%, 7/5/2012 (3) | | | 135 | | | | 135 | |
Union Bank of Mena, 0.30%, 7/5/2012 (3) | | | 16 | | | | 16 | |
Union Center National Bank, 0.30%, 7/5/2012 (3) | | | 46,382 | | | | 46,382 | |
United Bank, 0.30%, 7/5/2012 (3) | | | 2,152 | | | | 2,152 | |
United Bank, 0.30%, 7/5/2012 (3) | | | 105 | | | | 105 | |
United Bank Inc., 0.30%, 7/5/2012 (3) | | | 1,967 | | | | 1,967 | |
USNY Bank, 0.30%, 7/5/2012 (3) | | | 666 | | | | 666 | |
Valley Bank, 0.30%, 7/5/2012 (3) | | | 759 | | | | 759 | |
Valley National Bank, 0.30%, 7/5/2012 (3) | | | 220,141 | | | | 220,141 | |
Valliance Bank, 0.30%, 7/5/2012 (3) | | | 126 | | | | 126 | |
Veritex Community Bank National Association, 0.30%, 7/5/2012 (3) | | | 43 | | | | 43 | |
Verus Bank of Commerce, 0.30%, 7/5/2012 (3) | | | 3,444 | | | | 3,444 | |
Victory Bank, 0.30%, 7/5/2012 (3) | | | 217 | | | | 217 | |
ViewPoint Bank National Association, 0.30%, 7/5/2012 (3) | | | 5,278 | | | | 5,278 | |
Village Bank & Trust, 0.30%, 7/5/2012 (3) | | | 8 | | | | 8 | |
Virginia Heritage Bank, 0.30%, 7/5/2012 (3) | | | 3,297 | | | | 3,297 | |
Warren Bank & Trust Company, 0.30%, 7/5/2012 (3) | | | 1,088 | | | | 1,088 | |
Washington Trust Bank, 0.30%, 7/5/2012 (3) | | | 1,405 | | | | 1,405 | |
Washington Trust Company of Westerly, 0.30%, 7/5/2012 (3) | | | 152 | | | | 152 | |
Webster Bank National Association, 0.30%, 7/5/2012 (3) | | | 104 | | | | 104 | |
Wells Fargo Bank National Association, 0.30%, 7/5/2012 (3) | | | 238 | | | | 238 | |
West Town Savings Bank, 0.30%, 7/5/2012 (3) | | | 16 | | | | 16 | |
Western Alliance Bank, 0.30%, 7/5/2012 (3) | | | 53 | | | | 53 | |
Western National Bank, 0.30%, 7/5/2012 (3) | | | 197 | | | | 197 | |
Wheaton Bank & Trust Company, 0.30%, 7/5/2012 (3) | | | 1 | | | | 1 | |
Whidbey Island Bank, 0.30%, 7/5/2012 (3) | | | 74 | | | | 74 | |
Wilmington Savings Fund Society FSB, 0.30%, 7/5/2012 (3) | | | 4,324 | | | | 4,324 | |
Wilmington Trust National Association, 0.30%, 7/5/2012 (3) | | | 108 | | | | 108 | |
Wisconsin Community Bank, 0.30%, 7/5/2012 (3) | | | 42,621 | | | | 42,621 | |
Wolverine Bank Federal Savings Bank, 0.30%, 7/5/2012 (3) | | | 4 | | | | 4 | |
Xenith Bank, 0.30%, 7/5/2012 (3) | | | 3,914 | | | | 3,914 | |
Total Bank Obligations (Cost $5,004,521) | | | | | | | 5,004,521 | |
The accompanying notes are an integral part of these financial statements.
| | 2012 Semi-Annual Report | June 30, 2012 |
Schedule of Investments
June 30, 2012 (unaudited)
| The Dynamic Growth Fund | |
| | | Shares or Principal Amount ($) | | | | | |
| Floating Rate Demand Notes — 2.0% | | | | | | | | |
Caterpillar Financial Power Investment Floating Rate Demand Note, 0.60%, 7/1/2012 (4) | | | 1,812,063 | | | | 1,812,063 | |
Total Floating Rate Demand Notes (Cost $1,812,063) | | | | | | | 1,812,063 | |
| | | | | | | | | |
| U.S. Government Obligations — 3.3% | | | | | | | | |
U.S. Treasury Bill, 0.12%, due 9/6/2012 (5) | | | 3,000,000 | | | | 2,999,628 | |
Total U.S. Government Obligations (Cost $2,999,340) | | | | | | | 2,999,628 | |
Total Investments — 99.1% (Cost $88,554,722 )(1) | | | | | | | 90,214,945 | |
| Other Assets less Liabilities — 0.9% | | | | | | | 803,850 | |
Total Net Assets — 100.0% | | | | | | | 91,018,795 | |
Trustee Deferred Compensation (6) | | | | | | | | |
| The Flex-funds Aggressive Growth Fund | | | 1,837 | | | | 14,586 | |
The Flex-funds Balanced Fund | | | 940 | | | | 9,127 | |
| The Flex-funds Dynamic Growth Fund | | | 592 | | | | 4,920 | |
The Flex-funds Muirfield Fund | | | 2,183 | | | | 12,116 | |
The Flex-funds Quantex Fund | | | 1,193 | | | | 27,081 | |
| The Flex-funds Utilities & Infrastructure Fund | | | 210 | | | | 4,958 | |
Total Trustee Deferred Compensation (Cost $60,610) | | | | | | | 72,788 | |
| The Dynamic Growth Fund | |
| | | | | | Unrealized Appreciation (Depreciation) ($) | |
| | | | | | | |
| Futures Contracts | |
| Standard & Poors 500 expiring September 2012, notional value $29,501,700 | | | 87 | | | | 824,760 | |
| Standard & Poors Mid Cap 400 E-Mini expiring September 2012, notional value $3,382,200 | | | 36 | | | | 83,610 | |
Total Futures Contracts | | | 123 | | | | 908,370 | |
| (1) | Represents cost for financial reporting purposes and differs for federal income tax purposes by the amount of losses deferred for federal income tax reporting in the amount of $418,568. Cost for federal income tax purposes of $88,973,290 differs from value by net unrealized appreciation (depreciation) of securities as follows: |
Unrealized appreciation | | $ | 2,205,934 | |
Unrealized depreciation | | | (964,279 | ) |
| Net unrealized appreciation (depreciation) | | $ | 1,241,655 | |
| (2) | Investment in affiliate. The yield shown represents the 7-day yield in effect at June 30, 2012. |
| (3) | Illiquid security. The sale or disposition of such security would not be possible in the ordinary course of business within seven days at approximately the value at which the Fund has valued the security. These securities were purchased through StoneCastle Partners, LLC, an independent, privately held asset management and investment services company, and are insured through the Federal Deposit Insurance Corporation (FDIC). The interest rate varies monthly and any accrued interest is reinvested into the program on a monthly basis. The securities are classified as illiquid because if the Fund were to redeem its investment in the program, the proceeds are delivered only once per week; on the Wednesday of the next week following the redemption request. The maximum number of days from a redemption request to receiving the proceeds is nine days. Hence the Fund may not be able to receive its proceeds within seven days. As of June 30, 2012, illiquid securities represented 5.5% of Total Investments. |
| (4) | Floating rate security. The rate shown represents the rate in effect at June 30, 2012. |
| (5) | Pledged as collateral on futures contracts. |
| (6) | Assets of affiliates to The Dynamic Growth Fund held for the benefit of the Fund’s Trustees in connection with the Trustee Deferred Compensation Plan. |
The accompanying notes are an integral part of these financial statements.
| | 2012 Semi-Annual Report | June 30, 2012 |
Schedule of Investments
June 30, 2012 (unaudited)
| The Aggressive Growth Fund | |
| | | Shares or Principal Amount ($) | | | | | |
| Registered Investment Companies — 58.5% | |
Energy Select Sector SPDR Fund | | | 20,425 | | | | 1,355,607 | |
| Health Care Select Sector SPDR Fund | | | 35,925 | | | | 1,365,330 | |
| iShares Russell 1000 Growth Index Fund | | | 35,000 | | | | 2,213,050 | |
| iShares Russell 1000 Value Index Fund | | | 19,475 | | | | 1,328,584 | |
iShares Russell 2000 Index Fund | | | 8,450 | | | | 672,282 | |
Ivy Mid Cap Growth Fund | | | 57,157 | | | | 1,011,680 | |
| JPMorgan Disciplined Equity Fund | | | 175,988 | | | | 3,076,267 | |
RS Technology Fund | | | 91,651 | | | | 1,701,046 | |
SPDR S&P 500 ETF Trust | | | 6,000 | | | | 816,630 | |
| Wells Fargo Advantage Growth Fund | | | 117,642 | | | | 4,826,835 | |
Total Registered Investment Companies (Cost $17,873,573) | | | | | | | 18,367,311 | |
| Money Market Registered Investment Companies — 19.1% | |
The Flex-funds Money Market Fund - Institutional Class, 0.17% (2) | | | 6,008,908 | | | | 6,008,908 | |
Total Money Market Registered Investment Companies (Cost $6,008,908) | | | | | | | 6,008,908 | |
| Bank Obligations — 15.9% | | | | | | | | |
Access National Bank, 0.30%, 7/5/2012 (3) | | | 987 | | | | 987 | |
Allied Bank, 0.30%, 7/5/2012 (3) | | | 434 | | | | 434 | |
Alma Bank, 0.30%, 7/5/2012 (3) | | | 4,804 | | | | 4,804 | |
AloStar Bank of Commerce, 0.30%, 7/5/2012 (3) | | | 3,797 | | | | 3,797 | |
Alpine Bank, 0.30%, 7/5/2012 (3) | | | 3,060 | | | | 3,060 | |
Ameriana Bank, 0.30%, 7/5/2012 (3) | | | 19 | | | | 19 | |
American Enterprise Bank of Florida, 0.30%, 7/5/2012 (3) | | | 492 | | | | 492 | |
American Momentum Bank, 0.30%, 7/5/2012 (3) | | | 5,694 | | | | 5,694 | |
American National Bank, 0.30%, 7/5/2012 (3) | | | 2,277 | | | | 2,277 | |
American National Bank-Fox Cities, 0.30%, 7/5/2012 (3) | | | 215 | | | | 215 | |
American Savings Bank F.S.B., 0.30%, 7/5/2012 (3) | | | 16 | | | | 16 | |
American Savings Bank FSB, 0.30%, 7/5/2012 (3) | | | 155 | | | | 155 | |
Americas United Bank, 0.30%, 7/5/2012 (3) | | | 1,306 | | | | 1,306 | |
AmFirst Bank N.A., 0.30%, 7/5/2012 (3) | | | 38 | | | | 38 | |
Anthem Bank & Trust, 0.30%, 7/5/2012 (3) | | | 873 | | | | 873 | |
Arizona Bank & Trust, 0.30%, 7/5/2012 (3) | | | 4,192 | | | | 4,192 | |
Arvest Bank, 0.30%, 7/5/2012 (3) | | | 220 | | | | 220 | |
Austin Bank of Chicago, 0.30%, 7/5/2012 (3) | | | 869 | | | | 869 | |
Avidia Bank, 0.30%, 7/5/2012 (3) | | | 4,192 | | | | 4,192 | |
Bancorp Bank, 0.30%, 7/5/2012 (3) | | | 10,749 | | | | 10,749 | |
Bank Hapoalim B.M., 0.30%, 7/5/2012 (3) | | | 1,511 | | | | 1,511 | |
Bank Leumi USA, 0.30%, 7/5/2012 (3) | | | 240,000 | | | | 240,000 | |
Bank of America National Association, 0.30%, 7/5/2012 (3) | | | 448 | | | | 448 | |
Bank of Augusta, 0.30%, 7/5/2012 (3) | | | 917 | | | | 917 | |
Bank of Cadiz and Trust Company, 0.30%, 7/5/2012 (3) | | | 1,055 | | | | 1,055 | |
| The Aggressive Growth Fund | |
| | | Shares or Principal Amount ($) | | | | | |
| Bank Obligations — continued | | | | | | | | |
Bank of Cave City, 0.30%, 7/5/2012 (3) | | | 437 | | | | 437 | |
Bank of England, 0.30%, 7/5/2012 (3) | | | 1,867 | | | | 1,867 | |
Bank of Fayetteville, 0.30%, 7/5/2012 (3) | | | 436 | | | | 436 | |
Bank of Hawaii, 0.30%, 7/5/2012 (3) | | | 4,983 | | | | 4,983 | |
Bank of Houston, 0.30%, 7/5/2012 (3) | | | 2,661 | | | | 2,661 | |
Bank of Jackson Hole, 0.30%, 7/5/2012 (3) | | | 442 | | | | 442 | |
Bank of Manhattan N.A., 0.30%, 7/5/2012 (3) | | | 1,665 | | | | 1,665 | |
Bank of Marin, 0.30%, 7/5/2012 (3) | | | 218 | | | | 218 | |
Bank of Missouri, 0.30%, 7/5/2012 (3) | | | 4,968 | | | | 4,968 | |
Bank of Princeton, 0.30%, 7/5/2012 (3) | | | 651 | | | | 651 | |
Bank of the Ozarks, 0.30%, 7/5/2012 (3) | | | 108 | | | | 108 | |
Bank of the Panhandle, 0.30%, 7/5/2012 (3) | | | 1,062 | | | | 1,062 | |
Bank of the West, 0.30%, 7/5/2012 (3) | | | 13,559 | | | | 13,559 | |
Bar Harbor Bank & Trust, 0.30%, 7/5/2012 (3) | | | 869 | | | | 869 | |
Belmont Savings Bank, 0.30%, 7/5/2012 (3) | | | 4,601 | | | | 4,601 | |
Benchmark Bank, 0.30%, 7/5/2012 (3) | | | 3 | | | | 3 | |
Benefit Bank, 0.30%, 7/5/2012 (3) | | | 1,345 | | | | 1,345 | |
Berkshire Bank, 0.30%, 7/5/2012 (3) | | | 6,256 | | | | 6,256 | |
Beverly Bank & Trust Company National Associa, 0.30%, 7/5/2012 (3) | | | 30 | | | | 30 | |
Biltmore Bank of Arizona, 0.30%, 7/5/2012 (3) | | | 2,408 | | | | 2,408 | |
BMO Harris Bank National Association, 0.30%, 7/5/2012 (3) | | | 2,493 | | | | 2,493 | |
BOKF National Association, 0.30%, 7/5/2012 (3) | | | 5,969 | | | | 5,969 | |
Boone Bank & Trust Co., 0.30%, 7/5/2012 (3) | | | 1,220 | | | | 1,220 | |
Boston Private Bank & Trust Company, 0.30%, 7/5/2012 (3) | | | 2,184 | | | | 2,184 | |
Branch Banking and Trust Company, 0.30%, 7/5/2012 (3) | | | 1,980 | | | | 1,980 | |
Brookhaven Bank, 0.30%, 7/5/2012 (3) | | | 250 | | | | 250 | |
Business Bank, 0.30%, 7/5/2012 (3) | | | 1,431 | | | | 1,431 | |
Business Bank, 0.30%, 7/5/2012 (3) | | | 462 | | | | 462 | |
Business Bank of Saint Louis, 0.30%, 7/5/2012 (3) | | | 2,094 | | | | 2,094 | |
Business First Bank, 0.30%, 7/5/2012 (3) | | | 2,092 | | | | 2,092 | |
Cache Valley Bank, 0.30%, 7/5/2012 (3) | | | 3,057 | | | | 3,057 | |
Cadence Bank N.A., 0.30%, 7/5/2012 (3) | | | 209,741 | | | | 209,741 | |
California Bank & Trust, 0.30%, 7/5/2012 (3) | | | 87 | | | | 87 | |
Capital Bank, 0.30%, 7/5/2012 (3) | | | 1,156 | | | | 1,156 | |
Capital One National Association, 0.30%, 7/5/2012 (3) | | | 157,954 | | | | 157,954 | |
CapitalMark Bank & Trust, 0.30%, 7/5/2012 (3) | | | 2,903 | | | | 2,903 | |
CapStar Bank, 0.30%, 7/5/2012 (3) | | | 11,181 | | | | 11,181 | |
CapStone Bank, 0.30%, 7/5/2012 (3) | | | 2,126 | | | | 2,126 | |
Cardinal Bank, 0.30%, 7/5/2012 (3) | | | 4,028 | | | | 4,028 | |
Carolina Alliance Bank, 0.30%, 7/5/2012 (3) | | | 115 | | | | 115 | |
Carver Federal Savings Bank, 0.30%, 7/5/2012 (3) | | | 46,382 | | | | 46,382 | |
Cathay Bank, 0.30%, 7/5/2012 (3) | | | 240,000 | | | | 240,000 | |
Celtic Bank, 0.30%, 7/5/2012 (3) | | | 2,441 | | | | 2,441 | |
Centennial Bank, 0.30%, 7/5/2012 (3) | | | 466 | | | | 466 | |
The accompanying notes are an integral part of these financial statements.
| | 2012 Semi-Annual Report | June 30, 2012 |
Schedule of Investments
June 30, 2012 (unaudited)
| The Aggressive Growth Fund | |
| | | Shares or Principal Amount ($) | | | | | |
| Bank Obligations — continued | | | | | | | | |
Centra Bank Inc., 0.30%, 7/5/2012 (3) | | | 2,084 | | | | 2,084 | |
Central Bank, 0.30%, 7/5/2012 (3) | | | 695 | | | | 695 | |
Central Bank Illinois, 0.30%, 7/5/2012 (3) | | | 32 | | | | 32 | |
Central Bank of Kansas City, 0.30%, 7/5/2012 (3) | | | 38 | | | | 38 | |
CheckSpring Bank, 0.30%, 7/5/2012 (3) | | | 23 | | | | 23 | |
Chemical Bank, 0.30%, 7/5/2012 (3) | | | 399 | | | | 399 | |
Chickasha Bank & Trust Company, 0.30%, 7/5/2012 (3) | | | 442 | | | | 442 | |
Citizens Bank & Trust Company, 0.30%, 7/5/2012 (3) | | | 3,770 | | | | 3,770 | |
Citizens Bank of Pennsylvania, 0.30%, 7/5/2012 (3) | | | 133 | | | | 133 | |
Citizens National Bank, 0.30%, 7/5/2012 (3) | | | 212 | | | | 212 | |
Citizens National Bank of Bluffton, 0.30%, 7/5/2012 (3) | | | 446 | | | | 446 | |
City First Bank of D.C. National Association, 0.30%, 7/5/2012 (3) | | | 1,597 | | | | 1,597 | |
City National Bank, 0.30%, 7/5/2012 (3) | | | 271 | | | | 271 | |
City National Bank of Sulphur Springs, 0.30%, 7/5/2012 (3) | | | 146 | | | | 146 | |
City National Bank of Taylor, 0.30%, 7/5/2012 (3) | | | 970 | | | | 970 | |
Cole Taylor Bank, 0.30%, 7/5/2012 (3) | | | 79,682 | | | | 79,682 | |
Collin Bank, 0.30%, 7/5/2012 (3) | | | 1,135 | | | | 1,135 | |
Columbia State Bank, 0.30%, 7/5/2012 (3) | | | 3,884 | | | | 3,884 | |
Comerica Bank, 0.30%, 7/5/2012 (3) | | | 4,837 | | | | 4,837 | |
Commencement Bank, 0.30%, 7/5/2012 (3) | | | 1,327 | | | | 1,327 | |
Commerce Bank & Trust Company, 0.30%, 7/5/2012 (3) | | | 6,820 | | | | 6,820 | |
Commerce National Bank, 0.30%, 7/5/2012 (3) | | | 81 | | | | 81 | |
Community Bank & Trust, 0.30%, 7/5/2012 (3) | | | 2,970 | | | | 2,970 | |
Community Bank of Oelwein, 0.30%, 7/5/2012 (3) | | | 907 | | | | 907 | |
Community Bank of Santa Maria, 0.30%, 7/5/2012 (3) | | | 103 | | | | 103 | |
Community Bank of the Bay, 0.30%, 7/5/2012 (3) | | | 167 | | | | 167 | |
Community Mutual Savings Bank, 0.30%, 7/5/2012 (3) | | | 1,168 | | | | 1,168 | |
Community Trust Bank, 0.30%, 7/5/2012 (3) | | | 240,000 | | | | 240,000 | |
Compass Bank, 0.30%, 7/5/2012 (3) | | | 240,000 | | | | 240,000 | |
Congaree State Bank, 0.30%, 7/5/2012 (3) | | | 1,252 | | | | 1,252 | |
Congressional Bank, 0.30%, 7/5/2012 (3) | | | 1,356 | | | | 1,356 | |
Cooper State Bank, 0.30%, 7/5/2012 (3) | | | 431 | | | | 431 | |
Crescent State Bank, 0.30%, 7/5/2012 (3) | | | 2,140 | | | | 2,140 | |
Crystal Lake Bank and Trust Company N.A., 0.30%, 7/5/2012 (3) | | | 1 | | | | 1 | |
Delta Trust & Bank, 0.30%, 7/5/2012 (3) | | | 4,330 | | | | 4,330 | |
DeWitt Bank & Trust Company, 0.30%, 7/5/2012 (3) | | | 322 | | | | 322 | |
Diamond Bank, 0.30%, 7/5/2012 (3) | | | 3,222 | | | | 3,222 | |
DMB Community Bank, 0.30%, 7/5/2012 (3) | | | 3,070 | | | | 3,070 | |
| The Aggressive Growth Fund | |
| | | Shares or Principal Amount ($) | | | | | |
| Bank Obligations — continued | | | | | | | | |
Dollar Bank Federal Savings Bank, 0.30%, 7/5/2012 (3) | | | 1,095 | | | | 1,095 | |
Dubuque Bank & Trust Company, 0.30%, 7/5/2012 (3) | | | 431 | | | | 431 | |
Eagle Bank and Trust Company, 0.30%, 7/5/2012 (3) | | | 1,118 | | | | 1,118 | |
EagleBank, 0.30%, 7/5/2012 (3) | | | 240,000 | | | | 240,000 | |
East River Bank, 0.30%, 7/5/2012 (3) | | | 115 | | | | 115 | |
East West Bank, 0.30%, 7/5/2012 (3) | | | 240,511 | | | | 240,511 | |
Empire National Bank, 0.30%, 7/5/2012 (3) | | | 434 | | | | 434 | |
Encore Bank National Association, 0.30%, 7/5/2012 (3) | | | 319 | | | | 319 | |
Encore National Bank, 0.30%, 7/5/2012 (3) | | | 125 | | | | 125 | |
Enterprise Bank & Trust, 0.30%, 7/5/2012 (3) | | | 7,692 | | | | 7,692 | |
Equity Bank A National Association, 0.30%, 7/5/2012 (3) | | | 994 | | | | 994 | |
Exchange Bank & Trust Company, 0.30%, 7/5/2012 (3) | | | 2,303 | | | | 2,303 | |
Exchange State Bank, 0.30%, 7/5/2012 (3) | | | 433 | | | | 433 | |
Fannin Bank, 0.30%, 7/5/2012 (3) | | | 1 | | | | 1 | |
Farmers & Merchants Bank of Long Beach, 0.30%, 7/5/2012 (3) | | | 69 | | | | 69 | |
Farmers & Merchants State Bank, 0.30%, 7/5/2012 (3) | | | 124 | | | | 124 | |
Farmers and Merchants State Bank of Blooming , 0.30%, 7/5/2012 (3) | | | 839 | | | | 839 | |
Farmers Bank, 0.30%, 7/5/2012 (3) | | | 135 | | | | 135 | |
Farmers Exchange Bank, 0.30%, 7/5/2012 (3) | | | 1,580 | | | | 1,580 | |
Farmers State Bank, 0.30%, 7/5/2012 (3) | | | 1 | | | | 1 | |
Fidelity Bank, 0.30%, 7/5/2012 (3) | | | 2,975 | | | | 2,975 | |
Fifth Third Bank, 0.30%, 7/5/2012 (3) | | | 240,000 | | | | 240,000 | |
First Bank & Trust, 0.30%, 7/5/2012 (3) | | | 2 | | | | 2 | |
First Bank Financial Centre, 0.30%, 7/5/2012 (3) | | | 103 | | | | 103 | |
First Choice Bank, 0.30%, 7/5/2012 (3) | | | 1,929 | | | | 1,929 | |
First Commercial Bank, 0.30%, 7/5/2012 (3) | | | 102 | | | | 102 | |
First Commercial Bank, 0.30%, 7/5/2012 (3) | | | 853 | | | | 853 | |
First Community Bank, 0.30%, 7/5/2012 (3) | | | 2,057 | | | | 2,057 | |
First County Bank, 0.30%, 7/5/2012 (3) | | | 5,903 | | | | 5,903 | |
First Federal Bank, 0.30%, 7/5/2012 (3) | | | 1,589 | | | | 1,589 | |
First Foundation Bank, 0.30%, 7/5/2012 (3) | | | 11,657 | | | | 11,657 | |
First International Bank & Trust, 0.30%, 7/5/2012 (3) | | | 136 | | | | 136 | |
First Internet Bank of Indiana, 0.30%, 7/5/2012 (3) | | | 4,820 | | | | 4,820 | |
First Interstate Bank, 0.30%, 7/5/2012 (3) | | | 80 | | | | 80 | |
First N.A., 0.30%, 7/5/2012 (3) | | | 1,858 | | | | 1,858 | |
First National Bank, 0.30%, 7/5/2012 (3) | | | 4,171 | | | | 4,171 | |
First National Bank, 0.30%, 7/5/2012 (3) | | | 104 | | | | 104 | |
First National Bank - Fox Valley, 0.30%, 7/5/2012 (3) | | | 147 | | | | 147 | |
First National Bank in Green Forest, 0.30%, 7/5/2012 (3) | | | 221 | | | | 221 | |
First National Bank in Sioux Falls, 0.30%, 7/5/2012 (3) | | | 102 | | | | 102 | |
The accompanying notes are an integral part of these financial statements.
| | 2012 Semi-Annual Report | June 30, 2012 |
Schedule of Investments
June 30, 2012 (unaudited)
| The Aggressive Growth Fund | |
| | | Shares or Principal Amount ($) | | | | | |
| Bank Obligations — continued | | | | | | | | |
First National Bank of America, 0.30%, 7/5/2012 (3) | | | 111 | | | | 111 | |
First National Bank of Fort Smith, 0.30%, 7/5/2012 (3) | | | 164 | | | | 164 | |
First National Bank of Long Island, 0.30%, 7/5/2012 (3) | | | 10,706 | | | | 10,706 | |
First National Bank of Omaha, 0.30%, 7/5/2012 (3) | | | 70 | | | | 70 | |
First National Bank of Santa Fe, 0.30%, 7/5/2012 (3) | | | 2,406 | | | | 2,406 | |
First Premier Bank, 0.30%, 7/5/2012 (3) | | | 3,221 | | | | 3,221 | |
First Security Bank, 0.30%, 7/5/2012 (3) | | | 8,935 | | | | 8,935 | |
First Security Bank & Trust Company, 0.30%, 7/5/2012 (3) | | | 11 | | | | 11 | |
First State Bank, 0.30%, 7/5/2012 (3) | | | 875 | | | | 875 | |
First State Bank, 0.30%, 7/5/2012 (3) | | | 40 | | | | 40 | |
First State Bank of DeQueen, 0.30%, 7/5/2012 (3) | | | 924 | | | | 924 | |
First State Bank of Northwest Arkansas, 0.30%, 7/5/2012 (3) | | | 626 | | | | 626 | |
First Trade Union Bank, 0.30%, 7/5/2012 (3) | | | 167 | | | | 167 | |
First Utah Bank, 0.30%, 7/5/2012 (3) | | | 107 | | | | 107 | |
First Virginia Community Bank, 0.30%, 7/5/2012 (3) | | | 892 | | | | 892 | |
First Western Bank, 0.30%, 7/5/2012 (3) | | | 9 | | | | 9 | |
First-Citizens Bank & Trust Company, 0.30%, 7/5/2012 (3) | | | 10,582 | | | | 10,582 | |
FirstAtlantic Bank, 0.30%, 7/5/2012 (3) | | | 104 | | | | 104 | |
FirstBank, 0.30%, 7/5/2012 (3) | | | 1,326 | | | | 1,326 | |
FirstBank Puerto Rico, 0.30%, 7/5/2012 (3) | | | 240,000 | | | | 240,000 | |
FirstMerit Bank National Association, 0.30%, 7/5/2012 (3) | | | 218 | | | | 218 | |
Flagship Community Bank, 0.30%, 7/5/2012 (3) | | | 102 | | | | 102 | |
Flatirons Bank, 0.30%, 7/5/2012 (3) | | | 1,327 | | | | 1,327 | |
Florida Business Bank, 0.30%, 7/5/2012 (3) | | | 434 | | | | 434 | |
Florida Parishes Bank, 0.30%, 7/5/2012 (3) | | | 87 | | | | 87 | |
Forrest City Bank NA, 0.30%, 7/5/2012 (3) | | | 213 | | | | 213 | |
Fortune Bank, 0.30%, 7/5/2012 (3) | | | 1,402 | | | | 1,402 | |
Fox Chase Bank, 0.30%, 7/5/2012 (3) | | | 893 | | | | 893 | |
Franklin Synergy Bank, 0.30%, 7/5/2012 (3) | | | 3,885 | | | | 3,885 | |
Frost National Bank, 0.30%, 7/5/2012 (3) | | | 131 | | | | 131 | |
Genesee Regional Bank, 0.30%, 7/5/2012 (3) | | | 3,091 | | | | 3,091 | |
Georgia Bank & Trust Company of Augusta, 0.30%, 7/5/2012 (3) | | | 2,347 | | | | 2,347 | |
Georgia Banking Company, 0.30%, 7/5/2012 (3) | | | 1,407 | | | | 1,407 | |
German American Bancorp, 0.30%, 7/5/2012 (3) | | | 651 | | | | 651 | |
Glacier Bank, 0.30%, 7/5/2012 (3) | | | 7,385 | | | | 7,385 | |
Glens Falls National Bank and Trust Company, 0.30%, 7/5/2012 (3) | | | 32 | | | | 32 | |
Golden Pacific Bank National Association, 0.30%, 7/5/2012 (3) | | | 102 | | | | 102 | |
Gotham Bank of New York, 0.30%, 7/5/2012 (3) | | | 1,903 | | | | 1,903 | |
| The Aggressive Growth Fund | |
| | | Shares or Principal Amount ($) | | | | | |
| Bank Obligations — continued | | | | | | | | |
Grand Savings Bank, 0.30%, 7/5/2012 (3) | | | 1,095 | | | | 1,095 | |
Grand Valley Bank, 0.30%, 7/5/2012 (3) | | | 431 | | | | 431 | |
Green Bank National Association, 0.30%, 7/5/2012 (3) | | | 2,381 | | | | 2,381 | |
Guaranty Bank, 0.30%, 7/5/2012 (3) | | | 1,335 | | | | 1,335 | |
Guaranty Bond Bank, 0.30%, 7/5/2012 (3) | | | 18,610 | | | | 18,610 | |
GulfShore Bank, 0.30%, 7/5/2012 (3) | | | 1,327 | | | | 1,327 | |
Happy State Bank, 0.30%, 7/5/2012 (3) | | | 136 | | | | 136 | |
Heartland Bank, 0.30%, 7/5/2012 (3) | | | 16 | | | | 16 | |
Heartland Bank, 0.30%, 7/5/2012 (3) | | | 8 | | | | 8 | |
Helena National Bank, 0.30%, 7/5/2012 (3) | | | 776 | | | | 776 | |
Heritage Oaks Bank, 0.30%, 7/5/2012 (3) | | | 4,623 | | | | 4,623 | |
Hingham Institution for Savings, 0.30%, 7/5/2012 (3) | | | 4,192 | | | | 4,192 | |
Home Federal Bank, 0.30%, 7/5/2012 (3) | | | 1,409 | | | | 1,409 | |
Horizon Bank National Association, 0.30%, 7/5/2012 (3) | | | 143 | | | | 143 | |
Hyperion Bank, 0.30%, 7/5/2012 (3) | | | 221 | | | | 221 | |
IBERIABANK, 0.30%, 7/5/2012 (3) | | | 240,000 | | | | 240,000 | |
Icon Bank of Texas National Association, 0.30%, 7/5/2012 (3) | | | 300 | | | | 300 | |
Independence Bank, 0.30%, 7/5/2012 (3) | | | 69 | | | | 69 | |
Independent Bank of Texas, 0.30%, 7/5/2012 (3) | | | 104 | | | | 104 | |
Inland Bank and Trust, 0.30%, 7/5/2012 (3) | | | 19 | | | | 19 | |
Integrity Bank, 0.30%, 7/5/2012 (3) | | | 888 | | | | 888 | |
Investors Community Bank, 0.30%, 7/5/2012 (3) | | | 434 | | | | 434 | |
Isabella Bank, 0.30%, 7/5/2012 (3) | | | 113 | | | | 113 | |
Israel Discount Bank of New York, 0.30%, 7/5/2012 (3) | | | 240,000 | | | | 240,000 | |
JPMorgan Chase Bank National Association, 0.30%, 7/5/2012 (3) | | | 68 | | | | 68 | |
Kaiser Federal Bank, 0.30%, 7/5/2012 (3) | | | 433 | | | | 433 | |
Katahdin Trust Company, 0.30%, 7/5/2012 (3) | | | 2,338 | | | | 2,338 | |
KeyBank National Association, 0.30%, 7/5/2012 (3) | | | 1,679 | | | | 1,679 | |
KeySource Commercial Bank, 0.30%, 7/5/2012 (3) | | | 150 | | | | 150 | |
Lake Forest Bank & Trust Company, 0.30%, 7/5/2012 (3) | | | 1 | | | | 1 | |
Lake National Bank, 0.30%, 7/5/2012 (3) | | | 8 | | | | 8 | |
Landmark Community Bank, 0.30%, 7/5/2012 (3) | | | 873 | | | | 873 | |
Landmark National Bank, 0.30%, 7/5/2012 (3) | | | 228 | | | | 228 | |
Leader Bank National Association, 0.30%, 7/5/2012 (3) | | | 1,031 | | | | 1,031 | |
Legacy Bank, 0.30%, 7/5/2012 (3) | | | 103 | | | | 103 | |
Legacy National Bank, 0.30%, 7/5/2012 (3) | | | 438 | | | | 438 | |
LegacyTexas Bank, 0.30%, 7/5/2012 (3) | | | 8 | | | | 8 | |
Level One Bank, 0.30%, 7/5/2012 (3) | | | 2,638 | | | | 2,638 | |
Lewis & Clark Bank, 0.30%, 7/5/2012 (3) | | | 432 | | | | 432 | |
Libertad Bank SSB, 0.30%, 7/5/2012 (3) | | | 400 | | | | 400 | |
Liberty Bank, 0.30%, 7/5/2012 (3) | | | 3,419 | | | | 3,419 | |
The accompanying notes are an integral part of these financial statements.
| | 2012 Semi-Annual Report | June 30, 2012 |
Schedule of Investments
June 30, 2012 (unaudited)
| The Aggressive Growth Fund | |
| | | Shares or Principal Amount ($) | | | | | |
| Bank Obligations — continued | | | | | | | | |
Liberty Bank, 0.30%, 7/5/2012 (3) | | | 430 | | | | 430 | |
Liberty Bank National Association, 0.30%, 7/5/2012 (3) | | | 1 | | | | 1 | |
Liberty Bank of Arkansas, 0.30%, 7/5/2012 (3) | | | 3,955 | | | | 3,955 | |
Libertyville Bank & Trust Company, 0.30%, 7/5/2012 (3) | | | 1 | | | | 1 | |
Lifestore Bank, 0.30%, 7/5/2012 (3) | | | 104 | | | | 104 | |
Lone Star National Bank, 0.30%, 7/5/2012 (3) | | | 4,878 | | | | 4,878 | |
MainStreet Bank, 0.30%, 7/5/2012 (3) | | | 2,352 | | | | 2,352 | |
Manufacturers Bank, 0.30%, 7/5/2012 (3) | | | 46,382 | | | | 46,382 | |
MB Financial Bank N.A., 0.30%, 7/5/2012 (3) | | | 137 | | | | 137 | |
mBank, 0.30%, 7/5/2012 (3) | | | 984 | | | | 984 | |
Mercantil Commercebank National Association, 0.30%, 7/5/2012 (3) | | | 542 | | | | 542 | |
Mercantile Bank & Trust Company, 0.30%, 7/5/2012 (3) | | | 1,840 | | | | 1,840 | |
Mercantile Bank of Michigan, 0.30%, 7/5/2012 (3) | | | 5,175 | | | | 5,175 | |
Merchants & Farmers Bank, 0.30%, 7/5/2012 (3) | | | 213 | | | | 213 | |
Merchants Bank, 0.30%, 7/5/2012 (3) | | | 53 | | | | 53 | |
Meridian Bank, 0.30%, 7/5/2012 (3) | | | 272 | | | | 272 | |
Metropolitan Capital Bank & Trust, 0.30%, 7/5/2012 (3) | | | 1,911 | | | | 1,911 | |
Metropolitan National Bank, 0.30%, 7/5/2012 (3) | | | 12,123 | | | | 12,123 | |
Midwest Regional Bank, 0.30%, 7/5/2012 (3) | | | 51 | | | | 51 | |
Mifflin County Savings Bank, 0.30%, 7/5/2012 (3) | | | 212 | | | | 212 | |
MileStone Bank, 0.30%, 7/5/2012 (3) | | | 651 | | | | 651 | |
Miners Bank, 0.30%, 7/5/2012 (3) | | | 873 | | | | 873 | |
Minnesota Bank & Trust, 0.30%, 7/5/2012 (3) | | | 1,838 | | | | 1,838 | |
Morris Bank, 0.30%, 7/5/2012 (3) | | | 161 | | | | 161 | |
National Bank & Trust Company, 0.30%, 7/5/2012 (3) | | | 1,134 | | | | 1,134 | |
National Bank of California, 0.30%, 7/5/2012 (3) | | | 41 | | | | 41 | |
Needham Bank, 0.30%, 7/5/2012 (3) | | | 3,036 | | | | 3,036 | |
New Mexico Bank & Trust, 0.30%, 7/5/2012 (3) | | | 1,506 | | | | 1,506 | |
Newburyport Five Cents Savings Bank, 0.30%, 7/5/2012 (3) | | | 19 | | | | 19 | |
NOA Bank, 0.30%, 7/5/2012 (3) | | | 130 | | | | 130 | |
Noah Bank, 0.30%, 7/5/2012 (3) | | | 774 | | | | 774 | |
North Jersey Community Bank, 0.30%, 7/5/2012 (3) | | | 2,188 | | | | 2,188 | |
North Shore Community Bank & Trust Company, 0.30%, 7/5/2012 (3) | | | 1 | | | | 1 | |
Northbrook Bank & Trust Company, 0.30%, 7/5/2012 (3) | | | 9 | | | | 9 | |
Northern Bank & Trust Company, 0.30%, 7/5/2012 (3) | | | 4,789 | | | | 4,789 | |
Nuvo Bank & Trust Company, 0.30%, 7/5/2012 (3) | | | 1,356 | | | | 1,356 | |
| The Aggressive Growth Fund | |
| | | Shares or Principal Amount ($) | | | | | |
| Bank Obligations — continued | | | | | | | | |
Oak View National Bank, 0.30%, 7/5/2012 (3) | | | 211 | | | | 211 | |
Oasis Bank SSB, 0.30%, 7/5/2012 (3) | | | 28 | | | | 28 | |
OceanFirst Bank, 0.30%, 7/5/2012 (3) | | | 103 | | | | 103 | |
Ohio Commerce Bank, 0.30%, 7/5/2012 (3) | | | 473 | | | | 473 | |
Old Plank Trail Community Bank National Assoc, 0.30%, 7/5/2012 (3) | | | 46 | | | | 46 | |
One Bank & Trust National Association, 0.30%, 7/5/2012 (3) | | | 212 | | | | 212 | |
OneWest Bank FSB, 0.30%, 7/5/2012 (3) | | | 3,047 | | | | 3,047 | |
Ossian State Bank, 0.30%, 7/5/2012 (3) | | | 81 | | | | 81 | |
Pacific Commerce Bank, 0.30%, 7/5/2012 (3) | | | 2,502 | | | | 2,502 | |
Pacific Enterprise Bank, 0.30%, 7/5/2012 (3) | | | 2,855 | | | | 2,855 | |
Paragon Commercial Bank, 0.30%, 7/5/2012 (3) | | | 9,584 | | | | 9,584 | |
Parkside Financial Bank & Trust, 0.30%, 7/5/2012 (3) | | | 1,326 | | | | 1,326 | |
Peapack-Gladstone Bank, 0.30%, 7/5/2012 (3) | | | 1 | | | | 1 | |
Pegasus Bank, 0.30%, 7/5/2012 (3) | | | 318 | | | | 318 | |
Peoples Bank National Association, 0.30%, 7/5/2012 (3) | | | 116 | | | | 116 | |
Peoples Bank of Commerce, 0.30%, 7/5/2012 (3) | | | 870 | | | | 870 | |
Peoples Community Bank, 0.30%, 7/5/2012 (3) | | | 1,287 | | | | 1,287 | |
Peoples United Bank, 0.30%, 7/5/2012 (3) | | | 240,000 | | | | 240,000 | |
Petit Jean State Bank, 0.30%, 7/5/2012 (3) | | | 766 | | | | 766 | |
Pine Bluff National Bank, 0.30%, 7/5/2012 (3) | | | 547 | | | | 547 | |
Plaza Bank, 0.30%, 7/5/2012 (3) | | | 104 | | | | 104 | |
PNC Bank National Association, 0.30%, 7/5/2012 (3) | | | 2,029 | | | | 2,029 | |
Post Oak Bank N.A., 0.30%, 7/5/2012 (3) | | | 434 | | | | 434 | |
Premier Bank, 0.30%, 7/5/2012 (3) | | | 2,347 | | | | 2,347 | |
Premier Bank, 0.30%, 7/5/2012 (3) | | | 1,127 | | | | 1,127 | |
PrinsBank, 0.30%, 7/5/2012 (3) | | | 542 | | | | 542 | |
Private Bank Minnesota, 0.30%, 7/5/2012 (3) | | | 1,330 | | | | 1,330 | |
ProAmérica Bank, 0.30%, 7/5/2012 (3) | | | 2,343 | | | | 2,343 | |
Professional Business Bank, 0.30%, 7/5/2012 (3) | | | 434 | | | | 434 | |
Progress Bank and Trust, 0.30%, 7/5/2012 (3) | | | 441 | | | | 441 | |
Quad City Bank and Trust Company, 0.30%, 7/5/2012 (3) | | | 4,938 | | | | 4,938 | |
Quontic Bank, 0.30%, 7/5/2012 (3) | | | 102 | | | | 102 | |
RBS Citizens National Association, 0.30%, 7/5/2012 (3) | | | 147 | | | | 147 | |
Regent Bank, 0.30%, 7/5/2012 (3) | | | 107 | | | | 107 | |
Regions Bank, 0.30%, 7/5/2012 (3) | | | 11,552 | | | | 11,552 | |
Renasant Bank, 0.30%, 7/5/2012 (3) | | | 4,106 | | | | 4,106 | |
Republic Bank, 0.30%, 7/5/2012 (3) | | | 435 | | | | 435 | |
Republic Bank & Trust, 0.30%, 7/5/2012 (3) | | | 257 | | | | 257 | |
Republic Bank & Trust Company, 0.30%, 7/5/2012 (3) | | | 103 | | | | 103 | |
River Community Bank N.A., 0.30%, 7/5/2012 (3) | | | 1,020 | | | | 1,020 | |
The accompanying notes are an integral part of these financial statements.
| | 2012 Semi-Annual Report | June 30, 2012 |
Schedule of Investments
June 30, 2012 (unaudited)
| The Aggressive Growth Fund | |
| | | Shares or Principal Amount ($) | | | | | |
| Bank Obligations — continued | | | | | | | | |
RiverBend Bank, 0.30%, 7/5/2012 (3) | | | 21 | | | | 21 | |
Riverside Bank, 0.30%, 7/5/2012 (3) | | | 132 | | | | 132 | |
Riverview Bank, 0.30%, 7/5/2012 (3) | | | 869 | | | | 869 | |
Rockland Trust Company, 0.30%, 7/5/2012 (3) | | | 5,732 | | | | 5,732 | |
RSNB Bank, 0.30%, 7/5/2012 (3) | | | 1,628 | | | | 1,628 | |
Saratoga National Bank & Trust Company, 0.30%, 7/5/2012 (3) | | | 32 | | | | 32 | |
Sauk Valley Bank & Trust Company, 0.30%, 7/5/2012 (3) | | | 4 | | | | 4 | |
Savings Institute Bank and Trust Company, 0.30%, 7/5/2012 (3) | | | 651 | | | | 651 | |
Schaumburg Bank & Trust Company National Asso, 0.30%, 7/5/2012 (3) | | | 1 | | | | 1 | |
Seaside National Bank & Trust, 0.30%, 7/5/2012 (3) | | | 9,132 | | | | 9,132 | |
Seaway Bank and Trust Company, 0.30%, 7/5/2012 (3) | | | 2,334 | | | | 2,334 | |
Security First Bank, 0.30%, 7/5/2012 (3) | | | 16 | | | | 16 | |
SharePlus Federal Bank, 0.30%, 7/5/2012 (3) | | | 176 | | | | 176 | |
Signature Bank, 0.30%, 7/5/2012 (3) | | | 1,014 | | | | 1,014 | |
Signature Bank, 0.30%, 7/5/2012 (3) | | | 199,340 | | | | 199,340 | |
Signature Bank National Association, 0.30%, 7/5/2012 (3) | | | 112 | | | | 112 | |
Solera National Bank, 0.30%, 7/5/2012 (3) | | | 476 | | | | 476 | |
Southern Bancorp Bank, 0.30%, 7/5/2012 (3) | | | 75 | | | | 75 | |
Southern Bank, 0.30%, 7/5/2012 (3) | | | 10 | | | | 10 | |
Southwest Bank, 0.30%, 7/5/2012 (3) | | | 2,434 | | | | 2,434 | |
Sovereign Bank National Association, 0.30%, 7/5/2012 (3) | | | 240,000 | | | | 240,000 | |
St. Charles Bank & Trust Company, 0.30%, 7/5/2012 (3) | | | 146 | | | | 146 | |
State Bank and Trust Company, 0.30%, 7/5/2012 (3) | | | 265 | | | | 265 | |
State Bank of the Lakes, 0.30%, 7/5/2012 (3) | | | 1 | | | | 1 | |
Sterling National Bank, 0.30%, 7/5/2012 (3) | | | 34,411 | | | | 34,411 | |
Sturdy Savings Bank, 0.30%, 7/5/2012 (3) | | | 103 | | | | 103 | |
Summit Bank, 0.30%, 7/5/2012 (3) | | | 393 | | | | 393 | |
Summit Bank & Trust, 0.30%, 7/5/2012 (3) | | | 1,904 | | | | 1,904 | |
Summit Community Bank Inc., 0.30%, 7/5/2012 (3) | | | 448 | | | | 448 | |
TD Bank N.A., 0.30%, 7/5/2012 (3) | | | 240,000 | | | | 240,000 | |
Team Capital Bank, 0.30%, 7/5/2012 (3) | | | 11,180 | | | | 11,180 | |
Texas Capital Bank National Association, 0.30%, 7/5/2012 (3) | | | 240,000 | | | | 240,000 | |
Touchmark National Bank, 0.30%, 7/5/2012 (3) | | | 1,389 | | | | 1,389 | |
Town Bank, 0.30%, 7/5/2012 (3) | | | 3 | | | | 3 | |
Transportation Alliance Bank Inc., 0.30%, 7/5/2012 (3) | | | 8 | | | | 8 | |
Treynor State Bank, 0.30%, 7/5/2012 (3) | | | 2,373 | | | | 2,373 | |
TriSummit Bank, 0.30%, 7/5/2012 (3) | | | 2,280 | | | | 2,280 | |
U.S. Bank National Association, 0.30%, 7/5/2012 (3) | | | 165 | | | | 165 | |
Uinta Bank, 0.30%, 7/5/2012 (3) | | | 1,442 | | | | 1,442 | |
| The Aggressive Growth Fund | |
| | | Shares or Principal Amount ($) | | | | | |
| Bank Obligations — continued | | | | | | | | |
UMB Bank Arizona National Association, 0.30%, 7/5/2012 (3) | | | 107 | | | | 107 | |
UMB Bank Colorado National Association, 0.30%, 7/5/2012 (3) | | | 16 | | | | 16 | |
UMB Bank National Association, 0.30%, 7/5/2012 (3) | | | 134 | | | | 134 | |
Umpqua Bank, 0.30%, 7/5/2012 (3) | | | 81 | | | | 81 | |
Union Bank National Association, 0.30%, 7/5/2012 (3) | | | 135 | | | | 135 | |
Union Bank of Mena, 0.30%, 7/5/2012 (3) | | | 16 | | | | 16 | |
Union Center National Bank, 0.30%, 7/5/2012 (3) | | | 46,382 | | | | 46,382 | |
United Bank, 0.30%, 7/5/2012 (3) | | | 2,152 | | | | 2,152 | |
United Bank, 0.30%, 7/5/2012 (3) | | | 105 | | | | 105 | |
United Bank Inc., 0.30%, 7/5/2012 (3) | | | 1,967 | | | | 1,967 | |
USNY Bank, 0.30%, 7/5/2012 (3) | | | 666 | | | | 666 | |
Valley Bank, 0.30%, 7/5/2012 (3) | | | 759 | | | | 759 | |
Valley National Bank, 0.30%, 7/5/2012 (3) | | | 220,141 | | | | 220,141 | |
Valliance Bank, 0.30%, 7/5/2012 (3) | | | 126 | | | | 126 | |
Veritex Community Bank National Association, 0.30%, 7/5/2012 (3) | | | 43 | | | | 43 | |
Verus Bank of Commerce, 0.30%, 7/5/2012 (3) | | | 3,444 | | | | 3,444 | |
Victory Bank, 0.30%, 7/5/2012 (3) | | | 217 | | | | 217 | |
ViewPoint Bank National Association, 0.30%, 7/5/2012 (3) | | | 5,278 | | | | 5,278 | |
Village Bank & Trust, 0.30%, 7/5/2012 (3) | | | 8 | | | | 8 | |
Virginia Heritage Bank, 0.30%, 7/5/2012 (3) | | | 3,297 | | | | 3,297 | |
Warren Bank & Trust Company, 0.30%, 7/5/2012 (3) | | | 1,088 | | | | 1,088 | |
Washington Trust Bank, 0.30%, 7/5/2012 (3) | | | 1,405 | | | | 1,405 | |
Washington Trust Company of Westerly, 0.30%, 7/5/2012 (3) | | | 152 | | | | 152 | |
Webster Bank National Association, 0.30%, 7/5/2012 (3) | | | 104 | | | | 104 | |
Wells Fargo Bank National Association, 0.30%, 7/5/2012 (3) | | | 238 | | | | 238 | |
West Town Savings Bank, 0.30%, 7/5/2012 (3) | | | 16 | | | | 16 | |
Western Alliance Bank, 0.30%, 7/5/2012 (3) | | | 53 | | | | 53 | |
Western National Bank, 0.30%, 7/5/2012 (3) | | | 197 | | | | 197 | |
Wheaton Bank & Trust Company, 0.30%, 7/5/2012 (3) | | | 1 | | | | 1 | |
Whidbey Island Bank, 0.30%, 7/5/2012 (3) | | | 74 | | | | 74 | |
Wilmington Savings Fund Society FSB, 0.30%, 7/5/2012 (3) | | | 4,324 | | | | 4,324 | |
Wilmington Trust National Association, 0.30%, 7/5/2012 (3) | | | 108 | | | | 108 | |
Wisconsin Community Bank, 0.30%, 7/5/2012 (3) | | | 42,621 | | | | 42,621 | |
Wolverine Bank Federal Savings Bank, 0.30%, 7/5/2012 (3) | | | 4 | | | | 4 | |
Xenith Bank, 0.30%, 7/5/2012 (3) | | | 3,914 | | | | 3,914 | |
Total Bank Obligations (Cost $5,004,521) | | | | | | | 5,004,521 | |
The accompanying notes are an integral part of these financial statements.
| | 2012 Semi-Annual Report | June 30, 2012 |
Schedule of Investments
June 30, 2012 (unaudited)
| The Aggressive Growth Fund | |
| | | Shares or Principal Amount ($) | | | | | |
| Floating Rate Demand Notes — 0.6% | | | | | | | | |
Caterpillar Financial Power Investment Floating Rate Demand Note, 0.60%, 7/1/2012 (4) | | | 200,669 | | | | 200,669 | |
Total Floating Rate Demand Notes (Cost $200,669) | | | | | | | 200,669 | |
| U.S. Government Obligations — 4.8% | | | | | | | | |
U.S. Treasury Bill, 0.12%, due 9/6/2012 (5) | | | 1,500,000 | | | | 1,499,814 | |
Total U.S. Government Obligations (Cost $1,499,670) | | | | | | | 1,499,814 | |
Total Investments — 99.0% (Cost $30,587,341 )(1) | | | | | | | 31,081,223 | |
| Other Assets less Liabilities — 1.0% | | | | | | | 314,768 | |
Total Net Assets — 100.0% | | | | | | | 31,395,991 | |
Trustee Deferred Compensation (6) | | | | | | | | |
| The Flex-funds Aggressive Growth Fund | | | 991 | | | | 7,869 | |
The Flex-funds Balanced Fund | | | 519 | | | | 5,039 | |
| The Flex-funds Dynamic Growth Fund | | | 316 | | | | 2,626 | |
The Flex-funds Muirfield Fund | | | 1,306 | | | | 7,248 | |
The Flex-funds Quantex Fund | | | 753 | | | | 17,093 | |
| The Flex-funds Utilities & Infrastructure Fund | | | 113 | | | | 2,668 | |
Total Trustee Deferred Compensation (Cost $35,992) | | | | | | | 42,543 | |
| The Aggressive Growth Fund | |
| | | | | | Unrealized Appreciation (Depreciation) ($) | |
| | | | | | | |
| Futures Contracts | |
| Standard & Poors 500 expiring September 2012, notional value $10,851,200 | | | 32 | | | | 303,360 | |
| Standard & Poors Mid Cap 400 E-Mini expiring September 2012, notional value $1,409,250 | | | 15 | | | | 34,838 | |
| Total Futures Contracts | | | 47 | | | | 338,198 | |
| (1) | Represents cost for financial reporting purposes and differs for federal income tax purposes by the amount of losses deferred for federal income tax reporting in the amount of $368,788. Cost for federal income tax purposes of $30,956,129 differs from value by net unrealized appreciation (depreciation) of securities as follows: |
Unrealized appreciation | | $ | 784,228 | |
Unrealized depreciation | | | (659,134 | ) |
| Net unrealized appreciation (depreciation) | | $ | 125,094 | |
| (2) | Investment in affiliate. The yield shown represents the 7-day yield in effect at June 30, 2012. |
| (3) | Illiquid security. The sale or disposition of such security would not be possible in the ordinary course of business within seven days at approximately the value at which the Fund has valued the security. These securities were purchased through StoneCastle Partners, LLC, an independent, privately held asset management and investment services company, and are insured through the Federal Deposit Insurance Corporation (FDIC). The interest rate varies monthly and any accrued interest is reinvested into the program on a monthly basis. The securities are classified as illiquid because if the Fund were to redeem its investment in the program, the proceeds are delivered only once per week; on the Wednesday of the next week following the redemption request. The maximum number of days from a redemption request to receiving the proceeds is nine days. Hence the Fund may not be able to receive its proceeds within seven days. As of June 30, 2012, illiquid securities represented 16.1% of Total Investments. |
| (4) | Floating rate security. The rate shown represents the rate in effect at June 30, 2012. |
| (5) | Pledged as collateral on futures contracts. |
| (6) | Assets of affiliates to The Aggressive Growth Fund held for the benefit of the Fund’s Trustees in connection with the Trustee Deferred Compensation Plan. |
The accompanying notes are an integral part of these financial statements.
| | 2012 Semi-Annual Report | June 30, 2012 |
Schedule of Investments
June 30, 2012 (unaudited)
| The Balanced Fund | |
| | | Shares or Principal Amount ($) | | | | | |
| Registered Investment Companies — 67.1% | |
| Consumer Staples Select Sector SPDR Fund | | | 34,775 | | | | 1,209,127 | |
| DoubleLine Total Return Bond Fund | | | 494,914 | | | | 5,533,135 | |
Energy Select Sector SPDR Fund | | | 26,925 | | | | 1,787,012 | |
Federated Bond Fund | | | 757,156 | | | | 7,117,269 | |
| Health Care Select Sector SPDR Fund | | | 74,900 | | | | 2,846,575 | |
| iShares iBoxx $ Investment Grade Corporate Bond Fund | | | 51,975 | | | | 6,111,740 | |
| iShares Russell 1000 Growth Index Fund | | | 46,300 | | | | 2,927,549 | |
| iShares Russell 1000 Value Index Fund | | | 57,725 | | | | 3,937,999 | |
Ivy Mid Cap Growth Fund | | | 66,591 | | | | 1,178,655 | |
| JPMorgan Disciplined Equity Fund | | | 296,165 | | | | 5,176,965 | |
PowerShares QQQ Trust | | | 55,625 | | | | 3,568,900 | |
| SPDR Dow Jones Industrial Average ETF Trust | | | 24,300 | | | | 3,121,335 | |
Vanguard Equity Income Fund | | | 68,494 | | | | 3,330,166 | |
| Vanguard Intermediate-Term Corporate Bond ETF | | | 71,400 | | | | 6,083,994 | |
| Wells Fargo Advantage Growth Fund | | | 150,235 | | | | 6,164,136 | |
Total Registered Investment Companies (Cost $58,756,537) | | | | | | | 60,094,557 | |
| Money Market Registered Investment Companies — 18.4% | |
The Flex-funds Money Market Fund - Institutional Class, 0.17% (2) | | | 16,463,885 | | | | 16,463,885 | |
Total Money Market Registered Investment Companies (Cost $16,463,885) | | | | | | | 16,463,885 | |
| Bank Obligations — 5.6% | | | | | | | | |
Access National Bank, 0.30%, 7/5/2012 (3) | | | 987 | | | | 987 | |
Allied Bank, 0.30%, 7/5/2012 (3) | | | 434 | | | | 434 | |
Alma Bank, 0.30%, 7/5/2012 (3) | | | 4,804 | | | | 4,804 | |
AloStar Bank of Commerce, 0.30%, 7/5/2012 (3) | | | 3,797 | | | | 3,797 | |
Alpine Bank, 0.30%, 7/5/2012 (3) | | | 3,060 | | | | 3,060 | |
Ameriana Bank, 0.30%, 7/5/2012 (3) | | | 19 | | | | 19 | |
American Enterprise Bank of Florida, 0.30%, 7/5/2012 (3) | | | 492 | | | | 492 | |
American Momentum Bank, 0.30%, 7/5/2012 (3) | | | 5,694 | | | | 5,694 | |
American National Bank, 0.30%, 7/5/2012 (3) | | | 2,277 | | | | 2,277 | |
American National Bank-Fox Cities, 0.30%, 7/5/2012 (3) | | | 215 | | | | 215 | |
American Savings Bank F.S.B., 0.30%, 7/5/2012 (3) | | | 16 | | | | 16 | |
American Savings Bank FSB, 0.30%, 7/5/2012 (3) | | | 155 | | | | 155 | |
Americas United Bank, 0.30%, 7/5/2012 (3) | | | 1,306 | | | | 1,306 | |
AmFirst Bank N.A., 0.30%, 7/5/2012 (3) | | | 38 | | | | 38 | |
Anthem Bank & Trust, 0.30%, 7/5/2012 (3) | | | 873 | | | | 873 | |
Arizona Bank & Trust, 0.30%, 7/5/2012 (3) | | | 4,192 | | | | 4,192 | |
Arvest Bank, 0.30%, 7/5/2012 (3) | | | 220 | | | | 220 | |
Austin Bank of Chicago, 0.30%, 7/5/2012 (3) | | | 869 | | | | 869 | |
Avidia Bank, 0.30%, 7/5/2012 (3) | | | 4,192 | | | | 4,192 | |
| The Balanced Fund | |
| | | Shares or Principal Amount ($) | | | | | |
| Bank Obligations — continued | | | | | | | | |
Bancorp Bank, 0.30%, 7/5/2012 (3) | | | 10,749 | | | | 10,749 | |
Bank Hapoalim B.M., 0.30%, 7/5/2012 (3) | | | 1,511 | | | | 1,511 | |
Bank Leumi USA, 0.30%, 7/5/2012 (3) | | | 240,000 | | | | 240,000 | |
Bank of America National Association, 0.30%, 7/5/2012 (3) | | | 448 | | | | 448 | |
Bank of Augusta, 0.30%, 7/5/2012 (3) | | | 917 | | | | 917 | |
Bank of Cadiz and Trust Company, 0.30%, 7/5/2012 (3) | | | 1,055 | | | | 1,055 | |
Bank of Cave City, 0.30%, 7/5/2012 (3) | | | 437 | | | | 437 | |
Bank of England, 0.30%, 7/5/2012 (3) | | | 1,867 | | | | 1,867 | |
Bank of Fayetteville, 0.30%, 7/5/2012 (3) | | | 436 | | | | 436 | |
Bank of Hawaii, 0.30%, 7/5/2012 (3) | | | 4,983 | | | | 4,983 | |
Bank of Houston, 0.30%, 7/5/2012 (3) | | | 2,661 | | | | 2,661 | |
Bank of Jackson Hole, 0.30%, 7/5/2012 (3) | | | 442 | | | | 442 | |
Bank of Manhattan N.A., 0.30%, 7/5/2012 (3) | | | 1,665 | | | | 1,665 | |
Bank of Marin, 0.30%, 7/5/2012 (3) | | | 218 | | | | 218 | |
Bank of Missouri, 0.30%, 7/5/2012 (3) | | | 4,968 | | | | 4,968 | |
Bank of Princeton, 0.30%, 7/5/2012 (3) | | | 651 | | | | 651 | |
Bank of the Ozarks, 0.30%, 7/5/2012 (3) | | | 108 | | | | 108 | |
Bank of the Panhandle, 0.30%, 7/5/2012 (3) | | | 1,062 | | | | 1,062 | |
Bank of the West, 0.30%, 7/5/2012 (3) | | | 13,559 | | | | 13,559 | |
Bar Harbor Bank & Trust, 0.30%, 7/5/2012 (3) | | | 869 | | | | 869 | |
Belmont Savings Bank, 0.30%, 7/5/2012 (3) | | | 4,601 | | | | 4,601 | |
Benchmark Bank, 0.30%, 7/5/2012 (3) | | | 3 | | | | 3 | |
Benefit Bank, 0.30%, 7/5/2012 (3) | | | 1,345 | | | | 1,345 | |
Berkshire Bank, 0.30%, 7/5/2012 (3) | | | 6,256 | | | | 6,256 | |
Beverly Bank & Trust Company National Associa, 0.30%, 7/5/2012 (3) | | | 30 | | | | 30 | |
Biltmore Bank of Arizona, 0.30%, 7/5/2012 (3) | | | 2,408 | | | | 2,408 | |
BMO Harris Bank National Association, 0.30%, 7/5/2012 (3) | | | 2,493 | | | | 2,493 | |
BOKF National Association, 0.30%, 7/5/2012 (3) | | | 5,969 | | | | 5,969 | |
Boone Bank & Trust Co., 0.30%, 7/5/2012 (3) | | | 1,220 | | | | 1,220 | |
Boston Private Bank & Trust Company, 0.30%, 7/5/2012 (3) | | | 2,184 | | | | 2,184 | |
Branch Banking and Trust Company, 0.30%, 7/5/2012 (3) | | | 1,980 | | | | 1,980 | |
Brookhaven Bank, 0.30%, 7/5/2012 (3) | | | 250 | | | | 250 | |
Business Bank, 0.30%, 7/5/2012 (3) | | | 1,431 | | | | 1,431 | |
Business Bank, 0.30%, 7/5/2012 (3) | | | 462 | | | | 462 | |
Business Bank of Saint Louis, 0.30%, 7/5/2012 (3) | | | 2,094 | | | | 2,094 | |
Business First Bank, 0.30%, 7/5/2012 (3) | | | 2,092 | | | | 2,092 | |
Cache Valley Bank, 0.30%, 7/5/2012 (3) | | | 3,057 | | | | 3,057 | |
Cadence Bank N.A., 0.30%, 7/5/2012 (3) | | | 209,741 | | | | 209,741 | |
California Bank & Trust, 0.30%, 7/5/2012 (3) | | | 87 | | | | 87 | |
Capital Bank, 0.30%, 7/5/2012 (3) | | | 1,156 | | | | 1,156 | |
Capital One National Association, 0.30%, 7/5/2012 (3) | | | 157,954 | | | | 157,954 | |
CapitalMark Bank & Trust, 0.30%, 7/5/2012 (3) | | | 2,903 | | | | 2,903 | |
CapStar Bank, 0.30%, 7/5/2012 (3) | | | 11,181 | | | | 11,181 | |
The accompanying notes are an integral part of these financial statements.
| | 2012 Semi-Annual Report | June 30, 2012 |
Schedule of Investments
June 30, 2012 (unaudited)
| The Balanced Fund | |
| | | Shares or Principal Amount ($) | | | | | |
| Bank Obligations — continued | | | | | | | | |
CapStone Bank, 0.30%, 7/5/2012 (3) | | | 2,126 | | | | 2,126 | |
Cardinal Bank, 0.30%, 7/5/2012 (3) | | | 4,028 | | | | 4,028 | |
Carolina Alliance Bank, 0.30%, 7/5/2012 (3) | | | 115 | | | | 115 | |
Carver Federal Savings Bank, 0.30%, 7/5/2012 (3) | | | 46,382 | | | | 46,382 | |
Cathay Bank, 0.30%, 7/5/2012 (3) | | | 240,000 | | | | 240,000 | |
Celtic Bank, 0.30%, 7/5/2012 (3) | | | 2,441 | | | | 2,441 | |
Centennial Bank, 0.30%, 7/5/2012 (3) | | | 466 | | | | 466 | |
Centra Bank Inc., 0.30%, 7/5/2012 (3) | | | 2,084 | | | | 2,084 | |
Central Bank, 0.30%, 7/5/2012 (3) | | | 695 | | | | 695 | |
Central Bank Illinois, 0.30%, 7/5/2012 (3) | | | 32 | | | | 32 | |
Central Bank of Kansas City, 0.30%, 7/5/2012 (3) | | | 38 | | | | 38 | |
CheckSpring Bank, 0.30%, 7/5/2012 (3) | | | 23 | | | | 23 | |
Chemical Bank, 0.30%, 7/5/2012 (3) | | | 399 | | | | 399 | |
Chickasha Bank & Trust Company, 0.30%, 7/5/2012 (3) | | | 442 | | | | 442 | |
Citizens Bank & Trust Company, 0.30%, 7/5/2012 (3) | | | 3,770 | | | | 3,770 | |
Citizens Bank of Pennsylvania, 0.30%, 7/5/2012 (3) | | | 133 | | | | 133 | |
Citizens National Bank, 0.30%, 7/5/2012 (3) | | | 212 | | | | 212 | |
Citizens National Bank of Bluffton, 0.30%, 7/5/2012 (3) | | | 446 | | | | 446 | |
City First Bank of D.C. National Association, 0.30%, 7/5/2012 (3) | | | 1,597 | | | | 1,597 | |
City National Bank, 0.30%, 7/5/2012 (3) | | | 271 | | | | 271 | |
City National Bank of Sulphur Springs, 0.30%, 7/5/2012 (3) | | | 146 | | | | 146 | |
City National Bank of Taylor, 0.30%, 7/5/2012 (3) | | | 970 | | | | 970 | |
Cole Taylor Bank, 0.30%, 7/5/2012 (3) | | | 79,682 | | | | 79,682 | |
Collin Bank, 0.30%, 7/5/2012 (3) | | | 1,135 | | | | 1,135 | |
Columbia State Bank, 0.30%, 7/5/2012 (3) | | | 3,884 | | | | 3,884 | |
Comerica Bank, 0.30%, 7/5/2012 (3) | | | 4,837 | | | | 4,837 | |
Commencement Bank, 0.30%, 7/5/2012 (3) | | | 1,327 | | | | 1,327 | |
Commerce Bank & Trust Company, 0.30%, 7/5/2012 (3) | | | 6,820 | | | | 6,820 | |
Commerce National Bank, 0.30%, 7/5/2012 (3) | | | 81 | | | | 81 | |
Community Bank & Trust, 0.30%, 7/5/2012 (3) | | | 2,970 | | | | 2,970 | |
Community Bank of Oelwein, 0.30%, 7/5/2012 (3) | | | 907 | | | | 907 | |
Community Bank of Santa Maria, 0.30%, 7/5/2012 (3) | | | 103 | | | | 103 | |
Community Bank of the Bay, 0.30%, 7/5/2012 (3) | | | 167 | | | | 167 | |
Community Mutual Savings Bank, 0.30%, 7/5/2012 (3) | | | 1,168 | | | | 1,168 | |
Community Trust Bank, 0.30%, 7/5/2012 (3) | | | 240,000 | | | | 240,000 | |
Compass Bank, 0.30%, 7/5/2012 (3) | | | 240,000 | | | | 240,000 | |
Congaree State Bank, 0.30%, 7/5/2012 (3) | | | 1,252 | | | | 1,252 | |
Congressional Bank, 0.30%, 7/5/2012 (3) | | | 1,356 | | | | 1,356 | |
Cooper State Bank, 0.30%, 7/5/2012 (3) | | | 431 | | | | 431 | |
Crescent State Bank, 0.30%, 7/5/2012 (3) | | | 2,140 | | | | 2,140 | |
| The Balanced Fund | |
| | | Shares or Principal Amount ($) | | | | | |
| Bank Obligations — continued | | | | | | | | |
Crystal Lake Bank and Trust Company N.A., 0.30%, 7/5/2012 (3) | | | 1 | | | | 1 | |
Delta Trust & Bank, 0.30%, 7/5/2012 (3) | | | 4,330 | | | | 4,330 | |
DeWitt Bank & Trust Company, 0.30%, 7/5/2012 (3) | | | 322 | | | | 322 | |
Diamond Bank, 0.30%, 7/5/2012 (3) | | | 3,222 | | | | 3,222 | |
DMB Community Bank, 0.30%, 7/5/2012 (3) | | | 3,070 | | | | 3,070 | |
Dollar Bank Federal Savings Bank, 0.30%, 7/5/2012 (3) | | | 1,095 | | | | 1,095 | |
Dubuque Bank & Trust Company, 0.30%, 7/5/2012 (3) | | | 431 | | | | 431 | |
Eagle Bank and Trust Company, 0.30%, 7/5/2012 (3) | | | 1,118 | | | | 1,118 | |
EagleBank, 0.30%, 7/5/2012 (3) | | | 240,000 | | | | 240,000 | |
East River Bank, 0.30%, 7/5/2012 (3) | | | 115 | | | | 115 | |
East West Bank, 0.30%, 7/5/2012 (3) | | | 240,511 | | | | 240,511 | |
Empire National Bank, 0.30%, 7/5/2012 (3) | | | 434 | | | | 434 | |
Encore Bank National Association, 0.30%, 7/5/2012 (3) | | | 319 | | | | 319 | |
Encore National Bank, 0.30%, 7/5/2012 (3) | | | 125 | | | | 125 | |
Enterprise Bank & Trust, 0.30%, 7/5/2012 (3) | | | 7,692 | | | | 7,692 | |
Equity Bank A National Association, 0.30%, 7/5/2012 (3) | | | 994 | | | | 994 | |
Exchange Bank & Trust Company, 0.30%, 7/5/2012 (3) | | | 2,303 | | | | 2,303 | |
Exchange State Bank, 0.30%, 7/5/2012 (3) | | | 433 | | | | 433 | |
Fannin Bank, 0.30%, 7/5/2012 (3) | | | 1 | | | | 1 | |
Farmers & Merchants Bank of Long Beach, 0.30%, 7/5/2012 (3) | | | 69 | | | | 69 | |
Farmers & Merchants State Bank, 0.30%, 7/5/2012 (3) | | | 124 | | | | 124 | |
Farmers and Merchants State Bank of Blooming , 0.30%, 7/5/2012 (3) | | | 839 | | | | 839 | |
Farmers Bank, 0.30%, 7/5/2012 (3) | | | 135 | | | | 135 | |
Farmers Exchange Bank, 0.30%, 7/5/2012 (3) | | | 1,580 | | | | 1,580 | |
Farmers State Bank, 0.30%, 7/5/2012 (3) | | | 1 | | | | 1 | |
Fidelity Bank, 0.30%, 7/5/2012 (3) | | | 2,975 | | | | 2,975 | |
Fifth Third Bank, 0.30%, 7/5/2012 (3) | | | 240,000 | | | | 240,000 | |
First Bank & Trust, 0.30%, 7/5/2012 (3) | | | 2 | | | | 2 | |
First Bank Financial Centre, 0.30%, 7/5/2012 (3) | | | 103 | | | | 103 | |
First Choice Bank, 0.30%, 7/5/2012 (3) | | | 1,929 | | | | 1,929 | |
First Commercial Bank, 0.30%, 7/5/2012 (3) | | | 102 | | | | 102 | |
First Commercial Bank, 0.30%, 7/5/2012 (3) | | | 853 | | | | 853 | |
First Community Bank, 0.30%, 7/5/2012 (3) | | | 2,057 | | | | 2,057 | |
First County Bank, 0.30%, 7/5/2012 (3) | | | 5,903 | | | | 5,903 | |
First Federal Bank, 0.30%, 7/5/2012 (3) | | | 1,589 | | | | 1,589 | |
First Foundation Bank, 0.30%, 7/5/2012 (3) | | | 11,657 | | | | 11,657 | |
First International Bank & Trust, 0.30%, 7/5/2012 (3) | | | 136 | | | | 136 | |
First Internet Bank of Indiana, 0.30%, 7/5/2012 (3) | | | 4,820 | | | | 4,820 | |
First Interstate Bank, 0.30%, 7/5/2012 (3) | | | 80 | | | | 80 | |
First N.A., 0.30%, 7/5/2012 (3) | | | 1,858 | | | | 1,858 | |
First National Bank, 0.30%, 7/5/2012 (3) | | | 4,171 | | | | 4,171 | |
First National Bank, 0.30%, 7/5/2012 (3) | | | 104 | | | | 104 | |
The accompanying notes are an integral part of these financial statements.
| | 2012 Semi-Annual Report | June 30, 2012 |
Schedule of Investments
June 30, 2012 (unaudited)
| The Balanced Fund | |
| | | Shares or Principal Amount ($) | | | | | |
| Bank Obligations — continued | | | | | | | | |
First National Bank - Fox Valley, 0.30%, 7/5/2012 (3) | | | 147 | | | | 147 | |
First National Bank in Green Forest, 0.30%, 7/5/2012 (3) | | | 221 | | | | 221 | |
First National Bank in Sioux Falls, 0.30%, 7/5/2012 (3) | | | 102 | | | | 102 | |
First National Bank of America, 0.30%, 7/5/2012 (3) | | | 111 | | | | 111 | |
First National Bank of Fort Smith, 0.30%, 7/5/2012 (3) | | | 164 | | | | 164 | |
First National Bank of Long Island, 0.30%, 7/5/2012 (3) | | | 10,706 | | | | 10,706 | |
First National Bank of Omaha, 0.30%, 7/5/2012 (3) | | | 70 | | | | 70 | |
First National Bank of Santa Fe, 0.30%, 7/5/2012 (3) | | | 2,406 | | | | 2,406 | |
First Premier Bank, 0.30%, 7/5/2012 (3) | | | 3,221 | | | | 3,221 | |
First Security Bank, 0.30%, 7/5/2012 (3) | | | 8,935 | | | | 8,935 | |
First Security Bank & Trust Company, 0.30%, 7/5/2012 (3) | | | 11 | | | | 11 | |
First State Bank, 0.30%, 7/5/2012 (3) | | | 875 | | | | 875 | |
First State Bank, 0.30%, 7/5/2012 (3) | | | 40 | | | | 40 | |
First State Bank of DeQueen, 0.30%, 7/5/2012 (3) | | | 924 | | | | 924 | |
First State Bank of Northwest Arkansas, 0.30%, 7/5/2012 (3) | | | 626 | | | | 626 | |
First Trade Union Bank, 0.30%, 7/5/2012 (3) | | | 167 | | | | 167 | |
First Utah Bank, 0.30%, 7/5/2012 (3) | | | 107 | | | | 107 | |
First Virginia Community Bank, 0.30%, 7/5/2012 (3) | | | 892 | | | | 892 | |
First Western Bank, 0.30%, 7/5/2012 (3) | | | 9 | | | | 9 | |
First-Citizens Bank & Trust Company, 0.30%, 7/5/2012 (3) | | | 10,582 | | | | 10,582 | |
FirstAtlantic Bank, 0.30%, 7/5/2012 (3) | | | 104 | | | | 104 | |
FirstBank, 0.30%, 7/5/2012 (3) | | | 1,326 | | | | 1,326 | |
FirstBank Puerto Rico, 0.30%, 7/5/2012 (3) | | | 240,000 | | | | 240,000 | |
FirstMerit Bank National Association, 0.30%, 7/5/2012 (3) | | | 218 | | | | 218 | |
Flagship Community Bank, 0.30%, 7/5/2012 (3) | | | 102 | | | | 102 | |
Flatirons Bank, 0.30%, 7/5/2012 (3) | | | 1,327 | | | | 1,327 | |
Florida Business Bank, 0.30%, 7/5/2012 (3) | | | 434 | | | | 434 | |
Florida Parishes Bank, 0.30%, 7/5/2012 (3) | | | 87 | | | | 87 | |
Forrest City Bank NA, 0.30%, 7/5/2012 (3) | | | 213 | | | | 213 | |
Fortune Bank, 0.30%, 7/5/2012 (3) | | | 1,402 | | | | 1,402 | |
Fox Chase Bank, 0.30%, 7/5/2012 (3) | | | 893 | | | | 893 | |
Franklin Synergy Bank, 0.30%, 7/5/2012 (3) | | | 3,885 | | | | 3,885 | |
Frost National Bank, 0.30%, 7/5/2012 (3) | | | 131 | | | | 131 | |
Genesee Regional Bank, 0.30%, 7/5/2012 (3) | | | 3,091 | | | | 3,091 | |
Georgia Bank & Trust Company of Augusta, 0.30%, 7/5/2012 (3) | | | 2,347 | | | | 2,347 | |
Georgia Banking Company, 0.30%, 7/5/2012 (3) | | | 1,407 | | | | 1,407 | |
German American Bancorp, 0.30%, 7/5/2012 (3) | | | 651 | | | | 651 | |
Glacier Bank, 0.30%, 7/5/2012 (3) | | | 7,385 | | | | 7,385 | |
| The Balanced Fund | |
| | | Shares or Principal Amount ($) | | | | | |
| Bank Obligations — continued | | | | | | | | |
Glens Falls National Bank and Trust Company, 0.30%, 7/5/2012 (3) | | | 32 | | | | 32 | |
Golden Pacific Bank National Association, 0.30%, 7/5/2012 (3) | | | 102 | | | | 102 | |
Gotham Bank of New York, 0.30%, 7/5/2012 (3) | | | 1,903 | | | | 1,903 | |
Grand Savings Bank, 0.30%, 7/5/2012 (3) | | | 1,095 | | | | 1,095 | |
Grand Valley Bank, 0.30%, 7/5/2012 (3) | | | 431 | | | | 431 | |
Green Bank National Association, 0.30%, 7/5/2012 (3) | | | 2,381 | | | | 2,381 | |
Guaranty Bank, 0.30%, 7/5/2012 (3) | | | 1,335 | | | | 1,335 | |
Guaranty Bond Bank, 0.30%, 7/5/2012 (3) | | | 18,610 | | | | 18,610 | |
GulfShore Bank, 0.30%, 7/5/2012 (3) | | | 1,327 | | | | 1,327 | |
Happy State Bank, 0.30%, 7/5/2012 (3) | | | 136 | | | | 136 | |
Heartland Bank, 0.30%, 7/5/2012 (3) | | | 16 | | | | 16 | |
Heartland Bank, 0.30%, 7/5/2012 (3) | | | 8 | | | | 8 | |
Helena National Bank, 0.30%, 7/5/2012 (3) | | | 776 | | | | 776 | |
Heritage Oaks Bank, 0.30%, 7/5/2012 (3) | | | 4,623 | | | | 4,623 | |
Hingham Institution for Savings, 0.30%, 7/5/2012 (3) | | | 4,192 | | | | 4,192 | |
Home Federal Bank, 0.30%, 7/5/2012 (3) | | | 1,409 | | | | 1,409 | |
Horizon Bank National Association, 0.30%, 7/5/2012 (3) | | | 143 | | | | 143 | |
Hyperion Bank, 0.30%, 7/5/2012 (3) | | | 221 | | | | 221 | |
IBERIABANK, 0.30%, 7/5/2012 (3) | | | 240,000 | | | | 240,000 | |
Icon Bank of Texas National Association, 0.30%, 7/5/2012 (3) | | | 300 | | | | 300 | |
Independence Bank, 0.30%, 7/5/2012 (3) | | | 69 | | | | 69 | |
Independent Bank of Texas, 0.30%, 7/5/2012 (3) | | | 104 | | | | 104 | |
Inland Bank and Trust, 0.30%, 7/5/2012 (3) | | | 19 | | | | 19 | |
Integrity Bank, 0.30%, 7/5/2012 (3) | | | 888 | | | | 888 | |
Investors Community Bank, 0.30%, 7/5/2012 (3) | | | 434 | | | | 434 | |
Isabella Bank, 0.30%, 7/5/2012 (3) | | | 113 | | | | 113 | |
Israel Discount Bank of New York, 0.30%, 7/5/2012 (3) | | | 240,000 | | | | 240,000 | |
JPMorgan Chase Bank National Association, 0.30%, 7/5/2012 (3) | | | 68 | | | | 68 | |
Kaiser Federal Bank, 0.30%, 7/5/2012 (3) | | | 433 | | | | 433 | |
Katahdin Trust Company, 0.30%, 7/5/2012 (3) | | | 2,338 | | | | 2,338 | |
KeyBank National Association, 0.30%, 7/5/2012 (3) | | | 1,679 | | | | 1,679 | |
KeySource Commercial Bank, 0.30%, 7/5/2012 (3) | | | 150 | | | | 150 | |
Lake Forest Bank & Trust Company, 0.30%, 7/5/2012 (3) | | | 1 | | | | 1 | |
Lake National Bank, 0.30%, 7/5/2012 (3) | | | 8 | | | | 8 | |
Landmark Community Bank, 0.30%, 7/5/2012 (3) | | | 873 | | | | 873 | |
Landmark National Bank, 0.30%, 7/5/2012 (3) | | | 228 | | | | 228 | |
Leader Bank National Association, 0.30%, 7/5/2012 (3) | | | 1,031 | | | | 1,031 | |
Legacy Bank, 0.30%, 7/5/2012 (3) | | | 103 | | | | 103 | |
The accompanying notes are an integral part of these financial statements.
| | 2012 Semi-Annual Report | June 30, 2012 |
Schedule of Investments
June 30, 2012 (unaudited)
| The Balanced Fund | |
| | | Shares or Principal Amount ($) | | | | | |
| Bank Obligations — continued | | | | | | | | |
Legacy National Bank, 0.30%, 7/5/2012 (3) | | | 438 | | | | 438 | |
LegacyTexas Bank, 0.30%, 7/5/2012 (3) | | | 8 | | | | 8 | |
Level One Bank, 0.30%, 7/5/2012 (3) | | | 2,638 | | | | 2,638 | |
Lewis & Clark Bank, 0.30%, 7/5/2012 (3) | | | 432 | | | | 432 | |
Libertad Bank SSB, 0.30%, 7/5/2012 (3) | | | 400 | | | | 400 | |
Liberty Bank, 0.30%, 7/5/2012 (3) | | | 3,419 | | | | 3,419 | |
Liberty Bank, 0.30%, 7/5/2012 (3) | | | 430 | | | | 430 | |
Liberty Bank National Association, 0.30%, 7/5/2012 (3) | | | 1 | | | | 1 | |
Liberty Bank of Arkansas, 0.30%, 7/5/2012 (3) | | | 3,955 | | | | 3,955 | |
Libertyville Bank & Trust Company, 0.30%, 7/5/2012 (3) | | | 1 | | | | 1 | |
Lifestore Bank, 0.30%, 7/5/2012 (3) | | | 104 | | | | 104 | |
Lone Star National Bank, 0.30%, 7/5/2012 (3) | | | 4,878 | | | | 4,878 | |
MainStreet Bank, 0.30%, 7/5/2012 (3) | | | 2,352 | | | | 2,352 | |
Manufacturers Bank, 0.30%, 7/5/2012 (3) | | | 46,382 | | | | 46,382 | |
MB Financial Bank N.A., 0.30%, 7/5/2012 (3) | | | 137 | | | | 137 | |
mBank, 0.30%, 7/5/2012 (3) | | | 984 | | | | 984 | |
Mercantil Commercebank National Association, 0.30%, 7/5/2012 (3) | | | 542 | | | | 542 | |
Mercantile Bank & Trust Company, 0.30%, 7/5/2012 (3) | | | 1,840 | | | | 1,840 | |
Mercantile Bank of Michigan, 0.30%, 7/5/2012 (3) | | | 5,175 | | | | 5,175 | |
Merchants & Farmers Bank, 0.30%, 7/5/2012 (3) | | | 213 | | | | 213 | |
Merchants Bank, 0.30%, 7/5/2012 (3) | | | 53 | | | | 53 | |
Meridian Bank, 0.30%, 7/5/2012 (3) | | | 272 | | | | 272 | |
Metropolitan Capital Bank & Trust, 0.30%, 7/5/2012 (3) | | | 1,911 | | | | 1,911 | |
Metropolitan National Bank, 0.30%, 7/5/2012 (3) | | | 12,123 | | | | 12,123 | |
Midwest Regional Bank, 0.30%, 7/5/2012 (3) | | | 51 | | | | 51 | |
Mifflin County Savings Bank, 0.30%, 7/5/2012 (3) | | | 212 | | | | 212 | |
MileStone Bank, 0.30%, 7/5/2012 (3) | | | 651 | | | | 651 | |
Miners Bank, 0.30%, 7/5/2012 (3) | | | 873 | | | | 873 | |
Minnesota Bank & Trust, 0.30%, 7/5/2012 (3) | | | 1,838 | | | | 1,838 | |
Morris Bank, 0.30%, 7/5/2012 (3) | | | 161 | | | | 161 | |
National Bank & Trust Company, 0.30%, 7/5/2012 (3) | | | 1,134 | | | | 1,134 | |
National Bank of California, 0.30%, 7/5/2012 (3) | | | 41 | | | | 41 | |
Needham Bank, 0.30%, 7/5/2012 (3) | | | 3,036 | | | | 3,036 | |
New Mexico Bank & Trust, 0.30%, 7/5/2012 (3) | | | 1,506 | | | | 1,506 | |
Newburyport Five Cents Savings Bank, 0.30%, 7/5/2012 (3) | | | 19 | | | | 19 | |
NOA Bank, 0.30%, 7/5/2012 (3) | | | 130 | | | | 130 | |
Noah Bank, 0.30%, 7/5/2012 (3) | | | 774 | | | | 774 | |
North Jersey Community Bank, 0.30%, 7/5/2012 (3) | | | 2,188 | | | | 2,188 | |
| The Balanced Fund | |
| | | Shares or Principal Amount ($) | | | | | |
| Bank Obligations — continued | | | | | | | | |
North Shore Community Bank & Trust Company, 0.30%, 7/5/2012 (3) | | | 1 | | | | 1 | |
Northbrook Bank & Trust Company, 0.30%, 7/5/2012 (3) | | | 9 | | | | 9 | |
Northern Bank & Trust Company, 0.30%, 7/5/2012 (3) | | | 4,789 | | | | 4,789 | |
Nuvo Bank & Trust Company, 0.30%, 7/5/2012 (3) | | | 1,356 | | | | 1,356 | |
Oak View National Bank, 0.30%, 7/5/2012 (3) | | | 211 | | | | 211 | |
Oasis Bank SSB, 0.30%, 7/5/2012 (3) | | | 28 | | | | 28 | |
OceanFirst Bank, 0.30%, 7/5/2012 (3) | | | 103 | | | | 103 | |
Ohio Commerce Bank, 0.30%, 7/5/2012 (3) | | | 473 | | | | 473 | |
Old Plank Trail Community Bank National Assoc, 0.30%, 7/5/2012 (3) | | | 46 | | | | 46 | |
One Bank & Trust National Association, 0.30%, 7/5/2012 (3) | | | 212 | | | | 212 | |
OneWest Bank FSB, 0.30%, 7/5/2012 (3) | | | 3,047 | | | | 3,047 | |
Ossian State Bank, 0.30%, 7/5/2012 (3) | | | 81 | | | | 81 | |
Pacific Commerce Bank, 0.30%, 7/5/2012 (3) | | | 2,502 | | | | 2,502 | |
Pacific Enterprise Bank, 0.30%, 7/5/2012 (3) | | | 2,855 | | | | 2,855 | |
Paragon Commercial Bank, 0.30%, 7/5/2012 (3) | | | 9,584 | | | | 9,584 | |
Parkside Financial Bank & Trust, 0.30%, 7/5/2012 (3) | | | 1,326 | | | | 1,326 | |
Peapack-Gladstone Bank, 0.30%, 7/5/2012 (3) | | | 1 | | | | 1 | |
Pegasus Bank, 0.30%, 7/5/2012 (3) | | | 318 | | | | 318 | |
Peoples Bank National Association, 0.30%, 7/5/2012 (3) | | | 116 | | | | 116 | |
Peoples Bank of Commerce, 0.30%, 7/5/2012 (3) | | | 870 | | | | 870 | |
Peoples Community Bank, 0.30%, 7/5/2012 (3) | | | 1,287 | | | | 1,287 | |
Peoples United Bank, 0.30%, 7/5/2012 (3) | | | 240,000 | | | | 240,000 | |
Petit Jean State Bank, 0.30%, 7/5/2012 (3) | | | 766 | | | | 766 | |
Pine Bluff National Bank, 0.30%, 7/5/2012 (3) | | | 547 | | | | 547 | |
Plaza Bank, 0.30%, 7/5/2012 (3) | | | 104 | | | | 104 | |
PNC Bank National Association, 0.30%, 7/5/2012 (3) | | | 2,029 | | | | 2,029 | |
Post Oak Bank N.A., 0.30%, 7/5/2012 (3) | | | 434 | | | | 434 | |
Premier Bank, 0.30%, 7/5/2012 (3) | | | 2,347 | | | | 2,347 | |
Premier Bank, 0.30%, 7/5/2012 (3) | | | 1,127 | | | | 1,127 | |
PrinsBank, 0.30%, 7/5/2012 (3) | | | 542 | | | | 542 | |
Private Bank Minnesota, 0.30%, 7/5/2012 (3) | | | 1,330 | | | | 1,330 | |
ProAmérica Bank, 0.30%, 7/5/2012 (3) | | | 2,343 | | | | 2,343 | |
Professional Business Bank, 0.30%, 7/5/2012 (3) | | | 434 | | | | 434 | |
Progress Bank and Trust, 0.30%, 7/5/2012 (3) | | | 441 | | | | 441 | |
Quad City Bank and Trust Company, 0.30%, 7/5/2012 (3) | | | 4,938 | | | | 4,938 | |
Quontic Bank, 0.30%, 7/5/2012 (3) | | | 102 | | | | 102 | |
RBS Citizens National Association, 0.30%, 7/5/2012 (3) | | | 147 | | | | 147 | |
Regent Bank, 0.30%, 7/5/2012 (3) | | | 107 | | | | 107 | |
The accompanying notes are an integral part of these financial statements.
| | 2012 Semi-Annual Report | June 30, 2012 |
Schedule of Investments
June 30, 2012 (unaudited)
| The Balanced Fund | |
| | | Shares or Principal Amount ($) | | | | | |
| Bank Obligations — continued | | | | | | | | |
Regions Bank, 0.30%, 7/5/2012 (3) | | | 11,552 | | | | 11,552 | |
Renasant Bank, 0.30%, 7/5/2012 (3) | | | 4,106 | | | | 4,106 | |
Republic Bank, 0.30%, 7/5/2012 (3) | | | 435 | | | | 435 | |
Republic Bank & Trust, 0.30%, 7/5/2012 (3) | | | 257 | | | | 257 | |
Republic Bank & Trust Company, 0.30%, 7/5/2012 (3) | | | 103 | | | | 103 | |
River Community Bank N.A., 0.30%, 7/5/2012 (3) | | | 1,020 | | | | 1,020 | |
RiverBend Bank, 0.30%, 7/5/2012 (3) | | | 21 | | | | 21 | |
Riverside Bank, 0.30%, 7/5/2012 (3) | | | 132 | | | | 132 | |
Riverview Bank, 0.30%, 7/5/2012 (3) | | | 869 | | | | 869 | |
Rockland Trust Company, 0.30%, 7/5/2012 (3) | | | 5,732 | | | | 5,732 | |
RSNB Bank, 0.30%, 7/5/2012 (3) | | | 1,628 | | | | 1,628 | |
Saratoga National Bank & Trust Company, 0.30%, 7/5/2012 (3) | | | 32 | | | | 32 | |
Sauk Valley Bank & Trust Company, 0.30%, 7/5/2012 (3) | | | 4 | | | | 4 | |
Savings Institute Bank and Trust Company, 0.30%, 7/5/2012 (3) | | | 651 | | | | 651 | |
Schaumburg Bank & Trust Company National Asso, 0.30%, 7/5/2012 (3) | | | 1 | | | | 1 | |
Seaside National Bank & Trust, 0.30%, 7/5/2012 (3) | | | 9,132 | | | | 9,132 | |
Seaway Bank and Trust Company, 0.30%, 7/5/2012 (3) | | | 2,334 | | | | 2,334 | |
Security First Bank, 0.30%, 7/5/2012 (3) | | | 16 | | | | 16 | |
SharePlus Federal Bank, 0.30%, 7/5/2012 (3) | | | 176 | | | | 176 | |
Signature Bank, 0.30%, 7/5/2012 (3) | | | 1,014 | | | | 1,014 | |
Signature Bank, 0.30%, 7/5/2012 (3) | | | 199,340 | | | | 199,340 | |
Signature Bank National Association, 0.30%, 7/5/2012 (3) | | | 112 | | | | 112 | |
Solera National Bank, 0.30%, 7/5/2012 (3) | | | 476 | | | | 476 | |
Southern Bancorp Bank, 0.30%, 7/5/2012 (3) | | | 75 | | | | 75 | |
Southern Bank, 0.30%, 7/5/2012 (3) | | | 10 | | | | 10 | |
Southwest Bank, 0.30%, 7/5/2012 (3) | | | 2,434 | | | | 2,434 | |
Sovereign Bank National Association, 0.30%, 7/5/2012 (3) | | | 240,000 | | | | 240,000 | |
St. Charles Bank & Trust Company, 0.30%, 7/5/2012 (3) | | | 146 | | | | 146 | |
State Bank and Trust Company, 0.30%, 7/5/2012 (3) | | | 265 | | | | 265 | |
State Bank of the Lakes, 0.30%, 7/5/2012 (3) | | | 1 | | | | 1 | |
Sterling National Bank, 0.30%, 7/5/2012 (3) | | | 34,411 | | | | 34,411 | |
Sturdy Savings Bank, 0.30%, 7/5/2012 (3) | | | 103 | | | | 103 | |
Summit Bank, 0.30%, 7/5/2012 (3) | | | 393 | | | | 393 | |
Summit Bank & Trust, 0.30%, 7/5/2012 (3) | | | 1,904 | | | | 1,904 | |
Summit Community Bank Inc., 0.30%, 7/5/2012 (3) | | | 448 | | | | 448 | |
TD Bank N.A., 0.30%, 7/5/2012 (3) | | | 240,000 | | | | 240,000 | |
Team Capital Bank, 0.30%, 7/5/2012 (3) | | | 11,180 | | | | 11,180 | |
Texas Capital Bank National Association, 0.30%, 7/5/2012 (3) | | | 240,000 | | | | 240,000 | |
Touchmark National Bank, 0.30%, 7/5/2012 (3) | | | 1,389 | | | | 1,389 | |
| The Balanced Fund | |
| | | Shares or Principal Amount ($) | | | | | |
| Bank Obligations — continued | | | | | | | | |
Town Bank, 0.30%, 7/5/2012 (3) | | | 3 | | | | 3 | |
Transportation Alliance Bank Inc., 0.30%, 7/5/2012 (3) | | | 8 | | | | 8 | |
Treynor State Bank, 0.30%, 7/5/2012 (3) | | | 2,373 | | | | 2,373 | |
TriSummit Bank, 0.30%, 7/5/2012 (3) | | | 2,280 | | | | 2,280 | |
U.S. Bank National Association, 0.30%, 7/5/2012 (3) | | | 165 | | | | 165 | |
Uinta Bank, 0.30%, 7/5/2012 (3) | | | 1,442 | | | | 1,442 | |
UMB Bank Arizona National Association, 0.30%, 7/5/2012 (3) | | | 107 | | | | 107 | |
UMB Bank Colorado National Association, 0.30%, 7/5/2012 (3) | | | 16 | | | | 16 | |
UMB Bank National Association, 0.30%, 7/5/2012 (3) | | | 134 | | | | 134 | |
Umpqua Bank, 0.30%, 7/5/2012 (3) | | | 81 | | | | 81 | |
Union Bank National Association, 0.30%, 7/5/2012 (3) | | | 135 | | | | 135 | |
Union Bank of Mena, 0.30%, 7/5/2012 (3) | | | 16 | | | | 16 | |
Union Center National Bank, 0.30%, 7/5/2012 (3) | | | 46,382 | | | | 46,382 | |
United Bank, 0.30%, 7/5/2012 (3) | | | 2,152 | | | | 2,152 | |
United Bank, 0.30%, 7/5/2012 (3) | | | 105 | | | | 105 | |
United Bank Inc., 0.30%, 7/5/2012 (3) | | | 1,967 | | | | 1,967 | |
USNY Bank, 0.30%, 7/5/2012 (3) | | | 666 | | | | 666 | |
Valley Bank, 0.30%, 7/5/2012 (3) | | | 759 | | | | 759 | |
Valley National Bank, 0.30%, 7/5/2012 (3) | | | 220,141 | | | | 220,141 | |
Valliance Bank, 0.30%, 7/5/2012 (3) | | | 126 | | | | 126 | |
Veritex Community Bank National Association, 0.30%, 7/5/2012 (3) | | | 43 | | | | 43 | |
Verus Bank of Commerce, 0.30%, 7/5/2012 (3) | | | 3,444 | | | | 3,444 | |
Victory Bank, 0.30%, 7/5/2012 (3) | | | 217 | | | | 217 | |
ViewPoint Bank National Association, 0.30%, 7/5/2012 (3) | | | 5,278 | | | | 5,278 | |
Village Bank & Trust, 0.30%, 7/5/2012 (3) | | | 8 | | | | 8 | |
Virginia Heritage Bank, 0.30%, 7/5/2012 (3) | | | 3,297 | | | | 3,297 | |
Warren Bank & Trust Company, 0.30%, 7/5/2012 (3) | | | 1,088 | | | | 1,088 | |
Washington Trust Bank, 0.30%, 7/5/2012 (3) | | | 1,405 | | | | 1,405 | |
Washington Trust Company of Westerly, 0.30%, 7/5/2012 (3) | | | 152 | | | | 152 | |
Webster Bank National Association, 0.30%, 7/5/2012 (3) | | | 104 | | | | 104 | |
Wells Fargo Bank National Association, 0.30%, 7/5/2012 (3) | | | 238 | | | | 238 | |
West Town Savings Bank, 0.30%, 7/5/2012 (3) | | | 16 | | | | 16 | |
Western Alliance Bank, 0.30%, 7/5/2012 (3) | | | 53 | | | | 53 | |
Western National Bank, 0.30%, 7/5/2012 (3) | | | 197 | | | | 197 | |
Wheaton Bank & Trust Company, 0.30%, 7/5/2012 (3) | | | 1 | | | | 1 | |
Whidbey Island Bank, 0.30%, 7/5/2012 (3) | | | 74 | | | | 74 | |
Wilmington Savings Fund Society FSB, 0.30%, 7/5/2012 (3) | | | 4,324 | | | | 4,324 | |
Wilmington Trust National Association, 0.30%, 7/5/2012 (3) | | | 108 | | | | 108 | |
The accompanying notes are an integral part of these financial statements.
| | 2012 Semi-Annual Report | June 30, 2012 |
Schedule of Investments
June 30, 2012 (unaudited)
| The Balanced Fund | |
| | | Shares or Principal Amount ($) | | | | | |
| Bank Obligations — continued | | | | | | | | |
Wisconsin Community Bank, 0.30%, 7/5/2012 (3) | | | 42,621 | | | | 42,621 | |
Wolverine Bank Federal Savings Bank, 0.30%, 7/5/2012 (3) | | | 4 | | | | 4 | |
Xenith Bank, 0.30%, 7/5/2012 (3) | | | 3,914 | | | | 3,914 | |
Total Bank Obligations (Cost $5,004,521) | | | | | | | 5,004,521 | |
| Floating Rate Demand Notes — 6.2% | | | | | | | | |
Caterpillar Financial Power Investment Floating Rate Demand Note, 0.60%, 7/1/2012 (4) | | | 5,551,599 | | | | 5,551,599 | |
Total Floating Rate Demand Notes (Cost $5,551,599) | | | | | | | 5,551,599 | |
| U.S. Government Obligations — 2.2% | | | | | | | | |
U.S. Treasury Bill, 0.12%, due 9/6/2012 (5) | | | 2,000,000 | | | | 1,999,752 | |
Total U.S. Government Obligations (Cost $1,999,560) | | | | | | | 1,999,752 | |
Total Investments — 99.4% (Cost $87,776,102 )(1) | | | | | | | 89,114,314 | |
| Other Assets less Liabilities — 0.6% | | | | | | | 509,593 | |
Total Net Assets — 100.0% | | | | | | | 89,623,907 | |
Trustee Deferred Compensation (6) | | | | | | | | |
| The Flex-funds Aggressive Growth Fund | | | 1,631 | | | | 12,950 | |
The Flex-funds Balanced Fund | | | 860 | | | | 8,351 | |
| The Flex-funds Dynamic Growth Fund | | | 520 | | | | 4,321 | |
The Flex-funds Muirfield Fund | | | 1,508 | | | | 8,369 | |
The Flex-funds Quantex Fund | | | 671 | | | | 15,232 | |
| The Flex-funds Utilities & Infrastructure Fund | | | 186 | | | | 4,391 | |
Total Trustee Deferred Compensation (Cost $48,279) | | | | | | | 53,614 | |
| The Balanced Fund | |
| | | | | | Unrealized Appreciation (Depreciation) ($) | |
| | | | | | | |
| Futures Contracts | |
| Standard & Poors 500 expiring September 2012, notional value $18,650,500 | | | 55 | | | | 521,400 | |
| Standard & Poors Mid Cap 400 E-Mini expiring September 2012, notional value $1,691,100 | | | 18 | | | | 41,805 | |
| Total Futures Contracts (Long and Short) | | | 73 | | | | 563,205 | |
| (1) | Represents cost for financial reporting purposes and differs for federal income tax purposes by the amount of losses deferred for federal income tax reporting in the amount of $347,751. Cost for federal income tax purposes of $88,123,853 differs from value by net unrealized appreciation (depreciation) of securities as follows: |
Unrealized appreciation | | $ | 1,664,594 | |
Unrealized depreciation | | | (674,133 | ) |
| Net unrealized appreciation (depreciation) | | $ | 990,461 | |
| (2) | Investment in affiliate. The yield shown represents the 7-day yield in effect at June 30, 2012. |
| (3) | Illiquid security. The sale or disposition of such security would not be possible in the ordinary course of business within seven days at approximately the value at which the Fund has valued the security. These securities were purchased through StoneCastle Partners, LLC, an independent, privately held asset management and investment services company, and are insured through the Federal Deposit Insurance Corporation (FDIC). The interest rate varies monthly and any accrued interest is reinvested into the program on a monthly basis. The securities are classified as illiquid because if the Fund were to redeem its investment in the program, the proceeds are delivered only once per week; on the Wednesday of the next week following the redemption request. The maximum number of days from a redemption request to receiving the proceeds is nine days. Hence the Fund may not be able to receive its proceeds within seven days. As of June 30, 2012, illiquid securities represented 5.6% of Total Investments. |
| (4) | Floating rate security. The rate shown represents the rate in effect at June 30, 2012. |
| (5) | Pledged as collateral on futures contracts. |
| (6) | Assets of affiliates to The Balanced Fund held for the benefit of the Fund’s Trustees in connection with the Trustee Deferred Compensation Plan. |
The accompanying notes are an integral part of these financial statements.
| | 2012 Semi-Annual Report | June 30, 2012 |
Schedule of Investments
June 30, 2012 (unaudited)
| The Strategic Growth Fund | |
| | | Shares or Principal Amount ($) | | | | | |
| Registered Investment Companies — 78.4% | |
Energy Select Sector SPDR Fund | | | 53,975 | | | | 3,582,321 | |
| iShares Dow Jones U.S. Real Estate Index Fund | | | 156,050 | | | | 9,977,057 | |
iShares MSCI EAFE Index Fund | | | 72,000 | | | | 3,597,120 | |
| iShares MSCI Emerging Markets Index Fund | | | 77,300 | | | | 3,025,135 | |
| iShares Russell 2000 Growth Index Fund | | | 52,375 | | | | 4,790,741 | |
Ivy Mid Cap Growth Fund | | | 387,406 | | | | 6,857,090 | |
| Materials Select Sector SPDR Trust | | | 44,775 | | | | 1,580,110 | |
| Oppenheimer Developing Markets Fund | | | 113,514 | | | | 3,557,529 | |
| Oppenheimer International Growth Fund | | | 125,130 | | | | 3,383,500 | |
| RidgeWorth Small Cap Value Equity Fund | | | 384,196 | | | | 5,029,126 | |
| RS Global Natural Resources Fund | | | 126,780 | | | | 4,491,830 | |
| Wells Fargo Advantage Growth Fund | | | 294,583 | | | | 12,086,750 | |
Total Registered Investment Companies (Cost $61,005,019) | | | | | | | 61,958,309 | |
| Money Market Registered Investment Companies — 9.9% | |
The Flex-funds Money Market Fund - Institutional Class, 0.17% (2) | | | 7,799,684 | | | | 7,799,684 | |
Total Money Market Registered Investment Companies (Cost $7,799,684) | | | | | | | 7,799,684 | |
| Bank Obligations — 6.3% | | | | | | | | |
Access National Bank, 0.30%, 7/5/2012 (3) | | | 987 | | | | 987 | |
Allied Bank, 0.30%, 7/5/2012 (3) | | | 434 | | | | 434 | |
Alma Bank, 0.30%, 7/5/2012 (3) | | | 4,804 | | | | 4,804 | |
AloStar Bank of Commerce, 0.30%, 7/5/2012 (3) | | | 3,797 | | | | 3,797 | |
Alpine Bank, 0.30%, 7/5/2012 (3) | | | 3,060 | | | | 3,060 | |
Ameriana Bank, 0.30%, 7/5/2012 (3) | | | 19 | | | | 19 | |
American Enterprise Bank of Florida, 0.30%, 7/5/2012 (3) | | | 492 | | | | 492 | |
American Momentum Bank, 0.30%, 7/5/2012 (3) | | | 5,694 | | | | 5,694 | |
American National Bank, 0.30%, 7/5/2012 (3) | | | 2,277 | | | | 2,277 | |
American National Bank-Fox Cities, 0.30%, 7/5/2012 (3) | | | 215 | | | | 215 | |
American Savings Bank F.S.B., 0.30%, 7/5/2012 (3) | | | 16 | | | | 16 | |
American Savings Bank FSB, 0.30%, 7/5/2012 (3) | | | 155 | | | | 155 | |
Americas United Bank, 0.30%, 7/5/2012 (3) | | | 1,306 | | | | 1,306 | |
AmFirst Bank N.A., 0.30%, 7/5/2012 (3) | | | 38 | | | | 38 | |
Anthem Bank & Trust, 0.30%, 7/5/2012 (3) | | | 873 | | | | 873 | |
Arizona Bank & Trust, 0.30%, 7/5/2012 (3) | | | 4,192 | | | | 4,192 | |
Arvest Bank, 0.30%, 7/5/2012 (3) | | | 220 | | | | 220 | |
Austin Bank of Chicago, 0.30%, 7/5/2012 (3) | | | 869 | | | | 869 | |
Avidia Bank, 0.30%, 7/5/2012 (3) | | | 4,192 | | | | 4,192 | |
Bancorp Bank, 0.30%, 7/5/2012 (3) | | | 10,749 | | | | 10,749 | |
Bank Hapoalim B.M., 0.30%, 7/5/2012 (3) | | | 1,511 | | | | 1,511 | |
Bank Leumi USA, 0.30%, 7/5/2012 (3) | | | 240,000 | | | | 240,000 | |
Bank of America National Association, 0.30%, 7/5/2012 (3) | | | 448 | | | | 448 | |
| The Strategic Growth Fund | |
| | | Shares or Principal Amount ($) | | | | | |
| Bank Obligations — continued | | | | | | | | |
Bank of Augusta, 0.30%, 7/5/2012 (3) | | | 917 | | | | 917 | |
Bank of Cadiz and Trust Company, 0.30%, 7/5/2012 (3) | | | 1,055 | | | | 1,055 | |
Bank of Cave City, 0.30%, 7/5/2012 (3) | | | 437 | | | | 437 | |
Bank of England, 0.30%, 7/5/2012 (3) | | | 1,867 | | | | 1,867 | |
Bank of Fayetteville, 0.30%, 7/5/2012 (3) | | | 436 | | | | 436 | |
Bank of Hawaii, 0.30%, 7/5/2012 (3) | | | 4,983 | | | | 4,983 | |
Bank of Houston, 0.30%, 7/5/2012 (3) | | | 2,661 | | | | 2,661 | |
Bank of Jackson Hole, 0.30%, 7/5/2012 (3) | | | 442 | | | | 442 | |
Bank of Manhattan N.A., 0.30%, 7/5/2012 (3) | | | 1,665 | | | | 1,665 | |
Bank of Marin, 0.30%, 7/5/2012 (3) | | | 218 | | | | 218 | |
Bank of Missouri, 0.30%, 7/5/2012 (3) | | | 4,968 | | | | 4,968 | |
Bank of Princeton, 0.30%, 7/5/2012 (3) | | | 651 | | | | 651 | |
Bank of the Ozarks, 0.30%, 7/5/2012 (3) | | | 108 | | | | 108 | |
Bank of the Panhandle, 0.30%, 7/5/2012 (3) | | | 1,062 | | | | 1,062 | |
Bank of the West, 0.30%, 7/5/2012 (3) | | | 13,559 | | | | 13,559 | |
Bar Harbor Bank & Trust, 0.30%, 7/5/2012 (3) | | | 869 | | | | 869 | |
Belmont Savings Bank, 0.30%, 7/5/2012 (3) | | | 4,601 | | | | 4,601 | |
Benchmark Bank, 0.30%, 7/5/2012 (3) | | | 3 | | | | 3 | |
Benefit Bank, 0.30%, 7/5/2012 (3) | | | 1,345 | | | | 1,345 | |
Berkshire Bank, 0.30%, 7/5/2012 (3) | | | 6,256 | | | | 6,256 | |
Beverly Bank & Trust Company National Associa, 0.30%, 7/5/2012 (3) | | | 30 | | | | 30 | |
Biltmore Bank of Arizona, 0.30%, 7/5/2012 (3) | | | 2,408 | | | | 2,408 | |
BMO Harris Bank National Association, 0.30%, 7/5/2012 (3) | | | 2,493 | | | | 2,493 | |
BOKF National Association, 0.30%, 7/5/2012 (3) | | | 5,969 | | | | 5,969 | |
Boone Bank & Trust Co., 0.30%, 7/5/2012 (3) | | | 1,220 | | | | 1,220 | |
Boston Private Bank & Trust Company, 0.30%, 7/5/2012 (3) | | | 2,184 | | | | 2,184 | |
Branch Banking and Trust Company, 0.30%, 7/5/2012 (3) | | | 1,980 | | | | 1,980 | |
Brookhaven Bank, 0.30%, 7/5/2012 (3) | | | 250 | | | | 250 | |
Business Bank, 0.30%, 7/5/2012 (3) | | | 1,431 | | | | 1,431 | |
Business Bank, 0.30%, 7/5/2012 (3) | | | 462 | | | | 462 | |
Business Bank of Saint Louis, 0.30%, 7/5/2012 (3) | | | 2,094 | | | | 2,094 | |
Business First Bank, 0.30%, 7/5/2012 (3) | | | 2,092 | | | | 2,092 | |
Cache Valley Bank, 0.30%, 7/5/2012 (3) | | | 3,057 | | | | 3,057 | |
Cadence Bank N.A., 0.30%, 7/5/2012 (3) | | | 209,741 | | | | 209,741 | |
California Bank & Trust, 0.30%, 7/5/2012 (3) | | | 87 | | | | 87 | |
Capital Bank, 0.30%, 7/5/2012 (3) | | | 1,156 | | | | 1,156 | |
Capital One National Association, 0.30%, 7/5/2012 (3) | | | 157,954 | | | | 157,954 | |
CapitalMark Bank & Trust, 0.30%, 7/5/2012 (3) | | | 2,903 | | | | 2,903 | |
CapStar Bank, 0.30%, 7/5/2012 (3) | | | 11,181 | | | | 11,181 | |
CapStone Bank, 0.30%, 7/5/2012 (3) | | | 2,126 | | | | 2,126 | |
Cardinal Bank, 0.30%, 7/5/2012 (3) | | | 4,028 | | | | 4,028 | |
Carolina Alliance Bank, 0.30%, 7/5/2012 (3) | | | 115 | | | | 115 | |
Carver Federal Savings Bank, 0.30%, 7/5/2012 (3) | | | 46,382 | | | | 46,382 | |
The accompanying notes are an integral part of these financial statements.
| | 2012 Semi-Annual Report | June 30, 2012 |
Schedule of Investments
June 30, 2012 (unaudited)
| The Strategic Growth Fund | |
| | | Shares or Principal Amount ($) | | | | | |
| Bank Obligations — continued | | | | | | | | |
Cathay Bank, 0.30%, 7/5/2012 (3) | | | 240,000 | | | | 240,000 | |
Celtic Bank, 0.30%, 7/5/2012 (3) | | | 2,441 | | | | 2,441 | |
Centennial Bank, 0.30%, 7/5/2012 (3) | | | 466 | | | | 466 | |
Centra Bank Inc., 0.30%, 7/5/2012 (3) | | | 2,084 | | | | 2,084 | |
Central Bank, 0.30%, 7/5/2012 (3) | | | 695 | | | | 695 | |
Central Bank Illinois, 0.30%, 7/5/2012 (3) | | | 32 | | | | 32 | |
Central Bank of Kansas City, 0.30%, 7/5/2012 (3) | | | 38 | | | | 38 | |
CheckSpring Bank, 0.30%, 7/5/2012 (3) | | | 23 | | | | 23 | |
Chemical Bank, 0.30%, 7/5/2012 (3) | | | 399 | | | | 399 | |
Chickasha Bank & Trust Company, 0.30%, 7/5/2012 (3) | | | 442 | | | | 442 | |
Citizens Bank & Trust Company, 0.30%, 7/5/2012 (3) | | | 3,770 | | | | 3,770 | |
Citizens Bank of Pennsylvania, 0.30%, 7/5/2012 (3) | | | 133 | | | | 133 | |
Citizens National Bank, 0.30%, 7/5/2012 (3) | | | 212 | | | | 212 | |
Citizens National Bank of Bluffton, 0.30%, 7/5/2012 (3) | | | 446 | | | | 446 | |
City First Bank of D.C. National Association, 0.30%, 7/5/2012 (3) | | | 1,597 | | | | 1,597 | |
City National Bank, 0.30%, 7/5/2012 (3) | | | 271 | | | | 271 | |
City National Bank of Sulphur Springs, 0.30%, 7/5/2012 (3) | | | 146 | | | | 146 | |
City National Bank of Taylor, 0.30%, 7/5/2012 (3) | | | 970 | | | | 970 | |
Cole Taylor Bank, 0.30%, 7/5/2012 (3) | | | 79,682 | | | | 79,682 | |
Collin Bank, 0.30%, 7/5/2012 (3) | | | 1,135 | | | | 1,135 | |
Columbia State Bank, 0.30%, 7/5/2012 (3) | | | 3,884 | | | | 3,884 | |
Comerica Bank, 0.30%, 7/5/2012 (3) | | | 4,837 | | | | 4,837 | |
Commencement Bank, 0.30%, 7/5/2012 (3) | | | 1,327 | | | | 1,327 | |
Commerce Bank & Trust Company, 0.30%, 7/5/2012 (3) | | | 6,820 | | | | 6,820 | |
Commerce National Bank, 0.30%, 7/5/2012 (3) | | | 81 | | | | 81 | |
Community Bank & Trust, 0.30%, 7/5/2012 (3) | | | 2,970 | | | | 2,970 | |
Community Bank of Oelwein, 0.30%, 7/5/2012 (3) | | | 907 | | | | 907 | |
Community Bank of Santa Maria, 0.30%, 7/5/2012 (3) | | | 103 | | | | 103 | |
Community Bank of the Bay, 0.30%, 7/5/2012 (3) | | | 167 | | | | 167 | |
Community Mutual Savings Bank, 0.30%, 7/5/2012 (3) | | | 1,168 | | | | 1,168 | |
Community Trust Bank, 0.30%, 7/5/2012 (3) | | | 240,000 | | | | 240,000 | |
Compass Bank, 0.30%, 7/5/2012 (3) | | | 240,000 | | | | 240,000 | |
Congaree State Bank, 0.30%, 7/5/2012 (3) | | | 1,252 | | | | 1,252 | |
Congressional Bank, 0.30%, 7/5/2012 (3) | | | 1,356 | | | | 1,356 | |
Cooper State Bank, 0.30%, 7/5/2012 (3) | | | 431 | | | | 431 | |
Crescent State Bank, 0.30%, 7/5/2012 (3) | | | 2,140 | | | | 2,140 | |
Crystal Lake Bank and Trust Company N.A., 0.30%, 7/5/2012 (3) | | | 1 | | | | 1 | |
Delta Trust & Bank, 0.30%, 7/5/2012 (3) | | | 4,330 | | | | 4,330 | |
DeWitt Bank & Trust Company, 0.30%, 7/5/2012 (3) | | | 322 | | | | 322 | |
| The Strategic Growth Fund | |
| | | Shares or Principal Amount ($) | | | | | |
| Bank Obligations — continued | | | | | | | | |
Diamond Bank, 0.30%, 7/5/2012 (3) | | | 3,222 | | | | 3,222 | |
DMB Community Bank, 0.30%, 7/5/2012 (3) | | | 3,070 | | | | 3,070 | |
Dollar Bank Federal Savings Bank, 0.30%, 7/5/2012 (3) | | | 1,095 | | | | 1,095 | |
Dubuque Bank & Trust Company, 0.30%, 7/5/2012 (3) | | | 431 | | | | 431 | |
Eagle Bank and Trust Company, 0.30%, 7/5/2012 (3) | | | 1,118 | | | | 1,118 | |
EagleBank, 0.30%, 7/5/2012 (3) | | | 240,000 | | | | 240,000 | |
East River Bank, 0.30%, 7/5/2012 (3) | | | 115 | | | | 115 | |
East West Bank, 0.30%, 7/5/2012 (3) | | | 240,511 | | | | 240,511 | |
Empire National Bank, 0.30%, 7/5/2012 (3) | | | 434 | | | | 434 | |
Encore Bank National Association, 0.30%, 7/5/2012 (3) | | | 319 | | | | 319 | |
Encore National Bank, 0.30%, 7/5/2012 (3) | | | 125 | | | | 125 | |
Enterprise Bank & Trust, 0.30%, 7/5/2012 (3) | | | 7,692 | | | | 7,692 | |
Equity Bank A National Association, 0.30%, 7/5/2012 (3) | | | 994 | | | | 994 | |
Exchange Bank & Trust Company, 0.30%, 7/5/2012 (3) | | | 2,303 | | | | 2,303 | |
Exchange State Bank, 0.30%, 7/5/2012 (3) | | | 433 | | | | 433 | |
Fannin Bank, 0.30%, 7/5/2012 (3) | | | 1 | | | | 1 | |
Farmers & Merchants Bank of Long Beach, 0.30%, 7/5/2012 (3) | | | 69 | | | | 69 | |
Farmers & Merchants State Bank, 0.30%, 7/5/2012 (3) | | | 124 | | | | 124 | |
Farmers and Merchants State Bank of Blooming , 0.30%, 7/5/2012 (3) | | | 839 | | | | 839 | |
Farmers Bank, 0.30%, 7/5/2012 (3) | | | 135 | | | | 135 | |
Farmers Exchange Bank, 0.30%, 7/5/2012 (3) | | | 1,580 | | | | 1,580 | |
Farmers State Bank, 0.30%, 7/5/2012 (3) | | | 1 | | | | 1 | |
Fidelity Bank, 0.30%, 7/5/2012 (3) | | | 2,975 | | | | 2,975 | |
Fifth Third Bank, 0.30%, 7/5/2012 (3) | | | 240,000 | | | | 240,000 | |
First Bank & Trust, 0.30%, 7/5/2012 (3) | | | 2 | | | | 2 | |
First Bank Financial Centre, 0.30%, 7/5/2012 (3) | | | 103 | | | | 103 | |
First Choice Bank, 0.30%, 7/5/2012 (3) | | | 1,929 | | | | 1,929 | |
First Commercial Bank, 0.30%, 7/5/2012 (3) | | | 102 | | | | 102 | |
First Commercial Bank, 0.30%, 7/5/2012 (3) | | | 853 | | | | 853 | |
First Community Bank, 0.30%, 7/5/2012 (3) | | | 2,057 | | | | 2,057 | |
First County Bank, 0.30%, 7/5/2012 (3) | | | 5,903 | | | | 5,903 | |
First Federal Bank, 0.30%, 7/5/2012 (3) | | | 1,589 | | | | 1,589 | |
First Foundation Bank, 0.30%, 7/5/2012 (3) | | | 11,657 | | | | 11,657 | |
First International Bank & Trust, 0.30%, 7/5/2012 (3) | | | 136 | | | | 136 | |
First Internet Bank of Indiana, 0.30%, 7/5/2012 (3) | | | 4,820 | | | | 4,820 | |
First Interstate Bank, 0.30%, 7/5/2012 (3) | | | 80 | | | | 80 | |
First N.A., 0.30%, 7/5/2012 (3) | | | 1,858 | | | | 1,858 | |
First National Bank, 0.30%, 7/5/2012 (3) | | | 4,171 | | | | 4,171 | |
First National Bank, 0.30%, 7/5/2012 (3) | | | 104 | | | | 104 | |
First National Bank - Fox Valley, 0.30%, 7/5/2012 (3) | | | 147 | | | | 147 | |
First National Bank in Green Forest, 0.30%, 7/5/2012 (3) | | | 221 | | | | 221 | |
The accompanying notes are an integral part of these financial statements.
| | 2012 Semi-Annual Report | June 30, 2012 |
Schedule of Investments
June 30, 2012 (unaudited)
| The Strategic Growth Fund | |
| | | Shares or Principal Amount ($) | | | | | |
| Bank Obligations — continued | | | | | | | | |
First National Bank in Sioux Falls, 0.30%, 7/5/2012 (3) | | | 102 | | | | 102 | |
First National Bank of America, 0.30%, 7/5/2012 (3) | | | 111 | | | | 111 | |
First National Bank of Fort Smith, 0.30%, 7/5/2012 (3) | | | 164 | | | | 164 | |
First National Bank of Long Island, 0.30%, 7/5/2012 (3) | | | 10,706 | | | | 10,706 | |
First National Bank of Omaha, 0.30%, 7/5/2012 (3) | | | 70 | | | | 70 | |
First National Bank of Santa Fe, 0.30%, 7/5/2012 (3) | | | 2,406 | | | | 2,406 | |
First Premier Bank, 0.30%, 7/5/2012 (3) | | | 3,221 | | | | 3,221 | |
First Security Bank, 0.30%, 7/5/2012 (3) | | | 8,935 | | | | 8,935 | |
First Security Bank & Trust Company, 0.30%, 7/5/2012 (3) | | | 11 | | | | 11 | |
First State Bank, 0.30%, 7/5/2012 (3) | | | 875 | | | | 875 | |
First State Bank, 0.30%, 7/5/2012 (3) | | | 40 | | | | 40 | |
First State Bank of DeQueen, 0.30%, 7/5/2012 (3) | | | 924 | | | | 924 | |
First State Bank of Northwest Arkansas, 0.30%, 7/5/2012 (3) | | | 626 | | | | 626 | |
First Trade Union Bank, 0.30%, 7/5/2012 (3) | | | 167 | | | | 167 | |
First Utah Bank, 0.30%, 7/5/2012 (3) | | | 107 | | | | 107 | |
First Virginia Community Bank, 0.30%, 7/5/2012 (3) | | | 892 | | | | 892 | |
First Western Bank, 0.30%, 7/5/2012 (3) | | | 9 | | | | 9 | |
First-Citizens Bank & Trust Company, 0.30%, 7/5/2012 (3) | | | 10,582 | | | | 10,582 | |
FirstAtlantic Bank, 0.30%, 7/5/2012 (3) | | | 104 | | | | 104 | |
FirstBank, 0.30%, 7/5/2012 (3) | | | 1,326 | | | | 1,326 | |
FirstBank Puerto Rico, 0.30%, 7/5/2012 (3) | | | 240,000 | | | | 240,000 | |
FirstMerit Bank National Association, 0.30%, 7/5/2012 (3) | | | 218 | | | | 218 | |
Flagship Community Bank, 0.30%, 7/5/2012 (3) | | | 102 | | | | 102 | |
Flatirons Bank, 0.30%, 7/5/2012 (3) | | | 1,327 | | | | 1,327 | |
Florida Business Bank, 0.30%, 7/5/2012 (3) | | | 434 | | | | 434 | |
Florida Parishes Bank, 0.30%, 7/5/2012 (3) | | | 87 | | | | 87 | |
Forrest City Bank NA, 0.30%, 7/5/2012 (3) | | | 213 | | | | 213 | |
Fortune Bank, 0.30%, 7/5/2012 (3) | | | 1,402 | | | | 1,402 | |
Fox Chase Bank, 0.30%, 7/5/2012 (3) | | | 893 | | | | 893 | |
Franklin Synergy Bank, 0.30%, 7/5/2012 (3) | | | 3,885 | | | | 3,885 | |
Frost National Bank, 0.30%, 7/5/2012 (3) | | | 131 | | | | 131 | |
Genesee Regional Bank, 0.30%, 7/5/2012 (3) | | | 3,091 | | | | 3,091 | |
Georgia Bank & Trust Company of Augusta, 0.30%, 7/5/2012 (3) | | | 2,347 | | | | 2,347 | |
Georgia Banking Company, 0.30%, 7/5/2012 (3) | | | 1,407 | | | | 1,407 | |
German American Bancorp, 0.30%, 7/5/2012 (3) | | | 651 | | | | 651 | |
Glacier Bank, 0.30%, 7/5/2012 (3) | | | 7,385 | | | | 7,385 | |
Glens Falls National Bank and Trust Company, 0.30%, 7/5/2012 (3) | | | 32 | | | | 32 | |
Golden Pacific Bank National Association, 0.30%, 7/5/2012 (3) | | | 102 | | | | 102 | |
| The Strategic Growth Fund | |
| | | Shares or Principal Amount ($) | | | | | |
| Bank Obligations — continued | | | | | | | | |
Gotham Bank of New York, 0.30%, 7/5/2012 (3) | | | 1,903 | | | | 1,903 | |
Grand Savings Bank, 0.30%, 7/5/2012 (3) | | | 1,095 | | | | 1,095 | |
Grand Valley Bank, 0.30%, 7/5/2012 (3) | | | 431 | | | | 431 | |
Green Bank National Association, 0.30%, 7/5/2012 (3) | | | 2,381 | | | | 2,381 | |
Guaranty Bank, 0.30%, 7/5/2012 (3) | | | 1,335 | | | | 1,335 | |
Guaranty Bond Bank, 0.30%, 7/5/2012 (3) | | | 18,610 | | | | 18,610 | |
GulfShore Bank, 0.30%, 7/5/2012 (3) | | | 1,327 | | | | 1,327 | |
Happy State Bank, 0.30%, 7/5/2012 (3) | | | 136 | | | | 136 | |
Heartland Bank, 0.30%, 7/5/2012 (3) | | | 16 | | | | 16 | |
Heartland Bank, 0.30%, 7/5/2012 (3) | | | 8 | | | | 8 | |
Helena National Bank, 0.30%, 7/5/2012 (3) | | | 776 | | | | 776 | |
Heritage Oaks Bank, 0.30%, 7/5/2012 (3) | | | 4,623 | | | | 4,623 | |
Hingham Institution for Savings, 0.30%, 7/5/2012 (3) | | | 4,192 | | | | 4,192 | |
Home Federal Bank, 0.30%, 7/5/2012 (3) | | | 1,409 | | | | 1,409 | |
Horizon Bank National Association, 0.30%, 7/5/2012 (3) | | | 143 | | | | 143 | |
Hyperion Bank, 0.30%, 7/5/2012 (3) | | | 221 | | | | 221 | |
IBERIABANK, 0.30%, 7/5/2012 (3) | | | 240,000 | | | | 240,000 | |
Icon Bank of Texas National Association, 0.30%, 7/5/2012 (3) | | | 300 | | | | 300 | |
Independence Bank, 0.30%, 7/5/2012 (3) | | | 69 | | | | 69 | |
Independent Bank of Texas, 0.30%, 7/5/2012 (3) | | | 104 | | | | 104 | |
Inland Bank and Trust, 0.30%, 7/5/2012 (3) | | | 19 | | | | 19 | |
Integrity Bank, 0.30%, 7/5/2012 (3) | | | 888 | | | | 888 | |
Investors Community Bank, 0.30%, 7/5/2012 (3) | | | 434 | | | | 434 | |
Isabella Bank, 0.30%, 7/5/2012 (3) | | | 113 | | | | 113 | |
Israel Discount Bank of New York, 0.30%, 7/5/2012 (3) | | | 240,000 | | | | 240,000 | |
JPMorgan Chase Bank National Association, 0.30%, 7/5/2012 (3) | | | 68 | | | | 68 | |
Kaiser Federal Bank, 0.30%, 7/5/2012 (3) | | | 433 | | | | 433 | |
Katahdin Trust Company, 0.30%, 7/5/2012 (3) | | | 2,338 | | | | 2,338 | |
KeyBank National Association, 0.30%, 7/5/2012 (3) | | | 1,679 | | | | 1,679 | |
KeySource Commercial Bank, 0.30%, 7/5/2012 (3) | | | 150 | | | | 150 | |
Lake Forest Bank & Trust Company, 0.30%, 7/5/2012 (3) | | | 1 | | | | 1 | |
Lake National Bank, 0.30%, 7/5/2012 (3) | | | 8 | | | | 8 | |
Landmark Community Bank, 0.30%, 7/5/2012 (3) | | | 873 | | | | 873 | |
Landmark National Bank, 0.30%, 7/5/2012 (3) | | | 228 | | | | 228 | |
Leader Bank National Association, 0.30%, 7/5/2012 (3) | | | 1,031 | | | | 1,031 | |
Legacy Bank, 0.30%, 7/5/2012 (3) | | | 103 | | | | 103 | |
Legacy National Bank, 0.30%, 7/5/2012 (3) | | | 438 | | | | 438 | |
LegacyTexas Bank, 0.30%, 7/5/2012 (3) | | | 8 | | | | 8 | |
Level One Bank, 0.30%, 7/5/2012 (3) | | | 2,638 | | | | 2,638 | |
Lewis & Clark Bank, 0.30%, 7/5/2012 (3) | | | 432 | | | | 432 | |
The accompanying notes are an integral part of these financial statements.
| | 2012 Semi-Annual Report | June 30, 2012 |
Schedule of Investments
June 30, 2012 (unaudited)
| The Strategic Growth Fund | |
| | | Shares or Principal Amount ($) | | | | | |
| Bank Obligations — continued | | | | | | | | |
Libertad Bank SSB, 0.30%, 7/5/2012 (3) | | | 400 | | | | 400 | |
Liberty Bank, 0.30%, 7/5/2012 (3) | | | 3,419 | | | | 3,419 | |
Liberty Bank, 0.30%, 7/5/2012 (3) | | | 430 | | | | 430 | |
Liberty Bank National Association, 0.30%, 7/5/2012 (3) | | | 1 | | | | 1 | |
Liberty Bank of Arkansas, 0.30%, 7/5/2012 (3) | | | 3,955 | | | | 3,955 | |
Libertyville Bank & Trust Company, 0.30%, 7/5/2012 (3) | | | 1 | | | | 1 | |
Lifestore Bank, 0.30%, 7/5/2012 (3) | | | 104 | | | | 104 | |
Lone Star National Bank, 0.30%, 7/5/2012 (3) | | | 4,878 | | | | 4,878 | |
MainStreet Bank, 0.30%, 7/5/2012 (3) | | | 2,352 | | | | 2,352 | |
Manufacturers Bank, 0.30%, 7/5/2012 (3) | | | 46,382 | | | | 46,382 | |
MB Financial Bank N.A., 0.30%, 7/5/2012 (3) | | | 137 | | | | 137 | |
mBank, 0.30%, 7/5/2012 (3) | | | 984 | | | | 984 | |
Mercantil Commercebank National Association, 0.30%, 7/5/2012 (3) | | | 542 | | | | 542 | |
Mercantile Bank & Trust Company, 0.30%, 7/5/2012 (3) | | | 1,840 | | | | 1,840 | |
Mercantile Bank of Michigan, 0.30%, 7/5/2012 (3) | | | 5,175 | | | | 5,175 | |
Merchants & Farmers Bank, 0.30%, 7/5/2012 (3) | | | 213 | | | | 213 | |
Merchants Bank, 0.30%, 7/5/2012 (3) | | | 53 | | | | 53 | |
Meridian Bank, 0.30%, 7/5/2012 (3) | | | 272 | | | | 272 | |
Metropolitan Capital Bank & Trust, 0.30%, 7/5/2012 (3) | | | 1,911 | | | | 1,911 | |
Metropolitan National Bank, 0.30%, 7/5/2012 (3) | | | 12,123 | | | | 12,123 | |
Midwest Regional Bank, 0.30%, 7/5/2012 (3) | | | 51 | | | | 51 | |
Mifflin County Savings Bank, 0.30%, 7/5/2012 (3) | | | 212 | | | | 212 | |
MileStone Bank, 0.30%, 7/5/2012 (3) | | | 651 | | | | 651 | |
Miners Bank, 0.30%, 7/5/2012 (3) | | | 873 | | | | 873 | |
Minnesota Bank & Trust, 0.30%, 7/5/2012 (3) | | | 1,838 | | | | 1,838 | |
Morris Bank, 0.30%, 7/5/2012 (3) | | | 161 | | | | 161 | |
National Bank & Trust Company, 0.30%, 7/5/2012 (3) | | | 1,134 | | | | 1,134 | |
National Bank of California, 0.30%, 7/5/2012 (3) | | | 41 | | | | 41 | |
Needham Bank, 0.30%, 7/5/2012 (3) | | | 3,036 | | | | 3,036 | |
New Mexico Bank & Trust, 0.30%, 7/5/2012 (3) | | | 1,506 | | | | 1,506 | |
Newburyport Five Cents Savings Bank, 0.30%, 7/5/2012 (3) | | | 19 | | | | 19 | |
NOA Bank, 0.30%, 7/5/2012 (3) | | | 130 | | | | 130 | |
Noah Bank, 0.30%, 7/5/2012 (3) | | | 774 | | | | 774 | |
North Jersey Community Bank, 0.30%, 7/5/2012 (3) | | | 2,188 | | | | 2,188 | |
North Shore Community Bank & Trust Company, 0.30%, 7/5/2012 (3) | | | 1 | | | | 1 | |
Northbrook Bank & Trust Company, 0.30%, 7/5/2012 (3) | | | 9 | | | | 9 | |
Northern Bank & Trust Company, 0.30%, 7/5/2012 (3) | | | 4,789 | | | | 4,789 | |
| The Strategic Growth Fund | |
| | | Shares or Principal Amount ($) | | | | | |
| Bank Obligations — continued | | | | | | | | |
Nuvo Bank & Trust Company, 0.30%, 7/5/2012 (3) | | | 1,356 | | | | 1,356 | |
Oak View National Bank, 0.30%, 7/5/2012 (3) | | | 211 | | | | 211 | |
Oasis Bank SSB, 0.30%, 7/5/2012 (3) | | | 28 | | | | 28 | |
OceanFirst Bank, 0.30%, 7/5/2012 (3) | | | 103 | | | | 103 | |
Ohio Commerce Bank, 0.30%, 7/5/2012 (3) | | | 473 | | | | 473 | |
Old Plank Trail Community Bank National Assoc, 0.30%, 7/5/2012 (3) | | | 46 | | | | 46 | |
One Bank & Trust National Association, 0.30%, 7/5/2012 (3) | | | 212 | | | | 212 | |
OneWest Bank FSB, 0.30%, 7/5/2012 (3) | | | 3,047 | | | | 3,047 | |
Ossian State Bank, 0.30%, 7/5/2012 (3) | | | 81 | | | | 81 | |
Pacific Commerce Bank, 0.30%, 7/5/2012 (3) | | | 2,502 | | | | 2,502 | |
Pacific Enterprise Bank, 0.30%, 7/5/2012 (3) | | | 2,855 | | | | 2,855 | |
Paragon Commercial Bank, 0.30%, 7/5/2012 (3) | | | 9,584 | | | | 9,584 | |
Parkside Financial Bank & Trust, 0.30%, 7/5/2012 (3) | | | 1,326 | | | | 1,326 | |
Peapack-Gladstone Bank, 0.30%, 7/5/2012 (3) | | | 1 | | | | 1 | |
Pegasus Bank, 0.30%, 7/5/2012 (3) | | | 318 | | | | 318 | |
Peoples Bank National Association, 0.30%, 7/5/2012 (3) | | | 116 | | | | 116 | |
Peoples Bank of Commerce, 0.30%, 7/5/2012 (3) | | | 870 | | | | 870 | |
Peoples Community Bank, 0.30%, 7/5/2012 (3) | | | 1,287 | | | | 1,287 | |
Peoples United Bank, 0.30%, 7/5/2012 (3) | | | 240,000 | | | | 240,000 | |
Petit Jean State Bank, 0.30%, 7/5/2012 (3) | | | 766 | | | | 766 | |
Pine Bluff National Bank, 0.30%, 7/5/2012 (3) | | | 547 | | | | 547 | |
Plaza Bank, 0.30%, 7/5/2012 (3) | | | 104 | | | | 104 | |
PNC Bank National Association, 0.30%, 7/5/2012 (3) | | | 2,029 | | | | 2,029 | |
Post Oak Bank N.A., 0.30%, 7/5/2012 (3) | | | 434 | | | | 434 | |
Premier Bank, 0.30%, 7/5/2012 (3) | | | 2,347 | | | | 2,347 | |
Premier Bank, 0.30%, 7/5/2012 (3) | | | 1,127 | | | | 1,127 | |
PrinsBank, 0.30%, 7/5/2012 (3) | | | 542 | | | | 542 | |
Private Bank Minnesota, 0.30%, 7/5/2012 (3) | | | 1,330 | | | | 1,330 | |
ProAmérica Bank, 0.30%, 7/5/2012 (3) | | | 2,343 | | | | 2,343 | |
Professional Business Bank, 0.30%, 7/5/2012 (3) | | | 434 | | | | 434 | |
Progress Bank and Trust, 0.30%, 7/5/2012 (3) | | | 441 | | | | 441 | |
Quad City Bank and Trust Company, 0.30%, 7/5/2012 (3) | | | 4,938 | | | | 4,938 | |
Quontic Bank, 0.30%, 7/5/2012 (3) | | | 102 | | | | 102 | |
RBS Citizens National Association, 0.30%, 7/5/2012 (3) | | | 147 | | | | 147 | |
Regent Bank, 0.30%, 7/5/2012 (3) | | | 107 | | | | 107 | |
Regions Bank, 0.30%, 7/5/2012 (3) | | | 11,552 | | | | 11,552 | |
Renasant Bank, 0.30%, 7/5/2012 (3) | | | 4,106 | | | | 4,106 | |
Republic Bank, 0.30%, 7/5/2012 (3) | | | 435 | | | | 435 | |
Republic Bank & Trust, 0.30%, 7/5/2012 (3) | | | 257 | | | | 257 | |
Republic Bank & Trust Company, 0.30%, 7/5/2012 (3) | | | 103 | | | | 103 | |
The accompanying notes are an integral part of these financial statements.
| | 2012 Semi-Annual Report | June 30, 2012 |
Schedule of Investments
June 30, 2012 (unaudited)
| The Strategic Growth Fund | |
| | | Shares or Principal Amount ($) | | | | | |
| Bank Obligations — continued | | | | | | | | |
River Community Bank N.A., 0.30%, 7/5/2012 (3) | | | 1,020 | | | | 1,020 | |
RiverBend Bank, 0.30%, 7/5/2012 (3) | | | 21 | | | | 21 | |
Riverside Bank, 0.30%, 7/5/2012 (3) | | | 132 | | | | 132 | |
Riverview Bank, 0.30%, 7/5/2012 (3) | | | 869 | | | | 869 | |
Rockland Trust Company, 0.30%, 7/5/2012 (3) | | | 5,732 | | | | 5,732 | |
RSNB Bank, 0.30%, 7/5/2012 (3) | | | 1,628 | | | | 1,628 | |
Saratoga National Bank & Trust Company, 0.30%, 7/5/2012 (3) | | | 32 | | | | 32 | |
Sauk Valley Bank & Trust Company, 0.30%, 7/5/2012 (3) | | | 4 | | | | 4 | |
Savings Institute Bank and Trust Company, 0.30%, 7/5/2012 (3) | | | 651 | | | | 651 | |
Schaumburg Bank & Trust Company National Asso, 0.30%, 7/5/2012 (3) | | | 1 | | | | 1 | |
Seaside National Bank & Trust, 0.30%, 7/5/2012 (3) | | | 9,132 | | | | 9,132 | |
Seaway Bank and Trust Company, 0.30%, 7/5/2012 (3) | | | 2,334 | | | | 2,334 | |
Security First Bank, 0.30%, 7/5/2012 (3) | | | 16 | | | | 16 | |
SharePlus Federal Bank, 0.30%, 7/5/2012 (3) | | | 176 | | | | 176 | |
Signature Bank, 0.30%, 7/5/2012 (3) | | | 1,014 | | | | 1,014 | |
Signature Bank, 0.30%, 7/5/2012 (3) | | | 199,340 | | | | 199,340 | |
Signature Bank National Association, 0.30%, 7/5/2012 (3) | | | 112 | | | | 112 | |
Solera National Bank, 0.30%, 7/5/2012 (3) | | | 476 | | | | 476 | |
Southern Bancorp Bank, 0.30%, 7/5/2012 (3) | | | 75 | | | | 75 | |
Southern Bank, 0.30%, 7/5/2012 (3) | | | 10 | | | | 10 | |
Southwest Bank, 0.30%, 7/5/2012 (3) | | | 2,434 | | | | 2,434 | |
Sovereign Bank National Association, 0.30%, 7/5/2012 (3) | | | 240,000 | | | | 240,000 | |
St. Charles Bank & Trust Company, 0.30%, 7/5/2012 (3) | | | 146 | | | | 146 | |
State Bank and Trust Company, 0.30%, 7/5/2012 (3) | | | 265 | | | | 265 | |
State Bank of the Lakes, 0.30%, 7/5/2012 (3) | | | 1 | | | | 1 | |
Sterling National Bank, 0.30%, 7/5/2012 (3) | | | 34,411 | | | | 34,411 | |
Sturdy Savings Bank, 0.30%, 7/5/2012 (3) | | | 103 | | | | 103 | |
Summit Bank, 0.30%, 7/5/2012 (3) | | | 393 | | | | 393 | |
Summit Bank & Trust, 0.30%, 7/5/2012 (3) | | | 1,904 | | | | 1,904 | |
Summit Community Bank Inc., 0.30%, 7/5/2012 (3) | | | 448 | | | | 448 | |
TD Bank N.A., 0.30%, 7/5/2012 (3) | | | 240,000 | | | | 240,000 | |
Team Capital Bank, 0.30%, 7/5/2012 (3) | | | 11,180 | | | | 11,180 | |
Texas Capital Bank National Association, 0.30%, 7/5/2012 (3) | | | 240,000 | | | | 240,000 | |
Touchmark National Bank, 0.30%, 7/5/2012 (3) | | | 1,389 | | | | 1,389 | |
Town Bank, 0.30%, 7/5/2012 (3) | | | 3 | | | | 3 | |
Transportation Alliance Bank Inc., 0.30%, 7/5/2012 (3) | | | 8 | | | | 8 | |
Treynor State Bank, 0.30%, 7/5/2012 (3) | | | 2,373 | | | | 2,373 | |
TriSummit Bank, 0.30%, 7/5/2012 (3) | | | 2,280 | | | | 2,280 | |
| The Strategic Growth Fund | |
| | | Shares or Principal Amount ($) | | | | | |
| Bank Obligations — continued | | | | | | | | |
U.S. Bank National Association, 0.30%, 7/5/2012 (3) | | | 165 | | | | 165 | |
Uinta Bank, 0.30%, 7/5/2012 (3) | | | 1,442 | | | | 1,442 | |
UMB Bank Arizona National Association, 0.30%, 7/5/2012 (3) | | | 107 | | | | 107 | |
UMB Bank Colorado National Association, 0.30%, 7/5/2012 (3) | | | 16 | | | | 16 | |
UMB Bank National Association, 0.30%, 7/5/2012 (3) | | | 134 | | | | 134 | |
Umpqua Bank, 0.30%, 7/5/2012 (3) | | | 81 | | | | 81 | |
Union Bank National Association, 0.30%, 7/5/2012 (3) | | | 135 | | | | 135 | |
Union Bank of Mena, 0.30%, 7/5/2012 (3) | | | 16 | | | | 16 | |
Union Center National Bank, 0.30%, 7/5/2012 (3) | | | 46,382 | | | | 46,382 | |
United Bank, 0.30%, 7/5/2012 (3) | | | 2,152 | | | | 2,152 | |
United Bank, 0.30%, 7/5/2012 (3) | | | 105 | | | | 105 | |
United Bank Inc., 0.30%, 7/5/2012 (3) | | | 1,967 | | | | 1,967 | |
USNY Bank, 0.30%, 7/5/2012 (3) | | | 666 | | | | 666 | |
Valley Bank, 0.30%, 7/5/2012 (3) | | | 759 | | | | 759 | |
Valley National Bank, 0.30%, 7/5/2012 (3) | | | 220,141 | | | | 220,141 | |
Valliance Bank, 0.30%, 7/5/2012 (3) | | | 126 | | | | 126 | |
Veritex Community Bank National Association, 0.30%, 7/5/2012 (3) | | | 43 | | | | 43 | |
Verus Bank of Commerce, 0.30%, 7/5/2012 (3) | | | 3,444 | | | | 3,444 | |
Victory Bank, 0.30%, 7/5/2012 (3) | | | 217 | | | | 217 | |
ViewPoint Bank National Association, 0.30%, 7/5/2012 (3) | | | 5,278 | | | | 5,278 | |
Village Bank & Trust, 0.30%, 7/5/2012 (3) | | | 8 | | | | 8 | |
Virginia Heritage Bank, 0.30%, 7/5/2012 (3) | | | 3,297 | | | | 3,297 | |
Warren Bank & Trust Company, 0.30%, 7/5/2012 (3) | | | 1,088 | | | | 1,088 | |
Washington Trust Bank, 0.30%, 7/5/2012 (3) | | | 1,405 | | | | 1,405 | |
Washington Trust Company of Westerly, 0.30%, 7/5/2012 (3) | | | 152 | | | | 152 | |
Webster Bank National Association, 0.30%, 7/5/2012 (3) | | | 104 | | | | 104 | |
Wells Fargo Bank National Association, 0.30%, 7/5/2012 (3) | | | 238 | | | | 238 | |
West Town Savings Bank, 0.30%, 7/5/2012 (3) | | | 16 | | | | 16 | |
Western Alliance Bank, 0.30%, 7/5/2012 (3) | | | 53 | | | | 53 | |
Western National Bank, 0.30%, 7/5/2012 (3) | | | 197 | | | | 197 | |
Wheaton Bank & Trust Company, 0.30%, 7/5/2012 (3) | | | 1 | | | | 1 | |
Whidbey Island Bank, 0.30%, 7/5/2012 (3) | | | 74 | | | | 74 | |
Wilmington Savings Fund Society FSB, 0.30%, 7/5/2012 (3) | | | 4,324 | | | | 4,324 | |
Wilmington Trust National Association, 0.30%, 7/5/2012 (3) | | | 108 | | | | 108 | |
Wisconsin Community Bank, 0.30%, 7/5/2012 (3) | | | 42,621 | | | | 42,621 | |
Wolverine Bank Federal Savings Bank, 0.30%, 7/5/2012 (3) | | | 4 | | | | 4 | |
The accompanying notes are an integral part of these financial statements.
| | 2012 Semi-Annual Report | June 30, 2012 |
Schedule of Investments
June 30, 2012 (unaudited)
| The Strategic Growth Fund | |
| | | Shares or Principal Amount ($) | | | | | |
| Bank Obligations — continued | | | | | | | | |
Xenith Bank, 0.30%, 7/5/2012 (3) | | | 3,914 | | | | 3,914 | |
Total Bank Obligations (Cost $5,004,521) | | | | | | | 5,004,521 | |
| Floating Rate Demand Notes — 2.5% | | | | | | | | |
Caterpillar Financial Power Investment Floating Rate Demand Note, 0.60%, 7/1/2012 (4) | | | 2,002,547 | | | | 2,002,547 | |
Total Floating Rate Demand Notes (Cost $2,002,547) | | | | | | | 2,002,547 | |
| U.S. Government Obligations — 2.5% | | | | | | | | |
U.S. Treasury Bill, 0.12%, due 9/6/2012 (5) | | | 2,000,000 | | | | 1,999,752 | |
Total U.S. Government Obligations (Cost $1,999,560) | | | | | | | 1,999,752 | |
Total Investments — 99.6% (Cost $77,811,331 )(1) | | | | | | | 78,764,813 | |
| Other Assets less Liabilities — 0.4% | | | | | | | 299,490 | |
Total Net Assets — 100.0% | | | | | | | 79,064,303 | |
Trustee Deferred Compensation (6) | | | | | | | | |
| The Flex-funds Aggressive Growth Fund | | | 1,417 | | | | 11,251 | |
The Flex-funds Balanced Fund | | | 751 | | | | 7,292 | |
| The Flex-funds Dynamic Growth Fund | | | 452 | | | | 3,756 | |
The Flex-funds Muirfield Fund | | | 1,321 | | | | 7,332 | |
The Flex-funds Quantex Fund | | | 582 | | | | 13,211 | |
| The Flex-funds Utilities & Infrastructure Fund | | | 162 | | | | 3,825 | |
Total Trustee Deferred Compensation (Cost $42,720) | | | | | | | 46,667 | |
| The Strategic Growth Fund | |
| | | | | | Unrealized Appreciation (Depreciation) ($) | |
| | | | | | | |
| Futures Contracts | |
| Standard & Poors 500 expiring September 2012, notional value $6,782,000 | | | 20 | | | | 189,600 | |
| Standard & Poors Mid Cap 400 E-Mini expiring September 2012, notional value $8,737,350 | | | 93 | | | | 215,993 | |
Total Futures Contracts | | | 113 | | | | 405,593 | |
| (1) | Represents cost for financial reporting purposes and differs for federal income tax purposes by the amount of losses deferred for federal income tax reporting in the amount of $317,330. Cost for federal income tax purposes of $78,128,661 differs from value by net unrealized appreciation (depreciation) of securities as follows: |
Unrealized appreciation | | $ | 2,287,904 | |
Unrealized depreciation | | | (1,651,752 | ) |
| Net unrealized appreciation (depreciation) | | $ | 636,152 | |
| (2) | Investment in affiliate. The yield shown represents the 7-day yield in effect at June 30, 2012. |
| (3) | Illiquid security. The sale or disposition of such security would not be possible in the ordinary course of business within seven days at approximately the value at which the Fund has valued the security. These securities were purchased through StoneCastle Partners, LLC, an independent, privately held asset management and investment services company, and are insured through the Federal Deposit Insurance Corporation (FDIC). The interest rate varies monthly and any accrued interest is reinvested into the program on a monthly basis. The securities are classified as illiquid because if the Fund were to redeem its investment in the program, the proceeds are delivered only once per week; on the Wednesday of the next week following the redemption request. The maximum number of days from a redemption request to receiving the proceeds is nine days. Hence the Fund may not be able to receive its proceeds within seven days. As of June 30, 2012, illiquid securities represented 6.4% of Total Investments. |
| (4) | Floating rate security. The rate shown represents the rate in effect at June 30, 2012. |
| (5) | Pledged as collateral on futures contracts. |
| (6) | Assets of affiliates to The Strategic Growth Fund held for the benefit of the Fund’s Trustees in connection with the Trustee Deferred Compensation Plan. |
The accompanying notes are an integral part of these financial statements.
| | 2012 Semi-Annual Report | June 30, 2012 |
Schedule of Investments
June 30, 2012 (unaudited)
| The Quantex Fund | |
| | | Shares or Principal Amount ($) | | | | | |
| Common Stocks — 96.3% | |
| Basic Materials — 2.0% | | | | | | |
| Alpha Natural Resources, Inc. (2) | | | 9,985 | | | | 86,969 | |
| United States Steel Corp. | | | 7,700 | | | | 158,620 | |
| Vulcan Materials Company | | | 5,175 | | | | 205,500 | |
| (Cost $ 633,802) | | | | | | | 451,089 | |
| Business Services — 7.1% | | | | | | | | |
| Cintas Corporation | | | 5,855 | | | | 226,062 | |
| DeVry, Inc. | | | 5,305 | | | | 164,296 | |
| H&R Block, Inc. | | | 12,495 | | | | 199,670 | |
| Interpublic Group of Companies, Inc./The | | | 20,965 | | | | 227,470 | |
| Robert Half International, Inc. | | | 7,165 | | | | 204,704 | |
| R.R. Donnelly & Sons Company | | | 14,135 | | | | 166,369 | |
| Ryder System, Inc. | | | 3,840 | | | | 138,278 | |
| Total System Services, Inc. | | | 10,435 | | | | 249,710 | |
| (Cost $ 1,665,637) | | | | | | | 1,576,559 | |
| Communications — 0.9% | | | | | | | | |
| Cablevision Systems Corp. | | | 14,355 | | | | 190,778 | |
| (Cost $ 211,233) | | | | | | | 190,778 | |
| Consumer Cyclical — 1.9% | | | | | | | | |
| Hasbro, Inc. | | | 6,390 | | | | 216,430 | |
Netflix, Inc. (2) | | | 2,945 | | | | 201,688 | |
| (Cost $ 448,063) | | | | | | | 418,118 | |
| Consumer Goods — 12.8% | | | | | | | | |
| Avery Dennison Corp. | | | 7,110 | | | | 194,388 | |
| Bemis Company, Inc. | | | 6,780 | | | | 212,485 | |
Constellation Brands, Inc. (2) | | | 9,870 | | | | 267,082 | |
Dean Foods Company (2) | | | 18,215 | | | | 310,202 | |
| Harman International Industries, Inc. | | | 5,360 | | | | 212,256 | |
| Hormel Foods Corp. | | | 6,970 | | | | 212,027 | |
| International Flavors & Fragrances, Inc. | | | 3,890 | | | | 213,172 | |
| JC Penney Company, Inc. | | | 5,800 | | | | 135,198 | |
| Masco Corp. | | | 19,470 | | | | 270,049 | |
| Newell Rubbermaid, Inc. | | | 12,635 | | | | 229,199 | |
Owens-Illinois, Inc. (2) | | | 10,530 | | | | 201,860 | |
| Pitney Bowes, Inc. | | | 10,995 | | | | 164,595 | |
| Sealed Air Corp. | | | 11,845 | | | | 182,887 | |
| (Cost $ 2,893,112) | | | | | | | 2,805,400 | |
| Consumer Services — 14.1% | | | | | | | | |
| Abercrombie and Fitch Co. | | | 4,170 | | | | 142,364 | |
AutoNation, Inc. (2) | | | 5,530 | | | | 195,098 | |
Big Lots, Inc. (2) | | | 5,395 | | | | 220,062 | |
| D.R. Horton, Inc. | | | 16,175 | | | | 297,297 | |
| Expedia, Inc. | | | 7,030 | | | | 337,931 | |
| GameStop Corp. | | | 8,445 | | | | 155,050 | |
| Lennar Corp. | | | 10,385 | | | | 321,000 | |
PulteGroup, Inc. (2) | | | 32,343 | | | | 346,070 | |
Sears Holdings Corp. (2) | | | 6,415 | | | | 382,976 | |
| SUPERVALU, Inc. | | | 25,125 | | | | 130,148 | |
TripAdvisor, Inc. (2) | | | 8,090 | | | | 361,542 | |
Urban Outfitters, Inc. (2) | | | 7,400 | | | | 204,166 | |
| (Cost $ 2,642,097) | | | | | | | 3,093,704 | |
| Energy — 5.7% | | | | | | | | |
| Diamond Offshore Drilling, Inc. | | | 3,690 | | | | 218,190 | |
Nabors Industries, Ltd. (2) | | | 11,765 | | | | 169,416 | |
| The Quantex Fund | |
| | | Shares or Principal Amount ($) | | | | | |
| Common Stocks — continued | |
Newfield Exploration Company (2) | | | 5,395 | | | | 158,127 | |
Rowan Companies (2) | | | 6,715 | | | | 217,096 | |
SunCoke Energy, Inc. (2) | | | 2,635 | | | | 38,603 | |
| Sunoco, Inc. | | | 4,965 | | | | 235,837 | |
| Tesoro Corp. | | | 8,730 | | | | 217,901 | |
| (Cost $ 1,312,380) | | | | | | | 1,255,170 | |
| Financial Services — 15.2% | | | | | | | | |
Apartment Investment & Management Company (3) | | | 8,900 | | | | 240,567 | |
| Assurant, Inc. | | | 4,960 | | | | 172,806 | |
| Cincinnati Financial Corporation | | | 6,690 | | | | 254,688 | |
E*TRADE Financial Corp. (2) | | | 25,627 | | | | 206,041 | |
| Equifax, Inc. | | | 5,265 | | | | 245,349 | |
| Federated Investors, Inc. | | | 13,470 | | | | 294,319 | |
| First Horizon National Corp. | | | 25,502 | | | | 220,592 | |
Genworth Financial, Inc. (2) | | | 31,150 | | | | 176,309 | |
| Hudson City Bancorp, Inc. | | | 32,640 | | | | 207,917 | |
| Huntington Bancshares, Inc. | | | 37,160 | | | | 237,824 | |
| Legg Mason, Inc. | | | 8,475 | | | | 223,486 | |
| NASDAQ OMX Group, Inc./The | | | 8,330 | | | | 188,841 | |
| People's United Financial, Inc. | | | 15,870 | | | | 184,251 | |
| Torchmark Corp. | | | 4,695 | | | | 237,332 | |
Wells Fargo & Co. Preferred (2) | | | 1,700 | | | | 0 | |
| Zions Bancorporation | | | 12,535 | | | | 243,430 | |
| (Cost $ 3,362,551) | | | | | | | 3,333,752 | |
| Hardware — 7.5% | | | | | | | | |
Advanced Micro Devices, Inc. (2) | | | 37,780 | | | | 216,479 | |
| Jabil Circuit, Inc. | | | 10,380 | | | | 211,025 | |
JDS Uniphase Corp. (2) | | | 19,547 | | | | 215,017 | |
Lam Research Corp. (2) | | | 5,557 | | | | 209,721 | |
| Lexmark International, Inc. | | | 6,175 | | | | 164,132 | |
LSI Corp. (2) | | | 34,285 | | | | 218,395 | |
| Molex, Inc. | | | 8,540 | | | | 204,448 | |
Teradyne, Inc. (2) | | | 14,965 | | | | 210,408 | |
| (Cost $ 1,727,869) | | | | | | | 1,649,625 | |
| Healthcare — 6.2% | | | | | | | | |
| Coventry Health Care, Inc. | | | 6,710 | | | | 213,311 | |
| DENTSPLY International, Inc. | | | 5,820 | | | | 220,054 | |
Hospira, Inc. (2) | | | 6,710 | | | | 234,716 | |
| Patterson Companies, Inc. | | | 6,905 | | | | 238,015 | |
| PerkinElmer, Inc. | | | 10,195 | | | | 263,031 | |
Tenet Healthcare Corp. (2) | | | 39,770 | | | | 208,395 | |
| (Cost $ 1,310,854) | | | | | | | 1,377,522 | |
| Industrial Materials — 7.4% | | | | | | | | |
| Allegheny Technologies, Inc. | | | 4,265 | | | | 136,011 | |
| FLIR Systems, Inc. | | | 8,135 | | | | 158,633 | |
Goodyear Tire & Rubber Company/The (2) | | | 14,395 | | | | 170,005 | |
| Leggett & Platt, Inc. | | | 8,850 | | | | 187,000 | |
| Leucadia National Corp. | | | 8,960 | | | | 190,579 | |
| SAIC, Inc. | | | 16,595 | | | | 201,131 | |
| Snap-on, Inc. | | | 4,030 | | | | 250,868 | |
| Titanium Metals Corp. | | | 13,615 | | | | 153,986 | |
| Xylem, Inc, | | | 7,950 | | | | 200,101 | |
| (Cost $ 1,947,513) | | | | | | | 1,648,314 | |
The accompanying notes are an integral part of these financial statements.
| | 2012 Semi-Annual Report | June 30, 2012 |
Schedule of Investments
June 30, 2012 (unaudited)
| The Quantex Fund | |
| | | Shares or Principal Amount ($) | | | | | |
| Common Stocks — continued | |
| Media — 3.2% | | | | | | | | |
| Gannett Company, Inc. | | | 15,250 | | | | 224,633 | |
| Scripps Networks Interactive | | | 4,805 | | | | 273,212 | |
| Washington Post Company/The | | | 540 | | | | 201,863 | |
| (Cost $ 682,554) | | | | | | | 699,708 | |
| Real Estate Management — 1.0% | | | | | | | | |
CBRE Group, Inc. (2) | | | 13,400 | | | | 219,224 | |
| (Cost $ 223,240) | | | | | | | 219,224 | |
| Software — 1.9% | | | | | | | | |
Compuware Corp. (2) | | | 24,520 | | | | 228,036 | |
| Dun & Bradstreet Corp./The | | | 2,725 | | | | 193,938 | |
| (Cost $ 445,324) | | | | | | | 421,974 | |
| Technology — 3.6% | | | | | | | | |
| Computer Sciences Corp. | | | 8,610 | | | | 213,700 | |
First Solar, Inc. (2) | | | 6,040 | | | | 90,963 | |
| Harris Corp. | | | 5,660 | | | | 236,871 | |
| Whirlpool Corp. | | | 4,300 | | | | 262,988 | |
| (Cost $ 882,873) | | | | | | | 804,522 | |
| Utilities — 6.1% | | | | | | | | |
| AGL Resources, Inc. | | | 4,826 | | | | 187,008 | |
| Integrys Energy Group, Inc. | | | 3,760 | | | | 213,831 | |
MetroPCS Communications, Inc. (2) | | | 23,505 | | | | 142,205 | |
NRG Energy, Inc. (2) | | | 11,255 | | | | 195,387 | |
| Pepco Holdings, Inc. | | | 10,055 | | | | 196,776 | |
Quanta Services, Inc. (2) | | | 9,465 | | | | 227,823 | |
| TECO Energy, Inc. | | | 10,660 | | | | 192,520 | |
| (Cost $ 1,429,520) | | | | | | | 1,355,550 | |
| Total Common Stocks (Cost $ 21,818,622) | | | | | | | 21,301,009 | |
| Money Market Registered Investment Companies — 3.2% | |
The Flex-funds Money Market Fund - Institutional Class, 0.17% (4) | | | 709,530 | | | | 709,530 | |
| Total Money Market Registered Investment Companies (Cost $709,530) | | | | | | | 709,530 | |
| Floating Rate Demand Notes — 0.0% | | | | | | | | |
Caterpillar Financial Power Investment Floating Rate Demand Note, 0.60%, 7/1/2012 (5) | | | 86 | | | | 86 | |
| Total Floating Rate Demand Notes (Cost $86) | | | | | | | 86 | |
| U.S. Government Obligations — 0.5% | | | | | | | | |
U.S. Treasury Bill, 0.12%, due 9/6/2012 (6) | | | 100,000 | | | | 99,988 | |
| Total U.S. Government Obligations (Cost $99,978) | | | | | | | 99,988 | |
Total Investments — 99.9% (Cost $ 22,628,216 )(1) | | | | | | | 22,110,613 | |
| Other Assets less Liabilities — 0.1% | | | | | | | 32,779 | |
| Total Net Assets — 100.0% | | | | | | | 22,143,392 | |
| The Quantex Fund | |
| | | Shares or Principal Amount ($) | | | | | |
Trustee Deferred Compensation (7) | | | | | | | | |
| The Flex-funds Aggressive Growth Fund | | | 742 | | | | 5,891 | |
| The Flex-funds Balanced Fund | | | 389 | | | | 3,777 | |
| The Flex-funds Dynamic Growth Fund | | | 236 | | | | 1,961 | |
| The Flex-funds Muirfield Fund | | | 1,578 | | | | 8,758 | |
| The Flex-funds Quantex Fund | | | 1,102 | | | | 25,015 | |
| The Flex-funds Utilities & Infrastructure Fund | | | 85 | | | | 2,007 | |
| Total Trustee Deferred Compensation (Cost $37,654) | | | | | | | 47,409 | |
| | | | | | Unrealized Appreciation (Depreciation) ($) | |
| | | | | | | |
| Futures Contracts | |
| Standard & Poors Mid Cap 400 E-Mini expiring September 2012, notional value $657,650 | | | 7 | | | | 16,258 | |
Total Futures Contracts | | | 7 | | | | 16,258 | |
| (1) | Represents cost for financial reporting purposes and differs for federal income tax purposes by the amount of losses deferred for federal income tax reporting in the amount of $158,145. Cost for federal income tax purposes of $22,786,361 differs from value by net unrealized appreciation (depreciation) of securities as follows: |
Unrealized appreciation | | $ | 1,769,195 | |
Unrealized depreciation | | | (2,444,943 | ) |
| Net unrealized appreciation (depreciation) | | $ | (675,748 | ) |
| (2) | Represents non-income producing securities. |
| (3) | Real estate investment trust. |
| (4) | Investment in affiliate. The yield shown represents the 7-day yield in effect at June 30, 2012. |
| (5) | Floating rate security. The rate shown represents the rate in effect at June 30, 2012. |
| (6) | Pledged as collateral on Futures Contracts. |
| (7) | Assets of affiliates to The Flex-funds Quantex Fund held for the benefit of the Fund’s Trustees in connection with the Trustee Deferred Compensation Plan. |
The accompanying notes are an integral part of these financial statements.
| | 2012 Semi-Annual Report | June 30, 2012 |
Schedule of Investments
June 30, 2012 (unaudited)
| The Utilities and Infrastructure Fund | |
| | | Shares or Principal Amount ($) | | | | | |
| Common Stocks — 96.7% | |
| Electric Utility 18.2% | | | | | | |
AES Corp. (2) | | | 60,812 | | | | 780,218 | |
Enersis S.A. - ADR (3) | | | 43,251 | | | | 808,794 | |
| General Electric Co. | | | 58,764 | | | | 1,224,642 | |
| ITC Holdings Corp. | | | 16,978 | | | | 1,169,954 | |
| MDU Resources Group, Inc. | | | 54,783 | | | | 1,183,861 | |
| Northeast Utilities | | | 15,068 | | | | 584,789 | |
| (Cost $ 5,369,839) | | | | | | | 5,752,258 | |
| Natural Gas Distribution 12.9% | | | | | | | | |
| Energy Transfer Equity, L.P. | | | 17,674 | | | | 724,988 | |
| MarkWest Energy Partners, L.P. | | | 15,397 | | | | 759,226 | |
National Grid PLC - ADR (3) | | | 16,308 | | | | 864,161 | |
| ONEOK, Inc. | | | 15,278 | | | | 646,412 | |
| Williams Companies, Inc./The | | | 38,615 | | | | 1,112,884 | |
| (Cost $ 3,388,616) | | | | | | | 4,107,671 | |
| Oil Exploration & Production 8.3% | | | | | | | | |
| CARBO Ceramics, Inc. | | | 7,252 | | | | 556,446 | |
| Energen Corporation | | | 11,931 | | | | 538,446 | |
Ensco PLC - ADR (3) | | | 13,087 | | | | 614,696 | |
| EQT Corp. | | | 17,216 | | | | 923,294 | |
| (Cost $ 3,098,849) | | | | | | | 2,632,882 | |
| Pipelines 18.1% | | | | | | | | |
| Enterprise Products Partners, L.P. | | | 26,354 | | | | 1,350,379 | |
| Kinder Morgan Energy Partners, L.P. | | | 12,857 | | | | 1,010,303 | |
| National Fuel Gas Co. | | | 20,831 | | | | 978,641 | |
| Questar Corp. | | | 76,826 | | | | 1,602,590 | |
| Spectra Energy Corp. | | | 26,919 | | | | 782,266 | |
| (Cost $ 4,494,700) | | | | | | | 5,724,179 | |
| Telephone & Telecommunications 19.9% | | | | | | | | |
| American Tower Corp. | | | 10,635 | | | | 743,493 | |
| AT&T, Inc. | | | 39,215 | | | | 1,398,407 | |
NII Holdings, Inc. (2) | | | 60,865 | | | | 622,649 | |
| QUALCOMM, Inc. | | | 21,369 | | | | 1,189,826 | |
| Telephone and Data Systems, Inc. | | | 30,104 | | | | 640,914 | |
| Verizon Communications, Inc. | | | 17,409 | | | | 773,656 | |
Vodafone Group PLC - ADR (3) | | | 32,442 | | | | 914,216 | |
| (Cost $ 7,082,688) | | | | | | | 6,283,161 | |
| Utility Services — 13.4% | | | | | | | | |
ABB Limited - ADR (2)(3) | | | 34,435 | | | | 561,979 | |
EnerSys (2) | | | 13,480 | | | | 472,744 | |
| Fluor Corp. | | | 8,645 | | | | 426,544 | |
| NiSource, Inc. | | | 112,054 | | | | 2,773,268 | |
| (Cost $ 3,758,646) | | | | | | | 4,234,535 | |
| Water Utility — 6.0% | | | | | | | | |
| American Water Works Co., Inc. | | | 37,299 | | | | 1,278,610 | |
Veolia Environnement - ADR (3) | | | 48,641 | | | | 613,849 | |
| (Cost $ 1,657,313) | | | | | | | 1,892,459 | |
| Total Common Stocks (Cost $ 28,850,651) | | | | | | | 30,627,145 | |
| The Utilities and Infrastructure Fund | |
| | | Shares or Principal Amount ($) | | | | | |
| Money Market Registered Investment Companies — 3.2% | |
The Flex-funds Money Market Fund - Institutional Class, 0.17% (4) | | | 1,009,813 | | | | 1,009,813 | |
| Total Money Market Registered Investment Companies (Cost $1,009,813) | | | | | | | 1,009,813 | |
Total Investments — 99.9% (Cost $29,860,464 )(1) | | | | | | | 31,636,958 | |
| Other Assets less Liabilities — 0.1% | | | | | | | 39,675 | |
| Total Net Assets — 100.0% | | | | | | | 31,676,633 | |
Trustee Deferred Compensation (5) | | | | | | | | |
| The Flex-funds Aggressive Growth Fund | | | 892 | | | | 7,082 | |
| The Flex-funds Balanced Fund | | | 470 | | | | 4,564 | |
| The Flex-funds Dynamic Growth Fund | | | 284 | | | | 2,360 | |
| The Flex-funds Muirfield Fund | | | 1,485 | | | | 8,242 | |
| The Flex-funds Quantex Fund | | | 958 | | | | 21,747 | |
| The Flex-funds Utilities & Infrastructure Fund | | | 102 | | | | 2,408 | |
| Total Trustee Deferred Compensation (Cost $37,811) | | | | | | | 46,403 | |
| (1) | Represents cost for financial reporting purposes and differs for federal income tax purposes by the amount of losses deferred for federal income tax reporting in the amount of $99,197. Cost for federal income tax purposes of $29,959,661 differs from value by net unrealized appreciation (depreciation) of securities as follows: |
Unrealized appreciation | | $ | 4,432,468 | |
Unrealized depreciation | | | (2,755,171 | ) |
| Net unrealized appreciation (depreciation) | | $ | 1,677,297 | |
| (2) | Represents non-income producing securities. |
| (3) | American Depositary Receipt |
| (4) | Investment in affiliate. The yield shown represents the 7-day yield in effect at June 30, 2012. |
| (5) | Assets of affiliates to The Utilities & Infrastructure Fund held for the benefit of the Fund’s Trustees in connection with the Trustees Deferred Compensation Plan. |
The accompanying notes are an integral part of these financial statements.
| | 2012 Semi-Annual Report | June 30, 2012 |
Schedule of Investments
June 30, 2012 (unaudited)
| The Total Return Bond Fund | |
| | | Shares or Principal Amount ($) | | | | | |
| Registered Investment Companies — 99.2% | |
| AllianceBernstein High Income Fund | | | 389,578 | | | | 3,502,303 | |
| DoubleLine Total Return Bond Fund | | | 459,242 | | | | 5,134,321 | |
Federated Bond Fund | | | 1,022,264 | | | | 9,609,278 | |
Fidelity Capital & Income Fund | | | 623,823 | | | | 5,651,834 | |
| iShares iBoxx $ High Yield Corporate Bond Fund | | | 30,400 | | | | 2,775,216 | |
| iShares iBoxx $ Investment Grade Corporate Bond Fund | | | 89,925 | | | | 10,574,281 | |
| iShares JP Morgan USD Emerging Markets Bond Fund | | | 35,950 | | | | 4,124,184 | |
| SPDR Barclays Capital High Yield Bond ETF | | | 70,125 | | | | 2,767,132 | |
| TCW Emerging Markets Income Fund | | | 744,045 | | | | 6,480,634 | |
| Vanguard Intermediate-Term Corporate Bond ETF | | | 113,025 | | | | 9,630,860 | |
| Vanguard Total Bond Market ETF | | | 99,575 | | | | 8,402,138 | |
Total Registered Investment Companies (Cost $68,023,157) | | | | | | | 68,652,181 | |
| Money Market Registered Investment Companies — 0.9% | |
The Flex-funds Money Market Fund - Institutional Class, 0.17% (2) | | | 614,726 | | | | 614,726 | |
Total Money Market Registered Investment Companies (Cost $614,726) | | | | | | | 614,726 | |
| U.S. Government Obligations — 0.2% | | | | | | | | |
| Government National Mortgage Association, 6.50%, due 07/20/2038 | | | 31,415 | | | | 39,790 | |
U.S. Treasury Bill, 0.12%, due 9/6/2012 (3) | | | 100,000 | | | | 99,988 | |
Total U.S. Government Obligations (Cost $139,923) | | | | | | | 139,778 | |
Total Investments — 100.2% (Cost $68,777,806 )(1) | | | | | | | 69,406,685 | |
| Liabilities less Other Assets — (0.2%) | | | | | | | (113,514 | ) |
Total Net Assets — 100.0% | | | | | | | 69,293,171 | |
| The Total Return Bond Fund | |
| | | Shares or Principal Amount ($) | | | | | |
Trustee Deferred Compensation (4) | | | | | | | | |
| The Flex-funds Aggressive Growth Fund | | | 211 | | | | 1,675 | |
The Flex-funds Balanced Fund | | | 109 | | | | 1,058 | |
| The Flex-funds Dynamic Growth Fund | | | 72 | | | | 598 | |
The Flex-funds Muirfield Fund | | | 244 | | | | 1,354 | |
The Flex-funds Quantex Fund | | | 114 | | | | 2,588 | |
| The Flex-funds Utilities & Infrastructure Fund | | | 25 | | | | 590 | |
Total Trustee Deferred Compensation (Cost $7,476) | | | | | | | 7,863 | |
| (1) | Represents cost for financial reporting purposes and differs for federal income tax purposes by the amount of losses deferred for federal income tax reporting in the amount of $344,653. Cost for federal income tax purposes of $69,122,459 differs from value by net unrealized appreciation (depreciation) of securities as follows |
Unrealized appreciation | | $ | 679,986 | |
Unrealized depreciation | | | (395,760 | ) |
| Net unrealized appreciation (depreciation) | | $ | 284,226 | |
| (2) | Investment in affiliate. The yield shown represents the 7-day yield in effect at June 30, 2012. |
| (3) | Pledged as collateral on futures contracts. |
| (4) | Assets of affiliates to The Total Return Bond Fund held for the benefit of the Fund’s Trustees in connection with the Trustee Deferred Compensation Plan. |
The accompanying notes are an integral part of these financial statements.
| | 2012 Semi-Annual Report | June 30, 2012 |
Schedule of Investments
June 30, 2012 (unaudited)
| The Money Market Fund | |
| | | | | Principal Amount ($) or Shares | | | | |
| Bank Obligations — 6.9% | |
Access National Bank (3) | | | 0.30 | %(2) | 07/05/12 | | | 9,213 | | | | 9,213 | |
Allied Bank (3) | | | 0.30 | %(2) | 07/05/12 | | | 4,053 | | | | 4,053 | |
Alma Bank (3) | | | 0.30 | %(2) | 07/05/12 | | | 44,836 | | | | 44,836 | |
AloStar Bank of Commerce (3) | | | 0.30 | %(2) | 07/05/12 | | | 35,445 | | | | 35,445 | |
Alpine Bank (3) | | | 0.30 | %(2) | 07/05/12 | | | 28,558 | | | | 28,558 | |
Ameriana Bank (3) | | | 0.30 | %(2) | 07/05/12 | | | 175 | | | | 175 | |
American Enterprise Bank of Florida (3) | | | 0.30 | %(2) | 07/05/12 | | | 4,592 | | | | 4,592 | |
American Momentum Bank (3) | | | 0.30 | %(2) | 07/05/12 | | | 53,144 | | | | 53,144 | |
American National Bank (3) | | | 0.30 | %(2) | 07/05/12 | | | 21,255 | | | | 21,255 | |
American National Bank-Fox Cities (3) | | | 0.30 | %(2) | 07/05/12 | | | 2,011 | | | | 2,011 | |
American Savings Bank F.S.B. (3) | | | 0.30 | %(2) | 07/05/12 | | | 152 | | | | 152 | |
American Savings Bank FSB (3) | | | 0.30 | %(2) | 07/05/12 | | | 1,447 | | | | 1,447 | |
Americas United Bank (3) | | | 0.30 | %(2) | 07/05/12 | | | 12,186 | | | | 12,186 | |
AmFirst Bank N.A. (3) | | | 0.30 | %(2) | 07/05/12 | | | 359 | | | | 359 | |
Anthem Bank & Trust (3) | | | 0.30 | %(2) | 07/05/12 | | | 8,150 | | | | 8,150 | |
Arizona Bank & Trust (3) | | | 0.30 | %(2) | 07/05/12 | | | 39,132 | | | | 39,132 | |
Arvest Bank (3) | | | 0.30 | %(2) | 07/05/12 | | | 2,052 | | | | 2,052 | |
Austin Bank of Chicago (3) | | | 0.30 | %(2) | 07/05/12 | | | 8,109 | | | | 8,109 | |
Avidia Bank (3) | | | 0.30 | %(2) | 07/05/12 | | | 39,132 | | | | 39,132 | |
Bancorp Bank (3) | | | 0.30 | %(2) | 07/05/12 | | | 100,327 | | | | 100,327 | |
Bank Hapoalim B.M. (3) | | | 0.30 | %(2) | 07/05/12 | | | 14,106 | | | | 14,106 | |
Bank Leumi USA (3) | | | 0.30 | %(2) | 07/05/12 | | | 240,000 | | | | 240,000 | |
Bank Midwest Deposit Account | | | 0.65 | %(2) | 07/01/12 | | | 250,073 | | | | 250,073 | |
Bank of America National Association (3) | | | 0.30 | %(2) | 07/05/12 | | | 896 | | | | 896 | |
Bank of Augusta (3) | | | 0.30 | %(2) | 07/05/12 | | | 8,557 | | | | 8,557 | |
Bank of Cadiz and Trust Company (3) | | | 0.30 | %(2) | 07/05/12 | | | 9,844 | | | | 9,844 | |
Bank of Cave City (3) | | | 0.30 | %(2) | 07/05/12 | | | 4,083 | | | | 4,083 | |
Bank of England (3) | | | 0.30 | %(2) | 07/05/12 | | | 17,425 | | | | 17,425 | |
Bank of Fayetteville (3) | | | 0.30 | %(2) | 07/05/12 | | | 4,069 | | | | 4,069 | |
Bank of Hawaii (3) | | | 0.30 | %(2) | 07/05/12 | | | 46,507 | | | | 46,507 | |
Bank of Houston (3) | | | 0.30 | %(2) | 07/05/12 | | | 24,836 | | | | 24,836 | |
Bank of Jackson Hole (3) | | | 0.30 | %(2) | 07/05/12 | | | 4,123 | | | | 4,123 | |
Bank of Manhattan N.A. (3) | | | 0.30 | %(2) | 07/05/12 | | | 15,540 | | | | 15,540 | |
Bank of Marin (3) | | | 0.30 | %(2) | 07/05/12 | | | 2,031 | | | | 2,031 | |
Bank of Missouri (3) | | | 0.30 | %(2) | 07/05/12 | | | 46,367 | | | | 46,367 | |
Bank of Princeton (3) | | | 0.30 | %(2) | 07/05/12 | | | 6,073 | | | | 6,073 | |
Bank of the Ozarks (3) | | | 0.30 | %(2) | 07/05/12 | | | 1,013 | | | | 1,013 | |
Bank of the Panhandle (3) | | | 0.30 | %(2) | 07/05/12 | | | 9,915 | | | | 9,915 | |
Bank of the West (3) | | | 0.30 | %(2) | 07/05/12 | | | 126,563 | | | | 126,563 | |
Bar Harbor Bank & Trust (3) | | | 0.30 | %(2) | 07/05/12 | | | 8,109 | | | | 8,109 | |
Belmont Savings Bank (3) | | | 0.30 | %(2) | 07/05/12 | | | 42,941 | | | | 42,941 | |
Benchmark Bank (3) | | | 0.30 | %(2) | 07/05/12 | | | 7 | | | | 7 | |
Benefit Bank (3) | | | 0.30 | %(2) | 07/05/12 | | | 12,550 | | | | 12,550 | |
Berkshire Bank (3) | | | 0.30 | %(2) | 07/05/12 | | | 58,394 | | | | 58,394 | |
Beverly Bank & Trust Company National Associa (3) | | | 0.30 | %(2) | 07/05/12 | | | 277 | | | | 277 | |
Biltmore Bank of Arizona (3) | | | 0.30 | %(2) | 07/05/12 | | | 22,481 | | | | 22,481 | |
BMO Harris Bank National Association (3) | | | 0.30 | %(2) | 07/05/12 | | | 23,268 | | | | 23,268 | |
BOKF National Association (3) | | | 0.30 | %(2) | 07/05/12 | | | 55,714 | | | | 55,714 | |
| The Money Market Fund | |
| | | | | Principal Amount ($) or Shares | | | | |
| Bank Obligations — continued | |
Boone Bank & Trust Co. (3) | | | 0.30 | %(2) | 07/05/12 | | | 11,384 | | | | 11,384 | |
Boston Private Bank & Trust Company (3) | | | 0.30 | %(2) | 07/05/12 | | | 20,386 | | | | 20,386 | |
Branch Banking and Trust Company (3) | | | 0.30 | %(2) | 07/05/12 | | | 18,480 | | | | 18,480 | |
Brookhaven Bank (3) | | | 0.30 | %(2) | 07/05/12 | | | 2,330 | | | | 2,330 | |
Business Bank (3) | | | 0.30 | %(2) | 07/05/12 | | | 13,353 | | | | 13,353 | |
Business Bank (3) | | | 0.30 | %(2) | 07/05/12 | | | 4,315 | | | | 4,315 | |
Business Bank of Saint Louis (3) | | | 0.30 | %(2) | 07/05/12 | | | 19,548 | | | | 19,548 | |
Business First Bank (3) | | | 0.30 | %(2) | 07/05/12 | | | 19,530 | | | | 19,530 | |
Cache Valley Bank (3) | | | 0.30 | %(2) | 07/05/12 | | | 28,534 | | | | 28,534 | |
Cadence Bank N.A. (3) | | | 0.30 | %(2) | 07/05/12 | | | 240,000 | | | | 240,000 | |
California Bank & Trust (3) | | | 0.30 | %(2) | 07/05/12 | | | 811 | | | | 811 | |
Capital Bank (3) | | | 0.30 | %(2) | 07/05/12 | | | 10,788 | | | | 10,788 | |
Capital One National Association (3) | | | 0.30 | %(2) | 07/05/12 | | | 240,000 | | | | 240,000 | |
CapitalMark Bank & Trust (3) | | | 0.30 | %(2) | 07/05/12 | | | 27,101 | | | | 27,101 | |
CapStar Bank (3) | | | 0.30 | %(2) | 07/05/12 | | | 104,359 | | | | 104,359 | |
CapStone Bank (3) | | | 0.30 | %(2) | 07/05/12 | | | 19,848 | | | | 19,848 | |
Cardinal Bank (3) | | | 0.30 | %(2) | 07/05/12 | | | 37,594 | | | | 37,594 | |
Carolina Alliance Bank (3) | | | 0.30 | %(2) | 07/05/12 | | | 1,074 | | | | 1,074 | |
Carver Federal Savings Bank (3) | | | 0.30 | %(2) | 07/05/12 | | | 240,000 | | | | 240,000 | |
Cathay Bank (3) | | | 0.30 | %(2) | 07/05/12 | | | 240,000 | | | | 240,000 | |
Celtic Bank (3) | | | 0.30 | %(2) | 07/05/12 | | | 22,784 | | | | 22,784 | |
Centennial Bank (3) | | | 0.30 | %(2) | 07/05/12 | | | 4,349 | | | | 4,349 | |
Centra Bank Inc. (3) | | | 0.30 | %(2) | 07/05/12 | | | 19,448 | | | | 19,448 | |
Central Bank (3) | | | 0.30 | %(2) | 07/05/12 | | | 6,487 | | | | 6,487 | |
Central Bank Illinois (3) | | | 0.30 | %(2) | 07/05/12 | | | 65 | | | | 65 | |
Central Bank of Kansas City (3) | | | 0.30 | %(2) | 07/05/12 | | | 358 | | | | 358 | |
CheckSpring Bank (3) | | | 0.30 | %(2) | 07/05/12 | | | 215 | | | | 215 | |
Chemical Bank (3) | | | 0.30 | %(2) | 07/05/12 | | | 3,726 | | | | 3,726 | |
Chickasha Bank & Trust Company (3) | | | 0.30 | %(2) | 07/05/12 | | | 4,128 | | | | 4,128 | |
Citizens Bank & Trust Company (3) | | | 0.30 | %(2) | 07/05/12 | | | 35,192 | | | | 35,192 | |
Citizens Bank of Pennsylvania (3) | | | 0.30 | %(2) | 07/05/12 | | | 267 | | | | 267 | |
Citizens National Bank (3) | | | 0.30 | %(2) | 07/05/12 | | | 1,974 | | | | 1,974 | |
Citizens National Bank of Bluffton (3) | | | 0.30 | %(2) | 07/05/12 | | | 4,159 | | | | 4,159 | |
City First Bank of D.C. National Association (3) | | | 0.30 | %(2) | 07/05/12 | | | 14,909 | | | | 14,909 | |
City National Bank (3) | | | 0.30 | %(2) | 07/05/12 | | | 543 | | | | 543 | |
City National Bank of Sulphur Springs (3) | | | 0.30 | %(2) | 07/05/12 | | | 1,364 | | | | 1,364 | |
City National Bank of Taylor (3) | | | 0.30 | %(2) | 07/05/12 | | | 9,050 | | | | 9,050 | |
Cole Taylor Bank (3) | | | 0.30 | %(2) | 07/05/12 | | | 240,000 | | | | 240,000 | |
Collin Bank (3) | | | 0.30 | %(2) | 07/05/12 | | | 10,595 | | | | 10,595 | |
Columbia State Bank (3) | | | 0.30 | %(2) | 07/05/12 | | | 36,249 | | | | 36,249 | |
| Columbus First Bank Demand Deposit Account | | | 0.55 | %(2) | 07/01/12 | | | 249,917 | | | | 249,917 | |
Comerica Bank (3) | | | 0.30 | %(2) | 07/05/12 | | | 45,151 | | | | 45,151 | |
Commencement Bank (3) | | | 0.30 | %(2) | 07/05/12 | | | 12,384 | | | | 12,384 | |
Commerce Bank & Trust Company (3) | | | 0.30 | %(2) | 07/05/12 | | | 63,657 | | | | 63,657 | |
The accompanying notes are an integral part of these financial statements.
| | 2012 Semi-Annual Report | June 30, 2012 |
Schedule of Investments
June 30, 2012 (unaudited)
| The Money Market Fund | |
| | | | | Principal Amount ($) or Shares | | | | |
| Bank Obligations — continued | |
Commerce National Bank (3) | | | 0.30 | %(2) | 07/05/12 | | | 754 | | | | 754 | |
Community Bank & Trust (3) | | | 0.30 | %(2) | 07/05/12 | | | 27,719 | | | | 27,719 | |
Community Bank of Oelwein (3) | | | 0.30 | %(2) | 07/05/12 | | | 8,466 | | | | 8,466 | |
Community Bank of Santa Maria (3) | | | 0.30 | %(2) | 07/05/12 | | | 962 | | | | 962 | |
Community Bank of the Bay (3) | | | 0.30 | %(2) | 07/05/12 | | | 1,560 | | | | 1,560 | |
Community Mutual Savings Bank (3) | | | 0.30 | %(2) | 07/05/12 | | | 10,900 | | | | 10,900 | |
Community Trust Bank (3) | | | 0.30 | %(2) | 07/05/12 | | | 240,000 | | | | 240,000 | |
Congaree State Bank (3) | | | 0.30 | %(2) | 07/05/12 | | | 11,690 | | | | 11,690 | |
Congressional Bank (3) | | | 0.30 | %(2) | 07/05/12 | | | 12,653 | | | | 12,653 | |
Cooper State Bank (3) | | | 0.30 | %(2) | 07/05/12 | | | 4,019 | | | | 4,019 | |
Crescent State Bank (3) | | | 0.30 | %(2) | 07/05/12 | | | 19,972 | | | | 19,972 | |
Crystal Lake Bank and Trust Company N.A. (3) | | | 0.30 | %(2) | 07/05/12 | | | 9 | | | | 9 | |
Delta Trust & Bank (3) | | | 0.30 | %(2) | 07/05/12 | | | 40,412 | | | | 40,412 | |
DeWitt Bank & Trust Company (3) | | | 0.30 | %(2) | 07/05/12 | | | 3,003 | | | | 3,003 | |
Diamond Bank (3) | | | 0.30 | %(2) | 07/05/12 | | | 30,074 | | | | 30,074 | |
DMB Community Bank (3) | | | 0.30 | %(2) | 07/05/12 | | | 28,654 | | | | 28,654 | |
Dollar Bank Federal Savings Bank (3) | | | 0.30 | %(2) | 07/05/12 | | | 10,224 | | | | 10,224 | |
Dubuque Bank & Trust Company (3) | | | 0.30 | %(2) | 07/05/12 | | | 4,019 | | | | 4,019 | |
Eagle Bank and Trust Company (3) | | | 0.30 | %(2) | 07/05/12 | | | 10,439 | | | | 10,439 | |
EagleBank (3) | | | 0.30 | %(2) | 07/05/12 | | | 240,000 | | | | 240,000 | |
East River Bank (3) | | | 0.30 | %(2) | 07/05/12 | | | 1,077 | | | | 1,077 | |
East West Bank (3) | | | 0.30 | %(2) | 07/05/12 | | | 240,955 | | | | 240,955 | |
Empire National Bank (3) | | | 0.30 | %(2) | 07/05/12 | | | 4,048 | | | | 4,048 | |
Encore Bank National Association (3) | | | 0.30 | %(2) | 07/05/12 | | | 2,974 | | | | 2,974 | |
Encore National Bank (3) | | | 0.30 | %(2) | 07/05/12 | | | 1,168 | | | | 1,168 | |
Enterprise Bank & Trust (3) | | | 0.30 | %(2) | 07/05/12 | | | 71,793 | | | | 71,793 | |
Equity Bank A National Association (3) | | | 0.30 | %(2) | 07/05/12 | | | 9,279 | | | | 9,279 | |
| EverBank Money Market Account | | | 0.76 | %(2) | 07/01/12 | | | 250,269 | | | | 250,269 | |
| Excel Bank Demand Deposit Account | | | 0.40 | %(2) | 07/01/12 | | | 249,716 | | | | 249,716 | |
Exchange Bank & Trust Company (3) | | | 0.30 | %(2) | 07/05/12 | | | 21,492 | | | | 21,492 | |
Exchange State Bank (3) | | | 0.30 | %(2) | 07/05/12 | | | 4,045 | | | | 4,045 | |
Fannin Bank (3) | | | 0.30 | %(2) | 07/05/12 | | | 7 | | | | 7 | |
Farmers & Merchants Bank of Long Beach (3) | | | 0.30 | %(2) | 07/05/12 | | | 644 | | | | 644 | |
Farmers & Merchants State Bank (3) | | | 0.30 | %(2) | 07/05/12 | | | 1,159 | | | | 1,159 | |
Farmers and Merchants State Bank of Blooming (3) | | | 0.30 | %(2) | 07/05/12 | | | 7,833 | | | | 7,833 | |
Farmers Bank (3) | | | 0.30 | %(2) | 07/05/12 | | | 270 | | | | 270 | |
Farmers Exchange Bank (3) | | | 0.30 | %(2) | 07/05/12 | | | 14,750 | | | | 14,750 | |
Farmers State Bank (3) | | | 0.30 | %(2) | 07/05/12 | | | 7 | | | | 7 | |
Fidelity Bank (3) | | | 0.30 | %(2) | 07/05/12 | | | 27,766 | | | | 27,766 | |
First Bank & Trust (3) | | | 0.30 | %(2) | 07/05/12 | | | 18 | | | | 18 | |
| The Money Market Fund | |
| | | | | Principal Amount ($) or Shares | | | | |
| Bank Obligations — continued | |
First Bank Financial Centre (3) | | | 0.30 | %(2) | 07/05/12 | | | 964 | | | | 964 | |
First Choice Bank (3) | | | 0.30 | %(2) | 07/05/12 | | | 18,008 | | | | 18,008 | |
First Commercial Bank (3) | | | 0.30 | %(2) | 07/05/12 | | | 953 | | | | 953 | |
First Commercial Bank (3) | | | 0.30 | %(2) | 07/05/12 | | | 7,961 | | | | 7,961 | |
First Community Bank (3) | | | 0.30 | %(2) | 07/05/12 | | | 19,201 | | | | 19,201 | |
First County Bank (3) | | | 0.30 | %(2) | 07/05/12 | | | 55,098 | | | | 55,098 | |
First Federal Bank (3) | | | 0.30 | %(2) | 07/05/12 | | | 14,830 | | | | 14,830 | |
First Foundation Bank (3) | | | 0.30 | %(2) | 07/05/12 | | | 108,810 | | | | 108,810 | |
First International Bank & Trust (3) | | | 0.30 | %(2) | 07/05/12 | | | 273 | | | | 273 | |
First Internet Bank of Indiana (3) | | | 0.30 | %(2) | 07/05/12 | | | 44,991 | | | | 44,991 | |
First Interstate Bank (3) | | | 0.30 | %(2) | 07/05/12 | | | 747 | | | | 747 | |
| First Merchants Bank Demand Deposit Account | | | 0.30 | %(2) | 07/01/12 | | | 249,527 | | | | 249,527 | |
First N.A. (3) | | | 0.30 | %(2) | 07/05/12 | | | 17,345 | | | | 17,345 | |
First National Bank - Fox Valley (3) | | | 0.30 | %(2) | 07/05/12 | | | 295 | | | | 295 | |
First National Bank (3) | | | 0.30 | %(2) | 07/05/12 | | | 38,932 | | | | 38,932 | |
First National Bank (3) | | | 0.30 | %(2) | 07/05/12 | | | 969 | | | | 969 | |
First National Bank in Green Forest (3) | | | 0.30 | %(2) | 07/05/12 | | | 2,061 | | | | 2,061 | |
First National Bank in Sioux Falls (3) | | | 0.30 | %(2) | 07/05/12 | | | 953 | | | | 953 | |
First National Bank of America (3) | | | 0.30 | %(2) | 07/05/12 | | | 1,040 | | | | 1,040 | |
First National Bank of Fort Smith (3) | | | 0.30 | %(2) | 07/05/12 | | | 1,528 | | | | 1,528 | |
First National Bank of Long Island (3) | | | 0.30 | %(2) | 07/05/12 | | | 99,927 | | | | 99,927 | |
First National Bank of Omaha (3) | | | 0.30 | %(2) | 07/05/12 | | | 657 | | | | 657 | |
First National Bank of Santa Fe (3) | | | 0.30 | %(2) | 07/05/12 | | | 22,460 | | | | 22,460 | |
First Premier Bank (3) | | | 0.30 | %(2) | 07/05/12 | | | 30,069 | | | | 30,069 | |
First Security Bank & Trust Company (3) | | | 0.30 | %(2) | 07/05/12 | | | 103 | | | | 103 | |
First Security Bank (3) | | | 0.30 | %(2) | 07/05/12 | | | 83,403 | | | | 83,403 | |
First State Bank (3) | | | 0.30 | %(2) | 07/05/12 | | | 376 | | | | 376 | |
First State Bank (3) | | | 0.30 | %(2) | 07/05/12 | | | 8,170 | | | | 8,170 | |
First State Bank of DeQueen (3) | | | 0.30 | %(2) | 07/05/12 | | | 8,627 | | | | 8,627 | |
First State Bank of Northwest Arkansas (3) | | | 0.30 | %(2) | 07/05/12 | | | 5,842 | | | | 5,842 | |
First Trade Union Bank (3) | | | 0.30 | %(2) | 07/05/12 | | | 1,562 | | | | 1,562 | |
First Utah Bank (3) | | | 0.30 | %(2) | 07/05/12 | | | 999 | | | | 999 | |
First Virginia Community Bank (3) | | | 0.30 | %(2) | 07/05/12 | | | 8,325 | | | | 8,325 | |
First Western Bank (3) | | | 0.30 | %(2) | 07/05/12 | | | 19 | | | | 19 | |
FirstAtlantic Bank (3) | | | 0.30 | %(2) | 07/05/12 | | | 967 | | | | 967 | |
FirstBank (3) | | | 0.30 | %(2) | 07/05/12 | | | 12,380 | | | | 12,380 | |
First-Citizens Bank & Trust Company (3) | | | 0.30 | %(2) | 07/05/12 | | | 98,770 | | | | 98,770 | |
FirstMerit Bank National Association (3) | | | 0.30 | %(2) | 07/05/12 | | | 2,039 | | | | 2,039 | |
Flagship Community Bank (3) | | | 0.30 | %(2) | 07/05/12 | | | 951 | | | | 951 | |
Flatirons Bank (3) | | | 0.30 | %(2) | 07/05/12 | | | 12,384 | | | | 12,384 | |
The accompanying notes are an integral part of these financial statements.
| | 2012 Semi-Annual Report | June 30, 2012 |
Schedule of Investments
June 30, 2012 (unaudited)
| The Money Market Fund | |
| | | | | Principal Amount ($) or Shares | | | | |
| Bank Obligations — continued | |
Florida Business Bank (3) | | | 0.30 | %(2) | 07/05/12 | | | 4,048 | | | | 4,048 | |
Florida Parishes Bank (3) | | | 0.30 | %(2) | 07/05/12 | | | 811 | | | | 811 | |
Forrest City Bank NA (3) | | | 0.30 | %(2) | 07/05/12 | | | 1,984 | | | | 1,984 | |
Fortune Bank (3) | | | 0.30 | %(2) | 07/05/12 | | | 13,085 | | | | 13,085 | |
Fox Chase Bank (3) | | | 0.30 | %(2) | 07/05/12 | | | 8,334 | | | | 8,334 | |
Franklin Synergy Bank (3) | | | 0.30 | %(2) | 07/05/12 | | | 36,266 | | | | 36,266 | |
Frost National Bank (3) | | | 0.30 | %(2) | 07/05/12 | | | 262 | | | | 262 | |
Genesee Regional Bank (3) | | | 0.30 | %(2) | 07/05/12 | | | 28,854 | | | | 28,854 | |
Georgia Bank & Trust Company of Augusta (3) | | | 0.30 | %(2) | 07/05/12 | | | 21,910 | | | | 21,910 | |
Georgia Banking Company (3) | | | 0.30 | %(2) | 07/05/12 | | | 13,134 | | | | 13,134 | |
German American Bancorp (3) | | | 0.30 | %(2) | 07/05/12 | | | 6,074 | | | | 6,074 | |
Glacier Bank (3) | | | 0.30 | %(2) | 07/05/12 | | | 68,927 | | | | 68,927 | |
Glens Falls National Bank and Trust Company (3) | | | 0.30 | %(2) | 07/05/12 | | | 302 | | | | 302 | |
Golden Pacific Bank National Association (3) | | | 0.30 | %(2) | 07/05/12 | | | 957 | | | | 957 | |
Gotham Bank of New York (3) | | | 0.30 | %(2) | 07/05/12 | | | 17,765 | | | | 17,765 | |
Grand Savings Bank (3) | | | 0.30 | %(2) | 07/05/12 | | | 10,224 | | | | 10,224 | |
Grand Valley Bank (3) | | | 0.30 | %(2) | 07/05/12 | | | 4,019 | | | | 4,019 | |
Green Bank National Association (3) | | | 0.30 | %(2) | 07/05/12 | | | 22,225 | | | | 22,225 | |
Guaranty Bank (3) | | | 0.30 | %(2) | 07/05/12 | | | 12,465 | | | | 12,465 | |
Guaranty Bond Bank (3) | | | 0.30 | %(2) | 07/05/12 | | | 173,707 | | | | 173,707 | |
GulfShore Bank (3) | | | 0.30 | %(2) | 07/05/12 | | | 12,384 | | | | 12,384 | |
Happy State Bank (3) | | | 0.30 | %(2) | 07/05/12 | | | 272 | | | | 272 | |
Heartland Bank (3) | | | 0.30 | %(2) | 07/05/12 | | | 31 | | | | 31 | |
Heartland Bank (3) | | | 0.30 | %(2) | 07/05/12 | | | 15 | | | | 15 | |
Helena National Bank (3) | | | 0.30 | %(2) | 07/05/12 | | | 7,244 | | | | 7,244 | |
Heritage Oaks Bank (3) | | | 0.30 | %(2) | 07/05/12 | | | 43,147 | | | | 43,147 | |
Hingham Institution for Savings (3) | | | 0.30 | %(2) | 07/05/12 | | | 39,132 | | | | 39,132 | |
Home Federal Bank (3) | | | 0.30 | %(2) | 07/05/12 | | | 13,152 | | | | 13,152 | |
Horizon Bank National Association (3) | | | 0.30 | %(2) | 07/05/12 | | | 1,339 | | | | 1,339 | |
Hyperion Bank (3) | | | 0.30 | %(2) | 07/05/12 | | | 2,063 | | | | 2,063 | |
IBERIABANK (3) | | | 0.30 | %(2) | 07/05/12 | | | 240,000 | | | | 240,000 | |
Icon Bank of Texas National Association (3) | | | 0.30 | %(2) | 07/05/12 | | | 2,798 | | | | 2,798 | |
Independence Bank (3) | | | 0.30 | %(2) | 07/05/12 | | | 642 | | | | 642 | |
Independent Bank of Texas (3) | | | 0.30 | %(2) | 07/05/12 | | | 967 | | | | 967 | |
Inland Bank and Trust (3) | | | 0.30 | %(2) | 07/05/12 | | | 175 | | | | 175 | |
Integrity Bank (3) | | | 0.30 | %(2) | 07/05/12 | | | 8,291 | | | | 8,291 | |
Investors Community Bank (3) | | | 0.30 | %(2) | 07/05/12 | | | 4,047 | | | | 4,047 | |
Isabella Bank (3) | | | 0.30 | %(2) | 07/05/12 | | | 1,054 | | | | 1,054 | |
Israel Discount Bank of New York (3) | | | 0.30 | %(2) | 07/05/12 | | | 240,000 | | | | 240,000 | |
JPMorgan Chase Bank National Association (3) | | | 0.30 | %(2) | 07/05/12 | | | 137 | | | | 137 | |
Kaiser Federal Bank (3) | | | 0.30 | %(2) | 07/05/12 | | | 4,045 | | | | 4,045 | |
Katahdin Trust Company (3) | | | 0.30 | %(2) | 07/05/12 | | | 21,828 | | | | 21,828 | |
KeyBank National Association (3) | | | 0.30 | %(2) | 07/05/12 | | | 15,669 | | | | 15,669 | |
KeySource Commercial Bank (3) | | | 0.30 | %(2) | 07/05/12 | | | 1,404 | | | | 1,404 | |
| The Money Market Fund | |
| | | | | Principal Amount ($) or Shares | | | | |
| Bank Obligations — continued | |
Lake Forest Bank & Trust Company (3) | | | 0.30 | %(2) | 07/05/12 | | | 9 | | | | 9 | |
Lake National Bank (3) | | | 0.30 | %(2) | 07/05/12 | | | 16 | | | | 16 | |
Landmark Community Bank (3) | | | 0.30 | %(2) | 07/05/12 | | | 8,150 | | | | 8,150 | |
Landmark National Bank (3) | | | 0.30 | %(2) | 07/05/12 | | | 2,131 | | | | 2,131 | |
Leader Bank National Association (3) | | | 0.30 | %(2) | 07/05/12 | | | 9,625 | | | | 9,625 | |
Legacy Bank (3) | | | 0.30 | %(2) | 07/05/12 | | | 959 | | | | 959 | |
Legacy National Bank (3) | | | 0.30 | %(2) | 07/05/12 | | | 4,084 | | | | 4,084 | |
LegacyTexas Bank (3) | | | 0.30 | %(2) | 07/05/12 | | | 16 | | | | 16 | |
Level One Bank (3) | | | 0.30 | %(2) | 07/05/12 | | | 24,623 | | | | 24,623 | |
Lewis & Clark Bank (3) | | | 0.30 | %(2) | 07/05/12 | | | 4,032 | | | | 4,032 | |
Libertad Bank SSB (3) | | | 0.30 | %(2) | 07/05/12 | | | 3,733 | | | | 3,733 | |
Liberty Bank (3) | | | 0.30 | %(2) | 07/05/12 | | | 31,909 | | | | 31,909 | |
Liberty Bank (3) | | | 0.30 | %(2) | 07/05/12 | | | 4,019 | | | | 4,019 | |
Liberty Bank National Association (3) | | | 0.30 | %(2) | 07/05/12 | | | 4 | | | | 4 | |
Liberty Bank of Arkansas (3) | | | 0.30 | %(2) | 07/05/12 | | | 36,917 | | | | 36,917 | |
Libertyville Bank & Trust Company (3) | | | 0.30 | %(2) | 07/05/12 | | | 4 | | | | 4 | |
Lifestore Bank (3) | | | 0.30 | %(2) | 07/05/12 | | | 967 | | | | 967 | |
Lone Star National Bank (3) | | | 0.30 | %(2) | 07/05/12 | | | 45,533 | | | | 45,533 | |
MainStreet Bank (3) | | | 0.30 | %(2) | 07/05/12 | | | 21,950 | | | | 21,950 | |
Manufacturers Bank (3) | | | 0.30 | %(2) | 07/05/12 | | | 240,000 | | | | 240,000 | |
MB Financial Bank N.A. (3) | | | 0.30 | %(2) | 07/05/12 | | | 274 | | | | 274 | |
mBank (3) | | | 0.30 | %(2) | 07/05/12 | | | 9,181 | | | | 9,181 | |
Mercantil Commercebank National Association (3) | | | 0.30 | %(2) | 07/05/12 | | | 5,059 | | | | 5,059 | |
Mercantile Bank & Trust Company (3) | | | 0.30 | %(2) | 07/05/12 | | | 17,174 | | | | 17,174 | |
Mercantile Bank of Michigan (3) | | | 0.30 | %(2) | 07/05/12 | | | 48,305 | | | | 48,305 | |
Merchants & Farmers Bank (3) | | | 0.30 | %(2) | 07/05/12 | | | 1,991 | | | | 1,991 | |
Merchants Bank (3) | | | 0.30 | %(2) | 07/05/12 | | | 496 | | | | 496 | |
Meridian Bank (3) | | | 0.30 | %(2) | 07/05/12 | | | 2,537 | | | | 2,537 | |
Metropolitan Capital Bank & Trust (3) | | | 0.30 | %(2) | 07/05/12 | | | 17,833 | | | | 17,833 | |
Metropolitan National Bank (3) | | | 0.30 | %(2) | 07/05/12 | | | 113,155 | | | | 113,155 | |
Midwest Regional Bank (3) | | | 0.30 | %(2) | 07/05/12 | | | 471 | | | | 471 | |
Mifflin County Savings Bank (3) | | | 0.30 | %(2) | 07/05/12 | | | 1,978 | | | | 1,978 | |
MileStone Bank (3) | | | 0.30 | %(2) | 07/05/12 | | | 6,073 | | | | 6,073 | |
Miners Bank (3) | | | 0.30 | %(2) | 07/05/12 | | | 8,150 | | | | 8,150 | |
Minnesota Bank & Trust (3) | | | 0.30 | %(2) | 07/05/12 | | | 17,155 | | | | 17,155 | |
Morris Bank (3) | | | 0.30 | %(2) | 07/05/12 | | | 322 | | | | 322 | |
National Bank & Trust Company (3) | | | 0.30 | %(2) | 07/05/12 | | | 10,590 | | | | 10,590 | |
National Bank of California (3) | | | 0.30 | %(2) | 07/05/12 | | | 388 | | | | 388 | |
| Nationwide Bank Deposit Account | | | 0.77 | %(2) | 07/01/12 | | | 250,220 | | | | 250,220 | |
Needham Bank (3) | | | 0.30 | %(2) | 07/05/12 | | | 28,338 | | | | 28,338 | |
New Mexico Bank & Trust (3) | | | 0.30 | %(2) | 07/05/12 | | | 14,056 | | | | 14,056 | |
Newburyport Five Cents Savings Bank (3) | | | 0.30 | %(2) | 07/05/12 | | | 37 | | | | 37 | |
NOA Bank (3) | | | 0.30 | %(2) | 07/05/12 | | | 1,211 | | | | 1,211 | |
Noah Bank (3) | | | 0.30 | %(2) | 07/05/12 | | | 7,229 | | | | 7,229 | |
North Jersey Community Bank (3) | | | 0.30 | %(2) | 07/05/12 | | | 20,423 | | | | 20,423 | |
The accompanying notes are an integral part of these financial statements.
| | 2012 Semi-Annual Report | June 30, 2012 |
Schedule of Investments
June 30, 2012 (unaudited)
| The Money Market Fund | |
| | | | | Principal Amount ($) or Shares | | | | |
| Bank Obligations — continued | |
North Shore Community Bank & Trust Company (3) | | | 0.30 | %(2) | 07/05/12 | | | 9 | | | | 9 | |
Northbrook Bank & Trust Company (3) | | | 0.30 | %(2) | 07/05/12 | | | 19 | | | | 19 | |
Northern Bank & Trust Company (3) | | | 0.30 | %(2) | 07/05/12 | | | 44,696 | | | | 44,696 | |
Nuvo Bank & Trust Company (3) | | | 0.30 | %(2) | 07/05/12 | | | 12,653 | | | | 12,653 | |
Oak View National Bank (3) | | | 0.30 | %(2) | 07/05/12 | | | 1,966 | | | | 1,966 | |
Oasis Bank SSB (3) | | | 0.30 | %(2) | 07/05/12 | | | 263 | | | | 263 | |
OceanFirst Bank (3) | | | 0.30 | %(2) | 07/05/12 | | | 963 | | | | 963 | |
Ohio Commerce Bank (3) | | | 0.30 | %(2) | 07/05/12 | | | 4,417 | | | | 4,417 | |
Old Plank Trail Community Bank National Assoc (3) | | | 0.30 | %(2) | 07/05/12 | | | 429 | | | | 429 | |
One Bank & Trust National Association (3) | | | 0.30 | %(2) | 07/05/12 | | | 1,984 | | | | 1,984 | |
OneWest Bank FSB (3) | | | 0.30 | %(2) | 07/05/12 | | | 28,439 | | | | 28,439 | |
Ossian State Bank (3) | | | 0.30 | %(2) | 07/05/12 | | | 754 | | | | 754 | |
Pacific Commerce Bank (3) | | | 0.30 | %(2) | 07/05/12 | | | 23,356 | | | | 23,356 | |
Pacific Enterprise Bank (3) | | | 0.30 | %(2) | 07/05/12 | | | 26,651 | | | | 26,651 | |
Paragon Commercial Bank (3) | | | 0.30 | %(2) | 07/05/12 | | | 89,456 | | | | 89,456 | |
Parkside Financial Bank & Trust (3) | | | 0.30 | %(2) | 07/05/12 | | | 12,380 | | | | 12,380 | |
Peapack-Gladstone Bank (3) | | | 0.30 | %(2) | 07/05/12 | | | 9 | | | | 9 | |
Pegasus Bank (3) | | | 0.30 | %(2) | 07/05/12 | | | 2,973 | | | | 2,973 | |
Peoples Bank National Association (3) | | | 0.30 | %(2) | 07/05/12 | | | 1,082 | | | | 1,082 | |
Peoples Bank of Commerce (3) | | | 0.30 | %(2) | 07/05/12 | | | 8,117 | | | | 8,117 | |
Peoples Community Bank (3) | | | 0.30 | %(2) | 07/05/12 | | | 12,011 | | | | 12,011 | |
Peoples United Bank (3) | | | 0.30 | %(2) | 07/05/12 | | | 240,000 | | | | 240,000 | |
Petit Jean State Bank (3) | | | 0.30 | %(2) | 07/05/12 | | | 7,148 | | | | 7,148 | |
Pine Bluff National Bank (3) | | | 0.30 | %(2) | 07/05/12 | | | 5,103 | | | | 5,103 | |
Plaza Bank (3) | | | 0.30 | %(2) | 07/05/12 | | | 971 | | | | 971 | |
PNC Bank National Association (3) | | | 0.30 | %(2) | 07/05/12 | | | 18,936 | | | | 18,936 | |
Post Oak Bank N.A. (3) | | | 0.30 | %(2) | 07/05/12 | | | 4,048 | | | | 4,048 | |
Premier Bank (3) | | | 0.30 | %(2) | 07/05/12 | | | 21,906 | | | | 21,906 | |
Premier Bank (3) | | | 0.30 | %(2) | 07/05/12 | | | 10,522 | | | | 10,522 | |
PrinsBank (3) | | | 0.30 | %(2) | 07/05/12 | | | 5,060 | | | | 5,060 | |
Private Bank Minnesota (3) | | | 0.30 | %(2) | 07/05/12 | | | 12,413 | | | | 12,413 | |
ProAmérica Bank (3) | | | 0.30 | %(2) | 07/05/12 | | | 21,871 | | | | 21,871 | |
Professional Business Bank (3) | | | 0.30 | %(2) | 07/05/12 | | | 4,048 | | | | 4,048 | |
Progress Bank and Trust (3) | | | 0.30 | %(2) | 07/05/12 | | | 4,116 | | | | 4,116 | |
Quad City Bank and Trust Company (3) | | | 0.30 | %(2) | 07/05/12 | | | 46,095 | | | | 46,095 | |
Quontic Bank (3) | | | 0.30 | %(2) | 07/05/12 | | | 956 | | | | 956 | |
RBS Citizens National Association (3) | | | 0.30 | %(2) | 07/05/12 | | | 294 | | | | 294 | |
Regent Bank (3) | | | 0.30 | %(2) | 07/05/12 | | | 1,002 | | | | 1,002 | |
Regions Bank (3) | | | 0.30 | %(2) | 07/05/12 | | | 107,830 | | | | 107,830 | |
Renasant Bank (3) | | | 0.30 | %(2) | 07/05/12 | | | 38,323 | | | | 38,323 | |
Republic Bank & Trust (3) | | | 0.30 | %(2) | 07/05/12 | | | 2,395 | | | | 2,395 | |
Republic Bank & Trust Company (3) | | | 0.30 | %(2) | 07/05/12 | | | 966 | | | | 966 | |
Republic Bank (3) | | | 0.30 | %(2) | 07/05/12 | | | 4,065 | | | | 4,065 | |
| The Money Market Fund | |
| | | | | Principal Amount ($) or Shares | | | | |
| Bank Obligations — continued | |
River Community Bank N.A. (3) | | | 0.30 | %(2) | 07/05/12 | | | 9,523 | | | | 9,523 | |
RiverBend Bank (3) | | | 0.30 | %(2) | 07/05/12 | | | 197 | | | | 197 | |
Riverside Bank (3) | | | 0.30 | %(2) | 07/05/12 | | | 264 | | | | 264 | |
Riverview Bank (3) | | | 0.30 | %(2) | 07/05/12 | | | 8,107 | | | | 8,107 | |
Rockland Trust Company (3) | | | 0.30 | %(2) | 07/05/12 | | | 53,502 | | | | 53,502 | |
RSNB Bank (3) | | | 0.30 | %(2) | 07/05/12 | | | 15,192 | | | | 15,192 | |
Saratoga National Bank & Trust Company (3) | | | 0.30 | %(2) | 07/05/12 | | | 302 | | | | 302 | |
Sauk Valley Bank & Trust Company (3) | | | 0.30 | %(2) | 07/05/12 | | | 35 | | | | 35 | |
Savings Institute Bank and Trust Company (3) | | | 0.30 | %(2) | 07/05/12 | | | 6,073 | | | | 6,073 | |
Schaumburg Bank & Trust Company National Asso (3) | | | 0.30 | %(2) | 07/05/12 | | | 9 | | | | 9 | |
Seaside National Bank & Trust (3) | | | 0.30 | %(2) | 07/05/12 | | | 85,240 | | | | 85,240 | |
Seaway Bank and Trust Company (3) | | | 0.30 | %(2) | 07/05/12 | | | 21,783 | | | | 21,783 | |
Security First Bank (3) | | | 0.30 | %(2) | 07/05/12 | | | 151 | | | | 151 | |
SharePlus Federal Bank (3) | | | 0.30 | %(2) | 07/05/12 | | | 1,639 | | | | 1,639 | |
Signature Bank (3) | | | 0.30 | %(2) | 07/05/12 | | | 9,469 | | | | 9,469 | |
Signature Bank (3) | | | 0.30 | %(2) | 07/05/12 | | | 240,000 | | | | 240,000 | |
Signature Bank National Association (3) | | | 0.30 | %(2) | 07/05/12 | | | 1,044 | | | | 1,044 | |
Solera National Bank (3) | | | 0.30 | %(2) | 07/05/12 | | | 4,444 | | | | 4,444 | |
Southern Bancorp Bank (3) | | | 0.30 | %(2) | 07/05/12 | | | 698 | | | | 698 | |
Southern Bank (3) | | | 0.30 | %(2) | 07/05/12 | | | 19 | | | | 19 | |
Southwest Bank (3) | | | 0.30 | %(2) | 07/05/12 | | | 22,716 | | | | 22,716 | |
St. Charles Bank & Trust Company (3) | | | 0.30 | %(2) | 07/05/12 | | | 1,364 | | | | 1,364 | |
State Bank and Trust Company (3) | | | 0.30 | %(2) | 07/05/12 | | | 2,470 | | | | 2,470 | |
State Bank of the Lakes (3) | | | 0.30 | %(2) | 07/05/12 | | | 3 | | | | 3 | |
Sterling National Bank (3) | | | 0.30 | %(2) | 07/05/12 | | | 240,000 | | | | 240,000 | |
Sturdy Savings Bank (3) | | | 0.30 | %(2) | 07/05/12 | | | 964 | | | | 964 | |
Summit Bank & Trust (3) | | | 0.30 | %(2) | 07/05/12 | | | 17,772 | | | | 17,772 | |
Summit Bank (3) | | | 0.30 | %(2) | 07/05/12 | | | 3,668 | | | | 3,668 | |
Summit Community Bank Inc. (3) | | | 0.30 | %(2) | 07/05/12 | | | 4,183 | | | | 4,183 | |
| TD Bank Demand Deposit Account | | | 0.30 | %(2) | 07/01/12 | | | 249,437 | | | | 249,437 | |
TD Bank N.A. (3) | | | 0.30 | %(2) | 07/05/12 | | | 240,000 | | | | 240,000 | |
Team Capital Bank (3) | | | 0.30 | %(2) | 07/05/12 | | | 104,359 | | | | 104,359 | |
Texas Capital Bank National Association (3) | | | 0.30 | %(2) | 07/05/12 | | | 240,000 | | | | 240,000 | |
Touchmark National Bank (3) | | | 0.30 | %(2) | 07/05/12 | | | 12,970 | | | | 12,970 | |
Town Bank (3) | | | 0.30 | %(2) | 07/05/12 | | | 6 | | | | 6 | |
Transportation Alliance Bank Inc. (3) | | | 0.30 | %(2) | 07/05/12 | | | 16 | | | | 16 | |
Treynor State Bank (3) | | | 0.30 | %(2) | 07/05/12 | | | 22,152 | | | | 22,152 | |
TriSummit Bank (3) | | | 0.30 | %(2) | 07/05/12 | | | 21,285 | | | | 21,285 | |
U.S. Bank National Association (3) | | | 0.30 | %(2) | 07/05/12 | | | 331 | | | | 331 | |
Uinta Bank (3) | | | 0.30 | %(2) | 07/05/12 | | | 13,459 | | | | 13,459 | |
UMB Bank Arizona National Association (3) | | | 0.30 | %(2) | 07/05/12 | | | 997 | | | | 997 | |
The accompanying notes are an integral part of these financial statements.
| | 2012 Semi-Annual Report | June 30, 2012 |
Schedule of Investments
June 30, 2012 (unaudited)
| The Money Market Fund | |
| | | | | Principal Amount ($) or Shares | | | | |
| Bank Obligations — continued | |
UMB Bank Colorado National Association (3) | | | 0.30 | %(2) | 07/05/12 | | | 148 | | | | 148 | |
UMB Bank National Association (3) | | | 0.30 | %(2) | 07/05/12 | | | 269 | | | | 269 | |
Umpqua Bank (3) | | | 0.30 | %(2) | 07/05/12 | | | 760 | | | | 760 | |
Union Bank National Association (3) | | | 0.30 | %(2) | 07/05/12 | | | 271 | | | | 271 | |
Union Bank of Mena (3) | | | 0.30 | %(2) | 07/05/12 | | | 32 | | | | 32 | |
Union Center National Bank (3) | | | 0.30 | %(2) | 07/05/12 | | | 240,000 | | | | 240,000 | |
United Bank (3) | | | 0.30 | %(2) | 07/05/12 | | | 20,086 | | | | 20,086 | |
United Bank (3) | | | 0.30 | %(2) | 07/05/12 | | | 979 | | | | 979 | |
United Bank Inc. (3) | | | 0.30 | %(2) | 07/05/12 | | | 18,359 | | | | 18,359 | |
USNY Bank (3) | | | 0.30 | %(2) | 07/05/12 | | | 6,214 | | | | 6,214 | |
Valley Bank (3) | | | 0.30 | %(2) | 07/05/12 | | | 7,090 | | | | 7,090 | |
Valley National Bank (3) | | | 0.30 | %(2) | 07/05/12 | | | 240,000 | | | | 240,000 | |
Valliance Bank (3) | | | 0.30 | %(2) | 07/05/12 | | | 1,176 | | | | 1,176 | |
Veritex Community Bank National Association (3) | | | 0.30 | %(2) | 07/05/12 | | | 401 | | | | 401 | |
Verus Bank of Commerce (3) | | | 0.30 | %(2) | 07/05/12 | | | 32,149 | | | | 32,149 | |
Victory Bank (3) | | | 0.30 | %(2) | 07/05/12 | | | 2,027 | | | | 2,027 | |
ViewPoint Bank National Association (3) | | | 0.30 | %(2) | 07/05/12 | | | 49,265 | | | | 49,265 | |
Village Bank & Trust (3) | | | 0.30 | %(2) | 07/05/12 | | | 15 | | | | 15 | |
Virginia Heritage Bank (3) | | | 0.30 | %(2) | 07/05/12 | | | 30,771 | | | | 30,771 | |
Warren Bank & Trust Company (3) | | | 0.30 | %(2) | 07/05/12 | | | 10,155 | | | | 10,155 | |
Washington Trust Bank (3) | | | 0.30 | %(2) | 07/05/12 | | | 13,116 | | | | 13,116 | |
Washington Trust Company of Westerly (3) | | | 0.30 | %(2) | 07/05/12 | | | 305 | | | | 305 | |
Webster Bank National Association (3) | | | 0.30 | %(2) | 07/05/12 | | | 972 | | | | 972 | |
Wells Fargo Bank National Association (3) | | | 0.30 | %(2) | 07/05/12 | | | 477 | | | | 477 | |
West Town Savings Bank (3) | | | 0.30 | %(2) | 07/05/12 | | | 151 | | | | 151 | |
Western Alliance Bank (3) | | | 0.30 | %(2) | 07/05/12 | | | 497 | | | | 497 | |
Western National Bank (3) | | | 0.30 | %(2) | 07/05/12 | | | 1,841 | | | | 1,841 | |
Wheaton Bank & Trust Company (3) | | | 0.30 | %(2) | 07/05/12 | | | 9 | | | | 9 | |
Whidbey Island Bank (3) | | | 0.30 | %(2) | 07/05/12 | | | 687 | | | | 687 | |
Wilmington Savings Fund Society FSB (3) | | | 0.30 | %(2) | 07/05/12 | | | 40,358 | | | | 40,358 | |
Wilmington Trust National Association (3) | | | 0.30 | %(2) | 07/05/12 | | | 1,006 | | | | 1,006 | |
Wisconsin Community Bank (3) | | | 0.30 | %(2) | 07/05/12 | | | 240,000 | | | | 240,000 | |
Wolverine Bank Federal Savings Bank (3) | | | 0.30 | %(2) | 07/05/12 | | | 35 | | | | 35 | |
Xenith Bank (3) | | | 0.30 | %(2) | 07/05/12 | | | 36,537 | | | | 36,537 | |
Total Bank Obligations (Cost $11,763,023) | | | | | | | | | | | | 11,763,023 | |
| The Money Market Fund | |
| | | | | Principal Amount ($) or Shares | | | | |
| Certificates of Deposit — 3.2% | |
Ally Bank | | | 0.45 | % | 06/06/13 | | | 249,000 | | | | 249,000 | |
Amboy Bank | | | 0.30 | % | 03/12/13 | | | 249,000 | | | | 249,000 | |
Bank Hapoalim | | | 0.30 | % | 03/07/13 | | | 249,000 | | | | 249,000 | |
Bank of Baroda | | | 0.35 | % | 03/08/13 | | | 249,000 | | | | 249,000 | |
Bank of China | | | 0.60 | % | 11/30/12 | | | 249,000 | | | | 249,000 | |
Bank of the West | | | 0.50 | % | 06/13/13 | | | 248,000 | | | | 248,000 | |
Beal Bank SSB | | | 0.35 | % | 02/06/13 | | | 249,000 | | | | 249,000 | |
Beal Bank USA | | | 0.35 | % | 02/06/13 | | | 249,000 | | | | 249,000 | |
BMW Bank NA | | | 0.45 | % | 11/30/12 | | | 249,000 | | | | 249,000 | |
Compass Bank FDIC | | | 0.35 | % | 05/16/13 | | | 249,000 | | | | 249,000 | |
Discover Bank | | | 0.45 | % | 11/30/12 | | | 249,000 | | | | 249,000 | |
Doral Bank | | | 0.50 | % | 02/08/13 | | | 249,000 | | | | 249,000 | |
Fifth Third Bank | | | 0.55 | % | 12/21/12 | | | 249,000 | | | | 249,000 | |
First Bank of Puerto Rico | | | 0.55 | % | 12/31/12 | | | 249,000 | | | | 249,000 | |
Goldman Sachs Bank | | | 0.35 | % | 02/08/13 | | | 249,000 | | | | 249,000 | |
Huntington National Bank | | | 0.45 | % | 06/07/13 | | | 249,000 | | | | 249,000 | |
Medallion Bank | | | 0.30 | % | 03/08/13 | | | 249,000 | | | | 249,000 | |
Mizuho Corp. Bank | | | 0.30 | % | 03/14/13 | | | 249,000 | | | | 249,000 | |
Private Bank & Trust | | | 0.35 | % | 05/10/13 | | | 249,000 | | | | 249,000 | |
Safra National Bank | | | 0.40 | % | 05/17/13 | | | 249,000 | | | | 249,000 | |
Sovereign Bank | | | 0.40 | % | 02/07/13 | | | 249,000 | | | | 249,000 | |
Synovus Bank FDIC | | | 0.35 | % | 05/24/13 | | | 249,000 | | | | 249,000 | |
Total Certificates of Deposit (Cost $5,477,000) | | | | | | | | | | | | 5,477,000 | |
| Commercial Paper — 6.6% | | | | | | | | | | | | | |
Bank Nova Scotia | | | 0.40 | % | 07/11/12 | | | 250,000 | | | | 249,975 | |
Bank of Tokyo | | | 0.35 | % | 07/02/12 | | | 110,000 | | | | 110,000 | |
Bank of Tokyo | | | 0.40 | % | 08/16/12 | | | 1,000,000 | | | | 999,500 | |
Prudential Funding | | | 0.26 | % | 07/06/12 | | | 1,000,000 | | | | 999,971 | |
Prudential Funding | | | 0.35 | % | 08/06/12 | | | 1,000,000 | | | | 999,660 | |
Prudential Funding | | | 0.40 | % | 08/31/12 | | | 1,000,000 | | | | 999,333 | |
Prudential Funding | | | 0.42 | % | 12/13/12 | | | 1,000,000 | | | | 998,087 | |
Toyota Motor Credit | | | 0.52 | % | 09/14/12 | | | 1,000,000 | | | | 998,931 | |
Toyota Motor Credit | | | 0.51 | % | 10/01/12 | | | 1,000,000 | | | | 998,711 | |
Toyota Motor Credit | | | 0.63 | % | 11/19/12 | | | 1,000,000 | | | | 997,550 | |
Toyota Motor Credit | | | 0.45 | % | 12/04/12 | | | 1,000,000 | | | | 998,063 | |
Toyota Motor Credit | | | 0.50 | % | 01/02/13 | | | 1,000,000 | | | | 997,444 | |
Toyota Motor Credit | | | 0.57 | % | 02/04/13 | | | 1,000,000 | | | | 996,564 | |
Total Commercial Paper (Cost $11,360,000) | | | | | | | | | | | | 11,343,789 | |
| Corporate Obligations — 43.6% | |
Bank Nova Scotia | | | 2.25 | % | 01/22/13 | | | 5,000,000 | | | | 5,049,919 | |
Bank Nova Scotia Yankee CD | | | 0.79 | %(2) | 08/15/12 | | | 1,250,000 | | | | 1,251,949 | |
Bath Technologies (5) | | | 0.29 | % | 07/05/12 | | | 735,000 | | | | 735,000 | |
Canadian Imperial Bank (5) | | | 2.00 | % | 02/04/13 | | | 5,000,000 | | | | 5,048,017 | |
| Canadian Imperial Bank NY Yankee CD | | | 0.66 | %(2) | 09/12/12 | | | 4,000,000 | | | | 4,001,125 | |
| Caterpillar Financial Power Investment Floating Rate Demand Note | | | 0.60 | %(4) | 07/01/12 | | | 9,766,457 | | | | 9,766,457 | |
Clinic Building, LLC. (5) | | | 0.24 | % | 07/05/12 | | | 3,675,000 | | | | 3,675,000 | |
The accompanying notes are an integral part of these financial statements.
| | 2012 Semi-Annual Report | June 30, 2012 |
Schedule of Investments
June 30, 2012 (unaudited)
| The Money Market Fund | |
| | | | | Principal Amount ($) or Shares | | | | |
| Corporate Obligations —continued | |
Commonwealth Bank of Australia (5) | | | 1.25 | %(2) | 08/20/12 | | | 5,000,000 | | | | 5,009,760 | |
Commonwealth Bank of Australia (5) | | | 1.02 | %(2) | 09/19/12 | | | 5,000,000 | | | | 5,016,546 | |
GE Demand Note | | | 0.70 | %(2) | 07/01/12 | | | 9,252,807 | | | | 9,252,807 | |
JP Morgan Chase | | | 5.38 | % | 10/01/12 | | | 5,000,000 | | | | 5,060,533 | |
Martin Wheel Co. Inc. (5) | | | 3.00 | % | 07/05/12 | | | 1,580,000 | | | | 1,580,000 | |
Met Life Global Funding | | | 2.50 | % | 01/11/13 | | | 1,000,000 | | | | 1,010,136 | |
National Bank of Australia (5) | | | 2.35 | % | 11/16/12 | | | 2,000,000 | | | | 2,013,678 | |
National Bank of Australia (5) | | | 2.50 | % | 01/08/13 | | | 1,500,000 | | | | 1,515,072 | |
| Royal Bank of Canada Yankee CD | | | 2.25 | % | 03/15/13 | | | 1,300,000 | | | | 1,314,909 | |
| Royal Bank of Canada Yankee CD | | | 0.56 | %(2) | 09/13/12 | | | 5,000,000 | | | | 5,000,000 | |
Springside Corp. Exchange Partners, LLC (5) | | | 0.24 | % | 07/05/12 | | | 2,000,000 | | | | 2,000,000 | |
Toyota Motor Credit | | | 0.67 | %(2) | 07/24/12 | | | 1,000,000 | | | | 1,000,000 | |
Westpac Banking Corp. | | | 0.57 | %(2) | 08/10/12 | | | 5,000,000 | | | | 5,000,000 | |
Total Corporate Obligations (Cost $74,059,264) | | | | | | | | | | | | 74,300,908 | |
| U.S. Government Agency Obligations — 8.6% | |
Fannie Mae | | | 0.38 | %(2) | 09/13/12 | | | 4,000,000 | | | | 4,000,929 | |
Federal Farm Credit | | | 0.20 | %(2) | 07/06/12 | | | 2,000,000 | | | | 2,000,000 | |
Federal Farm Credit | | | 0.19 | %(2) | 07/27/12 | | | 2,000,000 | | | | 2,000,000 | |
Federal Farm Credit | | | 4.55 | % | 08/10/12 | | | 35,000 | | | | 35,152 | |
Federal Farm Credit | | | 0.24 | %(2) | 08/17/12 | | | 1,000,000 | | | | 1,000,000 | |
Federal Farm Credit | | | 0.28 | %(2) | 09/07/12 | | | 1,700,000 | | | | 1,700,016 | |
Federal Home Loan Bank | | | 0.21 | %(2) | 07/18/12 | | | 4,000,000 | | | | 3,999,973 | |
Total U.S. Government Agency Obligations (Cost $14,735,000) | | | | | | | | | 14,736,070 | |
| | Shares or Principal Amount ($) | | | | |
| | | | | | | |
| Money Market Registered Investment Companies — 31.1% | |
Dreyfus Treasury & Agency Cash Management Institutional Fund, 0.01% (6) | | | 687 | | | | 687 | |
Federated Prime Value Obligations Fund, 0.22% (6) | | | 40,896,046 | | | | 40,896,046 | |
Fidelity Institutional Money Market Portfolio, 0.22% (6) | | | 12,232,292 | | | | 12,232,292 | |
Total Money Market Registered Investment Companies (Cost $53,129,025) | | | | | | | 53,129,025 | |
Total Investments — 99.9% (Cost $170,749,815 ) (1) | | | | | | | 170,749,815 | |
| Other Assets less Liabilities — 0.1% | | | | | | | 238,827 | |
Total Net Assets — 100.0% | | | | | | | 170,988,642 | |
| The Money Market Fund | |
| | Shares or Principal Amount ($) | | | | |
| | | | | | | |
Trustee Deferred Compensation (7) | |
| The Flex-funds Aggressive Growth Fund | | | 627 | | | | 4,978 | |
The Flex-funds Balanced Fund | | | 325 | | | | 3,156 | |
| The Flex-funds Dynamic Growth Fund | | | 198 | | | | 1,645 | |
The Flex-funds Muirfield Fund | | | 1,347 | | | | 7,476 | |
The Flex-funds Quantex Fund | | | 954 | | | | 21,656 | |
| The Flex-funds Utilities & Infrastructure Fund | | | 71 | | | | 1,676 | |
Total Trustee Deferred Compensation (Cost $34,572) | | | | | | | 40,587 | |
| (1) | Cost for federal income tax and financial reporting purposes are the same. |
| (2) | Variable rate security. Securities payable at par including accrued interest (usually within seven days notice) and unconditionally secured as to principal and interest by letters of credit or other credit support agreements from major banks. The interest rates are adjustable and are based on bank prime rates or other interest rate adjustment indices. The rate shown represents the rate in effect at June 30, 2012. The maturity date shown reflects the earlier of the next demand date or stated maturity date. |
| (3) | Illiquid security. The sale or disposition of such security would not be possible in the ordinary course of business within seven days at approximately the value at which the Fund has valued the security. These securities were purchased through StoneCastle Partners, LLC, an independent, privately held asset management and investment services company, and are insured through the Federal Deposit Insurance Corporation (FDIC). The interest rate varies monthly and any accrued interest is reinvested into the program on a monthly basis. The securities are classified as illiquid because if the Fund were to redeem its investment in the program, the proceeds are delivered only once per week; on the Wednesday of the next week following the redemption request. The maximum number of days from a redemption request to receiving the proceeds is nine days. Hence the Fund may not be able to receive its proceeds within seven days. As of June 30, 2012, illiquid securities represented 5.9% of Total Investments, but at the time of purchase was below 5.0%. |
| (4) | Floating rate security. The rate shown represents the rate in effect at June 30, 2012. The maturity date shown reflects the earlier of the next demand date or stated maturity date. |
| (5) | Represents a restricted security purchased under Rule 144A, which is exempt from registration under the Securities Act of 1933, as amended. Security is restricted as to resale to institutional investors, but has been deemed liquid in accordance with guidelines approved by the Board of Trustees. Bath Technologies was acquired on 10/18/1999. Clinic Building, LLC was acquired on 11/4/2011. Martin Wheel Co., Inc. was acquired on 1/26/2001. Springside Corp. Exchange Partners, LLC was acquired on 2/5/2004. Canadian Imperial Bank was acquired on 3/7/2012. Commonwealth Bank of Australia was acquired on 2/8/2012. Commonwealth Bank of Australia was acquired on 3/7/2012. National Bank of Australia was acquired on 3/6/2012. National Bank of Australia was acquired on 3/7/2012. As of June 30, 2012, securities restricted as to resale to institutional investors represented 15.6% of Total Investments. The acquisition cost is the same as amortized cost. The fair value noted approximates amortized cost. |
| (6) | 7-day yield as of June 30, 2012. |
| (7) | Assets of affiliates to The Money Market Fund held for the benefit of the Fund’s Trustees in connection with the Trustee Deferred Compensation Plan. |
The accompanying notes are an integral part of these financial statements.
| | 2012 Semi-Annual Report | June 30, 2012 |
Statements of Assets & Liabilities June 30, 2012 (unaudited) |
| | | | | | | |
| Assets | | | | | | |
| Investments, at fair value* | | $ | 89,659,111 | | | $ | 67,353,500 | |
| Investments in affiliates, at fair value* | | | 23,827,920 | | | | 22,861,445 | |
| Trustee deferred compensation investments, at fair value | | | 131,655 | | | | 72,788 | |
| Receivable for net variation margin on futures contracts | | | 874,040 | | | | 835,980 | |
| Receivable for capital stock issued | | | 109,451 | | | | 34,343 | |
| Interest and dividend receivable | | | 95,801 | | | | 78,891 | |
Prepaid expenses/other assets | | | 18,393 | | | | 13,800 | |
| | | 114,716,371 | | | | 91,250,747 | |
| | | | | | | | | |
| Liabilities | | | | | | | | |
| Payable for Trustee Deferred Compensation Plan | | | 131,655 | | | | 72,788 | |
| Payable for capital stock redeemed | | | 27,011 | | | | 21,332 | |
| Dividends payable | | | — | | | | — | |
| Dividends payable - The Money Market Fund - Retail Class | | | | | | | | |
| Dividends payable - The Money Market Fund - Institutional Class | | | | | | | | |
| Payable to investment advisor | | | 10,650 | | | | 7,620 | |
| Accrued distribution plan (12b-1) and administrative service plan fees | | | 96,206 | | | | 104,100 | |
| Accrued transfer agent, fund accounting, CCO, and administrative fees | | | 3,965 | | | | 3,537 | |
| Accrued trustee fees | | | 7,012 | | | | 5,757 | |
Other accrued liabilities | | | 19,961 | | | | 16,818 | |
| | | 296,460 | | | | 231,952 | |
| | | | | | | | | |
| | $ | 114,419,911 | | | $ | 91,018,795 | |
| | | | | | | | | |
| Net Assets | | | | | | | | |
| Capital | | $ | 114,250,336 | | | $ | 94,392,111 | |
| Accumulated undistributed (distributions in excess of) net investment income | | | (413,701 | ) | | | (323,462 | ) |
| Accumulated undistributed net realized gain (loss) from investments and futures contracts | | | (2,421,911 | ) | | | (5,618,447 | ) |
Net unrealized appreciation (depreciation) of investments and futures contracts | | | 3,005,187 | | | | 2,568,593 | |
| | $ | 114,419,911 | | | $ | 91,018,795 | |
| | | | | | | | | |
| Net Assets | | | | | | | | |
| The Money Market Fund - Retail Class | | | | | | | | |
The Money Market Fund - Institutional Class | | | | | | | | |
| | | | | | | | |
| | | | | | | | | |
| Capital Stock Outstanding (unlimited number of shares authorized, $0.10 par value) | | | 20,598,224 | | | | 10,955,923 | |
| The Money Market Fund - Retail Class | | | | | | | | |
The Money Market Fund - Institutional Class | | | | | | | | |
Total Capital Stock Outstanding | | | | | | | | |
| | | | | | | | | |
| Net Asset Value, Offering and Redemption Price Per Share | | $ | 5.55 | | | $ | 8.31 | |
| The Money Market Fund - Retail Class | | | | | | | | |
The Money Market Fund - Institutional Class | | | | | | | | |
| | | | | | | | | |
* Investments and affiliated investments at cost | | $ | 111,437,994 | | | $ | 88,554,722 | |
The accompanying notes are an integral part of these financial statements.
| | 2012 Semi-Annual Report | June 30, 2012 |
The Aggressive Growth Fund | | | | | | | | | | | | The Utilities and Infrastructure Fund | | | The Total Return Bond Fund | | | | |
| | | | | | | | | | | | | | | | | | | | |
| $ | 25,072,315 | | | $ | 72,650,429 | | | $ | 70,965,129 | | | $ | 21,401,083 | | | $ | 30,627,145 | | | $ | 68,791,959 | | | $ | 170,749,815 | |
| | 6,008,908 | | | | 16,463,885 | | | | 7,799,684 | | | | 709,530 | | | | 1,009,813 | | | | 614,726 | | | | — | |
| | 42,543 | | | | 53,614 | | | | 46,667 | | | | 47,409 | | | | 46,403 | | | | 7,863 | | | | 40,587 | |
| | 312,200 | | | | 515,740 | | | | 419,240 | | | | 18,760 | | | | — | | | | — | | | | — | |
| | 22,048 | | | | 76,675 | | | | 9,253 | | | | 12,899 | | | | 12,628 | | | | 69,045 | | | | — | |
| | 24,591 | | | | 84,962 | | | | 13,030 | | | | 21,298 | | | | 96,456 | | | | 54,967 | | | | 261,384 | |
| | 12,595 | | | | 18,910 | | | | 15,376 | | | | 12,880 | | | | 13,430 | | | | 33,139 | | | | 16,584 | |
| | 31,495,200 | | | | 89,864,215 | | | | 79,268,379 | | | | 22,223,859 | | | | 31,805,875 | | | | 69,571,699 | | | | 171,068,370 | |
| | | | | | | | | | | | | | | | | | | | | | | | | | | |
| | | | | | | | | | | | | | | | | | | | | | | | | | | |
| | 42,543 | | | | 53,614 | | | | 46,667 | | | | 47,409 | | | | 46,403 | | | | 7,863 | | | | 40,587 | |
| | 15 | | | | 65,784 | | | | 34,668 | | | | 6,835 | | | | 28,079 | | | | 179,845 | | | | — | |
| | — | | | | — | | | | — | | | | — | | | | 435 | | | | 60 | | | | | |
| | | | | | | | | | | | | | | | | | | | | | | | | | 167 | |
| | | | | | | | | | | | | | | | | | | | | | | | | | 12,035 | |
| | 2,871 | | | | 8,125 | | | | 6,314 | | | | 2,221 | | | | 15,138 | | | | 2,037 | | | | 1,967 | |
| | 36,997 | | | | 89,421 | | | | 90,914 | | | | 11,536 | | | | 20,632 | | | | 71,447 | | | | 1,600 | |
| | 1,802 | | | | 3,541 | | | | 3,102 | | | | 1,309 | | | | 1,699 | | | | 2,381 | | | | 4,606 | |
| | 2,567 | | | | 5,209 | | | | 5,370 | | | | 1,832 | | | | 2,544 | | | | 3,826 | | | | 1,590 | |
| | 12,414 | | | | 14,614 | | | | 17,041 | | | | 9,325 | | | | 14,312 | | | | 11,069 | | | | 17,176 | |
| | 99,209 | | | | 240,308 | | | | 204,076 | | | | 80,467 | | | | 129,242 | | | | 278,528 | | | | 79,728 | |
| | | | | | | | | | | | | | | | | | | | | | | | | | | |
| $ | 31,395,991 | | | $ | 89,623,907 | | | $ | 79,064,303 | | | $ | 22,143,392 | | | $ | 31,676,633 | | | $ | 69,293,171 | | | $ | 170,988,642 | |
| | | | | | | | | | | | | | | | | | | | | | | | | | | |
| | | | | | | | | | | | | | | | | | | | | | | | | | | |
| $ | 36,663,593 | | | $ | 90,737,517 | | | $ | 80,943,009 | | | $ | 23,279,503 | | | $ | 30,081,100 | | | $ | 70,476,013 | | | $ | 170,988,642 | |
| | (172,876 | ) | | | 72,642 | | | | (179,813 | ) | | | 11,875 | | | | 168,473 | | | | (107,877 | ) | | | — | |
| | (5,926,806 | ) | | | (3,087,669 | ) | | | (3,057,968 | ) | | | (646,641 | ) | | | (349,434 | ) | | | (1,703,844 | ) | | | — | |
| | 832,080 | | | | 1,901,417 | | | | 1,359,075 | | | | (501,345 | ) | | | 1,776,494 | | | | 628,879 | | | | — | |
| $ | 31,395,991 | | | $ | 89,623,907 | | | $ | 79,064,303 | | | $ | 22,143,392 | | | $ | 31,676,633 | | | $ | 69,293,171 | | | $ | 170,988,642 | |
| | | | | | | | | | | | | | | | | | | | | | | | | | | |
| | | | | | | | | | | | | | | | | | | | | | | | | | | |
| | | | | | | | | | | | | | | | | | | | | | | | | $ | 75,562,703 | |
| | | | | | | | | | | | | | | | | | | | | | | | | | 95,425,939 | |
| | | | | | | | | | | | | | | | | | | | | | | | | $ | 170,988,642 | |
| | | | | | | | | | | | | | | | | | | | | | | | | | | |
| | 3,952,563 | | | | 9,225,666 | | | | 8,423,530 | | | | 975,668 | | | | 1,341,687 | | | | 7,056,612 | | | | | |
| | | | | | | | | | | | | | | | | | | | | | | | | | 75,562,703 | |
| | | | | | | | | | | | | | | | | | | | | | | | | | 95,425,939 | |
| | | | | | | | | | | | | | | | | | | | | | | | | | 170,988,642 | |
| | | | | | | | | | | | | | | | | | | | | | | | | | | |
| $ | 7.94 | | | $ | 9.71 | | | $ | 9.39 | | | $ | 22.70 | | | $ | 23.61 | | | $ | 9.82 | | | | | |
| | | | | | | | | | | | | | | | | | | | | | | | | $ | 1.00 | |
| | | | | | | | | | | | | | | | | | | | | | | | | $ | 1.00 | |
| | | | | | | | | | | | | | | | | | | | | | | | | | | |
| $ | 30,587,341 | | | $ | 87,776,102 | | | $ | 77,811,331 | | | $ | 22,628,216 | | | $ | 29,860,464 | | | $ | 68,777,806 | | | $ | 170,749,815 | |
| | 2012 Semi-Annual Report | June 30, 2012 |
Statements of Operations For the Period Ended June 30, 2012 (unaudited) |
| | | | | | | |
| Investment Income | | | | | | |
| Interest | | $ | 45,254 | | | $ | 12,550 | |
| Interest from affiliates | | | 23,664 | | | | 21,750 | |
| | | 347,342 | | | | 297,259 | |
| | | 416,260 | | | | 331,559 | |
| | | | | | | | | |
| Fund Expenses | | | | | | | | |
| Investment advisor | | | 495,804 | | | | 353,461 | |
| Transfer agent | | | 71,661 | | | | 56,554 | |
| Transfer agent - The Money Market Fund - Retail Class | | | | | | | | |
| Transfer agent - The Money Market Fund - Institutional Class | | | | | | | | |
| Fund accounting | | | 24,472 | | | | 23,213 | |
| Administrative | | | 52,774 | | | | 42,702 | |
| Trustee | | | 6,593 | | | | 5,496 | |
| Audit | | | 5,466 | | | | 5,466 | |
| Legal | | | 2,664 | | | | 2,664 | |
| Custody | | | 8,765 | | | | 7,788 | |
| Printing | | | 5,316 | | | | 4,189 | |
| Distribution plan (12b-1) | | | 118,706 | | | | 117,301 | |
| Distribution plan (12b-1) - The Money Market Fund - Retail Class | | | | | | | | |
| Distribution plan (12b-1) - The Money Market Fund - Institutional Class | | | | | | | | |
| Administrative service plan | | | 118,941 | | | | 93,794 | |
| Postage | | | 3,174 | | | | 2,516 | |
| Registration and filing | | | 12,355 | | | | 12,097 | |
| Insurance | | | 5,259 | | | | 4,535 | |
| Chief Compliance Officer | | | 2,664 | | | | 2,664 | |
| | | 7,193 | | | | 6,432 | |
Total Expenses Before Reductions | | | 941,807 | | | | 740,872 | |
| | | | | | | | | |
| Expenses reimbursed/waived by investment advisor | | | (56,430 | ) | | | (51,667 | ) |
| Expenses paid indirectly | | | (20,966 | ) | | | (17,778 | ) |
| Distribution plan (12b-1) expenses waived | | | (7,128 | ) | | | (8,906 | ) |
| Administrative service plan expenses waived | | | (27,322 | ) | | | (7,500 | ) |
Transfer agent expenses waived | | | — | | | | — | |
| | | | | | | | | |
| | | 829,961 | | | | 655,021 | |
| | | | | | | | | |
Net Investment Income (Loss) | | | (413,701 | ) | | | (323,462 | ) |
| | | | | | | | | |
| Realized and Unrealized Gain (Loss) from Investments | | | | | | | | |
| Net realized gains (losses) from investments | | | 3,606,744 | | | | 3,700,356 | |
| Net realized gains (losses) from futures contracts | | | 1,887,075 | | | | 1,475,222 | |
Net Realized Gains (Losses) from Investment Transactions, Futures Contracts, and Distributions of Long-term Realized Gains by Other Investment Companies | | | 5,493,819 | | | | 5,175,578 | |
| | | | | | | | | |
Net change in unrealized appreciation (depreciation) of investments and futures contracts | | | 4,004,698 | | | | 2,661,023 | |
| | | | | | | | | |
Net Realized and Unrealized Gain (Loss) from Investments | | | 9,498,517 | | | | 7,836,601 | |
| | | | | | | | | |
Net Change in Net Assets Resulting from Operations | | $ | 9,084,816 | | | $ | 7,513,139 | |
The accompanying notes are an integral part of these financial statements.
| | 2012 Semi-Annual Report | June 30, 2012 |
The Aggressive Growth Fund | | | | | | | | | | | | The Utilities and Infrastructure Fund | | | The Total Return Bond Fund | | | | |
| | | | | | | | | | | | | | | | | | | | |
| $ | 7,035 | | | $ | 68,472 | | | $ | 15,470 | | | $ | 488 | | | $ | — | | | $ | 46,212 | | | $ | 349,027 | |
| | 5,714 | | | | 12,262 | | | | 7,349 | | | | 384 | | | | 374 | | | | 1,625 | | | | — | |
| | 81,013 | | | | 639,908 | | | | 399,590 | | | | 181,279 | | | | 558,660 | | | | 1,396,218 | | | | — | |
| | 93,762 | | | | 720,642 | | | | 422,409 | | | | 182,151 | | | | 559,034 | | | | 1,444,055 | | | | 349,027 | |
| | | | | | | | | | | | | | | | | | | | | | | | | | | |
| | | | | | | | | | | | | | | | | | | | | | | | | | | |
| | 125,716 | | | | 326,157 | | | | 324,253 | | | | 105,162 | | | | 160,708 | | | | 128,117 | | | | 299,801 | |
| | 20,115 | | | | 52,185 | | | | 51,881 | | | | 12,687 | | | | 19,285 | | | | 25,486 | | | | | |
| | | | | | | | | | | | | | | | | | | | | | | | | | 38,025 | |
| | | | | | | | | | | | | | | | | | | | | | | | | | 41,008 | |
| | 17,842 | | | | 22,849 | | | | 22,771 | | | | 13,072 | | | | 17,713 | | | | 20,906 | | | | 27,492 | |
| | 16,762 | | | | 39,790 | | | | 39,587 | | | | 10,572 | | | | 16,071 | | | | 30,623 | | | | 76,936 | |
| | 2,339 | | | | 5,073 | | | | 5,234 | | | | 1,621 | | | | 2,212 | | | | 3,859 | | | | 1,314 | |
| | 5,466 | | | | 5,466 | | | | 5,466 | | | | 5,466 | | | | 5,466 | | | | 5,466 | | | | 5,466 | |
| | 2,664 | | | | 2,664 | | | | 2,664 | | | | 2,664 | | | | 2,664 | | | | 2,664 | | | | 2,664 | |
| | 4,142 | | | | 7,363 | | | | 7,563 | | | | 3,607 | | | | 2,816 | | | | 5,540 | | | | 6,744 | |
| | 1,563 | | | | 3,808 | | | | 4,006 | | | | 926 | | | | 1,468 | | | | 2,850 | | | | 7,640 | |
| | 41,696 | | | | 108,109 | | | | 107,608 | | | | 20,989 | | | | 39,975 | | | | 79,779 | | | | | |
| | | | | | | | | | | | | | | | | | | | | | | | | | 77,018 | |
| | | | | | | | | | | | | | | | | | | | | | | | | | 15,380 | |
| | 33,315 | | | | 86,365 | | | | 85,878 | | | | 20,992 | | | | 31,923 | | | | 63,782 | | | | — | |
| | 1,159 | | | | 2,322 | | | | 2,470 | | | | 800 | | | | 2,311 | | | | 1,783 | | | | 3,682 | |
| | 11,075 | | | | 12,280 | | | | 11,439 | | | | 11,161 | | | | 12,112 | | | | 19,829 | | | | 15,375 | |
| | 2,313 | | | | 3,287 | | | | 4,672 | | | | 1,195 | | | | 1,576 | | | | — | | | | 5,001 | |
| | 2,664 | | | | 2,664 | | | | 2,664 | | | | 2,664 | | | | 2,664 | | | | 2,664 | | | | 2,664 | |
| | 5,342 | | | | 6,385 | | | | 6,278 | | | | 5,069 | | | | 6,581 | | | | 5,311 | | | | 13,424 | |
| | 294,173 | | | | 686,767 | | | | 684,434 | | | | 218,647 | | | | 325,545 | | | | 398,659 | | | | 639,634 | |
| | | | | | | | | | | | | | | | | | | | | | | | | | | |
| | (14,794 | ) | | | (21,954 | ) | | | (56,051 | ) | | | (25,868 | ) | | | — | | | | (66,534 | ) | | | (298,806 | ) |
| | (3,071 | ) | | | (12,485 | ) | | | (12,831 | ) | | | — | | | | — | | | | (360 | ) | | | — | |
| | (4,835 | ) | | | (2,163 | ) | | | (8,170 | ) | | | (8,412 | ) | | | (7,833 | ) | | | (5,416 | ) | | | (91,142 | ) |
| | (4,835 | ) | | | (2,163 | ) | | | (5,160 | ) | | | (14,091 | ) | | | (11,031 | ) | | | (2,230 | ) | | | — | |
| | — | | | | — | | | | — | | | | — | | | | — | | | | (6,268 | ) | | | (24,538 | ) |
| | | | | | | | | | | | | | | | | | | | | | | | | | | |
| | 266,638 | | | | 648,002 | | | | 602,222 | | | | 170,276 | | | | 306,681 | | | | 317,851 | | | | 225,148 | |
| | | | | | | | | | | | | | | | | | | | | | | | | | | |
| | (172,876 | ) | | | 72,640 | | | | (179,813 | ) | | | 11,875 | | | | 252,353 | | | | 1,126,204 | | | | 123,879 | |
| | | | | | | | | | | | | | | | | | | | | | | | | | | |
| | | | | | | | | | | | | | | | | | | | | | | | | | | |
| | 752,152 | | | | 1,719,338 | | | | (279,282 | ) | | | 364,975 | | | | (424,943 | ) | | | (397,137 | ) | | | | |
| | 330,683 | | | | 411,538 | | | | 697,676 | | | | 92,692 | | | | — | | | | (401,808 | ) | | | | |
| | 1,082,835 | | | | 2,130,876 | | | | 418,394 | | | | 457,667 | | | | (424,943 | ) | | | (798,945 | ) | | | | |
| | | | | | | | | | | | | | | | | | | | | | | | | | | |
| | 1,432,890 | | | | 2,774,404 | | | | 4,647,942 | | | | (94,586 | ) | | | (348,746 | ) | | | 1,256,589 | | | | | |
| | | | | | | | | | | | | | | | | | | | | | | | | | | |
| | 2,515,725 | | | | 4,905,280 | | | | 5,066,336 | | | | 363,081 | | | | (773,689 | ) | | | 457,644 | | | | | |
| | | | | | | | | | | | | | | | | | | | | | | | | | | |
| $ | 2,342,849 | | | $ | 4,977,920 | | | $ | 4,886,523 | | | $ | 374,956 | | | $ | (521,336 | ) | | $ | 1,583,848 | | | $ | 123,879 | |
| | 2012 Semi-Annual Report | June 30, 2012 |
Statements of Changes in Net Assets For the Period Ended June 30, 2012 (unaudited) and the Year Ended December 31, 2011 |
| | | | | | | |
| | | | | | | | | | | | | |
| Operations | | | | | | | | | | | | |
| Net investment income (loss) | | $ | (413,701 | ) | | $ | (134,080 | ) | | $ | (323,462 | ) | | $ | (75,334 | ) |
| Net realized gain (loss) from investment transactions, futures contracts, and distributions of long-term realized gains by other investment companies | | | 5,493,819 | | | | 8,319,052 | | | | 5,175,578 | | | | 6,399,074 | |
Net change in unrealized appreciation (depreciation) of investments and futures contracts | | | 4,004,698 | | | | (15,948,476 | ) | | | 2,661,023 | | | | (13,161,740 | ) |
Net change in net assets resulting from operations | | | 9,084,816 | | | | (7,763,504 | ) | | | 7,513,139 | | | | (6,838,000 | ) |
| | | | | | | | | | | | | | | | | |
| Distributions to Shareholders | | | | | | | | | | | | | | | | |
From net investment income | | | — | | | | (171,704 | ) | | | — | | | | — | |
Net change in net assets resulting from distributions | | | — | | | | (171,704 | ) | �� | | — | | | | — | |
| | | | | | | | | | | | | | | | | |
| Capital Transactions | | | | | | | | | | | | | | | | |
| Issued | | | 16,044,489 | | | | 46,474,732 | | | | 11,316,978 | | | | 28,124,254 | |
| Reinvested | | | — | | | | 171,192 | | | | — | | | | — | |
| | | (30,495,936 | ) | | | (41,190,644 | ) | | | (18,713,812 | ) | | | (25,623,187 | ) |
Net change in net assets resulting from capital transactions | | | (14,451,447 | ) | | | 5,455,280 | | | | (7,396,834 | ) | | | 2,501,067 | |
| | | | | | | | | | | | | | | | | |
Total Change in Net Assets | | | (5,366,631 | ) | | | (2,479,928 | ) | | | 116,305 | | | | (4,336,933 | ) |
| | | | | | | | | | | | | | | | | |
Net Assets - Beginning of Year | | | 119,786,542 | | | | 122,266,470 | | | | 90,902,490 | | | | 95,239,423 | |
| | | | | | | | | | | | | | | | | |
| | $ | 114,419,911 | | | $ | 119,786,542 | | | $ | 91,018,795 | | | $ | 90,902,490 | |
| | | | | | | | | | | | | | | | | |
Accumulated undistributed (distributions in excess of) net investment income | | $ | (413,701 | ) | | $ | — | | | $ | (323,462 | ) | | $ | — | |
| | | | | | | | | | | | | | | | | |
| Share Transactions | | | | | | | | | | | | | | | | |
| Issued | | | 2,892,152 | | | | 8,711,044 | | | | 1,361,806 | | | | 3,460,348 | |
| Reinvested | | | — | | | | 33,112 | | | | — | | | | — | |
| | | (5,469,422 | ) | | | (7,393,311 | ) | | | (2,249,589 | ) | | | (3,310,326 | ) |
| | | (2,577,270 | ) | | | 1,350,845 | | | | (887,783 | ) | | | 150,022 | |
The accompanying notes are an integral part of these financial statements.
| | 2012 Semi-Annual Report | June 30, 2012 |
The Aggressive Growth Fund | | | | | | The Strategic Growth Fund | |
| | | | | | | | | | | | | | | | |
| | | | | | | | | | | | | | | | | |
| $ | (172,876 | ) | | $ | (291,584 | ) | | $ | 72,640 | | | $ | 962,717 | | | $ | (179,813 | ) | | $ | (305,636 | ) |
| | 1,082,835 | | | | 2,730,480 | | | | 2,130,876 | | | | 473,406 | | | | 418,394 | | | | (1,521,176 | ) |
| | 1,432,890 | | | | (5,857,907 | ) | | | 2,774,404 | | | | (4,953,875 | ) | | | 4,647,942 | | | | (8,642,047 | ) |
| | 2,342,849 | | | | (3,419,011 | ) | | | 4,977,920 | | | | (3,517,752 | ) | | | 4,886,523 | | | | (10,468,859 | ) |
| | | | | | | | | | | | | | | | | | | | | | | |
| | | | | | | | | | | | | | | | | | | | | | | |
| | — | | | | — | | | | — | | | | (962,717 | ) | | | — | | | | — | |
| | — | | | | — | | | | — | | | | (962,717 | ) | | | — | | | | — | |
| | | | | | | | | | | | | | | | | | | | | | | |
| | | | | | | | | | | | | | | | | | | | | | | |
| | 6,718,889 | | | | 24,363,507 | | | | 20,827,163 | | | | 51,025,191 | | | | 11,617,330 | | | | 74,435,544 | |
| | — | | | | — | | | | — | | | | 961,698 | | | | — | | | | — | |
| | (9,833,064 | ) | | | (22,685,494 | ) | | | (21,978,477 | ) | | | (19,487,752 | ) | | | (22,111,344 | ) | | | (41,725,732 | ) |
| | (3,114,175 | ) | | | 1,678,013 | | | | (1,151,314 | ) | | | 32,499,137 | | | | (10,494,014 | ) | | | 32,709,812 | |
| | | | | | | | | | | | | | | | | | | | | | | |
| | (771,326 | ) | | | (1,740,998 | ) | | | 3,826,606 | | | | 28,018,668 | | | | (5,607,491 | ) | | | 22,240,953 | |
| | | | | | | | | | | | | | | | | | | | | | | |
| | 32,167,317 | | | | 33,908,315 | | | | 85,797,301 | | | | 57,778,633 | | | | 84,671,794 | | | | 62,430,841 | |
| | | | | | | | | | | | | | | | | | | | | | | |
| $ | 31,395,991 | | | $ | 32,167,317 | | | $ | 89,623,907 | | | $ | 85,797,301 | | | $ | 79,064,303 | | | $ | 84,671,794 | |
| | | | | | | | | | | | | | | | | | | | | | | |
| $ | (172,876 | ) | | $ | — | | | $ | 72,642 | | | $ | 2 | | | $ | (179,813 | ) | | $ | — | |
| | | | | | | | | | | | | | | | | | | | | | | |
| | | | | | | | | | | | | | | | | | | | | | | |
| | 835,046 | | | | 3,029,752 | | | | 2,141,115 | | | | 5,370,164 | | | | 1,212,547 | | | | 7,582,758 | |
| | — | | | | — | | | | — | | | | 105,708 | | | | — | | | | — | |
| | (1,226,841 | ) | | | (2,941,080 | ) | | | (2,259,186 | ) | | | (2,074,924 | ) | | | (2,305,427 | ) | | | (4,495,548 | ) |
| | (391,795 | ) | | | 88,672 | | | | (118,071 | ) | | | 3,400,948 | | | | (1,092,880 | ) | | | 3,087,210 | |
| | 2012 Semi-Annual Report | June 30, 2012 |
Statements of Changes in Net Assets For the Period Ended June 30, 2012 (unaudited) and the Year Ended December 31, 2011 |
| | | | |
| | | | | | | |
| Operations | | | | | | |
| Net investment income (loss) | | $ | 11,875 | | | $ | 2,030 | |
| Net realized gain (loss) from investment transactions, futures contracts, and distributions of long-term realized gains by other investment companies | | | 457,667 | | | | 1,162,400 | |
Net change in unrealized appreciation (depreciation) of investments and futures contracts | | | (94,586 | ) | | | (3,349,847 | ) |
Net change in net assets resulting from operations | | | 374,956 | | | | (2,185,417 | ) |
| | | | | | | | | |
| Distributions to Shareholders | | | | | | | | |
From net investment income | | | — | | | | (5,803 | ) |
Net change in net assets resulting from distributions | | | — | | | | (5,803 | ) |
| | | | | | | | | |
| Distributions to Shareholders - The Money Market Fund | | | | | | | | |
| From net investment income (Retail Class) | | | | | | | | |
From net investment income (Institutional Class) | | | | | | | | |
Net change in net assets resulting from distributions | | | | | | | | |
| | | | | | | | | |
| Capital Transactions | | | | | | | | |
| Issued | | | 6,909,248 | | | | 13,071,807 | |
| Reinvested | | | 6 | | | | 5,745 | |
| | | (2,574,367 | ) | | | (10,476,424 | ) |
Net change in net assets resulting from capital transactions | | | 4,334,887 | | | | 2,601,128 | |
| | | | | | | | | |
Total Change in Net Assets | | | 4,709,843 | | | | 409,908 | |
| | | | | | | | | |
Net Assets - Beginning of Year | | | 17,433,549 | | | | 17,023,641 | |
| | | | | | | | | |
| | $ | 22,143,392 | | | $ | 17,433,549 | |
| | | | | | | | | |
Accumulated undistributed (distributions in excess of) net investment income | | $ | 11,875 | | | $ | — | |
| | | | | | | | | |
| Share Transactions | | | | | | | | |
| Issued | | | 287,481 | | | | 543,000 | |
| Reinvested | | | — | | | | 263 | |
| | | (109,937 | ) | | | (492,877 | ) |
| | | 177,544 | | | | 50,386 | |
| * | Commenced operations June 30, 2011. |
The accompanying notes are an integral part of these financial statements.
| | 2012 Semi-Annual Report | June 30, 2012 |
The Utilities and Infrastructure Fund | | | The Total Return Bond Fund | | | | |
| | | | | | | | | | 2011* | | | | 2012 | | | | 2011 | |
| | | | | | | | | | | | | | | | | | | | |
| $ | 252,353 | | | $ | 264,736 | | | $ | 1,126,204 | | | $ | 1,038,809 | | | $ | 123,879 | | | $ | 158,254 | |
| | (424,943 | ) | | | 234,752 | | | | (798,945 | ) | | | (904,899 | ) | | | — | | | | — | |
| | (348,746 | ) | | | 804 | | | | 1,256,589 | | | | (627,710 | ) | | | — | | | | — | |
| | (521,336 | ) | | | 500,292 | | | | 1,583,848 | | | | (493,800 | ) | | | 123,879 | | | | 158,254 | |
| | | | | | | | | | | | | | | | | | | | | | | |
| | | | | | | | | | | | | | | | | | | | | | | |
| | (83,959 | ) | | | (487,367 | ) | | | (1,234,081 | ) | | | (1,038,809 | ) | | | | | | | | |
| | (83,959 | ) | | | (487,367 | ) | | | (1,234,081 | ) | | | (1,038,809 | ) | | | | | | | | |
| | | | | | | | | | | | | | | | | | | | | | | |
| | | | | | | | | | | | | | | | | | | | | | | |
| | | | | | | | | | | | | | | | | | (37,759 | ) | | | (99,688 | ) |
| | | | | | | | | | | | | | | | | | (86,120 | ) | | | (58,566 | ) |
| | | | | | | | | | | | | | | | | | (123,879 | ) | | | (158,254 | ) |
| | | | | | | | | | | | | | | | | | | | | | | |
| | | | | | | | | | | | | | | | | | | | | | | |
| | 4,323,678 | | | | 17,335,004 | | | | 21,899,602 | | | | 62,982,890 | | | | 345,304,197 | | | | 373,929,928 | |
| | 81,787 | | | | 474,790 | | | | 1,233,910 | | | | 1,038,808 | | | | 43,960 | | | | 114,790 | |
| | (4,732,926 | ) | | | (9,357,157 | ) | | | (11,188,232 | ) | | | (5,490,965 | ) | | | (276,493,611 | ) | | | (401,582,218 | ) |
| | (327,461 | ) | | | 8,452,637 | | | | 11,945,280 | | | | 58,530,733 | | | | 68,854,546 | | | | (27,537,500 | ) |
| | | | | | | | | | | | | | | | | | | | | | | |
| | (932,756 | ) | | | 8,465,562 | | | | 12,295,047 | | | | 56,998,124 | | | | 68,854,546 | | | | (27,537,500 | ) |
| | | | | | | | | | | | | | | | | | | | | | | |
| | 32,609,389 | | | | 24,143,827 | | | | 56,998,124 | | | | — | | | | 102,134,096 | | | | 129,671,596 | |
| | | | | | | | | | | | | | | | | | | | | | | |
| $ | 31,676,633 | | | $ | 32,609,389 | | | $ | 69,293,171 | | | $ | 56,998,124 | | | $ | 170,988,642 | | | $ | 102,134,096 | |
| | | | | | | | | | | | | | | | | | | | | | | |
| $ | 168,473 | | | $ | 79 | | | $ | (107,877 | ) | | $ | — | | | $ | — | | | $ | — | |
| | | | | | | | | | | | | | | | | | | | | | | |
| | | | | | | | | | | | | | | | | | | | | | | |
| | 179,516 | | | | 705,848 | | | | 2,207,831 | | | | 6,309,532 | | | | 345,304,197 | | | | 373,929,928 | |
| | 3,421 | | | | 19,781 | | | | 125,039 | | | | 105,778 | | | | 43,960 | | | | 114,790 | |
| | (196,380 | ) | | | (397,554 | ) | | | (1,135,641 | ) | | | (555,926 | ) | | | (276,493,611 | ) | | | (401,582,218 | ) |
| | (13,443 | ) | | | 328,075 | | | | 1,197,229 | | | | 5,859,384 | | | | 68,854,546 | | | | (27,537,500 | ) |
| | 2012 Semi-Annual Report | June 30, 2012 |
Financial Highlights For a Share Outstanding Through the Period Ended June 30, 2012 (unaudited) and Each Fiscal Year Ended December 31, |
| | | | | | Income from Investment Operations | | | | |
| | Net Asset Value, Beginning of Period | | | Net Investment Income (Loss) (5) | | | Net gains (losses) on securities, futures, and options (both realized and unrealized) | | | Total from Investment Operations | | | From Net Investment Income | | | | | | From Tax Return of Capital | | | | |
| The Muirfield Fund (1)(2)(3)(4) | |
| 2012 | | $ | 5.17 | | | | (0.02 | ) | | | 0.40 | | | | 0.38 | | | | 0.00 | | | | 0.00 | | | | 0.00 | | | | 0.00 | |
| 2011 | | $ | 5.60 | | | | (0.01 | ) | | | (0.41 | ) | | | (0.42 | ) | | | (0.01 | ) | | | 0.00 | | | | 0.00 | | | | (0.01 | ) |
| 2010 | | $ | 4.99 | | | | 0.02 | | | | 0.61 | | | | 0.63 | | | | (0.02 | ) | | | 0.00 | | | | 0.00 | | | | (0.02 | ) |
| 2009 | | $ | 4.21 | | | | 0.01 | | | | 0.79 | | | | 0.80 | | | | (0.02 | ) | | | 0.00 | | | | 0.00 | | | | (0.02 | ) |
| 2008 | | $ | 6.02 | | | | 0.02 | | | | (1.83 | ) | | | (1.81 | ) | | | 0.00 | | | | 0.00 | | | | 0.00 | | | | 0.00 | |
| 2007 | | $ | 5.81 | | | | 0.18 | | | | 0.23 | | | | 0.41 | | | | (0.20 | ) | | | 0.00 | | | | 0.00 | | | | (0.20 | ) |
The Dynamic Growth Fund (1)(2)(3)(4) | |
| 2012 | | $ | 7.68 | | | | (0.03 | ) | | | 0.66 | | | | 0.63 | | | | 0.00 | | | | 0.00 | | | | 0.00 | | | | 0.00 | |
| 2011 | | $ | 8.14 | | | | (0.01 | ) | | | (0.45 | ) | | | (0.46 | ) | | | 0.00 | | | | 0.00 | | | | 0.00 | | | | 0.00 | |
| 2010 | | $ | 7.06 | | | | 0.02 | | | | 1.08 | | | | 1.10 | | | | (0.02 | ) | | | 0.00 | | | | 0.00 | | | | (0.02 | ) |
| 2009 | | $ | 5.48 | | | | 0.00 | | | | 1.58 | | | | 1.58 | | | | 0.00 | * | | | 0.00 | | | | 0.00 | | | | 0.00 | * |
| 2008 | | $ | 9.24 | | | | 0.04 | | | | (3.71 | ) | | | (3.67 | ) | | | (0.04 | ) | | | (0.05 | ) | | | 0.00 | | | | (0.09 | ) |
| 2007 | | $ | 9.56 | | | | 0.29 | | | | 0.38 | | | | 0.67 | | | | (0.30 | ) | | | (0.69 | ) | | | 0.00 | | | | (0.99 | ) |
The Aggressive Growth Fund (1)(2)(3)(4) | |
| 2012 | | $ | 7.40 | | | | (0.04 | ) | | | 0.58 | | | | 0.54 | | | | 0.00 | | | | 0.00 | | | | 0.00 | | | | 0.00 | |
| 2011 | | $ | 7.97 | | | | (0.07 | ) | | | (0.50 | ) | | | (0.57 | ) | | | 0.00 | | | | 0.00 | | | | 0.00 | | | | 0.00 | |
| 2010 | | $ | 6.89 | | | | (0.01 | ) | | | 1.09 | | | | 1.08 | | | | 0.00 | | | | 0.00 | | | | 0.00 | | | | 0.00 | |
| 2009 | | $ | 5.19 | | | | (0.01 | ) | | | 1.71 | | | | 1.70 | | | | 0.00 | | | | 0.00 | | | | 0.00 | | | | 0.00 | |
| 2008 | | $ | 8.59 | | | | 0.05 | | | | (3.40 | ) | | | (3.35 | ) | | | (0.05 | ) | | | 0.00 | | | | 0.00 | | | | (0.05 | ) |
| 2007 | | $ | 8.13 | | | | 0.04 | | | | 0.46 | | | | 0.50 | | | | (0.04 | ) | | | 0.00 | | | | 0.00 | | | | (0.04 | ) |
The Balanced Fund (1)(2)(3)(4) | |
| 2012 | | $ | 9.18 | | | | 0.01 | | | | 0.52 | | | | 0.53 | | | | 0.00 | | | | 0.00 | | | | 0.00 | | | | 0.00 | |
| 2011 | | $ | 9.72 | | | | 0.13 | | | | (0.57 | ) | | | (0.44 | ) | | | (0.10 | ) | | | 0.00 | | | | 0.00 | | | | (0.10 | ) |
| 2010 | | $ | 8.98 | | | | 0.14 | | | | 0.74 | | | | 0.88 | | | | (0.14 | ) | | | 0.00 | | | | 0.00 | | | | (0.14 | ) |
| 2009 | | $ | 7.86 | | | | 0.03 | | | | 1.12 | | | | 1.15 | | | | (0.03 | ) | | | 0.00 | | | | 0.00 | | | | (0.03 | ) |
| 2008 | | $ | 10.46 | | | | 0.07 | | | | (2.60 | ) | | | (2.53 | ) | | | (0.07 | ) | | | 0.00 | | | | 0.00 | | | | (0.07 | ) |
| 2007 | | $ | 10.51 | | | | 0.07 | | | | 0.45 | | | | 0.52 | | | | (0.07 | ) | | | (0.50 | ) | | | 0.00 | | | | (0.57 | ) |
The Strategic Growth Fund (1)(2)(3)(4) | |
| 2012 | | $ | 8.90 | | | | (0.02 | ) | | | 0.51 | | | | 0.49 | | | | 0.00 | | | | 0.00 | | | | 0.00 | | | | 0.00 | |
| 2011 | | $ | 9.71 | | | | (0.04 | ) | | | (0.77 | ) | | | (0.81 | ) | | | 0.00 | | | | 0.00 | | | | 0.00 | | | | 0.00 | |
| 2010 | | $ | 8.12 | | | | 0.04 | | | | 1.58 | | | | 1.62 | | | | (0.03 | ) | | | 0.00 | | | | 0.00 | | | | (0.03 | ) |
| 2009 | | $ | 5.98 | | | | (0.01 | ) | | | 2.15 | | | | 2.14 | | | | 0.00 | | | | 0.00 | | | | 0.00 | | | | 0.00 | |
| 2008 | | $ | 10.58 | | | | 0.05 | | | | (4.60 | ) | | | (4.55 | ) | | | (0.05 | ) | | | 0.00 | | | | 0.00 | | | | (0.05 | ) |
| 2007 | | $ | 10.73 | | | | 0.08 | | | | 0.46 | | | | 0.54 | | | | (0.07 | ) | | | (0.62 | ) | | | 0.00 | | | | (0.69 | ) |
| 1 | Ratio of net expenses to average net assets, ratio of net investment income (loss) to average net assets, ratio of expenses to average net assets after reductions, excluding expenses paid indirectly, and ratio of expenses to average net assets before reductions do not include impact of expenses of the underlying security holdings as represented in the schedule of investments. |
| 2 | Recognition of net investment income by the Fund is affected by the timing of the declaration of dividends by the underlying investment companies in which the Fund invests. |
| 3 | Total return and portfolio turnover rate are not annualized for periods of less than one full year. |
| | 2012 Semi-Annual Report | June 30, 2012 |
| | | | | | | | |
Net Asset Value, End of Period | | | Total Return (Assumes Reinvestment of Distributions) | | | Net Assets, End of Period ($000) | | | Ratio of Net Expenses to Average Net Assets | | | Ratio of Net Investment Income (Loss) to Average Net Assets | | | Ratio of Expenses to Average Net Assets after Reductions, Excluding Expenses Paid Indirectly | | | Ratio of Expenses to Average Net Assets Before Reductions | | | | |
| | |
| $ | 5.55 | | | | 7.35 | % | | $ | 114,420 | | | | 1.39 | % | | | (0.69 | %) | | | 1.43 | % | | | 1.58 | % | | | 90 | % |
| $ | 5.17 | | | | (7.55 | %) | | $ | 119,787 | | | | 1.39 | % | | | (0.11 | %) | | | 1.46 | % | | | 1.58 | % | | | 189 | % |
| $ | 5.60 | | | | 12.65 | % | | $ | 122,266 | | | | 1.39 | % | | | 0.40 | % | | | 1.47 | % | | | 1.60 | % | | | 128 | % |
| $ | 4.99 | | | | 18.95 | % | | $ | 115,138 | | | | 1.43 | % | | | 0.17 | % | | | 1.51 | % | | | 1.66 | % | | | 166 | % |
| $ | 4.21 | | | | (30.07 | %) | | $ | 86,310 | | | | 1.39 | % | | | 0.54 | % | | | 1.48 | % | | | 1.75 | % | | | 173 | % |
| $ | 6.02 | | | | 7.02 | % | | $ | 50,374 | | | | 1.38 | % | | | 3.01 | % | | | 1.52 | % | | | 1.88 | % | | | 144 | % |
| |
| $ | 8.31 | | | | 8.20 | % | | $ | 91,019 | | | | 1.39 | % | | | (0.69 | %) | | | 1.43 | % | | | 1.57 | % | | | 92 | % |
| $ | 7.68 | | | | (5.65 | %) | | $ | 90,902 | | | | 1.39 | % | | | (0.08 | %) | | | 1.46 | % | | | 1.57 | % | | | 176 | % |
| $ | 8.14 | | | | 15.54 | % | | $ | 95,239 | | | | 1.39 | % | | | 0.23 | % | | | 1.47 | % | | | 1.59 | % | | | 119 | % |
| $ | 7.06 | | | | 28.87 | % | | $ | 84,358 | | | | 1.37 | % | | | (0.04 | %) | | | 1.48 | % | | | 1.63 | % | | | 148 | % |
| $ | 5.48 | | | | (39.77 | %) | | $ | 67,298 | | | | 1.34 | % | | | 0.95 | % | | | 1.46 | % | | | 1.69 | % | | | 122 | % |
| $ | 9.24 | | | | 7.06 | % | | $ | 19,115 | | | | 1.32 | % | | | 2.94 | % | | | 1.46 | % | | | 1.86 | % | | | 150 | % |
| |
| $ | 7.94 | | | | 7.30 | % | | $ | 31,396 | | | | 1.59 | % | | | (1.03 | %) | | | 1.61 | % | | | 1.75 | % | | | 78 | % |
| $ | 7.40 | | | | (7.15 | %) | | $ | 32,167 | | | | 1.59 | % | | | (0.73 | %) | | | 1.65 | % | | | 1.70 | % | | | 224 | % |
| $ | 7.97 | | | | 15.67 | % | | $ | 33,908 | | | | 1.59 | % | | | (0.07 | %) | | | 1.66 | % | | | 1.77 | % | | | 124 | % |
| $ | 6.89 | | | | 32.76 | % | | $ | 29,895 | | | | 1.54 | % | | | (0.25 | %) | | | 1.63 | % | | | 1.82 | % | | | 156 | % |
| $ | 5.19 | | | | (38.98 | %) | | $ | 20,715 | | | | 1.62 | % | | | 0.77 | % | | | 1.65 | % | | | 1.84 | % | | | 213 | % |
| $ | 8.59 | | | | 6.14 | % | | $ | 28,841 | | | | 1.70 | % | | | 0.49 | % | | | 1.70 | % | | | 1.83 | % | | | 170 | % |
| |
| $ | 9.71 | | | | 5.77 | % | | $ | 89,624 | | | | 1.49 | % | | | 0.17 | % | | | 1.52 | % | | | 1.58 | % | | | 116 | % |
| $ | 9.18 | | | | (4.49 | %) | | $ | 85,797 | | | | 1.44 | % | | | 1.29 | % | | | 1.51 | % | | | 1.60 | % | | | 164 | % |
| $ | 9.72 | | | | 9.76 | % | | $ | 57,779 | | | | 1.52 | % | | | 1.51 | % | | | 1.57 | % | | | 1.66 | % | | | 161 | % |
| $ | 8.98 | | | | 14.65 | % | | $ | 49,388 | | | | 1.54 | % | | | 0.41 | % | | | 1.59 | % | | | 1.72 | % | | | 182 | % |
| $ | 7.86 | | | | (24.16 | %) | | $ | 34,766 | | | | 1.54 | % | | | 0.67 | % | | | 1.55 | % | | | 1.70 | % | | | 204 | % |
| $ | 10.46 | | | | 5.03 | % | | $ | 74,290 | | | | 1.56 | % | | | 0.79 | % | | | 1.56 | % | | | 1.66 | % | | | 137 | % |
| |
| $ | 9.39 | | | | 5.51 | % | | $ | 79,064 | | | | 1.39 | % | | | (0.42 | %) | | | 1.42 | % | | | 1.58 | % | | | 60 | % |
| $ | 8.90 | | | | (8.34 | %) | | $ | 84,672 | | | | 1.39 | % | | | (0.37 | %) | | | 1.48 | % | | | 1.58 | % | | | 166 | % |
| $ | 9.71 | | | | 19.96 | % | | $ | 62,431 | | | | 1.49 | % | | | 0.48 | % | | | 1.59 | % | | | 1.70 | % | | | 115 | % |
| $ | 8.12 | | | | 35.79 | % | | $ | 34,052 | | | | 1.54 | % | | | (0.13 | %) | | | 1.65 | % | | | 1.80 | % | | | 75 | % |
| $ | 5.98 | | | | (43.00 | %) | | $ | 21,074 | | | | 1.57 | % | | | 0.47 | % | | | 1.59 | % | | | 1.74 | % | | | 178 | % |
| $ | 10.58 | | | | 5.08 | % | | $ | 63,785 | | | | 1.58 | % | | | 0.75 | % | | | 1.58 | % | | | 1.68 | % | | | 134 | % |
| 4 | Ratio of net expenses to average net assets, ratio of net investment income (loss) to average net assets, ratio of average net assets after reductions, excluding expenses paid indirectly, and ratio of expenses to average net assets before reductions are annualized for periods of less than one full year. |
| 5 | Except for The Money Market Fund, net investment income per share is based on average shares outstanding during the period. |
| * | Actual amounts were less than one-half of a cent per share |
The accompanying notes are integral part of these financial statements.
| | 2012 Semi-Annual Report | June 30, 2012 |
Financial Highlights For a Share Outstanding Through the Period Ended June 30, 2012 (unaudited) and Each Fiscal Year Ended December 31, |
| | | | | | | Income from Investment Operations | | | | |
| | | Net Asset Value, Beginning of Period | | | Net Investment Income (Loss) (5) | | | Net gains (losses) on securities, futures, and options (both realized and unrealized) | | | Total from Investment Operations | | | From Net Investment Income | | | | | | From Tax Return of Capital | | | | |
| The Quantex Fund (3)(4) | |
| 2012 | | | $ | 21.84 | | | | 0.01 | | | | 0.85 | | | | 0.86 | | | | 0.00 | | | | 0.00 | | | | 0.00 | | | | 0.00 | |
| 2011 | | | $ | 22.77 | | | | 0.00 | | | | (0.92 | ) | | | (0.92 | ) | | | (0.01 | ) | | | 0.00 | | | | 0.00 | | | | (0.01 | ) |
| 2010 | | | $ | 18.48 | | | | (0.06 | ) | | | 4.35 | | | | 4.29 | | | | 0.00 | | | | 0.00 | | | | 0.00 | | | | 0.00 | |
| 2009 | | | $ | 10.42 | | | | (0.01 | ) | | | 8.07 | | | | 8.06 | | | | 0.00 | ** | | | 0.00 | | | | 0.00 | | | | 0.00 | ** |
| 2008 | | | $ | 18.32 | | | | 0.00 | | | | (7.90 | ) | | | (7.90 | ) | | | 0.00 | | | | 0.00 | | | | 0.00 | | | | 0.00 | |
| 2007 | | | $ | 19.86 | | | | 0.16 | | | | (1.54 | ) | | | (1.38 | ) | | | (0.16 | ) | | | 0.00 | | | | 0.00 | | | | (0.16 | ) |
The Utilities and Infrastructure Fund (3)(4) | |
| 2012 | | | $ | 24.06 | | | | 0.19 | | | | (0.58 | ) | | | (0.39 | ) | | | (0.06 | ) | | | 0.00 | | | | 0.00 | | | | (0.06 | ) |
| 2011 | | | $ | 23.51 | | | | 0.22 | | | | 0.70 | | | | 0.92 | | | | (0.37 | ) | | | 0.00 | | | | 0.00 | | | | (0.37 | ) |
| 2010 | | | $ | 20.73 | | | | 0.15 | | | | 2.76 | | | | 2.91 | | | | (0.13 | ) | | | 0.00 | | | | 0.00 | | | | (0.13 | ) |
| 2009 | | | $ | 16.13 | | | | 0.15 | | | | 4.74 | | | | 4.89 | | | | (0.16 | ) | | | 0.00 | | | | (0.13 | ) | | | (0.29 | ) |
| 2008 | | | $ | 26.14 | | | | 0.09 | | | | (9.90 | ) | | | (9.81 | ) | | | (0.14 | ) | | | 0.00 | | | | (0.06 | ) | | | (0.20 | ) |
| 2007 | | | $ | 22.23 | | | | 0.14 | | | | 3.91 | | | | 4.05 | | | | (0.14 | ) | | | 0.00 | | | | 0.00 | | | | (0.14 | ) |
The Total Return Bond Fund (1)(2)(3)(4) | |
| 2012 | | | $ | 9.73 | | | | 0.17 | | | | 0.11 | | | | 0.28 | | | | (0.19 | ) | | | 0.00 | | | | 0.00 | | | | (0.19 | ) |
| 2011* | | | $ | 10.00 | | | | 0.25 | | | | (0.31 | ) | | | (0.06 | ) | | | (0.21 | ) | | | 0.00 | | | | 0.00 | | | | (0.21 | ) |
The Money Market Fund - Retail Class (3)(4) | |
| 2012 | | | $ | 1.00 | | | | 0.000 | | | | N/A | | | | 0.000 | | | | 0.000 | | | | 0.000 | | | | 0.000 | | | | 0.000 | |
| 2011 | | | $ | 1.00 | | | | 0.001 | | | | N/A | | | | 0.001 | | | | (0.001 | ) | | | 0.000 | | | | 0.000 | | | | (0.001 | ) |
| 2010 | | | $ | 1.00 | | | | 0.002 | | | | N/A | | | | 0.002 | | | | (0.002 | ) | | | 0.000 | | | | 0.000 | | | | (0.002 | ) |
| 2009 | | | $ | 1.00 | | | | 0.006 | | | | N/A | | | | 0.006 | | | | (0.006 | ) | | | 0.000 | | | | 0.000 | | | | (0.006 | ) |
| 2008 | | | $ | 1.00 | | | | 0.026 | | | | N/A | | | | 0.026 | | | | (0.026 | ) | | | 0.000 | | | | 0.000 | | | | (0.026 | ) |
| 2007 | | | $ | 1.00 | | | | 0.048 | | | | N/A | | | | 0.048 | | | | (0.048 | ) | | | 0.000 | | | | 0.000 | | | | (0.048 | ) |
The Money Market Fund - Institutional Class (3)(4) | |
| 2012 | | | $ | 1.00 | | | | 0.001 | | | | N/A | | | | 0.001 | | | | (0.001 | ) | | | 0.000 | | | | 0.000 | | | | (0.001 | ) |
| 2011 | | | $ | 1.00 | | | | 0.002 | | | | N/A | | | | 0.002 | | | | (0.002 | ) | | | 0.000 | | | | 0.000 | | | | (0.002 | ) |
| 2010 | | | $ | 1.00 | | | | 0.003 | | | | N/A | | | | 0.003 | | | | (0.003 | ) | | | 0.000 | | | | 0.000 | | | | (0.003 | ) |
| 2009 | | | $ | 1.00 | | | | 0.008 | | | | N/A | | | | 0.008 | | | | (0.008 | ) | | | 0.000 | | | | 0.000 | | | | (0.008 | ) |
| 2008 | | | $ | 1.00 | | | | 0.028 | | | | N/A | | | | 0.028 | | | | (0.028 | ) | | | 0.000 | | | | 0.000 | | | | (0.028 | ) |
| 2007 | | | $ | 1.00 | | | | 0.050 | | | | N/A | | | | 0.050 | | | | (0.050 | ) | | | 0.000 | | | | 0.000 | | | | (0.050 | ) |
| 1 | Ratio of net expenses to average net assets, ratio of net investment income (loss) to average net assets, ratio of expenses to average net assets after reductions, excluding expenses paid indirectly, and ratio of expenses to average net assets before reductions do not include impact of expenses of the underlying security holdings as represented in the schedule of investments. |
| 2 | Recognition of net investment income by the Fund is affected by the timing of the declaration of dividends by the underlying investment companies in which the Fund invests. |
| 3 | Total return and portfolio turnover rate are not annualized for periods of less than one full year. |
| 4 | Ratio of net expenses to average net assets, ratio of net investment income (loss) to average net assets, ratio of average net assets after reductions, excluding expenses paid indirectly, and ratio of expenses to average net assets before reductions are annualized for periods of less than one full year. |
| | 2012 Semi-Annual Report | June 30, 2012 |
| | | | | | | | |
Net Asset Value, End of Period | | | Total Return (Assumes Reinvestment of Distributions) | | | Net Assets, End of Period ($000) | | | Ratio of Net Expenses to Average Net Assets | | | Ratio of Net Investment Income (Loss) to Average Net Assets | | | Ratio of Expenses to Average Net Assets after Reductions, Excluding Expenses Paid Indirectly | | | Ratio of Expenses to Average Net Assets Before Reductions | | | | |
| | |
| $ | 22.70 | | | | 3.94 | % | | $ | 22,143 | | | | 1.61 | % | | | 0.11 | % | | | 1.61 | % | | | 2.07 | % | | | 27 | % |
| $ | 21.84 | | | | (4.05 | %) | | $ | 17,434 | | | | 1.62 | % | | | 0.01 | % | | | 1.62 | % | | | 2.06 | % | | | 57 | % |
| $ | 22.77 | | | | 23.21 | % | | $ | 17,024 | | | | 1.65 | % | | | (0.26 | %) | | | 1.65 | % | | | 2.17 | % | | | 55 | % |
| $ | 18.48 | | | | 77.37 | % | | $ | 12,667 | | | | 1.79 | % | | | (0.05 | %) | | | 1.79 | % | | | 2.39 | % | | | 34 | % |
| $ | 10.42 | | | | (43.12 | %) | | $ | 6,743 | | | | 1.73 | % | | | 0.01 | % | | | 1.73 | % | | | 2.26 | % | | | 49 | % |
| $ | 18.32 | | | | (7.00 | %) | | $ | 17,450 | | | | 1.56 | % | | | 0.76 | % | | | 1.56 | % | | | 2.09 | % | | | 56 | % |
| |
| $ | 23.61 | | | | (1.61 | %) | | $ | 31,677 | | | | 1.91 | % | | | 1.57 | % | | | 1.91 | % | | | 2.03 | % | | | 15 | % |
| $ | 24.06 | | | | 3.93 | % | | $ | 32,609 | | | | 1.90 | % | | | 0.87 | % | | | 1.90 | % | | | 2.02 | % | | | 43 | % |
| $ | 23.51 | | | | 14.10 | % | | $ | 24,144 | | | | 1.92 | % | | | 0.70 | % | | | 1.92 | % | | | 2.11 | % | | | 53 | % |
| $ | 20.73 | | | | 30.63 | % | | $ | 20,731 | | | | 2.00 | % | | | 0.90 | % | | | 2.00 | % | | | 2.20 | % | | | 35 | % |
| $ | 16.13 | | | | (37.63 | %) | | $ | 15,859 | | | | 1.96 | % | | | 0.42 | % | | | 1.96 | % | | | 2.14 | % | | | 48 | % |
| $ | 26.14 | | | | 18.24 | % | | $ | 27,333 | | | | 1.90 | % | | | 0.57 | % | | | 1.90 | % | | | 2.10 | % | | | 50 | % |
| |
| $ | 9.82 | | | | 2.85 | % | | $ | 69,293 | | | | 0.99 | % | | | 3.52 | % | | | 0.99 | % | | | 1.24 | % | | | 114 | % |
| $ | 9.73 | | | | (0.57 | %) | | $ | 56,998 | | | | 0.99 | % | | | 4.97 | % | | | 1.06 | % | | | 1.36 | % | | | 125 | % |
| |
| $ | 1.00 | | | | 0.05 | % | | $ | 75,563 | | | | 0.29 | % | | | 0.10 | % | | | 0.29 | % | | | 0.82 | % | | | N/A | |
| $ | 1.00 | | | | 0.11 | % | | $ | 78,903 | | | | 0.30 | % | | | 0.11 | % | | | 0.30 | % | | | 0.90 | % | | | N/A | |
| $ | 1.00 | | | | 0.20 | % | | $ | 96,087 | | | | 0.38 | % | | | 0.20 | % | | | 0.38 | % | | | 0.86 | % | | | N/A | |
| $ | 1.00 | | | | 0.64 | % | | $ | 122,142 | | | | 0.55 | % | | | 0.66 | % | | | 0.55 | % | | | 0.84 | % | | | N/A | |
| $ | 1.00 | | | | 2.65 | % | | $ | 161,232 | | | | 0.49 | % | | | 2.64 | % | | | 0.49 | % | | | 0.83 | % | | | N/A | |
| $ | 1.00 | | | | 4.95 | % | | $ | 195,479 | | | | 0.48 | % | | | 4.83 | % | | | 0.48 | % | | | 0.84 | % | | | N/A | |
| |
| $ | 1.00 | | | | 0.08 | % | | $ | 95,426 | | | | 0.22 | % | | | 0.17 | % | | | 0.22 | % | | | 0.63 | % | | | N/A | |
| $ | 1.00 | | | | 0.20 | % | | $ | 23,231 | | | | 0.21 | % | | | 0.20 | % | | | 0.21 | % | | | 0.71 | % | | | N/A | |
| $ | 1.00 | | | | 0.28 | % | | $ | 33,584 | | | | 0.29 | % | | | 0.29 | % | | | 0.29 | % | | | 0.68 | % | | | N/A | |
| $ | 1.00 | | | | 0.75 | % | | $ | 46,249 | | | | 0.43 | % | | | 0.83 | % | | | 0.43 | % | | | 0.67 | % | | | N/A | |
| $ | 1.00 | | | | 2.79 | % | | $ | 77,294 | | | | 0.37 | % | | | 2.55 | % | | | 0.37 | % | | | 0.68 | % | | | N/A | |
| $ | 1.00 | | | | 5.09 | % | | $ | 20,333 | | | | 0.34 | % | | | 4.98 | % | | | 0.34 | % | | | 0.67 | % | | | N/A | |
| 5 | Except for The Money Market Fund, net investment income per share is based on average shares outstanding during the period. |
| * | Commenced Operations June 30, 2011 |
| ** | Actual amounts were less than one-half of a cent per share |
The accompanying notes are integral part of these financial statements.
| | 2012 Semi-Annual Report | June 30, 2012 |
Notes to Financial Statements June 30, 2012 (unaudited) |
1. Organization and Significant Accounting Policies
The Flex-funds® Trust (the “Trust”) was organized in 1982 and is registered under the Investment Company Act of 1940, as amended (the “1940 Act”), as a diversified, open-end management investment company. The Trust offers nine separate series and is presently comprised of nine separate funds as follows: The Muirfield Fund® (“Muirfield”), The Dynamic Growth Fund (“Dynamic”), The Aggressive Growth Fund (“Aggressive”), The Balanced Fund (f.k.a. The Defensive Balanced Fund)(“Balanced”)(please see second paragraph of Note #1 for more information), The Strategic Growth Fund (“Strategic”), The Quantex Fund™ (“Quantex”), The Utilities and Infrastructure Fund, The Total Return Bond Fund (“Total Bond”), and The Money Market Fund (“Money Market”) (each a “Fund” and collectively the “Funds”). Money Market offers two classes of shares (the Retail Class (“Retail Class”) and the Institutional Class (“Institutional Class”)). Each class of shares has equal rights as to earnings and assets except that each class bears different distribution and transfer agent expenses. The investment objective of Muirfield, Dynamic, Aggressive, and Strategic is growth of capital. The investment objective of Balanced is growth of capital, with current income usually of secondary importance. The investment objective of Quantex is long term capital appreciation. The investment objective of Utilities is total returns, including current income and growth of income. The investment objective of Total Bond is total returns, including current income and capital growth. The investment objective of Money Market is current income while maintaining a stable share price of $1.00.
Effective April 30, 2012, the Board of Trustees (“Trustees”), including a majority of non-interested or independent Trustees, approved the change of name of The Defensive Balanced Fund to The Balanced Fund. The investment strategy remains the same with an investment objective seeking growth of capital, with current income usually of secondary importance.
Use of estimates. The preparation of financial statements in conformity with accounting principles generally accepted in the United States of America (“GAAP”) requires management to make estimates and assumptions that affect the reported amounts of assets and liabilities and disclosure of contingent assets and liabilities at the date of the financial statements and the reported amounts of increases and decreases in net assets from operations during the reporting period. Actual results could differ from those estimates.
Security valuation. All investments in securities are recorded at their estimated fair value, as described in Note #2.
Repurchase agreements. Each Fund may engage in repurchase agreement transactions whereby the Fund takes possession of an underlying debt instrument subject to an obligation of the seller to repurchase the instrument from the Fund and an obligation of the Fund to resell the instrument at an agreed upon price and term. At all times, the Fund maintains the value of collateral, including accrued interest, of at least 100% of the amount of the repurchase agreement, plus accrued interest. If the seller defaults or if the fair value of the collateral declines, realization of the collateral by the Fund may be delayed or limited.
Futures & options. Each Fund, except Money Market, may engage in transactions in financial futures contracts and options contracts in order to manage the risk of unanticipated changes in market values of securities held in the Fund, or which it intends to purchase. The futures and options contracts are adjusted by the daily exchange rate of the underlying currency, or index, and any gains or losses are recorded for financial statement purposes as unrealized gains or losses in the statement of assets and liabilities and the statement of operations until the contract settlement date, at which time realized gains and losses are included in the statement of operations.
To the extent that the Fund enters into futures contracts on an index or group of securities, the Fund exposes itself to an indeterminate liability and will be required to pay or receive a sum of money measured by the change in the value of the index. Upon entering into a futures contract, the Fund is required to deposit an initial margin, which is either cash (disclosed as cash held at broker on the Statements of Assets & Liabilities) or securities (disclosed as pledged as collateral on the Schedules of Investments) in an amount equal to a certain percentage of the contract value. Subsequently, the variation margin, which is equal to changes in the daily settlement price or last sale price on the exchanges where futures contracts trade, is received or paid and is recorded as an unrealized gain or loss until the contract is closed. When the contract is closed, the Fund records a realized gain or loss equal to the difference between the proceeds from (or cost of) the closing transaction and the Fund’s basis in the contract. Should market conditions move unexpectedly, the Fund may not achieve the anticipated benefits of the futures contract and may realize a loss. The use of futures transactions involves the risk of imperfect correlation in movements in the price of futures contracts, interest rates, and the underlying hedged assets. With futures, there is minimal counterparty credit risk to the Fund since futures are exchange traded and the exchange’s clearinghouse, as counterparty to all exchange traded futures, guarantees the futures against default. Except for Money Market and Utilities, it is normal practice for each Fund to invest in futures contracts on a daily basis. Although Utilities is permitted to invest in futures contracts, it typically does not.
| | 2012 Semi-Annual Report | June 30, 2012 |
Call and put option contracts involve the payment of a premium for the right to purchase or sell an individual security or index aggregate at a specified price until the expiration of the contract. Such transactions expose the Fund to the loss of the premium paid if the Fund does not sell or exercise the contract prior to the expiration date. In the case of a call option, sufficient cash or money market instruments will be segregated to complete the purchase. Options are valued on the basis of the daily settlement price or last sale on the exchanges where they trade and the changes in value are recorded as unrealized appreciation or depreciation until closed, exercised or expired. For the six months ended June 30, 2012, there were no call or put options transacted for any of the Funds.
The Funds may write covered call or put options for which premiums received are recorded as liabilities and are subsequently adjusted to the current value of the options written. When written options are closed or exercised, premiums received are offset against the proceeds paid, and the Fund records realized gains or losses for the difference. When written options expire, the liability is eliminated, and the Fund records realized gains for the entire amount of premiums received. Although permitted, it is currently not normal practice for the Funds to write call and put options and none were written during the six months ended June 30, 2012.
The fair value of derivative instruments, not accounted for as hedging instruments, as reported within the Statements of Assets and Liabilities as of June 30, 2012 was as follows:
| Amount of Net Variation Margin and Unrealized Appreciation (Depreciation) on Derivatives | |
| | | | | | | | | |
| | | Statements of Assets & Liabilities Location* | | Fair Value
of Variation
Margin | | | Fair Value of Unrealized Appreciation | |
The Muirfield Fund® | Equity contracts | Assets, Receivable for net variation margin on futures contracts; Net Assets, Net unrealized appreciation of investments and futures contracts | | $ | 874,040 | | | $ | 956,150 | |
| The Dynamic Growth Fund | Equity contracts | Assets, Receivable for net variation margin on futures contracts; Net Assets, Net unrealized appreciation of investments and futures contracts | | | 835,980 | | | | 908,370 | |
| The Aggressive Growth Fund | Equity contracts | Assets, Receivable for net variation margin on futures contracts; Net Assets, Net unrealized appreciation of investments and futures contracts | | | 312,200 | | | | 338,198 | |
| The Balanced Fund | Equity contracts | Assets, Receivable for net variation margin on futures contracts; Net Assets, Net unrealized appreciation of investments and futures contracts | | | 515,740 | | | | 563,205 | |
| The Strategic Growth Fund | Equity contracts | Assets, Receivable for net variation margin on futures contracts; Net Assets, Net unrealized appreciation of investments and futures contracts | | | 419,240 | | | | 405,593 | |
| The Quantex Fund™ | Equity contracts | Assets, Receivable for net variation margin on futures contracts; Net Assets, Net unrealized appreciation of investments and futures contracts | | | 18,760 | | | | 16,258 | |
| * | Unrealized appreciation on futures contracts is included with unrealized appreciation (depreciation) of investments on the Statements of Assets & Liabilities. |
| | 2012 Semi-Annual Report | June 30, 2012 |
The effect of derivative instruments on the Statements of Operations for the period January 1, 2012 through June 30, 2012 was as follows:
| Amount of Realized Gain on Derivatives Recognized in Income | |
| | | | | | | | | | | | |
| | | | Contracts
Opened
During
the Year | | | Contracts
Closed
During
the Year | | Statement of
Operations Location | | For the Six Months
Ended June 30, 2012 | |
The Muirfield Fund® | Equity contracts | | | 531 | | | | 417 | | Net realized gains (losses) from futures contracts | | $ | 1,887,075 | |
| The Dynamic Growth Fund | Equity contracts | | | 431 | | | | 317 | | Net realized gains (losses) from futures contracts | | | 1,475,222 | |
| The Aggressive Growth Fund | Equity contracts | | | 165 | | | | 120 | | Net realized gains (losses) from futures contracts | | | 330,683 | |
| The Balanced Fund | Equity contracts | | | 452 | | | | 385 | | Net realized gains (losses) from futures contracts | | | 411,538 | |
| The Strategic Growth Fund | Equity contracts | | | 388 | | | | 287 | | Net realized gains (losses) from futures contracts | | | 697,676 | |
| The Quantex Fund™ | Equity contracts | | | 16 | | | | 11 | | Net realized gains (losses) from futures contracts | | | 92,691 | |
| The Total Return Bond Fund | US Treasury Bond contracts | | | 205 | | | | 235 | | Net realized gains (losses) from futures contracts | | | (401,809 | ) |
| Change in Unrealized Gain or (Loss) on Derivatives Recognized in Income | |
| | | | | | |
| | | Statement of Operations Location | | For the Six Months
Ended June 30, 2012 | |
The Muirfield Fund® | Equity contracts | Net change in unrealized appreciation (depreciation) of investments and futures contracts | | $ | 865,510 | |
| The Dynamic Growth Fund | Equity contracts | Net change in unrealized appreciation (depreciation) of investments and futures contracts | | | 832,025 | |
| The Aggressive Growth Fund | Equity contracts | Net change in unrealized appreciation (depreciation) of investments and futures contracts | | | 315,538 | |
| The Balanced Fund | Equity contracts | Net change in unrealized appreciation (depreciation) of investments and futures contracts | | | 495,225 | |
| The Strategic Growth Fund | Equity contracts | Net change in unrealized appreciation (depreciation) of investments and futures contracts | | | 264,383 | |
| The Quantex Fund™ | Equity contracts | Net change in unrealized appreciation (depreciation) of investments and futures contracts | | | (20,527 | ) |
| The Total Return Bond Fund | US Treasury Bond contracts | Net change in unrealized appreciation (depreciation) of investments and futures contracts | | | (17,588 | ) |
Federal income taxes. It is each Fund’s policy to continue to comply with the requirements of Subchapter M of the Internal Revenue Code applicable to regulated investment companies and to distribute substantially all of its taxable income and net capital gains to its shareholders. Therefore, no federal income tax provision is required.
As of and during the six months ended June 30, 2012, the Funds did not have a liability for any unrecognized tax benefits. The Funds recognize interest and penalties, if any, related to unrecognized tax benefits as income tax expense in the statements of operations. During the six months ended June 30, 2012, the Funds did not incur any interest or penalties.
| | 2012 Semi-Annual Report | June 30, 2012 |
The Funds are not subject to examination by U.S. federal and state tax authorities for tax years before 2008.
Distributions to shareholders. Distributions to shareholders are recorded on the ex-dividend date. Muirfield, Quantex, Dynamic, Aggressive, Balanced, and Strategic declare and pay dividends from net investment income, if any, on a quarterly basis. Utilities and Total Bond declare and pay dividends from net investment income on a monthly basis. Money Market declares dividends from net investment income on a daily basis and pays such dividends on a monthly basis. Each Fund distributes net capital gains, if any, on an annual basis.
Distributions from net investment income and from net capital gains are determined in accordance with income tax regulations, which may differ from GAAP. These differences are primarily due to deferrals of certain losses, expiring capital loss carryforwards, and differing treatments of unrealized gains and losses of futures contracts held by each Fund. Accordingly, timing differences relating to shareholder distributions are reflected in the components of net assets and permanent book and tax differences have been reclassified within the components of net assets based on their ultimate characterization for federal income tax purposes. For the year ended December 31, 2011, the Funds made the following reclassifications to increase/(decrease) the components of net assets:
| | | | | | Accumulated Undistributed (Distributions in Excess of) Net Investment Income | | | Accumulated Undistributed Net Realized Gain (Loss) from Investments and Futures Contracts | |
The Muirfield Fund® | | $ | (134,080 | ) | | $ | 134,080 | | | $ | — | |
| The Dynamic Growth Fund | | | (75,334 | ) | | | 75,334 | | | | — | |
| The Aggressive Growth Fund | | | (291,584 | ) | | | 291,584 | | | | — | |
| The Strategic Growth Fund | | | (305,636 | ) | | | 305,636 | | | | — | |
| The Quantex Fund™ | | | (3,773 | ) | | | 3,773 | | | | — | |
| The Utilities & Infrastructure Fund | | | (250,770 | ) | | | 223,498 | | | | 27,272 | |
Investment income & expenses. For Money Market, income and expenses (other than expenses attributable to a specific class) are allocated to each class of shares based on its relative net assets. Expenses incurred by the Trust that do not specifically relate to an individual Fund of the Trust are allocated to the Funds based on each Fund’s relative net assets or other appropriate basis.
Capital Share Transactions. Money Market is authorized to issue an unlimited number of shares in the Retail Class and the Institutional Class. Transactions in the capital shares of the Fund for the six months ended June 30, 2012 and the year ended December 31, 2011 were as follows:
| | | | | | | |
| | | | | | | | | | | | | |
| Retail Class | | | | | | | | | | | | |
| Issued | | $ | 43,652,563 | | | | 43,652,563 | | | $ | 96,538,959 | | | | 96,538,959 | |
| Reinvested | | | 37,206 | | | | 37,206 | | | | 97,230 | | | | 97,230 | |
| Redeemed | | | (47,029,670 | ) | | | (47,029,670 | ) | | | (113,821,031 | ) | | | (113,821,031 | ) |
| Net increase (decrease) | | $ | (3,339,901 | ) | | | (3,339,901 | ) | | $ | (17,184,842 | ) | | | (17,184,842 | ) |
| | | | | | | | | | | | | | | | | |
| Institutional Class | | | | | | | | | | | | | | | | |
| Issued | | $ | 301,651,634 | | | | 301,651,634 | | | $ | 277,390,969 | | | | 277,390,969 | |
| Reinvested | | | 6,754 | | | | 6,754 | | | | 17,560 | | | | 17,560 | |
| Redeemed | | | (229,463,941 | ) | | | (229,463,941 | ) | | | (287,761,187 | ) | | | (287,761,187 | ) |
| Net increase (decrease) | | $ | 72,194,447 | | | | 72,194,447 | | | $ | (10,352,658 | ) | | | (10,352,658 | ) |
| | 2012 Semi-Annual Report | June 30, 2012 |
Other. The Funds record security transactions on the trade date. Gains and losses realized from the sale of securities are determined on the specific identification basis. Dividend income is recognized on the ex-dividend date and interest income (including amortization of premium and accretion of discount) is recognized as earned. Short-term capital gain distributions from underlying funds are classified as dividend income for financial reporting purposes. Long-term capital gains are broken out as such. Discounts and premiums are amortized over the lives of the respective securities. Distributions received from partnerships are recorded as return of capital distributions. Withholding taxes on foreign dividends have been provided for in accordance with the Funds’ understanding of the applicable country’s tax rules and rates.
2. Securities Valuations
As described in Note #1, the Funds utilize various methods to measure the fair value of their investments on a recurring basis. GAAP establishes a hierarchy that prioritizes inputs to valuation methods. The three levels of inputs are as follows:
Level 1 – Unadjusted quoted prices in active markets for identical assets or liabilities that the Funds have the ability to access.
Level 2 – Observable inputs other than quoted prices included in level 1 that are observable for the asset or liability, either directly or indirectly. These inputs may include quoted prices for the identical instrument on an inactive market, prices for similar instruments, interest rates, prepayment speeds, credit risk, yield curves, default rates and similar data.
Level 3 – Significant unobservable inputs for the asset or liability, to the extent relevant observable inputs are not available, representing the Funds’ own assumptions about the assumptions a market participant would use in valuing the asset or liability, and would be based on the best information available.
The availability of observable inputs can vary from security to security and is affected by a wide variety of factors, including, for example, the type of security, whether the security is new and not yet established in the marketplace, the liquidity of markets, and other characteristics particular to the security. To the extent that valuation is based on models or inputs that are less observable or unobservable in the market, the determination of fair value requires more judgment. Accordingly, the degree of judgment exercised in determining fair value is greatest for instruments categorized in level 3.
The inputs used to measure fair value may fall into different levels of the fair value hierarchy. In such cases, for disclosure purposes, the level in the fair value hierarchy within which the fair value measurement falls in its entirety, is determined based on the lowest level input that is significant to the fair value measurement in its entirety.
A description of the valuation techniques applied to the Funds’ major categories of assets and liabilities measured at fair value on a recurring basis follows.
Equity securities (including publicly traded partnerships, real estate investment trusts, american depositary receipts, exchange traded funds, and common stock). Securities traded on a national securities exchange (or reported on the NASDAQ national market) are stated at the last reported sales price on the day of valuation and are categorized in level 1 of the fair value hierarchy.
Investments in registered open-end investment companies, including money market funds, are valued at the daily redemption value as reported by the underlying fund and are categorized in level 1 of the fair value hierarchy.
Corporate bonds. The fair value of corporate bonds is estimated using various techniques, which may consider recently executed transactions in securities of the issuer or comparable issuers, market price quotations (where observable), bond spreads, fundamental data relating to the issuer, and credit default swap spreads adjusted for any basis difference between cash and derivative instruments. While most corporate bonds are categorized in level 2 of the fair value hierarchy, in instances where lower relative weight is placed on transaction prices, quotations, or similar observable inputs, they are categorized in level 3.
Short-term notes (including bank obligations, commercial paper, corporate obligations, U.S. government agency obligations, and floating rate demand notes). Short-term notes held in the Funds, except Money Market, maturing more than sixty days after the valuation date, are valued at the last sales price as of the close of business on the day of valuation, or, lacking any sales, at the most recent bid price or yield equivalent as obtained from dealers that make markets in such securities. When valued at last sales price, the securities will be categorized as level 1. When using bid prices or yield equivalents, they will be categorized as level 2. When such securities are valued within sixty days or less to maturity, the difference between the valuation existing on the sixty-first day before maturity and maturity value is amortized on a straight-line basis to maturity and will be categorized as level 2.
| | 2012 Semi-Annual Report | June 30, 2012 |
All securities held in Money Market, other than money market funds, are valued at amortized cost, which approximates fair value, and will be categorized as level 2.
Certificates of deposit. Certificates of deposit are valued at acquisition cost and will be categorized as level 2.
U.S. government obligations. U.S. government obligations are normally valued using a model that incorporates market observable data such as reported sales of similar securities, broker quotes, yields, bids, offers, and reference data. Certain securities are valued principally using dealer quotations. In either case, these securities will be categorized as level 2.
Restricted securities (equity and debt). Restricted securities for which quotations are not readily available are valued at fair value as determined by the Trustees. Depending on the relative significance of valuation inputs, these instruments may be classified in either level 2 or level 3 of the fair value hierarchy.
Derivative instruments (futures contracts). Listed derivative instruments that are actively traded, including futures contracts, are valued based on quoted prices from the exchange and are categorized in level 1 of the fair value hierarchy.
For the six months ended June 30, 2012, the Funds did not hold any assets at any time in which significant unobservable inputs were used in determining fair value. Therefore, no reconciliation of level 3 securities is provided. Also, there were no significant transfers between level 1 and level 2 securities. The following table summarizes the inputs used to value the Funds’ assets and liabilities measured at fair value as of June 30, 2012.
Muirfield – Assets/(Liabilities) | | | | | | | | | | | | | |
Registered investment companies | | | $ | 68,533,119 | | | $ | — | | | $ | — | | | $ | 68,533,119 | |
Money market registered investment companies | | | | 23,827,920 | | | | — | | | | — | | | | 23,827,920 | |
Bank obligations | | | | — | | | | 5,004,521 | | | | — | | | | 5,004,521 | |
Floating rate demand notes | | | | — | | | | 12,621,905 | | | | — | | | | 12,621,905 | |
U.S. government obligations | | | | — | | | | 3,499,566 | | | | — | | | | 3,499,566 | |
Total | | | $ | 92,361,039 | | | $ | 21,125,992 | | | $ | — | | | $ | 113,487,031 | |
Trustee deferred compensation | | | $ | 131,655 | | | $ | — | | | $ | — | | | $ | 131,655 | |
Futures contracts* | | | $ | 956,150 | | | $ | — | | | $ | — | | | $ | 956,150 | |
Dynamic – Assets/(Liabilities) | | | | | | | | | | | | | |
Registered investment companies | | | $ | 57,537,288 | | | $ | — | | | $ | — | | | $ | 57,537,288 | |
Money market registered investment companies | | | | 22,861,445 | | | | — | | | | — | | | | 22,861,445 | |
Bank obligations | | | | — | | | | 5,004,521 | | | | — | | | | 5,004,521 | |
Floating rate demand notes | | | | — | | | | 1,812,063 | | | | — | | | | 1,812,063 | |
U.S. government obligations | | | | — | | | | 2,999,628 | | | | — | | | | 2,999,628 | |
Total | | | $ | 80,398,733 | | | $ | 9,816,212 | | | $ | — | | | $ | 90,214,945 | |
Trustee deferred compensation | | | $ | 72,788 | | | $ | — | | | $ | — | | | $ | 72,788 | |
Futures contracts* | | | $ | 908,370 | | | $ | — | | | $ | — | | | $ | 908,370 | |
Aggressive – Assets/(Liabilities) | | | | | | | | | | | | | |
Registered investment companies | | | $ | 18,367,311 | | | $ | — | | | $ | — | | | $ | 18,367,311 | |
Money market registered investment companies | | | | 6,008,908 | | | | — | | | | — | | | | 6,008,908 | |
Bank obligations | | | | — | | | | 5,004,521 | | | | — | | | | 5,004,521 | |
Floating rate demand notes | | | | — | | | | 200,669 | | | | — | | | | 200,669 | |
U.S. government obligations | | | | — | | | | 1,499,814 | | | | — | | | | 1,499,814 | |
Total | | | $ | 24,376,219 | | | $ | 6,705,004 | | | $ | — | | | $ | 31,081,223 | |
Trustee deferred compensation | | | $ | 42,543 | | | $ | — | | | $ | — | | | $ | 42,543 | |
Futures contracts* | | | $ | 338,198 | | | $ | — | | | $ | — | | | $ | 338,198 | |
| | 2012 Semi-Annual Report | June 30, 2012 |
Balanced – Assets/(Liabilities) | | | | | | | | | | | | | |
Registered investment companies | | | $ | 60,094,557 | | | $ | — | | | $ | — | | | $ | 60,094,557 | |
Money market registered investment companies | | | | 16,463,885 | | | | — | | | | — | | | | 16,463,885 | |
Bank obligations | | | | — | | | | 5,004,521 | | | | — | | | | 5,004,521 | |
Floating rate demand notes | | | | — | | | | 5,551,599 | | | | — | | | | 5,551,599 | |
U.S. government obligations | | | | — | | | | 1,999,752 | | | | — | | | | 1,999,752 | |
Total | | | $ | 76,558,442 | | | $ | 12,555,872 | | | $ | — | | | $ | 89,114,314 | |
Trustee deferred compensation | | | $ | 53,614 | | | $ | — | | | $ | — | | | $ | 53,614 | |
Futures contracts* | | | $ | 563,205 | | | $ | — | | | $ | — | | | $ | 563,205 | |
Strategic – Assets/(Liabilities) | | | | | | | | | | | | | |
Registered investment companies | | | $ | 61,958,309 | | | $ | — | | | $ | — | | | $ | 61,958,309 | |
Money market registered investment companies | | | | 7,799,684 | | | | — | | | | — | | | | 7,799,684 | |
Bank obligations | | | | — | | | | 5,004,521 | | | | — | | | | 5,004,521 | |
Floating rate demand notes | | | | — | | | | 2,002,547 | | | | — | | | | 2,002,547 | |
U.S. government obligations | | | | — | | | | 1,999,752 | | | | — | | | | 1,999,752 | |
Total | | | $ | 69,757,993 | | | $ | 9,006,820 | | | $ | — | | | $ | 78,764,813 | |
Trustee deferred compensation | | | $ | 46,667 | | | $ | — | | | $ | — | | | $ | 46,667 | |
Futures contracts* | | | $ | 405,593 | | | $ | — | | | $ | — | | | $ | 405,593 | |
Quantex – Assets/(Liabilities) | | | | | | | | | | | | | |
Common stocks** | | | $ | 21,301,009 | | | $ | — | | | $ | — | | | $ | 21,301,009 | |
Money market registered investment companies | | | | 709,530 | | | | — | | | | — | | | | 709,530 | |
Floating rate demand notes | | | | — | | | | 86 | | | | — | | | | 86 | |
U.S. government obligations | | | | — | | | | 99,988 | | | | — | | | | 99,988 | |
Total | | | $ | 22,010,539 | | | $ | 100,074 | | | $ | — | | | $ | 22,110,613 | |
Trustee deferred compensation | | | $ | 47,409 | | | $ | — | | | $ | — | | | $ | 47,409 | |
Futures contracts* | | | $ | 16,258 | | | $ | — | | | $ | — | | | $ | 16,258 | |
Utilities – Assets/(Liabilities) | | | | | | | | | | | | | |
Common stocks** | | | $ | 30,627,145 | | | $ | — | | | $ | — | | | $ | 30,627,145 | |
Money market registered investment companies | | | | 1,009,813 | | | | — | | | | — | | | | 1,009,813 | |
Total | | | $ | 31,636,958 | | | $ | — | | | $ | — | | | $ | 31,636,958 | |
Trustee deferred compensation | | | $ | 46,403 | | | $ | — | | | $ | — | | | $ | 46,403 | |
Total Bond – Assets/(Liabilities) | | | | | | | | | | | | | |
Registered investment companies | | | $ | 68,652,181 | | | $ | — | | | $ | — | | | $ | 68,652,181 | |
Money market registered investment companies | | | | 614,726 | | | | — | | | | — | | | | 614,726 | |
U.S. government obligations | | | | — | | | | 139,778 | | | | — | | | | 139,778 | |
Total | | | $ | 69,266,907 | | | $ | 139,778 | | | $ | — | | | $ | 69,406,685 | |
Trustee deferred compensation | | | $ | 7,863 | | | $ | — | | | $ | — | | | $ | 7,863 | |
| | 2012 Semi-Annual Report | June 30, 2012 |
Money Market – Assets/(Liabilities) | | | | | | | | | | | | | |
Bank obligations | | | $ | — | | | $ | 11,763,023 | | | $ | — | | | $ | 11,763,023 | |
Certificates of deposit | | | | — | | | | 5,477,000 | | | | — | | | | 5,477,000 | |
Commercial paper | | | | — | | | | 11,343,789 | | | | — | | | | 11,343,789 | |
Corporate obligations | | | | — | | | | 74,300,908 | | | | — | | | | 74,300,908 | |
U.S. government agency obligations | | | | — | | | | 14,736,070 | | | | — | | | | 14,736,070 | |
Money Market registered investment companies | | | | 53,129,025 | | | | — | | | | — | | | | 53,129,025 | |
Total | | | $ | 53,129,025 | | | $ | 117,620,790 | | | $ | — | | | $ | 170,749,815 | |
Trustee deferred compensation | | | $ | 40,587 | | | $ | — | | | $ | — | | | $ | 40,587 | |
| * | Futures contracts include cumulative unrealized gain/loss on contracts open at June 30, 2012. |
| ** | See schedule of investments for industry classifications. |
3. Investment Transactions
For the six months ended June 30, 2012, the cost of purchases and proceeds from sales or maturities of long-term investments for the Funds, including U.S. Government investments, were as follows:
| | | | | | | |
The Muirfield Fund® | | $ | 67,160,520 | | | $ | 111,340,504 | |
The Dynamic Growth Fund | | | 57,509,349 | | | | 93,484,598 | |
The Aggressive Growth Fund | | | 17,079,192 | | | | 31,853,227 | |
The Balanced Fund | | | 73,396,844 | | | | 98,676,814 | |
The Strategic Growth Fund | | | 41,450,126 | | | | 63,247,983 | |
The Quantex Fund™ | | | 9,956,908 | | | | 5,459,743 | |
The Utilities & Infrastructure Fund | | | 4,883,799 | | | | 5,147,990 | |
The Total Return Bond Fund | | | 84,047,357 | | | | 71,496,418 | |
For the six months ended June 30, 2012, the cost of purchases and proceeds from sales or maturities of long-term U.S. Government investments for the Funds are as follows:
| | | | | | | |
The Balanced Fund | | $ | 3,354,400 | | | $ | 5,623,790 | |
The Total Return Bond Fund | | | — | | | | 5,544,210 | |
4. Investment Advisory Fees and Other Transactions with Affiliates
Meeder Asset Management, Inc. (“MAM”), a wholly-owned subsidiary of Meeder Financial, Inc. (“Meeder”), provides each Fund, under a separate Investment Advisory Contract, with investment management, research, statistical and advisory services. The services of MAM will terminate automatically if assigned and may be terminated without penalty at any time upon 60 days prior written notice by majority vote of the Fund, by the Trustees of the Fund, or by MAM. For such services the Funds pay a fee at the following annual rates:
| | 2012 Semi-Annual Report | June 30, 2012 |
| | Percentage of Average Daily Net Assets up to $50 Million | Percentage of Average Daily Net Assets Exceeding $50 Million up to $100 Million | Percentage of Average Daily Net Assets up to $100 Million | Percentage of Average Daily Net Assets up to $200 Million | Percentage of Average Daily Net Assets Exceeding $100 Million | Percentage of Average Daily Net Assets Exceeding $200 Million |
| Muirfield | 1.00% | 0.75% | N/A | N/A | 0.60% | N/A |
| Quantex* | 1.00% | 0.75% | N/A | N/A | 0.60% | N/A |
| Utilities** | 1.00% | 0.75% | N/A | N/A | 0.60% | N/A |
| Dynamic | N/A | N/A | N/A | 0.75% | N/A | 0.60% |
| Aggressive | N/A | N/A | N/A | 0.75% | N/A | 0.60% |
| Balanced | N/A | N/A | N/A | 0.75% | N/A | 0.60% |
| Strategic | N/A | N/A | N/A | 0.75% | N/A | 0.60% |
| Total Bond | N/A | N/A | 0.40% | N/A | 0.20% | N/A |
| Money Market*** | N/A | N/A | 0.40% | N/A | 0.25% | N/A |
| * | MAM has contractually agreed to reduce its investment advisory fee by 0.25% for Quantex for average daily net assets up to $50 million. The foregoing reduction in investment advisory fees shall automatically renew annually on or about April 30th, unless MAM elects to terminate this reduction. During the six months ended June 30, 2012, $25,868 of investment advisory fees was waived in Quantex. |
| ** | Under a separate Investment Subadvisory Agreement with MAM, Miller/Howard Investments, Inc. (“Miller/Howard”) serves as subadvisor of Utilities. The Investment Subadvisory Agreement provides that it will terminate automatically if assigned, and that it may be terminated by MAM without penalty to the Fund by MAM, the Trustees of the Fund, or by the vote of a majority of the outstanding voting securities of the Fund upon not less than 30 days written notice. As subadvisor to Utilities, Miller/Howard receives a fee paid by MAM. |
| *** | During the six months ended June 30, 2012, MAM voluntarily agreed to reduce $20,284 of investment advisory fees in Money Market. |
Mutual Funds Service Co. (“MFSCo”), a wholly-owned subsidiary of Meeder, serves as stock transfer, dividend disbursing and shareholder services agent for each Fund. In compensation for such services, each Fund pays MFSCo an annual fee equal to the greater of the following:
| | | | | | Amount
Per Active Shareholder Account | | | Percentage of Average Daily
Net Assets | |
| Muirfield | | $ | 4,000 | | | $ | 15 | | | | 0.12% | |
| Quantex | | | 4,000 | | | | 15 | | | | 0.12% | |
| Utilities | | | 4,000 | | | | 15 | | | | 0.12% | |
| Dynamic | | | 4,000 | | | | 15 | | | | 0.12% | |
| Aggressive | | | 4,000 | | | | 15 | | | | 0.12% | |
| Balanced | | | 4,000 | | | | 15 | | | | 0.12% | |
| Strategic | | | 4,000 | | | | 15 | | | | 0.12% | |
| Total Bond | | | 4,000 | | | | 15 | | | | 0.08% | |
| Retail Class | | | 4,000 | | | | 20 | | | | 0.08% | |
| Institutional Class | | | 4,000 | | | | 20 | | | | 0.08% | |
| | 2012 Semi-Annual Report | June 30, 2012 |
For fixed income Funds that are subject to an expense cap and which are above the voluntary expense cap, the basis point fee will be reduced by 0.02%. During the six months ended June 30, 2012, MFSCo waived $6,268 and $24,538 of transfer agent fees for Total Bond and the Institutional Class, respectively.
MFSCo provides the Trust with certain administrative services. In compensation for such services, each Fund pays MFSCo at the following annual rates:
| | | Percentage of Average Daily
Net Assets up
to $50 Million | | | Percentage of Average Daily Net Assets Exceeding $50 Million | |
| Muirfield | | | 0.10% | | | | 0.08% | |
| Quantex | | | 0.10% | | | | 0.08% | |
| Utilities | | | 0.10% | | | | 0.08% | |
| Dynamic | | | 0.10% | | | | 0.08% | |
| Aggressive | | | 0.10% | | | | 0.08% | |
| Balanced | | | 0.10% | | | | 0.08% | |
| Strategic | | | 0.10% | | | | 0.08% | |
| Total Bond | | | 0.10% | | | | 0.08% | |
| Money Market | | | 0.10% | | | | 0.08% | |
MFSCo serves as accounting services agent for each Fund. In compensation for such services, each Fund pays MFSCo an annual fee equal to the greater of a minimum fee or at a rate based on the percentage of average daily net assets. The annual rates are as follows:
| | | | | | Percentage of Average Daily Net Assets up to $10 Million | | | Percentage of Average Daily Net Assets Exceeding $10 Million up to $30 Million | | | Percentage of Average Daily Net Assets Exceeding $30 Million up to $80 Million | | | Percentage of Average Daily Net Assets Exceeding $80 Million | |
| Muirfield | | $ | 7,500 | | | | 0.15% | | | | 0.10% | | | | 0.02% | | | | 0.01% | |
| Quantex | | | 7,500 | | | | 0.15% | | | | 0.10% | | | | 0.02% | | | | 0.01% | |
| Utilities | | | 7,500 | | | | 0.15% | | | | 0.10% | | | | 0.02% | | | | 0.01% | |
| Dynamic | | | 7,500 | | | | 0.15% | | | | 0.10% | | | | 0.02% | | | | 0.01% | |
| Aggressive | | | 7,500 | | | | 0.15% | | | | 0.10% | | | | 0.02% | | | | 0.01% | |
| Balanced | | | 7,500 | | | | 0.15% | | | | 0.10% | | | | 0.02% | | | | 0.01% | |
| Strategic | | | 7,500 | | | | 0.15% | | | | 0.10% | | | | 0.02% | | | | 0.01% | |
| Total Bond | | | 7,500 | | | | 0.15% | | | | 0.10% | | | | 0.02% | | | | 0.01% | |
| Money Market | | | 30,000 | | | | 0.15% | | | | 0.10% | | | | 0.02% | | | | 0.01% | |
For the six months ended June 30, 2012, MAM voluntarily agreed to reduce its fees and/or reimburse expenses (excluding brokerage fees and commissions, taxes, interest, and extraordinary or non-recurring expenses), to limit the total annual operating expenses of certain Funds. Such reductions and/or reimbursements are limited to the total of fees charged to each Fund or Class by MAM and MFSCo. For the six months ended June 30, 2012, the annual operating expense limitations and amounts voluntarily reimbursed for each Fund are as follows:
| | 2012 Semi-Annual Report | June 30, 2012 |
| | | Annual Expense Limitation as a Percentage of Average Daily
Net Assets | | | Voluntary
Expense Reimbursements | |
Muirfield | | | 1.39% | | | $ | 56,430 | |
Dynamic | | | 1.39% | | | | 51,667 | |
Aggressive | | | 1.59% | | | | 14,794 | |
Balanced | | | 1.49% | | | | 21,954 | |
Strategic | | | 1.39% | | | | 56,051 | |
Total Bond | | | 0.99% | | | | 66,534 | |
Retail Class | | | 0.29% | | | | 119,392 | |
Institutional Class | | | 0.22% | | | | 159,130 | |
Certain Funds have entered into an agreement with the Trust’s custodian, The Huntington National Bank (“HNB”), whereby HNB receives distribution, service, and administration fees (collectively the “fees”) from the underlying security holdings of the Funds, and forwards those fees to the appropriate Funds. The Funds use the fees received to reduce the gross expenses of each Fund. It is possible that the Funds may invest in security holdings in which fees are not paid. As such, the gross expenses of a Fund would not be decreased. Also, without this agreement it is likely that the Funds would not collect any fees from underlying security holdings. For the six months ended June 30, 2012, gross expenses were reduced by the following amounts:
| | | Amount Received to Reduce Gross Expenses | |
| Muirfield | | $ | 20,966 | |
| Dynamic | | | 17,778 | |
| Aggressive | | | 3,071 | |
| Balanced | | | 12,485 | |
| Strategic | | | 12,831 | |
| Total Bond | | | 360 | |
Pursuant to Rule 12b-1 of the 1940 Act, a mutual fund can adopt a written plan to pay certain expenses out of fund assets relating to the sale and distribution of its shares. The annual adopted distribution plan limitations and the amounts waived for the six months ended June 30, 2012 are as follows:
| | | Maximum Annual Rule 12b-1 Plan Expense Limitations as a Percentage of Average Daily
Net Assets | | | | |
Muirfield | | | 0.20% | | | $ | 7,128 | |
Quantex | | | 0.20% | | | | 8,412 | |
Utilities | | | 0.25% | | | | 7,833 | |
Dynamic | | | 0.25% | | | | 8,906 | |
Aggressive | | | 0.25% | | | | 4,835 | |
Balanced | | | 0.25% | | | | 2,163 | |
Strategic | | | 0.25% | | | | 8,170 | |
Total Bond | | | 0.25% | | | | 5,416 | |
Retail Class | | | 0.20% | | | | 75,764 | |
Institutional Class | | | 0.03% | | | | 15,378 | |
| | 2012 Semi-Annual Report | June 30, 2012 |
An Administrative Services Plan has been adopted for each Fund of the Trust, except Money Market, to pay service organizations that provide administrative support services to their customers who own shares of record, or beneficially, of the Funds. The annual adopted administrative services plan limitations and the amounts waived for the six months ended June 30, 2012 are as follows:
| | | Maximum Annual Administrative Services Plan Expense Limitations as a Percentage of Average Daily
Net Assets | | | | |
Muirfield | | | 0.20% | | | $ | 27,322 | |
Quantex | | | 0.20% | | | | 14,091 | |
Utilities | | | 0.20% | | | | 11,031 | |
Dynamic | | | 0.20% | | | | 7,500 | |
Aggressive | | | 0.20% | | | | 4,835 | |
Balanced | | | 0.20% | | | | 2,163 | |
Strategic | | | 0.20% | | | | 5,160 | |
Total Bond | | | 0.20% | | | | 2,230 | |
The Funds have adopted a Deferred Compensation Plan (the “Plan”) for the independent Trustees. Under the Plan, each eligible Trustee is permitted to defer all or a portion of the trustees fees payable by any of the Funds as an investment into any combination of Funds until a specified point of time. The investment into the Funds is recorded as an asset however an offsetting liability is also recorded for the deferred payment. Once the eligible Trustees’ deferral amounts can be distributed, a lump sum or generally equal annual installments over a period of up to ten (10) years can be made to the eligible Trustee(s). The Funds may terminate this Plan at any time.
Certain trustees and officers of the Funds are also officers or directors of Meeder, MAM, and MFSCo.
During the six months ended June 30, 2012, several of the Funds invested in The Money Market Fund, an affiliate, as described in Section 2(a)(3) of the Investment Company Act of 1940. As of June 30, 2012, the 7-day yield of the Institutional Class was 0.17%. A summary of the Funds’ investments in this affiliate during the year is noted below:
| | | | | | | | | | | | | | | | | | | |
The Muirfield Fund® | | $ | 295,130 | | | $ | 79,779,703 | | | $ | (56,246,913 | ) | | $ | 23,827,920 | | | $ | 23,664 | | | $ | 23,827,920 | |
The Dynamic Growth Fund | | | 392,637 | | | | 66,153,123 | | | | (43,684,315 | ) | | | 22,861,445 | | | | 21,750 | | | | 22,861,445 | |
The Aggressive Growth Fund | | | 423,510 | | | | 29,154,130 | | | | (23,568,732 | ) | | | 6,008,908 | | | | 5,714 | | | | 6,008,908 | |
The Balanced Fund | | | 994,119 | | �� | | 71,290,518 | | | | (55,820,752 | ) | | | 16,463,885 | | | | 12,262 | | | | 16,463,885 | |
The Strategic Growth Fund | | | 1,437,882 | | | | 57,658,192 | | | | (51,296,390 | ) | | | 7,799,684 | | | | 7,349 | | | | 7,799,684 | |
The Quantex Fund™ | | | 323,007 | | | | 6,858,674 | | | | (6,472,151 | ) | | | 709,530 | | | | 384 | | | | 709,530 | |
The Utilities & Infrastructure Fund | | | 355,581 | | | | 3,597,561 | | | | (2,943,329 | ) | | | 1,009,813 | | | | 374 | | | | 1,009,813 | |
The Total Return Bond Fund | | | 1,420,475 | | | | 39,775,891 | | | | (40,581,640 | ) | | | 614,726 | | | | 1,625 | | | | 614,726 | |
| | 2012 Semi-Annual Report | June 30, 2012 |
5. Federal Tax Information
The tax characteristics of dividends paid by the Funds during the year ended December 31, 2011 were as follows:
| | | | | | Net Short-Term Capital Gains | | | Net Long-Term Capital Gains | | | | | | | |
The Muirfield Fund® | | $ | 173,017 | | | $ | — | | | $ | — | | | $ | — | | | $ | 173,017 | |
The Dynamic Growth Fund | | | 189 | | | | — | | | | — | | | | — | | | | 189 | |
The Aggressive Growth Fund | | | — | | | | — | | | | — | | | | — | | | | — | |
The Balanced Fund | | | 966,354 | | | | — | | | | — | | | | — | | | | 966,354 | |
The Strategic Growth Fund | | | 149 | | | | — | | | | — | | | | — | | | | 149 | |
The Quantex Fund™ | | | 5,745 | | | | — | | | | — | | | | — | | | | 5,745 | |
The Utilities & Infrastructure Fund | | | 480,205 | | | | — | | | | — | | | | — | | | | 480,205 | |
The Total Return Bond Fund | | | 1,038,809 | | | | — | | | | — | | | | — | | | | 1,038,809 | |
The Money Market Fund | | | 161,244 | | | | — | | | | — | | | | — | | | | 161,244 | |
The tax characteristics of dividends paid by the Funds during the year ended December 31, 2010 were as follows:
| | | | | | Net Short-Term Capital Gains | | | Net Long-Term Capital Gains | | | | | | | |
The Muirfield Fund® | | $ | 458,892 | | | $ | — | | | $ | — | | | $ | — | | | $ | 458,892 | |
The Dynamic Growth Fund | | | 198,567 | | | | — | | | | — | | | | — | | | | 198,567 | |
The Aggressive Growth Fund | | | — | | | | — | | | | — | | | | — | | | | — | |
The Balanced Fund | | | 792,255 | | | | — | | | | — | | | | — | | | | 792,255 | |
The Strategic Growth Fund | | | 198,274 | | | | — | | | | — | | | | — | | | | 198,274 | |
The Quantex Fund™ | | | 25 | | | | — | | | | — | | | | — | | | | 25 | |
The Utilities & Infrastructure Fund | | | 133,540 | | | | — | | | | — | | | | — | | | | 133,540 | |
The Money Market Fund | | | 330,246 | | | | — | | | | — | | | | — | | | | 330,246 | |
As of December 31, 2011, the components of accumulated earnings/(deficit) on a tax basis for the Funds were as follows:
| | | Undistributed Ordinary Income | | | | | | Accumulated Capital and Other Gains and (Losses) | | | Unrealized Appreciation/(Depreciation)** | | | Total Accumulated Earnings/(Deficit) | |
The Muirfield Fund® | | $ | 509 | | | $ | (509 | ) | | $ | (7,032,540 | ) | | $ | (1,882,701 | ) | | $ | (8,915,241 | ) |
The Dynamic Growth Fund | | | — | | | | — | | | | (10,299,112 | ) | | | (587,343 | ) | | | (10,886,455 | ) |
The Aggressive Growth Fund | | | — | | | | — | | | | (6,618,193 | ) | | | (992,258 | ) | | | (7,610,451 | ) |
The Balanced Fund | | | 805 | | | | (803 | ) | | | (4,802,814 | ) | | | (1,288,718 | ) | | | (6,091,530 | ) |
The Strategic Growth Fund | | | — | | | | — | | | | (3,017,822 | ) | | | (3,747,407 | ) | | | (6,765,229 | ) |
The Quantex Fund™ | | | 58 | | | | (58 | ) | | | (909,378 | ) | | | (601,689 | ) | | | (1,511,067 | ) |
The Utilities & Infrastructure Fund | | | 8,378 | | | | (7,511 | ) | | | 173,918 | | | | 2,026,043 | | | | 2,200,828 | |
The Total Return Bond Fund | | | — | | | | — | | | | (542,658 | ) | | | (989,951 | ) | | | (1,532,609 | ) |
The Money Market Fund | | | 3,084 | | | | (3,084 | ) | | | — | | | | — | | | | — | |
| * | Total dividends paid may differ from the amount reported in the Statement of Changes in Net Assets because for tax purposes dividends are recognized when actually paid. |
| ** | The differences between book- and tax-basis unrealized appreciation/(depreciation) are attributable primarily to: deferral of post October losses, wash sales, and the realization for tax purposes of unrealized gains/(losses) on certain derivative instruments. |
| | 2012 Semi-Annual Report | June 30, 2012 |
The Regulated Investment Company Modernization Act of 2010 (the “Act”) was enacted on December 22, 2010. The Act makes changes to several tax rules impacting the Funds. In general, some provisions of the Act, not including the changes to capital loss carryforwards, are effective for the Funds’ fiscal year ended December 31, 2011. Although the Act provides several benefits, including the unlimited carryover of future capital losses, there may be a greater likelihood that all or a portion of the Funds’ pre-enactment capital loss carryovers may expire without being utilized due to the fact that post-enactment capital losses get utilized before pre-enactment capital loss carryovers. Additionally, post Act losses that are carried forward will retain their character as either short-term or long-term capital loss carryovers rather than being considered all short-term as under previous law.
For federal income tax purposes, the following Funds have capital loss carryforwards as of December 31, 2011, which are available to offset future capital gains, if any. To the extent that these carryforwards are used to offset future capital gains, it is probable that the gains that are offset will not be distributed to shareholders:
Post Act Carryforwards (no expiration) | | | | | | | |
| The Strategic Growth Fund | | $ | 1,180,663 | | | | Short-term | |
| The Total Return Bond Fund | | | 542,658 | | | | Short-term | |
| | | | | | |
The Muirfield Fund® | | $ | 1,549,155 | | | | 2016 | |
The Muirfield Fund® | | | 5,483,385 | | | | 2017 | |
| The Dynamic Growth Fund | | | 10,299,112 | | | | 2017 | |
| The Aggressive Growth Fund | | | 3,263,651 | | | | 2016 | |
| The Aggressive Growth Fund | | | 3,354,542 | | | | 2017 | |
| The Balanced Fund | | | 3,888,973 | | | | 2016 | |
| The Balanced Fund | | | 913,841 | | | | 2017 | |
| The Strategic Growth Fund | | | 1,837,159 | | | | 2017 | |
| The Quantex Fund™ | | | 909,378 | | | | 2017 | |
Under current tax laws, Management has elected to defer net capital losses incurred after October 31, within a Fund’s fiscal year, and are deemed to arise on the first business day of the following fiscal year for tax purposes. For the year ended December 31, 2011, Total Bond deferred post October losses in the amount of $221,284.
6. Control Ownership
The beneficial ownership, either directly or indirectly, of more than 25% of the voting securities of a fund creates a presumption of control of the fund under Section 2(a)(9) of the 1940 Act. As of June 30, 2012, account holders that held more than 25% of the voting securities of the Funds and may be deemed to control the Funds are as follows:
| | | | Percent of Voting Securities |
The Muirfield Fund® | Nationwide Trust Company, FSB held for the benefit of others | | 52% |
| The Dynamic Growth Fund | Nationwide Trust Company, FSB held for the benefit of others | | 73% |
| The Aggressive Growth Fund | Nationwide Trust Company, FSB held for the benefit of others | | 66% |
| The Balanced Fund | Nationwide Trust Company, FSB held for the benefit of others | | 75% |
| The Strategic Growth Fund | Nationwide Trust Company, FSB held for the benefit of others | | 88% |
| The Quantex Fund™ | Nationwide Trust Company, FSB held for the benefit of others | | 27% |
| The Utilities & Infrastructure Fund | Charles Schwab & Co. held for the benefit of others | | 28% |
| The Total Return Bond Fund | Nationwide Life Insurance Company held for the benefit of others | | 78% |
| The Money Market Fund – Institutional Class | Carey & Co. held for the benefit of others | | 92% |
| | 2012 Semi-Annual Report | June 30, 2012 |
Trustees and Officers (unaudited)
Certain trustees and officers of the Funds are also officers or directors of Meeder, MAM, and MFSCo. The Trustees oversee the management of the Trust and elect its officers. The officers are responsible for the Funds’ day-to-day operations. The Trustees’ and officers’ names, addresses, years of birth, positions held with the Trust, and length of service with The Flex-funds are listed below. Also included is each Board member’s principal occupation during, at least, the past five years. Except as indicated, each individual has held the office shown or other offices in the same company for the last five years. Those Trustees who are “interested persons”, as defined in the 1940 Act, by virtue of their affiliation with the Trust, are indicated by an asterisk (*).
Name, Address1, and Year of Birth | Year First Elected a Trustee or Officer of the Trust | Position and Number of Funds Overseen2 | Principal Occupation During Past Five Years and Other Directorships Held |
Robert S. Meeder, Jr.* Year of Birth: 1961 | 1992 | Trustee and President | President of Meeder Asset Management, Inc. |
Jack W. Nicklaus** Year of Birth: 1961 | 1998 | Trustee | Designer, Nicklaus Design, a golf course design firm and division of The Nicklaus Companies. |
Stuart M. Allen** Year of Birth: 1961 | 2006 | Trustee | President of Gardiner Allen DeRoberts Insurance LLC, an insurance agency; Chairman of the Trust’s Audit Committee. |
Anthony D’Angelo** Year of Birth: 1959 | 2006 | Trustee | Director of Sales, WSYX ABC 6/WTTE Fox 28, television stations owned and operated by Sinclair Broadcast Group; Lead Trustee of the Trust. |
Dale W. Smith Year of Birth: 1959 | 2006 | Vice President | Chief Financial Officer of Meeder Asset Management, Inc. (2005 - present); formerly Senior Vice President of Financial Services of BISYS Fund Services (1996 – 2004). |
Mary “Maggie” Bull Year of Birth: 1966 | 2011 | Chief Compliance Officer | Chief Compliance Officer, Legal Counsel and Anti-Money Laundering Officer of the Funds (2011 – present); Independent Legal Consultant (2007 – 2010); Assistant General Counsel of Nationwide (2006 – 2007). |
Stephen E. Hoffman Year of Birth: 1964 | 2011 | Assistant Chief Compliance Officer | Director of Human Resources, Meeder Asset Management, Inc. (2011 – present); Chief Compliance Officer, Meeder Asset Management, Inc. (2011 – present); Financial Consultant for Beacon Hill Fund Services (2009 – present); Chief Financial Officer for Sanese Services (2006 – 2008). |
| | 2012 Semi-Annual Report | June 30, 2012 |
Name, Address1, and Year of Birth | Year First Elected a Trustee or Officer of the Trust | Position and Number of Funds Overseen2 | Principal Occupation During Past Five Years and Other Directorships Held |
Bruce E. McKibben Year of Birth: 1969 | 2002 | Treasurer | Director of Fund Accounting of Mutual Funds Service Co., the Trust’s transfer agent (1997 – present). Interim Chief Operating Officer of Meeder Asset Management, Inc. (June 2008 – October 2008). |
Ruth Kirkpatrick Year of Birth: 1951 | 2009 | Secretary, pro tempore | Senior Legal Specialist of Meeder Asset Management, Inc. |
| 1 | The address of each Trustee is 6125 Memorial Drive, Dublin, OH 43017. |
| 2 | Each Trustee serves for an indefinite term, until his or her resignation, death, or removal. Each Trustee oversees all nine Funds in the Trust. |
| * | Robert S. Meeder, Jr. is deemed an “interested person” of the Trust by virtue of his position as President of Meeder Asset Management, Inc., the Advisor of the Trust. |
| ** | Each independent Trustee is a member of the Trust’s Audit Committee, Compensation Committee, and Nominating Committee. |
The Statement of Additional Information includes additional information about each Trustee and is available without charge. To obtain a copy of the Statement of Additional Information, please contact your financial representative or call toll free 1-800-325-3539.
The Funds file their complete schedules of portfolios holdings with the Securities and Exchange Commission (“SEC”) for the first and third quarters of each fiscal year on Form N-Q. In addition, The Money Market Fund files its complete schedule of portfolio holdings with the SEC each month on Form N-MFP. The Funds’ Forms N-Q and N-MFP are available on the SEC’s website at http://www.sec.gov and may be reviewed and copied at the SEC’s Public Reference Room in Washington, DC. Information on the operation of the Public Reference Room may be obtained by calling 1-800-SEC-0330. The Funds’ schedules of positions are also available on the Funds’ website at www.flexfunds.com.
A description of the policies and procedures that the Funds use to determine how to vote proxies relating to portfolio securities, and information regarding how the Funds voted these proxies for the 12-month period ended June 30, 2012, is available on the SEC’s website at http://www.sec.gov, or, without charge, upon request by calling toll-free 1-800-325-3539.
[This page intentionally left blank]
| | 2012 Semi-Annual Report | June 30, 2012 |
Manager and Investment Advisor
Meeder Asset Management, Inc.
6125 Memorial Drive
P.O. Box 7177
Dublin, Ohio 43017
Subadvisor / The Utilities and Infrastructure Fund
Miller/Howard Investments, Inc.
141 Upper Byrdcliffe Road, P.O. Box 549
Woodstock, New York 12498
Board of Trustees
Stuart Allen
Anthony D’Angelo
Robert S. Meeder, Jr.
Jack Nicklaus II
Custodian
The Huntington National Bank
Columbus, Ohio 43215
Transfer Agent & Dividend Disbursing Agent
Mutual Funds Service Co.
6125 Memorial Drive
Dublin, Ohio 43017
Independent Registered Public Accounting Firm
Cohen Fund Audit Services, Ltd.
800 Westpoint Parkway, Suite 1100
Westlake, Ohio 44145

Item 2. Code of Ethics.
The registrant has adopted a code of ethics that applies to the registrant’s principal executive officer, principal financial officer, comptroller or principal accounting officer, and any person who performs a similar function.
Item 3. Audit Committee Financial Expert.
Currently, The Flex-funds (the “Funds”) do not have an Audit Committee member who possesses all of the attributes required to be an "audit committee financial expert" as defined in instruction 2(b) of Item 3 of Form N-CSR. However, the Board of Trustees believes that each member of the Audit Committee has substantial experience relating to the review of financial statements and the operations of audit committees. Accordingly, the Board of Trustees believes that the members are qualified to evaluate the Funds’ financial statements, supervise the Funds’ preparation of its financial statements, and oversee the work of the Funds’ independent auditors. The Board of Trustees also believes that, although no single Audit Committee member possesses all of the attributes required to be an “audit committee financial expert”, the Audit Committee members collectively as a group possess the attributes required to be an “audit committee financial expert.”
Item 4. Principal Accountant Fees and Services.
(a) – (d) Aggregate fees billed to the registrant for the last two fiscal years for professional services rendered by the registrant’s principal accountant were as follows:
| | | 2012 | | | 2011 | |
| Audit Fees | | $ | 67,500 | | | $ | 67,500 | |
| Audit-Related Fees | | | 325 | | | | 1,050 | |
| Tax Fees | | | 13,500 | | | | 20,250 | |
| All Other Fees | | | 0 | | | | 2,500 | |
(e)(1) A purpose of the Audit Committee is to approve the engagement of the registrant’s independent auditors (i) to render audit and non-audit services for the registrant in accordance with Rule 2-01(c)(7)(i) of Regulation S-X, subject to the waiver provisions set forth in Rule 2-01(c)(7)(i)(C) of Regulation S-X, and (ii) to render non-audit services for the registrant’s investment advisors (other than a sub-advisor whose role is primarily portfolio management and is subcontracted or overseen by another investment advisor) and any other entity controlling by, or under common control with the investment advisor that provides ongoing services to the registrant, in each case under (ii) if the engagement relates directly to the operations and financial reporting of the registrant, in accordance with Rule 2-01(c)(7)(ii) of Regulation S-X, subject to waiver provisions set forth in Rule 2-01(c)(7)(ii) of Regulation S-X.
(e)(2) 100% of services included in (b) – (d) above were approved pursuant to Rule 2-01(c)(7)(i)(C) of Regulation S-X.
(f) Not applicable.
(g) The aggregate fees billed for the most recent fiscal year and the preceding fiscal year by the registrant’s principal accountant for non-audit services rendered to the registrant, its investment advisor, and any entity controlling, controlled by, or under common control with the investment advisor that provides ongoing services to the registrant were $29,795 and $25,535 respectively.
(h) Not applicable.
Items 5. Audit Committee of Listed Registrants.
Not applicable.
Item 6. Schedule of Investments.
Not applicable.
Item 7. Disclosure of Proxy Voting Policies and Procedures for Closed-End Management Investment Companies.
Not applicable.
Item 8. Portfolio Managers of Closed-End Management Investment Companies.
Not applicable.
Item 9. Purchases of Equity Securities by Closed-End Management Investment Company and Affiliated Purchasers.
Not applicable.
Item 10. Submission of Matters to a Vote of Security Holders.
Not applicable.
Item 11. Controls and Procedures.
(a) Based on our evaluation conducted within 90 days of the filing date, hereof, the design and operation of the registrant's disclosure controls and procedures are effective to ensure that material information relating to the registrant is made known to the certifying officers by others within the appropriate entities, particularly during the period in which Forms N-CSR are being prepared, and the registrant's disclosure controls and procedures allow timely preparation and review of the information for the registrant's Form N-CSR and the officer certifications of such Form N-CSR.
(b) There were no significant changes in the registrant's internal controls or in other factors that could significantly affect these controls subsequent to the date of their evaluation, including any corrective actions with regard to significant deficiencies and material weaknesses.
Item 12. Exhibits.
(a)(1) Code of Ethics filed herewith as EX-99.CODE ETH.
(a)(2) A separate certification for each principal executive and principal financial officer of the registrant as required by Rule 30a-2(a) under the Act(17 CFR270.30a-2(a)). Filed herewith as EX-99.CERT.
(b) Certifications of principal executive officer and principal financial officer, under Section 906 of the Sarbanes-Oxley Act of 2002, and 18 U.S.C. ss.1350. Filed herewith as EX-99.906 CERT.
SIGNATURES
Pursuant to the requirements of the Securities Exchange Act of 1934 and the Investment Company Act of 1940, the registrant has duly caused this report to be signed on its behalf by the undersigned, thereunto duly authorized.
The Flex-funds
| By: | /s/ Bruce E. McKibben |
| | Bruce E. McKibben, Treasurer |
| | |
| Date: | September 7, 2012 |
Pursuant to the requirements of the Securities Exchange Act of 1934 and the Investment Company Act of 1940, this report has been signed below by the following persons on behalf of the registrant and in the capacities and on the dates indicated.
| By: | /s/ Bruce E. McKibben |
| | Bruce E. McKibben, Treasurer |
| | |
| Date: | September 7, 2012 |
| | |
| | |
| By: | /s/ Robert S. Meeder, Jr. |
| | Robert S. Meeder, Jr., President |
| | |
| Date: | September 7, 2012 |