Notes to Financial Statements
June 30, 2013 (unaudited)
1. Organization and Significant Accounting Policies
Meeder Funds® Trust (formerly known as The Flex-funds® Trust)(the “Trust”)(please see second paragraph of Note #1 for more information) was organized in 1982 and is registered under the Investment Company Act of 1940, as amended (the “1940 Act”), as a diversified, open-end management investment company. The Trust offers nine separate series and is presently comprised of nine separate funds as follows: Muirfield Fund® (“Muirfield”), Dynamic Growth Fund (“Dynamic”), Aggressive Growth Fund (“Aggressive”), Balanced Fund (“Balanced”), Strategic Growth Fund (“Strategic”), Quantex Fund™ (“Quantex”), Utilities and Infrastructure Fund (“Utilities”), Total Return Bond Fund (“Total Bond”), and Money Market Fund (“Money Market”) (each a “Fund” and collectively the “Funds”). Money Market offers two classes of shares (the Retail Class (“Retail Class”) and the Institutional Class (“Institutional Class”)). Each class of shares has equal rights as to earnings and assets except that each class bears different distribution and transfer agent expenses. The investment objective of Muirfield, Dynamic, Aggressive, and Strategic is growth of capital. The investment objective of Balanced is growth of capital, with current income usually of secondary importance. The investment objective of Quantex is long term capital appreciation. The investment objective of Utilities is total returns, including current income and growth of income. The investment objective of Total Bond is total returns, including current income and capital growth. The investment objective of Money Market is current income while maintaining a stable share price of $1.00.
Effective December 31, 2012, the Board of Trustees (“Trustees”), including a majority of non-interested independent Trustees, approved the name change of The Flex-funds® to Meeder Funds. The investment philosophy, strategic direction, and commitment to clients remain the same.
Use of estimates. The preparation of financial statements in conformity with accounting principles generally accepted in the United States of America (“GAAP”) requires management to make estimates and assumptions that affect the reported amounts of assets and liabilities and disclosure of contingent assets and liabilities at the date of the financial statements and the reported amounts of increases and decreases in net assets from operations during the reporting period. Actual results could differ from those estimates.
Security valuation. All investments in securities are recorded at their estimated fair value, as described in Note #2.
Repurchase agreements. Each Fund may engage in repurchase agreement transactions whereby the Fund takes possession of an underlying debt instrument subject to an obligation of the seller to repurchase the instrument from the Fund and an obligation of the Fund to resell the instrument at an agreed upon price and term. At all times, the Fund maintains the value of collateral, including accrued interest, of at least 100% of the amount of the repurchase agreement, plus accrued interest. If the seller defaults and the fair value of the collateral declines, realization of the collateral by the Fund may be delayed or limited.
Futures & options. Each Fund, except Money Market, may engage in transactions in financial futures contracts and options contracts in order to manage the risk of unanticipated changes in market values of securities held in the Fund, or which it intends to purchase. The futures and options contracts are adjusted by the daily exchange rate of the underlying currency, or index, and any gains or losses are recorded for financial statement purposes as unrealized gains or losses in the statement of assets and liabilities and the statement of operations until the contract settlement date, at which time realized gains and losses are included in the statement of operations.
To the extent that the Fund enters into futures contracts on an index or group of securities, the Fund exposes itself to an indeterminate liability and will be required to pay or receive a sum of money measured by the change in the value of the index. Upon entering into a futures contract, the Fund is required to deposit an initial margin, which is either cash or securities (disclosed as pledged as collateral on the Schedules of Investments) in an amount equal to a certain percentage of the contract value. Subsequently, the variation margin, which is equal to changes in the daily settlement price or last sale price on the exchanges where futures contracts trade, is received or paid and is recorded as an unrealized gain or loss until the contract is closed. When the contract is closed, the Fund records a realized gain or loss equal to the difference between the proceeds from (or cost of) the closing transaction and the Fund’s basis in the contract. Should market conditions move unexpectedly, the Fund may not achieve the anticipated benefits of the futures contract and may realize a loss. The use of futures transactions involves the risk of imperfect correlation in movements in the price of futures contracts, interest rates, and the underlying hedged assets. With futures, there is minimal counterparty credit risk to the Fund since futures are exchange traded and the exchange’s clearinghouse, as counterparty to all exchange traded futures, guarantees the futures against default. Except for Money Market and Utilities, it is normal practice for each Fund to invest in futures contracts on a daily basis. Although Utilities is permitted to invest in futures contracts, it typically does not.
| Page 54 | 2013 Semi-Annual Report | June 30, 2013 |
Call and put option contracts involve the payment of a premium for the right to purchase or sell an individual security or index aggregate at a specified price until the expiration of the contract. Such transactions expose the Fund to the loss of the premium paid if the Fund does not sell or exercise the contract prior to the expiration date. In the case of a call option, sufficient cash or money market instruments will be segregated to complete the purchase. Options are valued on the basis of the daily settlement price or last sale on the exchanges where they trade and the changes in value are recorded as unrealized appreciation or depreciation until closed, exercised or expired. For the six months ended June 30, 2013, there were no call or put options transacted for any of the Funds.
The Funds may write covered call or put options for which premiums received are recorded as liabilities and are subsequently adjusted to the current value of the options written. When written options are closed or exercised, premiums received are offset against the proceeds paid, and the Fund records realized gains or losses for the difference. When written options expire, the liability is eliminated, and the Fund records realized gains for the entire amount of premiums received. Although permitted, it is currently not normal practice for the Funds to write call and put options and none were written during the six months ended June 30, 2013.
The fair value of derivative instruments, not accounted for as hedging instruments, as reported within the Statements of Assets and Liabilities as of June 30, 2013 was as follows:
| Amount of Net Variation Margin and Unrealized Appreciation (Depreciation) on Derivatives | |
| | | Statements of Assets & Liabilities Location* | | Fair Value of Variation Margin | | | Fair Value of Unrealized Appreciation (Depreciation) | |
Muirfield Fund® | Equity contracts | Liabilities, Payable for net variation margin on futures contracts; Net Assets, Net unrealized appreciation (depreciation) of investments and futures contracts | | $ | (34,675 | ) | | $ | (231,468 | ) |
| Dynamic Growth Fund | Equity contracts | Liabilities, Payable for net variation margin on futures contracts; Net Assets, Net unrealized appreciation (depreciation) of investments and futures contracts | | | (18,250 | ) | | | (121,825 | ) |
| Aggressive Growth Fund | Equity contracts | Liabilities, Payable for net variation margin on futures contracts; Net Assets, Net unrealized appreciation (depreciation) of investments and futures contracts | | | (10,950 | ) | | | (73,095 | ) |
| Balanced Fund | Equity contracts | Liabilities, Payable for net variation margin on futures contracts; Net Assets, Net unrealized appreciation (depreciation) of investments and futures contracts | | | (16,425 | ) | | | (109,643 | ) |
| Strategic Growth Fund | Equity contracts | Liabilities, Payable for net variation margin on futures contracts; Net Assets, Net unrealized appreciation of investments and futures contracts | | | (23,698 | ) | | | (61,783 | ) |
| Quantex Fund™ | Equity contracts | Liabilities, Payable for net variation margin on futures contracts; Net Assets, Net unrealized appreciation of investments and futures contracts | | | (580 | ) | | | (3,915 | ) |
| * | Unrealized appreciation (depreciation) on futures contracts is included with unrealized appreciation (depreciation) of investments on the Statements of Assets & Liabilities. |
| 2013 Semi-Annual Report | June 30, 2013 | Page 55 |
The effect of derivative instruments on the Statements of Operations for the six months ended June 30, 2013 was as follows:
| Amount of Realized Gain (Loss) on Derivatives Recognized in Income | |
| | | | Contracts as of December 31, 2012 | | | Contracts Opened During the Period | | | Contracts Closed During the Period | | | Contracts as of June 30, 2013 | | Statement of Operations Location | | For the Six Months Ended June 30, 2013 | |
Muirfield Fund® | Equity contracts | | | 136 | | | | 123 | | | | 240 | | | | 19 | | Net realized gains from futures contracts | | $ | 2,758,897 | |
| Dynamic Growth Fund | Equity contracts | | | 120 | | | | 70 | | | | 180 | | | | 10 | | Net realized gains from futures contracts | | | 2,148,300 | |
| Aggressive Growth Fund | Equity contracts | | | 49 | | | | 84 | | | | 127 | | | | 6 | | Net realized gains from futures contracts | | | 1,073,770 | |
| Balanced Fund | Equity contracts | | | 70 | | | | 72 | | | | 133 | | | | 9 | | Net realized gains from futures contracts | | | 1,455,741 | |
| Strategic Growth Fund | Equity contracts | | | 105 | | | | 150 | | | | 244 | | | | 11 | | Net realized gains from futures contracts | | | 1,775,586 | |
| Quantex Fund™ | Equity contracts | | | 4 | | | | 74 | | | | 76 | | | | 2 | | Net realized gains from futures contracts | | | 103,884 | |
| Total Return Bond Fund | US Treasury Bond/Note contracts | | | 10 | | | | 30 | | | | 40 | | | | 0 | | Net realized gains from futures contracts | | | 6,351 | |
| Change in Unrealized Gain or (Loss) on Derivatives Recognized in Income | |
| | | Statement of Operations Location | | For the Six Months Ended June 30, 2013 | |
Muirfield Fund® | Equity contracts | Net change in unrealized appreciation (depreciation) of investments and futures contracts | | $ | (175,768 | ) |
| Dynamic Growth Fund | Equity contracts | Net change in unrealized appreciation (depreciation) of investments and futures contracts | | | (74,800 | ) |
| Aggressive Growth Fund | Equity contracts | Net change in unrealized appreciation (depreciation) of investments and futures contracts | | | (27,138 | ) |
| Balanced Fund | Equity contracts | Net change in unrealized appreciation (depreciation) of investments and futures contracts | | | (78,003 | ) |
| Strategic Growth Fund | Equity contracts | Net change in unrealized appreciation (depreciation) of investments and futures contracts | | | (183,876 | ) |
| Quantex Fund™ | Equity contracts | Net change in unrealized appreciation (depreciation) of investments and futures contracts | | | (10,765 | ) |
| Total Return Bond Fund | US Treasury Bond/Note contracts | Net change in unrealized appreciation (depreciation) of investments and futures contracts | | | 3,825 | |
Federal income taxes. It is each Fund’s policy to continue to comply with the requirements of Subchapter M of the Internal Revenue Code applicable to regulated investment companies and to distribute substantially all of its taxable income and net capital gains to its shareholders. Therefore, no federal income tax provision is required.
As of and during the six months ended June 30, 2013, the Funds did not have a liability for any unrecognized tax benefits. The Funds recognize interest and penalties, if any, related to unrecognized tax benefits as income tax expense in the statements of operations. During the six months ended June 30, 2013, the Funds did not incur any interest or penalties.
| Page 56 | 2013 Semi-Annual Report | June 30, 2013 |
The Funds are not subject to examination by U.S. federal and state tax authorities for tax years before 2009.
Distributions to shareholders. Distributions to shareholders are recorded on the ex-dividend date. Muirfield, Quantex, Dynamic, Aggressive, Balanced, and Strategic declare and pay dividends from net investment income, if any, on a quarterly basis. Utilities and Total Bond declare and pay dividends from net investment income on a monthly basis. Money Market declares dividends from net investment income on a daily basis and pays such dividends on a monthly basis. Each Fund distributes net capital gains, if any, on an annual basis.
Distributions from net investment income and from net capital gains are determined in accordance with income tax regulations, which may differ from GAAP. These differences are primarily due to deferrals of certain losses, expiring capital loss carryforwards, and differing treatments of unrealized gains and losses of futures contracts held by each Fund. Accordingly, timing differences relating to shareholder distributions are reflected in the components of net assets and permanent book and tax differences have been reclassified within the components of net assets based on their ultimate characterization for federal income tax purposes. For the year ended December 31, 2012, the Funds made the following reclassifications to increase/(decrease) the components of net assets:
| | | | | | Accumulated Undistributed (Distributions in Excess of) Net Investment Income | | | Accumulated Undistributed Net Realized Gain (Loss) from Investments and Futures Contracts | |
Muirfield Fund® | | $ | (142,350 | ) | | $ | 142,350 | | | $ | — | |
| Dynamic Growth Fund | | | (37,271 | ) | | | 37,271 | | | | — | |
| Aggressive Growth Fund | | | (154,490 | ) | | | 154,490 | | | | — | |
| Strategic Growth Fund | | | (38,075 | ) | | | 38,075 | | | | — | |
| Quantex Fund™ | | | (7,377 | ) | | | 7,377 | | | | — | |
| Utilities & Infrastructure Fund | | | — | | | | 47,389 | | | | (47,389 | ) |
| Total Return Bond Fund | | | (1 | ) | | | 1 | | | | — | |
Investment income & expenses. For Money Market, income and expenses (other than expenses attributable to a specific class) are allocated to each class of shares based on its relative net assets. Expenses incurred by the Trust that do not specifically relate to an individual Fund of the Trust are allocated to the Funds based on each Fund’s relative net assets or other appropriate basis.
Capital Share Transactions. Money Market is authorized to issue an unlimited number of shares in the Retail Class and the Institutional Class. Transactions in the capital shares of the Fund for the six months ended June 30, 2013 and the year ended December 31, 2012 were as follows:
| | | | | | | |
| | | | | | | | | | | | | |
| Retail Class | | | | | | | | | | | | |
| Issued | | $ | 51,212,969 | | | | 51,212,969 | | | $ | 97,838,118 | | | | 97,838,118 | |
| Reinvested | | | 24,855 | | | | 24,855 | | | | 71,757 | | | | 71,757 | |
| Redeemed | | | (59,888,817 | ) | | | (59,888,817 | ) | | | (103,266,488 | ) | | | (103,266,488 | ) |
| Net increase (decrease) | | $ | (8,650,993 | ) | | | (8,650,993 | ) | | $ | (5,356,613 | ) | | | (5,356,613 | ) |
| | | | | | | | | | | | | | | | | |
| Institutional Class | | | | | | | | | | | | | | | | |
| Issued | | $ | 208,139,957 | | | | 208,139,957 | | | $ | 394,109,465 | | | | 394,109,465 | |
| Reinvested | | | 8,717 | | | | 8,717 | | | | 13,277 | | | | 13,277 | |
| Redeemed | | | (253,854,447 | ) | | | (253,854,447 | ) | | | (332,400,811 | ) | | | (332,400,811 | ) |
| Net increase (decrease) | | $ | (45,705,773 | ) | | | (45,705,773 | ) | | $ | 61,721,931 | | | | 61,721,931 | |
| 2013 Semi-Annual Report | June 30, 2013 | Page 57 |
Other. The Funds record security transactions on the trade date. Gains and losses realized from the sale of securities are determined on the specific identification basis. Dividend income is recognized on the ex-dividend date and interest income (including amortization of premium and accretion of discount) is recognized as earned. Short-term capital gain distributions from underlying funds are classified as dividend income for financial reporting purposes. Long-term capital gains are broken out as such. Discounts and premiums are amortized over the lives of the respective securities. Distributions received from partnerships are recorded as return of capital distributions. Withholding taxes on foreign dividends have been provided for in accordance with the Funds’ understanding of the applicable country’s tax rules and rates.
2. Securities Valuations
As described in Note #1, the Funds utilize various methods to measure the fair value of their investments on a recurring basis. GAAP establishes a hierarchy that prioritizes inputs to valuation methods. The three levels of inputs are as follows:
Level 1 – Unadjusted quoted prices in active markets for identical assets or liabilities that the Funds have the ability to access.
Level 2 – Observable inputs other than quoted prices included in level 1 that are observable for the asset or liability, either directly or indirectly. These inputs may include quoted prices for the identical instrument on an inactive market, prices for similar instruments, interest rates, prepayment speeds, credit risk, yield curves, default rates and similar data.
Level 3 – Significant unobservable inputs for the asset or liability, to the extent relevant observable inputs are not available, representing the Funds’ own assumptions about the assumptions a market participant would use in valuing the asset or liability, and would be based on the best information available.
The availability of observable inputs can vary from security to security and is affected by a wide variety of factors, including, for example, the type of security, whether the security is new and not yet established in the marketplace, the liquidity of markets, and other characteristics particular to the security. To the extent that valuation is based on models or inputs that are less observable or unobservable in the market, the determination of fair value requires more judgment. Accordingly, the degree of judgment exercised in determining fair value is greatest for instruments categorized in level 3.
The inputs used to measure fair value may fall into different levels of the fair value hierarchy. In such cases, for disclosure purposes, the level in the fair value hierarchy within which the fair value measurement falls in its entirety, is determined based on the lowest level input that is significant to the fair value measurement in its entirety.
A description of the valuation techniques applied to the Funds’ major categories of assets and liabilities measured at fair value on a recurring basis follows.
Equity securities (including publicly traded partnerships, real estate investment trusts, american depositary receipts, exchange traded funds, and common stock). Securities traded on a national securities exchange (or reported on the NASDAQ national market) are stated at the last reported sales price on the day of valuation and are categorized in level 1 of the fair value hierarchy.
Investments in registered open-end investment companies, including money market funds, are valued at the daily redemption value as reported by the underlying fund and are categorized in level 1 of the fair value hierarchy.
Short-term notes (including bank obligations, commercial paper, corporate obligations, Repurchase Agreements, U.S. government agency obligations, and floating rate demand notes). Short-term notes held in the Funds, except Money Market, maturing more than sixty days after the valuation date, are valued at the last sales price as of the close of business on the day of valuation, or, lacking any sales, at the most recent bid price or yield equivalent as obtained from dealers that make markets in such securities. When valued at last sales price, the securities will be categorized as level 1. When using bid prices or yield equivalents, they will be categorized as level 2. When such securities are valued within sixty days or less to maturity, the difference between the valuation existing on the sixty-first day before maturity and maturity value is amortized on a straight-line basis to maturity and will be categorized as level 2.
All securities held in Money Market, other than money market funds, are valued at amortized cost, which approximates fair value, and will be categorized as level 2.
Certificates of deposit. Certificates of deposit are valued at acquisition cost and will be categorized as level 2.
| Page 58 | 2013 Semi-Annual Report | June 30, 2013 |
U.S. government obligations. U.S. government obligations are normally valued using a model that incorporates market observable data such as reported sales of similar securities, broker quotes, yields, bids, offers, and reference data. Certain securities are valued principally using dealer quotations. In either case, these securities will be categorized as level 2.
Restricted securities (equity and debt). Restricted securities for which quotations are not readily available are valued at fair value as determined by the Trustees. Depending on the relative significance of valuation inputs, these instruments may be classified in either level 2 or level 3 of the fair value hierarchy.
Derivative instruments (futures contracts). Listed derivative instruments that are actively traded, including futures contracts, are valued based on quoted prices from the exchange and are categorized in level 1 of the fair value hierarchy.
For the six months ended June 30, 2013, the Funds did not hold any assets at any time in which significant unobservable inputs were used in determining fair value. Therefore, no reconciliation of level 3 securities is provided. Also, there were no transfers between level 1 and level 2 securities. The Trust recognizes transfers between fair value hierarchy levels at the end of the reporting period. The following table summarizes the inputs used to value the Funds’ assets and liabilities measured at fair value as of June 30, 2013.
Muirfield – Assets/(Liabilities) | | | | | | | | | | | | |
| Common stocks* | | $ | 121,718,160 | | | $ | — | | | $ | — | | | $ | 121,718,160 | |
| Money market registered investment companies | | | 6,955,414 | | | | — | | | | — | | | | 6,955,414 | |
| Floating rate demand notes | | | — | | | | 1,879 | | | | — | | | | 1,879 | |
| U.S. government obligations | | | — | | | | 499,982 | | | | — | | | | 499,982 | |
| Total | | $ | 128,673,574 | | | $ | 501,861 | | | $ | — | | | $ | 129,175,435 | |
| Trustee deferred compensation | | $ | 175,620 | | | $ | — | | | $ | — | | | $ | 175,620 | |
| Futures contracts** | | $ | (231,468 | ) | | $ | — | | | $ | — | | | $ | (231,468 | ) |
Dynamic – Assets/(Liabilities) | | | | | | | | | | | | |
| Common stocks* | | $ | 79,084,851 | | | $ | — | | | $ | — | | | $ | 79,084,851 | |
| Money market registered investment companies | | | 3,747,569 | | | | — | | | | — | | | | 3,747,569 | |
| Floating rate demand notes | | | — | | | | 270 | | | | — | | | | 270 | |
| U.S. government obligations | | | — | | | | 299,989 | | | | — | | | | 299,989 | |
| Total | | $ | 82,832,420 | | | $ | 300,259 | | | $ | — | | | $ | 83,132,679 | |
| Trustee deferred compensation | | $ | 98,657 | | | $ | — | | | $ | — | | | $ | 98,657 | |
| Futures contracts** | | $ | (121,825 | ) | | $ | — | | | $ | — | | | $ | (121,825 | ) |
Aggressive – Assets/(Liabilities) | | | | | | | | | | | | |
| Common stocks* | | $ | 50,568,573 | | | $ | — | | | $ | — | | | $ | 50,568,573 | |
| Money market registered investment companies | | | 2,154,221 | | | | — | | | | — | | | | 2,154,221 | |
| Floating rate demand notes | | | — | | | | 30 | | | | — | | | | 30 | |
| U.S. government obligations | | | — | | | | 299,989 | | | | — | | | | 299,989 | |
| Total | | $ | 52,722,794 | | | $ | 300,019 | | | $ | — | | | $ | 53,022,813 | |
| Trustee deferred compensation | | $ | 56,965 | | | $ | — | | | $ | — | | | $ | 56,965 | |
| Futures contracts** | | $ | (73,095 | ) | | $ | — | | | $ | — | | | $ | (73,095 | ) |
| 2013 Semi-Annual Report | June 30, 2013 | Page 59 |
Balanced – Assets/(Liabilities) | | | | | | | | | | | | |
| Common stocks* | | $ | 64,184,507 | | | $ | — | | | $ | — | | | $ | 64,184,507 | |
| Registered investment companies | | | 29,636,684 | | | | — | | | | — | | | | 29,636,684 | |
| Money market registered investment companies | | | 2,995,527 | | | | — | | | | — | | | | 2,995,527 | |
| Floating rate demand notes | | | — | | | | 826 | | | | — | | | | 826 | |
| U.S. government obligations | | | — | | | | 499,982 | | | | — | | | | 499,982 | |
| Total | | $ | 96,816,718 | | | $ | 500,808 | | | $ | — | | | $ | 97,317,526 | |
| Trustee deferred compensation | | $ | 74,306 | | | $ | — | | | $ | — | | | $ | 74,306 | |
| Futures contracts** | | $ | (109,643 | ) | | $ | — | | | $ | — | | | $ | (109,643 | ) |
Strategic – Assets/(Liabilities) | | | | | | | | | | | | |
| Common stocks* | | $ | 63,741,882 | | | $ | — | | | $ | — | | | $ | 63,741,882 | |
| Registered investment companies | | | 13,928,891 | | | | — | | | | — | | | | 13,928,891 | |
| Money market registered investment companies | | | 4,206,680 | | | | — | | | | — | | | | 4,206,680 | |
| Floating rate demand notes | | | — | | | | 298 | | | | — | | | | 298 | |
| U.S. government obligations | | | — | | | | 299,989 | | | | — | | | | 299,989 | |
| Total | | $ | 81,877,453 | | | $ | 300,287 | | | $ | — | | | $ | 82,177,740 | |
| Trustee deferred compensation | | $ | 65,078 | | | $ | — | | | $ | — | | | $ | 65,078 | |
| Futures contracts** | | $ | (61,783 | ) | | $ | — | | | $ | — | | | $ | (61,783 | ) |
Quantex – Assets/(Liabilities) | | | | | | | | | | | | |
| Common stocks* | | $ | 33,958,952 | | | $ | — | | | $ | — | | | $ | 33,958,952 | |
| Money market registered investment companies | | | 586,397 | | | | — | | | | — | | | | 586,397 | |
| U.S. government obligations | | | — | | | | 99,996 | | | | — | | | | 99,996 | |
| Total | | $ | 34,545,349 | | | $ | 99,996 | | | $ | — | | | $ | 34,645,345 | |
| Trustee deferred compensation | | $ | 62,893 | | | $ | — | | | $ | — | | | $ | 62,893 | |
| Futures contracts** | | $ | (3,915 | ) | | $ | — | | | $ | — | | | $ | (3,915 | ) |
Utilities – Assets/(Liabilities) | | | | | | | | | | | | |
| Common stocks* | | $ | 32,831,427 | | | $ | — | | | $ | — | | | $ | 32,831,427 | |
| Money market registered investment companies | | | 1,085,456 | | | | — | | | | — | | | | 1,085,456 | |
| Total | | $ | 33,916,883 | | | $ | — | | | $ | — | | | $ | 33,916,883 | |
| Trustee deferred compensation | | $ | 61,713 | | | $ | — | | | $ | — | | | $ | 61,713 | |
Total Bond – Assets/(Liabilities) | | | | | | | | | | | | |
| Registered investment companies | | $ | 79,034,646 | | | $ | — | | | $ | — | | | $ | 79,034,646 | |
| Money market registered investment companies | | | 4,425,155 | | | | — | | | | — | | | | 4,425,155 | |
| U.S. government obligations | | | — | | | | 3,054,995 | | | | — | | | | 3,054,995 | |
| Total | | $ | 83,459,801 | | | $ | 3,054,995 | | | $ | — | | | $ | 86,514,796 | |
| Trustee deferred compensation | | $ | 17,940 | | | $ | — | | | $ | — | | | $ | 17,940 | |
| Page 60 | 2013 Semi-Annual Report | June 30, 2013 |
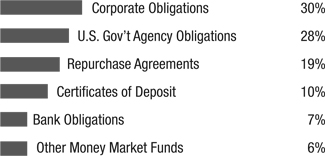
Money Market – Assets/(Liabilities) | | | | | | | | | | | | |
| Bank obligations | | $ | — | | | $ | 9,773,499 | | | $ | — | | | $ | 9,773,499 | |
| Certificates of deposit | | | — | | | | 7,461,000 | | | | — | | | | 7,461,000 | |
| Commercial paper | | | — | | | | 1,999,448 | | | | — | | | | 1,999,448 | |
| Corporate obligations | | | — | | | | 53,849,437 | | | | — | | | | 53,849,437 | |
| Repurchase agreements | | | — | | | | 15,000,000 | | | | — | | | | 15,000,000 | |
| U.S. government agency obligations | | | — | | | | 24,007,203 | | | | — | | | | 24,007,203 | |
| Money Market registered investment companies | | | 46,245,946 | | | | — | | | | — | | | | 46,245,946 | |
| Total | | $ | 46,245,946 | | | $ | 112,090,587 | | | $ | — | | | $ | 158,336,533 | |
| Trustee deferred compensation | | $ | 48,229 | | | $ | — | | | $ | — | | | $ | 48,229 | |
| * | See schedule of investments for industry classifications. |
| ** | Futures contracts include cumulative unrealized gain/loss on contracts open at June 30, 2013. |
3. Investment Transactions
For the six months ended June 30, 2013, the cost of purchases and proceeds from sales or maturities of long-term investments for the Funds, including U.S. Government investments, were as follows:
| | | | | | | |
Muirfield Fund® | | $ | 246,903,679 | | | $ | 207,040,070 | |
| Dynamic Growth Fund | | | 160,590,705 | | | | 154,295,880 | |
| Aggressive Growth Fund | | | 97,761,623 | | | | 86,028,682 | |
| Balanced Fund | | | 147,050,500 | | | | 121,865,167 | |
| Strategic Growth Fund | | | 137,251,383 | | | | 131,019,544 | |
| Quantex Fund™ | | | 13,906,473 | | | | 7,648,993 | |
| Utilities & Infrastructure Fund | | | 3,220,304 | | | | 4,149,711 | |
| Total Return Bond Fund | | | 43,080,058 | | | | 30,676,081 | |
For the six months ended June 30, 2013, the cost of purchases and proceeds from sales or maturities of long-term U.S. Government investments for the Funds are as follows:
| | | | | | | |
| Total Return Bond Fund | | $ | 965,757 | | | $ | — | |
4. Investment Advisory Fees and Other Transactions with Affiliates
Meeder Asset Management, Inc. (“MAM”), a wholly-owned subsidiary of Meeder Investment Management, Inc (f.k.a. Meeder Financial, Inc.)(“Meeder”), provides each Fund, under a separate Investment Advisory Contract, with investment management, research, statistical and advisory services. The services of MAM will terminate automatically if assigned and may be terminated without penalty at any time upon 60 days prior written notice by majority vote of the Fund, by the Trustees of the Fund, or by MAM. For such services the Funds pay a fee at the following annual rates:
| 2013 Semi-Annual Report | June 30, 2013 | Page 61 |
| | Percentage of Average Daily Net Assets up to $50 Million | Percentage of Average Daily Net Assets Exceeding $50 Million up to $100 Million | Percentage of Average Daily Net Assets up to $100 Million | Percentage of Average Daily Net Assets up to $200 Million | Percentage of Average Daily Net Assets Exceeding $100 Million | Percentage of Average Daily Net Assets Exceeding $200 Million |
| Muirfield | 1.00% | 0.75% | N/A | N/A | 0.60% | N/A |
| Quantex* | 1.00% | 0.75% | N/A | N/A | 0.60% | N/A |
| Utilities** | 1.00% | 0.75% | N/A | N/A | 0.60% | N/A |
| Dynamic | N/A | N/A | N/A | 0.75% | N/A | 0.60% |
| Aggressive | N/A | N/A | N/A | 0.75% | N/A | 0.60% |
| Balanced | N/A | N/A | N/A | 0.75% | N/A | 0.60% |
| Strategic | N/A | N/A | N/A | 0.75% | N/A | 0.60% |
| Total Bond | N/A | N/A | 0.40% | N/A | 0.20% | N/A |
| Money*** | N/A | N/A | 0.40% | N/A | 0.25% | N/A |
| * | MAM has contractually agreed to reduce its investment advisory fee by 0.25% for Quantex for average daily net assets up to $50 million. The foregoing reduction in investment advisory fees shall automatically renew annually on or about April 30th, unless MAM elects to terminate this reduction. During the six months ended June 30, 2013, $39,212 of investment advisory fees was waived in Quantex and is not subject to recoupment. |
| ** | Under a separate Investment Subadvisory Agreement with MAM, Miller/Howard Investments, Inc. (“Miller/Howard”) serves as subadvisor of Utilities. The Investment Subadvisory Agreement provides that it will terminate automatically if assigned, and that it may be terminated by MAM without penalty to the Fund by MAM, the Trustees of the Fund, or by the vote of a majority of the outstanding voting shares of the Fund upon not less than 30 days written notice. As subadvisor to Utilities, Miller/Howard receives a fee paid by MAM. |
| *** | During the six months ended June 30, 2013, MAM voluntarily agreed to reduce $36,567 of investment advisory fees in Money Market. |
Mutual Funds Service Co. (“MFSCo”), a wholly-owned subsidiary of Meeder, serves as stock transfer, dividend disbursing and shareholder services agent for each Fund. In compensation for such services, each Fund pays MFSCo an annual fee equal to the greater of the following:
| | | | | | Amount Per Active Shareholder Account | | | Percentage of Average Daily Net Assets | |
| Muirfield | | $ | 4,000 | | | $ | 15 | | | | 0.12 | % |
| Quantex | | | 4,000 | | | | 15 | | | | 0.12 | % |
| Utilities | | | 4,000 | | | | 15 | | | | 0.12 | % |
| Dynamic | | | 4,000 | | | | 15 | | | | 0.12 | % |
| Aggressive | | | 4,000 | | | | 15 | | | | 0.12 | % |
| Balanced | | | 4,000 | | | | 15 | | | | 0.12 | % |
| Strategic | | | 4,000 | | | | 15 | | | | 0.12 | % |
| Total Bond | | | 4,000 | | | | 15 | | | | 0.08 | % |
| Retail Class | | | 4,000 | | | | 20 | | | | 0.08 | % |
| Institutional Class | | | 4,000 | | | | 20 | | | | 0.08 | % |
| Page 62 | 2013 Semi-Annual Report | June 30, 2013 |
For fixed income Funds (Total Bond and Money Market) that are subject to an expense cap and which are above the expense cap, the basis point fee will be reduced by 0.02%. During the six months ended June 30, 2013, MFSCo waived $8,342 and $12,306 of transfer agent fees for Total Bond and the Institutional Class, respectively.
MFSCo provides the Trust with certain administrative services. In compensation for such services, each Fund pays MFSCo at the following annual rates:
| | Percentage of Average Daily Net Assets up to $50 Million | Percentage of Average Daily Net Assets Exceeding $50 Million |
| Muirfield | 0.10% | 0.08% |
| Quantex | 0.10% | 0.08% |
| Utilities | 0.10% | 0.08% |
| Dynamic | 0.10% | 0.08% |
| Aggressive | 0.10% | 0.08% |
| Balanced | 0.10% | 0.08% |
| Strategic | 0.10% | 0.08% |
| Total Bond | 0.10% | 0.08% |
| Money | 0.10% | 0.08% |
MFSCo serves as accounting services agent for each Fund. In compensation for such services, each Fund pays MFSCo an annual fee equal to the greater of a minimum fee or at a rate based on the percentage of average daily net assets. The annual rates are as follows:
| | | Percentage of Average Daily Net Assets up to $10 Million | Percentage of Average Daily Net Assets Exceeding $10 Million up to $30 Million | Percentage of Average Daily Net Assets Exceeding $30 Million up to $80 Million | Percentage of Average Daily Net Assets Exceeding $80 Million |
| Muirfield | $7,500 | 0.15% | 0.10% | 0.02% | 0.01% |
| Quantex | 7,500 | 0.15% | 0.10% | 0.02% | 0.01% |
| Utilities | 7,500 | 0.15% | 0.10% | 0.02% | 0.01% |
| Dynamic | 7,500 | 0.15% | 0.10% | 0.02% | 0.01% |
| Aggressive | 7,500 | 0.15% | 0.10% | 0.02% | 0.01% |
| Balanced | 7,500 | 0.15% | 0.10% | 0.02% | 0.01% |
| Strategic | 7,500 | 0.15% | 0.10% | 0.02% | 0.01% |
| Total Bond | 7,500 | 0.15% | 0.10% | 0.02% | 0.01% |
| Money | 30,000 | 0.15% | 0.10% | 0.02% | 0.01% |
For the period January 1, 2013 through April 30, 2013, MAM agreed to contractually reduce its fees and/or reimburse expenses of the Funds, except Money Market, to the extent necessary to limit the total operating expenses of each class of shares of the Funds (exclusive of brokerage costs (but not excluding any expenses paid indirectly as a result of any directed brokerage arrangements), interest, taxes, dividends, litigation, indemnification, expenses associated with the investments in underlying investment companies, and extraordinary expenses (as determined under GAAP)). For the period May 1, 2013 through June 30, 2013, MAM agreed to voluntarily reduce its fees and/or reimburse expenses (excluding brokerage fees and commissions, taxes, interest, and extraordinary or non-recurring expenses), to limit the total annual operating expenses of the Funds, except Money Market. For Money Market, MAM agreed to voluntarily reduce its fees and/or reimburse expenses (excluding brokerage fees and commissions, taxes, interest, and extraordinary or non-recurring expenses), to limit the total annual operating expenses of the Fund for the six months ended June 30, 2013. Such reductions and/or reimbursements are limited to the total of fees charged to each Fund or Class by MAM and MFSCo. For the six months ended June 30, 2013, the annual operating expense limitations and amounts reimbursed for each Fund are as follows:
| 2013 Semi-Annual Report | June 30, 2013 | Page 63 |
| | | Annualized Contractual Expense Limitation as a Percentage of Average Daily Net Assets 1/1/13 – 4/30/13* | | Annualized Voluntary Expense Limitation as a Percentage of Average Daily Net Assets 5/1/13 – 6/30/13 | | Contractual Expense Limitation Through 4/30/13 | | Ratio of Net Expenses to Average Net Assets | | Voluntary Expense Reimbursements | | | Contractual Expense Reimbursements** | |
| Muirfield | | | 1.32 | % | | | 0.98 | % | | | 1.39 | % | | | 1.20 | % | | $ | 22,984 | | | $ | 49,794 | |
| Quantex | | | 1.36 | % | | | 1.58 | % | | | 1.65 | % | | | 1.44 | % | | | — | | | | — | *** |
| Utilities | | | 1.90 | % | | | 1.87 | % | | | 1.92 | % | | | 1.89 | % | | | — | | | | — | |
| Dynamic | | | 1.31 | % | | | 1.18 | % | | | 1.39 | % | | | 1.27 | % | | | 20,630 | | | | 40,570 | |
| Aggressive | | | 1.51 | % | | | 1.23 | % | | | 1.59 | % | | | 1.41 | % | | | 34 | | | | 1,137 | |
| Balanced | | | 1.44 | % | | | 1.19 | % | | | 1.49 | % | | | 1.35 | % | | | 14,408 | | | | 28,346 | |
| Strategic | | | 1.30 | % | | | 1.13 | % | | | 1.39 | % | | | 1.24 | % | | | 23,200 | | | | 42,790 | |
| Total Bond | | | 0.98 | % | | | 0.95 | % | | | 0.99 | % | | | 0.97 | % | | | 22,349 | | | | 42,868 | |
| Retail Class | | | N/A | | | | N/A | | | | N/A | | | | 0.23 | % | | | 142,838 | | | | N/A | |
| Institutional Class | | | N/A | | | | N/A | | | | N/A | | | | 0.16 | % | | | 112,736 | | | | N/A | |
| * | Ratios reflect expenses paid to the Funds indirectly after contractual expense limitations were applied. |
| ** | The contractual expense reimbursements are subject to repayment by the applicable Fund within the three fiscal years following the fiscal year in which the particular expense was incurred, provided that the Fund is able to make the repayment without exceeding the contractual expense limitation in the table listed above. The repayment expiration date is December 31, 2016. |
| *** | The Fund was operating below the contractual expense limitation; however $39,212 of investment advisory fees was contractually waived and is not subject to recoupment as noted on page 62. |
Expenses were contractually reimbursed in 2012 for Muirfield, Dynamic, Balanced, Strategic, and Total Bond in the amounts of $40,054, $29,382, $32,787, $28,319, and $52,431, respectively. These contractual expense reimbursements are subject to repayment by the applicable Fund before December 31, 2015.
Certain Funds have entered into an agreement with the Trust’s custodian, The Huntington National Bank (“HNB”), whereby HNB receives distribution, service, and administration fees (collectively the “fees”) from the underlying security holdings of the Funds, and forwards those fees to the appropriate Funds. The Funds use the fees received to reduce the gross expenses of each Fund. It is possible that the Funds may invest in security holdings in which fees are not paid. As such, the gross expenses of a Fund would not be decreased. Also, without this agreement it is likely that the Funds would not collect any fees from underlying security holdings. For the six months ended June 30, 2013, gross expenses were reduced by the following amounts:
| | | Amount Received to Reduce Gross Expenses | |
| Aggressive | | $ | 247 | |
| Strategic | | | 1,796 | |
Certain Funds have entered into a directed brokerage agreement with ConvergEx Group, an independent broker/dealer, whereby certain eligible Fund expenses are paid for indirectly. The Funds use these amounts received to reduce the gross expenses of each Fund. It is possible that the Funds may invest in security holdings in which brokerage fees are not recaptured. As such, the gross expenses of a Fund would not be decreased. Also, without this agreement it is likely that the Funds would not recapture any fees from portfolio transactions. For the six months ended June 30, 2013, fees paid indirectly through directed brokerage arrangements were as follows:
| Page 64 | 2013 Semi-Annual Report | June 30, 2013 |
| | | Amount Received to Reduce Gross Expenses | |
| Muirfield | | $ | 120,046 | |
| Dynamic | | | 54,169 | |
| Aggressive | | | 42,691 | |
| Balanced | | | 66,020 | |
| Strategic | | | 62,121 | |
| Quantex | | | 20,141 | |
| Total Bond | | | 8,684 | |
Pursuant to Rule 12b-1 of the 1940 Act, the Funds have adopted a written plan to pay certain expenses out of fund assets relating to the sale and distribution of its shares, including, but not necessarily limited to, compensation to dealers, advertising, marketing, printing and mailing of prospectuses, and certain telephone related expenses. The annual adopted distribution plan limitations and the amounts waived for the six months ended June 30, 2013 are as follows:
| | | Maximum Annual 12b-1 Plan Expense Limitations as a Percentage of Average Daily Net Assets | | | | |
| Muirfield | | | 0.20 | % | | $ | 6,179 | |
| Quantex | | | 0.20 | % | | | 8,470 | |
| Utilities | | | 0.25 | % | | | 8,210 | |
| Dynamic | | | 0.25 | % | | | 12,683 | |
| Aggressive | | | 0.25 | % | | | 12,236 | |
| Balanced | | | 0.25 | % | | | — | |
| Strategic | | | 0.25 | % | | | 8,198 | |
| Total Bond | | | 0.25 | % | | | 8,340 | |
| Retail Class | | | 0.20 | % | | | 68,908 | |
| Institutional Class | | | 0.03 | % | | | 8,324 | |
An Administrative Services Plan has been adopted for each Fund of the Trust, except Money Market, to pay service organizations that provide administrative support services to their customers who own shares of record, or beneficially, of the Funds. The annual adopted administrative services plan limitations and the amounts waived for the six months ended June 30, 2013 are as follows:
| | | Maximum Annual Administrative Services Plan Expense Limitations as a Percentage of Average Daily Net Assets | | | | |
| Muirfield | | | 0.20 | % | | $ | 30,896 | |
| Quantex | | | 0.20 | % | | | 16,312 | |
| Utilities | | | 0.20 | % | | | 11,495 | |
| Dynamic | | | 0.20 | % | | | 12,683 | |
| Aggressive | | | 0.20 | % | | | 9,788 | |
| Balanced | | | 0.20 | % | | | — | |
| Strategic | | | 0.20 | % | | | 8,198 | |
| Total Bond | | | 0.20 | % | | | 4,170 | |
| 2013 Semi-Annual Report | June 30, 2013 | Page 65 |
The Funds have adopted a Deferred Compensation Plan (the “Plan”) for the independent Trustees. Under the Plan, each eligible Trustee is permitted to defer all or a portion of the trustees fees payable by any of the Funds as an investment into any combination of Funds until a specified point of time. The investment into the Funds is recorded as an asset however an offsetting liability is also recorded for the deferred payment. Once the eligible Trustees’ deferral amounts can be distributed, a lump sum or generally equal annual installments over a period of up to ten (10) years can be made to the eligible Trustee(s). The Funds may terminate this Plan at any time.
Certain trustees and officers of the Funds are also officers or directors of Meeder, MAM, and MFSCo.
During the six months ended June 30, 2013, several of the Funds invested in the Money Market Fund, an affiliate, as described in Section 2(a)(3) of the Investment Company Act of 1940. As of June 30, 2013, the 7-day yield of the Institutional Class was 0.14%. A summary of the Funds’ investments in this affiliate during the year is noted below:
| | | | | | | | | | | | | | | | | | | |
Muirfield Fund® | | $ | 23,673,935 | | | $ | 50,069,310 | | | $ | (66,787,831 | ) | | $ | 6,955,414 | | | $ | 8,079 | | | $ | 6,955,414 | |
| Dynamic Growth Fund | | | 19,765,043 | | | | 41,693,029 | | | | (57,710,503 | ) | | | 3,747,569 | | | | 5,166 | | | | 3,747,569 | |
| Aggressive Growth Fund | | | 7,303,954 | | | | 32,804,462 | | | | (37,954,195 | ) | | | 2,154,221 | | | | 3,561 | | | | 2,154,221 | |
| Balanced Fund | | | 11,209,336 | | | | 38,536,481 | | | | (46,750,290 | ) | | | 2,995,527 | | | | 4,475 | | | | 2,995,527 | |
| Strategic Growth Fund | | | 5,632,446 | | | | 43,217,755 | | | | (44,643,521 | ) | | | 4,206,680 | | | | 4,866 | | | | 4,206,680 | |
| Quantex Fund™ | | | 307,300 | | | | 9,319,058 | | | | (9,039,961 | ) | | | 586,397 | | | | 604 | | | | 586,397 | |
| Utilities & Infrastructure Fund | | | 617,057 | | | | 4,247,498 | | | | (3,779,099 | ) | | | 1,085,456 | | | | 511 | | | | 1,085,456 | |
| Total Return Bond Fund | | | 458,194 | | | | 27,081,882 | | | | (23,114,921 | ) | | | 4,425,155 | | | | 1,810 | | | | 4,425,155 | |
5. Federal Tax Information
The tax characteristics of dividends paid by the Funds during the year ended December 31, 2012 were as follows:
| | | | | | Net Short- Term Capital Gains | | | Net Long- Term Capital Gains | | | | | | | |
Muirfield Fund® | | $ | — | | | $ | — | | | $ | — | | | $ | — | | | $ | — | |
| Dynamic Growth Fund | | | — | | | | — | | | | — | | | | — | | | | — | |
| Aggressive Growth Fund | | | — | | | | — | | | | — | | | | — | | | | — | |
| Balanced Fund | | | 662,800 | | | | — | | | | — | | | | — | | | | 662,800 | |
| Strategic Growth Fund | | | — | | | | — | | | | — | | | | — | | | | — | |
| Quantex Fund™ | | | 70,336 | | | | — | | | | — | | | | — | | | | 70,336 | |
| Utilities & Infrastructure Fund | | | 208,323 | | | | — | | | | 127,080 | | | | — | | | | 335,403 | |
| Total Return Bond Fund | | | 3,055,897 | | | | — | | | | — | | | | — | | | | 3,055,897 | |
| Money Market Fund | | | 228,128 | | | | — | | | | — | | | | — | | | | 228,128 | |
| Page 66 | 2013 Semi-Annual Report | June 30, 2013 |
The tax characteristics of dividends paid by the Funds during the year ended December 31, 2011 were as follows:
| | | | | | Net Short- Term Capital Gains | | | Net Long- Term Capital Gains | | | | | | | |
Muirfield Fund® | | $ | 173,017 | | | $ | — | | | $ | — | | | $ | — | | | $ | 173,017 | |
| Dynamic Growth Fund | | | 189 | | | | — | | | | — | | | | — | | | | 189 | |
| Aggressive Growth Fund | | | — | | | | — | | | | — | | | | — | | | | — | |
| Balanced Fund | | | 966,354 | | | | — | | | | — | | | | — | | | | 966,354 | |
| Strategic Growth Fund | | | 149 | | | | — | | | | — | | | | — | | | | 149 | |
| Quantex Fund™ | | | 5,745 | | | | — | | | | — | | | | — | | | | 5,745 | |
| Utilities & Infrastructure Fund | | | 480,205 | | | | — | | | | — | | | | — | | | | 480,205 | |
| Total Return Bond Fund | | | 1,038,809 | | | | — | | | | — | | | | — | | | | 1,038,809 | |
| Money Market Fund | | | 161,244 | | | | — | | | | — | | | | — | | | | 161,244 | |
As of December 31, 2012, the components of accumulated earnings/(deficit) on a tax basis for the Funds were as follows:
| | | Undistributed Ordinary Income | | | | | | Accumulated Capital and Other Gains and (Losses) | | | Unrealized Appreciation/(Depreciation)** | | | Total Accumulated Earnings/ (Deficit) | |
Muirfield Fund® | | $ | — | | | $ | — | | | $ | 2,510,218 | | | $ | 3,031,935 | | | $ | 5,542,153 | |
| Dynamic Growth Fund | | | — | | | | — | | | | (987,859 | ) | | | 2,959,616 | | | | 1,971,757 | |
| Aggressive Growth Fund | | | — | | | | — | | | | (4,159,286 | ) | | | 916,381 | | | | (3,242,905 | ) |
| Balanced Fund | | | 143 | | | | (141 | ) | | | (203,680 | ) | | | 2,410,803 | | | | 2,207,125 | |
| Strategic Growth Fund | | | — | | | | — | | | | 139,849 | | | | 3,644,204 | | | | 3,784,053 | |
| Quantex Fund™ | | | 142 | | | | (142 | ) | | | (382,772 | ) | | | 1,913,169 | | | | 1,530,397 | |
| Utilities & Infrastructure Fund | | | 41,773 | | | | (977 | ) | | | (1,725,567 | ) | | | 4,054,091 | | | | 2,369,320 | |
| Total Return Bond Fund | | | (113 | ) | | | 113 | | | | (722,904 | ) | | | 1,862,165 | | | | 1,139,261 | |
| Money Market Fund | | | 9,477 | | | | (9,477 | ) | | | — | | | | — | | | | — | |
| * | Total dividends paid may differ from the amount reported in the Statement of Changes in Net Assets because for tax purposes dividends are recognized when actually paid. |
| ** | The differences between book- and tax-basis unrealized appreciation/(depreciation) are attributable primarily to: deferral of post October losses, wash sales, and the realization for tax purposes of unrealized gains/(losses) on certain derivative instruments. |
The Regulated Investment Company Modernization Act of 2010 (the “Act”) was enacted on December 22, 2010. Although the Act provides several benefits, including the unlimited carryover of future capital losses, there may be a greater likelihood that all or a portion of the Funds’ pre-enactment capital loss carryovers may expire without being utilized due to the fact that post-enactment capital losses get utilized before pre-enactment capital loss carryovers. Additionally, post Act losses that are carried forward will retain their character as either short-term or long-term capital loss carryovers rather than being considered all short-term as under previous law.
| 2013 Semi-Annual Report | June 30, 2013 | Page 67 |
For federal income tax purposes, the following Funds have capital loss carryforwards as of December 31, 2012, which are available to offset future capital gains, if any. To the extent that these carryforwards are used to offset future capital gains, it is probable that the gains that are offset will not be distributed to shareholders:
Post Act Carryforwards (no expiration) | | | | | |
| Total Return Bond Fund | | $ | 9,464 | | Short-term | |
| Total Return Bond Fund | | | 713,440 | | Long-term | |
| Utilities & Infrastructure Fund | | | 1,646,070 | | Short-term | |
| Utilities & Infrastructure Fund | | | 79,497 | | Long-term | |
| | | | | | |
| Dynamic Growth Fund | | $ | 987,859 | | | | 2017 | |
| Aggressive Growth Fund | | | 804,744 | | | | 2016 | |
| Aggressive Growth Fund | | | 3,354,542 | | | | 2017 | |
| Balanced Fund | | | 203,680 | | | | 2017 | |
| Quantex Fund™ | | | 382,772 | | | | 2017 | |
Under current tax laws, Management has elected to defer net capital losses incurred after October 31, within a Fund’s fiscal year, and are deemed to arise on the first business day of the following fiscal year for tax purposes. For the year ended December 31, 2012, Quantex and Utilities deferred post October losses in the amounts of $10,660 and $128,207, respectively.
6. Control Ownership
The beneficial ownership, either directly or indirectly, of more than 25% of the voting securities of a fund creates a presumption of control of the fund under Section 2(a)(9) of the 1940 Act. As of June 30, 2013, account holders that held more than 25% of the voting securities of the Funds and may be deemed to control the Funds are as follows:
| | | | Percent of Voting Securities |
Muirfield Fund® | Nationwide Trust Company, FSB held for the benefit of others | | 45% |
| Dynamic Growth Fund | Nationwide Trust Company, FSB held for the benefit of others | | 58% |
| Aggressive Growth Fund | Nationwide Trust Company, FSB held for the benefit of others | | 62% |
| Balanced Fund | Nationwide Trust Company, FSB held for the benefit of others | | 64% |
| Strategic Growth Fund | Nationwide Trust Company, FSB held for the benefit of others | | 85% |
| Quantex Fund | Nationwide Trust Company, FSB held for the benefit of others | | 36% |
| Utilities & Infrastructure Fund | Charles Schwab & Co. held for the benefit of others | | 25% |
| Total Return Bond Fund | Nationwide Trust Company, FSB held for the benefit of others | | 66% |
| Money Market Fund – Institutional Class | Carey & Co. held for the benefit of others | | 79% |
| Page 68 | 2013 Semi-Annual Report | June 30, 2013 |