UNITED STATES SECURITIES AND EXCHANGE COMMISSION
Washington, D.C. 20549
FORM N-CSR
CERTIFIED SHAREHOLDER REPORT
OF REGISTERED MANAGEMENT INVESTMENT COMPANIES
Investment Company Act file number 811-3462
Meeder Funds Trust
6125 Memorial Drive
Dublin, OH 43017
Bruce McKibben
c/o Meeder Funds Trust
6125 Memorial Drive
Dublin, OH 43017
Registrant’s telephone number, including area code: 800-325-3539
Date of fiscal year end: December 31, 2014
Date of reporting period: June 30, 2014
Item 1. Report to Stockholders.
| Letter to Shareholders | 1 |
Muirfield Fund® | 4 |
Quantex FundTM | 6 |
| Aggressive Growth Fund | 8 |
| Dynamic Growth Fund | 10 |
| Strategic Growth Fund | 12 |
| Utilities and Infrastructure Fund | 14 |
| Balanced Fund | 16 |
| Total Return Bond Fund | 18 |
| Money Market Fund | 20 |
| Shareholder Expense Analysis | 22 |
| Disclosures | 23 |
| Fund Holdings & Financial Statements | 25 |
LETTER TO SHAREHOLDERS June 30, 2014
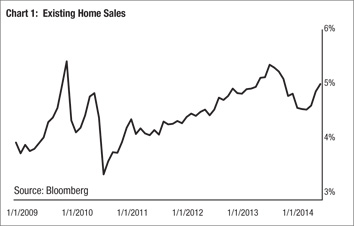
During the opening months of 2014, a sharp drop-off in the pace of economic data sparked concern among some investors that a swoon was underway, while others maintained that the setback was temporary due to the impact of adverse weather conditions. Given the strong rebound in various economic reports received during the second quarter, it appears that those in the latter camp were correct. Various measures of economic strength performed well during the past couple months. For instance, the employment report showed a gain of 288,000 jobs in June, while existing home sales increased 4.9% (chart 1) according to a report on May activity. These levels stand in stark contrast to reports from the first quarter, which showed outright declines in housing data while monthly job additions averaged less than 200,000. As a result, some economists are now estimating that second quarter gross domestic product (GDP), a broad gauge of economic activity, accelerated to over 3.0% annualized growth compared to the first quarter decline of 2.9%. In response, the S&P 500 Index increased 5.23% during the second quarter, bringing the year-to-date gain to 7.14%. Stock markets around the world are rebounding as well, with the MSCI Emerging Markets Index posting an increase of 6.60% in the second quarter. Following the volatility in economic data, interest rates have experienced overall declines this year, with the 10-year U.S. Treasury yield ending the second quarter at 2.53% compared to 3.03% at the start of the year. The broader bond market, as evidenced by the Barclays U.S. Aggregate Bond Index, gained 2.04% in the quarter, which brings the year-to-date return to 3.93%.
Improving Economic Data
A collective sigh of relief was expressed by economists and investors alike as we progressed through the second quarter and realized that the economic weakness experienced during the first few months of 2014 was transitory. Regardless of the cause of the first quarter downturn, which was almost universally attributed to the harsh winter, it was the fourth largest quarterly decline in GDP in the past 30 years. For us, it is reassuring to witness such a sharp rebound in key economic statistics, including gauges related to the employment and housing market discussed earlier. There are other notable improvements that we would highlight as well, such as the Institute for Supply Management’s index of manufacturing and service sector activity. These indexes, which provide more timely insight into economic activity than the GDP report, are firmly indicating expansion in key sectors of the economy. We are also encouraged by the continued gains made by the Conference Board’s Consumer Confidence Index, which in June reached the highest levels since January 2008 and is reflective of improving business conditions as well as gains in the labor market.
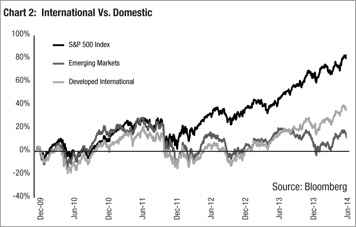
Opportunities in International Markets
As we reflect on our portfolio allocations during the first half of 2014, the most significant change in positioning was our exposure to international markets. Over the past several years, the challenges facing the international markets have been substantial, and include the European debt crisis, economic instability in emerging markets, and uncertainty over the impact from global monetary policy. In response, developed international and emerging market equities have returned 8.25% and 3.85% annualized (chart 2) since the end of 2009, compared to the S&P 500 return of 15.77%. While these issues have led to underperformance of emerging market and developed international equities relative to the U.S., it has also created opportunities. For instance, during the
| 2014 Semiannual Report | June 30, 2014 | Page 1 |
second quarter, our quantitative methodology that evaluates domestic and international equity securities began to identify attractive valuations in several international markets, especially in emerging market countries. In addition, our momentum factors shifted in favor of international regions, while the currency factors we utilize were showing preference for emerging markets. Finally, an index of global leading economic indicators began to show signs of stabilization, which may portend acceleration in global economic growth. Due to these developments, we implemented tactical exposure to international markets, particularly in emerging markets. As of the end of the second quarter, we had our largest exposure to international securities in over three years.
Outlook
The gains in both the stock and bond markets have caught many investors by surprise this year. Few anticipated that equity securities would continue their ascent following the outstanding gains registered in 2013, and prognosticators mostly expected that interest rates would be a one-way bet: up. As we have commented often in recent quarters, our view is that domestic stocks are in line with historical valuations and thus fairly valued, and may be attractively valued given the low level of inflation and interest rates. Throughout the first half of 2014, our quantitative Asset Allocation Model (we strongly encourage you to read the 1Q 2014 Progress Report for a brief overview of our investment models) maintained a positive bias toward stocks, which led us to remain close to fully invested in our defensive equity strategies. Going forward, we believe investor views toward tightening of the Fed’s monetary policy will be the most important driver of stock and bond market returns. More specifically, investors will carefully monitor economic and inflation data in order to gauge the timing of an increase in the fed funds rate, which has remained near zero since 2008. Although it seems strange, stronger performance out of the economy and labor market could actually lead to stock market volatility, as investors would anticipate interest rate hikes sooner rather than later. As of June 30, 2014, the Fed has remained committed to ensuring that the economic recovery is durable, and has signaled that they remain wary of withdrawing monetary support too soon. This should continue to create a favorable backdrop for stocks over the near-term.
Final Thoughts
As we monitor the capital markets and our investment models, we will continuously evaluate our defensive position in the Muirfield Fund® and the equity portion of the Balanced Fund. We will look for opportunities to adjust portfolio weights among growth and value stocks, large-, mid-, and small- caps, and domestic and international investments in order to enhance returns and manage risk for our clients. We will continue to proactively manage our sector exposures and will make adjustments as our investment models evolve, and we will continue to select securities that we believe are best positioned to outperform. In our fixed income Funds, we will look to enhance returns by managing credit quality as well as adjusting portfolio duration.
On behalf of all the associates of Meeder Investment Management and the Meeder Funds®, we thank you for the trust and confidence you have placed in our investment management services.
Robert S. Meeder
President Meeder Funds® June 30, 2014
| Page 2 | 2014 Semiannual Report | June 30, 2014 |
| |
Fund Performance June 30, 2014 |
| |
| |
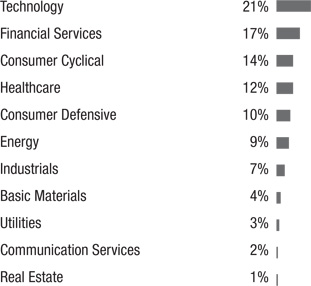
| Muirfield Fund® The Meeder Muirfield Fund® returned 6.62% for the six-month period ended June 30, 2014 compared to its custom benchmark index return of 4.24% and the S&P 500 Index return of 7.14%. The Fund has outperformed its custom benchmark over the 1-, 3-, 5-, and 10-year periods. In the Muirfield Fund®, we entered the year fully invested in equities following output from our investment model that indicated a favorable risk/reward dynamic in the stock market. Toward the end of the second quarter, we established a modest defensive position in cash due to the presence of near-term risks in the stock market. In our equity exposure during the first quarter, we maintained our overweight positions in the technology, healthcare, and consumer discretionary sectors while being underweight the consumer staples, industrial, and telecom sectors. We also maintained our exposure to mid- and small-cap investments, although we reduced our positions in these market capitalization ranges as the year progressed. In the second quarter, we generally maintained our sector exposures, but also began to initiate positions in international markets. While we initially focused on adding developed international exposure, our quantitative investment model that evaluates domestic and international securities evolved to favor emerging markets. As a result, we eliminated our position in developed international securities and ended the period with an allocation to emerging market equity securities. Relative to the S&P 500 Index, our allocation decisions among the healthcare and industrials sector benefited performance, while our allocation to the consumer discretionary sector detracted from performance. Stock selection in the technology sector was the strongest contributor to our results, while selection in the energy and consumer discretionary sectors were additive to relative performance as well. Stock selection in the healthcare sector provided the largest drag on performance. Our top performing holding for the period was Hillshire Brands, while Nu Skin Enterprises was our worst performing security. Overall, our positions in international securities detracted from relative performance for the period. The Fund also incorporates the use of equity derivatives, such as stock index futures contracts, in order to equitize cash balances held in the Fund. For the year-to-date period through June 30, 2014, the use of equity derivatives has benefited the performance of the Fund as the domestic stock market has outperformed the return on cash investments, which are generally held in money market mutual funds. |
| |
| Page 4 | 2014 Semiannual Report | June 30, 2014 |
Period & Average Annual Total Returns as of June 30, 2014 (Unaudited)
| | YTD | 1 Year | 3 Year | 5 Year | 10 Year |
Muirfield Fund® Expense Ratios: Net Audited 1.22% Gross 1.62%+ | 6.62% | 26.47% | 12.07% | 13.65% | 5.66% |
Blended Index1 | 4.24% | 14.25% | 9.87% | 11.20% | 5.54% |
| S&P 500 Index | 7.14% | 24.61% | 16.59% | 18.83% | 7.78% |
Top 10 Holdings as of June 30, 2014 | % of total net assets |
| 1. | iShares MSCI Emerging Markets ETF | 13.2% |
| 2. | Hewlett-Packard Co. | 3.0% |
| 3. | Apple, Inc. | 2.9% |
| 4. | Western Digital Corp. | 2.7% |
| 5. | Pfizer, Inc. | 2.4% |
| 6. | Xerox Corp. | 2.2% |
| 7. | Oracle Corp. | 2.2% |
| 8. | Intel Corp. | 2.1% |
| 9. | ConocoPhillips | 2.1% |
| 10. | Wells Fargo & Co. | 2.0% |
Excluding cash. The Fund has invested in stock index futures contracts in order to equitize cash balances.
Inception Date: 8/10/88
| 2014 Semiannual Report | June 30, 2014 | Page 5 |
| |
Quantex Fund™ The Meeder Quantex Fund™ returned 8.45% for the year-to-date period ended June 30, 2014. For the same time period, the S&P MidCap 400 and the Russell 2000 Indices returned 7.50% and 3.19%, respectively. For the period ended June 30, 2014, the Quantex Fund™ outperformed both the S&P MidCap 400 Index and the Russell 2000 Index for the 1-, 3-, and 5-year time period. We have consistently employed our quantitative stock selection process since April 30, 2005 for the Quantex Fund™. We utilize quantitative rankings to determine which securities are to be held in the Fund on an annual basis, and as a result, the Fund is rebalanced annually in January. Currently, there is a strong preference for value holdings, with mid-cap value companies comprising 50% of the Fund, followed by mid-cap core with 34%, and mid-cap growth with 15%. Small-cap holdings of 1% comprise the remainder according to our quantitative allocation rankings as of June 30th. Relative to the S&P 400 MidCap Index, stock selection within the technology and energy sectors provided the greatest benefit to the Fund, while our overweight allocation to the telecom sector benefited performance as well. The largest detractor from performance was our stock selection in the materials and consumer staples sectors. Stock selection in the utilities sector contributed to performance, while our underweight allocation to consumer staples detracted from returns. However, the Fund benefited from other sector allocation decisions, including an overweight to the energy sector during the first half of 2014. For the first half of 2014, many stocks contributed positively to the performance of the Fund. The top performing stock for the period was Newfield Exploration, which was up 79%. Other top performers for the first half include Nabors (up 73%) and Electronic Arts (up 56%). The largest detractors from performance during the period were Cliffs Natural Resources (down 42%), Verisign (down 19%), and PetSmart (down 17%). The Fund also incorporates the use of equity derivatives, such as stock index futures contracts, in order to equitize cash balances held in the Fund. For the year-to-date period through June 30, 2014, the use of equity derivatives has benefited the performance of the Fund as the domestic stock market has outperformed the return on cash investments, which are generally held in money market mutual funds |
| |
| Page 6 | 2014 Semiannual Report | June 30, 2014 |
Period & Average Annual Total Returns as of June 30, 2014 (Unaudited)
| | YTD | 1 Year | 3 Year | 5 Year | 4/30/05 – 6/30/14 | 10 Year |
Quantex Fund™ Expense Ratios: Net Audited 1.52% Gross 1.94%+ | 8.45% | 28.90% | 17.39% | 24.79% | 11.14% | 10.21% |
Blended Index2 | 5.33% | 24.46% | 14.95% | 20.97% | 10.32% | 9.64% |
| Russell 2000 Index | 3.19% | 23.64% | 14.57% | 20.21% | 9.66% | 8.70% |
| S&P 400 MidCap Index | 7.50% | 25.24% | 15.26% | 21.67% | 10.90% | 10.51% |
Top 10 Holdings as of June 30, 2014 | % of total net assets |
| 1. | Newfield Exploration Co. | 1.5% |
| 2. | Nabors Industries, Ltd. | 1.5% |
| 3. | Electronic Arts, Inc. | 1.3% |
| 4. | Pepco Holdings, Inc. | 1.2% |
| 5. | Harman International Industries, Inc. | 1.1% |
| 6. | Integrys Energy Group, Inc. | 1.1% |
| 7. | First Solar, Inc. | 1.1% |
| 8. | Edwards Lifesciences Corp. | 1.1% |
| 9. | Allegion PLC | 1.1% |
| 10 | Allegheny Technologies, Inc. | 1.1% |
The Fund has invested in stock index futures contracts in order to equitize cash balances held in the Fund.
Inception Date: 3/20/85
The Quantex Fund™ was previously known as The Highlands Growth Fund. On April 30, 2005, The Highlands Growth Fund changed its name to the Quantex Fund™, also changing the Fund’s investment objective and strategies. The Highlands Growth Fund focused on large-cap equities, while the Quantex Fund™ invests primarily in small- and mid-cap equities. Due to this change in strategies on April 30, 2005, the S&P 500 Index is a more comparative index for Fund performance prior to April 30, 2005. The Russell 2000 Index and S&P 400 MidCap Index are more comparative indices for Fund performance after April 30, 2005.
| 2014 Semiannual Report | June 30, 2014 | Page 7 |
| |
The Meeder Aggressive Growth Fund returned 7.15% for the year-to-date period ended June 30, 2014 compared to the S&P 500 Index return of 7.14%. During the first quarter, we maintained a value bias while actively seeking growth sectors in accordance with our quantitative investment models. This balance proved beneficial for fund performance relative to the S&P 500 Index as growth and value strategies performed differently throughout the quarter. We maintained our exposure to mid- and small-cap stocks in the first quarter, although we decreased our positions as the quarter progressed. Our sector allocations remained fairly stable, and we were able to limit sector turnover by implementing style shifts at the stock-specific level. Stock selection within the consumer staples sector was the largest laggard on relative portfolio performance as Nu Skin Enterprises was the Fund’s worst performing stock for the period. Also dragging on performance were our relative weights to the consumer discretionary and utilities sectors. Both our overweight allocation and security selection within the technology sector contributed positively to relative performance. The top performing stock within the Fund for the quarter was Green Plains. Also contributing positively to relative performance was Nabors Industries and our security selection within the consumer discretionary sector.
During the second quarter, we actively rotated our exposure among market capitalizations in accordance with our quantitative investment models. While we maintained our exposure to mid-cap securities, we reduced our exposure to small-cap stocks as the quarter progressed due primarily to intermediate-term momentum factors. The most significant change to our allocation in the second quarter was the decision to add international exposure. Momentum, valuation, and currency factors favored international securities, especially in emerging markets. Within the domestic portion of the portfolio, stock selection within the technology sector was the largest detractor on relative portfolio performance. Also detracting from relative performance was our stock selection in the industrial sector. However, this was offset by our relative underweight to the overall sector. Also detracting from portfolio performance was stock selection within the health care sector. Offsetting these drags to performance was our underweight allocation to the financial sector. In addition, our security selection within the financial sector added the most to performance. The Fund’s best performing stock for the second quarter was Hillshire Brands after a buyout offer generated competing bids for the company’s assets. The Fund’s worst performing stock was Brocade. The Fund also incorporates the use of equity derivatives, such as stock index futures contracts, in order to equitize cash balances held in the Fund. For the year-to-date period through June 30, 2014, the use of equity derivatives has benefited the performance of the Fund as the domestic stock market has outperformed the return on cash investments, which are generally held in money market mutual funds. |
| |
| Page 8 | 2014 Semiannual Report | June 30, 2014 |
Period & Average Annual Total Returns as of June 30, 2014 (Unaudited)
| | YTD | 1 Year | 3 Year | 5 Year | 10 Year |
Aggressive Growth Fund Expense Ratios: Net Audited 1.35% Gross 1.74%+ | 7.15% | 27.76% | 12.69% | 15.85% | 6.39% |
| S&P 500 Index | 7.14% | 24.61% | 16.59% | 18.83% | 7.78% |
Top 10 Holdings as of June 30, 2014 | % of total net assets |
| 1. | iShares MSCI Emerging Markets ETF | 24.4% |
| 2. | Hewlett-Packard Co. | 3.8% |
| 3. | Western Digital Corp. | 3.4% |
| 4. | Xerox Corp. | 2.9% |
| 5. | American International Group, Inc. | 2.5% |
| 6. | Hess Corp. | 2.5% |
| 7. | Becton Dickinson and Co. | 2.4% |
| 8. | Occidental Petroleum Corp. | 2.2% |
| 9. | Oracle Corp. | 2.2% |
| 10. | Altria Group, Inc. | 2.0% |
Excluding cash. The Fund has invested in stock index futures contracts in order to equitize cash balances.
Inception Date: 2/29/00
| 2014 Semiannual Report | June 30, 2014 | Page 9 |
| |
Dynamic Growth Fund The Meeder Dynamic Growth Fund returned 5.99% for the year-to-date period ended June 30, 2014 compared to the S&P 500 Index return of 7.14%. During the first quarter, we maintained a value bias while actively seeking growth sectors in accordance with our quantitative investment models. This balance proved beneficial for fund performance relative to the S&P 500 Index as growth and value strategies performed differently throughout the quarter. We maintained our exposure to mid- and small-cap stocks in the first quarter, although we decreased our positions as the quarter progressed. Our sector allocations remained fairly stable, and we were able to limit sector turnover by implementing style shifts at the stock-specific level. Stock selection within the financial sector was the largest laggard on relative portfolio performance as our overweight to Principal Financial Group’s was impacted by the stock’s negative performance. Also dragging on performance were our relative weights to the consumer discretionary and utilities sectors. Both our overweight allocation and security selection within the technology sector contributed positively to relative performance. In addition, our security selection in the industrial sector helped performance. The top performing stock within the Fund for the quarter was Lexmark International. Also contributing positively to relative performance was Hewlett-Packard and our security selection within the consumer discretionary sector. During the second quarter, we actively rotated our exposure among market capitalizations in accordance with our quantitative investment models. While we maintained a modest weight to mid-cap securities, we reduced our exposure slightly as the quarter progressed due primarily to intermediate-term momentum factors. The most significant change to our allocation in the second quarter was the decision to add international exposure. Momentum, valuation, and currency factors favored international securities. While we built a modest position in developed international markets throughout the quarter, our quantitative model ended up pointing more heavily toward emerging markets by the end of the quarter. Within the domestic portion of the portfolio, stock selections within the healthcare and consumer staples sectors were the largest detractors on relative portfolio performance. Also detracting from portfolio performance were our sector underweights to the health care and utilities sectors. Our underweight allocation and security selection within the financial sector contributed positively to relative performance in addition to our underweight allocation to industrials. The Fund’s best performing stock for the second quarter was ConocoPhillips. The Fund’s worst performing stock was RR Donnelley & Sons. The Fund also incorporates the use of equity derivatives, such as stock index futures contracts, in order to equitize cash balances held in the Fund. For the year-to-date period through June 30, 2014, the use of equity derivatives has benefited the performance of the Fund as the domestic stock market has outperformed the return on cash investments, which are generally held in money market mutual funds. |
| |
| Page 10 | 2014 Semiannual Report | June 30, 2014 |
Period & Average Annual Total Returns as of June 30, 2014 (Unaudited)
| | YTD | 1 Year | 3 Year | 5 Year | 10 Year |
Dynamic Growth Fund Expense Ratios: Net Audited 1.22% Gross 1.66%+ | 5.99% | 25.90% | 13.62% | 15.88% | 6.42% |
| S&P 500 Index | 7.14% | 24.61% | 16.59% | 18.83% | 7.78% |
Top 10 Holdings as of June 30, 2014 | % of total net assets |
| 1. | iShares MSCI Emerging Markets ETF | 14.5% |
| 2. | Hewlett-Packard Co. | 3.2% |
| 3. | Western Digital Corp. | 2.9% |
| 4. | Apple, Inc. | 2.9% |
| 5. | JPMorgan Chase & Co. | 2.5% |
| 6. | Xerox Corp. | 2.5% |
| 7. | Pfizer, Inc. | 2.5% |
| 8. | Intel Corp. | 2.4% |
| 9. | Wells Fargo & Co. | 2.3% |
10. | Oracle Corp. | 2.3% |
Excluding cash. The Fund has invested in stock index futures contracts in order to equitize cash balances.
Inception Date: 2/29/00
| 2014 Semiannual Report | June 30, 2014 | Page 11 |
| |
The Meeder Strategic Growth Fund returned 8.80% for the six-month period ended June 30, 2014 compared to the S&P 500 Index return of 7.14%. The Strategic Growth Fund is fully invested in the equity market at all times, and holds a fixed allocation across six distinct investment categories. The mix of investments selected to represent each investment category is variable and actively managed by using our proprietary investment selection process. The targeted fixed allocation is comprised of the following: 30% international, 25% large-cap, 20% mid-cap, 10% small-cap, 7.5% real estate, and 7.5% commodities. Within each respective category, we seek to identify stocks and funds that will outperform their respective benchmark by utilizing an evaluation process based on fundamental and momentum factors. Securities that fall out of favor within our models are sold and replaced with investments ranked higher by our quantitative evaluation process. In the first half of 2014, the Fund benefited from its allocation to real estate and mid-cap investments compared to the performance of the S&P 500 Index. However, the small-cap and international categories detracted from performance relative to the S&P 500 as historically elevated valuations impacted domestic small capitalization companies while concerns lingered regarding outlook for the Eurozone. Fund selections in the international category also underperformed their respective benchmarks. Within our domestic stock selection, we experienced favorable results in the consumer discretionary, technology, and energy sector. Stock selection in the materials sector detracted from performance. For the year-to-date period, our top performing holdings on a total return basis were Hillshire Brands and Ashford Hospitality, while our worst performing holdings were Nu Skin Enterprises and Best Buy. The Fund also incorporates the use of equity derivatives, such as stock index futures contracts, in order to equitize cash balances held in the Fund. For the year-to-date period through June 30, 2014, the use of equity derivatives has benefited the performance of the Fund as the domestic stock market has outperformed the return on cash investments, which are generally held in money market mutual funds. |
| |
| Page 12 | 2014 Semiannual Report | June 30, 2014 |
Period & Average Annual Total Returns as of June 30, 2014 (Unaudited)
| | YTD | 1 Year | 3 Year | 5 Year | 10 Year |
Strategic Growth Fund Expense Ratios: Net Audited 1.23% Gross 1.75%+ | 8.80% | 26.44% | 6.69% | 16.00% | 4.70% |
| Blended Index3 | 7.57% | 20.86% | 11.52% | 6.99% | 6.15% |
| Blended Index4 | 7.01% | 10.67% | 7.17% | 16.20% | 6.40% |
| S&P 500 Index | 7.14% | 24.61% | 16.59% | 18.83% | 7.78% |
Top 10 Holdings as of June 30, 2014 | % of total net assets |
| 1. | iShares MSCI EAFE ETF | 7.9% |
| 2. | Oppenheimer Developing Markets Fund | 7.5% |
| 3. | iShares MSCI Emerging Markets ETF | 7.1% |
| 4. | Oppenheimer International Growth Fund | 6.4% |
| 5. | Patterson-UTI Energy, Inc. | 2.8% |
| 6. | Hewlett-Packard, Co. | 2.6% |
| 7. | Western Digital Corp. | 2.6% |
| 8. | Xerox Corp. | 2.4% |
| 9. | PPG Industries, Inc. | 1.8% |
| 10. | Computer Sciences Corp. | 1.6% |
Excluding cash. The Fund has invested in stock index futures contracts in order to equitize cash balances.
Inception Date: 1/31/06
On August 25, 2008, The Focused Growth Fund became known as The Strategic Growth Fund and its investment strategy changed. The Focused Growth Fund focused on equity ETFs targeting various styles, sectors and capitalization ranges of the stock market, while The Strategic Growth Fund holds a fixed allocation across six distinct equity investment categories. Due to the change in strategy, the S&P 500 Index is a more comparative index for fund performance prior to August 25, 2008, while the blended indexes along with the S&P 500 Index are more comparative indices for fund performance after August 25, 2008.
| 2014 Semiannual Report | June 30, 2014 | Page 13 |
| |
Utilities and Infrastructure Fund
The Meeder Utilities & Infrastructure Fund returned 13.03% for the year-to-date period ended June 30, 2014 compared to the benchmark Russell 3000 Utilities Index return of 12.30%. The Fund also outperformed its benchmark for the 1-, 3-, 5-, and 10-year periods. During the first quarter, large-cap electric utilities were surprisingly strong in contrast to the negative sentiment that prevailed during the prior year. Usage was strong due to severe winter weather, while economic data was far from robust and interest rates did not provide the kind of headwind that many were expecting. In our portfolio, the year began with a timely purchase of Capstone Turbine, the world’s leading manufacturer of micro-turbines used to provide electricity to remotely located infrastructure as well as backups. Capstone is experiencing strong demand from oil, gas, and mining companies that are traveling far afield for new reserves, particularly outside North America. To fund this purchase, as well as others in the quarter, we sold Turkcell due to the volatile political environment in Turkey, and took advantage of strong prices to sell or trim ARRIS, Ensco, ITC, Corning, National Grid, Questar, NiSource, Qualcomm, and Black Hills. Strong contributions from companies producing, transporting, and processing natural gas and renewable energy drove portfolio returns in the second quarter. In June, the Supreme Court put to bed any doubt about the EPA’s authority to implement its plan to reduce power plant emissions 30% by 2030. An economy powered by cleaner-burning natural gas and renewables continues to emerge, and there are plentiful opportunities for those companies building and enabling the massive infrastructure required. This quarter we initiated a position in Ormat Technologies, the world’s largest private producer of geothermal power. Ormat designs, builds, owns, and operates utility-scale generation facilities, the bulk of which are located in Nevada, California, and Hawaii. Long-time holding American Tower turned in strong performance for the quarter on better than expected earnings and an acquisition of 4,600 cell towers in Brazil. Looking ahead, infrastructure is the critical bottleneck for economic and social development. As of June 30, 2014, we were invested in this theme, and believed it provides a durable tailwind for our companies. |
| |
| Page 14 | 2014 Semiannual Report | June 30, 2014 |
Period & Average Annual Total Returns as of June 30, 2014 (Unaudited)
| | YTD | 1 Year | 3 Year | 5 Year | 10 Year |
| Utilities and Infrastructure Fund Expense Ratios: Net Audited 1.87% Gross 1.99%+ | 13.03% | 27.69% | 13.27% | 16.27% | 10.30% |
| Russell 3000 Utilities Index | 12.30% | 16.43% | 13.02% | 14.81% | 9.23% |
As a percentage of total net assets Concentrations are subject to change.
Top 10 Holdings as of June 30, 2014 | % of total net assets |
| 1. | Williams Companies, Inc. | 5.0% |
| 2. | Enterprise Products Partners L.P. | 4.6% |
| 3. | American Tower Corp. | 3.9% |
| 4. | Macquarie Infrastructure Co. LLC | 3.9% |
| 5. | Energy Transfer Equity L.P. | 3.7% |
| 6. | National Fuel Gas Co. | 3.6% |
| 7. | Veolia Environnement SA | 3.6% |
| 8. | American Water Works Company, Inc. | 3.6% |
| 9. | General Electric Co. | 3.5% |
| 10. | Telephone & Data Systems, Inc. | 3.4% |
Excluding cash. The Fund has invested in stock index futures contracts in order to equitize cash balances.
The Utilities and Infrastructure Fund was previously known as The Total Return Utilities Fund. On June 30, 2011, the Total Return Utilities Fund changed its name to the Utilities and Infrastructure Fund, but the investment strategy remained the same.
| 2014 Semiannual Report | June 30, 2014 | Page 15 |
| |
The Meeder Balanced Fund returned 5.73% for the six-month period ended June 30, 2014 compared to its custom benchmark index return of 4.17% and the S&P 500 Index return of 7.14%. Furthermore, the Fund has outperformed its custom benchmark over the 1-, 3-, and 5-year periods as well. The Balanced Fund will always invest at least 30% of its assets in fixed income securities. The Fund will also hold a minimum 30% allocation in equity securities, with additional investments determined by our defensive equity discipline. In the equity portion of the Balanced Fund, we entered the year fully invested in equity investments following output from our investment model that indicated a favorable risk/reward dynamic in the stock market. Toward the end of the second quarter, we established a modest defensive position in cash due to the presence of near-term risks in the stock market. In our equity exposure during the first half of 2014, we were overweight the technology, consumer discretionary, and healthcare sector while being underweight the industrials, consumer staples, and telecom sector. We also entered the year with exposure to mid- and small-cap investments, but reduced these positions as the year progressed due to momentum and valuation factors in our quantitative investment model. During the second quarter, we began increasing our exposure to international markets, particularly in emerging markets. Relative to the S&P 500 Index, our allocation decisions among the healthcare and industrials sector benefited performance, while our allocation to the consumer discretionary sector detracted from performance. Stock selection in the technology sector was the strongest contributor to our results, while stock selection in the healthcare sector provided the largest drag on performance. Our top performing holding for the period was Hillshire Brands, while Nu Skin Enterprises was our worst performing security. Overall, our positions in international securities detracted from relative performance. The Fund also incorporates the use of equity derivatives, such as stock index futures contracts, in order to equitize cash balances held in the Fund. For the year-to-date period through June 30, 2014, the use of equity derivatives has benefited the performance of the Fund as the domestic stock market has outperformed the return on cash investments, which are generally held in money market mutual funds. In the fixed income portion of the Fund, our overweight allocation to investment grade bonds benefited performance during the first half of 2014. We also experienced favorable results from our allocation to high yield as well as emerging market bonds, where we increased our allocation as the year progressed. Duration in the fixed income portion of the Fund was held below the Barclays Aggregate Bond Index during the first half of 2014. |
| |
| Page 16 | 2014 Semiannual Report | June 30, 2014 |
Period & Average Annual Total Returns as of June 30, 2014 (Unaudited)
| | YTD | 1 Year | 3 Year | 8/31/08 – 6/30/14 | 5 Year | Since Inception |
| Balanced Fund Expense Ratios: Net Audited 1.33% Gross 1.79%+ | 5.73% | 19.86% | 9.24% | 6.40% | 10.44% | 4.23% |
| | 3.67% | 10.76% | 7.78% | 5.81% | 9.11% | 5.18% |
Blended Index6 | 4.17% | 11.25% | 8.06% | 6.06% | 9.36% | 5.33% |
| S&P 500 Index | 7.14% | 24.61% | 16.59% | 9.92% | 18.83% | 7.45% |
Top 10 Holdings as of June 30, 2014 | % of total net assets |
| 1. | iShares MSCI Emerging Markets ETF | 10.0% |
| 2. | Sentinel Total Return Bond Fund | 5.6% |
| 3. | Putnam Diversified Income Trust | 5.2% |
| 4. | Federated Bond Fund | 4.5% |
| 5. | Prudential Total Return Bond Fund | 4.2% |
| 6. | Thompson Bond Fund | 3.7% |
| 7. | Ivy High Income Fund | 2.5% |
| 8. | Hewlett-Packard Co. | 2.3% |
| 9. | Apple, Inc. | 2.2% |
| 10. | Western Digital Corp. | 2.1% |
Excluding cash. The Fund has invested in stock index futures contracts in order to equitize cash balances.
On August 25, 2008, The Defensive Growth Fund became known as The Defensive Balanced Fund and its investment strategy changed. The Defensive Growth Fund focused on equity ETFs targeting various styles, sectors and capitalization ranges of the stock market, while The Defensive Balanced Fund had the ability to invest in stocks, bonds or cash depending on our assessment of stock market risk, and maintains a 30% allocation to fixed income securities. In 2012, The Defensive Balanced Fund became known as the Balanced Fund, but the investment strategy remained the same.
| 2014 Semiannual Report | June 30, 2014 | Page 17 |
| |
The Meeder Total Return Bond Fund realized positive performance in the first half of 2014 with a reported gain of 3.43%. Performance was driven by a combination of economic data and Fed policy which provided an accommodative landscape for bond investors in most sectors. In the first quarter of the year weather was the main hurdle investors faced. Economic data was dramatically affected by the harsh winter which painted a more sluggish picture of U.S. growth. The Fed was the second hurdle as the committee continued on its path of reducing accommodation in a measured manner. Investors analyzed every word uttered by the committee in an attempt to gain insight into future policy intentions. In the end, investors were presented with an environment which offered opportunity to extend duration and credit risk. All fixed income sectors captured positive gains, contributing to the Fund’s performance. The Total Return Bond Fund was overweight the corporate bond sector throughout the first half of the year, which helped performance in the first half of the year. Despite all the news surrounding weather and the FOMC, corporations in the U.S. were believed to be in position to maintain solid earnings growth and build on their fundamental strength. Investors believed U.S. based companies were more financially sound due to strong cash positions and improved leverage ratios, which should continue to result in lower than average default rates. Corporate bonds, including investment grade and high yield also offered positive yield spread opportunities versus U.S. Treasury securities. Also performing well in the first half of the year were emerging market bonds, which benefited the performance of the Fund as we increased our exposure to this sector throughout the first and second quarter. We continue to expect market volatility in the near future, and consequently we continue to monitor portfolio duration and investments that historically perform in concert with our strategy and model output. We will continue to watch for indications of changes in Fed policy as any abrupt decline in demand for fixed income securities could result in a higher level of interest rates and, conversely, lower prices for bonds. Finally, we incorporated the use of derivatives in the Fund, such as US Treasury futures, in order to manage the duration of the Fund. Our use of US Treasury futures throughout the first half of 2014 had a positive impact on the Fund’s performance. |
| |
| Page 18 | 2014 Semiannual Report | June 30, 2014 |
Period & Average Annual Total Returns as of June 30, 2014 (Unaudited)
| | YTD | 1 Year | 3 Year | Since Inception |
| Total Return Bond Fund Expense Ratios: Net Audited 0.99% Gross 1.53%+ | 3.43% | 6.29% | 3.86% | 3.86% |
Barclays Capital Aggregate Bond Index | 3.93% | 4.37% | 3.67% | 3.67% |
Top 10 Holdings as of June 30, 2014 | % of total net assets |
| 1. | iShares JP Morgan USD Emerging Markets Bond ETF | 9.0% |
| 2. | TCW Emerging Markets Income Fund | 8.4% |
| 3. | Putnam Diversified Income Trust | 7.9% |
| 4. | Ivy High Income Fund | 7.8% |
| 5. | Federated Bond Fund | 7.5% |
| 6. | AllianceBernstein High Income Fund | 7.4% |
| 7. | Putnam Absolute Return 300 Fund | 6.8% |
| 8. | Thompson Bond Fund | 6.2% |
| 9. | Eaton Vance Floating-Rate Advantaged Fund | 6.1% |
| 10. | Sentinel Total Return Bond Fund | 5.6% |
Excluding cash. The Fund has invested in stock index futures contracts in order to equitize cash balances.
Inception Date: 6/30/11
| 2014 Semiannual Report | June 30, 2014 | Page 19 |
| |
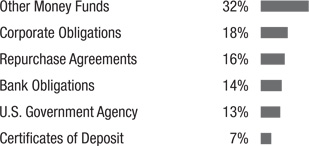
Managing the money market fund in the first half of 2014 was a challenging task mainly due to the market environment, monetary policy of the Federal Reserve and potential regulatory headwinds. The Fed Funds target rate, which is the barometer by which many industry related investments are priced against, remained locked in a range of 0.0% to 0.25%. Consequently, short-term investment opportunities which provide attractive yield and limited risk were restricted. In addition to the market environment, the Fed remained steadfast in its stance to gradually remove policy tools only if supported by improving economic metrics. Finally, the industry has been held captive by proposals to bring additional regulatory reform. The changes are being presented as an effort to enhance safety features of the money market industry. Despite the challenges facing us, the Fund continued to have success versus the competition year-to-date. Currently, both the retail and institutional share classes rank among the top money market funds in the country. Additionally, the Fund has been in the top 10% of all retail money market funds every year since its inception in 1985. The investment philosophy of the Fund remains focused on safety and liquidity. Holdings in the Fund remain biased toward investment opportunities that provide above average credit quality standards and guard against interest rate sensitivity. |
| |
| Page 20 | 2014 Semiannual Report | June 30, 2014 |
Period & Average Annual Total Returns as of June 30, 2014 (Unaudited)
| | YTD | 1 Year | 3 Year | 5 Year | 10 Year |
Money Market Fund- Retail ClassExpense Ratios: Net Audited 0.22% Gross 0.90%+ | 0.03% | 0.06% | 3.86% | 0.14% | 1.68% |
| Current & Effective Yields* | | 7-day Compound: 0.06% | 7-day Simple 0.06% |
Lipper Average General Purpose Money Market Fund | 0.01% | 0.01% | 0.01% | 0.02% | 1.50% |
| | YTD | 1 Year | 3 Year | 5 Year | Since Inception |
Money Market Fund- Institutional ClassExpense Ratios: Net Audited 0.15% Gross 0.71%+ | 0.06% | 0.12% | 0.15% | 023% | 1.82% |
| Current & Effective Yields* | | 7-day Compound: 0.14% | 7-day Simple 0.14% |
Lipper Average General Purpose Money Market Fund | 0.01% | 0.01% | 0.01% | 0.02% | 1.53% |
Top 10 Holdings as of June 30, 2014 | % of total net assets |
| 1. | Fidelity Money Market Portfolio | 32.2% |
| 2. | FICA Bank Deposit Program (StoneCastle) | 12.1% |
| 3. | GX Clarke Repo, 0.22%, 7/1/2014 | 8.0% |
| 4. | GX Clarke Repo, 0.22%, 7/3/2014 | 8.0% |
| 5. | Caterpillar Financial Power Investment Floating Rate Demand Note, 0.45% | 7.9% |
| 6. | GE Demand Note, 0.45% | 7.2% |
| 7. | FFCB, 0.195%, 9/24/2014 | 4.5% |
| 8. | FFCB, 0.10%, 10/28/2014 | 4.0% |
| 9. | FFCB, 0.13%, 2/23/2015 | 4.0% |
| 10. | Springside Corp. Exchange Partners, LLC, 0.18%, 7/3/2014 | 1.6% |
Inception Date: Retail- 3/27/85 Institutional- 12/28/04
| 2014 Semiannual Report | June 30, 2014 | Page 21 |
Shareholder Expense Analysis (Unaudited)
Shareholders of mutual funds pay ongoing expenses, such as advisory fees, distribution and service fees (12b-1 fees) and other fund expenses. The following examples are intended to help you understand your ongoing costs (in dollars) of investing in the Funds and to compare these costs with the ongoing costs of investing in other mutual funds.
The table below provides information on actual and hypothetical account values. The examples shown are based on an investment of $1,000 invested at the beginning of the period and held for the six-month period from December 31, 2013 to June 30, 2014.
ACTUAL EXPENSES: You may use actual account values and actual expenses, along with the amount you invested, to estimate the expenses that you paid over the period. Simply divide your account value by $1,000 (e.g.: an $8,600 account value divided by $1,000 = 8.6), then multiply the result by the number in the line under the heading “Expenses Paid During the Period” to estimate the expenses you paid on your account during this period.
HYPOTHETICAL EXAMPLE FOR COMPARISON PURPOSES: Hypothetical account values and hypothetical expenses are based on the Funds’ actual expense ratios and assume rates of return of 5% per year before expenses, which are not the Funds’ actual return. The hypothetical account values and expenses may not be used to estimate the actual ending account balance or expenses you paid for the period. You may use this information to compare the ongoing costs of investing in the Funds to other funds. To do so, compare this 5% hypothetical example with the 5% hypothetical examples that appear in the shareholder reports of the other funds.
| | | Beginning Account Value (12/31/2013) | Ending Account Value (6/30/2014) | Expenses Paid During Period1 (12/31/2013-6/30/2014) | Expense Ratio (Annualized) |
Muirfield Fund® | Actual | $1,000.00 | $1,066.20 | $6.25 | 1.22% |
| | Hypothetical | 1,000.00 | 1,018.74 | 6.11 | 1.22% |
| Utilities & Infrastructure Fund | Actual | 1,000.00 | 1,130.30 | 9.72 | 1.84% |
| | Hypothetical | 1,000.00 | 1,015.67 | 9.20 | 1.84% |
Quantex FundTM | Actual | 1,000.00 | 1,084.50 | 7.18 | 1.39% |
| | Hypothetical | 1,000.00 | 1,017.90 | 6.95 | 1.39% |
| Dynamic Growth Fund | Actual | 1,000.00 | 1,059.90 | 6.23 | 1.22% |
| | Hypothetical | 1,000.00 | 1,018.74 | 6.11 | 1.22% |
| Aggressive Growth Fund | Actual | 1,000.00 | 1,071.50 | 6.78 | 1.32% |
| | Hypothetical | 1,000.00 | 1,018.25 | 6.61 | 1.32% |
| Balanced Fund | Actual | 1,000.00 | 1,057.30 | 6.78 | 1.33% |
| | Hypothetical | 1,000.00 | 1,018.20 | 6.66 | 1.33% |
| Strategic Growth Fund | Actual | 1,000.00 | 1,088.00 | 6.47 | 1.25% |
| | Hypothetical | 1,000.00 | 1,018.60 | 6.26 | 1.25% |
| Total Return Bond Fund | Actual | 1,000.00 | 1,034.30 | 4.99 | 0.99% |
| | Hypothetical | 1,000.00 | 1,019.89 | 4.96 | 0.99% |
| Money Market Fund - Retail Class | Actual | 1,000.00 | 1,000.30 | 0.84 | 0.17% |
| | Hypothetical | 1,000.00 | 1,023.95 | 0.85 | 0.17% |
| Money Market Fund - Institutional Class | Actual | 1,000.00 | 1,000.60 | 0.60 | 0.12% |
| | Hypothetical | 1,000.00 | 1,024.20 | 0.60 | 0.12% |
Please note that the expenses shown in the table above are meant to highlight your ongoing costs only and do not reflect any transactional costs, such as redemption fees or exchange fees. Therefore, hypothetical information is useful in comparing ongoing costs only, and will not help you determine the relative total costs of owning different funds. In addition, if any transactional costs were included, your costs would have been higher.
1 | Expenses are equal to the Funds’ annualized expense ratios, multiplied by the average account value over the period by 181/365 (to reflect the total number of days in the six-month period). |
| Page 22 | 2014 Semiannual Report | June 30, 2014 |
Investment Risks, Performance and Fees
Past performance is not a guarantee of future results. Investing in securities involves inherent risks, including the risk that you can lose the value of your investment. There is no assurance that the investment process will lead to successful results. Investments in foreign securities may entail unique and additional risks including political, market and currency risks. Returns for periods of one year and greater are annualized. All performance figures represent total returns and average annual total returns or current and effective yields for the periods ended June 30, 2014. Investment performance assumes reinvestment of all dividend and capital gain distributions. Current performance may be lower or higher than the performance data quoted.
Opinions and forecasts regarding sectors, industries, companies, countries and/or themes, portfolio composition and holdings as of 6/30/2014 are all subject to change at any time, based on market and other conditions, and should not be construed as a recommendation of any specific security, industry, or sector.
Management fees and/or expenses were waived and/or reimbursed in Meeder Funds® during the periods shown to reduce expenses. For the Quantex Fund™, the advisor has contractually agreed to waive fees and/or to reimburse expenses until April 30, 2015, unless sooner terminated at the sole discretion of the Funds' Board of Trustees.
This is not an offer to purchase securities. Investors are advised to consider the investment objectives, risks, charges and expenses of the Meeder Funds®, as well as current Fund performance information, carefully before investing. The Meeder Funds® prospectus contains this and other information about the Funds and should be read carefully before investing. To request or receive a copy of the Meeder Funds® prospectus, contact Shareholder Services at 800.325.3539 or visit www.meederfunds.com.
| + | The Net Audited Expense Ratio is calculated based on the actual fees paid during the 2013 fiscal year ended December 31st, as reflected in the Fund's annual report. The Gross Expense Ratio is a percentage of the Fund’s average daily net assets, including acquired fund fees and expenses, as shown in the most current Fund Prospectus. |
| * | The current and effective yields quoted for the Money Market Fund are as of June 30, 2014. Yield quotations more closely reflect the current earnings of the Money Market Fund than do total return quotations. To obtain the most current 7-day yields for the Money Market Fund, call Meeder Funds® Shareholder Services Department toll free at (800) 325-3539 or (614) 760-2159. Investments in the Money Market Fund (either class) are not a bank deposit and are neither insured nor guaranteed by the Federal Deposit Insurance Corporation or any other governmental agency. Although the Fund seeks to preserve the value of your investment at $1.00 per share, it is possible to lose money by investing in the Money Market Fund (either class.) |
Index Disclosures
The Russell 2000 Index is a market-capitalization weighted index of the 2,000 smallest companies included in the Russell 3000 Index. The Russell 3000 Index is a market-capitalization weighted index measuring the performance of the 3,000 largest U.S. companies based on total market capitalization.
The Standard & Poor’s (S&P) MidCap 400 Index is an index of common stock prices of mid-sized companies.
The Standard & Poor’s (S&P) 500 Index is a market value-weighted index of common stocks considered representative of the broad market.
The Barclays Capital Intermediate-Term Government/Credit Index is an index of fixed-rate bonds issued by the U.S. Government and its agencies that are rated investment grade or higher and have one to ten years remaining until maturity and at least $100 million outstanding.
The Barclays Capital U.S. Aggregate Bond Index is a broad-based benchmark that measures the investment grade, U.S. dollar-denominated, fixed-rate taxable bond market, including Treasures, government-related and corporate securities, Mortgage-Backed Securities (agency fixed-rate and hybrid ARM pass-throughs), Asset-Backed Securities and Commercial Mortgage-Backed Securities. The Barclays Capital U.S. Aggregate rolls up into other Barclays Capital flagship indices such as the multi-currency Global Aggregate Index and the U.S. Universal Index, which includes high-yield and emerging markets debt. The Barclays Capital U.S. Aggregate Index was created in 1986, with index history backfilled to January 1, 1976.
The Barclays Capital Intermediate Government Index is an index of dollar-denominated non-convertible fixed-rate bonds issued by the U.S. Government that are rated investment-grade or higher, have a maturity of one to ten years, and at least $250 million outstanding.
The MSCI EAFE Index (Europe, Australasia, Far East) is a free float-adjusted market capitalization index that is designed to measure the equity market performance of developed markets, excluding the US & Canada. The MSCI EAFE Index consists of the following 22 developed market country indices: Australia, Austria, Belgium, Denmark, Finland, France, Germany, Greece, Hong Kong, Ireland, Israel, Italy, Japan, the Netherlands, New Zealand, Norway, Portugal, Singapore, Spain, Sweden, Switzerland, and the United Kingdom.
The MSCI Emerging Markets Index captures large and mid cap representation across 23 emerging markets countries. With 823 constituents, the index covers approximately 85% of the free float-adjusted market capitalization in each country.
The S&P GSCI Index is a leading measure of general price movements and inflation in the world economy.
Dow Jones U.S. Select Real Estate Securities Index measures the performance of publicly traded real estate securities.
All indexes are unmanaged and total returns for each index assumes change in security prices and reinvestment of dividends and capital gain distributions. Returns for an index do not take into account the deduction of expenses associated with a mutual fund such as investment management and accounting fees, brokerage commissions, or other expenses associated with investing. One cannot invest directly in an index. Source for equity index data: Bloomberg LP. Source for fixed income index data: Morningstar, Inc. Source for average general-purpose money market fund performance: Lipper, Inc.
Blended Indices
| 1 | Muirfield Fund®: 60% of the S&P 500 Index and 40% of the average 90-day U.S. Treasury bill. |
| 2014 Semiannual Report | June 30, 2014 | Page 23 |
| 2 | Quantex Fund™: 50% of the Russell 2000 Index and 50% of the S&P MidCap 400 Index. |
| 3 | Strategic Growth Fund: 25% of the S&P 500 Index, 20% of the S&P MidCap 400 Index, 12.5% of the Russell 2000 Index, 12.5% of the Dow Jones U.S. Select REIT Index, 12.5% of the S&P GSCI Index, 12% of the MSCI EAFE Index, and 5.5% of the MSCI Emerging Markets Index. |
| 4 | Strategic Growth Fund: 25% of the S&P 500 Index, 20% of the S&P 400 MidCap Index, 15% MSCI Emerging Market Index, 15% of the MSCI EAFE Index, 10% of the Russell 2000 Index, 7.5% of the S&P GSCI Index, and 7.5% Dow Jones U.S. Select REIT Index. |
| 5 | Balanced Fund: 42% of the S&P 500 Index, 28% of the average 90-day U.S. Treasury bill and 30% of the Barclays Capital Intermediate-Term Government/Credit Index. |
| 6 | Balanced Fund: 42% of the S&P 500 Index, 28% of the average 90-day U.S. Treasury bill and 30% of the Barclays Capital Aggregate Bond Index. |
©2013 Morningstar, Inc. All rights reserved. The Morningstar information contained herein (1) is proprietary to Morningstar and/or its content providers; (2) may not be copied or redistributed; and (3) is not warranted to be accurate complete or timely. Neither Morningstar nor its content providers are responsible for any damages or losses arising from any use of this information.
©2013 Reuters. All rights reserved. Lipper, a Reuters Company, supplied information contained in this report. Any copying, republication or redistribution of Lipper content, including by caching, framing or similar means, is expressly prohibited without the prior written consent of Lipper. Lipper shall not be liable for any errors or delays in the content, or for any actions taken in reliance thereon. Rankings are based on all classes available within the classification as of the date shown. Rankings are based only on the universe shown.
Meeder does not review the Morningstar or Lipper data. For fund performance you should review the fund’s current prospectus or other fund materials for the most current information concerning applicable fees and expenses. Although Meeder believes the data gathered from third-party sources is reliable, it does not review such information and cannot warrant it to be accurate, complete, or timely. Meeder is not responsible for any damages or losses arising from any use of this third-party information.
| Page 24 | 2014 Semiannual Report | June 30, 2014 |
| |
2014 Semiannual Report Fund Holdings & Financial Statements |
| |
Schedule of Investments
June 30, 2014 (unaudited)
Muirfield Fund® | |
| | Shares or Principal Amount ($) | | | | |
| | | | | | | |
| Common Stocks — 75.6% | | | | | | |
| Consumer Discretionary — 11.2% | | | | | | |
| Aarons, Inc. | | | 28,355 | | | | 1,010,572 | |
Apollo Education Group, Inc. (2) | | | 26,890 | | | | 840,313 | |
| Best Buy Co., Inc. | | | 38,370 | | | | 1,189,854 | |
| Dillards, Inc. | | | 11,105 | | | | 1,294,954 | |
Discovery Communications, Inc. (2) | | | 32,220 | | | | 2,393,302 | |
| Foot Locker, Inc. | | | 29,490 | | | | 1,495,733 | |
| Lear Corp. | | | 13,210 | | | | 1,179,917 | |
Live Nation Entertainment, Inc. (2) | | | 62,390 | | | | 1,540,409 | |
| Macy's, Inc. | | | 55,390 | | | | 3,213,728 | |
| Time Warner, Inc. | | | 47,230 | | | | 3,317,907 | |
| Viacom, Inc. | | | 14,350 | | | | 1,244,575 | |
Visteon Corp. (2) | | | 16,150 | | | | 1,566,711 | |
| Walt Disney Co. | | | 13,290 | | | | 1,139,485 | |
| Whirlpool Corp. | | | 6,520 | | | | 907,714 | |
| (Cost $20,498,649) | | | | | | | 22,335,174 | |
| | | | | | | | | |
| Consumer Staples — 6.5% | | | | | | | | |
| Altria Group, Inc. | | | 76,810 | | | | 3,221,411 | |
| Archer-Daniels-Midland Co. | | | 74,525 | | | | 3,287,298 | |
| Bunge, Limited | | | 13,060 | | | | 987,858 | |
| Kimberly-Clark Corp. | | | 9,965 | | | | 1,108,307 | |
| Kroger Co./The | | | 40,485 | | | | 2,001,174 | |
| Spectrum Brands Holdings, Inc. | | | 12,840 | | | | 1,104,625 | |
| Wal-Mart Stores, Inc. | | | 17,190 | | | | 1,290,453 | |
| (Cost $12,080,877) | | | | | | | 13,001,126 | |
| | | | | | | | | |
| Energy — 7.8% | | | | | | | | |
| ConocoPhillips | | | 48,300 | | | | 4,140,758 | |
| Exxon Mobil Corp. | | | 30,880 | | | | 3,108,998 | |
| Hess Corp. | | | 40,085 | | | | 3,964,006 | |
| Occidental Petroleum Corp. | | | 35,000 | | | | 3,592,050 | |
| Valero Energy Corp. | | | 15,560 | | | | 779,556 | |
| (Cost $13,494,101) | | | | | | | 15,585,368 | |
| | | | | | | | | |
| Financials — 11.8% | | | | | | | | |
| Allstate Corp./The | | | 26,205 | | | | 1,538,758 | |
| American Equity Investment Life Holding Co. | | | 44,275 | | | | 1,089,165 | |
| American International Group, Inc. | | | 40,530 | | | | 2,212,127 | |
| Assurant, Inc. | | | 25,095 | | | | 1,644,977 | |
Genworth Financial, Inc. (2) | | | 48,800 | | | | 849,120 | |
| JPMorgan Chase & Co. | | | 52,560 | | | | 3,028,507 | |
| MetLife, Inc. | | | 27,270 | | | | 1,515,121 | |
| Old Republic International Corp. | | | 48,055 | | | | 794,830 | |
| Principal Financial Group, Inc. | | | 45,635 | | | | 2,303,655 | |
| Protective Life Corp. | | | 32,450 | | | | 2,249,759 | |
Muirfield Fund® | |
| | Shares or Principal Amount ($) | | | | |
| | | | | | | |
| Common Stocks — continued | | | | | | |
| SunTrust Banks, Inc. | | | 55,015 | | | | 2,203,901 | |
| Wells Fargo & Co. | | | 77,395 | | | | 4,067,881 | |
| (Cost $21,304,830) | | | | | | | 23,497,801 | |
| | | | | | | | | |
| Healthcare — 10.7% | | | | | | | | |
| Abbott Laboratories | | | 56,645 | | | | 2,316,781 | |
| Becton Dickinson and Co. | | | 29,700 | | | | 3,513,510 | |
Davita, Inc. (2) | | | 50,330 | | | | 3,639,866 | |
Gilead Sciences, Inc. (2) | | | 28,565 | | | | 2,368,324 | |
| Johnson & Johnson | | | 14,320 | | | | 1,498,158 | |
Lifepoint Hospital, Inc. (2) | | | 19,355 | | | | 1,201,946 | |
| Pfizer, Inc. | | | 161,525 | | | | 4,794,061 | |
| Stryker Corp. | | | 12,580 | | | | 1,060,746 | |
VCA Antech, Inc. (2) | | | 25,345 | | | | 889,356 | |
| (Cost $20,450,458) | | | | | | | 21,282,748 | |
| | | | | | | | | |
| Industrials — 4.4% | | | | | | | | |
Aecom Technology Corporation (2) | | | 61,350 | | | | 1,975,470 | |
| Caterpillar, Inc. | | | 13,505 | | | | 1,467,588 | |
| Honeywell International, Inc. | | | 11,625 | | | | 1,080,544 | |
| Manpowergroup, Inc. | | | 12,550 | | | | 1,064,868 | |
| Parker Hannifin Corp. | | | 19,210 | | | | 2,415,273 | |
| RR Donnelley & Sons Co. | | | 51,825 | | | | 878,952 | |
| (Cost $8,458,418) | | | | | | | 8,882,695 | |
| | | | | | | | | |
| Information Technology — 19.5% | | | | | | | | |
| Apple, Inc. | | | 61,135 | | | | 5,681,275 | |
Benchmark Electronics, Inc. (2) | | | 14,340 | | | | 365,383 | |
Google, Inc. Class A (2) | | | 645 | | | | 377,112 | |
Google, Inc. Class C (2) | | | 3,215 | | | | 1,849,525 | |
| Hewlett-Packard Co. | | | 178,053 | | | | 5,996,825 | |
| Intel Corp. | | | 136,765 | | | | 4,226,039 | |
| Lexmark International, Inc. | | | 28,295 | | | | 1,362,687 | |
| Microsoft Corp. | | | 62,755 | | | | 2,616,884 | |
| Oracle Corp. | | | 106,895 | | | | 4,332,454 | |
| Seagate Technology PLC | | | 15,230 | | | | 865,369 | |
| Solera Holdings, Inc. | | | 22,180 | | | | 1,489,387 | |
| Western Digital Corp. | | | 58,071 | | | | 5,359,953 | |
| Xerox Corp. | | | 355,780 | | | | 4,425,903 | |
| (Cost $30,621,596) | | | | | | | 38,948,796 | |
| | | | | | | | | |
| Materials — 1.6% | | | | | | | | |
| Dow Chemical Co./The | | | 16,575 | | | | 852,950 | |
| Mosaic Co./The | | | 16,865 | | | | 833,974 | |
| PPG Industries, Inc. | | | 7,125 | | | | 1,497,319 | |
| (Cost $2,960,011) | | | | | | | 3,184,243 | |
The accompanying notes are an integral part of these financial statements.
| Page 26 | 2014 Semiannual Report | June 30, 2014 |
Schedule of Investments
June 30, 2014 (unaudited)
Muirfield Fund® | |
| | Shares or Principal Amount ($) | | | | |
| | | | | | | |
| Common Stocks — continued | | | | | | |
| Utilities — 2.1% | | | | | | |
| American Electric Power, Inc. | | | 33,410 | | | | 1,863,276 | |
| Entergy Corp. | | | 12,305 | | | | 1,010,117 | |
| UGI Corp. | | | 14,375 | | | | 725,938 | |
| Vectren Corporation | | | 15,025 | | | | 638,563 | |
| (Cost $3,964,529) | | | | | | | 4,237,894 | |
| | | | | | | | | |
| Total Common Stocks (Cost $133,833,469) | | | | | | | 150,955,845 | |
| Registered Investment Companies — 13.2% | |
iShares MSCI Emerging Markets Index Fund (7) | | | 611,735 | | | | 26,445,304 | |
| Total Registered Investment Companies (Cost $26,013,190) | | | | | | | 26,445,304 | |
| Money Market Registered Investment Companies — 10.7% | |
Meeder Money Market Fund - Institutional Class, 0.11% (3) | | | 21,505,908 | | | | 21,505,908 | |
| Total Money Market Registered Investment Companies (Cost $21,505,908) | | | | | | | 21,505,908 | |
| Floating Rate Demand Notes — 0.0% | | | | | | |
| Caterpillar Financial Power Investment Floating Rate Demand Note, | | | | | | |
0.45%, 7/1/2014 (4) | | | 1,890 | | | | 1,890 | |
| Total Floating Rate Demand Notes (Cost $1,890) | | | | | | | 1,890 | |
| U.S. Government Obligations — 0.3% | | | | | | |
U.S. Treasury Bill, 0.11%, due 3/5/2015 (5) | | | 500,000 | | | | 499,803 | |
| Total U.S. Government Obligations (Cost $499,786) | | | | | | | 499,803 | |
Total Investments — 99.8% (Cost $181,854,243) (1) | | | | | | | 199,408,750 | |
| Other Assets less Liabilities — 0.2% | | | | | | | 322,971 | |
| Total Net Assets — 100.0% | | | | | | | 199,731,721 | |
Muirfield Fund® | |
| | Shares or Principal Amount ($) | | | | |
| | | | | | | |
Trustee Deferred Compensation (6) | | | | | | |
| Meeder Aggressive Growth Fund | | | 3,263 | | | | 38,144 | |
| Meeder Balanced Fund | | | 1,855 | | | | 21,704 | |
| Meeder Dynamic Growth Fund | | | 1,185 | | | | 12,999 | |
Meeder Muirfield Fund® | | | 5,290 | | | | 39,199 | |
Meeder Quantex FundTM | | | 3,009 | | | | 114,192 | |
| Meeder Utilities & Infrastructure Fund | | | 384 | | | | 13,409 | |
| Total Trustee Deferred Compensation (Cost $141,587) | | | | | | | 239,647 | |
| | | | | | Unrealized Appreciation (Depreciation)($) | |
| | | | | | | |
| Futures Contracts | |
| Standard & Poors 500 expiring September 2014, notional value $7,321,500 | | | 15 | | | | 34,438 | |
| Total Futures Contracts | | | 15 | | | | 34,438 | |
| (1) | Cost for federal income tax and financial reporting purposes are the same. |
| (2) | Represents non-income producing securities. |
| (3) | Investment in affiliate. The yield shown represents the 7-day yield in effect at June 30, 2014. |
| (4) | Floating rate security. The rate shown represents the rate in effect at June 30, 2014. |
| (5) | Pledged as collateral on futures contracts. |
| (6) | Assets of affiliates to the Muirfield Fund® held for the benefit of the Fund’s Trustees in connection with the Trustee Deferred Compensation Plan. |
The accompanying notes are an integral part of these financial statements.
| 2014 Semiannual Report | June 30, 2014 | Page 27 |
Schedule of Investments
June 30, 2014 (unaudited)
| Dynamic Growth Fund | |
| | Shares or Principal Amount ($) | | | | |
| | | | | | | |
| Common Stocks — 80.2% | |
| Consumer Discretionary — 11.5% | | | | | | |
Apollo Education Group, Inc. (2) | | | 14,115 | | | | 441,094 | |
| Dillards, Inc. | | | 5,995 | | | | 699,077 | |
Discovery Communications, Inc. (2) | | | 22,310 | | | | 1,657,187 | |
| Foot Locker, Inc. | | | 7,205 | | | | 365,438 | |
| Lear Corp. | | | 11,080 | | | | 989,666 | |
Live Nation Entertainment, Inc. (2) | | | 21,470 | | | | 530,094 | |
| Macy's, Inc. | | | 34,685 | | | | 2,012,424 | |
| Scripps Networks Interactive, Inc. | | | 7,675 | | | | 622,750 | |
Tenneco, Inc. (2) | | | 17,740 | | | | 1,165,518 | |
| Time Warner, Inc. | | | 37,795 | | | | 2,655,098 | |
Visteon Corp. (2) | | | 16,530 | | | | 1,603,575 | |
| Whirlpool Corp. | | | 6,485 | | | | 902,842 | |
| (Cost $12,640,698) | | | | | | | 13,644,763 | |
| | | | | | | | | |
| Consumer Staples — 7.6% | | | | | | | | |
| Altria Group, Inc. | | | 40,880 | | | | 1,714,507 | |
| Archer-Daniels-Midland Co. | | | 58,000 | | | | 2,558,379 | |
| Kimberly-Clark Corp. | | | 4,730 | | | | 526,071 | |
| Kroger Co./The | | | 30,365 | | | | 1,500,942 | |
| Spectrum Brands Holdings, Inc. | | | 6,320 | | | | 543,710 | |
| Wal-Mart Stores, Inc. | | | 29,300 | | | | 2,199,551 | |
| (Cost $8,251,503) | | | | | | | 9,043,160 | |
| | | | | | | | | |
| Energy — 6.5% | | | | | | | | |
| ConocoPhillips | | | 14,200 | | | | 1,217,366 | |
| Exxon Mobil Corp. | | | 26,240 | | | | 2,641,843 | |
| Hess Corp. | | | 24,990 | | | | 2,471,261 | |
| Occidental Petroleum Corp. | | | 13,555 | | | | 1,391,150 | |
| (Cost $6,849,707) | | | | | | | 7,721,620 | |
| | | | | | | | | |
| Financials — 12.1% | | | | | | | | |
| Allstate Corp./The | | | 21,435 | | | | 1,258,663 | |
| American International Group, Inc. | | | 38,930 | | | | 2,124,799 | |
| Assurant, Inc. | | | 11,470 | | | | 751,859 | |
| JPMorgan Chase & Co. | | | 52,415 | | | | 3,020,151 | |
| MetLife, Inc. | | | 21,825 | | | | 1,212,597 | |
| Old Republic International Corp. | | | 30,575 | | | | 505,711 | |
| Principal Financial Group, Inc. | | | 18,680 | | | | 942,966 | |
| SunTrust Banks, Inc. | | | 47,415 | | | | 1,899,445 | |
| Wells Fargo & Co. | | | 52,445 | | | | 2,756,509 | |
| (Cost $13,661,814) | | | | | | | 14,472,700 | |
| | | | | | | | | |
| Healthcare — 11.7% | | | | | | | | |
| Abbott Laboratories | | | 35,440 | | | | 1,449,496 | |
| Becton Dickinson and Co. | | | 17,825 | | | | 2,108,698 | |
Davita, Inc. (2) | | | 23,010 | | | | 1,664,083 | |
| Dynamic Growth Fund | |
| | Shares or Principal Amount ($) | | | | |
| | | | | | | |
| Common Stocks — continued | | | | | | |
Gilead Sciences, Inc. (2) | | | 5,895 | | | | 488,754 | |
| Johnson & Johnson | | | 10,560 | | | | 1,104,787 | |
| McKesson Corp. | | | 9,400 | | | | 1,750,374 | |
| Pfizer, Inc. | | | 98,605 | | | | 2,926,595 | |
| Stryker Corp. | | | 17,615 | | | | 1,485,297 | |
United Therapeutics Corp. (2) | | | 4,065 | | | | 359,712 | |
VCA Antech, Inc. (2) | | | 17,040 | | | | 597,934 | |
| (Cost $13,518,990) | | | | | | | 13,935,730 | |
| | | | | | | | | |
| Industrials — 5.2% | | | | | | | | |
Aecom Technology Corp. (2) | | | 30,840 | | | | 993,048 | |
| Caterpillar, Inc. | | | 14,145 | | | | 1,537,137 | |
| General Electric Co. | | | 56,465 | | | | 1,483,900 | |
| Honeywell International, Inc. | | | 5,585 | | | | 519,126 | |
| Parker Hannifin Corp. | | | 13,210 | | | | 1,660,893 | |
| (Cost $5,851,900) | | | | | | | 6,194,104 | |
| | | | | | | | | |
| Information Technology — 21.7% | | | | | | | | |
| Apple, Inc. | | | 36,795 | | | | 3,419,359 | |
Google, Inc. Class A (2) | | | 2,355 | | | | 1,376,898 | |
Google, Inc. Class C (2) | | | 2,355 | | | | 1,354,784 | |
| Hewlett-Packard Co. | | | 113,050 | | | | 3,807,523 | |
| Intel Corp. | | | 91,015 | | | | 2,812,364 | |
| Lexmark International, Inc. | | | 17,565 | | | | 845,930 | |
| Microsoft Corp. | | | 39,665 | | | | 1,654,031 | |
| Oracle Corp. | | | 66,845 | | | | 2,709,228 | |
| Seagate Technology PLC | | | 23,925 | | | | 1,359,419 | |
| Western Digital Corp. | | | 37,596 | | | | 3,470,111 | |
| Xerox Corp. | | | 241,160 | | | | 3,000,030 | |
| (Cost $20,500,292) | | | | | | | 25,809,677 | |
| | | | | | | | | |
| Materials — 1.5% | | | | | | | | |
| Dow Chemical Co./The | | | 16,485 | | | | 848,318 | |
| PPG Industries, Inc. | | | 4,690 | | | | 985,604 | |
| (Cost $1,713,827) | | | | | | | 1,833,922 | |
| | | | | | | | | |
| Utilities — 2.4% | | | | | | | | |
| American Electric Power, Inc. | | | 28,840 | | | | 1,608,407 | |
| Entergy Corp. | | | 15,040 | | | | 1,234,634 | |
| (Cost $2,633,599) | | | | | | | 2,843,041 | |
| | | | | | | | | |
| Total Common Stocks (Cost $85,622,330) | | | | | | | 95,498,717 | |
The accompanying notes are an integral part of these financial statements.
| Page 28 | 2014 Semiannual Report | June 30, 2014 |
Schedule of Investments
June 30, 2014 (unaudited)
| |
| | Shares or Principal Amount ($) | | | | |
| | | | | | | |
Registered Investment Companies — 14.5% | |
iShares MSCI Emerging Markets Index Fund (7) | | | 397,990 | | | | 17,205,107 | |
| Total Registered Investment Companies (Cost $16,928,451) | | | | | | | 17,205,107 | |
| Money Market Registered Investment Companies — 4.9% | |
Meeder Money Market Fund - Institutional Class, 0.11% (3) | | | 5,881,916 | | | | 5,881,916 | |
| Total Money Market Registered Investment Companies (Cost $5,881,916) | | | | | | | 5,881,916 | |
| Floating Rate Demand Notes — 0.0% | |
| Caterpillar Financial Power Investment Floating Rate Demand Note, | | | | | | |
0.45%, 7/1/2014 (4) | | | 271 | | | | 271 | |
| Total Floating Rate Demand Notes (Cost $271) | | | | | | | 271 | |
| U.S. Government Obligations — 0.3% | |
U.S. Treasury Bill, 0.11%, due 3/5/2015 (5) | | | 300,000 | | | | 299,882 | |
| Total U.S. Government Obligations (Cost $299,871) | | | | | | | 299,882 | |
Total Investments — 99.9% (Cost $108,732,839)(1) | | | | | | | 118,885,893 | |
| Other Assets less Liabilities — 0.1% | | | | | | | 156,796 | |
| Total Net Assets — 100.0% | | | | | | | 119,042,689 | |
Trustee Deferred Compensation (6) | |
| Meeder Aggressive Growth Fund | | | 2,376 | | | | 27,775 | |
| Meeder Balanced Fund | | | 1,341 | | | | 15,690 | |
| Meeder Dynamic Growth Fund | | | 865 | | | | 9,489 | |
Meeder Muirfield Fund® | | | 2,890 | | | | 21,415 | |
Meeder Quantex FundTM | | | 1,365 | | | | 51,802 | |
| Meeder Utilities & Infrastructure Fund | | | 279 | | | | 9,743 | |
| Total Trustee Deferred Compensation (Cost $84,490) | | | | | | | 135,914 | |
| Dynamic Growth Fund | |
| | | | | | Unrealized Appreciation (Depreciation)($) | |
| | | | | | | |
| Futures Contracts | |
| Standard & Poors 500 expiring September 2014, notional value $6,345,300 | | | 13 | | | | 37,954 | |
| Total Futures Contracts | | | 13 | | | | 37,954 | |
| (1) | Cost for federal income tax and financial reporting purposes are the same. |
| (2) | Represents non-income producing securities. |
| (3) | Investment in affiliate. The yield shown represents the 7-day yield in effect at June 30, 2014. |
| (4) | Floating rate security. The rate shown represents the rate in effect at June 30, 2014. |
| (5) | Pledged as collateral on futures contracts. |
| (6) | Assets of affiliates to the Dynamic Growth Fund held for the benefit of the Fund’s Trustees in connection with the Trustee Deferred Compensation Plan. |
The accompanying notes are an integral part of these financial statements.
| 2014 Semiannual Report | June 30, 2014 | Page 29 |
Schedule of Investments
June 30, 2014 (unaudited)
| Aggressive Growth Fund | |
| | Shares or Principal Amount ($) | | | | |
| | | | | | | |
| Common Stocks — 71.3% | |
| Consumer Discretionary — 11.7% | | | | | | |
Apollo Education Group, Inc. (2) | | | 3,725 | | | | 116,406 | |
| Best Buy Co., Inc. | | | 25,310 | | | | 784,863 | |
| Dillards, Inc. | | | 5,240 | | | | 611,036 | |
Discovery Communications, Inc. (2) | | | 13,245 | | | | 983,839 | |
| Jack in the Box, Inc. | | | 9,825 | | | | 587,928 | |
| Lear Corp. | | | 9,255 | | | | 826,657 | |
Live Nation Entertainment, Inc. (2) | | | 34,170 | | | | 843,657 | |
| Macy's, Inc. | | | 18,940 | | | | 1,098,898 | |
Tenneco, Inc. (2) | | | 12,920 | | | | 848,844 | |
| Time Warner, Inc. | | | 11,855 | | | | 832,814 | |
Visteon Corp. (2) | | | 11,685 | | | | 1,133,562 | |
| (Cost $7,350,201) | | | | | | | 8,668,504 | |
| | | | | | | | | |
| Consumer Staples — 7.5% | | | | | | | | |
| Altria Group, Inc. | | | 33,450 | | | | 1,402,893 | |
| Archer-Daniels-Midland Co. | | | 29,460 | | | | 1,299,481 | |
| Bunge, Limited | | | 16,660 | | | | 1,260,162 | |
| Kroger Co./The | | | 19,230 | | | | 950,539 | |
| Spectrum Brands Holdings, Inc. | | | 7,540 | | | | 648,666 | |
| (Cost $5,170,892) | | | | | | | 5,561,741 | |
| | | | | | | | | |
| Energy — 6.2% | | | | | | | | |
| Hess Corp. | | | 17,725 | | | | 1,752,825 | |
| Occidental Petroleum Corp. | | | 15,390 | | | | 1,579,476 | |
| Superior Energy Services, Inc. | | | 21,250 | | | | 767,975 | |
| Valero Energy Corp. | | | 10,055 | | | | 503,756 | |
| (Cost $4,197,115) | | | | | | | 4,604,032 | |
| | | | | | | | | |
| Financials — 10.4% | | | | | | | | |
| American Equity Investment Life Holding Co. | | | 21,995 | | | | 541,077 | |
| American International Group, Inc. | | | 32,370 | | | | 1,766,754 | |
| Assurant, Inc. | | | 4,805 | | | | 314,968 | |
Genworth Financial, Inc. (2) | | | 40,240 | | | | 700,176 | |
| JPMorgan Chase & Co. | | | 18,575 | | | | 1,070,292 | |
| Principal Financial Group, Inc. | | | 10,910 | | | | 550,737 | |
| Protective Life Corp. | | | 18,260 | | | | 1,265,966 | |
| SunTrust Banks, Inc. | | | 10,545 | | | | 422,433 | |
| Wells Fargo & Co. | | | 20,365 | | | | 1,070,384 | |
| (Cost $6,400,314) | | | | | | | 7,702,787 | |
| | | | | | | | | |
| Healthcare — 11.7% | | | | | | | | |
| Abbott Laboratories | | | 28,320 | | | | 1,158,288 | |
| Becton Dickinson and Co. | | | 14,430 | | | | 1,707,068 | |
Davita, Inc. (2) | | | 14,745 | | | | 1,066,358 | |
| Endo International PLC | | | 7,285 | | | | 510,096 | |
| Aggressive Growth Fund | |
| | Shares or Principal Amount ($) | | | | |
| | | | | | | |
| Common Stocks — continued | | | | | | |
Gilead Sciences, Inc. (2) | | | 12,380 | | | | 1,026,426 | |
Lifepoint Hospital, Inc. (2) | | | 8,505 | | | | 528,161 | |
| McKesson Corp. | | | 3,630 | | | | 675,942 | |
| MedAssets, Inc. | | | 9,085 | | | | 207,501 | |
| Stryker Corp. | | | 10,380 | | | | 875,242 | |
Team Health Holdings, Inc. | | | 7,735 | | | | 386,286 | |
VCA Antech, Inc. (2) | | | 16,805 | | | | 589,687 | |
| (Cost $8,279,259) | | | | | | | 8,731,055 | |
| | | | | | | | | |
| Industrials — 3.6% | | | | | | | | |
Aecom Technology Corporation (2) | | | 40,825 | | | | 1,314,565 | |
| Caterpillar, Inc. | | | 2,895 | | | | 314,600 | |
| Manpowergroup, Inc. | | | 12,645 | | | | 1,072,928 | |
| (Cost $2,602,797) | | | | | | | 2,702,093 | |
| | | | | | | | | |
| Information Technology — 16.1% | | | | | | | | |
Benchmark Electronics, Inc. (2) | | | 20,490 | | | | 522,085 | |
| CDW Corp./DE | | | 10,735 | | | | 342,232 | |
Google, Inc. Class A (2) | | | 295 | | | | 172,478 | |
Google, Inc. Class C (2) | | | 295 | | | | 169,708 | |
| Hewlett-Packard Co. | | | 79,430 | | | | 2,675,202 | |
| Intel Corp. | | | 16,525 | | | | 510,623 | |
| Lexmark International, Inc. | | | 16,840 | | | | 811,014 | |
| Oracle Corp. | | | 37,405 | | | | 1,516,025 | |
Vantiv, Inc. (2) | | | 22,080 | | | | 742,330 | |
| Western Digital Corp. | | | 26,120 | | | | 2,410,875 | |
| Xerox Corp. | | | 166,605 | | | | 2,072,566 | |
| (Cost $9,115,983) | | | | | | | 11,945,138 | |
| | | | | | | | | |
| Materials — 2.1% | | | | | | | | |
| Cabot Corp. | | | 4,655 | | | | 269,943 | |
| Compass Minerals International, Inc. | | | 2,775 | | | | 265,679 | |
| Mosaic Co./The | | | 20,540 | | | | 1,015,703 | |
| (Cost $1,519,583) | | | | | | | 1,551,325 | |
| | | | | | | | | |
| Utilities — 2.0% | | | | | | | | |
| American Electric Power Co., Inc. | | | 12,570 | | | | 701,029 | |
| UGI Corp. | | | 6,390 | | | | 322,695 | |
| Vectren Corp. | | | 11,535 | | | | 490,238 | |
| (Cost $1,416,569) | | | | | | | 1,513,962 | |
| | | | | | | | | |
| Total Common Stocks (Cost $46,052,713) | | | | | | | 52,980,637 | |
The accompanying notes are an integral part of these financial statements.
| Page 30 | 2014 Semiannual Report | June 30, 2014 |
Schedule of Investments
June 30, 2014 (unaudited)
| Aggressive Growth Fund | |
| | Shares or Principal Amount ($) | | | | |
| | | | | | | |
| Registered Investment Companies — 23.2% | |
iShares MSCI Emerging Markets Index Fund (7) | | | 399,235 | | | | 17,258,928 | |
| Total Registered Investment Companies (Cost $16,992,397) | | | | | | | 17,258,928 | |
| Money Market Registered Investment Companies — 4.9% | |
Meeder Money Market Fund - Institutional Class, 0.11% (3) | | | 3,611,978 | | | | 3,611,978 | |
| Total Money Market Registered Investment Companies (Cost $3,611,978) | | | | | | | 3,611,978 | |
| Floating Rate Demand Notes — 0.0% | |
| Caterpillar Financial Power Investment Floating Rate Demand Note, | | | | | | |
0.45%, 7/1/2014 (4) | | | 30 | | | | 30 | |
| Total Floating Rate Demand Notes (Cost $30) | | | | | | | 30 | |
| U.S. Government Obligations — 0.4% | |
U.S. Treasury Bill, 0.11%, due 3/5/2015 (5) | | | 300,000 | | | | 299,882 | |
| Total U.S. Government Obligations (Cost $299,871) | | | | | | | 299,882 | |
Total Investments — 99.8% (Cost $66,956,989)(1) | | | | | | | 74,151,455 | |
| Other Assets less Liabilities — 0.2% | | | | | | | 178,666 | |
| Total Net Assets — 100.0% | | | | | | | 74,330,121 | |
Trustee Deferred Compensation (6) | |
| Meeder Aggressive Growth Fund | | | 1,300 | | | | 15,197 | |
| Meeder Balanced Fund | | | 748 | | | | 8,752 | |
| Meeder Dynamic Growth Fund | | | 469 | | | | 5,145 | |
Meeder Muirfield Fund® | | | 1,718 | | | | 12,730 | |
Meeder Quantex FundTM | | | 854 | | | | 32,409 | |
| Meeder Utilities & Infrastructure Fund | | | 153 | | | | 5,343 | |
| Total Trustee Deferred Compensation (Cost $49,966) | | | | | | | 79,576 | |
| Aggressive Growth Fund | |
| | | | | | Unrealized Appreciation (Depreciation)($) | |
| | | | | | | |
| Futures Contracts | |
| Standard & Poors 500 expiring September 2014, notional value $3,904,800 | | | 8 | | | | 30,515 | |
| Total Futures Contracts | | | 8 | | | | 30,515 | |
| (1) | Cost for federal income tax purposes of $66,987,368 differs from value by net unrealized appreciation (depreciation) of securities as follows: |
| Unrealized appreciation | | $ | 7,335,328 | |
| Unrealized depreciation | | | (171,241 | ) |
| Net unrealized appreciation (depreciation) | | $ | 7,164,087 | |
| (2) | Represents non-income producing securities. |
| (3) | Investment in affiliate. The yield shown represents the 7-day yield in effect at June 30, 2014. |
| (4) | Floating rate security. The rate shown represents the rate in effect at June 30, 2014. |
| (5) | Pledged as collateral on futures contracts. |
| (6) | Assets of affiliates to the Aggressive Growth Fund held for the benefit of the Fund’s Trustees in connection with the Trustee Deferred Compensation Plan. |
The accompanying notes are an integral part of these financial statements.
| 2014 Semiannual Report | June 30, 2014 | Page 31 |
Schedule of Investments
June 30, 2014 (unaudited)
| Balanced Fund | |
| | Shares or Principal Amount ($) | | | | |
| | | | | | | |
| Common Stocks — 55.0% | |
| Consumer Discretionary — 8.0% | | | | | | |
| Aaron's, Inc. | | | 13,210 | | | | 470,804 | |
Apollo Education Group, Inc. (2) | | | 12,100 | | | | 378,125 | |
| Best Buy Co., Inc. | | | 17,685 | | | | 548,412 | |
| Dillard's, Inc. | | | 5,355 | | | | 624,447 | |
Discovery Communications, Inc. (2) | | | 14,500 | | | | 1,077,060 | |
| Foot Locker, Inc. | | | 13,655 | | | | 692,582 | |
| Lear Corp. | | | 6,205 | | | | 554,231 | |
Live Nation Entertainment, Inc. (2) | | | 32,635 | | | | 805,758 | |
| Macy's, Inc. | | | 25,805 | | | | 1,497,205 | |
| Time Warner, Inc. | | | 21,655 | | | | 1,521,264 | |
| Viacom, Inc. | | | 10,615 | | | | 920,639 | |
Visteon Corp. (2) | | | 7,260 | | | | 704,293 | |
| Walt Disney Co./The | | | 3,010 | | | | 258,077 | |
| Whirlpool Corp. | | | 3,040 | | | | 423,229 | |
| (Cost $9,707,158) | | | | | | | 10,476,126 | |
| | | | | | | | | |
| Consumer Staples — 4.7% | | | | | | | | |
| Altria Group, Inc. | | | 37,055 | | | | 1,554,087 | |
| Archer-Daniels-Midland Co. | | | 34,458 | | | | 1,519,941 | |
| Bunge, Limited | | | 11,540 | | | | 872,886 | |
| Kimberly-Clark Corp. | | | 4,645 | | | | 516,617 | |
| Kroger Co./The | | | 15,865 | | | | 784,207 | |
| Spectrum Brands Holdings, Inc. | | | 9,495 | | | | 816,855 | |
| Wal-Mart Stores, Inc. | | | 1,440 | | | | 108,101 | |
| (Cost $5,715,807) | | | | | | | 6,172,694 | |
| | | | | | | | | |
| Energy — 5.7% | | | | | | | | |
| ConocoPhillips | | | 22,230 | | | | 1,905,778 | |
| Exxon Mobil Corp. | | | 18,140 | | | | 1,826,335 | |
| Hess Corp. | | | 18,245 | | | | 1,804,248 | |
| Occidental Petroleum Corp. | | | 15,890 | | | | 1,630,791 | |
| Valero Energy Corp. | | | 6,295 | | | | 315,380 | |
| (Cost $6,513,181) | | | | | | | 7,482,532 | |
| | | | | | | | | |
| Financials — 8.2% | | | | | | | | |
| Allstate Corp./The | | | 11,235 | | | | 659,719 | |
| American Equity Investment Life Holding Co. | | | 20,345 | | | | 500,487 | |
| American International Group, Inc. | | | 20,130 | | | | 1,098,695 | |
| Assurant, Inc. | | | 11,495 | | | | 753,497 | |
Genworth Financial, Inc. (2) | | | 25,540 | | | | 444,396 | |
| JPMorgan Chase & Co. | | | 25,760 | | | | 1,484,291 | |
| MetLife, Inc. | | | 12,135 | | | | 674,221 | |
| Old Republic International Corp. | | | 23,175 | | | | 383,315 | |
| Principal Financial Group, Inc. | | | 22,065 | | | | 1,113,841 | |
| Protective Life Corp. | | | 15,045 | | | | 1,043,070 | |
| Balanced Fund | |
| | Shares or Principal Amount ($) | | | | |
| | | | | | | |
| Common Stocks — continued | | | | | | |
| SunTrust Banks, Inc. | | | 28,310 | | | | 1,134,099 | |
| Wells Fargo & Co. | | | 28,515 | | | | 1,498,748 | |
| (Cost $9,802,745) | | | | | | | 10,788,379 | |
| | | | | | | | | |
| Healthcare — 7.7% | | | | | | | | |
Abbott Laboratories | | | 24,925 | | | | 1,019,433 | |
| Becton Dickinson and Co. | | | 13,305 | | | | 1,573,982 | |
Davita, Inc. (2) | | | 22,265 | | | | 1,610,205 | |
Gilead Sciences, Inc. (2) | | | 16,865 | | | | 1,398,277 | |
| Johnson & Johnson | | | 8,025 | | | | 839,576 | |
Lifepoint Hospital, Inc. (2) | | | 7,780 | | | | 483,138 | |
| Pfizer, Inc. | | | 76,730 | | | | 2,277,345 | |
| Stryker Corp. | | | 5,055 | | | | 426,238 | |
VCA Antech, Inc. (2) | | | 11,630 | | | | 408,097 | |
| (Cost $9,702,296) | | | | | | | 10,036,291 | |
| | | | | | | | | |
| Industrials — 3.3% | | | | | | | | |
Aecom Technology Corp. (2) | | | 28,865 | | | | 929,453 | |
| Caterpillar, Inc. | | | 6,515 | | | | 707,985 | |
| Honeywell International, Inc. | | | 5,425 | | | | 504,254 | |
| Manpowergroup, Inc. | | | 5,275 | | | | 447,584 | |
| Parker Hannifin Corp. | | | 8,810 | | | | 1,107,681 | |
| RR Donnelley & Sons Co. | | | 36,690 | | | | 622,262 | |
| (Cost $4,148,489) | | | | | | | 4,319,219 | |
| | | | | | | | | |
| Information Technology — 14.8% | | | | | | | | |
| Apple, Inc. | | | 29,975 | | | | 2,785,577 | |
Benchmark Electronics, Inc. (2) | | | 7,505 | | | | 191,227 | |
Google, Inc. Class A (2) | | | 415 | | | | 242,638 | |
Google, Inc. Class C (2) | | | 3,185 | | | | 1,832,267 | |
| Hewlett-Packard Co. | | | 83,820 | | | | 2,823,057 | |
| Intel Corp. | | | 62,860 | | | | 1,942,374 | |
| Lexmark International, Inc. | | | 10,130 | | | | 487,861 | |
| Microsoft Corp. | | | 31,910 | | | | 1,330,647 | |
| Oracle Corp. | | | 50,035 | | | | 2,027,919 | |
| Seagate Technology PLC | | | 5,935 | | | | 337,227 | |
| Solera Holdings, Inc. | | | 10,705 | | | | 718,841 | |
| Western Digital Corp. | | | 27,700 | | | | 2,556,710 | |
| Xerox Corp. | | | 163,545 | | | | 2,034,500 | |
| (Cost $15,414,634) | | | | | | | 19,310,845 | |
| | | | | | | | | |
| Materials — 1.1% | | | | | | | | |
| Dow Chemical Co./The | | | 7,740 | | | | 398,300 | |
| Mosaic Co./The | | | 7,860 | | | | 388,677 | |
| PPG Industries, Inc. | | | 3,330 | | | | 699,800 | |
| (Cost $1,403,913) | | | | | | | 1,486,777 | |
The accompanying notes are an integral part of these financial statements.
| Page 32 | 2014 Semiannual Report | June 30, 2014 |
Schedule of Investments
June 30, 2014 (unaudited)
| Balanced Fund | |
| | Shares or Principal Amount ($) | | | | |
| | | | | | | |
| Common Stocks — continued | | | | | | |
| Utilities — 1.5% | | | | | | |
| American Electric Power, Inc. | | | 15,565 | | | | 868,060 | |
| Entergy Corp. | | | 5,935 | | | | 487,204 | |
| UGI Corp. | | | 6,700 | | | | 338,350 | |
| Vectren Corporation | | | 6,040 | | | | 256,700 | |
| (Cost $1,823,470) | | | | | | | 1,950,314 | |
| | | | | | | | | |
| Total Common Stocks (Cost $64,231,693) | | | | | | | 72,023,177 | |
| Registered Investment Companies — 39.4% | |
| Federated Bond Fund | | | 579,943 | | | | 5,567,453 | |
iShares iBoxx $ High Yield Corporate Bond ETF (7) | | | 16,175 | | | | 1,539,860 | |
iShares JP Morgan USD Emerging Markets Bond ETF (7) | | | 17,620 | | | | 2,031,057 | |
iShares MSCI Emerging Markets ETF (7) | | | 286,770 | | | | 12,397,066 | |
| Ivy High Income Fund | | | 358,669 | | | | 3,141,941 | |
| Prudential Total Return Bond Fund | | | 363,427 | | | | 5,240,623 | |
| Putnam Absolute Return 300 Fund | | | 140,318 | | | | 1,512,629 | |
| Putnam Diversified Income Trust | | | 812,819 | | | | 6,421,271 | |
| Sentinel Total Return Bond Fund | | | 633,405 | | | | 6,904,116 | |
| TCW Emerging Markets Income Fund | | | 269,160 | | | | 2,365,920 | |
| Thompson Bond Fund | | | 380,525 | | | | 4,539,659 | |
| Total Registered Investment Companies (Cost $51,108,432) | | | | | | | 51,661,595 | |
| Money Market Registered Investment Companies — 5.1% | |
Meeder Money Market Fund - Institutional Class, 0.11% (3) | | | 6,675,924 | | | | 6,675,924 | |
| Total Money Market Registered Investment Companies (Cost $6,675,924) | | | | | | | 6,675,924 | |
| Floating Rate Demand Notes — 0.0% | |
| Caterpillar Financial Power Investment Floating Rate Demand Note, | | | | | | |
0.45%, 7/1/2014 (4) | | | 831 | | | | 831 | |
| Total Floating Rate Demand Notes (Cost $831) | | | | | | | 831 | |
| Balanced Fund | |
| | Shares or Principal Amount ($) | | | | |
| | | | | | | |
| U.S. Government Obligations — 0.4% | |
U.S. Treasury Bill, 0.11%, due 3/5/2015 (5) | | | 500,000 | | | | 499,803 | |
| Total U.S. Government Obligations (Cost $499,786) | | | | | | | 499,803 | |
Total Investments — 99.9% (Cost $122,516,666)(1) | | | | | | | 130,861,330 | |
| Other Assets less Liabilities — 0.1% | | | | | | | 107,473 | |
| Total Net Assets — 100.0% | | | | | | | 130,968,803 | |
Trustee Deferred Compensation (6) | |
| Meeder Aggressive Growth Fund | | | 2,187 | | | | 25,566 | |
| Meeder Balanced Fund | | | 1,264 | | | | 14,789 | |
| Meeder Dynamic Growth Fund | | | 791 | | | | 8,677 | |
Meeder Muirfield Fund® | | | 2,174 | | | | 16,109 | |
Meeder Quantex FundTM | | | 832 | | | | 31,574 | |
| Meeder Utilities & Infrastructure Fund | | | 257 | | | | 8,974 | |
| Total Trustee Deferred Compensation (Cost $71,761) | | | | | | | 105,689 | |
| | | | | | Unrealized Appreciation (Depreciation)($) | |
| | | | | | | |
| Futures Contracts | |
| Standard & Poors 500 expiring September 2014, notional value $488,100 | | | 1 | | | | 968 | |
| Total Futures Contracts | | | 1 | | | | 968 | |
| (1) | Cost for federal income tax purposes of $122,519,172 differs from value by net unrealized appreciation (depreciation) of securities as follows: |
| Unrealized appreciation | | $ | 8,847,975 | |
| Unrealized depreciation | | | (505,817 | ) |
| Net unrealized appreciation (depreciation) | | $ | 8,342,158 | |
| (2) | Represents non-income producing securities. |
| (3) | Investment in affiliate. The yield shown represents the 7-day yield in effect at June 30, 2014. |
| (4) | Floating rate security. The rate shown represents the rate in effect at June 30, 2014. |
| (5) | Pledged as collateral on futures contracts. |
| (6) | Assets of affiliates to the Balanced Fund held for the benefit of the Fund’s Trustees in connection with the Trustee Deferred Compensation Plan. |
The accompanying notes are an integral part of these financial statements.
| 2014 Semiannual Report | June 30, 2014 | Page 33 |
Schedule of Investments
June 30, 2014 (unaudited)
| Strategic Growth Fund | |
| | Shares or Principal Amount ($) | | | | |
| | | | | | | |
| Common Stocks — 64.7% | |
| Consumer Discretionary — 8.7% | | | | | | |
| Aarons, Inc. | | | 23,370 | | | | 832,907 | |
| Best Buy Co., Inc. | | | 29,110 | | | | 902,701 | |
| Dillards, Inc. | | | 6,895 | | | | 804,026 | |
Discovery Communications, Inc. (2) | | | 10,660 | | | | 791,825 | |
| Graham Holdings Co. | | | 1,730 | | | | 1,242,330 | |
| Jack in the Box, Inc. | | | 11,470 | | | | 686,365 | |
Live Nation Entertainment, Inc. (2) | | | 54,370 | | | | 1,342,395 | |
| Macy's, Inc. | | | 23,355 | | | | 1,355,057 | |
Visteon Corp. (2) | | | 12,740 | | | | 1,235,907 | |
| (Cost $7,195,063) | | | | | | | 9,193,513 | |
| | | | | | | | | |
| Consumer Staples — 4.4% | | | | | | | | |
| Bunge, Limited | | | 16,260 | | | | 1,229,906 | |
| Dr. Pepper Snapple Group, Inc. | | | 24,415 | | | | 1,430,231 | |
| Energizer Holdings, Inc. | | | 5,285 | | | | 644,929 | |
| Kimberly-Clark Corp. | | | 6,215 | | | | 691,232 | |
| Molson Coors Brewing Co. | | | 9,340 | | | | 692,654 | |
| (Cost $4,609,937) | | | | | | | 4,688,952 | |
| | | | | | | | | |
| Energy — 9.2% | | | | | | | | |
| Baker Hughes, Inc. | | | 14,195 | | | | 1,056,818 | |
| ConocoPhillips | | | 16,500 | | | | 1,414,545 | |
Forum Energy Technologies, Inc. (2) | | | 12,685 | | | | 462,115 | |
| Hess Corp. | | | 15,410 | | | | 1,523,895 | |
| Occidental Petroleum Corp. | | | 8,180 | | | | 839,513 | |
Oil States International, Inc. (2) | | | 10,135 | | | | 649,552 | |
| Patterson-UTI Energy, Inc. | | | 83,335 | | | | 2,911,725 | |
| Superior Energy Services, Inc. | | | 10,425 | | | | 376,760 | |
| Western Refining, Inc. | | | 12,730 | | | | 478,012 | |
| (Cost $8,485,162) | | | | | | | 9,712,935 | |
| | | | | | | | | |
| Financials — 15.0% | | | | | | | | |
| American Equity Investment Life Holding Co. | | | 22,045 | | | | 542,307 | |
| American International Group, Inc. | | | 20,740 | | | | 1,131,989 | |
Ashford Hospitality Trust, Inc. (3) | | | 50,835 | | | | 586,636 | |
| Assurant, Inc. | | | 9,450 | | | | 619,448 | |
Brandywine Realty Trust (3) | | | 73,640 | | | | 1,148,784 | |
DCT Industrial Trust, Inc. (3) | | | 89,615 | | | | 735,739 | |
Equity Lifestyle Properties. Inc. (3) | | | 16,625 | | | | 734,160 | |
Genworth Financial, Inc. (2) | | | 86,395 | | | | 1,503,273 | |
Host Hotels & Resorts, Inc. (3) | | | 35,130 | | | | 773,211 | |
| Old Republic International Corp. | | | 54,180 | | | | 896,137 | |
| Principal Financial Group, Inc. | | | 31,800 | | | | 1,605,264 | |
Prologis, Inc. (3) | | | 23,425 | | | | 962,533 | |
| Protective Life Corp. | | | 23,640 | | | | 1,638,961 | |
| Strategic Growth Fund | |
| | Shares or Principal Amount ($) | | | | |
| | | | | | | |
| Common Stocks — continued | | | | | | |
Retail Properties of America, Inc. (3) | | | 46,970 | | | | 722,399 | |
RLJ Lodging Trust (3) | | | 42,380 | | | | 1,224,358 | |
Strategic Hotels & Resorts, Inc. (2)(3) | | | 64,880 | | | | 759,745 | |
| Symetra Financial Corp. | | | 12,370 | | | | 281,294 | |
| (Cost $13,267,915) | | | | | | | 15,866,238 | |
| | | | | | | | | |
| Healthcare — 5.8% | | | | | | | | |
| Bio-Rad Laboratories, Inc. | | | 4,225 | | | | 505,775 | |
| Cardinal Health, Inc. | | | 6,830 | | | | 468,265 | |
DaVita HealthCare Partners, Inc. (2) | | | 12,770 | | | | 923,526 | |
LifePoint Hospitals, Inc. (2) | | | 8,450 | | | | 524,745 | |
Magellan Health, Inc. (2) | | | 9,205 | | | | 572,919 | |
| STERIS Corp. | | | 6,640 | | | | 355,107 | |
| Stryker Corp. | | | 7,880 | | | | 664,442 | |
VCA, Inc. (2) | | | 12,430 | | | | 436,169 | |
WellCare Health Plans, Inc. (2) | | | 9,665 | | | | 721,589 | |
| Zimmer Holdings, Inc. | | | 9,415 | | | | 977,842 | |
| (Cost $5,660,004) | | | | | | | 6,150,379 | |
| | | | | | | | | |
| Industrials — 5.1% | | | | | | | | |
Aecom Technology Corp. (2) | | | 21,285 | | | | 685,377 | |
| Civeo Corp. | | | 20,270 | | | | 507,358 | |
| General Electric Co. | | | 49,900 | | | | 1,311,372 | |
| Manpowergroup, Inc. | | | 15,715 | | | | 1,333,418 | |
Moog, Inc. (2) | | | 4,605 | | | | 335,658 | |
| SPX Corp. | | | 11,235 | | | | 1,215,739 | |
| (Cost $5,146,250) | | | | | | | 5,388,922 | |
| | | | | | | | | |
| Information Technology — 11.5% | | | | | | | | |
| Computer Sciences Corp. | | | 26,130 | | | | 1,651,416 | |
| Hewlett-Packard Co. | | | 82,410 | | | | 2,775,569 | |
| Lexmark International, Inc. | | | 13,995 | | | | 673,999 | |
| Oracle Corp. | | | 32,680 | | | | 1,324,520 | |
Tech Data Corp. (2) | | | 7,670 | | | | 479,528 | |
| Western Digital Corp. | | | 29,485 | | | | 2,721,466 | |
| Xerox Corp. | | | 199,930 | | | | 2,487,129 | |
| (Cost $9,075,481) | | | | | | | 12,113,627 | |
| | | | | | | | | |
| Materials — 3.8% | | | | | | | | |
| Ashland, Inc. | | | 7,020 | | | | 763,355 | |
| Cabot Corp. | | | 3,080 | | | | 178,609 | |
| Compass Minerals International, Inc. | | | 7,990 | | | | 764,963 | |
| Dow Chemical Co./The | | | 9,405 | | | | 483,981 | |
| PPG Industries, Inc. | | | 8,856 | | | | 1,861,088 | |
| (Cost $3,442,018) | | | | | | | 4,051,996 | |
The accompanying notes are an integral part of these financial statements.
| Page 34 | 2014 Semiannual Report | June 30, 2014 |
Schedule of Investments
June 30, 2014 (unaudited)
| Strategic Growth Fund | |
| | Shares or Principal Amount ($) | | | | |
| | | | | | | |
| Common Stocks — continued | | | | | | |
| Utilities — 1.2% | | | | | | |
| AGL Resources, Inc. | | | 8,930 | | | | 491,418 | |
| UGI Corp. | | | 14,445 | | | | 729,473 | |
| (Cost $1,155,264) | | | | | | | 1,220,891 | |
| | | | | | | | | |
| Total Common Stocks (Cost $58,037,094) | | | | | | | 68,387,453 | |
| Registered Investment Companies — 28.9% | |
iShares MSCI EAFE Index Fund (8) | | | 121,725 | | | | 8,322,338 | |
iShares MSCI Emerging Markets Index Fund (8) | | | 173,545 | | | | 7,502,350 | |
| Oppenheimer Developing Markets Fund | | | 198,625 | | | | 7,909,235 | |
| Oppenheimer International Growth Fund | | | 173,266 | | | | 6,769,496 | |
| Total Registered Investment Companies (Cost $27,179,956) | | | | | | | 30,503,419 | |
| Money Market Registered Investment Companies — 5.8% | |
Meeder Money Market Fund - Institutional Class, 0.11% (4) | | | 6,163,612 | | | | 6,163,612 | |
| Total Money Market Registered Investment Companies (Cost $6,163,612) | | | | | | | 6,163,612 | |
| Floating Rate Demand Notes — 0.0% | | | | | | |
| Caterpillar Financial Power Investment Floating Rate Demand Note, | | | | | | |
0.45%, 7/1/2014 (5) | | | 300 | | | | 300 | |
| Total Floating Rate Demand Notes (Cost $300) | | | | | | | 300 | |
| U.S. Government Obligations — 0.3% | | | | | | |
U.S. Treasury Bill, 0.11%, due 3/5/2015 (6) | | | 300,000 | | | | 299,882 | |
| Total U.S. Government Obligations (Cost $299,871) | | | | | | | 299,882 | |
Total Investments — 99.7% (Cost $91,680,833)(1) | | | | | | | 105,354,666 | |
| Other Assets less Liabilities — 0.3% | | | | | | | 345,281 | |
| Total Net Assets — 100.0% | | | | | | | 105,699,947 | |
| Strategic Growth Fund | |
| | Shares or Principal Amount ($) | | | | |
| | | | | | | |
Trustee Deferred Compensation (7) | | | | | | |
| Meeder Aggressive Growth Fund | | | 1,911 | | | | 22,340 | |
| Meeder Balanced Fund | | | 1,110 | | | | 12,987 | |
| Meeder Dynamic Growth Fund | | | 693 | | | | 7,602 | |
Meeder Muirfield Fund® | | | 1,912 | | | | 14,168 | |
Meeder Quantex FundTM | | | 725 | | | | 27,514 | |
| Meeder Utilities & Infrastructure Fund | | | 225 | | | | 7,857 | |
| Total Trustee Deferred Compensation (Cost $63,504) | | | | | | | 92,468 | |
| | | | | | Unrealized Appreciation (Depreciation)($) | |
| | | | | | | |
| Futures Contracts | | | | | | |
| Standard & Poors 500 expiring September 2014, notional value $2,440,500 | | | 5 | | | | 18,038 | |
| Standard & Poors Mid Cap 400 E-Mini expiring September 2014, notional value $1,000,510 | | | 7 | | | | 12,322 | |
| Russell 2000 Mini expiring September 2014, notional value $3,213,810 | | | 27 | | | | 66,188 | |
| Total Futures Contracts | | | 39 | | | | 96,548 | |
| (1) | Cost for federal income tax and financial reporting purposes are the same. |
| (2) | Represents non-income producing securities. |
| (3) | Real estate investment trust. |
| (4) | Investment in affiliate. The yield shown represents the 7-day yield in effect at June 30, 2014. |
| (5) | Floating rate security. The rate shown represents the rate in effect at June 30, 2014. |
| (6) | Pledged as collateral on futures contracts. |
| (7) | Assets of affiliates to the Strategic Growth Fund held for the benefit of the Fund’s Trustees in connection with the Trustee Deferred Compensation Plan. |
The accompanying notes are an integral part of these financial statements.
| 2014 Semiannual Report | June 30, 2014 | Page 35 |
Schedule of Investments
June 30, 2014 (unaudited)
Quantex FundTM | |
| | Shares or Principal Amount ($) | | | | |
| | | | | | | |
| Common Stocks — 96.0% | |
| Consumer Discretionary — 18.3% | | | | | | |
AutoNation, Inc. (2) | | | 9,685 | | | | 578,001 | |
| Cablevision Systems Corp. | | | 26,865 | | | | 474,167 | |
| Darden Restaurants, Inc. | | | 8,860 | | | | 409,952 | |
| DR Horton, Inc. | | | 21,585 | | | | 530,559 | |
| Family Dollar Stores, Inc. | | | 7,380 | | | | 488,113 | |
Fossil Group, Inc. (2) | | | 4,015 | | | | 419,648 | |
| GameStop Corp. | | | 9,780 | | | | 395,797 | |
| Gannett Co., Inc. | | | 16,280 | | | | 509,727 | |
| Goodyear Tire & Rubber Co./The | | | 20,195 | | | | 561,017 | |
| Graham Holdings Co. | | | 725 | | | | 520,630 | |
| H&R Block, Inc. | | | 16,585 | | | | 555,929 | |
| Harman International Industries, Inc. | | | 5,880 | | | | 631,688 | |
| Hasbro, Inc. | | | 8,755 | | | | 464,453 | |
| International Game Technology | | | 26,515 | | | | 421,854 | |
| Interpublic Group of Cos., Inc./The | | | 27,210 | | | | 530,867 | |
| Leggett & Platt, Inc. | | | 15,565 | | | | 533,568 | |
| Lennar Corp. | | | 12,120 | | | | 508,798 | |
| PetSmart, Inc. | | | 6,595 | | | | 394,381 | |
| PulteGroup, Inc. | | | 23,555 | | | | 474,869 | |
Urban Outfitters, Inc. (2) | | | 12,985 | | | | 439,672 | |
| (Cost $7,556,762) | | | | | | | 9,843,690 | |
| | | | | | | | | |
| Consumer Staples — 1.7% | | | | | | | | |
| Avon Products, Inc. | | | 27,865 | | | | 407,108 | |
| Safeway, Inc. | | | 14,785 | | | | 507,717 | |
| (Cost $748,216) | | | | | | | 914,825 | |
| | | | | | | | | |
| Energy — 9.4% | | | | | | | | |
| Denbury Resources, Inc. | | | 29,190 | | | | 538,847 | |
| Diamond Offshore Drilling, Inc. | | | 8,475 | | | | 420,614 | |
| Nabors Industries, Ltd. | | | 28,250 | | | | 829,703 | |
Newfield Exploration Co. (2) | | | 19,565 | | | | 864,773 | |
| Peabody Energy Corp. | | | 24,550 | | | | 401,393 | |
| QEP Resources, Inc. | | | 15,715 | | | | 542,168 | |
| Rowan Cos. Plc | | | 13,625 | | | | 435,046 | |
| Tesoro Corp. | | | 8,190 | | | | 480,507 | |
WPX Energy, Inc. (2) | | | 23,630 | | | | 564,993 | |
| (Cost $4,410,556) | | | | | | | 5,078,044 | |
| | | | | | | | | |
| Financials — 13.3% | | | | | | | | |
Apartment Investment & Management Co. (3) | | | 18,590 | | | | 599,899 | |
| Assurant, Inc. | | | 7,255 | | | | 475,565 | |
E*TRADE Financial Corp. (2) | | | 24,532 | | | | 521,550 | |
Genworth Financial, Inc. (2) | | | 31,025 | | | | 539,835 | |
| Hudson City Bancorp, Inc. | | | 51,050 | | | | 501,822 | |
Quantex FundTM | |
| | Shares or Principal Amount ($) | | | | |
| | | | | | | |
| Common Stocks — continued | | | | | | |
| Huntington Bancshares, Inc. | | | 49,910 | | | | 476,141 | |
Kimco Realty Corp. (3) | | | 24,285 | | | | 558,069 | |
| Legg Mason, Inc. | | | 11,080 | | | | 568,515 | |
Macerich Co./The (3) | | | 8,140 | | | | 543,345 | |
| NASDAQ OMX Group, Inc./The | | | 12,095 | | | | 467,109 | |
| People's United Financial, Inc. | | | 31,840 | | | | 483,013 | |
Plum Creek Timber Co., Inc. (3) | | | 10,310 | | | | 464,981 | |
Wells Fargo & Co. Preferred (2) | | | 1 | | | | — | |
| Torchmark Corp. | | | 6,165 | | | | 505,037 | |
| Zions Bancorporation | | | 16,075 | | | | 473,730 | |
| (Cost $5,190,517) | | | | | | | 7,178,611 | |
| | | | | | | | | |
| Healthcare — 9.0% | | | | | | | | |
| DENTSPLY International, Inc. | | | 9,935 | | | | 470,422 | |
Edwards Lifesciences Corp. (2) | | | 7,285 | | | | 625,344 | |
Hospira, Inc. (2) | | | 11,665 | | | | 599,231 | |
Laboratory Corp. of America Holdings (2) | | | 5,250 | | | | 537,600 | |
| Patterson Cos., Inc. | | | 11,690 | | | | 461,872 | |
| PerkinElmer, Inc. | | | 11,680 | | | | 547,091 | |
| Quest Diagnostics, Inc. | | | 8,960 | | | | 525,862 | |
Tenet Healthcare Corp. (2) | | | 11,457 | | | | 537,792 | |
Varian Medical Systems, Inc. (2) | | | 6,175 | | | | 513,390 | |
| (Cost $3,878,809) | | | | | | | 4,818,604 | |
| | | | | | | | | |
| Industrials — 13.4% | | | | | | | | |
| ADT Corp./The | | | 11,850 | | | | 414,039 | |
| Allegion PLC | | | 10,855 | | | | 615,261 | |
| Cintas Corp. | | | 8,025 | | | | 509,908 | |
| Dun & Bradstreet Corp./The | | | 3,925 | | | | 432,535 | |
| Iron Mountain, Inc. | | | 15,720 | | | | 557,274 | |
Jacobs Engineering Group, Inc. (2) | | | 7,710 | | | | 410,789 | |
| Joy Global, Inc. | | | 8,195 | | | | 504,648 | |
| Masco Corp. | | | 21,065 | | | | 467,643 | |
| Pitney Bowes, Inc. | | | 20,670 | | | | 570,905 | |
Quanta Services, Inc. (2) | | | 15,260 | | | | 527,691 | |
| Robert Half International, Inc. | | | 11,470 | | | | 547,578 | |
| Ryder System, Inc. | | | 6,575 | | | | 579,192 | |
| Snap-on, Inc. | | | 4,395 | | | | 520,895 | |
| Xylem, Inc. | | | 13,915 | | | | 543,798 | |
| (Cost $5,509,149) | | | | | | | 7,202,156 | |
| | | | | | | | | |
| Information Technology — 10.2% | | | | | | | | |
Blackhawk Network Holdings, Inc. (2) | | | 2,426 | | | | 65,138 | |
| Computer Sciences Corp. | | | 8,585 | | | | 542,572 | |
Electronic Arts, Inc. (2) | | | 21,000 | | | | 753,270 | |
F5 Networks, Inc. (2) | | | 5,280 | | | | 588,403 | |
First Solar, Inc. (2) | | | 8,810 | | | | 626,039 | |
The accompanying notes are an integral part of these financial statements.
| Page 36 | 2014 Semiannual Report | June 30, 2014 |
Schedule of Investments
June 30, 2014 (unaudited)
Quantex FundTM | |
| | Shares or Principal Amount ($) | | | | |
| | | | | | | |
| Common Stocks — continued | | | | | | |
| FLIR Systems, Inc. | | | 15,995 | | | | 555,506 | |
| Harris Corp. | | | 6,685 | | | | 506,389 | |
| Jabil Circuit, Inc. | | | 27,625 | | | | 577,363 | |
Teradata Corp. (2) | | | 10,545 | | | | 423,909 | |
| Total System Services, Inc. | | | 14,475 | | | | 454,660 | |
VeriSign, Inc. (2) | | | 8,025 | | | | 391,700 | |
| (Cost $4,206,514) | | | | | | | 5,484,949 | |
| | | | | | | | | |
| Materials — 11.0% | | | | | | | | |
| Airgas, Inc. | | | 4,290 | | | | 467,224 | |
| Allegheny Technologies, Inc. | | | 13,495 | | | | 608,625 | |
| Avery Dennison Corp. | | | 9,435 | | | | 483,544 | |
| Ball Corp. | | | 9,280 | | | | 581,670 | |
| Bemis Co., Inc. | | | 11,760 | | | | 478,162 | |
| Cliffs Natural Resources, Inc. | | | 18,340 | | | | 276,017 | |
| International Flavors & Fragrances, Inc. | | | 5,605 | | | | 584,489 | |
| MeadWestvaco Corp. | | | 13,040 | | | | 577,150 | |
Owens-Illinois, Inc. (2) | | | 13,460 | | | | 466,254 | |
| Sealed Air Corp. | | | 14,140 | | | | 483,164 | |
| United States Steel Corp. | | | 16,320 | | | | 424,973 | |
| Vulcan Materials Co. | | | 8,075 | | | | 514,781 | |
| (Cost $5,188,007) | | | | | | | 5,946,053 | |
| | | | | | | | | |
| Telecommunication Services — 2.2% | | | | | | | | |
| Frontier Communications Corp. | | | 103,530 | | | | 604,615 | |
| Windstream Holdings, Inc. | | | 60,430 | | | | 601,883 | |
| (Cost $999,388) | | | | | | | 1,206,498 | |
| | | | | | | | | |
| Utilities — 7.5% | | | | | | | | |
| AGL Resources, Inc. | | | 10,196 | | | | 561,086 | |
| CMS Energy Corp. | | | 17,915 | | | | 558,052 | |
| Integrys Energy Group, Inc. | | | 8,845 | | | | 629,145 | |
| Pepco Holdings, Inc. | | | 25,175 | | | | 691,809 | |
| Pinnacle West Capital Corp. | | | 9,095 | | | | 526,055 | |
| SCANA Corp. | | | 10,215 | | | | 549,669 | |
| TECO Energy, Inc. | | | 27,925 | | | | 516,054 | |
| (Cost $3,330,262) | | | | | | | 4,031,870 | |
| | | | | | | | | |
| Total Common Stocks (Cost $41,018,180) | | | | | | | 51,705,300 | |
| Money Market Registered Investment Companies — 8.7% | |
Meeder Money Market Fund - Institutional Class, 0.11% (4) | | | 4,670,714 | | | | 4,670,714 | |
| Total Money Market Registered Investment Companies (Cost $4,670,714) | | | | | | | 4,670,714 | |
Quantex FundTM | |
| | Shares or Principal Amount ($) | | | | |
| | | | | | | |
| U.S. Government Obligations — 0.6% | | | | | | |
U.S. Treasury Bill, 0.11%, due 3/5/2015 (5) | | | 300,000 | | | | 299,882 | |
| Total U.S. Government Obligations (Cost $299,871) | | | | | | | 299,882 | |
Total Investments — 105.3% (Cost $45,988,765)(1) | | | | | | | 56,675,896 | |
| Liabilities less Other Assets — (5.3%) | | | | | | | (2,836,573 | ) |
| Total Net Assets — 100.0% | | | | | | | 53,839,323 | |
Trustee Deferred Compensation (6) | | | | | | |
| Meeder Aggressive Growth Fund | | | 969 | | | | 11,328 | |
| Meeder Balanced Fund | | | 558 | | | | 6,529 | |
| Meeder Dynamic Growth Fund | | | 349 | | | | 3,829 | |
Meeder Muirfield Fund® | | | 1,935 | | | | 14,338 | |
Meeder Quantex FundTM | | | 1,194 | | | | 45,312 | |
| Meeder Utilities & Infrastructure Fund | | | 114 | | | | 3,981 | |
| Total Trustee Deferred Compensation (Cost $48,886) | | | | | | | 85,317 | |
| | | | | | Unrealized Appreciation (Depreciation)($) | |
| | | | | | | |
| Futures Contracts | |
| Standard & Poors Mid Cap 400 E-Mini expiring September 2014, notional value $1,429,300 | | | 10 | | | | 24,340 | |
| Total Futures Contracts | | | 10 | | | | 24,340 | |
| (1) | Cost for federal income tax purposes of $46,078,876 differs from value by net unrealized appreciation (depreciation) of securities as follows: |
| Unrealized appreciation | | $ | 11,546,416 | |
| Unrealized depreciation | | | (859,271 | ) |
| Net unrealized appreciation (depreciation) | | $ | 10,687,145 | |
| (2) | Represents non-income producing securities. |
| (3) | Real estate investment trust. |
| (4) | Investment in affiliate. The yield shown represents the 7-day yield in effect at June 30, 2014. |
| (5) | Pledged as collateral on Futures Contracts. |
| (6) | Assets of affiliates to the Quantex FundTM held for the benefit of the Fund’s Trustees in connection with the Trustee Deferred Compensation Plan. |
The accompanying notes are an integral part of these financial statements.
| 2014 Semiannual Report | June 30, 2014 | Page 37 |
Schedule of Investments
June 30, 2014 (unaudited)
| Utilities & Infrastructure Fund | |
| | Shares or Principal Amount ($) | | | | |
| | | | | | | |
| Common Stocks — 98.6% | |
| Electric Utility — 12.5% | | | | | | |
Capstone Turbine Corp. (2) | | | 239,969 | | | | 362,353 | |
Covanta Holding Corp. (2) | | | 64,429 | | | | 1,327,882 | |
| General Electric Co. | | | 57,507 | | | | 1,511,284 | |
| ITC Holdings Corp. | | | 28,046 | | | | 1,023,118 | |
| MDU Resources Group, Inc. | | | 35,686 | | | | 1,252,579 | |
| (Cost $4,166,897) | | | | | | | 5,477,216 | |
| | | | | | | | | |
| Natural Gas Distribution — 18.6% | | | | | | | | |
| Energy Transfer Equity, L.P. | | | 27,539 | | | | 1,623,149 | |
| MarkWest Energy Partners, L.P. | | | 15,067 | | | | 1,078,496 | |
National Grid PLC - ADR (3) | | | 11,377 | | | | 846,221 | |
| ONE Gas, Inc. | | | 3,737 | | | | 141,072 | |
| ONEOK, Inc. | | | 14,951 | | | | 1,017,864 | |
| WGL Holdings, Inc. | | | 29,755 | | | | 1,282,441 | |
Williams Cos., Inc./The (2) | | | 37,789 | | | | 2,199,630 | |
| (Cost $3,979,950) | | | | | | | 8,188,873 | |
| | | | | | | | | |
| Oil Exploration & Production — 4.9% | | | | | | | | |
| Energen Corporation | | | 10,208 | | | | 907,287 | |
| EQT Corp. | | | 11,677 | | | | 1,248,271 | |
| (Cost $1,178,043) | | | | | | | 2,155,558 | |
| | | | | | | | | |
| Pipelines — 16.2% | | | | | | | | |
| Enterprise Products Partners, L.P. | | | 25,790 | | | | 2,019,099 | |
| Kinder Morgan, Inc. | | | 37,040 | | | | 1,343,070 | |
| National Fuel Gas Co. | | | 20,385 | | | | 1,596,146 | |
| Questar Corp. | | | 40,834 | | | | 1,012,683 | |
| Spectra Energy Corp. | | | 26,343 | | | | 1,119,051 | |
| (Cost $4,575,489) | | | | | | | 7,090,049 | |
| | | | | | | | | |
| Telecommunication Services — 24.3% | | | | | | | | |
American Tower Corp. (4) | | | 19,127 | | | | 1,721,047 | |
| AT&T, Inc. | | | 38,375 | | | | 1,356,940 | |
| BCE, Inc. | | | 17,000 | | | | 771,120 | |
| Corning, Inc. | | | 60,829 | | | | 1,335,197 | |
| QUALCOMM, Inc. | | | 17,975 | | | | 1,423,620 | |
Telefonaktiebolaget LM Ericsson - ADR (3) | | | 83,881 | | | | 1,013,282 | |
| Telephone & Data Systems, Inc. | | | 57,442 | | | | 1,499,811 | |
| Verizon Communications, Inc. | | | 22,321 | | | | 1,092,167 | |
Vodafone Group PLC - ADR (3) | | | 10,960 | | | | 365,954 | |
| (Cost $8,688,892) | | | | | | | 10,579,138 | |
| | | | | | | | | |
| Utility Services — 14.9% | | | | | | | | |
| Black Hills Corp. | | | 6,649 | | | | 408,182 | |
| Fluor Corp. | | | 10,315 | | | | 793,224 | |
| Macquarie Infrastructure Company, LLC. | | | 27,466 | | | | 1,713,054 | |
| NiSource, Inc. | | | 21,939 | | | | 863,080 | |
| Ormat Technologies, Inc. | | | 21,600 | | | | 622,728 | |
| Utilities & Infrastructure Fund | |
| | Shares or Principal Amount ($) | | | | |
| | | | | | | |
| Common Stocks — continued | | | | | | |
Quanta Services, Inc. (2) | | | 35,418 | | | | 1,224,754 | |
| UGI Corp. | | | 17,877 | | | | 902,789 | |
| (Cost $5,120,110) | | | | | | | 6,527,811 | |
| | | | | | | | | |
| Water Utility — 7.2% | | | | | | | | |
| American Water Works Co., Inc. | | | 31,676 | | | | 1,566,378 | |
Veolia Environnement SA - ADR (3) | | | 83,667 | | | | 1,589,673 | |
| (Cost $2,448,925) | | | | | | | 3,156,051 | |
| | | | | | | | | |
| Total Common Stocks (Cost $30,158,306) | | | | | | | 43,174,696 | |
| Money Market Registered Investment Companies — 1.3% | |
Meeder Money Market Fund - Institutional Class, 0.11% (5) | | | 568,792 | | | | 568,792 | |
| Total Money Market Registered Investment Companies (Cost $568,792) | | | | | | | 568,792 | |
Total Investments — 99.9% (Cost $30,727,098)(1) | | | | | | | 43,743,488 | |
| Other Assets less Liabilities — 0.1% | | | | | | | 23,767 | |
| Total Net Assets — 100.0% | | | | | | | 43,767,255 | |
Trustee Deferred Compensation (6) | | | | | | |
| Meeder Aggressive Growth Fund | | | 1,130 | | | | 13,210 | |
| Meeder Balanced Fund | | | 651 | | | | 7,617 | |
| Meeder Dynamic Growth Fund | | | 406 | | | | 4,454 | |
Meeder Muirfield Fund® | | | 1,843 | | | | 13,657 | |
Meeder Quantex FundTM | | | 1,049 | | | | 39,810 | |
| Meeder Utilities & Infrastructure Fund | | | 133 | | | | 4,644 | |
| Total Trustee Deferred Compensation (Cost $49,219) | | | | | | | 83,392 | |
| (1) | Cost for federal income tax purposes of $30,829,819 differs from value by net unrealized appreciation (depreciation) of securities as follows: |
| Unrealized appreciation | | $ | 12,640,275 | |
| Unrealized depreciation | | | (206,237 | ) |
| Net unrealized appreciation (depreciation) | | $ | 12,434,038 | |
| (2) | Represents non-income producing securities. |
| (3) | American Depositary Receipt. |
| (4) | Real estate investment trust. |
| (5) | Investment in affiliate. The yield shown represents the 7-day yield in effect at June 30, 2014. |
| (6) | Assets of affiliates to the Utilities & Infrastructure Fund held for the benefit of the Fund’s Trustees in connection with the Trustees Deferred Compensation Plan. |
The accompanying notes are an integral part of these financial statements.
| Page 38 | 2014 Semiannual Report | June 30, 2014 |
Schedule of Investments
June 30, 2014 (unaudited)
| Total Return Bond Fund | |
| | Shares or Principal Amount ($) | | | | |
| | | | | | | |
| Registered Investment Companies — 96.1% | |
| AllianceBernstein Bond Fund, Inc. - High Income Fund | | | 871,247 | | | | 8,416,249 | |
| AllianceBernstein Limited Duration High Income Portfolio | | | 514,322 | | | | 5,518,680 | |
| Eaton Vance Floating-Rate Advantaged Fund | | | 618,579 | | | | 6,897,155 | |
| Federated Bond Fund | | | 889,990 | | | | 8,543,904 | |
| Fidelity Capital & Income Fund | | | 236,962 | | | | 2,424,124 | |
| Goldman Sachs Strategic Income Fund | | | 298,762 | | | | 3,154,923 | |
iShares iBoxx $ Investment Grade Corporate Bond ETF (5) | | | 50,615 | | | | 6,036,345 | |
iShares JP Morgan USD Emerging Markets Bond ETF (5) | | | 88,850 | | | | 10,241,739 | |
| Ivy High Income Fund | | | 1,006,835 | | | | 8,819,874 | |
Pimco Total Return ETF (5) | | | 37,950 | | | | 4,136,550 | |
| Prudential Total Return Bond Fund | | | 354,316 | | | | 5,109,233 | |
| Putnam Absolute Return 300 Fund | | | 716,968 | | | | 7,728,910 | |
| Putnam Diversified Income Trust | | | 1,132,829 | | | | 8,949,346 | |
| Sentinel Total Return Bond Fund | | | 585,646 | | | | 6,383,537 | |
| TCW Emerging Markets Income Fund | | | 1,088,710 | | | | 9,569,757 | |
| Thompson Bond Fund | | | 592,388 | | | | 7,067,192 | |
| Total Registered Investment Companies (Cost $107,481,471) | | | | | | | 108,997,518 | |
| Money Market Registered Investment Companies — 3.7% | |
Meeder Money Market Fund - Institutional Class, 0.11% (2) | | | 4,142,426 | | | | 4,142,426 | |
| Total Money Market Registered Investment Companies (Cost $4,142,426) | | | | | | | 4,142,426 | |
| U.S. Government Obligations — 0.2% | | | | | | |
| Government National Mortgage Association, 6.50%, due 7/20/2038 | | | 35,766 | | | | 43,185 | |
U.S. Treasury Bill, 0.11%, due 3/5/2015 (3) | | | 200,000 | | | | 199,921 | |
| Total U.S. Government Obligations (Cost $243,484) | | | | | | | 243,106 | |
Total Investments — 100.0% (Cost $111,867,381)(1) | | | | | | | 113,383,050 | |
| Liabilities less Other Assets — (0.0%) | | | | | | | (42,777 | ) |
| Total Net Assets — 100.0% | | | | | | | 113,340,273 | |
| Total Return Bond Fund | |
| | Shares or Principal Amount ($) | | | | |
| | | | | | | |
Trustee Deferred Compensation (4) | | | | | | |
| Meeder Aggressive Growth Fund | | | 687 | | | | 8,031 | |
| Meeder Balanced Fund | | | 401 | | | | 4,692 | |
| Meeder Dynamic Growth Fund | | | 264 | | | | 2,896 | |
Meeder Muirfield Fund® | | | 728 | | | | 5,394 | |
Meeder Quantex FundTM | | | 238 | | | | 9,032 | |
| Meeder Utilities & Infrastructure Fund | | | 84 | | | | 2,933 | |
| Total Trustee Deferred Compensation (Cost $25,530) | | | | | | | 32,978 | |
| | | | | | Unrealized Appreciation (Depreciation)($) | |
| | | | | | | |
| Futures Contracts | |
| 10-Year U.S. Treasury Bond Futures expiring September 2014, notional value $2,743,750 | | | 20 | | | | (3,275 | ) |
| Total Futures Contracts | | | 20 | | | | (3,275 | ) |
| (1) | Cost for federal income tax purposes of $111,850,201 differs from value by net unrealized appreciation (depreciation) of securities as follows: |
| Unrealized appreciation | | $ | 1,574,295 | |
| Unrealized depreciation | | | (79,400 | ) |
| Net unrealized appreciation (depreciation) | | $ | 1,494,895 | |
| (2) | Investment in affiliate. The yield shown represents the 7-day yield in effect at June 30, 2014. |
| (3) | Pledged as collateral on futures contracts. |
| (4) | Assets of affiliates to the Total Return Bond Fund held for the benefit of the Fund’s Trustees in connection with the Trustee Deferred Compensation Plan. |
The accompanying notes are an integral part of these financial statements.
| 2014 Semiannual Report | June 30, 2014 | Page 39 |
Schedule of Investments
June 30, 2014 (unaudited)
| Money Market Fund | |
| | | | | | | Principal Amount ($) or Shares | | | | |
| | | | | | | | | | | | | |
| Bank Obligations — 14.5% | |
| American National Bank Deposit Account | | | 0.20 | % (2) | | 07/01/14 | | | | 249,124 | | | | 249,124 | |
| Bank Midwest Deposit Account | | | 0.65 | % (2) | | 07/01/14 | | | | 249,404 | | | | 249,404 | |
| Capital Bank Deposit Account | | | 0.65 | % (2) | | 07/01/14 | | | | 249,000 | | | | 249,000 | |
| Columbus First Bank Demand Deposit Account | | | 0.45 | % (2) | | 07/01/14 | | | | 249,283 | | | | 249,283 | |
| EverBank Money Market Account | | | 0.61 | % (2) | | 07/01/14 | | | | 249,379 | | | | 249,379 | |
FICA Bank Deposit Program (3) | | | 0.23 | % | | | — | | | | 15,013,644 | | | | 15,013,644 | |
| First Merchants Bank Demand Account | | | 0.25 | % (2) | | 07/01/14 | | | | 249,157 | | | | 249,157 | |
| Metro City Bank Deposit Account | | | 0.45 | % (2) | | 07/01/14 | | | | 249,282 | | | | 249,282 | |
| Mid America Bank Demand Deposit Account | | | 0.40 | % (2) | | 07/01/14 | | | | 249,240 | | | | 249,240 | |
| Nationwide Bank Deposit Account | | | 0.60 | % (2) | | 07/01/14 | | | | 249,377 | | | | 249,377 | |
| Plaza Bank Deposit Account | | | 0.55 | % (2) | | 07/01/14 | | | | 249,346 | | | | 249,346 | |
| PNC Bank Deposit Account | | | 0.20 | % (2) | | 07/01/14 | | | | 249,124 | | | | 249,124 | |
| TD Bank Demand Deposit Account | | | 0.20 | % (2) | | 07/01/14 | | | | 249,126 | | | | 249,126 | |
| Total Bank Obligations (Cost $18,004,486) | | | | 18,004,486 | |
| Certificates of Deposit — 6.6% | |
| 1st State Bank of Blakely | | | 0.40 | % | | 12/30/14 | | | | 249,000 | | | | 249,000 | |
| AmericanWest Bank | | | 0.30 | % | | 06/18/15 | | | | 249,000 | | | | 249,000 | |
| Apple Bank for Savings | | | 0.30 | % | | 06/11/15 | | | | 249,000 | | | | 249,000 | |
| Bank of Baroda | | | 0.30 | % | | 12/15/14 | | | | 249,000 | | | | 249,000 | |
| Bank of China | | | 0.35 | % | | 06/04/15 | | | | 249,000 | | | | 249,000 | |
| Bank of India | | | 0.50 | % | | 09/17/14 | | | | 248,000 | | | | 248,000 | |
| Bank of the West | | | 0.30 | % | | 06/04/15 | | | | 249,000 | | | | 249,000 | |
| Beal Bank USA | | | 0.40 | % | | 09/24/14 | | | | 249,000 | | | | 249,000 | |
| Berkshire Bank | | | 0.25 | % | | 12/29/14 | | | | 249,000 | | | | 249,000 | |
| CFG Community Bank | | | 0.25 | % | | 08/27/14 | | | | 249,000 | | | | 249,000 | |
| Citizens Bank of PA | | | 0.20 | % | | 09/03/14 | | | | 249,000 | | | | 249,000 | |
| Cole Taylor Bank | | | 0.30 | % | | 05/29/15 | | | | 249,000 | | | | 249,000 | |
| Comenity Capital Bank | | | 0.35 | % | | 06/02/15 | | | | 249,000 | | | | 249,000 | |
| Customers Bank | | | 0.45 | % | | 01/15/15 | | | | 248,000 | | | | 248,000 | |
| Discover Bank | | | 0.30 | % | | 06/04/15 | | | | 249,000 | | | | 249,000 | |
| Enterprise Bank | | | 0.30 | % | | 01/16/15 | | | | 249,000 | | | | 249,000 | |
| Federal Savings Bank | | | 0.30 | % | | 06/05/15 | | | | 249,000 | | | | 249,000 | |
| Money Market Fund | |
| | | | | | Principal Amount ($) or Shares | | | | |
| | | | | | | | | | | | |
| Certificates of Deposit — continued | |
| First Bank & Trust | | | 0.20 | % | | 11/26/14 | | | | 249,000 | | | | 249,000 | |
| First Bank of Puerto Rico | | | 0.35 | % | | 05/29/15 | | | | 249,000 | | | | 249,000 | |
| First Mid Illinois | | | 0.30 | % | | 09/26/14 | | | | 249,000 | | | | 249,000 | |
| Home Bank NA | | | 0.25 | % | | 12/26/14 | | | | 249,000 | | | | 249,000 | |
| Merrick Bank | | | 0.30 | % | | 03/11/15 | | | | 249,000 | | | | 249,000 | |
| Mizrahi Tefahot Bank | | | 0.25 | % | | 10/01/14 | | | | 249,000 | | | | 249,000 | |
| People's United Bank | | | 0.25 | % | | 12/26/14 | | | | 249,000 | | | | 249,000 | |
| RBS Citizens | | | 0.20 | % | | 09/03/14 | | | | 249,000 | | | | 249,000 | |
| S&T Bank | | | 0.40 | % | | 06/26/15 | | | | 249,000 | | | | 249,000 | |
| Santander Bank | | | 0.20 | % | | 09/11/14 | | | | 249,000 | | | | 249,000 | |
| State Bank of India | | | 0.50 | % | | 09/23/14 | | | | 248,000 | | | | 248,000 | |
| Synchrony Bank | | | 0.45 | % | | 06/19/15 | | | | 249,000 | | | | 249,000 | |
| Synovus Bank | | | 0.40 | % | | 06/24/15 | | | | 249,000 | | | | 249,000 | |
| Volunteer Bank | | | 0.20 | % | | 09/18/14 | | | | 249,000 | | | | 249,000 | |
| Wex Bank | | | 0.20 | % | | 09/02/14 | | | | 249,000 | | | | 249,000 | |
| Xenith Bank | | | 0.25 | % | | 09/17/14 | | | | 249,000 | | | | 249,000 | |
| Total Certificates of Deposit (Cost $8,214,000) | | | | 8,214,000 | |
| Corporate Obligations — 18.1% | |
Bath Technologies (5) | | | 0.30 | % (2) | | 07/03/14 | | | | 555,000 | | | | 555,000 | |
| Caterpillar Financial Power Investment Floating Rate Demand Note | | | 0.45 | % (4) | | 07/01/14 | | | | 9,884,361 | | | | 9,884,361 | |
| GE Demand Note | | | 0.45 | % (4) | | 07/01/14 | | | | 9,014,495 | | | | 9,014,495 | |
| Rabobank Nederland | | | 0.27 | % (4) | | 09/03/14 | | | | 1,000,000 | | | | 1,000,000 | |
Springside Corp. Exchange Partners, LLC (5) | | | 0.16 | % (2) | | 07/03/14 | | | | 2,000,000 | | | | 2,000,000 | |
| Total Corporate Obligations (Cost $22,453,856) | | | | 22,453,856 | |
| Repurchase Agreements — 16.1% | |
G.X. Clarke (Collateralized by $9,911,000 various Federal National Mortgage Associations and Federal Home Loan Mortgage Corps., 1.25% - 5.375%, due 4/15/15 - 1/13/22, fair value $10,204,240). (proceeds $10,000,000), purchase date 6/24/14 | | | 0.22 | % | | 07/01/14 | | | | 10,000,000 | | | | 10,000,000 | |
The accompanying notes are an integral part of these financial statements.
| Page 40 | 2014 Semiannual Report | June 30, 2014 |
Schedule of Investments
June 30, 2014 (unaudited)
| Money Market Fund | |
| | | | | | | Principal Amount ($) or Shares | | | | |
| | | | | | | | | | | | | |
| Repurchase Agreements — continued | |
G.X. Clarke (Collateralized by $9,348,300 various Federal National Mortgage Associations and U.S. Treasury Notes, 0.125% - 5.375%, due 7/15/16 - 10/30/23, fair value $10,200,613) (proceeds $10,000,000), purchase date 6/26/14 | | | 0.22 | % | | 07/03/14 | | | | 10,000,000 | | | | 10,000,000 | |
| Total Repurchase Agreements (Cost $20,000,000) | | | | 20,000,000 | |
| U.S. Government Agency Obligations — 12.6% | |
| Federal Farm Credit Bank | | | 0.10 | % (4) | | 07/28/14 | | | | 5,000,000 | | | | 4,999,837 | |
| Federal Farm Credit Bank | | | 0.13 | % (4) | | 08/23/14 | | | | 5,000,000 | | | | 4,999,820 | |
| Federal Farm Credit Bank | | | 0.20 | % (4) | | 09/24/14 | | | | 5,605,000 | | | | 5,606,041 | |
| Total U.S. Government Agency Obligations (Cost $15,605,698) | | | | 15,605,698 | |
| | Shares or Principal Amount ($) | | | | |
| | | | | | | |
| Money Market Registered Investment Companies — 32.3% | |
Fidelity Institutional Money Market Portfolio, 0.09% (6) | | | 40,128,207 | | | | 40,128,207 | |
| Total Money Market Registered Investment Companies (Cost $40,128,207) | | | | | | | 40,128,207 | |
Total Investments — 100.2% (Cost $124,406,247) (1) | | | | | | | 124,406,247 | |
| Liabilities less Other Assets — (-0.2%) | | | | | | | (212,770 | ) |
| Total Net Assets — 100.0% | | | | | | | 124,193,477 | |
| Money Market Fund | |
| | Shares or Principal Amount ($) | | | | |
| | | | | | | |
Trustee Deferred Compensation (7) | |
| Meeder Aggressive Growth Fund | | | 812 | | | | 9,492 | |
| Meeder Balanced Fund | | | 465 | | | | 5,441 | |
| Meeder Dynamic Growth Fund | | | 290 | | | | 3,181 | |
Meeder Muirfield Fund® | | | 1,669 | | | | 12,367 | |
Meeder Quantex FundTM | | | 1,055 | | | | 40,037 | |
| Meeder Utilities & Infrastructure Fund | | | 95 | | | | 3,317 | |
| Total Trustee Deferred Compensation (Cost $44,128) | | | | 73,835 | |
| (1) | Cost for federal income tax and financial reporting purposes are the same. |
| (2) | Variable rate security. Securities payable at par including accrued interest (usually within seven days notice) and unconditionally secured as to principal and interest by letters of credit or other credit support agreements from major banks. The interest rates are adjustable and are based on bank prime rates or other interest rate adjustment indices. The rate shown represents the rate in effect at June 30, 2014. The maturity date shown, if applicable, reflects the earlier of the next demand date or stated maturity date. |
| (3) | The FICA bank deposits were purchased through StoneCastle Partners, LLC, an independent, privately held asset management and investment services company. The underlying bank deposits are insured through the Federal Deposit Insurance Corporation (FDIC). The interest rate varies monthly and any accrued interest is reinvested into the program on a monthly basis. For a complete list of the underlying bank deposits that make up this program, visit www.meederinvestment.com. |
| (4) | Floating rate security. The rate shown represents the rate in effect at June 30, 2014. The maturity date shown reflects the earlier of the next demand date or stated maturity date. |
| (5) | Represents a restricted security purchased under Rule 144A, which is exempt from registration under the Securities Act of 1933, as amended. Security is restricted as to resale to institutional investors, but has been deemed liquid in accordance with guidelines approved by the Board of Trustees. Bath Technologies was acquired on 10/18/1999 at a cost of $580,000. Springside Corp. Exchange Partners, LLC was acquired on 2/5/2004 at a cost of $2,000,000. As of June 30, 2014, securities restricted as to resale to institutional investors represented 2.1% of Total Investments. The fair value noted approximates amortized cost. |
| (6) | 7-day yield as of June 30, 2014. |
| (7) | Assets of affiliates to the Money Market Fund held for the benefit of the Fund’s Trustees in connection with the Trustee Deferred Compensation Plan. |
The accompanying notes are an integral part of these financial statements.
| 2014 Semiannual Report | June 30, 2014 | Page 41 |
Statements of Assets & Liabilities
June 30, 2014 (unaudited)
| | | | | | | |
| Assets | | | | | | |
| Investments, at fair value* | | $ | 177,902,842 | | | $ | 113,003,977 | |
| Repurchase agreements, at fair value* | | | — | | | | — | |
| Investments in affiliates, at fair value and cost* | | | 21,505,908 | | | | 5,881,916 | |
| Trustee deferred compensation investments, at fair value | | | 239,647 | | | | 135,914 | |
| Receivable for net variation margin on futures contracts | | | 1,500 | | | | 1,300 | |
| Receivable for capital stock issued | | | 153,005 | | | | 63,514 | |
| Receivable from investment advisor | | | — | | | | — | |
| Interest and dividend receivable | | | 411,858 | | | | 258,716 | |
| Receivable for commissions recaptured | | | 32,290 | | | | 18,037 | |
Prepaid expenses/other assets | | | 24,121 | | | | 17,015 | |
| | | 200,271,171 | | | | 119,380,389 | |
| | | | | | | | | |
| Liabilities | | | | | | | | |
| Payable for securities purchased | | | — | | | | — | |
| Payable for Trustee Deferred Compensation Plan | | | 239,647 | | | | 135,914 | |
| Payable for capital stock redeemed | | | 32,245 | | | | 7,767 | |
| Dividends payable | | | — | | | | — | |
| Dividends payable - Money Market Fund - Retail Class | | | | | | | | |
| Dividends payable - Money Market Fund - Institutional Class | | | | | | | | |
| Payable to investment advisor | | | 68,036 | | | | 56,144 | |
| Accrued distribution plan (12b-1) and administrative service plan fees | | | 163,920 | | | | 109,984 | |
| Accrued transfer agent, fund accounting, CCO, and administrative fees | | | 8,716 | | | | 5,934 | |
| Accrued trustee fees | | | 4,800 | | | | 3,268 | |
Other accrued liabilities | | | 22,086 | | | | 18,689 | |
| | | 539,450 | | | | 337,700 | |
| | | | | | | | | |
| | $ | 199,731,721 | | | $ | 119,042,689 | |
| | | | | | | | | |
| Net Assets | | | | | | | | |
| Capital | | $ | 159,723,103 | | | $ | 96,206,886 | |
| Accumulated undistributed (distributions in excess of) net investment income | | | 419,704 | | | | 310,534 | |
| Accumulated undistributed net realized gain (loss) from investments and futures contracts | | | 21,999,969 | | | | 12,334,261 | |
Net unrealized appreciation (depreciation) of investments and futures contracts | | | 17,588,945 | | | | 10,191,008 | |
| | $ | 199,731,721 | | | $ | 119,042,689 | |
| | | | | | | | | |
| Net Assets | | | | | | | | |
| Money Market Fund - Retail Class | | | | | | | | |
Money Market Fund - Institutional Class | | | | | | | | |
| | | | | | | | |
| | | | | | | | | |
| Capital Stock Outstanding (unlimited number of shares authorized, $0.10 par value) | | | 26,945,192 | | | | 10,850,462 | |
| Money Market Fund - Retail Class | | | | | | | | |
Money Market Fund - Institutional Class | | | | | | | | |
Total Capital Stock Outstanding | | | | | | | | |
| | | | | | | | | |
| Net Asset Value, Offering and Redemption Price Per Share | | $ | 7.41 | | | $ | 10.97 | |
| Money Market Fund - Retail Class | | | | | | | | |
Money Market Fund - Institutional Class | | | | | | | | |
| | | | | | | | | |
| * Investments and affiliated investments at cost | | $ | 181,854,243 | | | $ | 108,732,839 | |
The accompanying notes are an integral part of these financial statements.
| Page 42 | 2014 Semiannual Report | June 30, 2014 |
| | | | | | | | | | | | Utilities and Infrastructure Fund | | | | | | | |
| | | | | | | | | | | | | | | | | | | | |
| $ | 70,539,477 | | | $ | 124,185,406 | | | $ | 99,191,054 | | | $ | 52,005,182 | | | $ | 43,174,696 | | | $ | 109,240,624 | | | $ | 104,406,247 | |
| | — | | | | — | | | | — | | | | — | | | | — | | | | — | | | | 20,000,000 | |
| | 3,611,978 | | | | 6,675,924 | | | | 6,163,612 | | | | 4,670,714 | | | | 568,792 | | | | 4,142,426 | | | | — | |
| | 79,576 | | | | 105,689 | | | | 92,468 | | | | 85,317 | | | | 83,392 | | | | 32,978 | | | | 73,835 | |
| | 800 | | | | 100 | | | | 27,600 | | | | 6,700 | | | | — | | | | 5,625 | | | | — | |
| | 39,374 | | | | 108,124 | | | | 41,019 | | | | 17,038 | | | | 16,748 | | | | 98,237 | | | | — | |
| | — | | | | — | | | | — | | | | — | | | | — | | | | — | | | | 31,408 | |
| | 215,639 | | | | 193,152 | | | | 408,759 | | | | 56,444 | | | | 72,691 | | | | 2,453 | | | | 17,834 | |
| | 16,793 | | | | 15,582 | | | | 7,681 | | | | 2,649 | | | | — | | | | 1,737 | | | | — | |
| | 15,486 | | | | 16,255 | | | | 13,976 | | | | 15,495 | | | | 18,002 | | | | 18,649 | | | | 19,298 | |
| | 74,519,123 | | | | 131,300,232 | | | | 105,946,169 | | | | 56,859,539 | | | | 43,934,321 | | | | 113,542,729 | | | | 124,548,622 | |
| | | | | | | | | | | | | | | | | | | | | | | | | | | |
| | | | | | | | | | | | | | | | | | | | | | | | | | | |
| | — | | | | — | | | | — | | | | 2,871,184 | | | | — | | | | — | | | | 249,000 | |
| | 79,576 | | | | 105,689 | | | | 92,468 | | | | 85,317 | | | | 83,392 | | | | 32,978 | | | | 73,835 | |
| | 2,132 | | | | 50,964 | | | | 2,153 | | | | 4,303 | | | | 22,611 | | | | 22,236 | | | | — | |
| | — | | | | 84 | | | | 1 | | | | 151 | | | | 429 | | | | 62 | | | | | |
| | | | | | | | | | | | | | | | | | | | | | | | | | 123 | |
| | | | | | | | | | | | | | | | | | | | | | | | | | 4,811 | |
| | 14,626 | | | | 29,202 | | | | 11,256 | | | | 6,606 | | | | 24,162 | | | | 15,601 | | | | — | |
| | 70,199 | | | | 119,006 | | | | 112,838 | | | | 34,405 | | | | 19,694 | | | | 108,109 | | | | 3,991 | |
| | 4,429 | | | | 6,277 | | | | 5,537 | | | | 3,677 | | | | 3,267 | | | | 4,598 | | | | 6,298 | |
| | 2,339 | | | | 3,413 | | | | 3,223 | | | | 1,657 | | | | 1,603 | | | | 3,070 | | | | 1,040 | |
| | 15,701 | | | | 16,794 | | | | 18,746 | | | | 12,916 | | | | 11,908 | | | | 15,802 | | | | 16,047 | |
| | 189,002 | | | | 331,429 | | | | 246,222 | | | | 3,020,216 | | | | 167,066 | | | | 202,456 | | | | 355,145 | |
| | | | | | | | | | | | | | | | | | | | | | | | | | | |
| $ | 74,330,121 | | | $ | 130,968,803 | | | $ | 105,699,947 | | | $ | 53,839,323 | | | $ | 43,767,255 | | | $ | 113,340,273 | | | $ | 124,193,477 | |
| | | | | | | | | | | | | | | | | | | | | | | | | | | |
| | | | | | | | | | | | | | | | | | | | | | | | | | | |
| $ | 59,094,462 | | | $ | 113,046,287 | | | $ | 83,717,025 | | | $ | 37,793,778 | | | $ | 28,014,233 | | | $ | 113,452,595 | | | $ | 124,193,477 | |
| | 85,787 | | | | 228,361 | | | | 95,710 | | | | 29,381 | | | | (222,662 | ) | | | (137,644 | ) | | | — | |
| | 7,924,891 | | | | 9,348,523 | | | | 8,116,831 | | | | 5,304,693 | | | | 2,959,294 | | | | (1,487,072 | ) | | | — | |
| | 7,224,981 | | | | 8,345,632 | | | | 13,770,381 | | | | 10,711,471 | | | | 13,016,390 | | | | 1,512,394 | | | | — | |
| $ | 74,330,121 | | | $ | 130,968,803 | | | $ | 105,699,947 | | | $ | 53,839,323 | | | $ | 43,767,255 | | | $ | 113,340,273 | | | $ | 124,193,477 | |
| | | | | | | | | | | | | | | | | | | | | | | | | | | |
| | | | | | | | | | | | | | | | | | | | | | | | | | | |
| | | | | | | | | | | | | | | | | | | | | | | | | $ | 62,187,628 | |
| | | | | | | | | | | | | | | | | | | | | | | | | | 62,005,849 | |
| | | | | | | | | | | | | | | | | | | | | | | | | $ | 124,193,477 | |
| | | | | | | | | | | | | | | | | | | | | | | | | | | |
| | 6,357,227 | | | | 11,189,308 | | | | 8,561,510 | | | | 1,418,526 | | | | 1,253,446 | | | | 11,369,844 | | | | | |
| | | | | | | | | | | | | | | | | | | | | | | | | | 62,187,628 | |
| | | | | | | | | | | | | | | | | | | | | | | | | | 62,005,849 | |
| | | | | | | | | | | | | | | | | | | | | | | | | | 124,193,477 | |
| | | | | | | | | | | | | | | | | | | | | | | | | | | |
| $ | 11.69 | | | $ | 11.70 | | | $ | 12.35 | | | $ | 37.95 | | | $ | 34.92 | | | $ | 9.97 | | | | | |
| | | | | | | | | | | | | | | | | | | | | | | | | $ | 1.00 | |
| | | | | | | | | | | | | | | | | | | | | | | | | $ | 1.00 | |
| | | | | | | | | | | | | | | | | | | | | | | | | | | |
| $ | 66,956,989 | | | $ | 122,516,666 | | | $ | 91,680,833 | | | $ | 45,988,765 | | | $ | 30,727,098 | | | $ | 111,867,381 | | | $ | 124,406,247 | |
The accompanying notes are an integral part of these financial statements.
| 2014 Semiannual Report | June 30, 2014 | Page 43 |
Statements of Operations
For the Period Ended June 30, 2014 (unaudited)
| | | | | | | |
| Investment Income | | | | | | |
| Interest | | $ | 136 | | | $ | 79 | |
| Interest from affiliates | | | 6,748 | | | | 2,704 | |
| | | 1,456,166 | | | | 955,671 | |
| | | 1,463,050 | | | | 958,454 | |
| | | | | | | | | |
| Fund Expenses | | | | | | | | |
| Investment advisor | | | 649,951 | | | | 398,667 | |
| Transfer agent | | | 102,716 | | | | 63,787 | |
| Transfer agent - Money Market Fund - Retail Class | | | | | | | | |
| Transfer agent - Money Market Fund - Institutional Class | | | | | | | | |
| Fund accounting | | | 26,908 | | | | 23,663 | |
| Administrative | | | 73,436 | | | | 47,483 | |
| Trustee | | | 7,378 | | | | 4,900 | |
| Audit | | | 5,841 | | | | 5,841 | |
| Legal | | | 2,811 | | | | 2,811 | |
| Custody | | | 10,923 | | | | 8,197 | |
| Printing | | | 5,904 | | | | 3,763 | |
| Distribution plan (12b-1) | | | 171,194 | | | | 132,889 | |
| Distribution plan (12b-1) - Money Market Fund - Retail Class | | | | | | | | |
| Distribution plan (12b-1) - Money Market Fund - Institutional Class | | | | | | | | |
| Administrative service plan | | | 168,343 | | | | 100,996 | |
| Postage | | | 4,592 | | | | 3,348 | |
| Registration and filing | | | 15,102 | | | | 13,618 | |
| Insurance | | | 4,024 | | | | 2,167 | |
| Chief Compliance Officer | | | 2,755 | | | | 2,755 | |
| | | 7,582 | | | | 7,157 | |
Total Expenses Before Reductions | | | 1,259,460 | | | | 822,042 | |
| | | | | | | | | |
| Expenses voluntarily reimbursed/waived by investment advisor (See Note #4) | | | (897 | ) | | | (38,780 | ) |
| Expenses contractually reimbursed/waived by investment advisor (See Note #4) | | | — | | | | — | |
| Commissions recaptured and fees received from custodian (See Note #4) | | | (215,217 | ) | | | (135,342 | ) |
Transfer agent expenses contractually waived (See Note #4) | | | — | | | | — | |
| | | | | | | | | |
| | | 1,043,346 | | | | 647,920 | |
| | | | | | | | | |
Net Investment Income (Loss) | | | 419,704 | | | | 310,534 | |
| | | | | | | | | |
| Net Realized and Unrealized Gain (Loss) from Investments | | | | | | | | |
| Net realized gains (losses) from investments | | | 14,657,176 | | | | 8,739,208 | |
| Net realized gains (losses) from futures contracts | | | 215,653 | | | | 216,270 | |
Distributions of long-term realized gains by other investment companies | | | — | | | | — | |
Net Realized Gains (Losses) from Investment Transactions, Futures Contracts, and Distributions of Long-term Realized Gains by Other Investment Companies | | | 14,872,829 | | | | 8,955,478 | |
| | | | | | | | | |
Net change in unrealized appreciation (depreciation) of investments and futures contracts | | | (3,865,042 | ) | | | (2,854,186 | ) |
| | | | | | | | | |
Net Realized and Unrealized Gain (Loss) from Investments | | | 11,007,787 | | | | 6,101,292 | |
Net Change in Net Assets Resulting from Operations | | $ | 11,427,491 | | | $ | 6,411,826 | |
The accompanying notes are an integral part of these financial statements.
| Page 44 | 2014 Semiannual Report | June 30, 2014 |
| | | | | | | | | | | | Utilities and Infrastructure Fund | | | | | | | |
| | | | | | | | | | | | | | | | | | | | |
| $ | 78 | | | $ | 132 | | | $ | 79 | | | $ | 61 | | | $ | — | | | $ | 1,010 | | | $ | 127,959 | |
| | 1,663 | | | | 3,549 | | | | 2,359 | | | | 1,755 | | | | 421 | | | | 3,489 | | | | — | |
| | 521,157 | | | | 1,352,576 | | | | 759,686 | | | | 427,624 | | | | 496,649 | | | | 1,742,737 | | | | — | |
| | 522,898 | | | | 1,356,257 | | | | 762,124 | | | | 429,440 | | | | 497,070 | | | | 1,747,236 | | | | 127,959 | |
| | | | | | | | | | | | | | | | | | | | | | | | | | | |
| | | | | | | | | | | | | | | | | | | | | | | | | | | |
| | 248,436 | | | | 425,304 | | | | 347,632 | | | | 237,160 | | | | 201,471 | | | | 197,175 | | | | 213,079 | |
| | 39,750 | | | | 68,049 | | | | 55,621 | | | | 28,459 | | | | 24,177 | | | | 40,181 | | | | | |
| | | | | | | | | | | | | | | | | | | | | | | | | | 25,340 | |
| | | | | | | | | | | | | | | | | | | | | | | | | | 20,658 | |
| | 21,006 | | | | 24,019 | | | | 22,983 | | | | 19,124 | | | | 18,410 | | | | 23,370 | | | | 23,904 | |
| | 31,459 | | | | 50,325 | | | | 42,040 | | | | 23,684 | | | | 20,147 | | | | 45,138 | | | | 49,405 | |
| | 3,289 | | | | 5,057 | | | | 4,444 | | | | 2,396 | | | | 2,154 | | | | 4,460 | | | | 1,202 | |
| | 5,841 | | | | 5,841 | | | | 5,841 | | | | 5,841 | | | | 5,841 | | | | 5,841 | | | | 5,841 | |
| | 2,811 | | | | 2,811 | | | | 2,811 | | | | 2,811 | | | | 2,811 | | | | 2,811 | | | | 2,811 | |
| | 6,065 | | | | 8,375 | | | | 7,683 | | | | 4,337 | | | | 2,523 | | | | 6,673 | | | | 4,167 | |
| | 2,371 | | | | 3,899 | | | | 3,370 | | | | 1,602 | | | | 1,392 | | | | 3,385 | | | | 5,041 | |
| | 82,488 | | | | 141,768 | | | | 114,038 | | | | 47,432 | | | | 40,294 | | | | 125,559 | | | | | |
| | | | | | | | | | | | | | | | | | | | | | | | | | 3,955 | |
| | | | | | | | | | | | | | | | | | | | | | | | | | 2 | |
| | 62,937 | | | | 113,415 | | | | 92,702 | | | | 28,459 | | | | 26,191 | | | | 100,447 | | | | — | |
| | 2,053 | | | | 3,072 | | | | 2,686 | | | | 1,870 | | | | 2,706 | | | | 2,735 | | | | 2,684 | |
| | 12,859 | | | | 13,400 | | | | 12,389 | | | | 11,322 | | | | 12,713 | | | | 12,636 | | | | 15,651 | |
| | 1,667 | | | | 2,702 | | | | 2,355 | | | | 1,037 | | | | 871 | | | | 2,335 | | | | 2,107 | |
| | 2,755 | | | | 2,755 | | | | 2,755 | | | | 2,755 | | | | 2,755 | | | | 2,755 | | | | 2,755 | |
| | 6,026 | | | | 6,750 | | | | 6,657 | | | | 6,173 | | | | 5,967 | | | | 6,716 | | | | 10,234 | |
| | 531,813 | | | | 877,542 | | | | 726,007 | | | | 424,462 | | | | 370,423 | | | | 582,217 | | | | 388,836 | |
| | | | | | | | | | | | | | | | | | | | | | | | | | | |
| | — | | | | (18,542 | ) | | | (81,959 | ) | | | — | | | | — | | | | (64,136 | ) | | | (298,583 | ) |
| | — | | | | — | | | | — | | | | (59,292 | ) | | | — | | | | — | | | | — | |
| | (94,702 | ) | | | (105,362 | ) | | | (63,148 | ) | | | (34,439 | ) | | | — | | | | (10,798 | ) | | | — | |
| | — | | | | — | | | | — | | | | — | | | | — | | | | (10,047 | ) | | | (9,016 | ) |
| | | | | | | | | | | | | | | | | | | | | | | | | | | |
| | 437,111 | | | | 753,638 | | | | 580,900 | | | | 330,731 | | | | 370,423 | | | | 497,236 | | | | 81,237 | |
| | | | | | | | | | | | | | | | | | | | | | | | | | | |
| | 85,787 | | | | 602,619 | | | | 181,224 | | | | 98,709 | | | | 126,647 | | | | 1,250,000 | | | | 46,722 | |
| | | | | | | | | | | | | | | | | | | | | | | | | | | |
| | | | | | | | | | | | | | | | | | | | | | | | | | | |
| | 6,513,078 | | | | 6,709,844 | | | | 6,685,434 | | | | 4,415,221 | | | | 2,878,676 | | | | 9,670 | | | | | |
| | 164,410 | | | | 263,532 | | | | 104,750 | | | | 227,360 | | | | — | | | | 69,712 | | | | | |
| | — | | | | — | | | | — | | | | — | | | | — | | | | 25,883 | | | | | |
| | 6,677,488 | | | | 6,973,376 | | | | 6,790,184 | | | | 4,642,581 | | | | 2,878,676 | | | | 105,265 | | | | | |
| | | | | | | | | | | | | | | | | | | | | | | | | | | |
| | (1,998,489 | ) | | | (810,887 | ) | | | 1,020,976 | | | | (678,052 | ) | | | 2,056,168 | | | | 2,097,182 | | | | | |
| | | | | | | | | | | | | | | | | | | | | | | | | | | |
| | 4,678,999 | | | | 6,162,489 | | | | 7,811,160 | | | | 3,964,529 | | | | 4,934,844 | | | | 2,202,447 | | | | | |
| $ | 4,764,786 | | | $ | 6,765,108 | | | $ | 7,992,384 | | | $ | 4,063,238 | | | $ | 5,061,491 | | | $ | 3,452,447 | | | $ | 46,722 | |
The accompanying notes are an integral part of these financial statements.
| 2014 Semiannual Report | June 30, 2014 | Page 45 |
Statements of Changes in Net Assets
For the Period Ended June 30, 2014 (unaudited) and the Year Ended December 31, 2013
| | | | | | | |
| | | | | | | | | | | | | |
| Operations | | | | | | | | | | | | |
| Net investment income (loss) | | $ | 419,704 | | | $ | 187,405 | | | $ | 310,534 | | | $ | 177,379 | |
| Net realized gain (loss) from investment transactions, futures contracts, and distributions of long-term realized gains by other investment companies | | | 14,872,829 | | | | 17,519,403 | | | | 8,955,478 | | | | 14,845,431 | |
Net change in unrealized appreciation (depreciation) of investments and futures contracts | | | (3,865,042 | ) | | | 18,388,739 | | | | (2,854,186 | ) | | | 10,113,052 | |
Net change in net assets resulting from operations | | | 11,427,491 | | | | 36,095,547 | | | | 6,411,826 | | | | 25,135,862 | |
| | | | | | | | | | | | | | | | | |
| Distributions to Shareholders | | | | | | | | | | | | | | | | |
| From net investment income | | | — | | | | (187,406 | ) | | | — | | | | (177,380 | ) |
From net realized gain from investment transactions | | | — | | | | (12,869,167 | ) | | | — | | | | (10,506,262 | ) |
Net change in net assets resulting from distributions | | | — | | | | (13,056,573 | ) | | | — | | | | (10,683,642 | ) |
| | | | | | | | | | | | | | | | | |
| Capital Transactions | | | | | | | | | | | | | | | | |
| Issued | | | 42,148,566 | | | | 46,249,025 | | | | 19,247,393 | | | | 27,172,772 | |
| Reinvested | | | 437 | | | | 13,050,523 | | | | — | | | | 10,669,300 | |
| | | (15,668,234 | ) | | | (34,686,165 | ) | | | (9,542,230 | ) | | | (41,345,834 | ) |
Net change in net assets resulting from capital transactions | | | 26,480,769 | | | | 24,613,383 | | | | 9,705,163 | | | | (3,503,762 | ) |
| | | | | | | | | | | | | | | | | |
Total Change in Net Assets | | | 37,908,260 | | | | 47,652,357 | | | | 16,116,989 | | | | 10,948,458 | |
| | | | | | | | | | | | | | | | | |
Net Assets - Beginning of Year | | | 161,823,461 | | | | 114,171,104 | | | | 102,925,700 | | | | 91,977,242 | |
| | | | | | | | | | | | | | | | | |
| | $ | 199,731,721 | | | $ | 161,823,461 | | | $ | 119,042,689 | | | $ | 102,925,700 | |
| | | | | | | | | | | | | | | | | |
Accumulated undistributed (distributions in excess of) net investment income | | $ | 419,704 | | | $ | — | | | $ | 310,534 | | | $ | — | |
| | | | | | | | | | | | | | | | | |
| Share Transactions | | | | | | | | | | | | | | | | |
| Issued | | | 5,941,622 | | | | 6,896,759 | | | | 1,831,337 | | | | 2,662,777 | |
| Reinvested | | | 64 | | | | 1,910,291 | | | | — | | | | 1,048,793 | |
| | | (2,273,934 | ) | | | (5,170,272 | ) | | | (925,348 | ) | | | (4,218,417 | ) |
| | | 3,667,752 | | | | 3,636,778 | | | | 905,989 | | | | (506,847 | ) |
The accompanying notes are an integral part of these financial statements.
| Page 46 | 2014 Semiannual Report | June 30, 2014 |
| | | | | | | |
| | | | | | | | | | | | | | | | |
| | | | | | | | | | | | | | | | | |
| $ | 85,787 | | | $ | (15,583 | ) | | $ | 602,619 | | | $ | 823,955 | | | $ | 181,224 | | | $ | 311,097 | |
| | 6,677,488 | | | | 5,974,266 | | | | 6,973,376 | | | | 9,945,347 | | | | 6,790,184 | | | | 9,136,193 | |
| | (1,998,489 | ) | | | 8,303,612 | | | | (810,887 | ) | | | 6,772,174 | | | | 1,020,976 | | | | 8,884,158 | |
| | 4,764,786 | | | | 14,262,295 | | | | 6,765,108 | | | | 17,541,476 | | | | 7,992,384 | | | | 18,331,448 | |
| | | | | | | | | | | | | | | | | | | | | | | |
| | | | | | | | | | | | | | | | | | | | | | | |
| | — | | | | — | | | | (374,260 | ) | | | (823,955 | ) | | | (85,514 | ) | | | (417,500 | ) |
| | — | | | | (548,517 | ) | | | — | | | | (7,392,978 | ) | | | — | | | | (7,621,949 | ) |
| | — | | | | (548,517 | ) | | | (374,260 | ) | | | (8,216,933 | ) | | | (85,514 | ) | | | (8,039,449 | ) |
| | | | | | | | | | | | | | | | | | | | | | | |
| | | | | | | | | | | | | | | | | | | | | | | |
| | 10,677,599 | | | | 25,520,032 | | | | 26,823,192 | | | | 39,570,813 | | | | 13,545,159 | | | | 23,069,477 | |
| | — | | | | 548,469 | | | | 374,147 | | | | 8,215,987 | | | | 85,513 | | | | 8,039,299 | |
| | (5,720,432 | ) | | | (14,113,081 | ) | | | (8,260,917 | ) | | | (38,097,606 | ) | | | (7,606,928 | ) | | | (29,077,214 | ) |
| | 4,957,167 | | | | 11,955,420 | | | | 18,936,422 | | | | 9,689,194 | | | | 6,023,744 | | | | 2,031,562 | |
| | | | | | | | | | | | | | | | | | | | | | | |
| | 9,721,953 | | | | 25,669,198 | | | | 25,327,270 | | | | 19,013,737 | | | | 13,930,614 | | | | 12,323,561 | |
| | | | | | | | | | | | | | | | | | | | | | | |
| | 64,608,168 | | | | 38,938,970 | | | | 105,641,533 | | | | 86,627,796 | | | | 91,769,333 | | | | 79,445,772 | |
| | | | | | | | | | | | | | | | | | | | | | | |
| $ | 74,330,121 | | | $ | 64,608,168 | | | $ | 130,968,803 | | | $ | 105,641,533 | | | $ | 105,699,947 | | | $ | 91,769,333 | |
| | | | | | | | | | | | | | | | | | | | | | | |
| $ | 85,787 | | | $ | — | | | $ | 228,361 | | | $ | 2 | | | $ | 95,710 | | | $ | — | |
| | | | | | | | | | | | | | | | | | | | | | | |
| | | | | | | | | | | | | | | | | | | | | | | |
| | 963,026 | | | | 2,695,239 | | | | 2,370,993 | | | | 3,609,663 | | | | 1,145,439 | | | | 2,063,813 | |
| | — | | | | 51,307 | | | | 32,400 | | | | 747,060 | | | | 6,924 | | | | 716,662 | |
| | (526,312 | ) | | | (1,440,213 | ) | | | (733,593 | ) | | | (3,447,305 | ) | | | (667,858 | ) | | | (2,591,032 | ) |
| | 436,714 | | | | 1,306,333 | | | | 1,669,800 | | | | 909,418 | | | | 484,505 | | | | 189,443 | |
The accompanying notes are an integral part of these financial statements.
| 2014 Semiannual Report | June 30, 2014 | Page 47 |
Statements of Changes in Net Assets
For the Period Ended June 30, 2014 (unaudited) and the Year Ended December 31, 2013
| | | | |
| | | | | | | |
| Operations | | | | | | |
| Net investment income (loss) | | $ | 98,709 | | | $ | 94,807 | |
Net realized gain (loss) from investment transactions, futures contracts, and distributions of long-term realized gains by other investment companies | | | 4,642,581 | | | | 2,286,066 | |
Net change in unrealized appreciation (depreciation) of investments and futures contracts | | | (678,052 | ) | | | 9,310,650 | |
Net change in net assets resulting from operations | | | 4,063,238 | | | | 11,691,523 | |
| | | | | | | | | |
| Distributions to Shareholders | | | | | | | | |
| From net investment income | | | (69,328 | ) | | | (101,837 | ) |
From net realized gain from investment transactions | | | — | | | | (1,068,448 | ) |
Net change in net assets resulting from distributions | | | (69,328 | ) | | | (1,170,285 | ) |
| | | | | | | | | |
| Distributions to Shareholders - Money Market Fund | | | | | | | | |
| From net investment income (Retail Class) | | | | | | | | |
From net investment income (Institutional Class) | | | | | | | | |
Net change in net assets resulting from distributions | | | | | | | | |
| | | | | | | | | |
| Capital Transactions | | | | | | | | |
| Issued | | | 8,559,833 | | | | 18,025,679 | |
| Reinvested | | | 69,083 | | | | 1,168,437 | |
| | | (3,259,305 | ) | | | (8,545,053 | ) |
Net change in net assets resulting from capital transactions | | | 5,369,611 | | | | 10,649,063 | |
| | | | | | | | | |
Total Change in Net Assets | | | 9,363,521 | | | | 21,170,301 | |
| | | | | | | | | |
Net Assets - Beginning of Year | | | 44,475,802 | | | | 23,305,501 | |
| | | | | | | | | |
| | $ | 53,839,323 | | | $ | 44,475,802 | |
| | | | | | | | | |
Accumulated undistributed (distributions in excess of) net investment income | | $ | 29,381 | | | $ | — | |
| | | | | | | | | |
| Share Transactions | | | | | | | | |
| Issued | | | 239,671 | | | | 592,171 | |
| Reinvested | | | 1,859 | | | | 34,253 | |
| | | (92,255 | ) | | | (272,430 | ) |
| | | 149,275 | | | | 353,994 | |
The accompanying notes are an integral part of these financial statements.
| Page 48 | 2014 Semiannual Report | June 30, 2014 |
Utilities and Infrastructure Fund | | | | | | | |
| | | | | | | | | | | | | | | | |
| | | | | | | | | | | | | | | | | |
| $ | 126,647 | | | $ | 214,636 | | | $ | 1,250,000 | | | $ | 3,309,311 | | | $ | 46,722 | | | $ | 118,086 | |
| | 2,878,676 | | | | 1,697,926 | | | | 105,265 | | | | (767,526 | ) | | | — | | | | — | |
| | 2,056,168 | | | | 6,719,645 | | | | 2,097,182 | | | | (2,548,860 | ) | | | — | | | | — | |
| | 5,061,491 | | | | 8,632,207 | | | | 3,452,447 | | | | (7,075 | ) | | | 46,722 | | | | 118,086 | |
| | | | | | | | | | | | | | | | | | | | | | | |
| | | | | | | | | | | | | | | | | | | | | | | |
| | (112,686 | ) | | | (214,640 | ) | | | (1,387,646 | ) | | | (3,309,309 | ) | | | | | | | | |
| | — | | | | — | | | | — | | | | — | | | | | | | | | |
| | (112,686 | ) | | | (214,640 | ) | | | (1,387,646 | ) | | | (3,309,309 | ) | | | | | | | | |
| | | | | | | | | | | | | | | | | | | | | | | |
| | | | | | | | | | | | | | | | | | | | | | | |
| | | | | | | | | | | | | | | | | | (17,786 | ) | | | (50,875 | ) |
| | | | | | | | | | | | | | | | | | (28,936 | ) | | | (67,211 | ) |
| | | | | | | | | | | | | | | | | | (46,722 | ) | | | (118,086 | ) |
| | | | | | | | | | | | | | | | | | | | | | | |
| | | | | | | | | | | | | | | | | | | | | | | |
| | 6,056,009 | | | | 8,258,219 | | | | 26,793,858 | | | | 45,778,615 | | | | 195,620,691 | | | | 435,368,654 | |
| | 109,754 | | | | 209,958 | | | | 1,387,430 | | | | 3,308,450 | | | | 20,806 | | | | 59,786 | |
| | (5,335,322 | ) | | | (9,349,262 | ) | | | (6,985,893 | ) | | | (31,691,541 | ) | | | (176,220,190 | ) | | | (489,155,684 | ) |
| | 830,441 | | | | (881,085 | ) | | | 21,195,395 | | | | 17,395,524 | | | | 19,421,307 | | | | (53,727,244 | ) |
| | | | | | | | | | | | | | | | | | | | | | | |
| | 5,779,246 | | | | 7,536,482 | | | | 23,260,196 | | | | 14,079,140 | | | | 19,421,307 | | | | (53,727,244 | ) |
| | | | | | | | | | | | | | | | | | | | | | | |
| | 37,988,009 | | | | 30,451,527 | | | | 90,080,077 | | | | 76,000,937 | | | | 104,772,170 | | | | 158,499,414 | |
| | | | | | | | | | | | | | | | | | | | | | | |
| $ | 43,767,255 | | | $ | 37,988,009 | | | $ | 113,340,273 | | | $ | 90,080,077 | | | $ | 124,193,477 | | | $ | 104,772,170 | |
| | | | | | | | | | | | | | | | | | | | | | | |
| $ | (222,662 | ) | | $ | (236,623 | ) | | $ | (137,644 | ) | | $ | 2 | | | $ | — | | | $ | — | |
| | | | | | | | | | | | | | | | | | | | | | | |
| | | | | | | | | | | | | | | | | | | | | | | |
| | 186,146 | | | | 292,474 | | | | 2,715,157 | | | | 4,600,576 | | | | 195,620,691 | | | | 435,368,654 | |
| | 3,332 | | | | 7,317 | | | | 140,435 | | | | 335,050 | | | | 20,806 | | | | 59,786 | |
| | (162,304 | ) | | | (333,224 | ) | | | (707,202 | ) | | | (3,203,649 | ) | | | (176,220,190 | ) | | | (489,155,684 | ) |
| | 27,174 | | | | (33,433 | ) | | | 2,148,390 | | | | 1,731,977 | | | | 19,421,307 | | | | (53,727,244 | ) |
The accompanying notes are an integral part of these financial statements.
| 2014 Semiannual Report | June 30, 2014 | Page 49 |
Financial Highlights
For a Share Outstanding Through the Period Ended June 30, 2014 (unaudited) and
Each Fiscal Year Ended December 31,
| | | | | | Income from Investment Operations | | | | |
| | Net Asset Value, Beginning of Period | | | Net Investment Income (Loss) (5) | | | Net gains (losses) on securities, futures, and options (both realized and unrealized) | | | Total from Investment Operations | | | From Net Investment Income | | | | | | From Tax Return of Capital | | | | |
Muirfield Fund® (1)(2)(3)(4) | |
| 2014 | | $ | 6.95 | | | | 0.02 | | | | 0.44 | | | | 0.46 | | | | 0.00 | | | | 0.00 | | | | 0.00 | | | | 0.00 | |
| 2013 | | $ | 5.81 | | | | 0.01 | | | | 1.75 | | | | 1.76 | | | | (0.01 | ) | | | (0.61 | ) | | | 0.00 | | | | (0.62 | ) |
| 2012 | | $ | 5.17 | | | | (0.01 | ) | | | 0.65 | | | | 0.64 | | | | 0.00 | | | | 0.00 | | | | 0.00 | | | | 0.00 | |
| 2011 | | $ | 5.60 | | | | (0.01 | ) | | | (0.41 | ) | | | (0.42 | ) | | | (0.01 | ) | | | 0.00 | | | | 0.00 | | | | (0.01 | ) |
| 2010 | | $ | 4.99 | | | | 0.02 | | | | 0.61 | | | | 0.63 | | | | (0.02 | ) | | | 0.00 | | | | 0.00 | | | | (0.02 | ) |
| 2009 | | $ | 4.21 | | | | 0.01 | | | | 0.79 | | | | 0.80 | | | | (0.02 | ) | | | 0.00 | | | | 0.00 | | | | (0.02 | ) |
Dynamic Growth Fund (1)(2)(3)(4) | |
| 2014 | | $ | 10.35 | | | | 0.03 | | | | 0.59 | | | | 0.62 | | | | 0.00 | | | | 0.00 | | | | 0.00 | | | | 0.00 | |
| 2013 | | $ | 8.80 | | | | 0.02 | | | | 2.74 | | | | 2.76 | | | | (0.02 | ) | | | (1.19 | ) | | | 0.00 | | | | (1.21 | ) |
| 2012 | | $ | 7.68 | | | | 0.00 | | | | 1.12 | | | | 1.12 | | | | 0.00 | | | | 0.00 | | | | 0.00 | | | | 0.00 | |
| 2011 | | $ | 8.14 | | | | (0.01 | ) | | | (0.45 | ) | | | (0.46 | ) | | | 0.00 | | | | 0.00 | | | | 0.00 | | | | 0.00 | |
| 2010 | | $ | 7.06 | | | | 0.02 | | | | 1.08 | | | | 1.10 | | | | (0.02 | ) | | | 0.00 | | | | 0.00 | | | | (0.02 | ) |
| 2009 | | $ | 5.48 | | | | 0.00 | | | | 1.58 | | | | 1.58 | | | | 0.00 | * | | | 0.00 | | | | 0.00 | | | | 0.00 | * |
Aggressive Growth Fund (1)(2)(3)(4) | |
| 2014 | | $ | 10.91 | | | | 0.01 | | | | 0.77 | | | | 0.78 | | | | 0.00 | | | | 0.00 | | | | 0.00 | | | | 0.00 | |
| 2013 | | $ | 8.44 | | | | (0.00 | )* | | | 2.56 | | | | 2.56 | | | | 0.00 | | | | (0.09 | ) | | | 0.00 | | | | (0.09 | ) |
| 2012 | | $ | 7.40 | | | | (0.03 | ) | | | 1.07 | | | | 1.04 | | | | 0.00 | | | | 0.00 | | | | 0.00 | | | | 0.00 | |
| 2011 | | $ | 7.97 | | | | (0.07 | ) | | | (0.50 | ) | | | (0.57 | ) | | | 0.00 | | | | 0.00 | | | | 0.00 | | | | 0.00 | |
| 2010 | | $ | 6.89 | | | | (0.01 | ) | | | 1.09 | | | | 1.08 | | | | 0.00 | | | | 0.00 | | | | 0.00 | | | | 0.00 | |
| 2009 | | $ | 5.19 | | | | (0.01 | ) | | | 1.71 | | | | 1.70 | | | | 0.00 | | | | 0.00 | | | | 0.00 | | | | 0.00 | |
Balanced Fund (1)(2)(3)(4) | |
| 2014 | | $ | 11.10 | | | | 0.06 | | | | 0.58 | | | | 0.64 | | | | (0.04 | ) | | | 0.00 | | | | 0.00 | | | | (0.04 | ) |
| 2013 | | $ | 10.06 | | | | 0.09 | | | | 1.89 | | | | 1.98 | | | | (0.09 | ) | | | (0.85 | ) | | | 0.00 | | | | (0.94 | ) |
| 2012 | | $ | 9.18 | | | | 0.07 | | | | 0.89 | | | | 0.96 | | | | (0.08 | ) | | | 0.00 | | | | 0.00 | | | | (0.08 | ) |
| 2011 | | $ | 9.72 | | | | 0.13 | | | | (0.57 | ) | | | (0.44 | ) | | | (0.10 | ) | | | 0.00 | | | | 0.00 | | | | (0.10 | ) |
| 2010 | | $ | 8.98 | | | | 0.14 | | | | 0.74 | | | | 0.88 | | | | (0.14 | ) | | | 0.00 | | | | 0.00 | | | | (0.14 | ) |
| 2009 | | $ | 7.86 | | | | 0.03 | | | | 1.12 | | | | 1.15 | | | | (0.03 | ) | | | 0.00 | | | | 0.00 | | | | (0.03 | ) |
Strategic Growth Fund (1)(2)(3)(4) | |
| 2014 | | $ | 11.36 | | | | 0.02 | | | | 0.98 | | | | 1.00 | | | | (0.01 | ) | | | 0.00 | | | | 0.00 | | | | (0.01 | ) |
| 2013 | | $ | 10.07 | | | | 0.04 | | | | 2.34 | | | | 2.38 | | | | (0.05 | ) | | | (1.04 | ) | | | 0.00 | | | | (1.09 | ) |
| 2012 | | $ | 8.90 | | | | 0.00 | | | | 1.17 | | | | 1.17 | | | | 0.00 | | | | 0.00 | | | | 0.00 | | | | 0.00 | |
| 2011 | | $ | 9.71 | | | | (0.04 | ) | | | (0.77 | ) | | | (0.81 | ) | | | 0.00 | | | | 0.00 | | | | 0.00 | | | | 0.00 | |
| 2010 | | $ | 8.12 | | | | 0.04 | | | | 1.58 | | | | 1.62 | | | | (0.03 | ) | | | 0.00 | | | | 0.00 | | | | (0.03 | ) |
| 2009 | | $ | 5.98 | | | | (0.01 | ) | | | 2.15 | | | | 2.14 | | | | 0.00 | | | | 0.00 | | | | 0.00 | | | | 0.00 | |
| 1 | Ratio of net expenses to average net assets, ratio of net investment income (loss) to average net assets, ratio of expenses to average net assets after reductions, excluding commissions recaptured and fees received from custodian, and ratio of expenses to average net assets before reductions do not include impact of expenses of the underlying security holdings as represented in the schedule of investments. |
| 2 | Recognition of net investment income by the Fund is affected by the timing of the declaration of dividends by the underlying investment companies in which the Fund invests. |
| 3 | Total return and portfolio turnover rate are not annualized for periods of less than one full year. |
The accompanying notes are an integral part of these financial statements.
| Page 50 | 2014 Semiannual Report | June 30, 2014 |
| | | | | | | | |
Net Asset Value, End of Period | | | Total Return (Assumes Reinvestment of Distributions) | | | Net Assets, End of Period ($000) | | | Ratio of Net Expenses to Average Net Assets | | | Ratio of Net Investment Income (Loss) to Average Net Assets | | | Ratio of Expenses to Average Net Assets after Reductions, Excluding Commissions Recaptured and Fees Received from Custodian | | | Ratio of Expenses to Average Net Assets Before Reductions | | | | |
| | |
| $ | 7.41 | | | | 6.62 | % | | $ | 199,732 | | | | 1.22 | % | | | 0.49 | % | | | 1.47 | % | | | 1.47 | % | | | 106 | % |
| $ | 6.95 | | | | 30.46 | % | | $ | 161,823 | | | | 1.22 | % | | | 0.14 | % | | | 1.42 | % | | | 1.54 | % | | | 260 | % |
| $ | 5.81 | | | | 12.38 | % | | $ | 114,171 | | | | 1.39 | % | | | (0.12 | %) | | | 1.42 | % | | | 1.58 | % | | | 154 | % |
| $ | 5.17 | | | | (7.55 | %) | | $ | 119,787 | | | | 1.39 | % | | | (0.11 | %) | | | 1.46 | % | | | 1.58 | % | | | 189 | % |
| $ | 5.60 | | | | 12.65 | % | | $ | 122,266 | | | | 1.39 | % | | | 0.40 | % | | | 1.47 | % | | | 1.60 | % | | | 128 | % |
| $ | 4.99 | | | | 18.95 | % | | $ | 115,138 | | | | 1.43 | % | | | 0.17 | % | | | 1.51 | % | | | 1.66 | % | | | 166 | % |
| |
| $ | 10.97 | | | | 5.99 | % | | $ | 119,043 | | | | 1.22 | % | | | 0.58 | % | | | 1.48 | % | | | 1.55 | % | | | 107 | % |
| $ | 10.35 | | | | 31.61 | % | | $ | 102,926 | | | | 1.22 | % | | | 0.20 | % | | | 1.39 | % | | | 1.58 | % | | | 276 | % |
| $ | 8.80 | | | | 14.58 | % | | $ | 91,977 | | | | 1.39 | % | | | (0.04 | %) | | | 1.42 | % | | | 1.57 | % | | | 154 | % |
| $ | 7.68 | | | | (5.65 | %) | | $ | 90,902 | | | | 1.39 | % | | | (0.08 | %) | | | 1.46 | % | | | 1.57 | % | | | 176 | % |
| $ | 8.14 | | | | 15.54 | % | | $ | 95,239 | | | | 1.39 | % | | | 0.23 | % | | | 1.47 | % | | | 1.59 | % | | | 119 | % |
| $ | 7.06 | | | | 28.87 | % | | $ | 84,358 | | | | 1.37 | % | | | (0.04 | %) | | | 1.48 | % | | | 1.63 | % | | | 148 | % |
| |
| $ | 11.69 | | | | 7.15 | % | | $ | 74,330 | | | | 1.32 | % | | | 0.26 | % | | | 1.61 | % | | | 1.61 | % | | | 107 | % |
| $ | 10.91 | | | | 30.40 | % | | $ | 64,608 | | | | 1.35 | % | | | (0.03 | %) | | | 1.57 | % | | | 1.65 | % | | | 272 | % |
| $ | 8.44 | | | | 14.05 | % | | $ | 38,939 | | | | 1.59 | % | | | (0.44 | %) | | | 1.62 | % | | | 1.74 | % | | | 167 | % |
| $ | 7.40 | | | | (7.15 | %) | | $ | 32,167 | | | | 1.59 | % | | | (0.73 | %) | | | 1.65 | % | | | 1.70 | % | | | 224 | % |
| $ | 7.97 | | | | 15.67 | % | | $ | 33,908 | | | | 1.59 | % | | | (0.07 | %) | | | 1.66 | % | | | 1.77 | % | | | 124 | % |
| $ | 6.89 | | | | 32.76 | % | | $ | 29,895 | | | | 1.54 | % | | | (0.25 | %) | | | 1.63 | % | | | 1.82 | % | | | 156 | % |
| |
| $ | 11.70 | | | | 5.73 | % | | $ | 130,969 | | | | 1.33 | % | | | 1.06 | % | | | 1.52 | % | | | 1.55 | % | | | 78 | % |
| $ | 11.10 | | | | 19.79 | % | | $ | 105,642 | | | | 1.33 | % | | | 0.85 | % | | | 1.47 | % | | | 1.57 | % | | | 217 | % |
| $ | 10.06 | | | | 10.42 | % | | $ | 86,628 | | | | 1.49 | % | | | 0.76 | % | | | 1.51 | % | | | 1.58 | % | | | 168 | % |
| $ | 9.18 | | | | (4.49 | %) | | $ | 85,797 | | | | 1.44 | % | | | 1.29 | % | | | 1.51 | % | | | 1.60 | % | | | 164 | % |
| $ | 9.72 | | | | 9.76 | % | | $ | 57,779 | | | | 1.52 | % | | | 1.51 | % | | | 1.57 | % | | | 1.66 | % | | | 161 | % |
| $ | 8.98 | | | | 14.65 | % | | $ | 49,388 | | | | 1.54 | % | | | 0.41 | % | | | 1.59 | % | | | 1.72 | % | | | 182 | % |
| |
| $ | 12.35 | | | | 8.80 | % | | $ | 105,700 | | | | 1.25 | % | | | 0.39 | % | | | 1.39 | % | | | 1.57 | % | | | 49 | % |
| $ | 11.36 | | | | 23.82 | % | | $ | 91,769 | | | | 1.23 | % | | | 0.36 | % | | | 1.40 | % | | | 1.58 | % | | | 231 | % |
| $ | 10.07 | | | | 13.15 | % | | $ | 79,446 | | | | 1.39 | % | | | (0.05 | %) | | | 1.42 | % | | | 1.58 | % | | | 86 | % |
| $ | 8.90 | | | | (8.34 | %) | | $ | 84,672 | | | | 1.39 | % | | | (0.37 | %) | | | 1.48 | % | | | 1.58 | % | | | 166 | % |
| $ | 9.71 | | | | 19.96 | % | | $ | 62,431 | | | | 1.49 | % | | | 0.48 | % | | | 1.59 | % | | | 1.70 | % | | | 115 | % |
| $ | 8.12 | | | | 35.79 | % | | $ | 34,052 | | | | 1.54 | % | | | (0.13 | %) | | | 1.65 | % | | | 1.80 | % | | | 75 | % |
| 4 | Ratio of net expenses to average net assets, ratio of net investment income (loss) to average net assets, ratio of average net assets after reductions, excluding commissions recaptured and fees received from custodian, and ratio of expenses to average net assets before reductions are annualized for periods of less than one full year. |
| 5 | Net investment income per share is based on average shares outstanding during the period. |
| * | Actual amounts were less than one-half of a cent per share |
The accompanying notes are an integral part of these financial statements.
| 2014 Semiannual Report | June 30, 2014 | Page 51 |
Financial Highlights
For a Share Outstanding Through the Period Ended June 30, 2014 (unaudited) and
Each Fiscal Year Ended December 31,
| | | | | | Income from Investment Operations | | | | |
| | Net Asset Value, Beginning of Period | | | Net Investment Income (Loss) (5) | | | Net gains (losses) on securities, futures, and options (both realized and unrealized) | | | Total from Investment Operations | | | From Net Investment Income | | | | | | From Tax Return of Capital | | | | |
Quantex FundTM (3)(4) | |
| 2014 | | $ | 35.04 | | | | 0.07 | | | | 2.89 | | | | 2.96 | | | | (0.05 | ) | | | 0.00 | | | | 0.00 | | | | (0.05 | ) |
| 2013 | | $ | 25.46 | | | | 0.09 | | | | 10.45 | | | | 10.54 | | | | (0.08 | ) | | | (0.88 | ) | | | 0.00 | | | | (0.96 | ) |
| 2012 | | $ | 21.84 | | | | 0.07 | | | | 3.63 | | | | 3.70 | | | | (0.08 | ) | | | 0.00 | | | | 0.00 | | | | (0.08 | ) |
| 2011 | | $ | 22.77 | | | | 0.00 | ** | | | (0.92 | ) | | | (0.92 | ) | | | (0.01 | ) | | | 0.00 | | | | 0.00 | | | | (0.01 | ) |
| 2010 | | $ | 18.48 | | | | (0.06 | ) | | | 4.35 | | | | 4.29 | | | | 0.00 | | | | 0.00 | | | | 0.00 | | | | 0.00 | |
| 2009 | | $ | 10.42 | | | | (0.01 | ) | | | 8.07 | | | | 8.06 | | | | 0.00 | ** | | | 0.00 | | | | 0.00 | | | | 0.00 | ** |
Utilities and Infrastructure Fund (3)(4) | |
| 2014 | | $ | 30.98 | | | | 0.10 | | | | 3.93 | | | | 4.03 | | | | (0.09 | ) | | | 0.00 | | | | 0.00 | | | | (0.09 | ) |
| 2013 | | $ | 24.17 | | | | 0.17 | | | | 6.81 | | | | 6.98 | | | | (0.17 | ) | | | 0.00 | | | | 0.00 | | | | (0.17 | ) |
| 2012 | | $ | 24.06 | | | | 0.15 | | | | 0.21 | | | | 0.36 | | | | (0.15 | ) | | | (0.10 | ) | | | 0.00 | | | | (0.25 | ) |
| 2011 | | $ | 23.51 | | | | 0.22 | | | | 0.70 | | | | 0.92 | | | | (0.37 | ) | | | 0.00 | | | | 0.00 | | | | (0.37 | ) |
| 2010 | | $ | 20.73 | | | | 0.15 | | | | 2.76 | | | | 2.91 | | | | (0.13 | ) | | | 0.00 | | | | 0.00 | | | | (0.13 | ) |
| 2009 | | $ | 16.13 | | | | 0.15 | | | | 4.74 | | | | 4.89 | | | | (0.16 | ) | | | 0.00 | | | | (0.13 | ) | | | (0.29 | ) |
Total Return Bond Fund (1)(2)(3)(4) | |
| 2014 | | $ | 9.77 | | | | 0.12 | | | | 0.21 | | | | 0.33 | | | | (0.13 | ) | | | 0.00 | | | | 0.00 | | | | (0.13 | ) |
| 2013 | | $ | 10.15 | | | | 0.38 | | | | (0.38 | ) | | | (0.00 | ) | | | (0.38 | ) | | | 0.00 | | | | 0.00 | | | | (0.38 | ) |
| 2012 | | $ | 9.73 | | | | 0.44 | | | | 0.41 | | | | 0.85 | | | | (0.43 | ) | | | 0.00 | | | | 0.00 | | | | (0.43 | ) |
| 2011* | | $ | 10.00 | | | | 0.25 | | | | (0.31 | ) | | | (0.06 | ) | | | (0.21 | ) | | | 0.00 | | | | 0.00 | | | | (0.21 | ) |
Money Market Fund - Retail Class (3)(4) | |
| 2014 | | $ | 1.00 | | | | 0.000 | ** | | | N/A | | | | 0.000 | ** | | | (0.000 | )** | | | 0.000 | | | | 0.000 | | | | (0.000 | )** |
| 2013 | | $ | 1.00 | | | | 0.001 | | | | N/A | | | | 0.001 | | | | (0.001 | ) | | | 0.000 | | | | 0.000 | | | | (0.001 | ) |
| 2012 | | $ | 1.00 | | | | 0.001 | | | | N/A | | | | 0.001 | | | | (0.001 | ) | | | 0.000 | | | | 0.000 | | | | (0.001 | ) |
| 2011 | | $ | 1.00 | | | | 0.001 | | | | N/A | | | | 0.001 | | | | (0.001 | ) | | | 0.000 | | | | 0.000 | | | | (0.001 | ) |
| 2010 | | $ | 1.00 | | | | 0.002 | | | | N/A | | | | 0.002 | | | | (0.002 | ) | | | 0.000 | | | | 0.000 | | | | (0.002 | ) |
| 2009 | | $ | 1.00 | | | | 0.006 | | | | N/A | | | | 0.006 | | | | (0.006 | ) | | | 0.000 | | | | 0.000 | | | | (0.006 | ) |
Money Market Fund - Institutional Class (3)(4) | |
| 2014 | | $ | 1.00 | | | | 0.001 | | | | N/A | | | | 0.001 | | | | (0.001 | ) | | | 0.000 | | | | 0.000 | | | | (0.001 | ) |
| 2013 | | $ | 1.00 | | | | 0.001 | | | | N/A | | | | 0.001 | | | | (0.001 | ) | | | 0.000 | | | | 0.000 | | | | (0.001 | ) |
| 2012 | | $ | 1.00 | | | | 0.002 | | | | N/A | | | | 0.002 | | | | (0.002 | ) | | | 0.000 | | | | 0.000 | | | | (0.002 | ) |
| 2011 | | $ | 1.00 | | | | 0.002 | | | | N/A | | | | 0.002 | | | | (0.002 | ) | | | 0.000 | | | | 0.000 | | | | (0.002 | ) |
| 2010 | | $ | 1.00 | | | | 0.003 | | | | N/A | | | | 0.003 | | | | (0.003 | ) | | | 0.000 | | | | 0.000 | | | | (0.003 | ) |
| 2009 | | $ | 1.00 | | | | 0.008 | | | | N/A | | | | 0.008 | | | | (0.008 | ) | | | 0.000 | | | | 0.000 | | | | (0.008 | ) |
| 1 | Ratio of net expenses to average net assets, ratio of net investment income (loss) to average net assets, ratio of expenses to average net assets after reductions, excluding commissions recaptured and fees received from custodian, and ratio of expenses to average net assets before reductions do not include impact of expenses of the underlying security holdings as represented in the schedule of investments. |
| 2 | Recognition of net investment income by the Fund is affected by the timing of the declaration of dividends by the underlying investment companies in which the Fund invests. |
| 3 | Total return and portfolio turnover rate are not annualized for periods of less than one full year. |
The accompanying notes are an integral part of these financial statements.
| Page 52 | 2014 Semiannual Report | June 30, 2014 |
| | | | | | | | |
Net Asset Value, End of Period | | | Total Return (Assumes Reinvestment of Distributions) | | | Net Assets, End of Period ($000) | | | Ratio of Net Expenses to Average Net Assets | | | Ratio of Net Investment Income (Loss) to Average Net Assets | | | Ratio of Expenses to Average Net Assets after Reductions, Excluding Commissions Recaptured and Fees Received from Custodian | | | Ratio of Expenses to Average Net Assets Before Reductions | | | | |
| | |
| $ | 37.95 | | | | 8.45 | % | | $ | 53,839 | | | | 1.39 | % | | | 0.42 | % | | | 1.54 | % | | | 1.79 | % | | | 31 | % |
| $ | 35.04 | | | | 41.54 | % | | $ | 44,476 | | | | 1.52 | % | | | 0.27 | % | | | 1.58 | % | | | 1.94 | % | | | 25 | % |
| $ | 25.46 | | | | 16.93 | % | | $ | 23,306 | | | | 1.60 | % | | | 0.29 | % | | | 1.61 | % | | | 2.06 | % | | | 31 | % |
| $ | 21.84 | | | | (4.05 | %) | | $ | 17,434 | | | | 1.62 | % | | | 0.01 | % | | | 1.62 | % | | | 2.06 | % | | | 57 | % |
| $ | 22.77 | | | | 23.21 | % | | $ | 17,024 | | | | 1.65 | % | | | (0.26 | %) | | | 1.65 | % | | | 2.17 | % | | | 55 | % |
| $ | 18.48 | | | | 77.37 | % | | $ | 12,667 | | | | 1.79 | % | | | (0.05 | %) | | | 1.79 | % | | | 2.39 | % | | | 34 | % |
| |
| $ | 34.92 | | | | 13.03 | % | | $ | 43,767 | | | | 1.84 | % | | | 0.63 | % | | | 1.84 | % | | | 1.84 | % | | | 20 | % |
| $ | 30.98 | | | | 28.96 | % | | $ | 37,988 | | | | 1.87 | % | | | 0.62 | % | | | 1.87 | % | | | 1.99 | % | | | 19 | % |
| $ | 24.17 | | | | 1.52 | % | | $ | 30,452 | | | | 1.89 | % | | | 0.63 | % | | | 1.89 | % | | | 2.02 | % | | | 29 | % |
| $ | 24.06 | | | | 3.93 | % | | $ | 32,609 | | | | 1.90 | % | | | 0.87 | % | | | 1.90 | % | | | 2.02 | % | | | 43 | % |
| $ | 23.51 | | | | 14.10 | % | | $ | 24,144 | | | | 1.92 | % | | | 0.70 | % | | | 1.92 | % | | | 2.11 | % | | | 53 | % |
| $ | 20.73 | | | | 30.63 | % | | $ | 20,731 | | | | 2.00 | % | | | 0.90 | % | | | 2.00 | % | | | 2.20 | % | | | 35 | % |
| |
| $ | 9.97 | | | | 3.43 | % | | $ | 113,340 | | | | 0.99 | % | | | 2.49 | % | | | 1.01 | % | | | 1.16 | % | | | 25 | % |
| $ | 9.77 | | | | 0.01 | % | | $ | 90,080 | | | | 0.99 | % | | | 3.87 | % | | | 1.01 | % | | | 1.19 | % | | | 79 | % |
| $ | 10.15 | | | | 8.93 | % | | $ | 76,001 | | | | 0.99 | % | | | 4.45 | % | | | 1.00 | % | | | 1.23 | % | | | 157 | % |
| $ | 9.73 | | | | (0.57 | %) | | $ | 56,998 | | | | 0.99 | % | | | 4.97 | % | | | 1.06 | % | | | 1.36 | % | | | 125 | % |
| |
| $ | 1.00 | | | | 0.03 | % | | $ | 62,188 | | | | 0.17 | % | | | 0.06 | % | | | 0.17 | % | | | 0.71 | % | | | N/A | |
| $ | 1.00 | | | | 0.08 | % | | $ | 61,288 | | | | 0.22 | % | | | 0.08 | % | | | 0.22 | % | | | 0.90 | % | | | N/A | |
| $ | 1.00 | | | | 0.10 | % | | $ | 73,546 | | | | 0.30 | % | | | 0.10 | % | | | 0.30 | % | | | 0.82 | % | | | N/A | |
| $ | 1.00 | | | | 0.11 | % | | $ | 78,903 | | | | 0.30 | % | | | 0.11 | % | | | 0.30 | % | | | 0.90 | % | | | N/A | |
| $ | 1.00 | | | | 0.20 | % | | $ | 96,087 | | | | 0.38 | % | | | 0.20 | % | | | 0.38 | % | | | 0.86 | % | | | N/A | |
| $ | 1.00 | | | | 0.64 | % | | $ | 122,142 | | | | 0.55 | % | | | 0.66 | % | | | 0.55 | % | | | 0.84 | % | | | N/A | |
| |
| $ | 1.00 | | | | 0.06 | % | | $ | 62,006 | | | | 0.12 | % | | | 0.11 | % | | | 0.12 | % | | | 0.67 | % | | | N/A | |
| $ | 1.00 | | | | 0.14 | % | | $ | 43,485 | | | | 0.15 | % | | | 0.14 | % | | | 0.15 | % | | | 0.71 | % | | | N/A | |
| $ | 1.00 | | | | 0.16 | % | | $ | 84,953 | | | | 0.23 | % | | | 0.17 | % | | | 0.23 | % | | | 0.63 | % | | | N/A | |
| $ | 1.00 | | | | 0.20 | % | | $ | 23,231 | | | | 0.21 | % | | | 0.20 | % | | | 0.21 | % | | | 0.71 | % | | | N/A | |
| $ | 1.00 | | | | 0.28 | % | | $ | 33,584 | | | | 0.29 | % | | | 0.29 | % | | | 0.29 | % | | | 0.68 | % | | | N/A | |
| $ | 1.00 | | | | 0.75 | % | | $ | 46,249 | | | | 0.43 | % | | | 0.83 | % | | | 0.43 | % | | | 0.67 | % | | | N/A | |
| 4 | Ratio of net expenses to average net assets, ratio of net investment income (loss) to average net assets, ratio of average net assets after reductions, excluding commissions recaptured and fees received from custodian, and ratio of expenses to average net assets before reductions are annualized for periods of less than one full year. |
| 5 | Except for Money Market Fund, net investment income per share is based on average shares outstanding during the period. |
| * | Commenced Operations June 30, 2011 |
| ** | Actual amounts were less than one-half of a cent per share |
The accompanying notes are an integral part of these financial statements.
| 2014 Semiannual Report | June 30, 2014 | Page 53 |
Notes to Financial Statements
June 30, 2014 (unaudited)
| 1. | Organization and Significant Accounting Policies |
Meeder Funds® Trust (the “Trust”) was organized in 1982 and is registered under the Investment Company Act of 1940, as amended (the “1940 Act”), as a diversified, open-end management investment company. The Trust offers nine separate series and is presently comprised of nine separate funds as follows: Muirfield Fund® (“Muirfield”), Dynamic Growth Fund (“Dynamic”), Aggressive Growth Fund (“Aggressive”), Balanced Fund (“Balanced”), Strategic Growth Fund (“Strategic”), Quantex FundTM (“Quantex”), Utilities and Infrastructure Fund (“Utilities”), Total Return Bond Fund (“Bond”), and Money Market Fund (“Money Market”) (each a “Fund” and collectively the “Funds”). Money Market offers two classes of shares (the Retail Class (“Retail Class”) and the Institutional Class (“Institutional Class”)). Each class of shares has equal rights as to earnings and assets except that each class bears different distribution and transfer agent expenses. The investment objective of Muirfield, Dynamic, Aggressive, and Strategic is growth of capital. The investment objective of Balanced is growth of capital, with current income usually of secondary importance. The investment objective of Quantex is long term capital appreciation. The investment objective of Utilities is total returns, including current income and growth of income. The investment objective of Bond is total returns, including current income and capital growth. The investment objective of Money Market is current income while maintaining a stable share price of $1.00.
Use of estimates. The preparation of financial statements in conformity with accounting principles generally accepted in the United States of America (“GAAP”) requires management to make estimates and assumptions that affect the reported amounts of assets and liabilities and disclosure of contingent assets and liabilities at the date of the financial statements and the reported amounts of increases and decreases in net assets from operations during the reporting period. Actual results could differ from those estimates.
Security valuation. All investments in securities are recorded at their estimated fair value, as described in Note #2.
Repurchase agreements. Each Fund may engage in repurchase agreement transactions whereby the Fund takes possession of an underlying debt instrument subject to an obligation of the seller to repurchase the instrument from the Fund and an obligation of the Fund to resell the instrument at an agreed upon price and term. At all times, the Fund maintains the value of collateral, including accrued interest, of at least 100% of the amount of the repurchase agreement, plus accrued interest. If the seller defaults and the fair value of the collateral declines, realization of the collateral by the Fund may be delayed or limited.
Futures & options. Each Fund, except Money Market, may engage in transactions in financial futures contracts and options contracts in order to manage the risk of unanticipated changes in market values of securities held in the Fund, or which it intends to purchase. The futures and options contracts are adjusted by the daily exchange rate of the underlying currency, or index, and any gains or losses are recorded for financial statement purposes as unrealized gains or losses in the statement of assets and liabilities and the statement of operations until the contract settlement date, at which time realized gains and losses are included in the statement of operations.
To the extent that the Fund enters into futures contracts on an index or group of securities, the Fund exposes itself to an indeterminate liability and will be required to pay or receive a sum of money measured by the change in the value of the index. Upon entering into a futures contract, the Fund is required to deposit an initial margin, which is either cash or securities (disclosed as pledged as collateral on the Schedules of Investments) in an amount equal to a certain percentage of the contract value. Subsequently, the variation margin, which is equal to changes in the daily settlement price or last sale price on the exchanges where futures contracts trade, is received or paid and is recorded as an unrealized gain or loss until the contract is closed. When the contract is closed, the Fund records a realized gain or loss equal to the difference between the proceeds from (or cost of) the closing transaction and the Fund’s basis in the contract. Should market conditions move unexpectedly, the Fund may not achieve the anticipated benefits of the futures contract
| Page 54 | 2014 Semiannual Report | June 30, 2014 |
and may realize a loss. The use of futures transactions involves the risk of imperfect correlation in movements in the price of futures contracts, interest rates, and the underlying hedged assets. With futures, there is minimal counterparty credit risk to the Fund since futures are exchange traded and the exchange’s clearinghouse, as counterparty to all exchange traded futures, guarantees the futures against default. Except for Money Market and Utilities, it is normal practice for each Fund to invest in futures contracts on a daily basis. The equity funds typically utilize equity index futures contracts to equitize cash positions or adjust targeted stock market exposure. Bond and the fixed income portion of Balanced can utilize Treasury futures contracts in order to adjust duration. Although Utilities is permitted to invest in futures contracts, it typically does not.
Call and put option contracts involve the payment of a premium for the right to purchase or sell an individual security or index aggregate at a specified price until the expiration of the contract. Such transactions expose the Fund to the loss of the premium paid if the Fund does not sell or exercise the contract prior to the expiration date. In the case of a call option, sufficient cash or money market instruments will be segregated to complete the purchase. Options are valued on the basis of the daily settlement price or last sale on the exchanges where they trade and the changes in value are recorded as unrealized appreciation or depreciation until closed, exercised or expired. For the six months ended June 30, 2014, there were no call or put options transacted for any of the Funds.
The Funds may write covered call or put options for which premiums received are recorded as liabilities and are subsequently adjusted to the current value of the options written. When written options are closed or exercised, premiums received are offset against the proceeds paid, and the Fund records realized gains or losses for the difference. When written options expire, the liability is eliminated, and the Fund records realized gains for the entire amount of premiums received. Although permitted, it is currently not normal practice for the Funds to write call and put options and none were written during the six months ended June 30, 2014.
The fair value of derivative instruments, not accounted for as hedging instruments, as reported within the Statements of Assets and Liabilities as of June 30, 2014 was as follows:
| Amount of Net Variation Margin and Unrealized Appreciation (Depreciation) on Derivatives | |
| | | Statements of Assets & Liabilities Location* | | Fair Value of Variation Margin | | | Fair Value of Unrealized Appreciation (Depreciation) | |
Muirfield Fund® | Equity contracts | Assets, Receivable for net variation margin on futures contracts; Net Assets, Net unrealized appreciation (depreciation) of investments and futures contracts | | $ | 1,500 | | | $ | 34,438 | |
| Dynamic Growth Fund | Equity contracts | Assets, Receivable for net variation margin on futures contracts; Net Assets, Net unrealized appreciation (depreciation) of investments and futures contracts | | | 1,300 | | | | 37,954 | |
| Aggressive Growth Fund | Equity contracts | Assets, Receivable for net variation margin on futures contracts; Net Assets, Net unrealized appreciation (depreciation) of investments and futures contracts | | | 800 | | | | 30,515 | |
| Balanced Fund | Equity contracts | Assets, Receivable for net variation margin on futures contracts; Net Assets, Net unrealized appreciation (depreciation) of investments and futures contracts | | | 100 | | | | 968 | |
| 2014 Semiannual Report | June 30, 2014 | Page 55 |
| Amount of Net Variation Margin and Unrealized Appreciation (Depreciation) on Derivatives | |
| | Type of Derivative/Risk | Statements of Assets & Liabilities Location* | | Fair Value of Variation Margin | | | Fair Value of Unrealized Appreciation (Depreciation) | |
| Strategic Growth Fund | Equity contracts | Assets, Receivable for net variation margin on futures contracts; Net Assets, Net unrealized appreciation (depreciation) of investments and futures contracts | | $ | 27,600 | | | $ | 96,548 | |
Quantex FundTM | Equity contracts | Assets, Receivable for net variation margin on futures contracts; Net Assets, Net unrealized appreciation (depreciation) of investments and futures contracts | | | 6,700 | | | | 24,340 | |
| Total Return Bond Fund | US Treasury Bond/Note contracts | Assets, Receivable for net variation margin on futures contracts; Net Assets, Net unrealized appreciation (depreciation) of investments and futures contracts | | | 5,625 | | | | (3,275 | ) |
| * | Unrealized appreciation (depreciation) on futures contracts is included with unrealized appreciation (depreciation) of investments on the Statements of Assets & Liabilities. |
The effect of derivative instruments on the Statements of Operations for the six months ended June 30, 2014 was as follows:
| Amount of Realized Gain (Loss) on Derivatives Recognized in Income | |
| | | | Contracts as of December 31, 2013 | | Contracts Opened During the Period | | Contracts Closed During the Period | | Contracts as of June 30, 2014 | | Statement of Operations Location | | For the Six Months Ended June 30, 2014 | |
Muirfield Fund® | Equity contracts | | | 15 | | | 124 | | | 124 | | | 15 | | Net realized gains from futures contracts | | $ | 215,653 | |
| Dynamic Growth Fund | Equity contracts | | | 9 | | | 51 | | | 47 | | | 13 | | Net realized gains from futures contracts | | | 216,270 | |
| Aggressive Growth Fund | Equity contracts | | | 6 | | | 23 | | | 21 | | | 8 | | Net realized gains from futures contracts | | | 164,410 | |
| Balanced Fund | Equity contracts | | | 9 | | | 44 | | | 52 | | | 1 | | Net realized gains from futures contracts | | | 263,532 | |
| Strategic Growth Fund | Equity contracts | | | 47 | | | 136 | | | 144 | | | 39 | | Net realized gains from futures contracts | | | 104,750 | |
| Page 56 | 2014 Semiannual Report | June 30, 2014 |
| Amount of Realized Gain (Loss) on Derivatives Recognized in Income | |
| | Type of Derivative/ Risk | | Contracts as of December 31, 2013 | | Contracts Opened During the Period | | Contracts Closed During the Period | | Contracts as of June 30, 2014 | | Statement of Operations Location | | For the Six Months Ended June 30, 2014 | |
Quantex FundTM | Equity contracts | | | 26 | | | 87 | | | 103 | | | 10 | | Net realized gains from futures contracts | | $ | 227,360 | |
| Total Return Bond Fund | US Treasury Bond/Note contracts | | | 0 | | | 60 | | | 40 | | | 20 | | Net realized gains from futures contracts | | | 69,712 | |
| Change in Unrealized Gain or (Loss) on Derivatives Recognized in Income | |
| | | Statement of Operations Location | | For the Six Months Ended June 30, 2014 | |
Muirfield Fund® | Equity contracts | Net change in unrealized appreciation (depreciation) of investments and futures contracts | | $ | (45,050 | ) |
| Dynamic Growth Fund | Equity contracts | Net change in unrealized appreciation (depreciation) of investments and futures contracts | | | (25,179 | ) |
| Aggressive Growth Fund | Equity contracts | Net change in unrealized appreciation (depreciation) of investments and futures contracts | | | (13,115 | ) |
| Balanced Fund | Equity contracts | Net change in unrealized appreciation (depreciation) of investments and futures contracts | | | (12,065 | ) |
| Strategic Growth Fund | Equity contracts | Net change in unrealized appreciation (depreciation) of investments and futures contracts | | | 59,900 | |
Quantex FundTM | Equity contracts | Net change in unrealized appreciation (depreciation) of investments and futures contracts | | | (83,090 | ) |
| Total Return Bond Fund | US Treasury Bond/Note contracts | Net change in unrealized appreciation (depreciation) of investments and futures contracts | | | (3,275 | ) |
Federal income taxes. It is each Fund’s policy to continue to comply with the requirements of Subchapter M of the Internal Revenue Code applicable to regulated investment companies and to distribute substantially all of its taxable income and net capital gains to its shareholders. Therefore, no federal income tax provision is required.
As of and during the six months ended June 30, 2014, the Funds did not have a liability for any unrecognized tax benefits. The Funds recognize interest and penalties, if any, related to unrecognized tax benefits as income tax expense in the statements of operations. During the six months ended June 30, 2014, the Funds did not incur any interest or penalties.
The Funds are not subject to examination by U.S. federal and state tax authorities for tax years before 2010.
| 2014 Semiannual Report | June 30, 2014 | Page 57 |
Distributions to shareholders. Distributions to shareholders are recorded on the ex-dividend date. Muirfield, Quantex, Dynamic, Aggressive, Balanced, and Strategic declare and pay dividends from net investment income, if any, on a quarterly basis. Utilities and Bond declare and pay dividends from net investment income on a monthly basis. Money Market declares dividends from net investment income on a daily basis and pays such dividends on a monthly basis. Each Fund distributes net capital gains, if any, on an annual basis.
Distributions from net investment income and from net capital gains are determined in accordance with income tax regulations, which may differ from GAAP. These differences are primarily due to deferrals of certain losses, expiring capital loss carryforwards, and differing treatments of unrealized gains and losses of futures contracts held by each Fund. Accordingly, timing differences relating to shareholder distributions are reflected in the components of net assets and permanent book and tax differences have been reclassified within the components of net assets based on their ultimate characterization for federal income tax purposes. For the year ended December 31, 2013, the Funds made the following reclassifications to increase/(decrease) the components of net assets:
| | | | | | Accumulated Undistributed (Distributions in Excess of) Net Investment Income | | | Accumulated Undistributed Net Realized Gain (Loss) from Investments and Futures Contracts | |
Muirfield Fund® | | $ | — | | | $ | 1 | | | $ | (1 | ) |
| Dynamic Growth Fund | | | — | | | | 1 | | | | (1 | ) |
| Aggressive Growth Fund | | | — | | | | 15,583 | | | | (15,583 | ) |
| Strategic Growth Fund | | | — | | | | 106,403 | | | | (106,403 | ) |
Quantex FundTM | | | — | | | | 7,030 | | | | (7,030 | ) |
| Utilities & Infrastructure Fund | | | (17,330 | ) | | | (284,086 | ) | | | 301,416 | |
Investment income & expenses. For Money Market, income and expenses (other than expenses attributable to a specific class) are allocated to each class of shares based on its relative net assets. Expenses incurred by the Trust that do not specifically relate to an individual Fund of the Trust are allocated to the Funds based on each Fund’s relative net assets or other appropriate basis.
Capital Share Transactions. Money Market is authorized to issue an unlimited number of shares in the Retail Class and the Institutional Class. Transactions in the capital shares of the Fund for the six months ended June 30, 2014 and the year ended December 31, 2013 were as follows:
| | | | | | | |
| | | | | | | | | | | | | |
| Retail Class | | | | | | | | | | | | |
| Issued | | $ | 51,711,265 | | | | 51,711,265 | | | $ | 97,899,233 | | | | 97,899,233 | |
| Reinvested | | | 16,971 | | | | 16,971 | | | | 48,913 | | | | 48,913 | |
| Redeemed | | | (50,828,263 | ) | | | (50,828,263 | ) | | | (110,206,483 | ) | | | (110,206,483 | ) |
| Net increase (decrease) | | $ | 899,973 | | | | 899,973 | | | $ | (12,258,337 | ) | | | (12,258,337 | ) |
| | | | | | | | | | | | | | | | | |
| Institutional Class | | | | | | | | | | | | | | | | |
| Issued | | $ | 143,909,426 | | | | 143,909,426 | | | $ | 337,469,421 | | | | 337,469,421 | |
| Reinvested | | | 3,835 | | | | 3,835 | | | | 10,873 | | | | 10,873 | |
| Redeemed | | | (125,391,927 | ) | | | (125,391,927 | ) | | | (378,949,201 | ) | | | (378,949,201 | ) |
| Net increase (decrease) | | $ | 18,521,334 | | | | 18,521,334 | | | $ | (41,468,907 | ) | | | (41,468,907 | ) |
| Page 58 | 2014 Semiannual Report | June 30, 2014 |
Offsetting Assets & Liabilities. The Funds have adopted financial reporting rules regarding offsetting assets and liabilities and related arrangements to enable users of their financial statements to understand the effect of those arrangements on their financial positions. The Funds’ policy is to recognize a net asset/liability equal to the net variation margin for futures contracts. Risks arise from the possible inability of counterparties to meet the terms of their contracts. During the six months ended June 30, 2014, the Funds were not subject to any master netting arrangements nor were there any liability offsets to report as of June 30, 2014. The table below reflects the offsetting assets and liabilities relating to the futures contracts and repurchase agreements shown on the Statements of Assets and Liabilities at June 30, 2014.
| | | | | | | | | | | | Gross Amounts Not Offset in the Statements of Assets and Liabilities | | | | |
| Description/ Fund | | Gross Amounts of Recognized Assets | | | Gross Amounts Offset in the Statements of Assets and Liabilities | | | Net Amounts Presented in the Statements of Assets and Liabilities | | | Financial Instruments | | | Collateral Pledged (Received) | | | Net Amount | |
| Assets: | | | | | | | | | | | | | | | | | | |
| Futures Contracts | | | | | | | | | | | | | | | | | | |
Muirfield Fund® | | $ | 1,500 | | | $ | — | | | $ | 1,500 | | | $ | — | | | $ | — | | | $ | 1,500 | |
| Dynamic Growth Fund | | | 1,300 | | | | — | | | | 1,300 | | | | — | | | | — | | | | 1,300 | |
| Aggressive Growth Fund | | | 800 | | | | — | | | | 800 | | | | — | | | | — | | | | 800 | |
| Balanced Fund | | | 100 | | | | — | | | | 100 | | | | — | | | | — | | | | 100 | |
| Strategic Growth Fund | | | 27,600 | | | | — | | | | 27,600 | | | | — | | | | — | | | | 27,600 | |
Quantex FundTM | | | 6,700 | | | | — | | | | 6,700 | | | | — | | | | — | | | | 6,700 | |
| Total Return Bond Fund | | | 5,625 | | | | — | | | | 5,625 | | | | — | | | | — | | | | 5,625 | |
| | | | | | | | | | | | | | | | | | | | | | | | | |
| Repurchase Agreements | | | | | | | | | | | | | | | | | | | | | |
| Money Market Fund | | $ | 20,000,000 | | | $ | — | | | $ | 20,000,000 | | | $ | — | | | $ | — | | | $ | 20,000,000 | |
| | | | | | | | | | | | | | | | | | | | | | | | | |
| Liabilities: | | | | | | | | | | | | | | | | | | | | | | | | |
| N/A | | | N/A | | | | N/A | | | | N/A | | | | N/A | | | | N/A | | | | N/A | |
Other. The Funds record security transactions on the trade date. Gains and losses realized from the sale of securities are determined on the specific identification basis. Dividend income is recognized on the ex-dividend date and interest income (including amortization of premium and accretion of discount) is recognized as earned. Short-term capital gain distributions from underlying funds are classified as dividend income for financial reporting purposes. Long-term capital gains distributions are broken out as such. Discounts and premiums are amortized over the lives of the respective securities. Distributions received from partnerships are recorded as return of capital distributions. Withholding taxes on foreign dividends, if applicable, have been provided for in accordance with the Funds’ understanding of the applicable country’s tax rules and rates.
The Funds utilize various methods to measure the fair value of their investments on a recurring basis. GAAP establishes a hierarchy that prioritizes inputs to valuation methods. The three levels of inputs are as follows:
Level 1 – Unadjusted quoted prices in active markets for identical assets or liabilities that the Funds have the ability to access.
Level 2 – Observable inputs other than quoted prices included in level 1 that are observable for the asset or liability, either directly or indirectly. These inputs may include quoted prices for the identical instrument on an inactive market, prices for similar instruments, interest rates, prepayment speeds, credit risk, yield curves, default rates and similar data.
| 2014 Semiannual Report | June 30, 2014 | Page 59 |
Level 3 – Significant unobservable inputs for the asset or liability, to the extent relevant observable inputs are not available, representing the Funds’ own assumptions about the assumptions a market participant would use in valuing the asset or liability, and would be based on the best information available.
The availability of observable inputs can vary from security to security and is affected by a wide variety of factors, including, for example, the type of security, whether the security is new and not yet established in the marketplace, the liquidity of markets, and other characteristics particular to the security. To the extent that valuation is based on models or inputs that are less observable or unobservable in the market, the determination of fair value requires more judgment. Accordingly, the degree of judgment exercised in determining fair value is greatest for instruments categorized in level 3.
The inputs used to measure fair value may fall into different levels of the fair value hierarchy. In such cases, for disclosure purposes, the level in the fair value hierarchy within which the fair value measurement falls in its entirety, is determined based on the lowest level input that is significant to the fair value measurement in its entirety.
A description of the valuation techniques applied to the Funds’ major categories of assets and liabilities measured at fair value on a recurring basis follows.
Equity securities (including publicly traded partnerships, real estate investment trusts, american depositary receipts, exchange traded funds, and common stock). Securities traded on a national securities exchange (or reported on the NASDAQ national market) are stated at the last reported sales price on the day of valuation and are categorized in level 1 of the fair value hierarchy.
Investments in registered open-end investment companies, including money market funds, are valued at the daily redemption value as reported by the underlying fund and are categorized in level 1 of the fair value hierarchy.
Short-term notes (including bank obligations, commercial paper, corporate obligations, Repurchase Agreements, U.S. government agency obligations, and floating rate demand notes). Short-term notes held in the Funds, except Money Market, maturing more than sixty days after the valuation date, are valued at the last sales price as of the close of business on the day of valuation, or, lacking any sales, at the most recent bid price or yield equivalent as obtained from dealers that make markets in such securities. When valued at last sales price, the securities will be categorized as level 1. When using bid prices or yield equivalents, they will be categorized as level 2. When such securities are valued within sixty days or less to maturity, the difference between the valuation existing on the sixty-first day before maturity and maturity value is amortized on a straight-line basis to maturity and will be categorized as level 2.
All securities held in Money Market, other than money market funds, are valued at amortized cost, which approximates fair value, and will be categorized as level 2.
Certificates of deposit. Certificates of deposit are valued at acquisition cost and will be categorized as level 2.
U.S. government obligations. U.S. government obligations are normally valued using a model that incorporates market observable data such as reported sales of similar securities, broker quotes, yields, bids, offers, and reference data. Certain securities are valued principally using dealer quotations. In either case, these securities will be categorized as level 2.
Restricted securities (equity and debt). Restricted securities for which quotations are not readily available are valued at fair value as determined by the Trustees. Depending on the relative significance of valuation inputs, these instruments may be classified in either level 2 or level 3 of the fair value hierarchy.
Derivative instruments (futures contracts). Listed derivative instruments that are actively traded, including futures contracts, are valued based on quoted prices from the exchange and are categorized in level 1 of the fair value hierarchy.
| Page 60 | 2014 Semiannual Report | June 30, 2014 |
For the six months ended June 30, 2014, the Funds did not hold any assets at any time in which significant unobservable inputs were used in determining fair value. Therefore, no reconciliation of level 3 securities is provided. Also, there were no transfers between level 1 and level 2 securities. The Funds recognize transfers between fair value hierarchy levels at the end of the reporting period. The following table summarizes the inputs used to value the Funds’ assets and liabilities measured at fair value as of June 30, 2014.
Muirfield – Assets/(Liabilities) | | | | | | | | | | | | |
| Common stocks* | | $ | 150,955,845 | | | $ | — | | | $ | — | | | $ | 150,955,845 | |
| Registered investment companies | | | 26,445,304 | | | | — | | | | — | | | | 26,445,304 | |
| Money market registered investment companies | | | 21,505,908 | | | | — | | | | — | | | | 21,505,908 | |
| Floating rate demand notes | | | — | | | | 1,890 | | | | — | | | | 1,890 | |
| U.S. government obligations | | | — | | | | 499,803 | | | | — | | | | 499,803 | |
| Total | | $ | 198,907,057 | | | $ | 501,693 | | | $ | — | | | $ | 199,408,750 | |
| Trustee deferred compensation | | $ | 239,647 | | | $ | — | | | $ | — | | | $ | 239,647 | |
| Futures contracts** | | $ | 34,438 | | | $ | — | | | $ | — | | | $ | 34,438 | |
Dynamic – Assets/(Liabilities) | | | | | | | | | | | | |
| Common stocks* | | $ | 95,498,717 | | | $ | — | | | $ | — | | | $ | 95,498,717 | |
| Registered investment companies | | | 17,205,107 | | | | — | | | | — | | | | 17,205,107 | |
| Money market registered investment companies | | | 5,881,916 | | | | — | | | | — | | | | 5,881,916 | |
| Floating rate demand notes | | | — | | | | 271 | | | | — | | | | 271 | |
| U.S. government obligations | | | — | | | | 299,882 | | | | — | | | | 299,882 | |
| Total | | $ | 118,585,740 | | | $ | 300,153 | | | $ | — | | | $ | 118,885,893 | |
| Trustee deferred compensation | | $ | 135,914 | | | $ | — | | | $ | — | | | $ | 135,914 | |
| Futures contracts** | | $ | 37,954 | | | $ | — | | | $ | — | | | $ | 37,954 | |
Aggressive – Assets/(Liabilities) | | | | | | | | | | | | |
| Common stocks* | | $ | 52,980,637 | | | $ | — | | | $ | — | | | $ | 52,980,637 | |
| Registered investment companies | | | 17,258,928 | | | | — | | | | — | | | | 17,258,928 | |
| Money market registered investment companies | | | 3,611,978 | | | | — | | | | — | | | | 3,611,978 | |
| Floating rate demand notes | | | — | | | | 30 | | | | — | | | | 30 | |
| U.S. government obligations | | | — | | | | 299,882 | | | | — | | | | 299,882 | |
| Total | | $ | 73,851,543 | | | $ | 299,912 | | | $ | — | | | $ | 74,151,455 | |
| Trustee deferred compensation | | $ | 79,576 | | | $ | — | | | $ | — | | | $ | 79,576 | |
| Futures contracts** | | $ | 30,515 | | | $ | — | | | $ | — | | | $ | 30,515 | |
Balanced – Assets/(Liabilities) | | | | | | | | | | | | |
| Common stocks* | | $ | 72,023,177 | | | $ | — | | | $ | — | | | $ | 72,023,177 | |
| Registered investment companies | | | 51,661,595 | | | | — | | | | — | | | | 51,661,595 | |
| Money market registered investment companies | | | 6,675,924 | | | | — | | | | — | | | | 6,675,924 | |
| Floating rate demand notes | | | — | | | | 831 | | | | — | | | | 831 | |
| U.S. government obligations | | | — | | | | 499,803 | | | | — | | | | 499,803 | |
| Total | | $ | 130,360,696 | | | $ | 500,634 | | | $ | — | | | $ | 130,861,330 | |
| Trustee deferred compensation | | $ | 105,689 | | | $ | — | | | $ | — | | | $ | 105,689 | |
| Futures contracts** | | $ | 968 | | | $ | — | | | $ | — | | | $ | 968 | |
| 2014 Semiannual Report | June 30, 2014 | Page 61 |
Strategic – Assets/(Liabilities) | | | | | | | | | | | | |
| Common stocks* | | $ | 68,387,453 | | | $ | — | | | $ | — | | | $ | 68,387,453 | |
| Registered investment companies | | | 30,503,419 | | | | — | | | | — | | | | 30,503,419 | |
| Money market registered investment companies | | | 6,163,612 | | | | — | | | | — | | | | 6,163,612 | |
| Floating rate demand notes | | | — | | | | 300 | | | | — | | | | 300 | |
| U.S. government obligations | | | — | | | | 299,882 | | | | — | | | | 299,882 | |
| Total | | $ | 105,054,484 | | | $ | 300,182 | | | $ | — | | | $ | 105,354,666 | |
| Trustee deferred compensation | | $ | 92,468 | | | $ | — | | | $ | — | | | $ | 92,468 | |
| Futures contracts** | | $ | 96,548 | | | $ | — | | | $ | — | | | $ | 96,548 | |
Quantex – Assets/(Liabilities) | | | | | | | | | | | | |
| Common stocks* | | $ | 51,705,300 | | | $ | — | | | $ | — | | | $ | 51,705,300 | |
| Money market registered investment companies | | | 4,670,714 | | | | — | | | | — | | | | 4,670,714 | |
| U.S. government obligations | | | — | | | | 299,882 | | | | — | | | | 299,882 | |
| Total | | $ | 56,376,014 | | | $ | 299,882 | | | $ | — | | | $ | 56,675,896 | |
| Trustee deferred compensation | | $ | 85,317 | | | $ | — | | | $ | — | | | $ | 85,317 | |
| Futures contracts** | | $ | 24,340 | | | $ | — | | | $ | — | | | $ | 24,340 | |
Utilities – Assets/(Liabilities) | | | | | | | | | | | | |
| Common stocks* | | $ | 43,174,696 | | | $ | — | | | $ | — | | | $ | 43,174,696 | |
| Money market registered investment companies | | | 568,792 | | | | — | | | | — | | | | 568,792 | |
| Total | | $ | 43,743,488 | | | $ | — | | | $ | — | | | $ | 43,743,488 | |
| Trustee deferred compensation | | $ | 83,392 | | | $ | — | | | $ | — | | | $ | 83,392 | |
Total Bond – Assets/(Liabilities) | | | | | | | | | | | | |
| Registered investment companies | | $ | 109,003,493 | | | $ | — | | | $ | — | | | $ | 109,003,493 | |
| Money market registered investment companies | | | 4,142,426 | | | | — | | | | — | | | | 4,142,426 | |
| U.S. government obligations | | | — | | | | 243,106 | | | | — | | | | 243,106 | |
| Total | | $ | 113,145,919 | | | | 243,106 | | | $ | — | | | $ | 113,389,025 | |
| Trustee deferred compensation | | $ | 32,978 | | | $ | — | | | $ | — | | | $ | 32,978 | |
Money Market – Assets/(Liabilities) | | | | | | | | | | | | |
| Bank obligations | | $ | — | | | $ | 18,004,486 | | | $ | — | | | $ | 18,004,486 | |
| Certificates of deposit | | | — | | | | 8,214,000 | | | | — | | | | 8,214,000 | |
| Corporate obligations | | | — | | | | 22,453,856 | | | | — | | | | 22,453,856 | |
| Repurchase agreements | | | — | | | | 20,000,000 | | | | — | | | | 20,000,000 | |
| U.S. government agency obligations | | | — | | | | 15,605,698 | | | | — | | | | 15,605,698 | |
| Money Market registered investment companies | | | 40,128,207 | | | | — | | | | — | | | | 40,128,207 | |
| Total | | $ | 40,128,207 | | | $ | 84,278,040 | | | $ | — | | | $ | 124,406,247 | |
| Trustee deferred compensation | | $ | 73,835 | | | $ | — | | | $ | — | | | $ | 73,835 | |
| * | See schedule of investments for industry classifications. |
| ** | Futures contracts include cumulative unrealized gain/loss on contracts open at June 30, 2014. |
| Page 62 | 2014 Semiannual Report | June 30, 2014 |
| 3. | Investment Transactions |
For the six months ended June 30, 2014, the cost of purchases and proceeds from sales or maturities of long-term investments for the Funds, excluding U.S. Government investments, were as follows:
| | | | | | | |
Muirfield Fund® | | $ | 184,202,529 | | | $ | 172,148,378 | |
| Dynamic Growth Fund | | | 118,475,566 | | | | 110,249,458 | |
| Aggressive Growth Fund | | | 72,520,230 | | | | 68,767,176 | |
| Balanced Fund | | | 102,431,371 | | | | 84,846,997 | |
| Strategic Growth Fund | | | 50,825,129 | | | | 43,909,870 | |
Quantex FundTM | | | 21,242,479 | | | | 14,017,873 | |
| Utilities & Infrastructure Fund | | | 9,387,712 | | | | 8,145,617 | |
| Total Return Bond Fund | | | 45,201,326 | | | | 23,575,105 | |
For the six months ended June 30, 2014, there were no long-term U.S. Government investments purchased or sold for the Funds.
| 4. | Investment Advisory Fees and Other Transactions with Affiliates |
Meeder Asset Management, Inc. (“MAM”), a wholly-owned subsidiary of Meeder Investment Management, Inc. (“Meeder”), provides each Fund, under a separate Investment Advisory Contract, with investment management, research, statistical and advisory services. The services of MAM will terminate automatically if assigned and may be terminated without penalty at any time upon 60 days prior written notice by majority vote of the Fund, by the Trustees of the Fund, or by MAM. For such services the Funds pay a fee at the following annual rates:
| | Percentage of Average Daily Net Assets up to $50 Million | Percentage of Average Daily Net Assets Exceeding $50 Million up to $100 Million | Percentage of Average Daily Net Assets up to $100 Million | Percentage of Average Daily Net Assets up to $200 Million | Percentage of Average Daily Net Assets Exceeding $100 Million | Percentage of Average Daily Net Assets Exceeding $200 Million |
| Muirfield | 1.00% | 0.75% | N/A | N/A | 0.60% | N/A |
| Quantex* | 1.00% | 0.75% | N/A | N/A | 0.60% | N/A |
| Utilities** | 1.00% | 0.75% | N/A | N/A | 0.60% | N/A |
| Dynamic | N/A | N/A | N/A | 0.75% | N/A | 0.60% |
| Aggressive | N/A | N/A | N/A | 0.75% | N/A | 0.60% |
| Balanced | N/A | N/A | N/A | 0.75% | N/A | 0.60% |
| Strategic | N/A | N/A | N/A | 0.75% | N/A | 0.60% |
| Bond | N/A | N/A | 0.40% | N/A | 0.20% | N/A |
| Money Market*** | N/A | N/A | 0.40% | N/A | 0.25% | N/A |
| * | MAM has contractually agreed to reduce its investment advisory fee by 0.25% for Quantex for average daily net assets up to $50 million. The foregoing reduction in investment advisory fees shall automatically renew annually on or about April 30th, unless MAM elects to terminate this reduction. During the six months ended June 30, 2014, $59,292 of investment advisory fees was waived in Quantex and is not subject to recoupment. |
| ** | Under a separate Investment Subadvisory Agreement with MAM, Miller/Howard Investments, Inc. (“Miller/Howard”) serves as subadvisor of Utilities. The Investment Subadvisory Agreement provides that it will terminate automatically if assigned, and that it may be terminated without penalty to the Fund by MAM, the Trustees of the Fund, or by the vote of a majority of the outstanding voting shares of the Fund upon not less than 30 days written notice. As subadvisor to Utilities, Miller/Howard receives a fee paid by MAM. |
| *** | During the six months ended June 30, 2014, MAM voluntarily agreed to reduce $40,818 of investment advisory fees in Money Market. |
| 2014 Semiannual Report | June 30, 2014 | Page 63 |
Mutual Funds Service Co. (“MFSCo”), a wholly-owned subsidiary of Meeder, serves as stock transfer, dividend disbursing and shareholder services agent for each Fund. In compensation for such services, each Fund pays MFSCo an annual fee equal to the greater of the following:
| | | | | | Amount Per Active Shareholder Account | | | Percentage of Average Daily Net Assets | |
| Muirfield | | $ | 4,000 | | | $ | 15 | | | | 0.12 | % |
| Quantex | | | 4,000 | | | | 15 | | | | 0.12 | % |
| Utilities | | | 4,000 | | | | 15 | | | | 0.12 | % |
| Dynamic | | | 4,000 | | | | 15 | | | | 0.12 | % |
| Aggressive | | | 4,000 | | | | 15 | | | | 0.12 | % |
| Balanced | | | 4,000 | | | | 15 | | | | 0.12 | % |
| Strategic | | | 4,000 | | | | 15 | | | | 0.12 | % |
| Bond | | | 4,000 | | | | 15 | | | | 0.08 | % |
| Retail Class | | | 4,000 | | | | 20 | | | | 0.08 | % |
| Institutional Class | | | 4,000 | | | | 20 | | | | 0.08 | % |
For fixed income Funds (Bond and Money Market) that are subject to an expense cap and which are above the expense cap, the basis point fee will be reduced by 0.02%. During the six months ended June 30, 2014, MFSCo waived $10,047 and $9,016 of transfer agent fees for Bond and the Institutional Class, respectively.
MFSCo provides the Trust with certain administrative services. In compensation for such services, each Fund pays MFSCo at the following annual rates:
| | Percentage of Average Daily Net Assets up to $50 Million | Percentage of Average Daily Net Assets Exceeding $50 Million |
| Muirfield | 0.10% | 0.08% |
| Quantex | 0.10% | 0.08% |
| Utilities | 0.10% | 0.08% |
| Dynamic | 0.10% | 0.08% |
| Aggressive | 0.10% | 0.08% |
| Balanced | 0.10% | 0.08% |
| Strategic | 0.10% | 0.08% |
| Bond | 0.10% | 0.08% |
| Money Market | 0.10% | 0.08% |
| Page 64 | 2014 Semiannual Report | June 30, 2014 |
MFSCo serves as accounting services agent for each Fund. In compensation for such services, each Fund pays MFSCo an annual fee equal to the greater of a minimum fee or at a rate based on the percentage of average daily net assets. The annual rates are as follows:
| | | | | | Percentage of Average Daily Net Assets up to $10 Million | | Percentage of Average Daily Net Assets Exceeding $10 Million up to $30 Million | | Percentage of Average Daily Net Assets Exceeding $30 Million up to $80 Million | | Percentage of Average Daily Net Assets Exceeding $80 Million |
| Muirfield | | $ | 7,500 | | | | 0.15 | % | | | 0.10 | % | | | 0.02 | % | | | 0.01 | % |
| Quantex | | | 7,500 | | | | 0.15 | % | | | 0.10 | % | | | 0.02 | % | | | 0.01 | % |
| Utilities | | | 7,500 | | | | 0.15 | % | | | 0.10 | % | | | 0.02 | % | | | 0.01 | % |
| Dynamic | | | 7,500 | | | | 0.15 | % | | | 0.10 | % | | | 0.02 | % | | | 0.01 | % |
| Aggressive | | | 7,500 | | | | 0.15 | % | | | 0.10 | % | | | 0.02 | % | | | 0.01 | % |
| Balanced | | | 7,500 | | | | 0.15 | % | | | 0.10 | % | | | 0.02 | % | | | 0.01 | % |
| Strategic | | | 7,500 | | | | 0.15 | % | | | 0.10 | % | | | 0.02 | % | | | 0.01 | % |
| Bond | | | 7,500 | | | | 0.15 | % | | | 0.10 | % | | | 0.02 | % | | | 0.01 | % |
| Money Market | | | 30,000 | | | | 0.15 | % | | | 0.10 | % | | | 0.02 | % | | | 0.01 | % |
For the six months ended June 30, 2014, MAM voluntarily reduced its fees and/or reimbursed expenses (excluding brokerage fees and commissions, taxes, interest, and extraordinary or non-recurring expenses), to limit the total annual operating expenses of the Funds. Such reductions and/or reimbursements are limited to the total of fees charged to each Fund or Class by MAM and MFSCo. For the six months ended June 30, 2014, the annual operating expense limitations and amounts reimbursed for each Fund are as follows:
| | | Ratio of Net Expenses to Average Net Assets | | Voluntary Expense Reimbursements | |
| Muirfield | | | 1.22 | % | | $ | 897 | |
| Quantex* | | | 1.39 | % | | | — | |
| Utilities | | | 1.84 | % | | | — | |
| Dynamic | | | 1.22 | % | | | 38,780 | |
| Aggressive | | | 1.32 | % | | | — | |
| Balanced | | | 1.33 | % | | | 18,542 | |
| Strategic | | | 1.25 | % | | | 81,959 | |
| Bond | | | 0.99 | % | | | 64,136 | |
| Retail Class | | | 0.17 | % | | | 138,166 | |
| Institutional Class | | | 0.12 | % | | | 119,599 | |
| * | $59,292 of investment advisory fees was contractually waived and is not subject to recoupment as noted on page 63. |
| 2014 Semiannual Report | June 30, 2014 | Page 65 |
Expenses were contractually reimbursed in 2012 for Muirfield, Dynamic, Balanced, Strategic, and Bond in the amounts of $40,054, $29,382, $32,787, $28,319, and $52,431, respectively. These contractual expense reimbursements are subject to repayment by the applicable Fund before December 31, 2015. For Quantex, $55,151 of investment advisory fees was contractually waived in 2012 and is not subject to recoupment. Expenses were contractually reimbursed in 2013 for Muirfield, Dynamic, Aggressive, Balanced, Strategic, and Bond in the amounts of $49,794, $40,570, $1,137, $28,346, $42,790, and $42,868, respectively. These contractual expense reimbursements are subject to repayment by the applicable Fund before December 31, 2016. For Quantex, $88,884 of investment advisory fees was contractually waived in 2013 and is not subject to recoupment.
Certain Funds have entered into an agreement with the Trust’s custodian, The Huntington National Bank (“HNB”), whereby HNB receives distribution, service, and administration fees (collectively the “fees”) from the underlying security holdings of the Funds, and forwards those fees to the appropriate Funds. The Funds use the fees received to reduce the gross expenses of each Fund. It is possible that the Funds may invest in security holdings in which fees are not paid. As such, the gross expenses of a Fund would not be decreased. Also, without this agreement it is likely that the Funds would not collect any fees from underlying security holdings. For the six months ended June 30, 2014, gross expenses were reduced by the following amounts:
| | | Amount Received to Reduce Gross Expenses | |
| Balanced | | $ | 639 | |
| Bond | | | 660 | |
Certain Funds have entered into a directed brokerage agreement with ConvergEx Group, an independent broker/dealer, whereby Fund expenses are reduced. The Funds use these amounts received to reduce the gross expenses of each Fund. It is possible that the Funds may invest in security holdings in which brokerage fees are not recaptured. As such, the gross expenses of a Fund would not be decreased. Also, without this agreement it is likely that the Funds would not recapture any fees from portfolio transactions. For the six months ended June 30, 2014, commissions recaptured through directed brokerage arrangements were as follows:
| | | Amount Received to Reduce Gross Expenses | |
| Muirfield | | $ | 215,217 | |
| Dynamic | | | 135,342 | |
| Aggressive | | | 94,702 | |
| Balanced | | | 104,723 | |
| Strategic | | | 63,148 | |
| Quantex | | | 34,439 | |
| Bond | | | 10,138 | |
Pursuant to Rule 12b-1 of the 1940 Act, the Funds have adopted a written plan to pay certain expenses out of fund assets relating to the sale and distribution of its shares, including, but not necessarily limited to, compensation to dealers, advisors (including affiliates of Meeder), advertising, marketing, printing and mailing of prospectuses, and certain telephone related expenses. In addition, an Administrative Services Plan has been adopted for each Fund of the Trust, except Money Market, to pay service organizations that provide administrative support services to their customers who own shares of record, or beneficially, of the Funds. The annual adopted distribution plan and administrative services plan maximum limitations are as follows:
| Page 66 | 2014 Semiannual Report | June 30, 2014 |
| | Maximum Annual 12b-1 Plan Expense Limitations as a Percentage of Average Daily Net Assets | Maximum Annual Administrative Services Plan Expense Limitations as a Percentage of Average Daily Net Assets |
| Muirfield | 0.20% | 0.20% |
| Quantex | 0.20% | 0.20% |
| Utilities | 0.25% | 0.20% |
| Dynamic | 0.25% | 0.20% |
| Aggressive | 0.25% | 0.20% |
| Balanced | 0.25% | 0.20% |
| Strategic | 0.25% | 0.20% |
| Total Bond | 0.25% | 0.20% |
| Retail Class | 0.20% | N/A |
| Institutional Class | 0.03% | N/A |
The Funds have adopted a Deferred Compensation Plan (the “Plan”) for the independent Trustees. Under the Plan, each eligible Trustee is permitted to defer all or a portion of the trustees fees payable by any of the Funds as an investment into any combination of Funds until a specified point of time. The investment into the Funds is recorded as an asset however an offsetting liability is also recorded for the deferred payment. Once the eligible Trustees’ deferral amounts can be distributed, a lump sum or generally equal annual installments over a period of up to ten (10) years can be made to the eligible Trustee(s). The Funds may terminate this Plan at any time.
Certain trustees and officers of the Funds are also officers or directors of Meeder, MAM, and MFSCo.
During the six months ended June 30, 2014, several of the Funds invested in the Money Market Fund, an affiliate, as described in Section 2(a)(3) of the Investment Company Act of 1940. As of June 30, 2014, the 7-day yield of the Institutional Class was 0.11%. The purchases/sales amounts in the following table are presented on a gross basis, while the statement of changes in net assets shows subscriptions and redemptions into and out of the Institutional Class on a net basis. A summary of the Funds’ investments in this affiliate during the year is noted below:
| | | | | | | | | | | | | | | | | | | |
Muirfield Fund® | | $ | 6,371,521 | | | $ | 52,237,356 | | | $ | (37,102,969 | ) | | $ | 21,505,908 | | | $ | 6,748 | | | $ | 21,505,908 | |
| Dynamic Growth Fund | | | 3,939,573 | | | | 17,283,950 | | | | (15,341,607 | ) | | | 5,881,916 | | | | 2,704 | | | | 5,881,916 | |
| Aggressive Growth Fund | | | 2,252,733 | | | | 11,414,925 | | | | (10,055,680 | ) | | | 3,611,978 | | | | 1,663 | | | | 3,611,978 | |
| Balanced Fund | | | 4,825,673 | | | | 27,299,146 | | | | (25,448,895 | ) | | | 6,675,924 | | | | 3,549 | | | | 6,675,924 | |
| Strategic Growth Fund | | | 7,012,251 | | | | 19,864,172 | | | | (20,712,811 | ) | | | 6,163,612 | | | | 2,359 | | | | 6,163,612 | |
Quantex FundTM | | | 3,502,332 | | | | 7,233,776 | | | | (6,065,394 | ) | | | 4,670,714 | | | | 1,755 | | | | 4,670,714 | |
| Utilities & Infrastructure Fund | | | 766,924 | | | | 6,033,854 | | | | (6,231,986 | ) | | | 568,792 | | | | 421 | | | | 568,792 | |
| Total Return Bond Fund | | | 4,283,602 | | | | 30,748,209 | | | | (30,889,385 | ) | | | 4,142,426 | | | | 3,489 | | | | 4,142,426 | |
| 2014 Semiannual Report | June 30, 2014 | Page 67 |
| 5. | Federal Tax Information |
The tax characteristics of dividends paid by the Funds during the year ended December 31, 2013 were as follows:
| | | | | | Net Short-Term Capital Gains | | | Net Long-Term Capital Gains | | | | | | | |
Muirfield Fund® | | $ | 187,286 | | | $ | 8,348,387 | | | $ | 4,520,781 | | | $ | — | | | $ | 13,056,454 | |
| Dynamic Growth Fund | | | 177,368 | | | | 7,337,091 | | | | 3,169,172 | | | | — | | | | 10,683,631 | |
| Aggressive Growth Fund | | | — | | | | — | | | | 548,517 | | | | — | | | | 548,517 | |
| Balanced Fund | | | 823,964 | | | | 4,667,755 | | | | 2,725,223 | | | | — | | | | 8,216,942 | |
| Strategic Growth Fund | | | 311,092 | | | | 3,457,716 | | | | 4,270,636 | | | | — | | | | 8,039,444 | |
Quantex FundTM | | | 94,759 | | | | 112,273 | | | | 963,205 | | | | — | | | | 1,170,237 | |
| Utilities & Infrastructure Fund | | | 214,711 | | | | — | | | | — | | | | — | | | | 214,711 | |
| Total Return Bond Fund | | | 3,309,309 | | | | — | | | | — | | | | — | | | | 3,309,309 | |
| Money Market Fund | | | 124,107 | | | | — | | | | — | | | | — | | | | 124,107 | |
The tax characteristics of dividends paid by the Funds during the year ended December 31, 2012 were as follows:
| | | | | | Net Short-Term Capital Gains | | | Net Long-Term Capital Gains | | | | | | | |
Muirfield Fund® | | $ | 509 | | | $ | — | | | $ | — | | | $ | — | | | $ | 509 | |
| Dynamic Growth Fund | | | — | | | | — | | | | — | | | | — | | | | — | |
| Aggressive Growth Fund | | | — | | | | — | | | | — | | | | — | | | | — | |
| Balanced Fund | | | 662,800 | | | | — | | | | — | | | | — | | | | 662,800 | |
| Strategic Growth Fund | | | — | | | | — | | | | — | | | | — | | | | — | |
Quantex FundTM | | | 70,336 | | | | — | | | | — | | | | — | | | | 70,336 | |
| Utilities & Infrastructure Fund | | | 208,323 | | | | — | | | | 127,080 | | | | — | | | | 335,403 | |
| Total Return Bond Fund | | | 3,055,897 | | | | — | | | | — | | | | — | | | | 3,055,897 | |
| Money Market Fund | | | 228,128 | | | | — | | | | — | | | | — | | | | 228,128 | |
As of December 31, 2013, the components of accumulated earnings/(deficit) on a tax basis for the Funds were as follows:
| | | Undistributed Ordinary Income | | | | | | Accumulated Capital and Other Gains and (Losses) | | | Unrealized Appreciation/(Depreciation)** | | | Total Accumulated Earnings/(Deficit) | |
Muirfield Fund® | | $ | 5,429,466 | | | $ | (119 | ) | | $ | 1,777,281 | | | $ | 21,374,499 | | | $ | 28,581,127 | |
| Dynamic Growth Fund | | | 3,040,345 | | | | (11 | ) | | | 401,582 | | | | 12,982,061 | | | | 16,423,977 | |
| Aggressive Growth Fund | | | 517,811 | | | | — | | | | 803,601 | | | | 9,149,461 | | | | 10,470,873 | |
| Balanced Fund | | | 2,240,660 | | | | (132 | ) | | | 150,160 | | | | 9,140,980 | | | | 11,531,668 | |
| Strategic Growth Fund | | | 906,926 | | | | (5 | ) | | | 456,374 | | | | 12,712,757 | | | | 14,076,052 | |
Quantex FundTM | | | 366,940 | | | | (190 | ) | | | 492,903 | | | | 11,191,982 | | | | 12,051,635 | |
| Utilities & Infrastructure Fund | | | 97,450 | | | | (906 | ) | | | (149,828 | ) | | | 10,857,501 | | | | 10,804,217 | |
| Total Return Bond Fund | | | 115 | | | | (113 | ) | | | (1,571,563 | ) | | | (605,562 | ) | | | (2,177,123 | ) |
| Money Market Fund | | | 3,456 | | | | (3,456 | ) | | | — | | | | — | | | | — | |
| * | Total dividends paid may differ from the amount reported in the Statement of Changes in Net Assets because for tax purposes dividends are recognized when actually paid. |
| ** | The differences between book- and tax-basis unrealized appreciation/(depreciation) are attributable primarily to: deferral of post October losses, wash sales, and the realization for tax purposes of unrealized gains/(losses) on certain derivative instruments. |
| Page 68 | 2014 Semiannual Report | June 30, 2014 |
For federal income tax purposes, the following Funds have capital loss carryforwards as of December 31, 2013, which are available to offset future capital gains, if any. To the extent that these carryforwards are used to offset future capital gains, it is probable that the gains that are offset will not be distributed to shareholders:
Capital Loss Carryforwards | | | | |
| Total Return Bond Fund | | $ | 1,571,563 | | Short-term |
| Utilities & Infrastructure Fund | | | 149,828 | | Short-term |
The beneficial ownership, either directly or indirectly, of more than 25% of the voting securities of a fund creates a presumption of control of the fund under Section 2(a)(9) of the 1940 Act. As of June 30, 2014, account holders that held more than 25% of the voting securities of the Funds and may be deemed to control the Funds are as follows:
| | | Percent of Voting Securities |
Muirfield Fund® | Nationwide Trust Company, FSB and certain affiliates held for the benefit of others | 34% |
| Dynamic Growth Fund | Nationwide Trust Company, FSB and certain affiliates held for the benefit of others | 48% |
| Aggressive Growth Fund | Nationwide Trust Company, FSB and certain affiliates held for the benefit of others | 52% |
| Balanced Fund | Nationwide Trust Company, FSB and certain affiliates held for the benefit of others | 53% |
| Strategic Growth Fund | Nationwide Trust Company, FSB and certain affiliates held for the benefit of others | 78% |
Quantex FundTM | Nationwide Trust Company, FSB and certain affiliates held for the benefit of others | 27% |
| Total Return Bond Fund | Nationwide Trust Company, FSB and certain affiliates held for the benefit of others | 56% |
| Money Market Fund – Institutional Class | Carey & Co. held for the benefit of others | 92% |
| 2014 Semiannual Report | June 30, 2014 | Page 69 |
Trustees and Officers (unaudited)
Certain trustees and officers of the Funds are also officers or directors of Meeder, MAM, and MFSCo. The Trustees oversee the management of the Trust and elect its officers. The officers are responsible for the Funds’ day-to-day operations. The Trustees’ and officers’ names, addresses, years of birth, positions held with the Trust, and length of service with the Meeder Funds® are listed below. Also included is each Board member’s principal occupation during, at least, the past five years. Except as indicated, each individual has held the office shown or other offices in the same company for the last five years. Those Trustees who are “interested persons”, as defined in the 1940 Act, by virtue of their affiliation with the Trust, are indicated by an asterisk (*).
Name, Address1, and Year of Birth | Year First Elected a Trustee or Officer of the Trust | Position and Number of Funds Overseen2 | Principal Occupation During Past Five Years and Other Directorships Held |
Robert S. Meeder, Jr.* Year of Birth: 1961 | 1992 | Trustee and President | President of Meeder Asset Management, Inc. |
Jack W. Nicklaus** Year of Birth: 1961 | 1998 | Trustee | Designer, Nicklaus Design, a golf course design firm and division of The Nicklaus Companies. |
Stuart M. Allen** Year of Birth: 1961 | 2006 | Trustee | President of Gardiner Allen DeRoberts Insurance LLC, an insurance agency; Chairman of the Trust’s Audit Committee. |
Anthony D’Angelo** Year of Birth: 1959 | 2006 | Trustee | General Manager, WSYX ABC 6/WTTE-TV Fox 28/WWHO television stations, Columbus, Ohio, operated by Sinclair Broadcast Group (2014 – present); Director of Sales (2004 – 2014); Lead Trustee of the Trust. |
Dale W. Smith Year of Birth: 1959 | 2006 | Vice President | Chief Financial Officer of Meeder Asset Management, Inc. (2005 – present); formerly Senior Vice President of Financial Services of BISYS Fund Services (1996 – 2004). |
Mary “Maggie” Bull Year of Birth: 1966 | 2011 | Chief Compliance Officer | Chief Compliance Officer, Legal Counsel and Anti-Money Laundering Officer of the Funds (2011 – present); Independent Legal Consultant (2007 – 2010); Assistant General Counsel of Nationwide (2006 – 2007). |
Bruce E. McKibben Year of Birth: 1969 | 2002 | Treasurer | Director of Fund Accounting of Mutual Funds Service Co., the Trust’s transfer agent (1997 – present). Interim Chief Operating Officer of Meeder Asset Management, Inc. (June 2008 – October 2008). |
Ruth Kirkpatrick Year of Birth: 1951 | 2009 | Secretary, pro tempore | Senior Legal Specialist of Meeder Asset Management, Inc. |
| 1 | The address of each Trustee is 6125 Memorial Drive, Dublin, OH 43017. |
| 2 | Each Trustee serves for an indefinite term, until his or her resignation, death, or removal. Each Trustee oversees all nine Funds in the Trust. |
| * | Robert S. Meeder, Jr. is deemed an “interested person” of the Trust by virtue of his position as President of Meeder Asset Management, Inc., the Advisor of the Trust. |
| ** | Each independent Trustee is a member of the Trust’s Audit Committee, Compensation Committee, and Nominating Committee. |
The Statement of Additional Information includes additional information about each Trustee and is available without charge. To obtain a copy of the Statement of Additional Information, please contact your financial representative or call toll free 1-800-325-3539.
| Page 70 | 2014 Semiannual Report | June 30, 2014 |
The Funds file their complete schedules of portfolios holdings with the Securities and Exchange Commission (“SEC”) for the first and third quarters of each fiscal year on Form N-Q. In addition, Money Market Fund files its complete schedule of portfolio holdings with the SEC each month on Form N-MFP. The Funds’ Forms N-Q and N-MFP are available on the SEC’s website at http://www.sec.gov and may be reviewed and copied at the SEC’s Public Reference Room in Washington, DC. Information on the operation of the Public Reference Room may be obtained by calling 1-800-SEC-0330. The Funds’ schedules of positions are also available on the Funds’ website at www.meederfunds.com.
A description of the policies and procedures that the Funds use to determine how to vote proxies related to portfolio securities, and information regarding how the Funds voted these proxies for the 12-month period ended June 30, 2014, is available on the SEC’s website at http://www/sec.gov, or, without charge, upon request by calling toll-free 1-800-325-3539.
| 2014 Semiannual Report | June 30, 2014 | Page 71 |
[This page intentionally left blank]
Manager and Investment Advisor
Meeder Asset Management, Inc.
6125 Memorial Drive
P.O. Box 7177
Dublin, Ohio 43017
Subadvisor/Utilities and Infrastructure Fund
Miller/Howard Investments, Inc.
141 Upper Byrdcliffe Road, P.O. Box 549
Woodstock, New York 12498
Board of Trustees
Stuart Allen
Anthony D’Angelo
Robert S. Meeder
Jack Nicklaus II
Custodian
The Huntington National Bank
Columbus, Ohio 43215
Transfer Agent & Dividend Disbursing Agent
Mutual Funds Service Co.
6125 Memorial Drive
Dublin, Ohio 43017
Independent Registered Public Accounting Firm
Cohen Fund Audit Services, Ltd.
1350 Euclid Ave., Suite 800
Cleveland, Ohio 44115

6125 Memorial Drive Dublin, Ohio 43017
Semiannual Report
June 30, 2014
Mutual funds can be a quick, efficient, cost-effective way to achieve investment diversification. The investment options available through Meeder Funds® are suitable for a wide range of investors, from the conservative-minded to the growth-oriented, to help investors achieve their individual financial goals.
We provide professional management, ongoing supervision of clients’ holdings, automatic diversification and e-Delivery of statements and fund mailings: all important elements of a well-rounded investment plan.
No matter what your objectives may be, Meeder Funds® can help you make the most of your personal investment plan and help you achieve your individual financial goals.
Managed by Meeder Asset Management, Inc.
6125 Memorial Drive, Dublin, Ohio 43017
Call Toll Free: 800-325-3539
Local: 614-760-2159
Fax: 614-766-6669
www.meederfunds.com
meederfunds@meederinvestment.com