UNITED STATES
SECURITIES AND EXCHANGE COMMISSION
Washington, D.C. 20549
FORM N-CSR
CERTIFIED SHAREHOLDER REPORT OF REGISTERED
MANAGEMENT INVESTMENT COMPANIES
| | |
| Investment Company Act file number 811-3462 |
The Flex-funds Trust
6125 Memorial Drive
Dublin, OH 43017
Bruce McKibben
c/o The Flex-funds Trust
6125 Memorial Drive
Dublin, OH 43017
Registrant’s telephone number, including area code: 800-325-3539
Date of fiscal year end: December 31, 2005
Date of reporting period: December 31, 2005
| Item 1. | Report to Stockholders. |
The Flex-funds
2005 Annual Report
December 31, 2005

| | | | |
| | | | The Flex-funds |
| | |
| | | | Managed by Meeder Asset Management, Inc. |
| | | | 6125 Memorial Drive, Dublin Ohio, 43017 |
| | | | Call Toll Free 800-325-3539 | 760-2159 |
| | | | Fax: 614-766-6669 | www.flexfunds.com |
| | | | Email: flexfunds@meederfinancial.com |
| | |
| The Flex-funds | | 2005 Annual Report | December 31, 2005 |
TABLE OF CONTENTS
Our Mission Statement
Every day, our mission is to exceed, with integrity, passion, and discipline, the expectations of our clients’
overall investment experience.
Core Values
The Client Is Our #1 Priority
Always remember whom we are serving. Our livelihood depends on providing a superior overall investment
experience that exceeds the expectation of our clients and prospective clients.
Clarity Of Purpose
Our organization has a clear, well-defined vision. All of our associates are committed to and understand how
they will contribute to that vision.
Communication
We expect open and effective communication, full reporting, including good and bad news, and constructive
feedback.
Integrity
We insist upon honesty and adhere to the highest ethical standards.
Excellence/ Innovation
Our associates strive each day for excellence in the work they perform, seek innovative ways to solve problems
and introduce new ideas to take advantage of opportunities. We are a “Think Outside The Box” company.
Associate Well-Being
We value the success and well-being of our associates. We recognize and reward our associates’ contributions,
Respect For Others
Respect all people, value the differences among them and treat them as you would like to be treated.
Seek First To Understand
When interacting with others, place curiosity and understanding of their perspective FIRST, setting aside pre-
conceived opinions and quick judgment.
Teamwork
We are a synergistic organization that works as a team to exceed our objectives.
Profit
We are profitable. Profitability enhances our services and capabilities, and affords everyone the opportunity to
further their financial well-being
| | |
| The Flex-funds | | 2005 Annual Report | December 31, 2005 |
Letter to Shareholders
Although the overall U.S. equity and bond markets experienced modest returns during the past year, we are pleased to report that the majority of The Flex-Funds out-performed their respective benchmark indices during 2005. For the 12-month period ended December 31, 2005, the S&P 500 Index returned 4.9%, the NASDAQ Composite Index returned 2.1%, the Russell 2000 Index returned 4.6%, and the Lehman Brothers Intermediate Government/Credit Index returned 1.6%.
As we mentioned in The Flex-funds’ 2005 Semi-Annual Report, during the first half of 2005 we focused on developing additional investment models and enhancing our existing models. During the second half of the year, these models began to pay dividends. For example, enhancements that we made to our security selection and sector allocation models enabled both The Dynamic Growth Fund and The Aggressive Growth Fund to outperform their respective benchmark indices during 2005. The Dynamic Growth Fund returned 5.08% for the twelve-month period ended December 31, 2005, in comparison to the S&P 500 Index, which returned 4.91%. During this same period, The Aggressive Growth Fund returned 5.62%, versus the NASDAQ Composite Index, which returned only 2.12%. Meanwhile, The Quantex Fund and The Total Return Utilities Fund returned 7.21% and 16.80%, respectively, during 2005. In regards to The Muirfield Fund, we are pleased to report that the Fund’s relative performance improved significantly during the second half of the year, largely as a result of improvements that we made to our tactical asset allocation investment model.
The U.S. Government Bond Fund slightly under-performed its benchmark during 2005 due to an unexpected decline in long-term interest rates in the face of rising short-term rates, which Federal Reserve Chairman Alan Greenspan referred to as a “conundrum”. However, our new interest-rate investment model correctly projected the direction of intermediate-term interest rates. We believe that this model will significantly aid the Fund’s performance during the coming year, as many economists expect the historical relationship between intermediate-term interest rates and long-term rates to return over the coming months. As of December 31, 2005, we believe that The U.S. Government Bond Fund is well positioned for the current interest rate environment.
We are also happy to report that for the twentieth consecutive year, the retail class of The Flex-funds Money Market Fund ranked in the top 10% of all general-purpose money market funds in the U.S. for the 12 months ended December 31, 2005. As many of you know, The Money Market Fund has held this status for every rolling 12-month period since its inception in 1985.
Looking forward, we have several other positive developments to report. On January 31, 2006, The Flex-funds will begin offering two new mutual funds to investors – The Defensive Growth Fund and The Focused Growth Fund. Both of these Funds will invest primarily in exchange traded funds (“ETFs”) as a cost-effective way to access Meeder Asset Management’s investment strategies. Because of the pricing flexibility and lack of redemption fees provided by ETFs, as well as the vast number and different types of ETFs now available to investors, we felt that the time was right to begin offering mutual funds to investors who want to invest in a diversified portfolio of ETFs. Additionally, in February 2006, we are adding another professional to our team of investment analysts. While the previous addition to our investment team brought significant experience to the firm in the way of fundamental analysis, the latest addition to our team will bring considerable experience in the realm of technical analysis.
This past June, we shared with you our associates’ commitment to Meeder Asset Management’s new corporate vision and mission statement, which is presented on the page to the left. I am truly pleased with the progress we have made towards accomplishing this vision and I believe we are taking the right steps to fulfill our goal for each of The Flex-funds to consistently rank in the top 25% of its respective peer group over any three- to five-year period. On behalf of everyone at Meeder Asset Management, Inc., I thank you for your continued support.
|
Sincerely, |
|

|
|
Robert Meeder, Jr. |
President |
Meeder Asset Management, Inc. and The Flex-Funds |
January 20, 2006 |
| | |
| The Flex-Funds 2005 Annual Report | December 31, 2005 | | Page 1 |
| | |
| The Flex-funds | | 2005 Annual Report | December 31, 2005 |
The Muirfield Fund
Annual Market Perspective
Portfolio Management Team (Left to Right): Albert Chu, CFA;
Robert S. Meeder; Dale Smith; Robert M. Wagner, CFA; Joseph A. Zarr
| | |
 | | The Muirfield Fund strives to earn attractive returns during low-risk investment environments and to minimize losses during high-risk environments. |
As we discussed in our June 2005 Semi-Annual Report, during late 2004 we embarked on a mission to improve the investment results of The Muirfield Fund, as well as the other mutual funds managed by Meeder Asset Management. During the first half of 2005, we focused on developing additional investment models and improving our existing models. Although The Muirfield Fund under-performed the benchmark S&P 500 Index for the full year ended December 31, 2005, largely as a result of the Fund’s under-exposure to the equity markets during the first half of the year, enhancements that we made to our investment models aided the Fund’s performance during the second half of 2005. To be specific, after generating a negative return of 2.74% during the first half of 2005, The Muirfield Fund earned a positive return of 5.00% during the final six months of the year, as compared to the S&P 500 Index, which generated a total return of 5.76%. The enhancements that we made to our investment models included the addition of several new fundamental investment criteria, as well as additional trend and technical indicators.
During the months of March and April, stock prices in general fell precipitously, with the S&P 500 Index declining 7.1% from a high of 1,225 on March 7 to a low of 1,138 on April 20, 2005. In adhering to our defensive strategy of protecting investors’ capital from incurring potentially significant losses during high-risk stock market environments, we sold some of the Fund’s holdings during this period and held a portion of the Fund’s assets in cash-equivalent securities. When stock prices rebounded during May, the Fund’s under-exposure to equity securities caused it to under-perform the S&P 500 Index.
The first major test of our upgraded asset allocation model was presented during the period from early August through mid-October when the S&P 500 Index fell 5.5% in response to rising inflationary pressures, continued increases in short-term interest rates, and the fallout from hurricanes Katrina and Rita. Although many market analysts during this period were warning of further declines in stock prices, our enhanced investment model indicated that The Muirfield Fund should remain fully invested in equity securities, as the risk/reward relationship of the stock market continued to be, on balance, positive. The significant rally in stock prices during the second half of October and throughout the month of November confirmed that our model had given the correct asset allocation signal, resulting in The Muirfield Fund generating a return of 5.00% during the final six months of 2005.
During the second half of 2005, we added significant exposure to the mid-cap sector of the market, as our analysis indicated that mid-caps would continue to demonstrate market leadership through the remainder of the year. In addition, we initiated a position in the international markets, as our economic analysis favored a movement toward foreign-denominated assets. Our purchase of the SSGA International Stock Selection Fund on 11/09/05 generated a return of 6.47% through the remainder of 2005, in comparison to the S&P 500 Index, which returned only 2.55% during this period.*
While the recent performance of our enhanced investment models is very encouraging, we are continuing to refine our models and to test additional factors for inclusion in these models.
| | |
| Page 2 | | The Flex-Funds 2005 Annual Report | December 31, 2005 |
| | |
| The Flex-funds | | 2005 Annual Report | December 31, 2005 |
Performance Perspective
Period & Average Annual Total Returns as of December 31, 2005
| | | | | | | | | | | | |
| | | 1 Year | | | 3
Year | | | 5
Year | | | 10
Year | |
The Muirfield Fund | | 2.13 | % | | 11.59 | % | | 1.72 | % | | 5.58 | % |
60% S&P 500 Index & 40% | | | | | | | | | | | | |
90-day T-bills | | 4.29 | % | | 9.42 | % | | 1.62 | % | | 7.31 | % |
S&P 500 Index | | 4.91 | % | | 14.38 | % | | 0.54 | % | | 9.07 | % |
Past performance does not guarantee future results. All performance figures represent average annual total returns for the periods ended December 31, 2005 and assume reinvestment of all dividend and capital gain distributions. The investment return and principal value of an investment will fluctuate so that an investor’s shares, when redeemed, may be worth more or less than their original cost. Management fees were waived and/or expenses were reimbursed in order to reduce the operating expenses of The Muirfield Fund during the periods shown above. Source for index data: Morningstar, Inc.
The S&P 500 Index is a widely recognized unmanaged index of common stock prices that does not take into account the deduction of expenses associated with a mutual Fund, such as investment management and accounting fees. One cannot invest directly in an index.
Growth of $10,000: 12/31/95 - 12/31/05
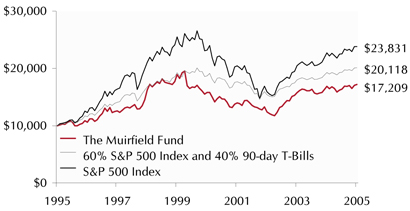
The Growth of $10,000 chart compares The Muirfield Fund’s value to the S&P 500 Index and to an index composed of 60% of the S&P 500 Index and 40% of 90-day T-bills (“the 60/40 index”). The chart is intended to give you a general idea of how the Fund performed compared to these indices over the period from December 31, 1995 to December 31, 2005. An understanding of the differences between your Fund and these indices is important. The S&P 500 Index is a hypothetical unmanaged index of common stocks that does not take into account the deduction of expenses associated with a mutual fund, such as investment management and accounting fees; likewise, the 60/40 index is a hypothetical unmanaged index of common stocks and 90-day T-bills. One cannot invest directly in an index.
Past performance does not guarantee future results. The chart and the table above do not reflect the deduction of taxes that a shareholder would pay on fund distributions or the redemption of fund shares.
| | |
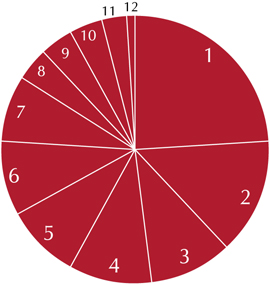
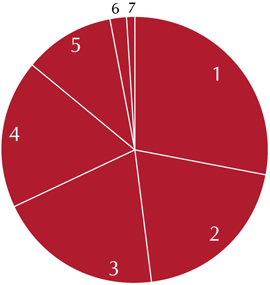
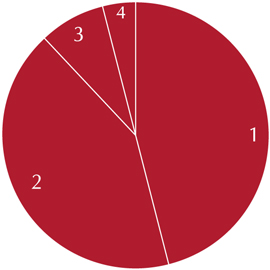
| Fund Holdings as of December 31, 2005 | | Fund holdings are subject to change. |

| | | | | |
1) | | American Beacon LgCp Value Fund | | 21 | % |
| | |
2) | | Artisan MidCap Value Fund | | 15 | % |
| | |
3) | | American Growth Fund of America - A | | 15 | % |
| | |
4) | | First American MidCap Growth Fund | | 15 | % |
| | |
5) | | JP Morgan Divers MidCap Value Fund | | 9 | % |
| | |
6) | | SSgA Int’l Stock Selection Fund | | 9 | % |
| | |
7) | | S&P MidCap 400 Futures | | 6 | % |
| | |
8) | | HighMark Small Cap Value Fund | | 4 | % |
| | |
9) | | NASDAQ 100 Index Tracking Stock | | 4 | % |
| | |
10) | | iShares Russell 1000 Growth Index Fund | | 2 | % |
| | |
| The Flex-Funds 2005 Annual Report | December 31, 2005 | | Page 3 |
| | |
| The Flex-funds | | 2005 Annual Report | December 31, 2005 |
The Dynamic Growth Fund
Annual Market Perspective
| | | | |
 | |  | | Our economic analysis indicates that foreign stocks may continue to outperform domestic stocks in the year ahead. |
Robert M. Wagner, CFA Portfolio Manager | | Albert H. Chu, CFA Portfolio Manager | | |
For the 12-month period ended December 31, 2005, The Dynamic Growth Fund outperformed the S&P 500 Index, with a total return of 5.08%, versus the benchmark’s return of 4.91%. We are encouraged by the Fund’s recent performance and believe that significant improvements that we recently made to our security selection models will enable the Fund to perform even better in the months and years ahead.
During the first three months of 2005, The Fund held positions in mutual funds that had significant exposure to small-cap stocks. However, as the small-cap leadership began to wane, we rotated the Fund’s holdings toward the mid-cap sector of the market, which was showing relative strength. As mid-cap stocks continued to demonstrate market leadership throughout the remainder of 2005, the Fund’s over-exposure to this sector aided its investment performance. In addition, the Fund’s over-exposure to the Energy and Utilities sectors added to its overall investment performance during 2005, despite the weakness experienced in these sectors during the early part of the fourth quarter. Yet, with crude oil prices holding above their long-term moving average during the final weeks of December, we continued to hold mutual funds that had significant exposure to the Energy sector in The Dynamic Growth Fund.
In response to indications of a slowing economy, we increased the Fund’s exposure to large-cap stocks during August and again in early November. In addition, we initiated some exposure to the international markets during November, as our economic analysis indicated that foreign stocks may outperform domestic securities going forward. Specifically, we established a position in the Allianz NACM International Fund on November 9, 2005, which was over-weighted in stocks in the Basic Materials and Industrial sectors, with an emphasis on Japan. This position generated a return of 7.86% for the remainder of the year, versus the S&P 500 Index, which returned only 2.51% during this same period. We are considering making further increases in the Fund’s exposure to the international markets.
Looking forward, we believe that The Dynamic Growth Fund is well positioned to capture investment returns in the better performing sectors of the market during 2006. As of 12/31/05, approximately 44% was allocated to mid-cap stocks, 43% to large-caps, 4% to small-cap, and 9% to foreign stocks.
We thank you for your continued support and look forward to helping you achieve your investment goals over the years ahead.
| | |
| Page 4 | | The Flex-Funds 2005 Annual Report | December 31, 2005 |
| | |
| The Flex-funds | | 2005 Annual Report | December 31, 2005 |
Performance Perspective
Period & Average Annual Total Returns as of December 31, 2005
| | | | | | | | | | | | |
| | | 1 Year | | | 3 Year | | | 5 Year | | | Since Inception1 | |
The Dynamic Growth Fund | | 5.08 | % | | 14.35 | % | | -0.41 | % | | -2.81 | % |
S&P 500 Index2 | | 4.91 | % | | 14.38 | % | | 0.54 | % | | 0.04 | % |
| 1 | Inception date for The Dynamic Growth Fund is 2/29/00. |
| 2 | The S&P 500 Index is a widely recognized unmanaged index of common stock prices that does not take into account the deduction of expenses associated with a mutual fund, such as investment management and accounting fees. One cannot invest directly in an index. |
Past performance does not guarantee future results. All performance figures represent average annual total returns for the periods ended December 31, 2005, and assume reinvestment of all dividend and capital gain distributions. The investment return and principal value of an investment will fluctuate so that an investor’s shares, when redeemed, may be worth more or less than their original cost. Management fees were waived and/or expenses were reimbursed in order to reduce the operating expenses of The Dynamic Growth Fund during the periods shown above. Source for index data: Morningstar, Inc.
Growth of $10,000: 2/29/00 - 12/31/05
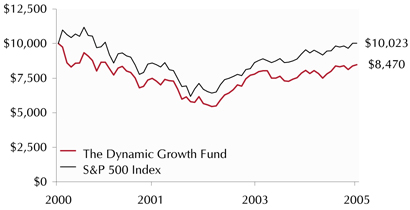
The Growth of $10,000 chart compares The Dynamic Growth Fund’s value to the S&P 500 Index. The chart is intended to give you a general idea of how the Fund performed compared to this benchmark over the period from its inception on February 29, 2000 to December 31, 2005. An understanding of the differences between your Fund and this index is important. The S&P 500 Index is a hypothetical unmanaged index of common stocks that does not take into account the deduction of expenses associated with a mutual fund, such as investment management and accounting fees. One cannot invest directly in an index.
Past performance does not guarantee future results. The chart and the table above do not reflect the deduction of taxes that a shareholder would pay on fund distributions or the redemption of fund shares.
| | |
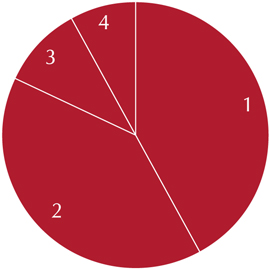
Fund Holdings as of December 31, 2005 | | Fund holdings are subject to change. |
| | | | | |
1) | | Goldman Sachs Mid Cap Value Fund | | 24 | % |
| | |
2) | | American Growth Fund of America - A | | 14 | % |
| | |
3) | | American Beacon LgCpValue Fund | | 10 | % |
| | |
4) | | First American MdCap Growth Fund | | 10 | % |
| | |
5) | | iShares Russell 1000 Value Index Fund | | 9 | % |
| | |
6) | | Allianz NACM Int’l Fund - I | | 9 | % |
| | |
7) | | S&P MidCap 400 Futures | | 8 | % |
| | |
8) | | NASDAQ 100 Index Tracking Stock | | 4 | % |
| | |
9) | | Munder MidCap Core Growth Fund - A | | 4 | % |
| | |
10) | | HighMark Small CapValue Fund | | 4 | % |
| | |
11) | | iShares Russell 1000 Growth Index Fund | | 3 | % |
| | |
12) | | Munder Small CapValue Fund -A | | 1 | % |
| | |
| The Flex-Funds 2005 Annual Report | December 31, 2005 | | Page 5 |
| | |
| The Flex-funds | | 2005 Annual Report | December 31, 2005 |
The Aggressive Growth Fund
Annual Market Perspective
| | | | |
| | | | Our research indicates that economic growth in the emerging markets is continuing to expand at rapid rates and that the value of foreign-denominated assets may increase at a faster pace than domestic assets in 2006. |
Robert M. Wagner, CFA Portfolio Manager | | Albert H. Chu, CFA
Portfolio Manager | | |
For the 12-month period ended December 31, 2005, The Aggressive Growth Fund returned 5.62%, in comparison to the Nasdaq Composite Index, which returned only 2.12%. We are pleased with the Fund’s performance and believe that the Fund is well positioned to continue its strong performance during the coming year.
During the first quarter of 2005, the Fund held positions in mutual funds that had significant exposure to small-cap stocks. However, when the small-cap sector of the market began to falter, we realigned the Fund’s holdings, placing more of an emphasis on mid-cap stocks. This decision proved to be timely, as mid-cap stocks significantly outperformed other market-cap sectors throughout the remainder of 2005.
We also focused on mutual funds that had significant exposure to the Energy and Utilities sectors during 2005, in response to our relative strength investment models, which indicated that these sectors would be strong performers throughout the year. As the prices of mid-cap stocks and stocks in both the Energy and Utilities sectors continued to advance during 2005, The Aggressive Growth Fund’s over-exposure to these sectors significantly aided the Fund’s performance. Although the correction in Energy and Utility stocks detracted from the Fund’s performance during the fourth quarter, our continued emphasis on these sectors resulted in significant gains for The Aggressive Growth Fund for the full year ended December 31, 2005.
In addition to our emphasis on the sectors mentioned above, the Fund’s exposure to the international markets continued to add value to its performance throughout 2005. Over the past five years, investment returns in the emerging markets have outpaced the performance of the domestic markets, with an average annual return of 15%.1 During this same period, the underlying earnings growth of companies whose securities compose the Emerging Markets Index has been so rapid that price-to-earnings ratios have risen only slightly since the beginning of 2000.
Later during the year, our analysis indicated that economic growth in several foreign economies would continue to grow at a rapid rate and that foreign-denominated assets would increase in value at a faster rate than domestic asset values. We therefore increased the Fund’s exposure to the international markets during the fourth quarter and are considering further increases in its exposure to foreign stocks. Our purchase of the Harding Loevner Emerging Markets Fund on 8/01/05 returned 19.47% throughout the remainder of 2005, in comparison to the Nasdaq Composite Index, which returned a mere 0.83%.2
| 1 | MSCI Emerging Markets Index; Source: Morningstar, Inc. |
| | |
| Page 6 | | The Flex-Funds 2005 Annual Report | December 31, 2005 |
| | |
| The Flex-funds | | 2005 Annual Report | December 31, 2005 |
Performance Perspective
Period & Average Annual Total Returns as of December 31, 2005
| | | | | | | | | | | | |
| | | 1
Year | | | 3
Year | | | 5
Year | | | Since
Inception1 | |
The Aggressive Growth Fund | | 5.62 | % | | 14.62 | % | | -1.70 | % | | -5.41 | % |
Nasdaq Composite Index | | 2.12 | % | | 18.89 | % | | -1.75 | % | | -12.75 | % |
| 1 | Inception date for The Aggressive Growth Fund is 2/29/00. |
| 2 | The Nasdaq Composite Index is a broad-based capitalization-weighted index of all Nasdaq National Market and Small-Cap stocks that does not take into account the deduction of expenses associated with a mutual fund, such as investment management and accounting fees. One cannot invest directly in an index. |
Past performance does not guarantee future results. All performance figures represent period and average annual total returns for the periods ended December 31, 2005, and assume reinvestment of all dividend and capital gain distributions. The investment return and principal value of an investment will fluctuate so that an investor’s shares, when redeemed, may be worth more or less than their original cost. Management fees were waived and/or expenses were reimbursed in order to reduce the operating expenses of The Aggressive Growth Fund during the periods shown above. Source for index data: Morningstar, Inc.
Growth of $10,000: 2/29/00 - 12/31/05
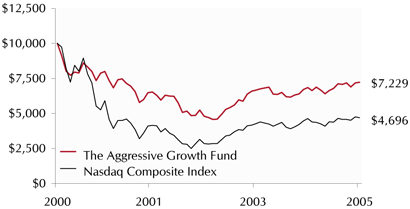
The Growth of $10,000 chart compares The Aggressive Growth Fund’s value to the Nasdaq Composite Index. The chart is intended to give you a general idea of how the Fund performed compared to this benchmark over the period from its inception on February 29, 2000 to December 31, 2005. An understanding of the differences between your Fund and this index is important. The Nasdaq Composite Index is a hypothetical unmanaged index of common stocks that does not take into account the deduction of expenses associated with a mutual fund, such as investment management and accounting fees. One cannot invest directly in an index.
Past performance does not guarantee future results. The chart and the table above do not reflect the deduction of taxes that a shareholder would pay on fund distributions or the redemption of fund shares.
| | |
| Fund Holdings as of December 31, 2005 | | Fund holdings are subject to change. |
| | | | | |
| 1) | | Munder MidCap Core Growth Fund - A | | 18 | % |
| | |
| 2) | | Fidelity Adv Levrgd Co Stock Fund - A | | 15 | % |
| | |
| 3) | | Gartmore US Growth Leaders Fund - A | | 13 | % |
| | |
| 4) | | Harding Loevner Emerging Markets | | 9 | % |
| | |
| 5) | | American Beacon LgCp Value Fund | | 8 | % |
| | |
| 6) | | Goldman Sachs Mid Cap Value Fund | | 8 | % |
| | |
7) | | iShares Russell 1000 Value Index Fund | | 7 | % |
| | |
8) | | S&P MidCap 400 Futures | | 6 | % |
| | |
9) | | NASDAQ 100 Index Tracking Stock | | 6 | % |
| | |
10) | | HighMark Small Cap Value Fund | | 5 | % |
| | |
11) | | iShares Russell 1000 Growth Index Fund | | 4 | % |
| | |
12) | | Munder Small Cap Value Fund - A | | 1 | % |
| | |
| The Flex-Funds 2005 Annual Report | December 31, 2005 | | Page 7 |
| | |
| The Flex-funds | | 2005 Annual Report | December 31, 2005 |
The Quantex Fund
Annual Market Perspective
| | |
 | | The Quantex Fund employs a quantitative investment model to select stocks of companies that have declined significantly in price and of small, up-and-coming companies. |
Joseph A. Zarr Portfolio Manager | | |
During 2005, we implemented many new initiatives at Meeder Asset Management, the investment advisor to The Quantex Fund, in an effort to better serve our clients and to improve the investment results for each of The Flex-Funds. In regards to The Quantex Fund (formerly The Highlands Growth Fund), on April 30, 2005 we changed the Fund’s investment strategy from a sector-neutral, enhanced-S&P 500 Index strategy, which focused primarily on investments in large-cap stocks, to a quantitative investment strategy focused on small- and mid-cap stocks. This strategy, which we refer to as our SMID discipline, invests in (1) stocks of large companies that had declined significantly in price prior to being included in the Fund (“fallen angels”), (2) stocks of small, up-and-coming companies (“rising stars”), and (3) stocks that remain within our predetermined market capitalization range. We have employed this strategy since 1989 to manage investment portfolios for high net-worth individual investors, retirement plans, and institutional investors.
Although The Quantex Fund invested primarily in large-cap stocks prior to April 30, 2005, and primarily in small- and mid-cap stocks during the remainder of 2005, the Fund managed to outperform both the S&P 500 Index and the Russell 2000 Index during the year. For the 12-month period ended December 31, 2005, The Quantex Fund returned 7.21%, in comparison to the S&P 500 Index, which returned 4.91%, the Russell 2000 Index, which returned 4.55%, and the S&P Mid-Cap 400 Index, which returned 12.55%.*
When the Fund began transitioning to its new investment strategy on April 30, 2005, approximately 20% of the stocks purchased for The Quantex Fund were stocks of large, generally stable companies that had fallen, on average, 15% during 2004. Although our research indicates that many of these types of stocks, which we refer to as “fallen angels”, tend to rebound significantly in price over subsequent periods, the “fallen angels” purchased for The Quantex Fund in the month of May did not rebound during 2005 in the way that they normally have in the past. Yet, we believe that history is on our side and we expect many of these stocks to perform differently during the coming year. Since May 2005, the Fund was over-weighted in the Consumer Cyclicals and Communications sectors, which under-performed most other market sectors during 2005. However, in the month of December, Consumer Cyclicals sector rallied 3.06%, on average, in comparison to the S&P 500 Index, which rose only 0.04%.*
Looking forward, we are confident that The Quantex Fund’s new investment strategy will enable it to perform strongly in the years ahead.
| | |
| Page 8 | | The Flex-Funds 2005 Annual Report | December 31, 2005 |
| | |
| The Flex-funds | | 2005 Annual Report | December 31, 2005 |
Performance Perspective
Period & Average Annual Total Returns as of December 31, 2005
| | | | | | | | | | | | |
| | | 1
Year | | | 3
Year | | | 5
Year | | | 10
Year | |
The Quantex Fund | | 7.21 | % | | 13.65 | % | | -0.85 | % | | 6.21 | % |
Russell 2000 Index1 | | 4.55 | % | | 22.13 | % | | 8.22 | % | | 9.26 | % |
S&P Mid-Cap 400 Index2 | | 12.55 | % | | 21.13 | % | | 8.59 | % | | 14.35 | % |
S&P 500 Index3 | | 4.91 | % | | 14.38 | % | | 0.54 | % | | 9.07 | % |
Past performance does not guarantee future results. All performance figures represent average annual total returns for the periods ended December 31, 2005, and assume reinvestment of all dividend and capital gain distributions. The investment return and principal value of an investment will fluctuate so that an investor’s shares, when redeemed, may be worth more or less than their original cost. Management fees were waived and/or expenses were reimbursed in order to reduce the operating expenses of The Quantex Fund during the periods shown above. Source for index data: Morningstar, Inc.
The Quantex Fund was previously known as The Highlands Growth Fund. On April 30, 2005, The Highlands Growth Fund changed its name to The Quantex Fund, also changing the Fund’s investment objective and strategies. The Highlands Growth Fund focused on large-cap equities, while The Quantex Fund utilizes quantitative investment strategies that invest primarily in small- and mid-cap equities. Due to this change in strategies on April 30, 2005, the S&P 500 Index is a more comparative index for Fund performance prior to April 30, 2005. The Russell 2000 Index and S&P Mid-Cap 400 Index are more comparative indices for Fund performance after April 30, 2005. Source for index data: Morningstar, Inc.
1 The Russell 2000 Index is a market-capitalization weighted index measuring performance of the smallest 2,000 companies, on a market capitalization basis, in the Russell 3000 Index. The Russell 3000 Index is a market-capitalization weighted index measuring the performance of the 3,000 largest U.S. companies based on total market capitalization. 2 The S&P Mid-Cap 400 Index is an unmanaged index of common stock prices of mid-sized companies. 3 The S&P 500 Index is a widely recognized unmanaged index of common stock prices.
Growth of $10,000: 12/31/95 - 12/31/05
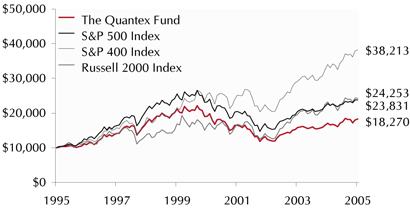
The Growth of $10,000 chart compares The Quantex Fund’s value to the S&P 500 Index, the S&P 400 Mid-Cap Index, and the Russell 2000 Index. The chart is intended to show you how the Fund performed in comparison to these benchmarks from December 31, 1995 through December 31, 2005. There are important differences between the Fund and the benchmark indices. The benchmark indices are hypothetical unmanaged indices of common stock that do not take into account the deduction of expenses associated with a mutual fund, such as investment management and accounting fees. One cannot invest directly in an index. None of the indexes described incur any sales charges, expenses, or fees. The table above and this chart do not reflect the deduction of taxes that a shareholder would pay on fund distributions or the redemption of fund shares. Please refer to the disclosure following the performance table above for a description of the indices. Past performance does not guarantee future results. The chart and the table above do not reflect the deduction of taxes that a shareholder would pay on fund distributions or the redemption of fund shares.
| | |
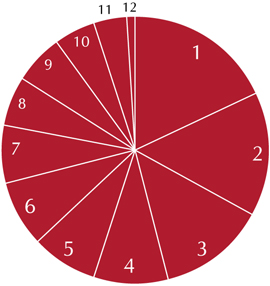
| Sector Weightings as of December 31, 2005 | | Fund holdings are subject to change. |
| | | | | |
| 1) | | Consumer, Cyclical | | 17 | % |
| | |
| 2) | | Industrial | | 16 | % |
| | |
| 3) | | Technology | | 13 | % |
| | |
| 4) | | Consumer, Non-cyclical | | 12 | % |
| | |
| 5) | | Russell 2000 Futures | | 12 | % |
| | |
| 6) | | Basic Materials | | 9 | % |
| | |
| 7) | | Communications | | 9 | % |
| | |
| 8) | | Utilities | | 7 | % |
| | |
| 9) | | Financial | | 3 | % |
| | |
| 10) | | Energy | | 2 | % |
| | |
| The Flex-Funds 2005 Annual Report | December 31, 2005 | | Page 9 |
| | |
| The Flex-funds | | 2005 Annual Report | December 31, 2005 |
The Total Return Utilities Fund
Annual Market Perspective
| | |
 | | Investments for The Total Return Utilities Fund are selected on the basis of fundamental analysis. We look for companies that have high credit ratings, above-average earnings growth, and strong management. |
| |
Lowell G. Miller Portfolio Manager | | |
The Total Return Utilities Fund had a stellar year in 2005, generating a total return of 16.80%. The Fund has also continued to perform well over the longer term, with an average annual total return of 8.02% for the ten-year period ended December 31, 2005, as compared to the S&P Utilities Index, which returned only 6.76% over this same period, and an average annual total return of 9.04% since the Fund’s inception on June 21, 1995, versus the benchmark’s return of 7.91%.
On August 8, 2005, the U.S. Congress passed The Energy Policy Act of 2005, which is the first national energy plan in a generation, and it repealed the Public Utility Holding Company Act (“PUHCA”). In addition to providing numerous tax incentives and loan guarantees for energy production, the repeal of the PUHCA is expected to lead to a new wave of mergers and acquisitions in the Utilities industry. This expectation led investors seeking capital gains to bid up the prices of Utilities stocks during 2005. Among other features, the new Energy Bill encourages and facilitates investment in our aging electrical transmission infrastructure. We believe this could serve as a catalyst for increased long-term earnings growth for Utilities companies as they deploy capital in much-needed projects to upgrade and update our electrical system in this country.
During 2005, many investors continued to demonstrate their appetite for companies that make regular dividend payments, as dividends are now taxed at a much more favorable federal income-tax rate (of only 15%) than they were prior to 2003, when dividends were taxed at federal income tax rates of up to 38.6%. We believe there are several factors that support continued investor interest in the Utilities sector and are confident that investors in The Total Return Utilities Fund will benefit from these developments. First, the Utilities industry has gone through a “back to basics” sea change and numerous companies within the industry now have solid balance sheets, focused business models, and a chastened attitude that will likely provide discipline for future growth initiatives. Second, investors are placing a higher value on the stocks of companies that have reliable, sustainable business models, as well as asset-based businesses and companies that offer cash dividends rather than just promises of growth. Third, there is a great need to deploy capital to improve our nation’s infrastructure and the new Energy Bill now provides added incentives for companies to .fill this need. Last, consolidation is a continuing theme that supports stock valuations in the Utilities industry and encourages investors to hold their positions in Utilities stocks.
In regards to specific holdings, Questar Corporation (NSYE: STR), a Gas Distribution company, and Sierra Pacific Resources (NYSE: SRP), a Nevada-based Utility company, were among the Fund’s better performers during 2005, while Energy East Corporation (NYSE: EAS) and Peoples Energy Corporation (NYSE: PGL) were among its poorer performers. Although Energy East’s and Peoples Energy’s stock prices declined during 2005, we are continuing to hold each of these positions. We believe that Energy East is well positioned to benefit from the renewed interest in consolidation, especially for distribution-focused Utilities. Meanwhile, Peoples Energy’s 69-year track record of uninterrupted dividend offers some level of stability, with a dividend yield of 5.9%.*
| | |
| Page 10 | | The Flex-Funds 2005 Annual Report | December 31, 2005 |
| | |
| The Flex-funds | | 2005 Annual Report | December 31, 2005 |
Performance Perspective
Period & Average Annual Total Returns as of December 31, 2005
| | | | | | | | | | | | | | | |
| | | 1 Year | | | 3 Year | | | 5 Year | | | 10 Year | | | Since
Inception* | |
The Total Return Utilities Fund | | 16.80 | % | | 16.75 | % | | -1.09 | % | | 8.02 | % | | 9.04 | % |
S&P Utilities Index | | 16.79 | % | | 22.33 | % | | -2.26 | % | | 6.76 | % | | 7.91 | % |
| * | Inception date for The Total Return Utilities Fund is 6/21/95. |
Past performance does not guarantee future results. All performance figures represent average annual total returns for the periods ended December 31, 2005, and assume reinvestment of all dividend and capital gain distributions. The investment return and principal value of an investment will fluctuate so that an investor’s shares, when redeemed, may be worth more or less than their original cost. Management fees were waived and/or expenses were reimbursed in order to reduce the operating expenses of The Total Return Utilities Fund during the periods shown above. Because The Total Return Utilities Fund concentrates its investments in public utility companies, the value of the Fund’s shares may fluctuate more than if invested in a greater number of industries. Changes in interest rates may also affect the value of Utility stocks, and rising interest rates can be expected to reduce the Fund’s net asset value. Source for index data: Bloomberg, LP.
The S&P Utilities Index is an unmanaged index of 33 utility sector stocks that does not take into account the deduction of expenses associated with a mutual fund, such as investment management and accounting fees. One cannot invest directly in an index.
Growth of $10,000: 12/31/95 - 12/31/05
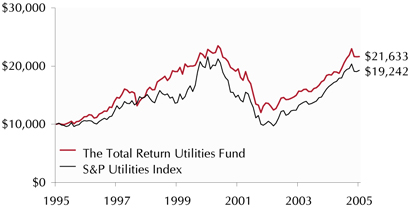
The Growth of $10,000 chart compares The Total Return Utilities Fund’s value to the S&P Utilities Index. The chart is intended to give you a general idea of how the Fund performed compared to this benchmark over the period from December 31, 1995 to December 31, 2005. An understanding of the differences between your Fund and this index is important. The S&P Utilities Index is a hypothetical unmanaged index of common stocks that does not take into account the deduction of expenses associated with a mutual fund, such as investment management and accounting fees. One cannot invest directly in an index.
Past performance does not guarantee future results. The chart and the table above do not reflect the deduction of taxes that a shareholder would pay on fund distributions or the redemption of fund shares.
| | |
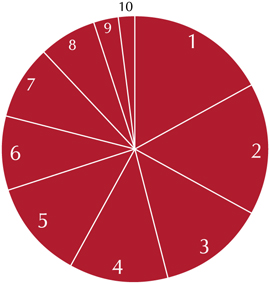
Sector Weightings as of December 31, 2005 | | Fund holdings are subject to change. |
| | | | | |
1) | | Oil & Natural Gas | | 28 | % |
| | |
2) | | Telecomm. Services | | 20 | % |
| | |
3) | | Electric Utility | | 20 | % |
| | |
4) | | Natural Gas (Distributor) | | 18 | % |
| | |
5) | | Electric/Gas Utility | | 11 | % |
| | |
6) | | Water Utility | | 2 | % |
| | |
7) | | Cash Equivalents | | 1 | % |
| | |
| The Flex-Funds 2005 Annual Report | December 31, 2005 | | Page 11 |
| | |
| The Flex-funds | | 2005 Annual Report | December 31, 2005 |
The U.S. Government Bond Fund
Annual Market Perspective
| | | | |
| | | | “Rising interest rates have been advertised for so long and in so many places that anyone who has not appropriately hedged his position by now, obviously, is desirous of losing money.” (Alan Greenspan) |
Robert M. Wagner, CFA Portfolio Manager | | Albert H. Chu, CFA
Portfolio Manager | | |
During 2005, our interest-rate model correctly indicated that intermediate-term interest rates would rise throughout the year. Given that there has historically been a strong relationship between the direction of intermediate-term interest rates and long-term interest rates, we expected long-term rates to also rise during 2005. We therefore held the majority of The U.S. Government Bond Fund’s assets in fixed-income securities that had relatively short maturities, as bonds that are close to maturing tend to decline less in price than bonds that have long-term maturities. Although we believe this was a correct decision, the unexpected decline in long-term interest rates in the face of rising short-term rates, which Federal Reserve Chairman Alan Greenspan referred to as a “conundrum”, resulted in The U.S. Government Bond Fund under-performing its benchmark during 2005. (Note: While the yield on the 5-year U.S. Treasury Note rose to 4.35% on 12/31/05, from 3.63% on 12/31/04, the yield on the 20-year U.S. Treasury Note fell to 4.61%, from 4.85%).*
During the second half of 2005, we initiated a small position (representing approximately 10% of the Fund’s assets) in investment-grade corporate bonds, in response to our technical investment models, which indicated that corporate securities were attractive relative to Treasuries. However, we continued to over-weight U.S. Government Bonds, including investments in U.S. Government Agency securities, which were paying higher yields.
Although The U.S. Government Bond Fund generated a slightly negative return during 2005, we believe that our decision to hold bonds that had relatively short maturities was correct for the given interest-rate environment. As of 12/31/05, the yield on the 2-year Treasury was 4.41%, as compared to the yield on the 10-year Treasury, which was 4.39%.* Thus, we continue to feel that there is little justification for investing the Fund’s assets in bonds that have long-term maturities.
If intermediate-term interest rates continue to rise and the correlation to long-term interest rates returns, the prices of long-term bonds will decline significantly more than those of short-term maturities. Hence, we feel that The U.S. Government Bond Fund is positioned well for the current interest rate environment.
| | |
| Page 12 | | The Flex-Funds 2005 Annual Report | December 31, 2005 |
| | |
| The Flex-funds | | 2005 Annual Report | December 31, 2005 |
Performance Perspective
Period & Average Annual Total Returns as of December 31, 2005
| | | | | | | | | | | | |
| | | 1 Year | | | 3 Year | | | 5 Year | | | 10 Year | |
The U.S. Government Bond Fund | | -0.14 | % | | -1.01 | % | | 1.61 | % | | 3.35 | % |
Lehman Bros. Intermediate Government/Credit Index | | 1.58 | % | | 2.97 | % | | 5.50 | % | | 5.80 | % |
Past performance does not guarantee future results. All performance figures represent average annual total returns for the periods ended December 31, 2005, and assume reinvestment of all dividend and capital gain distributions. The investment return and principal value of an investment will fluctuate so that an investor’s shares, when redeemed, may be worth more or less than their original cost. Management fees were waived and/or expenses were reimbursed in order to reduce the operating expenses of The U.S. Government Bond Fund during the periods shown above. Source for index data: Morningstar, Inc.
The Lehman Brothers Intermediate Government/Credit Index is an unmanaged index of fixed-rate bonds issued by the U.S. Government and its agencies that are rated investment-grade or higher, have one to ten years remaining until maturity, and at least $100 million outstanding. The Lehman Brothers Intermediate Government/Credit Index does not take into account the deduction of expenses associated with a mutual fund, such as investment management and accounting fees. One cannot invest directly in an index.
Growth of $10,000: 12/31/95 - 12/31/05
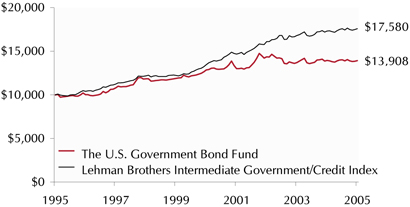
The Growth of $10,000 chart compares The U.S. Government Bond Fund’s value to the Lehman Brothers Intermediate Government/Credit Index The chart is intended to give you a general idea of how the Fund performed compared to this benchmark over the period from December 31, 1995 to December 31, 2005. An understanding of the differences between your Fund and this index is important. The Lehman Brothers Intermediate Government/Credit Index is a hypothetical unmanaged index of fixed-rate bonds issued by the U.S. Government and its agencies that are rated investment-grade or higher, have one to ten years remaining until maturity, and at least $100 million outstanding. This index does not take into account the deduction of expenses associated with a mutual fund, such as investment management and accounting fees. One cannot invest directly in an index.
Past performance does not guarantee future results. The chart and the table above do not reflect the deduction of taxes that a shareholder would pay on fund distributions or the redemption of fund shares.
| | |
Fund Holdings as of December 31, 2005 | | Fund holdings are subject to change. |
| | | | | |
1) | | U.S. Treasury Notes | | 42 | % |
| | |
2) | | U.S. Gov’t Agency Notes | | 40 | % |
| | |
3) | | Corporate Notes | | 10 | % |
| | |
4) | | Cash Equivalents | | 8 | % |
| | |
| The Flex-Funds 2005 Annual Report | December 31, 2005 | | Page 13 |
| | |
| The Flex-funds | | 2005 Annual Report | December 31, 2005 |
The Money Market Fund
Annual Market Perspective
| | |
| | The Money Market Fund continues to be among the top-performing money market Funds in the country. |
Joseph A. Zarr Portfolio Manager | | |
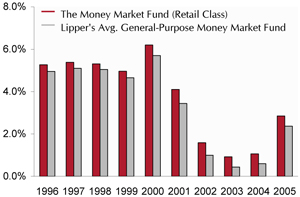
Throughout 2005, the retail class of The Flex-Funds Money Market Fund continued its record of ranking among the top general-purpose money market funds in the U.S. For every 12-month period over the past 20 years, the retail class of The Money Market Fund has ranked in the top 10% of general-purpose money market funds, based on 12-month total returns.1 As illustrated in the table on the following page, the retail class of the Fund returned 2.85% for the one-year period ended December 31, 2005, as compared to the Lipper Average Money Market Fund, which returned 2.37%. During this same period, the institutional class of The Money Market Fund returned 2.99%, versus the Average First-Tier Institutional Money Market Fund, which returned 2.88%.2
During the first three months of 2005, short-term interest rates rose sharply in response to the Federal Reserve’s fight to control inflationary pressures. Anticipating that interest rates would continue to rise throughout the year, we lowered the average maturity of the Fund’s holdings to 35 days in March 2005, from a high of 57 days in January. Over the next two months, we continued to lower the average maturity (to as low as 29 days) so that we would be able to respond quickly to further increases in short-term interest rates — to have cash available for investing at potentially higher yields. As many of the Fund’s holdings matured during June, we invested the proceeds into higher-yielding floating-rate securities. Our decision to actively manage the weighted average maturity of the Fund’s holdings and to invest a significant portion of assets in corporate securities, as opposed to U.S. Government securities, enabled The Money Market Fund to outperform its benchmark during 2005.
Throughout 2005, the Fed continued to raise short-term interest rates and investors debated the level at which the Fed would cease tightening. Every phrase from each of the Fed’s eight meetings on interest rate policy, as well as every word spoken by Fed Chairman Alan Greenspan at U.S. Congressional hearings, was dissected and analyzed by investors for the slightest nuance in an effort to judge when the Fed might cease its policy of raising short-term interest rates. By the end of 2005, the Fed had raised the Target Fed Funds Rate to 4.25%, from 2.25% on December 31, 2004. Although the Fed indicated in the “minutes” to its latest meeting on interest rate policy (on 12/13/05) that it plans to continue raising this key short-term interest rate over the near term, the Fed hinted that it might be near the end of raising short-term rates.
Looking forward, our research indicates that the Fed will raise the Target Fed Funds Rate two more times during the first half of 2006 in an effort to maintain economic stability and to control inflationary pressures. Our research also indicates that the Fed has been targeting asset values (e.g. Housing prices) during the past year to a far greater degree than they have in past years. Given that growth in the Housing market appears to be moderating, at this time we do not expect the Fed to increase the Target Fed Funds Rate beyond 4.75%.
| | |
| Page 14 | | The Flex-Funds 2005 Annual Report | December 31, 2005 |
| | |
| The Flex-funds | | 2005 Annual Report | December 31, 2005 |
Performance Perspective
Period & Average Annual Total Returns as of December 31, 2005
| | | | | | | | | | | | | | | |
| | | 1 Year | | | 3 Year | | | 5 Year | | | 10 Year | | | Since Inception | |
The Money Market Fund (Retail Class) | | 2.85 | % | | 1.61 | % | | 2.10 | % | | 3.75 | % | | 5.04 | %1 |
Lipper’s Average General Purpose Money Market Fund | | 2.37 | % | | 1.14 | % | | 1.59 | % | | 3.32 | % | | 4.65 | %2 |
Current & Effective Yields | | 7-day Simple Yield: 3.89%* | | | | | | 7-day Compound Yield: 3.96%* | |
| | | | | |
The Money Market Fund (Institutional Class) | | 2.99 | % | | N/A | | | N/A | | | N/A | | | 2.98 | %3 |
iMoneyNet Average First-Tier Institutional Money Market Fund | | 2.92 | % | | N/A | | | N/A | | | N/A | | | 2.92 | %4 |
Current & Effective Yields | | 7-day Simple Yield: 4.03%* | | | | | | 7-day Compound Yield: 4.11%* | |
| 1 | Inception date for the retail class of The Money Market Fund was 3/27/85. |
| 2 | Performance results for the Lipper Average General Purpose Money Market Fund is from 3/31/85 through 12/31/05. |
| 3 | Inception date for the institutional class of The Money Market Fund was 12/28/04. |
| 4 | Performance results for the iMoneyNet Average First-Tier Institutional Money Market Fund is from 3/31/85 through 12/31/05. |
| * | For the seven-day period ended December 31, 2005, yield quotations more closely reflect the current earnings of The Money Market Fund than do total return quotations. |
Past performance does not guarantee future results. Except for the current and effective yields, all performance figures represent average annual total returns for the periods ended December 31, 2005, and assume reinvestment of all dividend and capital gain distributions. The investment return and principal value of an investment will fluctuate so that an investor’s shares, when redeemed, may be worth more or less than their original cost. Management fees were waived and/or expenses were reimbursed in order to reduce the operating expenses of both the retail class and the institutional class of The Money Market Fund during the periods shown above. Investments in The Money Market Fund are neither insured nor guaranteed by the Federal Deposit Insurance Corporation or any other governmental agency. Although the Fund seeks to preserve the value of your investment at $1.00 per share, it is possible to lose money by investing in The Money Market Fund. Source for average general purpose money market fund data: Lipper, Inc. Source for average first-tier institutional money market fund data: iMoneyNet, Inc.
| | |
Annual Returns (Retail Class): 1996 - 2005 | | Annual Returns (Institutional Class): 2005 |
| |
 | |  |
| | |
| Fund Holdings as of December 31, 2005 | | Fund holdings are subject to change. |
| | | | | |
| 1) | | Corporate Notes | | 46 | % |
| | |
| 2) | | Variable Rate Corporate Notes | | 42 | % |
| | |
| 3) | | Repurchase Agreements | | 8 | % |
| | |
| 4) | | U.S. Gov’t Agency Notes | | 4 | % |
| | |
| The Flex-Funds 2005 Annual Report | December 31, 2005 | | Page 15 |
| | |
| The Flex-funds | | 2005 Annual Report | December 31, 2005 |
Shareholder Expense Analysis (Unaudited)
Shareholders of mutual funds pay ongoing expenses, such as advisory fees, distribution and service fees (12b-1 fees) and other fund expenses. The following examples are intended to help you understand your ongoing costs (in dollars) of investing in the Funds and to compare these costs with the ongoing costs of investing in other mutual funds.
The examples below are based on an investment of $1,000 invested at the beginning of the period and held for the six-month period from June 30, 2005 to December 31, 2005.
ACTUAL EXPENSES: The first table below provides information about actual account values and actual expenses. You may use the information in this table, together with the amount you invested, to estimate the expenses that you paid over the period. Simply divide your account value by $1,000 (e.g.: an $8,600 account value divided by $1,000 = 8.6), then multiply the result by the number in the line under the heading “Expenses Paid During the Period” to estimate the expenses you paid on your account during this period.
ACTUAL EXPENSES
| | | | | | | | | | | | |
| | | Beginning Account
Value 6/30/05 | | Ending Account
Value 12/31/05 | | Expenses Paid
During Period*
6/30/2005 - - 12/31/2005 | | Expense Ratio
(Annualized) | |
The Muirfield Fund | | $ | 1,000.00 | | $ | 1,050.00 | | $ | 8.11 | | 1.57 | % |
The Dynamic Growth Fund | | $ | 1,000.00 | | $ | 1,058.80 | | $ | 8.15 | | 1.57 | % |
The Aggressive Growth Fund | | $ | 1,000.00 | | $ | 1,065.50 | | $ | 10.57 | | 2.03 | % |
The Quantex Fund | | $ | 1,000.00 | | $ | 1,046.60 | | $ | 9.18 | | 1.78 | % |
The Total Return Utilities Fund | | $ | 1,000.00 | | $ | 1,051.40 | | $ | 10.75 | | 2.08 | % |
The U.S. Government Bond Fund | | $ | 1,000.00 | | $ | 992.00 | | $ | 5.52 | | 1.10 | % |
The Money Market Fund - Retail Class | | $ | 1,000.00 | | $ | 1,016.80 | | $ | 2.44 | | 0.48 | % |
The Money Market Fund - Institutional Class | | $ | 1,000.00 | | $ | 1,017.50 | | $ | 1.73 | | 0.34 | % |
HYPOTHETICAL EXAMPLE FOR COMPARISON PURPOSES: The second table below provides information about hypothetical account values and hypothetical expenses based on the Funds’ actual expense ratios and assumed rates of return of 5% per year before expenses, which are not the Funds’ actual returns. The hypothetical account values and expenses may not be used to estimate the actual ending account balance or expenses you paid for the period. You may use this information to compare the ongoing costs of investing in the Funds to other mutual funds. To do so, compare this 5% hypothetical example with the 5% hypothetical examples that appear in the shareholder reports of the other funds.
HYPOTHETICAL EXAMPLE
(5% return before expenses)
| | | | | | | | | | | | |
| | | Beginning Account
Value 6/30/05 | | Ending Account
Value 12/31/05 | | Expenses Paid During Period* 6/30/2005 - - 12/31/2005 | | Expense Ratio (Annualized) | |
The Muirfield Fund | | $ | 1,000.00 | | $ | 1,017.29 | | $ | 7.98 | | 1.57 | % |
The Dynamic Growth Fund | | $ | 1,000.00 | | $ | 1,017.29 | | $ | 7.98 | | 1.57 | % |
The Aggressive Growth Fund | | $ | 1,000.00 | | $ | 1,014.97 | | $ | 10.31 | | 2.03 | % |
The Quantex Fund | | $ | 1,000.00 | | $ | 1,016.23 | | $ | 9.05 | | 1.78 | % |
The Total Return Utilities Fund | | $ | 1,000.00 | | $ | 1,014.72 | | $ | 10.56 | | 2.08 | % |
The U.S. Government Bond Fund | | $ | 1,000.00 | | $ | 1,019.66 | | $ | 5.60 | | 1.10 | % |
The Money Market Fund - Retail Class | | $ | 1,000.00 | | $ | 1,022.79 | | $ | 2.45 | | 0.48 | % |
The Money Market Fund - Institutional Class | | $ | 1,000.00 | | $ | 1,023.49 | | $ | 1.73 | | 0.34 | % |
Please note that the expenses shown in the tables are meant to highlight your ongoing costs only and do not reflect any transactional costs, such as redemption fees or exchange fees. Therefore, the second table is useful in comparing ongoing costs only, and will not help you determine the relative total costs of owning different Funds. In addition, if any transactional costs were included, your costs would have been higher.
| * | Expenses are equal to the Funds’ annualized expense ratios, multiplied by the average account value over the period, multiplied by 184/365 (to reflect the total number of days in the six-month period). |
| | |
| Page 16 | | The Flex-Funds 2005 Annual Report | December 31, 2005 |
| | |
| The Flex-funds | | 2005 Annual Report | December 31, 2005 |
2005 Annual Report
Fund Holdings & Financial Statements
| | |
| The Flex-Funds 2005 Annual Report | December 31, 2005 | | Page 17 |
Schedule of Investments
December 31, 2005
The Muirfield Fund
| | | | |
Security Description
| | Shares or
Principal
Amount ($)
| | Value ($)
|
Registered Investment Companies — 91.9% |
American Beacon Large Cap Value Fund | | 809,455 | | 16,140,526 |
American Growth Fund of America — A | | 367,151 | | 11,330,284 |
Artisan MidCap Value Fund | | 621,516 | | 11,653,417 |
First American Mid Cap Growth Fund | | 285,378 | | 11,066,952 |
HighMark Small Cap Value Fund | | 180,381 | | 3,070,078 |
iShares Russell 1000 Growth Index Fund | | 37,500 | | 1,912,875 |
JP Morgan Diversified Mid Cap Value Fund | | 459,011 | | 6,981,565 |
NASDAQ 100 Index Tracking Stock | | 70,600 | | 2,853,087 |
SSgA International Stock Selection Fund | | 623,938 | | 6,882,041 |
| | | | |
|
Total Registered Investment Companies (Cost $74,721,094) | | | | 71,890,825 |
| | | | |
|
U.S. Government Obligations — 1.4% |
U.S. Treasury Bill, 3.875%, due 03/09/06* | | 1,100,000 | | 1,091,651 |
| | | | |
|
Total U.S. Government Obligations (Cost $1,092,055) | | | | 1,091,651 |
| | | | |
|
Repurchase Agreements — 5.3% | | | | |
Morgan Stanley DW, Inc., 4.31%, 01/03/06, (Collateralized by $4,213,117 Klio II Funding, Ltd. Commercial Paper, at 4.31%, due 01/26/2006, value — $4,199,340) purchase date 12/30/2005 | | 4,117,000 | | 4,117,000 |
| | | | |
|
Total Repurchase Agreements
(Cost $4,117,000) | | | | 4,117,000 |
| | | | |
|
Total Investments — 98.6%
(Cost $79,930,149)(a) | | | | 77,099,476 |
| | | | |
|
Other Assets less Liabilities — 1.4% | | | | 1,081,640 |
| | | | |
|
Total Net Assets — 100.0% | | | | 78,181,116 |
| | | | |
|
Trustee Deferred Compensation** | | | | |
The Flex-funds Dynamic Growth Fund | | 2,988 | | 24,741 |
The Flex-funds Quantex Fund | | 3,369 | | 57,576 |
The Flex-funds Muirfield Fund | | 10,732 | | 55,270 |
The Flex-funds Total Return Utilities Fund | | 2,294 | | 43,655 |
| | | | |
|
Total Trustee Deferred Compensation (Cost $170,553) | | | | 181,242 |
| | | | |
|
The Muirfield Fund
| | | | | |
Security Description
| | Long
Contracts
| | Unrealized
Appreciation
(Depreciation) ($)
| |
Futures Contracts | | | | | |
Standard & Poors MidCap 400 expiring March 2006, notional value $4,830,800 | | 13 | | (86,450 | ) |
| | | | |
|
|
Total Futures Contracts | | | | (86,450 | ) |
| | | | |
|
|
| (a) | Represents cost for financial reporting purposes and differs for federal income tax purposes by the amount of losses recognized in excess of federal income tax reporting of approximately $11,439. Cost for federal income tax purposes of $79,941,588 differs from value by net unrealized appreciation (depreciation) of securities as follows: |
| | | | |
Unrealized appreciation | | $ | 771,291 | |
Unrealized depreciation | | | (3,613,403 | ) |
| | |
|
|
|
Net unrealized appreciation (depreciation) | | $ | (2,842,112 | ) |
| | |
|
|
|
| # | Represents non-income producing securities. |
| * | Pledged as collateral on futures contracts. |
| ** | Assets of affiliates to The Muirfield Fund held for the benefit of the Fund’s Trustees in connection with the Trustee Deferred Compensation Plan. |
The accompanying notes are an integral part of these financial statements.
Schedule of Investments
December 31, 2005
The Total Return Utilities Fund
| | | | |
Security Description
| | Shares or
Principal
Amount ($)
| | Value ($)
|
Common Stocks — 98.3% | | | | |
Electric/Gas Utility — 11.3% | | | | |
AGL Resources, Inc. | | 21,440 | | 746,326 |
ATMOS Energy Corp. | | 15,630 | | 408,881 |
MDU Resources Group, Inc. | | 17,905 | | 586,210 |
NiSource, Inc. | | 38,895 | | 811,350 |
| | | | |
|
| | | | | 2,552,767 |
| | | | |
|
Electric Utility — 20.3% | | | | |
Energy East Corp. | | 35,310 | | 805,068 |
KeySpan Corp. | | 13,365 | | 476,997 |
IDACORP, Inc. | | 21,440 | | 628,192 |
Northeast Utilities | | 32,190 | | 633,821 |
NRG Energy, Inc.# | | 10,335 | | 486,985 |
Pepco Holdings, Inc. | | 16,900 | | 378,053 |
Sierra Pacific Resources# | | 89,780 | | 1,170,731 |
| | | | |
|
| | | | | 4,579,847 |
| | | | |
|
Natural Gas (Distributor) — 17.5% | | | | |
Dynegy, Inc.# | | 75,645 | | 366,122 |
Enterprise Products Partners, L.P. | | 23,096 | | 554,535 |
National Fuel Gas Co. | | 19,920 | | 621,305 |
Nicor, Inc. | | 13,260 | | 521,250 |
ONEOK, Inc. | | 22,695 | | 604,368 |
Southern Union Co.# | | 19,045 | | 450,033 |
Vectren Corp. | | 22,190 | | 602,680 |
WGL Holdings, Inc. | | 8,575 | | 257,765 |
| | | | |
|
| | | | | 3,978,058 |
| | | | |
|
Oil & Natural Gas — 28.0% | | | | |
Anadarko Petroleum Corp. | | 6,515 | | 617,296 |
Equitable Resources, Inc. | | 26,230 | | 962,379 |
Kinder Morgan Energy Partners, L.P. | | 19,518 | | 933,351 |
Peoples Energy Corp. | | 10,590 | | 371,391 |
Pioneer Natural Resources Co. | | 21,180 | | 1,085,898 |
Questar Corp. | | 14,775 | | 1,118,468 |
Ultra Petroleum Corp.# | | 22,715 | | 1,267,430 |
| | | | |
|
| | | | | 6,356,213 |
| | | | |
|
Telecommunication Services — 19.7% | | | | |
AT&T, Inc. | | 29,505 | | 722,578 |
Brasil Telecom ADR | | 11,855 | | 442,784 |
China Mobile Limited ADR | | 22,700 | | 545,708 |
Cypress Semiconductor Corp.# | | 16,900 | | 240,825 |
Nokia Corp. — ADR | | 28,450 | | 520,635 |
PT Telekomunikasi Indonesia — ADR | | 23,200 | | 553,552 |
Sprint Nextel Corp. | | 22,450 | | 524,432 |
Telefonos de Mexico SA de CV ADR | | 23,710 | | 585,163 |
Vodafone AirTouch PLC — ADR | | 15,130 | | 324,841 |
| | | | |
|
| | | | | 4,460,518 |
| | | | |
|
Water Utility — 1.5% | | | | |
United Utilities PLC — ADR | | 14,625 | | 341,346 |
| | | | |
|
Total Common Stocks
(Cost $18,384,685 ) | | | | 22,268,749 |
| | | | |
|
The Total Return Utilities Fund
| | | | |
Security Description
| | Shares or
Principal
Amount ($)
| | Value ($)
|
Repurchase Agreements — 1.6% | | | | |
Morgan Stanley DW, Inc., 4.31%, 01/03/06, (Collateralized by $375,568 Klio II Funding, Ltd. Commercial Paper, at 4.31%, due 01/26/2006, value — $374,340) purchase date 12/30/2005 | | 367,000 | | 367,000 |
| | | | |
|
Total Repurchase Agreements
(Cost $367,000 ) | | | | 367,000 |
| | | | |
|
Total Investments — 99.9%
(Cost $18,751,685 )(a) | | | | 22,635,749 |
| | | | |
|
Other Assets less Liabilities — 0.1% | | | | 8,229 |
| | | | |
|
Total Net Assets — 100.0% | | | | 22,643,978 |
| | | | |
|
Trustee Deferred Compensation* | | | | |
The Flex-funds Dynamic Growth Fund | | 1,050 | | 8,694 |
The Flex-funds Quantex Fund | | 1,040 | | 17,774 |
The Flex-funds Muirfield Fund | | 3,574 | | 18,406 |
The Flex-funds Total Return Utilities Fund | | 741 | | 14,101 |
| | | | |
|
Total Trustee Deferred Compensation (Cost $51,815 ) | | | | 58,975 |
| | | | |
|
| (a) | Cost for financial reporting purposes and federal income tax purposes are the same. Cost for federal income tax purposes differs from value by net unrealized appreciation (depreciation) of securities as follows: |
| | | | |
Unrealized appreciation | | $ | 4,446,620 | |
Unrealized depreciation | | | (562,556 | ) |
| | |
|
|
|
Net unrealized appreciation (depreciation) | | $ | 3,884,064 | |
| | |
|
|
|
ADR: American Depositary Receipt
| # | Represents non-income producing securities. |
| * | Assets of affiliates to The Total Return Utilities Fund held for the benefit of the Fund’s Trustees in connection with the Trustees Deferred Compensation Plan. |
The accompanying notes are an integral part of these financial statements.
Schedule of Investments
December 31, 2005
The Quantex Fund
| | | | |
Security Description
| | Shares or
Principal
Amount ($)
| | Value ($)
|
Common Stocks — 87.8% | | | | |
Basic Materials — 8.6% | | | | |
Allegheny Technologies, Inc. | | 7,400 | | 266,992 |
Ashland, Inc. | | 2,600 | | 150,540 |
Eastman Chemical Co. | | 2,700 | | 139,293 |
Engelhard Corp. | | 4,800 | | 144,720 |
Hercules, Inc.# | | 10,000 | | 113,000 |
Int’l Flavors & Fragrances, Inc. | | 3,700 | | 123,950 |
Louisiana Pacific Corp. | | 5,700 | | 156,579 |
Marathon Oil Corp. | | 614 | | 37,435 |
Sigma — Aldrich Corp. | | 2,400 | | 151,896 |
Temple — Inland, Inc. | | 4,300 | | 192,855 |
| | | | |
|
| | | | | 1,477,260 |
| | | | |
|
Communications — 8.6% | | | | |
ADC Telecom., Inc.# | | 8,114 | | 181,104 |
Andrew Corp.# | | 11,000 | | 118,030 |
CenturyTel, Inc. | | 4,200 | | 139,272 |
Ciena Corp.# | | 47,400 | | 140,778 |
Citizens Communications Co. | | 10,200 | | 124,746 |
Dow Jones & Co., Inc. | | 3,400 | | 120,666 |
JDS Uniphase Corp.# | | 47,000 | | 110,920 |
Meredith Corp. | | 2,700 | | 141,318 |
Monster Worldwide, Inc.# | | 5,000 | | 204,100 |
Tellabs, Inc.# | | 17,100 | | 186,390 |
| | | | |
|
| | | | | 1,467,324 |
| | | | |
|
Consumer Cyclical — 17.5% | | | | |
Big Lots, Inc.# | | 12,600 | | 151,326 |
Brunswick Corp. | | 3,000 | | 121,980 |
Circuit City Stores, Inc. | | 10,500 | | 237,195 |
Cooper Tire & Rubber Co. | | 6,900 | | 105,708 |
Dana Corp. | | 8,500 | | 61,030 |
Darden Restaurants, Inc. | | 5,400 | | 209,952 |
Delphi Corp. | | 57,800 | | 16,819 |
Delta Air Lines, Inc.# | | 21,100 | | 15,825 |
Dillards, Inc. | | 5,500 | | 136,510 |
Hasbro, Inc. | | 7,600 | | 153,368 |
Jones Apparel Group, Inc. | | 3,900 | | 119,808 |
Liz Claiborne, Inc. | | 3,600 | | 128,952 |
Maytag Corp. | | 7,400 | | 139,268 |
Navistar International Corp.# | | 3,400 | | 97,308 |
OfficeMax, lnc. | | 4,800 | | 121,728 |
Reebok International, Ltd. | | 3,200 | | 186,336 |
Sabre Holdings Corp. | | 6,700 | | 161,537 |
The Goodyear Tire & Rubber Co.# | | 10,000 | | 173,800 |
Tiffany & Co. | | 4,600 | | 176,134 |
Visteon Corp.# | | 16,100 | | 100,786 |
Wendy’s International, Inc. | | 3,700 | | 204,462 |
Whirlpool Corp. | | 2,100 | | 175,896 |
| | | | |
|
| | | | | 2,995,728 |
| | | | |
|
Consumer Noncyclical — 12.1% | | | | |
Alberto — Culver Co. | | 3,000 | | 137,250 |
Bausch & Lomb, Inc. | | 2,300 | | 156,170 |
Convergys Corp.# | | 9,800 | | 155,330 |
Equifax, Inc. | | 5,300 | | 201,506 |
Humana, Inc.# | | 4,800 | | 260,784 |
King Pharmaceuticals, Inc.# | | 11,700 | | 197,964 |
Manor Care, Inc. | | 4,200 | | 167,034 |
The Quantex Fund
| | | | |
Security Description
| | Shares or
Principal
Amount ($)
| | Value ($)
|
Common Stocks — continued | | | | |
Millipore Corp.# | | 3,000 | | 198,120 |
Molson Coors Brewing Co. | | 2,000 | | 133,980 |
Mylan Laboratories, Inc. | | 8,300 | | 165,668 |
Supervalu, Inc. | | 4,300 | | 139,664 |
Watson Pharmaceuticals, lnc.# | | 4,600 | | 149,546 |
| | | | |
|
| | | | | 2,063,016 |
| | | | |
|
Energy — 2.1% | | | | |
Dynegy, Inc.# | | 32,700 | | 158,268 |
Rowan Cos., Inc. | | 5,700 | | 203,148 |
| | | | |
|
| | | | | 361,416 |
| | | | |
|
Financial — 2.9% | | | | |
Apartment Investment & Management Co. | | 3,900 | | 147,693 |
Federated Investors, Inc. | | 4,800 | | 177,792 |
Janus Capital Group, Inc. | | 9,000 | | 167,670 |
Wachovia Corp. Pref. Dividend Equalization | | 1,700 | | — |
| | | | |
|
| | | | | 493,155 |
| | | | |
|
Industrial — 16.2% | | | | |
Allied Waste Industries, Inc.# | | 16,100 | | 140,714 |
American Power Conversion Corp. | | 7,000 | | 154,000 |
Applera Corp. — Applied Biosystems | | 7,000 | | 185,920 |
Bemis Co. | | 5,200 | | 144,924 |
Chemtura Corp. | | 11,560 | | 146,812 |
Cummins, Inc. | | 1,800 | | 161,514 |
Fluor Corp. | | 2,800 | | 216,328 |
Goodrich Corp. | | 4,600 | | 189,060 |
Pactiv Corp.# | | 5,800 | | 127,600 |
Pall Corp. | | 4,900 | | 131,614 |
PerkinElmer, lnc. | | 6,800 | | 160,208 |
Power — One, Inc.# | | 17,500 | | 105,350 |
Ryder System, Inc. | | 3,100 | | 127,162 |
Sanmina — SCI Corp.# | | 17,900 | | 76,254 |
Sealed Air Corp.# | | 2,700 | | 151,659 |
Snap — On, Inc. | | 4,300 | | 161,508 |
Stanley Works / The | | 3,000 | | 144,120 |
Symbol Technologies, Inc. | | 8,800 | | 112,816 |
Tektronix, Inc. | | 5,000 | | 141,050 |
| | | | |
|
| | | | | 2,778,613 |
| | | | |
|
Technology — 12.8% | | | | |
Applied Micro Circuits Corp.# | | 36,400 | | 93,548 |
BMC Software, Inc.# | | 8,100 | | 165,969 |
Citrix Systems, Inc.# | | 6,300 | | 180,999 |
Compuware Corp.# | | 23,600 | | 211,692 |
Gateway, Inc.# | | 26,100 | | 65,511 |
LSI Logic Corp.# | | 25,100 | | 200,800 |
Mercury Interactive Corp.# | | 3,200 | | 88,928 |
Novell, Inc.# | | 22,500 | | 198,675 |
Novellus Systems, Inc.# | | 5,300 | | 127,836 |
Nvidia Corp.# | | 6,300 | | 230,328 |
Parametric Technology Corp.# | | 26,900 | | 164,090 |
PMC — Sierra, Inc.# | | 14,200 | | 109,482 |
QLogic Corp.# | | 3,900 | | 126,789 |
Teradyne, Inc.# | | 8,800 | | 128,216 |
Unisys Corp.# | | 14,700 | | 85,701 |
| | | | |
|
| | | | | 2,178,564 |
| | | | |
|
Schedule of Investments
December 31, 2005
The Quantex Fund
| | | | | |
Security Description
| | Shares or
Principal
Amount ($)
| | Value ($)
| |
Common Stocks — continued | | | | | |
Utilities — 7.0% | | | | | |
Allegheny Energy, Inc.# | | 7,600 | | 240,540 | |
Calpine Corp.# | | 41,800 | | 8,694 | |
Centrepoint Energy, Inc. | | 13,100 | | 168,335 | |
CMS Energy Corp.# | | 14,200 | | 206,042 | |
Nicor, Inc. | | 3,900 | | 153,309 | |
Peoples Energy Corp. | | 3,400 | | 119,238 | |
Pinnacle West Capital Corp. | | 3,300 | | 136,455 | |
TECO Energy, Inc. | | 9,500 | | 163,210 | |
| | | | |
|
|
| | | | | 1,195,823 | |
| | | | |
|
|
Total Common Stocks
(Cost $13,137,908) | | | | 15,010,899 | |
| | | | |
|
|
U.S. Government Obligations — 1.7% | | | | | |
U.S. Treasury Bill,
3.875%, due 03/09/2006* | | 300,000 | | 297,723 | |
| | | | |
|
|
Total U.S. Government Obligations
(Cost $297,839) | | | | 297,723 | |
| | | | |
|
|
Repurchase Agreements — 10.7% | | | | | |
Morgan Stanley DW, Inc., 4.31%, 01/03/06, (Collateralized by $1,878,864 Klio II Funding, Ltd. Commercial Paper, at 4.31%, due 01/26/2006, value — $1,872,720) purchase date 12/30/2005 | | 1,836,000 | | 1,836,000 | |
| | | | |
|
|
Total Repurchase Agreements
(Cost $1,836,000) | | | | 1,836,000 | |
| | | | |
|
|
Total Investments — 100.2%
(Cost $15,271,747)(a) | | | | 17,144,622 | |
| | | | |
|
|
Liabilities less Other Assets — (0.2%) | | | | (30,179 | ) |
| | | | |
|
|
Total Net Assets — 100.0% | | | | 17,114,443 | |
| | | | |
|
|
Trustee Deferred Compensation** | | | | | |
The Flex-funds Dynamic Growth Fund | | 1,544 | | 12,784 | |
The Flex-funds Quantex Fund | | 1,511 | | 25,823 | |
The Flex-funds Muirfield Fund | | 5,267 | | 27,125 | |
The Flex-funds Total Return Utilities Fund | | 1,138 | | 21,656 | |
| | | | |
|
|
Total Trustee Deferred Compensation (Cost $79,477) | | | | 87,388 | |
| | | | |
|
|
The Quantex Fund
| | | | | |
Security Description
| | Long
Contracts
| | Unrealized
Appreciation
(Depreciation) ($)
| |
Futures Contracts | | | | | |
Russell 2000 expiring March 2006, notional value $2,034,900 | | 6 | | (48,300 | ) |
| | | | |
|
|
Total Futures Contracts | | | | (48,300 | ) |
| | | | |
|
|
| (a) | Cost for financial reporting purposes and federal income tax purposes are the same. Cost for federal income tax purposes differs from value by net unrealized appreciation (depreciation) of securities as follows: |
| | | | |
Unrealized appreciation | | $ | 2,479,979 | |
Unrealized depreciation | | | (607,104 | ) |
| | |
|
|
|
Net unrealized appreciation (depreciation) | | $ | 1,872,875 | |
| | |
|
|
|
ADR: American Depositary Receipt
| # | Represents non-income producing securities. |
| * | Pledged as collateral on Futures Contracts. |
| ** | Assets of affiliates to The Flex-funds Quantex Fund held for the benefit of the Fund’s Trustees in connection with the Trustee Deferred Compensation Plan. |
The accompanying notes are an integral part of these financial statements.
Schedule of Investments
December 31, 2005
The Dynamic Growth Fund
| | | | | |
Security Description
| | Shares or
Principal
Amount ($)
| | Value ($)
| |
Registered Investment Companies — 92.9% | |
Allianz NACM International Fund — I | | 144,690 | | 2,788,183 | |
American Beacon Large Cap Value Fund | | 169,162 | | 3,373,094 | |
American Growth Fund of America — A | | 146,840 | | 4,531,483 | |
First American Mid Cap Growth Fund | | 81,542 | | 3,162,198 | |
Goldman Sachs Mid Cap Value Fund | | 225,438 | | 7,890,335 | |
HighMark Small Cap Value Fund | | 69,855 | | 1,188,930 | |
iShares Russell 1000 Growth Index Fund | | 16,700 | | 851,867 | |
iShares Russell 1000 Value Index Fund | | 44,100 | | 3,044,223 | |
Munder Mid Cap Core Growth Fund — A | | 55,905 | | 1,261,764 | |
Munder Small Cap Value Fund — A | | 11,125 | | 304,153 | |
NASDAQ 100 Index Tracking Stock | | 31,500 | | 1,272,978 | |
| | �� | | |
|
|
Total Registered Investment Companies (Cost $30,106,090) | | | | 29,669,208 | |
| | | | |
|
|
U.S. Government Obligations — 1.3% | |
U.S. Treasury Bill,
3.875%, due 03/09/06* | | 400,000 | | 396,964 | |
| | | | |
|
|
Total U.S. Government Obligations
(Cost $397,119) | | | | 396,964 | |
| | | | |
|
|
Repurchase Agreements — 7.1% | |
Morgan Stanley DW, Inc., 4.31%, 01/03/06, (Collateralized by $2,331,183 Klio II Funding, Ltd. Commercial Paper, at 4.31%, due 01/26/2006, value — $2,323,560) purchase date 12/30/2005 | | 2,278,000 | | 2,278,000 | |
| | | | |
|
|
Total Repurchase Agreements
(Cost $2,278,000) | | | | 2,278,000 | |
| | | | |
|
|
Total Investments — 101.3%
(Cost $32,781,209)(a) | | | | 32,344,172 | |
| | | | |
|
|
Liabilities less Other Assets — (1.3%) | | | | (401,188 | ) |
| | | | |
|
|
Total Net Assets — 100.0% | | | | 31,942,984 | |
| | | | |
|
|
Trustee Deferred Compensation** | |
The Flex-funds Dynamic Growth Fund | | 717 | | 5,937 | |
The Flex-funds Quantex Fund | | 668 | | 11,416 | |
The Flex-funds Muirfield Fund | | 2,426 | | 12,494 | |
The Flex-funds Total Return Utilities Fund | | 492 | | 9,363 | |
| | | | |
|
|
Total Trustee Deferred Compensation (Cost $32,565) | | | | 39,210 | |
| | | | |
|
|
The Dynamic Growth Fund
| | | | |
Security Description
| | Long
Contracts
| | Unrealized
Appreciation
(Depreciation) ($)
|
Futures Contracts | | | | |
Standard & Poors MidCap 400 expiring March 2006, notional value $2,601,200 | | 7 | | (44,450) |
| | | | |
|
Total Futures Contracts | | | | (44,450) |
| | | | |
|
| (a) | Cost for financial reporting purposes and federal income tax purposes are the same. Cost for federal income tax purposes differs from value by net unrealized appreciation (depreciation) of securities as follows: |
| | | | |
Unrealized appreciation | | $ | 290,681 | |
Unrealized depreciation | | | (727,718 | ) |
| | |
|
|
|
Net unrealized appreciation (depreciation) | | $ | (437,037 | ) |
| | |
|
|
|
| # | Represents non-income producing security. |
| * | Pledged as collateral on futures contracts. |
| ** | Assets of affiliates to The Dynamic Growth Fund held for the benefit of the Fund’s Trustees in connection with the Trustee Deferred Compensation Plan. |
The accompanying notes are an integral part of these financial statements.
Schedule of Investments
December 31, 2005
The Aggressive Growth Fund
| | | | | |
Security Description
| | Shares or
Principal
Amount ($)
| | Value ($)
| |
Registered Investment Companies — 92.3% | | | |
American Beacon Large Cap Value Fund | | 48,612 | | 969,316 | |
Fidelity Advisor Leveraged Company Stock Fund — A | | 60,839 | | 1,725,391 | |
Gartmore US Growth Leaders Fund — A | | 157,003 | | 1,560,605 | |
Goldman Sachs Mid Cap Value Fund | | 25,571 | | 894,995 | |
Harding Loevner Emerging Markets Fund | | 30,237 | | 1,051,939 | |
HighMark Small Cap Value Fund | | 32,686 | | 556,315 | |
iShares Russell 1000 Growth Index Fund | | 8,500 | | 433,585 | |
iShares Russell 1000 Value Index Fund | | 10,900 | | 752,427 | |
Munder Mid Cap Core Growth Fund — A | | 91,001 | | 2,053,883 | |
Munder Small Cap Value Fund — A | | 3,778 | | 103,301 | |
NASDAQ 100 Index Tracking Stock | | 15,900 | | 642,551 | |
| | | | |
|
|
Total Registered Investment Companies (Cost $10,524,020) | | | | 10,744,308 | |
| | | | |
|
|
U.S. Government Obligations — 1.7% | | | |
U.S. Treasury Bill,
3.875%, due 03/09/06* | | 200,000 | | 198,482 | |
| | | | |
|
|
Total U.S. Government Obligations
(Cost $198,559) | | | | 198,482 | |
| | | | |
|
|
Repurchase Agreements — 6.2% | | | |
Morgan Stanley DW, Inc., 4.31%, 01/03/06, (Collateralized by $730,669 Klio II Funding, Ltd. Commercial Paper, at 4.31%, due 01/26/2006, value —$728,280) purchase date 12/30/2005 | | 714,000 | | 714,000 | |
| | | | |
|
|
Total Repurchase Agreements
(Cost $714,000) | | | | 714,000 | |
| | | | |
|
|
Total Investments — 100.2%
(Cost $11,436,579)(a) | | | | 11,656,790 | |
| | | | |
|
|
Liabilities less Other Assets — (0.2%) | | | | (17,503 | ) |
| | | | |
|
|
Total Net Assets — 100.0% | | | | 11,639,287 | |
| | | | |
|
|
Trustee Deferred Compensation** | | | |
The Flex-funds Dynamic Growth Fund | | 615 | | 5,092 | |
The Flex-funds Quantex Fund | | 547 | | 9,348 | |
The Flex-funds Muirfield Fund | | 2,049 | | 10,552 | |
The Flex-funds Total Return Utilities Fund | | 416 | | 7,916 | |
| | | | |
|
|
Total Trustee Deferred Compensation (Cost $27,200) | | | | 32,908 | |
| | | | |
|
|
The Aggressive Growth Fund
| | | | | |
Security Description
| | Long
Contracts
| | Unrealized
Appreciation
(Depreciation) ($)
| |
Futures Contracts | | | |
Standard & Poors MidCap 400 expiring March 2006, notional value $743,200 | | 2 | | (13,300 | ) |
| | | | |
|
|
Total Futures Contracts | | | | (13,300 | ) |
| | | | |
|
|
| (a) | Cost for financial reporting purposes and federal income tax purposes are the same. Cost for federal income tax purposes differs from value by net unrealized appreciation (depreciation) of securities as follows: |
| | | | |
Unrealized appreciation | | $ | 398,451 | |
Unrealized depreciation | | | (178,240 | ) |
| | |
|
|
|
Net unrealized appreciation (depreciation) | | $ | 220,211 | |
| | |
|
|
|
| # | Represents non-income producing securities. |
| * | Pledged as collateral on futures contracts. |
| ** | Assets of affiliates to The Aggressive Growth Fund held for the benefit of the Fund’s Trustees in connection with the Trustee Deferred Compensation Plan. |
The accompanying notes are an integral part of these financial statements.
Schedule of Investments
December 31, 2005
The U.S. Government Bond Fund
| | | | |
Security Description
| | Principal
Amount ($)
or Shares
| | Value ($)
|
Registered Investment Companies — 9.9% |
iShares GS$ InvesTop Corporate Bond Fund | | 5,800 | | 624,602 |
| | | | |
|
Total Registered Investment Companies
(Cost $642,176) | | | | 624,602 |
| | | | |
|
U.S. Government Obligations — 81.3% | | |
Federal Farm Credit, 2.32%, due 12/26/06 | | 500,000 | | 488,438 |
Federal Farm Credit, 2.25%, due 06/28/07 | | 500,000 | | 482,308 |
Federal Home Loan Bank,
3.125%, due 05/21/07 | | 400,000 | | 391,400 |
Federal Home Loan Bank,
3.00%, due 12/28/07 | | 400,000 | | 387,131 |
Freddie Mac, 3.00%, due 06/02/06 | | 800,000 | | 794,727 |
U.S. Treasury Inflation Protected Security, 3.375%, due 01/15/07 | | 502,884 | | 506,656 |
U.S. Treasury Note, 6.50%, due 10/15/06 | | 500,000 | | 507,734 |
U.S. Treasury Note, 4.00%, due 06/15/09 | | 200,000 | | 197,562 |
U.S. Treasury Note, 5.00%, due 08/15/11 | | 770,000 | | 794,664 |
U.S. Treasury Note, 4.375%, due 08/15/12 | | 300,000 | | 299,953 |
U.S. Treasury Note, 4.00%, due 11/15/12 | | 300,000 | | 293,578 |
| | | | |
|
Total U.S. Government Obligations
(Cost $5,152,750) | | | | 5,144,151 |
| | | | |
|
Repurchase Agreements — 8.3% | | | | |
Morgan Stanley DW, Inc., 4.31%, 01/03/06, (Collateralized by $539,304 Klio II Funding, Ltd. Commercial Paper, at 4.31%, due 01/26/2006, value — $537,540) purchase date 12/30/2005 | | 527,000 | | 527,000 |
| | | | |
|
Total Repurchase Agreements
(Cost $527,000) | | | | 527,000 |
| | | | |
|
Total Investments — 99.5%
(Cost $6,321,926)(a) | | | | 6,295,753 |
| | | | |
|
Other Assets less Liabilities — 0.5% | | | | 28,475 |
| | | | |
|
Total Net Assets — 100.0% | | | | 6,324,228 |
| | | | |
|
The U.S. Government Bond Fund
| | | | |
Security Description
| | Principal
Amount ($)
or Shares
| | Value ($)
|
Trustee Deferred Compensation* | | | | |
The Flex-funds Dynamic Growth Fund | | 793 | | 6,566 |
The Flex-funds Quantex Fund | | 826 | | 14,116 |
The Flex-funds Muirfield Fund | | 2,739 | | 14,106 |
The Flex-funds Total Return Utilities Fund | | 569 | | 10,828 |
| | | | |
|
Total Trustee Deferred Compensation
(Cost $40,413) | | | | 45,616 |
| | | | |
|
| (a) | Represents cost for financial reporting purposes and differs for federal income tax purposes by the amount of losses recognized in excess of federal income tax reporting of approximately $48,816. Cost for federal income tax purposes of $6,370,742 differs from value by net unrealized appreciation (depreciation) of securities as follows: |
| | | | |
Unrealized appreciation | | $ | 6,673 | |
Unrealized depreciation | | | (81,662 | ) |
| | |
|
|
|
Net unrealized appreciation (depreciation) | | $ | (74,989 | ) |
| | |
|
|
|
| * | Assets of affiliates to The U.S. Government Bond Fund held for the benefit of the Fund’s Trustees in connection with the Trustee Deferred Compensation Plan. |
The accompanying notes are an integral part of these financial statements.
Schedule of Investments
December 31, 2005
The Money Market Fund
| | | | | | | | | |
Security Description
| | Coupon/
Yield
| | | Maturity
| | Principal
Amount ($)
or Shares
| | Value ($)
|
Corporate Obligations — 87.2% | | | | |
Aquarium Holdings, KY** | | 4.38% | * | | 01/05/06 | | 108,000 | | 108,000 |
ASIF Global Finance | | 2.65% | | | 01/17/06 | | 2,700,000 | | 2,698,163 |
AT&T Inc. | | 5.75% | | | 05/02/06 | | 3,500,000 | | 3,513,143 |
Bank Of America Corp. | | 6.20% | | | 02/15/06 | | 1,450,000 | | 1,454,371 |
Bank Of America Corp. | | 6.50% | | | 03/15/06 | | 1,245,000 | | 1,251,725 |
Bank One Corp. | | 6.25% | | | 02/01/06 | | 3,242,000 | | 3,247,424 |
Bath Technologies, Inc.** | | 4.46% | * | | 01/05/06 | | 1,190,000 | | 1,190,000 |
Beaver Creek Enterprise** | | 4.46% | * | | 01/05/06 | | 1,935,000 | | 1,935,000 |
Bellsouth Corp.** | | 4.26% | * | | 04/26/06 | | 2,000,000 | | 1,997,667 |
Cargill Inc. | | 6.25% | | | 05/01/06 | | 5,000,000 | | 5,027,637 |
Cascade Plaza Project** | | 4.46% | * | | 01/05/06 | | 7,928,000 | | 7,928,000 |
CIT Group, Inc. | | 4.13% | | | 02/21/06 | | 3,000,000 | | 2,998,470 |
CIT Group, Inc. | | 6.50% | | | 02/07/06 | | 2,000,000 | | 2,003,574 |
Citicorp | | 7.04% | | | 04/25/06 | | 2,000,000 | | 2,014,920 |
Clark Grave Vault Co.** | | 4.38% | * | | 01/05/06 | | 600,000 | | 600,000 |
Colgate-Palmolive Co. | | 5.34% | | | 03/27/06 | | 1,100,000 | | 1,102,294 |
Don’s Launderers-Cleaners, Inc.** | | 4.38% | * | | 01/05/06 | | 900,000 | | 900,000 |
Espanola/Nambe** | | 4.56% | * | | 01/05/06 | | 325,000 | | 325,000 |
First Chicago NBD | | 6.13% | | | 02/15/06 | | 2,000,000 | | 2,003,380 |
FPL Group Capital | | 3.25% | | | 04/11/06 | | 5,033,000 | | 5,016,596 |
General Dynamics Co. | | 2.13% | | | 05/15/06 | | 4,608,000 | | 4,567,299 |
General Electric Capital | | 2.00% | | | 01/30/06 | | 500,000 | | 499,034 |
Glaxo Wellcome PLC | | 6.13% | | | 01/25/06 | | 1,700,000 | | 1,701,854 |
Goldman Sachs Group | | 6.75% | | | 02/15/06 | | 1,000,000 | | 1,002,773 |
Gordon Flesch Co. Project** | | 4.46% | * | | 01/05/06 | | 700,000 | | 700,000 |
HSBC Finance Corp. | | 3.38% | | | 02/21/06 | | 2,000,000 | | 1,996,685 |
HSBC Finance Corp. | | 6.50% | | | 01/24/06 | | 4,630,000 | | 4,636,116 |
International Lease Finance | | 4.00% | | | 01/17/06 | | 2,500,000 | | 2,499,569 |
Isaac Tire, Inc.** | | 4.38% | * | | 01/05/06 | | 805,000 | | 805,000 |
JT2 LLC** | | 4.55% | * | | 01/05/06 | | 2,100,000 | | 2,100,000 |
Jim White Co.** | | 4.55% | * | | 01/05/06 | | 715,000 | | 715,000 |
K.L. Morris, Inc.** | | 4.38% | * | | 01/05/06 | | 2,015,000 | | 2,015,000 |
Keiser Street, Inc.** | | 4.46% | * | | 01/05/06 | | 1,595,000 | | 1,595,000 |
Lehman Brothers Holdings | | 6.25% | | | 05/15/06 | | 890,000 | | 895,404 |
Martin Wheel Co, Inc.** | | 4.69% | * | | 01/05/06 | | 2,275,000 | | 2,275,000 |
Mega Star Arbor LLC** | | 4.55% | * | | 01/05/06 | | 4,440,000 | | 4,440,000 |
Mellon Bank | | 7.00% | | | 03/15/06 | | 1,200,000 | | 1,206,372 |
Merck & Co. Inc.** | | 4.73% | * | | 02/22/06 | | 7,500,000 | | 7,500,850 |
Merrill Lynch | | 6.15% | | | 01/26/06 | | 2,500,000 | | 2,503,815 |
MetLife Insurance Co.*** | | 4.08% | * | | 01/03/06 | | 7,500,000 | | 7,500,000 |
Morgan Stanley | | 6.10% | | | 04/15/06 | | 3,800,000 | | 3,817,074 |
Mubea, Inc.** | | 4.55% | * | | 01/05/06 | | 2,800,000 | | 2,800,000 |
National Rural Utilities | | 4.45% | | | 02/17/06 | | 2,000,000 | | 2,000,083 |
National Rural Utilities | | 3.00% | | | 02/15/06 | | 4,000,000 | | 3,994,042 |
Osco Industries, Inc.** | | 4.51% | * | | 01/05/06 | | 600,000 | | 600,000 |
O.K.I. Supply Co.** | | 4.38% | * | | 01/05/06 | | 1,095,000 | | 1,095,000 |
Pro Tire, Inc.** | | 4.38% | * | | 01/05/06 | | 965,000 | | 965,000 |
Seariver Maritime, Inc.** | | 4.30% | * | | 01/03/06 | | 3,500,000 | | 3,500,000 |
SGS Tool Co.** | | 4.56% | * | | 01/05/06 | | 120,000 | | 120,000 |
Springside Corp Exchange Partners LLC** | | 4.46% | * | | 01/05/06 | | 2,000,000 | | 2,000,000 |
Sysco Corp. | | 7.00% | | | 05/01/06 | | 1,500,000 | | 1,511,888 |
The Money Market Fund
| | | | | | | | | |
Security Description
| | Coupon/
Yield
| | | Maturity
| | Principal
Amount ($)
or Shares
| | Value ($)
|
Corporate Obligations — continued | | | | |
Taylor Brothers Properties LLC** | | 4.38% | * | | 01/05/06 | | 1,170,000 | | 1,170,000 |
Wells Fargo Co. | | 5.90% | | | 05/21/06 | | 4,000,000 | | 4,018,388 |
White Castle Project** | | 4.46% | * | | 01/05/06 | | 5,000,000 | | 5,000,000 |
| | | | | | | | | |
|
Total Corporate Obligations
(Cost $131,061,610) | | | | | | | 131,061,610 |
| | | | | | | | | |
|
U.S. Government Agency Obligations — 3.9% | | |
Fannie Mae | | 2.25% | | | 02/17/06 | | 500,000 | | 499,081 |
Fannie Mae | | 2.00% | | | 04/12/06 | | 500,000 | | 496,575 |
Federal Home Loan Bank | | 3.90% | * | | 01/24/06 | | 2,000,000 | | 2,000,000 |
Federal Home Loan Bank | | 3.00% | | | 01/25/06 | | 2,000,000 | | 2,000,000 |
Federal Home Loan Bank | | 2.00% | | | 02/27/06 | | 500,000 | | 498,784 |
Freddie Mac | | 2.13% | | | 02/13/06 | | 330,000 | | 329,183 |
| | | | | | | | | |
|
Total U.S. Government Agency Obligations (Cost $5,823,623) | | | | 5,823,623 |
| | | | | | | | | |
|
Repurchase Agreements — 7.8% | | | | |
Morgan Stanley DW, Inc., 4.31%, 01/03/06, (Collateralized by $12,060,137 Klio II Funding, Ltd. Commercial Paper, at 4.31%, due 01/26/2006, value — $12,020,701) purchase date 12/30/2005 | | | | | 11,785,000 | | 11,785,000 |
| | | | | | | | | |
|
Total Repurchase Agreements (Cost $11,785,000) | | | | | | | 11,785,000 |
| | | | | | | | | |
|
Total Investments — 98.9%
(Cost $148,670,233)(a) | | | | | | | 148,670,233 |
| | | | | | | | | |
|
Other Assets less Liabilities — 1.1% | | | | 1,612,657 |
| | | | | | | | | |
|
Total Net Assets — 100.0% | | | | 150,282,890 |
| | | | | | | | | |
|
Schedule of Investments
December 31, 2005
The Money Market Fund
| | | | | | | | |
Security Description
| | Coupon/
Yield
| | Maturity
| | Principal
Amount ($)
or Shares
| | Value ($)
|
Trustee Deferred Compensation**** | | |
The Flex-funds Dynamic Growth Fund | | | | | | 1,331 | | 11,021 |
The Flex-funds Quantex Fund | | | | | | 1,418 | | 24,234 |
The Flex-funds Muirfield Fund | | | | | | 4,816 | | 24,802 |
The Flex-funds Total Return Utilities Fund | | | | | | 1,105 | | 21,028 |
| | | | | | | | |
|
Total Trustee Deferred Compensation
(Cost $78,327) | | | | | | 81,085 |
| | | | | | | | |
|
| (a) | Cost for federal income tax and financial reporting purposes are the same. |
| * | Variable rate security. Interest rate is as of December 31, 2005. Maturity date reflects the next rate change date. |
| ** | Represents a restricted security purchased under Rule 144A, which is exempt from registration under the Securities Act of 1933, as amended. Security is restricted as to resale to institutional investors, but has been deemed liquid in accordance with guidelines approved by the Board of Trustees. As of December 31, 2005, securities restricted as to resale to institutional investors represented 39.3% of Total Investments. |
| *** | Illiquid security. The sale or disposition of such security would not be possible in the ordinary course of business within seven days at approximately the value at which the Fund has valued the security. As of December 31, 2005, illiquid securities represented 5.0% of Total Investments. |
| **** | Assets of affiliates to The Money Market Fund held for the benefit of the Fund’s Trustees in connection with the Trustee Deferred Compensation Plan. |
[THIS PAGE INTENTIONALLY LEFT BLANK]
Statements of Assets & Liabilities
December 31, 2005
| | | | | | | | |
| | | The
Muirfield
Fund
| | | The Total
Return
Utilities Fund
| |
Assets | | | | | | | | |
Investments, at value* | | $ | 72,982,476 | | | $ | 22,268,749 | |
Repurchase agreements, at value* | | | 4,117,000 | | | | 367,000 | |
Trustee deferred compensation investments, at value | | | 181,242 | | | | 58,975 | |
Cash | | | 869 | | | | 957 | |
Receivable for capital stock issued | | | 1,372,377 | | | | 22,476 | |
Receivable from investment advisor | | | — | | | | — | |
Interest and dividend receivable | | | 986 | | | | 54,440 | |
Prepaid expenses/other assets | | | 16,947 | | | | 14,554 | |
Total Assets | | | 78,671,897 | | | | 22,787,151 | |
| | |
Liabilities | | | | | | | | |
Payable for Trustee Deferred Compensation Plan | | | 181,242 | | | | 58,975 | |
Payable for net variation margin on futures contracts | | | 16,250 | | | | — | |
Payable for capital stock redeemed | | | 143,485 | | | | 25,751 | |
Dividends payable | | | 5,982 | | | | 2,197 | |
Dividends payable — The Money Market Fund — Retail Class | | | | | | | | |
Dividends payable — The Money Market Fund — Institutional Class | | | | | | | | |
Payable to investment advisor | | | 61,109 | | | | 19,581 | |
Accrued distribution plan (12b-1) and administrative service plan fees | | | 26,135 | | | | 5,594 | |
Accrued transfer agent, fund accounting, CCO, and administrative fees | | | 18,551 | | | | 7,120 | |
Accrued trustee fees | | | 5,039 | | | | 3,030 | |
Other accrued liabilities | | | 32,988 | | | | 20,925 | |
Total Liabilities | | | 490,781 | | | | 143,173 | |
| | | | | | | | | |
Net Assets | | $ | 78,181,116 | | | $ | 22,643,978 | |
| | |
Net Assets | | | | | | | | |
Capital | | $ | 89,050,182 | | | $ | 25,588,465 | |
Accumulated undistributed (distributions in excess of) net investment income | | | 436 | | | | — | |
Accumulated undistributed net realized gain (loss) from investments and futures contracts | | | (7,952,379 | ) | | | (6,828,551 | ) |
Net unrealized appreciation (depreciation) of investments and futures contracts | | | (2,917,123 | ) | | | 3,884,064 | |
Total Net Assets | | $ | 78,181,116 | | | $ | 22,643,978 | |
| | |
Net Assets | | | | | | | | |
The Money Market Fund — Retail Class | | | | | | | | |
The Money Market Fund — Institutional Class | | | | | | | | |
Total Net Assets | | | | | | | | |
| | |
Capital Stock Outstanding (indefinite number of shares authorized,
$0.10 par value) | | | 15,172,013 | | | | 1,189,615 | |
The Money Market Fund — Retail Class | | | | | | | | |
The Money Market Fund — Institutional Class | | | | | | | | |
Total Capital Stock Outstanding | | | | | | | | |
| | |
Net Asset Value, Offering and Redemption Price Per Share | | $ | 5.15 | | | $ | 19.03 | |
The Money Market Fund — Retail Class | | | | | | | | |
The Money Market Fund — Institutional Class | | | | | | | | |
* Investments and repurchase agreements, at cost | | $ | 79,930,149 | | | $ | 18,751,685 | |
The accompanying notes are an integral part of these financial statements.
| | | | | | | | | | | | | | | | | |
The
Quantex
Fund
| | | The Dynamic
Growth Fund
| | | The Aggressive
Growth Fund
| | | The U.S.
Government
Bond Fund
| | | The Money
Market Fund
|
| | | | | | | | | | | | | | | | | | |
| $ | 15,308,622 | | | $ | 30,066,172 | | | $ | 10,942,790 | | | $ | 5,768,753 | | | $ | 136,885,233 |
| | 1,836,000 | | | | 2,278,000 | | | | 714,000 | | | | 527,000 | | | | 11,785,000 |
| | 87,388 | | | | 39,210 | | | | 32,908 | | | | 45,616 | | | | 81,085 |
| | 903 | | | | 367 | | | | 343 | | | | 353 | | | | 475 |
| | 3,191 | | | | 24,202 | | | | 7,935 | | | | 1,137 | | | | — |
| | — | | | | — | | | | — | | | | 3,569 | | | | 16,892 |
| | 9,933 | | | | 545 | | | | 171 | | | | 48,469 | | | | 1,730,184 |
| | 13,541 | | | | 10,542 | | | | 11,375 | | | | 5,796 | | | | 30,253 |
| | 17,259,578 | | | | 32,419,038 | | | | 11,709,522 | | | | 6,400,693 | | | | 150,529,122 |
| | | | |
| | | | | | | | | | | | | | | | | | |
| | 87,388 | | | | 39,210 | | | | 32,908 | | | | 45,616 | | | | 81,085 |
| | 5,700 | | | | 8,750 | | | | 2,500 | | | | — | | | | — |
| | 9,696 | | | | 365,200 | | | | — | | | | 4,133 | | | | — |
| | 92 | | | | 207 | | | | 204 | | | | 1,415 | | | | |
| | | | | | | | | | | | | | | | | | 6,742 |
| | | | | | | | | | | | | | | | | | 27,586 |
| | 11,023 | | | | 20,751 | | | | 7,455 | | | | 2,141 | | | | 24,600 |
| | 1,871 | | | | 11,892 | | | | 3,675 | | | | 1,649 | | | | 15,259 |
| | 5,557 | | | | 9,532 | | | | 4,035 | | | | 2,109 | | | | 26,744 |
| | 2,587 | | | | 2,993 | | | | 2,476 | | | | 2,476 | | | | 2,035 |
| | 21,221 | | | | 17,519 | | | | 16,982 | | | | 16,926 | | | | 62,181 |
| | 145,135 | | | | 476,054 | | | | 70,235 | | | | 76,465 | | | | 246,232 |
| | | | | | | | | | | | | | | | | | |
| $ | 17,114,443 | | | $ | 31,942,984 | | | $ | 11,639,287 | | | $ | 6,324,228 | | | $ | 150,282,890 |
| | | | |
| | | | | | | | | | | | | | | | | | |
| $ | 20,079,417 | | | $ | 34,778,594 | | | $ | 17,887,014 | | | $ | 7,245,124 | | | $ | 150,282,890 |
| | — | | | | — | | | | — | | | | 157,533 | | | | — |
| | | | |
| | (4,789,549 | ) | | | (2,354,123 | ) | | | (6,454,638 | ) | | | (1,052,256 | ) | | | — |
| | | | |
| | 1,824,575 | | | | (481,487 | ) | | | 206,911 | | | | (26,173 | ) | | | — |
| $ | 17,114,443 | | | $ | 31,942,984 | | | $ | 11,639,287 | | | $ | 6,324,228 | | | $ | 150,282,890 |
| | | | |
| | | | | | | | | | | | | | | | | | |
| | | | | | | | | | | | | | | | | $ | 129,199,804 |
| | | | | | | | | | | | | | | | | | 21,083,086 |
| | | | | | | | | | | | | | | | | $ | 150,282,890 |
| | | | |
| | 1,001,178 | | | | 3,858,742 | | | | 1,619,117 | | | | 312,812 | | | | |
| | | | | | | | | | | | | | | | | | 129,199,804 |
| | | | | | | | | | | | | | | | | | 21,083,086 |
| | | | | | | | | | | | | | | | | | 150,282,890 |
| | | | |
| $ | 17.09 | | | $ | 8.28 | | | $ | 7.19 | | | $ | 20.22 | | | | |
| | | | | | | | | | | | | | | | | $ | 1.00 |
| | | | | | | | | | | | | | | | | $ | 1.00 |
| $ | 15,271,747 | | | $ | 32,781,209 | | | $ | 11,436,579 | | | $ | 6,321,926 | | | $ | 148,670,233 |
Statements of Operations
For the Year Ended December 31, 2005
| | | | | | | | |
| | | The
Muirfield
Fund
| | | The Total
Return Utilities
Fund
| |
Investment Income | | | | | | | | |
Interest | | $ | 395,834 | | | $ | 21,614 | |
Dividends | | | 1,671,231 | | | | 749,512 | |
Total Investment Income | | | 2,067,065 | | | | 771,126 | |
| | |
Fund Expenses | | | | | | | | |
Investment advisor | | | 681,607 | | | | 230,527 | |
Transfer agent | | | 89,057 | | | | 27,663 | |
Transfer agent — The Money Market Fund — Retail Class | | | | | | | | |
Transfer agent — The Money Market Fund — Institutional Class | | | | | | | | |
Fund accounting | | | 43,841 | | | | 28,053 | |
Administrative | | | 55,131 | | | | 17,930 | |
Trustee | | | 38,164 | | | | 16,777 | |
Audit | | | 8,290 | | | | 8,690 | |
Legal | | | 14,205 | | | | 13,770 | |
Custody | | | 11,264 | | | | 4,936 | |
Printing | | | 8,991 | | | | 4,104 | |
Distribution plan (12b-1) | | | 148,102 | | | | 57,661 | |
Distribution plan (12b-1) — The Money Market Fund — Retail Class | | | | | | | | |
Distribution plan (12b-1) — The Money Market Fund — Institutional Class | | | | | | | | |
Administrative service plan | | | 148,780 | | | | 46,155 | |
Postage | | | 10,228 | | | | 8,204 | |
Registration and filing | | | 19,814 | | | | 17,181 | |
Insurance | | | 13,816 | | | | 5,865 | |
Chief Compliance Officer | | | 5,000 | | | | 5,000 | |
Other | | | 13,206 | | | | 11,544 | |
Total Expenses Before Reductions | | | 1,309,496 | | | | 504,060 | |
| | |
Expenses reimbursed/waived by investment advisor | | | — | | | | — | |
Expenses paid indirectly | | | (77,978 | ) | | | (4,037 | ) |
Distribution plan (12b-1) expenses waived | | | (66,794 | ) | | | (5,302 | ) |
Administrative service plan expenses waived | | | (110,581 | ) | | | (26,973 | ) |
Transfer agent expenses waived | | | — | | | | — | |
Net Expenses | | | 1,054,143 | | | | 467,748 | |
| | | | | | | | | |
Net Investment Income (Loss) | | | 1,012,922 | | | | 303,378 | |
| | |
Realized and Unrealized Gain (Loss) from Investments | | | | | | | | |
Net realized gains (losses) from investments | | | 5,153,416 | | | | 3,978,333 | |
Net realized gains (losses) from futures contracts | | | 849,763 | | | | — | |
Net realized gains (losses) from options contracts | | | (138,748 | ) | | | — | |
Net realized (losses) on the disposal of futures contracts* | | | (5,815 | ) | | | — | |
Distributions of realized gains by other investment companies | | | 3,325,766 | | | | — | |
Net increase from payments by affiliates* | | | 5,815 | | | | — | |
Net Realized Gains (Losses) from Investment Transactions, Futures Contracts, Options Contracts, and Distributions of Realized Gains by Other Investment Companies. | | | 9,190,197 | | | | 3,978,333 | |
| | |
Net change in unrealized appreciation (depreciation) of investments, futures contracts, and options contracts | | | (8,346,668 | ) | | | (910,310 | ) |
Net Realized and Unrealized Gain (Loss) from Investments | | | 843,529 | | | | 3,068,023 | |
| | | | | | | | | |
Net Change in Net Assets Resulting from Operations | | $ | 1,856,451 | | | $ | 3,371,401 | |
*See Note #3 in the Notes to Financial Statements
The accompanying notes are an integral part of these financial statements.
| | | | | | | | | | | | | | | | | | |
The
Quantex
Fund
| | | The Dynamic
Growth Fund
| | | The Aggressive
Growth Fund
| | | The U.S.
Government
Bond Fund
| | | The Money
Market Fund
| |
| | | | | | | | | | | | | | | | | | | |
| $ | 67,595 | | | $ | 78,285 | | | $ | 23,389 | | | $ | 267,726 | | | $ | 5,262,088 | |
| | 247,014 | | | | 567,700 | | | | 219,867 | | | | 25,087 | | | | — | |
| | 314,609 | | | | 645,985 | | | | 243,256 | | | | 292,813 | | | | 5,262,088 | |
| | | | |
| | | | | | | | | | | | | | | | | | | |
| | 156,626 | | | | 212,148 | | | | 81,582 | | | | 30,422 | | | | 553,366 | |
| | 20,867 | | | | 33,944 | | | | 13,053 | | | | 6,084 | | | | | |
| | | | | | | | | | | | | | | | | | 116,598 | |
| | | | | | | | | | | | | | | | | | 23,488 | |
| | 22,389 | | | | 32,801 | | | | 15,877 | | | | 11,408 | | | | 53,135 | |
| | 13,379 | | | | 22,515 | | | | 8,448 | | | | 5,564 | | | | 111,835 | |
| | 14,074 | | | | 18,229 | | | | 12,838 | | | | 13,128 | | | | 16,109 | |
| | 8,690 | | | | 8,348 | | | | 8,690 | | | | 8,690 | | | | 7,837 | |
| | 14,603 | | | | 14,936 | | | | 15,130 | | | | 15,070 | | | | 15,151 | |
| | 9,556 | | | | 4,980 | | | | 4,020 | | | | 3,591 | | | | 13,326 | |
| | 5,030 | | | | 1,923 | | | | 1,471 | | | | 1,847 | | | | 36,771 | |
| | 34,761 | | | | 70,734 | | | | 27,198 | | | | 15,215 | | | | | |
| | | | | | | | | | | | | | | | | | 264,163 | |
| | | | | | | | | | | | | | | | | | 8,860 | |
| | 34,786 | | | | 56,647 | | | | 21,737 | | | | 15,211 | | | | — | |
| | 5,562 | | | | 2,103 | | | | 1,825 | | | | 2,103 | | | | 43,397 | |
| | 17,197 | | | | 21,163 | | | | 21,586 | | | | 8,323 | | | | 27,952 | |
| | 4,662 | | | | 5,477 | | | | 3,382 | | | | 3,260 | | | | 16,835 | |
| | 5,000 | | | | 5,000 | | | | 5,000 | | | | 5,000 | | | | 5,000 | |
| | 13,570 | | | | 9,820 | | | | 8,612 | | | | 8,754 | | | | 65,106 | |
| | 380,752 | | | | 520,768 | | | | 250,449 | | | | 153,670 | | | | 1,378,929 | |
| | | | |
| | (12,359 | ) | | | — | | | | — | | | | (48,382 | ) | | | (452,681 | ) |
| | (4,834 | ) | | | (48,116 | ) | | | (16,168 | ) | | | — | | | | — | |
| | (24,867 | ) | | | (31,670 | ) | | | (12,195 | ) | | | (4,944 | ) | | | (202,894 | ) |
| | (34,779 | ) | | | (41,567 | ) | | | (16,986 | ) | | | (15,211 | ) | | | — | |
| | — | | | | — | | | | — | | | | (1,473 | ) | | | (5,877 | ) |
| | 303,913 | | | | 399,415 | | | | 205,100 | | | | 83,660 | | | | 717,477 | |
| | | | | | | | | | | | | | | | | | | |
| | 10,696 | | | | 246,570 | | | | 38,156 | | | | 209,153 | | | | 4,544,611 | |
| | | | |
| | | | | | | | | | | | | | | | | | | |
| | 556,933 | | | | 1,883,372 | | | | 542,778 | | | | (190,329 | ) | | | | |
| | 373,857 | | | | 147,075 | | | | (1,174 | ) | | | 16,641 | | | | | |
| | — | | | | — | | | | — | | | | 4,618 | | | | | |
| | — | | | | (1,454 | ) | | | (2,181 | ) | | | — | | | | | |
| | — | | | | 939,055 | | | | 153,670 | | | | — | | | | | |
| | — | | | | 1,454 | | | | 2,181 | | | | — | | | | | |
|
930,790
|
| | | 2,969,502 | | | | 695,274 | | | | (169,070 | ) | | | | |
| | | | |
|
216,650
|
| | | (1,532,538 | ) | | | (184,177 | ) | | | (48,081 | ) | | | | |
| | 1,147,440 | | | | 1,436,964 | | | | 511,097 | | | | (217,151 | ) | | | | |
| | | | | | | | | | | | | | | | | | | |
| $ | 1,158,136 | | | $ | 1,683,534 | | | $ | 549,253 | | | $ | (7,998 | ) | | $ | 4,544,611 | |
Statements of Changes in Net Assets
For the Years Ended December 31,
| | | | | | | | | | | | | | | | | | | | | | | | |
| | | The Muirfield Fund
| | | The Total Return
Utilities Fund
| | | The Quantex Fund
| |
| | | 2005
| | | 2004
| | | 2005
| | | 2004
| | | 2005
| | | 2004
| |
Operations | | | | | | | | | | | | | | | | | | | | | | | | |
Net investment income (loss) | | $ | 1,012,922 | | | $ | 75,185 | | | $ | 303,378 | | | $ | 514,154 | | | $ | 10,696 | | | $ | (745 | ) |
Net realized gain (loss) from investments, futures contracts, options contracts, and distributions by other investment companies | | | 9,190,197 | | | | 7,962,376 | | | | 3,978,333 | | | | 719,760 | | | | 930,790 | | | | 1,909,414 | |
Net change in unrealized appreciation (depreciation) of investments, futures contracts, and options contracts | | | (8,346,668 | ) | | | (3,834,890 | ) | | | (910,310 | ) | | | 2,816,677 | | | | 216,650 | | | | (544,725 | ) |
Net change in net assets resulting from operations | | | 1,856,451 | | | | 4,202,671 | | | | 3,371,401 | | | | 4,050,591 | | | | 1,158,136 | | | | 1,363,944 | |
| | | | | | |
Distributions to Shareholders | | | | | | | | | | | | | | | | | | | | | | | | |
From net investment income | | | (1,012,922 | ) | | | (74,749 | ) | | | (303,378 | ) | | | (514,154 | ) | | | (10,696 | ) | | | — | |
Net change in net assets resulting from distributions | | | (1,012,922 | ) | | | (74,749 | ) | | | (303,378 | ) | | | (514,154 | ) | | | (10,696 | ) | | | — | |
| | | | | | |
Distributions to Shareholders
— The Money Market Fund
— Retail Class | | | | | | | | | | | | | | | | | | | | | | | | |
From net investment income | | | | | | | | | | | | | | | | | | | | | | | | |
Net change in net assets resulting from distributions | | | | | | | | | | | | | | | | | | | | | | | | |
| | | | | | |
Distributions to Shareholders
— The Money Market Fund
— Institutional Class | | | | | | | | | | | | | | | | | | | | | | | | |
From net investment income | | | | | | | | | | | | | | | | | | | | | | | | |
Net change in net assets resulting from distributions | | | | | | | | | | | | | | | | | | | | | | | | |
| | | | | | |
Capital Transactions | | | | | | | | | | | | | | | | | | | | | | | | |
Issued | | | 29,413,006 | | | | 17,909,135 | | | | 6,411,954 | | | | 11,870,719 | | | | 2,633,034 | | | | 1,054,939 | |
Reinvested | | | 1,006,943 | | | | 73,953 | | | | 294,783 | | | | 501,546 | | | | 10,604 | | | | — | |
Redeemed | | | (22,738,425 | ) | | | (10,979,145 | ) | | | (15,578,080 | ) | | | (8,499,731 | ) | | | (5,529,545 | ) | | | (3,534,471 | ) |
Net change in net assets resulting from capital transactions | | | 7,681,524 | | | | 7,003,943 | | | | (8,871,343 | ) | | | 3,872,534 | | | | (2,885,907 | ) | | | (2,479,532 | ) |
Total Change in Net Assets | | | 8,525,053 | | | | 11,131,865 | | | | (5,803,320 | ) | | | 7,408,971 | | | | (1,738,467 | ) | | | (1,115,588 | ) |
| | | | | | |
Net Assets — Beginning of Period | | | 69,656,063 | | | | 58,524,198 | | | | 28,447,298 | | | | 21,038,327 | | | | 18,852,910 | | | | 19,968,498 | |
Net Assets — End of Period | | $ | 78,181,116 | | | $ | 69,656,063 | | | $ | 22,643,978 | | | $ | 28,447,298 | | | $ | 17,114,443 | | | $ | 18,852,910 | |
Accumulated undistributed (distributions in excess of) net investment income | | $ | 436 | | | $ | 436 | | | $ | — | | | $ | — | | | $ | — | | | $ | — | |
| | | | | | |
Share Transactions | | | | | | | | | | | | | | | | | | | | | | | | |
Issued | | | 5,869,136 | | | | 3,672,259 | | | | 350,433 | | | | 775,311 | | | | 161,114 | | | | 71,695 | |
Reinvested | | | 195,523 | | | | 14,472 | | | | 16,132 | | | | 32,842 | | | | 620 | | | | — | |
Redeemed | | | (4,521,772 | ) | | | (2,273,773 | ) | | | (900,250 | ) | | | (557,400 | ) | | | (342,385 | ) | | | (237,722 | ) |
Net change in shares | | | 1,542,887 | | | | 1,412,958 | | | | (533,685 | ) | | | 250,753 | | | | (180,651 | ) | | | (166,027 | ) |
The accompanying notes are an integral part of these financial statements.
| | | | | | | | | | | | | | | | | | | | | | | | | | | | | | |
The Dynamic
Growth Fund
| | | The Aggressive
Growth Fund
| | | The U.S. Government
Bond Fund
| | | The Money
Market Fund
| |
2005
| | | 2004
| | | 2005
| | | 2004
| | | 2005
| | | 2004
| | | 2005
| | | 2004
| |
| | | | | | | | | | | | | | | | | | | | | | | | | | | | | | | |
| $ | 246,570 | | | $ | (103,451 | ) | | $ | 38,156 | | | $ | (38,345 | ) | | $ | 209,153 | | | $ | 249,077 | | | $ | 4,544,611 | | | $ | 1,739,958 | |
|
2,969,502 |
| | | 2,855,007 | | | | 695,274 | | | | 1,178,747 | | | | (169,070 | ) | | | (102,303 | ) | | | — | | | | — | |
|
(1,532,538) |
| | | (1,981,137 | ) | | | (184,177 | ) | | | (800,831 | ) | | | (48,081 | ) | | | 23,533 | | | | — | | | | — | |
|
1,683,534 |
| | | 770,419 | | | | 549,253 | | | | 339,571 | | | | (7,998 | ) | | | 170,307 | | | | 4,544,611 | | | | 1,739,958 | |
| | | | | | | |
| | | | | | | | | | | | | | | | | | | | | | | | | | | | | | | |
| | (246,570 | ) | | | — | | | | (38,156 | ) | | | — | | | | (207,143 | ) | | | (249,091 | ) | | | | | | | | |
|
(246,570) |
| | | — | | | | (38,156 | ) | | | — | | | | (207,143 | ) | | | (249,091 | ) | | | | | | | | |
| | | | | | | |
| | | | | | | | | | | | | | | | | | | | | | | | | | | | | | | |
| | | | | | | | | | | | | | | | | | | | | | | | | | (3,685,130 | ) | | | (1,733,806 | ) |
| | | | | | | | | | | | | | | | | | | | | | | | | | (3,685,130 | ) | | | (1,733,806 | ) |
| | | | | | | |
| | | | | | | | | | | | | | | | | | | | | | | | | | | | | | | |
| | | | | | | | | | | | | | | | | | | | | | | | | | (859,481 | ) | | | (6,152 | ) |
| | | | | | | | | | | | | | | | | | | | | | | | | | (859,481 | ) | | | (6,152 | ) |
| | | | | | | |
| | | | | | | | | | | | | | | | | | | | | | | | | | | | | | | |
| | 11,727,152 | | | | 9,050,784 | | | | 3,505,018 | | | | 3,075,034 | | | | 1,202,042 | | | | 494,492 | | | | 228,409,933 | | | | 207,085,220 | |
| | 246,363 | | | | — | | | | 37,953 | | | | — | | | | 192,482 | | | | 236,063 | | | | 4,140,721 | | | | 1,767,382 | |
| | (6,329,274 | ) | | | (5,983,189 | ) | | | (3,188,136 | ) | | | (1,763,665 | ) | | | (4,170,973 | ) | | | (2,175,723 | ) | | | (261,227,686 | ) | | | (195,499,283 | ) |
|
5,644,241 |
| | | 3,067,595 | | | | 354,835 | | | | 1,311,369 | | | | (2,776,449 | ) | | | (1,445,168 | ) | | | (28,677,032 | ) | | | 13,353,319 | |
| | 7,081,205 | | | | 3,838,014 | | | | 865,932 | | | | 1,650,940 | | | | (2,991,590 | ) | | | (1,523,952 | ) | | | (28,677,032 | ) | | | 13,353,319 | |
| | | | | | | |
|
24,861,779 |
| | | 21,023,765 | | | | 10,773,355 | | | | 9,122,415 | | | | 9,315,818 | | | | 10,839,770 | | | | 178,959,922 | | | | 165,606,603 | |
| $ | 31,942,984 | | | $ | 24,861,779 | | | $ | 11,639,287 | | | $ | 10,773,355 | | | $ | 6,324,228 | | | $ | 9,315,818 | | | $ | 150,282,890 | | | $ | 178,959,922 | |
| | | | | | | |
| $ | — | | | $ | — | | | $ | — | | | $ | — | | | $ | 157,533 | | | $ | 155,523 | | | $ | — | | | $ | — | |
| | | | | | | |
| | | | | | | | | | | | | | | | | | | | | | | | | | | | | | | |
| | 1,496,180 | | | | 1,181,099 | | | | 509,855 | | | | 474,779 | | | | 58,904 | | | | 23,441 | | | | 228,409,933 | | | | 207,085,220 | |
| | 29,754 | | | | — | | | | 5,279 | | | | — | | | | 9,401 | | | | 11,240 | | | | 4,140,721 | | | | 1,767,382 | |
| | (798,045 | ) | | | (790,574 | ) | | | (473,804 | ) | | | (269,214 | ) | | | (202,863 | ) | | | (103,508 | ) | | | (261,227,686 | ) | | | (195,499,283 | ) |
| | 727,889 | | | | 390,525 | | | | 41,330 | | | | 205,565 | | | | (134,558 | ) | | | (68,827 | ) | | | (28,677,032 | ) | | | 13,353,319 | |
Financial Highlights
For a Share Outstanding Through Each Fiscal Year Ended December 31,
The Muirfield Fund
| | | | | | | | | | | | | | | | | | | | |
| | | 2005
| | | 2004
| | | 2003
| | | 2002
| | | 2001
| |
Net Asset Value, Beginning of Period | | $ | 5.11 | | | $ | 4.79 | | | $ | 3.76 | | | $ | 4.25 | | | $ | 4.95 | |
| | | | | |
Income from Investment Operations | | | | | | | | | | | | | | | | | | | | |
Net investment income (loss) | | | 0.07 | | | | 0.01 | | | | (0.04 | ) | | | (0.02 | ) | | | 0.01 | |
Net gains (losses) on investments, futures, options, and distributions by other investment companies (both realized and unrealized) | | | 0.04 | | | | 0.32 | | | | 1.07 | | | | (0.47 | ) | | | (0.58 | ) |
Total from Investment Operations | | | 0.11 | | | | 0.33 | | | | 1.03 | | | | (0.49 | ) | | | (0.57 | ) |
| | | | | |
Less Distributions | | | | | | | | | | | | | | | | | | | | |
From net investment income | | | (0.07 | ) | | | (0.01 | ) | | | — | | | | — | | | | (0.13 | ) |
Total Distributions | | | (0.07 | ) | | | (0.01 | ) | | | 0.00 | | | | 0.00 | | | | (0.13 | ) |
| | | | | | | | | | | | | | | | | | | | | |
Net Asset Value, End of Period | | $ | 5.15 | | | $ | 5.11 | | | $ | 4.79 | | | $ | 3.76 | | | $ | 4.25 | |
| | | | | |
Total Return (assumes reinvestment of distributions)(5)(7) | | | 2.13% | | | | 6.80% | | | | 27.39% | | | | (11.42% | ) | | | (11.52% | ) |
| | | | | |
Ratios/Supplemental Data | | | | | | | | | | | | | | | | | | | | |
Net assets, end of period ($000) | | $ | 78,181 | | | $ | 69,656 | | | $ | 58,524 | | | $ | 47,644 | | | $ | 61,577 | |
Ratio of net expenses to average net assets(1)(2)(6) | | | 1.42% | | | | 1.26% | | | | 1.39% | | | | 1.41% | | | | 1.31% | |
Ratio of net investment income (loss) to average net assets(1)(2)(4)(6) | | | 1.36% | | | | 0.12% | | | | (1.06% | ) | | | (0.43% | ) | | | 0.11% | |
Ratio of expenses to average net assets after reductions, excluding expenses paid indirectly(1)(2)(6) | | | 1.53% | | | | 1.45% | | | | 1.47% | | | | 1.46% | | | | 1.37% | |
Ratio of expenses to average net assets before reductions(1)(2)(6) | | | 1.76% | | | | 1.70% | | | | 1.60% | | | | 1.46% | | | | 1.37% | |
Portfolio turnover rate(3)(5) | | | 145% | | | | 145% | | | | 252% | | | | 278% | | | | 298% | |
| (1) | Ratio reflects reductions in corresponding portfolio, if applicable. |
| (2) | These ratios exclude the impact of expenses of the underlying security holdings as represented in the schedule of investments. |
| (3) | Prior to the year ended December 31, 2003, the portfolio turnover rate represented the turnover rate of the corresponding portfolio. During 2003, the Fund’s portfolio turnover rate for the period January 1 through April 13 is equivalent to the portfolio into which the Fund invested. Beginning April 14 the Fund commenced calculating the portfolio turnover rate based on its own activities. Hence, the portfolio turnover rate represented for 2003 is a combination of these two periods. Subsequent to 2003 the portfolio turnover rate is specific to the Fund. |
| (4) | Recognition of net investment income by the Fund is affected by the timing of the declaration of dividends by the underlying investment companies in which the Fund invests. |
| (5) | Not annualized for periods of less than one full year. |
| (6) | Annualized for periods of less than one full year. |
| (7) | In 2005, the advisor voluntarily reimbursed the Fund for a realized investment loss, which had no impact to total return (See Note #3 in the Notes to Financial Statements). |
The accompanying notes are an integral part of these financial statements.
Financial Highlights
For a Share Outstanding Through Each Fiscal Year Ended December 31,
The Total Return Utilities Fund
| | | | | | | | | | | | | | | | | | | | |
| | | 2005
| | | 2004
| | | 2003
| | | 2002
| | | 2001
| |
Net Asset Value, Beginning of Period | | $ | 16.51 | | | $ | 14.29 | | | $ | 12.66 | | | $ | 18.63 | | | $ | 22.17 | |
| | | | | |
Income from Investment Operations | | | | | | | | | | | | | | | | | | | | |
Net investment income | | | 0.24 | | | | 0.32 | | | | 0.29 | | | | 0.34 | | | | 0.35 | |
Net gains (losses) on securities, futures, and options (both realized and unrealized) | | | 2.52 | | | | 2.22 | | | | 1.63 | | | | (5.97 | ) | | | (3.56 | ) |
Total from Investment Operations | | | 2.76 | | | | 2.54 | | | | 1.92 | | | | (5.63 | ) | | | (3.21 | ) |
| | | | | |
Less Distributions | | | | | | | | | | | | | | | | | | | | |
From net investment income | | | (0.24 | ) | | | (0.32 | ) | | | (0.29 | ) | | | (0.34 | ) | | | (0.33 | ) |
Total Distributions | | | (0.24 | ) | | | (0.32 | ) | | | (0.29 | ) | | | (0.34 | ) | | | (0.33 | ) |
| | | | | | | | | | | | | | | | | | | | | |
Net Asset Value, End of Period | | $ | 19.03 | | | $ | 16.51 | | | $ | 14.29 | | | $ | 12.66 | | | $ | 18.63 | |
| | | | | |
Total Return (assumes reinvestment of distributions)(3) | | | 16.80% | | | | 18.01% | | | | 15.46% | | | | (30.36% | ) | | | (14.57% | ) |
| | | | | |
Ratios/Supplemental Data | | | | | | | | | | | | | | | | | | | | |
Net assets, end of period ($000) | | $ | 22,644 | | | $ | 28,447 | | | $ | 21,038 | | | $ | 19,133 | | | $ | 31,267 | |
Ratio of net expenses to average net assets(1)(4) | | | 2.03% | | | | 1.91% | | | | 1.92% | | | | 1.81% | | | | 1.72% | |
Ratio of net investment income to average net assets(1)(4) | | | 1.32% | | | | 2.21% | | | | 2.25% | | | | 2.32% | | | | 1.66% | |
Ratio of expenses to average net assets after reductions, excluding expenses paid indirectly(1)(4) | | | 2.05% | | | | 1.91% | | | | 1.94% | | | | 1.88% | | | | 1.80% | |
Ratio of expenses to average net assets before reductions(1)(4) | | | 2.19% | | | | 1.99% | | | | 1.94% | | | | 1.88% | | | | 1.80% | |
Portfolio turnover rate(2)(3) | | | 28% | | | | 38% | | | | 41% | | | | 32% | | | | 23% | |
| (1) | Ratio reflects reductions in corresponding portfolio, if applicable. |
| (2) | Prior to the year ended December 31, 2003, the portfolio turnover rate represented the turnover rate of the corresponding portfolio. During 2003, the Fund’s portfolio turnover rate for the period January 1 through April 13 is equivalent to the portfolio into which the Fund invested. Beginning April 14 the Fund commenced calculating the portfolio turnover rate based on its own activities. Hence, the portfolio turnover rate represented for 2003 is a combination of these two periods. Subsequent to 2003 the portfolio turnover rate is specific to the Fund. |
| (3) | Not annualized for periods of less than one full year. |
| (4) | Annualized for periods of less than one full year. |
The accompanying notes are an integral part of these financial statements.
Financial Highlights
For a Share Outstanding Through Each Fiscal Year Ended December 31,
The Quantex Fund
| | | | | | | | | | | | | | | | | | | |
| | | 2005
| | | 2004
| | 2003
| | | 2002
| | | 2001
| |
Net Asset Value, Beginning of Period | | $ | 15.95 | | | $ | 14.82 | | $ | 11.65 | | | $ | 15.47 | | | $ | 18.66 | |
| | | | | |
Income from Investment Operations | | | | | | | | | | | | | | | | | | | |
Net investment income (loss) | | | 0.01 | | | | — | | | (0.01 | ) | | | (0.03 | ) | | | — | |
Net gains (losses) on securities, futures, and options (both realized and unrealized) | | | 1.14 | | | | 1.13 | | | 3.18 | | | | (3.79 | ) | | | (2.49 | ) |
Total from Investment Operations | | | 1.15 | | | | 1.13 | | | 3.17 | | | | (3.82 | ) | | | (2.49 | ) |
| | | | | |
Less Distributions | | | | | | | | | | | | | | | | | | | |
From net investment income | | | (0.01 | ) | | | — | | | — | | | | — | | | | — | |
From net capital gains | | | — | | | | — | | | — | | | | — | | | | (0.70 | ) |
Total Distributions | | | (0.01 | ) | | | 0.00 | | | 0.00 | | | | 0.00 | | | | (0.70 | ) |
| | | | | | | | | | | | | | | | | | | | |
Net Asset Value, End of Period | | $ | 17.09 | | | $ | 15.95 | | $ | 14.82 | | | $ | 11.65 | | | $ | 15.47 | |
| | | | | |
Total Return (assumes reinvestment of distributions)(3) | | | 7.21% | | | | 7.62% | | | 27.21% | | | | (24.69% | ) | | | (13.33% | ) |
| | | | | |
Ratios/Supplemental Data | | | | | | | | | | | | | | | | | | | |
Net assets, end of period ($000) | | $ | 17,114 | | | $ | 18,853 | | $ | 19,968 | | | $ | 18,360 | | | $ | 32,248 | |
Ratio of net expenses to average net assets(1)(4) | | | 1.75% | | | | 1.73% | | | 1.84% | | | | 1.76% | | | | 1.64% | |
Ratio of net investment income (loss) to average net assets(1)(4) | | | 0.06% | | | | 0.00% | | | (0.11% | ) | | | (0.20% | ) | | | (0.23% | ) |
Ratio of expenses to average net assets after reductions, excluding expenses paid indirectly(1)(4) | | | 1.78% | | | | 1.77% | | | 1.84% | | | | 1.78% | | | | 1.66% | |
Ratio of expenses to average net assets before reductions(1)(4) | | | 2.19% | | | | 2.06% | | | 1.91% | | | | 1.79% | | | | 1.66% | |
Portfolio turnover rate(2)(3) | | | 171% | | | | 253% | | | 140% | | | | 54% | | | | 37% | |
| (1) | Ratio reflects reductions in corresponding portfolio, if applicable. |
| (2) | Prior to the year ended December 31, 2003, the portfolio turnover rate represented the turnover rate of the corresponding portfolio. During 2003, the Fund’s portfolio turnover rate for the period January 1 through April 13 is equivalent to the portfolio into which the Fund invested. Beginning April 14 the Fund commenced calculating the portfolio turnover rate based on its own activities. Hence, the portfolio turnover rate represented for 2003 is a combination of these two periods. Subsequent to 2003 the portfolio turnover rate is specific to the Fund. |
| (3) | Not annualized for periods of less than one full year. |
| (4) | Annualized for periods of less than one full year. |
The accompanying notes are an integral part of these financial statements.
Financial Highlights
For a Share Outstanding Through Each Fiscal Year Ended December 31,
The Dynamic Growth Fund
| | | | | | | | | | | | | | | | | | | | |
| | | 2005
| | | 2004
| | | 2003
| | | 2002
| | | 2001
| |
Net Asset Value, Beginning of Period | | $ | 7.94 | | | $ | 7.67 | | | $ | 5.58 | | | $ | 7.37 | | | $ | 8.52 | |
| | | | | |
Income from Investment Operations | | | | | | | | | | | | | | | | | | | | |
Net investment income (loss) | | | 0.06 | | | | (0.04 | ) | | | (0.06 | ) | | | (0.04 | ) | | | — | |
Net gains (losses) on investments, futures, options, and distributions by other investment companies (both realized and unrealized) | | | 0.34 | | | | 0.31 | | | | 2.15 | | | | (1.75 | ) | | | (1.15 | ) |
Total from Investment Operations | | | 0.40 | | | | 0.27 | | | | 2.09 | | | | (1.79 | ) | | | (1.15 | ) |
| | | | | |
Less Distributions | | | | | | | | | | | | | | | | | | | | |
From net investment income | | | (0.06 | ) | | | — | | | | — | | | | — | | | | — | |
Total Distributions | | | (0.06 | ) | | | 0.00 | | | | 0.00 | | | | 0.00 | | | | 0.00 | |
| | | | | | | | | | | | | | | | | | | | | |
Net Asset Value, End of Period | | $ | 8.28 | | | $ | 7.94 | | | $ | 7.67 | | | $ | 5.58 | | | $ | 7.37 | |
| | | | | |
Total Return (assumes reinvestment of distributions)(1)(7) | | | 5.08% | | | | 3.52% | | | | 37.46% | | | | (24.29% | ) | | | (13.47% | ) |
| | | | | |
Ratios/Supplemental Data | | | | | | | | | | | | | | | | | | | | |
Net assets, end of period ($000) | | $ | 31,943 | | | $ | 24,862 | | | $ | 21,024 | | | $ | 17,094 | | | $ | 23,126 | |
Ratio of net expenses to average net assets(2)(3)(4) | | | 1.41% | | | | 1.20% | | | | 1.22% | | | | 1.18% | | | | 1.03% | |
Ratio of net investment income (loss) to average net assets(2)(3)(4)(6) | | | 0.87% | | | | (0.48% | ) | | | (0.84% | ) | | | (0.69% | ) | | | (0.62% | ) |
Ratio of expenses to average net assets after reductions, excluding expenses paid indirectly(2)(3)(4) | | | 1.58% | | | | 1.41% | | | | 1.27% | | | | 1.29% | | | | 1.19% | |
Ratio of expenses to average net assets before reductions(2)(3)(4) | | | 1.84% | | | | 1.70% | | | | 1.60% | | | | 1.35% | | | | 1.34% | |
Portfolio turnover rate(1)(5) | | | 202% | | | | 174% | | | | 250% | | | | 392% | | | | 131% | |
| (1) | Not annualized for periods of less than one full year. |
| (2) | Annualized for periods of less than one full year. |
| (3) | Ratio reflects reductions in corresponding portfolio, if applicable. |
| (4) | These ratios exclude the impact of expenses of the underlying security holdings as represented in the schedule of investments. |
| (5) | Prior to the year ended December 31, 2003, the portfolio turnover rate represented the turnover rate of the corresponding portfolio. During 2003, the Fund’s portfolio turnover rate for the period January 1 through April 13 is equivalent to the portfolio into which the Fund invested. Beginning April 14 the Fund commenced calculating the portfolio turnover rate based on its own activities. Hence, the portfolio turnover rate represented for 2003 is a combination of these two periods. Subsequent to 2003 the portfolio turnover rate is specific to the Fund. |
| (6) | Recognition of net investment income by the Fund is affected by the timing of the declaration of dividends by the underlying investment companies in which the Fund invests. |
| (7) | In 2005, the advisor voluntarily reimbursed the Fund for a realized investment loss, which had no impact to total return (See Note #3 in the Notes to Financial Statements). |
The accompanying notes are an integral part of these financial statements.
Financial Highlights
For a Share Outstanding Through Each Fiscal Year Ended December 31,
The Aggressive Growth Fund
| | | | | | | | | | | | | | | | | | | | |
| | | 2005
| | | 2004
| | | 2003
| | | 2002
| | | 2001
| |
Net Asset Value, Beginning of Period | | $ | 6.83 | | | $ | 6.65 | | | $ | 4.79 | | | $ | 6.52 | | | $ | 7.86 | |
| | | | | |
Income from Investment Operations | | | | | | | | | | | | | | | | | | | | |
Net investment income (loss) | | | 0.02 | | | | (0.03 | ) | | | (0.05 | ) | | | (0.06 | ) | | | — | |
Net gains (losses) on investments, futures, options, and distributions by other investment companies (both realized and unrealized) | | | 0.36 | | | | 0.21 | | | | 1.91 | | | | (1.67 | ) | | | (1.34 | ) |
Total from Investment Operations | | | 0.38 | | | | 0.18 | | | | 1.86 | | | | (1.73 | ) | | | (1.34 | ) |
| | | | | |
Less Distributions | | | | | | | | | | | | | | | | | | | | |
From net investment income | | | (0.02 | ) | | | — | | | | — | | | | — | | | | — | |
Total Distributions | | | (0.02 | ) | | | 0.00 | | | | 0.00 | | | | 0.00 | | | | 0.00 | |
| | | | | | | | | | | | | | | | | | | | | |
Net Asset Value, End of Period | | $ | 7.19 | | | $ | 6.83 | | | $ | 6.65 | | | $ | 4.79 | | | $ | 6.52 | |
| | | | | |
Total Return (assumes reinvestment of distributions)(1)(7) | | | 5.62% | | | | 2.71% | | | | 38.83% | | | | (26.53% | ) | | | (17.04% | ) |
| | | | | |
Ratios/Supplemental Data | | | | | | | | | | | | | | | | | | | | |
Net assets, end of period ($000) | | $ | 11,639 | | | $ | 10,773 | | | $ | 9,122 | | | $ | 7,046 | | | $ | 12,379 | |
Ratio of net expenses to average net assets(2)(3)(4) | | | 1.88% | | | | 1.64% | | | | 1.39% | | | | 1.22% | | | | 1.03% | |
Ratio of net investment income (loss) to average net assets(2)(3)(4)(6) | | | 0.35% | | | | (0.41% | ) | | | (0.85% | ) | | | (0.95% | ) | | | (0.69% | ) |
Ratio of expenses to average net assets after reductions, excluding expenses paid indirectly(2)(3)(4) | | | 2.03% | | | | 1.80% | | | | 1.44% | | | | 1.32% | | | | 1.19% | |
Ratio of expenses to average net assets before reductions(2)(3)(4) | | | 2.30% | | | | 2.07% | | | | 1.99% | | | | 1.67% | | | | 1.52% | |
Portfolio turnover rate(1)(5) | | | 181% | | | | 264% | | | | 255% | | | | 349% | | | | 127% | |
| (1) | Not annualized for periods of less than one full year. |
| (2) | Annualized for periods of less than one full year. |
| (3) | Ratio reflects reductions in corresponding portfolio, if applicable. |
| (4) | These ratios exclude the impact of expenses of the underlying security holdings as represented in the schedule of investments. |
| (5) | Prior to the year ended December 31, 2003, the portfolio turnover rate represented the turnover rate of the corresponding portfolio. During 2003, the Fund’s portfolio turnover rate for the period January 1 through April 13 is equivalent to the portfolio into which the Fund invested. Beginning April 14 the Fund commenced calculating the portfolio turnover rate based on its own activities. Hence, the portfolio turnover rate represented for 2003 is a combination of these two periods. Subsequent to 2003 the portfolio turnover rate is specific to the Fund. |
| (6) | Recognition of net investment income by the Fund is affected by the timing of the declaration of dividends by the underlying investment companies in which the Fund invests. |
| (7) | In 2005, the advisor voluntarily reimbursed the Fund for a realized investment loss, which had no impact to total return (See Note #3 in the Notes to Financial Statements). |
The accompanying notes are an integral part of these financial statements.
Financial Highlights
For a Share Outstanding Through Each Fiscal Year Ended December 31,
The U.S. Government Bond Fund
| | | | | | | | | | | | | | | | | | | | |
| | | 2005
| | | 2004
| | | 2003
| | | 2002
| �� | | 2001
| |
Net Asset Value, Beginning of Period | | $ | 20.82 | | | $ | 21.00 | | | $ | 22.79 | | | $ | 21.41 | | | $ | 21.92 | |
| | | | | |
Income from Investment Operations | | | | | | | | | | | | | | | | | | | | |
Net investment income | | | 0.73 | | | | 0.52 | | | | 0.35 | | | | 0.54 | | | | 0.79 | |
Net gains (losses) on securities, futures, and options (both realized and unrealized) | | | (0.76 | ) | | | (0.18 | ) | | | (1.35 | ) | | | 1.65 | | | | (0.51 | ) |
Total from Investment Operations | | | (0.03 | ) | | | 0.34 | | | | (1.00 | ) | | | 2.19 | | | | 0.28 | |
| | | | | |
Less Distributions | | | | | | | | | | | | | | | | | | | | |
From net investment income | | | (0.57 | ) | | | (0.52 | ) | | | (0.35 | ) | | | (0.54 | ) | | | (0.79 | ) |
From net capital gains | | | — | | | | — | | | | (0.44 | ) | | | (0.27 | ) | | | — | |
Total Distributions | | | (0.57 | ) | | | (0.52 | ) | | | (0.79 | ) | | | (0.81 | ) | | | (0.79 | ) |
| | | | | | | | | | | | | | | | | | | | | |
Net Asset Value, End of Period | | $ | 20.22 | | | $ | 20.82 | | | $ | 21.00 | | | $ | 22.79 | | | $ | 21.41 | |
| | | | | |
Total Return (assumes reinvestment of distributions)(3) | | | (0.14% | ) | | | 1.64% | | | | (4.43% | ) | | | 10.34% | | | | 1.23% | |
| | | | | |
Ratios/Supplemental Data | | | | | | | | | | | | | | | | | | | | |
Net assets, end of period ($000) | | $ | 6,324 | | | $ | 9,316 | | | $ | 10,840 | | | $ | 14,226 | | | $ | 13,080 | |
Ratio of net expenses to average net assets(1)(4) | | | 1.10% | | | | 1.10% | | | | 1.10% | | | | 1.10% | | | | 1.07% | |
Ratio of net investment income to average net assets(1)(4) | | | 2.75% | | | | 2.49% | | | | 1.59% | | | | 2.43% | | | | 3.58% | |
Ratio of expenses to average net assets before reductions(1)(4) | | | 2.02% | | | | 1.58% | | | | 1.24% | | | | 1.13% | | | | 1.13% | |
Portfolio turnover rate(2)(3) | | | 159% | | | | 352% | | | | 568% | | | | 408% | | | | 503% | |
| (1) | Ratio reflects reductions in corresponding portfolio, if applicable. |
| (2) | Prior to the year ended December 31, 2003, the portfolio turnover rate represented the turnover rate of the corresponding portfolio. During 2003, the Fund’s portfolio turnover rate for the period January 1 through April 13 is equivalent to the portfolio into which the Fund invested. Beginning April 14 the Fund commenced calculating the portfolio turnover rate based on its own activities. Hence, the portfolio turnover rate represented for 2003 is a combination of these two periods. Subsequent to 2003 the portfolio turnover rate is specific to the Fund. |
| (3) | Not annualized for periods of less than one full year. |
| (4) | Annualized for periods of less than one full year. |
The accompanying notes are an integral part of these financial statements.
Financial Highlights
For a Share Outstanding Through Each Fiscal Year Ended December 31,
The Money Market Fund — Retail Class
| | | | | | | | | | | | | | | | | | | | |
| | | 2005
| | | 2004
| | | 2003
| | | 2002
| | | 2001
| |
Net Asset Value, Beginning of Period | | $ | 1.00 | | | $ | 1.00 | | | $ | 1.00 | | | $ | 1.00 | | | $ | 1.00 | |
| | | | | |
Income from Investment Operations | | | | | | | | | | | | | | | | | | | | |
Net investment income | | | 0.028 | | | | 0.011 | | | | 0.009 | | | | 0.016 | | | | 0.040 | |
Total from Investment Operations | | | 0.028 | | | | 0.011 | | | | 0.009 | | | | 0.016 | | | | 0.040 | |
| | | | | |
Less Distributions | | | | | | | | | | | | | | | | | | | | |
From net investment income | | | (0.028 | ) | | | (0.011 | ) | | | (0.009 | ) | | | (0.016 | ) | | | (0.040 | ) |
Total Distributions | | | (0.028 | ) | | | (0.011 | ) | | | (0.009 | ) | | | (0.016 | ) | | | (0.040 | ) |
| | | | | | | | | | | | | | | | | | | | | |
Net Asset Value, End of Period | | $ | 1.00 | | | $ | 1.00 | | | $ | 1.00 | | | $ | 1.00 | | | $ | 1.00 | |
| | | | | |
Total Return (assumes reinvestment of distributions)(2) | | | 2.85% | | | | 1.06% | | | | 0.92% | | | | 1.59% | | | | 4.10% | |
| | | | | |
Ratios/Supplemental Data | | | | | | | | | | | | | | | | | | | | |
Net assets, end of period ($000) | | $ | 129,200 | | | $ | 148,650 | | | $ | 165,607 | | | $ | 186,280 | | | $ | 221,594 | |
Ratio of net expenses to average net assets(1)(3) | | | 0.47% | | | | 0.46% | | | | 0.43% | | | | 0.44% | | | | 0.44% | |
Ratio of net investment income to average net assets(1)(3) | | | 2.79% | | | | 1.04% | | | | 0.92% | | | | 1.58% | | | | 4.00% | |
Ratio of expenses to average net assets before reductions(1)(3) | | | 0.89% | | | | 0.84% | | | | 0.82% | | | | 0.66% | | | | 0.62% | |
| (1) | Ratio reflects reduction in corresponding portfolio, if applicable. |
| (2) | Not annualized for periods of less than one full year. |
| (3) | Annualized for periods of less than one full year. |
The accompanying notes are an integral part of these financial statements.
Financial Highlights
For a Share Outstanding Through Each Fiscal Year Ended December 31,
The Money Market Fund — Institutional Class
| | | | | | | | |
| | | 2005
| | | 2004*
| |
Net Asset Value, Beginning of Period | | $ | 1.00 | | | $ | 1.00 | |
| | |
Income from Investment Operations | | | | | | | | |
Net investment income | | | 0.030 | | | | — | ** |
Total from Investment Operations | | | 0.030 | | | | 0.000 | |
| | |
Less Distributions | | | | | | | | |
From net investment income | | | (0.030 | ) | | | — | ** |
Total Distributions | | | (0.030 | ) | | | 0.000 | |
| | | | | | | | | |
Net Asset Value, End of Period | | $ | 1.00 | | | $ | 1.00 | |
| | |
Total Return (assumes reinvestment of distributions)(1) | | | 2.99% | | | | 0.02% | |
| | |
Ratios/Supplemental Data | | | | | | | | |
Net assets, end of period ($000) | | $ | 21,083 | | | $ | 30,310 | |
Ratio of net expenses to average net assets(2) | | | 0.33% | | | | 0.33% | |
Ratio of net investment income to average net assets(2) | | | 2.93% | | | | 1.96% | |
Ratio of expenses to average net assets before reductions(2) | | | 0.71% | | | | 0.67% | |
| (1) | Not annualized for periods of less than one full year. |
| (2) | Annualized for periods of less than one full year. |
| * | Commenced operations on December 28, 2004. |
| ** | Actual amounts were less than one-tenth of one cent. |
The accompanying notes are an integral part of these financial statements.
Notes to Financial Statements
December 31, 2005
1. Organization and Significant Accounting Policies
The Flex-funds Trust (the “Trust”) was organized in 1982 and is registered under the Investment Company Act of 1940, as amended (the “1940 Act”), as a diversified, open-end management investment company. The Trust offers seven separate series and is presently comprised of seven separate funds as follows: The Muirfield Fund® (“Muirfield”), The Total Return Utilities Fund (“TRUF”), The Quantex Fund™ (“Quantex”) (formerly known as The Highlands Growth Fund) (please see second paragraph of note #1 for more information), The Dynamic Growth Fund (“Dynamic”), The Aggressive Growth Fund (“Aggressive”), The U.S. Government Bond Fund (“Bond”), and The Money Market Fund (“Money Market”) (each a “Fund” and collectively the “Funds”). Money Market offers two classes of shares (the Retail Class (“Retail Class”) and the Institutional Class (“Institutional Class”)). Each class of shares has equal rights as to earnings and assets except that each class bears different distribution and transfer agent expenses. The investment objective of Muirfield, Quantex, Dynamic, and Aggressive is growth of capital. The investment objective of TRUF is current income and growth of income. The investment objective of Bond is maximum current income. The investment objective of Money Market is current income while maintaining a stable share price of $1.00.
Effective April 30, 2005, Meeder Asset Management, Inc., the investment advisor to the Funds, changed the investment strategy and name of The Highlands Growth Fund. The new investment strategy has incorporated a quantitative approach to stock selection focused on small- and mid-sized companies. The Fund’s new investment strategy, which Meeder Asset Management, Inc. has employed on behalf of institutional investors since 1989, has historically met the long-term growth objectives of those investors. The name of the Fund has changed to The Quantex Fund, which better reflects the Fund’s new investment strategy and the nature of the Fund’s portfolio holdings.
Use of estimates. The preparation of financial statements in conformity with accounting principles generally accepted in the United States of America (“GAAP”) requires management to make estimates and assumptions that affect the reported amounts of assets and liabilities and disclosure of contingent assets and liabilities at the date of the financial statements and the reported amounts of revenues and expenses during the reporting period. Actual results could differ from those estimates.
Security valuation. Securities that are traded on stock exchanges are valued at the last sales price as of the close of business of the New York Stock Exchange on the day of valuation or, lacking any sales, are valued using fair value procedures approved by the Board of Trustees (“Trustees”). Securities traded over-the-counter are valued at the most recent bid price or yield equivalent as obtained from one or more dealers that make markets in such securities. Registered investment companies are valued at the daily redemption value as reported by the underlying fund. Bond values the securities held at 4:00 P.M. Eastern Time. Money market securities held in Money Market are valued at amortized cost, which approximates value. The Funds obtain prices from independent pricing services, which use valuation techniques approved by the Trustees. Money Market, in compliance with Rule 2a-7 of the 1940 Act, compares its amortized values, including illiquid and restricted securities, to the prices obtained from the independent pricing services. The ability of issuers of debt securities held by the Funds to meet their obligations may be affected by economic and political developments in a specific country or region.
Money market securities held in the Funds, except Money Market, maturing more than sixty days after the valuation date are valued at the last sales price as of the close of business on the day of valuation, or, lacking any sales, at the most recent bid price or yield equivalent as obtained from dealers that make markets in such securities. When such securities are valued within sixty days or less to maturity, the difference between the valuation existing on the sixty-first day before maturity and maturity value is amortized on a straight-line basis to maturity. Securities maturing within sixty days from their date of acquisition are valued at amortized cost.
Repurchase agreements. Each Fund may engage in repurchase agreement transactions whereby the Fund takes possession of an underlying debt instrument subject to an obligation of the seller to repurchase the instrument from the Fund and an obligation of the Fund to resell the instrument at an agreed upon price and term. At all times, the Fund maintains the value of collateral, including accrued interest, of at least 100% of the amount of the repurchase agreement, plus accrued interest. If the seller defaults or the fair value of the collateral declines, realization of the collateral by the Funds may be delayed or limited.
Futures & options. Each Fund, except Money Market, may engage in transactions in financial futures contracts and options contracts in order to manage the risk of unanticipated changes in market values of securities held in the fund,
or which it intends to purchase. The futures and options contracts are adjusted by the daily exchange rate of the underlying currency, or index, and any gains or losses are recorded for financial statement purposes as unrealized gains or losses in the statement of assets and liabilities and the statement of operations until the contract settlement date, at which time realized gains and losses are included in the statement of operations.
To the extent that the Fund enters into futures contracts on an index or group of securities, the Fund exposes itself to an indeterminate liability and will be required to pay or receive a sum of money measured by the change in the value of the index. Upon entering into a futures contract, the Fund is required to deposit an initial margin, which is either cash or securities in an amount equal to a certain percentage of the contract value. Subsequently, the variation margin, which is equal to changes in the daily settlement price or last sale price on the exchanges where futures contracts trade, is received or paid and is recorded as an unrealized gain or loss until the contract is closed. When the contract is closed, the Fund records a realized gain or loss equal to the difference between the proceeds from (or cost of) the closing transaction and the Fund’s basis in the contract. Should market conditions move unexpectedly, the Fund may not achieve the anticipated benefits of the futures contract and may realize a loss. The use of futures transactions involves the risk of imperfect correlation in movements in the price of futures contracts, interest rates, and the underlying hedged assets.
Call and put option contracts involve the payment of a premium for the right to purchase or sell an individual security or index aggregate at a specified price until the expiration of the contract. Such transactions expose the Fund to the loss of the premium paid if the Fund does not sell or exercise the contract prior to the expiration date. In the case of a call option, sufficient cash or money market instruments will be segregated to complete the purchase. Options are valued on the basis of the daily settlement price or last sale on the exchanges where they trade and the changes in value are recorded as unrealized appreciation or depreciation until closed, exercised or expired.
The Funds may write covered call or put options for which premiums received are recorded as liabilities and are subsequently adjusted to the current value of the options written. When written options are closed or exercised, premiums received are offset against the proceeds paid, and the Fund records realized gains or losses for the difference. When written options expire, the liability is eliminated, and the Fund records realized gains for the entire amount of premiums received.
Transactions in options during the year ended December 31, 2005 were as follows:
| | | | | | |
Bond
| | Number of
Contracts
| | | Premiums
Received/(Paid)
| |
Options outstanding at December 31, 2004 | | — | | | — | |
Options written | | 9 | | | 4,618 | |
Options terminated in closing purchase transactions | | (9 | ) | | (4,618 | ) |
Options expired | | — | | | — | |
Options exercised | | — | | | — | |
Options outstanding at December 31, 2005 | | — | | | — | |
| | | | | | |
Muirfield
| | Number of
Contracts
| | | Premiums
Received/(Paid)
| |
Options outstanding at December 31, 2004 | | — | | | — | |
Options written | | 115 | | | 138,748 | |
Options terminated in closing purchase transactions | | (115 | ) | | (138,748 | ) |
Options expired | | — | | | — | |
Options exercised | | — | | | — | |
Options outstanding at December 31, 2005 | | — | | | — | |
Federal income taxes. It is each Fund’s policy to continue to comply with the requirements of Subchapter M of the Internal Revenue Code applicable to regulated investment companies and to distribute substantially all of its taxable income and net capital gains to its shareholders. Therefore, no federal income tax provision is required.
Distributions to shareholders. Distributions to shareholders are recorded on the ex-dividend date. Muirfield, Quantex, Dynamic, and Aggressive declare and pay dividends from net investment income, if any, on a quarterly basis. TRUF declares and pays dividends from net investment income on a monthly basis. Bond and Money Market declare dividends from net investment income on a daily basis and pay such dividends on a monthly basis. Each Fund distributes net capital gains, if any, on an annual basis.
Distributions from net investment income and from net capital gains are determined in accordance with income tax regulations, which may differ from GAAP. These differences are primarily due to deferrals of certain losses, expiring capital loss carryforwards, and differing treatments of unrealized gains and losses of futures contracts held by each Fund. Accordingly, timing differences relating to shareholder distributions are reflected in the components of net assets and permanent book and tax differences relating to shareholder distributions have been reclassified within the components of net assets. Differences identified and reclasses made for the period ended December 31, 2005 were as follows:
| | | | | | | |
| | | Capital
| | | Undistributed
Net Investment
Income
|
The Total Return Utilities Fund | | $ | (27,624 | ) | | $ | 27,624 |
The Quantex Fund™ | | | (2,873 | ) | | | 2,873 |
Investment income & expenses. For Money Market, income and expenses (other than expenses attributable to a specific class) are allocated to each class of shares based on its relative net assets. Expenses incurred by the Trust that do not specifically relate to an individual Fund of the Trust are allocated to the Funds based on each Fund’s relative net assets or other appropriate basis.
Capital Share Transactions. Money Market is authorized to issue an indefinite number of shares in the Retail Class and the Institutional Class. Transactions in the capital shares of the Fund were as follows (the Retail Class illustrates the years ended December 31, 2005 and December 31, 2004 while the Institutional Class represents the year ended December 31, 2005 and the period December 28 (commencement date) through December 31, 2004):
| | | | | | | | | | | | | | |
| | | 2005
| | | 2004
| |
| | | Amount
| | | Shares
| | | Amount
| | | Shares
| |
Retail Class | | | | | | | | | | | | | | |
Issued | | $ | 155,320,448 | | | 155,320,448 | | | $ | 168,014,354 | | | 168,014,354 | |
Reinvested | | | 3,629,377 | | | 3,629,377 | | | | 1,729,195 | | | 1,729,195 | |
Redeemed | | | (178,399,813 | ) | | (178,399,813 | ) | | | (186,700,360 | ) | | (186,700,360 | ) |
Net increase (decrease) | | $ | (19,449,988 | ) | | (19,449,988 | ) | | $ | (16,956,811 | ) | | (16,956,811 | ) |
Institutional Class | | | | | | | | | | | | | | |
Issued | | $ | 73,089,485 | | | 73,089,485 | | | $ | 39,106,382 | | | 39,106,382 | |
Reinvested | | | 511,344 | | | 511,344 | | | | 2,671 | | | 2,671 | |
Redeemed | | | (82,827,873 | ) | | (82,827,873 | ) | | | (8,798,923 | ) | | (8,798,923 | ) |
Net increase (decrease) | | $ | (9,227,044 | ) | | (9,227,044 | ) | | $ | 30,310,130 | | | 30,310,130 | |
Other. The Funds record security transactions on the trade date. Gains and losses realized from the sale of securities are determined on the specific identification basis. Dividend income is recognized on the ex-dividend date and interest income (including amortization of premium and accretion of discount) is recognized as earned.
Under a Deferred Compensation Plan (the “Plan”), non-interested Trustees may elect to defer receipt of a portion of their annual compensation. Under the Plan, deferred amounts are invested in shares of the Funds. Deferred amounts remain in the Funds until distributed in accordance with the Plan.
2. Investment Transactions
For the year ended December 31, 2005, the cost of purchases and proceeds from sales or maturities of long-term investments for the Funds were as follows:
| | | | | | |
| | | Purchases
| | Sales
|
The Muirfield Fund® | | $ | 99,877,171 | | $ | 90,538,977 |
The Total Return Utilities Fund | | | 6,375,272 | | | 15,569,419 |
The Quantex Fund™ | | | 26,745,463 | | | 30,886,090 |
The Dynamic Growth Fund | | | 59,007,770 | | | 52,168,870 |
The Aggressive Growth Fund | | | 19,041,844 | | | 18,439,003 |
The U.S. Government Bond Fund | | | 11,084,584 | | | 14,303,401 |
3. Investment Advisory Fees and Other Transactions with Affiliates
Meeder Asset Management, Inc. (“MAM”), a wholly-owned subsidiary of Meeder Financial, Inc. (“Meeder”), provides each Fund, under a separate Investment Advisory Contract, with investment management, research, statistical and advisory services. The services of MAM will terminate automatically if assigned and may be terminated without penalty at any time upon 60 days prior written notice by majority vote of the Fund, by the Trustees of the Fund, or by MAM. Under a separate Investment Subadvisory Agreement with MAM, Miller/Howard Investments, Inc. (“Miller/Howard”) serves as subadvisor of TRUF. The Investment Subadvisory Agreement provides that it will terminate automatically if assigned, and that it may be terminated by MAM without penalty to the Fund by MAM, the Trustees of the Fund, or by the vote of a majority of the outstanding voting securities of the Fund upon not less than 30 days written notice.
For such services the Funds pay a fee at the following annual rates: Muirfield, TRUF, and Quantex, 1.00% of average daily net assets up to $50 million, 0.75% of average daily net assets exceeding $50 million up to $100 million and 0.60% of average daily net assets exceeding $100 million. As subadvisor to TRUF, Miller/Howard is paid 0.00% of the 1.00% of average daily net assets up to $10 million, 0.40% of the 1.00% of average daily net assets exceeding $10 million up to $50 million, 0.40% of the 0.75% of average daily net assets exceeding $50 million up to $60 million, 0.30% of the 0.75% of average daily net assets exceeding $60 million up to $100 million and 0.25% of the 0.60% of average daily net assets exceeding $100 million; Dynamic and Aggressive, 0.75% of average daily net assets up to $200 million and 0.60% of average daily net assets exceeding $200 million; Bond, 0.40% of average daily net assets up to $100 million and 0.20% of average daily net assets exceeding $100 million; and Money Market, 0.40% of average daily net assets up to $100 million and 0.25% of average daily net assets exceeding $100 million. Effective July 13, 2005, MAM has contractually agreed to reduce its investment advisory fee by 0.25% for Quantex. MAM may terminate this agreement after April 30, 2006. For the period April 30, 2005 through July 12, 2005, MAM voluntarily reduced its investment advisory fee by 0.25% for Quantex so that the total advisory fee would not exceed 0.75% of average daily net assets. During the year ended December 31, 2005, $12,359 of investment advisory fees was waived in Quantex. During the year ended December 31, 2005, MAM agreed to reduce $262,473 of investment advisory fees in Money Market.
A Chief Compliance Officer (“CCO”), who is an affiliate of the Trust and MAM, provides the Trust with certain compliance services. In compensation for such services, the Trust pays the CCO 70% of an annual fee of $50,000, which equates to $5,000 per year for each Fund. For the year ended December 31, 2005, the CCO received $5,000 from each Fund. The remaining 30% is paid by another mutual fund trust managed by MAM.
Mutual Funds Service Co. (“MFSCo”), a wholly-owned subsidiary of Meeder, serves as stock transfer, dividend disbursing and shareholder services agent for each Fund. In compensation for such services, each Fund pays MFSCo an annual fee calculated as follows: For Muirfield, TRUF, Quantex, Dynamic, and Aggressive, such fee is equal to the greater of $15 per active shareholder account or 0.12% of each Fund’s average daily net assets. For Bond, such fee is equal to the greater of $15 per active shareholder account or 0.08% of the Fund’s average daily net assets. For Money Market Retail Class and Money Market Institutional Class, such fee is equal to the greater of $20 per active shareholder account or 0.08% of the Fund’s average daily net assets. MFSCo is entitled to receive an annual minimum fee of $4,000 for each Fund or class. For Funds that are subject to an expense cap and which are above the expense cap, the basis point fee will be reduced by 0.02%. During the year ended December 31, 2005, MFSCo waived $1,473 and $5,877 of transfer agent fees for Bond and Money Market, respectively.
MFSCo provides the Trust with certain administrative services. In compensation for such services, each Fund pays MFSCo an annual fee equal to 0.10% of each Fund’s average daily net assets up to $50 million and 0.08% of each Fund’s average daily net assets exceeding $50 million. Prior to June 17, 2005, each Fund paid MFSCo an annual fee equal to 0.05% of each Fund’s average daily net assets.
MFSCo serves as accounting services agent for each Fund. In compensation for such services, each Fund pays MFSCo an annual fee equal to the greater of:
| | a. | 0.15% of the first $10 million of average daily net assets, 0.10% of the next $20 million of average daily net assets, 0.02% of the next $50 million of average daily net assets, and 0.01% in excess of $80 million of average daily net assets, or |
| | b. | $7,500 for non-Money Market Funds and $30,000 for Money Market. |
MAM has voluntarily agreed to reduce its fees and/or reimburse expenses (excluding brokerage fees and commissions, taxes, interest, and extraordinary or non-recurring expenses), to limit Bond’s total annual operating expenses to 1.10% of average daily net assets. MAM has also agreed to reduce its fees and/or reimburse expenses to the extent necessary to achieve an effective yield for the Retail Class that will rank in the top 10% of yields for all general-purpose money market funds in 2005. Lastly, MAM limited the Institutional Class’ total annual operating expenses to 0.33% of average daily net assets. Such reduction and/or reimbursement is limited to the total of fees charged to each Fund or Class by MAM and MFSCo. For the year ended December 31, 2005, MAM and/or MFSCo reimbursed $48,382, $136,084, and $54,124 to Bond, the Retail Class, and the Institutional Class, respectively.
Adviser Dealer Services, Inc. (“ADS”), an affiliated broker-dealer of MAM, has an arrangement with TRUF whereby a portion of the commissions received from security trades directed through it will be used to help pay expenses of the aforementioned Fund. For the year ended December 31, 2005, ADS received $4,644 in net commissions in connection with the purchase and sale of investments for TRUF and paid $4,037 of expenses under this arrangement for the aforementioned Fund. Prior to April 30, 2005, Quantex (when it was formerly known as Highlands) had the same arrangement with ADS. For the year ended December 31, 2005, ADS received $3,930 in net commissions in connection with the purchase and sale of investments for Quantex (when it was formerly known as Highlands) and paid $4,834 of expenses under this arrangement. Effective April 30, 2005, the arrangement between ADS and Quantex was discontinued.
Muirfield, Dynamic, and Aggressive have entered into an agreement with the Trust’s custodian, The Huntington National Bank (“HNB”), acting as a broker-dealer. HNB receives distribution, service, and administration fees (collectively the “fees”) from the underlying security holdings of the aforementioned Funds. HNB retains 0.03% of the fees collected and forwards the remainder to the appropriate Fund. The Funds use their portion of the fees received to reduce the gross expenses of each Fund. For the year ended December 31, 2005, Muirfield, Dynamic, and Aggressive used $77,978, $48,116, and $16,168 of fees received, respectively, to reduce gross expenses of each Fund. It is possible that the Funds may invest in security holdings in which fees are not paid. As such, the gross expenses of a Fund would not be decreased. Also, without this agreement it is likely that the Funds would not collect any fees from underlying security holdings.
Pursuant to Rule 12b-1 of the 1940 Act, a mutual fund can adopt a written plan to pay certain expenses out of fund assets relating to the sale and distribution of its shares. Muirfield, Quantex, Bond, and the Retail Class have adopted a distribution plan with an annual limitation of 0.20% of average daily net assets. TRUF, Dynamic, and Aggressive have adopted a distribution plan with an annual limitation of 0.25% of average daily net assets. The Institutional Class has adopted a distribution plan with an annual limitation of 0.03% of average daily net assets. For the year ended December 31, 2005, Muirfield, TRUF, Quantex, Dynamic, Aggressive, and Bond waived $66,794, $5,302, $24,867, $31,670, $12,195, and $4,944 of distribution plan (12b-1) expenses, respectively. The Retail Class and the Institutional Class waived $199,371 and $3,523, respectively, for a total of $202,894.
An Administrative Services Plan has been adopted for each Fund of the Trust except Money Market. The Administrative Services Plan allows for each eligible Fund to pay a maximum annual amount of 0.20% of average daily net assets to Service Organizations that provide administrative support services to their customers who own shares of record or benefically. For the year ended December 31, 2005, Muirfield, TRUF, Quantex, Dynamic, Aggressive, and Bond waived $110,581, $26,973, $34,779, $41,567, $16,986, and $15,211 of administrative service plan expenses, respectively.
The Funds have adopted a Deferred Compensation Plan (the “Plan”) for the independent Trustees. Under the Plan, each eligible Trustee is permitted to defer all or a portion of the trustees fees payable by any of the Funds as an investment into any combination of Funds until a specified point of time. The investment into the Funds is recorded as an asset, however an offsetting liability is also recorded for the deferred payment. Once the eligible Trustees’ deferral amounts can be distributed, a lump sum or generally equal annual installments over a period of up to ten (10) years can be made to the eligible Trustee(s). The Funds may terminate this Plan at any time.
Certain trustees and officers of the Funds are also officers or directors of Meeder, MAM, MFSCo, and ADS.
On August 1, 2005, MAM inadvertently purchased excess futures contracts in Muirfield, Dynamic, and Aggressive, resulting in investment transaction losses for each Fund. For the year ended December 31, 2005, Muirfield, Dynamic, and Aggressive were voluntarily reimbursed $5,815, $1,454, and $2,181, respectively, by MAM for losses on investment transactions.
4. Federal Tax Information
The tax characteristics of dividends paid by the Funds during the year ended December 31, 2005 were as follows:
| | | | | | | | | |
| | | Ordinary
Income
| | Net
Short-Term
Capital Gains
| | Total
Dividends
Paid(1)
|
The Muirfield Fund® | | $ | 1,007,736 | | $ | — | | $ | 1,007,736 |
The Dynamic Growth Fund | | | 246,363 | | | — | | | 246,363 |
The Aggressive Growth Fund | | | 37,952 | | | — | | | 37,952 |
The Quantex Fund™ | | | 10,604 | | | — | | | 10,604 |
The Total Return Utilities Fund | | | 303,370 | | | — | | | 303,370 |
The U.S. Government Bond Fund | | | 206,740 | | | — | | | 206,740 |
The Money Market Fund | | | 4,515,922 | | | — | | | 4,515,922 |
The tax characteristics of dividends paid by the Funds during the year ended December 31, 2004 were as follows:
| | | | | | | | | |
| | | Ordinary
Income
| | Net
Short-Term
Capital Gains
| | Total
Dividends
Paid(1)
|
The Muirfield Fund® | | $ | 73,953 | | $ | — | | $ | 73,953 |
The Total Return Utilities Fund | | | 511,965 | | | — | | | 511,965 |
The U.S. Government Bond Fund | | | 248,065 | | | — | | | 248,065 |
The Money Market Fund | | | 1,734,319 | | | — | | | 1,734,319 |
As of December 31, 2005, the components of accumulated earnings/(deficit) on a tax basis for the Funds were as follows:
| | | | | | | | | | | | | | | | | | | |
| | | Undistributed
Ordinary
Income
| | Dividends
Payable
| | | Accumulated
Capital and
Other Gains
and (Losses)
| | | Unrealized
Appreciation/
(Depreciation)(2)
| | | Total
Accumulated
Earnings/
(Deficit)
| |
The Muirfield Fund® | | $ | 6,418 | | $ | (5,982 | ) | | $ | (8,027,390 | ) | | $ | (2,842,112 | ) | | $ | (10,869,066 | ) |
The Total Return Utilities Fund | | | 2,197 | | | (2,197 | ) | | | (6,828,551 | ) | | | 3,884,064 | | | | (2,944,487 | ) |
The Quantex Fund™ | | | 92 | | | (92 | ) | | | (4,837,849 | ) | | | 1,872,875 | | | | (2,964,974 | ) |
The Dynamic Growth Fund | | | 207 | | | (207 | ) | | | (2,398,573 | ) | | | (437,037 | ) | | | (2,835,610 | ) |
The Aggressive Growth Fund | | | 204 | | | (204 | ) | | | (6,467,938 | ) | | | 220,211 | | | | (6,247,727 | ) |
The U.S. Government Bond Fund | | | 158,948 | | | (1,415 | ) | | | (1,003,440 | ) | | | (74,989 | ) | | | (920,896 | ) |
The Money Market Fund | | | 34,328 | | | (34,328 | ) | | | — | | | | — | | | | — | |
For federal income tax purposes, the following Funds have capital loss carryforwards as of December 31, 2005, which are available to offset future capital gains, if any. To the extent that these carryforwards are used to offset future capital gains, it is probable that the gains that are offset will not be distributed to shareholders:
| | | | | |
| | | Amount
| | Expires
|
The Muirfield Fund® | | $ | 4,367,373 | | 2009 |
The Muirfield Fund® | | | 3,660,017 | | 2010 |
The Total Return Utilities Fund | | | 4,785,064 | | 2010 |
The Total Return Utilities Fund | | | 2,043,487 | | 2011 |
The QuantexFund™ | | | 3,588,183 | | 2010 |
The QuantexFund™ | | | 1,249,666 | | 2011 |
The Dynamic Growth Fund | | | 2,398,573 | | 2010 |
The Aggressive Growth Fund | | | 1,811,496 | | 2008 |
The Aggressive Growth Fund | | | 618,687 | | 2009 |
The Aggressive Growth Fund | | | 4,037,755 | | 2010 |
The U.S. Government Bond Fund | | | 735,915 | | 2011 |
The U.S. Government Bond Fund | | | 125,708 | | 2012 |
The U.S. Government Bond Fund | | | 141,817 | | 2013 |
Under current tax laws, net capital losses incurred after October 31, within a Fund’s fiscal year, are deemed to arise on the first business day of the following fiscal year for tax purposes. For the year ended December 31, 2005, the Funds deferred post October capital losses of:
| | | |
| | | Post-October
Capital Losses
|
The U.S. Government Bond Fund | | $ | 48,816 |
| (1) | Total dividends paid may differ from the amount reported in the Statement of Changes in Net Assets because for tax purposes dividends are recognized when actually paid. |
| (2) | The differences between book- and tax-basis unrealized appreciation/(depreciation) are attributable primarily to: deferral of losses on wash sales and the realization for tax purposes of unrealized gains/(losses) on certain derivative instruments. |
5. Control Ownership
The beneficial ownership, either directly or indirectly, of more than 25% of the voting securities of a fund creates a presumption of control of the fund under Section 2(a)(9) of the 1940 Act. As of December 31, 2005, Charles Schwab & Co., Inc. held for the benefit of others, in aggregate, 50.80% of TRUF; Nationwide Trust Company, FSB held 48.26% of Dynamic; Nationwide Trust Company, FSB held 39.06% of Aggressive; Nationwide Trust Company, FSB held 35.40% of Muirfield and therefore may be deemed to control the Funds.
6. Subsequent Events
The Trust has offered two new series comprised of two separate funds, which commenced operations on January 31, 2006. The names of the funds are The Defensive Growth Fund and The Focused Growth Fund. Each Fund’s investment objective is growth of capital. MAM serves as each Fund’s investment advisor.
To The Shareholders and
Board of Trustees of
The Flex-funds
REPORT OF INDEPENDENT REGISTERED PUBLIC ACCOUNTING FIRM
We have audited the accompanying statements of assets and liabilities, including the schedules of investments, of The Flex-funds, comprising The Muirfield Fund, The Total Return Utilities Fund, The Quantex Fund, The Dynamic Growth Fund, The Aggressive Growth Fund, The U.S. Government Bond Fund, and The Money Market Fund (the “Funds”), as of December 31, 2005, and the related statements of operations for the year then ended, and the statements of changes in net assets and the financial highlights for each of the two years in the period then ended. These financial statements and financial highlights are the responsibility of the Funds’ management. Our responsibility is to express an opinion on these financial statements and financial highlights based on our audits. The financial highlights for the periods indicated prior to December 31, 2004 were audited by other auditors, who expressed unqualified opinions on those highlights.
We conducted our audit in accordance with the standards of the Public Company Accounting Oversight Board (United States). Those standards require that we plan and perform the audit to obtain reasonable assurance about whether the financial statements and financial highlights are free of material misstatement. An audit includes examining, on a test basis, evidence supporting the amounts and disclosures in the financial statements. Our procedures included confirmation of investments owned as of December 31, 2005, by correspondence with the Funds’ custodian and brokers. An audit also includes assessing the accounting principles used and significant estimates made by management, as well as evaluating the overall financial statement presentation. We believe that our audits provide a reasonable basis for our opinion.
In our opinion, the financial statements and financial highlights referred to above present fairly, in all material respects, the financial position of each of the Funds constituting The Flex-funds, as of December 31, 2005, the results of their operations for the year then ended, and the changes in their net assets and financial highlights for each of the two years in the period then ended, in conformity with accounting principles generally accepted in the United States of America.
Cohen McCurdy, Ltd.
Westlake, Ohio
February 15, 2006
Trustees and Officers (unaudited)
Certain trustees and officers of the Funds are also officers or directors of Meeder, MAM, MFSCo, and ADS. The Trustees oversee the management of the Trust and elect their officers. The officers are responsible for the Funds’ day-to-day operations. The Trustees’ and officers’ names, addresses, years of birth, positions held with the Trust, and length of service as a Flex-funds Trustee are listed below. Also included is each Board member’s principal occupation during, at least, the past five years. Except as indicated, each individual has held the office shown or other offices in the same company for the last five years. Those Trustees who are “interested persons”, as defined in the 1940 Act, by virtue of their affiliation with the Trust, are indicated by an asterisk (*).
| | | | | | |
Name, Address(1), and
Year of Birth
| | Year First Elected a
Director or Officer of Trust
| | Position and
Number of Funds
Overseen(2)
| | Principal
Occupation During
Past Five Years and
Other Directorships Held(3)
|
Milton S. Bartholomew Year of Birth: 1929 | | 1982 | | Trustee | | Retired; formerly a practicing attorney in Columbus, Ohio; member of the Trust’s Audit Committee. |
| | | |
Robert S. Meeder, Jr.* Year of Birth: 1961 | | 1992 | | Trustee and President | | President of Meeder Asset Management, Inc. |
| | | |
Walter L. Ogle Year of Birth: 1937 | | 1982 | | Trustee | | Retired; formerly Executive Vice President of Aon Consulting, an employee benefits consulting group; member of the Trust’s Audit Committee. |
| | | |
James W. Didion Year of Birth: 1930 | | 1982, 1998 | | Trustee | | Retired; formerly Executive Vice President of Core Source, Inc., an employee benefit and Workers’ Compensation administration and consulting firm (1991 – 1997); Chairman of the Trust’s Audit Committee. |
| | | |
Jack W. Nicklaus Year of Birth: 1961 | | 1998 | | Trustee | | Designer, Nicklaus Design, a golf course design firm and division of The Nicklaus Companies; member of the Trust’s Audit Committee. |
| | | |
Wesley F. Hoag Year of Birth: 1957 | | 1993 | | Vice President, Secretary, and Chief Compliance Officer | | General Counsel of Meeder Asset Management, Inc. and Mutual Funds Service Co., the Trust’s transfer agent. |
| | | |
Bruce E. McKibben Year of Birth: 1969 | | 2002 | | Treasurer | | Director of Fund Accounting of Mutual Funds Service Co., the Trust’s transfer agent. |
| (1) | The address of each Trustee is 6125 Memorial Drive, Dublin, OH 43017. |
| (2) | Each Trustee serves for an indefinite term, until his or her resignation, death, or removal. Each Trustee oversees all seven Funds in the Trust. |
| (3) | Robert S. Meeder, Jr. serves as Trustee of the Meeder Premier Portfolios, which is managed by Meeder Asset Management, Inc., the Advisor of the Trust. |
| * | Robert S. Meeder, Jr. is deemed an “interested person” of the Trust by virtue of his position as President of Meeder Asset Management, Inc., the Advisor of the Trust. |
The Statement of Addition Information includes additional information about each Trustee and is available without charge. To obtain a copy of the Statement of Additional Information, please contact your financial representative or call toll free 1-800-325-3539.
Other Information
The Funds file their complete schedules of portfolios holdings with the Securities and Exchange Commission (“SEC”) for the first and third quarters of each fiscal year on Form N-Q. The Funds’ Forms N-Q are available on the SEC’s website at http://www.sec.gov and may be reviewed and copied at the SEC’s Public Reference Room in Washington, DC. Information on the operation of the Public Reference Room may be obtained by calling 1-800-SEC-0330. The Funds’ schedules of positions are also available on the Funds’ website at www.flexfunds.com.
A description of the policies and procedures that the Funds use to determine how to vote proxies relating to portfolio securities, and information regarding how the Funds voted these proxies for the 12-month period ended June 30, 2005, is available on the SEC’s website at http://www/sec.gov, or, without charge, upon request by calling toll-free 1-800-325-3539.
| | |
| The Flex-funds | | 2005 Annual Report | December 31, 2005 |
Manager and Investment Advisor
Meeder Asset Management, Inc.
6125 Memorial Drive
P.O. Box 7177
Dublin, Ohio 43017
Subadvisor/The Total Return Utilities Fund
Miller/Howard Investments, Inc.
141 Upper Byrdcliffe Road, P.O. Box 549
Woodstock, New York 12498
Board of Trustees
Milton S. Bartholomew
James Didion
Robert S. Meeder, Jr.
Jack Nicklaus II
Walter L. Ogle
Custodian
The Huntington National Bank
Columbus, Ohio 43215
Transfer Agent & Dividend Disbursing Agent
Mutual Funds Service Co.
6125 Memorial Drive
Dublin, Ohio 43017
Auditors
Cohen McCurdy, Ltd.
800 Westpoint Parkway, Suite 1100
Westlake, Ohio 44145
| | |
| The Flex-Funds 2005 Annual Report | December 31, 2005 | | |
The Flex-funds
Managed by Meeder Asset Management, Inc.
6125 Memorial Drive, Dublin Ohio, 43017
Call Toll Free 800-325-3539 | 760-2159
Fax: 614-766-6669 | www.flexfunds.com
Email: flexfunds@meederfinancial.com
The registrant has adopted a code of ethics that applies to the registrant’s principal executive officer, principal financial officer, comptroller or principal accounting officer, and any person who performs a similar function.
| Item 3. | Audit Committee Financial Expert. |
Currently, The Flex-funds (the “Funds”) do not have an Audit Committee member who possesses all of the attributes required to be an “audit committee financial expert” as defined in instruction 2(b) of Item 3 of Form N-CSR. However, the Board of Trustees believes that each member of the Audit Committee has substantial experience relating to the review of financial statements and the operations of audit committees. Accordingly, the Board of Trustees believes that the members are qualified to evaluate the Funds’ financial statements, supervise the Funds’ preparation of its financial statements, and oversee the work of the Funds’ independent auditors. The Board of Trustees also believes that, although no single Audit Committee member possesses all of the attributes required to be an “audit committee financial expert”, the Audit Committee members collectively as a group possess the attributes required to be an “audit committee financial expert.”
| Item 4. | Principal Accountant Fees and Services. |
(a) – (d) Aggregate fees billed to the registrant for the last two fiscal years for professional services rendered by the registrant’s principal accountant were as follows:
| | | | | | |
| | | 2005 | | 2004 |
Audit Fees | | $ | 48,400 | | $ | 52,809 |
Audit-Related Fees | | | 1,595 | | | — |
Tax Fees | | | 15,620 | | | 19,260 |
All Other Fees | | | 4,250 | | | 8,910 |
Audit fees include amounts related to the audit of the registrant’s annual financial statements and services normally provided by the accountant in connection with statutory and regulatory filings. Audit-related fees include amounts
reasonably related to the performance of the audit of the registrant’s financial statements. Tax fees include amounts related to tax compliance, tax planning, and tax advice. All other fees include amounts related to the registrant’s annual filing of Form N1A.
(e)(1) A purpose of the Audit Committee is to approve the engagement of the registrant’s independent auditors (i) to render audit and non-audit services for the registrant in accordance with Rule 2-01(c)(7)(i) of Regulation S-X, subject to the waiver provisions set forth in Rule 2-01(c)(7)(i)(C) of Regulation S-X, and (ii) to render non-audit services for the registrant’s investment advisors (other than a sub-advisor whose role is primarily portfolio management and is subcontracted or overseen by another investment advisor) and any other entity controlling by, or under common control with the investment advisor that provides ongoing services to the registrant, in each case under (ii) if the engagement relates directly to the operations and financial reporting of the registrant, in accordance with Rule 2-01(c)(7)(ii) of Regulation S-X, subject to waiver provisions set forth in Rule 2-01(c)(7)(ii) of Regulation S-X.
(e)(2) 100% of services included in (b) – (d) above were approved pursuant to Rule 2-01(c)(7)(i)(C) of Regulation S-X.
(f) Not applicable.
(g) The aggregate fees billed for the most recent fiscal year and the preceding fiscal year by the registrant’s principal accountant for non-audit services rendered to the registrant, its investment advisor, and any entity controlling, controlled by, or under common control with the investment advisor that provides ongoing services to the registrant were $21,410 and $50,800 respectively.
(h) Not applicable.
| Items 5. | Audit Committee of Listed Registrants. |
Not applicable.
| Item 6. | Schedule of Investments. |
Not applicable.
| Item 7. | Disclosure of Proxy Voting Policies and Procedures for Closed-End Management Investment Companies. |
Not applicable.
| Item 8. | Portfolio Managers of Closed-End Management Investment Companies. |
Not applicable.
| Item 9. | Purchases of Equity Securities by Closed-End Management Investment Company and Affiliated Purchasers. |
Not applicable.
| Item 10. | Submission of Matters to a Vote of Security Holders. |
Not applicable.
| Item 11. | Controls and Procedures. |
(a) Based on our evaluation conducted within 90 days of the filing date, hereof, the design and operation of the registrant’s disclosure controls and procedures are effective to ensure that material information relating to the registrant is made known to the certifying officers by others within the appropriate entities, particularly during the period in which Forms N-CSR are being prepared, and the registrant’s disclosure controls and procedures allow timely preparation and review of the information for the registrant’s Form N-CSR and the officer certifications of such Form N-CSR.
(b) There were no significant changes in the registrant’s internal controls or in other factors that could significantly affect these controls subsequent to the date of their evaluation, including any corrective actions with regard to significant deficiencies and material weaknesses.
(a)(1) Code of Ethics filed herewith as EX-99.CODE ETH.
(a)(2) A separate certification for each principal executive and principal financial officer of the registrant as required by Rule 30a-2(a) under the Act(17 CFR270.30a-2(a)). Filed herewith as EX-99.CERT.
(b) Certifications of principal executive officer and principal financial officer, under Section 906 of the Sarbanes-Oxley Act of 2002, and 18 U.S.C. ss.1350. Filed herewith as EX-99.906 CERT.
SIGNATURES
Pursuant to the requirements of the Securities Exchange Act of 1934 and the Investment Company Act of 1940, the registrant has duly caused this report to be signed on its behalf by the undersigned, thereunto duly authorized.
| | |
The Flex-funds |
| |
By: | | /s/ Bruce E. McKibben |
| | Bruce E. McKibben, Treasurer |
| |
Date: | | February 15, 2006 |
Pursuant to the requirements of the Securities Exchange Act of 1934 and the Investment Company Act of 1940, this report has been signed below by the following persons on behalf of the registrant and in the capacities and on the dates indicated.
| | |
By: | | /s/ Bruce E. McKibben |
| | Bruce E. McKibben, Treasurer |
| |
Date: | | February 15, 2006 |
| | |
By: | | /s/ Robert S. Meeder, Jr. |
| | Robert S. Meeder, Jr., President |
| |
Date: | | February 15, 2006 |