UNITED STATES
SECURITIES AND EXCHANGE COMMISSION
Washington, D.C. 20549
FORM N-CSR
CERTIFIED SHAREHOLDER REPORT
OF REGISTERED MANAGEMENT INVESTMENT COMPANIES
Investment Company Act file number 811-3462
The Flex-funds Trust
6125 Memorial Drive
Dublin, OH 43017
Bruce McKibben
c/o The Flex-funds Trust
6125 Memorial Drive
Dublin, OH 43017
Registrant’s telephone number, including area code: 800-325-3539
Date of fiscal year end: December 31, 2007
Date of reporting period: December 31, 2007
| Item 1. | Report to Stockholders. |
The Flex-funds
2007 ANNUAL REPORT
DECEMBER 31, 2007
| | |
| | The Flex-funds |
| | MANAGEDBY MEEDER ASSET MANAGEMENT, INC. |
| | 6125 MEMORIAL DRIVE, DUBLIN OHIO, 43017 |
| | CALL TOLL FREE 800-325-3539 | 766-7000 FAX: 614-791-2572 | WWW.FLEXFUNDS.COM |
| | EMAIL: FLEXFUNDS@MEEDERFINANCIAL.COM |
| | |
| The Flex-funds | | 2007 ANNUAL REPORT | DECEMBER 31, 2007 |
TABLE OF CONTENTS
| | | | | | |
Letter to Shareholders | | Page 1 | | The Socially Responsible Utilities Fund | | Page 16 |
The Dynamic Growth Fund | | Page 6 | | The Quantex FundTM | | Page 18 |
The Muirfield Fund® | | Page 8 | | The U.S. Government Bond Fund | | Page 20 |
The Aggressive Growth Fund | | Page 10 | | The Money Market Fund | | Page 22 |
The Defensive Growth Fund | | Page 12 | | Shareholder Expense Analysis | | Page 24 |
The Focused Growth Fund | | Page 14 | | Fund Holdings & Financial Statements | | Page 25 |
OUR MISSION STATEMENT
Every day, our mission is to exceed, with integrity, passion, and discipline, the expectations of our shareholders’ and clients’ overall investment experience.
CORE VALUES
THE CLIENT/SHAREHOLDER IS OUR #1 PRIORITY
Always remember whom we are serving. Our livelihood depends on providing a superior overall investment experience that exceeds the expectation of our shareholders and clients.
CLARITY OF PURPOSE
Our organization has a clear, well-defined vision. All of our associates are committed to and understood how they will contribute to that vision.
COMMUNICATION
We expect open and effective communication, full reporting, including good and bad news, and constructive feedback.
INTEGRITY
We insist upon honesty and adhere to the highest ethical standards.
EXCELLENCE/ INNOVATION
Our associates strive each day for excellence in the work they perform, seek innovative ways to solve problems and introduce new ideas to take advantage of opportunities. We are a “Think Outside The Box” company.
ASSOCIATE WELL-BEING
We value the success and well-being of our associates. We recognize and reward our associates’ contributions.
RESPECT FOR OTHERS
Respect all people, value the differences among them and treat them as you would like to be treated.
SEEK FIRST TO UNDERSTAND
When interacting with others, place curiosity and understanding of their perspective FIRST, setting aside preconceived opinions and quick judgment.
TEAMWORK
We are a synergistic organization that works as a team to exceed our objectives.
PROFIT
We are profitable. Profitability enhances our services and capabilities, and affords everyone the opportunity to further their financial well-being.
| | |
| The Flex-funds | | 2007 Annual Report | December 31, 2007 |
Letter To Shareholders
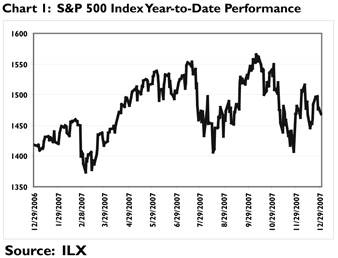
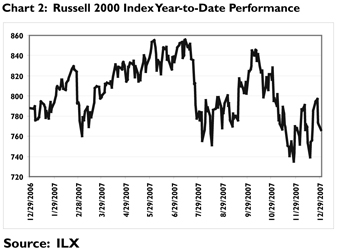
Stock prices hit record highs early in the fourth quarter, but quickly retreated and finished the quarter lower than where they began. Investors were increasingly worried that continued problems in the housing and credit markets might spill over to the broader economy and lead to a significant slowdown in economic growth. In that environment, the S&P 500 Index declined 3.33% in the fourth quarter, while the smaller cap Russell 2000 Index posted a loss of 4.58%
Despite these recent losses, the S&P 500 Index delivered a modest return for the full year. For 2007, the S&P 500 Index returned 5.49%, while the Russell 2000 Index actually declined 1.55%. (See Charts 1 & 2)
Against this backdrop, we are pleased that for the 3 months, 1 year and 3 years ending December 31, 2007, the majority of our Equity Funds outperformed their respective benchmark indices.
Positive Economic Developments
Although there has been growing concern on Wall Street about the health of the economy, recent data shows that economic conditions throughout the year remained mostly positive. Consider factors such as:
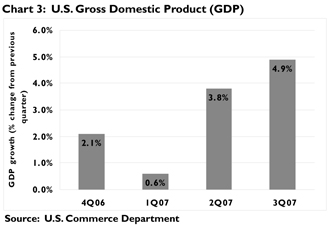
* Strong economic growth. In late November, the U.S. Commerce Department reported that the U.S. economy grew by 4.9% in the third quarter—its strongest pace in four years, and higher than analysts’ initial estimate of 3.9% (see Chart 3).
However, the Federal Reserve Board (the “Fed”) did say in its meeting on December 11, 2007 that “the pace of the economic expansion would likely slow in the near term.” In fact, Morgan Stanley recently projected only a 1% fourth quarter GDP growth. The future indicates a potential decline in economic activity.
* Impressive productivity gains. Productivity—the amount of output per hour of work—surged by 6.3% on an annualized basis during the third quarter (see Chart 4). What’s more, productivity growth has significantly outpaced several gauges of inflationary activity, helping to keep overall
| | |
| The Flex-funds 2007 Annual Report | December 31, 2007 | | Page 1 |
| | |
| The Flex-funds | | 2007 Annual Report | December 31, 2007 |

inflation contained. For example, unit labor costs (a barometer of inflation pressures from wages) declined by 2% during the third quarter, while the latest consumer price index data shows that consumer prices rose 0.3% in November. This data suggests that the impact on inflation from wage pressure should be muted.
* Low unemployment. The unemployment rate had been holding steady at 4.7%—quite low relative to historical levels. Additionally, employers added 60,000 jobs to their payrolls in November and another 82,000 in December, more than the market expected in either month. These positive developments suggest that the overall job market is not being hurt by the slowdown in the housing industry. The recent surge in unemployment for December to 5.0% suggests that the consumer may be at risk going forward. Though one month’s data does not constitute a trend, we continue to remain cautious.
* Robust consumer spending. The latest data shows that consumer spending—which accounts for approximately two-thirds of the economy—remains robust. Spending by consumers in November was much stronger than expected, rising at its most rapid pace since May 2004. Consumer spending increased another .2% in December which was higher than the estimated .1%.
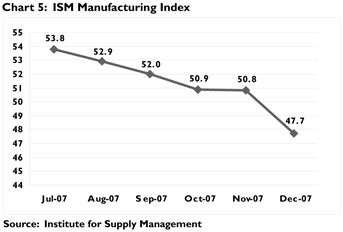
* Expanding manufacturing. While declining in December, manufacturing activity has continued to expand for the prior 10 months with only the recent month contracting, according to the Institute for Supply Management. (See Chart 5—readings above 50 indicate business expansion, while readings below 50 indicate a contraction.).
Economic Concerns Prompt Fed Action
That said, many investors worried throughout the second half of 2007 that the prolonged slump in the housing sector—and the resulting reduction in the amount of credit available to consumers and businesses—would significantly dampen economic growth. Some feared that these conditions might even lead to a recession.
These concerns were fueled in part by statements made by the Fed suggesting the potential for economic weakness. For example, Fed Chairman Ben Bernanke stated that the problems in the housing and credit markets could create “headwinds for the consumer in the months ahead” and that the Fed would need to be “exceptionally alert and flexible.” Other Fed officials made similar comments during the quarter.
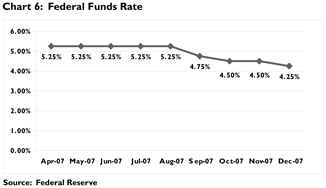
To respond to the possibility of an economic slowdown, the Fed cut a key short-term interest rate (the federal funds rate) twice during the fourth quarter. Coupled with a previous rate reduction in September, these cuts brought the federal funds rate down to 4.25% (see Chart 6). The Fed also made additional funds available to banks to help create liquidity and ensure adequate lending capabilities.
There were troubling signs during the fourth quarter and the year. Nearly every new development regarding the housing market in 2007 was negative. Some of the most recent data revealed that home foreclosure filings rose by 30% in the third quarter of 2007, new home
| | |
| Page 2 | | The Flex-funds 2007 Annual Report | December 31, 2007 |
| | |
| The Flex-funds | | 2007 Annual Report | December 31, 2007 |
construction in November slowed to its weakest pace in 16 years, and home prices in October fell by the largest amount since early 1991. Furthermore, numerous lenders and financial services firms reported large losses due to bad investments in the troubled mortgage sector—including Citigroup, Wachovia and Fannie Mae during the fourth quarter. These issues reinforced the belief among some investors that the risk of a recession is significant.
It is important to recognize however, that many of the negative predictions about the economy are still only potential scenarios. While we are cautious about a potential economic slowdown, we still see the current state of the economy held together by a resilient consumer. Certainly there are some potential problems at work, but rest assured, we are diligently monitoring numerous factors to help identify the direction of the economy.
Our “Fund of Funds”... A Focus on Growth
Shares of large- and mid-cap stocks outperformed small company shares during the year, as nervous investors favored the relative safety and consistency of large, financially stable companies. Our continued focus on larger companies and avoidance of small companies in our “fund of funds” (Muirfield, Dynamic Growth, Defensive Growth, Focused Growth, Aggressive Growth) assisted in the absolute and relative performance for the year.
Based on the full range of economic and market data, our investment models continued to indicate that the risk reward relationship of the stock market was positive. Indeed, every market sector except two (Financial Services and Consumer Discretionary) outperformed the broader market during the fourth quarter.
Therefore, our Defensive Equity Funds (Muirfield and Defensive Growth Funds) remained fully invested in the stock market throughout the entire year. However, we made changes to the Funds’ style allocations as market conditions developed. For example, we shifted from a somewhat defensive, value-oriented approach early in the year to a focus on growth-oriented stocks based on indications from our investment models that growth stocks offered a better trade-off between risk and return. This approach benefited our Funds as value stocks (which consist largely of Financial stocks) underperformed during much of the year.
Additionally, we increased our exposure to international stocks, which offered strong growth prospects and attractive valuations. International stocks performed well during 2007, driven in part by the falling value of the U.S. Dollar.
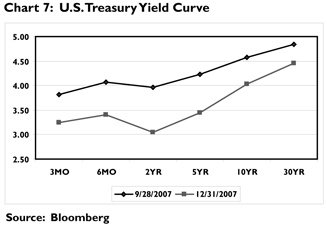
In the fixed-income markets, investors flocked to high-quality securities as they sought relative safety in the wake of concerns about the economy. Bond yields fell in that environment, pushing up prices. However, gains in the fixed-income markets were concentrated among U.S. Treasury and agency securities, as investors avoided bonds issued by firms that they feared could have exposure to the troubled mortgage sector. The yield on a 10-year Treasury note fell from 4.59% at the beginning of the fourth quarter to 4.04% by the end of the year (see Chart 7).
Our strategy for The U.S Government Bond Fund continued to focus on securities with strong credit ratings. That approach benefited the Fund as investors favored high-quality bonds during the fourth quarter. In addition, we extended the weighted average maturities from below average to above average in the Fund. This decision allowed us to lock in relatively high yields as the Fed cut interest rates during the quarter, and should allow us to continue to do so if further rate cuts occur in 2008.
The Flex-funds Money Market Fund also delivered strong performance. Once again, the Fund finished in the top 10% of all general purpose money market funds as it has for every
| | |
| The Flex-funds 2007 Annual Report | December 31, 2007 | | Page 3 |
| | |
| The Flex-funds | | 2007 Annual Report | December 31, 2007 |
rolling 12-month period since its inception. We accomplished this without investing in asset-backed commercial paper. Though asset-backed commercial paper now offers relatively high yields, we continue to believe that those yields do not adequately compensate investors for the significant additional risk in this type of investment. The continued concerns surrounding asset-backed securities further reinforce our belief.
Going Forward
Two key issues facing the markets as we enter 2008 are the effect of the Fed’s three recent rate cuts and the extent to which the economy might slow during the coming months.
While some investors believe that the Fed’s actions will promote a “soft landing”—strong economic growth with low inflation—others believe that the economy is more likely to slide into recession. The Fed itself has estimated that GDP for all of 2008 will grow by 1.8% to 2.5%. Still other investors worry that the rate cuts could push inflation much higher than the Fed desires, making it more difficult for the Fed to cut rates further if necessary.
As always, our job as money managers is not to simply speculate on Fed policy or the direction of the overall economy or financial markets. We base our investment decisions on facts and empirical data as they emerge, not on speculation about what might occur. As of December 31, 2007, those facts continued to indicate that the relationship between risk and reward in the stock market is, on balance, positive. Therefore, our Defensive Equity Funds remain fully invested. That said, we will continue to carefully monitor conditions in the financial markets and make adjustments to our Funds as necessary to capture additional returns while managing downside risk.
On behalf of all of the associates at Meeder Asset Management and The Flex-funds, I thank you for the continued trust and confidence you have placed in our investment management services. We look forward to working with you and helping you achieve your most important financial goals.
|
| Sincerely, |
|
 |
| Robert S. Meeder, Jr. |
| President |
| The Flex-funds |
| December 31, 2007 |
| | |
| Page 4 | | The Flex-funds 2007 Annual Report | December 31, 2007 |
| | |
| The Flex-funds | | 2007 Annual Report | December 31, 2007 |
2007 Mutual Fund Commentary
| | |
| Fund of Funds | | |
| |
The Dynamic Growth Fund | | Page 6 |
The Muirfield Fund® | | Page 8 |
The Aggressive Growth Fund | | Page 10 |
The Defensive Growth Fund | | Page 12 |
The Focused Growth Fund | | Page 14 |
| |
| Stock Funds | | |
| |
The Socially Responsible Utilities Fund | | Page 16 |
The Quantex Fund™ | | Page 18 |
| |
| Fixed-Income Funds | | |
| |
The U.S. Government Bond Fund | | Page 20 |
The Money Market Fund | | Page 22 |
| | |
| The Flex-funds 2007 Annual Report | December 31, 2007 | | Page 5 |
| | |
| The Flex-funds | | 2007 Annual Report | December 31, 2007 |
The Dynamic Growth Fund
Annual Market Perspective
The Dynamic Growth Fund is one of only 6% of Growth Funds that
have outperformed the S&P 500 in each of the past 3 years.
For the year ended December 31, 2007, The Dynamic Growth Fund outperformed the S&P 500 Index, with a total return of 7.06%, versus the S&P 500’s return of 5.49%. We are also pleased to report that The Dynamic Growth Fund has exceeded the S&P 500’s return for each of the last three years, a feat that, according to data from Morningstar, only 6% of growth mutual funds can claim. The Dynamic Growth Fund has an annualized return of 9.27% versus the S&P500’s 8.62% for those three years. Additionally, for the past five years, the Fund has provided an annualized return of 13.17% compared to a 12.81% return for the S&P 500.
We consistently avoided small-cap stocks throughout all of 2007, which added to Fund performance, as small-cap stocks actually declined 1.55% for the year. An over-emphasis on mid-cap value securities resulted in the Fund’s outperformance during the first half of the year. During the third quarter, growth oriented securities began to outperform and the Fund lagged for the quarter as we were still overweighted in value securities. We rotated into growth holdings late in the third quarter, which proved beneficial, as growth stocks continued to outperform throughout the fourth quarter, particularly as financial stocks struggled in light of the sub-prime issues facing the markets.
Our moderate level of developed market international holdings, which we added to during the year, also benefited the Fund’s relative performance, primarily due to currency gains from a weak U.S. dollar.
| | |
| Page 6 | | The Flex-funds 2007 Annual Report | December 31, 2007 |
| | |
| The Flex-funds | | 2007 Annual Report | December 31, 2007 |
Performance Perspective
Period & Average Annual Total Returns as of December 31, 2007
| | | | | | | | | | | | | | | | | | |
| | | 1
Year | | | 3
Year | | | 5
Year | | | Since
Inception1 | | | Net Expense
Ratio | | | Gross Expense
Ratio | |
The Dynamic Growth Fund | | 7.06 | % | | 9.27 | % | | 13.17 | % | | 0.64 | % | | 1.32 | % | | 1.86 | % |
S&P 500 Index2 | | 5.49 | % | | 8.62 | % | | 12.81 | % | | 2.61 | % | | — | | | — | |
1 | Inception date for The Dynamic Growth Fund is 2/29/00. |
2 | The S&P 500 Index is a widely recognized unmanaged index of common stock prices that does not take into account the deduction of expenses associated with a mutual fund, such as investment management and accounting fees. One cannot invest directly in an index. |
Performance quoted represents past performance. Past Performance does not guarantee future results. All performance figures represent average annual total returns for the periods ended December 31, 2007, and assume reinvestment of all dividend and capital gain distributions. The investment return and principal value of an investment will fluctuate so that an investor’s shares, when redeemed, may be worth more or less than their original cost. Current performance may be higher or lower than the performance quoted. Current month-end performance may be obtained at www.flexfunds.com or by calling 1.800.325.3539. Management fees were waived and/or expenses were reimbursed in order to reduce the operating expenses of The Dynamic Growth Fund during the periods shown above. Source for index data: Morningstar, Inc.
| | |
Growth of $10,000: 2/29/00 - 12/31/07 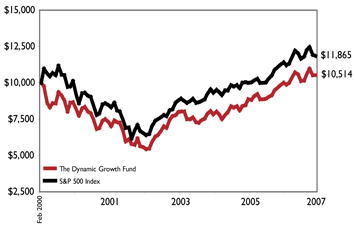
| | The Growth of $10,000 chart compares The Dynamic Growth Fund’s value to the S&P 500 Index. The chart is intended to give you a general idea of how the Fund performed compared to this benchmark over the period from its inception on February 29, 2000 to December 31, 2007. An understanding of the differences between the Fund and this index is important. The S&P 500 Index is a hypothetical unmanaged index of common stocks that does not take into account the deduction of expenses associated with a mutual fund, such as investment management and accounting fees. One cannot invest directly in an index. Past performance does not guarantee future results. The chart and the table above do not reflect the deduction of taxes that a shareholder would pay on fund distributions or the redemption of fund shares. |
| | |
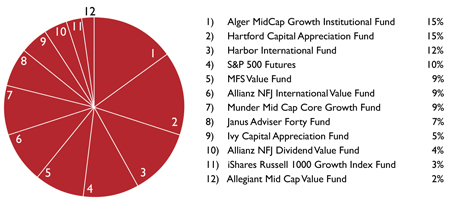
Fund Holdings as of December 31, 2007 | | Fund Holdings are subject to change. |
| | |
| The Flex-funds 2007 Annual Report | December 31, 2007 | | Page 7 |
| | |
| The Flex-funds | | 2007 Annual Report | December 31, 2007 |
The Muirfield Fund®
Annual Market Perspective
The Muirfield Fund strives to earn attractive returns ruring low-risk
environments and to minimize losses during high-risk environments.
For the year ended December 31, 2007, The Muirfield Fund® returned 7.02%, which exceeded the return of the S&P 500, which returned 5.49%. Given that, as conditions warrant, The Muirfield Fund® is sometimes invested “defensively” (either partially or fully invested in cash equivalent securities), we believe the most appropriate benchmark comparison of performance is a blended index consisting of 60% of the return of the S&P 500 Index and 40% of the return of the 90-day U.S. Treasury Bill. For 2007, the blended index returned 5.32%. The Muirfield Fund® also outperformed this blended index for longer time periods, including a 3-year annualized return of 7.49% and a 5-year annualized return of 11.06%, compared to the blended index, which returned 6.99% and 8.94% for the same 3-year and 5-year periods, respectively.
Our quantitative tactical asset allocation model, which is designed to identify the risk reward relationship of the stock market, remained on balance positive throughout all of 2007. Consequently, The Muirfield Fund® maintained a 100% invested position in the stock market throughout all of 2007 even though there were declines in the S&P 500 Index of 6% in mid-February and 9% from mid-July to mid-August. Adhering to our discipline during these challenging periods was the right decision as demonstrated by the Fund’s performance relative to its benchmarks for 2007.
We consistently avoided small-cap stocks throughout all of 2007, which added to Fund performance, as small-cap stocks actually declined 1.55%, as represented by the Russell 2000 Index, for the year. An overemphasis on mid-cap value securities resulted in the fund’s outperformance during the first half of the year. During the third quarter, growth oriented securities began to outperform and the Fund lagged for the quarter as we were still overweighted in value securities. We rotated into growth holdings late in the third quarter, which proved beneficial, as growth stocks continued to outperform throughout the fourth quarter, particularly as financial stocks struggled in light of the sub-prime issues facing the markets.
Our moderate level of developed market international holdings, which we added to during the year, also benefited the Fund’s relative performance, primarily due to currency gains from a weak U.S. dollar.
| | |
| Page 8 | | The Flex-funds 2007 Annual Report | December 31, 2007 |
| | |
| The Flex-funds | | 2007 Annual Report | December 31, 2007 |
Performance Perspective
Period & Average Annual Total Returns as of December 31, 2007
| | | | | | | | | | | | | | | | | | |
| | | 1
Year | | | 3
Year | | | 5
Year | | | 10
Year | | | Net Expense
Ratio | | | Gross Expense
Ratio | |
The Muirfield Fund®1 | | 7.02 | % | | 7.49 | % | | 11.06 | % | | 5.23 | % | | 1.38 | % | | 1.88 | % |
60/40 Index2 | | 5.32 | % | | 6.99 | % | | 8.94 | % | | 5.30 | % | | — | | | — | |
S&P 500 Index3 | | 5.49 | % | | 8.62 | % | | 12.81 | % | | 5.90 | % | | — | | | — | |
1 | Inception date for The Muirfield Fund® is 8/10/88. |
2 | The 60/40 Index is comprised of 60% S&P 500 Index & 40% 90-day T-bills. This index does not take into account the deduction of expenses associated with a mutual fund, such as investment management and accounting fees. One cannot invest directly in an index. |
3 | The S&P 500 Index is a widely recognized unmanaged index of common stock prices that does not take into account the deduction of expenses associated with a mutual fund, such as investment management and accounting fees. One cannot invest directly in an index. |
Performance quoted represents past performance. Past Performance does not guarantee future results. All performance figures represent average annual total returns for the periods ended December 31, 2007, and assume reinvestment of all dividend and capital gain distributions. The investment return and principal value of an investment will fluctuate so that an investor’s shares, when redeemed, may be worth more or less than their original cost. Current performance may be higher or lower than the performance quoted. Current month-end performance may be obtained at www.flexfunds.com or by calling 1.800.325.3539. Management fees were waived and/or expenses were reimbursed in order to reduce the operating expenses of The Muirfield Fund® during the periods shown above. Source for index data: Morningstar, Inc.
| | |
Growth Of $10,000: 12/31/97 - 12/31/07 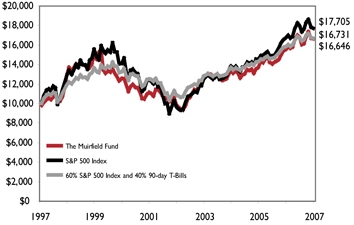
| | The Growth of $10,000 chart compares the value of The Muirfield Fund® to the S&P 500 Index and to an index composed of 60% of the S&P 500 Index and 40% of 90-day T-bills (“the 60/40 index”). The chart is intended to give you a general idea of how the Fund performed compared to these indices over the period from December 31, 1997 to December 31, 2007. An understanding of the differences between the Fund and these indices is important. The benchmark indices are hypothetical unmanaged indices of common stocks and 90-day T-bills that do not take into account the deduction of expenses associated with a mutual fund, such as investment management and accounting fees. One cannot invest directly in an index. Past performance does not guarantee future results. The chart and the table above do not the deduction of taxes that a shareholder would pay on fund distributions or the redemption of fund shares. |
| | |
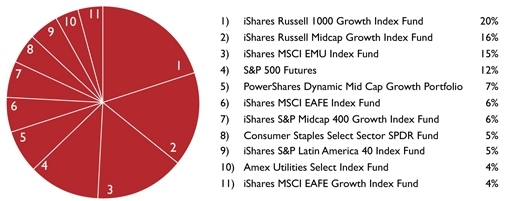
| Fund Holdings as of December 31, 2007 | | Fund Holdings are subject to change. |

| | |
| The Flex-funds 2007 Annual Report | December 31, 2007 | | Page 9 |
| | |
| The Flex-funds | | 2007 Annual Report | December 31, 2007 |
The Aggressive Growth Fund
Annual Market Perspective
For the first time in several years, growth stocks significantly outperformed value stocks.
The Aggressive Growth Fund returned 6.14% in 2007. In comparison, the NASDAQ Composite Index returned 10.66% for the same period. For the 3-year period ending December 31, 2007, The Aggressive Growth Fund has outperformed its benchmark, returning an annualized 8.37%, compared to 7.65% for the NASDAQ Composite. Additionally, since its inception, The Aggressive Growth Fund has significantly outperformed the NASDAQ Composite (see page 11).
2007 was a strong year for the NASDAQ Composite. We use this as the Fund’s benchmark as it is generally considered a more aggressive target than the S&P 500. We consistently avoided small-cap stocks throughout 2007, which benefited Fund performance as small-cap stocks actually declined 1.55% for the year. For the first half of 2007, we had a fairly significant overweight in value oriented holdings. For the first half of 2007, both growth and value performed generally in line with each other. However, beginning in the third quarter, as the sub-prime issues began roiling the markets, financial stocks began to suffer and growth stocks began to outperform value holdings. Across all market cap ranges, growth stocks outperformed value stocks between 4% and 6%. In light of credit concerns, financial stocks, which make up a meaningful portion of all value stocks, were under fire, and our value holdings were not immune. As a result, we significantly underperformed the NASDAQ Composite Index in the third quarter. We rotated to growth stocks late in the third quarter and continued this position throughout the fourth quarter. As a result, the Fund essentially performed in line with the Fund’s aggressive benchmark in the fourth quarter.
We also initiated positions in the Utilities and Consumer Staples sectors, as they demonstrated relative strength compared to other domestic assets. We increased international exposure to 30%, including positions in Europe, and a 5% stake in the emerging markets. Downward pressure on the U.S. Dollar versus the Euro continued to aid performance. According to Bloomberg, the Euro appreciated 3.7% for the fourth quarter versus the U.S Dollar. With potential rate cuts going forward, the U.S. Dollar may continue to be under pressure in the coming months.
| | |
| Page 10 | | The Flex-funds 2007 Annual Report | December 31, 2007 |
| | |
| The Flex-funds | | 2007 Annual Report | December 31, 2007 |
Performance Perspective
Period & Average Annual Total Returns as of December 31, 2007
| | | | | | | | | | | | | | | | | | |
| | | 1
Year | | | 3
Year | | | 5
Year | | | Since
Inception1 | | | Net Expense
Ratio | | | Gross Expense
Ratio | |
The Aggressive Growth Fund | | 6.14 | % | | 8.37 | % | | 12.66 | % | | -1.74 | % | | 1.70 | % | | 1.83 | % |
Nasdaq Composite Index2 | | 10.66 | % | | 7.65 | % | | 15.46 | % | | -6.53 | % | | — | | | — | |
1 | Inception date for The Aggressive Growth Fund is 2/29/00. |
2 | The Nasdaq Composite Index is a broad-based capitalization-weighted index of all Nasdaq National Market and small-cap stocks that does not take into account the deduction of expenses associated with a mutual fund, such as investment management and accounting fees. One cannot invest directly in an index. |
Performance quoted represents past performance. Past Performance does not guarantee future results. All performance figures represent average annual total returns for the periods ended December 31, 2007, and assume reinvestment of all dividend and capital gain distributions. The investment return and principal value of an investment will fluctuate so that an investor’s shares, when redeemed, may be worth more or less than their original cost. Current performance may be higher or lower than the performance quoted. Current month-end performance may be obtained at www.flexfunds.com or by calling 1.800.325.3539. Management fees were waived and/or expenses were reimbursed in order to reduce the operating expenses of The Aggressive Growth Fund during the periods shown above. Source for index data: Morningstar, Inc.
| | |
Growth of $10,000: 2/29/00 - 12/31/07 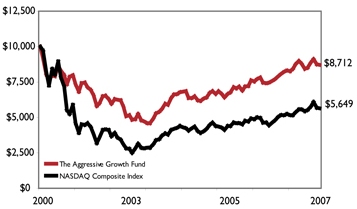
| | The Growth of $10,000 chart compares The Aggressive Growth Fund’s value to the Nasdaq Composite Index. The chart is intended to give you a general idea of how the Fund performed compared to this benchmark over the period from its inception on February 29, 2000 to December 31, 2007. An understanding of the differences between the Fund and this index is important. The Nasdaq Composite Index is a hypothetical unmanaged index of small-cap and Nasdaq National Market stocks that does not take into account the deduction of expenses associated with a mutual fund, such as investment management and accounting fees. One cannot invest directly in an index. Past performance does not guarantee future results. The chart and the table above do not reflect the deduction of taxes that a shareholder would pay on fund distributions or the redemption of fund shares. |
| | |
| Fund Holdings as of December 31, 2007 | | Fund holdings are subject to change. |
| | |
| The Flex-funds 2007 Annual Report | December 31, 2007 | | Page 11 |
| | |
| The Flex-funds | | 2007 Annual Report | December 31, 2007 |
The Defensive Growth Fund
Annual Market Perspective
We maintained a 100% equity exposure throughout all of 2007.
In its first full calendar year, The Defensive Growth Fund returned 5.03% for 2007. In comparison, the S&P 500 returned 5.49% for the same period. Given that, as conditions warrant, The Defensive Growth Fund is sometimes invested “defensively” (either partially or fully invested in cash equivalent securities), we believe the most appropriate benchmark comparison of performance is a blended index consisting of 60% of the return of the S&P 500 Index and 40% of the return of the 90-day U.S. Treasury Bill. For 2007, the blended index returned 5.32%.
Our quantitative tactical asset allocation model, which is designed to identify the risk reward relationship of the stock market, remained on balance positive throughout all of 2007. Consequently, The Defensive Growth Fund maintained a 100% invested position in the stock market throughout all of 2007 even though there were declines in the S&P 500 Index of 6% in mid-February and 9% from mid-July to mid-August. Adhering to our discipline during these challenging periods was the right decision.
We consistently avoided small-cap stocks throughout all of 2007, which added to Fund performance, as small-cap stocks actually declined 1.55% for the year. During the third quarter, growth oriented securities began to outperform and the Fund lagged for the quarter as we were still overweighted in value securities. We rotated into growth holdings late in the third quarter, which proved beneficial, as growth stocks continued to outperform throughout the fourth quarter, particularly as financial stocks struggled in light of the sub-prime issues facing the markets.
Our moderate level of developed market international holdings, which we added to during the year, also benefited the Fund’s relative performance, primarily due to currency gains from a weak U.S. dollar.
| | |
| Page 12 | | The Flex-funds 2007 Annual Report | December 31, 2007 |
| | |
| The Flex-funds | | 2007 Annual Report | December 31, 2007 |
Performance Perspective
Period & Average Annual Total Returns as of December 31, 2007
| | | | | | | | | | | | |
| | | 1
Year | | | Since
Inception1 | | | Net Expense
Ratio | | | Gross Expense
Ratio | |
The Defensive Growth Fund | | 5.03 | % | | 5.68 | % | | 1.56 | % | | 1.66 | % |
60/40 Index2 | | 5.32 | % | | 7.74 | % | | — | | | — | |
S&P 500 Index3 | | 5.49 | % | | 9.51 | % | | — | | | — | |
1 | Inception date for The Defensive Growth Fund is 1/31/06. |
2 | The 60/40 Index is comprised of 60% S&P 500 Index & 40% 90-day T-bills. This index does not take into account the deduction of expenses associated with a mutual fund, such as investment management and accounting fees. One cannot invest directly in an index. |
3 | The S&P 500 Index is a widely recognized unmanaged index of common stock prices that does not take into account the deduction of expenses associated with a mutual fund, such as investment management and accounting fees. One cannot invest directly in an index. |
Performance quoted represents past performance. Past Performance does not guarantee future results. All performance figures represent average annual total returns for the periods ended December 31, 2007, and assume reinvestment of all dividend and capital gain distributions. The investment return and principal value of an investment will fluctuate so that an investor’s shares, when redeemed, may be worth more or less than their original cost. Current performance may be higher or lower than the performance quoted. Current month-end performance may be obtained at www.flexfunds.com or by calling 1.800.325.3539. Management fees were waived and/or expenses were reimbursed in order to reduce the operating expenses of The Defensive Growth Fund during the periods shown above. Source for index data: Morningstar, Inc.
| | |
Growth of $10,000: 1/31/06 - 12/31/07 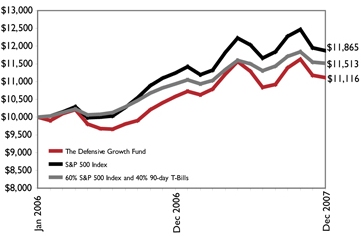
| | The Growth of $10,000 chart compares The Defensive Growth Fund’s value to the S&P 500 Index and to the 60/40 index(60% of the S&P 500 Index and 40% of 90-day T-bills ). The chart is intended to give you a general idea of how the Fund performed compared to these indices over the period from its inception on January 31, 2006 through December 31, 2007. An understanding of the differences between the Fund and these indices is important. The benchmark indices are hypothetical unmanaged indices of common stock that do not take into account the deduction of expenses associated with a mutual fund, such as investment management and accounting fees. One cannot invest directly in an index. Past performance does not guarantee future results. The chart and the table above do not reflect the deduction of taxes that a shareholder would pay on fund distributions or the redemption of fund shares. |
| | |
| Fund Holdings as of December 31, 2007 | | Fund holdings are subject to change. |

| | |
| The Flex-funds 2007 Annual Report | December 31, 2007 | | Page 13 |
| | |
| The Flex-funds | | 2007 Annual Report | December 31, 2007 |
The Focused Growth Fund
Annual Market Perspective
We consistently avoided small-cap equity exposure for all of 2007.
In its first full calendar year, The Focused Growth Fund returned 5.08% for the year ended December 31, 2007. In comparison, the S&P 500 Index returned 5.49% for the same period.
We consistently avoided small-cap stocks throughout all of 2007, which added to Fund performance, as small-cap stocks actually declined 1.55% for the year. An overemphasis on mid-cap value securities resulted in the Fund’s outperformance in the first quarter, but those relative gains were given up during the second quarter. During the third quarter, growth oriented securities began to outperform and the Fund lagged for the quarter as we were still overweighted in value securities. We rotated into growth holdings late in the third quarter, which proved beneficial, as growth stocks continued to outperform throughout the fourth quarter, particularly as financial stocks struggled in light of the sub-prime issues facing the markets. The Fund outperformed its benchmark by more than 1% in the fourth quarter.
Our moderate level of developed market international holdings, which we added to during the year, also benefited the Fund’s relative performance, primarily due to currency gains from a weak U.S. dollar.
| | |
| Page 14 | | The Flex-funds 2007 Annual Report | December 31, 2007 |
| | |
| The Flex-funds | | 2007 Annual Report | December 31, 2007 |
Performance Perspective
Period & Average Annual Total Returns as of December 31, 2007
| | | | | | | | | | | | |
| | | 1
Year | | | Since
Inception1 | | | Net Expense
Ratio | | | Gross Expense
Ratio | |
The Focused Growth Fund | | 5.08 | % | | 6.79 | % | | 1.58 | % | | 1.68 | % |
| | | | |
S&P 500 Index2 | | 5.49 | % | | 9.51 | % | | — | | | — | |
1 | Inception date for The Focused Growth Fund is 1/31/06. |
2 | The S&P 500 Index is a widely recognized unmanaged index of common stock prices that does not take into account the deduction of expenses associated with a mutual fund, such as investment management and accounting fees. One cannot invest directly in an index. |
Performance quoted represents past performance. Past Performance does not guarantee future results. All performance figures represent average annual total returns for the periods ended December 31, 2007, and assume reinvestment of all dividend and capital gain distributions. The investment return and principal value of an investment will fluctuate so that an investor’s shares, when redeemed, may be worth more or less than their original cost. Current performance may be higher or lower than the performance quoted. Current month-end performance may be obtained at www.flexfunds.com or by calling 1.800.325.3539. Management fees were waived and/or expenses were reimbursed in order to reduce the operating expenses of The Focused Growth Fund during the periods shown above. Source for index data: Morningstar, Inc.
| | |
Growth of $10,000: 1/31/06 - 12/31/07 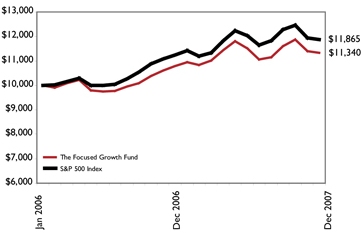
| | The Growth of $10,000 chart compares The Focused Growth Fund’s value to the S&P 500 Index. The chart is intended to give you a general idea of how the Fund performed compared to this benchmark over the period from its inception on January 31, 2006 to December 31, 2007. An understanding of the differences between the Fund and this index is important. The S&P 500 Index is a hypothetical unmanaged index of common stocks that does not take into account the deduction of expenses associated with a mutual fund, such as investment management and accounting fees. One cannot invest directly in an index. Past performance does not guarantee future results. The chart and the table above do not reflect the deduction of taxes that a shareholder would pay on fund distributions or the redemption of fund shares. |
| | |
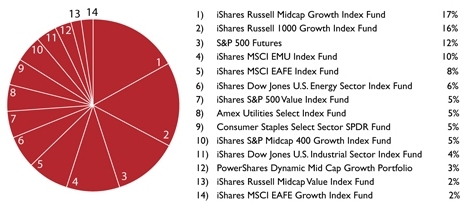
| Fund Holdings as of December 31, 2007 | | Fund holdings are subject to change. |
| | |
| The Flex-funds 2007 Annual Report | December 31, 2007 | | Page 15 |
| | |
| The Flex-funds | | 2007 Annual Report | December 31, 2007 |
The Socially Responsible Utilities Fund
Annual Market Perspective
Investments for the socially responsible utilities fund are selected
on the basis of fundamental analysis. we look for companies that
have high credit ratings, above-average earnings growth, and
strong management. we will not invest in electric utilities that
generate power from Nuclear Reactors.
The Flex-funds Socially Responsible Utilities Fund returned 18.24% for the year ended December 31, 2007, compared to the Russell 3000 Utilities Index which returned 9.14% for the same period. Because of the lower volatility of this Fund, we also compare it to a blended index consisting of 60% of the Russell 3000 Utilities Index and 40% of the Lehman Brothers Long Credit Index. This benchmark returned 6.92% in 2007. Most pleasing to report is The Socially Responsible Utilities Fund has outperformed both these benchmarks for the past 3-year, 5-year, 10-year and since inception periods.
Many, but not all, of our foreign companies continued to drive the portfolio higher. We also benefited from positive movements in the more traditional domestic utilities that had been a drag in the third quarter.
Positive moves in the electric utility indices helped provide a buoyant environment for our more traditional utilities, which recovered after profit-taking in the third quarter. In the gas area, buyers produced gains in El Paso, Equitable Resources, Questar and Spectra Energy. Natural gas producers were mixed, but Kinder Morgan Energy Partners reflected both stability and strength in a Master Limited Partnership (MLP) environment that had been irrationally sold last summer.
Weak stocks were mercifully few and those that didn’t perform well were small positions. PT Telekomunikasi saw profit-taking, and demonstrated that the foreign telecom area is not monolithic. It was joined by a small decline late in the year by America Movil as well as a notable drop in NI Holdings which we had added prior to news of slowing subscriber growth.
Ever since the financial press insisted in 2002 that U.S utilities were headed for mass bankruptcy, the group, along with telecoms, has provided the best returns and the best risk-adjusted returns of any traditional domestic sector. Over the years, we have heard many investing “experts” say the sector is “too narrow,” though life as we know it cannot go on without utilities, and they always participate in long-term economic growth. Plenty of opportunities remain as the world turns toward increasing broadband, decreasing carbon and increasing reliance on both natural gas and electricity.
| | |
| Page 16 | | The Flex-funds 2007 Annual Report | December 31, 2007 |
| | |
| The Flex-funds | | 2007 Annual Report | December 31, 2007 |
Performance Perspective
Period & Average Annual Total Returns as of December 31, 2007
| | | | | | | | | | | | | | | | | | |
| | | 1
Year | | | 3
Year | | | 5
Year | | | 10
Year | | | Net Expense
Ratio | | | Gross Expense
Ratio | |
| | | | | | |
The Socially Responsible Utilities Fund1 | | 18.24 | % | | 17.57 | % | | 17.23 | % | | 7.52 | % | | 1.90 | % | | 2.10 | % |
| | | | | | |
Blended Index2 | | 6.92 | % | | 9.82 | % | | 11.74 | % | | 4.50 | % | | — | | | — | |
| | | | | | |
Russell 3000 Utilities Index3 | | 9.14 | % | | 13.96 | % | | 15.52 | % | | 3.11 | % | | — | | | — | |
1 | Inception date for The Socially Responsible Utilities Fund is 6/21/1995. |
2 | The blended index is comprised of 60% of the Russell 3000 Utilities Index and 40% of the Lehman Bros. Long Credit Index. One cannot invest directly in an index. |
3 | The Russell 3000 Utilities Index is a market capitalization-weighted index that is comprised of utility stocks that are included in the Russell 3000 Index. This index does not take into account the deduction of expenses associated with a mutual fund, such as investment management and accounting fees. One cannot invest directly in an index. |
Performance quoted represents past performance. Past Performance does not guarantee future results. All performance figures represent average annual total returns for the periods ended December 31, 2007, and assume reinvestment of all dividend and capital gain distributions. The investment return and principal value of an investment will fluctuate so that an investor’s shares, when redeemed, may be worth more or less than their original cost. Current performance may be higher or lower than the performance quoted. Current month-end performance may be obtained at www.flexfunds.com or by calling 1.800.325.3539. Management fees were waived and/or expenses were reimbursed in order to reduce the operating expenses of The Socially Responsible Utilities Fund during the periods shown above. Because The Socially Responsible Utilities Fund concentrates its investments in public utility companies, the value of the Fund’s shares may fluctuate more than if invested in a greater number of industries. Changes in interest rates may also affect the value of Utility stocks, and rising interest rates can be expected to reduce the Fund’s net asset value. Source for index data: Bloomberg, LP.
| | |
Growth of $10,000: 1/31/06 - 12/31/07 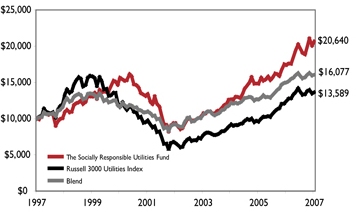
| | The Growth of $10,000 chart compares The Socially Responsible Utilities Fund’s value to the Russell 3000 Utilities Index and to the Blended Index (comprised of 60% of the Russell 3000 Utilities Index and 40% of the Lehman Bros. Long Credit Index). The chart is intended to give you a general idea of how the Fund performed compared to these benchmarks over the period from December 31, 1997 to December 31, 2007. An understanding of the differences between the Fund and these indices is important. The benchmark indices do not take into account the deduction of expenses associated with a mutual fund, such as investment management and accounting fees. One cannot invest directly in an index. Past performance does not guarantee future results. The chart and the table above do not reflect the deduction of taxes that a shareholder would pay on fund distributions or the redemption of fund shares. |
| | |
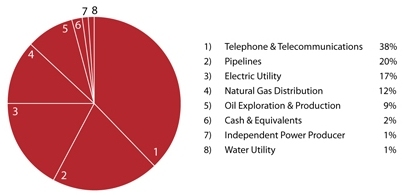
| Sector Weightings as of December 31, 2007 | | Fund holdings are subject to change. |
| | |
| The Flex-funds 2007 Annual Report | December 31, 2007 | | Page 17 |
| | |
| The Flex-funds | | 2007 Annual Report | December 31, 2007 |
The Quantex Fund™
Annual Market Perspective
The Quantex Fund™ employs a quantitative investment model to select
stocks of companies that have declined significantly in price and of
small, up-and-coming companies.
The Quantex Fund™ returned -7.00% for the year ended December 31, 2007. In comparison, the Russell 2000 Small-Cap Index returned -1.55%, while the S&P 400 Mid-Cap Index returned 7.93% for the same period.
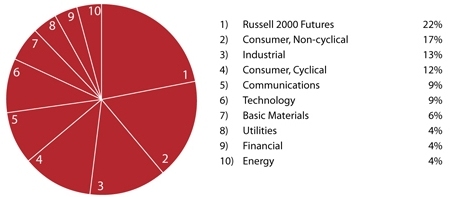
The Quantex Fund™ typically owns approximately 100 stocks, which are selected using a quantitative investment model that focuses on small- and mid-cap stocks. This strategy, which we refer to as our Small to Mid Cap (SMID) discipline identifies a capitalization range from which to select stocks annually. Those stocks within this capitalization range, that are also part of a specific fund index, become the stocks that the Fund owns. These stocks are typically 1) stocks of large companies that have declined in price prior to being included in the Fund (which we refer to as “fallen angels”), or 2) stocks of small, up and coming companies (“rising stars”). We have employed this strategy since 1989 for our high net-worth individual investors, retirement plans and institutional investors with considerable success.
For the past two years, this Fund has had an overweight in value oriented stocks. Emphasizing value oriented securities added to the Fund’s performance in 2006 and the first half of 2007. However, having a value oriented emphasis detracted from performance in the last half of 2007. For the first half of the year, the Fund performed generally in line with mid caps and was 3% ahead of small caps. In the second half of the year, when growth stocks began to significantly outperform value stocks, the value holdings of the Fund lagged. An underweight in Energy stocks detracted from performance for the year, and an overweight in Consumer stocks also detracted from returns.
This investment strategy has had periods of short-term underperformance in the past. For example, in the fourth quarter of 1999 and the first quarter of 2000, the SMID strategy returned 3.8% and -6.3%, respectively, while the S&P 400 Mid-Cap Index returned 17.2% and 12.7%. However, for the subsequent 7 1/4 year period from March 31, 2000 to June 30, 2007, this strategy returned 14.4% on an annualized basis, while the S&P 400 Mid-Cap Index only returned 9.6% and the Russell 2000 Index returned 7.6%.
| | |
| Page 18 | | The Flex-funds 2007 Annual Report | December 31, 2007 |
| | |
| The Flex-funds | | 2007 Annual Report | December 31, 2007 |
Performance Perspective
Period & Average Annual Total Returns as of December 31, 2007
| | | | | | | | | | | | | | | | | | | | | |
| | | 1
Year | | | 4/30/05 to
12/31/07* | | | 3
Year | | | 5
Year | | | 10
Year | | | Net Expense
Ratio | | | Gross Expense
Ratio | |
The Quantex Fund™1 | | -7.00 | % | | 8.09 | % | | 5.17 | % | | 9.76 | % | | 3.46 | % | | 1.56 | % | | 2.09 | % |
Russell 2000 Index2 | | -1.55 | % | | 12.39 | % | | 6.84 | % | | 16.28 | % | | 7.17 | % | | — | | | — | |
S&P 400 Mid-Cap Index3 | | 7.93 | % | | 13.42 | % | | 10.26 | % | | 16.17 | % | | 11.18 | % | | — | | | — | |
Blended Index4 | | 3.19 | % | | 12.91 | % | | 8.55 | % | | 16.22 | % | | 9.18 | % | | — | | | — | |
1 | The inception date of The Quantex Fund TM is 3/20/1985. |
2 | The Russell 2000 Index is a market-capitalization weighted index measuring performance of the smallest 2,000 companies, on a market capitalization basis, in the Russell 3000 Index. One cannot invest directly in an index. |
3 | The S&P 400 Mid-Cap Index is an unmanaged index of common stock prices of mid-sized companies. One cannot invest directly in an index. |
4 | The Blended Index consists of 50% Russell 2000 Index and 50% S&P 400 Mid-Cap Index. One cannot invest directly in an index. |
Performance quoted represents past performance. Past Performance does not guarantee future results. All performance figures represent average annual total returns for the periods ended December 31, 2007, and assume reinvestment of all dividend and capital gain distributions. The investment return and principal value of an investment will fluctuate so that an investor’s shares, when redeemed, may be worth more or less than their original cost. Current performance may be higher or lower than the performance quoted. Current month-end performance may be obtained at www.flexfunds.com or by calling 1.800.325.3539. Management fees were waived and/or expenses were reimbursed in order to reduce the operating expenses of The Quantex Fund™ during the periods shown above. Source for index data: Morningstar, Inc.
The Quantex Fund™ was previously known as The Highlands Growth Fund. On April 30, 2005, The Highlands Growth Fund changed its name to The Quantex Fund™, also changing the Fund’s investment objective and strategies. The Highlands Growth Fund focused on large-cap equities, while The Quantex Fund™ utilizes quantitative investment strategies that invest primarily in small- and mid-cap equities. Due to this change in strategies on April 30, 2005, the S&P 500 Index is a more comparative index for Fund performance prior to April 30, 2005. The Russell 2000 Index and S&P 400 Mid-Cap Index are more comparative indices for Fund performance after April 30, 2005. Source for index data: Morningstar, Inc.
| | |
Growth of $10,000: 1/31/06 - 12/31/07 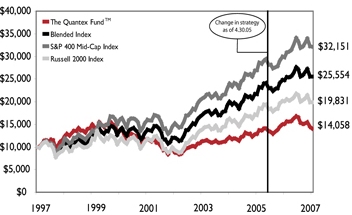
| | The Quantex Fund™ was previously known as The Highlands Growth Fund. On April 30, 2005, The Highlands Growth Fund changed its name to The Quantex Fund™, also changing the Fund’s investment objective and strategies. Due to this, the Russell 2000 Index and the S&P 400 Mid-Cap Index are more comparative indices for Fund performance. The Growth of $10,000 chart compares the value of The Quantex Fund™ to the S&P 400 Mid-Cap Index, the Russell 2000 Index, and a Blended Index (comprised of 50% Russell 2000 and 50% S&P 400 Mid-Cap). The chart is intended to show you how the Fund performed in comparison to these benchmarks from December 31, 1997 through December 31, 2007. There are important differences between the Fund and the benchmark indices. The benchmark indices are hypothetical unmanaged indices of common stock that do not take into account the deduction of expenses associated with a mutual fund, such as investment management and accounting fees. One cannot invest directly in an index. Past performance does not guarantee future results. |
| | |
| Sector Weightings as of December 31, 2007 | | Fund holdings are subject to change. |
| | |
| The Flex-funds 2007 Annual Report | December 31, 2007 | | Page 19 |
| | |
| The Flex-funds | | 2007 Annual Report | December 31, 2007 |
The U.S. Government Bond Fund
Annual Market Perspective
The U.S. Government Bond Fund is one of less than 2% of intermediate - term U.S. Government Bond Funds that exceeded the Lehman Brothers Intermediate - Term Government Credit Index for each of the past 2 years.
The U.S Government Bond Fund returned 7.44% for the year ended December 31, 2007. In comparison, the benchmark Lehman Brothers Intermediate-Term Government/Credit Index returned 7.39% for the same period. This was the 2nd consecutive year this fund outperformed this difficult benchmark index, a feat that can be claimed by less than 2% of all Intermediate-Term U.S Government Bond Funds, according to data from Morningstar.
Throughout the first half of 2007, our models indicated that interest rates would be relatively stable, with a slight bias towards lower rates. As a result, we maintained a slightly longer than average weighted average maturity.
The real estate story during the first half of the year turned into the sub-prime story in the third quarter. Increased foreclosures and decreased demand for asset-backed securities (largely mortgage asset-backed) took a toll on the performance of these sub-prime and asset-backed securities. Sub-prime investors ranging from large international banks and hedge funds to regional bank and money market funds struggled during the third and fourth quarters as defaults rose and liquidity all but disappeared. The lack of liquidity forced many in the sub-prime business to substantially reduce or close their operations.
As the credit markets suffered during the second half of the year, higher credit quality was rewarded more than the position on the yield curve. While we gradually increased our weighted average maturity during the second half, the Fund benefited most due to the higher credit quality holdings that the Fund owned.
| | |
| Page 20 | | The Flex-funds 2007 Annual Report | December 31, 2007 |
| | |
| The Flex-funds | | 2007 Annual Report | December 31, 2007 |
Performance Perspective
Period & Average Annual Total Returns as of December 31, 2007
| | | | | | | | | | | | | | | | | | |
| | | 1
Year | | | 3
Year | | | 5
Year | | | 10
Year | | | Net Expense
Ratio | | | Gross Expense
Ratio | |
The U.S. Government Bond Fund1 | | 7.44 | % | | 3.76 | % | | 1.65 | % | | 3.73 | % | | 1.01 | % | | 1.72 | % |
Lehman Bros. Intermediate-Term Government/Credit Index2 | | 7.39 | % | | 4.32 | % | | 4.06 | % | | 5.76 | % | | — | | | — | |
1 | The inception date of The U.S. Government Bond Fund is 12/31/1988. |
2 | The Lehman Brothers Intermediate-Term Government/Credit Index is an unmanaged index of fixed-rate bonds issued by the U.S. Government and its agencies that are rated investment-grade or higher, have one to ten years remaining until maturity, and at least $100 million outstanding. The Lehman Brothers Intermediate-Term Government/Credit Index does not take into account the deduction of expenses associated with a mutual fund, such as investment management and accounting fees. One cannot invest directly in an index. |
Performance quoted represents past performance. Past Performance does not guarantee future results. All performance figures represent average annual total returns for the periods ended December 31, 2007, and assume reinvestment of all dividend and capital gain distributions. The investment return and principal value of an investment will fluctuate so that an investor’s shares, when redeemed, may be worth more or less than their original cost. Current performance may be higher or lower than the performance quoted. Current month-end performance may be obtained at www.flexfunds.com or by calling 1.800.325.3539. Management fees were waived and/or expenses were reimbursed in order to reduce the operating expenses of The U.S. Government Bond Fund during the periods shown above. Source for index data: Morningstar, Inc.
| | |
Growth of $10,000: 12/31/97 - 12/31/07 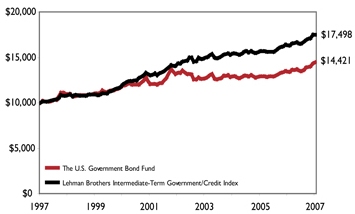
| | The Growth of $10,000 chart compares The U.S. Government Bond Fund’s value to the Lehman Brothers Intermediate-Term Government/Credit Index. The chart is intended to give you a general idea of how the Fund performed compared to this benchmark over the period from December 31, 1997 to December 31, 2007. An understanding of the differences between the Fund and this index is important. The Lehman Brothers Intermediate-Term Government/Credit Index is a hypothetical unmanaged index of fixed bonds issued by the U.S. Government and its agencies that are rated investment-grade or higher, have one to ten years remaining until maturity, and at least $100 million outstanding. This index does not take into account the deduction of expenses associated with a mutual fund, such as investment management and accounting fees. One cannot invest directly in an index. Past performance does not guarantee future results. The chart and the table do not reflect the deduction of taxes that a shareholder would pay on fund distributions or the redemption of fund shares. |
| | |
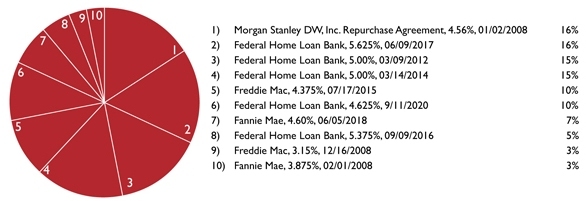
| Fund Holdings as of December 31, 2007 | | Fund holdings are subject to change. |
| | |
| The Flex-funds 2007 Annual Report | December 31, 2007 | | Page 21 |
| | |
| The Flex-funds | | 2007 Annual Report | December 31, 2007 |
The Money Market Fund
Annual Market Perspective
The Money Market Fund continues to provide above average returns while not investing in any asset-backed commercial paper.
“Stocks fall, bonds rise on sub-prime turmoil” – Reuters
“Bank freezes funds, markets plummet on sub-prime fears” – USA TODAY
“Credit crisis turns spotlight on money markets” – MSNBC
Headlines like these were abundant in the last two quarters of 2007. As the year progressed, credit concerns for corporations continued to multiply. Concerns in the market regarding asset-backed commercial paper increased, resulting in a period of abnormal volatility and liquidity. Many institutional investors from state-sponsored investment pools to sophisticated hedge fund managers were affected. Despite the far reaching nature of these events, The Flex-funds Money Market Fund was not affected. Our investments in traditional money market securities proved to be safe and timely as exotic products began to unravel in the face of uncertainty. Throughout this turmoil, we are pleased that The Flex-funds Money Market Fund Retail Class remained in the top 10% of all general purpose money market funds for the 22nd consecutive year according to iMoneyNet. This is true for every rolling 12-month period since the Fund’s inception in 1985.
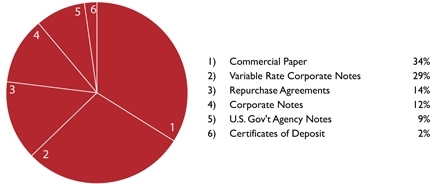
Early in the year, we maintained an overweight exposure to floating-rate instruments and overnight repurchase agreements versus conventional corporate debt securities such as notes and commercial paper. This enabled the Fund to earn a higher yield as both floating rate instruments and repurchase agreements provided a positive yield spread over corporate note and commercial paper securities.
With the possibility of lower rates looming in the future, we then made a concerted effort to maintain an above average weighted average maturity in an attempt to retain an above average yield for the Fund. Further, we continue to believe this philosophy will be suitable to defend against the potential for lower interest rates over the next several months. The Fund’s strategy shifted to reduce its position in overnight repurchase agreements and increase investments in commercial paper and fixed-term corporate notes. The credit quality of the holdings of the Fund remains high as we do not hold mortgage-backed or asset-backed type products.
| | |
| Page 22 | | The Flex-funds 2007 Annual Report | December 31, 2007 |
| | |
| The Flex-funds | | 2007 Annual Report | December 31, 2007 |
Performance Perspective
Period & Average Annual Total Returns as of December 31, 2007
| | | | | | | | | | | | | | | |
| | | 1
Year | | | 3
Year | | | 5
Year | | | 10
Year | | | Since
Inception | |
The Money Market Fund1 (Retail Class) | | 4.95 | % | | 4.16 | % | | 2.88 | % | | 3.65 | % | | 5.02 | %1 |
Lipper’s Average General Purpose Money Market Fund2 | | 4.49 | % | | 3.68 | % | | 2.40 | % | | 3.17 | % | | 4.65 | %2 |
Current & Effective Yields | | 7-day Compound Yield: 4.57%* | | | 7-day Simple Yield: 4.48%* | |
| | | | | |
The Money Market Fund (Institutional Class)3 | | 5.09 | % | | 4.31 | % | | N/A | | | N/A | | | 4.31 | %3 |
| | | | | |
iMoneyNet Average First-Tier | | | | | | | | | | | | | | | |
Institutional Money Market Fund 4 | | 5.06 | % | | 4.24 | % | | N/A | | | N/A | | | 4.24 | %4 |
Current & Effective Yields | | 7-day Compound Yield: 4.72%* | | | 7-day Simple Yield: 4.62%* | |
1 | Inception date for the retail class of The Money Market Fund was 3/27/85. |
2 | Performance results for the Lipper Average General Purpose Money Market Fund is from 3/31/85 through 12/31/07. |
3 | Inception date for the Institutional class of The Money Market Fund was 12/28/04. |
4 | Performance results for the iMoneyNet Average First-Tier Institutional Money Market Fund is from 12/28/04 through 12/31/07. |
| * | For the seven-day period ended December 31, 2007, yield quotations more closely reflect the current earnings of The Money Market Fund than do total return quotations. |
Performance quoted represents past performance. Past Performance does not guarantee future results. All performance figures represent average annual total returns for the periods ended December 31, 2007, and assume reinvestment of all dividend and capital gain distributions. The investment return and principal value of an investment will fluctuate so that an investor’s shares, when redeemed, may be worth more or less than their original cost. Current performance may be higher or lower than the performance quoted. Current month-end performance may be obtained at www.flexfunds.com or by calling 1.800.325.3539. Management fees were waived and/or expenses were reimbursed in order to reduce the operating expenses of both the retail class and the institutional class of The Money Market Fund during the periods shown above. Investments in The Money Market Fund are neither insured nor guaranteed by the Federal Deposit Insurance Corporation or any other governmental agency. Although the Fund seeks to preserve the value of your investment at $1.00 per share, it is possible to lose money by investing in The Money Market Fund. Source for average general purpose money market fund data: Lipper, Inc. Source for average first-tier institutional money market fund data: iMoneyNet, Inc.
| | |
Annual Returns (Retail Class): 1998 - 2007 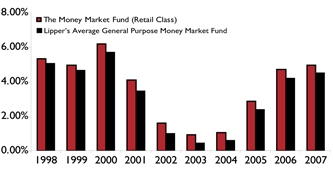
| | Annual Returns (Institutional Class): 2005 - 2007 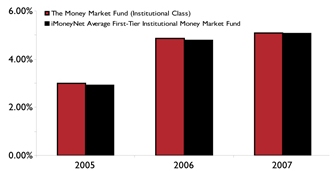
|
| | |
Fund Holdings as of December 31, 2007 | | Fund holdings are Subject to change. |
| | |
| The Flex-funds 2007 Annual Report | December 31, 2007 | | Page 23 |
| | |
| The Flex-funds | | 2007 Annual Report | December 31, 2007 |
Shareholder Expense Analysis (Unaudited)
Shareholders of mutual funds pay ongoing expenses, such as advisory fees, distribution and service fees (12b-1 fees) and other fund expenses. The following examples are intended to help you understand your ongoing costs (in dollars) of investing in the Funds and to compare these costs with the ongoing costs of investing in other mutual funds.
The examples below are based on an investment of $1,000 invested at the beginning of the period and held for the six-month period from June 30, 2007 to December 31, 2007.
ACTUAL EXPENSES: The first table below provides information about actual account values and actual expenses. You may use the information in this table, together with the amount you invested, to estimate the expenses that you paid over the period. Simply divide your account value by $1,000 (e.g.: an $8,600 account value divided by $1,000 = 8.6), then multiply the result by the number in the line under the heading “Expenses Paid During the Period” to estimate the expenses you paid on your account during this period.
| | | | | | | | | | | | |
| ACTUAL EXPENSES | | Beginning
Account Value
(6/30/2007) | | Ending
Account Value
(12/31/2007) | | Expenses Paid
During Period1
(6/30/2007 -
12/31/2007) | | Expense Ratio
(Annualized) | |
The Muirfield Fund® | | $ | 1,000.00 | | $ | 993.30 | | $ | 6.83 | | 1.36 | % |
The Dynamic Growth Fund | | | 1,000.00 | | | 994.60 | | | 6.59 | | 1.31 | % |
The Aggressive Growth Fund | | | 1,000.00 | | | 990.70 | | | 8.53 | | 1.70 | % |
The Defensive Growth Fund | | | 1,000.00 | | | 984.70 | | | 7.65 | | 1.53 | % |
The Focused Growth Fund | | | 1,000.00 | | | 984.80 | | | 7.70 | | 1.54 | % |
The Quantex Fund™ | | | 1,000.00 | | | 849.60 | | | 7.32 | | 1.57 | % |
The Socially Responsible Utilities Fund | | | 1,000.00 | | | 1,049.10 | | | 9.76 | | 1.89 | % |
The U.S. Government Bond Fund | | | 1,000.00 | | | 1,067.00 | | | 5.11 | | 0.98 | % |
The Money Market Fund - Retail Class | | | 1,000.00 | | | 1,024.10 | | | 2.45 | | 0.48 | % |
The Money Market Fund - Institutional Class | | | 1,000.00 | | | 1,024.80 | | | 1.74 | | 0.34 | % |
HYPOTHETICAL EXAMPLE FOR COMPARISON PURPOSES: The second table below provides information about hypothetical account values and hypothetical expenses based on the Funds’ actual expense ratios and assumed rates of return of 5% per year before expenses, which are not the Funds’ actual returns. The hypothetical account values and expenses may not be used to estimate the actual ending account balance or expenses you paid for the period. You may use this information to compare the ongoing costs of investing in the Funds to other funds. To do so, compare this 5% hypothetical example with the 5% hypothetical examples that appear in the shareholder reports of the other funds.
| | | | | | | | | | | | |
HYPOTHETICAL EXAMPLE (5% return before expenses) | | Beginning
Account Value
(6/30/2007) | | Ending
Account Value
(12/31/2007) | | Expenses Paid
During Period1
(6/30/2007 -
12/31/2007) | | Expense Ratio
(Annualized) | |
The Muirfield Fund® | | $ | 1,000.00 | | $ | 1,018.35 | | $ | 6.92 | | 1.36 | % |
The Dynamic Growth Fund | | | 1,000.00 | | | 1,018.60 | | | 6.67 | | 1.31 | % |
The Aggressive Growth Fund | | | 1,000.00 | | | 1,016.64 | | | 8.64 | | 1.70 | % |
The Defensive Growth Fund | | | 1,000.00 | | | 1,017.49 | | | 7.78 | | 1.53 | % |
The Focused Growth Fund | | | 1,000.00 | | | 1,017.44 | | | 7.83 | | 1.54 | % |
The Quantex Fund™ | | | 1,000.00 | | | 1,017.29 | | | 7.98 | | 1.57 | % |
The Socially Responsible Utilities Fund | | | 1,000.00 | | | 1,015.68 | | | 9.60 | | 1.89 | % |
The U.S. Government Bond Fund | | | 1,000.00 | | | 1,020.27 | | | 4.99 | | 0.98 | % |
The Money Market Fund - Retail Class | | | 1,000.00 | | | 1,022.79 | | | 2.45 | | 0.48 | % |
The Money Market Fund - Institutional Class | | | 1,000.00 | | | 1,023.49 | | | 1.73 | | 0.34 | % |
Please note that the expenses shown in the tables are meant to highlight your ongoing costs only and do not reflect any transactional costs, such as redemption fees or exchange fees. Therefore, the second table is useful in comparing ongoing costs only, and will not help you determine the relative total costs of owning different funds. In addition, if any transactional costs were included, your costs would have been higher.
1 | Expenses are equal to the Funds’ annualized expense ratios, multiplied by the average account value over the period, multiplied by 184/365(to reflect the total number of days in the six-month period). |
| | |
| Page 24 | | The Flex-funds 2007 Annual Report | December 31, 2007 |
| | |
| The Flex-funds | | 2007 Annual Report | December 31, 2007 |
2007 Annual Report
Fund Holdings & Financial Statements
| | |
| The Flex-funds 2007 Annual Report | December 31, 2007 | | Page 25 |
Schedule of Investments
December 31, 2007
The Muirfield Fund
| | | | | |
Security Description | | Shares or
Principal
Amount ($) | | Value ($) | |
Registered Investment Companies — 93.2% | |
Alger MidCap Growth Institutional Fund — Class I | | 411,479 | | 7,859,241 | |
Allegiant Mid Cap Value Fund — Class A | | 61,235 | | 832,182 | |
Allianz NFJ Dividend Value Fund — Class D | | 129,263 | | 2,140,600 | |
Allianz NFJ International Value Fund — Class A | | 196,390 | | 5,172,925 | |
Harbor International Fund — Inst. Class | | 79,182 | | 5,650,420 | |
Hartford Capital Appreciation Fund — Class A | | 204,648 | | 8,278,001 | |
Heritage Mid Cap Stock Fund — A | | 37,896 | | 1,062,236 | |
iShares Russell 1000 Growth Index Fund | | 35,325 | | 2,147,054 | |
Ivy Capital Appreciation Fund — Class A | | 201,249 | | 2,253,991 | |
Janus Adviser Forty Fund — Class S | | 86,069 | | 3,568,409 | |
MFS Value Fund — Class A | | 151,452 | | 4,018,024 | |
Munder Mid Cap Core Growth Fund — Class A | | 132,399 | | 3,957,400 | |
| | | | | |
Total Registered Investment Companies (Cost $47,880,894) | | | | 46,940,483 | |
| | | | | |
U.S. Government Obligations — 1.2% | |
U.S. Treasury Bill, 3.64%, due 02/07/2008* | | 100,000 | | 99,635 | |
U.S. Treasury Bill, 3.03%, due 03/06/2008* | | 500,000 | | 497,241 | |
| | | | | |
Total U.S. Government Obligations
(Cost $596,900) | | | | 596,876 | |
| | | | | |
Repurchase Agreements — 5.9% | |
Morgan Stanley DW, Inc., 4.56%, 01/02/2008, (Collateralized by $3,176,798 various Certificates of Deposit, Government Agencies, Agency Strips, Commercial Papers, Treasury Notes at 2.625% — 7.25%, due 01/07/2008 — 04/15/2030, value — $3,028,380) purchase date 12/31/2007 | | 2,969,000 | | 2,969,000 | |
| | | | | |
Total Repurchase Agreements
(Cost $2,969,000) | | | | 2,969,000 | |
| | | | | |
Total Investments — 100.3%
(Cost $51,446,794)(a) | | | | 50,506,359 | |
| | | | | |
Liabilities less Other Assets — (0.3%) | | | | (132,268 | ) |
| | | | | |
Total Net Assets — 100.0% | | | | 50,374,091 | |
| | | | | |
Trustee Deferred Compensation** | |
The Flex-funds Aggressive Growth Fund | | 410 | | 3,522 | |
The Flex-funds Defensive Growth Fund | | 224 | | 2,343 | |
The Flex-funds Dynamic Growth Fund | | 2,121 | | 19,598 | |
The Flex-funds Muirfield Fund | | 5,206 | | 31,340 | |
The Flex-funds Quantex Fund | | 1,887 | | 34,570 | |
The Flex-funds Socially Responsible Utilities Fund | | 378 | | 9,881 | |
| | | | | |
Total Trustee Deferred Compensation (Cost $80,323) | | | | 101,254 | |
| | | | | |
The Muirfield Fund
| | | | |
Security Description | | Long
Contracts | | Unrealized
Appreciation
(Depreciation)($) |
Futures Contracts | | |
Standard & Poors 500 expiring March 2008, notional value $3,693,000 | | 10 | | 6,300 |
| | | | |
Total Futures Contracts | | | | 6,300 |
| | | | |
| (a) | Cost for financial reporting purposes and federal income tax purposes are the same. Cost for federal income tax purposes differs from value by net unrealized appreciation (depreciation) of securities as follows: |
| | | | |
Unrealized appreciation | | $ | 634,779 | |
Unrealized depreciation | | | (1,575,214 | ) |
| | | | |
Net unrealized appreciation (depreciation) | | $ | (940,435 | ) |
| | | | |
| * | Pledged as collateral on futures contracts. |
| ** | Assets of affiliates to The Muirfield Fund held for the benefit of the Fund’s Trustees in connection with the Trustee Deferred Compensation Plan. |
The accompanying notes are an integral part of these financial statements.
Schedule of Investments
December 31, 2007
The Dynamic Growth Fund
| | | | |
Security Description | | Shares or
Principal
Amount ($) | | Value ($) |
Registered Investment Companies — 89.6% |
Alger MidCap Growth Institutional Fund — Class I | | 151,833 | | 2,900,001 |
Allegiant Mid Cap Value Fund — Class A | | 27,512 | | 373,890 |
Allianz NFJ Dividend Value Fund — Class D | | 45,162 | | 747,877 |
Allianz NFJ International Value Fund — Class A | | 67,114 | | 1,767,793 |
Harbor International Fund — Inst. Class | | 31,116 | | 2,220,421 |
Hartford Capital Appreciation Fund — Class A | | 68,777 | | 2,782,016 |
iShares Russell 1000 Growth Index Fund | | 7,725 | | 469,526 |
Ivy Capital Appreciation Fund — Class A | | 82,054 | | 919,009 |
Janus Adviser Forty Fund — Class S | | 33,180 | | 1,375,624 |
MFS Value Fund — Class A | | 67,643 | | 1,794,563 |
Munder Mid Cap Core Growth Fund — Class A | | 59,531 | | 1,779,375 |
| | | | |
Total Registered Investment Companies (Cost $17,557,254) | | | | 17,130,095 |
| | | | |
U.S. Government Obligations — 2.1% |
U.S. Treasury Bill, 3.03%, due 03/06/2008* | | 400,000 | | 397,793 |
| | | | |
Total U.S. Government Obligations
(Cost $397,812) | | | | 397,793 |
| | | | |
Repurchase Agreements — 7.9% |
Morgan Stanley DW, Inc., 4.56%, 01/02/2008, (Collateralized by $1,614,614 various Certificates of Deposit, Government Agencies, Agency Strips, Commercial Papers, Treasury Notes at 2.625% — 7.25%, due 01/07/2008 — 04/15/2030, value — $1,539,180) purchase date 12/31/2007 | | 1,509,000 | | 1,509,000 |
| | | | |
Total Repurchase Agreements
(Cost $1,509,000) | | | | 1,509,000 |
| | | | |
Total Investments — 99.6%
(Cost $19,464,066)(a) | | | | 19,036,888 |
| | | | |
Other Assets less Liabilities — 0.4% | | | | 77,761 |
| | | | |
Total Net Assets — 100.0% | | | | 19,114,649 |
| | | | |
Trustee Deferred Compensation** |
The Flex-funds Aggressive Growth Fund | | 201 | | 1,727 |
The Flex-funds Defensive Growth Fund | | 110 | | 1,151 |
The Flex-funds Dynamic Growth Fund | | 541 | | 4,999 |
The Flex-funds Muirfield Fund | | 1,408 | | 8,476 |
The Flex-funds Quantex Fund | | 539 | | 9,874 |
The Flex-funds Socially Responsible Utilities Fund | | 82 | | 2,143 |
| | | | |
Total Trustee Deferred Compensation (Cost $24,020) | | | | 28,370 |
| | | | |
The Dynamic Growth Fund
| | | | | |
Security Description | | Long
Contracts | | Unrealized
Appreciation
(Depreciation)($) | |
Futures Contracts | | | |
Standard & Poors 500 expiring March 2008, notional value $1,846,500 | | 5 | | (4,763 | ) |
| | | | | |
Total Futures Contracts | | | | (4,763 | ) |
| | | | | |
| (a) | Cost for financial reporting purposes and federal income tax purposes are the same. Cost for federal income tax purposes differs from value by net unrealized appreciation (depreciation) of securities as follows: |
| | | | |
Unrealized appreciation | | $ | 215,802 | |
Unrealized depreciation | | | (642,980 | ) |
| | | | |
Net unrealized appreciation (depreciation) | | $ | (427,178 | ) |
| | | | |
| * | Pledged as collateral on futures contracts. |
| ** | Assets of affiliates to The Dynamic Growth Fund held for the benefit of the Fund’s Trustees in connection with the Trustee Deferred Compensation Plan. |
The accompanying notes are an integral part of these financial statements.
Schedule of Investments
December 31, 2007
The Aggressive Growth Fund
| | | | | |
Security Description | | Shares or
Principal
Amount ($) | | Value ($) | |
Registered Investment Companies — 88.5% | |
Consumer Staples Select Sector SPDR Fund | | 46,275 | | 1,332,720 | |
iShares MSCI EAFE Growth Index Fund | | 14,700 | | 1,142,337 | |
iShares MSCI EAFE Index Fund | | 23,190 | | 1,820,415 | |
iShares MSCI EMU Index Fund | | 36,455 | | 4,349,811 | |
iShares Russell 1000 Growth Index Fund | | 95,400 | | 5,798,412 | |
iShares Russell Midcap Growth Index Fund | | 41,325 | | 4,708,571 | |
iShares S&P Latin American 40 Index Fund | | 5,900 | | 1,468,569 | |
iShares S&P MidCap 400 Growth Index Fund | | 17,625 | | 1,570,740 | |
Powershares Dynamic Mid Cap Growth Portfolio | | 87,775 | | 2,129,421 | |
Utilities Select Sector SPDR Fund | | 28,075 | | 1,188,415 | |
| | | | | |
Total Registered Investment Companies (Cost $25,149,743) | | | | 25,509,411 | |
| | | | | |
U.S. Government Obligations — 0.7% | |
U.S. Treasury Bill, 3.03%, due 03/06/08* | | 200,000 | | 198,896 | |
| | | | | |
Total U.S. Government Obligations
(Cost $198,906) | | | | 198,896 | |
| | | | | |
Repurchase Agreements — 11.0% | |
Morgan Stanley DW, Inc., 4.56%, 01/02/2008, (Collateralized by $3,401,496 various Certificates of Deposit, Government Agencies, Agency Strips, Commercial Papers, Treasury Notes at 2.625% — 7.25%, due 01/07/2008 — 04/15/2030, value — $3,242,580) purchase date 12/31/2007 | | 3,179,000 | | 3,179,000 | |
| | | | | |
Total Repurchase Agreements
(Cost $3,179,000) | | | | 3,179,000 | |
| | | | | |
Total Investments — 100.2%
(Cost $28,527,649)(a) | | | | 28,887,307 | |
| | | | | |
Liabilities less Other Assets — (0.2%) | | | | (46,590 | ) |
| | | | | |
Total Net Assets — 100.0% | | | | 28,840,717 | |
| | | | | |
Trustee Deferred Compensation** | |
The Flex-funds Aggressive Growth Fund | | 225 | | 1,933 | |
The Flex-funds Defensive Growth Fund | | 123 | | 1,287 | |
The Flex-funds Dynamic Growth Fund | | 479 | | 4,426 | |
The Flex-funds Muirfield Fund | | 1,219 | | 7,338 | |
The Flex-funds Quantex Fund | | 450 | | 8,244 | |
The Flex-funds Socially Responsible Utilities Fund | | 77 | | 2,013 | |
| | | | | |
Total Trustee Deferred Compensation (Cost $21,607) | | | | 25,241 | |
| | | | | |
The Aggressive Growth Fund
| | | | | |
Security Description | | Long
Contracts | | Unrealized
Appreciation
(Depreciation)($) | |
Futures Contracts | | | |
Standard & Poors 500 expiring March 2008, notional value $3,323,700 | | 9 | | (13,013 | ) |
| | | | | |
Total Futures Contracts | | | | (13,013 | ) |
| | | | | |
| (a) | Cost for financial reporting purposes and federal income tax purposes are the same. Cost for federal income tax purposes differs from value by net unrealized appreciation (depreciation) of securities as follows: |
| | | | |
Unrealized appreciation | | $ | 491,246 | |
Unrealized depreciation | | | (131,588 | ) |
| | | | |
Net unrealized appreciation (depreciation) | | $ | 359,658 | |
| | | | |
| * | Pledged as collateral on futures contracts. |
| ** | Assets of affiliates to The Aggressive Growth Fund held for the benefit of the Fund’s Trustees in connection with the Trustee Deferred Compensation Plan. |
The accompanying notes are an integral part of these financial statements.
Schedule of Investments
December 31, 2007
The Defensive Growth Fund
| | | | | |
Security Description | | Shares or
Principal
Amount ($) | | Value ($) | |
Registered Investment Companies — 88.0% | |
Consumer Staples Select Sector SPDR Fund | | 145,675 | | 4,195,440 | |
iShares Dow Jones U.S. Energy Sector Index Fund | | 28,225 | | 3,865,978 | |
iShares Dow Jones U.S. Industrial Sector Index Fund | | 37,315 | | 2,716,532 | |
iShares MSCI EAFE Growth Index Fund | | 20,400 | | 1,585,284 | |
iShares MSCI EAFE Index Fund | | 76,375 | | 5,995,438 | |
iShares MSCI EMU Index Fund | | 59,575 | | 7,108,489 | |
iShares Russell 1000 Growth Index Fund | | 201,660 | | 12,256,895 | |
iShares Russell Midcap Growth Index Fund | | 111,185 | | 12,668,419 | |
iShares Russell Midcap Value Index Fund | | 10,218 | | 1,441,351 | |
iShares S&P 500 Value Index Fund | | 53,175 | | 4,060,443 | |
iShares S&P MidCap 400 Growth Index Fund | | 40,900 | | 3,645,008 | |
Powershares Dynamic Mid Cap Growth Portfolio | | 92,950 | | 2,254,967 | |
Utilities Select Sector SPDR Fund | | 84,450 | | 3,574,768 | |
| | | | | |
Total Registered Investment Companies (Cost $64,496,454) | | | | 65,369,012 | |
| | | | | |
U.S. Government Obligations — 0.6% | |
U.S. Treasury Bill, 3.85%, due 01/03/2008* | | 100,000 | | 99,979 | |
U.S. Treasury Bill, 3.03%, due 03/06/2008* | | 110,000 | | 109,393 | |
U.S. Treasury Bill, 2.76%, due 03/13/2008* | | 100,000 | | 99,380 | |
U.S. Treasury Bill, 3.363%, due 03/27/2008* | | 190,000 | | 188,544 | |
| | | | | |
Total U.S. Government Obligations
(Cost $497,336) | | | | 497,296 | |
| | | | | |
Repurchase Agreements — 12.5% | |
Morgan Stanley DW, Inc., 4.56%, 01/02/2008, (Collateralized by $9,915,591 various Certificates of Deposit, Government Agencies, Agency Strips, Commercial Papers, Treasury Notes at 2.625% — 7.25%, due 01/07/2008 — 04/15/2030, value — $9,452,340) purchase date 12/31/2007 | | 9,267,000 | | 9,267,000 | |
| | | | | |
Total Repurchase Agreements
(Cost $9,267,000) | | | | 9,267,000 | |
| | | | | |
Total Investments — 101.1%
(Cost $74,260,790)(a) | | | | 75,133,308 | |
| | | | | |
Liabilities less Other Assets — (1.1%) | | | | (842,861 | ) |
| | | | | |
Total Net Assets — 100.0% | | | | 74,290,447 | |
| | | | | |
Trustee Deferred Compensation** | |
The Flex- funds Aggressive Growth Fund | | 382 | | 3,281 | |
The Flex-funds Defensive Growth Fund | | 209 | | 2,186 | |
The Flex-funds Dynamic Growth Fund | | 118 | | 1,090 | |
The Flex-funds Muirfield Fund | | 360 | | 2,167 | |
The Flex-funds Quantex Fund | | 158 | | 2,895 | |
The Flex-funds Socially Responsible Utilities Fund | | 44 | | 1,150 | |
| | | | | |
Total Trustee Deferred Compensation (Cost $13,075) | | | | 12,769 | |
| | | | | |
The Defensive Growth Fund
| | | | |
Security Description | | Long
Contracts | | Unrealized
Appreciation
(Depreciation)($) |
Futures Contracts | | |
Standard & Poors 500 expiring March 2008, notional value $8,863,200 | | 24 | | 8,875 |
| | | | |
Total Futures Contracts | | | | 8,875 |
| | | | |
| (a) | Represents cost for financial reporting purposes and differs for federal income tax purposes by the amount of losses deferred for federal income tax reporting in the amount of $212,868. Cost for federal income tax purposes of $74,473,658 differs from value by net unrealized appreciation (depreciation) of securities as follows: |
| | | | |
Unrealized appreciation | | $ | 1,472,435 | |
Unrealized depreciation | | | (812,785 | ) |
| | | | |
Net unrealized appreciation (depreciation) | | $ | 659,650 | |
| | | | |
| * | Pledged as collateral on futures contracts. |
| ** | Assets of affiliates to The Defensive Growth Fund held for the benefit of the Fund’s Trustees in connection with the Trustee Deferred Compensation Plan. |
The accompanying notes are an integral part of these financial statements.
Schedule of Investments
December 31, 2007
The Focused Growth Fund
| | | | |
Security Description | | Shares or
Principal
Amount ($) | | Value ($) |
Registered Investment Companies — 87.6% |
Consumer Staples Select Sector SPDR Fund | | 100,675 | | 2,899,440 |
iShares Dow Jones U.S. Energy Sector Index Fund | | 25,575 | | 3,503,008 |
iShares Dow Jones U.S. Industrial Sector Index Fund | | 34,974 | | 2,546,107 |
iShares MSCI EAFE Growth Index Fund | | 17,100 | | 1,328,841 |
iShares MSCI EAFE Index Fund | | 65,645 | | 5,153,132 |
iShares MSCI EMU Index Fund | | 52,464 | | 6,260,004 |
iShares Russell 1000 Growth Index Fund | | 171,520 | | 10,424,986 |
iShares Russell Midcap Growth Index Fund | | 96,850 | | 11,035,089 |
iShares Russell Midcap Value Index Fund | | 8,787 | | 1,239,494 |
iShares S&P 500 Value Index Fund | | 40,925 | | 3,125,033 |
iShares S&P MidCap 400 Growth Index Fund | | 38,225 | | 3,406,612 |
Powershares Dynamic Mid Cap Growth Portfolio | | 80,475 | | 1,952,324 |
Utilities Select Sector SPDR Fund | | 70,750 | | 2,994,847 |
| | | | |
Total Registered Investment Companies (Cost $55,048,306) | | | | 55,868,917 |
| | | | |
U.S. Government Obligations — 0.8% |
U.S. Treasury Bill, 3.363%, due 03/27/2008* | | 475,000 | | 471,361 |
| | | | |
Total U.S. Government Obligations
(Cost $471,278) | | | | 471,361 |
| | | | |
Repurchase Agreements — 11.1% |
Morgan Stanley DW, Inc., 4.56%, 01/02/2008, (Collateralized by $7,593,714 various Certificates of Deposit, Government Agencies, Agency Strips, Commercial Papers, Treasury Notes at 2.625% — 7.25%, due 01/07/2008 — 04/15/2030, value — $7,238,940) purchase date 12/31/2007 | | 7,097,000 | | 7,097,000 |
| | | | |
Total Repurchase Agreements
(Cost $7,097,000) | | | | 7,097,000 |
| | | | |
Total Investments — 99.5%
(Cost $62,616,584)(a) | | | | 63,437,278 |
| | | | |
Other Assets less Liabilities — 0.5% | | | | 348,208 |
| | | | |
Total Net Assets — 100.0% | | | | 63,785,486 |
| | | | |
Trustee Deferred Compensation** |
The Flex-funds Aggressive Growth Fund | | 346 | | 2,972 |
The Flex-funds Defensive Growth Fund | | 189 | | 1,977 |
The Flex-funds Dynamic Growth Fund | | 107 | | 989 |
The Flex-funds Muirfield Fund | | 328 | | 1,975 |
The Flex-funds Quantex Fund | | 145 | | 2,656 |
The Flex-funds Socially Responsible Utilities Fund | | 40 | | 1,046 |
| | | | |
Total Trustee Deferred Compensation (Cost $11,867) | | | | 11,615 |
| | | | |
The Focused Growth Fund
| | | | | |
Security Description | | Long
Contracts | | Unrealized
Appreciation
(Depreciation)($) | |
Futures Contracts | | | |
Standard & Poors 500 expiring March 2008, notional value $7,755,300 | | 21 | | (5,625 | ) |
| | | | | |
Total Futures Contracts | | | | (5,625 | ) |
| | | | | |
| (a) | Represents cost for financial reporting purposes and differs for federal income tax purposes by the amount of losses deferred for federal income tax reporting in the amount of $230,383. Cost for federal income tax purposes of $62,846,967 differs from value by net unrealized appreciation (depreciation) of securities as follows: |
| | | | |
Unrealized appreciation | | $ | 1,331,011 | |
Unrealized depreciation | | | (740,700 | ) |
| | | | |
Net unrealized appreciation (depreciation) | | $ | 590,311 | |
| | | | |
| * | Pledged as collateral on futures contracts. |
| ** | Assets of affiliates to The Focused Growth Fund held for the benefit of the Fund’s Trustees in connection with the Trustee Deferred Compensation Plan. |
The accompanying notes are an integral part of these financial statements.
Schedule of Investments
December 31, 2007
The Quantex Fund
| | | | |
Security Description | | Shares or
Principal
Amount ($) | | Value ($) |
Common Stocks — 80.4% | | | | |
Basic Materials — 6.4% | | | | |
Ashland, Inc. | | 2,535 | | 120,235 |
Eastman Chemical Co. | | 2,915 | | 178,077 |
Hercules, Inc. | | 8,600 | | 166,410 |
Int’l Flavors & Fragrances, Inc. | | 3,415 | | 164,364 |
MeadWestvaco Corp. | | 5,560 | | 174,028 |
Sigma — Aldrich Corp. | | 4,295 | | 234,507 |
Temple-Inland, Inc. | | 3,615 | | 75,373 |
| | | | |
(Cost $1,002,397) | | | | 1,112,994 |
| | | | |
Communications — 9.4% | | | | |
ADC Telecommunications, Inc.# | | 11,439 | | 177,876 |
CenturyTel, Inc. | | 3,800 | | 157,548 |
Ciena Corp.# | | 6,009 | | 204,967 |
Citizens Communications Co. | | 11,555 | | 147,095 |
Comverse Technology, Inc.# | | 7,330 | | 126,443 |
EW Scripps Co. | | 3,905 | | 175,764 |
Interpublic Group of Cos., Inc.# | | 13,575 | | 110,093 |
JDS Uniphase Corp.# | | 11,392 | | 151,514 |
Meredith Corp. | | 2,915 | | 160,267 |
New York Times Co. | | 6,960 | | 122,009 |
Tellabs, Inc.# | | 16,205 | | 105,981 |
| | | | |
(Cost $1,769,134) | | | | 1,639,557 |
| | | | |
Consumer Cyclical — 12.4% | | | | |
Automation, Inc.# | | 7,805 | | 122,226 |
Big Lots, Inc.# | | 7,215 | | 115,368 |
Brunswick Corp. | | 5,175 | | 88,234 |
Centex Corp. | | 4,250 | | 107,355 |
Cintas Corp. | | 4,180 | | 140,532 |
Circuit City Stores, Inc. | | 8,775 | | 36,855 |
Dillards, Inc. | | 4,770 | | 89,581 |
Family Dollar Stores, Inc. | | 5,950 | | 114,419 |
Hasbro, Inc. | | 6,035 | | 154,375 |
Jones Apparel Group, Inc. | | 5,070 | | 81,069 |
KB Home | | 3,210 | | 69,336 |
Liz Claiborne, Inc. | | 3,750 | | 76,313 |
OfficeMax, lnc. | | 3,325 | | 68,695 |
RadioShack Corp. | | 9,755 | | 164,469 |
The Goodyear Tire & Rubber Co.# | | 7,260 | | 204,877 |
Tiffany & Co. | | 4,180 | | 192,405 |
W.W. Grainger, Inc. | | 2,350 | | 205,672 |
Wendy’s International, Inc. | | 4,970 | | 128,425 |
| | | | |
(Cost $2,830,074) | | | | 2,160,206 |
| | | | |
Consumer Noncyclical — 17.5% | | | | |
Barr Pharmaceuticals, Inc.# | | 3,325 | | 176,557 |
Brown-Forman Corp. | | 2,535 | | 187,869 |
Constellation Brands, Inc.# | | 8,100 | | 191,484 |
Convergys Corp.# | | 6,920 | | 113,903 |
Equifax, Inc. | | 4,840 | | 175,982 |
Estee Lauder Cos., Inc./The | | 4,005 | | 174,658 |
Health Management Associates, Inc. | | 7,895 | | 47,212 |
Hospira, Inc.# | | 4,970 | | 211,921 |
IMS Health, Inc. | | 6,195 | | 142,733 |
King Pharmaceuticals, Inc.# | | 10,345 | | 105,933 |
McCormick & Co., Inc. | | 4,320 | | 163,771 |
Millipore Corp.# | | 2,480 | | 181,486 |
Molson Coors Brewing Co. | | 4,480 | | 231,258 |
Mylan Laboratories, Inc. | | 8,265 | | 116,206 |
The Quantex Fund
| | | | |
Security Description | | Shares or
Principal
Amount ($) | | Value ($) |
Common Stocks — continued | | | | |
Patterson Cos., Inc.# | | 4,685 | | 159,056 |
Pepsi Bottling Group, Inc. | | 5,765 | | 227,487 |
Tenet Healthcare Corp.# | | 23,345 | | 118,593 |
Tyson Foods, Inc. | | 10,155 | | 155,676 |
Watson Pharmaceuticals, lnc.# | | 6,340 | | 172,068 |
| | | | |
(Cost $3,105,283) | | | | 3,053,853 |
| | | | |
Energy — 3.2% | | | | |
Dynegy, Inc. # | | 22,950 | | 163,863 |
Integrys Energy Group, Inc. | | 3,055 | | 157,913 |
Rowan Cos., Inc. | | 6,240 | | 246,230 |
| | | | |
(Cost $467,350) | | | | 568,006 |
| | | | |
Financial — 4.3% | | | | |
Apartment Investment & Management Co. | | 2,910 | | 101,064 |
Federated Investors, Inc. | | 4,840 | | 199,214 |
First Horizon National Corp. | | 4,250 | | 77,138 |
Forestar Real Estate Group, Inc.# | | 1,205 | | 28,426 |
Guaranty Financial Group, Inc.# | | 1,205 | | 19,280 |
Janus Capital Group, Inc. | | 8,010 | | 263,128 |
MGIC Investment Corp. | | 2,620 | | 58,767 |
Wachovia Corp. Pref. Dividend Equalization# | | 1,700 | | 0 |
| | | | |
(Cost $819,292) | | | | 747,017 |
| | | | |
Industrial — 13.4% | | | | |
Allied Waste Industries, Inc.# | | 13,470 | | 148,439 |
Ball Corp. | | 3,705 | | 166,725 |
Bemis Co. | | 5,070 | | 138,817 |
Black & Decker Corp. | | 2,050 | | 142,782 |
Leggett & Platt, Inc. | | 7,035 | | 122,690 |
Molex, Inc. | | 5,275 | | 144,007 |
Pactiv Corp.# | | 4,685 | | 124,762 |
Pall Corp. | | 4,770 | | 192,327 |
PerkinElmer, lnc. | | 7,580 | | 197,232 |
Ryder System, Inc. | | 3,140 | | 147,611 |
Sanmina — SCI Corp.# | | 48,155 | | 87,642 |
Sealed Air Corp. | | 5,275 | | 122,064 |
Snap — On, Inc. | | 3,460 | | 166,910 |
Stanley Works / The | | 3,285 | | 159,257 |
Waters Corp.# | | 3,415 | | 270,024 |
| | | | |
(Cost $2,244,785) | | | | 2,331,289 |
| | | | |
Technology — 9.1% | | | | |
Citrix Systems, Inc.# | | 6,150 | | 233,761 |
Compuware Corp.# | | 19,920 | | 176,889 |
Jabil Circuit, Inc. | | 6,740 | | 102,920 |
LSI Logic Corp.# | | 20,470 | | 108,696 |
Novell, Inc.# | | 26,755 | | 183,807 |
Novellus Systems, Inc.# | | 4,770 | | 131,509 |
Parametric Technology Corp.# | | 9,600 | | 171,360 |
PMC — Sierra, Inc.# | | 24,695 | | 161,505 |
QLogic Corp.# | | 7,605 | | 107,991 |
Teradyne, Inc.# | | 11,090 | | 114,671 |
Unisys Corp.# | | 21,190 | | 100,229 |
| | | | |
(Cost $1,685,505) | | | | 1,593,338 |
| | | | |
Utilities — 4.7% | | | | |
Centrepoint Energy, Inc. | | 9,755 | | 167,103 |
CMS Energy Corp. | | 10,045 | | 174,582 |
Nicor, Inc. | | 3,545 | | 150,131 |
Schedule of Investments
December 31, 2007
The Quantex Fund
| | | | | |
Security Description | | Shares or
Principal
Amount ($) | | Value ($) | |
Common Stocks — continued | | | | | |
Pinnacle West Capital Corp. | | 3,210 | | 136,136 | |
TECO Energy, Inc. | | 11,320 | | 194,817 | |
| | | | | |
(Cost $749,201) | | | | 822,769 | |
| | | | | |
Total Common Stocks
(Cost $14,673,021) | | | | 14,029,029 | |
| | | | | |
U.S. Government Obligations — 1.7% | | | | | |
U.S. Treasury Bill,
3.03%, due 03/06/2008* | | 300,000 | | 298,345 | |
| | | | | |
Total U.S. Government Obligations
(Cost $298,359) | | | | 298,345 | |
| | | | | |
Repurchase Agreements — 22.0% | | | | | |
Morgan Stanley DW, Inc., 4.56%, 01/02/2008, (Collateralized by $4,101,269 various Certificates of Deposit, Government Agencies, Agency Strips, Commercial Papers, Treasury Notes at 2.625% — 7.25%, due 01/07/2008 — 04/15/2030, value — $3,909,660) purchase date 12/31/2007 | | 3,833,000 | | 3,833,000 | |
| | | | | |
Total Repurchase Agreements
(Cost $3,833,000) | | | | 3,833,000 | |
| | | | | |
Total Investments — 104.1%
(Cost $18,804,380)(a) | | | | 18,160,374 | |
| | | | | |
Liabilities less Other Assets — (4.1%) | | | | (709,987 | ) |
| | | | | |
Total Net Assets — 100.0% | | | | 17,450,387 | |
| | | | | |
Trustee Deferred Compensation** | |
The Flex-funds Aggressive Growth Fund | | 206 | | 1,770 | |
The Flex-funds Defensive Growth Fund | | 113 | | 1,182 | |
The Flex-funds Dynamic Growth Fund | | 1,094 | | 10,109 | |
The Flex-funds Muirfield Fund | | 2,602 | | 15,664 | |
The Flex-funds Quantex Fund | | 887 | | 16,250 | |
The Flex-funds Socially Responsible Utilities Fund | | 189 | | 4,940 | |
| | | | | |
Total Trustee Deferred Compensation (Cost $39,098) | | | | 49,915 | |
| | | | | |
The Quantex Fund
| | | | | |
Security Description | | Long
Contracts | | Unrealized
Appreciation
(Depreciation)($) | |
Futures Contracts | | | |
Standard & Poors MidCap 400 expiring March 2008, notional value $3,891,600 | | 9 | | (6,075 | ) |
| | | | | |
Total Futures Contracts | | | | (6,075 | ) |
| | | | | |
| (a) | Cost for financial reporting purposes and federal income tax purposes are the same. Cost for federal income tax purposes differs from value by net unrealized appreciation (depreciation) of securities as follows: |
| | | | |
Unrealized appreciation | | $ | 1,427,550 | |
Unrealized depreciation | | | (2,071,556 | ) |
| | | | |
Net unrealized appreciation (depreciation) | | $ | (644,006 | ) |
| | | | |
ADR American Depositary Receipt
| # | Represents non-income producing securities. |
| * | Pledged as collateral on Futures Contracts. |
| ** | Assets of affiliates to The Flex-funds Quantex Fund held for the benefit of the Fund’s Trustees in connection with the Trustee Deferred Compensation Plan. |
The accompanying notes are an integral part of these financial statements.
Schedule of Investments
December 31, 2007
The Socially Responsible Utilities Fund
| | | | |
Security Description | | Shares or
Principal
Amount ($) | | Value ($) |
Common Stocks — 98.3% | | | | |
Electric Utility — 17.0% | | | | |
AES Corp.# | | 59,655 | | 1,276,020 |
Covanta Holding Corp.# | | 28,485 | | 787,895 |
MDU Resources Group, Inc. | | 23,237 | | 641,574 |
Northeast Utilities | | 16,755 | | 524,599 |
Pepco Holdings, Inc. | | 15,215 | | 446,256 |
Sierra Pacific Resources | | 56,125 | | 953,003 |
| | | | |
(Cost $3,611,109) | | | | 4,629,347 |
| | | | |
Independent Power Producer — 0.8% | | | | |
Dynegy, Inc.# | | 31,770 | | 226,838 |
| | | | |
(Cost $148,072) | | | | 226,838 |
| | | | |
Natural Gas Distribution — 11.5% | | | | |
AGL Resources, Inc. | | 14,865 | | 559,519 |
ATMOS Energy Corp. | | 9,645 | | 270,446 |
NiSource, Inc. | | 55,760 | | 1,053,306 |
ONEOK, Inc. | | 8,625 | | 386,141 |
Southern Union Co. | | 30,960 | | 908,986 |
| | | | |
(Cost $2,778,617) | | | | 3,178,398 |
| | | | |
Oil Exploration & Production — 9.4% | | | | |
GMX Resources, Inc.# | | 11,185 | | 361,052 |
Goodrich Petroleum Corp.# | | 10,340 | | 233,891 |
Pioneer Natural Resources Co. | | 18,115 | | 884,736 |
Ultra Petroleum Corp.# | | 14,610 | | 1,044,615 |
| | | | |
(Cost $1,791,598) | | | | 2,524,294 |
| | | | |
Pipelines — 20.1% | | | | |
El Paso Corp. | | 45,815 | | 789,851 |
Enterprise Products Partners, L.P. | | 21,646 | | 690,074 |
Equitable Resources, Inc. | | 11,175 | | 595,404 |
Kinder Morgan Energy Partners, L.P. | | 17,818 | | 961,994 |
Questar Corp. | | 25,625 | | 1,386,312 |
Spectra Energy Corp. | | 41,550 | | 1,072,821 |
| | | | |
(Cost $4,148,268) | | | | 5,496,456 |
| | | | |
Telephone & Telecommunications — 39.0% | | |
America Movil SA de CV — ADR | | 11,270 | | 691,865 |
AT&T, Inc. | | 32,200 | | 1,338,164 |
Brasil Telecom — ADR | | 3,985 | | 297,201 |
China Mobile Limited — ADR | | 3,505 | | 304,479 |
Corning, Inc. | | 40,090 | | 961,759 |
Cypress Semiconductor Corp.# | | 14,610 | | 526,399 |
Leap Wireless International, Inc.# | | 15,655 | | 730,149 |
Philippine Long Distance Telephone Company — ADR | | 9,245 | | 700,032 |
PT Telekomunikasi Indonesia — ADR | | 9,405 | | 395,104 |
Qwest Communications International, Inc.# | | 76,190 | | 534,092 |
Telefonica S.A. — ADR | | 10,020 | | 977,852 |
Telus Corp. | | 12,650 | | 610,489 |
Turkcell Iletisim Hizmetleri AS — ADR | | 31,595 | | 871,074 |
Verizon Communications, Inc. | | 29,045 | | 1,268,976 |
Vivo Participacoes SA — ADR | | 83,230 | | 455,268 |
| | | | |
(Cost $7,852,808) | | | | 10,662,903 |
| | | | |
Water Utility — 0.5% | | | | |
Mueller Water Products, Inc. | | 15,170 | | 144,418 |
| | | | |
(Cost $244,620) | | | | 144,418 |
| | | | |
Total Common Stocks
(Cost $20,575,092) | | | | 26,862,654 |
| | | | |
The Socially Responsible Utilities Fund
| | | | | |
Security Description | | Shares or
Principal
Amount ($) | | Value ($) | |
Repurchase Agreements — 1.8% | | | | | |
Morgan Stanley DW, Inc., 4.56%, 01/02/2008, (Collateralized by $523,225 various Certificates of Deposit, Government Agencies, Agency Strips, Commercial Papers, Treasury Notes at 2.625% — 7.25%, due 01/07/2008 —04/15/2030, value — $498,780) purchase date 12/31/2007 | | 489,000 | | 489,000 | |
| | | | | |
Total Repurchase Agreements
(Cost $489,000) | | | | 489,000 | |
| | | | | |
Total Investments — 100.1%
(Cost $21,064,092)(a) | | | | 27,351,654 | |
| | | | | |
Liabilities less Other Assets — (0.1%) | | | | (19,137 | ) |
| | | | | |
Total Net Assets — 100.0% | | | | 27,332,517 | |
| | | | | |
Trustee Deferred Compensation* | | | | | |
The Flex-funds Aggressive Growth Fund | | 237 | | 2,036 | |
The Flex-funds Defensive Growth Fund | | 129 | | 1,349 | |
The Flex-funds Dynamic Growth Fund | | 774 | | 7,152 | |
The Flex-funds Muirfield Fund | | 1,913 | | 11,516 | |
The Flex-funds Quantex Fund | | 692 | | 12,677 | |
The Flex-funds Socially Responsible Utilities Fund | | 132 | | 3,450 | |
| | | | | |
Total Trustee Deferred Compensation (Cost $30,797) | | | | 38,180 | |
| | | | | |
| (a) | Cost for financial reporting purposes and federal income tax purposes are the same. Cost for federal income tax purposes differs from value by net unrealized appreciation (depreciation) of securities as follows: |
| | | | |
Unrealized appreciation | | $ | 6,834,483 | |
Unrealized depreciation | | | (546,921 | ) |
| | | | |
Net unrealized appreciation (depreciation) | | $ | 6,287,562 | |
| | | | |
ADR American Depositary Receipt
| # | Represents non-income producing securities. |
| * | Assets of affiliates to The Socially Responsible Utilities Fund held for the benefit of the Fund’s Trustees in connection with the Trustees Deferred Compensation Plan. |
The accompanying notes are an integral part of these financial statements.
Schedule of Investments
December 31, 2007
The U.S. Government Bond Fund
| | | | |
Security Description | | Principal
Amount ($)
or Shares | | Value ($) |
U.S. Government Obligations — 83.3% |
Fannie Mae, 3.875%, due 02/01/2008 | | 400,000 | | 399,765 |
Fannie Mae, 4.60%, due 06/05/2018 | | 1,000,000 | | 1,000,703 |
Federal Home Loan Bank,
5.00%, due 03/09/2012 | | 2,000,000 | | 2,084,832 |
Federal Home Loan Bank,
5.00%, due 03/14/2014 | | 2,000,000 | | 2,093,186 |
Federal Home Loan Bank,
5.375%, due 09/09/2016 | | 600,000 | | 640,191 |
Federal Home Loan Bank,
5.625%, due 06/09/2017 | | 2,000,000 | | 2,169,866 |
Federal Home Loan Bank,
4.625%, due 09/11/2020 | | 1,300,000 | | 1,290,738 |
Federal Home Loan Mortgage Corporation, 3.15%, due 12/16/2008 | | 386,000 | | 382,742 |
Federal Home Loan Mortgage Corporation, 4.375%, due 07/17/2015 | | 1,400,000 | | 1,412,600 |
| | | | |
Total U.S. Government Obligations
(Cost $11,106,538) | | | | 11,474,623 |
| | | | |
Repurchase Agreements — 15.7% |
Morgan Stanley DW, Inc., 4.56%, 01/02/2008, (Collateralized by $2,312,247 various Certificates of Deposit, Government Agencies, Agency Strips, Commercial Papers, Treasury Notes at 2.625% — 7.25%, due 01/07/2008 — 04/15/2030, value — $2,204,220) purchase date 12/31/2007 | | 2,161,000 | | 2,161,000 |
| | | | |
Total Repurchase Agreements
(Cost $2,161,000) | | | | 2,161,000 |
| | | | |
Total Investments — 99.0%
(Cost $13,267,538)(a) | | | | 13,635,623 |
| | | | |
Other Assets less Liabilities — 1.0% | | | | 132,972 |
| | | | |
Total Net Assets — 100.0% | | | | 13,768,595 |
| | | | |
Trustee Deferred Compensation* |
The Flex-funds Aggressive Growth Fund | | 173 | | 1,486 |
The Flex-funds Defensive Growth Fund | | 95 | | 994 |
The Flex-funds Dynamic Growth Fund | | 583 | | 5,387 |
The Flex-funds Muirfield Fund | | 1,432 | | 8,621 |
The Flex-funds Quantex Fund | | 521 | | 9,545 |
The Flex-funds Socially Responsible Utilities Fund | | 101 | | 2,640 |
| | | | |
Total Trustee Deferred Compensation
(Cost $23,288) | | | | 28,673 |
| | | | |
The U.S. Government Bond Fund
| (a) | Cost for financial reporting purposes and federal income tax purposes are the same. Cost for federal income tax purposes differs from value by net unrealized appreciation (depreciation) of securities as follows: |
| | | | |
Unrealized appreciation | | $ | 368,122 | |
Unrealized depreciation | | | (37 | ) |
| | | | |
Net unrealized appreciation (depreciation) | | $ | 368,085 | |
| | | | |
| * | Assets of affiliates to The U.S. Government Bond Fund held for the benefit of the Fund’s Trustees in connection with the Trustee Deferred Compensation Plan. |
The accompanying notes are an integral part of these financial statements.
Schedule of Investments
December 31, 2007
The Money Market Fund
| | | | | | | | | |
Security Description | | Coupon/
Yield | | | Maturity | | Principal
Amount ($)
or Shares | | Value ($) |
Certificates of Deposit — 2.3% | | | | |
Barclay’s Capital CD | | 5.40% | | | 01/14/08 | | 5,000,000 | | 5,000,000 |
| | | | | | | | | |
Total Certificates of Deposit
(Cost $5,000,000) | | | | | | | | | 5,000,000 |
| | | | | | | | | |
Commercial Paper — 33.9% | | | | |
Abbey National | | 4.67% | | | 02/05/08 | | 2,500,000 | | 2,488,650 |
ABN-AMRO NA | | 5.11% | | | 01/10/08 | | 3,500,000 | | 3,495,596 |
ABN-AMRO NA | | 4.95% | | | 01/15/08 | | 2,500,000 | | 2,495,188 |
CBA Delaware Finance | | 5.10% | | | 02/08/08 | | 1,000,000 | | 994,617 |
CBA Delaware Finance | | 4.94% | | | 02/21/08 | | 2,500,000 | | 2,482,522 |
Citigroup Funding | | 5.00% | | | 02/14/08 | | 2,500,000 | | 2,484,722 |
Dexia Delaware | | 4.85% | | | 03/19/08 | | 3,000,000 | | 2,968,475 |
GE Capital Corp | | 4.70% | | | 03/21/08 | | 2,500,000 | | 2,473,889 |
Goldman Sachs | | 5.25% | | | 01/07/08 | | 2,500,000 | | 2,497,812 |
Goldman Sachs | | 5.10% | | | 01/11/08 | | 2,500,000 | | 2,496,458 |
Goldman Sachs | | 4.75% | | | 02/08/08 | | 2,500,000 | | 2,487,465 |
ING Funding | | 4.74% | | | 01/25/08 | | 2,500,000 | | 2,492,100 |
ING Funding | | 4.67% | | | 03/25/08 | | 5,000,000 | | 4,945,517 |
J.P. Morgan Chase | | 5.07% | | | 01/03/08 | | 2,500,000 | | 2,499,296 |
J.P. Morgan Chase | | 5.00% | | | 03/03/08 | | 2,500,000 | | 2,478,472 |
J.P. Morgan Chase | | 4.95% | | | 03/24/08 | | 2,500,000 | | 2,471,469 |
Mitsubishi International | | 4.65% | | | 01/22/08 | | 3,555,000 | | 3,545,357 |
Prudential Financial | | 4.56% | | | 01/08/08 | | 2,500,000 | | 2,497,784 |
Societe Generale | | 5.08% | | | 01/15/08 | | 2,500,000 | | 2,495,061 |
Societe Generale | | 5.09% | | | 02/05/08 | | 2,500,000 | | 2,487,628 |
Societe Generale | | 4.88% | | | 02/19/08 | | 3,000,000 | | 2,980,073 |
Toyota Motor Credit | | 4.75% | | | 03/06/08 | | 2,500,000 | | 2,478,559 |
Toyota Motor Credit | | 4.85% | | | 04/04/08 | | 3,000,000 | | 2,962,009 |
UBS Finance Delaware | | 4.65% | | | 01/29/08 | | 2,500,000 | | 2,490,959 |
UBS Finance Delaware | | 5.31% | | | 02/19/08 | | 1,500,000 | | 1,489,159 |
UBS Finance Delaware | | 4.92% | | | 04/07/08 | | 2,500,000 | | 2,466,892 |
Walt Disney Company | | 4.60% | | | 02/15/08 | | 2,500,000 | | 2,485,625 |
Walt Disney Company | | 4.81% | | | 02/22/08 | | 2,500,000 | | 2,482,631 |
| | | | | | | | | |
Total Commercial Paper (Cost $73,113,984) | | | | | | | | | 73,113,984 |
| | | | | | | | | |
Corporate Obligations — 37.6% | | | | |
American Express | | 3.00% | | | 05/16/08 | | 3,300,000 | | 3,276,259 |
American General Finance | | 2.75% | | | 06/15/08 | | 985,000 | | 973,251 |
Aquarium Holdings Ky** | | 4.98% | * | | 01/03/08 | | 108,000 | | 108,000 |
Bank of America | | 3.25% | | | 08/15/08 | | 575,000 | | 570,341 |
Barclay’s Bank | | 4.99% | * | | 01/16/08 | | 3,640,000 | | 3,638,632 |
Bath Technologies** | | 5.11% | * | | 01/03/08 | | 1,070,000 | | 1,070,000 |
Bear Stearns Co., Inc. | | 4.00% | | | 01/31/08 | | 250,000 | | 249,698 |
Bear Stearns Co., Inc. | | 5.16% | * | | 01/29/08 | | 2,000,000 | | 2,000,763 |
Beaver Creek Enterprise** | | 5.06% | * | | 01/03/08 | | 1,685,000 | | 1,685,000 |
Cascade Plaza Project** | | 5.06% | * | | 01/03/08 | | 7,330,000 | | 7,330,000 |
CIT Group Inc. | | 4.00% | | | 05/08/08 | | 1,381,000 | | 1,374,216 |
Citigroup Global | | 5.19% | * | | 03/07/08 | | 2,025,000 | | 2,024,853 |
Credit Suisse First Boston | | 6.50% | | | 06/01/08 | | 750,000 | | 753,009 |
Deutsche Bank | | 4.40% | * | | 01/02/08 | | 4,000,000 | | 4,000,000 |
Don’s Launderers-Cleaners, Inc.** | | 4.91% | * | | 01/03/08 | | 900,000 | | 900,000 |
GE Capital Corp. | | 8.63% | | | 06/15/08 | | 2,000,000 | | 2,031,916 |
GE Capital Corp. | | 5.07% | * | | 01/24/08 | | 500,000 | | 499,568 |
The Money Market Fund
| | | | | | | | | |
Security Description | | Coupon/
Yield | | | Maturity | | Principal
Amount ($)
or Shares | | Value ($) |
Corporate Obligations — continued | | | | |
General Dynamics | | 3.00% | | | 05/15/08 | | 3,090,000 | | 3,063,758 |
Gordon Flesch Co. Project** | | 5.06% | * | | 01/03/08 | | 700,000 | | 700,000 |
HSBC Finance Corp. | | 4.13% | | | 03/11/08 | | 1,170,000 | | 1,168,153 |
HSBC Finance Corp. | | 5.04% | * | | 02/09/08 | | 3,110,000 | | 3,111,819 |
HSBC Finance Corp. | | 4.98% | * | | 02/21/08 | | 500,000 | | 500,056 |
International Lease | | 4.50% | | | 05/01/08 | | 3,785,000 | | 3,773,684 |
International Lease | | 4.63% | | | 06/02/08 | | 1,000,000 | | 996,889 |
Isaac Tire, Inc.** | | 4.91% | * | | 01/03/08 | | 725,000 | | 725,000 |
J2T LLC** | | 5.11% | * | | 01/03/08 | | 40,000 | | 40,000 |
John Deere Capital Corp. | | 3.90% | | | 01/15/08 | | 450,000 | | 449,772 |
Keiser Street, Inc.** | | 5.06% | * | | 01/03/08 | | 1,385,000 | | 1,385,000 |
Lehman Brothers Holdings | | 4.00% | | | 01/22/08 | | 950,000 | | 949,227 |
Lehman Brothers Holdings | | 5.26% | * | | 01/03/08 | | 200,000 | | 200,022 |
Lehman Brothers Holdings | | 5.09% | * | | 02/28/08 | | 1,760,000 | | 1,760,310 |
Martin Wheel Co, Inc.** | | 5.16% | * | | 01/03/08 | | 2,110,000 | | 2,110,000 |
MBNA Corp. | | 5.31% | * | | 02/05/08 | | 2,000,000 | | 2,000,583 |
Merrill Lynch | | 4.83% | | | 10/27/08 | | 2,500,000 | | 2,497,395 |
MetLife Insurance Co.*** | | 5.26% | * | | 01/02/08 | | 7,500,000 | | 7,500,000 |
O.K.I. Supply Co.** | | 4.91% | * | | 01/03/08 | | 735,000 | | 735,000 |
Pro Tire, Inc.** | | 4.91% | * | | 01/03/08 | | 870,000 | | 870,000 |
Prudential Financial | | 3.75% | | | 05/01/08 | | 3,105,000 | | 3,088,209 |
Seariver Maritime, Inc. | | 4.68% | * | | 01/02/08 | | 2,400,000 | | 2,400,000 |
Springside Corp Exchange Partners LLC** | | 5.06% | * | | 01/03/08 | | 2,000,000 | | 2,000,000 |
Taylor Brothers Properties LLC** | | 4.91% | * | | 01/03/08 | | 1,055,000 | | 1,055,000 |
US Bank, N.A. | | 5.20% | * | | 01/03/08 | | 1,500,000 | | 1,499,998 |
Wachovia Bank | | 5.20% | * | | 01/03/08 | | 1,200,000 | | 1,198,613 |
White Castle Project** | | 5.06% | * | | 01/03/08 | | 3,000,000 | | 3,000,000 |
| | | | | | | | | |
Total Corporate Obligations (Cost $81,263,994) | | | | | | | | | 81,263,994 |
| | | | | | | | | |
U.S. Government Agency Obligations — 11.6% | | |
Federal Farm Credit Bank | | 4.20% | | | 01/07/08 | | 750,000 | | 749,867 |
Federal Home Loan Bank | | 5.13% | | | 01/17/08 | | 5,000,000 | | 5,000,000 |
Federal Home Loan Bank | | 4.30% | | | 01/30/08 | | 500,000 | | 499,616 |
Federal Home Loan Bank | | 5.00% | | | 06/10/08 | | 200,000 | | 199,876 |
Federal Home Loan Bank | | 4.50% | | | 11/07/08 | | 5,000,000 | | 5,000,000 |
Federal Home Loan Bank | | 4.63% | | | 11/19/08 | | 5,000,000 | | 5,000,000 |
Federal Home Loan Bank | | 4.63% | | | 12/04/08 | | 3,000,000 | | 3,000,000 |
Federal Home Loan Bank | | 5.07% | * | | 01/12/08 | | 5,000,000 | | 5,000,000 |
Federal Home Loan Mortgage Corp. | | 5.01% | | | 07/25/08 | | 500,000 | | 500,000 |
| | | | | | | | | |
Total U.S. Government Agency Obligations (Cost $24,949,359) | | | | 24,949,359 |
| | | | | | | | | |
Schedule of Investments
December 31, 2007
The Money Market Fund
| | | | | | | | |
Security Description | | Coupon/
Yield | | Maturity | | Principal
Amount ($)
or Shares | | Value ($) |
Repurchase Agreements — 14.2% | | | | |
Morgan Stanley DW, Inc., 4.56%, 01/02/2008, (Collateralized by $32,806,943 various Certificates of Deposit, Government Agencies, Agency Strips, Commercial Papers, Treasury Notes at 2.625% — 7.25%, due 01/07/2008 — 04/15/2030, value — $31,274,220) purchase date 12/31/2007 | | | | 30,661,000 | | 30,661,000 |
Total Repurchase Agreements (Cost $30,661,000) | | | | | | 30,661,000 |
| | | | | | | | |
Total Investments — 99.6% (Cost $214,988,337) (a) | | | | | | 214,988,337 |
| | | | | | | | |
Other Assets less Liabilities — 0.4% | | | | 824,114 |
| | | | | | | | |
Total Net Assets — 100.0% | | | | | | 215,812,451 |
| | | | | | | | |
Trustee Deferred Compensation**** | | | | |
The Flex-funds Aggressive Growth Fund | | | | | | 173 | | 1,486 |
The Flex-funds Defensive Growth Fund | | | | | | 95 | | 994 |
The Flex-funds Dynamic Growth Fund | | | | | | 942 | | 8,704 |
The Flex-funds Muirfield Fund | | | | | | 2,262 | | 13,617 |
The Flex-funds Quantex Fund | | | | | | 786 | | 14,400 |
The Flex-funds Socially Responsible Utilities Fund | | | | | | 169 | | 4,418 |
| | | | | | | | |
Total Trustee Deferred Compensation
(Cost $38,268) | | | | | | 43,619 |
| | | | | | | | |
| (a) | Cost for federal income tax and financial reporting purposes are the same. |
| * | Variable rate security. Securities payable on demand at par including accrued interest (usually within seven days notice) and unconditionally secured as to principal and interest by letters of credit or other credit support agreements from major banks. The interest rates are adjustable and are based on bank prime rates or other interest rate adjustment indices. The rate shown represents the rate in effect at December 31, 2007. The maturity date shown reflects next rate change date. |
The Money Market Fund
| ** | Represents a restricted security purchased under Rule 144A, which is exempt from registration under the Securities Act of 1933, as amended. Security is restricted as to resale to institutional investors, but has been deemed liquid in accordance with guidelines approved by the Board of Trustees. As of December 31, 2007, securities restricted as to resale to institutional investors represented 11.0% of Total Investments. |
| *** | Illiquid security. The sale or disposition of such security would not be possible in the ordinary course of business within seven days at approximately the value at which the Fund has valued the security. As of December 31, 2007, illiquid securities represented 3.5% of Total Investments. |
| **** | Assets of affiliates to The Money Market Fund held for the benefit of the Fund’s Trustees in connection with the Trustee Deferred Compensation Plan. |
The accompanying notes are an integral part of these financial statements.
[THIS PAGE INTENTIONALLY LEFT BLANK]
Statements of Assets & Liabilities
December 31, 2007
| | | | | | | | |
| | | The
Muirfield
Fund | | | The Dynamic
Growth Fund | |
Assets | | | | | | | | |
Investments, at value* | | $ | 47,537,359 | | | $ | 17,527,888 | |
Repurchase agreements, at value* | | | 2,969,000 | | | | 1,509,000 | |
Trustee deferred compensation investments, at value | | | 101,254 | | | | 28,370 | |
Cash | | | 780 | | | | 437 | |
Receivable for securities sold | | | — | | | | — | |
Receivable for capital stock issued | | | 251,443 | | | | 131,925 | |
Receivable from investment advisor | | | — | | | | — | |
Interest and dividend receivable | | | 5,348 | | | | 1,278 | |
Prepaid expenses/other assets | | | 33,794 | | | | 13,919 | |
Total Assets | | | 50,898,978 | | | | 19,212,817 | |
| | |
Liabilities | | | | | | | | |
Payable for securities purchased | | | — | | | | — | |
Payable for Trustee Deferred Compensation Plan | | | 101,254 | | | | 28,370 | |
Payable for net variation margin on futures contracts | | | 20,750 | | | | 10,375 | |
Payable for capital stock redeemed | | | 308,599 | | | | 22,605 | |
Dividends payable | | | 11,337 | | | | 669 | |
Dividends payable — The Money Market Fund — Retail Class | | | | | | | | |
Dividends payable — The Money Market Fund — Institutional Class | | | | | | | | |
Payable to investment advisor | | | 41,874 | | | | 11,778 | |
Accrued distribution plan (12b-1) and administrative service plan fees | | | 5,042 | | | | 2,012 | |
Accrued transfer agent, fund accounting, CCO, and administrative fees | | | 12,941 | | | | 5,851 | |
Accrued trustee fees | | | 3,643 | | | | 1,775 | |
Other accrued liabilities | | | 19,447 | | | | 14,733 | |
Total Liabilities | | | 524,887 | | | | 98,168 | |
| | | | | | | | | |
Net Assets | | $ | 50,374,091 | | | $ | 19,114,649 | |
| | |
Net Assets | | | | | | | | |
Capital | | $ | 51,702,286 | | | $ | 18,971,134 | |
Accumulated undistributed (distributions in excess of) net investment income | | | — | | | | — | |
Accumulated undistributed net realized gain (loss) from investments and futures contracts | | | (394,060 | ) | | | 575,456 | |
Net unrealized appreciation (depreciation) of investments and futures contracts | | | (934,135 | ) | | | (431,941 | ) |
Total Net Assets | | $ | 50,374,091 | | | $ | 19,114,649 | |
| | |
Net Assets | | | | | | | | |
The Money Market Fund — Retail Class | | | | | | | | |
The Money Market Fund — Institutional Class | | | | | | | | |
Total Net Assets | | | | | | | | |
| | |
Capital Stock Outstanding (indefinite number of shares authorized,
$0.10 par value) | | | 8,368,863 | | | | 2,069,421 | |
The Money Market Fund — Retail Class | | | | | | | | |
The Money Market Fund — Institutional Class | | | | | | | | |
Total Capital Stock Outstanding | | | | | | | | |
| | |
Net Asset Value, Offering and Redemption Price Per Share | | $ | 6.02 | | | $ | 9.24 | |
The Money Market Fund — Retail Class | | | | | | | | |
The Money Market Fund — Institutional Class | | | | | | | | |
* Investments and repurchase agreements, at cost | | $ | 51,446,794 | | | $ | 19,464,066 | |
The accompanying notes are an integral part of these financial statements.
| | | | | | | | | | | | | | | | | | | | | | | | | |
The Aggressive
Growth Fund | | | The Defensive
Growth Fund | | | The Focused
Growth Fund | | | The
Quantex
Fund | | | The Socially
Responsible
Utilities Fund | | | The U.S.
Government
Bond Fund | | | The Money
Market Fund |
| | | | | | | | | | | | | | | | | | | | | | | | | |
| $ | 25,708,307 | | | $ | 65,866,308 | | | $ | 56,340,278 | | | $ | 14,327,374 | | | $ | 26,862,654 | | | $ | 11,474,623 | | | $ | 184,327,337 |
| | 3,179,000 | | | | 9,267,000 | | | | 7,097,000 | | | | 3,833,000 | | | | 489,000 | | | | 2,161,000 | | | | 30,661,000 |
| | 25,241 | | | | 12,769 | | | | 11,615 | | | | 49,915 | | | | 38,180 | | | | 28,673 | | | | 43,619 |
| | 631 | | | | 430 | | | | 144 | | | | 597 | | | | 594 | | | | 477 | | | | 609 |
| | 2,424,173 | | | | — | | | | — | | | | — | | | | — | | | | — | | | | — |
| | 29,807 | | | | 99,071 | | | | 80,924 | | | | 170,434 | | | | 17,737 | | | | 18,911 | | | | — |
| | — | | | | — | | | | — | | | | — | | | | — | | | | 3,871 | | | | 11,712 |
| | 229,843 | | | | 491,908 | | | | 432,880 | | | | 21,172 | | | | 24,481 | | | | 134,526 | | | | 953,581 |
| | 17,175 | | | | 19,765 | | | | 19,322 | | | | 10,260 | | | | 11,584 | | | | 10,576 | | | | 31,951 |
| | 31,614,177 | | | | 75,757,251 | | | | 63,982,163 | | | | 18,412,752 | | | | 27,444,230 | | | | 13,832,657 | | | | 216,029,809 |
| | | | | | |
| | | | | | | | | | | | | | | | | | | | | | | | | |
| | 2,528,282 | | | | 1,237,190 | | | | — | | | | — | | | | — | | | | — | | | | — |
| | 25,241 | | | | 12,769 | | | | 11,615 | | | | 49,915 | | | | 38,180 | | | | 28,673 | | | | 43,619 |
| | 18,675 | | | | 53,980 | | | | 43,575 | | | | 16,200 | | | | — | | | | — | | | | — |
| | 133,333 | | | | — | | | | — | | | | 855,181 | | | | 11,738 | | | | 1,000 | | | | — |
| | — | | | | — | | | | — | | | | 324 | | | | 1,282 | | | | 1,883 | | | | |
| | | | | | | | | | | | | | | | | | | | | | | | | 8,313 |
| | | | | | | | | | | | | | | | | | | | | | | | | 19,738 |
| | 18,187 | | | | 46,035 | | | | 39,754 | | | | 11,454 | | | | 22,439 | | | | 4,326 | | | | 34,488 |
| | 22,708 | | | | 77,987 | | | | 65,912 | | | | 5,635 | | | | 9,363 | | | | 9,260 | | | | 30,197 |
| | 8,584 | | | | 12,863 | | | | 11,613 | | | | 5,715 | | | | 8,006 | | | | 3,643 | | | | 30,651 |
| | 2,424 | | | | 5,050 | | | | 4,496 | | | | 1,838 | | | | 2,293 | | | | 1,511 | | | | 1,625 |
| | 16,026 | | | | 20,930 | | | | 19,712 | | | | 16,103 | | | | 18,412 | | | | 13,766 | | | | 48,727 |
| | 2,773,460 | | | | 1,466,804 | | | | 196,677 | | | | 962,365 | | | | 111,713 | | | | 64,062 | | | | 217,358 |
| | | | | | | | | | | | | | | | | | | | | | | | | | |
| $ | 28,840,717 | | | $ | 74,290,447 | | | $ | 63,785,486 | | | $ | 17,450,387 | | | $ | 27,332,517 | | | $ | 13,768,595 | | | $ | 215,812,451 |
| | | | | | |
| | | | | | | | | | | | | | | | | | | | | | | | | |
| $ | 31,768,292 | | | $ | 73,630,796 | | | $ | 63,195,175 | | | $ | 19,578,898 | | | $ | 22,448,726 | | | $ | 14,437,011 | | | $ | 215,812,451 |
| | — | | | | — | | | | — | | | | — | | | | — | | | | 2,010 | | | | — |
| (3,274,220 | ) | | | (221,742 | ) | | | (224,758 | ) | | | (1,478,430 | ) | | | (1,403,771 | ) | | | (1,038,511 | ) | | | — |
| | 346,645 | | | | 881,393 | | | | 815,069 | | | | (650,081 | ) | | | 6,287,562 | | | | 368,085 | | | | — |
| $ | 28,840,717 | | | $ | 74,290,447 | | | $ | 63,785,486 | | | $ | 17,450,387 | | | $ | 27,332,517 | | | $ | 13,768,595 | | | $ | 215,812,451 |
| | | | | | |
| | | | | | | | | | | | | | | | | | | | | | | | | |
| | | | | | | | | | | | | | | | | | | | | | | | $ | 195,479,217 |
| | | | | | | | | | | | | | | | | | | | | | | | | | 20,333,234 |
| | | | | | | | | | | | | | | | | | | | | | | | | $ | 215,812,451 |
| | | | | | |
| 3,359,309 | | | | 7,103,505 | | | | 6,027,542 | | | | 952,719 | | | | 1,045,691 | | | | 669,089 | | | | |
| | | | | | | | | | | | | | | | | | | | | | | | | 195,479,217 |
| | | | | | | | | | | | | | | | | | | | | | | | | | 20,333,234 |
| | | | | | | | | | | | | | | | | | | | | | | | | | 215,812,451 |
| | | | | | |
| $ | 8.59 | | | $ | 10.46 | | | $ | 10.58 | | | $ | 18.32 | | | $ | 26.14 | | | $ | 20.58 | | | | |
| | | | | | | | | | | | | | | | | | | | | | | | $ | 1.00 |
| | | | | | | | | | | | | | | | | | | | | | | | | $ | 1.00 |
| $ | 28,527,649 | | | $ | 74,260,790 | | | $ | 62,616,584 | | | $ | 18,804,380 | | | $ | 21,064,092 | | | $ | 13,267,538 | | | $ | 214,988,337 |
Statements of Operations
For the Year Ended December 31, 2007
| | | | | | | | |
| | | The
Muirfield
Fund | | | The Dynamic
Growth Fund | |
Investment Income | | | | | | | | |
Interest | | $ | 157,035 | | | $ | 72,173 | |
Dividends | | | 2,101,717 | | | | 752,670 | |
Total Investment Income | | | 2,258,752 | | | | 824,843 | |
| | |
Fund Expenses | | | | | | | | |
Investment advisor | | | 509,993 | | | | 145,214 | |
Transfer agent | | | 61,668 | | | | 23,234 | |
Transfer agent — The Money Market Fund — Retail Class | | | | | | | | |
Transfer agent — The Money Market Fund — Institutional Class | | | | | | | | |
Fund accounting | | | 39,278 | | | | 24,362 | |
Administrative | | | 51,078 | | | | 19,362 | |
Trustee | | | 17,110 | | | | 8,799 | |
Audit | | | 9,125 | | | | 9,167 | |
Legal | | | 8,325 | | | | 8,325 | |
Custody | | | 8,491 | | | | 4,309 | |
Printing | | | 11,224 | | | | 4,220 | |
Distribution plan (12b-1) | | | 102,757 | | | | 48,351 | |
Distribution plan (12b-1) — The Money Market Fund — Retail Class | | | | | | | | |
Distribution plan (12b-1) — The Money Market Fund — Institutional Class | | | | | | | | |
Administrative service plan | | | 102,858 | | | | 38,653 | |
Postage | | | 6,759 | | | | 2,244 | |
Registration and filing | | | 15,850 | | | | 8,407 | |
Insurance | | | 4,139 | | | | 1,356 | |
Chief Compliance Officer | | | 5,228 | | | | 5,228 | |
Other | | | 13,293 | | | | 8,888 | |
Total Expenses Before Reductions | | | 967,176 | | | | 360,119 | |
| | |
Expenses reimbursed/waived by investment advisor | | | — | | | | — | |
Expenses paid indirectly | | | (74,388 | ) | | | (27,437 | ) |
Distribution plan (12b-1) expenses waived | | | (82,226 | ) | | | (40,662 | ) |
Administrative service plan expenses waived | | | (99,186 | ) | | | (37,177 | ) |
Transfer agent expenses waived | | | — | | | | — | |
Net Expenses | | | 711,376 | | | | 254,843 | |
| | | | | | | | | |
Net Investment Income | | | 1,547,376 | | | | 570,000 | |
| | |
Realized and Unrealized Gain (Loss) from Investments | | | | | | | | |
Net realized gains from investments | | | 4,716,918 | | | | 1,816,824 | |
Net realized gains (losses) from futures contracts | | | 15,427 | | | | 11,377 | |
Distributions of long term realized gains by other investment companies | | | 1,289,929 | | | | 466,880 | |
Net Realized Gains (Losses) from Investment Transactions, Futures Contracts,
and Distributions of Long Term Realized Gains by Other Investment Companies | | | 6,022,274 | | | | 2,295,081 | |
| | |
Net change in unrealized appreciation (depreciation) of investments
and futures contracts | | | (4,099,302 | ) | | | (1,567,528 | ) |
Net Realized and Unrealized Gain (Loss) from Investments | | | 1,922,972 | | | | 727,553 | |
| | | | | | | | | |
Net Change in Net Assets Resulting from Operations | | $ | 3,470,348 | | | $ | 1,297,553 | |
The accompanying notes are an integral part of these financial statements.
| | | | | | | | | | | | | | | | | | | | | | | | | | |
The
Aggressive
Growth Fund | | | The
Defensive
Growth Fund | | | The Focused
Growth Fund | | | The Quantex
Fund | | | The Socially
Responsible Utilities
Fund | | | The U.S.
Government
Bond Fund | | | The Money
Market Fund | |
| | | | | | | | | | | | | | | | | | | | | | | | | | |
| $ | 111,174 | | | $ | 345,215 | | | $ | 295,007 | | | $ | 168,442 | | | $ | 36,912 | | | $ | 488,862 | | | | 10,737,992 | |
| | 471,821 | | | | 1,088,599 | | | | 948,966 | | | | 359,089 | | | | 603,983 | | | | — | | | | — | |
| | 582,995 | | | | 1,433,814 | | | | 1,243,973 | | | | 527,531 | | | | 640,895 | | | | 488,862 | | | | 10,737,992 | |
| | | | | | |
| | | | | | | | | | | | | | | | | | | | | | | | | | |
| | 199,127 | | | | 458,265 | | | | 400,743 | | | | 227,402 | | | | 260,164 | | | | 39,664 | | | | 655,173 | |
| | 31,860 | | | | 73,323 | | | | 64,119 | | | | 27,288 | | | | 31,220 | | | | 7,933 | | | | | |
| | | | | | | | | | | | | | | | | | | �� | | | | | | 143,789 | |
| | | | | | | | | | | | | | | | | | | | | | | | | 17,883 | |
| | 31,548 | | | | 41,220 | | | | 39,686 | | | | 27,741 | | | | 31,016 | | | | 14,052 | | | | 57,207 | |
| | 26,550 | | | | 58,748 | | | | 52,222 | | | | 22,741 | | | | 26,016 | | | | 9,916 | | | | 171,655 | |
| | 11,074 | | | | 20,916 | | | | 18,875 | | | | 9,511 | | | | 10,799 | | | | 7,457 | | | | 8,953 | |
| | 9,167 | | | | 9,099 | | | | 9,067 | | | | 9,067 | | | | 9,149 | | | | 9,099 | | | | 10,188 | |
| | 8,325 | | | | 8,325 | | | | 8,325 | | | | 8,422 | | | | 8,253 | | | | 8,422 | | | | 8,855 | |
| | 4,483 | | | | 10,190 | | | | 9,019 | | | | 8,627 | | | | 4,212 | | | | 3,000 | | | | 16,357 | |
| | 5,969 | | | | 13,675 | | | | 11,945 | | | | 4,789 | | | | 5,656 | | | | 2,337 | | | | 52,410 | |
| | 66,450 | | | | 152,928 | | | | 133,812 | | | | 45,444 | | | | 65,032 | | | | 19,796 | | | | | |
| | | | | | | | | | | | | | | | | | | | | | | | | 358,853 | |
| | | | | | | | | | | | | | | | | | | | | | | | | 6,788 | |
| | 53,129 | | | | 122,204 | | | | 106,865 | | | | 45,408 | | | | 51,963 | | | | 19,817 | | | | — | |
| | 2,833 | | | | 5,597 | | | | 4,909 | | | | 3,535 | | | | 7,676 | | | | 1,508 | | | | 31,435 | |
| | 18,346 | | | | 21,882 | | | | 21,436 | | | | 17,891 | | | | 15,491 | | | | 14,756 | | | | 41,122 | |
| | 2,124 | | | | 3,929 | | | | 3,531 | | | | 1,864 | | | | 2,368 | | | | 643 | | | | 22,010 | |
| | 5,228 | | | | 5,215 | | | | 5,215 | | | | 5,228 | | | | 5,778 | | | | 5,228 | | | | 5,260 | |
| | 8,595 | | | | 7,575 | | | | 7,445 | | | | 9,449 | | | | 11,288 | | | | 7,311 | | | | 56,591 | |
| | 484,808 | | | | 1,013,091 | | | | 897,214 | | | | 474,407 | | | | 546,081 | | | | 170,939 | | | | 1,664,529 | |
| | | | | | |
| | — | | | | — | | | | — | | | | (56,849 | ) | | | — | | | | (56,039 | ) | | | (449,164 | ) |
| | — | | | | — | | | | — | | | | — | | | | — | | | | — | | | | — | |
| | (10,355 | ) | | | (18,942 | ) | | | (16,564 | ) | | | (30,016 | ) | | | (18,993 | ) | | | (5,652 | ) | | | (237,681 | ) |
| | (22,834 | ) | | | — | | | | — | | | | (33,882 | ) | | | (33,824 | ) | | | (7,735 | ) | | | — | |
| | — | | | | (42,772 | ) | | | (37,403 | ) | | | — | | | | — | | | | (1,613 | ) | | | (38,477 | ) |
| | 451,619 | | | | 951,377 | | | | 843,247 | | | | 353,660 | | | | 493,264 | | | | 99,900 | | | | 939,207 | |
| | | | | | | | | | | | | | | | | | | | | | | | | | | |
| | 131,376 | | | | 482,437 | | | | 400,726 | | | | 173,871 | | | | 147,631 | | | | 388,962 | | | | 9,798,785 | |
| | | | | | |
| | | | | | | | | | | | | | | | | | | | | | | | | | |
| | 2,299,164 | | | | 3,529,746 | | | | 3,504,860 | | | | 2,077,456 | | | | 3,807,509 | | | | 78,163 | | | | | |
| | 78,479 | | | | 87,859 | | | | 121,757 | | | | (15,786 | ) | | | — | | | | — | | | | | |
| | — | | | | — | | | | — | | | | — | | | | — | | | | — | | | | | |
| 2,377,643 | | | | 3,617,605 | | | | 3,626,617 | | | | 2,061,670 | | | | 3,807,509 | | | | 78,163 | | | | | |
| | | | | | |
| (1,158,622 | ) | | | (1,651,889 | ) | | | (1,944,304 | ) | | | (3,891,736 | ) | | | 448,200 | | | | 331,609 | | | | | |
| | 1,219,021 | | | | 1,965,716 | | | | 1,682,313 | | | | (1,830,066 | ) | | | 4,255,709 | | | | 409,772 | | | | | |
| | | | | | | | | | | | | | | | | | | | | | | | | | | |
| $ | 1,350,397 | | | $ | 2,448,153 | | | $ | 2,083,039 | | | ($ | 1,656,195 | ) | | $ | 4,403,340 | | | $ | 798,734 | | | $ | 9,798,785 | |
Statements of Changes in Net Assets
For the Years Ended December 31,
| | | | | | | | | | | | | | | | |
| | | The Muirfield Fund | | | The Dynamic Growth Fund | |
| | | 2007 | | | 2006 | | | 2007 | | | 2006 | |
Operations | | | | | | | | | | | | | | | | |
Net investment income (loss) | | $ | 1,547,376 | | | $ | 374,043 | | | $ | 570,000 | | | $ | 92,486 | |
Net realized gain (loss) from investments, futures contracts and distributions by other investment companies | | | 6,022,274 | | | | 1,536,045 | | | | 2,295,081 | | | | 1,914,777 | |
Net change in unrealized appreciation (depreciation) of investments and futures contracts | | | (4,099,302 | ) | | | 6,082,290 | | | | (1,567,528 | ) | | | 1,617,074 | |
Net change in net assets resulting from operations | | | 3,470,348 | | | | 7,992,378 | | | | 1,297,553 | | | | 3,624,337 | |
| | | | |
Distributions to Shareholders | | | | | | | | | | | | | | | | |
From net investment income | | | (1,605,522 | ) | | | (374,043 | ) | | | (595,949 | ) | | | (92,486 | ) |
From net realized gain from investments, futures contracts, options contracts, and distributions by other investment companies | | | — | | | | — | | | | (1,280,280 | ) | | | — | |
Net change in net assets resulting from distributions | | | (1,605,522 | ) | | | (374,043 | ) | | | (1,876,229 | ) | | | (92,486 | ) |
| | | | |
Capital Transactions | | | | | | | | | | | | | | | | |
Issued | | | 3,848,671 | | | | 19,627,011 | | | | 2,106,628 | | | | 7,144,136 | |
Reinvested | | | 1,594,194 | | | | 371,082 | | | | 1,873,772 | | | | 92,487 | |
Redeemed | | | (10,160,626 | ) | | | (52,570,518 | ) | | | (5,853,044 | ) | | | (21,145,489 | ) |
Net change in net assets resulting from capital transactions | | | (4,717,761 | ) | | | (32,572,425 | ) | | | (1,872,644 | ) | | | (13,908,866 | ) |
| | | | | | | | | | | | | | | | | |
Total Change in Net Assets | | | (2,852,935 | ) | | | (24,954,090 | ) | | | (2,451,320 | ) | | | (10,377,015 | ) |
Net Assets — Beginning of Period | | | 53,227,026 | | | | 78,181,116 | | | | 21,565,969 | | | | 31,942,984 | |
Net Assets —End of Period | | $ | 50,374,091 | | | $ | 53,227,026 | | | $ | 19,114,649 | | | $ | 21,565,969 | |
Accumulated undistributed (distributions in excess of) net investment income | | $ | — | | | $ | 436 | | | $ | — | | | $ | — | |
| | | | |
Share Transactions | | | | | | | | | | | | | | | | |
Issued | | | 636,390 | | | | 3,627,119 | | | | 212,451 | | | | 800,334 | |
Reinvested | | | 264,816 | | | | 63,870 | | | | 200,434 | | | | 9,674 | |
Redeemed | | | (1,687,261 | ) | | | (9,708,084 | ) | | | (598,981 | ) | | | (2,413,233 | ) |
Net change in shares | | | (786,055 | ) | | | (6,017,095 | ) | | | (186,096 | ) | | | (1,603,225 | ) |
| * | Commenced Operations January 31, 2006 |
The accompanying notes are an integral part of these financial statements.
| | | | | | | | | | | | | | | | | | | | | | |
| The Aggressive Growth Fund | | | The Defensive Growth Fund | | | The Focused Growth Fund | |
| 2007 | | | 2006 | | | 2007 | | | 2006* | | | 2007 | | | 2006* | |
| | | | | | | | | | | | | | | | | | | | | | |
| $ | 131,376 | | | $ | 88,397 | | | $ | 482,437 | | | $ | 295,633 | | | $ | 400,726 | | | $ | 207,143 | |
|
2,377,643 |
| | | 802,775 | | | | 3,617,605 | | | | (486,069 | ) | | | 3,626,617 | | | | (352,194 | ) |
| (1,158,622 | ) | | | 1,298,356 | | | | (1,651,889 | ) | | | 2,533,282 | | | | (1,944,304 | ) | | | 2,759,373 | |
| | 1,350,397 | | | | 2,189,528 | | | | 2,448,153 | | | | 2,342,846 | | | | 2,083,039 | | | | 2,614,322 | |
| | | | | |
| | | | | | | | | | | | | | | | | | | | | | |
| | (131,376 | ) | | | (88,397 | ) | | | (482,437 | ) | | | (295,633 | ) | | | (400,726 | ) | | | (207,143 | ) |
| — | | | | — | | | | (3,353,278 | ) | | | — | | | | (3,499,181 | ) | | | — | |
| | (131,376 | ) | | | (88,397 | ) | | | (3,835,715 | ) | | | (295,633 | ) | | | (3,899,907 | ) | | | (207,143 | ) |
| | | | | |
| | | | | | | | | | | | | | | | | | | | | | |
| | 12,049,990 | | | | 11,265,260 | | | | 34,599,984 | | | | 42,079,796 | | | | 30,283,775 | | | | 35,057,589 | |
| | 131,376 | | | | 87,562 | | | | 3,835,713 | | | | 295,634 | | | | 3,900,118 | | | | 207,140 | |
| | (6,114,035 | ) | | | (3,538,875 | ) | | | (5,246,462 | ) | | | (1,933,869 | ) | | | (5,115,025 | ) | | | (1,138,422 | ) |
|
6,067,331 |
| | | 7,813,947 | | | | 33,189,235 | | | | 40,441,561 | | | | 29,068,868 | | | | 34,126,307 | |
| | | | | | | | | | | | | | | | | | | | | | | |
| | 7,286,352 | | | | 9,915,078 | | | | 31,801,673 | | | | 42,488,774 | | | | 27,252,000 | | | | 36,533,486 | |
| | 21,554,365 | | | | 11,639,287 | | | | 42,488,774 | | | | | | | | 36,533,486 | | | | | |
| $ | 28,840,717 | | | $ | 21,554,365 | | | $ | 74,290,447 | | | $ | 42,488,774 | | | $ | 63,785,486 | | | $ | 36,533,486 | |
$ | — | | | $ | — | | | $ | — | | | $ | — | | | $ | — | | | $ | — | |
| | | | | |
| | | | | | | | | | | | | | | | | | | | | | |
| | 1,417,233 | | | | 1,486,767 | | | | 3,168,990 | | | | 4,211,363 | | | | 2,709,639 | | | | 3,499,231 | |
| | 15,294 | | | | 10,770 | | | | 366,328 | | | | 28,129 | | | | 368,262 | | | | 19,305 | |
| | (725,226 | ) | | | (464,646 | ) | | | (475,026 | ) | | | (196,279 | ) | | | (454,147 | ) | | | (114,748 | ) |
| | 707,301 | | | | 1,032,891 | | | | 3,060,292 | | | | 4,043,213 | | | | 2,623,754 | | | | 3,403,788 | |
Statements of Changes in Net Assets
For the Years Ended December 31,
| | | | | | | | |
| | |
The Quantex Fund | |
| | | 2007 | | | 2006 | |
Operations | | | | | | | | |
Net investment income (loss) | | $ | 173,871 | | | $ | 79,757 | |
Net realized gain (loss) from investments, futures contracts and distributions by other investment companies | | | 2,061,670 | | | | 1,249,449 | |
Net change in unrealized appreciation (depreciation) of investments and futures contracts | | | (3,891,736 | ) | | | 1,417,080 | |
Net change in net assets resulting from operations | | | (1,656,195 | ) | | | 2,746,286 | |
| | |
Distributions to Shareholders | | | | | | | | |
From net investment income | | | (173,871 | ) | | | (79,757 | ) |
From net realized gain from investments, futures contracts and distributions by other investment companies | | | — | | | | — | |
Net change in net assets resulting from distributions | | | (173,871 | ) | | | (79,757 | ) |
| | |
Distributions to Shareholders — The Money Market Fund | | | | | | | | |
From net investment income (Retail Class) | | | | | | | | |
From net investment income (Institutional Class) | | | | | | | | |
Net change in net assets resulting from distributions | | | | | | | | |
| | |
Capital Transactions | | | | | | | | |
Issued | | | 12,925,921 | | | | 3,868,932 | |
Reinvested | | | 173,206 | | | | 78,941 | |
Redeemed | | | (13,892,276 | ) | | | (3,655,243 | ) |
Net change in net assets resulting from capital transactions | | | (793,149 | ) | | | 292,630 | |
| | | | | | | | | |
Total Change in Net Assets | | | (2,623,215 | ) | | | 2,959,159 | |
| | |
Net Assets — Beginning of Period | | | 20,073,602 | | | | 17,114,443 | |
Net Assets — End of Period | | $ | 17,450,387 | | | $ | 20,073,602 | |
Accumulated undistributed (distributions in
excess of) net investment income | | $ | — | | | $ | — | |
| | |
Share Transactions | | | | | | | | |
Issued | | | 633,860 | | | | 206,066 | |
Reinvested | | | 8,768 | | | | 3,975 | |
Redeemed | | | (700,862 | ) | | | (200,266 | ) |
Net change in shares | | | (58,234 | ) | | | 9,775 | |
The accompanying notes are an integral part of these financial statements.
| | | | | | | | | | | | | | | | | | | | | | |
The Socially Responsible
Utilities Fund | | | The U.S. Government
Bond Fund | | | The Money
Market Fund | |
| 2007 | | | 2006 | | | 2007 | | | 2006 | | | 2007 | | | 2006 | |
| | | | | | | | | | | | | | | | | | | | | | |
| $ | 147,631 | | | $ | 169,419 | | | $ | 388,962 | | | $ | 196,016 | | | $ | 9,798,785 | | | $ | 7,867,928 | |
| | | | | |
| | 3,807,509 | | | | 1,617,271 | | | | 78,163 | | | | (64,418 | ) | | | — | | | | — | |
| | | | | |
| | 448,200 | | | | 1,955,298 | | | | 331,609 | | | | 62,649 | | | | — | | | | — | |
| | 4,403,340 | | | | 3,741,988 | | | | 798,734 | | | | 194,247 | | | | 9,798,785 | | | | 7,867,928 | |
| | | | | |
| | | | | | | | | | | | | | | | | | | | | | |
| | (147,631 | ) | | | (169,419 | ) | | | (542,472 | ) | | | (198,029 | ) | | | | | | | | |
| | | | | |
| | — | | | | — | | | | — | | | | — | | | | | | | | | |
| | (147,631 | ) | | | (169,419 | ) | | | (542,472 | ) | | | (198,029 | ) | | | | | | | | |
| | | | | |
| | | | | | | | | | | | | | | | | | | | | | |
| | | | | | | | | | | | | | | | | (8,686,515 | ) | | | (6,642,167 | ) |
| | | | | | | | | | | | | | | | | | (1,112,270 | ) | | | (1,225,761 | ) |
| | | | | | | | | | | | | | | | | | (9,798,785 | ) | | | (1,225,761 | ) |
| | | | | |
| | | | | | | | | | | | | | | | | | | | | | |
| | 7,190,576 | | | | 4,477,094 | | | | 11,723,184 | | | | 3,225,017 | | | | 229,384,675 | | | | 240,918,986 | |
| | 143,876 | | | | 166,370 | | | | 509,089 | | | | 178,780 | | | | 9,336,911 | | | | 7,284,810 | |
| | (8,226,493 | ) | | | (6,891,162 | ) | | | (5,837,854 | ) | | | (2,606,329 | ) | | | (206,667,713 | ) | | | (214,728,108 | ) |
| | (892,041 | ) | | | (2,247,698 | ) | | | 6,394,419 | | | | 797,468 | | | | 32,053,873 | | | | 33,475,688 | |
| | | | | | | | | | | | | | | | | | | | | | | |
| | 3,363,668 | | | | 1,324,871 | | | | 6,650,681 | | | | 793,686 | | | | 32,053,873 | | | | 33,475,688 | |
| | | | | |
| | 23,968,849 | | | | 22,643,978 | | | | 7,117,914 | | | | 6,324,228 | | | | 183,758,578 | | | | 150,282,890 | |
| $ | 27,332,517 | | | $ | 23,968,849 | | | $ | 13,768,595 | | | $ | 7,117,914 | | | $ | 215,812,451 | | | $ | 183,758,578 | |
| | | | | |
| $ | — | | | $ | — | | | $ | 2,010 | | | $ | 155,520 | | | $ | — | | | $ | — | |
| | | | | |
| | | | | | | | | | | | | | | | | | | | | | |
| | 295,788 | | | | 219,810 | | | | 581,998 | | | | 158,721 | | | | 229,384,675 | | | | 240,918,986 | |
| | 5,678 | | | | 8,186 | | | | 25,266 | | | | 8,871 | | | | 9,336,911 | | | | 7,284,810 | |
| | (334,197 | ) | | | (339,189 | ) | | | (288,752 | ) | | | (129,827 | ) | | | (206,667,713 | ) | | | (214,728,108 | ) |
| | (32,731 | ) | | | (111,193 | ) | | | 318,512 | | | | 37,765 | | | | 32,053,873 | | | | 33,475,688 | |
Financial Highlights
For a Share Outstanding Through Each Fiscal Year Ended December 31,
| | | | | | | | | | | | | | | | | | | |
| | | | | Income from Investment Operations | | Less Distributions | |
| | | Net Asset
Value,
Beginning
of Period | | Net
Investment
Income | | |
Net gains (losses) on
securities, futures, and
options (both realized
and unrealized) | | Total from
Investment
Operations | | From Net
Investment
Income | | | From Net
Capital
Gains | | | Total
Distributions | |
The Muirfield Fund (1)(2)(3)(4)(7) | |
2007 | | $ | 5.81 | | 0.18 | | | 0.23 | | 0.41 | | (0.20 | ) | | 0.00 | | | (0.20 | ) |
2006 | | $ | 5.15 | | 0.04 | | | 0.66 | | 0.70 | | (0.04 | ) | | 0.00 | | | (0.04 | ) |
2005 | | $ | 5.11 | | 0.07 | | | 0.04 | | 0.11 | | (0.07 | ) | | 0.00 | | | (0.07 | ) |
2004 | | $ | 4.79 | | 0.01 | | | 0.32 | | 0.33 | | (0.01 | ) | | 0.00 | | | (0.01 | ) |
2003 | | $ | 3.76 | | (0.04 | ) | | 1.07 | | 1.03 | | 0.00 | | | 0.00 | | | 0.00 | |
The Dynamic Growth Fund (1)(2)(3)(4)(7) | |
2007 | | $ | 9.56 | | 0.29 | | | 0.38 | | 0.67 | | (0.30 | ) | | (0.69 | ) | | (0.99 | ) |
2006 | | $ | 8.28 | | 0.04 | | | 1.28 | | 1.32 | | (0.04 | ) | | 0.00 | | | (0.04 | ) |
2005 | | $ | 7.94 | | 0.06 | | | 0.34 | | 0.40 | | (0.06 | ) | | 0.00 | | | (0.06 | ) |
2004 | | $ | 7.67 | | (0.04 | ) | | 0.31 | | 0.27 | | 0.00 | | | 0.00 | | | 0.00 | |
2003 | | $ | 5.58 | | (0.06 | ) | | 2.15 | | 2.09 | | 0.00 | | | 0.00 | | | 0.00 | |
The Aggressive Growth Fund (1)(2)(3)(4)(7) | |
2007 | | $ | 8.13 | | 0.04 | | | 0.46 | | 0.50 | | (0.04 | ) | | 0.00 | | | (0.04 | ) |
2006 | | $ | 7.19 | | 0.03 | | | 0.94 | | 0.97 | | (0.03 | ) | | 0.00 | | | (0.03 | ) |
2005 | | $ | 6.83 | | 0.02 | | | 0.36 | | 0.38 | | (0.02 | ) | | 0.00 | | | (0.02 | ) |
2004 | | $ | 6.65 | | (0.03 | ) | | 0.21 | | 0.18 | | 0.00 | | | 0.00 | | | 0.00 | |
2003 | | $ | 4.79 | | (0.05 | ) | | 1.91 | | 1.86 | | 0.00 | | | 0.00 | | | 0.00 | |
The Defensive Growth Fund (2)(4)(5)(6) | |
2007 | | $ | 10.51 | | 0.07 | | | 0.45 | | 0.52 | | (0.07 | ) | | (0.50 | ) | | (0.57 | ) |
2006* | | $ | 10.00 | | 0.07 | | | 0.51 | | 0.58 | | (0.07 | ) | | 0.00 | | | (0.07 | ) |
The Focused Growth Fund (2)(4)(5)(6) | |
2007 | | $ | 10.73 | | 0.08 | | | 0.46 | | 0.54 | | (0.07 | ) | | (0.62 | ) | | (0.69 | ) |
2006* | | $ | 10.00 | | 0.06 | | | 0.73 | | 0.79 | | (0.06 | ) | | 0.00 | | | (0.06 | ) |
| 1 | Ratio of net expenses to average net assets, ratio of net investment income (loss) to average net assets, and ratio of average net assets after reductions, excluding expenses paid indirectly, reflect reductions in corresponding portfolio, if applicable. |
| 2 | Ratio of net expenses to average net assets, ratio of net investment income (loss) to average net assets, ratio of average net assets after reductions, excluding expenses paid indirectly, and ratio of expenses to average net assets before reductions do not include impact of expenses of the underlying security holdings as represented in the schedule of investments. |
| 3 | During 2003, the Fund’s portfolio turnover rate for the period January 1 through April 13 is equivalent to the portfolio into which the fund invested. Beginning April 14 the Fund commenced calculating the portfolio turnover rate based on its own activities. Hence, the portfolio turnover rate represented for 2003 is a combination of these two periods. Subsequent to 2003 the portfolio turnover rate is specific to the Fund. |
The accompanying notes are integral part of these financial statements.
| | | | | | | | | | | | | | | | | | | | | | |
| | | | | | Ratios/Supplemental Data | |
Net Asset
Value,
End of
Period | | Total Return
(Assumes
Reinvestment
of Distributions) | | | Net Assets,
End of
Period
($000) | | Ratio of Net
Expenses to
Average Net
Assets | | | Ratio of Net
Investment
Income (Loss)
to Average
Net Assets | | | Ratio of Expenses to
Average Net Assets
after Reductions,
Excluding Expenses
Paid Indirectly | | | Ratio of Expenses
to Average Net
Assets Before
Reductions | | | Portfolio
Turnover
Rate | |
| | | | | | | | | | | | | | | | | | | | | | |
| $ | 6.02 | | 7.02 | % | | $ | 50,374 | | 1.38 | % | | 3.01 | % | | 1.52 | % | | 1.88 | % | | 144 | % |
| $ | 5.81 | | 13.62 | % | | $ | 53,227 | | 1.45 | % | | 0.65 | % | | 1.56 | % | | 1.85 | % | | 131 | % |
| $ | 5.15 | | 2.13 | % | | $ | 78,181 | | 1.42 | % | | 1.36 | % | | 1.53 | % | | 1.76 | % | | 145 | % |
| $ | 5.11 | | 6.80 | % | | $ | 69,656 | | 1.26 | % | | 0.12 | % | | 1.45 | % | | 1.70 | % | | 145 | % |
| $ | 4.79 | | 27.39 | % | | $ | 58,524 | | 1.39 | % | | (1.06 | %) | | 1.47 | % | | 1.60 | % | | 252 | % |
| | | | | | | | | | | | | | | | | | | | | | |
| $ | 9.24 | | 7.06 | % | | $ | 19,115 | | 1.32 | % | | 2.94 | % | | 1.46 | % | | 1.86 | % | | 150 | % |
| $ | 9.56 | | 15.96 | % | | $ | 21,566 | | 1.42 | % | | 0.42 | % | | 1.55 | % | | 1.86 | % | | 123 | % |
| $ | 8.28 | | 5.08 | % | | $ | 31,943 | | 1.41 | % | | 0.87 | % | | 1.58 | % | | 1.84 | % | | 202 | % |
| $ | 7.94 | | 3.52 | % | | $ | 24,862 | | 1.20 | % | | (0.48 | %) | | 1.41 | % | | 1.70 | % | | 174 | % |
| $ | 7.67 | | 37.46 | % | | $ | 21,024 | | 1.22 | % | | (0.84 | %) | | 1.27 | % | | 1.60 | % | | 250 | % |
| | | | | | | | | | | | | | | | | | | | | | |
| $ | 8.59 | | 6.14 | % | | $ | 28,841 | | 1.70 | % | | 0.49 | % | | 1.70 | % | | 1.83 | % | | 170 | % |
| $ | 8.13 | | 13.54 | % | | $ | 21,554 | | 1.80 | % | | 0.51 | % | | 1.81 | % | | 1.98 | % | | 200 | % |
| $ | 7.19 | | 5.62 | % | | $ | 11,639 | | 1.88 | % | | 0.35 | % | | 2.03 | % | | 2.30 | % | | 181 | % |
| $ | 6.83 | | 2.71 | % | | $ | 10,773 | | 1.64 | % | | (0.41 | %) | | 1.80 | % | | 2.07 | % | | 264 | % |
| $ | 6.65 | | 38.83 | % | | $ | 9,122 | | 1.39 | % | | (0.85 | %) | | 1.44 | % | | 1.99 | % | | 255 | % |
| | | | | | | | | | | | | | | | | | | | | | |
| $ | 10.46 | | 5.03 | % | | $ | 74,290 | | 1.56 | % | | 0.79 | % | | 1.56 | % | | 1.66 | % | | 137 | % |
| $ | 10.51 | | 5.84 | % | | $ | 42,489 | | 1.72 | % | | 1.20 | % | | 1.72 | % | | 1.81 | % | | 105 | % |
| | | | | | | | | | | | | | | | | | | | | | |
| $ | 10.58 | | 5.08 | % | | $ | 63,785 | | 1.58 | % | | 0.75 | % | | 1.58 | % | | 1.68 | % | | 134 | % |
| $ | 10.73 | | 7.91 | % | | $ | 36,533 | | 1.75 | % | | 0.94 | % | | 1.75 | % | | 1.84 | % | | 92 | % |
| 4 | Recognition of net investment income by the Fund is affected by the timing of the declaration of dividends by the underlying investment companies in which the Fund invests. |
| 5 | Total return and portfolio turnover rate are not annualized for periods of less than one full year. |
| 6 | Ratio of net expenses to average net assets, ratio of net investment income (loss) to average net assets, ratio of average net assets after reductions, excluding expenses paid indirectly, and ratio of expenses to average net assets after before reductions are annualized for periods of less than one full year. |
| 7 | In 2005, the advisor voluntarily reimbursed the Fund for a realized investment loss, which had no impact to total return. |
| * | Commenced Operations January 31, 2006 |
| ** | Commenced Operations on December 28, 2004 |
| *** | Actual amounts were less than one-tenth of a cent |
Financial Highlights
For a Share Outstanding Through Each Fiscal Year Ended December 31,
| | | | | | | | | | | | | | | | | | | | | |
| | | | | Income from Investment Operations | | | Less Distributions | |
| | | Net Asset
Value,
Beginning
of Period | | Net
Investment
Income | | |
Net gains (losses) on
securities, futures, and
options (both realized
and unrealized) | | | Total from
Investment
Operations | | | From Net
Investment
Income | | | From Net
Capital
Gains | | | Total
Distributions | |
The Quantex Fund (1)(3) | |
2007 | | $ | 19.86 | | 0.16 | | | (1.54 | ) | | (1.38 | ) | | (0.16 | ) | | 0.00 | | | (0.16 | ) |
2006 | | $ | 17.09 | | 0.08 | | | 2.77 | | | 2.85 | | | (0.08 | ) | | 0.00 | | | (0.08 | ) |
2005 | | $ | 15.95 | | 0.01 | | | 1.14 | | | 1.15 | | | (0.01 | ) | | 0.00 | | | (0.01 | ) |
2004 | | $ | 14.82 | | 0.00 | | | 1.13 | | | 1.13 | | | 0.00 | | | 0.00 | | | 0.00 | |
2003 | | $ | 11.65 | | (0.01 | ) | | 3.18 | | | 3.17 | | | 0.00 | | | 0.00 | | | 0.00 | |
The Socially Responsible Utilities Fund (1)(3) | |
2007 | | $ | 22.23 | | 0.14 | | | 3.91 | | | 4.05 | | | (0.14 | ) | | 0.00 | | | (0.14 | ) |
2006 | | $ | 19.03 | | 0.15 | | | 3.20 | | | 3.35 | | | (0.15 | ) | | 0.00 | | | (0.15 | ) |
2005 | | $ | 16.51 | | 0.24 | | | 2.52 | | | 2.76 | | | (0.24 | ) | | 0.00 | | | (0.24 | ) |
2004 | | $ | 14.29 | | 0.32 | | | 2.22 | | | 2.54 | | | (0.32 | ) | | 0.00 | | | (0.32 | ) |
2003 | | $ | 12.66 | | 0.29 | | | 1.63 | | | 1.92 | | | (0.29 | ) | | 0.00 | | | (0.29 | ) |
The U.S. Government Bond Fund (1)(3) | |
2007 | | $ | 20.30 | | 0.73 | | | 0.72 | | | 1.45 | | | (1.17 | ) | | 0.00 | | | (1.17 | ) |
2006 | | $ | 20.22 | | 0.68 | | | 0.14 | | | 0.82 | | | (0.74 | ) | | 0.00 | | | (0.74 | ) |
2005 | | $ | 20.82 | | 0.73 | | | (0.76 | ) | | (0.03 | ) | | (0.57 | ) | | 0.00 | | | (0.57 | ) |
2004 | | $ | 21.00 | | 0.52 | | | (0.18 | ) | | 0.34 | | | (0.52 | ) | | 0.00 | | | (0.52 | ) |
2003 | | $ | 22.79 | | 0.35 | | | (1.35 | ) | | (1.00 | ) | | (0.35 | ) | | (0.44 | ) | | (0.79 | ) |
The Money Market Fund - Retail Class (1) | |
2007 | | $ | 1.00 | | 0.048 | | | N/A | | | 0.048 | | | (0.048 | ) | | 0.000 | | | (0.048 | ) |
2006 | | $ | 1.00 | | 0.046 | | | N/A | | | 0.046 | | | (0.046 | ) | | 0.000 | | | (0.046 | ) |
2005 | | $ | 1.00 | | 0.028 | | | N/A | | | 0.028 | | | (0.028 | ) | | 0.000 | | | (0.028 | ) |
2004 | | $ | 1.00 | | 0.011 | | | N/A | | | 0.011 | | | (0.011 | ) | | 0.000 | | | (0.011 | ) |
2003 | | $ | 1.00 | | 0.009 | | | N/A | | | 0.009 | | | (0.009 | ) | | 0.000 | | | (0.009 | ) |
The Money Market Fund - Institutional Class (5)(6) | |
2007 | | $ | 1.00 | | 0.050 | | | N/A | | | 0.050 | | | (0.050 | ) | | 0.000 | | | (0.050 | ) |
2006 | | $ | 1.00 | | 0.048 | | | N/A | | | 0.048 | | | (0.048 | ) | | 0.000 | | | (0.048 | ) |
2005 | | $ | 1.00 | | 0.030 | | | N/A | | | 0.030 | | | (0.030 | ) | | 0.000 | | | (0.030 | ) |
2004** | | $ | 1.00 | | 0.000 | *** | | N/A | | | 0.000 | | | 0.000 | | | 0.000 | | | 0.000 | *** |
| 1 | Ratio of net expenses to average net assets, ratio of net investment income (loss) to average net assets, and ratio of average net assets after reductions, excluding expenses paid indirectly, reflect reductions in corresponding portfolio, if applicable. |
| 2 | Ratio of net expenses to average net assets, ratio of net investment income (loss) to average net assets, ratio of average net assets after reductions, excluding expenses paid indirectly, and ratio of expenses to average net assets before reductions do not include impact of expenses of the underlying security holdings as represented in the schedule of investments. |
| 3 | During 2003, the Fund’s portfolio turnover rate for the period January 1 through April 13 is equivalent to the portfolio into which the fund invested. Beginning April 14 the Fund commenced calculating the portfolio turnover rate based on its own activities. Hence, the portfolio turnover rate represented for 2003 is a combination of these two periods. Subsequent to 2003 the portfolio turnover rate is specific to the Fund. |
The accompanying notes are integral part of these financial statements.
| | | | | | | | | | | | | | | | | | | | | | |
| | | | | | Ratios/Supplemental Data | |
Net Asset
Value,
End of
Period | | Total Return
(Assumes
Reinvestment
of Distributions) | | | Net Assets,
End of
Period
($000) | | Ratio of Net
Expenses to
Average
Net Assets | | | Ratio of Net
Investment
Income (Loss)
to Average
Net Assets | | | Ratio of Expenses to
Average Net Assets
after Reductions,
Excluding Expenses
Paid Indirectly | | | Ratio of Expenses
to Average Net
Assets Before
Reductions | | | Portfolio
Turnover
Rate | |
| | | | | | | | | | | | | | | | | | | | | | |
| $ | 18.32 | | (7.00 | %) | | $ | 17,450 | | 1.56 | % | | 0.76 | % | | 1.56 | % | | 2.09 | % | | 56 | % |
| $ | 19.86 | | 16.67 | % | | $ | 20,074 | | 1.66 | % | | 0.47 | % | | 1.66 | % | | 2.25 | % | | 30 | % |
| $ | 17.09 | | 7.21 | % | | $ | 17,114 | | 1.75 | % | | 0.06 | % | | 1.78 | % | | 2.19 | % | | 171 | % |
| $ | 15.95 | | 7.62 | % | | $ | 18,853 | | 1.73 | % | | 0.00 | % | | 1.77 | % | | 2.06 | % | | 253 | % |
| $ | 14.82 | | 27.21 | % | | $ | 19,968 | | 1.84 | % | | (0.11 | %) | | 1.84 | % | | 1.91 | % | | 140 | % |
| | | | | | | | | | | | | | | | | | | | | | |
| $ | 26.14 | | 18.24 | % | | $ | 27,333 | | 1.90 | % | | 0.57 | % | | 1.90 | % | | 2.10 | % | | 50 | % |
| $ | 22.23 | | 17.68 | % | | $ | 23,969 | | 2.05 | % | | 0.74 | % | | 2.05 | % | | 2.18 | % | | 27 | % |
| $ | 19.03 | | 16.80 | % | | $ | 22,644 | | 2.03 | % | | 1.32 | % | | 2.05 | % | | 2.19 | % | | 28 | % |
| $ | 16.51 | | 18.01 | % | | $ | 28,447 | | 1.91 | % | | 2.21 | % | | 1.91 | % | | 1.99 | % | | 38 | % |
| $ | 14.29 | | 15.46 | % | | $ | 21,038 | | 1.92 | % | | 2.25 | % | | 1.94 | % | | 1.94 | % | | 41 | % |
| | | | | | | | | | | | | | | | | | | | | | |
| $ | 20.58 | | 7.44 | % | | $ | 13,769 | | 1.01 | % | | 3.92 | % | | 1.01 | % | | 1.72 | % | | 88 | % |
| $ | 20.30 | | 4.13 | % | | $ | 7,118 | | 1.10 | % | | 3.59 | % | | 1.10 | % | | 2.22 | % | | 106 | % |
| $ | 20.22 | | (0.14 | %) | | $ | 6,324 | | 1.10 | % | | 2.75 | % | | 1.10 | % | | 2.02 | % | | 159 | % |
| $ | 20.82 | | 1.64 | % | | $ | 9,316 | | 1.10 | % | | 2.49 | % | | 1.10 | % | | 1.58 | % | | 352 | % |
| $ | 21.00 | | (4.43 | %) | | $ | 10,840 | | 1.10 | % | | 1.59 | % | | 1.10 | % | | 1.24 | % | | 568 | % |
| | | | | | | | | | | | | | | | | | | | | | |
| $ | 1.00 | | 4.95 | % | | $ | 195,479 | | 0.48 | % | | 4.83 | % | | 0.48 | % | | 0.84 | % | | N/A | |
| $ | 1.00 | | 4.71 | % | | $ | 159,641 | | 0.48 | % | | 4.64 | % | | 0.48 | % | | 0.87 | % | | N/A | |
| $ | 1.00 | | 2.85 | % | | $ | 129,200 | | 0.47 | % | | 2.79 | % | | 0.47 | % | | 0.89 | % | | N/A | |
| $ | 1.00 | | 1.06 | % | | $ | 148,650 | | 0.46 | % | | 1.04 | % | | 0.46 | % | | 0.84 | % | | N/A | |
| $ | 1.00 | | 0.92 | % | | $ | 165,607 | | 0.43 | % | | 0.92 | % | | 0.43 | % | | 0.82 | % | | N/A | |
| | | | | | | | | | | | | | | | | | | | | | |
| $ | 1.00 | | 5.09 | % | | $ | 20,333 | | 0.34 | % | | 4.98 | % | | 0.34 | % | | 0.67 | % | | N/A | |
| $ | 1.00 | | 4.86 | % | | $ | 24,118 | | 0.34 | % | | 4.76 | % | | 0.34 | % | | 0.71 | % | | N/A | |
| $ | 1.00 | | 2.99 | % | | $ | 21,083 | | 0.33 | % | | 2.93 | % | | 0.33 | % | | 0.71 | % | | N/A | |
| $ | 1.00 | | 0.02 | % | | $ | 30,310 | | 0.33 | % | | 1.96 | % | | 0.33 | % | | 0.67 | % | | N/A | |
| 4 | Recognition of net investment income by the Fund is affected by the timing of the declaration of dividends by the underlying investment companies in which the Fund invests. |
| 5 | Total return and portfolio turnover rate are not annualized for periods of less than one full year. |
| 6 | Ratio of net expenses to average net assets, ratio of net investment income (loss) to average net assets, ratio of average net assets after reductions, excluding expenses paid indirectly, and ratio of expenses to average net assets after before reductions are annualized for periods of less than one full year. |
| 7 | In 2005, the advisor voluntarily reimbursed the Fund for a realized investment loss, which had no impact to total return. |
| * | Commenced Operations January 31, 2006 |
| ** | Commenced Operations on December 28, 2004 |
| *** | Actual amounts were less than one-tenth of a cent |
Notes to Financial Statements
December 31, 2007
1. Organization and Significant Accounting Policies
The Flex-funds Trust (the “Trust”) was organized in 1982 and is registered under the Investment Company Act of 1940, as amended (the “1940 Act”), as a diversified, open-end management investment company. The Trust offers nine separate series and is presently comprised of nine separate funds as follows: The Muirfield Fund® (“Muirfield”), The Socially Responsible Utilities Fund (f.k.a. The Total Return Utilities Fund)(“Utilities”)(please see second paragraph of note #1 for more information), The Quantex Fund™ (“Quantex”), The Dynamic Growth Fund (“Dynamic”), The Aggressive Growth Fund (“Aggressive”), The Defensive Growth Fund (“Defensive”), The Focused Growth Fund (“Focused”), The U.S. Government Bond Fund (“Bond”), and The Money Market Fund (“Money Market”) (each a “Fund” and collectively the “Funds”). Money Market offers two classes of shares (the Retail Class (“Retail Class”) and the Institutional Class (“Institutional Class”)). Each class of shares has equal rights as to earnings and assets except that each class bears different distribution and transfer agent expenses. The investment objective of Muirfield, Quantex, Dynamic, Aggressive, Defensive, and Focused is growth of capital. The investment objective of Utilities is current income and growth of income. The investment objective of Bond is maximum current income. The investment objective of Money Market is current income while maintaining a stable share price of $1.00.
On April 13, 2007, the Board of Trustees of The Total Return Utilities Fund approved to change the name of the Fund to The Socially Responsible Utilities Fund to specifically identify it as a socially responsible fund. The change in name more accurately reflects the Fund’s environmental philosophy of prohibiting fund investments in the nuclear energy sector. The investment objective remains current income and growth of income.
Use of estimates. The preparation of financial statements in conformity with accounting principles generally accepted in the United States of America (“GAAP”) requires management to make estimates and assumptions that affect the reported amounts of assets and liabilities and disclosure of contingent assets and liabilities at the date of the financial statements and the reported amounts of increases and decreases in net assets from operations during the reporting period. Actual results could differ from those estimates.
Security valuation. Securities and exchange traded funds that are traded on stock exchanges are valued at the last sales price as of the close of business of the New York Stock Exchange on the day of valuation or, lacking any sales, are valued using fair value procedures approved by the Board of Trustees (“Trustees”). Securities traded over-the-counter are valued at the most recent bid price or yield equivalent as obtained from one or more dealers that make markets in such securities. Registered investment companies are valued at the daily redemption value as reported by the underlying fund. Bond values the securities held at 4:00 P.M. Eastern Time. Securities held in Money Market are valued at amortized cost, which approximates value. The Funds obtain prices from independent pricing services, which use valuation techniques approved by the Trustees. Money Market, in compliance with Rule 2a-7 of the 1940 Act, compares its amortized values, including illiquid and restricted securities, to the prices obtained from the independent pricing services. The ability of issuers of debt securities held by the Funds to meet their obligations may be affected by economic and political developments in a specific country or region.
Fixed income securities held in the Funds, except Money Market, maturing more than sixty days after the valuation date, are valued at the last sales price as of the close of business on the day of valuation, or, lacking any sales, at the most recent bid price or yield equivalent as obtained from dealers that make markets in such securities. When such securities are valued within sixty days or less to maturity, the difference between the valuation existing on the sixty-first day before maturity and maturity value is amortized on a straight-line basis to maturity. Securities maturing within sixty days from their date of acquisition are valued at amortized cost.
In September 2006, the Financial Accounting Standards Board issued Statement on Financial Accounting Standard (“SFAS”) No. 157 “Fair Value Measurements.” This standard establishes a single authoritative definition of fair value, sets out a framework for measuring fair value and requires additional disclosure about fair value measurements. SFAS No. 157 applies to fair value measurements already required or permitted by existing standards. SFAS No. 157 is effective for financial statements issued for fiscal years beginning after November 15, 2007. The changes to current generally accepted accounting principles from the application of this Statement relate to the definition of fair value, the methods used to measure fair value, and the expanded disclosures about fair value measurements. Management has determined that the adoption of SFAS No. 157 will have no material impact to any financial statement amounts, however, additional disclosures will be required about the inputs used to develop the measurements and the effect of certain measurements on changes in net assets for the period.
Repurchase agreements. Each Fund may engage in repurchase agreement transactions whereby the Fund takes possession of an underlying debt instrument subject to an obligation of the seller to repurchase the instrument from the Fund and an obligation of the Fund to resell the instrument at an agreed upon price and term. At all times, the Fund maintains the value of collateral, including accrued interest, of at least 100% of the amount of the repurchase agreement, plus accrued interest. If the seller defaults or the fair value of the collateral declines, realization of the collateral by the Funds may be delayed or limited.
Futures & options. Each Fund, except Money Market, may engage in transactions in financial futures contracts and options contracts in order to manage the risk of unanticipated changes in market values of securities held in the fund, or which it intends to purchase. The futures and options contracts are adjusted by the daily exchange rate of the underlying currency, or index, and any gains or losses are recorded for financial statement purposes as unrealized gains or losses in the statement of assets and liabilities and the statement of operations until the contract settlement date, at which time realized gains and losses are included in the statement of operations.
To the extent that the Fund enters into futures contracts on an index or group of securities, the Fund exposes itself to an indeterminate liability and will be required to pay or receive a sum of money measured by the change in the value of the index. Upon entering into a futures contract, the Fund is required to deposit an initial margin, which is either cash or securities in an amount equal to a certain percentage of the contract value. Subsequently, the variation margin, which is equal to changes in the daily settlement price or last sale price on the exchanges where futures contracts trade, is received or paid and is recorded as an unrealized gain or loss until the contract is closed. When the contract is closed, the Fund records a realized gain or loss equal to the difference between the proceeds from (or cost of) the closing transaction and the Fund’s basis in the contract. Should market conditions move unexpectedly, the Fund may not achieve the anticipated benefits of the futures contract and may realize a loss. The use of futures transactions involves the risk of imperfect correlation in movements in the price of futures contracts, interest rates, and the underlying hedged assets.
Call and put option contracts involve the payment of a premium for the right to purchase or sell an individual security or index aggregate at a specified price until the expiration of the contract. Such transactions expose the Fund to the loss of the premium paid if the Fund does not sell or exercise the contract prior to the expiration date. In the case of a call option, sufficient cash or money market instruments will be segregated to complete the purchase. Options are valued on the basis of the daily settlement price or last sale on the exchanges where they trade and the changes in value are recorded as unrealized appreciation or depreciation until closed, exercised or expired.
The Funds may write covered call or put options for which premiums received are recorded as liabilities and are subsequently adjusted to the current value of the options written. When written options are closed or exercised, premiums received are offset against the proceeds paid, and the Fund records realized gains or losses for the difference. When written options expire, the liability is eliminated, and the Fund records realized gains for the entire amount of premiums received.
Federal income taxes. It is each Fund’s policy to continue to comply with the requirements of Subchapter M of the Internal Revenue Code applicable to regulated investment companies and to distribute substantially all of its taxable income and net capital gains to its shareholders. Therefore, no federal income tax provision is required.
The Funds adopted the provisions of Financial Accounting Standards Board Interpretation No. 48 (“FIN 48”), Accounting for Uncertainty in Income Taxes, in 2007. The implementation of FIN 48 resulted in no material liability for unrecognized tax benefits and no material changes to the beginning net asset values of the Funds.
As of and during the year ended December 31, 2007, the Funds did not have a liability for any unrecognized tax benefits. The Funds recognize interest and penalties, if any, related to unrecognized tax benefits as income tax expense in the statements of operations. During the year ended December 31, 2007, the Funds did not incur any interest or penalties.
The Funds are not subject to examination by U.S. federal and state tax authorities for tax years before 2004.
Distributions to shareholders. Distributions to shareholders are recorded on the ex-dividend date. Muirfield, Quantex, Dynamic, Aggressive, Defensive, and Focused declare and pay dividends from net investment income, if any, on a quarterly basis. Utilities declares and pays dividends from net investment income on a monthly basis. Bond and Money Market declare dividends from net investment income on a daily basis and pay such dividends on a monthly basis. Each Fund distributes net capital gains, if any, on an annual basis.
Distributions from net investment income and from net capital gains are determined in accordance with income tax regulations, which may differ from GAAP. These differences are primarily due to deferrals of certain losses, expiring capital loss carryforwards, and differing treatments of unrealized gains and losses of futures contracts held by each Fund. Accordingly, timing differences relating to shareholder distributions are reflected in the components of net assets and permanent book and tax differences have been reclassified within the components of net assets based on their ultimate characterization for federal income tax purposes. For the year ended December 31, 2007, over-distributions of net investment income were reclassified to paid-in-capital in the amounts of $57,710 and $25,949, for Muirfield and Dynamic, respectively.
Investment income & expenses. For Money Market, income and expenses (other than expenses attributable to a specific class) are allocated to each class of shares based on its relative net assets. Expenses incurred by the Trust that do not specifically relate to an individual Fund of the Trust are allocated to the Funds based on each Fund’s relative net assets or other appropriate basis.
Capital Share Transactions. Money Market is authorized to issue an indefinite number of shares in the Retail Class and the Institutional Class. Transactions in the capital shares of the Fund for the year ended December 31, 2007 and the year ended December 31, 2006 were as follows:
| | | | | | | | | | | | | | |
| | | 2007 | | | 2006 | |
| | | Amount | | | Shares | | | Amount | | | Shares | |
Retail Class | | | | | | | | | | | | | | |
Issued | | $ | 196,554,206 | | | 196,554,206 | | | $ | 187,692,091 | | | 187,692,091 | |
Reinvested | | | 8,603,255 | | | 8,603,255 | | | | 6,552,436 | | | 6,552,436 | |
Redeemed | | | (169,319,266 | ) | | (169,319,266 | ) | | | (163,803,310 | ) | | (163,803,310 | ) |
Net increase (decrease) | | $ | 35,838,195 | | | 35,838,195 | | | $ | 30,441,217 | | | 30,441,217 | |
Institutional Class | | | | | | | | | | | | | | |
Issued | | $ | 32,830,469 | | | 32,830,469 | | | $ | 53,226,895 | | | 53,226,895 | |
Reinvested | | | 733,656 | | | 733,656 | | | | 732,374 | | | 732,374 | |
Redeemed | | | (37,348,447 | ) | | (37,348,447 | ) | | | (50,924,798 | ) | | (50,924,798 | ) |
Net increase (decrease) | | $ | (3,784,322 | ) | | (3,784,322 | ) | | $ | 3,034,471 | | | 3,034,471 | |
Other. The Funds record security transactions on the trade date. Gains and losses realized from the sale of securities are determined on the specific identification basis. Dividend income is recognized on the ex-dividend date and interest income (including amortization of premium and accretion of discount) is recognized as earned.
2. Investment Transactions
For the year ended December 31, 2007, the cost of purchases and proceeds from sales or maturities of long-term investments for the Funds were as follows:
| | | | | | |
| | | Purchases | | Sales |
The Muirfield Fund® | | $ | 69,407,516 | | $ | 70,095,498 |
The Dynamic Growth Fund | | | 26,891,106 | | | 28,416,707 |
The Aggressive Growth Fund | | | 46,156,406 | | | 41,471,555 |
The Defensive Growth Fund | | | 99,058,178 | | | 75,168,192 |
The Focused Growth Fund | | | 83,467,224 | | | 64,414,530 |
The Quantex Fund™ | | | 10,569,704 | | | 11,620,797 |
The Socially Responsible Utilities Fund | | | 12,625,325 | | | 13,621,795 |
The U.S. Government Bond Fund | | | 12,575,575 | | | 7,430,853 |
3. Investment Advisory Fees and Other Transactions with Affiliates
Meeder Asset Management, Inc. (“MAM”), a wholly-owned subsidiary of Meeder Financial, Inc. (“Meeder”), provides each Fund, under a separate Investment Advisory Contract, with investment management, research, statistical and advisory services. The services of MAM will terminate automatically if assigned and may be terminated without penalty at any time upon 60 days prior written notice by majority vote of the Fund, by the Trustees of the Fund, or by MAM. Under a separate Investment Subadvisory Agreement with MAM, Miller/Howard Investments, Inc. (“Miller/Howard”) serves as subadvisor of Utilities. The Investment Subadvisory Agreement provides that it will terminate automatically if assigned, and that it may be terminated by MAM without penalty to the Fund by MAM, the Trustees of the Fund, or by the vote of a majority of the outstanding voting securities of the Fund upon not less than 30 days written notice.
For such services the Funds pay a fee at the following annual rates: Muirfield, Utilities, and Quantex, 1.00% of average daily net assets up to $50 million, 0.75% of average daily net assets exceeding $50 million up to $100 million and 0.60% of average daily net assets exceeding $100 million. As subadvisor to Utilities, Miller/Howard is paid 0.00% of the 1.00% of average daily net assets up to $10 million, 0.40% of the 1.00% of average daily net assets exceeding $10 million up to $50 million, 0.40% of the 0.75% of average daily net assets exceeding $50 million up to $60 million, 0.30% of the 0.75% of average daily net assets exceeding $60 million up to $100 million and 0.25% of the 0.60% of average daily net assets exceeding $100 million; Dynamic, Aggressive, Defensive, and Focused, 0.75% of average daily net assets up to $200 million and 0.60% of average daily net assets exceeding $200 million; Bond, 0.40% of average daily net assets up to $100 million and 0.20% of average daily net assets exceeding $100 million; and Money Market, 0.40% of average daily net assets up to $100 million and 0.25% of average daily net assets exceeding $100 million. MAM has contractually agreed to reduce its investment advisory fee by 0.25% for Quantex. During the year ended December 31, 2007, $56,849 of investment advisory fees were waived in Quantex. During the year ended December 31, 2007, MAM voluntarily agreed to reduce $271,241 of investment advisory fees in Money Market.
The Chief Compliance Officer (“CCO”) of the Trust, who is unaffiliated with the Trust, provides the Trust with certain compliance services. In compensation for such services, the Trust pays the CCO an annual fee of $46,350, plus out-of-pocket expenses. Prior to September 1, 2007, the CCO was paid an annual fee of $45,000, plus out-of-pocket expenses.
Mutual Funds Service Co. (“MFSCo”), a wholly-owned subsidiary of Meeder, serves as stock transfer, dividend disbursing and shareholder services agent for each Fund. In compensation for such services, each Fund pays MFSCo an annual fee calculated as follows: For Muirfield, Utilities, Quantex, Dynamic, Aggressive, Defensive, and Focused, such fee is equal to the greater of $15 per active shareholder account or 0.12% of each Fund’s average daily net assets. For Bond, such fee is equal to the greater of $15 per active shareholder account or 0.08% of the Fund’s average daily net assets. For Money Market Retail Class and Money Market Institutional Class, such fee is equal to the greater of $20 per active shareholder account or 0.08% of the Fund’s average daily net assets. MFSCo is entitled to receive an annual minimum fee of $4,000 for each Fund or class. For Funds that are subject to an expense cap and which are above the expense cap, the basis point fee will be reduced by 0.02%. During the year ended December 31, 2007, MFSCo waived $1,613 and $38,477 of transfer agent fees for Bond and Money Market, respectively. MFSCo also voluntarily waived $42,772 and $37,403 of transfer agent fees for Defensive and Focused, respectively, during the year ended December 31, 2007.
MFSCo provides the Trust with certain administrative services. In compensation for such services, each Fund pays MFSCo an annual fee equal to 0.10% of each Fund’s average daily net assets up to $50 million and 0.08% of each Fund’s average daily net assets exceeding $50 million.
MFSCo serves as accounting services agent for each Fund. In compensation for such services, each Fund pays MFSCo an annual fee equal to the greater of:
| | a. | 0.15% of the first $10 million of average daily net assets, 0.10% of the next $20 million of average daily net assets, 0.02% of the next $50 million of average daily net assets, and 0.01% in excess of $80 million of average daily net assets, or |
| | b. | $7,500 for non-Money Market Funds and $30,000 for Money Market. |
For the period January 1, 2007 through April 30, 2007, MAM voluntarily agreed to reduce its fees and/or reimburse expenses (excluding brokerage fees and commissions, taxes, interest, and extraordinary or non-recurring expenses), to limit Bond’s total annual operating expenses to 1.10% of average daily net assets. For the period May 1, 2007 through December 31, 2007, MAM voluntarily decreased that limit to 0.99% of average daily net assets. MAM has also agreed to reduce its fees and/or reimburse expenses to the extent necessary to achieve an effective yield for the Retail Class that will rank in the top 10% of yields for all general-purpose money market funds in 2007. Lastly, MAM limited the Institutional Class’ total annual operating expenses to 0.34% of average daily net assets. Such reduction and/or reimbursement is limited to the total of fees charged to each Fund or Class by MAM and MFSCo. For the year ended December 31, 2007, MAM and/or MFSCo reimbursed $56,039, $141,877, and $36,046 to Bond, the Retail Class, and the Institutional Class, respectively.
Muirfield and Dynamic have entered into an agreement with the Trust’s custodian, The Huntington National Bank (“HNB”), whereby HNB receives distribution, service, and administration fees (collectively the “fees”) from the underlying security holdings of the aforementioned Funds. HNB retains 0.03% of the fees collected and forwards the
remainder to the appropriate Fund. The Funds use their portion of the fees received to reduce the gross expenses of each Fund. For the year ended December 31, 2007, Muirfield and Dynamic used $74,388 and $27,437 of fees received, respectively, to reduce gross expenses of each Fund. It is possible that the Funds may invest in security holdings in which fees are not paid. As such, the gross expenses of a Fund would not be decreased. Also, without this agreement it is likely that the Funds would not collect any fees from underlying security holdings.
Pursuant to Rule 12b-1 of the 1940 Act, a mutual fund can adopt a written plan to pay certain expenses out of fund assets relating to the sale and distribution of its shares. Muirfield, Quantex, Bond, and the Retail Class have adopted a distribution plan with an annual limitation of 0.20% of average daily net assets. Utilities, Dynamic, Aggressive, Defensive, and Focused have adopted a distribution plan with an annual limitation of 0.25% of average daily net assets. The Institutional Class has adopted a distribution plan with an annual limitation of 0.03% of average daily net assets. For the year ended December 31, 2007, Muirfield, Utilities, Quantex, Dynamic, Aggressive, Defensive, Focused, and Bond waived $82,226, $18,993, $30,016, $40,662, $10,355, $18,942, $16,564, and $5,652 of distribution plan (12b-1) expenses, respectively. The Retail Class and the Institutional Class waived $233,657 and $4,024, respectively, for a total of $237,681.
An Administrative Services Plan has been adopted for each Fund of the Trust except Money Market. The Administrative Services Plan allows for each eligible Fund to pay a maximum annual amount of 0.20% of average daily net assets to Service Organizations that provide administrative support services to their customers who own Shares of record or beneficially. For the year ended December 31, 2007, Muirfield, Utilities, Quantex, Dynamic, Aggressive, and Bond waived $99,186, $33,824, $33,882, $37,177, $22,834, and $7,735 of administrative service plan expenses, respectively.
The Funds have adopted a Deferred Compensation Plan (the “Plan”) for the independent Trustees. Under the Plan, each eligible Trustee is permitted to defer all or a portion of the trustees fees payable by any of the Funds as an investment into any combination of Funds until a specified point of time. The investment into the Funds is recorded as an asset, however an offsetting liability is also recorded for the deferred payment. Once the eligible Trustees’ deferral amounts can be distributed, a lump sum or generally equal annual installments over a period of up to ten (10) years can be made to the eligible Trustee(s). The Funds may terminate this Plan at any time.
Certain trustees and officers of the Funds are also officers or directors of Meeder, MAM, and MFSCo.
4. Federal Tax Information
The tax characteristics of dividends paid by the Funds during the year ended December 31, 2007 were as follows:
| | | | | | | | | | | | |
| | | Ordinary
Income | | Net
Short-Term
Capital Gains | | Net
Long-Term
Capital Gains | | Total
Dividends
Paid(1) |
The Muirfield Fund® | | $ | 1,597,151 | | $ | — | | $ | — | | $ | 1,597,151 |
The Dynamic Growth Fund | | | 595,277 | | | 238,705 | | | 1,041,578 | | | 1,875,560 |
The Aggressive Growth Fund | | | 132,213 | | | — | | | — | | | 132,213 |
The Defensive Growth Fund | | | 482,437 | | | 1,399,872 | | | 1,953,406 | | | 3,835,715 |
The Focused Growth Fund | | | 400,727 | | | 749,648 | | | 2,749,532 | | | 3,899,907 |
The Quantex Fund™ | | | 174,362 | | | — | | | — | | | 174,362 |
The Socially Responsible Utilities Fund | | | 146,532 | | | — | | | — | | | 146,532 |
The U.S. Government Bond Fund | | | 542,339 | | | — | | | — | | | 542,339 |
The Money Market Fund | | | 9,829,339 | | | — | | | — | | | 9,829,339 |
| 1 | Total dividends paid may differ from the amount reported in the Statement of Changes in Net Assets because for tax purposes dividends are recognized when actually paid. |
The tax characteristics of dividends paid by the Funds during the year ended December 31, 2006 were as follows:
| | | | | | | | | |
| | | Ordinary
Income | | Net
Short-Term
Capital Gains | | Total
Dividends
Paid(1) |
The Muirfield Fund® | | $ | 377,059 | | $ | — | | $ | 377,059 |
The Dynamic Growth Fund | | | 92,692 | | | — | | | 92,692 |
The Aggressive Growth Fund | | | 87,765 | | | — | | | 87,765 |
The Defensive Growth Fund | | | 295,633 | | | — | | | 295,633 |
The Focused Growth Fund | | | 207,143 | | | — | | | 207,143 |
The Quantex Fund™ | | | 79,033 | | | — | | | 79,033 |
The Socially Responsible Utilities Fund | | | 171,433 | | | — | | | 171,433 |
The U.S. Government Bond Fund | | | 197,693 | | | — | | | 197,693 |
The Money Market Fund | | | 7,871,702 | | | — | | | 7,871,702 |
As of December 31, 2007, the components of accumulated earnings/(deficit) on a tax basis for the Funds were as follows:
| | | | | | | | | | | | | | | | | | | |
| | | Undistributed
Ordinary
Income | | Dividends
Payable | | | Accumulated
Capital and
Other Gains
and (Losses) | | | Unrealized
Appreciation/
(Depreciation)(2) | | | Total
Accumulated
Earnings/
(Deficit) | |
The Muirfield Fund® | | $ | — | | $ | — | | | $ | (387,760 | ) | | $ | (940,435 | ) | | $ | (1,328,195 | ) |
The Dynamic Growth Fund | | | — | | | — | | | | 570,693 | | | | (427,178 | ) | | | 143,515 | |
The Aggressive Growth Fund | | | — | | | — | | | | (3,287,233 | ) | | | 359,658 | | | | (2,927,575 | ) |
The Defensive Growth Fund | | | — | | | — | | | | — | | | | 659,651 | | | | 659,651 | |
The Focused Growth Fund | | | — | | | — | | | | — | | | | 590,311 | | | | 590,311 | |
The Quantex Fund™ | | | 324 | | | (324 | ) | | | (1,484,505 | ) | | | (644,006 | ) | | | (2,128,511 | ) |
The Socially Responsible Utilities Fund | | | — | | | — | | | | (1,403,771 | ) | | | 6,287,562 | | | | 4,883,791 | |
The U.S. Government Bond Fund | | | 3,893 | | | (1,883 | ) | | | (1,038,511 | ) | | | 368,085 | | | | (668,416 | ) |
The Money Market Fund | | | — | | | — | | | | — | | | | — | | | | — | |
For federal income tax purposes, the following Funds have capital loss carryforwards as of December 31, 2007, which are available to offset future capital gains, if any. To the extent that these carryforwards are used to offset future capital gains, it is probable that the gains that are offset will not be distributed to shareholders:
| | | | | |
| | | Amount | | Expires |
The Muirfield Fund® | | $ | 387,760 | | 2010 |
The Aggressive Growth Fund | | | 3,287,233 | | 2010 |
The Quantex Fund™ | | | 234,839 | | 2010 |
The Quantex Fund™ | | | 1,249,666 | | 2011 |
The Socially Responsible Utilities Fund | | | 1,403,772 | | 2011 |
The U.S. Government Bond Fund | | | 657,752 | | 2011 |
The U.S. Government Bond Fund | | | 125,708 | | 2012 |
The U.S. Government Bond Fund | | | 141,817 | | 2013 |
The U.S. Government Bond Fund | | | 113,234 | | 2014 |
Under current tax laws, net capital losses incurred after October 31, within a Fund’s fiscal year, are deemed to arise on the first business day of the following fiscal year for tax purposes. For the year ended December 31, 2007, Defensive and Focused deferred post October losses in the amounts of $212,868 and $230,383, respectively.
| (1) | Total dividends paid may differ from the amount reported in the Statement of Changes in Net Assets because for tax purposes dividends are recognized when actually paid. |
| (2) | The differences between book- and tax-basis unrealized appreciation/(depreciation) are attributable primarily to: deferral of post October losses and the realization for tax purposes of unrealized gains/(losses) on certain derivative instruments. |
5. Control Ownership
The beneficial ownership, either directly or indirectly, of more than 25% of the voting securities of a fund creates a presumption of control of the fund under Section 2(a)(9) of the 1940 Act. As of December 31, 2007, Charles Schwab & Co., Inc. held for the benefit of others, in aggregate, 47% of Utilities; Nationwide Trust Company, FSB held for the benefit of others, in aggregate, 93% of Defensive; Nationwide Trust Company, FSB held for the benefit of others, in aggregate, 94% of Focused; Saxon & Co. held 40% of Dynamic; Nationwide Trust Company, FSB held for the benefit of others, in aggregate, 74% of Aggressive; and Nationwide Trust Company, FSB held for the benefit of others, in aggregate, 64% of Bond and therefore may be deemed to control the Funds.
6. Board Review of Investment Advisory and Subadvisory Agreements (unaudited)
At a meeting held September 13, 2007, the Board of Trustees (the “Board”), including a majority of non-interested or independent Trustees, approved the renewal of the investment advisory agreements for the nine separate funds comprising The Flex-funds (the “Funds”) and the investment sub-advisory agreement relating to The Socially Responsible Utilities Fund (individually, an “Agreement” and collectively, the “Agreements”).
At the June 2007 meeting, The Trustees agreed to shift the “section 15(c)” investment advisory agreements renewal process from an annual June renewal to an annual September renewal timetable. At the September 2007 meeting, the Trustees reviewed materials appropriately updated and supplemented to make the information as current as possible for the September 2007 meeting and renewed the investment advisory contracts previously approved in June 2007 in order to move the final renewal time to September.
The Board then reviewed the meeting materials relating to their consideration of whether to approve the renewal of each Fund’s Agreements. Management reviewed with the Trustees the materials prepared by them in response to Funds’ legal counsel’s supplemental written request pursuant to Section 15(c) of the Investment Company Act of 1940 for the provision to the Trustees of appropriately updated and amended information necessary or appropriate to assist the Trustees in their deliberations concerning renewal of the Agreements. In reaching the decision to renew the Agreements, the Board also took into account information furnished throughout the year at regular Board meetings. Information furnished and discussed throughout the year included investment performance reports and related financial information for each Fund, as well as periodic reports on shareholder services, legal compliance, pricing, brokerage commissions and execution and other services provided by the investment manager, Meeder Asset Management, Inc. (“Manager”) and its affiliates, or by or on behalf of The Socially Responsible Utilities Fund’s Subadviser, Miller/Howard Investments, Inc. Information furnished specifically in connection with the renewal process included a report for the Funds prepared by Lipper Financial Services (“Lipper”), an independent organization, as well as a Funds’ profitability analysis prepared by the Manager. The Lipper report compared each Fund’s management fees and expenses with those of other mutual funds deemed comparable to the Fund. The Funds’ profitability analysis discussed the profitability to the Manager and Mutual Funds Service Co., an affiliate of the Manager, from the overall Funds’ operations utilizing expense allocation methodologies deemed reasonable by the Manager.
In considering such materials, the independent Trustees noted that they had received assistance and advice from and met separately with the Funds’ legal counsel and chief compliance officer prior to this meeting. In their deliberations, the Board dealt with each Fund separately. In approving continuance of the Agreement for each Fund, the Board, including a majority of independent Trustees, considered each Fund’s Agreement, a copy of which was made available at the meeting, and determined that the existing management fee structure was fair and reasonable and that continuance of the Agreement was in the best interests of each Fund and its shareholders. While attention was given to all information furnished, the following discusses the primary factors relevant to the Board’s decision.
Nature, Extent and Quality of Services. The Board continues to be satisfied with the nature and quality of the overall services provided by the Manager and its affiliates to the Funds and their shareholders. In addition to investment performance and expenses discussed earlier, the Board’s opinion was based, in part, upon periodic reports furnished them showing that the investment policies and restrictions for each Fund were consistently complied with as well as other reports periodically furnished the Board. Other factors taken into account by the Board were the Manager’s compliance procedures and the qualifications of the Manager’s chief compliance officer. Consideration was also given to the experience of each Fund’s portfolio management team. The Board also took into account the transfer agent, fund accounting agent and administrative services provided to Fund shareholders by an affiliate of the Manager, noting continuing expenditures by management to increase and improve the scope of such services. Similar considerations were applied to the Subadviser to The Socially Responsible Utilities Fund.
Investment Performance. The Board placed emphasis on the investment performance of each Fund in view of its importance to shareholders. While consideration was given to performance reports and discussions with portfolio managers at Board meetings during the year, particular attention in assessing performance was given to the Morningstar reports furnished for the Agreement renewals. The Morningstar report prepared for each Fund showed the investment performance of the Fund for the three-month and one-, three-, and five-year (or period since inception if shorter) periods, as applicable, ended June 30, 2007 (the “relevant periods”) in comparison with a performance universe similar to each Fund’s investment objectives.
| | |
Fund | | Performance Benchmark |
The Muirfield Fund® | | Blended Benchmark of 60% S&P 500 Index and 40% T-bill, S&P 500 Index, Morningstar’s Average Asset Allocation Fund, Morningstar Average Balanced Fund |
| |
The Quantex Fund™ (Formerly The Highlands Growth Fund) | | Russell 2000 Index, S&P 400 Mid-Cap Index, Morningstar’s Average Growth Fund |
| |
The Dynamic Growth Fund | | S&P 500 Index, Morningstar’s Average Growth Fund |
| |
The Socially Responsible Utilities Fund (Formerly The Total Return Utilities Fund) | | Russell 3000 Utilities Index, Blended Index of 60% Russell 3000 Utilities and 40% Lehman Brothers Long Credit Index, S&P 500 Utilities Index, Morningstar Average Utility Fund |
| |
The U.S. Government Bond Fund | | Lehman Brothers Intermediate Government/Credit Index, Morningstar Average General U.S. Government Bond Fund |
| |
The Aggressive Growth Fund | | NASDAQ Composite Index, Morningstar’s Average Aggressive Growth Fund |
| |
The Defensive Growth Fund | | S&P 500 Index, Blended Benchmark of 60% S&P 500 Index and 40% 90-day T-Bills, Morningstar Average Asset Allocation Fund, Morningstar Average Balanced Fund |
| |
The Focused Growth Fund | | S&P 500 Index, Morningstar Average Growth Fund |
| |
The Money Market Fund | | |
| |
Retail Class | | Lipper Average General Purpose Money Market Fund |
| |
Institutional Class | | iMoneyNet’s Average General Purpose Institutional Money Market Fund |
The Board noted the continual improvement in investment performance of The Flex-funds overall. The Board also discussed with management the factors contributing to such performance and the actions being taken to improve the Funds’ investment results. The Board recognized that the Manager has made changes in its investment personnel and improvements in its investment processes in an effort to improve results. The portfolio managers went into detail regarding the factors taken into account when selecting investments and enhancements of their investment selection models and the Trustees acknowledged an overall trend of improvement in fund performance.
The Board indicated its intention to continue to monitor investment performance to assess the effectiveness of these changes and to evaluate whether additional steps to improve performance are necessary or appropriate. The Board concluded that continued dialogue between the Board and the Manager is the most effective method of addressing investment results.
Comparative Expenses. Consideration was given to a comparative analysis of the management fees and total expense ratios of each Fund compared with those of a group of other funds.
Management Profitability. The Board also considered the level of profits realized by the Manager and its affiliates in connection with the operation of the Funds. In this respect, the Board reviewed the Funds’ profitability analysis that
addresses the overall profitability of The Flex-funds’ business. The Board also considered the extent to which the Manager and its affiliates might derive ancillary benefits from fund operations, including potential benefits resulting from allocation of fund brokerage and the declining use of “soft” commission dollars to pay for research. The Board also took into account management’s expenditures in improving shareholder services provided the Funds, as well as the need to meet additional regulatory and compliance requirements resulting from the Sarbanes-Oxley Act and recent SEC requirements. The Board determined that the level of profits realized by the Manager under its Agreements with the Funds was not excessive in view of the nature, quality and extent of services provided.
Economies of Scale. The Board also considered whether economies of scale are realized by the Manager as the Funds grow larger and the extent to which this is reflected in the level of management fees charged. While recognizing that any precise determination is inherently subjective, the Board noted that based upon the Funds’ profitability analysis, it appears that as some Funds get larger, at some point economies of scale do result in the Manager realizing a larger profit margin on management services provided to such a Fund. The Board also noted that economies of scale are shared with each Fund and its shareholders through management fee breakpoints so that as a Fund grows in size, its effective management fee rate declines. The Board reviewed, and expressed continued satisfaction with, each Fund’s fee structure under its Agreement, as well as The Socially Responsible Utilities Fund’s fee structure under the investment subadvisory agreement with Miller/Howard Investments, Inc.
To The Shareholders and
Board of Trustees of
The Flex-funds
REPORT OF INDEPENDENT REGISTERED PUBLIC ACCOUNTING FIRM
We have audited the accompanying statements of assets and liabilities, including the schedules of investments, of The Flex-funds (the “Funds”), comprising The Muirfield Fund, The Socially Responsible Utilities Fund, The Quantex Fund, The Dynamic Growth Fund, The Aggressive Growth Fund, The U.S. Government Bond Fund, The Money Market Fund, The Defensive Growth Fund, and The Focused Growth Fund as of December 31, 2007, and the related statements of operations for the year then ended, statements of changes in net assets for each of the two years in the period then ended, and the financial highlights for each of the four years in the period then ended for The Muirfield Fund, The Socially Responsible Utilities Fund, The Quantex Fund, The Dynamic Growth Fund, The Aggressive Growth Fund, The U.S. Government Bond Fund, and The Money Market Fund, and financial highlights for each of the two years in the period then ended for The Defensive Growth Fund and The Focused Growth Fund. These financial statements and financial highlights are the responsibility of Fund management. Our responsibility is to express an opinion on these financial statements and financial highlights based on our audit. The financial highlights for the periods indicated prior to December 31, 2004 were audited by another independent accounting firm which expressed unqualified opinions on those statements and highlights.
We conducted our audits in accordance with the standards of the Public Company Accounting Oversight Board (United States). Those standards require that we plan and perform the audit to obtain reasonable assurance about whether the financial statements and financial highlights are free of material misstatement. An audit includes examining, on a test basis, evidence supporting the amounts and disclosures in the financial statements. Our procedures included confirmation of securities owned as of December 31, 2007, by correspondence with the Funds’ custodian and brokers. An audit also includes assessing the accounting principles used and significant estimates made by management, as well as evaluating the overall financial statement presentation. We believe that our audits provide a reasonable basis for our opinion.
In our opinion, the financial statements and financial highlights referred to above present fairly, in all material respects, the financial position of each of the funds constituting The Flex-funds, as of December 31, 2007, the results of their operations, the changes in their net assets, and their financial highlights for the periods indicated therein in conformity with accounting principles generally accepted in the United States of America.
Cohen Fund Audit Services, Ltd.
Westlake, Ohio
February 20, 2008
Trustees and Officers (unaudited)
Certain trustees and officers of the Funds are also officers or directors of Meeder, MAM, and MFSCo. The Trustees oversee the management of the Trust and elect its officers. The officers are responsible for the Funds’ day-to-day operations. The Trustees’ and officers’ names, addresses, years of birth, positions held with the Trust, and length of service with The Flex-funds are listed below. Also included is each Board member’s principal occupation during, at least, the past five years. Except as indicated, each individual has held the office shown or other offices in the same company for the last five years. Those Trustees who are “interested persons”, as defined in the 1940 Act, by virtue of their affiliation with the Trust, are indicated by an asterisk (*).
| | | | | | |
Name, Address1, and
Year of Birth | | Year First Elected a
Trustee or Officer of the Trust | | Position and
Number of Funds
Overseen2 | | Principal
Occupation During
Past Five Years and
Other Directorships Held |
Robert S. Meeder, Jr.* Year of Birth: 1961 | | 1992 | | Trustee and President | | President of Meeder Asset Management, Inc. |
| | | |
Walter L. Ogle** Year of Birth: 1937 | | 1982 | | Trustee | | Retired; formerly Executive Vice President of Aon Consulting, an employee benefits consulting group; Lead Trustee of the Trust. |
| | | |
James W. Didion** Year of Birth: 1930 | | 1982, 1998 | | Trustee | | Retired; formerly Executive Vice President of Core Source, Inc., an employee benefit and Workers’ Compensation administration and consulting firm (1991 – 1997); Chairman of the Trust’s Audit Committee. |
| | | |
Jack W. Nicklaus** Year of Birth: 1961 | | 1998 | | Trustee | | Designer, Nicklaus Design, a golf course design firm and division of The Nicklaus Companies; Chairman of the Trust’s Nominating Committee. |
| | | |
Stuart M. Allen** Year of Birth: 1961 | | 2006 | | Trustee | | President of Gardiner Allen DeRoberts Insurance LLC, an insurance agency; Chairman of the Trust’s Performance Committee. |
| | | |
Anthony D’Angelo** Year of Birth: 1959 | | 2006 | | Trustee | | Director of Sales, WSYX ABC 6/WTTE Fox 28, television stations owned and operated by Sinclair Broadcast Group; Chairman of the Trust’s Compensation Committee. |
| | | |
Dale W. Smith Year of Birth: 1959 | | 2006 | | Vice President | | Chief Financial Officer of Meeder Asset Management, Inc. (2005 - present); formerly Senior Vice President of Financial Services of BISYS Fund Services (1996 – 2004). |
| | | | | | |
Name, Address1, and
Year of Birth | | Year First Elected a
Trustee or Officer of the Trust | | Position and
Number of Funds
Overseen2 | | Principal
Occupation During
Past Five Years and
Other Directorships Held |
David R. Carson Year of Birth: 1958 | | 2006 | | Chief Compliance Officer | | Chief Compliance Officer and Anti-Money Laundering Officer of the Huntington Funds and Huntington VA Funds (2005 – present); Treasurer and Assistant Treasurer of the Huntington Funds, Huntington Asset Advisors, Inc. (2002 – 2005). |
| | | |
Bruce E. McKibben Year of Birth: 1969 | | 2002 | | Treasurer | | Director of Fund Accounting of Mutual Funds Service Co., the Trust’s transfer agent. |
| 1 | The address of each Trustee is 6125 Memorial Drive, Dublin, OH 43017. |
| 2 | Each Trustee serves for an indefinite term, until his or her resignation, death, or removal. Each Trustee oversees all nine Funds in the Trust. |
| * | Robert S. Meeder, Jr. is deemed an “interested person” of the Trust by virtue of his position as President of Meeder Asset Management, Inc., the Advisor of the Trust. |
| ** | Each independent Trustee is a member of the Trust’s Audit Committee, Performance Committee, Compensation Committee, and Nominating Committee. |
The Statement of Additional Information includes additional information about each Trustee and is available without charge. To obtain a copy of the Statement of Additional Information, please contact your financial representative or call toll free 1-800-325-3539.
Other Information
The Funds file their complete schedules of portfolios holdings with the Securities and Exchange Commission (“SEC”) for the first and third quarters of each fiscal year on Form N-Q. The Funds’ Forms N-Q are available on the SEC’s website at http://www.sec.gov and may be reviewed and copied at the SEC’s Public Reference Room in Washington, DC. Information on the operation of the Public Reference Room may be obtained by calling 1-800-SEC-0330. The Funds’ schedules of positions are also available on the Funds’ website at www.flexfunds.com.
A description of the policies and procedures that the Funds use to determine how to vote proxies relating to portfolio securities, and information regarding how the Funds voted these proxies for the 12-month period ended June 30, 2007, is available on the SEC’s website at http://www/sec.gov, or, without charge, upon request by calling toll-free 1-800-325-3539.
| | |
| The Flex-funds | | 2007 Annual Report | December 31, 2007 |
Manager and Investment Advisor
Meeder Asset Management, Inc.
6125 Memorial Drive
P.O. Box 7177
Dublin, Ohio 43017
Subadvisor/The Socially Responsible Utilities Fund
Miller/Howard Investments, Inc.
141 Upper Byrdcliffe Road, P.O. Box 549
Woodstock, New York 12498
Board of Trustees
James Didion
Robert S. Meeder, Jr.
Jack Nicklaus II
Walter L. Ogle
Anthony D’Angelo
Stuart Allen
Custodian
The Huntington National Bank
Columbus, Ohio 43215
Transfer Agent & Dividend Disbursing Agent
Mutual Funds Service Co.
6125 Memorial Drive
Dublin, Ohio 43017
Auditors
Cohen Fund Audit Services, LTD
800 Westpoint Parkway, Suite 1100
Westlake, Ohio 44145
| | |
| The Flex-funds 2007 Annual Report | December 31, 2007 | | |
The Flex-funds
MANAGEDBY MEEDER ASSET MANAGEMENT, INC.
6125 MEMORIAL DRIVE, DUBLIN OHIO, 43017
CALL TOLL FREE 800-325-3539 | 766-7000
FAX: 614-791-2572 | WWW.FLEXFUNDS.COM
EMAIL: FLEXFUNDS@MEEDERFINANCIAL.COM
The registrant has adopted a code of ethics that applies to the registrant’s principal executive officer, principal financial officer, comptroller or principal accounting officer, and any person who performs a similar function.
| Item 3. | Audit Committee Financial Expert. |
Currently, The Flex-funds (the “Funds”) do not have an Audit Committee member who possesses all of the attributes required to be an “audit committee financial expert” as defined in instruction 2(b) of Item 3 of Form N-CSR. However, the Board of Trustees believes that each member of the Audit Committee has substantial experience relating to the review of financial statements and the operations of audit committees. Accordingly, the Board of Trustees believes that the members are qualified to evaluate the Funds’ financial statements, supervise the Funds’ preparation of its financial statements, and oversee the work of the Funds’ independent auditors. The Board of Trustees also believes that, although no single Audit Committee member possesses all of the attributes required to be an “audit committee financial expert”, the Audit Committee members collectively as a group possess the attributes required to be an “audit committee financial expert.”
| Item 4. | Principal Accountant Fees and Services. |
(a) – (d) Aggregate fees billed to the registrant for the last two fiscal years for professional services rendered by the registrant’s principal accountant were as follows:
| | | | | | |
| | | 2007 | | 2006 |
Audit Fees | | $ | 59,500 | | $ | 48,500 |
Audit-Related Fees | | | 2,200 | | | 1,850 |
Tax Fees | | | 18,900 | | | 11,590 |
All Other Fees | | | 3,000 | | | 5,690 |
Audit fees include amounts related to the audit of the registrant’s annual financial statements and services normally provided by the accountant in connection with statutory and regulatory filings. Audit-related fees include amounts
reasonably related to the performance of the audit of the registrant’s financial statements. Tax fees include amounts related to tax compliance, tax planning, and tax advice. All other fees include amounts related to the registrant’s annual filing of Form N1A.
(e)(1) A purpose of the Audit Committee is to approve the engagement of the registrant’s independent auditors (i) to render audit and non-audit services for the registrant in accordance with Rule 2-01(c)(7)(i) of Regulation S-X, subject to the waiver provisions set forth in Rule 2-01(c)(7)(i)(C) of Regulation S-X, and (ii) to render non-audit services for the registrant’s investment advisors (other than a sub-advisor whose role is primarily portfolio management and is subcontracted or overseen by another investment advisor) and any other entity controlling by, or under common control with the investment advisor that provides ongoing services to the registrant, in each case under (ii) if the engagement relates directly to the operations and financial reporting of the registrant, in accordance with Rule 2-01(c)(7)(ii) of Regulation S-X, subject to waiver provisions set forth in Rule 2-01(c)(7)(ii) of Regulation S-X.
(e)(2) 100% of services included in (b) – (d) above were approved pursuant to Rule 2-01(c)(7)(i)(C) of Regulation S-X.
(f) Not applicable.
(g) The aggregate fees billed for the most recent fiscal year and the preceding fiscal year by the registrant’s principal accountant for non-audit services rendered to the registrant, its investment advisor, and any entity controlling, controlled by, or under common control with the investment advisor that provides ongoing services to the registrant were $25,525 and $19,080 respectively.
(h) Not applicable.
| Items 5. | Audit Committee of Listed Registrants. |
Not applicable.
| Item 6. | Schedule of Investments. |
Not applicable.
| Item 7. | Disclosure of Proxy Voting Policies and Procedures for Closed-End Management Investment Companies. |
Not applicable.
| Item 8. | Portfolio Managers of Closed-End Management Investment Companies. |
Not applicable.
| Item 9. | Purchases of Equity Securities by Closed-End Management Investment Company and Affiliated Purchasers. |
Not applicable.
| Item 10. | Submission of Matters to a Vote of Security Holders. |
Not applicable.
| Item 11. | Controls and Procedures. |
(a) Based on our evaluation conducted within 90 days of the filing date, hereof, the design and operation of the registrant’s disclosure controls and procedures are effective to ensure that material information relating to the registrant is made known to the certifying officers by others within the appropriate entities, particularly during the period in which Forms N-CSR are being prepared, and the registrant’s disclosure controls and procedures allow timely
preparation and review of the information for the registrant’s Form N-CSR and the officer certifications of such Form N-CSR.
(b) There were no significant changes in the registrant’s internal controls or in other factors that could significantly affect these controls subsequent to the date of their evaluation, including any corrective actions with regard to significant deficiencies and material weaknesses.
(a)(1) Code of Ethics filed herewith as EX-99.CODE ETH.
(a)(2) A separate certification for each principal executive and principal financial officer of the registrant as required by Rule 30a-2(a) under the Act(17 CFR270.30a-2(a)). Filed herewith as EX-99.CERT.
(b) Certifications of principal executive officer and principal financial officer, under Section 906 of the Sarbanes-Oxley Act of 2002, and 18 U.S.C. ss.1350. Filed herewith as EX-99.906 CERT.
SIGNATURES
Pursuant to the requirements of the Securities Exchange Act of 1934 and the Investment Company Act of 1940, the registrant has duly caused this report to be signed on its behalf by the undersigned, thereunto duly authorized.
The Flex-funds
| | |
| By: | | /s/ Bruce E. McKibben |
| | Bruce E. McKibben, Treasurer |
| |
| Date: | | February 27, 2008 |
Pursuant to the requirements of the Securities Exchange Act of 1934 and the Investment Company Act of 1940, this report has been signed below by the following persons on behalf of the registrant and in the capacities and on the dates indicated.
| | |
| By: | | /s/ Bruce E. McKibben |
| | Bruce E. McKibben, Treasurer |
| |
| Date: | | February 27, 2008 |
| |
| By: | | /s/ Robert S. Meeder, Jr. |
| | Robert S. Meeder, Jr., President |
| |
| Date: | | February 27, 2008 |