UNITED STATES
SECURITIES AND EXCHANGE COMMISSION
Washington, D.C. 20549
FORM N-CSR
CERTIFIED SHAREHOLDER REPORT
OF REGISTERED MANAGEMENT INVESTMENT COMPANIES
Investment Company Act file number 811-3462
The Flex-funds Trust
6125 Memorial Drive
Dublin, OH 43017
Bruce McKibben
c/o The Flex-funds Trust
6125 Memorial Drive
Dublin, OH 43017
Registrant’s telephone number, including area code: 800-325-3539
Date of fiscal year end: December 31, 2009
Date of reporting period: December 31, 2009
Item 1. Report to Stockholders.
The Flex-funds®
2009 Annual Report
December 31, 2009

| | | | |
| | | | The Flex-funds® Managed by Meeder Asset Management, Inc. 6125 Memorial Drive, Dublin Ohio, 43017 Call Toll Free 800-325-3539 | 760-2159 Fax: 614-766-6669 | www.flexfunds.com Email: flexfunds@meederfinancial.com |
| | |
| The Flex-funds® | | 2009 Annual Report | December 31, 2009 |
TABLE OF CONTENTS
Our Mission Statement
Every day, our mission is to exceed, with integrity, passion, and discipline, the expectations of our shareholders’ and
clients’ overall investment experience.
Core Values
The Client/Shareholder Is Our #1 Priority
Always remember whom we are serving. Our livelihood depends on providing a superior overall investment
experience that exceeds the expectation of our shareholders and clients.
Clarity Of Purpose
Our organization has a clear, well-defined vision. All of our associates are committed to and understand how they
will contribute to that vision.
Communication
We expect open and effective communication, full reporting, including good and bad news, and constructive feedback.
Integrity
We insist upon honesty and adhere to the highest ethical standards.
Excellence/ Innovation
Our associates strive each day for excellence in the work they perform, seek innovative ways to solve problems and
introduce new ideas to take advantage of opportunities. We are a “Think Outside The Box” company.
Associate Well-Being
We value the success and well-being of our associates. We recognize and reward our associates’ contributions.
Respect For Others
Respect all people, value the differences among them and treat them as you would like to be treated.
Seek First To Understand
When interacting with others, place curiosity and understanding of their perspective FIRST, setting aside
preconceived opinions and quick judgment.
Teamwork
We are a synergistic organization that works as a team to exceed our objectives.
Profit
We are profitable. Profitability enhances our services and capabilities, and affords everyone the opportunity
to further their financial well-being.
| | |
| The Flex-funds® | | 2009 Annual Report | December 31, 2009 |
LETTER TO SHAREHOLDERS
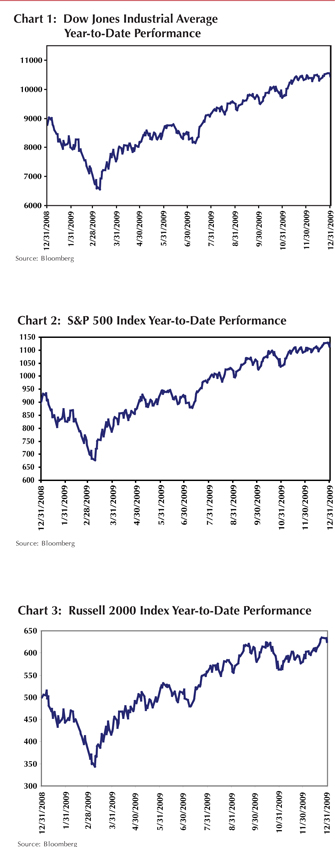
Following significant challenges encountered by the economy and financial markets during the first quarter, a recovery materialized and was reflected by impressive stock market gains for 2009. Compared to the lowest level reached on March 9, 2009, the domestic stock market gained approximately 68% through year end as measured by the S&P 500 Index. For the year ending December 31, 2009, the Dow Jones Industrial Average returned 22.7% (see chart 1), the S&P 500 Index returned 26.5% (see chart 2), and the Russell 2000 returned 27.2% (see chart 3).
We are quite pleased with the performance of many of our Funds. For instance, The Quantex FundTM gained 77.4% for the year. As a result of this impressive performance, the Wall Street Journal recently recognized The Quantex FundTM as the second best performing mid-cap value fund (out of 251 funds) in the country for the year ending December 31, 2009. The Flex-funds® Total Return Utilities Fund was the seventh best performing utilities fund (out of 42 funds) during 2009 according to Morningstar. Additionally, The Dynamic Growth Fund, The Aggressive Growth Fund, and The Strategic Growth Fund all outperformed the S&P 500 for the one year period ended December 31, 2009. Furthermore, The Muirfield Fund®, The Defensive Balanced Fund, and The Strategic Growth Fund all outperformed their custom benchmarks for 2009. Finally, we are pleased to inform you that the retail and institutional classes of The Flex-funds® Money Market Fund continue to be among the top performing money market funds in the country. Based on the 7-day simple yield as of December 29th, the retail class was ranked first out of 232 first tier retail funds, and the institutional class was ranked first out of 286 first tier institutional funds according to iMoneyNet.
2009 witnessed an abundance of events and news headlines that contributed to a volatile stock market. Corporate earnings reports consistently beat analyst expectations since the second quarter as companies moved to dramatically reduce cost structures in order to cope with the recession. Following declines during the first and second quarter, the report on third quarter gross domestic product (GDP) showed an annualized increase of 2.2%, due in part to stimulative actions and programs being implemented by the government. Stimulus funds from the $787 billion American Recovery and Reinvestment Act, which was passed by Congress during the first quarter, are still permeating throughout the economy. Despite these positive developments, many are concerned about the strength and sustainability of an economic recovery.
| | |
The Flex-funds® 2009 Annual Report | December 31, 2009 | | Page 1 |
| | |
| The Flex-funds® | | 2009 Annual Report | December 31, 2009 |
Given the sharp stock market gains, signs of an economic recovery, and development of positive investor sentiment, we continue to evaluate whether this marks the beginning of a new secular bull market, or if downside risks are still a threat in the market. Based on our investment models, we believe we are in a cyclical bull market within a long-term secular bear market. A secular bear market is characterized by pronounced stock market declines, which are counter balanced by advances, and result in an overall long-term trend that is sideways to down. A cyclical bull market within a secular bear market is defined as an intermediate-term rally within the long-term sideways to downward trending secular bear market. Because of the potential risks that are prevalent in secular bear markets, we believe an active management approach to risk exposure is absolutely critical. The following pages will provide an overview of how we managed our risk exposure and the strategies we employed during 2009. We will also provide a brief summary on the economic and financial events that punctuated the full year, and review the performance of our Funds.
2009 in Review
2009 was highlighted by better than expected corporate profits and improving economic data that provided fuel for a stock market rally. However, the economic situation remains fragile and tentative, especially given the lingering weakness in the employment market. The following is a brief overview of significant events that occurred during 2009.
* Improving economic data. Several indicators gauging various components of the economy lend support that the worst has now been realized and a recovery has commenced. Factory orders have increased during seven of the past nine months, after falling for six consecutive months through January 2009. Broader gauges of the manufacturing sector displayed sharp increases compared to the cyclical low points during this recession. The Institute for Supply Management (ISM) Manufacturing Index was reported at 55.9 during the month of December, and has been reported above 50 for the past five months (see Chart 4). By comparison, the manufacturing ISM reached 32.9 in December 2008 during the lowest point of the recession. A reading below 50 indicates contraction while a reading above 50 indicates expansion.
* Corporate earnings show improvement on cost-cutting measures. Corporate earnings reports provide additional insight into the current and prospective economic environment. Following a dismal first quarter, corporate profits during the second and third quarter rebounded stronger than anticipated due to extreme cost-cutting measures. As of the time of this writing, nearly all of the companies comprising the S&P 500 Index have reported earnings for the calendar third quarter time period. The results thus far have been encouraging, with approximately 85% of companies reporting positive earnings surprises during the quarter. As previously mentioned, these results have been driven by significant cost-cutting measures on part of corporations, such as inventory and workforce reductions. However, sales have been generally weaker than expected, leading to concerns that corporate profits could remain depressed if sales do not rebound in subsequent quarters. As a result, we believe investors will continue to pay close attention to the strength of sales during subsequent earnings seasons.
* Housing market displaying signs of improvement. Following a prolonged and severe downturn, there are finally solid indications that the housing market may be in a recovery process due to the economic recovery and stimulus programs. In the most recent report, existing home sales rose by 7.4% in November from the prior month, which follows a 9.9% increase in October and increases during six out of seven prior months (see Chart 5). However, new home sales fell by 11.3% in November compared

| | |
Page 2 | | The Flex-funds® 2009 Annual Report | December 31, 2009 |
| | |
| The Flex-funds® | | 2009 Annual Report | December 31, 2009 |
to the previous month. On a month-to-month basis, housing market data has been quite erratic, driven in part by speculation on the expiration of housing stimulus programs. Additionally, home prices continue to decline as indicated by the S&P/Case-Shiller Home Price Index, which showed an approximate 7.3% drop in national home prices during October compared to the previous year, although the rate of the decline has improved significantly throughout the year. Several initiatives have been announced and implemented by the government and banks which are designed to aid struggling homeowners, including loan modification programs that will lower monthly mortgage payments and a federal tax credit for qualified homebuyers.
* Uncertainty clouds the outlook for the financial sector. The financial sector, which has been at the epicenter of stock market and economic woes since the recession began, has tended to lead the market on the downside as well as the upside during 2009. For instance, financial sector stocks are up 134.3% from the March lows, but are only up 17.2% (compared to 26.5% for the S&P 500) for 2009 due to steep declines during the first quarter. Investor optimism has been driven by improvements in bank sector financial reports as well as the successful capital-raising efforts that should provide a cushion against further potential losses. However, many uncertainties surround the financial sector, including escalating small and regional bank failures as well as fears regarding losses stemming from commercial real estate. For instance, there were 140 bank failures in 2009, mostly comprised of small local and regional banks, compared to 25 bank failures during 2008. Furthermore, there are currently 552 banks on the Federal Deposit Insurance Corporation (FDIC) distressed bank list, and deteriorating conditions in the commercial real estate market are expected to lead to more local and regional bank failures in 2010.
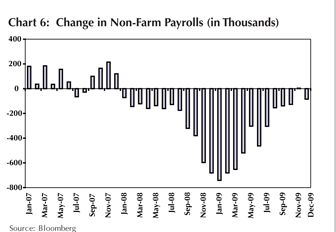
* Job market sending mixed signals. The challenges facing the job market are ubiquitous; however, government actions to stimulate the economy appear to be stabilizing the rate of job losses. In the most recent report, payrolls were reduced by 85,000 in December, which follows a gain of 4,000 in November (see Chart 6). Through December, the economy has lost jobs during twenty-three of the past twenty-four months, with a cumulative loss of over 7 million jobs since January of 2008. Additionally, while the unemployment rate remains elevated, it has at least stabilized at 10.0% during November and December. For comparison purposes, the unemployment rate stood at 7.2% during December of 2008.
* GDP report indicates improving economy. Following declines during the first and second quarters, the report on third quarter gross domestic product (GDP) showed an annualized increase of 2.2%. The improvement from the declines experienced during the first and second quarters is being driven by government spending through stimulus efforts, which is being offset by weakness in business spending as well as the commercial real estate market. The personal consumption component, which increased by 2.8% during the third quarter, is being monitored closely since it comprises approximately two-thirds of total GDP. Also, businesses have been keen to reduce inventories during the recession, which detracts from GDP as well. However, businesses have cut inventories so drastically that many economists anticipate a subsequent boost to GDP through inventory restocking, which would represent a positive contribution to GDP. Coupled with a continuation of heightened government spending due to the fiscal stimulus, it is likely that GDP will continue to expand during the fourth quarter of 2009 and into 2010.
* Inflation debate taking center stage. As the most recent inflation reports show year-over-year price increases at both the producer and consumer levels, a debate regarding the possibility of accelerating inflation is becoming more prominent. In particular, there are fears that the existing federal government deficits, expansion of the Federal Reserve’s balance sheet and massive amounts of spending on the economic stimulus and bailout of various industries will drive inflationary pressure in the future. As a result, there has been much concern regarding the ability of the government and Federal Reserve to reverse spending initiatives in order to remove money from the monetary system. However, reversing the expansion of the monetary base and negating the stimulus package too soon presents the risk of ending these programs before the economy has returned to full health.
| | |
The Flex-funds® 2009 Annual Report | December 31, 2009 | | Page 3 |
| | |
| The Flex-funds® | | 2009 Annual Report | December 31, 2009 |
The events that took place during 2009 highlight the improvements being realized in several sectors of the economy. The stimulative actions being taken by the government and unconventional tactics being employed by the Federal Reserve have helped stabilize the economy and financial system. However, challenges remain prominent, including the lackluster job market and the reluctance of consumers to spend.
Our Investment Approach
Equity Funds
2009 was witness to a volatile stock market environment that presented investors with numerous opportunities. We employed various tactics and strategies throughout 2009 in response to the dynamic and uncertain economic and securities market environment. In The Muirfield Fund® and the equity portion of The Defensive Balanced Fund, we began 2009 with an approximate 60% allocation to the stock market and a 40% defensive position in cash equivalent securities. We increased our defensive position during the first quarter in response to a deteriorating stock market. However, as the year progressed, we decreased our defensive position and increased exposure to the stock market in response to an improving risk/reward relationship indicated by our investment models. We ended 2009 approximately 90% invested in the stock market and 10% invested in short-term bond funds in The Muirfield Fund®.
We utilized our investment models to manage our exposure to growth versus value investments and across the range of market capitalization in all our fund-of-funds based mutual funds. We began the year with an overweight toward value investments due to indications from our investment models. We also maintained our overweight position in small-cap stocks due to readings from our investment models, as well as attractive relative valuations and favorable historical performance during the latter stages of recessions. At the mid-point of 2009, our models indicated a preference for a neutral stance among growth versus value investments, and we responded accordingly. However, this preference was temporary and we reestablished our overweight to value investments during the third quarter, which was maintained for the remainder of the year. Additionally, we ended 2009 with an overweight to small-cap investments as well.
We also managed our industry and sector exposure throughout the year and initiated changes in sector allocations as 2009 progressed. We began 2009 with an overweight to sectors with defensive characteristics, such as consumer staples, healthcare, and utilities. However, late in the first quarter we began reducing our exposure to defensive sectors, and simultaneously began increasing our exposure to sectors with greater potential for capital appreciation, such as energy, materials, and financials. We maintained our materials overweight for the duration of the year, and subsequently restored our overweight to the healthcare and consumer staples sectors due to our models indicating preference for these sectors.
Due to indications from our investment models, we decided to invest in the international markets in the second quarter, which we had avoided since the beginning of the fourth quarter of 2008. We initially established a position in emerging markets, which was soon followed by a position in developed international markets. Interestingly, during the fourth quarter our investment models increased preference for emerging markets, yet they deteriorated for the developed international markets. As a result, we increased our exposure to emerging markets and decreased our exposure to developed international markets.
Fixed Income Funds
The fixed-income markets of 2009 will be long remembered for their volatile movements. At the beginning of the year capital markets were immersed in fear, leading one month U.S. Treasury bills to actually reach negative yields and long maturity U.S. Treasury bonds to trade at record low yields as investors reflected concerns regarding economic collapse. Anchored by a Federal Funds rate near zero percent, 3-month U.S. Treasury bills traded in a narrow range with a yield as low as 0.01% and as high as 0.32%. As for longer dated securities, the 10-year U.S. Treasury bond traded with a yield as low as 2.20% and as high as 4.00% . Consequently, yield spread comparisons to U.S. Treasuries achieved record highs in mortgage, investment grade and high yield sectors. Default concerns were raised across almost every sector.
2009 progressed with everything from “green shoots” to glimmers of hope that the economy would stabilize and a depression scenario would be averted. Economic data began to decline at slower rates, and confidence improved following government intervention. As it appeared a crisis was averted, yield spreads began to tighten which rewarded riskier investors. As data continued to improve, investors’ attention started to focus on characteristics of a stabilizing economy, excess money in the banking system, government stimulus and historically low interest rates. As a result, inflation and accelerating growth began to surface in conversations and forecasts throughout the industry. Finally, yield differentials between the 2-year and 10-year U.S. Treasury securities were pushed to a record high of 2.84%.
| | |
Page 4 | | The Flex-funds® 2009 Annual Report | December 31, 2009 |
| | |
| The Flex-funds® | | 2009 Annual Report | December 31, 2009 |
In 2009 credit risk was rewarded. Investors had priced in excessive default scenarios in case a crisis was not prevented, and this was particularly evident in high yield debt which grossly outperformed all other sectors of the bond market. Safety was not rewarded as U.S. Treasury securities experienced the greatest underperformance of the market. Other sectors which performed well were investment grade corporate bonds, mortgage-backed securities and inflation protected securities.
In conjunction with our models, we maintained the maximum exposure allowable in investment grade securities. Investment grade holdings were slanted toward higher quality diversified financial, technology, and mortgage-backed securities. Among U.S. government securities, we maintained preference for U.S. government agency securities versus U.S. Treasury securities. As always, our fund strategy would favor sectors in the markets where we could participate in upside while not relinquishing control of risk factor. In the U.S. government agency sector, we maintained positions in senior debt and mortgage-backed securities. Finally, where our models indicated some exposure to U.S. Treasury securities, we opted for inflation protected securities (TIPS). With the anticipation of higher inflation on the horizon, TIPS posted strong performance in 2009.
Finally, The Flex-funds® Money Market Fund performance remains among the top performers in the iMoneyNet universe of first tier retail and institutional money market funds. Our investment strategy for this Fund remained unchanged throughout 2009 and the Fund’s strong performance was accomplished by maintaining its focus on high-quality money market securities and expense controls.
Concluding Remarks
In stark contrast to how the year began, 2009 delivered one of the best stock market performances in recent history. In the second quarter, we discussed the attributes of the stock market rally as related to an improvement in the rate of economic decline as well as clearly visible signs of ‘green shoots,’ which refers to positive signs of economic activity. During the third quarter, we stated that in order for the stock market to sustain its gains and continue its advance, a transition to actual gains in economic activity would need to be evident as opposed to just an improvement in the rate of decline. In many instances, gains in economic activity were realized during the third and fourth quarters, which reinforced the stock market gains and led to new 2009 highs for the major market indices.
As we monitor the stock market and our investment models, we will continuously evaluate our defensive position in The Muirfield Fund® and The Defensive Balanced Fund. For all of our fund-of-funds based mutual funds, we will look for opportunities to adjust portfolio weights among growth and value stocks, large-, mid-, and small-caps, and domestic and international investments in order to enhance returns and manage risk for our clients. We will also continue to proactively manage our sector exposures and will make adjustments as we modify our outlook for the economy and financial markets. On the following pages you will find a review of how our Funds have performed. Please read the commentaries to learn more about the investment decisions that were made during the past year.
These are definitely challenging times in the financial services industry. Since 1974, Meeder Financial has navigated through periods of extremely difficult market environments. On behalf of all of the associates at Meeder Asset Management, I thank you for the continued trust and confidence you have placed in our investment management services. Be assured we are 100% committed to working with you and helping you achieve your most important financial goals.
|
| Sincerely |
|
 |
|
| Robert S. Meeder, Jr. |
| President |
| The Flex-funds® |
| December 31, 2009 |
| | |
The Flex-funds® 2009 Annual Report | December 31, 2009 | | Page 5 |
| | |
| The Flex-funds® | | 2009 Annual Report | December 31, 2009 |
The Quantex Fund™ (formerly The Highlands Growth Fund*)
Annual Market Perspective
With a 77.37% total return for 2009, The Quantex Fund™ ranked as the #2 Mid-Cap Value Fund for 2009 according to the Wall Street Journal.
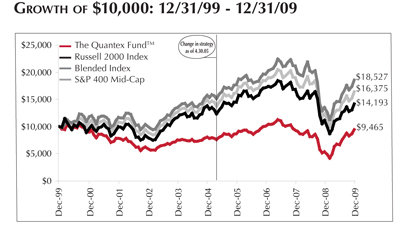
The Quantex Fund™ returned 77.37% for the year ended December 31, 2009. By comparison, the Russell 2000 Index returned 27.17% and the S&P 400 Mid-Cap Index returned 37.38% for the same period. As a result of this impressive performance, the Wall Street Journal recently recognized The Quantex Fund™ as the second best performing mid-cap value fund (out of 251 funds) in the country for the year ending December 31, 2009. We would also note that the Fund performed favorably against broader measures of stock market performance, such as the S&P 500 Index which returned 26.47% for 2009. Further, The Quantex Fund™ is now well ahead of the blended index, consisting of 50% of the Russell 2000 Index and 50% of the S&P 400 Mid-Cap Index, for the 5-year period. As the past two years have demonstrated, the Fund has a tendency to encounter stiff headwinds during turbulent markets, offset by the ability to lead the market higher on the upside, which was demonstrated in 2009. We believe this tendency is due to the ‘fallen angel’ status of many of our holdings. In other words, the Fund tends to hold stocks that are out of favor and have declined to a pre-determined capitalization range for inclusion into the Fund.
We have consistently employed our quantitative stock selection process since April 30, 2005 for The Quantex Fund™. We utilize rankings from our financial model to determine which securities are to be held in the Fund on an annual basis. As a result, the Fund is rebalanced once each year in January. From a broad standpoint for 2010, the Fund will begin the year with a 40% allocation to the manufacturing sector, a 37% allocation to the service sector, and a 23% allocation to information technology. In the 2010 Fund, there is a strong preference for value holdings, with mid-cap value companies comprising 39% of the Fund, followed by mid-cap core with 35%, mid-cap growth with 14%, and small-cap holdings of 12% comprise the remainder according to our allocation analysis at the beginning of the year.
For 2009, the single best performing stock was XL Capital, LTD (up 420%) followed by Tenet Healthcare Corporation (up 369%) and Advanced Micro Devices (up 348%). The worst performing stocks during 2009 include Huntington Bancshares, Inc. (down 52%), Eastman Kodak Co. (down 36%), and Dynegy, Inc. (down 10%).
| | |
Page 6 | | The Flex-funds® 2009 Annual Report | December 31, 2009 |
| | |
| The Flex-funds® | | 2009 Annual Report | December 31, 2009 |
PERFORMANCE PERSPECTIVE
Period & Average Annual Total Returns as of December 31, 2009
| | | | | | | | | | | | | | | | | | |
| | | 1
Year | | | 4/30/05 to
12/31/09* | | | 5
Year | | | 10
Year | | | Net Expense
Ratio+ | | | Gross Expense
Ratio+ | |
The Quantex Fund™1 | | 77.37 | % | | 4.75 | % | | 3.25 | % | | -0.55 | % | | 1.73 | % | | 2.26 | % |
| | | | | | |
Russell 2000 Index2 | | 27.17 | % | | 3.05 | % | | 0.54 | % | | 3.55 | % | | — | | | — | |
| | | | | | |
Blended Index3 | | 32.24 | % | | 3.81 | % | | 1.94 | % | | 5.06 | % | | — | | | — | |
| | | | | | |
S&P 400 Mid-Cap Index4 | | 37.38 | % | | 4.47 | % | | 3.27 | % | | 6.35 | % | | — | | | — | |
| 1 | The inception date of The Quantex Fund™ is 3/20/1985. |
| 2 | The Russell 2000 Index is a market-capitalization weighted index measuring performance of the smallest 2,000 companies, on a market capitalization basis, in the Russell 3000 Index. One cannot invest directly in an index. |
| 3 | The Blended Index consists of 50% Russell 2000 Index and 50% S&P 400 Mid-Cap Index. One cannot invest directly in an index. |
| 4 | The S&P 400 Mid-Cap Index is an unmanaged index of common stock prices of mid-sized companies. One cannot invest directly in an index. |
| * | The Quantex Fund™ was previously known as The Highlands Growth Fund. On April 30, 2005, The Highlands Growth Fund changed its name to The Quantex Fund™, also changing the Fund’s investment objective and strategies. The Highlands Growth Fund focused on large-cap equities, while The Quantex Fund™ utilizes quantitative investment strategies that invest primarily in small- and mid-cap equities. Due to this change in strategies on April 30, 2005, the S&P 500 Index is a more comparative index for Fund performance prior to April 30, 2005. The Russell 2000 Index and S&P 400 Mid-Cap Index are more comparative indices for Fund performance after April 30, 2005. |
| + | The Net and Gross Expense Ratios are percentages of the Fund’s average net assets as they are shown in the most current Fund’s Prospectus. The Net Expense Ratio includes all waivers, reimbursements and expenses paid indirectly. |
Performance quoted represents past performance. Past performance does not guarantee future results. All performance figures represent average annual total returns for the periods ended December 31, 2009, and assume reinvestment of all dividend and capital gain distributions. The investment return and principal value of an investment will fluctuate so that an investor’s shares, when redeemed, may be worth more or less than their original cost. Current performance may be higher or lower than the performance quoted. Current month-end performance may be obtained at www.flexfunds.com or by calling 1.800.325.3539. Management fees were waived and/ or expenses were reimbursed in order to reduce the operating expenses of The Quantex Fund™ during the periods shown above. Source for index data: Morningstar, Inc.
The Quantex Fund™ was previously known as The Highlands Growth Fund. On April 30, 2005, The Highlands Growth Fund changed its name to The Quantex Fund™, also changing the Fund’s investment objective and strategies. Due to this, the Russell 2000 Index and the S&P 400 Mid-Cap Index are more comparative indices for Fund performance.
The Growth of $10,000 chart compares the value of The Quantex Fund™ to the S&P 400 Mid-Cap Index and the Russell 2000 Index, the Fund’s broad-based benchmarks, and to the Blended Index described above. The chart is intended to give you a general idea of how the Fund performed compared to these benchmarks over the period from December 31, 1999 to December 31, 2009. An understanding of the differences between the Fund and these indices is important. The benchmark indices do not take into account the deduction of expenses associated with a mutual fund, such as investment management and accounting fees. One cannot invest directly in an index.
Past performance does not guarantee future results. The chart and the table do not reflect the deduction of taxes that a shareholder would pay on fund distributions or the redemption of fund shares.
| | | | | | | |
| | Top Ten Holdings as of December 31, 2009 | |
| | | |
 | | 1) | | XL Capital, LTD. | | 2.9 | % |
| | 2) | | Tenet Heathcare Corp. | | 2.4 | % |
| | 3) | | Genworth Financial, Inc. | | 2.4 | % |
| | 4) | | Micron Technology, Inc. | | 2.4 | % |
| | 5) | | Advanced Micro Devices, Inc. | | 2.3 | % |
| | 6) | | Expedia, Inc. | | 1.9 | % |
| | 7) | | Massey Energy | | 1.8 | % |
| | 8) | | SanDisk Corporation | | 1.8 | % |
| | 9) | | Pioneer Natural Resources Company | | 1.8 | % |
| | 10) | | Whole Foods Market, Inc. | | 1.7 | % |
| | |
The Flex-funds® 2009 Annual Report | December 31, 2009 | | Page 7 |
| | |
| The Flex-funds® | | 2009 Annual Report | December 31, 2009 |
The Aggressive Growth Fund
Annual Market Perspective
The Aggressive Growth Fund returned 32.76% for 2009.
The Flex-Funds® Aggressive Growth Fund returned 32.76% for 2009. The year witnessed an abundance of events and news headlines that contributed to significant stock market gains. The report on third quarter gross domestic product (GDP) showed an annualized increase of 2.2%, due in part to stimulative actions and programs being implemented by the government. Additionally, corporate earnings reports consistently beat analyst expectations since the second quarter as companies moved to dramatically reduce cost structures in order to cope with the recession.
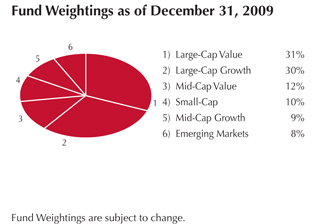
In The Aggressive Growth Fund, we utilize investment models in order to aid the investment decision-making process, which impacts our exposure to growth versus value investments and across the range of market capitalization. We began the year with an overweight toward value investments due to indications from our investment models. We also maintained our overweight position in small-cap stocks due to readings from our investment models, as well as attractive relative valuations and favorable historical performance during the latter stages of recessions. At the midpoint of 2009, our models indicated a preference for a neutral stance among growth versus value investments, and we responded accordingly. However, this preference was temporary and we reestablished our overweight to value investments during the third quarter, which was maintained for the remainder of the year. Additionally, we ended 2009 with an overweight to mid- and small-cap investments as well.
Due to indications from our investment models, we decided to invest in the international markets in the second quarter, which we had avoided since the beginning of the fourth quarter of 2008. We initially established a position in emerging markets, which was soon followed by a position in developed international markets. Interestingly, during the fourth quarter our investment models increased preference for emerging markets, yet they deteriorated for the developed international markets. As a result, we increased our exposure to emerging markets and decreased our exposure to developed international markets.
We also managed our industry and sector exposure throughout the year and initiated changes in sector allocations as 2009 progressed. We began 2009 with an overweight to sectors with defensive characteristics, such as consumer staples, healthcare, and utilities. However, late in the first quarter we began reducing our exposure to defensive sectors, and simultaneously began increasing our exposure to sectors with greater potential for capital appreciation. We maintained an overweight in materials for the duration of the year, and subsequently restored our overweight to the healthcare and consumer staples sector due to model indications.
| | |
Page 8 | | The Flex-funds® 2009 Annual Report | December 31, 2009 |
| | |
| The Flex-funds® | | 2009 Annual Report | December 31, 2009 |
PERFORMANCE PERSPECTIVE
Period & Average Annual Total Returns as of December 31, 2009
| | | | | | | | | | | | | | | |
| | | 1
Year | | | 5
Year | | | Since
Inception | | | Net Expense
Ratio+ | | | Gross Expense
Ratio+ | |
The Aggressive Growth Fund | | 32.76 | % | | 0.61 | % | | -3.48 | %1 | | 1.62 | % | | 1.84 | % |
| | | | | |
S&P 500 Index2 | | 26.47 | % | | 0.42 | % | | -0.25 | % | | | | | | |
| | | | | |
NASDAQ Composite Index3 | | 45.36 | % | | 1.71 | % | | -6.54 | % | | — | | | — | |
| 1 | Inception date for The Aggressive Growth Fund is 2/29/00. |
| 2 | The S&P 500 Index is a widely recognized unmanaged index of common stock prices that does not take into account the deduction of expenses associated with a mutual fund, such as investment management and accounting fees. One cannot invest directly in an index. |
| 3 | The NASDAQ Composite Index is a broad-based capitalization-weighted index of all NASDAQ National Market and small-cap stocks that does not take into account the deduction of expenses associated with a mutual fund, such as investment management and accounting fees. One cannot invest directly in an index. |
| + | The Net and Gross Expense Ratios are percentages of the Fund’s average net assets as they are shown in the most current Fund’s Prospectus. The Net Expense Ratio includes all waivers, reimbursements and expenses paid indirectly. |
Performance quoted represents past performance. Past performance does not guarantee future results. All performance figures represent average annual total returns for the periods ended December 31, 2009, and assume reinvestment of all dividend and capital gain distributions. The investment return and principal value of an investment will fluctuate so that an investor’s shares, when redeemed, may be worth more or less than their original cost. Current performance may be higher or lower than the performance quoted. Current month-end performance may be obtained at www.flexfunds.com or by calling 1.800.325.3539. Management fees were waived and/or expenses were reimbursed in order to reduce the operating expenses of The Aggressive Growth Fund during the periods shown above. Source for index data: Morningstar, Inc.
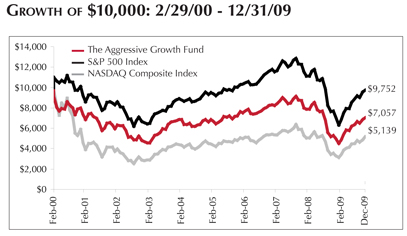
The Growth of $10,000 chart compares The Aggressive Growth Fund’s value to the NASDAQ Composite Index, the Fund’s broad-based benchmark and the S&P 500 Index. The chart is intended to give you a general idea of how the Fund performed compared to these benchmarks over the period from its inception on February 29, 2000 to December 31, 2009. An understanding of the differences between the Fund and these indices is important. The NASDAQ Composite Index is a hypothetical unmanaged index of small-cap and NASDAQ National Market stocks that does not take into account the deduction of expenses associated with a mutual fund, such as investment management and accounting fees. The S&P 500 Index is a widely recognized unmanaged index of common stock prices that does not take into account the deduction of expenses associated with a mutual fund, such as investment management and accounting fees. One cannot invest directly in an index.
Past performance does not guarantee future results. The chart and the table do not reflect the deduction of taxes that a shareholder would pay on fund distributions or the redemption of fund shares.
| | | | | | | |
| | Top Ten Holdings as of December 31, 2009 | |
| | | |
 | | 1) | | Fairholme Fund | | 8.6 | % |
| | 2) | | iShares MSCI Emerging Markets Index Fund | | 8.2 | % |
| | 3) | | Nuveen Tradewinds Value Opportunities Fund | | 7.5 | % |
| | 4) | | Fidelity Advisor Leveraged Company Stock Fund | | 7.0 | % |
| | 5) | | PowerShares QQQ | | 6.6 | % |
| | 6) | | Technology Select Sector SPDR Fund | | 6.5 | % |
| | 7) | | Janus Forty Fund | | 6.3 | % |
| | 8) | | TCW Small Cap Growth Fund | | 6.2 | % |
| | 9) | | RS Emerging Markets Fund | | 6.0 | % |
| | 10) | | Energy Select Sector SPDR Fund | | 5.8 | % |
| | | | | | | |
| | |
The Flex-funds® 2009 Annual Report | December 31, 2009 | | Page 9 |
| | |
| The Flex-funds® | | 2009 Annual Report | December 31, 2009 |
The Dynamic Growth Fund
Annual Market Perspective
The Dynamic Growth Fund performed 2.40% better than the S&P 500 Index in 2009.
The Flex-funds® Dynamic Growth Fund returned 28.87% during 2009. By comparison, the S&P 500 Index benchmark returned 26.47% for the same time period. The domestic stock market continued its impressive rally through the fourth quarter of 2009 and is now approximately 68% above the lowest level experienced on March 9, 2009 as measured by the S&P 500 Index. Despite the challenges encountered by the economy and financial markets during the first quarter, a recovery materialized and was reflected by impressive stock market gains.
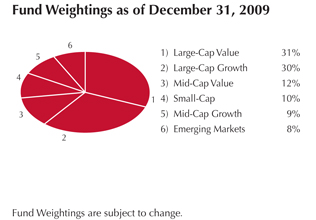
Regarding our stock market exposure, we utilized our investment models to manage our exposure to growth versus value investments and across the range of market capitalization in The Dynamic Growth Fund. We began the year with an overweight toward value investments due to indications from our investment models, and we also maintained our overweight position in small-cap stocks. At the mid-point of 2009, our models indicated a preference for a neutral stance among growth versus value investments, and we responded accordingly. However, this preference was temporary and we reestablished our overweight to value investments during the third quarter, which was maintained for the remainder of the year. We ended 2009 with an overweight to small-cap investments as well.
We also managed our industry and sector exposure throughout the year and initiated changes in sector allocations as 2009 progressed. We began 2009 with an overweight to sectors with defensive characteristics, such as consumer staples, healthcare, and utilities. However, late in the first quarter we began reducing our exposure to defensive sectors, and simultaneously began increasing our exposure to sectors with greater potential for capital appreciation. We maintained an overweight in materials for the duration of the year, and subsequently restored our overweight positions to the healthcare and consumer staples sectors due to model indications. Additionally, we decided to invest in the international markets in the second quarter, which we had avoided since the beginning of the fourth quarter of 2008. We initially established a position in emerging markets, which was soon followed by a position in developed international markets. Interestingly, during the fourth quarter our investment models increased preference for emerging markets, yet they deteriorated for the developed international markets. As a result, we increased our exposure to emerging markets and decreased our exposure to developed international markets. Global stimulus programs were also a key factor in our decision to invest in emerging markets, which generally exhibited a stronger rebound compared to developed nations.
| | |
Page 10 | | The Flex-funds® 2009 Annual Report | December 31, 2009 |
| | |
| The Flex-funds® | | 2009 Annual Report | December 31, 2009 |
PERFORMANCE PERSPECTIVE
Period & Average Annual Total Returns as of December 31, 2009
| | | | | | | | | | | | | | | |
| | | 1
Year | | | 5
Year | | | Since
Inception | | | Net Expense
Ratio+ | | | Gross Expense
Ratio+ | |
| | | | | |
The Dynamic Growth Fund | | 28.87 | % | | 0.25 | % | | -2.04 | %1 | | 1.34 | % | | 1.69 | % |
| | | | | |
S&P 500 Index2 | | 26.47 | % | | 0.42 | % | | -0.25 | % | | — | | | — | |
| 1 | Inception date for The Dynamic Growth Fund is 2/29/00. |
| 2 | The S&P 500 Index is a widely recognized unmanaged index of common stock prices that does not take into account the deduction of expenses associated with a mutual fund, such as investment management and accounting fees. One cannot invest directly in an index. |
| + | The Net and Gross Expense Ratios are percentages of the Fund’s average net assets as they are shown in the most current Fund’s Prospectus. The Net Expense Ratio includes all waivers, reimbursements and expenses paid indirectly. |
Performance quoted represents past performance. Past performance does not guarantee future results. All performance figures represent average annual total returns for the periods ended December 31, 2009, and assume reinvestment of all dividend and capital gain distributions. The investment return and principal value of an investment will fluctuate so that an investor’s shares, when redeemed, may be worth more or less than their original cost. Current performance may be higher or lower than the performance quoted. Current month-end performance may be obtained at www.flexfunds.com or by calling 1.800.325.3539. Management fees were waived and/or expenses were reimbursed in order to reduce the operating expenses of The Dynamic Growth Fund during the periods shown above. Source for index data: Morningstar, Inc.
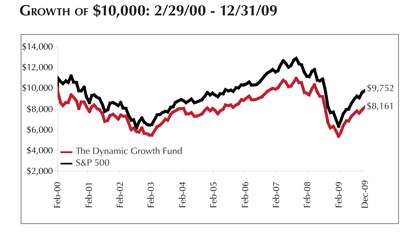
The Growth of $10,000 chart compares The Dynamic Growth Fund’s value to the S&P 500 Index, the Fund’s broad-based benchmark. The chart is intended to give you a general idea of how the Fund performed compared to this benchmark over the period from its inception on February 29, 2000 to December 31, 2009. An understanding of the differences between the Fund and this index is important. The S&P 500 Index is a hypothetical unmanaged index of common stocks that does not take into account the deduction of expenses associated with a mutual fund, such as investment management and accounting fees. One cannot invest directly in an index.
Past performance does not guarantee future results. The chart and the table do not reflect the deduction of taxes that a shareholder would pay on fund distributions or the redemption of fund shares.
| | | | | | | |
 | | Top Ten Holdings as of December 31, 2009 | |
| | 1) | | Nuveen Tradewinds Value Opportunities Fund | | 7.5 | % |
| | 2) | | Fairholme Fund | | 7.3 | % |
| | 3) | | Energy Select Sector SPDR Fund | | 5.5 | % |
| | 4) | | Fidelity Advisor Leveraged Company Stock Fund | | 5.4 | % |
| | 5) | | PowerShares QQQ | | 5.2 | % |
| | 6) | | Ridgeworth Small Cap Value Equity Fund | | 4.9 | % |
| | 7) | | Janus Forty Fund | | 4.8 | % |
| | 8) | | Ridgeworth Mid Cap Value Equity Fund | | 4.8 | % |
| | 9) | | Consumer Staples Select Sector SPDR Fund | | 4.7 | % |
| | 10) | | Heartland Value Plus Fund | | 4.6 | % |
| | |
The Flex-funds® 2009 Annual Report | December 31, 2009 | | Page 11 |
| | |
| The Flex-funds® | | 2009 Annual Report | December 31, 2009 |
The Strategic Growth Fund (formerly The Focused Growth Fund*)
Annual Market Perspective
The Strategic Growth Fund outperformed its custom benchmark by 4.51% in 2009.
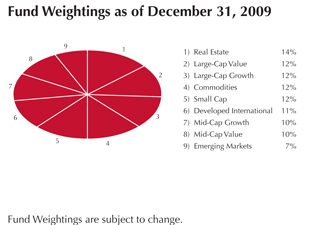
For the year ended December 31, 2009, The Strategic Growth Fund returned 35.79%, outperforming both the S&P 500 Index and its custom benchmark. The Strategic Growth Fund is fully invested in the equity market at all times and holds a fixed allocation across six distinct investment categories. The mix of investments selected to represent each investment category is variable and actively managed by using our strategic fund selection process. The asset allocation mix was determined by optimizing the overall portfolio return while minimizing risk during a specified time period. The current target allocation is comprised of the following: 25% large-cap holdings, 20% mid-cap holdings, 17.5% international holdings, 12.5% small-cap holdings, 12.5% real estate holdings, and 12.5% commodities holdings.
The Fund’s favorable performance during 2009 versus its custom benchmark and the S&P 500 Index can be directly attributed to several of the asset allocation categories as well as fund selection. For instance, the MSCI Emerging Markets Index increased by 78% during 2009, and is a component of our international holdings allocation (be advised one cannot invest directly in an index). Additionally, indexes tracking mid-cap stocks and real estate-related stocks rose by 37% and 28%, respectively, during 2009. On a combined basis, the three aforementioned categories comprise approximately 38% of the target allocation of the Fund.
The Fund’s performance is compared against a custom benchmark that reflects the target allocations previously specified. For the year through December 31, 2009, the Fund outperformed the benchmark as a result of favorable fund selection in various categories. For instance, the Allianz NFJ International Value Fund outperformed its benchmark during 2009. We also experienced favorable results among several large-cap holdings, including the Fairholme Fund and the Hartford Capital Appreciation Fund. The Van Eck Global Hard Assets Fund contributed positively to our holdings of commodity-related stocks, and our real estate holding of First American Real Estate Fund proved beneficial. However, a few funds detracted from our performance against the custom benchmark, including our large-cap holdings of the AIM Diversified Dividend Fund and the Ivy Asset Strategy Fund. Additionally, the Heartland Value Plus Fund detracted from our small-cap performance.
The custom benchmark for The Strategic Growth Fund is comprised of 25% of the S&P 500 Index, 20% of the S&P 400 Index, 12.5% of the Russell 2000 Index, 12.5% of the Dow Jones US Select REIT Index, 12.5% of the S&P GSCI Index, 12% of the MSCI EAFE Index, and 5.5% of the MSCI Emerging Markets Index.
| | |
Page 12 | | The Flex-funds® 2009 Annual Report | December 31, 2009 |
| | |
| The Flex-funds® | | 2009 Annual Report | December 31, 2009 |
PERFORMANCE PERSPECTIVE
Period & Average Annual Total Returns as of December 31, 2009
| | | | | | | | | | | | | | | |
| | | 1
Year | | | 8/25/08 to
12/31/09* | | | Since
Inception | | | Net Expense
Ratio+ | | | Gross Expense
Ratio+ | |
The Strategic Growth Fund* | | 35.79 | % | | -11.38 | % | | -3.28 | %1 | | 1.57 | % | | 1.74 | % |
| | | | | |
Blended Index2 | | 31.28 | % | | -11.87 | %4 | | -1.61 | % | | — | | | — | |
| | | | | |
S&P 500 Index3 | | 26.47 | % | | -6.68 | % | | -1.35 | % | | — | | | — | |
| 1 | Inception date for The Strategic Growth Fund is 1/31/06. |
| 2 | The Blended Index consists of 25% of the S&P 500 Index, 20% of the S&P 400 Index, 12.5% of the Russell 2000 Index, 12.5% of the Dow Jones US Select REIT Index, 12.5% of the S&P GSCI Index, 12% of the MSCI EAFE Index, and 5.5% of the MSCI Emerging Markets Index. |
| 3 | The S&P 500 Index is a widely recognized unmanaged index of common stock prices that does not take into account the deduction of expenses associated with a mutual fund, such as investment management and accounting fees. One cannot invest directly in an index. |
| 4 | Return for the Blended Index is from 8/31/08 through 12/31/09. |
| * | On August 25, 2008, The Focused Growth Fund became known as The Strategic Growth Fund and its investment strategy changed. This Fund will pursue its goal by investing primarily in open-end or closed-end investment companies that seek capital growth or appreciation without regard to current income. In addition, this fund will always have set allocations to U.S. large-cap equities, U.S. mid-cap equities, U.S. small-cap equities, non-U.S./International (including emerging markets) equities, real estate equities and commodity based equities. |
| + | The Net and Gross Expense Ratios are percentages of the Fund’s average net assets as they are shown in the most current Fund’s Prospectus. The Net Expense Ratio includes all waivers, reimbursements and expenses paid indirectly. |
Performance quoted represents past performance. Past performance does not guarantee future results. All performance figures represent average annual total returns for the periods ended December 31, 2009, and assume reinvestment of all dividend and capital gain distributions. The investment return and principal value of an investment will fluctuate so that an investor’s shares, when redeemed, may be worth more or less than their original cost. Current performance may be higher or lower than the performance quoted. Current month-end performance may be obtained at www.flexfunds.com or by calling 1.800.325.3539. Management fees were waived and/or expenses were reimbursed in order to reduce the operating expenses of The Strategic Growth Fund during the periods shown above. Source for index data: Morningstar, Inc.
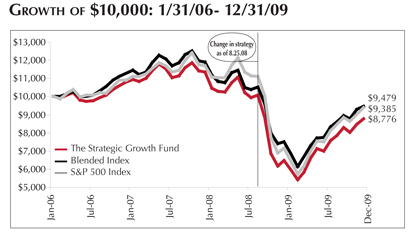
The Growth of $10,000 chart compares The Strategic Growth Fund’s value to the S&P 500 Index, the Fund’s broad-based benchmark, and the Blended Index, which is described above. The chart is intended to give you a general idea of how the Fund performed compared to these indices over the period from its inception on January 31, 2006 to December 31, 2009. An understanding of the differences between the Fund and these indices is important. The benchmark indices are hypothetical unmanaged indices of common stock that do not take into account the deduction of expenses associated with a mutual fund, such as investment management and accounting fees. One cannot invest directly in an index.
Past performance does not guarantee future results. The chart and the table do not reflect the deduction of taxes that a shareholder would pay on fund distributions or the redemption of fund shares.
| | | | | | | |
| | Top Ten Holdings as of December 31, 2009 | |
| | 1) | | Allianz NFJ International Value Fund | | 10.3 | % |
| | 2) | | Van Eck Global Hard Assets Fund | | 8.7 | % |
| | 3) | | RS Emerging Markets Fund | | 7.4 | % |
| | 4) | | First American Real Estate Securities Fund | | 7.0 | % |
| | 5) | | Oppenheimer Real Estate Fund | | 6.6 | % |
| | 6) | | Nuveen Tradewinds Value Opportunities Fund | | 4.8 | % |
| | 7) | | Touchstone Mid Cap Growth Fund | | 4.7 | % |
| | 8) | | Fairholme Fund | | 4.5 | % |
| | 9) | | Ridgeworth Small Cap Value Fund | | 4.4 | % |
| | 10) | | Heartland Value Plus Fund | | 4.3 | % |
| | | | | | | |
| | |
The Flex-funds® 2009 Annual Report | December 31, 2009 | | Page 13 |
| | |
| The Flex-funds® | | 2009 Annual Report | December 31, 2009 |
The Muirfield Fund®
Annual Market Perspective
Due to our asset allocation decisions, The Muirfield Fund® outperformed its custom benchmark by 3.04% in 2009
The Flex-funds Muirfield Fund® returned 18.95% for the year ended December 31, 2009. By comparison, a blended benchmark comprised of 60% of the S&P 500 Index and 40% of the 90-day U.S. Treasury Bill returned 15.91% during 2009.
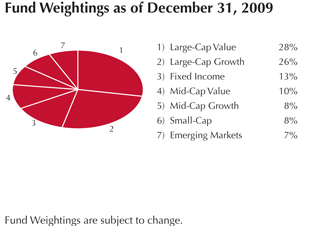
The Muirfield Fund® began 2009 approximately 60% invested in the stock market and 40% invested in cash equivalent securities. We increased our defensive position during the first quarter in response to a deteriorating stock market. However, as the year progressed, we decreased our defensive position and increased exposure to the stock market in response to an improving risk/ reward relationship indicated by our investment models. We ended 2009 approximately 90% invested in the stock market and 10% invested in short-term bond funds in The Muirfield Fund®.
We managed our industry and sector exposure throughout the year and initiated changes in sector allocations as 2009 progressed. We began 2009 with an overweight to sectors with defensive characteristics, such as consumer staples, healthcare, and utilities. However, late in the first quarter we began reducing our exposure to defensive sectors, and simultaneously began increasing our exposure to sectors with greater potential for capital appreciation, such as energy, materials, and financials. We maintained our materials overweight for the remainder of the year, and subsequently restored our overweight to the healthcare and consumer staples sectors due to our models indicating preference for these sectors.
We also managed our exposure to large-, mid-, and small-cap companies, as well as growth versus value investments. We began the year with an overweight toward value investments due to indications from our investment models. We also maintained our overweight position in small-cap stocks due to readings from our investment models, as well as attractive relative valuations and favorable historical performance during the latter stages of recessions. At the midpoint of 2009, our models indicated a preference for a neutral stance among growth versus value investments, and we responded accordingly. However, this preference was temporary and we reestablished our overweight to value investments during the third quarter, which was maintained for the remainder of the year. Additionally, we ended 2009 with an overweight to small-cap investments as well.
Finally, we decided to invest in the international markets in the second quarter, which we had avoided since the beginning of the fourth quarter of 2008. We initially established a position in emerging markets, which was soon followed by a position in developed international markets. Interestingly, during the fourth quarter our investment models increased preference for emerging markets, yet they deteriorated for the developed international markets. As a result, we increased our exposure to emerging markets and decreased our exposure to developed international markets.
| | |
Page 14 | | The Flex-funds® 2009 Annual Report | December 31, 2009 |
| | |
| The Flex-funds® | | 2009 Annual Report | December 31, 2009 |
PERFORMANCE PERSPECTIVE
Period & Average Annual Total Returns as of December 31, 2009
| | | | | | | | | | | | | | | |
| | | 1
Year | | | 5
Year | | | 10
Year | | | Net Expense
Ratio+ | | | Gross Expense
Ratio+ | |
The Muirfield Fund®1 | | 18.95 | % | | 0.65 | % | | -0.83 | % | | 1.39 | % | | 1.75 | % |
| | | | | |
Blended Index2 | | 15.91 | % | | 1.75 | % | | 0.89 | % | | — | | | — | |
| | | | | |
S&P 500 Index3 | | 26.47 | % | | 0.42 | % | | -0.95 | % | | — | | | — | |
| 1 | Inception date for The Muirfield Fund® is 8/10/88. |
| 2 | The Blended Index is comprised of 60% S&P 500 Index & 40% 90-day T-bills. This index does not take into account the deduction of expenses associated with a mutual fund, such as investment management and accounting fees. One cannot invest directly in an index. |
| 3 | The S&P 500 Index is a widely recognized unmanaged index of common stock prices that does not take into account the deduction of expenses associated with a mutual fund, such as investment management and accounting fees. One cannot invest directly in an index. |
| + | The Net and Gross Expense Ratios are percentages of the Fund’s average net assets as they are shown in the most current Fund’s Prospectus. The Net Expense Ratio includes all waivers, reimbursements and expenses paid indirectly. |
Performance quoted represents past performance. Past performance does not guarantee future results. All performance figures represent average annual total returns for the periods ended December 31, 2009, and assume reinvestment of all dividend and capital gain distributions. The investment return and principal value of an investment will fluctuate so that an investor’s shares, when redeemed, may be worth more or less than their original cost. Current performance may be higher or lower than the performance quoted. Current month-end performance may be obtained at www.flexfunds.com or by calling 1.800.325.3539. Management fees were waived and/or expenses were reimbursed in order to reduce the operating expenses of The Muirfield Fund® during the periods shown above. Source for index data: Morningstar, Inc.
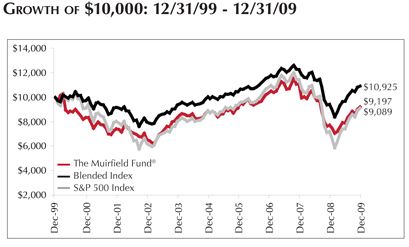
The Growth of $10,000 chart compares the value of The Muirfield Fund* to the S&P 500 Index, the Fund’s broad-based benchmark, and to an index composed of 60% of the S&P 500 Index and 40% of 90-day T-bills. The chart is intended to give you a general idea of how the Fund performed compared to these indices over the period from December 31, 1999 to December 31, 2009. An understanding of the differences between the Fund and these indices is important. The benchmark indices are hypothetical unmanaged indices of common stocks and 90-day T-bills that do not take into account the deduction of expenses associated with a mutual fund, such as investment management and accounting fees. One cannot invest directly in an index.
Past performance does not guarantee future results. The chart and the table do not reflect the deduction of taxes that a shareholder would pay on fund distributions or the redemption of fund shares.
| | | | | | | |
| | Top Ten Holdings as of December 31, 2009 | |
 | | 1) | | Fairholme Fund | | 7.8 | % |
| | 2) | | Nuveen Tradewinds Value Opportunities Fund | | 6.0 | % |
| | 3) | | Janus Forty Fund | | 5.7 | % |
| | 4) | | Fidelity Advisor Leveraged Company Stock Fund | | 4.8 | % |
| | 5) | | PowerShares QQQ | | 4.7 | % |
| | 6) | | Energy Select Sector SPDR Fund | | 4.6 | % |
| | 7) | | Ridgeworth Mid Cap Value Equity Fund | | 4.4 | % |
| | 8) | | Ridgeworth Small Cap Value Equity Fund | | 4.1 | % |
| | 9) | | Putnam Equity Income Fund | | 4.0 | % |
| | 10) | | Technology Select Sector SPDR Fund | | 3.9 | % |
| | |
The Flex-funds® 2009 Annual Report | December 31, 2009 | | Page 15 |
| | |
| The Flex-funds® | | 2009 Annual Report | December 31, 2009 |
The Defensive Balanced Fund (formerly The Defensive Growth Fund*)
Annual Market Perspective
The Defensive Balanced Fund outperformed its custom benchmark by 1.89% in 2009
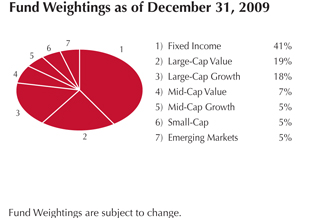
The Defensive Balanced Fund returned 14.65% for the year ended December 31, 2009. By comparison, its custom benchmark returned 12.76% for the same time period. The Defensive Balanced Fund will always have at least 30%, and up to 70%, of assets invested in the stock market. The Fund will also have at least 30%, and up to 70%, of assets in fixed-income securities.
In the equity portion of The Defensive Balanced Fund, we began 2009 approximately 60% invested in the stock market and 40% invested in cash equivalent securities. We increased our defensive position during the first quarter in response to a deteriorating stock market. However, as the year progressed, we decreased our defensive position and increased exposure to the stock market in response to an improving risk/reward relationship indicated by our investment models. We ended 2009 approximately 90% invested in the stock market and 10% invested in short-term bond funds for the equity portion of the Fund. Additionally, we began the year with an overweight toward value investments due to indications from our investment models. We also maintained our overweight position in small-cap stocks. At the mid-point of 2009, our models indicated a preference for a neutral stance among growth versus value investments, and we responded accordingly. However, this preference was temporary and we reestablished our overweight to value investments during the third quarter, which was maintained for the remainder of the year. We also ended 2009 with an overweight to small-cap investments as well.
In terms of industry and sector exposure, we began 2009 with an overweight to sectors with defensive characteristics, such as consumer staples, healthcare, and utilities. However, late in the first quarter we began reducing our exposure to defensive sectors, and simultaneously began increasing our exposure to sectors with greater potential for capital appreciation. We maintained an overweight in materials for the duration of the year, and subsequently restored our overweight to the healthcare and consumer staples sector due to model indications. Finally, we decided to invest in the international markets in the second quarter, which we had avoided since the beginning of the fourth quarter of 2008. We initially established a position in emerging markets, which was soon followed by a position in developed international markets. Interestingly, during the fourth quarter our investment models increased preference for emerging markets, yet they deteriorated for the developed international markets. As a result, we increased our exposure to emerging markets and decreased our exposure to developed international markets.
In the fixed-income portion of the Fund, our most dramatic move for 2009 was to shift our target allocation toward an overweight in investment grade bond funds. This would ultimately benefit the Fund as this sector of the fixed-income market maintained relative strength into year end. Due to indications in our models, we expect to continue holding an overweight to investment grade credit in the near-term. Yield spreads are not as generous as they were in the early part of 2009 , yet we believe there is additional value to be generated from this sector. The average weighted maturity of the fixed-income portion of the Fund was maintained slightly below that of our benchmark, as readings from our fixed-income models indicate that intermediate-term interest rates may gradually increase.
| | |
Page 16 | | The Flex-funds® 2009 Annual Report | December 31, 2009 |
| | |
| The Flex-funds® | | 2009 Annual Report | December 31, 2009 |
PERFORMANCE PERSPECTIVE
Period & Average Annual Total Returns as of December 31, 2009
| | | | | | | | | | | | | | | |
| | | 1
Year | | | 8/25/08 to
12/31/09* | | | Since
Inception | | | Net Expense
Ratio+ | | | Gross Expense
Ratio+ | |
The Defensive Balanced Fund* | | 14.65 | % | | -1.36 | % | | -0.87 | %1 | | 1.54 | % | | 1.70 | % |
| | | | | |
Blended Index2 | | 12.76 | % | | -0.67 | %4 | | 2.25 | % | | — | | | — | |
| | | | | |
S&P 500 Index3 | | 26.47 | % | | -6.68 | % | | -1.35 | % | | — | | | — | |
| 1 | Inception date for The Defensive Balanced Fund is 1/31/06. |
| 2 | The Blended Index consists of 42% of the S&P 500 Index, 28% of the average 90-day U.S. Treasury bill and 30% of the Barclays Intermediate-Term Government/Credit Index. These indices do not take into account the deduction of expenses associated with a mutual fund such as investment management and accounting fees. One cannot invest directly in an index. |
| 3 | The S&P 500 Index is a widely recognized unmanaged index of common stock prices that does not take into account the deduction of expenses associated with a mutual fund, such as investment management and accounting fees. One cannot invest directly in an index. |
| 4 | Return for the Blended Index is from 8/31/08 through 12/31/09. |
| * | On August 25, 2008, The Defensive Growth Fund became known as The Defensive Balanced Fund and its investment strategy changed. This Fund will always invest at least 30% and may invest up to 70% of its assets primarily in equity mutual funds. In addition, this Fund will always invest at least 30% and may invest up to 70% of its assets primarily in investment grade bonds, money market instruments, or exchange traded funds. |
| + | The Net and Gross Expense Ratios are percentages of the Fund’s average net assets as they are shown in the most current Fund’s Prospectus. The Net Expense Ratio includes all waivers, reimbursements and expenses paid indirectly. |
Performance quoted represents past performance. Past performance does not guarantee future results. All performance figures represent average annual total returns for the periods ended December 31, 2009, and assume reinvestment of all dividend and capital gain distributions. The investment return and principal value of an investment will fluctuate so that an investor’s shares, when redeemed, may be worth more or less than their original cost. Current performance may be higher or lower than the performance quoted. Current month-end performance may be obtained at www.flexfunds.com or by calling 1.800.325.3539. Management fees were waived and/or expenses were reimbursed in order to reduce the operating expenses of The Defensive Balanced Fund during the periods shown above. Source for index data: Morningstar, Inc.
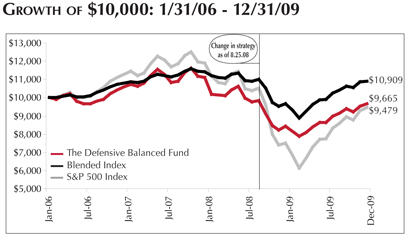
The Growth of $10,000 chart compares The Defensive Balanced Fund’s value to the S&P 500 Index, the Fund’s broad-based benchmark, and to the Blended Index which is comprised of 42% of the S&P 500 Index, 28% of the average 90-day U.S. Treasury bill and 30% of the Barclays Intermediate-Term Government/Credit Index. The chart is intended to give you a general idea of how the Fund performed compared to these indices over the period from its inception on January 31, 2006 through December 31, 2009. An understanding of the differences between the Fund and these indices is important. The benchmark indices are hypothetical unmanaged indices of common stock that do not take into account the deduction of expenses associated with a mutual fund, such as investment management and accounting fees. One cannot invest directly in an index.
Past performance does not guarantee future results. The chart and the table do not reflect the deduction of taxes that a shareholder would pay on fund distributions or the redemption of fund shares.
| | | | | | | |
| | Top Ten Holdings as of December 31, 2009 | |
 | | 1) | | Fairholme Fund | | 5.6 | % |
| | 2) | | The Flex-funds® Money Market Fund | | 5.0 | % |
| | 3) | | Janus Short-Term Bond Fund | | 4.8 | % |
| | 4) | | Caterpillar Financial Power Investment Floating Rate Demand Note, 2.05% | | 4.6 | % |
| | 5) | | Ridgeworth Intermediate Bond Fund | | 4.6 | % |
| | 6) | | iShares iBoxx$ Investment Grade Corp. Bond Fund | | 4.1 | % |
| | 7) | | Delaware Diversified Income Fund | | 4.1 | % |
| | 8) | | Federal Farm Credit Note, 2.60%, 1/28/2013 | | 4.1 | % |
| | 9) | | Harbor Bond Fund | | 4.0 | % |
| | 10) | | Nuveen Tradewinds Value Opportunities Fund | | 3.8 | % |
| | |
The Flex-funds® 2009 Annual Report | December 31, 2009 | | Page 17 |
| | |
| The Flex-funds® | | 2009 Annual Report | December 31, 2009 |
The Total Return Utilities Fund (formerly The Socially Responsible Utilities Fund*)
Annual Market Perspective
The Total Return Utilities Fund was ranked as one of the top 7 utility funds for 2009.
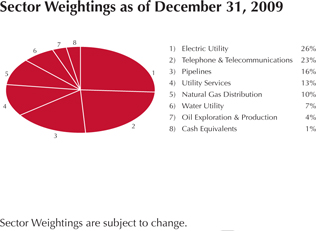
The Flex-funds® Total Return Utilities Fund returned 30.63% for the year ended December 31, 2009, compared to the benchmark Russell 3000 Utilities Index return of 11.07%, and a blended index consisting of 60% of the Russell 3000 Utilities Index and 40% of the Barclays Capital Long Credit Index that returned 13.61%. More importantly, the Fund has also outperformed the Russell 3000 Utilities Index and the blended index for the 5-year, 10-year, and since inception periods as well. Additionally, The Flex-funds® Total Return Utilities Fund was the seventh best performing utilities fund (out of 42 funds) during 2009 according to Morningstar. We are quite pleased with the performance of the Fund during 2009, especially considering that the broader utilities sector lagged the general stock market as measured by the S&P 500 Index. We would also point out that the Fund’s return also exceeded the return for the S&P 500 Index for the 1-, 5-, and 10-year periods.
During the first half of 2009, concerns regarding the large-cap utility indices significantly dissipated as attractive valuations within the sector made stocks broadly appealing. Although lagging the broader market since the stock market rally materialized, utility stocks provided favorable returns, and the Fund’s performance relative to the peer group was impressive during 2009. The strongest portion of the gains in the stock market rally was generally experienced in lower-quality stocks; however, we have been able to obtain similar results with a portfolio of quality names characterized by strong continuing operations, healthy balance sheets, and stable or increasing dividends. Given our preference for quality, our investment strategy does not emphasize the pursuit of short-term returns; alternatively, we prefer the sustainability of gains that have been achieved. Within the Fund, our holdings are much broader than traditional utility indexes, which provided a relative advantage since stocks in general have been buoyant during much of 2009. In addition, there were 24 dividend increases from 21 stocks this year.
While there are plenty of issues regarding environmental legislation, we do not believe there will be any adverse impact on our holdings at this time. We continue to believe our holdings are modestly priced, and we are prepared to sell when valuations exceed our standards. As previously noted, the major utilities significantly underperformed the broad market in 2009, but it is quite possible that investors held back due to the uncertainties surrounding legislation. In 2010, either those uncertainties will be resolved in a bill (doubtful in our view) or they will fade as any threats become less imminent. Also, should the economy improve, the business of conventional utilities would improve in tandem, which might lead to better than expected profits.
| | |
Page 18 | | The Flex-funds® 2009 Annual Report | December 31, 2009 |
| | |
| The Flex-funds® | | 2009 Annual Report | December 31, 2009 |
PERFORMANCE PERSPECTIVE
Period & Average Annual Total Returns as of December 31, 2009
| | | | | | | | | | | | | | | |
| | | 1
Year | | | 5
Year | | | 10
Year | | | Net Expense
Ratio+ | | | Gross Expense
Ratio+ | |
The Total Return Utilities Fund1* | | 30.63 | % | | 5.78 | % | | 2.57 | % | | 1.96 | % | | 2.14 | % |
| | | | | |
Russell 3000 Utilities Index2 | | 11.07 | % | | 3.30 | % | | -3.75 | % | | — | | | — | |
| | | | | |
Blended Index3 | | 13.61 | % | | 4.01 | % | | 0.98 | % | | — | | | — | |
| 1 | Inception date for The Total Return Utilities Fund is 6/21/1995. |
| 2 | The Russell 3000 Utilities Index is a market capitalization-weighted index that is comprised of utility stocks that are included in the Russell 3000 Index. This index does not take into account the deduction of expenses associated with a mutual fund, such as investment management and accounting fees. One cannot invest directly in an index. |
| 3 | The Blended Index consists of 60% of the Russell 3000 Utilities Index and 40% of the Barclays Capital Long Credit Index. One cannot invest directly in an index. |
| * | While the name of the fund has changed, the investment objective has remained the same. |
| + | The Net and Gross Expense Ratios are percentages of the Fund’s average net assets as they are shown in the most current Fund’s Prospectus. The Net Expense Ratio includes all waivers, reimbursements and expenses paid indirectly. |
Performance quoted represents past performance. Past performance does not guarantee future results. All performance figures represent average annual total returns for the periods ended December 31, 2009, and assume reinvestment of all dividend and capital gain distributions. The investment return and principal value of an investment will fluctuate so that an investor’s shares, when redeemed, may be worth more or less than their original cost. Current performance may be higher or lower than the performance quoted. Current month-end performance may be obtained at www.flexfunds.com or by calling 1.800.325.3539. Management fees were waived and/or expenses were reimbursed in order to reduce the operating expenses of The Total Return Utilities Fund during the periods shown above. Because The Total Return Utilities Fund concentrates its investments in public utility companies, the value of the Fund’s shares may fluctuate more than if invested in a greater number of industries. Changes in interest rates may also affect the value of utility stocks, and rising interest rates can be expected to reduce the Fund’s net asset value. Source for index data: Bloomberg, LP.
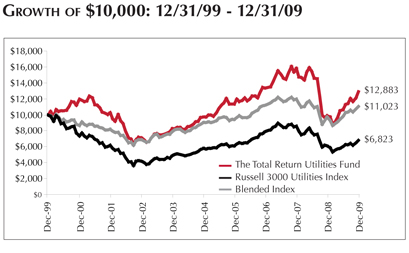
The Growth of $10,000 chart compares The Total Return Utilities Fund’s value to the Russell 3000 Utilities Index, the Fund’s broad-based benchmark, and to the Blended Index described above. The chart is intended to give you a general idea of how the Fund performed compared to these benchmarks over the period from December 31, 1999 to December 31, 2009. An understanding of the differences between the Fund and these indices is important. The benchmark indices do not take into account the deduction of expenses associated with a mutual fund, such as investment management and accounting fees. One cannot invest directly in an index.
Past performance does not guarantee future results. The chart and the table do not reflect the deduction of taxes that a shareholder would pay on fund distributions or the redemption of fund shares.
| | | | | | | |
| | Top Ten Holdings as of December 31, 2009 | |
 | | 1) | | NII Holdings, Inc. | | 5.5 | % |
| | 2) | | American Water Works, Inc. | | 4.9 | % |
| | 3) | | Enterprise Products Partners, L.P. | | 4.6 | % |
| | 4) | | Verizon Communications, Inc. | | 4.5 | % |
| | 5) | | Northeast Utilities | | 4.4 | % |
| | 6) | | MDU Resource Group, Inc. | | 4.1 | % |
| | 7) | | AT&T, Inc. | | 4.1 | % |
| | 8) | | Kinder Morgan Energy Partners, L.P. | | 4.0 | % |
| | 9) | | NiSource, Inc. | | 3.7 | % |
| | 10) | | Akamai Technologies, Inc. | | 3.2 | % |
| | | | | | | |
| | |
The Flex-funds® 2009 Annual Report | December 31, 2009 | | Page 19 |
| | |
| The Flex-funds® | | 2009 Annual Report | December 31, 2009 |
The U.S. Government Bond Fund
Annual Market Perspective
In a year when Treasury indices declined in value, The U.S. Government Bond Fund returned 2.10%.
The Flex-funds® U.S. Government Bond Fund returned 2.10% for the year ending December 31, 2009. Within the government debt sector mortgage-backed securities aided the Fund’s performance. As part of an effort to support the markets, the Federal Reserve initiated programs which would ultimately support certain sectors of the markets, such as mortgage-backed securities issued by agencies of the government. U.S. Treasury securities lagged the most in 2009 despite also being targeted in these programs. However, massive amounts of new Treasury debt issuance would over shadow government efforts. As a result, for the year, The Flex-funds® U.S. Government Bond Fund’s sector allocation continued to be positioned away from U.S. Treasury securities and toward U.S. Government agency securities. At the midpoint of 2009, the Fund was also invested up to its maximum allocation of 20% in investment grade corporate bonds, and we believed that favorable interest rate policy would continue to benefit this sector.
Investment grade credit may see additional out performance in 2010 over government debt while government agency debt may outperform U.S. Treasury investments. Treasury securities will most likely be faced with more sizable auctions, ongoing conversations about inflation and the expectations of an increase in the Federal Funds rate. Interest rate projections based on our models indicate intermediate-term and long-term interest rates may move higher in the coming year. With this in mind, coupled with signs of improving economic data, we believed it was appropriate to slightly shorten the Fund’s weighted average maturity. An increase in interest rates would force yields on bonds with longer dated maturities to rise and their prices to fall.
As we look to 2010 we do not anticipate much change in the holdings of the Fund. However, we do believe opportunities may arise throughout the year to reevaluate the holdings and adjust our allocation accordingly. In the meantime, we will remain vigilant and monitor the market environment and manage the Fund in the best interest of our shareholders.
| | |
Page 20 | | The Flex-funds® 2009 Annual Report | December 31, 2009 |
| | |
| The Flex-funds® | | 2009 Annual Report | December 31, 2009 |
PERFORMANCE PERSPECTIVE
Period & Average Annual Total Returns as of December 31, 2009
| | | | | | | | | | | | | | | |
| | | 1
Year | | | 5
Year | | | 10
Year | | | Net Expense
Ratio+ | | | Gross Expense
Ratio+ | |
The U.S. Government Bond Fund1 | | 2.10 | % | | 3.70 | % | | 3.48 | % | | 0.99 | % | | 1.58 | % |
| | | | | |
Barclays Capital Intermediate Government Index2 | | -0.33 | % | | 4.74 | % | | 5.65 | % | | — | | | — | |
| | | | | |
Barclays Capital Intermediate -Term Government/Credit Index3 | | 5.24 | % | | 4.65 | % | | 5.93 | % | | — | | | — | |
| 1 | Inception date of The U.S. Government Bond Fund is 12/31/1998. |
| 2 | The Barclays Capital Intermediate Government Index is an unmanaged index of dollar-denominated non-convertible fixed-rate bonds issued by the U.S. Government that are rated investment-grade or higher, have a maturity of one to ten years, and at least $250 million outstanding. The Index does not take into account the deduction of expenses associated with a mutual fund, such as investment management and accounting fees. One cannot invest directly in an index. |
| 3 | The Barclays Capital Intermediate-Term Government/Credit Index is an unmanaged index of fixed-rate bonds issued by the U.S. Government and its agencies that are rated investment-grade or higher, have one to ten years remaining until maturity, and at least $100 million outstanding. The Barclays Capital Intermediate-Term Government/Credit Index does not take into account the deduction of expenses associated with a mutual fund, such as investment management and accounting fees. One cannot invest directly in an index. |
| + | The Net and Gross Expense Ratios are percentages of the Fund’s average net assets as they are shown in the most current Fund’s Prospectus. The Net Expense Ratio includes all waivers, reimbursements and expenses paid indirectly. |
Performance quoted represents past performance. Past performance does not guarantee future results. All performance figures represent average annual total returns for the periods ended December 31, 2009, and assume reinvestment of all dividend and capital gain distributions. The investment return and principal value of an investment will fluctuate so that an investor’s shares, when redeemed, may be worth more or less than their original cost. Current performance may be higher or lower than the performance quoted. Current month-end performance may be obtained at www.flexfunds.com or by calling 1.800.325.3539. Management fees were waived and/or expenses were reimbursed in order to reduce the operating expenses of The U.S. Government Bond Fund during the periods shown above. Source for index data: Morningstar, Inc.
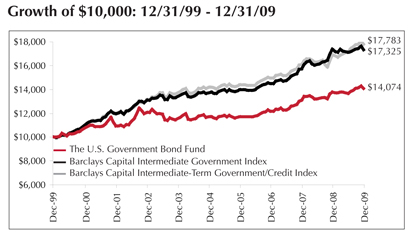
The Growth of $10,000 chart compares The US. Government Bond Fund’s value to the Barclays Capital Intermediate Government Index and the Barclays Capital Intermediate-Term Government/Credit Index, the Fund’s broad-based benchmark. The chart is intended to give you a general idea of how the Fund performed compared to these benchmarks over the period from December 31, 1999 to December 31, 2009. An understanding of the differences between the Fund and these indices is important. The indices are hypothetical unmanaged indices, as described above, that do not take into account the deduction of expenses associated with a mutual fund, such as investment management and accounting fees. One cannot invest directly in an index.
Past performance does not guarantee future results. The chart and the table do not reflect the deduction of taxes that a shareholder would pay on fund distributions or the redemption of fund shares.
| | | | | | | |
| | Top Ten Holdings as of December 31, 2009 | |
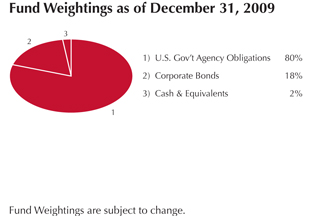 | | 1) | | U.S. Treasury Note, 2.375%, 8/31/2014 | | 8.6 | % |
| | 2) | | GNMA Single Family, 5.00%, 10/01/2039 | | 5.9 | % |
| | 3) | | Farmer Mac, 3.25%, 8/11/2014 | | 5.9 | % |
| | 4) | | GNMA Single Family, 5.00%, 7/20/2039 | | 5.9 | % |
| | 5) | | FHLMC, 5.30%, 5/12/2020 | | 5.9 | % |
| | 6) | | IBM Corp., 2.10%, 5/16/2013 | | 5.8 | % |
| | 7) | | FNMA, 4.00%, 2/20/2024 | | 5.8 | % |
| | 8) | | FHLB, 3.25%, 4/13/2015 | | 5.7 | % |
| | 9) | | FNMA, 5.25%, 11/19/2024 | | 5.7 | % |
| | 10) | | GNMA Single Family, 5.00%, 4/15/2038 | | 5.1 | % |
| | | | | | | |
| | |
The Flex-funds® 2009 Annual Report | December 31, 2009 | | Page 21 |
| | |
| The Flex-funds® | | 2009 Annual Report | December 31, 2009 |
The Money Market Fund
Annual Market Perspective
Both the retail and institutional classes of The Flex-funds® Money Market Fund ranked #1 in their respective categories as of December 29, 2009.
Both the retail and institutional class of The Flex-funds® Money Market Fund continued to rank among the top general purpose money market funds in the country during the year ended December 31, 2009, according to iMoneyNet, Inc. Separately the retail and institutional classes of The Flex-funds® Money Market Fund closed the year with a 7-day simple yield of 0.30% and 0.47%, respectively. The median first tier retail and institutional money market fund finished the quarter with a yield of 0.01% and 0.04%, respectively. As a result, the retail class was ranked first out of 232 iMoneyNet first tier retail funds based on the 7-day simple yield. In addition, the institutional class was ranked first out of iMoneyNet’s 286 first tier institutional fund universe.
In 2009, we maintained our strong emphasis on caution in the Fund. For a majority of the second half of the year, investors debated the prospects for rising interest rates and the economy. The quantitative easing programs introduced by the Federal Reserve a year ago and the accompanying mountain of debt issuance have turned investors bearish on the prospects of fixed-income products. Despite the hold the Federal Open Market Committee (the Fed) has on the Fed Funds rate, money market products have begun to realize a slight increase in yields. To better prepare for potentially higher interest rates, we proceeded to shorten the Fund’s weighted average maturity (WAM). Holdings in the Fund remained allocated toward investments with higher credit quality. We continue to believe this strategy added value to our funds while providing shareholders with greater confidence in the Fund. Overall, we believe our strategies were effective despite challenges faced throughout the year in the money market sector.
The Fund’s allocation continued to favor U.S. government agency securities and securities backed with FDIC insurance while we maintained positions in commercial paper and investment grade debt investments. At the end of the year, the Fund’s portfolio composition was as follows: 40% in other money market funds, 27% corporate obligations, 21% U.S. Government agency securities, and 12% in certificates of deposit.
As we enter 2010, we believe the Fund is positioned properly to maintain its outperformance. We will continue to face challenges with short-term investment options since we expect supply of available investment options and credit quality to be depressed for the next several months. The quality of the Fund’s investments will remain top priority as we navigate through these turbulent times.
| | |
Page 22 | | The Flex-funds® 2009 Annual Report | December 31, 2009 |
| | |
| The Flex-funds® | | 2009 Annual Report | December 31, 2009 |
PERFORMANCE PERSPECTIVE
Period & Average Annual Total Returns as of December 31, 2009
| | | | | | | | |
| | | 1
Year | | 5
Year | | 10
Year | | Since
Inception |
The Money Market Fund (Retail Class) | | 0.64% | | 3.15% | | 2.95% | | 4.75%1 |
| | | | |
Lipper’s Average General Purpose Money | | | | | | | | |
| | | | |
Market Fund | | 0.17% | | 2.66% | | 2.47% | | 4.47%2 |
| | |
Current & Effective Yields | | 7-day Compound Yield: 0.30%* | | 7-day Simple Yield: 0.30%* |
| | | | |
The Money Market Fund (Institutional Class) | | 0.75% | | 3.29% | | — | | 3.28%3 |
| | | | |
iMoneyNet Average First-Tier | | | | | | | | |
| | | | |
Institutional Money Market Fund | | 0.34% | | 3.13% | | — | | 3.13%4 |
| | |
Current & Effective Yields | | 7-day Compound Yield: 0.47%* | | 7-day Simple Yield: 0.47%* |
| 1 | Inception date for the Retail class of The Money Market Fund is 3/27/85. |
| 2 | Performance results for the Lipper Average General Purpose Money Market Fund are from 3/31/85 through 12/31/09. |
| 3 | Inception date for the Institutional class of The Money Market Fund is 12/28/04. |
| 4 | Performance results for the iMoneyNet Average First-Tier Institutional Money Market Fund are from 12/31/04 through 12/31/09. |
| * | For the seven-day period ended December 31, 2009, yield quotations more closely reflect the current earnings of The Money Market Fund than do total return quotations. |
Performance quoted represents past performance. Past performance does not guarantee future results. All performance figures represent average annual total returns for the periods ended December 31, 2009, and assume reinvestment of all dividend and capital gain distributions. The investment return and principal value of an investment will fluctuate so that an investor’s shares, when redeemed, may be worth more or less than their original cost. Current performance may be higher or lower than the performance quoted. Current month-end performance may be obtained at www.flexfunds.com or by calling 1.800.325.3539. Management fees were waived and/or expenses were reimbursed in order to reduce the operating expenses of both the retail class and the institutional class of The Money Market Fund during the periods shown above. Investments in The Money Market Fund are neither insured nor guaranteed by the Federal Deposit Insurance Corporation or any other governmental agency. Although the Fund seeks to preserve the value of your investment at $1.00 per share, it is possible to lose money by investing in The Money Market Fund. Source for average general purpose money market fund data: Lipper, Inc. Source for average first-tier institutional money market fund data: iMoneyNet, Inc.
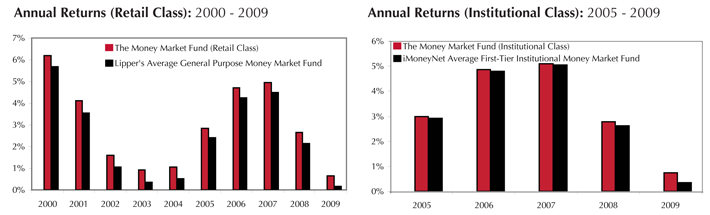
| | | | | | | |
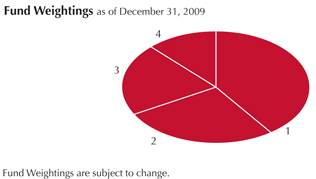
| | | | | | | |
| | 1) | | Other Money Market Funds | | 40 | % |
| | 2) | | Corporate Obligations | | 27 | % |
| | 3) | | U.S. Gov’t Agency Notes | | 21 | % |
| | 4) | | Certificates of Deposit | | 12 | % |
| | | | | | | |
| | | | | | | |
| | | | | | | |
| | |
The Flex-funds® 2009 Annual Report | December 31, 2009 | | Page 23 |
| | |
| The Flex-funds® | | 2009 Annual Report | December 31, 2009 |
Shareholder Expense Analysis (Unaudited)
Shareholders of mutual funds pay ongoing expenses, such as advisory fees, distribution and service fees (12b-1 fees) and other fund expenses. The following examples are intended to help you understand your ongoing costs (in dollars) of investing in the Funds and to compare these costs with the ongoing costs of investing in other mutual funds.
The examples below are based on an investment of $1,000 invested at the beginning of the period and held for the six-month period from June 30, 2009 to December 31, 2009.
ACTUAL EXPENSES: The first table below provides information about actual account values and actual expenses. You may use the information in this table, together with the amount you invested, to estimate the expenses that you paid over the period. Simply divide your account value by $1,000 (e.g.: an $8,600 account value divided by $1,000 = 8.6), then multiply the result by the number in the line under the heading “Expenses Paid During the Period” to estimate the expenses you paid on your account during this period.
ACTUAL EXPENSES
| | | | | | | | | | | | |
| | | Beginning
Account Value
(6/30/2009) | | Ending
Account Value
(12/31/2009) | | Expenses Paid
During Period1
(6/30/2009 -
12/31/2009) | | Expense Ratio
(Annualized) | |
The Money Market Fund - Retail Class | | $ | 1,000.00 | | $ | 1,002.00 | | $ | 2.57 | | 0.51 | % |
The Money Market Fund - Institutional Class | | | 1,000.00 | | | 1,002.60 | | | 2.02 | | 0.40 | % |
The U.S. Government Bond Fund | | | 1,000.00 | | | 1,028.80 | | | 5.06 | | 0.99 | % |
The Muirfield Fund® | | | 1,000.00 | | | 1,164.70 | | | 7.26 | | 1.33 | % |
The Defensive Balanced Fund | | | 1,000.00 | | | 1,120.80 | | | 7.91 | | 1.48 | % |
The Dynamic Growth Fund | | | 1,000.00 | | | 1,199.00 | | | 7.04 | | 1.27 | % |
The Aggressive Growth Fund | | | 1,000.00 | | | 1,219.50 | | | 8.28 | | 1.48 | % |
The Strategic Growth Fund | | | 1,000.00 | | | 1,253.10 | | | 8.40 | | 1.48 | % |
The Total Return Utilities Fund | | | 1,000.00 | | | 1,211.10 | | | 10.09 | | 1.81 | % |
The Quantex Fund™ | | | 1,000.00 | | | 1,426.10 | | | 8.62 | | 1.41 | % |
HYPOTHETICAL EXAMPLE FOR COMPARISON PURPOSES: The second table below provides information about hypothetical account values and hypothetical expenses based on the Funds’ actual expense ratios and assumed rates of return of 5% per year before expenses, which are not the Funds’ actual returns. The hypothetical account values and expenses may not be used to estimate the actual ending account balance or expenses you paid for the period. You may use this information to compare the ongoing costs of investing in the Funds to other funds. To do so, compare this 5% hypothetical example with the 5% hypothetical examples that appear in the shareholder reports of the other funds.
HYPOTHETICAL EXAMPLE
(5% return before expenses)
| | | | | | | | | | | | |
| | | Beginning
Account Value
(6/30/2009) | | Ending
Account Value
(12/31/2009) | | Expenses Paid
During Period1
(6/30/2009 -
12/31/2009) | | Expense Ratio
(Annualized) | |
The Money Market Fund - Retail Class | | $ | 1,000.00 | | $ | 1,022.63 | | $ | 2.60 | | 0.51 | % |
The Money Market Fund - Institutional Class | | | 1,000.00 | | | 1,023.19 | | | 2.04 | | 0.40 | % |
The U.S. Government Bond Fund | | | 1,000.00 | | | 1,020.21 | | | 5.04 | | 0.99 | % |
The Muirfield Fund® | | | 1,000.00 | | | 1,018.50 | | | 6.77 | | 1.33 | % |
The Defensive Balanced Fund | | | 1,000.00 | | | 1,017.74 | | | 7.53 | | 1.48 | % |
The Dynamic Growth Fund | | | 1,000.00 | | | 1,018.80 | | | 6.46 | | 1.27 | % |
The Aggressive Growth Fund | | | 1,000.00 | | | 1,017.74 | | | 7.53 | | 1.48 | % |
The Strategic Growth Fund | | | 1,000.00 | | | 1,017.74 | | | 7.53 | | 1.48 | % |
The Total Return Utilities Fund | | | 1,000.00 | | | 1,016.08 | | | 9.20 | | 1.81 | % |
The Quantex Fund™ | | | 1,000.00 | | | 1,018.10 | | | 7.17 | | 1.41 | % |
Please note that the expenses shown in the tables are meant to highlight your ongoing costs only and do not reflect any transactional costs, such as redemption fees or exchange fees. Therefore, the second table is useful in comparing ongoing costs only, and will not help you determine the relative total costs of owning different funds. In addition, if any transactional costs were included, your costs would have been higher.
| 1 | Expenses are equal to the Funds’ annualized expense ratios, multiplied by the average account value over the period, multiplied by 184/365 (to reflect the total number of days in the six-month period). |
| | |
Page 24 | | The Flex-funds® 2009 Annual Report | December 31, 2009 |
| | |
| The Flex-funds® | | 2009 Annual Report | December 31, 2009 |
2009 Annual Report
Fund Holdings & Financial Statements
| | |
The Flex-funds® 2009 Annual Report | December 31, 2009 | | Page 25 |
Schedule of Investments
December 31, 2009
The Muirfield Fund
| | | | | |
Security Description | | Shares or
Principal
Amount ($) | | Value ($) | |
Registered Investment Companies — 94.7% | |
AIM Diversified Dividend Fund | | 317,672 | | 3,453,099 | |
BB&T Equity Income Fund@ | | 333,887 | | 4,066,738 | |
Calvert Long Term Income Fund@ | | 168,370 | | 2,798,316 | |
Consumer Staples Select Sector SPDR Fund | | 163,775 | | 4,335,124 | |
Delaware Diversified Income Fund | | 225,680 | | 2,103,340 | |
Delaware Inflation Protected Bond Fund | | 94,871 | | 983,814 | |
Energy Select Sector SPDR Fund | | 91,950 | | 5,242,070 | |
Fairholme Fund | | 297,781 | | 8,960,245 | |
Fidelity Advisor Leveraged Company Stock Fund | | 197,553 | | 5,535,436 | |
Harbor Bond Fund | | 172,266 | | 2,091,309 | |
Hartford Capital Appreciation Fund | | 129,221 | | 3,964,514 | |
Health Care Select Sector SPDR Fund | | 113,475 | | 3,525,668 | |
Heartland Value Plus Fund | | 185,434 | | 4,341,010 | |
iShares MSCI Emerging Markets Index | | 96,350 | | 3,998,525 | |
Ivy Asset Strategy Fund | | 95,479 | | 2,127,264 | |
Janus Forty Fund# | | 206,824 | | 6,519,102 | |
Janus Short-Term Bond Fund | | 1,371,230 | | 4,209,676 | |
Nuveen Tradewinds Value Opportunities Fund# | | 233,577 | | 6,934,908 | |
PowerShares QQQ | | 118,480 | | 5,420,460 | |
Putnam Equity Income Fund | | 335,182 | | 4,558,480 | |
RidgeWorth Mid Cap Value Equity Fund | | 504,392 | | 5,018,704 | |
RidgeWorth Small Cap Value Equity Fund | | 434,912 | | 4,692,698 | |
RS Emerging Markets Fund | | 183,526 | | 4,244,964 | |
Sentinel Short Maturity Government Fund | | 216,450 | | 1,997,836 | |
Technology Select Sector SPDR Fund | | 196,375 | | 4,502,879 | |
Touchstone Mid Cap Growth Fund# | | 180,111 | | 3,431,117 | |
| | | | | |
Total Registered Investment Companies (Cost $100,765,044) | | | | 109,057,296 | |
| | | | | |
Money Market Registered Investment Companies — 2.2% | |
The Flex-funds Money Market Fund — Institutional Class, 0.47%* | | 2,521,062 | | 2,521,062 | |
| | | | | |
Total Money Market Registered Investment Companies
(Cost $2,521,062) | | | | 2,521,062 | |
| | | | | |
Floating Rate Demand Notes — 2.8% | |
Caterpillar Financial Power Investment Floating Rate Demand Note, 2.05%, 1/4/2010** | | 3,258,715 | | 3,258,715 | |
| | | | | |
Total Floating Rate Demand Notes
(Cost $3,258,715) | | | | 3,258,715 | |
| | | | | |
U.S. Government Obligations — 0.7% | |
U.S. Treasury Bill,
0.035%, due 3/18/2010*** | | 800,000 | | 799,926 | |
| | | | | |
Total U.S. Government Obligations
(Cost $799,941) | | | | 799,926 | |
| | | | | |
Total Investments — 100.4%
(Cost $107,344,762)(a) | | | | 115,636,999 | |
| | | | | |
Liabilities less Other Assets — (0.4%) | | (498,843 | ) |
| | | | | |
Total Net Assets — 100.0% | | | | 115,138,156 | |
| | | | | |
The Muirfield Fund
| | | | |
Security Description | | Shares or
Principal
Amount ($) | | Value ($) |
Trustee Deferred Compensation**** | | |
The Flex-funds Aggressive Growth Fund | | 1,452 | | 10,004 |
The Flex-funds Defensive Balanced Fund | | 728 | | 6,537 |
The Flex-funds Dynamic Growth Fund | | 1,115 | | 7,872 |
The Flex-funds Muirfield Fund | | 4,073 | | 20,324 |
The Flex-funds Quantex Fund | | 2,298 | | 42,467 |
The Flex-funds Total Return Utilities Fund | | 271 | | 5,618 |
| | | | |
Total Trustee Deferred Compensation
(Cost $83,770) | | | | 92,822 |
| | | | |
| | | | |
| | | Long
Contracts | | Unrealized
Appreciation
(Depreciation) ($) |
Futures Contracts |
Standard & Poors 500 expiring March 2010, notional value $4,442,800 | | 16 | | 54,630 |
| | | | |
Total Futures Contracts | | | | 54,630 |
| | | | |
| (a) | Represents cost for financial reporting purposes and differs for federal income tax purposes by the amount of losses deferred for federal income tax reporting in the amount of $1,001,685. Cost for federal income tax purposes of $108,346,447 differs from value by net unrealized appreciation (depreciation) of securities as follows: |
| | | | |
Unrealized appreciation | | $ | 8,867,593 | |
Unrealized depreciation | | | (1,577,041 | ) |
| | | | |
Net unrealized appreciation (depreciation) | | $ | 7,290,552 | |
| | | | |
| @ | A portion of this security may be deemed illiquid due to the Investment Company Act of 1940 provision stating that no issuer of any investment company security purchased or acquired by a registered investment company shall be obligated to redeem such security in an amount exceeding 1 per centum of such issuer’s total outstanding securities during any period of less than thirty days. |
| # | Represents non-income producing securities. |
| * | Investment in affiliate. The yield shown represents the 7-day yield in effect at December 31, 2009. |
| ** | Floating rate security. The rate shown represents the rate in effect at December 31, 2009. |
| *** | Pledged as collateral on futures contracts. |
| **** | Assets of affiliates to The Muirfield Fund held for the benefit of the Fund’s Trustees in connection with the Trustee Deferred Compensation Plan. |
The accompanying notes are an integral part of these financial statements.
Schedule of Investments
December 31, 2009
The Dynamic Growth Fund
| | | | | |
Security Description | | Shares or
Principal
Amount ($) | | Value ($) | |
Registered Investment Companies — 96.0% | |
AIM Diversified Dividend Fund | | 229,806 | | 2,497,995 | |
BB&T Equity Income Fund | | 233,635 | | 2,845,670 | |
Consumer Staples Select Sector SPDR Fund | | 151,200 | | 4,002,264 | |
DWS Large Cap Value Fund | | 82,243 | | 1,321,646 | |
Energy Select Sector SPDR Fund | | 80,825 | | 4,607,833 | |
Fairholme Fund | | 205,988 | | 6,198,189 | |
Fidelity Advisor Leveraged Company Stock Fund | | 162,090 | | 4,541,762 | |
Hartford Capital Appreciation Fund | | 118,690 | | 3,641,421 | |
Health Care Select Sector SPDR Fund | | 85,900 | | 2,668,913 | |
Heartland Value Plus Fund | | 165,094 | | 3,864,856 | |
iShares MSCI Emerging Markets Index | | 81,800 | | 3,394,700 | |
Ivy Asset Strategy Fund | | 135,690 | | 3,023,171 | |
Ivy Large Cap Growth Fund | | 144,995 | | 1,652,938 | |
Janus Forty Fund# | | 129,322 | | 4,076,233 | |
Nuveen Tradewinds Value Opportunities Fund# | | 213,501 | | 6,338,832 | |
PowerShares QQQ | | 96,425 | | 4,411,444 | |
Putnam Equity Income Fund | | 253,425 | | 3,446,575 | |
RidgeWorth Mid Cap Value Equity Fund | | 404,120 | | 4,020,992 | |
RidgeWorth Small Cap Value Equity Fund | | 385,661 | | 4,161,286 | |
RS Emerging Markets Fund | | 150,580 | | 3,482,924 | |
Technology Select Sector SPDR Fund | | 166,110 | | 3,808,902 | |
Touchstone Mid Cap Growth Fund# | | 154,979 | | 2,952,349 | |
| | | | | |
Total Registered Investment Companies (Cost $74,341,786) | | | | 80,960,895 | |
| | | | | |
Money Market Registered Investment Companies — 3.2% | |
The Flex-funds Money Market Fund — Institutional Class, 0.47%* | | 2,660,901 | | 2,660,901 | |
| | | | | |
Total Money Market Registered Investment Companies
(Cost $2,660,901) | | | | 2,660,901 | |
| | | | | |
Floating Rate Demand Notes — 0.3% | |
Caterpillar Financial Power Investment Floating Rate Demand Note, 2.05%, 1/4/2010** | | 250,583 | | 250,583 | |
| | | | | |
Total Floating Rate Demand Notes
(Cost $250,583) | | | | 250,583 | |
| | | | | |
U.S. Government Obligations — 0.9% | |
U.S. Treasury Bill,
0.035%, due 3/18/2010*** | | 800,000 | | 799,926 | |
| | | | | |
Total U.S. Government Obligations
(Cost $799,941) | | | | 799,926 | |
| | | | | |
Total Investments — 100.4%
(Cost $78,053,211)(a) | | | | 84,672,305 | |
| | | | | |
Liabilities less Other Assets — (0.4%) | | | | (314,224 | ) |
| | | | | |
Total Net Assets — 100.0% | | | | 84,358,081 | |
| | | | | |
The Dynamic Growth Fund
| | | | |
Security Description | | Shares or
Principal
Amount ($) | | Value ($) |
Trustee Deferred Compensation**** | | |
The Flex-funds Aggressive Growth Fund | | 1,002 | | 6,904 |
The Flex-funds Defensive Balanced Fund | | 493 | | 4,427 |
The Flex-funds Dynamic Growth Fund | | 467 | | 3,297 |
The Flex-funds Muirfield Fund | | 1,562 | | 7,794 |
The Flex-funds Quantex Fund | | 854 | | 15,782 |
The Flex-funds Total Return Utilities Fund | | 128 | | 2,653 |
| | | | |
Total Trustee Deferred Compensation
(Cost $36,624) | | | | 40,857 |
| | | | |
| | | | |
| | | Long
Contracts | | Unrealized
Appreciation
(Depreciation) ($) |
Futures Contracts |
Standard & Poors 500 expiring March 2010, notional value $3,332,100 | | 12 | | 41,010 |
| | | | |
Total Futures Contracts | | | | 41,010 |
| | | | |
| (a) | Represents cost for financial reporting purposes and differs for federal income tax purposes by the amount of losses deferred for federal income tax reporting in the amount of $569,701. Cost for federal income tax purposes of $78,622,912 differs from value by net unrealized appreciation (depreciation) of securities as follows: |
| | | | |
Unrealized appreciation | | $ | 7,897,134 | |
Unrealized depreciation | | | (1,847,741 | ) |
| | | | |
Net unrealized appreciation (depreciation) | | $ | 6,049,393 | |
| | | | |
| # | Represents non-income producing securities. |
| * | Investment in affiliate. The yield shown represents the 7-day yield in effect at December 31, 2009. |
| ** | Floating rate security. The rate shown represents the rate in effect at December 31, 2009. |
| *** | Pledged as collateral on futures contracts. |
| **** | Assets of affiliates to The Dynamic Growth Fund held for the benefit of the Fund’s Trustees in connection with the Trustee Deferred Compensation Plan. |
The accompanying notes are an integral part of these financial statements.
Schedule of Investments
December 31, 2009
The Aggressive Growth Fund
| | | | | |
Security Description | | Shares or
Principal
Amount ($) | | Value ($) | |
Registered Investment Companies — 96.8% | |
AIM Diversified Dividend Fund | | 123,316 | | 1,340,449 | |
Consumer Staples Select Sector SPDR Fund | | 41,125 | | 1,088,579 | |
DWS Large Cap Value Fund | | 16,211 | | 260,509 | |
Energy Select Sector SPDR Fund | | 30,550 | | 1,741,656 | |
Fairholme Fund | | 85,725 | | 2,579,472 | |
Fidelity Advisor Leveraged Company Stock Fund | | 75,000 | | 2,101,512 | |
Hartford Capital Appreciation Fund | | 30,602 | | 938,878 | |
Health Care Select Sector SPDR Fund | | 15,550 | | 483,139 | |
iShares MSCI Emerging Markets Index | | 59,475 | | 2,468,211 | |
Janus Forty Fund# | | 59,525 | | 1,876,224 | |
Nuveen Tradewinds Value Opportunities Fund# | | 75,972 | | 2,255,603 | |
PowerShares QQQ | | 43,310 | | 1,981,433 | |
RidgeWorth Large Cap Value Equity Fund | | 92,267 | | 1,013,094 | |
RidgeWorth Mid Cap Value Equity Fund | | 174,870 | | 1,739,958 | |
RidgeWorth Small Cap Value Equity Fund | | 136,441 | | 1,472,196 | |
RS Emerging Markets Fund | | 77,901 | | 1,801,859 | |
TCW Small Cap Growth Fund# | | 77,127 | | 1,848,732 | |
Technology Select Sector SPDR Fund | | 84,450 | | 1,936,438 | |
| | | | | |
Total Registered Investment Companies
(Cost $24,735,850) | | | | 28,927,942 | |
| | | | | |
Money Market Registered Investment Companies — 2.6% | |
The Flex-funds Money Market Fund — Institutional Class, 0.47%* | | 779,984 | | 779,984 | |
| | | | | |
Total Money Market Registered Investment Companies
(Cost $779,984) | | | | 779,984 | |
| | | | | |
U.S. Government Obligations — 1.0% | |
U.S. Treasury Bill,
0.035%, due 3/18/2010** | | 300,000 | | 299,972 | |
| | | | | |
Total U.S. Government Obligations
(Cost $299,978) | | | | 299,972 | |
| | | | | |
Total Investments — 100.4%
(Cost $25,815,812)(a) | | | | 30,007,898 | |
| | | | | |
Liabilities less Other Assets — (0.4%) | | | | (112,908 | ) |
| | | | | |
Total Net Assets — 100.0% | | | | 29,894,990 | |
| | | | | |
Trustee Deferred Compensation*** | |
The Flex-funds Aggressive Growth Fund | | 611 | | 4,210 | |
The Flex-funds Defensive Balanced Fund | | 314 | | 2,820 | |
The Flex-funds Dynamic Growth Fund | | 323 | | 2,280 | |
The Flex-funds Muirfield Fund | | 1,121 | | 5,594 | |
The Flex-funds Quantex Fund | | 603 | | 11,143 | |
The Flex-funds Total Return Utilities Fund | | 84 | | 1,741 | |
| | | | | |
Total Trustee Deferred Compensation (Cost $26,259) | | | | 27,788 | |
| | | | | |
The Aggressive Growth Fund
| | | | |
| | | Long
Contracts | | Unrealized
Appreciation
(Depreciation) ($) |
Futures Contracts | | | | |
Standard & Poors 500 expiring March 2010, notional value $833,025 | | 3 | | 10,253 |
| | | | |
Total Futures Contracts | | | | 10,253 |
| | | | |
| (a) | Represents cost for financial reporting purposes and differs for federal income tax purposes by the amount of losses deferred for federal income tax reporting in the amount of $131,785. Cost for federal income tax purposes of $25,947,597 differs from value by net unrealized appreciation (depreciation) of securities as follows: |
| | | | |
Unrealized appreciation | | $ | 4,253,399 | |
Unrealized depreciation | | | (193,098 | ) |
| | | | |
Net unrealized appreciation (depreciation) | | $ | 4,060,301 | |
| | | | |
| # | Represents non-income producing securities. |
| * | Investment in affiliate. The yield shown represents the 7-day yield in effect at December 31, 2009. |
| ** | Pledged as collateral on futures contracts. |
| *** | Assets of affiliates to The Aggressive Growth Fund held for the benefit of the Fund’s Trustees in connection with the Trustee Deferred Compensation Plan. |
The accompanying notes are an integral part of these financial statements.
Schedule of Investments
December 31, 2009
The Defensive Balanced Fund
| | | | |
Security Description | | Shares or
Principal
Amount ($) | | Value ($) |
Registered Investment Companies — 77.7% |
AIM Diversified Dividend Fund | | 96,162 | | 1,045,277 |
BB&T Equity Income Fund | | 107,647 | | 1,311,136 |
Consumer Staples Select Sector SPDR Fund | | 49,900 | | 1,320,853 |
Delaware Diversified Income Fund | | 215,023 | | 2,004,012 |
Delaware Inflation Protected Bond Fund | | 47,436 | | 491,907 |
Energy Select Sector SPDR Fund | | 24,700 | | 1,408,147 |
Fairholme Fund | | 91,826 | | 2,763,047 |
Fidelity Advisor Leveraged Company Stock Fund | | 60,976 | | 1,708,558 |
Harbor Bond Fund | | 164,048 | | 1,991,540 |
Hartford Capital Appreciation Fund | | 24,773 | | 760,044 |
Health Care Select Sector SPDR Fund | | 29,100 | | 904,137 |
Heartland Value Plus Fund | | 50,619 | | 1,184,984 |
iShares iBoxx $ Investment Grade Corporate Bond Fund | | 19,350 | | 2,015,302 |
iShares MSCI Emerging Markets Index | | 30,125 | | 1,250,187 |
Ivy Asset Strategy Fund | | 42,032 | | 936,465 |
Janus Forty Fund# | | 54,701 | | 1,724,185 |
Janus Short-Term Bond Fund | | 777,948 | | 2,388,299 |
Nuveen Tradewinds Value Opportunities Fund# | | 63,801 | | 1,894,241 |
PowerShares QQQ | | 34,575 | | 1,581,806 |
Putnam Equity Income Fund | | 79,547 | | 1,081,842 |
RidgeWorth Intermediate Bond Fund | | 215,281 | | 2,247,534 |
RidgeWorth Mid Cap Value Equity Fund | | 128,464 | | 1,278,219 |
RidgeWorth Small Cap Value Equity Fund | | 137,137 | | 1,479,713 |
RS Emerging Markets Fund | | 50,932 | | 1,178,048 |
Technology Select Sector SPDR Fund | | 63,500 | | 1,456,055 |
Touchstone Mid Cap Growth
Fund# | | 52,805 | | 1,005,933 |
| | | | |
Total Registered Investment Companies
(Cost $35,571,106) | | | | 38,411,471 |
| | | | |
Money Market Registered Investment Companies — 5.0% |
The Flex-funds Money Market Fund — Institutional Class, 0.47%* | | 2,449,157 | | 2,449,157 |
| | | | |
Total Money Market Registered Investment Companies
(Cost $2,449,157) | | | | 2,449,157 |
| | | | |
Floating Rate Demand Notes — 4.6% |
Caterpillar Financial Power Investment Floating Rate Demand Note, 2.05%, 1/4/2010** | | 2,253,836 | | 2,253,836 |
| | | | |
Total Floating Rate Demand Notes
(Cost $2,253,836) | �� | | | 2,253,836 |
| | | | |
U.S. Government Obligations — 13.2% | | |
Federal Agricultural Mortgage Corp., 3.05%, due 5/14/2014 | | 1,000,000 | | 1,012,720 |
Federal National Mortgage Association, 3.02%, due 12/08/2014 | | 500,000 | | 494,710 |
Federal National Mortgage Association, 3.125%, due 06/29/2015 | | 250,000 | | 247,885 |
Federal National Mortgage Association, 3.80%, due 12/21/2016 | | 250,000 | | 244,983 |
The Defensive Balanced Fund
| | | | | |
Security Description | | Shares or
Principal
Amount ($) | | Value ($) | |
U.S. Government Obligations — continued | | | |
Federal Farm Credit Bank,
0.23%, due 11/27/2012*** | | 250,000 | | 249,640 | |
Federal Farm Credit Bank,
2.60%, due 01/28/2013 | | 2,000,000 | | 2,000,420 | |
Federal Farm Credit Bank,
3.20%, due 06/02/2015 | | 250,000 | | 246,665 | |
Federal Home Loan Bank,
1.25%, due 11/27/2012*** | | 250,000 | | 247,535 | |
Federal Home Loan Bank,
3.42%, due 06/17/2016 | | 500,000 | | 487,955 | |
Federal Home Loan Mortgage Corp.,
2.00%, due 01/29/2014*** | | 1,000,000 | | 998,690 | |
U.S. Treasury Bill,
0.035%, due 03/18/2010**** | | 300,000 | | 299,972 | |
| | | | | |
Total U.S. Government Obligations
(Cost $6,549,700) | | | | 6,531,175 | |
| | | | | |
Total Investments — 100.5%
(Cost $46,823,799)(a) | | | | 49,645,639 | |
| | | | | |
Liabilities less Other Assets —(0.5%) | | (257,205 | ) |
| | | | | |
Total Net Assets—100.0% | | | | 49,388,434 | |
| | | | | |
Trustee Deferred Compensation***** | |
The Flex-funds Aggressive Growth Fund | | 965 | | 6,649 | |
The Flex-funds Defensive Balanced Fund | | 501 | | 4,499 | |
The Flex-funds Dynamic Growth Fund | | 290 | | 2,047 | |
The Flex-funds Muirfield Fund | | 818 | | 4,082 | |
The Flex-funds Quantex Fund | | 392 | | 7,244 | |
The Flex-funds Total Return Utilities Fund | | 105 | | 2,177 | |
| | | | | |
Total Trustee Deferred Compensation
(Cost $26,638) | | | | 26,698 | |
| | | | | |
| | | | |
| | | Long
Contracts | | Unrealized
Appreciation
(Depreciation) ($) |
Futures Contracts | | | | |
Standard & Poors 500 expiring March 2010, notional value $2,221,400 | | 8 | | 27,240 |
| | | | |
Total Futures Contracts | | | | 27,240 |
| | | | |
| (a) | Represents cost for financial reporting purposes and differs for federal income tax purposes by the amount of losses deferred for federal income tax reporting in the amount of $105,795. Cost for federal income tax purposes of $46,929,594 differs from value by net unrealized appreciation (depreciation) of securities as follows: |
| | | | |
Unrealized appreciation | | $ | 3,006,422 | |
Unrealized depreciation | | | (290,377 | ) |
| | | | |
Net unrealized appreciation (depreciation) | | $ | 2,716,045 | |
| | | | |
| # | Represents non-income producing securities. |
| * | Investment in affiliate. The yield shown represents the 7-day yield in effect at December 31, 2009. |
| ** | Floating rate security. The rate shown represents the rate in effect at December 31, 2009. |
Schedule of Investments
December 31, 2009
The Defensive Balanced Fund
| *** | Variable rate security. The rate shown represents the rate in effect at December 31, 2009. |
| **** | Pledged as collateral on futures contracts. |
| ***** | Assets of affiliates to The Defensive Balanced Fund held for the benefit of the Fund’s Trustees in connection with the Trustee Deferred Compensation Plan. |
The accompanying notes are an integral part of these financial statements.
Schedule of Investments
December 31, 2009
The Strategic Growth Fund
| | | | | |
Security Description | | Shares or
Principal
Amount ($) | | Value ($) | |
Registered Investment Companies — 93.2% | |
AIM Diversified Dividend Fund | | 133,495 | | 1,451,086 | |
Allianz NFJ International Value Fund | | 184,783 | | 3,521,965 | |
DWS Large Cap Value Fund | | 21,614 | | 347,345 | |
Fairholme Fund | | 50,798 | | 1,528,514 | |
First American Real Estate Securities Fund | | 166,625 | | 2,382,735 | |
Hartford Capital Appreciation Fund | | 10,201 | | 312,959 | |
Heartland Value Plus Fund | | 62,275 | | 1,457,854 | |
Ivy Asset Strategy Fund | | 38,592 | | 859,837 | |
Janus Forty Fund# | | 45,741 | | 1,441,742 | |
Materials Select Sector SPDR Trust | | 38,675 | | 1,275,888 | |
Nuveen Tradewinds Value Opportunities Fund# | | 54,540 | | 1,619,306 | |
Oppenheimer Real Estate Fund (The) | | 149,455 | | 2,243,318 | |
PowerShares QQQ | | 16,775 | | 767,456 | |
Putnam Equity Income Fund | | 100,818 | | 1,371,121 | |
RidgeWorth Mid Cap Value Equity Fund | | 139,851 | | 1,391,518 | |
RidgeWorth Small Cap Value Equity Fund | | 138,049 | | 1,489,544 | |
RS Emerging Markets Fund | | 108,274 | | 2,504,381 | |
TCW Small Cap Growth Fund# | | 51,813 | | 1,241,969 | |
Touchstone Mid Cap Growth Fund# | | 83,893 | | 1,598,169 | |
Van Eck Global Hard Assets Fund# | | 72,185 | | 2,953,795 | |
| | | | | |
Total Registered Investment Companies (Cost $27,901,208) | | | | 31,760,502 | |
| | | | | |
Money Market Registered Investment Companies — 5.5% | |
The Flex-funds Money Market Fund —Institutional Class, 0.47%* | | 1,858,964 | | 1,858,964 | |
| | | | | |
Total Money Market Registered Investment Companies
(Cost $1,858,964) | | | | 1,858,964 | |
| | | | | |
Floating Rate Demand Notes — 0.7% | |
Caterpillar Financial Power Investment Floating Rate Demand Note, 2.05%, 1/4/2010** | | 250,583 | | 250,583 | |
| | | | | |
Total Floating Rate Demand Notes
(Cost $250,583) | | | | 250,583 | |
| | | | | |
U.S. Government Obligations — 0.9% | |
U.S. Treasury Bill,
0.035%, due 3/18/2010*** | | 300,000 | | 299,972 | |
| | | | | |
Total U.S. Government Obligations
(Cost $299,978) | | | | 299,972 | |
| | | | | |
Total Investments — 100.3%
(Cost $30,310,733)(a) | | | | 34,170,021 | |
| | | | | |
Liabilities less Other Assets — (0.3%) | | | | (118,140 | ) |
| | | | | |
Total Net Assets — 100.0% | | | | 34,051,881 | |
| | | | | |
Trustee Deferred Compensation**** | |
The Flex-funds Aggressive Growth Fund | | 788 | | 5,429 | |
The Flex-funds Defensive Balanced Fund | | 413 | | 3,709 | |
The Flex-funds Dynamic Growth Fund | | 236 | | 1,666 | |
The Flex-funds Muirfield Fund | | 675 | | 3,368 | |
The Flex-funds Quantex Fund | | 322 | | 5,951 | |
The Flex-funds Total Return Utilities Fund | | 86 | | 1,783 | |
| | | | | |
Total Trustee Deferred Compensation
(Cost $22,283) | | | | 21,906 | |
| | | | | |
The Strategic Growth Fund
| | | | |
| | | Long
Contracts | | Unrealized
Appreciation
(Depreciation) ($) |
Futures Contracts |
Standard & Poors Mid Cap 400 expiring March 2010, notional value $2,174,700 | | 6 | | 35,655 |
| | | | |
Total Futures Contracts | | | | 35,655 |
| | | | |
| (a) | Represents cost for financial reporting purposes and differs for federal income tax purposes by the amount of losses deferred for federal income tax reporting in the amount of $112,373. Cost for federal income tax purposes of $30,423,106 differs from value by net unrealized appreciation (depreciation) of securities as follows: |
| | | | |
Unrealized appreciation | | $ | 3,873,204 | |
Unrealized depreciation | | | (126,289 | ) |
| | | | |
Net unrealized appreciation (depreciation) | | $ | 3,746,915 | |
| | | | |
| # | Represents non-income producing securities. |
| * | Investment in affiliate. The yield shown represents the 7-day yield in effect at December 31, 2009. |
| ** | Floating rate security. The rate shown represents the rate in effect at December 31, 2009. |
| *** | Pledged as collateral on futures contracts. |
| **** | Assets of affiliates to The Strategic Growth Fund held for the benefit of the Fund’s Trustees in connection with the Trustee Deferred Compensation Plan. |
The accompanying notes are an integral part of these financial statements.
Schedule of Investments
December 31, 2009
The Quantex Fund
| | | | |
Security Description | | Shares or
Principal
Amount ($) | | Value ($) |
Common Stocks — 96.8% | | |
Business Services — 6.5% | | | | |
Convergys Corp.# | | 10,080 | | 108,360 |
IMS Health, Inc. | | 4,265 | | 89,821 |
Interpublic Group of Companies, Inc./The# | | 15,005 | | 110,737 |
Monster Worldwide, Inc.# | | 5,340 | | 92,916 |
R.R. Donnelly & Sons Co. | | 5,530 | | 123,153 |
Ryder System, Inc. | | 1,660 | | 68,342 |
Teradata Corp.# | | 4,380 | | 137,663 |
Total System Services, Inc. | | 5,360 | | 92,567 |
| | | | |
(Cost $895,718) | | | | 823,559 |
| | | | |
Consumer Goods — 8.0% | | | | |
Bemis Co., Inc. | | 2,720 | | 80,648 |
Dean Foods Company# | | 3,590 | | 64,764 |
Eastman Kodak Company | | 11,410 | | 48,150 |
Harman International Industries, Inc. | | 3,850 | | 135,828 |
International Flavors & Fragrances, Inc. | | 2,165 | | 89,068 |
Jones Apparel Group, Inc. | | 11,020 | | 176,981 |
Newell Rubbermaid, Inc. | | 7,680 | | 115,277 |
Polo Ralph Lauren Corp. | | 1,410 | | 114,182 |
Sealed Air Corp. | | 4,315 | | 94,326 |
Tyson Foods, Inc. | | 7,375 | | 90,491 |
| | | | |
(Cost $1,093,683) | | | | 1,009,715 |
| | | | |
Consumer Services — 17.8% | | | | |
Abercrombie and Fitch Co. | | 3,250 | | 113,263 |
AutoNation, Inc.# | | 6,535 | | 125,145 |
Big Lots, Inc.# | | 4,455 | | 129,106 |
D.R. Horton, Inc. | | 9,170 | | 99,678 |
Expedia, Inc.# | | 9,120 | | 234,658 |
KB HOME | | 4,730 | | 64,706 |
Lennar Corp. | | 6,840 | | 87,347 |
Limited Brands, Inc. | | 7,480 | | 143,915 |
Nordstrom, Inc. | | 5,640 | | 211,951 |
Office Depot, Inc.# | | 21,700 | | 139,965 |
Pulte Homes, Inc. | | 11,833 | | 118,330 |
RadioShack Corp. | | 5,405 | | 105,397 |
Sears Holdings Corp.# | | 1,920 | | 160,224 |
Whole Foods Market, Inc.# | | 7,960 | | 218,502 |
Wyndham Worldwide Corp. | | 9,860 | | 198,876 |
Wynn Resorts, Ltd. | | 1,770 | | 103,067 |
| | | | |
(Cost $1,845,065) | | | | 2,254,130 |
| | | | |
Energy — 5.9% | | | | |
Cabot Oil & Gas Corp. | | 2,880 | | 125,539 |
Massey Energy Company | | 5,440 | | 228,534 |
Pioneer Natural Resources Company | | 4,630 | | 223,027 |
Rowan Companies, Inc. | | 4,050 | | 91,692 |
Tesoro Corp. | | 5,690 | | 77,099 |
| | | | |
(Cost $466,479) | | | | 745,891 |
| | | | |
Financial Services — 14.3% | | | | |
American Capital, Ltd.# | | 30,902 | | 75,401 |
Apartment Investment & Management Company@ | | 6,555 | | 104,356 |
Banco Santander SA — ADR | | 7,016 | | 115,343 |
CB Richard Ellis Group, Inc.# | | 14,960 | | 203,007 |
Developers Diversified Realty Corp.@ | | 14,824 | | 137,270 |
E*TRADE Financial Corp.# | | 56,240 | | 98,982 |
Federated Investors, Inc. | | 3,800 | | 104,500 |
The Quantex Fund
| | | | |
Security Description | | Shares or
Principal
Amount ($) | | Value ($) |
Common Stocks — continued | | |
First Horizon National Corp.# | | 6,567 | | 87,996 |
Genworth Financial, Inc.# | | 26,560 | | 301,456 |
Huntington Bancshares, Inc. | | 9,810 | | 35,807 |
Janus Capital Group, Inc. | | 8,050 | | 108,272 |
MBIA, Inc.# | | 15,890 | | 63,242 |
Wells Fargo & Co. Preferred# | | 1 | | 0 |
XL Capital, Ltd. | | 20,310 | | 372,282 |
| | | | |
(Cost $1,689,504) | | | | 1,807,914 |
| | | | |
Hardware — 16.5% | | | | |
Advanced Micro Devices, Inc.# | | 29,940 | | 289,819 |
Ciena Corp.# | | 9,639 | | 104,487 |
Jabil Circuit, Inc. | | 9,570 | | 166,231 |
JDS Uniphase Corp.# | | 17,712 | | 146,124 |
Lexmark International, Inc.# | | 2,390 | | 62,092 |
LSI Corp.# | | 19,650 | | 118,097 |
Micron Technology, Inc.# | | 28,470 | | 300,643 |
Molex, Inc. | | 4,405 | | 94,928 |
National Semiconductor Corp. | | 7,460 | | 114,586 |
Novellus Systems, Inc.# | | 5,240 | | 122,302 |
QLogic Corp.# | | 4,805 | | 90,670 |
SanDisk Corp.# | | 7,820 | | 226,702 |
Tellabs, Inc.# | | 15,695 | | 89,148 |
Teradyne, Inc.# | | 15,320 | | 164,384 |
| | | | |
(Cost $1,725,223) | | | | 2,090,213 |
| | | | |
Healthcare — 6.2% | | | | |
Coventry Health Care, Inc.# | | 5,050 | | 122,665 |
King Pharmaceuticals, Inc.# | | 6,075 | | 74,540 |
Patterson Companies, Inc.# | | 3,435 | | 96,111 |
PerkinElmer, Inc. | | 4,620 | | 95,126 |
Tenet Healthcare Corp.# | | 56,235 | | 303,106 |
Watson Pharmaceuticals, lnc.# | | 2,430 | | 96,252 |
| | | | |
(Cost $653,299) | | | | 787,800 |
| | | | |
Industrial Materials — 11.6% | | | | |
AK Steel Holding Corp. | | 8,060 | | 172,081 |
Allegheny Technologies, Inc. | | 2,940 | | 131,624 |
Black & Decker Corp./The | | 1,530 | | 99,190 |
CF Industries Holdings, Inc. | | 1,520 | | 137,986 |
Eastman Chemical Company | | 2,045 | | 123,191 |
Goodyear Tire & Rubber Company/The# | | 12,590 | | 177,519 |
Leggett & Platt, Inc. | | 4,245 | | 86,598 |
Manitowoc Company, Inc./The | | 8,670 | | 86,440 |
MeadWestvaco Corp. | | 6,710 | | 192,107 |
Snap-on, Inc. | | 1,630 | | 68,884 |
Stanley Works/The | | 1,885 | | 97,096 |
Titanium Metals Corp. | | 7,330 | | 91,772 |
| | | | |
(Cost $1,140,970) | | | | 1,464,488 |
| | | | |
Media — 4.3% | | | | |
Gannett Co., Inc. | | 9,390 | | 139,442 |
Meredith Corp. | | 3,775 | | 116,459 |
New York Times Co./The | | 8,820 | | 109,015 |
Scripps Networks Interactive | | 2,715 | | 112,672 |
Washington Post Company/The | | 155 | | 68,138 |
| | | | |
(Cost $599,369) | | | | 545,726 |
| | | | |
Software — 2.1% | | | | |
Akamai Technologies, Inc.# | | 4,970 | | 125,940 |
Compuware Corp.# | | 9,570 | | 69,191 |
Schedule of Investments
December 31, 2009
The Quantex Fund
| | | | | |
Security Description | | Shares or
Principal
Amount ($) | | Value ($) | |
Common Stocks — continued | | | |
Novell, Inc.# | | 16,615 | | 68,952 | |
| | | | | |
(Cost $281,104) | | | | 264,083 | |
| | | | | |
Telephone & Telecommunications — 1.1% | | | |
CenturyTel, Inc. | | 2,360 | | 85,456 | |
Frontier Communications Corp. | | 7,395 | | 57,755 | |
| | | | | |
(Cost $189,249) | | | | 143,211 | |
| | | | | |
Utilities — 2.5% | | | | | |
CMS Energy Corp. | | 6,395 | | 100,146 | |
Dynegy, Inc.# | | 32,340 | | 58,535 | |
Nicor, Inc. | | 1,855 | | 78,095 | |
TECO Energy, Inc. | | 5,230 | | 84,831 | |
| | | | | |
(Cost $396,810) | | | | 321,607 | |
| | | | | |
Total Common Stocks
(Cost $10,976,473) | | | | 12,258,337 | |
| | | | | |
Money Market Registered Investment Companies — 1.0% | |
The Flex-funds Money Market Fund — Institutional Class, 0.47%* | | 126,786 | | 126,786 | |
| | | | | |
Total Money Market Registered Investment Companies
(Cost $126,786) | | | | 126,786 | |
| | | | | |
Floating Rate Demand Notes — 1.6% | |
Caterpillar Financial Power Investment Floating Rate Demand Note, 2.05%, 1/4/2010** | | 200,467 | | 200,467 | |
| | | | | |
Total Floating Rate Demand Notes
(Cost $200,467) | | | | 200,467 | |
| | | | | |
U.S. Government Obligations — 0.7% | |
U.S. Treasury Bill,
0.035%, due 3/18/2010*** | | 100,000 | | 99,991 | |
| | | | | |
Total U.S. Government Obligations
(Cost $99,993) | | | | 99,991 | |
| | | | | |
Total Investments — 100.1%
(Cost $11,403,719)(a) | | | | 12,685,581 | |
| | | | | |
Liabilities less Other Assets — (0.1%) | | | | (18,106 | ) |
| | | | | |
Total Net Assets — 100.0% | | | | 12,667,475 | |
| | | | | |
Trustee Deferred Compensation**** | |
The Flex-funds Aggressive Growth Fund | | 491 | | 3,383 | |
The Flex-funds Defensive Balanced Fund | | 253 | | 2,272 | |
The Flex-funds Dynamic Growth Fund | | 497 | | 3,509 | |
The Flex-funds Muirfield Fund | | 1,911 | | 9,536 | |
The Flex-funds Quantex Fund | | 1,001 | | 18,498 | |
The Flex-funds Total Return Utilities Fund | | 111 | | 2,301 | |
| | | | | |
Total Trustee Deferred Compensation
(Cost $35,874) | | | | 39,499 | |
| | | | | |
The Quantex Fund
| | | | |
| | | Long
Contracts | | Unrealized
Appreciation
(Depreciation) ($) |
Futures Contracts | | |
Standard & Poors Mid Cap 400 expiring March 2010, notional value $362,450 | | 1 | | 5,943 |
| | | | |
Total Futures Contracts | | | | 5,943 |
| | | | |
| (a) | Represents cost for financial reporting purposes and differs for federal income tax purposes by the amount of losses deferred for federal income tax reporting in the amount of $20,540. Cost for federal income tax purposes of $11,424,209 differs from value by net unrealized appreciation (depreciation) of securities as follows: |
| | | | |
Unrealized appreciation | | $ | 2,802,544 | |
Unrealized depreciation | | | (1,541,222 | ) |
| | | | |
Net unrealized appreciation (depreciation) | | $ | 1,261,322 | |
| | | | |
ADR American Depositary Receipt
| # | Represents non-income producing securities. |
| @ | Real estate investment trust. |
| * | Investment in affiliate. The yield shown represents the 7-day yield in effect at December 31, 2009. |
| ** | Floating rate security. The rate shown represents the rate in effect at December 31, 2009. |
| *** | Pledged as collateral on Futures Contracts. |
| **** | Assets of affiliates to The Flex-funds Quantex Fund held for the benefit of the Fund’s Trustees in connection with the Trustee Deferred Compensation Plan. |
The accompanying notes are an integral part of these financial statements.
Schedule of Investments
December 31, 2009
The Total Return Utilities Fund
| | | | |
Security Description | | Shares or
Principal
Amount ($) | | Value ($) |
Common Stocks — 97.2% | | | | |
Electric Utility — 26.0% | | | | |
AES Corp.# | | 42,965 | | 571,864 |
American Superconductor Corp.# | | 11,420 | | 467,078 |
CMS Energy Corp. | | 31,045 | | 486,165 |
Covanta Holding Corp.# | | 21,705 | | 392,643 |
ITC Holdings Corp. | | 12,440 | | 648,000 |
MDU Resources Group, Inc. | | 35,982 | | 849,175 |
Northeast Utilities | | 35,115 | | 905,616 |
NV Energy, Inc. | | 29,975 | | 371,090 |
Pepco Holdings, Inc. | | 14,320 | | 241,292 |
Quanta Services, Inc.# | | 21,530 | | 448,685 |
| | | | |
(Cost $5,489,650) | | | | 5,381,608 |
| | | | |
Natural Gas Distribution — 10.0% | | | | |
National Grid PLC — ADR | | 7,111 | | 386,696 |
NiSource, Inc. | | 50,060 | | 769,923 |
ONEOK, Inc. | | 7,625 | | 339,846 |
Southern Union Co. | | 25,900 | | 587,930 |
| | | | |
(Cost $2,248,218) | | | | 2,084,395 |
| | | | |
Oil Exploration & Production — 3.3% | | | | |
EQT Corp. | | 8,715 | | 382,763 |
Ultra Petroleum Corp.# | | 5,680 | | 283,205 |
| | | | |
(Cost $580,870) | | | | 665,968 |
| | | | |
Pipelines — 16.0% | | | | |
El Paso Corp. | | 44,365 | | 436,108 |
Enterprise Products Partners, L.P. | | 30,451 | | 956,466 |
Kinder Morgan Energy Partners, L.P. | | 13,443 | | 819,754 |
Questar Corp. | | 11,805 | | 490,734 |
Spectra Energy Corp. | | 30,220 | | 619,812 |
| | | | |
(Cost $2,903,028) | | | | 3,322,874 |
| | | | |
Telephone & Telecommunications — 23.1% | | |
Akamai Technologies, Inc.# | | 26,140 | | 662,388 |
AT&T, Inc. | | 30,005 | | 841,040 |
BCE, Inc. | | 8,195 | | 226,264 |
China Mobile Limited — ADR | | 5,865 | | 272,312 |
General Cable Corp.# | | 6,525 | | 191,966 |
NII Holdings, Inc.# | | 33,615 | | 1,128,725 |
Philippine Long Distance Telephone Company — ADR | | 3,580 | | 202,879 |
Telephone and Data Systems, Inc. | | 10,080 | | 341,914 |
Verizon Communications, Inc. | | 28,040 | | 928,965 |
| | | | |
(Cost $5,154,033) | | | | 4,796,453 |
| | | | |
Utility Services — 12.3% | | |
A123 Systems, Inc.# | | 22,130 | | 496,597 |
Calgon Carbon Corp.# | | 31,675 | | 440,282 |
Chicago Bridge & Iron Co. | | 31,770 | | 642,389 |
Fluor Corp. | | 8,030 | | 361,671 |
Shaw Group, Inc./The# | | 21,000 | | 603,750 |
| | | | |
(Cost $2,193,666) | | | | 2,544,689 |
| | | | |
Water Utility — 6.5% | | | | |
American Water Works Co., Inc. | | 44,765 | | 1,003,184 |
Veolia Environnement — ADR | | 10,655 | | 350,336 |
| | | | |
(Cost $1,286,519) | | | | 1,353,520 |
| | | | |
Total Common Stocks
(Cost $19,855,984) | | | | 20,149,507 |
| | | | |
The Total Return Utilities Fund
| | | | |
Security Description | | Shares or
Principal
Amount ($) | | Value ($) |
Money Market Registered Investment Companies — 1.2% |
The Flex-funds Money Market Fund —Institutional Class, 0.47% * | | 257,874 | | 257,874 |
| | | | |
Total Money Market Registered Investment Companies
(Cost $257,874) | | | | 257,874 |
| | | | |
Total Investments — 98.4%
(Cost $20,113,858)(a) | | | | 20,407,381 |
| | | | |
Other Assets less Liabilities — 1.6% | | | | 323,849 |
| | | | |
Total Net Assets — 100.0% | | | | 20,731,230 |
| | | | |
Trustee Deferred Compensation** |
The Flex-funds Aggressive Growth Fund | | 566 | | 3,900 |
The Flex-funds Defensive Balanced Fund | | 293 | | 2,631 |
The Flex-funds Dynamic Growth Fund | | 408 | | 2,880 |
The Flex-funds Muirfield Fund | | 1,488 | | 7,425 |
The Flex-funds Quantex Fund | | 824 | | 15,228 |
The Flex-funds Total Return Utilities Fund | | 98 | | 2,032 |
| | | | |
Total Trustee Deferred Compensation (Cost $31,433) | | | | 34,096 |
| | | | |
| (a) | Represents cost for financial reporting purposes and differs for federal income tax purposes by the amount of losses deferred for federal income tax reporting in the amount of $72,658. Cost for federal income tax purposes of $20,186,516 differs from value by net unrealized appreciation (depreciation) of securities as follows: |
| | | | |
Unrealized appreciation | | $ | 2,236,348 | |
Unrealized depreciation | | | (2,015,483 | ) |
| | | | |
Net unrealized appreciation (depreciation) | | $ | 220,865 | |
| | | | |
ADR American Depositary Receipt
| # | Represents non-income producing securities. |
| * | Investment in affiliate. The yield shown represents the 7-day yield in effect at December 31, 2009. |
| ** | Assets of affiliates to The Total Return Utilities Fund held for the benefit of the Fund’s Trustees in connection with the Trustees Deferred Compensation Plan. |
The accompanying notes are an integral part of these financial statements.
Schedule of Investments
December 31, 2009
The U.S. Government Bond Fund
| | | | |
Security Description | | Principal
Amount ($)
or Shares | | Value ($) |
U.S. Government Obligations — 80.6% |
Fannie Mae,
3.125%, due 06/29/2015 | | 250,000 | | 247,885 |
Fannie Mae,
3.80%, due 12/21/2016 | | 250,000 | | 244,982 |
Fannie Mae,
4.125%, due 11/10/2017 | | 500,000 | | 492,330 |
Fannie Mae,
4.00%, due 02/20/2024* | | 1,000,000 | | 992,160 |
Fannie Mae,
5.25%, due 11/19/2024 | | 1,000,000 | | 977,360 |
Federal Agricultural Mortgage Corporation,
3.25%, due 08/11/2014 | | 1,000,000 | | 1,016,880 |
Federal Farm Credit Bank,
0.23%, due 11/27/2012* | | 250,000 | | 249,640 |
Federal Farm Credit Bank,
3.20%, due 06/02/2015 | | 250,000 | | 246,665 |
Federal Home Loan Bank,
3.00%, due 12/29/2014 | | 500,000 | | 495,470 |
Federal Home Loan Bank,
3.25%, due 04/13/2015 | | 1,000,000 | | 990,050 |
Federal Home Loan Bank,
3.80%, due 05/20/2016 | | 500,000 | | 494,720 |
Federal Home Loan Bank,
3.42%, due 06/17/2016 | | 500,000 | | 487,955 |
Federal Home Loan Mortgage Corporation,
5.30%, due 05/12/2020 | | 1,000,000 | | 1,009,410 |
Government National Mortgage Association,
6.00%, due 02/15/2038 | | 752,486 | | 793,872 |
Government National Mortgage Association,
5.00%, due 04/15/2038 | | 849,105 | | 873,516 |
Government National Mortgage Association,
5.50%, due 07/20/2038 | | 216,586 | | 217,089 |
Government National Mortgage Association,
6.50%, due 07/20/2038 | | 26,716 | | 28,495 |
Government National Mortgage Association,
5.00%, due 07/20/2039 | | 982,765 | | 1,009,791 |
Government National Mortgage Association,
5.00%, due 10/20/2039 | | 993,811 | | 1,021,141 |
U.S. Treasury Note,
2.375%, due 08/31/2014 | | 1,500,000 | | 1,489,226 |
U.S. Treasury Note,
3.125%, due 05/15/2019 | | 500,000 | | 473,516 |
| | | | |
Total U.S. Government Obligations
(Cost $13,830,173) | | | | 13,852,153 |
| | | | |
Corporate Bonds — 17.8% |
GE Capital Corp.,
0.37%, due 04/28/2011* | | 500,000 | | 495,365 |
Goldman Sachs,
3.625%, due 08/01/2012 | | 500,000 | | 522,745 |
The U.S. Government Bond Fund
| | | | | |
Security Description | | Principal
Amount ($)
or Shares | | Value ($) | |
Corporate Bonds — continued | |
IBM Corp.,
2.10%, due 05/16/2013 | | 1,000,000 | | 1,000,000 | |
Paccar Financial Corp.,
3.78%, due 01/12/2011* | | 500,000 | | 515,925 | |
Partnerre Finance,
6.875%, due 06/01/2018 | | 500,000 | | 531,850 | |
| | | | | |
Total Corporate Bonds
(Cost $3,021,896) | | | | 3,065,885 | |
| | | | | |
Money Market Registered Investment Companies — 0.5% | |
The Flex-funds Money Market Fund —Institutional Class, 0.47%** | | 88,306 | | 88,306 | |
| | | | | |
Total Money Market Registered Investment Companies
(Cost $88,306) | | | | 88,306 | |
| | | | | |
Floating Rate Demand Notes — 1.2% | |
Caterpillar Financial Power Investment Floating Rate Demand Note, 2.05%, 1/4/2010*** | | 200,700 | | 200,700 | |
| | | | | |
Total Floating Rate Demand Notes
(Cost $200,700) | | | | 200,700 | |
| | | | | |
Total Investments — 100.1%
(Cost $17,141,075)(a) | | | | 17,207,044 | |
| | | | | |
Liabilities less Other Assets — (0.1%) | | | | (16,477 | ) |
| | | | | |
Total Net Assets — 100.0% | | | | 17,190,567 | |
| | | | | |
Trustee Deferred Compensation**** | |
The Flex-funds Aggressive Growth Fund | | 456 | | 3,142 | |
The Flex-funds Defensive Balanced Fund | | 233 | | 2,092 | |
The Flex-funds Dynamic Growth Fund | | 317 | | 2,238 | |
The Flex-funds Muirfield Fund | | 1,137 | | 5,674 | |
The Flex-funds Quantex Fund | | 634 | | 11,716 | |
The Flex-funds Total Return Utilities Fund | | 78 | | 1,617 | |
| | | | | |
Total Trustee Deferred Compensation (Cost $24,385) | | | | 26,479 | |
| | | | | |
| (a) | Represents cost for financial reporting purposes and differs for federal income tax purposes by the amount of losses deferred for federal income tax reporting in the amount of $1,067. Cost for federal income tax purposes of $17,142,142 differs from value by net unrealized appreciation (depreciation) of securities as follows: |
| | | | |
Unrealized appreciation | | $ | 185,351 | |
Unrealized depreciation | | | (120,449 | ) |
| | | | |
Net unrealized appreciation (depreciation) | | $ | 64,902 | |
| | | | |
| * | Variable rate security. The rate shown represents the rate in effect at December 31, 2009. |
| ** | Investment in affiliate. The yield shown represents the 7-day yield in effect at December 31, 2009. |
| *** | Floating rate security. The rate shown represents the rate in effect at December 31, 2009. |
| **** | Assets of affiliates to The U.S. Government Bond Fund held for the benefit of the Fund’s Trustees in connection with the Trustee Deferred Compensation Plan. |
The accompanying notes are an integral part of these financial statements.
Schedule of Investments
December 31, 2009
The Money Market Fund
| | | | | | | | | |
Security Description | | Coupon/
Yield | | | Maturity | | Principal
Amount ($)
or Shares | | Value ($) |
Bank Obligations — 0.2% |
Everbank Money Market Account | | 1.50% | * | | 01/04/10 | | 150,000 | | 150,000 |
Huntington National Bank Conservative Deposit Account | | 1.10% | * | | 01/04/10 | | 250,000 | | 250,000 |
| | | | | | | | | |
Total Bank Obligations
(Cost $400,000) | | | | | | | | | 400,000 |
| | | | | | | | | |
Certificates of Deposit — 12.5% |
1st Bank | | 2.00% | | | 03/18/10 | | 94,000 | | 94,000 |
Access National Bank | | 2.00% | | | 03/25/10 | | 94,500 | | 94,500 |
Alpine Bank | | 1.65% | | | 05/13/10 | | 96,250 | | 96,250 |
Amalgamated Bank | | 1.90% | | | 04/08/10 | | 94,000 | | 94,000 |
Amalgamated Bank | | 1.05% | | | 06/10/10 | | 141,500 | | 141,500 |
Amarillo National Bank | | 1.30% | | | 05/20/10 | | 95,250 | | 95,250 |
Amegy Bank, NA | | 1.70% | | | 05/06/10 | | 94,500 | | 94,500 |
Amegy Bank, NA | | 1.05% | | | 06/10/10 | | 142,000 | | 142,000 |
American Community Bank | | 1.30% | | | 05/20/10 | | 45,500 | | 45,500 |
American Commercial Bank & Trust | | 1.65% | | | 05/13/10 | | 96,250 | | 96,250 |
American Gateway Bank | | 1.90% | | | 04/08/10 | | 94,000 | �� | 94,000 |
American National Bank | | 1.65% | | | 05/13/10 | | 96,250 | | 96,250 |
American National Bank | | 1.30% | | | 05/20/10 | | 95,250 | | 95,250 |
American National Bank of Texas, The | | 1.30% | | | 05/20/10 | | 95,250 | | 95,250 |
Ameris Bank | | 1.05% | | | 06/10/10 | | 236,500 | | 236,500 |
Avenue Bank | | 2.00% | | | 03/25/10 | | 94,500 | | 94,500 |
Banco Popular De Puerto Rico | | 1.05% | | | 06/10/10 | | 236,500 | | 236,500 |
Banco Popular North America | | 1.90% | | | 04/22/10 | | 93,500 | | 93,500 |
Bank Forward | | 1.90% | | | 04/08/10 | | 8,131 | | 8,131 |
Bank of American Fork | | 1.30% | | | 05/20/10 | | 95,250 | | 95,250 |
Bank of Colorado | | 1.30% | | | 05/20/10 | | 95,250 | | 95,250 |
Bank of Florida — Southwest | | 1.65% | | | 05/13/10 | | 96,250 | | 96,250 |
Bank of Kremlin, The | | 1.30% | | | 05/20/10 | | 95,250 | | 95,250 |
Bank of Nevada | | 1.90% | | | 04/22/10 | | 18,716 | | 18,716 |
Bank of Prairie du Sac | | 1.65% | | | 05/13/10 | | 96,250 | | 96,250 |
Bank of Smithtown | | 1.65% | | | 05/13/10 | | 1,643 | | 1,643 |
Bank of Southern Connecticut, The | | 1.65% | | | 05/13/10 | | 96,250 | | 96,250 |
Bank of the Cascades | | 1.30% | | | 05/20/10 | | 95,250 | | 95,250 |
Bank of the Sierra | | 2.00% | | | 03/25/10 | | 94,500 | | 94,500 |
Borel Private Bank & Trust Co. | | 1.65% | | | 05/13/10 | | 96,250 | | 96,250 |
Bridgehampton National Bank, The | | 1.30% | | | 05/20/10 | | 47,500 | | 47,500 |
Business First Bank | | 2.00% | | | 03/18/10 | | 94,000 | | 94,000 |
Camelback Community Bank | | 1.30% | | | 05/20/10 | | 95,250 | | 95,250 |
CapitalMark Bank & Trust | | 1.75% | | | 04/29/10 | | 95,250 | | 95,250 |
Carolina Alliance Bank | | 1.90% | | | 04/22/10 | | 93,500 | | 93,500 |
Carolina First Bank | | 1.30% | | | 05/20/10 | | 95,250 | | 95,250 |
Central Bank and Trust Company | | 1.90% | | | 04/08/10 | | 51,869 | | 51,869 |
Central Bank of Illinois | | 2.00% | | | 04/01/10 | | 94,500 | | 94,500 |
Central National Bank & Trust Co. of Enid | | 1.30% | | | 05/20/10 | | 95,250 | | 95,250 |
Centrix Bank & Trust | | 2.00% | | | 03/25/10 | | 94,500 | | 94,500 |
Chevy Chase Bank FSB | | 2.00% | | | 03/18/10 | | 94,000 | | 94,000 |
Citizens Bank of Florida | | 1.90% | | | 04/22/10 | | 46,284 | | 46,284 |
Citizens Business Bank | | 1.90% | | | 04/22/10 | | 93,500 | | 93,500 |
The Money Market Fund
| | | | | | | | |
Security Description | | Coupon/
Yield | | Maturity | | Principal
Amount ($)
or Shares | | Value ($) |
Certificates of Deposit — continued |
Citizens Business Bank | | 1.05% | | 06/10/10 | | 141,000 | | 141,000 |
Citizens First Bank | | 1.70% | | 05/06/10 | | 94,500 | | 94,500 |
Citizens First National Bank | | 1.65% | | 05/13/10 | | 96,250 | | 96,250 |
CNLBank | | 2.00% | | 03/18/10 | | 94,000 | | 94,000 |
Cole Taylor Bank | | 1.30% | | 05/20/10 | | 95,250 | | 95,250 |
Colony Bank | | 2.00% | | 03/25/10 | | 94,500 | | 94,500 |
Community Bank | | 1.30% | | 05/20/10 | | 95,250 | | 95,250 |
Community Bank of Broward | | 1.30% | | 05/20/10 | | 95,250 | | 95,250 |
Community Southern Bank | | 1.90% | | 04/08/10 | | 94,000 | | 94,000 |
Community West Bank, NA | | 1.30% | | 05/20/10 | | 47,500 | | 47,500 |
Cornerstone Community Bank | | 1.75% | | 04/29/10 | | 95,250 | | 95,250 |
Cornerstone National Bank & Trust Co. | | 2.00% | | 03/18/10 | | 94,000 | | 94,000 |
Darby Bank & Trust Co. | | 1.30% | | 05/20/10 | | 95,250 | | 95,250 |
Destin First Bank | | 1.30% | | 05/20/10 | | 95,250 | | 95,250 |
Dexia Credit Local | | 1.02% | | 08/13/10 | | 5,000,000 | | 5,000,616 |
EagleBank | | 2.00% | | 03/18/10 | | 94,000 | | 94,000 |
EverBank | | 2.00% | | 04/01/10 | | 94,500 | | 94,500 |
F&M Bank & Trust Company, The | | 2.00% | | 03/25/10 | | 88,264 | | 88,264 |
F&M Bank & Trust Company, The | | 1.70% | | 05/06/10 | | 6,236 | | 6,236 |
Far East National Bank | | 1.90% | | 04/08/10 | | 94,000 | | 94,000 |
First A National Banking Association, The | | 1.30% | | 05/20/10 | | 95,250 | | 95,250 |
First American Bank | | 1.30% | | 05/20/10 | | 95,250 | | 95,250 |
First Bank & Trust Company, The | | 1.65% | | 05/13/10 | | 96,250 | | 96,250 |
First Chicago Bank & Trust | | 2.00% | | 03/25/10 | | 61,236 | | 61,236 |
First Clover Leaf Bank | | 2.00% | | 04/01/10 | | 66,853 | | 66,853 |
First Clover Leaf Bank | | 1.65% | | 05/13/10 | | 27,647 | | 27,647 |
First Community Bank | | 1.30% | | 05/20/10 | | 71,355 | | 71,355 |
First Community Bank of Plainfield | | 1.30% | | 05/20/10 | | 95,250 | | 95,250 |
First Community Bank, NA | | 2.00% | | 04/01/10 | | 94,500 | | 94,500 |
First Federal Bank of the Midwest | | 1.30% | | 05/20/10 | | 95,250 | | 95,250 |
First Federal Savings and Loan Association | | 1.90% | | 04/22/10 | | 93,500 | | 93,500 |
First Financial Bank | | 1.30% | | 05/20/10 | | 95,250 | | 95,250 |
First Foundation Bank | | 1.65% | | 05/13/10 | | 96,250 | | 96,250 |
First Freedom Bank | | 2.00% | | 04/01/10 | | 94,500 | | 94,500 |
First Interstate Bank | | 1.30% | | 05/20/10 | | 95,250 | | 95,250 |
First National Bank | | 1.90% | | 04/22/10 | | 93,500 | | 93,500 |
First National Bank of Fort Smith, The | | 1.70% | | 05/06/10 | | 94,500 | | 94,500 |
First National Bank of Midland | | 1.65% | | 05/13/10 | | 96,250 | | 96,250 |
First National Bank of Omaha | | 1.30% | | 05/20/10 | | 95,250 | | 95,250 |
First State Bank | | 1.65% | | 05/13/10 | | 96,250 | | 96,250 |
First State Bank | | 1.30% | | 05/20/10 | | 95,250 | | 95,250 |
First Tennessee Bank, NA | | 1.30% | | 05/20/10 | | 39,945 | | 39,945 |
First United Bank & Trust | | 1.90% | | 04/08/10 | | 94,000 | | 94,000 |
First United Bank and Trust Co. | | 1.30% | | 05/20/10 | | 95,250 | | 95,250 |
FirsTier Bank | | 1.65% | | 05/13/10 | | 96,250 | | 96,250 |
Foundation Bank | | 1.30% | | 05/20/10 | | 95,250 | | 95,250 |
Frost National Bank, The | | 2.00% | | 03/25/10 | | 94,500 | | 94,500 |
Schedule of Investments
December 31, 2009
The Money Market Fund
| | | | | | | | |
Security Description | | Coupon/
Yield | | Maturity | | Principal
Amount ($)
or Shares | | Value ($) |
Certificates of Deposit — continued |
Gibraltar Private Bank & Trust Co. | | 1.30% | | 05/20/10 | | 68,742 | | 68,742 |
Great American Bank | | 1.30% | | 05/20/10 | | 95,250 | | 95,250 |
Great Southern Bank | | 1.70% | | 05/06/10 | | 94,500 | | 94,500 |
Great Southern Bank | | 1.05% | | 06/10/10 | | 142,000 | | 142,000 |
Harris, NA | | 1.75% | | 04/29/10 | | 95,250 | | 95,250 |
Hawthorn Bank | | 1.70% | | 05/06/10 | | 94,500 | | 94,500 |
Heritage Bank | | 1.05% | | 06/10/10 | | 150,081 | | 150,081 |
Home Federal Bank | | 1.30% | | 05/20/10 | | 95,250 | | 95,250 |
IBERIABANK | | 1.75% | | 04/29/10 | | 95,250 | | 95,250 |
Independent Bank | | 1.75% | | 04/29/10 | | 95,250 | | 95,250 |
Inland Community Bank, NA | | 1.70% | | 05/06/10 | | 94,500 | | 94,500 |
Johnson Bank | | 2.00% | | 03/25/10 | | 94,500 | | 94,500 |
Lakeside Bank | | 2.00% | | 03/18/10 | | 94,000 | | 94,000 |
Leaders Bank, The | | 1.30% | | 05/20/10 | | 95,250 | | 95,250 |
Lorain National Bank | | 1.30% | | 05/20/10 | | 95,250 | | 95,250 |
MB Financial Bank, NA | | 1.70% | | 05/06/10 | | 94,500 | | 94,500 |
MB Financial Bank, NA | | 1.05% | | 06/10/10 | | 142,000 | | 142,000 |
McHenry Savings Bank | | 1.30% | | 05/20/10 | | 95,250 | | 95,250 |
Metropolitan National Bank | | 2.00% | | 04/01/10 | | 82,647 | | 82,647 |
Metropolitan National Bank | | 1.70% | | 05/06/10 | | 11,853 | | 11,853 |
MidFirst Bank | | 1.30% | | 05/20/10 | | 95,250 | | 95,250 |
Midwest Bank of Western Illinois | | 1.70% | | 05/06/10 | | 94,500 | | 94,500 |
Midwest Bank of Western Illinois | | 1.05% | | 06/10/10 | | 142,000 | | 142,000 |
Mission Valley Bank | | 1.30% | | 05/20/10 | | 46,000 | | 46,000 |
Modern Bank, NA | | 1.30% | | 05/20/10 | | 95,250 | | 95,250 |
Morton Community Bank | | 2.00% | | 03/18/10 | | 42,412 | | 42,412 |
Mutual of Omaha Bank | | 1.90% | | 04/08/10 | | 94,000 | | 94,000 |
NCB, FSB | | 1.30% | | 05/20/10 | | 95,250 | | 95,250 |
Neighborhood National Bank | | 1.70% | | 05/06/10 | | 94,500 | | 94,500 |
Norstates Bank | | 1.30% | | 05/20/10 | | 95,250 | | 95,250 |
Northstar Bank of Texas | | 1.30% | | 05/20/10 | | 95,250 | | 95,250 |
Orion Bank | | 1.90% | | 04/22/10 | | 93,500 | | 93,500 |
Pacific Capital Bank, NA | | 2.00% | | 03/25/10 | | 94,500 | | 94,500 |
Paradise Bank | | 1.30% | | 05/20/10 | | 95,250 | | 95,250 |
Paragon Commercial Bank | | 1.90% | | 04/22/10 | | 93,500 | | 93,500 |
Park National Bank, The | | 1.30% | | 05/20/10 | | 95,250 | | 95,250 |
Pinnacle Bank | | 1.75% | | 04/29/10 | | 47,500 | | 47,500 |
Pinnacle Bank | | 1.30% | | 05/20/10 | | 47,750 | | 47,750 |
Pinnacle National Bank | | 1.90% | | 04/08/10 | | 94,000 | | 94,000 |
PrivateBank and Trust Company, The | | 2.00% | | 03/18/10 | | 94,000 | | 94,000 |
PrivateBank, The | | 1.75% | | 04/29/10 | | 95,250 | | 95,250 |
Provident Bank of Maryland | | 1.90% | | 04/08/10 | | 94,000 | | 94,000 |
Pulaski Bank | | 1.75% | | 04/29/10 | | 95,250 | | 95,250 |
Queensborough National Bank & Trust Company | | 1.90% | | 04/08/10 | | 94,000 | | 94,000 |
RBC Bank | | 1.70% | | 05/06/10 | | 36,911 | | 36,911 |
Republic Bank & Trust Company | | 2.00% | | 04/01/10 | | 94,500 | | 94,500 |
Rhinebeck Savings Bank | | 1.30% | | 05/20/10 | | 95,250 | | 95,250 |
River City Bank | | 1.65% | | 05/13/10 | | 96,250 | | 96,250 |
Rocky Mountain Bank | | 2.00% | | 04/01/10 | | 94,500 | | 94,500 |
Rocky Mountain Bank | | 1.90% | | 04/08/10 | | 94,000 | | 94,000 |
S&T Bank | | 2.00% | | 04/01/10 | | 94,500 | | 94,500 |
ShoreBank | | 1.70% | | 05/06/10 | | 94,500 | | 94,500 |
ShoreBank Pacific | | 1.05% | | 06/10/10 | | 148,669 | | 148,669 |
The Money Market Fund
| | | | | | | | | |
Security Description | | Coupon/
Yield | | | Maturity | | Principal
Amount ($)
or Shares | | Value ($) |
Certificates of Deposit — continued |
Signature Bank, NA | | 1.30% | | | 05/20/10 | | 95,250 | | 95,250 |
Sovereign Bank | | 1.30% | | | 05/20/10 | | 95,250 | | 95,250 |
SpiritBank | | 1.90% | | | 04/22/10 | | 93,500 | | 93,500 |
State Bank Financial | | 1.30% | | | 05/20/10 | | 71,684 | | 71,684 |
State Bank of Countryside | | 2.00% | | | 03/18/10 | | 94,000 | | 94,000 |
Sterling National Bank | | 1.30% | | | 05/20/10 | | 95,250 | | 95,250 |
Sterling Savings Bank | | 1.65% | | | 05/13/10 | | 96,250 | | 96,250 |
Summit Community Bank, Inc. | | 1.90% | | | 04/22/10 | | 93,500 | | 93,500 |
Sun West Bank | | 2.00% | | | 03/18/10 | | 17,588 | | 17,588 |
Sunrise Bank | | 1.65% | | | 05/13/10 | | 96,250 | | 96,250 |
Texas Champion Bank | | 1.30% | | | 05/20/10 | | 14,079 | | 14,079 |
Texas Citizens Bank, NA | | 2.00% | | | 04/01/10 | | 94,500 | | 94,500 |
Texas Community Bank, NA | | 1.75% | | | 04/29/10 | | 95,250 | | 95,250 |
TriSummit Bank | | 1.30% | | | 05/20/10 | | 95,250 | | 95,250 |
Umpqua Bank | | 2.00% | | | 04/01/10 | | 94,500 | | 94,500 |
Union Bank & Trust Company | | 1.75% | | | 04/29/10 | | 95,250 | | 95,250 |
Union Bank & Trust Company | | 1.05% | | | 06/10/10 | | 141,250 | | 141,250 |
Union Bank, The | | 1.65% | | | 05/13/10 | | 45,710 | | 45,710 |
Union Center National Bank | | 1.05% | | | 06/10/10 | | 236,500 | | 236,500 |
Union State Bank | | 1.65% | | | 05/13/10 | | 96,250 | | 96,250 |
United Bank | | 1.65% | | | 05/13/10 | | 96,250 | | 96,250 |
United Bank & Trust — Washtenaw | | 1.30% | | | 05/20/10 | | 95,250 | | 95,250 |
United Commercial Bank | | 1.90% | | | 04/22/10 | | 93,500 | | 93,500 |
United Community Bank | | 1.65% | | | 05/13/10 | | 96,250 | | 96,250 |
United Southern Bank | | 1.75% | | | 04/29/10 | | 95,250 | | 95,250 |
United Western Bank | | 1.30% | | | 05/20/10 | | 95,250 | | 95,250 |
Village Bank and Trust | | 1.30% | | | 05/20/10 | | 95,250 | | 95,250 |
Virginia Commerce Bank | | 2.00% | | | 03/25/10 | | 94,500 | | 94,500 |
Vision Bank | | 1.30% | | | 05/20/10 | | 95,250 | | 95,250 |
VIST Bank | | 1.30% | | | 05/20/10 | | 23,196 | | 23,196 |
Waccamaw Bank | | 1.30% | | | 05/20/10 | | 95,250 | | 95,250 |
West Bank | | 2.00% | | | 03/18/10 | | 94,000 | | 94,000 |
West Coast Bank | | 1.65% | | | 05/13/10 | | 96,250 | | 96,250 |
| | | | | | | | | |
Total Certificates of Deposit
(Cost $21,000,616) | | | | 21,000,616 |
| | | | | | | | | |
Corporate Obligations — 26.6% |
Bath Technologies*** | | 0.43% | * | | 01/07/10 | | 935,000 | | 935,000 |
Cascade Plaza Project*** | | 0.33% | * | | 01/07/10 | | 6,741,000 | | 6,741,000 |
Caterpillar Financial Power Investment Floating Rate Demand Note | | 2.05% | ** | | 01/04/10 | | 9,036,188 | | 9,036,188 |
Commonwealth Bank of Australia*** | | 0.69% | | | 10/29/10 | | 5,000,000 | | 5,000,000 |
Commonwealth Bank of Australia*** | | 0.64% | | | 01/05/11 | | 3,000,000 | | 3,000,000 |
General Electric Interest Plus Variable Rate Demand Note | | 1.90% | * | | 01/04/10 | | 9,014,495 | | 9,014,495 |
Martin Wheel Co, Inc.*** | | 2.98% | * | | 01/07/10 | | 1,920,000 | | 1,920,000 |
Seariver Maritime | | 0.75% | * | | 01/04/10 | | 1,200,000 | | 1,200,000 |
Springside Corp Exchange Partners LLC*** | | 0.33% | * | | 01/07/10 | | 2,000,000 | | 2,000,000 |
Schedule of Investments
December 31, 2009
The Money Market Fund
| | | | | | | | | |
Security Description | | Coupon/
Yield | | | Maturity | | Principal
Amount ($)
or Shares | | Value ($) |
Corporate Obligations — continued |
Toyota Motor Credit | | 1.53% | * | | 01/14/10 | | 5,000,000 | | 5,000,052 |
White Castle Project*** | | 0.48% | * | | 01/07/10 | | 1,000,000 | | 1,000,000 |
| | | | | | | | | |
Total Corporate Obligations
(Cost $44,846,735) | | | | 44,846,735 |
| | | | | | | | | |
U.S. Government Agency Obligations — 21.1% |
Federal Home Loan Bank | | 0.76% | * | | 01/04/10 | | 5,000,000 | | 5,000,000 |
Federal Home Loan Bank | | 0.83% | * | | 01/04/10 | | 5,000,000 | | 5,000,000 |
Federal Home Loan Bank | | 0.78% | * | | 01/04/10 | | 5,000,000 | | 5,000,000 |
Federal Home Loan Bank | | 4.55% | | | 08/06/10 | | 35,000 | | 35,817 |
Federal Home Loan Bank | | 0.55% | | | 10/05/10 | | 2,000,000 | | 2,000,028 |
Federal Home Loan Bank | | 0.50% | | | 10/15/10 | | 4,000,000 | | 4,000,000 |
Federal Home Loan Bank | | 0.55% | | | 11/03/10 | | 2,000,000 | | 2,000,000 |
Federal Home Loan Bank | | 0.50% | | | 01/05/11 | | 2,500,000 | | 2,500,000 |
Federal Home Loan Bank Discount | | 1.02% | | | 02/02/10 | | 5,000,000 | | 4,995,556 |
Federal National Mortgage Association Discount | | 0.97% | | | 02/03/10 | | 5,000,000 | | 4,995,644 |
| | | | | | | | | |
Total U.S. Government Agency Obligations
(Cost $35,527,045) | | | | 35,527,045 |
| | | | | | | | | |
Money Market Registered Investment Companies — 39.5% |
Federated Prime Value Obligations Fund, 0.18%# | | | | | 10,000,617 | | 10,000,617 |
Fidelity Institutional Money Market Portfolio, 0.29%# | | | | | | | 56,448,965 | | 56,448,965 |
| | | | | | | | | |
Total Money Market Registered Investment Companies
(Cost $66,449,582) | | | | | | | 66,449,582 |
| | | | | | | | | |
Total Investments — 99.9%
(Cost $168,223,978)(a) | | | | | | | 168,223,978 |
| | | | | | | | | |
Other Assets less Liabilities — 0.1% | | | | 167,328 |
| | | | | | | | | |
Total Net Assets — 100.0% | | | | | | | 168,391,306 |
| | | | | | | | | |
Trustee Deferred Compensation**** |
The Flex-funds Aggressive Growth Fund | | | | | 453 | | 3,121 |
The Flex-funds Defensive Balanced Fund | | | | | 232 | | 2,083 |
The Flex-funds Dynamic Growth Fund | | | | | 438 | | 3,092 |
The Flex-funds Muirfield Fund | | | | | 1,616 | | 8,064 |
The Flex-funds Quantex Fund | | | | | 898 | | 16,595 |
The Flex-funds Total Return Utilities Fund | | | | | 117 | | 2,425 |
| | | | | | | | | |
Total Trustee Deferred Compensation
(Cost $35,032) | | | | 35,380 |
| | | | | | | | | |
The Money Market Fund
| (a) | Cost for federal income tax and financial reporting purposes are the same. |
| # | 7-day yield as of December 31, 2009. |
| * | Variable rate security. Securities payable on demand at par including accrued interest (usually within seven days notice) and unconditionally secured as to principal and interest by letters of credit or other credit support agreements from major banks. The interest rates are adjustable and are based on bank prime rates or other interest rate adjustment indices. The rate shown represents the rate in effect at December 31, 2009. The maturity date shown reflects next rate change date. |
| ** | Floating rate security. The rate shown represents the rate in effect at December 31, 2009. |
| *** | Represents a restricted security purchased under Rule 144A, which is exempt from registration under the Securities Act of 1933, as amended. Security is restricted as to resale to institutional investors, but has been deemed liquid in accordance with guidelines approved by the Board of Trustees. As of December 31, 2009, securities restricted as to resale to institutional investors represented 12.2% of Total Investments. |
| **** | Assets of affiliates to The Money Market Fund held for the benefit of the Fund’s Trustees in connection with the Trustee Deferred Compensation Plan. |
The accompanying notes are an integral part of these financial statements.
[THIS PAGE INTENTIONALLY LEFT BLANK]
Statements of Assets & Liabilities
December 31, 2009
| | | | | | | | |
| | | The
Muirfield
Fund | | | The Dynamic
Growth Fund | |
Assets | | | | | | | | |
Investments, at value* | | $ | 113,115,937 | | | $ | 82,011,404 | |
Investments in affiliates, at amortized cost and value* | | | 2,521,062 | | | | 2,660,901 | |
Trustee deferred compensation investments, at value | | | 92,822 | | | | 40,857 | |
Receivable for securities sold | | | — | | | | — | |
Receivable for capital stock issued | | | 12,464 | | | | 13,298 | |
Interest and dividend receivable | | | 14,555 | | | | 2,127 | |
Prepaid expenses/other assets | | | 27,066 | | | | 26,876 | |
Total Assets | | | 115,783,906 | | | | 84,755,463 | |
| | |
Liabilities | | | | | | | | |
Payable for Trustee Deferred Compensation Plan | | | 92,822 | | | | 40,857 | |
Payable for net variation margin on futures contracts | | | 47,468 | | | | 34,200 | |
Payable for capital stock redeemed | | | 290,134 | | | | 149,642 | |
Dividends payable | | | 1,467 | | | | 20 | |
Dividends payable — The Money Market Fund — Retail Class | | | | | | | | |
Dividends payable — The Money Market Fund — Institutional Class | | | | | | | | |
Payable to investment advisor | | | 80,730 | | | | 52,401 | |
Accrued distribution plan (12b-1) and administrative service plan fees | | | 79,873 | | | | 76,823 | |
Accrued transfer agent, fund accounting, CCO, and administrative fees | | | 20,438 | | | | 15,264 | |
Accrued trustee fees | | | 6,992 | | | | 5,670 | |
Other accrued liabilities | | | 25,826 | | | | 22,505 | |
Total Liabilities | | | 645,750 | | | | 397,382 | |
| | | | | | | | | |
Net Assets | | | 115,138,156 | | | | 84,358,081 | |
| | |
Net Assets | | | | | | | | |
Capital | | | 129,940,796 | | | | 102,011,421 | |
Accumulated undistributed (distributions in excess of) net investment income | | | 171,705 | | | | — | |
Accumulated undistributed net realized gain (loss) from investments and futures contracts | | | (23,321,212 | ) | | | (24,313,444 | ) |
Net unrealized appreciation (depreciation) of investments and futures contracts | | | 8,346,867 | | | | 6,660,104 | |
Total Net Assets | | $ | 115,138,156 | | | $ | 84,358,081 | |
| | |
Net Assets | | | | | | | | |
The Money Market Fund — Retail Class | | | | | | | | |
The Money Market Fund — Institutional Class | | | | | | | | |
Total Net Assets | | | | | | | | |
| | |
Capital Stock Outstanding (indefinite number of shares authorized, $0.10 par value) | | | 23,050,761 | | | | 11,942,911 | |
The Money Market Fund — Retail Class | | | | | | | | |
The Money Market Fund — Institutional Class | | | | | | | | |
Total Capital Stock Outstanding | | | | | | | | |
| | |
Net Asset Value, Offering and Redemption Price Per Share | | $ | 4.99 | | | $ | 7.06 | |
The Money Market Fund — Retail Class | | | | | | | | |
The Money Market Fund — Institutional Class | | | | | | | | |
* Investments and affiliated investments at cost | | $ | 107,344,762 | | | $ | 78,053,211 | |
| | | | | | | | | | | | | | | | | | | | | | | | | |
The
Aggressive
Growth Fund | | | The Defensive
Balanced Fund | | | The Strategic
Growth Fund | | | The
Quantex
Fund | | | The Total
Return
Utilities Fund | | | The U.S.
Government
Bond Fund | | | The Money
Market Fund |
| | | | | | | | | | | | | | | | | | | | | | | | | |
| $ | 29,227,914 | | | $ | 47,196,482 | | | $ | 32,311,057 | | | $ | 12,558,795 | | | $ | 20,149,507 | | | $ | 17,118,738 | | | $ | 168,223,978 |
| | 779,984 | | | | 2,449,157 | | | | 1,858,964 | | | | 126,786 | | | | 257,874 | | | | 88,306 | | | | — |
| | 27,788 | | | | 26,698 | | | | 21,906 | | | | 39,499 | | | | 34,096 | | | | 26,479 | | | | 35,380 |
| | — | | | | — | | | | — | | | | — | | | | 346,554 | | | | — | | | | — |
| | 2,440 | | | | 9,525 | | | | 10,204 | | | | 2,043 | | | | 1,691 | | | | 994 | | | | — |
| | 917 | | | | 50,197 | | | | 986 | | | | 6,877 | | | | 31,056 | | | | 107,306 | | | | 284,849 |
| | 9,657 | | | | 17,418 | | | | 19,363 | | | | 5,132 | | | | 5,756 | | | | 6,696 | | | | 30,904 |
| | 30,048,700 | | | | 49,749,477 | | | | 34,222,480 | | | | 12,739,132 | | | | 20,826,534 | | | | 17,348,519 | | | | 168,575,111 |
| | | | | | |
| | | | | | | | | | | | | | | | | | | | | | | | | |
| | 27,788 | | | | 26,698 | | | | 21,906 | | | | 39,499 | | | | 34,096 | | | | 26,479 | | | | 35,380 |
| | 8,550 | | | | 22,800 | | | | 30,033 | | | | 4,283 | | | | — | | | | — | | | | — |
| | 48,195 | | | | 200,308 | | | | 38,244 | | | | 103 | | | | 11,772 | | | | 92,539 | | | | — |
| | — | | | | — | | | | — | | | | 25 | | | | 1,550 | | | | 1,480 | | | | |
| | | | | | | | | | | | | | | | | | | | | | | | | 2,223 |
| | | | | | | | | | | | | | | | | | | | | | | | | 11,013 |
| | 15,693 | | | | 30,985 | | | | 21,262 | | | | 7,820 | | | | 16,914 | | | | 5,788 | | | | 39,082 |
| | 27,650 | | | | 49,929 | | | | 33,964 | | | | 790 | | | | 6,087 | | | | 12,159 | | | | 22,094 |
| | 8,475 | | | | 9,585 | | | | 7,359 | | | | 3,900 | | | | 6,000 | | | | 4,339 | | | | 28,090 |
| | 2,255 | | | | 3,244 | | | | 2,457 | | | | 1,401 | | | | 1,710 | | | | 1,526 | | | | 1,394 |
| | 15,104 | | | | 17,494 | | | | 15,374 | | | | 13,836 | | | | 17,175 | | | | 13,642 | | | | 44,529 |
| | 153,710 | | | | 361,043 | | | | 170,599 | | | | 71,657 | | | | 95,304 | | | | 157,952 | | | | 183,805 |
| | | | | | | | | | | | | | | | | | | | | | | | | | |
| | 29,894,990 | | | | 49,388,434 | | | | 34,051,881 | | | | 12,667,475 | | | | 20,731,230 | | | | 17,190,567 | | | | 168,391,306 |
| | | | | | |
| | | | | | | | | | | | | | | | | | | | | | | | | |
| | 39,252,154 | | | | 55,519,504 | | | | 38,744,894 | | | | 15,172,891 | | | | 21,587,712 | | | | 17,735,308 | | | | 168,391,306 |
| | — | | | | — | | | | — | | | | — | | | | — | | | | 1,851 | | | | — |
| | (13,559,503 | ) | | | (8,980,150 | ) | | | (8,587,956 | ) | | | (3,793,221 | ) | | | (1,150,005 | ) | | | (612,561 | ) | | | — |
| | 4,202,339 | | | | 2,849,080 | | | | 3,894,943 | | | | 1,287,805 | | | | 293,523 | | | | 65,969 | | | | — |
| $ | 29,894,990 | | | $ | 49,388,434 | | | $ | 34,051,881 | | | $ | 12,667,475 | | | $ | 20,731,230 | | | $ | 17,190,567 | | | $ | 168,391,306 |
| | | | | | |
| | | | | | | | | | | | | | | | | | | | | | | | | |
| | | | | | | | | | | | | | | | | | | | | | | | $ | 122,142,190 |
| | | | | | | | | | | | | | | | | | | | | | | | | | 46,249,116 |
| | | | | | | | | | | | | | | | | | | | | | | | | $ | 168,391,306 |
| | | | | | |
| | 4,340,331 | | | | 5,502,228 | | | | 4,191,997 | | | | 685,458 | | | | 1,000,067 | | | | 827,002 | | | | |
| | | | | | | | | | | | | | | | | | | | | | | | | 122,142,190 |
| | | | | | | | | | | | | | | | | | | | | | | | | | 46,249,116 |
| | | | | | | | | | | | | | | | | | | | | | | | | | 168,391,306 |
| | | | | | |
| $ | 6.89 | | | $ | 8.98 | | | $ | 8.12 | | | $ | 18.48 | | | $ | 20.73 | | | $ | 20.79 | | | | |
| | | | | | | | | | | | | | | | | | | | | | | | $ | 1.00 |
| | | | | | | | | | | | | | | | | | | | | | | | | $ | 1.00 |
| $ | 25,815,812 | | | $ | 46,823,799 | | | $ | 30,310,733 | | | $ | 11,403,719 | | | $ | 20,113,858 | | | $ | 17,141,075 | | | $ | 168,223,978 |
Statements of Operations
For the Year Ended December 31, 2009
| | | | | | | | |
| | | The
Muirfield
Fund | | | The Dynamic
Growth Fund | |
Investment Income | | | | | | | | |
Interest | | $ | 14,177 | | | $ | 2,234 | |
Interest from affiliates | | | 189,077 | | | | 24,864 | |
Dividends | | | 1,378,541 | | | | 965,473 | |
Total Investment Income | | | 1,581,795 | | | | 992,571 | |
| | |
Fund Expenses | | | | | | | | |
Investment advisor | | | 857,894 | | | | 557,922 | |
Transfer agent | | | 118,341 | | | | 89,290 | |
Transfer agent — The Money Market Fund — Retail Class | | | | | | | | |
Transfer agent — The Money Market Fund — Institutional Class | | | | | | | | |
Fund accounting | | | 46,857 | | | | 43,730 | |
Administrative | | | 88,884 | | | | 69,512 | |
Trustee | | | 26,304 | | | | 20,450 | |
Audit | | | 10,027 | | | | 10,027 | |
Legal | | | 4,576 | | | | 3,521 | |
Custody | | | 17,628 | | | | 13,118 | |
Printing | | | 18,856 | | | | 14,681 | |
Distribution plan (12b-1) | | | 197,002 | | | | 185,888 | |
Distribution plan (12b-1) — The Money Market Fund — Retail Class | | | | | | | | |
Distribution plan (12b-1) — The Money Market Fund — Institutional Class | | | | | | | | |
Administrative service plan | | | 197,501 | | | | 148,792 | |
Postage | | | 9,020 | | | | 6,517 | |
Registration and filing | | | 20,469 | | | | 25,669 | |
Insurance | | | 10,595 | | | | 7,683 | |
Chief Compliance Officer | | | 3,972 | | | | 3,962 | |
Other | | | 10,904 | | | | 8,721 | |
Total Expenses Before Reductions | | | 1,638,830 | | | | 1,209,483 | |
| | |
Expenses reimbursed/waived by investment advisor | | | — | | | | — | |
Expenses paid indirectly | | | (74,951 | ) | | | (76,616 | ) |
Distribution plan (12b-1) expenses waived | | | (51,281 | ) | | | (22,322 | ) |
Administrative service plan expenses waived | | | (63,115 | ) | | | (52,086 | ) |
Transfer agent expenses waived | | | (39,457 | ) | | | (37,217 | ) |
Net Expenses | | | 1,410,026 | | | | 1,021,242 | |
| | | | | | | | | |
Net Investment Income (Loss) | | | 171,769 | | | | (28,671 | ) |
| | |
Realized and Unrealized Gain (Loss) from Investments | | | | | | | | |
Net realized gains (losses) from investments | | | (2,601,735 | ) | | | (5,816,074 | ) |
Net realized gains (losses) from futures contracts | | | (538,957 | ) | | | 403,513 | |
Distributions of long-term realized gains by other investment companies | | | 25,710 | | | | — | |
Net Realized Gains (Losses) from Investment Transactions, Futures Contracts, and Distributions of Long-term Realized Gains by Other Investment Companies | | | (3,114,982 | ) | | | (5,412,561 | ) |
| | |
Net change in unrealized appreciation (depreciation) of investments and futures contracts | | | 21,711,512 | | | | 24,472,483 | |
Net Realized and Unrealized Gain (Loss) from Investments | | | 18,596,530 | | | | 19,059,922 | |
| | | | | | | | | |
Net Change in Net Assets Resulting from Operations | | $ | 18,768,299 | | | $ | 19,031,251 | |
The accompanying notes are an integral part of these financial statements.
| | | | | | | | | | | | | | | | | | | | | | | | | | |
The Aggressive
Growth Fund | | | The Defensive
Balanced Fund | | | The Strategic
Growth Fund | | | The
Quantex
Fund | | | The Total
Return
Utilities Fund | | | The U.S.
Government
Bond Fund | | | The Money
Market Fund | |
| | | | | | | | | | | | | | | | | | | | | | | | | | |
| $ | 1,190 | | | $ | 220,315 | | | $ | 1,126 | | | $ | 755 | | | $ | — | | | $ | 593,451 | | | $ | 2,552,306 | |
| | 8,375 | | | | 71,301 | | | | 10,333 | | | | 3,856 | | | | 2,046 | | | | 10,434 | | | | — | |
| | 306,528 | | | | 522,352 | | | | 369,984 | | | | 150,691 | | | | 487,539 | | | | — | | | | — | |
| | 316,093 | | | | 813,968 | | | | 381,443 | | | | 155,302 | | | | 489,585 | | | | 603,885 | | | | 2,552,306 | |
| | | | | | |
| | | | | | | | | | | | | | | | | | | | | | | | | | |
| | 183,456 | | | | 311,881 | | | | 202,827 | | | | 89,384 | | | | 168,555 | | | | 62,159 | | | | 673,584 | |
| | 29,353 | | | | 49,908 | | | | 32,459 | | | | 10,726 | | | | 20,226 | | | | 12,432 | | | | | |
| | | | | | | | | | | | | | | | | | | | | | | | | 122,772 | |
| | | | | | | | | | | | | | | | | | | | | | | | | 48,355 | |
| | 29,460 | | | | 37,317 | | | | 31,378 | | | | 13,125 | | | | 21,855 | | | | 20,540 | | | | 57,944 | |
| | 24,461 | | | | 41,584 | | | | 27,044 | | | | 8,938 | | | | 16,855 | | | | 15,540 | | | | 177,547 | |
| | 8,646 | | | | 12,954 | | | | 9,606 | | | | 6,300 | | | | 6,949 | | | | 6,463 | | | | 6,232 | |
| | 10,027 | | | | 10,027 | | | | 10,027 | | | | 10,027 | | | | 10,027 | | | | 10,027 | | | | 10,027 | |
| | 3,531 | | | | 3,352 | | | | 3,531 | | | | 3,531 | | | | 6,878 | | | | 3,538 | | | | 3,512 | |
| | 5,885 | | | | 11,322 | | | | 5,806 | | | | 4,834 | | | | 3,757 | | | | 3,335 | | | | 16,004 | |
| | 4,831 | | | | 7,968 | | | | 5,264 | | | | 1,909 | | | | 3,393 | | | | 2,929 | | | | 41,335 | |
| | 61,051 | | | | 103,960 | | | | 67,740 | | | | 17,863 | | | | 42,192 | | | | 31,054 | | | | | |
| | | | | | | | | | | | | | | | | | | | | | | | | 297,589 | |
| | | | | | | | | | | | | | | | | | | | | | | | | 18,133 | |
| | 48,926 | | | | 83,168 | | | | 54,220 | | | | 17,888 | | | | 33,720 | | | | 31,080 | | | | — | |
| | 2,390 | | | | 3,634 | | | | 2,428 | | | | 1,450 | | | | 4,795 | | | | 1,669 | | | | 21,201 | |
| | 17,770 | | | | 19,130 | | | | 19,129 | | | | 14,275 | | | | 15,293 | | | | 17,509 | | | | 35,908 | |
| | 2,944 | | | | 3,805 | | | | 2,798 | | | | 1,160 | | | | 2,228 | | | | 1,628 | | | | 84,139 | |
| | 3,962 | | | | 3,962 | | | | 3,962 | | | | 3,972 | | | | 3,984 | | | | 3,972 | | | | 3,962 | |
| | 8,423 | | | | 9,518 | | | | 9,023 | | | | 8,450 | | | | 9,610 | | | | 8,136 | | | | 39,299 | |
| | 445,116 | | | | 713,490 | | | | 487,242 | | | | 213,832 | | | | 370,317 | | | | 232,011 | | | | 1,657,543 | |
| | | | | | |
| | (24,545 | ) | | | (5,535 | ) | | | (9,102 | ) | | | (22,346 | ) | | | — | | | | (59,291 | ) | | | (327,683 | ) |
| | (21,871 | ) | | | (20,727 | ) | | | (29,049 | ) | | | — | | | | — | | | | — | | | | — | |
| | (3,915 | ) | | | (16,220 | ) | | | (10,820 | ) | | | (14,123 | ) | | | (10,959 | ) | | | (6,527 | ) | | | (226,587 | ) |
| | (17,127 | ) | | | — | | | | (1,893 | ) | | | (17,609 | ) | | | (22,256 | ) | | | (9,324 | ) | | | — | |
| | — | | | | (29,116 | ) | | | (18,937 | ) | | | — | | | | — | | | | (3,108 | ) | | | (27,803 | ) |
| | 377,658 | | | | 641,892 | | | | 417,441 | | | | 159,754 | | | | 337,102 | | | | 153,761 | | | | 1,075,470 | |
| | | | | | | | | | | | | | | | | | | | | | | | | | | |
| | (61,565 | ) | | | 172,076 | | | | (35,998 | ) | | | (4,452 | ) | | | 152,483 | | | | 450,124 | | | | 1,476,836 | |
| | | | | | |
| | | | | | | | | | | | | | | | | | | | | | | | | | |
| | (2,417,036 | ) | | | 199,781 | | | | (2,031,970 | ) | | | (1,781,896 | ) | | | (570,777 | ) | | | 109,775 | | | | | |
| | 385,053 | | | | 385,053 | | | | 580,610 | | | | 230,320 | | | | — | | | | — | | | | | |
| | — | | | | 5,645 | | | | — | | | | — | | | | — | | | | — | | | | | |
|
(2,031,983) |
| | | 590,479 | | | | (1,451,360 | ) | | | (1,551,576 | ) | | | (570,777 | ) | | | 109,775 | | | | | |
| | | | | | |
| | 9,413,372 | | | | 5,319,008 | | | | 10,598,970 | | | | 6,664,258 | | | | 4,992,276 | | | | (225,024 | ) | | | | |
| | 7,381,389 | | | | 5,909,487 | | | | 9,147,610 | | | | 5,112,682 | | | | 4,421,499 | | | | (115,249 | ) | | | | |
| | | | | | | | | | | | | | | | | | | | | | | | | | | |
| $ | 7,319,824 | | | $ | 6,081,563 | | | $ | 9,111,612 | | | $ | 5,108,230 | | | $ | 4,573,982 | | | $ | 334,875 | | | $ | 1,476,836 | |
Statements of Changes in Net Assets
For the Years Ended December 31,
| | | | | | | | | | | | | | | | |
| | | The Muirfield Fund | | | The Dynamic Growth Fund | |
| | | 2009 | | | 2008 | | | 2009 | | | 2008 | |
Operations | | | | | | | | | | | | | | | | |
Net investment income (loss) | | $ | 171,769 | | | $ | 414,472 | | | $ | (28,671 | ) | | $ | 477,049 | |
Net realized gain (loss) from investment transactions, futures contracts, and distributions of long-term realized gains by other investment companies | | | (3,114,982 | ) | | | (19,812,170 | ) | | | (5,412,561 | ) | | | (18,905,646 | ) |
Net change in unrealized appreciation (depreciation) of investments and futures contracts | | | 21,711,512 | | | | (12,430,510 | ) | | | 24,472,483 | | | | (17,380,438 | ) |
Net change in net assets resulting from operations | | | 18,768,299 | | | | (31,828,208 | ) | | | 19,031,251 | | | | (35,809,035 | ) |
| | | | |
Distributions to Shareholders | | | | | | | | | | | | | | | | |
From net investment income | | | (414,472 | ) | | | — | | | | (25,950 | ) | | | (451,101 | ) |
From net realized gain from investment transactions, futures contracts, and distributions of long-term realized gains by other investment companies | | | — | | | | — | | | | — | | | | (570,693 | ) |
Net change in net assets resulting from distributions | | | (414,472 | ) | | | — | | | | (25,950 | ) | | | (1,021,794 | ) |
| | | | |
Capital Transactions | | | | | | | | | | | | | | | | |
Issued | | | 25,393,304 | | | | 82,754,194 | | | | 18,550,561 | | | | 92,763,745 | |
Reinvested | | | 413,001 | | | | — | | | | 25,931 | | | | 1,014,370 | |
Redeemed | | | (15,332,338 | ) | | | (14,989,715 | ) | | | (20,521,732 | ) | | | (8,763,915 | ) |
Net change in net assets resulting from capital transactions | | | 10,473,967 | | | | 67,764,479 | | | | (1,945,240 | ) | | | 85,014,200 | |
| | | | | | | | | | | | | | | | | |
Total Change in Net Assets | | | 28,827,794 | | | | 35,936,271 | | | | 17,060,061 | | | | 48,183,371 | |
| | | | |
Net Assets — Beginning of Year | | | 86,310,362 | | | | 50,374,091 | | | | 67,298,020 | | | | 19,114,649 | |
Net Assets — End of Year | | $ | 115,138,156 | | | $ | 86,310,362 | | | $ | 84,358,081 | | | $ | 67,298,020 | |
Accumulated undistributed (distributions in excess of) net investment income | | $ | 171,705 | | | $ | 414,472 | | | $ | — | | | $ | 25,948 | |
| | | | |
Share Transactions | | | | | | | | | | | | | | | | |
Issued | | | 5,941,024 | | | | 15,296,042 | | | | 3,216,909 | | | | 11,373,131 | |
Reinvested | | | 82,766 | | | | — | | | | 3,673 | | | | 186,643 | |
Redeemed | | | (3,493,767 | ) | | | (3,144,167 | ) | | | (3,566,560 | ) | | | (1,340,303 | ) |
Net change in shares | | | 2,530,023 | | | | 12,151,875 | | | | (345,978 | ) | | | 10,219,471 | |
The accompanying notes are an integral part of these financial statements.
| | | | | | | | | | | | | | | | | | | | | | |
| The Aggressive Growth Fund | | | The Defensive Balanced Fund | | | The Strategic Growth Fund | |
| 2009 | | | 2008 | | | 2009 | | | 2008 | | | 2009 | | | 2008 | |
| | | | | | | | | | | | | | | | | | | | | | |
| $ | (61,565 | ) | | $ | 203,662 | | | $ | 172,076 | | | $ | 318,682 | | | $ | (35,998 | ) | | $ | 175,093 | |
| (2,031,983 | ) | | | (8,253,300 | ) | | | 590,479 | | | | (9,348,887 | ) | | | (1,451,360 | ) | | | (6,911,838 | ) |
| 9,413,372 | | | | (5,557,678 | ) | | | 5,319,008 | | | | (3,351,321 | ) | | | 10,598,970 | | | | (7,519,096 | ) |
| | 7,319,824 | | | | (13,607,316 | ) | | | 6,081,563 | | | | (12,381,526 | ) | | | 9,111,612 | | | | (14,255,841 | ) |
| | | | | |
| | | | | | | | | | | | | | | | | | | | | | |
| | — | | | | (203,662 | ) | | | (172,076 | ) | | | (318,682 | ) | | | — | | | | (175,093 | ) |
| — | | | | — | | | | — | | | | — | | | | — | | | | — | |
| | — | | | | (203,662 | ) | | | (172,076 | ) | | | (318,682 | ) | | | — | | | | (175,093 | ) |
| | | | | |
| | | | | | | | | | | | | | | | | | | | | | |
| | 6,009,484 | | | | 19,997,583 | | | | 14,079,147 | | | | 34,494,596 | | | | 10,087,974 | | | | 36,110,816 | |
| | — | | | | 203,343 | | | | 172,076 | | | | 318,559 | | | | — | | | | 175,094 | |
| | (4,149,362 | ) | | | (14,515,621 | ) | | | (5,537,909 | ) | | | (61,637,761 | ) | | | (6,221,991 | ) | | | (64,566,176 | ) |
| 1,860,122 | | | | 5,685,305 | | | | 8,713,314 | | | | (26,824,606 | ) | | | 3,865,983 | | | | (28,280,266 | ) |
| | | | | | | | | | | | | | | | | | | | | | | |
| | 9,179,946 | | | | (8,125,673 | ) | | | 14,622,801 | | | | (39,524,814 | ) | | | 12,977,595 | | | | (42,711,200 | ) |
| | | | | |
| | 20,715,044 | | | | 28,840,717 | | | | 34,765,633 | | | | 74,290,447 | | | | 21,074,286 | | | | 63,785,486 | |
| $ | 29,894,990 | | | $ | 20,715,044 | | | $ | 49,388,434 | | | $ | 34,765,633 | | | $ | 34,051,881 | | | $ | 21,074,286 | |
$ | — | | | $ | — | | | $ | — | | | $ | — | | | $ | — | | | $ | — | |
| | | | | |
| | | | | | | | | | | | | | | | | | | | | | |
| | 1,079,928 | | | | 2,595,026 | | | | 1,738,105 | | | | 3,689,768 | | | | 1,612,620 | | | | 3,983,712 | |
| | — | | | | 39,205 | | | | 19,162 | | | | 40,529 | | | | — | | | | 29,280 | |
| | (731,065 | ) | | | (2,002,069 | ) | | | (677,563 | ) | | | (6,411,277 | ) | | | (942,395 | ) | | | (6,518,762 | ) |
| | 348,863 | | | | 632,162 | | | | 1,079,704 | | | | (2,680,980 | ) | | | 670,225 | | | | (2,505,770 | ) |
Statements of Changes in Net Assets
For the Years Ended December 31,
| | | | | | | | |
| | | The Quantex Fund | |
| | | 2009 | | | 2008 | |
Operations | | | | | | | | |
Net investment income (loss) | | $ | (4,452 | ) | | $ | 1,540 | |
Net realized gain (loss) from investment transactions, futures contracts, and distributions of long-term realized gains by other investment companies | | | (1,551,576 | ) | | | (763,215 | ) |
Net change in unrealized appreciation (depreciation) of investments and futures contracts | | | 6,664,258 | | | | (4,726,372 | ) |
Net change in net assets resulting from operations | | | 5,108,230 | | | | (5,488,047 | ) |
| | |
Distributions to Shareholders | | | | | | | | |
From net investment income | | | (1,536 | ) | | | — | |
From net realized gain from investment transactions, futures contracts, and distributions of long-term realized gains by other investment companies | | | — | | | | — | |
From tax return of capital | | | — | | | | — | |
Net change in net assets resulting from distributions | | | (1,536 | ) | | | — | |
| | |
Distributions to Shareholders | | | | | | | | |
— The Money Market Fund | | | | | | | | |
From net investment income (Retail Class) | | | | | | | | |
From net investment income (Institutional Class) | | | | | | | | |
Net change in net assets resulting from distributions | | | | | | | | |
| | |
Capital Transactions | | | | | | | | |
Issued | | | 3,088,875 | | | | 7,427,714 | |
Reinvested | | | 1,511 | | | | — | |
Redeemed | | | (2,272,834 | ) | | | (12,646,825 | ) |
Net change in net assets resulting from capital transactions | | | 817,552 | | | | (5,219,111 | ) |
| | | | | | | | | |
Total Change in Net Assets | | | 5,924,246 | | | | (10,707,158 | ) |
| | |
Net Assets — Beginning of Year | | | 6,743,229 | | | | 17,450,387 | |
Net Assets — End of Year | | $ | 12,667,475 | | | $ | 6,743,229 | |
Accumulated undistributed (distributions in excess of) net investment income | | $ | — | | | $ | 1,540 | |
| | |
Share Transactions | | | | | | | | |
Issued | | | 218,531 | | | | 451,739 | |
Reinvested | | | 82 | | | | — | |
Redeemed | | | (180,496 | ) | | | (757,116 | ) |
Net change in shares | | | 38,117 | | | | (305,377 | ) |
The accompanying notes are an integral part of these financial statements.
| | | | | | | | | | | | | | | | | | | | | | |
| The Total Return Utilities Fund | | | The U.S. Government Bond Fund | | | The Money Market Fund | |
| 2009 | | | 2008 | | | 2009 | | | 2008 | | | 2009 | | | 2008 | |
| | | | | | | | | | | | | | | | | | | | | | |
| $ | 152,483 | | | $ | 207,234 | | | $ | 450,124 | | | $ | 469,243 | | | $ | 1,476,836 | | | $ | 6,120,576 | |
|
(570,777) |
| | | 821,946 | | | | 109,775 | | | | 316,016 | | | | — | | | | — | |
|
4,992,276 |
| | | (11,096,660 | ) | | | (225,024 | ) | | | (77,092 | ) | | | — | | | | — | |
| | 4,573,982 | | | | (10,067,480 | ) | | | 334,875 | | | | 708,167 | | | | 1,476,836 | | | | 6,120,576 | |
| | | | | |
| | | | | | | | | | | | | | | | | | | | | | |
| | (152,483 | ) | | | (147,421 | ) | | | (450,124 | ) | | | (469,243 | ) | | | | | | | | |
|
— |
| | | — | | | | — | | | | — | | | | | | | | | |
| | (123,774 | ) | | | (59,813 | ) | | | — | | | | — | | | | | | | | | |
| | (276,257 | ) | | | (207,234 | ) | | | (450,124 | ) | | | (469,243 | ) | | | | | | | | |
| | | | | |
| | | | | | | | | | | | | | | | | | | | | | |
| | | | | | | | | | | | | | | | | | | | | | |
| | | | | | | | | | | | | | | | | (977,452 | ) | | | (5,139,222 | ) |
| | | | | | | | | | | | | | | | | | (499,384 | ) | | | (981,354 | ) |
| | | | | | | | | | | | | | | | | | (1,476,836 | ) | | | (6,120,576 | ) |
| | | | | |
| | | | | | | | | | | | | | | | | | | | | | |
| | 3,397,816 | | | | 5,332,650 | | | | 6,327,512 | | | | 8,134,715 | | | | 303,809,610 | | | | 354,625,946 | |
| | 265,690 | | | | 199,707 | | | | 433,301 | | | | 451,147 | | | | 1,011,767 | | | | 5,401,443 | |
| | (3,089,127 | ) | | | (6,731,034 | ) | | | (3,491,220 | ) | | | (8,557,158 | ) | | | (374,956,022 | ) | | | (337,313,889 | ) |
| | 574,379 | | | | (1,198,677 | ) | | | 3,269,593 | | | | 28,704 | | | | (70,134,645 | ) | | | 22,713,500 | |
| | | | | | | | | | | | | | | | | | | | | | | |
| | 4,872,104 | | | | (11,473,391 | ) | | | 3,154,344 | | | | 267,628 | | | | (70,134,645 | ) | | | 22,713,500 | |
| | | | | |
| | 15,859,126 | | | | 27,332,517 | | | | 14,036,223 | | | | 13,768,595 | | | | 238,525,951 | | | | 215,812,451 | |
| $ | 20,731,230 | | | $ | 15,859,126 | | | $ | 17,190,567 | | | $ | 14,036,223 | | | $ | 168,391,306 | | | $ | 238,525,951 | |
| $ | — | | | $ | — | | | $ | 1,851 | | | $ | 1,851 | | | $ | — | | | $ | — | |
| | | | | |
| | | | | | | | | | | | | | | | | | | | | | |
| | 185,225 | | | | 240,848 | | | | 304,454 | | | | 393,943 | | | | 303,809,610 | | | | 354,625,946 | |
| | 15,135 | | | | 10,427 | | | | 20,819 | | | | 21,863 | | | | 1,011,767 | | | | 5,401,443 | |
| | (183,535 | ) | | | (313,724 | ) | | | (167,871 | ) | | | (415,296 | ) | | | (374,956,022 | ) | | | (337,313,889 | ) |
| | 16,825 | | | | (62,449 | ) | | | 157,402 | | | | 510 | | | | (70,134,645 | ) | | | 22,713,500 | |
Financial Highlights
For a Share Outstanding Through Each Fiscal Period Ended December 31,
| | | | | | | | | | | | | | | | | | | | | | | |
| | | | | Income from Investment Operations | | | Less Distributions | |
| | | Net Asset
Value,
Beginning
of Period | | Net
Investment
Income(6) | | | Net gains (losses) on
securities, futures, and
options (both realized
and unrealized) | | | Total from
Investment
Operations | | | From Net
Investment
Income | | | From Net
Capital
Gains | | | From Tax
Return of
Capital | | Total
Distributions | |
The Muirfield Fund(1)(2)(5) | | | | | | | | | | | | | | | | | | |
2009 | | $ | 4.21 | | 0.01 | | | 0.79 | | | 0.80 | | | (0.02 | ) | | — | | | — | | (0.02 | ) |
2008 | | $ | 6.02 | | 0.02 | | | (1.83 | ) | | (1.81 | ) | | — | | | — | | | — | | — | |
2007 | | $ | 5.81 | | 0.18 | | | 0.23 | | | 0.41 | | | (0.20 | ) | | — | | | — | | (0.20 | ) |
2006 | | $ | 5.15 | | 0.04 | | | 0.66 | | | 0.70 | | | (0.04 | ) | | — | | | — | | (0.04 | ) |
2005 | | $ | 5.11 | | 0.07 | | | 0.04 | | | 0.11 | | | (0.07 | ) | | — | | | — | | (0.07 | ) |
The Dynamic Growth Fund(1)(2)(5) | | | | | | | | | | | | |
2009 | | $ | 5.48 | | 0.00 | | | 1.58 | | | 1.58 | | | — | ** | | — | | | — | | — | ** |
2008 | | $ | 9.24 | | 0.04 | | | (3.71 | ) | | (3.67 | ) | | (0.04 | ) | | (0.05 | ) | | — | | (0.09 | ) |
2007 | | $ | 9.56 | | 0.29 | | | 0.38 | | | 0.67 | | | (0.30 | ) | | (0.69 | ) | | — | | (0.99 | ) |
2006 | | $ | 8.28 | | 0.04 | | | 1.28 | | | 1.32 | | | (0.04 | ) | | — | | | — | | (0.04 | ) |
2005 | | $ | 7.94 | | 0.06 | | | 0.34 | | | 0.40 | | | (0.06 | ) | | — | | | — | | (0.06 | ) |
The Aggressive Growth Fund(1)(2)(5) | | | | | | | | | | | | |
2009 | | $ | 5.19 | | (0.01 | ) | | 1.71 | | | 1.70 | | | — | | | — | | | — | | — | |
2008 | | $ | 8.59 | | 0.05 | | | (3.40 | ) | | (3.35 | ) | | (0.05 | ) | | — | | | — | | (0.05 | ) |
2007 | | $ | 8.13 | | 0.04 | | | 0.46 | | | 0.50 | | | (0.04 | ) | | — | | | — | | (0.04 | ) |
2006 | | $ | 7.19 | | 0.03 | | | 0.94 | | | 0.97 | | | (0.03 | ) | | — | | | — | | (0.03 | ) |
2005 | | $ | 6.83 | | 0.02 | | | 0.36 | | | 0.38 | | | (0.02 | ) | | — | | | — | | (0.02 | ) |
The Defensive Balanced Fund(1)(2)(3)(4) | | | | | | | | | | | | |
2009 | | $ | 7.86 | | 0.03 | | | 1.12 | | | 1.15 | | | (0.03 | ) | | — | | | — | | (0.03 | ) |
2008 | | $ | 10.46 | | 0.07 | | | (2.60 | ) | | (2.53 | ) | | (0.07 | ) | | — | | | — | | (0.07 | ) |
2007 | | $ | 10.51 | | 0.07 | | | 0.45 | | | 0.52 | | | (0.07 | ) | | (0.50 | ) | | — | | (0.57 | ) |
2006* | | $ | 10.00 | | 0.07 | | | 0.51 | | | 0.58 | | | (0.07 | ) | | — | | | — | | (0.07 | ) |
The Strategic Growth Fund(1)(2)(3)(4) | | | | | | | | | | | | |
2009 | | $ | 5.98 | | (0.01 | ) | | 2.15 | | | 2.14 | | | — | | | — | | | — | | — | |
2008 | | $ | 10.58 | | 0.05 | | | (4.60 | ) | | (4.55 | ) | | (0.05 | ) | | — | | | — | | (0.05 | ) |
2007 | | $ | 10.73 | | 0.08 | | | 0.46 | | | 0.54 | | | (0.07 | ) | | (0.62 | ) | | — | | (0.69 | ) |
2006* | | $ | 10.00 | | 0.06 | | | 0.73 | | | 0.79 | | | (0.06 | ) | | — | | | — | | (0.06 | ) |
| 1 | Ratio of net expenses to average net assets, ratio of net investment income (loss) to average net assets, ratio of expenses to average net assets after reductions, excluding expenses paid indirectly, and ratio of expenses to average net assets before reductions do not include impact of expenses of the underlying security holdings as represented in the schedule of investments. |
| 2 | Recognition of net investment income by the Fund is affected by the timing of the declaration of dividends by the underlying investment companies in which the Fund invests. |
| 3 | Total return and portfolio turnover rate are not annualized for periods of less than one full year. |
The accompanying notes are integral part of these financial statements.
| | | | | | | | | | | | | | | | | | | | | | |
| | | | | | Ratios/Supplemental Data | |
Net Asset
Value,
End of
Period | | Total Return
(Assumes
Reinvestment
of Distributions) | | | Net Assets,
End of
Period
($000) | | Ratio of Net
Expenses
to Average
Net Assets | | | Ratio of Net
Investment
Income (Loss)
to Average
Net Assets | | | Ratio of Expenses
to Average Net Assets
after Reductions,
Excluding Expenses
Paid Indirectly | | | Ratio of Expenses
to Average Net
Assets Before
Reductions | | | Portfolio
Turnover
Rate | |
| | | | | | | | | | | | | | | | | | | | | | |
| $ | 4.99 | | 18.95 | % | | $ | 115,138 | | 1.43 | % | | 0.17 | % | | 1.51 | % | | 1.66 | % | | 166 | % |
| $ | 4.21 | | (30.07 | %) | | $ | 86,310 | | 1.39 | % | | 0.54 | % | | 1.48 | % | | 1.75 | % | | 173 | % |
| $ | 6.02 | | 7.02 | % | | $ | 50,374 | | 1.38 | % | | 3.01 | % | | 1.52 | % | | 1.88 | % | | 144 | % |
| $ | 5.81 | | 13.62 | % | | $ | 53,227 | | 1.45 | % | | 0.65 | % | | 1.56 | % | | 1.85 | % | | 131 | % |
| $ | 5.15 | | 2.13 | % | | $ | 78,181 | | 1.42 | % | | 1.36 | % | | 1.53 | % | | 1.76 | % | | 145 | % |
| | | | | | | | | | | | | | | | | | | | | | |
| $ | 7.06 | | 28.87 | % | | $ | 84,358 | | 1.37 | % | | (0.04 | %) | | 1.48 | % | | 1.63 | % | | 148 | % |
| $ | 5.48 | | (39.77 | %) | | $ | 67,298 | | 1.34 | % | | 0.95 | % | | 1.46 | % | | 1.69 | % | | 122 | % |
| $ | 9.24 | | 7.06 | % | | $ | 19,115 | | 1.32 | % | | 2.94 | % | | 1.46 | % | | 1.86 | % | | 150 | % |
| $ | 9.56 | | 15.96 | % | | $ | 21,566 | | 1.42 | % | | 0.42 | % | | 1.55 | % | | 1.86 | % | | 123 | % |
| $ | 8.28 | | 5.08 | % | | $ | 31,943 | | 1.41 | % | | 0.87 | % | | 1.58 | % | | 1.84 | % | | 202 | % |
| | | | | | | | | | | | | | | | | | | | | | |
| $ | 6.89 | | 32.76 | % | | $ | 29,895 | | 1.54 | % | | (0.25 | %) | | 1.63 | % | | 1.82 | % | | 156 | % |
| $ | 5.19 | | (38.98 | %) | | $ | 20,715 | | 1.62 | % | | 0.77 | % | | 1.65 | % | | 1.84 | % | | 213 | % |
| $ | 8.59 | | 6.14 | % | | $ | 28,841 | | 1.70 | % | | 0.49 | % | | 1.70 | % | | 1.83 | % | | 170 | % |
| $ | 8.13 | | 13.54 | % | | $ | 21,554 | | 1.80 | % | | 0.51 | % | | 1.81 | % | | 1.98 | % | | 200 | % |
| $ | 7.19 | | 5.62 | % | | $ | 11,639 | | 1.88 | % | | 0.35 | % | | 2.03 | % | | 2.30 | % | | 181 | % |
| | | | | | | | | | | | | | | | | | | | | | |
| $ | 8.98 | | 14.65 | % | | $ | 49,388 | | 1.54 | % | | 0.41 | % | | 1.59 | % | | 1.72 | % | | 182 | % |
| $ | 7.86 | | (24.16 | %) | | $ | 34,766 | | 1.54 | % | | 0.67 | % | | 1.55 | % | | 1.70 | % | | 204 | % |
| $ | 10.46 | | 5.03 | % | | $ | 74,290 | | 1.56 | % | | 0.79 | % | | 1.56 | % | | 1.66 | % | | 137 | % |
| $ | 10.51 | | 5.84 | % | | $ | 42,489 | | 1.72 | % | | 1.20 | % | | 1.72 | % | | 1.81 | % | | 105 | % |
| | | | | | | | | | | | | | | | | | | | | | |
| $ | 8.12 | | 35.79 | % | | $ | 34,052 | | 1.54 | % | | (0.13 | %) | | 1.65 | % | | 1.80 | % | | 75 | % |
| $ | 5.98 | | (43.00 | %) | | $ | 21,074 | | 1.57 | % | | 0.47 | % | | 1.59 | % | | 1.74 | % | | 178 | % |
| $ | 10.58 | | 5.08 | % | | $ | 63,785 | | 1.58 | % | | 0.75 | % | | 1.58 | % | | 1.68 | % | | 134 | % |
| $ | 10.73 | | 7.91 | % | | $ | 36,533 | | 1.75 | % | | 0.94 | % | | 1.75 | % | | 1.84 | % | | 92 | % |
| 4 | Ratio of net expenses to average net assets, ratio of net investment income (loss) to average net assets, ratio of average net assets after reductions, excluding expenses paid indirectly, and ratio of expenses to average net assets before reductions are annualized for periods of less than one full year. |
| 5 | In 2005, the advisor voluntarily reimbursed the Fund for a realized investment loss, which had no impact to total return. |
| 6 | Except for The Money Market Fund, net investment income per share is based on average shares outstanding during the period. |
| * | Commenced Operations January 31, 2006 |
| ** | Actual amounts were less than one-half of a cent per share |
Financial Highlights
For a Share Outstanding Through Each Fiscal Period Ended December 31,
| | | | | | | | | | | | | | | | | | | | | | | |
| | | | | Income from Investment Operations | | | Less Distributions | |
| | | Net Asset
Value,
Beginning
of Period | | Net
Investment
Income(1) | | | Net gains (losses) on
securities, futures, and
options (both realized
and unrealized) | | | Total from
Investment
Operations | | | From Net
Investment
Income | | | From Net
Capital
Gains | | From Tax
Return of
Capital | | | Total
Distributions | |
The Quantex Fund | | | | | | | | | | | | | | | | | | |
2009 | | $ | 10.42 | | (0.01 | ) | | 8.07 | | | 8.06 | | | — | ** | | — | | — | | | — | ** |
2008 | | $ | 18.32 | | — | | | (7.90 | ) | | (7.90 | ) | | — | | | — | | — | | | — | |
2007 | | $ | 19.86 | | 0.16 | | | (1.54 | ) | | (1.38 | ) | | (0.16 | ) | | — | | — | | | (0.16 | ) |
2006 | | $ | 17.09 | | 0.08 | | | 2.77 | | | 2.85 | | | (0.08 | ) | | — | | — | | | (0.08 | ) |
2005 | | $ | 15.95 | | 0.01 | | | 1.14 | | | 1.15 | | | (0.01 | ) | | — | | — | | | (0.01 | ) |
The Total Return Utilities Fund | | | | | | | | | | | | |
2009 | | $ | 16.13 | | 0.15 | | | 4.74 | | | 4.89 | | | (0.16 | ) | | — | | (0.13 | ) | | (0.29 | ) |
2008 | | $ | 26.14 | | 0.09 | | | (9.90 | ) | | (9.81 | ) | | (0.14 | ) | | — | | (0.06 | ) | | (0.20 | ) |
2007 | | $ | 22.23 | | 0.14 | | | 3.91 | | | 4.05 | | | (0.14 | ) | | — | | — | | | (0.14 | ) |
2006 | | $ | 19.03 | | 0.15 | | | 3.20 | | | 3.35 | | | (0.15 | ) | | — | | — | | | (0.15 | ) |
2005 | | $ | 16.51 | | 0.24 | | | 2.52 | | | 2.76 | | | (0.24 | ) | | — | | — | | | (0.24 | ) |
The U.S. Government Bond Fund | | | | | | | | | | | | |
2009 | | $ | 20.96 | | 0.60 | | | (0.17 | ) | | 0.43 | | | (0.60 | ) | | — | | — | | | (0.60 | ) |
2008 | | $ | 20.58 | | 0.66 | | | 0.38 | | | 1.04 | | | (0.66 | ) | | — | | — | | | (0.66 | ) |
2007 | | $ | 20.30 | | 0.73 | | | 0.72 | | | 1.45 | | | (1.17 | ) | | — | | — | | | (1.17 | ) |
2006 | | $ | 20.22 | | 0.68 | | | 0.14 | | | 0.82 | | | (0.74 | ) | | — | | — | | | (0.74 | ) |
2005 | | $ | 20.82 | | 0.73 | | | (0.76 | ) | | (0.03 | ) | | (0.57 | ) | | — | | — | | | (0.57 | ) |
The Money Market Fund - Retail Class | | | | | | | | | | | | |
2009 | | $ | 1.00 | | 0.006 | | | N/A | | | 0.006 | | | (0.006 | ) | | — | | — | | | (0.006 | ) |
2008 | | $ | 1.00 | | 0.026 | | | N/A | | | 0.026 | | | (0.026 | ) | | — | | — | | | (0.026 | ) |
2007 | | $ | 1.00 | | 0.048 | | | N/A | | | 0.048 | | | (0.048 | ) | | — | | — | | | (0.048 | ) |
2006 | | $ | 1.00 | | 0.046 | | | N/A | | | 0.046 | | | (0.046 | ) | | — | | — | | | (0.046 | ) |
2005 | | $ | 1.00 | | 0.028 | | | N/A | | | 0.028 | | | (0.028 | ) | | — | | — | | | (0.028 | ) |
The Money Market Fund - Institutional Class | | | | | | | | | | | | |
2009 | | $ | 1.00 | | 0.008 | | | N/A | | | 0.008 | | | (0.008 | ) | | — | | — | | | (0.008 | ) |
2008 | | $ | 1.00 | | 0.028 | | | N/A | | | 0.028 | | | (0.028 | ) | | — | | — | | | (0.028 | ) |
2007 | | $ | 1.00 | | 0.050 | | | N/A | | | 0.050 | | | (0.050 | ) | | — | | — | | | (0.050 | ) |
2006 | | $ | 1.00 | | 0.048 | | | N/A | | | 0.048 | | | (0.048 | ) | | — | | — | | | (0.048 | ) |
2005 | | $ | 1.00 | | 0.030 | | | N/A | | | 0.030 | | | (0.030 | ) | | — | | — | | | (0.030 | ) |
| 1 | Except for The Money Market Fund, net investment income per share is based on average shares outstanding during the period. |
| * | Commenced Operations January 31, 2006 |
| ** | Actual amounts were less than one-half of a cent per share |
The accompanying notes are integral part of these financial statements.
| | | | | | | | | | | | | | | | | | | | | | |
| | | | | | Ratios/Supplemental Data | |
Net Asset
Value,
End of
Period | | Total Return
(Assumes
Reinvestment
of Distributions) | | | Net Assets,
End of
Period
($000) | | Ratio of Net
Expenses
to Average
Net Assets | | | Ratio of Net
Investment
Income (Loss)
to Average
Net Assets | | | Ratio of Expenses
to Average Net Assets
after Reductions,
Excluding Expenses
Paid Indirectly | | | Ratio of Expenses
to Average Net
Assets Before
Reductions | | | Portfolio
Turnover
Rate | |
| | | | | | | | | | | | | | | | | | | | | | |
| $ | 18.48 | | 77.37 | % | | $ | 12,667 | | 1.79 | % | | (0.05 | %) | | 1.79 | % | | 2.39 | % | | 34 | % |
| $ | 10.42 | | (43.12 | %) | | $ | 6,743 | | 1.73 | % | | 0.01 | % | | 1.73 | % | | 2.26 | % | | 49 | % |
| $ | 18.32 | | (7.00 | %) | | $ | 17,450 | | 1.56 | % | | 0.76 | % | | 1.56 | % | | 2.09 | % | | 56 | % |
| $ | 19.86 | | 16.67 | % | | $ | 20,074 | | 1.66 | % | | 0.47 | % | | 1.66 | % | | 2.25 | % | | 30 | % |
| $ | 17.09 | | 7.21 | % | | $ | 17,114 | | 1.75 | % | | 0.06 | % | | 1.78 | % | | 2.19 | % | | 171 | % |
| | | | | | | | | | | | | | | | | | | | | | |
| $ | 20.73 | | 30.63 | % | | $ | 20,731 | | 2.00 | % | | 0.90 | % | | 2.00 | % | | 2.20 | % | | 35 | % |
| $ | 16.13 | | (37.63 | %) | | $ | 15,859 | | 1.96 | % | | 0.42 | % | | 1.96 | % | | 2.14 | % | | 48 | % |
| $ | 26.14 | | 18.24 | % | | $ | 27,333 | | 1.90 | % | | 0.57 | % | | 1.90 | % | | 2.10 | % | | 50 | % |
| $ | 22.23 | | 17.68 | % | | $ | 23,969 | | 2.05 | % | | 0.74 | % | | 2.05 | % | | 2.18 | % | | 27 | % |
| $ | 19.03 | | 16.80 | % | | $ | 22,644 | | 2.03 | % | | 1.32 | % | | 2.05 | % | | 2.19 | % | | 28 | % |
| | | | | | | | | | | | | | | | | | | | | | |
| $ | 20.79 | | 2.10 | % | | $ | 17,191 | | 0.99 | % | | 2.90 | % | | 0.99 | % | | 1.49 | % | | 138 | % |
| $ | 20.96 | | 5.16 | % | | $ | 14,036 | | 0.99 | % | | 3.20 | % | | 0.99 | % | | 1.58 | % | | 118 | % |
| $ | 20.58 | | 7.44 | % | | $ | 13,769 | | 1.01 | % | | 3.92 | % | | 1.01 | % | | 1.72 | % | | 88 | % |
| $ | 20.30 | | 4.13 | % | | $ | 7,118 | | 1.10 | % | | 3.59 | % | | 1.10 | % | | 2.22 | % | | 106 | % |
| $ | 20.22 | | (0.14 | %) | | $ | 6,324 | | 1.10 | % | | 2.75 | % | | 1.10 | % | | 2.02 | % | | 159 | % |
| | | | | | | | | | | | | | | | | | | | | | |
| $ | 1.00 | | 0.64 | % | | $ | 122,142 | | 0.55 | % | | 0.66 | % | | 0.55 | % | | 0.84 | % | | N/A | |
| $ | 1.00 | | 2.65 | % | | $ | 161,232 | | 0.49 | % | | 2.64 | % | | 0.49 | % | | 0.83 | % | | N/A | |
| $ | 1.00 | | 4.95 | % | | $ | 195,479 | | 0.48 | % | | 4.83 | % | | 0.48 | % | | 0.84 | % | | N/A | |
| $ | 1.00 | | 4.71 | % | | $ | 159,641 | | 0.48 | % | | 4.64 | % | | 0.48 | % | | 0.87 | % | | N/A | |
| $ | 1.00 | | 2.85 | % | | $ | 129,200 | | 0.47 | % | | 2.79 | % | | 0.47 | % | | 0.89 | % | | N/A | |
| | | | | | | | | | | | | | | | | | | | | | |
| $ | 1.00 | | 0.75 | % | | $ | 46,249 | | 0.43 | % | | 0.83 | % | | 0.43 | % | | 0.67 | % | | N/A | |
| $ | 1.00 | | 2.79 | % | | $ | 77,294 | | 0.37 | % | | 2.55 | % | | 0.37 | % | | 0.68 | % | | N/A | |
| $ | 1.00 | | 5.09 | % | | $ | 20,333 | | 0.34 | % | | 4.98 | % | | 0.34 | % | | 0.67 | % | | N/A | |
| $ | 1.00 | | 4.86 | % | | $ | 24,118 | | 0.34 | % | | 4.76 | % | | 0.34 | % | | 0.71 | % | | N/A | |
| $ | 1.00 | | 2.99 | % | | $ | 21,083 | | 0.33 | % | | 2.93 | % | | 0.33 | % | | 0.71 | % | | N/A | |
Notes to Financial Statements
December 31, 2009
1. Organization and Significant Accounting Policies
The Flex-funds® Trust (the “Trust”) was organized in 1982 and is registered under the Investment Company Act of 1940, as amended (the “1940 Act”), as a diversified, open-end management investment company. The Trust offers nine separate series and is presently comprised of nine separate funds as follows: The Muirfield Fund® (“Muirfield”), The Total Return Utilities Fund (f.k.a. The Socially Responsible Utilities Fund)(“Utilities”), The Quantex Fund™ (f.k.a. The Highlands Growth Fund)(“Quantex”), The Dynamic Growth Fund (“Dynamic”), The Aggressive Growth Fund (“Aggressive”), The Defensive Balanced Fund (f.k.a. The Defensive Growth Fund)(“Defensive”), The Strategic Growth Fund (f.k.a. The Focused Growth Fund)(“Strategic”), The U.S. Government Bond Fund (“Bond”), and The Money Market Fund (“Money Market”) (each a “Fund” and collectively the “Funds”). Money Market offers two classes of shares (the Retail Class (“Retail Class”) and the Institutional Class (“Institutional Class”)). Each class of shares has equal rights as to earnings and assets except that each class bears different distribution and transfer agent expenses. The investment objective of Muirfield, Dynamic, Aggressive, and Strategic is growth of capital. The investment objective of Defensive is growth of capital, with current income usually of secondary importance. The investment objective of Quantex is long term capital appreciation. The investment objective of Utilities is total returns, including current income and growth of income. The investment objective of Bond is maximum current income. The investment objective of Money Market is current income while maintaining a stable share price of $1.00.
Use of estimates. The preparation of financial statements in conformity with accounting principles generally accepted in the United States of America (“GAAP”) requires management to make estimates and assumptions that affect the reported amounts of assets and liabilities and disclosure of contingent assets and liabilities at the date of the financial statements and the reported amounts of increases and decreases in net assets from operations during the reporting period. Actual results could differ from those estimates.
Security valuation. All investments in securities are recorded at their estimated fair value, as described in Note #2.
Repurchase agreements. Each Fund may engage in repurchase agreement transactions whereby the Fund takes possession of an underlying debt instrument subject to an obligation of the seller to repurchase the instrument from the Fund and an obligation of the Fund to resell the instrument at an agreed upon price and term. At all times, the Fund maintains the value of collateral, including accrued interest, of at least 100% of the amount of the repurchase agreement, plus accrued interest. If the seller defaults or the fair value of the collateral declines, realization of the collateral by the Funds may be delayed or limited.
Futures & options. Each Fund, except Money Market, may engage in transactions in financial futures contracts and options contracts in order to manage the risk of unanticipated changes in market values of securities held in the Fund, or which it intends to purchase. The futures and options contracts are adjusted by the daily exchange rate of the underlying currency, or index, and any gains or losses are recorded for financial statement purposes as unrealized gains or losses in the statement of assets and liabilities and the statement of operations until the contract settlement date, at which time realized gains and losses are included in the statement of operations.
To the extent that the Fund enters into futures contracts on an index or group of securities, the Fund exposes itself to an indeterminate liability and will be required to pay or receive a sum of money measured by the change in the value of the index. Upon entering into a futures contract, the Fund is required to deposit an initial margin, which is either cash or securities in an amount equal to a certain percentage of the contract value. Subsequently, the variation margin, which is equal to changes in the daily settlement price or last sale price on the exchanges where futures contracts trade, is received or paid and is recorded as an unrealized gain or loss until the contract is closed. When the contract is closed, the Fund records a realized gain or loss equal to the difference between the proceeds from (or cost of) the closing transaction and the Fund’s basis in the contract. Should market conditions move unexpectedly, the Fund may not achieve the anticipated benefits of the futures contract and may realize a loss. The use of futures transactions involves the risk of imperfect correlation in movements in the price of futures contracts, interest rates, and the underlying hedged assets. With futures, there is minimal counterparty credit risk to the Fund since futures are exchange traded and the exchange’s clearinghouse, as counterparty to all exchange traded futures, guarantees the futures against default. Except for Money Market and Utilities, it is normal practice for each Fund to invest in futures contracts on a daily basis. Although Utilities is permitted to invest in futures contracts, it typically does not.
Call and put option contracts involve the payment of a premium for the right to purchase or sell an individual security or index aggregate at a specified price until the expiration of the contract. Such transactions expose the Fund to the loss of the premium paid if the Fund does not sell or exercise the contract prior to the expiration date. In the case of a call option, sufficient cash or money market instruments will be segregated to complete the purchase. Options are valued on the basis of the daily settlement price or last sale on the exchanges where they trade and the changes in value are recorded as unrealized appreciation or depreciation until closed, exercised or expired. For the year ended December 31, 2009, there were no call or put options transacted for any of the Funds.
The Funds may write covered call or put options for which premiums received are recorded as liabilities and are subsequently adjusted to the current value of the options written. When written options are closed or exercised, premiums received are offset against the proceeds paid, and the Fund records realized gains or losses for the difference. When written options expire, the liability is eliminated, and the Fund records realized gains for the entire amount of premiums received. Although permitted, it is currently not normal practice for the Funds to invest in call and put options.
The fair value of derivative instruments as reported within the Statements of Assets and Liabilities as of December 31, 2009 was as follows:
Amount of Net Variation Margin on Derivatives
| | | | | | | |
| | | Type of
Derivative/Risk | | Balance Sheet Location | | Fair Value |
The Muirfield Fund® | | Equity contracts | | Liabilities, Payable for net variation margin on futures contracts | | $ | 47,768 |
The Dynamic Growth Fund | | Equity contracts | | Liabilities, Payable for net variation margin on futures contracts | | | 34,200 |
The Aggressive Growth Fund | | Equity contracts | | Liabilities, Payable for net variation margin on futures contracts | | | 8,550 |
The Defensive Balanced Fund | | Equity contracts | | Liabilities, Payable for net variation margin on futures contracts | | | 22,800 |
The Strategic Growth Fund | | Equity contracts | | Liabilities, Payable for net variation margin on futures contracts | | | 30,033 |
The Quantex Fund™ | | Equity contracts | | Liabilities, Payable for net variation margin on futures contracts | | | 4,283 |
The effect of derivative instruments on the Statements of Operations for the period January 1, 2009 through December 31, 2009 was as follows:
Amount of Realized Gain or (Loss) on Derivatives Recognized in Income
| | | | | | | | | | | | |
| | | Type of
Derivative/Risk | | Contracts
Opened
During the
Year | | Contracts
Closed
During the
Year | | Statement of Operations Location | | For the
Year Ended
December 31,
2009 | |
The Muirfield Fund® | | Equity contracts | | 325 | | 328 | | Net realized gains (losses) from futures contracts | | $ | (538,957 | ) |
The Dynamic Growth Fund | | Equity contracts | | 111 | | 116 | | Net realized gains (losses) from futures contracts | | | 403,513 | |
The Aggressive Growth Fund | | Equity contracts | | 37 | | 36 | | Net realized gains (losses) from futures contracts | | | 385,053 | |
The Defensive Balanced Fund | | Equity contracts | | 94 | | 92 | | Net realized gains (losses) from futures contracts | | | 385,053 | |
The Strategic Growth Fund | | Equity contracts | | 51 | | 53 | | Net realized gains (losses) from futures contracts | | | 580,610 | |
The Quantex Fund™ | | Equity contracts | | 12 | | 14 | | Net realized gains (losses) from futures contracts | | | 230,320 | |
Change in Unrealized Gain or (Loss) on Derivatives Recognized in Income
| | | | | | | | |
| | | Type of
Derivative/Risk | | Statement of Operations Location | | For the
Year Ended
December 31
2009 | |
The Muirfield Fund® | | Equity contracts | | Net change in unrealized appreciation (depreciation) of investments and futures contracts | | $ | 81,610 | |
The Dynamic Growth Fund | | Equity contracts | | Net change in unrealized appreciation (depreciation) of investments and futures contracts | | | 65,150 | |
The Aggressive Growth Fund | | Equity contracts | | Net change in unrealized appreciation (depreciation) of investments and futures contracts | | | 13,093 | |
The Defensive Balanced Fund | | Equity contracts | | Net change in unrealized appreciation (depreciation) of investments and futures contracts | | | 35,760 | |
The Strategic Growth Fund | | Equity contracts | | Net change in unrealized appreciation (depreciation) of investments and futures contracts | | | (17,485 | ) |
The Quantex Fund™ | | Equity contracts | | Net change in unrealized appreciation (depreciation) of investments and futures contracts | | | (13,986 | ) |
Federal income taxes. It is each Fund’s policy to continue to comply with the requirements of Subchapter M of the Internal Revenue Code applicable to regulated investment companies and to distribute substantially all of its taxable income and net capital gains to its shareholders. Therefore, no federal income tax provision is required.
As of and during the year ended December 31, 2009, the Funds did not have a liability for any unrecognized tax benefits. The Funds recognize interest and penalties, if any, related to unrecognized tax benefits as income tax expense in the statements of operations. During the year ended December 31, 2009, the Funds did not incur any interest or penalties.
The Funds are not subject to examination by U.S. federal and state tax authorities for tax years before 2006.
Distributions to shareholders. Distributions to shareholders are recorded on the ex-dividend date. Muirfield, Quantex, Dynamic, Aggressive, Defensive, and Strategic declare and pay dividends from net investment income, if any, on a quarterly basis. Utilities declares and pays dividends from net investment income on a monthly basis. Bond and Money Market declare dividends from net investment income on a daily basis and pay such dividends on a monthly basis. Each Fund distributes net capital gains, if any, on an annual basis.
Distributions from net investment income and from net capital gains are determined in accordance with income tax regulations, which may differ from GAAP. These differences are primarily due to deferrals of certain losses, expiring capital loss carryforwards, and differing treatments of unrealized gains and losses of futures contracts held by each Fund. Accordingly, timing differences relating to shareholder distributions are reflected in the components of net assets and permanent book and tax differences have been reclassified within the components of net assets based on their ultimate characterization for federal income tax purposes. For the year ended December 31, 2009, net investment loss was reclassified to paid-in-capital in the amount of $28,673, $61,565, $35,998, and $4,448 for Dynamic, Aggressive, Strategic, and Quantex, respectively. For Muirfield, net investment income was reclassified to paid-in-capital in the amount of $64. For Utilities, $123,774 of over-distributions from net investment income were re-designated as return of paid-in-capital.
Investment income & expenses. For Money Market, income and expenses (other than expenses attributable to a specific class) are allocated to each class of shares based on its relative net assets. Expenses incurred by the Trust that do not specifically relate to an individual Fund of the Trust are allocated to the Funds based on each Fund’s relative net assets or other appropriate basis.
Capital Share Transactions. Money Market is authorized to issue an indefinite number of shares in the Retail Class and the Institutional Class. Transactions in the capital shares of the Fund for the year ended December 31, 2009 and the year ended December 31, 2008 were as follows:
| | | | | | | | | | | | | | |
| | | 2009 | | | 2008 | |
| | | Amount | | | Shares | | | Amount | | | Shares | |
Retail Class | | | | | | | | | | | | | | |
Issued | | $ | 111,881,231 | | | 111,881,231 | | | $ | 217,175,811 | | | 217,175,811 | |
Reinvested | | | 902,521 | | | 902,521 | | | | 4,945,212 | | | 4,945,212 | |
Redeemed | | | (151,873,802 | ) | | (151,873,802 | ) | | | (256,368,000 | ) | | (256,368,000 | ) |
Net increase (decrease) | | $ | (39,090,050 | ) | | (39,090,050 | ) | | $ | (34,246,977 | ) | | (34,246,977 | ) |
Institutional Class | | | | | | | | | | | | | | |
Issued | | $ | 191,928,379 | | | 191,928,379 | | | $ | 137,450,135 | | | 137,450,135 | |
Reinvested | | | 109,246 | | | 109,246 | | | | 456,231 | | | 456,231 | |
Redeemed | | | (223,082,220 | ) | | (223,082,220 | ) | | | (80,945,889 | ) | | (80,945,889 | ) |
Net increase (decrease) | | $ | (31,044,595 | ) | | (31,044,595 | ) | | $ | 56,960,477 | | | 56,960,477 | |
Other. The Funds record security transactions on the trade date. Gains and losses realized from the sale of securities are determined on the specific identification basis. Dividend income is recognized on the ex-dividend date and interest income (including amortization of premium and accretion of discount) is recognized as earned. Discounts and premiums are amortized over the lives of the respective securities.
Effective September 19, 2008, Money Market participated in the U.S. Treasury’s Temporary Guarantee Program for money market funds. The guarantee provided coverage to the total number of shares held in Money Market as of the close of business on September 19, 2008 less redemptions since September 19, 2008. The program covered all retail and institutional class money market funds that were regulated under Rule 2a-7 of the Investment Company Act of 1940, were publicly offered, were registered with the Securities and Exchange Commission, and maintained a stable share price of $1. The expense to participate in the program is included in the Insurance Expense disclosed in the Statements of Operations in this annual report. The insurance was extended to cover the Fund through September 18, 2009. The coverage has since expired.
Subsequent Events. Management has evaluated subsequent events through February 23, 2010, the date the financial statements were issued.
2. Securities Valuations
As described in Note #1, the Funds utilize various methods to measure the fair value of most of their investments on a recurring basis. Generally Accepted Accounting Principles (“GAAP”) establishes a hierarchy that prioritizes inputs to valuation methods. The three levels of inputs are as follows:
Level 1 — Unadjusted quoted prices in active markets for identical assets or liabilities that the Funds have the ability to access.
Level 2 — Observable inputs other than quoted prices included in level 1 that are observable for the asset or liability, either directly or indirectly. These inputs may include quoted prices for the identical instrument on an inactive market, prices for similar instruments, interest rates, prepayment speeds, credit risk, yield curves, default rates and similar data.
Level 3 — Unobservable inputs for the asset or liability, to the extent relevant observable inputs are not available, representing the Funds’ own assumptions about the assumptions a market participant would use in valuing the asset or liability, and would be based on the best information available.
The availability of observable inputs can vary from security to security and is affected by a wide variety of factors, including, for example, the type of security, whether the security is new and not yet established in the marketplace, the liquidity of markets, and other characteristics particular to the security. To the extent that valuation is based on models or inputs that are less observable or unobservable in the market, the determination of fair value requires more judgment. Accordingly, the degree of judgment exercised in determining fair value is greatest for instruments categorized in level 3.
The inputs used to measure fair value may fall into different levels of the fair value hierarchy. In such cases, for disclosure purposes, the level in the fair value hierarchy within which the fair value measurement falls in its entirety, is determined based on the lowest level input that is significant to the fair value measurement in its entirety.
A description of the valuation techniques applied to the Funds’ major categories of assets and liabilities measured at fair value on a recurring basis follows.
Equity securities (including publicly traded partnerships and common stock). Securities traded on a national securities exchange (or reported on the NASDAQ national market) are stated at the last reported sales price on the day of valuation or, lacking any sales, are valued using fair value procedures approved by the Trustees.
Investments in registered investment companies, including money market funds, are valued at the daily redemption value as reported by the underlying fund. The Funds obtain prices from independent pricing services, which use valuation techniques approved by the Trustees. To the extent these securities are actively traded and valuation adjustments are not applied, they are categorized in level 1 of the fair value hierarchy.
Corporate bonds. The fair value of corporate bonds is estimated using various techniques, which may consider recently executed transactions in securities of the issuer or comparable issuers, market price quotations (where observable), bond spreads, fundamental data relating to the issuer, and credit default swap spreads adjusted for any basis difference between cash and derivative instruments. While most corporate bonds are categorized in level 2 of the fair value hierarchy, in instances where lower relative weight is placed on transaction prices, quotations, or similar observable inputs, they are categorized in level 3.
Short-term notes (including bank obligations, certificates of deposit, corporate obligations, U.S. government agency obligations, and floating rate demand notes). Short-term notes held in the Funds, except Money Market, maturing more than sixty days after the valuation date, are valued at the last sales price as of the close of business on the day of valuation, or, lacking any sales, at the most recent bid price or yield equivalent as obtained from dealers that make markets in such securities. When valued at last sales price, the securities will be categorized as level 1. When using bid prices or yield equivalents, they will be categorized as level 2. When such securities are valued within sixty days or less to maturity, the difference between the valuation existing on the sixty-first day before maturity and maturity value is amortized on a straight-line basis to maturity and will be categorized as level 2.
All short-term notes held in Money Market, including illiquid and restricted securities, are valued at amortized cost, which approximates fair value, and will be categorized as level 2.
U.S. government obligations. U.S. government obligations are normally valued using a model that incorporates market observable data such as reported sales of similar securities, broker quotes, yields, bids, offers, and reference data. Certain securities are valued principally using dealer quotations. In either case, these securities will be categorized as level 2.
Restricted securities (equity and debt). Restricted securities for which quotations are not readily available are valued at fair value as determined by the Trustees. Depending on the relative significance of valuation inputs, these instruments may be classified in either level 2 or level 3 of the fair value hierarchy.
Derivative instruments (futures contracts). Listed derivative instruments that are actively traded, including futures contracts, are valued based on quoted prices from the exchange and are categorized in level 1 of the fair value hierarchy.
For the year ended December 31, 2009, the Funds did not hold any assets at any time in which significant unobservable inputs were used in determining fair value. Therefore, no reconciliation of Level 3 securities is provided. The following table summarizes the inputs used to value the Funds’ assets and liabilities measured at fair value as of December 31, 2009.
| | | | | | | | | | | | |
Muirfield — Assets/(Liabilities) | | Level 1 | | Level 2 | | Level 3 | | Total |
Registered investment companies | | $ | 109,057,296 | | $ | — | | $ | — | | $ | 109,057,296 |
Money market registered investment companies | | | 2,521,062 | | | — | | | — | | | 2,521,062 |
Floating rate demand notes | | | — | | | 3,258,715 | | | — | | | 3,258,715 |
U.S. government obligations | | | — | | | 799,926 | | | — | | | 799,926 |
| | | | | | | | | | | | |
Total | | $ | 111,578,358 | | $ | 4,058,641 | | $ | — | | $ | 115,636,999 |
| | | | | | | | | | | | |
Trustee deferred compensation | | $ | 92,822 | | $ | — | | $ | — | | $ | 92,822 |
| | | | | | | | | | | | |
Futures contracts* | | $ | 54,630 | | $ | — | | $ | — | | $ | 54,630 |
| | | | | | | | | | | | |
| | | | | | | | | | | | |
Dynamic — Assets/(Liabilities) | | Level 1 | | Level 2 | | Level 3 | | Total |
Registered investment companies | | $ | 80,960,895 | | $ | — | | $ | — | | $ | 80,960,895 |
Money market registered investment companies | | | 2,660,901 | | | — | | | — | | | 2,660,901 |
Floating rate demand notes | | | — | | | 250,583 | | | — | | | 250,583 |
U.S. government obligations | | | — | | | 799,926 | | | — | | | 799,926 |
| | | | | | | | | | | | |
Total | | $ | 83,621,796 | | $ | 1,050,509 | | $ | — | | $ | 84,672,305 |
| | | | | | | | | | | | |
Trustee deferred compensation | | $ | 40,857 | | $ | — | | $ | — | | $ | 40,857 |
| | | | | | | | | | | | |
Futures contracts* | | $ | 41,010 | | $ | — | | $ | — | | $ | 41,010 |
| | | | | | | | | | | | |
| | | | |
Aggressive — Assets/(Liabilities) | | Level 1 | | Level 2 | | Level 3 | | Total |
Registered investment companies | | $ | 28,927,942 | | $ | — | | $ | — | | $ | 28,927,942 |
Money market registered investment companies | | | 779,984 | | | — | | | — | | | 779,984 |
U.S. government obligations | | | — | | | 299,972 | | | — | | | 299,972 |
| | | | | | | | | | | | |
Total | | $ | 29,707,926 | | $ | 299,972 | | $ | — | | $ | 30,007,898 |
| | | | | | | | | | | | |
Trustee deferred compensation | | $ | 27,788 | | $ | — | | $ | — | | $ | 27,788 |
| | | | | | | | | | | | |
Futures contracts* | | $ | 10,253 | | $ | — | | $ | — | | $ | 10,253 |
| | | | | | | | | | | | |
| | | | |
Defensive — Assets/(Liabilities) | | Level 1 | | Level 2 | | Level 3 | | Total |
Registered investment companies | | $ | 38,411,471 | | $ | — | | $ | — | | $ | 38,411,471 |
Money market registered investment companies | | | 2,449,157 | | | — | | | — | | | 2,449,157 |
Floating rate demand notes | | | — | | | 2,253,836 | | | — | | | 2,253,836 |
U.S. government obligations | | | — | | | 6,531,175 | | | — | | | 6,531,175 |
| | | | | | | | | | | | |
Total | | $ | 40,860,628 | | $ | 8,785,011 | | $ | — | | $ | 49,645,639 |
| | | | | | | | | | | | |
Trustee deferred compensation | | $ | 26,698 | | $ | — | | $ | — | | $ | 26,698 |
| | | | | | | | | | | | |
Futures contracts* | | $ | 27,240 | | $ | — | | $ | — | | $ | 27,240 |
| | | | | | | | | | | | |
| | | | |
Strategic — Assets/(Liabilities) | | Level 1 | | Level 2 | | Level 3 | | Total |
Registered investment companies | | $ | 31,760,502 | | $ | — | | $ | — | | $ | 31,760,502 |
Money market registered investment companies | | | 1,858,964 | | | — | | | — | | | 1,858,964 |
Floating rate demand notes | | | — | | | 250,583 | | | — | | | 250,583 |
U.S. government obligations | | | — | | | 299,972 | | | — | | | 299,972 |
| | | | | | | | | | | | |
Total | | $ | 33,619,466 | | $ | 550,555 | | $ | — | | $ | 34,170,021 |
| | | | | | | | | | | | |
Trustee deferred compensation | | $ | 21,906 | | $ | — | | $ | — | | $ | 21,906 |
| | | | | | | | | | | | |
Futures contracts* | | $ | 35,655 | | $ | — | | $ | — | | $ | 35,655 |
| | | | | | | | | | | | |
| | | | |
Quantex — Assets/(Liabilities) | | Level 1 | | Level 2 | | Level 3 | | Total |
Common stocks** | | $ | 12,258,337 | | $ | — | | $ | — | | $ | 12,258,337 |
Money market registered investment companies | | | 126,786 | | | — | | | — | | | 126,786 |
Floating rate demand notes | | | — | | | 200,467 | | | — | | | 200,467 |
U.S. government obligations | | | — | | | 99,991 | | | — | | | 99,991 |
| | | | | | | | | | | | |
Total | | $ | 12,385,123 | | $ | 300,458 | | $ | — | | $ | 12,685,581 |
| | | | | | | | | | | | |
Trustee deferred compensation | | $ | 39,499 | | $ | — | | $ | — | | $ | 39,499 |
| | | | | | | | | | | | |
Futures contracts* | | $ | 5,943 | | $ | — | | $ | — | | $ | 5,943 |
| | | | | | | | | | | | |
| | | | | | | | | | | | |
Utilities — Assets/(Liabilities) | | Level 1 | | Level 2 | | Level 3 | | Total |
Common stocks** | | $ | 20,149,507 | | $ | — | | $ | — | | $ | 20,149,507 |
Money market registered investment companies | | | 257,874 | | | — | | | — | | | 257,874 |
| | | | | | | | | | | | |
Total | | $ | 20,407,381 | | $ | — | | $ | — | | $ | 20,407,381 |
| | | | | | | | | | | | |
Trustee deferred compensation | | $ | 34,096 | | $ | — | | $ | — | | $ | 34,096 |
| | | | | | | | | | | | |
| | | | |
Bond — Assets/(Liabilities) | | Level 1 | | Level 2 | | Level 3 | | Total |
U.S. government obligations | | $ | — | | $ | 13,852,153 | | $ | — | | $ | 13,852,153 |
Corporate bonds | | | — | | | 3,065,885 | | | — | | | 3,065,885 |
Money market registered investment companies | | | 88,306 | | | — | | | — | | | 88,306 |
Floating rate demand notes | | | — | | | 200,700 | | | — | | | 200,700 |
| | | | | | | | | | | | |
Total | | $ | 88,306 | | $ | 17,118,738 | | $ | — | | $ | 17,207,044 |
| | | | | | | | | | | | |
Trustee deferred compensation | | $ | 26,479 | | $ | — | | $ | — | | $ | 26,479 |
| | | | | | | | | | | | |
| | | | |
Money Market — Assets/(Liabilities) | | Level 1 | | Level 2 | | Level 3 | | Total |
Bank obligations | | $ | — | | $ | 400,000 | | $ | — | | $ | 400,000 |
Certificates of deposit | | | — | | | 21,000,616 | | | — | | | 21,000,616 |
Corporate obligations | | | — | | | 44,846,735 | | | — | | | 44,846,735 |
U.S. government agency obligations | | | — | | | 35,527,045 | | | — | | | 35,527,045 |
Money Market registered investment companies | | | 66,449,582 | | | — | | | — | | | 66,449,582 |
| | | | | | | | | | | | |
Total | | $ | 66,449,582 | | $ | 101,774,396 | | $ | — | | $ | 168,223,978 |
| | | | | | | | | | | | |
Trustee deferred compensation | | $ | 35,380 | | $ | — | | $ | — | | $ | 35,380 |
| | | | | | | | | | | | |
| * | Futures contracts include cumulative gain/loss on contracts open at December 31, 2009. |
| ** | See schedule of investments for industry classifications. |
3. Investment Transactions
For the year ended December 31, 2009, the cost of purchases and proceeds from sales or maturities of long-term investments for the Funds were as follows:
| | | | | | |
| | | Purchases | | Sales |
The Muirfield Fund® | | $ | 171,384,011 | | $ | 127,914,463 |
The Dynamic Growth Fund | | | 104,561,643 | | | 105,446,714 |
The Aggressive Growth Fund | | | 37,824,116 | | | 35,820,106 |
The Defensive Balanced Fund | | | 76,434,440 | | | 61,307,319 |
The Strategic Growth Fund | | | 23,571,736 | | | 18,834,641 |
The Quantex Fund™ | | | 4,098,958 | | | 2,804,673 |
The Total Return Utilities Fund | | | 6,167,059 | | | 5,859,893 |
The U.S. Government Bond Fund | | | 21,921,746 | | | 20,319,978 |
For the year ended December 31, 2009, included above are the cost of purchases and proceeds from sales or maturities of long-term U.S. Government investments for the Funds as follows:
| | | | | | |
| | | Purchases | | Sales |
The Defensive Balanced Fund | | $ | 14,549,041 | | $ | 15,586,520 |
The U.S. Government Bond Fund | | | 18,295,185 | | | 19,420,999 |
4. Investment Advisory Fees and Other Transactions with Affiliates
Meeder Asset Management, Inc. (“MAM”), a wholly-owned subsidiary of Meeder Financial, Inc. (“Meeder”), provides each Fund, under a separate Investment Advisory Contract, with investment management, research, statistical and advisory services. The services of MAM will terminate automatically if assigned and may be terminated without penalty
at any time upon 60 days prior written notice by majority vote of the Fund, by the Trustees of the Fund, or by MAM. Under a separate Investment Subadvisory Agreement with MAM, Miller/Howard Investments, Inc. (“Miller/Howard”) serves as subadvisor of Utilities. The Investment Subadvisory Agreement provides that it will terminate automatically if assigned, and that it may be terminated by MAM without penalty to the Fund by MAM, the Trustees of the Fund, or by the vote of a majority of the outstanding voting securities of the Fund upon not less than 30 days written notice.
For such services the Funds pay a fee at the following annual rates: Muirfield, Utilities, and Quantex, 1.00% of average daily net assets up to $50 million, 0.75% of average daily net assets exceeding $50 million up to $100 million and 0.60% of average daily net assets exceeding $100 million. As subadvisor to Utilities, Miller/Howard is paid 0.00% of the 1.00% of average daily net assets up to $10 million, 0.40% of the 1.00% of average daily net assets exceeding $10 million up to $50 million, 0.40% of the 0.75% of average daily net assets exceeding $50 million up to $60 million, 0.30% of the 0.75% of average daily net assets exceeding $60 million up to $100 million and 0.25% of the 0.60% of average daily net assets exceeding $100 million; Dynamic, Aggressive, Defensive, and Strategic, 0.75% of average daily net assets up to $200 million and 0.60% of average daily net assets exceeding $200 million; Bond, 0.40% of average daily net assets up to $100 million and 0.20% of average daily net assets exceeding $100 million; and Money Market, 0.40% of average daily net assets up to $100 million and 0.25% of average daily net assets exceeding $100 million. MAM has contractually agreed to reduce its investment advisory fee by 0.25% for Quantex. During the year ended December 31, 2009, $22,346 of investment advisory fees were waived in Quantex. During the year ended December 31, 2009, MAM voluntarily agreed to reduce $175,155 of investment advisory fees in Money Market.
Mutual Funds Service Co. (“MFSCo”), a wholly-owned subsidiary of Meeder, serves as stock transfer, dividend disbursing and shareholder services agent for each Fund. In compensation for such services, each Fund pays MFSCo an annual fee calculated as follows: For Muirfield, Utilities, Quantex, Dynamic, Aggressive, Defensive, and Strategic, such fee is equal to the greater of $15 per active shareholder account or 0.12% of each Fund’s average daily net assets. For Bond, such fee is equal to the greater of $15 per active shareholder account or 0.08% of the Fund’s average daily net assets. For Money Market Retail Class and Money Market Institutional Class, such fee is equal to the greater of $20 per active shareholder account or 0.08% of the Fund’s average daily net assets. MFSCo is entitled to receive an annual minimum fee of $4,000 for each Fund or class. For fixed income Funds that are subject to an expense cap and which are above the voluntary expense cap, the basis point fee will be reduced by 0.02%. During the year ended December 31, 2009, MFSCo waived $3,108, $0, and $27,803 of transfer agent fees for Bond, the Retail Class, and the Institutional Class, respectively. MFSCo also voluntarily waived $39,457, $37,217, $29,116, and $18,937 of transfer agent fees for Muirfield, Dynamic, Defensive, and Strategic, respectively, during the year ended December 31, 2009.
MFSCo provides the Trust with certain administrative services. In compensation for such services, each Fund pays MFSCo an annual fee equal to 0.10% of each Fund’s average daily net assets up to $50 million and 0.08% of each Fund’s average daily net assets exceeding $50 million.
MFSCo serves as accounting services agent for each Fund. In compensation for such services, each Fund pays MFSCo an annual fee equal to the greater of:
| | a. | 0.15% of the first $10 million of average daily net assets, 0.10% of the next $20 million of average daily net assets, 0.02% of the next $50 million of average daily net assets, and 0.01% in excess of $80 million of average daily net assets, or |
| | b. | $7,500 for non-Money Market Funds and $30,000 for Money Market. |
For the year ended December 31, 2009, MAM voluntarily agreed to reduce its fees and/or reimburse expenses (excluding brokerage fees and commissions, taxes, interest, and extraordinary or non-recurring expenses), to limit total annual operating expenses to 0.99%, 1.54%, 1.54%, and 1.54% of average daily net assets for Bond, Aggressive, Defensive, and Strategic, respectively. MAM has also voluntarily agreed to reduce its fees and/or reimburse expenses to limit the Retail Class’ and the Institutional Class’ total annual operating expenses to 0.55% and 0.43% of average daily net assets, respectively. Such reductions and/or reimbursements are limited to the total of fees charged to each Fund or Class by MAM and MFSCo. For the year ended December 31, 2009, MAM and/or MFSCo reimbursed $24,545, $5,535, $9,102, $59,291, and $152,528 to Aggressive, Defensive, Strategic, Bond, and Money Market, respectively.
Muirfield, Dynamic, Aggressive, Defensive, and Strategic have entered into an agreement with the Trust’s custodian, The Huntington National Bank (“HNB”), whereby HNB receives distribution, service, and administration fees
(collectively the “fees”) from the underlying security holdings of the aforementioned Funds, and forwards those fees to the appropriate Funds. The Funds use the fees received to reduce the gross expenses of each Fund. For the year ended December 31, 2009, Muirfield, Dynamic, Aggressive, Defensive, and Strategic used $74,951, $76,616, $21,871, $20,727, and $29,049 of fees received, respectively, to reduce gross expenses of each Fund. It is possible that the Funds may invest in security holdings in which fees are not paid. As such, the gross expenses of a Fund would not be decreased. Also, without this agreement it is likely that the Funds would not collect any fees from underlying security holdings.
Pursuant to Rule 12b-1 of the 1940 Act, a mutual fund can adopt a written plan to pay certain expenses out of fund assets relating to the sale and distribution of its shares. Muirfield, Quantex, Bond, and the Retail Class have adopted a distribution plan with an annual limitation of 0.20% of average daily net assets. Utilities, Dynamic, Aggressive, Defensive, and Strategic have adopted a distribution plan with an annual limitation of 0.25% of average daily net assets. The Institutional Class has adopted a distribution plan with an annual limitation of 0.03% of average daily net assets. For the year ended December 31, 2009, Muirfield, Utilities, Quantex, Dynamic, Aggressive, Defensive, Strategic, and Bond waived $51,281, $10,959, $14,123, $22,322, $3,915, $16,220, $10,820, and $6,527 of distribution plan (12b-1) expenses, respectively. The Retail Class and the Institutional Class waived $208,454 and $18,133, respectively, for a total of $226,587.
An Administrative Services Plan has been adopted for each Fund of the Trust except Money Market. The Administrative Services Plan allows for each eligible Fund to pay a maximum annual amount of 0.20% of average daily net assets to Service Organizations that provide administrative support services to their customers who own Shares of record or beneficially. For the year ended December 31, 2009, Muirfield, Utilities, Quantex, Dynamic, Aggressive, Strategic, and Bond waived $63,115, $22,256, $17,609, $52,086, $17,127, $1,893, and $9,324 of administrative service plan expenses, respectively.
The Funds have adopted a Deferred Compensation Plan (the “Plan”) for the independent Trustees. Under the Plan, each eligible Trustee is permitted to defer all or a portion of the trustees fees payable by any of the Funds as an investment into any combination of Funds until a specified point of time. The investment into the Funds is recorded as an asset, however an offsetting liability is also recorded for the deferred payment. Once the eligible Trustees’ deferral amounts can be distributed, a lump sum or generally equal annual installments over a period of up to ten (10) years can be made to the eligible Trustee(s). The Funds may terminate this Plan at any time.
Certain trustees and officers of the Funds are also officers or directors of Meeder, MAM, and MFSCo.
During the year ended December 31, 2009, several of the Funds invested in The Money Market Fund, an affiliate, as described in Section 2(a)(3) of the Investment Company Act of 1940. As of December 31, 2009, the 7-day yield of the Institutional Class was 0.47%. A summary of the Funds’ investments in this affiliate during the year is noted below:
| | | | | | | | | | | | | | | | | | | |
| | | 12/31/08
Balance | | Purchases | | Sales | | | 12/31/09
Cost | | Income | | 12/31/09
Value |
The Muirfield Fund® | | $ | 39,001,248 | | $ | 52,591,502 | | $ | (89,071,688 | ) | | $ | 2,521,062 | | $ | 189,077 | | $ | 2,521,062 |
The Dynamic Growth Fund | | | 3,196,192 | | | 35,804,989 | | | (36,340,280 | ) | | | 2,660,901 | | | 24,864 | | | 2,660,901 |
The Aggressive Growth Fund | | | 233,519 | | | 11,347,582 | | | (10,801,117 | ) | | | 779,984 | | | 8,375 | | | 779,984 |
The Defensive Balanced Fund | | | 11,278,859 | | | 37,368,831 | | | (46,198,533 | ) | | | 2,449,157 | | | 71,301 | | | 2,449,157 |
The Strategic Growth Fund | | | 1,886,088 | | | 13,184,547 | | | (13,211,671 | ) | | | 1,858,964 | | | 10,333 | | | 1,858,964 |
The Quantex Fund™ | | | 324,465 | | | 3,731,405 | | | (3,929,084 | ) | | | 126,786 | | | 3,856 | | | 126,786 |
The Total Return Utilities Fund | | | 218,301 | | | 4,727,726 | | | (4,688,153 | ) | | | 257,874 | | | 2,046 | | | 257,874 |
The U.S. Government Bond Fund | | | 561,082 | | | 20,290,101 | | | (20,762,877 | ) | | | 88,306 | | | 10,434 | | | 88,306 |
5. Federal Tax Information
The tax characteristics of dividends paid by the Funds during the year ended December 31, 2009 were as follows:
| | | | | | | | | | | | | | | |
| | | Ordinary
Income | | Net
Short-Term
Capital Gains | | Net
Long-Term
Capital Gains | | Tax
Return
of Capital | | Total
Dividends
Paid(1) |
The Muirfield Fund® | | $ | 413,069 | | $ | — | | $ | — | | $ | — | | $ | 413,069 |
The Dynamic Growth Fund | | | 29,265 | | | — | | | — | | | — | | | 29,265 |
The Aggressive Growth Fund | | | 5 | | | — | | | — | | | — | | | 5 |
| | | | | | | | | | | | | | | |
| | | Ordinary
Income | | Net
Short-Term
Capital Gains | | Net
Long-Term
Capital Gains | | Tax
Return
of Capital | | Total
Dividends
Paid(1) |
The Defensive Balanced Fund | | $ | 172,199 | | $ | — | | $ | — | | $ | — | | $ | 172,199 |
The Strategic Growth Fund | | | — | | | — | | | — | | | — | | | — |
The Quantex Fund™ | | | 1,515 | | | — | | | — | | | — | | | 1,515 |
The Total Return Utilities Fund | | | 152,723 | | | — | | | — | | | 123,774 | | | 276,497 |
The U.S. Government Bond Fund | | | 450,396 | | | — | | | — | | | — | | | 450,396 |
The Money Market Fund | | | 1,592,107 | | | — | | | — | | | — | | | 1,592,107 |
The tax characteristics of dividends paid by the Funds during the year ended December 31, 2008 were as follows:
| | | | | | | | | | | | | | | |
| | | Ordinary
Income | | Net
Short-Term
Capital Gains | | Net
Long-Term
Capital Gains | | Tax
Return of
Capital | | Total
Dividends
Paid(1) |
The Muirfield Fund® | | $ | 11,273 | | $ | — | | $ | — | | $ | — | | $ | 11,273 |
The Dynamic Growth Fund | | | 448,435 | | | — | | | 570,693 | | | — | | | 1,019,128 |
The Aggressive Growth Fund | | | 203,657 | | | — | | | — | | | — | | | 203,657 |
The Defensive Balanced Fund | | | 318,559 | | | — | | | — | | | — | | | 318,559 |
The Strategic Growth Fund | | | 175,093 | | | — | | | — | | | — | | | 175,093 |
The Quantex Fund™ | | | 320 | | | — | | | — | | | — | | | 320 |
The Total Return Utilities Fund | | | 146,913 | | | — | | | — | | | 59,813 | | | 206,726 |
The U.S. Government Bond Fund | | | 469,374 | | | — | | | — | | | — | | | 469,374 |
The Money Market Fund | | | 5,992,069 | | | — | | | — | | | — | | | 5,992,069 |
As of December 31, 2009, the components of accumulated earnings/(deficit) on a tax basis for the Funds were as follows:
| | | | | | | | | | | | | | | | | | |
| | | Undistributed
Ordinary
Income | | Dividends
Payable | | | Accumulated
Capital and
Other Gains
and (Losses) | | | Unrealized
Appreciation/
(Depreciation)(2) | | Total
Accumulated
Earnings/
(Deficit) | |
The Muirfield Fund® | | $ | 173,172 | | $ | (1,467 | ) | | $ | (22,264,897 | ) | | $ | 7,290,552 | | $ | (14,802,640 | ) |
The Dynamic Growth Fund | | | 20 | | | (20 | ) | | | (23,702,733 | ) | | | 6,049,393 | | | (17,653,340 | ) |
The Aggressive Growth Fund | | | — | | | — | | | | (13,417,465 | ) | | | 4,060,301 | | | (9,357,164 | ) |
The Defensive Balanced Fund | | | — | | | — | | | | (8,847,115 | ) | | | 2,716,045 | | | (6,131,070 | ) |
The Strategic Growth Fund | | | — | | | — | | | | (8,439,928 | ) | | | 3,746,915 | | | (4,693,013 | ) |
The Quantex Fund™ | | | 25 | | | (25 | ) | | | (3,766,738 | ) | | | 1,261,322 | | | (2,505,416 | ) |
The Total Return Utilities Fund | | | 1,550 | | | (1,550 | ) | | | (1,077,347 | ) | | | 220,865 | | | (856,482 | ) |
The U.S. Government Bond Fund | | | 3,331 | | | (1,480 | ) | | | (611,494 | ) | | | 64,902 | | | (544,741 | ) |
The Money Market Fund | | | 13,236 | | | (13,236 | ) | | | — | | | | — | | | — | |
| (1) | Total dividends paid may differ from the amount reported in the Statement of Changes in Net Assets because for tax purposes dividends are recognized when actually paid. |
| (2) | The differences between book- and tax-basis unrealized appreciation/(depreciation) are attributable primarily to: deferral of post October losses, wash sales, and the realization for tax purposes of unrealized gains/(losses) on certain derivative instruments. |
For federal income tax purposes, the following Funds have capital loss carryforwards as of December 31, 2009, which are available to offset future capital gains, if any. To the extent that these carryforwards are used to offset future capital gains, it is probable that the gains that are offset will not be distributed to shareholders:
| | | | | |
| | | Amount | | Expires |
The Muirfield Fund® | | $ | 387,760 | | 2010 |
The Muirfield Fund® | | | 16,393,752 | | 2016 |
The Muirfield Fund® | | | 5,483,385 | | 2017 |
The Dynamic Growth Fund | | | 12,564,846 | | 2016 |
The Dynamic Growth Fund | | | 11,137,887 | | 2017 |
The Aggressive Growth Fund | | | 3,287,233 | | 2010 |
The Aggressive Growth Fund | | | 6,775,690 | | 2016 |
The Aggressive Growth Fund | | | 3,354,542 | | 2017 |
| | | | | |
| | | Amount | | Expires |
The Defensive Balanced Fund | | $ | 7,933,274 | | 2016 |
The Defensive Balanced Fund | | | 913,841 | | 2017 |
The Strategic Growth Fund | | | 6,478,990 | | 2016 |
The Strategic Growth Fund | | | 1,960,938 | | 2017 |
The Quantex Fund™ | | | 234,839 | | 2010 |
The Quantex Fund™ | | | 1,249,666 | | 2011 |
The Quantex Fund™ | | | 731,427 | | 2016 |
The Quantex Fund™ | | | 1,550,806 | | 2017 |
The Total Return Utilities Fund | | | 343,105 | | 2011 |
The Total Return Utilities Fund | | | 734,242 | | 2017 |
The U.S. Government Bond Fund | | | 230,735 | | 2011 |
The U.S. Government Bond Fund | | | 125,708 | | 2012 |
The U.S. Government Bond Fund | | | 141,817 | | 2013 |
The U.S. Government Bond Fund | | | 113,234 | | 2014 |
Under current tax laws, net capital losses incurred after October 31, within a Fund’s fiscal year, are deemed to arise on the first business day of the following fiscal year for tax purposes. For the year ended December 31, 2009, Dynamic, Aggressive, Strategic, Quantex, Utilities, and Bond deferred post October losses in the amounts of $185,860, $28,997, $79,592, $19,859, $60,792, and $1,067, respectively.
6. Control Ownership
The beneficial ownership, either directly or indirectly, of more than 25% of the voting securities of a fund creates a presumption of control of the fund under Section 2(a)(9) of the 1940 Act. As of December 31, 2009, Charles Schwab & Co., Inc. held for the benefit of others, in aggregate, 46% of Utilities; Nationwide Trust Company, FSB held for the benefit of others, in aggregate, 94% of Defensive; Nationwide Trust Company, FSB held for the benefit of others, in aggregate, 89% of Strategic; Nationwide Trust Company, FSB held for the benefit of others, in aggregate, 87% of Dynamic; Nationwide Trust Company, FSB held for the benefit of others, in aggregate, 81% of Aggressive; Nationwide Trust Company, FSB held for the benefit of others, in aggregate, 66% of Muirfield; Nationwide Trust Company, FSB held for the benefit of others, in aggregate, 68% of Bond; and Carey & Co. held for the benefit of others, in aggregate, 73% of Institutional Class and therefore may be deemed to control the Funds.
7. Board Review of Investment Advisory and Subadvisory Agreements (unaudited)
At a meeting held September 3, 2009, the Board of Trustees (the “Board”), including a majority of non-interested or independent Trustees, approved the renewal of the investment advisory agreements for the nine separate funds comprising The Flex-funds (the “Funds”) and the investment sub-advisory agreement relating to The Total Return Utilities Fund (individually, an “Agreement” and collectively, the “Agreements”).
The Board reviewed materials sent to each Trustee in advance of the meeting for consideration in determining whether to approve the renewal of each Fund’s Agreements. Management reviewed with the Trustees the materials prepared by them in response to Funds’ legal counsel’s supplemental written request pursuant to Section 15(c) of the Investment Company Act of 1940 for the provision to the Trustees of appropriately updated and amended information necessary or appropriate to assist the Trustees in their deliberations concerning renewal of the Agreements. In reaching the decision to renew the Agreements, the Board also took into account information furnished throughout the year at regular Board meetings. Information furnished and discussed throughout the year included investment performance reports and related financial information for each Fund, as well as periodic reports on shareholder services, legal compliance, pricing, brokerage commissions and execution and other services provided by the investment manager, Meeder Asset Management, Inc. (“Manager”) and its affiliates, or by or on behalf of The Total Return Utilities Fund’s Subadviser, Miller/Howard Investments, Inc. Information furnished specifically in connection with the renewal process included a report for the Funds prepared by Lipper Financial Services (“Lipper”), an independent organization, as well as a Funds’ profitability analysis prepared by the Manager. The Lipper report compared each Fund’s management fees and expenses with those of other mutual funds deemed comparable to the Fund. The Funds’ profitability analysis discussed the profitability to the Manager and Mutual Funds Service Co., an affiliate of the Manager, from the overall Funds’ operations utilizing expense allocation methodologies deemed reasonable by the Manager.
In considering such materials, the independent Trustees noted that they had received assistance and advice from and met separately with the Funds’ legal counsel and chief compliance officer prior to this meeting. In their deliberations,
the Board dealt with each Fund separately. In approving continuance of the Agreement for each Fund, the Board, including a majority of independent Trustees, considered each Fund’s Agreement, a copy of which was made available at the meeting, and determined that the existing management fee structure was fair and reasonable and that continuance of the Agreement was in the best interests of each Fund and its shareholders. While attention was given to all information furnished, the following discusses the primary factors relevant to the Board’s decision.
Nature, Extent and Quality of Services. The Board continues to be satisfied with the nature and quality of the overall services provided by the Manager and its affiliates to the Funds and their shareholders. In addition to investment performance and expenses discussed earlier, the Board’s opinion was based, in part, upon periodic reports furnished them showing that the investment policies and restrictions for each Fund were consistently complied with as well as other reports periodically furnished the Board. Other factors taken into account by the Board were the Manager’s compliance procedures and the qualifications of the Manager’s chief compliance officer. Consideration was also given to the experience of each Fund’s portfolio management team. The Board also took into account the transfer agent, fund accounting agent and administrative services provided to Fund shareholders by an affiliate of the Manager, noting continuing expenditures by management to increase and improve the scope of such services. Similar considerations were applied to the Subadviser to The Total Return Utilities Fund.
Investment Performance. The Board placed emphasis on the investment performance of each Fund in view of its importance to shareholders. While consideration was given to performance reports and discussions with portfolio managers at Board meetings during the year, particular attention in assessing performance was given to the Lipper reports furnished for the Agreement renewals. The Lipper report prepared for each Fund showed the investment performance of the Fund for the one-, three-, and five-year periods, as applicable, ended June 30, 2009 (the “relevant periods”) in comparison with a performance universe similar to each Fund’s investment objectives.
| | |
Fund | | Performance Benchmark |
The Muirfield Fund® | | Blended Benchmark of 60% S&P 500 Index and 40% Average 90-day U.S. T-Bill; S&P 500 Index; Lipper’s Average Flexible Portfolio Fund Universe; Lipper Index(1) |
| |
The Quantex Fund™ (Formerly The Highlands Growth Fund) | | Blended Benchmark of 50% Russell 2000 Index and 50% S&P 400 Mid-Cap Index; Russell 2000 Index; S&P 400 Mid-Cap Index; Lipper’s Average Mid-Cap Value Fund Universe; Lipper Index(1) |
| |
The Dynamic Growth Fund | | S&P 500 Index; Lipper’s Average Multi-Cap Core Fund Universe; Lipper Index(1) |
| |
The Total Return Utilities Fund (Formerly The Socially Responsible Utilities Fund) | | Russell 3000 Utilities Index; Blended Index of 60% Russell 3000 Utilities and 40% Barclays Capital Long Credit Index; S&P 500 Utilities Index; Lipper’s Average Utility Fund Universe; Lipper Index(1) |
| |
The U.S. Government Bond Fund | | Barclays Capital Intermediate-Term Government/Credit Index; Lipper’s Average General U.S. Government Fund Universe; Lipper Index(1) |
| |
The Aggressive Growth Fund | | NASDAQ Composite Index; Lipper’s Average Multi-Cap Growth Fund Universe; Lipper Index(1) |
| |
The Defensive Balanced Fund (Formerly The Defensive Growth Fund) | | S&P 500 Index; 70% of a Blended Benchmark consisting of 60% S&P 500 Index and 40% Average 90-day U.S. T-Bill; Lipper’s Average Flexible Portfolio Fund Universe; Lipper Index(1) |
| |
The Strategic Growth Fund (Formerly The Focused Growth Fund) | | S&P 500 Index; Blended Benchmark of 25% S&P 500 Index, 20% S&P 400 Index, 12.5% Russell 2000 Index, 12% MSCI EAFE Index, 5.5% iShares MSCI Emerging Markets Index, 12.5% Dow Jones U.S. Select Real Estate Investment Trust, 12.5% Goldman Sachs Commodity Index; Lipper’s Average Multi-Cap Core Fund Universe; Lipper Index(1) |
| | |
Fund | | Performance Benchmark |
| |
The Money Market Fund | | |
| |
Retail Class | | Lipper Average General Purpose Money Market Fund |
| |
Institutional Class | | iMoneyNet’s Average First Tier Institutional Money Market Fund |
| (1) | Given an adequate quantity of funds, the Lipper Index for a given investment classification or objective consists of the largest ten or thirty funds in that classification or objective. Each index is calculated daily with adjustments for dividends and capital gains. |
Comparative Expenses. Consideration was given to a comparative analysis of the management fees and total expense ratios of each Fund compared with those of a group of other funds.
Management Profitability. The Board also considered the level of profits realized by the Manager and its affiliates in connection with the operation of the Funds. In this respect, the Board reviewed the Funds’ profitability analysis that addresses the overall profitability of The Flex-funds’ business. The Board also considered the extent to which the Manager and its affiliates might derive ancillary benefits from fund operations, including potential benefits resulting from allocation of fund brokerage and the declining use of “soft” commission dollars to pay for research. The Board also took into account management’s expenditures in improving shareholder services provided to the Funds, as well as the need to meet additional regulatory and compliance requirements resulting from the Sarbanes-Oxley Act and recent SEC requirements. The Board determined that the level of profits realized by the Manager under its Agreements with the Funds was not excessive in view of the nature, quality and extent of services provided.
Economies of Scale. The Board also considered whether economies of scale are realized by the Manager as the Funds grow larger and the extent to which this is reflected in the level of management fees charged. While recognizing that any precise determination is inherently subjective, the Board noted that based upon the Funds’ profitability analysis, it appears that as some Funds get larger, at some point economies of scale do result in the Manager realizing a larger profit margin on management services provided to such a Fund. The Board also noted that economies of scale are shared with each Fund and its shareholders through management fee breakpoints so that as a Fund grows in size, its effective management fee rate declines. The Board reviewed, and expressed continued satisfaction with, each Fund’s fee structure under its Agreement, as well as The Total Return Utilities Fund’s fee structure under the investment subadvisory agreement with Miller/Howard Investments, Inc.
To The Shareholders and
Board of Trustees of
The Flex-funds
REPORT OF INDEPENDENT REGISTERED PUBLIC ACCOUNTING FIRM
We have audited the accompanying statements of assets and liabilities, including the schedules of investments, of The Flex-funds (the “Funds”), comprising The Muirfield Fund, The Dynamic Growth Fund, The Aggressive Growth Fund, The Defensive Balanced Fund, The Strategic Growth Fund, The Quantex Fund, The Total Return Utilities Fund, The U.S. Government Bond Fund, and The Money Market Fund, as of December 31, 2009, and the related statements of operations for the year then ended, statements of changes in net assets for each of the two years in the period then ended, and the financial highlights for each of the five years in the period then ended for The Muirfield Fund, The Dynamic Growth Fund, The Aggressive Growth Fund, The Quantex Fund, The Total Return Utilities Fund, The U.S. Government Bond Fund, and The Money Market Fund, and financial highlights for each of the four periods in the period then ended for The Defensive Balanced Fund and The Strategic Growth Fund. These financial statements and financial highlights are the responsibility of Fund management. Our responsibility is to express an opinion on these financial statements and financial highlights based on our audits.
We conducted our audits in accordance with the standards of the Public Company Accounting Oversight Board (United States). Those standards require that we plan and perform the audit to obtain reasonable assurance about whether the financial statements and financial highlights are free of material misstatement. An audit includes examining, on a test basis, evidence supporting the amounts and disclosures in the financial statements. Our procedures included confirmation of securities owned as of December 31, 2009, by correspondence with the custodian and brokers. An audit also includes assessing the accounting principles used and significant estimates made by management, as well as evaluating the overall financial statement presentation. We believe that our audits provide a reasonable basis for our opinion.
In our opinion, the financial statements and financial highlights referred to above present fairly, in all material respects, the financial position of each of the funds constituting The Flex-funds, as of December 31, 2009, the results of their operations, the changes in their net assets, and their financial highlights for the periods indicated herein, in conformity with accounting principles generally accepted in the United States of America.
COHEN FUND AUDIT SERVICES, LTD.
Westlake, Ohio
February 23, 2010
Trustees and Officers (unaudited)
Certain trustees and officers of the Funds are also officers or directors of Meeder, MAM, and MFSCo. The Trustees oversee the management of the Trust and elect its officers. The officers are responsible for the Funds’ day-to-day operations. The Trustees’ and officers’ names, addresses, years of birth, positions held with the Trust, and length of service with The Flex-funds are listed below. Also included is each Board member’s principal occupation during, at least, the past five years. Except as indicated, each individual has held the office shown or other offices in the same company for the last five years. Those Trustees who are “interested persons”, as defined in the 1940 Act, by virtue of their affiliation with the Trust, are indicated by an asterisk (*).
| | | | | | |
Name, Address(1), and
Year of Birth | | Year First Elected a
Trustee or Officer of the Trust | | Position and
Number of Funds
Overseen(2) | | Principal
Occupation During
Past Five Years and
Other Directorships Held |
Robert S. Meeder, Jr.* Year of Birth: 1961 | | 1992 | | Trustee and President | | President of Meeder Asset Management, Inc. |
| | | |
Walter L. Ogle** Year of Birth: 1937 | | 1982 | | Trustee | | Retired; formerly Executive Vice President of Aon Consulting, an employee benefits consulting group; Lead Trustee of the Trust. |
| | | |
James W. Didion** Year of Birth: 1930 | | 1982, 1998 | | Trustee | | Retired; formerly Executive Vice President of Core Source, Inc., an employee benefit and Workers’ Compensation administration and consulting firm (1991 – 1997); Chairman of the Trust’s Audit Committee. |
| | | |
Jack W. Nicklaus** Year of Birth: 1961 | | 1998 | | Trustee | | Designer, Nicklaus Design, a golf course design firm and division of The Nicklaus Companies; Chairman of the Trust’s Nominating Committee. |
| | | |
Stuart M. Allen** Year of Birth: 1961 | | 2006 | | Trustee | | President of Gardiner Allen DeRoberts Insurance LLC, an insurance agency; Chairman of the Trust’s Performance Committee. |
| | | |
Anthony D’Angelo** Year of Birth: 1959 | | 2006 | | Trustee | | Director of Sales, WSYX ABC 6/WTTE Fox 28, television stations owned and operated by Sinclair Broadcast Group; Chairman of the Trust’s Compensation Committee. |
| | | |
Dale W. Smith Year of Birth: 1959 | | 2006 | | Vice President | | Chief Financial Officer of Meeder Asset Management, Inc. (2005 - present); formerly Senior Vice President of Financial Services of BISYS Fund Services (1996 – 2004). |
| | | | | | |
Name, Address(1), and
Year of Birth | | Year First Elected a
Trustee or Officer of the Trust | | Position and
Number of Funds
Overseen2 | | Principal
Occupation During
Past Five Years and
Other Directorships Held |
David R. Carson Year of Birth: 1958 | | 2006 | | Chief Compliance Officer | | Chief Compliance Officer and Anti-Money Laundering Officer of the Huntington Funds and Huntington VA Funds (2005 – present); Treasurer and Assistant Treasurer of the Huntington Funds, Huntington Asset Advisors, Inc. (2002 – 2005). |
| | | |
James B. Craver Year of Birth: 1943 | | 2009 | | Assistant Chief Compliance Officer | | President, James B. Craver & Associates, P.C., law firm (2009 – present); Counsel, K&L Gates, law firm (2007 – 2009); Of Counsel, Seyfarth Shaw, law firm (2005 – 2007). |
| | | |
Bruce E. McKibben Year of Birth: 1969 | | 2002 | | Treasurer | | Director of Fund Accounting of Mutual Funds Service Co., the Trust’s transfer agent (1997 – present). Interim Chief Operating Officer of Meeder Asset Management, Inc. (June 2008 – October 2008). |
| (1) | The address of each Trustee is 6125 Memorial Drive, Dublin, OH 43017. |
| (2) | Each Trustee serves for an indefinite term, until his or her resignation, death, or removal. Each Trustee oversees all nine Funds in the Trust. |
| * | Robert S. Meeder, Jr. is deemed an “interested person” of the Trust by virtue of his position as President of Meeder Asset Management, Inc., the Advisor of the Trust. |
| ** | Each independent Trustee is a member of the Trust’s Audit Committee, Performance Committee, Compensation Committee, and Nominating Committee. |
The Statement of Additional Information includes additional information about each Trustee and is available without charge. To obtain a copy of the Statement of Additional Information, please contact your financial representative or call toll free 1-800-325-3539.
Other Information
The Funds file their complete schedules of portfolios holdings with the Securities and Exchange Commission (“SEC”) for the first and third quarters of each fiscal year on Form N-Q. The Funds’ Forms N-Q are available on the SEC’s website at http://www.sec.gov and may be reviewed and copied at the SEC’s Public Reference Room in Washington, DC. Information on the operation of the Public Reference Room may be obtained by calling 1-800-SEC-0330. The Funds’ schedules of positions are also available on the Funds’ website at www.flexfunds.com.
A description of the policies and procedures that the Funds use to determine how to vote proxies relating to portfolio securities, and information regarding how the Funds voted these proxies for the 12-month period ended June 30, 2009, is available on the SEC’s website at http://www/sec.gov, or, without charge, upon request by calling toll-free 1-800-325-3539.
| | |
| The Flex-funds® | | 2009 Annual Report | December 31, 2009 |
Manager and Investment Advisor
Meeder Asset Management, Inc.
6125 Memorial Drive
P.O. Box 7177
Dublin, Ohio 43017
Subadvisor / The Total Return Utilities Fund
Miller/Howard Investments, Inc.
141 Upper Byrdcliffe Road, P.O. Box 549
Woodstock, New York 12498
Board of Trustees
Stuart Allen
Anthony D’Angelo
James Didion
Robert S. Meeder, Jr.
Jack Nicklaus II
Walter L. Ogle
Custodian
The Huntington National Bank
Columbus, Ohio 43215
Transfer Agent & Dividend Disbursing Agent
Mutual Funds Service Co.
6125 Memorial Drive
Dublin, Ohio 43017
Independent Registered Public Accounting Firm
Cohen Fund Audit Services, LTD
800 Westpoint Parkway, Suite 1100
Westlake, Ohio 44145
| | |
| | | The Flex-funds® 2009 Annual Report | December 31, 2009 |

Item 2. Code of Ethics.
The registrant has adopted a code of ethics that applies to the registrant’s principal executive officer, principal financial officer, comptroller or principal accounting officer, and any person who performs a similar function.
Item 3. Audit Committee Financial Expert.
Currently, The Flex-funds (the “Funds”) do not have an Audit Committee member who possesses all of the attributes required to be an “audit committee financial expert” as defined in instruction 2(b) of Item 3 of Form N-CSR. However, the Board of Trustees believes that each member of the Audit Committee has substantial experience relating to the review of financial statements and the operations of audit committees. Accordingly, the Board of Trustees believes that the members are qualified to evaluate the Funds’ financial statements, supervise the Funds’ preparation of its financial statements, and oversee the work of the Funds’ independent auditors. The Board of Trustees also believes that, although no single Audit Committee member possesses all of the attributes required to be an “audit committee financial expert”, the Audit Committee members collectively as a group possess the attributes required to be an “audit committee financial expert.”
Item 4. Principal Accountant Fees and Services.
(a) – (d) Aggregate fees billed to the registrant for the last two fiscal years for professional services rendered by the registrant’s principal accountant were as follows:
| | | | | | |
| | | 2009 | | 2008 |
Audit Fees | | $ | 63,000 | | $ | 61,000 |
Audit-Related Fees | | | 3,200 | | | 2,525 |
Tax Fees | | | 29,250 | | | 19,800 |
All Other Fees | | | 3,000 | | | 2,750 |
Audit fees include amounts related to the audit of the registrant’s annual financial statements and services normally provided by the accountant in connection with statutory and regulatory filings. Audit-related fees include amounts reasonably related to the performance of the audit of the registrant’s financial statements. Tax fees include amounts related to tax compliance, tax planning, and tax advice. All other fees include amounts related to the registrant’s annual filing of Form N1A.
(e)(1) A purpose of the Audit Committee is to approve the engagement of the registrant’s independent auditors (i) to render audit and non-audit services for the registrant in accordance with Rule 2-01(c)(7)(i) of Regulation S-X, subject to the waiver provisions set forth in Rule 2-01(c)(7)(i)(C) of Regulation S-X, and (ii) to render non-audit services for the registrant’s investment advisors (other than a sub-advisor whose role is primarily portfolio management and is subcontracted or overseen by another investment advisor) and any other entity controlling by, or under common control with the investment advisor that provides ongoing services to the registrant, in each case under (ii) if the engagement relates directly to the operations and financial reporting of the registrant, in accordance with Rule 2-01(c)(7)(ii) of Regulation S-X, subject to waiver provisions set forth in Rule 2-01(c)(7)(ii) of Regulation S-X.
(e)(2) 100% of services included in (b) – (d) above were approved pursuant to Rule 2-01(c)(7)(i)(C) of Regulation S-X.
(g) The aggregate fees billed for the most recent fiscal year and the preceding fiscal year by the registrant’s principal accountant for non-audit services rendered to the registrant, its investment advisor, and any entity controlling, controlled by, or under common control with the investment advisor that provides ongoing services to the registrant were $25,700 and $24,675 respectively.
Items 5. Audit Committee of Listed Registrants.
Not applicable.
Item 6. Schedule of Investments.
Not applicable.
Item 7. Disclosure of Proxy Voting Policies and Procedures for Closed-End Management Investment Companies.
Not applicable.
Item 8. Portfolio Managers of Closed-End Management Investment Companies.
Not applicable.
Item 9. Purchases of Equity Securities by Closed-End Management Investment Company and Affiliated Purchasers.
Not applicable.
Item 10. Submission of Matters to a Vote of Security Holders.
Not applicable.
Item 11. Controls and Procedures.
(a) Based on our evaluation conducted within 90 days of the filing date, hereof, the design and operation of the registrant’s disclosure controls and procedures are effective to ensure that material information relating to the registrant is made known to the certifying officers by others within the appropriate entities, particularly during the period in which Forms N-CSR are being prepared, and the registrant’s disclosure controls and procedures allow timely preparation and review of the information for the registrant’s Form N-CSR and the officer certifications of such Form N-CSR.
(b) There were no significant changes in the registrant’s internal controls or in other factors that could significantly affect these controls subsequent to the date of their evaluation, including any corrective actions with regard to significant deficiencies and material weaknesses.
Item 12. Exhibits.
(a)(1) Code of Ethics filed herewith as EX-99.CODE ETH.
(a)(2) A separate certification for each principal executive and principal financial officer of the registrant as required by Rule 30a-2(a) under the Act(17 CFR270.30a-2(a)). Filed herewith as EX-99.CERT.
(b) Certifications of principal executive officer and principal financial officer, under Section 906 of the Sarbanes-Oxley Act of 2002, and 18 U.S.C. ss.1350. Filed herewith as EX-99.906 CERT.
SIGNATURES
Pursuant to the requirements of the Securities Exchange Act of 1934 and the Investment Company Act of 1940, the registrant has duly caused this report to be signed on its behalf by the undersigned, thereunto duly authorized.
| | |
| The Flex-funds |
| |
| By: | | /s/ Bruce E. McKibben |
| | Bruce E. McKibben, Treasurer |
| |
| Date: | | February 23, 2010 |
Pursuant to the requirements of the Securities Exchange Act of 1934 and the Investment Company Act of 1940, this report has been signed below by the following persons on behalf of the registrant and in the capacities and on the dates indicated.
| | |
| By: | | /s/ Bruce E. McKibben |
| | Bruce E. McKibben, Treasurer |
| |
| Date: | | February 23, 2010 |
| |
| By: | | /s/ Robert S. Meeder, Jr. |
| | Robert S. Meeder, Jr., President |
| |
| Date: | | February 23, 2010 |