| Letter to Shareholders | 1 |
The Quantex FundTM | 4 |
| The Aggressive Growth Fund | 6 |
| The Dynamic Growth Fund | 8 |
| The Strategic Growth Fund | 10 |
| The Muirfield Fund® | 12 |
| The Defensive Balanced Fund | 14 |
| The Utilities and Infrastructure Fund | 16 |
| The Total Return Bond Fund | 18 |
| The Money Market Fund | 20 |
| Shareholder Expense Analysis | 22 |
| Disclosures | 23 |
| Fund Holdings & Financial Statements | 24 |
Our Mission Statement Every day, our mission is to exceed, with integrity, passion, and discipline, the expectations of our shareholders’ and clients’ overall investment experience. Core Values The Client/Shareholder Is Our #1 Priority Always remember whom we are serving. Our livelihood depends on providing a superior overall investment experience that exceeds the expectation of our shareholders and clients. Clarity Of Purpose Our organization has a clear, well-defined vision. All of our associates are committed to and understand how they will contribute to that vision. Communication We expect open and effective communication, full reporting, including good and bad news, and constructive feedback. Integrity We insist upon honesty and adhere to the highest ethical standards. Excellence/ Innovation Our associates strive each day for excellence in the work they perform, seek innovative ways to solve problems and introduce new ideas to take advantage of opportunities. We are a “Think Outside The Box” company. Associate Well-Being We value the success and well-being of our associates. We recognize and reward our associates’ contributions. Respect For Others Respect all people, value the differences among them and treat them as you would like to be treated. Seek First To Understand When interacting with others, place curiosity and understanding of their perspective FIRST, setting aside preconceived opinions and quick judgment. Teamwork We are a synergistic organization that works as a team to exceed our objectives. Profit We are profitable. Profitability enhances our services and capabilities, and affords everyone the opportunity to further their financial well-being. |
 | 2011 Annual Report | December 31, 2011 |
| Letter to Shareholders | December 31, 2011 |
The year ended December 31, 2011 proved difficult for investors in the face of renewed uncertainty. Europe drove the financial news cycle, which lead to a heightened level of volatility in the capital markets. Slow growth in the U.S. was met with negligible growth in Europe, and the possibility of a European recession is on the horizon. Tepid growth and harsh austerity measures have led to political unrest in the developed world, while the upcoming U.S. presidential election has ensured that politics will continue to play a pivotal role. Despite the presence of negative headlines, there were positive developments in 2011 as well. Corporate earnings in the U.S. reached historically high levels while the S&P 500 Index remains nearly 20% below its peak in October 2007, which creates favorable valuations. A strong jobs report at the beginning of 2012, along with a reduction in the unemployment rate to 8.5%, showed a marked improvement in the labor market. Overall, the economic picture remains clouded by uncertainty as we await resolution to the European sovereign debt crisis, which depends on the actions of policymakers.
European Debt Problems Linger
The European debt crisis entered a dangerous new phase in 2011 as Italy faced increased credit market pressure and Italian bond yields spiked even higher. Both Italy and Spain saw yields on their government bonds increase significantly throughout 2011 as investors shunned risky assets in favor of safe-havens, such as U.S. Treasuries. This development is significant since Italy is the third largest Eurozone economy and is home to the third largest bond market in the world. European leaders continue the struggle to find common ground in an effort to fight the crisis, with Germany opposed to creating “Eurobonds.” In addition, Germany remains unsupportive in calls for the European Central Bank (ECB) to make large scale bond purchases that could help contain the bond yields of countries already under pressure. As the primary creditor to European debtor nations, Germany’s actions are being followed closely. In response to these issues, the credit ratings of several European countries, including France and Spain, have been lowered.
U.S. Debt Ceiling Debate
The debate in Congress over raising the U.S. debt ceiling was fraught with conflict as a compromise between Republicans and Democrats proved elusive. For the first time, the Federal Government came perilously close to defaulting on its debt. After much public disagreement, both political parties were able to reach a compromise. Unfortunately, the package that was approved has been widely viewed as a short-term fix as opposed to a long-term solution. The agreed upon deal consists of raising the debt ceiling and simultaneously cutting spending in similar amounts, allowing the U.S. to avoid a default. The deal also delegated much of the decision making authority to a bipartisan deficit “Super Committee” consisting of 12 members
| | 2011 Annual Report | December 31, 2011 |
of Congress. Unfortunately, the Super Committee was unable to reach a compromise, and any ultimate decision has again been delayed, potentially leading to automatic spending cuts in 2013.
U.S. Credit Rating Downgrade
On Friday August 5th, the credit rating agency Standard & Poor’s (S&P) downgraded the United States Government’s long-term credit rating. The rating was cut one notch, from the highest rating of AAA to AA+. The short-term debt rating was affirmed at A-1+, which is the highest short-term rating available at S&P. Rather than reflecting the immediate inability of the U.S. to meet its obligations, the downgrade was viewed as a critique of the inability of Congress to reach a long-term debt and deficit reduction deal. The downgrade of America’s credit rating sent a negative ripple into the equity markets, adding to mounting uncertainty about the global economy. Ironically, Treasury yields continued to decline following the downgrade as U.S. Treasury securities are still perceived as a safe haven asset. Despite the downgrade from S&P, the other two major rating agencies, Moody’s and Fitch, have both recently affirmed their AAA credit rating on the U.S.
Fed Remains Accommodative
Against the backdrop of lackluster economic growth and threats posed by the European sovereign debt crisis, the Federal Reserve continued down a path of easy monetary policy designed to keep interest rates extremely low. This included additional language in Fed statements that commits to low rates into 2014, as well as a program called “Operation Twist”. This consists of selling short-term treasury securities while simultaneously buying long-term treasuries, in an effort to suppress long-term interest rates. The Fed’s actions, along with elevated levels of risk and volatility around the world, combined to drive U.S. treasury yields lower in 2011. Low treasury yields impact many areas of the economy, and influence the interest rates that businesses pay for loans as well as mortgage rates for home buyers.
Economic Data Improving
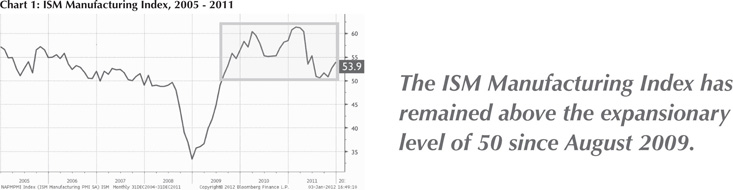
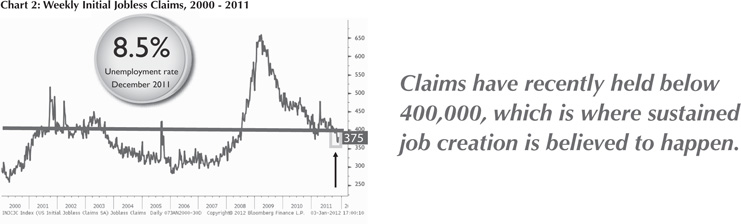
Economic data in the U.S. continues to improve, and there is evidence that consumers are feeling more optimistic as we transition into 2012. The Conference Board’s Consumer Confidence Index currently stands at 64.5, which is the highest level since April of 2011 and is significantly above the levels seen early in the recovery. Although GDP growth has been relatively anemic compared to past recoveries, we still have had eight consecutive quarters of growth. A key statistic related to manufacturing activity, the Institute for Supply Management’s (ISM) Manufacturing Index, was reported at 53.9 for December, and has remained above the expansionary level of 50 since August of 2009 (see Chart 1 on previous page). The unemployment rate declined to 8.5% for December, and is currently at the lowest level since February of 2009. Going forward, the current level of weekly initial jobless claims bodes well for the labor market. Claims have recently held below 400,000, which is a level that many economists consider significant since it is believed that sustained job creation occurs below this level (see Chart 2).
| | 2011 Annual Report | December 31, 2011 |
Emerging market economies raise interest rates to stifle inflation
Since 2010, fast growing economies such as China and India have begun tightening monetary policy in an attempt to ward off rising rates of inflation. For instance, the Reserve Bank of India embarked on an interest rate tightening cycle, while The People’s Bank of China has raised rates as well. China has also raised its bank reserve requirements in an effort to decrease its money supply and fight inflation. This stands in stark contrast to developed economies, which have generally maintained interest rates at historically low levels in an effort to boost economic growth. However, as emerging market economies began tightening monetary policy, there was concern that such actions would slow their growth too much, especially against the backdrop of slowing growth in many developed economies.
Outlook for 2012
Many of the issues impacting 2011 are expected to persist well into 2012. Uncertainty is ever present as the European sovereign debt crisis continues to weigh on the capital markets, while the political landscape in both the U.S. and Europe remains volatile. Despite this, we have found several reasons to remain optimistic about the prospects for the domestic economy. Corporate earnings are strong, which also creates favorable valuations in the stock market. Job growth is showing signs of strength, which should aid the economic recovery, while manufacturing and consumer confidence
levels have both shown marked improvement since the start of the recovery. The Federal Reserve has maintained its accommodative stance, which should preserve the low interest rate environment. If European leaders can agree to a comprehensive solution to stem the sovereign debt crisis, then we believe the aforementioned factors could propel the U.S. economy to stronger than expected performance in 2012.
As we monitor the capital markets and our investment models, we will continuously evaluate our defensive position in The Muirfield Fund® and the equity portion of The Defensive Balanced Fund. We will look for opportunities to adjust portfolio weights among growth and value stocks, large-, mid-, and small-caps, and domestic and international investments in order to enhance returns and manage risk for our clients. We will also continue to proactively manage our sector exposures and will make adjustments as our investment models evolve. We will continue to select mutual funds and ETFs that we believe are best positioned to outperform. In our fixed income Funds, we will look to enhance returns by adjusting portfolio durations as well as manage credit quality.
On the following pages, you will find a review of how the The Flex-funds® Mutual Funds have performed. Please read the commentaries to learn more about the investment decisions we made during the past year. On behalf of all of the associates at Meeder Asset Management and The Flex-funds®, we thank you for the trust and confidence you have placed in our investment management services.
Robert S. Meeder
President
The Flex-funds®
December 31, 2011
| | 2011 Annual Report | December 31, 2011 |
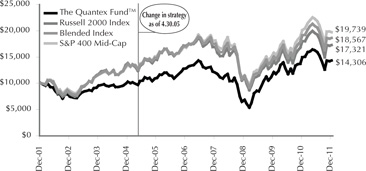
The Quantex Fund™ The Quantex FundTM outperformed both the Russell 2000 and the S&P 400 Mid-Cap indices for the three year period ended 12/31/11. |
The Flex-funds® Quantex Fund™ returned -4.05% for the year ended December 31, 2011. For the same time period, the Russell 2000 and the S&P 400 Mid-Cap Indices returned -4.17% and -1.73%, respectively. For the period ended December 31, 2011, The Quantex Fund™ has outperformed both the Russell 2000 Index and the S&P 400 Mid-Cap Index for the 3-year time period.
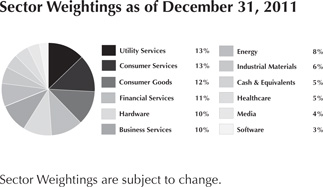
We have consistently employed our quantitative stock selection process since April 30, 2005 for The Quantex Fund™. We utilize rankings from our quantitative financial model to determine which securities are to be held in the Fund on an annual basis. As a result, the Fund is rebalanced annually in January. After rebalancing the Fund in January 2011, there was a strong preference for value holdings, with mid-cap value companies comprising 44% of the Fund, followed by mid-cap core with 26%, and mid-cap growth with 19%. Small-cap holdings of 11% comprise the remainder according to our allocation analysis at the beginning of 2011.
Relative to the S&P 400 Mid-Cap Index, stock selection within the energy sector provided the greatest benefit to the Fund. The largest detractor from performance was stock selection within the consumer discretionary sector, although the Fund’s overweight to the sector partially offset the negative selection impact. Stock selection in the utilities sector also contributed to performance, while selection in the financial sector detracted from returns. However, the Fund also benefited from other sector allocation decisions, including an overweight to the consumer staples and utilities sectors during 2011.
For the full year 2011, many stocks contributed positively to the performance of the Fund. The top performing stock for the year was Cabot Oil & Gas, which was up nearly 101%. Other top performers for the year include H&R Block (up 42%) and NiSource (up 40%). The largest detractors from performance during the year were First Solar (down 74%), Sears Holdings (down 57%), and E*Trade Financial (down 50%).
| | 2011 Annual Report | December 31, 2011 |
Period & Average Annual Total Returns as of December 31, 2011 (Unaudited)
| | 1 | 3 | 5 | 4/30/05 to | 10 | Inception |
| | Year | Year | Year | 12/31/112 | Year | Date |
The Flex-funds® Quantex FundExpense Ratios+: Current net 1.62% Gross 2.07% | -4.05% | 28.00% | 2.09% | 5.93% | 3.65% | 3/20/85 |
Blended Index1 | -2.94% | 17.62% | 1.77% | 5.88% | 6.37% | 3/31/85 |
| Russell 2000 Index | -4.17% | 15.65% | 0.15% | 5.14% | 5.64% | 3/31/85 |
| S&P 400 Mid-Cap Index | -1.73% | 19.59% | 3.31% | 6.55% | 7.03% | 3/31/85 |
Growth of $10,000: 12/31/01 - 12/31/11
The Quantex Fund™ was previously known as The Highlands Growth Fund. On April 30, 2005, The Highlands Growth Fund changed its name to The Quantex Fund™, also changing the Fund’s investment objective and strategies. Due to this, the Russell 2000 Index and the S&P 400 Mid-Cap Index are more comparative indices for Fund performance.
The Growth of $10,000 chart compares the value of The Quantex Fund™ to the S&P 400 Mid-Cap Index and the Russell 2000 Index, the Fund’s broad-based benchmarks, and to the Blended Index, which consists of 50% of the Russell 2000 Index and 50% of the S&P 400 Mid-Cap Index. The chart is intended to give you a general idea of how the Fund performed compared to these benchmarks over the period from December 31, 2001 to December 31, 2011. An understanding of the differences between the Fund and these indices is important. The benchmark indices do not take into account the deduction of expenses associated with a mutual fund, such as investment management and accounting fees. One cannot invest directly in an index.
Past performance does not guarantee future results. The chart and the table do not reflect the deduction of taxes that a shareholder would pay on Fund distributions or the redemption of Fund shares.
Top Ten Holdings as of December 31, 2011
| 1. | Cabot Oil & Gas Corp. | 2.1% |
| 2. | H&R Block, Inc. | 1.4% |
| 3. | Apollo Group, Inc. | 1.4% |
| 4. | NiSource, Inc. | 1.4% |
| 5. | AutoNation, Inc. | 1.4% |
| 6. | Novellus Systems, Inc. | 1.3% |
| 7. | Total System Services, Inc. | 1.3% |
| 8. | Dean Foods Co. | 1.3% |
| 9. | Tesoro Corp. | 1.3% |
| 10. | Airgas, Inc. | 1.3% |
As a percentage of total investments
Management fees were waived and/or expenses were reimbursed in order to reduce the operating expenses of The Quantex Fund™ during the periods shown above. + The current net expense ratio is based on average daily net assets for the year ended 12/31/11, including effect of contractual expense waivers and reimbursements. This ratio may increase or decrease depending on fluctuations in Fund net assets. The Gross Expense Ratio is a percentage of the Fund’s average daily net assets as shown in the most current Fund Prospectus. Please see additional disclosures on page 23.
| | 2011 Annual Report | December 31, 2011 |
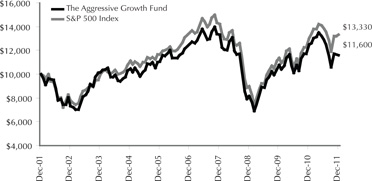
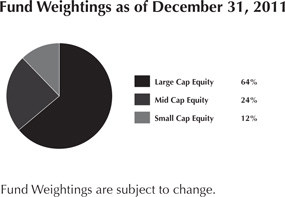
The Aggressive Growth Fund The Fund seeks growth of capital by investing in actively managed mutual funds and exchange-traded funds that invest in equity securities. |
The Flex-funds® Aggressive Growth Fund returned -7.15% for the year ended December 31, 2011. By comparison, the S&P 500 Index returned 2.11% during the same time period. Overall, our allocation to mid- and small-cap investments as well as underlying fund holdings caused the Fund to underperform its benchmark during 2011, and is discussed in more detail below.
We entered the first quarter with an overweight position among growth versus value investments, but reduced our growth overweight as the quarter progressed due to indications from our investment models. We also maintained our overweight in mid- and small-cap stocks, which benefited performance and has been a key component of our investment allocation since the stock market recovery commenced. Sector exposure was concentrated among the energy and industrial materials sectors throughout the first quarter, and our growth exposure also resulted an overweight to the technology sector. We were underweight the consumer staples and healthcare sector. We also held a direct position in emerging market securities, which detracted from performance, but continued to avoid direct exposure to developed international markets.
During the second quarter, we maintained our overweight position among growth versus value investments. We also maintained our overweight in mid- and small-cap stocks, which detracted from performance during the quarter. Our sector exposure remained consistent with the first quarter, which was characterized by an overweight position among the energy and industrial materials, and technology sector; while being underweight the consumer staples and healthcare sector. We continued to maintain a direct position in emerging market securities.
We began the third quarter with our overweight position to growth investments, and also maintained our overweight in mid- and small-cap stocks. However, we reduced the size of our overweight position as the quarter progressed due to shifting preferences in our investment models. We eliminated our direct exposure to the energy sector, but maintained our overweight to the technology sector and also became overweight to the healthcare sector. Also, we exited our direct position in emerging market securities at the beginning of the third quarter.
In the fourth quarter, we remained overweight to growth versus value investments due to ongoing preference from our investment models. We also maintained a position in mid- and small-cap stocks; however, we reduced our exposure further as the quarter progressed. We continued to overweight the healthcare and technology sectors, while avoiding the financial and energy sectors. Finally, we avoided direct exposure to all international markets.
| | 2011 Annual Report | December 31, 2011 |
Period & Average Annual Total Returns as of December 31, 2011 (Unaudited)
| | 1 Year | 3 Years | 5 Years | 10 Years | Inception Date |
The Flex-funds® Aggressive Growth Fund Expense Ratios+: Current net 1.59% Gross 1.70% | -7.15% | 12.55% | -1.58% | 1.50% | 12/31/94 |
| S&P 500 Index | 2.11% | 14.13% | -0.25% | 2.92% | 2/29/00 |
Growth of $10,000: 12/31/01 - 12/31/11
The Growth of $10,000 chart compares The Aggressive Growth Fund’s value to the S&P 500 Index, the Fund’s broad-based benchmark. The chart is intended to give you a general idea of how the Fund performed compared to this benchmark over the period from December 31, 2001 to December 31, 2011. An understanding of the differences between the Fund and this index is important. The S&P 500 Index is a widely recognized unmanaged index of common stock prices that does not take into account the deduction of expenses associated with a mutual fund, such as investment management and accounting fees. One cannot invest directly in an index.
Past performance does not guarantee future results. The chart and the table do not reflect the deduction of taxes that a shareholder would pay on Fund distributions or the redemption of Fund shares.
| Top Ten Holdings as of December 31, 2011 |
| 1. | Harbor Capital Appreciation Fund | 14.8% |
| 2. | Allianz NFJ Dividend Value Fund | 14.8% |
| 3. | Wells Fargo Advantage Growth Fund | 14.6% |
| 4. | T. Rowe Price Value Fund | 13.0% |
| 5. | Columbia Dividend Income Fund | 9.1% |
| 6. | RS Technology Fund | 5.5% |
| 7. | Ivy Mid Cap Growth Fund | 4.9% |
| 8. | JPMorgan Mid Cap Value Fund | 4.6% |
| 9. | Health Care Select Sector SPDR Fund | 4.6% |
| 10. | iShares Russell 2000 Index Fund | 4.4% |
As a percentage of total investments
Management fees were waived and/or expenses were reimbursed in order to reduce the operating expenses of The Aggressive Growth Fund during the periods shown above. This waiver is voluntary and may be terminated at any time. + The current net expense ratio is based on average daily net assets for the year ended 12/31/11, including effect of voluntary expense waivers and reimbursements. This ratio may increase or decrease depending on fluctuations in Fund net assets. The Gross Expense Ratio is a percentage of the Fund’s average daily net assets, not including acquired fund fees and expenses, as shown in the most current Fund Prospectus. Please see additional disclosures on page 23.
| | 2011 Annual Report | December 31, 2011 |
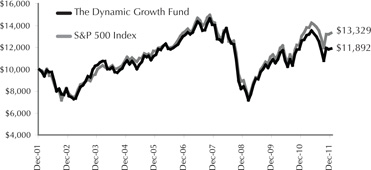
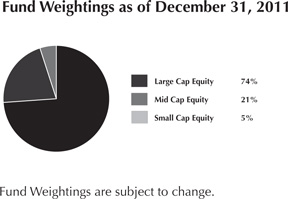
The Dynamic Growth Fund The Fund seeks growth of capital by investing in actively managed mutual funds, exchange-traded funds, and stock index futures. |
The Flex-funds® Dynamic Growth Fund returned -5.65% for the year ended December 31, 2011 compared to the S&P 500 Index return of 2.11% for the same time period. The performance of the Fund relative to the S&P 500 during 2011 was driven by numerous factors. Our allocation decisions, which consisted of our exposure to mid- and small-caps, our position in growth versus value investments, as well as our temporary emerging market exposure detracted from performance during the year. We also experienced an overall negative impact from our underlying fund holdings.
During the first quarter, we maintained our overweight allocation to growth investments versus value; however, we reduced this overweight during the quarter as our investment models began to shift toward a neutral position. Additionally, our investment models continued to maintain preference for mid- and small-cap companies, which has led us to maintain our overweight allocation to these investments. We established an overweight position in the energy sector early in the first quarter, while also overweighting the industrial materials sector. We were underweight the consumer staples and healthcare sector. On an international basis, we continued to avoid direct exposure to developed international markets, but held exposure to emerging markets.
We entered the second quarter with an overweight allocation to growth investments versus value, and we maintained this positioning throughout the quarter due to indications from our investment models. Additionally, our investment models continued to maintain preference for mid- and small-cap companies, which led us to preserve our overweight allocation to these investments. Our overweight position in the energy and industrial materials sector, which was maintained from the first quarter, detracted from performance during the second quarter. On an international basis, we continued to avoid direct exposure to developed international markets, but maintained exposure to emerging markets.
We began the third quarter with an overweight allocation to growth investments versus value, and we increased our growth positioning throughout the quarter due to indications from our investment models. However, our investment models decreased preference for mid- and small-cap companies, which led us to reduce our overweight allocation to these investments. Also during the third quarter, we were overweight to the healthcare and technology sector, while being underweight the financial and energy sectors. On an international basis, we have avoided direct exposure to the developed international markets since December of 2009, and eliminated our exposure to emerging markets at the beginning of the third quarter.
During the fourth quarter, we maintained our overweight position to growth versus value investments due to preference from our investment models. We also maintained a position in mid- and small-cap stocks; however, we reduced our exposure as the quarter progressed. We continued to overweight the healthcare and technology sectors, while avoiding the financial and energy sectors. Finally, we continued to avoid direct exposure to developed international and emerging markets.
| | 2011 Annual Report | December 31, 2011 |
Period & Average Annual Total Returns as of December 31, 2011 (Unaudited)
| | 1 Year | 3 Years | 5 Years | 10 Years | Inception Date |
The Flex-funds® Dynamic Growth Fund Expense Ratios+: Current net 1.39% Gross 1.55% | -5.65% | 12.00% | -1.96% | 1.75% | 2/29/00 |
| S&P 500 Index | 2.11% | 14.13% | -0.25% | 2.92% | 2/29/00 |
Growth of $10,000: 12/31/01 - 12/31/11
The Growth of $10,000 chart compares The Dynamic Growth Fund’s value to the S&P 500 Index, the Fund’s broad-based benchmark. The chart is intended to give you a general idea of how the Fund performed compared to this benchmark over the period from December 31, 2001 to December 31, 2011. An understanding of the differences between the Fund and this index is important. The S&P 500 Index is a hypothetical unmanaged index of common stocks that does not take into account the deduction of expenses associated with a mutual fund, such as investment management and accounting fees. One cannot invest directly in an index.
Past performance does not guarantee future results. The chart and the table do not reflect the deduction of taxes that a shareholder would pay on Fund distributions or the redemption of Fund shares.
| Top Ten Holdings as of December 31, 2011 |
| 1. | Allianz NFJ Dividend Value Fund | 14.9% |
| 2. | Harbor Capital Appreciation Fund | 13.2% |
| 3. | Wells Fargo Advantage Growth Fund | 13.1% |
| 4. | T. Rowe Price Value Fund | 10.2% |
| 5. | Columbia Dividend Income Fund | 9.2% |
| 6. | Alger Capital Appreciation Fund | 7.4% |
| 7. | PowerShares QQQ Trust | 6.0% |
| 8. | Health Care Select Sector SPDR Fund | 5.1% |
| 9. | Blackrock Equity Dividend Fund | 4.5% |
| 10. | Consumer Staples Select Sector SPDR Fund | 3.8% |
As a percentage of total investments
Management fees were waived and/or expenses were reimbursed in order to reduce the operating expenses of The Dynamic Growth Fund during the periods shown above. This waiver is voluntary and may be terminated at any time. + The current net expense ratio is based on average daily net assets for the year ended 12/31/11, including effect of voluntary expense waivers and reimbursements. This ratio may increase or decrease depending on fluctuations in Fund net assets. The Gross Expense Ratio is a percentage of the Fund’s average daily net assets, not including acquired fund fees and expenses, as shown in the most current Fund Prospectus. Please see additional disclosures on page 23.
| | 2011 Annual Report | December 31, 2011 |
The Strategic Growth Fund The Fund seeks growth of capital by investing in actively managed mutual funds and exchange-traded funds using a targeted asset allocation structure. |
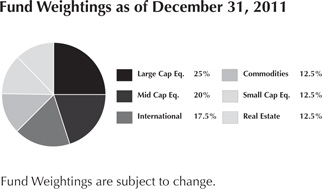
The Flex-funds® Strategic Growth Fund returned -8.34% for the year ended December 31, 2011, compared to the custom benchmark return of -1.93% for the same period. The Fund also underperformed the broader market during the year, as measured by the S&P 500 Index, which returned 2.11%. The Strategic Growth Fund is fully invested in the equity market at all times, and holds a fixed allocation across six distinct investment categories. The mix of investments selected to represent each investment category is variable and actively managed by using our strategic fund selection process. The current target allocation is comprised of the following: 25% large-cap, 20% mid-cap, 17.5% international, 12.5% small-cap, 12.5% real estate, and 12.5% commodities. Within each respective category, we seek to identify funds that will outperform their peers through an evaluation process based on valuation factors, measures of volatility, and risk-adjusted returns. Funds that fall out of favor within our models are sold and replaced with funds ranked higher by our evaluation process.
The Fund’s performance during 2011 versus the S&P 500 can be directly attributed to several of the asset allocation categories. While the S&P 500 posted a modest gain of 2.11% during the year, several of the other asset allocation categories significantly underperformed the broader market. For instance, the MSCI Emerging Markets Index declined by 20.34% in 2011, while the MSCI EAFE Index of developed international stocks declined by 12.13% during the year (be advised that one cannot invest directly in an index). The two aforementioned categories comprise approximately 17.5% of the Fund’s allocation. Furthermore, the Russell 2000 Index of small-cap stocks and the S&P 400 Mid-Cap Index of mid-cap stocks declined by 4.17% and 1.73%, respectively. These categories comprise nearly 33% of the Fund’s allocation. The only asset allocation category to outperform the S&P 500 Index during 2011 was the Dow Jones REIT Index, which increased by 9.39% during the year.
The Fund also underperformed the custom benchmark during 2011, which is the result of underperformance of underlying fund holdings against their respective benchmark indexes. For instance, our commodity holding of the Van Eck Global Hard Assets fund declined 16.62% in 2011, and underperformed its respective benchmark.
| | 2011 Annual Report | December 31, 2011 |
Period & Average Annual Total Returns as of December 31, 2011 (Unaudited)
| | 1 Year | 3 Years | 8/25/08 to 12/31/114 | 5 Years | Since Inception | Inception Date |
The Flex-funds® Strategic Growth Fund Expense Ratios+: Current net 1.39% Gross 1.57% | -8.34% | 14.29% | -0.77% | -2.21% | -0.60% | 1/31/06 |
Blended Index3 | -1.93% | 15.29% | -0.42%5 | 0.11% | 1.55% | 1/31/06 |
| S&P 500 Index | 2.11% | 14.13% | 1.65%5 | -0.25% | 1.84% | 1/31/06 |
Growth of $10,000: 1/31/06 - 12/31/11
The Growth of $10,000 chart compares The Strategic Growth Fund’s value to the S&P 500 Index, the Fund’s broad-based benchmark, and the Blended Index, which consists of 25% of the S&P 500 Index, 20% of the S&P 400 Index, 12.5% of the Russell 2000 Index, 12.5% of the Dow Jones US Select REIT Index, 12.5% of the S&P GSCI Index, 12% of the MSCI EAFE Index, and 5.5% of the MSCI Emerging Markets Index. The chart is intended to give you a general idea of how the Fund performed compared to these indices over the period from its inception on January 31, 2006 to December 31, 2011. An understanding of the differences between the Fund and these indices is important. The benchmark indices are hypothetical unmanaged indices of common stock that do not take into account the deduction of expenses associated with a mutual fund, such as investment management and accounting fees. One cannot invest directly in an index.
Past performance does not guarantee future results. The chart and the table do not reflect the deduction of taxes that a shareholder would pay on Fund distributions or the redemption of Fund shares.
| Top Ten Holdings as of December 31, 2011 |
| 1. | Nuveen Real Estate Securities Fund | 12.7% |
| 2. | Wells Fargo Advantage Growth Fund | 12.5% |
| 3. | Allianz NFJ Dividend Value Fund | 11.7% |
| 4. | JPMorgan Mid Cap Value Fund | 8.6% |
| 5. | Oppenheimer International Growth Fund | 8.5% |
| 6. | Ivy Mid Cap Growth Fund | 8.3% |
| 7. | Wells Fargo Advantage Emerging Markets Equity Fund | 8.2% |
| 8. | RidgeWorth Small Cap Value Equity Fund | 6.1% |
| 9. | Lord Abbett Developing Growth Fund | 6.1% |
| 10. | Invesco Energy Fund | 5.8% |
As a percentage of total investments
Management fees were waived and/or expenses were reimbursed in order to reduce the operating expenses of The Strategic Growth Fund during the periods shown above. This waiver is voluntary and may be terminated at any time. + The current net expense ratio is based on average daily net assets for the year ended 12/31/11, including effect of voluntary expense waivers and reimbursements. This ratio may increase or decrease depending on fluctuations in Fund net assets. The Gross Expense Ratio is a percentage of the Fund’s average daily net assets, not including acquired fund fees and expenses, as shown in the most current Fund Prospectus. Please see additional disclosures on page 23.
| | 2011 Annual Report | December 31, 2011 |
The Muirfield Fund® The Fund seeks growth of capital by investing in actively managed mutual funds and exchange-traded funds using a “Defensive Investing” strategy. |
The Flex-funds Muirfield Fund® returned -7.55% for the year ended December 31, 2011. The Fund’s performance compared to the S&P 500 Index during 2011 was the result of multiple factors. Our defensive positioning detracted from performance and was the result of heightened volatility that occurred in the stock market. In the invested portion of the Fund, our exposure to mid- and small-caps as well as our temporary emerging market exposure detracted from performance during the year. We also experienced an overall negative impact from our underlying fund holdings.
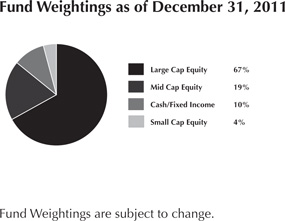
In The Muirfield Fund®, we entered 2011 essentially fully-invested in the stock market. We had maintained a fully-invested position since the fourth quarter of 2010 as a result of our investment models, which continued to indicate a favorable risk/reward relationship in the stock market. However, as stock market declines materialized during the third quarter, we noted significant deterioration of the trend and technical components of our quantitative investment model. As a result, we increased our defensive posture by adopting a 20% position in fixed-income investments. Despite the stock market volatility, we noted that nearly all of the interest rate, fundamental, and valuation factors in our quantitative investment model remained positive, but we preferred to be cautious given the uncertainties present in the global capital markets. As volatility eased during the fourth quarter, we noted improvements in some of the trend and technical components of our quantitative investment model, which led us to increase our stock market exposure as the quarter progressed. As a result, we ended the year with a 10% defensive position in The Muirfield Fund®.
We managed our industry and sector exposure throughout the year and initiated changes in sector allocations in the Fund as stock market conditions progressed. During the first quarter, we continued to add to our energy position, which resulted in an overweight exposure to the sector and benefited our performance. We also remained overweight to the industrial materials sector, while being underweight the consumer staples and healthcare sectors. As the second quarter progressed, we eliminated our energy overweight and subsequently established an overweight to the healthcare sector following indications from our investment models. In addition to remaining overweight to the healthcare sector, we established an overweight to the technology sector while being underweight the financial and energy sectors in the third quarter. We maintained this sector positioning through the end of 2011, which was additive to performance during the third quarter but detracted from performance in the fourth quarter.
Throughout 2011, we maintained an overweight allocation to growth investments versus value, which benefited our performance. We also entered 2011 with an overweight exposure to mid- and small-cap investments. However, we reduced our overweight during the third quarter as these capitalization ranges underperformed large-caps following steep stock market declines. Overall, our exposure to mid- and small-cap investments detracted from performance in 2011.
Regarding international exposure, we entered 2011 with a position in emerging markets, and continued to avoid direct exposure to the developed international markets. However, we also eliminated our emerging markets position early in the third quarter, and avoided direct exposure to all international investments for the remainder of the year.
| | 2011 Annual Report | December 31, 2011 |
Period & Average Annual Total Returns as of December 31, 2011 (Unaudited)
| | 1 Year | 3 Years | 5 Years | 10 Years | Inception Date |
The Flex-funds Muirfield Fund® Expense Ratios+: Current net 1.39% Gross 1.56% | -7.55% | 7.40% | -1.50% | 2.63% | 8/10/88 |
Blended Index6 | 1.55% | 8.75% | 0.80% | 2.83% | 8/10/88 |
| S&P 500 Index | 2.11% | 14.13% | -0.25% | 2.92% | 8/10/88 |
Growth of $10,000: 12/31/01 - 12/31/11
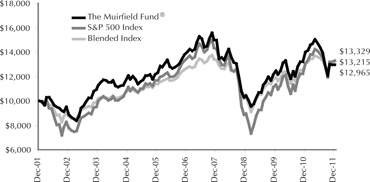
The Growth of $10,000 chart compares the value of The Muirfield Fund® to the S&P 500 Index, the Fund’s broad-based benchmark, and to an index composed of 60% of the S&P 500 Index and 40% of 90-day T-bills. The chart is intended to give you a general idea of how the Fund performed compared to these indices over the period from December 31, 2001 to December 31, 2011. An understanding of the differences between the Fund and these indices is important. The benchmark indices are hypothetical unmanaged indices of common stocks and 90-day T-bills that do not take into account the deduction of expenses associated with a mutual fund, such as investment management and accounting fees. One cannot invest directly in an index.
Past performance does not guarantee future results. The chart and the table do not reflect the deduction of taxes that a shareholder would pay on Fund distributions or the redemption of Fund shares.
| Top Ten Holdings as of December 31, 2011 |
| 1. | Allianz NFJ Dividend Value Fund | 13.4% |
| 2. | Wells Fargo Advantage Growth Fund | 12.0% |
| 3. | Harbor Capital Appreciation Fund | 11.6% |
| 4. | Caterpillar Financial Power Investment Floating Rate Demand Note, 0.60%, 1/1/12 | 11.3% |
| 5. | T. Rowe Price Value Fund | 9.0% |
| 6. | Columbia Dividend Income Fund | 8.1% |
| 7. | Alger Capital Appreciation Fund | 6.7% |
| 8. | PowerShares QQQ Trust | 5.4% |
| 9. | Health Care Select Sector SPDR Fund | 4.6% |
| 10. | Blackrock Equity Dividend Fund | 4.1% |
As a percentage of total investments
Management fees were waived and/or expenses were reimbursed in order to reduce the operating expenses of The Muirfield Fund® during the periods shown above. This waiver is voluntary and may be terminated at any time. + The current net expense ratio is based on average daily net assets for the year ended 12/31/11, including effect of voluntary expense waivers and reimbursements. This ratio may increase or decrease depending on fluctuations in Fund net assets. The Gross Expense Ratio is a percentage of the Fund’s average daily net assets, not including acquired fund fees and expenses, as shown in the most current Fund Prospectus. Please see additional disclosures on page 23.
| | 2011 Annual Report | December 31, 2011 |
The Defensive Balanced Fund The Fund seeks income and growth of capital by investing in actively managed mutual funds and exchange-traded funds using a “Defensive Investing” strategy. |
The Flex-funds® Defensive Balanced Fund returned -4.49% for the year ended December 31, 2011. The Defensive Balanced Fund will always invest at least 30% of its assets in fixed-income securities. The Fund will also hold a minimum 30% allocation in equity securities, with additional investments determined by our defensive equity discipline. The Fund’s performance lagged the S&P 500 Index during 2011, and was driven by a number of factors including our allocation decisions, defensive positioning, and underlying fund holdings.
In the equity portion of the Fund, we entered 2011 essentially fully-invested in the stock market. We had maintained a fully-invested position since the fourth quarter of 2010 as a result of our investment models, which continued to indicate a favorable risk/reward relationship in the stock market. However, as stock market declines materialized during the third quarter, we noted significant deterioration of the trend and technical components of our quantitative investment model. As a result, we increased our defensive posture by adopting a 20% position in fixed-income investments. Despite the stock market volatility, we noted that nearly all of the interest rate, fundamental, and valuation factors in our quantitative investment model remained positive, but we preferred to be cautious given the uncertainties present in the global capital markets. As volatility eased during the fourth quarter, we noted improvements in some of the trend and technical components of our quantitative investment model, which led us to increase our stock market exposure as the quarter progressed. As a result, we ended the year with a 10% defensive position.
Throughout 2011, we maintained an overweight allocation to growth investments versus value, which benefited our performance. We also entered 2011 with an overweight exposure to mid- and small-cap investments. However, we reduced our overweight during the third quarter as these capitalization ranges underperformed large-caps following steep stock market declines. Overall, our exposure to mid- and small-cap investments detracted from performance in 2011. Regarding international exposure, we entered 2011 with a position in emerging markets, and continued to avoid direct exposure to the developed international markets. However, we also eliminated our emerging markets position early in the third quarter, and avoided direct exposure to all international investments for the remainder of the year.
We also managed our industry and sector exposure throughout the year and initiated changes in sector allocations in the Fund as stock market conditions progressed. During the first quarter, we continued to add to our energy position, which resulted in an overweight exposure to the sector and benefited our performance. We also remained overweight to the industrial materials sector, while being underweight the consumer staples and healthcare sectors. As the second quarter progressed, we eliminated our energy overweight and subsequently established an overweight to the healthcare sector following indications from our investment models. In addition to remaining overweight to the healthcare sector, we established an overweight to the technology sector while being underweight in the financial and energy sectors in the third quarter. We maintained this sector positioning through the end of 2011, which was additive to performance during the third quarter but detracted from performance in the fourth quarter.
In the fixed-income portion of the Fund, the target allocation was overweight in investment grade corporate bond funds throughout 2011. During much of the past year, the environment for investing in this sector remained favorable. The financial position of bond issuers was bolstered by historically low interest rates, steady profit growth, and a recovering economy in the United States. In combination, these factors have provided for a low probability of expected issuer defaults. The duration of the fixed-income portion of the Fund was maintained mostly in line with our benchmark during 2011, consistent with readings from our fixed-income models that favored this position.
| | 2011 Annual Report | December 31, 2011 |
Period & Average Annual Total Returns as of December 31, 2011 (Unaudited)
| | 1 | 3 | 8/25/08 to | 5 | Since | Inception |
| | Year | Year | 12/31/118 | Year | Inception | Date |
The Flex-funds® Defensive Balanced Fund | -4.49% | 6.32% | 1.00% | -0.87% | 0.22% | 1/31/06 |
Expense Ratios+: Current net 1.44% Gross 1.60% |
Blended Index7 | 2.91% | 7.96% | 1.63%5 | 2.45% | 3.38% | 1/31/06 |
| S&P 500 Index | 2.11% | 14.13% | 1.65%5 | -0.25% | 1.84% | 1/31/06 |
Growth of $10,000: 1/31/06 - 12/31/11
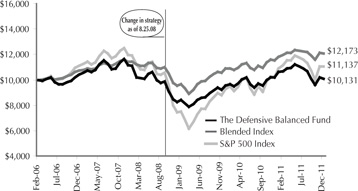
The Growth of $10,000 chart compares The Defensive Balanced Fund’s value to the S&P 500 Index, the Fund’s broad-based benchmark, and to the Blended Index, which is comprised of 42% of the S&P 500 Index, 28% of the average 90-day U.S. T-bill and 30% of the Barclays Intermediate-Term Government/Credit Index. The chart is intended to give you a general idea of how the Fund performed compared to these indices over the period from its inception on January 31, 2006 through December 31, 2011. An understanding of the differences between the Fund and these indices is important. The benchmark indices are hypothetical unmanaged indices of common stock that do not take into account the deduction of expenses associated with a mutual fund, such as investment management and accounting fees. One cannot invest directly in an index.
Past performance does not guarantee future results. The chart and the table do not reflect the deduction of taxes that a shareholder would pay on Fund distributions or the redemption of Fund shares.
| Top Ten Holdings as of December 31, 2011 |
| 1. | Allianz NFJ Dividend Value Fund | 9.2% |
| 2. | Wells Fargo Advantage Growth Fund | 8.4% |
| 3. | Harbor Capital Appreciation Fund | 8.0% |
| 4. | Caterpillar Financial Power Investment Floating Rate Demand Note, 0.60%, 1/1/12 | 6.5% |
| 5. | T. Rowe Price Value Fund | 6.4% |
| 6. | Federated Bond Fund | 6.2% |
| 7. | Prudential Total Return Bond Fund | 6.1% |
| 8. | DoubleLine Total Return Bond Fund | 6.1% |
| 9. | Putnam Income Fund | 6.0% |
| 10. | Columbia Dividend Income Fund | 5.3% |
As a percentage of total investments
Management fees were waived and/or expenses were reimbursed in order to reduce the operating expenses of The Defensive Balanced Fund during the periods shown above. This waiver is voluntary and may be terminated at any time. + The current net expense ratio is based on average daily net assets for the year ended 12/31/11, including effect of voluntary expense waivers and reimbursements. This ratio may increase or decrease depending on fluctuations in Fund net assets. The Gross Expense Ratio is a percentage of the Fund’s average daily net assets, not including acquired fund fees and expenses, as shown in the most current Fund Prospectus. Please see additional disclosures on page 23.
| | 2011 Annual Report | December 31, 2011 |
The Utilities and Infrastructure Fund (Formerly known as The Total Return Utilities Fund) The Fund outperformed the Russell 3000 Utilities benchmark for the 3-, 5-, and 10-year periods ended December 31, 2011. |
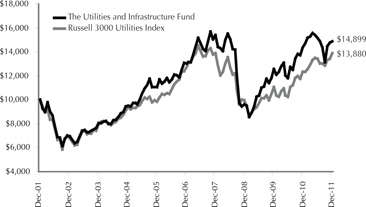
The Flex-funds® Utilities and Infrastructure Fund returned 3.93% for the year ended December 31, 2011. The Fund has outperformed the Russell 3000 Utilities benchmark for the 3- 5-, and 10-year periods ended December 31, 2011.
We experienced many opportunities across different industries during the first quarter. Natural gas companies with both production and delivery exposure performed well, despite ongoing low natural gas pricing. El Paso led our list, and was joined by Southern Union, National Fuel Gas, ONEOK, and MDU Resources. Battery and power management newcomer EnerSys hit a succession of new highs after beating expectations with a 61% earnings advance. Communications chip maker Qualcomm rose, as its chips have become extremely popular in new cellphones and tablets. Telecommunications companies were among our underperformers, despite big final-week runs in AT&T and Verizon. American Tower was negatively impacted by AT&T’s offer for T-Mobile, as investors assumed it would mean less need for towers and fewer customers.
During a volatile second quarter for equities, the utilities sector was one of the stronger performing segments of the stock market. Our best performers comprised a mix of various industries. Southern Union increased following a pair of offers, while American Water Works exceeded earnings expectations once again and raised its dividend 4.5%. We experienced a gain from Millicom International Cellular on a rally to fair value, and received a boost from dominant Canadian telecom BCE, which beat earnings expectations and raised its financial forecast. On the downside, many of our infrastructure enablers declined as a result of the poor broad market conditions that prevailed during the quarter, and included stocks like American Superconductor, GE, Cisco, driller Ensco, global engineering and construction firm Fluor, battery company EnerSys, and Veolia Environnement.
Although traditional utilities performed well in the third quarter, our exposure to more economically sensitive areas such as energy, enabling companies, and selected telecommunications companies detracted from our performance. NiSource was the strongest contributor to performance, and benefited from extensive legacy assets in the Marcellus Shale. Independent transmission company ITC Holdings announced new projects and expected success in its existing business. While the company is not the cheapest stock we own, its business is unique, monopolistic, and may expand much more than previously estimated. On the downside, National Fuel Gas fell after announcing that it had not found a partner for its Marcellus Shale properties at an acceptable price. Following a multi-year run of acquisitions, Veolia Environnement has been shedding assets. Between the general international stock-price degradation and additional difficulty of making asset sales in this cautious environment, the stock price declined significantly.
In the fourth quarter, stocks connected to corporate transactions and potential mergers and acquisitions candidates dominated portfolio news. Both Kinder Morgan and El Paso posted strong fourth quarter returns, following the former’s $38 billion offer for the latter. NiSource also performed well as investors postulated its potential as a takeover candidate. Stocks that detracted from performance for the quarter included Veolia Environnement, which is struggling to reduce debt levels from earlier expansions and NII Holdings, which suffered from heightened competition in Latin America.
| | 2011 Annual Report | December 31, 2011 |
Period & Average Annual Total Returns as of December 31, 2011 (Unaudited)
| | 1 Year | 3 Years | 5 Years | 10 Years | Inception Date |
The Flex-funds Utilities and Infrastructure Fund9 Expense Ratios+: Current net 1.90% Gross 2.05% | 3.93% | 15.71% | 2.70% | 4.07% | 6/21/95 |
| Russell 3000 Utilities Index | 12.46% | 11.77% | 1.73% | 3.33% | 6/30/95 |
Growth of $10,000: 12/31/01 - 12/31/11
The Growth of $10,000 chart compares The Utilities and Infrastructure Fund’s value to the Russell 3000 Utilities Index, the Fund’s broad-based benchmark. The chart is intended to give you a general idea of how the Fund performed compared to this benchmarks over the period from December 31, 2001 to December 31, 2011. An understanding of the differences between the Fund and this index is important. The benchmark index does not take into account the deduction of expenses associated with a mutual fund, such as investment management and accounting fees. One cannot invest directly in an index.
Past performance does not guarantee future results. The chart and the table do not reflect the deduction of taxes that a shareholder would pay on Fund distributions or the redemption of Fund shares.
| Top Ten Holdings as of December 31, 2011 |
| 1. | NiSource, Inc. | 8.9% |
| 2. | American Water Works Co., Inc. | 5.1% |
| 3. | Questar Corp. | 4.9% |
| 4. | National Fuel Gas Co. | 4.4% |
| 5. | MDU Resources Group, Inc. | 4.1% |
| 6. | Williams Companies, Inc. | 3.9% |
| 7. | AT&T, Inc. | 3.8% |
| 8. | Enterprise Products Partners, L.P. | 3.8% |
| 9. | QUALCOMM, Inc. | 3.7% |
| 10. | National Grid PLC - ADR | 3.5% |
As a percentage of total investments
Management fees were waived and/or expenses were reimbursed in order to reduce the operating expenses of The Utilities and Infrastructure Fund during the periods shown above. This waiver is voluntary and may be terminated at any time. + The current net expense ratio is based on average daily net assets for the year ended 12/31/11, including effect of voluntary expense waivers and reimbursements. This ratio may increase or decrease depending on fluctuations in Fund net assets. The Gross Expense Ratio is a percentage of the Fund’s average daily net assets as shown in the most current Fund Prospectus. Please see additional disclosures on page 23.
| | 2011 Annual Report | December 31, 2011 |
The Total Return Bond Fund The Fund seeks to maximize current income and capital growth primarily through investment in fixed-income securities or investments that provide exposure to fixed-income securities. |
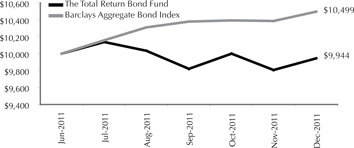
As of December 31, 2011, the Flex-funds® Total Return Bond Fund returned -0.57% since the Fund’s inception on June 30, 2011. This performance placed the Fund in the top 55% of the Fund’s peer group. Over the aforementioned time period the Fund’s benchmark, the Barclays Aggregate Bond Index, returned 4.99%. All of the Fund’s underperformance versus the benchmark was experienced during the third quarter of 2011.
During the third quarter of 2011, political, economic, and banking system risks dominated the news headlines, creating above average volatility across all fixed-income sectors. As fears over a potential European debt crisis increased, investors looked for safety in U.S. Government securities, leading to strong outperformance by these securities during the quarter. The Fund was underweight these securities relative to its benchmark which detracted from the Fund’s performance. However, the Fund did hold more U.S. Government securities than its peers, leading it to finish within the top 28% of the category for the quarter. Additionally, the Fund maintained exposure to both high yield corporate bonds and emerging market bonds throughout the quarter, which detracted from performance.
During the fourth quarter of 2011, European leaders took steps towards a solution to the developing debt crisis. This prompted fixed income investors to once again take on risk as they began buying high yield corporate bonds in search of increased yield. The Fund’s exposure to corporate bonds, both high yield and investment grade, added to its performance for the quarter, and ultimately led to outperformance versus the benchmark. The Fund did maintain some exposure to U.S. Treasury securities, which detracted from the performance of the Fund.
| | 2011 Annual Report | December 31, 2011 |
Period & Average Annual Total Returns as of December 31, 2011 (Unaudited)
| | Since Inception | Inception Date |
The Flex-funds® Total Return Bond Fund Expense Ratios+: Current net 0.99% Gross 1.41% | -0.57% | 6/30/11 |
| Barclays Aggregate Bond Index | 4.99% | 6/30/11 |
Growth of $10,000: 7/31/11 - 12/31/11
The Growth of $10,000 chart compares The Total Return Bond Fund’s value to the Barclays Aggregate Bond Index, the Fund’s broad-based benchmark. The chart is intended to give you a general idea of how the Fund performed compared to this benchmark over the period from June 30, 2011 to December 31, 2011. An understanding of the differences between the Fund and this index is important. The index is a hypothetical unmanaged index that does not take into account the deduction of expenses associated with a mutual fund, such as investment management and accounting fees. One cannot invest directly in an index.
Past performance does not guarantee future results. The chart and the table do not reflect the deduction of taxes that a shareholder would pay on Fund distributions or the redemption of Fund shares.
| Top Ten Holdings as of December 31, 2011 |
| 1. | Federated Bond Fund | 11.9% |
| 2. | Prudential Total Return Bond Fund | 11.7% |
| 3. | DoubleLine Total Return Bond Fund | 11.7% |
| 4. | iShares JPMorgan Emerging Bond Fund | 9.6% |
| 5. | Putnam Income Fund | 8.0% |
| 6. | iShares iBoxx $High Yield Corporate Bond Fund | 7.3% |
| 7. | SPDR Barclays Capital High Yield Bond Fund | 7.2% |
| 8. | iShares iBoxx $Investment Grade Corporate Bond Fund | 4.6% |
| 9. | iShares Barclays Intermediate Credit Bond Fund | 4.4% |
| 10. | TCW Emerging Markets Income Fund | 3.9% |
As a percentage of total investments
Management fees were waived and/or expenses were reimbursed in order to reduce the operating expenses of The Total Return Bond Fund during the periods shown above. This waiver is voluntary and may be terminated at any time. + The current net expense ratio is based on average daily net assets for the year ended 12/31/11, including effect of voluntary waivers and reimbursements. This ratio may increase or decrease depending on fluctuations in Fund net assets. The Gross Expense Ratio is a percentage of the Fund’s average daily net assets, not including acquired fund fees and expenses, as shown in the most current Fund Prospectus. Please see Additional Disclosures on page 23.
| | 2011 Annual Report | December 31, 2011 |
The Money Market Fund For 2011, the retail class finished the year ranked second out of 264 general purpose money market funds as measured by Lipper. The Fund has been in the top 10% of all retail money market funds every year since its inception in 1985. |
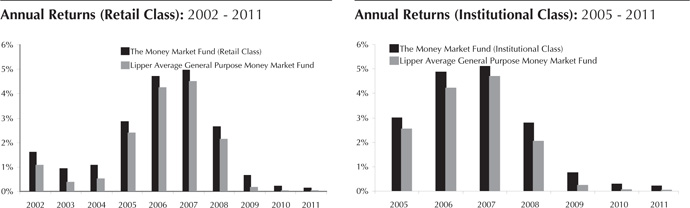
The Flex-funds ® Money Market Fund enjoyed continued success versus the competition in 2011, with both the retail and institutional share classes ranking among the top general purpose money market funds in the country. For 2011, the retail class finished the year ranked 2nd out of 264 general purpose money market funds as measured by Lipper. Equally as impressive, the Fund also ranked 2nd out of 249 general purpose money funds for the three year period ending December 31, 2011. More importantly, the Fund has been in the top 10% of all retail money market funds every year since its inception in 1985.
We entered the first quarter of 2011 in a similar market environment which has faced the Fund over the past couple of years. As it stands, an aggressively low Fed Funds target rate continued to keep yields low on eligible investment options within the money market arena, and offered no optimism that the probability of higher short-term rates would come soon. During 2011, debates escalated over the current policy; however, the target rate of 0.00% to 0.25% seems cemented based on recent Fed statements. Yield spreads of higher quality investments as compared to U.S. Treasury bills showed limited value throughout the year. At times, value was presented in longer dated offerings, with the Fund in position to take advantage of the opportunity.
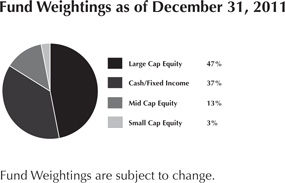
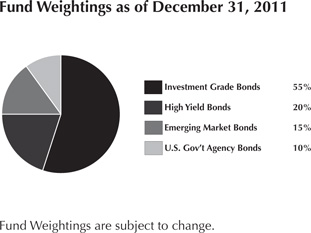
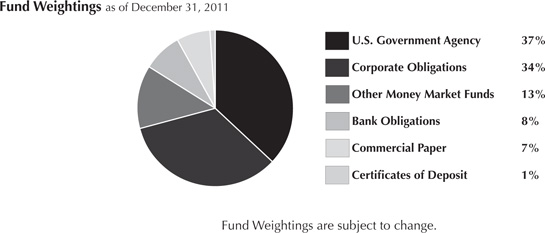
During 2011, we maintained a weighted average maturity that was in line or slightly below that of our peers. Holdings in the Fund remained allocated toward investments with superior credit quality, as we believed the risk and reward relationship favored this position. Our sector allocation favored an overweight in high quality liquid investments and short-term investment grade corporate debt. At the end of 2011, the Fund’s composition was as follows: 37% U.S. Government agency securities, 34% corporate obligations, 13% in other money market funds, 8% in bank obligations, 7% in commercial paper, and 1% certificates of deposit.
As we complete the year, we believe the Fund is positioned to maintain its strong performance during a difficult environment. As we continuously monitor the markets and our strategy, we will remain vigilant and keep in mind the best interests of our shareholders.
| | 2011 Annual Report | December 31, 2011 |
Period & Average Annual Total Returns as of December 31, 2011 (Unaudited)
| | 1 | 3 | 5 | 10 | Since | Inception |
| | Year | Year | Year | Year | Inception | Date |
The Flex-funds® Money Market Fund- Retail Class | 0.11% | 0.32% | 1.69% | 1.95% | 4.40% | 3/27/85 |
| Current & Effective Yields* | 7-day Compound: 0.11% 7-day Simple 0.11% |
| Lipper Average General Purpose Money Market Fund | 0.02% | 0.07% | 1.36% | 1.56% | 4.11% | 3/31/85 |
The Flex-funds® Money Market Fund- Instl Class | 0.20% | 0.41% | 1.81% | - | 2.41% | 12/28/04 |
| Current & Effective Yields* | 7-day Compound: 0.17% 7-day Simple 0.17% |
| Lipper Average General Purpose Money Market Fund | 0.02% | 0.07% | 1.36% | - | 2.07% | 12/31/04 |
Performance quoted represents past performance. Past performance does not guarantee future results. All performance figures represent average annual total returns for the periods ended December 31, 2011, and assume reinvestment of all dividend and capital gain distributions. The investment return and principal value of an investment will fluctuate so that an investor’s shares, when redeemed, may be worth more or less than their original cost. Current performance may be higher or lower than the performance quoted. Current month-end performance may be obtained at www.flexfunds.com or by calling 1.800.325.3539. Management fees were waived and/or expenses were reimbursed in order to reduce the operating expenses of both the retail class and the institutional class of The Money Market Fund during the periods shown above. Investments in The Money Market Fund are neither insured nor guaranteed by the Federal Deposit Insurance Corporation or any other governmental agency. Although the Fund seeks to preserve the value of your investment at $1.00 per share, it is possible to lose money by investing in The Money Market Fund. Source for average general purpose money market fund data: Lipper, Inc.
| | 2011 Annual Report | December 31, 2011 |
Shareholder Expense Analysis (Unaudited)
Shareholders of mutual funds pay ongoing expenses, such as advisory fees, distribution and service fees (12b-1 fees) and other fund expenses. The following examples are intended to help you understand your ongoing costs (in dollars) of investing in the Funds and to compare these costs with the ongoing costs of investing in other mutual funds.
The examples below are based on an investment of $1,000 invested at the beginning of the period and held for the six-month period from June 30, 2011 to December 31, 2011.
ACTUAL EXPENSES: The first table below provides information about actual account values and actual expenses. You may use the information in this table, together with the amount you invested, to estimate the expenses that you paid over the period. Simply divide your account value by $1,000 (e.g.: an $8,600 account value divided by $1,000 = 8.6), then multiply the result by the number in the line under the heading “Expenses Paid During the Period” to estimate the expenses you paid on your account during this period.
| ACTUAL EXPENSES | Beginning Account Value (6/30/2011) | Ending Account Value (12/31/2011) | Expenses Paid During Period1 (6/30/2011 - 12/31/2011) | Expense Ratio (Annualized) |
| The Quantex Fund | $1,000.00 | $901.30 | $8.15 | 1.70% |
| The Aggressive Growth Fund | 1,000.00 | 898.10 | 7.80 | 1.63% |
| The Dynamic Growth Fund | 1,000.00 | 917.60 | 6.72 | 1.39% |
| The Strategic Growth Fund | 1,000.00 | 884.70 | 6.46 | 1.36% |
| The Muirfield Fund | 1,000.00 | 900.40 | 6.66 | 1.39% |
| The Defensive Balanced Fund | 1,000.00 | 932.10 | 6.77 | 1.39% |
| The Utilities and Infrastructure Fund | 1,000.00 | 982.00 | 9.64 | 1.93% |
| The Total Return Bond Fund | 1,000.00 | 994.30 | 4.98 | 0.99% |
| The Money Market Fund - Retail Class | 1,000.00 | 1,000.50 | 1.41 | 0.28% |
| The Money Market Fund - Institutional Class | 1,000.00 | 1,000.80 | 1.01 | 0.20% |
HYPOTHETICAL EXAMPLE FOR COMPARISON PURPOSES: The second table below provides information about hypothetical account values and hypothetical expenses based on the Funds’ actual expense ratios and assumed rates of return of 5% per year before expenses, which are not the Funds’ actual returns. The hypothetical account values and expenses may not be used to estimate the actual ending account balance or expenses you paid for the period. You may use this information to compare the ongoing costs of investing in the Funds to other funds. To do so, compare this 5% hypothetical example with the 5% hypothetical examples that appear in the shareholder reports of the other funds.
HYPOTHETICAL EXAMPLE (5% return before expenses) | Beginning Account Value (6/30/2011) | Ending Account Value (12/31/2011) | Expenses Paid During Period1 (6/30/2011- 12/31/2011) | Expense Ratio (Annualized) |
| The Quantex Fund | $1,000.00 | $1,016.64 | $8.64 | 1.70% |
| The Aggressive Growth Fund | 1,000.00 | 1,016.99 | 8.29 | 1.63% |
| The Dynamic Growth Fund | 1,000.00 | 1,018.20 | 7.07 | 1.39% |
| The Strategic Growth Fund | 1,000.00 | 1,018.35 | 6.92 | 1.36% |
| The Muirfield Fund | 1,000.00 | 1,018.20 | 7.07 | 1.39% |
| The Defensive Balanced Fund | 1,000.00 | 1,018.20 | 7.07 | 1.39% |
| The Utilities and Infrastructure Fund | 1,000.00 | 1,015.48 | 9.80 | 1.93% |
| The Total Return Bond Fund | 1,000.00 | 1,020.21 | 5.04 | 0.99% |
| The Money Market Fund - Retail Class | 1,000.00 | 1,023.79 | 1.43 | 0.28% |
| The Money Market Fund - Institutional Class | 1,000.00 | 1,024.20 | 1.02 | 0.20% |
Please note that the expenses shown in the tables are meant to highlight your ongoing costs only and do not reflect any transactional costs, such as redemption fees or exchange fees. Therefore, the second table is useful in comparing ongoing costs only, and will not help you determine the relative total costs of owning different funds. In addition, if any transactional costs were included, your costs would have been higher.
1 Expenses are equal to the Funds’ annualized expense ratios, multiplied by the average account value over the period, multiplied by 184/365 (to reflect the total number of days in the six-month period).
| | 2011 Annual Report | December 31, 2011 |
Past performance is not a guarantee of future results. All performance figures represent total returns and average annual total returns or current and effective yields for the periods ended December 31, 2011. Investment performance assumes reinvestment of all dividend and capital gain distributions. The investment return and principal value of an investment will fluctuate so an investor’s shares or units, when redeemed, may be worth more or less than their original cost. Management fees and/or expenses were waived and/or reimbursed in The Flex-funds® during the periods shown to reduce expenses. All expenses, management fees, reimbursements or waivers for the Funds are voluntary and may be terminated at any time, except for Quantex Fund TM. The Quantex Fund TM management fee waiver is contractual and can be terminated annually by the Adviser on its renewal date, April 29, 2012.
| 1 | The blended index consists of 50% of the Russell 2000 Index and 50% of the S&P 400 Mid-Cap Index. |
| 2 | The Quantex Fund™ was previously known as The Highlands Growth Fund. On April 30, 2005, The Highlands Growth Fund changed its name to The Quantex Fund™, also changing the Fund’s investment objective and strategies. The Highlands Growth Fund focused on large-cap equities, while The Quantex Fund™ utilizes quantitative investment strategies that invest primarily in small- and mid-cap equities. Due to this change in strategies on April 30, 2005, the S&P 500 Index is a more comparative index for Fund performance prior to April 30, 2005. The Russell 2000 Index and S&P 400 Mid-Cap Index are more comparative indices for Fund performance after April 30, 2005. |
| 3 | The blended index consists of 25% of the S&P 500 Index, 20% of the S&P 400 Index, 12.5% of the Russell 2000 Index, 12.5% of the Dow Jones US Select REIT Index, 12.5% of the S&P GSCI Index, 12% of the MSCI EAFE Index, and 5.5% of the MSCI Emerging Markets Index. |
| 4 | On August 25, 2008, The Focused Growth Fund became known as The Strategic Growth Fund and its investment strategy changed. This Fund will pursue its goal by investing primarily in open-end or closed-end investment companies that seek capital growth or appreciation without regard to current income. In addition, this Fund will always have set allocations to U.S. large-cap equities, U.S. mid-cap equities, U.S. small-cap equities, non-U.S./International (including emerging markets) equities, real estate equities and commodity based equities. |
| 5 | Specified index returns are calculated for the period 8/31/08 to 12/31/11. |
| 6 | The blended index is comprised of 60% of the S&P 500 Index and 40% of the average 90-day U.S. T-bill. |
| 7 | The blended index consists of 42% of the S&P 500 Index, 28% of the average 90-day U.S. T-bill and 30% of the Barclays Intermediate-Term Government/Credit Index. |
| 8 | On August 25, 2008, The Defensive Growth Fund became known as The Defensive Balanced Fund and its investment strategy changed. This Fund will always invest at least 30% and may invest up to 70% of its assets primarily in equity mutual funds. In addition, this Fund will always invest at least 30% and may invest up to 70% of its assets primarily in investment grade bonds, money market instruments, or exchange traded funds. |
| 9 | The Utilities and Infrastructure Fund was previously known as The Total Return Utilities Fund. On June 30, 2011, the Total Return Utilities Fund changed its name to The Utilities and Infrastructure Fund. Its investment objective and strategy remained unchanged. |
| + | The current net expense ratio is based on average daily net assets for the year ended 12/31/11, including effect of voluntary and/or contractual expense waivers and reimbursements. This ratio may increase or decrease depending on fluctuations in Fund net assets. Gross Expense Ratios are percentages of the Funds’ assets, not including acquired fund fees and expenses, as they are shown in the most recent Prospectus. |
| * | The current and effective yields quoted for The Money Market Fund are as of December 31, 2011. Yield quotations more closely reflect the current earnings of The Money Market Fund than do total return quotations. To obtain the current 7-day yields for The Money Market Fund, call The Flex-funds® Shareholder Services Department toll free at 800-325-3539 or 614-760-2159. Investments in The Money Market Fund (either class) are not a deposit and are neither insured nor guaranteed by the Federal Deposit Insurance Corporation or any other governmental agency. Although the Fund seeks to preserve the value of your investment at $1.00 per share, it is possible to lose money by investing in The Money Market Fund (either class). |
To obtain a prospectus containing more information about The Flex-funds®, including other fees and expenses that apply to a continued investment in the Funds, you may call (800)325-3539, or write to P.O. Box 7177, Dublin, OH 43017. Please read the prospectus carefully before investing.
Note on comparative indices: Returns for an index do not reflect fees, brokerage commissions, or other expenses associated with investing. One cannot invest directly in an index. Source for equity index data: Bloomberg LP. Source for fixed income index data: Morningstar, Inc. Source for average general-purpose money market fund performance: Lipper, Inc.
| | 2011 Annual Report | December 31, 2011 |
2011 Annual Report Fund Holdings & Financial Statements |
| | 2011 Annual Report | December 31, 2011 |
Statements of Operations For the Period Ended December 31, 2011 | |
| | | | | | | |
| Investment Income | | | | | | |
| Interest | | $ | 69,247 | | | $ | 7,759 | |
| Interest from affiliates | | | 4,056 | | | | 3,188 | |
| | | 1,443,466 | | | | 1,232,118 | |
| | | 1,516,769 | | | | 1,243,065 | |
| Fund Expenses | | | | | | | | |
| Investment advisor | | | 986,465 | | | | 709,994 | |
| Transfer agent | | | 142,295 | | | | 113,607 | |
| Transfer agent - The Money Market Fund - Retail Class | | | | | | | | |
| Transfer agent - The Money Market Fund - Institutional Class | | | | | | | | |
| Fund accounting | | | 48,858 | | | | 46,467 | |
| Administrative | | | 104,862 | | | | 85,733 | |
| Trustee | | | 13,711 | | | | 10,567 | |
| Audit | | | 10,001 | | | | 9,998 | |
| Legal | | | 3,685 | | | | 3,685 | |
| Custody | | | 18,785 | | | | 16,559 | |
| Printing | | | 10,162 | | | | 7,162 | |
| Distribution plan (12b-1) | | | 237,290 | | | | 236,249 | |
| Distribution plan (12b-1) - The Money Market Fund - Retail Class | | | | | | | | |
| Distribution plan (12b-1) - The Money Market Fund - Institutional Class | | | | | | | | |
| Administrative service plan | | | 237,459 | | | | 188,981 | |
| Postage | | | 7,058 | | | | 5,475 | |
| Registration and filing | | | 24,501 | | | | 24,357 | |
| Insurance | | | 11,051 | | | | 8,919 | |
| Chief Compliance Officer | | | 4,696 | | | | 4,693 | |
| | | 14,609 | | | | 13,287 | |
Total Expenses Before Reductions | | | 1,875,488 | | | | 1,485,733 | |
| Expenses reimbursed/waived by investment advisor | | | (61,248 | ) | | | (70,019 | ) |
| Expenses paid indirectly | | | (76,821 | ) | | | (67,966 | ) |
| Distribution plan (12b-1) expenses waived | | | (24,904 | ) | | | (18,935 | ) |
| Administrative service plan expenses waived | | | (61,666 | ) | | | (10,414 | ) |
Transfer agent expenses waived | | | — | | | | — | |
| | | 1,650,849 | | | | 1,318,399 | |
| | | | | | | | |
Net Investment Income (Loss) | | | (134,080 | ) | | | (75,334 | ) |
| Realized and Unrealized Gain (Loss) from Investments | | | | | | | | |
| Net realized gains (losses) from investments | | | 7,654,168 | | | | 6,074,533 | |
| Net realized gains (losses) from futures contracts | | | 125,200 | | | | (102,743 | ) |
Distributions of long-term realized gains by other investment companies | | | 539,684 | | | | 427,284 | |
Net Realized Gains (Losses) from Investment Transactions, Futures Contracts, and Distributions of Long-term Realized Gains by Other Investment Companies | | | 8,319,052 | | | | 6,399,074 | |
Net change in unrealized appreciation (depreciation) of investments and futures contracts | | | (15,948,476 | ) | | | (13,161,740 | ) |
Net Realized and Unrealized Gain (Loss) from Investments | | | (7,629,424 | ) | | | (6,762,666 | ) |
| | | | | | | | |
Net Change in Net Assets Resulting from Operations | | $ | (7,763,504 | ) | | $ | (6,838,000 | ) |
| * | Commenced operations June 30, 2011. |
| The accompanying notes are an integral part of these financial statements. |
| | 2011 Annual Report | December 31, 2011 |
| |
The Aggressive Growth Fund | | | The Defensive Balanced Fund | | | | | | | | | The Utilities and Infrastructure Fund | | | The Total Return Bond Fund* | | | | |
| | | | | | | | | | | | | | | | | | | | |
| $ | 1,006 | | | $ | 60,932 | | | $ | 9,235 | | | $ | 385 | | | $ | — | | | $ | 5,374 | | | $ | 485,555 | |
| | 2,183 | | | | 3,805 | | | | 2,876 | | | | 1,392 | | | | 1,584 | | | | 981 | | | | — | |
| | 342,973 | | | | 1,975,104 | | | | 825,045 | | | | 333,310 | | | | 842,360 | | | | 1,238,476 | | | | — | |
| | 346,162 | | | | 2,039,841 | | | | 837,156 | | | | 335,087 | | | | 843,944 | | | | 1,244,831 | | | | 485,555 | |
| | | | | | | | | | | | | | | | | | | | | | | | | | | |
| | 300,255 | | | | 559,195 | | | | 615,474 | | | | 205,091 | | | | 304,084 | | | | 83,595 | | | | 445,273 | |
| | 48,041 | | | | 89,455 | | | | 98,474 | | | | 24,611 | | | | 36,490 | | | | 16,719 | | | | | |
| | | | | | | | | | | | | | | | | | | | | | | | | | 82,530 | |
| | | | | | | | | | | | | | | | | | | | | | | | | | 23,705 | |
| | 36,999 | | | | 43,663 | | | | 44,789 | | | | 25,509 | | | | 33,985 | | | | 17,767 | | | | 48,811 | |
| | 39,971 | | | | 69,647 | | | | 75,651 | | | | 20,509 | | | | 30,409 | | | | 20,881 | | | | 104,487 | |
| | 5,495 | | | | 10,075 | | | | 9,784 | | | | 3,615 | | | | 4,986 | | | | 4,849 | | | | 3,014 | |
| | 10,004 | | | | 10,001 | | | | 10,015 | | | | 10,016 | | | | 9,999 | | | | 10,792 | | | | 10,032 | |
| | 3,685 | | | | 3,685 | | | | 3,685 | | | | 3,685 | | | | 3,685 | | | | 1,658 | | | | 3,685 | |
| | 8,743 | | | | 15,052 | | | | 14,403 | | | | 7,506 | | | | 6,306 | | | | 6,816 | | | | 8,858 | |
| | 3,056 | | | | 7,125 | | | | 7,420 | | | | 1,605 | | | | 2,661 | | | | 4,099 | | | | 9,513 | |
| | 99,986 | | | | 186,734 | | | | 205,101 | | | | 41,082 | | | | 76,046 | | | | 52,316 | | | | | |
| | | | | | | | | | | | | | | | | | | | | | | | | | 177,708 | |
| | | | | | | | | | | | | | | | | | | | | | | | | | 8,914 | |
| | 79,991 | | | | 148,765 | | | | 164,013 | | | | 40,990 | | | | 60,809 | | | | 41,562 | | | | — | |
| | 2,934 | | | | 4,884 | | | | 5,998 | | | | 1,757 | | | | 5,576 | | | | 2,373 | | | | 6,159 | |
| | 21,282 | | | | 21,050 | | | | 21,861 | | | | 20,189 | | | | 19,713 | | | | 12,259 | | | | 29,836 | |
| | 3,847 | | | | 6,031 | | | | 7,107 | | | | 2,038 | | | | 2,687 | | | | — | | | | 12,347 | |
| | 4,693 | | | | 4,693 | | | | 4,693 | | | | 4,693 | | | | 4,693 | | | | 2,510 | | | | 4,694 | |
| | 10,786 | | | | 11,820 | | | | 11,024 | | | | 9,994 | | | | 13,570 | | | | 5,637 | | | | 24,636 | |
| | 679,768 | | | | 1,191,875 | | | | 1,299,492 | | | | 422,890 | | | | 615,699 | | | | 283,833 | | | | 1,004,202 | |
| | (2,580 | ) | | | (51,681 | ) | | | (62,514 | ) | | | (51,275 | ) | | | — | | | | (56,749 | ) | | | (498,486 | ) |
| | (25,429 | ) | | | (45,919 | ) | | | (72,848 | ) | | | — | | | | — | | | | (14,374 | ) | | | — | |
| | (7,607 | ) | | | (11,931 | ) | | | (15,593 | ) | | | (14,562 | ) | | | (16,421 | ) | | | (2,508 | ) | | | (164,196 | ) |
| | (6,406 | ) | | | (5,220 | ) | | | (5,745 | ) | | | (23,996 | ) | | | (20,070 | ) | | | — | | | | — | |
| | — | | | | — | | | | — | | | | — | | | | — | | | | (4,180 | ) | | | (14,219 | ) |
| | 637,746 | | | | 1,077,124 | | | | 1,142,792 | | | | 333,057 | | | | 579,208 | | | | 206,022 | | | | 327,301 | |
| | | | | | | | | | | | | | | | | | | | | | | | | | | |
| | (291,584 | ) | | | 962,717 | | | | (305,636 | ) | | | 2,030 | | | | 264,736 | | | | 1,038,809 | | | | 158,254 | |
| | | | | | | | | | | | | | | | | | | | | | | | | | | |
| | 2,448,355 | | | | 336,545 | | | | (2,377,193 | ) | | | 1,265,551 | | | | 234,752 | | | | (1,029,655 | ) | | | | |
| | 31,852 | | | | (188,355 | ) | | | (189,886 | ) | | | (103,151 | ) | | | — | | | | 31,169 | | | | | |
| | 250,273 | | | | 325,216 | | | | 1,045,903 | | | | — | | | | — | | | | 93,587 | | | | | |
| | 2,730,480 | | | | 473,406 | | | | (1,521,176 | ) | | | 1,162,400 | | | | 234,752 | | | | (904,899 | ) | | | | |
| | (5,857,907 | ) | | | (4,953,875 | ) | | | (8,642,047 | ) | | | (3,349,847 | ) | | | 804 | | | | (627,710 | ) | | | | |
| | (3,127,427 | ) | | | (4,480,469 | ) | | | (10,163,223 | ) | | | (2,187,447 | ) | | | 235,556 | | | | (1,532,609 | ) | | | | |
| | | | | | | | | | | | | | | | | | | | | | | | | | | |
| $ | (3,419,011 | ) | | $ | (3,517,752 | ) | | $ | (10,468,859 | ) | | $ | (2,185,417 | ) | | $ | 500,292 | | | $ | (493,800 | ) | | $ | 158,254 | |
| | 2011 Annual Report | December 31, 2011 |
Statements of Changes in Net Assets For the Years Ended December 31, | |
| | | | | | | |
| | | | | | | | | | | | | |
| Operations | | | | | | | | | | | | |
| Net investment income (loss) | | $ | (134,080 | ) | | $ | 459,246 | | | $ | (75,334 | ) | | $ | 198,731 | |
| Net realized gain (loss) from investment transactions, futures contracts, and distributions of long-term realized gains by other investment companies | | | 8,319,052 | | | | 7,086,430 | | | | 6,399,074 | | | | 7,120,345 | |
Net change in unrealized appreciation (depreciation) of investments and futures contracts | | | (15,948,476 | ) | | | 6,602,098 | | | | (13,161,740 | ) | | | 6,409,206 | |
Net change in net assets resulting from operations | | | (7,763,504 | ) | | | 14,147,774 | | | | (6,838,000 | ) | | | 13,728,282 | |
| Distributions to Shareholders | | | | | | | | | | | | | | | | |
From net investment income | | | (171,704 | ) | | | (459,247 | ) | | | — | | | | (198,736 | ) |
Net change in net assets resulting from distributions | | | (171,704 | ) | | | (459,247 | ) | | | — | | | | (198,736 | ) |
| Capital Transactions | | | | | | | | | | | | | | | | |
| Issued | | | 46,474,732 | | | | 24,058,379 | | | | 28,124,254 | | | | 25,201,324 | |
| Reinvested | | | 171,192 | | | | 457,414 | | | | — | | | | 198,546 | |
| | | (41,190,644 | ) | | | (31,076,006 | ) | | | (25,623,187 | ) | | | (28,048,074 | ) |
Net change in net assets resulting from capital transactions | | | 5,455,280 | | | | (6,560,213 | ) | | | 2,501,067 | | | | (2,648,204 | ) |
| | | | | | | | | | | | | | | | |
Total Change in Net Assets | | | (2,479,928 | ) | | | 7,128,314 | | | | (4,336,933 | ) | | | 10,881,342 | |
Net Assets - Beginning of Year | | | 122,266,470 | | | | 115,138,156 | | | | 95,239,423 | | | | 84,358,081 | |
| | $ | 119,786,542 | | | $ | 122,266,470 | | | $ | 90,902,490 | | | $ | 95,239,423 | |
Accumulated undistributed (distributions in excess of) net investment income | | $ | — | | | $ | 171,704 | | | $ | — | | | $ | — | |
| Share Transactions | | | | | | | | | | | | | | | | |
| Issued | | | 8,711,044 | | | | 4,734,508 | | | | 3,460,348 | | | | 3,526,238 | |
| Reinvested | | | 33,112 | | | | 81,680 | | | | — | | | | 24,392 | |
| | | (7,393,311 | ) | | | (6,042,300 | ) | | | (3,310,326 | ) | | | (3,799,857 | ) |
| | | 1,350,845 | | | | (1,226,112 | ) | | | 150,022 | | | | (249,227 | ) |
| The accompanying notes are an integral part of these financial statements. |
| | 2011 Annual Report | December 31, 2011 |
| |
The Aggressive Growth Fund | | | The Defensive Balanced Fund | | | The Strategic Growth Fund | |
| | | | | | | | | | | | | | | | |
| | | | | | | | | | | | | | | | | |
| $ | (291,584 | ) | | $ | (21,654 | ) | | $ | 962,717 | | | $ | 796,697 | | | $ | (305,636 | ) | | $ | 198,423 | |
| | 2,730,480 | | | | 3,819,382 | | | | 473,406 | | | | 3,288,199 | | | | (1,521,176 | ) | | | 6,632,770 | |
| | (5,857,907 | ) | | | 1,054,758 | | | | (4,953,875 | ) | | | 1,231,808 | | | | (8,642,047 | ) | | | 1,458,237 | |
| | (3,419,011 | ) | | | 4,852,486 | | | | (3,517,752 | ) | | | 5,316,704 | | | | (10,468,859 | ) | | | 8,289,430 | |
| | | | | | | | | | | | | | | | | | | | | | | |
| | — | | | | — | | | | (962,717 | ) | | | (796,695 | ) | | | — | | | | (198,423 | ) |
| | — | | | | — | | | | (962,717 | ) | | | (796,695 | ) | | | — | | | | (198,423 | ) |
| | | | | | | | | | | | | | | | | | | | | | | |
| | 24,363,507 | | | | 8,752,427 | | | | 51,025,191 | | | | 17,820,187 | | | | 74,435,544 | | | | 32,446,042 | |
| | — | | | | — | | | | 961,698 | | | | 792,255 | | | | — | | | | 198,274 | |
| | (22,685,494 | ) | | | (9,591,588 | ) | | | (19,487,752 | ) | | | (14,742,252 | ) | | | (41,725,732 | ) | | | (12,356,363 | ) |
| | 1,678,013 | | | | (839,161 | ) | | | 32,499,137 | | | | 3,870,190 | | | | 32,709,812 | | | | 20,287,953 | |
| | | | | | | | | | | | | | | | | | | | | | | |
| | (1,740,998 | ) | | | 4,013,325 | | | | 28,018,668 | | | | 8,390,199 | | | | 22,240,953 | | | | 28,378,960 | |
| | 33,908,315 | | | | 29,894,990 | | | | 57,778,633 | | | | 49,388,434 | | | | 62,430,841 | | | | 34,051,881 | |
| $ | 32,167,317 | | | $ | 33,908,315 | | | $ | 85,797,301 | | | $ | 57,778,633 | | | $ | 84,671,794 | | | $ | 62,430,841 | |
| $ | — | | | $ | — | | | $ | 2 | | | $ | 2 | | | $ | — | | | $ | — | |
| | | | | | | | | | | | | | | | | | | | | | | |
| | 3,029,752 | | | | 1,240,188 | | | | 5,370,164 | | | | 1,948,394 | | | | 7,582,758 | | | | 3,648,465 | |
| | — | | | | — | | | | 105,708 | | | | 81,508 | | | | — | | | | 20,420 | |
| | (2,941,080 | ) | | | (1,324,833 | ) | | | (2,074,924 | ) | | | (1,589,341 | ) | | | (4,495,548 | ) | | | (1,431,682 | ) |
| | 88,672 | | | | (84,645 | ) | | | 3,400,948 | | | | 440,561 | | | | 3,087,210 | | | | 2,237,203 | |
| | 2011 Annual Report | December 31, 2011 |
Statements of Changes in Net Assets For the Periods Ended December 31, | |
| | | | |
| | | | | | | |
| Operations | | | | | | |
| Net investment income (loss) | | $ | 2,030 | | | $ | (39,827 | ) |
| Net realized gain (loss) from investment transactions, futures contracts, and distributions of long-term realized gains by other investment companies | | | 1,162,400 | | | | 1,526,513 | |
Net change in unrealized appreciation (depreciation) of investments and futures contracts | | | (3,349,847 | ) | | | 1,655,283 | |
Net change in net assets resulting from operations | | | (2,185,417 | ) | | | 3,141,969 | |
| Distributions to Shareholders | | | | | | | | |
From net investment income | | | (5,803 | ) | | | — | |
Net change in net assets resulting from distributions | | | (5,803 | ) | | | — | |
| Distributions to Shareholders - The Money Market Fund | | | | | | | | |
| From net investment income (Retail Class) | | | | | | | | |
From net investment income (Institutional Class) | | | | | | | | |
Net change in net assets resulting from distributions | | | | | | | | |
| Capital Transactions | | | | | | | | |
| Issued | | | 13,071,807 | | | | 8,147,706 | |
| Reinvested | | | 5,745 | | | | — | |
| | | (10,476,424 | ) | | | (6,933,509 | ) |
Net change in net assets resulting from capital transactions | | | 2,601,128 | | | | 1,214,197 | |
| | | | | | | | |
Total Change in Net Assets | | | 409,908 | | | | 4,356,166 | |
Net Assets - Beginning of Year | | | 17,023,641 | | | | 12,667,475 | |
| | $ | 17,433,549 | | | $ | 17,023,641 | |
Accumulated undistributed (distributions in excess of) net investment income | | $ | — | | | $ | — | |
| Share Transactions | | | | | | | | |
| Issued | | | 543,000 | | | | 413,282 | |
| Reinvested | | | 263 | | | | — | |
| | | (492,877 | ) | | | (351,002 | ) |
| | | 50,386 | | | | 62,280 | |
| * | Commenced operations June 30, 2011. |
| The accompanying notes are an integral part of these financial statements. |
| | 2011 Annual Report | December 31, 2011 |
| |
The Utilities and Infrastructure Fund | | | The Total Return Bond Fund | | | | |
| | | | | | | 2011* | | | | 2011 | | | | 2010 | |
| | | | | | | | | | | | | | | | | |
| $ | 264,736 | | | $ | 150,010 | | | $ | 1,038,809 | | | $ | 158,254 | | | $ | 323,084 | |
| | 234,752 | | | | 959,028 | | | | (904,899 | ) | | | — | | | | — | |
| | 804 | | | | 1,830,913 | | | | (627,710 | ) | | | — | | | | — | |
| | 500,292 | | | | 2,939,951 | | | | (493,800 | ) | | | 158,254 | | | | 323,084 | |
| | | | | | | | | | | | | | | | | | | |
| | (487,367 | ) | | | (132,339 | ) | | | (1,038,809 | ) | | | | | | | | |
| | (487,367 | ) | | | (132,339 | ) | | | (1,038,809 | ) | | | | | | | | |
| | | | | | | | | | | | | | | | | | | |
| | | | | | | | | | | | | | (99,688 | ) | | | (219,387 | ) |
| | | | | | | | | | | | | | (58,566 | ) | | | (103,697 | ) |
| | | | | | | | | | | | | | (158,254 | ) | | | (323,084 | ) |
| | | | | | | | | | | | | | | | | | | |
| | 17,335,004 | | | | 5,387,988 | | | | 62,982,890 | | | | 373,929,928 | | | | 362,248,902 | |
| | 474,790 | | | | 120,242 | | | | 1,038,808 | | | | 114,790 | | | | 246,254 | |
| | (9,357,157 | ) | | | (4,903,245 | ) | | | (5,490,965 | ) | | | (401,582,218 | ) | | | (401,214,866 | ) |
| | 8,452,637 | | | | 604,985 | | | | 58,530,733 | | | | (27,537,500 | ) | | | (38,719,710 | ) |
| | | | | | | | | | | | | | | | | | | |
| | 8,465,562 | | | | 3,412,597 | | | | 56,998,124 | | | | (27,537,500 | ) | | | (38,719,710 | ) |
| | 24,143,827 | | | | 20,731,230 | | | | — | | | | 129,671,596 | | | | 168,391,306 | |
| $ | 32,609,389 | | | $ | 24,143,827 | | | $ | 56,998,124 | | | $ | 102,134,096 | | | $ | 129,671,596 | |
| $ | 79 | | | $ | (788 | ) | | $ | — | | | $ | — | | | $ | — | |
| | | | | | | | | | | | | | | | | | | |
| | 705,848 | | | | 252,216 | | | | 6,309,532 | | | | 373,929,928 | | | | 362,248,902 | |
| | 19,781 | | | | 5,611 | | | | 105,778 | | | | 114,790 | | | | 246,254 | |
| | (397,554 | ) | | | (230,839 | ) | | | (555,926 | ) | | | (401,582,218 | ) | | | (401,214,866 | ) |
| | 328,075 | | | | 26,988 | | | | 5,859,384 | | | | (27,537,500 | ) | | | (38,719,710 | ) |
| | 2011 Annual Report | December 31, 2011 |
Financial Highlights For a Share Outstanding Through Each Fiscal Year Ended December 31, | |
| | | | | | Income from Investment Operations | | | | |
| | Net Asset Value, Beginning of Period | | | Net Investment Income (Loss) (3) | | | Net gains (losses) on securities, futures, and options (both realized and unrealized) | | | Total from Investment Operations | | | From Net Investment Income | | | | | | From Tax Return of Capital | | | | |
| The Muirfield Fund (1)(2) | |
| 2011 | | $ | 5.60 | | | | (0.01 | ) | | | (0.41 | ) | | | (0.42 | ) | | | (0.01 | ) | | | 0.00 | | | | 0.00 | | | | (0.01 | ) |
| 2010 | | $ | 4.99 | | | | 0.02 | | | | 0.61 | | | | 0.63 | | | | (0.02 | ) | | | 0.00 | | | | 0.00 | | | | (0.02 | ) |
| 2009 | | $ | 4.21 | | | | 0.01 | | | | 0.79 | | | | 0.80 | | | | (0.02 | ) | | | 0.00 | | | | 0.00 | | | | (0.02 | ) |
| 2008 | | $ | 6.02 | | | | 0.02 | | | | (1.83 | ) | | | (1.81 | ) | | | 0.00 | | | | 0.00 | | | | 0.00 | | | | 0.00 | |
| 2007 | | $ | 5.81 | | | | 0.18 | | | | 0.23 | | | | 0.41 | | | | (0.20 | ) | | | 0.00 | | | | 0.00 | | | | (0.20 | ) |
The Dynamic Growth Fund (1)(2) | |
| 2011 | | $ | 8.14 | | | | (0.01 | ) | | | (0.45 | ) | | | (0.46 | ) | | | 0.00 | | | | 0.00 | | | | 0.00 | | | | 0.00 | |
| 2010 | | $ | 7.06 | | | | 0.02 | | | | 1.08 | | | | 1.10 | | | | (0.02 | ) | | | 0.00 | | | | 0.00 | | | | (0.02 | ) |
| 2009 | | $ | 5.48 | | | | 0.00 | | | | 1.58 | | | | 1.58 | | | | 0.00 | * | | | 0.00 | | | | 0.00 | | | | 0.00 | * |
| 2008 | | $ | 9.24 | | | | 0.04 | | | | (3.71 | ) | | | (3.67 | ) | | | (0.04 | ) | | | (0.05 | ) | | | 0.00 | | | | (0.09 | ) |
| 2007 | | $ | 9.56 | | | | 0.29 | | | | 0.38 | | | | 0.67 | | | | (0.30 | ) | | | (0.69 | ) | | | 0.00 | | | | (0.99 | ) |
The Aggressive Growth Fund (1)(2) | |
| 2011 | | $ | 7.97 | | | | (0.07 | ) | | | (0.50 | ) | | | (0.57 | ) | | | 0.00 | | | | 0.00 | | | | 0.00 | | | | 0.00 | |
| 2010 | | $ | 6.89 | | | | (0.01 | ) | | | 1.09 | | | | 1.08 | | | | 0.00 | | | | 0.00 | | | | 0.00 | | | | 0.00 | |
| 2009 | | $ | 5.19 | | | | (0.01 | ) | | | 1.71 | | | | 1.70 | | | | 0.00 | | | | 0.00 | | | | 0.00 | | | | 0.00 | |
| 2008 | | $ | 8.59 | | | | 0.05 | | | | (3.40 | ) | | | (3.35 | ) | | | (0.05 | ) | | | 0.00 | | | | 0.00 | | | | (0.05 | ) |
| 2007 | | $ | 8.13 | | | | 0.04 | | | | 0.46 | | | | 0.50 | | | | (0.04 | ) | | | 0.00 | | | | 0.00 | | | | (0.04 | ) |
The Defensive Balanced Fund (1)(2) | |
| 2011 | | $ | 9.72 | | | | 0.13 | | | | (0.57 | ) | | | (0.44 | ) | | | (0.10 | ) | | | 0.00 | | | | 0.00 | | | | (0.10 | ) |
| 2010 | | $ | 8.98 | | | | 0.14 | | | | 0.74 | | | | 0.88 | | | | (0.14 | ) | | | 0.00 | | | | 0.00 | | | | (0.14 | ) |
| 2009 | | $ | 7.86 | | | | 0.03 | | | | 1.12 | | | | 1.15 | | | | (0.03 | ) | | | 0.00 | | | | 0.00 | | | | (0.03 | ) |
| 2008 | | $ | 10.46 | | | | 0.07 | | | | (2.60 | ) | | | (2.53 | ) | | | (0.07 | ) | | | 0.00 | | | | 0.00 | | | | (0.07 | ) |
| 2007 | | $ | 10.51 | | | | 0.07 | | | | 0.45 | | | | 0.52 | | | | (0.07 | ) | | | (0.50 | ) | | | 0.00 | | | | (0.57 | ) |
The Strategic Growth Fund (1)(2) | |
| 2011 | | $ | 9.71 | | | | (0.04 | ) | | | (0.77 | ) | | | (0.81 | ) | | | 0.00 | | | | 0.00 | | | | 0.00 | | | | 0.00 | |
| 2010 | | $ | 8.12 | | | | 0.04 | | | | 1.58 | | | | 1.62 | | | | (0.03 | ) | | | 0.00 | | | | 0.00 | | | | (0.03 | ) |
| 2009 | | $ | 5.98 | | | | (0.01 | ) | | | 2.15 | | | | 2.14 | | | | 0.00 | | | | 0.00 | | | | 0.00 | | | | 0.00 | |
| 2008 | | $ | 10.58 | | | | 0.05 | | | | (4.60 | ) | | | (4.55 | ) | | | (0.05 | ) | | | 0.00 | | | | 0.00 | | | | (0.05 | ) |
| 2007 | | $ | 10.73 | | | | 0.08 | | | | 0.46 | | | | 0.54 | | | | (0.07 | ) | | | (0.62 | ) | | | 0.00 | | | | (0.69 | ) |
| 1 | Ratio of net expenses to average net assets, ratio of net investment income (loss) to average net assets, ratio of expenses to average net assets after reductions, excluding expenses paid indirectly, and ratio of expenses to average net assets before reductions do not include impact of expenses of the underlying security holdings as represented in the schedule of investments. |
| 2 | Recognition of net investment income by the Fund is affected by the timing of the declaration of dividends by the underlying investment companies in which the Fund invests. |
| 3 | Net investment income per share is based on average shares outstanding during the period. |
| * | Actual amounts were less than one-half of a cent per share |
| The accompanying notes are integral part of these financial statements. |
| | 2011 Annual Report | December 31, 2011 |
| |
| | | | | | | | |
Net Asset Value, End of Period | | | Total Return (Assumes Reinvestment of Distributions) | | | Net Assets, End of Period ($000) | | | Ratio of Net Expenses to Average Net Assets | | | Ratio of Net Investment Income (Loss) to Average Net Assets | | | Ratio of Expenses to Average Net Assets after Reductions, Excluding Expenses Paid Indirectly | | | Ratio of Expenses to Average Net Assets Before Reductions | | | | |
| | |
| $ | 5.17 | | | | (7.55 | %) | | $ | 119,787 | | | | 1.39 | % | | | (0.11 | %) | | | 1.46 | % | | | 1.58 | % | | | 189 | % |
| $ | 5.60 | | | | 12.65 | % | | $ | 122,266 | | | | 1.39 | % | | | 0.40 | % | | | 1.47 | % | | | 1.60 | % | | | 128 | % |
| $ | 4.99 | | | | 18.95 | % | | $ | 115,138 | | | | 1.43 | % | | | 0.17 | % | | | 1.51 | % | | | 1.66 | % | | | 166 | % |
| $ | 4.21 | | | | (30.07 | %) | | $ | 86,310 | | | | 1.39 | % | | | 0.54 | % | | | 1.48 | % | | | 1.75 | % | | | 173 | % |
| $ | 6.02 | | | | 7.02 | % | | $ | 50,374 | | | | 1.38 | % | | | 3.01 | % | | | 1.52 | % | | | 1.88 | % | | | 144 | % |
| |
| $ | 7.68 | | | | (5.65 | %) | | $ | 90,902 | | | | 1.39 | % | | | (0.08 | %) | | | 1.46 | % | | | 1.57 | % | | | 176 | % |
| $ | 8.14 | | | | 15.54 | % | | $ | 95,239 | | | | 1.39 | % | | | 0.23 | % | | | 1.47 | % | | | 1.59 | % | | | 119 | % |
| $ | 7.06 | | | | 28.87 | % | | $ | 84,358 | | | | 1.37 | % | | | (0.04 | %) | | | 1.48 | % | | | 1.63 | % | | | 148 | % |
| $ | 5.48 | | | | (39.77 | %) | | $ | 67,298 | | | | 1.34 | % | | | 0.95 | % | | | 1.46 | % | | | 1.69 | % | | | 122 | % |
| $ | 9.24 | | | | 7.06 | % | | $ | 19,115 | | | | 1.32 | % | | | 2.94 | % | | | 1.46 | % | | | 1.86 | % | | | 150 | % |
| |
| $ | 7.40 | | | | (7.15 | %) | | $ | 32,167 | | | | 1.59 | % | | | (0.73 | %) | | | 1.65 | % | | | 1.70 | % | | | 224 | % |
| $ | 7.97 | | | | 15.67 | % | | $ | 33,908 | | | | 1.59 | % | | | (0.07 | %) | | | 1.66 | % | | | 1.77 | % | | | 124 | % |
| $ | 6.89 | | | | 32.76 | % | | $ | 29,895 | | | | 1.54 | % | | | (0.25 | %) | | | 1.63 | % | | | 1.82 | % | | | 156 | % |
| $ | 5.19 | | | | (38.98 | %) | | $ | 20,715 | | | | 1.62 | % | | | 0.77 | % | | | 1.65 | % | | | 1.84 | % | | | 213 | % |
| $ | 8.59 | | | | 6.14 | % | | $ | 28,841 | | | | 1.70 | % | | | 0.49 | % | | | 1.70 | % | | | 1.83 | % | | | 170 | % |
| |
| $ | 9.18 | | | | (4.49 | %) | | $ | 85,797 | | | | 1.44 | % | | | 1.29 | % | | | 1.51 | % | | | 1.60 | % | | | 164 | % |
| $ | 9.72 | | | | 9.76 | % | | $ | 57,779 | | | | 1.52 | % | | | 1.51 | % | | | 1.57 | % | | | 1.66 | % | | | 161 | % |
| $ | 8.98 | | | | 14.65 | % | | $ | 49,388 | | | | 1.54 | % | | | 0.41 | % | | | 1.59 | % | | | 1.72 | % | | | 182 | % |
| $ | 7.86 | | | | (24.16 | %) | | $ | 34,766 | | | | 1.54 | % | | | 0.67 | % | | | 1.55 | % | | | 1.70 | % | | | 204 | % |
| $ | 10.46 | | | | 5.03 | % | | $ | 74,290 | | | | 1.56 | % | | | 0.79 | % | | | 1.56 | % | | | 1.66 | % | | | 137 | % |
| |
| $ | 8.90 | | | | (8.34 | %) | | $ | 84,672 | | | | 1.39 | % | | | (0.37 | %) | | | 1.48 | % | | | 1.58 | % | | | 166 | % |
| $ | 9.71 | | | | 19.96 | % | | $ | 62,431 | | | | 1.49 | % | | | 0.48 | % | | | 1.59 | % | | | 1.70 | % | | | 115 | % |
| $ | 8.12 | | | | 35.79 | % | | $ | 34,052 | | | | 1.54 | % | | | (0.13 | %) | | | 1.65 | % | | | 1.80 | % | | | 75 | % |
| $ | 5.98 | | | | (43.00 | %) | | $ | 21,074 | | | | 1.57 | % | | | 0.47 | % | | | 1.59 | % | | | 1.74 | % | | | 178 | % |
| $ | 10.58 | | | | 5.08 | % | | $ | 63,785 | | | | 1.58 | % | | | 0.75 | % | | | 1.58 | % | | | 1.68 | % | | | 134 | % |
| | | | | | | | | | | | | | | | | | | |
| | 2011 Annual Report | December 31, 2011 |
Financial Highlights For a Share Outstanding Through Each Fiscal Period Ended December 31, | |
| | | | | | | Income from Investment Operations | | | | |
| | | Net Asset Value, Beginning of Period | | | Net Investment Income (Loss) (5) | | | Net gains (losses) on securities, futures, and options (both realized and unrealized) | | | Total from Investment Operations | | | From Net Investment Income | | | | | | From Tax Return of Capital | | | | |
| The Quantex Fund | |
| 2011 | | | $ | 22.77 | | | | 0.00 | | | | (0.92 | ) | | | (0.92 | ) | | | (0.01 | ) | | | 0.00 | | | | 0.00 | | | | (0.01 | ) |
| 2010 | | | $ | 18.48 | | | | (0.06 | ) | | | 4.35 | | | | 4.29 | | | | 0.00 | | | | 0.00 | | | | 0.00 | | | | 0.00 | |
| 2009 | | | $ | 10.42 | | | | (0.01 | ) | | | 8.07 | | | | 8.06 | | | | 0.00 | ** | | | 0.00 | | | | 0.00 | | | | 0.00 | ** |
| 2008 | | | $ | 18.32 | | | | 0.00 | | | | (7.90 | ) | | | (7.90 | ) | | | 0.00 | | | | 0.00 | | | | 0.00 | | | | 0.00 | |
| 2007 | | | $ | 19.86 | | | | 0.16 | | | | (1.54 | ) | | | (1.38 | ) | | | (0.16 | ) | | | 0.00 | | | | 0.00 | | | | (0.16 | ) |
The Utilities and Infrastructure Fund | |
| 2011 | | | $ | 23.51 | | | | 0.21 | | | | 0.71 | | | | 0.92 | | | | (0.37 | ) | | | 0.00 | | | | 0.00 | | | | (0.37 | ) |
| 2010 | | | $ | 20.73 | | | | 0.15 | | | | 2.76 | | | | 2.91 | | | | (0.13 | ) | | | 0.00 | | | | 0.00 | | | | (0.13 | ) |
| 2009 | | | $ | 16.13 | | | | 0.15 | | | | 4.74 | | | | 4.89 | | | | (0.16 | ) | | | 0.00 | | | | (0.13 | ) | | | (0.29 | ) |
| 2008 | | | $ | 26.14 | | | | 0.09 | | | | (9.90 | ) | | | (9.81 | ) | | | (0.14 | ) | | | 0.00 | | | | (0.06 | ) | | | (0.20 | ) |
| 2007 | | | $ | 22.23 | | | | 0.14 | | | | 3.91 | | | | 4.05 | | | | (0.14 | ) | | | 0.00 | | | | 0.00 | | | | (0.14 | ) |
The Total Return Bond Fund (1)(2)(3)(4) | |
| 2011* | | $ | 10.00 | | | | 0.25 | | | | (0.31 | ) | | | (0.06 | ) | | | (0.21 | ) | | | 0.00 | | | | 0.00 | | | | (0.21 | ) |
The Money Market Fund - Retail Class | |
| 2011 | | | $ | 1.00 | | | | 0.001 | | | | N/A | | | | 0.001 | | | | (0.001 | ) | | | 0.000 | | | | 0.000 | | | | (0.001 | ) |
| 2010 | | | $ | 1.00 | | | | 0.002 | | | | N/A | | | | 0.002 | | | | (0.002 | ) | | | 0.000 | | | | 0.000 | | | | (0.002 | ) |
| 2009 | | | $ | 1.00 | | | | 0.006 | | | | N/A | | | | 0.006 | | | | (0.006 | ) | | | 0.000 | | | | 0.000 | | | | (0.006 | ) |
| 2008 | | | $ | 1.00 | | | | 0.026 | | | | N/A | | | | 0.026 | | | | (0.026 | ) | | | 0.000 | | | | 0.000 | | | | (0.026 | ) |
| 2007 | | | $ | 1.00 | | | | 0.048 | | | | N/A | | | | 0.048 | | | | (0.048 | ) | | | 0.000 | | | | 0.000 | | | | (0.048 | ) |
The Money Market Fund - Institutional Class | |
| 2011 | | | $ | 1.00 | | | | 0.002 | | | | N/A | | | | 0.002 | | | | (0.002 | ) | | | 0.000 | | | | 0.000 | | | | (0.002 | ) |
| 2010 | | | $ | 1.00 | | | | 0.003 | | | | N/A | | | | 0.003 | | | | (0.003 | ) | | | 0.000 | | | | 0.000 | | | | (0.003 | ) |
| 2009 | | | $ | 1.00 | | | | 0.008 | | | | N/A | | | | 0.008 | | | | (0.008 | ) | | | 0.000 | | | | 0.000 | | | | (0.008 | ) |
| 2008 | | | $ | 1.00 | | | | 0.028 | | | | N/A | | | | 0.028 | | | | (0.028 | ) | | | 0.000 | | | | 0.000 | | | | (0.028 | ) |
| 2007 | | | $ | 1.00 | | | | 0.050 | | | | N/A | | | | 0.050 | | | | (0.050 | ) | | | 0.000 | | | | 0.000 | | | | (0.050 | ) |
| 1 | Ratio of net expenses to average net assets, ratio of net investment income (loss) to average net assets, ratio of expenses to average net assets after reductions, excluding expenses paid indirectly, and ratio of expenses to average net assets before reductions do not include impact of expenses of the underlying security holdings as represented in the schedule of investments. |
| 2 | Recognition of net investment income by the Fund is affected by the timing of the declaration of dividends by the underlying investment companies in which the Fund invests. |
| 3 | Total return and portfolio turnover rate are not annualized for periods of less than one full year. |
| 4 | Ratio of net expenses to average net assets, ratio of net investment income (loss) to average net assets, ratio of average net assets after reductions, excluding expenses paid indirectly, and ratio of expenses to average net assets before reductions are annualized for periods of less than one full year. |
| 5 | Except for The Money Market Fund, net investment income per share is based on average shares outstanding during the period. |
| * | Commenced Operations June 30, 2011 |
| ** | Actual amounts were less than one-half of a cent per share |
| | 2011 Annual Report | December 31, 2011 |
| |
| | | | | | | | |
Net Asset Value, End of Period | | | Total Return (Assumes Reinvestment of Distributions) | | | Net Assets, End of Period ($000) | | | Ratio of Net Expenses to Average Net Assets | | | Ratio of Net Investment Income (Loss) to Average Net Assets | | | Ratio of Expenses to Average Net Assets after Reductions, Excluding Expenses Paid Indirectly | | | Ratio of Expenses to Average Net Assets Before Reductions | | | | |
| | |
| $ | 21.84 | | | | (4.05 | %) | | $ | 17,434 | | | | 1.62 | % | | | 0.01 | % | | | 1.62 | % | | | 2.06 | % | | | 57 | % |
| $ | 22.77 | | | | 23.21 | % | | $ | 17,024 | | | | 1.65 | % | | | (0.26 | %) | | | 1.65 | % | | | 2.17 | % | | | 55 | % |
| $ | 18.48 | | | | 77.37 | % | | $ | 12,667 | | | | 1.79 | % | | | (0.05 | %) | | | 1.79 | % | | | 2.39 | % | | | 34 | % |
| $ | 10.42 | | | | (43.12 | %) | | $ | 6,743 | | | | 1.73 | % | | | 0.01 | % | | | 1.73 | % | | | 2.26 | % | | | 49 | % |
| $ | 18.32 | | | | (7.00 | %) | | $ | 17,450 | | | | 1.56 | % | | | 0.76 | % | | | 1.56 | % | | | 2.09 | % | | | 56 | % |
| |
| $ | 24.06 | | | | 3.93 | % | | $ | 32,609 | | | | 1.90 | % | | | 0.87 | % | | | 1.90 | % | | | 2.02 | % | | | 43 | % |
| $ | 23.51 | | | | 14.10 | % | | $ | 24,144 | | | | 1.92 | % | | | 0.70 | % | | | 1.92 | % | | | 2.11 | % | | | 53 | % |
| $ | 20.73 | | | | 30.63 | % | | $ | 20,731 | | | | 2.00 | % | | | 0.90 | % | | | 2.00 | % | | | 2.20 | % | | | 35 | % |
| $ | 16.13 | | | | (37.63 | %) | | $ | 15,859 | | | | 1.96 | % | | | 0.42 | % | | | 1.96 | % | | | 2.14 | % | | | 48 | % |
| $ | 26.14 | | | | 18.24 | % | | $ | 27,333 | | | | 1.90 | % | | | 0.57 | % | | | 1.90 | % | | | 2.10 | % | | | 50 | % |
| |
| $ | 9.73 | | | | (0.57 | %) | | $ | 56,998 | | | | 0.99 | % | | | 4.97 | % | | | 1.06 | % | | | 1.36 | % | | | 125 | % |
| |
| $ | 1.00 | | | | 0.11 | % | | $ | 78,903 | | | | 0.30 | % | | | 0.11 | % | | | 0.30 | % | | | 0.90 | % | | | N/A | |
| $ | 1.00 | | | | 0.20 | % | | $ | 96,087 | | | | 0.38 | % | | | 0.20 | % | | | 0.38 | % | | | 0.86 | % | | | N/A | |
| $ | 1.00 | | | | 0.64 | % | | $ | 122,142 | | | | 0.55 | % | | | 0.66 | % | | | 0.55 | % | | | 0.84 | % | | | N/A | |
| $ | 1.00 | | | | 2.65 | % | | $ | 161,232 | | | | 0.49 | % | | | 2.64 | % | | | 0.49 | % | | | 0.83 | % | | | N/A | |
| $ | 1.00 | | | | 4.95 | % | | $ | 195,479 | | | | 0.48 | % | | | 4.83 | % | | | 0.48 | % | | | 0.84 | % | | | N/A | |
| |
| $ | 1.00 | | | | 0.20 | % | | $ | 23,231 | | | | 0.21 | % | | | 0.20 | % | | | 0.21 | % | | | 0.71 | % | | | N/A | |
| $ | 1.00 | | | | 0.28 | % | | $ | 33,584 | | | | 0.29 | % | | | 0.29 | % | | | 0.29 | % | | | 0.68 | % | | | N/A | |
| $ | 1.00 | | | | 0.75 | % | | $ | 46,249 | | | | 0.43 | % | | | 0.83 | % | | | 0.43 | % | | | 0.67 | % | | | N/A | |
| $ | 1.00 | | | | 2.79 | % | | $ | 77,294 | | | | 0.37 | % | | | 2.55 | % | | | 0.37 | % | | | 0.68 | % | | | N/A | |
| $ | 1.00 | | | | 5.09 | % | | $ | 20,333 | | | | 0.34 | % | | | 4.98 | % | | | 0.34 | % | | | 0.67 | % | | | N/A | |
| The accompanying notes are integral part of these financial statements. |
| | 2011 Annual Report | December 31, 2011 |
Notes to Financial Statements December 31, 2011 |
| 1. | Organization and Significant Accounting Policies |
The Flex-funds® Trust (the “Trust”) was organized in 1982 and is registered under the Investment Company Act of 1940, as amended (the “1940 Act”), as a diversified, open-end management investment company. The Trust offers nine separate series and is presently comprised of nine separate funds as follows: The Muirfield Fund® (“Muirfield”), The Dynamic Growth Fund (“Dynamic”), The Aggressive Growth Fund (“Aggressive”), The Defensive Balanced Fund (“Defensive”), The Strategic Growth Fund (“Strategic”), The Quantex Fund™ (“Quantex”), The Utilities and Infrastructure Fund (f.k.a. The Total Return Utilities Fund)(“Utilities”)(please see second paragraph of Note #1 for more information), The Total Return Bond Fund (“Total Bond”)(please see third paragraph of Note #1 for more information), and The Money Market Fund (“Money Market”) (each a “Fund” and collectively the “Funds”). Money Market offers two classes of shares (the Retail Class (“Retail Class”) and the Institutional Class (“Institutional Class”)). Each class of shares has equal rights as to earnings and assets except that each class bears different distribution and transfer agent expenses. The investment objective of Muirfield, Dynamic, Aggressive, and Strategic is growth of capital. The investment objective of Defensive is growth of capital, with current income usually of secondary importance. The investment objective of Quantex is long term capital appreciation. The investment objective of Utilities is total returns, including current income and growth of income. The investment objective of Total Bond is total returns, including current income and capital growth. The investment objective of Money Market is current income while maintaining a stable share price of $1.00.
Effective April 29, 2011, the Board of Trustees (“Trustees”), including a majority of non-interested or independent Trustees, approved the change of name of The Total Return Utilities Fund to The Utilities and Infrastructure Fund. The investment strategy remains the same with an investment objective seeking total returns through income and capital appreciation. The Fund does not and will not invest in electric utilities that generate power from nuclear reactors.
On June 30, 2011, Meeder Asset Management, Inc. (“MAM”), the investment advisor to the Funds, offered a new fund to the Trust. The Total Return Bond Fund seeks total return, consisting of income and capital growth, consistent with preservation of capital by investing at least 80% of its assets in bonds which include fixed income securities and/or investments that provide exposure to fixed income securities. MAM uses a combination of quantitative models that seek to measure the relative risks and opportunities of each market segment based upon economic, market, political, currency and technical data, and its own assessment of economic and market conditions, to create an optimal risk/return allocation of the Fund’s assets among various segments of the fixed income market. After sector allocations are made, MAM uses traditional credit analysis to identify individual securities for the Fund’s portfolio.
Use of estimates. The preparation of financial statements in conformity with accounting principles generally accepted in the United States of America (“GAAP”) requires management to make estimates and assumptions that affect the reported amounts of assets and liabilities and disclosure of contingent assets and liabilities at the date of the financial statements and the reported amounts of increases and decreases in net assets from operations during the reporting period. Actual results could differ from those estimates.
Security valuation. All investments in securities are recorded at their estimated fair value, as described in Note #2.
Repurchase agreements. Each Fund may engage in repurchase agreement transactions whereby the Fund takes possession of an underlying debt instrument subject to an obligation of the seller to repurchase the instrument from the Fund and an obligation of the Fund to resell the instrument at an agreed upon price and term. At all times, the Fund maintains the value of collateral, including accrued interest, of at least 100% of the amount of the repurchase agreement, plus accrued interest. If the seller defaults or if the fair value of the collateral declines, realization of the collateral by the Fund may be delayed or limited.
Futures & options. Each Fund, except Money Market, may engage in transactions in financial futures contracts and options contracts in order to manage the risk of unanticipated changes in market values of securities held in the Fund, or which it intends to purchase. The futures and options contracts are adjusted by the daily exchange rate of the underlying currency, or index, and any gains or losses are recorded for financial statement purposes as unrealized gains or losses in the statement of assets and liabilities and the statement of operations until the contract settlement date, at which time realized gains and losses are included in the statement of operations.
| | 2011 Annual Report | December 31, 2011 |
To the extent that the Fund enters into futures contracts on an index or group of securities, the Fund exposes itself to an indeterminate liability and will be required to pay or receive a sum of money measured by the change in the value of the index. Upon entering into a futures contract, the Fund is required to deposit an initial margin, which is either cash (disclosed as cash held at broker on the Statements of Assets & Liabilities) or securities (disclosed as pledged as collateral on the Schedules of Investments) in an amount equal to a certain percentage of the contract value. Subsequently, the variation margin, which is equal to changes in the daily settlement price or last sale price on the exchanges where futures contracts trade, is received or paid and is recorded as an unrealized gain or loss until the contract is closed. When the contract is closed, the Fund records a realized gain or loss equal to the difference between the proceeds from (or cost of) the closing transaction and the Fund’s basis in the contract. Should market conditions move unexpectedly, the Fund may not achieve the anticipated benefits of the futures contract and may realize a loss. The use of futures transactions involves the risk of imperfect correlation in movements in the price of futures contracts, interest rates, and the underlying hedged assets. With futures, there is minimal counterparty credit risk to the Fund since futures are exchange traded and the exchange’s clearinghouse, as counterparty to all exchange traded futures, guarantees the futures against default. Except for Money Market and Utilities, it is normal practice for each Fund to invest in futures contracts on a daily basis. Although Utilities is permitted to invest in futures contracts, it typically does not.
Call and put option contracts involve the payment of a premium for the right to purchase or sell an individual security or index aggregate at a specified price until the expiration of the contract. Such transactions expose the Fund to the loss of the premium paid if the Fund does not sell or exercise the contract prior to the expiration date. In the case of a call option, sufficient cash or money market instruments will be segregated to complete the purchase. Options are valued on the basis of the daily settlement price or last sale on the exchanges where they trade and the changes in value are recorded as unrealized appreciation or depreciation until closed, exercised or expired. For the year ended December 31, 2011, there were no call or put options transacted for any of the Funds.
The Funds may write covered call or put options for which premiums received are recorded as liabilities and are subsequently adjusted to the current value of the options written. When written options are closed or exercised, premiums received are offset against the proceeds paid, and the Fund records realized gains or losses for the difference. When written options expire, the liability is eliminated, and the Fund records realized gains for the entire amount of premiums received. Although permitted, it is currently not normal practice for the Funds to write call and put options and none were written during the year ended December 31, 2011.
The fair value of derivative instruments, not accounted for as hedging instruments, as reported within the Statements of Assets and Liabilities as of December 31, 2011 was as follows:
| Amount of Net Variation Margin and Unrealized Appreciation (Depreciation) on Derivatives | |
| | | Statements of Assets & Liabilities Location* | Fair Value of Variation Margin | Fair Value of Unrealized Appreciation |
| The Muirfield Fund® | Equity contracts | Liabilities, Payable for net variation margin on futures contracts; Net Assets, Net unrealized appreciation of investments and futures contracts | $9,600 | $90,640 |
| The Dynamic Growth Fund | Equity contracts | Liabilities, Payable for net variation margin on futures contracts; Net Assets, Net unrealized appreciation of investments and futures contracts | 10,800 | 76,345 |
| The Aggressive Growth Fund | Equity contracts | Liabilities, Payable for net variation margin on futures contracts; Net Assets, Net unrealized appreciation of investments and futures contracts | 2,400 | 22,660 |
| The Defensive Balanced Fund | Equity contracts | Liabilities, Payable for net variation margin on futures contracts; Net Assets, Net unrealized appreciation of investments and futures contracts | 7,200 | 67,980 |
| The Strategic Growth Fund | Equity contracts | Liabilities, Payable for net variation margin on futures contracts; Net Assets, Net unrealized appreciation of investments and futures contracts | 18,400 | 141,210 |
| The Quantex Fund™ | Equity contracts | Liabilities, Payable for net variation margin on futures contracts; Net Assets, Net unrealized appreciation of investments and futures contracts | 3,400 | 36,785 |
| The Total Return Bond Fund | US Treasury Bond contracts | Assets, Receivable for net variation margin on futures contracts; Net Assets, Net unrealized appreciation of investments and futures contracts | 8,906 | 17,588 |
| * | Unrealized appreciation on futures contracts is included with unrealized appreciation (depreciation) of investments on the Statements of Assets & Liabilities. |
| | 2011 Annual Report | December 31, 2011 |
The effect of derivative instruments on the Statements of Operations for the period January 1, 2011 through December 31, 2011 was as follows:
| Amount of Realized Gain on Derivatives Recognized in Income |
| | | Contracts Opened During the Year | Contracts Closed During the Year | Statement of Operations Location | For the Year Ended December 31, 2011 |
| The Muirfield Fund® | Equity contracts | 271 | 279 | Net realized gains from futures contracts | $125,200 |
| The Dynamic Growth Fund | Equity contracts | 95 | 95 | Net realized gains (losses) from futures contracts | (102,743) |
| The Aggressive Growth Fund | Equity contracts | 62 | 63 | Net realized gains from futures contracts | 31,852 |
| The Defensive Balanced Fund | Equity contracts | 145 | 143 | Net realized gains (losses) from futures contracts | (188,355) |
| The Strategic Growth Fund | Equity contracts | 78 | 72 | Net realized gains (losses) from futures contracts | (189,886) |
| The Quantex Fund™ | Equity contracts | 35 | 35 | Net realized gains (losses) from futures contracts | (103,151) |
| The Total Return Bond Fund | US Treasury Bond contracts | 150 | 120 | Net realized gains from futures contracts | 31,169 |
| Change in Unrealized Gain or (Loss) on Derivatives Recognized in Income |
| | | Statement of Operations Location | For the Year Ended December 31, 2011 |
| The Muirfield Fund® | Equity contracts | Net change in unrealized appreciation (depreciation) of investments and futures contracts | $23,760 |
| The Dynamic Growth Fund | Equity contracts | Net change in unrealized appreciation (depreciation) of investments and futures contracts | 46,900 |
| The Aggressive Growth Fund | Equity contracts | Net change in unrealized appreciation (depreciation) of investments and futures contracts | 10,120 |
| The Defensive Balanced Fund | Equity contracts | Net change in unrealized appreciation (depreciation) of investments and futures contracts | 51,260 |
| The Strategic Growth Fund | Equity contracts | Net change in unrealized appreciation (depreciation) of investments and futures contracts | 110,505 |
| The Quantex Fund™ | Equity contracts | Net change in unrealized appreciation (depreciation) of investments and futures contracts | 26,550 |
| The Total Return Bond Fund | US Treasury Bond contracts | Net change in unrealized appreciation (depreciation) of investments and futures contracts | 17,588 |
Federal income taxes. It is each Fund’s policy to continue to comply with the requirements of Subchapter M of the Internal Revenue Code applicable to regulated investment companies and to distribute substantially all of its taxable income and net capital gains to its shareholders. Therefore, no federal income tax provision is required.
As of and during the year ended December 31, 2011, the Funds did not have a liability for any unrecognized tax benefits. The Funds recognize interest and penalties, if any, related to unrecognized tax benefits as income tax expense in the statements of operations. During the year ended December 31, 2011, the Funds did not incur any interest or penalties.
The Funds are not subject to examination by U.S. federal and state tax authorities for tax years before 2008.
| | 2011 Annual Report | December 31, 2011 |
Distributions to shareholders. Distributions to shareholders are recorded on the ex-dividend date. Muirfield, Quantex, Dynamic, Aggressive, Defensive, and Strategic declare and pay dividends from net investment income, if any, on a quarterly basis. Utilities and Total Bond declare and pay dividends from net investment income on a monthly basis. Money Market declares dividends from net investment income on a daily basis and pays such dividends on a monthly basis. Each Fund distributes net capital gains, if any, on an annual basis.
Distributions from net investment income and from net capital gains are determined in accordance with income tax regulations, which may differ from GAAP. These differences are primarily due to deferrals of certain losses, expiring capital loss carryforwards, and differing treatments of unrealized gains and losses of futures contracts held by each Fund. Accordingly, timing differences relating to shareholder distributions are reflected in the components of net assets and permanent book and tax differences have been reclassified within the components of net assets based on their ultimate characterization for federal income tax purposes. For the year ended December 31, 2011, the Funds made the following reclassifications to increase/(decrease) the components of net assets:
| | | | | | Accumulated Undistributed (Distributions in Excess of) Net Investment Income | | | Accumulated Undistributed Net Realized Gain (Loss) from Investments and Futures Contracts | |
| The Muirfield Fund® | | $ | (134,080 | ) | | $ | 134,080 | | | $ | — | |
| The Dynamic Growth Fund | | | (75,334 | ) | | | 75,334 | | | | — | |
| The Aggressive Growth Fund | | | (291,584 | ) | | | 291,584 | | | | — | |
| The Strategic Growth Fund | | | (305,636 | ) | | | 305,636 | | | | — | |
| The Quantex Fund™ | | | (3,773 | ) | | | 3,773 | | | | — | |
| The Utilities & Infrastructure Fund | | | (250,770 | ) | | | 223,498 | | | | 27,272 | |
Investment income & expenses. For Money Market, income and expenses (other than expenses attributable to a specific class) are allocated to each class of shares based on its relative net assets. Expenses incurred by the Trust that do not specifically relate to an individual Fund of the Trust are allocated to the Funds based on each Fund’s relative net assets or other appropriate basis.
Capital Share Transactions. Money Market is authorized to issue an unlimited number of shares in the Retail Class and the Institutional Class. Transactions in the capital shares of the Fund for the year ended December 31, 2011 and the year ended December 31, 2010 were as follows:
| | | | | | | |
| | | | | | | | | | | | | |
| Retail Class | | | | | | | | | | | | |
| Issued | | $ | 96,538,959 | | | | 96,538,959 | | | $ | 107,339,519 | | | | 107,339,519 | |
| Reinvested | | | 97,230 | | | | 97,230 | | | | 210,200 | | | | 210,200 | |
| Redeemed | | | (113,821,031 | ) | | | (113,821,031 | ) | | | (133,604,462 | ) | | | (133,604,462 | ) |
| Net increase (decrease) | | $ | (17,184,842 | ) | | | (17,184,842 | ) | | $ | (26,054,743 | ) | | | (26,054,743 | ) |
| | | | | | | | | | | | | | | | | |
| Institutional Class | | | | | | | | | | | | | | | | |
| Issued | | $ | 277,390,969 | | | | 277,390,969 | | | $ | 254,909,383 | | | | 254,909,383 | |
| Reinvested | | | 17,560 | | | | 17,560 | | | | 36,054 | | | | 36,054 | |
| Redeemed | | | (287,761,187 | ) | | | (287,761,187 | ) | | | (267,610,404 | ) | | | (267,610,404 | ) |
| Net increase (decrease) | | $ | (10,352,658 | ) | | | (10,352,658 | ) | | $ | (12,664,967 | ) | | | (12,664,967 | ) |
Other. The Funds record security transactions on the trade date. Gains and losses realized from the sale of securities are determined on the specific identification basis. Dividend income is recognized on the ex-dividend date and interest income (including amortization of premium and accretion of discount) is recognized as earned. Short-term capital gain distributions from underlying funds are classified as dividend income for financial reporting purposes. Long-term capital gains are broken out as such. Discounts and premiums are amortized over the lives of the respective securities. Distributions received from partnerships are recorded as return of capital distributions. Withholding taxes on foreign dividends have been provided for in accordance with the Funds’ understanding of the applicable country’s tax rules and rates.
| | 2011 Annual Report | December 31, 2011 |
As described in Note #1, the Funds utilize various methods to measure the fair value of their investments on a recurring basis. GAAP establishes a hierarchy that prioritizes inputs to valuation methods. The three levels of inputs are as follows:
Level 1 – Unadjusted quoted prices in active markets for identical assets or liabilities that the Funds have the ability to access.
Level 2 – Observable inputs other than quoted prices included in level 1 that are observable for the asset or liability, either directly or indirectly. These inputs may include quoted prices for the identical instrument on an inactive market, prices for similar instruments, interest rates, prepayment speeds, credit risk, yield curves, default rates and similar data.
Level 3 – Significant unobservable inputs for the asset or liability, to the extent relevant observable inputs are not available, representing the Funds’ own assumptions about the assumptions a market participant would use in valuing the asset or liability, and would be based on the best information available.
The availability of observable inputs can vary from security to security and is affected by a wide variety of factors, including, for example, the type of security, whether the security is new and not yet established in the marketplace, the liquidity of markets, and other characteristics particular to the security. To the extent that valuation is based on models or inputs that are less observable or unobservable in the market, the determination of fair value requires more judgment. Accordingly, the degree of judgment exercised in determining fair value is greatest for instruments categorized in level 3.
The inputs used to measure fair value may fall into different levels of the fair value hierarchy. In such cases, for disclosure purposes, the level in the fair value hierarchy within which the fair value measurement falls in its entirety, is determined based on the lowest level input that is significant to the fair value measurement in its entirety.
A description of the valuation techniques applied to the Funds’ major categories of assets and liabilities measured at fair value on a recurring basis follows.
Equity securities (including publicly traded partnerships, real estate investment trusts, american depositary receipts, exchange traded funds, and common stock). Securities traded on a national securities exchange (or reported on the NASDAQ national market) are stated at the last reported sales price on the day of valuation and are categorized in level 1 of the fair value hierarchy.
Investments in registered open-end investment companies, including money market funds, are valued at the daily redemption value as reported by the underlying fund and are categorized in level 1 of the fair value hierarchy.
Corporate bonds. The fair value of corporate bonds is estimated using various techniques, which may consider recently executed transactions in securities of the issuer or comparable issuers, market price quotations (where observable), bond spreads, fundamental data relating to the issuer, and credit default swap spreads adjusted for any basis difference between cash and derivative instruments. While most corporate bonds are categorized in level 2 of the fair value hierarchy, in instances where lower relative weight is placed on transaction prices, quotations, or similar observable inputs, they are categorized in level 3.
Short-term notes (including bank obligations, commercial paper, corporate obligations, U.S. government agency obligations, and floating rate demand notes). Short-term notes held in the Funds, except Money Market, maturing more than sixty days after the valuation date, are valued at the last sales price as of the close of business on the day of valuation, or, lacking any sales, at the most recent bid price or yield equivalent as obtained from dealers that make markets in such securities. When valued at last sales price, the securities will be categorized as level 1. When using bid prices or yield equivalents, they will be categorized as level 2. When such securities are valued within sixty days or less to maturity, the difference between the valuation existing on the sixty-first day before maturity and maturity value is amortized on a straight-line basis to maturity and will be categorized as level 2.
All securities held in Money Market, other than money market funds, are valued at amortized cost, which approximates fair value, and will be categorized as level 2.
Certificates of deposit. Certificates of deposit are valued at acquisition cost and will be categorized as level 2.
U.S. government obligations. U.S. government obligations are normally valued using a model that incorporates market observable data such as reported sales of similar securities, broker quotes, yields, bids, offers, and reference data. Certain securities are valued principally using dealer quotations. In either case, these securities will be categorized as level 2.
Restricted securities (equity and debt). Restricted securities for which quotations are not readily available are valued at fair value as determined by the Trustees. Depending on the relative significance of valuation inputs, these instruments may be classified in either level 2 or level 3 of the fair value hierarchy.
| | 2011 Annual Report | December 31, 2011 |
Derivative instruments (futures contracts). Listed derivative instruments that are actively traded, including futures contracts, are valued based on quoted prices from the exchange and are categorized in level 1 of the fair value hierarchy.
For the year ended December 31, 2011, the Funds did not hold any assets at any time in which significant unobservable inputs were used in determining fair value. Therefore, no reconciliation of level 3 securities is provided. Also, there were no significant transfers between level 1 and level 2 securities. The following table summarizes the inputs used to value the Funds’ assets and liabilities measured at fair value as of December 31, 2011.
Muirfield – Assets/(Liabilities) | | | | | | | | | | | | |
Registered investment companies | | $ | 105,962,332 | | | $ | — | | | $ | — | | | $ | 105,962,332 | |
Money market registered investment companies | | | 295,130 | | | | — | | | | — | | | | 295,130 | |
Floating rate demand notes | | | — | | | | 13,583,772 | | | | — | | | | 13,583,772 | |
| U.S. government obligations | | | — | | | | 799,971 | | | | — | | | | 799,971 | |
| Total | | $ | 106,257,462 | | | $ | 14,383,743 | | | $ | — | | | $ | 120,641,205 | |
Trustee deferred compensation | | $ | 115,883 | | | $ | — | | | $ | — | | | $ | 115,883 | |
Futures contracts* | | $ | 90,640 | | | $ | — | | | $ | — | | | $ | 90,640 | |
Dynamic – Assets/(Liabilities) | | | | | | | | | | | | |
Registered investment companies | | $ | 87,979,105 | | | $ | — | | | $ | — | | | $ | 87,979,105 | |
Money market registered investment companies | | | 392,637 | | | | — | | | | — | | | | 392,637 | |
Floating rate demand notes | | | — | | | | 1,806,669 | | | | — | | | | 1,806,669 | |
U.S. government obligations | | | — | | | | 799,971 | | | | — | | | | 799,971 | |
Total | | $ | 88,371,742 | | | $ | 2,606,640 | | | $ | — | | | $ | 90,978,382 | |
Trustee deferred compensation | | $ | 61,865 | | | $ | — | | | $ | — | | | $ | 61,865 | |
Futures contracts* | | $ | 76,345 | | | $ | — | | | $ | — | | | $ | 76,345 | |
Aggressive – Assets/(Liabilities) | | | | | | | | | | | | |
Registered investment companies | | $ | 31,272,026 | | | $ | — | | | $ | — | | | $ | 31,272,026 | |
Money market registered investment companies | | | 423,510 | | | | — | | | | — | | | | 423,510 | |
Floating rate demand notes | | | — | | | | 200,086 | | | | — | | | | 200,086 | |
U.S. government obligations | | | — | | | | 299,989 | | | | — | | | | 299,989 | |
Total | | $ | 31,695,536 | | | $ | 500,075 | | | $ | — | | | $ | 32,195,611 | |
Trustee deferred compensation | | $ | 37,357 | | | $ | — | | | $ | — | | | $ | 37,357 | |
Futures contracts* | | $ | 22,660 | | | $ | — | | | $ | — | | | $ | 22,660 | |
Defensive – Assets/(Liabilities) | | | | | | | | | | | | |
Registered investment companies | | $ | 76,723,974 | | | $ | — | | | $ | — | | | $ | 76,723,974 | |
Money market registered investment companies | | | 994,119 | | | | — | | | | — | | | | 994,119 | |
Floating rate demand notes | | | — | | | | 5,534,924 | | | | — | | | | 5,534,924 | |
U.S. government obligations | | | — | | | | 2,495,964 | | | | — | | | | 2,495,964 | |
Total | | $ | 77,718,093 | | | $ | 8,030,888 | | | $ | — | | | $ | 85,748,981 | |
Trustee deferred compensation | | $ | 43,995 | | | $ | — | | | $ | — | | | $ | 43,995 | |
Futures contracts* | | $ | 67,980 | | | $ | — | | | $ | — | | | $ | 67,980 | |
Strategic – Assets/(Liabilities) | | | | | | | | | | | | |
Registered investment companies | | $ | 79,652,036 | | | $ | — | | | $ | — | | | $ | 79,652,036 | |
Money market registered investment companies | | | 1,437,882 | | | | — | | | | — | | | | 1,437,882 | |
Floating rate demand notes | | | — | | | | 3,308,182 | | | | — | | | | 3,308,182 | |
U.S. government obligations | | | — | | | | 299,989 | | | | — | | | | 299,989 | |
Total | | $ | 81,089,918 | | | $ | 3,608,171 | | | $ | — | | | $ | 84,698,089 | |
Trustee deferred compensation | | $ | 37,400 | | | $ | — | | | $ | — | | | $ | 37,400 | |
Futures contracts* | | $ | 141,210 | | | $ | — | | | $ | — | | | $ | 141,210 | |
| | 2011 Annual Report | December 31, 2011 |
Quantex – Assets/(Liabilities) | | | | | | | | | | | | |
Common stocks** | | $ | 16,514,012 | | | $ | — | | | $ | — | | | $ | 16,514,012 | |
Money market registered investment companies | | | 323,007 | | | | — | | | | — | | | | 323,007 | |
Floating rate demand notes | | | — | | | | 400,059 | | | | — | | | | 400,059 | |
U.S. government obligations | | | — | | | | 199,993 | | | | — | | | | 199,993 | |
Total | | $ | 16,837,019 | | | $ | 600,052 | | | $ | — | | | $ | 17,437,071 | |
Trustee deferred compensation | | $ | 43,067 | | | $ | — | | | $ | — | | | $ | 43,067 | |
Futures contracts* | | $ | 36,785 | | | $ | — | | | $ | — | | | $ | 36,785 | |
Utilities – Assets/(Liabilities) | | | | | | | | | | | | |
Common stocks** | | $ | 32,289,366 | | | $ | — | | | $ | — | | | $ | 32,289,366 | |
Money market registered investment companies | | | 355,581 | | | | — | | | | — | | | | 355,581 | |
Total | | $ | 32,644,947 | | | $ | — | | | $ | — | | | $ | 32,644,947 | |
Trustee deferred compensation | | $ | 41,094 | | | $ | — | | | $ | — | | | $ | 41,094 | |
Total Bond – Assets/(Liabilities) | | | | | | | | | | | | |
Registered investment companies | | $ | 49,860,948 | | | $ | — | | | $ | — | | | $ | 49,860,948 | |
Money market registered investment companies | | | 1,420,475 | | | | — | | | | — | | | | 1,420,475 | |
U.S. government obligations | | | — | | | | 5,468,311 | | | | — | | | | 5,468,311 | |
Total | | $ | 51,281,423 | | | $ | 5,468,311 | | | $ | — | | | $ | 56,749,734 | |
Trustee deferred compensation | | $ | 2,707 | | | $ | — | | | $ | — | | | $ | 2,707 | |
Futures contracts* | | $ | 17,588 | | | $ | — | | | $ | — | | | $ | 17,588 | |
Money Market – Assets/(Liabilities) | | | | | | | | | | | | |
Bank obligations | | $ | — | | | $ | 7,991,624 | | | $ | — | | | $ | 7,991,624 | |
Certificates of deposit | | | — | | | | 1,494,000 | | | | — | | | | 1,494,000 | |
Commercial paper | | | — | | | | 7,541,056 | | | | — | | | | 7,541,056 | |
Corporate obligations | | | — | | | | 34,763,212 | | | | — | | | | 34,763,212 | |
U.S. government agency obligations | | | — | | | | 37,268,455 | | | | — | | | | 37,268,455 | |
Money Market registered investment companies | | | 13,048,622 | | | | — | | | | — | | | | 13,048,622 | |
Total | | $ | 13,048,622 | | | $ | 89,058,347 | | | $ | — | | | $ | 102,106,969 | |
Trustee deferred compensation | | $ | 38,713 | | | $ | — | | | $ | — | | | $ | 38,713 | |
| * | Futures contracts include cumulative unrealized gain/loss on contracts open at December 31, 2011. |
| ** | See schedule of investments for industry classifications. |
3. Investment Transactions
For the year ended December 31, 2011, the cost of purchases and proceeds from sales or maturities of long-term investments for the Funds, including U.S. Government investments, were as follows:
| | | | | | | |
The Muirfield Fund® | | $ | 204,088,454 | | | $ | 200,773,367 | |
The Dynamic Growth Fund | | | 164,510,784 | | | | 161,918,635 | |
The Aggressive Growth Fund | | | 88,275,418 | | | | 86,649,295 | |
The Defensive Balanced Fund | | | 139,366,719 | | | | 111,316,636 | |
The Strategic Growth Fund | | | 160,023,686 | | | | 129,888,739 | |
The Quantex Fund™ | | | 13,520,075 | | | | 11,012,083 | |
The Utilities & Infrastructure Fund | | | 22,032,942 | | | | 12,795,262 | |
The Total Return Bond Fund | | | 112,076,088 | | | | 55,118,788 | |
| | 2011 Annual Report | December 31, 2011 |
For the year ended December 31, 2011, the cost of purchases and proceeds from sales or maturities of long-term U.S. Government investments for the Funds are as follows:
| | | | | | | |
The Defensive Balanced Fund | | $ | 2,197,680 | | | $ | 1,000,000 | |
The Total Return Bond Fund | | | 5,463,401 | | | | — | |
| 4. | Investment Advisory Fees and Other Transactions with Affiliates |
Meeder Asset Management, Inc. (“MAM”), a wholly-owned subsidiary of Meeder Financial, Inc. (“Meeder”), provides each Fund, under a separate Investment Advisory Contract, with investment management, research, statistical and advisory services. The services of MAM will terminate automatically if assigned and may be terminated without penalty at any time upon 60 days prior written notice by majority vote of the Fund, by the Trustees of the Fund, or by MAM. For such services the Funds pay a fee at the following annual rates: Muirfield and Quantex, 1.00% of average daily net assets up to $50 million, 0.75% of average daily net assets exceeding $50 million up to $100 million and 0.60% of average daily net assets exceeding $100 million; Dynamic, Aggressive, Defensive, and Strategic, 0.75% of average daily net assets up to $200 million and 0.60% of average daily net assets exceeding $200 million; Total Bond, 0.40% of average daily net assets up to $100 million and 0.20% of average daily net assets exceeding $100 million; and Money Market, 0.40% of average daily net assets up to $100 million and 0.25% of average daily net assets exceeding $100 million. MAM has contractually agreed to reduce its investment advisory fee by 0.25% for Quantex for average daily net assets up to $50 million. The foregoing reduction in investment advisory fees shall automatically renew annually on or about April 30th, unless MAM elects to terminate this reduction. During the year ended December 31, 2011, $51,275 of investment advisory fees was waived in Quantex.
Under a separate Investment Subadvisory Agreement with MAM, Miller/Howard Investments, Inc. (“Miller/Howard”) serves as subadvisor of Utilities. The Investment Subadvisory Agreement provides that it will terminate automatically if assigned, and that it may be terminated by MAM without penalty to the Fund by MAM, the Trustees of the Fund, or by the vote of a majority of the outstanding voting securities of the Fund upon not less than 30 days written notice. For its services, Utilities pays MAM a fee of 1.00% of average daily net assets up to $50 million, 0.75% of average daily net assets exceeding $50 million up to $100 million and 0.60% of average daily net assets exceeding $100 million. As subadvisor to Utilities, Miller/Howard receives a fee paid by MAM.
Mutual Funds Service Co. (“MFSCo”), a wholly-owned subsidiary of Meeder, serves as stock transfer, dividend disbursing and shareholder services agent for each Fund. In compensation for such services, each Fund pays MFSCo an annual fee calculated as follows: For Muirfield, Utilities, Quantex, Dynamic, Aggressive, Defensive, and Strategic, such fee is equal to the greater of $15 per active shareholder account or 0.12% of each Fund’s average daily net assets. For Total Bond, such fee is equal to the greater of $15 per active shareholder account or 0.08% of the Fund’s average daily net assets. For Money Market Retail Class and Money Market Institutional Class, such fee is equal to the greater of $20 per active shareholder account or 0.08% of the Fund’s average daily net assets. MFSCo is entitled to receive an annual minimum fee of $4,000 for each Fund or class. For fixed income Funds that are subject to an expense cap and which are above the voluntary expense cap, the basis point fee will be reduced by 0.02%. During the year ended December 31, 2011, MFSCo waived $4,180 and $14,219 of transfer agent fees for Total Bond and the Institutional Class, respectively.
MFSCo provides the Trust with certain administrative services. In compensation for such services, each Fund pays MFSCo an annual fee equal to 0.10% of each Fund’s average daily net assets up to $50 million and 0.08% of each Fund’s average daily net assets exceeding $50 million.
MFSCo serves as accounting services agent for each Fund. In compensation for such services, each Fund pays MFSCo an annual fee equal to the greater of:
| | a. | 0.15% of the first $10 million of average daily net assets, 0.10% of the next $20 million of average daily net assets, 0.02% of the next $50 million of average daily net assets, and 0.01% in excess of $80 million of average daily net assets, |
| | b. | $7,500 for non-Money Market Funds and $30,000 for Money Market. |
| | 2011 Annual Report | December 31, 2011 |
For the year ended December 31, 2011, MAM voluntarily agreed to reduce its fees and/or reimburse expenses (excluding brokerage fees and commissions, taxes, interest, and extraordinary or non-recurring expenses), to limit total annual operating expenses to 1.39%, 1.39%, 1.59%, 1.44%, 1.39%, and 0.99% of average daily net assets for Muirfield, Dynamic, Aggressive, Defensive, Strategic, and Total Bond, respectively. MAM has also voluntarily agreed to reduce its fees and/or reimburse expenses to limit the Retail Class’ and the Institutional Class’ total annual operating expenses to 0.30% and 0.21% of average daily net assets, respectively. Such reductions and/or reimbursements are limited to the total of fees charged to each Fund or Class by MAM and MFSCo. For the year ended December 31, 2011, MAM and/or MFSCo reimbursed and/or waived $61,248, $70,019, $2,580, $51,681, $62,514, $56,749, and $498,486 to Muirfield, Dynamic, Aggressive, Defensive, Strategic, Total Bond, and Money Market, respectively.
Muirfield, Dynamic, Aggressive, Defensive, Strategic, and Total Bond have entered into an agreement with the Trust’s custodian, The Huntington National Bank (“HNB”), whereby HNB receives distribution, service, and administration fees (collectively the “fees”) from the underlying security holdings of the aforementioned Funds, and forwards those fees to the appropriate Funds. The Funds use the fees received to reduce the gross expenses of each Fund. For the year ended December 31, 2011, Muirfield, Dynamic, Aggressive, Defensive, Strategic, and Total Bond used $76,821, $67,966, $25,429, $45,919, $72,848, and $14,374 of fees received, respectively, to reduce gross expenses of each Fund. It is possible that the Funds may invest in security holdings in which fees are not paid. As such, the gross expenses of a Fund would not be decreased. Also, without this agreement it is likely that the Funds would not collect any fees from underlying security holdings.
Pursuant to Rule 12b-1 of the 1940 Act, a mutual fund can adopt a written plan to pay certain expenses out of fund assets relating to the sale and distribution of its shares. Muirfield, Quantex, and the Retail Class have adopted a distribution plan with an annual limitation of 0.20% of average daily net assets. Utilities, Dynamic, Aggressive, Defensive, Strategic, and Total Bond have adopted a distribution plan with an annual limitation of 0.25% of average daily net assets. The Institutional Class has adopted a distribution plan with an annual limitation of 0.03% of average daily net assets. For the year ended December 31, 2011, Muirfield, Dynamic, Aggressive, Defensive, Strategic, Quantex, Utilities, and Total Bond paid less than the maximum annual amount, effectively waiving $24,904, $18,935, $7,607, $11,931, $15,593, $14,562, $16,421, and $2,508 of distribution plan (12b-1) expenses, respectively. The Retail Class and the Institutional Class waived $155,307 and $8,889, respectively, for a total of $164,196.
An Administrative Services Plan has been adopted for each Fund of the Trust except Money Market. The Administrative Services Plan allows for each eligible Fund to pay a maximum annual amount of 0.20% of average daily net assets to service organizations that provide administrative support services to their customers who own shares of record or beneficially. For the year ended December 31, 2011, Muirfield, Dynamic, Aggressive, Defensive, Strategic, Quantex, and Utilities elected to charge less than the maximum annual amount, effectively waiving $61,666, $10,414, $6,406, $5,220, $5,745, $23,996, and $20,070 of administrative service plan expenses, respectively.
The Funds have adopted a Deferred Compensation Plan (the “Plan”) for the independent Trustees. Under the Plan, each eligible Trustee is permitted to defer all or a portion of the trustees fees payable by any of the Funds as an investment into any combination of Funds until a specified point of time. The investment into the Funds is recorded as an asset however an offsetting liability is also recorded for the deferred payment. Once the eligible Trustees’ deferral amounts can be distributed, a lump sum or generally equal annual installments over a period of up to ten (10) years can be made to the eligible Trustee(s). The Funds may terminate this Plan at any time.
Certain trustees and officers of the Funds are also officers or directors of Meeder, MAM, and MFSCo.
During the year ended December 31, 2011, several of the Funds invested in The Money Market Fund, an affiliate, as described in Section 2(a)(3) of the Investment Company Act of 1940. As of December 31, 2011, the 7-day yield of the Institutional Class was 0.17%. A summary of the Funds’ investments in this affiliate during the year is noted below:
| | 2011 Annual Report | December 31, 2011 |
| | | | | | | | | | | | | | | | | | | |
The Muirfield Fund® | | $ | 1,186,440 | | | $ | 80,502,672 | | | $ | (81,393,982 | ) | | $ | 295,130 | | | $ | 4,056 | | | $ | 295,130 | |
The Dynamic Growth Fund | | | 1,901,691 | | | | 36,230,931 | | | | (37,739,985 | ) | | | 392,637 | | | | 3,188 | | | | 392,637 | |
The Aggressive Growth Fund | | | 604,959 | | | | 26,671,905 | | | | (26,853,354 | ) | | | 423,510 | | | | 2,183 | | | | 423,510 | |
The Defensive Balanced Fund | | | 981,486 | | | | 54,298,381 | | | | (54,285,748 | ) | | | 994,119 | | | | 3,805 | | | | 994,119 | |
The Strategic Growth Fund | | | 1,553,744 | | | | 45,075,351 | | | | (45,191,213 | ) | | | 1,437,882 | | | | 2,876 | | | | 1,437,882 | |
The Quantex Fund™ | | | 635,526 | | | | 14,209,515 | | | | (14,522,034 | ) | | | 323,007 | | | | 1,392 | | | | 323,007 | |
The Utilities & Infrastructure Fund | | | 1,091,819 | | | | 16,891,989 | | | | (17,628,227 | ) | | | 355,581 | | | | 1,584 | | | | 355,581 | |
The Total Return Bond Fund | | | — | | | | 36,900,366 | | | | (35,479,891 | ) | | | 1,420,475 | | | | 981 | | | | 1,420,475 | |
| 5. | Federal Tax Information |
The tax characteristics of dividends paid by the Funds during the year ended December 31, 2011 were as follows:
| | | | | | Net Short- Term Capital Gains | | | Net Long- Term Capital Gains | | | | | | | |
The Muirfield Fund® | | $ | 173,017 | | | $ | — | | | $ | — | | | $ | — | | | $ | 173,017 | |
The Dynamic Growth Fund | | | 189 | | | | — | | | | — | | | | — | | | | 189 | |
The Aggressive Growth Fund | | | — | | | | — | | | | — | | | | — | | | | — | |
The Defensive Balanced Fund | | | 966,354 | | | | — | | | | — | | | | — | | | | 966,354 | |
The Strategic Growth Fund | | | 149 | | | | — | | | | — | | | | — | | | | 149 | |
The Quantex Fund™ | | | 5,745 | | | | — | | | | — | | | | — | | | | 5,745 | |
The Utilities & Infrastructure Fund | | | 480,205 | | | | — | | | | — | | | | — | | | | 480,205 | |
The Total Return Bond Fund | | | 1,038,809 | | | | — | | | | — | | | | — | | | | 1,038,809 | |
The Money Market Fund | | | 161,244 | | | | — | | | | — | | | | — | | | | 161,244 | |
The tax characteristics of dividends paid by the Funds during the year ended December 31, 2010 were as follows:
| | | | | | Net Short- Term Capital Gains | | | Net Long- Term Capital Gains | | | | | | | |
The Muirfield Fund® | | $ | 458,892 | | | $ | — | | | $ | — | | | $ | — | | | $ | 458,892 | |
The Dynamic Growth Fund | | | 198,567 | | | | — | | | | — | | | | — | | | | 198,567 | |
The Aggressive Growth Fund | | | — | | | | — | | | | — | | | | — | | | | — | |
The Defensive Balanced Fund | | | 792,255 | | | | — | | | | — | | | | — | | | | 792,255 | |
The Strategic Growth Fund | | | 198,274 | | | | — | | | | — | | | | — | | | | 198,274 | |
The Quantex Fund™ | | | 25 | | | | — | | | | — | | | | — | | | | 25 | |
The Utilities & Infrastructure Fund | | | 133,540 | | | | — | | | | — | | | | — | | | | 133,540 | |
The Money Market Fund | | | 330,246 | | | | — | | | | — | | | | — | | | | 330,246 | |
| * | Total dividends paid may differ from the amount reported in the Statement of Changes in Net Assets because for tax purposes dividends are recognized when actually paid. |
| | 2011 Annual Report | December 31, 2011 |
As of December 31, 2011, the components of accumulated earnings/(deficit) on a tax basis for the Funds were as follows:
| | | Undistributed Ordinary Income | | | | | | Accumulated Capital and Other Gains and (Losses) | | | Unrealized Appreciation/ (Depreciation)** | | | Total Accumulated Earnings/ (Deficit) | |
The Muirfield Fund® | | $ | 509 | | | $ | (509 | ) | | $ | (7,032,540 | ) | | $ | (1,882,701 | ) | | $ | (8,915,241 | ) |
The Dynamic Growth Fund | | | — | | | | — | | | | (10,299,112 | ) | | | (587,343 | ) | | | (10,886,455 | ) |
The Aggressive Growth Fund | | | — | | | | — | | | | (6,618,193 | ) | | | (992,258 | ) | | | (7,610,451 | ) |
The Defensive Balanced Fund | | | 805 | | | | (803 | ) | | | (4,802,814 | ) | | | (1,288,718 | ) | | | (6,091,530 | ) |
The Strategic Growth Fund | | | — | | | | — | | | | (3,017,822 | ) | | | (3,747,407 | ) | | | (6,765,229 | ) |
The Quantex Fund™ | | | 58 | | | | (58 | ) | | | (909,378 | ) | | | (601,689 | ) | | | (1,511,067 | ) |
The Utilities & Infrastructure Fund | | | 8,378 | | | | (7,511 | ) | | | 173,918 | | | | 2,026,043 | | | | 2,200,828 | |
The Total Return Bond Fund | | | — | | | | — | | | | (542,658 | ) | | | (989,951 | ) | | | (1,532,609 | ) |
The Money Market Fund | | | 3,084 | | | | (3,084 | ) | | | — | | | | — | | | | — | |
| ** | The differences between book- and tax-basis unrealized appreciation/(depreciation) are attributable primarily to: deferral of post October losses, wash sales, and the realization for tax purposes of unrealized gains/(losses) on certain derivative instruments. |
The Regulated Investment Company Modernization Act of 2010 (the “Act”) was enacted on December 22, 2010. The Act makes changes to several tax rules impacting the Funds. In general, some provisions of the Act, not including the changes to capital loss carryforwards, are effective for the Funds’ fiscal year ended December 31, 2011. Although the Act provides several benefits, including the unlimited carryover of future capital losses, there may be a greater likelihood that all or a portion of the Funds’ pre-enactment capital loss carryovers may expire without being utilized due to the fact that post-enactment capital losses get utilized before pre-enactment capital loss carryovers. Additionally, post Act losses that are carried forward will retain their character as either short-term or long-term capital loss carryovers rather than being considered all short-term as under previous law.
For federal income tax purposes, the following Funds have capital loss carryforwards as of December 31, 2011, which are available to offset future capital gains, if any. To the extent that these carryforwards are used to offset future capital gains, it is probable that the gains that are offset will not be distributed to shareholders:
Post Act Carryforwards (no expiration) | | | | |
The Strategic Growth Fund | | $ | 1,180,663 | | Short-term |
The Total Return Bond Fund | | | 542,658 | | Short-term |
| | | | | | |
The Muirfield Fund® | | $ | 1,549,155 | | | | 2016 | |
The Muirfield Fund® | | | 5,483,385 | | | | 2017 | |
The Dynamic Growth Fund | | | 10,299,112 | | | | 2017 | |
The Aggressive Growth Fund | | | 3,263,651 | | | | 2016 | |
The Aggressive Growth Fund | | | 3,354,542 | | | | 2017 | |
The Defensive Balanced Fund | | | 3,888,973 | | | | 2016 | |
The Defensive Balanced Fund | | | 913,841 | | | | 2017 | |
The Strategic Growth Fund | | | 1,837,159 | | | | 2017 | |
The Quantex Fund™ | | | 909,378 | | | | 2017 | |
Under current tax laws, Management has elected to defer net capital losses incurred after October 31, within a Fund’s fiscal year, and are deemed to arise on the first business day of the following fiscal year for tax purposes. For the year ended December 31, 2011, Total Bond deferred post October losses in the amount of $221,284.
| | 2011 Annual Report | December 31, 2011 |
The beneficial ownership, either directly or indirectly, of more than 25% of the voting securities of a fund creates a presumption of control of the fund under Section 2(a)(9) of the 1940 Act. As of December 31, 2011, Charles Schwab & Co., Inc. held for the benefit of others, in aggregate, 27% of Utilities; Nationwide Trust Company, FSB held for the benefit of others, in aggregate, 83% of Defensive; Nationwide Trust Company, FSB held for the benefit of others, in aggregate, 88% of Strategic; Nationwide Trust Company, FSB held for the benefit of others, in aggregate, 78% of Dynamic; Nationwide Trust Company, FSB held for the benefit of others, in aggregate, 71% of Aggressive; Nationwide Trust Company, FSB held for the benefit of others, in aggregate, 59% of Muirfield; Nationwide Life Insurance Company held for the benefit of others, in aggregate, 84% of Total Bond; Carey & Co. held for the benefit of others, in aggregate, 61% of Institutional Class; and IBEW 683 Health & Welfare Plan held 32% of Institutional Class, and therefore may be deemed to control the Funds.
| 7. | Board Review of Investment Advisory and Subadvisory Agreements (unaudited) |
At a meeting held September 1, 2011, the Board of Trustees (the “Board”), including a majority of non-interested or independent Trustees, approved the renewal of the investment advisory agreements for each of the separate funds comprising The Flex-funds (the “Funds”) and the investment sub-advisory agreement relating to The Utilities and Infrastructure Fund (individually, an “Agreement” and collectively, the “Agreements”).
The Board reviewed materials sent to each Trustee in advance of the meeting for consideration in determining whether to approve the renewal of each Fund’s Agreements. Management reviewed with the Trustees the materials prepared by them in response to Funds’ legal counsel’s supplemental written request pursuant to Section 15(c) of the Investment Company Act of 1940 for the provision to the Trustees of appropriately updated and amended information necessary or appropriate to assist the Trustees in their deliberations concerning renewal of the Agreements. In reaching the decision to renew the Agreements, the Board also took into account information furnished throughout the year at regular Board meetings. Information furnished and discussed throughout the year included investment performance reports and related financial information for each Fund, as well as periodic reports on shareholder services, legal compliance, pricing, brokerage commissions and execution and other services provided by the investment manager, Meeder Asset Management, Inc. (“Manager”) and its affiliates, or by or on behalf of The Utilities and Infrastructure Fund’s Subadviser, Miller/Howard Investments, Inc. Information furnished specifically in connection with the renewal process included a report for the Funds prepared by Lipper Financial Services (“Lipper”), an independent organization, as well as a Funds’ profitability analysis prepared by the Manager. The Lipper report compared each Fund’s management fees and expenses with those of other mutual funds deemed comparable to the Fund. The Funds’ profitability analysis discussed the profitability to the Manager and Mutual Funds Service Co., an affiliate of the Manager, from the overall Funds’ operations utilizing expense allocation methodologies deemed reasonable by the Manager.
In considering such materials, the independent Trustees noted that they had received assistance and advice from and met separately with the Funds’ legal counsel and chief compliance officer prior to this meeting. In their deliberations, the Board dealt with each Fund separately. In approving continuance of the Agreement for each Fund, the Board, including a majority of independent Trustees, considered each Fund’s Agreement, a copy of which was made available at the meeting, and determined that the existing management fee structure was fair and reasonable and that continuance of the Agreement was in the best interests of each Fund and its shareholders. While attention was given to all information furnished, the following discusses the primary factors relevant to the Board’s decision.
Nature, Extent and Quality of Services. The Board continues to be satisfied with the nature and quality of the overall services provided by the Manager and its affiliates to the Funds and their shareholders. In addition to investment performance and expenses discussed earlier, the Board’s opinion was based, in part, upon periodic reports furnished them showing that the investment policies and restrictions for each Fund were consistently complied with as well as other reports periodically furnished the Board. Other factors taken into account by the Board were the Manager’s compliance procedures and the qualifications of the Manager’s chief compliance officer. Consideration was also given to the experience of each Fund’s portfolio management team. The Board also took into account the transfer agent, fund accounting agent and administrative services provided to Fund shareholders by an affiliate of the Manager, noting continuing expenditures by management to increase and improve the scope of such services. Similar considerations were applied to the Subadviser to The Utilities and Infrastructure Fund.
Investment Performance. The Board placed emphasis on the investment performance of each Fund in view of its importance to shareholders. While consideration was given to performance reports and discussions with portfolio managers at Board meetings during the year, particular attention in assessing performance was given to the Lipper reports furnished for the Agreement renewals. The Lipper report prepared for each Fund showed the investment performance of the Fund for the one-, three-, and five-year periods, as applicable, ended June 30, 2011 (the “relevant periods”) in comparison with a performance universe similar to each Fund’s investment objectives.
| | 2011 Annual Report | December 31, 2011 |
| |
| The Muirfield Fund® | Blended Benchmark of 60% S&P 500 Index and 40% Average 90-day U.S. T-Bill; S&P 500 Index; Lipper’s Average Flexible Portfolio Fund Universe; Lipper Index1 |
The Quantex Fund™ (Formerly The Highlands Growth Fund) | Blended Benchmark of 50% Russell 2000 Index and 50% S&P 400 Mid-Cap Index; Russell 2000 Index; S&P 400 Mid-Cap Index; Lipper’s Average Mid-Cap Value Fund Universe; Lipper Index1 |
| The Dynamic Growth Fund | S&P 500 Index; Lipper’s Average Multi-Cap Core Fund Universe; Lipper Index1 |
The Utilities and Infrastructure Fund (Formerly The Total Return Utilities Fund) | Russell 3000 Utilities Index; Lipper’s Average Utility Fund Universe; Lipper Index1 |
| The Aggressive Growth Fund | S&P 500 Index; Lipper’s Average Multi-Cap Growth Fund Universe; Lipper Index1 |
The Defensive Balanced Fund (Formerly The Defensive Growth Fund) | S&P 500 Index; Blended Benchmark consisting of 30% Barclays Intermediate Government/Credit Index, 42% S&P 500 Index, and 28% Average 90-day U.S. T-Bill; Lipper’s Average Flexible Portfolio Fund Universe; Lipper Index1 |
The Strategic Growth Fund (Formerly The Focused Growth Fund) | S&P 500 Index; Blended Benchmark of 25% S&P 500 Index, 20% S&P 400 Index, 12.5% Russell 2000 Index, 12% MSCI EAFE Index, 5.5% iShares MSCI Emerging Markets Index, 12.5% Dow Jones U.S. Select Real Estate Investment Trust, 12.5% Goldman Sachs Commodity Index; Lipper’s Average Multi-Cap Core Fund Universe; Lipper Index1 |
| The Money Market Fund | |
| Retail Class | Lipper Average General Purpose Money Market Fund |
| Institutional Class | Lipper Average General Purpose Money Market Fund |
| 1 | Given an adequate quantity of funds, the Lipper Index for a given investment classification or objective consists of the largest ten or thirty funds in that classification or objective. Each index is calculated daily with adjustments for dividends and capital gains. |
Comparative Expenses. Consideration was given to a comparative analysis of the management fees and total expense ratios of each Fund compared with those of a group of other funds.
Management Profitability. The Board also considered the level of profits realized by the Manager and its affiliates in connection with the operation of the Funds. In this respect, the Board reviewed the Funds’ profitability analysis that addresses the overall profitability of The Flex-funds’ business. The Board also considered the extent to which the Manager and its affiliates might derive ancillary benefits from fund operations, including potential benefits resulting from allocation of fund brokerage and the declining use of “soft” commission dollars to pay for research. The Board also took into account management’s expenditures in improving shareholder services provided to the Funds, as well as the need to meet additional regulatory and compliance requirements resulting from recent SEC requirements. The Board determined that the level of profits realized by the Manager under its Agreements with the Funds was not excessive in view of the nature, quality and extent of services provided.
Economies of Scale. The Board also considered whether economies of scale are realized by the Manager as the Funds grow larger and the extent to which this is reflected in the level of management fees charged. While recognizing that any precise determination is inherently subjective, the Board noted that based upon the Funds’ profitability analysis, it appears that as some Funds get larger, at some point economies of scale do result in the Manager realizing a larger profit margin on management services provided to such a Fund. The Board also noted that economies of scale are shared with each Fund and its shareholders through management fee breakpoints so that as a Fund grows in size, its effective management fee rate declines. The Board reviewed, and expressed continued satisfaction with, each Fund’s fee structure under its Agreement, as well as The Utilities and Infrastructure Fund’s fee structure under the investment sub-advisory agreement with Miller/Howard Investments, Inc.
| | 2011 Annual Report | December 31, 2011 |
REPORT OF INDEPENDENT REGISTERED PUBLIC ACCOUNTING FIRM |
To the Shareholders and Board of Trustees
The Flex-funds
We have audited the accompanying statements of assets and liabilities, including the schedules of investments, of The Flex-funds (the “Funds”), comprising The Muirfield Fund, The Dynamic Growth Fund, The Aggressive Growth Fund, The Defensive Balanced Fund, The Strategic Growth Fund, The Quantex Fund, The Utilities and Infrastructure Fund (formerly, The Total Return Utilities Fund), The Total Return Bond Fund, and The Money Market Fund, as of December 31, 2011, and the related statements of operations for the year then ended, statements of changes in net assets for each of the two years in the period then ended, and the financial highlights for each of the five years in the period then ended for The Muirfield Fund, The Dynamic Growth Fund, The Aggressive Growth Fund, The Defensive Balanced Fund, The Strategic Growth Fund, The Quantex Fund, The Utilities and Infrastructure Fund, and The Money Market Fund, and the related statements of operations and changes in net assets and the financial highlights for the period June 30, 2011 (commencement of operations) through December 31, 2011, for The Total Return Bond Fund. These financial statements and financial highlights are the responsibility of Fund management. Our responsibility is to express an opinion on these financial statements and financial highlights based on our audits.
We conducted our audits in accordance with the standards of the Public Company Accounting Oversight Board (United States). Those standards require that we plan and perform the audit to obtain reasonable assurance about whether the financial statements and financial highlights are free of material misstatement. An audit includes examining, on a test basis, evidence supporting the amounts and disclosures in the financial statements. Our procedures included confirmation of securities owned as of December 31, 2011, by correspondence with the custodians and broker. An audit also includes assessing the accounting principles used and significant estimates made by management, as well as evaluating the overall financial statement presentation. We believe that our audits provide a reasonable basis for our opinion.
In our opinion, the financial statements and financial highlights referred to above present fairly, in all material respects, the financial position of each of the Funds constituting The Flex-funds, as of December 31, 2011, the results of their operations, the changes in their net assets and their financial highlights for the periods indicated above, in conformity with accounting principles generally accepted in the United States of America.
COHEN FUND AUDIT SERVICES, LTD.
Westlake, Ohio
February 22, 2012
| | 2011 Annual Report | December 31, 2011 |
Trustees and Officers (unaudited)
Certain trustees and officers of the Funds are also officers or directors of Meeder, MAM, and MFSCo. The Trustees oversee the management of the Trust and elect its officers. The officers are responsible for the Funds’ day-to-day operations. The Trustees’ and officers’ names, addresses, years of birth, positions held with the Trust, and length of service with The Flex-funds are listed below. Also included is each Board member’s principal occupation during, at least, the past five years. Except as indicated, each individual has held the office shown or other offices in the same company for the last five years. Those Trustees who are “interested persons”, as defined in the 1940 Act, by virtue of their affiliation with the Trust, are indicated by an asterisk (*).
Name, Address1, and Year of Birth | Year First Elected a Trustee or Officer of the Trust | Position and Number of Funds Overseen2 | Principal Occupation During Past Five Years and Other Directorships Held |
Robert S. Meeder, Jr.* Year of Birth: 1961 | 1992 | Trustee and President | President of Meeder Asset Management, Inc. |
Jack W. Nicklaus** Year of Birth: 1961 | 1998 | Trustee | Designer, Nicklaus Design, a golf course design firm and division of The Nicklaus Companies. |
Stuart M. Allen** Year of Birth: 1961 | 2006 | Trustee | President of Gardiner Allen DeRoberts Insurance LLC, an insurance agency; Chairman of the Trust’s Audit Committee. |
Anthony D’Angelo** Year of Birth: 1959 | 2006 | Trustee | Director of Sales, WSYX ABC 6/WTTE Fox 28, television stations owned and operated by Sinclair Broadcast Group; Lead Trustee of the Trust. |
Dale W. Smith Year of Birth: 1959 | 2006 | Vice President | Chief Financial Officer of Meeder Asset Management, Inc. (2005 - present); formerly Senior Vice President of Financial Services of BISYS Fund Services (1996 – 2004). |
Mary “Maggie” Bull Year of Birth: 1966 | 2011 | Chief Compliance Officer | Chief Compliance Officer, Legal Counsel and Anti-Money Laundering Officer of the Funds (2011 – present); Independent Legal Consultant (2007 – 2010); Assistant General Counsel of Nationwide (2006 – 2007). |
Stephen E. Hoffman Year of Birth: 1964 | 2011 | Assistant Chief Compliance Officer | Director of Human Resources, Meeder Asset Management, Inc. (2011 – present); Chief Compliance Officer, Meeder Asset Management, Inc. (2011 – present); Financial Consultant for Beacon Hill Fund Services (2009 – present); Chief Financial Officer for Sanese Services (2006 – 2008). |
| | 2011 Annual Report | December 31, 2011 |
Name, Address1, and Year of Birth | Year First Elected a Trustee or Officer of the Trust | Position and Number of Funds Overseen2 | Principal Occupation During Past Five Years and Other Directorships Held |
Bruce E. McKibben Year of Birth: 1969 | 2002 | Treasurer | Director of Fund Accounting of Mutual Funds Service Co., the Trust’s transfer agent (1997 – present). Interim Chief Operating Officer of Meeder Asset Management, Inc. (June 2008 – October 2008). |
Ruth Kirkpatrick Year of Birth: 1951 | 2009 | Secretary, pro tempore | Senior Legal Specialist of Meeder Asset Management, Inc. |
| 1 | The address of each Trustee is 6125 Memorial Drive, Dublin, OH 43017. |
| 2 | Each Trustee serves for an indefinite term, until his or her resignation, death, or removal. Each Trustee oversees all nine Funds in the Trust. |
| * | Robert S. Meeder, Jr. is deemed an “interested person” of the Trust by virtue of his position as President of Meeder Asset Management, Inc., the Advisor of the Trust. |
| ** | Each independent Trustee is a member of the Trust’s Audit Committee, Compensation Committee, and Nominating Committee. |
The Statement of Additional Information includes additional information about each Trustee and is available without charge. To obtain a copy of the Statement of Additional Information, please contact your financial representative or call toll free 1-800-325-3539.
The Funds file their complete schedules of portfolios holdings with the Securities and Exchange Commission (“SEC”) for the first and third quarters of each fiscal year on Form N-Q. In addition, The Money Market Fund files its complete schedule of portfolio holdings with the SEC each month on Form N-MFP. The Funds’ Forms N-Q and N-MFP are available on the SEC’s website at http://www.sec.gov and may be reviewed and copied at the SEC’s Public Reference Room in Washington, DC. Information on the operation of the Public Reference Room may be obtained by calling 1-800-SEC-0330. The Funds’ schedules of positions are also available on the Funds’ website at www.flexfunds.com.
A description of the policies and procedures that the Funds use to determine how to vote proxies relating to portfolio securities, and information regarding how the Funds voted these proxies for the 12-month period ended June 30, 2011, is available on the SEC’s website at http://www.sec.gov, or, without charge, upon request by calling toll-free 1-800-325-3539.
[This page intentionally left blank]
| | 2011 Annual Report | December 31, 2011 |
Manager and Investment Advisor
Meeder Asset Management, Inc.
6125 Memorial Drive
P.O. Box 7177
Dublin, Ohio 43017
Subadvisor / The Utilities and Infrastructure Fund
Miller/Howard Investments, Inc.
141 Upper Byrdcliffe Road, P.O. Box 549
Woodstock, New York 12498
Board of Trustees
Stuart Allen
Anthony D’Angelo
Robert S. Meeder, Jr.
Jack Nicklaus II
Custodian
The Huntington National Bank
Columbus, Ohio 43215
Transfer Agent & Dividend Disbursing Agent
Mutual Funds Service Co.
6125 Memorial Drive
Dublin, Ohio 43017
Independent Registered Public Accounting Firm
Cohen Fund Audit Services, Ltd.
800 Westpoint Parkway, Suite 1100
Westlake, Ohio 44145

Item 2. Code of Ethics.
The registrant has adopted a code of ethics that applies to the registrant’s principal executive officer, principal financial officer, comptroller or principal accounting officer, and any person who performs a similar function.
Item 3. Audit Committee Financial Expert.
Currently, The Flex-funds (the “Funds”) do not have an Audit Committee member who possesses all of the attributes required to be an "audit committee financial expert" as defined in instruction 2(b) of Item 3 of Form N-CSR. However, the Board of Trustees believes that each member of the Audit Committee has substantial experience relating to the review of financial statements and the operations of audit committees. Accordingly, the Board of Trustees believes that the members are qualified to evaluate the Funds’ financial statements, supervise the Funds’ preparation of its financial statements, and oversee the work of the Funds’ independent auditors. The Board of Trustees also believes that, although no single Audit Committee member possesses all of the attributes required to be an “audit committee financial expert”, the Audit Committee members collectively as a group possess the attributes required to be an “audit committee financial expert.”
Item 4. Principal Accountant Fees and Services.
(a) – (d) Aggregate fees billed to the registrant for the last two fiscal years for professional services rendered by the registrant’s principal accountant were as follows:
| | | 2011 | | | 2010 | |
| Audit Fees | | $ | 67,500 | | | $ | 63,000 | |
| Audit-Related Fees | | | 1,050 | | | | 800 | |
| Tax Fees | | | 20,250 | | | | 20,250 | |
| All Other Fees | | | 2,500 | | | | 3,425 | |
Audit fees include amounts related to the audit of the registrant’s annual financial statements and services normally provided by the accountant in connection with statutory and regulatory filings. Audit-related fees include amounts reasonably related to the performance of the audit of the registrant’s financial statements. Tax fees include amounts related to tax compliance, tax planning, and tax advice. All other fees include amounts related to the registrant’s annual filing of Form N1A.
(e)(1) A purpose of the Audit Committee is to approve the engagement of the registrant’s independent auditors (i) to render audit and non-audit services for the registrant in accordance with Rule 2-01(c)(7)(i) of Regulation S-X, subject to the waiver provisions set forth in Rule 2-01(c)(7)(i)(C) of Regulation S-X, and (ii) to render non-audit services for the registrant’s investment advisors (other than a sub-advisor whose role is primarily portfolio management and is subcontracted or overseen by another investment advisor) and any other entity controlling by, or under common control with the investment advisor that provides ongoing services to the registrant, in each case under (ii) if the engagement relates directly to the operations and financial reporting of the registrant, in accordance with Rule 2-01(c)(7)(ii) of Regulation S-X, subject to waiver provisions set forth in Rule 2-01(c)(7)(ii) of Regulation S-X.
(e)(2) 100% of services included in (b) – (d) above were approved pursuant to Rule 2-01(c)(7)(i)(C) of Regulation S-X.
(f) Not applicable.
(g) The aggregate fees billed for the most recent fiscal year and the preceding fiscal year by the registrant’s principal accountant for non-audit services rendered to the registrant, its investment advisor, and any entity controlling, controlled by, or under common control with the investment advisor that provides ongoing services to the registrant were $25,535 and $25,460 respectively.
(h) Not applicable.
Items 5. Audit Committee of Listed Registrants.
Not applicable.
Item 6. Schedule of Investments.
Not applicable.
Item 7. Disclosure of Proxy Voting Policies and Procedures for Closed-End Management Investment Companies.
Not applicable.
Item 8. Portfolio Managers of Closed-End Management Investment Companies.
Not applicable.
Item 9. Purchases of Equity Securities by Closed-End Management Investment Company and Affiliated Purchasers.
Not applicable.
Item 10. Submission of Matters to a Vote of Security Holders.
Not applicable.
Item 11. Controls and Procedures.
(a) Based on our evaluation conducted within 90 days of the filing date, hereof, the design and operation of the registrant's disclosure controls and procedures are effective to ensure that material information relating to the registrant is made known to the certifying officers by others within the appropriate entities, particularly during the period in which Forms N-CSR are being prepared, and the registrant's disclosure controls and procedures allow timely preparation and review of the information for the registrant's Form N-CSR and the officer certifications of such Form N-CSR.
(b) There were no significant changes in the registrant's internal controls or in other factors that could significantly affect these controls subsequent to the date of their evaluation, including any corrective actions with regard to significant deficiencies and material weaknesses.
Item 12. Exhibits.
(a)(1) Code of Ethics filed herewith as EX-99.CODE ETH.
(a)(2) A separate certification for each principal executive and principal financial officer of the registrant as required by Rule 30a-2(a) under the Act(17 CFR270.30a-2(a)). Filed herewith as EX-99.CERT.
(b) Certifications of principal executive officer and principal financial officer, under Section 906 of the Sarbanes-Oxley Act of 2002, and 18 U.S.C. ss.1350. Filed herewith as EX-99.906 CERT.
SIGNATURES
Pursuant to the requirements of the Securities Exchange Act of 1934 and the Investment Company Act of 1940, the registrant has duly caused this report to be signed on its behalf by the undersigned, thereunto duly authorized.
The Flex-funds
Bruce E. McKibben, Treasurer
Pursuant to the requirements of the Securities Exchange Act of 1934 and the Investment Company Act of 1940, this report has been signed below by the following persons on behalf of the registrant and in the capacities and on the dates indicated.
Bruce E. McKibben, Treasurer
| By: | /s/ Robert S. Meeder, Jr. |
Robert S. Meeder, Jr., President