UNITED STATES SECURITIES AND EXCHANGE COMMISSION
Washington, D.C. 20549
FORM N-CSR
CERTIFIED SHAREHOLDER REPORT
OF REGISTERED MANAGEMENT INVESTMENT COMPANIES
Investment Company Act file number 811-3462
Meeder Funds Trust
6125 Memorial Drive
Dublin, OH 43017
Bruce McKibben
c/o Meeder Funds Trust
6125 Memorial Drive
Dublin, OH 43017
Registrant’s telephone number, including area code: 800-325-3539
Date of fiscal year end: December 31, 2014
Date of reporting period: December 31, 2014
Item 1. Report to Stockholders.
TABLE OF CONTENTS
| Letter to Shareholders | 1 |
| Money Market Fund | 4 |
| Total Return Bond Fund | 6 |
Quantex FundTM | 8 |
Muirfield Fund® | 10 |
| Balanced Fund | 12 |
| Dynamic Growth Fund | 14 |
| Aggressive Growth Fund | 16 |
| Strategic Growth Fund | 18 |
| Utilities and Infrastructure Fund | 20 |
| Shareholder Expense Analysis | 22 |
| Disclosures | 23 |
| Fund Holdings & Financial Statements | 24 |
Our Mission Statement Every day, our mission is to exceed, with integrity, passion, and discipline, the expectations of our clients’ overall investment experience. Core Values Integrity We hold ourselves to the highest standards, acting ethically, honestly, and with the best interests of our clients in mind. Passion We take pride in our work and believe in our strategies and our people. Discipline We employ proven processes in our pursuit for exceptional results and distinguished service. Results We are committed to accomplishing the goals of our clients and ourselves through responsible, diligent strategies. Excellence We strive to exceed expectations in everything we do and seek innovative ways to solve problems and capitalize on opportunities. |
LETTER TO SHAREHOLDERS December 31, 2014
During the opening months of 2014, a sharp drop-off in the pace of economic data sparked concern among some investors that a swoon was underway, while others maintained that the setback was temporary due to the impact of adverse weather conditions. Given the strong rebound in various economic reports received during the second quarter, it appears that those in the latter camp were correct. The year ended with elevated levels of volatility across numerous asset classes. While the S&P 500 Index managed a gain of 4.93% for the 4th quarter, the Index declined as much as 10% from its peak during October. Although that is the steepest decline that the S&P 500 has experienced since 2012, the loss paled in comparison to falling oil prices. Due primarily to a surge in supply, oil fell by 49% in the second half of 2014 to end the year around $53 per barrel. The price of gasoline tumbled as well, with the national average price coming in at $2.24 per gallon at year end compared to $3.67 on June 30th. While we expect the decline in gas to provide a boost to consumers going into 2015, we would like to highlight the positive news on the economic front throughout the year as well.
The unemployment rate now sits at 5.6%, and follows stronger than expected job creation in December. In fact, the U.S. added 2.95 million jobs in 2014, which was the strongest year for job creation since 1999. Reflecting the improving labor market conditions, the Conference Board’s measure of consumer confidence has recovered to levels last seen in 2007. Additionally, third quarter GDP was revised higher than expected, and grew by 5.0% from the prior quarter. This was the largest increase in quarterly GDP in over 10 years and stands in stark contrast to the first quarter of 2014 which saw a decline of 2.9%.
The S&P 500’s gains in the fourth quarter punctuated another strong year for the stock market, with a 13.69% gain overall as well as more record highs. While large-cap stocks fared well for the year, smaller company stocks and international markets struggled to keep pace. The Russell 2000 Index of small-cap stocks was up only 4.89% for the year, while the developed international and emerging market indexes actually fell by 4.90% and 2.19%, respectively. The fixed-income market benefited from falling yields, with the Barclays US Aggregate Bond Index up 5.97% for 2014.
The year was highlighted by several milestones and achievements for Meeder Investment Management as well, which marked the 40th year serving our clients. We have continued to expand and add new relationships with our clients across both the public and private sector, which has led our assets under management, advisement, or administration to increase to over $8.5 billion as of December 31, 2014. Our team of associates has grown as well, including the addition of two Portfolio Managers in 2014 who have both earned the CFA® designation. We are also proud of the investment results we achieved in 2014, where four of eight variable mutual funds finished in the top third of their Morningstar peer group.
Additionally, we are pleased with the performance of our Funds on a longer-term basis. The Muirfield Fund® is in the top percentile for tactical allocation funds in the country on both a 3- and 5-year basis, while the Quantex Fund™ is in the 19th, 20th, and 10th percentile of mid-cap value funds on 3-, 5-, and 10-year basis according to Morningstar. The Balanced Fund, which is also categorized in the tactical allocation category, placed in the top 10% of its peer group over the past year, and is in the fourth percentile on a 3-year basis based on Morningstar as well. Finally, the retail class of the Money Market Fund finished the year as the top rated fund in the country on a 1- and 3-year basis according to Lipper.
Perhaps most importantly, we continued to update and evolve the quantitative investment models that are utilized in our decision-making process throughout 2014. Our investment philosophy is built on the foundation of a multi-disciplined/multi-factor method, where we construct our Funds by using a “weight of the evidence” approach that evaluates trend/technical factors, interest rate/macroeconomic factors, and valuation/fundamental metrics. Our proprietary investment models are incorporated throughout the decision-making process, from determining the risk/reward relationship of the stock market to which securities are most attractive for investment. In 2014, we
2014 Annual Report | December 31, 2014 | Page 1 |
revisited and enhanced numerous investment models, reflecting the dynamic and ever-changing nature of the capital markets.
We believe the dynamic characteristics of the capital markets necessitate the evaluation of a wide range of factors. Just as 2014 presented a number of challenges for investors, we believe 2015 will certainly be no different. For instance, while domestic stock valuations are slowly becoming expensive on an absolute basis, how do they appear when considering the inflationary and interest rate backdrop? Many international stock markets are becoming attractively valued, but how does the diverging paths of global monetary policy impact currency relationships and domestic investor returns? The Federal Reserve may be ready to raise interest rates in 2015, but what does the steepness of the yield curve say for stock returns going forward?
It is the answer to these questions and more that will determine investor outcomes for the year ahead. To address these questions, we have developed a list of primary factors and themes to monitor in 2015 that includes stock market valuations, interest rates, inflation, energy prices and the stabilization of international markets.
Stock market valuations remain a key concern for investors as we enter 2015. However, as we have noted frequently in the past, stock valuations remain somewhat attractive when considering the low inflation and interest rate backdrop. Regarding interest rates, the Fed is widely expected to raise the fed funds rate for the first time in nine years, which is leading to concerns that the economic recovery could be derailed and result in losses for bond investors. While 2015 will likely experience the first Fed rate hike, there are other factors that may limit how quickly the Fed tightens from that point. Although the labor market is improving, inflation remains exceptionally low and could see further downside pressure due to the pullback in commodity prices, most notably in the price of oil. As a result, inflation expectations and energy prices will be key variables to monitor throughout 2015 in order to anticipate the path of tighter monetary policy. Finally, international markets continued to struggle in 2014 due to decelerating growth in emerging markets and signs of deflation in Europe. We will closely follow our quantitative investment model in the year ahead to determine the stability of capital markets.

Robert S. Meeder
President
Meeder Funds®
December 31, 2014
| Page 2 | 2014 Annual Report | December 31, 2014 |
2014 Annual Report Fund Summaries |
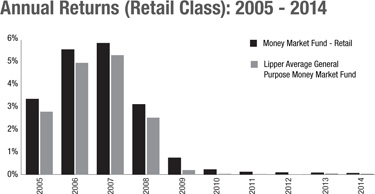
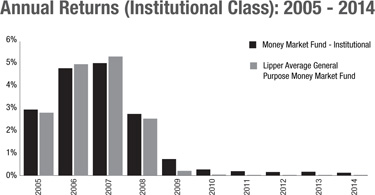
Money Market Fund The Meeder Money Market Fund enjoyed continued success versus the competition in 2014, with both the retail and institutional share classes ranking among the top general purpose money market funds in the country. Consistency continues to be extremely important when managing the Fund as it has been in the top 10% of all general purpose money market funds since its inception in 1985. The Money Market Fund industry continued to be mired in a challenging market environment during 2014. The main driver behind this was the reluctance of The Federal Reserve Open Market Committee (FOMC) to move from its policy stance of a historically low policy rate. The target rate remained locked at 0.00-0.25% for the whole year and has been unchanged since it was first implemented in December 2008. Other events facing the industry during the year were regulatory pressures, and inconsistent global economic conditions. The former came to fruition in July as the U.S. Securities and Exchange Commission adopted enhanced guidelines in an effort to improve risk controls throughout the industry. The main components included the potential for new variable NAV pricing coupled with liquidity buffers. Finally, global economic data from Europe to Asia seemed to keep investors debating whether conditions were pointing to improvement or not. In the end, the yields of money market investments were constrained for most of the year with limited opportunities. The Fund realized most of its benefit from a mix of eligible products and term structures which provided the flexibility to act on opportunities as they became available. During 2014, we maintained a weighted average maturity that was below that of our peers. Holdings in the Fund remained allocated toward investments with superior credit quality, as we believed the risk and reward relationship favored this position. Our sector allocation favored an overweight in high-quality liquid investments and short-term investment grade corporate debt. At the end of 2014, the Fund’s composition was as follows: 42% other money market funds, 15% repurchase agreements, 12% corporate obligations, 12% certificates of deposit, 10% U.S. government agency, and 9% bank obligations. As we completed 2014, our belief was that the Fund should be positioned to maintain its strong performance if the challenging environment persists. As we continuously monitor the markets and our strategy, we will remain vigilant and keep in mind the best interests of our shareholders. |
Period & Average Annual Total Returns as of December 31, 2014 (Unaudited)
| | 1 Year | 3 Year | 5 Year | 10 Year | Inception Date |
Money Market Fund - Retail Class
Expense Ratios+: Audited Net 0.16% Gross 0.90% | 0.06% | 0.08% | 0.11% | 1.62% | 3/27/85 |
| Current & Effective Yields* | 7-day Compound: 0.08% 7-day Simple: 0.08% |
| Lipper Average General Purpose Money Market Fund | 0.01% | 0.01% | 0.02% | 1.45% | 3/31/85 |
| | 1 Year | 3 Year | 5 Year | Since Inception | Inception Date |
Money Market Fund - Institutional Class
Expense Ratios+: Audited Net 0.10% Gross 0.71% | 0.11% | 0.14% | 0.18% | 1.72% | 12/28/04 |
| Current & Effective Yields* | 7-day Compound: 0.14% 7-day Simple: 0.14% |
| Lipper Average General Purpose Money Market Fund | 0.01% | 0.01% | 0.02% | 1.47% | 12/31/04 |
 | |  |
| | | |
 | | Top 10 Holdings |
| as of December 31, 2014 |
| 1. | Fidelity Institutional Money Market Portfolio | 42.3% |
| 2. | FICA Bank Deposit Program (StoneCastle) | 7.4% |
| 3. | GX Clarke Repo, 0.26%, 01/05/2015 | 4.9% |
| 4. | GX Clarke Repo, 0.18%, 01/02/2015 | 4.9% |
| 5. | GX Clarke Repo, 0.26%, 01/06/2015 | 4.9% |
| 6. | Caterpillar Financial Power Investment Floating Rate Demand Note, 0.45% | 4.9% |
| 7. | Federal Home Loan Bank, 0.22%, 10/07/2015 | 2.5% |
| 8. | Federal Farm Credit Bank, 0.20%, 8/03/2015 | 2.5% |
| 9. | Royal Bank of Canada, 0.23%, 6/10/2015 | 2.5% |
| 10. | Federal Farm Credit Bank, 0.13%, 2/23/2015 | 2.5% |
| | | |
| As a percentage of total net assets. |
Management fees and/or expenses were voluntarily waived and/or reimbursed in order to reduce the operating expenses of both the retail class and the institutional class of the Money Market Fund during the periods shown above. Investments in the Money Market Fund are neither insured nor guaranteed by the Federal Deposit Insurance Corporation or any other governmental agency. Although the Fund seeks to preserve the value of your investment at $1.00 per share, it is possible to lose money by investing in the Money Market Fund. + The Audited Net Expense Ratio is based on average daily net assets and reflects actual expenses of the Fund paid over the one year period ended 12/31/14, including the effect of expense waivers and reimbursements. This ratio may increase or decrease depending on fluctuations in Fund net assets. The Gross Expense Ratio is a percentage of the Fund’s average daily net assets as shown in the most current Fund Prospectus. Please see additional disclosures on page 23.
2014 Annual Report | December 31, 2014 | Page 5 |
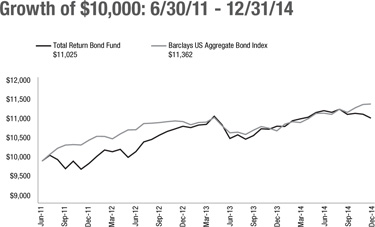
Total Return Bond Fund The Meeder Total Return Bond Fund returned 1.78% for the year ended December 31, 2014. The Fund’s benchmark, the Barclays US Aggregate Bond Index, returned 5.97% over the aforementioned time period. The main drivers contributing to the performance differential were the Fund duration and underweight allocation to U.S. Government securities versus that of the benchmark. At the beginning of the year, a majority of strategists/economists were of the belief that 2014 was the year interest rates would finally rise. The stage was set. The FOMC had instituted tapering of its bond purchase program, widely referred to as Quantitative Easing. Economic data points here in the U.S. which targeted employment remained consistent. Growth prospects for the economy were anticipated to be building momentum after a first quarter weather related setback. Economies of developed countries around the world, while not necessarily stable were dabbling with accommodative discussions in an effort to support their domestic well-being. But despite all the building blocks and positive tones, market sentiment gravitated in the opposite direction. The long end of the U.S. Treasury yield curve, the 30-year bond, appreciated in price causing a significant flattening of the yield curve (the yield difference between two points on the yield curve). The difference in yield between the 30-year bond and the 10-year note actually reached levels not seen since 2009. By the end of the year, the yield on the 30-year bond had declined by over 100 basis points. For the Total Return Bond Fund, 2014 was a tale of two halves. The first half of the year the Fund slightly underperformed the benchmark despite maintaining a significantly lower allocation to U.S. Government securities and managing the portfolio to a lower average duration. The Fund had a greater allocation to credit sensitive sectors including corporate bonds and emerging market bonds. Being invested in these sectors assisted the Fund in its ability to maintain pace with the benchmark index. What detracted most from performance in the first half of the year was the Fund’s average duration, which was approximately 3.5 years while the benchmark was approximately 5.5 years. During the second half of the year, the Fund’s underperformance versus the benchmark index escalated in response to two specific events. Volatility increased during the third quarter as credit spreads began to widen in response to geopolitical events which had been building in Eastern Europe and the Middle East. After the shock from the initial news headlines wore off, investors made moves to resume activity in credit sensitive sectors. But this was not the last we would hear of this volatility. Later in the year credit spreads widened again, with a greater ferocity. Before the end of September, geopolitical uneasiness began to penetrate the headlines again. Credit sensitive sectors again realized a widening of yield spreads versus U.S. Treasury securities. Finally, as talk of global economic uncertainty began to gain traction another perpetrator introduced itself to the markets – oil. By the end of the year oil had dropped by more than half with sources claiming oversupply and the lack of conviction from interested sovereigns to intervene and reduce production. Credit sectors again were at the mercy of excessive selling pressure. In the last quarter of the year, longer dated U.S. Treasury securities realized their greatest gain in price, dropping yields close to historical lows. As a result, the majority of performance differential of the Fund versus the benchmark was realized in the second half of 2014. Finally, at times throughout the year we incorporated the use of derivatives in the Fund, such as US Treasury futures, in order to manage the duration of the Fund. Our use of US Treasury futures during the year had a slight positive impact on the Fund’s performance. |
Period & Average Annual Total Returns as of December 31, 2014 (Unaudited)
| 1 Year | 3 Year | Since Inception | Inception Date |
Total Return Bond Fund
Expense Ratios+: Audited Net 0.99% Gross 1.53% | 1.78% | 3.50% | 2.82% | 6/30/11 |
| Barclays US Aggregate Bond Index | 5.97% | 2.66% | 3.67% | 6/30/11 |
 | |  |
| | | |
The Growth of $10,000 chart compares the Total Return Bond Fund’s value to the Barclays US Aggregate Bond Index, the Fund’s broad-based benchmark. The chart is intended to give you a general idea of how the Fund performed compared to this benchmark over the period from June 30, 2011 to December 31, 2014. An understanding of the differences between the Fund and this index is important. The index is a hypothetical unmanaged index that does not take into account the deduction of expenses associated with a mutual fund, such as investment management and accounting fees. One cannot invest directly in an index. The chart and the table do not reflect the deduction of taxes that a shareholder would pay on Fund distributions or the redemption of Fund shares. | | Top 10 Holdings |
| | as of December 31, 2014 |
| | 1. | Federated Bond Fund | 6.9% |
| | 2. | Fidelity® Capital & Income Fund | 6.7% |
| | 3. | DoubleLine Total Return Bond Fund | 6.6% |
| | 4. | Sentinel Total Return Bond Fund | 6.4% |
| | 5. | Vanguard Total Bond Market ETF | 6.3% |
| | 6. | Putnam Absolute Return 300 Fund | 6.2% |
| | 7. | AllianceBernstein High Income Fund | 5.7% |
| | 8. | Prudential Total Return Bond Fund | 5.7% |
| | 9. | Thompson Bond Fund | 5.5% |
| | 10. | iShares JPMorgan USD Emerging Markets Bond Fund | 5.4% |
| | | | |
| | As a percentage of total net assets. |
Management fees and/or expenses were voluntarily waived and/or reimbursed in order to reduce the operating expenses of the Total Return Bond Fund during the periods shown above. + The Audited Net Expense Ratio is based on average daily net assets and reflects actual expenses of the Fund paid over the one year period ended 12/31/14, including the effect of expense waivers and reimbursements. This ratio may increase or decrease depending on fluctuations in Fund net assets. The Gross Expense Ratio is a percentage of the Fund’s average daily net assets, including acquired fund fees and expenses, as shown in the most current Fund Prospectus. Please see additional disclosures on page 23.
2014 Annual Report | December 31, 2014 | Page 7 |
Quantex Fund™ The Meeder Quantex Fund™ returned 9.48% for the year ended December 31, 2014. For the same time period, the S&P MidCap 400 and Russell 2000 Indexes returned 9.77% and 4.89%, respectively. In addition to the 1-year period, the Quantex Fund™ outperformed the Russell 2000 Index for the 3- and 5-year periods ending December 31, 2014. It also outperformed the S&P MidCap 400 Index on a 3-year period and slightly lagged on a 5-year period ending December 31, 2014. We utilized rankings from our quantitative financial model to determine which securities were to be held in the Fund at the beginning of each year. Relative to the S&P MidCap 400 Index, stock selection within the industrials sector provided the greatest benefit to the Fund, with stock selection in the information technology sector having benefited performance as well. With the drastic drop in oil prices, it is not a surprise the largest detractor from performance was our sector overweight in energy. In addition, stock selection within the consumer staples sector detracted from performance. Stock selection in the utilities sector also contributed to performance, while our underweight allocation to financials detracted from relative returns. For the full year 2014, many stocks contributed positively to the performance of the Fund. The top performing stock for the year was Electronic Arts, which was up 105%. Other top performers for the year included Edwards Lifesciences (up 93%) and Frontier Communications (up 54%). The largest detractors from performance during the year were Cliff’s Natural Resources (down 72%), Peabody Energy (down 59%), and Denbury Resources (down 49%). Additionally, we incorporated the use of equity index derivatives, such as stock index futures, in the Fund in order to equitize cash positions. Since these derivatives are designed to track the respective stock index in question, there was no discernible impact to the Fund’s relative performance in 2014. |
Period & Average Annual Total Returns as of December 31, 2014 (Unaudited)
| | 1 Year | 3 Year | 5 Year | 4/30/05 – 12/31/142 | 10 Year | Inception Date |
Quantex Fund™
Expense Ratios+: Audited Net 1.44% Gross 1.94% | 9.48% | 21.91% | 16.46% | 10.65% | 9.66% | 3/20/85 |
Blended Index1 | 7.35% | 19.62% | 16.06% | 9.98% | 8.78% | 3/31/85 |
| Russell 2000 Index | 4.89% | 19.21% | 15.55% | 9.28% | 7.77% | 3/31/85 |
| S&P MidCap 400 Index | 9.77% | 19.99% | 16.54% | 10.67% | 9.71% | 3/31/85 |
 | | Sector Concentration |
| | as of December 31, 2014 |
| | 1. | Consumer Discretionary | 18.5% |
| | 2. | Financials | 14.1% |
| | 3. | Industrials | 11.8% |
| | 4. | Materials | 10.2% |
| | 5. | Information Technology | 10.0% |
| | 6. | Healthcare | 9.6% |
| | 7. | Utilities | 7.6% |
| | 8. | Energy | 5.5% |
| | 9. | Telecommunication Services | 2.1% |
| | 10. | Consumer Staples | 1.4% |
| | 11. | Other | 9.2% |
| | | | |
| | As a percentage of total net assets. Concentrations are subject to change. The Fund has invested in stock index futures contracts in order to equitize cash balances held in the Fund. |
| |
| The Growth of $10,000 chart compares the value of the Quantex Fund™ to the S&P MidCap 400 Index and the Russell 2000 Index, the Fund’s broad-based benchmarks, and to the Blended Index, which consists of 50% of the Russell 2000 Index and 50% of the S&P MidCap 400 Index. The chart is intended to give you a general idea of how the Fund performed compared to these benchmarks over the period from December 31, 2004 to December 31, 2014. An understanding of the differences between the Fund and these indices is important. The benchmark indices do not take into account the deduction of expenses associated with a mutual fund, such as investment management and accounting fees. One cannot invest directly in an index.
The chart and the table do not reflect the deduction of taxes that a shareholder would pay on Fund distributions or the redemption of Fund shares. | | Top 10 Holdings |
| | as of December 31, 2014 |
| | 1. | Electronic Arts, Inc. | 1.7% |
| | 2. | Edwards Lifesciences Corp. | 1.6% |
| | 3. | Hospira, Inc. | 1.2% |
| | 4. | Apartment Investment & Management Company | 1.2% |
| | 5. | Frontier Communications Corp. | 1.2% |
| | 6. | F5 Networks, Inc. | 1.2% |
| | 7. | Integrys Energy Group, Inc. | 1.2% |
| | 8. | Macerich Co. | 1.2% |
| | 9. | Pepco Holdings, Inc. | 1.2% |
| | 10. | Robert Half International, Inc. | 1.1% |
| | | | |
| | As a percentage of total net assets. |
The Adviser has contractually agreed to reduce its management fee by 0.25%. This agreement may be terminated by the Adviser after April 30, 2015.
+ The Audited Net Expense Ratio is based on average daily net assets and reflects actual expenses of the Fund paid over the one year period ended 12/31/14, including the effect of expense waivers and reimbursements. This ratio may increase or decrease depending on fluctuations in Fund net assets. The Gross Expense Ratio is a percentage of the Fund’s average daily net assets as shown in the most current Fund Prospectus. Please see additional disclosures on page 23.
2014 Annual Report | December 31, 2014 | Page 9 |
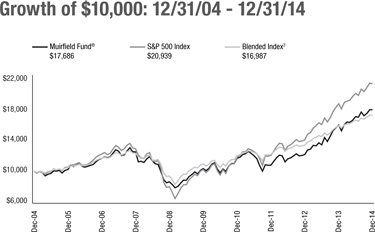
Muirfield Fund® The Meeder Muirfield Fund® returned 12.12% for the year ended December 31, 2014 compared to the Fund’s Blended Index return of 8.08% and S&P 500 Index return of 13.69%. We entered 2014 fully invested in the equity markets following output from our investment model that indicated a favorable risk/reward dynamic in the stock market. Throughout the year we opportunistically took minor defensive positions. However, none of these positions exceeded 10% at any given moment. During the first quarter, we maintained our exposure to value investments and were overweight the healthcare, technology, and consumer discretionary sectors. In addition, we were underweight consumer staples, telecom, and utilities. We also maintained exposure to mid- and small-cap investments, which had mixed results on our relative performance. Security selection in the technology sector was the most profitable for the Fund whereas security selection in the healthcare sector detracted the most from performance. We initiated a position in developed international markets following output from our investment model toward the tail end of the quarter, and continued to build this position into the next couple months. As the second quarter progressed, our investment model continued its preference for international investments which was driven by a combination of currency, valuation, and momentum factors. While emerging markets kept pace with domestic, our allocation to developed foreign markets hindered performance relative to the S&P 500 Index. In addition, our underweight to the industrials sector contributed positively to performance, while stock selection in the financials sector benefited performance as well. Overall stock selection in the healthcare sector was the largest detractor from relative performance. Our most additive stock to performance for the quarter was Hillshire Brands. During the third quarter, we continued to focus on growth sectors, including the consumer discretionary, healthcare, and technology sectors. While we continued to hold emerging markets from the previous quarter, we eliminated this position by the end of September. Relative to the S&P 500 Index, our overall sector positioning benefited performance with the strongest contribution coming from our underweight to industrials and energy. Overall, our stock selection detracted from performance although this was largely influenced by our picks within the consumer discretionary and financial sectors. Combating the underperforming picks in these sectors were beneficial picks in the consumer staple, energy, healthcare, and industrial sectors. Overall, our best performing stock for the quarter was United Therapeutics, while Aaron’s Inc. was our worst performing stock. We entered the fourth quarter with a slight tilt to large-cap securities. Toward the end of the quarter we began to move some of this allocation more toward small-cap stocks as momentum factors shifted. Throughout the quarter we were essentially fully invested which transpired from a modest allocation to cash during the prior quarter. We continued to remain focused on the consumer discretionary, technology, and healthcare sectors. Throughout the quarter, our increasing exposure to small- and mid-capitalization stocks paralleled the improvement in our investment model. Regarding relative performance, our underweight to the energy sector contributed most favorably from an allocation standpoint, while our stock choices within the technology sector generated the largest outperformance from a security selection standpoint. The largest detractor from performance for the quarter was Intercept Pharmaceuticals, while the largest individual contributors to relative performance were IBM and Becton Dickinson. The best performing held position for the period was Delta Air Lines. Additionally, we incorporated the use of equity index derivatives, such as stock index futures, in the Fund in order to equitize cash positions as well as manage the equity exposure of the Fund. With regard to equitizing cash positions, these derivatives are designed to track the respective stock index, so there was no discernible impact to the Fund’s relative performance. With regard to managing the Fund’s equity exposure, the use of stock index futures had a slight negative impact on the performance of the Fund relative to the S&P 500 Index during 2014. |
Period & Average Annual Total Returns as of December 31, 2014 (Unaudited)
| | 1 Year | 3 Year | 5 Year | 10 Year | Inception Date |
Muirfield Fund®
Expense Ratios+: Audited Net 1.22% Gross 1.62% | 12.12% | 18.02% | 11.35% | 5.87% | 8/10/88 |
Blended Index3 | 8.08% | 12.03% | 9.36% | 5.48% | 7/31/88 |
| S&P 500 Index | 13.69% | 20.41% | 15.45% | 7.67% | 7/31/88 |
 | | Sector Concentration |
| | as of December 31, 2014 |
| | 1. | Information Technology | 18.9% |
| | 2. | Healthcare | 11.6% |
| | 3. | Consumer Discretionary | 9.6% |
| | 4. | Financials | 9.2% |
| | 5. | Industrials | 8.3% |
| | 6. | Consumer Staples | 7.5% |
| | 7. | Energy | 3.1% |
| | 8. | Telecommunication Services | 1.1% |
| | 9. | Materials | 1.0% |
| | 10. | Utilities | 0.6% |
| | 11. | Other | 29.1% |
| | | | |
| | As a percentage of total net assets. Concentrations are subject to change. The Fund has invested in stock index futures contracts in order to equitize cash balances held in the Fund. |
| | | | | |
The Growth of $10,000 chart compares the value of the Muirfield Fund® to the S&P 500 Index, the Fund’s broad-based benchmark, and to an index composed of 60% of the S&P 500 Index and 40% of 90-day T-bills. The chart is intended to give you a general idea of how the Fund performed compared to these benchmarks over the period from December 31, 2004 to December 31, 2014. An understanding of the differences between the Fund and these benchmarks is important. The benchmark indices are hypothetical unmanaged indices of common stocks and 90-day T-bills that do not take into account the deduction of expenses associated with a mutual fund, such as investment management and accounting fees. One cannot invest directly in an index.
The chart and the table do not reflect the deduction of taxes that a shareholder would pay on Fund distributions or the redemption of Fund shares. | | Top 10 Holdings |
| | as of December 31, 2014 |
| | 1. | Apple, Inc. | 2.7% |
| | 2. | Intel Corp. | 1.7% |
| | 3. | Oracle Corp. | 1.6% |
| | 4. | Berkshire Hathaway, Inc. | 1.6% |
| | 5. | Hewlett-Packard Co. | 1.5% |
| | 6. | Exxon Mobil Corp. | 1.4% |
| | 7. | Johnson & Johnson | 1.3% |
| | 8. | American International Group, Inc. | 1.2% |
| | 9. | Archer-Daniels Midland Co. | 1.2% |
| | 10. | CVS Health Corp. | 1.1% |
| | | | |
| | As a percentage of total net assets. |
Management fees and/or expenses were voluntarily waived and/or reimbursed in order to reduce the operating expenses of the Muirfield Fund® during the periods shown above. + The Audited Net Expense Ratio is based on average daily net assets and reflects actual expenses of the Fund paid over the one year period ended 12/31/14, including the effect of expense waivers and reimbursements. This ratio may increase or decrease depending on fluctuations in Fund net assets. The Gross Expense Ratio is a percentage of the Fund’s average daily net assets, including acquired fund fees and expenses, as shown in the most current Fund Prospectus. Please see additional disclosures on page 23.
2014 Annual Report | December 31, 2014 | Page 11 |
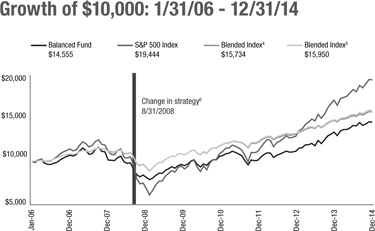
Balanced Fund The Meeder Balanced Fund returned 8.61% for the year ended December 31, 2014 compared to the Blended Index (4) return of 6.57%, the Blended Index (5) return of 7.49%, and the S&P 500 Index return of 13.69%. We entered 2014 fully invested in the stock market following output from our investment model that indicated a favorable risk/reward dynamic in the stock market. Throughout the year we opportunistically took minor defensive positions. However, none of these positions exceeded 7% at any given moment and the Fund remained essentially fully invested throughout the year. During the first quarter, we were overweight the healthcare, technology, and consumer discretionary sectors. In addition, we were underweight consumer staples, telecom, and utilities. Security selection in the technology sector was the most profitable for the Fund whereas security selection in the healthcare sector detracted the most from performance. We initiated a position in developed international markets following output from our investment model toward the tail end of the first quarter, and continued to build this position into the next quarter. Our model preference for international investments was driven by a combination of currency, valuation, and momentum factors. Our allocation to developed foreign markets hindered performance relative to the S&P 500 Index during the second quarter. In addition, our underweight to the industrials sector contributed positively to performance, while stock selection in the financials sector benefited performance as well. Overall stock selection in the healthcare sector was the largest detractor from relative performance. During the third quarter, we continued to focus on growth sectors inclusive of consumer discretionary, healthcare, and technology. While we continued to hold emerging markets from the second quarter, we eliminated this position by the end of September. Relative to the S&P 500 Index, our overall sector positioning benefited performance with the strongest contribution coming from our underweight to industrials and energy. Combating the underperforming picks in the consumer discretionary and financial sectors were beneficial picks in the consumer staple, energy, healthcare, and industrial sectors. We entered the fourth quarter with a slight tilt to large-cap securities. Toward the end of the quarter we began to move some of this allocation more toward small-cap stocks as momentum factors shifted. Throughout the quarter we were essentially fully invested. We continued to remain focused on the consumer discretionary, technology, and healthcare sectors. Regarding relative performance, our underweight to the energy sector contributed most favorably from an allocation standpoint, while our stock choices within the technology sector generated the largest outperformance from a security selection standpoint. In the fixed income portion of the Fund, we were overweight investments with greater credit risk versus that of the broader fixed income market as measured by the Barclays US Aggregate Bond Index. This portion of the Fund underperformed versus the Index due to an underweight allocation to U.S. Government securities. We maintained this portfolio stance as healthy corporate balance sheets and low default rates were supported by an underlying stable U.S. economy. We also maintained an allocation to emerging market bonds which added to relative returns. Throughout the year, duration in the fixed income portion of the Fund was held on average below that of the Index. Additionally, we incorporated the use of equity index derivatives, such as stock index futures, in the Fund in order to equitize cash positions as well as manage the equity exposure of the Fund. With regard to equitizing cash positions, these derivatives are designed to track the respective stock index, so there was no discernible impact to the Fund’s relative performance. With regard to managing the Fund’s equity exposure, the use of stock index futures had a slight negative impact on the performance of the Fund relative to the S&P 500 Index during 2014. |
Period & Average Annual Total Returns as of December 31, 2014 (Unaudited)
| | 1 Year | 3 Year | 5 Year | 8/31/2008 – 12/31/20146 | Since Inception | Inception Date |
Balanced Fund
Expense Ratios+: Audited Net 1.33% Gross 1.79% | 8.61% | 12.84% | 8.53% | 6.43% | 4.30% | 1/31/06 |
Blended Index4 | 6.57% | 8.98% | 7.70% | 5.80% | 5.28% | 1/31/06 |
Blended Index5 | 7.49% | 9.14% | 7.89% | 6.16% | 5.52% | 1/31/06 |
| S&P 500 Index | 13.69% | 20.41% | 15.45% | 10.13% | 7.70% | 1/31/06 |
 | | Sector Concentration |
| | as of December 31, 2014 |
| | 1. | Information Technology | 14.3% |
| | 2. | Healthcare | 8.6% |
| | 3. | Financials | 6.7% |
| | 4. | Consumer Discretionary | 6.5% |
| | 5. | Industrials | 6.1% |
| | 6. | Consumer Staples | 5.5% |
| | 7. | Energy | 2.3% |
| | 8. | Materials | 0.8% |
| | 9. | Telecommunication Services | 0.8% |
| | 10. | Utilities | 0.4% |
| | 11. | Other | 48.0% |
| | | | |
| | As a percentage of total net assets. Concentrations are subject to change. The Fund has invested in stock index futures contracts in order to equitize cash balances held in the Fund. |
| | | | | |
| The Growth of $10,000 chart compares the Balanced Fund’s value to the S&P 500 Index, the Fund’s broad-based benchmark, to the Blended Index (4), which is comprised of 42% of the S&P 500 Index, 28% of the average 90-day U.S. T-bill and 30% of the Barclays Intermediate-Term Government/Credit Index and to the Blended Index (5) which is comprised of 2% of the S&P 500 Index, 28% of the average 90-day U.S. Treasury bill and 30% of the Barclays Aggregate Bond Index. The chart is intended to give you a general idea of how the Fund performed compared to these benchmarks over the period from its inception on January 31, 2006 through December 31, 2014. An understanding of the differences between the Fund and these indices is important. The benchmark indices are hypothetical unmanaged indices of common stock that do not take into account the deduction of expenses associated with a mutual fund, such as investment management and accounting fees. One cannot invest directly in an index.
The chart and the table do not reflect the deduction of taxes that a shareholder would pay on Fund distributions or the redemption of Fund shares. | | Top 10 Holdings |
| | as of December 31, 2014 |
| | 1. | Sentinel Total Return Bond Fund | 5.2% |
| | 2. | Prudential Total Return Bond Fund | 3.3% |
| | 3. | Federated Bond Fund | 3.2% |
| | 4. | Thompson Bond Fund | 2.5% |
| | 5. | Apple, Inc. | 2.1% |
| | 6. | Vanguard Total Bond Market ETF | 2.0% |
| | 7. | Putnam Diversified Income Trust | 1.6% |
| | 8. | Ivy High Income Fund | 1.5% |
| | 9. | Intel Corp. | 1.3% |
| | 10. | Oracle Corp. | 1.3% |
| | | | |
| | | As a percentage of total net assets. |
Management fees and/or expenses were voluntarily waived and/or reimbursed in order to reduce the operating expenses of the Balanced Fund during the periods shown above. +The Audited Net Expense Ratio is based on average daily net assets and reflects actual expenses of the Fund paid over the one year period ended 12/31/14, including the effect of expense waivers and reimbursements. This ratio may increase or decrease depending on fluctuations in Fund net assets. The Gross Expense Ratio is a percentage of the Fund’s average daily net assets, including acquired fund fees and expenses, as shown in the most current Fund Prospectus. Please see additional disclosures on page 23.
2014 Annual Report | December 31, 2014 | Page 13 |
Dynamic Growth Fund The Meeder Dynamic Growth Fund returned 12.80% for the year ended December 31, 2014 compared to the S&P 500 Index return of 13.69% for the same time period. Although we entered the first quarter with a slight tilt toward small-cap investments, the fund eventually shifted focus back to large-caps as the quarter progressed. The Fund’s performance in the quarter was clearly driven by security selection within the technology sector. Specifically, there was broad based support among our stock picks in the hardware and equipment space. In addition to these picks, the Fund benefited from owning Questcor Pharmaceuticals which ultimately received a buy-out offer. We had immaterial exposure to international markets in the quarter. The largest detractors on performance included our underweight to the financials sector and our security selection within consumer staples. We began the second quarter with an overweight to the consumer discretionary, healthcare, and technology sectors. Additionally, we were underweight the energy, material, and industrial sectors. As the second quarter progressed, we maintained a focus on these sectors within the domestic allocation of the Fund. However, due to an increase in our international holdings, these overweights were brought down in-line with that of the S&P 500. We had exposure to both developed international and emerging markets throughout the quarter and although both had positive performance, the positions ultimately lagged the domestic markets. Allocation effects within the technology and financial sectors had the biggest impact on our positive performance while security selection in the consumer staples sector was the largest detractor from performance. The stock contributing the most to performance for the quarter was Xerox while Western Digital negatively impacted relative performance. Our best performing stock for the period was Conoco Phillips. Our worst performing stock was RR Donnelley & Sons. We entered the third quarter with approximately a 15% weight to emerging markets and maintained this through the end of August. Starting in September we began to trim the position and were completely out of it by the end of the quarter. In addition, during the quarter we shifted our allocation from a slight overweight to mid-cap securities to a neutral weight, adding to large-caps as we brought this exposure down. Overall, our stock picks within the energy and consumer staple sectors proved the most beneficial to the Fund. Our stock picks in the consumer discretionary sector proved to be the largest detractor on performance. Our sector allocations provided the most performance overall as our underweights to energy and industrials were positive. Also, our overweight to technology proved beneficial as well. Security selection in the consumer discretionary sector lowered performance as our retail stocks did poorly. Our best performing stock for the period was United Therapeutics, while the strongest contributor to relative performance was Gilead Sciences due to its larger weight in the Fund. Our worst performing stock for the quarter was Tenneco. We entered the fourth quarter maintaining an overweight to the technology, healthcare, and consumer discretionary sectors. Conversely, our sector underweights were the telecomm, consumer staple, and financial sectors. We began the quarter solely focused on the domestic markets and continued this focus throughout the entire quarter. Toward the end of December, we increased our exposure to momentum names in the portfolio. Our overweight to the technology sector and underweight to energy contributed positively to performance relative to the S&P 500 Index. Our individual equity selection within the healthcare sector was the largest detractor from performance. The best performing stock for the quarter was Delta Air Lines, while Visa contributed the most to performance due to its weight in the Fund. The worst performing stock for the quarter was Intercept Pharmaceuticals which was also the largest detractor relative to the S&P 500 Index. Additionally, we incorporated the use of equity index derivatives, such as stock index futures, in the Fund in order to equitize cash positions. Since these derivatives are designed to track the respective stock index in question, there was no discernible impact to the Fund’s relative performance in 2014. |
Period & Average Annual Total Returns as of December 31, 2014 (Unaudited)
| | 1 Year | 3 Year | 5 Year | 10 Year | Inception Date |
Dynamic Growth Fund
Expense Ratios+: Audited Net 1.22% Gross 1.66% | 12.80% | 19.37% | 13.14% | 6.50% | 2/29/00 |
| S&P 500 Index | 13.69% | 20.41% | 15.45% | 7.67% | 2/29/00 |
 | | Sector Concentration |
| | as of December 31, 2014 |
| | 1. | Information Technology | 25.7% |
| | 2. | Healthcare | 16.2% |
| | 3. | Industrials | 11.9% |
| | 4. | Financials | 11.8% |
| | 5. | Consumer Discretionary | 10.9% |
| | 6. | Consumer Staples | 10.2% |
| | 7. | Energy | 5.9% |
| | 8. | Telecommunication Services | 1.3% |
| | 9. | Materials | 1.0% |
| | 10. | Utilities | 0.9% |
| | 11. | Other | 4.2% |
| | | | |
| | As a percentage of total net assets. Concentrations are subject to change. The Fund has invested in stock index futures contracts in order to equitize cash balances held in the Fund. |
| | | | | |
The Growth of $10,000 chart compares the Dynamic Growth Fund’s value to the S&P 500 Index, the Fund’s broad-based benchmark. The chart is intended to give you a general idea of how the Fund performed compared to this benchmark over the period from December 31, 2004 to December 31, 2014. An understanding of the differences between the Fund and this index is important. The S&P 500 Index is a hypothetical unmanaged index of common stocks that does not take into account the deduction of expenses associated with a mutual fund, such as investment management and accounting fees. One cannot invest directly in an index.
The chart and the table do not reflect the deduction of taxes that a shareholder would pay on Fund distributions or the redemption of Fund shares. | | Top 10 Holdings |
| | as of December 31, 2014 |
| | 1. | Apple, Inc. | 3.1% |
| | 2. | Hewlett-Packard Co. | 1.8% |
| | 3. | Berkshire Hathaway, Inc. | 1.7% |
| | 4. | PepsiCo, Inc. | 1.7% |
| | 5. | Intel Corp. | 1.6% |
| | 6. | Visa, Inc. | 1.6% |
| | 7. | Exxon Mobil Corp. | 1.6% |
| | 8. | Johnson & Johnson | 1.5% |
| | 9. | Oracle Corp. | 1.5% |
| | 10. | Gilead Sciences, Inc. | 1.3% |
| | | | |
| | As a percentage of total net assets. |
Management fees and/or expenses were voluntarily waived and/or reimbursed in order to reduce the operating expenses of the Dynamic Growth Fund during the periods shown above. + The Audited Net Expense Ratio is based on average daily net assets and reflects actual expenses of the Fund paid over the one year period ended 12/31/14, including the effect of expense waivers and reimbursements. This ratio may increase or decrease depending on fluctuations in Fund net assets. The Gross Expense Ratio is a percentage of the Fund’s average daily net assets, including acquired fund fees and expenses, as shown in the most current Fund Prospectus. Please see additional disclosures on page 23.
2014 Annual Report | December 31, 2014 | Page 15 |
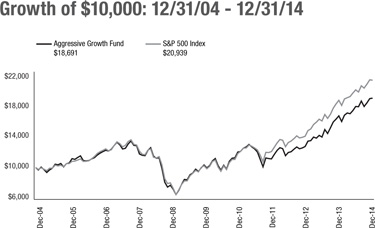
Aggressive Growth Fund The Meeder Aggressive Growth Fund returned 13.49% for the year ended December 31, 2014. By comparison, the S&P 500 Index returned 13.69% during the same time period. Although we maintained positions in mid- and small-cap stocks during the first quarter, we decreased our weight and added to large-cap stocks in accordance with our quantitative models. We also maintained an overweight exposure to the healthcare, information technology, and consumer discretionary sectors. Even though we added a position in developed international markets during the first quarter, we avoided emerging markets following output from our investment model. We began the second quarter with an overweight to the technology, healthcare, and consumer discretionary sectors, while we were underweight energy, telecomm, and utilities in the Fund. As the quarter progressed, we added a position to emerging markets and maintained this position throughout the entire quarter. Both of our international positions (developed and emerging) added to performance but lagged the S&P 500 Index for the quarter. Relative to this index, our underweight to the industrials sector benefited performance, while stock selection in the financial sector contributed to performance as well. Stock selection in the technology sector was the largest detractor from performance. Our best performing stocks in the quarter were Hillshire Brands and Protective Life, both up over 30% for the quarter. Our worst performing stocks were Brocade Communications and Unifirst Corp, both down approximately 13%. During the third quarter, we exited our international position as both developed and emerging markets lagged the S&P 500 Index. Our model that compares domestic and international markets began to favor domestic markets due to currency and momentum factors. In our domestic stock market exposure, we continued to focus on the technology, healthcare, and consumer discretionary sectors. Overall, our stock selection within the healthcare sector added the most to performance while our underweight to the energy sector helped as well. Our selection within the technology sector offset some of the positive gains made by our overweight allocation. The largest detractor to performance was our security selection within the consumer discretionary sector. Security selection within the consumer staples sector added to performance which was driven by a broad number of names contributing positively to relative returns. We began the fourth quarter with a focus on large-cap domestic equities. As the valuation and momentum metrics in our investment model changed, we began to slightly shift away from this position toward more mid- and small-cap securities. We maintained zero exposure to international markets throughout the quarter which proved beneficial as both developed and emerging markets trailed the S&P 500 Index for the quarter by more than 9%. Security selection within the technology sector had a broad base positive contribution with numerous holdings showing steady wins over the benchmark. Adding to this positive performance was our overweight allocation to the sector. This positive contribution was offset by our security selection within the financial sector as well as our underweight allocation. The biggest driver of this underperformance came from Genworth Financial (down 35% for the quarter) as the company continued to struggle with capital flexibility. Our security selection and allocation to the healthcare and consumer staples sectors detracted from performance while our selection and allocation in the energy and materials sectors added to performance. Additionally, we incorporated the use of equity index derivatives, such as stock index futures, in the Fund in order to equitize cash positions. Since these derivatives are designed to track the respective stock index in question, there was no discernible impact to the Fund’s relative performance during 2014. |
Period & Average Annual Total Returns as of December 31, 2014 (Unaudited)
| | 1 Year | 3 Year | 5 Year | 10 Year | Inception Date |
Aggressive Growth Fund
Expense Ratios+: Audited Net 1.33% Gross 1.74% | 13.49% | 19.06% | 12.63% | 6.45% | 2/29/00 |
| S&P 500 Index | 13.69% | 20.41% | 15.45% | 7.67% | 2/29/00 |
| | Sector Concentration |
| | as of December 31, 2014 |
| | 1. | Information Technology | 25.9% |
| | 2. | Healthcare | 16.5% |
| | 3. | Consumer Discretionary | 12.6% |
| | 4. | Financials | 12.0% |
| | 5. | Industrials | 11.3% |
| | 6. | Consumer Staples | 8.7% |
| | 7. | Energy | 4.4% |
| | 8. | Materials | 1.8% |
| | 9. | Utilities | 1.1% |
| | 10. | Telecommunication Services | 0.6% |
| | 11. | Other | 5.1% |
| | | | |
| | As a percentage of total net assets. Concentrations are subject to change. The Fund has invested in stock index futures contracts in order to equitize cash balances held in the Fund. |
| | | | | |
The Growth of $10,000 chart compares the Aggressive Growth Fund’s value to the S&P 500 Index, the Fund’s broad-based benchmark. The chart is intended to give you a general idea of how the Fund performed compared to this benchmark over the period from December 31, 2004 to December 31, 2014. An understanding of the differences between the Fund and this index is important. The S&P 500 Index is a widely recognized unmanaged index of common stock prices that does not take into account the deduction of expenses associated with a mutual fund, such as investment management and accounting fees. One cannot invest directly in an index.
The chart and the table do not reflect the deduction of taxes that a shareholder would pay on Fund distributions or the redemption of Fund shares. | | Top 10 Holdings |
| | as of December 31, 2014 |
| | 1. | Apple, Inc. | 3.2% |
| | 2. | Hewlett-Packard Co. | 2.3% |
| | 3. | Oracle Corp. | 1.9% |
| | 4. | Intel Corp. | 1.8% |
| | 5. | PepsiCo, Inc. | 1.7% |
| | 6. | Visa, Inc. | 1.6% |
| | 7. | Berkshire Hathaway, Inc. | 1.6% |
| | 8. | CVS Health Corp. | 1.5% |
| | 9. | Archer-Daniels Midland Co. | 1.4% |
| | 10. | Gilead Sciences, Inc. | 1.4% |
| | | | |
| | As a percentage of total net assets. |
Management fees and/or expenses were voluntarily waived and/or reimbursed in order to reduce the operating expenses of the Aggressive Growth Fund during the periods shown above. + The Audited Net Expense Ratio is based on average daily net assets and reflects actual expenses of the Fund paid over the one year period ended 12/31/14, including the effect of expense waivers and reimbursements. This ratio may increase or decrease depending on fluctuations in Fund net assets. The Gross Expense Ratio is a percentage of the Fund’s average daily net assets, including acquired fund fees and expenses, as shown in the most current Fund Prospectus. Please see additional disclosures on page 23.
2014 Annual Report | December 31, 2014 | Page 17 |
Strategic Growth Fund The Meeder Strategic Growth Fund returned 5.87% for the year ended December 31, 2014, compared to the custom benchmark return of 4.30% for the same period. The Fund underperformed the broader market during the year, as measured by the S&P 500 Index, which returned 13.69%. The Strategic Growth Fund is fully invested in the equity market at all times, and holds a fixed allocation across six distinct investment categories. The mix of investments selected to represent each investment category is variable and actively managed using our strategic investment selection process. The target allocation as of the end of 2014 was: 30% international, 25% large-cap, 20% mid-cap, 10% small-cap, 7.5% real estate, and 7.5% commodities. The strategic weights to each of these categories are designed to optimize the return and risk tradeoff based on our analysis. The Fund’s performance during 2014 versus the S&P 500 can be attributed to several of the asset allocation categories. While the S&P 500 posted a gain of 13.69% during the year, the international category, which comprised 30% of the Fund, lagged the performance of the S&P 500 with developed international falling 4.90% for the year while emerging markets declined by 2.19%. Additionally, the commodities category fell by 33.06%, driven by the sharp decline in oil prices. Domestically, smaller market cap ranges also underperformed the S&P 500, with the Russell 2000 Index of small-cap stocks returning 4.89%, while the S&P MidCap 400 Index gained 9.77% for 2014. The only asset allocation category in question that posted returns above the S&P 500 in 2014 was real estate investments, with the Dow Jones US Select REIT Index increasing 32.00% for the year. The Fund experienced favorable results when comparing the performance of underlying holdings against their respective benchmark indexes in several asset allocation categories. Overall, our mid-cap holdings outperformed the respective benchmark, which was partially driven by acquisition activity involving positions such as Protective Life and Hillshire Brands. We also experienced favorable relative performance in our commodity-related holdings, with Tesoro, PPG Industries, and Rock-Tenn providing positive results. Our holdings in the international and large-cap categories performed approximately in line with their respective benchmarks, while our holdings in the real estate category trailed the benchmark. Additionally, we incorporated the use of equity index derivatives, such as stock index futures, in the Fund in order to equitize cash positions and make adjustments to certain asset allocation categories. Since these derivatives are designed to track the respective stock index in question, there was no discernible impact to the Fund’s relative performance in 2014. |
Period & Average Annual Total Returns as of December 31, 2014 (Unaudited)
| | 1 Year | 3 Year | 5 Year | 8/31/2008 – 12/31/20149 | Since Inception | Inception Date |
Strategic Growth Fund
Expense Ratios+: Audited Net 1.23% Gross 1.75% | 5.87% | 14.04% | 10.28% | 5.97% | 4.10% | 1/31/06 |
Blended Index7 | 4.30% | 13.54% | 10.66% | 5.85% | 5.96% | 1/31/06 |
Blended Index8 | 3.99% | 13.43% | 10.61% | 6.01% | 6.54% | 1/31/06 |
| S&P 500 Index | 13.69% | 20.41% | 15.45% | 10.13% | 7.70% | 1/31/06 |
 | | Sector Concentration |
| as of December 31, 2014 |
| 1. | Emerging Markets | 15.0% |
| 2. | Developed International | 14.8% |
| 3. | Information Technology | 13.3% |
| 4. | Financials | 13.0% |
| 5. | Energy | 8.4% |
| 6. | Consumer Discretionary | 7.8% |
| 7. | Healthcare | 7.6% |
| 8. | Consumer Staples | 6.1% |
| 9. | Industrials | 5.8% |
| 10. | Materials | 1.6% |
| 11. | Utilities | 1.4% |
| 12. | Telecommunication Services | 0.7% |
| 13. | Other | 4.5% |
| | | |
| As a percentage of total net assets. Concentrations are subject to change. The Fund has invested in stock index futures contracts in order to equitize cash balances held in the Fund. |
| | | | | |
The Growth of $10,000 chart compares the Strategic Growth Fund’s value to the S&P 500 Index, the Fund’s broad-based benchmark, a Blended Index (7), which consists of 25% of the S&P 500 Index, 20% of the S&P 400 Index, 15% of the MSCI EAFE Index, 15% of the MSCI Emerging Markets Index, 10% of the Russell 2000 Index, 7.5% of the Dow Jones US Select REIT Index and 7.5% of the S&P GSCI Index and a Blended Index (8) which consists of 25% of the S&P 500 Index, 20% of the S&P MidCap 400 Index, 12.5% of the Russell 2000 Index, 12.5% of the Dow Jones U.S. Select REIT Index, 12.5% of the S&P GSCI Index, 12% of the MSCI EAFE Index, and 5.5% of the MSCI Emerging Markets Index. The chart is intended to give you a general idea of how the Fund performed compared to these benchmarks over the period from its inception on January 31, 2006 to December 31, 2014. An understanding of the differences between the Fund and these indices is important. The benchmark indices are hypothetical unmanaged indices of common stock that do not take into account the deduction of expenses associated with a mutual fund, such as investment management and accounting fees. One cannot invest directly in an index.
The chart and the table do not reflect the deduction of taxes that a shareholder would pay on Fund distributions or the redemption of Fund shares. | | Top 10 Holdings |
| as of December 31, 2014 |
| | | |
| 1. | iShares MSCI Emerging Markets ETF | 7.8% |
| 2. | iShares MSCI EAFE ETF | 7.5% |
| 3. | Ivy International Core Equity Fund | 7.3% |
| 4. | Oppenheimer Developing Markets Fund | 7.2% |
| 5. | Oracle Corp. | 1.3% |
| 6. | Diamondrock Hospitality Co. | 1.2% |
| 7. | Hewlett-Packard Co. | 1.1% |
| 8. | Exxon Mobil Corp. | 1.1% |
| 9. | Visa, Inc. | 1.0% |
| 10. | Western Digital Corp. | 1.0% |
| | | |
| As a percentage of total net assets. |
Management fees and/or expenses were voluntarily waived and/or reimbursed in order to reduce the operating expenses of the Strategic Growth Fund during the periods shown above. +The Audited Net Expense Ratio is based on average daily net assets and reflects actual expenses of the Fund paid over the one year period ended 12/31/14, including the effect of expense waivers and reimbursements. This ratio may increase or decrease depending on fluctuations in Fund net assets. The Gross Expense Ratio is a percentage of the Fund’s average daily net assets, including acquired fund fees and expenses, as shown in the most current Fund Prospectus. Please see additional disclosures on page 23.
2014 Annual Report | December 31, 2014 | Page 19 |
Utilities and Infrastructure Fund The Meeder Utilities and Infrastructure Fund returned 9.42% for the year ended December 31, 2014, compared to the Russell 3000 Utilities Index return of 16.33% for the same time period. During the first quarter, large-cap electric utilities were surprisingly strong in contrast to the negative sentiment that prevailed during the prior year. Usage was strong due to severe winter weather, while economic data was far from robust and interest rates did not provide the kind of headwind that many were expecting. In our portfolio, the year began with a timely purchase of Capstone Turbine, the world’s leading manufacturer of micro-turbines used to provide electricity to remotely located infrastructure as well as backups. Capstone is experiencing strong demand from oil, gas, and mining companies that are traveling far afield for new reserves, particularly outside North America. To fund this purchase, as well as others in the quarter, we sold Turkcell due to the volatile political environment in Turkey, and took advantage of strong prices to sell or trim ARRIS, Ensco, ITC, Corning, National Grid, Questar, NiSource, Qualcomm, and Black Hills. Strong contributions from companies producing, transporting, and processing natural gas and renewable energy drove portfolio returns in the second quarter. We initiated a position in Ormat Technologies, the world’s largest private producer of geothermal power. Ormat designs, builds, owns, and operates utility-scale generation facilities, the bulk of which are located in Nevada, California, and Hawaii. Long-time holding American Tower turned in strong performance for the quarter on better than expected earnings and an acquisition of 4,600 cell towers in Brazil. During the third quarter, investors took a moment to collectively pause and assess the market’s next turn. While the headlines provided ample fodder to keep investors on edge, the persistent underlying favorable trends among the essential service providers in this arena remained intact. During the quarter we added UIL Holdings, a decades-old electric and gas utility. UIL has operations in Massachusetts and Connecticut and is set to nearly double its customer base following its blockbuster privatization of city-owned Philadelphia Gas Works (PGW). We also added MasTec, one of North America’s leading engineering and construction firms, when an opportunistic entry point emerged. To make room for MasTec, we took partial profits in Sempra Energy, National Fuel Gas, Corning, American Tower, and Williams, and exited our position in Capstone Turbine. Utility companies had a stellar fourth quarter while energy infrastructure lagged. At the beginning of the quarter we bought OGE Energy, which owns a 50% general partner interest and 26% interest in Enable Midstream, a regional natural gas transportation MLP. Rapid growth at Enable supplements steady growth in OGE’s legacy utility businesses in eastern Oklahoma and western Arkansas. We bought AES, a global utility that is aggressively cleaning up its balance sheet, divesting nonessential businesses, and trading at a healthy discount. Lastly, on the regulated utility front we added to MDU on weakness related to its Bakken region exposure. Substantially none of MDU’s $824 million infrastructure growth backlog is at risk, and the company is exiting its oil operations. To fund these positions we sold NiSource as well as ONE Gas and Black Hills, and trimmed General Electric, American Water, and Covanta. With a unique combination of essential-service providers and their enabling industries, we believe this dynamic portfolio is well positioned going forward. |
Period & Average Annual Total Returns as of December 31, 2014 (Unaudited)
| | 1 Year | 3 Year | 5 Year | 10 Year | Inception Date |
Utilities and Infrastructure Fund10
Expense Ratios+: Audited Net 1.88% Gross 1.99% | 9.42% | 12.73% | 11.18% | 8.44% | 6/21/95 |
| Russell 3000 Utilities Index | 16.33% | 13.05% | 12.67% | 7.93% | 6/30/95 |
 | | Sector Concentration |
| | as of December 31, 2014 |
| | 1. | Telecommunication Services | 23.0% |
| | 2. | Utility Services | 22.2% |
| | 3. | Pipelines | 16.1% |
| | 4. | Natural Gas Distribution | 14.1% |
| | 5. | Electric Utility | 11.8% |
| | 6. | Water Utility | 5.2% |
| | 7. | Oil Exploration & Production | 3.3% |
| | 8. | Other | 4.3% |
| | | | |
| | As a percentage of total net assets. Concentrations are subject to change. |
| | | | | |
| The Growth of $10,000 chart compares the Utilities and Infrastructure Fund’s value to the Russell 3000 Utilities Index, the Fund’s broad-based benchmark. The chart is intended to give you a general idea of how the Fund performed compared to this benchmarks over the period from December 31, 2004 to December 31, 2014. An understanding of the differences between the Fund and this index is important. The benchmark index does not take into account the deduction of expenses associated with a mutual fund, such as investment management and accounting fees. One cannot invest directly in an index.
The chart and the table do not reflect the deduction of taxes that a shareholder would pay on Fund distributions or the redemption of Fund shares. | | Top 10 Holdings |
| | as of December 31, 2014 |
| | 1. | Kinder Morgan, Inc. | 5.3% |
| | 2. | Macquarie Infrastructure Co. LLC | 4.3% |
| | 3. | Enterprise Products Partners LP | 4.1% |
| | 4. | Corning, Inc. | 3.9% |
| | 5. | Energy Transfer Equity LP | 3.4% |
| | 6. | MDU Resources Group, Inc. | 3.3% |
| | 7. | Veolia Environnement SA ADR | 3.3% |
| | 8. | American Tower Corp. | 3.3% |
| | 9. | Telephone and Data Systems, Inc. | 3.2% |
| | 10. | Qualcomm, Inc. | 2.9% |
| | | | |
| | As a percentage of total net assets. |
Management fees and/or expenses were voluntarily waived and/or reimbursed in order to reduce the operating expenses of the Utilities and Infrastructure Fund during the periods shown above. + The Audited Net Expense Ratio is based on average daily net assets and reflects actual expenses of the Fund paid over the one year period ended 12/31/14, including the effect of expense waivers and reimbursements. This ratio may increase or decrease depending on fluctuations in Fund net assets. The Gross Expense Ratio is a percentage of the Fund’s average daily net assets as shown in the most current Fund Prospectus. Please see additional disclosures on page 23.
2014 Annual Report | December 31, 2014 | Page 21 |
Shareholder Expense Analysis (Unaudited)
Shareholders of mutual funds pay ongoing expenses, such as advisory fees, distribution and service fees (12b-1 fees) and other fund expenses. The following examples are intended to help you understand your ongoing costs (in dollars) of investing in the Funds and to compare these costs with the ongoing costs of investing in other mutual funds.
The examples below are based on an investment of $1,000 invested at the beginning of the period and held for the six-month period from June 30, 2014 to December 31, 2014.
ACTUAL EXPENSES: You may use actual account values and actual expenses, along with the amount you invested, to estimate the expenses that you paid over the period. Simply divide your account value by $1,000 (e.g.: an $8,600 account value divided by $1,000 = 8.6), then multiply the result by the number in the line under the heading “Expenses Paid During the Period” to estimate the expenses you paid on your account during this period.
HYPOTHETICAL EXAMPLE FOR COMPARISON PURPOSES: Hypothetical account values and hypothetical expenses are based on the Funds’ actual expense ratios and assume rates of return of 5% per year before expenses, which are not the Funds’ actual returns. The hypothetical account values and expenses may not be used to estimate the actual ending account balance or expenses you paid for the period. You may use this information to compare the ongoing costs of investing in the Funds to other funds. To do so, compare this 5% hypothetical example with the 5% hypothetical examples that appear in the shareholder reports of the other funds.
| | | Beginning
Account Value
(6/30/2014) | Ending
Account Value (12/31/2014) | Expenses Paid
During Period1
(6/30/2014 - 12/31/2014) | Expense Ratio
(Annualized) |
Muirfield Fund® | Actual | $1,000.00 | $1,051.60 | $6.31 | 1.22% |
| | Hypothetical | $1,000.00 | $1,019.06 | $6.21 | 1.22% |
| Utilities & Infrastructure Fund | Actual | $1,000.00 | $968.10 | $9.52 | 1.92% |
| | Hypothetical | $1,000.00 | $1,015.53 | $9.75 | 1.92% |
| Quantex Fund™ | Actual | $1,000.00 | $1,009.50 | $7.55 | 1.49% |
| | Hypothetical | $1,000.00 | $1,017.69 | $7.58 | 1.49% |
| Dynamic Growth Fund | Actual | $1,000.00 | $1,064.20 | $6.35 | 1.22% |
| | Hypothetical | $1,000.00 | $1,019.06 | $6.21 | 1.22% |
| Aggressive Growth Fund | Actual | $1,000.00 | $1,059.20 | $6.96 | 1.34% |
| | Hypothetical | $1,000.00 | $1,018.45 | $6.82 | 1.34% |
| Balanced Fund | Actual | $1,000.00 | $1,027.30 | $6.80 | 1.33% |
| | Hypothetical | $1,000.00 | $1,018.50 | $6.77 | 1.33% |
| Strategic Growth Fund | Actual | $1,000.00 | $973.10 | $6.02 | 1.21% |
| | Hypothetical | $1,000.00 | $1,019.11 | $6.16 | 1.21% |
| Total Return Bond Fund | Actual | $1,000.00 | $984.00 | $4.95 | 0.99% |
| | Hypothetical | $1,000.00 | $1,020.21 | $5.04 | 0.99% |
| Money Market Fund - Retail Class | Actual | $1,000.00 | $1,000.30 | $0.76 | 0.15% |
| | Hypothetical | $1,000.00 | $1,024.45 | $0.77 | 0.15% |
| Money Market Fund - Institutional Class | Actual | $1,000.00 | $1,000.50 | $0.40 | 0.08% |
| | Hypothetical | $1,000.00 | $1,024.80 | $0.41 | 0.08% |
Please note that the expenses shown in the tables are meant to highlight your ongoing costs only and do not reflect any transactional costs, such as redemption fees or exchange fees. Therefore, hypothetical information is useful in comparing ongoing costs only, and will not help you determine the relative total costs of owning different funds. In addition, if any transactional costs were included, your costs would have been higher.
| 1 | Expenses are equal to the Funds’ annualized expense ratios, multiplied by the average account value over the period, multiplied by 184/365 (to reflect the total number of days in the six-month period). |
| Page 22 | 2014 Annual Report | December 31, 2014 |
Disclosures
Past performance is not a guarantee of future results. Investing in securities involves inherent risks, including the risk that you can lose the value of your investment. There is no assurance that the investment process will lead to successful results. Investments in foreign securities may entail unique and additional risks including political, market and currency risks. Returns for periods of one year and greater are annualized. All performance figures represent total returns and average annual total returns or current and effective yields for the periods ended December 31, 2014. Investment performance assumes reinvestment of all dividend and capital gain distributions. The investment return and principal value of an investment will fluctuate so an investor’s shares or units, when redeemed, may be worth more or less than their original cost. Current performance may be lower or higher than the performance data quoted. Current performance data is available at www.meederfunds.com. Management fees and/or expenses were voluntarily waived and/or reimbursed in Meeder Funds® during the periods shown to reduce expenses. Any transfer agent fee waivers are contractual. The Quantex FundTM management fee waiver is contractual and can be terminated annually by the Adviser on its renewal date, April 30, 2015.
| 1 | The blended index consists of 50% of the Russell 2000 Index and 50% of the S&P MidCap 400 Index. |
| 2 | The Quantex Fund™ was previously known as The Highlands Growth Fund. On April 30, 2005, The Highlands Growth Fund changed its name to the Quantex Fund™, also changing the Fund’s investment objective and strategies. The Highlands Growth Fund focused on large-cap equities, while the Quantex Fund™ utilizes quantitative investment strategies that invest primarily in small- and mid-cap equities. Due to this change in strategies on April 30, 2005, the S&P 500 Index is a more comparative index for Fund performance prior to April 30, 2005. The Russell 2000 Index and S&P MidCap 400 Index are more comparative indices for Fund performance after April 30, 2005. |
| 3 | The blended index is comprised of 60% of the S&P 500 Index and 40% of the average 90-day U.S. T-bill. |
| 4 | The blended index is comprised of 42% of the S&P 500 Index, 28% of the average 90-day U.S. T-bill and 30% of the Barclays Intermediate-Term Government/Credit Index. The Blended Index was used from January 1, 2010 to December 31, 2013. |
| 5 | The blended index is comprised of 42% of the S&P 500 Index, 28% of the average 90-day U.S. Treasury bill and 30% of the Barclays Aggregate Bond Index. The Blended Index was used from January 1, 2014 to December 31, 2014. |
| 6 | On August 25, 2008, The Defensive Growth Fund became known as The Defensive Balanced Fund and its investment strategy changed. In 2012, The Defensive Balanced Fund became known as the Balanced Fund. This Fund will always invest at least 30% and may invest up to 70% of its assets primarily in equity mutual funds. In addition, this Fund will always invest at least 30% and may invest up to 70% of its assets primarily in investment grade bonds, money market instruments, or exchange traded funds. |
| 7 | The blended index is comprised of 25% of the S&P 500 Index, 20% of the S&P 400 Index, 15% of the MSCI EAFE Index, 15% of the MSCI Emerging Markets Index, 10% of the Russell 2000 Index, 7.5% of the Dow Jones US Select REIT Index and 7.5% of the S&P GSCI Index. The Blended Index is representative of the average composition of the Strategic Growth Fund from January 1, 2014 to December 31, 2014. |
| 8 | The blended index is comprised of 25% of the S&P 500 Index, 20% of the S&P MidCap 400 Index, 12.5% of the Russell 2000 Index, 12.5% of the Dow Jones U.S. Select REIT Index, 12.5% of the S&P GSCI Index, 12% of the MSCI EAFE Index, and 5.5% of the MSCI Emerging Markets Index. The Blended Index is representative of the average composition of the Strategic Growth Fund from August 25, 2008 to December 31, 2013. |
| 9 | On August 25, 2008, The Focused Growth Fund became known as the Strategic Growth Fund and its investment strategy changed. This Fund will pursue its goal by investing primarily in open-end or closed-end investment companies that seek capital growth or appreciation without regard to current income. In addition, this Fund will always have set allocations to U.S. large-cap equities, U.S. mid-cap equities, U.S. small-cap equities, non-U.S./International (including emerging markets) equities, real estate equities and commodity based equities. |
| 10 | The Utilities and Infrastructure Fund was previously known as The Total Return Utilities Fund. On June 30, 2011, the Total Return Utilities Fund changed its name to the Utilities and Infrastructure Fund. Its investment objective and strategy remained unchanged. |
| * | The current and effective yields quoted for the Money Market Fund are as of December 31, 2014. Yield quotations more closely reflect the current earnings of the Money Market Fund than do total return quotations. To obtain the current 7-day yields for the Money Market Fund, call Meeder Funds® Client Services Department toll free at (800) 325-3539 or (614) 760-2159. Investments in the Money Market Fund (either class) are not a deposit and are neither insured nor guaranteed by the Federal Deposit Insurance Corporation or any other governmental agency. Although the Fund seeks to preserve the value of your investment at $1.00 per share, it is possible to lose money by investing in Money Market Fund (either class). |
This is not an offer to purchase securities. Investors are advised to consider the investment objectives, risks, charges and expenses of the Meeder Funds®, as well as current Fund performance information, carefully before investing. The Meeder Funds® prospectus contains this and other information. To request or receive a copy of the Meeder Funds® prospectus, you may call (800) 325-3539, visit our website at www.meederfunds.com, or write to P.O. Box 7177, Dublin, OH 43017.
Note on comparative indices: Returns for an index do not reflect fees, brokerage commissions, or other expenses associated with investing. One cannot invest directly in an index. Source for equity index data: Bloomberg LP. Source for fixed income index data: Morningstar, Inc. Source for average general-purpose money market fund performance: Lipper, Inc.
©2015 Morningstar, Inc. All rights reserved. The Morningstar information contained herein (1) is proprietary to Morningstar and/or its content providers; (2) may not be copied or redistributed; and (3) is not warranted to be accurate complete or timely. Neither Morningstar nor its content providers are responsible for any damages or losses arising from any use of this information.
©2015 Reuters. All rights reserved. Lipper, a Reuters Company, supplied information contained in this report. Any copying, republication or redistribution of Lipper content, including by caching, framing or similar means, is expressly prohibited without the prior written consent of Lipper. Lipper shall not be liable for any errors or delays in the content, or for any actions taken in reliance thereon. Rankings are based on all classes available within the classification as of the date shown. Rankings are based only on the universe shown.
Meeder does not review the Morningstar or Lipper data. For fund performance you should review the fund’s current prospectus or other fund materials for the most current information concerning applicable fees and expenses. Although Meeder believes the data gathered from third-party sources is reliable, it does not review such information and cannot warrant it to be accurate, complete, or timely. Meeder is not responsible for any damages or losses arising from any use of this third-party information.
Meeder Funds® are distributed by Adviser Dealer Services, Inc. Member FINRA.
2014 Annual Report | December 31, 2014 | Page 23 |
2014 Annual Report Fund Holdings & Financial Statements |
Schedule of Investments
December 31, 2014
| Muirfield Fund | |
| Security Description | | Shares or
Principal
Amount ($) | | | Fair
Value ($) | |
| | | | | | | |
| Common Stocks — 70.9% | |
| Consumer Discretionary — 9.6% | | | | | | |
| Advance Auto Parts, Inc. | | | 7,780 | | | | 1,239,198 | |
| Aramark | | | 57,120 | | | | 1,779,288 | |
AutoNation, Inc. (2) | | | 20,275 | | | | 1,224,813 | |
AutoZone, Inc. (2) | | | 4,645 | | | | 2,875,766 | |
Bed Bath & Beyond, Inc. (2) | | | 16,415 | | | | 1,250,331 | |
| Best Buy Co., Inc. | | | 33,370 | | | | 1,300,763 | |
| Choice Hotels International, Inc. | | | 11,800 | | | | 661,036 | |
| Cooper Tire & Rubber Co. | | | 30,780 | | | | 1,066,527 | |
| DeVry Education Group, Inc. | | | 20,430 | | | | 969,812 | |
| Expedia, Inc. | | | 19,940 | | | | 1,702,078 | |
Gentherm, Inc. (2) | | | 26,150 | | | | 957,613 | |
| Home Depot, Inc./The | | | 25,550 | | | | 2,681,983 | |
Iconix Brand Group, Inc. (2) | | | 25,200 | | | | 851,508 | |
| Lear Corp. | | | 13,210 | | | | 1,295,637 | |
Murphy USA, Inc. (2) | | | 16,830 | | | | 1,158,914 | |
| Nexstar Broadcasting Group, Inc. | | | 12,815 | | | | 663,689 | |
O'Reilly Automotive, Inc. (2) | | | 6,395 | | | | 1,231,805 | |
Penn National Gaming, Inc. (2) | | | 37,620 | | | | 516,523 | |
| Scripps Networks Interactive, Inc. | | | 15,660 | | | | 1,178,728 | |
Starz (2) | | | 21,620 | | | | 642,114 | |
| Target Corp. | | | 25,780 | | | | 1,956,960 | |
| Walt Disney Co./The | | | 13,290 | | | | 1,251,785 | |
| (Cost $26,984,301 ) | | | | | | | 28,456,871 | |
| | | | | | | | | |
| Consumer Staples — 7.5% | | | | | | | | |
| Altria Group, Inc. | | | 41,065 | | | | 2,023,273 | |
| Archer-Daniels-Midland Co. | | | 68,590 | | | | 3,566,679 | |
| Costco Wholesale Corp. | | | 12,035 | | | | 1,705,961 | |
| CVS Health Corp. | | | 34,270 | | | | 3,300,544 | |
| Dr Pepper Snapple Group, Inc. | | | 7,215 | | | | 517,171 | |
| Keurig Green Mountain, Inc. | | | 7,575 | | | | 1,002,892 | |
| Kroger Co./The | | | 17,070 | | | | 1,096,065 | |
Monster Beverage Corp. (2) | | | 5,795 | | | | 627,888 | |
| PepsiCo, Inc. | | | 32,330 | | | | 3,057,125 | |
| Procter & Gamble Co./The | | | 22,580 | | | | 2,056,812 | |
Sanderson Farms, Inc. (4) | | | 10,505 | | | | 882,683 | |
| Tyson Foods, Inc. | | | 10,130 | | | | 406,112 | |
| Wal-Mart Stores, Inc. | | | 23,865 | | | | 2,049,526 | |
| (Cost $21,217,187) | | | | | | | 22,292,731 | |
| | | | | | | | | |
| Energy — 3.1% | | | | | | | | |
| Anadarko Petroleum Corp. | | | 8,475 | | | | 699,188 | |
| Chevron Corp. | | | 16,010 | | | | 1,796,002 | |
| Exxon Mobil Corp. | | | 43,880 | | | | 4,056,705 | |
| Green Plains, Inc. | | | 21,410 | | | | 530,540 | |
| Marathon Petroleum Corp. | | | 8,200 | | | | 740,132 | |
| Muirfield Fund | |
| Security Description | | Shares or
Principal
Amount ($) | | | Fair
Value ($) | |
| | | | | | | |
| Common Stocks — continued | |
| Valero Energy Corp. | | | 28,915 | | | | 1,431,293 | |
| (Cost $9,736,328) | | | | | | | 9,253,860 | |
| | | | | | | | | |
| Financials — 9.2% | | | | | | | | |
| Allstate Corp./The | | | 26,070 | | | | 1,831,418 | |
| American Equity Investment Life Holding Co. | | | 36,405 | | | | 1,062,662 | |
| American International Group, Inc. | | | 65,795 | | | | 3,685,178 | |
| Bank of New York Mellon Corp./The | | | 28,075 | | | | 1,139,003 | |
Berkshire Hathaway, Inc. (2) | | | 31,380 | | | | 4,711,706 | |
| Capital One Financial Corp. | | | 18,710 | | | | 1,544,511 | |
DuPont Fabros Technology, Inc. (3) | | | 14,585 | | | | 484,805 | |
| Fulton Financial Corp. | | | 50,550 | | | | 624,798 | |
Genworth Financial, Inc. (2) | | | 48,800 | | | | 414,800 | |
| Hanover Insurance Group, Inc./The | | | 8,690 | | | | 619,771 | |
Investment Technology Group, Inc. (2) | | | 15,305 | | | | 318,650 | |
| Jones Lang LaSalle, Inc. | | | 5,535 | | | | 829,863 | |
| JPMorgan Chase & Co. | | | 42,710 | | | | 2,672,792 | |
| Northwest Bancshares, Inc. | | | 16,170 | | | | 202,610 | |
PRA Group, Inc. (2) | | | 17,115 | | | | 991,472 | |
Ryman Hospitality Properties, Inc. (3) | | | 18,950 | | | | 999,423 | |
Springleaf Holdings, Inc. (2) | | | 13,780 | | | | 498,423 | |
| Travelers Cos., Inc./The | | | 15,235 | | | | 1,612,625 | |
| Wells Fargo & Co. | | | 56,200 | | | | 3,080,884 | |
| (Cost $25,480,020) | | | | | | | 27,325,394 | |
| | | | | | | | | |
| Healthcare — 11.6% | | | | | | | | |
| Abbott Laboratories | | | 27,305 | | | | 1,229,271 | |
| AbbVie, Inc. | | | 17,375 | | | | 1,137,020 | |
| Aetna, Inc. | | | 6,635 | | | | 589,387 | |
Alexion Pharmaceuticals, Inc. (2) | | | 3,190 | | | | 590,246 | |
Amsurg Corp. (2) | | | 16,845 | | | | 921,927 | |
| Anthem, Inc. | | | 11,965 | | | | 1,503,642 | |
| Cardinal Health, Inc. | | | 8,905 | | | | 718,901 | |
Celgene Corp. (2) | | | 19,225 | | | | 2,150,509 | |
Centene Corp. (2) | | | 6,565 | | | | 681,775 | |
Gilead Sciences, Inc. (2) | | | 32,670 | | | | 3,079,473 | |
HCA Holdings, Inc. (2) | | | 20,385 | | | | 1,496,055 | |
Health Net, Inc./CA (2) | | | 9,200 | | | | 492,476 | |
| HealthSouth Corp. | | | 18,685 | | | | 718,625 | |
Hospira, Inc. (2) | | | 7,955 | | | | 487,244 | |
| Humana, Inc. | | | 7,185 | | | | 1,031,982 | |
| Johnson & Johnson | | | 36,990 | | | | 3,868,044 | |
LifePoint Hospitals, Inc. (2) | | | 19,355 | | | | 1,391,818 | |
| McKesson Corp. | | | 8,930 | | | | 1,853,689 | |
| Merck & Co., Inc. | | | 44,100 | | | | 2,504,439 | |
Molina Healthcare, Inc. (2) | | | 9,260 | | | | 495,688 | |
| Pfizer, Inc. | | | 98,540 | | | | 3,069,521 | |
The accompanying notes are an integral part of these financial statements.
2014 Annual Report | December 31, 2014 | Page 25 |
Schedule of Investments
December 31, 2014
| Muirfield Fund | |
| Security Description | | Shares or
Principal
Amount ($) | | | Fair
Value ($) | |
| | | | | | | |
| Common Stocks — continued | |
| Teva Pharmaceutical Industries, Ltd. | | | 33,665 | | | | 1,936,074 | |
| UnitedHealth Group, Inc. | | | 14,555 | | | | 1,471,365 | |
VCA, Inc. (2) | | | 25,345 | | | | 1,236,076 | |
| (Cost $32,010,647) | | | | | | | 34,655,247 | |
| | | | | | | | | |
| Industrials — 8.3% | | | | | | | | |
AECOM (2) | | | 23,810 | | | | 723,110 | |
Avis Budget Group, Inc. (2) | | | 25,240 | | | | 1,674,169 | |
| AZZ, Inc. | | | 4,455 | | | | 209,029 | |
| Briggs & Stratton Corp. | | | 15,505 | | | | 316,612 | |
| Caterpillar, Inc. | | | 12,650 | | | | 1,157,855 | |
CBIZ, Inc. (2) | | | 10,230 | | | | 87,569 | |
| CSX Corp. | | | 28,705 | | | | 1,039,982 | |
| Delta Air Lines, Inc. | | | 30,320 | | | | 1,491,441 | |
| Deluxe Corp. | | | 16,575 | | | | 1,031,794 | |
| FedEx Corp. | | | 3,080 | | | | 534,873 | |
| General Dynamics Corp. | | | 9,825 | | | | 1,352,117 | |
| General Electric Co. | | | 41,800 | | | | 1,056,286 | |
Greenbrier Cos., Inc./The (4) | | | 16,690 | | | | 896,754 | |
JetBlue Airways Corp. (2) | | | 79,620 | | | | 1,262,773 | |
| Lockheed Martin Corp. | | | 8,585 | | | | 1,653,213 | |
| Northrop Grumman Corp. | | | 8,810 | | | | 1,298,506 | |
| Quad/Graphics, Inc. | | | 9,640 | | | | 221,334 | |
| Raytheon Co. | | | 12,475 | | | | 1,349,421 | |
| Roper Industries, Inc. | | | 9,555 | | | | 1,493,924 | |
| Southwest Airlines Co. | | | 37,490 | | | | 1,586,577 | |
Teledyne Technologies, Inc. (2) | | | 6,905 | | | | 709,420 | |
| Union Pacific Corp. | | | 18,255 | | | | 2,174,717 | |
United Rentals, Inc. (2) | | | 13,420 | | | | 1,368,974 | |
| (Cost $23,460,316) | | | | | | | 24,690,450 | |
| | | | | | | | | |
| Information Technology — 18.9% | | | | | | | | |
| Apple, Inc. | | | 74,270 | | | | 8,197,922 | |
| Broadcom Corp. | | | 32,260 | | | | 1,397,826 | |
Calix, Inc. (2) | | | 15,705 | | | | 157,364 | |
| CDW Corp./DE | | | 47,530 | | | | 1,671,630 | |
| Corning, Inc. | | | 98,960 | | | | 2,269,153 | |
| EarthLink Holdings Corp. | | | 68,180 | | | | 299,310 | |
Electronic Arts, Inc. (2) | | | 29,030 | | | | 1,364,845 | |
Emulex Corp. (2) | | | 47,440 | | | | 268,985 | |
Entropic Communications, Inc. (2) | | | 40,325 | | | | 102,022 | |
Fiserv, Inc. (2) | | | 15,470 | | | | 1,097,906 | |
Google, Inc. - Class C (2) | | | 4,565 | | | | 2,403,016 | |
Google, Inc. - Class A (2) | | | 2,040 | | | | 1,082,546 | |
| Hewlett-Packard Co. | | | 109,553 | | | | 4,396,362 | |
| Intel Corp. | | | 136,765 | | | | 4,963,202 | |
| International Business Machines Corp. | | | 18,260 | | | | 2,929,634 | |
| Muirfield Fund | |
| Security Description | | Shares or
Principal
Amount ($) | | | Fair
Value ($) | |
| | | | | | | |
| Common Stocks — continued | |
| Lam Research Corp. | | | 8,465 | | | | 671,613 | |
| Lexmark International, Inc. | | | 28,295 | | | | 1,167,735 | |
Micron Technology, Inc. (2) | | | 43,315 | | | | 1,516,458 | |
| Microsoft Corp. | | | 62,755 | | | | 2,914,970 | |
| Monolithic Power Systems, Inc. | | | 6,060 | | | | 301,424 | |
NeuStar, Inc. (2)(4) | | | 23,210 | | | | 645,238 | |
OmniVision Technologies, Inc. (2) | | | 18,565 | | | | 482,690 | |
| Oracle Corp. | | | 106,895 | | | | 4,807,067 | |
PMC-Sierra, Inc. (2) | | | 55,555 | | | | 508,884 | |
Rovi Corp. (2) | | | 49,705 | | | | 1,122,836 | |
| Science Applications International Corp. | | | 10,235 | | | | 506,940 | |
| Skyworks Solutions, Inc. | | | 8,735 | | | | 635,122 | |
Take-Two Interactive Software, Inc. (2) | | | 18,955 | | | | 531,309 | |
TeleTech Holdings, Inc. (2) | | | 4,330 | | | | 102,534 | |
| Tessera Technologies, Inc. | | | 20,095 | | | | 718,597 | |
| Texas Instruments, Inc. | | | 45,410 | | | | 2,427,846 | |
| Western Digital Corp. | | | 23,131 | | | | 2,560,602 | |
| Xerox Corp. | | | 145,040 | | | | 2,010,254 | |
| (Cost $46,768,886) | | | | | | | 56,233,842 | |
| | | | | | | | | |
| Materials — 1.0% | | | | | | | | |
| Celanese Corp. | | | 10,820 | | | | 648,767 | |
| Mosaic Co./The | | | 32,455 | | | | 1,481,570 | |
Resolute Forest Products, Inc. (2) | | | 15,941 | | | | 280,721 | |
| Rock-Tenn Co. | | | 11,595 | | | | 707,063 | |
| (Cost $3,097,576) | | | | | | | 3,118,121 | |
| | | | | | | | | |
| Telecommunication Services — 1.1% | | | | | | | | |
| CenturyLink, Inc. | | | 24,440 | | | | 967,335 | |
Premiere Global Services, Inc. (2) | | | 9,805 | | | | 104,129 | |
| Verizon Communications, Inc. | | | 47,520 | | | | 2,222,985 | |
| (Cost $3,426,639) | | | | | | | 3,294,449 | |
| | | | | | | | | |
| Utilities — 0.6% | | | | | | | | |
| Public Service Enterprise Group, Inc. | | | 6,585 | | | | 272,685 | |
| UGI Corp. | | | 21,562 | | | | 818,925 | |
| Vectren Corp. | | | 15,025 | | | | 694,606 | |
| (Cost $1,526,634) | | | | | | | 1,786,216 | |
| | | | | | | | | |
Total Common Stocks
(Cost $193,708,534) | | | | | | | 211,107,181 | |
The accompanying notes are an integral part of these financial statements.
| Page 26 | 2014 Annual Report | December 31, 2014 |
Schedule of Investments
December 31, 2014
| Muirfield Fund | |
| Security Description | | Shares or
Principal
Amount ($) | | | Fair
Value ($) | |
| | | | | | | |
| Money Market Registered Investment Companies — 28.3% | |
Fidelity Institutional Money Market Portfolio, 0.11% (5) | | | 2,471,902 | | | | 2,471,902 | |
Meeder Money Market Fund - Institutional Class, 0.14% (6) | | | 81,863,069 | | | | 81,863,069 | |
Total Money Market Registered Investment Companies
(Cost $84,334,971) | | | | | | | 84,334,971 | |
| | | | | | | | | |
| Bank Obligations — 0.3% | | | | | | | | |
Capital Bank Deposit Account,
0.65%, 1/2/2015 (7) | | | 249,603 | | | | 249,603 | |
EverBank Money Market Account, 0.61%, 1/2/2015 (7) | | | 249,558 | | | | 249,558 | |
Mid America Bank Demand Deposit Account, 0.50%, 1/2/2015 (7) | | | 249,386 | | | | 249,386 | |
Pacific Mercantile Bank Deposit Account, 0.55%, 1/2/2015 (7) | | | 249,270 | | | | 249,270 | |
Total Bank Obligations
(Cost $997,817) | | | | | | | 997,817 | |
| | | | | | | | | |
| U.S. Government Obligations — 0.7% | | | | | | | | |
U.S. Treasury Bill, 0.07%, due 3/5/2015 (8) | | | 2,000,000 | | | | 1,999,940 | |
Total U.S. Government Obligations
(Cost $1,999,857) | | | | | | | 1,999,940 | |
Total Investments — 100.2%
(Cost $281,041,179)(1) | | | | | | | 298,439,909 | |
| Liabilities less Other Assets — (0.2%) | | | | | | | (578,497 | ) |
| Total Net Assets — 100.0% | | | | | | | 297,861,412 | |
| | | | | | | | | |
Trustee Deferred Compensation (9) | | | | | | | | |
| Meeder Aggressive Growth Fund | | | 4,036 | | | | 42,257 | |
| Meeder Balanced Fund | | | 2,137 | | | | 23,464 | |
| Meeder Dynamic Growth Fund | | | 1,449 | | | | 14,519 | |
| Meeder Muirfield Fund | | | 6,035 | | | | 42,426 | |
| Meeder Quantex Fund | | | 3,320 | | | | 116,864 | |
| Meeder Utilities & Infrastructure Fund | | | 449 | | | | 13,672 | |
Total Trustee Deferred Compensation
(Cost $173,534) | | | | | | | 253,202 | |
| Muirfield Fund | |
| | | Long Contracts | | | Unrealized Appreciation (Depreciation)($) | |
| | | | | | | |
| Futures Contracts | |
| Standard & Poors 500 Mini Futures expiring March 2015, notional value $68,139,680 | | | 664 | | | | 855,462 | |
| Russell 2000 Mini Index Futures expiring March 2015, notional value $16,809,800 | | | 140 | | | | (12,828 | ) |
| Total Futures Contracts | | | 804 | | | | 842,634 | |
| (1) | Cost for federal income tax purposes of $281,273,544 differs from value by net unrealized appreciation (depreciation) of securities as follows: |
| Unrealized appreciation | | $ | 19,765,484 | |
| Unrealized depreciation | | | (2,599,119 | ) |
| Net unrealized appreciation (depreciation) | | $ | 17,166,365 | |
| (2) | Represents non-income producing securities. |
| (3) | Real estate investment trust. |
| (4) | All or a portion of this security is on loan. |
| (5) | Investment purchased as securities lending collateral. The yield shown represents the 7-day yield in effect at December 31, 2014. |
| (6) | Investment in affiliate. The yield shown represents the 7-day yield in effect at December 31, 2014. |
| (7) | Variable rate security. Securities payable at par including accrued interest (usually within seven days notice) and unconditionally secured as to principal and interest by letters of credit or other credit support agreements from major banks. The interest rates are adjustable and are based on bank prime rates or other interest rate adjustment indices. The rate shown represents the rate in effect at December 31, 2014. The maturity date shown, if applicable, reflects the earlier of the next demand date or stated maturity date. |
| (8) | Pledged as collateral on futures contracts. |
| (9) | Assets of affiliates to the Muirfield Fund held for the benefit of the Fund’s Trustees in connection with the Trustee Deferred Compensation Plan. |
The accompanying notes are an integral part of these financial statements.
2014 Annual Report | December 31, 2014 | Page 27 |
Schedule of Investments
December 31, 2014
| Dynamic Growth Fund | |
| Security Description | | Shares or
Principal
Amount ($) | | | Fair
Value ($) | |
| | | | | | | |
| Common Stocks — 95.8% | |
| Consumer Discretionary — 10.9% | | | | | | |
| Advance Auto Parts, Inc. | | | 3,565 | | | | 567,833 | |
Amazon.com, Inc. (2) | | | 220 | | | | 68,277 | |
| Aramark | | | 34,275 | | | | 1,067,666 | |
AutoNation, Inc. (2) | | | 9,290 | | | | 561,209 | |
AutoZone, Inc. (2) | | | 1,670 | | | | 1,033,914 | |
Bed Bath & Beyond, Inc. (2) | | | 4,105 | | | | 312,678 | |
| Best Buy Co., Inc. | | | 15,295 | | | | 596,199 | |
| Choice Hotels International, Inc. | | | 6,810 | | | | 381,496 | |
| Cooper Tire & Rubber Co. | | | 9,160 | | | | 317,394 | |
| CST Brands, Inc. | | | 5,675 | | | | 247,487 | |
| Dana Holding Corp. | | | 11,760 | | | | 255,662 | |
| DeVry Education Group, Inc. | | | 6,140 | | | | 291,466 | |
| Expedia, Inc. | | | 9,115 | | | | 778,056 | |
Gentherm, Inc. (2) | | | 14,385 | | | | 526,779 | |
| Harman International Industries, Inc. | | | 4,295 | | | | 458,319 | |
| Home Depot, Inc./The | | | 15,315 | | | | 1,607,616 | |
Iconix Brand Group, Inc. (2) | | | 13,860 | | | | 468,329 | |
| Interpublic Group of Cos., Inc./The | | | 22,345 | | | | 464,106 | |
| Lear Corp. | | | 11,080 | | | | 1,086,725 | |
| Leggett & Platt, Inc. | | | 10,825 | | | | 461,253 | |
Murphy USA, Inc. (2) | | | 4,755 | | | | 327,429 | |
| Nexstar Broadcasting Group, Inc. | | | 7,390 | | | | 382,728 | |
O'Reilly Automotive, Inc. (2) | | | 2,930 | | | | 564,377 | |
Penn National Gaming, Inc. (2) | | | 18,810 | | | | 258,261 | |
| Scripps Networks Interactive, Inc. | | | 3,915 | | | | 294,682 | |
Starz (2) | | | 12,355 | | | | 366,944 | |
| Target Corp. | | | 13,570 | | | | 1,030,099 | |
| Walt Disney Co./The | | | 7,650 | | | | 720,554 | |
| (Cost $14,757,252) | | | | | | | 15,497,538 | |
| | | | | | | | | |
| Consumer Staples — 10.2% | | | | | | | | |
| Altria Group, Inc. | | | 19,555 | | | | 963,475 | |
| Archer-Daniels-Midland Co. | | | 27,770 | | | | 1,444,040 | |
| Bunge, Ltd. | | | 4,340 | | | | 394,549 | |
| Coca-Cola Co./The | | | 7,480 | | | | 315,806 | |
| Costco Wholesale Corp. | | | 6,015 | | | | 852,626 | |
| CVS Health Corp. | | | 16,545 | | | | 1,593,449 | |
| Dr Pepper Snapple Group, Inc. | | | 5,770 | | | | 413,594 | |
| Keurig Green Mountain, Inc. | | | 6,540 | | | | 865,863 | |
| Kroger Co./The | | | 8,535 | | | | 548,032 | |
Monster Beverage Corp. (2) | | | 1,340 | | | | 145,189 | |
| PepsiCo, Inc. | | | 25,670 | | | | 2,427,354 | |
| Procter & Gamble Co./The | | | 7,905 | | | | 720,066 | |
| Reynolds American, Inc. | | | 5,445 | | | | 349,950 | |
Sanderson Farms, Inc. (4) | | | 4,925 | | | | 413,823 | |
| Tyson Foods, Inc. | | | 10,130 | | | | 406,112 | |
| Dynamic Growth Fund | |
| Security Description | | Shares or
Principal
Amount ($) | | | Fair
Value ($) | |
| | | | | | | |
| Common Stocks — continued | |
| Walgreens Boots Alliance, Inc. | | | 14,765 | | | | 1,125,093 | |
| Wal-Mart Stores, Inc. | | | 17,900 | | | | 1,537,252 | |
| (Cost $13,753,929) | | | | | | | 14,516,273 | |
| | | | | | | | | |
| Energy — 5.9% | | | | | | | | |
| Anadarko Petroleum Corp. | | | 5,650 | | | | 466,125 | |
Carrizo Oil & Gas, Inc. (2) | | | 6,215 | | | | 258,544 | |
| Chevron Corp. | | | 13,255 | | | | 1,486,946 | |
| ConocoPhillips | | | 8,315 | | | | 574,234 | |
| Exxon Mobil Corp. | | | 24,250 | | | | 2,241,912 | |
| Murphy Oil Corp. | | | 13,020 | | | | 657,770 | |
| Superior Energy Services, Inc. | | | 31,630 | | | | 637,345 | |
| Tesoro Corp. | | | 9,270 | | | | 689,225 | |
| Valero Energy Corp. | | | 25,815 | | | | 1,277,843 | |
| (Cost $8,556,738) | | | | | | | 8,289,944 | |
| | | | | | | | | |
| Financials — 11.8% | | | | | | | | |
| Allstate Corp./The | | | 14,485 | | | | 1,017,571 | |
| American Equity Investment Life Holding Co. | | | 20,020 | | | | 584,384 | |
| American International Group, Inc. | | | 33,390 | | | | 1,870,174 | |
| Bank of America Corp. | | | 33,975 | | | | 607,813 | |
| Bank of New York Mellon Corp./The | | | 38,725 | | | | 1,571,073 | |
Berkshire Hathaway, Inc. (2) | | | 16,410 | | | | 2,463,961 | |
| Citigroup, Inc. | | | 1,770 | | | | 95,775 | |
Digital Realty Trust, Inc. (3) | | | 6,035 | | | | 400,121 | |
DuPont Fabros Technology, Inc. (3) | | | 1,020 | | | | 33,905 | |
Equity LifeStyle Properties, Inc. (3) | | | 4,835 | | | | 249,244 | |
| Erie Indemnity Co. | | | 4,470 | | | | 405,742 | |
| Fulton Financial Corp. | | | 29,485 | | | | 364,435 | |
| Hanover Insurance Group, Inc./The | | | 7,605 | | | | 542,389 | |
Investment Technology Group, Inc. (2) | | | 7,655 | | | | 159,377 | |
| JPMorgan Chase & Co. | | | 23,210 | | | | 1,452,482 | |
| Northwest Bancshares, Inc. | | | 8,085 | | | | 101,305 | |
PRA Group, Inc. (2) | | | 9,415 | | | | 545,411 | |
Ryman Hospitality Properties, Inc. (3) | | | 10,425 | | | | 549,815 | |
Springleaf Holdings, Inc. (2) | | | 11,020 | | | | 398,593 | |
| Travelers Cos., Inc./The | | | 11,430 | | | | 1,209,866 | |
Vornado Realty Trust (3) | | | 1,355 | | | | 159,497 | |
| Wells Fargo & Co. | | | 34,010 | | | | 1,864,428 | |
| (Cost $15,456,062) | | | | | | | 16,647,361 | |
| | | | | | | | | |
| Healthcare — 16.2% | | | | | | | | |
| Abbott Laboratories | | | 12,525 | | | | 563,876 | |
| AbbVie, Inc. | | | 11,200 | | | | 732,928 | |
| Aetna, Inc. | | | 11,925 | | | | 1,059,298 | |
Alere, Inc. (2) | | | 5,250 | | | | 199,500 | |
Alexion Pharmaceuticals, Inc. (2) | | | 1,595 | | | | 295,123 | |
The accompanying notes are an integral part of these financial statements.
| Page 28 | 2014 Annual Report | December 31, 2014 |
Schedule of Investments
December 31, 2014
| Dynamic Growth Fund | |
| Security Description | | Shares or
Principal
Amount ($) | | | Fair
Value ($) | |
| | | | | | | |
| Common Stocks — continued | |
| AmerisourceBergen Corp. | | | 4,395 | | | | 396,253 | |
| Anthem, Inc. | | | 3,890 | | | | 488,856 | |
| Cardinal Health, Inc. | | | 11,190 | | | | 903,369 | |
Celgene Corp. (2) | | | 12,210 | | | | 1,365,810 | |
| Cigna Corp. | | | 1,710 | | | | 175,976 | |
| CR Bard, Inc. | | | 2,985 | | | | 497,361 | |
Edwards Lifesciences Corp. (2) | | | 1,885 | | | | 240,111 | |
| Eli Lilly & Co. | | | 8,400 | | | | 579,516 | |
Gilead Sciences, Inc. (2) | | | 20,245 | | | | 1,908,294 | |
HCA Holdings, Inc. (2) | | | 6,275 | | | | 460,522 | |
Health Net, Inc./CA (2) | | | 5,520 | | | | 295,486 | |
| HealthSouth Corp. | | | 13,350 | | | | 513,441 | |
| Hill-Rom Holdings, Inc. | | | 4,365 | | | | 199,131 | |
Hologic, Inc. (2) | | | 16,635 | | | | 444,820 | |
Hospira, Inc. (2) | | | 2,385 | | | | 146,081 | |
| Humana, Inc. | | | 8,035 | | | | 1,154,067 | |
| Johnson & Johnson | | | 20,345 | | | | 2,127,476 | |
Laboratory Corp. of America Holdings (2) | | | 4,905 | | | | 529,250 | |
Magellan Health, Inc. (2) | | | 3,350 | | | | 201,101 | |
| McKesson Corp. | | | 6,210 | | | | 1,289,072 | |
| Merck & Co., Inc. | | | 22,050 | | | | 1,252,220 | |
| Pfizer, Inc. | | | 61,245 | | | | 1,907,782 | |
| STERIS Corp. | | | 3,005 | | | | 194,874 | |
Surgical Care Affiliates, Inc. (2) | | | 4,660 | | | | 156,809 | |
| Teva Pharmaceutical Industries, Ltd. | | | 18,805 | | | | 1,081,476 | |
| UnitedHealth Group, Inc. | | | 6,795 | | | | 686,907 | |
VCA, Inc. (2) | | | 17,040 | | | | 831,041 | |
| (Cost $21,506,122) | | | | | | | 22,877,827 | |
| | | | | | | | | |
| Industrials — 11.9% | | | | | | | | |
AECOM (2) | | | 14,455 | | | | 438,998 | |
Avis Budget Group, Inc. (2) | | | 8,415 | | | | 558,167 | |
| AZZ, Inc. | | | 2,230 | | | | 104,632 | |
| Briggs & Stratton Corp. | | | 7,750 | | | | 158,255 | |
| Caterpillar, Inc. | | | 12,650 | | | | 1,157,855 | |
CBIZ, Inc. (2) | | | 5,115 | | | | 43,784 | |
| CSX Corp. | | | 20,090 | | | | 727,861 | |
| Cummins, Inc. | | | 4,260 | | | | 614,164 | |
| Curtiss-Wright Corp. | | | 2,500 | | | | 176,475 | |
| Delta Air Lines, Inc. | | | 28,930 | | | | 1,423,067 | |
| Deluxe Corp. | | | 7,145 | | | | 444,776 | |
| FedEx Corp. | | | 7,155 | | | | 1,242,537 | |
| General Dynamics Corp. | | | 8,980 | | | | 1,235,828 | |
| General Electric Co. | | | 56,465 | | | | 1,426,870 | |
| Lockheed Martin Corp. | | | 6,910 | | | | 1,330,659 | |
| Northrop Grumman Corp. | | | 7,890 | | | | 1,162,907 | |
Polypore International, Inc. (2) | | | 3,170 | | | | 149,149 | |
| Dynamic Growth Fund | |
| Security Description | | Shares or
Principal
Amount ($) | | | Fair
Value ($) | |
| | | | | | | |
| Common Stocks — continued | |
| Quad/Graphics, Inc. | | | 4,820 | | | | 110,667 | |
| Raytheon Co. | | | 8,630 | | | | 933,507 | |
| Roper Industries, Inc. | | | 1,590 | | | | 248,597 | |
| Southwest Airlines Co. | | | 24,990 | | | | 1,057,577 | |
| Stanley Black & Decker, Inc. | | | 2,060 | | | | 197,925 | |
Teledyne Technologies, Inc. (2) | | | 4,195 | | | | 430,994 | |
| Union Pacific Corp. | | | 9,130 | | | | 1,087,657 | |
United Rentals, Inc. (2) | | | 4,475 | | | | 456,495 | |
| (Cost $16,018,586) | | | | | | | 16,919,403 | |
| | | | | | | | | |
| Information Technology — 25.7% | | | | | | | | |
| Apple, Inc. | | | 40,330 | | | | 4,451,624 | |
| Broadcom Corp. | | | 39,765 | | | | 1,723,017 | |
Calix, Inc. (2) | | | 7,855 | | | | 78,707 | |
| CDW Corp./DE | | | 28,515 | | | | 1,002,873 | |
| Cisco Systems, Inc. | | | 38,210 | | | | 1,062,811 | |
| Corning, Inc. | | | 59,375 | | | | 1,361,469 | |
| EarthLink Holdings Corp. | | | 34,090 | | | | 149,655 | |
Electronic Arts, Inc. (2) | | | 8,465 | | | | 397,982 | |
Emulex Corp. (2) | | | 23,720 | | | | 134,492 | |
Entropic Communications, Inc. (2) | | | 20,160 | | | | 51,005 | |
Facebook, Inc. (2) | | | 3,155 | | | | 246,153 | |
| Fair Isaac Corp. | | | 2,085 | | | | 150,746 | |
Fiserv, Inc. (2) | | | 3,580 | | | | 254,073 | |
Google, Inc. - Class C (2) | | | 2,355 | | | | 1,239,672 | |
Google, Inc. - Class A (2) | | | 2,355 | | | | 1,249,704 | |
| Hewlett-Packard Co. | | | 64,045 | | | | 2,570,126 | |
| Intel Corp. | | | 64,400 | | | | 2,337,076 | |
| International Business Machines Corp. | | | 9,255 | | | | 1,484,872 | |
Itron, Inc. (2) | | | 4,820 | | | | 203,838 | |
| IXYS Corp. | | | 12,245 | | | | 154,287 | |
| Lexmark International, Inc. | | | 17,565 | | | | 724,908 | |
Micron Technology, Inc. (2) | | | 49,985 | | | | 1,749,975 | |
| Microsoft Corp. | | | 39,665 | | | | 1,842,439 | |
NeuStar, Inc. (2)(4) | | | 14,505 | | | | 403,239 | |
| Oracle Corp. | | | 45,875 | | | | 2,062,998 | |
PMC-Sierra, Inc. (2) | | | 16,665 | | | | 152,651 | |
| QUALCOMM, Inc. | | | 24,560 | | | | 1,825,545 | |
Rovi Corp. (2) | | | 20,210 | | | | 456,544 | |
TeleTech Holdings, Inc. (2) | | | 2,165 | | | | 51,267 | |
| Tessera Technologies, Inc. | | | 8,930 | | | | 319,337 | |
| Texas Instruments, Inc. | | | 30,960 | | | | 1,655,276 | |
| Visa, Inc. | | | 8,645 | | | | 2,266,719 | |
| Western Digital Corp. | | | 11,566 | | | | 1,280,356 | |
| Xerox Corp. | | | 99,235 | | | | 1,375,397 | |
| (Cost $31,205,592) | | | | | | | 36,470,833 | |
The accompanying notes are an integral part of these financial statements.
2014 Annual Report | December 31, 2014 | Page 29 |
Schedule of Investments
December 31, 2014
| Dynamic Growth Fund | |
| Security Description | | Shares or
Principal
Amount ($) | | | Fair
Value ($) | |
| | | | | | | |
| Common Stocks — continued | |
| Materials — 1.0% | | | | | | |
| Mosaic Co./The | | | 21,635 | | | | 987,638 | |
Resolute Forest Products, Inc. (2) | | | 25,650 | | | | 451,697 | |
| (Cost $1,437,283) | | | | | | | 1,439,335 | |
| | | | | | | | | |
| Telecommunication Services — 1.3% | | | | | | | | |
| CenturyLink, Inc. | | | 14,665 | | | | 580,441 | |
Premiere Global Services, Inc. (2) | | | 4,900 | | | | 52,038 | |
| Verizon Communications, Inc. | | | 26,860 | | | | 1,256,510 | |
| (Cost $1,964,150) | | | | | | | 1,888,989 | |
| | | | | | | | | |
| Utilities — 0.9% | | | | | | | | |
| American Electric Power Co., Inc. | | | 3,410 | | | | 207,055 | |
| NRG Energy, Inc. | | | 24,435 | | | | 658,523 | |
| PG&E Corp. | | | 3,360 | | | | 178,886 | |
| Public Service Enterprise Group, Inc. | | | 3,895 | | | | 161,292 | |
| (Cost $1,198,218) | | | | | | | 1,205,756 | |
| | | | | | | | | |
Total Common Stocks
(Cost $125,853,932) | | | | | | | 135,753,259 | |
| | | | | | | | | |
| Money Market Registered Investment Companies — 3.5% | |
Fidelity Institutional Money Market Portfolio, 0.11% (5) | | | 833,103 | | | | 833,103 | |
Meeder Money Market Fund - Institutional Class, 0.14% (6) | | | 4,114,155 | | | | 4,114,155 | |
Total Money Market Registered Investment Companies
(Cost $4,947,258) | | | | | | | 4,947,258 | |
| | | | | | | | | |
| Bank Obligations — 0.7% | | | | | | | | |
Capital Bank Deposit Account,
0.65%, 1/2/2015 (7) | | | 249,603 | | | | 249,603 | |
EverBank Money Market Account, 0.61%, 1/2/2015 (7) | | | 249,558 | | | | 249,558 | |
Mid America Bank Demand Deposit Account, 0.50%, 1/2/2015 (7) | | | 249,386 | | | | 249,386 | |
Pacific Mercantile Bank Deposit Account, 0.55%, 1/2/2015 (7) | | | 249,270 | | | | 249,270 | |
Total Bank Obligations
(Cost $997,817) | | | | | | | 997,817 | |
| Dynamic Growth Fund | |
| Security Description | | Shares or
Principal
Amount ($) | | | Fair
Value ($) | |
| | | | | | | |
| U.S. Government Obligations — 0.5% | | | | | | |
U.S. Treasury Bill, 0.07%, due 3/5/2015 (8) | | | 700,000 | | | | 699,979 | |
Total U.S. Government Obligations
(Cost $699,943) | | | | | | | 699,979 | |
Total Investments — 100.5%
(Cost $132,498,950)(1) | | | | | | | 142,398,313 | |
| Liabilities less Other Assets — (0.5%) | | | | | | | (760,779 | ) |
| Total Net Assets — 100.0% | | | | | | | 141,637,534 | |
| | | | | | | | | |
Trustee Deferred Compensation (9) | | | | | | | | |
| Meeder Aggressive Growth Fund | | | 2,909 | | | | 30,457 | |
| Meeder Balanced Fund | | | 1,527 | | | | 16,766 | |
| Meeder Dynamic Growth Fund | | | 1,046 | | | | 10,481 | |
| Meeder Muirfield Fund | | | 3,298 | | | | 23,185 | |
| Meeder Quantex Fund | | | 1,511 | | | | 53,187 | |
| Meeder Utilities & Infrastructure Fund | | | 322 | | | | 9,805 | |
Total Trustee Deferred Compensation
(Cost $103,218) | | | | | | | 143,881 | |
| | | Long Contracts | | | Unrealized Appreciation (Depreciation)($) | |
| | | | | | | |
| Futures Contracts | |
| Standard & Poors 500 Mini Futures expiring March 2015, notional value $5,541,480 | | | 54 | | | | 87,214 | |
| Total Futures Contracts | | | 54 | | | | 87,214 | |
| (1) | Cost for federal income tax purposes of $132,551,788 differs from value by net unrealized appreciation (depreciation) of securities as follows: |
| Unrealized appreciation | | $ | 11,524,819 | |
| Unrealized depreciation | | | (1,678,294 | ) |
| Net unrealized appreciation (depreciation) | | $ | 9,846,525 | |
| (2) | Represents non-income producing securities. |
| (3) | Real estate investment trust. |
| (4) | All or a portion of this security is on loan. |
| (5) | Investment purchased as securities lending collateral. The yield shown represents the 7-day yield in effect at December 31, 2014. |
| (6) | Investment in affiliate. The yield shown represents the 7-day yield in effect at December 31, 2014. |
| (7) | Variable rate security. Securities payable at par including accrued interest (usually within seven days notice) and unconditionally secured as to principal and interest by letters of credit or other credit support agreements from major banks. The interest rates are adjustable and are based on bank prime rates or other interest rate adjustment indices. The rate shown represents the rate in effect at December 31, 2014. The maturity date shown, if applicable, reflects the earlier of the next demand date or stated maturity date. |
| (8) | Pledged as collateral on futures contracts. |
| (9) | Assets of affiliates to the Dynamic Growth Fund held for the benefit of the Fund’s Trustees in connection with the Trustee Deferred Compensation Plan. |
The accompanying notes are an integral part of these financial statements.
| Page 30 | 2014 Annual Report | December 31, 2014 |
Schedule of Investments
December 31, 2014
| Aggressive Growth Fund | |
| Security Description | | Shares or
Principal
Amount ($) | | | Fair
Value ($) | |
| | | | | | | |
| Common Stocks — 94.9% | |
| Consumer Discretionary — 12.6% | | | | | | |
Apollo Education Group, Inc. (2) | | | 10,095 | | | | 344,340 | |
| Aramark | | | 30,465 | | | | 948,985 | |
AutoNation, Inc. (2) | | | 4,645 | | | | 280,604 | |
AutoZone, Inc. (2) | | | 1,500 | | | | 928,664 | |
| Best Buy Co., Inc. | | | 7,645 | | | | 298,002 | |
| Big Lots, Inc. | | | 8,130 | | | | 325,363 | |
| Choice Hotels International, Inc. | | | 8,610 | | | | 482,332 | |
| Cooper Tire & Rubber Co. | | | 12,310 | | | | 426,542 | |
| CST Brands, Inc. | | | 8,185 | | | | 356,948 | |
| Dana Holding Corp. | | | 20,640 | | | | 448,714 | |
| DeVry Education Group, Inc. | | | 6,195 | | | | 294,077 | |
| Expedia, Inc. | | | 3,990 | | | | 340,586 | |
Gentherm, Inc. (2) | | | 7,845 | | | | 287,284 | |
| Harman International Industries, Inc. | | | 2,865 | | | | 305,724 | |
| Home Depot, Inc./The | | | 6,145 | | | | 645,041 | |
Houghton Mifflin Harcourt Co. (2) | | | 7,550 | | | | 156,361 | |
Iconix Brand Group, Inc. (2) | | | 7,560 | | | | 255,452 | |
| Interpublic Group of Cos., Inc./The | | | 14,895 | | | | 309,369 | |
| Lear Corp. | | | 9,255 | | | | 907,730 | |
| Leggett & Platt, Inc. | | | 7,215 | | | | 307,431 | |
Murphy USA, Inc. (2) | | | 5,240 | | | | 360,826 | |
| Nexstar Broadcasting Group, Inc. | | | 2,955 | | | | 153,039 | |
O'Reilly Automotive, Inc. (2) | | | 1,465 | | | | 282,188 | |
Penn National Gaming, Inc. (2) | | | 9,405 | | | | 129,131 | |
| Scripps Networks Interactive, Inc. | | | 6,730 | | | | 506,567 | |
Skechers U.S.A., Inc. (2) | | | 5,515 | | | | 304,704 | |
Starz (2) | | | 9,265 | | | | 275,171 | |
| (Cost $10,043,005) | | | | | | | 10,661,175 | |
| | | | | | | | | |
| Consumer Staples — 8.7% | | | | | | | | |
| Archer-Daniels-Midland Co. | | | 23,515 | | | | 1,222,780 | |
| Bunge, Ltd. | | | 3,800 | | | | 345,458 | |
| Costco Wholesale Corp. | | | 3,150 | | | | 446,513 | |
| CVS Health Corp. | | | 13,010 | | | | 1,252,993 | |
Harbinger Group, Inc. (2) | | | 27,300 | | | | 386,568 | |
| Keurig Green Mountain, Inc. | | | 4,545 | | | | 601,735 | |
| PepsiCo, Inc. | | | 15,510 | | | | 1,466,625 | |
Sanderson Farms, Inc. (4) | | | 3,415 | | | | 286,945 | |
| Tyson Foods, Inc. | | | 7,595 | | | | 304,484 | |
| Walgreens Boots Alliance, Inc. | | | 6,040 | | | | 460,248 | |
| Wal-Mart Stores, Inc. | | | 7,160 | | | | 614,901 | |
| (Cost $7,025,639) | | | | | | | 7,389,250 | |
| | | | | | | | | |
| Energy — 4.4% | | | | | | | | |
| Anadarko Petroleum Corp. | | | 3,955 | | | | 326,288 | |
Carrizo Oil & Gas, Inc. (2) | | | 6,215 | | | | 258,544 | |
| Aggressive Growth Fund | |
| Security Description | | Shares or
Principal
Amount ($) | | | Fair
Value ($) | |
| | | | | | | |
| Common Stocks — continued | |
| Chevron Corp. | | | 8,365 | | | | 938,385 | |
| Exxon Mobil Corp. | | | 8,045 | | | | 743,760 | |
| Green Plains, Inc. | | | 8,680 | | | | 215,090 | |
| Marathon Petroleum Corp. | | | 2,230 | | | | 201,280 | |
| Superior Energy Services, Inc. | | | 21,250 | | | | 428,188 | |
| Tesoro Corp. | | | 5,405 | | | | 401,862 | |
| Valero Energy Corp. | | | 4,150 | | | | 205,425 | |
| (Cost $4,208,607) | | | | | | | 3,718,822 | |
| | | | | | | | | |
| Financials — 12.0% | | | | | | | | |
| American Equity Investment Life Holding Co. | | | 10,010 | | | | 292,192 | |
| American International Group, Inc. | | | 17,610 | | | | 986,336 | |
| Bank of New York Mellon Corp./The | | | 20,050 | | | | 813,429 | |
Berkshire Hathaway, Inc. (2) | | | 8,940 | | | | 1,342,340 | |
Digital Realty Trust, Inc. (3) | | | 5,280 | | | | 350,064 | |
DuPont Fabros Technology, Inc. (3) | | | 8,750 | | | | 290,850 | |
Equity LifeStyle Properties, Inc. (3) | | | 4,835 | | | | 249,244 | |
| Erie Indemnity Co. | | | 3,350 | | | | 304,080 | |
| Fulton Financial Corp. | | | 25,275 | | | | 312,399 | |
Genworth Financial, Inc. (2) | | | 40,240 | | | | 342,040 | |
| Hanover Insurance Group, Inc./The | | | 4,345 | | | | 309,885 | |
Investment Technology Group, Inc. (2) | | | 3,825 | | | | 79,637 | |
| Jones Lang LaSalle, Inc. | | | 3,690 | | | | 553,242 | |
| JPMorgan Chase & Co. | | | 16,800 | | | | 1,051,344 | |
| Northwest Bancshares, Inc. | | | 4,040 | | | | 50,621 | |
PRA Group, Inc. (2) | | | 4,705 | | | | 272,561 | |
Ryman Hospitality Properties, Inc. (3) | | | 5,715 | | | | 301,409 | |
Springleaf Holdings, Inc. (2) | | | 7,580 | | | | 274,169 | |
Sunstone Hotel Investors, Inc. (3) | | | 12,075 | | | | 199,358 | |
| Travelers Cos., Inc./The | | | 7,035 | | | | 744,655 | |
Vornado Realty Trust (3) | | | 1,695 | | | | 199,518 | |
| Wells Fargo & Co. | | | 16,355 | | | | 896,581 | |
| (Cost $9,549,076) | | | | | | | 10,215,954 | |
| | | | | | | | | |
| Healthcare — 16.5% | | | | | | | | |
| Abbott Laboratories | | | 6,825 | | | | 307,262 | |
| Aetna, Inc. | | | 4,975 | | | | 441,929 | |
Alere, Inc. (2) | | | 6,565 | | | | 249,470 | |
Amsurg Corp. (2) | | | 5,295 | | | | 289,795 | |
| Anthem, Inc. | | | 2,725 | | | | 342,451 | |
| Cardinal Health, Inc. | | | 5,425 | | | | 437,960 | |
CareFusion Corp. (2) | | | 6,950 | | | | 412,413 | |
Celgene Corp. (2) | | | 4,380 | | | | 489,947 | |
Centene Corp. (2) | | | 5,160 | | | | 535,866 | |
| Cigna Corp. | | | 1,900 | | | | 195,529 | |
Edwards Lifesciences Corp. (2) | | | 3,240 | | | | 412,711 | |
The accompanying notes are an integral part of these financial statements.
2014 Annual Report | December 31, 2014 | Page 31 |
Schedule of Investments
December 31, 2014
| Aggressive Growth Fund | |
| Security Description | | Shares or
Principal
Amount ($) | | | Fair
Value ($) | |
| | | | | | | |
| Common Stocks — continued | |
Exact Sciences Corp. (2)(4) | | | 17,280 | | | | 474,163 | |
Gilead Sciences, Inc. (2) | | | 12,380 | | | | 1,166,938 | |
HCA Holdings, Inc. (2) | | | 4,455 | | | | 326,952 | |
Health Net, Inc./CA (2) | | | 6,490 | | | | 347,410 | |
| HealthSouth Corp. | | | 8,675 | | | | 333,641 | |
| Hill-Rom Holdings, Inc. | | | 5,455 | | | | 248,857 | |
Hologic, Inc. (2) | | | 11,090 | | | | 296,547 | |
Hospira, Inc. (2) | | | 5,030 | | | | 308,088 | |
| Humana, Inc. | | | 3,245 | | | | 466,079 | |
LifePoint Hospitals, Inc. (2) | | | 8,505 | | | | 611,595 | |
Magellan Health, Inc. (2) | | | 4,190 | | | | 251,526 | |
| McKesson Corp. | | | 4,465 | | | | 926,845 | |
| Merck & Co., Inc. | | | 11,870 | | | | 674,097 | |
PAREXEL International Corp. (2) | | | 5,395 | | | | 299,746 | |
PDL BioPharma, Inc. (4) | | | 43,860 | | | | 338,161 | |
| Pfizer, Inc. | | | 24,735 | | | | 770,495 | |
| Select Medical Holdings Corp. | | | 23,295 | | | | 335,448 | |
| STERIS Corp. | | | 3,755 | | | | 243,512 | |
United Therapeutics Corp. (2) | | | 4,215 | | | | 545,800 | |
| UnitedHealth Group, Inc. | | | 4,365 | | | | 441,258 | |
VCA, Inc. (2) | | | 10,850 | | | | 529,155 | |
| (Cost $12,767,762) | | | | | | | 14,051,646 | |
| | | | | | | | | |
| Industrials — 11.3% | | | | | | | | |
AECOM (2) | | | 10,205 | | | | 309,926 | |
| Alaska Air Group, Inc. | | | 6,825 | | | | 407,862 | |
Avis Budget Group, Inc. (2) | | | 12,620 | | | | 837,084 | |
| AZZ, Inc. | | | 1,115 | | | | 52,316 | |
| Briggs & Stratton Corp. | | | 3,875 | | | | 79,128 | |
| Caterpillar, Inc. | | | 9,105 | | | | 833,381 | |
CBIZ, Inc. (2) | | | 2,555 | | | | 21,871 | |
| Cintas Corp. | | | 5,250 | | | | 411,810 | |
| CSX Corp. | | | 6,860 | | | | 248,538 | |
| Curtiss-Wright Corp. | | | 3,570 | | | | 252,006 | |
| Delta Air Lines, Inc. | | | 17,685 | | | | 869,925 | |
| Deluxe Corp. | | | 3,315 | | | | 206,359 | |
| General Dynamics Corp. | | | 1,845 | | | | 253,909 | |
Greenbrier Cos., Inc./The (4) | | | 6,675 | | | | 358,648 | |
| Huntington Ingalls Industries, Inc. | | | 3,320 | | | | 373,367 | |
JetBlue Airways Corp. (2) | | | 31,845 | | | | 505,062 | |
| Landstar System, Inc. | | | 3,740 | | | | 271,262 | |
| Lockheed Martin Corp. | | | 1,360 | | | | 261,895 | |
| Northrop Grumman Corp. | | | 1,890 | | | | 278,567 | |
Polypore International, Inc. (2) | | | 5,285 | | | | 248,659 | |
| Quad/Graphics, Inc. | | | 2,410 | | | | 55,334 | |
| Raytheon Co. | | | 2,475 | | | | 267,721 | |
| Roper Industries, Inc. | | | 2,545 | | | | 397,911 | |
| Aggressive Growth Fund | |
| Security Description | | Shares or
Principal
Amount ($) | | | Fair
Value ($) | |
| | | | | | | |
| Common Stocks — continued | |
RPX Corp. (2) | | | 3,845 | | | | 52,984 | |
| Southwest Airlines Co. | | | 10,270 | | | | 434,626 | |
| Stanley Black & Decker, Inc. | | | 2,575 | | | | 247,406 | |
Teledyne Technologies, Inc. (2) | | | 3,205 | | | | 329,282 | |
United Rentals, Inc. (2) | | | 6,710 | | | | 684,487 | |
| (Cost $9,142,884) | | | | | | | 9,551,326 | |
| | | | | | | | | |
| Information Technology — 25.9% | | | | | | | | |
| Apple, Inc. | | | 25,245 | | | | 2,786,542 | |
| Broadcom Corp. | | | 24,765 | | | | 1,073,067 | |
Calix, Inc. (2) | | | 3,925 | | | | 39,329 | |
| CDW Corp./DE | | | 28,195 | | | | 991,618 | |
| Corning, Inc. | | | 49,480 | | | | 1,134,576 | |
| EarthLink Holdings Corp. | | | 17,045 | | | | 74,828 | |
Electronic Arts, Inc. (2) | | | 4,180 | | | | 196,523 | |
Emulex Corp. (2) | | | 11,860 | | | | 67,246 | |
Entropic Communications, Inc. (2) | | | 10,080 | | | | 25,502 | |
| Fair Isaac Corp. | | | 3,475 | | | | 251,243 | |
Google, Inc. - Class C (2) | | | 1,600 | | | | 842,240 | |
Google, Inc. - Class A (2) | | | 295 | | | | 156,545 | |
| Hewlett-Packard Co. | | | 50,560 | | | | 2,028,972 | |
Integrated Device Technology, Inc. (2) | | | 22,780 | | | | 446,488 | |
| Intel Corp. | | | 43,330 | | | | 1,572,446 | |
Itron, Inc. (2) | | | 6,025 | | | | 254,797 | |
| Lam Research Corp. | | | 2,350 | | | | 186,449 | |
| Lexmark International, Inc. | | | 16,840 | | | | 694,987 | |
Micron Technology, Inc. (2) | | | 10,105 | | | | 353,776 | |
| Microsoft Corp. | | | 9,560 | | | | 444,062 | |
NeuStar, Inc. (2)(4) | | | 7,690 | | | | 213,782 | |
OmniVision Technologies, Inc. (2) | | | 18,690 | | | | 485,940 | |
| Oracle Corp. | | | 37,405 | | | | 1,682,103 | |
PMC-Sierra, Inc. (2) | | | 11,110 | | | | 101,768 | |
Rovi Corp. (2) | | | 9,040 | | | | 204,214 | |
| Science Applications International Corp. | | | 6,140 | | | | 304,114 | |
Take-Two Interactive Software, Inc. (2) | | | 11,370 | | | | 318,701 | |
TeleTech Holdings, Inc. (2) | | | 1,080 | | | | 25,574 | |
| Tessera Technologies, Inc. | | | 5,585 | | | | 199,720 | |
| Texas Instruments, Inc. | | | 20,640 | | | | 1,103,518 | |
TriQuint Semiconductor, Inc. (2) | | | 17,515 | | | | 482,538 | |
| Visa, Inc. | | | 5,140 | | | | 1,347,708 | |
| Western Digital Corp. | | | 9,830 | | | | 1,088,181 | |
| Xerox Corp. | | | 65,045 | | | | 901,524 | |
| (Cost $18,835,514) | | | | | | | 22,080,621 | |
| | | | | | | | | |
| Materials — 1.8% | | | | | | | | |
| Celanese Corp. | | | 4,995 | | | | 299,500 | |
| Mosaic Co./The | | | 16,225 | | | | 740,671 | |
The accompanying notes are an integral part of these financial statements.
| Page 32 | 2014 Annual Report | December 31, 2014 |
Schedule of Investments
December 31, 2014
| Aggressive Growth Fund | |
| Security Description | | Shares or
Principal
Amount ($) | | | Fair
Value ($) | |
| | | | | | | |
| Common Stocks — continued | |
Resolute Forest Products, Inc. (2) | | | 7,357 | | | | 129,557 | |
| Rock-Tenn Co. | | | 5,350 | | | | 326,243 | |
| (Cost $1,486,997) | | | | | | | 1,495,971 | |
| | | | | | | | | |
| Telecommunication Services — 0.6% | | | | | | | | |
| CenturyLink, Inc. | | | 12,220 | | | | 483,668 | |
Premiere Global Services, Inc. (2) | | | 2,450 | | | | 26,019 | |
| (Cost $523,439) | | | | | | | 509,687 | |
| | | | | | | | | |
| Utilities — 1.1% | | | | | | | | |
| UGI Corp. | | | 9,585 | | | | 364,038 | |
| Vectren Corp. | | | 11,535 | | | | 533,262 | |
| (Cost $761,216) | | | | | | | 897,300 | |
| | | | | | | | | |
Total Common Stocks
(Cost $74,344,139) | | | | | | | 80,571,752 | |
| | | | | | | | | |
| Money Market Registered Investment Companies — 5.6% | |
Fidelity Institutional Money Market Portfolio, 0.11% (5) | | | 1,699,135 | | | | 1,699,135 | |
Meeder Money Market Fund - Institutional Class, 0.14% (6) | | | 3,031,754 | | | | 3,031,754 | |
Total Money Market Registered Investment Companies
(Cost $4,730,889) | | | | | | | 4,730,889 | |
| | | | | | | | | |
| Bank Obligations — 1.2% | | | | | | | | |
Capital Bank Deposit Account,
0.65%, 1/2/2015 (7) | | | 249,603 | | | | 249,603 | |
EverBank Money Market Account, 0.61%, 1/2/2015 (7) | | | 249,558 | | | | 249,558 | |
Mid America Bank Demand Deposit Account, 0.50%, 1/2/2015 (7) | | | 249,386 | | | | 249,386 | |
Pacific Mercantile Bank Deposit Account, 0.55%, 1/2/2015 (7) | | | 249,270 | | | | 249,270 | |
Total Bank Obligations
(Cost $997,817) | | | | | | | 997,817 | |
| | | | | | | | | |
| U.S. Government Obligations — 0.4% | | | | | | | | |
U.S. Treasury Bill, 0.07%, due 3/5/2015 (8) | | | 300,000 | | | | 299,991 | |
Total U.S. Government Obligations
(Cost $299,967) | | | | | | | 299,991 | |
Total Investments — 102.1%
(Cost $80,372,812)(1) | | | | | | | 86,600,449 | |
| Liabilities less Other Assets — (2.1%) | | | | | | | (1,753,290 | ) |
| Total Net Assets — 100.0% | | | | | | | 84,847,159 | |
| Aggressive Growth Fund | |
| Security Description | | Shares or
Principal
Amount ($) | | | Fair
Value ($) | |
| | | | | | | |
Trustee Deferred Compensation (9) | | | | | | |
| Meeder Aggressive Growth Fund | | | 1,600 | | | | 16,752 | |
| Meeder Balanced Fund | | | 857 | | | | 9,410 | |
| Meeder Dynamic Growth Fund | | | 571 | | | | 5,721 | |
| Meeder Muirfield Fund | | | 1,964 | | | | 13,807 | |
| Meeder Quantex Fund | | | 945 | | | | 33,264 | |
| Meeder Utilities & Infrastructure Fund | | | 178 | | | | 5,420 | |
Total Trustee Deferred Compensation
(Cost $61,033) | | | | | | | 84,374 | |
| | | Long Contracts | | | Unrealized Appreciation (Depreciation)($) | |
| | | | | | | |
| Futures Contracts | |
| Standard & Poors 500 Mini Futures expiring March 2015, notional value $4,104,800 | | | 40 | | | | 53,290 | |
| Total Futures Contracts | | | 40 | | | | 53,290 | |
| (1) | Cost for federal income tax purposes of $80,398,881 differs from value by net unrealized appreciation (depreciation) of securities as follows: |
| Unrealized appreciation | | $ | 7,426,710 | |
| Unrealized depreciation | | | (1,225,142 | ) |
| Net unrealized appreciation (depreciation) | | $ | 6,201,568 | |
| (2) | Represents non-income producing securities. |
| (3) | Real estate investment trust. |
| (4) | All or a portion of this security is on loan. |
| (5) | Investment purchased as securities lending collateral. The yield shown represents the 7-day yield in effect at December 31, 2014. |
| (6) | Investment in affiliate. The yield shown represents the 7-day yield in effect at December 31, 2014. |
| (7) | Variable rate security. Securities payable at par including accrued interest (usually within seven days notice) and unconditionally secured as to principal and interest by letters of credit or other credit support agreements from major banks. The interest rates are adjustable and are based on bank prime rates or other interest rate adjustment indices. The rate shown represents the rate in effect at December 31, 2014. The maturity date shown, if applicable, reflects the earlier of the next demand date or stated maturity date. |
| (8) | Pledged as collateral on futures contracts. |
| (9) | Assets of affiliates to the Aggressive Growth Fund held for the benefit of the Fund’s Trustees in connection with the Trustee Deferred Compensation Plan. |
The accompanying notes are an integral part of these financial statements.
2014 Annual Report | December 31, 2014 | Page 33 |
Schedule of Investments
December 31, 2014
| Balanced Fund | |
| Security Description | | Shares or
Principal
Amount ($) | | | Fair
Value ($) | |
| | | | | | | |
| Common Stocks — 52.0% | |
| Consumer Discretionary — 6.5% | | | | | | |
| Advance Auto Parts, Inc. | | | 3,195 | | | | 508,900 | |
| Aramark | | | 20,050 | | | | 624,558 | |
AutoNation, Inc. (2) | | | 8,325 | | | | 502,913 | |
AutoZone, Inc. (2) | | | 1,630 | | | | 1,009,149 | |
Bed Bath & Beyond, Inc. (2) | | | 6,795 | | | | 517,575 | |
| Best Buy Co., Inc. | | | 13,700 | | | | 534,026 | |
| Choice Hotels International, Inc. | | | 4,895 | | | | 274,218 | |
| Cooper Tire & Rubber Co. | | | 13,720 | | | | 475,398 | |
| DeVry Education Group, Inc. | | | 9,105 | | | | 432,214 | |
| Expedia, Inc. | | | 8,750 | | | | 746,900 | |
Gentherm, Inc. (2) | | | 10,735 | | | | 393,116 | |
| Home Depot, Inc./The | | | 11,025 | | | | 1,157,294 | |
Iconix Brand Group, Inc. (2) | | | 10,345 | | | | 349,558 | |
| Lear Corp. | | | 6,205 | | | | 608,586 | |
Murphy USA, Inc. (2) | | | 7,500 | | | | 516,450 | |
| Nexstar Broadcasting Group, Inc. | | | 5,315 | | | | 275,264 | |
O'Reilly Automotive, Inc. (2) | | | 2,625 | | | | 505,628 | |
Penn National Gaming, Inc. (2) | | | 15,280 | | | | 209,794 | |
| Scripps Networks Interactive, Inc. | | | 6,485 | | | | 488,126 | |
Starz (2) | | | 8,965 | | | | 266,261 | |
| Target Corp. | | | 10,585 | | | | 803,507 | |
| Walt Disney Co./The | | | 3,010 | | | | 283,512 | |
| (Cost $10,919,984) | | | | | | | 11,482,947 | |
| | | | | | | | | |
| Consumer Staples — 5.5% | | | | | | | | |
| Altria Group, Inc. | | | 16,860 | | | | 830,692 | |
| Archer-Daniels-Midland Co. | | | 29,690 | | | | 1,543,880 | |
| Costco Wholesale Corp. | | | 5,225 | | | | 740,644 | |
| CVS Health Corp. | | | 14,845 | | | | 1,429,721 | |
| Dr Pepper Snapple Group, Inc. | | | 3,225 | | | | 231,168 | |
| Keurig Green Mountain, Inc. | | | 3,270 | | | | 432,932 | |
| Kroger Co./The | | | 7,065 | | | | 453,644 | |
Monster Beverage Corp. (2) | | | 2,390 | | | | 258,957 | |
| PepsiCo, Inc. | | | 13,995 | | | | 1,323,367 | |
| Procter & Gamble Co./The | | | 9,730 | | | | 886,306 | |
Sanderson Farms, Inc. (4) | | | 4,315 | | | | 362,568 | |
| Tyson Foods, Inc. | | | 4,355 | | | | 174,592 | |
| Wal-Mart Stores, Inc. | | | 11,610 | | | | 997,067 | |
| (Cost $9,195,411) | | | | | | | 9,665,538 | |
| | | | | | | | | |
| Energy — 2.3% | | | | | | | | |
| Anadarko Petroleum Corp. | | | 3,645 | | | | 300,713 | |
| Chevron Corp. | | | 6,605 | | | | 740,949 | |
| Exxon Mobil Corp. | | | 19,575 | | | | 1,809,709 | |
| Green Plains, Inc. | | | 9,540 | | | | 236,401 | |
| Marathon Petroleum Corp. | | | 3,575 | | | | 322,680 | |
| Balanced Fund | |
| Security Description | | Shares or
Principal
Amount ($) | | | Fair
Value ($) | |
| | | | | | | |
| Common Stocks — continued | |
| Valero Energy Corp. | | | 12,530 | | | | 620,235 | |
| (Cost $4,249,568) | | | | | | | 4,030,687 | |
| | | | | | | | | |
| Financials — 6.7% | | | | | | | | |
| Allstate Corp./The | | | 10,705 | | | | 752,026 | |
| American Equity Investment Life Holding Co. | | | 14,950 | | | | 436,391 | |
| American International Group, Inc. | | | 31,035 | | | | 1,738,270 | |
| Bank of New York Mellon Corp./The | | | 12,270 | | | | 497,794 | |
Berkshire Hathaway, Inc. (2) | | | 12,930 | | | | 1,941,440 | |
| Capital One Financial Corp. | | | 8,630 | | | | 712,407 | |
DuPont Fabros Technology, Inc. (3) | | | 5,925 | | | | 196,947 | |
| Fulton Financial Corp. | | | 20,530 | | | | 253,751 | |
Genworth Financial, Inc. (2) | | | 25,540 | | | | 217,090 | |
| Hanover Insurance Group, Inc./The | | | 3,530 | | | | 251,760 | |
Investment Technology Group, Inc. (2) | | | 6,215 | | | | 129,396 | |
| Jones Lang LaSalle, Inc. | | | 2,470 | | | | 370,327 | |
| JPMorgan Chase & Co. | | | 21,230 | | | | 1,328,573 | |
| Northwest Bancshares, Inc. | | | 6,570 | | | | 82,322 | |
PRA Group, Inc. (2) | | | 7,025 | | | | 406,958 | |
Ryman Hospitality Properties, Inc. (3) | | | 7,780 | | | | 410,317 | |
Springleaf Holdings, Inc. (2) | | | 5,595 | | | | 202,371 | |
| Travelers Cos., Inc./The | | | 6,945 | | | | 735,128 | |
| Wells Fargo & Co. | | | 18,850 | | | | 1,033,357 | |
| (Cost $10,921,537) | | | | | | | 11,696,625 | |
| | | | | | | | | |
| Healthcare — 8.6% | | | | | | | | |
| Abbott Laboratories | | | 11,820 | | | | 532,136 | |
| AbbVie, Inc. | | | 7,205 | | | | 471,495 | |
| Aetna, Inc. | | | 3,155 | | | | 280,259 | |
Alexion Pharmaceuticals, Inc. (2) | | | 1,475 | | | | 272,919 | |
Amsurg Corp. (2) | | | 6,915 | | | | 378,458 | |
| Anthem, Inc. | | | 5,245 | | | | 659,139 | |
| Cardinal Health, Inc. | | | 3,890 | | | | 314,040 | |
Celgene Corp. (2) | | | 8,600 | | | | 961,996 | |
Centene Corp. (2) | | | 2,870 | | | | 298,050 | |
Gilead Sciences, Inc. (2) | | | 14,885 | | | | 1,403,060 | |
HCA Holdings, Inc. (2) | | | 8,755 | | | | 642,529 | |
Health Net, Inc./CA (2) | | | 4,095 | | | | 219,205 | |
| HealthSouth Corp. | | | 7,590 | | | | 291,911 | |
Hospira, Inc. (2) | | | 3,280 | | | | 200,900 | |
| Humana, Inc. | | | 3,160 | | | | 453,871 | |
| Johnson & Johnson | | | 16,710 | | | | 1,747,365 | |
LifePoint Hospitals, Inc. (2) | | | 7,780 | | | | 559,460 | |
| McKesson Corp. | | | 2,845 | | | | 590,565 | |
| Merck & Co., Inc. | | | 19,380 | | | | 1,100,590 | |
Molina Healthcare, Inc. (2) | | | 4,080 | | | | 218,402 | |
The accompanying notes are an integral part of these financial statements.
| Page 34 | 2014 Annual Report | December 31, 2014 |
Schedule of Investments
December 31, 2014
| Balanced Fund | |
| Security Description | | Shares or
Principal
Amount ($) | | | Fair
Value ($) | |
| | | | | | | |
| Common Stocks — continued | |
| Pfizer, Inc. | | | 42,510 | | | | 1,324,187 | |
| Teva Pharmaceutical Industries, Ltd. | | | 15,640 | | | | 899,456 | |
| UnitedHealth Group, Inc. | | | 6,525 | | | | 659,612 | |
VCA, Inc. (2) | | | 11,630 | | | | 567,195 | |
| (Cost $13,917,301) | | | | | | | 15,046,800 | |
| | | | | | | | | |
| Industrials — 6.1% | | | | | | | | |
AECOM (2) | | | 9,670 | | | | 293,678 | |
Avis Budget Group, Inc. (2) | | | 11,485 | | | | 761,800 | |
| AZZ, Inc. | | | 1,810 | | | | 84,925 | |
| Briggs & Stratton Corp. | | | 6,300 | | | | 128,646 | |
| Caterpillar, Inc. | | | 5,440 | | | | 497,923 | |
CBIZ, Inc. (2) | | | 4,155 | | | | 35,567 | |
| CSX Corp. | | | 14,540 | | | | 526,784 | |
| Delta Air Lines, Inc. | | | 13,675 | | | | 672,673 | |
| Deluxe Corp. | | | 6,805 | | | | 423,611 | |
| FedEx Corp. | | | 1,375 | | | | 238,783 | |
| General Dynamics Corp. | | | 4,260 | | | | 586,261 | |
| General Electric Co. | | | 14,675 | | | | 370,837 | |
Greenbrier Cos., Inc./The (4) | | | 7,440 | | | | 399,751 | |
JetBlue Airways Corp. (2) | | | 35,485 | | | | 562,792 | |
| Lockheed Martin Corp. | | | 3,720 | | | | 716,360 | |
| Northrop Grumman Corp. | | | 3,825 | | | | 563,767 | |
| Quad/Graphics, Inc. | | | 3,915 | | | | 89,888 | |
| Raytheon Co. | | | 5,420 | | | | 586,281 | |
| Roper Industries, Inc. | | | 4,170 | | | | 651,980 | |
| Southwest Airlines Co. | | | 16,385 | | | | 693,413 | |
Teledyne Technologies, Inc. (2) | | | 2,805 | | | | 288,186 | |
| Union Pacific Corp. | | | 8,110 | | | | 966,144 | |
United Rentals, Inc. (2) | | | 6,105 | | | | 622,771 | |
| (Cost $10,210,026) | | | | | | | 10,762,821 | |
| | | | | | | | | |
| Information Technology — 14.3% | | | | | | | | |
| Apple, Inc. | | | 33,655 | | | | 3,714,838 | |
| Broadcom Corp. | | | 14,280 | | | | 618,752 | |
Calix, Inc. (2) | | | 6,380 | | | | 63,928 | |
| CDW Corp./DE | | | 16,685 | | | | 586,811 | |
| Corning, Inc. | | | 42,690 | | | | 978,882 | |
| EarthLink Holdings Corp. | | | 27,690 | | | | 121,559 | |
Electronic Arts, Inc. (2) | | | 12,665 | | | | 595,445 | |
Emulex Corp. (2) | | | 19,270 | | | | 109,261 | |
Entropic Communications, Inc. (2) | | | 16,380 | | | | 41,441 | |
Fiserv, Inc. (2) | | | 6,960 | | | | 493,951 | |
Google, Inc. - Class C (2) | | | 2,065 | | | | 1,087,016 | |
Google, Inc. - Class A (2) | | | 1,015 | | | | 538,620 | |
| Hewlett-Packard Co. | | | 52,450 | | | | 2,104,819 | |
| Intel Corp. | | | 62,860 | | | | 2,281,189 | |
| Balanced Fund | |
| Security Description | | Shares or
Principal
Amount ($) | | | Fair
Value ($) | |
| | | | | | | |
| Common Stocks — continued | |
| International Business Machines Corp. | | | 8,095 | | | | 1,298,762 | |
| Lam Research Corp. | | | 3,505 | | | | 278,087 | |
| Lexmark International, Inc. | | | 10,130 | | | | 418,065 | |
Micron Technology, Inc. (2) | | | 20,280 | | | | 710,003 | |
| Microsoft Corp. | | | 27,290 | | | | 1,267,621 | |
| Monolithic Power Systems, Inc. | | | 2,485 | | | | 123,604 | |
NeuStar, Inc. (2)(4) | | | 9,615 | | | | 267,297 | |
OmniVision Technologies, Inc. (2) | | | 8,295 | | | | 215,670 | |
| Oracle Corp. | | | 50,035 | | | | 2,250,074 | |
PMC-Sierra, Inc. (2) | | | 22,910 | | | | 209,856 | |
Rovi Corp. (2) | | | 20,410 | | | | 461,062 | |
| Science Applications International Corp. | | | 4,570 | | | | 226,352 | |
| Skyworks Solutions, Inc. | | | 4,405 | | | | 320,288 | |
Take-Two Interactive Software, Inc. (2) | | | 8,465 | | | | 237,274 | |
TeleTech Holdings, Inc. (2) | | | 1,760 | | | | 41,677 | |
| Tessera Technologies, Inc. | | | 8,320 | | | | 297,523 | |
| Texas Instruments, Inc. | | | 19,590 | | | | 1,047,379 | |
| Western Digital Corp. | | | 10,050 | | | | 1,112,535 | |
| Xerox Corp. | | | 67,450 | | | | 934,857 | |
| (Cost $20,799,399) | | | | | | | 25,054,498 | |
| | | | | | | | | |
| Materials — 0.8% | | | | | | | | |
| Celanese Corp. | | | 4,485 | | | | 268,921 | |
| Mosaic Co./The | | | 14,270 | | | | 651,426 | |
Resolute Forest Products, Inc. (2) | | | 6,610 | | | | 116,402 | |
| Rock-Tenn Co. | | | 4,810 | | | | 293,314 | |
| (Cost $1,322,377) | | | | | | | 1,330,063 | |
| | | | | | | | | |
| Telecommunication Services — 0.8% | | | | | | | | |
| CenturyLink, Inc. | | | 10,545 | | | | 417,371 | |
Premiere Global Services, Inc. (2) | | | 3,980 | | | | 42,268 | |
| Verizon Communications, Inc. | | | 19,855 | | | | 928,817 | |
| (Cost $1,444,138) | | | | | | | 1,388,456 | |
| | | | | | | | | |
| Utilities — 0.4% | | | | | | | | |
| Public Service Enterprise Group, Inc. | | | 2,935 | | | | 121,538 | |
| UGI Corp. | | | 10,050 | | | | 381,699 | |
| Vectren Corp. | | | 6,040 | | | | 279,229 | |
| (Cost $667,407) | | | | | | | 782,466 | |
| | | | | | | | | |
Total Common Stocks
(Cost $83,647,148) | | | | | | | 91,240,901 | |
| | | | | | | | | |
| Registered Investment Companies — 27.0% | |
| DoubleLine Total Return Bond Fund | | | 184,348 | | | | 2,022,298 | |
| Eaton Vance Bond Fund | | | 183,943 | | | | 1,973,708 | |
| Federated Bond Fund | | | 593,646 | | | | 5,580,268 | |
The accompanying notes are an integral part of these financial statements.
2014 Annual Report | December 31, 2014 | Page 35 |
Schedule of Investments
December 31, 2014
| Balanced Fund | |
| Security Description | | Shares or
Principal
Amount ($) | | | Fair
Value ($) | |
| | | | | | | |
| Registered Investment Companies — continued | |
| Fidelity Capital & Income Fund | | | 104,516 | | | | 1,011,717 | |
| Frost Total Return Bond Fund | | | 93,596 | | | | 998,668 | |
| Goldman Sachs Emerging Market Debt Fund | | | 79,221 | | | | 979,174 | |
iShares 7-10 Year Treasury Bond ETF (11) | | | 18,850 | | | | 1,997,912 | |
| Ivy High Income Fund | | | 320,270 | | | | 2,584,576 | |
| John Hancock Bond Fund | | | 62,306 | | | | 998,765 | |
| Prudential Total Return Bond Fund | | | 406,807 | | | | 5,862,096 | |
| Putnam Absolute Return 300 Fund | | | 145,760 | | | | 1,510,071 | |
| Putnam Diversified Income Trust | | | 367,103 | | | | 2,767,953 | |
Sentinel Total Return Bond Fund (5) | | | 870,979 | | | | 9,206,249 | |
| TCW Emerging Markets Income Fund | | | 275,887 | | | | 2,223,646 | |
| Thompson Bond Fund | | | 388,896 | | | | 4,433,414 | |
Vanguard Total Bond Market ETF (11) | | | 42,595 | | | | 3,508,550 | |
Total Registered Investment Companies
(Cost $48,769,865) | | | | | | | 47,659,065 | |
| | | | | | | | | |
| Money Market Registered Investment Companies — 20.1% | |
Fidelity Institutional Money Market Portfolio, 0.11% (6) | | | 1,034,856 | | | | 1,034,856 | |
Meeder Money Market Fund - Institutional Class, 0.14% (7) | | | 34,211,013 | | | | 34,211,013 | |
Total Money Market Registered Investment Companies
(Cost $35,245,869) | | | | | | | 35,245,869 | |
| | | | | | | | | |
| Bank Obligations — 0.6% | | | | | | | | |
Capital Bank Deposit Account,
0.65%, 1/2/2015 (8) | | | 249,603 | | | | 249,603 | |
EverBank Money Market Account, 0.61%, 1/2/2015 (8) | | | 249,558 | | | | 249,558 | |
Mid America Bank Demand Deposit Account, 0.50%, 1/2/2015 (8) | | | 249,386 | | | | 249,386 | |
Pacific Mercantile Bank Deposit Account, 0.55%, 1/2/2015 (8) | | | 249,270 | | | | 249,270 | |
Total Bank Obligations
(Cost $997,817) | | | | | | | 997,817 | |
| | | | | | | | | |
| U.S. Government Obligations — 0.5% | | | | | | | | |
U.S. Treasury Bill, 0.07%, due 3/5/2015 (9) | | | 800,000 | | | | 799,976 | |
Total U.S. Government Obligations
(Cost $799,932) | | | | | | | 799,976 | |
Total Investments — 100.2%
(Cost $169,460,631)(1) | | | | | | | 175,943,628 | |
| Liabilities less Other Assets — (0.2%) | | | | | | | (409,927 | ) |
| Total Net Assets — 100.0% | | | | | | | 175,533,701 | |
| Balanced Fund | |
| Security Description | Shares or
Principal
Amount ($) | | Fair
Value ($) | |
| | | | | |
Trustee Deferred Compensation (10) | | | | |
Meeder Aggressive Growth Fund | | | 2,700 | | | | 28,269 | |
Meeder Balanced Fund | | | 1,452 | | | | 15,943 | |
Meeder Dynamic Growth Fund | | | 965 | | | | 9,669 | |
Meeder Muirfield Fund | | | 2,519 | | | | 17,709 | |
Meeder Quantex Fund | | | 934 | | | | 32,877 | |
Meeder Utilities & Infrastructure Fund | | | 300 | | | | 9,135 | |
Total Trustee Deferred Compensation
(Cost $88,318) | | | | | | | 113,602 | |
| | | Long Contracts | | | Unrealized Appreciation (Depreciation)($) | |
| | | | | | | |
| Futures Contracts | |
Standard & Poors 500 Mini Futures expiring March 2015,
notional value $23,294,740 | | | 227 | | | | 350,320 | |
Russell 2000 Mini Index Futures expiring March 2015,
notional value $6,964,060 | | | 58 | | | | (5,314 | ) |
| Total Futures Contracts | | | 285 | | | | 345,006 | |
| (1) | Cost for federal income tax purposes of $169,564,033 differs from value by net unrealized appreciation (depreciation) of securities as follows: |
| Unrealized appreciation | | $ | 8,735,088 | |
| Unrealized depreciation | | | (2,355,493 | ) |
| Net unrealized appreciation (depreciation) | | $ | 6,379,595 | |
| (2) | Represents non-income producing securities. |
| (3) | Real estate investment trust. |
| (4) | All or a portion of this security is on loan. |
| (5) | A portion of this security may be deemed illiquid due to the Investment Company Act of 1940 provision stating that no issuer of any investment company security purchased or acquired by a registered investment company shall be obligated to redeem such security in an amount exceeding 1 per centum of such issuer’s total outstanding shares during any period of less than thirty days. As of December 31, 2014, the fair value of illiquid securities held by the Fund was $1,583,874 or 0.90% of net assets. |
| (6) | Investment purchased as securities lending collateral. The yield shown represents the 7-day yield in effect at December 31, 2014. |
| (7) | Investment in affiliate. The yield shown represents the 7-day yield in effect at December 31, 2014. |
| (8) | Variable rate security. Securities payable at par including accrued interest (usually within seven days notice) and unconditionally secured as to principal and interest by letters of credit or other credit support agreements from major banks. The interest rates are adjustable and are based on bank prime rates or other interest rate adjustment indices. The rate shown represents the rate in effect at December 31, 2014. The maturity date shown, if applicable, reflects the earlier of the next demand date or stated maturity date. |
| (9) | Pledged as collateral on futures contracts. |
| (10) | Assets of affiliates to the Balanced Fund held for the benefit of the Fund’s Trustees in connection with the Trustee Deferred Compensation Plan. |
| (11) | Exchange-traded fund. |
The accompanying notes are an integral part of these financial statements.
| Page 36 | 2014 Annual Report | December 31, 2014 |
Schedule of Investments
December 31, 2014
| Strategic Growth Fund | |
| Security Description | | Shares or
Principal
Amount ($) | | | Fair
Value ($) | |
| | | | | | | |
| Common Stocks — 65.6% | |
| Consumer Discretionary — 7.8% | | | | | | |
| Advance Auto Parts, Inc. | | | 4,555 | | | | 725,520 | |
| Aramark | | | 11,475 | | | | 357,446 | |
AutoZone, Inc. (2) | | | 1,505 | | | | 931,761 | |
Bed Bath & Beyond, Inc. (2) | | | 9,730 | | | | 741,134 | |
| CST Brands, Inc. | | | 4,540 | | | | 197,989 | |
| Dana Holding Corp. | | | 9,220 | | | | 200,443 | |
| Expedia, Inc. | | | 8,000 | | | | 682,880 | |
| Harman International Industries, Inc. | | | 4,665 | | | | 497,802 | |
Hilton Worldwide Holdings, Inc. (2) | | | 23,440 | | | | 611,550 | |
| Interpublic Group of Cos., Inc./The | | | 19,455 | | | | 404,080 | |
| Leggett & Platt, Inc. | | | 9,490 | | | | 404,369 | |
| Nexstar Broadcasting Group, Inc. | | | 5,765 | | | | 298,569 | |
| Scripps Networks Interactive, Inc. | | | 9,565 | | | | 719,958 | |
Starz (2) | | | 24,100 | | | | 715,770 | |
| Target Corp. | | | 13,840 | | | | 1,050,594 | |
| (Cost $8,281,422) | | | | | | | 8,539,865 | |
| | | | | | | | | |
| Consumer Staples — 6.1% | | | | | | | | |
| Bunge, Ltd. | | | 6,495 | | | | 590,460 | |
| Dr Pepper Snapple Group, Inc. | | | 12,415 | | | | 889,907 | |
| Energizer Holdings, Inc. | | | 5,285 | | | | 679,440 | |
| Molson Coors Brewing Co. | | | 9,340 | | | | 696,017 | |
| PepsiCo, Inc. | | | 11,150 | | | | 1,054,344 | |
| Reynolds American, Inc. | | | 9,400 | | | | 604,138 | |
| Spectrum Brands Holdings, Inc. | | | 5,815 | | | | 556,379 | |
| Tyson Foods, Inc. | | | 9,760 | | | | 391,278 | |
| Wal-Mart Stores, Inc. | | | 13,835 | | | | 1,188,150 | |
| (Cost $6,122,155) | | | | | | | 6,650,113 | |
| | | | | | | | | |
| Energy — 8.4% | | | | | | | | |
| Anadarko Petroleum Corp. | | | 9,735 | | | | 803,138 | |
| Chevron Corp. | | | 6,790 | | | | 761,702 | |
| Devon Energy Corp. | | | 13,015 | | | | 796,648 | |
| Exxon Mobil Corp. | | | 13,630 | | | | 1,260,093 | |
Forum Energy Technologies, Inc. (2) | | | 12,685 | | | | 262,960 | |
| Green Plains, Inc. | | | 14,705 | | | | 364,390 | |
| Marathon Petroleum Corp. | | | 12,105 | | | | 1,092,597 | |
| Murphy Oil Corp. | | | 11,345 | | | | 573,149 | |
| National Oilwell Varco, Inc. | | | 14,235 | | | | 932,820 | |
Oil States International, Inc. (2) | | | 10,135 | | | | 495,602 | |
| PBF Energy, Inc. | | | 13,720 | | | | 365,501 | |
| Superior Energy Services, Inc. | | | 10,425 | | | | 210,064 | |
| Tesoro Corp. | | | 11,660 | | | | 866,921 | |
| Valero Energy Corp. | | | 8,640 | | | | 427,680 | |
| (Cost $10,043,892) | | | | | | | 9,213,265 | |
| Strategic Growth Fund | |
| Security Description | | Shares or
Principal
Amount ($) | | | Fair
Value ($) | |
| | | | | | | |
| Common Stocks — continued | |
| Financials — 13.0% | | | | | | |
Alleghany Corp. (2) | | | 900 | | | | 417,150 | |
| Allstate Corp./The | | | 10,850 | | | | 762,213 | |
| American International Group, Inc. | | | 20,740 | | | | 1,161,647 | |
Ashford Hospitality Trust, Inc. (3) | | | 50,835 | | | | 532,751 | |
Ashford, Inc. (2) | | | 584 | | | | 54,896 | |
DiamondRock Hospitality Co. (3) | | | 91,185 | | | | 1,355,920 | |
Equity LifeStyle Properties, Inc. (3) | | | 16,625 | | | | 857,019 | |
| Erie Indemnity Co. | | | 5,510 | | | | 500,143 | |
| Fulton Financial Corp. | | | 20,990 | | | | 259,436 | |
Genworth Financial, Inc. (2) | | | 86,395 | | | | 734,358 | |
| Hanover Insurance Group, Inc./The | | | 3,630 | | | | 258,892 | |
| Jones Lang LaSalle, Inc. | | | 3,625 | | | | 543,496 | |
LaSalle Hotel Properties (3) | | | 21,300 | | | | 862,011 | |
Pebblebrook Hotel Trust (3) | | | 20,150 | | | | 919,445 | |
Post Properties, Inc. (3) | | | 14,520 | | | | 853,340 | |
PRA Group, Inc. (2) | | | 8,750 | | | | 506,888 | |
Retail Properties of America, Inc. (3) | | | 46,970 | | | | 783,929 | |
Ryman Hospitality Properties, Inc. (3) | | | 17,200 | | | | 907,128 | |
Sunstone Hotel Investors, Inc. (3) | | | 66,640 | | | | 1,100,226 | |
| Travelers Cos., Inc./The | | | 8,900 | | | | 942,065 | |
| (Cost $13,208,319) | | | | | | | 14,312,953 | |
| | | | | | | | | |
| Healthcare — 7.6% | | | | | | | | |
| AbbVie, Inc. | | | 7,225 | | | | 472,804 | |
| Aetna, Inc. | | | 2,305 | | | | 204,753 | |
Alere, Inc. (2) | | | 6,690 | | | | 254,220 | |
Alexion Pharmaceuticals, Inc. (2) | | | 1,060 | | | | 196,132 | |
| Anthem, Inc. | | | 1,555 | | | | 195,417 | |
Centene Corp. (2) | | | 2,265 | | | | 235,220 | |
| Cigna Corp. | | | 7,165 | | | | 737,350 | |
Gilead Sciences, Inc. (2) | | | 11,280 | | | | 1,063,253 | |
Health Net, Inc./CA (2) | | | 5,000 | | | | 267,650 | |
| Hill-Rom Holdings, Inc. | | | 5,480 | | | | 249,998 | |
Hologic, Inc. (2) | | | 22,315 | | | | 596,703 | |
Hospira, Inc. (2) | | | 2,470 | | | | 151,288 | |
LifePoint Hospitals, Inc. (2) | | | 8,450 | | | | 607,640 | |
MedAssets, Inc. (2) | | | 17,065 | | | | 337,204 | |
| Merck & Co., Inc. | | | 13,165 | | | | 747,640 | |
Molina Healthcare, Inc. (2) | | | 2,045 | | | | 109,469 | |
| Pfizer, Inc. | | | 16,460 | | | | 512,729 | |
| UnitedHealth Group, Inc. | | | 7,460 | | | | 754,131 | |
VCA, Inc. (2) | | | 12,430 | | | | 606,211 | |
| (Cost $7,785,528) | | | | | | | 8,299,812 | |
| | | | | | | | | |
| Industrials — 5.8% | | | | | | | | |
| Cintas Corp. | | | 8,380 | | | | 657,327 | |
The accompanying notes are an integral part of these financial statements.
2014 Annual Report | December 31, 2014 | Page 37 |
Schedule of Investments
December 31, 2014
| Strategic Growth Fund | |
| Security Description | | Shares or
Principal
Amount ($) | | | Fair
Value ($) | |
| | | | | | | |
| Common Stocks — continued | |
| Curtiss-Wright Corp. | | | 3,545 | | | | 250,242 | |
| Delta Air Lines, Inc. | | | 21,460 | | | | 1,055,617 | |
| Deluxe Corp. | | | 5,060 | | | | 314,985 | |
| FedEx Corp. | | | 5,885 | | | | 1,021,989 | |
| General Dynamics Corp. | | | 5,605 | | | | 771,360 | |
| Huntington Ingalls Industries, Inc. | | | 5,690 | | | | 639,897 | |
Polypore International, Inc. (2) | | | 5,240 | | | | 246,542 | |
| Regal-Beloit Corp. | | | 4,235 | | | | 318,472 | |
| Southwest Airlines Co. | | | 14,530 | | | | 614,910 | |
| Stanley Black & Decker, Inc. | | | 5,135 | | | | 493,371 | |
| (Cost $5,824,190) | | | | | | | 6,384,712 | |
| | | | | | | | | |
| Information Technology — 13.3% | | | | | | | | |
| Broadcom Corp. | | | 14,195 | | | | 615,069 | |
| Broadridge Financial Solutions, Inc. | | | 17,465 | | | | 806,534 | |
| Cisco Systems, Inc. | | | 32,005 | | | | 890,219 | |
| Computer Sciences Corp. | | | 16,060 | | | | 1,012,583 | |
Electronic Arts, Inc. (2) | | | 4,780 | | | | 224,732 | |
| Fair Isaac Corp. | | | 3,465 | | | | 250,520 | |
| Hewlett-Packard Co. | | | 33,235 | | | | 1,333,721 | |
| Intel Corp. | | | 31,970 | | | | 1,160,191 | |
Itron, Inc. (2) | | | 5,940 | | | | 251,203 | |
| Lam Research Corp. | | | 2,160 | | | | 171,374 | |
| Lexmark International, Inc. | | | 13,995 | | | | 577,574 | |
Micron Technology, Inc. (2) | | | 15,145 | | | | 530,226 | |
| Monolithic Power Systems, Inc. | | | 1,680 | | | | 83,563 | |
NeuStar, Inc. (2)(4) | | | 19,400 | | | | 539,320 | |
OmniVision Technologies, Inc. (2) | | | 18,645 | | | | 484,770 | |
| Oracle Corp. | | | 32,680 | | | | 1,469,619 | |
PMC-Sierra, Inc. (2) | | | 21,955 | | | | 201,108 | |
| Skyworks Solutions, Inc. | | | 4,100 | | | | 298,111 | |
| Tessera Technologies, Inc. | | | 5,110 | | | | 182,734 | |
| Visa, Inc. | | | 4,665 | | | | 1,223,163 | |
| Western Digital Corp. | | | 10,780 | | | | 1,193,346 | |
| Xerox Corp. | | | 79,000 | | | | 1,094,940 | |
| (Cost $12,425,311) | | | | | | | 14,594,620 | |
| | | | | | | | | |
| Materials — 1.6% | | | | | | | | |
| Ball Corp. | | | 3,580 | | | | 244,049 | |
| Celanese Corp. | | | 8,090 | | | | 485,076 | |
| Rock-Tenn Co. | | | 17,230 | | | | 1,050,685 | |
| (Cost $1,643,693) | | | | | | | 1,779,810 | |
| | | | | | | | | |
| Telecommunication Services — 0.7% | | | | | | | | |
| Verizon Communications, Inc. | | | 16,020 | | | | 749,416 | |
| (Cost $785,608) | | | | | | | 749,416 | |
| Strategic Growth Fund | |
| Security Description | | Shares or
Principal
Amount ($) | | | Fair
Value ($) | |
| | | | | | | |
| Common Stocks — continued | |
| Utilities — 1.4% | | | | | | |
| UGI Corp. | | | 21,667 | | | | 822,913 | |
| Vectren Corp. | | | 15,865 | | | | 733,439 | |
| (Cost $1,277,913) | | | | | | | 1,556,352 | |
| | | | | | | | | |
Total Common Stocks
(Cost $67,398,031) | | | | | | | 72,080,918 | |
| | | | | | | | | |
| Registered Investment Companies — 29.8% | |
iShares MSCI EAFE Index Fund (4)(10) | | | 135,790 | | | | 8,261,464 | |
iShares MSCI Emerging Markets Index Fund (10) | | | 218,275 | | | | 8,576,025 | |
| Ivy International Core Equity Fund | | | 469,542 | | | | 8,024,467 | |
| Oppenheimer Developing Markets Fund | | | 225,734 | | | | 7,914,232 | |
Total Registered Investment Companies
(Cost $34,545,570) | | | | | | | 32,776,188 | |
| | | | | | | | | |
| Money Market Registered Investment Companies — 10.4% | |
Fidelity Institutional Money Market Portfolio, 0.11% (5) | | | 7,805,936 | | | | 7,805,936 | |
Meeder Money Market Fund - Institutional Class, 0.14% (6) | | | 3,575,894 | | | | 3,575,894 | |
Total Money Market Registered Investment Companies
(Cost $11,381,830) | | | | | | | 11,381,830 | |
| | | | | | | | | |
| Bank Obligations — 0.9% | | | | | | | | |
Capital Bank Deposit Account,
0.65%, 1/2/2015 (7) | | | 249,603 | | | | 249,603 | |
EverBank Money Market Account, 0.61%, 1/2/2015 (7) | | | 249,558 | | | | 249,558 | |
Mid America Bank Demand Deposit Account, 0.50%, 1/2/2015 (7) | | | 249,386 | | | | 249,386 | |
Pacific Mercantile Bank Deposit Account, 0.55%, 1/2/2015 (7) | | | 249,270 | | | | 249,270 | |
Total Bank Obligations
(Cost $997,817) | | | | | | | 997,817 | |
| | | | | | | | | |
| U.S. Government Obligations — 0.4% | | | | | | | | |
U.S. Treasury Bill, 0.07%, due 3/5/2015 (8) | | | 400,000 | | | | 399,988 | |
Total U.S. Government Obligations
(Cost $399,960) | | | | | | | 399,988 | |
Total Investments — 107.1%
(Cost $114,723,208)(1) | | | | | | | 117,636,741 | |
| Liabilities less Other Assets — (7.1%) | | | | | | | (7,792,155 | ) |
| Total Net Assets — 100.0% | | | | | | | 109,844,586 | |
The accompanying notes are an integral part of these financial statements.
| Page 38 | 2014 Annual Report | December 31, 2014 |
Schedule of Investments
December 31, 2014
| Strategic Growth Fund | |
| Security Description | | Shares or
Principal
Amount ($) | | | Fair
Value ($) | |
| | | | | | | |
Trustee Deferred Compensation (9) | | | | | | |
| Meeder Aggressive Growth Fund | | | 2,342 | | | | 24,521 | |
| Meeder Balanced Fund | | | 1,263 | | | | 13,868 | |
| Meeder Dynamic Growth Fund | | | 839 | | | | 8,407 | |
| Meeder Muirfield Fund | | | 2,197 | | | | 15,445 | |
| Meeder Quantex Fund | | | 809 | | | | 28,477 | |
| Meeder Utilities & Infrastructure Fund | | | 260 | | | | 7,917 | |
Total Trustee Deferred Compensation
(Cost $77,242) | | | | | | | 98,635 | |
| | | Long Contracts | | | Unrealized Appreciation (Depreciation)($) | |
| | | | | | | |
| Futures Contracts | | | | | | |
| Standard & Poors 500 Mini Futures expiring March 2015, notional value $3,489,080 | | | 34 | | | | 22,644 | |
| Russell 2000 Mini Index Futures expiring March 2015, notional value $1,200,700 | | | 10 | | | | 42,610 | |
| Total Futures Contracts | | | 44 | | | | 65,254 | |
| (1) | Cost for federal income tax purposes of $115,584,565 differs from value by net unrealized appreciation (depreciation) of securities as follows: |
| Unrealized appreciation | | $ | 6,841,261 | |
| Unrealized depreciation | | | (4,789,085 | ) |
| Net unrealized appreciation (depreciation) | | $ | 2,052,176 | |
| (2) | Represents non-income producing securities. |
| (3) | Real estate investment trust. |
| (4) | All or a portion of this security is on loan. |
| (5) | Investment purchased as securities lending collateral. The yield shown represents the 7-day yield in effect at December 31, 2014. |
| (6) | Investment in affiliate. The yield shown represents the 7-day yield in effect at December 31, 2014. |
| (7) | Variable rate security. Securities payable at par including accrued interest (usually within seven days notice) and unconditionally secured as to principal and interest by letters of credit or other credit support agreements from major banks. The interest rates are adjustable and are based on bank prime rates or other interest rate adjustment indices. The rate shown represents the rate in effect at December 31, 2014. The maturity date shown, if applicable, reflects the earlier of the next demand date or stated maturity date. |
| (8) | Pledged as collateral on futures contracts. |
| (9) | Assets of affiliates to the Strategic Growth Fund held for the benefit of the Fund’s Trustees in connection with the Trustee Deferred Compensation Plan. |
| (10) | Exchange-traded fund. |
The accompanying notes are an integral part of these financial statements.
2014 Annual Report | December 31, 2014 | Page 39 |
Schedule of Investments
December 31, 2014
Quantex FundTM | |
| Security Description | | Shares or
Principal
Amount ($) | | | Fair
Value ($) | |
| | | | | | | |
| Common Stocks — 90.8% | |
| Consumer Discretionary — 18.5% | | | | | | |
AutoNation, Inc. (2) | | | 10,445 | | | | 630,982 | |
| Cablevision Systems Corp. | | | 28,965 | | | | 597,838 | |
| Darden Restaurants, Inc. | | | 9,555 | | | | 560,210 | |
| DR Horton, Inc. | | | 23,275 | | | | 588,625 | |
| Family Dollar Stores, Inc. | | | 7,380 | | | | 584,570 | |
Fossil Group, Inc. (2) | | | 4,330 | | | | 479,504 | |
GameStop Corp. (4) | | | 10,545 | | | | 356,421 | |
| Gannett Co., Inc. | | | 17,555 | | | | 560,531 | |
| Goodyear Tire & Rubber Co./The | | | 21,775 | | | | 622,112 | |
| Graham Holdings Co. | | | 780 | | | | 673,693 | |
| H&R Block, Inc. | | | 17,880 | | | | 602,198 | |
| Harman International Industries, Inc. | | | 6,340 | | | | 676,541 | |
| Hasbro, Inc. | | | 9,440 | | | | 519,106 | |
| International Game Technology | | | 28,590 | | | | 493,178 | |
| Interpublic Group of Cos., Inc./The | | | 29,340 | | | | 609,392 | |
| Leggett & Platt, Inc. | | | 16,785 | | | | 715,209 | |
| Lennar Corp. | | | 13,070 | | | | 585,667 | |
| PetSmart, Inc. | | | 7,110 | | | | 578,007 | |
| PulteGroup, Inc. | | | 25,400 | | | | 545,084 | |
Urban Outfitters, Inc. (2) | | | 14,000 | | | | 491,820 | |
| (Cost $8,263,944) | | | | | | | 11,470,688 | |
| | | | | | | | | |
| Consumer Staples — 1.4% | | | | | | | | |
| Avon Products, Inc. | | | 30,045 | | | | 282,123 | |
| Safeway, Inc. | | | 15,940 | | | | 559,813 | |
| (Cost $812,644) | | | | | | | 841,936 | |
| | | | | | | | | |
| Energy — 5.5% | | | | | | | | |
| Denbury Resources, Inc. | | | 31,475 | | | | 255,892 | |
Diamond Offshore Drilling, Inc. (4) | | | 9,140 | | | | 335,529 | |
| Nabors Industries, Ltd. | | | 30,460 | | �� | | 395,371 | |
Newfield Exploration Co. (2) | | | 21,095 | | | | 572,095 | |
| Peabody Energy Corp. | | | 26,470 | | | | 204,878 | |
| QEP Resources, Inc. | | | 16,945 | | | | 342,628 | |
| Rowan Cos. Plc | | | 14,690 | | | | 342,571 | |
| Tesoro Corp. | | | 8,830 | | | | 656,511 | |
WPX Energy, Inc. (2) | | | 25,480 | | | | 296,332 | |
| (Cost $4,700,304) | | | | | | | 3,401,807 | |
| | | | | | | | | |
| Financials — 14.1% | | | | | | | | |
Apartment Investment & Management Co. (3) | | | 20,045 | | | | 744,672 | |
| Assurant, Inc. | | | 7,825 | | | | 535,465 | |
E*TRADE Financial Corp. (2) | | | 26,452 | | | | 641,593 | |
Genworth Financial, Inc. (2) | | | 33,450 | | | | 284,325 | |
| Hudson City Bancorp, Inc. | | | 55,045 | | | | 557,055 | |
Quantex FundTM | |
| Security Description | | Shares or
Principal
Amount ($) | | | Fair
Value ($) | |
| | | | | | | |
| Common Stocks — continued | |
| Huntington Bancshares, Inc./OH | | | 53,815 | | | | 566,134 | |
Iron Mountain, Inc. (3) | | | 18,548 | | | | 717,066 | |
Kimco Realty Corp. (3) | | | 26,185 | | | | 658,291 | |
| Legg Mason, Inc. | | | 11,945 | | | | 637,505 | |
Macerich Co./The (3) | | | 8,775 | | | | 731,923 | |
| NASDAQ OMX Group, Inc./The | | | 13,040 | | | | 625,398 | |
| People's United Financial, Inc. | | | 34,330 | | | | 521,129 | |
Plum Creek Timber Co., Inc. (3) | | | 11,115 | | | | 475,611 | |
| Torchmark Corp. | | | 9,972 | | | | 540,183 | |
Wells Fargo & Co. Preferred (2) | | | 1 | | | | — | |
| Zions Bancorporation | | | 17,330 | | | | 494,078 | |
| (Cost $6,301,196) | | | | | | | 8,730,428 | |
| | | | | | | | | |
| Healthcare — 9.6% | | | | | | | | |
| DENTSPLY International, Inc. | | | 10,710 | | | | 570,522 | |
Edwards Lifesciences Corp. (2) | | | 7,855 | | | | 1,000,569 | |
Hospira, Inc. (2) | | | 12,575 | | | | 770,219 | |
Laboratory Corp. of America Holdings (2) | | | 5,660 | | | | 610,714 | |
| Patterson Cos., Inc. | | | 12,605 | | | | 606,301 | |
| PerkinElmer, Inc. | | | 12,595 | | | | 550,779 | |
| Quest Diagnostics, Inc. | | | 9,660 | | | | 647,800 | |
Tenet Healthcare Corp. (2) | | | 12,352 | | | | 625,876 | |
Varian Medical Systems, Inc. (2) | | | 6,660 | | | | 576,157 | |
| (Cost $4,271,373) | | | | | | | 5,958,937 | |
| | | | | | | | | |
| Industrials — 11.8% | | | | | | | | |
| ADT Corp./The | | | 12,775 | | | | 462,838 | |
| Allegion PLC | | | 11,705 | | | | 649,160 | |
| Cintas Corp. | | | 8,655 | | | | 678,898 | |
| Dun & Bradstreet Corp./The | | | 4,230 | | | | 511,661 | |
Jacobs Engineering Group, Inc. (2) | | | 8,315 | | | | 371,597 | |
| Joy Global, Inc. | | | 8,835 | | | | 411,004 | |
| Masco Corp. | | | 22,715 | | | | 572,418 | |
| Pitney Bowes, Inc. | | | 22,285 | | | | 543,085 | |
Quanta Services, Inc. (2) | | | 16,455 | | | | 467,157 | |
| Robert Half International, Inc. | | | 12,365 | | | | 721,869 | |
| Ryder System, Inc. | | | 7,090 | | | | 658,307 | |
| Snap-on, Inc. | | | 4,740 | | | | 648,148 | |
| Xylem, Inc./NY | | | 15,005 | | | | 571,240 | |
| (Cost $5,512,619) | | | | | | | 7,267,382 | |
| | | | | | | | | |
| Information Technology — 10.0% | | | | | | | | |
Blackhawk Network Holdings, Inc. (2) | | | 2,616 | | | | 98,597 | |
| Computer Sciences Corp. | | | 9,255 | | | | 583,528 | |
Electronic Arts, Inc. (2) | | | 22,645 | | | | 1,064,654 | |
F5 Networks, Inc. (2) | | | 5,695 | | | | 742,998 | |
First Solar, Inc. (2) | | | 9,500 | | | | 423,653 | |
The accompanying notes are an integral part of these financial statements.
| Page 40 | 2014 Annual Report | December 31, 2014 |
Schedule of Investments
December 31, 2014
Quantex FundTM | |
| Security Description | | Shares or
Principal
Amount ($) | | | Fair
Value ($) | |
| | | | | | | |
| Common Stocks — continued | |
| FLIR Systems, Inc. | | | 17,245 | | | | 557,186 | |
| Harris Corp. | | | 7,210 | | | | 517,822 | |
| Jabil Circuit, Inc. | | | 29,785 | | | | 650,207 | |
Teradata Corp. (2) | | | 11,370 | | | | 496,642 | |
| Total System Services, Inc. | | | 15,605 | | | | 529,946 | |
VeriSign, Inc. (2) | | | 8,655 | | | | 493,335 | |
| (Cost $4,612,060) | | | | | | | 6,158,568 | |
| | | | | | | | | |
| Materials — 10.2% | | | | | | | | |
| Airgas, Inc. | | | 4,625 | | | | 532,708 | |
| Allegheny Technologies, Inc. | | | 14,550 | | | | 505,904 | |
| Avery Dennison Corp. | | | 10,175 | | | | 527,879 | |
| Ball Corp. | | | 10,005 | | | | 682,041 | |
| Bemis Co., Inc. | | | 12,680 | | | | 573,263 | |
Cliffs Natural Resources, Inc. (4) | | | 19,775 | | | | 141,194 | |
| International Flavors & Fragrances, Inc. | | | 6,045 | | | | 612,721 | |
| MeadWestvaco Corp. | | | 14,060 | | | | 624,123 | |
Owens-Illinois, Inc. (2) | | | 14,515 | | | | 391,760 | |
| Sealed Air Corp. | | | 15,245 | | | | 646,845 | |
| United States Steel Corp. | | | 17,595 | | | | 470,490 | |
| Vulcan Materials Co. | | | 8,705 | | | | 572,180 | |
| (Cost $5,623,195) | | | | | | | 6,281,108 | |
| | | | | | | | | |
| Telecommunication Services — 2.1% | | | | | | | | |
| Frontier Communications Corp. | | | 111,630 | | | | 744,571 | |
Windstream Holdings, Inc. (4) | | | 65,155 | | | | 536,877 | |
| (Cost $1,099,258) | | | | | | | 1,281,448 | |
| | | | | | | | | |
| Utilities — 7.6% | | | | | | | | |
| AGL Resources, Inc. | | | 10,996 | | | | 599,392 | |
| CMS Energy Corp. | | | 19,315 | | | | 671,196 | |
| Integrys Energy Group, Inc. | | | 9,535 | | | | 742,300 | |
| Pepco Holdings, Inc. | | | 27,145 | | | | 731,014 | |
| Pinnacle West Capital Corp. | | | 9,805 | | | | 669,780 | |
| SCANA Corp. | | | 11,015 | | | | 665,306 | |
| TECO Energy, Inc. | | | 30,110 | | | | 616,954 | |
| (Cost $3,643,957) | | | | | | | 4,695,942 | |
| | | | | | | | | |
Total Common Stocks
(Cost $44,840,550) | | | | | | | 56,088,244 | |
Quantex FundTM | |
| Security Description | | Shares or
Principal
Amount ($) | | | Fair
Value ($) | |
| | | | | | | |
| Money Market Registered Investment Companies — 9.7% | |
Fidelity Institutional Money Market Portfolio, 0.11% (5) | | | 1,394,775 | | | | 1,394,775 | |
Meeder Money Market Fund - Institutional Class, 0.14% (6) | | | 4,609,306 | | | | 4,609,306 | |
Total Money Market Registered Investment Companies
(Cost $6,004,081) | | | | | | | 6,004,081 | |
| | | | | | | | | |
| Bank Obligations — 1.5% | | | | | | | | |
Capital Bank Deposit Account,
0.65%, 1/2/2015 (7) | | | 249,603 | | | | 249,603 | |
EverBank Money Market Account, 0.61%, 1/2/2015 (7) | | | 249,558 | | | | 249,558 | |
Mid America Bank Demand Deposit Account, 0.50%, 1/2/2015 (7) | | | 249,386 | | | | 249,386 | |
Pacific Mercantile Bank Deposit Account, 0.55%, 1/2/2015 (7) | | | 249,270 | | | | 249,270 | |
Total Bank Obligations
(Cost $997,817) | | | | | | | 997,817 | |
| | | | | | | | | |
| U.S. Government Obligations — 0.5% | | | | | | | | |
U.S. Treasury Bill, 0.07%, due 3/5/2015 (8) | | | 300,000 | | | | 299,991 | |
Total U.S. Government Obligations
(Cost $299,967) | | | | | | | 299,991 | |
Total Investments — 102.5%
(Cost $52,142,415)(1) | | | | | | | 63,390,133 | |
| Liabilities less Other Assets — (2.5%) | | | | | | | (1,556,393 | ) |
| Total Net Assets — 100.0% | | | | | | | 61,833,740 | |
| | | | | | | | | |
Trustee Deferred Compensation (9) | | | | | | | | |
| Meeder Aggressive Growth Fund | | | 1,193 | | | | 12,491 | |
| Meeder Balanced Fund | | | 639 | | | | 7,016 | |
| Meeder Dynamic Growth Fund | | | 425 | | | | 4,259 | |
| Meeder Muirfield Fund | | | 2,191 | | | | 15,403 | |
| Meeder Quantex Fund | | | 1,312 | | | | 46,182 | |
| Meeder Utilities & Infrastructure Fund | | | 133 | | | | 4,050 | |
Total Trustee Deferred Compensation
(Cost $59,369) | | | | | | | 89,401 | |
2014 Annual Report | December 31, 2014 | Page 41 |
Schedule of Investments
December 31, 2014
Quantex FundTM | |
| | | Long Contracts | | | Unrealized Appreciation (Depreciation)($) | |
| | | | | | | |
| Futures Contracts | | | | | | |
| Standard & Poors Mid Cap 400 E-Mini expiring March 2015, notional value $5,794,400 | | | 40 | | | | 121,290 | |
| Total Futures Contracts | | | 40 | | | | 121,290 | |
| (1) | Cost for federal income tax purposes of $52,204,558 differs from value by net unrealized appreciation (depreciation) of securities as follows: |
| Unrealized appreciation | | $ | 13,872,492 | |
| Unrealized depreciation | | | (2,686,917 | ) |
| Net unrealized appreciation (depreciation) | | $ | 11,185,575 | |
| (2) | Represents non-income producing securities. |
| (3) | Real estate investment trust. |
| (4) | All or a portion of this security is on loan. |
| (5) | Investment purchased as securities lending collateral. The yield shown represents the 7-day yield in effect at December 31, 2014. |
| (6) | Investment in affiliate. The yield shown represents the 7-day yield in effect at December 31, 2014. |
| (7) | Variable rate security. Securities payable at par including accrued interest (usually within seven days notice) and unconditionally secured as to principal and interest by letters of credit or other credit support agreements from major banks. The interest rates are adjustable and are based on bank prime rates or other interest rate adjustment indices. The rate shown represents the rate in effect at December 31, 2014. The maturity date shown, if applicable, reflects the earlier of the next demand date or stated maturity date. |
| (8) | Pledged as collateral on Futures Contracts. |
| (9) | Assets of affiliates to the Quantex Fund held for the benefit of the Fund’s Trustees in connection with the Trustee Deferred Compensation Plan. |
The accompanying notes are an integral part of these financial statements.
| Page 42 | 2014 Annual Report | December 31, 2014 |
Schedule of Investments
December 31, 2014
| Utilities & Infrastructure Fund | |
| Security Description | | Shares or
Principal
Amount ($) | | | Fair
Value ($) | |
| | | | | | | |
| Common Stocks — 96.0% | |
| Electric Utility — 11.8% | | | | | | |
| AES Corp. | | | 64,157 | | | | 883,442 | |
| Covanta Holding Corp. | | | 38,397 | | | | 845,118 | |
| General Electric Co. | | | 42,745 | | | | 1,080,166 | |
| ITC Holdings Corp. | | | 28,592 | | | | 1,155,975 | |
| MDU Resources Group, Inc. | | | 66,372 | | | | 1,559,742 | |
| (Cost $4,600,088) | | | | | | | 5,524,443 | |
| | | | | | | | | |
| Natural Gas Distribution — 14.1% | | | | | | | | |
| Energy Transfer Equity, L.P. | | | 28,075 | | | | 1,610,944 | |
| MarkWest Energy Partners, L.P. | | | 15,360 | | | | 1,032,038 | |
National Grid PLC - ADR (3) | | | 11,598 | | | | 819,515 | |
| ONEOK, Inc. | | | 15,242 | | | | 758,899 | |
| WGL Holdings, Inc. | | | 22,824 | | | | 1,246,647 | |
| Williams Cos., Inc./The | | | 26,477 | | | | 1,189,876 | |
| (Cost $3,468,976) | | | | | | | 6,657,919 | |
| | | | | | | | | |
| Oil Exploration & Production — 3.3% | | | | | | | | |
| Energen Corp. | | | 10,407 | | | | 663,550 | |
| EQT Corp. | | | 11,904 | | | | 901,133 | |
| (Cost $1,210,655) | | | | | | | 1,564,683 | |
| | | | | | | | | |
| Pipelines — 16.1% | | | | | | | | |
| Enterprise Products Partners, L.P. | | | 52,584 | | | | 1,899,334 | |
| Kinder Morgan, Inc. | | | 58,642 | | | | 2,481,075 | |
| National Fuel Gas Co. | | | 18,940 | | | | 1,316,898 | |
| Questar Corp. | | | 41,628 | | | | 1,052,356 | |
| Spectra Energy Corp. | | | 21,454 | | | | 778,780 | |
| (Cost $5,256,433) | | | | | | | 7,528,443 | |
| | | | | | | | | |
| Telecommunication Services — 23.0% | | | | | | | | |
American Tower Corp. (4) | | | 15,449 | | | | 1,527,134 | |
| AT&T, Inc. | | | 39,122 | | | | 1,314,108 | |
| BCE, Inc. | | | 17,331 | | | | 794,800 | |
| Corning, Inc. | | | 79,142 | | | | 1,814,726 | |
| QUALCOMM, Inc. | | | 18,325 | | | | 1,362,097 | |
Telefonaktiebolaget LM Ericsson - ADR (3) | | | 85,513 | | | | 1,034,707 | |
| Telephone & Data Systems, Inc. | | | 58,560 | | | | 1,478,640 | |
| Verizon Communications, Inc. | | | 22,755 | | | | 1,064,479 | |
Vodafone Group PLC - ADR (3) | | | 11,173 | | | | 381,781 | |
| (Cost $9,186,293) | | | | | | | 10,772,472 | |
| | | | | | | | | |
| Utility Services — 22.2% | | | | | | | | |
| Cummins, Inc. | | | 7,959 | | | | 1,147,449 | |
| Fluor Corp. | | | 10,516 | | | | 637,585 | |
| Macquarie Infrastructure Company, LLC | | | 28,000 | | | | 1,990,520 | |
MasTec, Inc. (2) | | | 42,489 | | | | 960,676 | |
| OGE Energy Corp. | | | 23,374 | | | | 829,310 | |
| Ormat Technologies, Inc. | | | 22,020 | | | | 598,504 | |
Quanta Services, Inc. (2) | | | 36,107 | | | | 1,025,078 | |
| Pattern Energy Group, Inc. | | | 34,848 | | | | 859,352 | |
| Utilities & Infrastructure Fund | |
| Security Description | | Shares or
Principal
Amount ($) | | | Fair
Value ($) | |
| | | | | | | |
| Common Stocks — continued | |
| UGI Corp. | | | 27,337 | | | | 1,038,259 | |
| UIL Holding Corp. | | | 30,131 | | | | 1,311,904 | |
| (Cost $9,690,818) | | | | | | | 10,398,637 | |
| | | | | | | | | |
| Water Utility — 5.2% | | | | | | | | |
| American Water Works Co., Inc. | | | 16,841 | | | | 897,625 | |
Veolia Environnement SA - ADR (3) | | | 85,295 | | | | 1,536,163 | |
| (Cost $2,166,968) | | | | | | | 2,433,788 | |
| | | | | | | | | |
Total Common Stocks
(Cost $35,580,231) | | | | | | | 44,880,385 | |
| | | | | | | | | |
| Money Market Registered Investment Companies — 4.1% | |
Fidelity Institutional Money Market Portfolio, 0.11% (5) | | | 3 | | | | 3 | |
Meeder Money Market Fund - Institutional Class, 0.14% (6) | | | 1,919,031 | | | | 1,919,031 | |
Total Money Market Registered Investment Companies
(Cost $1,919,034) | | | | | | | 1,919,034 | |
Total Investments — 100.1%
(Cost $37,499,265)(1) | | | | | | | 46,799,419 | |
| Liabilities less Other Assets — (0.1%) | | | | | | | (53,918 | ) |
| Total Net Assets — 100.0% | | | | | | | 46,745,501 | |
| | | | | | | | | |
Trustee Deferred Compensation (7) | | | | | | | | |
| Meeder Aggressive Growth Fund | | | 1,374 | | | | 14,386 | |
| Meeder Balanced Fund | | | 736 | | | | 8,081 | |
| Meeder Dynamic Growth Fund | | | 488 | | | | 4,890 | |
| Meeder Muirfield Fund | | | 2,080 | | | | 14,622 | |
| Meeder Quantex Fund | | | 1,151 | | | | 40,515 | |
| Meeder Utilities & Infrastructure Fund | | | 152 | | | | 4,628 | |
Total Trustee Deferred Compensation
(Cost $59,355) | | | | | | | 87,122 | |
| (1) | Cost for federal income tax purposes of $37,668,160 differs from value by net unrealized appreciation (depreciation) of securities as follows: |
| Unrealized appreciation | | $ | 9,586,546 | |
| Unrealized depreciation | | | (455,287 | ) |
| Net unrealized appreciation (depreciation) | | $ | 9,131,259 | |
| (2) | Represents non-income producing securities. |
| (3) | American Depositary Receipt. |
| (4) | Real estate investment trust. |
| (5) | Investment purchased as securities lending collateral. The yield shown represents the 7-day yield in effect at December 31, 2014. |
| (6) | Investment in affiliate. The yield shown represents the 7-day yield in effect at December 31, 2014. |
| (7) | Assets of affiliates to the Utilities & Infrastructure Fund held for the benefit of the Fund’s Trustees in connection with the Trustees Deferred Compensation Plan. |
The accompanying notes are an integral part of these financial statements.
2014 Annual Report | December 31, 2014 | Page 43 |
Schedule of Investments
December 31, 2014
| Total Return Bond Fund | |
| Security Description | | Shares or
Principal
Amount ($) | | | Fair
Value ($) | |
| | | | | | | |
| Registered Investment Companies — 95.3% | |
| AllianceBernstein Bond Fund, Inc. - High Income Fund | | | 922,229 | | | | 8,263,175 | |
| DoubleLine Total Return Bond Fund | | | 864,045 | | | | 9,478,570 | |
| Eaton Vance Bond Fund | | | 367,886 | | | | 3,947,416 | |
| Federated Bond Fund | | | 1,058,881 | | | | 9,953,482 | |
| Fidelity Capital & Income Fund | | | 998,293 | | | | 9,663,479 | |
| Frost Total Return Bond Fund | | | 655,310 | | | | 6,992,161 | |
| Goldman Sachs Emerging Market Debt Fund | | | 159,494 | | | | 1,971,344 | |
| Guggenheim Total Return Bond Fund | | | 162,882 | | | | 4,394,549 | |
iShares 7-10 Year Treasury Bond ETF (6) | | | 47,120 | | | | 4,994,249 | |
iShares iBoxx $ High Yield Corporate Bond ETF (6) | | | 33,090 | | | | 2,964,864 | |
iShares JP Morgan USD Emerging Markets Bond ETF (6) | | | 71,380 | | | | 7,831,100 | |
| Ivy High Income Fund | | | 706,446 | | | | 5,701,018 | |
| John Hancock Bond Fund | | | 435,959 | | | | 6,988,418 | |
| Prudential Total Return Bond Fund | | | 571,772 | | | | 8,239,236 | |
| Putnam Absolute Return 300 Fund | | | 856,589 | | | | 8,874,261 | |
Sentinel Total Return Bond Fund (7) | | | 869,390 | | | | 9,189,449 | |
SPDR Barclays High Yield Bond ETF (6) | | | 76,510 | | | | 2,954,051 | |
| TCW Emerging Markets Income Fund | | | 877,368 | | | | 7,071,586 | |
| Thompson Bond Fund | | | 691,782 | | | | 7,886,318 | |
Vanguard Total Bond Market ETF (6) | | | 109,480 | | | | 9,017,867 | |
Total Registered Investment Companies
(Cost $139,213,188) | | | | | | | 136,376,593 | |
| | | | | | | | | |
| Money Market Registered Investment Companies — 4.6% | |
Meeder Money Market Fund - Institutional Class, 0.14% (2) | | | 6,508,078 | | | | 6,508,078 | |
Total Money Market Registered Investment Companies
(Cost $6,508,078) | | | | | | | 6,508,078 | |
| | | | | | | | | |
| Bank Obligations — 0.7% | | | | | | | | |
Capital Bank Deposit Account,
0.65%, 1/2/2015 (3) | | | 249,603 | | | | 249,603 | |
EverBank Money Market Account, 0.61%, 1/2/2015 (3) | | | 249,558 | | | | 249,558 | |
Mid America Bank Demand Deposit Account, 0.50%, 1/2/2015 (3) | | | 249,386 | | | | 249,386 | |
Pacific Mercantile Bank Deposit Account, 0.55%, 1/2/2015 (3) | | | 249,270 | | | | 249,270 | |
Total Bank Obligations
(Cost $997,817) | | | | | | | 997,817 | |
| Total Return Bond Fund | |
| Security Description | | Shares or
Principal
Amount ($) | | | Fair
Value ($) | |
| | | | | | | |
| U.S. Government Obligations — 0.2% | | | | | | |
| Government National Mortgage Association, 6.50%, due 7/20/2038 | | | 36,944 | | | | 46,239 | |
U.S. Treasury Bill, 0.07%, due 3/5/2015 (4) | | | 200,000 | | | | 199,994 | |
Total U.S. Government Obligations
(Cost $244,528) | | | | | | | 246,233 | |
Total Investments — 100.8%
(Cost $146,963,611)(1) | | | | | | | 144,128,721 | |
| Liabilities less Other Assets — (0.8%) | | | | | | | (1,083,201 | ) |
| Total Net Assets — 100.0% | | | | | | | 143,045,520 | |
| | | | | | | | | |
Trustee Deferred Compensation (5) | | | | | | | | |
| Meeder Aggressive Growth Fund | | | 908 | | | | 9,507 | |
| Meeder Balanced Fund | | | 496 | | | | 5,446 | |
| Meeder Dynamic Growth Fund | | | 344 | | | | 3,447 | |
| Meeder Muirfield Fund | | | 900 | | | | 6,327 | |
| Meeder Quantex Fund | | | 284 | | | | 9,997 | |
| Meeder Utilities & Infrastructure Fund | | | 106 | | | | 3,228 | |
Total Trustee Deferred Compensation
(Cost $33,246) | | | | | | | 37,952 | |
| (1) | Cost for federal income tax purposes of $147,338,904 differs from value by net unrealized appreciation (depreciation) of securities as follows: |
| Unrealized appreciation | | $ | 316,383 | |
| Unrealized depreciation | | | (3,526,566 | ) |
| Net unrealized appreciation (depreciation) | | $ | (3,210,183 | ) |
| (2) | Investment in affiliate. The yield shown represents the 7-day yield in effect at December 31, 2014. |
| (3) | Variable rate security. Securities payable at par including accrued interest (usually within seven days notice) and unconditionally secured as to principal and interest by letters of credit or other credit support agreements from major banks. The interest rates are adjustable and are based on bank prime rates or other interest rate adjustment indices. The rate shown represents the rate in effect at December 31, 2014. The maturity date shown, if applicable, reflects the earlier of the next demand date or stated maturity date. |
| (4) | Pledged as collateral on futures contracts. |
| (5) | Assets of affiliates to the Total Return Bond Fund held for the benefit of the Fund’s Trustees in connection with the Trustee Deferred Compensation Plan. |
| (7) | A portion of this security may be deemed illiquid due to the Investment Company Act of 1940 provision stating that no issuer of any investment company security purchased or acquired by a registered investment company shall be obligated to redeem such security in an amount exceeding 1 per centum of such issuer’s total outstanding shares during any period of less than thirty days. As of December 31, 2014, the fair value of illiquid securities held by the Fund was $1,567,074 or 1.10% of net assets. |
The accompanying notes are an integral part of these financial statements.
| Page 44 | 2014 Annual Report | December 31, 2014 |
Schedule of Investments
December 31, 2014
| Money Market Fund | |
| Security Description | | Coupon/Yield | | | Maturity/ Demand Date | | | Principal Amount ($) or Shares | | | Fair
Value ($) | |
| | | | | | | | | | | | | |
| Bank Obligations — 9.1% | |
| American National Bank Deposit Account | | | 0.20 | %(2) | | 01/02/15 | | | | 249,373 | | | | 249,373 | |
| Bank Midwest Deposit Account | | | 0.65 | %(2) | | 01/02/15 | | | | 249,124 | | | | 249,124 | |
| Capital Bank Deposit Account | | | 0.65 | %(2) | | 01/02/15 | | | | 249,133 | | | | 249,133 | |
| Columbus First Bank Demand Deposit Account | | | 0.45 | %(2) | | 01/02/15 | | | | 249,000 | | | | 249,000 | |
| EverBank Money Market Account | | | 0.61 | %(2) | | 01/02/15 | | | | 249,116 | | | | 249,116 | |
FICA Bank Deposit Program (3) | | | 0.23 | % | | | — | | | | 15,030,947 | | | | 15,030,947 | |
| First Merchants Bank Demand Account | | | 0.25 | %(2) | | 01/02/15 | | | | 249,470 | | | | 249,470 | |
| Metro City Bank Deposit Account | | | 0.45 | %(2) | | 01/02/15 | | | | 249,000 | | | | 249,000 | |
| Mid America Bank Demand Deposit Account | | | 0.50 | %(2) | | 01/02/15 | | | | 249,096 | | | | 249,096 | |
| Nationwide Bank Deposit Account | | | 0.60 | %(2) | | 01/02/15 | | | | 249,106 | | | | 249,106 | |
| Pacific Mercantile Bank Deposit Account | | | 0.55 | %(2) | | 01/02/15 | | | | 249,270 | | | | 249,270 | |
| Plaza Bank Deposit Account | | | 0.55 | %(2) | | 01/02/15 | | | | 249,000 | | | | 249,000 | |
| PNC Bank Deposit Account | | | 0.20 | %(2) | | 01/02/15 | | | | 249,373 | | | | 249,373 | |
| TD Bank Demand Deposit Account | | | 0.20 | %(2) | | 01/02/15 | | | | 249,375 | | | | 249,375 | |
| The PrivateBank Deposit Account | | | 0.25 | %(2) | | 01/02/15 | | | | 249,227 | | | | 249,227 | |
Total Bank Obligations
(Cost $18,519,610) | | | | 18,519,610 | |
| | | | | | | | | | | | | | | | | |
| Certificates of Deposit — 12.2% | |
| American Express Bank | | | 0.35 | % | | 03/18/15 | | | | 249,000 | | | | 249,000 | |
| AmericanWest Bank WA | | | 0.30 | % | | 06/18/15 | | | | 249,000 | | | | 249,000 | |
| Apple Bank for Savings | | | 0.30 | % | | 06/11/15 | | | | 249,000 | | | | 249,000 | |
| Banco Popular de Puerto Rico | | | 0.60 | % | | 12/24/15 | | | | 248,000 | | | | 248,000 | |
| Bank Hapoalim BM of NY | | | 0.40 | % | | 07/17/15 | | | | 249,000 | | | | 249,000 | |
| Bank of Baroda | | | 0.50 | % | | 06/23/15 | | | | 248,000 | | | | 248,000 | |
| Bank of China NY | | | 0.35 | % | | 06/04/15 | | | | 249,000 | | | | 249,000 | |
| Bank of India NY | | | 0.40 | % | | 03/18/15 | | | | 249,000 | | | | 249,000 | |
| Bank of the West | | | 0.30 | % | | 06/04/15 | | | | 249,000 | | | | 249,000 | |
| Bank Tennessee | | | 0.30 | % | | 05/05/15 | | | | 249,000 | | | | 249,000 | |
| Bank United NA | | | 0.30 | % | | 06/19/15 | | | | 249,000 | | | | 249,000 | |
| Money Market Fund | |
| Security Description | | Coupon/Yield | | | | | Principal Amount ($) or Shares | | | Fair
Value ($) | |
| | | | | | | | | | | | |
| Certificates of Deposit — continued | |
| Bankers Bank of KS | | | 0.45 | % | | 12/22/15 | | | 249,000 | | | | 249,000 | |
| Bankers Bank of the West | | | 0.40 | % | | 12/17/15 | | | 249,000 | | | | 249,000 | |
| Bankers Bank OK | | | 0.30 | % | | 11/12/15 | | | 249,000 | | | | 249,000 | |
| Barclays Bank Delaware | | | 0.45 | % | | 12/17/15 | | | 248,000 | | | | 248,000 | |
| BBCN Bank | | | 0.35 | % | | 08/14/15 | | | 249,000 | | | | 249,000 | |
| Beal Bank SSB | | | 0.50 | % | | 09/16/15 | | | 249,000 | | | | 249,000 | |
| Beal Bank USA | | | 0.50 | % | | 09/30/15 | | | 249,000 | | | | 249,000 | |
| Biddeford Savings Bank | | | 0.35 | % | | 07/29/15 | | | 249,000 | | | | 249,000 | |
| Blue Hills Bank | | | 0.25 | % | | 03/30/15 | | | 249,000 | | | | 249,000 | |
| Brand Banking Company | | | 0.30 | % | | 01/26/15 | | | 249,000 | | | | 249,000 | |
| Bremer Bank NA | | | 0.35 | % | | 11/05/15 | | | 249,000 | | | | 249,000 | |
| Bridge Community Bank | | | 0.30 | % | | 04/17/15 | | | 249,000 | | | | 249,000 | |
| Capital Bank Miami FL | | | 0.45 | % | | 08/13/15 | | | 249,000 | | | | 249,000 | |
| Cardinal Bank NA | | | 0.25 | % | | 01/12/15 | | | 249,000 | | | | 249,000 | |
| Cathay Bank | | | 0.25 | % | | 03/05/15 | | | 249,000 | | | | 249,000 | |
| Celtic Bank | | | 0.30 | % | | 11/06/15 | | | 249,000 | | | | 249,000 | |
| Central Bank Tampa | | | 0.40 | % | | 12/23/15 | | | 249,000 | | | | 249,000 | |
| Citizens Bank of Pennsylvania | | | 0.35 | % | | 03/30/15 | | | 249,000 | | | | 249,000 | |
| Cole Taylor Bank | | | 0.30 | % | | 05/29/15 | | | 249,000 | | | | 249,000 | |
| Comenity Capital Bank | | | 0.35 | % | | 06/02/15 | | | 249,000 | | | | 249,000 | |
| Community Bank of Chesapeake | | | 0.30 | % | | 09/30/15 | | | 249,000 | | | | 249,000 | |
| Currie State Bank | | | 0.30 | % | | 06/10/15 | | | 249,000 | | | | 249,000 | |
| Customers Bank | | | 0.45 | % | | 01/15/15 | | | 248,000 | | | | 248,000 | |
| Discover Bank | | | 0.30 | % | | 06/04/15 | | | 249,000 | | | | 249,000 | |
| Dollar Bank FSB PA | | | 0.40 | % | | 11/17/15 | | | 249,000 | | | | 249,000 | |
| Enerbank USA | | | 0.45 | % | | 11/25/15 | | | 248,000 | | | | 248,000 | |
| Enterprise Bank & Trust | | | 0.20 | % | | 04/30/15 | | | 249,000 | | | | 249,000 | |
| Enterprise Bank PA | | | 0.30 | % | | 01/16/15 | | | 249,000 | | | | 249,000 | |
| Espirito Santo Bank | | | 0.40 | % | | 12/08/15 | | | 249,000 | | | | 249,000 | |
| F&M Bank TN | | | 0.40 | % | | 09/25/15 | | | 249,000 | | | | 249,000 | |
| Federal Savings Bank | | | 0.30 | % | | 06/05/15 | | | 249,000 | | | | 249,000 | |
| First Bank of Puerto Rico | | | 0.35 | % | | 05/29/15 | | | 249,000 | | | | 249,000 | |
| First Merit Bank OH | | | 0.45 | % | | 07/16/15 | | | 249,000 | | | | 249,000 | |
| First Niagara Bank NY | | | 0.35 | % | | 01/20/15 | | | 249,000 | | | | 249,000 | |
| First Savings Bank FSB | | | 0.20 | % | | 04/30/15 | | | 249,000 | | | | 249,000 | |
| First Source Bank | | | 0.30 | % | | 04/23/15 | | | 249,000 | | | | 249,000 | |
| Flushing Bank | | | 0.50 | % | | 12/10/15 | | | 249,000 | | | | 249,000 | |
| GE Capital Bank | | | 0.40 | % | | 11/16/15 | | | 249,000 | | | | 249,000 | |
| Goldman Sachs Bank USA | | | 0.40 | % | | 07/16/15 | | | 249,000 | | | | 249,000 | |
| Grand River Bank MI | | | 0.30 | % | | 08/05/15 | | | 249,000 | | | | 249,000 | |
| Hardin County Bank | | | 0.40 | % | | 10/23/15 | | | 249,000 | | | | 249,000 | |
| Homestreet Bank | | | 0.25 | % | | 05/04/15 | | | 249,000 | | | | 249,000 | |
The accompanying notes are an integral part of these financial statements.
2014 Annual Report | December 31, 2014 | Page 45 |
Schedule of Investments
December 31, 2014
| Money Market Fund | |
| Security Description | | Coupon/Yield | | | Maturity/ Demand Date | | Principal Amount ($) or Shares | | | Fair
Value ($) | |
| | | | | | | | | | | | |
| Certificates of Deposit — continued | |
| Inland Bank & Trust Oak Brook | | | 0.30 | % | | 06/01/15 | | | 249,000 | | | | 249,000 | |
| Investors Bank Short Hills | | | 0.30 | % | | 02/17/15 | | | 249,000 | | | | 249,000 | |
| Lakeside Bank | | | 0.45 | % | | 12/23/15 | | | 249,000 | | | | 249,000 | |
| Lincoln Savings Bank | | | 0.40 | % | | 09/11/15 | | | 249,000 | | | | 249,000 | |
| Mahopac National Bank NY | | | 0.30 | % | | 07/31/15 | | | 249,000 | | | | 249,000 | |
| Mbank Manistique MI | | | 0.20 | % | | 02/26/15 | | | 249,000 | | | | 249,000 | |
| Medallion Bank UT | | | 0.45 | % | | 08/03/15 | | | 249,000 | | | | 249,000 | |
| Merchants Bank of Indiana | | | 0.30 | % | | 01/12/15 | | | 249,000 | | | | 249,000 | |
| Meridian Bank Berwyn PA | | | 0.35 | % | | 10/16/15 | | | 249,000 | | | | 249,000 | |
| Merrick Bank | | | 0.30 | % | | 03/11/15 | | | 249,000 | | | | 249,000 | |
| Mizrahi Tefahot Bank LA | | | 0.25 | % | | 01/29/15 | | | 249,000 | | | | 249,000 | |
| Mizuho Corp. Bank USA | | | 0.35 | % | | 04/01/15 | | | 249,000 | | | | 249,000 | |
| MVB Bank Inc | | | 0.30 | % | | 09/23/15 | | | 249,000 | | | | 249,000 | |
| Northfield Bank | | | 0.45 | % | | 12/09/15 | | | 248,000 | | | | 248,000 | |
| Pacific Continental Bank | | | 0.30 | % | | 07/23/15 | | | 249,000 | | | | 249,000 | |
| Pacific Premier Bank | | | 0.35 | % | | 10/23/15 | | | 249,000 | | | | 249,000 | |
| Pacific Western Bank | | | 0.45 | % | | 11/19/15 | | | 249,000 | | | | 249,000 | |
| Passumpsic Savings Bank | | | 0.25 | % | | 05/18/15 | | | 249,000 | | | | 249,000 | |
| Plains Capital Bank TX | | | 0.35 | % | | 10/15/15 | | | 249,000 | | | | 249,000 | |
| Putnam First Mercantile Bank | | | 0.40 | % | | 12/10/15 | | | 249,000 | | | | 249,000 | |
| RBS Citizens NA RI | | | 0.35 | % | | 03/30/15 | | | 249,000 | | | | 249,000 | |
| Reliant Bank Brentwood | | | 0.30 | % | | 05/06/15 | | | 249,000 | | | | 249,000 | |
| Ridgestone Bank | | | 0.20 | % | | 02/26/15 | | | 249,000 | | | | 249,000 | |
| S&T Bank | | | 0.40 | % | | 06/26/15 | | | 249,000 | | | | 249,000 | |
| Safra National Bank | | | 0.50 | % | | 07/30/15 | | | 249,000 | | | | 249,000 | |
| Sallie Mae Bank Murray | | | 0.25 | % | | 02/19/15 | | | 249,000 | | | | 249,000 | |
| Santander Bank NA | | | 0.50 | % | | 07/22/15 | | | 248,000 | | | | 248,000 | |
| Southeast Bank | | | 0.30 | % | | 06/12/15 | | | 249,000 | | | | 249,000 | |
| Southern First Bank | | | 0.40 | % | | 12/23/15 | | | 249,000 | | | | 249,000 | |
| Standard Bank & Trust Co | | | 0.40 | % | | 09/11/15 | | | 249,000 | | | | 249,000 | |
| State Bank of India | | | 0.35 | % | | 01/14/15 | | | 249,000 | | | | 249,000 | |
| Stearns Bank | | | 0.45 | % | | 12/18/15 | | | 248,000 | | | | 248,000 | |
| Sterling Bank | | | 0.40 | % | | 10/30/15 | | | 249,000 | | | | 249,000 | |
| Sterling Bank & Trust | | | 0.30 | % | | 02/11/15 | | | 249,000 | | | | 249,000 | |
| Summit Community Bank | | | 0.25 | % | | 06/22/15 | | | 249,000 | | | | 249,000 | |
| Synchrony Bank | | | 0.45 | % | | 06/19/15 | | | 249,000 | | | | 249,000 | |
| Synovus Bank GA | | | 0.40 | % | | 06/24/15 | | | 249,000 | | | | 249,000 | |
| TCF National Bank | | | 0.35 | % | | 07/16/15 | | | 249,000 | | | | 249,000 | |
| TCM Bank NA | | | 0.30 | % | | 03/19/15 | | | 249,000 | | | | 249,000 | |
| Town North Bank | | | 0.40 | % | | 07/24/15 | | | 249,000 | | | | 249,000 | |
| Money Market Fund | |
| Security Description | | Coupon/Yield | | | Maturity/ Demand Date | | Principal Amount ($) or Shares | | | Fair
Value ($) | |
| | | | | | | | | | | | |
| Certificates of Deposit — continued | |
| Trans Alliance Bank | | | 0.40 | % | | 12/31/15 | | | 249,000 | | | | 249,000 | |
| United Bank | | | 0.30 | % | | 11/03/15 | | | 249,000 | | | | 249,000 | |
| Valley Central Savings Bank | | | 0.40 | % | | 12/04/15 | | | 249,000 | | | | 249,000 | |
| Volunteer State Bank TN | | | 0.20 | % | | 05/07/15 | | | 249,000 | | | | 249,000 | |
| Wilshire State Bank | | | 0.35 | % | | 07/31/15 | | | 249,000 | | | | 249,000 | |
| Xenith Bank | | | 0.25 | % | | 03/17/15 | | | 249,000 | | | | 249,000 | |
Total Certificates of Deposit
(Cost $24,643,000) | | | | 24,643,000 | |
| | | | | | | | | | | | | | | |
| Corporate Obligations — 11.8% | |
Bath Technologies (5) | | | 0.27 | %(2) | | 01/02/15 | | | 505,000 | | | | 505,000 | |
| Caterpillar Financial Power Investment Floating Rate Demand Note | | 0.45 | %(4) | | 01/02/15 | | | 9,906,686 | | | | 9,906,686 | |
| GE Demand Note | | | 0.45 | %(4) | | 01/02/15 | | | 1,470,000 | | | | 1,470,000 | |
| Royal Bank of Canada | | | 0.23 | %(2) | | 06/10/15 | | | 5,000,000 | | | | 5,000,242 | |
Springside Corp. Exchange Partners, LLC (5) | | | 0.15 | %(2) | | 01/02/15 | | | 2,000,000 | | | | 2,000,000 | |
| Toyota Motor Credit | | | 0.21 | %(2) | | 01/03/15 | | | 2,000,000 | | | | 2,000,000 | |
| Toyota Motor Credit | | | 0.21 | %(2) | | 01/08/15 | | | 2,000,000 | | | | 2,000,000 | |
| Toyota Motor Credit | | | 0.22 | %(2) | | 01/09/15 | | | 1,000,000 | | | | 1,000,000 | |
Total Corporate Obligations
(Cost $23,881,928) | | | | 23,881,928 | |
| | | | | | | | | | | | | | | |
| Repurchase Agreements — 14.8% | |
| G.X. Clarke (Collateralized by $10,195,000 Farm Credit Banks, 0.184%, due 6/20/17, fair value $10,200,721)(proceeds $10,000,000), purchase date 12/31/14 | | | 0.18 | % | | 01/02/15 | | | 10,000,000 | | | | 10,000,000 | |
| G.X. Clarke (Collateralized by $10,155,000 various Federal Home Loan Banks and Farm Credit Banks, 0.184% - 2.44%, due 6/20/17 - 12/20/24, fair value $10,204,676)(proceeds $10,000,000), purchase date 12/29/14 | | | 0.26 | % | | 01/05/15 | | | 10,000,000 | | | | 10,000,000 | |
The accompanying notes are an integral part of these financial statements.
| Page 46 | 2014 Annual Report | December 31, 2014 |
Schedule of Investments
December 31, 2014
| Money Market Fund | |
| Security Description | | Coupon/Yield | | | Maturity/ Demand Date | | Principal Amount ($) or Shares | | | Fair
Value ($) | |
| | | | | | | | | | | | |
| Repurchase Agreements — continued | |
| G.X. Clarke (Collateralized by $10,195,000 various Federal Home Loan Banks and Farm Credit Banks, 0.184% - 1.00%, due 9/28/16 - 6/21/17, fair value $10,200,798)(proceeds $10,000,000), purchase date 12/30/14 | | | 0.26 | % | | 01/06/15 | | | 10,000,000 | | | | 10,000,000 | |
Total Repurchase Agreements
(Cost $30,000,000) | | | | 30,000,000 | |
| | | | | | | | | | | | | | | |
| U.S. Government Agency Obligations — 9.8% | |
| Fannie Mae | | | 0.45 | %(4) | | 02/24/15 | | | 4,865,000 | | | | 4,875,193 | |
| Federal Farm Credit Bank | | | 0.20 | %(4) | | 02/03/15 | | | 5,000,000 | | | | 5,001,204 | |
| Federal Farm Credit Bank | | | 0.13 | %(4) | | 02/23/15 | | | 5,000,000 | | | | 4,999,960 | |
| Federal Home Loan Bank | | | 0.22 | %(4) | | 01/07/15 | | | 5,000,000 | | | | 5,001,932 | |
Total U.S. Government Agency Obligations
(Cost $19,878,289) | | | | 19,878,289 | |
| Security Description | | Shares or
Principal
Amount ($) | | | Fair
Value ($) | |
| | | | | | | |
| Money Market Registered Investment Companies — 42.3% | |
Fidelity Institutional Money Market Portfolio, 0.11% (6) | | | 85,714,685 | | | | 85,714,685 | |
Total Money Market Registered Investment Companies
(Cost $85,714,685) | | | | | | | 85,714,685 | |
Total Investments — 100.0%
(Cost $202,637,512)(1) | | | | | | | 202,637,512 | |
| Other Assets less Liabilities — 0.0% | | | | | | | 28,430 | |
| Total Net Assets — 100.0% | | | | | | | 202,665,942 | |
| Money Market Fund | |
| Security Description | | Shares or
Principal
Amount ($) | | | Fair
Value ($) | |
| | | | | | | |
Trustee Deferred Compensation (7) | |
| Meeder Aggressive Growth Fund | | | 979 | | | | 10,250 | |
| Meeder Balanced Fund | | | 520 | | | | 5,710 | |
| Meeder Dynamic Growth Fund | | | 345 | | | | 3,457 | |
| Meeder Muirfield Fund | | | 1,867 | | | | 13,125 | |
| Meeder Quantex Fund | | | 1,153 | | | | 40,586 | |
| Meeder Utilities & Infrastructure Fund | | | 108 | | | | 3,289 | |
Total Trustee Deferred Compensation
(Cost $52,196) | | | | 76,417 | |
| (1) | Cost for federal income tax and financial reporting purposes are the same. |
| (2) | Variable rate security. Securities payable at par including accrued interest (usually within seven days notice) and unconditionally secured as to principal and interest by letters of credit or other credit support agreements from major banks. The interest rates are adjustable and are based on bank prime rates or other interest rate adjustment indices. The rate shown represents the rate in effect at December 31, 2014. The maturity date shown, if applicable, reflects the earlier of the next demand date or stated maturity date. |
| (3) | The FICA bank deposits were purchased through StoneCastle Partners, LLC, an independent, privately held asset management and investment services company. The underlying bank deposits are insured through the Federal Deposit Insurance Corporation (FDIC). The interest rate varies monthly and any accrued interest is reinvested into the program on a monthly basis. For a complete list of the underlying bank deposits that make up this program, visit www.meederinvestment.com. |
| (4) | Floating rate security. The rate shown represents the rate in effect at December 31, 2014. The maturity date shown reflects the earlier of the next demand date or stated maturity date. |
| (5) | Represents a restricted security purchased under Rule 144A, which is exempt from registration under the Securities Act of 1933, as amended. Security is restricted as to resale to institutional investors, but has been deemed liquid in accordance with guidelines approved by the Board of Trustees. Bath Technologies was acquired on 10/18/1999 at a cost of $505,000. Springside Corp. Exchange Partners, LLC was acquired on 2/5/2004 at a cost of $2,000,000. As of December 31, 2014, securities restricted as to resale to institutional investors represented 1.2% of Total Investments. The fair value noted approximates amortized cost. |
| (6) | 7-day yield as of December 31, 2014. |
| (7) | Assets of affiliates to the Money Market Fund held for the benefit of the Fund’s Trustees in connection with the Trustee Deferred Compensation Plan. |
The accompanying notes are an integral part of these financial statements.
2014 Annual Report | December 31, 2014 | Page 47 |
Statements of Assets & Liabilities
December 31, 2014
| | | Muirfield
Fund® | | | Dynamic Growth Fund | |
| Assets | | | | | | |
| Investments, at fair value (1)(2) | | $ | 216,576,840 | | | $ | 138,284,158 | |
| Repurchase agreements, at fair value (1) | | | — | | | | — | |
| Investments in affiliates, at fair value and cost (1) | | | 81,863,069 | | | | 4,114,155 | |
| Trustee deferred compensation investments, at fair value | | | 253,202 | | | | 143,881 | |
| Cash held at broker for collateral on futures | | | 1,989,974 | | | | — | |
| Receivable for capital stock issued | | | 844,826 | | | | 235,476 | |
| Receivable from investment advisor | | | — | | | | — | |
| Interest and dividend receivable | | | 229,902 | | | | 146,451 | |
| Receivable from securities lending agent (See Note #4) | | | 4,025 | | | | 113 | |
| Receivable for commissions recaptured | | | 72,297 | | | | 40,071 | |
| Prepaid expenses/other assets | | | 32,906 | | | | 23,635 | |
| Total Assets | | | 301,867,041 | | | | 142,987,940 | |
| | | | | | | | | |
| Liabilities | | | | | | | | |
| Payable for collateral on securities loaned | | | 2,471,902 | | | | 833,103 | |
| Payable for Trustee Deferred Compensation Plan | | | 253,202 | | | | 143,881 | |
| Payable for net variation margin on futures contracts | | | 942,560 | | | | 65,610 | |
| Payable for capital stock redeemed | | | 69,793 | | | | 125,591 | |
| Dividends payable | | | 15,656 | | | | 109 | |
| Dividends payable - Money Market Fund - Retail Class | | | | | | | | |
| Dividends payable - Money Market Fund - Institutional Class | | | | | | | | |
| Payable to investment advisor | | | 22,947 | | | | 32,581 | |
| Accrued distribution plan (12b-1) and administrative service plan fees | | | 189,582 | | | | 118,069 | |
| Accrued transfer agent, fund accounting, CCO, and administrative fees | | | 6,176 | | | | 3,420 | |
| Accrued trustee fees | | | 4,007 | | | | 2,158 | |
| Other accrued liabilities | | | 29,804 | | | | 25,884 | |
| Total Liabilities | | | 4,005,629 | | | | 1,350,406 | |
| | | | | | | | | |
| Net Assets | | $ | 297,861,412 | | | $ | 141,637,534 | |
| | | | | | | | | |
| Net Assets | | | | | | | | |
| Capital | | $ | 271,517,215 | | | $ | 130,362,993 | |
| Accumulated undistributed (distributions in excess of) net investment income | | | — | | | | — | |
| Accumulated undistributed net realized gain (loss) from investments and futures contracts | | | 8,102,833 | | | | 1,287,964 | |
| Net unrealized appreciation (depreciation) of investments and futures contracts | | | 18,241,364 | | | | 9,986,577 | |
| Total Net Assets | | $ | 297,861,412 | | | $ | 141,637,534 | |
| | | | | | | | | |
| Net Assets | | | | | | | | |
| Money Market Fund - Retail Class | | | | | | | | |
| Money Market Fund - Institutional Class | | | | | | | | |
| Total Net Assets | | | | | | | | |
| | | | | | | | | |
| Capital Stock Outstanding (unlimited number of shares authorized, $0.10 par value) | | | 42,372,390 | | | | 14,137,521 | |
| Money Market Fund - Retail Class | | | | | | | | |
| Money Market Fund - Institutional Class | | | | | | | | |
| Total Capital Stock Outstanding | | | | | | | | |
| | | | | | | | | |
| Net Asset Value, Offering and Redemption Price Per Share | | $ | 7.03 | | | $ | 10.02 | |
| Money Market Fund - Retail Class | | | | | | | | |
| Money Market Fund - Institutional Class | | | | | | | | |
| | | | | | | | | |
| (1) Investments and affiliated investments at cost | | $ | 281,041,179 | | | $ | 132,498,950 | |
| (2) Fair value of securities loaned included in investments at fair value (See Note #1 and Note #4) | | $ | 2,402,585 | | | $ | 803,640 | |
The accompanying notes are an integral part of these financial statements.
| Page 48 | 2014 Annual Report | December 31, 2014 |
| Aggressive Growth Fund | | | Balanced
Fund | | | Strategic
Growth Fund | | | Quantex
FundTM | | | Utilities and Infrastructure Fund | | | Total Return
Bond Fund | | | Money
Market Fund | |
| | | | | | | | | | | | | | | | | | | |
| $ | 83,568,695 | | | $ | 141,732,615 | | | $ | 114,060,847 | | | $ | 58,780,827 | | | $ | 44,880,388 | | | $ | 137,620,643 | | | $ | 172,637,512 | |
| | — | | | | — | | | | — | | | | — | | | | — | | | | — | | | | 30,000,000 | |
| | 3,031,754 | | | | 34,211,013 | | | | 3,575,894 | | | | 4,609,306 | | | | 1,919,031 | | | | 6,508,078 | | | | — | |
| | 84,374 | | | | 113,602 | | | | 98,635 | | | | 89,401 | | | | 87,122 | | | | 37,952 | | | | 76,417 | |
| | — | | | | 795,990 | | | | — | | | | — | | | | — | | | | — | | | | — | |
| | 124,677 | | | | 271,670 | | | | 47,418 | | | | 76,965 | | | | 46,867 | | | | 230,309 | | | | — | |
| | — | | | | — | | | | — | | | | — | | | | — | | | | — | | | | 21,066 | |
| | 74,033 | | | | 96,229 | | | | 145,715 | | | | 64,131 | | | | 107,887 | | | | 30,487 | | | | 37,726 | |
| | 3,258 | | | | 1,718 | | | | 532 | | | | 4,317 | | | | 282 | | | | — | | | | — | |
| | 26,967 | | | | 30,761 | | | | 25,334 | | | | — | | | | — | | | | 3,626 | | | | — | |
| | 13,508 | | | | 25,439 | | | | 20,156 | | | | 12,201 | | | | 12,468 | | | | 24,862 | | | | 18,660 | |
| | 86,927,266 | | | | 177,279,037 | | | | 117,974,531 | | | | 63,637,148 | | | | 47,054,045 | | | | 144,455,957 | | | | 202,791,381 | |
| | | | | | | | | | | | | | | | | | | | | | | | | | | |
| | | | | | | | | | | | | | | | | | | | | | | | | | | |
| | 1,699,135 | | | | 1,034,856 | | | | 7,805,936 | | | | 1,394,775 | | | | 3 | | | | — | | | | — | |
| | 84,374 | | | | 113,602 | | | | 98,635 | | | | 89,401 | | | | 87,122 | | | | 37,952 | | | | 76,417 | |
| | 48,600 | | | | 332,065 | | | | 51,010 | | | | 74,800 | | | | — | | | | — | | | | — | |
| | 145,401 | | | | 62,861 | | | | 26,388 | | | | 182,483 | | | | 124,668 | | | | 1,219,435 | | | | — | |
| | — | | | | 209 | | | | 17 | | | | 658 | | | | 18,150 | | | | 237 | | | | | |
| | | | | | | | | | | | | | | | | | | | | | | | | | 136 | |
| | | | | | | | | | | | | | | | | | | | | | | | | | 10,470 | |
| | 5,352 | | | | 25,337 | | | | 21,854 | | | | 3,899 | | | | 26,449 | | | | 10,162 | | | | — | |
| | 70,951 | | | | 144,365 | | | | 98,275 | | | | 32,060 | | | | 26,050 | | | | 113,669 | | | | 4,447 | |
| | 2,460 | | | | 4,070 | | | | 2,925 | | | | 2,177 | | | | 1,818 | | | | 2,738 | | | | 9,710 | |
| | 1,367 | | | | 2,576 | | | | 1,693 | | | | 1,043 | | | | 831 | | | | 2,307 | | | | 675 | |
| | 22,467 | | | | 25,395 | | | | 23,212 | | | | 22,112 | | | | 23,453 | | | | 23,937 | | | | 23,584 | |
| | 2,080,107 | | | | 1,745,336 | | | | 8,129,945 | | | | 1,803,408 | | | | 308,544 | | | | 1,410,437 | | | | 125,439 | |
| | | | | | | | | | | | | | | | | | | | | | | | | | | |
| $ | 84,847,159 | | | $ | 175,533,701 | | | $ | 109,844,586 | | | $ | 61,833,740 | | | $ | 46,745,501 | | | $ | 143,045,520 | | | $ | 202,665,942 | |
| | | | | | | | | | | | | | | | | | | | | | | | | | | |
| | | | | | | | | | | | | | | | | | | | | | | | | | | |
| $ | 77,766,748 | | | $ | 167,681,601 | | | $ | 105,051,021 | | | $ | 49,989,643 | | | $ | 36,809,963 | | | $ | 147,753,128 | | | $ | 202,665,941 | |
| | — | | | | — | | | | — | | | | — | | | | (461,136 | ) | | | 1 | | | | 1 | |
| | 799,484 | | | | 1,024,097 | | | | 1,814,778 | | | | 475,089 | | | | 1,096,520 | | | | (1,872,719 | ) | | | — | |
| | 6,280,927 | | | | 6,828,003 | | | | 2,978,787 | | | | 11,369,008 | | | | 9,300,154 | | | | (2,834,890 | ) | | | — | |
| $ | 84,847,159 | | | $ | 175,533,701 | | | $ | 109,844,586 | | | $ | 61,833,740 | | | $ | 46,745,501 | | | $ | 143,045,520 | | | $ | 202,665,942 | |
| | | | | | | | | | | | | | | | | | | | | | | | | | | |
| | | | | | | | | | | | | | | | | | | | | | | | | | | |
| | | | | | | | | | | | | | | | | | | | | | | | | $ | 54,926,565 | |
| | | | | | | | | | | | | | | | | | | | | | | | | | 147,739,377 | |
| | | | | | | | | | | | | | | | | | | | | | | | | $ | 202,665,942 | |
| | | | | | | | | | | | | | | | | | | | | | | | | | | |
| | 8,102,713 | | | | 15,983,256 | | | | 10,582,304 | | | | 1,756,750 | | | | 1,535,275 | | | | 14,861,341 | | | | | |
| | | | | | | | | | | | | | | | | | | | | | | | | | 54,926,565 | |
| | | | | | | | | | | | | | | | | | | | | | | | | | 147,739,377 | |
| | | | | | | | | | | | | | | | | | | | | | | | | | 202,665,942 | |
| | | | | | | | | | | | | | | | | | | | | | | | | | | |
| $ | 10.47 | | | $ | 10.98 | | | $ | 10.38 | | | $ | 35.20 | | | $ | 30.45 | | | $ | 9.63 | | | | | |
| | | | | | | | | | | | | | | | | | | | | | | | | $ | 1.00 | |
| | | | | | | | | | | | | | | | | | | | | | | | | $ | 1.00 | |
| | | | | | | | | | | | | | | | | | | | | | | | | | | |
| $ | 80,372,812 | | | $ | 169,460,631 | | | $ | 114,723,208 | | | $ | 52,142,415 | | | $ | 37,499,265 | | | $ | 146,963,611 | | | $ | 202,637,512 | |
| $ | 1,641,179 | | | $ | 1,006,454 | | | $ | 7,609,452 | | | $ | 1,357,454 | | | $ | — | | | $ | — | | | $ | — | |
The accompanying notes are an integral part of these financial statements.
2014 Annual Report | December 31, 2014 | Page 49 |
Statements of Operations
For the Year Ended December 31, 2014
| | | Muirfield
Fund® | | | Dynamic
Growth Fund | |
| Investment Income | | | | | | |
| Interest | | $ | 2,925 | | | $ | 2,566 | |
| Interest from affiliates | | | 27,241 | | | | 5,971 | |
| Dividends | | | 2,916,406 | | | | 1,907,332 | |
| Total Investment Income | | | 2,946,572 | | | | 1,915,869 | |
| | | | | | | | | |
| Fund Expenses | | | | | | | | |
| Investment advisor | | | 1,507,287 | | | | 886,537 | |
| Transfer agent | | | 246,457 | | | | 141,846 | |
| Transfer agent - Money Market Fund - Retail Class | | | | | | | | |
| Transfer agent - Money Market Fund - Institutional Class | | | | | | | | |
| Fund accounting | | | 57,538 | | | | 48,820 | |
| Administrative | | | 174,305 | | | | 104,564 | |
| Trustee | | | 15,659 | | | | 8,933 | |
| Audit | | | 13,181 | | | | 13,181 | |
| Legal | | | 5,612 | | | | 5,612 | |
| Custody | | | 26,606 | | | | 19,520 | |
| Printing | | | 12,831 | | | | 7,105 | |
| Distribution plan (12b-1) | | | 410,762 | | | | 295,512 | |
| Distribution plan (12b-1) - Money Market Fund - Retail Class | | | | | | | | |
| Distribution plan (12b-1) - Money Market Fund - Institutional Class | | | | | | | | |
| Administrative service plan | | | 404,454 | | | | 224,590 | |
| Postage | | | 5,968 | | | | 4,703 | |
| Registration and filing | | | 35,686 | | | | 29,022 | |
| Insurance | | | 9,716 | | | | 5,531 | |
| Chief Compliance Officer | | | 5,555 | | | | 5,555 | |
| Other | | | 16,165 | | | | 14,654 | |
| Total Expenses Before Reductions | | | 2,947,782 | | | | 1,815,685 | |
| | | | | | | | | |
| Expenses voluntarily reimbursed/waived by investment advisor (See Note #4) | | | — | | | | (109,681 | ) |
| Expenses contractually reimbursed/waived by investment advisor (See Note #4) | | | — | | | | — | |
| Commissions recaptured and fees received from custodian (See Note #4) | | | (446,169 | ) | | | (261,346 | ) |
| Securities lending credit (See Note #4) | | | (4,790 | ) | | | (113 | ) |
| Transfer agent expenses contractually waived (See Note #4) | | | — | | | | — | |
| | | | | | | | | |
| Net Expenses | | | 2,496,823 | | | | 1,444,545 | |
| | | | | | | | | |
| Net Investment Income (Loss) | | | 449,749 | | | | 471,324 | |
| | | | | | | | | |
| Net Realized and Unrealized Gain (Loss) from Investments | | | | | | | | |
| Net realized gains (losses) from investments | | | 24,878,483 | | | | 16,382,297 | |
| Net realized gains (losses) from futures contracts | | | 1,821,935 | | | | 860,423 | |
| Distributions of long-term realized gains by other investment companies | | | — | | | | — | |
Net Realized Gains (Losses) from Investment Transactions, Futures Contracts, and
Distributions of Long-term Realized Gains by Other Investment Companies | | | 26,700,418 | | | | 17,242,720 | |
| | | | | | | | | |
| Net change in unrealized appreciation (depreciation) of investments and futures contracts | | | (3,212,623 | ) | | | (3,058,617 | ) |
| | | | | | | | | |
| Net Realized and Unrealized Gain (Loss) from Investments | | | 23,487,795 | | | | 14,184,103 | |
| | | | | | | | | |
| Net Change in Net Assets Resulting from Operations | | $ | 23,937,544 | | | $ | 14,655,427 | |
The accompanying notes are an integral part of these financial statements.
| Page 50 | 2014 Annual Report | December 31, 2014 |
Aggressive
Growth Fund | | | Balanced
Fund | | | Strategic
Growth Fund | | | Quantex
FundTM | | | Utilities and Infrastructure Fund | | | Total Return
Bond Fund | | | Money
Market Fund | |
| | | | | | | | | | | | | | | | | | | |
| $ | 2,576 | | | $ | 2,680 | | | $ | 3,508 | | | $ | 2,590 | | | $ | 44 | | | $ | 4,366 | | | $ | 280,463 | |
| | 3,418 | | | | 13,044 | | | | 4,546 | | | | 3,235 | | | | 970 | | | | 7,404 | | | | — | |
| | 962,870 | | | | 2,982,528 | | | | 1,762,642 | | | | 934,393 | | | | 1,058,283 | | | | 4,975,253 | | | | — | |
| | 968,864 | | | | 2,998,252 | | | | 1,770,696 | | | | 940,218 | | | | 1,059,297 | | | | 4,987,023 | | | | 280,463 | |
| | | | | | | | | | | | | | | | | | | | | | | | | | | |
| | | | | | | | | | | | | | | | | | | | | | | | | | | |
| | 545,512 | | | | 989,595 | | | | 748,108 | | | | 522,017 | | | | 421,607 | | | | 425,428 | | | | 477,664 | |
| | 87,282 | | | | 158,335 | | | | 119,697 | | | | 62,641 | | | | 50,593 | | | | 91,153 | | | | | |
| | | | | | | | | | | | | | | | | | | | | | | | | | 49,620 | |
| | | | | | | | | | | | | | | | | | | | | | | | | | 56,384 | |
| | 43,500 | | | | 50,195 | | | | 46,975 | | | | 39,440 | | | | 37,432 | | | | 48,394 | | | | 50,115 | |
| | 68,188 | | | | 115,557 | | | | 89,798 | | | | 51,513 | | | | 42,161 | | | | 101,151 | | | | 114,917 | |
| | 5,566 | | | | 10,078 | | | | 7,229 | | | | 4,233 | | | | 3,406 | | | | 8,600 | | | | 1,814 | |
| | 13,181 | | | | 13,181 | | | | 13,181 | | | | 13,181 | | | | 13,181 | | | | 13,181 | | | | 13,181 | |
| | 5,612 | | | | 5,612 | | | | 5,612 | | | | 5,612 | | | | 5,612 | | | | 5,612 | | | | 5,720 | |
| | 14,472 | | | | 21,867 | | | | 14,966 | | | | 11,070 | | | | 6,433 | | | | 14,936 | | | | 9,836 | |
| | 4,231 | | | | 8,188 | | | | 5,649 | | | | 3,030 | | | | 2,807 | | | | 7,034 | | | | 8,936 | |
| | 180,865 | | | | 329,865 | | | | 204,812 | | | | 104,401 | | | | 101,321 | | | | 284,847 | | | | | |
| | | | | | | | | | | | | | | | | | | �� | | | | | | | 7,975 | |
| | | | | | | | | | | | | | | | | | | | | | | | | | 4 | |
| | 145,470 | | | | 263,892 | | | | 199,495 | | | | 62,641 | | | | 56,009 | | | | 227,877 | | | | — | |
| | 2,322 | | | | 3,477 | | | | 2,315 | | | | 4,167 | | | | 6,542 | | | | 3,149 | | | | 2,012 | |
| | 26,790 | | | | 28,393 | | | | 24,787 | | | | 23,140 | | | | 26,554 | | | | 26,625 | | | | 29,741 | |
| | 3,893 | | | | 6,481 | | | | 5,461 | | | | 2,564 | | | | 2,175 | | | | 5,660 | | | | 5,843 | |
| | 5,555 | | | | 5,555 | | | | 5,555 | | | | 5,555 | | | | 5,555 | | | | 5,555 | | | | 5,555 | |
| | 12,386 | | | | 16,120 | | | | 14,510 | | | | 11,962 | | | | 14,151 | | | | 16,783 | | | | 25,051 | |
| | 1,164,825 | | | | 2,026,391 | | | | 1,508,150 | | | | 927,167 | | | | 795,539 | | | | 1,285,985 | | | | 864,368 | |
| | | | | | | | | | | | | | | | | | | | | | | | | | | |
| | — | | | | (54,965 | ) | | | (140,509 | ) | | | — | | | | (1,533 | ) | | | (100,999 | ) | | | (671,042 | ) |
| | — | | | | — | | | | — | | | | (130,512 | ) | | | — | | | | — | | | | — | |
| | (192,145 | ) | | | (214,924 | ) | | | (137,833 | ) | | | (38,140 | ) | | | — | | | | (34,178 | ) | | | — | |
| | (3,572 | ) | | | (2,056 | ) | | | (1,032 | ) | | | (7,481 | ) | | | (924 | ) | | | — | | | | — | |
| | — | | | | — | | | | — | | | | — | | | | — | | | | (22,790 | ) | | | (25,580 | ) |
| | | | | | | | | | | | | | | | | | | | | | | | | | | |
| | 969,108 | | | | 1,754,446 | | | | 1,228,776 | | | | 751,034 | | | | 793,082 | | | | 1,128,018 | | | | 167,746 | |
| | | | | | | | | | | | | | | | | | | | | | | | | | | |
| | (244 | ) | | | 1,243,806 | | | | 541,920 | | | | 189,184 | | | | 266,215 | | | | 3,859,005 | | | | 112,717 | |
| | | | | | | | | | | | | | | | | | | | | | | | | | | |
| | | | | | | | | | | | | | | | | | | | | | | | | | | |
| | 11,841,871 | | | | 11,070,780 | | | | 13,556,111 | | | | 4,458,921 | | | | 5,021,590 | | | | (796,921 | ) | | | | |
| | 546,201 | | | | 1,043,661 | | | | 208,225 | | | | 98,539 | | | | — | | | | 100,661 | | | | | |
| | — | | | | 82,578 | | | | 645,988 | | | | — | | | | — | | | | 415,878 | | | | | |
| | 12,388,072 | | | | 12,197,019 | | | | 14,410,324 | | | | 4,557,460 | | | | 5,021,590 | | | | (280,382 | ) | | | | |
| | | | | | | | | | | | | | | | | | | | | | | | | | | |
| | (2,942,543 | ) | | | (2,328,516 | ) | | | (9,770,618 | ) | | | (20,515 | ) | | | (1,660,068 | ) | | | (2,250,102 | ) | | | | |
| | | | | | | | | | | | | | | | | | | | | | | | | | | |
| | 9,445,529 | | | | 9,868,503 | | | | 4,639,706 | | | | 4,536,945 | | | | 3,361,522 | | | | (2,530,484 | ) | | | | |
| | | | | | | | | | | | | | | | | | | | | | | | | | | |
| $ | 9,445,285 | | | $ | 11,112,309 | | | $ | 5,181,626 | | | $ | 4,726,129 | | | $ | 3,627,737 | | | $ | 1,328,521 | | | $ | 112,717 | |
The accompanying notes are an integral part of these financial statements.
2014 Annual Report | December 31, 2014 | Page 51 |
Statements of Changes in Net Assets
For the Years Ended December 31,
| | | Muirfield Fund® | | | Dynamic Growth Fund | |
| | | 2014 | | | 2013 | | | 2014 | | | 2013 | |
| Operations | | | | | | | | | | | | |
| Net investment income (loss) | | $ | 449,749 | | | $ | 187,405 | | | $ | 471,324 | | | $ | 177,379 | |
| Net realized gain (loss) from investment transactions, futures contracts, and distributions of long-term realized gains by other investment companies | | | 26,700,418 | | | | 17,519,403 | | | | 17,242,720 | | | | 14,845,431 | |
| Net change in unrealized appreciation (depreciation) of investments and futures contracts | | | (3,212,623 | ) | | | 18,388,739 | | | | (3,058,617 | ) | | | 10,113,052 | |
| Net change in net assets resulting from operations | | | 23,937,544 | | | | 36,095,547 | | | | 14,655,427 | | | | 25,135,862 | |
| | | | | | | | | | | | | | | | | |
| Distributions to Shareholders | | | | | | | | | | | | | | | | |
| From net investment income | | | (5,879,491 | ) | | | (187,406 | ) | | | (3,511,885 | ) | | | (177,380 | ) |
| From net realized gain from investment transactions | | | (20,294,983 | ) | | | (12,869,167 | ) | | | (16,292,978 | ) | | | (10,506,262 | ) |
| Net change in net assets resulting from distributions | | | (26,174,474 | ) | | | (13,056,573 | ) | | | (19,804,863 | ) | | | (10,683,642 | ) |
| | | | | | | | | | | | | | | | | |
| Capital Transactions | | | | | | | | | | | | | | | | |
| Issued | | | 154,701,216 | | | | 46,249,025 | | | | 48,965,894 | | | | 27,172,772 | |
| Reinvested | | | 25,116,304 | | | | 13,050,523 | | | | 19,800,900 | | | | 10,669,300 | |
| Redeemed | | | (41,542,639 | ) | | | (34,686,165 | ) | | | (24,905,524 | ) | | | (41,345,834 | ) |
| Net change in net assets resulting from capital transactions | | | 138,274,881 | | | | 24,613,383 | | | | 43,861,270 | | | | (3,503,762 | ) |
| | | | | | | | | | | | | | | | | |
| Total Change in Net Assets | | | 136,037,951 | | | | 47,652,357 | | | | 38,711,834 | | | | 10,948,458 | |
| | | | | | | | | | | | | | | | | |
| Net Assets - Beginning of Year | | | 161,823,461 | | | | 114,171,104 | | | | 102,925,700 | | | | 91,977,242 | |
| | | | | | | | | | | | | | | | | |
| Net Assets - End of Year | | $ | 297,861,412 | | | $ | 161,823,461 | | | $ | 141,637,534 | | | $ | 102,925,700 | |
| | | | | | | | | | | | | | | | | |
Accumulated undistributed (distributions in excess of)
net investment income | | $ | — | | | $ | — | | | $ | — | | | $ | — | |
| | | | | | | | | | | | | | | | | |
| Share Transactions | | | | | | | | | | | | | | | | |
| Issued | | | 21,304,503 | | | | 6,896,759 | | | | 4,565,469 | | | | 2,662,777 | |
| Reinvested | | | 3,590,370 | | | | 1,910,291 | | | | 1,973,154 | | | | 1,048,793 | |
| Redeemed | | | (5,799,923 | ) | | | (5,170,272 | ) | | | (2,345,575 | ) | | | (4,218,417 | ) |
| Net change in shares | | | 19,094,950 | | | | 3,636,778 | | | | 4,193,048 | | | | (506,847 | ) |
The accompanying notes are an integral part of these financial statements.
| Page 52 | 2014 Annual Report | December 31, 2014 |
| Aggressive Growth Fund | | | Balanced Fund | | | Strategic Growth Fund | |
| 2014 | | | 2013 | | | 2014 | | | 2013 | | | 2014 | | | 2013 | |
| | | | | | | | | | | | | | | | |
| $ | (244 | ) | | $ | (15,583 | ) | | $ | 1,243,806 | | | $ | 823,955 | | | $ | 541,920 | | | $ | 311,097 | |
| | 12,388,072 | | | | 5,974,266 | | | | 12,197,019 | | | | 9,945,347 | | | | 14,410,324 | | | | 9,136,193 | |
| | (2,942,543 | ) | | | 8,303,612 | | | | (2,328,516 | ) | | | 6,772,174 | | | | (9,770,618 | ) | | | 8,884,158 | |
| | 9,445,285 | | | | 14,262,295 | | | | 11,112,309 | | | | 17,541,476 | | | | 5,181,626 | | | | 18,331,448 | |
| | | | | | | | | | | | | | | | | | | | | | | |
| | | | | | | | | | | | | | | | | | | | | | | |
| | (517,807 | ) | | | — | | | | (3,484,493 | ) | | | (823,955 | ) | | | (1,542,587 | ) | | | (417,500 | ) |
| | (12,317,940 | ) | | | (548,517 | ) | | | (11,307,384 | ) | | | (7,392,978 | ) | | | (12,921,526 | ) | | | (7,621,949 | ) |
| | (12,835,747 | ) | | | (548,517 | ) | | | (14,791,877 | ) | | | (8,216,933 | ) | | | (14,464,113 | ) | | | (8,039,449 | ) |
| | | | | | | | | | | | | | | | | | | | | | | |
| | | | | | | | | | | | | | | | | | | | | | | |
| | 26,130,227 | | | | 25,520,032 | | | | 81,723,404 | | | | 39,570,813 | | | | 31,635,498 | | | | 23,069,477 | |
| | 12,834,936 | | | | 548,469 | | | | 14,790,348 | | | | 8,215,987 | | | | 14,463,880 | | | | 8,039,299 | |
| | (15,335,710 | ) | | | (14,113,081 | ) | | | (22,942,016 | ) | | | (38,097,606 | ) | | | (18,741,638 | ) | | | (29,077,214 | ) |
| | 23,629,453 | | | | 11,955,420 | | | | 73,571,736 | | | | 9,689,194 | | | | 27,357,740 | | | | 2,031,562 | |
| | | | | | | | | | | | | | | | | | | | | | | |
| | 20,238,991 | | | | 25,669,198 | | | | 69,892,168 | | | | 19,013,737 | | | | 18,075,253 | | | | 12,323,561 | |
| | | | | | | | | | | | | | | | | | | | | | | |
| | 64,608,168 | | | | 38,938,970 | | | | 105,641,533 | | | | 86,627,796 | | | | 91,769,333 | | | | 79,445,772 | |
| | | | | | | | | | | | | | | | | | | | | | | |
| $ | 84,847,159 | | | $ | 64,608,168 | | | $ | 175,533,701 | | | $ | 105,641,533 | | | $ | 109,844,586 | | | $ | 91,769,333 | |
| | | | | | | | | | | | | | | | | | | | | | | |
| $ | — | | | $ | — | | | $ | — | | | $ | 2 | | | $ | — | | | $ | — | |
| | | | | | | | | | | | | | | | | | | | | | | |
| | | | | | | | | | | | | | | | | | | | | | | |
| | 2,298,608 | | | | 2,695,239 | | | | 7,126,019 | | | | 3,609,663 | | | | 2,710,992 | | | | 2,063,813 | |
| | 1,243,931 | | | | 51,307 | | | | 1,343,900 | | | | 747,060 | | | | 1,395,753 | | | | 716,662 | |
| | (1,360,339 | ) | | | (1,440,213 | ) | | | (2,006,171 | ) | | | (3,447,305 | ) | | | (1,601,446 | ) | | | (2,591,032 | ) |
| | 2,182,200 | | | | 1,306,333 | | | | 6,463,748 | | | | 909,418 | | | | 2,505,299 | | | | 189,443 | |
The accompanying notes are an integral part of these financial statements.
2014 Annual Report | December 31, 2014 | Page 53 |
Statements of Changes in Net Assets
For the Years Ended December 31,
| | | Quantex FundTM | |
| | | 2014 | | | 2013 | |
| Operations | | | | | | |
| Net investment income (loss) | | $ | 189,184 | | | $ | 94,807 | |
Net realized gain (loss) from investment transactions, futures contracts, and
distributions of long-term realized gains by other investment companies | | | 4,557,460 | | | | 2,286,066 | |
| Net change in unrealized appreciation (depreciation) of investments and futures contracts | | | (20,515 | ) | | | 9,310,650 | |
| Net change in net assets resulting from operations | | | 4,726,129 | | | | 11,691,523 | |
| | | | | | | | | |
| Distributions to Shareholders | | | | | | | | |
| From net investment income | | | (623,095 | ) | | | (101,837 | ) |
| From net realized gain from investment transactions | | | (4,310,572 | ) | | | (1,068,448 | ) |
| Net change in net assets resulting from distributions | | | (4,933,667 | ) | | | (1,170,285 | ) |
| | | | | | | | | |
| Distributions to Shareholders - Money Market Fund | | | | | | | | |
| From net investment income (Retail Class) | | | | | | | | |
| From net investment income (Institutional Class) | | | | | | | | |
| Net change in net assets resulting from distributions | | | | | | | | |
| | | | | | | | | |
| Capital Transactions | | | | | | | | |
| Issued | | | 21,424,612 | | | | 18,025,679 | |
| Reinvested | | | 4,922,968 | | | | 1,168,437 | |
| Redeemed | | | (8,782,104 | ) | | | (8,545,053 | ) |
| Net change in net assets resulting from capital transactions | | | 17,565,476 | | | | 10,649,063 | |
| | | | | | | | | |
| Total Change in Net Assets | | | 17,357,938 | | | | 21,170,301 | |
| | | | | | | | | |
| Net Assets - Beginning of Year | | | 44,475,802 | | | | 23,305,501 | |
| | | | | | | | | |
| Net Assets - End of Year | | $ | 61,833,740 | | | $ | 44,475,802 | |
| | | | | | | | | |
| Accumulated undistributed (distributions in excess of) net investment income | | $ | — | | | $ | — | |
| | | | | | | | | |
| Share Transactions | | | | | | | | |
| Issued | | | 587,005 | | | | 592,171 | |
| Reinvested | | | 142,308 | | | | 34,253 | |
| Redeemed | | | (241,814 | ) | | | (272,430 | ) |
| Net change in shares | | | 487,499 | | | | 353,994 | |
The accompanying notes are an integral part of these financial statements.
| Page 54 | 2014 Annual Report | December 31, 2014 |
| Utilities and Infrastructure Fund | | | Total Return Bond Fund | | | Money Market Fund | |
| 2014 | | | 2013 | | | 2014 | | | 2013 | | | 2014 | | | 2013 | |
| | | | | | | | | | | | | | | | |
| $ | 266,215 | | | $ | 214,636 | | | $ | 3,859,005 | | | $ | 3,309,311 | | | $ | 112,717 | | | $ | 118,086 | |
| | 5,021,590 | | | | 1,697,926 | | | | (280,382 | ) | | | (767,526 | ) | | | — | | | | — | |
| | (1,660,068 | ) | | | 6,719,645 | | | | (2,250,102 | ) | | | (2,548,860 | ) | | | — | | | | — | |
| | 3,627,737 | | | | 8,632,207 | | | | 1,328,521 | | | | (7,075 | ) | | | 112,717 | | | | 118,086 | |
| | | | | | | | | | | | | | | | | | | | | | | |
| | | | | | | | | | | | | | | | | | | | | | | |
| | (1,184,559 | ) | | | (214,640 | ) | | | (3,859,006 | ) | | | (3,309,309 | ) | | | | | | | | |
| | (3,457,377 | ) | | | — | | | | — | | | | — | | | | | | | | | |
| | (4,641,936 | ) | | | (214,640 | ) | | | (3,859,006 | ) | | | (3,309,309 | ) | | | | | | | | |
| | | | | | | | | | | | | | | | | | | | | | | |
| | | | | | | | | | | | | | | | | | | | | | | |
| | | | | | | | | | | | | | | | | | (35,192 | ) | | | (50,875 | ) |
| | | | | | | | | | | | | | | | | | (77,524 | ) | | | (67,211 | ) |
| | | | | | | | | | | | | | | | | | (112,716 | ) | | | (118,086 | ) |
| | | | | | | | | | | | | | | | | | | | | | | |
| | | | | | | | | | | | | | | | | | | | | | | |
| | 17,093,759 | | | | 8,258,219 | | | | 70,794,768 | | | | 45,778,615 | | | | 575,762,988 | | | | 435,368,654 | |
| | 4,530,578 | | | | 209,958 | | | | 3,858,320 | | | | 3,308,450 | | | | 40,062 | | | | 59,786 | |
| | (11,852,646 | ) | | | (9,349,262 | ) | | | (19,157,160 | ) | | | (31,691,541 | ) | | | (477,909,279 | ) | | | (489,155,684 | ) |
| | 9,771,691 | | | | (881,085 | ) | | | 55,495,928 | | | | 17,395,524 | | | | 97,893,771 | | | | (53,727,244 | ) |
| | | | | | | | | | | | | | | | | | | | | | | |
| | 8,757,492 | | | | 7,536,482 | | | | 52,965,443 | | | | 14,079,140 | | | | 97,893,772 | | | | (53,727,244 | ) |
| | | | | | | | | | | | | | | | | | | | | | | |
| | 37,988,009 | | | | 30,451,527 | | | | 90,080,077 | | | | 76,000,937 | | | | 104,772,170 | | | | 158,499,414 | |
| | | | | | | | | | | | | | | | | | | | | | | |
| $ | 46,745,501 | | | $ | 37,988,009 | | | $ | 143,045,520 | | | $ | 90,080,077 | | | $ | 202,665,942 | | | $ | 104,772,170 | |
| | | | | | | | | | | | | | | | | | | | | | | |
| $ | (461,136 | ) | | $ | (236,623 | ) | | $ | 1 | | | $ | 2 | | | $ | 1 | | | $ | — | |
| | | | | | | | | | | | | | | | | | | | | | | |
| | | | | | | | | | | | | | | | | | | | | | | |
| | 517,223 | | | | 292,474 | | | | 7,194,856 | | | | 4,600,576 | | | | 575,762,988 | | | | 435,368,654 | |
| | 149,254 | | | | 7,317 | | | | 393,552 | | | | 335,050 | | | | 40,062 | | | | 59,786 | |
| | (357,474 | ) | | | (333,224 | ) | | | (1,948,521 | ) | | | (3,203,649 | ) | | | (477,909,279 | ) | | | (489,155,684 | ) |
| | 309,003 | | | | (33,433 | ) | | | 5,639,887 | | | | 1,731,977 | | | | 97,893,771 | | | | (53,727,244 | ) |
The accompanying notes are an integral part of these financial statements.
2014 Annual Report | December 31, 2014 | Page 55 |
Financial Highlights
For a Share Outstanding Through Each Fiscal Year Ended December 31,
| | | | | | Income from Investment Operations | | | Less Distributions | |
| | | Net Asset Value, Beginning of Period | | | Net Investment Income (Loss) (3) | | | Net gains (losses) on securities, futures, and options (both realized and unrealized) | | | Total from Investment Operations | | | From Net Investment Income | | | From Net Capital Gains | | | From Tax Return of Capital | | | Total
Distributions | |
Muirfield Fund® (1)(2) | |
| 2014 | | $ | 6.95 | | | | 0.01 | | | | 0.81 | | | | 0.82 | | | | (0.18 | ) | | | (0.56 | ) | | | 0.00 | | | | (0.74 | ) |
| 2013 | | $ | 5.81 | | | | 0.01 | | | | 1.75 | | | | 1.76 | | | | (0.01 | ) | | | (0.61 | ) | | | 0.00 | | | | (0.62 | ) |
| 2012 | | $ | 5.17 | | | | (0.01 | ) | | | 0.65 | | | | 0.64 | | | | 0.00 | | | | 0.00 | | | | 0.00 | | | | 0.00 | |
| 2011 | | $ | 5.60 | | | | (0.01 | ) | | | (0.41 | ) | | | (0.42 | ) | | | (0.01 | ) | | | 0.00 | | | | 0.00 | | | | (0.01 | ) |
| 2010 | | $ | 4.99 | | | | 0.02 | | | | 0.61 | | | | 0.63 | | | | (0.02 | ) | | | 0.00 | | | | 0.00 | | | | (0.02 | ) |
| Dynamic Growth Fund (1)(2) | |
| 2014 | | $ | 10.35 | | | | 0.04 | | | | 1.25 | | | | 1.29 | | | | (0.30 | ) | | | (1.32 | ) | | | 0.00 | | | | (1.62 | ) |
| 2013 | | $ | 8.80 | | | | 0.02 | | | | 2.74 | | | | 2.76 | | | | (0.02 | ) | | | (1.19 | ) | | | 0.00 | | | | (1.21 | ) |
| 2012 | | $ | 7.68 | | | | 0.00 | | | | 1.12 | | | | 1.12 | | | | 0.00 | | | | 0.00 | | | | 0.00 | | | | 0.00 | |
| 2011 | | $ | 8.14 | | | | (0.01 | ) | | | (0.45 | ) | | | (0.46 | ) | | | 0.00 | | | | 0.00 | | | | 0.00 | | | | 0.00 | |
| 2010 | | $ | 7.06 | | | | 0.02 | | | | 1.08 | | | | 1.10 | | | | (0.02 | ) | | | 0.00 | | | | 0.00 | | | | (0.02 | ) |
| Aggressive Growth Fund (1)(2) | |
| 2014 | | $ | 10.91 | | | | (0.00 | )* | | | 1.43 | | | | 1.43 | | | | (0.08 | ) | | | (1.79 | ) | | | 0.00 | | | | (1.87 | ) |
| 2013 | | $ | 8.44 | | | | (0.00 | )* | | | 2.56 | | | | 2.56 | | | | 0.00 | | | | (0.09 | ) | | | 0.00 | | | | (0.09 | ) |
| 2012 | | $ | 7.40 | | | | (0.03 | ) | | | 1.07 | | | | 1.04 | | | | 0.00 | | | | 0.00 | | | | 0.00 | | | | 0.00 | |
| 2011 | | $ | 7.97 | | | | (0.07 | ) | | | (0.50 | ) | | | (0.57 | ) | | | 0.00 | | | | 0.00 | | | | 0.00 | | | | 0.00 | |
| 2010 | | $ | 6.89 | | | | (0.01 | ) | | | 1.09 | | | | 1.08 | | | | 0.00 | | | | 0.00 | | | | 0.00 | | | | 0.00 | |
| Balanced Fund (1)(2) | |
| 2014 | | $ | 11.10 | | | | 0.10 | | | | 0.84 | | | | 0.94 | | | | (0.27 | ) | | | (0.79 | ) | | | 0.00 | | | | (1.06 | ) |
| 2013 | | $ | 10.06 | | | | 0.09 | | | | 1.89 | | | | 1.98 | | | | (0.09 | ) | | | (0.85 | ) | | | 0.00 | | | | (0.94 | ) |
| 2012 | | $ | 9.18 | | | | 0.07 | | | | 0.89 | | | | 0.96 | | | | (0.08 | ) | | | 0.00 | | | | 0.00 | | | | (0.08 | ) |
| 2011 | | $ | 9.72 | | | | 0.13 | | | | (0.57 | ) | | | (0.44 | ) | | | (0.10 | ) | | | 0.00 | | | | 0.00 | | | | (0.10 | ) |
| 2010 | | $ | 8.98 | | | | 0.14 | | | | 0.74 | | | | 0.88 | | | | (0.14 | ) | | | 0.00 | | | | 0.00 | | | | (0.14 | ) |
| Strategic Growth Fund (1)(2) | |
| 2014 | | $ | 11.36 | | | | 0.06 | | | | 0.58 | | | | 0.64 | | | | (0.16 | ) | | | (1.46 | ) | | | 0.00 | | | | (1.62 | ) |
| 2013 | | $ | 10.07 | | | | 0.04 | | | | 2.34 | | | | 2.38 | | | | (0.05 | ) | | | (1.04 | ) | | | 0.00 | | | | (1.09 | ) |
| 2012 | | $ | 8.90 | | | | 0.00 | | | | 1.17 | | | | 1.17 | | | | 0.00 | | | | 0.00 | | | | 0.00 | | | | 0.00 | |
| 2011 | | $ | 9.71 | | | | (0.04 | ) | | | (0.77 | ) | | | (0.81 | ) | | | 0.00 | | | | 0.00 | | | | 0.00 | | | | 0.00 | |
| 2010 | | $ | 8.12 | | | | 0.04 | | | | 1.58 | | | | 1.62 | | | | (0.03 | ) | | | 0.00 | | | | 0.00 | | | | (0.03 | ) |
| 1 | Ratio of net expenses to average net assets, ratio of net investment income (loss) to average net assets, ratio of expenses to average net assets after reductions, excluding commissions recaptured and fees received from custodian, and ratio of expenses to average net assets before reductions do not include impact of expenses of the underlying security holdings as represented in the schedule of investments. |
| 2 | Recognition of net investment income by the Fund is affected by the timing of the declaration of dividends by the underlying investment companies in which the Fund invests. |
| 3 | Net investment income per share is based on average shares outstanding during the period. |
| * | Actual amounts were less than one-half of a cent per share. |
The accompanying notes are an integral part of these financial statements.
| Page 56 | 2014 Annual Report | December 31, 2014 |
| | | | | | | Ratios/Supplemental Data | |
| Net Asset Value, End of Period | | | Total Return (Assumes Reinvestment of Distributions) | | | Net Assets, End of Period ($000) | | | Ratio of Net Expenses to Average Net Assets | | | Ratio of Net Investment Income (Loss) to Average Net Assets | | | Ratio of Expenses to Average Net Assets after Reductions, Excluding Commissions Recaptured and Fees Received from Custodian | | | Ratio of Expenses to Average Net Assets Before Reductions | | | Portfolio Turnover Rate | |
| |
| $ | 7.03 | | | | 12.12 | % | | $ | 297,861 | | | | 1.22 | % | | | 0.22 | % | | | 1.44 | % | | | 1.44 | % | | | 238 | % |
| $ | 6.95 | | | | 30.46 | % | | $ | 161,823 | | | | 1.22 | % | | | 0.14 | % | | | 1.42 | % | | | 1.54 | % | | | 260 | % |
| $ | 5.81 | | | | 12.38 | % | | $ | 114,171 | | | | 1.39 | % | | | (0.12 | %) | | | 1.42 | % | | | 1.58 | % | | | 154 | % |
| $ | 5.17 | | | | (7.55 | %) | | $ | 119,787 | | | | 1.39 | % | | | (0.11 | %) | | | 1.46 | % | | | 1.58 | % | | | 189 | % |
| $ | 5.60 | | | | 12.65 | % | | $ | 122,266 | | | | 1.39 | % | | | 0.40 | % | | | 1.47 | % | | | 1.60 | % | | | 128 | % |
| |
| $ | 10.02 | | | | 12.80 | % | | $ | 141,638 | | | | 1.22 | % | | | 0.40 | % | | | 1.45 | % | | | 1.54 | % | | | 230 | % |
| $ | 10.35 | | | | 31.61 | % | | $ | 102,926 | | | | 1.22 | % | | | 0.20 | % | | | 1.39 | % | | | 1.58 | % | | | 276 | % |
| $ | 8.80 | | | | 14.58 | % | | $ | 91,977 | | | | 1.39 | % | | | (0.04 | %) | | | 1.42 | % | | | 1.57 | % | | | 154 | % |
| $ | 7.68 | | | | (5.65 | %) | | $ | 90,902 | | | | 1.39 | % | | | (0.08 | %) | | | 1.46 | % | | | 1.57 | % | | | 176 | % |
| $ | 8.14 | | | | 15.54 | % | | $ | 95,239 | | | | 1.39 | % | | | 0.23 | % | | | 1.47 | % | | | 1.59 | % | | | 119 | % |
| |
| $ | 10.47 | | | | 13.49 | % | | $ | 84,847 | | | | 1.33 | % | | | 0.00 | % | | | 1.59 | % | | | 1.60 | % | | | 239 | % |
| $ | 10.91 | | | | 30.40 | % | | $ | 64,608 | | | | 1.35 | % | | | (0.03 | %) | | | 1.57 | % | | | 1.65 | % | | | 272 | % |
| $ | 8.44 | | | | 14.05 | % | | $ | 38,939 | | | | 1.59 | % | | | (0.44 | %) | | | 1.62 | % | | | 1.74 | % | | | 167 | % |
| $ | 7.40 | | | | (7.15 | %) | | $ | 32,167 | | | | 1.59 | % | | | (0.73 | %) | | | 1.65 | % | | | 1.70 | % | | | 224 | % |
| $ | 7.97 | | | | 15.67 | % | | $ | 33,908 | | | | 1.59 | % | | | (0.07 | %) | | | 1.66 | % | | | 1.77 | % | | | 124 | % |
| |
| $ | 10.98 | | | | 8.61 | % | | $ | 175,534 | | | | 1.33 | % | | | 0.94 | % | | | 1.49 | % | | | 1.54 | % | | | 180 | % |
| $ | 11.10 | | | | 19.79 | % | | $ | 105,642 | | | | 1.33 | % | | | 0.85 | % | | | 1.47 | % | | | 1.57 | % | | | 217 | % |
| $ | 10.06 | | | | 10.42 | % | | $ | 86,628 | | | | 1.49 | % | | | 0.76 | % | | | 1.51 | % | | | 1.58 | % | | | 168 | % |
| $ | 9.18 | | | | (4.49 | %) | | $ | 85,797 | | | | 1.44 | % | | | 1.29 | % | | | 1.51 | % | | | 1.60 | % | | | 164 | % |
| $ | 9.72 | | | | 9.76 | % | | $ | 57,779 | | | | 1.52 | % | | | 1.51 | % | | | 1.57 | % | | | 1.66 | % | | | 161 | % |
| |
| $ | 10.38 | | | | 5.87 | % | | $ | 109,845 | | | | 1.23 | % | | | 0.54 | % | | | 1.37 | % | | | 1.51 | % | | | 143 | % |
| $ | 11.36 | | | | 23.82 | % | | $ | 91,769 | | | | 1.23 | % | | | 0.36 | % | | | 1.40 | % | | | 1.58 | % | | | 231 | % |
| $ | 10.07 | | | | 13.15 | % | | $ | 79,446 | | | | 1.39 | % | | | (0.05 | %) | | | 1.42 | % | | | 1.58 | % | | | 86 | % |
| $ | 8.90 | | | | (8.34 | %) | | $ | 84,672 | | | | 1.39 | % | | | (0.37 | %) | | | 1.48 | % | | | 1.58 | % | | | 166 | % |
| $ | 9.71 | | | | 19.96 | % | | $ | 62,431 | | | | 1.49 | % | | | 0.48 | % | | | 1.59 | % | | | 1.70 | % | | | 115 | % |
The accompanying notes are an integral part of these financial statements.
2014 Annual Report | December 31, 2014 | Page 57 |
Financial Highlights
For a Share Outstanding Through Each Fiscal Period Ended December 31,
| | | | | | Income from Investment Operations | | | Less Distributions | |
| | | Net Asset Value, Beginning of Period | | | Net Investment Income (Loss) (5) | | | Net gains (losses) on securities, futures, and options (both realized and unrealized) | | | Total from Investment Operations | | | From Net Investment Income | | | From Net Capital Gains | | | From Tax Return of Capital | | | Total
Distributions | |
Quantex FundTM | |
| 2014 | | $ | 35.04 | | | | 0.13 | | | | 3.11 | | | | 3.24 | | | | (0.40 | ) | | | (2.68 | ) | | | 0.00 | | | | (3.08 | ) |
| 2013 | | $ | 25.46 | | | | 0.09 | | | | 10.45 | | | | 10.54 | | | | (0.08 | ) | | | (0.88 | ) | | | 0.00 | | | | (0.96 | ) |
| 2012 | | $ | 21.84 | | | | 0.07 | | | | 3.63 | | | | 3.70 | | | | (0.08 | ) | | | 0.00 | | | | 0.00 | | | | (0.08 | ) |
| 2011 | | $ | 22.77 | | | | 0.00 | ** | | | (0.92 | ) | | | (0.92 | ) | | | (0.01 | ) | | | 0.00 | | | | 0.00 | | | | (0.01 | ) |
| 2010 | | $ | 18.48 | | | | (0.06 | ) | | | 4.35 | | | | 4.29 | | | | 0.00 | | | | 0.00 | | | | 0.00 | | | | 0.00 | |
| Utilities and Infrastructure Fund | |
| 2014 | | $ | 30.98 | | | | 0.19 | | | | 2.64 | | | | 2.83 | | | | (0.83 | ) | | | (2.53 | ) | | | 0.00 | | | | (3.36 | ) |
| 2013 | | $ | 24.17 | | | | 0.17 | | | | 6.81 | | | | 6.98 | | | | (0.17 | ) | | | 0.00 | | | | 0.00 | | | | (0.17 | ) |
| 2012 | | $ | 24.06 | | | | 0.15 | | | | 0.21 | | | | 0.36 | | | | (0.15 | ) | | | (0.10 | ) | | | 0.00 | | | | (0.25 | ) |
| 2011 | | $ | 23.51 | | | | 0.22 | | | | 0.70 | | | | 0.92 | | | | (0.37 | ) | | | 0.00 | | | | 0.00 | | | | (0.37 | ) |
| 2010 | | $ | 20.73 | | | | 0.15 | | | | 2.76 | | | | 2.91 | | | | (0.13 | ) | | | 0.00 | | | | 0.00 | | | | (0.13 | ) |
| Total Return Bond Fund (1)(2)(3)(4) | |
| 2014 | | $ | 9.77 | | | | 0.33 | | | | (0.15 | ) | | | 0.18 | | | | (0.32 | ) | | | 0.00 | | | | 0.00 | | | | (0.32 | ) |
| 2013 | | $ | 10.15 | | | | 0.38 | | | | (0.38 | ) | | | (0.00 | ) | | | (0.38 | ) | | | 0.00 | | | | 0.00 | | | | (0.38 | ) |
| 2012 | | $ | 9.73 | | | | 0.44 | | | | 0.41 | | | | 0.85 | | | | (0.43 | ) | | | 0.00 | | | | 0.00 | | | | (0.43 | ) |
| 2011* | | $ | 10.00 | | | | 0.25 | | | | (0.31 | ) | | | (0.06 | ) | | | (0.21 | ) | | | 0.00 | | | | 0.00 | | | | (0.21 | ) |
| Money Market Fund - Retail Class | |
| 2014 | | $ | 1.00 | | | | 0.001 | ** | | | N/ | A | | | 0.001 | ** | | | (0.001 | )** | | | 0.000 | | | | 0.000 | | | | (0.001 | )** |
| 2013 | | $ | 1.00 | | | | 0.001 | | | | N/ | A | | | 0.001 | | | | (0.001 | ) | | | 0.000 | | | | 0.000 | | | | (0.001 | ) |
| 2012 | | $ | 1.00 | | | | 0.001 | | | | N/ | A | | | 0.001 | | | | (0.001 | ) | | | 0.000 | | | | 0.000 | | | | (0.001 | ) |
| 2011 | | $ | 1.00 | | | | 0.001 | | | | N/ | A | | | 0.001 | | | | (0.001 | ) | | | 0.000 | | | | 0.000 | | | | (0.001 | ) |
| 2010 | | $ | 1.00 | | | | 0.002 | | | | N/ | A | | | 0.002 | | | | (0.002 | ) | | | 0.000 | | | | 0.000 | | | | (0.002 | ) |
| Money Market Fund - Institutional Class | |
| 2014 | | $ | 1.00 | | | | 0.001 | | | | N/ | A | | | 0.001 | | | | (0.001 | ) | | | 0.000 | | | | 0.000 | | | | (0.001 | ) |
| 2013 | | $ | 1.00 | | | | 0.001 | | | | N/ | A | | | 0.001 | | | | (0.001 | ) | | | 0.000 | | | | 0.000 | | | | (0.001 | ) |
| 2012 | | $ | 1.00 | | | | 0.002 | | | | N/ | A | | | 0.002 | | | | (0.002 | ) | | | 0.000 | | | | 0.000 | | | | (0.002 | ) |
| 2011 | | $ | 1.00 | | | | 0.002 | | | | N/ | A | | | 0.002 | | | | (0.002 | ) | | | 0.000 | | | | 0.000 | | | | (0.002 | ) |
| 2010 | | $ | 1.00 | | | | 0.003 | | | | N/ | A | | | 0.003 | | | | (0.003 | ) | | | 0.000 | | | | 0.000 | | | | (0.003 | ) |
| 1 | Ratio of net expenses to average net assets, ratio of net investment income (loss) to average net assets, ratio of expenses to average net assets after reductions, excluding commissions recaptured and fees received from custodian, and ratio of expenses to average net assets before reductions do not include impact of expenses of the underlying security holdings as represented in the schedule of investments. |
| 2 | Recognition of net investment income by the Fund is affected by the timing of the declaration of dividends by the underlying investment companies in which the Fund invests. |
| 3 | Total return and portfolio turnover rate are not annualized for periods of less than one full year. |
| 4 | Ratio of net expenses to average net assets, ratio of net investment income (loss) to average net assets, ratio of average net assets after reductions, excluding commissions recaptured, and ratio of expenses to average net assets before reductions are annualized for periods of less than one full year. |
| 5 | Except for Money Market Fund, net investment income per share is based on average shares outstanding during the period. |
| * | Commenced operations June 30, 2011. |
| ** | Actual amounts were less than one-half of a cent per share. |
The accompanying notes are an integral part of these financial statements.
| Page 58 | 2014 Annual Report | December 31, 2014 |
| | | | | | | Ratios/Supplemental Data | |
| Net Asset Value, End of Period | | | Total Return (Assumes Reinvestment of Distributions) | | | Net Assets, End of Period ($000) | | | Ratio of Net Expenses to Average Net Assets | | | Ratio of Net Investment Income (Loss) to Average Net Assets | | | Ratio of Expenses to Average Net Assets after Reductions, Excluding Commissions Recaptured and Fees Received from Custodian | | | Ratio of Expenses to Average Net Assets Before Reductions | | | Portfolio Turnover Rate | |
| |
| $ | 35.20 | | | | 9.48 | % | | $ | 61,834 | | | | 1.44 | % | | | 0.36 | % | | | 1.51 | % | | | 1.78 | % | | | 29 | % |
| $ | 35.04 | | | | 41.54 | % | | $ | 44,476 | | | | 1.52 | % | | | 0.27 | % | | | 1.58 | % | | | 1.94 | % | | | 25 | % |
| $ | 25.46 | | | | 16.93 | % | | $ | 23,306 | | | | 1.60 | % | | | 0.29 | % | | | 1.61 | % | | | 2.06 | % | | | 31 | % |
| $ | 21.84 | | | | (4.05 | %) | | $ | 17,434 | | | | 1.62 | % | | | 0.01 | % | | | 1.62 | % | | | 2.06 | % | | | 57 | % |
| $ | 22.77 | | | | 23.21 | % | | $ | 17,024 | | | | 1.65 | % | | | (0.26 | %) | | | 1.65 | % | | | 2.17 | % | | | 55 | % |
| |
| $ | 30.45 | | | | 9.42 | % | | $ | 46,746 | | | | 1.88 | % | | | 0.63 | % | | | 1.88 | % | | | 1.89 | % | | | 34 | % |
| $ | 30.98 | | | | 28.96 | % | | $ | 37,988 | | | | 1.87 | % | | | 0.62 | % | | | 1.87 | % | | | 1.99 | % | | | 19 | % |
| $ | 24.17 | | | | 1.52 | % | | $ | 30,452 | | | | 1.89 | % | | | 0.63 | % | | | 1.89 | % | | | 2.02 | % | | | 29 | % |
| $ | 24.06 | | | | 3.93 | % | | $ | 32,609 | | | | 1.90 | % | | | 0.87 | % | | | 1.90 | % | | | 2.02 | % | | | 43 | % |
| $ | 23.51 | | | | 14.10 | % | | $ | 24,144 | | | | 1.92 | % | | | 0.70 | % | | | 1.92 | % | | | 2.11 | % | | | 53 | % |
| |
| $ | 9.63 | | | | 1.78 | % | | $ | 143,046 | | | | 0.99 | % | | | 3.39 | % | | | 1.02 | % | | | 1.13 | % | | | 82 | % |
| $ | 9.77 | | | | 0.01 | % | | $ | 90,080 | | | | 0.99 | % | | | 3.87 | % | | | 1.01 | % | | | 1.19 | % | | | 79 | % |
| $ | 10.15 | | | | 8.93 | % | | $ | 76,001 | | | | 0.99 | % | | | 4.45 | % | | | 1.00 | % | | | 1.23 | % | | | 157 | % |
| $ | 9.73 | | | | (0.57 | %) | | $ | 56,998 | | | | 0.99 | % | | | 4.97 | % | | | 1.06 | % | | | 1.36 | % | | | 125 | % |
| |
| $ | 1.00 | | | | 0.06 | % | | $ | 54,927 | | | | 0.16 | % | | | 0.06 | % | | | 0.16 | % | | | 0.67 | % | | | N/ | A |
| $ | 1.00 | | | | 0.08 | % | | $ | 61,288 | | | | 0.22 | % | | | 0.08 | % | | | 0.22 | % | | | 0.90 | % | | | N/ | A |
| $ | 1.00 | | | | 0.10 | % | | $ | 73,546 | | | | 0.30 | % | | | 0.10 | % | | | 0.30 | % | | | 0.82 | % | | | N/ | A |
| $ | 1.00 | | | | 0.11 | % | | $ | 78,903 | | | | 0.30 | % | | | 0.11 | % | | | 0.30 | % | | | 0.90 | % | | | N/ | A |
| $ | 1.00 | | | | 0.20 | % | | $ | 96,087 | | | | 0.38 | % | | | 0.20 | % | | | 0.38 | % | | | 0.86 | % | | | N/ | A |
| |
| $ | 1.00 | | | | 0.11 | % | | $ | 147,739 | | | | 0.10 | % | | | 0.11 | % | | | 0.10 | % | | | 0.65 | % | | | N/ | A |
| $ | 1.00 | | | | 0.14 | % | | $ | 43,485 | | | | 0.15 | % | | | 0.14 | % | | | 0.15 | % | | | 0.71 | % | | | N/ | A |
| $ | 1.00 | | | | 0.16 | % | | $ | 84,953 | | | | 0.23 | % | | | 0.17 | % | | | 0.23 | % | | | 0.63 | % | | | N/ | A |
| $ | 1.00 | | | | 0.20 | % | | $ | 23,231 | | | | 0.21 | % | | | 0.20 | % | | | 0.21 | % | | | 0.71 | % | | | N/ | A |
| $ | 1.00 | | | | 0.28 | % | | $ | 33,584 | | | | 0.29 | % | | | 0.29 | % | | | 0.29 | % | | | 0.68 | % | | | N/ | A |
The accompanying notes are an integral part of these financial statements.
2014 Annual Report | December 31, 2014 | Page 59 |
Notes to Financial Statements
December 31, 2014
| 1. | Organization and Significant Accounting Policies |
Meeder Funds® Trust (the “Trust”) was organized in 1982 and is registered under the Investment Company Act of 1940, as amended (the “1940 Act”), as a diversified, open-end management investment company. The Trust offers nine separate series and is presently comprised of nine separate funds as follows: Muirfield Fund® (“Muirfield”), Dynamic Growth Fund (“Dynamic”), Aggressive Growth Fund (“Aggressive”), Balanced Fund (“Balanced”), Strategic Growth Fund (“Strategic”), Quantex Fund™ (“Quantex”), Utilities and Infrastructure Fund (“Utilities”), Total Return Bond Fund (“Bond”), and Money Market Fund (“Money Market��) (each a “Fund” and collectively the “Funds”). Money Market offers two classes of shares (the Retail Class (“Retail Class”) and the Institutional Class (“Institutional Class”)). Each class of shares has equal rights as to earnings and assets except that each class bears different distribution and transfer agent expenses. The investment objective of Muirfield, Dynamic, Aggressive, and Strategic is growth of capital. The investment objective of Balanced is growth of capital, with current income usually of secondary importance. The investment objective of Quantex is long term capital appreciation. The investment objective of Utilities is total returns, including current income and growth of income. The investment objective of Bond is total returns, including current income and capital growth. The investment objective of Money Market is current income while maintaining a stable share price of $1.00.
Use of estimates. The preparation of financial statements in conformity with accounting principles generally accepted in the United States of America (“GAAP”) requires management to make estimates and assumptions that affect the reported amounts of assets and liabilities and disclosure of contingent assets and liabilities at the date of the financial statements and the reported amounts of increases and decreases in net assets from operations during the reporting period. Actual results could differ from those estimates.
Security valuation. All investments in securities are recorded at their estimated fair value, as described in Note #2.
Repurchase agreements. Each Fund may engage in repurchase agreement transactions whereby the Fund takes possession of an underlying debt instrument subject to an obligation of the seller to repurchase the instrument from the Fund and an obligation of the Fund to resell the instrument at an agreed upon price and term. At all times, the Fund maintains the fair value of collateral, including accrued interest, of at least 100% of the amount of the repurchase agreement, plus accrued interest. If the seller defaults or the fair value of the collateral declines, realization of the collateral by the Fund may be delayed or limited.
Futures & options. Each Fund, except Money Market, may engage in transactions in financial futures contracts and options contracts in order to manage the risk of unanticipated changes in market values of securities held in the Fund, or which it intends to purchase. The futures and options contracts are adjusted by the daily exchange rate of the underlying currency, or index, and any gains or losses are recorded for financial statement purposes as unrealized gains or losses in the statement of assets and liabilities and the statement of operations until the contract settlement date, at which time realized gains and losses are included in the statement of operations.
To the extent that the Fund enters into futures contracts on an index or group of securities, the Fund exposes itself to an indeterminate liability and will be required to pay or receive a sum of money measured by the change in the fair value of the index. Upon entering into a futures contract, the Fund is required to deposit an initial margin, which is either cash or securities (disclosed as pledged as collateral on the Schedules of Investments) in an amount equal to a certain percentage of the contract value. Subsequently, the variation margin, which is equal to changes in the daily settlement price or last sale price on the exchanges where futures contracts trade, is received or paid and is recorded as an unrealized gain or loss until the contract is closed. When the contract is closed, the Fund records a realized gain or loss equal to the difference between the proceeds from (or cost of) the closing transaction and the Fund’s basis in the contract. Should market conditions move unexpectedly, the Fund may not achieve the anticipated benefits of the futures contract and
| Page 60 | 2014 Annual Report | December 31, 2014 |
may realize a loss. The use of futures transactions involves the risk of imperfect correlation in movements in the price of futures contracts, interest rates, and the underlying hedged assets. With futures, there is minimal counterparty credit risk to the Fund since futures are exchange traded and the exchange’s clearinghouse, as counterparty to all exchange traded futures, guarantees the futures against default. Except for Money Market and Utilities, it is normal practice for each Fund to invest in futures contracts on a daily basis. The Funds, except for Bond and Money Market, typically utilize equity index futures contracts to equitize cash positions or adjust targeted stock market exposure. Bond and the fixed income portion of Balanced can utilize Treasury futures contracts in order to adjust duration. Although Utilities is permitted to invest in futures contracts, it typically does not.
Call and put option contracts involve the payment of a premium for the right to purchase or sell an individual security or index aggregate at a specified price until the expiration of the contract. Such transactions expose the Fund to the loss of the premium paid if the Fund does not sell or exercise the contract prior to the expiration date. In the case of a call option, sufficient cash or money market instruments will be segregated to complete the purchase. Options are fair valued on the basis of the daily settlement price or last sale on the exchanges where they trade and the changes in fair value are recorded as unrealized appreciation or depreciation until closed, exercised or expired. For the year ended December 31, 2014, there were no call or put options transacted for any of the Funds.
The Funds may write covered call or put options for which premiums received are recorded as liabilities and are subsequently adjusted to the current value of the options written. When written options are closed or exercised, premiums received are offset against the proceeds paid, and the Fund records realized gains or losses for the difference. When written options expire, the liability is eliminated, and the Fund records realized gains for the entire amount of premiums received. Although permitted, it is currently not normal practice for the Funds to write call and put options and none were written during the year ended December 31, 2014.
The fair value of derivative instruments, not accounted for as hedging instruments, as reported within the Statements of Assets and Liabilities as of December 31, 2014 was as follows:
| Amount of Net Variation Margin and Unrealized Appreciation (Depreciation) on Derivatives | |
| Type of Derivative/Risk | Statements of Assets
& Liabilities Location* | | Fair Value of Variation Margin | | | Fair Value of Unrealized Appreciation (Depreciation) | |
Muirfield Fund® | Equity contracts | Liabilities, Payable for net variation margin on futures contracts; Net Assets, Net unrealized appreciation (depreciation) of investments and futures contracts | | $ | 942,560 | | | $ | 842,634 | |
| Dynamic Growth Fund | Equity contracts | Liabilities, Payable for net variation margin on futures contracts; Net Assets, Net unrealized appreciation (depreciation) of investments and futures contracts | | | 65,610 | | | | 87,214 | |
| Aggressive Growth Fund | Equity contracts | Liabilities, Payable for net variation margin on futures contracts; Net Assets, Net unrealized appreciation (depreciation) of investments and futures contracts | | | 48,600 | | | | 53,290 | |
| Balanced Fund | Equity contracts | Liabilities, Payable for net variation margin on futures contracts; Net Assets, Net unrealized appreciation (depreciation) of investments and futures contracts | | | 332,065 | | | | 345,006 | |
2014 Annual Report | December 31, 2014 | Page 61 |
| Amount of Net Variation Margin and Unrealized Appreciation (Depreciation) on Derivatives | |
| Type of Derivative/Risk | Statements of Assets
& Liabilities Location* | | Fair Value of Variation Margin | | | Fair Value of Unrealized Appreciation (Depreciation) | |
| Strategic Growth Fund | Equity contracts | Liabilities, Payable for net variation margin on futures contracts; Net Assets, Net unrealized appreciation (depreciation) of investments and futures contracts | | | 51,010 | | | | 65,254 | |
Quantex FundTM | Equity contracts | Liabilities, Payable for net variation margin on futures contracts; Net Assets, Net unrealized appreciation (depreciation) of investments and futures contracts | | | 74,800 | | | | 121,290 | |
| * | Unrealized appreciation (depreciation) on futures contracts is included with unrealized appreciation (depreciation) of investments on the Statements of Assets & Liabilities. |
The effect of derivative instruments on the Statements of Operations for the year ended December 31, 2014 was as follows:
Amount of Realized Gain (Loss) on Derivatives Recognized in Income
| Type of Derivative/ Risk | | Contracts as of December 31, 2013 | | | Contracts Opened During the Period | | | Contracts Closed/ Expired During the Period | | | Contracts as of December 31, 2014 | | Statement of Operations Location | | For the Year Ended December 31, 2014 | |
Muirfield Fund® | Equity contracts | | | 15 | | | | 2,005 | | | | 1,216 | | | | 804 | | Net realized gains from futures contracts | | $ | 1,821,935 | |
| Dynamic Growth Fund | Equity contracts | | | 9 | | | | 386 | | | | 341 | | | | 54 | | Net realized gains from futures contracts | | | 860,423 | |
| Aggressive Growth Fund | Equity contracts | | | 6 | | | | 227 | | | | 193 | | | | 40 | | Net realized gains from futures contracts | | | 546,201 | |
| Balanced Fund | Equity contracts | | | 9 | | | | 791 | | | | 515 | | | | 285 | | Net realized gains from futures contracts | | | 1,043,661 | |
| Strategic Growth Fund | Equity contracts | | | 47 | | | | 377 | | | | 380 | | | | 44 | | Net realized gains from futures contracts | | | 208,225 | |
Quantex FundTM | Equity contracts | | | 26 | | | | 213 | | | | 199 | | | | 40 | | Net realized gains from futures contracts | | | 98,539 | |
| Total Return Bond Fund | US Treasury Bond/Note contracts | | | — | | | | 60 | | | | 60 | | | | — | | Net realized gains from futures contracts | | | 100,661 | |
| Page 62 | 2014 Annual Report | December 31, 2014 |
Change in Unrealized Gain or (Loss) on Derivatives Recognized in Income
| Type of Derivative/Risk | Statement of Operations Location | | For the Year Ended December 31,
2014 | |
Muirfield Fund® | Equity contracts | Net change in unrealized appreciation (depreciation) of investments and futures contracts | | $ | 763,146 | |
| Dynamic Growth Fund | Equity contracts | Net change in unrealized appreciation (depreciation) of investments and futures contracts | | | 24,081 | |
| Aggressive Growth Fund | Equity contracts | Net change in unrealized appreciation (depreciation) of investments and futures contracts | | | 9,660 | |
| Balanced Fund | Equity contracts | Net change in unrealized appreciation (depreciation) of investments and futures contracts | | | 331,973 | |
| Strategic Growth Fund | Equity contracts | Net change in unrealized appreciation (depreciation) of investments and futures contracts | | | 28,606 | |
Quantex FundTM | Equity contracts | Net change in unrealized appreciation (depreciation) of investments and futures contracts | | | 13,860 | |
Federal income taxes. It is each Fund’s policy to continue to comply with the requirements of Subchapter M of the Internal Revenue Code applicable to regulated investment companies and to distribute substantially all of its taxable income and net capital gains to its shareholders. Therefore, no federal income tax provision is required.
As of and during the year ended December 31, 2014, the Funds did not have a liability for any unrecognized tax benefits. The Funds recognize interest and penalties, if any, related to unrecognized tax benefits as income tax expense in the statements of operations. During the year ended December 31, 2014, the Funds did not incur any interest or penalties.
The Funds are not subject to examination by U.S. federal and state tax authorities for tax years before 2011.
Distributions to shareholders. Distributions to shareholders are recorded on the ex-dividend date. Muirfield, Quantex, Dynamic, Aggressive, Balanced, and Strategic declare and pay dividends from net investment income, if any, on a quarterly basis. Utilities and Bond declare and pay dividends from net investment income on a monthly basis. Money Market declares dividends from net investment income on a daily basis and pays such dividends on a monthly basis. Each Fund distributes net capital gains, if any, on an annual basis.
2014 Annual Report | December 31, 2014 | Page 63 |
Distributions from net investment income and from net capital gains are determined in accordance with income tax regulations, which may differ from GAAP. These differences are primarily due to deferrals of certain losses, expiring capital loss carryforwards, and differing treatments of unrealized gains and losses of futures contracts held by each Fund. Accordingly, timing differences relating to shareholder distributions are reflected in the components of net assets and permanent book and tax differences have been reclassified within the components of net assets based on their ultimate characterization for federal income tax purposes. For the year ended December 31, 2014, the Funds made the following reclassifications to increase/(decrease) the components of net assets:
| | | Capital | | | Accumulated Undistributed (Distributions in Excess of) Net Investment Income | | | Accumulated Undistributed Net Realized Gain (Loss) from Investments and Futures Contracts | |
Muirfield Fund® | | $ | — | | | $ | 5,429,742 | | | $ | (5,429,742 | ) |
| Dynamic Growth Fund | | | — | | | | 3,040,561 | | | | (3,040,561 | ) |
| Aggressive Growth Fund | | | — | | | | 518,051 | | | | (518,051 | ) |
| Balanced Fund | | | — | | | | 2,240,685 | | | | (2,240,685 | ) |
| Strategic Growth Fund | | | — | | | | 1,000,667 | | | | (1,000,667 | ) |
Quantex FundTM | | | — | | | | 433,911 | | | | (433,911 | ) |
| Utilities & Infrastructure Fund | | | (145,520 | ) | | | 693,831 | | | | (548,311 | ) |
Investment income & expenses. For Money Market, income and expenses (other than expenses attributable to a specific class) are allocated to each class of shares based on its relative net assets. Expenses incurred by the Trust that do not specifically relate to an individual Fund of the Trust are allocated to the Funds based on each Fund’s relative net assets or other appropriate basis.
Capital Share Transactions. Money Market is authorized to issue an unlimited number of shares in the Retail Class and the Institutional Class. Transactions in the capital shares of the Fund for the year ended December 31, 2014 and the year ended December 31, 2013 were as follows:
| | | 2014 | | | 2013 | |
| | | Amount | | | Shares | | | Amount | | | Shares | |
| Retail Class | | | | | | | | | | | | |
| Issued | | $ | 103,062,606 | | | | 103,062,606 | | | $ | 97,899,233 | | | | 97,899,233 | |
| Reinvested | | | 33,592 | | | | 33,592 | | | | 48,913 | | | | 48,913 | |
| Redeemed | | | (109,457,288 | ) | | | (109,457,288 | ) | | | (110,206,483 | ) | | | (110,206,483 | ) |
| Net increase (decrease) | | $ | (6,361,090 | ) | | | (6,361,090 | ) | | $ | (12,258,337 | ) | | | (12,258,337 | ) |
| | | | | | | | | | | | | | | | | |
| Institutional Class | | | | | | | | | | | | | | | | |
| Issued | | $ | 472,700,382 | | | | 472,700,382 | | | $ | 337,469,421 | | | | 337,469,421 | |
| Reinvested | | | 6,470 | | | | 6,470 | | | | 10,873 | | | | 10,873 | |
| Redeemed | | | (368,451,991 | ) | | | (368,451,991 | ) | | | (378,949,201 | ) | | | (378,949,201 | ) |
| Net increase (decrease) | | $ | 104,254,861 | | | | 104,254,861 | | | $ | (41,468,907 | ) | | | (41,468,907 | ) |
| Page 64 | 2014 Annual Report | December 31, 2014 |
Offsetting Assets & Liabilities. The Funds’ policy is to recognize a net asset/liability equal to the net variation margin for futures contracts. Risks arise from the possible inability of counterparties to meet the terms of their contracts. During the year ended December 31, 2014, the Funds were not subject to any master netting arrangements. The table below reflects the offsetting assets and liabilities relating to securities lending, futures contracts, and repurchase agreements shown on the Statements of Assets and Liabilities at December 31, 2014.
| | | | | | | | | | | Gross Amounts Not Offset in the Statements of Assets and Liabilities | | | | |
| Description/ Fund | | Gross Amounts of Recognized Assets/ Liabilities | | | Gross Amounts Offset in the Statements of Assets and Liabilities | | | Net Amounts Presented in the Statements of Assets and Liabilities | | | Financial Instruments* | | | Collateral Pledged (Received)* | | | Net Amount | |
Assets: | | | | | | | | | | | | | | | | | | |
| Securities Loaned | | | | | | | | | | | | | | | | | | |
Muirfield Fund® | | $ | 2,402,585 | | | $ | — | | | $ | 2,402,585 | | | $ | — | | | $ | (2,402,585 | ) | | $ | — | |
| Dynamic Growth Fund | | | 803,640 | | | | — | | | | 803,640 | | | | — | | | | (803,640 | ) | | | — | |
| Aggressive Growth Fund | | | 1,641,179 | | | | — | | | | 1,641,179 | | | | — | | | | (1,641,179 | ) | | | — | |
| Balanced Fund | | | 1,006,454 | | | | — | | | | 1,006,454 | | | | — | | | | (1,006,454 | ) | | | — | |
| Strategic Growth Fund | | | 7,609,452 | | | | — | | | | 7,609,452 | | | | — | | | | (7,609,452 | ) | | | — | |
Quantex FundTM | | | 1,357,454 | | | | — | | | | 1,357,454 | | | | — | | | | (1,357,454 | ) | | | — | |
| | | | | | | | | | | | | | | | | | | | | | | | | |
| Repurchase Agreements | | | | | | | | | | | | | | | | | | | | | |
| Money Market Fund | | $ | 30,000,000 | | | $ | — | | | $ | 30,000,000 | | | $ | — | | | $ | — | | | $ | 30,000,000 | |
| | | | | | | | | | | | | | | | | | | | | | | | | |
Liabilities: | | | | | | | | | | | | | | | | | | | | | | | | |
| Futures Contracts | | | | | | | | | | | | | | | | | | | | | | | | |
Muirfield Fund® | | $ | 942,560 | | | $ | — | | | $ | 942,560 | | | $ | 942,560 | | | $ | — | | | $ | — | |
| Dynamic Growth Fund | | | 65,610 | | | | — | | | | 65,610 | | | | 65,610 | | | | — | | | | — | |
| Aggressive Growth Fund | | | 48,600 | | | | — | | | | 48,600 | | | | 48,600 | | | | — | | | | — | |
| Balanced Fund | | | 332,065 | | | | — | | | | 332,065 | | | | 332,065 | | | | — | | | | — | |
| Strategic Growth Fund | | | 51,010 | | | | — | | | | 51,010 | | | | 51,010 | | | | — | | | | — | |
Quantex FundTM | | | 74,800 | | | | — | | | | 74,800 | | | | 74,800 | | | | — | | | | — | |
| * | The amount is limited to the net amounts of financial assets and liabilities and accordingly does not include excess collateral pledged. |
Other. The Funds record security transactions on the trade date. Gains and losses realized from the sale of securities are determined on the specific identification basis. Dividend income is recognized on the ex-dividend date and interest income (including amortization of premium and accretion of discount) is recognized as earned. Short-term capital gain distributions from underlying funds are classified as dividend income for financial reporting purposes. Long-term capital gains distributions are broken out as such. Discounts and premiums are amortized over the lives of the respective securities. Distributions received from partnerships are recorded as return of capital distributions. Withholding taxes on foreign dividends, if applicable, have been provided for in accordance with the Funds’ understanding of the applicable country’s tax rules and rates.
The Funds utilize various methods to measure the fair value of their investments on a recurring basis. GAAP establishes a hierarchy that prioritizes inputs to valuation methods. The three levels of inputs are as follows:
Level 1 – Unadjusted quoted prices in active markets for identical assets or liabilities that the Funds have the ability to access.
2014 Annual Report | December 31, 2014 | Page 65 |
Level 2 – Observable inputs other than quoted prices included in level 1 that are observable for the asset or liability, either directly or indirectly. These inputs may include quoted prices for the identical instrument on an inactive market, prices for similar instruments, interest rates, prepayment speeds, credit risk, yield curves, default rates and similar data.
Level 3 – Significant unobservable inputs for the asset or liability, to the extent relevant observable inputs are not available, representing the Funds’ own assumptions about the assumptions a market participant would use in valuing the asset or liability, and would be based on the best information available.
The availability of observable inputs can vary from security to security and is affected by a wide variety of factors, including, for example, the type of security, whether the security is new and not yet established in the marketplace, the liquidity of markets, and other characteristics particular to the security. To the extent that valuation is based on models or inputs that are less observable or unobservable in the market, the determination of fair value requires more judgment. Accordingly, the degree of judgment exercised in determining fair value is greatest for instruments categorized in level 3.
The inputs used to measure fair value may fall into different levels of the fair value hierarchy. In such cases, for disclosure purposes, the level in the fair value hierarchy within which the fair value measurement falls in its entirety, is determined based on the lowest level input that is significant to the fair value measurement in its entirety.
A description of the valuation techniques applied to the Funds’ major categories of assets and liabilities measured at fair value on a recurring basis follows.
Equity securities (including publicly traded partnerships, real estate investment trusts, american depositary receipts, exchange traded funds, and common stock). Securities traded on a national securities exchange (or reported on the NASDAQ national market) are stated at the last reported sales price on the day of valuation and are categorized in level 1 of the fair value hierarchy.
Investments in registered open-end investment companies, including money market funds, are valued at the daily redemption value as reported by the underlying fund and are categorized in level 1 of the fair value hierarchy.
Short-term notes (including bank obligations, commercial paper, corporate obligations, repurchase agreements, U.S. government agency obligations, and floating rate demand notes). Short-term notes held in the Funds, except Money Market, maturing more than sixty days after the valuation date, are valued at the last sales price as of the close of business on the day of valuation, or, lacking any sales, at the most recent bid price or yield equivalent as obtained from dealers that make markets in such securities. When valued at last sales price, the securities will be categorized as level 1. When using bid prices or yield equivalents, they will be categorized as level 2. When such securities are valued within sixty days or less to maturity, the difference between the valuation existing on the sixty-first day before maturity and maturity value is amortized on a straight-line basis to maturity and will be categorized as level 2.
All securities held in Money Market, other than money market funds, are valued at amortized cost, which approximates fair value, and will be categorized as level 2.
Certificates of deposit. Certificates of deposit are valued at acquisition cost, which approximates fair value, and will be categorized as level 2.
U.S. government obligations. U.S. government obligations are normally valued using a model that incorporates market observable data such as reported sales of similar securities, broker quotes, yields, bids, offers, and reference data. Certain securities are valued principally using dealer quotations. In either case, these securities will be categorized as level 2.
Restricted securities (equity and debt). Restricted securities for which quotations are not readily available are valued at fair value as determined by the Trustees. Depending on the relative significance of valuation inputs, these instruments may be classified in either level 2 or level 3 of the fair value hierarchy.
| Page 66 | 2014 Annual Report | December 31, 2014 |
Derivative instruments (futures contracts). Listed derivative instruments that are actively traded, including futures contracts, are valued based on quoted prices from the exchange and are categorized in level 1 of the fair value hierarchy.
For the year ended December 31, 2014, the Funds did not hold any assets at any time in which significant unobservable inputs were used in determining fair value. Therefore, no reconciliation of level 3 securities is provided. Also, there were no transfers between level 1 and level 2 securities. The Funds recognize transfers between fair value hierarchy levels at the end of the reporting period. The following table summarizes the inputs used to value the Funds’ assets and liabilities measured at fair value as of December 31, 2014.
| Muirfield – Assets/(Liabilities) | | Level 1 | | | Level 2 | | | Level 3 | | | Total | |
| Common stocks* | | $ | 211,107,181 | | | $ | — | | | $ | — | | | $ | 211,107,181 | |
| Money market registered investment companies | | | 84,334,971 | | | | — | | | | — | | | | 84,334,971 | |
| Bank Obligations | | | — | | | | 997,817 | | | | — | | | | 997,817 | |
| U.S. government obligations | | | — | | | | 1,999,940 | | | | — | | | | 1,999,940 | |
| Total | | $ | 295,442,152 | | | $ | 2,997,757 | | | $ | — | | | $ | 298,439,909 | |
| Trustee deferred compensation | | $ | 253,202 | | | $ | — | | | $ | — | | | $ | 253,202 | |
| Futures contracts** | | $ | 842,634 | | | $ | — | | | $ | — | | | $ | 842,634 | |
| Dynamic – Assets/(Liabilities) | | Level 1 | | | Level 2 | | | Level 3 | | | Total | |
| Common stocks* | | $ | 135,753,259 | | | $ | — | | | $ | — | | | $ | 135,753,259 | |
| Money market registered investment companies | | | 4,947,258 | | | | — | | | | — | | | | 4,947,258 | |
| Bank Obligations | | | — | | | | 997,817 | | | | — | | | | 997,817 | |
| U.S. government obligations | | | — | | | | 699,979 | | | | — | | | | 699,979 | |
| Total | | $ | 140,700,517 | | | $ | 1,697,796 | | | $ | — | | | $ | 142,398,313 | |
| Trustee deferred compensation | | $ | 143,881 | | | $ | — | | | $ | — | | | $ | 143,881 | |
| Futures contracts** | | $ | 87,214 | | | $ | — | | | $ | — | | | $ | 87,214 | |
| Aggressive – Assets/(Liabilities) | | Level 1 | | | Level 2 | | | Level 3 | | | Total | |
| Common stocks* | | $ | 80,571,752 | | | $ | — | | | $ | — | | | $ | 80,571,752 | |
| Money market registered investment companies | | | 4,730,889 | | | | — | | | | — | | | | 4,730,889 | |
| Bank Obligations | | | — | | | | 997,817 | | | | — | | | | 997,817 | |
| U.S. government obligations | | | — | | | | 299,991 | | | | — | | | | 299,991 | |
| Total | | $ | 85,302,641 | | | $ | 1,297,808 | | | $ | — | | | $ | 86,600,449 | |
| Trustee deferred compensation | | $ | 84,374 | | | $ | — | | | $ | — | | | $ | 84,374 | |
| Futures contracts** | | $ | 53,290 | | | $ | — | | | $ | — | | | $ | 53,290 | |
| Balanced – Assets/(Liabilities) | | Level 1 | | | Level 2 | | | Level 3 | | | Total | |
| Common stocks* | | $ | 91,240,901 | | | $ | — | | | $ | — | | | $ | 91,240,901 | |
| Registered investment companies | | | 47,659,065 | | | | — | | | | — | | | | 47,659,065 | |
| Money market registered investment companies | | | 35,245,869 | | | | — | | | | — | | | | 35,245,869 | |
| Bank Obligations | | | — | | | | 997,817 | | | | — | | | | 997,817 | |
| U.S. government obligations | | | — | | | | 799,976 | | | | — | | | | 799,976 | |
| Total | | $ | 174,145,835 | | | $ | 1,797,793 | | | $ | — | | | $ | 175,943,628 | |
| Trustee deferred compensation | | $ | 113,602 | | | $ | — | | | $ | — | | | $ | 113,602 | |
| Futures contracts** | | $ | 345,006 | | | $ | — | | | $ | — | | | $ | 345,006 | |
2014 Annual Report | December 31, 2014 | Page 67 |
| Strategic – Assets/(Liabilities) | | Level 1 | | | Level 2 | | | Level 3 | | | Total | |
| Common stocks* | | $ | 72,080,918 | | | $ | — | | | $ | — | | | $ | 72,080,918 | |
| Registered investment companies | | | 32,776,188 | | | | — | | | | — | | | | 32,776,188 | |
| Money market registered investment companies | | | 11,381,830 | | | | — | | | | — | | | | 11,381,830 | |
| Bank Obligations | | | — | | | | 997,817 | | | | — | | | | 997,817 | |
| U.S. government obligations | | | — | | | | 399,988 | | | | — | | | | 399,988 | |
| Total | | $ | 116,238,936 | | | $ | 1,397,805 | | | $ | — | | | $ | 117,636,741 | |
| Trustee deferred compensation | | $ | 98,635 | | | $ | — | | | $ | — | | | $ | 98,635 | |
| Futures contracts** | | $ | 65,254 | | | $ | — | | | $ | — | | | $ | 65,254 | |
| Quantex – Assets/(Liabilities) | | Level 1 | | | Level 2 | | | Level 3 | | | Total | |
| Common stocks* | | $ | 56,088,244 | | | $ | — | | | $ | — | | | $ | 56,088,244 | |
| Money market registered investment companies | | | 6,004,081 | | | | — | | | | — | | | | 6,004,081 | |
| Bank Obligations | | | — | | | | 997,817 | | | | — | | | | 997,817 | |
| U.S. government obligations | | | — | | | | 299,991 | | | | — | | | | 299,991 | |
| Total | | $ | 62,092,325 | | | $ | 1,297,808 | | | $ | — | | | $ | 63,390,133 | |
| Trustee deferred compensation | | $ | 89,401 | | | $ | — | | | $ | — | | | $ | 89,401 | |
| Futures contracts** | | $ | 121,290 | | | $ | — | | | $ | — | | | $ | 121,290 | |
| Utilities – Assets/(Liabilities) | | Level 1 | | | Level 2 | | | Level 3 | | | Total | |
| Common stocks* | | $ | 44,880,385 | | | $ | — | | | $ | ��� | | | $ | 44,880,385 | |
| Money market registered investment companies | | | 1,919,034 | | | | — | | | | — | | | | 1,919,034 | |
| Total | | $ | 46,799,419 | | | $ | — | | | $ | — | | | $ | 46,799,419 | |
| Trustee deferred compensation | | $ | 87,122 | | | $ | — | | | $ | — | | | $ | 87,122 | |
| Bond – Assets/(Liabilities) | | Level 1 | | | Level 2 | | | Level 3 | | | Total | |
| Registered investment companies | | $ | 136,376,593 | | | $ | — | | | $ | — | | | $ | 136,376,593 | |
| Money market registered investment companies | | | 6,508,078 | | | | — | | | | — | | | | 6,508,078 | |
| Bank Obligations | | | — | | | | 997,817 | | | | — | | | | 997,817 | |
| U.S. government obligations | | | — | | | | 246,233 | | | | — | | | | 246,233 | |
| Total | | $ | 142,884,671 | | | | 1,244,050 | | | $ | — | | | $ | 144,128,721 | |
| Trustee deferred compensation | | $ | 37,952 | | | $ | — | | | $ | — | | | $ | 37,952 | |
| Money Market – Assets/(Liabilities) | | Level 1 | | | Level 2 | | | Level 3 | | | Total | |
| Bank obligations | | $ | — | | | $ | 18,519,610 | | | $ | — | | | $ | 18,519,610 | |
| Certificates of deposit | | | — | | | | 24,643,000 | | | | — | | | | 24,643,000 | |
| Corporate obligations | | | — | | | | 23,881,928 | | | | — | | | | 23,881,928 | |
| Repurchase agreements | | | — | | | | 30,000,000 | | | | — | | | | 30,000,000 | |
| U.S. government agency obligations | | | — | | | | 19,878,289 | | | | — | | | | 19,878,289 | |
| Money Market registered investment companies | | | 85,714,685 | | | | — | | | | — | | | | 85,714,685 | |
| Total | | $ | 85,714,685 | | | $ | 116,922,827 | | | $ | — | | | $ | 202,637,512 | |
| Trustee deferred compensation | | $ | 76,417 | | | $ | — | | | $ | — | | | $ | 76,417 | |
| * | See schedule of investments for industry classifications. |
| ** | Futures contracts include unrealized gain/loss on contracts open at December 31, 2014. |
| Page 68 | 2014 Annual Report | December 31, 2014 |
| 3. | Investment Transactions |
For the year ended December 31, 2014, the cost of purchases and proceeds from sales or maturities of long-term investments for the Funds, excluding U.S. Government investments, were as follows:
| | | Purchases | | | Sales | |
Muirfield Fund® | | $ | 460,798,312 | | | $ | 425,103,187 | |
| Dynamic Growth Fund | | | 282,876,143 | | | | 258,989,749 | |
| Aggressive Growth Fund | | | 175,176,316 | | | | 165,452,904 | |
| Balanced Fund | | | 244,594,083 | | | | 214,318,456 | |
| Strategic Growth Fund | | | 152,434,477 | | | | 135,570,057 | |
Quantex FundTM | | | 25,089,377 | | | | 14,017,916 | |
| Utilities & Infrastructure Fund | | | 18,616,431 | | | | 14,009,366 | |
| Total Return Bond Fund | | | 141,653,315 | | | | 87,612,500 | |
For the year ended December 31, 2014, the cost of purchases of long-term U.S. Government investments for Total Return Bond Fund was $2,319. There were no sales or maturities of long-term U.S. Government investments for any of the Funds.
| 4. | Investment Advisory Fees and Other Transactions with Affiliates |
Meeder Asset Management, Inc. (“MAM”), a wholly-owned subsidiary of Meeder Investment Management, Inc. (“Meeder”), provides each Fund, under a separate Investment Advisory Contract, with investment management, research, statistical and advisory services. The services of MAM will terminate automatically if assigned and may be terminated without penalty at any time upon 60 days prior written notice by majority vote of the Fund, by the Trustees of the Fund, or by MAM. For such services the Funds pay a fee at the following annual rates:
| | Percentage of Average Daily Net Assets up to $50 Million | Percentage of Average Daily Net Assets Exceeding $50 Million up to $100 Million | Percentage of Average Daily Net Assets up to $100 Million | Percentage of Average Daily Net Assets up to $200 Million | Percentage of Average Daily Net Assets Exceeding $100 Million | Percentage of Average Daily Net Assets Exceeding $200 Million |
| Muirfield | 1.00% | 0.75% | N/A | N/A | 0.60% | N/A |
| Quantex* | 1.00% | 0.75% | N/A | N/A | 0.60% | N/A |
| Utilities** | 1.00% | 0.75% | N/A | N/A | 0.60% | N/A |
| Dynamic | N/A | N/A | N/A | 0.75% | N/A | 0.60% |
| Aggressive | N/A | N/A | N/A | 0.75% | N/A | 0.60% |
| Balanced | N/A | N/A | N/A | 0.75% | N/A | 0.60% |
| Strategic | N/A | N/A | N/A | 0.75% | N/A | 0.60% |
| Bond | N/A | N/A | 0.40% | N/A | 0.20% | N/A |
| Money Market*** | N/A | N/A | 0.40% | N/A | 0.25% | N/A |
| * | MAM has contractually agreed to reduce its investment advisory fee by 0.25% for Quantex for average daily net assets up to $50 million. The foregoing reduction in investment advisory fees shall automatically renew annually on or about April 30th, unless MAM elects to terminate this reduction. During the year ended December 31, 2014, $130,512 of investment advisory fees was waived in Quantex and is not subject to recoupment. |
| ** | Under a separate Investment Subadvisory Agreement with MAM, Miller/Howard Investments, Inc. (“Miller/Howard”) serves as subadvisor of Utilities. The Investment Subadvisory Agreement provides that it will terminate automatically if assigned, and that it may be terminated without penalty to the Fund by MAM, the Trustees of the Fund, or by the vote of a majority of the outstanding voting shares of the Fund upon not less than 30 days written notice. As subadvisor to Utilities, Miller/Howard receives a fee paid by MAM. |
| *** | During the year ended December 31, 2014, MAM voluntarily agreed to reduce $71,082 of investment advisory fees in Money Market. |
2014 Annual Report | December 31, 2014 | Page 69 |
Mutual Funds Service Co. (“MFSCo”), a wholly-owned subsidiary of Meeder, serves as stock transfer, dividend disbursing and shareholder services agent for each Fund. In compensation for such services, each Fund pays MFSCo an annual fee equal to the greater of the following:
| | | Minimum Fee | | | Amount Per Active Shareholder Account | | | Percentage of Average Daily Net Assets | |
| Muirfield | | $ | 4,000 | | | $ | 15 | | | | 0.12 | % |
| Quantex | | | 4,000 | | | | 15 | | | | 0.12 | % |
| Utilities | | | 4,000 | | | | 15 | | | | 0.12 | % |
| Dynamic | | | 4,000 | | | | 15 | | | | 0.12 | % |
| Aggressive | | | 4,000 | | | | 15 | | | | 0.12 | % |
| Balanced | | | 4,000 | | | | 15 | | | | 0.12 | % |
| Strategic | | | 4,000 | | | | 15 | | | | 0.12 | % |
| Bond | | | 4,000 | | | | 15 | | | | 0.08 | % |
| Retail Class | | | 4,000 | | | | 20 | | | | 0.08 | % |
| Institutional Class | | | 4,000 | | | | 20 | | | | 0.08 | % |
For fixed income Funds (Bond and Money Market) that are subject to an expense cap and which are above the expense cap, the basis point fee will be contractually reduced by 0.02%. During the year ended December 31, 2014, MFSCo waived $22,790 and $25,580 of transfer agent fees for Bond and the Institutional Class, respectively.
MFSCo provides the Trust with certain administrative services. In compensation for such services, each Fund pays MFSCo at the following annual rates:
| | | Percentage of Average Daily Net Assets up to $50 Million | | | Percentage of Average Daily Net Assets Exceeding $50 Million | |
| Muirfield | | | 0.10 | % | | | 0.08 | % |
| Quantex | | | 0.10 | % | | | 0.08 | % |
| Utilities | | | 0.10 | % | | | 0.08 | % |
| Dynamic | | | 0.10 | % | | | 0.08 | % |
| Aggressive | | | 0.10 | % | | | 0.08 | % |
| Balanced | | | 0.10 | % | | | 0.08 | % |
| Strategic | | | 0.10 | % | | | 0.08 | % |
| Bond | | | 0.10 | % | | | 0.08 | % |
| Money Market | | | 0.10 | % | | | 0.08 | % |
| Page 70 | 2014 Annual Report | December 31, 2014 |
MFSCo serves as accounting services agent for each Fund. In compensation for such services, each Fund pays MFSCo an annual fee equal to the greater of a minimum fee or at a rate based on the percentage of average daily net assets. The annual rates are as follows:
| | | Minimum Fee | | | Percentage of Average Daily Net Assets up to $10 Million | | | Percentage of Average Daily Net Assets Exceeding $10 Million up to $30 Million | | | Percentage of Average Daily Net Assets Exceeding $30 Million up to $80 Million | | | Percentage of Average Daily Net Assets Exceeding $80 Million | |
| Muirfield | | $ | 7,500 | | | | 0.15 | % | | | 0.10 | % | | | 0.02 | % | | | 0.01 | % |
| Quantex | | | 7,500 | | | | 0.15 | % | | | 0.10 | % | | | 0.02 | % | | | 0.01 | % |
| Utilities | | | 7,500 | | | | 0.15 | % | | | 0.10 | % | | | 0.02 | % | | | 0.01 | % |
| Dynamic | | | 7,500 | | | | 0.15 | % | | | 0.10 | % | | | 0.02 | % | | | 0.01 | % |
| Aggressive | | | 7,500 | | | | 0.15 | % | | | 0.10 | % | | | 0.02 | % | | | 0.01 | % |
| Balanced | | | 7,500 | | | | 0.15 | % | | | 0.10 | % | | | 0.02 | % | | | 0.01 | % |
| Strategic | | | 7,500 | | | | 0.15 | % | | | 0.10 | % | | | 0.02 | % | | | 0.01 | % |
| Bond | | | 7,500 | | | | 0.15 | % | | | 0.10 | % | | | 0.02 | % | | | 0.01 | % |
| Money Market | | | 30,000 | | | | 0.15 | % | | | 0.10 | % | | | 0.02 | % | | | 0.01 | % |
For the year ended December 31, 2014, MAM agreed to voluntarily waive and/or reimburse investment advisory fees. The amount waived and/or reimbursed and the net expense ratio (excluding brokerage fees and commissions, taxes, interest, and extraordinary or non-recurring expenses) for each Fund are as follows:
| | | Voluntary Expense Reimbursements | | | Ratio of Net Expenses to Average Net Assets | |
| Muirfield | | $ | — | | | | 1.22 | % |
| Quantex* | | | — | | | | 1.44 | % |
| Utilities | | | 1,533 | | | | 1.88 | % |
| Dynamic | | | 109,681 | | | | 1.22 | % |
| Aggressive | | | — | | | | 1.33 | % |
| Balanced | | | 54,965 | | | | 1.33 | % |
| Strategic | | | 140,509 | | | | 1.23 | % |
| Bond | | | 100,999 | | | | 0.99 | % |
| Retail Class | | | 276,989 | | | | 0.16 | % |
| Institutional Class | | | 322,971 | | | | 0.10 | % |
| * | $130,512 of investment advisory fees was contractually waived and is not subject to recoupment as noted on page 69. |
Expenses were contractually reimbursed by MAM in 2012 for Muirfield, Dynamic, Balanced, Strategic, and Bond in the amounts of $40,054, $29,382, $32,787, $28,319, and $52,431, respectively. These contractual expense reimbursements are subject to repayment by the applicable Fund before December 31, 2015, contingent upon the Fund operating below the contractual expense limitation in place at the time in which the amount was waived. Expenses were contractually reimbursed by MAM in 2013 for Muirfield, Dynamic, Aggressive, Balanced, Strategic, and Bond in the amounts of $49,794, $40,570, $1,137, $28,346, $42,790, and $42,868, respectively. These contractual expense reimbursements are subject to repayment by the applicable Fund before December 31, 2016, contingent upon the Fund operating below the contractual expense limitation in place at the time in which the amount was waived.
2014 Annual Report | December 31, 2014 | Page 71 |
Certain Funds have entered into an agreement with the Trust’s custodian, The Huntington National Bank (“HNB”), whereby HNB receives distribution, service, and administration fees (collectively the “fees”) from the underlying security holdings of the Funds, and forwards those fees to the appropriate Funds. The Funds use the fees received to reduce the gross expenses of each Fund. The Funds may invest in security holdings in which fees are not paid. As such, the gross expenses of a Fund would not be decreased. Also, without this agreement it is likely that the Funds would not collect any fees from underlying security holdings. For the year ended December 31, 2014, gross expenses were reduced by the following amounts:
| | | Amount Received to Reduce Gross Expenses | |
| Balanced | | $ | 4,417 | |
| Bond | | | 7,564 | |
Certain Funds have entered into securities lending arrangements with HNB. Under the terms of the agreement, HNB is authorized to loan securities on behalf of the Funds to approved brokers. In exchange, under normal market conditions, the Funds receive cash collateral in the amount of at least 102% of the value of securities loaned. The cash collateral is invested in short term instruments as noted in the Schedules of Investments. Although risk is mitigated by the collateral, the Funds could experience a delay in recovering their securities and possible loss of income or value if the borrower fails to return the borrowed securities. In addition, the Funds bear the risk of loss associated with the investment of cash collateral received. After predetermined rebates to brokers, a percentage of the net securities lending revenue is credited to the Funds to be used as an offset against charges incurred by the Funds. HNB is paid a fee for administering the securities lending program for the Funds, equal to the remaining percentage of the net securities lending revenues generated under the agreement. As of December 31, 2014, the Funds (excluding Utilities, Bond and Money Market) had loaned securities that were collateralized by cash. The cash collateral received was invested in securities as listed in each Fund’s Schedule of Investments. Income earned from these investments is allocated to each Fund based on each Fund’s portion of total cash collateral received. Securities lending income is disclosed in each Fund’s Statement of Operations as a securities lending credit.
Certain Funds have entered into a directed brokerage agreement with ConvergEx Group, an independent broker/dealer, whereby Fund expenses are reduced. The Funds use these amounts received to reduce the gross expenses of each Fund. The Funds may invest in security holdings in which brokerage fees are not recaptured. As such, the gross expenses of a Fund would not be decreased. Also, without this agreement it is likely that the Funds would not recapture any fees from portfolio transactions. For the year ended December 31, 2014, commissions recaptured through directed brokerage arrangements were as follows:
| | | Amount Received to Reduce Gross Expenses | |
| Muirfield | | $ | 446,169 | |
| Dynamic | | | 261,346 | |
| Aggressive | | | 192,145 | |
| Balanced | | | 210,507 | |
| Strategic | | | 137,833 | |
| Quantex | | | 38,140 | |
| Bond | | | 26,614 | |
| Page 72 | 2014 Annual Report | December 31, 2014 |
The Funds have adopted a written plan pursuant to Rule 12b-1 of the Act that allows the Funds to pay fees for the sale and distribution of Fund shares and for services provided to Fund shareholders. 12b-1 fees are paid by the Funds to financial intermediaries, securities brokers, investment advisers, and other persons, including MAM and its affiliates. In addition, the Funds (other than Money Market) have adopted an administrative services plan that allows the Funds to pay financial intermediaries and other persons, including “platforms,” for providing administrative services to Fund shareholders and maintaining shareholder accounts. The annual adopted 12b-1 plan and administrative services plan maximum limitations, along with 12b-1 plan expense payments made to MAM and its affiliates for the year ended December 31, 2014, are as follows:
| | | Maximum Annual 12b-1 Plan Expense as a Percentage of Average Daily Net Assets | | | Maximum Annual Administrative Services Plan Expense as a Percentage of Average Daily Net Assets | | | 12b-1 Plan Expense Payments Made to MAM and Its Affiliates | |
| Muirfield | | | 0.20% | | | | 0.20% | | | $ | 150,677 | |
| Quantex | | | 0.20% | | | | 0.20% | | | | 36,004 | |
| Utilities | | | 0.25% | | | | 0.20% | | | | 23,715 | |
| Dynamic | | | 0.25% | | | | 0.20% | | | | 61,962 | |
| Aggressive | | | 0.25% | | | | 0.20% | | | | 50,216 | |
| Balanced | | | 0.25% | | | | 0.20% | | | | 50,282 | |
| Strategic | | | 0.25% | | | | 0.20% | | | | 22,872 | |
| Bond | | | 0.25% | | | | 0.20% | | | | 58,897 | |
| Retail Class | | | 0.20% | | | | N/A | | | | N/A | |
| Institutional Class | | | 0.03% | | | | N/A | | | | N/A | |
The Funds have adopted a Deferred Compensation Plan (the “Plan”) for the independent Trustees. Under the Plan, each eligible Trustee is permitted to defer all or a portion of the trustees fees payable by any of the Funds as an investment into any combination of Funds until a specified point of time. The investment into the Funds is recorded as an asset however an offsetting liability is also recorded for the deferred payment. Once the eligible Trustees’ deferral amounts can be distributed, a lump sum or generally equal annual installments over a period of up to ten (10) years can be made to the eligible Trustee(s). The Funds may terminate this Plan at any time.
Certain trustees and officers of the Funds are also officers or directors of Meeder, MAM, and MFSCo.
2014 Annual Report | December 31, 2014 | Page 73 |
During the year ended December 31, 2014, several of the Funds invested in the Money Market Fund, an affiliate, as described in Section 2(a)(3) of the Investment Company Act of 1940. As of December 31, 2014, the 7-day yield of the Institutional Class was 0.14%. The purchases/sales amounts in the following table are presented on a gross basis, while the statement of changes in net assets shows subscriptions and redemptions into and out of the Institutional Class on a net basis. A summary of the Funds’ investments in this affiliate during the year is noted below:
| | | 12/31/13 Fair Value | | | Purchases | | | Sales | | | 12/31/14 Cost | | | Income | | | 12/31/14 Fair Value | |
Muirfield Fund® | | $ | 6,371,521 | | | $ | 194,855,025 | | | $ | (119,363,477 | ) | | $ | 81,863,069 | | | $ | 27,241 | | | $ | 81,863,069 | |
| Dynamic Growth Fund | | | 3,939,573 | | | | 56,786,829 | | | | (56,612,247 | ) | | | 4,114,155 | | | | 5,971 | | | | 4,114,155 | |
| Aggressive Growth Fund | | | 2,252,733 | | | | 34,285,072 | | | | (33,506,051 | ) | | | 3,031,754 | | | | 3,418 | | | | 3,031,754 | |
| Balanced Fund | | | 4,825,673 | | | | 101,486,074 | | | | (72,100,734 | ) | | | 34,211,013 | | | | 13,044 | | | | 34,211,013 | |
| Strategic Growth Fund | | | 7,012,251 | | | | 40,045,972 | | | | (43,482,329 | ) | | | 3,575,894 | | | | 4,546 | | | | 3,575,894 | |
Quantex FundTM | | | 3,502,332 | | | | 16,398,607 | | | | (15,291,633 | ) | | | 4,609,306 | | | | 3,235 | | | | 4,609,306 | |
| Utilities & Infrastructure Fund | | | 766,924 | | | | 14,265,402 | | | | (13,113,295 | ) | | | 1,919,031 | | | | 970 | | | | 1,919,031 | |
| Total Return Bond Fund | | | 4,283,602 | | | | 85,524,627 | | | | (83,300,151 | ) | | | 6,508,078 | | | | 7,404 | | | | 6,508,078 | |
| 5. | Federal Tax Information |
The tax characteristics of dividends paid by the Funds during the year ended December 31, 2014 were as follows:
| | | Ordinary Income | | | Net Short-Term Capital Gains | | | Net Long-Term Capital Gains | | | Tax Return of Capital | | | Total
Dividends Paid* | |
Muirfield Fund® | | $ | 434,212 | | | $ | 18,050,608 | | | $ | 7,674,117 | | | $ | — | | | $ | 26,158,937 | |
| Dynamic Growth Fund | | | 471,226 | | | | 11,967,242 | | | | 7,366,297 | | | | — | | | | 19,804,765 | |
| Aggressive Growth Fund | | | — | | | | 7,408,648 | | | | 5,427,099 | | | | — | | | | 12,835,747 | |
| Balanced Fund | | | 1,243,731 | | | | 8,971,878 | | | | 4,576,191 | | | | — | | | | 14,791,800 | |
| Strategic Growth Fund | | | 541,908 | | | | 7,088,245 | | | | 6,833,948 | | | | — | | | | 14,464,101 | |
Quantex FundTM | | | 188,716 | | | | 964,549 | | | | 3,779,934 | | | | — | | | | 4,933,199 | |
| Utilities & Infrastructure Fund | | | 948,157 | | | | 218,193 | | | | 3,458,342 | | | | — | | | | 4,624,692 | |
| Total Return Bond Fund | | | 3,858,882 | | | | — | | | | — | | | | — | | | | 3,858,882 | |
| Money Market Fund | | | 105,566 | | | | — | | | | — | | | | — | | | | 105,566 | |
The tax characteristics of dividends paid by the Funds during the year ended December 31, 2013 were as follows:
| | | Ordinary Income | | | Net Short-Term Capital Gains | | | Net Long-Term Capital Gains | | | Tax Return of Capital | | | Total
Dividends Paid* | |
Muirfield Fund® | | $ | 187,286 | | | $ | 8,348,387 | | | $ | 4,520,781 | | | $ | — | | | $ | 13,056,454 | |
| Dynamic Growth Fund | | | 177,368 | | | | 7,337,091 | | | | 3,169,172 | | | | — | | | | 10,683,631 | |
| Aggressive Growth Fund | | | — | | | | — | | | | 548,517 | | | | — | | | | 548,517 | |
| Balanced Fund | | | 823,964 | | | | 4,667,755 | | | | 2,725,223 | | | | — | | | | 8,216,942 | |
| Strategic Growth Fund | | | 311,092 | | | | 3,457,716 | | | | 4,270,636 | | | | — | | | | 8,039,444 | |
Quantex FundTM | | | 94,759 | | | | 112,273 | | | | 963,205 | | | | — | | | | 1,170,237 | |
| Utilities & Infrastructure Fund | | | 214,711 | | | | — | | | | — | | | | — | | | | 214,711 | |
| Total Return Bond Fund | | | 3,309,309 | | | | — | | | | — | | | | — | | | | 3,309,309 | |
| Money Market Fund | | | 124,107 | | | | — | | | | — | | | | — | | | | 124,107 | |
| Page 74 | 2014 Annual Report | December 31, 2014 |
As of December 31, 2014, the components of accumulated earnings/(deficit) on a tax basis for the Funds were as follows:
| | | Undistributed Ordinary Income | | | Accumulated Capital and Other Gains and (Losses) | | | Unrealized Appreciation/(Depreciation)** | | | Total Accumulated Earnings/(Deficit) | |
Muirfield Fund® | | $ | 3,939,172 | | | $ | 5,238,660 | | | $ | 17,166,365 | | | $ | 26,344,197 | |
| Dynamic Growth Fund | | | 941,178 | | | | 486,838 | | | | 9,846,525 | | | | 11,274,541 | |
| Aggressive Growth Fund | | | 596,373 | | | | 282,470 | | | | 6,201,568 | | | | 7,080,411 | |
| Balanced Fund | | | 751,209 | | | | 721,296 | | | | 6,379,595 | | | | 7,852,100 | |
| Strategic Growth Fund | | | — | | | | 2,741,389 | | | | 2,052,176 | | | | 4,793,565 | |
Quantex FundTM | | | 269,412 | | | | 389,110 | | | | 11,185,575 | | | | 11,844,097 | |
| Utilities & Infrastructure Fund | | | — | | | | 804,279 | | | | 9,131,259 | | | | 9,935,538 | |
| Total Return Bond Fund | | | 1 | | | | (1,497,425 | ) | | | (3,210,183 | ) | | | (4,707,607 | ) |
| Money Market Fund | | | 1 | | | | — | | | | — | | | | 1 | |
| * | Total dividends paid may differ from the amount reported in the Statement of Changes in Net Assets because for tax purposes dividends are recognized when actually paid. |
| ** | The differences between book- and tax-basis unrealized appreciation/(depreciation) are attributable primarily to: deferral of post-October losses, wash sales, and the realization for tax purposes of unrealized gains/(losses) on certain derivative instruments. |
The Strategic Growth Fund and Total Return Bond Fund elected to defer post-October losses in the amounts of $771,255 and $355,071, respectively.
For federal income tax purposes, the following Fund has capital loss carryforwards as of December 31, 2014, which are not subject to expiration and are available to offset future capital gains, if any. To the extent that these carryforwards are used to offset future capital gains, it is probable that the gains that are offset will not be distributed to shareholders:
| Capital Loss Carryforwards | | Amount | | Tax Character |
| Total Return Bond Fund | | $ | 1,495,858 | | Short-term |
| Total Return Bond Fund | | | 1,567 | | Long-term |
The beneficial ownership, either directly or indirectly, of more than 25% of the voting securities of a fund creates a presumption of control of the fund under Section 2(a)(9) of the 1940 Act. As of December 31, 2014, account holders that held more than 25% of the voting securities of the Funds and may be deemed to control the Funds are as follows:
| Name of Account Holder | Percent of
Voting Securities |
| Dynamic Growth Fund | Nationwide Trust Company, FSB and certain affiliates held for the benefit of others | 41% |
| Aggressive Growth Fund | Nationwide Trust Company, FSB and certain affiliates held for the benefit of others | 46% |
| Balanced Fund | Nationwide Trust Company, FSB and certain affiliates held for the benefit of others | 42% |
| Balanced Fund | National Financial Services Corp. and certain affiliates held for the benefit of others | 30% |
| Strategic Growth Fund | Nationwide Trust Company, FSB and certain affiliates held for the benefit of others | 78% |
| Total Return Bond Fund | Nationwide Trust Company, FSB and certain affiliates held for the benefit of others | 48% |
| Total Return Bond Fund | National Financial Services Corp. and certain affiliates held for the benefit of others | 26% |
Money Market Fund –
Institutional Class | Carey & Co. held for the benefit of others | 97% |
2014 Annual Report | December 31, 2014 | Page 75 |
Management evaluated subsequent events through the date these financial statements were issued and concluded no subsequent events required recognition or disclosure in these financial statements.
| 8. | Board Review of Investment Advisory and Subadvisory Agreements (unaudited) |
At a meeting held September 16, 2014, the Board of Trustees (the “Board”), including a majority of non-interested or independent Trustees, approved the renewal of the investment advisory agreements for each of the separate funds comprising the Meeder Funds (the “Funds”) and the investment sub-advisory agreement relating to the Utilities and Infrastructure Fund (individually, an “Agreement” and collectively, the “Agreements”).
The Board reviewed materials sent to each Trustee in advance of the meeting for consideration in determining whether to approve the renewal of each Fund’s Agreements. Management reviewed with the Trustees the materials prepared by them in response to Funds’ legal counsel’s supplemental written request pursuant to Section 15(c) of the Investment Company Act of 1940 for the provision to the Trustees of appropriately updated and amended information necessary or appropriate to assist the Trustees in their deliberations concerning renewal of the Agreements. In reaching the decision to renew the Agreements, the Board also took into account information furnished throughout the year at regular Board meetings. Information furnished and discussed throughout the year included investment performance reports and related financial information for each Fund, as well as periodic reports on shareholder services, legal compliance, pricing, brokerage commissions and execution and other services provided by the investment manager, Meeder Asset Management, Inc. (“Manager”) and its affiliates, or by or on behalf of the Utilities and Infrastructure Fund’s Subadviser, Miller/Howard Investments, Inc. Information furnished specifically in connection with the renewal process included a report for the Funds prepared by Lipper Financial Services (“Lipper”), an independent organization, as well as a Funds’ profitability analysis prepared by the Manager. The Lipper report compared each Fund’s management fees and expenses with those of other mutual funds deemed comparable to the Fund. The Funds’ profitability analysis discussed the profitability to the Manager and Mutual Funds Service Co., an affiliate of the Manager, from the overall Funds’ operations, as well as an analysis based on the profitability resulting from the operation of each individal Fund, utilizing expense allocation methodologies deemed reasonable by the Manager.
In considering such materials, the independent Trustees noted that they had received assistance and advice from and met separately with the Funds’ legal counsel and chief compliance officer prior to this meeting. In their deliberations, the Board dealt with each Fund separately. In approving continuance of the Agreement for each Fund, the Board, including a majority of independent Trustees, considered each Fund’s Agreement, a copy of which was made available at the meeting, and determined that the existing management fee structure was fair and reasonable and that continuance of the Agreement was in the best interests of each Fund and its shareholders. While attention was given to all information furnished, the following discusses the primary factors relevant to the Board’s decision.
Nature, Extent and Quality of Services. The Board continues to be satisfied with the nature and quality of the overall services provided by the Manager and its affiliates to the Funds and their shareholders. In addition to investment performance and expenses discussed earlier, the Board’s opinion was based, in part, upon periodic reports furnished them showing that the investment policies and restrictions for each Fund were consistently complied with as well as other reports periodically furnished the Board. Other factors taken into account by the Board were the Manager’s compliance procedures and the qualifications of the Manager’s chief compliance officer. Consideration was also given to the experience of each Fund’s portfolio management team. The Board also took into account the transfer agent, fund accounting agent and administrative services provided to Fund shareholders by an affiliate of the Manager, noting continuing expenditures by management to increase and improve the scope of such services. Similar considerations were applied to the Subadviser to the Utilities and Infrastructure Fund.
| Page 76 | 2014 Annual Report | December 31, 2014 |
Investment Performance. The Board placed emphasis on the investment performance of each Fund in view of its importance to shareholders. While consideration was given to performance reports and discussions with portfolio managers at Board meetings during the year, particular attention in assessing performance was given to the Lipper reports furnished for the Agreement renewals. The Lipper report prepared for each Fund showed the investment performance of the Fund for the one-, three-, five-, and ten-year periods, as applicable, ended June 30, 2014 (the “relevant periods”) in comparison with a performance universe similar to each Fund’s investment objectives.
| Fund | Performance Benchmark |
Muirfield Fund® | Blended Benchmark of 60% S&P 500 Index and 40% Average 90-day U.S. T-Bill; S&P 500 Index; Lipper’s Average Flexible Portfolio Fund Universe; Lipper Index1 |
Quantex FundTM | Blended Benchmark of 50% Russell 2000 Index and 50% S&P 400 Mid-Cap Index; Russell 2000 Index; S&P 400 Mid-Cap Index; Lipper’s Average Mid-Cap Value Fund Universe; Lipper Index1 |
| Dynamic Growth Fund | S&P 500 Index; Lipper’s Average Multi-Cap Core Fund Universe; Lipper Index1 |
| Utilities and Infrastructure Fund | Russell 3000 Utilities Index; Lipper’s Average Utility Fund Universe; Lipper Index1 |
| Aggressive Growth Fund | S&P 500 Index; Lipper’s Average Multi-Cap Value Fund Universe; Lipper Index1 |
Balanced Fund | S&P 500 Index; Blended Benchmark consisting of 30% Barclays Intermediate Government/Credit Index, 42% S&P 500 Index, and 28% Average 90-day U.S. T-Bill; Lipper’s Average Flexible Portfolio Fund Universe; Lipper Index1 |
| Strategic Growth Fund | S&P 500 Index; Blended Benchmark of 25% S&P 500 Index, 20% S&P 400 Index, 10% Russell 2000 Index, 15% MSCI EAFE Index, 15% iShares MSCI Emerging Markets Index, 7.5% Dow Jones U.S. Select Real Estate Investment Trust, 7.5% Goldman Sachs Commodity Index; Lipper’s Average Multi-Cap Value Fund Universe; Lipper Index1 |
| Total Return Bond Fund | Barclays Aggregate Bond Index; Lipper’s Average General Bond Fund Universe; Lipper Index1 |
| Money Market Fund | |
| Retail Class | Lipper Average General Purpose Money Market Fund |
| Institutional Class | Lipper Average General Purpose Money Market Fund |
| 1 | Given an adequate quantity of funds, the Lipper Index for a given investment classification or objective consists of the largest ten or thirty funds in that classification or objective. Each index is calculated daily with adjustments for dividends and capital gains. |
Comparative Expenses. Consideration was given to a comparative analysis of the management fees and total expense ratios of each Fund compared with those of a group of other funds. The Board also considered an analysis comparing the Funds’ management fees with the fees charged by the Manager to private clients, but noted the significant differences in services provided to the Funds and the private clients.
Management Profitability. The Board also considered the level of profits realized by the Manager and its affiliates in connection with the operation of the Funds. In this respect, the Board reviewed the Funds’ profitability analysis that addresses the overall profitability of the Meeder Funds’ business, as well as the profitability resulting from the operation of each Fund. The Board also considered the extent to which the Manager and its affiliates might derive ancillary benefits from fund operations, including potential benefits resulting from allocation of fund brokerage and the use of “soft” commission dollars to pay for research. The Board also took into account management’s expenditures in improving shareholder services provided to the Funds, as well as the need to meet additional regulatory and compliance requirements resulting from recent SEC requirements. The Board determined that the level of profits realized by the Manager under its Agreements with the Funds was not excessive in view of the nature, quality and extent of services provided.
2014 Annual Report | December 31, 2014 | Page 77 |
Economies of Scale. The Board also considered whether economies of scale are realized by the Manager as the Funds grow larger and the extent to which this is reflected in the level of management fees charged. While recognizing that any precise determination is inherently subjective, the Board noted that based upon the Funds’ profitability analysis, it appears that as some Funds get larger, at some point economies of scale do result in the Manager realizing a larger profit margin on management services provided to such a Fund. The Board also noted that economies of scale are shared with each Fund and its shareholders through management fee breakpoints so that as a Fund grows in size, its effective management fee rate declines. Further, the Board noted that investments in the Fund business made by Meeder, and the resulting improvements in Fund operations and shareholder services, was an additional way in which any potential economies of scale were shared with each Fund and its shareholders. The Board reviewed, and expressed continued satisfaction with, each Fund’s fee structure under its Agreement, as well as the Utilities and Infrastructure Fund’s fee structure under the investment sub-advisory agreement with Miller/Howard Investments, Inc.
| Page 78 | 2014 Annual Report | December 31, 2014 |
Report of Independent Registered Public Accounting Firm
To the Shareholders and Board of Trustees of
Meeder Funds
We have audited the accompanying statements of assets and liabilities, including the schedules of investments, of the Meeder Funds comprising Muirfield Fund, Dynamic Growth Fund, Aggressive Growth Fund, Balanced Fund, Strategic Growth Fund, Quantex Fund, Utilities and Infrastructure Fund, Total Return Bond Fund, and Money Market Fund (the “Funds”) as of December 31, 2014, and the related statements of operations for the year then ended, the statements of changes in net assets for each of the two years in the period then ended, and the financial highlights for each of the five years in the period then ended for Muirfield Fund, Dynamic Growth Fund, Aggressive Growth Fund, Balanced Fund, Strategic Growth Fund, Quantex Fund, Utilities and Infrastructure Fund, and Money Market Fund, and the related statements of operation for the year then ended, statement of changes in net assets for each of the two years in the period then ended, and the financial highlights for the four periods in the period then ended for Total Return Bond Fund. These financial statements and financial highlights are the responsibility of the Funds’ management. Our responsibility is to express an opinion on these financial statements and financial highlights based on our audits.
We conducted our audits in accordance with the standards of the Public Company Accounting Oversight Board (United States). Those standards require that we plan and perform the audit to obtain reasonable assurance about whether the financial statements and financial highlights are free of material misstatement. An audit includes examining, on a test basis, evidence supporting the amounts and disclosures in the financial statements. Our procedures included confirmation of securities owned as of December 31, 2014, by correspondence with the custodians and brokers. An audit also includes assessing the accounting principles used and significant estimates made by management, as well as evaluating the overall financial statement presentation. We believe that our audits provide a reasonable basis for our opinion.
In our opinion, the financial statements and financial highlights referred to above present fairly, in all material respects, the financial position of each of the Funds constituting the Meeder Funds, as of December 31, 2014, and the results of their operations for the year then ended, the changes in their net assets for each of the two years in the period then ended, and the financial highlights for the periods indicated above, in conformity with accounting principles generally accepted in the United States of America.
COHEN FUND AUDIT SERVICES, LTD.
Cleveland, Ohio
February 24, 2015
2014 Annual Report | December 31, 2014 | Page 79 |
Trustees and Officers (unaudited)
Certain trustees and officers of the Funds are also officers or directors of Meeder, MAM, and MFSCo. The Trustees oversee the management of the Trust and elect its officers. The officers are responsible for the Funds’ day-to-day operations. The Trustees’ and officers’ names, addresses, years of birth, positions held with the Trust, and length of service with the Meeder Funds are listed below. Also included is each Board member’s principal occupation during, at least, the past five years. Except as indicated, each individual has held the office shown or other offices in the same company for the last five years. Those Trustees who are “interested persons”, as defined in the 1940 Act, by virtue of their affiliation with the Trust, are indicated by an asterisk (*).
Name, Address1,
and Year of Birth | Year First Elected a Trustee or Officer of the Trust | Position and Number
of Funds Overseen2 | Principal Occupation During
Past Five Years and Other
Directorships Held |
Robert S. Meeder, Jr.* Year of Birth: 1961 | 1992 | Trustee and President | President of Meeder Asset Management, Inc. |
Jack W. Nicklaus** Year of Birth: 1961 | 1998 | Trustee | Designer, Nicklaus Design, a golf course design firm and division of The Nicklaus Companies. |
Stuart M. Allen** Year of Birth: 1961 | 2006 | Trustee | President of Gardiner Allen DeRoberts Insurance LLC, an insurance agency; Chairman of the Trust’s Audit Committee. |
Anthony D’Angelo** Year of Birth: 1959 | 2006 | Trustee | General Manager, WSYX ABC 6 /WTTE-TV Fox 28 /WWHO television stations, Columbus, Ohio, operated by Sinclair Broadcast Group (2014 – present); Director of Sales (2004 – 2014); Lead Trustee of the Trust. |
Dale W. Smith Year of Birth: 1959 | 2006 | Vice President | Chief Financial Officer of Meeder Asset Management, Inc. (2005 – present); formerly Senior Vice President of Financial Services of BISYS Fund Services (1996 – 2004). |
Mary “Maggie” Bull Year of Birth: 1966 | 2011 | Chief Compliance Officer | Chief Compliance Officer, Legal Counsel and Anti-Money Laundering Officer of the Funds (2011 – present); Independent Legal Consultant (2007 – 2010); Assistant General Counsel of Nationwide (2006 – 2007). |
Bruce E. McKibben Year of Birth: 1969 | 2002 | Treasurer | Director of Fund Accounting of Mutual Funds Service Co., the Trust’s transfer agent (1997 – present). Interim Chief Operating Officer of Meeder Asset Management, Inc. (June 2008 – October 2008). |
Ruth Kirkpatrick Year of Birth: 1951 | 2009 | Secretary, pro tempore | Senior Legal Specialist of Meeder Asset Management, Inc. |
| 1 | The address of each Trustee is 6125 Memorial Drive, Dublin, OH 43017. |
| 2 | Each Trustee serves for an indefinite term, until his or her resignation, death, or removal. Each Trustee oversees all nine Funds in the Trust. |
| * | Robert S. Meeder, Jr. is deemed an “interested person” of the Trust by virtue of his position as President of Meeder Asset Management, Inc., the Advisor of the Trust. |
| ** | Each independent Trustee is a member of the Trust’s Audit Committee, Compensation Committee, and Nominating Committee. |
The Statement of Additional Information includes additional information about each Trustee and is available without charge. To obtain a copy of the Statement of Additional Information, please contact your financial representative or call toll free 1-800-325-3539.
| Page 80 | 2014 Annual Report | December 31, 2014 |
The Funds file their complete schedules of portfolios holdings with the Securities and Exchange Commission (“SEC”) for the first and third quarters of each fiscal year on Form N-Q. In addition, Money Market Fund files its complete schedule of portfolio holdings with the SEC each month on Form N-MFP. The Funds’ Forms N-Q and N-MFP are available on the SEC’s website at http://www.sec.gov and may be reviewed and copied at the SEC’s Public Reference Room in Washington, DC. Information on the operation of the Public Reference Room may be obtained by calling 1-800-SEC-0330. The Funds’ schedules of positions are also available on the Funds’ website at www.meederfunds.com.
A description of the policies and procedures that the Funds use to determine how to vote proxies related to portfolio securities, and information regarding how the Funds voted these proxies for the 12-month period ended June 30, 2014, is available on the SEC’s website at http://www/sec.gov, or, without charge, upon request by calling toll-free 1-800-325-3539.
2014 Annual Report | December 31, 2014 | Page 81 |
[This page intentionally left blank]
[This page intentionally left blank]
[This page intentionally left blank]
Manager and Investment Advisor
Meeder Asset Management, Inc.
6125 Memorial Drive
P.O. Box 7177
Dublin, Ohio 43017
Subadvisor/Utilities and Infrastructure Fund
Miller/Howard Investments, Inc.
141 Upper Byrdcliffe Road, P.O. Box 549
Woodstock, New York 12498
Board of Trustees
Stuart Allen
Anthony D’Angelo
Robert S. Meeder
Jack Nicklaus II
Custodian
The Huntington National Bank
Columbus, Ohio 43215
Transfer Agent & Dividend Disbursing Agent
Mutual Funds Service Co.
6125 Memorial Drive
Dublin, Ohio 43017
Independent Registered Public Accounting Firm
Cohen Fund Audit Services, Ltd.
1350 Euclid Ave., Suite 800
Cleveland, Ohio 44115
Distributor
Adviser Dealer Services, Inc.
6125 Memorial Drive
Dublin, Ohio 43017
Item 2. Code of Ethics.
The registrant has adopted a code of ethics that applies to the registrant’s principal executive officer, principal financial officer, comptroller or principal accounting officer, and any person who performs a similar function.
Item 3. Audit Committee Financial Expert.
Currently, the Meeder Funds (the “Funds”) do not have an Audit Committee member who possesses all of the attributes required to be an "audit committee financial expert" as defined in instruction 2(b) of Item 3 of Form N-CSR. However, the Board of Trustees believes that each member of the Audit Committee has substantial experience relating to the review of financial statements and the operations of audit committees. Accordingly, the Board of Trustees believes that the members are qualified to evaluate the Funds’ financial statements, supervise the Funds’ preparation of its financial statements, and oversee the work of the Funds’ independent auditors. The Board of Trustees also believes that, although no single Audit Committee member possesses all of the attributes required to be an “audit committee financial expert”, the Audit Committee members collectively as a group possess the attributes required to be an “audit committee financial expert.”
Item 4. Principal Accountant Fees and Services.
(a) – (d) Aggregate fees billed to the registrant for the last two fiscal years for professional services rendered by the registrant’s principal accountant were as follows:
| | 2014 | 2013 |
| Audit Fees | $74,250 | $72,000 |
| Audit-Related Fees | 300 | 600 |
| Tax Fees | 22,500 | 22,500 |
| All Other Fees | 2,900 | 1,800 |
Audit fees include amounts related to the audit of the registrant’s annual financial statements and services normally provided by the accountant in connection with statutory and regulatory filings. Audit-related fees include amounts reasonably related to the performance of the audit of the registrant’s financial statements. Tax fees include amounts related to tax compliance, tax planning, and tax advice. All other fees include amounts related to the registrant’s annual filing of Form N1A.
(e)(1) A purpose of the Audit Committee is to approve the engagement of the registrant’s independent auditors (i) to render audit and non-audit services for the registrant in accordance with Rule 2-01(c)(7)(i) of Regulation S-X, subject to the waiver provisions set forth in Rule 2-01(c)(7)(i)(C) of Regulation S-X, and (ii) to render non-audit services for the registrant’s investment advisors (other than a sub-advisor whose role is primarily portfolio management and is subcontracted or overseen by another investment advisor) and any other entity controlling by, or under common control with the investment advisor that provides ongoing services to the registrant, in each case under (ii) if the engagement relates directly to the operations and financial reporting of the registrant, in accordance with Rule 2-01(c)(7)(ii) of Regulation S-X, subject to waiver provisions set forth in Rule 2-01(c)(7)(ii) of Regulation S-X.
(e)(2) 100% of services included in (b) – (d) above were approved pursuant to Rule 2-01(c)(7)(i)(C) of Regulation S-X.
(f) Not applicable.
(g) The aggregate fees billed for the most recent fiscal year and the preceding fiscal year by the registrant’s principal accountant for non-audit services rendered to the registrant, its investment advisor, and any entity controlling, controlled by, or under common control with the investment advisor that provides ongoing services to the registrant were $33,850 and $43,100 respectively.
(h) Not applicable.
Items 5. Audit Committee of Listed Registrants.
Not applicable.
Item 6. Schedule of Investments.
Not applicable.
Item 7. Disclosure of Proxy Voting Policies and Procedures for Closed-End Management Investment Companies.
Not applicable.
Item 8. Portfolio Managers of Closed-End Management Investment Companies.
Not applicable.
Item 9. Purchases of Equity Securities by Closed-End Management Investment Company and Affiliated Purchasers.
Not applicable.
Item 10. Submission of Matters to a Vote of Security Holders.
Not applicable.
Item 11. Controls and Procedures.
(a) Based on our evaluation conducted within 90 days of the filing date, hereof, the design and operation of the registrant's disclosure controls and procedures are effective to ensure that material information relating to the registrant is made known to the certifying officers by others within the appropriate entities, particularly during the period in which Forms N-CSR are being prepared, and the registrant's disclosure controls and procedures allow timely preparation and review of the information for the registrant's Form N-CSR and the officer certifications of such Form N-CSR.
(b) There were no significant changes in the registrant's internal controls or in other factors that could significantly affect these controls subsequent to the date of their evaluation, including any corrective actions with regard to significant deficiencies and material weaknesses.
Item 12. Exhibits.
(a)(1) Code of Ethics filed herewith as EX-99.CODE ETH.
(a)(2) A separate certification for each principal executive and principal financial officer of the registrant as required by Rule 30a-2(a) under the Act(17 CFR270.30a-2(a)). Filed herewith as EX-99.CERT.
(b) Certifications of principal executive officer and principal financial officer, under Section 906 of the Sarbanes-Oxley Act of 2002, and 18 U.S.C. ss.1350. Filed herewith as EX-99.906 CERT.
SIGNATURES
Pursuant to the requirements of the Securities Exchange Act of 1934 and the Investment Company Act of 1940, the registrant has duly caused this report to be signed on its behalf by the undersigned, thereunto duly authorized.
Meeder Funds
Bruce E. McKibben, Treasurer
Pursuant to the requirements of the Securities Exchange Act of 1934 and the Investment Company Act of 1940, this report has been signed below by the following persons on behalf of the registrant and in the capacities and on the dates indicated.
Bruce E. McKibben, Treasurer
| By: | /s/ Robert S. Meeder, Jr. |
Robert S. Meeder, Jr., President