UNITED STATES SECURITIES AND EXCHANGE COMMISSION
Washington, D.C. 20549
FORM N-CSR
CERTIFIED SHAREHOLDER REPORT
OF REGISTERED MANAGEMENT INVESTMENT COMPANIES
Investment Company Act file number 811-3462
Meeder Funds Trust
6125 Memorial Drive
Dublin, OH 43017
Bruce McKibben
c/o Meeder Funds Trust
6125 Memorial Drive
Dublin, OH 43017
Registrant’s telephone number, including area code: 800-325-3539
Date of fiscal year end: December 31, 2013
Date of reporting period: December 31, 2013
Item 1. Report to Stockholders.
TABLE OF CONTENTS
| Letter to Shareholders | 1 |
| Money Market Fund | 4 |
| Total Return Bond Fund | 6 |
Quantex FundTM | 8 |
Muirfield Fund® | 10 |
| Balanced Fund | 12 |
| Dynamic Growth Fund | 14 |
| Aggressive Growth Fund | 16 |
| Strategic Growth Fund | 18 |
| Utilities and Infrastructure Fund | 20 |
| Shareholder Expense Analysis | 22 |
| Disclosures | 23 |
Our Mission Statement Every day, our mission is to exceed, with integrity, passion, and discipline, the expectations of our clients’ overall investment experience. Core Values Integrity We hold ourselves to the highest standards, acting ethically, honestly, and with the best interests of our clients in mind.
Passion We take pride in our work and believe in our strategies and our people.
Discipline We employ proven processes in our pursuit for exceptional results and distinguished service.
Results We are committed to accomplishing the goals of our clients and ourselves through responsible, diligent strategies.
Excellence We strive to exceed expectations in everything we do and seek innovative ways to solve problems and capitalize on opportunities. |
LETTER TO SHAREHOLDERS December 31, 2013
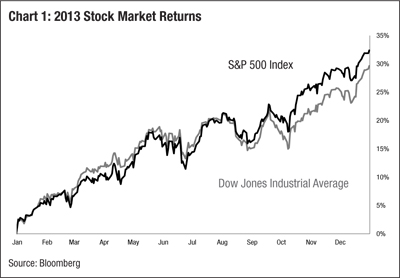
The start of 2013 was bolstered on the resolution of 2012’s fiscal cliff (an amalgamation of tax hikes and government spending cuts that coincided with December 31, 2012). As a last minute deal was struck, markets started the year trading with a tremendous 2.5% increase within the first trading day of 2013. That performance continued to gain momentum throughout the year as economic, political, and monetary events unfolded.
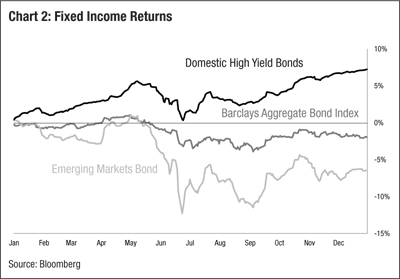
For the year ending December 31, 2013, the S&P 500 Index posted solid gains with a return of 32.39%, while the Dow Jones Industrial Average returned 29.65% (Chart 1). In fixed income markets, the Barclays Aggregate Bond Index posted a return of -2.02% for the year, while emerging market debt and high yield bonds posted returns of -6.45% and 7.44%, respectively (Chart 2).
Political
Coinciding with the fiscal cliff in the first quarter of 2013 was a warning from the US Treasury that America was getting close to hitting its debt ceiling, or legal limit the government can borrow. Had measures not been taken, the US Government would have been left in a precarious position by the end of February. Thankfully, a resolution was quickly addressed and the markets regained focus on economic releases and general business factors. The resolution agreed to in January allowed Congress to extend the debt ceiling by several months, unknowingly setting up the perfect storm of political wrangling to take place in early October.
This wrangling revolved around the continuation of the aforementioned debt ceiling in addition to the government’s yearly budgetary issues. Historically, Congress has passed a continuing resolution, giving themselves more time to work out any shortfalls within the following year’s budget. However, due to Republican’s obstinate stance on the new healthcare law, the House proposed a continuing resolution containing a provision that called for the defunding of the Affordable Care Act, commonly referred to as Obamacare. As September wound down, it was evident that Senate Democrats and House Republicans would not come to an agreement on either a budget or continuing resolution. While essential services were maintained, anything considered otherwise ceased and the government officially shutdown. Of greater importance was the issue of the debt ceiling, as it continued to pose a significant threat to the global financial markets should it have gone unresolved. Once again, a last minute resolution took place where Congress raised the debt ceiling and later passed a budget, re-opening the government.
Monetary
The Federal Reserve continued to play a dominant force in 2013 as the institution started the year with a limitless amount of quantitative easing (QE), the equivalent to printing electronic money. In late May/early June, the Federal Reserve made statements indicating they would reduce QE if sufficient data supported such an action. As the unwinding of unprecedented policy has started to take
| 2013 Annual Report | December 31, 2013 | Page 1 |
place, the ripple effects of such a move will be far and wide. To illustrate, in the second quarter when the Fed first mentioned a cutback to QE, the ten year treasury yield climbed to 2.52% from where it was at the beginning of the quarter at 1.87%. This rippled through, causing the US Dollar to strengthen as capital searched for higher interest rates. This strength in the US Dollar led to a weakening of emerging market currencies. As investors sold those emerging market currencies, they sold the assets in which those currencies were invested (i.e. stocks and bonds). It is important to note interest rates have a substantial effect on many assets. As interest rates rise, the cost of capital for companies goes up making their future earnings worth less. Also, the prospects for inflation go down, causing a decline in commodity type hedges such as gold.
As the markets continued into late September, top officials of the Federal Reserve met and, much to the surprise of the market, decided to keep the current pace of quantitative easing unchanged at $85 billion per month. As a result, the response from many strategists and commentators was critical of the Fed’s actions and questioned when they would begin to taper their QE program.
By the end of the fourth quarter, the Fed announced a cutback of $10 billion in monthly purchases. Even though this may appear to be a significant amount, it is worth noting that this is only a minor reduction in the pace at which the Fed continues to grow the money supply. The steps instituted and carried out by the Federal Reserve were, and continue to be, significant enough to ensure the Federal Reserve a spot on discussion boards for quite some time.
Economics
The past year saw upbeat economic data support the stellar rise in the stock market. To highlight a few metrics, retail sales, jobless claims, and home sales continued to improve throughout the year. With so much of the American economy dependent on the consumer, we were delighted to see the consumer gaining confidence and spending a bit more. This went hand-in-hand with an improving labor market.
The 4 week average of initial jobless claims trended down for most of 2013. Although the end of the year saw a spike in claims, the overall level remained below 400,000, a threshold thought to signal an improving employment picture. While the unemployment rate has continued to trend down, we tend to weigh the initial claims a little heavier over the official posted unemployment rate as the latter is prone to more distortions in calculation.
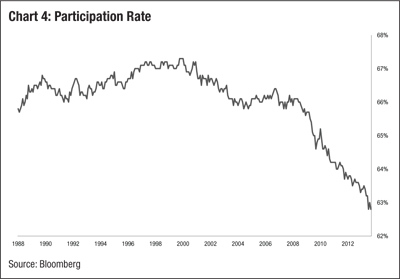
The biggest issue within jobs revolved around the “true” unemployment rate. On the surface, the unemployment rate has come down (Chart 3). However, this was also coupled with a lower participation rate (Chart 4). To briefly describe the participation rate, it is the percentage of working age people that are employed or looking for employment. In effect, what happened was the unemployment rate came down, but partially as a result of people leaving the workforce, not an increase in people becoming employed. This point is highly contentious but material enough of an issue that the Federal Reserve cited a lower participation rate as one of their supporting factors in not reducing quantitative easing in September.
| Page 2 | 2013 Annual Report | December 31, 2013 |
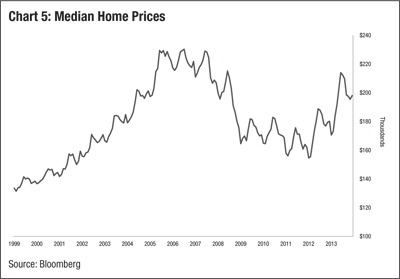
An improving housing market also supported the economic recovery throughout 2013. While there are peculiarities in interpreting housing numbers, overall, these were a welcomed sign for the economy given housing can account for 17% of US GDP. Homebuilder confidence rose, giving support to future expenditures within this vital part of the economy. In addition, median home prices rose (chart 5), giving indirect support to a better business environment.
In general, our models trended right along with the economic releases in being positive, and helped us achieve strong performance for the year. In fact, seven of Meeder’s nine Funds beat their benchmarks for the year. As gratifying as this is to us, one should not conclude if we or any investment manager has been successful based upon short-term returns. What is more important in determining success or failure is the long-term result of that particular investment solution/portfolio. With that said, we are pleased with the long-term performance as our investment solutions continue to confirm that our proven process has added value for our clients over time.
Outlook 2014
We expect that many of the themes that influenced the markets in 2013 will continue to feature prominently in 2014 as well. Perhaps the biggest catalyst for market movements this year will revolve around the Fed, where the actions and comments of a new Fed Chairman will be closely scrutinized amidst a backdrop of tapering in quantitative easing. As it pertains to the stock market, we believe upside potential will depend more on earnings expansion as opposed to the willingness of investors to pay more for those earnings via a higher price-to-earnings ratio. Since corporate profit margins are running near historical peaks, we believe that sales growth will be critical to the earnings story. In addition, macro factors such as global growth and pending government action will continue to influence markets in 2014 just as it did last year.
As we monitor the capital markets and our investment models, we will continuously evaluate our defensive position in the Muirfield Fund® and the equity portion of the Balanced Fund. We will look for opportunities to adjust portfolio weights among growth and value stocks, large-, mid-, and small-caps, and domestic and international investments in order to enhance returns and manage risk for our clients. We will also continue to proactively manage our sector exposures and will make adjustments as our investment models evolve. We will continue to select securities that we believe are best positioned to outperform. In our fixed income Funds, we will look to enhance returns by managing credit quality as well as adjusting portfolio durations.
On the following pages, you will find a review of how the Meeder Funds® have performed. Please read the commentaries to learn more about the investment decisions we made during the past year. On behalf of all of the associates at Meeder Asset Management and the Meeder Funds®, we thank you for the trust and confidence you have placed in our investment management services.
Robert S. Meeder
President
Meeder Funds®
December 31, 2013
| 2013 Annual Report | December 31, 2013 | Page 3 |
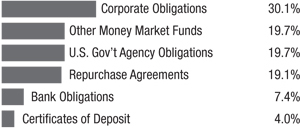
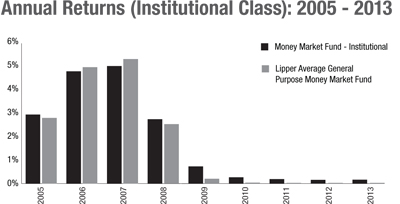
Money Market Fund The Meeder Money Market Fund enjoyed continued success versus the competition in 2013, with both the retail and institutional share classes ranking among the top general purpose money market funds in the country. For the year ended December 31, 2013, the retail class was recognized by Crane Data, LLC for having the highest total return out of 221 prime retail money market funds. The Fund was also ranked 1st for performance on a 5-year return basis. Consistency continues to be extremely important when managing the Fund as it has been in the top 10% of all general purpose money market funds since its inception in 1985. The Money Market Fund industry continued to be in the middle of a challenging market environment during 2013. With the Fed’s target interest rate locked in at historically low levels, corresponding short-term investment opportunities were limited. Despite the movement in bonds with greater credit and duration risk, short-term fixed income securities with maturities of less than one year were virtually unchanged during the year. Expectations were still abound that the Fed would leave the target interest rate locked at its current range of 0.00-0.25% for potentially another two years. Yield spreads of higher quality investments, as compared to U.S. Treasury bills, showed limited value throughout the year. At times, value was presented in longer dated offerings, with the Fund in position to take advantage of the opportunity. During 2013, we maintained a weighted average maturity that was below that of our peers. Holdings in the Fund remained allocated toward investments with superior credit quality, as we believed the risk and reward relationship favored this position. Our sector allocation favored an overweight in high quality liquid investments and short-term investment grade corporate debt. At the end of 2013, the Fund’s composition was as follows: 30% corporate obligations, 20% other money market funds, 20% U.S. government agency, 19% repurchase agreements, 7% bank obligations, and 4% certificates of deposit. As we complete the year, we believe the Fund is positioned to maintain its strong performance in a difficult environment. As we continuously monitor the markets and our strategy, we will remain vigilant and keep in mind the best interests of our shareholders. |
Period & Average Annual Total Returns as of December 31, 2013 (Unaudited)
| | 1 Year | 3 Year | 5 Year | 10 Year | Inception Date |
Money Market Fund - Retail Class Expense Ratios+: Audited Net 0.22% Gross 0.82% | 0.08% | 0.09% | 0.22% | 1.72% | 3/27/85 |
| Current & Effective Yields* | 7-day Compound: 0.09% | 7-day Simple: 0.09% |
| Lipper Average General Purpose Money Market Fund | 0.01% | 0.01% | 0.06% | 1.53% | 3/31/85 |
| | 1 Year | 3 Year | 5 Year | Since Inception | Inception Date |
Money Market Fund - Instl Class Expense Ratios+: Audited Net 0.15% Gross 0.63% | 0.14% | 0.17% | 0.31% | 1.90% | 12/28/04 |
| Current & Effective Yields* | 7-day Compound: 0.13% | 7-day Simple: 0.13% |
| Lipper Average General Purpose Money Market Fund | 0.01% | 0.01% | 0.06% | 1.61% | 12/31/04 |
 | | Fund Weightings as of December 31, 2013 Fund Weightings are subject to change. |
| | | |
 | | Top 10 Holdings as of December 31, 2013 |
| 1. | Fidelity Money Market Portfolio | 19.7% |
| 2. | G.X. Clarke Repurchase Agreement, 0.21%, 1/2/2014 | 9.5% |
| 3. | G.X. Clarke Repurchase Agreement, 0.16%, 1/7/2014 | 9.5% |
| 4. | Caterpillar Financial Power Investment Floating Rate Demand Note, 0.60% | 9.4% |
| 5. | GE Demand Note, 0.70% | 8.6% |
| 6. | FFCB, 0.226%, 9/24/2014 | 5.4% |
| 7. | FNMA, 0.36%, 6/23/2014 | 4.8% |
| 8. | FFCB, 0.06%, 5/13/2014 | 4.8% |
| 9. | FFCB, 0.09%, 10/28/2014 | 4.8% |
| 10. | MetLife Inst. Funding Agreement, 1.144%, 4/4/2014 | 4.6% |
| As a percentage of total net assets |
Performance quoted represents past performance. Past performance does not guarantee future results. All performance figures represent average annual total returns for the periods ended December 31, 2013, and assume reinvestment of all dividend and capital gain distributions. The investment return and principal value of an investment will fluctuate so that an investor’s shares, when redeemed, may be worth more or less than their original cost. Current performance may be higher or lower than the performance quoted. Current month-end performance may be obtained at www.meederfunds.com or by calling (800) 325-3539. Management fees were waived and/or expenses were reimbursed in order to reduce the operating expenses of both the retail class and the institutional class of the Money Market Fund during the periods shown above. Investments in the Money Market Fund are neither insured nor guaranteed by the Federal Deposit Insurance Corporation or any other governmental agency. Although the Fund seeks to preserve the value of your investment at $1.00 per share, it is possible to lose money by investing in the Money Market Fund. + The Audited Net Expense Ratio is based on average daily net assets and reflects actual expenses of the Fund paid over the one year period ended 12/31/13, including the effect of expense waivers and reimbursements. This ratio may increase or decrease depending on fluctuations in Fund net assets. The Gross Expense Ratio is a percentage of the Fund’s average daily net assets as shown in the most current Fund Prospectus. Please see additional disclosures on page 23. Source for average general purpose money market fund data: Lipper, Inc.
| 2013 Annual Report | December 31, 2013 | Page 5 |
Total Return Bond Fund The Meeder Total Return Bond Fund returned 0.01% for the year ended December 31, 2013. The Fund’s benchmark, the Barclays Aggregate Bond Index, declined by 2.02% over the aforementioned time period. In the first quarter of 2013, the Total Return Bond Fund outperformed the Barclays Aggregate Bond Index. The Fund had a greater allocation to the investment grade bond sector versus the Index, and outperformance was also aided by an allocation to high yield corporate bonds. The sectors which detracted from performance during the quarter were allocations to U.S. government bonds and emerging market bonds. During the second quarter, the Fund underperformed the Barclays Aggregate Bond Index, which was directly tied to an aggressive move by investors to sell bonds. Fixed income selling pressure was due in large part to investor speculation that the Fed may begin to reduce its bond purchase program in the second half of 2013. Investors expect any abrupt decline in demand will result in a higher level of bond yields and, conversely, a lower price for bonds across all sectors. All fixed income sectors contributed to detraction from performance in the quarter, with U.S. Treasury and emerging market bonds declining the most. High yield corporate bonds fared the best in the second quarter as investors continued to believe U.S. based companies were more financially sound, leading to lower than average default rates. For the third quarter, the Fund’s outperformance versus the Index was directly tied to managing the portfolio around a volatile market environment for fixed income investments. The market movements in the third quarter continued to be driven by investor speculation that the Fed would begin to reduce its bond purchase program. In the end, the Fed surprised most by delaying any action until economic data warranted such a change. As a result, reluctance to hold U.S. Treasury securities subsided, pushing yields off their highest levels as the quarter ended. All fixed income sectors contributed to gyrations surrounding the quarter’s performance, with U.S. Treasury securities lagging all other sectors. High yield corporate bonds fared the best during the quarter as investors continued to believe U.S. based companies were more financially stable. During the fourth quarter, we continued to realize favorable relative performance as we structured the portfolio to navigate market instability. Once again, this was driven by the back-and-forth rant between investors surrounding QE and the Fed’s potential actions. As the quarter progressed, we received more economic data that pointed to a growing economy, but by the end of the quarter it was the surprise of an actual taper that brought volatility back to the market. In the end, bond sectors that carried greater credit risk performed best in the quarter. U.S. Treasury securities provided the lowest performance of the quarter as investors abandoned the sector in favor of other opportunities, including investment grade, high yield, and emerging market bonds. The high yield bond sector again performed the best in the quarter as it did for most of the year. Emerging market bonds finished a tough year with improved momentum as valuation metrics enticed investors searching for bargains. Finally, we incorporated the use of derivatives in the Fund, such as US Treasury futures, in order to manage the duration of the Fund. Our use of US Treasury futures throughout the year had a slight negative impact on the Fund’s performance. |
Period & Average Annual Total Returns as of December 31, 2013 (Unaudited)
| | 1 Year | Since Inception | Inception Date |
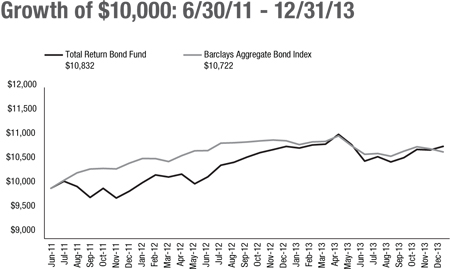
Total Return Bond Fund Expense Ratios+: Audited Net 0.99% Gross 1.59% | 0.01% | 3.24% | 6/30/11 |
| Barclays Aggregate Bond Index | -2.02% | 2.82% | 6/30/11 |
 | | Fund Weightings as of December 31, 2013 Fund Weightings are subject to change. |
| | | |
The Growth of $10,000 chart compares the Total Return Bond Fund’s value to the Barclays Aggregate Bond Index, the Fund’s broad-based benchmark. The chart is intended to give you a general idea of how the Fund performed compared to this benchmark over the period from June 30, 2011 to December 31, 2013. An understanding of the differences between the Fund and this index is important. The index is a hypothetical unmanaged index that does not take into account the deduction of expenses associated with a mutual fund, such as investment management and accounting fees. One cannot invest directly in an index. Past performance does not guarantee future results. The chart and the table do not reflect the deduction of taxes that a shareholder would pay on Fund distributions or the redemption of Fund shares. | | Top 10 Holdings as of December 31, 2013 |
| 1. | Putnam Diversified Income Fund | 9.6% |
| 2. | Ivy High Income Fund | 9.4% |
| 3. | Federated Bond Fund | 9.0% |
| 4. | TCW Emerging Markets Income Fund | 8.9% |
| 5. | AllianceBernstein High Income Fund | 8.9% |
| 6. | Goldman Sachs Strategic Income Fund | 6.8% |
| 7. | Eaton Vance Floating-Rate Advantage Fund | 6.5% |
| 8. | iShares JP Morgan Emerging Bond Fund | 5.5% |
| 9. | Sentinel Total Return Bond Fund | 4.6% |
| 10. | Pimco Total Return Exchange-Traded Fund | 4.4% |
| As a percentage of total net assets |
Management fees were waived and/or expenses were reimbursed in order to reduce the operating expenses of the Total Return Bond Fund during the periods shown above. This waiver was contractual through April 30, 2013 at which time it became voluntary. + The Audited Net Expense Ratio is based on average daily net assets and reflects actual expenses of the Fund paid over the one year period ended 12/31/13, including the effect of expense waivers and reimbursements. This ratio may increase or decrease depending on fluctuations in Fund net assets. The Gross Expense Ratio is a percentage of the Fund’s average daily net assets, including acquired fund fees and expenses, as shown in the most current Fund Prospectus. Please see additional disclosures on page 23.
| 2013 Annual Report | December 31, 2013 | Page 7 |
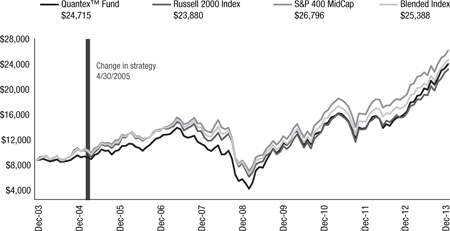
Quantex Fund™ The Meeder Quantex Fund™ returned 41.54% for the year ended December 31, 2013. For the same time period, the S&P MidCap 400 and Russell 2000 Indexes returned 33.50% and 38.82%, respectively. In addition to the 1-year period, the Quantex Fund™ outperformed both the S&P MidCap 400 Index and the Russell 2000 Index for the 3- and 5-year periods ended December 31, 2013. We have consistently employed our quantitative stock selection process since April 30, 2005 for the Quantex Fund™. We utilize rankings from our quantitative financial model to determine which securities are to be held in the Fund on an annual basis. As a result, the Fund is rebalanced annually in January. After rebalancing the Fund in January 2013, there was a strong preference for value holdings, with mid-cap value companies comprising 44% of the Fund, followed by mid-cap core with 36%, and mid-cap growth with 10%. Small-cap holdings of 10% comprised the remainder according to our allocation analysis at the beginning of 2013. Relative to the S&P MidCap 400 Index, stock selection within the financial sector provided the greatest benefit to the Fund, while our overweight to the consumer discretionary sector benefited performance as well. The largest detractor from performance was stock selection within the utilities sector. Stock selection in the consumer discretionary sector also contributed to performance, while selection in the healthcare sector detracted from returns. However, the Fund also benefited from other sector allocation decisions, including an underweight to the financial sector during 2013. For the full year 2013, many stocks contributed positively to the performance of the Fund. The top performing stock for the year was Netflix, which was up 298%. Other top performers for the year included Best Buy (up 244%) and T-Mobile (up 152%). The largest detractors from performance during the year were J.C. Penney (down 54%), Cliffs Natural Resources (down 30%), and Abercrombie & Fitch (down 30%). Additionally, we incorporated the use of equity index derivatives, such as stock index futures, in the Fund in order to equitize cash positions. Since these derivatives are designed to track the respective stock index in question, there was no discernible impact to the Fund’s relative performance in 2013. |
Period & Average Annual Total Returns as of December 31, 2013 (Unaudited)
| | 1 Year | 3 Year | 5 Year | 4/30/05 – 12/31/132 | 10 Year | Inception Date |
Quantex Fund™ Expense Ratios+: Audited Net 1.52% Gross 1.81% | 41.54% | 16.67% | 28.26% | 10.79% | 9.47% | 3/20/85 |
Blended Index1 | 36.16% | 15.69% | 21.02% | 10.29% | 9.76% | 3/31/85 |
| Russell 2000 Index | 38.82% | 15.67% | 20.08% | 9.80% | 9.07% | 3/31/85 |
| S&P 400 MidCap Index | 33.50% | 15.64% | 21.89% | 10.77% | 10.36% | 3/31/85 |
 | | Sector Concentration |
| as of December 31, 2013 |
| 1. | Consumer Discretionary | 26.4% |
| 2. | Financials | 16.9% |
| 3. | Information Technology | 9.9% |
| 4. | Industrials | 9.4% |
| 5. | Other | 8.6% |
| 6. | Materials | 7.8% |
| 7. | Consumer Staples | 5.5% |
| 8. | Energy | 5.3% |
| 9. | Healthcare | 4.2% |
| 10. | Utilities | 3.5% |
| 11. | Telecommunication Services | 2.5% |
| As a percentage of total net assets |
| Concentrations are subject to change. |
| |
The Quantex Fund™ was previously known as The Highlands Growth Fund. On April 30, 2005, The Highlands Growth Fund changed its name to Quantex Fund™, also changing the Fund’s investment objective and strategies. Due to this, the Russell 2000 Index, the S&P 400 MidCap Index, and Blended Index are more comparative indices for Fund performance. The Growth of $10,000 chart compares the value of the Quantex Fund™ to the S&P 400 MidCap Index and the Russell 2000 Index, the Fund’s broad-based benchmarks, and to the Blended Index, which consists of 50% of the Russell 2000 Index and 50% of the S&P 400 MidCap Index. The chart is intended to give you a general idea of how the Fund performed compared to these benchmarks over the period from December 31, 2003 to December 31, 2013. An understanding of the differences between the Fund and these indices is important. The benchmark indices do not take into account the deduction of expenses associated with a mutual fund, such as investment management and accounting fees. One cannot invest directly in an index. Past performance does not guarantee future results. The chart and the table do not reflect the deduction of taxes that a shareholder would pay on Fund distributions or the redemption of Fund shares. | | Top 10 Holdings as of December 31, 2013 |
| 1. | Netflix, Inc. | 2.6% |
| 2. | Best Buy Co., Inc. | 2.3% |
| 3. | E*TRADE Financial Corp. | 1.5% |
| 4. | Pitney Bowes, Inc. | 1.4% |
| 5. | Genworth Financial, Inc. | 1.4% |
| 6. | GameStop Corp. | 1.3% |
| 7. | TripAdvisor, Inc. | 1.3% |
| 8. | Sealed Air Corp. | 1.3% |
| 9. | Assurant, Inc. | 1.3% |
| 10. | Constellation Brands, Inc. | 1.3% |
| As a percentage of total net assets |
The Adviser has contractually agreed to reduce its management fee by 0.25%. This agreement may be terminated by the Adviser after April 30, 2014. + The Audited Net Expense Ratio is based on average daily net assets and reflects actual expenses of the Fund paid over the one year period ended 12/31/13, including the effect of expense waivers and reimbursements. This ratio may increase or decrease depending on fluctuations in Fund net assets. The Gross Expense Ratio is a percentage of the Fund’s average daily net assets as shown in the most current Fund Prospectus. Please see additional disclosures on page 23.
| 2013 Annual Report | December 31, 2013 | Page 9 |
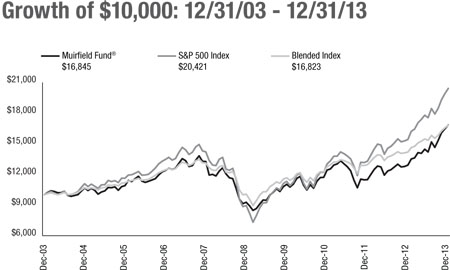
Muirfield Fund® The Meeder Muirfield Fund® returned 30.46% for the year ended December 31, 2013 compared to the Fund’s Blended Index return of 18.56% and S&P 500 Index return of 32.39%. We entered 2013 with a modest defensive position in fixed income investments following output from our investment model that indicated a mostly favorable risk/reward dynamic in the stock market. However, we increased our stock market exposure as the quarter progressed following an improvement in the stock market’s technical components. We were essentially fully invested in the stock market throughout the remainder of the year due to ongoing favorable output from our investment model. In our equity exposure during the first quarter, we increased our exposure to value investments and were overweight the healthcare sector while being underweight the materials sector. We also maintained our exposure to mid- and small-cap investments, which benefited our relative performance. We exited our position in developed international markets following output from our investment model, and we continued to avoid direct exposure to emerging markets. We entered the second quarter with an overweight to the consumer discretionary, healthcare, and consumer staples sectors. Additionally, we were underweight the technology, materials, and utilities sector. As the second quarter progressed, our investment model increased preference for growth-oriented sectors, such as technology, which was driven by steepening of the yield curve. Relative to the S&P 500 Index, our overweight to the consumer discretionary sector contributed positively to performance, while stock selection in the healthcare sector benefited performance as well. Overall stock selection in the energy sector was the largest detractor from relative performance. Our best performing stock for the period was Live Nation Entertainment, while our worst performing stock was Marathon Petroleum. We also briefly held a modest allocation in developed international securities during May, which detracted from relative performance. During the third quarter, we continued to overweight growth sectors, including the consumer discretionary, healthcare, and technology sectors. Additionally, we remained underweight the telecomm, materials, and utilities sectors. Relative to the S&P 500 Index, our overall sector positioning benefited performance with the strongest contribution coming from our underweight to telecomm and utilities. We also experienced relative outperformance from stock selection, particularly within consumer categories. We experienced a negative impact from stock selection in the healthcare and technology sector. Overall, our best performing stock for the quarter was Rite Aid, while RR Donnelley & Sons was our worst performing stock. Finally, we established a position in developed international securities during August following improvement in currency and momentum model factors, which benefited relative performance. In the fourth quarter, we continued to overweight the consumer discretionary, technology, and healthcare sectors. Throughout the quarter, our increasing exposure to small and mid-capitalization stocks paralleled the improvement in our investment model. Regarding relative performance, our underweight to the utilities sector contributed most favorably from an allocation standpoint, while our stock choices within the technology sector generated the largest outperformance from a security selection standpoint. The largest detractor from performance for the quarter was Parexel, while the largest individual contributor to relative performance was McKesson. The best performing held position for the period was Parker Drilling. Our position in international securities detracted from relative performance for the quarter. Additionally, we incorporated the use of equity index derivatives, such as stock index futures, in the Fund in order to equitize cash positions as well as manage the equity exposure of the Fund. With regard to equitizing cash positions, these derivatives are designed to track the respective stock index, so there was no discernible impact to the Fund’s relative performance. With regard to managing the Fund’s equity exposure, the use of stock index futures had a slight negative impact on the performance of the Fund relative to the S&P 500 Index during 2013. |
Period & Average Annual Total Returns as of December 31, 2013 (Unaudited)
| | 1 Year | 3 Year | 5 Year | 10 Year | Inception Date |
Muirfield Fund® Expense Ratios+: Audited Net 1.22% Gross 1.64% | 30.46% | 10.67% | 12.68% | 5.35% | 8/10/88 |
Blended Index3 | 18.56% | 9.66% | 6.37% | 5.34% | 7/31/88 |
| S&P 500 Index | 32.39% | 16.18% | 17.94% | 7.41% | 7/31/88 |
 | | Sector Concentration |
| as of December 31, 2013 |
| 1. | Information Technology | 21.5% |
| 2. | Consumer Discretionary | 16.7% |
| 3. | Healthcare | 15.6% |
| 4. | Financials | 13.2% |
| 5. | Industrials | 11.2% |
| 6. | Consumer Staples | 8.7% |
| 7. | Other | 6.3% |
| 8. | Energy | 6.1% |
| 9. | Materials | 0.7% |
| As a percentage of total net assets |
| Concentrations are subject to change. |
| |
The Growth of $10,000 chart compares the value of the Muirfield Fund® to the S&P 500 Index, the Fund’s broad-based benchmark, and to an index composed of 60% of the S&P 500 Index and 40% of 90-day T-bills. The chart is intended to give you a general idea of how the Fund performed compared to these indices over the period from December 31, 2003 to December 31, 2013. An understanding of the differences between the Fund and these indices is important. The benchmark indices are hypothetical unmanaged indices of common stocks and 90-day T-bills that do not take into account the deduction of expenses associated with a mutual fund, such as investment management and accounting fees. One cannot invest directly in an index. Past performance does not guarantee future results. The chart and the table do not reflect the deduction of taxes that a shareholder would pay on Fund distributions or the redemption of Fund shares. | | Top 10 Holdings as of December 31, 2013 |
| 1. | Hewlett-Packard Co. | 3.1% |
| 2. | Western Digital Corp. | 3.0% |
| 3. | Xerox Corp. | 2.7% |
| 4. | Viacom, Inc. | 2.6% |
| 5. | Whirlpool Corp. | 2.5% |
| 6. | Principal Financial Group, Inc. | 2.5% |
| 7. | SanDisk Corp. | 2.5% |
| 8. | Activision Blizzard, Inc. | 2.5% |
| 9. | Cardinal Health, Inc. | 2.5% |
| 10. | McKesson Corp. | 2.4% |
| As a percentage of total net assets |
Management fees were waived and/or expenses were reimbursed in order to reduce the operating expenses of the Muirfield Fund® during the periods shown above. This waiver was contractual through April 30, 2013 at which time it became voluntary. + The Audited Net Expense Ratio is based on average daily net assets and reflects actual expenses of the Fund paid over the one year period ended 12/31/13, including the effect of expense waivers and reimbursements. This ratio may increase or decrease depending on fluctuations in Fund net assets. The Gross Expense Ratio is a percentage of the Fund’s average daily net assets, including acquired fund fees and expenses, as shown in the most current Fund Prospectus. Please see additional disclosures on page 23.
| 2013 Annual Report | December 31, 2013 | Page 11 |
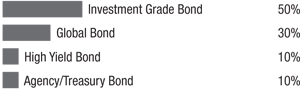
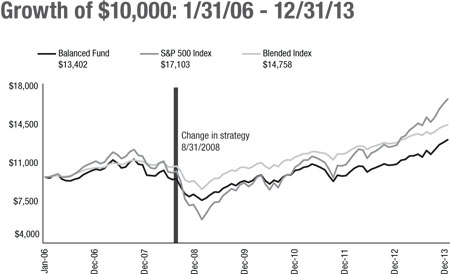
Balanced Fund The Meeder Balanced Fund returned 19.79% for the year ended December 31, 2013 compared to the Blended Index return of 12.42% and the S&P 500 Index return of 32.39%. In the equity portion of the Balanced Fund, we entered 2013 with a modest defensive position in fixed income investments following output from our investment model that indicated a mostly favorable risk/reward dynamic in the stock market. However, we increased our stock market exposure as the quarter progressed following an improvement in the stock market’s technical components. We were essentially fully invested in the equity portion of the Fund throughout the remainder of the year due to ongoing favorable output from our investment model. In our equity exposure, we increased our position value investments and were overweight the healthcare sector while being underweight the materials sector during the first quarter. We also maintained our exposure to mid- and small-cap investments, which benefited our relative performance. We also exited our position in developed international markets following output from our investment model, and we continued to avoid direct exposure to emerging markets. We entered the second quarter with an overweight to the consumer discretionary, healthcare, and consumer staples sectors. Additionally, we were underweight the technology, materials, and utilities sector. As the second quarter progressed, our investment model increased preference for growth-oriented sectors. Relative to the S&P 500 Index, our overweight to the consumer discretionary sector contributed positively to performance, while stock selection in the energy sector was the largest detractor from relative performance. Also, we briefly held a modest allocation in developed international securities during May, which detracted from relative performance. During the third quarter, we maintained our overweight to the consumer discretionary, healthcare, and technology sectors. Additionally, we were underweight the telecomm, materials, and utilities sectors. On a sector allocation basis, our underweight to the utilities and telecomm sectors contributed positively to performance, while stock selection in consumer sectors also benefited relative performance. Stock selection in the technology sector was the largest detractor from performance. We maintained our overweight to the consumer discretionary, technology, and healthcare sectors into the fourth quarter. On a sector allocation basis, our underweight to the utilities sector was most beneficial to relative performance. Conversely, our stock selection in the consumer discretionary sector was the most costly on a relative contribution basis. Western Digital was the largest positive contributor to relative performance, while Dana Holding was the largest individual laggard. Additionally, we incorporated the use of equity index derivatives, such as stock index futures, in the Fund in order to equitize cash positions as well as manage the equity exposure of the Fund. With regard to equitizing cash positions, these derivatives are designed to track the respective stock index in question, so there was no discernible impact to the Fund’s relative performance. With regard to managing the Fund’s equity exposure, the use of stock index futures had a slight negative impact on the performance of the Fund relative to the S&P 500 Index during 2013. In the fixed income portion of the Fund, we were overweight investment grade bonds throughout 2013, which benefited our performance relative to the broader fixed income market as measured by the Barclays Aggregate Bond Index. Additionally, we added a position in high yield bonds during the second quarter due to healthy corporate balance sheets and low default rates, and maintained this allocation for the remainder of the year which benefited our relative performance. We also added an allocation to emerging market bonds during the second quarter, although this position detracted from relative returns. Throughout the year, duration in the fixed income portion of the Fund was held mostly below the Barclays Aggregate Bond Index. |
Period & Average Annual Total Returns as of December 31, 2013 (Unaudited)
| | 1 Year | 3 Year | 8/31/2008 – 12/31/20135 | 5 Year | Since Inception | Inception Date |
Balanced Fund Expense Ratios+: Audited Net 1.33% Gross 1.78% | 19.79% | 8.11% | 6.03% | 9.72% | 3.77% | 1/31/06 |
Blended Index4 | 12.42% | 7.65% | 5.65%6 | 6.08% | 5.04% | 1/31/06 |
| S&P 500 Index | 32.39% | 16.18% | 9.47%6 | 17.94% | 7.01% | 1/31/06 |
 | | Sector Concentration |
| as of December 31, 2013 |
| 1. | Other | 35.1% |
| 2. | Information Technology | 14.6% |
| 3. | Consumer Discretionary | 11.6% |
| 4. | Healthcare | 10.5% |
| 5. | Industrials | 9.5% |
| 6. | Financials | 7.9% |
| 7. | Consumer Staples | 5.9% |
| 8. | Energy | 4.4% |
| 9. | Materials | 0.5% |
| As a percentage of total net assets |
| Concentrations are subject to change. |
| |
The Growth of $10,000 chart compares the Balanced Fund’s value to the S&P 500 Index, the Fund’s broad-based benchmark, and to the Blended Index, which is comprised of 42% of the S&P 500 Index, 28% of the average 90-day U.S. T-bill and 30% of the Barclays Intermediate-Term Government/Credit Index. The chart is intended to give you a general idea of how the Fund performed compared to these indices over the period from its inception on January 31, 2006 through December 31, 2013. An understanding of the differences between the Fund and these indices is important. The benchmark indices are hypothetical unmanaged indices of common stock that do not take into account the deduction of expenses associated with a mutual fund, such as investment management and accounting fees. One cannot invest directly in an index. Past performance does not guarantee future results. The chart and the table do not reflect the deduction of taxes that a shareholder would pay on Fund distributions or the redemption of Fund shares. | | Top 10 Holdings as of December 31, 2013 |
| 1. | Putnam Diversified Income Fund | 6.8% |
| 2. | Sentinel Total Return Bond Fund | 4.9% |
| 3. | Prudential Total Return Bond Fund | 4.7% |
| 4. | Federated Bond Fund | 4.1% |
| 5. | Vanguard Intermediate-Term Corporate Bond ETF | 3.1% |
| 6. | Ivy High Income Fund | 2.9% |
| 7. | Boeing Company | 2.7% |
| 8. | Western Digital Corp. | 2.2% |
| 9. | Hewlett-Packard Co. | 2.1% |
| 10. | Xerox Corp. | 1.9% |
| As a percentage of total net assets |
Management fees were waived and/or expenses were reimbursed in order to reduce the operating expenses of the Balanced Fund during the periods shown above. This waiver was contractual through April 30, 2013 at which time it became voluntary. +The Audited Net Expense Ratio is based on average daily net assets and reflects actual expenses of the Fund paid over the one year period ended 12/31/13, including the effect of expense waivers and reimbursements. This ratio may increase or decrease depending on fluctuations in Fund net assets. The Gross Expense Ratio is a percentage of the Fund’s average daily net assets, including acquired fund fees and expenses, as shown in the most current Fund Prospectus. Please see additional disclosures on page 23.
| 2013 Annual Report | December 31, 2013 | Page 13 |
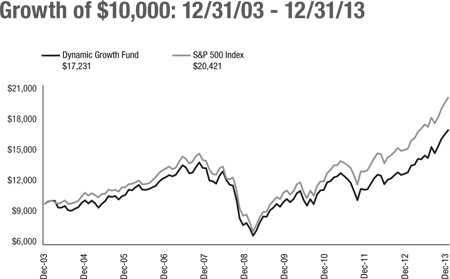
Dynamic Growth Fund The Meeder Dynamic Growth Fund returned 31.61% for the year ended December 31, 2013 compared to the S&P 500 Index return of 32.39% for the same time period. During the first quarter, we increased our exposure to value investments and maintained our positions in mid- and small-cap stocks, which benefited our relative performance. We also continued to overweight the healthcare sector and were underweight the materials sector. We exited our position in developed international markets during the first quarter, and also continued to avoid emerging market exposure following output from our investment model. We began the second quarter with an overweight to the industrials, healthcare, and consumer staples sectors. Additionally, we were underweight the technology, materials, and utilities sector. As the second quarter progressed, our investment model shifted preference toward growth-oriented sectors, such as consumer discretionary, which was driven by steepening of the yield curve. Relative to the S&P 500 Index, our overweight to the consumer discretionary sector contributed positively to performance, while stock selection in the healthcare sector benefited performance as well. Overall stock selection in the energy sector was the largest detractor from relative performance. Our best performing stock for the period was Western Digital, while our worst performing stock was Marathon Petroleum. We also briefly held a modest allocation in developed international securities during May, which detracted from relative performance. We entered the third quarter with an overweight to the technology, healthcare, and consumer discretionary sectors. Additionally, we were underweight the telecomm, materials, and utilities sectors. We also added a position in developed international securities during August following an improvement in currency and momentum model factors that we utilize to compare domestic and international stock markets. In our domestic positioning, our underweight to the telecomm and utilities sectors contributed positively to performance relative to the S&P 500 Index. Stock selection in the technology and materials sectors was the largest detractor from relative performance. Our best performing stock for the period was Safeway, while the strongest contributor to relative performance was Walgreens due to its larger weight in the Fund. Our worst performing stock for the quarter was Hewlett-Packard, which was also the largest detractor from relative performance. In the fourth quarter, we maintained our overweight to the technology, healthcare, and consumer discretionary sectors. Conversely, our sector underweights continued to be telecomm, materials, and utilities. We began the quarter with a developed international position, but eventually eliminated the allocation as momentum factors weakened in our international model. Regarding the domestic allocation, our overweight to the technology sector and underweight to energy contributed positively to performance relative to the S&P 500 Index. Our individual equity selection within the consumer discretionary sector was the largest detractor from performance. The best performing stock for the quarter was Hewlett-Packard, while the worst performing stock for the quarter was Schweitzer-Mauduit. McKesson contributed the most to performance, while Halliburton was the largest detractor relative to the S&P 500 Index. Additionally, we incorporated the use of equity index derivatives, such as stock index futures, in the Fund in order to equitize cash positions. Since these derivatives are designed to track the respective stock index in question, there was no discernible impact to the Fund’s relative performance in 2013. |
Period & Average Annual Total Returns as of December 31, 2013 (Unaudited)
| | 1 Year | 3 Year | 5 Year | 10 Year | Inception Date |
Dynamic Growth Fund Expense Ratios+: Audited Net 1.22% Gross 1.64% | 31.61% | 12.47% | 16.20% | 5.59% | 2/29/00 |
| S&P 500 Index | 32.39% | 16.18% | 17.94% | 7.41% | 2/29/00 |
 | | Sector Concentration |
| as of December 31, 2013 |
| 1. | Information Technology | 21.1% |
| 2. | Consumer Discretionary | 17.2% |
| 3. | Healthcare | 16.0% |
| 4. | Financials | 12.8% |
| 5. | Industrials | 10.7% |
| 6. | Consumer Staples | 9.5% |
| 7. | Other | 5.7% |
| 8. | Energy | 6.6% |
| 9. | Materials | 0.4% |
| As a percentage of total net assets |
| Concentrations are subject to change. |
| |
The Growth of $10,000 chart compares the Dynamic Growth Fund’s value to the S&P 500 Index, the Fund’s broad-based benchmark. The chart is intended to give you a general idea of how the Fund performed compared to this benchmark over the period from December 31, 2003 to December 31, 2013. An understanding of the differences between the Fund and this index is important. The S&P 500 Index is a hypothetical unmanaged index of common stocks that does not take into account the deduction of expenses associated with a mutual fund, such as investment management and accounting fees. One cannot invest directly in an index. Past performance does not guarantee future results. The chart and the table do not reflect the deduction of taxes that a shareholder would pay on Fund distributions or the redemption of Fund shares. | | Top 10 Holdings as of December 31, 2013 |
| 1. | Hewlett-Packard Co. | 3.1% |
| 2. | Western Digital Corp. | 3.1% |
| 3. | Xerox Corp. | 2.9% |
| 4. | Viacom, Inc. | 2.7% |
| 5. | Northrop Grumman Corp. | 2.6% |
| 6. | Whirlpool Corp. | 2.6% |
| 7. | Cardinal Health, Inc. | 2.6% |
| 8. | Activision Blizzard, Inc. | 2.6% |
| 9. | Principal Financial Group, Inc. | 2.5% |
| 10. | WellPoint, Inc. | 2.5% |
| As a percentage of total net assets |
Management fees were waived and/or expenses were reimbursed in order to reduce the operating expenses of the Dynamic Growth Fund during the periods shown above. This waiver was contractual through April 30, 2013 at which time it became voluntary. + The Audited Net Expense Ratio is based on average daily net assets and reflects actual expenses of the Fund paid over the one year period ended 12/31/13, including the effect of expense waivers and reimbursements. This ratio may increase or decrease depending on fluctuations in Fund net assets. The Gross Expense Ratio is a percentage of the Fund’s average daily net assets, including acquired fund fees and expenses, as shown in the most current Fund Prospectus. Please see additional disclosures on page 23.
| 2013 Annual Report | December 31, 2013 | Page 15 |
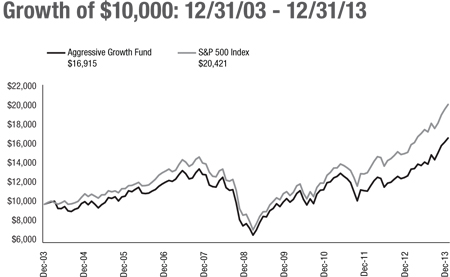
Aggressive Growth Fund The Meeder Aggressive Growth Fund returned 30.40% for the year ended December 31, 2013. By comparison, the S&P 500 Index returned 32.39% during the same time period. During the first quarter, we increased our exposure to value investments and maintained our positions in mid- and small-cap stocks, which benefited our relative performance. We also continued to overweight the healthcare sector and were underweight the materials sector. We exited our position in developed international markets during the first quarter, and also continued to avoid emerging market exposure following output from our investment model. We began the second quarter with an overweight to the industrial, healthcare, and consumer staples sectors, while we were underweight materials, telecomm, and utilities in the Fund. As the quarter progressed, we focused on overweighting more growth-oriented sectors, including consumer discretionary and technology. Relative to the S&P 500 Index, our overweight to the consumer discretionary sector benefited performance, while stock selection in the healthcare sector contributed to performance as well. Stock selection in the energy sector was the largest detractor from performance. Our best performing stock in the quarter was Live Nation Entertainment, while the largest contributor to the Fund’s return was Western Digital. Our worst performing stock was Marathon Petroleum, which was also the largest detractor from the Fund’s return. Finally, we briefly held a modest allocation in developed international securities during May, which detracted from relative performance. During the third quarter, our model that compares domestic and international markets began to favor developed international markets due to currency and momentum factors, which led us to establish an international position. We increased this position as the quarter progressed, which benefited our relative performance compared to the S&P 500 Index. In our domestic stock market exposure, we began the third quarter with an overweight to the technology, healthcare, and consumer discretionary sectors, while we were underweight materials, telecomm, and utilities. In addition to our international position, our decision to underweight the utilities and telecomm sectors benefited performance, while stock selection in the healthcare sector detracted from relative performance. Stock selection in the consumer staples and discretionary sectors benefited performance, which was driven by positions in Rite Aid, Walgreens, and Safeway. Our worst performing stocks in the quarter were found in the technology and healthcare sectors, including Hutchinson Technology, Dawson Geophysical, and First Solar. We began the fourth quarter with a sizable allocation to developed international equities. As the valuation and momentum metrics of developed international declined in our investment model, we began to reduce this position. We ultimately liquidated the remaining position in early December in exchange for domestic equity exposure. Our sector allocations remained fairly stable throughout the quarter, reflecting low factor variance within our quantitative sector model. Domestically, our overweight sectors included healthcare and technology. Conversely, our domestic sector underweights included utilities and materials. With regard to relative performance, our individual security selection within the consumer discretionary sector proved most costly, while our stock choices within the financial sector was most beneficial. Individually, McKesson was both the largest contributor to relative performance and the best performing stock for the quarter, while Dana Holding was the largest detractor on performance. Additionally, we incorporated the use of equity index derivatives, such as stock index futures, in the Fund in order to equitize cash positions. Since these derivatives are designed to track the respective stock index in question, there was no discernible impact to the Fund’s relative performance during 2013. |
Period & Average Annual Total Returns as of December 31, 2013 (Unaudited)
| | 1 Year | 3 Year | 5 Year | 10 Year | Inception Date |
Aggressive Growth Fund Expense Ratios+: Audited Net 1.35% Gross 1.81% | 30.40% | 11.36% | 16.22% | 5.40% | 2/29/00 |
| S&P 500 Index | 32.39% | 16.18% | 17.94% | 7.41% | 2/29/00 |
 | | Sector Concentration |
| as of December 31, 2013 |
| 1. | Information Technology | 20.5% |
| 2. | Consumer Discretionary | 17.2% |
| 3. | Healthcare | 16.4% |
| 4. | Financials | 14.4% |
| 5. | Industrials | 10.2% |
| 6. | Consumer Staples | 9.8% |
| 7. | Other | 6.0% |
| 8. | Energy | 4.9% |
| 9. | Materials | 0.6% |
| As a percentage of total net assets |
| Concentrations are subject to change. |
| |
The Growth of $10,000 chart compares the Aggressive Growth Fund’s value to the S&P 500 Index, the Fund’s broad-based benchmark. The chart is intended to give you a general idea of how the Fund performed compared to this benchmark over the period from December 31, 2003 to December 31, 2013. An understanding of the differences between the Fund and this index is important. The S&P 500 Index is a widely recognized unmanaged index of common stock prices that does not take into account the deduction of expenses associated with a mutual fund, such as investment management and accounting fees. One cannot invest directly in an index. Past performance does not guarantee future results. The chart and the table do not reflect the deduction of taxes that a shareholder would pay on Fund distributions or the redemption of Fund shares. | | Top 10 Holdings as of December 31, 2013 |
| 1. | Hewlett-Packard Co. | 3.4% |
| 2. | Western Digital Corp. | 3.4% |
| 3. | Viacom, Inc. | 3.2% |
| 4. | Xerox Corp. | 3.1% |
| 5. | Whirlpool Corp. | 3.1% |
| 6. | Cardinal Health, Inc. | 3.0% |
| 7. | WellPoint, Inc. | 2.9% |
| 8. | Activision Blizzard, Inc. | 2.6% |
| 9. | American International Group | 2.6% |
| 10. | McKesson Corp. | 2.5% |
| As a percentage of total net assets |
Management fees were waived and/or expenses were reimbursed in order to reduce the operating expenses of the Aggressive Growth Fund during the periods shown above. This waiver was contractual through April 30, 2013 at which time it became voluntary. + The Audited Net Expense Ratio is based on average daily net assets and reflects actual expenses of the Fund paid over the one year period ended 12/31/13, including the effect of expense waivers and reimbursements. This ratio may increase or decrease depending on fluctuations in Fund net assets. The Gross Expense Ratio is a percentage of the Fund’s average daily net assets, including acquired fund fees and expenses, as shown in the most current Fund Prospectus. Please see additional disclosures on page 23.
| 2013 Annual Report | December 31, 2013 | Page 17 |
Strategic Growth Fund The Meeder Strategic Growth Fund returned 23.82% for the year ended December 31, 2013, compared to the custom benchmark return of 21.57% for the same period. The Fund underperformed the broader market during the year, as measured by the S&P 500 Index, which returned 32.39%. The Strategic Growth Fund is fully invested in the equity market at all times, and holds a fixed allocation across six distinct investment categories. The mix of investments selected to represent each investment category is variable and actively managed using our strategic investment selection process. The target allocation as of the end of 2013 was: 25% large-cap, 20% mid-cap, 17.5% international, 12.5% small-cap, 12.5% real estate, and 12.5% commodities. At the end of the year, we evaluated the strategic weights to each of these categories in order to optimize return and minimize risk. As a result of this analysis, the weightings to our allocations going forward are as follows: 25% large-cap, 20% mid-cap, 30% international, 10% small-cap, 7.5% real estate, and 7.5% commodities. The Fund’s performance during 2013 versus the S&P 500 can be attributed to several of the asset allocation categories. While the S&P 500 posted a gain of 32.39% during the year, the international category, which comprised 17.5% of the Fund, lagged the performance of the S&P 500 with developed international gaining 22.81% for the year while emerging markets actually fell by 2.84%. Additionally, the commodities category fell by 1.75%, which comprised 12.5% of the Fund. However, other asset allocation categories outperformed the S&P 500 Index, with the strongest gain experienced in small-cap stocks, as evidenced by the Russell 2000 Index increase of 38.82%. We also experienced favorable results among domestic mid-cap stocks, with the S&P MidCap 400 Index up 33.50% for 2013. The Fund also experienced favorable results when comparing the performance of underlying holdings against their respective benchmark indexes. The Oppenheimer Developing Markets Fund returned 8.68% compared to the MSCI Emerging Markets Index return of -2.84%. Also, the Oppenheimer International Growth Fund retuned 25.46% compared to the MSCI EAFE Index return of 22.81%. Additionally, we incorporated the use of equity index derivatives, such as stock index futures, in the Fund in order to equitize cash positions and make adjustments to certain asset allocation categories. Since these derivatives are designed to track the respective stock index in question, there was no discernible impact to the Fund’s relative performance in 2013. |
Period & Average Annual Total Returns as of December 31, 2013 (Unaudited)
| | 1 Year | 3 Year | 8/31/2008 – 12/31/20138 | 5 Year | Since Inception | Inception Date |
Strategic Growth Fund Expense Ratios+: Audited Net 1.23% Gross 1.70% | 23.82% | 8.69% | 5.99% | 15.91% | 3.88% | 1/31/06 |
Blended Index7 | 21.57% | 11.09% | 6.21%6 | 16.46% | 5.57% | 1/31/06 |
| S&P 500 Index | 32.39% | 16.18% | 9.47%6 | 17.94% | 7.01% | 1/31/06 |
 | | Sector Concentration |
| as of December 31, 2013 |
| 1. | Other | 25.9% |
| 2. | Financials | 18.6% |
| 3. | Information Technology | 12.9% |
| 4. | Healthcare | 10.1% |
| 5. | Consumer Discretionary | 9.9% |
| 6. | Materials | 9.1% |
| 7. | Industrials | 6.1% |
| 8. | Consumer Staples | 5.7% |
| 9. | Energy | 1.7% |
| As a percentage of total net assets |
| Concentrations are subject to change. |
| |
The Growth of $10,000 chart compares the Strategic Growth Fund’s value to the S&P 500 Index, the Fund’s broad-based benchmark, and the Blended Index, which consists of 25% of the S&P 500 Index, 20% of the S&P MidCap 400 Index, 12.5% of the Russell 2000 Index, 12.5% of the Dow Jones US Select REIT Index, 12.5% of the S&P GSCI Index, 12% of the MSCI EAFE Index, and 5.5% of the MSCI Emerging Markets Index. The chart is intended to give you a general idea of how the Fund performed compared to these indices over the period from its inception on January 31, 2006 to December 31, 2013. An understanding of the differences between the Fund and these indices is important. The benchmark indices are hypothetical unmanaged indices of common stock that do not take into account the deduction of expenses associated with a mutual fund, such as investment management and accounting fees. One cannot invest directly in an index. Past performance does not guarantee future results. The chart and the table do not reflect the deduction of taxes that a shareholder would pay on Fund distributions or the redemption of Fund shares. | | Top 10 Holdings as of December 31, 2013 |
| 1. | iShares MSCI EAFE Index Fund | 5.0% |
| 2. | iShares MSCI Emerging Markets Index Fund | 5.0% |
| 3. | Oppenheimer Developing Markets Fund | 4.0% |
| 4. | McKesson Corp. | 4.0% |
| 5. | Oppenheimer International Growth Fund | 3.9% |
| 6. | Western Digital Corp. | 2.7% |
| 7. | Xerox Corp. | 2.7% |
| 8. | WellPoint, Inc. | 2.5% |
| 9. | Hewlett-Packard Co. | 2.5% |
| 10. | Vornado Realty Trust | 2.5% |
| As a percentage of total net assets |
Management fees were waived and/or expenses were reimbursed in order to reduce the operating expenses of the Strategic Growth Fund during the periods shown above. This waiver was contractual through April 30, 2013 at which time it became voluntary. +The Audited Net Expense Ratio is based on average daily net assets and reflects actual expenses of the Fund paid over the one year period ended 12/31/13, including the effect of expense waivers and reimbursements. This ratio may increase or decrease depending on fluctuations in Fund net assets. The Gross Expense Ratio is a percentage of the Fund’s average daily net assets, including acquired fund fees and expenses, as shown in the most current Fund Prospectus. Please see additional disclosures on page 23.
| 2013 Annual Report | December 31, 2013 | Page 19 |
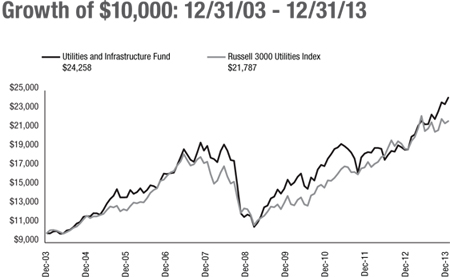
Utilities and Infrastructure Fund The Meeder Utilities and Infrastructure Fund returned 28.96% for the year ended December 31, 2013, compared to the Russell 3000 Utilities Index return of 15.66% for the same time period. In the first quarter, we benefited from the general outperformance of utilities as well as a renewal of interest in gas-related stocks, the latter being a notable weight in the Fund. Toward the end of the quarter, we trimmed NiSource since a long period of strong performance brought the stock closer to our estimate of fair value. We bought Corning, a supplier of glass for mobile devices (and TVs) as well as fiber optic cable, which may be due for another cycle of demand. We also increased our position in Qualcomm, which has been dominating the chip market for mobile phones across all platforms. Our top performing stocks during the second quarter were rather immune to sector pressures stemming from Fed speculation and the potential for interest rate increases. As we previously mentioned, we added Corning in anticipation that the premier high-end glass manufacturer for mobile devices and fiber optic cables would see resurgent demand. The yield was unusually high at 3% for this communications enabler, and the company also beat earnings and boosted the dividend, which led a 7% gain in the stock during the quarter. Our higher-yielding midstream energy holdings, including Kinder Morgan, ONEOK, and Williams, underperformed due to their sensitivity to interest rate movements. The Fund’s performance in the third quarter benefited from its broad view of the essential-services landscape, with our results driven by a global water services firm, a diversified infrastructure contractor, and a telecommunications equipment manufacturer. During the quarter, we initiated a position in BCE, which is Canada’s largest provider of satellite, phone, internet, and mobile services. We also added Arris, a leading global manufacturer of commercial and residential video and broadband equipment, with multiple exciting opportunities in cloud computing. To fund these positions, we trimmed our position in Black Hills. During the fourth quarter, the Fund continued to benefit from our pursuit of a broader universe beyond the traditional utility stocks. None of the portfolio’s top five performers — which includes Arris Group, Corning, General Electric, Fluor, and Qualcomm—are actually utilities. Yet the Fund’s defining characteristics could apply to each of these holdings: stable recurring revenues and cash flows, defensive business models, high customer switching costs, and attractive dividends. During the fourth quarter, we initiated a position in Quanta Services, a mid-cap engineering and construction specialist in electricity transmission, midstream oil and gas development, and increasingly, renewable generation. We raised our position in Covanta, the nation’s largest waste-to-energy producer, following a decline in the stock that boosted the yield to attractive levels. To fund these purchases, we took advantage of strong pricing in Fluor, National Fuel Gas, Veolia, and Vodafone to reduce weights. We also exited the remaining ENI position amid an unfavorable regulatory environment. |
Period & Average Annual Total Returns as of December 31, 2013 (Unaudited)
| | 1 Year | 3 Year | 5 Year | 10 Year | Inception Date |
Utilities and Infrastructure Fund9 Expense Ratios+: Audited Net 1.87% Gross 2.02% | 28.96% | 10.81% | 15.19% | 9.27% | 6/21/95 |
| Russell 3000 Utilities Index | 15.66% | 11.89% | 11.71% | 8.10% | 6/30/95 |
 | | Sector Concentration |
| as of December 31, 2013 |
| 1. | Telecommunication Services | 23.1% |
| 2. | Pipelines | 18.4% |
| 3. | Natural Gas Distribution | 14.8% |
| 4. | Utility Services | 14.6% |
| 5. | Electric Utility | 14.3% |
| 6. | Oil Exploration & Production | 9.1% |
| 7. | Water Utility | 3.6% |
| 8. | Other | 2.1% |
| As a percentage of total net assets |
| Concentrations are subject to change. |
| |
The Growth of $10,000 chart compares the Utilities and Infrastructure Fund’s value to the Russell 3000 Utilities Index, the Fund’s broad-based benchmark. The chart is intended to give you a general idea of how the Fund performed compared to this benchmarks over the period from December 31, 2003 to December 31, 2013. An understanding of the differences between the Fund and this index is important. The benchmark index does not take into account the deduction of expenses associated with a mutual fund, such as investment management and accounting fees. One cannot invest directly in an index. Past performance does not guarantee future results. The chart and the table do not reflect the deduction of taxes that a shareholder would pay on Fund distributions or the redemption of Fund shares. | | Top 10 Holdings as of December 31, 2013 |
| 1. | Enterprise Products Partners, L.P. | 4.6% |
| 2. | Questar Corp. | 4.6% |
| 3. | MDU Resources Group, Inc. | 4.4% |
| 4. | General Electric Co. | 4.3% |
| 5. | Telephone & Data Systems, Inc. | 4.0% |
| 6. | The Williams Cos., Inc. | 3.9% |
| 7. | National Fuel Gas Co. | 3.9% |
| 8. | EQT Corp. | 3.7% |
| 9. | AT&T, Inc. | 3.6% |
| 10. | Corning, Inc. | 3.6% |
| As a percentage of total net assets |
Management fees were waived and/or expenses were reimbursed in order to reduce the operating expenses of the Utilities and Infrastructure Fund during the periods shown above. This waiver was contractual through April 30, 2013 at which time it became voluntary. + The Audited Net Expense Ratio is based on average daily net assets and reflects actual expenses of the Fund paid over the one year period ended 12/31/13, including the effect of expense waivers and reimbursements. This ratio may increase or decrease depending on fluctuations in Fund net assets. The Gross Expense Ratio is a percentage of the Fund’s average daily net assets as shown in the most current Fund Prospectus. Please see additional disclosures on page 23.
| 2013 Annual Report | December 31, 2013 | Page 21 |
Shareholder Expense Analysis (Unaudited)
Shareholders of mutual funds pay ongoing expenses, such as advisory fees, distribution and service fees (12b-1 fees) and other fund expenses. The following examples are intended to help you understand your ongoing costs (in dollars) of investing in the Funds and to compare these costs with the ongoing costs of investing in other mutual funds.
The examples below are based on an investment of $1,000 invested at the beginning of the period and held for the six-month period from June 30, 2013 to December 31, 2013.
ACTUAL EXPENSES: The first table below provides information about actual account values and actual expenses. You may use the information in this table, together with the amount you invested, to estimate the expenses that you paid over the period. Simply divide your account value by $1,000 (e.g.: an $8,600 account value divided by $1,000 = 8.6), then multiply the result by the number in the line under the heading “Expenses Paid During the Period” to estimate the expenses you paid on your account during this period.
| ACTUAL EXPENSES | Beginning Account Value (6/30/2013) | Ending Account Value (12/31/2013) | Expenses Paid During Period1 (6/30/2013 - 12/31/2013) | Expense Ratio (Annualized) |
| Money Market Fund - Retail Class | $1,000.00 | $1,000.40 | $1.06 | 0.21% |
| Money Market Fund - Institutional Class | $1,000.00 | $1,000.70 | $0.71 | 0.14% |
| Total Return Bond Fund | $1,000.00 | $1,027.70 | $5.16 | 1.01% |
Quantex FundTM | $1,000.00 | $1,188.60 | $8.83 | 1.60% |
Muirfield Fund® | $1,000.00 | $1,186.20 | $6.83 | 1.24% |
| Balanced Fund | $1,000.00 | $1,133.70 | $7.05 | 1.31% |
| Dynamic Growth Fund | $1,000.00 | $1,187.90 | $6.45 | 1.17% |
| Aggressive Growth Fund | $1,000.00 | $1,192.40 | $7.13 | 1.29% |
| Strategic Growth Fund | $1,000.00 | $1,162.10 | $6.65 | 1.22% |
| Utilities and Infrastructure Fund | $1,000.00 | $1,129.80 | $9.93 | 1.85% |
HYPOTHETICAL EXAMPLE FOR COMPARISON PURPOSES: The second table below provides information about hypothetical account values and hypothetical expenses based on the Funds’ actual expense ratios and assumed rates of return of 5% per year before expenses, which are not the Funds’ actual returns. The hypothetical account values and expenses may not be used to estimate the actual ending account balance or expenses you paid for the period. You may use this information to compare the ongoing costs of investing in the Funds to other funds. To do so, compare this 5% hypothetical example with the 5% hypothetical examples that appear in the shareholder reports of the other funds.
HYPOTHETICAL EXAMPLE (5% return before expenses) | Beginning Account Value (6/30/2013) | Ending Account Value (12/31/2013) | Expenses Paid During Period1 (6/30/2013- 12/31/2013) | Expense Ratio (Annualized) |
Money Market Fund - Retail Class | | | | |
Money Market Fund - Institutional Class | | | | |
| | | | |
| | | | |
| | | | |
| | | | |
| | | | |
| | | | |
| | | | |
Utilities and Infrastructure Fund | | | | |
Please note that the expenses shown in the tables are meant to highlight your ongoing costs only and do not reflect any transactional costs, such as redemption fees or exchange fees. Therefore, the second table is useful in comparing ongoing costs only, and will not help you determine the relative total costs of owning different funds. In addition, if any transactional costs were included, your costs would have been higher.
| 1 | Expenses are equal to the Funds’ annualized expense ratios, multiplied by the average account value over the period, multiplied by 184/365 (to reflect the total number of days in the six-month period). |
| Page 22 | 2013 Annual Report | December 31, 2013 |
Disclosures
Past performance is not a guarantee of future results. All performance figures represent total returns and average annual total returns or current and effective yields for the periods ended December 31, 2013. Investment performance assumes reinvestment of all dividend and capital gain distributions. The investment return and principal value of an investment will fluctuate so an investor’s shares or units, when redeemed, may be worth more or less than their original cost. Current performance may be lower or higher than the performance data quoted. Current performance data is available at www.meederfunds.com. Management fees and/or expenses were waived and/or reimbursed in Meeder Funds® during the periods shown to reduce expenses. The advisor contractually agreed to waive and/or reimburse certain expenses through April 30, 2013 at which time the contractual waiver was terminated. All expenses, management fees, reimbursements and waivers for the funds were voluntary after April 30, 2013 except for the transfer agent fee waivers. The Quantex FundTM management fee waiver is contractual and can be terminated annually by the Adviser on its renewal date, April 30, 2014.
| 1 | The blended index consists of 50% of the Russell 2000 Index and 50% of the S&P 400 MidCap Index. |
| 2 | The Quantex Fund™ was previously known as The Highlands Growth Fund. On April 30, 2005, The Highlands Growth Fund changed its name to the Quantex Fund™, also changing the Fund’s investment objective and strategies. The Highlands Growth Fund focused on large-cap equities, while the Quantex Fund™ utilizes quantitative investment strategies that invest primarily in small- and mid-cap equities. Due to this change in strategies on April 30, 2005, the S&P 500 Index is a more comparative index for Fund performance prior to April 30, 2005. The Russell 2000 Index and S&P 400 MidCap Index are more comparative indices for Fund performance after April 30, 2005. |
| 3 | The blended index is comprised of 60% of the S&P 500 Index and 40% of the average 90-day U.S. T-bill. |
| 4 | The blended index consists of 42% of the S&P 500 Index, 28% of the average 90-day U.S. T-bill and 30% of the Barclays Intermediate-Term Government/Credit Index. |
| 5 | On August 25, 2008, The Defensive Growth Fund became known as The Defensive Balanced Fund and its investment strategy changed. In 2012, The Defensive Balanced Fund became known as the Balanced Fund. This Fund will always invest at least 30% and may invest up to 70% of its assets primarily in equity mutual funds. In addition, this Fund will always invest at least 30% and may invest up to 70% of its assets primarily in investment grade bonds, money market instruments, or exchange traded funds. |
| 6 | Specified index returns are calculated for the period 8/31/08 to 12/31/13. |
| 7 | The blended index consists of 25% of the S&P 500 Index, 20% of the S&P 400 Index, 12.5% of the Russell 2000 Index, 12.5% of the Dow Jones US Select REIT Index, 12.5% of the S&P GSCI Index, 12% of the MSCI EAFE Index, and 5.5% of the MSCI Emerging Markets Index. |
| 8 | On August 25, 2008, The Focused Growth Fund became known as the Strategic Growth Fund and its investment strategy changed. This Fund will pursue its goal by investing primarily in open-end or closed-end investment companies that seek capital growth or appreciation without regard to current income. In addition, this Fund will always have set allocations to U.S. large-cap equities, U.S. mid-cap equities, U.S. small-cap equities, non-U.S./International (including emerging markets) equities, real estate equities and commodity based equities. |
| 9 | The Utilities and Infrastructure Fund was previously known as The Total Return Utilities Fund. On June 30, 2011, the Total Return Utilities Fund changed its name to the Utilities and Infrastructure Fund. Its investment objective and strategy remained unchanged. |
| * | The current and effective yields quoted for the Money Market Fund are as of December 31, 2013. Yield quotations more closely reflect the current earnings of the Money Market Fund than do total return quotations. To obtain the current 7-day yields for the Money Market Fund, call Meeder Funds® Client Services Department toll free at (800) 325-3539 or (614) 760-2159. Investments in the Money Market Fund (either class) are not a deposit and are neither insured nor guaranteed by the Federal Deposit Insurance Corporation or any other governmental agency. Although the Fund seeks to preserve the value of your investment at $1.00 per share, it is possible to lose money by investing in Money Market Fund (either class). |
To obtain a prospectus containing more information about the Meeder Funds®, including other fees and expenses that apply to a continued investment in the Funds, you may call (800) 325-3539, visit our website at www.meederfunds.com, or write to P.O. Box 7177, Dublin, OH 43017. Please read the prospectus carefully before investing.
Note on comparative indices: Returns for an index do not reflect fees, brokerage commissions, or other expenses associated with investing. One cannot invest directly in an index. Source for equity index data: Bloomberg LP. Source for fixed income index data: Morningstar, Inc. Source for average general-purpose money market fund performance: Lipper, Inc.
| 2013 Annual Report | December 31, 2013 | Page 23 |
[This page intentionally left blank]
2013 Annual Report Fund Holdings & Financial Statements |
Schedule of Investments
| Muirfield Fund | |
| | Shares or Principal Amount ($) | | | | |
| | | | | | | |
| Common Stocks — 93.7% | |
| Consumer Discretionary — 16.7% | | | | | | |
| Best Buy Co., Inc. | | | 38,370 | | | | 1,530,196 | |
| BorgWarner, Inc. | | | 25,090 | | | | 1,402,782 | |
| Dana Holding Corp. | | | 55,895 | | | | 1,096,660 | |
Graham Holdings Co. (2) | | | 3,115 | | | | 2,066,242 | |
Jack in the Box, Inc. (2) | | | 20,380 | | | | 1,019,408 | |
| Johnson Controls, Inc. | | | 43,290 | | | | 2,220,777 | |
Live Nation Entertainment, Inc. (2) | | | 62,390 | | | | 1,232,827 | |
| Nike, Inc. | | | 39,095 | | | | 3,074,431 | |
Tenneco, Inc. (2) | | | 18,230 | | | | 1,031,271 | |
| Time Warner, Inc. | | | 40,400 | | | | 2,816,688 | |
| Viacom, Inc. | | | 48,350 | | | | 4,222,889 | |
Visteon Corp. (2) | | | 16,150 | | | | 1,322,523 | |
| Whirlpool Corp. | | | 25,875 | | | | 4,058,752 | |
| (Cost $22,865,001) | | | | | | | 27,095,446 | |
| | | | | | | | | |
| Consumer Staples — 8.7% | | | | | | | | |
| Archer-Daniels-Midland Co. | | | 74,525 | | | | 3,234,385 | |
| Casey's General Stores, Inc. | | | 10,630 | | | | 746,758 | |
| Kroger Company | | | 41,948 | | | | 1,658,204 | |
| Nu Skin Enterprises, Inc. | | | 18,210 | | | | 2,516,986 | |
Rite Aid Corp. (2) | | | 189,435 | | | | 958,541 | |
| Safeway, Inc. | | | 63,230 | | | | 2,059,401 | |
| Tyson Foods, Inc. | | | 33,295 | | | | 1,114,051 | |
| Walgreen Co. | | | 30,314 | | | | 1,741,236 | |
| (Cost $11,939,383) | | | | | | | 14,029,562 | |
| | | | | | | | | |
| Energy — 6.1% | | | | | | | | |
| ConocoPhillips | | | 48,300 | | | | 3,412,395 | |
| Green Plains Renewable Energy, Inc. | | | 22,025 | | | | 426,845 | |
| Halliburton Co. | | | 39,215 | | | | 1,990,161 | |
| Nabors Industries, Ltd. | | | 64,100 | | | | 1,089,059 | |
Parker Drilling Co. (2) | | | 59,880 | | | | 486,824 | |
| Phillips 66 | | | 32,795 | | | | 2,529,478 | |
| (Cost $8,762,903) | | | | | | | 9,934,762 | |
| | | | | | | | | |
| Financials — 13.2% | | | | | | | | |
| Aflac, Inc. | | | 42,320 | | | | 2,826,976 | |
| American Equity Investment Life Holding Co. | | | 44,275 | | | | 1,167,974 | |
| American International Group, Inc. | | | 40,530 | | | | 2,069,057 | |
| Assurant, Inc. | | | 25,095 | | | | 1,665,555 | |
| CNO Financial Group, Inc. | | | 84,780 | | | | 1,499,758 | |
Genworth Financial, Inc. (2) | | | 48,800 | | | | 757,864 | |
| MetLife, Inc. | | | 18,015 | | | | 971,369 | |
| Morgan Stanley | | | 79,740 | | | | 2,500,646 | |
| Old Republic International Corp. | | | 43,580 | | | | 752,627 | |
| Principal Financial Group, Inc. | | | 82,305 | | | | 4,058,460 | |
| Prudential Financial, Inc. | | | 10,415 | | | | 960,471 | |
| Muirfield Fund | |
| | Shares or Principal Amount ($) | | | | |
| | | | | | | |
| Common Stocks — continued | |
| StanCorp Financial Group, Inc. | | | 22,960 | | | | 1,521,100 | |
| Symetra Financial Corp. | | | 28,085 | | | | 532,492 | |
| (Cost $18,316,574) | | | | | | | 21,284,349 | |
| | | | | | | | | |
| Healthcare — 15.6% | | | | | | | | |
| AbbVie, Inc. | | | 19,580 | | | | 1,034,020 | |
Amsurg Corp. (2) | | | 17,725 | | | | 813,932 | |
| Cardinal Health, Inc. | | | 59,405 | | | | 3,968,848 | |
Centene Corporation (2) | | | 11,800 | | | | 695,610 | |
| Cigna Corp. | | | 27,835 | | | | 2,435,006 | |
Health Net, Inc. (2) | | | 25,185 | | | | 747,239 | |
Henry Schein, Inc. (2) | | | 9,720 | | | | 1,110,607 | |
| Hill-Rom Holdings, Inc. | | | 18,915 | | | | 781,946 | |
| Johnson & Johnson | | | 8,415 | | | | 770,730 | |
LifePoint Hospitals, Inc. (2) | | | 28,230 | | | | 1,491,673 | |
Magellan Health Services, Inc. (2) | | | 19,720 | | | | 1,181,425 | |
| McKesson Corp. | | | 24,490 | | | | 3,952,686 | |
| Questcor Pharmaceuticals, Inc. | | | 29,615 | | | | 1,612,537 | |
VCA Antech, Inc. (2) | | | 25,345 | | | | 794,819 | |
| WellPoint, Inc. | | | 41,870 | | | | 3,868,369 | |
| (Cost $23,477,048) | | | | | | | 25,259,447 | |
| | | | | | | | | |
| Industrials — 11.2% | | | | | | | | |
| Boeing Company | | | 25,550 | | | | 3,487,320 | |
| Crane Co. | | | 18,580 | | | | 1,249,505 | |
| Curtiss-Wright Corp. | | | 14,805 | | | | 921,315 | |
| Dover Corp. | | | 31,185 | | | | 3,010,600 | |
Esterline Technologies Corp. (2) | | | 10,160 | | | | 1,035,914 | |
| ITT Corporation | | | 20,245 | | | | 879,038 | |
| Northrop Grumman Corp. | | | 30,100 | | | | 3,449,761 | |
| Oshkosh Corp. | | | 20,460 | | | | 1,030,775 | |
| Parker Hannifin Corp. | | | 19,210 | | | | 2,471,174 | |
| RR Donnelly & Sons Co. | | | 29,400 | | | | 596,232 | |
| (Cost $15,310,763) | | | | | | | 18,131,634 | |
| | | | | | | | | |
| Information Technology — 21.5% | | | | | | | | |
| Activision Blizzard, Inc. | | | 223,233 | | | | 3,980,244 | |
| Apple, Inc. | | | 3,815 | | | | 2,140,291 | |
Benchmark Electronics, Inc. (2) | | | 14,340 | | | | 330,967 | |
| Computer Sciences Corp. | | | 42,870 | | | | 2,395,576 | |
| Convergys Corp. | | | 48,965 | | | | 1,030,713 | |
| Hewlett-Packard Co. | | | 178,053 | | | | 4,981,923 | |
| Lexmark International, Inc. | | | 28,295 | | | | 1,005,038 | |
Plexus Corp. (2) | | | 16,110 | | | | 697,402 | |
| SanDisk Corporation | | | 57,155 | | | | 4,031,714 | |
Sanmina Corp. (2) | | | 19,270 | | | | 321,809 | |
| Seagate Technology PLC | | | 15,230 | | | | 855,317 | |
Synnex Corp. (2) | | | 15,005 | | | | 1,011,337 | |
| The accompanying notes are an integral part of these financial statements. |
| Page 26 | 2013 Annual Report | December 31, 2013 |
| Muirfield Fund | |
| | Shares or Principal Amount ($) | | | | |
| | | | | | | |
| Common Stocks — continued | |
| TE Connectivity, Ltd | | | 31,700 | | | | 1,746,987 | |
| Western Digital Corp. | | | 58,071 | | | | 4,872,157 | |
| Xerox Corp. | | | 355,780 | | | | 4,329,843 | |
Zebra Technologies Corp. (2) | | | 18,660 | | | | 1,009,133 | |
| (Cost $28,399,389) | | | | | | | 34,740,451 | |
| | | | | | | | | |
| Materials — 0.7% | | | | | | | | |
| Minerals Technologies, Inc. | | | 8,290 | | | | 497,980 | |
| Schweitzer-Mauduit International, Inc. | | | 12,420 | | | | 639,257 | |
| (Cost $1,170,709) | | | | | | | 1,137,237 | |
| | | | | | | | | |
| Total Common Stocks (Cost $130,241,770) | | | | | | | 151,612,888 | |
| Registered Investment Companies — 1.8% | |
iShares Russell 2000 Growth Index Fund (7) | | | 21,385 | | | | 2,897,881 | |
| Total Registered Investment Companies (Cost $2,894,498) | | | | | | | 2,897,881 | |
| Money Market Registered Investment Companies — 3.9% | |
Meeder Money Market Fund - Institutional Class, 0.13% (3) | | | 6,371,521 | | | | 6,371,521 | |
| Total Money Market Registered Investment Companies (Cost $6,371,521) | | | | | | | 6,371,521 | |
| Floating Rate Demand Notes — 0.0% | |
| Caterpillar Financial Power Investment Floating Rate Demand Note, | | | | | | |
0.60%, 1/1/2014 (4) | | | 1,884 | | | | 1,884 | |
| Total Floating Rate Demand Notes (Cost $1,884) | | | | | | | 1,884 | |
| U.S. Government Obligations — 0.3% | |
U.S. Treasury Bill, 0.09%, due 3/6/2014 (5) | | | 500,000 | | | | 499,954 | |
| Total U.S. Government Obligations (Cost $499,956) | | | | | | | 499,954 | |
Total Investments — 99.7% (Cost $140,009,629)(1) | | | | | | | 161,384,128 | |
| Other Assets less Liabilities — 0.3% | | | | | | | 439,333 | |
| Total Net Assets — 100.0% | | | | | | | 161,823,461 | |
| Muirfield Fund | |
| | Shares or Principal Amount ($) | | | | |
| | | | | | | |
Trustee Deferred Compensation (6) | |
| Meeder Aggressive Growth Fund | | | 3,121 | | | | 34,050 | |
| Meeder Balanced Fund | | | 1,762 | | | | 19,558 | |
Meeder Dynamic Growth Fund | | | 1,130 | | | | 11,696 | |
| Meeder Muirfield Fund | | | 5,159 | | | | 35,855 | |
| Meeder Quantex Fund | | | 2,977 | | | | 104,314 | |
| Meeder Utilities & Infrastructure Fund | | | 366 | | | | 11,339 | |
| Total Trustee Deferred Compensation (Cost $135,491) | | | | | | | 216,812 | |
| | | | | | Unrealized Appreciation (Depreciation)($) | |
| | | | | | | |
| Futures Contracts | | | | | | |
| Standard & Poors 500 expiring March 2014, notional value $6,904,125 | | | 15 | | | | 79,488 | |
| Total Futures Contracts | | | | | | | 79,488 | |
| (1) | Cost for federal income tax and financial reporting purposes are the same. |
| (2) | Represents non-income producing securities. |
| (3) | Investment in affiliate. The yield shown represents the 7-day yield in effect at December 31, 2013. |
| (4) | Floating rate security. The rate shown represents the rate in effect at December 31, 2013. |
| (5) | Pledged as collateral on futures contracts. |
| (6) | Assets of affiliates to the Muirfield Fund held for the benefit of the Fund’s Trustees in connection with the Trustee Deferred Compensation Plan. |
| The accompanying notes are an integral part of these financial statements. |
| 2013 Annual Report | December 31, 2013 | Page 27 |
Schedule of Investments
| Dynamic Growth Fund | |
| | Shares or Principal Amount ($) | | | | |
| | | | | | | |
| Common Stocks — 94.3% | |
| Consumer Discretionary — 17.2% | | | | | | |
| BorgWarner, Inc. | | | 23,330 | | | | 1,304,380 | |
| Dana Holding Corp. | | | 35,190 | | | | 690,428 | |
| Ford Motor Company | | | 28,730 | | | | 443,304 | |
Graham Holdings Co. (2) | | | 1,935 | | | | 1,283,524 | |
Jack in the Box, Inc. (2) | | | 10,860 | | | | 543,217 | |
| Johnson Controls, Inc. | | | 34,735 | | | | 1,781,906 | |
Live Nation Entertainment, Inc. (2) | | | 21,470 | | | | 424,247 | |
| Nike, Inc. | | | 29,935 | | | | 2,354,089 | |
| Time Warner, Inc. | | | 30,410 | | | | 2,120,185 | |
| Viacom, Inc. | | | 31,260 | | | | 2,730,248 | |
Visteon Corp. (2) | | | 16,530 | | | | 1,353,642 | |
| Whirlpool Corp. | | | 17,120 | | | | 2,685,443 | |
| (Cost $15,355,946) | | | | | | | 17,714,613 | |
| | | | | | | | | |
| Consumer Staples — 9.5% | | | | | | | | |
| Archer-Daniels-Midland Co. | | | 58,000 | | | | 2,517,200 | |
| Casey's General Stores, Inc. | | | 6,855 | | | | 481,564 | |
| Kroger Company | | | 40,096 | | | | 1,584,995 | |
| Nu Skin Enterprises, Inc. | | | 10,925 | | | | 1,510,054 | |
Rite Aid Corp. (2) | | | 90,151 | | | | 456,164 | |
| Roundy's, Inc. | | | 54,125 | | | | 533,673 | |
| Safeway, Inc. | | | 31,835 | | | | 1,036,866 | |
| Walgreen Co. | | | 29,735 | | | | 1,707,978 | |
| (Cost $8,412,036) | | | | | | | 9,828,494 | |
| | | | | | | | | |
| Energy — 6.6% | | | | | | | | |
| ConocoPhillips | | | 33,395 | | | | 2,359,357 | |
| Halliburton Co. | | | 38,195 | | | | 1,938,396 | |
| Phillips 66 | | | 31,940 | | | | 2,463,532 | |
| (Cost $6,165,147) | | | | | | | 6,761,285 | |
| | | | | | | | | |
| Financials — 12.8% | | | | | | | | |
| Aflac, Inc. | | | 29,490 | | | | 1,969,932 | |
| American Equity Investment Life Holding Co. | | | 23,575 | | | | 621,909 | |
| American International Group, Inc. | | | 38,930 | | | | 1,987,377 | |
| Assurant, Inc. | | | 11,470 | | | | 761,264 | |
| CNO Financial Group, Inc. | | | 25,970 | | | | 459,409 | |
| MetLife, Inc. | | | 9,590 | | | | 517,093 | |
| Moody's Corp. | | | 10,376 | | | | 814,205 | |
| Morgan Stanley | | | 68,645 | | | | 2,152,707 | |
| Principal Financial Group, Inc. | | | 53,070 | | | | 2,616,882 | |
| Prudential Financial, Inc. | | | 5,545 | | | | 511,360 | |
| StanCorp Financial Group, Inc. | | | 11,830 | | | | 783,738 | |
| (Cost $11,679,118) | | | | | | | 13,195,876 | |
| | | | | | | | | |
| Healthcare — 16.0% | | | | | | | | |
| AbbVie, Inc. | | | 37,210 | | | | 1,965,060 | |
| Dynamic Growth Fund | |
| | Shares or Principal Amount ($) | | | | |
| | | | | | | |
| Common Stocks — continued | |
Amsurg Corp. (2) | | | 6,855 | | | | 314,782 | |
| Cardinal Health, Inc. | | | 39,860 | | | | 2,663,047 | |
Centene Corporation (2) | | | 6,060 | | | | 357,237 | |
| Cigna Corp. | | | 17,310 | | | | 1,514,279 | |
Henry Schein, Inc. (2) | | | 6,705 | | | | 766,113 | |
| Johnson & Johnson | | | 5,375 | | | | 492,296 | |
Magellan Health Services, Inc. (2) | | | 11,375 | | | | 681,476 | |
| McKesson Corp. | | | 15,645 | | | | 2,525,103 | |
Parexel International Corp. (2) | | | 13,185 | | | | 595,698 | |
| Questcor Pharmaceuticals, Inc. | | | 25,915 | | | | 1,411,072 | |
VCA Antech, Inc. (2) | | | 17,040 | | | | 534,374 | |
| WellPoint, Inc. | | | 28,055 | | | | 2,592,002 | |
| (Cost $14,988,035) | | | | | | | 16,412,539 | |
| | | | | | | | | |
| Industrials — 10.7% | | | | | | | | |
| Boeing Company | | | 18,175 | | | | 2,480,706 | |
| Curtiss-Wright Corp. | | | 8,315 | | | | 517,442 | |
| Dover Corp. | | | 21,965 | | | | 2,120,501 | |
| Honeywell International, Inc. | | | 15,225 | | | | 1,391,108 | |
| Northrop Grumman Corp. | | | 23,565 | | | | 2,700,785 | |
| Oshkosh Corp. | | | 11,520 | | | | 580,378 | |
| Parker Hannifin Corp. | | | 9,530 | | | | 1,225,939 | |
| (Cost $9,220,926) | | | | | | | 11,016,859 | |
| | | | | | | | | |
| Information Technology — 21.1% | | | | | | | | |
| Activision Blizzard, Inc. | | | 149,235 | | | | 2,660,860 | |
| Apple, Inc. | | | 2,720 | | | | 1,525,974 | |
| Computer Sciences Corp. | | | 28,295 | | | | 1,581,125 | |
| Convergys Corp. | | | 24,365 | | | | 512,883 | |
| Hewlett-Packard Co. | | | 113,050 | | | | 3,163,139 | |
| Lexmark International, Inc. | | | 8,950 | | | | 317,904 | |
| SanDisk Corporation | | | 36,665 | | | | 2,586,349 | |
| Seagate Technology PLC | | | 23,925 | | | | 1,343,628 | |
| TE Connectivity, Ltd | | | 22,825 | | | | 1,257,886 | |
| Western Digital Corp. | | | 37,596 | | | | 3,154,304 | |
| Xerox Corp. | | | 241,160 | | | | 2,934,917 | |
Zebra Technologies Corp. (2) | | | 11,130 | | | | 601,910 | |
| (Cost $17,682,941) | | | | | | | 21,640,879 | |
| | | | | | | | | |
| Materials — 0.4% | | | | | | | | |
| Schweitzer-Mauduit International, Inc. | | | 7,955 | | | | 409,444 | |
| (Cost $495,632) | | | | | | | 409,444 | |
| | | | | | | | | |
| Total Common Stocks (Cost $83,999,781) | | | | | | | 96,979,989 | |
| The accompanying notes are an integral part of these financial statements. |
| Page 28 | 2013 Annual Report | December 31, 2013 |
| Dynamic Growth Fund | |
| | Shares or Principal Amount ($) | | | | |
| | | | | | | |
| Registered Investment Companies — 1.5% | |
iShares Russell 2000 Growth Index Fund (7) | | | 11,720 | | | | 1,588,177 | |
| Total Registered Investment Companies (Cost $1,586,323) | | | | | | | 1,588,177 | |
| Money Market Registered Investment Companies — 3.8% | |
Meeder Money Market Fund - Institutional Class, 0.13% (3) | | | 3,939,573 | | | | 3,939,573 | |
| Total Money Market Registered Investment Companies (Cost $3,939,573) | | | | | | | 3,939,573 | |
| Floating Rate Demand Notes — 0.0% | |
| Caterpillar Financial Power Investment Floating Rate Demand Note, | | | | | | |
0.60%, 1/1/2014 (4) | | | 270 | | | | 270 | |
| Total Floating Rate Demand Notes (Cost $270) | | | | | | | 270 | |
| U.S. Government Obligations — 0.3% | |
U.S. Treasury Bill, 0.09%, due 3/6/2014 (5) | | | 300,000 | | | | 299,972 | |
| Total U.S. Government Obligations (Cost $299,973) | | | | | | | 299,972 | |
Total Investments — 99.9% (Cost $89,825,920)(1) | | | | | | | 102,807,981 | |
| Other Assets less Liabilities — 0.1% | | | | | | | 117,719 | |
| Total Net Assets — 100.0% | | | | | | | 102,925,700 | |
Trustee Deferred Compensation (6) | |
| Meeder Aggressive Growth Fund | | | 2,286 | | | | 24,940 | |
| Meeder Balanced Fund | | | 1,280 | | | | 14,208 | |
| Meeder Dynamic Growth Fund | | | 830 | | | | 8,591 | |
| Meeder Muirfield Fund | | | 2,805 | | | | 19,495 | |
| Meeder Quantex Fund | | | 1,344 | | | | 47,094 | |
| Meeder Utilities & Infrastructure Fund | | | 268 | | | | 8,303 | |
| Total Trustee Deferred Compensation (Cost $80,601) | | | | | | | 122,631 | |
| Dynamic Growth Fund | |
| | | | | | Unrealized Appreciation (Depreciation)($) | |
| | | | | | | |
| Futures Contracts | |
| Standard & Poors 500 expiring March 2014, notional value $4,142,475 | | | 9 | | | | 63,133 | |
| Total Futures Contracts | | | | | | | 63,133 | |
| (1) | Cost for federal income tax and financial reporting purposes are the same. |
| (2) | Represents non-income producing securities. |
| (3) | Investment in affiliate. The yield shown represents the 7-day yield in effect at December 31, 2013. |
| (4) | Floating rate security. The rate shown represents the rate in effect at December 31, 2013. |
| (5) | Pledged as collateral on futures contracts. |
| (6) | Assets of affiliates to the Dynamic Growth Fund held for the benefit of the Fund’s Trustees in connection with the Trustee Deferred Compensation Plan. |
| The accompanying notes are an integral part of these financial statements. |
| 2013 Annual Report | December 31, 2013 | Page 29 |
Schedule of Investments
| Aggressive Growth Fund | |
| | Shares or Principal Amount ($) | | | | |
| | | | | | | |
| Common Stocks — 94.0% | |
| Consumer Discretionary — 17.2% | | | | | | |
| Best Buy Co., Inc. | | | 25,310 | | | | 1,009,363 | |
| BorgWarner, Inc. | | | 16,640 | | | | 930,342 | |
| Dana Holding Corp. | | | 30,160 | | | | 591,739 | |
Graham Holdings Co. (2) | | | 1,250 | | | | 829,150 | |
Jack in the Box, Inc. (2) | | | 9,825 | | | | 491,447 | |
Live Nation Entertainment, Inc. (2) | | | 34,170 | | | | 675,199 | |
Tenneco, Inc. (2) | | | 5,580 | | | | 315,661 | |
| Time Warner, Inc. | | | 18,040 | | | | 1,257,749 | |
| Viacom, Inc. | | | 23,690 | | | | 2,069,085 | |
Visteon Corp. (2) | | | 11,685 | | | | 956,885 | |
| Whirlpool Corp. | | | 12,625 | | | | 1,980,356 | |
| (Cost $9,068,207) | | | | | | | 11,106,976 | |
| | | | | | | | | |
| Consumer Staples — 9.8% | | | | | | | | |
| Archer-Daniels-Midland Co. | | | 29,460 | | | | 1,278,564 | |
| Casey's General Stores, Inc. | | | 6,520 | | | | 458,030 | |
| Nature's Sunshine Products, Inc. | | | 8,070 | | | | 139,772 | |
| Nu Skin Enterprises, Inc. | | | 8,740 | | | | 1,208,043 | |
Rite Aid Corp. (2) | | | 164,200 | | | | 830,852 | |
| Roundy's, Inc. | | | 17,225 | | | | 169,839 | |
| Safeway, Inc. | | | 17,275 | | | | 562,647 | |
The Pantry, Inc. (2) | | | 12,885 | | | | 216,210 | |
| Tyson Foods, Inc. | | | 11,890 | | | | 397,839 | |
| Walgreen Co. | | | 19,170 | | | | 1,101,125 | |
| (Cost $5,272,900) | | | | | | | 6,362,921 | |
| | | | | | | | | |
| Energy — 4.9% | | | | | | | | |
| Comstock Resources, Inc. | | | 17,320 | | | | 316,783 | |
| ConocoPhillips | | | 14,700 | | | | 1,038,555 | |
Dawson Geophysical Co. (2) | | | 2,620 | | | | 88,608 | |
| Green Plains Renewable Energy, Inc. | | | 9,180 | | | | 177,908 | |
| Nabors Industries, Ltd. | | | 32,050 | | | | 544,530 | |
Newpark Resources, Inc. (2) | | | 24,705 | | | | 303,624 | |
Parker Drilling Co. (2) | | | 44,355 | | | | 360,606 | |
| Phillips 66 | | | 3,955 | | | | 305,049 | |
| (Cost $2,970,234) | | | | | | | 3,135,663 | |
| | | | | | | | | |
| Financials — 14.4% | | | | | | | | |
| Aflac, Inc. | | | 11,200 | | | | 748,160 | |
| American Equity Investment Life Holding Co. | | | 21,995 | | | | 580,228 | |
| American International Group, Inc. | | | 32,370 | | | | 1,652,489 | |
| Assurant, Inc. | | | 4,805 | | | | 318,908 | |
| CNO Financial Group, Inc. | | | 44,630 | | | | 789,505 | |
Genworth Financial, Inc. (2) | | | 40,240 | | | | 624,927 | |
| MetLife, Inc. | | | 9,060 | | | | 488,515 | |
| Morgan Stanley | | | 11,950 | | | | 374,752 | |
| Principal Financial Group, Inc. | | | 23,560 | | | | 1,161,744 | |
| Aggressive Growth Fund | |
| | Shares or Principal Amount ($) | | | | |
| | | | | | | |
| Common Stocks — continued | |
| Protective Life Corp. | | | 18,260 | | | | 925,052 | |
| Prudential Financial, Inc. | | | 5,235 | | | | 482,772 | |
| StanCorp Financial Group, Inc. | | | 10,970 | | | | 726,762 | |
| Symetra Financial Corp. | | | 24,170 | | | | 458,263 | |
| (Cost $7,824,095) | | | | | | | 9,332,077 | |
| | | | | | | | | |
| Healthcare — 16.4% | | | | | | | | |
Amsurg Corp. (2) | | | 10,835 | | | | 497,543 | |
| Cardinal Health, Inc. | | | 29,440 | | | | 1,966,886 | |
Centene Corporation (2) | | | 4,430 | | | | 261,149 | |
Health Net, Inc. (2) | | | 15,345 | | | | 455,286 | |
| Hill-Rom Holdings, Inc. | | | 11,525 | | | | 476,444 | |
LifePoint Hospitals, Inc. (2) | | | 9,430 | | | | 498,281 | |
Magellan Health Services, Inc. (2) | | | 10,440 | | | | 625,460 | |
| McKesson Corp. | | | 9,860 | | | | 1,591,404 | |
NuVasive, Inc. (2) | | | 15,945 | | | | 515,502 | |
Providence Service Corp. (2) | | | 3,330 | | | | 85,648 | |
| Questcor Pharmaceuticals, Inc. | | | 12,670 | | | | 689,882 | |
VCA Antech, Inc. (2) | | | 16,805 | | | | 527,005 | |
WellCare Health Plans, Inc. (2) | | | 6,885 | | | | 484,842 | |
| WellPoint, Inc. | | | 20,455 | | | | 1,889,837 | |
| (Cost $9,804,099) | | | | | | | 10,565,169 | |
| | | | | | | | | |
| Industrials — 10.2% | | | | | | | | |
| Boeing Company | | | 4,905 | | | | 669,484 | |
| Crane Co. | | | 7,220 | | | | 485,545 | |
| Curtiss-Wright Corp. | | | 7,685 | | | | 478,238 | |
| Dover Corp. | | | 4,830 | | | | 466,288 | |
Esterline Technologies Corp. (2) | | | 5,115 | | | | 521,525 | |
| ITT Corporation | | | 16,370 | | | | 710,785 | |
JetBlue Airways Corp. (2) | | | 28,025 | | | | 239,334 | |
| Manpower, Inc. | | | 5,590 | | | | 479,957 | |
| Northrop Grumman Corp. | | | 11,275 | | | | 1,292,228 | |
| Oshkosh Corp. | | | 9,690 | | | | 488,182 | |
| RR Donnelly & Sons Co. | | | 25,215 | | | | 511,360 | |
| UniFirst Corp. | | | 2,540 | | | | 271,780 | |
| (Cost $5,360,726) | | | | | | | 6,614,706 | |
| | | | | | | | | |
| Information Technology — 20.5% | | | | | | | | |
| Activision Blizzard, Inc. | | | 93,600 | | | | 1,668,888 | |
| Anixter International, Inc. | | | 5,275 | | | | 473,906 | |
Benchmark Electronics, Inc. (2) | | | 6,180 | | | | 142,634 | |
Brocade Communications Systems, Inc. (2) | | | 39,745 | | | | 352,339 | |
Checkpoint Systems, Inc. (2) | | | 8,995 | | | | 141,851 | |
| Computer Sciences Corp. | | | 23,295 | | | | 1,301,725 | |
comScore, Inc. (2) | | | 5,055 | | | | 144,624 | |
| Convergys Corp. | | | 23,030 | | | | 484,782 | |
| Hewlett-Packard Co. | | | 79,430 | | | | 2,222,451 | |
| The accompanying notes are an integral part of these financial statements. |
| Page 30 | 2013 Annual Report | December 31, 2013 |
| Aggressive Growth Fund | |
| | Shares or Principal Amount ($) | | | | |
| | | | | | | |
| Common Stocks — continued | |
| Lexmark International, Inc. | | | 16,840 | | | | 598,157 | |
Plexus Corp. (2) | | | 9,220 | | | | 399,134 | |
Synnex Corp. (2) | | | 7,645 | | | | 515,273 | |
| Western Digital Corp. | | | 26,120 | | | | 2,191,468 | |
| Xerox Corp. | | | 166,605 | | | | 2,027,583 | |
Zebra Technologies Corp. (2) | | | 10,130 | | | | 547,830 | |
| (Cost $10,794,938) | | | | | | | 13,212,645 | |
| | | | | | | | | |
| Materials — 0.6% | | | | | | | | |
| Schweitzer-Mauduit International, Inc. | | | 7,520 | | | | 387,054 | |
| (Cost $443,621) | | | | | | | 387,054 | |
| | | | | | | | | |
| Total Common Stocks (Cost $51,538,820) | | | | | | | 60,717,211 | |
| Registered Investment Companies — 1.9% | |
iShares Russell 2000 Growth Index Fund (7) | | | 9,165 | | | | 1,241,949 | |
| Total Registered Investment Companies (Cost $1,240,499) | | | | | | | 1,241,949 | |
| Money Market Registered Investment Companies — 3.5% | |
Meeder Money Market Fund - Institutional Class, 0.13% (3) | | | 2,252,733 | | | | 2,252,733 | |
| Total Money Market Registered Investment Companies (Cost $2,252,733) | | | | | | | 2,252,733 | |
| Floating Rate Demand Notes — 0.0% | |
| Caterpillar Financial Power Investment Floating Rate Demand Note, | | | | | | |
0.60%, 1/1/2014 (4) | | | 30 | | | | 30 | |
| Total Floating Rate Demand Notes (Cost $30) | | | | | | | 30 | |
| U.S. Government Obligations — 0.5% | |
U.S. Treasury Bill, 0.09%, due 3/6/2014 (5) | | | 300,000 | | | | 299,972 | |
| Total U.S. Government Obligations (Cost $299,973) | | | | | | | 299,972 | |
Total Investments — 99.9% (Cost $55,332,055)(1) | | | | | | | 64,511,895 | |
| Other Assets less Liabilities — 0.1% | | | | | | | 96,273 | |
| Total Net Assets — 100.0% | | | | | | | 64,608,168 | |
| Aggressive Growth Fund | |
| | Shares or Principal Amount ($) | | | | |
| | | | | | | |
Trustee Deferred Compensation (6) | | | | | | |
| Meeder Aggressive Growth Fund | | | 1,240 | | | | 13,528 | |
| Meeder Balanced Fund | | | 708 | | | | 7,859 | |
| Meeder Dynamic Growth Fund | | | 446 | | | | 4,616 | |
| Meeder Muirfield Fund | | | 1,662 | | | | 11,551 | |
| Meeder Quantex Fund | | | 840 | | | | 29,434 | |
| Meeder Utilities & Infrastructure Fund | | | 146 | | | | 4,523 | |
| Total Trustee Deferred Compensation (Cost $47,402) | | | | | | | 71,511 | |
| | | | | | Unrealized Appreciation (Depreciation)($) | |
| | | | | | | |
| Futures Contracts | | | | | | |
| Standard & Poors 500 expiring March 2014, notional value $2,761,650 | | | 6 | | | | 43,630 | |
| Total Futures Contracts | | | | | | | 43,630 | |
| (1) | Cost for federal income tax purposes of $55,362,434 differs from value by net unrealized appreciation (depreciation) of securities as follows: |
| Unrealized appreciation | | $ | 9,465,490 | |
| Unrealized depreciation | | | (316,029 | ) |
| Net unrealized appreciation (depreciation) | | $ | 9,149,461 | |
| (2) | Represents non-income producing securities. |
| (3) | Investment in affiliate. The yield shown represents the 7-day yield in effect at December 31, 2013. |
| (4) | Floating rate security. The rate shown represents the rate in effect at December 31, 2013. |
| (5) | Pledged as collateral on futures contracts. |
| (6) | Assets of affiliates to the Aggressive Growth Fund held for the benefit of the Fund’s Trustees in connection with the Trustee Deferred Compensation Plan. |
| The accompanying notes are an integral part of these financial statements. |
| 2013 Annual Report | December 31, 2013 | Page 31 |
Schedule of Investments
| Balanced Fund | |
| | Shares or Principal Amount ($) | | | | |
| | | | | | | |
| Common Stocks — 64.9% | |
| Consumer Discretionary — 11.6% | | | | | | |
| Best Buy Co., Inc. | | | 17,685 | | | | 705,278 | |
| BorgWarner, Inc. | | | 13,130 | | | | 734,098 | |
| Dana Holding Corp. | | | 28,915 | | | | 567,312 | |
Graham Holdings Co. (2) | | | 1,445 | | | | 958,497 | |
Jack in the Box, Inc. (2) | | | 9,880 | | | | 494,198 | |
| Johnson Controls, Inc. | | | 16,350 | | | | 838,755 | |
Live Nation Entertainment, Inc. (2) | | | 32,635 | | | | 644,868 | |
| Nike, Inc. | | | 18,040 | | | | 1,418,666 | |
Tenneco, Inc. (2) | | | 9,540 | | | | 539,678 | |
| Time Warner, Inc. | | | 18,690 | | | | 1,303,067 | |
| Viacom, Inc. | | | 22,370 | | | | 1,953,795 | |
Visteon Corp. (2) | | | 5,290 | | | | 433,198 | |
| Whirlpool Corp. | | | 11,090 | | | | 1,739,577 | |
| (Cost $10,392,976) | | | | | | | 12,330,987 | |
| | | | | | | | | |
| Consumer Staples — 5.9% | | | | | | | | |
| Archer-Daniels-Midland Co. | | | 34,458 | | | | 1,495,476 | |
| Casey's General Stores, Inc. | | | 5,005 | | | | 351,601 | |
| Kroger Company | | | 3,518 | | | | 139,067 | |
| Nu Skin Enterprises, Inc. | | | 8,200 | | | | 1,133,404 | |
Rite Aid Corp. (2) | | | 99,150 | | | | 501,699 | |
| Safeway, Inc. | | | 29,265 | | | | 953,161 | |
| Tyson Foods, Inc. | | | 17,425 | | | | 583,041 | |
| Walgreen Co. | | | 18,257 | | | | 1,048,682 | |
| (Cost $5,309,631) | | | | | | | 6,206,131 | |
| | | | | | | | | |
| Energy — 4.4% | | | | | | | | |
| ConocoPhillips | | | 22,230 | | | | 1,570,550 | |
| Green Plains Renewable Energy, Inc. | | | 11,530 | | | | 223,451 | |
| Halliburton Co. | | | 18,200 | | | | 923,650 | |
| Nabors Industries, Ltd. | | | 31,090 | | | | 528,219 | |
Parker Drilling Co. (2) | | | 31,340 | | | | 254,794 | |
| Phillips 66 | | | 15,100 | | | | 1,164,663 | |
| (Cost $4,102,781) | | | | | | | 4,665,327 | |
| | | | | | | | | |
| Financials — 7.9% | | | | | | | | |
| Aflac, Inc. | | | 19,510 | | | | 1,303,268 | |
| American Equity Investment Life Holding Co. | | | 9,365 | | | | 247,049 | |
| American International Group, Inc. | | | 20,130 | | | | 1,027,637 | |
| Assurant, Inc. | | | 6,885 | | | | 456,957 | |
| CNO Financial Group, Inc. | | | 44,550 | | | | 788,090 | |
Genworth Financial, Inc. (2) | | | 25,540 | | | | 396,636 | |
| Morgan Stanley | | | 33,215 | | | | 1,041,622 | |
| Old Republic International Corp. | | | 11,400 | | | | 196,878 | |
| Principal Financial Group, Inc. | | | 38,565 | | | | 1,901,640 | |
| StanCorp Financial Group, Inc. | | | 10,920 | | | | 723,450 | |
| Balanced Fund | |
| | Shares or Principal Amount ($) | | | | |
| | | | | | | |
| Common Stocks — continued | |
| Symetra Financial Corp. | | | 12,130 | | | | 229,985 | |
| (Cost $7,042,690) | | | | | | | 8,313,212 | |
| | | | | | | | | |
| Healthcare — 10.5% | | | | | | | | |
| AbbVie, Inc. | | | 8,025 | | | | 423,800 | |
Amsurg Corp. (2) | | | 8,245 | | | | 378,610 | |
| Cardinal Health, Inc. | | | 27,440 | | | | 1,833,266 | |
Centene Corporation (2) | | | 3,040 | | | | 179,208 | |
| Cigna Corp. | | | 15,655 | | | | 1,369,500 | |
Health Net, Inc. (2) | | | 9,915 | | | | 294,178 | |
Henry Schein, Inc. (2) | | | 5,115 | | | | 584,440 | |
| Hill-Rom Holdings, Inc. | | | 7,395 | | | | 305,709 | |
LifePoint Hospitals, Inc. (2) | | | 11,530 | | | | 609,245 | |
Magellan Health Services, Inc. (2) | | | 10,430 | | | | 624,861 | |
| McKesson Corp. | | | 11,060 | | | | 1,785,084 | |
| Questcor Pharmaceuticals, Inc. | | | 14,820 | | | | 806,949 | |
VCA Antech, Inc. (2) | | | 4,160 | | | | 130,458 | |
| WellPoint, Inc. | | | 18,705 | | | | 1,728,155 | |
| (Cost $10,294,093) | | | | | | | 11,053,463 | |
| | | | | | | | | |
| Industrials — 9.5% | | | | | | | | |
AECOM Technology Corp. (2) | | | 20,305 | | | | 597,576 | |
| Boeing Company | | | 20,745 | | | | 2,831,484 | |
| Crane Co. | | | 8,600 | | | | 578,350 | |
| Curtiss-Wright Corp. | | | 6,850 | | | | 426,276 | |
| Dover Corp. | | | 14,390 | | | | 1,389,211 | |
Esterline Technologies Corp. (2) | | | 4,575 | | | | 466,467 | |
| ITT Corporation | | | 10,595 | | | | 460,035 | |
| Northrop Grumman Corp. | | | 13,850 | | | | 1,587,349 | |
| Oshkosh Corp. | | | 7,160 | | | | 360,721 | |
| Parker Hannifin Corp. | | | 8,810 | | | | 1,133,319 | |
| RR Donnelly & Sons Co. | | | 8,200 | | | | 166,296 | |
| (Cost $8,785,065) | | | | | | | 9,997,084 | |
| | | | | | | | | |
| Information Technology — 14.6% | | | | | | | | |
| Activision Blizzard, Inc. | | | 104,896 | | | | 1,870,296 | |
| Apple, Inc. | | | 1,480 | | | | 830,310 | |
Benchmark Electronics, Inc. (2) | | | 7,505 | | | | 173,215 | |
| Computer Sciences Corp. | | | 19,845 | | | | 1,108,938 | |
| Convergys Corp. | | | 15,165 | | | | 319,223 | |
| Hewlett-Packard Co. | | | 78,965 | | | | 2,209,441 | |
| Lexmark International, Inc. | | | 10,130 | | | | 359,818 | |
Plexus Corp. (2) | | | 8,560 | | | | 370,562 | |
| SanDisk Corporation | | | 25,080 | | | | 1,769,143 | |
Sanmina Corp. (2) | | | 10,085 | | | | 168,419 | |
| Seagate Technology PLC | | | 5,935 | | | | 333,310 | |
Synnex Corp. (2) | | | 5,825 | | | | 392,605 | |
| TE Connectivity, Ltd | | | 14,520 | | | | 800,197 | |
| The accompanying notes are an integral part of these financial statements. |
| Page 32 | 2013 Annual Report | December 31, 2013 |
| Balanced Fund | |
| | Shares or Principal Amount ($) | | | | |
| | | | | | | |
| Common Stocks — continued | |
| Western Digital Corp. | | | 27,700 | | | | 2,324,030 | |
| Xerox Corp. | | | 163,545 | | | | 1,990,343 | |
Zebra Technologies Corp. (2) | | | 9,850 | | | | 532,688 | |
| (Cost $12,584,576) | | | | | | | 15,552,538 | |
| | | | | | | | | |
| Materials — 0.5% | | | | | | | | |
| Minerals Technologies, Inc. | | | 3,900 | | | | 234,273 | |
| Schweitzer-Mauduit International, Inc. | | | 5,800 | | | | 298,526 | |
| (Cost $544,299) | | | | | | | 532,799 | |
| | | | | | | | | |
| Total Common Stocks (Cost $59,056,111) | | | | | | | 68,651,541 | |
| Registered Investment Companies — 29.9% | |
| Federated Bond Fund | | | 465,700 | | | | 4,321,694 | |
iShares iBoxx $ High Yield Corporate Bond ETF (7) | | | 16,175 | | | | 1,502,334 | |
iShares Russell 2000 Growth Index Fund (7) | | | 6,650 | | | | 901,142 | |
| Ivy High Income Fund | | | 349,333 | | | | 3,018,234 | |
| Prudential Total Return Bond Fund | | | 357,843 | | | | 4,999,070 | |
| Putnam Diversified Income Fund | | | 912,767 | | | | 7,174,346 | |
| Sentinel Total Return Bond Fund | | | 485,355 | | | | 5,120,492 | |
| TCW Emerging Markets Income Fund | | | 151,688 | | | | 1,274,181 | |
Vanguard Intermediate-Term Corporate Bond ETF (7) | | | 39,425 | | | | 3,260,448 | |
| Total Registered Investment Companies (Cost $32,023,883) | | | | | | | 31,571,941 | |
| Money Market Registered Investment Companies — 4.6% | |
Meeder Money Market Fund - Institutional Class, 0.13% (3) | | | 4,825,673 | | | | 4,825,673 | |
| Total Money Market Registered Investment Companies (Cost $4,825,673) | | | | | | | 4,825,673 | |
| Floating Rate Demand Notes — 0.0% | | | | |
| Caterpillar Financial Power Investment Floating Rate Demand Note, | | | | | | |
0.60%, 1/1/2014 (4) | | | 829 | | | | 829 | |
| Total Floating Rate Demand Notes (Cost $829) | | | | | | | 829 | |
| Balanced Fund | |
| | Shares or Principal Amount ($) | | | | |
| | | | | | | |
| U.S. Government Obligations — 0.5% | |
U.S. Treasury Bill, 0.09%, due 3/6/2014 (5) | | | 500,000 | | | | 499,954 | |
| Total U.S. Government Obligations (Cost $499,956) | | | | | | | 499,954 | |
Total Investments — 99.9% (Cost $96,406,452)(1) | | | | | | | 105,549,938 | |
| Other Assets less Liabilities — 0.1% | | | | | | | 91,595 | |
| Total Net Assets — 100.0% | | | | | | | 105,641,533 | |
Trustee Deferred Compensation (6) | | | | |
| Meeder Aggressive Growth Fund | | | 2,090 | | | | 22,802 | |
| Meeder Balanced Fund | | | 1,200 | | | | 13,320 | |
| Meeder Dynamic Growth Fund | | | 753 | | | | 7,794 | |
| Meeder Muirfield Fund | | | 2,083 | | | | 14,477 | |
| Meeder Quantex Fund | | | 810 | | | | 28,382 | |
| Meeder Utilities & Infrastructure Fund | | | 245 | | | | 7,590 | |
| Total Trustee Deferred Compensation (Cost $67,652) | | | | | | | 94,365 | |
| | | | | | Unrealized Appreciation (Depreciation)($) | |
| | | | | | | |
| Futures Contracts | | | | | | |
| Standard & Poors 500 expiring March 2014, notional value $4,142,475 | | | 9 | | | | 13,033 | |
| Total Futures Contracts | | | | | | | 13,033 | |
| (1) | Cost for federal income tax purposes of $96,408,958 differs from value by net unrealized appreciation (depreciation) of securities as follows: |
| Unrealized appreciation | | $ | 10,004,530 | |
| Unrealized depreciation | | | (863,550 | ) |
| Net unrealized appreciation (depreciation) | | $ | 9,140,980 | |
| (2) | Represents non-income producing securities. |
| (3) | Investment in affiliate. The yield shown represents the 7-day yield in effect at December 31, 2013. |
| (4) | Floating rate security. The rate shown represents the rate in effect at December 31, 2013. |
| (5) | Pledged as collateral on futures contracts. |
| (6) | Assets of affiliates to the Balanced Fund held for the benefit of the Fund’s Trustees in connection with the Trustee Deferred Compensation Plan. |
| The accompanying notes are an integral part of these financial statements. |
| 2013 Annual Report | December 31, 2013 | Page 33 |
Schedule of Investments
| Strategic Growth Fund | |
| | Shares or Principal Amount ($) | | | | |
| | | | | | | |
| Common Stocks — 74.1% | |
| Consumer Discretionary — 9.9% | | | | | | |
| Best Buy Co., Inc. | | | 29,110 | | | | 1,160,907 | |
| Dana Holding Corp. | | | 22,230 | | | | 436,153 | |
Graham Holdings Co. (2) | | | 1,730 | | | | 1,147,544 | |
| Harman International Industries, Inc. | | | 17,150 | | | | 1,403,727 | |
Jack in the Box, Inc. (2) | | | 11,470 | | | | 573,729 | |
| Johnson Controls, Inc. | | | 2,640 | | | | 135,432 | |
Live Nation Entertainment, Inc. (2) | | | 54,370 | | | | 1,074,351 | |
| Time Warner, Inc. | | | 10,060 | | | | 701,383 | |
| Viacom, Inc. | | | 16,025 | | | | 1,399,624 | |
Visteon Corp. (2) | | | 12,740 | | | | 1,043,279 | |
| (Cost $7,393,899) | | | | | | | 9,076,129 | |
| | | | | | | | | |
| Consumer Staples — 5.7% | | | | | | | | |
| Nu Skin Enterprises, Inc. | | | 10,070 | | | | 1,391,875 | |
Rite Aid Corp. (2) | | | 124,570 | | | | 630,324 | |
| Safeway, Inc. | | | 10,530 | | | | 342,962 | |
| Sanderson Farms, Inc. | | | 8,950 | | | | 647,354 | |
| Walgreen Co. | | | 38,799 | | | | 2,228,615 | |
| (Cost $4,471,011) | | | | | | | 5,241,130 | |
| | | | | | | | | |
| Energy — 1.7% | | | | | | | | |
| ConocoPhillips | | | 7,680 | | | | 542,592 | |
Oil States International, Inc. (2) | | | 10,135 | | | | 1,030,932 | |
| (Cost $1,646,361) | | | | | | | 1,573,524 | |
| | | | | | | | | |
| Financials — 18.6% | | | | | | | | |
| American Equity Investment Life Holding Co. | | | 22,045 | | | | 581,547 | |
| American International Group, Inc. | | | 20,740 | | | | 1,058,777 | |
Ashford Hospitality Prime, Inc. (3) | | | 10,167 | | | | 185,039 | |
Ashford Hospitality Trust, Inc. (3) | | | 50,835 | | | | 420,914 | |
Brandywine Realty Trust (3) | | | 73,640 | | | | 1,037,588 | |
| CNO Financial Group, Inc. | | | 38,450 | | | | 680,181 | |
Genworth Financial, Inc. (2) | | | 86,395 | | | | 1,341,714 | |
Host Hotels & Resorts, Inc. (3) | | | 82,770 | | | | 1,609,049 | |
Potlatch Corp. (3) | | | 19,380 | | | | 808,921 | |
| Principal Financial Group, Inc. | | | 23,605 | | | | 1,163,963 | |
Prologis, Inc. (3) | | | 30,650 | | | | 1,132,517 | |
| Protective Life Corp. | | | 23,640 | | | | 1,197,602 | |
RAIT Financial Trust (3) | | | 88,465 | | | | 793,531 | |
RLJ Lodging Trust (3) | | | 84,760 | | | | 2,061,363 | |
| StanCorp Financial Group, Inc. | | | 5,080 | | | | 336,550 | |
| Symetra Financial Corp. | | | 12,370 | | | | 234,535 | |
Vornado Realty Trust (3) | | | 25,785 | | | | 2,289,450 | |
| (Cost $15,422,695) | | | | | | | 16,933,241 | |
| | | | | | | | | |
| Healthcare — 10.1% | | | | | | | | |
| Cardinal Health, Inc. | | | 6,830 | | | | 456,312 | |
| Strategic Growth Fund | |
| | Shares or Principal Amount ($) | | | | |
| | | | | | | |
| Common Stocks — continued | |
Centene Corp. (2) | | | 7,015 | | | | 413,534 | |
| HealthSouth Corp. | | | 10,942 | | | | 364,587 | |
Henry Schein, Inc. (2) | | | 6,080 | | | | 694,701 | |
LifePoint Hospitals, Inc. (2) | | | 8,450 | | | | 446,498 | |
Magellan Health Services, Inc. (2) | | | 9,205 | | | | 551,472 | |
| McKesson Corp. | | | 22,580 | | | | 3,644,412 | |
VCA Antech, Inc. (2) | | | 12,430 | | | | 389,805 | |
| WellPoint, Inc. | | | 24,975 | | | | 2,307,440 | |
| (Cost $8,079,035) | | | | | | | 9,268,761 | |
| | | | | | | | | |
| Industrials — 6.1% | | | | | | | | |
| Dover Corp. | | | 3,710 | | | | 358,163 | |
Esterline Technologies Corp. (2) | | | 5,785 | | | | 589,839 | |
| ITT Corp. | | | 16,305 | | | | 707,963 | |
Moog, Inc. (2) | | | 4,605 | | | | 312,864 | |
| Northrop Grumman Corp. | | | 11,625 | | | | 1,332,341 | |
| Oshkosh Corp. | | | 6,140 | | | | 309,333 | |
| Towers Watson & Co. | | | 9,715 | | | | 1,239,731 | |
| UniFirst Corp. | | | 7,160 | | | | 766,120 | |
| (Cost $4,049,681) | | | | | | | 5,616,354 | |
| | | | | | | | | |
| Information Technology — 12.9% | | | | | | | | |
| Activision Blizzard, Inc. | | | 6,550 | | | | 116,786 | |
Brocade Communications Systems, Inc. (2) | | | 37,700 | | | | 334,211 | |
| Computer Sciences Corp. | | | 26,130 | | | | 1,460,144 | |
| Convergys Corp. | | | 29,370 | | | | 618,239 | |
| Hewlett-Packard Co. | | | 82,410 | | | | 2,305,832 | |
Lam Research Corp. (2) | | | 9,400 | | | | 511,830 | |
| Lexmark International, Inc. | | | 13,995 | | | | 497,102 | |
Plexus Corp. (2) | | | 7,580 | | | | 328,138 | |
| Western Digital Corp. | | | 29,485 | | | | 2,473,791 | |
| Xerox Corp. | | | 199,930 | | | | 2,433,148 | |
Zebra Technologies Corp. (2) | | | 14,420 | | | | 779,834 | |
| (Cost $9,504,536) | | | | | | | 11,859,055 | |
| | | | | | | | | |
| Materials — 9.1% | | | | | | | | |
| Minerals Technologies, Inc. | | | 12,550 | | | | 753,878 | |
| Packaging Corp of America | | | 21,520 | | | | 1,361,786 | |
| PPG Industries, Inc. | | | 8,856 | | | | 1,679,629 | |
| Schweitzer-Mauduit International, Inc. | | | 3,880 | | | | 199,704 | |
| Sealed Air Corp. | | | 40,820 | | | | 1,389,921 | |
| Sonoco Products Co. | | | 33,280 | | | | 1,388,442 | |
| Worthington Industries, Inc. | | | 37,550 | | | | 1,580,104 | |
| (Cost $6,807,694) | | | | | | | 8,353,464 | |
| | | | | | | | | |
| Total Common Stocks (Cost $57,374,912) | | | | | | | 67,921,658 | |
| The accompanying notes are an integral part of these financial statements. |
| Page 34 | 2013 Annual Report | December 31, 2013 |
| Strategic Growth Fund | |
| | Shares or Principal Amount ($) | | | | |
| | | | | | | |
| Registered Investment Companies — 17.9% | | | | |
iShares MSCI EAFE Index Fund (8) | | | 68,660 | | | | 4,606,743 | |
iShares MSCI Emerging Markets Index Fund (8) | | | 109,925 | | | | 4,594,315 | |
| Oppenheimer Developing Markets Fund | | | 97,485 | | | | 3,661,543 | |
| Oppenheimer International Growth Fund | | | 92,906 | | | | 3,545,287 | |
| Total Registered Investment Companies (Cost $14,241,876) | | | | | | | 16,407,888 | |
| Money Market Registered Investment Companies — 7.6% | |
Meeder Money Market Fund - Institutional Class, 0.13% (4) | | | 7,012,251 | | | | 7,012,251 | |
| Total Money Market Registered Investment Companies (Cost $7,012,251) | | | | | | | 7,012,251 | |
| Floating Rate Demand Notes — 0.0% | | | | |
| Caterpillar Financial Power Investment Floating Rate Demand Note, | | | | | | |
0.60%, 1/1/2014 (5) | | | 299 | | | | 299 | |
| Total Floating Rate Demand Notes (Cost $299) | | | | | | | 299 | |
| U.S. Government Obligations — 0.3% | | | | |
U.S. Treasury Bill, 0.09%, due 3/6/2014 (6) | | | 300,000 | | | | 299,972 | |
| Total U.S. Government Obligations (Cost $299,973) | | | | | | | 299,972 | |
Total Investments — 99.9% (Cost $78,929,311)(1) | | | | | | | 91,642,068 | |
| Other Assets less Liabilities — 0.1% | | | | | | | 127,265 | |
| Total Net Assets — 100.0% | | | | | | | 91,769,333 | |
Trustee Deferred Compensation (7) | | | | |
| Meeder Aggressive Growth Fund | | | 1,831 | | | | 19,976 | |
| Meeder Balanced Fund | | | 1,057 | | | | 11,733 | |
| Meeder Dynamic Growth Fund | | | 661 | | | | 6,841 | |
| Meeder Muirfield Fund | | | 1,837 | | | | 12,767 | |
| Meeder Quantex Fund | | | 707 | | | | 24,773 | |
| Meeder Utilities & Infrastructure Fund | | | 216 | | | | 6,692 | |
| Total Trustee Deferred Compensation (Cost $60,096) | | | | | | | 82,782 | |
| Strategic Growth Fund | |
| | | | | | Unrealized Appreciation (Depreciation)($) | |
| | | | | | | |
| Futures Contracts | | | | | | |
| Standard & Poors 500 expiring March 2014, notional value $1,841,100 | | | 4 | | | | 4,770 | |
| Standard & Poors Mid Cap 400 E-Mini expiring March 2014, notional value $1,607,280 | | | 12 | | | | 1,350 | |
| Russell 2000 Mini expiring March 2014, notional value $3,600,340 | | | 31 | | | | 30,528 | |
| Total Futures Contracts | | | | | | | 36,648 | |
| (1) | Cost for federal income tax and financial reporting purposes are the same. |
| (2) | Represents non-income producing securities. |
| (3) | Real estate investment trust. |
| (4) | Investment in affiliate. The yield shown represents the 7-day yield in effect at December 31, 2013. |
| (5) | Floating rate security. The rate shown represents the rate in effect at December 31, 2013. |
| (6) | Pledged as collateral on futures contracts. |
| (7) | Assets of affiliates to the Strategic Growth Fund held for the benefit of the Fund’s Trustees in connection with the Trustee Deferred Compensation Plan. |
| The accompanying notes are an integral part of these financial statements. |
| 2013 Annual Report | December 31, 2013 | Page 35 |
Schedule of Investments
| Quantex Fund | |
| | Shares or Principal Amount ($) | | | | |
| | | | | | | |
| Common Stocks — 91.4% | |
| Consumer Discretionary — 26.4% | | | | | | |
| Abercrombie & Fitch Co. | | | 6,255 | | | | 205,852 | |
Apollo Group, Inc. (2) | | | 14,305 | | | | 390,813 | |
AutoNation, Inc. (2) | | | 7,595 | | | | 377,396 | |
| Best Buy Co., Inc. | | | 25,075 | | | | 999,991 | |
Big Lots, Inc. (2) | | | 10,490 | | | | 338,722 | |
| Cablevision Systems Corp. | | | 19,555 | | | | 350,621 | |
D.R. Horton, Inc. (2) | | | 14,735 | | | | 328,885 | |
| Darden Restaurants, Inc. | | | 6,625 | | | | 360,201 | |
| Expedia, Inc. | | | 4,770 | | | | 332,278 | |
Fossil, Inc. (2) | | | 3,200 | | | | 383,808 | |
| GameStop Corp. | | | 11,800 | | | | 581,268 | |
| Gannett Co., Inc. | | | 16,280 | | | | 481,562 | |
| Garmin, Ltd. | | | 7,200 | | | | 332,568 | |
| Goodyear Tire & Rubber Company/The | | | 21,255 | | | | 506,932 | |
Graham Holdings Co. (2) | | | 810 | | | | 537,289 | |
| H&R Block, Inc. | | | 15,695 | | | | 455,783 | |
| Harman International Industries, Inc. | | | 6,560 | | | | 536,936 | |
| Hasbro, Inc. | | | 8,370 | | | | 460,434 | |
| International Game Technology, Inc. | | | 20,750 | | | | 376,820 | |
| Interpublic Group of Cos., Inc./The | | | 26,145 | | | | 462,767 | |
J.C. Penney Co., Inc. (2) | | | 14,605 | | | | 133,636 | |
| Leggett & Platt, Inc. | | | 10,765 | | | | 333,069 | |
Netflix, Inc. (2) | | | 3,185 | | | | 1,172,621 | |
| Scripps Networks Interactive | | | 5,075 | | | | 438,531 | |
TripAdvisor, Inc. (2) | | | 6,880 | | | | 569,870 | |
Urban Outfitters, Inc. (2) | | | 7,405 | | | | 274,725 | |
| (Cost $7,575,623) | | | | | | | 11,723,378 | |
| | | | | | | | | |
| Consumer Staples — 5.5% | | | | | | | | |
Constellation Brands, Inc. (2) | | | 8,035 | | | | 565,503 | |
Crimson Wine Group, Ltd. (2) | | | 1,193 | | | | 10,546 | |
Dean Foods Co. (2) | | | 8,687 | | | | 149,330 | |
| Hormel Foods Corp. | | | 9,405 | | | | 424,824 | |
| Safeway, Inc. | | | 16,420 | | | | 534,799 | |
| Tyson Foods, Inc. | | | 15,120 | | | | 505,915 | |
WhiteWave Foods Co. (2) | | | 10,886 | | | | 249,725 | |
| (Cost $1,347,596) | | | | | | | 2,440,642 | |
| | | | | | | | | |
| Energy — 5.3% | | | | | | | | |
| Diamond Offshore Drilling, Inc. | | | 4,365 | | | | 248,456 | |
| Helmerich & Payne, Inc. | | | 5,315 | | | | 446,885 | |
| Nabors Industries, Ltd. | | | 20,595 | | | | 349,909 | |
Newfield Exploration Co. (2) | | | 11,250 | | | | 277,087 | |
| QEP Resources, Inc. | | | 9,950 | | | | 304,967 | |
Rowan Cos. (2) | | | 9,460 | | | | 334,506 | |
WPX Energy, Inc. (2) | | | 20,090 | | | | 409,434 | |
| (Cost $2,281,608) | | | | | | | 2,371,244 | |
| Quantex Fund | |
| | Shares or Principal Amount ($) | | | | |
| | | | | | | |
| Common Stocks — continued | |
| Financials — 16.9% | | | | | | |
Apartment Investment & Management Co. (3) | | | 10,855 | | | | 281,253 | |
| Assurant, Inc. | | | 8,540 | | | | 566,800 | |
| Cincinnati Financial Corp. | | | 7,545 | | | | 395,132 | |
| Comerica, Inc. | | | 9,670 | | | | 459,712 | |
E*TRADE Financial Corp. (2) | | | 33,122 | | | | 650,516 | |
| Federated Investors, Inc. | | | 14,355 | | | | 413,424 | |
| First Horizon National Corp. | | | 29,987 | | | | 349,349 | |
Genworth Financial, Inc. (2) | | | 38,745 | | | | 601,710 | |
| Hudson City Bancorp, Inc. | | | 36,340 | | | | 342,686 | |
| Huntington Bancshares, Inc. | | | 46,080 | | | | 444,672 | |
| Legg Mason, Inc. | | | 11,350 | | | | 493,498 | |
| Leucadia National Corp. | | | 12,315 | | | | 349,007 | |
| NASDAQ OMX Group, Inc./The | | | 11,770 | | | | 468,446 | |
| People's United Financial, Inc. | | | 24,475 | | | | 370,062 | |
| Torchmark Corp. | | | 5,720 | | | | 447,018 | |
| Unum Group | | | 14,100 | | | | 494,628 | |
Wells Fargo & Co. Preferred (2) | | | 1 | | | | 0 | |
| Zions Bancorporation | | | 13,665 | | | | 409,403 | |
| (Cost $5,130,471) | | | | | | | 7,537,316 | |
| | | | | | | | | |
| Healthcare — 4.2% | | | | | | | | |
| DENTSPLY International, Inc. | | | 7,425 | | | | 359,964 | |
Hospira, Inc. (2) | | | 9,515 | | | | 392,779 | |
| Patterson Cos., Inc. | | | 8,570 | | | | 353,084 | |
| PerkinElmer, Inc. | | | 9,245 | | | | 381,171 | |
Tenet Healthcare Corp. (2) | | | 8,942 | | | | 376,637 | |
| (Cost $1,377,029) | | | | | | | 1,863,635 | |
| | | | | | | | | |
| Industrials — 9.4% | | | | | | | | |
| Cintas Corp. | | | 7,155 | | | | 426,366 | |
| Dun & Bradstreet Corp./The | | | 3,790 | | | | 465,222 | |
| Iron Mountain, Inc. | | | 9,465 | | | | 287,263 | |
Jacobs Engineering Group, Inc. (2) | | | 6,870 | | | | 432,741 | |
| Pitney Bowes, Inc. | | | 27,520 | | | | 641,216 | |
Quanta Services, Inc. (2) | | | 10,740 | | | | 338,954 | |
| Robert Half International, Inc. | | | 9,250 | | | | 388,407 | |
| Ryder System, Inc. | | | 5,860 | | | | 432,351 | |
| Snap-on, Inc. | | | 3,680 | | | | 403,034 | |
| Xylem, Inc. | | | 10,750 | | | | 371,950 | |
| (Cost $2,963,032) | | | | | | | 4,187,504 | |
| | | | | | | | | |
| Information Technology — 9.9% | | | | | | | | |
Advanced Micro Devices, Inc. (2) | | | 120,420 | | | | 466,025 | |
Electronic Arts, Inc. (2) | | | 20,185 | | | | 463,044 | |
First Solar, Inc. (2) | | | 9,410 | | | | 514,162 | |
| FLIR Systems, Inc. | | | 12,785 | | | | 384,828 | |
| Harris Corp. | | | 5,960 | | | | 416,068 | |
| The accompanying notes are an integral part of these financial statements. |
| Page 36 | 2013 Annual Report | December 31, 2013 |
| Quantex Fund | |
| | Shares or Principal Amount ($) | | | | |
| | | | | | | |
| Common Stocks — continued | |
| Jabil Circuit, Inc. | | | 15,250 | | | | 265,960 | |
JDS Uniphase Corp. (2) | | | 21,402 | | | | 277,905 | |
| Leidos Holdings, Inc. | | | 6,571 | | | | 305,486 | |
| LSI Corp. | | | 40,055 | | | | 442,007 | |
| Science Applications International Corp. | | | 3,755 | | | | 124,178 | |
Teradyne, Inc. (2) | | | 17,295 | | | | 304,738 | |
| Total System Services, Inc. | | | 13,695 | | | | 455,770 | |
| (Cost $3,511,626) | | | | | | | 4,420,171 | |
| | | | | | | | | |
| Materials — 7.8% | | | | | | | | |
| Allegheny Technologies, Inc. | | | 9,660 | | | | 344,186 | |
| Avery Dennison Corp. | | | 8,415 | | | | 422,349 | |
| Bemis Co., Inc. | | | 8,820 | | | | 361,267 | |
| Cliffs Natural Resources, Inc. | | | 7,690 | | | | 201,555 | |
| International Flavors & Fragrances, Inc. | | | 4,370 | | | | 375,733 | |
| MeadWestvaco Corp. | | | 9,250 | | | | 341,603 | |
Owens-Illinois, Inc. (2) | | | 13,740 | | | | 491,617 | |
| Sealed Air Corp. | | | 16,720 | | | | 569,316 | |
| United States Steel Corp. | | | 11,925 | | | | 351,788 | |
| (Cost $2,851,395) | | | | | | | 3,459,414 | |
| | | | | | | | | |
| Telecommunication Services — 2.5% | | | | | | | | |
| Frontier Communications Corp. | | | 67,630 | | | | 314,480 | |
T-Mobile US, Inc. (2) | | | 15,167 | | | | 510,218 | |
| Windstream Corp. | | | 35,115 | | | | 280,218 | |
| (Cost $859,507) | | | | | | | 1,104,916 | |
| | | | | | | | | |
| Utilities — 3.5% | | | | | | | | |
| AGL Resources, Inc. | | | 7,386 | | | | 348,841 | |
| Integrys Energy Group, Inc. | | | 5,655 | | | | 307,689 | |
| Pepco Holdings, Inc. | | | 14,955 | | | | 286,089 | |
| Pinnacle West Capital Corp. | | | 5,775 | | | | 305,613 | |
| TECO Energy, Inc. | | | 17,685 | | | | 304,889 | |
| (Cost $1,481,361) | | | | | | | 1,553,121 | |
| | | | | | | | | |
| Total Common Stocks (Cost $29,379,248) | | | | | | | 40,661,341 | |
| | | | | | | | | |
| Money Market Registered Investment Companies — 7.9% | |
Meeder Money Market Fund - Institutional Class, 0.13% (4) | | | 3,502,332 | | | | 3,502,332 | |
| Total Money Market Registered Investment Companies (Cost $3,502,332) | | | | | | | 3,502,332 | |
| Quantex Fund | |
| | Shares or Principal Amount ($) | | | | |
| | | | | | | |
| U.S. Government Obligations — 0.3% | | | | |
U.S. Treasury Bill, 0.09%, due 3/6/2014 (5) | | | 150,000 | | | | 149,986 | |
| Total U.S. Government Obligations (Cost $149,986) | | | | | | | 149,986 | |
Total Investments — 99.6% (Cost $33,031,566)(1) | | | | | | | 44,313,659 | |
| Other Assets less Liabilities — 0.4% | | | | | | | 162,143 | |
| Total Net Assets — 100.0% | | | | | | | 44,475,802 | |
Trustee Deferred Compensation (6) | | | | | | |
| Meeder Aggressive Growth Fund | | | 923 | | | | 10,070 | |
| Meeder Balanced Fund | | | 528 | | | | 5,861 | |
| Meeder Dynamic Growth Fund | | | 331 | | | | 3,426 | |
| Meeder Muirfield Fund | | | 1,893 | | | | 13,156 | |
| Meeder Quantex Fund | | | 1,183 | | | | 41,452 | |
| Meeder Utilities & Infrastructure Fund | | | 109 | | | | 3,377 | |
| Total Trustee Deferred Compensation (Cost $46,926) | | | | | | | 77,342 | |
| | | | | Unrealized Appreciation (Depreciation)($) | |
| | | | | | | |
| Futures Contracts | | | | | | |
| Standard & Poors Mid Cap 400 E-Mini expiring March 2014, notional value $3,482,440 | | | 26 | | | | 107,430 | |
| Total Futures Contracts | | | | | | | 107,430 | |
| (1) | Cost for federal income tax purposes of $33,121,677 differs from value by net unrealized appreciation (depreciation) of securities as follows: |
| Unrealized appreciation | | $ | 11,981,640 | |
| Unrealized depreciation | | | (789,658 | ) |
| Net unrealized appreciation (depreciation) | | $ | 11,191,982 | |
| (2) | Represents non-income producing securities. |
| (3) | Real estate investment trust. |
| (4) | Investment in affiliate. The yield shown represents the 7-day yield in effect at December 31, 2013. |
| (5) | Pledged as collateral on Futures Contracts. |
| (6) | Assets of affiliates to the Quantex Fund held for the benefit of the Fund’s Trustees in connection with the Trustee Deferred Compensation Plan. |
| The accompanying notes are an integral part of these financial statements. |
| 2013 Annual Report | December 31, 2013 | Page 37 |
Schedule of Investments
| Utilities & Infrastructure Fund | |
| | Shares or Principal Amount ($) | | | | |
| | | | | | | |
| Common Stocks — 97.9% | |
| Electric Utility — 14.3% | | | | | | |
| Covanta Holding Corp. | | | 65,838 | | | | 1,168,625 | |
| General Electric Co. | | | 58,764 | | | | 1,647,155 | |
| ITC Holdings Corp. | | | 9,885 | | | | 947,181 | |
| MDU Resources Group, Inc. | | | 54,783 | | | | 1,673,621 | |
| (Cost $4,300,316) | | | | | | | 5,436,582 | |
| | | | | | | | | |
| Natural Gas Distribution — 14.8% | | | | | | | | |
| Energy Transfer Equity, L.P. | | | 14,071 | | | | 1,150,164 | |
| MarkWest Energy Partners, L.P. | | | 15,397 | | | | 1,018,204 | |
National Grid PLC - ADR (3) | | | 16,308 | | | | 1,065,239 | |
| ONEOK, Inc. | | | 15,278 | | | | 949,986 | |
| Williams Companies, Inc./The | | | 38,615 | | | | 1,489,381 | |
| (Cost $3,067,370) | | | | | | | 5,672,974 | |
| | | | | | | | | |
| Oil Exploration & Production — 9.1% | | | | | | | | |
| Energen Corporation | | | 10,431 | | | | 737,993 | |
| Ensco PLC | | | 22,958 | | | | 1,312,738 | |
| EQT Corp. | | | 15,716 | | | | 1,410,982 | |
| (Cost $2,558,300) | | | | | | | 3,461,713 | |
| | | | | | | | | |
| Pipelines — 18.4% | | | | | | | | |
| Enterprise Products Partners, L.P. | | | 26,354 | | | | 1,747,201 | |
| Kinder Morgan Energy Partners, L.P. | | | 12,857 | | | | 1,037,046 | |
| National Fuel Gas Co. | | | 20,831 | | | | 1,487,333 | |
| Questar Corp. | | | 75,826 | | | | 1,743,240 | |
| Spectra Energy Corp. | | | 26,919 | | | | 958,855 | |
| (Cost $4,217,931) | | | | | | | 6,973,675 | |
| | | | | | | | | |
| Telecommunication Services — 23.1% | | | | | | | | |
American Tower Corp. (4) | | | 8,635 | | | | 689,246 | |
| AT&T, Inc. | | | 39,215 | | | | 1,378,799 | |
| BCE Inc. | | | 17,372 | | | | 752,034 | |
| Corning, Inc. | | | 77,068 | | | | 1,373,352 | |
| QUALCOMM, Inc. | | | 18,369 | | | | 1,363,898 | |
| Telephone and Data Systems, Inc. | | | 58,699 | | | | 1,513,260 | |
| Verizon Communications, Inc. | | | 17,409 | | | | 855,478 | |
Vodafone Group PLC - ADR (3) | | | 20,534 | | | | 807,192 | |
| (Cost $7,198,377) | | | | | | | 8,733,259 | |
| | | | | | | | | |
| Utility Services — 14.6% | | | | | | | | |
ARRIS Group, Inc. (2) | | | 33,232 | | | | 808,867 | |
| Black Hills Corp. | | | 13,297 | | | | 698,225 | |
| Fluor Corp. | | | 10,540 | | | | 846,257 | |
| NiSource, Inc. | | | 39,609 | | | | 1,302,344 | |
Quanta Services, Inc. (2) | | | 36,193 | | | | 1,142,251 | |
| UGI Corp. | | | 18,268 | | | | 757,391 | |
| (Cost $4,080,680) | | | | | | | 5,555,335 | |
| Utilities & Infrastructure Fund | |
| | Shares or Principal Amount ($) | | | | |
| | | | | | | |
| Common Stocks — continued | |
| Water Utility — 3.6% | | | | | | |
| American Water Works Co., Inc. | | | 32,369 | | | | 1,367,914 | |
| (Cost $818,256) | | | | | | | 1,367,914 | |
| | | | | | | | | |
| Total Common Stocks (Cost $26,241,230) | | | | | | | 37,201,452 | |
| Money Market Registered Investment Companies — 2.0% | |
Meeder Money Market Fund - Institutional Class, 0.13% (5) | | | 766,924 | | | | 766,924 | |
| Total Money Market Registered Investment Companies (Cost $766,924) | | | | | | | 766,924 | |
Total Investments — 99.9% (Cost $27,008,154)(1) | | | | | | | 37,968,376 | |
| Other Assets less Liabilities — 0.1% | | | | | | | 19,633 | |
| Total Net Assets — 100.0% | | | | | | | 37,988,009 | |
Trustee Deferred Compensation (6) | | | | | | |
| Meeder Aggressive Growth Fund | | | 1,090 | | | | 11,892 | |
| Meeder Balanced Fund | | | 625 | | | | 6,938 | |
| Meeder Dynamic Growth Fund | | | 391 | | | | 4,047 | |
| Meeder Muirfield Fund | | | 1,807 | | | | 12,559 | |
| Meeder Quantex Fund | | | 1,039 | | | | 36,407 | |
| Meeder Utilities & Infrastructure Fund | | | 129 | | | | 3,996 | |
| Total Trustee Deferred Compensation (Cost $47,507) | | | | | | | 75,839 | |
| (1) | Cost for federal income tax purposes of $27,110,875 differs from value by net unrealized appreciation (depreciation) of securities as follows: |
| Unrealized appreciation | | $ | 11,079,926 | |
| Unrealized depreciation | | | (222,425 | ) |
| Net unrealized appreciation (depreciation) | | $ | 10,857,501 | |
| (2) | Represents non-income producing securities. |
| (3) | American Depositary Receipt. |
| (4) | Real estate investment trust. |
| (5) | Investment in affiliate. The yield shown represents the 7-day yield in effect at December 31, 2013. |
| (6) | Assets of affiliates to the Utilities & Infrastructure Fund held for the benefit of the Fund’s Trustees in connection with the Trustees Deferred Compensation Plan. |
| The accompanying notes are an integral part of these financial statements. |
| Page 38 | 2013 Annual Report | December 31, 2013 |
| Total Return Bond Fund | |
| | Shares or Principal Amount ($) | | | | |
| | | | | | | |
| Registered Investment Companies — 94.7% | |
| AllianceBernstein High Income Fund | | | 850,349 | | | | 7,984,775 | |
| Eaton Vance Floating-Rate Advantage Fund | | | 518,461 | | | | 5,806,763 | |
| Federated Bond Fund | | | 871,141 | | | | 8,084,188 | |
| Fidelity Capital & Income Fund | | | 326,930 | | | | 3,223,530 | |
| Goldman Sachs Strategic Income Fund | | | 575,919 | | | | 6,139,295 | |
iShares iBoxx $ High Yield Corporate Bond ETF (5) | | | 18,905 | | | | 1,755,896 | |
iShares iBoxx $ Investment Grade Corporate Bond (5) | | | 26,125 | | | | 2,983,161 | |
iShares JP Morgan Emerging Bond Fund (5) | | | 45,335 | | | | 4,903,433 | |
| Ivy High Income Fund | | | 980,626 | | | | 8,472,609 | |
PIMCO Total Return Exchange-Traded Fund (5) | | | 37,950 | | | | 3,974,883 | |
| Prudential Total Return Bond Fund | | | 211,151 | | | | 2,949,786 | |
| Putnam Absolute Return 300 Fund | | | 337,699 | | | | 3,569,477 | |
| Putnam Diversified Income Fund | | | 1,101,008 | | | | 8,653,923 | |
| Sentinel Total Return Bond Fund | | | 391,557 | | | | 4,130,923 | |
SPDR Barclays High Yield Bond ETF (5) | | | 43,380 | | | | 1,759,493 | |
| TCW Emerging Markets Income Fund | | | 951,483 | | | | 7,992,459 | |
| Templeton Global Total Return Fund | | | 222,626 | | | | 3,003,224 | |
| Total Registered Investment Companies (Cost $85,969,293) | | | | | | | 85,387,818 | |
| Money Market Registered Investment Companies — 4.8% | |
Meeder Money Market Fund - Institutional Class, 0.13% (2) | | | 4,283,602 | | | | 4,283,602 | |
| Total Money Market Registered Investment Companies (Cost $4,283,602) | | | | | | | 4,283,602 | |
| U.S. Government Obligations — 0.3% | |
| Government National Mortgage Association, 6.50%, due 7/20/2038 | | | 34,625 | | | | 39,305 | |
U.S. Treasury Bill, 0.09%, due 3/6/2014 (3) | | | 200,000 | | | | 199,982 | |
| Total U.S. Government Obligations (Cost $242,600) | | | | | | | 239,287 | |
Total Investments — 99.8% (Cost $90,495,495)(1) | | | | | | | 89,910,707 | |
| Other Assets less Liabilities — 0.2% | | | | | | | 169,370 | |
| Total Net Assets — 100.0% | | | | | | | 90,080,077 | |
| Total Return Bond Fund | |
| | Shares or Principal Amount ($) | | | | |
| | | | | | | |
Trustee Deferred Compensation (4) | | | | | | |
| Meeder Aggressive Growth Fund | | | 601 | | | | 6,557 | |
| Meeder Balanced Fund | | | 345 | | | | 3,830 | |
| Meeder Dynamic Growth Fund | | | 231 | | | | 2,391 | |
| Meeder Muirfield Fund | | | 649 | | | | 4,511 | |
| Meeder Quantex Fund | | | 221 | | | | 7,744 | |
| Meeder Utilities & Infrastructure Fund | | | 75 | | | | 2,324 | |
| Total Trustee Deferred Compensation (Cost $21,956) | | | | | | | 27,357 | |
| (1) | Cost for federal income tax purposes of $90,516,269 differs from value by net unrealized appreciation (depreciation) of securities as follows: |
| Unrealized appreciation | | $ | 450,148 | |
| Unrealized depreciation | | | (1,055,710 | ) |
| Net unrealized appreciation (depreciation) | | $ | (605,562 | ) |
| (2) | Investment in affiliate. The yield shown represents the 7-day yield in effect at December 31, 2013. |
| (3) | Pledged as collateral on futures contracts. |
| (4) | Assets of affiliates to the Total Return Bond Fund held for the benefit of the Fund’s Trustees in connection with the Trustee Deferred Compensation Plan. |
| The accompanying notes are an integral part of these financial statements. |
| 2013 Annual Report | December 31, 2013 | Page 39 |
Schedule of Investments
| Money Market Fund | |
| | | | | | | Principal Amount ($) or Shares | | | | |
| | | | | | | | | | | | | |
| Bank Obligations — 7.4% | |
| American National Bank | | | 0.20 | %(2) | | 01/02/14 | | | | 249,177 | | | | 249,177 | |
| Bank Midwest Deposit Account | | | 0.65 | %(2) | | 01/02/14 | | | | 249,808 | | | | 249,808 | |
| Columbus First Bank Demand Deposit Account | | | 0.45 | %(2) | | 01/02/14 | | | | 249,563 | | | | 249,563 | |
| EverBank Money Market Account | | | 0.61 | %(2) | | 01/02/14 | | | | 249,771 | | | | 249,771 | |
FICA Bank Deposit Program (3) | | | 0.23 | % | | — | | | | 5,005,545 | | | | 5,005,545 | |
| First Merchants Bank Demand Account | | | 0.30 | %(2) | | 01/02/14 | | | | 249,375 | | | | 249,375 | |
| Metro City Bank | | | 0.45 | %(2) | | 01/02/14 | | | | 249,401 | | | | 249,401 | |
| Mid America Bank Demand Deposit Account | | | 0.40 | %(2) | | 01/02/14 | | | | 249,581 | | | | 249,581 | |
| Nationwide Bank Deposit Account | | | 0.60 | %(2) | | 01/02/14 | | | | 249,751 | | | | 249,751 | |
| Plaza Bank Deposit Account | | | 0.55 | %(2) | | 01/02/14 | | | | 249,778 | | | | 249,778 | |
| PNC Bank | | | 0.20 | %(2) | | 01/02/14 | | | | 249,178 | | | | 249,178 | |
| TD Bank Demand Deposit Account | | | 0.20 | %(2) | | 01/02/14 | | | | 249,261 | | | | 249,261 | |
| Total Bank Obligations (Cost $7,750,189) | | | | 7,750,189 | |
| Certificates of Deposit — 4.0% | |
| Banco Popular de Puerto Rico | | | 0.40 | % | | 06/11/14 | | | | 249,000 | | | | 249,000 | |
| Bank of Baroda/New York NY | | | 0.35 | % | | 05/09/14 | | | | 249,000 | | | | 249,000 | |
| Bank of India/New York NY | | | 0.50 | % | | 09/17/14 | | | | 248,000 | | | | 248,000 | |
| Beal Bank USA | | | 0.40 | % | | 09/24/14 | | | | 249,000 | | | | 249,000 | |
| BMW Bank of North America | | | 0.25 | % | | 05/09/14 | | | | 249,000 | | | | 249,000 | |
| Compass Bank | | | 0.30 | % | | 03/25/14 | | | | 249,000 | | | | 249,000 | |
| Discover Bank/Greenwood DE | | | 0.30 | % | | 04/10/14 | | | | 248,000 | | | | 248,000 | |
| Doral Bank | | | 0.35 | % | | 05/30/14 | | | | 249,000 | | | | 249,000 | |
| Enterprise Bank & Trust/Clayton MO | | | 0.25 | % | | 05/16/14 | | | | 249,000 | | | | 249,000 | |
| Fifth Third Bank/Cincinnati OH | | | 0.40 | % | | 04/10/14 | | | | 248,000 | | | | 248,000 | |
| First Mid-Illinois Bank & Trust NA | | | 0.30 | % | | 09/26/14 | | | | 249,000 | | | | 249,000 | |
| First Niagara Bank NA | | | 0.35 | % | | 06/13/14 | | | | 249,000 | | | | 249,000 | |
| FirstBank Puerto Rico | | | 0.30 | % | | 05/23/14 | | | | 249,000 | | | | 249,000 | |
| Investors Bank/Short Hills NJ | | | 0.25 | % | | 02/24/14 | | | | 249,000 | | | | 249,000 | |
| Money Market Fund | |
| | | | | | | Principal Amount ($) or Shares | | | | |
| | | | | | | | | | | | | |
| Certificates of Deposit — continued | |
| Mizuho Corporate Bank USA | | | 0.30 | % | | 05/29/14 | | | | 249,000 | | | | 249,000 | |
| Safra National Bank of New York | | | 0.25 | % | | 06/30/14 | | | | 249,000 | | | | 249,000 | |
| State Bank of India/New York NY | | | 0.50 | % | | 09/23/14 | | | | 248,000 | | | | 248,000 | |
| Total Certificates of Deposit (Cost $4,229,000) | | | | 4,229,000 | |
| Corporate Obligations — 30.1% | | | | | | | |
Bath Technologies (5) | | | 0.30 | %(2) | | 01/02/14 | | | | 605,000 | | | | 605,000 | |
| Caterpillar Financial Power Investment Floating Rate Demand Note | | | 0.60 | %(4) | | 01/02/14 | | | | 9,854,833 | | | | 9,854,833 | |
| GE Demand Note | | | 0.70 | %(4) | | 01/02/14 | | | | 9,014,495 | | | | 9,014,495 | |
MassMutual Global (5) | | | 0.62 | %(4) | | 01/14/14 | | | | 4,234,000 | | | | 4,234,653 | |
Met Life Global Funding (5) | | | 1.14 | %(4) | | 01/04/14 | | | | 4,800,000 | | | | 4,810,815 | |
| Rabobank Nederland | | | 0.28 | %(4) | | 03/03/14 | | | | 1,000,000 | | | | 1,000,000 | |
Springside Corp. Exchange Partners, LLC (5) | | | 0.17 | %(2) | | 01/02/14 | | | | 2,000,000 | | | | 2,000,000 | |
| Total Corporate Obligations (Cost $31,519,796) | | | | 31,519,796 | |
| Repurchase Agreements — 19.1% | |
| G.X. Clarke (Collateralized by $10,164,000 various Federal National Mortgage Associations, 0.85% - 2.20%, due 9/30/16 - 7/16/18, fair value $10,203,982), (proceeds $10,000,000), purchase date 12/26/13 | | | 0.21 | % | | 01/02/14 | | | | 10,000,000 | | | | 10,000,000 | |
| G.X. Clarke (Collateralized by $10,205,000 Federal National Mortgage Association, 0.85%, due 12/30/16, fair value $10,200,408), (proceeds $10,000,000), purchase date 12/31/13 | | | 0.16 | % | | 01/07/14 | | | | 10,000,000 | | | | 10,000,000 | |
| The accompanying notes are an integral part of these financial statements. |
| Page 40 | 2013 Annual Report | December 31, 2013 |
| Money Market Fund | |
| | | | | | | Principal Amount ($) or Shares | | | | |
| | | | | | | | | | | | | |
| Total Repurchase Agreements (Cost $20,000,000) | | | | 20,000,000 | |
| | | | | | | | | | | | | | |
| U.S. Government Agency Obligations — 19.7% | |
| Fannie Mae | | | 0.36 | %(4) | | 01/02/14 | | | | 5,000,000 | | | | 5,006,389 | |
| Federal Farm Credit Bank | | | 0.06 | %(4) | | 01/02/14 | | | | 5,000,000 | | | | 4,999,819 | |
| Federal Farm Credit Bank | | | 0.23 | %(4) | | 01/07/14 | | | | 5,605,000 | | | | 5,608,259 | |
| Federal Farm Credit Bank | | | 0.09 | %(4) | | 01/02/14 | | | | 5,000,000 | | | | 4,999,589 | |
| Total U.S. Government Agency Obligations (Cost $20,614,056) | | | | 20,614,056 | |
| | Shares or Principal Amount ($) | | | | |
| | | | | | | |
| Money Market Registered Investment Companies — 19.7% | |
Fidelity Institutional Money Market Portfolio, 0.07% (6) | | | 20,623,366 | | | | 20,623,366 | |
| Total Money Market Registered Investment Companies (Cost $20,623,366) | | | | | | | 20,623,366 | |
Total Investments — 100.0% (Cost $104,736,407) (1) | | | | | | | 104,736,407 | |
| Other Assets less Liabilities — 0.0% | | | | | | | 35,763 | |
| Total Net Assets — 100.0% | | | | | | | 104,772,170 | |
Trustee Deferred Compensation (7) | | | | | | |
| Meeder Aggressive Growth Fund | | | 792 | | | | 8,641 | |
| Meeder Balanced Fund | | | 450 | | | | 4,995 | |
| Meeder Dynamic Growth Fund | | | 282 | | | | 2,919 | |
| Meeder Muirfield Fund | | | 1,650 | | | | 11,468 | |
| Meeder Quantex Fund | | | 1,050 | | | | 36,792 | |
| Meeder Utilities & Infrastructure Fund | | | 93 | | | | 2,881 | |
| Total Trustee Deferred Compensation (Cost $43,235) | | | | | | | 67,696 | |
| (1) | Cost for federal income tax and financial reporting purposes are the same. |
| (2) | Variable rate security. Securities payable at par including accrued interest (usually within seven days notice) and unconditionally secured as to principal and interest by letters of credit or other credit support agreements from major banks. The interest rates are adjustable and are based on bank prime rates or other interest rate adjustment indices. The rate shown represents the rate in effect at December 31, 2013. The maturity date shown, if applicable, reflects the earlier of the next demand date or stated maturity date. |
| (3) | The FICA bank deposits were purchased through StoneCastle Partners, LLC, an independent, privately held asset management and investment services company. The underlying bank deposits are insured through the Federal Deposit Insurance Corporation (FDIC). The interest rate varies monthly and any accrued interest is reinvested into the program on a monthly basis. For a complete list of the underlying bank deposits that make up this program, visit www.meederinvestment.com. |
| (4) | Floating rate security. The rate shown represents the rate in effect at December 31, 2013. The maturity date shown reflects the earlier of the next demand date or stated maturity date. |
| (5) | Represents a restricted security purchased under Rule 144A, which is exempt from registration under the Securities Act of 1933, as amended. Security is restricted as to resale to institutional investors, but has been deemed liquid in accordance with guidelines approved by the Board of Trustees. Bath Technologies was acquired on 10/18/1999 at a cost of $605,000. Springside Corp. Exchange Partners, LLC was acquired on 2/5/2004 at a cost of $2,000,000. MassMutual Global was acquired on 3/20/2013 at a cost of $4,248,819. Met Life Global Funding was acquired on 3/20/2013 at a cost of $4,843,608. As of December 31, 2013, securities restricted as to resale to institutional investors represented 11.1% of Total Investments. The fair value noted approximates amortized cost. |
| (6) | 7-day yield as of December 31, 2013. |
| (7) | Assets of affiliates to the Money Market Fund held for the benefit of the Fund’s Trustees in connection with the Trustee Deferred Compensation Plan. |
| The accompanying notes are an integral part of these financial statements. |
| 2013 Annual Report | December 31, 2013 | Page 41 |
Statements of Assets & Liabilities
| | | | | | | |
| Assets | | | | | | |
| Investments, at fair value* | | $ | 155,012,607 | | | $ | 98,868,408 | |
| Repurchase agreements, at fair value* | | | — | | | | — | |
| Investments in affiliates, at fair value and cost* | | | 6,371,521 | | | | 3,939,573 | |
| Trustee deferred compensation investments, at fair value | | | 216,812 | | | | 122,631 | |
| Receivable for net variation margin on futures contracts | | | 22,818 | | | | 13,218 | |
| Receivable for capital stock issued | | | 383,955 | | | | 125,034 | |
| Receivable from investment advisor | | | — | | | | — | |
| Interest and dividend receivable | | | 136,112 | | | | 88,883 | |
| Receivable for commissions recaptured | | | 21,860 | | | | 11,997 | |
Prepaid expenses/other assets | | | 21,408 | | | | 16,381 | |
| | | 162,187,093 | | | | 103,186,125 | |
| | | | | | | | | |
| Liabilities | | | | | | | | |
| Payable for Trustee Deferred Compensation Plan | | | 216,812 | | | | 122,631 | |
| Payable for capital stock redeemed | | | 1,391 | | | | 22,875 | |
| Dividends payable | | | 119 | | | | 11 | |
| Dividends payable - Money Market Fund - Retail Class | | | | | | | | |
| Dividends payable - Money Market Fund - Institutional Class | | | | | | | | |
| Payable to investment advisor | | | 13,875 | | | | 5,128 | |
| Accrued distribution plan (12b-1) and administrative service plan fees | | | 98,730 | | | | 81,323 | |
| Accrued transfer agent, fund accounting, CCO, and administrative fees | | | 3,337 | | | | 3,364 | |
| Accrued trustee fees | | | 3,381 | | | | 2,204 | |
Other accrued liabilities | | | 25,987 | | | | 22,889 | |
| | | 363,632 | | | | 260,425 | |
| | | | | | | | | |
| | $ | 161,823,461 | | | $ | 102,925,700 | |
| | | | | | | | | |
| Net Assets | | | | | | | | |
| Capital | | $ | 133,242,334 | | | $ | 86,501,723 | |
| Accumulated undistributed (distributions in excess of) net investment income | | | — | | | | — | |
| Accumulated undistributed net realized gain (loss) from investments and futures contracts | | | 7,127,140 | | | | 3,378,783 | |
Net unrealized appreciation (depreciation) of investments and futures contracts | | | 21,453,987 | | | | 13,045,194 | |
| | $ | 161,823,461 | | | $ | 102,925,700 | |
| | | | | | | | | |
| Net Assets | | | | | | | | |
| Money Market Fund - Retail Class | | | | | | | | |
Money Market Fund - Institutional Class | | | | | | | | |
| | | | | | | | |
| | | | | | | | | |
| Capital Stock Outstanding (unlimited number of shares authorized, $0.10 par value) | | | 23,277,440 | | | | 9,944,473 | |
| Money Market Fund - Retail Class | | | | | | | | |
Money Market Fund - Institutional Class | | | | | | | | |
Total Capital Stock Outstanding | | | | | | | | |
| | | | | | | | | |
| Net Asset Value, Offering and Redemption Price Per Share | | $ | 6.95 | | | $ | 10.35 | |
| Money Market Fund - Retail Class | | | | | | | | |
Money Market Fund - Institutional Class | | | | | | | | |
| | | | | | | | | |
* Investments and affiliated investments at cost | | $ | 140,009,629 | | | $ | 89,825,920 | |
| The accompanying notes are an integral part of these financial statements. |
| Page 42 | 2013 Annual Report | December 31, 2013 |
| | | | | | | | | | | | Utilities and Infrastructure Fund | | | | | | | |
| | | | | | | | | | | | | | | | | | | | |
| $ | 62,259,162 | | | $ | 100,724,265 | | | $ | 84,629,817 | | | $ | 40,811,327 | | | $ | 37,201,452 | | | $ | 85,627,105 | | | $ | 84,736,407 | |
| | — | | | | — | | | | — | | | | — | | | | — | | | | — | | | | 20,000,000 | |
| | 2,252,733 | | | | 4,825,673 | | | | 7,012,251 | | | | 3,502,332 | | | | 766,924 | | | | 4,283,602 | | | | — | |
| | 71,511 | | | | 94,365 | | | | 82,782 | | | | 77,342 | | | | 75,839 | | | | 27,357 | | | | 67,696 | |
| | 9,600 | | | | 13,218 | | | | 25,480 | | | | 9,100 | | | | — | | | | — | | | | — | |
| | 88,932 | | | | 101,269 | | | | 91,068 | | | | 149,997 | | | | 62,405 | | | | 212,329 | | | | — | |
| | — | | | | 2,101 | | | | — | | | | — | | | | — | | | | — | | | | 10,326 | |
| | 80,788 | | | | 69,433 | | | | 100,135 | | | | 41,502 | | | | 91,732 | | | | 51,336 | | | | 40,069 | |
| | 10,324 | | | | 8,359 | | | | 5,570 | | | | — | | | | — | | | | 2,154 | | | | — | |
| | 9,120 | | | | 20,600 | | | | 18,595 | | | | 9,733 | | | | 10,499 | | | | 13,717 | | | | 18,527 | |
| | 64,782,170 | | | | 105,859,283 | | | | 91,965,698 | | | | 44,601,333 | | | | 38,208,851 | | | | 90,217,600 | | | | 104,873,025 | |
| | | | | | | | | | | | | | | | | | | | | | | | | | | |
| | | | | | | | | | | | | | | | | | | | | | | | | | | |
| | 71,511 | | | | 94,365 | | | | 82,782 | | | | 77,342 | | | | 75,839 | | | | 27,357 | | | | 67,696 | |
| | 22,406 | | | | 4,088 | | | | 81 | | | | 787 | | | | 79,750 | | | | 4,006 | | | | — | |
| | — | | | | 132 | | | | 5 | | | | 190 | | | | 906 | | | | 113 | | | | | |
| | | | | | | | | | | | | | | | | | | | | | | | | | 140 | |
| | | | | | | | | | | | | | | | | | | | | | | | | | 3,316 | |
| | 4,014 | | | | — | | | | 4,943 | | | | 3,548 | | | | 20,871 | | | | 2,033 | | | | — | |
| | 51,485 | | | | 91,641 | | | | 81,902 | | | | 20,620 | | | | 19,744 | | | | 78,725 | | | | 1,379 | |
| | 2,898 | | | | 2,856 | | | | 2,504 | | | | 2,921 | | | | 2,849 | | | | 1,888 | | | | 4,505 | |
| | 1,569 | | | | 2,441 | | | | 2,178 | | | | 1,156 | | | | 1,114 | | | | 2,208 | | | | 678 | |
| | 20,119 | | | | 22,227 | | | | 21,970 | | | | 18,967 | | | | 19,769 | | | | 21,193 | | | | 23,141 | |
| | 174,002 | | | | 217,750 | | | | 196,365 | | | | 125,531 | | | | 220,842 | | | | 137,523 | | | | 100,855 | |
| | | | | | | | | | | | | | | | | | | | | | | | | | | |
| $ | 64,608,168 | | | $ | 105,641,533 | | | $ | 91,769,333 | | | $ | 44,475,802 | | | $ | 37,988,009 | | | $ | 90,080,077 | | | $ | 104,772,170 | |
| | | | | | | | | | | | | | | | | | | | | | | | | | | |
| | | | | | | | | | | | | | | | | | | | | | | | | | | |
| $ | 54,137,295 | | | $ | 94,109,865 | | | $ | 77,693,281 | | | $ | 32,424,167 | | | $ | 27,183,792 | | | $ | 92,257,200 | | | $ | 104,772,170 | |
| | — | | | | 2 | | | | — | | | | — | | | | (236,623 | ) | | | 2 | | | | — | |
| | 1,247,403 | | | | 2,375,147 | | | | 1,326,647 | | | | 662,112 | | | | 80,618 | | | | (1,592,337 | ) | | | — | |
| | 9,223,470 | | | | 9,156,519 | | | | 12,749,405 | | | | 11,389,523 | | | | 10,960,222 | | | | (584,788 | ) | | | — | |
| $ | 64,608,168 | | | $ | 105,641,533 | | | $ | 91,769,333 | | | $ | 44,475,802 | | | $ | 37,988,009 | | | $ | 90,080,077 | | | $ | 104,772,170 | |
| | | | | | | | | | | | | | | | | | | | | | | | | | | |
| | | | | | | | | | | | | | | | | | | | | | | | | | | |
| | | | | | | | | | | | | | | | | | | | | | | | | $ | 61,287,654 | |
| | | | | | | | | | | | | | | | | | | | | | | | | | 43,484,516 | |
| | | | | | | | | | | | | | | | | | | | | | | | | $ | 104,772,170 | |
| | | | | | | | | | | | | | | | | | | | | | | | | | | |
| | 5,920,513 | | | | 9,519,508 | | | | 8,077,005 | | | | 1,269,251 | | | | 1,226,272 | | | | 9,221,454 | | | | | |
| | | | | | | | | | | | | | | | | | | | | | | | | | 61,287,654 | |
| | | | | | | | | | | | | | | | | | | | | | | | | | 43,484,516 | |
| | | | | | | | | | | | | | | | | | | | | | | | | | 104,772,170 | |
| | | | | | | | | | | | | | | | | | | | | | | | | | | |
| $ | 10.91 | | | $ | 11.10 | | | $ | 11.36 | | | $ | 35.04 | | | $ | 30.98 | | | $ | 9.77 | | | | | |
| | | | | | | | | | | | | | | | | | | | | | | | | $ | 1.00 | |
| | | | | | | | | | | | | | | | | | | | | | | | | $ | 1.00 | |
| | | | | | | | | | | | | | | | | | | | | | | | | | | |
| $ | 55,332,055 | | | $ | 96,406,452 | | | $ | 78,929,311 | | | $ | 33,031,566 | | | $ | 27,008,154 | | | $ | 90,495,495 | | | $ | 104,736,407 | |
| The accompanying notes are an integral part of these financial statements. |
| 2013 Annual Report | December 31, 2013 | Page 43 |
Statements of Operations
For the Year Ended December 31, 2013
| | | | | | | |
| Investment Income | | | | | | |
| Interest | | $ | 13,015 | | | $ | 2,981 | |
| Interest from affiliates | | | 12,792 | | | | 7,980 | |
| | | 1,819,662 | | | | 1,265,394 | |
| | | 1,845,469 | | | | 1,276,355 | |
| | | | | | | | | |
| Fund Expenses | | | | | | | | |
| Investment advisor | | | 1,089,007 | | | | 674,723 | |
| Transfer agent | | | 162,802 | | | | 107,956 | |
| Transfer agent - Money Market Fund - Retail Class | | | | | | | | |
| Transfer agent - Money Market Fund - Institutional Class | | | | | | | | |
| Fund accounting | | | 50,567 | | | | 45,989 | |
| Administrative | | | 118,534 | | | | 81,970 | |
| Trustee | | | 15,928 | | | | 10,785 | |
| Audit | | | 10,897 | | | | 10,897 | |
| Legal | | | 4,268 | | | | 4,268 | |
| Custody | | | 23,681 | | | | 17,100 | |
| Printing | | | 10,490 | | | | 6,231 | |
| Distribution plan (12b-1) | | | 271,333 | | | | 224,908 | |
| Distribution plan (12b-1) - Money Market Fund - Retail Class | | | | | | | | |
| Distribution plan (12b-1) - Money Market Fund - Institutional Class | | | | | | | | |
| Administrative service plan | | | 271,951 | | | | 180,199 | |
| Postage | | | 6,858 | | | | 5,156 | |
| Registration and filing | | | 24,096 | | | | 24,659 | |
| Insurance | | | 7,629 | | | | 6,644 | |
| Chief Compliance Officer | | | 5,555 | | | | 5,555 | |
| | | 15,937 | | | | 14,925 | |
Total Expenses Before Reductions | | | 2,089,533 | | | | 1,421,965 | |
| | | | | | | | | |
| Expenses voluntarily reimbursed/waived by investment advisor (See Note #4) | | | (85,919 | ) | | | (125,341 | ) |
| Expenses contractually reimbursed/waived by investment advisor (See Note #4) | | | (49,794 | ) | | | (40,570 | ) |
| Commissions recaptured and fees received from custodian (See Note #4) | | | (269,979 | ) | | | (148,981 | ) |
| Distribution plan (12b-1) expenses voluntarily waived (See Note #4) | | | — | | | | — | |
| Administrative service plan expenses voluntarily waived (See Note #4) | | | (25,777 | ) | | | (8,097 | ) |
Transfer agent expenses contractually waived (See Note #4) | | | — | | | | — | |
| | | | | | | | | |
| | | 1,658,064 | | | | 1,098,976 | |
| | | | | | | | | |
Net Investment Income (Loss) | | | 187,405 | | | | 177,379 | |
| | | | | | | | | |
| Net Realized and Unrealized Gain (Loss) from Investments | | | | | | | | |
| Net realized gains (losses) from investments | | | 14,552,713 | | | | 12,234,129 | |
| Net realized gains (losses) from futures contracts | | | 2,966,690 | | | | 2,611,302 | |
Distributions of long-term realized gains by other investment companies | | | — | | | | — | |
Net Realized Gains (Losses) from Investment Transactions, Futures Contracts, and Distributions of Long-term Realized Gains by Other Investment Companies | | | 17,519,403 | | | | 14,845,431 | |
| | | | | | | | | |
Net change in unrealized appreciation (depreciation) of investments and futures contracts | | | 18,388,739 | | | | 10,113,052 | |
| | | | | | | | | |
Net Realized and Unrealized Gain (Loss) from Investments | | | 35,908,142 | | | | 24,958,483 | |
| | | | | | | | | |
Net Change in Net Assets Resulting from Operations | | $ | 36,095,547 | | | $ | 25,135,862 | |
| The accompanying notes are an integral part of these financial statements. |
| Page 44 | 2013 Annual Report | December 31, 2013 |
| | | | | | | | | | | | Utilities and Infrastructure Fund | | | | | | | |
| | | | | | | | | | | | | | | | | | | | |
| $ | 1,156 | | | $ | 6,128 | | | $ | 2,919 | | | $ | 76 | | | $ | — | | | $ | 38,958 | | | $ | 334,997 | |
| | 5,229 | | | | 6,690 | | | | 7,533 | | | | 1,930 | | | | 808 | | | | 3,788 | | | | — | |
| | 716,656 | | | | 2,106,594 | | | | 1,353,844 | | | | 634,861 | | | | 861,009 | | | | 4,113,869 | | | | — | |
| | 723,041 | | | | 2,119,412 | | | | 1,364,296 | | | | 636,867 | | | | 861,817 | | | | 4,156,615 | | | | 334,997 | |
| | | | | | | | | | | | | | | | | | | | | | | | | | | |
| | | | | | | | | | | | | | | | | | | | | | | | | | | |
| | 410,551 | | | | 729,582 | | | | 640,965 | | | | 355,535 | | | | 345,181 | | | | 341,631 | | | | 437,502 | |
| | 65,688 | | | | 116,733 | | | | 102,554 | | | | 42,664 | | | | 41,422 | | | | 68,329 | | | | | |
| | | | | | | | | | | | | | | | | | | | | | | | | | 59,565 | |
| | | | | | | | | | | | | | | | | | | | | | | | | | 38,908 | |
| | 39,948 | | | | 46,728 | | | | 45,546 | | | | 35,591 | | | | 35,904 | | | | 45,516 | | | | 48,519 | |
| | 53,553 | | | | 87,822 | | | | 78,370 | | | | 35,553 | | | | 34,518 | | | | 78,326 | | | | 102,153 | |
| | 7,135 | | | | 11,707 | | | | 10,710 | | | | 5,134 | | | | 5,053 | | | | 10,077 | | | | 2,838 | |
| | 10,897 | | | | 10,897 | | | | 10,897 | | | | 10,897 | | | | 10,897 | | | | 10,897 | | | | 10,897 | |
| | 4,269 | | | | 4,268 | | | | 4,268 | | | | 4,268 | | | | 4,269 | | | | 4,268 | | | | 4,195 | |
| | 14,550 | | | | 20,180 | | | | 18,121 | | | | 9,317 | | | | 4,542 | | | | 12,320 | | | | 8,639 | |
| | 4,578 | | | | 7,268 | | | | 6,224 | | | | 3,252 | | | | 2,659 | | | | 6,453 | | | | 8,102 | |
| | 136,853 | | | | 243,189 | | | | 213,647 | | | | 71,105 | | | | 86,195 | | | | 213,529 | | | | | |
| | | | | | | | | | | | | | | | | | | | | | | | | | 132,958 | |
| | | | | | | | | | | | | | | | | | | | | | | | | | 14,594 | |
| | 109,440 | | | | 194,050 | | | | 171,226 | | | | 70,931 | | | | 69,037 | | | | 170,704 | | | | — | |
| | 3,455 | | | | 4,730 | | | | 3,769 | | | | 4,039 | | | | 6,566 | | | | 4,209 | | | | 2,879 | |
| | 22,604 | | | | 24,193 | | | | 21,856 | | | | 20,857 | | | | 21,346 | | | | 23,641 | | | | 29,597 | |
| | 2,908 | | | | 7,316 | | | | 5,873 | | | | 2,165 | | | | 2,582 | | | | 6,651 | | | | 12,288 | |
| | 5,555 | | | | 5,555 | | | | 5,555 | | | | 5,555 | | | | 5,555 | | | | 5,555 | | | | 5,555 | |
| | 12,828 | | | | 16,042 | | | | 14,159 | | | | 11,751 | | | | 11,842 | | | | 18,168 | | | | 24,520 | |
| | 904,812 | | | | 1,530,260 | | | | 1,353,740 | | | | 688,614 | | | | 687,568 | | | | 1,020,274 | | | | 943,709 | |
| | | | | | | | | | | | | | | | | | | | | | | | | | | |
| | (35,808 | ) | | | (65,809 | ) | | | (109,777 | ) | | | (7,274 | ) | | | — | | | | (97,353 | ) | | | (563,389 | ) |
| | (1,137 | ) | | | (28,346 | ) | | | (42,790 | ) | | | (88,884 | ) | | | — | | | | (42,868 | ) | | | — | |
| | (123,769 | ) | | | (140,648 | ) | | | (143,701 | ) | | | (21,242 | ) | | | — | | | | (15,665 | ) | | | — | |
| | — | | | | — | | | | — | | | | — | | | | (16,224 | ) | | | — | | | | (143,488 | ) |
| | (5,474 | ) | | | — | | | | (4,273 | ) | | | (29,154 | ) | | | (24,163 | ) | | | — | | | | — | |
| | — | | | | — | | | | — | | | | — | | | | — | | | | (17,084 | ) | | | (19,921 | ) |
| | | | | | | | | | | | | | | | | | | | | | | | | | | |
| | 738,624 | | | | 1,295,457 | | | | 1,053,199 | | | | 542,060 | | | | 647,181 | | | | 847,304 | | | | 216,911 | |
| | | | | | | | | | | | | | | | | | | | | | | | | | | |
| | (15,583 | ) | | | 823,955 | | | | 311,097 | | | | 94,807 | | | | 214,636 | | | | 3,309,311 | | | | 118,086 | |
| | | | | | | | | | | | | | | | | | | | | | | | | | | |
| | | | | | | | | | | | | | | | | | | | | | | | | | | |
| | 4,617,681 | | | | 8,206,231 | | | | 6,867,514 | | | | 2,048,288 | | | | 1,697,926 | | | | (878,934 | ) | | | | |
| | 1,356,585 | | | | 1,635,370 | | | | 2,253,225 | | | | 237,778 | | | | — | | | | (62,749 | ) | | | | |
| | — | | | | 103,746 | | | | 15,454 | | | | — | | | | — | | | | 174,157 | | | | | |
| | 5,974,266 | | | | 9,945,347 | | | | 9,136,193 | | | | 2,286,066 | | | | 1,697,926 | | | | (767,526 | ) | | | | |
| | | | | | | | | | | | | | | | | | | | | | | | | | | |
| | 8,303,612 | | | | 6,772,174 | | | | 8,884,158 | | | | 9,310,650 | | | | 6,719,645 | | | | (2,548,860 | ) | | | | |
| | | | | | | | | | | | | | | | | | | | | | | | | | | |
| | 14,277,878 | | | | 16,717,521 | | | | 18,020,351 | | | | 11,596,716 | | | | 8,417,571 | | | | (3,316,386 | ) | | | | |
| | | | | | | | | | | | | | | | | | | | | | | | | | | |
| $ | 14,262,295 | | | $ | 17,541,476 | | | $ | 18,331,448 | | | $ | 11,691,523 | | | $ | 8,632,207 | | | $ | (7,075 | ) | | $ | 118,086 | |
| The accompanying notes are an integral part of these financial statements. |
| 2013 Annual Report | December 31, 2013 | Page 45 |
Statements of Changes in Net Assets
For the Years Ended December 31,
| | | | | | | |
| | | | | | | | | | | | | |
| Operations | | | | | | | | | | | | |
| Net investment income (loss) | | $ | 187,405 | | | $ | (142,350 | ) | | $ | 177,379 | | | $ | (37,271 | ) |
| Net realized gain (loss) from investment transactions, futures contracts, and distributions of long-term realized gains by other investment companies | | | 17,519,403 | | | | 10,392,635 | | | | 14,845,431 | | | | 9,833,640 | |
Net change in unrealized appreciation (depreciation) of investments and futures contracts | | | 18,388,739 | | | | 4,064,759 | | | | 10,113,052 | | | | 3,024,572 | |
Net change in net assets resulting from operations | | | 36,095,547 | | | | 14,315,044 | | | | 25,135,862 | | | | 12,820,941 | |
| | | | | | | | | | | | | | | | | |
| Distributions to Shareholders | | | | | | | | | | | | | | | | |
| From net investment income | | | (187,406 | ) | | | — | | | | (177,380 | ) | | | — | |
From net realized gain from investment transactions | | | (12,869,167 | ) | | | — | | | | (10,506,262 | ) | | | — | |
Net change in net assets resulting from distributions | | | (13,056,573 | ) | | | — | | | | (10,683,642 | ) | | | — | |
| | | | | | | | | | | | | | | | | |
| Capital Transactions | | | | | | | | | | | | | | | | |
| Issued | | | 46,249,025 | | | | 24,067,138 | | | | 27,172,772 | | | | 20,097,762 | |
| Reinvested | | | 13,050,523 | | | | — | | | | 10,669,300 | | | | — | |
| | | (34,686,165 | ) | | | (43,997,620 | ) | | | (41,345,834 | ) | | | (31,843,951 | ) |
Net change in net assets resulting from capital transactions | | | 24,613,383 | | | | (19,930,482 | ) | | | (3,503,762 | ) | | | (11,746,189 | ) |
| | | | | | | | | | | | | | | | | |
Total Change in Net Assets | | | 47,652,357 | | | | (5,615,438 | ) | | | 10,948,458 | | | | 1,074,752 | |
| | | | | | | | | | | | | | | | | |
Net Assets - Beginning of Year | | | 114,171,104 | | | | 119,786,542 | | | | 91,977,242 | | | | 90,902,490 | |
| | | | | | | | | | | | | | | | | |
| | $ | 161,823,461 | | | $ | 114,171,104 | | | $ | 102,925,700 | | | $ | 91,977,242 | |
| | | | | | | | | | | | | | | | | |
Accumulated undistributed (distributions in excess of) net investment income | | $ | — | | | $ | — | | | $ | — | | | $ | — | |
| | | | | | | | | | | | | | | | | |
| Share Transactions | | | | | | | | | | | | | | | | |
| Issued | | | 6,896,759 | | | | 4,290,764 | | | | 2,662,777 | | | | 2,379,078 | |
| Reinvested | | | 1,910,291 | | | | — | | | | 1,048,793 | | | | — | |
| | | (5,170,272 | ) | | | (7,825,596 | ) | | | (4,218,417 | ) | | | (3,771,464 | ) |
| | | 3,636,778 | | | | (3,534,832 | ) | | | (506,847 | ) | | | (1,392,386 | ) |
| The accompanying notes are an integral part of these financial statements. |
| Page 46 | 2013 Annual Report | December 31, 2013 |
| | | | | | | |
| | | | | | | | | | | | | | | | |
| | | | | | | | | | | | | | | | | |
| $ | (15,583 | ) | | $ | (154,490 | ) | | $ | 823,955 | | | $ | 662,138 | | | $ | 311,097 | | | $ | (38,075 | ) |
| | 5,974,266 | | | | 2,846,878 | | | | 9,945,347 | | | | 5,041,323 | | | | 9,136,193 | | | | 3,395,168 | |
| | 8,303,612 | | | | 1,520,668 | | | | 6,772,174 | | | | 3,257,332 | | | | 8,884,158 | | | | 7,154,114 | |
| | 14,262,295 | | | | 4,213,056 | | | | 17,541,476 | | | | 8,960,793 | | | | 18,331,448 | | | | 10,511,207 | |
| | | | | | | | | | | | | | | | | | | | | | | |
| | | | | | | | | | | | | | | | | | | | | | | |
| | — | | | | — | | | | (823,955 | ) | | | (662,138 | ) | | | (417,500 | ) | | | — | |
| | (548,517 | ) | | | — | | | | (7,392,978 | ) | | | — | | | | (7,621,949 | ) | | | — | |
| | (548,517 | ) | | | — | | | | (8,216,933 | ) | | | (662,138 | ) | | | (8,039,449 | ) | | | — | |
| | | | | | | | | | | | | | | | | | | | | | | |
| | | | | | | | | | | | | | | | | | | | | | | |
| | 25,520,032 | | | | 17,278,925 | | | | 39,570,813 | | | | 32,156,480 | | | | 23,069,477 | | | | 18,751,146 | |
| | 548,469 | | | | — | | | | 8,215,987 | | | | 661,998 | | | | 8,039,299 | | | | — | |
| | (14,113,081 | ) | | | (14,720,328 | ) | | | (38,097,606 | ) | | | (40,286,638 | ) | | | (29,077,214 | ) | | | (34,488,375 | ) |
| | 11,955,420 | | | | 2,558,597 | | | | 9,689,194 | | | | (7,468,160 | ) | | | 2,031,562 | | | | (15,737,229 | ) |
| | | | | | | | | | | | | | | | | | | | | | | |
| | 25,669,198 | | | | 6,771,653 | | | | 19,013,737 | | | | 830,495 | | | | 12,323,561 | | | | (5,226,022 | ) |
| | | | | | | | | | | | | | | | | | | | | | | |
| | 38,938,970 | | | | 32,167,317 | | | | 86,627,796 | | | | 85,797,301 | | | | 79,445,772 | | | | 84,671,794 | |
| | | | | | | | | | | | | | | | | | | | | | | |
| $ | 64,608,168 | | | $ | 38,938,970 | | | $ | 105,641,533 | | | $ | 86,627,796 | | | $ | 91,769,333 | | | $ | 79,445,772 | |
| | | | | | | | | | | | | | | | | | | | | | | |
| $ | — | | | $ | — | | | $ | 2 | | | $ | 2 | | | $ | — | | | $ | — | |
| | | | | | | | | | | | | | | | | | | | | | | |
| | | | | | | | | | | | | | | | | | | | | | | |
| | 2,695,239 | | | | 2,095,714 | | | | 3,609,663 | | | | 3,272,221 | | | | 2,063,813 | | | | 1,944,792 | |
| | 51,307 | | | | — | | | | 747,060 | | | | 65,808 | | | | 716,662 | | | | — | |
| | (1,440,213 | ) | | | (1,825,892 | ) | | | (3,447,305 | ) | | | (4,071,676 | ) | | | (2,591,032 | ) | | | (3,573,640 | ) |
| | 1,306,333 | | | | 269,822 | | | | 909,418 | | | | (733,647 | ) | | | 189,443 | | | | (1,628,848 | ) |
| The accompanying notes are an integral part of these financial statements. |
| 2013 Annual Report | December 31, 2013 | Page 47 |
Statements of Changes in Net Assets
For the Years Ended December 31,
| | | | |
| | | | | | | |
| Operations | | | | | | |
| Net investment income (loss) | | $ | 94,807 | | | $ | 63,043 | |
| Net realized gain (loss) from investment transactions, futures contracts, and distributions of long-term realized gains by other investment companies | | | 2,286,066 | | | | 555,832 | |
Net change in unrealized appreciation (depreciation) of investments and futures contracts | | | 9,310,650 | | | | 2,485,632 | |
Net change in net assets resulting from operations | | | 11,691,523 | | | | 3,104,507 | |
| | | | | | | | | |
| Distributions to Shareholders | | | | | | | | |
| From net investment income | | | (101,837 | ) | | | (70,420 | ) |
From net realized gain from investment transactions | | | (1,068,448 | ) | | | — | |
Net change in net assets resulting from distributions | | | (1,170,285 | ) | | | (70,420 | ) |
| | | | | | | | | |
| Distributions to Shareholders - Money Market Fund | | | | | | | | |
| From net investment income (Retail Class) | | | | | | | | |
From net investment income (Institutional Class) | | | | | | | | |
Net change in net assets resulting from distributions | | | | | | | | |
| | | | | | | | | |
| Capital Transactions | | | | | | | | |
| Issued | | | 18,025,679 | | | | 9,007,944 | |
| Reinvested | | | 1,168,437 | | | | 70,279 | |
| | | (8,545,053 | ) | | | (6,240,358 | ) |
Net change in net assets resulting from capital transactions | | | 10,649,063 | | | | 2,837,865 | |
| | | | | | | | | |
Total Change in Net Assets | | | 21,170,301 | | | | 5,871,952 | |
| | | | | | | | | |
Net Assets - Beginning of Year | | | 23,305,501 | | | | 17,433,549 | |
| | | | | | | | | |
| | $ | 44,475,802 | | | $ | 23,305,501 | |
| | | | | | | | | |
Accumulated undistributed (distributions in excess of) net investment income | | $ | — | | | $ | — | |
| | | | | | | | | |
| Share Transactions | | | | | | | | |
| Issued | | | 592,171 | | | | 378,139 | |
| Reinvested | | | 34,253 | | | | 2,760 | |
| | | (272,430 | ) | | | (263,766 | ) |
| | | 353,994 | | | | 117,133 | |
| The accompanying notes are an integral part of these financial statements. |
| Page 48 | 2013 Annual Report | December 31, 2013 |
Utilities and Infrastructure Fund | | | | | | | |
| | | | | | | | | | | | | | | | |
| | | | | | | | | | | | | | | | | |
| $ | 214,636 | | | $ | 201,788 | | | $ | 3,309,311 | | | $ | 3,056,009 | | | $ | 118,086 | | | $ | 234,521 | |
| | 1,697,926 | | | | (1,819,764 | ) | | | (767,526 | ) | | | 80,088 | | | | — | | | | — | |
| | 6,719,645 | | | | 2,115,337 | | | | (2,548,860 | ) | | | 2,591,782 | | | | — | | | | — | |
| | 8,632,207 | | | | 497,361 | | | | (7,075 | ) | | | 5,727,879 | | | | 118,086 | | | | 234,521 | |
| | | | | | | | | | | | | | | | | | | | | | | |
| | | | | | | | | | | | | | | | | | | | | | | |
| | (214,640 | ) | | | (201,789 | ) | | | (3,309,309 | ) | | | (3,056,010 | ) | | | | | | | | |
| | — | | | | (127,080 | ) | | | — | | | | — | | | | | | | | | |
| | (214,640 | ) | | | (328,869 | ) | | | (3,309,309 | ) | | | (3,056,010 | ) | | | | | | | | |
| | | | | | | | | | | | | | | | | | | | | | | |
| | | | | | | | | | | | | | | | | | | | | | | |
| | | | | | | | | | | | | | | | | | (50,875 | ) | | | (72,936 | ) |
| | | | | | | | | | | | | | | | | | (67,211 | ) | | | (161,585 | ) |
| | | | | | | | | | | | | | | | | | (118,086 | ) | | | (234,521 | ) |
| | | | | | | | | | | | | | | | | | | | | | | |
| | | | | | | | | | | | | | | | | | | | | | | |
| | 8,258,219 | | | | 6,778,672 | | | | 45,778,615 | | | | 35,084,159 | | | | 435,368,654 | | | | 491,947,583 | |
| | 209,958 | | | | 321,751 | | | | 3,308,450 | | | | 3,055,654 | | | | 59,786 | | | | 85,034 | |
| | (9,349,262 | ) | | | (9,426,777 | ) | | | (31,691,541 | ) | | | (21,808,869 | ) | | | (489,155,684 | ) | | | (435,667,299 | ) |
| | (881,085 | ) | | | (2,326,354 | ) | | | 17,395,524 | | | | 16,330,944 | | | | (53,727,244 | ) | | | 56,365,318 | |
| | | | | | | | | | | | | | | | | | | | | | | |
| | 7,536,482 | | | | (2,157,862 | ) | | | 14,079,140 | | | | 19,002,813 | | | | (53,727,244 | ) | | | 56,365,318 | |
| | | | | | | | | | | | | | | | | | | | | | | |
| | 30,451,527 | | | | 32,609,389 | | | | 76,000,937 | | | | 56,998,124 | | | | 158,499,414 | | | | 102,134,096 | |
| | | | | | | | | | | | | | | | | | | | | | | |
| $ | 37,988,009 | | | $ | 30,451,527 | | | $ | 90,080,077 | | | $ | 76,000,937 | | | $ | 104,772,170 | | | $ | 158,499,414 | |
| | | | | | | | | | | | | | | | | | | | | | | |
| $ | (236,623 | ) | | $ | 78 | | | $ | 2 | | | $ | — | | | $ | — | | | $ | — | |
| | | | | | | | | | | | | | | | | | | | | | | |
| | | | | | | | | | | | | | | | | | | | | | | |
| | 292,474 | | | | 282,532 | | | | 4,600,576 | | | | 3,510,541 | | | | 435,368,654 | | | | 491,947,583 | |
| | 7,317 | | | | 13,281 | | | | 335,050 | | | | 304,969 | | | | 59,786 | | | | 85,034 | |
| | (333,224 | ) | | | (391,238 | ) | | | (3,203,649 | ) | | | (2,185,416 | ) | | | (489,155,684 | ) | | | (435,667,299 | ) |
| | (33,433 | ) | | | (95,425 | ) | | | 1,731,977 | | | | 1,630,094 | | | | (53,727,244 | ) | | | 56,365,318 | |
| The accompanying notes are an integral part of these financial statements. |
| 2013 Annual Report | December 31, 2013 | Page 49 |
Financial Highlights
For a Share Outstanding Through Each Fiscal Year Ended December 31,
| | | | | | Income from Investment Operations | | | | |
| | Net Asset Value, Beginning of Period | | | Net Investment Income (Loss) (3) | | | Net gains (losses) on securities, futures, and options (both realized and unrealized) | | | Total from Investment Operations | | | From Net Investment Income | | | | | | From Tax Return of Capital | | | | |
| Muirfield Fund (1)(2) | |
| 2013 | | $ | 5.81 | | | | 0.01 | | | | 1.75 | | | | 1.76 | | | | (0.01 | ) | | | (0.61 | ) | | | 0.00 | | | | (0.62 | ) |
| 2012 | | $ | 5.17 | | | | (0.01 | ) | | | 0.65 | | | | 0.64 | | | | 0.00 | | | | 0.00 | | | | 0.00 | | | | 0.00 | |
| 2011 | | $ | 5.60 | | | | (0.01 | ) | | | (0.41 | ) | | | (0.42 | ) | | | (0.01 | ) | | | 0.00 | | | | 0.00 | | | | (0.01 | ) |
| 2010 | | $ | 4.99 | | | | 0.02 | | | | 0.61 | | | | 0.63 | | | | (0.02 | ) | | | 0.00 | | | | 0.00 | | | | (0.02 | ) |
| 2009 | | $ | 4.21 | | | | 0.01 | | | | 0.79 | | | | 0.80 | | | | (0.02 | ) | | | 0.00 | | | | 0.00 | | | | (0.02 | ) |
Dynamic Growth Fund (1)(2) | |
| 2013 | | $ | 8.80 | | | | 0.02 | | | | 2.74 | | | | 2.76 | | | | (0.02 | ) | | | (1.19 | ) | | | 0.00 | | | | (1.21 | ) |
| 2012 | | $ | 7.68 | | | | 0.00 | | | | 1.12 | | | | 1.12 | | | | 0.00 | | | | 0.00 | | | | 0.00 | | | | 0.00 | |
| 2011 | | $ | 8.14 | | | | (0.01 | ) | | | (0.45 | ) | | | (0.46 | ) | | | 0.00 | | | | 0.00 | | | | 0.00 | | | | 0.00 | |
| 2010 | | $ | 7.06 | | | | 0.02 | | | | 1.08 | | | | 1.10 | | | | (0.02 | ) | | | 0.00 | | | | 0.00 | | | | (0.02 | ) |
| 2009 | | $ | 5.48 | | | | 0.00 | | | | 1.58 | | | | 1.58 | | | | 0.00 | * | | | 0.00 | | | | 0.00 | | | | 0.00 | * |
Aggressive Growth Fund (1)(2) | |
| 2013 | | $ | 8.44 | | | | (0.00 | )* | | | 2.56 | | | | 2.56 | | | | 0.00 | | | | (0.09 | ) | | | 0.00 | | | | (0.09 | ) |
| 2012 | | $ | 7.40 | | | | (0.03 | ) | | | 1.07 | | | | 1.04 | | | | 0.00 | | | | 0.00 | | | | 0.00 | | | | 0.00 | |
| 2011 | | $ | 7.97 | | | | (0.07 | ) | | | (0.50 | ) | | | (0.57 | ) | | | 0.00 | | | | 0.00 | | | | 0.00 | | | | 0.00 | |
| 2010 | | $ | 6.89 | | | | (0.01 | ) | | | 1.09 | | | | 1.08 | | | | 0.00 | | | | 0.00 | | | | 0.00 | | | | 0.00 | |
| 2009 | | $ | 5.19 | | | | (0.01 | ) | | | 1.71 | | | | 1.70 | | | | 0.00 | | | | 0.00 | | | | 0.00 | | | | 0.00 | |
| |
| 2013 | | $ | 10.06 | | | | 0.09 | | | | 1.89 | | | | 1.98 | | | | (0.09 | ) | | | (0.85 | ) | | | 0.00 | | | | (0.94 | ) |
| 2012 | | $ | 9.18 | | | | 0.07 | | | | 0.89 | | | | 0.96 | | | | (0.08 | ) | | | 0.00 | | | | 0.00 | | | | (0.08 | ) |
| 2011 | | $ | 9.72 | | | | 0.13 | | | | (0.57 | ) | | | (0.44 | ) | | | (0.10 | ) | | | 0.00 | | | | 0.00 | | | | (0.10 | ) |
| 2010 | | $ | 8.98 | | | | 0.14 | | | | 0.74 | | | | 0.88 | | | | (0.14 | ) | | | 0.00 | | | | 0.00 | | | | (0.14 | ) |
| 2009 | | $ | 7.86 | | | | 0.03 | | | | 1.12 | | | | 1.15 | | | | (0.03 | ) | | | 0.00 | | | | 0.00 | | | | (0.03 | ) |
Strategic Growth Fund (1)(2) | |
| 2013 | | $ | 10.07 | | | | 0.04 | | | | 2.34 | | | | 2.38 | | | | (0.05 | ) | | | (1.04 | ) | | | 0.00 | | | | (1.09 | ) |
| 2012 | | $ | 8.90 | | | | 0.00 | | | | 1.17 | | | | 1.17 | | | | 0.00 | | | | 0.00 | | | | 0.00 | | | | 0.00 | |
| 2011 | | $ | 9.71 | | | | (0.04 | ) | | | (0.77 | ) | | | (0.81 | ) | | | 0.00 | | | | 0.00 | | | | 0.00 | | | | 0.00 | |
| 2010 | | $ | 8.12 | | | | 0.04 | | | | 1.58 | | | | 1.62 | | | | (0.03 | ) | | | 0.00 | | | | 0.00 | | | | (0.03 | ) |
| 2009 | | $ | 5.98 | | | | (0.01 | ) | | | 2.15 | | | | 2.14 | | | | 0.00 | | | | 0.00 | | | | 0.00 | | | | 0.00 | |
| 1 | Ratio of net expenses to average net assets, ratio of net investment income (loss) to average net assets, ratio of expenses to average net assets after reductions, excluding commissions recaptured and fees received from custodian, and ratio of expenses to average net assets before reductions do not include impact of expenses of the underlying security holdings as represented in the schedule of investments. |
| 2 | Recognition of net investment income by the Fund is affected by the timing of the declaration of dividends by the underlying investment companies in which the Fund invests. |
| 3 | Net investment income per share is based on average shares outstanding during the period. |
| * | Actual amounts were less than one-half of a cent per share |
| The accompanying notes are an integral part of these financial statements. |
| Page 50 | 2013 Annual Report | December 31, 2013 |
| | | | | | | | |
Net Asset Value, End of Period | | | Total Return (Assumes Reinvestment of Distributions) | | | Net Assets, End of Period ($000) | | | Ratio of Net Expenses to Average Net Assets | | | Ratio of Net Investment Income (Loss) to Average Net Assets | | | Ratio of Expenses to Average Net Assets after Reductions, Excluding Commissions Recaptured and Fees Received from Custodian | | | Ratio of Expenses to Average Net Assets Before Reductions | | | | |
| | |
| $ | 6.95 | | | | 30.46 | % | | $ | 161,823 | | | | 1.22 | % | | | 0.14 | % | | | 1.42 | % | | | 1.54 | % | | | 260 | % |
| $ | 5.81 | | | | 12.38 | % | | $ | 114,171 | | | | 1.39 | % | | | (0.12 | %) | | | 1.42 | % | | | 1.58 | % | | | 154 | % |
| $ | 5.17 | | | | (7.55 | %) | | $ | 119,787 | | | | 1.39 | % | | | (0.11 | %) | | | 1.46 | % | | | 1.58 | % | | | 189 | % |
| $ | 5.60 | | | | 12.65 | % | | $ | 122,266 | | | | 1.39 | % | | | 0.40 | % | | | 1.47 | % | | | 1.60 | % | | | 128 | % |
| $ | 4.99 | | | | 18.95 | % | | $ | 115,138 | | | | 1.43 | % | | | 0.17 | % | | | 1.51 | % | | | 1.66 | % | | | 166 | % |
| |
| $ | 10.35 | | | | 31.61 | % | | $ | 102,926 | | | | 1.22 | % | | | 0.20 | % | | | 1.39 | % | | | 1.58 | % | | | 276 | % |
| $ | 8.80 | | | | 14.58 | % | | $ | 91,977 | | | | 1.39 | % | | | (0.04 | %) | | | 1.42 | % | | | 1.57 | % | | | 154 | % |
| $ | 7.68 | | | | (5.65 | %) | | $ | 90,902 | | | | 1.39 | % | | | (0.08 | %) | | | 1.46 | % | | | 1.57 | % | | | 176 | % |
| $ | 8.14 | | | | 15.54 | % | | $ | 95,239 | | | | 1.39 | % | | | 0.23 | % | | | 1.47 | % | | | 1.59 | % | | | 119 | % |
| $ | 7.06 | | | | 28.87 | % | | $ | 84,358 | | | | 1.37 | % | | | (0.04 | %) | | | 1.48 | % | | | 1.63 | % | | | 148 | % |
| |
| $ | 10.91 | | | | 30.40 | % | | $ | 64,608 | | | | 1.35 | % | | | (0.03 | %) | | | 1.57 | % | | | 1.65 | % | | | 272 | % |
| $ | 8.44 | | | | 14.05 | % | | $ | 38,939 | | | | 1.59 | % | | | (0.44 | %) | | | 1.62 | % | | | 1.74 | % | | | 167 | % |
| $ | 7.40 | | | | (7.15 | %) | | $ | 32,167 | | | | 1.59 | % | | | (0.73 | %) | | | 1.65 | % | | | 1.70 | % | | | 224 | % |
| $ | 7.97 | | | | 15.67 | % | | $ | 33,908 | | | | 1.59 | % | | | (0.07 | %) | | | 1.66 | % | | | 1.77 | % | | | 124 | % |
| $ | 6.89 | | | | 32.76 | % | | $ | 29,895 | | | | 1.54 | % | | | (0.25 | %) | | | 1.63 | % | | | 1.82 | % | | | 156 | % |
| |
| $ | 11.10 | | | | 19.79 | % | | $ | 105,642 | | | | 1.33 | % | | | 0.85 | % | | | 1.47 | % | | | 1.57 | % | | | 217 | % |
| $ | 10.06 | | | | 10.42 | % | | $ | 86,628 | | | | 1.49 | % | | | 0.76 | % | | | 1.51 | % | | | 1.58 | % | | | 168 | % |
| $ | 9.18 | | | | (4.49 | %) | | $ | 85,797 | | | | 1.44 | % | | | 1.29 | % | | | 1.51 | % | | | 1.60 | % | | | 164 | % |
| $ | 9.72 | | | | 9.76 | % | | $ | 57,779 | | | | 1.52 | % | | | 1.51 | % | | | 1.57 | % | | | 1.66 | % | | | 161 | % |
| $ | 8.98 | | | | 14.65 | % | | $ | 49,388 | | | | 1.54 | % | | | 0.41 | % | | | 1.59 | % | | | 1.72 | % | | | 182 | % |
| |
| $ | 11.36 | | | | 23.82 | % | | $ | 91,769 | | | | 1.23 | % | | | 0.36 | % | | | 1.40 | % | | | 1.58 | % | | | 231 | % |
| $ | 10.07 | | | | 13.15 | % | | $ | 79,446 | | | | 1.39 | % | | | (0.05 | %) | | | 1.42 | % | | | 1.58 | % | | | 86 | % |
| $ | 8.90 | | | | (8.34 | %) | | $ | 84,672 | | | | 1.39 | % | | | (0.37 | %) | | | 1.48 | % | | | 1.58 | % | | | 166 | % |
| $ | 9.71 | | | | 19.96 | % | | $ | 62,431 | | | | 1.49 | % | | | 0.48 | % | | | 1.59 | % | | | 1.70 | % | | | 115 | % |
| $ | 8.12 | | | | 35.79 | % | | $ | 34,052 | | | | 1.54 | % | | | (0.13 | %) | | | 1.65 | % | | | 1.80 | % | | | 75 | % |
| The accompanying notes are an integral part of these financial statements. |
| 2013 Annual Report | December 31, 2013 | Page 51 |
Financial Highlights
For a Share Outstanding Through Each Fiscal Period Ended December 31,
| | | | | Income from Investment Operations | | | | |
| Net Asset Value, Beginning of Period | | | Net Investment Income (Loss) (5) | | | Net gains (losses) on securities, futures, and options (both realized and unrealized) | | | Total from Investment Operations | | | From Net Investment Income | | | | | | From Tax Return of Capital | | | | |
| Quantex Fund | |
| 2013 | $ | 25.46 | | | | 0.09 | | | | 10.45 | | | | 10.54 | | | | (0.08 | ) | | | (0.88 | ) | | | 0.00 | | | | (0.96 | ) |
| 2012 | $ | 21.84 | | | | 0.07 | | | | 3.63 | | | | 3.70 | | | | (0.08 | ) | | | 0.00 | | | | 0.00 | | | | (0.08 | ) |
| 2011 | $ | 22.77 | | | | 0.00 | ** | | | (0.92 | ) | | | (0.92 | ) | | | (0.01 | ) | | | 0.00 | | | | 0.00 | | | | (0.01 | ) |
| 2010 | $ | 18.48 | | | | (0.06 | ) | | | 4.35 | | | | 4.29 | | | | 0.00 | | | | 0.00 | | | | 0.00 | | | | 0.00 | |
| 2009 | $ | 10.42 | | | | (0.01 | ) | | | 8.07 | | | | 8.06 | | | | 0.00 | ** | | | 0.00 | | | | 0.00 | | | | 0.00 | ** |
Utilities and Infrastructure Fund | |
| 2013 | $ | 24.17 | | | | 0.17 | | | | 6.81 | | | | 6.98 | | | | (0.17 | ) | | | 0.00 | | | | 0.00 | | | | (0.17 | ) |
| 2012 | $ | 24.06 | | | | 0.15 | | | | 0.21 | | | | 0.36 | | | | (0.15 | ) | | | (0.10 | ) | | | 0.00 | | | | (0.25 | ) |
| 2011 | $ | 23.51 | | | | 0.22 | | | | 0.70 | | | | 0.92 | | | | (0.37 | ) | | | 0.00 | | | | 0.00 | | | | (0.37 | ) |
| 2010 | $ | 20.73 | | | | 0.15 | | | | 2.76 | | | | 2.91 | | | | (0.13 | ) | | | 0.00 | | | | 0.00 | | | | (0.13 | ) |
| 2009 | $ | 16.13 | | | | 0.15 | | | | 4.74 | | | | 4.89 | | | | (0.16 | ) | | | 0.00 | | | | (0.13 | ) | | | (0.29 | ) |
Total Return Bond Fund (1)(2)(3)(4) | |
| 2013 | $ | 10.15 | | | | 0.38 | | | | (0.38 | ) | | | (0.00 | ) | | | (0.38 | ) | | | 0.00 | | | | 0.00 | | | | (0.38 | ) |
| 2012 | $ | 9.73 | | | | 0.44 | | | | 0.41 | | | | 0.85 | | | | (0.43 | ) | | | 0.00 | | | | 0.00 | | | | (0.43 | ) |
| 2011* | $ | 10.00 | | | | 0.25 | | | | (0.31 | ) | | | (0.06 | ) | | | (0.21 | ) | | | 0.00 | | | | 0.00 | | | | (0.21 | ) |
Money Market Fund - Retail Class | |
| 2013 | $ | 1.00 | | | | 0.001 | | | | N/A | | | | 0.001 | | | | (0.001 | ) | | | 0.000 | | | | 0.000 | | | | (0.001 | ) |
| 2012 | $ | 1.00 | | | | 0.001 | | | | N/A | | | | 0.001 | | | | (0.001 | ) | | | 0.000 | | | | 0.000 | | | | (0.001 | ) |
| 2011 | $ | 1.00 | | | | 0.001 | | | | N/A | | | | 0.001 | | | | (0.001 | ) | | | 0.000 | | | | 0.000 | | | | (0.001 | ) |
| 2010 | $ | 1.00 | | | | 0.002 | | | | N/A | | | | 0.002 | | | | (0.002 | ) | | | 0.000 | | | | 0.000 | | | | (0.002 | ) |
| 2009 | $ | 1.00 | | | | 0.006 | | | | N/A | | | | 0.006 | | | | (0.006 | ) | | | 0.000 | | | | 0.000 | | | | (0.006 | ) |
Money Market Fund - Institutional Class | |
| 2013 | $ | 1.00 | | | | 0.001 | | | | N/A | | | | 0.001 | | | | (0.001 | ) | | | 0.000 | | | | 0.000 | | | | (0.001 | ) |
| 2012 | $ | 1.00 | | | | 0.002 | | | | N/A | | | | 0.002 | | | | (0.002 | ) | | | 0.000 | | | | 0.000 | | | | (0.002 | ) |
| 2011 | $ | 1.00 | | | | 0.002 | | | | N/A | | | | 0.002 | | | | (0.002 | ) | | | 0.000 | | | | 0.000 | | | | (0.002 | ) |
| 2010 | $ | 1.00 | | | | 0.003 | | | | N/A | | | | 0.003 | | | | (0.003 | ) | | | 0.000 | | | | 0.000 | | | | (0.003 | ) |
| 2009 | $ | 1.00 | | | | 0.008 | | | | N/A | | | | 0.008 | | | | (0.008 | ) | | | 0.000 | | | | 0.000 | | | | (0.008 | ) |
| 1 | Ratio of net expenses to average net assets, ratio of net investment income (loss) to average net assets, ratio of expenses to average net assets after reductions, excluding commissions recaptured and fees received from custodian, and ratio of expenses to average net assets before reductions do not include impact of expenses of the underlying security holdings as represented in the schedule of investments. |
| 2 | Recognition of net investment income by the Fund is affected by the timing of the declaration of dividends by the underlying investment companies in which the Fund invests. |
| 3 | Total return and portfolio turnover rate are not annualized for periods of less than one full year. |
| 4 | Ratio of net expenses to average net assets, ratio of net investment income (loss) to average net assets, ratio of average net assets after reductions, excluding commissions recaptured, and ratio of expenses to average net assets before reductions are annualized for periods of less than one full year. |
| 5 | Except for Money Market Fund, net investment income per share is based on average shares outstanding during the period. |
| * | Commenced Operations June 30, 2011 |
| ** | Actual amounts were less than one-half of a cent per share |
| The accompanying notes are an integral part of these financial statements. |
| Page 52 | 2013 Annual Report | December 31, 2013 |
| | | | | | | | |
Net Asset Value, End of Period | | | Total Return (Assumes Reinvestment of Distributions) | | | Net Assets, End of Period ($000) | | | Ratio of Net Expenses to Average Net Assets | | | Ratio of Net Investment Income (Loss) to Average Net Assets | | | Ratio of Expenses to Average Net Assets after Reductions, Excluding Commissions Recaptured and Fees Received from Custodian | | | Ratio of Expenses to Average Net Assets Before Reductions | | | | |
| | |
| $ | 35.04 | | | | 41.54 | % | | $ | 44,476 | | | | 1.52 | % | | | 0.27 | % | | | 1.58 | % | | | 1.94 | % | | | 25 | % |
| $ | 25.46 | | | | 16.93 | % | | $ | 23,306 | | | | 1.60 | % | | | 0.29 | % | | | 1.61 | % | | | 2.06 | % | | | 31 | % |
| $ | 21.84 | | | | (4.05 | %) | | $ | 17,434 | | | | 1.62 | % | | | 0.01 | % | | | 1.62 | % | | | 2.06 | % | | | 57 | % |
| $ | 22.77 | | | | 23.21 | % | | $ | 17,024 | | | | 1.65 | % | | | (0.26 | %) | | | 1.65 | % | | | 2.17 | % | | | 55 | % |
| $ | 18.48 | | | | 77.37 | % | | $ | 12,667 | | | | 1.79 | % | | | (0.05 | %) | | | 1.79 | % | | | 2.39 | % | | | 34 | % |
| | |
| $ | 30.98 | | | | 28.96 | % | | $ | 37,988 | | | | 1.87 | % | | | 0.62 | % | | | 1.87 | % | | | 1.99 | % | | | 19 | % |
| $ | 24.17 | | | | 1.52 | % | | $ | 30,452 | | | | 1.89 | % | | | 0.63 | % | | | 1.89 | % | | | 2.02 | % | | | 29 | % |
| $ | 24.06 | | | | 3.93 | % | | $ | 32,609 | | | | 1.90 | % | | | 0.87 | % | | | 1.90 | % | | | 2.02 | % | | | 43 | % |
| $ | 23.51 | | | | 14.10 | % | | $ | 24,144 | | | | 1.92 | % | | | 0.70 | % | | | 1.92 | % | | | 2.11 | % | | | 53 | % |
| $ | 20.73 | | | | 30.63 | % | | $ | 20,731 | | | | 2.00 | % | | | 0.90 | % | | | 2.00 | % | | | 2.20 | % | | | 35 | % |
| | |
| $ | 9.77 | | | | 0.01 | % | | $ | 90,080 | | | | 0.99 | % | | | 3.87 | % | | | 1.01 | % | | | 1.19 | % | | | 79 | % |
| $ | 10.15 | | | | 8.93 | % | | $ | 76,001 | | | | 0.99 | % | | | 4.45 | % | | | 1.00 | % | | | 1.23 | % | | | 157 | % |
| $ | 9.73 | | | | (0.57 | %) | | $ | 56,998 | | | | 0.99 | % | | | 4.97 | % | | | 1.06 | % | | | 1.36 | % | | | 125 | % |
| | |
| $ | 1.00 | | | | 0.08 | % | | $ | 61,288 | | | | 0.22 | % | | | 0.08 | % | | | 0.22 | % | | | 0.90 | % | | | N/A | |
| $ | 1.00 | | | | 0.10 | % | | $ | 73,546 | | | | 0.30 | % | | | 0.10 | % | | | 0.30 | % | | | 0.82 | % | | | N/A | |
| $ | 1.00 | | | | 0.11 | % | | $ | 78,903 | | | | 0.30 | % | | | 0.11 | % | | | 0.30 | % | | | 0.90 | % | | | N/A | |
| $ | 1.00 | | | | 0.20 | % | | $ | 96,087 | | | | 0.38 | % | | | 0.20 | % | | | 0.38 | % | | | 0.86 | % | | | N/A | |
| $ | 1.00 | | | | 0.64 | % | | $ | 122,142 | | | | 0.55 | % | | | 0.66 | % | | | 0.55 | % | | | 0.84 | % | | | N/A | |
| | |
| $ | 1.00 | | | | 0.14 | % | | $ | 43,485 | | | | 0.15 | % | | | 0.14 | % | | | 0.15 | % | | | 0.71 | % | | | N/A | |
| $ | 1.00 | | | | 0.16 | % | | $ | 84,953 | | | | 0.23 | % | | | 0.17 | % | | | 0.23 | % | | | 0.63 | % | | | N/A | |
| $ | 1.00 | | | | 0.20 | % | | $ | 23,231 | | | | 0.21 | % | | | 0.20 | % | | | 0.21 | % | | | 0.71 | % | | | N/A | |
| $ | 1.00 | | | | 0.28 | % | | $ | 33,584 | | | | 0.29 | % | | | 0.29 | % | | | 0.29 | % | | | 0.68 | % | | | N/A | |
| $ | 1.00 | | | | 0.75 | % | | $ | 46,249 | | | | 0.43 | % | | | 0.83 | % | | | 0.43 | % | | | 0.67 | % | | | N/A | |
| The accompanying notes are an integral part of these financial statements. |
| 2013 Annual Report | December 31, 2013 | Page 53 |
Notes to Financial Statements
December 31, 2013
1. Organization and Significant Accounting Policies
Meeder Funds® Trust (the “Trust”) was organized in 1982 and is registered under the Investment Company Act of 1940, as amended (the “1940 Act”), as a diversified, open-end management investment company. The Trust offers nine separate series and is presently comprised of nine separate funds as follows: Muirfield Fund® (“Muirfield”), Dynamic Growth Fund (“Dynamic”), Aggressive Growth Fund (“Aggressive”), Balanced Fund (“Balanced”), Strategic Growth Fund (“Strategic”), Quantex FundTM (“Quantex”), Utilities and Infrastructure Fund (“Utilities”), Total Return Bond Fund (“Total Bond”), and Money Market Fund (“Money Market”) (each a “Fund” and collectively the “Funds”). Money Market offers two classes of shares (the Retail Class (“Retail Class”) and the Institutional Class (“Institutional Class”)). Each class of shares has equal rights as to earnings and assets except that each class bears different distribution and transfer agent expenses. The investment objective of Muirfield, Dynamic, Aggressive, and Strategic is growth of capital. The investment objective of Balanced is growth of capital, with current income usually of secondary importance. The investment objective of Quantex is long term capital appreciation. The investment objective of Utilities is total returns, including current income and growth of income. The investment objective of Total Bond is total returns, including current income and capital growth. The investment objective of Money Market is current income while maintaining a stable share price of $1.00.
Use of estimates. The preparation of financial statements in conformity with accounting principles generally accepted in the United States of America (“GAAP”) requires management to make estimates and assumptions that affect the reported amounts of assets and liabilities and disclosure of contingent assets and liabilities at the date of the financial statements and the reported amounts of increases and decreases in net assets from operations during the reporting period. Actual results could differ from those estimates.
Security valuation. All investments in securities are recorded at their estimated fair value, as described in Note #2.
Repurchase agreements. Each Fund may engage in repurchase agreement transactions whereby the Fund takes possession of an underlying debt instrument subject to an obligation of the seller to repurchase the instrument from the Fund and an obligation of the Fund to resell the instrument at an agreed upon price and term. At all times, the Fund maintains the value of collateral, including accrued interest, of at least 100% of the amount of the repurchase agreement, plus accrued interest. If the seller defaults and the fair value of the collateral declines, realization of the collateral by the Fund may be delayed or limited.
Futures & options. Each Fund, except Money Market, may engage in transactions in financial futures contracts and options contracts in order to manage the risk of unanticipated changes in market values of securities held in the Fund, or which it intends to purchase. The futures and options contracts are adjusted by the daily exchange rate of the underlying currency, or index, and any gains or losses are recorded for financial statement purposes as unrealized gains or losses in the statement of assets and liabilities and the statement of operations until the contract settlement date, at which time realized gains and losses are included in the statement of operations.
To the extent that the Fund enters into futures contracts on an index or group of securities, the Fund exposes itself to an indeterminate liability and will be required to pay or receive a sum of money measured by the change in the value of the index. Upon entering into a futures contract, the Fund is required to deposit an initial margin, which is either cash or securities (disclosed as pledged as collateral on the Schedules of Investments) in an amount equal to a certain percentage of the contract value. Subsequently, the variation margin, which is equal to changes in the daily settlement price or last sale price on the exchanges where futures contracts trade, is received or paid and is recorded as an unrealized gain or loss until the contract is closed. When the contract is closed, the Fund records a realized gain or loss equal to the difference between the proceeds from (or cost of) the closing transaction and the Fund’s basis in the contract. Should market conditions move unexpectedly, the Fund may not achieve the anticipated benefits of the futures contract and may realize a loss. The use of futures transactions involves the risk of imperfect correlation in movements in the price of futures contracts, interest rates,
| Page 54 | 2013 Annual Report | December 31, 2013 |
and the underlying hedged assets. With futures, there is minimal counterparty credit risk to the Fund since futures are exchange traded and the exchange’s clearinghouse, as counterparty to all exchange traded futures, guarantees the futures against default. Except for Money Market and Utilities, it is normal practice for each Fund to invest in futures contracts on a daily basis. The equity funds typically utilize equity index futures contracts to equitize cash positions or adjust targeted stock market exposure. Total Bond and the fixed income portion of Balanced can utilize Treasury futures contracts in order to adjust duration. Although Utilities is permitted to invest in futures contracts, it typically does not.
Call and put option contracts involve the payment of a premium for the right to purchase or sell an individual security or index aggregate at a specified price until the expiration of the contract. Such transactions expose the Fund to the loss of the premium paid if the Fund does not sell or exercise the contract prior to the expiration date. In the case of a call option, sufficient cash or money market instruments will be segregated to complete the purchase. Options are valued on the basis of the daily settlement price or last sale on the exchanges where they trade and the changes in value are recorded as unrealized appreciation or depreciation until closed, exercised or expired. For the year ended December 31, 2013, there were no call or put options transacted for any of the Funds.
The Funds may write covered call or put options for which premiums received are recorded as liabilities and are subsequently adjusted to the current value of the options written. When written options are closed or exercised, premiums received are offset against the proceeds paid, and the Fund records realized gains or losses for the difference. When written options expire, the liability is eliminated, and the Fund records realized gains for the entire amount of premiums received. Although permitted, it is currently not normal practice for the Funds to write call and put options and none were written during the year ended December 31, 2013.
The fair value of derivative instruments, not accounted for as hedging instruments, as reported within the Statements of Assets and Liabilities as of December 31, 2013 was as follows:
| Amount of Net Variation Margin and Unrealized Appreciation (Depreciation) on Derivatives | |
| | | Statements of Assets & Liabilities Location* | | Fair Value of Variation Margin | | | Fair Value of Unrealized Appreciation (Depreciation) | |
Muirfield Fund® | Equity contracts | Assets, Receivable for net variation margin on futures contracts; Net Assets, Net unrealized appreciation (depreciation) of investments and futures contracts | | $ | 22,818 | | | $ | 79,488 | |
| Dynamic Growth Fund | Equity contracts | Assets, Receivable for net variation margin on futures contracts; Net Assets, Net unrealized appreciation (depreciation) of investments and futures contracts | | | 13,218 | | | | 63,133 | |
| Aggressive Growth Fund | Equity contracts | Assets, Receivable for net variation margin on futures contracts; Net Assets, Net unrealized appreciation (depreciation) of investments and futures contracts | | | 9,600 | | | | 43,630 | |
| Balanced Fund | Equity contracts | Assets, Receivable for net variation margin on futures contracts; Net Assets, Net unrealized appreciation (depreciation) of investments and futures contracts | | | 13,218 | | | | 13,033 | |
| Strategic Growth Fund | Equity contracts | Assets, Receivable for net variation margin on futures contracts; Net Assets, Net unrealized appreciation of investments and futures contracts | | | 25,480 | | | | 36,648 | |
Quantex FundTM | Equity contracts | Assets, Receivable for net variation margin on futures contracts; Net Assets, Net unrealized appreciation of investments and futures contracts | | | 9,100 | | | | 107,430 | |
| * | Unrealized appreciation (depreciation) on futures contracts is included with unrealized appreciation (depreciation) of investments on the Statements of Assets & Liabilities. |
| The accompanying notes are an integral part of these financial statements. |
| 2013 Annual Report | December 31, 2013 | Page 55 |
The effect of derivative instruments on the Statements of Operations for the year ended December 31, 2013 was as follows:
| Amount of Realized Gain (Loss) on Derivatives Recognized in Income |
| | | Contracts as of December 31, 2012 | | Contracts Opened During the Period | | Contracts Closed During the Period | | Contracts as of December 31, 2013 | | Statement of Operations Location | For the Year Ended December 31, 2013 | |
Muirfield Fund® | Equity contracts | 136 | | 206 | | 327 | | 15 | | Net realized gains from futures contracts | $ | 2,966,690 | |
| Dynamic Growth Fund | Equity contracts | 120 | | 123 | | 234 | | 9 | | Net realized gains from futures contracts | | 2,611,302 | |
| Aggressive Growth Fund | Equity contracts | 49 | | 122 | | 165 | | 6 | | Net realized gains from futures contracts | | 1,356,585 | |
| Balanced Fund | Equity contracts | 70 | | 135 | | 196 | | 9 | | Net realized gains from futures contracts | | 1,635,370 | |
| Strategic Growth Fund | Equity contracts | 105 | | 267 | | 325 | | 47 | | Net realized gains from futures contracts | | 2,253,225 | |
Quantex FundTM | Equity contracts | 4 | | 145 | | 123 | | 26 | | Net realized gains from futures contracts | | 237,763 | |
| Total Return Bond Fund | US Treasury Bond/Note contracts | 10 | | 95 | | 105 | | 0 | | Net realized gains (losses) from futures contracts | | (62,749 | ) |
| Change in Unrealized Gain or (Loss) on Derivatives Recognized in Income |
| | | Statement of Operations Location | | For the Year Ended December 31, 2013 | |
Muirfield Fund® | Equity contracts | Net change in unrealized appreciation (depreciation) of investments and futures contracts | | $ | 135,188 | |
| Dynamic Growth Fund | Equity contracts | Net change in unrealized appreciation (depreciation) of investments and futures contracts | | | 110,158 | |
| Aggressive Growth Fund | Equity contracts | Net change in unrealized appreciation (depreciation) of investments and futures contracts | | | 89,587 | |
| Balanced Fund | Equity contracts | Net change in unrealized appreciation (depreciation) of investments and futures contracts | | | 44,673 | |
| Page 56 | 2013 Annual Report | December 31, 2013 |
| Change in Unrealized Gain or (Loss) on Derivatives Recognized in Income |
| | | Statement of Operations Location | | For the Year Ended December 31, 2013 | |
| Strategic Growth Fund | Equity contracts | Net change in unrealized appreciation (depreciation) of investments and futures contracts | | $ | (85,445 | ) |
Quantex FundTM | Equity contracts | Net change in unrealized appreciation (depreciation) of investments and futures contracts | | | 100,580 | |
| Total Return Bond Fund | US Treasury Bond/Note contracts | Net change in unrealized appreciation (depreciation) of investments and futures contracts | | | 3,825 | |
Federal income taxes. It is each Fund’s policy to continue to comply with the requirements of Subchapter M of the Internal Revenue Code applicable to regulated investment companies and to distribute substantially all of its taxable income and net capital gains to its shareholders. Therefore, no federal income tax provision is required.
As of and during the year ended December 31, 2013, the Funds did not have a liability for any unrecognized tax benefits. The Funds recognize interest and penalties, if any, related to unrecognized tax benefits as income tax expense in the statements of operations. During the year ended December 31, 2013, the Funds did not incur any interest or penalties.
The Funds are not subject to examination by U.S. federal and state tax authorities for tax years before 2010.
Distributions to shareholders. Distributions to shareholders are recorded on the ex-dividend date. Muirfield, Quantex, Dynamic, Aggressive, Balanced, and Strategic declare and pay dividends from net investment income, if any, on a quarterly basis. Utilities and Total Bond declare and pay dividends from net investment income on a monthly basis. Money Market declares dividends from net investment income on a daily basis and pays such dividends on a monthly basis. Each Fund distributes net capital gains, if any, on an annual basis.
Distributions from net investment income and from net capital gains are determined in accordance with income tax regulations, which may differ from GAAP. These differences are primarily due to deferrals of certain losses, expiring capital loss carryforwards, and differing treatments of unrealized gains and losses of futures contracts held by each Fund. Accordingly, timing differences relating to shareholder distributions are reflected in the components of net assets and permanent book and tax differences have been reclassified within the components of net assets based on their ultimate characterization for federal income tax purposes. For the year ended December 31, 2013, the Funds made the following reclassifications to increase/(decrease) the components of net assets:
| | | | | | Accumulated Undistributed (Distributions in Excess of) Net Investment Income | | | Accumulated Undistributed Net Realized Gain (Loss) from Investments and Futures Contracts | |
Muirfield Fund® | | $ | — | | | $ | 1 | | | $ | (1 | ) |
| Dynamic Growth Fund | | | — | | | | 1 | | | | (1 | ) |
| Aggressive Growth Fund | | | — | | | | 15,583 | | | | (15,583 | ) |
| Strategic Growth Fund | | | — | | | | 106,403 | | | | (106,403 | ) |
Quantex FundTM | | | — | | | | 7,030 | | | | (7,030 | ) |
| Utilities & Infrastructure Fund | | | (17,330 | ) | | | (284,086 | ) | | | 301,416 | |
| The accompanying notes are an integral part of these financial statements. |
| 2013 Annual Report | December 31, 2013 | Page 57 |
Investment income & expenses. For Money Market, income and expenses (other than expenses attributable to a specific class) are allocated to each class of shares based on its relative net assets. Expenses incurred by the Trust that do not specifically relate to an individual Fund of the Trust are allocated to the Funds based on each Fund’s relative net assets or other appropriate basis.
Capital Share Transactions. Money Market is authorized to issue an unlimited number of shares in the Retail Class and the Institutional Class. Transactions in the capital shares of the Fund for the year ended December 31, 2013 and the year ended December 31, 2012 were as follows:
| | | | | | | |
| | | | | | | | | | | | | |
| Retail Class | | | | | | | | | | | | |
| Issued | | $ | 97,899,233 | | | | 97,899,233 | | | $ | 97,838,118 | | | | 97,838,118 | |
| Reinvested | | | 48,913 | | | | 48,913 | | | | 71,757 | | | | 71,757 | |
| Redeemed | | | (110,206,483 | ) | | | (110,206,483 | ) | | | (103,266,488 | ) | | | (103,266,488 | ) |
| Net increase (decrease) | | $ | (12,258,337 | ) | | | (12,258,337 | ) | | $ | (5,356,613 | ) | | | (5,356,613 | ) |
| | | | | | | | | | | | | | | | | |
| Institutional Class | | | | | | | | | | | | | | | | |
| Issued | | $ | 337,469,421 | | | | 337,469,421 | | | $ | 394,109,465 | | | | 394,109,465 | |
| Reinvested | | | 10,873 | | | | 10,873 | | | | 13,277 | | | | 13,277 | |
| Redeemed | | | (378,949,201 | ) | | | (378,949,201 | ) | | | (332,400,811 | ) | | | (332,400,811 | ) |
| Net increase (decrease) | | $ | (41,468,907 | ) | | | (41,468,907 | ) | | $ | 61,721,931 | | | | 61,721,931 | |
Offsetting Assets & Liabilities. The Funds have adopted financial reporting rules regarding offsetting assets and liabilities and related arrangements to enable users of their financial statements to understand the effect of those arrangements on their financial positions. The Funds’ policy is to recognize a net asset/liability equal to the net variation margin for futures contracts. Risks arise from the possible inability of counterparties to meet the terms of their contracts. During the year ended December 31, 2013, the Funds were not subject to any master netting arrangements nor were there any liability offsets to report as of December 31, 2013. The table below reflects the offsetting assets and liabilities relating to the futures contracts and repurchase agreements shown on the Statements of Assets and Liabilities at December 31, 2013.
| | | | Gross Amounts Not Offset in the Statements of Assets and Liabilities | | | | |
| | Gross Amounts of Recognized Assets | | | Gross Amounts Offset in the Statements of Assets and Liabilities | | | Net Amounts Presented in the Statements of Assets and Liabilities | | | | | | Collateral Pledged (Received) | | | | |
| Assets: | | | | | | | | | | | | | | | | | | |
| Futures Contracts | | | | | | | | | | | | | | | | | | |
Muirfield Fund® | | $ | 22,818 | | | $ | — | | | $ | 22,818 | | | $ | — | | | $ | — | | | $ | 22,818 | |
| Dynamic Growth Fund | | | 13,218 | | | | — | | | | 13,218 | | | | — | | | | — | | | | 13,218 | |
| Aggressive Growth Fund | | | 9,600 | | | | — | | | | 9,600 | | | | — | | | | — | | | | 9,600 | |
| Balanced Fund | | | 13,218 | | | | — | | | | 13,218 | | | | — | | | | — | | | | 13,218 | |
| Strategic Growth Fund | | | 25,480 | | | | — | | | | 25,480 | | | | — | | | | — | | | | 25,480 | |
Quantex FundTM | | | 9,100 | | | | — | | | | 9,100 | | | | — | | | | — | | | | 9,100 | |
| | | | | | | | | | | | | | | | | | | | | | | | | |
| Repurchase Agreements | | | | | | | | | | | | | | | | | | | | | |
| Money Market Fund | | $ | 20,000,000 | | | $ | — | | | $ | 20,000,000 | | | $ | — | | | $ | — | | | $ | 20,000,000 | |
| | | | | | | | | | | | | | | | | | | | | | | | | |
| Liabilities: | | | | | | | | | | | | | | | | | | | | | | | | |
| N/A | | | N/A | | | | N/A | | | | N/A | | | | N/A | | | | N/A | | | | N/A | |
| Page 58 | 2013 Annual Report | December 31, 2013 |
Other. The Funds record security transactions on the trade date. Gains and losses realized from the sale of securities are determined on the specific identification basis. Dividend income is recognized on the ex-dividend date and interest income (including amortization of premium and accretion of discount) is recognized as earned. Short-term capital gain distributions from underlying funds are classified as dividend income for financial reporting purposes. Long-term capital gains distributions are broken out as such. Discounts and premiums are amortized over the lives of the respective securities. Distributions received from partnerships are recorded as return of capital distributions. Withholding taxes on foreign dividends, if applicable, have been provided for in accordance with the Funds’ understanding of the applicable country’s tax rules and rates.
2. Securities Valuations
The Funds utilize various methods to measure the fair value of their investments on a recurring basis. GAAP establishes a hierarchy that prioritizes inputs to valuation methods. The three levels of inputs are as follows:
Level 1 – Unadjusted quoted prices in active markets for identical assets or liabilities that the Funds have the ability to access.
Level 2 – Observable inputs other than quoted prices included in level 1 that are observable for the asset or liability, either directly or indirectly. These inputs may include quoted prices for the identical instrument on an inactive market, prices for similar instruments, interest rates, prepayment speeds, credit risk, yield curves, default rates and similar data.
Level 3 – Significant unobservable inputs for the asset or liability, to the extent relevant observable inputs are not available, representing the Funds’ own assumptions about the assumptions a market participant would use in valuing the asset or liability, and would be based on the best information available.
The availability of observable inputs can vary from security to security and is affected by a wide variety of factors, including, for example, the type of security, whether the security is new and not yet established in the marketplace, the liquidity of markets, and other characteristics particular to the security. To the extent that valuation is based on models or inputs that are less observable or unobservable in the market, the determination of fair value requires more judgment. Accordingly, the degree of judgment exercised in determining fair value is greatest for instruments categorized in level 3.
The inputs used to measure fair value may fall into different levels of the fair value hierarchy. In such cases, for disclosure purposes, the level in the fair value hierarchy within which the fair value measurement falls in its entirety, is determined based on the lowest level input that is significant to the fair value measurement in its entirety.
A description of the valuation techniques applied to the Funds’ major categories of assets and liabilities measured at fair value on a recurring basis follows.
Equity securities (including publicly traded partnerships, real estate investment trusts, american depositary receipts, exchange traded funds, and common stock). Securities traded on a national securities exchange (or reported on the NASDAQ national market) are stated at the last reported sales price on the day of valuation and are categorized in level 1 of the fair value hierarchy.
Investments in registered open-end investment companies, including money market funds, are valued at the daily redemption value as reported by the underlying fund and are categorized in level 1 of the fair value hierarchy.
Short-term notes (including bank obligations, commercial paper, corporate obligations, Repurchase Agreements, U.S. government agency obligations, and floating rate demand notes). Short-term notes held in the Funds, except Money Market, maturing more than sixty days after the valuation date, are valued at the last sales price as of the close of business on the day of valuation, or, lacking any sales, at the most recent bid price or yield equivalent as obtained from
| The accompanying notes are an integral part of these financial statements. |
| 2013 Annual Report | December 31, 2013 | Page 59 |
dealers that make markets in such securities. When valued at last sales price, the securities will be categorized as level 1. When using bid prices or yield equivalents, they will be categorized as level 2. When such securities are valued within sixty days or less to maturity, the difference between the valuation existing on the sixty-first day before maturity and maturity value is amortized on a straight-line basis to maturity and will be categorized as level 2.
All securities held in Money Market, other than money market funds, are valued at amortized cost, which approximates fair value, and will be categorized as level 2.
Certificates of deposit. Certificates of deposit are valued at acquisition cost and will be categorized as level 2.
U.S. government obligations. U.S. government obligations are normally valued using a model that incorporates market observable data such as reported sales of similar securities, broker quotes, yields, bids, offers, and reference data. Certain securities are valued principally using dealer quotations. In either case, these securities will be categorized as level 2.
Restricted securities (equity and debt). Restricted securities for which quotations are not readily available are valued at fair value as determined by the Trustees. Depending on the relative significance of valuation inputs, these instruments may be classified in either level 2 or level 3 of the fair value hierarchy.
Derivative instruments (futures contracts). Listed derivative instruments that are actively traded, including futures contracts, are valued based on quoted prices from the exchange and are categorized in level 1 of the fair value hierarchy.
For the year ended December 31, 2013, the Funds did not hold any assets at any time in which significant unobservable inputs were used in determining fair value. Therefore, no reconciliation of level 3 securities is provided. Also, there were no transfers between level 1 and level 2 securities. The Funds recognize transfers between fair value hierarchy levels at the end of the reporting period. The following table summarizes the inputs used to value the Funds’ assets and liabilities measured at fair value as of December 31, 2013.
Muirfield – Assets/(Liabilities) | | | | | | | | | | | | |
| Common stocks* | | $ | 151,612,888 | | | $ | — | | | $ | — | | | $ | 151,612,888 | |
| Registered investment companies | | | 2,897,881 | | | | — | | | | — | | | | 2,897,881 | |
| Money market registered investment companies | | | 6,371,521 | | | | — | | | | — | | | | 6,371,521 | |
| Floating rate demand notes | | | — | | | | 1,884 | | | | — | | | | 1,884 | |
| U.S. government obligations | | | — | | | | 499,954 | | | | — | | | | 499,954 | |
| Total | | $ | 160,882,290 | | | $ | 501,838 | | | $ | — | | | $ | 161,384,128 | |
| Trustee deferred compensation | | $ | 216,812 | | | $ | — | | | $ | — | | | $ | 216,812 | |
| Futures contracts** | | $ | 79,488 | | | $ | — | | | $ | — | | | $ | 79,488 | |
Dynamic – Assets/(Liabilities) | | | | | | | | | | | | |
| Common stocks* | | $ | 96,979,989 | | | $ | — | | | $ | — | | | $ | 96,979,989 | |
| Registered investment companies | | | 1,588,177 | | | | — | | | | — | | | | 1,588,177 | |
| Money market registered investment companies | | | 3,939,573 | | | | — | | | | — | | | | 3,939,573 | |
| Floating rate demand notes | | | — | | | | 270 | | | | — | | | | 270 | |
| U.S. government obligations | | | — | | | | 299,972 | | | | — | | | | 299,972 | |
| Total | | $ | 102,507,739 | | | $ | 300,242 | | | $ | — | | | $ | 102,807,981 | |
| Trustee deferred compensation | | $ | 122,631 | | | $ | — | | | $ | — | | | $ | 122,631 | |
| Futures contracts** | | $ | 63,133 | | | $ | — | | | $ | — | | | $ | 63,133 | |
| Page 60 | 2013 Annual Report | December 31, 2013 |
Aggressive – Assets/(Liabilities) | | | | | | | | | | | | |
| Common stocks* | | $ | 60,717,211 | | | $ | — | | | $ | — | | | $ | 60,717,211 | |
| Registered investment companies | | | 1,241,949 | | | | — | | | | — | | | | 1,241,949 | |
| Money market registered investment companies | | | 2,252,733 | | | | — | | | | — | | | | 2,252,733 | |
| Floating rate demand notes | | | — | | | | 30 | | | | — | | | | 30 | |
| U.S. government obligations | | | — | | | | 299,972 | | | | — | | | | 299,972 | |
| Total | | $ | 64,211,893 | | | $ | 300,002 | | | $ | — | | | $ | 64,511,895 | |
| Trustee deferred compensation | | $ | 71,511 | | | $ | — | | | $ | — | | | $ | 71,511 | |
| Futures contracts** | | $ | 43,630 | | | $ | — | | | $ | — | | | $ | 43,630 | |
Balanced – Assets/(Liabilities) | | | | | | | | | | | | |
| Common stocks* | | $ | 68,651,541 | | | $ | — | | | $ | — | | | $ | 68,651,541 | |
| Registered investment companies | | | 31,571,941 | | | | — | | | | — | | | | 31,571,941 | |
| Money market registered investment companies | | | 4,825,673 | | | | — | | | | — | | | | 4,825,673 | |
| Floating rate demand notes | | | — | | | | 829 | | | | — | | | | 829 | |
| U.S. government obligations | | | — | | | | 499,954 | | | | — | | | | 499,954 | |
| Total | | $ | 105,049,155 | | | $ | 500,783 | | | $ | — | | | $ | 105,549,938 | |
| Trustee deferred compensation | | $ | 94,365 | | | $ | — | | | $ | — | | | $ | 94,365 | |
| Futures contracts** | | $ | 13,033 | | | $ | — | | | $ | — | | | $ | 13,033 | |
Strategic – Assets/(Liabilities) | | | | | | | | | | | | |
| Common stocks* | | $ | 67,921,658 | | | $ | — | | | $ | — | | | $ | 67,921,658 | |
| Registered investment companies | | | 16,407,888 | | | | — | | | | — | | | | 16,407,888 | |
| Money market registered investment companies | | | 7,012,251 | | | | — | | | | — | | | | 7,012,251 | |
| Floating rate demand notes | | | — | | | | 299 | | | | — | | | | 299 | |
| U.S. government obligations | | | — | | | | 299,972 | | | | — | | | | 299,972 | |
| Total | | $ | 91,341,797 | | | $ | 300,271 | | | $ | — | | | $ | 91,642,068 | |
| Trustee deferred compensation | | $ | 82,782 | | | $ | — | | | $ | — | | | $ | 82,782 | |
| Futures contracts** | | $ | 36,648 | | | $ | — | | | $ | — | | | $ | 36,648 | |
Quantex – Assets/(Liabilities) | | | | | | | | | | | | |
| Common stocks* | | $ | 40,661,341 | | | $ | — | | | $ | — | | | $ | 40,661,341 | |
| Money market registered investment companies | | | 3,502,332 | | | | — | | | | — | | | | 3,502,332 | |
| U.S. government obligations | | | — | | | | 149,986 | | | | — | | | | 149,986 | |
| Total | | $ | 44,163,673 | | | $ | 149,986 | | | $ | — | | | $ | 44,313,659 | |
| Trustee deferred compensation | | $ | 77,342 | | | $ | — | | | $ | — | | | $ | 77,342 | |
| Futures contracts** | | $ | 107,430 | | | $ | — | | | $ | — | | | $ | 107,430 | |
Utilities – Assets/(Liabilities) | | | | | | | | | | | | |
| Common stocks* | | $ | 37,201,452 | | | $ | — | | | $ | — | | | $ | 37,201,452 | |
| Money market registered investment companies | | | 766,924 | | | | — | | | | — | | | | 766,924 | |
| Total | | $ | 37,968,376 | | | $ | — | | | $ | — | | | $ | 37,968,376 | |
| Trustee deferred compensation | | $ | 75,839 | | | $ | — | | | $ | — | | | $ | 75,839 | |
| The accompanying notes are an integral part of these financial statements. |
| 2013 Annual Report | December 31, 2013 | Page 61 |
Total Bond – Assets/(Liabilities) | | | | | | | | | | | | |
| Registered investment companies | | $ | 85,387,818 | | | $ | — | | | $ | — | | | $ | 85,387,818 | |
| Money market registered investment companies | | | 4,283,602 | | | | — | | | | — | | | | 4,283,602 | |
| U.S. government obligations | | | — | | | | 239,287 | | | | — | | | | 239,287 | |
| Total | | $ | 89,671,420 | | | | 239,287 | | | $ | — | | | $ | 89,910,707 | |
| Trustee deferred compensation | | $ | 27,357 | | | $ | — | | | $ | — | | | $ | 27,357 | |
Money Market – Assets/(Liabilities) | | | | | | | | | | | | |
| Bank obligations | | $ | — | | | $ | 7,750,189 | | | $ | — | | | $ | 7,750,189 | |
| Certificates of deposit | | | — | | | | 4,229,000 | | | | — | | | | 4,229,000 | |
| Corporate obligations | | | — | | | | 31,519,796 | | | | — | | | | 31,519,796 | |
| Repurchase agreements | | | — | | | | 20,000,000 | | | | — | | | | 20,000,000 | |
| U.S. government agency obligations | | | — | | | | 20,614,056 | | | | — | | | | 20,614,056 | |
| Money Market registered investment companies | | | 20,623,366 | | | | — | | | | — | | | | 20,623,366 | |
| Total | | $ | 20,623,366 | | | $ | 84,113,041 | | | $ | — | | | $ | 104,736,407 | |
| Trustee deferred compensation | | $ | 67,696 | | | $ | — | | | $ | — | | | $ | 67,696 | |
| * | See schedule of investments for industry classifications. |
| ** | Futures contracts include cumulative unrealized gain/loss on contracts open at December 31, 2013. |
3. Investment Transactions
For the year ended December 31, 2013, the cost of purchases and proceeds from sales or maturities of long-term investments for the Funds, excluding U.S. Government investments, were as follows:
| | | | | | | |
Muirfield Fund® | | $ | 368,597,462 | | | $ | 315,782,208 | |
| Dynamic Growth Fund | | | 242,931,918 | | | | 228,979,048 | |
| Aggressive Growth Fund | | | 160,878,547 | | | | 136,509,232 | |
| Balanced Fund | | | 217,569,342 | | | | 195,374,085 | |
| Strategic Growth Fund | | | 187,625,335 | | | | 184,814,572 | |
Quantex FundTM | | | 14,899,203 | | | | 8,388,918 | |
| Utilities & Infrastructure Fund | | | 6,605,085 | | | | 7,326,214 | |
| Total Return Bond Fund | | | 76,723,949 | | | | 62,278,785 | |
For the year ended December 31, 2013, the cost of purchases and proceeds from sales or maturities of long-term U.S. Government investments for the Funds are as follows:
| | | | | | | |
| Total Return Bond Fund | | $ | 966,861 | | | $ | 2,802,656 | |
| Page 62 | 2013 Annual Report | December 31, 2013 |
4. Investment Advisory Fees and Other Transactions with Affiliates
Meeder Asset Management, Inc. (“MAM”), a wholly-owned subsidiary of Meeder Investment Management, Inc (f.k.a. Meeder Financial, Inc.)(“Meeder”), provides each Fund, under a separate Investment Advisory Contract, with investment management, research, statistical and advisory services. The services of MAM will terminate automatically if assigned and may be terminated without penalty at any time upon 60 days prior written notice by majority vote of the Fund, by the Trustees of the Fund, or by MAM. For such services the Funds pay a fee at the following annual rates:
| | Percentage of Average Daily Net Assets up to $50 Million | Percentage of Average Daily Net Assets Exceeding $50 Million up to $100 Million | Percentage of Average Daily Net Assets up to $100 Million | Percentage of Average Daily Net Assets up to $200 Million | Percentage of Average Daily Net Assets Exceeding $100 Million | Percentage of Average Daily Net Assets Exceeding $200 Million |
| Muirfield | 1.00% | 0.75% | N/A | N/A | 0.60% | N/A |
| Quantex* | 1.00% | 0.75% | N/A | N/A | 0.60% | N/A |
| Utilities** | 1.00% | 0.75% | N/A | N/A | 0.60% | N/A |
| Dynamic | N/A | N/A | N/A | 0.75% | N/A | 0.60% |
| Aggressive | N/A | N/A | N/A | 0.75% | N/A | 0.60% |
| Balanced | N/A | N/A | N/A | 0.75% | N/A | 0.60% |
| Strategic | N/A | N/A | N/A | 0.75% | N/A | 0.60% |
| Total Bond | N/A | N/A | 0.40% | N/A | 0.20% | N/A |
| Money Market*** | N/A | N/A | 0.40% | N/A | 0.25% | N/A |
| * | MAM has contractually agreed to reduce its investment advisory fee by 0.25% for Quantex for average daily net assets up to $50 million. The foregoing reduction in investment advisory fees shall automatically renew annually on or about April 30th, unless MAM elects to terminate this reduction. During the year ended December 31, 2013, $88,884 of investment advisory fees was waived in Quantex and is not subject to recoupment. |
| ** | Under a separate Investment Subadvisory Agreement with MAM, Miller/Howard Investments, Inc. (“Miller/Howard”) serves as subadvisor of Utilities. The Investment Subadvisory Agreement provides that it will terminate automatically if assigned, and that it may be terminated without penalty to the Fund by MAM, the Trustees of the Fund, or by the vote of a majority of the outstanding voting shares of the Fund upon not less than 30 days written notice. As subadvisor to Utilities, Miller/Howard receives a fee paid by MAM. |
| *** | During the year ended December 31, 2013, MAM voluntarily agreed to reduce $80,440 of investment advisory fees in Money Market. |
Mutual Funds Service Co. (“MFSCo”), a wholly-owned subsidiary of Meeder, serves as stock transfer, dividend disbursing and shareholder services agent for each Fund. In compensation for such services, each Fund pays MFSCo an annual fee equal to the greater of the following:
| | | | | | Amount Per Active Shareholder Account | | | Percentage of Averagae Daily Net Assets |
| Muirfield | | $ | 4,000 | | | $ | 15 | | | 0.12 | % |
| Quantex | | | 4,000 | | | | 15 | | | 0.12 | % |
| Utilities | | | 4,000 | | | | 15 | | | 0.12 | % |
| Dynamic | | | 4,000 | | | | 15 | | | 0.12 | % |
| Aggressive | | | 4,000 | | | | 15 | | | 0.12 | % |
| Balanced | | | 4,000 | | | | 15 | | | 0.12 | % |
| Strategic | | | 4,000 | | | | 15 | | | 0.12 | % |
| Total Bond | | | 4,000 | | | | 15 | | | 0.08 | % |
| Retail Class | | | 4,000 | | | | 20 | | | 0.08 | % |
| Institutional Class | | | 4,000 | | | | 20 | | | 0.08 | % |
| The accompanying notes are an integral part of these financial statements. |
| 2013 Annual Report | December 31, 2013 | Page 63 |
For fixed income Funds (Total Bond and Money Market) that are subject to an expense cap and which are above the expense cap, the basis point fee will be reduced by 0.02%. During the year ended December 31, 2013, MFSCo waived $17,084 and $19,921 of transfer agent fees for Total Bond and the Institutional Class, respectively.
MFSCo provides the Trust with certain administrative services. In compensation for such services, each Fund pays MFSCo at the following annual rates:
| | Percentage of Average Daily Net Assets up to $50 Million | Percentage of Average Daily Net Assets Exceeding $50 Million |
| Muirfield | 0.10% | 0.08% |
| Quantex | 0.10% | 0.08% |
| Utilities | 0.10% | 0.08% |
| Dynamic | 0.10% | 0.08% |
| Aggressive | 0.10% | 0.08% |
| Balanced | 0.10% | 0.08% |
| Strategic | 0.10% | 0.08% |
| Total Bond | 0.10% | 0.08% |
| Money Market | 0.10% | 0.08% |
MFSCo serves as accounting services agent for each Fund. In compensation for such services, each Fund pays MFSCo an annual fee equal to the greater of a minimum fee or at a rate based on the percentage of average daily net assets. The annual rates are as follows:
| | | | Percentage of Average Daily Net Assets up to $10 Million | Percentage of Average Daily Net Assets Exceeding $10 Million up to $30 Million | Percentage of Average Daily Net Assets Exceeding $30 Million up to $80 Million | Percentage of Average Daily Net Assets Exceeding $80 Million |
| Muirfield | $ | $7,500 | 0.15% | 0.10% | 0.02% | 0.01% |
| Quantex | | 7,500 | 0.15% | 0.10% | 0.02% | 0.01% |
| Utilities | | 7,500 | 0.15% | 0.10% | 0.02% | 0.01% |
| Dynamic | | 7,500 | 0.15% | 0.10% | 0.02% | 0.01% |
| Aggressive | | 7,500 | 0.15% | 0.10% | 0.02% | 0.01% |
| Balanced | | 7,500 | 0.15% | 0.10% | 0.02% | 0.01% |
| Strategic | | 7,500 | 0.15% | 0.10% | 0.02% | 0.01% |
| Total Bond | | 7,500 | 0.15% | 0.10% | 0.02% | 0.01% |
| Money Market | | 30,000 | 0.15% | 0.10% | 0.02% | 0.01% |
For the period January 1, 2013 through April 30, 2013, MAM agreed to contractually reduce its fees and/or reimburse expenses of the Funds, except Money Market, to the extent necessary to limit the total operating expenses of each class of shares of the Funds (exclusive of brokerage costs (but not excluding any commissions recaptured as a result of any directed brokerage arrangements), interest, taxes, dividends, litigation, indemnification, expenses associated with the investments in underlying investment companies, and extraordinary expenses (as determined under GAAP)). For the period May 1, 2013 through December 31, 2013, MAM agreed to voluntarily reduce its fees and/or reimburse expenses (excluding brokerage fees and commissions, taxes, interest, and extraordinary or non-recurring expenses), to limit the total annual operating expenses of the Funds, except Money Market. For Money Market, MAM agreed to voluntarily reduce its fees and/or reimburse expenses (excluding brokerage fees and commissions, taxes, interest, and extraordinary
| Page 64 | 2013 Annual Report | December 31, 2013 |
or non-recurring expenses), to limit the total annual operating expenses of the Fund for the year ended December 31, 2013. Such reductions and/or reimbursements are limited to the total of fees charged to each Fund or Class by MAM and MFSCo. For the year ended December 31, 2013, the annual operating expense limitations and amounts reimbursed for each Fund are as follows:
| | Annualized Contractual Expense Limitation as a Percentage of Average Daily Net Assets 1/1/13 – 4/30/13* | Annualized Voluntary Expense Limitation as a Percentage of Average Daily Net Assets 5/1/13 – 12/31/13 | Contractual Expense Limitation Through 4/30/13 | Ratio of Net Expenses to Average Net Assets | | Voluntary Expense Reimbursements | | | Contractual Expense Reimbursements** |
| Muirfield | 1.31% | 1.18% | 1.39% | 1.22% | $ | 85,919 | | $ | 49,794 | |
| Quantex | 1.36% | 1.59% | 1.65% | 1.52% | | 7,274 | | | — | *** |
| Utilities | 1.89% | 1.87% | 1.92% | 1.87% | | — | | | — | |
| Dynamic | 1.30% | 1.18% | 1.39% | 1.22% | | 125,341 | | | 40,570 | |
| Aggressive | 1.51% | 1.29% | 1.59% | 1.35% | | 35,808 | | | 1,137 | |
| Balanced | 1.44% | 1.28% | 1.49% | 1.33% | | 65,809 | | | 28,346 | |
| Strategic | 1.29% | 1.20% | 1.39% | 1.23% | | 109,777 | | | 42,790 | |
| Total Bond | 0.98% | 1.00% | 0.99% | 0.99% | | 97,353 | | | 42,868 | |
| Retail Class | N/A | N/A | N/A | 0.22% | | 278,842 | | | N/A | |
| Institutional Class | N/A | N/A | N/A | 0.15% | | 204,107 | | | N/A | |
| * | Ratios reflect commissions recaptured and fees received from custodian after contractual expense limitations were applied. |
| ** | The contractual expense reimbursements are subject to repayment by the applicable Fund within the three fiscal years following the fiscal year in which the particular expense was incurred, provided that the Fund is able to make the repayment without exceeding the contractual expense limitation in the table listed above. The repayment expiration date is December 31, 2016. |
| *** | The Fund was operating below the contractual expense limitation; however $88,884 of investment advisory fees was contractually waived and is not subject to recoupment as noted on page 63. |
Expenses were contractually reimbursed in 2012 for Muirfield, Dynamic, Balanced, Strategic, and Total Bond in the amounts of $40,054, $29,382, $32,787, $28,319, and $52,431, respectively. These contractual expense reimbursements are subject to repayment by the applicable Fund before December 31, 2015.
Certain Funds have entered into an agreement with the Trust’s custodian, The Huntington National Bank (“HNB”), whereby HNB receives distribution, service, and administration fees (collectively the “fees”) from the underlying security holdings of the Funds, and forwards those fees to the appropriate Funds. The Funds use the fees received to reduce the gross expenses of each Fund. It is possible that the Funds may invest in security holdings in which fees are not paid. As such, the gross expenses of a Fund would not be decreased. Also, without this agreement it is likely that the Funds would not collect any fees from underlying security holdings. For the year ended December 31, 2013, gross expenses were reduced by the following amounts:
| | | Amount Received to Reduce Gross Expenses | |
| Aggressive | | $ | 247 | |
| Strategic | | | 1,796 | |
| The accompanying notes are an integral part of these financial statements. |
| 2013 Annual Report | December 31, 2013 | Page 65 |
Certain Funds have entered into a directed brokerage agreement with ConvergEx Group, an independent broker/dealer, whereby Fund expenses are reduced. The Funds use these amounts received to reduce the gross expenses of each Fund. It is possible that the Funds may invest in security holdings in which brokerage fees are not recaptured. As such, the gross expenses of a Fund would not be decreased. Also, without this agreement it is likely that the Funds would not recapture any fees from portfolio transactions. For the year ended December 31, 2013, commissions recaptured through directed brokerage arrangements were as follows:
| | | Amount Received to Reduce Gross Expenses | |
| Muirfield | | $ | 269,979 | |
| Dynamic | | | 148,981 | |
| Aggressive | | | 123,522 | |
| Balanced | | | 140,648 | |
| Strategic | | | 141,905 | |
| Quantex | | | 21,242 | |
| Total Bond | | | 15,665 | |
Pursuant to Rule 12b-1 of the 1940 Act, the Funds have adopted a written plan to pay certain expenses out of fund assets relating to the sale and distribution of its shares, including, but not necessarily limited to, compensation to dealers, advertising, marketing, printing and mailing of prospectuses, and certain telephone related expenses. The annual adopted distribution plan limitations and the amounts voluntarily waived for the year ended December 31, 2013 are as follows:
| | | Maximum Annual 12b-1 Plan Expense Limitations as a Percentage of Average Daily Net Assets | | | |
| Muirfield | | | 0.20 | % | | $ | — | |
| Quantex | | | 0.20 | % | | | — | |
| Utilities | | | 0.25 | % | | | 16,224 | |
| Dynamic | | | 0.25 | % | | | — | |
| Aggressive | | | 0.25 | % | | | — | |
| Balanced | | | 0.25 | % | | | — | |
| Strategic | | | 0.25 | % | | | — | |
| Total Bond | | | 0.25 | % | | | — | |
| Retail Class | | | 0.20 | % | | | 128,898 | |
| Institutional Class | | | 0.03 | % | | | 14,590 | |
| Page 66 | 2013 Annual Report | December 31, 2013 |
An Administrative Services Plan has been adopted for each Fund of the Trust, except Money Market, to pay service organizations that provide administrative support services to their customers who own shares of record, or beneficially, of the Funds. The annual adopted administrative services plan limitations and the amounts voluntarily waived for the year ended December 31, 2013 are as follows:
| | | Maximum Annual Administrative Services Plan Expense Limitations as a Percentage of Average Daily Net Assets | | | |
| Muirfield | | | 0.20 | % | | $ | 25,777 | |
| Quantex | | | 0.20 | % | | | 29,154 | |
| Utilities | | | 0.20 | % | | | 24,163 | |
| Dynamic | | | 0.20 | % | | | 8,097 | |
| Aggressive | | | 0.20 | % | | | 5,474 | |
| Balanced | | | 0.20 | % | | | — | |
| Strategic | | | 0.20 | % | | | 4,273 | |
| Total Bond | | | 0.20 | % | | | — | |
The Funds have adopted a Deferred Compensation Plan (the “Plan”) for the independent Trustees. Under the Plan, each eligible Trustee is permitted to defer all or a portion of the trustees fees payable by any of the Funds as an investment into any combination of Funds until a specified point of time. The investment into the Funds is recorded as an asset however an offsetting liability is also recorded for the deferred payment. Once the eligible Trustees’ deferral amounts can be distributed, a lump sum or generally equal annual installments over a period of up to ten (10) years can be made to the eligible Trustee(s). The Funds may terminate this Plan at any time.
Certain trustees and officers of the Funds are also officers or directors of Meeder, MAM, and MFSCo.
During the year ended December 31, 2013, several of the Funds invested in the Money Market Fund, an affiliate, as described in Section 2(a)(3) of the Investment Company Act of 1940. As of December 31, 2013, the 7-day yield of the Institutional Class was 0.13%. The purchases/sales amounts in the following table are presented on a gross basis, while the statement of changes in net assets shows subscriptions and redemptions into and out of the Institutional Class on a net basis. A summary of the Funds’ investments in this affiliate during the year is noted below:
| | | | | | | | | | | | | | | | | | | |
Muirfield Fund® | | $ | 23,673,935 | | | $ | 80,753,745 | | | $ | (98,056,159 | ) | | $ | 6,371,521 | | | $ | 12,792 | | | $ | 6,371,521 | |
| Dynamic Growth Fund | | | 19,765,043 | | | | 59,413,196 | | | | (75,238,666 | ) | | | 3,939,573 | | | | 7,980 | | | | 3,939,573 | |
| Aggressive Growth Fund | | | 7,303,954 | | | | 45,130,525 | | | | (50,181,746 | ) | | | 2,252,733 | | | | 5,229 | | | | 2,252,733 | |
| Balanced Fund | | | 11,209,336 | | | | 67,449,226 | | | | (73,832,889 | ) | | | 4,825,673 | | | | 6,690 | | | | 4,825,673 | |
| Strategic Growth Fund | | | 5,632,446 | | | | 65,611,449 | | | | (64,231,644 | ) | | | 7,012,251 | | | | 7,533 | | | | 7,012,251 | |
Quantex FundTM | | | 307,300 | | | | 16,167,138 | | | | (12,972,106 | ) | | | 3,502,332 | | | | 1,930 | | | | 3,502,332 | |
| Utilities & Infrastructure Fund | | | 617,057 | | | | 7,789,062 | | | | (7,639,195 | ) | | | 766,924 | | | | 808 | | | | 766,924 | |
| Total Return Bond Fund | | | 458,194 | | | | 58,315,860 | | | | (54,490,452 | ) | | | 4,283,602 | | | | 3,788 | | | | 4,283,602 | |
| The accompanying notes are an integral part of these financial statements. |
| 2013 Annual Report | December 31, 2013 | Page 67 |
5. Federal Tax Information
The tax characteristics of dividends paid by the Funds during the year ended December 31, 2013 were as follows:
| | | | | | Net Short-Term Capital Gains | | | Net Long-Term Capital Gains | | | | | | | |
Muirfield Fund® | | $ | 187,286 | | | $ | 8,348,387 | | | $ | 4,520,781 | | | $ | — | | | $ | 13,056,454 | |
| Dynamic Growth Fund | | | 177,368 | | | | 7,337,091 | | | | 3,169,172 | | | | — | | | | 10,683,631 | |
| Aggressive Growth Fund | | | — | | | | — | | | | 548,517 | | | | — | | | | 548,517 | |
| Balanced Fund | | | 823,964 | | | | 4,667,755 | | | | 2,725,223 | | | | — | | | | 8,216,942 | |
| Strategic Growth Fund | | | 311,092 | | | | 3,457,716 | | | | 4,270,636 | | | | — | | | | 8,039,444 | |
Quantex FundTM | | | 94,759 | | | | 112,273 | | | | 963,205 | | | | — | | | | 1,170,237 | |
| Utilities & Infrastructure Fund | | | 214,711 | | | | — | | | | — | | | | — | | | | 214,711 | |
| Total Return Bond Fund | | | 3,309,309 | | | | — | | | | — | | | | — | | | | 3,309,309 | |
| Money Market Fund | | | 124,107 | | | | — | | | | — | | | | — | | | | 124,107 | |
The tax characteristics of dividends paid by the Funds during the year ended December 31, 2012 were as follows:
| | | | | | Net Short-Term Capital Gains | | | Net Long-Term Capital Gains | | | | | | | |
Muirfield Fund® | | $ | 509 | | | $ | — | | | $ | — | | | $ | — | | | $ | 509 | |
| Dynamic Growth Fund | | | — | | | | — | | | | — | | | | — | | | | — | |
| Aggressive Growth Fund | | | — | | | | — | | | | — | | | | — | | | | — | |
| Balanced Fund | | | 662,800 | | | | — | | | | — | | | | — | | | | 662,800 | |
| Strategic Growth Fund | | | — | | | | — | | | | — | | | | — | | | | — | |
Quantex FundTM | | | 70,336 | | | | — | | | | — | | | | — | | | | 70,336 | |
| Utilities & Infrastructure Fund | | | 208,323 | | | | — | | | | 127,080 | | | | — | | | | 335,403 | |
| Total Return Bond Fund | | | 3,055,897 | | | | — | | | | — | | | | — | | | | 3,055,897 | |
| Money Market Fund | | | 228,128 | | | | — | | | | — | | | | — | | | | 228,128 | |
As of December 31, 2013, the components of accumulated earnings/(deficit) on a tax basis for the Funds were as follows:
| | | Undistributed Ordinary Income | | | | | | Accumulated Capital and Other Gains and (Losses) | | | Unrealized Appreciation/(Depreciation)** | | | Total Accumulated Earnings/(Deficit) | |
Muirfield Fund® | | $ | 5,429,466 | | | $ | (119 | ) | | $ | 1,777,281 | | | $ | 21,374,499 | | | $ | 28,581,127 | |
| Dynamic Growth Fund | | | 3,040,345 | | | | (11 | ) | | | 401,582 | | | | 12,982,061 | | | | 16,423,977 | |
| Aggressive Growth Fund | | | 517,811 | | | | — | | | | 803,601 | | | | 9,149,461 | | | | 10,470,873 | |
| Balanced Fund | | | 2,240,660 | | | | (132 | ) | | | 150,160 | | | | 9,140,980 | | | | 11,531,668 | |
| Strategic Growth Fund | | | 906,926 | | | | (5 | ) | | | 456,374 | | | | 12,712,757 | | | | 14,076,052 | |
Quantex FundTM | | | 366,940 | | | | (190 | ) | | | 492,903 | | | | 11,191,982 | | | | 12,051,635 | |
| Utilities & Infrastructure Fund | | | 97,450 | | | | (906 | ) | | | (149,828 | ) | | | 10,857,501 | | | | 10,804,217 | |
| Total Return Bond Fund | | | 115 | | | | (113 | ) | | | (1,571,563 | ) | | | (605,562 | ) | | | (2,177,123 | ) |
| Money Market Fund | | | 3,456 | | | | (3,456 | ) | | | — | | | | — | | | | — | |
| * | Total dividends paid may differ from the amount reported in the Statement of Changes in Net Assets because for tax purposes dividends are recognized when actually paid. |
| ** | The differences between book- and tax-basis unrealized appreciation/(depreciation) are attributable primarily to: deferral of post October losses, wash sales, and the realization for tax purposes of unrealized gains/(losses) on certain derivative instruments. |
| Page 68 | 2013 Annual Report | December 31, 2013 |
For federal income tax purposes, the following Funds have capital loss carryforwards as of December 31, 2013, which are available to offset future capital gains, if any. To the extent that these carryforwards are used to offset future capital gains, it is probable that the gains that are offset will not be distributed to shareholders:
Capital Loss Carryforwards | | | | |
| Total Return Bond Fund | | $ | 1,571,563 | | Short-term |
| Utilities & Infrastructure Fund | | | 149,828 | | Short-term |
6. Control Ownership
The beneficial ownership, either directly or indirectly, of more than 25% of the voting securities of a fund creates a presumption of control of the fund under Section 2(a)(9) of the 1940 Act. As of December 31, 2013, account holders that held more than 25% of the voting securities of the Funds and may be deemed to control the Funds are as follows:
| | | Percent of Voting Securities |
Muirfield Fund® | Nationwide Trust Company, FSB and certain affiliates held for the benefit of others | 40% |
| Dynamic Growth Fund | Nationwide Trust Company, FSB and certain affiliates held for the benefit of others | 54% |
| Aggressive Growth Fund | Nationwide Trust Company, FSB and certain affiliates held for the benefit of others | 58% |
| Balanced Fund | Nationwide Trust Company, FSB and certain affiliates held for the benefit of others | 63% |
| Strategic Growth Fund | Nationwide Trust Company, FSB and certain affiliates held for the benefit of others | 83% |
| Quantex Fund | Nationwide Trust Company, FSB and certain affiliates held for the benefit of others | 31% |
| Total Return Bond Fund | Nationwide Trust Company, FSB and certain affiliates held for the benefit of others | 65% |
| Money Market Fund – Institutional Class | Carey & Co. held for the benefit of others | 83% |
| 2013 Annual Report | December 31, 2013 | Page 69 |
7. Board Review of Investment Advisory and Subadvisory Agreements (unaudited)
At a meeting held September 25, 2013, the Board of Trustees (the “Board”), including a majority of non-interested or independent Trustees, approved the renewal of the investment advisory agreements for each of the separate funds comprising the Meeder Funds (the “Funds”) and the investment sub-advisory agreement relating to the Utilities and Infrastructure Fund (individually, an “Agreement” and collectively, the “Agreements”).
The Board reviewed materials sent to each Trustee in advance of the meeting for consideration in determining whether to approve the renewal of each Fund’s Agreements. Management reviewed with the Trustees the materials prepared by them in response to Funds’ legal counsel’s supplemental written request pursuant to Section 15(c) of the Investment Company Act of 1940 for the provision to the Trustees of appropriately updated and amended information necessary or appropriate to assist the Trustees in their deliberations concerning renewal of the Agreements. In reaching the decision to renew the Agreements, the Board also took into account information furnished throughout the year at regular Board meetings. Information furnished and discussed throughout the year included investment performance reports and related financial information for each Fund, as well as periodic reports on shareholder services, legal compliance, pricing, brokerage commissions and execution and other services provided by the investment manager, Meeder Asset Management, Inc. (“Manager”) and its affiliates, or by or on behalf of the Utilities and Infrastructure Fund’s Subadviser, Miller/Howard Investments, Inc. Information furnished specifically in connection with the renewal process included a report for the Funds prepared by Lipper Financial Services (“Lipper”), an independent organization, as well as a Funds’ profitability analysis prepared by the Manager. The Lipper report compared each Fund’s management fees and expenses with those of other mutual funds deemed comparable to the Fund. The Funds’ profitability analysis discussed the profitability to the Manager and Mutual Funds Service Co., an affiliate of the Manager, from the overall Funds’ operations utilizing expense allocation methodologies deemed reasonable by the Manager.
In considering such materials, the independent Trustees noted that they had received assistance and advice from and met separately with the Funds’ legal counsel and chief compliance officer prior to this meeting. In their deliberations, the Board dealt with each Fund separately. In approving continuance of the Agreement for each Fund, the Board, including a majority of independent Trustees, considered each Fund’s Agreement, a copy of which was made available at the meeting, and determined that the existing management fee structure was fair and reasonable and that continuance of the Agreement was in the best interests of each Fund and its shareholders. While attention was given to all information furnished, the following discusses the primary factors relevant to the Board’s decision.
Nature, Extent and Quality of Services. The Board continues to be satisfied with the nature and quality of the overall services provided by the Manager and its affiliates to the Funds and their shareholders. In addition to investment performance and expenses discussed earlier, the Board’s opinion was based, in part, upon periodic reports furnished them showing that the investment policies and restrictions for each Fund were consistently complied with as well as other reports periodically furnished the Board. Other factors taken into account by the Board were the Manager’s compliance procedures and the qualifications of the Manager’s chief compliance officer. Consideration was also given to the experience of each Fund’s portfolio management team. The Board also took into account the transfer agent, fund accounting agent and administrative services provided to Fund shareholders by an affiliate of the Manager, noting continuing expenditures by management to increase and improve the scope of such services. Similar considerations were applied to the Subadviser to the Utilities and Infrastructure Fund.
Investment Performance. The Board placed emphasis on the investment performance of each Fund in view of its importance to shareholders. While consideration was given to performance reports and discussions with portfolio managers at Board meetings during the year, particular attention in assessing performance was given to the Lipper reports furnished for the Agreement renewals. The Lipper report prepared for each Fund showed the investment performance of the Fund for the one-, three-, five-, and ten-year periods, as applicable, ended June 30, 2013 (the “relevant periods”) in comparison with a performance universe similar to each Fund’s investment objectives.
| Page 70 | 2013 Annual Report | December 31, 2013 |
| |
Muirfield Fund® | Blended Benchmark of 60% S&P 500 Index and 40% Average 90-day U.S. T-Bill; S&P 500 Index; Lipper’s Average Flexible Portfolio Fund Universe; Lipper Index1 |
Quantex FundTM | Blended Benchmark of 50% Russell 2000 Index and 50% S&P 400 Mid-Cap Index; Russell 2000 Index; S&P 400 Mid-Cap Index; Lipper’s Average Mid-Cap Value Fund Universe; Lipper Index1 |
| Dynamic Growth Fund | S&P 500 Index; Lipper’s Average Multi-Cap Core Fund Universe; Lipper Index1 |
| Utilities and Infrastructure Fund | Russell 3000 Utilities Index; Lipper’s Average Utility Fund Universe; Lipper Index1 |
| Aggressive Growth Fund | S&P 500 Index; Lipper’s Average Multi-Cap Growth Fund Universe; Lipper Index1 |
Balanced Fund | S&P 500 Index; Blended Benchmark consisting of 30% Barclays Intermediate Government/Credit Index, 42% S&P 500 Index, and 28% Average 90-day U.S. T-Bill; Lipper’s Average Flexible Portfolio Fund Universe; Lipper Index1 |
| Strategic Growth Fund | S&P 500 Index; Blended Benchmark of 25% S&P 500 Index, 20% S&P 400 Index, 12.5% Russell 2000 Index, 12% MSCI EAFE Index, 5.5% iShares MSCI Emerging Markets Index, 12.5% Dow Jones U.S. Select Real Estate Investment Trust, 12.5% Goldman Sachs Commodity Index; Lipper’s Average Multi-Cap Core Fund Universe; Lipper Index1 |
| Total Return Bond Fund | Barclays Aggregate Bond Index; Lipper’s Average General Bond Fund Universe; Lipper Index1 |
| Money Market Fund | |
| Retail Class | Lipper Average General Purpose Money Market Fund |
| Institutional Class | Lipper Average General Purpose Money Market Fund |
| 1 | Given an adequate quantity of funds, the Lipper Index for a given investment classification or objective consists of the largest ten or thirty funds in that classification or objective. Each index is calculated daily with adjustments for dividends and capital gains. |
Comparative Expenses. Consideration was given to a comparative analysis of the management fees and total expense ratios of each Fund compared with those of a group of other funds.
Management Profitability. The Board also considered the level of profits realized by the Manager and its affiliates in connection with the operation of the Funds. In this respect, the Board reviewed the Funds’ profitability analysis that addresses the overall profitability of the Meeder Funds’ business. The Board also considered the extent to which the Manager and its affiliates might derive ancillary benefits from fund operations, including potential benefits resulting from allocation of fund brokerage and the declining use of “soft” commission dollars to pay for research. The Board also took into account management’s expenditures in improving shareholder services provided to the Funds, as well as the need to meet additional regulatory and compliance requirements resulting from recent SEC requirements. The Board determined that the level of profits realized by the Manager under its Agreements with the Funds was not excessive in view of the nature, quality and extent of services provided.
Economies of Scale. The Board also considered whether economies of scale are realized by the Manager as the Funds grow larger and the extent to which this is reflected in the level of management fees charged. While recognizing that any precise determination is inherently subjective, the Board noted that based upon the Funds’ profitability analysis, it appears that as some Funds get larger, at some point economies of scale do result in the Manager realizing a larger profit margin on management services provided to such a Fund. The Board also noted that economies of scale are shared with each Fund and its shareholders through management fee breakpoints so that as a Fund grows in size, its effective management fee rate declines. The Board reviewed, and expressed continued satisfaction with, each Fund’s fee structure under its Agreement, as well as the Utilities and Infrastructure Fund’s fee structure under the investment sub-advisory agreement with Miller/Howard Investments, Inc.
| 2013 Annual Report | December 31, 2013 | Page 71 |
Report of Independent Registered Public Accounting Firm
To the Shareholders and Board of Trustees of
Meeder Funds
We have audited the accompanying statements of assets and liabilities, including the schedules of investments, of the Meeder Funds comprising Muirfield Fund, Dynamic Growth Fund, Aggressive Growth Fund, Balanced Fund, Strategic Growth Fund, Quantex Fund, Utilities and Infrastructure Fund, Total Return Bond Fund, and Money Market Fund (the “Funds”) as of December 31, 2013, and the related statements of operations for the year then ended, the statements of changes in net assets for each of the two years in the period then ended, and the financial highlights for each of the five years in the period then ended for Muirfield Fund, Dynamic Growth Fund, Aggressive Growth Fund, Balanced Fund, Strategic Growth Fund, Quantex Fund, Utilities and Infrastructure Fund, and Money Market Fund, and the related statements of operations for the year then ended, statement of changes in net assets for each of the two years in the period then ended, and the financial highlights for the three periods in the period then ended for Total Return Bond Fund. These financial statements and financial highlights are the responsibility of the Funds’ management. Our responsibility is to express an opinion on these financial statements and financial highlights based on our audits.
We conducted our audits in accordance with the standards of the Public Company Accounting Oversight Board (United States). Those standards require that we plan and perform the audit to obtain reasonable assurance about whether the financial statements and financial highlights are free of material misstatement. An audit includes examining, on a test basis, evidence supporting the amounts and disclosures in the financial statements. Our procedures included confirmation of securities owned as of December 31, 2013, by correspondence with the custodians and brokers. An audit also includes assessing the accounting principles used and significant estimates made by management, as well as evaluating the overall financial statement presentation. We believe that our audits provide a reasonable basis for our opinion.
In our opinion, the financial statements and financial highlights referred to above present fairly, in all material respects, the financial position of each of the Funds constituting the Meeder Funds, as of December 31, 2013, and the results of their operations for the year then ended, the changes in their net assets for each of the two years in the period then ended, and the financial highlights for the periods indicated above, in conformity with accounting principles generally accepted in the United States of America.
COHEN FUND AUDIT SERVICES, LTD.
Cleveland, Ohio
February 24, 2014
| Page 72 | 2013 Annual Report | December 31, 2013 |
Trustees and Officers (unaudited)
Certain trustees and officers of the Funds are also officers or directors of Meeder, MAM, and MFSCo. The Trustees oversee the management of the Trust and elect its officers. The officers are responsible for the Funds’ day-to-day operations. The Trustees’ and officers’ names, addresses, years of birth, positions held with the Trust, and length of service with the Meeder Funds are listed below. Also included is each Board member’s principal occupation during, at least, the past five years. Except as indicated, each individual has held the office shown or other offices in the same company for the last five years. Those Trustees who are “interested persons”, as defined in the 1940 Act, by virtue of their affiliation with the Trust, are indicated by an asterisk (*).
Name, Address1, and Year of Birth | Year First Elected a Trustee or Officer of the Trust | Position and Number of Funds Overseen2 | Principal Occupation During Past Five Years and Other Directorships Held |
Robert S. Meeder, Jr.* Year of Birth: 1961 | 1992 | Trustee and President | President of Meeder Asset Management, Inc. |
Jack W. Nicklaus** Year of Birth: 1961 | 1998 | Trustee | Designer, Nicklaus Design, a golf course design firm and division of The Nicklaus Companies. |
Stuart M. Allen** Year of Birth: 1961 | 2006 | Trustee | President of Gardiner Allen DeRoberts Insurance LLC, an insurance agency; Chairman of the Trust’s Audit Committee. |
Anthony D’Angelo** Year of Birth: 1959 | 2006 | Trustee | Director of Sales, WSYX ABC 6/WTTE Fox 28, television stations owned and operated by Sinclair Broadcast Group; Lead Trustee of the Trust. |
Dale W. Smith Year of Birth: 1959 | 2006 | Vice President | Chief Financial Officer of Meeder Asset Management, Inc. (2005 - present); formerly Senior Vice President of Financial Services of BISYS Fund Services (1996 – 2004). |
Mary “Maggie” Bull Year of Birth: 1966 | 2011 | Chief Compliance Officer | Chief Compliance Officer, Legal Counsel and Anti-Money Laundering Officer of the Funds (2011 – present); Independent Legal Consultant (2007 – 2010); Assistant General Counsel of Nationwide (2006 – 2007). |
Bruce E. McKibben Year of Birth: 1969 | 2002 | Treasurer | Director of Fund Accounting of Mutual Funds Service Co., the Trust’s transfer agent (1997 – present). Interim Chief Operating Officer of Meeder Asset Management, Inc. (June 2008 – October 2008). |
Ruth Kirkpatrick Year of Birth: 1951 | 2009 | Secretary, pro tempore | Senior Legal Specialist of Meeder Asset Management, Inc. |
| 1 | The address of each Trustee is 6125 Memorial Drive, Dublin, OH 43017. |
| 2 | Each Trustee serves for an indefinite term, until his or her resignation, death, or removal. Each Trustee oversees all nine Funds in the Trust. |
| * | Robert S. Meeder, Jr. is deemed an “interested person” of the Trust by virtue of his position as President of Meeder Asset Management, Inc., the Advisor of the Trust. |
| ** | Each independent Trustee is a member of the Trust’s Audit Committee, Compensation Committee, and Nominating Committee. |
The Statement of Additional Information includes additional information about each Trustee and is available without charge. To obtain a copy of the Statement of Additional Information, please contact your financial representative or call toll free 1-800-325-3539.
| 2013 Annual Report | December 31, 2013 | Page 73 |
The Funds file their complete schedules of portfolios holdings with the Securities and Exchange Commission (“SEC”) for the first and third quarters of each fiscal year on Form N-Q. In addition, Money Market Fund files its complete schedule of portfolio holdings with the SEC each month on Form N-MFP. The Funds’ Forms N-Q and N-MFP are available on the SEC’s website at http://www.sec.gov and may be reviewed and copied at the SEC’s Public Reference Room in Washington, DC. Information on the operation of the Public Reference Room may be obtained by calling 1-800-SEC-0330. The Funds’ schedules of positions are also available on the Funds’ website at www.meederfunds.com.
A description of the policies and procedures that the Funds use to determine how to vote proxies relating to portfolio securities, and information regarding how the Funds voted these proxies for the 12-month period ended June 30, 2013, is available on the SEC’s website at http://www/sec.gov, or, without charge, upon request by calling toll-free 1-800-325-3539.
| Page 74 | 2013 Annual Report | December 31, 2013 |
[This page intentionally left blank]
[This page intentionally left blank]
Manager and Investment Advisor
Meeder Asset Management, Inc.
6125 Memorial Drive
P.O. Box 7177
Dublin, Ohio 43017
Subadvisor/Utilities and Infrastructure Fund
Miller/Howard Investments, Inc.
141 Upper Byrdcliffe Road, P.O. Box 549
Woodstock, New York 12498
Board of Trustees
Stuart Allen
Anthony D’Angelo
Robert S. Meeder
Jack Nicklaus II
Custodian
The Huntington National Bank
Columbus, Ohio 43215
Transfer Agent & Dividend Disbursing Agent
Mutual Funds Service Co.
6125 Memorial Drive
Dublin, Ohio 43017
Independent Registered Public Accounting Firm
Cohen Fund Audit Services, Ltd.
1350 Euclid Ave., Suite 800
Cleveland, Ohio 44115
6125 Memorial Drive Dublin, Ohio 43017
Annual Report
December 31, 2013
Mutual funds can be a quick, efficient, cost-effective way to achieve investment diversification. The investment options available through Meeder Funds® are suitable for a wide range of investors, from the conservative-minded to the growth-oriented, to help investors achieve their individual financial goals.
We provide professional management, ongoing supervision of clients’ holdings, automatic diversification and e-Delivery of statements and fund mailings: all important elements of a well-rounded investment plan.
No matter what your objectives may be, Meeder Funds® can help you make the most of your personal investment plan and help you achieve your individual financial goals.
Managed by Meeder Asset Management, Inc.
6125 Memorial Drive, Dublin, Ohio 43017
Call Toll Free: 800-325-3539
Local: 614-760-2159
Fax: 614-766-6669
www.meederfunds.com
meederfunds@meederinvestment.com

Item 2. Code of Ethics.
The registrant has adopted a code of ethics that applies to the registrant’s principal executive officer, principal financial officer, comptroller or principal accounting officer, and any person who performs a similar function.
Item 3. Audit Committee Financial Expert.
Currently, the Meeder Funds (the “Funds”) do not have an Audit Committee member who possesses all of the attributes required to be an "audit committee financial expert" as defined in instruction 2(b) of Item 3 of Form N-CSR. However, the Board of Trustees believes that each member of the Audit Committee has substantial experience relating to the review of financial statements and the operations of audit committees. Accordingly, the Board of Trustees believes that the members are qualified to evaluate the Funds’ financial statements, supervise the Funds’ preparation of its financial statements, and oversee the work of the Funds’ independent auditors. The Board of Trustees also believes that, although no single Audit Committee member possesses all of the attributes required to be an “audit committee financial expert”, the Audit Committee members collectively as a group possess the attributes required to be an “audit committee financial expert.”
Item 4. Principal Accountant Fees and Services.
(a) – (d) Aggregate fees billed to the registrant for the last two fiscal years for professional services rendered by the registrant’s principal accountant were as follows:
| | | 2013 | | | 2012 | |
| Audit Fees | | $ | 72,000 | | | $ | 67,500 | |
| Audit-Related Fees | | | 600 | | | | 1,050 | |
| Tax Fees | | | 22,500 | | | | 20,250 | |
| All Other Fees | | | 1,800 | | | | 2,500 | |
Audit fees include amounts related to the audit of the registrant’s annual financial statements and services normally provided by the accountant in connection with statutory and regulatory filings. Audit-related fees include amounts reasonably related to the performance of the audit of the registrant’s financial statements. Tax fees include amounts related to tax compliance, tax planning, and tax advice. All other fees include amounts related to the registrant’s annual filing of Form N1A.
(e)(1) A purpose of the Audit Committee is to approve the engagement of the registrant’s independent auditors (i) to render audit and non-audit services for the registrant in accordance with Rule 2-01(c)(7)(i) of Regulation S-X, subject to the waiver provisions set forth in Rule 2-01(c)(7)(i)(C) of Regulation S-X, and (ii) to render non-audit services for the registrant’s investment advisors (other than a sub-advisor whose role is primarily portfolio management and is subcontracted or overseen by another investment advisor) and any other entity controlling by, or under common control with the investment advisor that provides ongoing services to the registrant, in each case under (ii) if the engagement relates directly to the operations and financial reporting of the registrant, in accordance with Rule 2-01(c)(7)(ii) of Regulation S-X, subject to waiver provisions set forth in Rule 2-01(c)(7)(ii) of Regulation S-X.
(e)(2) 100% of services included in (b) – (d) above were approved pursuant to Rule 2-01(c)(7)(i)(C) of Regulation S-X.
(f) Not applicable.
(g) The aggregate fees billed for the most recent fiscal year and the preceding fiscal year by the registrant’s principal accountant for non-audit services rendered to the registrant, its investment advisor, and any entity controlling, controlled by, or under common control with the investment advisor that provides ongoing services to the registrant were $43,100 and $57,445 respectively.
(h) Not applicable.
Items 5. Audit Committee of Listed Registrants.
Not applicable.
Item 6. Schedule of Investments.
Not applicable.
Item 7. Disclosure of Proxy Voting Policies and Procedures for Closed-End Management Investment Companies.
Not applicable.
Item 8. Portfolio Managers of Closed-End Management Investment Companies.
Not applicable.
Item 9. Purchases of Equity Securities by Closed-End Management Investment Company and Affiliated Purchasers.
Not applicable.
Item 10. Submission of Matters to a Vote of Security Holders.
Not applicable.
Item 11. Controls and Procedures.
(a) Based on our evaluation conducted within 90 days of the filing date, hereof, the design and operation of the registrant's disclosure controls and procedures are effective to ensure that material information relating to the registrant is made known to the certifying officers by others within the appropriate entities, particularly during the period in which Forms N-CSR are being prepared, and the registrant's disclosure controls and procedures allow timely preparation and review of the information for the registrant's Form N-CSR and the officer certifications of such Form N-CSR.
(b) There were no significant changes in the registrant's internal controls or in other factors that could significantly affect these controls subsequent to the date of their evaluation, including any corrective actions with regard to significant deficiencies and material weaknesses.
Item 12. Exhibits.
(a)(1) Code of Ethics filed herewith as EX-99.CODE ETH.
(a)(2) A separate certification for each principal executive and principal financial officer of the registrant as required by Rule 30a-2(a) under the Act(17 CFR270.30a-2(a)). Filed herewith as EX-99.CERT.
(b) Certifications of principal executive officer and principal financial officer, under Section 906 of the Sarbanes-Oxley Act of 2002, and 18 U.S.C. ss.1350. Filed herewith as EX-99.906 CERT.
SIGNATURES
Pursuant to the requirements of the Securities Exchange Act of 1934 and the Investment Company Act of 1940, the registrant has duly caused this report to be signed on its behalf by the undersigned, thereunto duly authorized.
Meeder Funds
Bruce E. McKibben, Treasurer
Pursuant to the requirements of the Securities Exchange Act of 1934 and the Investment Company Act of 1940, this report has been signed below by the following persons on behalf of the registrant and in the capacities and on the dates indicated.
Bruce E. McKibben, Treasurer
| By: | /s/ Robert S. Meeder, Jr. |
Robert S. Meeder, Jr., President