Washington, D.C. 20549
Item 1. Report to Stockholders.
TABLE OF CONTENTS
| Letter to Shareholders | 1 |
| Muirfield Fund | 3 |
| Dynamic Growth Fund | 5 |
| Aggressive Growth Fund | 6 |
| Balanced Fund | 8 |
| Global Opportunities Fund | 10 |
| Spectrum Fund | 12 |
| Quantex Fund | 14 |
| Infrastructure Fund | 15 |
| Dividend Opportunities Fund | 17 |
| Total Return Bond Fund | 18 |
| Prime Money Market Fund | 20 |
| Institutional Prime Money Market Fund | 21 |
| Shareholder Expense Analysis | 23 |
| Disclosures | 25 |
| Fund Holdings & Financial Statements | 27 |
Solutions for all types of investors and goals
Since 1974, Meeder Investment Management has served many different types of investors and advisors. From this experience, we have developed a comprehensive suite of product solutions, from mutual funds to managed account portfolios, to help clients fulfill a wide range of investment objectives.
| Meeder Funds | Separately Managed Accounts |
| | |
| Meeder Investment Portfolios | Cash Management |
| | |
| Meeder Retirement Portfolios | |
This Annual Report is prepared and distributed for the general information of the shareholders of the Funds. This material is not authorized for distribution to prospective investors unless preceded or accompanied by a prospectus. Investors are advised to consider carefully the investment objectives, risks, charges and expenses of the Fund before investing. The prospectus contains this and other information about the Funds.
Meeder Funds are distributed by Adviser Dealer Services, Inc. (Member FINRA), an affiliate of Meeder Investment Management. An affiliated registered investment adviser, Meeder Asset Management, Inc., serves as the investment adviser to Meeder Funds and is paid a fee for its services.
LETTER TO SHAREHOLDERS December 31, 2016
These Are Remarkable Times
I don’t know if I can recall a year quite like 2016. It was a year full of surprises at home and abroad; from the financial markets to the Fed, Brexit to the U.S. presidential election. These are remarkable times.
When I looked at the year from start to finish, it seemed to play out like a Jekyll and Hyde story. The year began with concerns over the slowdown in China, which had a big impact on the global economy. After the first week of trading in 2016, the market had its worst ever start with the S&P falling -4.9%. Unfortunately, this trend continued and from December 31, 2015 to February 11, 2016, the S&P 500 Index had fell by more than 10%. Then oil prices began to stabilize and the stock market rebounded to finish the first quarter in positive territory. That was the first time since 1933 that the market was down by more than 10% in the middle of a quarter only to finish the period with a positive gain.
The stock market continued an upward trajectory into the summer. Then came more disruption. The British citizens made the historic decision to leave the European Union. That vote, commonly referred to as “Brexit,” reverberated around the world, causing global stock markets to sell off and the British pound to sink to a 31-year low. Once world markets had a chance to determine the longer-term impact of Brexit, the U.S. stock market began to rise, climbing to over 8% just one month after the Brexit vote.
As we moved into the fall, the stock market took a prolonged pause in the days leading up to the election. The market declined for nine straight days, which was the first time since 1980 that the stock market saw such a stretch of consecutive down days. From the election on November 8 through the end of the year, the stock market rallied based on the President-elect’s proposals for jobs growth, improving the nation’s infrastructure, and tax reform. The S&P 500 Index rose 4.6% from Election Day through December 31, 2016. Not even the Fed’s decision to raise interest rates in December slowed the market down.
We’ve said many times that we believe that there’s more room to run in this current secular bull market. With a new administration about to take office in Washington, D.C., we will need to wait and see how quickly some of the President-elect’s proposals can be enacted, and how U.S. and global markets will respond.
Performance Spotlight
During the year, our team continued to adhere to the disciplined, time-tested, model-driven investment process that has helped us deliver competitive performance over the long term.
The Meeder Muirfield Fund received a 4-Star Overall Morningstar Rating as of December 31, 2016 out of 251 Tactical Allocation funds in the category. As a tactical allocation fund with the ability to go defensive during volatile periods, the Muirfield Fund was ranked by Morningstar in the top 16% of its category for the 3-year period, top 1% for the 5-year period, and top 22% for the 10-year period.
Our mid-cap value fund, the Meeder Quantex Fund, also performed well, receiving a Morningstar Ranking in the top 6% of its Mid-Cap Value category for the 1-year period and the top 22% for the 5 and 10-year periods.
Expect the Unexpected
If there’s a lesson to be gleaned from 2016, it’s to expect the unexpected. I’ve said before that market uncertainty is typical. As the New Year begins, it’s important to review your investment portfolio to ensure that it’s properly diversified and designed to help you meet your investment objectives.
As always, our investment team will continue to apply our disciplined investment process across all of our funds and portfolios. We are singularly focused on providing solutions that can help you improve your investment outcomes. Please review the following pages to learn more about the Meeder Funds’ positioning and performance for the year 2016.
On behalf of the entire team at Meeder Investment Management, we thank you for your continued support, trust and confidence in our investment management services.
Robert S. Meeder
President and CEO
Meeder Asset Management, Inc.
| 2016 Annual Report | December 31, 2016 | Page 1 |
2016 Annual Report
Fund Summaries
| Page 2 | 2016 Annual Report | December 31, 2016 |
Muirfield Fund
The Meeder Muirfield Fund retail class returned 5.72% compared to the blended benchmark of 7.28% and the S&P 500 Index return of 11.96%. We started 2016 with a 60% invested exposure and 40% defensive position. Our models continued to deteriorate and we increased our defensive position to as high as 55% at the end of January. As the quarter progressed, our models showed significant signs of improvement in trend and breadth indicators. By the end of the second quarter we became essentially fully invested and eliminated our defensive position. We were fully invested until mid-fourth quarter when our models started to deteriorate due to sentiment factors after the U.S. Presidential election. It is important to note that Meeder views sentiment as a contrarian factor, so when there appears to be a heightening optimism or euphoria present in the marketplace, our models will show signs of deterioration. At that time we increased our defensive position as high as 25% before gradually reducing it down to near 10% as of the end of 2016.
With the exception of late in the first quarter, we held a tactical position in international securities until the end of 2016. In the wake of the U.S. election results, momentum and currency factors in our international model evolved to favor domestic exposure, and as a result we eliminated our tactical international exposure at the end of November. Overall, our international exposure detracted from performance relative to the S&P 500 Index. For the year ending 2016, the top contributors to the portfolio’s return were Fifth Third Bank and Bank of America. An underweight to the pharmaceutical company Allergan helped boost performance relative to the benchmark. The greatest detractors to the portfolio were under weightings to specific securities that performed well in the financial sector which included Goldman Sachs, Wells Fargo and Citigroup.
In the portfolio, we will often use equity index derivatives in the Fund, such as stock index futures, to efficiently equitize our cash positions as well as manage the equity exposure of the Fund. In regard to equitizing cash positions, these derivatives are designed to track their respective stock index, so there was no discernible impact to the Fund’s relative performance. The use of stock index futures to manage the equity exposure of the Fund had a negative impact on the performance of the Fund relative to the S&P 500 Index during 2016.
Period & Average Annual Total Returns as of December 31, 2016 (Unaudited)
| | 1 Year | 3 Year | 5 Year | 10 Year | Inception Date |
| Muirfield Fund Retail Class | 5.72% | 3.86% | 10.43% | 4.30% | 8/10/88 |
Expense Ratios+: Audited Net 1.05% Gross 1.45% | | | |
Blended Index1 | 7.28% | 5.44% | 8.76% | 4.69% | 7/31/88 |
| S&P 500 Index | 11.96% | 8.87% | 14.66% | 6.95% | 7/31/88 |
| Information Technology | 17.1% |
| Financials | 12.8% |
| Healthcare | 10.6% |
| Industrials | 6.5% |
| Consumer Discretionary | 6.1% |
| Consumer Staples | 6.1% |
| Energy | 5.0% |
| Utilities | 2.3% |
| Telecommunication Services | 2.2% |
| Materials | 1.5% |
| Real Estate Investment Trust | 1.4% |
| Registered Investment Companies | 3.6% |
| Money Market Registered Investment Companies | 24.1% |
| Bank Obligations | 0.2% |
| Other Assets/Liabilities (Net) | 0.5% |
| Total | 100.0% |
As a percentage of total net assets. Concentrations are subject to change. The Fund has invested in stock index futures contracts in order to equitize cash balances held in the Fund.
Top 10 Holdings
as of December 31, 2016
| 1. | iShares Russell 2000 Value ETF | 3.6% |
| 2. | Apple, Inc. | 2.2% |
| 3. | Microsoft Corp. | 1.8% |
| 4. | JPMorgan Chase & Co. | 1.4% |
| 5. | Exxon Mobil Corp. | 1.4% |
| 6, | Alphabet, Inc. - Class C | 1.3% |
| 7. | Verizon Communications, Inc. | 1.3% |
| 8. | Johnson & Johnson | 1.3% |
| 9. | Bank of America Corporation | 1.3% |
| 10. | PepsiCo, Inc. | 1.1% |
As a percentage of total net assets.
| 2016 Annual Report | December 31, 2016 | Page 3 |
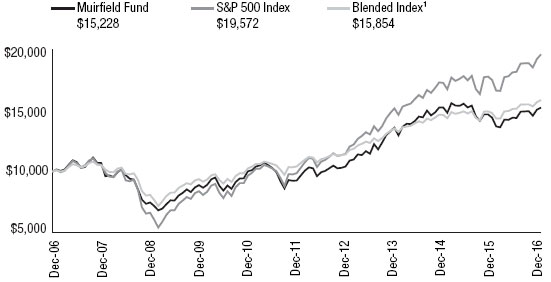
Growth of $10,000: 12/31/06 - 12/31/16
The Growth of $10,000 chart compares the value of the Muirfield Fund to the S&P 500 Index, the Fund’s broad-based benchmark, and to the Blended Index which is composed of 60% of the S&P 500 Index and 40% of 90-day T-bills. The chart is intended to give you a general idea of how the Fund performed compared to these benchmarks over the period from December 31, 2006 to December 31, 2016. An understanding of the differences between the Fund and these benchmarks is important. The benchmark indices are hypothetical unmanaged indices of common stocks and 90-day T-bills that do not take into account the deduction of expenses associated with a mutual fund, such as investment management and accounting fees. One cannot invest directly in an index.
The chart and the table do not reflect the deduction of taxes that a shareholder would pay on Fund distributions or the redemption of Fund shares. The performance data shown represents past performance, which does not guarantee future results. The investment return and principal value of an investment will fluctuate so that an investor’s shares, when redeemed, may be worth more or less than their original cost. Current performance may be lower or higher than the performance data quoted.
Effective October 31, 2016, the Fund offered retail, adviser, and institutional share classes. Period and average annual total returns, expense ratios, and the growth of $10,000 chart only include the retail class of shares. For additional information regarding multiple classes of shares, see Note #1 in the Notes to Financial Statements.
Management fees and/or expenses were voluntarily waived and/or reimbursed in order to reduce the operating expenses of the Muirfield Fund during certain periods shown above. + The Audited Net Expense Ratio is based on average daily net assets and reflects actual expenses of the Fund paid over the one year period ended 12/31/16, including the effect of expense waivers and reimbursements. This ratio may increase or decrease depending on fluctuations in Fund net assets. The Gross Expense Ratio is a percentage of the Fund’s average daily net assets, including acquired fund fees and expenses, as shown in the most current Fund Prospectus. Please see additional disclosures on page 25.
| Page 4 | 2016 Annual Report | December 31, 2016 |
Dynamic Growth Fund
The Dynamic Growth Fund retail class returned 5.37% for the year ending December 31, 2016 compared to the S&P 500 Index return of 11.96%. From a sector standpoint, we maintained a modest underweight to energy which hurt performance as oil prices hit a low of $26 a barrel in February before finishing the year nearly at over $52 a barrel. The largest individual contributors to performance in 2016 were an underweight to Allergan whose stock fell, while NVIDIA and Bank of America had positive performance. Some of the most significant detractors were Teekay Tankers Ltd., and an underweight in Wells Fargo and Goldman Sachs relative to the benchmark.
With the exception of late in the first quarter, we held a tactical position in international securities until the end of 2016. In the wake of the U.S. election results, momentum and currency factors in our international model evolved to favor domestic exposure, and as a result we eliminated our tactical international exposure at the end of November. Overall, our international exposure detracted from performance relative to the S&P 500 Index.
We utilized equity index derivatives in the Fund, such as stock index futures to equitize cash positions. Since these derivatives are designed to track a respective stock index, there was no discernable impact to the Fund’s relative performance in 2016.
Period & Average Annual Total Returns as of December 31, 2016 (Unaudited)
| | 1 Year | 3 Year | 5 Year | 10 Year | Inception Date |
| Dynamic Growth | | | | | |
| Fund Retail Class | 5.37% | 4.69% | 11.59% | 4.60% | 2/29/00 |
Expense Ratios+: Audited Net 1.05% Gross 1.63% | | | |
| S&P 500 Index | 11.96% | 8.87% | 14.66% | 6.95% | 2/29/00 |
Growth of $10,000: 12/31/06 - 12/31/16
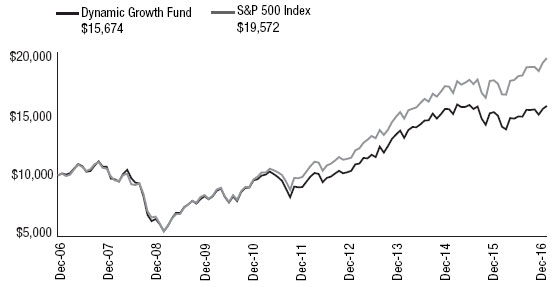
The Growth of $10,000 chart compares the Dynamic Growth Fund’s value to the S&P 500 Index, the Fund’s broad-based benchmark. The chart is intended to give you a general idea of how the Fund performed compared to this benchmark over the period from December 31, 2006 to December 31, 2016. An understanding of the differences between the Fund and this index is important. The S&P 500 Index is a hypothetical unmanaged index of common stocks that does not take into account the deduction of expenses associated with a mutual fund, such as investment management and accounting fees. One cannot invest directly in an index.
The chart and the table do not reflect the deduction of taxes that a shareholder would pay on Fund distributions or the redemption of Fund shares. The performance data shown represents past performance, which does not guarantee future results. The investment return and principal value of an investment will fluctuate so that an investor’s shares, when redeemed, may be worth more or less than their original cost. Current performance may be lower or higher than the performance data quoted.
Sector Concentration
| Information Technology | 21.4% |
| Financials | 14.3% |
| Healthcare | 12.8% |
| Industrials | 8.4% |
| Consumer Discretionary | 8.0% |
| Energy | 6.1% |
| Consumer Staples | 6.0% |
| Telecommunication Services | 2.6% |
| Utilities | 2.2% |
| Materials | 1.8% |
| Real Estate Investment Trust | 1.4% |
| Money Market Registered Investment Companies | 12.8% |
| Bank Obligations | 0.6% |
| Other Assets/Liabilities (Net) | 1.6% |
| Total | 100.0% |
As a percentage of total net assets. Concentrations are subject to change. The Fund has invested in stock index futures contracts in order to equitize cash balances held in the Fund.
Top 10 Holdings
as of December 31, 2016
| 1. | Apple, Inc. | 2.5% |
| 2. | Microsoft Corp. | 2.1% |
| 3. | JPMorgan Chase & Co. | 1.7% |
| 4. | Exxon Mobil Corp. | 1.6% |
| 5. | Bank of America Corporation | 1.5% |
| 6, | Alphabet, Inc. - Class C | 1.5% |
| 7. | Johnson & Johnson | 1.5% |
| 8. | Verizon Communications, Inc. | 1.4% |
| 9. | PepsiCo, Inc. | 1.3% |
| 10. | International Business Machines Corp. | 1.2% |
As a percentage of total net assets.
Effective October 31, 2016, the Fund offered retail, adviser, and institutional share classes. Period and average annual total returns, expense ratios, and the growth of $10,000 chart only include the retail class of shares. For additional information regarding multiple classes of shares, see Note #1 in the Notes to Financial Statements.
Management fees and/or expenses were voluntarily waived and/or reimbursed in order to reduce the operating expenses of the Dynamic Growth Fund during certain periods shown above. + The Audited Net Expense Ratio is based on average daily net assets and reflects actual expenses of the Fund paid over the one year period ended 12/31/16, including the effect of expense waivers and reimbursements. This ratio may increase or decrease depending on fluctuations in Fund net assets. The Gross Expense Ratio is a percentage of the Fund’s average daily net assets, including acquired fund fees and expenses, as shown in the most current Fund Prospectus. Please see additional disclosures on page 25.
| 2016 Annual Report | December 31, 2016 | Page 5 |
Aggressive Growth Fund
The Aggressive Growth Fund retail class returned 8.26% compared to the S&P 500 Index return of 11.96% for the year ending December 31, 2016. For the first three quarters of the year the Aggressive Growth Fund was managed as a Tactical Multi-Cap fund and its benchmark was the S&P 500 Index. During this time the Fund returned 2.92% compared to the S&P 500 Index return of 7.84%. On September 30th, 2016 the objective of the Fund changed from the style of large cap blend, to being a small cap blend strategy. Consequently, the benchmark also changed to the Russell 2500 Index. For the fourth quarter of 2016, the Aggressive Growth Fund was able to participate in the broad based rally of small and mid-cap companies and posted a return of 5.19% relative to the Russell 2500 Index return of 6.12% including dividends.
The top performers for the fourth quarter of the year were Steel Dynamics, TCF Financial Corporation, and Hancock Holding Company. The largest detractors from performance were Nu Skin Enterprises, Herbalife, and Tupperware Brands.
With the exception of late in the first quarter, we held a tactical position in international securities until the end of 2016. In the wake of the U.S. election results, momentum and currency factors in our international model evolved to favor domestic exposure, and as a result we eliminated our tactical international exposure at the end of November. Overall, our international exposure detracted from performance relative to the S&P 500 Index.
We utilized equity index derivatives in the Fund, such as stock index futures to equitize cash positions. Since these derivatives are designed to track a respective stock index, there was no discernable impact to the Fund’s relative performance in 2016.
Period & Average Annual Total Returns as of December 31, 2016 (Unaudited)
| | 1 Year | 3 Year | 5 Year | 10 Year | Inception Date |
| Aggressive Growth | | | | | |
| Fund Retail Class | 8.26% | 5.53% | 11.82% | 4.90% | 2/29/00 |
Expense Ratios+: Audited Net 1.16% Gross 1.68% | | | |
| Russell 2500 Index | 17.59% | 6.93% | 14.54% | 7.69% | 2/29/00 |
| S&P 500 Index | 11.96% | 8.87% | 14.66% | 6.95% | 2/29/00 |
Sector Concentration
as of December 31, 2016
| Industrials | 18.6% |
| Financials | 14.8% |
| Information Technology | 13.8% |
| Consumer Discretionary | 8.8% |
| Healthcare | 7.5% |
| Materials | 7.1% |
| Real Estate Investment Trust | 5.6% |
| Energy | 4.5% |
| Utilities | 3.2% |
| Consumer Staples | 2.8% |
| Telecommunication Services | 0.9% |
| Money Market Registered Investment Companies | 11.2% |
| Other Assets/Liabilities (Net) | 1.2% |
| Total | 100.0% |
As a percentage of total net assets. Concentrations are subject to change. The Fund has invested in stock index futures contracts in order to equitize cash balances held in the Fund.
Top 10 Holdings
| 1. | IDEXX Laboratories, Inc. | 1.1% |
| 2. | Everest Re Group, Ltd. | 1.1% |
| 3. | UGI Corp. | 1.1% |
| 4. | Huntington Ingalls Industries, Inc. | 1.1% |
| 5. | FMC Technologies, Inc. | 1.1% |
| 6, | Synopsys, Inc. | 1.1% |
| 7. | Reinsurance Group of America, Inc. | 1.1% |
| 8. | Spirit AeroSystems Holdings, Inc. | 1.1% |
| 9. | Hospitality Properties Trust | 1.1% |
| 10. | Jabil Circuit, Inc. | 1.0% |
As a percentage of total net assets.
| Page 6 | 2016 Annual Report | December 31, 2016 |
Growth of $10,000: 12/31/06 - 12/31/16
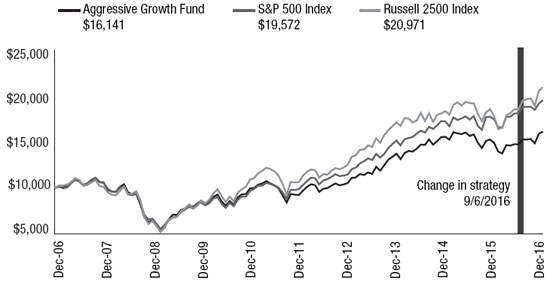
The Growth of $10,000 chart compares the Aggressive Growth Fund’s value to the S&P 500 Index and the Russell 2500 Index, the Fund’s broad-based benchmarks. The chart is intended to give you a general idea of how the Fund performed compared to these benchmarks over the period from December 31, 2006 to December 31, 2016. An understanding of the differences between the Fund and these indices is important. The S&P 500 Index and the Russell 2500 Index are hypothetical unmanaged indices of common stocks that do not take into account the deduction of expenses associated with a mutual fund, such as investment management and accounting fees. One cannot invest directly in an index.
The chart and the table do not reflect the deduction of taxes that a shareholder would pay on Fund distributions or the redemption of Fund shares. The performance data shown represents past performance, which does not guarantee future results. The investment return and principal value of an investment will fluctuate so that an investor’s shares, when redeemed, may be worth more or less than their original cost. Current performance may be lower or higher than the performance data quoted.
Effective October 31, 2016, the Fund offered retail, adviser, and institutional share classes. Period and average annual total returns, expense ratios, and the growth of $10,000 chart only include the retail class of shares. For additional information regarding multiple classes of shares, see Note #1 in the Notes to Financial Statements.
Management fees and/or expenses were voluntarily waived and/or reimbursed in order to reduce the operating expenses of the Aggressive Growth Fund during certain periods shown above. + The Audited Net Expense Ratio is based on average daily net assets and reflects actual expenses of the Fund paid over the one year period ended 12/31/16, including the effect of expense waivers and reimbursements. This ratio may increase or decrease depending on fluctuations in Fund net assets. The Gross Expense Ratio is a percentage of the Fund’s average daily net assets, including acquired fund fees and expenses, as shown in the most current Fund Prospectus. Please see additional disclosures on page 25.
| 2016 Annual Report | December 31, 2016 | Page 7 |
Balanced Fund
The Meeder Balanced Fund retail class returned 4.84% for the year ending December 31, 2016 when compared to the Blended Index return of 5.94% and the S&P 500 Index return of 11.96%. The Fund maintains exposure to both equity and fixed income. In the equity portion of the portfolio, the Fund started 2016 with a 60% invested exposure and 40% defensive position. Our models continued to deteriorate and we increased our defensive position to as high as 55% at the end of January. Our models then showed significant signs of improvement in trend and breadth indicators. By the end of the second quarter we became essentially fully invested and eliminated our defensive position. We were fully invested until mid-fourth quarter when our models started to deteriorate due to sentiment factors after the U.S. Presidential election. At that time we increased our defensive position as high as 25% before gradually reducing it down to near 10% as of the end of 2016. With the exception of late in the first quarter, we held a tactical position in international securities until the end of 2016. In the wake of the U.S. election results, momentum and currency factors in our international model evolved to favor domestic exposure, and as a result we eliminated our tactical international exposure at the end of November. Overall, our international exposure detracted from performance relative to the S&P 500 Index. For the year ending 2016, in the equity portion of the portfolio the top contributors to the portfolio’s return were Fifth Third Bank, Bank of America, and an underweight to the pharmaceutical company Allergan which fell. The greatest detractors to the portfolio were under weightings relative to the benchmark names in the financial sector which included Goldman Sachs, Wells Fargo and Citigroup.
In the fixed income portion of the portfolio, early in first quarter there were concerns about the slowing of the Chinese economy. This caused investors to flock to the safety of U.S. Treasuries. As oil prices stabilized, breadth improved in the market place. At the end of June, the United Kingdom voted to leave the European Union, also known as Brexit. Prior to this, our credit model favored risk-off sectors. As a result we positioned the Fund to be more defensive by increasing our allocations to U.S. Treasuries and the portfolio benefitted from this tactical shift.
In the second half of the year, markets showed resilience. Less than two weeks into the third quarter markets rose above pre-Brexit levels, and our models identified improvement in risk-on sectors due to short-term momentum and spread factors. We implemented this view by allocating our below-investment-grade bonds above 7% and 8% to emerging market debt. Our duration model continued to favor holding longer-dated U.S. treasuries. Early in November, we saw signs of deterioration in our fixed income Emerging Market model, as it started to favor domestic positions. By the end of the year, we gradually reduced our holdings in emerging market debt to approximately 5%. This reduction was reallocated to investment-grade securities which totaled 62% by the end of 2016, while below investment-grade holdings remained consistent near 16%.
In the portfolio, we will often use equity index derivatives in the Fund, such as stock index futures, to efficiently equitize our cash positions as well as manage the equity exposure of the fund. In regard to equitizing cash positions, these derivatives are designed to track their respective stock index, so there was no discernible impact to the Fund’s relative performance. The use of stock index futures to manage the equity exposure of the Fund had a negative impact on the performance of the Fund relative to the S&P 500 Index during 2016.
Period & Average Annual Total Returns as of December 31, 2016 (Unaudited)
| | 1 | 3 | 5 | 10 | Inception |
| | Year | Year | Year | Year | Date |
| Balanced Fund Retail Class | 4.84% | 2.84% | 7.55% | 3.25% | 1/31/06 |
Expense Ratios+: Audited Net 1.22% Gross 1.73% | | | |
Blended Index2 | 5.94% | 4.77% | 6.82% | 4.69% | 1/31/06 |
| S&P 500 Index | 11.96% | 8.87% | 14.66% | 6.95% | 1/31/06 |
| 1. | Prudential Total Return Bond Fund - Z | 3.4% |
| 2. | Metropolitan West Total Return Bond Fund - I | 3.3% |
| 3. | iShares Russell 2000 Value ETF | 3.0% |
| 4. | iShares iBoxx $ High Yield Corporate Bond ETF | 2.4% |
| 5. | iShares 7-10 Year Treasury Bond ETF | 2.2% |
| 6, | Pioneer Bond Fund - Y | 2.1% |
| 7. | Baird Core Plus Bond Fund - I | 2.0% |
| 8. | JPMorgan Core Plus Bond Fund - L | 2.0% |
| 9. | iShares 3-7 Year Treasury Bond ETF | 2.0% |
| 10. | Guggenheim Total Return Bond Fund - I | 1.7% |
As a percentage of total net assets.
Sector Concentration
as of December 31, 2016
| Information Technology | 12.3% |
| Financials | 9.1% |
| Healthcare | 7.6% |
| Industrials | 4.5% |
| Consumer Staples | 4.4% |
| Consumer Discretionary | 4.2% |
| Energy | 3.6% |
| Utilities | 1.6% |
| Telecommunication Services | 1.5% |
| Materials | 1.1% |
| Real Estate Investment Trust | 1.1% |
| Registered Investment Companies | 33.9% |
| Money Market Registered Investment Companies | 16.7% |
| Bank Obligations | 0.3% |
| Other Assets/Liabilities (Net) | (1.9%) |
| Total | 100.0% |
As a percentage of total net assets. Concentrations are subject to change. The Fund has invested in stock index futures contracts in order to equitize cash balances held in the Fund.
| Page 8 | 2016 Annual Report | December 31, 2016 |
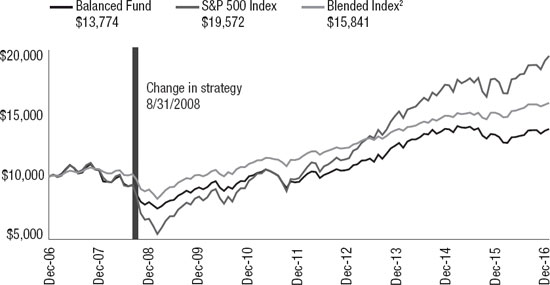
Growth of $10,000: 12/31/06 - 12/31/16
The Growth of $10,000 chart compares the Balanced Fund’s value to the S&P 500 Index, the Fund’s broad-based benchmark, and to the Blended Index which is comprised of 42% of the S&P 500 Index, 28% of the average 90-day U.S. Treasury bill and 30% of the Barclays Aggregate Bond Index. The chart is intended to give you a general idea of how the Fund performed compared to these benchmarks over the period from December 31, 2006 through December 31, 2016. An understanding of the differences between the Fund and these indices is important. The benchmark indices are hypothetical unmanaged indices of common stock that do not take into account the deduction of expenses associated with a mutual fund, such as investment management and accounting fees. One cannot invest directly in an index.
The chart and the table do not reflect the deduction of taxes that a shareholder would pay on Fund distributions or the redemption of Fund shares. The performance data shown represents past performance, which does not guarantee future results. The investment return and principal value of an investment will fluctuate so that an investor’s shares, when redeemed, may be worth more or less than their original cost. Current performance may be lower or higher than the performance data quoted.
Effective October 31, 2016, the Fund offered retail, adviser, and institutional share classes. Period and average annual total returns, expense ratios, and the growth of $10,000 chart only include the retail class of shares. For additional information regarding multiple classes of shares, see Note #1 in the Notes to Financial Statements.
Management fees and/or expenses were voluntarily waived and/or reimbursed in order to reduce the operating expenses of the Balanced Fund during certain periods shown above. + The Audited Net Expense Ratio is based on average daily net assets and reflects actual expenses of the Fund paid over the one year period ended 12/31/16, including the effect of expense waivers and reimbursements. This ratio may increase or decrease depending on fluctuations in Fund net assets. The Gross Expense Ratio is a percentage of the Fund’s average daily net assets as shown in the most current Fund Prospectus. Please see additional disclosures on page 25.
| 2016 Annual Report | December 31, 2016 | Page 9 |
Global Opportunities Fund
The Global Opportunities Fund pursues its objective by investing in a targeted allocation of U.S., international, and emerging market investments as well as real estate and commodity based equities. Securities are selected utilizing highly quantitative investment models in an attempt to outperform in each asset class. The Global Opportunities Fund is fully invested in the equity market at all times and holds a target allocation across different investment allocation categories. The target allocations for the Fund are: 40-55% international, 20-25% domestic large-cap holdings, 10-15% domestic mid-cap holdings, 5-10% domestic small cap holdings, 5-10% real estate holdings, and 5-10% commodities holdings. These are target investment allocations and therefore could differ from the actual holdings of the fund.
The Fund’s retail class performance for 2016 was up 3.54% compared to its blended benchmark of 9.58% and the S&P 500 Index of 11.96%. The blended benchmark is comprised of 34% of the MSCI EAFE Index, 22% of the S&P 500 Index, 12% of the S&P Mid-Cap 400 Index, 11% of the MSCI Emerging Market Index, 7% of the Dow Jones U.S. Select REIT Index, 7% of the Russell 2000 Index, and 7% of the S&P GSCI Index. The Fund’s performance in 2016 was hampered by its exposure to developed international securities. The MSCI EAFE Index’s 2016 return was just 1.00% while equities as represented by the S&P 500 Index were up 11.96%. The Fund’s 17% allocation to emerging markets was positive 11.19% as represented by the MSCI EM Index. The Fund received strong performance from mid and small-caps as represented by the S&P Mid-Cap 400 and Russell 2000 indexes with returns of 20.74% and 20.78% respectively.
With the exception of late in the first quarter, we held a tactical position in international securities until the end of 2016. In the wake of the U.S. election results, momentum and currency factors in our international model evolved to favor domestic exposure, and as a result we eliminated our tactical international exposure at the end of November. Overall, our international exposure detracted from performance relative to the S&P 500 Index.
The holdings in the Fund that were the largest contributors to performance were Computer Sciences Corp., an overweight to NVIDIA and Steel Dynamics. The largest detractors to the Fund were Teekay Tankers Ltd., Bank of America and Iron Mountain.
We utilized equity index derivatives in the Fund, such as stock index futures to equitize cash positions. Since these derivatives are designed to track a respective stock index, there was no discernable impact to the Fund’s relative performance in 2016.
Period & Average Annual Total Returns as of
December 31, 2016 (Unaudited)
| | 1 Year | 3 Year | 5 Year | 10 Year | Inception Date |
| Global Opportunities | | | | | |
| Fund Retail Class | 3.54% | 0.57% | 7.34% | 2.45% | 1/31/06 |
Expense Ratios+: Audited Net 1.16% Gross 1.72% | | | |
Blended Index3 | 12.67% | 3.60% | 9.31% | 4.78% | 1/31/06 |
Blended Index4 | 9.58% | 2.23% | 8.42% | 3.68% | 1/31/06 |
| S&P 500 Index | 11.96% | 8.87% | 14.66% | 6.95% | 1/31/06 |
Sector Concentration
as of December 31, 2016
| Information Technology | 12.0% |
| Financials | 7.9% |
| Real Estate Investment Trust | 7.3% |
| Healthcare | 4.6% |
| Materials | 3.6% |
| Energy | 3.4% |
| Consumer Staples | 2.8% |
| Telecommunication Services | 1.8% |
| Utilities | 1.5% |
| Industrials | 1.3% |
| Consumer Discretionary | 1.2% |
| Registered Investment Companies | 47.0% |
| Money Market Registered Investment Companies | 7.3% |
| Bank Obligations | 1.0% |
| Other Assets/Liabilities (Net) | (2.7%) |
| Total | 100.0% |
As a percentage of total net assets. Concentrations are subject to change. The Fund has invested in stock index futures contracts in order to equitize cash balances held in the Fund.
Top 10 Holdings
as of December 31, 2016
| 1. | iShares Core MSCI Emerging Markets ETF | 17.4% |
| 2. | iShares MSCI EAFE ETF | 14.7% |
| 3. | iShares Core MSCI EAFE ETF | 10.4% |
| 4. | Oppenheimer International Growth Fund - I | 2.1% |
| 5. | Goldman Sachs Emerging Markets Equity | |
| | Insights Fund - I | 1.8% |
| 6, | Intel Corp. | 1.6% |
| 7. | International Business Machines Corp. | 1.5% |
| 8. | Verizon Communications, Inc. | 1.5% |
| 9. | Wal-Mart Stores, Inc. | 1.4% |
| 10. | Texas Instruments, Inc. | 1.3% |
As a percentage of total net assets.
| Page 10 | 2016 Annual Report | December 31, 2016 |
Growth of $10,000: 12/31/06 - 12/31/16
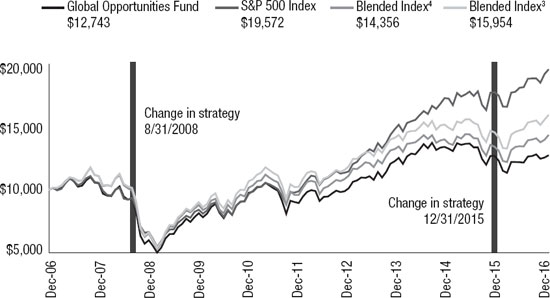
The Growth of $10,000 chart compares the Global Opportunities Fund’s value to the S&P 500 Index, the Fund’s broad-based benchmark and to the Blended Index4, which is comprised of 34% of the MSCI EAFE Index, 22% of the S&P 500 Index, 12% of the S&P Mid-Cap 400 Index, 11% of the MSCI Emerging Market Index, 7% of the Dow Jones U.S. Select REIT Index, 7% of the Russell 2000 Index, and 7% of the S&P GSCI Index. The Fund’s Blended Index benchmark was revised effective January 1, 2016 to better reflect the current allocation of the Fund’s assets. The chart is intended to give you a general idea of how the Fund performed compared to these benchmarks over the period from December 31, 2006 to December 31, 2016. An understanding of the differences between the Fund and these indices is important. The benchmark indices are hypothetical unmanaged indices of common stocks that do not take into account the deduction of expenses associated with a mutual fund, such as investment management and accounting fees. One cannot invest directly in an index.
The chart and the table do not reflect the deduction of taxes that a shareholder would pay on Fund distributions or the redemption of Fund shares. The performance data shown represents past performance, which does not guarantee future results. The investment return and principal value of an investment will fluctuate so that an investor’s shares, when redeemed, may be worth more or less than their original cost. Current performance may be lower or higher than the performance data quoted.
Effective October 31, 2016, the Fund offered retail, adviser, and institutional share classes. Period and average annual total returns, expense ratios, and the growth of $10,000 chart only include the retail class of shares. For additional information regarding multiple classes of shares, see Note #1 in the Notes to Financial Statements.
Management fees and/or expenses were voluntarily waived and/or reimbursed in order to reduce the operating expenses of the Global Opportunities Fund during certain periods shown above. + The Audited Net Expense Ratio is based on average daily net assets and reflects actual expenses of the Fund paid over the one year period ended 12/31/16, including the effect of expense waivers and reimbursements. This ratio may increase or decrease depending on fluctuations in Fund net assets. The Gross Expense Ratio is a percentage of the Fund’s average daily net assets, including acquired fund fees and expenses, as shown in the most current Fund Prospectus. Please see additional disclosures on page 25.
| 2016 Annual Report | December 31, 2016 | Page 11 |
Spectrum Fund
The Meeder Spectrum Fund retail class returned 6.97% compared to the blended benchmark of 7.28% and the S&P 500 Index return of 11.96%. We started 2016 with a 60% invested exposure and 40% defensive position. Our models continued to deteriorate and we increased our defensive position to as high as 55% at the end of January. As the quarter progressed, our models showed significant signs of improvement in trend and breadth indicators. By the end of the second quarter we became essentially fully invested and eliminated our defensive position. We were fully invested until mid-fourth quarter when our models started to deteriorate due to sentiment factors after the U.S. Presidential election. It is important to note that Meeder views sentiment as a contrarian factor, so when there appears to be a heightening optimism or euphoria present in the marketplace, our models will show signs of deterioration. At that time we increased our defensive position as high as 25% before gradually reducing it down to near 10% as of the end of 2016.
Three holdings that were some of the contributors to performance were Computer Sciences, Hewlett Packard and a short position in Celldex Therapeutics. The top detractors were Anacor Pharmaceuticals, Memorial Resource Corporation and a short position to Continental Resources which ended the year in positive territory.
With the exception of late in the first quarter, we held a tactical position in international securities until the end of 2016. In the wake of the U.S. election results, momentum and currency factors in our international model evolved to favor domestic exposure, and as a result we eliminated our tactical international exposure at the end of November. Overall, our international exposure detracted from performance relative to the S&P 500 Index.
In the portfolio, we will often use equity index derivatives in the Fund, such as stock index futures, to efficiently equitize our cash positions as well as manage the equity exposure of the fund. In regard to equitizing cash positions, these derivatives are designed to track their respective stock index, so there was no discernible impact to the Fund’s relative performance. The use of stock index futures to manage the equity exposure of the fund had a negative impact on the performance of the fund relative to the S&P 500 Index during 2016.
Period & Average Annual Total Returns as of
December 31, 2016 (Unaudited)
| | 1 Year | Since Inception | Inception Date |
| Spectrum Fund Retail Class | 6.97% | 2.80% | 1/1/15 |
Expense Ratios+: Audited Net 1.49% Gross 2.25% | | | |
Blended Index1 | 7.28% | 4.14% | 1/1/15 |
| S&P 500 Index | 11.96% | 6.57% | 1/1/15 |
Top 10 Holdings
as of December 31, 2016
| 1. | Apple, Inc. | 3.1% |
| 2. | Microsoft Corp. | 2.5% |
| 3. | Johnson & Johnson | 1.9% |
| 4. | AT&T, Inc. | 1.7% |
| 5. | Bank of America Corporation | 1.6% |
| 6, | Verizon Communications, Inc. | 1.6% |
| 7. | Pfizer, Inc. | 1.4% |
| 8. | Intel Corp. | 1.4% |
| 9. | Citigroup, Inc. | 1.3% |
| 10. | Cisco Systems, Inc. | 1.3% |
As a percentage of total net assets.
Sector Concentration
as of December 31, 2016
| Long Positions | |
| Information Technology | 22.8% |
| Financials | 14.6% |
| Healthcare | 13.7% |
| Industrials | 10.8% |
| Consumer Discretionary | 6.9% |
| Consumer Staples | 5.2% |
| Real Estate Investment Trust | 4.4% |
| Energy | 3.8% |
| Utilities | 3.8% |
| Materials | 3.5% |
| Telecommunication Services | 2.7% |
| Money Market Registered Investment Companies | 5.9% |
| Bank Obligations | 0.2% |
| Other Assets/Liabilities (Net) | 39.4% |
| Total Long | 137.7% |
| | |
| Short Positions | |
| Consumer Discretionary | (6.4%) |
| Industrials | (5.9%) |
| Financials | (5.0%) |
| Information Technology | (4.7%) |
| Real Estate Investment Trust | (4.3%) |
| Healthcare | (3.8%) |
| Consumer Staples | (2.4%) |
| Utilities | (2.3%) |
| Energy | (1.6%) |
| Materials | (1.3%) |
| Total Short | (37.7%) |
| Total | 100.0% |
As a percentage of total net assets. Concentrations are subject to change. The Fund has invested in stock index futures contracts in order to equitize cash balances held in the Fund.
| Page 12 | 2016 Annual Report | December 31, 2016 |
Growth of $10,000: 12/31/14 - 12/31/16
The Growth of $10,000 chart compares the Spectrum Fund’s value to the S&P 500 Index, the Fund’s broad-based benchmark, and to the Blended Index which is composed of 60% S&P 500 Index and of 40% 90-day T-Bills. The chart is intended to give you a general idea of how the Fund performed compared to these benchmarks over the period from December 31, 2014 to December 31, 2016. An understanding of the differences between the Fund and these indices is important. The benchmark indices are hypothetical unmanaged indices of common stocks that do not take into account the deduction of expenses associated with a mutual fund, such as investment management and accounting fees. One cannot invest directly in an index.
The chart and the table do not reflect the deduction of taxes that a shareholder would pay on Fund distributions or the redemption of Fund shares. The performance data shown represents past performance, which does not guarantee future results. The investment return and principal value of an investment will fluctuate so that an investor’s shares, when redeemed, may be worth more or less than their original cost. Current performance may be lower or higher than the performance data quoted.
Effective October 31, 2016, the Fund offered retail, adviser, and institutional share classes. Period and average annual total returns, expense ratios, and the growth of $10,000 chart only include the retail class of shares. For additional information regarding multiple classes of shares, see Note #1 in the Notes to Financial Statements.
Management fees and/or expenses were voluntarily waived and/or reimbursed in order to reduce the operating expenses of the Spectrum Fund during certain periods shown above. + The Audited Net Expense Ratio is based on average daily net assets and reflects actual expenses of the Fund paid over the one year period ended 12/31/16, including the effect of expense waivers and reimbursements. This ratio may increase or decrease depending on fluctuations in Fund net assets. The Gross Expense Ratio is a percentage of the Fund’s average daily net assets, including acquired fund fees and expenses, as shown in the most current Fund Prospectus. Please see additional disclosures on page 25.
| 2016 Annual Report | December 31, 2016 | Page 13 |
Quantex Fund
The Meeder Quantex Fund retail class returned 22.14% for the year ending December 31, 2016. During the same time period, the S&P MidCap 400 Index and Russell 2000 Index returned 20.74% and 21.31%, respectively.
We use a quantitative model to identify the capitalization ranges that incorporate our ideal portfolio of small- and mid-capitalization companies with strong growth potential each calendar year. Individual securities for the portfolio are equally weighted at the beginning of the year. The sectors that had the largest weightings in the portfolio were Consumer Cyclicals, Industrials, and Energy.
The largest contributors to the portfolio were Chemours, Talen Energy Corp., and Joy Global. The largest detractors in the portfolio for 2016 were California Resource Corp, while underweights to NVIDIA Corp. and Abercrombie & Fitch which experienced positive performance, hindered returns.
We utilized equity index derivatives in the Fund, such as stock index futures to equitize cash positions. Since these derivatives are designed to track a respective stock index, there was no discernable impact to the Fund’s relative performance in 2016.
Period & Average Annual Total Returns as of
December 31, 2016 (Unaudited)
| | 1 Year | 3 Year | 5 Year | 10 Year | Inception Date |
| Quantex Fund Retail Class | 22.14% | 7.28% | 15.36% | 8.53% | 3/20/85 |
Expense Ratios+: Audited Net 1.18% Gross 1.75% |
Blended Index5 | 21.07% | 7.93% | 14.93% | 8.15% | 3/31/85 |
| Russell 2000 Index | 21.31% | 6.74% | 14.46% | 7.07% | 3/31/85 |
| S&P MidCap 400 Index | 20.74% | 9.04% | 15.33% | 9.16% | 3/31/85 |
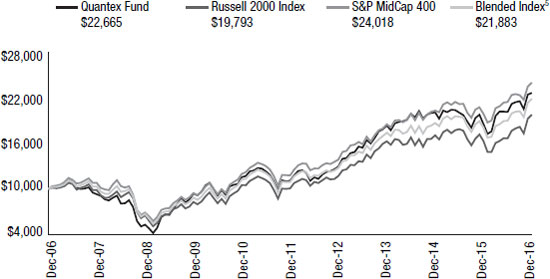
Growth of $10,000: 12/31/06 - 12/31/16
The Growth of $10,000 chart compares the value of the Quantex Fund to the S&P MidCap 400 Index and the Russell 2000 Index, the Fund’s broad-based benchmarks, and to the Blended Index, which consists of 50% of the Russell 2000 Index and 50% of the S&P MidCap 400 Index. The chart is intended to give you a general idea of how the Fund performed compared to these benchmarks over the period from December 31, 2006 to December 31, 2016. An understanding of the differences between the Fund and these indices is important. The benchmark indices do not take into account the deduction of expenses associated with a mutual fund, such as investment management and accounting fees. One cannot invest directly in an index.
The chart and the table do not reflect the deduction of taxes that a shareholder would pay on Fund distributions or the redemption of Fund shares. The performance data shown represents past performance, which does not guarantee future results. The investment return and principal value of an investment will fluctuate so that an investor’s shares, when redeemed, may be worth more or less than their original cost. Current performance may be lower or higher than the performance data quoted.
Sector Concentration
| Consumer Discretionary | 21.1% |
| Industrials | 16.3% |
| Energy | 10.1% |
| Financials | 9.8% |
| Information Technology | 9.2% |
| Materials | 5.0% |
| Utilities | 3.6% |
| Real Estate Investment Trust | 3.2% |
| Healthcare | 2.9% |
| Consumer Staples | 1.2% |
| Telecommunication Services | 0.5% |
| Money Market Registered Investment Companies | 19.2% |
| Bank Obligations | 0.9% |
| Other Assets/Liabilities (Net) | (3.0%) |
| Total | 100.0% |
As a percentage of total net assets. Concentrations are subject to change. The Fund has invested in stock index futures contracts in order to equitize cash balances held in the Fund.
Top 10 Holdings
as of December 31, 2016
| 1. | ONEOK, Inc. | 1.2% |
| 2. | International Bancshares Corp. | 1.2% |
| 3. | Quanta Services, Inc. | 1.1% |
| 4. | Greif, Inc. Class A | 1.1% |
| 5. | Comerica, Inc. | 1.1% |
| 6, | Kennametal, Inc. | 1.1% |
| 7. | MSA Safety, Inc. | 1.0% |
| 8. | Commercial Metals Co. | 1.0% |
| 9. | Zions Bancorp | 1.0% |
| 10. | Sothebys Class A | 1.0% |
As a percentage of total net assets.
Effective October 31, 2016, the Fund offered retail, adviser, and institutional share classes. Period and average annual total returns, expense ratios, and the growth of $10,000 chart only include the retail class of shares. For additional information regarding multiple classes of shares, see Note #1 in the Notes to Financial Statements.
The Adviser has contractually agreed to reduce its management fee by 0.25%. This agreement may be terminated by the Adviser on October 31, 2017. + The Audited Net Expense Ratio is based on average daily net assets and reflects actual expenses of the Fund paid over the one year period ended 12/31/16, including the effect of expense waivers and reimbursements. This ratio may increase or decrease depending on fluctuations in Fund net assets. The Gross Expense Ratio is a percentage of the Fund’s average daily net assets as shown in the most current Fund Prospectus. Please see additional disclosures on page 25.
| Page 14 | 2016 Annual Report | December 31, 2016 |
Infrastructure Fund
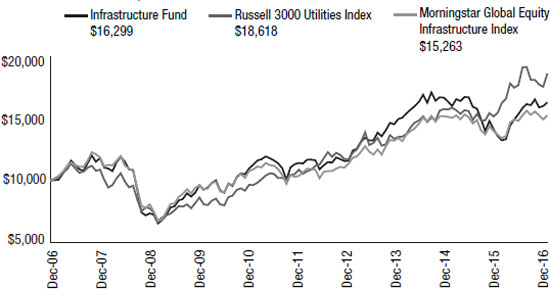
The Meeder Infrastructure Fund retail class was positive 19.87% for the year ending December 31, 2016, relative to the Russell 3000 Utilities Index return of 20.49%. Infrastructure was a topic of many headlines in 2016 as both U.S. Presidential candidates proposed massive spending packages to overhaul the country’s aging grid in the coming years.
Early in 2016 energy prices plummeted yet we saw strength in natural gas stocks. We remained committed to our energy stocks as oil prices rebounded. At the end of June, Brexit fears caused a temporary dislocation in many companies domiciled in the United Kingdom. We took advantage of this by increasing exposure in companies that provide basic resources like water, electricity, and telecom services. Individual stock selection contributed to the Fund’s performance in 2016. The holdings that were the largest contributors in the portfolio were Targa Resources Corp., MDU Resource Group and Spectra Energy. The top detractors from performance include Energy Transfer Equity, National Grid and Veolia Environnement.
Effective September 15, 2016, Miller/Howard Investment, Inc. resigned as subadvisor of the Miller/Howard Infrastructure Fund and the Fund was renamed Meeder Infrastructure Fund. While the Meeder Investment Team has always been the advisor on the Fund, they have taken over the day-to-day management of the Infrastructure Fund with the same investment objective.
We utilized equity index derivatives in the Fund, such as stock index futures to equitize cash positions. Since these derivatives are designed to track a respective stock index, there was no discernable impact to the Fund’s relative performance in 2016.
Period & Average Annual Total Returns as of
December 31, 2016 (Unaudited)
| | 1 Year | 3 Year | 5 Year | 10 Year | Inception Date |
| Infrastructure Fund | | | | | |
| Retail Class | 19.87% | 2.91% | 7.37% | 5.01% | 6/21/95 |
Expense Ratios+: Audited Net 2.15% Gross 2.01% | | | |
| Russell 3000 Utilities Index | 20.49% | 11.26% | 11.34% | 6.41% | 6/30/95 |
| Morningstar Global Equity Infrastructure Index | 11.48% | 4.34% | 8.01% | 4.32% | 6/30/95 |
Sector Concentration
| Telecommunication Services | 28.6% |
| Utility Services | 19.8% |
| Natural Gas Distribution | 16.5% |
| Pipelines | 15.1% |
| Electric Utility | 7.9% |
| Water Utility | 2.5% |
| Money Market Registered Investment Companies | 9.1% |
| Other Assets/Liabilities (Net) | 0.5% |
| Total | 100.0% |
As a percentage of total net assets. Concentrations are subject to change. The Fund has invested in stock index futures contracts in order to equitize cash balances held in the Fund.
Top 10 Holdings
as of December 31, 2016
| 1. | Targa Resources Corp. | 5.2% |
| 2. | Qualcomm, Inc. | 5.0% |
| 3. | OGE Energy Corp. | 4.1% |
| 4. | Macquarie Infrastructure Corp. | 4.0% |
| 5. | FedEx Corp. | 4.0% |
| 6, | National Grid PLC ADR | 3.6% |
| 7. | United Parcel Service, Inc. Class B | 3.5% |
| 8. | Corning, Inc. | 3.3% |
| 9. | Enterprise Products Partners LP | 3.2% |
| 10. | AT&T, Inc. | 3.1% |
As a percentage of total net assets.
| 2016 Annual Report | December 31, 2016 | Page 15 |
Growth of $10,000: 12/31/06 - 12/31/16
The Growth of $10,000 chart compares the Infrastructure Fund’s value to the Russell 3000 Utilities Index and Morningstar Global Equity Infrastructure Index, the Fund’s broad-based benchmarks. The chart is intended to give you a general idea of how the Fund performed compared to these benchmarks over the period from December 31, 2006 to December 31, 2016. An understanding of the differences between the Fund and these indices is important. The benchmark indices are hypothetical unmanaged indices of common stocks that do not take into account the deduction of expenses associated with a mutual fund, such as investment management and accounting fees. One cannot invest directly in an index.
The chart and the table do not reflect the deduction of taxes that a shareholder would pay on Fund distributions or the redemption of Fund shares. The performance data shown represents past performance, which does not guarantee future results. The investment return and principal value of an investment will fluctuate so that an investor’s shares, when redeemed, may be worth more or less than their original cost. Current performance may be lower or higher than the performance data quoted.
Effective October 31, 2016, the Fund offered retail, adviser, and institutional share classes. Period and average annual total returns, expense ratios, and the growth of $10,000 chart only include the retail class of shares. For additional information regarding multiple classes of shares, see Note #1 in the Notes to Financial Statements.
Management fees and/or expenses were voluntarily waived and/or reimbursed in order to reduce the operating expenses of the Infrastructure Fund during certain periods shown above. + The Audited Net Expense Ratio is based on average daily net assets and reflects actual expenses of the Fund paid over the one year period ended 12/31/16, including the effect of expense waivers and reimbursements. This ratio may increase or decrease depending on fluctuations in Fund net assets. The Gross Expense Ratio is a percentage of the Fund’s average daily net assets, including acquired fund fees and expenses, as shown in the most current Fund Prospectus. Please see additional disclosures on page 25.
| Page 16 | 2016 Annual Report | December 31, 2016 |
Dividend Opportunities Fund
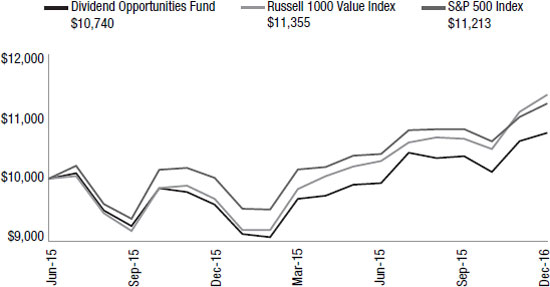
The Dividend Opportunities Fund retail class returned 12.06% for year ending December 31, 2016. The Russell 1000 Value Index returned 17.34% compared to the S&P 500 Index which returned 11.96% in 2016. An overweight to the Materials and Information Technology sectors contributed to performance while an underweight in the Energy sector detracted from the Fund’s performance. Some of the top contributors to the Fund in 2016 were Quad /Graphics, Computer Sciences Corp. and Mentor Graphics Corp. Some of the holdings that were the largest detractors from performance were Abercrombie & Fitch, and underweights to Citigroup and J.P. Morgan Chase relative to the benchmark.
With the exception of late in the first quarter, we held a tactical position in international securities until the end of 2016. In the wake of the U.S. election results, momentum and currency factors in our international model evolved to favor domestic exposure, and as a result we eliminated our tactical international exposure at the end of November. Overall, our international exposure detracted from performance relative to the S&P 500 Index.
We utilized equity index derivatives in the Fund, such as stock index futures to equitize cash positions. Since these derivatives are designed to track a respective stock index, there was no discernable impact to the Fund’s relative performance in 2016.
Period & Average Annual Total Returns as of
December 31, 2016 (Unaudited)
| | 1 Year | Since Inception | Inception Date |
| Dividend Opportunities Fund Retail Class | 12.06% | 4.88% | 6/30/15 |
Expense Ratios+: Audited Net 1.26% Gross 1.85% | | | |
| Russell 1000 Value Index | 17.34% | 8.80% | 6/30/15 |
| S&P 500 Index | 11.96% | 7.90% | 6/30/15 |
Growth of $10,000: 6/30/15 - 12/31/16
The Growth of $10,000 chart compares the Dividend Opportunities Fund’s value to the Russell 1000 Value Index and the S&P 500 Index, the Fund’s broad-based benchmarks. The chart is intended to give you a general idea of how the Fund performed compared to these benchmarks over the period from June 30, 2015 to December 31, 2016. An understanding of the differences between the Fund and these indices is important. The benchmark indices are hypothetical unmanaged indices of common stocks that do not take into account the deduction of expenses associated with a mutual fund, such as investment management and accounting fees. One cannot invest directly in an index.
The chart and the table do not reflect the deduction of taxes that a shareholder would pay on Fund distributions or the redemption of Fund shares. The performance data shown represents past performance, which does not guarantee future results. The investment return and principal value of an investment will fluctuate so that an investor’s shares, when redeemed, may be worth more or less than their original cost. Current performance may be lower or higher than the performance data quoted.
Sector Concentration
as of December 31, 2016
| Financials | 19.7% |
| Information Technology | 15.0% |
| Healthcare | 9.0% |
| Industrials | 8.6% |
| Consumer Discretionary | 6.5% |
| Energy | 6.2% |
| Utilities | 6.0% |
| Consumer Staples | 5.8% |
| Materials | 5.5% |
| Real Estate Investment Trust | 3.3% |
| Telecommunication Services | 2.2% |
| Money Market Registered Investment Companies | 9.6% |
| Bank Obligations | 0.4% |
| Other Assets/Liabilities (Net) | 2.2% |
| Total | 100.0% |
As a percentage of total net assets. Concentrations are subject to change. The Fund has invested in stock index futures contracts in order to equitize cash balances held in the Fund.
Top 10 Holdings
as of December 31, 2016
| 1. | Johnson & Johnson | 2.8% |
| 2. | Bank of America Corporation | 2.5% |
| 3. | Intel Corp. | 2.0% |
| 4. | Philip Morris International, Inc. | 1.7% |
| 5. | Merck & Co., Inc. | 1.6% |
| 6, | Verizon Communications, Inc. | 1.6% |
| 7. | Wal-Mart Stores, Inc. | 1.5% |
| 8. | Oracle Corp. | 1.4% |
| 9. | Qualcomm, Inc. | 1.3% |
| 10. | Morgan Stanley | 1.2% |
As a percentage of total net assets.
Effective October 31, 2016, the Fund offered retail, adviser, and institutional share classes. Period and average annual total returns, expense ratios, and the growth of $10,000 chart only include the retail class of shares. For additional information regarding multiple classes of shares, see Note #1 in the Notes to Financial Statements.
Management fees and/or expenses were voluntarily waived and/or reimbursed in order to reduce the operating expenses of the Dividend Opportunities Fund during certain periods shown above. + The Audited Net Expense Ratio is annualized and is based on average daily net assets and reflects actual expenses of the Fund paid over the one year period ended 12/31/16, including the effect of expense waivers and reimbursements. This ratio may increase or decrease depending on fluctuations in Fund net assets. The Gross Expense Ratio is a percentage of the Fund’s average daily net assets, including acquired fund fees and expenses, as shown in the most current Fund Prospectus. Please see additional disclosures on page 25.
| 2016 Annual Report | December 31, 2016 | Page 17 |
Total Return Bond Fund
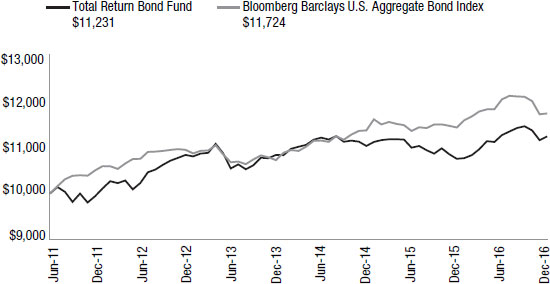
The Meeder Total Return Bond Fund retail class rose 4.49% in 2016. The Fund’s benchmark, the Bloomberg Barclay’s U.S. Aggregate Bond Index returned 2.65%. The past year contained a number of unexpected turns and twists. As the year began, the Fed initially projected that they might implement as many as four increases in the federal funds overnight lending rate. An unexpected slowdown in China’s economy increased market volatility and oil dropped to just $26 a barrel. Several European countries implemented negative interest rates to try and stimulate demand for risk assets. This caused investors to flock to the safety of U.S. Treasuries. As oil prices stabilized, breadth improved in the market place. At the end of June, the United Kingdom voted to leave the European Union, also known as Brexit. Prior to this, our credit model favored risk-off sectors. As a result we positioned the fund to be more defensive by increasing our allocations to U.S. Treasuries and the portfolio benefitted from this tactical shift.
In the second half of the year, markets showed resilience. Less than two weeks into the third quarter markets rose above pre-Brexit levels, and our models identified improvement in risk-on sectors due to short-term momentum and spread factors. We implemented this view by increasing our below-investment-grade bonds above 30% and allocating 17% to Emerging Market debt. Our duration model continued to favor holding longer-dated U.S. Treasuries. Early in November, we saw signs of deterioration in our fixed income Emerging Market model, as it started to favor domestic positions. By the end of the year, we gradually reduced our holdings in Emerging Market debt to approximately 10%. This reduction was reallocated to investment-grade securities which totaled 46% by the end of 2016, while below investment-grade holdings remained consistent near 32%. The remaining 12% was allocated among U.S. Treasuries. The U.S. Dollar reached its highest level since 2003 during the fourth quarter. The Fed pulled the trigger in what was a highly anticipated and widely expected move of raising the overnight lending rate by 0.25% to the range of 0.50% - 0.75%. It was only the second time that the Federal Open Market Committee has increased the overnight lending rate since June 2006.
While the future always brings a level of uncertainty, we anticipate that the Federal Reserve and the new U.S. Presidential administration will provide many news headlines in 2017. Regardless of what occurs, know that we will continue to follow our time-tested models and apply our disciplined investment process to the management of our investment portfolios.
Period & Average Annual Total Returns as of
December 31, 2016 (Unaudited)
| | 1 Year | 3 Year | 5 Year | Since Inception | Inception Date |
| Total Return Bond | | | | | |
| Fund Retail Class | 4.49% | 1.21% | 2.47% | 2.13% | 6/30/11 |
Expense Ratios+: Audited Net 0.88% Gross 1.76% | | | |
| Bloomberg Barclays U.S. Aggregate Bond Index | 2.65% | 3.03% | 2.23% | 2.93% | 6/30/11 |
Sector Concentration
as of December 31, 2016
| Registered Investment Companies | 96.9% |
| Money Market Registered Investment Companies | 2.9% |
| Bank Obligations | 0.3% |
| Other Assets/Liabilities (Net) | (0.1%) |
| Total | 100.0% |
As a percentage of total net assets. Concentrations are subject to change. The Fund primarily invests in underlying mutual funds. The sector concentration percentages are reflected on a “look through” basis.
Top 10 Holdings
as of December 31, 2016
| 1. | iShares iBoxx $ High Yield Corporate Bond ETF | 15.6% |
| 2. | iShares Core US Aggregate Bond ETF | 6.4% |
| 3. | Lord Abbett High Yield Fund - I | 5.8% |
| 4. | iShares JPMorgan USD Emerging Markets Bond ETF | 5.6% |
| 5. | iShares 7-10 Year Treasury Bond ETF | 5.5% |
| 6, | SPDR® Bloomberg Barclays High Yield Bond ETF | 5.3% |
| 7. | Prudential Total Return Bond Fund - Z | 5.2% |
| 8. | Metropolitan West Total Return Bond Fund - I | 5.1% |
| 9. | iShares 3-7 Year Treasury Bond ETF | 4.9% |
| 10. | TCW Emerging Markets Income Fund - I | 4.7% |
As a percentage of total net assets.
| Page 18 | 2016 Annual Report | December 31, 2016 |
Growth of $10,000: 6/30/11 - 12/31/16
The Growth of $10,000 chart compares the Total Return Bond Fund’s value to the Bloomberg Barclays U.S. Aggregate Bond Index, the Fund’s broad-based benchmark. The chart is intended to give you a general idea of how the Fund performed compared to this benchmark over the period from June 30, 2011 to December 31, 2016. An understanding of the differences between the Fund and this index is important. The index is a hypothetical unmanaged index that does not take into account the deduction of expenses associated with a mutual fund, such as investment management and accounting fees. One cannot invest directly in an index.
The chart and the table do not reflect the deduction of taxes that a shareholder would pay on Fund distributions or the redemption of Fund shares. The performance data shown represents past performance, which does not guarantee future results. The investment return and principal value of an investment will fluctuate so that an investor’s shares, when redeemed, may be worth more or less than their original cost. Current performance may be lower or higher than the performance data quoted.
Effective October 31, 2016, the Fund offered retail, adviser, and institutional share classes. Period and average annual total returns, expense ratios, and the growth of $10,000 chart only include the retail class of shares. For additional information regarding multiple classes of shares, see Note #1 in the Notes to Financial Statements.
Management fees and/or expenses were voluntarily waived and/or reimbursed in order to reduce the operating expenses of the Total Return Bond Fund during certain periods shown above. + The Audited Net Expense Ratio is based on average daily net assets and reflects actual expenses of the Fund paid over the one year period ended 12/31/16, including the effect of expense waivers and reimbursements. This ratio may increase or decrease depending on fluctuations in Fund net assets. The Gross Expense Ratio is a percentage of the Fund’s average daily net assets, including acquired fund fees and expenses, as shown in the most current Fund Prospectus. Please see additional disclosures on page 25.
| 2016 Annual Report | December 31, 2016 | Page 19 |
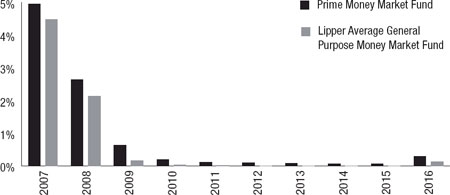
Prime Money Market Fund
The Money Market Fund industry went through a few rigorous but exciting changes in 2016. Over the last couple of years the industry has been hard at work retooling in the face of new regulatory requirements introduced by the U.S. Securities and Exchange Commission (SEC) in 2014. The final compliance date was in October 2016. The new rules were added in order to supplement the objective of safety among money market funds. In addition to changes in the industry, Meeder took the opportunity to bolster its money market lineup. As of October 2016, Meeder began offering two separate money market fund products. The Meeder Prime Money Market Fund, like its predecessor, is a constant net asset value (CNAV) fund offered only to natural persons. The objective of this fund is to maintain a CNAV at $1.00 per share.
Beyond regulatory reform, the Fund enjoyed the presence of elevated yields across investment offerings. This was brought about in late 2015 when the Federal Open Market Committee (FOMC) initially raised its target short-term interest rate by 25 basis points. This was the first increase in several years which was welcomed by the industry after years of near zero yield investment options. In 2016, the talk of elevating the target rate even higher gave our managers the ability to bring additional value to the portfolios. In December, the FOMC responded with a second interest rate increase signaling comfort with improving growth prospects of the U.S. economy. In addition to its action, the FOMC alluded to further action if conditions continue to improve. This again provided our managers with an environment ample with opportunities to add value to the portfolio.
Despite the change in monetary policy, there was not a significant change with the Fund’s investment strategy. Historically, the Fund has maintained ample liquidity in an effort to provide safety first. The liquidity has also been a solid tool for taking advantage of investment opportunities when they arise. With elevated interest rates throughout 2016, the portfolio management team was afforded an expanded array of investment options with which to add value for shareholders.
During the year the portfolio management team targeted a stable weighted average maturity. At this time we believe the FOMC is potentially pushing ahead with more interest rate increases. However, we anticipate the path and timeline to be more drawn out versus historical interest rate cycles. Our sector allocation favored an overweight in high-quality liquid investments. Although with the boost in interest rates, opportunities were abundant to replenish our position in short-term investment grade corporate debt without adding undo risk.
As we completed 2016, our belief was that the Fund should be positioned to maintain strong performance into 2017. In the event additional interest rate increases are triggered by the FOMC, we believe the portfolio is positioned to perform in this environment. As we continuously monitor the markets and our strategy, we will remain vigilant and act in the best interests of our shareholders.
Period & Average Annual Total Returns as of
December 31, 2016 (Unaudited)
| | 1 Year | 3 Year | 5 Year | 10 Year | Inception Date |
| Meeder Prime Money Market Fund | 0.29% | 0.14% | 0.12% | 0.90% | 3/27/85 |
Expense Ratios+: Audited Net 0.32% Gross 0.58% | | | |
| 7-day Current Yield: 0.42% | | | | | |
| Lipper Average General Purpose Money Market Fund | 0.13% | 0.05% | 0.04% | 0.75% | 3/27/85 |
Annual Returns: 2007 - 2016
Sector Concentration
as of December 31, 2016
| Commercial Paper | 37.2% |
| Money Market Registered Investment Companies | 34.1% |
| Repurchase Agreements | 19.1% |
| U.S. Government Agency Obligations | 4.4% |
| Certificates of Deposit | 3.3% |
| Corporate Obligations | 1.5% |
Other Assets/Liabilities (Net) | 0.4% |
| Total | 100.0% |
As a percentage of total net assets. Concentrations are subject to change.
Top 10 Holdings
as of December 31, 2016
| 1. | Fidelity Prime Institutional Money Market Portfolio, 0.83% | 31.3% |
| 2. | Int'l FCStone Repo, 0.62%, 1/3/2017 | 19.1% |
| 3. | Natixis SA/New York, NY, 1.31%, 6/30/2017 | 2.8% |
| 4. | BNP Paribas SA/New York, NY, 0.75%, 2/1/2017 | 2.7% |
| 5. | Morgan Stanley Government Institutional Fund, 0.44% | 2.7% |
| 6. | JP Morgan Securities LLC, 0.67%, 1/10/2017 | 1.4% |
| 7. | JP Morgan Securities LLC, 0.75%, 1/27/2017 | 1.4% |
| 8. | Canadian Imperial Holdings, Inc., 0.77%, 2/3/2017 | 1.4% |
| 9. | Swedbank AB, 0.92%, 2/16/2017 | 1.4% |
| 10. | Credit Suisse AG/New York, NY, 1.25%, 4/17/2017 | 1.4% |
As a percentage of total net assets.
Management fees and/or expenses were voluntarily waived and/or reimbursed in order to reduce the operating expenses of the Prime Money Market Fund during certain periods shown above. Investments in the Prime Money Market Fund are neither insured nor guaranteed by the Federal Deposit Insurance Corporation or any other governmental agency. Although the Fund seeks to preserve the value of your investment at $1.00 per share, it is possible to lose money by investing in the Prime Money Market Fund. + The Audited Net Expense Ratio is based on average daily net assets and reflects actual expenses of the Fund paid over the one year period ended 12/31/16, including the effect of expense waivers and reimbursements. This ratio may increase or decrease depending on fluctuations in Fund net assets. The Gross Expense Ratio is a percentage of the Fund’s average daily net assets as shown in the most current Fund Prospectus. Please see additional disclosures on page 25.
| Page 20 | 2016 Annual Report | December 31, 2016 |
Institutional Prime Money Market Fund
The Money Market Fund industry went through a few rigorous but exciting changes in 2016. Over the last couple of years the industry has been hard at work retooling in the face of new regulatory requirements introduced by the U.S. Securities and Exchange Commission (SEC) in 2014. The final compliance date was in October 2016. The new rules were added in order to supplement the objective of safety among money market funds. In addition to changes in the industry, Meeder took the opportunity to bolster its money market lineup. As of October 2016, Meeder began offering two separate money market fund products. The Meeder Institutional Prime Money Market Fund is a new fund which offers a floating net asset value (FNAV). A FNAV fund is characterized by a net asset value which could float above or below $1.00 per share.
Beyond regulatory reform, the Fund enjoyed the presence of elevated yields across investment offerings. This was brought about in late 2015 when the Federal Open Market Committee (FOMC) initially raised its target short-term interest rate by 25 basis points. This was the first increase in several years which was welcomed by the industry after years of near zero yield investment options. In 2016, the talk of elevating the target rate even higher gave our managers the ability to bring additional value to the portfolios. In December, the FOMC responded with a second interest rate increase signaling comfort with improving growth prospects of the U.S. economy. In addition to its action, the FOMC alluded to further action if conditions continue to improve. This again provided our managers with an environment ample with opportunities to add value to the portfolio.
Despite the change in monetary policy, there was not a significant change with the Fund’s investment strategy. Historically, the Fund has maintained ample liquidity in an effort to provide safety first. The liquidity has also been a solid tool for taking advantage of investment opportunities when they arise. With elevated interest rates throughout 2016, the portfolio management team was afforded an expanded array of investment options with which to add value for shareholders.
During the year the portfolio management team targeted a stable weighted average maturity. At this time we believe the FOMC is potentially pushing ahead with more interest rate increases. However, we anticipate the path and timeline to be more drawn out versus historical interest rate cycles. Our sector allocation favored an overweight in high-quality liquid investments. Although with the boost in interest rates, opportunities were abundant to replenish our position in short-term investment grade corporate debt without adding undo risk.
As we completed 2016, our belief was that the Fund should be positioned to maintain strong performance into 2017. In the event additional interest rate increases are triggered by the FOMC, we believe the portfolio is positioned to perform in this environment. As we continuously monitor the markets and our strategy, we will remain vigilant and act in the best interests of our shareholders.
Period & Average Annual Total Returns as of
December 31, 2016 (Unaudited)
| | 1 Year | 3 Year | 5 Year | 10 Year | Inception Date |
| Meeder Institutional Prime Money Market Fund | 0.38% | 0.20% | 0.18% | 0.99% | 10/7/16 |
Expense Ratios+: Audited Net 0.24% Gross 0.90% | | | |
| 7-day Current Yield: 0.64% | | | | | |
| Lipper Average General Purpose Money Market Fund | 0.13% | 0.05% | 0.04% | 0.75% | 10/7/16 |
Sector Concentration
as of December 31, 2016
| Money Market Registered Investment Companies | 46.3% |
| Commercial Paper | 36.7% |
| Repurchase Agreements | 9.6% |
| Certificates of Deposit | 3.4% |
| U.S. Government Agency Obligations | 2.9% |
| Corporate Obligations | 0.9% |
| Other Assets/Liabilities (Net) | 0.2% |
| Total | 100.0% |
As a percentage of total net assets. Concentrations are subject to change.
Top 10 Holdings
as of December 31, 2016
| 1. | Fidelity Prime Institutional Money Market Portfolio, 0.83% | 45.6% |
| 2. | Int'l FCStone Repo, 0.62%, 1/3/2017 | 9.6% |
| 3. | Prudential Funding, 0.50%, 1/3/2017 | 2.5% |
| 4. | Natixis SA/New York, NY, 0.68%, 1/3/2017 | 2.5% |
| 5. | Canadian Imperial Holdings, Inc., 0.77%, 2/3/2017 | 2.3% |
| 6. | BNP Paribas SA/New York, NY, 0.75%, 2/1/2017 | 1.6% |
| 7. | Bank of Tokyo-Mitsubishi UFJ, Ltd./New York, NY, 1.37%, 9/15/2017 | 1.5% |
| 8. | Abbey National Treasury Services PLC/Stamford, CT, 1.05%, 4/24/2017 | 1.3% |
| 9. | Bank of Tokyo-Mitsubishi UFJ, Ltd./New York, NY, 0.78%, 2/28/2017 | 1.0% |
| 10. | Credit Agricole Corporate and Investment Bank/New York, 1.24%, 6/21/2017 | 1.0% |
As a percentage of total net assets.
| 2016 Annual Report | December 31, 2016 | Page 21 |
Annual Returns: 2007 - 2016
The Fund’s performance prior to October 7, 2016 reflects the performance of the Meeder Money Market Fund, a predecessor fund managed equivalently to the Institutional Prime Money Market Fund.
Effective October 7, 2016, the Institutional Prime Money Market Fund was launched as a result of money market fund reform. Performance reflected in the chart and table includes the historical performance of the Institutional Class of the Meeder Money Market Fund. The Meeder Money Market Fund became a retail money market fund effective October 7, 2016, of which institutional shareholders can no longer invest.
Management fees and/or expenses were voluntarily waived and/or reimbursed in order to reduce the operating expenses of the Institutional Prime Money Market Fund during certain periods shown above. Investments in the Institutional Prime Money Market Fund are neither insured nor guaranteed by the Federal Deposit Insurance Corporation or any other governmental agency. It is possible to lose money by investing in the Institutional Prime Money Market Fund. + The Audited Net Expense Ratio is based on average daily net assets and reflects actual expenses of the Fund paid over the period from October 7, 2016 through December 31, 2016, including the effect of expense waivers and reimbursements. This ratio may increase or decrease depending on fluctuations in Fund net assets. The Gross Expense Ratio is a percentage of the Fund’s average daily net assets as shown in the most current Fund Prospectus. Please see additional disclosures on page 25.
| Page 22 | 2016 Annual Report | December 31, 2016 |
Shareholder Expense Analysis (Unaudited)
Shareholders of mutual funds pay ongoing expenses, such as advisory fees, distribution and service fees (12b-1 fees) and other fund expenses. The following examples are intended to help you understand your ongoing costs (in dollars) of investing in the Funds and to compare these costs with the ongoing costs of investing in other mutual funds.
The examples below are based on an investment of $1,000 invested at the beginning of the period and held for the six-month period from June 30, 2016 to December 31, 2016.
ACTUAL EXPENSES: You may use actual account values and actual expenses, along with the amount you invested, to estimate the expenses that you paid over the period. Simply divide your account value by $1,000 (e.g.: an $8,600 account value divided by $1,000 = 8.6), then multiply the result by the number in the line under the heading “Expenses Paid During the Period” to estimate the expenses you paid on your account during this period.
HYPOTHETICAL EXAMPLE FOR COMPARISON PURPOSES: Hypothetical account values and hypothetical expenses are based on the Funds’ actual expense ratios and assume rates of return of 5% per year before expenses, which are not the Funds’ actual returns. The hypothetical account values and expenses may not be used to estimate the actual ending account balance or expenses you paid for the period. You may use this information to compare the ongoing costs of investing in the Funds to other funds. To do so, compare this 5% hypothetical example with the 5% hypothetical examples that appear in the shareholder reports of the other funds.
| | | | | Beginning Account Value (6/30/16) | | | Ending Account Value (12/31/16) | | | Expenses Paid During Period1 (6/30/16 - 12/31/16) | | | Expense Ratio2 (Annualized) |
| Muirfield Fund - Retail Class | | Actual | | | $1,000.00 | | | | $1,058.90 | | | | $7.09 | | | | 1.37 | % |
| | Hypothetical | | | 1,000.00 | | | | 1,018.25 | | | | 6.95 | | | | 1.37 | % |
| Infrastructure Fund - Retail Class | | Actual | | | 1,000.00 | | | | 1,028.70 | | | | 11.17 | | | | 2.19 | % |
| | Hypothetical | | | 1,000.00 | | | | 1,014.13 | | | | 11.09 | | | | 2.19 | % |
| Quantex Fund - Retail Class | | Actual | | | 1,000.00 | | | | 1,124.50 | | | | 8.01 | | | | 1.50 | % |
| | Hypothetical | | | 1,000.00 | | | | 1,017.60 | | | | 7.61 | | | | 1.50 | % |
| Dynamic Growth Fund - Retail Class | | Actual | | | 1,000.00 | | | | 1,059.40 | | | | 7.51 | | | | 1.45 | % |
| | Hypothetical | | | 1,000.00 | | | | 1,017.85 | | | | 7.35 | | | | 1.45 | % |
| Aggressive Growth Fund - Retail Class | | Actual | | | 1,000.00 | | | | 1,095.10 | | | | 8.48 | | | | 1.61 | % |
| | Hypothetical | | | 1,000.00 | | | | 1,017.04 | | | | 8.16 | | | | 1.61 | % |
| Balanced Fund - Retail Class | | Actual | | | 1,000.00 | | | | 1,036.40 | | | | 7.47 | | | | 1.46 | % |
| | Hypothetical | | | 1,000.00 | | | | 1,017.80 | | | | 7.41 | | | | 1.46 | % |
| Global Opportunities Fund - Retail Class | | Actual | | | 1,000.00 | | | | 1,047.70 | | | | 7.41 | | | | 1.44 | % |
| | Hypothetical | | | 1,000.00 | | | | 1,017.90 | | | | 7.30 | | | | 1.44 | % |
| Spectrum Fund - Retail Class | | Actual | | | 1,000.00 | | | | 1,070.80 | | | | 10.62 | | | | 2.04 | % |
| | Hypothetical | | | 1,000.00 | | | | 1,014.88 | | | | 10.33 | | | | 2.04 | % |
| Dividend Opportunities Fund - Retail Class | | Actual | | | 1,000.00 | | | | 1,081.60 | | | | 8.48 | | | | 1.62 | % |
| | Hypothetical | | | 1,000.00 | | | | 1,016.99 | | | | 8.21 | | | | 1.62 | % |
| Total Return Bond Fund - Retail Class | | Actual | | | 1,000.00 | | | | 997.50 | | | | 4.87 | | | | 0.97 | % |
| | Hypothetical | | | 1,000.00 | | | | 1,020.26 | | | | 4.93 | | | | 0.97 | % |
| Prime Money Market Fund | | Actual | | | 1,000.00 | | | | 1,001.50 | | | | 1.96 | | | | 0.39 | % |
| | Hypothetical | | | 1,000.00 | | | | 1,024.18 | | | | 1.98 | | | | 0.39 | % |
| Institutional Prime Money Market Fund | | Actual | | | 1,000.00 | | | | 1,002.10 | | | | 1.21 | | | | 0.24 | % |
| | Hypothetical | | | 1,000.00 | | | | 1,023.93 | | | | 1.22 | | | | 0.24 | % |
| Muirfield Fund - Adviser Class | | Actual | | | 1,000.00 | | | | 1,060.20 | | | | 5.33 | | | | 1.03 | % |
| | Hypothetical | | | 1,000.00 | | | | 1,019.96 | | | | 5.23 | | | | 1.03 | % |
| Infrastructure Fund - Adviser Class | | Actual | | | 1,000.00 | | | | 1,029.50 | | | | 13.16 | | | | 2.58 | % |
| | Hypothetical | | | 1,000.00 | | | | 1,012.17 | | | | 13.05 | | | | 2.58 | % |
| Quantex Fund - Adviser Class | | Actual | | | 1,000.00 | | | | 1,125.30 | | | | 8.60 | | | | 1.61 | % |
| | Hypothetical | | | 1,000.00 | | | | 1,017.04 | | | | 8.16 | | | | 1.61 | % |
| 2016 Annual Report | December 31, 2016 | Page 23 |
| | | | | Beginning Account Value (6/30/16) | | | Ending Account Value (12/31/16) | | | Expenses Paid During Period1 (6/30/16 - 12/31/16) | | | Expense Ratio2 (Annualized) |
| Dynamic Growth Fund - Adviser Class | | Actual | | | 1,000.00 | | | | 1,060.60 | | | | 6.73 | | | | 1.30 | % |
| | Hypothetical | | | 1,000.00 | | | | 1,018.60 | | | | 6.60 | | | | 1.30 | % |
| Aggressive Growth Fund - Adviser Class | | Actual | | | 1,000.00 | | | | 1,096.50 | | | | 7.06 | | | | 1.34 | % |
| | Hypothetical | | | 1,000.00 | | | | 1,018.40 | | | | 6.80 | | | | 1.34 | % |
| Balanced Fund - Adviser Class | | Actual | | | 1,000.00 | | | | 1,036.50 | | | | 5.68 | | | | 1.11 | % |
| | Hypothetical | | | 1,000.00 | | | | 1,019.56 | | | | 5.63 | | | | 1.11 | % |
| Global Opportunities Fund - Adviser Class | | Actual | | | 1,000.00 | | | | 1,049.00 | | | | 7.06 | | | | 1.37 | % |
| | Hypothetical | | | 1,000.00 | | | | 1,018.25 | | | | 6.95 | | | | 1.37 | % |
| Spectrum Fund - Adviser Class | | Actual | | | 1,000.00 | | | | 1,071.70 | | | | 11.82 | | | | 2.27 | % |
| | Hypothetical | | | 1,000.00 | | | | 1,013.72 | | | | 11.49 | | | | 2.27 | % |
| Dividend Opportunities Fund - Adviser Class | | Actual | | | 1,000.00 | | | | 1,082.40 | | | | 6.65 | | | | 1.27 | % |
| | Hypothetical | | | 1,000.00 | | | | 1,018.75 | | | | 6.44 | | | | 1.27 | % |
| Total Return Bond Fund - Adviser Class | | Actual | | | 1,000.00 | | | | 998.40 | | | | 2.61 | | | | 0.52 | % |
| | Hypothetical | | | 1,000.00 | | | | 1,022.52 | | | | 2.64 | | | | 0.52 | % |
| Muirfield Fund - Institutional Class | | Actual | | | 1,000.00 | | | | 1,060.70 | | | | 5.23 | | | | 1.01 | % |
| | Hypothetical | | | 1,000.00 | | | | 1,020.06 | | | | 5.13 | | | | 1.01 | % |
| Infrastructure Fund - Institutional Class | | Actual | | | 1,000.00 | | | | 1,029.40 | | | | 13.47 | | | | 2.64 | % |
| | Hypothetical | | | 1,000.00 | | | | 1,011.86 | | | | 13.35 | | | | 2.64 | % |
| Quantex Fund - Institutional Class | | Actual | | | 1,000.00 | | | | 1,125.30 | | | | 8.60 | | | | 1.61 | % |
| | Hypothetical | | | 1,000.00 | | | | 1,017.04 | | | | 8.16 | | | | 1.61 | % |
| Dynamic Growth Fund - Institutional Class | | Actual | | | 1,000.00 | | | | 1,059.60 | | | | 6.63 | | | | 1.28 | % |
| | Hypothetical | | | 1,000.00 | | | | 1,018.70 | | | | 6.50 | | | | 1.28 | % |
| Aggressive Growth Fund - Institutional Class | | Actual | | | 1,000.00 | | | | 1,096.20 | | | | 7.17 | | | | 1.36 | % |
| | Hypothetical | | | 1,000.00 | | | | 1,018.30 | | | | 6.90 | | | | 1.36 | % |
| Balanced Fund - Institutional Class | | Actual | | | 1,000.00 | | | | 1,037.10 | | | | 5.79 | | | | 1.13 | % |
| | Hypothetical | | | 1,000.00 | | | | 1,019.46 | | | | 5.74 | | | | 1.13 | % |
| Global Opportunities Fund - Institutional Class | | Actual | | | 1,000.00 | | | | 1,048.90 | | | | 7.16 | | | | 1.39 | % |
| | Hypothetical | | | 1,000.00 | | | | 1,018.15 | | | | 7.05 | | | | 1.39 | % |
| Spectrum Fund - Institutional Class | | Actual | | | 1,000.00 | | | | 1,072.10 | | | | 11.72 | | | | 2.25 | % |
| | Hypothetical | | | 1,000.00 | | | | 1,013.83 | | | | 11.39 | | | | 2.25 | % |
| Dividend Opportunities Fund - Institutional Class | | Actual | | | 1,000.00 | | | | 1,082.40 | | | | 6.96 | | | | 1.33 | % |
| | Hypothetical | | | 1,000.00 | | | | 1,018.45 | | | | 6.75 | | | | 1.33 | % |
| Total Return Bond Fund - Institutional Class | | Actual | | | 1,000.00 | | | | 998.10 | | | | 2.61 | | | | 0.52 | % |
| | Hypothetical | | | 1,000.00 | | | | 1,022.52 | | | | 2.64 | | | | 0.52 | % |
Please note that the expenses shown in the tables are meant to highlight your ongoing costs only and do not reflect any transactional costs, such as redemption fees or exchange fees. Therefore, hypothetical information is useful in comparing ongoing costs only, and will not help you determine the relative total costs of owning different funds. In addition, if any transactional costs were included, your costs would have been higher.
| 1 | Expenses are equal to the Funds’ annualized expense ratios, multiplied by the average account value over the period by 184/366 (to reflect the total number of days in the six-month period). |
| 2 | Does not include the effects of acquired fund fees and expenses. |
| Page 24 | 2016 Annual Report | December 31, 2016 |
Disclosures
Meeder Funds
Investment performance assumes reinvestment of all dividend and capital gain distributions. Returns for less than one year are not annualized. Performance data reflects contractual and voluntary fee waivers, without which performance would have been lower. For the Quantex Fund, the adviser has agreed to waive fees or reimburse expenses until October 15, 2017. The agreement may be terminated annually by the adviser on its renewal date. For additional information, refer to the current prospectus.
Meeder Money Market Funds
You could lose money by investing in the Meeder Money Market Funds. Although the Prime Money Market Fund seeks to preserve the value of your investment at $1.00 per share, it cannot guarantee to do so. The Funds may impose a fee upon sale of your shares or may temporarily suspend your ability to sell shares if the Funds’ liquidity falls below required minimums because of market conditions or other factors. An investment in either Fund is not insured or guaranteed by the Federal Deposit Insurance Corporation or any other government agency. The Funds’ sponsor has no legal obligation to provide financial support to the Funds, and you should not expect that the sponsor will provide financial support to the Funds at any time.
The 7-day Current Yield is the current annualized net yield of the fund if dividends are not reinvested. Current Yield reflects any applicable fee waivers or expense reimbursements. Without such waivers, the yield would have been lower. The 7-day Current Yield more closely reflects the current earnings of the fund than total return.
Fund Benchmarks
Blended Index1 is a custom index comprised of 60% of the S&P 500 Index and 40% of the 90 day Treasury Bill Index.
Blended Index2 is a custom index comprised of 42% of the S&P 500 Index, 30% of Barclays U.S. Aggregate Bond Index and 28% of the average 90-Day Treasury Bill Index.
Blended Index3 is a custom index comprised of 25% of the S&P 500 Index, 20% of the S&P 400 Mid-Cap Index, 15% MSCI Emerging Market Index, 15% of the MSCI EAFE Index, 10% of the Russell 2000 Index, 7.5% of the S&P GSCI Index, and 7.5% Dow Jones U.S. Select REIT Index.
Blended Index4 is a custom index comprised of 34% of the MSCI EAFE Index, 22% of the S&P 500 Index, 12% of the S&P Mid-Cap 400 Index, 11% of the MSCI Emerging Market Index, 7% of the Dow Jones U.S. Select REIT Index, 7% of the Russell 2000 Index and 7% of the S&P GSCI Index.
Blended Index5 consists of 50% Russell 2000 Index and 50% S&P Mid-Cap 400 Index.
| 2016 Annual Report | December 31, 2016 | Page 25 |
2016 Annual Report
Fund Holdings & Financial Statements
Schedule of Investments
December 31, 2016
Muirfield Fund
| Security Description | | Shares or Principal Amount ($) | | | Fair Value ($) | |
| Common Stocks — 71.6% | | | | | | |
| Consumer Discretionary — 6.1% | | | | | | |
Amazon.com, Inc. (2) | | | 4,638 | | | | 3,477,897 | |
| Bed Bath & Beyond, Inc. | | | 8,639 | | | | 351,089 | |
| Best Buy Co., Inc. | | | 22,518 | | | | 960,843 | |
| Bloomin’ Brands, Inc. | | | 3,943 | | | | 71,092 | |
| Brinker International, Inc. | | | 4,870 | | | | 241,211 | |
| CBS Corp. | | | 1,273 | | | | 80,988 | |
| Comcast Corp. | | | 37,427 | | | | 2,584,334 | |
Cooper-Standard Holdings, Inc. (2) | | | 103 | | | | 10,648 | |
| Darden Restaurants, Inc. | | | 924 | | | | 67,193 | |
| Dick’s Sporting Goods, Inc. | | | 6,109 | | | | 324,388 | |
| Domino’s Pizza, Inc. | | | 2,396 | | | | 381,539 | |
| DR Horton, Inc. | | | 27,582 | | | | 753,816 | |
| Ford Motor Co. | | | 41,830 | | | | 507,398 | |
| Gap, Inc./The | | | 16,975 | | | | 380,919 | |
| General Motors Co. | | | 48,063 | | | | 1,674,515 | |
| Goodyear Tire & Rubber Co./The | | | 5,797 | | | | 178,953 | |
| H&R Block, Inc. | | | 2,636 | | | | 60,602 | |
| Harman International Industries, Inc. | | | 916 | | | | 101,823 | |
| Home Depot, Inc./The | | | 13,116 | | | | 1,758,593 | |
| HSN, Inc. | | | 1,659 | | | | 56,904 | |
| ILG, Inc. | | | 18,189 | | | | 330,494 | |
| International Game Technology PLC | | | 9,642 | | | | 246,064 | |
| Kohl’s Corp. | | | 6,815 | | | | 336,525 | |
| Las Vegas Sands Corp. | | | 19,645 | | | | 1,049,239 | |
Liberty Media Corp-Liberty SiriusXM (2) | | | 3,393 | | | | 117,126 | |
Lions Gate Entertainment Corp. (2) | | | 665 | | | | 16,319 | |
| Macy’s, Inc. | | | 21,218 | | | | 759,817 | |
| Marriott International, Inc./MD | | | 1,278 | | | | 105,665 | |
Michael Kors Holdings, Ltd. (2) | | | 11,315 | | | | 486,319 | |
Michaels Cos., Inc./The (2) | | | 9,589 | | | | 196,095 | |
Nordstrom, Inc. (3) | | | 10,391 | | | | 498,041 | |
Priceline Group, Inc./The (2) | | | 643 | | | | 942,677 | |
| PVH Corp. | | | 2,360 | | | | 212,966 | |
| Regal Entertainment Group | | | 6,215 | | | | 128,029 | |
Sally Beauty Holdings, Inc. (2) | | | 791 | | | | 20,898 | |
| Scripps Networks Interactive, Inc. | | | 1,532 | | | | 109,339 | |
| Staples, Inc. | | | 23,342 | | | | 211,245 | |
Tenneco, Inc. (2) | | | 1,726 | | | | 107,823 | |
| Time Warner, Inc. | | | 32,585 | | | | 3,145,429 | |
| Tupperware Brands Corp. | | | 4,142 | | | | 217,952 | |
Urban Outfitters, Inc. (2) | | | 2,176 | | | | 61,972 | |
| Viacom, Inc. | | | 455 | | | | 15,971 | |
| Whirlpool Corp. | | | 2,440 | | | | 443,519 | |
| | | | | | | | 23,784,269 | |
Muirfield Fund
| Security Description | | Shares or Principal Amount ($) | | | Fair Value ($) | |
| Common Stocks — continued | | | | | | |
| Consumer Staples — 6.1% | | | | | | |
| Altria Group, Inc. | | | 57,260 | | | | 3,871,921 | |
| Archer-Daniels-Midland Co. | | | 21,342 | | | | 974,262 | |
| Bunge, Ltd. | | | 260 | | | | 18,782 | |
| Dean Foods Co. | | | 6,290 | | | | 136,996 | |
Herbalife, Ltd. (2) | | | 5,771 | | | | 277,816 | |
| Kroger Co./The | | | 57,405 | | | | 1,981,047 | |
| Nu Skin Enterprises, Inc. | | | 2,672 | | | | 127,668 | |
| PepsiCo, Inc. | | | 39,217 | | | | 4,103,275 | |
| Philip Morris International, Inc. | | | 43,678 | | | | 3,996,100 | |
| Procter & Gamble Co./The | | | 13,805 | | | | 1,160,724 | |
| Reynolds American, Inc. | | | 17,124 | | | | 959,629 | |
| Sysco Corp. | | | 12,452 | | | | 689,467 | |
| Tyson Foods, Inc. | | | 36,296 | | | | 2,238,737 | |
US Foods Holding Corp. (2) | | | 304 | | | | 8,354 | |
| Wal-Mart Stores, Inc. | | | 49,496 | | | | 3,421,164 | |
| | | | | | | | 23,965,942 | |
| | | | | | | | | |
| Energy — 5.0% | | | | | | | | |
| Anadarko Petroleum Corp. | | | 12,669 | | | | 883,409 | |
| Apache Corp. | | | 6,102 | | | | 387,294 | |
Chesapeake Energy Corp. (2) | | | 12,859 | | | | 90,270 | |
| Chevron Corp. | | | 10,117 | | | | 1,190,771 | |
Continental Resources, Inc./OK (2) | | | 3,641 | | | | 187,657 | |
| Devon Energy Corp. | | | 40,775 | | | | 1,862,194 | |
| Ensco PLC | | | 2,504 | | | | 24,339 | |
| EOG Resources, Inc. | | | 26,985 | | | | 2,728,184 | |
| Exxon Mobil Corp. | | | 58,886 | | | | 5,315,049 | |
FMC Technologies, Inc. (2) | | | 6,943 | | | | 246,685 | |
| Kinder Morgan, Inc./DE | | | 39,433 | | | | 816,657 | |
Laredo Petroleum, Inc. (2) | | | 1,289 | | | | 18,226 | |
| Marathon Oil Corp. | | | 7,204 | | | | 124,701 | |
| Marathon Petroleum Corp. | | | 22,321 | | | | 1,123,862 | |
| Nabors Industries, Ltd. | | | 2,448 | | | | 40,147 | |
| Noble Energy, Inc. | | | 1,842 | | | | 70,107 | |
| Oceaneering International, Inc. | | | 4,651 | | | | 131,205 | |
QEP Resources, Inc. (2) | | | 3,018 | | | | 55,561 | |
Rice Energy, Inc. (2) | | | 168 | | | | 3,587 | |
| Schlumberger, Ltd. | | | 15,185 | | | | 1,274,781 | |
| SM Energy Co. | | | 1,064 | | | | 36,687 | |
Southwestern Energy Co. (2) | | | 8,893 | | | | 96,222 | |
| Spectra Energy Corp. | | | 28,965 | | | | 1,190,172 | |
| Targa Resources Corp. | | | 229 | | | | 12,840 | |
| Tesoro Corp. | | | 3,103 | | | | 271,357 | |
Transocean, Ltd. (2) | | | 1,573 | | | | 23,186 | |
| Valero Energy Corp. | | | 21,962 | | | | 1,500,444 | |
The accompanying notes are an integral part of these financial statements.
| 2016 Annual Report | December 31, 2016 | Page 27 |
Schedule of Investments
December 31, 2016
Muirfield Fund
| Security Description | | Shares or Principal Amount ($) | | | Fair Value ($) | |
| Common Stocks — continued | | | | | | |
WPX Energy, Inc. (2) | | | 3,394 | | | | 49,451 | |
| | | | | | | | 19,755,045 | |
| | | | | | | | | |
| Financials — 12.8% | | | | | | | | |
| Aflac, Inc. | | | 35,837 | | | | 2,494,255 | |
| Allstate Corp./The | | | 33,573 | | | | 2,488,431 | |
| Ally Financial, Inc. | | | 9,771 | | | | 185,844 | |
| Aon PLC | | | 10,715 | | | | 1,195,044 | |
| Assured Guaranty, Ltd. | | | 927 | | | | 35,013 | |
| Bank of America Corp. | | | 220,545 | | | | 4,874,045 | |
| BB&T Corp. | | | 55,432 | | | | 2,606,413 | |
Berkshire Hathaway, Inc. (2) | | | 10,237 | | | | 1,668,426 | |
| Capital One Financial Corp. | | | 7,148 | | | | 623,592 | |
| Chimera Investment Corp. | | | 15,686 | | | | 266,976 | |
| Citizens Financial Group, Inc. | | | 4,134 | | | | 147,294 | |
Essent Group, Ltd. (2) | | | 5,717 | | | | 185,059 | |
| Everest Re Group, Ltd. | | | 1,846 | | | | 399,474 | |
| Fifth Third Bancorp | | | 84,212 | | | | 2,271,198 | |
| FNB Corp./PA | | | 7,465 | | | | 119,664 | |
| Invesco Mortgage Capital, Inc. | | | 6,895 | | | | 100,667 | |
| JPMorgan Chase & Co. | | | 62,487 | | | | 5,392,002 | |
| Lazard, Ltd. | | | 4,450 | | | | 182,851 | |
| Lincoln National Corp. | | | 769 | | | | 50,962 | |
| LPL Financial Holdings, Inc. | | | 651 | | | | 22,922 | |
| Marsh & McLennan Cos., Inc. | | | 28,541 | | | | 1,929,086 | |
| MetLife, Inc. | | | 21,217 | | | | 1,143,384 | |
| MFA Financial, Inc. | | | 11,364 | | | | 86,707 | |
MGIC Investment Corp. (2) | | | 12,021 | | | | 122,494 | |
| Morgan Stanley | | | 67,746 | | | | 2,862,269 | |
| Navient Corp. | | | 14,739 | | | | 242,162 | |
| Popular, Inc. | | | 3,935 | | | | 172,432 | |
| Principal Financial Group, Inc. | | | 18,540 | | | | 1,072,724 | |
| Progressive Corp./The | | | 7,759 | | | | 275,445 | |
| Prudential Financial, Inc. | | | 25,720 | | | | 2,676,423 | |
| Regions Financial Corp. | | | 71,791 | | | | 1,030,919 | |
| Reinsurance Group of America, Inc. | | | 12,047 | | | | 1,515,874 | |
| S&P Global, Inc. | | | 21,780 | | | | 2,342,221 | |
Santander Consumer USA Holdings, Inc. (2) | | | 2,449 | | | | 33,062 | |
| Selective Insurance Group, Inc. | | | 5,677 | | | | 244,395 | |
| Synchrony Financial | | | 68,260 | | | | 2,475,790 | |
| TCF Financial Corp. | | | 26,470 | | | | 518,547 | |
| Unum Group | | | 7,799 | | | | 342,610 | |
| US Bancorp | | | 61,860 | | | | 3,177,748 | |
| Voya Financial, Inc. | | | 473 | | | | 18,551 | |
| Wells Fargo & Co. | | | 45,735 | | | | 2,520,456 | |
| | | | | | | | 50,113,431 | |
Muirfield Fund
| Security Description | | Shares or Principal Amount ($) | | | Fair Value ($) | |
| Common Stocks — continued | | | | | | |
| Healthcare — 10.6% | | | | | | |
| AbbVie, Inc. | | | 37,464 | | | | 2,345,996 | |
| Aetna, Inc. | | | 2,603 | | | | 322,798 | |
| Agilent Technologies, Inc. | | | 18,682 | | | | 851,152 | |
Alere, Inc. (2) | | | 1,124 | | | | 43,802 | |
Allscripts Healthcare Solutions, Inc. (2) | | | 1,640 | | | | 16,744 | |
| AmerisourceBergen Corp. | | | 12,418 | | | | 970,963 | |
| Amgen, Inc. | | | 12,184 | | | | 1,781,423 | |
| Baxter International, Inc. | | | 43,376 | | | | 1,923,292 | |
Biogen, Inc. (2) | | | 3,619 | | | | 1,026,276 | |
| Bruker Corp. | | | 496 | | | | 10,505 | |
| Cardinal Health, Inc. | | | 8,870 | | | | 638,374 | |
Charles River Laboratories International, Inc. (2) | | | 2,586 | | | | 197,027 | |
| Cigna Corp. | | | 2,291 | | | | 305,596 | |
| CR Bard, Inc. | | | 60 | | | | 13,480 | |
Endo International PLC (2) | | | 1,651 | | | | 27,192 | |
Express Scripts Holding Co. (2) | | | 2,301 | | | | 158,286 | |
| Gilead Sciences, Inc. | | | 30,254 | | | | 2,166,489 | |
HCA Holdings, Inc. (2) | | | 32,947 | | | | 2,438,737 | |
| Hill-Rom Holdings, Inc. | | | 4,549 | | | | 255,381 | |
HMS Holdings Corp. (2) | | | 3,966 | | | | 72,023 | |
Hologic, Inc. (2) | | | 4,717 | | | | 189,246 | |
| Humana, Inc. | | | 379 | | | | 77,327 | |
IDEXX Laboratories, Inc. (2) | | | 7,898 | | | | 926,198 | |
Ionis Pharmaceuticals, Inc. (2) | | | 1,051 | | | | 50,269 | |
| Johnson & Johnson | | | 42,339 | | | | 4,877,875 | |
LifePoint Health, Inc. (2) | | | 806 | | | | 45,781 | |
Mallinckrodt PLC (2) | | | 3,610 | | | | 179,850 | |
Masimo Corp. (2) | | | 4,424 | | | | 298,178 | |
| Medtronic PLC | | | 31,683 | | | | 2,256,780 | |
| Merck & Co., Inc. | | | 51,765 | | | | 3,047,406 | |
Mettler-Toledo International, Inc. (2) | | | 374 | | | | 156,541 | |
| Pfizer, Inc. | | | 71,225 | | | | 2,313,388 | |
Premier, Inc. (2) | | | 1,468 | | | | 44,568 | |
QIAGEN NV (2) | | | 1,910 | | | | 53,518 | |
| Quest Diagnostics, Inc. | | | 10,144 | | | | 932,234 | |
Quintiles IMS Holdings, Inc. (2) | | | 8,418 | | | | 640,189 | |
Seattle Genetics, Inc. (2) | | | 3,183 | | | | 167,967 | |
| St Jude Medical, Inc. | | | 30,537 | | | | 2,448,762 | |
| Stryker Corp. | | | 3,125 | | | | 374,406 | |
Tenet Healthcare Corp. (2) | | | 1,869 | | | | 27,736 | |
| Thermo Fisher Scientific, Inc. | | | 14,557 | | | | 2,053,993 | |
United Therapeutics Corp. (2) | | | 3,190 | | | | 457,542 | |
| UnitedHealth Group, Inc. | | | 22,165 | | | | 3,547,287 | |
VWR Corp. (2) | | | 7,508 | | | | 187,925 | |
WellCare Health Plans, Inc. (2) | | | 1,804 | | | | 247,292 | |
The accompanying notes are an integral part of these financial statements.
| Page 28 | 2016 Annual Report | December 31, 2016 |
Schedule of Investments
December 31, 2016
Muirfield Fund
| Security Description | | Shares or Principal Amount ($) | | | Fair Value ($) | |
| Common Stocks — continued | | | | | | |
| Zoetis, Inc. | | | 10,023 | | | | 536,531 | |
| | | | | | | | 41,704,325 | |
| | | | | | | | | |
| Industrials — 6.5% | | | | | | | | |
AECOM (2) | | | 1,157 | | | | 42,069 | |
| American Airlines Group, Inc. | | | 24,170 | | | | 1,128,497 | |
| Arconic, Inc. | | | 5,435 | | | | 100,765 | |
Avis Budget Group, Inc. (2) | | | 2,365 | | | | 86,748 | |
| Barnes Group, Inc. | | | 1,365 | | | | 64,728 | |
| Boeing Co./The | | | 21,448 | | | | 3,339,024 | |
| Brink’s Co./The | | | 2,076 | | | | 85,635 | |
| Carlisle Cos., Inc. | | | 1,986 | | | | 219,036 | |
| Crane Co. | | | 3,865 | | | | 278,744 | |
| Cummins, Inc. | | | 9,497 | | | | 1,297,955 | |
| Dun & Bradstreet Corp./The | | | 2,431 | | | | 294,929 | |
| Eaton Corp. PLC | | | 37,189 | | | | 2,495,010 | |
| EnerSys | | | 1,874 | | | | 146,359 | |
| Fortive Corp. | | | 21,481 | | | | 1,152,026 | |
HD Supply Holdings, Inc. (2) | | | 5,720 | | | | 243,157 | |
| Honeywell International, Inc. | | | 25,305 | | | | 2,931,584 | |
| Huntington Ingalls Industries, Inc. | | | 2,624 | | | | 483,315 | |
| Illinois Tool Works, Inc. | | | 20,312 | | | | 2,487,408 | |
Jacobs Engineering Group, Inc. (2) | | | 1,944 | | | | 110,808 | |
| Landstar System, Inc. | | | 4,047 | | | | 345,209 | |
| Lockheed Martin Corp. | | | 1,322 | | | | 330,421 | |
| ManpowerGroup, Inc. | | | 2,896 | | | | 257,368 | |
| Masco Corp. | | | 2,651 | | | | 83,825 | |
| MSC Industrial Direct Co., Inc. | | | 1,038 | | | | 95,901 | |
| Parker-Hannifin Corp. | | | 5,442 | | | | 761,880 | |
| Pitney Bowes, Inc. | | | 12,247 | | | | 186,032 | |
| Regal Beloit Corp. | | | 2,536 | | | | 175,618 | |
| Rockwell Automation, Inc. | | | 1,249 | | | | 167,866 | |
| Ryder System, Inc. | | | 1,259 | | | | 93,720 | |
| Spirit AeroSystems Holdings, Inc. | | | 9,128 | | | | 532,619 | |
| Terex Corp. | | | 315 | | | | 9,932 | |
| Trinity Industries, Inc. | | | 6,487 | | | | 180,079 | |
| Union Pacific Corp. | | | 18,441 | | | | 1,911,963 | |
United Continental Holdings, Inc. (2) | | | 16,351 | | | | 1,191,661 | |
| United Parcel Service, Inc. | | | 12,942 | | | | 1,483,671 | |
United Rentals, Inc. (2) | | | 2,502 | | | | 264,161 | |
| Universal Forest Products, Inc. | | | 502 | | | | 51,294 | |
WESCO International, Inc. (2) | | | 1,469 | | | | 97,762 | |
| West Corp. | | | 7,165 | | | | 177,405 | |
| | | | | | | | 25,386,184 | |
| | | | | | | | | |
| Information Technology — 17.1% | | | | | | | | |
| Accenture PLC | | | 23,690 | | | | 2,774,810 | |
Muirfield Fund
| Security Description | | Shares or Principal Amount ($) | | | Fair Value ($) | |
| Common Stocks — continued | | | | | | |
Alphabet, Inc. - Class C (2) | | | 6,555 | | | | 5,059,280 | |
Amkor Technology, Inc. (2) | | | 9,746 | | | | 102,820 | |
| Apple, Inc. | | | 72,434 | | | | 8,389,305 | |
| Applied Materials, Inc. | | | 79,750 | | | | 2,573,533 | |
ARRIS International PLC (2) | | | 6,561 | | | | 197,683 | |
| Booz Allen Hamilton Holding Corp. | | | 5,758 | | | | 207,691 | |
| Brocade Communications Systems, Inc. | | | 5,206 | | | | 65,023 | |
| CA, Inc. | | | 54,305 | | | | 1,725,270 | |
Cadence Design Systems, Inc. (2) | | | 24,740 | | | | 623,943 | |
| CDK Global, Inc. | | | 4,390 | | | | 262,039 | |
| Cisco Systems, Inc. | | | 124,367 | | | | 3,758,371 | |
Citrix Systems, Inc. (2) | | | 9,381 | | | | 837,817 | |
| Computer Sciences Corp. | | | 6,225 | | | | 369,890 | |
| CSRA, Inc. | | | 3,522 | | | | 112,140 | |
Dell Technologies, Inc. Class V (2) | | | 14,941 | | | | 821,307 | |
eBay, Inc. (2) | | | 85,703 | | | | 2,544,522 | |
Electronic Arts, Inc. (2) | | | 11,038 | | | | 869,353 | |
F5 Networks, Inc. (2) | | | 2,389 | | | | 345,736 | |
Facebook, Inc. (2) | | | 9,082 | | | | 1,044,884 | |
| Harris Corp. | | | 2,107 | | | | 215,904 | |
| Hewlett Packard Enterprise Co. | | | 111,962 | | | | 2,590,801 | |
| HP, Inc. | | | 97,151 | | | | 1,441,721 | |
| Intel Corp. | | | 81,580 | | | | 2,958,907 | |
| International Business Machines Corp. | | | 24,223 | | | | 4,020,776 | |
| Intuit, Inc. | | | 20,796 | | | | 2,383,430 | |
| Jabil Circuit, Inc. | | | 5,913 | | | | 139,961 | |
Keysight Technologies, Inc. (2) | | | 4,916 | | | | 179,778 | |
| KLA-Tencor Corp. | | | 643 | | | | 50,591 | |
| Linear Technology Corp. | | | 8,542 | | | | 532,594 | |
| Mastercard, Inc. | | | 1,037 | | | | 107,070 | |
| Maxim Integrated Products, Inc. | | | 31 | | | | 1,196 | |
Micron Technology, Inc. (2) | | | 3,672 | | | | 80,490 | |
| Microsoft Corp. | | | 114,641 | | | | 7,123,792 | |
| Motorola Solutions, Inc. | | | 1,231 | | | | 102,038 | |
NCR Corp. (2) | | | 1,237 | | | | 50,173 | |
| NetApp, Inc. | | | 14,243 | | | | 502,351 | |
Nuance Communications, Inc. (2) | | | 144 | | | | 2,146 | |
ON Semiconductor Corp. (2) | | | 17,286 | | | | 220,569 | |
| Oracle Corp. | | | 92,084 | | | | 3,540,630 | |
| QUALCOMM, Inc. | | | 33,262 | | | | 2,168,682 | |
Sanmina Corp. (2) | | | 6,290 | | | | 230,529 | |
| Science Applications International Corp. | | | 1,403 | | | | 118,974 | |
Semtech Corp. (2) | | | 3,735 | | | | 117,839 | |
| Skyworks Solutions, Inc. | | | 67 | | | | 5,002 | |
SunPower Corp. (2)(3) | | | 3,290 | | | | 21,747 | |
| Symantec Corp. | | | 33,784 | | | | 807,100 | |
Synopsys, Inc. (2) | | | 12,494 | | | | 735,397 | |
The accompanying notes are an integral part of these financial statements.
| 2016 Annual Report | December 31, 2016 | Page 29 |
Schedule of Investments
December 31, 2016
Muirfield Fund
| Security Description | | Shares or Principal Amount ($) | | | Fair Value ($) | |
| Common Stocks — continued | | | | | | |
| Texas Instruments, Inc. | | | 40,868 | | | | 2,982,138 | |
| Travelport Worldwide, Ltd. | | | 10,660 | | | | 150,306 | |
Versum Materials, Inc. (2) | | | 6,587 | | | | 184,897 | |
| Western Digital Corp. | | | 283 | | | | 19,230 | |
| Xerox Corp. | | | 52,451 | | | | 457,897 | |
| | | | | | | | 66,930,073 | |
| | | | | | | | | |
| Materials — 1.5% | | | | | | | | |
| Eastman Chemical Co. | | | 1,797 | | | | 135,152 | |
Freeport-McMoRan, Inc. (2) | | | 19,893 | | | | 262,389 | |
| Graphic Packaging Holding Co. | | | 1,237 | | | | 15,438 | |
| Huntsman Corp. | | | 2,695 | | | | 51,421 | |
| International Paper Co. | | | 27,298 | | | | 1,448,432 | |
| LyondellBasell Industries NV | | | 28,407 | | | | 2,436,752 | |
| Newmont Mining Corp. | | | 17,105 | | | | 582,767 | |
| Nucor Corp. | | | 8,017 | | | | 477,172 | |
Owens-Illinois, Inc. (2) | | | 1,258 | | | | 21,902 | |
| Packaging Corp of America | | | 1,181 | | | | 100,172 | |
| Reliance Steel & Aluminum Co. | | | 2,964 | | | | 235,757 | |
| Steel Dynamics, Inc. | | | 7,717 | | | | 274,571 | |
| United States Steel Corp. | | | 192 | | | | 6,338 | |
| | | | | | | | 6,048,263 | |
| | | | | | | | | |
| Real Estate Investment Trust — 1.4% | | | | | | | | |
| CBL & Associates Properties, Inc. | | | 6,477 | | | | 74,486 | |
CBRE Group, Inc. (2) | | | 26,595 | | | | 837,477 | |
| Communications Sales & Leasing, Inc. | | | 8,633 | | | | 219,365 | |
| CoreCivic, Inc. | | | 1,524 | | | | 37,277 | |
| Corporate Office Properties Trust | | | 9,870 | | | | 308,141 | |
| Duke Realty Corp. | | | 883 | | | | 23,452 | |
| EPR Properties | | | 1,475 | | | | 105,861 | |
| Gaming and Leisure Properties, Inc. | | | 33,574 | | | | 1,028,036 | |
| Highwoods Properties, Inc. | | | 5,731 | | | | 292,338 | |
| Hospitality Properties Trust | | | 31,723 | | | | 1,006,888 | |
| Jones Lang LaSalle, Inc. | | | 301 | | | | 30,413 | |
| Lamar Advertising Co. | | | 2,401 | | | | 161,443 | |
| Liberty Property Trust | | | 963 | | | | 38,039 | |
| NorthStar Realty Finance Corp. | | | 4,188 | | | | 63,448 | |
| Senior Housing Properties Trust | | | 2,790 | | | | 52,815 | |
| Tanger Factory Outlet Centers, Inc. | | | 1,228 | | | | 43,938 | |
| VEREIT, Inc. | | | 16,401 | | | | 138,752 | |
| Weyerhaeuser Co. | | | 28,735 | | | | 864,636 | |
| | | | | | | | 5,326,805 | |
Muirfield Fund
| Security Description | | Shares or Principal Amount ($) | | | Fair Value ($) | |
| Common Stocks — continued | | | | | | |
| Telecommunication Services — 2.2% | | | | | | |
| AT&T, Inc. | | | 69,672 | | | | 2,963,150 | |
| CenturyLink, Inc. | | | 6,364 | | | | 151,336 | |
| Telephone & Data Systems, Inc. | | | 14,746 | | | | 425,717 | |
| Verizon Communications, Inc. | | | 93,474 | | | | 4,989,642 | |
| | | | | | | | 8,529,845 | |
| Utilities — 2.3% | | | | | | | | |
| AES Corp./VA | | | 29,918 | | | | 347,647 | |
| American Electric Power Co., Inc. | | | 1,151 | | | | 72,467 | |
| CenterPoint Energy, Inc. | | | 50,725 | | | | 1,249,864 | |
| Edison International | | | 6,720 | | | | 483,773 | |
| Exelon Corp. | | | 71,844 | | | | 2,549,744 | |
| FirstEnergy Corp. | | | 50,034 | | | | 1,549,553 | |
| MDU Resources Group, Inc. | | | 1,487 | | | | 42,781 | |
| NiSource, Inc. | | | 18,200 | | | | 402,948 | |
| OGE Energy Corp. | | | 6,426 | | | | 214,950 | |
| Portland General Electric Co. | | | 12,154 | | | | 526,633 | |
| Public Service Enterprise Group, Inc. | | | 800 | | | | 35,104 | |
| Southwest Gas Holdings, Inc. | | | 3,263 | | | | 250,011 | |
| UGI Corp. | | | 24,811 | | | | 1,143,291 | |
| Westar Energy, Inc. | | | 3,140 | | | | 176,939 | |
| | | | | | | | 9,045,705 | |
| | | | | | | | | |
Total Common Stocks
(Cost $269,573,415) | | | | | | | 280,589,887 | |
| | | | | | | | | |
| Registered Investment Companies — 3.6% | | | | | |
iShares Russell 2000 Value ETF (8) | | | 117,502 | | | | 13,975,688 | |
Total Registered Investment Companies
(Cost $11,630,705) | | | | | | | 13,975,688 | |
| | | | | | | | | |
| | | | | | | | | |
| Money Market Registered Investment Companies — 24.1% | |
| Morgan Stanley Government | | | | | | | | |
Institutional Fund, 0.44% (4) | | | 515,537 | | | | 515,537 | |
| Meeder Institutional Prime Money | | | | | | | | |
Market Fund 0.64% (5) | | | 93,982,867 | | | | 93,992,266 | |
Total Money Market Registered Investment Companies
(Cost $94,504,624) | | | | | | | 94,507,803 | |
The accompanying notes are an integral part of these financial statements.
| Page 30 | 2016 Annual Report | December 31, 2016 |
Schedule of Investments
December 31, 2016
Muirfield Fund
| Security Description | | Shares or Principal Amount ($) | | | Fair Value ($) | |
| | | | | | | |
| Bank Obligations — 0.2% | | | | | | |
Capital Bank Deposit Account, 0.70%, 1/3/2017 (6) | | | 249,000 | | | | 249,000 | |
EverBank Money Market Account, 0.61%, 1/3/2017 (6) | | | 249,000 | | | | 249,000 | |
Pacific Mercantile Bank Deposit Account, 0.60%, 1/3/2017 (6) | | | 249,000 | | | | 249,000 | |
Total Bank Obligations
(Cost $747,000) | | | | | | | 747,000 | |
Total Investments — 99.5%
(Cost $376,455,744) (1) | | | | | | | 389,820,378 | |
| Other Assets less Liabilities — 0.5% | | | | | | | 1,995,788 | |
| Total Net Assets — 100.0% | | | | | | | 391,816,166 | |
| | | | | | | | | |
Trustee Deferred Compensation (7) | | | | | | | | |
| Meeder Aggressive Growth Fund | | | 5,183 | | | | 53,592 | |
| Meeder Balanced Fund | | | 2,754 | | | | 29,578 | |
| Meeder Dynamic Growth Fund | | | 1,878 | | | | 18,254 | |
| Meeder Muirfield Fund | | | 7,062 | | | | 47,951 | |
| Meeder Quantex Fund | | | 4,161 | | | | 138,811 | |
| Meeder Infrastructure Fund | | | 807 | | | | 17,205 | |
Total Trustee Deferred Compensation
(Cost $234,920) | | | | | | | 305,391 | |
Muirfield Fund
| | | Long Contracts | | | Unrealized Appreciation (Depreciation)($) | |
| Futures Contracts | | | | | | |
| Standard & Poors 500 Mini Futures expiring March 2017, notional value $68,204,100 | | | 610 | | | | (537,522 | ) |
| Total Futures Contracts | | | 610 | | | | (537,522 | ) |
| (1) | Cost for federal income tax purposes of $379,358,476 differs from value by net unrealized appreciation (depreciation) of securities as follows: |
| Unrealized appreciation | | $ | 18,424,458 | |
| Unrealized depreciation | | | (8,500,079 | ) |
| Net unrealized appreciation (depreciation) | | $ | 9,924,379 | |
| (2) | Represents non-income producing securities. |
| (3) | All or a portion of this security is on loan. |
| (4) | Investment purchased with cash received as securities lending collateral. The yield shown represents the 7-day yield in effect at December 31, 2016. |
| (5) | Investment in affiliate. The yield shown represents the 7-day yield in effect at December 31, 2016. |
| (6) | Variable rate security. Securities payable at par including accrued interest (usually within seven days notice) and unconditionally secured as to principal and interest by letters of credit or other credit support agreements from major banks. The interest rates are adjustable and are based on bank prime rates or other interest rate adjustment indices. The rate shown represents the rate in effect at December 31, 2016. The maturity date shown, if applicable, reflects the earlier of the next demand date or stated maturity date. |
| (7) | Assets of affiliates to the Muirfield Fund held for the benefit of the Fund’s Trustees in connection with the Trustee Deferred Compensation Plan. |
The accompanying notes are an integral part of these financial statements.
| 2016 Annual Report | December 31, 2016 | Page 31 |
Schedule of Investments
December 31, 2016
Dynamic Growth Fund
| Security Description | | Shares or Principal Amount ($) | | | Fair Value ($) | |
| Common Stocks — 85.0% | | | | | | |
| Consumer Discretionary — 8.0% | | | | | | |
Amazon.com, Inc. (2) | | | 1,762 | | | | 1,321,271 | |
| Aramark | | | 564 | | | | 20,146 | |
| Bed Bath & Beyond, Inc. | | | 1,760 | | | | 71,526 | |
| Best Buy Co., Inc. | | | 7,779 | | | | 331,930 | |
| Brinker International, Inc. | | | 1,521 | | | | 75,335 | |
| Comcast Corp. | | | 13,792 | | | | 952,338 | |
Cooper-Standard Holdings, Inc. (2) | | | 308 | | | | 31,841 | |
| Dick’s Sporting Goods, Inc. | | | 805 | | | | 42,746 | |
| Dillard’s, Inc. | | | 85 | | | | 5,329 | |
| Domino’s Pizza, Inc. | | | 597 | | | | 95,066 | |
| DR Horton, Inc. | | | 13,296 | | | | 363,380 | |
| Ford Motor Co. | | | 13,474 | | | | 163,440 | |
| Gap, Inc./The | | | 5,562 | | | | 124,811 | |
| General Motors Co. | | | 23,427 | | | | 816,197 | |
| Goodyear Tire & Rubber Co./The | | | 2,492 | | | | 76,928 | |
| H&R Block, Inc. | | | 1,271 | | | | 29,220 | |
| Harman International Industries, Inc. | | | 329 | | | | 36,572 | |
| Home Depot, Inc./The | | | 5,517 | | | | 739,719 | |
| International Game Technology PLC | | | 3,558 | | | | 90,800 | |
| Interpublic Group of Cos., Inc./The | | | 90 | | | | 2,107 | |
| Kohl’s Corp. | | | 2,271 | | | | 112,142 | |
| Las Vegas Sands Corp. | | | 15,125 | | | | 807,826 | |
Lions Gate Entertainment Corp. (2) | | | 721 | | | | 17,693 | |
| Macy’s, Inc. | | | 9,949 | | | | 356,274 | |
| Marriott International, Inc./MD | | | 6,926 | | | | 572,642 | |
Michael Kors Holdings, Ltd. (2) | | | 3,344 | | | | 143,725 | |
Michaels Cos., Inc./The (2) | | | 4,260 | | | | 87,117 | |
| Nordstrom, Inc. | | | 3,430 | | | | 164,400 | |
Priceline Group, Inc./The (2) | | | 92 | | | | 134,878 | |
| PVH Corp. | | | 1,176 | | | | 106,122 | |
| Regal Entertainment Group | | | 2,057 | | | | 42,374 | |
Sally Beauty Holdings, Inc. (2) | | | 813 | | | | 21,479 | |
| Scripps Networks Interactive, Inc. | | | 936 | | | | 66,802 | |
| Staples, Inc. | | | 6,428 | | | | 58,173 | |
Tenneco, Inc. (2) | | | 708 | | | | 44,229 | |
| Time Warner, Inc. | | | 11,676 | | | | 1,127,083 | |
TRI Pointe Group, Inc. (2) | | | 4,035 | | | | 46,322 | |
| Tupperware Brands Corp. | | | 1,422 | | | | 74,826 | |
Urban Outfitters, Inc. (2) | | | 603 | | | | 17,173 | |
| Whirlpool Corp. | | | 438 | | | | 79,615 | |
| | | | | | | | 9,471,597 | |
| | | | | | | | | |
| Consumer Staples — 6.0% | | | | | | | | |
| Altria Group, Inc. | | | 19,912 | | | | 1,346,449 | |
| Archer-Daniels-Midland Co. | | | 10,727 | | | | 489,688 | |
Herbalife, Ltd. (2) | | | 924 | | | | 44,481 | |
Dynamic Growth Fund
| Security Description | | Shares or Principal Amount ($) | | | Fair Value ($) | |
| Common Stocks — continued | | | | | | |
| Ingredion, Inc. | | | 70 | | | | 8,747 | |
| Kroger Co./The | | | 16,469 | | | | 568,345 | |
| Nu Skin Enterprises, Inc. | | | 775 | | | | 37,030 | |
| PepsiCo, Inc. | | | 14,003 | | | | 1,465,134 | |
| Philip Morris International, Inc. | | | 14,912 | | | | 1,364,299 | |
| Sysco Corp. | | | 206 | | | | 11,406 | |
| Tyson Foods, Inc. | | | 12,061 | | | | 743,922 | |
| Wal-Mart Stores, Inc. | | | 15,108 | | | | 1,044,265 | |
| | | | | | | | 7,123,766 | |
| | | | | | | | | |
| Energy — 6.1% | | | | | | | | |
| Anadarko Petroleum Corp. | | | 1,824 | | | | 127,188 | |
| Apache Corp. | | | 83 | | | | 5,268 | |
Chesapeake Energy Corp. (2) | | | 5,331 | | | | 37,424 | |
| Chevron Corp. | | | 4,307 | | | | 506,934 | |
| Devon Energy Corp. | | | 16,941 | | | | 773,695 | |
| Ensco PLC | | | 652 | | | | 6,337 | |
| EOG Resources, Inc. | | | 9,834 | | | | 994,217 | |
| Exxon Mobil Corp. | | | 20,442 | | | | 1,845,095 | |
FMC Technologies, Inc. (2) | | | 1,628 | | | | 57,843 | |
| Kinder Morgan, Inc./DE | | | 29,067 | | | | 601,978 | |
| Marathon Oil Corp. | | | 678 | | | | 11,736 | |
| Marathon Petroleum Corp. | | | 13,661 | | | | 687,831 | |
| Nabors Industries, Ltd. | | | 1,190 | | | | 19,516 | |
| Noble Corp. plc | | | 230 | | | | 1,362 | |
| Oceaneering International, Inc. | | | 923 | | | | 26,038 | |
QEP Resources, Inc. (2) | | | 1,081 | | | | 19,901 | |
| Schlumberger, Ltd. | | | 5,010 | | | | 420,590 | |
| SM Energy Co. | | | 558 | | | | 19,240 | |
Southwestern Energy Co. (2) | | | 3,835 | | | | 41,495 | |
| Tesoro Corp. | | | 1,176 | | | | 102,841 | |
| Valero Energy Corp. | | | 13,359 | | | | 912,687 | |
WPX Energy, Inc. (2) | | | 1,420 | | | | 20,689 | |
| | | | | | | | 7,239,905 | |
| | | | | | | | | |
| Financials — 14.3% | | | | | | | | |
| Aflac, Inc. | | | 12,313 | | | | 856,985 | |
| Allstate Corp./The | | | 12,078 | | | | 895,221 | |
| Ally Financial, Inc. | | | 3,777 | | | | 71,839 | |
| Aon PLC | | | 3,787 | | | | 422,364 | |
| Assured Guaranty, Ltd. | | | 533 | | | | 20,131 | |
| Bank of America Corp. | | | 81,453 | | | | 1,800,111 | |
| BB&T Corp. | | | 20,049 | | | | 942,704 | |
Berkshire Hathaway, Inc. (2) | | | 4,062 | | | | 662,025 | |
| Chimera Investment Corp. | | | 5,622 | | | | 95,686 | |
| Citigroup, Inc. | | | 673 | | | | 39,996 | |
| Citizens Financial Group, Inc. | | | 4,844 | | | | 172,592 | |
The accompanying notes are an integral part of these financial statements.
| Page 32 | 2016 Annual Report | December 31, 2016 |
Schedule of Investments
December 31, 2016
Dynamic Growth Fund
| Security Description | | Shares or Principal Amount ($) | | | Fair Value ($) | |
| Common Stocks — continued | | | | | | |
Essent Group, Ltd. (2) | | | 2,347 | | | | 75,972 | |
| Everest Re Group, Ltd. | | | 775 | | | | 167,710 | |
| Fifth Third Bancorp | | | 32,132 | | | | 866,600 | |
| First American Financial Corp. | | | 145 | | | | 5,311 | |
| Invesco Mortgage Capital, Inc. | | | 4,013 | | | | 58,590 | |
| JPMorgan Chase & Co. | | | 23,408 | | | | 2,019,876 | |
| Lazard, Ltd. | | | 1,682 | | | | 69,113 | |
| LPL Financial Holdings, Inc. | | | 49 | | | | 1,725 | |
| MetLife, Inc. | | | 9,962 | | | | 536,852 | |
| MFA Financial, Inc. | | | 5,059 | | | | 38,600 | |
MGIC Investment Corp. (2) | | | 1,754 | | | | 17,873 | |
| Morgan Stanley | | | 24,195 | | | | 1,022,239 | |
| Navient Corp. | | | 6,600 | | | | 108,438 | |
| Popular, Inc. | | | 3,686 | | | | 161,521 | |
| Principal Financial Group, Inc. | | | 4,611 | | | | 266,792 | |
| Progressive Corp./The | | | 72 | | | | 2,556 | |
| Prudential Financial, Inc. | | | 9,230 | | | | 960,474 | |
| Regions Financial Corp. | | | 11,817 | | | | 169,692 | |
| Reinsurance Group of America, Inc. | | | 3,909 | | | | 491,869 | |
| S&P Global, Inc. | | | 8,001 | | | | 860,428 | |
Santander Consumer USA Holdings, Inc. (2) | | | 1,200 | | | | 16,200 | |
| Selective Insurance Group, Inc. | | | 3,191 | | | | 137,373 | |
| Synchrony Financial | | | 18,166 | | | | 658,881 | |
| TCF Financial Corp. | | | 6,650 | | | | 130,274 | |
| Unum Group | | | 3,111 | | | | 136,666 | |
| US Bancorp | | | 22,313 | | | | 1,146,218 | |
| Voya Financial, Inc. | | | 567 | | | | 22,238 | |
| Wells Fargo & Co. | | | 15,045 | | | | 829,130 | |
| | | | | | | | 16,958,865 | |
| | | | | | | | | |
| Healthcare — 12.8% | | | | | | | | |
| AbbVie, Inc. | | | 15,809 | | | | 989,960 | |
| Agilent Technologies, Inc. | | | 3,702 | | | | 168,663 | |
Alere, Inc. (2) | | | 304 | | | | 11,847 | |
Align Technology, Inc. (2) | | | 691 | | | | 66,426 | |
| AmerisourceBergen Corp. | | | 5,320 | | | | 415,971 | |
| Amgen, Inc. | | | 4,056 | | | | 593,028 | |
| Baxter International, Inc. | | | 19,449 | | | | 862,369 | |
Biogen, Inc. (2) | | | 95 | | | | 26,940 | |
| Cardinal Health, Inc. | | | 1,947 | | | | 140,126 | |
Centene Corp. (2) | | | 390 | | | | 22,039 | |
Charles River Laboratories International, Inc. (2) | | | 577 | | | | 43,962 | |
| CR Bard, Inc. | | | 162 | | | | 36,395 | |
| Danaher Corp. | | | 7,683 | | | | 598,045 | |
Endo International PLC (2) | | | 851 | | | | 14,016 | |
| Gilead Sciences, Inc. | | | 9,699 | | | | 694,545 | |
Dynamic Growth Fund
| Security Description | | Shares or Principal Amount ($) | | | Fair Value ($) | |
| Common Stocks — continued | | | | | | |
HCA Holdings, Inc. (2) | | | 11,757 | | | | 870,253 | |
| Hill-Rom Holdings, Inc. | | | 507 | | | | 28,463 | |
Hologic, Inc. (2) | | | 4,070 | | | | 163,288 | |
IDEXX Laboratories, Inc. (2) | | | 3,954 | | | | 463,686 | |
Ionis Pharmaceuticals, Inc. (2) | | | 239 | | | | 11,431 | |
| Johnson & Johnson | | | 14,843 | | | | 1,710,062 | |
LifePoint Health, Inc. (2) | | | 361 | | | | 20,505 | |
Mallinckrodt PLC (2) | | | 1,080 | | | | 53,806 | |
Masimo Corp. (2) | | | 2,498 | | | | 168,365 | |
| Medtronic PLC | | | 12,986 | | | | 924,993 | |
| Merck & Co., Inc. | | | 17,246 | | | | 1,015,272 | |
Mettler-Toledo International, Inc. (2) | | | 423 | | | | 177,051 | |
| Pfizer, Inc. | | | 26,772 | | | | 869,555 | |
Premier, Inc. (2) | | | 287 | | | | 8,713 | |
QIAGEN NV (2) | | | 1,011 | | | | 28,328 | |
| Quest Diagnostics, Inc. | | | 4,381 | | | | 402,614 | |
Quintiles IMS Holdings, Inc. (2) | | | 4,529 | | | | 344,430 | |
Seattle Genetics, Inc. (2) | | | 541 | | | | 28,549 | |
| St Jude Medical, Inc. | | | 10,965 | | | | 879,283 | |
Tenet Healthcare Corp. (2) | | | 880 | | | | 13,059 | |
| Thermo Fisher Scientific, Inc. | | | 6,138 | | | | 866,072 | |
United Therapeutics Corp. (2) | | | 1,291 | | | | 185,168 | |
| UnitedHealth Group, Inc. | | | 7,842 | | | | 1,255,034 | |
VWR Corp. (2) | | | 1,099 | | | | 27,508 | |
WellCare Health Plans, Inc. (2) | | | 436 | | | | 59,767 | |
| | | | | | | | 15,259,587 | |
| | | | | | | | | |
| Industrials — 8.4% | | | | | | | | |
AECOM (2) | | | 1,011 | | | | 36,760 | |
| American Airlines Group, Inc. | | | 18,261 | | | | 852,606 | |
| Arconic, Inc. | | | 1,228 | | | | 22,767 | |
Avis Budget Group, Inc. (2) | | | 851 | | | | 31,215 | |
| Boeing Co./The | | | 7,377 | | | | 1,148,450 | |
| Brink’s Co./The | | | 683 | | | | 28,174 | |
| Carlisle Cos., Inc. | | | 252 | | | | 27,793 | |
| Crane Co. | | | 1,318 | | | | 95,054 | |
| CSX Corp. | | | 668 | | | | 24,001 | |
| Cummins, Inc. | | | 4,190 | | | | 572,647 | |
| Dover Corp. | | | 621 | | | | 46,532 | |
| Dun & Bradstreet Corp./The | | | 1,049 | | | | 127,265 | |
| Eaton Corp. PLC | | | 13,387 | | | | 898,134 | |
| Fortive Corp. | | | 9,537 | | | | 511,469 | |
HD Supply Holdings, Inc. (2) | | | 2,107 | | | | 89,569 | |
| Honeywell International, Inc. | | | 8,593 | | | | 995,499 | |
| Huntington Ingalls Industries, Inc. | | | 452 | | | | 83,254 | |
| Illinois Tool Works, Inc. | | | 7,397 | | | | 905,837 | |
Jacobs Engineering Group, Inc. (2) | | | 976 | | | | 55,632 | |
The accompanying notes are an integral part of these financial statements.
| 2016 Annual Report | December 31, 2016 | Page 33 |
Schedule of Investments
December 31, 2016
Dynamic Growth Fund
| Security Description | | Shares or Principal Amount ($) | | | Fair Value ($) | |
| Common Stocks — continued | | | | | | |
| Landstar System, Inc. | | | 1,115 | | | | 95,110 | |
| LSC Communications, Inc. | | | 21 | | | | 623 | |
| ManpowerGroup, Inc. | | | 1,408 | | | | 125,129 | |
| Masco Corp. | | | 772 | | | | 24,411 | |
| Parker-Hannifin Corp. | | | 1,127 | | | | 157,780 | |
| Pitney Bowes, Inc. | | | 4,457 | | | | 67,702 | |
| Regal Beloit Corp. | | | 233 | | | | 16,135 | |
| Rockwell Automation, Inc. | | | 1,243 | | | | 167,059 | |
| RR Donnelley & Sons Co. | | | 735 | | | | 11,995 | |
| Ryder System, Inc. | | | 246 | | | | 18,312 | |
| Spirit AeroSystems Holdings, Inc. | | | 2,242 | | | | 130,821 | |
| Trinity Industries, Inc. | | | 1,834 | | | | 50,912 | |
| Union Pacific Corp. | | | 4,291 | | | | 444,891 | |
United Continental Holdings, Inc. (2) | | | 10,491 | | | | 764,584 | |
| United Parcel Service, Inc. | | | 9,638 | | | | 1,104,900 | |
United Rentals, Inc. (2) | | | 833 | | | | 87,948 | |
| Universal Forest Products, Inc. | | | 287 | | | | 29,326 | |
WESCO International, Inc. (2) | | | 406 | | | | 27,019 | |
| West Corp. | | | 2,791 | | | | 69,105 | |
| | | | | | | | 9,946,420 | |
| | | | | | | | | |
| Information Technology — 21.4% | | | | | | | | |
| Accenture PLC | | | 8,040 | | | | 941,725 | |
Alphabet, Inc. - Class A (2) | | | 263 | | | | 208,414 | |
Alphabet, Inc. - Class C (2) | | | 2,284 | | | | 1,762,837 | |
Amkor Technology, Inc. (2) | | | 3,661 | | | | 38,624 | |
| Apple, Inc. | | | 25,681 | | | | 2,974,372 | |
| Applied Materials, Inc. | | | 28,645 | | | | 924,374 | |
ARRIS International PLC (2) | | | 1,990 | | | | 59,959 | |
| Booz Allen Hamilton Holding Corp. | | | 1,033 | | | | 37,260 | |
| Brocade Communications Systems, Inc. | | | 1,866 | | | | 23,306 | |
| CA, Inc. | | | 22,368 | | | | 710,631 | |
Cadence Design Systems, Inc. (2) | | | 8,967 | | | | 226,148 | |
| CDK Global, Inc. | | | 630 | | | | 37,605 | |
| Cisco Systems, Inc. | | | 46,862 | | | | 1,416,170 | |
Citrix Systems, Inc. (2) | | | 2,132 | | | | 190,409 | |
| Computer Sciences Corp. | | | 1,340 | | | | 79,623 | |
CoreLogic, Inc./United States (2) | | | 73 | | | | 2,689 | |
| CSRA, Inc. | | | 1,236 | | | | 39,354 | |
Dell Technologies, Inc. Class V (2) | | | 5,097 | | | | 280,182 | |
eBay, Inc. (2) | | | 30,848 | | | | 915,877 | |
Electronic Arts, Inc. (2) | | | 5,454 | | | | 429,557 | |
F5 Networks, Inc. (2) | | | 1,530 | | | | 221,422 | |
Facebook, Inc. (2) | | | 4,004 | | | | 460,660 | |
First Solar, Inc. (2) | | | 32 | | | | 1,027 | |
| Harris Corp. | | | 51 | | | | 5,226 | |
| Hewlett Packard Enterprise Co. | | | 38,908 | | | | 900,331 | |
Dynamic Growth Fund
| Security Description | | Shares or Principal Amount ($) | | | Fair Value ($) | |
| Common Stocks — continued | | | | | | |
| HP, Inc. | | | 54,587 | | | | 810,071 | |
IAC/InterActiveCorp (2) | | | 337 | | | | 21,834 | |
| Intel Corp. | | | 33,769 | | | | 1,224,802 | |
| International Business Machines Corp. | | | 8,714 | | | | 1,446,437 | |
| Intuit, Inc. | | | 7,624 | | | | 873,787 | |
| Jabil Circuit, Inc. | | | 3,250 | | | | 76,928 | |
| Juniper Networks, Inc. | | | 3,432 | | | | 96,988 | |
Keysight Technologies, Inc. (2) | | | 748 | | | | 27,354 | |
| KLA-Tencor Corp. | | | 124 | | | | 9,756 | |
| Linear Technology Corp. | | | 4,261 | | | | 265,673 | |
| Mastercard, Inc. | | | 109 | | | | 11,254 | |
Match Group, Inc. (2) | | | 62 | | | | 1,060 | |
Micron Technology, Inc. (2) | | | 11,110 | | | | 243,531 | |
| Microsoft Corp. | | | 39,954 | | | | 2,482,742 | |
| NetApp, Inc. | | | 3,909 | | | | 137,870 | |
| NVIDIA Corp. | | | 4,903 | | | | 523,346 | |
ON Semiconductor Corp. (2) | | | 6,457 | | | | 82,391 | |
| Oracle Corp. | | | 32,490 | | | | 1,249,241 | |
| QUALCOMM, Inc. | | | 12,067 | | | | 786,768 | |
Sanmina Corp. (2) | | | 3,515 | | | | 128,825 | |
| Science Applications International Corp. | | | 702 | | | | 59,530 | |
| Skyworks Solutions, Inc. | | | 1,800 | | | | 134,388 | |
SunPower Corp. (2)(3) | | | 937 | | | | 6,194 | |
| Symantec Corp. | | | 8,626 | | | | 206,075 | |
Synopsys, Inc. (2) | | | 4,656 | | | | 274,052 | |
| Teradyne, Inc. | | | 911 | | | | 23,139 | |
| Texas Instruments, Inc. | | | 14,774 | | | | 1,078,059 | |
| Travelport Worldwide, Ltd. | | | 3,293 | | | | 46,431 | |
Versum Materials, Inc. (2) | | | 2,278 | | | | 63,943 | |
| Western Union Co./The | | | 1,141 | | | | 24,783 | |
| Xerox Corp. | | | 18,833 | | | | 164,412 | |
| | | | | | | | 25,469,446 | |
| | | | | | | | | |
| Materials — 1.8% | | | | | | | | |
Berry Plastics Group, Inc. (2) | | | 619 | | | | 30,164 | |
| Eagle Materials, Inc. | | | 96 | | | | 9,459 | |
| Eastman Chemical Co. | | | 712 | | | | 53,550 | |
Freeport-McMoRan, Inc. (2) | | | 7,275 | | | | 95,957 | |
GCP Applied Technologies, Inc. (2) | | | 738 | | | | 19,742 | |
| Huntsman Corp. | | | 428 | | | | 8,166 | |
| International Paper Co. | | | 6,033 | | | | 320,111 | |
| LyondellBasell Industries NV | | | 10,255 | | | | 879,674 | |
| Newmont Mining Corp. | | | 6,944 | | | | 236,582 | |
| Nucor Corp. | | | 4,763 | | | | 283,494 | |
Owens-Illinois, Inc. (2) | | | 317 | | | | 5,519 | |
| Reliance Steel & Aluminum Co. | | | 1,089 | | | | 86,619 | |
| Steel Dynamics, Inc. | | | 2,098 | | | | 74,647 | |
The accompanying notes are an integral part of these financial statements.
| Page 34 | 2016 Annual Report | December 31, 2016 |
Schedule of Investments
December 31, 2016
Dynamic Growth Fund
| Security Description | | Shares or Principal Amount ($) | | | Fair Value ($) | |
| Common Stocks — continued | | | | | | |
| Trinseo SA | | | 149 | | | | 8,836 | |
| United States Steel Corp. | | | 94 | | | | 3,103 | |
| | | | | | | | 2,115,623 | |
| | | | | | | | | |
| Real Estate Investment Trust — 1.4% | | | | | | | | |
CBRE Group, Inc. (2) | | | 10,071 | | | | 317,136 | |
| Communications Sales & Leasing, Inc. | | | 3,724 | | | | 94,627 | |
| CoreCivic, Inc. | | | 812 | | | | 19,862 | |
| Corporate Office Properties Trust | | | 2,725 | | | | 85,075 | |
| EPR Properties | | | 68 | | | | 4,880 | |
| Gaming and Leisure Properties, Inc. | | | 11,938 | | | | 365,542 | |
| Hospitality Properties Trust | | | 12,580 | | | | 399,289 | |
| Iron Mountain, Inc. | | | 2,118 | | | | 68,793 | |
| Jones Lang LaSalle, Inc. | | | 554 | | | | 55,976 | |
| Lamar Advertising Co. | | | 1,398 | | | | 94,002 | |
| NorthStar Realty Finance Corp. | | | 3,457 | | | | 52,374 | |
| VEREIT, Inc. | | | 11,514 | | | | 97,408 | |
| | | | | | | | 1,654,964 | |
| | | | | | | | | |
| Telecommunication Services — 2.6% | | | | | | | | |
| AT&T, Inc. | | | 28,552 | | | | 1,214,317 | |
| CenturyLink, Inc. | | | 5,020 | | | | 119,376 | |
| Telephone & Data Systems, Inc. | | | 5,453 | | | | 157,428 | |
| Verizon Communications, Inc. | | | 30,614 | | | | 1,634,175 | |
| | | | | | | | 3,125,296 | |
| | | | | | | | | |
| Utilities — 2.2% | | | | | | | | |
| AES Corp./VA | | | 7,346 | | | | 85,361 | |
| CenterPoint Energy, Inc. | | | 15,632 | | | | 385,172 | |
| Exelon Corp. | | | 25,581 | | | | 907,870 | |
| FirstEnergy Corp. | | | 13,985 | | | | 433,115 | |
| MDU Resources Group, Inc. | | | 1,080 | | | | 31,072 | |
| NiSource, Inc. | | | 5,653 | | | | 125,157 | |
| OGE Energy Corp. | | | 1,906 | | | | 63,756 | |
| Southwest Gas Holdings, Inc. | | | 2,965 | | | | 227,178 | |
| UGI Corp. | | | 7,959 | | | | 366,751 | |
| | | | | | | | 2,625,432 | |
| | | | | | | | | |
Total Common Stocks
(Cost $96,871,430) | | | | | | | 100,990,901 | |
Dynamic Growth Fund
| Security Description | | Shares or Principal Amount ($) | | | Fair Value ($) | |
| Money Market Registered Investment Companies — 12.8% | |
Morgan Stanley Government Institutional Fund, 0.44% (4) | | | 4,912 | | | | 4,912 | |
Meeder Institutional Prime Money Market Fund 0.64% (5) | | | 15,268,579 | | | | 15,270,106 | |
Total Money Market Registered Investment Companies
(Cost $15,274,999) | | | | | | | 15,275,018 | |
| | | | | | | | | |
| Bank Obligations — 0.6% | | | | | | | | |
Capital Bank Deposit Account, 0.70%, 1/3/2017 (6) | | | 249,000 | | | | 249,000 | |
EverBank Money Market Account, 0.61%, 1/3/2017 (6) | | | 249,000 | | | | 249,000 | |
Pacific Mercantile Bank Deposit Account, 0.60%, 1/3/2017 (6) | | | 249,000 | | | | 249,000 | |
Total Bank Obligations
(Cost $747,000) | | | | | | | 747,000 | |
Total Investments — 98.4%
(Cost $112,893,429) (1) | | | | | | | 117,012,919 | |
| Other Assets less Liabilities — 1.6% | | | | | | | 1,920,025 | |
| Total Net Assets — 100.0% | | | | | | | 118,932,944 | |
| | | | | | | | | |
Trustee Deferred Compensation (7) | | | | | | | | |
| Meeder Aggressive Growth Fund | | | 3,403 | | | | 35,187 | |
| Meeder Balanced Fund | | | 1,774 | | | | 19,053 | |
| Meeder Dynamic Growth Fund | | | 1,230 | | | | 11,956 | |
| Meeder Muirfield Fund | | | 3,722 | | | | 25,272 | |
| Meeder Quantex Fund | | | 1,880 | | | | 62,717 | |
| Meeder Infrastructure Fund | | | 521 | | | | 11,108 | |
Total Trustee Deferred Compensation
(Cost $130,412) | | | | | | | 165,293 | |
The accompanying notes are an integral part of these financial statements.
| 2016 Annual Report | December 31, 2016 | Page 35 |
Schedule of Investments
December 31, 2016
Dynamic Growth Fund
| | Long Contracts | | Unrealized Appreciation (Depreciation)($) | |
| Futures Contracts | | | | |
| Standard & Poors 500 Mini Futures expiring March 2017, notional value $17,889,600 | | | 160 | | | | (48,825 | ) |
| Total Futures Contracts | | | 160 | | | | (48,825 | ) |
| (1) | Cost for federal income tax purposes of $113,865,684 differs from value by net unrealized appreciation (depreciation) of securities as follows: |
| Unrealized appreciation | | $ | 5,911,405 | |
| Unrealized depreciation | | | (2,812,995 | ) |
| Net unrealized appreciation (depreciation) | | $ | 3,098,410 | |
| (2) | Represents non-income producing securities. |
| (3) | All or a portion of this security is on loan. |
| (4) | Investment purchased with cash received as securities lending collateral. The yield shown represents the 7-day yield in effect at December 31, 2016. |
| (5) | Investment in affiliate. The yield shown represents the 7-day yield in effect at December 31, 2016. |
| (6) | Variable rate security. Securities payable at par including accrued interest (usually within seven days notice) and unconditionally secured as to principal and interest by letters of credit or other credit support agreements from major banks. The interest rates are adjustable and are based on bank prime rates or other interest rate adjustment indices. The rate shown represents the rate in effect at December 31, 2016. The maturity date shown, if applicable, reflects the earlier of the next demand date or stated maturity date. |
| (7) | Assets of affiliates to the Dynamic Growth Fund held for the benefit of the Fund’s Trustees in connection with the Trustee Deferred Compensation Plan. |
The accompanying notes are an integral part of these financial statements.
| Page 36 | 2016 Annual Report | December 31, 2016 |
Schedule of Investments
December 31, 2016
Aggressive Growth Fund
| Security Description | | Shares or Principal Amount ($) | | | Fair Value ($) | |
| Common Stocks — 87.6% | | | | | | |
| Consumer Discretionary — 8.8% | | | | | | |
| Bloomin' Brands, Inc. | | | 10,274 | | | | 185,240 | |
| Brinker International, Inc. | | | 8,467 | | | | 419,371 | |
Cooper-Standard Holdings, Inc. (2) | | | 3,491 | | | | 360,900 | |
| Dana, Inc. | | | 367 | | | | 6,966 | |
| DeVry Education Group, Inc. | | | 2,843 | | | | 88,702 | |
| Dick's Sporting Goods, Inc. | | | 2,185 | | | | 116,024 | |
| Domino's Pizza, Inc. | | | 482 | | | | 76,754 | |
Fossil Group, Inc. (2) | | | 1,970 | | | | 50,944 | |
| Goodyear Tire & Rubber Co./The | | | 6,428 | | | | 198,432 | |
| Harman International Industries, Inc. | | | 697 | | | | 77,479 | |
| HSN, Inc. | | | 4,301 | | | | 147,524 | |
| ILG, Inc. | | | 23,702 | | | | 430,664 | |
| International Game Technology PLC | | | 13,742 | | | | 350,696 | |
Liberty Media Corp-Liberty Media (2) | | | 9,377 | | | | 293,969 | |
Michaels Cos., Inc./The (2) | | | 4,898 | | | | 100,164 | |
| Staples, Inc. | | | 17,094 | | | | 154,701 | |
Tenneco, Inc. (2) | | | 3,039 | | | | 189,846 | |
TRI Pointe Group, Inc. (2) | | | 15,659 | | | | 179,765 | |
| Tupperware Brands Corp. | | | 7,979 | | | | 419,855 | |
| Wolverine World Wide, Inc. | | | 9,539 | | | | 209,381 | |
| | | | | | | | 4,057,377 | |
| | | | | | | | | |
| Consumer Staples — 2.8% | | | | | | | | |
Avon Products, Inc. (2) | | | 6,769 | | | | 34,116 | |
| Dean Foods Co. | | | 19,470 | | | | 424,056 | |
Herbalife, Ltd. (2) | | | 7,038 | | | | 338,809 | |
| Nu Skin Enterprises, Inc. | | | 8,660 | | | | 413,775 | |
United Natural Foods, Inc. (2) | | | 1,520 | | | | 72,534 | |
| | | | | | | | 1,283,290 | |
| | | | | | | | | |
| Energy — 4.5% | | | | | | | | |
Callon Petroleum Co. (2) | | | 20,130 | | | | 309,398 | |
Chesapeake Energy Corp. (2) | | | 11,906 | | | | 83,580 | |
FMC Technologies, Inc. (2) | | | 13,855 | | | | 492,267 | |
Oasis Petroleum, Inc. (2) | | | 8,475 | | | | 128,312 | |
| Oceaneering International, Inc. | | | 4,404 | | | | 124,237 | |
QEP Resources, Inc. (2) | | | 16,460 | | | | 303,029 | |
| SM Energy Co. | | | 2,704 | | | | 93,234 | |
Southwestern Energy Co. (2) | | | 14,832 | | | | 160,482 | |
| Western Refining, Inc. | | | 6,644 | | | | 251,475 | |
WPX Energy, Inc. (2) | | | 10,032 | | | | 146,166 | |
| | | | | | | | 2,092,180 | |
| | | | | | | | | |
| Financials — 14.8% | | | | | | | | |
| Aspen Insurance Holdings, Ltd. | | | 2,490 | | | | 136,950 | |
| Assured Guaranty, Ltd. | | | 11,816 | | | | 446,290 | |
Aggressive Growth Fund
| Security Description | | Shares or Principal Amount ($) | | | Fair Value ($) | |
| Common Stocks — continued | | | | | | |
| Chemical Financial Corp. | | | 8,233 | | | | 445,982 | |
| Chimera Investment Corp. | | | 23,400 | | | | 398,268 | |
Essent Group, Ltd. (2) | | | 11,404 | | | | 369,147 | |
| EverBank Financial Corp. | | | 1,013 | | | | 19,703 | |
| Everest Re Group, Ltd. | | | 2,319 | | | | 501,832 | |
| First American Financial Corp. | | | 2,362 | | | | 86,520 | |
Flagstar Bancorp, Inc. (2) | | | 1,491 | | | | 40,168 | |
Genworth Financial, Inc. (2) | | | 4,949 | | | | 18,856 | |
| Hancock Holding Co. | | | 9,987 | | | | 430,440 | |
| International Bancshares Corp. | | | 7,325 | | | | 298,860 | |
| Invesco Mortgage Capital, Inc. | | | 14,301 | | | | 208,795 | |
| Lazard, Ltd. | | | 10,758 | | | | 442,046 | |
MGIC Investment Corp. (2) | | | 43,002 | | | | 438,190 | |
| National General Holdings Corp. | | | 416 | | | | 10,396 | |
Nationstar Mortgage Holdings, Inc. (2)(3) | | | 12,637 | | | | 228,224 | |
| Navient Corp. | | | 28,180 | | | | 462,996 | |
| Popular, Inc. | | | 10,317 | | | | 452,091 | |
| Reinsurance Group of America, Inc. | | | 3,872 | | | | 487,214 | |
| Selective Insurance Group, Inc. | | | 10,002 | | | | 430,586 | |
| TCF Financial Corp. | | | 22,903 | | | | 448,670 | |
| | | | | | | | 6,802,224 | |
| | | | | | | | | |
| Healthcare — 7.5% | | | | | | | | |
Acceleron Pharma, Inc. (2) | | | 248 | | | | 6,329 | |
Advaxis, Inc. (2) | | | 669 | | | | 4,790 | |
Align Technology, Inc. (2) | | | 675 | | | | 64,888 | |
Atara Biotherapeutics, Inc. (2) | | | 33 | | | | 469 | |
Avexis, Inc. (2) | | | 1 | | | | 48 | |
Bellicum Pharmaceuticals, Inc. (2) | | | 38 | | | | 518 | |
Cara Therapeutics, Inc. (2) | | | 1,009 | | | | 9,374 | |
Charles River Laboratories International, Inc. (2) | | | 2,848 | | | | 216,989 | |
Dyax Corp. Contingent Value Rights (2)(7) | | | 7,373 | | | | — | |
Dynavax Technologies Corp. (2) | | | 789 | | | | 3,117 | |
Editas Medicine, Inc. (2) | | | 30 | | | | 487 | |
| Hill-Rom Holdings, Inc. | | | 5,606 | | | | 314,721 | |
HMS Holdings Corp. (2) | | | 12,477 | | | | 226,582 | |
Hologic, Inc. (2) | | | 9,084 | | | | 364,450 | |
IDEXX Laboratories, Inc. (2) | | | 4,295 | | | | 503,675 | |
Insys Therapeutics, Inc. (2)(3) | | | 952 | | | | 8,758 | |
Karyopharm Therapeutics, Inc. (2) | | | 769 | | | | 7,229 | |
Masimo Corp. (2) | | | 6,532 | | | | 440,256 | |
NewLink Genetics Corp. (2) | | | 1,199 | | | | 12,326 | |
PAREXEL International Corp. (2) | | | 3,111 | | | | 204,455 | |
Pfenex, Inc. (2) | | | 952 | | | | 8,635 | |
PRA Health Sciences, Inc. (2) | | | 2,279 | | | | 125,618 | |
PTC Therapeutics, Inc. (2) | | | 983 | | | | 10,725 | |
The accompanying notes are an integral part of these financial statements.
| 2016 Annual Report | December 31, 2016 | Page 37 |
Schedule of Investments
December 31, 2016
Aggressive Growth Fund
| Security Description | | Shares or Principal Amount ($) | | | Fair Value ($) | |
| Common Stocks — continued | | | | | | |
Puma Biotechnology, Inc. (2) | | | 501 | | | | 15,381 | |
Quintiles IMS Holdings, Inc. (2) | | | 3,496 | | | | 265,871 | |
Seres Therapeutics, Inc. (2) | | | 705 | | | | 6,980 | |
United Therapeutics Corp. (2) | | | 2,419 | | | | 346,957 | |
VWR Corp. (2) | | | 10,685 | | | | 267,446 | |
WellCare Health Plans, Inc. (2) | | | 190 | | | | 26,045 | |
| | | | | | | | 3,463,119 | |
| | | | | | | | | |
| Industrials — 18.6% | | | | | | | | |
| ABM Industries, Inc. | | | 609 | | | | 24,872 | |
Avis Budget Group, Inc. (2) | | | 7,504 | | | | 275,247 | |
| Barnes Group, Inc. | | | 689 | | | | 32,672 | |
| Brady Corp. | | | 11,129 | | | | 417,894 | |
| Brink's Co./The | | | 9,680 | | | | 399,300 | |
| Carlisle Cos., Inc. | | | 1,958 | | | | 215,948 | |
| Crane Co. | | | 6,097 | | | | 439,716 | |
| Dun & Bradstreet Corp./The | | | 3,743 | | | | 454,101 | |
| EMCOR Group, Inc. | | | 6,282 | | | | 444,513 | |
| EnerSys | | | 5,685 | | | | 443,999 | |
| G&K Services, Inc. | | | 193 | | | | 18,615 | |
HD Supply Holdings, Inc. (2) | | | 2,075 | | | | 88,208 | |
| Herman Miller, Inc. | | | 1,227 | | | | 41,963 | |
| Huntington Ingalls Industries, Inc. | | | 2,673 | | | | 492,340 | |
Jacobs Engineering Group, Inc. (2) | | | 7,671 | | | | 437,247 | |
| Landstar System, Inc. | | | 3,365 | | | | 287,035 | |
| ManpowerGroup, Inc. | | | 993 | | | | 88,248 | |
MasTec, Inc. (2) | | | 6,784 | | | | 259,488 | |
Moog, Inc. (2) | | | 909 | | | | 59,703 | |
| Mueller Industries, Inc. | | | 10,483 | | | | 418,901 | |
| Pitney Bowes, Inc. | | | 20,028 | | | | 304,225 | |
| Regal Beloit Corp. | | | 3,341 | | | | 231,364 | |
| SkyWest, Inc. | | | 1,093 | | | | 39,840 | |
| Spirit AeroSystems Holdings, Inc. | | | 8,266 | | | | 482,321 | |
Swift Transportation Co. (2) | | | 16,302 | | | | 397,117 | |
| Tetra Tech, Inc. | | | 4,316 | | | | 186,235 | |
| Timken Co./The | | | 694 | | | | 27,552 | |
| Trinity Industries, Inc. | | | 15,961 | | | | 443,076 | |
United Rentals, Inc. (2) | | | 815 | | | | 86,048 | |
Univar, Inc. (2) | | | 932 | | | | 26,441 | |
| Universal Forest Products, Inc. | | | 3,298 | | | | 336,990 | |
WESCO International, Inc. (2) | | | 6,358 | | | | 423,125 | |
| West Corp. | | | 10,847 | | | | 268,572 | |
| | | | | | | | 8,592,916 | |
| | | | | | | | | |
| Information Technology — 13.8% | | | | | | | | |
Amkor Technology, Inc. (2) | | | 15,047 | | | | 158,746 | |
ARRIS International PLC (2) | | | 5,771 | | | | 173,880 | |
Aggressive Growth Fund
| Security Description | | Shares or Principal Amount ($) | | | Fair Value ($) | |
| Common Stocks — continued | | | | | | |
Arrow Electronics, Inc. (2) | | | 2,309 | | | | 164,632 | |
Aspen Technology, Inc. (2) | | | 8,335 | | | | 455,758 | |
| Booz Allen Hamilton Holding Corp. | | | 11,456 | | | | 413,218 | |
| Brocade Communications Systems, Inc. | | | 3,965 | | | | 49,523 | |
Cadence Design Systems, Inc. (2) | | | 17,801 | | | | 448,941 | |
Cardtronics PLC (2) | | | 1,454 | | | | 79,345 | |
Cirrus Logic, Inc. (2) | | | 7,706 | | | | 435,696 | |
| Convergys Corp. | | | 7,215 | | | | 177,200 | |
| Fair Isaac Corp. | | | 1,765 | | | | 210,423 | |
Finisar Corp. (2) | | | 204 | | | | 6,175 | |
Gigamon, Inc. (2) | | | 2,560 | | | | 116,608 | |
IAC/InterActiveCorp (2) | | | 457 | | | | 29,609 | |
| Intersil Corp. | | | 1,321 | | | | 29,458 | |
| Jabil Circuit, Inc. | | | 19,992 | | | | 473,211 | |
Keysight Technologies, Inc. (2) | | | 5,266 | | | | 192,578 | |
| ManTech International Corp./VA | | | 912 | | | | 38,532 | |
Match Group, Inc. (2) | | | 2,986 | | | | 51,061 | |
| Mentor Graphics Corp. | | | 1,054 | | | | 38,882 | |
ON Semiconductor Corp. (2) | | | 23,644 | | | | 301,697 | |
Sanmina Corp. (2) | | | 12,070 | | | | 442,366 | |
| Science Applications International Corp. | | | 5,270 | | | | 446,896 | |
Semtech Corp. (2) | | | 4,377 | | | | 138,094 | |
Shutterstock, Inc. (2) | | | 1,844 | | | | 87,627 | |
| SYNNEX Corp. | | | 1,638 | | | | 198,231 | |
Synopsys, Inc. (2) | | | 8,285 | | | | 487,655 | |
TiVo Corp. (2) | | | 11,745 | | | | 245,471 | |
| Travelport Worldwide, Ltd. | | | 18,636 | | | | 262,768 | |
| | | | | | | | 6,354,281 | |
| | | | | | | | | |
| Materials — 7.1% | | | | | | | | |
Berry Plastics Group, Inc. (2) | | | 518 | | | | 25,242 | |
| Chemours Co./The | | | 4,092 | | | | 90,392 | |
Coeur Mining, Inc. (2) | | | 2,642 | | | | 24,016 | |
| Commercial Metals Co. | | | 12,234 | | | | 266,457 | |
| Eagle Materials, Inc. | | | 4,496 | | | | 442,991 | |
GCP Applied Technologies, Inc. (2) | | | 6,296 | | | | 168,418 | |
| Greif, Inc. | | | 1,387 | | | | 71,167 | |
| Huntsman Corp. | | | 6,567 | | | | 125,298 | |
Ingevity Corp. (2) | | | 659 | | | | 36,153 | |
| Innospec, Inc. | | | 3,400 | | | | 232,900 | |
| Minerals Technologies, Inc. | | | 3,059 | | | | 236,308 | |
| Reliance Steel & Aluminum Co. | | | 5,522 | | | | 439,220 | |
| Steel Dynamics, Inc. | | | 9,047 | | | | 321,892 | |
| Trinseo SA | | | 7,026 | | | | 416,641 | |
| Worthington Industries, Inc. | | | 7,490 | | | | 355,326 | |
| | | | | | | | 3,252,421 | |
The accompanying notes are an integral part of these financial statements.
| Page 38 | 2016 Annual Report | December 31, 2016 |
Schedule of Investments
December 31, 2016
Aggressive Growth Fund
| Security Description | | Shares or Principal Amount ($) | | | Fair Value ($) | |
| Common Stocks — continued | | | | | | |
| Real Estate Investment Trust — 5.6% | | | | |
| CBL & Associates Properties, Inc. | | | 9,930 | | | | 114,195 | |
| Communications Sales & Leasing, Inc. | | | 16,435 | | | | 417,613 | |
| Corporate Office Properties Trust | | | 3,029 | | | | 94,565 | |
| Hospitality Properties Trust | | | 14,940 | | | | 474,196 | |
| Jones Lang LaSalle, Inc. | | | 1,395 | | | | 140,951 | |
| Lamar Advertising Co. | | | 1,106 | | | | 74,367 | |
| Lexington Realty Trust | | | 21,664 | | | | 233,971 | |
| National Health Investors, Inc. | | | 5,928 | | | | 439,680 | |
| RLJ Lodging Trust | | | 8,705 | | | | 213,185 | |
| Select Income REIT | | | 5,442 | | | | 137,138 | |
| Sunstone Hotel Investors, Inc. | | | 2,928 | | | | 44,652 | |
| Xenia Hotels & Resorts, Inc. | | | 9,598 | | | | 186,393 | |
| | | | | | | | 2,570,906 | |
| | | | | | | | | |
| Telecommunication Services — 0.9% | | | | | | | | |
| Telephone & Data Systems, Inc. | | | 14,915 | | | | 430,596 | |
| | | | | | | | 430,596 | |
| | | | | | | | | |
| Utilities — 3.2% | | | | | | | | |
| El Paso Electric Co. | | | 638 | | | | 29,667 | |
| NRG Yield, Inc. | | | 6,765 | | | | 103,910 | |
| Portland General Electric Co. | | | 9,528 | | | | 412,848 | |
| Southwest Gas Holdings, Inc. | | | 5,832 | | | | 446,848 | |
| UGI Corp. | | | 10,736 | | | | 494,715 | |
| | | | | | | | 1,487,988 | |
Total Common Stocks
(Cost $38,177,014) | | | | | | | 40,387,298 | |
| | | | | | | | | |
| Money Market Registered Investment Companies — 11.2% | |
Morgan Stanley Government Institutional Fund, 0.44% (4) | | | 57,364 | | | | 57,364 | |
Meeder Institutional Prime Money Market Fund 0.64% (5) | | | 5,094,914 | | | | 5,095,423 | |
Total Money Market Registered Investment Companies
(Cost $5,152,757) | | | | | | | 5,152,787 | |
Total Investments — 98.8%
(Cost $43,329,771) (1) | | | | | | | 45,540,085 | |
| Other Assets less Liabilities — 1.2% | | | | | | | 541,105 | |
| Total Net Assets — 100.0% | | | | | | | 46,081,190 | |
Aggressive Growth Fund
| Security Description | | Shares or Principal Amount ($) | | | Fair Value ($) | |
Trustee Deferred Compensation (6) | | | | | | |
| Meeder Aggressive Growth Fund | | | 1,906 | | | | 19,708 | |
| Meeder Balanced Fund | | | 1,013 | | | | 10,880 | |
| Meeder Dynamic Growth Fund | | | 685 | | | | 6,658 | |
| Meeder Muirfield Fund | | | 2,235 | | | | 15,176 | |
| Meeder Quantex Fund | | | 1,180 | | | | 39,365 | |
| Meeder Infrastructure Fund | | | 293 | | | | 6,247 | |
Total Trustee Deferred Compensation
(Cost $77,986) | | | | | | | 98,034 | |
| | | Long Contracts | | | Unrealized Appreciation (Depreciation)($) | |
| Futures Contracts | | | | | | |
| Russell 2000 Mini Index Futures expiring March 2017, notional value $2,306,730 | | | 34 | | | | (51,507 | ) |
| E-mini Standard & Poors MidCap 400 Futures expiring March 2017, notional value $3,318,200 | | | 20 | | | | (70,850 | ) |
| Total Futures Contracts | | | 54 | | | | (122,357 | ) |
| (1) | Cost for federal income tax purposes of $43,367,829 differs from value by net unrealized appreciation (depreciation) of securities as follows: |
| Unrealized appreciation | | $ | 3,285,131 | |
| Unrealized depreciation | | | (1,235,232 | ) |
| Net unrealized appreciation (depreciation) | | $ | 2,049,899 | |
| (2) | Represents non-income producing securities. |
| (3) | All or a portion of this security is on loan. |
| (4) | Investment purchased with cash received as securities lending collateral. The yield shown represents the 7-day yield in effect at December 31, 2016. |
| (5) | Investment in affiliate. The yield shown represents the 7-day yield in effect at December 31, 2016. |
| (6) | Assets of affiliates to the Aggressive Growth Fund held for the benefit of the Fund’s Trustees in connection with the Trustee Deferred Compensation Plan. |
| (7) | Fair valued security deemed as Level 3 security. |
The accompanying notes are an integral part of these financial statements.
| 2016 Annual Report | December 31, 2016 | Page 39 |
Schedule of Investments
December 31, 2016
Balanced Fund
| Security Description | | Shares or Principal Amount ($) | | | Fair Value ($) | |
| Common Stocks — 51.0% | | | | | | |
| Consumer Discretionary — 4.2% | | | | | | |
Amazon.com, Inc. (2) | | | 1,972 | | | | 1,478,744 | |
| Bed Bath & Beyond, Inc. | | | 4,137 | | | | 168,128 | |
| Best Buy Co., Inc. | | | 8,809 | | | | 375,880 | |
| Bloomin' Brands, Inc. | | | 2,146 | | | | 38,692 | |
| Brinker International, Inc. | | | 2,017 | | | | 99,902 | |
| Comcast Corp. | | | 15,372 | | | | 1,061,436 | |
Cooper-Standard Holdings, Inc. (2) | | | 56 | | | | 5,789 | |
| Darden Restaurants, Inc. | | | 150 | | | | 10,908 | |
| Dick's Sporting Goods, Inc. | | | 2,595 | | | | 137,795 | |
| Domino's Pizza, Inc. | | | 834 | | | | 132,806 | |
| DR Horton, Inc. | | | 10,022 | | | | 273,901 | |
| Ford Motor Co. | | | 30,383 | | | | 368,546 | |
| Gap, Inc./The | | | 7,119 | | | | 159,750 | |
| General Motors Co. | | | 16,169 | | | | 563,328 | |
| Goodyear Tire & Rubber Co./The | | | 1,851 | | | | 57,140 | |
| H&R Block, Inc. | | | 881 | | | | 20,254 | |
| Harman International Industries, Inc. | | | 383 | | | | 42,574 | |
| Home Depot, Inc./The | | | 5,037 | | | | 675,361 | |
| HSN, Inc. | | | 597 | | | | 20,477 | |
| ILG, Inc. | | | 6,337 | | | | 115,143 | |
| International Game Technology PLC | | | 4,027 | | | | 102,769 | |
| Kohl's Corp. | | | 2,848 | | | | 140,634 | |
| Las Vegas Sands Corp. | | | 7,437 | | | | 397,210 | |
Liberty Media Corp-Liberty SiriusXM (2) | | | 2,801 | | | | 96,691 | |
| Macy's, Inc. | | | 8,659 | | | | 310,079 | |
Michael Kors Holdings, Ltd. (2) | | | 4,471 | | | | 192,164 | |
Michaels Cos., Inc./The (2) | | | 4,172 | | | | 85,317 | |
| Nordstrom, Inc. | | | 4,190 | | | | 200,827 | |
Priceline Group, Inc./The (2) | | | 278 | | | | 407,565 | |
| PVH Corp. | | | 902 | | | | 81,396 | |
| Regal Entertainment Group | | | 2,568 | | | | 52,901 | |
Sally Beauty Holdings, Inc. (2) | | | 482 | | | | 12,734 | |
| Scripps Networks Interactive, Inc. | | | 523 | | | | 37,327 | |
| Staples, Inc. | | | 12,560 | | | | 113,668 | |
Tenneco, Inc. (2) | | | 847 | | | | 52,912 | |
| Time Warner, Inc. | | | 13,624 | | | | 1,315,125 | |
| Tupperware Brands Corp. | | | 1,791 | | | | 94,242 | |
Urban Outfitters, Inc. (2) | | | 993 | | | | 28,281 | |
| Viacom, Inc. | | | 391 | | | | 13,724 | |
| Whirlpool Corp. | | | 1,240 | | | | 225,395 | |
| | | | | | | | 9,767,515 | |
| | | | | | | | | |
| Consumer Staples — 4.4% | | | | | | | | |
| Altria Group, Inc. | | | 23,941 | | | | 1,618,890 | |
| Archer-Daniels-Midland Co. | | | 13,220 | | | | 603,493 | |
| Dean Foods Co. | | | 2,738 | | | | 59,634 | |
Balanced Fund
| Security Description | | Shares or Principal Amount ($) | | | Fair Value ($) | |
| Common Stocks — continued | | | | | | |
Herbalife, Ltd. (2) | | | 2,283 | | | | 109,904 | |
| Kroger Co./The | | | 23,741 | | | | 819,302 | |
| Nu Skin Enterprises, Inc. | | | 1,213 | | | | 57,957 | |
| PepsiCo, Inc. | | | 16,397 | | | | 1,715,618 | |
| Philip Morris International, Inc. | | | 18,266 | | | | 1,671,156 | |
| Procter & Gamble Co./The | | | 8,069 | | | | 678,442 | |
| Reynolds American, Inc. | | | 5,349 | | | | 299,758 | |
| Sysco Corp. | | | 3,519 | | | | 194,847 | |
| Tyson Foods, Inc. | | | 14,991 | | | | 924,645 | |
| Wal-Mart Stores, Inc. | | | 20,695 | | | | 1,430,438 | |
| | | | | | | | 10,184,084 | |
| | | | | | | | | |
| Energy — 3.6% | | | | | | | | |
| Anadarko Petroleum Corp. | | | 5,260 | | | | 366,780 | |
| Apache Corp. | | | 2,655 | | | | 168,513 | |
Chesapeake Energy Corp. (2) | | | 6,050 | | | | 42,471 | |
| Chevron Corp. | | | 4,197 | | | | 493,987 | |
Continental Resources, Inc./OK (2) | | | 1,433 | | | | 73,857 | |
| Devon Energy Corp. | | | 16,238 | | | | 741,589 | |
| Ensco PLC | | | 1,307 | | | | 12,704 | |
| EOG Resources, Inc. | | | 11,285 | | | | 1,140,914 | |
| Exxon Mobil Corp. | | | 24,545 | | | | 2,215,431 | |
FMC Technologies, Inc. (2) | | | 2,572 | | | | 91,383 | |
| Kinder Morgan, Inc./DE | | | 17,345 | | | | 359,215 | |
Laredo Petroleum, Inc. (2) | | | 671 | | | | 9,488 | |
| Marathon Oil Corp. | | | 3,698 | | | | 64,012 | |
| Marathon Petroleum Corp. | | | 9,462 | | | | 476,412 | |
| Nabors Industries, Ltd. | | | 1,091 | | | | 17,892 | |
| Noble Energy, Inc. | | | 781 | | | | 29,725 | |
| Oceaneering International, Inc. | | | 1,681 | | | | 47,421 | |
QEP Resources, Inc. (2) | | | 1,154 | | | | 21,245 | |
Rice Energy, Inc. (2) | | | 22 | | | | 470 | |
| Schlumberger, Ltd. | | | 6,089 | | | | 511,172 | |
| SM Energy Co. | | | 420 | | | | 14,482 | |
Southwestern Energy Co. (2) | | | 3,173 | | | | 34,332 | |
| Spectra Energy Corp. | | | 13,089 | | | | 537,827 | |
| Tesoro Corp. | | | 1,128 | | | | 98,644 | |
Transocean, Ltd. (2) | | | 620 | | | | 9,139 | |
| Valero Energy Corp. | | | 8,842 | | | | 604,085 | |
WPX Energy, Inc. (2) | | | 1,437 | | | | 20,937 | |
| | | | | | | | 8,204,127 | |
| | | | | | | | | |
| Financials — 9.1% | | | | | | | | |
| Aflac, Inc. | | | 14,983 | | | | 1,042,817 | |
| Allstate Corp./The | | | 14,038 | | | | 1,040,497 | |
| Ally Financial, Inc. | | | 3,610 | | | | 68,662 | |
| Aon PLC | | | 4,393 | | | | 489,951 | |
The accompanying notes are an integral part of these financial statements.
| Page 40 | 2016 Annual Report | December 31, 2016 |
Schedule of Investments
December 31, 2016
Balanced Fund
| Security Description | | Shares or Principal Amount ($) | | | Fair Value ($) | |
| Common Stocks — continued | | | | | | |
| Assured Guaranty, Ltd. | | | 384 | | | | 14,504 | |
| Bank of America Corp. | | | 91,294 | | | | 2,017,597 | |
| BB&T Corp. | | | 23,188 | | | | 1,090,300 | |
Berkshire Hathaway, Inc. (2) | | | 4,193 | | | | 683,375 | |
| Capital One Financial Corp. | | | 1,811 | | | | 157,992 | |
| Chimera Investment Corp. | | | 6,490 | | | | 110,460 | |
| Citizens Financial Group, Inc. | | | 2,078 | | | | 74,039 | |
Essent Group, Ltd. (2) | | | 2,367 | | | | 76,620 | |
| Everest Re Group, Ltd. | | | 827 | | | | 178,963 | |
| Fifth Third Bancorp | | | 34,201 | | | | 922,401 | |
| JPMorgan Chase & Co. | | | 25,976 | | | | 2,241,468 | |
| Lazard, Ltd. | | | 1,648 | | | | 67,716 | |
| Lincoln National Corp. | | | 413 | | | | 27,370 | |
| LPL Financial Holdings, Inc. | | | 429 | | | | 15,105 | |
| Marsh & McLennan Cos., Inc. | | | 14,983 | | | | 1,012,701 | |
| MetLife, Inc. | | | 10,292 | | | | 554,636 | |
MGIC Investment Corp. (2) | | | 4,833 | | | | 49,248 | |
| Morgan Stanley | | | 28,326 | | | | 1,196,774 | |
| Navient Corp. | | | 6,101 | | | | 100,239 | |
| Popular, Inc. | | | 1,182 | | | | 51,795 | |
| Principal Financial Group, Inc. | | | 8,972 | | | | 519,120 | |
| Progressive Corp./The | | | 6,310 | | | | 224,005 | |
| Prudential Financial, Inc. | | | 10,754 | | | | 1,119,061 | |
| Regions Financial Corp. | | | 30,316 | | | | 435,338 | |
| Reinsurance Group of America, Inc. | | | 4,593 | | | | 577,937 | |
| S&P Global, Inc. | | | 9,108 | | | | 979,474 | |
Santander Consumer USA Holdings, Inc. (2) | | | 1,775 | | | | 23,963 | |
| Selective Insurance Group, Inc. | | | 1,989 | | | | 85,626 | |
| Synchrony Financial | | | 28,541 | | | | 1,035,182 | |
| TCF Financial Corp. | | | 10,592 | | | | 207,497 | |
| Unum Group | | | 2,559 | | | | 112,417 | |
| US Bancorp | | | 25,864 | | | | 1,328,634 | |
| Wells Fargo & Co. | | | 18,782 | | | | 1,035,076 | |
| | | | | | | | 20,968,560 | |
| Healthcare — 7.6% | | | | | | | | |
| AbbVie, Inc. | | | 15,394 | | | | 963,972 | |
| Aetna, Inc. | | | 300 | | | | 37,203 | |
| Agilent Technologies, Inc. | | | 9,540 | | | | 434,642 | |
Alere, Inc. (2) | | | 470 | | | | 18,316 | |
Align Technology, Inc. (2) | | | 205 | | | | 19,707 | |
Allscripts Healthcare Solutions, Inc. (2) | | | 976 | | | | 9,965 | |
| AmerisourceBergen Corp. | | | 5,231 | | | | 409,012 | |
| Amgen, Inc. | | | 5,295 | | | | 774,182 | |
| Baxter International, Inc. | | | 16,503 | | | | 731,743 | |
Biogen, Inc. (2) | | | 1,518 | | | | 430,474 | |
| Bruker Corp. | | | 750 | | | | 15,885 | |
| | | | | | | | | |
Balanced Fund
| Security Description | | Shares or Principal Amount ($) | | | Fair Value ($) | |
| Common Stocks — continued | | | | | | |
| Cardinal Health, Inc. | | | 1,235 | | | | 88,883 | |
Charles River Laboratories International, Inc. (2) | | | 1,038 | | | | 79,085 | |
| Cigna Corp. | | | 776 | | | | 103,511 | |
Endo International PLC (2) | | | 459 | | | | 7,560 | |
Express Scripts Holding Co. (2) | | | 842 | | | | 57,921 | |
| Gilead Sciences, Inc. | | | 12,260 | | | | 877,939 | |
HCA Holdings, Inc. (2) | | | 13,778 | | | | 1,019,848 | |
| Hill-Rom Holdings, Inc. | | | 2,069 | | | | 116,154 | |
HMS Holdings Corp. (2) | | | 1,311 | | | | 23,808 | |
Hologic, Inc. (2) | | | 3,121 | | | | 125,215 | |
| Humana, Inc. | | | 170 | | | | 34,685 | |
IDEXX Laboratories, Inc. (2) | | | 2,948 | | | | 345,712 | |
Ionis Pharmaceuticals, Inc. (2) | | | 453 | | | | 21,667 | |
| Johnson & Johnson | | | 18,383 | | | | 2,117,904 | |
LifePoint Health, Inc. (2) | | | 326 | | | | 18,517 | |
Mallinckrodt PLC (2) | | | 1,699 | | | | 84,644 | |
Masimo Corp. (2) | | | 1,844 | | | | 124,286 | |
| Medtronic PLC | | | 13,763 | | | | 980,338 | |
| Merck & Co., Inc. | | | 20,675 | | | | 1,217,137 | |
| Pfizer, Inc. | | | 30,099 | | | | 977,616 | |
Premier, Inc. (2) | | | 600 | | | | 18,216 | |
QIAGEN NV (2) | | | 1,278 | | | | 35,810 | |
| Quest Diagnostics, Inc. | | | 4,446 | | | | 408,587 | |
Quintiles IMS Holdings, Inc. (2) | | | 1,925 | | | | 146,396 | |
Seattle Genetics, Inc. (2) | | | 1,354 | | | | 71,451 | |
| St Jude Medical, Inc. | | | 12,648 | | | | 1,014,243 | |
| Stryker Corp. | | | 2,528 | | | | 302,880 | |
Tenet Healthcare Corp. (2) | | | 894 | | | | 13,267 | |
| Thermo Fisher Scientific, Inc. | | | 6,579 | | | | 928,297 | |
United Therapeutics Corp. (2) | | | 1,257 | | | | 180,292 | |
| UnitedHealth Group, Inc. | | | 9,503 | | | | 1,520,860 | |
VWR Corp. (2) | | | 3,416 | | | | 85,502 | |
WellCare Health Plans, Inc. (2) | | | 698 | | | | 95,682 | |
| Zoetis, Inc. | | | 6,135 | | | | 328,407 | |
| | | | | | | | 17,417,421 | |
| | | | | | | | | |
| Industrials — 4.5% | | | | | | | | |
AECOM (2) | | | 936 | | | | 34,033 | |
| American Airlines Group, Inc. | | | 10,519 | | | | 491,132 | |
| Arconic, Inc. | | | 2,576 | | | | 47,759 | |
Avis Budget Group, Inc. (2) | | | 949 | | | | 34,809 | |
| Barnes Group, Inc. | | | 615 | | | | 29,163 | |
| Boeing Co./The | | | 8,968 | | | | 1,396,138 | |
| Brink's Co./The | | | 978 | | | | 40,343 | |
| Carlisle Cos., Inc. | | | 753 | | | | 83,048 | |
| Crane Co. | | | 1,728 | | | | 124,623 | |
The accompanying notes are an integral part of these financial statements.
| 2016 Annual Report | December 31, 2016 | Page 41 |
Schedule of Investments
December 31, 2016
Balanced Fund
| Security Description | | Shares or Principal Amount ($) | | | Fair Value ($) | |
| Common Stocks — continued | | | | | | |
| Cummins, Inc. | | | 3,084 | | | | 421,490 | |
| Dun & Bradstreet Corp./The | | | 671 | | | | 81,406 | |
| Eaton Corp. PLC | | | 15,495 | | | | 1,039,560 | |
| EnerSys | | | 748 | | | | 58,419 | |
| Fortive Corp. | | | 9,905 | | | | 531,205 | |
HD Supply Holdings, Inc. (2) | | | 2,300 | | | | 97,773 | |
| Honeywell International, Inc. | | | 9,744 | | | | 1,128,841 | |
| Huntington Ingalls Industries, Inc. | | | 1,055 | | | | 194,320 | |
| Illinois Tool Works, Inc. | | | 8,161 | | | | 999,396 | |
Jacobs Engineering Group, Inc. (2) | | | 613 | | | | 34,941 | |
| Landstar System, Inc. | | | 2,123 | | | | 181,092 | |
| Lockheed Martin Corp. | | | 112 | | | | 27,993 | |
| LSC Communications, Inc. | | | 93 | | | | 2,760 | |
| ManpowerGroup, Inc. | | | 1,529 | | | | 135,882 | |
| MSC Industrial Direct Co., Inc. | | | 268 | | | | 24,761 | |
| Parker-Hannifin Corp. | | | 2,442 | | | | 341,880 | |
| Pitney Bowes, Inc. | | | 5,904 | | | | 89,682 | |
| Regal Beloit Corp. | | | 1,102 | | | | 76,314 | |
| RR Donnelley & Sons Co. | | | 24 | | | | 392 | |
| Ryder System, Inc. | | | 761 | | | | 56,649 | |
| Spirit AeroSystems Holdings, Inc. | | | 3,746 | | | | 218,579 | |
| Terex Corp. | | | 126 | | | | 3,973 | |
| Timken Co./The | | | 66 | | | | 2,620 | |
| Trinity Industries, Inc. | | | 2,784 | | | | 77,284 | |
| Union Pacific Corp. | | | 10,296 | | | | 1,067,489 | |
United Continental Holdings, Inc. (2) | | | 6,113 | | | | 445,515 | |
| United Parcel Service, Inc. | | | 4,991 | | | | 572,168 | |
United Rentals, Inc. (2) | | | 1,112 | | | | 117,405 | |
| Universal Forest Products, Inc. | | | 365 | | | | 37,296 | |
WESCO International, Inc. (2) | | | 629 | | | | 41,860 | |
| West Corp. | | | 2,736 | | | | 67,743 | |
| | | | | | | | 10,457,736 | |
| | | | | | | | | |
| Information Technology — 12.3% | | | | | | | | |
| Accenture PLC | | | 10,567 | | | | 1,237,713 | |
Alphabet, Inc. - Class C (2) | | | 2,741 | | | | 2,115,559 | |
Amkor Technology, Inc. (2) | | | 4,177 | | | | 44,067 | |
| Apple, Inc. | | | 30,262 | | | | 3,504,944 | |
| Applied Materials, Inc. | | | 30,808 | | | | 994,174 | |
ARRIS International PLC (2) | | | 2,852 | | | | 85,931 | |
| Booz Allen Hamilton Holding Corp. | | | 2,397 | | | | 86,460 | |
| Brocade Communications Systems, Inc. | | | 2,177 | | | | 27,191 | |
| CA, Inc. | | | 22,065 | | | | 701,005 | |
Cadence Design Systems, Inc. (2) | | | 10,811 | | | | 272,653 | |
| CDK Global, Inc. | | | 2,329 | | | | 139,018 | |
| Cisco Systems, Inc. | | | 51,914 | | | | 1,568,841 | |
Citrix Systems, Inc. (2) | | | 4,782 | | | | 427,080 | |
Balanced Fund
| Security Description | | Shares or Principal Amount ($) | | | Fair Value ($) | |
| Common Stocks — continued | | | | | | |
| Computer Sciences Corp. | | | 2,673 | | | | 158,830 | |
| CSRA, Inc. | | | 1,875 | | | | 59,700 | |
Dell Technologies, Inc. Class V (2) | | | 6,364 | | | | 349,829 | |
eBay, Inc. (2) | | | 35,840 | | | | 1,064,090 | |
Electronic Arts, Inc. (2) | | | 4,163 | | | | 327,878 | |
F5 Networks, Inc. (2) | | | 1,195 | | | | 172,940 | |
Facebook, Inc. (2) | | | 4,072 | | | | 468,484 | |
| Harris Corp. | | | 884 | | | | 90,583 | |
| Hewlett Packard Enterprise Co. | | | 46,821 | | | | 1,083,438 | |
| HP, Inc. | | | 54,374 | | | | 806,910 | |
IAC/InterActiveCorp (2) | | | 25 | | | | 1,620 | |
| Intel Corp. | | | 33,886 | | | | 1,229,045 | |
| International Business Machines Corp. | | | 10,128 | | | | 1,681,147 | |
| Intuit, Inc. | | | 8,814 | | | | 1,010,173 | |
| Jabil Circuit, Inc. | | | 2,345 | | | | 55,506 | |
Keysight Technologies, Inc. (2) | | | 2,536 | | | | 92,742 | |
| KLA-Tencor Corp. | | | 91 | | | | 7,160 | |
| Linear Technology Corp. | | | 3,451 | | | | 215,170 | |
| Microsoft Corp. | | | 47,426 | | | | 2,947,052 | |
| Motorola Solutions, Inc. | | | 197 | | | | 16,329 | |
NCR Corp. (2) | | | 768 | | | | 31,150 | |
| NetApp, Inc. | | | 5,886 | | | | 207,599 | |
ON Semiconductor Corp. (2) | | | 5,705 | | | | 72,796 | |
| Oracle Corp. | | | 38,509 | | | | 1,480,671 | |
| QUALCOMM, Inc. | | | 13,148 | | | | 857,250 | |
Sanmina Corp. (2) | | | 2,469 | | | | 90,489 | |
| Science Applications International Corp. | | | 563 | | | | 47,742 | |
Semtech Corp. (2) | | | 986 | | | | 31,108 | |
SunPower Corp. (2)(3) | | | 1,659 | | | | 10,966 | |
| Symantec Corp. | | | 13,904 | | | | 332,167 | |
Synopsys, Inc. (2) | | | 4,810 | | | | 283,117 | |
| Texas Instruments, Inc. | | | 17,091 | | | | 1,247,130 | |
| Travelport Worldwide, Ltd. | | | 4,343 | | | | 61,236 | |
Versum Materials, Inc. (2) | | | 2,786 | | | | 78,203 | |
| Western Union Co./The | | | 463 | | | | 10,056 | |
| Xerox Corp. | | | 21,728 | | | | 189,685 | |
| | | | | | | | 28,074,627 | |
| | | | | | | | | |
| Materials — 1.1% | | | | | | | | |
AdvanSix, Inc. (2) | | | 15 | | | | 332 | |
| Eastman Chemical Co. | | | 869 | | | | 65,357 | |
Freeport-McMoRan, Inc. (2) | | | 10,588 | | | | 139,656 | |
| Graphic Packaging Holding Co. | | | 2,891 | | | | 36,080 | |
| Huntsman Corp. | | | 1,784 | | | | 34,039 | |
| International Paper Co. | | | 11,669 | | | | 619,157 | |
| LyondellBasell Industries NV | | | 11,880 | | | | 1,019,066 | |
| Newmont Mining Corp. | | | 7,773 | | | | 264,826 | |
The accompanying notes are an integral part of these financial statements.
| Page 42 | 2016 Annual Report | December 31, 2016 |
Schedule of Investments
December 31, 2016
Balanced Fund
| Security Description | | Shares or Principal Amount ($) | | | Fair Value ($) | |
| Common Stocks — continued | | | | | | |
| Nucor Corp. | | | 2,581 | | | | 153,621 | |
Owens-Illinois, Inc. (2) | | | 587 | | | | 10,220 | |
| Packaging Corp of America | | | 204 | | | | 17,303 | |
| Reliance Steel & Aluminum Co. | | | 1,353 | | | | 107,618 | |
| Steel Dynamics, Inc. | | | 3,321 | | | | 118,161 | |
| United States Steel Corp. | | | 50 | | | | 1,651 | |
| | | | | | | | 2,587,087 | |
| | | | | | | | | |
| Real Estate Investment Trust — 1.1% | | | | | | |
| CBL & Associates Properties, Inc. | | | 3,859 | | | | 44,379 | |
CBRE Group, Inc. (2) | | | 9,753 | | | | 307,122 | |
| Communications Sales & Leasing, Inc. | | | 3,758 | | | | 95,491 | |
| CoreCivic, Inc. | | | 630 | | | | 15,410 | |
| Corporate Office Properties Trust | | | 4,978 | | | | 155,413 | |
| Duke Realty Corp. | | | 2,987 | | | | 79,335 | |
| EPR Properties | | | 425 | | | | 30,502 | |
| Gaming and Leisure Properties, Inc. | | | 15,298 | | | | 468,425 | |
| Highwoods Properties, Inc. | | | 2,240 | | | | 114,262 | |
| Hospitality Properties Trust | | | 13,789 | | | | 437,663 | |
| Jones Lang LaSalle, Inc. | | | 33 | | | | 3,334 | |
| Lamar Advertising Co. | | | 832 | | | | 55,944 | |
| NorthStar Realty Finance Corp. | | | 2,913 | | | | 44,132 | |
| Outfront Media, Inc. | | | 159 | | | | 3,954 | |
| Senior Housing Properties Trust | | | 2,718 | | | | 51,452 | |
| Tanger Factory Outlet Centers, Inc. | | | 1,522 | | | | 54,457 | |
| Weyerhaeuser Co. | | | 15,298 | | | | 460,317 | |
| | | | | | | | 2,421,592 | |
| | | | | | | | | |
| Telecommunication Services — 1.5% | | | | | | | | |
| AT&T, Inc. | | | 27,647 | | | | 1,175,827 | |
| CenturyLink, Inc. | | | 3,516 | | | | 83,610 | |
| Telephone & Data Systems, Inc. | | | 5,597 | | | | 161,585 | |
| Verizon Communications, Inc. | | | 39,083 | | | | 2,086,251 | |
| | | | | | | | 3,507,273 | |
| | | | | | | | | |
| Utilities — 1.6% | | | | | | | | |
| AES Corp./VA | | | 15,515 | | | | 180,284 | |
| CenterPoint Energy, Inc. | | | 21,802 | | | | 537,201 | |
| Edison International | | | 2,446 | | | | 176,088 | |
| Exelon Corp. | | | 30,039 | | | | 1,066,084 | |
| FirstEnergy Corp. | | | 20,431 | | | | 632,748 | |
| MDU Resources Group, Inc. | | | 984 | | | | 28,310 | |
| NiSource, Inc. | | | 4,368 | | | | 96,708 | |
| OGE Energy Corp. | | | 3,066 | | | | 102,558 | |
| Portland General Electric Co. | | | 4,903 | | | | 212,447 | |
| Southwest Gas Holdings, Inc. | | | 1,636 | | | | 125,350 | |
| UGI Corp. | | | 10,989 | | | | 506,373 | |
Balanced Fund
| Security Description | | Shares or Principal Amount ($) | | | Fair Value ($) | |
| Common Stocks — continued | | | | | | |
| Westar Energy, Inc. | | | 1,316 | | | | 74,157 | |
| | | | | | | | 3,738,308 | |
| | | | | | | | | |
Total Common Stocks
(Cost $112,840,852) | | | | | | | 117,328,330 | |
| | | | | | | | | |
| Registered Investment Companies — 33.9% | | | | | |
| Baird Core Plus Bond Fund - Class I | | | 423,411 | | | | 4,670,227 | |
| DoubleLine Total Return Bond Fund - Class I | | | 352,155 | | | | 3,739,883 | |
| Frost Total Return Bond Fund - Class I | | | 306,109 | | | | 3,171,284 | |
| Guggenheim Floating Rate Strategies Fund - Class I | | | 27,283 | | | | 711,550 | |
| Guggenheim Total Return Bond Fund - Class I | | | 145,936 | | | | 3,859,995 | |
iShares 1-3 Year Treasury Bond ETF (8) | | | 22,110 | | | | 1,867,190 | |
iShares 3-7 Year Treasury Bond ETF (8) | | | 36,690 | | | | 4,494,892 | |
iShares 7-10 Year Treasury Bond ETF (8) | | | 48,545 | | | | 5,088,486 | |
iShares Core U.S. Aggregate Bond ETF (8) | | | 26,700 | | | | 2,885,202 | |
iShares iBoxx $High Yield Corporate Bond ETF (3)(8) | | | 63,490 | | | | 5,495,060 | |
iShares JP Morgan USD Emerging Markets Bond ETF (8) | | | 17,705 | | | | 1,951,445 | |
iShares Russell 2000 Value ETF (8) | | | 57,698 | | | | 6,862,498 | |
| JPMorgan Core Plus Bond Fund - Class L | | | 568,977 | | | | 4,648,540 | |
| Lord Abbett Floating Rate Fund - Class I | | | 115,577 | | | | 1,069,083 | |
| Lord Abbett High Yield Fund - Class I | | | 286,570 | | | | 2,160,737 | |
| Metropolitan West Total Return Bond Fund - Class I | | | 715,003 | | | | 7,528,977 | |
PIMCO Investment Grade Corporate Bond Fund - Class I | | | 153,897 | | | | 1,571,289 | |
| Pioneer Bond Fund - Class Y | | | 493,202 | | | | 4,700,213 | |
| Prudential Total Return Bond Fund - Class Z | | | 544,623 | | | | 7,668,291 | |
SPDR Bloomberg Barclays High Yield Bond ETF (8) | | | 52,390 | | | | 1,909,616 | |
| TCW Emerging Markets Income Fund - Class I | | | 231,568 | | | | 1,875,698 | |
Total Registered Investment Companies
(Cost $77,551,359) | | | | | | | 77,930,156 | |
| | | | | | | | | |
| Money Market Registered Investment Companies — 16.7% | |
| Morgan Stanley Government | | | | | | | | |
Institutional Fund, 0.44% (4) | | | 5,589,029 | | | | 5,589,029 | |
Meeder Institutional Prime Money Market Fund 0.64% (5) | | | 32,880,825 | | | | 32,884,113 | |
| Total Money Market Registered | | | | | | | | |
Investment Companies
(Cost $38,473,126) | | | | | | | 38,473,142 | |
The accompanying notes are an integral part of these financial statements.
| 2016 Annual Report | December 31, 2016 | Page 43 |
Schedule of Investments
December 31, 2016
Balanced Fund
| Security Description | | Shares or Principal Amount ($) | | | Fair Value ($) | |
| Bank Obligations — 0.3% | | | | | | |
Capital Bank Deposit Account, 0.70%, 1/3/2017 (6) | | | 249,000 | | | | 249,000 | |
EverBank Money Market Account, 0.61%, 1/3/2017 (6) | | | 249,000 | | | | 249,000 | |
Pacific Mercantile Bank Deposit Account, 0.60%, 1/3/2017 (6) | | | 249,000 | | | | 249,000 | |
Total Bank Obligations
(Cost $747,000) | | | | | | | 747,000 | |
Total Investments — 101.9%
(Cost $229,612,337) (1) | | | | | | | 234,478,628 | |
| Liabilities less Other Assets — (1.9%) | | | | | | | (4,432,837 | ) |
| Total Net Assets — 100.0% | | | | | | | 230,045,791 | |
| | | | | | | | | |
Trustee Deferred Compensation (7) | | | | | | | | |
| Meeder Aggressive Growth Fund | | | 3,478 | | | | 35,963 | |
| Meeder Balanced Fund | | | 1,871 | | | | 20,095 | |
| Meeder Dynamic Growth Fund | | | 1,255 | | | | 12,199 | |
| Meeder Muirfield Fund | | | 3,164 | | | | 21,484 | |
| Meeder Quantex Fund | | | 1,255 | | | | 41,867 | |
| Meeder Infrastructure Fund | | | 541 | | | | 11,534 | |
Total Trustee Deferred Compensation
(Cost $122,238) | | | | | | | 143,142 | |
Balanced Fund
| | | Long Contracts | | | Unrealized Appreciation (Depreciation)($) | |
| Futures Contracts | | | | | | |
| Standard & Poors 500 Mini Futures expiring March 2017, notional value $20,237,610 | | | 181 | | | | (174,232 | ) |
| Total Futures Contracts | | | 181 | | | | (174,232 | ) |
| (1) | Cost for federal income tax purposes of $231,088,589 differs from value by net unrealized appreciation (depreciation) of securities as follows: |
| Unrealized appreciation | | $ | 8,246,454 | |
| Unrealized depreciation | | | (5,030,647 | ) |
| Net unrealized appreciation (depreciation) | | $ | 3,215,807 | |
| (2) | Represents non-income producing securities. |
| (3) | All or a portion of this security is on loan. |
| (4) | Investment purchased with cash received as securities lending collateral. The yield shown represents the 7-day yield in effect at December 31, 2016. |
| (5) | Investment in affiliate. The yield shown represents the 7-day yield in effect at December 31, 2016. |
| (6) | Variable rate security. Securities payable at par including accrued interest (usually within seven days notice) and unconditionally secured as to principal and interest by letters of credit or other credit support agreements from major banks. The interest rates are adjustable and are based on bank prime rates or other interest rate adjustment indices. The rate shown represents the rate in effect at December 31, 2016. The maturity date shown, if applicable, reflects the earlier of the next demand date or stated maturity date. |
| (7) | Assets of affiliates to the Balanced Fund held for the benefit of the Fund’s Trustees in connection with the Trustee Deferred Compensation Plan. |
The accompanying notes are an integral part of these financial statements.
| Page 44 | 2016 Annual Report | December 31, 2016 |
Schedule of Investments
December 31, 2016
Global Opportunities Fund
| Security Description | | Shares or Principal Amount ($) | | | Fair Value ($) | |
| Common Stocks — 47.4% | | | | | | |
| Consumer Discretionary — 1.2% | | | | | | |
| Best Buy Co., Inc. | | | 1,223 | | | | 52,185 | |
| Brinker International, Inc. | | | 1,958 | | | | 96,980 | |
| HSN, Inc. | | | 2,278 | | | | 78,135 | |
| ILG, Inc. | | | 4,584 | | | | 83,291 | |
| International Game Technology PLC | | | 9,580 | | | | 244,482 | |
| Macy's, Inc. | | | 2,414 | | | | 86,445 | |
Michael Kors Holdings, Ltd. (2) | | | 2,099 | | | | 90,215 | |
| Nordstrom, Inc. | | | 446 | | | | 21,377 | |
| Tupperware Brands Corp. | | | 3,563 | | | | 187,485 | |
| | | | | | | | 940,595 | |
| | | | | | | | | |
| Consumer Staples — 2.8% | | | | | | | | |
| Dean Foods Co. | | | 1,272 | | | | 27,704 | |
Herbalife, Ltd. (2) | | | 4,021 | | | | 193,571 | |
| Nu Skin Enterprises, Inc. | | | 5,372 | | | | 256,674 | |
| Philip Morris International, Inc. | | | 468 | | | | 42,817 | |
| Tyson Foods, Inc. | | | 8,804 | | | | 543,031 | |
| Wal-Mart Stores, Inc. | | | 15,119 | | | | 1,045,025 | |
| | | | | | | | 2,108,822 | |
| | | | | | | | | |
| Energy — 3.4% | | | | | | | | |
| Devon Energy Corp. | | | 10,776 | | | | 492,140 | |
| EOG Resources, Inc. | | | 3,319 | | | | 335,551 | |
FMC Technologies, Inc. (2) | | | 12,304 | | | | 437,161 | |
| Marathon Petroleum Corp. | | | 6,303 | | | | 317,356 | |
| Nabors Industries, Ltd. | | | 1,154 | | | | 18,926 | |
| Oceaneering International, Inc. | | | 4,566 | | | | 128,807 | |
QEP Resources, Inc. (2) | | | 13,100 | | | | 241,171 | |
| Tesoro Corp. | | | 2,732 | | | | 238,913 | |
| Valero Energy Corp. | | | 5,251 | | | | 358,748 | |
| Western Refining, Inc. | | | 712 | | | | 26,949 | |
| | | | | | | | 2,595,722 | |
| | | | | | | | | |
| Financials — 7.9% | | | | | | | | |
| Aflac, Inc. | | | 13,406 | | | | 933,059 | |
| Assured Guaranty, Ltd. | | | 3,013 | | | | 113,801 | |
| Bank of America Corp. | | | 22,015 | | | | 486,532 | |
| Chemical Financial Corp. | | | 352 | | | | 19,068 | |
Essent Group, Ltd. (2) | | | 10,424 | | | | 337,425 | |
| Everest Re Group, Ltd. | | | 2,464 | | | | 533,210 | |
| Fifth Third Bancorp | | | 20,468 | | | | 552,022 | |
| Hancock Holding Co. | | | 1,379 | | | | 59,435 | |
| Lazard, Ltd. | | | 1,236 | | | | 50,787 | |
MGIC Investment Corp. (2) | | | 36,928 | | | | 376,296 | |
| Navient Corp. | | | 11,872 | | | | 195,057 | |
| Popular, Inc. | | | 8,743 | | | | 383,118 | |
Global Opportunities Fund
| Security Description | | Shares or Principal Amount ($) | | | Fair Value ($) | |
| Common Stocks — continued | | | | | | |
| Principal Financial Group, Inc. | | | 829 | | | | 47,966 | |
| Reinsurance Group of America, Inc. | | | 6,835 | | | | 860,048 | |
| S&P Global, Inc. | | | 5,247 | | | | 564,262 | |
| Selective Insurance Group, Inc. | | | 3,057 | | | | 131,604 | |
| TCF Financial Corp. | | | 7,768 | | | | 152,175 | |
| Unum Group | | | 2,293 | | | | 100,731 | |
| Voya Financial, Inc. | | | 2,702 | | | | 105,972 | |
| | | | | | | | 6,002,568 | |
| | | | | | | | | |
| Healthcare — 4.6% | | | | | | | | |
| AbbVie, Inc. | | | 10,662 | | | | 667,654 | |
| AmerisourceBergen Corp. | | | 1,452 | | | | 113,532 | |
| Amgen, Inc. | | | 1,973 | | | | 288,472 | |
| Baxter International, Inc. | | | 6,872 | | | | 304,704 | |
| Gilead Sciences, Inc. | | | 11,486 | | | | 822,513 | |
HCA Holdings, Inc. (2) | | | 1,068 | | | | 79,053 | |
HMS Holdings Corp. (2) | | | 1,169 | | | | 21,229 | |
| Johnson & Johnson | | | 5,367 | | | | 618,332 | |
Masimo Corp. (2) | | | 4,177 | | | | 281,530 | |
| Merck & Co., Inc. | | | 1,598 | | | | 94,074 | |
| St Jude Medical, Inc. | | | 1,133 | | | | 90,855 | |
VWR Corp. (2) | | | 5,397 | | | | 135,087 | |
| | | | | | | | 3,517,035 | |
| | | | | | | | | |
| Industrials — 1.3% | | | | | | | | |
| American Airlines Group, Inc. | | | 1,512 | | | | 70,595 | |
| Crane Co. | | | 2,955 | | | | 213,115 | |
| EnerSys | | | 436 | | | | 34,052 | |
| Fortive Corp. | | | 3,229 | | | | 173,171 | |
| Spirit AeroSystems Holdings, Inc. | | | 1,897 | | | | 110,690 | |
Swift Transportation Co. (2) | | | 1,118 | | | | 27,234 | |
United Continental Holdings, Inc. (2) | | | 1,889 | | | | 137,670 | |
| Universal Forest Products, Inc. | | | 1,992 | | | | 203,543 | |
| West Corp. | | | 1,649 | | | | 40,829 | |
| | | | | | | | 1,010,899 | |
| | | | | | | | | |
| Information Technology — 12.0% | | | | | | | | |
Amkor Technology, Inc. (2) | | | 11,123 | | | | 117,348 | |
| Apple, Inc. | | | 4,233 | | | | 490,266 | |
| CA, Inc. | | | 14,735 | | | | 468,131 | |
Cadence Design Systems, Inc. (2) | | | 886 | | | | 22,345 | |
Cirrus Logic, Inc. (2) | | | 1,925 | | | | 108,840 | |
| Computer Sciences Corp. | | | 5,352 | | | | 318,016 | |
Dell Technologies, Inc. - Class V (2) | | | 5,952 | | | | 327,181 | |
eBay, Inc. (2) | | | 15,524 | | | | 460,908 | |
| Hewlett Packard Enterprise Co. | | | 7,380 | | | | 170,773 | |
| HP, Inc. | | | 21,657 | | | | 321,390 | |
The accompanying notes are an integral part of these financial statements.
| 2016 Annual Report | December 31, 2016 | Page 45 |
Schedule of Investments
December 31, 2016
Global Opportunities Fund
| Security Description | | Shares or Principal Amount ($) | | | Fair Value ($) | |
| Common Stocks — continued | | | | | | |
| Intel Corp. | | | 32,276 | | | | 1,170,652 | |
| International Business Machines Corp. | | | 6,798 | | | | 1,128,400 | |
| Intuit, Inc. | | | 3,688 | | | | 422,682 | |
| Jabil Circuit, Inc. | | | 3,781 | | | | 89,496 | |
| Microsoft Corp. | | | 2,001 | | | | 124,342 | |
| Oracle Corp. | | | 18,255 | | | | 701,905 | |
| QUALCOMM, Inc. | | | 5,130 | | | | 334,476 | |
Sanmina Corp. (2) | | | 10,253 | | | | 375,772 | |
| Science Applications International Corp. | | | 3,966 | | | | 336,317 | |
| Symantec Corp. | | | 13,103 | | | | 313,031 | |
| Texas Instruments, Inc. | | | 13,509 | | | | 985,752 | |
TiVo Corp. (2) | | | 10,913 | | | | 228,082 | |
| Travelport Worldwide, Ltd. | | | 9,486 | | | | 133,753 | |
| | | | | | | | 9,149,858 | |
| | | | | | | | | |
| Materials — 3.6% | | | | | | | | |
| Commercial Metals Co. | | | 6,380 | | | | 138,956 | |
| Eagle Materials, Inc. | | | 1,029 | | | | 101,387 | |
Freeport-McMoRan, Inc. (2) | | | 1,313 | | | | 17,318 | |
GCP Applied Technologies, Inc. (2) | | | 8,759 | | | | 234,303 | |
| Greif, Inc. | | | 1,272 | | | | 65,266 | |
| Innospec, Inc. | | | 1,138 | | | | 77,953 | |
| International Paper Co. | | | 1,389 | | | | 73,700 | |
| LyondellBasell Industries NV | | | 7,786 | | | | 667,883 | |
| Newmont Mining Corp. | | | 2,575 | | | | 87,730 | |
| Reliance Steel & Aluminum Co. | | | 6,218 | | | | 494,580 | |
| Steel Dynamics, Inc. | | | 6,581 | | | | 234,152 | |
| Trinseo SA | | | 6,571 | | | | 389,660 | |
| Worthington Industries, Inc. | | | 2,843 | | | | 134,872 | |
| | | | | | | | 2,717,760 | |
| | | | | | | | | |
| Real Estate Investment Trust — 7.3% | | | | | | | | |
| CBL & Associates Properties, Inc. | | | 13,661 | | | | 157,102 | |
CBRE Group, Inc. (2) | | | 28,982 | | | | 912,644 | |
| Communications Sales & Leasing, Inc. | | | 14,419 | | | | 366,387 | |
| Corporate Office Properties Trust | | | 9,902 | | | | 309,140 | |
| Gaming and Leisure Properties, Inc. | | | 30,173 | | | | 923,897 | |
| Hospitality Properties Trust | | | 29,959 | | | | 950,899 | |
| Jones Lang LaSalle, Inc. | | | 1,828 | | | | 184,701 | |
| Lamar Advertising Co. | | | 2,601 | | | | 174,891 | |
| LaSalle Hotel Properties | | | 1,289 | | | | 39,276 | |
| Lexington Realty Trust | | | 9,777 | | | | 105,592 | |
| National Health Investors, Inc. | | | 12,436 | | | | 922,378 | |
| RLJ Lodging Trust | | | 8,377 | | | | 205,153 | |
| Ryman Hospitality Properties, Inc. | | | 1,338 | | | | 84,307 | |
| Select Income REIT | | | 4,288 | | | | 108,058 | |
Global Opportunities Fund
| Security Description | | Shares or Principal Amount ($) | | | Fair Value ($) | |
| Common Stocks — continued | | | | | | |
| Sunstone Hotel Investors, Inc. | | | 4,791 | | | | 73,063 | |
| | | | | | | | 5,517,488 | |
| | | | | | | | | |
| Telecommunication Services — 1.8% | | | | | | | | |
| Telephone & Data Systems, Inc. | | | 8,082 | | | | 233,327 | |
| Verizon Communications, Inc. | | | 21,119 | | | | 1,127,332 | |
| | | | | | | | 1,360,659 | |
| | | | | | | | | |
| Utilities — 1.5% | | | | | | | | |
| AES Corp./VA | | | 14,382 | | | | 167,119 | |
| Exelon Corp. | | | 9,212 | | | | 326,934 | |
| Southwest Gas Holdings, Inc. | | | 3,735 | | | | 286,176 | |
| UGI Corp. | | | 8,180 | | | | 376,934 | |
| | | | | | | | 1,157,163 | |
| | | | | | | | | |
Total Common Stocks
(Cost $34,913,906) | | | | | | | 36,078,569 | |
| | | | | | | | | |
| Registered Investment Companies — 47.0% | | | | | |
| Goldman Sachs Emerging Markets Equity Insights Fund - Class I | | | 168,653 | | | | 1,371,148 | |
iShares Core MSCI EAFE ETF (3)(8) | | | 146,645 | | | | 7,864,571 | |
iShares Core MSCI Emerging Markets ETF (8) | | | 309,952 | | | | 13,157,461 | |
iShares MSCI EAFE ETF (8) | | | 192,427 | | | | 11,108,811 | |
| Oppenheimer Developing Markets Fund - Class Y | | | 18,600 | | | | 594,642 | |
| Oppenheimer International Growth Fund - Class I | | | 45,961 | | | | 1,593,917 | |
Total Registered Investment Companies
(Cost $36,347,023) | | | | | | | 35,690,550 | |
| | | | | | | | | |
| Money Market Registered Investment Companies — 7.3% | |
Morgan Stanley Government Institutional Fund, 0.44% (4) | | | 2,420,649 | | | | 2,420,649 | |
Meeder Institutional Prime Money Market Fund 0.64% (5) | | | 3,120,111 | | | | 3,120,423 | |
Total Money Market Registered
Investment Companies
(Cost $5,540,800) | | | | | | | 5,541,072 | |
The accompanying notes are an integral part of these financial statements.
| Page 46 | 2016 Annual Report | December 31, 2016 |
Schedule of Investments
December 31, 2016
Global Opportunities Fund
| Security Description | | Shares or Principal Amount ($) | | | Fair Value ($) | |
| Bank Obligations — 1.0% | | | | | | |
Capital Bank Deposit Account, 0.70%, 1/3/2017 (6) | | | 249,000 | | | | 249,000 | |
EverBank Money Market Account, 0.61%, 1/3/2017 (6) | | | 249,000 | | | | 249,000 | |
Pacific Mercantile Bank Deposit Account, 0.60%, 1/3/2017 (6) | | | 249,000 | | | | 249,000 | |
Total Bank Obligations
(Cost $747,000) | | | | | | | 747,000 | |
Total Investments — 102.7%
(Cost $77,548,729) (1) | | | | | | | 78,057,191 | |
| Liabilities less Other Assets — (2.7%) | | | | | | | (2,039,356 | ) |
| Total Net Assets — 100.0% | | | | | | | 76,017,835 | |
| | | | | | | | | |
Trustee Deferred Compensation (7) | | | | | | | | |
| Meeder Aggressive Growth Fund | | | 2,736 | | | | 28,290 | |
| Meeder Balanced Fund | | | 1,461 | | | | 15,691 | |
| Meeder Dynamic Growth Fund | | | 985 | | | | 9,574 | |
| Meeder Muirfield Fund | | | 2,520 | | | | 17,111 | |
| Meeder Quantex Fund | | | 1,029 | | | | 34,327 | |
| Meeder Infrastructure Fund | | | 420 | | | | 8,954 | |
Total Trustee Deferred Compensation
(Cost $96,638) | | | | | | | 113,947 | |
Global Opportunities Fund
| | | Long Contracts | | | Unrealized Appreciation (Depreciation)($) | |
| Futures Contracts | | | | | | |
| Standard & Poors 500 Mini Futures expiring March 2017, notional value $2,236,200 | | | 20 | | | | (25,296 | ) |
| Russell 2000 Mini Index Futures expiring March 2017, notional value $407,070 | | | 6 | | | | (5,837 | ) |
| E-mini Standard & Poors MidCap 400 Futures expiring March 2017, notional value $1,327,280 | | | 8 | | | | (26,231 | ) |
| Total Futures Contracts | | | 34 | | | | (57,364 | ) |
| (1) | Cost for federal income tax purposes of $77,725,501 differs from value by net unrealized appreciation (depreciation) of securities as follows: |
| Unrealized appreciation | | $ | 2,099,324 | |
| Unrealized depreciation | | | (1,824,998 | ) |
| Net unrealized appreciation (depreciation) | | $ | 274,326 | |
| (2) | Represents non-income producing securities. |
| (3) | All or a portion of this security is on loan. |
| (4) | Investment purchased with cash received as securities lending collateral. The yield shown represents the 7-day yield in effect at December 31, 2016. |
| (5) | Investment in affiliate. The yield shown represents the 7-day yield in effect at December 31, 2016. |
| (6) | Variable rate security. Securities payable at par including accrued interest (usually within seven days notice) and unconditionally secured as to principal and interest by letters of credit or other credit support agreements from major banks. The interest rates are adjustable and are based on bank prime rates or other interest rate adjustment indices. The rate shown represents the rate in effect at December 31, 2016. The maturity date shown, if applicable, reflects the earlier of the next demand date or stated maturity date. |
| (7) | Assets of affiliates to the Global Opportunities Fund held for the benefit of the Fund’s Trustees in connection with the Trustee Deferred Compensation Plan. |
The accompanying notes are an integral part of these financial statements.
| 2016 Annual Report | December 31, 2016 | Page 47 |
Schedule of Investments
December 31, 2016
Spectrum Fund
| Security Description | | Shares or Principal Amount ($) | | | Fair Value ($) | |
| Common Stocks - Long — 92.2% | | | | | | |
| Consumer Discretionary — 6.9% | | | | | | |
Aaron's, Inc. (5) | | | 3,069 | | | | 98,177 | |
| Abercrombie & Fitch Co. | | | 369 | | | | 4,428 | |
Amazon.com, Inc. (2)(5) | | | 710 | | | | 532,407 | |
America's Car-Mart, Inc./TX (2) | | | 265 | | | | 11,594 | |
Arctic Cat, Inc. (2) | | | 492 | | | | 7,390 | |
Ascena Retail Group, Inc. (2) | | | 2,018 | | | | 12,491 | |
At Home Group, Inc. (2) | | | 671 | | | | 9,817 | |
Barnes & Noble Education, Inc. (2) | | | 2,577 | | | | 29,558 | |
| Barnes & Noble, Inc. | | | 1,162 | | | | 12,956 | |
| Bassett Furniture Industries, Inc. | | | 185 | | | | 5,624 | |
Best Buy Co., Inc. (5) | | | 7,446 | | | | 317,721 | |
| Big 5 Sporting Goods Corp. | | | 87 | | | | 1,509 | |
| Bloomin' Brands, Inc. | | | 8,271 | | | | 149,126 | |
Boot Barn Holdings, Inc. (2) | | | 241 | | | | 3,017 | |
| Brinker International, Inc. | | | 3,733 | | | | 184,895 | |
Build-A-Bear Workshop, Inc. (2) | | | 2,140 | | | | 29,425 | |
| Caleres, Inc. | | | 473 | | | | 15,524 | |
| Cato Corp./The | | | 838 | | | | 25,207 | |
| Citi Trends, Inc. | | | 1,247 | | | | 23,493 | |
Coach, Inc. (5) | | | 6,477 | | | | 226,825 | |
Conn's, Inc. (2) | | | 969 | | | | 12,258 | |
Container Store Group, Inc./The (2) | | | 4,770 | | | | 30,290 | |
Cooper-Standard Holdings, Inc. (2) | | | 1,206 | | | | 124,676 | |
Crocs, Inc. (2) | | | 2,633 | | | | 18,062 | |
| Culp, Inc. | | | 215 | | | | 7,987 | |
| Dana, Inc. | | | 2,420 | | | | 45,932 | |
Darden Restaurants, Inc. (5) | | | 4,101 | | | | 298,225 | |
| DeVry Education Group, Inc. | | | 382 | | | | 11,918 | |
| Dick's Sporting Goods, Inc. | | | 1,203 | | | | 63,879 | |
DR Horton, Inc. (5) | | | 18,254 | | | | 498,881 | |
Express, Inc. (2) | | | 1,735 | | | | 18,669 | |
Fossil Group, Inc. (2) | | | 2,155 | | | | 55,728 | |
Francesca's Holdings Corp. (2) | | | 1,131 | | | | 20,392 | |
| Fred's, Inc. | | | 3,066 | | | | 56,905 | |
| Gap, Inc./The | | | 5,541 | | | | 124,340 | |
Genuine Parts Co. (5) | | | 3,408 | | | | 325,600 | |
G-III Apparel Group, Ltd. (2) | | | 115 | | | | 3,399 | |
Global Eagle Entertainment, Inc. (2) | | | 395 | | | | 2,552 | |
| GNC Holdings, Inc. | | | 423 | | | | 4,670 | |
| Goodyear Tire & Rubber Co./The | | | 3,291 | | | | 101,593 | |
Gray Television, Inc. (2) | | | 400 | | | | 4,340 | |
Groupon, Inc. (2) | | | 2,723 | | | | 9,040 | |
| Guess?, Inc. | | | 1,146 | | | | 13,867 | |
Habit Restaurants, Inc./The (2) | | | 1,030 | | | | 17,768 | |
| Harman International Industries, Inc. | | | 204 | | | | 22,677 | |
| Haverty Furniture Cos., Inc. | | | 912 | | | | 21,614 | |
Spectrum Fund
| Security Description | | Shares or Principal Amount ($) | | | Fair Value ($) | |
| Common Stocks - Long — continued | | | | | | |
Hemisphere Media Group, Inc. (2) | | | 434 | | | | 4,861 | |
Home Depot, Inc./The (5) | | | 2,400 | | | | 321,792 | |
| HSN, Inc. | | | 2,053 | | | | 70,418 | |
ILG, Inc. (5) | | | 20,158 | | | | 366,271 | |
International Game Technology PLC (5) | | | 14,069 | | | | 359,041 | |
| Jack in the Box, Inc. | | | 1,197 | | | | 133,633 | |
Jamba, Inc. (2) | | | 700 | | | | 7,210 | |
| John Wiley & Sons, Inc. | | | 788 | | | | 42,946 | |
Kirkland's, Inc. (2) | | | 2,070 | | | | 32,106 | |
Kona Grill, Inc. (2) | | | 658 | | | | 8,258 | |
| LCI Industries | | | 537 | | | | 57,862 | |
Liberty Media Corp-Liberty Media (2) | | | 1,596 | | | | 50,035 | |
| Liberty Tax, Inc. | | | 280 | | | | 3,752 | |
Liberty TripAdvisor Holdings, Inc. (2) | | | 168 | | | | 2,528 | |
Lions Gate Entertainment Corp. (2) | | | 5,383 | | | | 132,099 | |
Lumber Liquidators Holdings, Inc. (2)(3) | | | 625 | | | | 9,838 | |
| Macy's, Inc. | | | 5,165 | | | | 184,959 | |
Malibu Boats, Inc. (2) | | | 118 | | | | 2,251 | |
MarineMax, Inc. (2) | | | 588 | | | | 11,378 | |
| MDC Partners, Inc. | | | 1,923 | | | | 12,596 | |
Michael Kors Holdings, Ltd. (2)(5) | | | 7,214 | | | | 310,058 | |
Michaels Cos., Inc./The (2) | | | 14,275 | | | | 291,924 | |
| Movado Group, Inc. | | | 84 | | | | 2,415 | |
Nautilus, Inc. (2) | | | 174 | | | | 3,219 | |
New Home Co., Inc./The (2) | | | 643 | | | | 7,530 | |
| New Media Investment Group, Inc. | | | 348 | | | | 5,565 | |
Noodles & Co. (2) | | | 2,064 | | | | 8,462 | |
| Nordstrom, Inc. | | | 2,202 | | | | 105,542 | |
| Papa John's International, Inc. | | | 173 | | | | 14,805 | |
Perry Ellis International, Inc. (2) | | | 201 | | | | 5,007 | |
| Pier 1 Imports, Inc. | | | 1,591 | | | | 13,587 | |
| PVH Corp. | | | 1,002 | | | | 90,420 | |
Reading International, Inc. (2) | | | 48 | | | | 797 | |
| Rent-A-Center, Inc./TX | | | 2,926 | | | | 32,918 | |
Restoration Hardware, Inc. (2) | | | 488 | | | | 14,982 | |
Ruby Tuesday, Inc. (2) | | | 2,503 | | | | 8,085 | |
Sears Holdings Corp. (2)(3) | | | 2,581 | | | | 23,977 | |
Select Comfort Corp. (2) | | | 485 | | | | 10,971 | |
Shake Shack, Inc. (2) | | | 88 | | | | 3,150 | |
| Sonic Automotive, Inc. | | | 305 | | | | 6,985 | |
Sportsman's Warehouse Holdings, Inc. (2) | | | 1,088 | | | | 10,216 | |
Sequential Brands Group, Inc. (2) | | | 836 | | | | 3,912 | |
| Stage Stores, Inc. | | | 2,059 | | | | 8,998 | |
Staples, Inc. (5) | | | 17,263 | | | | 156,230 | |
| Tailored Brands, Inc. | | | 866 | | | | 22,126 | |
Tenneco, Inc. (2)(5) | | | 4,096 | | | | 255,877 | |
Tile Shop Holdings, Inc. (2) | | | 740 | | | | 14,467 | |
The accompanying notes are an integral part of these financial statements.
| Page 48 | 2016 Annual Report | December 31, 2016 |
Schedule of Investments
December 31, 2016
Spectrum Fund
| Security Description | | Shares or Principal Amount ($) | | | Fair Value ($) | |
| Common Stocks - Long — continued | |
Tilly's, Inc. (2) | | | 594 | | | | 7,835 | |
| Time Warner, Inc. | | | 7,537 | | | | 727,547 | |
Townsquare Media, Inc. (2) | | | 510 | | | | 5,309 | |
TRI Pointe Group, Inc. (2) | | | 15,140 | | | | 173,807 | |
Tuesday Morning Corp. (2) | | | 6,836 | | | | 36,914 | |
| Tupperware Brands Corp. | | | 3,880 | | | | 204,166 | |
Viacom, Inc. (5) | | | 6,759 | | | | 237,241 | |
Vince Holding Corp. (2) | | | 468 | | | | 1,895 | |
Vitamin Shoppe, Inc. (2) | | | 365 | | | | 8,669 | |
Weight Watchers International, Inc. (2) | | | 334 | | | | 3,824 | |
| Wolverine World Wide, Inc. | | | 3,618 | | | | 79,415 | |
Workhorse Group, Inc. (2) | | | 44 | | | | 311 | |
Yum! Brands, Inc. (5) | | | 2,804 | | | | 177,577 | |
ZAGG, Inc. (2) | | | 257 | | | | 1,825 | |
Zoe's Kitchen, Inc. (2) | | | 292 | | | | 7,005 | |
Zumiez, Inc. (2) | | | 333 | | | | 7,276 | |
| | | | | | | | 8,543,121 | |
| | | | | | | | | |
| Consumer Staples — 5.2% | | | | | | | | |
| Altria Group, Inc. | | | 13,372 | | | | 904,214 | |
Archer-Daniels-Midland Co. (5) | | | 10,739 | | | | 490,235 | |
Bunge, Ltd. (5) | | | 3,854 | | | | 278,413 | |
Chefs' Warehouse, Inc./The (2) | | | 1,032 | | | | 16,306 | |
Darling Ingredients, Inc. (2) | | | 1,166 | | | | 15,053 | |
| Dean Foods Co. | | | 3,629 | | | | 79,040 | |
| Fresh Del Monte Produce, Inc. | | | 949 | | | | 57,538 | |
Herbalife, Ltd. (2)(5) | | | 8,624 | | | | 415,159 | |
HRG Group, Inc. (2) | | | 2,093 | | | | 32,567 | |
| Ingles Markets, Inc. | | | 273 | | | | 13,131 | |
Ingredion, Inc. (5) | | | 4,032 | | | | 503,839 | |
Kroger Co./The (5) | | | 13,570 | | | | 468,301 | |
Lifevantage Corp. (2) | | | 84 | | | | 685 | |
Natural Grocers by Vitamin Cottage, Inc. (2) | | | 3,051 | | | | 36,276 | |
| Nu Skin Enterprises, Inc. | | | 1,670 | | | | 79,793 | |
| PepsiCo, Inc. | | | 9,151 | | | | 957,468 | |
| Philip Morris International, Inc. | | | 10,120 | | | | 925,879 | |
| Procter & Gamble Co./The | | | 497 | | | | 41,788 | |
Tyson Foods, Inc. (5) | | | 4,613 | | | | 284,530 | |
United Natural Foods, Inc. (2) | | | 1,084 | | | | 51,728 | |
| Village Super Market, Inc. | | | 146 | | | | 4,511 | |
| Wal-Mart Stores, Inc. | | | 11,725 | | | | 810,432 | |
| | | | | | | | 6,466,886 | |
| | | | | | | | | |
| Energy — 3.8% | | | | | | | | |
Chesapeake Energy Corp. (2) | | | 13,663 | | | | 95,914 | |
| Chevron Corp. | | | 502 | | | | 59,085 | |
Devon Energy Corp. (5) | | | 11,873 | | | | 542,240 | |
Spectrum Fund
| Security Description | | Shares or Principal Amount ($) | | | Fair Value ($) | |
| Common Stocks - Long — continued | |
Dril-Quip, Inc. (2) | | | 1,117 | | | | 67,076 | |
| EOG Resources, Inc. | | | 6,389 | | | | 645,928 | |
Exxon Mobil Corp. (5) | | | 8,682 | | | | 783,637 | |
FMC Technologies, Inc. (2) | | | 2,216 | | | | 78,734 | |
Laredo Petroleum, Inc. (2) | | | 156 | | | | 2,206 | |
Marathon Petroleum Corp. (5) | | | 8,906 | | | | 448,417 | |
Newfield Exploration Co. (2) | | | 9,131 | | | | 369,806 | |
| Oceaneering International, Inc. | | | 4,234 | | | | 119,441 | |
| ONEOK, Inc. | | | 4,602 | | | | 264,201 | |
QEP Resources, Inc. (2)(5) | | | 14,232 | | | | 262,011 | |
Rice Energy, Inc. (2) | | | 875 | | | | 18,681 | |
Southwestern Energy Co. (2) | | | 2,575 | | | | 27,862 | |
Tesoro Corp. (5) | | | 2,841 | | | | 248,445 | |
Valero Energy Corp. (5) | | | 8,972 | | | | 612,966 | |
| Western Refining, Inc. | | | 1,116 | | | | 42,241 | |
WPX Energy, Inc. (2) | | | 830 | | | | 12,093 | |
| | | | | | | | 4,700,984 | |
| | | | | | | | | |
| Financials — 14.6% | | | | | | | | |
Aflac, Inc. (5) | | | 8,615 | | | | 599,604 | |
| Allstate Corp./The | | | 2,619 | | | | 194,120 | |
| Ally Financial, Inc. | | | 7,571 | | | | 144,000 | |
| Aspen Insurance Holdings, Ltd. | | | 1,102 | | | | 60,610 | |
| Associated Banc-Corp | | | 1,484 | | | | 36,655 | |
| Banc of California, Inc. | | | 70 | | | | 1,215 | |
Bancorp, Inc./The (2) | | | 319 | | | | 2,507 | |
Bank of America Corp. (5) | | | 52,735 | | | | 1,165,443 | |
BB&T Corp. (5) | | | 13,244 | | | | 622,733 | |
Berkshire Hathaway, Inc. (2)(5) | | | 1,978 | | | | 322,374 | |
| Chemical Financial Corp. | | | 3,215 | | | | 174,157 | |
Chimera Investment Corp. (5) | | | 21,347 | | | | 363,326 | |
| Citigroup, Inc. | | | 16,932 | | | | 1,006,268 | |
| Citizens Financial Group, Inc. | | | 4,877 | | | | 173,768 | |
Citizens, Inc./TX (2) | | | 127 | | | | 1,247 | |
Customers Bancorp, Inc. (2) | | | 214 | | | | 7,665 | |
Donnelley Financial Solutions, Inc. (2) | | | 583 | | | | 13,397 | |
eHealth, Inc. (2) | | | 924 | | | | 9,841 | |
Encore Capital Group, Inc. (2) | | | 1,168 | | | | 33,463 | |
Enova International, Inc. (2) | | | 525 | | | | 6,589 | |
Essent Group, Ltd. (2)(5) | | | 10,029 | | | | 324,639 | |
EverBank Financial Corp. (5) | | | 2,472 | | | | 48,080 | |
| Everest Re Group, Ltd. | | | 742 | | | | 160,569 | |
| FBR & Co. | | | 693 | | | | 9,009 | |
| Federated National Holding Co. | | | 229 | | | | 4,280 | |
| Fidelity Southern Corp. | | | 137 | | | | 3,243 | |
Fifth Third Bancorp (5) | | | 21,352 | | | | 575,863 | |
First American Financial Corp. (5) | | | 11,241 | | | | 411,758 | |
The accompanying notes are an integral part of these financial statements.
| 2016 Annual Report | December 31, 2016 | Page 49 |
Schedule of Investments
December 31, 2016
Spectrum Fund
| Security Description | | Shares or Principal Amount ($) | | | Fair Value ($) | |
| Common Stocks - Long — continued | |
| First Connecticut Bancorp, Inc./ | | | | | | |
| Farmington CT | | | 598 | | | | 13,545 | |
| First Financial Northwest, Inc. | | | 355 | | | | 7,008 | |
First NBC Bank Holding Co. (2) | | | 671 | | | | 4,898 | |
First Northwest Bancorp (2) | | | 700 | | | | 10,920 | |
Flagstar Bancorp, Inc. (2) | | | 739 | | | | 19,909 | |
FNB Corp./PA (5) | | | 32,457 | | | | 520,286 | |
Franklin Financial Network, Inc. (2) | | | 155 | | | | 6,487 | |
Great Western Bancorp, Inc. (5) | | | 4,941 | | | | 215,378 | |
| Hancock Holding Co. | | | 4,128 | | | | 177,917 | |
| Heritage Insurance Holdings, Inc. | | | 133 | | | | 2,084 | |
| International Bancshares Corp. | | | 4,530 | | | | 184,824 | |
| Invesco Mortgage Capital, Inc. | | | 13,506 | | | | 197,188 | |
| JPMorgan Chase & Co. | | | 6,404 | | | | 552,601 | |
| KeyCorp | | | 7,868 | | | | 143,748 | |
Lazard, Ltd. (5) | | | 6,988 | | | | 287,137 | |
| Manning & Napier, Inc. | | | 397 | | | | 2,997 | |
| Marsh & McLennan Cos., Inc. | | | 127 | | | | 8,584 | |
| Merchants Bancshares, Inc./VT | | | 172 | | | | 9,322 | |
| MetLife, Inc. | | | 501 | | | | 26,999 | |
MFA Financial, Inc. (5) | | | 30,511 | | | | 232,799 | |
| MGIC Investment Corp. | | | 48,100 | | | | 490,139 | |
| Morgan Stanley | | | 16,064 | | | | 678,704 | |
National Commerce Corp. (2) | | | 53 | | | | 1,969 | |
Nationstar Mortgage Holdings, Inc. (2)(3) | | | 3,737 | | | | 67,490 | |
| Navient Corp. | | | 18,732 | | | | 307,767 | |
New Residential Investment Corp. (5) | | | 20,451 | | | | 321,490 | |
Ocwen Financial Corp. (2) | | | 587 | | | | 3,164 | |
Old Republic International Corp. (5) | | | 16,260 | | | | 308,940 | |
| Opus Bank | | | 147 | | | | 4,417 | |
| Orrstown Financial Services, Inc. | | | 296 | | | | 6,630 | |
Pacific Mercantile Bancorp (2) | | | 428 | | | | 3,124 | |
| Patriot National, Inc. | | | 31 | | | | 144 | |
Popular, Inc. (5) | | | 11,845 | | | | 519,048 | |
PRA Group, Inc. (2) | | | 440 | | | | 17,204 | |
| Principal Financial Group, Inc. | | | 9,518 | | | | 550,711 | |
| Progressive Corp./The | | | 14,536 | | | | 516,028 | |
Prudential Financial, Inc. (5) | | | 6,138 | | | | 638,720 | |
Regional Management Corp. (2) | | | 710 | | | | 18,659 | |
| Regions Financial Corp. | | | 26,776 | | | | 384,503 | |
| Reinsurance Group of America, Inc. | | | 4,255 | | | | 535,407 | |
Republic First Bancorp, Inc. (2) | | | 2,200 | | | | 18,370 | |
S&P Global, Inc. (5) | | | 5,238 | | | | 563,295 | |
Santander Consumer USA Holdings, Inc. (2) | | | 1,520 | | | | 20,520 | |
Selective Insurance Group, Inc. (5) | | | 10,332 | | | | 444,793 | |
SunTrust Banks, Inc. (5) | | | 1,543 | | | | 84,634 | |
| Synchrony Financial | | | 16,357 | | | | 593,268 | |
Spectrum Fund
| Security Description | | Shares or Principal Amount ($) | | | Fair Value ($) | |
| Common Stocks - Long — continued | |
| TCF Financial Corp. | | | 26,513 | | | | 519,390 | |
Unum Group (5) | | | 11,175 | | | | 490,918 | |
| US Bancorp | | | 14,521 | | | | 745,944 | |
Walter Investment Management Corp. (2) | | | 617 | | | | 2,931 | |
| Wells Fargo & Co. | | | 3,027 | | | | 166,818 | |
WisdomTree Investments, Inc. (3) | | | 778 | | | | 8,667 | |
World Acceptance Corp. (2) | | | 188 | | | | 12,085 | |
WP Glichmer, Inc. (2) | | | 3,654 | | | | 38,038 | |
| | | | | | | | 18,184,983 | |
| | | | | | | | | |
| Healthcare — 13.7% | | | | | | | | |
AAC Holdings, Inc. (2) | | | 957 | | | | 6,929 | |
Abbott Laboratories (5) | | | 13,803 | | | | 530,173 | |
AbbVie, Inc. (5) | | | 12,764 | | | | 799,281 | |
AcelRx Pharmaceuticals, Inc. (2) | | | 6,319 | | | | 16,429 | |
| Aceto Corp. | | | 1,408 | | | | 30,934 | |
Achillion Pharmaceuticals, Inc. (2) | | | 2,075 | | | | 8,570 | |
Addus HomeCare Corp. (2) | | | 264 | | | | 9,253 | |
Adeptus Health, Inc. - Class A (2)(3) | | | 968 | | | | 7,396 | |
Aduro Biotech, Inc. (2) | | | 1,041 | | | | 11,867 | |
Advaxis, Inc. (2) | | | 845 | | | | 6,050 | |
Adverum Biotechnologies, Inc. (2) | | | 4,065 | | | | 11,789 | |
Aetna, Inc. (5) | | | 4,652 | | | | 576,895 | |
Aevi Genomic Medicine, Inc. (2) | | | 2,445 | | | | 12,665 | |
Agenus, Inc. (2) | | | 1,461 | | | | 6,019 | |
Agile Therapeutics, Inc. (2) | | | 839 | | | | 4,782 | |
Agilent Technologies, Inc. (5) | | | 5,554 | | | | 253,040 | |
Air Methods Corp. (2) | | | 82 | | | | 2,612 | |
Akebia Therapeutics, Inc. (2) | | | 222 | | | | 2,311 | |
Align Technology, Inc. (2)(5) | | | 3,314 | | | | 318,575 | |
Allscripts Healthcare Solutions, Inc. (2) | | | 14,836 | | | | 151,476 | |
Almost Family, Inc. (2) | | | 756 | | | | 33,340 | |
American Renal Associates Holdings, Inc. (2) | | | 991 | | | | 21,088 | |
| AmerisourceBergen Corp. | | | 7,031 | | | | 549,754 | |
Amgen, Inc. (5) | | | 5,604 | | | | 819,360 | |
Amicus Therapeutics, Inc. (2) | | | 4,866 | | | | 24,184 | |
Ampio Pharmaceuticals, Inc. (2) | | | 8,000 | | | | 7,202 | |
Anavex Life Sciences Corp. (2)(3) | | | 1,490 | | | | 5,900 | |
Anthera Pharmaceuticals, Inc. (2) | | | 9,573 | | | | 6,214 | |
Applied Genetic Technologies Corp./DE (2) | | | 1,314 | | | | 12,286 | |
Aptevo Therapeutics, Inc. (2) | | | 4,932 | | | | 12,034 | |
Aratana Therapeutics, Inc. (2) | | | 873 | | | | 6,268 | |
Arena Pharmaceuticals, Inc. (2) | | | 463 | | | | 657 | |
Array BioPharma, Inc. (2) | | | 464 | | | | 4,079 | |
Arrowhead Pharmaceuticals, Inc. (2) | | | 2,015 | | | | 3,123 | |
Asterias Biotherapeutics, Inc. (2)(3) | | | 2,200 | | | | 10,120 | |
Atara Biotherapeutics, Inc. (2) | | | 427 | | | | 6,063 | |
The accompanying notes are an integral part of these financial statements.
| Page 50 | 2016 Annual Report | December 31, 2016 |
Schedule of Investments
December 31, 2016
Spectrum Fund
| Security Description | | Shares or Principal Amount ($) | | | Fair Value ($) | |
| Common Stocks - Long — continued | |
Avinger, Inc. (2) | | | 1,237 | | | | 4,577 | |
Axovant Sciences, Ltd. (2) | | | 67 | | | | 832 | |
Axsome Therapeutics, Inc. (2) | | | 600 | | | | 4,050 | |
Baxter International, Inc. (5) | | | 12,229 | | | | 542,234 | |
Bellicum Pharmaceuticals, Inc. (2) | | | 24 | | | | 327 | |
BioCryst Pharmaceuticals, Inc. (2) | | | 1,568 | | | | 9,925 | |
Bio-Path Holdings, Inc. (2) | | | 3,352 | | | | 4,525 | |
BioScrip, Inc. (2) | | | 1,518 | | | | 1,579 | |
Boston Scientific Corp. (2) | | | 1,146 | | | | 24,788 | |
| Bruker Corp. | | | 5,863 | | | | 124,178 | |
Capital Senior Living Corp. (2) | | | 1,777 | | | | 28,521 | |
Cara Therapeutics, Inc. (2) | | | 684 | | | | 6,354 | |
Cardinal Health, Inc. (5) | | | 5,083 | | | | 365,824 | |
Castlight Health, Inc. (2) | | | 1,843 | | | | 9,123 | |
Celldex Therapeutics, Inc. (2) | | | 5,235 | | | | 18,532 | |
Cellular Biomedicine Group, Inc. (2) | | | 354 | | | | 4,637 | |
Cempra, Inc. (2)(3) | | | 1,594 | | | | 4,463 | |
ChemoCentryx, Inc. (2) | | | 891 | | | | 6,593 | |
Chimerix, Inc. (2) | | | 4,321 | | | | 19,877 | |
ChromaDex Corp. (2) | | | 751 | | | | 2,486 | |
Cidara Therapeutics, Inc. (2) | | | 1,782 | | | | 18,533 | |
Civitas Solutions, Inc. (2) | | | 600 | | | | 11,940 | |
Clovis Oncology, Inc. (2) | | | 214 | | | | 9,506 | |
Coherus Biosciences, Inc. (2) | | | 53 | | | | 1,492 | |
Collegium Pharmaceutical, Inc. (2) | | | 448 | | | | 6,975 | |
Community Health Systems, Inc. (2) | | | 569 | | | | 3,181 | |
| Computer Programs & Systems, Inc. | | | 548 | | | | 12,933 | |
Concert Pharmaceuticals, Inc. (2) | | | 1,502 | | | | 15,456 | |
ConforMIS, Inc. (2) | | | 1,353 | | | | 10,959 | |
Corindus Vascular Robotics, Inc. (2) | | | 6,675 | | | | 4,662 | |
CorVel Corp. (2) | | | 428 | | | | 15,665 | |
Cotiviti Holdings, Inc. (2) | | | 618 | | | | 21,259 | |
CR Bard, Inc. (5) | | | 1,386 | | | | 311,379 | |
Cross Country Healthcare, Inc. (2) | | | 1,519 | | | | 23,712 | |
Cytokinetics, Inc. (2) | | | 266 | | | | 3,232 | |
CytomX Therapeutics, Inc. (2) | | | 541 | | | | 5,946 | |
CytRx Corp. (2) | | | 19,420 | | | | 7,228 | |
| DENTSPLY SIRONA, Inc. | | | 2,791 | | | | 161,124 | |
Dimension Therapeutics, Inc. (2) | | | 1,971 | | | | 8,574 | |
Durect Corp. (2) | | | 9,100 | | | | 12,194 | |
Dyax Corp. Contingent Value Rights (2)(9) | | | 6,220 | | | | — | |
Dynavax Technologies Corp. (2) | | | 4,781 | | | | 18,885 | |
Eagle Pharmaceuticals, Inc./DE (2) | | | 54 | | | | 4,284 | |
Editas Medicine, Inc. (2) | | | 428 | | | | 6,946 | |
Edwards Lifesciences Corp. (2) | | | 282 | | | | 26,423 | |
Egalet Corp. (2) | | | 1,705 | | | | 13,043 | |
Eiger BioPharmaceuticals, Inc. (2) | | | 568 | | | | 6,617 | |
Spectrum Fund
| Security Description | | Shares or Principal Amount ($) | | | Fair Value ($) | |
| Common Stocks - Long — continued | |
Endocyte, Inc. (2) | | | 5,657 | | | | 14,425 | |
Epizyme, Inc. (2) | | | 32 | | | | 387 | |
Esperion Therapeutics, Inc. (2) | | | 2,956 | | | | 37,009 | |
FibroGen, Inc. (2) | | | 226 | | | | 4,836 | |
Five Prime Therapeutics, Inc. (2) | | | 829 | | | | 41,541 | |
Flex Pharma, Inc. (2) | | | 703 | | | | 3,712 | |
Flexion Therapeutics, Inc. (2) | | | 316 | | | | 6,010 | |
Fluidigm Corp. (2) | | | 608 | | | | 4,426 | |
Fortress Biotech, Inc. (2) | | | 1,800 | | | | 4,860 | |
Galena Biopharma, Inc. (2) | | | 1,787 | | | | 3,467 | |
Genesis Healthcare, Inc. (2) | | | 5,839 | | | | 24,816 | |
Geron Corp. (2) | | | 3,616 | | | | 7,485 | |
Gilead Sciences, Inc. (5) | | | 10,840 | | | | 776,252 | |
Global Blood Therapeutics, Inc. (2) | | | 636 | | | | 9,190 | |
GlycoMimetics, Inc. (2) | | | 233 | | | | 1,421 | |
Halozyme Therapeutics, Inc. (2) | | | 1,035 | | | | 10,226 | |
HCA Holdings, Inc. (2)(5) | | | 7,920 | | | | 586,238 | |
Heron Therapeutics, Inc. (2) | | | 399 | | | | 5,227 | |
Hill-Rom Holdings, Inc. (5) | | | 5,582 | | | | 313,373 | |
HMS Holdings Corp. (2) | | | 4,256 | | | | 77,289 | |
Hologic, Inc. (2) | | | 1,262 | | | | 50,631 | |
Idera Pharmaceuticals, Inc. (2) | | | 5,461 | | | | 8,192 | |
IDEXX Laboratories, Inc. (2)(5) | | | 2,529 | | | | 296,576 | |
Ignyta, Inc. (2) | | | 2,765 | | | | 14,655 | |
Immune Design Corp. (2) | | | 1,696 | | | | 9,328 | |
ImmunoGen, Inc. (2) | | | 16,194 | | | | 33,036 | |
Immunomedics, Inc. (2) | | | 680 | | | | 2,496 | |
Infinity Pharmaceuticals, Inc. (2) | | | 8,138 | | | | 10,986 | |
Inotek Pharmaceuticals Corp. (2) | | | 801 | | | | 4,886 | |
Inovio Pharmaceuticals, Inc. (2) | | | 792 | | | | 5,496 | |
Insys Therapeutics, Inc. (2)(3) | | | 1,045 | | | | 9,614 | |
Intellia Therapeutics, Inc. (2) | | | 387 | | | | 5,074 | |
Intersect ENT, Inc. (2) | | | 482 | | | | 5,832 | |
Intra-Cellular Therapies, Inc. (2) | | | 2,016 | | | | 30,421 | |
Invitae Corp. (2) | | | 1,142 | | | | 9,067 | |
InVivo Therapeutics Holdings Corp. (2) | | | 1,140 | | | | 4,788 | |
iRadimed Corp. (2) | | | 879 | | | | 9,757 | |
Johnson & Johnson (5) | | | 12,191 | | | | 1,404,524 | |
Kadmon Holdings, Inc. (2)(3) | | | 1,036 | | | | 5,543 | |
Karyopharm Therapeutics, Inc. (2) | | | 597 | | | | 5,612 | |
| Kindred Healthcare, Inc. | | | 1,329 | | | | 10,433 | |
La Jolla Pharmaceutical Co. (2) | | | 772 | | | | 13,533 | |
| Landauer, Inc. | | | 55 | | | | 2,646 | |
Lannett Co., Inc. (2) | | | 337 | | | | 7,431 | |
LHC Group, Inc. (2) | | | 475 | | | | 21,708 | |
Lipocine, Inc. (2)(3) | | | 3,527 | | | | 12,979 | |
Loxo Oncology, Inc. (2) | | | 67 | | | | 2,152 | |
The accompanying notes are an integral part of these financial statements.
| 2016 Annual Report | December 31, 2016 | Page 51 |
Schedule of Investments
December 31, 2016
Spectrum Fund |
| Security Description | | Shares or Principal Amount ($) | | | Fair Value ($) | |
| Common Stocks - Long — continued | | | | | | |
MacroGenics, Inc. (2) | | | 52 | | | | 1,063 | |
Mallinckrodt PLC (2) | | | 1,482 | | | | 73,833 | |
MannKind Corp. (2) | | | 29,404 | | | | 18,722 | |
Masimo Corp. (2)(5) | | | 6,348 | | | | 427,855 | |
Medtronic PLC (5) | | | 10,474 | | | | 746,063 | |
Merck & Co., Inc. (5) | | | 14,050 | | | | 827,124 | |
Merrimack Pharmaceuticals, Inc. (2)(3) | | | 1,225 | | | | 4,998 | |
Mirati Therapeutics, Inc. (2) | | | 1,734 | | | | 8,237 | |
Momenta Pharmaceuticals, Inc. (2) | | | 223 | | | | 3,356 | |
Myriad Genetics, Inc. (2) | | | 111 | | | | 1,850 | |
NantHealth, Inc. (2) | | | 289 | | | | 2,873 | |
NantKwest, Inc. (2) | | | 1,705 | | | | 9,753 | |
Natera, Inc. (2) | | | 59 | | | | 691 | |
Neos Therapeutics, Inc. (2)(3) | | | 3,100 | | | | 18,135 | |
NewLink Genetics Corp. (2) | | | 1,792 | | | | 18,422 | |
Novavax, Inc. (2)(3) | | | 5,153 | | | | 6,493 | |
Novocure, Ltd. (2) | | | 382 | | | | 2,999 | |
Ocular Therapeutix, Inc. (2) | | | 1,388 | | | | 11,618 | |
Omeros Corp. (2) | | | 465 | | | | 4,613 | |
OncoMed Pharmaceuticals, Inc. (2) | | | 2,975 | | | | 22,937 | |
Ophthotech Corp. (2) | | | 492 | | | | 2,376 | |
Organovo Holdings, Inc. (2)(3) | | | 2,332 | | | | 7,905 | |
Osiris Therapeutics, Inc. (2) | | | 2,361 | | | | 11,593 | |
Otonomy, Inc. (2) | | | 1,263 | | | | 20,082 | |
OvaScience, Inc. (2) | | | 4,201 | | | | 6,428 | |
Pacira Pharmaceuticals, Inc./DE (2) | | | 590 | | | | 19,057 | |
Paratek Pharmaceuticals, Inc. (2) | | | 1,057 | | | | 16,278 | |
PAREXEL International Corp. (2) | | | 1,154 | | | | 75,841 | |
Pfenex, Inc. (2) | | | 34 | | | | 308 | |
| Pfizer, Inc. | | | 33,093 | | | | 1,074,861 | |
PharMerica Corp. (2) | | | 489 | | | | 12,298 | |
Portola Pharmaceuticals, Inc. (2) | | | 896 | | | | 20,106 | |
Progenics Pharmaceuticals, Inc. (2) | | | 639 | | | | 5,521 | |
Proteostasis Therapeutics, Inc. (2) | | | 29 | | | | 356 | |
Providence Service Corp./The (2) | | | 437 | | | | 16,628 | |
PTC Therapeutics, Inc. (2) | | | 1,158 | | | | 12,634 | |
Puma Biotechnology, Inc. (2) | | | 3 | | | | 92 | |
Quality Systems, Inc. (2) | | | 322 | | | | 4,234 | |
Quest Diagnostics, Inc. (5) | | | 4,654 | | | | 427,703 | |
Quorum Health Corp. (2) | | | 1,469 | | | | 10,680 | |
RadNet, Inc. (2) | | | 190 | | | | 1,226 | |
Regulus Therapeutics, Inc. (2) | | | 8,811 | | | | 19,825 | |
Revance Therapeutics, Inc. (2) | | | 759 | | | | 15,711 | |
Rigel Pharmaceuticals, Inc. (2) | | | 2,794 | | | | 6,650 | |
Rockwell Medical, Inc. (2)(3) | | | 1,563 | | | | 10,238 | |
Sangamo Therapeutics, Inc. (2) | | | 4,204 | | | | 12,822 | |
Second Sight Medical Products, Inc. (2) | | | 2,978 | | | | 5,867 | |
Spectrum Fund |
| Security Description | | Shares or Principal Amount ($) | | | Fair Value ($) | |
| Common Stocks - Long — continued | | | | | | |
Seres Therapeutics, Inc. (2) | | | 1,279 | | | | 12,662 | |
Sorrento Therapeutics, Inc. (2) | | | 806 | | | | 3,949 | |
Spectrum Pharmaceuticals, Inc. (2) | | | 2,054 | | | | 9,099 | |
| St Jude Medical, Inc. | | | 7,085 | | | | 568,146 | |
Stemline Therapeutics, Inc. (2) | | | 918 | | | | 9,823 | |
| Stryker Corp. | | | 812 | | | | 97,286 | |
Sucampo Pharmaceuticals, Inc. (2) | | | 327 | | | | 4,431 | |
Surgery Partners, Inc. (2) | | | 131 | | | | 2,076 | |
Syndax Pharmaceuticals, Inc. (2) | | | 216 | | | | 1,549 | |
Synthetic Biologics, Inc. (2) | | | 13,300 | | | | 10,143 | |
Syros Pharmaceuticals, Inc. (2) | | | 96 | | | | 1,167 | |
T2 Biosystems, Inc. (2)(3) | | | 2,270 | | | | 11,940 | |
Tandem Diabetes Care, Inc. (2) | | | 1,500 | | | | 3,225 | |
Teladoc, Inc. (2) | | | 856 | | | | 14,124 | |
Teligent, Inc. (2) | | | 2,991 | | | | 19,771 | |
Tetraphase Pharmaceuticals, Inc. (2) | | | 6,301 | | | | 25,393 | |
TG Therapeutics, Inc. (2) | | | 3,386 | | | | 15,745 | |
| Thermo Fisher Scientific, Inc. | | | 3,091 | | | | 436,140 | |
Titan Pharmaceuticals, Inc. (2) | | | 724 | | | | 2,896 | |
Tokai Pharmaceuticals, Inc. (2)(3) | | | 8,598 | | | | 8,408 | |
TransEnterix, Inc. (2) | | | 2,245 | | | | 2,919 | |
Trevena, Inc. (2) | | | 5,552 | | | | 32,646 | |
Trovagene, Inc. (2) | | | 6,188 | | | | 12,995 | |
United Therapeutics Corp. (2)(5) | | | 2,054 | | | | 294,605 | |
UnitedHealth Group, Inc. (5) | | | 5,785 | | | | 925,831 | |
Universal American Corp. (2) | | | 119 | | | | 1,184 | |
| US Physical Therapy, Inc. | | | 127 | | | | 8,915 | |
Veracyte, Inc. (2) | | | 394 | | | | 3,050 | |
ViewRay, Inc. (2) | | | 624 | | | | 1,953 | |
Vital Therapies, Inc. (2) | | | 2,231 | | | | 9,705 | |
Voyager Therapeutics, Inc. (2) | | | 11 | | | | 140 | |
vTv Therapeutics, Inc. (2) | | | 1,658 | | | | 8,008 | |
VWR Corp. (2) | | | 11,548 | | | | 289,046 | |
XBiotech, Inc. (2) | | | 15 | | | | 152 | |
Zafgen, Inc. (2) | | | 6,215 | | | | 19,764 | |
ZIOPHARM Oncology, Inc. (2)(3) | | | 2,966 | | | | 15,868 | |
Zogenix, Inc. (2) | | | 984 | | | | 11,956 | |
| | | | | | | 17,069,542 | |
| | | | | | | | | |
| Industrials — 10.8% | | | | | | | | |
| 3M Co. | | | 1,949 | | | | 348,033 | |
AECOM (2)(5) | | | 7,805 | | | | 283,790 | |
American Airlines Group, Inc. (5) | | | 11,252 | | | | 525,356 | |
AO Smith Corp. (5) | | | 2,962 | | | | 140,251 | |
| Applied Industrial Technologies, Inc. | | | 2,981 | | | | 177,071 | |
| Barnes Group, Inc. | | | 2,422 | | | | 114,851 | |
| Boeing Co./The | | | 662 | | | | 103,060 | |
The accompanying notes are an integral part of these financial statements.
| Page 52 | 2016 Annual Report | December 31, 2016 |
Schedule of Investments
December 31, 2016
Spectrum Fund |
| Security Description | | Shares or Principal Amount ($) | | | Fair Value ($) | |
| Common Stocks - Long — continued | | | | | | |
| Brady Corp. | | | 3,172 | | | | 119,109 | |
Brink's Co./The (5) | | | 4,074 | | | | 168,053 | |
Carlisle Cos., Inc. (5) | | | 4,609 | | | | 508,326 | |
Cogint, Inc. (2) | | | 786 | | | | 2,712 | |
Crane Co. (5) | | | 6,696 | | | | 482,916 | |
Cummins, Inc. (5) | | | 3,933 | | | | 537,523 | |
| Deluxe Corp. | | | 2,086 | | | | 149,378 | |
Dover Corp. (5) | | | 6,920 | | | | 518,516 | |
Dun & Bradstreet Corp./The (5) | | | 3,945 | | | | 478,607 | |
Eaton Corp. PLC (5) | | | 8,725 | | | | 585,360 | |
| EMCOR Group, Inc. | | | 589 | | | | 41,678 | |
EnerSys (5) | | | 2,911 | | | | 227,349 | |
Fluor Corp. (5) | | | 9,352 | | | | 491,167 | |
Fortive Corp. (5) | | | 6,423 | | | | 344,465 | |
General Electric Co. (5) | | | 8,547 | | | | 270,085 | |
Hawaiian Holdings, Inc. (2) | | | 701 | | | | 39,957 | |
HC2 Holdings, Inc. (2) | | | 1,300 | | | | 7,709 | |
HD Supply Holdings, Inc. (2)(5) | | | 12,681 | | | | 539,069 | |
| Herman Miller, Inc. | | | 5,527 | | | | 189,023 | |
| Hillenbrand, Inc. | | | 707 | | | | 27,113 | |
Huntington Ingalls Industries, Inc. (5) | | | 2,854 | | | | 525,678 | |
| Illinois Tool Works, Inc. | | | 1,505 | | | | 184,302 | |
Ingersoll-Rand PLC (5) | | | 6,965 | | | | 522,654 | |
| Landstar System, Inc. | | | 2,300 | | | | 196,190 | |
| LSC Communications, Inc. | | | 259 | | | | 7,687 | |
| ManpowerGroup, Inc. | | | 1,515 | | | | 134,638 | |
Masco Corp. (5) | | | 13,255 | | | | 419,123 | |
| Matson, Inc. | | | 1,327 | | | | 46,963 | |
Moog, Inc. (2) | | | 350 | | | | 22,988 | |
| Mueller Industries, Inc. | | | 200 | | | | 7,992 | |
Navistar International Corp. (2) | | | 723 | | | | 22,681 | |
NL Industries, Inc. (2) | | | 3 | | | | 24 | |
| Parker-Hannifin Corp. | | | 2,413 | | | | 337,820 | |
Pitney Bowes, Inc. (5) | | | 28,398 | | | | 431,366 | |
Radiant Logistics, Inc. (2) | | | 2,792 | | | | 10,889 | |
| Regal Beloit Corp. | | | 1,096 | | | | 75,898 | |
Rexnord Corp. (2) | | | 2,315 | | | | 45,351 | |
| Rockwell Automation, Inc. | | | 2,806 | | | | 377,126 | |
| RR Donnelley & Sons Co. | | | 1,418 | | | | 23,142 | |
Scorpio Bulkers, Inc. (2)(3) | | | 2,824 | | | | 14,261 | |
| SkyWest, Inc. | | | 203 | | | | 7,399 | |
Spirit AeroSystems Holdings, Inc. (5) | | | 6,336 | | | | 369,706 | |
Swift Transportation Co. (2) | | | 859 | | | | 20,925 | |
| Tetra Tech, Inc. | | | 559 | | | | 24,121 | |
| Timken Co./The | | | 5,716 | | | | 226,925 | |
TRC Cos., Inc. (2) | | | 173 | | | | 1,834 | |
| Trinity Industries, Inc. | | | 7,180 | | | | 199,317 | |
Spectrum Fund |
| Security Description | | Shares or Principal Amount ($) | | | Fair Value ($) | |
| Common Stocks - Long — continued | | | | | | |
| Union Pacific Corp. | | | 2,529 | | | | 262,207 | |
United Continental Holdings, Inc. (2) | | | 7,745 | | | | 564,455 | |
United Parcel Service, Inc. (5) | | | 2,570 | | | | 294,625 | |
United Rentals, Inc. (2)(5) | | | 767 | | | | 80,980 | |
| Universal Forest Products, Inc. | | | 2,629 | | | | 268,631 | |
USA Truck, Inc. (2) | | | 420 | | | | 3,658 | |
West Corp. (5) | | | 4,544 | | | | 112,509 | |
Xylem, Inc./NY (5) | | | 5,973 | | | | 295,783 | |
YRC Worldwide, Inc. (2) | | | 244 | | | | 3,240 | |
| | | | | | | | 13,563,615 | |
| | | | | | | | | |
| Information Technology — 22.8% | | | | | | | | |
Acacia Communications, Inc. (2) | | | 76 | | | | 4,693 | |
Accenture PLC (5) | | | 5,979 | | | | 700,320 | |
Activision Blizzard, Inc. (5) | | | 7,258 | | | | 262,086 | |
Advanced Energy Industries, Inc. (2) | | | 217 | | | | 11,881 | |
Aerohive Networks, Inc. (2) | | | 2,500 | | | | 14,250 | |
Alphabet, Inc. - Class A (2)(5) | | | 199 | | | | 157,698 | |
Alphabet, Inc. - Class C (2)(5) | | | 190 | | | | 146,646 | |
Amkor Technology, Inc. (2) | | | 7,043 | | | | 74,304 | |
Apple, Inc. (5) | | | 20,290 | | | | 2,349,986 | |
Applied Materials, Inc. (5) | | | 19,027 | | | | 614,001 | |
Applied Optoelectronics, Inc. (2) | | | 142 | | | | 3,328 | |
ARRIS International PLC (2)(5) | | | 3,782 | | | | 113,952 | |
Aspen Technology, Inc. (2) | | | 3,760 | | | | 205,597 | |
Autobytel, Inc. (2) | | | 585 | | | | 7,868 | |
Avid Technology, Inc. (2) | | | 397 | | | | 1,747 | |
Avnet, Inc. (5) | | | 9,626 | | | | 458,294 | |
| Black Box Corp. | | | 311 | | | | 4,743 | |
Booz Allen Hamilton Holding Corp. (5) | | | 10,032 | | | | 361,854 | |
Broadridge Financial Solutions, Inc. (5) | | | 7,663 | | | | 508,057 | |
Brocade Communications Systems, Inc. (5) | | | 1,161 | | | | 14,501 | |
CA, Inc. (5) | | | 16,780 | | | | 533,101 | |
Cadence Design Systems, Inc. (2)(5) | | | 19,861 | | | | 500,894 | |
Calix, Inc. (2) | | | 321 | | | | 2,472 | |
Cardtronics PLC (2) | | | 698 | | | | 38,090 | |
CDK Global, Inc. (5) | | | 7,720 | | | | 460,807 | |
Cirrus Logic, Inc. (2) | | | 2,286 | | | | 129,250 | |
Cisco Systems, Inc. (5) | | | 31,697 | | | | 957,883 | |
Citrix Systems, Inc. (2)(5) | | | 6,063 | | | | 541,487 | |
CommVault Systems, Inc. (2) | | | 1,339 | | | | 68,825 | |
Computer Sciences Corp. (5) | | | 8,654 | | | | 514,221 | |
| Comtech Telecommunications Corp. | | | 85 | | | | 1,007 | |
| Convergys Corp. | | | 635 | | | | 15,596 | |
| CSRA, Inc. | | | 771 | | | | 24,549 | |
Dell Technologies, Inc. Class V (2)(5) | | | 9,163 | | | | 503,690 | |
DHI Group, Inc. (2) | | | 197 | | | | 1,231 | |
The accompanying notes are an integral part of these financial statements.
| 2016 Annual Report | December 31, 2016 | Page 53 |
Schedule of Investments
December 31, 2016
Spectrum Fund |
| Security Description | | Shares or Principal Amount ($) | | | Fair Value ($) | |
| Common Stocks - Long — continued | | | | | | |
eBay, Inc. (2)(5) | | | 20,703 | | | | 614,672 | |
Electronic Arts, Inc. (2) | | | 6,543 | | | | 515,327 | |
| EMCORE Corp. | | | 1,163 | | | | 10,118 | |
Facebook, Inc. (2)(5) | | | 1,609 | | | | 185,115 | |
| Fair Isaac Corp. | | | 814 | | | | 97,045 | |
Gigamon, Inc. (2) | | | 682 | | | | 31,065 | |
Gogo, Inc. (2) | | | 490 | | | | 4,518 | |
Hewlett Packard Enterprise Co. (5) | | | 26,648 | | | | 616,635 | |
Hortonworks, Inc. (2) | | | 1,420 | | | | 11,800 | |
HP, Inc. (5) | | | 39,157 | | | | 581,090 | |
Immersion Corp. (2) | | | 790 | | | | 8,398 | |
Imperva, Inc. (2) | | | 174 | | | | 6,682 | |
Infinera Corp. (2) | | | 155 | | | | 1,316 | |
Intel Corp. (5) | | | 28,078 | | | | 1,018,388 | |
| InterDigital, Inc./PA | | | 580 | | | | 52,983 | |
International Business Machines Corp. (5) | | | 5,646 | | | | 937,180 | |
Intuit, Inc. (5) | | | 5,061 | | | | 580,041 | |
Jabil Circuit, Inc. (5) | | | 19,947 | | | | 472,145 | |
Keysight Technologies, Inc. (2) | | | 6,806 | | | | 248,895 | |
| KLA-Tencor Corp. | | | 6,524 | | | | 513,308 | |
Limelight Networks, Inc. (2) | | | 458 | | | | 1,154 | |
Linear Technology Corp. (5) | | | 8,758 | | | | 546,061 | |
| ManTech International Corp./VA | | | 33 | | | | 1,394 | |
Marchex, Inc. (2) | | | 1,500 | | | | 3,975 | |
Mastercard, Inc. (5) | | | 7,671 | | | | 792,031 | |
Match Group, Inc. (2) | | | 1,529 | | | | 26,146 | |
| Maxim Integrated Products, Inc. | | | 12,299 | | | | 474,372 | |
Maxwell Technologies, Inc. (2) | | | 24 | | | | 123 | |
Mentor Graphics Corp. (5) | | | 9,056 | | | | 334,076 | |
Micron Technology, Inc. (2) | | | 28,097 | | | | 615,886 | |
Microsoft Corp. (5) | | | 30,095 | | | | 1,870,102 | |
MicroStrategy, Inc. (2) | | | 47 | | | | 9,278 | |
| Motorola Solutions, Inc. | | | 6,584 | | | | 545,748 | |
NCR Corp. (2) | | | 5,064 | | | | 205,396 | |
| NetApp, Inc. | | | 3,428 | | | | 120,906 | |
NETGEAR, Inc. (2) | | | 368 | | | | 20,001 | |
| NIC, Inc. | | | 2,822 | | | | 67,446 | |
Nimble Storage, Inc. (2) | | | 743 | | | | 5,885 | |
ON Semiconductor Corp. (2) | | | 31,157 | | | | 397,563 | |
| Oracle Corp. | | | 21,265 | | | | 817,639 | |
| Paychex, Inc. | | | 1,800 | | | | 109,584 | |
PFSweb, Inc. (2) | | | 377 | | | | 3,205 | |
QUALCOMM, Inc. (5) | | | 11,966 | | | | 780,183 | |
QuinStreet, Inc. (2) | | | 1,968 | | | | 7,400 | |
Rapid7, Inc. (2) | | | 492 | | | | 5,988 | |
RealNetworks, Inc. (2) | | | 257 | | | | 1,249 | |
Red Hat, Inc. (2) | | | 875 | | | | 60,988 | |
Spectrum Fund |
| Security Description | | Shares or Principal Amount ($) | | | Fair Value ($) | |
| Common Stocks - Long — continued | | | | | | |
Rosetta Stone, Inc. (2) | | | 1,223 | | | | 10,897 | |
Rubicon Project, Inc./The (2) | | | 1,226 | | | | 9,097 | |
Sanmina Corp. (2) | | | 10,163 | | | | 372,474 | |
| Science Applications International Corp. | | | 2,289 | | | | 194,107 | |
Semtech Corp. (2)(5) | | | 3,281 | | | | 103,516 | |
Shutterstock, Inc. (2)(5) | | | 1,326 | | | | 63,012 | |
Silicon Laboratories, Inc. (2) | | | 270 | | | | 17,550 | |
Sonus Networks, Inc. (2) | | | 916 | | | | 5,771 | |
Symantec Corp. (5) | | | 22,273 | | | | 532,102 | |
Synopsys, Inc. (2)(5) | | | 8,655 | | | | 509,433 | |
Teradyne, Inc. (5) | | | 15,011 | | | | 381,279 | |
| Texas Instruments, Inc. | | | 9,889 | | | | 721,600 | |
TiVo Corp. (2) | | | 4,577 | | | | 95,659 | |
| Travelport Worldwide, Ltd. | | | 11,599 | | | | 163,546 | |
Unisys Corp. (2) | | | 87 | | | | 1,301 | |
Versum Materials, Inc. (2) | | | 1,637 | | | | 45,951 | |
Western Union Co./The (5) | | | 4,726 | | | | 102,649 | |
Xerox Corp. (5) | | | 54,416 | | | | 475,052 | |
Zillow Group, Inc. (2) | | | 766 | | | | 27,936 | |
| | | | | | | | 28,472,341 | |
| | | | | | | | | |
| Materials — 3.5% | | | | | | | | |
Avery Dennison Corp. (5) | | | 6,334 | | | | 444,773 | |
Boise Cascade Co. (2) | | | 370 | | | | 8,325 | |
| Cabot Corp. | | | 1,296 | | | | 65,500 | |
Coeur Mining, Inc. (2) | | | 997 | | | | 9,063 | |
| Domtar Corp. | | | 1,835 | | | | 71,620 | |
| Eagle Materials, Inc. | | | 1,798 | | | | 177,157 | |
Freeport-McMoRan, Inc. (2)(5) | | | 35,283 | | | | 465,383 | |
GCP Applied Technologies, Inc. (2)(5) | | | 4,915 | | | | 131,476 | |
| Graphic Packaging Holding Co. | | | 1,610 | | | | 20,093 | |
| Greif, Inc. | | | 148 | | | | 7,594 | |
| Innospec, Inc. | | | 496 | | | | 33,976 | |
International Paper Co. (5) | | | 5,222 | | | | 277,079 | |
LyondellBasell Industries NV (5) | | | 6,895 | | | | 591,453 | |
Newmont Mining Corp. (5) | | | 15,298 | | | | 521,203 | |
Nucor Corp. (5) | | | 6,758 | | | | 402,236 | |
Owens-Illinois, Inc. (2) | | | 5,571 | | | | 96,991 | |
Reliance Steel & Aluminum Co. (5) | | | 5,424 | | | | 431,425 | |
| Steel Dynamics, Inc. | | | 13,544 | | | | 481,896 | |
| Trinseo SA | | | 1,245 | | | | 73,829 | |
| | | | | | | | 4,311,072 | |
| | | | | | | | | |
| Real Estate Investment Trust — 4.4% | | | | | | | | |
| CBL & Associates Properties, Inc. | | | 8,675 | | | | 99,763 | |
CBRE Group, Inc. (2)(5) | | | 17,038 | | | | 536,527 | |
| Communications Sales & Leasing, Inc. | | | 8,410 | | | | 213,698 | |
The accompanying notes are an integral part of these financial statements.
| Page 54 | 2016 Annual Report | December 31, 2016 |
Schedule of Investments
December 31, 2016
Spectrum Fund |
| Security Description | | Shares or Principal Amount ($) | | | Fair Value ($) | |
| Common Stocks - Long — continued | | | | | | |
| Corporate Office Properties Trust | | | 11,634 | | | | 363,213 | |
| CoreCivic, Inc. | | | 942 | | | | 23,041 | |
| Duke Realty Corp. | | | 7,505 | | | | 199,333 | |
| Farmland Partners, Inc. | | | 844 | | | | 9,419 | |
Gaming and Leisure Properties, Inc. (5) | | | 10,446 | | | | 319,857 | |
Highwoods Properties, Inc. (5) | | | 10,652 | | | | 543,359 | |
Hospitality Properties Trust (5) | | | 17,172 | | | | 545,039 | |
Iron Mountain, Inc. (5) | | | 14,793 | | | | 480,477 | |
| Jones Lang LaSalle, Inc. | | | 2,199 | | | | 222,187 | |
| Lamar Advertising Co. | | | 2,165 | | | | 145,575 | |
| LaSalle Hotel Properties | | | 1,235 | | | | 37,630 | |
| Lexington Realty Trust | | | 31,204 | | | | 337,003 | |
| Liberty Property Trust | | | 11,216 | | | | 443,032 | |
| National Health Investors, Inc. | | | 4,196 | | | | 311,217 | |
| NorthStar Realty Finance Corp. | | | 4,382 | | | | 66,387 | |
| Potlatch Corp. | | | 154 | | | | 6,414 | |
| RLJ Lodging Trust | | | 7,330 | | | | 179,512 | |
| Ryman Hospitality Properties, Inc. | | | 3,339 | | | | 210,390 | |
| Sabra Health Care REIT, Inc. | | | 149 | | | | 3,639 | |
| Senior Housing Properties Trust | | | 1,308 | | | | 24,760 | |
| Sunstone Hotel Investors, Inc. | | | 4,959 | | | | 75,625 | |
| Xenia Hotels & Resorts, Inc. | | | 3,667 | | | | 71,213 | |
| | | | | | | | 5,468,310 | |
| | | | | | | | | |
| Telecommunication Services — 2.7% | | | | | | | | |
| AT&T, Inc. | | | 30,405 | | | | 1,293,124 | |
CenturyLink, Inc. (5) | | | 19,758 | | | | 469,845 | |
Triple-S Management Corp., Inc. (2) | | | 1,079 | | | | 22,335 | |
Telephone & Data Systems, Inc. (5) | | | 14,427 | | | | 416,507 | |
| Verizon Communications, Inc. | | | 21,813 | | | | 1,164,378 | |
| Vonage Holdings Corp. | | | 3,250 | | | | 22,263 | |
| | | | | | | | 3,388,452 | |
| | | | | | | | | |
| Utilities — 3.8% | | | | | | | | |
AES Corp./VA (5) | | | 42,633 | | | | 495,395 | |
Edison International (5) | | | 3,161 | | | | 227,560 | |
| El Paso Electric Co. | | | 1,987 | | | | 92,396 | |
Entergy Corp. (5) | | | 2,942 | | | | 216,149 | |
Exelon Corp. (5) | | | 17,312 | | | | 614,403 | |
FirstEnergy Corp. (5) | | | 17,979 | | | | 556,810 | |
| Genie Energy, Ltd. | | | 1,195 | | | | 6,871 | |
NiSource, Inc. (5) | | | 22,958 | | | | 508,290 | |
| NRG Yield, Inc. | | | 2,796 | | | | 42,947 | |
| OGE Energy Corp. | | | 579 | | | | 19,368 | |
| Pinnacle West Capital Corp. | | | 2,847 | | | | 222,151 | |
Portland General Electric Co. (5) | | | 9,439 | | | | 408,992 | |
| Southwest Gas Holdings, Inc. | | | 6,813 | | | | 522,012 | |
Spectrum Fund |
| Security Description | | Shares or Principal Amount ($) | | | Fair Value ($) | |
| Common Stocks - Long — continued | | | | | | |
| UGI Corp. | | | 12,026 | | | | 554,158 | |
| Westar Energy, Inc. | | | 4,259 | | | | 239,995 | |
| | | | | | | | 4,727,497 | |
| | | | | | | | | |
Total Common Stocks - Long
(Cost $110,882,233) | | | | | | | 114,896,803 | |
| | | | | | | | | |
| Money Market Registered Investment Companies — 5.9% | |
Morgan Stanley Government Institutional Fund, 0.44% (4) | | | 236,673 | | | | 236,673 | |
Meeder Institutional Prime Money Market Fund 0.64% (6) | | | 7,074,693 | | | | 7,075,401 | |
Total Money Market Registered Investment Companies
(Cost $7,312,046) | | | | | | | 7,312,074 | |
| | | | | | | | | |
| Bank Obligations — 0.2% | | | | | | | | |
Capital Bank Deposit Account, 0.70%, 1/3/2017 (7) | | | 249,000 | | | | 249,000 | |
Total Bank Obligations
(Cost $249,000) | | | | | | | 249,000 | |
Total Investments - Long — 98.3%
(Cost $118,443,279) (1) | | | | | | | 122,457,877 | |
Total Securities Sold Short — (37.7%)
(Proceeds Received $(46,237,362)) | | | | | | | (47,004,069 | ) |
| Other Assets less Liabilities — 39.4% | | | | | | | 49,064,077 | |
| Total Net Assets — 100.0% | | | | | | | 124,517,885 | |
| | | | | | | | | |
| Common Stocks - Short — (37.7%) | | | | | | | | |
| Consumer Discretionary — (6.4%) | | | | | | | | |
Buffalo Wild Wings, Inc. (2) | | | (560 | ) | | | (86,464 | ) |
| CalAtlantic Group, Inc. | | | (11,580 | ) | | | (393,836 | ) |
Career Education Corp. (2) | | | (1,961 | ) | | | (19,786 | ) |
CarMax, Inc. (2) | | | (8,312 | ) | | | (535,210 | ) |
Charter Communications, Inc. (2) | | | (1,428 | ) | | | (411,150 | ) |
Chipotle Mexican Grill, Inc. (2) | | | (1,364 | ) | | | (514,664 | ) |
| Columbia Sportswear Co. | | | (2,434 | ) | | | (141,902 | ) |
| Core-Mark Holding Co., Inc. | | | (1,420 | ) | | | (61,159 | ) |
Dollar Tree, Inc. (2) | | | (5,991 | ) | | | (462,385 | ) |
Dorman Products, Inc. (2) | | | (298 | ) | | | (21,772 | ) |
Five Below, Inc. (2) | | | (4,818 | ) | | | (192,527 | ) |
| Hanesbrands, Inc. | | | (10,653 | ) | | | (229,785 | ) |
Horizon Global Corp. (2) | | | (1,064 | ) | | | (25,536 | ) |
Hyatt Hotels Corp. (2) | | | (323 | ) | | | (17,849 | ) |
IMAX Corp. (2) | | | (1,305 | ) | | | (40,977 | ) |
Kate Spade & Co. (2) | | | (549 | ) | | | (10,250 | ) |
| L Brands, Inc. | | | (7,143 | ) | | | (470,295 | ) |
The accompanying notes are an integral part of these financial statements.
| 2016 Annual Report | December 31, 2016 | Page 55 |
Schedule of Investments
December 31, 2016
Spectrum Fund |
| Security Description | | Shares or Principal Amount ($) | | | Fair Value ($) | |
| Common Stocks - Short — continued | | | | | | |
Liberty Broadband Corp. (2) | | | (7,953 | ) | | | (576,273 | ) |
Lululemon Athletica, Inc. (2) | | | (5,653 | ) | | | (367,388 | ) |
Madison Square Garden Co./The (2) | | | (3,277 | ) | | | (562,038 | ) |
Modine Manufacturing Co. (2) | | | (264 | ) | | | (3,934 | ) |
| Monro Muffler Brake, Inc. | | | (3,810 | ) | | | (217,932 | ) |
Netflix, Inc. (2) | | | (3,381 | ) | | | (418,568 | ) |
Norwegian Cruise Line Holdings, Ltd. (2) | | | (2,358 | ) | | | (100,286 | ) |
Panera Bread Co. (2) | | | (889 | ) | | | (182,325 | ) |
| Polaris Industries, Inc. | | | (69 | ) | | | (5,685 | ) |
| Signet Jewelers, Ltd. | | | (1,375 | ) | | | (129,608 | ) |
| Spartan Motors, Inc. | | | (2,310 | ) | | | (21,368 | ) |
| Starbucks Corp. | | | (3,057 | ) | | | (169,725 | ) |
Tesla Motors, Inc. (2) | | | (2,512 | ) | | | (536,789 | ) |
Toll Brothers, Inc. (2) | | | (15,720 | ) | | | (487,320 | ) |
| Tribune Media Co. | | | (8,635 | ) | | | (302,052 | ) |
UCP, Inc. (2) | | | (1,100 | ) | | | (13,255 | ) |
Under Armour, Inc. (2) | | | (4,116 | ) | | | (119,570 | ) |
Vista Outdoor, Inc. (2) | | | (436 | ) | | | (16,088 | ) |
| Wendy's Co./The | | | (11,326 | ) | | | (153,128 | ) |
| | | | | | | | (8,018,879 | ) |
| | | | | | | | | |
| Consumer Staples — (2.4%) | | | | | | | | |
Alliance One International, Inc. (2) | | | (362 | ) | | | (6,950 | ) |
Boston Beer Co., Inc./The (2) | | | (276 | ) | | | (46,879 | ) |
| Constellation Brands, Inc. | | | (3,172 | ) | | | (486,299 | ) |
| Coty, Inc. | | | (29,893 | ) | | | (547,341 | ) |
Edgewell Personal Care Co. (2) | | | (1,528 | ) | | | (111,529 | ) |
Farmer Brothers Co. (2) | | | (129 | ) | | | (4,734 | ) |
Hain Celestial Group, Inc./The (2) | | | (4,505 | ) | | | (175,830 | ) |
| Kraft Heinz Co./The | | | (5,028 | ) | | | (439,045 | ) |
| Molson Coors Brewing Co. | | | (1,880 | ) | | | (182,943 | ) |
Monster Beverage Corp. (2) | | | (11,578 | ) | | | (513,369 | ) |
| Oil-Dri Corp of America | | | (73 | ) | | | (2,789 | ) |
| PriceSmart, Inc. | | | (1,685 | ) | | | (140,698 | ) |
Seneca Foods Corp. (2) | | | (259 | ) | | | (10,373 | ) |
| Snyder's-Lance, Inc. | | | (1,192 | ) | | | (45,701 | ) |
Sprouts Farmers Market, Inc. (2) | | | (10,333 | ) | | | (195,500 | ) |
TreeHouse Foods, Inc. (2) | | | (483 | ) | | | (34,868 | ) |
Turning Point Brands, Inc. (2) | | | (300 | ) | | | (3,675 | ) |
| Vector Group, Ltd. | | | (2,989 | ) | | | (67,970 | ) |
| | | | | | | | (3,016,493 | ) |
| | | | | | | | | |
| Energy — (1.6%) | | | | | | | | |
Cheniere Energy, Inc. (2) | | | (13,577 | ) | | | (562,495 | ) |
| CONSOL Energy, Inc. | | | (1,432 | ) | | | (26,105 | ) |
Dawson Geophysical Co./old (2) | | | (1,100 | ) | | | (8,844 | ) |
Geospace Technologies Corp. (2) | | | (196 | ) | | | (3,991 | ) |
Spectrum Fund |
| Security Description | | Shares or Principal Amount ($) | | | Fair Value ($) | |
| Common Stocks - Short — continued | | | | | | |
| Hess Corp. | | | (8,479 | ) | | | (528,157 | ) |
Matador Resources Co. (2) | | | (7,431 | ) | | | (191,423 | ) |
| Occidental Petroleum Corp. | | | (5,694 | ) | | | (405,584 | ) |
Pioneer Energy Services Corp. (2) | | | (2,581 | ) | | | (17,680 | ) |
REX American Resources Corp. (2) | | | (357 | ) | | | (35,254 | ) |
| RPC, Inc. | | | (3,610 | ) | | | (71,514 | ) |
| SemGroup Corp. | | | (2,064 | ) | | | (86,172 | ) |
Synergy Resources Corp. (2) | | | (4,833 | ) | | | (43,062 | ) |
| US Silica Holdings, Inc. | | | (992 | ) | | | (56,227 | ) |
Weatherford International PLC (2) | | | (2,280 | ) | | | (11,377 | ) |
| | | | | | | | (2,047,885 | ) |
| | | | | | | | | |
| Financials — (5.0%) | | | | | | | | |
Affiliated Managers Group, Inc. (2) | | | (983 | ) | | | (142,830 | ) |
Ambac Financial Group, Inc. (2) | | | (133 | ) | | | (2,993 | ) |
| American International Group, Inc. | | | (422 | ) | | | (27,561 | ) |
| Anworth Mortgage Asset Corp. | | | (11,554 | ) | | | (59,734 | ) |
| Astoria Financial Corp. | | | (4,504 | ) | | | (84,000 | ) |
| Bank of the Ozarks, Inc. | | | (10,711 | ) | | | (563,290 | ) |
| BankUnited, Inc. | | | (325 | ) | | | (12,249 | ) |
| Banner Corp. | | | (4,436 | ) | | | (247,573 | ) |
| Capital Bank Financial Corp. | | | (5,460 | ) | | | (214,305 | ) |
| Dynex Capital, Inc. | | | (394 | ) | | | (2,687 | ) |
| Financial Engines, Inc. | | | (1,979 | ) | | | (72,728 | ) |
| First Hawaiian, Inc. | | | (6,177 | ) | | | (215,083 | ) |
Global Indemnity, Ltd. (2) | | | (940 | ) | | | (35,917 | ) |
| Home BancShares, Inc./AR | | | (5,933 | ) | | | (164,759 | ) |
| Intercontinental Exchange, Inc. | | | (345 | ) | | | (19,465 | ) |
| Investors Bancorp, Inc. | | | (12,836 | ) | | | (179,062 | ) |
| Kinsale Capital Group, Inc. | | | (111 | ) | | | (3,775 | ) |
LendingClub Corp. (2) | | | (3,539 | ) | | | (18,580 | ) |
MBIA, Inc. (2) | | | (106 | ) | | | (1,134 | ) |
| Mercury General Corp. | | | (5,205 | ) | | | (313,393 | ) |
| New York Community Bancorp, Inc. | | | (32,853 | ) | | | (522,691 | ) |
| New York Mortgage Trust, Inc. | | | (2,613 | ) | | | (17,246 | ) |
| OneBeacon Insurance Group, Ltd. | | | (342 | ) | | | (5,489 | ) |
| Owens Realty Mortgage, Inc. | | | (48 | ) | | | (889 | ) |
| Pinnacle Financial Partners, Inc. | | | (2,108 | ) | | | (146,084 | ) |
| ProAssurance Corp. | | | (4,762 | ) | | | (267,624 | ) |
| RenaissanceRe Holdings, Ltd. | | | (3,744 | ) | | | (510,008 | ) |
| RLI Corp. | | | (7,107 | ) | | | (448,665 | ) |
| SEI Investments Co. | | | (2,250 | ) | | | (111,060 | ) |
Signature Bank/New York NY (2) | | | (3,562 | ) | | | (535,012 | ) |
Stifel Financial Corp. (2) | | | (3,245 | ) | | | (162,088 | ) |
| TFS Financial Corp. | | | (29,247 | ) | | | (556,863 | ) |
| United Bankshares, Inc./WV | | | (8,969 | ) | | | (414,816 | ) |
The accompanying notes are an integral part of these financial statements.
| Page 56 | 2016 Annual Report | December 31, 2016 |
Schedule of Investments
December 31, 2016
Spectrum Fund |
| Security Description | | Shares or Principal Amount ($) | | | Fair Value ($) | |
| Common Stocks - Short — continued | | | | | | |
| White Mountains Insurance Group, Ltd. | | | (80 | ) | | | (66,884 | ) |
| | | | | | | | (6,146,537 | ) |
| | | | | | | | | |
| Healthcare — (3.8%) | | | | | | | | |
Acadia Healthcare Co., Inc. (2) | | | (3,312 | ) | | | (109,627 | ) |
ACADIA Pharmaceuticals, Inc. (2) | | | (557 | ) | | | (16,064 | ) |
Alkermes PLC (2) | | | (301 | ) | | | (16,730 | ) |
Allergan plc (2) | | | (2,046 | ) | | | (429,680 | ) |
Alnylam Pharmaceuticals, Inc. (2) | | | (1,333 | ) | | | (49,908 | ) |
ARIAD Pharmaceuticals, Inc. (2) | | | (2,905 | ) | | | (36,138 | ) |
athenahealth, Inc. (2) | | | (3,844 | ) | | | (404,273 | ) |
BioMarin Pharmaceutical, Inc. (2) | | | (234 | ) | | | (19,385 | ) |
Bluebird Bio, Inc. (2) | | | (480 | ) | | | (29,616 | ) |
| Bristol-Myers Squibb Co. | | | (5,121 | ) | | | (299,271 | ) |
Brookdale Senior Living, Inc. (2) | | | (7,998 | ) | | | (99,335 | ) |
DaVita, Inc. (2) | | | (7,688 | ) | | | (493,570 | ) |
DexCom, Inc. (2) | | | (5,227 | ) | | | (312,052 | ) |
Envision Healthcare Corp. (2) | | | (2,364 | ) | | | (149,618 | ) |
Exact Sciences Corp. (2) | | | (64 | ) | | | (855 | ) |
Incyte Corp. (2) | | | (4,490 | ) | | | (450,211 | ) |
Insulet Corp. (2) | | | (2,597 | ) | | | (97,855 | ) |
Ionis Pharmaceuticals, Inc. (2) | | | (731 | ) | | | (34,964 | ) |
IRIDEX Corp. (2) | | | (139 | ) | | | (1,954 | ) |
Juno Therapeutics, Inc. (2) | | | (2,431 | ) | | | (45,824 | ) |
Kite Pharma, Inc. (2) | | | (1,392 | ) | | | (62,417 | ) |
Medicines Co./The (2) | | | (3,818 | ) | | | (129,583 | ) |
MEDNAX, Inc. (2) | | | (1,742 | ) | | | (116,122 | ) |
Nektar Therapeutics (2) | | | (977 | ) | | | (11,988 | ) |
Neurocrine Biosciences, Inc. (2) | | | (882 | ) | | | (34,133 | ) |
Nevro Corp. (2) | | | (2,232 | ) | | | (162,177 | ) |
NxStage Medical, Inc. (2) | | | (435 | ) | | | (11,401 | ) |
Penumbra, Inc. (2) | | | (336 | ) | | | (21,437 | ) |
| Perrigo Co. PLC | | | (2,683 | ) | | | (223,306 | ) |
Prothena Corp. PLC (2) | | | (767 | ) | | | (37,729 | ) |
Radius Health, Inc. (2) | | | (1,584 | ) | | | (60,240 | ) |
Regeneron Pharmaceuticals, Inc. (2) | | | (203 | ) | | | (74,519 | ) |
Sage Therapeutics, Inc. (2) | | | (1,163 | ) | | | (59,383 | ) |
Team Health Holdings, Inc. (2) | | | (2,046 | ) | | | (88,899 | ) |
TESARO, Inc. (2) | | | (441 | ) | | | (59,306 | ) |
Ultragenyx Pharmaceutical, Inc. (2) | | | (906 | ) | | | (63,701 | ) |
Vertex Pharmaceuticals, Inc. (2) | | | (2,768 | ) | | | (203,919 | ) |
Wright Medical Group NV (2) | | | (9,616 | ) | | | (220,976 | ) |
| | | | | | | | (4,738,166 | ) |
| | | | | | | | | |
| Industrials — (5.9%) | | | | | | | | |
2U, Inc. (2) | | | (3,001 | ) | | | (90,480 | ) |
| Acuity Brands, Inc. | | | (2,218 | ) | | | (512,047 | ) |
Spectrum Fund |
| Security Description | | Shares or Principal Amount ($) | | | Fair Value ($) | |
| Common Stocks - Short — continued | | | | | | |
| Argan, Inc. | | | (566 | ) | | | (39,931 | ) |
| Air Lease Corp. | | | (6,621 | ) | | | (227,299 | ) |
| Alamo Group, Inc. | | | (333 | ) | | | (25,341 | ) |
| Allegiant Travel Co. | | | (521 | ) | | | (86,694 | ) |
Ameresco, Inc. (2) | | | (1,266 | ) | | | (6,963 | ) |
Armstrong Flooring, Inc. (2) | | | (654 | ) | | | (13,021 | ) |
Armstrong World Industries, Inc. (2) | | | (12,382 | ) | | | (517,568 | ) |
CAI International, Inc. (2) | | | (51 | ) | | | (442 | ) |
Clean Harbors, Inc. (2) | | | (204 | ) | | | (11,353 | ) |
| Columbus McKinnon Corp./NY | | | (189 | ) | | | (5,111 | ) |
| Covanta Holding Corp. | | | (23,655 | ) | | | (369,018 | ) |
| Exponent, Inc. | | | (133 | ) | | | (8,020 | ) |
| Flowserve Corp. | | | (3,588 | ) | | | (172,403 | ) |
Gencor Industries, Inc. (2) | | | (600 | ) | | | (9,420 | ) |
Genesee & Wyoming, Inc. (2) | | | (98 | ) | | | (6,802 | ) |
GMS, Inc. (2) | | | (2,853 | ) | | | (83,536 | ) |
Great Lakes Dredge & Dock Corp. (2) | | | (5,117 | ) | | | (21,491 | ) |
| Harsco Corp. | | | (431 | ) | | | (5,862 | ) |
| Healthcare Services Group, Inc. | | | (11,853 | ) | | | (464,282 | ) |
| Heartland Express, Inc. | | | (1,121 | ) | | | (22,824 | ) |
| HEICO Corp. | | | (3,923 | ) | | | (302,659 | ) |
| Hexcel Corp. | | | (6,763 | ) | | | (347,889 | ) |
| Hurco Cos., Inc. | | | (200 | ) | | | (6,620 | ) |
IES Holdings, Inc. (2) | | | (1,300 | ) | | | (24,895 | ) |
| Kadant, Inc. | | | (200 | ) | | | (12,240 | ) |
KEYW Holding Corp./The (2) | | | (428 | ) | | | (5,046 | ) |
KLX, Inc. (2) | | | (2,218 | ) | | | (100,054 | ) |
| Macquarie Infrastructure Corp. | | | (1,166 | ) | | | (95,262 | ) |
Manitowoc Co., Inc./The (2) | | | (460 | ) | | | (2,751 | ) |
Middleby Corp./The (2) | | | (4,281 | ) | | | (551,435 | ) |
Milacron Holdings Corp. (2) | | | (317 | ) | | | (5,906 | ) |
| Miller Industries, Inc./TN | | | (500 | ) | | | (13,225 | ) |
MYR Group, Inc. (2) | | | (1,712 | ) | | | (64,508 | ) |
| Orbital ATK, Inc. | | | (1,829 | ) | | | (160,458 | ) |
Orion Group Holdings, Inc. (2) | | | (2,070 | ) | | | (20,597 | ) |
Patrick Industries, Inc. (2) | | | (46 | ) | | | (3,510 | ) |
Roadrunner Transportation Systems, Inc. (2) | | | (1,012 | ) | | | (10,515 | ) |
| Rockwell Collins, Inc. | | | (255 | ) | | | (23,654 | ) |
| Rollins, Inc. | | | (842 | ) | | | (28,443 | ) |
| Roper Technologies, Inc. | | | (2,862 | ) | | | (523,975 | ) |
SiteOne Landscape Supply, Inc. (2) | | | (59 | ) | | | (2,049 | ) |
| Snap-on, Inc. | | | (3,143 | ) | | | (538,302 | ) |
Spirit Airlines, Inc. (2) | | | (1,445 | ) | | | (83,608 | ) |
SPX Corp. (2) | | | (1,027 | ) | | | (24,360 | ) |
Stericycle, Inc. (2) | | | (6,881 | ) | | | (530,112 | ) |
| Supreme Industries, Inc. | | | (134 | ) | | | (2,104 | ) |
| Titan International, Inc. | | | (1,784 | ) | | | (19,999 | ) |
The accompanying notes are an integral part of these financial statements.
| 2016 Annual Report | December 31, 2016 | Page 57 |
Schedule of Investments
December 31, 2016
Spectrum Fund |
| Security Description | | Shares or Principal Amount ($) | | | Fair Value ($) | |
| Common Stocks - Short — continued | | | | | | |
| TransDigm Group, Inc. | | | (2,207 | ) | | | (549,455 | ) |
Tutor Perini Corp. (2) | | | (374 | ) | | | (10,472 | ) |
Verisk Analytics, Inc. (2) | | | (124 | ) | | | (10,065 | ) |
| Wabtec Corp./DE | | | (5,898 | ) | | | (489,652 | ) |
WageWorks, Inc. (2) | | | (7 | ) | | | (508 | ) |
| | | | | | | | (7,264,236 | ) |
| | | | | | | | | |
| Information Technology — (4.7%) | | | | | | | | |
Alpha & Omega Semiconductor, Ltd. (2) | | | (782 | ) | | | (16,633 | ) |
Arista Networks, Inc. (2) | | | (3,490 | ) | | | (337,727 | ) |
Cavium, Inc. (2) | | | (7,554 | ) | | | (471,672 | ) |
Cornerstone OnDemand, Inc. (2) | | | (1,907 | ) | | | (80,685 | ) |
CoStar Group, Inc. (2) | | | (2,978 | ) | | | (561,323 | ) |
| Cypress Semiconductor Corp. | | | (1,938 | ) | | | (22,171 | ) |
Electronics For Imaging, Inc. (2) | | | (493 | ) | | | (21,623 | ) |
Envestnet, Inc. (2) | | | (2,580 | ) | | | (90,945 | ) |
FireEye, Inc. (2) | | | (4,947 | ) | | | (58,869 | ) |
Fortinet, Inc. (2) | | | (79 | ) | | | (2,379 | ) |
Guidewire Software, Inc. (2) | | | (2,429 | ) | | | (119,823 | ) |
HubSpot, Inc. (2) | | | (737 | ) | | | (34,639 | ) |
| MACOM Technology Solutions | | | | | | | | |
Holdings, Inc. (2) | | | (3,250 | ) | | | (150,410 | ) |
NetScout Systems, Inc. (2) | | | (1,710 | ) | | | (53,865 | ) |
New Relic, Inc. (2) | | | (5,437 | ) | | | (153,595 | ) |
Palo Alto Networks, Inc. (2) | | | (3,202 | ) | | | (400,410 | ) |
Pandora Media, Inc. (2) | | | (3,459 | ) | | | (45,105 | ) |
Paylocity Holding Corp. (2) | | | (1,274 | ) | | | (38,233 | ) |
PDF Solutions, Inc. (2) | | | (755 | ) | | | (17,025 | ) |
Proofpoint, Inc. (2) | | | (2,033 | ) | | | (143,631 | ) |
ServiceNow, Inc. (2) | | | (1,431 | ) | | | (106,381 | ) |
Splunk, Inc. (2) | | | (7,697 | ) | | | (393,702 | ) |
| SS&C Technologies Holdings, Inc. | | | (1,189 | ) | | | (34,005 | ) |
Tableau Software, Inc. (2) | | | (1,580 | ) | | | (66,597 | ) |
Twitter, Inc. (2) | | | (16,535 | ) | | | (269,521 | ) |
Tyler Technologies, Inc. (2) | | | (34 | ) | | | (4,854 | ) |
Ultimate Software Group, Inc./The (2) | | | (587 | ) | | | (107,039 | ) |
Universal Display Corp. (2) | | | (2,794 | ) | | | (157,302 | ) |
VeriFone Systems, Inc. (2) | | | (6,910 | ) | | | (122,514 | ) |
ViaSat, Inc. (2) | | | (5,861 | ) | | | (388,115 | ) |
Vishay Precision Group, Inc. (2) | | | (105 | ) | | | (1,985 | ) |
Workday, Inc. (2) | | | (8,287 | ) | | | (547,688 | ) |
Yahoo!, Inc. (2) | | | (3,255 | ) | | | (125,871 | ) |
Yelp, Inc. (2) | | | (730 | ) | | | (27,835 | ) |
Zebra Technologies Corp. (2) | | | (4,167 | ) | | | (357,362 | ) |
Zendesk, Inc. (2) | | | (3,340 | ) | | | (70,808 | ) |
Zillow Group, Inc. (2) | | | (7,519 | ) | | | (274,068 | ) |
| | | | | | | | (5,876,410 | ) |
Spectrum Fund |
| Security Description | | Shares or Principal Amount ($) | | | Fair Value ($) | |
| Common Stocks - Short — continued | | | | | | |
| Materials — (1.3%) | | | | | | |
| Alcoa, Inc. | | | (2,936 | ) | | | (82,443 | ) |
| Allegheny Technologies, Inc. | | | (4,332 | ) | | | (69,009 | ) |
| Ampco-Pittsburgh Corp. | | | (300 | ) | | | (5,025 | ) |
| AptarGroup, Inc. | | | (233 | ) | | | (17,114 | ) |
| Ashland LLC | | | (351 | ) | | | (38,361 | ) |
| Balchem Corp. | | | (3,915 | ) | | | (328,547 | ) |
| Ball Corp. | | | (7,178 | ) | | | (538,852 | ) |
| Carpenter Technology Corp. | | | (2,045 | ) | | | (73,968 | ) |
| Ecolab, Inc. | | | (313 | ) | | | (36,690 | ) |
| FMC Corp. | | | (221 | ) | | | (12,500 | ) |
Handy & Harman, Ltd. (2) | | | (300 | ) | | | (7,665 | ) |
| Haynes International, Inc. | | | (571 | ) | | | (24,547 | ) |
| Kaiser Aluminum Corp. | | | (475 | ) | | | (36,903 | ) |
| Materion Corp. | | | (2,040 | ) | | | (80,784 | ) |
| Schnitzer Steel Industries, Inc. | | | (3,942 | ) | | | (101,309 | ) |
| Silgan Holdings, Inc. | | | (2,822 | ) | | | (144,430 | ) |
SunCoke Energy, Inc. (2) | | | (2,690 | ) | | | (30,505 | ) |
| | | | | | | | (1,628,652 | ) |
| | | | | | | | | |
| Real Estate Investment Trust — (4.3%) | | | | | | | | |
| Acadia Realty Trust | | | (5,206 | ) | | | (170,132 | ) |
| Alexandria Real Estate Equities, Inc. | | | (4,887 | ) | | | (543,092 | ) |
| AvalonBay Communities, Inc. | | | (156 | ) | | | (27,635 | ) |
| Colony Starwood Homes | | | (3,345 | ) | | | (96,369 | ) |
| CubeSmart | | | (22,010 | ) | | | (589,208 | ) |
| CyrusOne, Inc. | | | (8,158 | ) | | | (364,907 | ) |
| DDR Corp. | | | (11,293 | ) | | | (172,444 | ) |
| Empire State Realty Trust, Inc. | | | (3,554 | ) | | | (71,755 | ) |
| Essex Property Trust, Inc. | | | (2,384 | ) | | | (554,280 | ) |
| Extra Space Storage, Inc. | | | (1,951 | ) | | | (150,695 | ) |
| Gramercy Property Trust | | | (1,975 | ) | | | (18,131 | ) |
Howard Hughes Corp./The (2) | | | (4,825 | ) | | | (550,533 | ) |
| Kite Realty Group Trust | | | (1,130 | ) | | | (26,532 | ) |
| Life Storage, Inc. | | | (6,978 | ) | | | (594,944 | ) |
| Macerich Co./The | | | (284 | ) | | | (20,119 | ) |
| New York REIT, Inc. | | | (16,923 | ) | | | (171,261 | ) |
| Paramount Group, Inc. | | | (20,973 | ) | | | (335,358 | ) |
| Regency Centers Corp. | | | (3,883 | ) | | | (267,733 | ) |
| Retail Opportunity Investments Corp. | | | (3,400 | ) | | | (71,842 | ) |
| RMR Group, Inc./The | | | (820 | ) | | | (32,390 | ) |
| SL Green Realty Corp. | | | (4,885 | ) | | | (525,382 | ) |
| Vornado Realty Trust | | | (69 | ) | | | (7,202 | ) |
| | | | | | | | (5,361,944 | ) |
| Utilities — (2.3%) | | | | | | | | |
| Aqua America, Inc. | | | (16,096 | ) | | | (483,524 | ) |
The accompanying notes are an integral part of these financial statements.
| Page 58 | 2016 Annual Report | December 31, 2016 |
Schedule of Investments
December 31, 2016
Spectrum Fund |
| Security Description | | Shares or Principal Amount ($) | | | Fair Value ($) | |
| Common Stocks - Short — continued | | | | | | |
| Avangrid, Inc. | | | (15,248 | ) | | | (577,594 | ) |
| Black Hills Corp. | | | (3,648 | ) | | | (223,768 | ) |
| Connecticut Water Service, Inc. | | | (384 | ) | | | (21,446 | ) |
| Middlesex Water Co. | | | (56 | ) | | | (2,405 | ) |
| National Fuel Gas Co. | | | (5,679 | ) | | | (321,659 | ) |
| New Jersey Resources Corp. | | | (2,568 | ) | | | (91,164 | ) |
| Pattern Energy Group, Inc. | | | (9,692 | ) | | | (184,051 | ) |
| PNM Resources, Inc. | | | (17,122 | ) | | | (587,285 | ) |
| South Jersey Industries, Inc. | | | (11,746 | ) | | | (395,723 | ) |
| WGL Holdings, Inc. | | | (213 | ) | | | (16,248 | ) |
| | | | | | | | (2,904,867 | ) |
| | | | | | | | | |
Total Securities Sold Short
(Proceeds Received $(46,237,362)) | | | | | | | (47,004,069 | ) |
| | | | | | | | | |
Trustee Deferred Compensation (8) | | | | | | | | |
| Meeder Aggressive Growth Fund | | | 242 | | | | 2,502 | |
| Meeder Balanced Fund | | | 144 | | | | 1,547 | |
| Meeder Dynamic Growth Fund | | | 91 | | | | 885 | |
| Meeder Muirfield Fund | | | 200 | | | | 1,358 | |
| Meeder Quantex Fund | | | 47 | | | | 1,568 | |
| Meeder Infrastructure Fund | | | 43 | | | | 917 | |
Total Trustee Deferred Compensation
(Cost $8,505) | | | | | | | 8,777 | |
Spectrum Fund |
| | Long Contracts | | | Unrealized Appreciation (Depreciation)($) | |
| Futures Contracts | | | | | | |
| Standard & Poors 500 Mini Futures expiring March 2017, notional value $43,829,520 | | | 392 | | | | (213,454 | ) |
| Total Futures Contracts | | | 392 | | | | (213,454 | ) |
| (1) | Cost for federal income tax purposes of $118,610,021 differs from value by net unrealized appreciation (depreciation) of securities as follows: |
| Unrealized appreciation | | | $ | 9,553,127 | |
| Unrealized depreciation | | | | (6,685,432 | ) |
| Net unrealized appreciation (depreciation) | | | $ | 2,867,695 | |
| (2) | Represents non-income producing securities. |
| (3) | All or a portion of this security is on loan. |
| (4) | Investment purchased with cash received as securities lending collateral. The yield shown represents the 7-day yield in effect at December 31, 2016. |
| (5) | All or a portion of the security is held as collateral for securities sold short. The total fair value of this collateral on December 31, 2016 was $57,471,484. |
| (6) | Investment in affiliate. The yield shown represents the 7-day yield in effect at December 31, 2016. |
| (7) | Variable rate security. Securities payable at par including accrued interest (usually within seven days notice) and unconditionally secured as to principal and interest by letters of credit or other credit support agreements from major banks. The interest rates are adjustable and are based on bank prime rates or other interest rate adjustment indices. The rate shown represents the rate in effect at December 31, 2016. The maturity date shown, if applicable, reflects the earlier of the next demand date or stated maturity date. |
| (8) | Assets of affiliates to the Spectrum Fund held for the benefit of the Fund’s Trustees in connection with the Trustee Deferred Compensation Plan. |
| (9) | Fair valued security deemed as Level 3 security. |
The accompanying notes are an integral part of these financial statements.
| 2016 Annual Report | December 31, 2016 | Page 59 |
Schedule of Investments
December 31, 2016
Quantex Fund
| Security Description | | Shares or Principal Amount ($) | | | Fair Value ($) | |
| Common Stocks — 82.9% | | | | | | |
| Consumer Discretionary — 21.1% | | | | | | |
| Aaron's, Inc. | | | 24,020 | | | | 768,400 | |
| Abercrombie & Fitch Co. | | | 19,919 | | | | 239,028 | |
AutoNation, Inc. (2) | | | 11,817 | | | | 574,897 | |
| Bed Bath & Beyond, Inc. | | | 11,146 | | | | 452,973 | |
| Big Lots, Inc. | | | 13,954 | | | | 700,630 | |
| Chico's FAS, Inc. | | | 50,403 | | | | 725,299 | |
| Darden Restaurants, Inc. | | | 8,451 | | | | 614,557 | |
Deckers Outdoor Corp. (2) | | | 11,394 | | | | 631,114 | |
| DeVry Education Group, Inc. | | | 21,249 | | | | 662,969 | |
Fossil Group, Inc. (2) | | | 14,710 | | | | 380,401 | |
| GameStop Corp. | | | 19,180 | | | | 484,487 | |
| Garmin, Ltd. | | | 14,469 | | | | 701,602 | |
| Guess?, Inc. | | | 28,485 | | | | 344,669 | |
| H&R Block, Inc. | | | 31,121 | | | | 715,472 | |
| International Speedway Corp. | | | 15,949 | | | | 586,923 | |
| KB Home | | | 39,729 | | | | 628,115 | |
| Leggett & Platt, Inc. | | | 12,799 | | | | 625,615 | |
| MDC Holdings, Inc. | | | 22,119 | | | | 567,574 | |
| Meredith Corp. | | | 11,297 | | | | 668,218 | |
Michael Kors Holdings, Ltd. (2) | | | 13,425 | | | | 577,007 | |
| News Corp. | | | 40,255 | | | | 461,322 | |
| PulteGroup, Inc. | | | 30,774 | | | | 565,626 | |
| PVH Corp. | | | 7,302 | | | | 658,932 | |
| Rent-A-Center, Inc./TX | | | 35,925 | | | | 404,156 | |
| Scripps Networks Interactive, Inc. | | | 9,741 | | | | 695,215 | |
Sotheby's (2)(3) | | | 20,877 | | | | 832,157 | |
| Staples, Inc. | | | 56,790 | | | | 513,950 | |
| TEGNA, Inc. | | | 27,048 | | | | 578,557 | |
| Time, Inc. | | | 34,321 | | | | 612,630 | |
Urban Outfitters, Inc. (2) | | | 23,640 | | | | 673,267 | |
| Wynn Resorts, Ltd. | | | 6,205 | | | | 536,795 | |
| | | | | | | | 18,182,557 | |
| | | | | | | | | |
| Consumer Staples — 1.2% | | | | | | | | |
| Dean Foods Co. | | | 31,359 | | | | 682,999 | |
SUPERVALU, Inc. (2) | | | 79,322 | | | | 370,434 | |
| | | | | | | | 1,053,433 | |
| | | | | | | | | |
| Energy — 10.1% | | | | | | | | |
Atwood Oceanics, Inc. (3) | | | 52,571 | | | | 690,257 | |
| Cabot Oil & Gas Corp. | | | 30,402 | | | | 710,191 | |
Diamond Offshore Drilling, Inc. (2)(3) | | | 25,488 | | | | 451,138 | |
| Ensco PLC | | | 34,945 | | | | 339,665 | |
| EQT Corp. | | | 10,317 | | | | 674,732 | |
| Helmerich & Payne, Inc. | | | 10,043 | | | | 777,328 | |
| Murphy Oil Corp. | | | 23,956 | | | | 745,750 | |
Quantex Fund
| Security Description | | Shares or Principal Amount ($) | | | Fair Value ($) | |
| Common Stocks — continued | | | | | | |
Newfield Exploration Co. (2) | | | 16,796 | | | | 680,238 | |
Oil States International, Inc. (2) | | | 18,714 | | | | 729,846 | |
| ONEOK, Inc. | | | 17,683 | | | | 1,015,182 | |
| Range Resources Corp. | | | 18,786 | | | | 645,487 | |
Southwestern Energy Co. (2) | | | 45,078 | | | | 487,744 | |
Transocean, Ltd. (2)(3) | | | 48,930 | | | | 721,228 | |
| | | | | | | | 8,668,786 | |
| | | | | | | | | |
| Financials — 9.8% | | | | | | | | |
| Assurant, Inc. | | | 8,867 | | | | 823,390 | |
| Comerica, Inc. | | | 12,857 | | | | 875,690 | |
| International Bancshares Corp. | | | 23,477 | | | | 957,861 | |
| Kemper Corp. | | | 14,438 | | | | 639,603 | |
| Legg Mason, Inc. | | | 15,100 | | | | 451,641 | |
| Leucadia National Corp. | | | 33,907 | | | | 788,338 | |
| Navient Corp. | | | 46,970 | | | | 771,717 | |
| People's United Financial, Inc. | | | 41,793 | | | | 809,112 | |
| Torchmark Corp. | | | 9,409 | | | | 694,008 | |
| Trustmark Corp. | | | 23,342 | | | | 832,142 | |
Wells Fargo & Co. Preferred (2)(8) | | | 1 | | | | — | |
| Zions Bancorporation | | | 19,700 | | | | 847,888 | |
| | | | | | | | 8,491,390 | |
| | | | | | | | | |
| Healthcare — 2.9% | | | | | | | | |
Halyard Health, Inc. (2) | | | 16,097 | | | | 595,267 | |
| Patterson Cos., Inc. | | | 11,896 | | | | 488,093 | |
| PerkinElmer, Inc. | | | 10,039 | | | | 523,534 | |
Tenet Healthcare Corp. (2) | | | 17,749 | | | | 263,395 | |
Varian Medical Systems, Inc. (2) | | | 6,656 | | | | 597,576 | |
| | | | | | | | 2,467,865 | |
| | | | | | | | | |
| Industrials — 16.3% | | | | | | | | |
| Allegion PLC | | | 8,158 | | | | 522,112 | |
| Dun & Bradstreet Corp./The | | | 5,175 | | | | 627,831 | |
| Flowserve Corp. | | | 12,781 | | | | 614,127 | |
| Fluor Corp. | | | 11,892 | | | | 624,568 | |
FTI Consulting, Inc. (2) | | | 15,517 | | | | 699,506 | |
GATX Corp. (3) | | | 12,639 | | | | 778,310 | |
| Granite Construction, Inc. | | | 12,533 | | | | 689,315 | |
| Herman Miller, Inc. | | | 18,739 | | | | 640,874 | |
| HNI Corp. | | | 13,366 | | | | 747,427 | |
Jacobs Engineering Group, Inc. (2) | | | 12,820 | | | | 730,740 | |
| Kennametal, Inc. | | | 28,011 | | | | 875,624 | |
KLX, Inc. (2) | | | 17,467 | | | | 787,936 | |
| MSA Safety, Inc. | | | 12,372 | | | | 857,751 | |
NOW, Inc. (2) | | | 33,995 | | | | 695,878 | |
| Pitney Bowes, Inc. | | | 26,044 | | | | 395,608 | |
The accompanying notes are an integral part of these financial statements.
| Page 60 | 2016 Annual Report | December 31, 2016 |
Schedule of Investments
December 31, 2016
Quantex Fund
| Security Description | | Shares or Principal Amount ($) | | | Fair Value ($) | |
| Common Stocks — continued | | | | | | |
Quanta Services, Inc. (2) | | | 26,558 | | | | 925,546 | |
| Robert Half International, Inc. | | | 11,409 | | | | 556,531 | |
| Ryder System, Inc. | | | 10,001 | | | | 744,474 | |
| Werner Enterprises, Inc. | | | 29,776 | | | | 802,463 | |
| Xylem, Inc./NY | | | 14,734 | | | | 729,628 | |
| | | | | | | | 14,046,249 | |
| | | | | | | | | |
| Information Technology — 9.2% | | | | | | | | |
3D Systems Corp. (2)(3) | | | 45,675 | | | | 607,021 | |
Acxiom Corp. (2) | | | 25,850 | | | | 692,780 | |
CommVault Systems, Inc. (2) | | | 13,667 | | | | 702,484 | |
F5 Networks, Inc. (2) | | | 5,547 | | | | 802,761 | |
First Solar, Inc. (2)(3) | | | 19,638 | | | | 630,183 | |
| FLIR Systems, Inc. | | | 19,159 | | | | 693,364 | |
Knowles Corp. (2) | | | 40,345 | | | | 674,165 | |
| NetApp, Inc. | | | 20,272 | | | | 714,993 | |
| Plantronics, Inc. | | | 11,341 | | | | 621,033 | |
Qorvo, Inc. (2) | | | 10,566 | | | | 557,145 | |
Teradata Corp. (2) | | | 20,356 | | | | 553,073 | |
| Vishay Intertechnology, Inc. | | | 44,631 | | | | 723,022 | |
| | | | | | | | 7,972,024 | |
| | | | | | | | | |
| Real Estate Investment Trust — 3.2% | | | | | | |
| Alexander & Baldwin, Inc. | | | 18,234 | | | | 818,160 | |
| Apartment Investment & Management Co. | | | 13,435 | | | | 610,621 | |
| Iron Mountain, Inc. | | | 16,750 | | | | 544,040 | |
| Potlatch Corp. | | | 17,955 | | | | 747,826 | |
| | | | | | | | 2,720,647 | |
| | | | | | | | | |
| Materials — 5.0% | | | | | | | | |
| Avery Dennison Corp. | | | 8,583 | | | | 602,698 | |
| Carpenter Technology Corp. | | | 17,767 | | | | 642,632 | |
| Commercial Metals Co. | | | 39,284 | | | | 855,606 | |
| FMC Corp. | | | 12,952 | | | | 732,565 | |
| Greif, Inc. | | | 17,455 | | | | 895,616 | |
Owens-Illinois, Inc. (2) | | | 31,380 | | | | 546,326 | |
| | | | | | | | 4,275,443 | |
| | | | | | | | | |
| Telecommunication Services — 0.5% | | | | | | | | |
Frontier Communications Corp. (3) | | | 138,091 | | | | 466,748 | |
| | | | | | | | 466,748 | |
| | | | | | | | | |
| Utilities — 3.6% | | | | | | | | |
| AES Corp./VA | | | 56,197 | | | | 653,009 | |
| CenterPoint Energy, Inc. | | | 29,292 | | | | 721,755 | |
| NiSource, Inc. | | | 27,566 | | | | 610,311 | |
| NRG Energy, Inc. | | | 39,704 | | | | 486,771 | |
Quantex Fund
| Security Description | | Shares or Principal Amount ($) | | | Fair Value ($) | |
| Common Stocks — continued | | | | | | |
| Pinnacle West Capital Corp. | | | 8,341 | | | | 650,848 | |
| | | | | | | | 3,122,694 | |
| | | | | | | | | |
Total Common Stocks
(Cost $64,340,838) | | | | | | | 71,467,836 | |
| | | | | | | | | |
| Money Market Registered Investment Companies — 19.6% | |
Morgan Stanley Government Institutional Fund, 0.44% (4) | | | 5,226,665 | | | | 5,226,665 | |
Meeder Institutional Prime Money Market Fund 0.64% (5) | | | 11,728,826 | | | | 11,729,999 | |
Total Money Market Registered Investment Companies
(Cost $16,956,085) | | | | | | | 16,956,664 | |
| | | | | | | | | |
| Bank Obligations — 0.9% | | | | | | | | |
Capital Bank Deposit Account, 0.70%, 1/3/2017 (6) | | | 249,000 | | | | 249,000 | |
EverBank Money Market Account, 0.61%, 1/3/2017 (6) | | | 249,000 | | | | 249,000 | |
Pacific Mercantile Bank Deposit Account, 0.60%, 1/3/2017 (6) | | | 249,000 | | | | 249,000 | |
Total Bank Obligations
(Cost $747,000) | | | | | | | 747,000 | |
| | | | | | | | | |
Total Investments — 103.4%
(Cost $82,043,923) (1) | | | | | | | 89,171,500 | |
| Liabilities less Other Assets — (3.4%) | | | | | | | (2,953,740 | ) |
| Total Net Assets — 100.0% | | | | | | | 86,217,760 | |
| | | | | | | | | |
Trustee Deferred Compensation (7) | | | | | | | | |
| Meeder Aggressive Growth Fund | | | 1,455 | | | | 15,045 | |
| Meeder Balanced Fund | | | 777 | | | | 8,345 | |
| Meeder Dynamic Growth Fund | | | 523 | | | | 5,084 | |
| Meeder Muirfield Fund | | | 2,442 | | | | 16,581 | |
| Meeder Quantex Fund | | | 1,605 | | | | 53,543 | |
| Meeder Infrastructure Fund | | | 225 | | | | 4,797 | |
Total Trustee Deferred Compensation
(Cost $76,613) | | | | | | | 103,395 | |
The accompanying notes are an integral part of these financial statements.
| 2016 Annual Report | December 31, 2016 | Page 61 |
Schedule of Investments
December 31, 2016
Quantex Fund
| | | Long Contracts | | | Unrealized Appreciation (Depreciation)($) | |
| Futures Contracts | | | | | | |
| E-mini Standard & Poors MidCap 400 Futures expiring March 2017,notional value $14,765,990 | | | 89 | | | | (299,926 | ) |
| Total Futures Contracts | | | 89 | | | | (299,926 | ) |
| (1) | Cost for federal income tax purposes of $81,748,370 differs from value by net unrealized appreciation (depreciation) of securities as follows: |
| Unrealized appreciation | | $ | 12,725,177 | |
| Unrealized depreciation | | | (5,601,973 | ) |
| Net unrealized appreciation (depreciation) | | $ | 7,123,204 | |
| (2) | Represents non-income producing securities. |
| (3) | All or a portion of this security is on loan. |
| (4) | Investment purchased with cash received as securities lending collateral. The yield shown represents the 7-day yield in effect at December 31, 2016. |
| (5) | Investment in affiliate. The yield shown represents the 7-day yield in effect at December 31, 2016. |
| (6) | Variable rate security. Securities payable at par including accrued interest (usually within seven days notice) and unconditionally secured as to principal and interest by letters of credit or other credit support agreements from major banks. The interest rates are adjustable and are based on bank prime rates or other interest rate adjustment indices. The rate shown represents the rate in effect at December 31, 2016. The maturity date shown, if applicable, reflects the earlier of the next demand date or stated maturity date. |
| (7) | Assets of affiliates to the Quantex Fund held for the benefit of the Fund’s Trustees in connection with the Trustee Deferred Compensation Plan. |
| (8) | Fair valued security deemed as Level 3 security. |
The accompanying notes are an integral part of these financial statements.
| Page 62 | 2016 Annual Report | December 31, 2016 |
Schedule of Investments
December 31, 2016
Infrastructure Fund
| Security Description | | Shares or Principal Amount ($) | | | Fair Value ($) | |
| Common Stocks — 90.4% | | | | | | |
| Electric Utility — 7.9% | | | | | | |
| AES Corp. | | | 50,861 | | | | 591,005 | |
InfraREIT, Inc. (4) | | | 24,427 | | | | 437,488 | |
| MDU Resources Group, Inc. | | | 21,019 | | | | 604,717 | |
| | | | | | | | 1,633,210 | |
| | | | | | | | | |
| Natural Gas Distribution — 16.5% | | | | | | | | |
| Energy Transfer Equity, L.P. | | | 6,147 | | | | 220,124 | |
National Grid, PLC - ADR (3) | | | 12,607 | | | | 735,366 | |
| OGE Energy Corp. | | | 25,575 | | | | 855,484 | |
| Targa Resources Corp. | | | 19,306 | | | | 1,082,420 | |
| Williams Cos., Inc./The | | | 17,595 | | | | 547,908 | |
| | | | | | | | 3,441,302 | |
| | | | | | | | | |
| Pipelines — 15.1% | | | | | | | | |
| Enterprise Products Partners, L.P. | | | 24,297 | | | | 656,991 | |
| Kinder Morgan, Inc. | | | 29,394 | | | | 608,750 | |
| Marathon Petroleum Corp. | | | 12,488 | | | | 628,771 | |
| MPLX, L.P. | | | 7,733 | | | | 267,716 | |
| National Fuel Gas Co. | | | 8,751 | | | | 495,657 | |
| Spectra Energy Corp. | | | 11,504 | | | | 472,699 | |
| | | | | | | | 3,130,584 | |
| | | | | | | | | |
| Telecommunication Services — 28.6% | | | | | |
American Tower Corp. (4) | | | 5,278 | | | | 557,779 | |
Arris Group, Inc. (2) | | | 17,342 | | | | 522,514 | |
| AT&T, Inc. | | | 14,797 | | | | 629,316 | |
| BT Group, PLC - ADR (3) | | | 19,107 | | | | 440,034 | |
| Cisco Systems, Inc. | | | 16,483 | | | | 498,116 | |
| Corning, Inc. | | | 28,395 | | | | 689,147 | |
Crown Castle International Corp. (4) | | | 4,038 | | | | 350,377 | |
DISH Network Corp. (2) | | | 10,095 | | | | 584,803 | |
| QUALCOMM, Inc. | | | 15,759 | | | | 1,027,488 | |
| Telephone & Data Systems, Inc. | | | 9,264 | | | | 267,452 | |
| Verizon Communications, Inc. | | | 6,968 | | | | 371,952 | |
| | | | | | | | 5,938,978 | |
| | | | | | | | | |
| Utility Services — 19.8% | | | | | | | | |
| FedEx Corp. | | | 4,396 | | | | 818,535 | |
| Fortis, Inc. | | | 6,461 | | | | 199,516 | |
| Macquarie Infrastructure Company, LLC | | | 10,037 | | | | 820,023 | |
| NextEra Energy Partners, L.P. | | | 16,341 | | | | 417,349 | |
| Ormat Technologies, Inc. | | | 6,249 | | | | 335,071 | |
| Pattern Energy Group, Inc. | | | 18,966 | | | | 360,164 | |
| UGI Corp. | | | 9,415 | | | | 433,843 | |
| United Parcel Service, Inc. - Class B | | | 6,283 | | | | 720,283 | |
| | | | | | | | 4,104,784 | |
Infrastructure Fund
| Security Description | | Shares or Principal Amount ($) | | | Fair Value ($) | |
| Common Stocks — continued | | | | | | |
| Water Utility — 2.5% | | | | | | |
Veolia Environnement SA - ADR (3) | | | 30,560 | | | | 518,114 | |
| | | | | | | | 518,114 | |
| | | | | | | | | |
Total Common Stocks
(Cost $16,973,164) | | | | | | | 18,766,972 | |
| | | | | | | | | |
| Money Market Registered Investment Companies — 9.1% | |
Meeder Institutional Prime Money Market Fund 0.64% (5) | | | 1,891,473 | | | | 1,891,662 | |
Total Money Market Registered Investment Companies
(Cost $1,891,661) | | | | | | | 1,891,662 | |
Total Investments — 99.5%
(Cost $18,864,825) (1) | | | | | | | 20,658,634 | |
| Other Assets less Liabilities — 0.5% | | | | | | | 103,788 | |
| Total Net Assets — 100.0% | | | | | | | 20,762,422 | |
| | | | | | | | | |
Trustee Deferred Compensation (6) | | | | | | | | |
| Meeder Aggressive Growth Fund | | | 1,545 | | | | 15,975 | |
| Meeder Balanced Fund | | | 815 | | | | 8,753 | |
| Meeder Dynamic Growth Fund | | | 551 | | | | 5,356 | |
| Meeder Muirfield Fund | | | 2,244 | | | | 15,237 | |
| Meeder Quantex Fund | | | 1,395 | | | | 46,537 | |
| Meeder Infrastructure Fund | | | 235 | | | | 5,010 | |
Total Trustee Deferred Compensation
(Cost $72,410) | | | | | | | 96,868 | |
The accompanying notes are an integral part of these financial statements.
| 2016 Annual Report | December 31, 2016 | Page 63 |
Schedule of Investments
December 31, 2016
Infrastructure Fund
| | | Long Contracts | | | Unrealized Appreciation (Depreciation)($) | |
| Futures Contracts | | | | | | |
| Standard & Poors 500 Mini Futures expiring March 2017, notional value $1,677,150 | | | 15 | | | | (10,542 | ) |
| Total Futures Contracts | | | 15 | | | | (10,542 | ) |
| (1) | Cost for federal income tax purposes of $18,784,504 differs from value by net unrealized appreciation (depreciation) of securities as follows: |
| Unrealized appreciation | | $ | 2,989,293 | |
| Unrealized depreciation | | | (1,125,705 | ) |
| Net unrealized appreciation (depreciation) | | $ | 1,863,588 | |
| (2) | Represents non-income producing securities. |
| (3) | American Depositary Receipt. |
| (4) | Real estate investment trust. |
| (5) | Investment in affiliate. The yield shown represents the 7-day yield in effect at December 31, 2016. |
| (6) | Assets of affiliates to the Infrastructure Fund held for the benefit of the Fund’s Trustees in connection with the Trustees Deferred Compensation Plan. |
The accompanying notes are an integral part of these financial statements.
| Page 64 | 2016 Annual Report | December 31, 2016 |
Schedule of Investments
December 31, 2016
Dividend Opportunities Fund
| Security Description | | Shares or Principal Amount ($) | | | Fair Value ($) | |
| Common Stocks — 87.8% | | | | | | |
| Consumer Discretionary — 6.5% | | | | | | |
| Best Buy Co., Inc. | | | 9,024 | | | | 385,054 | |
| Dick's Sporting Goods, Inc. | | | 564 | | | | 29,948 | |
| DR Horton, Inc. | | | 13,663 | | | | 373,410 | |
| Gap, Inc./The | | | 15,393 | | | | 345,419 | |
| Goodyear Tire & Rubber Co./The | | | 2,593 | | | | 80,046 | |
| Harman International Industries, Inc. | | | 1,590 | | | | 176,744 | |
| ILG, Inc. | | | 20,558 | | | | 373,539 | |
| International Game Technology PLC | | | 14,028 | | | | 357,995 | |
| Macy's, Inc. | | | 10,291 | | | | 368,521 | |
| PVH Corp. | | | 3,902 | | | | 352,116 | |
| Time Warner, Inc. | | | 5,227 | | | | 504,562 | |
| Tupperware Brands Corp. | | | 6,861 | | | | 361,026 | |
| | | | | | | | 3,708,380 | |
| | | | | | | | | |
| Consumer Staples — 5.8% | | | | | | | | |
| Kroger Co./The | | | 6,734 | | | | 232,390 | |
| Nu Skin Enterprises, Inc. | | | 7,721 | | | | 368,909 | |
| PepsiCo, Inc. | | | 4,436 | | | | 464,139 | |
| Philip Morris International, Inc. | | | 10,448 | | | | 955,887 | |
| Tyson Foods, Inc. | | | 6,777 | | | | 418,005 | |
| Wal-Mart Stores, Inc. | | | 12,225 | | | | 844,992 | |
| | | | | | | | 3,284,322 | |
| | | | | | | | | |
| Energy — 6.2% | | | | | | | | |
| Devon Energy Corp. | | | 10,165 | | | | 464,236 | |
EOG Resources, Inc. (2) | | | 499 | | | | 50,449 | |
| Marathon Oil Corp. | | | 1,584 | | | | 27,419 | |
| Marathon Petroleum Corp. | | | 9,956 | | | | 501,285 | |
| Nabors Industries, Ltd. | | | 7,151 | | | | 117,276 | |
| Oceaneering International, Inc. | | | 12,597 | | | | 355,361 | |
QEP Resources, Inc. (2) | | | 21,242 | | | | 391,065 | |
| SM Energy Co. | | | 7,383 | | | | 254,566 | |
| Spectra Energy Corp. | | | 10,598 | | | | 435,472 | |
| Tesoro Corp. | | | 4,729 | | | | 413,551 | |
| Valero Energy Corp. | | | 7,711 | | | | 526,816 | |
| | | | | | | | 3,537,496 | |
| | | | | | | | | |
| Financials — 19.7% | | | | | | | | |
| Aflac, Inc. | | | 7,087 | | | | 493,255 | |
| Allstate Corp./The | | | 6,816 | | | | 505,202 | |
| Ally Financial, Inc. | | | 2,702 | | | | 51,392 | |
| Aspen Insurance Holdings, Ltd. | | | 334 | | | | 18,370 | |
| Assured Guaranty, Ltd. | | | 10,361 | | | | 391,335 | |
| Bank of America Corp. | | | 63,497 | | | | 1,403,283 | |
| BB&T Corp. | | | 7,877 | | | | 370,377 | |
| Chimera Investment Corp. | | | 22,646 | | | | 385,435 | |
Dividend Opportunities Fund
| Security Description | | Shares or Principal Amount ($) | | | Fair Value ($) | |
| Common Stocks — continued | | | | | | |
| EverBank Financial Corp. | | | 19,596 | | | | 381,142 | |
| Everest Re Group, Ltd. | | | 1,959 | | | | 423,928 | |
| Fifth Third Bancorp | | | 17,619 | | | | 475,184 | |
| First American Financial Corp. | | | 2,665 | | | | 97,619 | |
| FNB Corp./PA | | | 23,531 | | | | 377,202 | |
| Invesco Mortgage Capital, Inc. | | | 22,999 | | | | 335,785 | |
| Lazard, Ltd. | | | 9,209 | | | | 378,398 | |
| MFA Financial, Inc. | | | 16,454 | | | | 125,544 | |
| Morgan Stanley | | | 15,323 | | | | 647,397 | |
| Navient Corp. | | | 23,880 | | | | 392,348 | |
| New Residential Investment Corp. | | | 8,080 | | | | 127,018 | |
| Popular, Inc. | | | 9,112 | | | | 399,288 | |
| Principal Financial Group, Inc. | | | 7,775 | | | | 449,862 | |
| Prudential Financial, Inc. | | | 5,594 | | | | 582,112 | |
| Regions Financial Corp. | | | 22,387 | | | | 321,477 | |
| Reinsurance Group of America, Inc. | | | 3,275 | | | | 412,093 | |
| Selective Insurance Group, Inc. | | | 8,777 | | | | 377,850 | |
| SunTrust Banks, Inc. | | | 4,886 | | | | 267,997 | |
| Synchrony Financial | | | 4,365 | | | | 158,319 | |
| TCF Financial Corp. | | | 20,554 | | | | 402,653 | |
| Unum Group | | | 9,787 | | | | 429,943 | |
| Voya Financial, Inc. | | | 1,506 | | | | 59,065 | |
| | | | | | | | 11,240,873 | |
| Healthcare — 9.0% | | | | | | | | |
| AbbVie, Inc. | | | 5,725 | | | | 358,500 | |
| Agilent Technologies, Inc. | | | 680 | | | | 30,981 | |
| Amgen, Inc. | | | 2,539 | | | | 371,227 | |
| Baxter International, Inc. | | | 10,494 | | | | 465,304 | |
| Gilead Sciences, Inc. | | | 5,117 | | | | 366,428 | |
| Hill-Rom Holdings, Inc. | | | 5,318 | | | | 298,553 | |
| Johnson & Johnson | | | 13,612 | | | | 1,568,238 | |
| Merck & Co., Inc. | | | 15,240 | | | | 897,179 | |
| Quest Diagnostics, Inc. | | | 4,104 | | | | 377,158 | |
| St Jude Medical, Inc. | | | 4,645 | | | | 372,483 | |
| | | | | | | | 5,106,051 | |
| | | | | | | | | |
| Industrials — 8.6% | | | | | | | | |
| American Airlines Group, Inc. | | | 10,362 | | | | 483,802 | |
| Brink's Co./The | | | 8,912 | | | | 367,620 | |
| Crane Co. | | | 5,439 | | | | 392,261 | |
| Dover Corp. | | | 3,398 | | | | 254,612 | |
| Dun & Bradstreet Corp./The | | | 3,201 | | | | 388,345 | |
| Eaton Corp. PLC | | | 1,694 | | | | 113,650 | |
| EnerSys | | | 4,886 | | | | 381,597 | |
| Fortive Corp. | | | 7,928 | | | | 425,179 | |
| Herman Miller, Inc. | | | 5,188 | | | | 177,430 | |
The accompanying notes are an integral part of these financial statements.
| 2016 Annual Report | December 31, 2016 | Page 65 |
Schedule of Investments
December 31, 2016
Dividend Opportunities Fund
| Security Description | | Shares or Principal Amount ($) | | | Fair Value ($) | |
| Common Stocks — continued | | | | | | |
| Huntington Ingalls Industries, Inc. | | | 1,958 | | | | 360,644 | |
| ManpowerGroup, Inc. | | | 993 | | | | 88,248 | |
| Parker-Hannifin Corp. | | | 2,296 | | | | 321,440 | |
| Pitney Bowes, Inc. | | | 18,282 | | | | 277,704 | |
| Regal Beloit Corp. | | | 1,573 | | | | 108,930 | |
| Trinity Industries, Inc. | | | 14,138 | | | | 392,471 | |
| Universal Forest Products, Inc. | | | 3,607 | | | | 368,563 | |
| | | | | | | | 4,902,496 | |
| | | | | | | | | |
| Information Technology — 15.0% | | | | | | | | |
| Applied Materials, Inc. | | | 6,352 | | | | 204,979 | |
| CA, Inc. | | | 13,165 | | | | 418,252 | |
| Cisco Systems, Inc. | | | 20,953 | | | | 633,200 | |
| Computer Sciences Corp. | | | 6,812 | | | | 404,769 | |
| Hewlett Packard Enterprise Co. | | | 23,439 | | | | 542,378 | |
| HP, Inc. | | | 33,057 | | | | 490,566 | |
| Intel Corp. | | | 30,011 | | | | 1,088,498 | |
| International Business Machines Corp. | | | 3,526 | | | | 585,281 | |
| Intuit, Inc. | | | 3,232 | | | | 370,420 | |
| Jabil Circuit, Inc. | | | 4,423 | | | | 104,692 | |
| Mentor Graphics Corp. | | | 10,355 | | | | 381,996 | |
| Microsoft Corp. | | | 5,715 | | | | 355,130 | |
| NetApp, Inc. | | | 2,678 | | | | 94,453 | |
| Oracle Corp. | | | 19,860 | | | | 763,617 | |
| QUALCOMM, Inc. | | | 11,004 | | | | 717,461 | |
| Science Applications International Corp. | | | 4,451 | | | | 377,445 | |
| Symantec Corp. | | | 15,668 | | | | 374,309 | |
| Texas Instruments, Inc. | | | 4,920 | | | | 359,012 | |
| Xerox Corp. | | | 30,411 | | | | 265,488 | |
| | | | | | | | 8,531,946 | |
| | | | | | | | | |
| Materials — 5.5% | | | | | | | | |
| Commercial Metals Co. | | | 15,762 | | | | 343,296 | |
| Huntsman Corp. | | | 19,715 | | | | 376,162 | |
| LyondellBasell Industries NV | | | 5,156 | | | | 442,282 | |
| Newmont Mining Corp. | | | 13,684 | | | | 466,214 | |
| Nucor Corp. | | | 7,216 | | | | 429,496 | |
| Reliance Steel & Aluminum Co. | | | 4,749 | | | | 377,735 | |
| Steel Dynamics, Inc. | | | 10,777 | | | | 383,446 | |
| Worthington Industries, Inc. | | | 6,498 | | | | 308,265 | |
| | | | | | | | 3,126,896 | |
| | | | | | | | | |
| Real Estate Investment Trust — 3.3% | | | | | | | | |
| Communications Sales & Leasing, Inc. | | | 15,391 | | | | 391,085 | |
| Corporate Office Properties Trust | | | 11,472 | | | | 358,156 | |
| Hospitality Properties Trust | | | 13,136 | | | | 416,937 | |
| Jones Lang LaSalle, Inc. | | | 1,532 | | | | 154,793 | |
Dividend Opportunities Fund
| Security Description | | Shares or Principal Amount ($) | | | Fair Value ($) | |
| Common Stocks — continued | | | | | | |
| Lexington Realty Trust | | | 27,938 | | | | 301,730 | |
| Select Income REIT | | | 10,020 | | | | 252,504 | |
| | | | | | | | 1,875,205 | |
| | | | | | | | | |
| Telecommunication Services — 2.2% | | | | | | | | |
| Telephone & Data Systems, Inc. | | | 13,418 | | | | 387,378 | |
| Verizon Communications, Inc. | | | 16,538 | | | | 882,797 | |
| | | | | | | | 1,270,175 | |
| | | | | | | | | |
| Utilities — 6.0% | | | | | | | | |
| AES Corp./VA | | | 35,265 | | | | 409,779 | |
| CenterPoint Energy, Inc. | | | 8,018 | | | | 197,564 | |
| Exelon Corp. | | | 14,648 | | | | 519,858 | |
| FirstEnergy Corp. | | | 13,864 | | | | 429,368 | |
| NiSource, Inc. | | | 17,339 | | | | 383,885 | |
| OGE Energy Corp. | | | 8,867 | | | | 296,601 | |
| Portland General Electric Co. | | | 8,743 | | | | 378,834 | |
| Southwest Gas Holdings, Inc. | | | 4,988 | | | | 382,181 | |
| UGI Corp. | | | 9,175 | | | | 422,784 | |
| | | | | | | | 3,420,854 | |
| | | | | | | | | |
Total Common Stocks
(Cost $47,710,010) | | | | | | | 50,004,694 | |
| | | | | | | | | |
| Money Market Registered Investment Companies — 9.6% | |
Meeder Institutional Prime Money Market Fund 0.64% (3) | | | 5,488,313 | | | | 5,488,862 | |
Total Money Market Registered Investment Companies
(Cost $5,488,759) | | | | | | | 5,488,862 | |
| | | | | | | | | |
| Bank Obligations — 0.4% | | | | | | | | |
Capital Bank Deposit Account, 0.70%, 1/3/2017 (4) | | | 249,000 | | | | 249,000 | |
Total Bank Obligations
(Cost $249,000) | | | | | | | 249,000 | |
Total Investments — 97.8%
(Cost $53,447,769) (1) | | | | | | | 55,742,556 | |
| Other Assets less Liabilities — 2.2% | | | | | | | 1,252,596 | |
| Total Net Assets — 100.0% | | | | | | | 56,995,152 | |
The accompanying notes are an integral part of these financial statements.
| Page 66 | 2016 Annual Report | December 31, 2016 |
Schedule of Investments
December 31, 2016
Dividend Opportunities Fund
| Security Description | | Shares or Principal Amount ($) | | | Fair Value ($) | |
Trustee Deferred Compensation (5) | | | | | | |
| Meeder Aggressive Growth Fund | | | 85 | | | | 879 | |
| Meeder Balanced Fund | | | 50 | | | | 537 | |
| Meeder Dynamic Growth Fund | | | 32 | | | | 311 | |
| Meeder Muirfield Fund | | | 67 | | | | 455 | |
| Meeder Quantex Fund | | | 14 | | | | 467 | |
| Meeder Infrastructure Fund | | | 15 | | | | 320 | |
Total Trustee Deferred Compensation
(Cost $2,858) | | | | | | | 2,969 | |
| | | | | | | | | |
| | | Long Contracts | | | Unrealized Appreciation (Depreciation)($) | |
| Futures Contracts | | | | | | | | |
| Standard & Poors 500 Mini Futures expiring March 2017, notional value $6,820,410 | | | 61 | | | | (18,614 | ) |
| Total Futures Contracts | | | 61 | | | | (18,614 | ) |
| (1) | Cost for federal income tax purposes of $53,613,765 differs from value by net unrealized appreciation (depreciation) of securities as follows: |
| Unrealized appreciation | | $ | 3,468,056 | |
| Unrealized depreciation | | | (1,357,879 | ) |
| Net unrealized appreciation (depreciation) | | $ | 2,110,177 | |
| (2) | Represents non-income producing securities. |
| (3) | Investment in affiliate. The yield shown represents the 7-day yield in effect at December 31, 2016. |
| (4) | Variable rate security. Securities payable at par including accrued interest (usually within seven days notice) and unconditionally secured as to principal and interest by letters of credit or other credit support agreements from major banks. The interest rates are adjustable and are based on bank prime rates or other interest rate adjustment indices. The rate shown represents the rate in effect at December 31, 2016. The maturity date shown, if applicable, reflects the earlier of the next demand date or stated maturity date. |
| (5) | Assets of affiliates to the Dividend Opportunities Fund held for the benefit of the Fund’s Trustees in connection with the Trustee Deferred Compensation Plan. |
The accompanying notes are an integral part of these financial statements.
| 2016 Annual Report | December 31, 2016 | Page 67 |
Schedule of Investments
December 31, 2016
Total Return Bond Fund
| Security Description | | Shares or Principal Amount ($) | | | Fair Value ($) | |
| Registered Investment Companies — 96.9% | | | | | | |
| Baird Core Plus Bond Fund - Class I | | | 886,592 | | | | 9,779,110 | |
| DoubleLine Total Return Bond Fund - Class I | | | 696,540 | | | | 7,397,258 | |
| Frost Total Return Bond Fund - Class I | | | 678,153 | | | | 7,025,663 | |
| Guggenheim Floating Rate Strategies Fund - Class I | | | 165,483 | | | | 4,315,807 | |
| Guggenheim Total Return Bond Fund - Class I | | | 281,476 | | | | 7,445,052 | |
iShares 1-3 Year Treasury Bond ETF (5) | | | 51,730 | | | | 4,368,599 | |
iShares 3-7 Year Treasury Bond ETF (5) | | | 85,845 | | | | 10,516,871 | |
iShares 7-10 Year Treasury Bond ETF (5) | | | 113,560 | | | | 11,903,359 | |
iShares Core U.S. Aggregate Bond ETF (5) | | | 126,560 | | | | 13,676,074 | |
iShares iBoxx $High Yield Corporate Bond ETF (5) | | | 388,040 | | | | 33,584,862 | |
iShares JP Morgan USD Emerging Markets Bond ETF (5) | | | 108,420 | | | | 11,950,052 | |
| JPMorgan Core Plus Bond Fund - Class L | | | 1,223,126 | | | | 9,992,937 | |
| Lord Abbett Floating Rate Fund - Class I | | | 716,970 | | | | 6,631,975 | |
| Lord Abbett High Yield Fund - Class I | | | 1,643,535 | | | | 12,392,254 | |
| Metropolitan West Total Return Bond Fund - Class I | | | 1,046,605 | | | | 11,020,754 | |
| PIMCO Investment Grade Corporate Bond Fund - Class I | | | 351,876 | | | | 3,592,650 | |
| Pioneer Bond Fund - Class Y | | | 1,045,462 | | | | 9,963,249 | |
| Prudential Total Return Bond Fund - Class Z | | | 791,155 | | | | 11,139,465 | |
SPDR Bloomberg Barclays High Yield Bond ETF (5) | | | 313,750 | | | | 11,436,188 | |
| TCW Emerging Markets Income Fund - Class I | | | 1,250,287 | | | | 10,127,324 | |
Total Registered Investment Companies
(Cost $208,288,536) | | | | | | | 208,259,503 | |
| | | | | | | | | |
| Money Market Registered Investment Companies — 2.9% | | | | | | | | |
Meeder Institutional Prime Money Market Fund 0.64% (2) | | | 6,125,028 | | | | 6,125,641 | |
Total Money Market Registered Investment Companies
(Cost $6,125,413) | | | | | | | 6,125,641 | |
| | | | | | | | | |
| Bank Obligations — 0.3% | | | | | | | | |
Capital Bank Deposit Account, 0.70%, 1/3/2017 (3) | | | 249,000 | | | | 249,000 | |
EverBank Money Market Account, 0.61%, 1/3/2017 (3) | | | 249,000 | | | | 249,000 | |
Pacific Mercantile Bank Deposit Account, 0.60%, 1/3/2017 (3) | | | 249,000 | | | | 249,000 | |
Total Bank Obligations
(Cost $747,000) | | | | | | | 747,000 | |
Total Return Bond Fund
| Security Description | | Shares or Principal Amount ($) | | | Fair Value ($) | |
| U.S. Government Obligations — 0.0% | | | | | | |
| Government National Mortgage Association, 6.50%, due 7/20/2038 | | | 42,058 | | | | 49,874 | |
Total U.S. Government Obligations
(Cost $48,811) | | | | | | | 49,874 | |
Total Investments — 100.1%
(Cost $215,209,760) (1) | | | | | | | 215,182,018 | |
| Liabilities less Other Assets — (0.1%) | | | | | | | (273,193 | ) |
| Total Net Assets — 100.0% | | | | | | | 214,908,825 | |
| | | | | | | | | |
Trustee Deferred Compensation(4) | | | | | | | | |
| Meeder Aggressive Growth Fund | | | 1,479 | | | | 15,293 | |
| Meeder Balanced Fund | | | 822 | | | | 8,828 | |
| Meeder Dynamic Growth Fund | | | 560 | | | | 5,443 | |
| Meeder Muirfield Fund | | | 1,383 | | | | 9,391 | |
| Meeder Quantex Fund | | | 452 | | | | 15,079 | |
| Meeder Infrastructure Fund | | | 244 | | | | 5,202 | |
Total Trustee Deferred Compensation
(Cost $55,904) | | | | | | | 59,236 | |
| (1) | Cost for federal income tax purposes of $215,985,958 differs from value by net unrealized appreciation (depreciation) of securities as follows: |
| | | | |
| Unrealized appreciation | | $ | 2,218,486 | |
| Unrealized depreciation | | | (3,022,426 | ) |
| Net unrealized appreciation (depreciation) | | $ | (803,940 | ) |
| (2) | Investment in affiliate. The yield shown represents the 7-day yield in effect at December 31, 2016. |
| (3) | Variable rate security. Securities payable at par including accrued interest (usually within seven days notice) and unconditionally secured as to principal and interest by letters of credit or other credit support agreements from major banks. The interest rates are adjustable and are based on bank prime rates or other interest rate adjustment indices. The rate shown represents the rate in effect at December 31, 2016. The maturity date shown, if applicable, reflects the earlier of the next demand date or stated maturity date. |
| (4) | Assets of affiliates to the Total Return Bond Fund held for the benefit of the Fund’s Trustees in connection with the Trustee Deferred Compensation Plan. |
The accompanying notes are an integral part of these financial statements.
| Page 68 | 2016 Annual Report | December 31, 2016 |
Schedule of Investments
December 31, 2016
Prime Money Market Fund
| Security Description | | Coupon/ Yield | | Maturity/ Demand Date | | Principal Amount ($) or Shares | | | Fair Value ($) | |
| Certificates of Deposit — 3.3% | | | | | | | | | | |
| Banco Estado Chile Yankee CD | | | 1.12 | % | 05/17/17 | | | 250,000 | | | | 250,000 | |
| Bank of Montreal Yankee CD | | | 1.13 | %(2) | 02/01/17 | | | 223,800 | | | | 223,801 | |
| Dexia Credit Yankee CD | | | 1.22 | % | 08/31/17 | | | 250,000 | | | | 250,000 | |
| Royal Bank of Canada Yankee CD | | | 1.25 | %(2) | 01/03/17 | | | 223,800 | | | | 223,800 | |
| Royal Bank of Canada Yankee CD | | | 1.25 | %(2) | 03/08/17 | | | 250,000 | | | | 250,000 | |
Total Certificates of Deposit
(Cost $1,197,601) | | | | | | 1,197,601 | |
| | | | | | | | | | | | | | |
| Commercial Paper — 37.2% | | | | | | | | | | | | | |
| Abbey National Treasury Services PLC/Stamford, CT | | | 0.93 | % | 01/03/17 | | | 223,800 | | | | 223,788 | |
| Abbey National Treasury Services PLC/Stamford, CT | | | 0.92 | % | 01/06/17 | | | 223,800 | | | | 223,771 | |
| Abbey National Treasury Services PLC/Stamford, CT | | | 0.95 | % | 03/28/17 | | | 223,800 | | | | 223,292 | |
| Abbey National Treasury Services PLC/Stamford, CT | | | 1.05 | % | 04/24/17 | | | 450,000 | | | | 448,517 | |
| American Honda Finance Corp. | | | 0.70 | % | 01/27/17 | | | 475,000 | | | | 474,760 | |
| American Honda Finance Corp. | | | 0.80 | % | 03/13/17 | | | 250,000 | | | | 249,606 | |
| Bank of Montreal/Chicago, IL | | | 1.02 | % | 03/03/17 | | | 223,800 | | | | 223,412 | |
| Bank of Tokyo-Mitsubishi UFJ, Ltd./New York, NY | | | 1.02 | % | 03/10/17 | | | 223,800 | | | | 223,369 | |
| Bank of Tokyo-Mitsubishi UFJ, Ltd./New York, NY | | | 1.34 | % | 07/21/17 | | | 250,000 | | | | 248,130 | |
| Bank of Tokyo-Mitsubishi UFJ, Ltd./New York, NY | | | 1.32 | % | 07/25/17 | | | 250,000 | | | | 248,135 | |
| Banque et Caisse d'Epargne de l'Etat | | | 1.16 | % | 06/01/17 | | | 250,000 | | | | 248,794 | |
| BNP Paribas SA/New York, NY | | | 0.75 | % | 02/01/17 | | | 1,000,000 | | | | 999,354 | |
| Canadian Imperial Holdings, Inc. | | | 0.77 | % | 02/03/17 | | | 500,000 | | | | 499,647 | |
Prime Money Market Fund
| Security Description | | Coupon/ Yield | | Maturity/ Demand Date | | Principal Amount ($) or Shares | | | Fair Value ($) | |
| Commercial Paper — continued | | | | | | | | |
| Canadian Imperial Holdings, Inc. | | | 1.04 | % | 02/17/17 | | | 111,900 | | | | 111,748 | |
| Canadian Imperial Holdings, Inc. | | | 0.96 | % | 04/07/17 | | | 223,800 | | | | 223,227 | |
| Canadian Imperial Holdings, Inc. | | | 1.16 | % | 07/28/17 | | | 250,000 | | | | 248,339 | |
| Cooperatieve Rabobank UA/NY | | | 0.88 | % | 03/08/17 | | | 250,000 | | | | 249,597 | |
| Credit Agricole Corporate and Investment Bank/New York | | | 0.92 | % | 01/03/17 | | | 223,800 | | | | 223,789 | |
| Credit Agricole Corporate and Investment Bank/New York | | | 0.99 | % | 01/27/17 | | | 223,800 | | | | 223,640 | |
| Credit Agricole Corporate and Investment Bank/New York | | | 1.15 | % | 04/28/17 | | | 250,000 | | | | 249,074 | |
| Credit Agricole Corporate and Investment Bank/New York | | | 1.16 | % | 06/06/17 | | | 250,000 | | | | 248,754 | |
| Credit Suisse AG/New York, NY | | | 1.25 | % | 04/17/17 | | | 500,000 | | | | 498,175 | |
| Credit Suisse AG/New York, NY | | | 1.37 | % | 05/17/17 | | | 500,000 | | | | 497,431 | |
| Dexia Credit Local | | | 1.03 | % | 02/02/17 | | | 223,800 | | | | 223,595 | |
| Dexia Credit Local | | | 1.12 | % | 03/14/17 | | | 223,800 | | | | 223,299 | |
| Dexia Credit Local | | | 1.18 | % | 05/18/17 | | | 250,000 | | | | 248,877 | |
| Dexia Credit Local | | | 1.18 | % | 06/21/17 | | | 250,000 | | | | 248,599 | |
| Dexia Credit Local | | | 1.18 | % | 07/10/17 | | | 250,000 | | | | 248,443 | |
| Dexia Credit Local | | | 1.19 | % | 08/09/17 | | | 250,000 | | | | 248,197 | |
| ING US Funding LLC | | | 1.10 | % | 02/15/17 | | | 223,800 | | | | 223,492 | |
| ING US Funding LLC | | | 1.16 | % | 06/09/17 | | | 250,000 | | | | 248,730 | |
| JPMorgan Securities LLC | | | 0.67 | % | 01/10/17 | | | 500,000 | | | | 499,916 | |
| JPMorgan Securities LLC | | | 0.75 | % | 01/27/17 | | | 500,000 | | | | 499,729 | |
| JPMorgan Securities LLC | | | 0.99 | % | 03/23/17 | | | 223,800 | | | | 223,301 | |
| Natixis SA/New York, NY | | | 1.10 | % | 05/15/17 | | | 250,000 | | | | 248,986 | |
| Natixis SA/New York, NY | | | 1.12 | % | 06/16/17 | | | 250,000 | | | | 248,720 | |
| Natixis SA/New York, NY | | | 1.31 | % | 06/30/17 | | | 1,040,000 | | | | 1,033,241 | |
| Natixis SA/New York, NY | | | 1.21 | % | 07/05/17 | | | 250,000 | | | | 248,458 | |
| Swedbank AB | | | 0.92 | % | 02/16/17 | | | 500,000 | | | | 499,412 | |
The accompanying notes are an integral part of these financial statements.
| 2016 Annual Report | December 31, 2016 | Page 69 |
Schedule of Investments
December 31, 2016
Prime Money Market Fund
| Security Description | | Coupon/ Yield | | Maturity/ Demand Date | | Principal Amount ($) or Shares | | | Fair Value ($) | |
| Commercial Paper — continued | |
| Toyota Motor Credit Corp. | | | 1.01 | % | 04/04/17 | | | 223,800 | | | | 223,216 | |
| Toyota Motor Credit Corp. | | | 1.12 | % | 04/28/17 | | | 223,800 | | | | 222,985 | |
| Toyota Motor Credit Corp. | | | 1.26 | % | 06/16/17 | | | 223,800 | | | | 222,500 | |
| Toyota Motor Credit Corp. | | | 1.20 | % | 07/14/17 | | | 250,000 | | | | 248,383 | |
Total Commercial Paper
(Cost $13,640,428) | | | | | | 13,640,428 | |
| | | | | | | | | | | | | | |
| Corporate Obligations — 1.5% | | | | | |
| Bank of Montreal | | | 1.13 | %(2) | 01/17/17 | | | 250,000 | | | | 250,088 | |
| Merck & Co., Inc. | | | 1.01 | %(2) | 02/10/17 | | | 67,140 | | | | 67,147 | |
| UBS AG Stamford, CT | | | 1.49 | %(2) | 03/01/17 | | | 250,000 | | | | 250,265 | |
Total Corporate Obligations
(Cost $567,500) | | | | 567,500 | |
| | | | | | | | | | | | | | |
| Repurchase Agreements — 19.1% | | | | | | | | |
| INTL FCStone (Collateralized by $8,990,000 various FNMAs and GNMAs, 3.50% - 4.50%, due 9/16/39 - 12/1/46, fair value $7,144,162) (proceeds $7,000,000), purchase date 12/30/16 | | | 0.62 | % | 01/03/17 | | | 7,000,000 | | | | 7,000,000 | |
Total Repurchase Agreements
(Cost $7,000,000) | | | | 7,000,000 | |
Prime Money Market Fund
| Security Description | | Coupon/ Yield | | Maturity/ Demand Date | | Principal Amount ($) or Shares | | | Fair Value ($) | |
| U.S. Government and Agency Obligations — 4.4% | | | | |
| Federal Farm Credit Bank | | | 0.81 | %(2) | 01/27/17 | | | 284,226 | | | | 284,191 | |
| Federal Farm Credit Bank | | | 0.74 | %(2) | 03/22/17 | | | 335,700 | | | | 335,526 | |
| Federal Home Loan Bank | | | 0.75 | % | 01/20/17 | | | 223,800 | | | | 223,800 | |
| Federal Home Loan Bank | | | 0.88 | % | 03/10/17 | | | 223,800 | | | | 223,840 | |
| United States Treasury Note | | | 0.50 | % | 03/31/17 | | | 55,950 | | | | 55,935 | |
| United States Treasury Note | | | 0.50 | % | 04/30/17 | | | 55,950 | | | | 55,932 | |
| United States Treasury Note | | | 0.88 | % | 05/15/17 | | | 55,950 | | | | 56,010 | |
| United States Treasury Note | | | 0.63 | % | 05/31/17 | | | 111,900 | | | | 111,879 | |
| United States Treasury Note | | | 0.88 | % | 06/15/17 | | | 55,950 | | | | 55,995 | |
| United States Treasury Note | | | 0.50 | % | 07/31/17 | | | 111,900 | | | | 111,841 | |
| United States Treasury Note | | | 0.88 | % | 08/15/17 | | | 111,900 | | | | 112,082 | |
| | | | | | | | | |
Total U.S. Government and Agency Obligations
(Cost $1,627,031) | | | | 1,627,031 | |
| Security Description | | Shares or Principal Amount ($) | | | Fair Value ($) | |
| Money Market Registered Investment Companies — 34.1% | |
Fidelity Prime Institutional Money Market Portfolio, 0.83% (3) | | | 11,495,352 | | | | 11,499,950 | |
Morgan Stanley Government Institutional Fund, 0.44% (3) | | | 995,017 | | | | 995,017 | |
Total Money Market Registered Investment Companies
(Cost $12,494,967) | | | | | | | 12,494,967 | |
Total Investments — 99.6%
(Cost $36,527,527) (1) | | | | | | | 36,527,527 | |
| Other Assets less Liabilities — 0.4% | | | | | | | 138,300 | |
| Total Net Assets — 100.0% | | | | | | | 36,665,827 | |
The accompanying notes are an integral part of these financial statements.
| Page 70 | 2016 Annual Report | December 31, 2016 |
Schedule of Investments
December 31, 2016
Prime Money Market Fund
| Security Description | | Shares or Principal Amount ($) | | | Fair Value ($) | |
Trustee Deferred Compensation (4) | | | | | | |
| Meeder Aggressive Growth Fund | | | 1,092 | | | | 11,291 | |
| Meeder Balanced Fund | | | 571 | | | | 6,133 | |
| Meeder Dynamic Growth Fund | | | 386 | | | | 3,752 | |
| Meeder Muirfield Fund | | | 1,988 | | | | 13,499 | |
| Meeder Quantex Fund | | | 1,386 | | | | 46,237 | |
| Meeder Infrastructure Fund | | | 165 | | | | 3,518 | |
Total Trustee Deferred Compensation
(Cost $62,994) | | | | | | | 84,430 | |
| (1) | Cost for federal income tax and financial reporting purposes are the same. |
| (2) | Floating rate security. The rate shown represents the rate in effect at December 31, 2016. The maturity date shown reflects the earlier of the next demand date or stated maturity date. |
| (3) | 7-day yield as of December 31, 2016. The Fund may invest a significant portion of its assets in shares of one or more investment companies, including money market mutual funds. The Fund will incur additional indirect expenses (acquired fund fees and expenses) to the extent it invests in shares of other investment companies. From time to time, the Fund may invest greater than 25% of its net assets in one or more investment companies. As of December 31, 2016, Fidelity Prime Institutional Money Market Portfolio represented 31.4% of Prime Money Market Fund’s net assets. Additional information for this security, including its financial statements, is available from the Securities and Exchange Commission’s website at www.sec.gov. |
| (4) | Assets of affiliates to the Prime Money Market Fund held for the benefit of the Fund’s Trustees in connection with the Trustee Deferred Compensation Plan. |
The accompanying notes are an integral part of these financial statements.
| 2016 Annual Report | December 31, 2016 | Page 71 |
Schedule of Investments
December 31, 2016
Institutional Prime Money Market Fund
| Security Description | | Coupon/ Yield | | Maturity/ Demand Date | | Principal Amount ($) or Shares | | | Fair Value ($) | |
| Certificates of Deposit — 3.4% | | | | | | | | |
| Banco Estado Chile Yankee CD | | | 0.91 | % | | 03/01/17 | | | 1,000,000 | | | | 1,000,040 | |
| Banco Estado Chile Yankee CD | | | 1.01 | % | | 04/03/17 | | | 1,000,000 | | | | 999,813 | |
| Banco Estado Chile Yankee CD | | | 1.11 | % | | 05/01/17 | | | 1,000,000 | | | | 999,845 | |
| Banco Estado Chile Yankee CD | | | 1.12 | % | | 05/17/17 | | | 750,000 | | | | 749,782 | |
| Bank of Montreal Yankee CD | | | 1.13 | %(2) | | 02/01/17 | | | 776,200 | | | | 776,512 | |
| Dexia Credit Yankee CD | | | 1.22 | % | | 08/31/17 | | | 750,000 | | | | 749,567 | |
| Royal Bank of Canada Yankee CD | | | 1.25 | %(2) | | 01/03/17 | | | 776,200 | | | | 777,171 | |
| Royal Bank of Canada Yankee CD | | | 1.25 | %(2) | | 03/08/17 | | | 750,000 | | | | 749,981 | |
Total Certificates of Deposit
(Cost $6,802,405) | | | | | | | | | | | | | 6,802,711 | |
| Commercial Paper — 36.7% | | | | | | | | | |
| Abbey National Treasury Services PLC/ Stamford, CT | | | 0.93 | % | | 01/03/17 | | | 776,200 | | | | 776,147 | |
| Abbey National Treasury Services PLC/ Stamford, CT | | | 0.92 | % | | 01/06/17 | | | 776,200 | | | | 776,107 | |
| Abbey National Treasury Services PLC/ Stamford, CT | | | 0.95 | % | | 03/28/17 | | | 776,200 | | | | 774,519 | |
| Abbey National Treasury Services PLC/ Stamford, CT | | | 1.05 | % | | 04/24/17 | | | 2,500,000 | | | | 2,492,015 | |
| American Honda Finance Corp. | | | 0.75 | % | | 02/21/17 | | | 1,000,000 | | | | 999,089 | |
| American Honda Finance Corp. | | | 0.80 | % | | 03/13/17 | | | 750,000 | | | | 748,908 | |
| Bank of Montreal/ Chicago, IL | | | 1.02 | % | | 03/03/17 | | | 776,200 | | | | 774,974 | |
| Bank of Tokyo-Mitsubishi UFJ, Ltd./New York, NY | | | 0.78 | % | | 02/28/17 | | | 2,000,000 | | | | 1,997,400 | |
| Bank of Tokyo-Mitsubishi UFJ, Ltd./New York, NY | | | 1.02 | % | | 03/10/17 | | | 776,200 | | | | 774,928 | |
| Bank of Tokyo-Mitsubishi UFJ, Ltd./New York, NY | | | 1.18 | % | | 05/30/17 | | | 1,000,000 | | | | 995,038 | |
Institutional Prime Money Market Fund
| Security Description | | Coupon/ Yield | | Maturity/ Demand Date | | Principal Amount ($) or Shares5 | | | Fair Value ($) | |
| Commercial Paper — continued | | | | | | | | | |
| Bank of Tokyo-Mitsubishi UFJ, Ltd./New York, NY | | | 1.28 | % | | 06/29/17 | | | 1,000,000 | | | | 993,559 | |
| Bank of Tokyo-Mitsubishi UFJ, Ltd./New York, NY | | | 1.34 | % | | 07/21/17 | | | 750,000 | | | | 744,447 | |
| Bank of Tokyo-Mitsubishi UFJ, Ltd./New York, NY | | | 1.32 | % | | 07/25/17 | | | 750,000 | | | | 744,312 | |
| Bank of Tokyo-Mitsubishi UFJ, Ltd./New York, NY | | | 1.35 | % | | 08/25/17 | | | 1,000,000 | | | | 990,989 | |
| Bank of Tokyo-Mitsubishi UFJ, Ltd./New York, NY | | | 1.37 | % | | 09/15/17 | | | 3,000,000 | | | | 2,969,913 | |
| Banque et Caisse d'Epargne de l'Etat | | | 1.16 | % | | 06/01/17 | | | 750,000 | | | | 746,344 | |
| Banque et Caisse d'Epargne de l'Etat | | | 1.18 | % | | 06/06/17 | | | 1,000,000 | | | | 994,944 | |
| BNP Paribas SA/ New York, NY | | | 0.75 | % | | 02/01/17 | | | 3,200,000 | | | | 3,197,875 | |
| Canadian Imperial Holdings, Inc. | | | 0.77 | % | | 02/03/17 | | | 4,500,000 | | | | 4,497,300 | |
| Canadian Imperial Holdings, Inc. | | | 1.04 | % | | 02/17/17 | | | 388,100 | | | | 387,750 | |
| Canadian Imperial Holdings, Inc. | | | 0.96 | % | | 04/07/17 | | | 776,200 | | | | 774,003 | |
| Canadian Imperial Holdings, Inc. | | | 0.93 | % | | 04/13/17 | | | 1,000,000 | | | | 996,909 | |
| Canadian Imperial Holdings, Inc. | | | 1.16 | % | | 07/28/17 | | | 750,000 | | | | 744,645 | |
| Canadian Imperial Holdings, Inc. | | | 1.32 | % | | 09/18/17 | | | 500,000 | | | | 495,393 | |
| Cooperatieve Rabobank UA/NY | | | 0.88 | % | | 03/08/17 | | | 750,000 | | | | 749,031 | |
| Credit Agricole Corporate and Investment Bank/New York | | | 0.92 | % | | 01/03/17 | | | 776,200 | | | | 776,157 | |
| Credit Agricole Corporate and Investment Bank/New York | | | 0.99 | % | | 01/27/17 | | | 776,200 | | | | 775,810 | |
| Credit Agricole Corporate and Investment Bank/New York | | | 1.15 | % | | 04/28/17 | | | 750,000 | | | | 747,357 | |
| Credit Agricole Corporate and Investment Bank/New York | | | 1.11 | % | | 06/01/17 | | | 1,000,000 | | | | 995,386 | |
The accompanying notes are an integral part of these financial statements.
| Page 72 | 2016 Annual Report | December 31, 2016 |
Schedule of Investments
December 31, 2016
Institutional Prime Money Market Fund
| Security Description | | Coupon/ Yield | | Maturity/ Demand Date | | Principal Amount ($) or Shares | | | Fair Value ($) | |
| Commercial Paper — continued | | | | | | | | |
| Credit Agricole Corporate and Investment Bank/New York | | | 1.16 | % | | 06/06/17 | | | 750,000 | | | | 746,263 | |
| Credit Agricole Corporate and Investment Bank/New York | | | 1.24 | % | | 06/21/17 | | | 2,000,000 | | | | 1,988,178 | |
| Credit Agricole Corporate and Investment Bank/New York | | | 1.26 | % | | 06/28/17 | | | 2,000,000 | | | | 1,987,639 | |
| Credit Suisse AG/New York, NY | | | 1.25 | % | | 04/17/17 | | | 1,000,000 | | | | 996,754 | |
| Credit Suisse AG/New York, NY | | | 1.37 | % | | 05/17/17 | | | 1,000,000 | | | | 995,224 | |
| Dexia Credit Local | | | 1.03 | % | | 02/02/17 | | | 776,200 | | | | 775,738 | |
| Dexia Credit Local | | | 1.12 | % | | 03/14/17 | | | 776,200 | | | | 774,954 | |
| Dexia Credit Local | | | 1.18 | % | | 05/18/17 | | | 750,000 | | | | 746,983 | |
| Dexia Credit Local | | | 1.18 | % | | 06/21/17 | | | 750,000 | | | | 745,985 | |
| Dexia Credit Local | | | 1.18 | % | | 07/10/17 | | | 750,000 | | | | 745,476 | |
| Dexia Credit Local | | | 1.19 | % | | 08/09/17 | | | 750,000 | | | | 744,649 | |
| ING US Funding LLC | | | 1.10 | % | | 02/15/17 | | | 776,200 | | | | 775,328 | |
| ING US Funding LLC | | | 0.94 | % | | 03/03/17 | | | 1,000,000 | | | | 998,408 | |
| ING US Funding LLC | | | 1.16 | % | | 06/09/17 | | | 750,000 | | | | 745,904 | |
| JPMorgan Securities LLC | | | 0.67 | % | | 01/10/17 | | | 1,300,000 | | | | 1,299,795 | |
| JPMorgan Securities LLC | | | 0.75 | % | | 01/27/17 | | | 1,300,000 | | | | 1,299,402 | |
| JPMorgan Securities LLC | | | 0.75 | % | | 01/31/17 | | | 1,000,000 | | | | 999,460 | |
| JPMorgan Securities LLC | | | 0.99 | % | | 03/23/17 | | | 776,200 | | | | 774,536 | |
| JPMorgan Securities LLC | | | 1.31 | % | | 07/14/17 | | | 125,000 | | | | 124,175 | |
| Natixis SA/New York, NY | | | 0.68 | % | | 01/03/17 | | | 5,000,000 | | | | 4,999,664 | |
| Natixis SA/New York, NY | | | 0.93 | % | | 03/01/17 | | | 1,000,000 | | | | 998,648 | |
| Natixis SA/New York, NY | | | 0.96 | % | | 03/22/17 | | | 1,000,000 | | | | 997,784 | |
| Natixis SA/New York, NY | | | 1.10 | % | | 05/15/17 | | | 750,000 | | | | 746,793 | |
| Natixis SA/New York, NY | | | 1.12 | % | | 06/16/17 | | | 750,000 | | | | 745,688 | |
| Natixis SA/New York, NY | | | 1.21 | % | | 07/05/17 | | | 750,000 | | | | 744,978 | |
| Prudential Funding | | | 0.50 | % | | 01/03/17 | | | 5,000,000 | | | | 4,999,721 | |
| Swedbank AB | | | 0.92 | % | | 02/16/17 | | | 1,500,000 | | | | 1,498,877 | |
| Toyota Motor Credit Corp. | | | 1.01 | % | | 04/04/17 | | | 776,200 | | | | 774,430 | |
Institutional Prime Money Market Fund
| Security Description | | Coupon/ Yield | | Maturity/ Demand Date | | Principal Amount ($) or Shares | | | Fair Value ($) | |
| Commercial Paper — continued | | | | | | | | |
| Toyota Motor Credit Corp. | | | 1.12 | % | | 04/28/17 | | | 776,200 | | | | 773,793 | |
| Toyota Motor Credit Corp. | | | 1.26 | % | | 06/16/17 | | | 776,200 | | | | 772,251 | |
| Toyota Motor Credit Corp. | | | 1.20 | % | | 07/14/17 | | | 750,000 | | | | 745,194 | |
| Toyota Motor Credit Corp. | | | 1.25 | % | | 08/28/17 | | | 1,000,000 | | | | 991,190 | |
Total Commercial Paper
(Cost $72,483,136) | | | | | | | | | | | | | 72,485,111 | |
| Corporate Obligations — 0.9% | | | | |
| Bank of Montreal | | | 1.13 | %(2) | | 01/17/17 | | | 750,000 | | | | 750,275 | |
| Merck & Co., Inc. | | | 1.01 | %(2) | | 02/10/17 | | | 232,860 | | | | 232,912 | |
| UBS AG Stamford, CT | | | 1.49 | %(2) | | 03/01/17 | | | 750,000 | | | | 750,931 | |
Total Corporate Obligations
(Cost $1,733,945) | | | | | | | | | | | | | 1,734,118 | |
| | | | | | | | | | | | | | | |
| Repurchase Agreements — 9.6% | | | | | | | | |
| INTL FCStone (Collateralized by $31,583,555 various FNMAs, GNMAs, and FHLMCs, 0.00% - 6.00%, due 10/25/20- 1/15/54, fair value $19,380,232) (proceeds $19,000,000), purchase date 12/30/16 | | | 0.62 | % | | 01/03/17 | | | 19,000,000 | | | | 19,000,000 | |
Total Repurchase Agreements
(Cost $19,000,000) | | | | | | | | | | | | | 19,000,000 | |
| | | | | | | | | | | | | | | |
| U.S. Government and Agency Obligations — 2.9% | | | | | |
| Federal Farm Credit Bank | | | 0.81 | %(2) | | 01/27/17 | | | 985,774 | | | | 986,194 | |
| Federal Farm Credit Bank | | | 0.74 | %(2) | | 03/22/17 | | | 1,164,300 | | | | 1,164,171 | |
| Federal Home Loan Bank | | | 0.75 | % | | 01/20/17 | | | 776,200 | | | | 776,079 | |
| Federal Home Loan Bank | | | 0.88 | % | | 03/10/17 | | | 776,200 | | | | 776,494 | |
| United States Treasury Note | | | 0.50 | % | | 03/31/17 | | | 194,050 | | | | 194,068 | |
The accompanying notes are an integral part of these financial statements.
| 2016 Annual Report | December 31, 2016 | Page 73 |
Schedule of Investments
December 31, 2016
Institutional Prime Money Market Fund
| Security Description | | Coupon/ Yield | | Maturity/ Demand Date | | Principal Amount ($) or Shares | | | Fair Value ($) | |
| U.S. Government and Agency Obligations — continued | |
| United States Treasury Note | | | 0.50 | % | | 04/30/17 | | | 194,050 | | | | 194,043 | |
| United States Treasury Note | | | 0.88 | % | | 05/15/17 | | | 194,050 | | | | 194,247 | |
| United States Treasury Note | | | 0.63 | % | | 05/31/17 | | | 388,100 | | | | 388,070 | |
| United States Treasury Note | | | 0.88 | % | | 06/15/17 | | | 194,050 | | | | 194,240 | |
| United States Treasury Note | | | 0.50 | % | | 07/31/17 | | | 388,100 | | | | 387,721 | |
| United States Treasury Note | | | 0.88 | % | | 08/15/17 | | | 388,100 | | | | 388,525 | |
Total U.S. Government and Agency Obligations
(Cost $5,643,046) | | | | | | | | | | | | | 5,643,852 | |
| Security Description | | Shares or Principal Amount ($) | | | Fair Value ($) | |
| Money Market Registered Investment Companies — 46.3% | |
Fidelity Prime Institutional Money Market Portfolio, 0.83% (3) | | | 89,964,014 | | | | 90,000,000 | |
Morgan Stanley Government Institutional Fund, 0.44% (3) | | | 1,444,579 | | | | 1,444,579 | |
Total Money Market Registered Investment Companies
(Cost $91,444,579) | | | | | | | 91,444,579 | |
Total Investments — 99.8%
(Cost $197,107,111) (1) | | | | | | | 197,110,371 | |
| Other Assets less Liabilities — 0.2% | | | | | | | 369,865 | |
| Total Net Assets — 100.0% | | | | | | | 197,480,236 | |
| (1) | Cost for federal income tax and financial reporting purposes are the same. |
| Unrealized appreciation | | $ | 10,001 | |
| Unrealized depreciation | | | (6,741 | ) |
| Net unrealized appreciation (depreciation) | | $ | 3,260 | |
| (2) | Floating rate security. The rate shown represents the rate in effect at December 31, 2016. The maturity date shown reflects the earlier of the next demand date or stated maturity date. |
| (3) | 7-day yield as of December 31, 2016. The Fund may invest a significant portion of its assets in shares of one or more investment companies, including money market mutual funds. The Fund will incur additional indirect expenses (acquired fund fees and expenses) to the extent it invests in shares of other investment companies. From time to time, the Fund may invest greater than 25% of its net assets in one or more investment companies. As of December 31, 2016, Fidelity Prime Institutional Money Market Portfolio represented 45.6% of Prime Money Market Fund’s net assets. Additional information for this security, including its financial statements, is available from the Securities and Exchange Commission’s website at www.sec.gov. |
The accompanying notes are an integral part of these financial statements.
| Page 74 | 2016 Annual Report | December 31, 2016 |
[This page intentionally left blank]
Statements of Assets & Liabilities
December 31, 2016
| | | Muirfield Fund | | | Dynamic Growth Fund | | | Aggressive Growth Fund | |
| Assets | | | | | | | | | |
| Investments, at fair value (1)(2) | | $ | 295,828,112 | | | $ | 101,742,813 | | | $ | 40,444,662 | |
| Repurchase agreements, at fair value (1) | | | — | | | | — | | | | — | |
| Investments in affiliates, at fair value (1) | | | 93,992,266 | | | | 15,270,106 | | | | 5,095,423 | |
| Trustee deferred compensation investments, at fair value | | | 305,391 | | | | 165,293 | | | | 98,034 | |
| Cash | | | — | | | | — | | | | — | |
| Cash held at broker for collateral on securities sold short | | | — | | | | — | | | | — | |
| Cash held at broker for futures contracts (3) | | | 2,669,950 | | | | 1,931,335 | | | | 604,645 | |
| Receivable for securities sold | | | — | | | | — | | | | — | |
| Receivable for capital stock issued | | | 449,577 | | | | 109,866 | | | | 21,930 | |
| Receivable from investment advisor | | | — | | | | — | | | | — | |
| Interest and dividend receivable | | | 440,877 | | | | 161,844 | | | | 74,205 | |
| Receivable from securities lending agent (See Note #4) | | | 142 | | | | 32 | | | | 133 | |
| Receivable for commissions recaptured | | | 41,999 | | | | 17,583 | | | | 9,097 | |
| Prepaid expenses/other assets | | | 37,493 | | | | 17,237 | | | | 7,502 | |
| Total Assets | | | 393,765,807 | | | | 119,416,109 | | | | 46,355,631 | |
| | | | | | | | | | | | | |
| Liabilities | | | | | | | | | | | | |
| Securities sold short at fair value (proceeds $46,237,362) | | | — | | | | — | | | | — | |
| Payable for collateral on securities loaned | | | 515,537 | | | | 4,912 | | | | 57,364 | |
| Payable for Trustee Deferred Compensation Plan | | | 305,391 | | | | 165,293 | | | | 98,034 | |
| Payable for securities purchased | | | — | | | | — | | | | — | |
| Payable for capital stock redeemed | | | 356,707 | | | | 47,955 | | | | 706 | |
| Due to custodian | | | — | | | | — | | | | — | |
| Dividends payable | | | 28,912 | | | | 128 | | | | 31 | |
| Dividend expense payable on short positions | | | — | | | | — | | | | — | |
| Payable to investment advisor | | | 270,668 | | | | 92,229 | | | | 34,542 | |
| Accrued distribution plan (12b-1) and shareholder service plan fees | | | 357,915 | | | | 121,241 | | | | 50,287 | |
| Accrued transfer agent, fund accounting, CCO, and administrative fees | | | 75,224 | | | | 25,397 | | | | 12,392 | |
| Accrued trustee fees | | | 4,090 | | | | 1,084 | | | | 1,131 | |
| Other accrued liabilities | | | 35,197 | | | | 24,926 | | | | 19,954 | |
| Total Liabilities | | | 1,949,641 | | | | 483,165 | | | | 274,441 | |
| | | | | | | | | | | | | |
| Net Assets | | $ | 391,816,166 | | | $ | 118,932,944 | | | $ | 46,081,190 | |
| | | | | | | | | | | | | |
| Net Assets | | | | | | | | | | | | |
| Capital | | $ | 380,127,784 | | | $ | 115,052,119 | | | $ | 43,584,518 | |
| Accumulated undistributed (distributions in excess of) net investment income | | | — | | | | — | | | | — | |
| Accumulated undistributed net realized gain (loss) from investments and futures contracts | | | (1,138,730 | ) | | | (189,840 | ) | | | 408,715 | |
| Net unrealized appreciation (depreciation) of investments and futures contracts | | | 12,827,112 | | | | 4,070,665 | | | | 2,087,957 | |
| Total Net Assets | | $ | 391,816,166 | | | $ | 118,932,944 | | | $ | 46,081,190 | |
| | | | | | | | | | | | | |
| Net Asset Value Per Share | | | | | | | | | | | | |
| Retail Class | | | | | | | | | | | | |
| Net Assets | | $ | 390,817,161 | | | $ | 118,292,514 | | | $ | 45,717,716 | |
| Shares Outstanding | | | 57,539,753 | | | | 12,165,597 | | | | 4,422,059 | |
| Net Asset Value, Offering and Redemption Price Per Share | | $ | 6.79 | | | $ | 9.72 | | | $ | 10.34 | |
| | | | | | | | | | | | | |
| Adviser Class | | | | | | | | | | | | |
| Net Assets | | $ | 154,344 | | | $ | 48,110 | | | $ | 18,734 | |
| Shares Outstanding | | | 22,695 | | | | 4,947 | | | | 1,810 | |
| Net Asset Value, Offering and Redemption Price Per Share | | $ | 6.80 | | | $ | 9.73 | | | $ | 10.35 | |
| | | | | | | | | | | | | |
| Institutional Class | | | | | | | | | | | | |
| Net Assets | | $ | 844,661 | | | $ | 592,320 | | | $ | 344,740 | |
| Shares Outstanding | | | 124,245 | | | | 60,908 | | | | 33,314 | |
| Net Asset Value, Offering and Redemption Price Per Share | | $ | 6.80 | | | $ | 9.72 | | | $ | 10.35 | |
| | | | | | | | | | | | | |
| Net Asset Value Per Share - Money Market Funds | | | | | | | | | | | | |
| Net Assets | | | | | | | | | | | | |
| Shares Outstanding | | | | | | | | | | | | |
| Net Asset Value, Offering and Redemption Price Per Share | | | | | | | | | | | | |
| | | | | | | | | | | | | |
| (1) Investments and affiliated investments at cost | | $ | 376,455,744 | | | $ | 112,893,429 | | | $ | 43,329,771 | |
| (2) Fair value of securities loaned included in investments at fair value (See Note #1 and Note #4) | | $ | 499,791 | | | $ | 4,627 | | | $ | 56,122 | |
| (3) Required margin as collateral for futures contracts | | $ | 2,897,000 | | | $ | 760,000 | | | $ | 246,200 | |
The accompanying notes are an integral part of these financial statements.
| Page 76 | 2016 Annual Report | December 31, 2016 |
| Balanced Fund | | | Global Opportunities Fund | | | Spectrum Fund | | | Quantex Fund | | | Infrastructure Fund | | | Dividend Opportunities Fund | | | Total Return Bond Fund | | | Prime Money Market Fund | | | Institutional Prime Money Market Fund | |
| $ | 201,594,515 | | | $ | 74,936,768 | | | $ | 115,382,476 | | | $ | 77,441,501 | | | $ | 18,766,972 | | | $ | 50,253,694 | | | $ | 209,056,377 | | | $ | 29,527,527 | | | $ | 178,110,371 | |
| | — | | | | — | | | | — | | | | — | | | | — | | | | — | | | | — | | | | 7,000,000 | | | | 19,000,000 | |
| | 32,884,113 | | | | 3,120,423 | | | | 7,075,401 | | | | 11,729,999 | | | | 1,891,662 | | | | 5,488,862 | | | | 6,125,641 | | | | — | | | | — | |
| | 143,142 | | | | 113,947 | | | | 8,777 | | | | 103,395 | | | | 96,868 | | | | 2,969 | | | | 59,236 | | | | 84,430 | | | | — | |
| | — | | | | — | | | | — | | | | — | | | | — | | | | — | | | | — | | | | 774,898 | | | | 429,239 | |
| | — | | | | — | | | | 46,185,303 | | | | — | | | | — | | | | — | | | | — | | | | — | | | | — | |
| | 1,491,473 | | | | 428,178 | | | | 3,115,571 | | | | 2,242,564 | | | | 73,531 | | | | 1,197,402 | | | | — | | | | — | | | | — | |
| | — | | | | — | | | | — | | | | — | | | | — | | | | — | | | | — | | | | — | | | | 19,890,498 | |
| | 119,165 | | | | 35,165 | | | | 194,717 | | | | 87,069 | | | | 86,663 | | | | 59,913 | | | | 178,969 | | | | — | | | | — | |
| | — | | | | — | | | | — | | | | — | | | | — | | | | — | | | | — | | | | 9,333 | | | | — | |
| | 186,907 | | | | 64,477 | | | | 208,250 | | | | 115,538 | | | | 49,997 | | | | 127,815 | | | | 60,354 | | | | 15,439 | | | | 87,078 | |
| | 1,544 | | | | — | | | | 530 | | | | 1,035 | | | | — | | | | 6 | | | | — | | | | — | | | | — | |
| | 18,162 | | | | 6,423 | | | | 22,846 | | | | 2,138 | | | | — | | | | 8,273 | | | | — | | | | — | | | | — | |
| | 26,402 | | | | 16,279 | | | | 22,111 | | | | 12,491 | | | | 11,437 | | | | 9,957 | | | | 20,465 | | | | 20,447 | | | | 2,625 | |
| | 236,465,423 | | | | 78,721,660 | | | | 172,215,982 | | | | 91,735,750 | | | | 20,977,130 | | | | 57,148,891 | | | | 215,501,042 | | | | 37,432,074 | | | | 217,519,811 | |
| | | | | | | | | | | | | | | | | | | | | | | | | | | | | | | | | | | |
| | — | | | | — | | | | 47,004,069 | | | | — | | | | — | | | | — | | | | — | | | | — | | | | — | |
| | 5,589,029 | | | | 2,420,649 | | | | 236,673 | | | | 5,226,665 | | | | — | | | | — | | | | — | | | | — | | | | — | |
| | 143,142 | | | | 113,947 | | | | 8,777 | | | | 103,395 | | | | 96,868 | | | | 2,969 | | | | 59,236 | | | | 84,430 | | | | — | |
| | — | | | | — | | | | — | | | | — | | | | — | | | | — | | | | — | | | | 651,110 | | | | — | |
| | 227,670 | | | | 15,459 | | | | 109,334 | | | | 36,911 | | | | 66,731 | | | | 24,023 | | | | 224,565 | | | | — | | | | — | |
| | — | | | | — | | | | — | | | | — | | | | — | | | | — | | | | — | | | | — | | | | 19,890,498 | |
| | 1,388 | | | | 627 | | | | 198 | �� | | | 283 | | | | 873 | | | | 57 | | | | 1,838 | | | | 861 | | | | 85,566 | |
| | — | | | | — | | | | 86,791 | | | | — | | | | — | | | | — | | | | — | | | | — | | | | — | |
| | 168,209 | | | | 59,176 | | | | 79,160 | | | | 55,766 | | | | 12,791 | | | | 36,032 | | | | 52,935 | | | | — | | | | 6,827 | |
| | 212,526 | | | | 53,093 | | | | 110,815 | | | | 51,227 | | | | 7,289 | | | | 53,251 | | | | 191,532 | | | | 2,439 | | | | 504 | |
| | 45,299 | | | | 17,550 | | | | 26,105 | | | | 19,670 | | | | 5,871 | | | | 13,519 | | | | 31,920 | | | | 8,770 | | | | 32,739 | |
| | 3,813 | | | | 1,428 | | | | 1,942 | | | | 634 | | | | 708 | | | | 546 | | | | 2,324 | | | | 292 | | | | 440 | |
| | 28,556 | | | | 21,896 | | | | 34,233 | | | | 23,419 | | | | 23,577 | | | | 23,342 | | | | 27,867 | | | | 18,345 | | | | 23,001 | |
| | 6,419,632 | | | | 2,703,825 | | | | 47,698,097 | | | | 5,517,970 | | | | 214,708 | | | | 153,739 | | | | 592,217 | | | | 766,247 | | | | 20,039,575 | |
| | | | | | | | | | | | | | | | | | | | | | | | | | | | | | | | | | | |
| $ | 230,045,791 | | | $ | 76,017,835 | | | $ | 124,517,885 | | | $ | 86,217,760 | | | $ | 20,762,422 | | | $ | 56,995,152 | | | $ | 214,908,825 | | | $ | 36,665,827 | | | $ | 197,480,236 | |
| | | | | | | | | | | | | | | | | | | | | | | | | | | | | | | | | | | |
| $ | 226,912,079 | | | $ | 82,231,620 | | | $ | 119,477,554 | | | $ | 76,538,869 | | | $ | 19,603,599 | | | $ | 55, 520,441 | | | $ | 227,431,232 | | | $ | 36,665,827 | | | $ | 197,478,058 | |
| | — | | | | — | | | | — | | | | — | | | | (4,243 | ) | | | — | | | | — | | | | — | | | | 12 | |
| | (1,558,347 | ) | | | (6,664,883 | ) | | | 2,005,894 | | | | 2,851,240 | | | | (620,201 | ) | | | (801,462 | ) | | | (12,494,665 | ) | | | — | | | | (1,094 | ) |
| | 4,692,059 | | | | 451,098 | | | | 3,034,437 | | | | 6,827,651 | | | | 1,783,267 | | | | 2,276,173 | | | | (27,742 | ) | | | — | | | | 3,260 | |
| $ | 230,045,791 | | | $ | 76,017,835 | | | $ | 124,517,885 | | | $ | 86,217,760 | | | $ | 20,762,422 | | | $ | 56,995,152 | | | $ | 214,908,825 | | | $ | 36,665,827 | | | $ | 197,480,236 | |
| | | | | | | | | | | | | | | | | | | | | | | | | | | | | | | | | | | |
| | | | | | | | | | | | | | | | | | | | | | | | | | | | | | | | | | | |
| $ | 229,738,077 | | | $ | 75,657,251 | | | $ | 124,008,565 | | | $ | 85,235,444 | | | $ | 20,450,075 | | | $ | 56,743,859 | | | $ | 214,754,998 | | | | | | | | | |
| | 21,399,410 | | | | 7,915,256 | | | | 12,058,601 | | | | 2,554,945 | | | | 959,362 | | | | 5,423,743 | | | | 23,145,145 | | | | | | | | | |
| $ | 10.74 | | | $ | 9.56 | | | $ | 10.28 | | | $ | 33.36 | | | $ | 21.32 | | | $ | 10.46 | | | $ | 9.28 | | | | | | | | | |
| | | | | | | | | | | | | | | | | | | | | | | | | | | | | | | | | | | |
| $ | 89,094 | | | $ | 30,107 | | | $ | 48,319 | | | $ | 31,138 | | | $ | 7,492 | | | $ | 22,479 | | | $ | 83,959 | | | | | | | | | |
| | 8,294 | | | | 3,147 | | | | 4,696 | | | | 933 | | | | 351 | | | | 2,149 | | | | 9,051 | | | | | | | | | |
| $ | 10.74 | | | $ | 9.57 | | | $ | 10.29 | | | $ | 33.37 | | | $ | 21.34 | | | $ | 10.46 | | | $ | 9.28 | | | | | | | | | |
| | | | | | | | | | | | | | | | | | | | | | | | | | | | | | | | | | | |
| $ | 218,620 | | | $ | 330,477 | | | $ | 461,001 | | | $ | 951,178 | | | $ | 304,855 | | | $ | 228,814 | | | $ | 69,868 | | | | | | | | | |
| | 20,345 | | | | 34,503 | | | | 44,815 | | | | 28,505 | | | | 14,287 | | | | 21,850 | | | | 7,529 | | | | | | | | | |
| $ | 10.75 | | | $ | 9.58 | | | $ | 10.29 | | | $ | 33.37 | | | $ | 21.34 | | | $ | 10.47 | | | $ | 9.28 | | | | | | | | | |
| | | | | | | | | | | | | | | | | | | | | | | | | | | | | | | | | | | |
| | | | | | | | | | | | | | | | | | | | | | | | | | | | | $ | 36,665,827 | | | $ | 197,480,236 | |
| | | | | | | | | | | | | | | | | | | | | | | | | | | | | $ | 36,665,827 | | | | 197,469,829 | |
| | | | | | | | | | | | | | | | | | | | | | | | | | | | | | 1.00 | | | $ | 1.0001 | |
| | | | | | | | | | | | | | | | | | | | | | | | | | | | | | | | | | | |
| $ | 229,612,337 | | | $ | 77, 548,729 | | | $ | 118,443,279 | | | $ | 82,043,923 | | | $ | 18,864,825 | | | $ | 53, 447,769 | | | $ | 215,209,760 | | | $ | 36,527,527 | | | $ | 197,107,111 | |
| $ | 5,488,530 | | | $ | 2,386,535 | | | $ | 226,383 | | | $ | 5,098,403 | | | $ | — | | | $ | — | | | $ | — | | | $ | — | | | $ | — | |
| $ | 859,750 | | | $ | 168,400 | | | $ | 1,862,000 | | | $ | 596,300 | | | $ | 71,250 | | | $ | 289,750 | | | $ | — | | | $ | — | | | $ | — | |
The accompanying notes are an integral part of these financial statements.
| 2016 Annual Report | December 31, 2016 | Page 77 |
Statements of Operations
For the Period Ended December 31, 2016
| | | Muirfield Fund | | | DynamicGrowth Fund | | | Aggressive Growth Fund | |
| Investment Income | | | | | | | | | |
| Interest | | $ | 3,491 | | | $ | 4,007 $ | | | | 2,905 | |
| Income from affiliates | | | 256,665 | | | | 34,712 | | | | 21,186 | |
| Dividends | | | 6,657,282 | | | | 2,303,174 | | | | 1,227,530 | |
| Total Investment Income | | | 6,917,438 | | | | 2,341,893 | | | | 1,251,621 | |
| | | | | | | | | | | | | |
| Fund Expenses | | | | | | | | | | | | |
| Investment advisor | | | 2,611,456 | | | | 838,661 | | | | 485,636 | |
| Transfer agent - Retail Class | | | 467,066 | | | | 134,052 | | | | 77,643 | |
| Transfer agent - Adviser Class | | | 31 | | | | 10 | | | | 4 | |
| Transfer agent - Institutional Class | | | 195 | | | | 125 | | | | 55 | |
| Transfer agent - Money Market Funds (1) | | | | | | | | | | | | |
| Transfer agent - Money Market Fund - Institutional Class (1) | | | | | | | | | | | | |
| Fund accounting | | | 75,941 | | | | 48,182 | | | | 41,950 | |
| Administrative | | | 321,528 | | | | 99,457 | | | | 61,708 | |
| Trustee | | | 17,751 | | | | 5,201 | | | | 3,731 | |
| Audit | | | 12,772 | | | | 12,772 | | | | 12,772 | |
| Legal | | | 5,363 | | | | 5,363 | | | | 5,363 | |
| Custody | | | 42,158 | | | | 14,000 | | | | 8,714 | |
| Printing | | | 15,597 | | | | 4,059 | | | | 2,738 | |
| Distribution plan (12b-1) - Retail Class (2) | | | 774,093 | | | | 277,584 | | | | 161,121 | |
| Distribution plan (12b-1) - Money Market Funds (1) | | | | | | | | | | | | |
| Distribution plan (12b-1) - Money Market Fund - Institutional Class (1) | | | | | | | | | | | | |
| Shareholder service plan - Retail Class (3) | | | 778,444 | | | | 223,419 | | | | 129,405 | |
| Postage | | | 16,682 | | | | 9,642 | | | | 2,462 | |
| Registration and filing | | | 54,223 | | | | 29,982 | | | | 25,011 | |
| Insurance | | | 33,407 | | | | 13,326 | | | | 8,382 | |
| Chief Compliance Officer | | | 4,495 | | | | 4,495 | | | | 4,495 | |
| Short sale expense | | | — | | | | — | | | | — | |
| Dividend expense on securities sold short | | | — | | | | — | | | | — | |
| Excise tax expense | | | — | | | | — | | | | — | |
| Recoupment of prior expenses reimbursed by the investment advisor (See Note #4) | | | 49,794 | | | | — | | | | — | |
| Other | | | 29,684 | | | | 24,260 | | | | 21,452 | |
| Total Expenses Before Reductions | | | 5,310,680 | | | | 1,744,590 | | | | 1,052,642 | |
| | | | | | | | | | | | | |
| Expenses voluntarily reimbursed/waived by investment advisor (See Note #4) | | | — | | | | (160,774 | ) | | | (17,877 | ) |
| Expenses contractually reimbursed/waived by investment advisor (See Note #4) | | | — | | | | — | | | | — | |
| Commissions recaptured and fees received from custodian (See Note #4) | | | (1,203,962 | ) | | | (404,481 | ) | | | (275,566 | ) |
| Securities lending credit (See Note #4) | | | (32,582 | ) | | | (5,666 | ) | | | (8,536 | ) |
| Transfer agent expenses voluntarily waived (See Note #4) | | | — | | | | — | | | | — | |
| Transfer agent expenses contractually waived (See Note #4) | | | — | | | | — | | | | — | |
| | | | | | | | | | | | | |
| Net Expenses | | | 4,074,136 | | | | 1,173,669 | | | | 750,663 | |
| | | | | | | | | | | | | |
| Net Investment Income (Loss) | | | 2,843,302 | | | | 1,168,224 | | | | 500,958 | |
| | | | | | | | | | | | | |
| Net Realized and Unrealized Gain (Loss) from Investments | | | | | | | | | | | | |
| Net realized gains (losses) from investments ($2,976,985 loss on covered short securities(4)) | | | 1,669,047 | | | | (525,978 | ) | | | (222,869 | ) |
| Net realized gains (losses) from futures contracts | | | 7,240,410 | | | | 1,717,793 | | | | 1,623,675 | |
| Distributions of long-term realized gains by other investment companies | | | — | | | | — | | | | — | |
| Net Realized Gains (Losses) from Investment Transactions, Futures Contracts, and Distributions of Long-term Realized Gains by Other Investment Companies | | | 8,909,457 | | | | 1,191,815 | | | | 1,400,806 | |
| | | | | | | | | | | | | |
| Net change in unrealized appreciation (depreciation) of investments and futures contracts | | | 10,119,598 | | | | 3,129,274 | | | | 1,991,855 | |
| | | | | | | | | | | | | |
| Net Realized and Unrealized Gain (Loss) from Investments | | | 19,029,055 | | | | 4,321,089 | | | | 3,392,661 | |
| | | | | | | | | | | | | |
| Net Change in Net Assets Resulting from Operations | | $ | 21,872,357 | | | $ | 5,489,313 | | | $ | 3,893,619 | |
| (1) | See Note #1 of the Notes to Financial Statements. |
| (2) | Only the Retail Class of shares has adopted a Rule 12b-1 Plan. See Note #4 of the Notes to Financial Statements. |
| (3) | There were no Shareholder Services Plan fees accrued for the Adviser and Institutional Classes of shares. See Note #4 of the Notes to Financial Statements. |
The accompanying notes are an integral part of these financial statements.
| Page 78 | 2016 Annual Report | December 31, 2016 |
| Balanced Fund | | | Global Opportunities Fund | | | Spectrum Fund(4) | | | Quantex Fund | | | Infrastructure Fund | | | Dividend Opportunities Fund | | | Total Return Bond Fund | | | Prime Money Market Fund | | | Institutional Prime Money Market Fund(5) | |
| $ | 4,483 | | | $ | 3,306 | | | $ | 1,768 | | | $ | 5,068 | | | $ | — | | | $ | 1,715 | | | $ | 6,954 | | | $ | 737,171 | | | $ | 171,176 | |
| | 126,412 | | | | 11,681 | | | | 39,557 | | | | 20,652 | | | | 1,769 | | | | 12,194 | | | | 22,901 | | | | — | | | | — | |
| | 5,874,849 | | | | 1,882,817 | | | | 2,032,786 | | | | 1,109,555 | | | | 532,180 | | | | 1,292,121 | | | | 8,148,082 | | | | 173,580 | | | | 95,907 | |
| | 6,005,744 | | | | 1,897,804 | | | | 2,074,111 | | | | 1,135,275 | | | | 533,949 | | | | 1,306,030 | | | | 8,177,937 | | | | 910,751 | | | | 267,083 | |
| | | | | | | | | | | | | | | | | | | | | | | | | | | | | | | | | | | |
| | 1,911,751 | | | | 657,199 | | | | 943,273 | | | | 688,539 | | | | 198,155 | | | | 339,397 | | | | 636,434 | | | | 538,572 | | | | 134,960 | |
| | 322,293 | | | | 105,091 | | | | 150,805 | | | | 86,925 | | | | 84,722 | | | | 85,563 | | | | 174,556 | | | | | | | | | |
| | 18 | | | | 6 | | | | 10 | | | | 6 | | | | 1 | | | | 4 | | | | 9 | | | | | | | | | |
| | 40 | | | | 55 | | | | 110 | | | | 186 | | | | 50 | | | | 29 | | | | 7 | | | | | | | | | |
| | | | | | | | | | | | | | | | | | | | | | | | | | | | | | 35,449 | | | | 31,922 | |
| | | | | | | | | | | | | | | | | | | | | | | | | | | | | | 91,224 | | | | | |
| | 63,863 | | | | 45,728 | | | | 49,577 | | | | 42,649 | | | | 24,818 | | | | 38,051 | | | | 58,822 | | | | 52,436 | | | | 12,683 | |
| | 224,900 | | | | 80,101 | | | | 110,616 | | | | 65,004 | | | | 19,818 | | | | 44,815 | | | | 184,574 | | | | 140,731 | | | | 34,258 | |
| | 13,089 | | | | 4,480 | | | | 6,518 | | | | 3,393 | | | | 837 | | | | 2,426 | | | | 10,127 | | | | 1,192 | | | | 466 | |
| | 12,772 | | | | 12,772 | | | | 13,535 | | | | 12,772 | | | | 12,772 | | | | 12,772 | | | | 12,772 | | | | 12,772 | | | | 13,818 | |
| | 5,363 | | | | 5,363 | | | | 5,363 | | | | 5,363 | | | | 5,363 | | | | 5,693 | | | | 5,363 | | | | 5,363 | | | | 1,229 | |
| | 29,156 | | | | 11,141 | | | | 12,480 | | | | 6,651 | | | | 2,757 | | | | 4,655 | | | | 21,460 | | | | 12,306 | | | | 2,991 | |
| | 10,219 | | | | 3,669 | | | | 5,390 | | | | 2,712 | | | | 5,085 | | | | 1,934 | | | | 8,932 | | | | 9,553 | | | | 3,726 | |
| | 668,244 | | | | 182,998 | | | | 312,472 | | | | 136,362 | | | | 47,202 | | | | 113,065 | | | | 542,347 | | | | | | | | | |
| | | | | | | | | | | | | | | | | | | | | | | | | | | | | | 8,919 | | | | 690 | |
| | | | | | | | | | | | | | | | | | | | | | | | | | | | | | 3 | | | | | |
| | 537,156 | | | | 175,152 | | | | 251,341 | | | | 101,652 | | | | 25,708 | | | | 90,451 | | | | 436,385 | | | | | | | | | |
| | 13,193 | | | | 6,157 | | | | 11,658 | | | | 10,372 | | | | 18,974 | | | | 9,958 | | | | 8,662 | | | | 2,277 | | | | 1,672 | |
| | 56,867 | | | | 25,733 | | | | 50,815 | | | | 23,580 | | | | 25,397 | | | | 40,421 | | | | 35,304 | | | | 27,490 | | | | 927 | |
| | 20,469 | | | | 9,614 | | | | 5,829 | | | | 6,383 | | | | 2,120 | | | | 4,121 | | | | 16,834 | | | | 22,048 | | | | — | |
| | 4,495 | | | | 4,495 | | | | 4,495 | | | | 4,495 | | | | 4,495 | | | | 4,495 | | | | 4,495 | | | | 4,484 | | | | 1,291 | |
| | — | | | | — | | | | 82,903 | | | | — | | | | — | | | | — | | | | — | | | | — | | | | — | |
| | — | | | | — | | | | 462,701 | | | | — | | | | — | | | | — | | | | — | | | | — | | | | — | |
| | — | | | | — | | | | — | | | | — | | | | 1,732 | | | | — | | | | — | | | | — | | | | — | |
| | 28,346 | | | | — | | | | — | | | | — | | | | — | | | | — | | | | — | | | | — | | | | — | |
| | 24,777 | | | | 22,055 | | | | 19,324 | | | | 20,414 | | | | 26,176 | | | | 17,194 | | | | 24,145 | | | | 44,482 | | | | 7,621 | |
| | 3,947,011 | | | | 1,351,809 | | | | 2,499,215 | | | | 1,217,458 | | | | 506,182 | | | | 815,044 | | | | 2,181,228 | | | | 1,009,301 | | | | 248,254 | |
| | | | | | | | | | | | | | | | | | | | | | | | | | | | | | | | | | | |
| | — | | | | (114,067 | ) | | | — | | | | — | | | | (14,665 | ) | | | (83,740 | ) | | | (51 | ) | | | (621,432 | ) | | | (145,151 | ) |
| | — | | | | — | | | | — | | | | (172,873 | ) | | | — | | | | — | | | | — | | | | — | | | | — | |
| | (657,516 | ) | | | (194,639 | ) | | | (602,619 | ) | | | (179,835 | ) | | | (4,836 | ) | | | (140,657 | ) | | | (225,384 | ) | | | — | | | | — | |
| | (25,336 | ) | | | (23,962 | ) | | | (18,953 | ) | | | (53,621 | ) | | | (45 | ) | | | (16,830 | ) | | | — | | | | — | | | | — | |
| | — | | | | — | | | | — | | | | — | | | | (60,992 | ) | | | (2,902 | ) | | | — | | | | (496 | ) | | | — | |
| | — | | | | — | | | | — | | | | — | | | | — | | | | — | | | | (42,887 | ) | | | (22,203 | ) | | | (7,991 | ) |
| | | | | | | | | | | | | | | | | | | | | | | | | | | | | | | | | | | |
| | 3,264,159 | | | | 1,019,141 | | | | 1,877,643 | | | | 811,129 | | | | 425,644 | | | | 570,915 | | | | 1,912,906 | | | | 365,170 | | | | 95,112 | |
| | | | | | | | | | | | | | | | | | | | | | | | | | | | | | | | | | | |
| | 2,741,585 | | | | 878,663 | | | | 196,468 | | | | 324,146 | | | | 108,305 | | | | 735,115 | | | | 6,265,031 | | | | 545,581 | | | | 171,971 | |
| | | | | | | | | | | | | | | | | | | | | | | | | | | | | | | | | | | |
| | (2,472,203 | ) | | | (3,136,881 | ) | | | (1,463,084 | ) | | | 2,085,287 | | | | (393,962 | ) | | | 832,137 | | | | (2,157,021 | ) | | | | | | | (1,094 | ) |
| | 5,476,948 | | | | 871,255 | | | | 6,239,000 | | | | 1,829,988 | | | | 14,073 | | | | 366,017 | | | | — | | | | | | | | — | |
| | 51,645 | | | | — | | | | — | | | | — | | | | — | | | | — | | | | 101,110 | | | | | | | | — | |
| | | | | | | | | | | | | | | | | | | | | | | | | | | | | | | | | | | |
| | 3,056,390 | | | | (2,265,626 | ) | | | 4,775,916 | | | | 3,915,275 | | | | (379,889 | ) | | | 1,198,154 | | | | (2,055,911 | ) | | | | | | | (1,094 | ) |
| | | | | | | | | | | | | | | | | | | | | | | | | | | | | | | | | | | |
| | 6,956,644 | | | | 3,437,192 | | | | 3,628,533 | | | | 10,155,720 | | | | 3,752,341 | | | | 3,412,365 | | | | 4,922,395 | | | | | | | | 3,260 | |
| | | | | | | | | | | | | | | | | | | | | | | | | | | | | | | | | | | |
| | 10,013,034 | | | | 1,171,566 | | | | 8,404,449 | | | | 14,070,995 | | | | 3,372,452 | | | | 4,610,519 | | | | 2,866,484 | | | | | | | | 2,166 | |
| | | | | | | | | | | | | | | | | | | | | | | | | | | | | | | | | | | |
| $ | 12,754,619 | | | $ | 2,050,229 | | | $ | 8,600,917 | | | $ | 14,395,141 | | | $ | 3,480, 757 | | | $ | 5,345,634 | | | $ | 9,131,515 | | | $ | 545,581 | | | $ | 174,137 | |
| (4) | $2,976,985 loss on covered short securities. |
| (5) | Commenced operations on October 7, 2016. |
The accompanying notes are an integral part of these financial statements.
| 2016 Annual Report | December 31, 2016 | Page 79 |
Statements of Changes in Net Assets
For the Periods Ended December 31,
| | | Muirfield Fund | | | Dynamic Growth Fund | |
| | | 2016 | | | 2015 | | | 2016 | | | 2015 | |
| Operations | | | | | | | | | | | | |
| Net investment income (loss) | | $ | 2,843,302 | | | $ | 1,197,404 | | | $ | 1,168,224 | | | $ | 708,081 | |
| Net realized gain (loss) from investment transactions, futures contracts, and distributions of long-term realized gains by other investment companies | | | 8,909,457 | | | | (8,885,936 | ) | | | 1,191,815 | | | | 1,182,605 | |
| Net change in unrealized appreciation (depreciation) of investments and futures contracts | | | 10,119,598 | | | | (15,533,850 | ) | | | 3,129,274 | | | | (9,045,186 | ) |
| Net change in net assets resulting from operations | | | 21,872,357 | | | | (23,222,382 | ) | | | 5,489,313 | | | | (7,154,500 | ) |
| | | | | | | | | | | | | | | | | |
| Distributions to Shareholders | | | | | | | | | | | | | | | | |
| From net investment income: | | | | | | | | | | | | | | | | |
| Retail Class | | | (2,928,064 | ) | | | (1,206,913 | ) | | | (1,179,811 | ) | | | (713,972 | ) |
| Adviser Class | | | (335 | ) | | | — | | | | (105 | ) | | | — | |
| Institutional Class | | | (2,155 | ) | | | — | | | | (1,385 | ) | | | — | |
| From net realized gain from investment transactions: | | | | | | | | | | | | | | | | |
| Retail Class | | | — | | | | (9,177,856 | ) | | | (566,878 | ) | | | (3,263,183 | ) |
| Adviser Class | | | — | | | | — | | | | (225 | ) | | | — | |
| Institutional Class | | | — | | | | — | | | | (2,968 | ) | | | — | |
| From return of capital: | | | | | | | | | | | | | | | | |
| Retail Class | | | — | | | | — | | | | — | | | | — | |
| Adviser Class | | | — | | | | — | | | | — | | | | — | |
| Institutional Class | | | — | | | | — | | | | — | | | | — | |
| Net change in net assets resulting from distributions | | | (2,930,554 | ) | | | (10,384,769 | ) | | | (1,751,372 | ) | | | (3,977,155 | ) |
| | | | | | | | | | | | | | | | | |
| Capital Transactions: | | | | | | | | | | | | | | | | |
| Issued | | | 135,904,696 | | | | 261,740,230 | | | | 52,208,011 | | | | 98,814,975 | |
| Reinvested | | | 2,838,323 | | | | 10,071,809 | | | | 1,750,198 | | | | 3,975,540 | |
| Redeemed | | | (156,813,790 | ) | | | (145,121,166 | ) | | | (55,322,607 | ) | | | (116,736,993 | ) |
| Net change in net assets resulting from capital transactions | | | (18,070,771 | ) | | | 126,690,873 | | | | (1,364,398 | ) | | | (13,946,478 | ) |
| | | | | | | | | | | | | | | | | |
| Total Change in Net Assets | | | 871,032 | | | | 93,083,722 | | | | 2,373,543 | | | | (25,078,133 | ) |
| | | | | | | | | | | | | | | | | |
| Net Assets - Beginning of Year | | | 390,945,134 | | | | 297,861,412 | | | | 116,559,401 | | | | 141,637,534 | |
| | | | | | | | | | | | | | | | | |
| Net Assets - End of Year | | $ | 391,816,166 | | | $ | 390,945,134 | | | $ | 118,932,944 | | | $ | 116,559,401 | |
| | | | | | | | | | | | | | | | | |
| Accumulated undistributed (distributions in excess of) net investment income | | $ | — | | | $ | — | | | $ | — | | | $ | — | |
| | | | | | | | | | | | | | | | | |
| Share Transactions: | | | | | | | | | | | | | | | | |
| Issued | | | 20,962,657 | | | | 37,521,714 | | | | 5,547,887 | | | | 9,864,209 | |
| Reinvested | | | 428,665 | | | | 1,527,478 | | | | 182,450 | | | | 416,792 | |
| Redeemed | | | (24,105,739 | ) | | | (21,020,472 | ) | | | (5,956,619 | ) | | | (11,960,788 | ) |
| Net change in shares | | | (2,714,417 | ) | | | 18,028,720 | | | | (226,282 | ) | | | (1,679,787 | ) |
The accompanying notes are an integral part of these financial statements.
| Page 80 | 2016 Annual Report | December 31, 2016 |
| | Aggressive Growth Fund | | Balanced Fund | | Global Opportunities Fund | | Spectrum Fund | |
| | 2016 | | 2015 | | 2016 | | 2015 | | 2016 | | 2015 | | 2016 | | 2015 | |
| | $ | 500,958 | | $ | 220,622 | | $ | 2,741,585 | | $ | 1,908,119 | | $ | 878,663 | | $ | 490,056 | | $ | 196,468 | | $ | (235,916 | ) |
| | | | | | | | | | | | | | | | | | | | | | | | | |
| | | 1,400,806 | | | 1,021,382 | | | 3,056,390 | | | (4,166,746 | ) | | (2,265,626 | ) | | (3,441,622 | ) | | 4,775,916 | | | 358,758 | |
| | | | | | | | | | | | | | | | | | | | | | | | | |
| | | 1,991,855 | | | (6,184,825 | ) | | 6,956,644 | | | (9,092,588 | ) | | 3,437,192 | | | (5,964,881 | ) | | 3,628,533 | | | (594,096 | ) |
| | | 3,893,619 | | | (4,942,821 | ) | | 12,754,619 | | | (11,351,215 | ) | | 2,050,229 | | | (8,916,447 | ) | | 8,600,917 | | | (471,254 | ) |
| | | | | | | | | | | | | | | | | | | | | | | | | |
| | | | | | | | | | | | | | | | | | | | | | | | | |
| | | | | | | | | | | | | | | | | | | | | | | | | |
| | | (514,879 | ) | | (226,997 | ) | | (2,762,407 | ) | | (1,916,750 | ) | | (920,975 | ) | | (502,535 | ) | | (229,819 | ) | | — | |
| | | (26 | ) | | — | | | (336 | ) | | — | | | (189 | ) | | — | | | (85 | ) | | — | |
| | | (384 | ) | | — | | | (754 | ) | | — | | | (1,716 | ) | | — | | | (978 | ) | | — | |
| | | | | | | | | | | | | | | | | | | | | | | | | |
| | | — | | | (2,792,248 | ) | | — | | | (1,472,510 | ) | | — | | | (2,772,417 | ) | | (1,322,992 | ) | | (1,529,056 | ) |
| | | — | | | — | | | — | | | — | | | — | | | — | | | (512 | ) | | — | |
| | | — | | | — | | | — | | | — | | | — | | | — | | | (5,890 | ) | | — | |
| | | | | | | | | | | | | | | | | | | | | | | | | |
| | | — | | | — | | | — | | | — | | | — | | | — | | | — | | | (229,488 | ) |
| | | — | | | — | | | — | | | — | | | — | | | — | | | — | | | — | |
| | | — | | | — | | | — | | | — | | | — | | | — | | | — | | | — | |
| | | (515,289 | ) | | (3,019,245 | ) | | (2,763,497 | ) | | (3,389,260 | ) | | (922,880 | ) | | (3,274,952 | ) | | (1,560,276 | ) | | (1,758,544 | ) |
| | | | | | | | | | | | | | | | | | | | | | | | | |
| | | | | | | | | | | | | | | | | | | | | | | | | |
| | | 16,210,649 | | | 51,752,300 | | | 79,755,921 | | | 201,278,315 | | | 19,568,280 | | | 42,880,298 | | | 41,463,179 | | | 143,258,792 | |
| | | 515,052 | | | 3,018,277 | | | 2,759,403 | | | 3,388,893 | | | 921,716 | | | 3,274,831 | | | 1,559,046 | | | 1,758,324 | |
| | | (52,233,584 | ) | | (53,444,927 | ) | | (151,263,770 | ) | | (76,657,319 | ) | | (52,021,124 | ) | | (37,386,702 | ) | | (51,142,012 | ) | | (17,190,287 | ) |
| | | (35,507,883 | ) | | 1,325,650 | | | (68,748,446 | ) | | 128,009,889 | | | (31,531,128 | ) | | 8,768,427 | | | (8,119,787 | ) | | 127,826,829 | |
| | | | | | | | | | | | | | | | | | | | | | | | | |
| | | (32,129,553 | ) | | (6,636,416 | ) | | (58,757,324 | ) | | 113,269,414 | | | (30,403,779 | ) | | (3,422,972 | ) | | (1,079,146 | ) | | 125,597,031 | |
| | | | | | | | | | | | | | | | | | | | | | | | | |
| | | 78,210,743 | | | 84,847,159 | | | 288,803,115 | | | 175,533,701 | | | 106,421,614 | | | 109,844,586 | | | 125,597,031 | | | — | |
| | | | | | | | | | | | | | | | | | | | | | | | | |
| | $ | 46,081,190 | | $ | 78,210,743 | | $ | 230,045,791 | | $ | 288,803,115 | | $ | 76,017,835 | | $ | 106,421,614 | | $ | 124,517,885 | | $ | 125,597,031 | |
| | | | | | | | | | | | | | | | | | | | | | | | | |
| | $ | — | | $ | — | | $ | — | | $ | — | | $ | — | | $ | — | | $ | — | | $ | — | |
| | | | | | | | | | | | | | | | | | | | | | | | | |
| | | | | | | | | | | | | | | | | | | | | | | | | |
| | | 1,705,205 | | | 4,931,650 | | | 7,682,584 | | | 18,685,615 | | | 2,140,082 | | | 4,134,883 | | | 4,276,333 | | | 14,444,572 | |
| | | 53,363 | | | 308,082 | | | 260,363 | | | 322,277 | | | 97,608 | | | 345,625 | | | 150,043 | | | 179,238 | |
| | | (5,415,390 | ) | | (5,228,440 | ) | | (14,401,906 | ) | | (7,104,140 | ) | | (5,676,548 | ) | | (3,671,048 | ) | | (5,226,636 | ) | | (1,715,438 | ) |
| | | (3,656,822 | ) | | 11,292 | | | (6,458,959 | ) | | 11,903,752 | | | (3,438,858 | ) | | 809,460 | | | (800,260 | ) | | 12,908,372 | |
The accompanying notes are an integral part of these financial statements.
| 2016 Annual Report | December 31, 2016 | Page 81 |
Statements of Changes in Net Assets
For the Periods Ended December 31,
| | | Quantex Fund | | | Infrastructure Fund | |
| | | 2016 | | | 2015 | | | 2016 | | | 2015 | |
| Operations | | | | | | | | | | | | |
| Net investment income (loss) | | $ | 324,146 | | | $ | 325,015 | | | $ | 108,305 | | | $ | 227,628 | |
| Net realized gain (loss) from investment transactions, futures contracts, and distributions of long-term realized gains by other investment companies | | | 3,915,275 | | | | 8,553,680 | | | | (379,889 | ) | | | 4,841,093 | |
| Net change in unrealized appreciation (depreciation) of investments and futures contracts | | | 10,155,720 | | | | (14,697,077 | ) | | | 3,752,341 | | | | (11,269,228 | ) |
| Net change in net assets resulting from operations | | | 14,395,141 | | | | (5,818,382 | ) | | | 3,480,757 | | | | (6,200,507 | ) |
| | | | | | | | | | | | | | | | | |
| Distributions to Shareholders | | | | | | | | | | | | | | | | |
| From net investment income: | | | | | | | | | | | | | | | | |
| Retail Class | | | (359,961 | ) | | | (350,037 | ) | | | — | | | | (336,482 | ) |
| Adviser Class | | | (38 | ) | | | — | | | | — | | | | — | |
| Institutional Class | | | (1,160 | ) | | | — | | | | — | | | | — | |
| From net realized gain from investment transactions: | | | | | | | | | | | | | | | | |
| Retail Class | | | (1,234,598 | ) | | | (8,782,141 | ) | | | (194,130 | ) | | | (5,682,559 | ) |
| Adviser Class | | | (445 | ) | | | — | | | | (71 | ) | | | — | |
| Institutional Class | | | (13,585 | ) | | | — | | | | (2,418 | ) | | | — | |
| From return of capital: | | | | | | | | | | | | | | | | |
| Retail Class | | | — | | | | — | | | | (234,294 | ) | | | — | |
| Adviser Class | | | — | | | | — | | | | (10 | ) | | | — | |
| Institutional Class | | | — | | | | — | | | | (324 | ) | | | — | |
| Net change in net assets resulting from distributions | | | (1,609,787 | ) | | | (9,132,178 | ) | | | (431,247 | ) | | | (6,019,041 | ) |
| | | | | | | | | | | | | | | | | |
| Distributions to Shareholders - Money Market Funds | | | | | | | | | | | | | | | | |
| From net investment income | | | | | | | | | | | | | | | | |
| From net investment income (Retail Class) (2) | | | | | | | | | | | | | | | | |
| From net investment income (Institutional Class) (2) | | | | | | | | | | | | | | | | |
| Net change in net assets resulting from distributions | | | | | | | | | | | | | | | | |
| | | | | | | | | | | | | | | | | |
| Capital Transactions: | | | | | | | | | | | | | | | | |
| Issued (4) | | | 40,428,525 | | | | 36,625,210 | | | | 6,512,856 | | | | 22,621,256 | |
| Reinvested | | | 1,605,609 | | | | 9,118,613 | | | | 410,682 | | | | 5,825,232 | |
| Redeemed (4) | | | (27,484,256 | ) | | | (33,744,475 | ) | | | (9,244,777 | ) | | | (42,938,290 | ) |
| Net change in net assets resulting from capital transactions | | | 14,549,878 | | | | 11,999,348 | | | | (2,321,239 | ) | | | (14,491,802 | ) |
| | | | | | | | | | | | | | | | | |
| Total Change in Net Assets | | | 27,335,232 | | | | (2,951,212 | ) | | | 728,181 | | | | (26,711,350 | ) |
| | | | | | | | | | | | | | | | | |
| Net Assets - Beginning of Year | | | 58,882,528 | | | | 61,833,740 | | | | 20,034,151 | | | | 46,745,501 | |
| | | | | | | | | | | | | | | | | |
| Net Assets - End of Year | | $ | 86,217,760 | | | $ | 58,882,528 | | | $ | 20,762,422 | | | $ | 20,034,151 | |
| | | | | | | | | | | | | | | | | |
| Accumulated undistributed (distributions in excess of) net investment income | | $ | — | | | $ | — | | | $ | (4,243 | ) | | $ | (539,067 | ) |
| | | | | | | | | | | | | | | | | |
| Share Transactions: | | | | | | | | | | | | | | | | |
| Issued (4) | | | 1,330,055 | | | | 1,061,088 | | | | 314,588 | | | | 762,821 | |
| Reinvested | | | 48,133 | | | | 319,498 | | | | 19,734 | | | | 318,749 | |
| Redeemed (4) | | | (909,010 | ) | | | (1,022,131 | ) | | | (462,854 | ) | | | (1,514,313 | ) |
| Net change in shares | | | 469,178 | | | | 358,455 | | | | (128,532 | ) | | | (432,743 | ) |
| (1) | Commenced operations on October 7, 2016. |
| (2) | See Note #1 of the Notes to Financial Statements. |
| (3) | Commenced operations on June 30, 2015. |
The accompanying notes are an integral part of these financial statements.
| Page 82 | 2016 Annual Report | December 31, 2016 |
| | Dividend Opportunities Fund(3) | | Total Return Bond Fund | | Prime Money Market Fund | | Institutional Prime Money Market Fund(1) | |
| | | | | | | | | | | | | | | | | | | | | | |
| | 2016 | | 2015 | | 2016 | | 2015 | | 2016 | | 2015 | | 2016 | |
| | $ | 735,115 | | $ | 396,239 | | $ | 6,265,031 | | $ | 5,089,219 | | $ | 545,581 | | $ | 216,228 | | $ | 171,971 | |
| | | | | | | | | | | | | | | | | | | | | | |
| | | 1,198,154 | | | (2,001,377 | ) | | (2,055,911 | ) | | (8,566,033 | ) | | — | | | — | | | (1,094 | ) |
| | | | | | | | | | | | | | | | | | | | | | |
| | | 3,412,365 | | | (1,136,192 | ) | | 4,922,395 | | | (2,115,247 | ) | | — | | | — | | | 3,260 | |
| | | 5,345,634 | | | (2,741,330 | ) | | 9,131,515 | | | (5,592,061 | ) | | 545,581 | | | 216,228 | | | 174,137 | |
| | | | | | | | | | | | | | | | | | | | | | |
| | | | | | | | | | | | | | | | | | | | | | |
| | | | | | | | | | | | | | | | | | | | | | |
| | | (777,037 | ) | | (401,241 | ) | | (6,263,758 | ) | | (5,089,210 | ) | | | | | | | | | |
| | | (71 | ) | | — | | | (726 | ) | | — | | | | | | | | | | |
| | | (459 | ) | | — | | | (557 | ) | | — | | | | | | | | | | |
| | | | | | — | | | | | | — | | | | | | | | | | |
| | | — | | | — | | | — | | | — | | | | | | | | | | |
| | | — | | | — | | | — | | | — | | | | | | | | | | |
| | | — | | | — | | | — | | | — | | | | | | | | | | |
| | | — | | | — | | | — | | | — | | | | | | | | | | |
| | | — | | | — | | | — | | | — | | | | | | | | | | |
| | | — | | | — | | | — | | | — | | | | | | | | | | |
| | | — | | | — | | | — | | | — | | | | | | | | | | |
| | | (777,567 | ) | | (401,241 | ) | | (6,265,041 | ) | | (5,089,210 | ) | | | | | | | | | |
| | | | | | | | | | | | | | | | | | | | | | |
| | | | | | | | | | | | | | | | | | | | | | |
| | | | | | | | | | | | | | | (28,501 | ) | | — | | | (171,959 | ) |
| | | | | | | | | | | | | | | (113,390 | ) | | (36,789 | ) | | — | |
| | | | | | | | | | | | | | | (403,691 | ) | | (179,439 | ) | | — | |
| | | | | | | | | | | | | | | (545,582 | ) | | (216,228 | ) | | (171,959 | ) |
| | | | | | | | | | | | | | | | | | | | | | |
| | | | | | | | | | | | | | | | | | | | | | |
| | | 30,149,567 | | | 63,564,516 | | | 90,469,480 | | | 136,328,662 | | | 587,186,878 | | | 1,209,592,157 | | | 304,118,416 | |
| | | 777,204 | | | 401,229 | | | 6,255,443 | | | 5,086,663 | | | 137,783 | | | 37,827 | | | 14,473 | |
| | | (20,598,293 | ) | | (18,724,567 | ) | | (99,300,344 | ) | | (59,161,802 | ) | | (775,361,263 | ) | | (1,187,593,496 | ) | | (106,654,831 | ) |
| | | 10,328,478 | | | 45,241,178 | | | (2,575,421 | ) | | 82,253,523 | | | (188,036,602 | ) | | 22,036,488 | | | 197,478,058 | |
| | | | | | | | | | | | | | | | | | | | | | |
| | | 14,896,545 | | | 42,098,607 | | | 291,053 | | | 71,572,252 | | | (188,036,603 | ) | | 22,036,488 | | | 197,480,236 | |
| | | | | | | | | | | | | | | | | | | | | | |
| | | 42,098,607 | | | — | | | 214,617,772 | | | 143,045,520 | | | 224,702,430 | | | 202,665,942 | | | — | |
| | | | | | | | | | | | | | | | | | | | | | |
| | $ | 56,995,152 | | $ | 42,098,607 | | $ | 214,908,825 | | $ | 214,617,772 | | $ | 36,665,827 | | $ | 224,702,430 | | $ | 197,480,236 | |
| | | | | | | | | | | | | | | | | | | | | | |
| | $ | — | | $ | — | | $ | — | | $ | 10 | | $ | — | | $ | 1 | | $ | 12 | |
| | | | | | | | | | | | | | | | | | | | | | |
| | | | | | | | | | | | | | | | | | | | | | |
| | | 3,043,488 | | | 6,344,838 | | | 9,651,192 | | | 14,346,144 | | | 587,186,877 | | | 1,209,592,157 | | | 304,102,698 | |
| | | 79,378 | | | 41,958 | | | 668,172 | | | 537,772 | | | 137,783 | | | 37,827 | | | 14,472 | |
| | | (2,106,832 | ) | | (1,955,088 | ) | | (10,641,622 | ) | | (6,261,274 | ) | | (775,361,263 | ) | | (1,187,593,496 | ) | | (106,647,341 | ) |
| | | 1,016,034 | | | 4,431,708 | | | (322,258 | ) | | 8,622,642 | | | (188,036,603 | ) | | 22,036,488 | | | 197,469,829 | |
| (4) | On October 7, 2016, $131,014,084 was transferred in-kind from Prime Money Market Fund to Institutional Prime Money Market Fund. Therefore capital and shares redeemed for Prime Money Market Fund include this in-kind transfer, whereas capital and shares issued for Institutional Prime Money Market Fund include this amount as an initial contribution. |
The accompanying notes are an integral part of these financial statements.
| 2016 Annual Report | December 31, 2016 | Page 83 |
Financial Highlights
For the Periods Ended December 31,
| | | | | | Income from Investment Operations | | | | | | Less Distributions | | | | |
| | | Net Asset Value, Beginning of Period | | | Net Investment Income (Loss) (3) | | | Net gains (losses) on securities, futures, and options (both realized and unrealized) | | | Total from Investment Operations | | | From Net Investment Income | | | From Net Capital Gains | | | From Return of Capital | | | Total Distributions | |
| Muirfield Fund - Retail Class (1)(2) | | | | | | | | | | | | | | | | | | | | | | |
| 2016 | | $ | 6.47 | | | | 0.05 | | | | 0.32 | | | | 0.37 | | | | (0.05 | ) | | | 0.00 | | | | 0.00 | | | | (0.05 | ) |
| 2015 | | $ | 7.03 | | | | 0.02 | | | | (0.41 | ) | | | (0.39 | ) | | | (0.02 | ) | | | (0.15 | ) | | | 0.00 | | | | (0.17 | ) |
| 2014 | | $ | 6.95 | | | | 0.01 | | | | 0.81 | | | | 0.82 | | | | (0.18 | ) | | | (0.56 | ) | | | 0.00 | | | | (0.74 | ) |
| 2013 | | $ | 5.81 | | | | 0.01 | | | | 1.75 | | | | 1.76 | | | | (0.01 | ) | | | (0.61 | ) | | | 0.00 | | | | (0.62 | ) |
| 2012 | | $ | 5.17 | | | | (0.01 | ) | | | 0.65 | | | | 0.64 | | | | 0.00 | | | | 0.00 | | | | 0.00 | | | | 0.00 | |
| Muirfield Fund - Adviser Class (1)(2)(4) | | | | | | | | | | | | | | | | | | | | | | | | | |
| 2016 (5) | | $ | 6.51 | | | | 0.01 | | | | 0.29 | | | | 0.30 | | | | (0.01 | ) | | | 0.00 | | | | 0.00 | | | | (0.01 | ) |
| Muirfield Fund - Institutional Class (1)(2)(4) | | | | | | | | | | | | | | | | | | | | | | | | | |
| 2016 (5) | | $ | 6.51 | | | | 0.02 | | | | 0.29 | | | | 0.31 | | | | (0.02 | ) | | | 0.00 | | | | 0.00 | | | | (0.02 | ) |
| Dynamic Growth Fund - Retail Class (1)(2) | | | | | | | | | | | | | | | | | | | | | | | | | |
| 2016 | | $ | 9.36 | | | | 0.10 | | | | 0.40 | | | | 0.50 | | | | (0.09 | ) | | | (0.05 | ) | | | 0.00 | | | | (0.14 | ) |
| 2015 | | $ | 10.02 | | | | 0.05 | | | | (0.40 | ) | | | (0.35 | ) | | | (0.05 | ) | | | (0.26 | ) | | | 0.00 | | | | (0.31 | ) |
| 2014 | | $ | 10.35 | | | | 0.04 | | | | 1.25 | | | | 1.29 | | | | (0.30 | ) | | | (1.32 | ) | | | 0.00 | | | | (1.62 | ) |
| 2013 | | $ | 8.80 | | | | 0.02 | | | | 2.74 | | | | 2.76 | | | | (0.02 | ) | | | (1.19 | ) | | | 0.00 | | | | (1.21 | ) |
| 2012 | | $ | 7.68 | | | | 0.00 | | | | 1.12 | | | | 1.12 | | | | 0.00 | | | | 0.00 | | | | 0.00 | | | | 0.00 | |
| Dynamic Growth Fund - Adviser Class (1)(2)(4) | | | | | | | | | | | | | | | | | | | | | | | | | |
| 2016 (5) | | $ | 9.34 | | | | 0.02 | | | | 0.44 | | | | 0.46 | | | | (0.02 | ) | | | (0.05 | ) | | | 0.00 | | | | (0.07 | ) |
| Dynamic Growth Fund - Institutional Class (1)(2)(4) | | | | | | | | | | | | | | | | | | | | | |
| 2016 (5) | | $ | 9.34 | | | | 0.02 | | | | 0.43 | | | | 0.45 | | | | (0.02 | ) | | | (0.05 | ) | | | 0.00 | | | | (0.07 | ) |
| Aggressive Growth Fund - Retail Class (1)(2) | | | | | | | | | | | | | | | | | | | | | | | | | |
| 2016 | | $ | 9.64 | | | | 0.07 | | | | 0.72 | | | | 0.79 | | | | (0.09 | ) | | | 0.00 | | | | 0.00 | | | | (0.09 | ) |
| 2015 | | $ | 10.47 | | | | 0.03 | | | | (0.48 | ) | | | (0.45 | ) | | | (0.03 | ) | | | (0.35 | ) | | | 0.00 | | | | (0.38 | ) |
| 2014 | | $ | 10.91 | | | | 0.00 | | | | 1.43 | | | | 1.43 | | | | (0.08 | ) | | | (1.79 | ) | | | 0.00 | | | | (1.87 | ) |
| 2013 | | $ | 8.44 | | | | (0.00 | )* | | | 2.56 | | | | 2.56 | | | | 0.00 | | | | (0.09 | ) | | | 0.00 | | | | (0.09 | ) |
| 2012 | | $ | 7.40 | | | | (0.03 | ) | | | 1.07 | | | | 1.04 | | | | 0.00 | | | | 0.00 | | | | 0.00 | | | | 0.00 | |
| Aggressive Growth Fund - Adviser Class (1)(2)(4) | | | | | | | | | | | | | | | | | | | | | | | | | |
| 2016 (5) | | $ | 9.53 | | | | 0.01 | | | | 0.82 | | | | 0.83 | | | | (0.01 | ) | | | 0.00 | | | | 0.00 | | | | (0.01 | ) |
| Aggressive Growth Fund - Institutional Class (1)(2)(4) | | | | | | | | | | | | | | | | | | | | | |
| 2016 (5) | | $ | 9.53 | | | | 0.01 | | | | 0.82 | | | | 0.83 | | | | (0.01 | ) | | | 0.00 | | | | 0.00 | | | | (0.01 | ) |
| Balanced Fund - Retail Class (1)(2) | | | | | | | | | | | | | | | | | | | | | | | | | | | | | |
| 2016 | | $ | 10.36 | | | | 0.11 | | | | 0.39 | | | | 0.50 | | | | (0.12 | ) | | | 0.00 | | | | 0.00 | | | | (0.12 | ) |
| 2015 | | $ | 10.98 | | | | 0.09 | | | | (0.58 | ) | | | (0.49 | ) | | | (0.08 | ) | | | (0.05 | ) | | | 0.00 | | | | (0.13 | ) |
| 2014 | | $ | 11.10 | | | | 0.10 | | | | 0.84 | | | | 0.94 | | | | (0.27 | ) | | | (0.79 | ) | | | 0.00 | | | | (1.06 | ) |
| 2013 | | $ | 10.06 | | | | 0.09 | | | | 1.89 | | | | 1.98 | | | | (0.09 | ) | | | (0.85 | ) | | | 0.00 | | | | (0.94 | ) |
| 2012 | | $ | 9.18 | | | | 0.07 | | | | 0.89 | | | | 0.96 | | | | (0.08 | ) | | | 0.00 | | | | 0.00 | | | | (0.08 | ) |
| Balanced Fund - Adviser Class (1)(2)(4) | | | | | | | | | | | | | | | | | | | | | | | | | |
| 2016 (5) | | $ | 10.49 | | | | 0.04 | | | | 0.25 | | | | 0.29 | | | | (0.04 | ) | | | 0.00 | | | | 0.00 | | | | (0.04 | ) |
| Balanced Fund - Institutional Class (1)(2)(4) | | | | | | | | | | | | | | | | | | | | | | | | | |
| 2016 (5) | | $ | 10.49 | | | | 0.04 | | | | 0.26 | | | | 0.30 | | | | (0.04 | ) | | | 0.00 | | | | 0.00 | | | | (0.04 | ) |
| 1 | Ratio of net expenses to average net assets, ratio of net investment income (loss) to average net assets, ratio of expenses to average net assets after reductions, excluding commissions recaptured and fees received from custodian, and ratio of expenses to average net assets before reductions do not include impact of expenses of the underlying investment companies as represented in the schedule of investments. |
| 2 | Recognition of net investment income by the Fund is affected by the timing of the declaration of dividends by the underlying investment companies in which the Fund invests. |
| 3 | Except for the Money Market Funds, net investment income per share is based on average shares outstanding during the period. |
The accompanying notes are an integral part of these financial statements.
| Page 84 | 2016 Annual Report | December 31, 2016 |
| | | | | | | Ratios/Supplemental Data | |
| | Net Asset Value, End of Period | | Total Return (Assumes Reinvestment of Distributions) | | | Net Assets, End of Period ($000) | | | Ratio of Net Investment Income (Loss)to Average Net Assets | | | Ratio of Net Expenses to Average Net Assets | | | Ratio of Expenses to Average Net Assets after Reductions and Recoupment of Fees, Excluding Commissions Recaptured and Fees Received from Custodian | | | Ratio of Expenses to Average Net Assets Before Reductions or Recoupment of Fees | | | Portfolio Turnover Rate | |
| $ | 6.79 | | | 5.72 | % | | $ | 390,817 | | | | 0.73 | % | | | 1.05 | % | | | 1.36 | % | | | 1.35 | % | | | 414 | % |
| $ | 6.47 | | | (5.50 | %) | | $ | 390,945 | | | | 0.33 | % | | | 1.03 | % | | | 1.35 | % | | | 1.37 | % | | | 277 | % |
| $ | 7.03 | | | 12.12 | % | | $ | 297,861 | | | | 0.22 | % | | | 1.22 | % | | | 1.44 | % | | | 1.44 | % | | | 238 | % |
| $ | 6.95 | | | 30.46 | % | | $ | 161,823 | | | | 0.14 | % | | | 1.22 | % | | | 1.42 | % | | | 1.54 | % | | | 260 | % |
| $ | 5.81 | | | 12.38 | % | | $ | 114,171 | | | | (0.12 | %) | | | 1.39 | % | | | 1.42 | % | | | 1.58 | % | | | 154 | % |
| | | | | | | | | | | | | | | | | | | | | | | | | | | | | | |
| $ | 6.80 | | | 4.68 | % | | $ | 154 | | | | 1.32 | % | | | 0.73 | % | | | 0.99 | % | | | 0.99 | % | | | 414 | % |
| | | | | | | | | | | | | | | | | | | | | | | | | | | | | | |
| $ | 6.80 | | | 4.72 | % | | $ | 845 | | | | 1.33 | % | | | 0.72 | % | | | 0.98 | % | | | 0.98 | % | | | 414 | % |
| | | | | | | | | | | | | | | | | | | | | | | | | | | | | | |
| $ | 9.72 | | | 5.37 | % | | $ | 118,293 | | | | 1.04 | % | | | 1.05 | % | | | 1.42 | % | | | 1.56 | % | | | 369 | % |
| $ | 9.36 | | | (3.46 | %) | | $ | 116,559 | | | | 0.47 | % | | | 1.19 | % | | | 1.48 | % | | | 1.54 | % | | | 245 | % |
| $ | 10.02 | | | 12.80 | % | | $ | 141,638 | | | | 0.40 | % | | | 1.22 | % | | | 1.45 | % | | | 1.54 | % | | | 230 | % |
| $ | 10.35 | | | 31.61 | % | | $ | 102,926 | | | | 0.20 | % | | | 1.22 | % | | | 1.39 | % | | | 1.58 | % | | | 276 | % |
| $ | 8.80 | | | 14.58 | % | | $ | 91,977 | | | | (0.04 | %) | | | 1.39 | % | | | 1.42 | % | | | 1.57 | % | | | 154 | % |
| | | | | | | | | | | | | | | | | | | | | | | | | | | | | | |
| $ | 9.73 | | | 4.89 | % | | $ | 48 | | | | 1.33 | % | | | 0.81 | % | | | 1.12 | % | | | 1.12 | % | | | 369 | % |
| | | | | | | | | | | | | | | | | | | | | | | | | | | | | | |
| $ | 9.72 | | | 4.80 | % | | $ | 592 | | | | 1.33 | % | | | 0.80 | % | | | 1.11 | % | | | 1.11 | % | | | 369 | % |
| | | | | | | | | | | | | | | | | | | | | | | | | | | | | | |
| $ | 10.34 | | | 8.26 | % | | $ | 45,718 | | | | 0.77 | % | | | 1.16 | % | | | 1.60 | % | | | 1.63 | % | | | 361 | % |
| $ | 9.64 | | | (4.35 | %) | | $ | 78,211 | | | | 0.24 | % | | | 1.18 | % | | | 1.56 | % | | | 1.58 | % | | | 283 | % |
| $ | 10.47 | | | 13.49 | % | | $ | 84,847 | | | | 0.00 | % | | | 1.33 | % | | | 1.59 | % | | | 1.60 | % | | | 239 | % |
| $ | 10.91 | | | 30.40 | % | | $ | 64,608 | | | | (0.03 | %) | | | 1.35 | % | | | 1.57 | % | | | 1.65 | % | | | 272 | % |
| $ | 8.44 | | | 14.05 | % | | $ | 38,939 | | | | (0.44 | %) | | | 1.59 | % | | | 1.62 | % | | | 1.74 | % | | | 167 | % |
| | | | | | | | | | | | | | | | | | | | | | | | | | | | | | |
| $ | 10.35 | | | 8.75 | % | | $ | 19 | | | | 0.85 | % | | | 0.91 | % | | | 1.24 | % | | | 1.24 | % | | | 361 | % |
| | | | | | | | | | | | | | | | | | | | | | | | | | | | | | |
| $ | 10.35 | | | 8.73 | % | | $ | 345 | | | | 0.83 | % | | | 0.93 | % | | | 1.25 | % | | | 1.25 | % | | | 361 | % |
| | | | | | | | | | | | | | | | | | | | | | | | | | | | | | |
| $ | 10.74 | | | 4.84 | % | | $ | 229,738 | | | | 1.02 | % | | | 1.22 | % | | | 1.46 | % | | | 1.46 | % | | | 322 | % |
| $ | 10.36 | | | (4.47 | %) | | $ | 288,803 | | | | 0.81 | % | | | 1.22 | % | | | 1.47 | % | | | 1.48 | % | | | 246 | % |
| $ | 10.98 | | | 8.61 | % | | $ | 175,534 | | | | 0.94 | % | | | 1.33 | % | | | 1.50 | % | | | 1.54 | % | | | 180 | % |
| $ | 11.10 | | | 19.79 | % | | $ | 105,642 | | | | 0.85 | % | | | 1.33 | % | | | 1.47 | % | | | 1.57 | % | | | 217 | % |
| $ | 10.06 | | | 10.42 | % | | $ | 86,628 | | | | 0.76 | % | | | 1.49 | % | | | 1.51 | % | | | 1.58 | % | | | 168 | % |
| | | | | | | | | | | | | | | | | | | | | | | | | | | | | | |
| $ | 10.74 | | | 2.77 | % | | $ | 89 | | | | 2.42 | % | | | 0.85 | % | | | 1.06 | % | | | 1.06 | % | | | 322 | % |
| | | | | | | | | | | | | | | | | | | | | | | | | | | | | | |
| $ | 10.75 | | | 2.83 | % | | $ | 219 | | | | 2.42 | % | | | 0.85 | % | | | 1.07 | % | | | 1.07 | % | | | 322 | % |
| * | Actual amounts were less than one-half of a cent per share. |
| 4 | Ratio of net expenses to average net assets, ratio of investment income (loss) to average net assets, ratio of expenses to average net assets after reductions and recoupment of fees, excluding commissions recaptured and fees received from custodian, and ratio of expenses to average net assets before reductions or recoupment of fees are annualized for periods of less than one full year. Total return is not annualized. |
| 5 | Commenced operations on October 31, 2016. |
The accompanying notes are an integral part of these financial statements.
| 2016 Annual Report | December 31, 2016 | Page 85 |
Financial Highlights
For the Periods Ended December 31,
| | | | | | Income from Investment Operations | | | Less Distributions | | | | |
| | | Net Asset Value, Beginning of Period | | | Net Investment Income (Loss) (3) | | | Net gains (losses) on securities, futures, and options (both realized and unrealized) | | | Total from Investment Operations | | | From Net Investment Income | | | From Net Capital Gains | | | From Return of Capital | | | Total Distributions | |
| Global Opportunities Fund - Retail Class (1)(2) | | | | | | | | | | | | | | | | | | | |
| 2016 | | $ | 9.34 | | | | 0.09 | | | | 0.24 | | | | 0.33 | | | | (0.11 | ) | | | 0.00 | | | | 0.00 | | | | (0.11 | ) |
| 2015 | | $ | 10.38 | | | | 0.04 | | | | (0.79 | ) | | | (0.75 | ) | | | (0.04 | ) | | | (0.25 | ) | | | 0.00 | | | | (0.29 | ) |
| 2014 | | $ | 11.36 | | | | 0.06 | | | | 0.58 | | | | 0.64 | | | | (0.16 | ) | | | (1.46 | ) | | | 0.00 | | | | (1.62 | ) |
| 2013 | | $ | 10.07 | | | | 0.04 | | | | 2.34 | | | | 2.38 | | | | (0.05 | ) | | | (1.04 | ) | | | 0.00 | | | | (1.09 | ) |
| 2012 | | $ | 8.90 | | | | 0.00 | | | | 1.17 | | | | 1.17 | | | | 0.00 | | | | 0.00 | | | | 0.00 | | | | 0.00 | |
| Global Opportunities Fund - Adviser Class (1)(2)(4) | | | | | | | | | | | | | | | | | | | | | |
| 2016 (5) | | $ | 9.41 | | | | 0.06 | | | | 0.16 | | | | 0.22 | | | | (0.06 | ) | | | 0.00 | | | | 0.00 | | | | (0.06 | ) |
| Global Opportunities Fund - Institutional Class (1)(2)(4) | | | | | | | | | | | | | | | | | | | | | |
| 2016 (5) | | $ | 9.41 | | | | 0.06 | | | | 0.16 | | | | 0.22 | | | | (0.05 | ) | | | 0.00 | | | | 0.00 | | | | (0.05 | ) |
| Spectrum Fund - Retail Class (1)(2) | | | | | | | | | | | | | | | | | | | | | | | | | |
| 2016 | | $ | 9.73 | | | | 0.02 | | | | 0.66 | | | | 0.68 | | | | (0.02 | ) | | | (0.11 | ) | | | 0.00 | | | | (0.13 | ) |
| 2015 (6) | | $ | 10.00 | | | | (0.04 | ) | | | (0.08 | ) | | | (0.12 | ) | | | 0.00 | | | | (0.13 | ) | | | (0.02 | ) | | | (0.15 | ) |
| Spectrum Fund - Adviser Class (1)(2)(4) | | | | | | | | | | | | | | | | | | | | | | | | | |
| 2016 (5) | | $ | 9.97 | | | | 0.02 | | | | 0.43 | | | | 0.45 | | | | (0.02 | ) | | | (0.11 | ) | | | 0.00 | | | | (0.13 | ) |
| Spectrum Fund - Institutional Class (1)(2)(4) | | | | | | | | | | | | | | | | | | | | | | | | | |
| 2016 (5) | | $ | 9.97 | | | | 0.02 | | | | 0.43 | | | | 0.45 | | | | (0.02 | ) | | | (0.11 | ) | | | 0.00 | | | | (0.13 | ) |
| Quantex Fund - Retail Class (1)(2) | | | | | | | | | | | | | | | | | | | | | | | | | | | | | |
| 2016 | | $ | 27.84 | | | | 0.14 | | | | 6.02 | | | | 6.16 | | | | (0.16 | ) | | | (0.48 | ) | | | 0.00 | | | | (0.64 | ) |
| 2015 | | $ | 35.20 | | | | 0.17 | | | | (2.78 | ) | | | (2.61 | ) | | | (0.17 | ) | | | (4.58 | ) | | | 0.00 | | | | (4.75 | ) |
| 2014 | | $ | 35.04 | | | | 0.13 | | | | 3.11 | | | | 3.24 | | | | (0.40 | ) | | | (2.68 | ) | | | 0.00 | | | | (3.08 | ) |
| 2013 | | $ | 25.46 | | | | 0.09 | | | | 10.45 | | | | 10.54 | | | | (0.08 | ) | | | (0.88 | ) | | | 0.00 | | | | (0.96 | ) |
| 2012 | | $ | 21.84 | | | | 0.07 | | | | 3.63 | | | | 3.70 | | | | (0.08 | ) | | | 0.00 | | | | 0.00 | | | | (0.08 | ) |
| Quantex Fund - Adviser Class (1)(2)(4) | | | | | | | | | | | | | | | | | | | | | | | | | |
| 2016 (5) | | $ | 30.67 | | | | 0.04 | | | | 3.18 | | | | 3.22 | | | | (0.04 | ) | | | (0.48 | ) | | | 0.00 | | | | (0.52 | ) |
| Quantex - Institutional Class (1)(2)(4) | | | | | | | | | | | | | | | | | | | | | | | | | |
| 2016 (5) | | $ | 30.67 | | | | 0.04 | | | | 3.18 | | | | 3.22 | | | | (0.04 | ) | | | (0.48 | ) | | | 0.00 | | | | (0.52 | ) |
| Infrastructure Fund - Retail Class (1)(2) | | | | | | | | | | | | | | | | | | | | | | | | | |
| 2016 | | $ | 18.17 | | | | 0.11 | | | | 3.48 | | | | 3.59 | | | | 0.00 | | | | (0.20 | ) | | | (0.24 | ) | | | (0.44 | ) |
| 2015 | | $ | 30.45 | | | | 0.17 | | | | (5.40 | ) | | | (5.23 | ) | | | (0.25 | ) | | | (6.80 | ) | | | 0.00 | | | | (7.05 | ) |
| 2014 | | $ | 30.98 | | | | 0.19 | | | | 2.64 | | | | 2.83 | | | | (0.83 | ) | | | (2.53 | ) | | | 0.00 | | | | (3.36 | ) |
| 2013 | | $ | 24.17 | | | | 0.17 | | | | 6.81 | | | | 6.98 | | | | (0.17 | ) | | | 0.00 | | | | 0.00 | | | | (0.17 | ) |
| 2012 | | $ | 24.06 | | | | 0.15 | | | | 0.21 | | | | 0.36 | | | | (0.15 | ) | | | (0.10 | ) | | | 0.00 | | | | (0.25 | ) |
| Infrastructure Fund - Adviser Class (1)(2)(4) | | | | | | | | | | | | | | | | | | | | | | | | | |
| 2016 (5) | | $ | 21.02 | | | | 0.00 | * | | | 0.55 | | | | 0.55 | | | | 0.00 | | | | (0.20 | ) | | | (0.03 | ) | | | (0.23 | ) |
| Infrastructure - Institutional Class (1)(2)(4) | | | | | | | | | | | | | | | | | | | | | | | | | |
| 2016 (5) | | $ | 21.02 | | | | 0.00 | * | | | 0.55 | | | | 0.55 | | | | 0.00 | | | | (0.20 | ) | | | (0.03 | ) | | | (0.23 | ) |
| 1 | Ratio of net expenses to average net assets, ratio of net investment income (loss) to average net assets, ratio of expenses to average net assets after reductions, excluding commissions recaptured and fees received from custodian, and ratio of expenses to average net assets before reductions do not include impact of expenses of the underlying investment companies as represented in the schedule of investments. |
| 2 | Recognition of net investment income by the Fund is affected by the timing of the declaration of dividends by the underlying investment companies in which the Fund invests. |
| 3 | Except for the Money Market Funds, net investment income per share is based on average shares outstanding during the period. |
The accompanying notes are an integral part of these financial statements.
| Page 86 | 2016 Annual Report | December 31, 2016 |
| | | | | | | Ratios/Supplemental Data | |
| Net Asset Value, End of Period | | | Total Return (Assumes Reinvestment of Distributions) | | | Net Assets, End of Period ($000) | | | Ratio of Net Investment Income (Loss) to Average Net Assets | | | Ratio of Net Expenses to Average Net Assets | | | Ratio of Expenses to Average Net Assets after Reductions and Recoupment of Fees, Excluding Commissions Recaptured and Fees Received from Custodian | | | Ratio of Expenses to Average Net Assets Before Reductions or Recoupment of Fees | | | Portfolio Turnover Rate | |
| $ | 9.56 | | | | 3.54 | % | | $ | 75,657 | | | | 1.00 | % | | | 1.16 | % | | | 1.41 | % | | | 1.54 | % | | | 169 | % |
| $ | 9.34 | | | | (7.21 | %) | | $ | 106,422 | | | | 0.42 | % | | | 1.19 | % | | | 1.42 | % | | | 1.50 | % | | | 170 | % |
| $ | 10.38 | | | | 5.87 | % | | $ | 109,845 | | | | 0.54 | % | | | 1.23 | % | | | 1.37 | % | | | 1.51 | % | | | 143 | % |
| $ | 11.36 | | | | 23.82 | % | | $ | 91,769 | | | | 0.36 | % | | | 1.23 | % | | | 1.40 | % | | | 1.58 | % | | | 231 | % |
| $ | 10.07 | | | | 13.15 | % | | $ | 79,446 | | | | (0.05 | %) | | | 1.39 | % | | | 1.42 | % | | | 1.58 | % | | | 86 | % |
| | | | | | | | | | | | | | | | | | | | | | | | | | | | | | | |
| $ | 9.57 | | | | 2.34 | % | | $ | 30 | | | | 3.79 | % | | | 1.01 | % | | | 1.17 | % | | | 1.17 | % | | | 169 | % |
| | | | | | | | | | | | | | | | | | | | | | | | | | | | | | | |
| $ | 9.58 | | | | 2.34 | % | | $ | 330 | | | | 3.76 | % | | | 1.02 | % | | | 1.18 | % | | | 1.18 | % | | | 169 | % |
| | | | | | | | | | | | | | | | | | | | | | | | | | | | | | | |
| $ | 10.28 | | | | 6.97 | % | | $ | 124,009 | | | | 0.16 | % | | | 1.49 | % | | | 1.99 | % | | | 1.99 | % | | | 235 | % |
| $ | 9.73 | | | | (1.21 | %) | | $ | 125,597 | | | | (0.36 | %) | | | 1.49 | % | | | 2.12 | % | | | 2.19 | % | | | 161 | % |
| | | | | | | | | | | | | | | | | | | | | | | | | | | | | | | |
| $ | 10.29 | | | | 4.49 | % | | $ | 48 | | | | 1.07 | % | | | 1.38 | % | | | 1.88 | % | | | 1.88 | % | | | 235 | % |
| | | | | | | | | | | | | | | | | | | | | | | | | | | | | | | |
| $ | 10.29 | | | | 4.52 | % | | $ | 461 | | | | 1.07 | % | | | 1.38 | % | | | 1.87 | % | | | 1.87 | % | | | 235 | % |
| | | | | | | | | | | | | | | | | | | | | | | | | | | | | | | |
| $ | 33.36 | | | | 22.14 | % | | $ | 85,235 | | | | 0.47 | % | | | 1.18 | % | | | 1.52 | % | | | 1.77 | % | | | 91 | % |
| $ | 27.84 | | | | (7.68 | %) | | $ | 58,883 | | | | 0.46 | % | | | 1.09 | % | | | 1.26 | % | | | 1.75 | % | | | 87 | % |
| $ | 35.20 | | | | 9.48 | % | | $ | 61,834 | | | | 0.36 | % | | | 1.44 | % | | | 1.52 | % | | | 1.78 | % | | | 29 | % |
| $ | 35.04 | | | | 41.54 | % | | $ | 44,476 | | | | 0.27 | % | | | 1.52 | % | | | 1.58 | % | | | 1.94 | % | | | 25 | % |
| $ | 25.46 | | | | 16.93 | % | | $ | 23,306 | | | | 0.29 | % | | | 1.60 | % | | | 1.61 | % | | | 2.06 | % | | | 31 | % |
| | | | | | | | | | | | | | | | | | | | | | | | | | | | | | | |
| $ | 33.37 | | | | 10.48 | % | | $ | 31 | | | | 0.75 | % | | | 1.10 | % | | | 1.15 | % | | | 1.40 | % | | | 91 | % |
| | | | | | | | | | | | | | | | | | | | | | | | | | | | | | | |
| $ | 33.37 | | | | 10.48 | % | | $ | 951 | | | | 0.75 | % | | | 1.09 | % | | | 1.15 | % | | | 1.40 | % | | | 91 | % |
| | | | | | | | | | | | | | | | | | | | | | | | | | | | | | | |
| $ | 21.32 | | | | 19.87 | % | | $ | 20,450 | | | | 0.55 | % | | | 2.15 | % | | | 2.17 | % | | | 2.55 | % | | | 44 | % |
| $ | 18.17 | | | | (16.92 | %) | | $ | 20,034 | | | | 0.56 | % | | | 1.98 | % | | | 1.98 | % | | | 2.01 | % | | | 54 | % |
| $ | 30.45 | | | | 9.42 | % | | $ | 46,746 | | | | 0.63 | % | | | 1.88 | % | | | 1.88 | % | | | 1.89 | % | | | 34 | % |
| $ | 30.98 | | | | 28.96 | % | | $ | 37,988 | | | | 0.62 | % | | | 1.87 | % | | | 1.87 | % | | | 1.99 | % | | | 19 | % |
| $ | 24.17 | | | | 1.52 | % | | $ | 30,452 | | | | 0.63 | % | | | 1.89 | % | | | 1.89 | % | | | 2.02 | % | | | 29 | % |
| | | | | | | | | | | | | | | | | | | | | | | | | | | | | | | |
| $ | 21.34 | | | | 2.64 | % | | $ | 7 | | | | 0.11 | % | | | 1.87 | % | | | 1.93 | % | | | 2.18 | % | | | 44 | % |
| | | | | | | | | | | | | | | | | | | | | | | | | | | | | | | |
| $ | 21.34 | | | | 2.62 | % | | $ | 305 | | | | 0.08 | % | | | 1.90 | % | | | 1.96 | % | | | 2.21 | % | | | 44 | % |
| * | Actual amounts were less than one-half of a cent per share. |
| 4 | Ratio of net expenses to average net assets, ratio of investment income (loss) to average net assets, ratio of expenses to average net assets after reductions and recoupment of fees, excluding commissions recaptured and fees received from custodian, and ratio of expenses to average net assets before reductions or recoupment of fees are annualized for periods of less than one full year. Total return is not annualized. |
| 5 | Commenced operations on October 31, 2016. |
| 6 | Commenced operations on January 1, 2015. |
The accompanying notes are an integral part of these financial statements.
| 2016 Annual Report | December 31, 2016 | Page 87 |
Financial Highlights
For the Periods Ended December 31,
| | | | | | Income from Investment Operations | | | Less Distributions | |
| | | Net Asset Value, Beginning of Period | | | Net Investment Income (Loss) (3) | | | Net gains (losses) on securities, futures, and options (both realized and unrealized) | | | Total from Investment Operations | | | From Net Investment Income | | | From Net Capital Gains | | | From Return of Capital | | | Total Distributions | |
| Dividend Opportunities Fund - Retail Class (1)(2) | | | | | | | | | | | | | | | | | | | |
| 2016 | | $ | 9.50 | | | | 0.16 | | | | 0.97 | | | | 1.13 | | | | (0.17 | ) | | | 0.00 | | | | 0.00 | | | | (0.17 | ) |
| 2015 (4)(6) | | $ | 10.00 | | | | 0.18 | | | | (0.59 | ) | | | (0.41 | ) | | | (0.09 | ) | | | 0.00 | | | | 0.00 | | | | (0.09 | ) |
| Dividend Opportunities Fund - Adviser Class (1)(2)(4) | | | | | | | | | | | | | | | | | | | | | |
| 2016 (5) | | $ | 9.87 | | | | 0.03 | | | | 0.59 | | | | 0.62 | | | | (0.03 | ) | | | 0.00 | | | | 0.00 | | | | (0.03 | ) |
| Dividend Opportunities Fund - Institutional Class (1)(2)(4) | | | | | | | | | | | | | | | | | | | | | |
| 2016 (5) | | $ | 9.87 | | | | 0.03 | | | | 0.59 | | | | 0.62 | | | | (0.02 | ) | | | 0.00 | | | | 0.00 | | | | (0.02 | ) |
| Total Return Bond Fund - Retail Class (1)(2) | | | | | | | | | | | | | | | | | | | | | | | | | |
| 2016 | | $ | 9.14 | | | | 0.27 | | | | 0.14 | | | | 0.41 | | | | (0.27 | ) | | | 0.00 | | | | 0.00 | | | | (0.27 | ) |
| 2015 | | $ | 9.63 | | | | 0.27 | | | | (0.51 | ) | | | (0.24 | ) | | | (0.25 | ) | | | 0.00 | | | | 0.00 | | | | (0.25 | ) |
| 2014 | | $ | 9.77 | | | | 0.33 | | | | (0.15 | ) | | | 0.18 | | | | (0.32 | ) | | | 0.00 | | | | 0.00 | | | | (0.32 | ) |
| 2013 | | $ | 10.15 | | | | 0.38 | | | | (0.38 | ) | | | (0.00 | ) | | | (0.38 | ) | | | 0.00 | | | | 0.00 | | | | (0.38 | ) |
| 2012 | | $ | 9.73 | | | | 0.44 | | | | 0.41 | | | | 0.85 | | | | (0.43 | ) | | | 0.00 | | | | 0.00 | | | | (0.43 | ) |
| Total Return Bond Fund - Adviser Class (1)(2)(4) | | | | | | | | | | | | | | | | | | | | | | | | | |
| 2016 (5) | | $ | 9.46 | | | | 0.09 | | | | (0.19 | ) | | | (0.10 | ) | | | (0.08 | ) | | | 0.00 | | | | 0.00 | | | | (0.08 | ) |
| Total Return Bond Fund - Institutional Class (1)(2)(4) | | | | | | | | | | | | | | | | | | | | | |
| 2016 (5) | | $ | 9.46 | | | | 0.08 | | | | (0.18 | ) | | | (0.10 | ) | | | (0.08 | ) | | | 0.00 | | | | 0.00 | | | | (0.08 | ) |
| Prime Money Market Fund (1)(2) | | | | | | | | | | | | | | | | | | | | | | | | | | | | | |
| 2016 | | $ | 1.00 | | | | 0.003 | | | | N/A | | | | 0.003 | | | | (0.003 | ) | | | 0.000 | | | | 0.000 | | | | (0.003 | ) |
| 2015 | | $ | 1.00 | | | | 0.001 | | | | N/A | | | | 0.001 | | | | (0.001 | ) | | | 0.000 | | | | 0.000 | | | | (0.001 | ) |
| 2014 | | $ | 1.00 | | | | 0.001 | | | | N/A | | | | 0.001 | | | | (0.001 | ) | | | 0.000 | | | | 0.000 | | | | (0.001 | ) |
| 2013 | | $ | 1.00 | | | | 0.001 | | | | N/A | | | | 0.001 | | | | (0.001 | ) | | | 0.000 | | | | 0.000 | | | | (0.001 | ) |
| 2012 | | $ | 1.00 | | | | 0.001 | | | | N/A | | | | 0.001 | | | | (0.001 | ) | | | 0.000 | | | | 0.000 | | | | (0.001 | ) |
| Institutional Prime Money Market Fund (1)(2)(4) | | | | | | | | | | | | | | | | | | | | | | | | | |
| 2016 (7) | | $ | 1.0000 | | | | 0.0010 | | | | 0.0001 | | | | 0.0011 | | | | (0.0010 | ) | | | 0.0000 | | | | 0.0000 | | | | (0.0010 | ) |
| 1 | Ratio of net expenses to average net assets, ratio of net investment income (loss) to average net assets, ratio of expenses to average net assets after reductions, excluding commissions recaptured and fees received from custodian, and ratio of expenses to average net assets before reductions do not include impact of expenses of the underlying investment companies as represented in the schedule of investments. |
| 2 | Recognition of net investment income by the Fund is affected by the timing of the declaration of dividends by the underlying investment companies in which the Fund invests. |
| 3 | Except for the Money Market Funds, net investment income per share is based on average shares outstanding during the period. |
| * | Actual amounts were less than one-half of a cent per share. |
The accompanying notes are an integral part of these financial statements.
| Page 88 | 2016 Annual Report | December 31, 2016 |
| | | | | | | Ratios/Supplemental Data | |
| Net Asset Value, End of Period | | | Total Return (Assumes Reinvestment of Distributions) | | | Net Assets, End of Period ($000) | | | Ratio of Net Investment Income (Loss) to Average Net Assets | | | Ratio of Net Expenses to Average Net Assets | | | Ratio of Expenses to Average Net Assets after Reductions and Recoupment of Fees, Excluding Commissions Recaptured and Fees Received from Custodian | | | Ratio of Expenses to Average Net Assets Before Reductions or Recoupment of Fees | | | Portfolio Turnover Rate | |
| $ | 10.46 | | | | 12.06 | % | | $ | 56,744 | | | | 1.62 | % | | | 1.26 | % | | | 1.61 | % | | | 1.80 | % | | | 250 | % |
| $ | 9.50 | | | | (4.15 | %) | | $ | 42,099 | | | | 1.80 | % | | | 1.26 | % | | | 1.66 | % | | | 1.85 | % | | | 70 | % |
| | | | | | | | | | | | | | | | | | | | | | | | | | | | | | | |
| $ | 10.46 | | | | 6.32 | % | | $ | 22 | | | | 1.92 | % | | | 0.97 | % | | | 1.21 | % | | | 1.21 | % | | | 250 | % |
| | | | | | | | | | | | | | | | | | | | | | | | | | | | | | | |
| $ | 10.47 | | | | 6.31 | % | | $ | 229 | | | | 1.92 | % | | | 1.00 | % | | | 1.24 | % | | | 1.24 | % | | | 250 | % |
| | | | | | | | | | | | | | | | | | | | | | | | | | | | | | | |
| $ | 9.28 | | | | 4.49 | % | | $ | 214,755 | | | | 2.87 | % | | | 0.88 | % | | | 0.98 | % | | | 1.00 | % | | | 217 | % |
| $ | 9.14 | | | | (2.51 | %) | | $ | 214,618 | | | | 2.71 | % | | | 0.88 | % | | | 1.01 | % | | | 1.03 | % | | | 295 | % |
| $ | 9.63 | | | | 1.78 | % | | $ | 143,046 | | | | 3.39 | % | | | 0.99 | % | | | 1.02 | % | | | 1.13 | % | | | 82 | % |
| $ | 9.77 | | | | 0.01 | % | | $ | 90,080 | | | | 3.87 | % | | | 0.99 | % | | | 1.01 | % | | | 1.19 | % | | | 79 | % |
| $ | 10.15 | | | | 8.93 | % | | $ | 76,001 | | | | 4.45 | % | | | 0.99 | % | | | 1.00 | % | | | 1.23 | % | | | 157 | % |
| | | | | | | | | | | | | | | | | | | | | | | | | | | | | | | |
| $ | 9.28 | | | | (1.05 | %) | | $ | 84 | | | | 5.49 | % | | | 0.52 | % | | | 0.53 | % | | | 0.53 | % | | | 217 | % |
| | | | | | | | | | | | | | | | | | | | | | | | | | | | | | | |
| $ | 9.28 | | | | (1.08 | %) | | $ | 70 | | | | 5.35 | % | | | 0.51 | % | | | 0.53 | % | | | 0.53 | % | | | 217 | % |
| | | | | | | | | | | | | | | | | | | | | | | | | | | | | | | |
| $ | 1.00 | | | | 0.29 | % | | $ | 36,666 | | | | 0.28 | % | | | 0.32 | % | | | 0.32 | % | | | 0.69 | % | | | N/A | |
| $ | 1.00 | | | | 0.07 | % | | $ | 56,530 | | | | 0.07 | % | | | 0.18 | % | | | 0.18 | % | | | 0.58 | % | | | N/A | |
| $ | 1.00 | | | | 0.06 | % | | $ | 54,927 | | | | 0.06 | % | | | 0.16 | % | | | 0.16 | % | | | 0.67 | % | | | N/A | |
| $ | 1.00 | | | | 0.08 | % | | $ | 61,288 | | | | 0.08 | % | | | 0.22 | % | | | 0.22 | % | | | 0.90 | % | | | N/A | |
| $ | 1.00 | | | | 0.10 | % | | $ | 73,546 | | | | 0.10 | % | | | 0.30 | % | | | 0.30 | % | | | 0.82 | % | | | N/A | |
| | | | | | | | | | | | | | | | | | | | | | | | | | | | | | | |
| $ | 1.0001 | | | | 0.11 | % | | $ | 197,480 | | | | 0.43 | % | | | 0.24 | % | | | 0.24 | % | | | 0.62 | % | | | N/A | |
| 4 | Ratio of net expenses to average net assets, ratio of investment income (loss) to average net assets, ratio of expenses to average net assets after reductions and recoupment of fees, excluding commissions recaptured and fees received from custodian, and ratio of expenses to average net assets before reductions or recoupment of fees are annualized for periods of less than one full year. Total return is not annualized. |
| 5 | Commenced operations on October 31, 2016. |
| 6 | Commenced operations on June 30, 2015. |
| 7 | Commenced operations on October 7, 2016. |
The accompanying notes are an integral part of these financial statements.
| 2016 Annual Report | December 31, 2016 | Page 89 |
Notes to Financial Statements
December 31, 2016
| 1. | Organization and Significant Accounting Policies |
Meeder Funds® (the “Trust”) was organized as a Massachusetts business trust on December 31, 1991 as the successor to a Pennsylvania business trust organized on April 30, 1982 and is registered under the Investment Company Act of 1940, as amended (the “1940 Act”), as a diversified, open-end management investment company. The Trust offers twelve separate series and is presently comprised of twelve separate funds as follows: Muirfield Fund® (“Muirfield”), Dynamic Growth Fund (“Dynamic”), Aggressive Growth Fund (“Aggressive”), Balanced Fund (“Balanced”), Global Opportunities Fund (“Global”), Spectrum Fund (“Spectrum”), Dividend Opportunities Fund (“Dividend”), Quantex FundTM (“Quantex”), Infrastructure Fund (“Infrastructure”)(f.k.a. Miller/Howard Infrastructure Fund)( see sixth paragraph of Note #1 for more information), Total Return Bond Fund (“Bond”), Prime Money Market Fund (“Prime Money Market”)(f.k.a. Money Market Fund)( see second paragraph of Note #1 for more information), and Institutional Prime Money Market Fund (“Institutional Prime Money Market”)(see second paragraph of Note #1 for more information)(each a “Fund” and collectively the “Funds”).
In July 2014, the Securities and Exchange Commission adopted new money market fund rules that became effective on October 14, 2016. As part of these new rules, beneficial ownership of retail money market funds are now limited to natural persons; therefore, institutions are no longer permitted to own retail money market fund shares. As a result, effective October 7, 2016, the Meeder Money Market Fund became a retail money market fund with a stable net asset value per share of $1.00 and changed its name to Meeder Prime Money Market Fund. The Institutional Class of the Meeder Money Market Fund liquidated. Also effective October 7, 2016, an institutional money market fund was launched called Meeder Institutional Prime Money Market Fund with a floating net asset value per share. On October 7, 2016, investments in the amount of $131,014,084 were transferred in-kind from the Meeder Prime Money Market Fund into the Meeder Institutional Prime Money Market Fund. Organizational and offering costs of the Meeder Institutional Prime Money Market Fund were incurred by the advisor and are not subject to recoupment. For more information on these money market funds, please refer to each Fund’s prospectus.
The investment objective of Prime Money Market is to provide current income while maintaining a stable share price of $1.00. The investment objective of Institutional Prime Money Market is to provide current income consistent with liquidity and the preservation of capital. Prime Money Market and Institutional Prime Money Market (the “Money Market Funds”) each offer only one class of shares.
Prior to October 31, 2016, each Fund, other than Infrastructure and the Money Market Funds, offered one class of shares. Infrastructure offered two classes: Retail Class and Institutional Class. Effective October 31, 2016, the Funds, except for Infrastructure and the Money Market Funds, designated their single class of shares as Retail Class. Each of those Funds also launched Adviser Shares and Institutional Shares. Also on October 31, 2016, Infrastructure launched Adviser Shares. Each class of shares has equal rights as to earnings and assets, except that each class bears different distribution, shareholder servicing, and transfer agent expenses (see Note #4).
The investment objective of Muirfield, Dynamic, Aggressive, Global, Spectrum, and Quantex is to provide long term capital appreciation. The investment objective of Balanced is to provide income and long term capital appreciation. The investment objective of Dividend and Infrastructure is to provide total return, including capital appreciation and income. The investment objective of Bond is total return, consisting of income and capital growth, consistent with minimizing the risk of loss of capital.
Effective September 15, 2016, Miller/Howard Investments, Inc. resigned as subadviser to Infrastructure. As a result, Miller/Howard Infrastructure Fund changed its name to Infrastructure Fund. The Fund will continue to generally invest at least 80% of its net assets in infrastructure companies, and may invest up to 25% of its total assets in securities of master limited partnerships (“MLPs”) in the energy sector. The Fund will also continue to invest at least 25% of its total assets in securities of public utility companies.
Use of estimates. The financial statements are prepared in conformity with accounting principles generally accepted in the United States of America (“GAAP”) which requires management to make estimates and assumptions that affect the reported amounts of assets and liabilities and disclosure of contingent assets and liabilities at the date of the financial statements and the reported amounts of increases and decreases in net assets from operations during the reporting period. Actual results could differ from those estimates.
Security valuation. All investments in securities are recorded at their estimated fair value, as described in Note #2.
Repurchase agreements. Each Fund may engage in repurchase agreement transactions whereby the Fund takes possession of an underlying debt instrument subject to an obligation of the seller to repurchase the instrument from the Fund and an obligation of the Fund to resell the instrument at an agreed upon price and term. At all times, the Fund maintains the fair value of collateral, including accrued interest, of at least 100% of the amount of the repurchase agreement, plus accrued interest. If the seller defaults or the fair value of the collateral declines, realization of the collateral by the Fund may be delayed or limited.
Short sales. Spectrum may enter into short sales as part of its overall portfolio management strategy or to offset a potential decline in value of a security. The Fund may engage in short sales with respect to various types of securities, including ETFs. A short sale involves the sale of a security that is borrowed from a broker or other institution to complete the sale. The Fund may engage in short sales with respect to securities it owns, as well as securities that it does not own. Short sales expose the Fund to the risk that it will be required to acquire, convert or exchange securities to replace the borrowed securities (also known as “covering” the short position) at a time when the securities sold short have appreciated in value, thus resulting in a loss to the Fund. The Fund’s investment performance may also suffer if the Fund is required to close out a short position earlier than it had intended. The Fund must segregate assets determined to be liquid in accordance with procedures established by the Board, or otherwise cover its position in a permissible manner. The Fund will be required to pledge its liquid assets to the broker in order to secure its performance on short sales. As a result, the assets pledged may not be available to meet the Fund’s needs for immediate cash or other liquidity. In addition, the Fund may be subject to expenses related to short sales that are not typically associated with investing in securities directly, such as costs of borrowing and margin account maintenance costs associated with the Fund’s open short positions. These types of short sales expenses are sometimes referred to as the “negative cost of carry,” and will tend to cause the Fund to lose money on a short sale even in instances where the price of the underlying security sold short does not change over the duration of the short sale. Dividend expenses on securities sold short and borrowing costs will be borne by the Fund.
| Page 90 | 2016 Annual Report | December 31, 2016 |
Futures & options. Each Fund, except the Money Market Funds, may engage in transactions in financial futures contracts and options contracts in order to manage the risk of unanticipated changes in market values of securities held in the Fund, or which it intends to purchase. The futures and options contracts are adjusted by the daily exchange rate of the underlying currency, or index, and any gains or losses are recorded for financial statement purposes as unrealized gains or losses in the statement of assets and liabilities and the statement of operations until the contract settlement date, at which time realized gains and losses are included in the statement of operations.
To the extent that the Fund enters into futures contracts on an index or group of securities, the Fund exposes itself to an indeterminate liability and will be required to pay or receive a sum of money measured by the change in the fair value of the index. Upon entering into a futures contract, the Fund is required to deposit an initial margin, which is either cash or securities (disclosed as pledged as collateral on the Schedules of Investments) in an amount equal to a certain percentage of the contract value. Subsequently, margin movements, which are equal to changes in the daily price or last sale price on the exchanges where futures contracts trade, are recorded as unrealized gains or losses until the contract is closed. When the contract is closed, the Fund records a realized gain or loss equal to the difference between the proceeds from (or cost of) the closing transaction and the Fund’s basis in the contract. Should market conditions move unexpectedly, the Fund may not achieve the anticipated benefits of the futures contract and may realize a loss. The use of futures transactions involves the risk of imperfect correlation in movements in the price of futures contracts, interest rates, and the underlying hedged assets. With futures, there is minimal counterparty credit risk to the Fund since futures are exchange traded and the exchange’s clearinghouse, as counterparty to all exchange traded futures, guarantees the futures against default. Except for the Money Market Funds, it is normal practice for each Fund to invest in futures contracts on a daily basis. The Funds, except for Bond and the Money Market Funds, typically utilize equity index futures contracts to equitize cash positions or adjust targeted stock market exposure. Bond and the fixed income portion of Balanced can utilize Treasury futures contracts in order to adjust duration.
Call and put option contracts involve the payment of a premium for the right to purchase or sell an individual security or index aggregate at a specified price until the expiration of the contract. Such transactions expose the Fund to the loss of the premium paid if the Fund does not sell or exercise the contract prior to the expiration date. In the case of a call option, sufficient cash or money market instruments will be segregated to complete the purchase. Options are fair valued on the basis of the daily settlement price or last sale on the exchanges where they trade and the changes in fair value are recorded as unrealized appreciation or depreciation until closed, exercised or expired. For the period ended December 31, 2016, there were no call or put options transacted for any of the Funds.
The Funds may write covered call or put options for which premiums received are recorded as liabilities and are subsequently adjusted to the current value of the options written. When written options are closed or exercised, premiums received are offset against the proceeds paid, and the Fund records realized gains or losses for the difference. When written options expire, the liability is eliminated, and the Fund records realized gains for the entire amount of premiums received. Although permitted, it is currently not normal practice for the Funds to write call and put options and none were written during the period ended December 31, 2016.
The fair value of derivative instruments, not accounted for as hedging instruments, as reported within the Statements of Assets and Liabilities as of December 31, 2016 was as follows:
Amount of Cash Held at Broker and Unrealized Appreciation (Depreciation) on Derivatives
| | | Type of Derivative/ Risk | | Statements of Assets & Liabilities Location* | | Fair Value of Cash Held at Broker for Futures Contracts | | | Fair Value of Unrealized Appreciation (Depreciation) | |
| Muirfield | | Equity contracts | | Assets, Cash held at broker for futures contracts; Net Assets, Net unrealized appreciation (depreciation) of investments and futures contracts | | $ | 2,669,950 | | | $ | (537,522 | ) |
| Dynamic | | Equity contracts | | Assets, Cash held at broker for futures contracts; Net Assets, Net unrealized appreciation (depreciation) of investments and futures contracts | | | 1,931,335 | | | | (48,825 | ) |
| Aggressive | | Equity contracts | | Assets, Cash held at broker for futures contracts; Net Assets, Net unrealized appreciation (depreciation) of investments and futures contracts | | | 604,645 | | | | (122,357 | ) |
| Balanced | | Equity contracts | | Assets, Cash held at broker for futures contracts; Net Assets, Net unrealized appreciation (depreciation) of investments and futures contracts | | | 1,491,473 | | | | (174,232 | ) |
| 2016 Annual Report | December 31, 2016 | Page 91 |
Amount of Cash Held at Broker and Unrealized Appreciation (Depreciation) on Derivatives
| | | Type of Derivative/ Risk | | Statements of Assets & Liabilities Location* | | Fair Value of Cash Held at Broker for Futures Contracts | | | Fair Value of Unrealized Appreciation (Depreciation) | |
| Global | | Equity contracts | | Assets, Cash held at broker for futures contracts; Net Assets, Net unrealized appreciation (depreciation) of investments and futures contracts | | $ | 428,178 | | | $ | (57,364 | ) |
| Spectrum | | Equity contracts | | Assets, Cash held at broker for futures contracts; Net Assets, Net unrealized appreciation (depreciation) of investments and futures contracts | | | 3,115,571 | | | | (213,454 | ) |
| Quantex | | Equity contracts | | Assets, Cash held at broker for futures contracts; Net Assets, Net unrealized appreciation (depreciation) of investments and futures contracts | | | 2,242,564 | | | | (299,926 | ) |
| Dividend | | Equity contracts | | Assets, Cash held at broker for futures contracts; Net Assets, Net unrealized appreciation (depreciation) of investments and futures contracts | | | 1,197,402 | | | | (18,614 | ) |
| Infrastructure | | Equity contracts | | Assets, Cash held at broker for futures contracts; Net Assets, Net unrealized appreciation (depreciation) of investments and futures contracts | | | 73,531 | | | | (10,542 | ) |
| * | Unrealized appreciation (depreciation) on futures contracts is included with unrealized appreciation (depreciation) of investments on the Statements of Assets & Liabilities. |
The effect of derivative instruments on the Statements of Operations for the period ended December 31, 2016 was as follows:
Amount of Realized Gain (Loss) on Derivatives Recognized in Income
| | | Type of Derivative/ Risk | | Contracts as of December 31, 2015 | | | Long and Short Contracts Opened During the Period | | | Long and Short Contracts Closed/ Expired During the Period | | | Contracts as of December 31, 2016 | | Statement of Operations Location | | For the Period Ended December 31, 2016 | |
| Muirfield | | Equity contracts | | | 600 | | | | 6,429 | | | | 6,419 | | | | 610 | | Net realized gains (losses) from futures contracts | | $ | 7,240,410 | |
| Dynamic | | Equity contracts | | | 44 | | | | 1,443 | | | | 1,327 | | | | 160 | | Net realized gains (losses) from futures contracts | | | 1,717,793 | |
| Aggressive | | Equity contracts | | | 29 | | | | 1,114 | | | | 1,089 | | | | 54 | | Net realized gains (losses) from futures contracts | | | 1,623,675 | |
| Balanced | | Equity contracts | | | 353 | | | | 3,547 | | | | 3,719 | | | | 181 | | Net realized gains (losses) from futures contracts | | | 5,476,948 | |
| Global | | Equity contracts | | | 38 | | | | 661 | | | | 665 | | | | 34 | | Net realized gains (losses) from futures contracts | | | 871,255 | |
| Spectrum | | Equity contracts | | | 102 | | | | 3,063 | | | | 2,773 | | | | 392 | | Net realized gains (losses) from futures contracts | | | 6,239,000 | |
| Quantex | | Equity contracts | | | 15 | | | | 418 | | | | 344 | | | | 89 | | Net realized gains (losses) from futures contracts | | | 1,829,988 | |
| Dividend | | Equity contracts | | | 23 | | | | 496 | | | | 458 | | | | 61 | | Net realized gains (losses) from futures contracts | | | 366,017 | |
| Infrastructure | | Equity contracts | | | — | | | | 28 | | | | 13 | | | | 15 | | Net realized gains (losses) from futures contracts | | | 14,073 | |
| Page 92 | 2016 Annual Report | December 31, 2016 |
Change in Unrealized Gain or (Loss) on Derivatives Recognized in Income
| | | Type of Derivative/Risk | | Statement of Operations Location | | For the Period Ended December 31, 2016 | |
| Muirfield | | Equity contracts | | Net change in unrealized appreciation (depreciation) of investments and futures contracts | | $ | 426,175 | |
| Dynamic | | Equity contracts | | Net change in unrealized appreciation (depreciation) of investments and futures contracts | | | (114,201 | ) |
| Aggressive | | Equity contracts | | Net change in unrealized appreciation (depreciation) of investments and futures contracts | | | (163,312 | ) |
| Balanced | | Equity contracts | | Net change in unrealized appreciation (depreciation) of investments and futures contracts | | | 351,675 | |
| Global | | Equity contracts | | Net change in unrealized appreciation (depreciation) of investments and futures contracts | | | (112,854 | ) |
| Spectrum | | Equity contracts | | Net change in unrealized appreciation (depreciation) of investments and futures contracts | | | (341,665 | ) |
| Quantex | | Equity contracts | | Net change in unrealized appreciation (depreciation) of investments and futures contracts | | | (317,299 | ) |
| Dividend | | Equity contracts | | Net change in unrealized appreciation (depreciation) of investments and futures contracts | | | (14,741 | ) |
| Infrastructure | | Equity contracts | | Net change in unrealized appreciation (depreciation) of investments and futures contracts | | | (10,542 | ) |
Federal income taxes. It is each Fund’s policy to continue to comply with the requirements of Subchapter M of the Internal Revenue Code applicable to regulated investment companies and to distribute substantially all of its taxable income and net capital gains to its shareholders. Therefore, no federal income tax provision is required. The Funds recognize the tax benefits or expenses of uncertain tax positions only where the position is “more likely than not” to be sustained assuming examination by tax authorities. Management has reviewed tax positions taken on Federal income tax returns for all open tax years (tax years ended December 31, 2013 through December 31, 2016) and has concluded that no provision for unrecognized tax benefits or expenses is required in these financial statements. Each Fund identifies its major tax jurisdictions as U.S. Federal and certain State tax authorities; however the Funds are not aware of any tax positions for which it is reasonably possible that the total amounts of unrecognized tax benefits will change materially in the next twelve months. The Funds recognize interest and penalties, if any, related to unrecognized tax benefits as income tax expense in the Statements of Operations as incurred. During the period ended December 31, 2016, Infrastructure incurred excise tax expense in the amount of $1,732.
Distributions to shareholders. Distributions to shareholders are recorded on the ex-dividend date. Muirfield, Quantex, Dynamic, Aggressive, Balanced, Global, and Spectrum declare and pay dividends from net investment income, if any, on a quarterly basis. Infrastructure, Dividend, and Bond declare and pay dividends from net investment income on a monthly basis. The Money Market Funds declare dividends from net investment income on a daily basis and pay such dividends on a monthly basis. Each Fund distributes net capital gains, if any, on an annual basis.
Distributions from net investment income and from net capital gains are determined in accordance with income tax regulations, which may differ from GAAP. These differences are primarily due to net operating losses and partnership basis adjustments. Accordingly, timing differences relating to shareholder distributions are reflected in the components of net assets and permanent book and tax differences have been reclassified within the components of net assets based on their ultimate characterization for federal income tax purposes. For the period ended December 31, 2016, the Funds made the following reclassifications to increase/(decrease) the components of net assets:
| | | Capital | | | Accumulated Undistributed (Distributions in Excess of) Net Investment Income | | | Accumulated Undistributed Net Realized Gain (Loss) from Investments and Futures Contracts | |
| Muirfield | | $ | — | | | $ | 87,252 | | | $ | (87,252 | ) |
| Dynamic | | | — | | | | 13,077 | | | | (13,077 | ) |
| Aggressive | | | — | | | | 14,331 | | | | (14,331 | ) |
| Balanced | | | (22,330 | ) | | | 21,912 | | | | 418 | |
| Global | | | (44,217 | ) | | | 44,217 | | | | — | |
| Spectrum | | | — | | | | 34,414 | | | | (34,414 | ) |
| Quantex | | | — | | | | 37,013 | | | | (37,013 | ) |
| Infrastructure | | | (309,287 | ) | | | 426,519 | | | | (117,232 | ) |
| Dividend | | | (44,213 | ) | | | 42,452 | | | | 1,761 | |
| 2016 Annual Report | December 31, 2016 | Page 93 |
Investment income & expenses. For all Funds, except the Money Market Funds, income and expenses (other than expenses attributable to a specific class) are allocated to each class of shares based on its relative net assets. Expenses incurred by the Trust that do not specifically relate to an individual Fund of the Trust are allocated to the Funds based on each Fund’s relative net assets or other appropriate basis.
Capital Share Transactions. All Funds, except the Money Market Funds, are authorized to issue an unlimited number of shares in the Retail Class, the Adviser Class, and the Institutional Class. Transactions in the capital shares of the Funds for the period ended December 31, 2016 and the period ended December 31, 2015 were as follows:
| | | Issued | | | Reinvested | |
| | | Amount | | | Shares | | | Amount | | | Shares | |
| Period Ended December 31, 2016 | | | | | | | | | | | | |
| Muirfield - Retail | | $ | 134,775,425 | | | | 20,789,278 | | | $ | 2,835,833 | | | | 428,299 | |
| Muirfield - Adviser | | | 147,432 | | | | 22,647 | | | | 335 | | | | 49 | |
| Muirfield - Institutional | | | 981,839 | | | | 150,732 | | | | 2,155 | | | | 317 | |
| Dynamic - Retail | | | 51,549,145 | | | | 5,477,401 | | | | 1,745,515 | | | | 181,974 | |
| Dynamic - Adviser | | | 45,886 | | | | 4,913 | | | | 330 | | | | 34 | |
| Dynamic - Institutional | | | 612,980 | | | | 65,573 | | | | 4,353 | | | | 442 | |
| Aggressive - Retail | | | 15,870,787 | | | | 1,670,120 | | | | 514,642 | | | | 53,324 | |
| Aggressive - Adviser | | | 17,233 | | | | 1,808 | | | | 26 | | | | 2 | |
| Aggressive - Institutional | | | 322,629 | | | | 33,277 | | | | 384 | | | | 37 | |
| Balanced - Retail | | | 79,447,530 | | | | 7,653,253 | | | | 2,758,313 | | | | 260,262 | |
| Balanced - Adviser | | | 86,679 | | | | 8,263 | | | | 336 | | | | 31 | |
| Balanced - Institutional | | | 221,712 | | | | 21,068 | | | | 754 | | | | 70 | |
| Global - Retail | | | 19,207,912 | | | | 2,101,934 | | | | 919,811 | | | | 97,409 | |
| Global - Adviser | | | 29,425 | | | | 3,127 | | | | 189 | | | | 20 | |
| Global - Institutional | | | 330,943 | | | | 35,021 | | | | 1,716 | | | | 179 | |
| Spectrum - Retail | | | 40,881,075 | | | | 4,217,974 | | | | 1,551,581 | | | | 149,326 | |
| Spectrum - Adviser | | | 46,246 | | | | 4,639 | | | | 597 | | | | 57 | |
| Spectrum - Institutional | | | 535,858 | | | | 53,720 | | | | 6,868 | | | | 660 | |
| Quantex - Retail | | | 39,531,805 | | | | 1,300,850 | | | | 1,590,381 | | | | 47,686 | |
| Quantex - Adviser | | | 28,190 | | | | 919 | | | | 483 | | | | 14 | |
| Quantex - Institutional | | | 868,530 | | | | 28,286 | | | | 14,745 | | | | 433 | |
| Infrastructure - Retail | | | 6,207,005 | | | | 300,083 | | | | 407,859 | | | | 19,601 | |
| Infrastructure - Adviser | | | 7,305 | | | | 347 | | | | 81 | | | | 4 | |
| Infrastructure - Institutional | | | 298,546 | | | | 14,158 | | | | 2,742 | | | | 129 | |
| Dividend - Retail | | | 29,907,824 | | | | 3,019,540 | | | | 776,674 | | | | 79,327 | |
| Dividend - Adviser | | | 21,143 | | | | 2,142 | | | | 72 | | | | 7 | |
| Dividend - Institutional | | | 220,600 | | | | 21,806 | | | | 458 | | | | 44 | |
| Bond - Retail | | | 90,300,352 | | | | 9,633,295 | | | | 6,254,160 | | | | 668,034 | |
| Bond - Adviser | | | 84,879 | | | | 8,973 | | | | 726 | | | | 78 | |
| Bond - Institutional | | | 84,249 | | | | 8,924 | | | | 557 | | | | 60 | |
| Prime Money Market | | | 9,599,544 | | | | 9,599,543 | | | | 28,851 | | | | 28,851 | |
| Institutional Prime Money Market*** | | | 304,118,416 | | | | 304,102,698 | | | | 14,473 | | | | 14,472 | |
| Money Market - Retail** | | | 83,963,435 | | | | 83,963,435 | | | | 104,345 | | | | 104,345 | |
| Money Market - Institutional** | | | 493,623,899 | | | | 493,623,899 | | | | 4,587 | | | | 4,587 | |
| | | | | | | | | | | | | | | | | |
| Period Ended December 31, 2015 | | | | | | | | | | | | | | | | |
| Muirfield* | | $ | 261,740,230 | | | | 37,521,714 | | | $ | 10,071,809 | | | | 1,527,478 | |
| Dynamic* | | | 98,814,975 | | | | 9,864,209 | | | | 3,975,540 | | | | 416,792 | |
| Aggressive* | | | 51,752,300 | | | | 4,931,650 | | | | 3,018,277 | | | | 308,082 | |
| Balanced* | | | 201,278,315 | | | | 18,685,615 | | | | 3,388,893 | | | | 322,277 | |
| Global* | | | 42,880,298 | | | | 4,134,883 | | | | 3,274,831 | | | | 345,625 | |
| Spectrum* | | | 143,258,792 | | | | 14,444,572 | | | | 1,758,324 | | | | 179,238 | |
| Quantex* | | | 36,625,210 | | | | 1,061,088 | | | | 9,118,613 | | | | 319,498 | |
| Infrastructure* | | | 22,621,256 | | | | 762,821 | | | | 5,825,232 | | | | 318,749 | |
| Dividend* | | | 63,564,516 | | | | 6,344,838 | | | | 401,229 | | | | 41,958 | |
| Bond* | | | 136,328,662 | | | | 14,346,144 | | | | 5,086,663 | | | | 537,772 | |
| Money Market - Retail** | | | 121,657,074 | | | | 121,657,074 | | | | 34,305 | | | | 34,305 | |
| Money Market - Institutional** | | | 1,087,935,083 | | | | 1,087,935,083 | | | | 3,522 | | | | 3,522 | |
| Page 94 | 2016 Annual Report | December 31, 2016 |
| | | Redeemed | | | Net Increase (Decrease) | |
| | | Amount | | | Shares | | | Amount | | | Shares | |
| Period Ended December 31, 2016 | | | | | | | | | | | | |
| Muirfield - Retail | | $ | (156,631,222 | ) | | | (24,078,934 | ) | | $ | (19,019,964 | ) | | | (2,861,357 | ) |
| Muirfield - Adviser | | | (10 | ) | | | (1 | ) | | | 147,757 | | | | 22,695 | |
| Muirfield - Institutional | | | (182,558 | ) | | | (26,804 | ) | | | 801,436 | | | | 124,245 | |
| Dynamic - Retail | | | (55,272,607 | ) | | | (5,951,512 | ) | | | (1,977,947 | ) | | | (292,137 | ) |
| Dynamic - Adviser | | | — | | | | — | | | | 46,216 | | | | 4,947 | |
| Dynamic - Institutional | | | (50,000 | ) | | | (5,107 | ) | | | 567,333 | | | | 60,908 | |
| Aggressive - Retail | | | (52,233,584 | ) | | | (5,415,390 | ) | | | (35,848,155 | ) | | | (3,691,946 | ) |
| Aggressive - Adviser | | | — | | | | — | | | | 17,259 | | | | 1,810 | |
| Aggressive - Institutional | | | — | | | | — | | | | 323,013 | | | | 33,314 | |
| Balanced - Retail | | | (151,255,303 | ) | | | (14,401,113 | ) | | | (69,049,460 | ) | | | (6,487,598 | ) |
| Balanced - Adviser | | | — | | | | — | | | | 87,015 | | | | 8,294 | |
| Balanced - Institutional | | | (8,467 | ) | | | (793 | ) | | | 213,999 | | | | 20,345 | |
| Global - Retail | | | (52,014,518 | ) | | | (5,675,851 | ) | | | (31,886,795 | ) | | | (3,476,508 | ) |
| Global - Adviser | | | — | | | | — | | | | 29,614 | | | | 3,147 | |
| Global - Institutional | | | (6,606 | ) | | | (697 | ) | | | 326,053 | | | | 34,503 | |
| Spectrum - Retail | | | (51,043,012 | ) | | | (5,217,071 | ) | | | (8,610,356 | ) | | | (849,771 | ) |
| Spectrum - Adviser | | | — | | | | — | | | | 46,843 | | | | 4,696 | |
| Spectrum - Institutional | | | (99,000 | ) | | | (9,565 | ) | | | 443,726 | | | | 44,815 | |
| Quantex - Retail | | | (27,477,066 | ) | | | (908,796 | ) | | | 13,645,120 | | | | 439,740 | |
| Quantex - Adviser | | | — | | | | — | | | | 28,673 | | | | 933 | |
| Quantex - Institutional | | | (7,190 | ) | | | (214 | ) | | | 876,085 | | | | 28,505 | |
| Infrastructure - Retail | | | (9,244,777 | ) | | | (462,854 | ) | | | (2,629,913 | ) | | | (143,170 | ) |
| Infrastructure - Adviser | | | — | | | | — | | | | 7,386 | | | | 351 | |
| Infrastructure - Institutional | | | — | | | | — | | | | 301,288 | | | | 14,287 | |
| Dividend - Retail | | | (20,598,293 | ) | | | (2,106,832 | ) | | | 10,086,205 | | | | 992,035 | |
| Dividend - Adviser | | | — | | | | — | | | | 21,215 | | | | 2,149 | |
| Dividend - Institutional | | | — | | | | — | | | | 221,058 | | | | 21,850 | |
| Bond - Retail | | | (99,286,839 | ) | | | (10,640,167 | ) | | | (2,732,327 | ) | | | (338,838 | ) |
| Bond - Adviser | | | — | | | | — | | | | 85,605 | | | | 9,051 | |
| Bond - Institutional | | | (13,505 | ) | | | (1,455 | ) | | | 71,301 | | | | 7,529 | |
| Prime Money Market | | | (24,978,383 | ) | | | (24,978,383 | ) | | | (15,349,988 | ) | | | (15,349,989 | ) |
| Institutional Prime Money Market | | | (106,654,831 | ) | | | (106,647,341 | ) | | | 197,478,058 | | | | 197,469,829 | |
Money Market - Retail**,*** | | | (88,582,452 | ) | | | (88,582,452 | ) | | | (4,514,672 | ) | | | (4,514,672 | ) |
Money Market - Institutional**,*** | | | (661,800,428 | ) | | | (661,800,428 | ) | | | (168,171,942 | ) | | | (168,171,942 | ) |
| | | | | | | | | | | | | | | | | |
| Period Ended December 31, 2015 | | | | | | | | | | | | | | | | |
| Muirfield* | | $ | (145,121,166 | ) | | | (21,020,472 | ) | | $ | 126,690,873 | | | | 18,028,720 | |
| Dynamic* | | | (116,736,993 | ) | | | (11,960,788 | ) | | | (13,946,478 | ) | | | (1,679,787 | ) |
| Aggressive* | | | (53,444,927 | ) | | | (5,228,440 | ) | | | 1,325,650 | | | | 11,292 | |
| Balanced* | | | (76,657,319 | ) | | | (7,104,140 | ) | | | 128,009,889 | | | | 11,903,752 | |
| Global* | | | (37,386,702 | ) | | | (3,671,048 | ) | | | 8,768,427 | | | | 809,460 | |
| Spectrum* | | | (17,190,287 | ) | | | (1,715,438 | ) | | | 127,826,829 | | | | 12,908,372 | |
| Quantex* | | | (33,744,475 | ) | | | (1,022,131 | ) | | | 11,999,348 | | | | 358,455 | |
| Infrastructure* | | | (42,938,290 | ) | | | (1,514,313 | ) | | | (14,491,802 | ) | | | (432,743 | ) |
| Dividend* | | | (18,724,567 | ) | | | (1,955,088 | ) | | | 45,241,178 | | | | 4,431,708 | |
| Bond* | | | (59,161,802 | ) | | | (6,261,274 | ) | | | 82,253,523 | | | | 8,622,642 | |
| Money Market - Retail** | | | (120,087,456 | ) | | | (120,087,456 | ) | | | 1,603,923 | | | | 1,603,923 | |
| Money Market - Institutional** | | | (1,067,506,040 | ) | | | (1,067,506,040 | ) | | | 20,432,565 | | | | 20,432,565 | |
| * | Capital stock transactions in 2015 reflect transactions in the Funds prior to offering multiple classes. For more information, please see the fourth paragraph of Note #1 within these financial statements. |
| ** | Capital stock transactions reflect amounts when the Fund offered multiple classes of shares. For more information, please see the second paragraph of Note #1 within these financial statements. |
| *** | On October 7, 2016, $131,014,084 was transferred in-kind from Prime Money Market Fund to Institutional Prime Money Market Fund. Therefore capital and shares redeemed for Prime Money Market Fund include this in-kind transfer, whereas capital and shares issued for Institutional Prime Money Market Fund include this amount as an initial contribution. |
| 2016 Annual Report | December 31, 2016 | Page 95 |
Offsetting Assets & Liabilities. The Funds are party to enforceable master netting agreements between counter parties, such as the securities lending agreement, which provides for the right of offset under certain circumstances, such as the event of default. The securities lending transactions have an overnight and continuous contractual maturity. Risks arise from the possible inability of counterparties to meet the terms of their contracts. The table below reflects the offsetting assets and liabilities relating to securities lending, futures contracts, and repurchase agreements shown on the Statements of Assets and Liabilities at December 31, 2016.
| | | Gross Amounts of Recognized Assets/ Liabilities | | | Gross Amounts Offset in the Statements of Assets and Liabilities | | | Net Amounts Presented in the Statements of Assets and Liabilities | | | Gross Amounts Not Offset in the Statements of Assets and Liabilities | | | | |
| Description/ Fund | | | | | | | | Financial Instruments* | | | Collateral Pledged(Received)* | | | Net Amount | |
| Assets: | | | | | | | | | | | | | | | | | | |
| Securities Loaned | | | | | | | | | | | | | | | | | | |
| Muirfield | | $ | 499,791 | | | $ | — | | | $ | 499,791 | | | $ | — | | | $ | (499,791 | ) | | $ | — | |
| Dynamic | | | 4,627 | | | | — | | | | 4,627 | | | | — | | | | (4,627 | ) | | | — | |
| Aggressive | | | 56,122 | | | | — | | | | 56,122 | | | | — | | | | (56,122 | ) | | | — | |
| Balanced | | | 5,488,530 | | | | — | | | | 5,488,530 | | | | — | | | | (5,488,530 | ) | | | — | |
| Global | | | 2,386,535 | | | | — | | | | 2,386,535 | | | | — | | | | (2,386,535 | ) | | | — | |
| Spectrum | | | 226,383 | | | | — | | | | 226,383 | | | | — | | | | (226,383 | ) | | | — | |
| Quantex | | | 5,098,403 | | | | — | | | | 5,098,403 | | | | — | | | | (5,098,403 | ) | | | — | |
| | | | | | | | | | | | | | | | | | | | | | | | | |
| Repurchase Agreements | | | | | | | | | | | | | | | | | | | | | | | | |
| Prime Money Market | | $ | 7,000,000 | | | $ | — | | | $ | 7,000,000 | | | $ | (7,000,000 | ) | | $ | — | | | $ | — | |
| | | | | | | | | | | | | | | | | | | | | | | | | |
| Institutional Prime Money Market | | | 19,000,000 | | | | — | | | | 19,000,000 | | | | (19,000,000 | ) | | | — | | | | — | |
| | | | | | | | | | | | | | | | | | | | | | | | | |
| Liabilities: | | | | | | | | | | | | | | | | | | | | | | | | |
| Futures Contracts | | | | | | | | | | | | | | | | | | | | | | | | |
| Muirfield | | $ | (537,522 | ) | | $ | — | | | $ | (537,522 | ) | | $ | — | | | $ | 537,522 | | | $ | — | |
| Dynamic | | | (48,825 | ) | | | — | | | | (48,825 | ) | | | — | | | | 48,825 | | | | — | |
| Aggressive | | | (122,357 | ) | | | — | | | | (122,357 | ) | | | — | | | | 122,357 | | | | — | |
| Balanced | | | (174,232 | ) | | | — | | | | (174,232 | ) | | | — | | | | 174,232 | | | | — | |
| Global | | | (57,364 | ) | | | — | | | | (57,364 | ) | | | — | | | | 57,364 | | | | — | |
| Spectrum | | | (213,454 | ) | | | — | | | | (213,454 | ) | | | — | | | | 213,454 | | | | — | |
| Quantex | | | (299,926 | ) | | | — | | | | (299,926 | ) | | | — | | | | 299,926 | | | | — | |
| Dividend | | | (18,614 | ) | | | — | | | | (18,614 | ) | | | — | | | | 18,614 | | | | — | |
| Infrastructure | | | (10,542 | ) | | | — | | | | (10,542 | ) | | | — | | | | 10,542 | | | | — | |
| * | The amount is limited to the net amounts of financial assets and liabilities and accordingly does not include excess collateral pledged. |
Other. The Funds record security transactions on the trade date. Gains and losses realized from the sale of securities are determined on the specific identification basis. Dividend income and dividend expenses are recognized on the ex-dividend date and interest income (including amortization of premium and accretion of discount) is recognized as earned. Short-term capital gain distributions from underlying funds are classified as dividend income for financial reporting purposes. Long-term capital gains distributions are separately stated. Discounts and premiums are amortized using the effective yield over the lives of the respective securities. Distributions received from partnerships are recorded as return of capital distributions. Withholding taxes on foreign dividends, if applicable, have been provided for in accordance with the Funds’ understanding of the applicable country’s tax rules and rates.
The Funds are investment companies and accordingly follow the investment company accounting and reporting guidance of the Financial Accounting Standards (FASB) Accounting Standard Codification Topic 946 Financial Services – Investment Companies.
The Funds utilize various methods to measure the fair value of their investments on a recurring basis. GAAP establishes a hierarchy that prioritizes inputs to valuation methods. The three levels of inputs are as follows:
Level 1 – Unadjusted quoted prices in active markets for identical assets or liabilities that the Funds have the ability to access.
Level 2 – Observable inputs other than quoted prices included in level 1 that are observable for the asset or liability, either directly or indirectly. These inputs may include quoted prices for the identical instrument on an inactive market, prices for similar instruments, interest rates, prepayment speeds, credit risk, yield curves, default rates and similar data.
| Page 96 | 2016 Annual Report | December 31, 2016 |
Level 3 – Significant unobservable inputs for the asset or liability, to the extent relevant observable inputs are not available, representing the Funds’ own assumptions about the assumptions a market participant would use in valuing the asset or liability, and would be based on the best information available.
The availability of observable inputs can vary from security to security and is affected by a wide variety of factors, including, for example, the type of security, whether the security is new and not yet established in the marketplace, the liquidity of markets, and other characteristics particular to the security. To the extent that valuation is based on models or inputs that are less observable or unobservable in the market, the determination of fair value requires more judgment. Accordingly, the degree of judgment exercised in determining fair value is greatest for instruments categorized in level 3.
The inputs used to measure fair value may fall into different levels of the fair value hierarchy. In such cases, for disclosure purposes, the level in the fair value hierarchy within which the fair value measurement falls in its entirety, is determined based on the lowest level input that is significant to the fair value measurement in its entirety.
A description of the valuation techniques applied to the Funds’ major categories of assets and liabilities measured at fair value on a recurring basis follows.
Equity securities (including publicly traded partnerships, real estate investment trusts, American depositary receipts, exchange traded funds, and common stock). Securities traded on a national securities exchange (or reported on the NASDAQ national market) are stated at the last reported sales price on the day of valuation and are categorized in level 1 of the fair value hierarchy.
Investments in registered open-end investment companies, including money market funds, are valued at the daily redemption value as reported by the underlying fund and are categorized in level 1 of the fair value hierarchy.
Short-term notes (including bank obligations, commercial paper, corporate obligations, repurchase agreements, U.S. government agency obligations, and floating rate demand notes). Short-term notes held in the Funds, except Prime Money Market, maturing more than sixty days after the valuation date, are valued at the last sales price as of the close of business on the day of valuation, or, lacking any sales, at the most recent bid price or yield equivalent as obtained from dealers that make markets in such securities. When valued at last sales price, the securities will be categorized as level 1. When using bid prices or yield equivalents, they will be categorized as level 2. When such securities are valued within sixty days or less to maturity, the difference between the valuation existing on the sixty-first day before maturity and maturity value is amortized on a straight-line basis to maturity and will be categorized as level 2.
All securities held in Prime Money Market, other than money market funds, are valued at amortized cost, which approximates fair value, and will be categorized as level 2.
Certificates of deposit. Certificates of deposit are valued at acquisition cost, which approximates fair value, and will be categorized as level 2.
U.S. government obligations. U.S. government obligations are normally valued using a model that incorporates market observable data such as reported sales of similar securities, broker quotes, yields, bids, offers, and reference data. Certain securities are valued principally using dealer quotations. In either case, these securities will be categorized as level 2.
Restricted securities (equity and debt). Restricted securities for which quotations are not readily available are valued at fair value as determined by the Trustees. Depending on the relative significance of valuation inputs, these instruments may be classified in either level 2 or level 3 of the fair value hierarchy.
Derivative instruments (futures contracts). Listed derivative instruments that are actively traded, including futures contracts, are valued based on quoted prices from the exchange and are categorized in level 1 of the fair value hierarchy.
For the period ended December 31, 2016, the Funds did not hold any assets at any time in which significant unobservable inputs were used in determining fair value. Therefore, no reconciliation of level 3 securities is provided. Also, there were no transfers between level 1 and level 2 securities. The Funds recognize transfers between fair value hierarchy levels at the end of the reporting period. The following table summarizes the inputs used to value the Funds’ assets and liabilities measured at fair value as of December 31, 2016.
| Muirfield – Assets/(Liabilities) | | Level 1 | | | Level 2 | | | Level 3 | | | Total | |
| Common stocks* | | $ | 280,589,887 | | | $ | — | | | $ | — | | | $ | 280,589,887 | |
| Registered investment companies | | | 13,975,688 | | | | — | | | | — | | | | 13,975,688 | |
| Money market registered investment companies | | | 94,507,803 | | | | — | | | | — | | | | 94,507,803 | |
| Bank Obligations | | | — | | | | 747,000 | | | | — | | | | 747,000 | |
| Total | | $ | 389,073,378 | | | $ | 747,000 | | | $ | — | | | $ | 389,820,378 | |
| Trustee deferred compensation*** | | $ | 305,391 | | | $ | — | | | $ | — | | | $ | 305,391 | |
| Futures contracts** | | $ | (537,522 | ) | | $ | — | | | $ | — | | | $ | (537,522 | ) |
| 2016 Annual Report | December 31, 2016 | Page 97 |
| Dynamic – Assets/(Liabilities) | | Level 1 | | | Level 2 | | | Level 3 | | | Total | |
| Common stocks* | | $ | 100,990,901 | | | $ | — | | | $ | — | | | $ | 100,990,901 | |
| Money market registered investment companies | | | 15,275,018 | | | | — | | | | — | | | | 15,275,018 | |
| Bank Obligations | | | — | | | | 747,000 | | | | — | | | | 747,000 | |
| Total | | $ | 116,265,919 | | | $ | 747,000 | | | $ | — | | | $ | 117,012,919 | |
| Trustee deferred compensation*** | | $ | 165,293 | | | $ | — | | | $ | — | | | $ | 165,293 | |
| Futures contracts** | | $ | (48,825 | ) | | $ | — | | | $ | — | | | $ | (48,825 | ) |
| Aggressive – Assets/(Liabilities) | | Level 1 | | | Level 2 | | | Level 3 | | | Total | |
| Common stocks* | | $ | 40,387,298 | | | $ | — | | | $ | — | | | $ | 40,387,298 | |
| Money market registered investment companies | | | 5,152,787 | | | | — | | | | — | | | | 5,152,787 | |
| Total | | $ | 45,540,085 | | | $ | — | | | $ | — | | | $ | 45,540,085 | |
| Trustee deferred compensation*** | | $ | 98,034 | | | $ | — | | | $ | — | | | $ | 98,034 | |
| Futures contracts** | | $ | (122,357 | ) | | $ | — | | | $ | — | | | $ | (122,357 | ) |
| Balanced – Assets/(Liabilities) | | Level 1 | | | Level 2 | | | Level 3 | | | Total | |
| Common stocks* | | $ | 117,328,330 | | | $ | — | | | $ | — | | | $ | 117,328,330 | |
| Registered investment companies | | | 77,930,156 | | | | — | | | | — | | | | 77,930,156 | |
| Money market registered investment companies | | | 38,473,142 | | | | — | | | | — | | | | 38,473,142 | |
| Bank Obligations | | | — | | | | 747,000 | | | | — | | | | 747,000 | |
| Total | | $ | 233,731,628 | | | $ | 747,000 | | | $ | — | | | $ | 234,478,628 | |
| Trustee deferred compensation*** | | $ | 143,142 | | | $ | — | | | $ | — | | | $ | 143,142 | |
| Futures contracts** | | $ | (174,232 | ) | | $ | — | | | $ | — | | | $ | (174,232 | ) |
| Global – Assets/(Liabilities) | | Level 1 | | | Level 2 | | | Level 3 | | | Total | |
| Common stocks* | | $ | 36,078,569 | | | $ | — | | | $ | — | | | $ | 36,078,569 | |
| Registered investment companies | | | 35,690,550 | | | | — | | | | — | | | | 35,690,550 | |
| Money market registered investment companies | | | 5,541,072 | | | | — | | | | — | | | | 5,541,072 | |
| Bank Obligations | | | — | | | | 747,000 | | | | — | | | | 747,000 | |
| Total | | $ | 77,310,191 | | | $ | 747,000 | | | $ | — | | | $ | 78,057,191 | |
| Trustee deferred compensation*** | | $ | 113,947 | | | $ | — | | | $ | — | | | $ | 113,947 | |
| Futures contracts** | | $ | (57,364 | ) | | $ | — | | | $ | — | | | $ | (57,364 | ) |
| Spectrum – Assets/(Liabilities) | | Level 1 | | | Level 2 | | | Level 3 | | | Total | |
| Common stocks – Long* | | $ | 114,896,803 | | | $ | — | | | $ | — | | | $ | 114,896,803 | |
| Money market registered investment companies | | | 7,312,074 | | | | — | | | | — | | | | 7,312,074 | |
| Bank Obligations | | | — | | | | 249,000 | | | | — | | | | 249,000 | |
| Total – Long investments | | $ | 122,208,877 | | | $ | 249,000 | | | $ | — | | | $ | 122,457,877 | |
| Common stocks – Short* | | $ | (47,004,069 | ) | | $ | — | | | $ | — | | | $ | (47,004,069 | ) |
| Trustee deferred compensation*** | | $ | 8,777 | | | $ | — | | | $ | — | | | $ | 8,777 | |
| Futures contracts** | | $ | (213,454 | ) | | $ | — | | | $ | — | | | $ | (213,454 | ) |
| Quantex – Assets/(Liabilities) | | Level 1 | | | Level 2 | | | Level 3 | | | Total | |
| Common stocks* | | $ | 71,467,836 | | | $ | — | | | $ | — | | | $ | 71,467,836 | |
| Money market registered investment companies | | | 16,956,664 | | | | — | | | | — | | | | 16,956,664 | |
| Bank Obligations | | | — | | | | 747,000 | | | | — | | | | 747,000 | |
| Total | | $ | 88,424,500 | | | $ | 747,000 | | | $ | — | | | $ | 89,171,500 | |
| Trustee deferred compensation*** | | $ | 103,395 | | | $ | — | | | $ | — | | | $ | 103,395 | |
| Futures contracts** | | $ | (299,926 | ) | | $ | — | | | $ | — | | | $ | (299,926 | ) |
| Page 98 | 2016 Annual Report | December 31, 2016 |
| Infrastructure – Assets/(Liabilities) | | Level 1 | | | Level 2 | | | Level 3 | | | Total | |
| Common stocks* | | $ | 18,766,972 | | | $ | — | | | $ | — | | | $ | 18,766,972 | |
| Money market registered investment companies | | | 1,891,662 | | | | — | | | | — | | | | 1,891,662 | |
| Total | | $ | 20,658,634 | | | $ | — | | | $ | — | | | $ | 20,658,634 | |
| Trustee deferred compensation*** | | $ | 96,868 | | | $ | — | | | $ | — | | | $ | 96,868 | |
| Futures contracts** | | $ | (10,542 | ) | | $ | — | | | $ | — | | | $ | (10,542 | ) |
| Dividend – Assets/(Liabilities) | | Level 1 | | | Level 2 | | | Level 3 | | | Total | |
| Common stocks* | | $ | 50,004,694 | | | $ | — | | | $ | — | | | $ | 50,004,694 | |
| Money market registered investment companies | | | 5,488,862 | | | | — | | | | — | | | | 5,488,862 | |
| Bank Obligations | | | — | | | | 249,000 | | | | — | | | | 249,000 | |
| Total | | $ | 55,493,556 | | | $ | 249,000 | | | $ | — | | | $ | 55,742,556 | |
| Trustee deferred compensation*** | | $ | 2,969 | | | $ | — | | | $ | — | | | $ | 2,969 | |
| Futures contracts** | | $ | (18,614 | ) | | $ | — | | | $ | — | | | $ | (18,614 | ) |
| Bond – Assets/(Liabilities) | | Level 1 | | | Level 2 | | | Level 3 | | | Total | |
| Registered investment companies | | $ | 208,259,503 | | | $ | — | | | $ | — | | | $ | 208,259,503 | |
| Money market registered investment companies | | | 6,125,641 | | | | — | | | | — | | | | 6,125,641 | |
| Bank Obligations | | | — | | | | 747,000 | | | | — | | | | 747,000 | |
| U.S. government obligations | | | — | | | | 49,874 | | | | — | | | | 49,874 | |
| Total | | $ | 214,385,144 | | | $ | 796,874 | | | $ | — | | | $ | 215,182,018 | |
| Trustee deferred compensation*** | | $ | 59,236 | | | $ | — | | | $ | — | | | $ | 59,236 | |
| Prime Money Market – Assets/(Liabilities) | | Level 1 | | | Level 2 | | | Level 3 | | | Total | |
| Certificates of deposit | | $ | — | | | $ | 1,197,601 | | | $ | — | | | $ | 1,197,601 | |
| Commercial paper | | | — | | | | 13,640,428 | | | | — | | | | 13,640,428 | |
| Corporate obligations | | | — | | | | 567,500 | | | | — | | | | 567,500 | |
| Repurchase agreements | | | — | | | | 7,000,000 | | | | — | | | | 7,000,000 | |
| U.S. government agency obligations | | | — | | | | 1,627,031 | | | | — | | | | 1,627,031 | |
| Money Market registered investment companies | | | 12,494,967 | | | | — | | | | — | | | | 12,494,967 | |
| Total | | $ | 12,494,967 | | | $ | 24,032,560 | | | $ | — | | | $ | 36,527,527 | |
| Trustee deferred compensation*** | | $ | 84,430 | | | $ | — | | | $ | — | | | $ | 84,430 | |
| Institutional Prime Money Market – Assets/(Liabilities) | | Level 1 | | | Level 2 | | | Level 3 | | | Total | |
| Certificates of deposit | | $ | — | | | $ | 6,802,711 | | | $ | — | | | $ | 6,802,711 | |
| Commercial Paper | | | — | | | | 72,485,111 | | | | — | | | | 72,485,111 | |
| Corporate obligations | | | — | | | | 1,734,118 | | | | — | | | | 1,734,118 | |
| Repurchase agreements | | | — | | | | 19,000,000 | | | | — | | | | 19,000,000 | |
| U.S. government agency obligations | | | — | | | | 5,643,852 | | | | — | | | | 5,643,852 | |
| Money Market registered investment companies | | | 91,444,579 | | | | — | | | | — | | | | 91,444,579 | |
| Total | | $ | 91,444,579 | | | $ | 105,665,792 | | | $ | — | | | $ | 197,110,371 | |
| * | See schedule of investments for industry classifications. |
| ** | Futures contracts include unrealized gain/loss on contracts open at December 31, 2016. |
| *** | A corresponding liability exists that is marked to market and is fair valued under the Level 1 hierarchy. |
| 2016 Annual Report | December 31, 2016 | Page 99 |
| 3. | Investment Transactions |
For the period ended December 31, 2016, the cost of purchases and proceeds from sales or maturities of long-term investments for the Funds, excluding U.S. Government investments and short positions, were as follows:
| | | Purchases | | | Sales | |
| Muirfield | | $ | 1,282,826,296 | | | $ | 1,296,681,550 | |
| Dynamic | | | 374,249,131 | | | | 388,302,235 | |
| Aggressive | | | 207,783,134 | | | | 244,533,871 | |
| Balanced | | | 734,041,815 | | | | 788,907,064 | |
| Global | | | 141,496,496 | | | | 172,199,321 | |
| Spectrum | | | 262,107,300 | | | | 244,441,753 | |
| Quantex | | | 58,365,580 | | | | 56,285,020 | |
| Infrastructure | | | 8,518,909 | | | | 12,969,724 | |
| Dividend | | | 110,643,204 | | | | 104,611,712 | |
| Bond | | | 457,903,864 | | | | 459,886,936 | |
For the period ended December 31, 2016, the cost of purchases and proceeds from sales or maturities of long-term U.S. Government investments for the Funds are as follows:
| | | Purchases | | | Sales | |
| Bond | | $ | 2,640 | | | $ | — | |
| 4. | Investment Advisory Fees and Other Transactions with Affiliates |
Meeder Asset Management, Inc. (“MAM”), a wholly-owned subsidiary of Meeder Investment Management, Inc. (“Meeder”), provides each Fund, under a separate Investment Advisory Contract, with investment management, research, statistical and advisory services. The services of MAM will terminate automatically if assigned and may be terminated without penalty at any time upon 60 days prior written notice by majority vote of the Fund, by the Trustees of the Fund, or by MAM. For such services the Funds pay a fee at the following annual rates:
| | | Percentage of Average Daily Net Assets up to $50 Million | | Percentage of Average Daily Net Assets Exceeding $50 Million up to $100 Million | | Percentage of Average Daily Net Assets up to $100 Million | | Percentage of Average Daily Net Assets up to $200 Million | | Percentage of Average Daily Net Assets Exceeding $100 Million | | Percentage of Average Daily Net Assets Exceeding $200 Million |
| Muirfield | | 1.00% | | 0.75% | | N/A | | N/A | | 0.60% | | N/A |
| Quantex* | | 1.00% | | 0.75% | | N/A | | N/A | | 0.60% | | N/A |
| Infrastructure** | | 1.00% | | 0.75% | | N/A | | N/A | | 0.60% | | N/A |
| Dynamic | | N/A | | N/A | | N/A | | 0.75% | | N/A | | 0.60% |
| Aggressive | | N/A | | N/A | | N/A | | 0.75% | | N/A | | 0.60% |
| Balanced | | N/A | | N/A | | N/A | | 0.75% | | N/A | | 0.60% |
| Global | | N/A | | N/A | | N/A | | 0.75% | | N/A | | 0.60% |
| Spectrum | | N/A | | N/A | | N/A | | 0.75% | | N/A | | 0.60% |
| Dividend | | N/A | | N/A | | N/A | | 0.75% | | N/A | | 0.60% |
| Bond | | N/A | | N/A | | 0.40% | | N/A | | 0.20% | | N/A |
| Prime Money Market*** | | N/A | | N/A | | 0.40% | | N/A | | 0.25% | | N/A |
| Institutional Prime | | | | | | | | | | | | |
Money Market***,**** | | N/A | | N/A | | 0.40% | | N/A | | 0.25% | | N/A |
| * | MAM has contractually agreed to reduce its investment advisory fee by 0.25% for Quantex for average daily net assets up to $50 million. The foregoing reduction in investment advisory fees shall automatically renew annually on or about October 31st, unless MAM elects to terminate this reduction. During the period ended December 31, 2016, $172,873 of investment advisory fees was waived in Quantex and is not subject to recoupment. |
| ** | From the period September 16, 2016 through December 31, 2016, MAM voluntarily agreed to reduce $14,665 of investment advisory fees in Infrastructure. |
| *** | During the period ended December 31, 2016, MAM voluntarily agreed to reduce $621,432 and $145,151 of investment advisory fees in Prime Money Market and Institutional Prime Money Market, respectively. |
| **** | MAM has contractually agreed to reduce and/or reimburse expenses for Institutional Prime Money Market through at least April 30, 2018, to the extent necessary to limit the total operating expenses of the Fund, excluding brokerage fees and commissions, taxes, interest, and extraordinary or non-recurring expenses, to no more than 0.60% of average daily net assets. During the period ended December 31, 2016, there were no such fees waived. |
| Page 100 | 2016 Annual Report | December 31, 2016 |
Mutual Funds Service Co. (“MFSCo”), a wholly-owned subsidiary of Meeder, serves as stock transfer, dividend disbursing and shareholder services agent for each Fund. In compensation for such services, each Fund pays MFSCo an annual fee equal to the greater of the following:
| | | Minimum Fee | | | Amount Per Active Shareholder Account | | | Percentage of Average Daily Net Assets | |
| Muirfield* | | $ | 4,000 | | | $ | 15 | | | | 0.12 | % |
| Quantex* | | | 4,000 | | | | 15 | | | | 0.12 | % |
| Infrastructure* | | | 4,000 | | | | 15 | | | | 0.12 | % |
| Dynamic* | | | 4,000 | | | | 15 | | | | 0.12 | % |
| Aggressive* | | | 4,000 | | | | 15 | | | | 0.12 | % |
| Balanced* | | | 4,000 | | | | 15 | | | | 0.12 | % |
| Global* | | | 4,000 | | | | 15 | | | | 0.12 | % |
| Spectrum* | | | 4,000 | | | | 15 | | | | 0.12 | % |
| Dividend* | | | 4,000 | | | | 15 | | | | 0.12 | % |
| Bond* | | | 4,000 | | | | 15 | | | | 0.08 | % |
| Prime Money Market | | | 4,000 | | | | 20 | | | | 0.08 | % |
| Institutional Prime Money Market | | | 4,000 | | | | 20 | | | | 0.08 | % |
| * | All classes of shares were charged the same fee for the period ended December 31, 2016. |
For fixed income Funds (Bond, Prime Money Market, and Institutional Prime Money Market) that are subject to an expense cap and which are above the expense cap, the basis point fee will be contractually reduced by 0.02%. During the period ended December 31, 2016, MFSCo contractually waived $42,887, $22,203, and $7,991 of transfer agent fees for Bond, Prime Money Market, and Institutional Prime Money Market, respectively.
MFSCo also voluntarily waived $60,992, $2,902, and $496 for Infrastructure, Dividend, and Prime Money Market, respectively, during the period ended December 31, 2016. MFSCo provides the Trust with certain administrative services. In compensation for such services, each Fund pays MFSCo at the following annual rates:
| | Percentage of Average Daily Net Assets up to $50 Million | | Percentage of Average Daily Net Assets Exceeding $50 Million |
| Muirfield | 0.10% | | 0.08% |
| Quantex | 0.10% | | 0.08% |
| Infrastructure | 0.10% | | 0.08% |
| Dynamic | 0.10% | | 0.08% |
| Aggressive | 0.10% | | 0.08% |
| Balanced | 0.10% | | 0.08% |
| Global | 0.10% | | 0.08% |
| Spectrum | 0.10% | | 0.08% |
| Dividend | 0.10% | | 0.08% |
| Bond | 0.10% | | 0.08% |
| Prime Money Market | 0.10% | | 0.08% |
| Institutional Prime Money Market | 0.10% | | 0.08% |
| 2016 Annual Report | December 31, 2016 | Page 101 |
MFSCo serves as accounting services agent for each Fund. In compensation for such services, each Fund pays MFSCo an annual fee equal to the greater of a minimum fee or at a rate based on the percentage of average daily net assets. The annual rates are as follows:
| | | Minimum Fee | | | Percentage of Average Daily Net Assets up to $10 Million | | | Percentage of Average Daily Net Assets Exceeding $10 Million up to $30 Million | | | Percentage of Average Daily Net Assets Exceeding $30 Million up to $80 Million | | | Percentage of Average Daily Net Assets Exceeding $80 Million | |
| Muirfield | | $ | 7,500 | | | | 0.15 | % | | | 0.10 | % | | | 0.02 | % | | | 0.01 | % |
| Quantex | | | 7,500 | | | | 0.15 | % | | | 0.10 | % | | | 0.02 | % | | | 0.01 | % |
| Infrastructure | | | 7,500 | | | | 0.15 | % | | | 0.10 | % | | | 0.02 | % | | | 0.01 | % |
| Dynamic | | | 7,500 | | | | 0.15 | % | | | 0.10 | % | | | 0.02 | % | | | 0.01 | % |
| Aggressive | | | 7,500 | | | | 0.15 | % | | | 0.10 | % | | | 0.02 | % | | | 0.01 | % |
| Balanced | | | 7,500 | | | | 0.15 | % | | | 0.10 | % | | | 0.02 | % | | | 0.01 | % |
| Global | | | 7,500 | | | | 0.15 | % | | | 0.10 | % | | | 0.02 | % | | | 0.01 | % |
| Spectrum | | | 7,500 | | | | 0.15 | % | | | 0.10 | % | | | 0.02 | % | | | 0.01 | % |
| Dividend | | | 7,500 | | | | 0.15 | % | | | 0.10 | % | | | 0.02 | % | | | 0.01 | % |
| Bond | | | 7,500 | | | | 0.15 | % | | | 0.10 | % | | | 0.02 | % | | | 0.01 | % |
| Prime Money Market | | | 30,000 | | | | 0.15 | % | | | 0.10 | % | | | 0.02 | % | | | 0.01 | % |
| Institutional Prime Money Market | | | 30,000 | | | | 0.15 | % | | | 0.10 | % | | | 0.02 | % | | | 0.01 | % |
For the period ended December 31, 2016, MAM and MFSCo agreed to voluntarily waive and/or reimburse investment advisory fees and transfer agent fees, respectively. The cumulative amounts voluntarily waived and/or reimbursed and the net expense ratio (excluding brokerage fees and commissions, taxes, interest, and extraordinary or non-recurring expenses) for each Fund are as follows:
| | | Voluntary Expense Reimbursements | | | Impact of Voluntary Waivers to Average Net Assets | | | Impact of Voluntary Waivers to Average Net Assets – Retail Class | | | Impact of Voluntary Waivers to Average Net Assets – Adviser Class** | | | Impact of Voluntary Waivers to Average Net Assets – Institutional Class** | |
Muirfield | | $ | — | | | | N/A | | | | N/A | | | | N/A | | | | N/A | |
Quantex* | | | — | | | | N/A | | | | N/A | | | | N/A | | | | N/A | |
Infrastructure | | | 75,657 | | | | N/A | | | | 0.38 | % | | | N/A | | | | N/A | |
Dynamic | | | 160,774 | | | | N/A | | | | 0.14 | % | | | N/A | | | | N/A | |
Aggressive | | | 17,877 | | | | N/A | | | | 0.03 | % | | | N/A | | | | N/A | |
Balanced | | | — | | | | N/A | | | | N/A | | | | N/A | | | | N/A | |
Global | | | 114,067 | | | | N/A | | | | 0.13 | % | | | N/A | | | | N/A | |
Spectrum | | | — | | | | N/A | | | | N/A | | | | N/A | | | | N/A | |
Dividend | | | 86,642 | | | | N/A | | | | 0.19 | % | | | N/A | | | | N/A | |
Bond | | | 51 | | | | N/A | | | | N/A | | | | N/A | | | | N/A | |
Prime Money Market | | | 621,928 | | | | 0.38 | % | | | N/A | | | | N/A | | | | N/A | |
Institutional Prime Money Market | | | 145,151 | | | | 0.36 | % | | | N/A | | | | N/A | | | | N/A | |
| * | $172,873 of investment advisory fees was contractually waived and is not subject to recoupment as noted on page 100. |
| ** | There were no fees voluntarily waived or reimbursed in any Adviser or Institutional Class of shares. |
Expenses were contractually reimbursed by MAM in 2013 for Muirfield, Dynamic, Aggressive, Balanced, Global and Bond in the amounts of $49,794, $40,570, $1,137, $28,346, $42,970, and $42,868, respectively. These contractual expense reimbursements were subject to repayment by the applicable Fund before December 31, 2016, contingent upon approval by the Board of Trustees and the Fund operating below the contractual expense limitation in place at the time in which the amount was reimbursed. During 2016, Muirfield repaid $49,794 to MAM, resulting in an expense ratio of 1.37% (contractual limitation was 1.39%), while Balanced repaid $28,346 to MAM, resulting in an expense ratio of 1.47% (contractual limitation was 1.49%). All other Funds’ remaining repayments have expired as of December 31, 2016.
Certain Funds have entered into an agreement with the Trust’s custodian, The Huntington National Bank (“HNB”), whereby HNB receives distribution, service, and administration fees (collectively the “fees”) from holdings in other investment companies (or mutual funds, etc). The fees are remitted to the Funds, which are used to pay expenses of each Fund. The Funds may invest in security holdings in which fees are not paid. As such, the gross expenses of a Fund would not be decreased. Also, without this agreement it is likely that the Funds would not collect any fees from underlying security holdings. There were no fees received during the period ended December 31, 2016, and therefore gross expenses were not reduced.
| Page 102 | 2016 Annual Report | December 31, 2016 |
Certain Funds have entered into securities lending arrangements with HNB. Under the terms of the agreement, HNB is authorized to loan securities on behalf of the Funds to approved brokers. In exchange, under normal market conditions, the Funds receive cash collateral in the amount of at least 102% of the value of securities loaned. The cash collateral is invested in short term instruments as noted in the Schedules of Investments. Although risk is mitigated by the collateral, the Funds could experience a delay in recovering their securities and possible loss of income or value if the borrower fails to return the borrowed securities. In addition, the Funds bear the risk of loss associated with the investment of cash collateral received. After predetermined rebates to brokers, a percentage of the net securities lending revenue is credited to the Funds to be used as an offset against charges incurred by the Funds. HNB is paid a fee for administering the securities lending program for the Funds, equal to the remaining percentage of the net securities lending revenues generated under the agreement. As of December 31, 2016, the Funds (excluding Infrastructure, Dividend, Bond, Prime Money Market, and Institutional Prime Money Market) had loaned securities that were collateralized by cash. The cash collateral received was invested in securities as listed in each Fund’s Schedule of Investments. For the period ended December 31, 2016, income earned through securities lending arrangements was as follows:
| | | Amount Received to Reduce Gross Expenses | |
| Muirfield | | $ | 32,582 | |
| Dynamic | | | 5,666 | |
| Aggressive | | | 8,536 | |
| Balanced | | | 25,336 | |
| Global | | | 23,962 | |
| Spectrum | | | 18,953 | |
| Quantex | | | 53,621 | |
| Infrastructure | | | 45 | |
| Dividend | | | 16,830 | |
Certain Funds have entered into directed brokerage agreements with independent brokers/dealers, whereby Fund expenses are reduced. The Funds use these amounts received to reduce the gross expenses of each Fund. The Funds may invest in security holdings in which brokerage fees are not recaptured. As such, the gross expenses of a Fund would not be decreased. Also, without these agreements it is likely that the Funds would not recapture any fees from portfolio transactions. MAM received payment of or credit for advisor related expenses used for the Funds’ benefit. For the period ended December 31, 2016, commissions recaptured through directed brokerage arrangements were as follows:
| | | Amount Received to Reduce Gross Expenses | |
| Muirfield | | $ | 1,203,962 | |
| Dynamic | | | 404,481 | |
| Aggressive | | | 275,566 | |
| Balanced | | | 657,516 | |
| Global | | | 194,639 | |
| Spectrum | | | 602,619 | |
| Quantex | | | 179,835 | |
| Infrastructure | | | 4,836 | |
| Dividend | | | 140,657 | |
| Bond | | | 225,384 | |
| 2016 Annual Report | December 31, 2016 | Page 103 |
The Funds have adopted a written plan pursuant to Rule 12b-1 of the 1940 Act that allows the Funds to pay fees for the sale and distribution of Fund shares and for services provided to Fund shareholders. 12b-1 fees are paid by the Funds to financial intermediaries, securities brokers, investment advisers, and other persons, including MAM and its affiliates. The annual adopted 12b-1 plan maximum limitations, along with 12b-1 plan expense payments made to MAM and its affiliates for the period ended December 31, 2016, are as follows:
| | | Maximum Annual 12b-1 Plan Expense as a Percentage of Average Daily Net Assets | | | Maximum Annual 12b-1 Plan Expense as a Percentage of Average Daily Net Assets – Retail
Class | | | Maximum Annual 12b-1 Plan Expense as a Percentage of Average Daily Net Assets – Adviser Class | | | Maximum Annual 12b-1 Plan Expense as a Percentage of Average Daily Net Assets – Institutional Class | | | 12b-1 Plan Expense Payments Made to MAM and Its Affiliates | |
| Muirfield | | | N/A | | | | 0.20 | % | | | N/A | | | | N/A | | | $ | 136,366 | |
| Quantex | | | N/A | | | | 0.20 | % | | | N/A | | | | N/A | | | | 44,778 | |
| Infrastructure | | | N/A | | | | 0.25 | % | | | N/A | | | | N/A | | | | 14,802 | |
| Dynamic | | | N/A | | | | 0.25 | % | | | N/A | | | | N/A | | | | 61,804 | |
| Aggressive | | | N/A | | | | 0.25 | % | | | N/A | | | | N/A | | | | 42,677 | |
| Balanced | | | N/A | | | | 0.25 | % | | | N/A | | | | N/A | | | | 118,994 | |
| Global | | | N/A | | | | 0.25 | % | | | N/A | | | | N/A | | | | 40,942 | |
| Spectrum | | | N/A | | | | 0.25 | % | | | N/A | | | | N/A | | | | 50,152 | |
| Dividend | | | N/A | | | | 0.25 | % | | | N/A | | | | N/A | | | | 15,875 | |
| Bond | | | N/A | | | | 0.25 | % | | | N/A | | | | N/A | | | | 106,674 | |
| Prime Money Market | | | 0.20 | % | | | N/A | | | | N/A | | | | N/A | | | | N/A | |
| Institutional Prime Money Market | | | 0.25 | % | | | N/A | | | | N/A | | | | N/A | | | | N/A | |
The Funds (other than the Money Market Funds) have adopted a shareholder services plan that allows the Funds to pay financial intermediaries and other persons, including “platforms,” for providing shareholder and administrative services to Fund shareholders and maintaining shareholder accounts. The annual adopted shareholder services plan maximum limitations for the period ended December 31, 2016 are as follows:
| | | Maximum Annual Shareholder Services Plan Expense as a Percentage of Average Daily Net Assets –
Retail Class | | | Maximum Annual Shareholder Services Plan Expense as a Percentage of Average Daily Net Assets –Adviser Class* | | | Maximum Annual Shareholder Services Plan Expense as a Percentage of Average Daily Net Assets – Institutional Class* | |
| Muirfield | | | 0.20 | % | | | 0.25 | % | | | 0.10 | % |
| Quantex | | | 0.20 | % | | | 0.25 | % | | | 0.10 | % |
| Infrastructure | | | 0.20 | % | | | 0.25 | % | | | 0.10 | % |
| Dynamic | | | 0.20 | % | | | 0.25 | % | | | 0.10 | % |
| Aggressive | | | 0.20 | % | | | 0.25 | % | | | 0.10 | % |
| Balanced | | | 0.20 | % | | | 0.25 | % | | | 0.10 | % |
| Global | | | 0.20 | % | | | 0.25 | % | | | 0.10 | % |
| Spectrum | | | 0.20 | % | | | 0.25 | % | | | 0.10 | % |
| Dividend | | | 0.20 | % | | | 0.25 | % | | | 0.10 | % |
| Bond | | | 0.20 | % | | | 0.25 | % | | | 0.10 | % |
| * | There were no Shareholder Services Plan fees accrued for the Adviser and Institutional Classes of shares. |
The Funds have adopted a Deferred Compensation Plan (the “Plan”) for the independent Trustees. Under the Plan, each eligible Trustee is permitted to defer all or a portion of the trustees fees payable by any of the Funds as an investment into any combination of Funds until a specified point of time. The investment into the Funds is recorded as an asset however an offsetting liability is also recorded for the deferred payment. Once the eligible Trustees’ deferral amounts can be distributed, a lump sum or generally equal annual installments over a period of up to ten (10) years can be made to the eligible Trustee(s). The Funds may terminate this Plan at any time.
Certain trustees and officers of the Funds are also officers or directors of Meeder, MAM, and MFSCo. Legal Counsel is also an officer of the Funds.
| Page 104 | 2016 Annual Report | December 31, 2016 |
During the period ended December 31, 2016, several of the Funds invested in either the Prime Money Market Fund or the Institutional Prime Money Market Fund, both affiliates, as described in Section 2(a)(3) of the Investment Company Act of 1940. The purchases/sales amounts in the following tables are presented on a gross basis, while the statement of changes in net assets shows subscriptions and redemptions into and out of the Funds on a net basis. The Funds’ investments in the Prime Money Market Fund were as follows:
| | | | | | Purchases | | | Sales | | | 12/31/16
Cost | | | Income | | | | |
| Muirfield | | $ | 78,421,816 | | | $ | 185,223,202 | | | $ | (263,645,018 | ) | | $ | — | | | $ | 176,302 | | | $ | — | |
| Dynamic | | | 2,831,104 | | | | 76,848,780 | | | | (79,679,884 | ) | | | — | | | | 19,633 | | | | — | |
| Aggressive | | | 1,426,139 | | | | 54,468,082 | | | | (55,894,221 | ) | | | — | | | | 16,847 | | | | — | |
| Balanced | | | 34,709,544 | | | | 136,606,759 | | | | (171,316,303 | ) | | | — | | | | 103,140 | | | | — | |
| Global | | | 15,476,825 | | | | 38,099,494 | | | | (53,576,319 | ) | | | — | | | | 9,358 | | | | — | |
| Spectrum | | | 20,818,164 | | | | 55,030,278 | | | | (75,848,442 | ) | | | — | | | | 34,891 | | | | — | |
| Quantex | | | 593,012 | | | | 28,615,797 | | | | (29,208,809 | ) | | | — | | | | 7,175 | | | | — | |
| Infrastructure | | | 4,589 | | | | 6,823,335 | | | | (6,827,924 | ) | | | — | | | | 787 | | | | — | |
| Dividend | | | 1,138,794 | | | | 31,358,054 | | | | (32,496,848 | ) | | | — | | | | 5,215 | | | | — | |
| Bond | | | 10,140,525 | | | | 98,249,948 | | | | (108,390,473 | ) | | | — | | | | 15,910 | | | | — | |
The Funds’ investments in the Institutional Prime Money Market Fund, which had a 7-day yield of 0.64% on December 31, 2016, were as follows:
| | | | | | Purchases | | | Sales | | | | | | | | | | | | Income | | | | |
| Muirfield | | $ | — | | | $ | 123,986,965 | | | $ | (30,000,653 | ) | | $ | 2,775 | | | $ | 93,989,087 | | | $ | 3,179 | | | $ | 80,363 | | | $ | 93,992,266 | |
| Dynamic | | | — | | | | 28,250,414 | | | | (12,981,303 | ) | | | 976 | | | | 15,270,087 | | | | 19 | | | | 15,079 | | | | 15,270,106 | |
| Aggressive | | | — | | | | 10,643,942 | | | | (5,548,639 | ) | | | 90 | | | | 5,095,393 | | | | 30 | | | | 4,339 | | | | 5,095,423 | |
| Balanced | | | — | | | | 43,671,126 | | | | (10,787,521 | ) | | | 492 | | | | 32,884,097 | | | | 16 | | | | 23,272 | | | | 32,884,113 | |
| Global | | | — | | | | 11,133,699 | | | | (8,013,555 | ) | | | 7 | | | | 3,120,151 | | | | 272 | | | | 2,323 | | | | 3,120,423 | |
| Spectrum | | | — | | | | 24,794,213 | | | | (17,718,857 | ) | | | 17 | | | | 7,075,373 | | | | 28 | | | | 4,666 | | | | 7,075,401 | |
| Quantex | | | — | | | | 20,329,601 | | | | (8,600,949 | ) | | | 768 | | | | 11,729,420 | | | | 579 | | | | 13,477 | | | | 11,729,999 | |
| Infrastructure | | | — | | | | 3,655,498 | | | | (1,763,883 | ) | | | 46 | | | | 1,891,661 | | | | 1 | | | | 982 | | | | 1,891,662 | |
| Dividend | | | — | | | | 14,400,890 | | | | (8,912,911 | ) | | | 780 | | | | 5,488,759 | | | | 103 | | | | 6,979 | | | | 5,488,862 | |
| Bond | | | — | | | | 27,546,540 | | | | (21,420,901 | ) | | | (226 | ) | | | 6,125,413 | | | | 228 | | | | 6,991 | | | | 6,125,641 | |
| 5. | Federal Tax Information |
The tax characteristics of dividends paid by the Funds during the period ended December 31, 2016 were as follows:
| | | Ordinary Income | | | Net Short-Term Capital Gains*** | | | Net Long-Term Capital Gains | | | Tax Return of Capital | | | Total Dividends Paid* | |
| Muirfield | | $ | 2,921,928 | | | $ | — | | | $ | — | | | $ | — | | | $ | 2,921,928 | |
| Dynamic | | | 1,181,295 | | | | — | | | | 570,071 | | | | — | | | | 1,751,366 | |
| Aggressive | | | 515,324 | | | | — | | | | — | | | | — | | | | 515,324 | |
| Balanced | | | 2,762,245 | | | | — | | | | — | | | | — | | | | 2,762,245 | |
| Global | | | 922,270 | | | | — | | | | — | | | | — | | | | 922,270 | |
| Spectrum | | | 230,684 | | | | — | | | | 1,329,394 | | | | — | | | | 1,560,078 | |
| Quantex | | | 361,262 | | | | 871,863 | | | | 376,765 | | | | — | | | | 1,609,890 | |
| Infrastructure | | | 29,976 | | | | — | | | | 196,619 | | | | 221,929 | | | | 448,524 | |
| Dividend | | | 777,516 | | | | — | | | | — | | | | — | | | | 777,516 | |
| Bond | | | 6,263,564 | | | | — | | | | — | | | | — | | | | 6,263,564 | |
| Prime Money Market | | | 567,140 | | | | — | | | | — | | | | — | | | | 567,140 | |
| Institutional Prime Money Market | | | 86,393 | | | | — | | | | — | | | | — | | | | 86,393 | |
| 2016 Annual Report | December 31, 2016 | Page 105 |
The tax characteristics of dividends paid by the Funds during the year ended December 31, 2015 were as follows:
| | | Ordinary Income | | | Net Short-Term Capital Gains*** | | | Net Long-Term Capital Gains | | | Tax Return of Capital | | | Total Dividends Paid* | |
| Muirfield | | $ | 1,202,283 | | | $ | 3,939,196 | | | $ | 5,238,660 | | | $ | — | | | $ | 10,380,139 | |
| Dynamic | | | 713,959 | | | | 941,174 | | | | 2,322,009 | | | | — | | | | 3,977,142 | |
| Aggressive | | | 226,931 | | | | 1,170,375 | | | | 1,621,873 | | | | — | | | | 3,019,179 | |
| Balanced | | | 1,916,823 | | | | 751,208 | | | | 721,302 | | | | — | | | | 3,389,333 | |
| Global | | | 502,535 | | | | — | | | | 2,772,417 | | | | — | | | | 3,274,952 | |
| Spectrum | | | — | | | | 1,136,709 | | | | 392,347 | | | | 229,488 | | | | 1,758,544 | |
| Quantex | | | 350,309 | | | | 2,941,019 | | | | 5,841,122 | | | | — | | | | 9,132,450 | |
| Infrastructure | | | 354,632 | | | | — | | | | 5,682,559 | | | | — | | | | 6,037,191 | |
| Dividend | | | 401,235 | | | | — | | | | — | | | | — | | | | 401,235 | |
| Bond | | | 5,089,086 | | | | — | | | | — | | | | — | | | | 5,089,086 | |
| Prime Money Market | | | 204,416 | | | | — | | | | — | | | | — | | | | 204,416 | |
As of December 31, 2016, the components of accumulated earnings/(deficit) on a tax basis for the Funds were as follows:
| | | Undistributed Ordinary Income | | | Accumulated Capital and Other Gains and (Losses) | | | Unrealized Appreciation/ (Depreciation)** | | | Total Accumulated Earnings/(Deficit) | |
| Muirfield | | $ | — | | | $ | 1,764,003 | | | $ | 9,924,379 | | | $ | 11,688,382 | |
| Dynamic | | | — | | | | 782,415 | | | | 3,098,410 | | | | 3,880,825 | |
| Aggressive | | | — | | | | 446,773 | | | | 2,049,899 | | | | 2,496,672 | |
| Balanced | | | — | | | | (82,095 | ) | | | 3,215,807 | | | | 3,133,712 | |
| Global | | | — | | | | (6,488,111 | ) | | | 274,326 | | | | (6,213,785 | ) |
| Spectrum | | | — | | | | 2,172,636 | | | | 2,867,695 | | | | 5,040,331 | |
| Quantex | | | 2,013,070 | | | | 542,617 | | | | 7,123,204 | | | | 9,678,891 | |
| Infrastructure | | | — | | | | (704,765 | ) | | | 1,863,588 | | | | 1,158,823 | |
| Dividend | | | — | | | | (635,466 | ) | | | 2,110,177 | | | | 1,474,711 | |
| Bond | | | — | | | | (11,718,467 | ) | | | (803,940 | ) | | | (12,522,407 | ) |
| Prime Money Market | | | — | | | | — | | | | — | | | | — | |
| Institutional Prime Money Market | | | 12 | | | | (1,094 | ) | | | 3,260 | | | | 2,178 | |
| * | Total dividends paid may differ from the amount reported in the Statement of Changes in Net Assets because for tax purposes dividends are recognized when actually paid. |
| ** | The differences between book- and tax-basis unrealized appreciation/(depreciation) are attributable primarily to: wash sales and the realization for tax purposes of unrealized gains/(losses) on certain derivative instruments. |
| *** | Net short-term capital gains dividends are taxed as ordinary for federal tax purposes. |
The following Funds elected to defer the following amounts of post-October losses:
| | | Post-October Loss Deferral | |
| Infrastructure | | $ | 216,089 | |
| Bond | | | 285,930 | |
| Institutional Prime Money Market | | | 1,068 | |
| Page 106 | 2016 Annual Report | December 31, 2016 |
For federal income tax purposes, the following Funds have capital loss carryforwards as of December 31, 2016, which are not subject to expiration and are available to offset future capital gains, if any. To the extent that these carryforwards are used to offset future capital gains, it is probable that the gains that are offset will not be distributed to shareholders:
| Capital Loss Carryforwards | | Amount | | Tax Character |
| Infrastructure | | $ | 434,010 | | Short-Term |
| Infrastructure | | | 54,666 | | Long-Term |
| Balanced | | | 82,095 | | Short-Term |
| Global | | | 4,311,836 | | Short-Term |
| Global | | | 2,176,275 | | Long-Term |
| Bond | | | 7,252,401 | | Short-Term |
| Bond | | | 4,180,136 | | Long-Term |
| Dividend | | | 635,466 | | Short-Term |
| Institutional Prime Money Market | | | 26 | | Short-Term |
During the year ended December 31, 2016, Muirfield, Balanced and Dividend utilized capital loss carryforwards in the amounts of $5,759,125, $322,782 and $447,919, respectively.
The beneficial ownership, either directly or indirectly, of more than 25% of the voting securities of a fund creates a presumption of control of the fund under Section 2(a)(9) of the 1940 Act. As of December 31, 2016, account holders that held more than 25% of the voting securities of the Funds and may be deemed to control the Funds are as follows:
| | Name of Account Holder | Percent of Voting Securities |
| Dynamic | Nationwide Trust Company, FSB and certain affiliates held for the benefit of others | 26% |
| Aggressive | Nationwide Trust Company, FSB and certain affiliates held for the benefit of others | 36% |
| Balanced | National Financial Services Corp. and certain affiliates held for the benefit of others | 34% |
| Global | Nationwide Trust Company, FSB and certain affiliates held for the benefit of others | 70% |
| Spectrum | National Financial Services Corp. and certain affiliates held for the benefit of others | 30% |
| Dividend | Nationwide Trust Company, FSB and certain affiliates held for the benefit of others | 26% |
| Bond | National Financial Services Corp. and certain affiliates held for the benefit of others | 31% |
| Institutional Prime Money Market | Carey & Co. held for the benefit of others * | 93% |
| * | The Funds, with the exception of Prime Money Market, own shares of the Institutional Prime Money Market Fund. Carey & Co. holds these shares on behalf of the Funds. These accounts are considered to be affiliated to Institutional Prime Money Market. |
Management evaluated subsequent events through the date these financial statements were issued and concluded no subsequent events required recognition or disclosure in these financial statements.
| 2016 Annual Report | December 31, 2016 | Page 107 |
Report of Independent Registered Public Accounting Firm
To the Shareholders and Board of Trustees of
Meeder Funds
We have audited the accompanying statements of assets and liabilities, including the schedules of investments, of Meeder Funds comprising Muirfield Fund, Dynamic Growth Fund, Aggressive Growth Fund, Balanced Fund, Global Opportunities Fund, Spectrum Fund, Quantex Fund, Infrastructure Fund, Dividend Opportunities Fund, Total Return Bond Fund, Prime Money Market Fund, and Institutional Prime Money Market Fund (the “Funds”) as of December 31, 2016, and the related statements of operations, the statements of changes in net assets, and the financial highlights for each of the periods presented. These financial statements and financial highlights are the responsibility of the Funds’ management. Our responsibility is to express an opinion on these financial statements and financial highlights based on our audits.
We conducted our audits in accordance with the standards of the Public Company Accounting Oversight Board (United States). Those standards require that we plan and perform the audit to obtain reasonable assurance about whether the financial statements and financial highlights are free of material misstatement. An audit includes examining, on a test basis, evidence supporting the amounts and disclosures in the financial statements. Our procedures included confirmation of securities owned as of December 31, 2016, by correspondence with the custodian and brokers, or by other appropriate auditing procedures where replies from brokers or counterparties were not received. An audit also includes assessing the accounting principles used and significant estimates made by management, as well as evaluating the overall financial statement presentation. We believe that our audits provide a reasonable basis for our opinion.
In our opinion, the financial statements and financial highlights referred to above present fairly, in all material respects, the financial position of each of the Funds constituting Meeder Funds, as of December 31, 2016, the results of their operations, the changes in their net assets, and the financial highlights for each of the periods presented, in conformity with accounting principles generally accepted in the United States of America.
COHEN & COMPANY, LTD.
Cleveland, Ohio
February 24, 2017
| Page 108 | 2016 Annual Report | December 31, 2016 |
Trustees and Officers (unaudited)
Certain trustees and officers of the Funds are also officers or directors of Meeder, MAM, and MFSCo. The Trustees oversee the management of the Trust and elect its officers. The officers are responsible for the Funds’ day-to-day operations. The Trustees’ and officers’ names, addresses, years of birth, positions held with the Trust, and length of service with the Meeder Funds are listed below. Also included is each Board member’s principal occupation during, at least, the past five years. Except as indicated, each individual has held the office shown or other offices in the same company for the last five years. Those Trustees who are “interested persons”, as defined in the 1940 Act, by virtue of their affiliation with the Trust, are indicated by an asterisk (*).
Name, Address1, and Year of Birth | Year First Elected a Trustee or Officer of the Trust | Position and Number of Funds Overseen2 | Principal Occupation During Past Five Years and Other Directorships Held |
Robert S. Meeder, Jr.* Year of Birth: 1961 | 1992 | Trustee and President | President of Meeder Asset Management, Inc. |
Stuart M. Allen** Year of Birth: 1961 | 2006 | Trustee | President of Gardiner Allen DeRoberts Insurance LLC, an insurance agency; Chairman of the Trust’s Audit Committee. |
Anthony J. D’Angelo** Year of Birth: 1959 | 2006 | Trustee | General Manager, WSYX ABC 6 /WTTE-TV Fox 28 /WWHO television stations, Columbus, Ohio, operated by Sinclair Broadcast Group (2014 –present); Director of Sales (2004 – 2014); Lead Trustee of the Trust. |
Dale W. Smith Year of Birth: 1959 | 2006 | Vice President | Chief Financial Officer of Meeder Asset Management, Inc. (2005 –present). |
Susan E. Meeder Year of Birth: 1963 | 2014 | Vice President | Chief Operating Officer of Meeder Asset Management, Inc. (2009 –present). |
Timothy N. McCabe Year of Birth: 1976 | 2015 | Chief Legal Officer | Chief Legal Officer, Meeder Asset Management, Inc. (2015 – present); Senior Counsel & Regulatory Officer, Ohio Treasurer of State (2013 – 2015); Vice President, Managing Counsel of Pershing LLC, a BNY Mellon Company (2011 – 2013). |
James B. Craver Year of Birth: 1943 | 2016 | Chief Compliance Officer | James B. Craver & Associates, LLC (2009 – present). |
Douglas Jennings Year of Birth: 1962 | 2016 | Assistant Chief Compliance Officer | Chief Compliance Officer, Meeder Asset Management, Inc. (2016 – present); Assistant General Counsel, Meeder Asset Management, Inc. (2016 – present); Partner, Carlile Patchen & Murphy, LLP (2010 – 2016). |
Bruce E. McKibben Year of Birth: 1969 | 2002 | Treasurer | Director of Fund Accounting of Mutual Funds Service Co., the Trust’s transfer agent (1997 – present). |
Ruth A. Kirkpatrick Year of Birth: 1951 | 2009 | Secretary | Senior Legal Specialist of Meeder Asset Management, Inc. |
1 | The address of each Trustee is 6125 Memorial Drive, Dublin, OH 43017. |
2 | Each Trustee serves for an indefinite term, until his or her resignation, death, or removal. Each Trustee oversees all twelve Funds in the Trust. |
| * | Robert S. Meeder, Jr. is deemed an “interested person” of the Trust by virtue of his position as President of Meeder Asset Management, Inc., the Advisor of the Trust. |
| ** | Each independent Trustee is a member of the Trust’s Audit Committee, Compensation Committee, and Nominating Committee. |
The Statement of Additional Information includes additional information about each Trustee and is available without charge. To obtain a copy of the Statement of Additional Information, please contact your financial representative or call toll free 1-800-325-3539.
Board Review and Approval of Investment Advisory Agreement (unaudited)
At a meeting held September 15, 2016, the Board of Trustees (the “Board”), including a majority of non-interested or independent Trustees, approved the renewal of the investment advisory agreements for each of the separate funds comprising the Meeder Funds (the “Funds”)(individually, an “Agreement” and collectively, the “Agreements”).
The Board reviewed materials sent to each Trustee in advance of the meeting for consideration in determining whether to approve the renewal of each Fund’s Agreements. Management reviewed with the Trustees the materials prepared by them in response to Funds’ legal counsel’s supplemental written request pursuant to Section 15(c) of the Investment Company Act of 1940 for the provision to the Trustees of appropriately updated and amended information necessary or appropriate to assist the Trustees in their deliberations concerning renewal of the Agreements. In reaching the decision to renew the Agreements, the Board also took into account information furnished throughout the year at regular Board meetings. Information furnished and discussed throughout the year included investment performance reports and related financial information for each Fund, as well as periodic reports on shareholder services, legal compliance, pricing, brokerage commissions and execution and other services provided by the investment manager, Meeder Asset Management, Inc. (“Manager”) and its affiliates. Information furnished specifically in connection with the renewal process included a report for the Funds prepared by Broadridge Financial Solutions, Ltd. (“Broadridge”), an independent organization, as well as a Funds’ profitability analysis prepared by the Manager. The Broadridge report compared each Fund’s management fees and expenses with those of other mutual funds deemed comparable to the Fund. The Funds’ profitability analysis discussed the profitability to the Manager and Mutual Funds Service Co., an affiliate of the Manager, from the overall Funds’ operations, as well as an analysis based on the profitability resulting from the operation of each individual Fund, utilizing expense allocation methodologies deemed reasonable by the Manager.
| 2016 Annual Report | December 31, 2016 | Page 109 |
In considering such materials, the independent Trustees noted that they had received assistance and advice from and met separately with the Funds’ legal counsel and chief compliance officer prior to this meeting. In their deliberations, the Board dealt with each Fund separately. In approving continuance of the Agreement for each Fund, the Board, including a majority of independent Trustees, considered each Fund’s Agreement, a copy of which was made available at the meeting, and determined that the existing management fee structure was fair and reasonable and that continuance of the Agreement was in the best interests of each Fund and its shareholders. While attention was given to all information furnished, the following discusses the primary factors relevant to the Board’s decision.
Nature, Extent and Quality of Services. The Board continues to be satisfied with the nature and quality of the overall services provided by the Manager and its affiliates to the Funds and their shareholders. In addition to investment performance and expenses discussed earlier, the Board’s opinion was based, in part, upon periodic reports furnished them showing that the investment policies and restrictions for each Fund were consistently complied with as well as other reports periodically furnished the Board. Other factors taken into account by the Board were the Manager’s compliance procedures and the qualifications of the Manager’s chief compliance officer. Consideration was also given to the experience of each Fund’s portfolio management team. The Board also took into account the transfer agent, fund accounting agent and administrative services provided to Fund shareholders by an affiliate of the Manager, noting continuing expenditures by management to increase and improve the scope of such services. The Board concluded that the nature, extent and quality of the services provided by the Manager have benefited and should continue to benefit each Fund and its shareholders.
Investment Performance. The Board placed emphasis on the investment performance of each Fund in view of its importance to shareholders. While consideration was given to performance reports and discussions with portfolio managers at Board meetings during the year, particular attention in assessing performance was given to the Broadridge reports furnished for the Agreement renewals. The Broadridge report prepared for each Fund showed the investment performance of the Fund for the one-, three-, five-, and ten-year periods, as applicable, ended June 30, 2016 (the “relevant periods”) in comparison with a performance universe similar to each Fund’s investment objectives.
| Fund | Performance Benchmark |
| Muirfield Fund | Blended Benchmark of 60% S&P 500 Index and 40% Average 90-day U.S. T-Bills; S&P 500 Index; Lipper’s Average Flexible Portfolio Fund Universe; Lipper Index1 |
| Quantex Fund | Blended Benchmark of 50% Russell 2000 Index and 50% S&P 400 Mid-Cap Index; Russell 2000 Index; S&P 400 Mid-Cap Index; Lipper’s Average Mid-Cap Value Fund Universe; Lipper Index1 |
| Dynamic Growth Fund | S&P 500 Index; Lipper’s Average Multi-Cap Core Fund Universe; Lipper Index1 |
| Infrastructure Fund | Russell 3000 Utilities Index; Lipper’s Average Global Infrastructure Fund Universe; Lipper Index1 |
| Aggressive Growth Fund | S&P 500 Index; Lipper’s Average Multi-Cap Core Fund Universe; Lipper Index1 |
| Balanced Fund | S&P 500 Index; Blended Benchmark consisting of 42% S&P 500 Index, 28% Average 90-day U.S. T-Bills, and 30% Barclays Capital Aggregate Bond Index; Lipper’s Average Flexible Portfolio Fund Universe; Lipper Index1 |
| Global Opportunities Fund | S&P 500 Index; Blended Benchmark of 34% MSCI EAFE Index, 22% S&P 500 Index, 12% S&P MidCap 400 Index, 11% MSCI Emerging Markets Index, 7% Russell 2000 Index, 7% Dow Jones US Select REIT Index, and 7% S&P GSCI Total Return Index; Lipper’s Average Global Multi-Cap Core Fund Universe; Lipper Index1 |
| Spectrum Fund | S&P 500 Index; Blended Benchmark of 60% S&P 500 Index and 40% Average 90-day U.S. T-Bills; Lipper’s Average Flexible Portfolio Fund Universe; Lipper Index1 |
| Dividend Opportunities Fund | S&P 500 Index; Lipper’s Average Equity Income Fund Universe; Lipper Index1 |
| Total Return Bond Fund | Barclays Capital Aggregate Bond Index; Lipper’s Average General Bond Fund Universe; Lipper Index1 |
| Prime Money Market Fund | Lipper Average General Purpose Money Market Fund |
1 | Given an adequate quantity of funds, the Lipper Index for a given investment classification or objective consists of the largest ten or thirty funds in that classification or objective. Each index is calculated daily with adjustments for dividends and capital gains. |
The Board noted that the investment results of each Fund compared reasonably with each index used and with the Lipper indices, recognizing that none of the indices are perfect comparisons given each Fund’s specific characteristics. The Board concluded that the Funds’ investment results have been satisfactory for renewal of the Agreements and that the Manager’s record in managing the Funds indicated that its continued management should benefit the Funds and their shareholders.
| Page 110 | 2016 Annual Report | December 31, 2016 |
Comparative Expenses. Consideration was given to a comparative analysis of the management fees and total expense ratios of each Fund compared with those of a group of other relevant funds. The Board observed that the Funds’ advisory fees and expenses compared reasonably to those of other similar funds included in the comparable reports. The Board also considered an analysis comparing the Funds’ management fees with the fees charged by the Manager to private clients, but noted the significant investment, operational, regulatory, and market differences between advising the Funds and the private clients. The Board concluded that the Funds’ cost structures were fair and reasonable in relation to the services provided, and that the Funds’ shareholders receive reasonable value in return for the advisory fees and other amounts paid to the Manager by the Funds.
Management Profitability. The Board also considered the level of profits realized by the Manager and its affiliates in connection with the operation of the Funds. In this respect, the Board reviewed the Funds’ profitability analysis that addresses the overall profitability of the Meeder Funds’ business as well as the profitability resulting from the operation of each Fund. The Board also considered the extent to which the Manager and its affiliates might derive ancillary benefits from fund operations, including potential benefits resulting from allocation of fund brokerage and the use of “soft” commission dollars to pay for research. The Board also took into account management’s expenditures in improving shareholder services provided to the Funds, as well as the need to meet additional regulatory and compliance requirements resulting from recent SEC requirements. The Board determined that the level of profits realized by the Manager under its Agreements with the Funds was not excessive in view of the nature, quality and extent of services provided. The Board took the Manager’s profitability and ancillary benefits into account in evaluating the reasonableness of the advisory fees and other amounts paid to the Manager by the Funds.
Economies of Scale. The Board also considered whether economies of scale are realized by the Manager as the Funds grow larger and the extent to which this is reflected in the level of management fees charged. While recognizing that any precise determination is inherently subjective, the Board noted that based upon the Funds’ profitability analysis, it appears that as some Funds get larger, at some point economies of scale do result in the Manager realizing a larger profit margin on management services provided to such a Fund. The Board also noted that economies of scale are shared with each Fund and its shareholders through management fee breakpoints so that as a Fund grows in size, its effective management fee rate declines. Further, the Board noted that investments in the Fund business made by Meeder, and the resulting improvements in Fund operations and shareholder services, was an additional way in which any potential economies of scale were shared with each Fund and its shareholders. The Board reviewed and expressed continued satisfaction with each Fund’s fee structure under its Agreement.
Other Information
The Funds file their complete schedules of portfolios holdings with the Securities and Exchange Commission (“SEC”) for the first and third quarters of each fiscal year on Form N-Q. In addition, Prime Money Market Fund and Institutional Prime Money Market Fund file their complete schedules of portfolio holdings with the SEC each month on Form N-MFP. The Funds’ Forms N-Q and N-MFP are available on the SEC’s website at http://www.sec.gov and may be reviewed and copied at the SEC’s Public Reference Room in Washington, DC. Information on the operation of the Public Reference Room may be obtained by calling 1-800-SEC-0330. The Funds’ schedules of positions are also available on the Funds’ website at www.meederfunds.com.
A description of the policies and procedures that the Funds use to determine how to vote proxies related to portfolio securities, and information regarding how the Funds voted these proxies for the 12-month period ended June 30, 2016, is available on the SEC’s website at http://www/sec.gov, or, without charge, upon request by calling toll-free 1-800-325-3539.
| 2016 Annual Report | December 31, 2016 | Page 111 |
[This page intentionally left blank]
[This page intentionally left blank]
[This page intentionally left blank]
[This page intentionally left blank]
[This page intentionally left blank]
Manager and Investment Advisor
Meeder Asset Management, Inc.
6125 Memorial Drive
P.O. Box 7177
Dublin, Ohio 43017
Board of Trustees
Stuart Allen
Anthony D’Angelo
Robert S. Meeder
Custodian
The Huntington National Bank
Columbus, Ohio 43215
Transfer Agent & Dividend Disbursing Agent
Mutual Funds Service Co.
6125 Memorial Drive
Dublin, Ohio 43017
Independent Registered Public Accounting Firm
Cohen & Company, Ltd.
1350 Euclid Ave., Suite 800
Cleveland, Ohio 44115

6125 Memorial Drive Dublin, Ohio 43017
Item 2. Code of Ethics.
The registrant has adopted a code of ethics that applies to the registrant’s principal executive officer, principal financial officer, comptroller or principal accounting officer, and any person who performs a similar function. There were no amendments made to, or waivers granted from, the code of ethics during the fiscal year.
Item 3. Audit Committee Financial Expert.
Currently, the Meeder Funds (the “Funds”) do not have an Audit Committee member who possesses all of the attributes required to be an “audit committee financial expert” as defined in instruction 2(b) of Item 3 of Form N-CSR. However, the Board of Trustees believes that each member of the Audit Committee has substantial experience relating to the review of financial statements and the operations of audit committees. Accordingly, the Board of Trustees believes that the members are qualified to evaluate the Funds’ financial statements, supervise the Funds’ preparation of its financial statements, and oversee the work of the Funds’ independent auditors. The Board of Trustees also believes that, although no single Audit Committee member possesses all of the attributes required to be an “audit committee financial expert”, the Audit Committee members collectively as a group possess the attributes required to be an “audit committee financial expert.”
Item 4. Principal Accountant Fees and Services.
(a) – (d) Aggregate fees billed to the registrant for the last two fiscal years for professional services rendered by the registrant’s principal accountant were as follows:
Audit fees include amounts related to the audit of the registrant’s annual financial statements and services normally provided by the accountant in connection with statutory and regulatory filings. Audit-related fees include amounts reasonably related to the performance of the audit of the registrant’s financial statements, including, but not limited to, mileage, lodging, and meals. Tax fees include amounts related to tax compliance, tax planning, and tax advice, including the review and preparation of the Funds’ income tax returns, the review and preparation of the Funds’ excise tax returns, the review of supporting schedules and documentation provided by management, the review and recalculation of the Funds’ estimated distribution calculations, and the review of wash sales for reasonableness. All other fees include amounts related to the registrant’s annual filing of Form N1A.
(e)(1) A purpose of the Audit Committee is to approve the engagement of the registrant’s independent auditors (i) to render audit and non-audit services for the registrant in accordance with Rule 2-01(c)(7)(i) of Regulation S-X, subject to the waiver provisions set forth in Rule 2-01(c)(7)(i)(C) of Regulation S-X, and (ii) to render non-audit services for the registrant’s investment advisors (other than a sub-advisor whose role is primarily portfolio management and is subcontracted or overseen by another investment advisor) and any other entity controlling by, or under common control with the investment advisor that provides ongoing services to the registrant, in each case under (ii) if the engagement relates directly to the operations and financial reporting of the registrant, in accordance with Rule 2-01(c)(7)(ii) of Regulation S-X, subject to waiver provisions set forth in Rule 2-01(c)(7)(ii) of Regulation S-X.
(e)(2) 0% of services included in (b) – (d) above were approved pursuant to Rule 2-01(c)(7)(i)(C) of Regulation S-X.
(f) Not applicable.
(g) The aggregate fees billed for the most recent fiscal year and the preceding fiscal year by the registrant’s principal accountant for non-audit services rendered to the registrant, its investment advisor, and any entity controlling, controlled by, or under common control with the investment advisor that provides ongoing services to the registrant were $54,500 and $36,700 respectively.
Items 5. Audit Committee of Listed Registrants.
Not applicable.
Item 6. Schedule of Investments.
Not applicable.
Item 7. Disclosure of Proxy Voting Policies and Procedures for Closed-End Management Investment Companies.
Not applicable.
Item 8. Portfolio Managers of Closed-End Management Investment Companies.
Not applicable.
Item 9. Purchases of Equity Securities by Closed-End Management Investment Company and Affiliated Purchasers.
Not applicable.
Item 10. Submission of Matters to a Vote of Security Holders.
Not applicable.
Item 11. Controls and Procedures.
(a) Based on our evaluation conducted within 90 days of the filing date, hereof, the design and operation of the registrant’s disclosure controls and procedures are effective to ensure that material information relating to the registrant is made known to the certifying officers by others within the appropriate entities, particularly during the period in which Forms N-CSR are being prepared, and the registrant’s disclosure controls and procedures allow timely preparation and review of the information for the registrant’s Form N-CSR and the officer certifications of such Form N-CSR.
(b) There were no significant changes in the registrant’s internal controls or in other factors that could significantly affect these controls subsequent to the date of their evaluation, including any corrective actions with regard to significant deficiencies and material weaknesses.
Item 12. Exhibits.
(a)(1) Code of Ethics filed herewith as EX-99.CODE ETH.
(a)(2) A separate certification for each principal executive and principal financial officer of the registrant as required by Rule 30a-2(a) under the Act(17 CFR270.30a-2(a)). Filed herewith as EX-99.CERT.
(b) Certifications of principal executive officer and principal financial officer, under Section 906 of the Sarbanes-Oxley Act of 2002, and 18 U.S.C. ss.1350. Filed herewith as EX-99.906 CERT.
Pursuant to the requirements of the Securities Exchange Act of 1934 and the Investment Company Act of 1940, the registrant has duly caused this report to be signed on its behalf by the undersigned, thereunto duly authorized.