UNITED STATES
SECURITIES AND EXCHANGE COMMISSION
Washington, D.C. 20549
FORM N-CSR/A
CERTIFIED SHAREHOLDER REPORT
OF REGISTERED MANAGEMENT INVESTMENT COMPANIES
Investment Company Act file number 811-3462
Meeder Funds Trust
6125 Memorial Drive
Dublin, OH 43017
Bruce McKibben
c/o Meeder Funds Trust
6125 Memorial Drive
Dublin, OH 43017
Registrant’s telephone number, including area code: 800-325-3539
Date of fiscal year end: December 31, 2017
Date of reporting period: December 31, 2017
EXPLANATORY NOTE: This amended Annual Report is being filed solely for the purpose of correcting a minor error in the average annual total returns of the blended index that serves as the secondary benchmark for the Aggressive Allocation Fund and Dynamic Allocation Fund. Except as set forth above, this amendment does not amend, update or change any other items or disclosures found in the original Form N-CSR filing.
Item 1. Report to Stockholders
Aggressive Allocation Fund
The Meeder Aggressive Allocation Fund Institutional Class returned 13.52% compared to the Russell 2500 Index of 16.81%, the S&P 500 Index return of 21.83%, and the Blended Index return of 18.69%. For the year 2017, the largest average sector weightings in the portfolio were Industrials, Financials and Information Technology. Consumer Discretionary and Financials were the top contributing sectors to performance while the top individual contributors for the year included Michael Kors, Green Dot Corporation and Cadence Design System. The smallest average weightings in the portfolio were Energy, Consumer Staples and Telecommunications. The largest sector detractors were Industrials and Technology, while the largest individual detractors were Dean Foods, Foot Locker and NCR.
We began increasing exposure to international markets in the first quarter of 2017, starting with developed international and eventually adding positions in emerging markets as well. Our models indicated opportunities in international markets primarily as a result of positive price and currency momentum. We maintained overweight positions in international markets through year end.
We utilized equity index derivatives in the Fund, such as stock index futures to equitize cash positions. Since these derivatives are designed to track a respective stock index, there was no discernable impact to the Fund’s relative performance in 2017.
Investment Objective
The investment objective of the Fund is to provide long-term capital appreciation.
Average Annual Total Returns
as of December 31, 2017
| 1
Year | 5
Year | 10
Year |
Aggressive Allocation Fund Retail Class | 12.91% | 11.59% | 5.55% |
Aggressive Allocation Fund Institutional Class | 13.52% | — | — |
Aggressive Allocation Fund Adviser Class | 13.22% | — | — |
S&P 500 Index | 21.83% | 15.79% | 8.50% |
Russell 2500 Index | 16.81% | 14.33% | 9.22% |
Blended Index | 18.69% | 11.91% | 7.27% |
Growth of $10,000
as of December 31, 2017
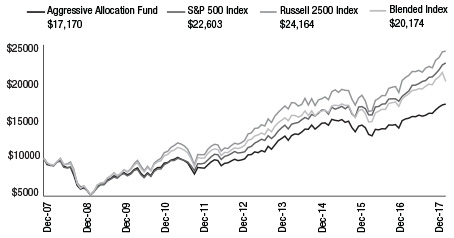
This chart compares the Aggressive Allocation Fund’s Retail Share Class over the period shown with dividends and capital gains reinvested against the Fund’s benchmarks. The benchmark indices are unmanaged and do not take into account the deduction of expenses associated with a mutual fund, such as investment management and accounting fees. One cannot invest directly in an index.
The chart and the table do not reflect the deduction of taxes that a shareholder would pay on Fund distributions or the redemption of Fund shares. The performance data shown represents past performance, which does not guarantee future results. The investment return and principal value of an investment will fluctuate so that an investor’s shares, when redeemed, may be worth more or less than their original cost. Current performance may be lower or higher than the performance data quoted.
From the inception date of the Fund until September 5, 2016, the S&P 500 Index was used as the broad-based securities market index for the Fund.
The Blended Index is comprised of 70% Russell 2500 Index, 25% MSCI ACWI ex USA Index, and 5% Bloomberg Barclays US Aggregate Bond Index.
Dynamic Allocation Fund
The Meeder Dynamic Allocation Fund Institutional Class returned 21.61% compared to the S&P 500 Index return of 21.83%. For the year 2017, the largest average sector weightings in the portfolio were Information Technology, Financials and Healthcare. Information Technology and Consumer Staples were the top contributing sectors, while the top individual contributors for the year included Apple, Microsoft and Boeing. Financials were the largest detracting sector in the portfolio while the smallest average sector weightings were Telecommunications, Materials and Real Estate. The largest individual detractors were Kroger, Synchrony Financial and Qualcomm.
We began increasing exposure to international markets in the first quarter of 2017, starting with developed international and eventually adding positions in emerging markets as well. Our models indicated opportunities in international markets primarily as a result of positive price and currency momentum. We maintained overweight positions in international markets through year end.
We utilized equity index derivatives in the Fund, such as stock index futures to equitize cash positions. Since these derivatives are designed to track a respective stock index, there was no discernable impact to the Fund’s relative performance in 2017.
Investment Objective
The investment objective of the Fund is to provide long-term capital appreciation.
Average Annual Total Returns
as of December 31, 2017
| 1
Year | 5
Year | 10
Year |
Dynamic Allocation Fund Retail Class | 21.20% | 12.85% | 5.90% |
Dynamic Allocation Fund Institutional Class | 21.61% | — | — |
Dynamic Allocation Fund Adviser Class | 21.42% | — | — |
S&P 500 Index | 21.83% | 15.79% | 8.50% |
Blended Index | 22.19% | 12.85% | 6.71% |
Growth of $10,000
as of December 31, 2017
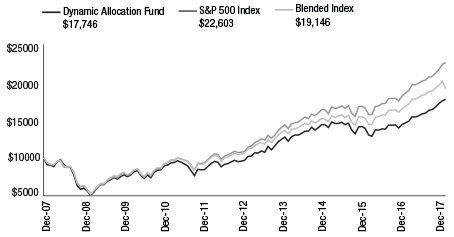
This chart compares the Dynamic Allocation Fund’s Retail Share Class over the period shown with dividends and capital gains reinvested against the Fund’s benchmarks. The benchmark indices are unmanaged and do not take into account the deduction of expenses associated with a mutual fund, such as investment management and accounting fees. One cannot invest directly in an index.
The chart and the table do not reflect the deduction of taxes that a shareholder would pay on Fund distributions or the redemption of Fund shares. The performance data shown represents past performance, which does not guarantee future results. The investment return and principal value of an investment will fluctuate so that an investor’s shares, when redeemed, may be worth more or less than their original cost. Current performance may be lower or higher than the performance data quoted.
The Blended Index is comprised of 70% S&P 500 Index, 25% MSCI ACWI ex USA Index, and 5% Bloomberg Barclays US Aggregate Bond Index.
SIGNATURES
Pursuant to the requirements of the Securities Exchange Act of 1934 and the Investment Company Act of 1940, the registrant has duly caused this report to be signed on its behalf by the undersigned, thereunto duly authorized.
| Meeder Funds | |
| | | |
| By: | /s/ Bruce E. McKibben | |
| | Bruce E. McKibben, Treasurer | |
| | | |
| Date: | June 20, 2018 | |
Pursuant to the requirements of the Securities Exchange Act of 1934 and the Investment Company Act of 1940, this report has been signed below by the following persons on behalf of the registrant and in the capacities and on the dates indicated.
| By: | /s/ Bruce E. McKibben | |
| | Bruce E. McKibben, Treasurer | |
| | | |
| Date: | June 20, 2018 | |
| By: | /s/ Robert S. Meeder, Jr. | |
| | Robert S. Meeder, Jr., President | |
| | | |
| Date: | June 20, 2018 | |