UNITED STATES SECURITIES AND EXCHANGE COMMISSION
Washington, D.C. 20549
FORM N-CSR
CERTIFIED SHAREHOLDER REPORT
OF REGISTERED MANAGEMENT INVESTMENT COMPANIES
Investment Company Act file number 811-3462
Meeder Funds Trust
6125 Memorial Drive
Dublin, OH 43017
Bruce McKibben
c/o Meeder Funds Trust
6125 Memorial Drive
Dublin, OH 43017
Registrant’s telephone number, including area code: 800-325-3539
Date of fiscal year end: December 31, 2017
Date of reporting period: December 31, 2017
Item 1. Report to Stockholders.
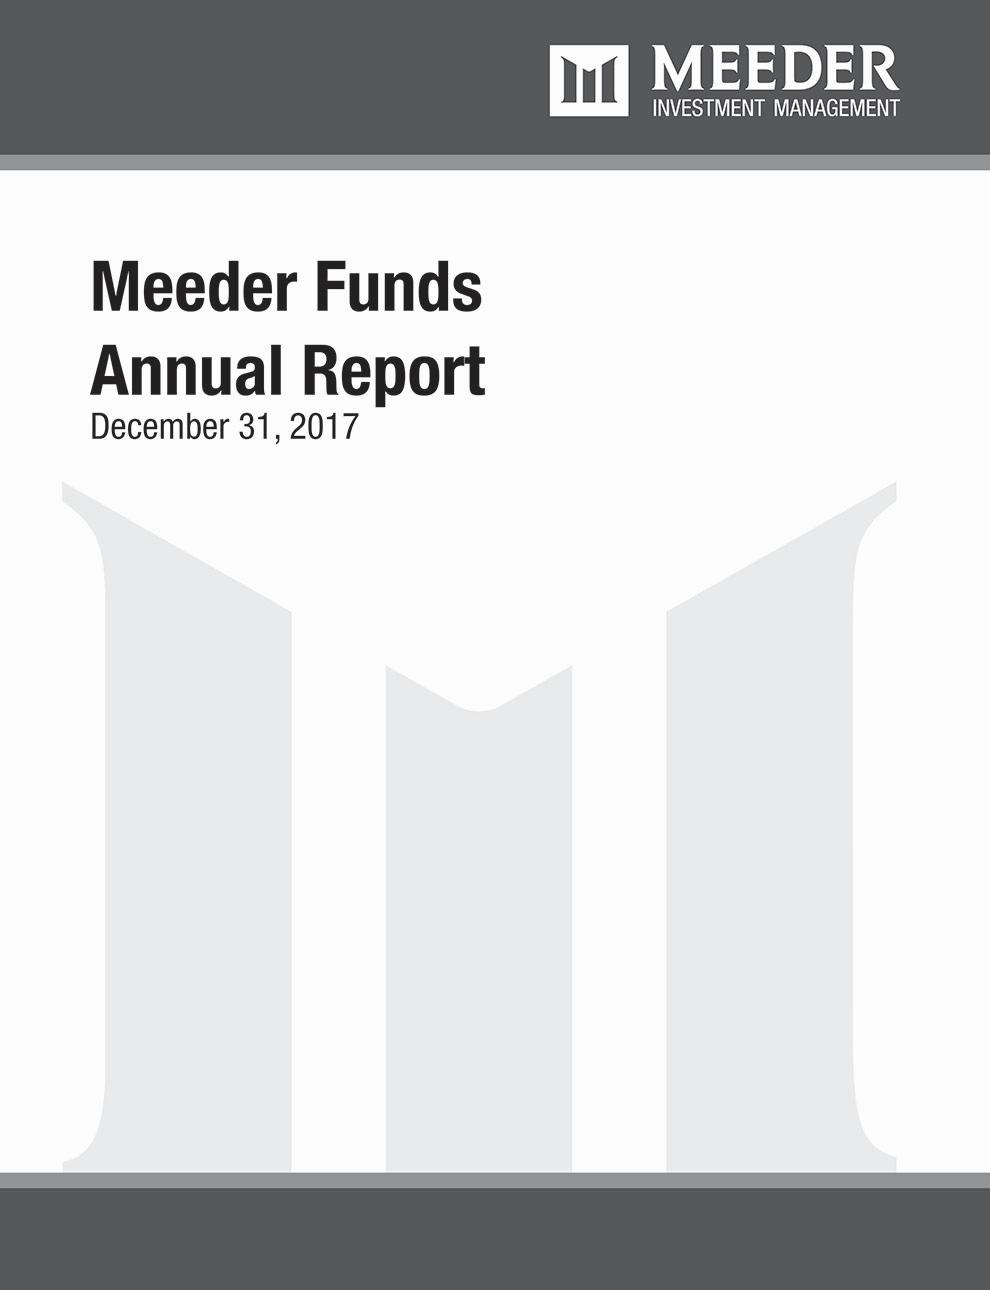
TABLE OF CONTENTS
Letter to Shareholders | 1 |
Fund Summaries | |
Muirfield Fund | 3 |
Dynamic Allocation Fund | 5 |
Aggressive Allocation Fund | 6 |
Balanced Fund | 7 |
Global Allocation Fund | 9 |
Spectrum Fund | 11 |
Quantex Fund | 13 |
Conservative Allocation Fund | 14 |
Moderate Allocation Fund | 16 |
Total Return Bond Fund | 18 |
Prime Money Market Fund | 19 |
Institutional Prime Money Market Fund | 20 |
Shareholder Expense Analysis | 21 |
Financial Statements | |
Schedules of Investments | 24 |
Statements of Assets and Liabilities | 104 |
Statements of Operations | 106 |
Statements of Changes in Net Assets | 108 |
Financial Highlights | 112 |
Notes to Financial Statements | 120 |
Report of Independent Registered Accounting Firm | 140 |
Management of the Trust | 141 |
Other Items | 142 |
Privacy Policy | 144 |
This Annual Report is prepared and distributed for the general information of the shareholders of the Funds. This material is not authorized for distribution to prospective investors unless preceded or accompanied by a prospectus. Investors are advised to consider carefully the investment objectives, risks, charges and expenses of the Fund before investing. The prospectus contains this and other information about the Funds.
Meeder Funds are distributed by Adviser Dealer Services, Inc. (Member FINRA), an affiliate of Meeder Investment Management. An affiliated registered investment adviser, Meeder Asset Management, Inc., serves as the investment adviser to Meeder Funds and is paid a fee for its services.
LETTER TO SHAREHOLDERS December 31, 2017
Is This Pace Sustainable?
2017 was certainly a remarkable year. We saw a new U.S. president and administration come into office. We observed continued geo-political unrest and saw escalated tensions between North Korea and the U.S. to a point we haven’t seen in decades. Millions of Americans were impacted by devastating natural disasters, from a series of hurricanes in the Atlantic to the Gulf of Mexico, to historic wildfires and mudslides out West that continue to wreak havoc. It was also a remarkable year for the markets.
The robust performance of U.S. equity markets in 2017 has made it a year for the record books. For the first time ever, the Dow Jones Industrial Average reached five 1,000-point milestones in a single calendar year while posting 75 new all-time highs. Information Technology led all S&P sectors in 2017, soaring nearly 39% for the year. This helped the tech-heavy NASDAQ also set 75 all-time highs throughout the year, while the S&P 500 set 65 all-time highs, rising nearly 22%. The amazing fact about these records is that they have all been achieved while maintaining the lowest level of volatility in the history of the market, as measured by the CBOE Volatility Index (VIX).
In December, the U.S. economy completed the 103rd consecutive month of this current economic expansion, which is the third longest expansion in our country’s history. To put this into perspective, the average economic expansion going back to 1900 is just 48 months. While history is suggesting that we are probably much closer to the end of this current cycle than the beginning, economic indicators continue to remain strong. Surveys like the ISM Manufacturing Index remained very strong in December. Broad-based economic strength has continued to be represented by the most recent Leading Economic Indicators Index report, which reached another new all-time high in November. New home sales increased to a seasonally adjusted annualized rate of 733,000, topping consensus estimates of 650,000. This represented a 17.5% monthly increase in November, making it the largest monthly increase in 25 years. The market’s strength also continues to be validated as the earnings from companies in the S&P 500 reached another all-time high in 2017.
While the U.S. economy has shown strength on a number of fronts, some of the domestic market’s equity gains are also likely to be attributed to the U.S. political environment. This is because Congress recently passed the Tax Cuts and Jobs Act, the largest comprehensive tax reform legislation to occur since 1986. This legislation includes many changes that are designed to be more tax-friendly for both individuals and corporations. One of the major corporate provisions reduces the federal corporate tax rate from 35% to 21%. The goal of this legislation is to level the playing field for U.S. businesses and put them on a more competitive global landscape. TaxFoundation.org estimates that this new tax legislation could increase the S&P 500 earnings per share up to 7%.
At the Fed, President Trump nominated Jerome H. Powell, current Governor of the Federal Reserve Board of Governors, to be the Chair of the Federal Open Market Committee (FOMC), replacing Janet Yellen, who was appointed by President Obama in 2014. This nomination was widely viewed by investors as being the safe choice by not causing any disruption to markets. Yellen announced that she will not remain on the Federal Reserve Board of Governors and will vacate that positon simultaneously with her departure as Fed Chair in February. This will leave four vacancies on the Fed Board of Governors. These future nominations could alter the Fed’s outlook and opinion on the economy, depending on who President Trump appoints. The Fed also reconfirmed their 2018 forecast of three rate hikes, and is currently proposing just two potential rate increases for 2019.
Performance Spotlight
During the year, our investment team continued to adhere to the disciplined, time-tested, model-driven investment process that has helped us deliver competitive performance over the long term.
The Meeder Quantex Fund was highlighted in Money magazine’s 2017 Investor’s Guide as a “best performer” among all mid-cap funds for the 1- and 5-year periods. This recognition was followed by the Fund receiving its third Lipper Fund Award as the Best Fund over the 10-year period in the Mid-Cap Value Funds category.
Our flagship fund, the Meeder Muirfield Fund, continued to deliver solid, consistent performance across multiple time periods and market cycles. For the period ended December 31, 2017, the Fund was ranked by Morningstar in the Tactical Allocation category in the top 10% for the 1-year period, top 4% for the 5-year period, top 13% for the 10-year period, and top 12% for the 15-year period.
Looking Ahead
2018 seems to certainly be picking up where 2017 left off with regard to the equity markets, but is this pace sustainable? As we’ve said previously, we believe this current secular bull market still has room to run, but we expect volatility to return and temper the pace at which we’ve seen market gains. There is clearly uncertainty in terms of the U.S. political environment and what may come in this mid-term election year. There is uncertainty as it relates to the Fed and what may come of proposed rate increases and the unwinding of their balance sheet. And, there are also geopolitical uncertainties that may increase volatility in the markets.
Regardless of the uncertainties, we’ve been committed to tactical asset allocation and managing volatility for nearly 45 years. We’ve managed investor assets over multiple market cycles, and a range of market and economic events. We are committed to improving investor outcomes and we want to ensure that investors stay invested through up and down markets.
On behalf of all of us at Meeder Investment Management, we thank you for your continued trust and confidence in our investment management services, and we wish you a very happy new year.

Robert S. Meeder
President and CEO
Meeder Asset Management, Inc.
2017 Annual Report | December 31, 2017 | Page 1 |
2017 Annual Report
Fund Summaries
Muirfield Fund
The Meeder Muirfield Fund Institutional Class returned 20.60% compared to the Blended Index return of 13.00% and the S&P 500 Index return of 21.83%. In January of 2017 we increased our equity exposure to being fully invested. We maintained a range of equity exposure that did not decline below 90% throughout the year.
In the beginning of February, our international model signaled a change that favored developed international due to near-term momentum and currency metrics. For most of the year, valuations favored developed international and emerging market equities. We then increased our allocation that ranged from 3 to 12% throughout the remainder of the year, which was split among developed and emerging market equities. These international allocations were a positive contributor to the fund’s performance.
For the year 2017, the largest average sector weightings in the portfolio were Information Technology, Financials and Healthcare. Information Technology and Staples were the top contributing sectors while the top individual contributors for the year included Apple, Microsoft and Boeing. Telecommunications was the largest detracting sector, while the smallest average sector weightings in the portfolio were Real Estate, Utilities, and Telecommunications. The largest individual detractors were Kroger, Qualcomm, and AT&T.
In the portfolio, we will often use equity index derivatives in the Fund, such as stock index futures, to efficiently equitize our cash positions as well as manage the equity exposure of the Fund. In regard to equitizing cash positions, these derivatives are designed to track their respective stock index, so there was no discernible impact to the Fund’s relative performance. The use of stock index futures to manage the equity exposure of the Fund had a negative impact on the performance of the Fund relative to the S&P 500 Index during 2017.
Investment Objective
The investment objective of the Fund is to provide long-term capital appreciation.
Average Annual Total Returns
as of December 31, 2017
| 1
Year | 5
Year | 10
Year |
Muirfield Fund Retail Class | 20.29% | 11.94% | 5.52% |
Muirfield Fund Institutional Class | 20.60% | — | — |
Muirfield Fund Adviser Class | 20.50% | — | — |
Blended Index | 13.00% | 9.44% | 5.45% |
S&P 500 Index | 21.83% | 15.79% | 8.50% |
Sector Concentration
as of December 31, 2017
Information Technology | 15.5% |
Financials | 11.0% |
Healthcare | 8.4% |
Consumer Discretionary | 7.0% |
Industrials | 5.8% |
Energy | 4.3% |
Consumer Staples | 4.1% |
Real Estate Investment Trust | 2.2% |
Materials | 1.9% |
Telecommunication Services | 1.6% |
Utilities | 1.4% |
Registered Investment Companies | 3.7% |
Money Market Registered Investment Companies | 31.8% |
Bank Obligations | 0.3% |
Other Assets/Liabilities (Net) | 1.0% |
Total | 100.0% |
As a percentage of total net assets. Concentrations are subject to change. The Fund has invested in stock index futures contracts in order to equitize cash balances held in the Fund.
Top 10 Holdings
as of December 31, 2017
1. | iShares Russell 2000 Growth ETF | 3.6% |
2. | Apple, Inc. | 2.1% |
3. | Microsoft Corp. | 1.9% |
4. | Berkshire Hathaway, Inc. Class B | 1.4% |
5. | Facebook, Inc. Class A | 1.3% |
6, | Amazon.com, Inc. | 1.1% |
7. | JPMorgan Chase & Co. | 1.1% |
8. | Exxon Mobil Corp. | 1.1% |
9. | Verizon Communications, Inc. | 1.0% |
10. | PepsiCo, Inc. | 0.9% |
As a percentage of total net assets. Holdings exclude short term investments and derivatives.
2017 Annual Report | December 31, 2017 | Page 3 |
Growth of $10,000
as of December 31, 2017
This chart compares the value of the Muirfield Fund’s Retail Share Class over the period shown with dividends and capital gains reinvested against the Fund’s benchmarks. The benchmark indices are unmanaged and do not take into account the deduction of expenses associated with a mutual fund, such as investment management and accounting fees. One cannot invest directly in an index.
The chart and the table do not reflect the deduction of taxes that a shareholder would pay on Fund distributions or the redemption of Fund shares. The performance data shown represents past performance, which does not guarantee future results. The investment return and principal value of an investment will fluctuate so that an investor’s shares, when redeemed, may be worth more or less than their original cost. Current performance may be lower or higher than the performance data quoted.
The Blended Index is comprised 60% of the S&P 500 Index and 40% of 90-day T-bills.
Page 4 | 2017 Annual Report | December 31, 2017 |
Dynamic Allocation Fund
The Meeder Dynamic Allocation Fund Institutional Class returned 21.61% compared to the S&P 500 Index return of 21.83%. For the year 2017, the largest average sector weightings in the portfolio were Information Technology, Financials and Healthcare. Information Technology and Consumer Staples were the top contributing sectors, while the top individual contributors for the year included Apple, Microsoft and Boeing. Financials were the largest detracting sector in the portfolio while the smallest average sector weightings were Telecommunications, Materials and Real Estate. The largest individual detractors were Kroger, Synchrony Financial and Qualcomm.
We began increasing exposure to international markets in the first quarter of 2017, starting with developed international and eventually adding positions in emerging markets as well. Our models indicated opportunities in international markets primarily as a result of positive price and currency momentum. We maintained overweight positions in international markets through year end.
We utilized equity index derivatives in the Fund, such as stock index futures to equitize cash positions. Since these derivatives are designed to track a respective stock index, there was no discernable impact to the Fund’s relative performance in 2017.
Investment Objective
The investment objective of the Fund is to provide long-term capital appreciation.
Average Annual Total Returns
as of December 31, 2017
| 1
Year | 5
Year | 10
Year |
Dynamic Allocation Fund Retail Class | 21.20% | 12.85% | 5.90% |
Dynamic Allocation Fund Institutional Class | 21.61% | — | — |
Dynamic Allocation Fund Adviser Class | 21.42% | — | — |
S&P 500 Index | 21.83% | 15.79% | 8.50% |
Blended Index | 21.39% | 13.85% | 7.38% |
Growth of $10,000
as of December 31, 2017

This chart compares the Dynamic Allocation Fund’s Retail Share Class over the period shown with dividends and capital gains reinvested against the Fund’s benchmarks. The benchmark indices are unmanaged and do not take into account the deduction of expenses associated with a mutual fund, such as investment management and accounting fees. One cannot invest directly in an index.
The chart and the table do not reflect the deduction of taxes that a shareholder would pay on Fund distributions or the redemption of Fund shares. The performance data shown represents past performance, which does not guarantee future results. The investment return and principal value of an investment will fluctuate so that an investor’s shares, when redeemed, may be worth more or less than their original cost. Current performance may be lower or higher than the performance data quoted.
Top 10 Holdings
as of December 31, 2017
1. | iShares Core MSCI EAFE ETF | 6.9% |
2. | iShares Core U.S. Aggregate Bond ETF | 5.3% |
3. | Apple, Inc. | 2.4% |
4. | Microsoft Corp. | 2.0% |
5. | Berkshire Hathaway, Inc. Class B | 1.5% |
6, | Alphabet, Inc. Class C | 1.4% |
7. | Facebook, Inc. Class A | 1.3% |
8. | JPMorgan Chase & Co. | 1.3% |
9. | Bank of America Corp. | 1.2% |
10. | Amazon.com, Inc. | 1.2% |
As a percentage of total net assets. Holdings exclude short term investments and derivatives.
Sector Concentration
as of December 31, 2017
Information Technology | 17.5% |
Financials | 13.7% |
Healthcare | 11.1% |
Consumer Discretionary | 6.8% |
Industrials | 5.2% |
Energy | 4.7% |
Consumer Staples | 3.6% |
Real Estate Investment Trust | 1.8% |
Materials | 1.7% |
Telecommunication Services | 1.5% |
Utilities | 1.0% |
Registered Investment Companies | 13.3% |
Money Market Registered Investment Companies | 16.2% |
Bank Obligations | 1.1% |
Other Assets/Liabilities (Net) | 0.8% |
Total | 100.0% |
As a percentage of total net assets. Concentrations are subject to change. The Fund has invested in stock index futures contracts in order to equitize cash balances held in the Fund.
The Blended Index is comprised of 70% S&P 500 Index, 25% MSCI ACWI ex USA Index, and 5% Bloomberg Barclays US Aggregate Bond Index.
2017 Annual Report | December 31, 2017 | Page 5 |
Aggressive Allocation Fund
The Meeder Aggressive Allocation Fund Institutional Class returned 13.52% compared to the Russell 2500 Index of 16.81%, the S&P 500 Index return of 21.83%, and the Blended Index return of 17.90%. For the year 2017, the largest average sector weightings in the portfolio were Industrials, Financials and Information Technology. Consumer Discretionary and Financials were the top contributing sectors to performance while the top individual contributors for the year included Michael Kors, Green Dot Corporation and Cadence Design System. The smallest average weightings in the portfolio were Energy, Consumer Staples and Telecommunications. The largest sector detractors were Industrials and Technology, while the largest individual detractors were Dean Foods, Foot Locker and NCR.
We began increasing exposure to international markets in the first quarter of 2017, starting with developed international and eventually adding positions in emerging markets as well. Our models indicated opportunities in international markets primarily as a result of positive price and currency momentum. We maintained overweight positions in international markets through year end.
We utilized equity index derivatives in the Fund, such as stock index futures to equitize cash positions. Since these derivatives are designed to track a respective stock index, there was no discernable impact to the Fund’s relative performance in 2017.
Investment Objective
The investment objective of the Fund is to provide long-term capital appreciation.
Average Annual Total Returns
as of December 31, 2017
| 1
Year | 5
Year | 10
Year |
Aggressive Allocation Fund Retail Class | 12.91% | 11.59% | 5.55% |
Aggressive Allocation Fund Institutional Class | 13.52% | — | — |
Aggressive Allocation Fund Adviser Class | 13.22% | — | — |
S&P 500 Index | 21.83% | 15.79% | 8.50% |
Russell 2500 Index | 16.81% | 14.33% | 9.22% |
Blended Index | 17.90% | 12.89% | 7.95% |
Growth of $10,000
as of December 31, 2017

This chart compares the Aggressive Allocation Fund’s Retail Share Class over the period shown with dividends and capital gains reinvested against the Fund’s benchmarks. The benchmark indices are unmanaged and do not take into account the deduction of expenses associated with a mutual fund, such as investment management and accounting fees. One cannot invest directly in an index.
The chart and the table do not reflect the deduction of taxes that a shareholder would pay on Fund distributions or the redemption of Fund shares. The performance data shown represents past performance, which does not guarantee future results. The investment return and principal value of an investment will fluctuate so that an investor’s shares, when redeemed, may be worth more or less than their original cost. Current performance may be lower or higher than the performance data quoted.
Top 10 Holdings
as of December 31, 2017
1. | iShares Core MSCI EAFE ETF | 5.9% |
2. | iShares Core U.S. Aggregate Bond ETF | 5.2% |
3. | NVR, Inc. | 0.8% |
4. | Cadence Design Systems, Inc. | 0.8% |
5. | Lear Corp. | 0.8% |
6, | Spirit AeroSystems Holdings, Inc. | 0.8% |
7. | Owens Corning | 0.8% |
8. | Huntington Ingalls Industries, Inc. | 0.8% |
9. | UGI Corp. | 0.8% |
10. | ManpowerGroup, Inc. | 0.8% |
As a percentage of total net assets. Holdings exclude short term investments and derivatives.
Sector Concentration
as of December 31, 2017
Financials | 11.1% |
Consumer Discretionary | 11.1% |
Industrials | 10.8% |
Information Technology | 9.3% |
Healthcare | 8.5% |
Energy | 4.5% |
Materials | 4.2% |
Real Estate Investment Trust | 3.4% |
Consumer Staples | 2.9% |
Utilities | 1.7% |
Telecommunication Services | 0.7% |
Registered Investment Companies | 11.8% |
Money Market Registered Investment Companies | 16.5% |
Bank Obligations | 2.4% |
Other Assets/Liabilities (Net) | 1.1% |
Total | 100.0% |
As a percentage of total net assets. Concentrations are subject to change. The Fund has invested in stock index futures contracts in order to equitize cash balances held in the Fund.
From the inception date of the Fund until September 5, 2016, the S&P 500 Index was used as the broad-based securities market index for the Fund.
The Blended Index is comprised of 70% Russell 2500 Index, 25% MSCI ACWI ex USA Index, and 5% Bloomberg Barclays US Aggregate Bond Index.
Page 6 | 2017 Annual Report | December 31, 2017 |
Balanced Fund
The Meeder Balanced Fund Institutional Class was positive 15.25% for the year compared to the S&P 500 Index return of 21.83% and the Blended Index return of 10.09%. The Fund maintains exposure to both equity and fixed income. In January, the equity portion of the portfolio increased its exposure to being fully invested. We maintained a range of equity exposure that did not decline below 90% throughout the year.
In the beginning of February, our international model signaled a change that favored developed international due to near-term momentum and currency metrics. For most of the year, valuations favored developed international and emerging market equities. We then increased our allocation that ranged from 3 to 12% throughout the remainder of the year, which was split among developed and emerging market equities. These international allocations were a positive contributor to the fund’s performance.
In the fixed income portion of the portfolio, the Fund maintained an emerging market debt allocation of less than 15% of the portfolio until the middle of November when it was reduced to roughly 10% for the remainder of the year. High yield exposure ranged from roughly 5-20% of the portfolio.
In the fixed income portion of the portfolio, high-yield exposure ranged from roughly 10-20% of the portfolio. We maintained an allocation of emerging market debt of less than 15% of the portfolio until the middle of November when we further reduced this exposure through the remainder of the year.
Fixed income markets remained mostly quiet, however emerging market debt and high yield asset classes were an exception as both experienced volatility when rumors of a default on Venezuelan debt began circulating in mid-November. Venezuela’s state-owned oil and natural gas company was late on a $1.1 billion bond payment in November. Technically a default did not occur, however this event has raised a broader awareness around the volatility involved with high yield and emerging market debt for fixed income investors. The Federal Reserve raised the short-term lending rate a total of three times over the year, leaving the final range from 1.25%-1.50%. This has contributed to the Treasury yield curve flattening considerably this year as the yield differential between 10- and 2-year Treasuries has become much closer. A flattening yield curve is a concern for economists as it historically has been an early indicator of an economic slow-down.
For the year 2017, the largest average sector weightings in the portfolio were Information Technology, Financials and Healthcare. Information Technology and Consumer Staples were the top contributing sectors while the top individual security contributors to the portfolio included Apple, Microsoft, and Boeing. The smallest average sector weightings in the portfolio were Real Estate, Utilities, and Telecommunications. The largest individual detractors to performance were Kroger, Schlumberger, and AT&T.
In the portfolio, we will often use equity index derivatives in the Fund, such as stock index futures, to efficiently equitize our cash positions as well as manage the equity exposure of the fund. In regard to equitizing cash positions, these derivatives are designed to track their respective stock index, so there was no discernible impact to the Fund’s relative performance. The use of stock index futures to manage the equity exposure of the fund had a negative impact on the performance of the fund relative to the S&P 500 Index during 2017.
Investment Objective
The investment objective of the Fund is to provide income and long-term capital appreciation.
Average Annual Total Returns
as of December 31, 2017
| 1
Year | 5
Year | 10
Year |
Balanced Fund Retail Class | 14.74% | 8.37% | 4.17% |
Balanced Fund Institutional Class | 15.25% | — | — |
Balanced Fund Adviser Class | 15.21% | — | — |
Blended Index | 10.09% | 7.23% | 5.12% |
S&P 500 Index | 21.83% | 15.79% | 8.50% |
Top 10 Holdings
as of December 31, 2017
1. | iShares 7-10 Year Treasury Bond ETF | 4.3% |
2. | iShares Core U.S. Aggregate Bond ETF | 4.2% |
3. | iShares 3-7 Year Treasury Bond ETF | 3.7% |
4. | iShares Russell 2000 Growth ETF | 3.0% |
5. | Prudential Total Return Bond Fund - Z | 1.7% |
6, | iShares JP Morgan USD Emerging Markets Bond ETF | 1.7% |
7. | Apple, Inc. | 1.6% |
8. | JPMorgan Core Plus Bond Fund - L | 1.5% |
9. | Lord Abbett High Yield Fund - I | 1.5% |
10. | Baird Core Plus Bond Fund - I | 1.5% |
As a percentage of total net assets. Holdings exclude short term investments and derivatives.
Sector Concentration
as of December 31, 2017
Information Technology | 11.8% |
Financials | 8.4% |
Healthcare | 6.5% |
Consumer Discretionary | 5.4% |
Industrials | 4.5% |
Energy | 3.3% |
Consumer Staples | 3.3% |
Real Estate Investment Trust | 1.7% |
Materials | 1.4% |
Telecommunication Services | 1.2% |
Utilities | 1.1% |
Registered Investment Companies | 33.4% |
Money Market Registered Investment Companies | 16.6% |
Bank Obligations | 0.5% |
Other Assets/Liabilities (Net) | 0.9% |
Total | 100.0% |
As a percentage of total net assets. Concentrations are subject to change. The Fund has invested in stock index futures contracts in order to equitize cash balances held in the Fund.
2017 Annual Report | December 31, 2017 | Page 7 |
Growth of $10,000
as of December 31, 2017

This chart compares the Balanced Fund’s Retail Share Class over the period shown with dividends and capital gains reinvested against the Fund’s benchmarks. The benchmark indices are unmanaged and do not take into account the deduction of expenses associated with a mutual fund, such as investment management and accounting fees. One cannot invest directly in an index.
The chart and the table do not reflect the deduction of taxes that a shareholder would pay on Fund distributions or the redemption of Fund shares. The performance data shown represents past performance, which does not guarantee future results. The investment return and principal value of an investment will fluctuate so that an investor’s shares, when redeemed, may be worth more or less than their original cost. Current performance may be lower or higher than the performance data quoted.
The Blended Index is comprised 42% of the S&P 500 Index, 28% of the average 90-day T-bills, and 30% of the Bloomberg Barclays US Aggregate Bond Index.
Page 8 | 2017 Annual Report | December 31, 2017 |
Global Allocation Fund
The Meeder Global Allocation Fund Institutional Class returned 23.07% compared to the MSCI ACWI benchmark return of 23.97%, the Bloomberg Barclay’s Aggregate Bond Index return of 3.54%, and the Blended Index return of 13.15%. For the year 2017, the largest average sector weightings in the portfolio were Information Technology, Financials and Real Estate. The largest sector contributors were Energy and Consumer Staples while the top individual contributors for the year included NVIDIA, Boeing and Apple. The smallest average sector weightings in the portfolio were Consumer Staples, Consumer Discretionary and Telecommunications. The largest sector detractors were Consumer Discretionary and Information Technology, while individual detractors were United Continental Holdings, Electronic Arts and Celgene Corporation. On November 20, 2017 the fund changed its mandate by eliminating the target allocations focus and implemented new allocation bands. The bands now range from 10-90% equity, 10-90% fixed income and a minimum of at least 40% non U.S. equity or debt.
We began increasing exposure to international markets in the first quarter of 2017, starting with developed international and eventually adding positions in emerging markets as well. Our models indicated opportunities in international markets primarily as a result of positive price and currency momentum. We maintained overweight positions in international markets through year end.
We utilized equity index derivatives in the Fund, such as stock index futures to equitize cash positions. Since these derivatives are designed to track a respective stock index, there was no discernable impact to the Fund’s relative performance in 2017.
Investment Objective
The investment objective of the Fund is to provide long-term capital appreciation.
Average Annual Total Returns
as of December 31, 2017
| 1
Year | 5
Year | 10
Year |
Global Allocation Fund Retail Class | 22.33% | 9.03% | 4.02% |
Global Allocation Fund Institutional Class | 23.07% | — | — |
Global Allocation Fund Adviser Class | 22.84% | — | — |
MSCI ACWI Index | 23.97% | 10.80% | 4.65% |
Blended Index | 13.15% | 6.16% | 3.39% |
Bloomberg Barclays US Aggregate Bond Index | 3.54% | 2.10% | 4.01% |
S&P 500 Index | 21.83% | 15.79% | 8.50% |
Sector Concentration
as of December 31, 2017
Information Technology | 11.2% |
Healthcare | 7.6% |
Financials | 6.9% |
Industrials | 3.8% |
Consumer Discretionary | 3.6% |
Energy | 2.4% |
Consumer Staples | 2.3% |
Real Estate Investment Trust | 1.6% |
Materials | 0.9% |
Utilities | 0.6% |
Telecommunication Services | 0.4% |
Registered Investment Companies | 39.9% |
Money Market Registered Investment Companies | 15.8% |
Bank Obligations | 2.0% |
Other Assets/Liabilities (Net) | 1.0% |
Total | 100.0% |
As a percentage of total net assets. Concentrations are subject to change. The Fund has invested in stock index futures contracts in order to equitize cash balances held in the Fund.
Top 10 Holdings
as of December 31, 2017
1. | iShares Core MSCI EAFE ETF | 22.1% |
2. | iShares Core MSCI Emerging Markets ETF | 4.7% |
3. | Goldman Sachs Emerging Markets Equity Insights Fund - I | 2.6% |
4. | iShares 7-10 Year Treasury Bond ETF | 1.8% |
5. | iShares 3-7 Year Treasury Bond ETF | 1.6% |
6, | Apple, Inc. | 1.4% |
7. | iShares Core U.S. Aggregate Bond ETF | 1.4% |
8. | Microsoft Corp. | 1.0% |
9. | Berkshire Hathaway, Inc. Class B | 0.9% |
10. | Bank of America Corp. | 0.7% |
As a percentage of total net assets. Holdings exclude short term investments and derivatives.
2017 Annual Report | December 31, 2017 | Page 9 |
Growth of $10,000
as of December 31, 2017

This chart compares the Global Allocation Fund’s Retail Share Class over the period shown with dividends and capital gains reinvested against the Fund’s benchmarks. The benchmark indices are unmanaged and do not take into account the deduction of expenses associated with a mutual fund, such as investment management and accounting fees. One cannot invest directly in an index.
The chart and the table do not reflect the deduction of taxes that a shareholder would pay on Fund distributions or the redemption of Fund shares. The performance data shown represents past performance, which does not guarantee future results. The investment return and principal value of an investment will fluctuate so that an investor’s shares, when redeemed, may be worth more or less than their original cost. Current performance may be lower or higher than the performance data quoted.
Since November 20, 2017, the Blended Index is comprised of 54% MSCI ACWI, 36% of 90 day T-Bills and 10% Bloomberg Barclays US Aggregate Bond Index. This Blended Index provides a better representation of the average composition of that Fund since that date.
Page 10 | 2017 Annual Report | December 31, 2017 |
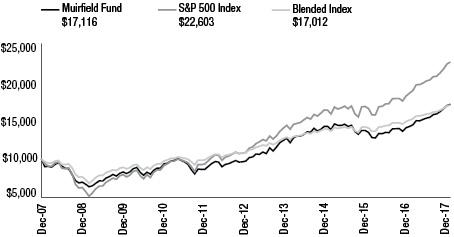
Spectrum Fund
The Meeder Spectrum Fund Institutional Class returned 19.75% compared to the Blended Index return of 13.00% and the S&P 500 Index return of 21.83%. For the year 2017, the largest average sector weightings in the portfolio were Information Technology, Healthcare and Financials. The largest sector contributors were Information Technology and Energy, while the top individual contributors for the year included Apple, Microsoft and Boeing. The smallest average sector weightings in the portfolio were Real Estate, Materials and Utilities. The largest sector detractors were Telecommunications and Financials while the biggest individual detractors were Altaba, Workday Inc. and Heico Corporation. In January of 2017 we increased our equity exposure to being fully invested. We maintained a range of equity exposure that did not decline below 90% throughout the year.
In the beginning of February, our international model signaled a change that favored developed international due to near-term momentum and currency metrics. For most of the year, valuations favored developed international and emerging market equities. We then increased our allocation that ranged from 3 to 12% throughout the remainder of the year, which was split among developed and emerging market equities. These international allocations were a positive contributor to the fund’s performance.
In the portfolio, we will often use equity index derivatives in the Fund, such as stock index futures, to efficiently equitize our cash positions as well as manage the equity exposure of the fund. In regard to equitizing cash positions, these derivatives are designed to track their respective stock index, so there was no discernible impact to the Fund’s relative performance. The use of stock index futures to manage the equity exposure of the fund had a negative impact on the performance of the fund relative to the S&P 500 Index during 2017.
Investment Objective
The investment objective of the Fund is to provide long-term capital appreciation.
Average Annual Total Returns
as of December 31, 2017
| 1
Year | Since
Inception | Inception
Date |
Spectrum Fund Retail Class | 19.28% | 8.02% | 1/1/15 |
Spectrum Fund Institutional Class | 19.75% | — | — |
Spectrum Fund Adviser Class | 19.65% | — | — |
Blended Index | 13.00% | 7.02% | 1/1/15 |
S&P 500 Index | 21.83% | 11.44% | 1/1/15 |
Top 10 Holdings
as of December 31, 2017
1. | Apple, Inc. | 1.8% |
2. | Microsoft Corp. | 1.4% |
3. | Berkshire Hathaway, Inc. Class B | 1.2% |
4. | Facebook, Inc. Class A | 0.9% |
5. | Alphabet, Inc. Class C | 0.9% |
6, | Amazon.com, Inc. | 0.9% |
7. | Johnson & Johnson | 0.8% |
8. | Exxon Mobil Corp. | 0.8% |
9. | PepsiCo, Inc. | 0.8% |
10. | Boeing Co./The | 0.7% |
As a percentage of total net assets. Holdings exclude short term investments and derivatives.
Sector Concentration
as of December 31, 2017
Long Positions | |
Financials | 20.7% |
Information Technology | 19.4% |
Healthcare | 12.0% |
Industrials | 11.7% |
Consumer Discretionary | 8.8% |
Consumer Staples | 6.3% |
Energy | 4.8% |
Utilities | 4.1% |
Real Estate Investment Trust | 3.9% |
Materials | 3.0% |
Telecommunication Services | 1.1% |
Money Market Registered Investment Companies | 3.8% |
Bank Obligations | 0.6% |
Other Assets/Liabilities (Net) | 39.9% |
Total Long | 140.1% |
Short Positions | |
Financials | (12.7%) |
Industrials | (5.6%) |
Information Technology | (5.2%) |
Utilities | (3.8%) |
Materials | (3.3%) |
Consumer Discretionary | (3.2%) |
Consumer Staples | (2.5%) |
Real Estate Investment Trust | (1.7%) |
Energy | (0.9%) |
Healthcare | (0.8%) |
Telecommunication Services | (0.4%) |
Total Short | (40.1%) |
Total | 100.0% |
As a percentage of total net assets. Concentrations are subject to change. The Fund has invested in stock index futures contracts in order to equitize cash balances held in the Fund.
2017 Annual Report | December 31, 2017 | Page 11 |
Growth of $10,000
as of December 31, 2017
This chart compares the Spectrum Fund’s Retail Share Class over the period shown with dividends and capital gains reinvested against the Fund’s benchmarks. The benchmark indices are unmanaged and do not take into account the deduction of expenses associated with a mutual fund, such as investment management and accounting fees. One cannot invest directly in an index.
The chart and the table do not reflect the deduction of taxes that a shareholder would pay on Fund distributions or the redemption of Fund shares. The performance data shown represents past performance, which does not guarantee future results. The investment return and principal value of an investment will fluctuate so that an investor’s shares, when redeemed, may be worth more or less than their original cost. Current performance may be lower or higher than the performance data quoted.
The Blended Index is comprised 60% of the S&P 500 Index and 40% of 90-day T-bills.
Page 12 | 2017 Annual Report | December 31, 2017 |
Quantex Fund
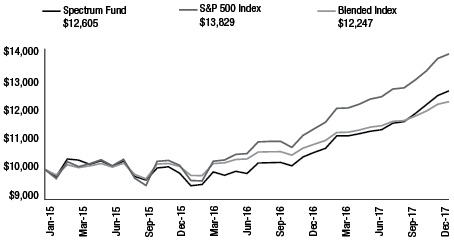
The Meeder Quantex Fund returned 13.84% for the year ending December 31, 2017. During the same time period, the S&P MidCap 400 Index and Russell 2000 Indexes returned 16.24% and 14.65%, respectively.
We use a quantitative model to identify the capitalization ranges that incorporate our ideal portfolio of small- and mid-capitalization companies with strong growth potential each calendar year. Individual securities for the portfolio are equally weighted at the beginning of the year.
The portfolio’s performance was primarily driven by our sector allocations. Consumer discretionary, Industrials and Information Technology were the largest sector weightings in the portfolio, while our largest underweights were in Telecommunications and Consumer Staples. The largest sector contributors were Real Estate and Consumer Staples, while the biggest individual contributors to performance were Restoration Hardware, NRG Energy and KB Home. Vista Outdoor, Frontier Communications and Endo International were the largest individual detractors to performance.
We utilized equity index derivatives in the Fund, such as stock index futures to equitize cash positions. Since these derivatives are designed to track a respective stock index, there was no discernable impact to the Fund’s relative performance in 2017.
Investment Objective
The investment objective of the Fund is to provide long-term capital appreciation.
Average Annual Total Returns
as of December 31, 2017
| 1
Year | 5
Year | 10
Year |
Quantex Fund Retail Class | 13.42% | 14.66% | 10.70% |
Quantex Fund Institutional Class | 13.84% | — | — |
Quantex Fund Adviser Class | 13.68% | — | — |
Blended Index | 15.47% | 14.60% | 9.38% |
Russell 2000 Index | 14.65% | 14.12% | 8.71% |
S&P MidCap 400 Index | 16.24% | 15.01% | 9.97% |
Growth of $10,000
as of December 31, 2017
This chart compares the value of the Quantex Fund’s Retail Share Class over the period shown with dividends and capital gains reinvested against the Fund’s benchmarks. The benchmark indices are unmanaged and do not take into account the deduction of expenses associated with a mutual fund, such as investment management and accounting fees. One cannot invest directly in an index.
The chart and the table do not reflect the deduction of taxes that a shareholder would pay on Fund distributions or the redemption of Fund shares. The performance data shown represents past performance, which does not guarantee future results. The investment return and principal value of an investment will fluctuate so that an investor’s shares, when redeemed, may be worth more or less than their original cost. Current performance may be lower or higher than the performance data quoted.
Top 10 Holdings
as of December 31, 2017
1. | RH | 2.2% |
2. | NRG Energy, Inc. | 1.8% |
3. | First Solar, Inc. | 1.6% |
4. | KB Home | 1.6% |
5. | Wynn Resorts, Ltd. | 1.5% |
6, | PulteGroup, Inc. | 1.4% |
7. | FMC Corp. | 1.3% |
8. | Avery Dennison Corp. | 1.3% |
9. | Total System Services, Inc. | 1.2% |
10. | Kemper Corp. | 1.2% |
As a percentage of total net assets. Holdings exclude short term investments and derivatives.
Sector Concentration
as of December 31, 2017
Consumer Discretionary | 32.5% |
Industrials | 14.8% |
Information Technology | 11.9% |
Healthcare | 10.0% |
Financials | 5.6% |
Utilities | 5.2% |
Materials | 4.5% |
Energy | 3.6% |
Real Estate Investment Trust | 3.0% |
Consumer Staples | 1.3% |
Telecommunication Services | 0.1% |
Money Market Registered Investment Companies | 5.5% |
Bank Obligations | 1.5% |
Other Assets/Liabilities (Net) | 0.5% |
Total | 100.0% |
As a percentage of total net assets. Concentrations are subject to change. The Fund has invested in stock index futures contracts in order to equitize cash balances held in the Fund.
The Blended Index consists of 50% of the Russell 2000 Index and 50% of the S&P MidCap 400 Index.
2017 Annual Report | December 31, 2017 | Page 13 |
Conservative Allocation Fund
The Meeder Conservative Allocation Fund Institutional Class returned 8.10% compared to the S&P 500 Index return of 21.83%, the Bloomberg Barclays U.S. Aggregate Bond Index return of 3.54%, the Morningstar Global Equity Infrastructure Index return of 18.95%, and the Blended Index return of 6.33%. For the year 2017, the largest average sector weightings in the portfolio were Utilities, Energy, and Information Technology. Consumer Staples and Financials were the largest sector detractors while the top individual contributors for the year included Veolia Environnement, Corning and Nextera Energy Partners. The smallest average sector weightings in the portfolio were Financials, Consumer Staples and Materials. The largest sector detractors were Energy and Telecommunications while the biggest individual detractors were Targa Res Corp, Kinder Morgan and Dish Network. On November 20, 2017 the fund changed its mandate by eliminating its Infrastructure focus. The new strategy has allocation bands of 0-30% equity and 70-100% fixed income.
In the portfolio, we will often use equity index derivatives in the Fund, such as stock index futures, to efficiently equitize our cash positions as well as manage the equity exposure of the fund. In regard to equitizing cash positions, these derivatives are designed to track their respective stock index, so there was no discernible impact to the Fund’s relative performance. The use of stock index futures to manage the equity exposure of the fund had a negative impact on the performance of the fund relative to the S&P 500 Index during 2017.
Investment Objective
The investment objective of the Fund is to provide income and long-term capital appreciation.
Average Annual Total Returns
as of December 31, 2017
| 1
Year | 5
Year | 10
Year |
Conservative Allocation Fund Retail Class | 7.64% | 8.63% | 4.02% |
Conservative Allocation Fund Institutional Class | 8.10% | — | — |
Conservative Allocation Fund Adviser Class | 8.01% | — | — |
S&P 500 Index | 21.83% | 15.79% | 8.50% |
Bloomberg Barclays US Aggregate Bond Index | 3.54% | 2.10% | 4.01% |
Blended Index | 6.33% | 4.30% | 4.54% |
Morningstar Global Equity Infrastructure Index | 18.95% | 9.82% | 4.33% |
Sector Concentration
as of December 31, 2017
Information Technology | 6.5% |
Healthcare | 4.7% |
Financials | 4.0% |
Industrials | 2.5% |
Consumer Discretionary | 2.5% |
Consumer Staples | 1.6% |
Energy | 1.5% |
Real Estate Investment Trust | 1.0% |
Materials | 0.8% |
Utilities | 0.3% |
Telecommunication Services | 0.2% |
Registered Investment Companies | 70.6% |
Money Market Registered Investment Companies | 1.4% |
Bank Obligations | 2.0% |
Other Assets/Liabilities (Net) | 0.4% |
Total | 100.0% |
As a percentage of total net assets. Concentrations are subject to change. The Fund has invested in stock index futures contracts in order to equitize cash balances held in the Fund.
Top 10 Holdings
as of December 31, 2017
1. | iShares 7-10 Year Treasury Bond ETF | 12.1% |
2. | iShares 3-7 Year Treasury Bond ETF | 10.5% |
3. | iShares Core U.S. Aggregate Bond ETF | 7.6% |
4. | Vanguard Total Bond Market ETF | 4.4% |
5. | TCW Emerging Markets Income Fund - I | 3.9% |
6, | Lord Abbett High Yield Fund - I | 3.9% |
7. | iShares JP Morgan USD Emerging Markets Bond ETF | 3.8% |
8. | Prudential Total Return Bond Fund - Z | 3.1% |
9. | Baird Core Plus Bond Fund - I | 2.7% |
10. | Guggenheim Total Return Bond Fund - I | 2.7% |
As a percentage of total net assets. Holdings exclude short term investments and derivatives.
Page 14 | 2017 Annual Report | December 31, 2017 |
Growth of $10,000
as of December 31, 2017

This chart compares the Conservative Allocation Fund’s Retail Share Class over the period shown with dividends and capital gains reinvested against the Fund’s benchmarks. The benchmark indices are unmanaged and do not take into account the deduction of expenses associated with a mutual fund, such as investment management and accounting fees. One cannot invest directly in an index.
The chart and the table do not reflect the deduction of taxes that a shareholder would pay on Fund distributions or the redemption of Fund shares. The performance data shown represents past performance, which does not guarantee future results. The investment return and principal value of an investment will fluctuate so that an investor’s shares, when redeemed, may be worth more or less than their original cost. Current performance may be lower or higher than the performance data quoted.
Since November 20, 2017, the Bloomberg Barclays US Aggregate Bond Index is the broad-based securities market index for the Fund.
Since November 20, 2017, the Blended Index is comprised 18% of the S&P 500 Index, 12% of the average 90-day T-bills, and 70% of the Bloomberg Barclays US Aggregate Bond Index. This Blended Index provides a better representation of the average composition of that Fund since that date.
Prior to that date, the Morningstar Global Equity Infrastructure Index was used as the broad-based securities market index for the Fund. This change reflects the change in the Fund’s name and investment strategy.
2017 Annual Report | December 31, 2017 | Page 15 |
Moderate Allocation Fund
The Meeder Moderate Allocation Fund Institutional Class returned 16.55% compared to the S&P 500 Index return of 21.83%, the Bloomberg Barclays U.S. Aggregate Bond Index return of 3.54%, and the Blended Index return of 8.22%. For the year 2017, the largest average sector weightings in the portfolio were Financials, Information Technology and Industrials. The biggest contributors to performance by sector were Real Estate and Telecommunications as the top individual contributors for the year included J.P. Morgan Chase, Bank of America and Wal-Mart. The smallest average sector weightings in the portfolio were Consumer Staples, Real Estate and Telecommunications. The biggest detractors to performance by sector were Information Technology and Financials as the largest individual detractors were SM Energy, Foot Locker and United States Steel Corporation. On November 20, 2017 the fund changed its mandate by eliminating the dividend component and equity focus. The new strategy focus has allocation bands of 0-50% equity and 50-100% fixed income.
We began adding tactical exposure to international markets in the first quarter of 2017, starting with developed international and eventually adding positions in emerging markets as well. Our models indicated opportunities in international markets primarily as a result of positive price and currency momentum. We maintained tactical positions in international markets through year end.
In the portfolio, we will often use equity index derivatives in the Fund, such as stock index futures, to efficiently equitize our cash positions as well as manage the equity exposure of the fund. In regard to equitizing cash positions, these derivatives are designed to track their respective stock index, so there was no discernible impact to the Fund’s relative performance. The use of stock index futures to manage the equity exposure of the fund had a negative impact on the performance of the fund relative to the S&P 500 Index during 2017.
Investment Objective
The investment objective of the Fund is to provide total return, including capital appreciation, and current income.
Average Annual Total Returns
as of December 31, 2017
| 1
Year | Since
Inception | Inception
Date |
Moderate Allocation Fund Retail Class | 15.99% | 9.17% | 6/30/15 |
Moderate Allocation Fund Institutional Class | 16.55% | — | — |
Moderate Allocation Fund Adviser Class | 16.40% | — | — |
S&P 500 Index | 21.83% | 13.29% | — |
Bloomberg Barclays US Aggregate Bond Index | 3.54% | 2.73% | — |
Blended Index | 8.22% | 5.47% | — |
Sector Concentration
as of December 31, 2017
Information Technology | 12.0% |
Financials | 8.0% |
Healthcare | 7.9% |
Consumer Discretionary | 4.2% |
Industrials | 3.7% |
Consumer Staples | 2.3% |
Energy | 2.2% |
Materials | 1.1% |
Real Estate Investment Trust | 0.8% |
Utilities | 0.6% |
Telecommunication Services | 0.3% |
Registered Investment Companies | 50.5% |
Money Market Registered Investment Companies | 4.3% |
Bank Obligations | 1.5% |
Other Assets/Liabilities (Net) | 0.6% |
Total | 100.0% |
As a percentage of total net assets. Concentrations are subject to change. The Fund has invested in stock index futures contracts in order to equitize cash balances held in the Fund.
Top 10 Holdings
as of December 31, 2017
1. | iShares 7-10 Year Treasury Bond ETF | 8.7% |
2. | iShares 3-7 Year Treasury Bond ETF | 7.5% |
3. | iShares Core U.S. Aggregate Bond ETF | 7.3% |
4. | iShares JP Morgan USD Emerging Markets Bond ETF | 2.9% |
5. | TCW Emerging Markets Income Fund - I | 2.6% |
6, | Lord Abbett High Yield Fund - I | 2.5% |
7. | Vanguard Total Bond Market ETF | 2.4% |
8. | Prudential Total Return Bond Fund - Z | 2.1% |
9. | Baird Core Plus Bond Fund - I | 1.8% |
10. | JPMorgan Core Plus Bond Fund - L | 1.8% |
As a percentage of total net assets. Holdings exclude short term investments and derivatives.
Page 16 | 2017 Annual Report | December 31, 2017 |
Growth of $10,000
as of December 31, 2017

This chart compares the Moderate Allocation Fund’s Retail Share Class over the period shown with dividends and capital gains reinvested against the Fund’s benchmarks. The benchmark indices are unmanaged and do not take into account the deduction of expenses associated with a mutual fund, such as investment management and accounting fees. One cannot invest directly in an index.
The chart and the table do not reflect the deduction of taxes that a shareholder would pay on Fund distributions or the redemption of Fund shares. The performance data shown represents past performance, which does not guarantee future results. The investment return and principal value of an investment will fluctuate so that an investor’s shares, when redeemed, may be worth more or less than their original cost. Current performance may be lower or higher than the performance data quoted.
Since November 20, 2017, the Bloomberg Barclays US Aggregate Bond Index is the broad-based securities market index for the Fund. Prior to that date, the S&P 500 Index was used as the broad-based securities market index for the Fund. This change reflects the change in the Fund’s name and investment strategy.
Since November 20, 2017, the Blended Index is comprised 30% of the S&P 500 Index, 20% of the average 90-day T-bills, and 50% of the Bloomberg Barclays US Aggregate Bond Index. This Blended Index provides a better representation of the average composition of that Fund since that date.
2017 Annual Report | December 31, 2017 | Page 17 |
Total Return Bond Fund
The Meeder Total Return Bond Fund Institutional Class was positive 4.20% for the year compared to the Bloomberg Barclays U.S. Aggregate Bond Index which returned 3.54%. The Fund maintained an emerging market debt allocation near 30% of the portfolio until the middle of November. The allocation to below investment-grade securities ranged from approximately 20-30% except for part of April, when sector momentum slowed and we reduced the exposure to near 10%. This continued until November 20, 2017 when the Fund updated its investment strategy. The new asset mix limits the Fund’s (domestic and foreign) below investment-grade exposure to a maximum of 35% and international debt exposure to a maximum of 30%. There is also an increased focus on investment-grade bonds.
Fixed income markets remained mostly quiet; however, emerging market debt and high yield asset classes were an exception as both experienced volatility when rumors of a default on Venezuelan debt began circulating in mid-November. Venezuela’s state-owned oil and natural gas company was late on a $1.1 billion bond payment in November. Technically a default did not occur, however this event has raised a broader awareness around the volatility involved with high yield and emerging market debt for fixed income investors. The Federal Reserve raised the short-term lending rate a total of three times over the year, leaving the final range from 1.25%-1.50%. This has contributed to the Treasury yield curve flattening considerably this year as the yield differential between 10- and 2-year Treasuries has become much closer. A flattening yield curve is a concern for economists as it historically has been an early indicator of an economic slow-down.
Investment Objective
The investment objective of the Fund is to provide total return, consisting of income and capital growth, consistent with minimizing the risk of loss of capital.
Average Annual Total Returns
as of December 31, 2017
| 1
Year | 5
Year | Since
Inception | Inception
Date |
Total Return Bond Fund Retail Class | 3.72% | 1.47% | 2.37% | 6/30/11 |
Total Return Bond Fund Institutional Class | 4.20% | — | 2.46% | 11/1/16 |
Total Return Bond Fund Adviser Class | 4.07% | — | 2.44% | 11/1/16 |
Bloomberg Barclays US Aggregate Bond Index | 3.54% | 2.10% | 3.03% | — |
Growth of $10,000
as of December 31, 2017

This chart compares the Total Return Bond Fund’s Retail Share Class over the period shown with dividends and capital gains reinvested against the Fund’s benchmarks. The benchmark index is unmanaged and does not take into account the deduction of expenses associated with a mutual fund, such as investment management and accounting fees. One cannot invest directly in an index.
The chart and the table do not reflect the deduction of taxes that a shareholder would pay on Fund distributions or the redemption of Fund shares. The performance data shown represents past performance, which does not guarantee future results. The investment return and principal value of an investment will fluctuate so that an investor’s shares, when redeemed, may be worth more or less than their original cost. Current performance may be lower or higher than the performance data quoted.
Top 10 Holdings
as of December 31, 2017
1. | iShares 7-10 Year Treasury Bond ETF | 15.7% |
2. | iShares 3-7 Year Treasury Bond ETF | 13.4% |
3. | iShares Core U.S. Aggregate Bond ETF | 10.6% |
4. | iShares JP Morgan USD Emerging Markets Bond ETF | 6.6% |
5. | Vanguard Total Bond Market ETF | 5.0% |
6, | iShares iBoxx $ High Yield Corporate Bond ETF | 4.8% |
7. | SPDR Bloomberg Barclays High Yield Bond ETF | 4.7% |
8. | Prudential Total Return Bond Fund - Z | 4.5% |
9. | Baird Core Plus Bond Fund - I | 4.0% |
10. | Guggenheim Total Return Bond Fund - I | 3.9% |
As a percentage of total net assets. Holdings exclude short term investments and derivatives.
Page 18 | 2017 Annual Report | December 31, 2017 |
Prime Money Market Fund
The Meeder Prime Money Market Fund is a constant net asset value (CNAV) fund offered only to natural persons. The objective of this fund is to maintain a CNAV at $1.00 per share while offering a competitive return to shareholders. The adviser to the Fund accomplishes the objective by investing in short-term, high-quality money market debt obligations. Money market debt obligations may be offered by the U.S. Government and its agencies, but may also include obligations of fundamentally sound corporate issuers.
The Money Market Fund industry entered 2017 with a fresh outlook. Over the past two years, the industry had been diligently addressing required regulatory changes aimed at enhancing shareholder safety. The changes were finalized later in 2016 and expected to support the main objectives of the industry which are limited risk and strong liquidity. In the midst of the overhaul, the Federal Open Market Committee (FOMC) also embarked on a path favorable to shareholders known as higher interest rates. This actually began at the end of 2015, but at an exceptionally slow pace. The Committee acted once again in December 2016, but then also signaled the potential for multiple changes to its target rate in 2017. With that information in hand, participants across the industry were eager to put regulatory changes behind them and focus on a more advantageous market environment. By the end of the year the FOMC had increased its benchmark rate on three occasions.
Typically with a change to monetary policy, the adviser will adjust the portfolio to best fit its strategy. However, the course instituted by FOMC to date continued to favor accommodation to investors. Consequently, the advisor believed it did not warrant significant adjustment to the Fund’s investment strategy. Historically, the Fund has maintained ample liquidity in an effort to provide safety first. The liquidity has also been a solid tool for taking advantage of investment opportunities when they arise. With elevated interest rates throughout 2017, the portfolio management team was afforded an expanded array of investment options with which to add value for shareholders.
During the year the portfolio management team targeted a stable weighted average maturity. This strategy allowed the management team opportunity to alter investments if the environment changed. At this time we believe the FOMC is potentially pushing ahead with more interest rate increases. However, we anticipate the path and timeline to be more drawn out versus historical interest rate cycles. Our sector allocation favors an overweight in high-quality liquid investments. Although with the boost in interest rates, opportunities should remain abundant to replenish our position in short-term, high-quality corporate debt without adding undo risk.
As we completed 2017, our belief was that the Fund should be positioned to maintain strong performance into 2018. In the event additional interest rate increases are triggered by the FOMC, we believe the portfolio is positioned to perform in this environment. As we continuously monitor the markets and our strategy, we will remain vigilant and act in the best interests of our shareholders.
Investment Objective
The investment objective of the Fund is to provide current income while maintaining a stable share price of $1.00.
Average Annual Total Returns
as of December 31, 2017
| 1
Year | 5
Year | 10
Year |
Meeder Prime Money Market Fund | 0.68% | 0.23% | 0.48% |
Lipper Average General Purpose Money Market Fund | 0.65% | 0.16% | 0.35% |
Annual Returns

Top 10 Holdings
as of December 31, 2017
1. | INTL FCStone Repo, 1.40%, 1/2/2018 | 19.9% |
2. | Fidelity Institutional Money Market Fund, 1.47% | 19.9% |
3. | Morgan Stanley Institutional Liquidity Government Fund, 1.20% | 10.5% |
4. | UBS AG, Stamford, CT, 2.37%, 3/26/2018 | 1.4% |
5. | Bank of Montreal, 1.69%, 3/1/2018 | 1.4% |
6. | Westpac Banking Corp., 1.95%, 1/9/2018 | 1.4% |
7. | Westpac Banking Corp., 1.60%, 1/12/2018 | 1.4% |
8. | Royal Bank of Canada, 1.50%, 1/16/2018 | 1.4% |
9. | Royal Bank of Canada, 1.73%, 5/25/2018 | 1.4% |
10. | Canadian Imperial Holdings, 1.34%, 1/2/2018 | 1.4% |
As a percentage of total net assets.
Sector Concentration
as of December 31, 2017
Commercial Paper | 32.0% |
Money Market Registered Investment Companies | 30.4% |
Repurchase Agreements | 19.9% |
Certificates of Deposit | 8.5% |
Corporate Obligations | 6.4% |
Bank Obligations | 2.8% |
Total | 100.0% |
As a percentage of total net assets. Concentrations are subject to change.
An investment in a money market fund is not insured by the FDIC or any other government agency. Although money market funds strive to preserve the value of the investments at $1.00 per share, it is possible to lose money by investing in a money market fund.
2017 Annual Report | December 31, 2017 | Page 19 |
Institutional Prime Money Market Fund
The Meeder Institutional Prime Money Market Fund offers a floating net asset value (FNAV). A FNAV fund is characterized by a net asset value which could vary incrementally above or below $1.00 per share. The objective of this fund is to maintain a FNAV near $1.00 per share while offering a competitive return to shareholders. The adviser to the Fund accomplishes the objective by investing in short-term, high-quality money market debt obligations. Money market debt obligations may be offered by the U.S. Government and its agencies, but may also include obligations of fundamentally sound corporate issuers.
The Money Market Fund industry entered 2017 with a fresh outlook. Over the past two years, the industry had been diligently addressing required regulatory changes aimed at enhancing shareholder safety. The changes were finalized later in 2016 and expected to support the main objectives of the industry which are limited risk and strong liquidity. In the midst of the overhaul, the Federal Open Market Committee (FOMC) also embarked on a path favorable to shareholders known as higher interest rates. This actually began at the end of 2015, but at an exceptionally slow pace. The Committee acted once again in December 2016, but then also signaled the potential for multiple changes to its target rate in 2017. With that information in hand, participants across the industry were eager to put regulatory changes behind them and focus on a more advantageous market environment. By the end of the year the FOMC had increased its benchmark rate on three occasions.
Typically with a change to monetary policy, the advisor will adjust the portfolio to best fit its strategy. However, the course instituted by FOMC to date continued to favor accommodation to investors. Consequently, the advisor believed it did not warrant significant adjustment to the Fund’s investment strategy. Historically, the Fund has maintained ample liquidity in an effort to provide safety first. The liquidity has also been a solid tool for taking advantage of investment opportunities when they arise. With elevated interest rates throughout 2017, the portfolio management team was afforded an expanded array of investment options with which to add value for shareholders.
During the year the portfolio management team targeted a stable weighted average maturity. This strategy allowed the management team opportunity to alter investments if the environment changed. At this time we believe the FOMC is potentially pushing ahead with more interest rate increases. However, we anticipate the path and timeline to be more drawn out versus historical interest rate cycles. Our sector allocation favors an overweight in high-quality liquid investments. Although with the boost in interest rates, opportunities should remain abundant to replenish our position in short-term, high-quality corporate debt without adding undo risk.
As we completed 2017, our belief was that the Fund should be positioned to maintain strong performance into 2018. In the event additional interest rate increases are triggered by the FOMC, we believe the portfolio is positioned to perform in this environment. As we continuously monitor the markets and our strategy, we will remain vigilant and act in the best interests of our shareholders.
Investment Objective
The investment objective of the Fund is to provide current income consistent with liquidity and the preservation of capital.
Average Annual Total Returns
as of December 31, 2017
| 1
Year | 5
Year | 10
Year |
Meeder Institutional Prime Money Market Fund | 0.96% | 0.34% | 0.59% |
Lipper Average General Purpose Money Market Fund | 0.65% | 0.16% | 0.35% |
Annual Returns

Top 10 Holdings
as of December 31, 2017
1. | South Street Repo, 1.65%, 1/2/2018 | 20.2% |
2. | Fidelity Institutional Money Market Fund, 1.47% | 10.1% |
3. | INTL FCStone Repo, 1.40%, 1/2/2018 | 7.8% |
4. | Morgan Stanley Institutional Liquidity Government Fund, 1.20% | 7.7% |
5. | American Honda Finance, 1.56%, 1/11/2018 | 1.7% |
6. | Westpac Banking Corp., 1.89%, 5/25/2018 | 0.7% |
7. | UBS AG, Stamford, CT, 2.37%, 3/26/2018 | 0.7% |
8. | Canadian Imperial Holdings, 1.69%, 7/13/2018 | 0.7% |
9. | Bank of Montreal, 1.69%, 3/1/2018 | 0.7% |
10. | Natixis NY Branch, 1.58%, 2/12/2018 | 0.7% |
As a percentage of total net assets.
Sector Concentration
as of December 31, 2017
Commercial Paper | 41.7% |
Repurchase Agreements | 28.0% |
Money Market Registered Investment Companies | 17.8% |
Certificates of Deposit | 9.0% |
Corporate Obligations | 3.3% |
Bank Obligations | 0.3% |
Other Assets/Liabilities (Net) | (0.1%) |
Total | 100.0% |
As a percentage of total net assets. Concentrations are subject to change.
The Fund’s performance prior to October 7, 2016 reflects the performance of the Meeder Money Market Fund, a predecessor fund managed equivalently to the Institutional Prime Money Market Fund.
An investment in a money market fund is not insured by the FDIC or any other government agency. Because the share price of the Fund will fluctuate, your shares may be worth more or less than what you originally paid for them.
Page 20 | 2017 Annual Report | December 31, 2017 |
Shareholder Expense Analysis (Unaudited)
Shareholders of mutual funds pay ongoing expenses, such as advisory fees, distribution and service fees (12b-1 fees) and other fund expenses. The following examples are intended to help you understand your ongoing costs (in dollars) of investing in the Funds and to compare these costs with the ongoing costs of investing in other mutual funds.
The examples below are based on an investment of $1,000 invested at the beginning of the period and held for the six-month period from June 30, 2017 to December 31, 2017.
ACTUAL EXPENSES: You may use actual account values and actual expenses, along with the amount you invested, to estimate the expenses that you paid over the period. Simply divide your account value by $1,000 (e.g.: an $8,600 account value divided by $1,000 = 8.6), then multiply the result by the number in the line under the heading “Expenses Paid During the Period” to estimate the expenses you paid on your account during this period.
HYPOTHETICAL EXAMPLE FOR COMPARISON PURPOSES: Hypothetical account values and hypothetical expenses are based on the Funds’ actual expense ratios and assume rates of return of 5% per year before expenses, which are not the Funds’ actual returns. The hypothetical account values and expenses may not be used to estimate the actual ending account balance or expenses you paid for the period. You may use this information to compare the ongoing costs of investing in the Funds to other funds. To do so, compare this 5% hypothetical example with the 5% hypothetical examples that appear in the shareholder reports of the other funds.
| | | Beginning
Account Value
(6/30/17) | Ending
Account Value (12/31/17) | Expenses Paid
During Period1
(6/30/17 -
12/31/17) | Expense Ratio2
(Annualized) |
Muirfield Fund - Retail Class | Actual | $1,000.00 | $1,109.70 | $7.18 | 1.35% |
| | Hypothetical | 1,000.00 | 1,018.40 | 6.87 | 1.35% |
Conservative Allocation Fund - Retail Class | Actual | 1,000.00 | 1,042.20 | 7.26 | 1.41% |
| | Hypothetical | 1,000.00 | 1,018.10 | 7.17 | 1.41% |
Quantex Fund - Retail Class | Actual | 1,000.00 | 1,099.90 | 8.26 | 1.56% |
| | Hypothetical | 1,000.00 | 1,017.34 | 7.93 | 1.56% |
Dynamic Allocation Fund - Retail Class | Actual | 1,000.00 | 1,115.10 | 8.00 | 1.50% |
| | Hypothetical | 1,000.00 | 1,017.64 | 7.63 | 1.50% |
Aggressive Allocation Fund - Retail Class | Actual | 1,000.00 | 1,094.20 | 9.29 | 1.76% |
| | Hypothetical | 1,000.00 | 1,016.33 | 8.94 | 1.76% |
Balanced Fund - Retail Class | Actual | 1,000.00 | 1,076.60 | 7.80 | 1.49% |
| | Hypothetical | 1,000.00 | 1,017.69 | 7.58 | 1.49% |
Global Allocation Fund - Retail Class | Actual | 1,000.00 | 1,117.50 | 8.97 | 1.68% |
| | Hypothetical | 1,000.00 | 1,016.74 | 8.54 | 1.68% |
Spectrum Fund - Retail Class | Actual | 1,000.00 | 1,113.70 | 11.51 | 2.16% |
| | Hypothetical | 1,000.00 | 1,014.32 | 10.97 | 2.16% |
Moderate Allocation Fund - Retail Class | Actual | 1,000.00 | 1,107.40 | 8.87 | 1.67% |
| | Hypothetical | 1,000.00 | 1,016.79 | 8.49 | 1.67% |
Total Return Bond Fund - Retail Class | Actual | 1,000.00 | 1,009.70 | 5.17 | 1.02% |
| | Hypothetical | 1,000.00 | 1,020.06 | 5.19 | 1.02% |
Prime Money Market Fund | Actual | 1,000.00 | 1,004.10 | 2.37 | 0.47% |
| | Hypothetical | 1,000.00 | 1,022.84 | 2.40 | 0.47% |
Institutional Prime Money Market Fund | Actual | 1,000.00 | 1,005.50 | 0.81 | 0.16% |
| | Hypothetical | 1,000.00 | 1,024.40 | 0.82 | 0.16% |
Muirfield Fund - Adviser Class | Actual | 1,000.00 | 1,108.70 | 5.58 | 1.05% |
| | Hypothetical | 1,000.00 | 1,019.91 | 5.35 | 1.05% |
Conservative Allocation Fund - Adviser Class | Actual | 1,000.00 | 1,043.90 | 1.24 | 0.24% |
| | Hypothetical | 1,000.00 | 1,024.00 | 1.22 | 0.24% |
Quantex Fund - Adviser Class | Actual | 1,000.00 | 1,100.50 | 7.68 | 1.45% |
| | Hypothetical | 1,000.00 | 1,017.90 | 7.37 | 1.45% |
2017 Annual Report | December 31, 2017 | Page 21 |
| | | Beginning
Account Value
(6/30/17) | Ending
Account Value (12/31/17) | Expenses Paid
During Period1
(6/30/17 -
12/31/17) | Expense Ratio2
(Annualized) |
Dynamic Allocation Fund - Adviser Class | Actual | $1,000.00 | $1,116.60 | $7.10 | 1.33% |
| | Hypothetical | 1,000.00 | 1,018.50 | 6.77 | 1.33% |
Aggressive Allocation Fund - Adviser Class | Actual | 1,000.00 | 1,095.20 | 7.18 | 1.36% |
| | Hypothetical | 1,000.00 | 1,018.35 | 6.92 | 1.36% |
Balanced Fund - Adviser Class | Actual | 1,000.00 | 1,077.80 | 5.97 | 1.14% |
| | Hypothetical | 1,000.00 | 1,019.46 | 5.80 | 1.14% |
Global Allocation Fund - Adviser Class | Actual | 1,000.00 | 1,119.60 | 7.05 | 1.32% |
| | Hypothetical | 1,000.00 | 1,018.55 | 6.72 | 1.32% |
Spectrum Fund - Adviser Class | Actual | 1,000.00 | 1,116.20 | 8.91 | 1.67% |
| | Hypothetical | 1,000.00 | 1,016.79 | 8.49 | 1.67% |
Moderate Allocation Fund - Adviser Class | Actual | 1,000.00 | 1,109.60 | 6.49 | 1.22% |
| | Hypothetical | 1,000.00 | 1,019.06 | 6.21 | 1.22% |
Total Return Bond Fund - Adviser Class | Actual | 1,000.00 | 1,010.40 | 4.46 | 0.88% |
| | Hypothetical | 1,000.00 | 1,020.77 | 4.48 | 0.88% |
Muirfield Fund - Institutional Class | Actual | 1,000.00 | 1,111.20 | 4.52 | 0.85% |
| | Hypothetical | 1,000.00 | 1,020.92 | 4.33 | 0.85% |
Conservative Allocation Fund - Institutional Class | Actual | 1,000.00 | 1,044.30 | -3.45 | -0.67% |
| | Hypothetical | 1,000.00 | 1,028.58 | -3.43 | -0.67% |
Quantex Fund - Institutional Class | Actual | 1,000.00 | 1,101.80 | 6.25 | 1.18% |
| | Hypothetical | 1,000.00 | 1,019.26 | 6.01 | 1.18% |
Dynamic Allocation Fund - Institutional Class | Actual | 1,000.00 | 1,117.10 | 5.66 | 1.06% |
| | Hypothetical | 1,000.00 | 1,019.86 | 5.40 | 1.06% |
Aggressive Allocation Fund - Institutional Class | Actual | 1,000.00 | 1,098.00 | 5.82 | 1.10% |
| | Hypothetical | 1,000.00 | 1,019.66 | 5.60 | 1.10% |
Balanced Fund - Institutional Class | Actual | 1,000.00 | 1,079.20 | 5.14 | 0.98% |
| | Hypothetical | 1,000.00 | 1,020.27 | 4.99 | 0.98% |
Global Allocation Fund - Institutional Class | Actual | 1,000.00 | 1,121.80 | 5.29 | 0.99% |
| | Hypothetical | 1,000.00 | 1,020.21 | 5.04 | 0.99% |
Spectrum Fund - Institutional Class | Actual | 1,000.00 | 1,117.10 | 8.91 | 1.67% |
| | Hypothetical | 1,000.00 | 1,016.79 | 8.49 | 1.67% |
Moderate Allocation Fund - Institutional Class | Actual | 1,000.00 | 1,111.00 | 5.32 | 1.00% |
| | Hypothetical | 1,000.00 | 1,020.16 | 5.09 | 1.00% |
Total Return Bond Fund - Institutional Class | Actual | 1,000.00 | 1,011.70 | 3.50 | 0.69% |
| | Hypothetical | 1,000.00 | 1,021.73 | 3.52 | 0.69% |
Please note that the expenses shown in the tables are meant to highlight your ongoing costs only and do not reflect any transactional costs, such as redemption fees or exchange fees. Therefore, hypothetical information is useful in comparing ongoing costs only, and will not help you determine the relative total costs of owning different funds. In addition, if any transactional costs were included, your costs would have been higher.
1 | Expenses are equal to the Funds’ annualized expense ratios, multiplied by the average account value over the period by 184/365 (to reflect the total number of days in the six-month period). |
2 | Does not include the effects of acquired fund fees and expenses. May be influenced by the timing of reimbursements made to the Fund. |
Page 22 | 2017 Annual Report | December 31, 2017 |
2017 Annual Report
Fund Holdings & Financial Statements
Schedule of Investments
December 31, 2017
| Muirfield Fund |
| Security Description | | Shares, Contracts or
Principal
Amount ($) | | Fair
Value ($) |
| Common Stocks — 63.2% |
| Consumer Discretionary — 7.0% | | | | | | | | |
Amazon.com, Inc. (1) | | | 4,642 | | | | 5,428,680 | |
| Bed Bath & Beyond, Inc. | | | 8,982 | | | | 197,514 | |
| Best Buy Co., Inc. | | | 8,790 | | | | 601,851 | |
Burlington Stores, Inc. (1) | | | 1,242 | | | | 152,803 | |
| Carnival Corp. | | | 313 | | | | 20,774 | |
| Carter's, Inc. | | | 1,496 | | | | 175,765 | |
Charter Communications, Inc. (1) | | | 2,573 | | | | 864,425 | |
| Comcast Corp. | | | 65,425 | | | | 2,620,271 | |
| Dollar General Corp. | | | 5,647 | | | | 525,227 | |
| Extended Stay America, Inc. | | | 1,378 | | | | 26,182 | |
| Ford Motor Co. | | | 45,212 | | | | 564,698 | |
GameStop Corp. (2) | | | 15,775 | | | | 283,161 | |
| Gap, Inc./The | | | 11,519 | | | | 392,337 | |
| General Motors Co. | | | 61,165 | | | | 2,507,153 | |
| Home Depot, Inc./The | | | 22,269 | | | | 4,220,644 | |
| Kohl's Corp. | | | 2,430 | | | | 131,779 | |
| Lear Corp. | | | 10,228 | | | | 1,806,878 | |
Liberty Interactive Corp. QVC Group (1) | | | 14,104 | | | | 344,420 | |
Liberty Media Corp-Liberty SiriusXM - Class A (1) | | | 5,481 | | | | 217,376 | |
Live Nation Entertainment, Inc. (1) | | | 13,106 | | | | 557,922 | |
| Lowe's Cos., Inc. | | | 4,942 | | | | 459,309 | |
| McDonald's Corp. | | | 3,686 | | | | 634,434 | |
Michael Kors Holdings, Ltd. (1) | | | 10,450 | | | | 657,828 | |
Michaels Cos., Inc./The (1) | | | 9,967 | | | | 241,102 | |
NVR, Inc. (1) | | | 139 | | | | 487,643 | |
Priceline Group, Inc./The (1) | | | 88 | | | | 152,921 | |
| PulteGroup, Inc. | | | 18,492 | | | | 614,859 | |
| PVH Corp. | | | 5,668 | | | | 777,706 | |
| Ross Stores, Inc. | | | 10,450 | | | | 838,613 | |
| Royal Caribbean Cruises, Ltd. | | | 10,457 | | | | 1,247,311 | |
| Scripps Networks Interactive, Inc. | | | 12,922 | | | | 1,103,280 | |
| Signet Jewelers, Ltd. | | | 1,537 | | | | 86,917 | |
Skechers U.S.A., Inc. (1) | | | 4,692 | | | | 177,545 | |
| Target Corp. | | | 15,816 | | | | 1,031,994 | |
| Thor Industries, Inc. | | | 3,012 | | | | 453,969 | |
| Walt Disney Co./The | | | 12,809 | | | | 1,377,096 | |
| Whirlpool Corp. | | | 5,352 | | | | 902,561 | |
| Yum China Holdings, Inc. | | | 12,140 | | | | 485,843 | |
| | | | | | | | 33,370,791 | |
| | | | | | | | | |
| Consumer Staples — 4.1% | | | | | | | | |
| Archer-Daniels-Midland Co. | | | 19,816 | | | | 794,225 | |
| Colgate-Palmolive Co. | | | 37,411 | | | | 2,822,660 | |
| CVS Health Corp. | | | 24,637 | | | | 1,786,183 | |
| Kroger Co./The | | | 3,161 | | | | 86,769 | |
| Lamb Weston Holdings, Inc. | | | 16,487 | | | | 930,691 | |
Monster Beverage Corp. (1) | | | 7,728 | | | | 489,105 | |
| Nu Skin Enterprises, Inc. | | | 7,431 | | | | 507,017 | |
| PepsiCo, Inc. | | | 36,211 | | | | 4,342,423 | |
| Philip Morris International, Inc. | | | 3,907 | | | | 412,775 | |
Pilgrim's Pride Corp. (1) | | | 8,232 | | | | 255,686 | |
| Procter & Gamble Co./The | | | 5,881 | | | | 540,346 | |
| Tyson Foods, Inc. | | | 28,302 | | | | 2,294,443 | |
| Walgreens Boots Alliance, Inc. | | | 18,327 | | | | 1,330,907 | |
| Wal-Mart Stores, Inc. | | | 30,516 | | | | 3,013,455 | |
| | | | | | | | 19,606,685 | |
| | | | | | | | | |
| Energy — 4.3% | | | | | | | | |
| Andeavor | | | 11,502 | | | | 1,315,139 | |
| Cabot Oil & Gas Corp. | | | 24,557 | | | | 702,330 | |
| Chevron Corp. | | | 30,728 | | | | 3,846,838 | |
| Cimarex Energy Co. | | | 4,487 | | | | 547,459 | |
CONSOL Energy, Inc. (1) | | | 3,014 | | | | 119,083 | |
| Exxon Mobil Corp. | | | 61,740 | | | | 5,163,934 | |
| HollyFrontier Corp. | | | 10,356 | | | | 530,434 | |
| Marathon Petroleum Corp. | | | 27,051 | | | | 1,784,825 | |
| Occidental Petroleum Corp. | | | 3,141 | | | | 231,366 | |
| PBF Energy, Inc. | | | 11,483 | | | | 407,072 | |
| Phillips 66 | | | 24,568 | | | | 2,485,053 | |
| RPC, Inc. | | | 41,710 | | | | 1,064,856 | |
| Schlumberger, Ltd. | | | 1,289 | | | | 86,866 | |
Southwestern Energy Co. (1) | | | 3,360 | | | | 18,749 | |
| Valero Energy Corp. | | | 24,631 | | | | 2,263,835 | |
| World Fuel Services Corp. | | | 4,809 | | | | 135,325 | |
| | | | | | | | 20,703,164 | |
| | | | | | | | | |
| Financials — 11.0% | | | | | | | | |
| Aflac, Inc. | | | 11,069 | | | | 971,637 | |
| Allstate Corp./The | | | 26,136 | | | | 2,736,701 | |
| American Express Co. | | | 19,649 | | | | 1,951,342 | |
| Ameriprise Financial, Inc. | | | 9,311 | | | | 1,577,935 | |
| Annaly Capital Management, Inc. | | | 193,816 | | | | 2,304,472 | |
| Bank of America Corp. | | | 121,334 | | | | 3,581,780 | |
| Bank of New York Mellon Corp./The | | | 54,026 | | | | 2,909,840 | |
| BB&T Corp. | | | 31,557 | | | | 1,569,014 | |
Berkshire Hathaway, Inc. (1) | | | 34,501 | | | | 6,838,788 | |
| BGC Partners, Inc. | | | 27,930 | | | | 422,022 | |
| Chimera Investment Corp. | | | 798 | | | | 14,747 | |
| Citigroup, Inc. | | | 38,674 | | | | 2,877,732 | |
| CNA Financial Corp. | | | 14,458 | | | | 766,997 | |
The accompanying notes are an integral part of these financial statements.
Page 24 | 2017 Annual Report | December 31, 2017 |
Schedule of Investments
December 31, 2017
| Muirfield Fund |
| Security Description | | Shares, Contracts or
Principal
Amount ($) | | Fair
Value ($) |
| Common Stocks — continued |
| Fifth Third Bancorp | | | 82,304 | | | | 2,497,103 | |
| First American Financial Corp. | | | 15,222 | | | | 853,041 | |
| Hanover Insurance Group, Inc./The | | | 1,630 | | | | 176,170 | |
| Huntington Bancshares, Inc./OH | | | 26,617 | | | | 387,544 | |
| JPMorgan Chase & Co. | | | 50,702 | | | | 5,422,072 | |
| Lazard, Ltd. | | | 16,365 | | | | 859,163 | |
| Marsh & McLennan Cos., Inc. | | | 9,582 | | | | 779,879 | |
| MSCI, Inc. | | | 2,853 | | | | 361,019 | |
| New Residential Investment Corp. | | | 89,909 | | | | 1,607,573 | |
| Old Republic International Corp. | | | 13,693 | | | | 292,756 | |
| PNC Financial Services Group, Inc./The | | | 14,329 | | | | 2,067,531 | |
| Progressive Corp./The | | | 46,130 | | | | 2,598,042 | |
| Regions Financial Corp. | | | 88,464 | | | | 1,528,658 | |
| Reinsurance Group of America, Inc. | | | 2,538 | | | | 395,750 | |
| SEI Investments Co. | | | 3,233 | | | | 232,323 | |
| T Rowe Price Group, Inc. | | | 12,424 | | | | 1,303,650 | |
| Wells Fargo & Co. | | | 46,205 | | | | 2,803,257 | |
| | | | | | | | 52,688,538 | |
| | | | | | | | | |
| Healthcare — 8.4% | | | | | | | | |
| Abbott Laboratories | | | 7,976 | | | | 455,190 | |
| AbbVie, Inc. | | | 26,171 | | | | 2,530,997 | |
| Aetna, Inc. | | | 9,752 | | | | 1,759,163 | |
| Agilent Technologies, Inc. | | | 26,081 | | | | 1,746,645 | |
Alexion Pharmaceuticals, Inc. (1) | | | 377 | | | | 45,085 | |
Alnylam Pharmaceuticals, Inc. (1) | | | 745 | | | | 94,652 | |
| Amgen, Inc. | | | 18,082 | | | | 3,144,460 | |
| Anthem, Inc. | | | 7,556 | | | | 1,700,176 | |
| Baxter International, Inc. | | | 40,796 | | | | 2,637,053 | |
Biogen, Inc. (1) | | | 6,246 | | | | 1,989,788 | |
Bioverativ, Inc. (1) | | | 7,402 | | | | 399,116 | |
| Bristol-Myers Squibb Co. | | | 26,655 | | | | 1,633,418 | |
Celgene Corp. (1) | | | 6,445 | | | | 672,600 | |
Centene Corp. (1) | | | 4,712 | | | | 475,347 | |
Cerner Corp. (1) | | | 20,935 | | | | 1,410,810 | |
| Cigna Corp. | | | 8,414 | | | | 1,708,799 | |
Express Scripts Holding Co. (1) | | | 4,246 | | | | 316,921 | |
| Gilead Sciences, Inc. | | | 33,133 | | | | 2,373,648 | |
| Hill-Rom Holdings, Inc. | | | 1,176 | | | | 99,125 | |
| Humana, Inc. | | | 6,939 | | | | 1,721,358 | |
Intuitive Surgical, Inc. (1) | | | 4,219 | | | | 1,539,682 | |
| Johnson & Johnson | | | 30,037 | | | | 4,196,770 | |
| McKesson Corp. | | | 5,899 | | | | 919,949 | |
| Medtronic PLC | | | 10,161 | | | | 820,501 | |
| Pfizer, Inc. | | | 7,242 | | | | 262,305 | |
Premier, Inc. (1) | | | 15,812 | | | | 461,552 | |
Regeneron Pharmaceuticals, Inc. (1) | | | 235 | | | | 88,351 | |
United Therapeutics Corp. (1) | | | 3,833 | | | | 567,092 | |
| UnitedHealth Group, Inc. | | | 16,661 | | | | 3,673,084 | |
Vertex Pharmaceuticals, Inc. (1) | | | 3,100 | | | | 464,566 | |
WellCare Health Plans, Inc. (1) | | | 2,246 | | | | 451,693 | |
| | | | | | | | 40,359,896 | |
| | | | | | | | | |
| Industrials — 5.8% | | | | | | | | |
| 3M Co. | | | 2,448 | | | | 576,186 | |
| Allison Transmission Holdings, Inc. | | | 11,346 | | | | 488,672 | |
| Boeing Co./The | | | 13,290 | | | | 3,919,354 | |
| Copa Holdings SA | | | 2,134 | | | | 286,084 | |
| Cummins, Inc. | | | 14,442 | | | | 2,551,035 | |
| Delta Air Lines, Inc. | | | 32,338 | | | | 1,810,928 | |
| Eaton Corp. PLC | | | 23,358 | | | | 1,845,516 | |
| Huntington Ingalls Industries, Inc. | | | 7,811 | | | | 1,841,053 | |
| Illinois Tool Works, Inc. | | | 5,414 | | | | 903,326 | |
| Ingersoll-Rand PLC | | | 7,064 | | | | 630,038 | |
| ITT, Inc. | | | 3,101 | | | | 165,500 | |
JetBlue Airways Corp. (1) | | | 21,137 | | | | 472,201 | |
| Kansas City Southern | | | 7,064 | | | | 743,274 | |
| ManpowerGroup, Inc. | | | 8,082 | | | | 1,019,221 | |
| Masco Corp. | | | 7,276 | | | | 319,707 | |
| Old Dominion Freight Line, Inc. | | | 2,411 | | | | 317,167 | |
| Orbital ATK, Inc. | | | 684 | | | | 89,946 | |
| Owens Corning | | | 9,053 | | | | 832,333 | |
| PACCAR, Inc. | | | 5,905 | | | | 419,727 | |
Quanta Services, Inc. (1) | | | 3,113 | | | | 121,749 | |
| Regal Beloit Corp. | | | 467 | | | | 35,772 | |
| Robert Half International, Inc. | | | 13,856 | | | | 769,562 | |
| Ryder System, Inc. | | | 5,053 | | | | 425,311 | |
| Spirit AeroSystems Holdings, Inc. | | | 10,833 | | | | 945,179 | |
| Stanley Black & Decker, Inc. | | | 4,944 | | | | 838,947 | |
| Union Pacific Corp. | | | 14,411 | | | | 1,932,515 | |
United Continental Holdings, Inc. (1) | | | 2,392 | | | | 161,221 | |
United Rentals, Inc. (1) | | | 5,356 | | | | 920,750 | |
WABCO Holdings, Inc. (1) | | | 1,803 | | | | 258,731 | |
Waste Management, Inc. (1) | | | 6,957 | | | | 600,389 | |
| Watsco, Inc. | | | 6,473 | | | | 1,100,669 | |
WESCO International, Inc. (1) | | | 4,603 | | | | 313,694 | |
| | | | | | | | 27,655,757 | |
| | | | | | | | | |
| Information Technology — 15.5% | | | | | | | | |
| Accenture PLC | | | 22,285 | | | | 3,411,611 | |
Adobe Systems, Inc. (1) | | | 9,304 | | | | 1,630,433 | |
Alphabet, Inc. - Class A (1) | | | 2,655 | | | | 2,796,777 | |
The accompanying notes are an integral part of these financial statements.
2017 Annual Report | December 31, 2017 | Page 25 |
Schedule of Investments
December 31, 2017
| Muirfield Fund |
| Security Description | | Shares, Contracts or
Principal
Amount ($) | | Fair
Value ($) |
| Common Stocks — continued |
Alphabet, Inc. - Class C (1) | | | 3,964 | | | | 4,147,930 | |
| Apple, Inc. | | | 60,650 | | | | 10,263,800 | |
| Applied Materials, Inc. | | | 26,156 | | | | 1,337,095 | |
ARRIS International PLC (1) | | | 18,836 | | | | 483,897 | |
| CA, Inc. | | | 45,447 | | | | 1,512,476 | |
Cadence Design Systems, Inc. (1) | | | 35,261 | | | | 1,474,615 | |
| Cisco Systems, Inc. | | | 88,453 | | | | 3,387,750 | |
| Cognex Corp. | | | 4,333 | | | | 265,006 | |
| Cognizant Technology Solutions Corp. | | | 17,226 | | | | 1,223,391 | |
Dell Technologies, Inc. Class V (1) | | | 7,531 | | | | 612,120 | |
| DXC Technology Co. | | | 19,069 | | | | 1,809,648 | |
eBay, Inc. (1) | | | 9,544 | | | | 360,191 | |
Electronic Arts, Inc. (1) | | | 3,404 | | | | 357,624 | |
Facebook, Inc. (1) | | | 35,047 | | | | 6,184,394 | |
| HP, Inc. | | | 109,913 | | | | 2,309,272 | |
IAC/InterActiveCorp (1) | | | 2,120 | | | | 259,234 | |
| Intel Corp. | | | 55,079 | | | | 2,542,447 | |
| International Business Machines Corp. | | | 16,397 | | | | 2,515,628 | |
| Intuit, Inc. | | | 16,729 | | | | 2,639,502 | |
IPG Photonics Corp. (1) | | | 1,233 | | | | 264,022 | |
| Jabil, Inc. | | | 13,305 | | | | 349,256 | |
| Juniper Networks, Inc. | | | 1,139 | | | | 32,462 | |
| Lam Research Corp. | | | 6,413 | | | | 1,180,441 | |
| Mastercard, Inc. | | | 9,383 | | | | 1,420,211 | |
Micron Technology, Inc. (1) | | | 19,553 | | | | 804,019 | |
| Microsoft Corp. | | | 106,682 | | | | 9,125,578 | |
| NVIDIA Corp. | | | 10,210 | | | | 1,975,635 | |
ON Semiconductor Corp. (1) | | | 30,337 | | | | 635,257 | |
| Oracle Corp. | | | 55,118 | | | | 2,605,979 | |
PayPal Holdings, Inc. (1) | | | 13,811 | | | | 1,016,766 | |
Red Hat, Inc. (1) | | | 3,754 | | | | 450,855 | |
Synopsys, Inc. (1) | | | 13,017 | | | | 1,109,569 | |
Take-Two Interactive Software, Inc. (1) | | | 2,884 | | | | 316,606 | |
| Texas Instruments, Inc. | | | 8,348 | | | | 871,865 | |
| Western Digital Corp. | | | 9,752 | | | | 775,577 | |
| | | | | | | | 74,458,939 | |
| | | | | | | | | |
| Materials — 1.9% | | | | | | | | |
| Alcoa Corp. | | | 3,833 | | | | 206,484 | |
| Avery Dennison Corp. | | | 7,662 | | | | 880,057 | |
| Cabot Corp. | | | 7,875 | | | | 485,021 | |
Crown Holdings, Inc. (1) | | | 28,816 | | | | 1,620,900 | |
| Eastman Chemical Co. | | | 12,038 | | | | 1,115,200 | |
Freeport-McMoRan, Inc. (1) | | | 26,137 | | | | 495,558 | |
| Huntsman Corp. | | | 13,716 | | | | 456,606 | |
| LyondellBasell Industries NV | | | 23,692 | | | | 2,613,701 | |
| Nucor Corp. | | | 4,596 | | | | 292,214 | |
| Steel Dynamics, Inc. | | | 16,424 | | | | 708,367 | |
| | | | | | | | 8,874,108 | |
| | | | | | | | | |
| Real Estate Investment Trust — 2.2% | | | | | | | | |
| American Tower Corp. | | | 4,797 | | | | 684,388 | |
| Apple Hospitality REIT, Inc. | | | 11,392 | | | | 223,397 | |
| CubeSmart | | | 10,016 | | | | 289,663 | |
| DDR Corp. | | | 7,450 | | | | 66,752 | |
| Essex Property Trust, Inc. | | | 4,223 | | | | 1,019,306 | |
| Gaming and Leisure Properties, Inc. | | | 5,615 | | | | 207,755 | |
| Hospitality Properties Trust | | | 10,582 | | | | 315,873 | |
| Host Hotels & Resorts, Inc. | | | 38,263 | | | | 759,521 | |
| Lamar Advertising Co. | | | 2,979 | | | | 221,161 | |
| Liberty Property Trust | | | 11,192 | | | | 481,368 | |
| Prologis, Inc. | | | 33,963 | | | | 2,190,953 | |
SBA Communications Corp. (1) | | | 3,297 | | | | 538,598 | |
| Simon Property Group, Inc. | | | 11,324 | | | | 1,944,784 | |
| VEREIT, Inc. | | | 65,696 | | | | 511,772 | |
| Vornado Realty Trust | | | 15,258 | | | | 1,192,870 | |
| | | | | | | | 10,648,161 | |
| | | | | | | | | |
| Telecommunication Services — 1.6% | | | | | | | | |
| AT&T, Inc. | | | 52,632 | | | | 2,046,332 | |
| Telephone & Data Systems, Inc. | | | 10,449 | | | | 290,482 | |
T-Mobile US, Inc. (1) | | | 10,342 | | | | 656,820 | |
| Verizon Communications, Inc. | | | 88,435 | | | | 4,680,865 | |
| | | | | | | | 7,674,499 | |
| | | | | | | | | |
| Utilities — 1.4% | | | | | | | | |
| American Electric Power Co., Inc. | | | 10,370 | | | | 762,921 | |
| CenterPoint Energy, Inc. | | | 44,280 | | | | 1,255,781 | |
| Exelon Corp. | | | 70,120 | | | | 2,763,429 | |
| Vectren Corp. | | | 26,288 | | | | 1,709,246 | |
Vistra Energy Corp. (1) | | | 8,168 | | | | 149,640 | |
| | | | | | | | 6,641,017 | |
| | | | | | | | | |
| Total Common Stocks (Cost $266,203,769) | | | | | | | 302,681,555 | |
| | | | | | | | | |
| Registered Investment Companies — 3.7% |
iShares Russell 2000 Growth ETF (7) | | | 91,035 | | | | 16,996,235 | |
| Total Registered Investment Companies (Cost $14,256,383) | | | | | | | 16,996,235 | |
The accompanying notes are an integral part of these financial statements.
Page 26 | 2017 Annual Report | December 31, 2017 |
Schedule of Investments
December 31, 2017
| Muirfield Fund |
| Security Description | | Shares, Contracts or
Principal
Amount ($) | | Fair
Value ($) |
| Money Market Registered Investment Companies — 31.8% |
Morgan Stanley Government Institutional Fund, 1.20% (3) | | | 290,975 | | | | 290,975 | |
Meeder Institutional Prime Money Market Fund, 1.32% (4) | | | 151,755,821 | | | | 151,740,645 | |
| Total Money Market Registered Investment Companies (Cost $152,052,326) | | | | | | | 152,031,620 | |
| | | | | | | | | |
| Bank Obligations — 0.3% |
Bank Midwest Deposit Account, 1.00%, 1/2/2018 (5) | | | 248,989 | | | | 248,989 | |
First Merchants Bank Deposit Account, 1.00%, 1/2/2018 (5) | | | 248,190 | | | | 248,190 | |
Metro City Bank Deposit Account, 1.00%, 1/2/2018 (5) | | | 248,190 | | | | 248,190 | |
Pacific Mercantile Bank Deposit Account, 1.21%, 1/2/2018 (5) | | | 249,127 | | | | 249,127 | |
Pacific Premier Bank Deposit Account, 1.05%, 1/2/2018 (5) | | | 249,198 | | | | 249,198 | |
Seacoast Community Bank Deposit Account, 1.00%, 1/2/2018 (5) | | | 249,000 | | | | 249,000 | |
Trans Pacific National Bank Deposit Account, 1.00%, 1/2/2018 (5) | | | 191 | | | | 191 | |
| Total Bank Obligations (Cost $1,492,885) | | | | | | | 1,492,885 | |
| Total Investments — 99.0% (Cost $434,005,363) | | | | | | | 473,202,295 | |
| Other Assets less Liabilities — 1.0% | | | | | | | 4,759,867 | |
| Total Net Assets — 100.0% | | | | | | | 477,962,162 | |
| | | | | | | | | |
| Trustee Deferred Compensation (6) |
| Meeder Aggressive Allocation Fund | | | 6,294 | | | | 65,772 | |
| Meeder Balanced Fund | | | 3,209 | | | | 37,256 | |
| Meeder Dynamic Allocation Fund | | | 2,219 | | | | 24,076 | |
| Meeder Muirfield Fund | | | 3,217 | | | | 24,256 | |
| Meeder Conservative Allocation Fund | | | 904 | | | | 20,376 | |
| Total Trustee Deferred Compensation (Cost $151,557) | | | | | | | 171,736 | |
| Muirfield Fund |
| | | Contracts | | Expiration Date | | Notional Value of Contracts ($) | | Value and Unrealized Appreciation (Depreciation) ($) |
| Futures Contracts |
| Index Futures | | | | | | | | | | | | | | |
| Mini MSCI EAFE Index Futures | | | 272 | | | 3/16/2018 | | | 27,818,800 | | | | 436,600 | |
| Mini MSCI Emerging Markets Index Futures | | | 82 | | | 3/16/2018 | | | 4,771,170 | | | | 191,173 | |
| Standard & Poors 500 Mini Futures | | | 716 | | | 3/16/2018 | | | 95,800,800 | | | | 970,833 | |
| Total Futures Contracts | | | 1,070 | | | | | | 128,390,770 | | | | 1,598,606 | |
(1) | Represents non-income producing securities. |
(2) | All or a portion of this security is on loan. |
(3) | Investment purchased with cash received as securities lending collateral. The yield shown represents the 7-day yield in effect at December 31, 2017. |
(4) | Investment in affiliate. The yield shown represents the 7-day yield in effect at December 31, 2017. |
(5) | Variable rate security. Securities payable at par including accrued interest (usually within seven days notice) and unconditionally secured as to principal and interest by letters of credit or other credit support agreements from major banks. The interest rates are adjustable and are not based on a published reference rate and spread but are determined by the issuer or agent and are based on current market conditions. These securities do not indicate a reference rate and spread in their description above. The rate shown represents the rate in effect at December 31, 2017. The maturity date shown, if applicable, reflects the earlier of the next demand date or stated maturity date. |
(6) | Assets of affiliates to the Muirfield Fund held for the benefit of the Fund’s Trustees in connection with the Trustee Deferred Compensation Plan. |
The accompanying notes are an integral part of these financial statements.
2017 Annual Report | December 31, 2017 | Page 27 |
Schedule of Investments
December 31, 2017
| Dynamic Allocation Fund |
| Security Description | | Shares or
Principal
Amount ($) | | Fair
Value ($) |
| Common Stocks — 68.6% |
| Consumer Discretionary — 6.8% | | | | | | | | |
Amazon.com, Inc. (1) | | | 1,288 | | | | 1,506,277 | |
| Bed Bath & Beyond, Inc. | | | 2,602 | | | | 57,218 | |
| Best Buy Co., Inc. | | | 4,920 | | | | 336,872 | |
Burlington Stores, Inc. (1) | | | 700 | | | | 86,121 | |
| Carter's, Inc. | | | 174 | | | | 20,443 | |
| Comcast Corp. | | | 17,155 | | | | 687,058 | |
| Dollar General Corp. | | | 988 | | | | 91,894 | |
| GameStop Corp. | | | 4,466 | | | | 80,165 | |
| Gap, Inc./The | | | 4,870 | | | | 165,872 | |
| General Motors Co. | | | 20,951 | | | | 858,781 | |
Hilton Grand Vacations, Inc. (1) | | | 421 | | | | 17,661 | |
| Home Depot, Inc./The | | | 7,487 | | | | 1,419,011 | |
| Kohl's Corp. | | | 490 | | | | 26,573 | |
| Lear Corp. | | | 2,775 | | | | 490,232 | |
Live Nation Entertainment, Inc. (1) | | | 3,315 | | | | 141,120 | |
Michael Kors Holdings, Ltd. (1) | | | 2,966 | | | | 186,710 | |
Michaels Cos., Inc./The (1) | | | 3,159 | | | | 76,416 | |
NVR, Inc. (1) | | | 30 | | | | 105,247 | |
| PulteGroup, Inc. | | | 7,295 | | | | 242,559 | |
| PVH Corp. | | | 1,370 | | | | 187,978 | |
| Ross Stores, Inc. | | | 2,926 | | | | 234,812 | |
| Royal Caribbean Cruises, Ltd. | | | 6,190 | | | | 738,343 | |
| Scripps Networks Interactive, Inc. | | | 966 | | | | 82,477 | |
| Signet Jewelers, Ltd. | | | 868 | | | | 49,085 | |
Skechers U.S.A., Inc. (1) | | | 2,018 | | | | 76,361 | |
| Target Corp. | | | 7,378 | | | | 481,415 | |
| Thor Industries, Inc. | | | 819 | | | | 123,440 | |
| TJX Cos., Inc./The | | | 1,492 | | | | 114,078 | |
| Whirlpool Corp. | | | 1,047 | | | | 176,566 | |
| Yum China Holdings, Inc. | | | 2,096 | | | | 83,882 | |
| | | | | | | | 8,944,667 | |
| | | | | | | | | |
| Consumer Staples — 3.6% | | | | | | | | |
| Archer-Daniels-Midland Co. | | | 1,072 | | | | 42,966 | |
| CVS Health Corp. | | | 12,909 | | | | 935,903 | |
| Kroger Co./The | | | 3,815 | | | | 104,722 | |
| Lamb Weston Holdings, Inc. | | | 891 | | | | 50,297 | |
| PepsiCo, Inc. | | | 9,059 | | | | 1,086,355 | |
Pilgrim's Pride Corp. (1) | | | 3,314 | | | | 102,933 | |
| Tyson Foods, Inc. | | | 9,291 | | | | 753,221 | |
| Walgreens Boots Alliance, Inc. | | | 10,498 | | | | 762,365 | |
| Wal-Mart Stores, Inc. | | | 8,697 | | | | 858,829 | |
| | | | | | | | 4,697,591 | |
| | | | | | | | | |
| Energy — 4.7% | | | | | | | | |
| Andeavor | | | 6,077 | | | | 694,844 | |
| Cabot Oil & Gas Corp. | | | 7,192 | | | | 205,691 | |
| Chevron Corp. | | | 6,756 | | | | 845,784 | |
CNX Resources Corp. (1) | | | 197 | | | | 2,882 | |
CONSOL Energy, Inc. (1) | | | 772 | | | | 30,502 | |
| Exxon Mobil Corp. | | | 16,696 | | | | 1,396,453 | |
| HollyFrontier Corp. | | | 3,363 | | | | 172,253 | |
| Marathon Petroleum Corp. | | | 11,904 | | | | 785,426 | |
| PBF Energy, Inc. | | | 2,916 | | | | 103,372 | |
| Phillips 66 | | | 8,175 | | | | 826,901 | |
| RPC, Inc. | | | 6,530 | | | | 166,711 | |
Southwestern Energy Co. (1) | | | 1,636 | | | | 9,129 | |
| Valero Energy Corp. | | | 8,893 | | | | 817,356 | |
| World Fuel Services Corp. | | | 1,276 | | | | 35,907 | |
| | | | | | | | 6,093,211 | |
| | | | | | | | | |
| Financials — 13.7% | | | | | | | | |
| Allstate Corp./The | | | 7,759 | | | | 812,445 | |
| American Express Co. | | | 3,215 | | | | 319,282 | |
| Ameriprise Financial, Inc. | | | 4,482 | | | | 759,565 | |
| Annaly Capital Management, Inc. | | | 59,965 | | | | 712,984 | |
| Bank of America Corp. | | | 52,453 | | | | 1,548,413 | |
| Bank of New York Mellon Corp./The | | | 15,774 | | | | 849,588 | |
| BB&T Corp. | | | 16,330 | | | | 811,928 | |
Berkshire Hathaway, Inc. (1) | | | 10,228 | | | | 2,027,394 | |
| BGC Partners, Inc. | | | 5,943 | | | | 89,799 | |
| Citigroup, Inc. | | | 18,417 | | | | 1,370,409 | |
| CNA Financial Corp. | | | 3,965 | | | | 210,343 | |
| Comerica, Inc. | | | 2,181 | | | | 189,333 | |
| East West Bancorp, Inc. | | | 2,967 | | | | 180,483 | |
| Fifth Third Bancorp | | | 24,570 | | | | 745,454 | |
| First American Financial Corp. | | | 5,854 | | | | 328,058 | |
| Hanover Insurance Group, Inc./The | | | 810 | | | | 87,545 | |
| Huntington Bancshares, Inc./OH | | | 41,724 | | | | 607,501 | |
| JPMorgan Chase & Co. | | | 15,339 | | | | 1,640,353 | |
| Lazard, Ltd. | | | 5,247 | | | | 275,468 | |
| Marsh & McLennan Cos., Inc. | | | 2,035 | | | | 165,629 | |
| MSCI, Inc. | | | 333 | | | | 42,138 | |
| New Residential Investment Corp. | | | 15,910 | | | | 284,471 | |
OneMain Holdings, Inc. (1) | | | 1,407 | | | | 36,568 | |
| PNC Financial Services Group, Inc./The | | | 6,372 | | | | 919,416 | |
| Progressive Corp./The | | | 14,058 | | | | 791,747 | |
| Regions Financial Corp. | | | 43,220 | | | | 746,842 | |
| Synovus Financial Corp. | | | 1,775 | | | | 85,094 | |
| T Rowe Price Group, Inc. | | | 3,550 | | | | 372,502 | |
| US Bancorp | | | 1,388 | | | | 74,369 | |
| Wells Fargo & Co. | | | 13,062 | | | | 792,472 | |
| | | | | | | | 17,877,593 | |
The accompanying notes are an integral part of these financial statements.
Page 28 | 2017 Annual Report | December 31, 2017 |
Schedule of Investments
December 31, 2017
| Dynamic Allocation Fund |
| Security Description | | Shares or
Principal
Amount ($) | | Fair
Value ($) |
| Common Stocks — continued |
| Healthcare — 11.1% | | | | | | | | |
| AbbVie, Inc. | | | 9,488 | | | | 917,584 | |
| Aetna, Inc. | | | 4,871 | | | | 878,680 | |
| Agilent Technologies, Inc. | | | 5,500 | | | | 368,335 | |
Alnylam Pharmaceuticals, Inc. (1) | | | 7 | | | | 889 | |
| Amgen, Inc. | | | 5,138 | | | | 893,498 | |
| Anthem, Inc. | | | 3,915 | | | | 880,914 | |
AquaBounty Technologies, Inc. (1) | | | 1,020 | | | | 3,590 | |
| Baxter International, Inc. | | | 12,014 | | | | 776,585 | |
Biogen, Inc. (1) | | | 2,866 | | | | 913,022 | |
Bioverativ, Inc. (1) | | | 2,493 | | | | 134,423 | |
| Bristol-Myers Squibb Co. | | | 138 | | | | 8,457 | |
Centene Corp. (1) | | | 3,795 | | | | 382,840 | |
Cerner Corp. (1) | | | 10,376 | | | | 699,239 | |
| Cigna Corp. | | | 4,184 | | | | 849,729 | |
Exelixis, Inc. (1) | | | 634 | | | | 19,274 | |
Express Scripts Holding Co. (1) | | | 2,496 | | | | 186,301 | |
| Gilead Sciences, Inc. | | | 13,883 | | | | 994,578 | |
| Humana, Inc. | | | 3,232 | | | | 801,762 | |
Intuitive Surgical, Inc. (1) | | | 2,232 | | | | 814,546 | |
| Johnson & Johnson | | | 8,668 | | | | 1,211,093 | |
| McKesson Corp. | | | 4,888 | | | | 762,284 | |
Premier, Inc. (1) | | | 5,038 | | | | 147,059 | |
United Therapeutics Corp. (1) | | | 906 | | | | 134,043 | |
| UnitedHealth Group, Inc. | | | 6,274 | | | | 1,383,166 | |
Vertex Pharmaceuticals, Inc. (1) | | | 1,629 | | | | 244,122 | |
WellCare Health Plans, Inc. (1) | | | 920 | | | | 185,021 | |
| | | | | | | | 14,591,034 | |
| | | | | | | | | |
| Industrials — 5.2% | | | | | | | | |
| Allison Transmission Holdings, Inc. | | | 2,738 | | | | 117,926 | |
| Boeing Co./The | | | 4,264 | | | | 1,257,496 | |
| Copa Holdings SA | | | 360 | | | | 48,262 | |
| Cummins, Inc. | | | 4,402 | | | | 777,569 | |
| Delta Air Lines, Inc. | | | 10,636 | | | | 595,616 | |
| Eaton Corp. PLC | | | 268 | | | | 21,175 | |
| Huntington Ingalls Industries, Inc. | | | 2,021 | | | | 476,350 | |
JetBlue Airways Corp. (1) | | | 6,516 | | | | 145,567 | |
| Kansas City Southern | | | 3,122 | | | | 328,497 | |
| ManpowerGroup, Inc. | | | 1,989 | | | | 250,833 | |
| Masco Corp. | | | 2,628 | | | | 115,474 | |
| Old Dominion Freight Line, Inc. | | | 894 | | | | 117,606 | |
| Orbital ATK, Inc. | | | 203 | | | | 26,695 | |
| Owens Corning | | | 2,931 | | | | 269,476 | |
| Pitney Bowes, Inc. | | | 915 | | | | 10,230 | |
Quanta Services, Inc. (1) | | | 2,842 | | | | 111,151 | |
| Regal Beloit Corp. | | | 338 | | | | 25,891 | |
| Robert Half International, Inc. | | | 3,204 | | | | 177,950 | |
| Ryder System, Inc. | | | 1,236 | | | | 104,034 | |
| Southwest Airlines Co. | | | 1,122 | | | | 73,435 | |
| Spirit AeroSystems Holdings, Inc. | | | 2,231 | | | | 194,655 | |
| Union Pacific Corp. | | | 6,913 | | | | 927,033 | |
United Rentals, Inc. (1) | | | 585 | | | | 100,567 | |
| Valmont Industries, Inc. | | | 230 | | | | 38,146 | |
WABCO Holdings, Inc. (1) | | | 516 | | | | 74,046 | |
Waste Management, Inc. (1) | | | 2,344 | | | | 202,287 | |
| Watsco, Inc. | | | 988 | | | | 168,000 | |
WESCO International, Inc. (1) | | | 1,086 | | | | 74,011 | |
| | | | | | | | 6,829,978 | |
| | | | | | | | | |
| Information Technology — 17.5% | | | | | | | | |
| Accenture PLC | | | 5,997 | | | | 918,081 | |
Adobe Systems, Inc. (1) | | | 1,913 | | | | 335,234 | |
Alphabet, Inc. - Class A (1) | | | 357 | | | | 376,064 | |
Alphabet, Inc. - Class C (1) | | | 1,699 | | | | 1,777,834 | |
| Apple, Inc. | | | 18,847 | | | | 3,189,478 | |
| Applied Materials, Inc. | | | 16,622 | | | | 849,717 | |
ARRIS International PLC (1) | | | 3,214 | | | | 82,568 | |
| CA, Inc. | | | 10,129 | | | | 337,093 | |
Cadence Design Systems, Inc. (1) | | | 11,109 | | | | 464,578 | |
| Cisco Systems, Inc. | | | 12,897 | | | | 493,955 | |
| Cognex Corp. | | | 2,027 | | | | 123,971 | |
| Cognizant Technology Solutions Corp. | | | 11,204 | | | | 795,708 | |
| DXC Technology Co. | | | 7,133 | | | | 676,922 | |
eBay, Inc. (1) | | | 21,078 | | | | 795,484 | |
Facebook, Inc. (1) | | | 9,955 | | | | 1,756,659 | |
| HP, Inc. | | | 37,735 | | | | 792,812 | |
IAC/InterActiveCorp (1) | | | 1,638 | | | | 200,295 | |
| Intel Corp. | | | 17,041 | | | | 786,613 | |
| International Business Machines Corp. | | | 597 | | | | 91,592 | |
| Intuit, Inc. | | | 5,124 | | | | 808,465 | |
IPG Photonics Corp. (1) | | | 667 | | | | 142,825 | |
| Jabil, Inc. | | | 1,052 | | | | 27,615 | |
| Lam Research Corp. | | | 4,182 | | | | 769,781 | |
| Mastercard, Inc. | | | 1,249 | | | | 189,049 | |
Micron Technology, Inc. (1) | | | 19,026 | | | | 782,349 | |
| Microsoft Corp. | | | 30,816 | | | | 2,636,001 | |
| NVIDIA Corp. | | | 4,200 | | | | 812,700 | |
ON Semiconductor Corp. (1) | | | 9,879 | | | | 206,866 | |
| Oracle Corp. | | | 16,927 | | | | 800,309 | |
PayPal Holdings, Inc. (1) | | | 3,186 | | | | 234,553 | |
Synopsys, Inc. (1) | | | 1,998 | | | | 170,310 | |
Take-Two Interactive Software, Inc. (1) | | | 900 | | | | 98,802 | |
| Texas Instruments, Inc. | | | 1,906 | | | | 199,063 | |
The accompanying notes are an integral part of these financial statements.
2017 Annual Report | December 31, 2017 | Page 29 |
Schedule of Investments
December 31, 2017
| Dynamic Allocation Fund |
| Security Description | | Shares or
Principal
Amount ($) | | Fair
Value ($) |
| Common Stocks — continued |
| Western Digital Corp. | | | 3,168 | | | | 251,951 | |
| | | | | | | | 22,975,297 | |
| | | | | | | | | |
| Materials — 1.7% | | | | | | | | |
| Alcoa Corp. | | | 2,919 | | | | 157,247 | |
| Avery Dennison Corp. | | | 2,140 | | | | 245,800 | |
| Cabot Corp. | | | 2,134 | | | | 131,433 | |
| Chemours Co./The | | | 445 | | | | 22,277 | |
Crown Holdings, Inc. (1) | | | 6,978 | | | | 392,513 | |
| Eastman Chemical Co. | | | 938 | | | | 86,896 | |
Freeport-McMoRan, Inc. (1) | | | 3,140 | | | | 59,534 | |
| Huntsman Corp. | | | 4,315 | | | | 143,646 | |
| LyondellBasell Industries NV | | | 7,299 | | | | 805,226 | |
| Steel Dynamics, Inc. | | | 3,241 | | | | 139,784 | |
| | | | | | | | 2,184,356 | |
| | | | | | | | | |
| Real Estate Investment Trust — 1.8% | | | | | | | | |
| American Tower Corp. | | | 816 | | | | 116,419 | |
| Apple Hospitality REIT, Inc. | | | 4,332 | | | | 84,951 | |
| Brixmor Property Group, Inc. | | | 3,281 | | | | 61,223 | |
| CubeSmart | | | 2,585 | | | | 74,758 | |
| DDR Corp. | | | 3,924 | | | | 35,159 | |
| Essex Property Trust, Inc. | | | 516 | | | | 124,547 | |
| Hospitality Properties Trust | | | 2,359 | | | | 70,416 | |
| Host Hotels & Resorts, Inc. | | | 1,959 | | | | 38,886 | |
| Lamar Advertising Co. | | | 397 | | | | 29,473 | |
| Liberty Property Trust | | | 2,733 | | | | 117,546 | |
| Prologis, Inc. | | | 8,694 | | | | 560,850 | |
| Retail Properties of America, Inc. | | | 3,498 | | | | 47,013 | |
SBA Communications Corp. (1) | | | 368 | | | | 60,116 | |
| Simon Property Group, Inc. | | | 3,988 | | | | 684,899 | |
| Spirit Realty Capital, Inc. | | | 5,051 | | | | 43,338 | |
| VEREIT, Inc. | | | 6,005 | | | | 46,779 | |
| Vornado Realty Trust | | | 1,951 | | | | 152,529 | |
| | | | | | | | 2,348,902 | |
| | | | | | | | | |
| Telecommunication Services — 1.5% | | | | | | | | |
| AT&T, Inc. | | | 2,963 | | | | 115,201 | |
| Telephone & Data Systems, Inc. | | | 3,150 | | | | 87,570 | |
T-Mobile US, Inc. (1) | | | 5,887 | | | | 373,883 | |
| Verizon Communications, Inc. | | | 27,184 | | | | 1,438,849 | |
| | | | | | | | 2,015,503 | |
| | | | | | | | | |
| Utilities — 1.0% | | | | | | | | |
| CenterPoint Energy, Inc. | | | 3,466 | | | | 98,296 | |
| Exelon Corp. | | | 20,755 | | | | 817,955 | |
| Vectren Corp. | | | 4,742 | | | | 308,325 | |
Vistra Energy Corp. (1) | | | 1,638 | | | | 29,993 | |
| | | | | | | | 1,254,569 | |
| | | | | | | | | |
| Total Common Stocks (Cost $76,841,748) | | | | | | | 89,812,701 | |
| | | | | | | | | |
| Registered Investment Companies — 13.3% |
iShares Core MSCI EAFE ETF (5) | | | 136,530 | | | | 9,023,268 | |
iShares Core MSCI Emerging Markets ETF (5) | | | 24,090 | | | | 1,370,721 | |
iShares Core U.S. Aggregate Bond ETF (5) | | | 63,629 | | | | 6,956,558 | |
| Total Registered Investment Companies (Cost $16,485,977) | | | | | | | 17,350,547 | |
| | | | | | | | | |
| Money Market Registered Investment Companies — 16.2% |
Meeder Institutional Prime Money Market Fund, 1.32% (2) | | | 21,162,338 | | | | 21,160,222 | |
| Total Money Market Registered Investment Companies (Cost $21,162,809) | | | | | | | 21,160,222 | |
| | | | | | | | | |
| Bank Obligations — 1.1% |
Bank Midwest Deposit Account, 1.00%, 1/2/2018 (3) | | | 248,989 | | | | 248,989 | |
First Merchants Bank Deposit Account, 1.00%, 1/2/2018 (3) | | | 248,190 | | | | 248,190 | |
Metro City Bank Deposit Account, 1.00%, 1/2/2018 (3) | | | 248,190 | | | | 248,190 | |
Pacific Mercantile Bank Deposit Account, 1.21%, 1/2/2018 (3) | | | 249,127 | | | | 249,127 | |
Pacific Premier Bank Deposit Account, 1.05%, 1/2/2018 (3) | | | 249,198 | | | | 249,198 | |
Seacoast Community Bank Deposit Account, 1.00%, 1/2/2018 (3) | | | 249,000 | | | | 249,000 | |
Trans Pacific National Bank Deposit Account, 1.00%, 1/2/2018 (3) | | | 184 | | | | 184 | |
| Total Bank Obligations (Cost $1,492,878 ) | | | | | | | 1,492,878 | |
| Total Investments — 99.2% (Cost $115,983,412) | | | | | | | 129,816,348 | |
| Other Assets less Liabilities — 0.8% | | | | | | | 1,081,295 | |
| Total Net Assets — 100.0% | | | | | | | 130,897,643 | |
The accompanying notes are an integral part of these financial statements.
Page 30 | 2017 Annual Report | December 31, 2017 |
Schedule of Investments
December 31, 2017
| Dynamic Allocation Fund |
| Security Description | | Shares or
Principal
Amount ($) | | Fair
Value ($) |
| Trustee Deferred Compensation (4) |
| Meeder Aggressive Allocation Fund | | | 3,963 | | | | 41,413 | |
| Meeder Balanced Fund | | | 1,974 | | | | 22,918 | |
| Meeder Dynamic Allocation Fund | | | 1,393 | | | | 15,114 | |
| Meeder Muirfield Fund | | | 1,923 | | | | 14,499 | |
| Meeder Conservative Allocation Fund | | | 557 | | | | 12,555 | |
| Total Trustee Deferred Compensation (Cost $91,600) | | | | | | | 106,499 | |
| Dynamic Allocation Fund |
| | | Contracts | | Expiration Date | | Notional Value of Contracts ($) | | Value and Unrealized Appreciation (Depreciation) ($) |
| Futures Contracts |
| Index Futures | | | | | | | | | | | | | | |
| Mini MSCI EAFE Index Futures | | | 135 | | | 3/16/2018 | | | 13,807,125 | | | | 220,325 | |
| Mini MSCI Emerging Markets Index Futures | | | 86 | | | 3/16/2018 | | | 5,003,910 | | | | 201,415 | |
| Standard & Poors 500 Mini Futures | | | 33 | | | 3/16/2018 | | | 4,415,400 | | | | 46,620 | |
| Total Futures Contracts | | | 254 | | | | | | 23,226,435 | | | | 468,360 | |
(1) | Represents non-income producing securities. |
(2) | Investment in affiliate. The yield shown represents the 7-day yield in effect at December 31, 2017. |
(3) | Variable rate security. Securities payable at par including accrued interest (usually within seven days notice) and unconditionally secured as to principal and interest by letters of credit or other credit support agreements from major banks. The interest rates are adjustable and are not based on a published reference rate and spread but are determined by the issuer or agent and are based on current market conditions. These securities do not indicate a reference rate and spread in their description above. The rate shown represents the rate in effect at December 31, 2017. The maturity date shown, if applicable, reflects the earlier of the next demand date or stated maturity date. |
(4) | Assets of affiliates to the Dynamic Allocation Fund held for the benefit of the Fund’s Trustees in connection with the Trustee Deferred Compensation Plan. |
The accompanying notes are an integral part of these financial statements.
2017 Annual Report | December 31, 2017 | Page 31 |
Schedule of Investments
December 31, 2017
| Aggressive Allocation Fund |
| Security Description | | Shares or
Principal
Amount ($) | | Fair
Value ($) |
| Common Stocks — 68.2% |
| Consumer Discretionary — 11.1% | | | | | | | | |
| Aramark | | | 761 | | | | 32,525 | |
| Big Lots, Inc. | | | 5,112 | | | | 287,039 | |
| Carter's, Inc. | | | 908 | | | | 106,681 | |
| Citi Trends, Inc. | | | 489 | | | | 12,939 | |
| Dana, Inc. | | | 9,360 | | | | 299,614 | |
| GameStop Corp. | | | 9,673 | | | | 173,630 | |
| Gannett Co., Inc. | | | 10,395 | | | | 120,478 | |
Grand Canyon Education, Inc. (1) | | | 3,224 | | | | 288,645 | |
| Hooker Furniture Corp. | | | 540 | | | | 22,923 | |
| HSN, Inc. | | | 1,135 | | | | 45,797 | |
J. Jill, Inc. (1) | | | 1,583 | | | | 12,347 | |
| Kohl's Corp. | | | 4,399 | | | | 238,558 | |
| Lear Corp. | | | 1,955 | | | | 345,370 | |
Live Nation Entertainment, Inc. (1) | | | 1,122 | | | | 47,764 | |
MCBC Holdings, Inc. (1) | | | 4,211 | | | | 93,568 | |
Michael Kors Holdings, Ltd. (1) | | | 4,782 | | | | 301,027 | |
| New Media Investment Group, Inc. | | | 5,194 | | | | 87,155 | |
NVR, Inc. (1) | | | 100 | | | | 350,822 | |
| Office Depot, Inc. | | | 3,966 | | | | 14,040 | |
Ollie's Bargain Outlet Holdings, Inc. (1) | | | 658 | | | | 35,039 | |
Overstock.com, Inc. (1) | | | 44 | | | | 2,812 | |
Penn National Gaming, Inc. (1) | | | 7,571 | | | | 237,199 | |
Pinnacle Entertainment, Inc. (1) | | | 5,543 | | | | 181,422 | |
| PulteGroup, Inc. | | | 5,950 | | | | 197,838 | |
RH (1) | | | 478 | | | | 41,208 | |
| Ruth's Hospitality Group, Inc. | | | 3,152 | | | | 68,241 | |
Skechers U.S.A., Inc. (1) | | | 1,641 | | | | 62,095 | |
Sleep Number Corp. (1) | | | 3,953 | | | | 148,593 | |
Stoneridge, Inc. (1) | | | 2,219 | | | | 50,726 | |
Taylor Morrison Home Corp. (1) | | | 11,962 | | | | 292,710 | |
| Thor Industries, Inc. | | | 926 | | | | 139,567 | |
TopBuild Corp. (1) | | | 1,644 | | | | 124,517 | |
| Tower International, Inc. | | | 772 | | | | 23,585 | |
Townsquare Media, Inc. (1) | | | 1,432 | | | | 10,998 | |
tronc, Inc. (1) | | | 2,716 | | | | 47,774 | |
Weight Watchers International, Inc. (1) | | | 598 | | | | 26,479 | |
ZAGG, Inc. (1) | | | 242 | | | | 4,465 | |
| | | | | | | | 4,576,190 | |
| | | | | | | | | |
| Consumer Staples — 2.9% | | | | | | | | |
Boston Beer Co., Inc./The (1) | | | 299 | | | | 57,139 | |
| Lamb Weston Holdings, Inc. | | | 3,563 | | | | 201,131 | |
| Medifast, Inc. | | | 1,601 | | | | 111,766 | |
| National Beverage Corp. | | | 761 | | | | 74,152 | |
Performance Food Group Co. (1) | | | 5,650 | | | | 187,015 | |
Pilgrim's Pride Corp. (1) | | | 7,193 | | | | 223,415 | |
| Sanderson Farms, Inc. | | | 1,659 | | | | 230,236 | |
Sprouts Farmers Market, Inc. (1) | | | 3,120 | | | | 75,972 | |
| Village Super Market, Inc. | | | 1,290 | | | | 29,580 | |
| | | | | | | | 1,190,406 | |
| | | | | | | | | |
| Energy — 4.5% | | | | | | | | |
| Arch Coal, Inc. | | | 2,177 | | | | 202,809 | |
| CVR Energy, Inc. | | | 1,230 | | | | 45,805 | |
| Delek US Holdings, Inc. | | | 1,368 | | | | 47,798 | |
Exterran Corp. (1) | | | 8,935 | | | | 280,916 | |
| HollyFrontier Corp. | | | 4,312 | | | | 220,861 | |
McDermott International, Inc. (1) | | | 14,077 | | | | 92,627 | |
Midstates Petroleum Co., Inc. (1) | | | 5,005 | | | | 82,983 | |
Natural Gas Services Group, Inc. (1) | | | 54 | | | | 1,415 | |
Par Pacific Holdings, Inc. (1) | | | 11,490 | | | | 221,527 | |
| PBF Energy, Inc. | | | 4,547 | | | | 161,191 | |
Peabody Energy Corp. (1) | | | 1,547 | | | | 60,905 | |
RigNet, Inc. (1) | | | 1,015 | | | | 15,174 | |
| RPC, Inc. | | | 10,453 | | | | 266,865 | |
SandRidge Energy, Inc. (1) | | | 4,838 | | | | 101,937 | |
W&T Offshore, Inc. (1) | | | 41 | | | | 136 | |
| World Fuel Services Corp. | | | 2,307 | | | | 64,919 | |
| | | | | | | | 1,867,868 | |
| | | | | | | | | |
| Financials — 11.1% | | | | | | | | |
| AG Mortgage Investment Trust, Inc. | | | 14,399 | | | | 273,725 | |
| American Equity Investment Life Holding Co. | | | 6,206 | | | | 190,710 | |
| Banco Latinoamericano de Comercio Exterior SA | | | 8,041 | | | | 216,303 | |
| BGC Partners, Inc. | | | 12,396 | | | | 187,304 | |
Cannae Holdings, Inc. (1) | | | 4,681 | | | | 79,717 | |
| Cherry Hill Mortgage Investment Corp. | | | 13,877 | | | | 249,647 | |
| Chimera Investment Corp. | | | 15,227 | | | | 281,395 | |
| Dynex Capital, Inc. | | | 6,906 | | | | 48,411 | |
Essent Group, Ltd. (1) | | | 6,627 | | | | 287,744 | |
| Evercore, Inc. | | | 2,775 | | | | 249,750 | |
| Fidelity Southern Corp. | | | 2,625 | | | | 57,225 | |
| First American Financial Corp. | | | 5,583 | | | | 312,871 | |
| FirstCash, Inc. | | | 2,320 | | | | 156,484 | |
Genworth Financial, Inc. (1) | | | 2,948 | | | | 9,168 | |
Green Dot Corp. (1) | | | 4,612 | | | | 277,919 | |
Health Insurance Innovations, Inc. (1) | | | 231 | | | | 5,763 | |
| Houlihan Lokey, Inc. | | | 6,344 | | | | 288,208 | |
| Invesco Mortgage Capital, Inc. | | | 15,697 | | | | 279,878 | |
LendingTree, Inc. (1) | | | 471 | | | | 160,352 | |
MGIC Investment Corp. (1) | | | 20,214 | | | | 285,220 | |
The accompanying notes are an integral part of these financial statements.
Page 32 | 2017 Annual Report | December 31, 2017 |
Schedule of Investments
December 31, 2017
| Aggressive Allocation Fund |
| Security Description | | Shares or
Principal
Amount ($) | | Fair
Value ($) |
| Common Stocks — continued |
| Moelis & Co. | | | 5,871 | | | | 284,744 | |
| New Residential Investment Corp. | | | 17,258 | | | | 308,573 | |
NewStar Financial, Inc. Contingent Value Rights (1)(5) | | | 179 | | | | 0 | |
NMI Holdings, Inc. (1) | | | 2,283 | | | | 38,811 | |
PennyMac Financial Services, Inc. (1) | | | 554 | | | | 12,382 | |
| Pzena Investment Management, Inc. | | | 925 | | | | 9,870 | |
Triumph Bancorp, Inc. (1) | | | 611 | | | | 19,247 | |
Walker & Dunlop, Inc. (1) | | | 605 | | | | 28,738 | |
World Acceptance Corp. (1) | | | 38 | | | | 3,067 | |
| | | | | | | | 4,603,226 | |
| | | | | | | | | |
| Healthcare — 8.5% | | | | | | | | |
Abeona Therapeutics, Inc. (1) | | | 356 | | | | 5,643 | |
ABIOMED, Inc. (1) | | | 796 | | | | 149,178 | |
Acorda Therapeutics, Inc. (1) | | | 868 | | | | 18,619 | |
Alnylam Pharmaceuticals, Inc. (1) | | | 811 | | | | 103,038 | |
Amphastar Pharmaceuticals, Inc. (1) | | | 1,863 | | | | 35,844 | |
Avexis, Inc. (1) | | | 104 | | | | 11,510 | |
Bio-Rad Laboratories, Inc. (1) | | | 98 | | | | 23,390 | |
Bioverativ, Inc. (1) | | | 2,391 | | | | 128,923 | |
Bluebird Bio, Inc. (1) | | | 338 | | | | 60,198 | |
Catalent, Inc. (1) | | | 6,638 | | | | 272,689 | |
Charles River Laboratories International, Inc. (1) | | | 953 | | | | 104,306 | |
Concert Pharmaceuticals, Inc. (1) | | | 86 | | | | 2,225 | |
Corcept Therapeutics, Inc. (1) | | | 1,912 | | | | 34,531 | |
Cutera, Inc. (1) | | | 70 | | | | 3,175 | |
Dyax Corp. Contingent Value Rights (1)(5) | | | 6,220 | | | | 0 | |
Emergent BioSolutions, Inc. (1) | | | 4,783 | | | | 222,266 | |
Enanta Pharmaceuticals, Inc. (1) | | | 803 | | | | 47,120 | |
Enzo Biochem, Inc. (1) | | | 3,758 | | | | 30,628 | |
Esperion Therapeutics, Inc. (1) | | | 257 | | | | 16,921 | |
Exact Sciences Corp. (1) | | | 1,709 | | | | 89,791 | |
Exactech, Inc. (1) | | | 63 | | | | 3,115 | |
Exelixis, Inc. (1) | | | 3,091 | | | | 93,966 | |
FibroGen, Inc. (1) | | | 1,083 | | | | 51,334 | |
Genomic Health, Inc. (1) | | | 1,122 | | | | 38,372 | |
Haemonetics Corp. (1) | | | 912 | | | | 52,969 | |
| Hill-Rom Holdings, Inc. | | | 805 | | | | 67,853 | |
Integer Holdings Corp. (1) | | | 2,034 | | | | 92,140 | |
Juno Therapeutics, Inc. (1) | | | 483 | | | | 22,078 | |
| LeMaitre Vascular, Inc. | | | 42 | | | | 1,337 | |
LivaNova PLC (1) | | | 1,295 | | | | 103,496 | |
Mallinckrodt PLC (1) | | | 3,663 | | | | 82,637 | |
Masimo Corp. (1) | | | 2,436 | | | | 206,573 | |
MyoKardia, Inc. (1) | | | 180 | | | | 7,578 | |
Myriad Genetics, Inc. (1) | | | 4,658 | | | | 159,979 | |
Nektar Therapeutics (1) | | | 1,092 | | | | 65,214 | |
Orthofix International NV (1) | | | 181 | | | | 9,901 | |
| Phibro Animal Health Corp. | | | 951 | | | | 31,859 | |
Premier, Inc. (1) | | | 8,559 | | | | 249,837 | |
Puma Biotechnology, Inc. (1) | | | 199 | | | | 19,671 | |
Quality Systems, Inc. (1) | | | 303 | | | | 4,115 | |
Sangamo Therapeutics, Inc. (1) | | | 199 | | | | 3,264 | |
Spectrum Pharmaceuticals, Inc. (1) | | | 1,315 | | | | 24,919 | |
| STERIS PLC | | | 919 | | | | 80,385 | |
Supernus Pharmaceuticals, Inc. (1) | | | 2,105 | | | | 83,884 | |
Titan Pharmaceuticals, Inc. (1) | | | 1,153 | | | | 1,528 | |
Triple-S Management Corp. (1) | | | 2,144 | | | | 53,278 | |
United Therapeutics Corp. (1) | | | 1,462 | | | | 216,303 | |
Vanda Pharmaceuticals, Inc. (1) | | | 1,276 | | | | 19,395 | |
WellCare Health Plans, Inc. (1) | | | 1,412 | | | | 283,967 | |
Zogenix, Inc. (1) | | | 368 | | | | 14,738 | |
| | | | | | | | 3,505,680 | |
| | | | | | | | | |
| Industrials — 10.8% | | | | | | | | |
| Allison Transmission Holdings, Inc. | | | 3,493 | | | | 150,444 | |
| Applied Industrial Technologies, Inc. | | | 304 | | | | 20,702 | |
| ArcBest Corp. | | | 353 | | | | 12,620 | |
| Argan, Inc. | | | 680 | | | | 30,600 | |
Builders FirstSource, Inc. (1) | | | 7,930 | | | | 172,795 | |
| BWX Technologies, Inc. | | | 2,234 | | | | 135,135 | |
Commercial Vehicle Group, Inc. (1) | | | 1,063 | | | | 11,363 | |
| Copa Holdings SA | | | 240 | | | | 32,174 | |
| EMCOR Group, Inc. | | | 1,281 | | | | 104,722 | |
| EnPro Industries, Inc. | | | 1,294 | | | | 121,002 | |
| Forward Air Corp. | | | 2,597 | | | | 149,172 | |
| Hillenbrand, Inc. | | | 860 | | | | 38,442 | |
| Huntington Ingalls Industries, Inc. | | | 1,408 | | | | 331,866 | |
| Hyster-Yale Materials Handling, Inc. | | | 104 | | | | 8,857 | |
JetBlue Airways Corp. (1) | | | 14,252 | | | | 318,390 | |
| Kadant, Inc. | | | 1,356 | | | | 136,142 | |
| Kelly Services, Inc. | | | 1,714 | | | | 46,741 | |
| Korn/Ferry International | | | 3,316 | | | | 137,216 | |
| Landstar System, Inc. | | | 1,180 | | | | 122,838 | |
| ManpowerGroup, Inc. | | | 2,555 | | | | 322,211 | |
Meritor, Inc. (1) | | | 7,919 | | | | 185,780 | |
| Old Dominion Freight Line, Inc. | | | 938 | | | | 123,394 | |
| Orbital ATK, Inc. | | | 339 | | | | 44,579 | |
| Owens Corning | | | 3,735 | | | | 343,396 | |
| Primoris Services Corp. | | | 2,050 | | | | 55,740 | |
| Regal Beloit Corp. | | | 2,867 | | | | 219,612 | |
| Robert Half International, Inc. | | | 2,263 | | | | 125,687 | |
The accompanying notes are an integral part of these financial statements.
2017 Annual Report | December 31, 2017 | Page 33 |
Schedule of Investments
December 31, 2017
| Aggressive Allocation Fund |
| Security Description | | Shares or
Principal
Amount ($) | | Fair
Value ($) |
| Common Stocks — continued |
| RPX Corp. | | | 6,371 | | | | 85,626 | |
Rush Enterprises, Inc. - Class A (1) | | | 1,693 | | | | 86,021 | |
| Ryder System, Inc. | | | 2,622 | | | | 220,694 | |
Saia, Inc. (1) | | | 1,619 | | | | 114,544 | |
| Spirit AeroSystems Holdings, Inc. | | | 3,949 | | | | 344,550 | |
Sterling Construction Co., Inc. (1) | | | 114 | | | | 1,856 | |
| Triton International, Ltd./Bermuda | | | 1,221 | | | | 45,726 | |
TrueBlue, Inc. (1) | | | 584 | | | | 16,060 | |
Vectrus, Inc. (1) | | | 1,244 | | | | 38,377 | |
| | | | | | | | 4,455,074 | |
| | | | | | | | | |
| Information Technology — 9.3% | | | | | | | | |
Advanced Energy Industries, Inc. (1) | | | 2,125 | | | | 143,395 | |
Amkor Technology, Inc. (1) | | | 9,961 | | | | 100,108 | |
ANSYS, Inc. (1) | | | 1,070 | | | | 157,921 | |
Appfolio, Inc. (1) | | | 606 | | | | 25,149 | |
Arista Networks, Inc. (1) | | | 534 | | | | 125,800 | |
ARRIS International PLC (1) | | | 5,620 | | | | 144,378 | |
Aspen Technology, Inc. (1) | | | 4,501 | | | | 297,966 | |
Cadence Design Systems, Inc. (1) | | | 8,388 | | | | 350,786 | |
Care.com, Inc. (1) | | | 9 | | | | 162 | |
Cirrus Logic, Inc. (1) | | | 608 | | | | 31,531 | |
| Cognex Corp. | | | 708 | | | | 43,301 | |
| Cohu, Inc. | | | 456 | | | | 10,009 | |
CommerceHub, Inc. (1) | | | 261 | | | | 5,374 | |
| Comtech Telecommunications Corp. | | | 2,218 | | | | 49,062 | |
Control4 Corp. (1) | | | 1,558 | | | | 46,366 | |
Electro Scientific Industries, Inc. (1) | | | 344 | | | | 7,372 | |
ePlus, Inc. (1) | | | 65 | | | | 4,888 | |
Extreme Networks, Inc. (1) | | | 2,150 | | | | 26,918 | |
IAC/InterActiveCorp (1) | | | 2,089 | | | | 255,443 | |
IPG Photonics Corp. (1) | | | 1,345 | | | | 288,005 | |
IXYS Corp. (1) | | | 636 | | | | 15,232 | |
| Jabil, Inc. | | | 7,316 | | | | 192,045 | |
KEMET Corp. (1) | | | 897 | | | | 13,509 | |
| MKS Instruments, Inc. | | | 328 | | | | 30,996 | |
Novanta, Inc. (1) | | | 390 | | | | 19,500 | |
ON Semiconductor Corp. (1) | | | 5,519 | | | | 115,568 | |
| Progress Software Corp. | | | 4,994 | | | | 212,595 | |
RingCentral, Inc. (1) | | | 1,965 | | | | 95,106 | |
Sanmina Corp. (1) | | | 204 | | | | 6,732 | |
Take-Two Interactive Software, Inc. (1) | | | 2,328 | | | | 255,568 | |
Tech Data Corp. (1) | | | 1,932 | | | | 189,278 | |
| Teradyne, Inc. | | | 7,274 | | | | 304,562 | |
| Travelport Worldwide, Ltd. | | | 19,273 | | | | 251,898 | |
Ultra Clean Holdings, Inc. (1) | | | 294 | | | | 6,788 | |
Xcerra Corp. (1) | | | 314 | | | | 3,074 | |
| | | | | | | | 3,826,385 | |
| | | | | | | | | |
| Materials — 4.2% | | | | | | | | |
AdvanSix, Inc. (1) | | | 502 | | | | 21,119 | |
| Alcoa Corp. | | | 3,726 | | | | 200,720 | |
Crown Holdings, Inc. (1) | | | 4,375 | | | | 246,094 | |
| Domtar Corp. | | | 751 | | | | 37,190 | |
| Huntsman Corp. | | | 6,046 | | | | 201,271 | |
| Kaiser Aluminum Corp. | | | 1,885 | | | | 201,412 | |
| Kronos Worldwide, Inc. | | | 2,074 | | | | 53,447 | |
Louisiana-Pacific Corp. (1) | | | 10,938 | | | | 287,232 | |
| Materion Corp. | | | 478 | | | | 23,231 | |
| Schnitzer Steel Industries, Inc. | | | 1,060 | | | | 35,510 | |
| Steel Dynamics, Inc. | | | 3,309 | | | | 142,717 | |
| Trinseo SA | | | 2,944 | | | | 213,734 | |
Verso Corp. (1) | | | 69 | | | | 1,212 | |
| Warrior Met Coal, Inc. | | | 3,236 | | | | 81,385 | |
| | | | | | | | 1,746,274 | |
| | | | | | | | | |
| Real Estate Investment Trust — 3.4% | | | | | | | | |
| Apple Hospitality REIT, Inc. | | | 9,643 | | | | 189,099 | |
| CubeSmart | | | 6,778 | | | | 196,020 | |
| DDR Corp. | | | 13,910 | | | | 124,634 | |
| Hospitality Properties Trust | | | 4,514 | | | | 134,743 | |
| Kite Realty Group Trust | | | 11,277 | | | | 221,029 | |
| Lamar Advertising Co. | | | 862 | | | | 63,995 | |
| Liberty Property Trust | | | 7,174 | | | | 308,554 | |
| Monmouth Real Estate Investment Corp. | | | 3,425 | | | | 60,965 | |
| Retail Properties of America, Inc. | | | 5,925 | | | | 79,632 | |
| Washington Prime Group, Inc. | | | 1,663 | | | | 11,841 | |
| | | | | | | | 1,390,512 | |
| | | | | | | | | |
| Telecommunication Services — 0.7% | | | | | | | | |
General Communication, Inc. (1) | | | 156 | | | | 6,087 | |
Straight Path Communications, Inc. (1) | | | 1,547 | | | | 281,229 | |
| | | | | | | | 287,316 | |
| Utilities — 1.7% | | | | | | | | |
| American States Water Co. | | | 2,583 | | | | 149,582 | |
| NRG Energy, Inc. | | | 312 | | | | 8,886 | |
| SJW Group | | | 102 | | | | 6,511 | |
| UGI Corp. | | | 7,046 | | | | 330,810 | |
Vistra Energy Corp. (1) | | | 11,479 | | | | 210,293 | |
| | | | | | | | 706,082 | |
| | | | | | | | | |
| Total Common Stocks (Cost $25,012,211) | | | | | | | 28,155,013 | |
The accompanying notes are an integral part of these financial statements.
Page 34 | 2017 Annual Report | December 31, 2017 |
Schedule of Investments
December 31, 2017
| Aggressive Allocation Fund |
| Security Description | | Shares or
Principal
Amount ($) | | Fair
Value ($) |
| Registered Investment Companies — 11.8% |
iShares Core MSCI EAFE ETF (6) | | | 36,743 | | | | 2,428,345 | |
iShares Core MSCI Emerging Markets ETF (6) | | | 5,206 | | | | 296,221 | |
iShares Core U.S. Aggregate Bond ETF (6) | | | 19,769 | | | | 2,161,345 | |
| Total Registered Investment Companies (Cost $4,673,733) | | | | | | | 4,885,911 | |
| | | | | | | | | |
| Money Market Registered Investment Companies — 16.5% |
Meeder Institutional Prime Money Market Fund, 1.32% (2) | | | 6,810,278 | | | | 6,809,597 | |
| Total Money Market Registered Investment Companies (Cost $6,810,424) | | | | | | | 6,809,597 | |
| | | | | | | | | |
| Bank Obligations — 2.4% | | | | | | | | |
Bank Midwest Deposit Account, 1.00%, 1/2/2018 (3) | | | 248,989 | | | | 248,989 | |
First Merchants Bank Deposit Account, 1.00%, 1/2/2018 (3) | | | 248,190 | | | | 248,190 | |
Metro City Bank Deposit Account, 1.00%, 1/2/2018 (3) | | | 248,190 | | | | 248,190 | |
Pacific Premier Bank Deposit Account, 1.05%, 1/2/2018 (3) | | | 249,198 | | | | 249,198 | |
| Total Bank Obligations (Cost $994,567) | | | | | | | 994,567 | |
| Total Investments — 98.9% (Cost $37,490,935) | | | | | | | 40,845,088 | |
| Other Assets less Liabilities — 1.1% | | | | | | | 456,172 | |
| Total Net Assets — 100.0% | | | | | | | 41,301,260 | |
| | | | | | | | | |
Trustee Deferred Compensation (4) | | | | | | | | |
| Meeder Aggressive Allocation Fund | | | 2,194 | | | | 22,927 | |
| Meeder Balanced Fund | | | 1,112 | | | | 12,910 | |
| Meeder Dynamic Allocation Fund | | | 767 | | | | 8,322 | |
| Meeder Muirfield Fund | | | 1,057 | | | | 7,970 | |
| Meeder Conservative Allocation Fund | | | 309 | | | | 6,965 | |
| Total Trustee Deferred Compensation (Cost $51,811) | | | | | | | 59,094 | |
| Aggressive Allocation Fund |
| | | Contracts | | Expiration Date | | Notional Value of Contracts ($) | | Value and Unrealized Appreciation (Depreciation) ($) |
| Futures Contracts |
| Index Futures | | | | | | | | | | | | | | |
| Mini MSCI EAFE Index Futures | | | 51 | | | 3/16/2018 | | | 5,216,025 | | | | 83,234 | |
| Mini MSCI Emerging Markets Index Futures | | | 31 | | | 3/16/2018 | | | 1,803,735 | | | | 72,603 | |
| Russell 2000 Mini Index Futures | | | 3 | | | 3/16/2018 | | | 230,475 | | | | 1,904 | |
| E-mini Standard & Poors MidCap 400 Futures | | | 5 | | | 3/16/2018 | | | 951,200 | | | | 7,486 | |
| Total Futures Contracts | | | 90 | | | | | | 8,201,435 | | | | 165,227 | |
(1) | Represents non-income producing securities. |
(2) | Investment in affiliate. The yield shown represents the 7-day yield in effect at December 31, 2017. |
(3) | Variable rate security. Securities payable at par including accrued interest (usually within seven days notice) and unconditionally secured as to principal and interest by letters of credit or other credit support agreements from major banks. The interest rates are adjustable and are not based on a published reference rate and spread but are determined by the issuer or agent and are based on current market conditions. These securities do not indicate a reference rate and spread in their description above. The rate shown represents the rate in effect at December 31, 2017. The maturity date shown, if applicable, reflects the earlier of the next demand date or stated maturity date. |
(4) | Assets of affiliates to the Aggressive Allocation Fund held for the benefit of the Fund’s Trustees in connection with the Trustee Deferred Compensation Plan. |
(5) | Fair valued security deemed as Level 3 security. |
The accompanying notes are an integral part of these financial statements.
2017 Annual Report | December 31, 2017 | Page 35 |
Schedule of Investments
December 31, 2017
| Balanced Fund |
| Security Description | | Shares, Contracts or
Principal
Amount ($) | | Fair
Value ($) |
| Common Stocks — 48.6% |
| Consumer Discretionary — 5.4% | | | | | | | | |
Amazon.com, Inc. (1) | | | 2,047 | | | | 2,393,905 | |
| Aramark | | | 1,587 | | | | 67,828 | |
| Bed Bath & Beyond, Inc. | | | 4,356 | | | | 95,788 | |
| Best Buy Co., Inc. | | | 3,418 | | | | 234,030 | |
Burlington Stores, Inc. (1) | | | 909 | | | | 111,834 | |
| Carnival Corp. | | | 1,016 | | | | 67,432 | |
| Carter's, Inc. | | | 304 | | | | 35,717 | |
Charter Communications, Inc. (1) | | | 1,321 | | | | 443,803 | |
| Comcast Corp. | | | 31,237 | | | | 1,251,042 | |
| Dollar General Corp. | | | 1,807 | | | | 168,069 | |
| Ford Motor Co. | | | 19,228 | | | | 240,158 | |
| GameStop Corp. | | | 6,132 | | | | 110,069 | |
| Gap, Inc./The | | | 5,818 | | | | 198,161 | |
| General Motors Co. | | | 26,575 | | | | 1,089,309 | |
| H&R Block, Inc. | | | 54 | | | | 1,416 | |
| Home Depot, Inc./The | | | 9,563 | | | | 1,812,475 | |
| Kohl's Corp. | | | 337 | | | | 18,276 | |
| Lear Corp. | | | 4,165 | | | | 735,789 | |
Liberty Interactive Corp. QVC Group (1) | | | 6,343 | | | | 154,896 | |
Liberty Media Corp-Liberty SiriusXM - Class A (1) | | | 2,987 | | | | 118,464 | |
Live Nation Entertainment, Inc. (1) | | | 6,676 | | | | 284,197 | |
| Lowe's Cos., Inc. | | | 2,565 | | | | 238,391 | |
| McDonald's Corp. | | | 2,809 | | | | 483,485 | |
Michael Kors Holdings, Ltd. (1) | | | 4,000 | | | | 251,800 | |
Michaels Cos., Inc./The (1) | | | 4,035 | | | | 97,607 | |
NVR, Inc. (1) | | | 51 | | | | 178,919 | |
Priceline Group, Inc./The (1) | | | 95 | | | | 165,085 | |
| PulteGroup, Inc. | | | 6,681 | | | | 222,143 | |
| PVH Corp. | | | 2,654 | | | | 364,155 | |
| Ross Stores, Inc. | | | 4,348 | | | | 348,927 | |
| Royal Caribbean Cruises, Ltd. | | | 4,669 | | | | 556,918 | |
| Scripps Networks Interactive, Inc. | | | 5,124 | | | | 437,487 | |
| Signet Jewelers, Ltd. | | | 735 | | | | 41,564 | |
Skechers U.S.A., Inc. (1) | | | 1,888 | | | | 71,442 | |
| Target Corp. | | | 7,026 | | | | 458,447 | |
| Thor Industries, Inc. | | | 1,431 | | | | 215,680 | |
| TJX Cos., Inc./The | | | 218 | | | | 16,668 | |
| Twenty-First Century Fox, Inc. | | | 2,200 | | | | 75,966 | |
| Walt Disney Co./The | | | 5,509 | | | | 592,273 | |
| Whirlpool Corp. | | | 2,657 | | | | 448,076 | |
| Yum China Holdings, Inc. | | | 5,476 | | | | 219,150 | |
| | | | | | | | 15,116,841 | |
| | | | | | | | | |
| Consumer Staples — 3.3% | | | | | | | | |
| Archer-Daniels-Midland Co. | | | 8,721 | | | | 349,538 | |
| Colgate-Palmolive Co. | | | 17,011 | | | | 1,283,480 | |
| CVS Health Corp. | | | 10,362 | | | | 751,245 | |
| Kroger Co./The | | | 2,682 | | | | 73,621 | |
| Lamb Weston Holdings, Inc. | | | 6,843 | | | | 386,287 | |
Monster Beverage Corp. (1) | | | 6,724 | | | | 425,562 | |
| Nu Skin Enterprises, Inc. | | | 3,806 | | | | 259,683 | |
| PepsiCo, Inc. | | | 16,207 | | | | 1,943,543 | |
| Philip Morris International, Inc. | | | 3,062 | | | | 323,500 | |
Pilgrim's Pride Corp. (1) | | | 2,742 | | | | 85,167 | |
| Procter & Gamble Co./The | | | 3,978 | | | | 365,499 | |
| Tyson Foods, Inc. | | | 13,422 | | | | 1,088,122 | |
| Walgreens Boots Alliance, Inc. | | | 8,199 | | | | 595,411 | |
| Wal-Mart Stores, Inc. | | | 13,969 | | | | 1,379,439 | |
| | | | | | | | 9,310,097 | |
| | | | | | | | | |
| Energy — 3.3% | | | | | | | | |
| Andeavor | | | 5,720 | | | | 654,025 | |
| Cabot Oil & Gas Corp. | | | 14,611 | | | | 417,875 | |
| Chevron Corp. | | | 12,930 | | | | 1,618,707 | |
| Cimarex Energy Co. | | | 2,107 | | | | 257,075 | |
Concho Resources, Inc. (1) | | | 505 | | | | 75,861 | |
CONSOL Energy, Inc. (1) | | | 1,302 | | | | 51,442 | |
| Exxon Mobil Corp. | | | 27,790 | | | | 2,324,356 | |
| HollyFrontier Corp. | | | 3,964 | | | | 203,036 | |
| Marathon Petroleum Corp. | | | 12,078 | | | | 796,906 | |
| Occidental Petroleum Corp. | | | 2,317 | | | | 170,670 | |
| PBF Energy, Inc. | | | 4,241 | | | | 150,343 | |
| Phillips 66 | | | 8,836 | | | | 893,761 | |
| RPC, Inc. | | | 19,119 | | | | 488,108 | |
| Schlumberger, Ltd. | | | 2,223 | | | | 149,808 | |
Southwestern Energy Co. (1) | | | 2,812 | | | | 15,691 | |
| Valero Energy Corp. | | | 8,943 | | | | 821,951 | |
| World Fuel Services Corp. | | | 1,918 | | | | 53,973 | |
| | | | | | | | 9,143,588 | |
| | | | | | | | | |
| Financials — 8.4% | | | | | | | | |
| Aflac, Inc. | | | 9,645 | | | | 846,638 | |
| Allstate Corp./The | | | 10,705 | | | | 1,120,921 | |
| American Express Co. | | | 10,527 | | | | 1,045,436 | |
| Ameriprise Financial, Inc. | | | 4,426 | | | | 750,074 | |
| Annaly Capital Management, Inc. | | | 73,676 | | | | 876,008 | |
| Bank of America Corp. | | | 58,678 | | | | 1,732,175 | |
| Bank of New York Mellon Corp./The | | | 24,176 | | | | 1,302,119 | |
| BB&T Corp. | | | 13,501 | | | | 671,270 | |
The accompanying notes are an integral part of these financial statements.
Page 36 | 2017 Annual Report | December 31, 2017 |
Schedule of Investments
December 31, 2017
| Balanced Fund |
| Security Description | | Shares, Contracts or
Principal
Amount ($) | | Fair
Value ($) |
| Common Stocks — continued |
Berkshire Hathaway, Inc. (1) | | | 15,441 | | | | 3,060,715 | |
| BGC Partners, Inc. | | | 10,929 | | | | 165,137 | |
| Chimera Investment Corp. | | | 2,608 | | | | 48,196 | |
| Citigroup, Inc. | | | 19,139 | | | | 1,424,133 | |
| CNA Financial Corp. | | | 6,090 | | | | 323,075 | |
| Comerica, Inc. | | | 426 | | | | 36,981 | |
| Fifth Third Bancorp | | | 36,985 | | | | 1,122,125 | |
| First American Financial Corp. | | | 6,169 | | | | 345,711 | |
| Hanover Insurance Group, Inc./The | | | 680 | | | | 73,494 | |
| Huntington Bancshares, Inc./OH | | | 3,951 | | | | 57,527 | |
| JPMorgan Chase & Co. | | | 23,987 | | | | 2,565,170 | |
| Lazard, Ltd. | | | 8,870 | | | | 465,675 | |
| Marsh & McLennan Cos., Inc. | | | 3,486 | | | | 283,726 | |
| MSCI, Inc. | | | 1,189 | | | | 150,456 | |
| New Residential Investment Corp. | | | 40,541 | | | | 724,873 | |
| Old Republic International Corp. | | | 8,277 | | | | 176,962 | |
| PNC Financial Services Group, Inc./The | | | 4,142 | | | | 597,649 | |
| Progressive Corp./The | | | 16,683 | | | | 939,587 | |
| Regions Financial Corp. | | | 32,804 | | | | 566,853 | |
| Reinsurance Group of America, Inc. | | | 886 | | | | 138,154 | |
| SEI Investments Co. | | | 1,085 | | | | 77,968 | |
| T Rowe Price Group, Inc. | | | 5,565 | | | | 583,935 | |
| Wells Fargo & Co. | | | 19,768 | | | | 1,199,325 | |
| | | | | | | | 23,472,068 | |
| | | | | | | | | |
| Healthcare — 6.5% | | | | | | | | |
| Abbott Laboratories | | | 4,206 | | | | 240,036 | |
| AbbVie, Inc. | | | 10,871 | | | | 1,051,334 | |
| Aetna, Inc. | | | 3,666 | | | | 661,310 | |
| Agilent Technologies, Inc. | | | 11,722 | | | | 785,022 | |
Alexion Pharmaceuticals, Inc. (1) | | | 1,037 | | | | 124,015 | |
Alnylam Pharmaceuticals, Inc. (1) | | | 263 | | | | 33,414 | |
| Amgen, Inc. | | | 7,619 | | | | 1,324,944 | |
| Anthem, Inc. | | | 2,808 | | | | 631,828 | |
| Baxter International, Inc. | | | 18,256 | | | | 1,180,068 | |
Biogen, Inc. (1) | | | 2,643 | | | | 841,981 | |
Bioverativ, Inc. (1) | | | 3,114 | | | | 167,907 | |
| Bristol-Myers Squibb Co. | | | 13,352 | | | | 818,211 | |
Celgene Corp. (1) | | | 3,893 | | | | 406,273 | |
Centene Corp. (1) | | | 2,064 | | | | 208,216 | |
Cerner Corp. (1) | | | 8,174 | | | | 550,846 | |
| Cigna Corp. | | | 3,369 | | | | 684,210 | |
Express Scripts Holding Co. (1) | | | 2,415 | | | | 180,256 | |
| Gilead Sciences, Inc. | | | 14,039 | | | | 1,005,754 | |
HCA Healthcare, Inc. (1) | | | 504 | | | | 44,271 | |
| Hill-Rom Holdings, Inc. | | | 865 | | | | 72,911 | |
| Humana, Inc. | | | 3,087 | | | | 765,792 | |
Intuitive Surgical, Inc. (1) | | | 1,964 | | | | 716,742 | |
| Johnson & Johnson | | | 11,953 | | | | 1,670,073 | |
| McKesson Corp. | | | 2,756 | | | | 429,798 | |
| Medtronic PLC | | | 5,096 | | | | 411,502 | |
| Pfizer, Inc. | | | 8,440 | | | | 305,697 | |
Premier, Inc. (1) | | | 8,077 | | | | 235,768 | |
Regeneron Pharmaceuticals, Inc. (1) | | | 189 | | | | 71,056 | |
United Therapeutics Corp. (1) | | | 1,834 | | | | 271,340 | |
| UnitedHealth Group, Inc. | | | 7,597 | | | | 1,674,835 | |
Vertex Pharmaceuticals, Inc. (1) | | | 1,616 | | | | 242,174 | |
WellCare Health Plans, Inc. (1) | | | 948 | | | | 190,652 | |
| | | | | | | | 17,998,236 | |
| | | | | | | | | |
| Industrials — 4.5% | | | | | | | | |
| 3M Co. | | | 2,030 | | | | 477,801 | |
| Allison Transmission Holdings, Inc. | | | 4,554 | | | | 196,141 | |
| Boeing Co./The | | | 6,060 | | | | 1,787,155 | |
| Copa Holdings SA | | | 1,017 | | | | 136,339 | |
| Cummins, Inc. | | | 5,295 | | | | 935,309 | |
| Delta Air Lines, Inc. | | | 12,413 | | | | 695,128 | |
| Eaton Corp. PLC | | | 12,596 | | | | 995,210 | |
| Huntington Ingalls Industries, Inc. | | | 3,691 | | | | 869,969 | |
| Illinois Tool Works, Inc. | | | 1,447 | | | | 241,432 | |
| Ingersoll-Rand PLC | | | 3,230 | | | | 288,084 | |
| ITT, Inc. | | | 2,228 | | | | 118,908 | |
JetBlue Airways Corp. (1) | | | 8,897 | | | | 198,759 | |
| Kansas City Southern | | | 4,661 | | | | 490,430 | |
| ManpowerGroup, Inc. | | | 2,926 | | | | 368,998 | |
| Masco Corp. | | | 4,651 | | | | 204,365 | |
| Old Dominion Freight Line, Inc. | | | 817 | | | | 107,476 | |
| Orbital ATK, Inc. | | | 306 | | | | 40,239 | |
| Owens Corning | | | 4,498 | | | | 413,546 | |
| PACCAR, Inc. | | | 3,253 | | | | 231,223 | |
| Pitney Bowes, Inc. | | | 6 | | | | 67 | |
Quanta Services, Inc. (1) | | | 1,115 | | | | 43,608 | |
| Regal Beloit Corp. | | | 472 | | | | 36,155 | |
| Robert Half International, Inc. | | | 5,451 | | | | 302,749 | |
| Ryder System, Inc. | | | 2,287 | | | | 192,497 | |
| Spirit AeroSystems Holdings, Inc. | | | 4,290 | | | | 374,303 | |
| Stanley Black & Decker, Inc. | | | 1,554 | | | | 263,698 | |
| Union Pacific Corp. | | | 5,907 | | | | 792,129 | |
United Continental Holdings, Inc. (1) | | | 1,732 | | | | 116,737 | |
United Rentals, Inc. (1) | | | 2,516 | | | | 432,526 | |
WABCO Holdings, Inc. (1) | | | 1,222 | | | | 175,357 | |
Waste Management, Inc. (1) | | | 3,422 | | | | 295,319 | |
The accompanying notes are an integral part of these financial statements.
2017 Annual Report | December 31, 2017 | Page 37 |
Schedule of Investments
December 31, 2017
| Balanced Fund |
| Security Description | | Shares, Contracts or
Principal
Amount ($) | | Fair
Value ($) |
| Common Stocks — continued |
| Watsco, Inc. | | | 2,720 | | | | 462,509 | |
WESCO International, Inc. (1) | | | 2,494 | | | | 169,966 | |
| | | | | | | | 12,454,132 | |
| Information Technology — 11.8% | | | | | | | | |
| Accenture PLC | | | 9,974 | | | | 1,526,920 | |
Adobe Systems, Inc. (1) | | | 4,110 | | | | 720,236 | |
Alphabet, Inc. - Class A (1) | | | 688 | | | | 724,739 | |
Alphabet, Inc. - Class C (1) | | | 2,298 | | | | 2,404,627 | |
| Apple, Inc. | | | 27,149 | | | | 4,594,425 | |
| Applied Materials, Inc. | | | 12,481 | | | | 638,029 | |
ARRIS International PLC (1) | | | 9,279 | | | | 238,378 | |
| CA, Inc. | | | 25,581 | | | | 851,336 | |
Cadence Design Systems, Inc. (1) | | | 17,015 | | | | 711,567 | |
| Cisco Systems, Inc. | | | 43,344 | | | | 1,660,075 | |
| Cognex Corp. | | | 1,415 | | | | 86,541 | |
| Cognizant Technology Solutions Corp. | | | 5,115 | | | | 363,267 | |
Dell Technologies, Inc. Class V (1) | | | 2,923 | | | | 237,581 | |
| DXC Technology Co. | | | 9,377 | | | | 889,877 | |
eBay, Inc. (1) | | | 3,545 | | | | 133,788 | |
Electronic Arts, Inc. (1) | | | 627 | | | | 65,873 | |
F5 Networks, Inc. (1) | | | 55 | | | | 7,217 | |
Facebook, Inc. (1) | | | 15,869 | | | | 2,800,244 | |
| HP, Inc. | | | 50,935 | | | | 1,070,144 | |
IAC/InterActiveCorp (1) | | | 716 | | | | 87,552 | |
| Intel Corp. | | | 24,079 | | | | 1,111,487 | |
| International Business Machines Corp. | | | 6,942 | | | | 1,065,042 | |
| Intuit, Inc. | | | 6,361 | | | | 1,003,639 | |
IPG Photonics Corp. (1) | | | 439 | | | | 94,003 | |
| Jabil, Inc. | | | 6,963 | | | | 182,779 | |
| Juniper Networks, Inc. | | | 1,014 | | | | 28,899 | |
| Lam Research Corp. | | | 2,975 | | | | 547,608 | |
| Mastercard, Inc. | | | 4,585 | | | | 693,986 | |
Micron Technology, Inc. (1) | | | 8,626 | | | | 354,701 | |
| Microsoft Corp. | | | 48,105 | | | | 4,114,902 | |
| NVIDIA Corp. | | | 4,201 | | | | 812,894 | |
ON Semiconductor Corp. (1) | | | 14,951 | | | | 313,074 | |
| Oracle Corp. | | | 23,202 | | | | 1,096,991 | |
PayPal Holdings, Inc. (1) | | | 4,570 | | | | 336,443 | |
Red Hat, Inc. (1) | | | 1,708 | | | | 205,131 | |
Synopsys, Inc. (1) | | | 5,167 | | | | 440,435 | |
Take-Two Interactive Software, Inc. (1) | | | 841 | | | | 92,325 | |
| Texas Instruments, Inc. | | | 3,298 | | | | 344,443 | |
| Western Digital Corp. | | | 4,500 | | | | 357,885 | |
| | | | | | | | 33,009,083 | |
| | | | | | | | | |
| Materials — 1.4% | | | | | | | | |
| Alcoa Corp. | | | 1,370 | | | | 73,802 | |
| Avery Dennison Corp. | | | 2,764 | | | | 317,473 | |
| Cabot Corp. | | | 3,689 | | | | 227,206 | |
Crown Holdings, Inc. (1) | | | 14,612 | | | | 821,925 | |
| Domtar Corp. | | | 80 | | | | 3,962 | |
| Eastman Chemical Co. | | | 6,339 | | | | 587,245 | |
Freeport-McMoRan, Inc. (1) | | | 13,125 | | | | 248,850 | |
| Huntsman Corp. | | | 5,764 | | | | 191,884 | |
| LyondellBasell Industries NV | | | 9,091 | | | | 1,002,919 | |
| Nucor Corp. | | | 2,024 | | | | 128,686 | |
| Steel Dynamics, Inc. | | | 6,393 | | | | 275,730 | |
| | | | | | | | 3,879,682 | |
| | | | | | | | | |
| Real Estate Investment Trust — 1.7% | | | | | | | | |
| American Tower Corp. | | | 2,841 | | | | 405,325 | |
| Apple Hospitality REIT, Inc. | | | 1,922 | | | | 37,690 | |
| CubeSmart | | | 4,517 | | | | 130,632 | |
| DDR Corp. | | | 5,647 | | | | 50,597 | |
| Essex Property Trust, Inc. | | | 2,387 | | | | 576,150 | |
| Gaming and Leisure Properties, Inc. | | | 2,588 | | | | 95,756 | |
| Hospitality Properties Trust | | | 4,312 | | | | 128,713 | |
| Host Hotels & Resorts, Inc. | | | 14,305 | | | | 283,954 | |
| Lamar Advertising Co. | | | 1,251 | | | | 92,874 | |
| Liberty Property Trust | | | 4,434 | | | | 190,706 | |
| Macerich Co./The | | | 147 | | | | 9,655 | |
| Prologis, Inc. | | | 13,541 | | | | 873,530 | |
SBA Communications Corp. (1) | | | 1,320 | | | | 215,635 | |
| Simon Property Group, Inc. | | | 5,093 | | | | 874,672 | |
| VEREIT, Inc. | | | 27,163 | | | | 211,600 | |
| Vornado Realty Trust | | | 7,554 | | | | 590,572 | |
| | | | | | | | 4,768,061 | |
| | | | | | | | | |
| Telecommunication Services — 1.2% | | | | | | | | |
| AT&T, Inc. | | | 23,777 | | | | 924,450 | |
| Telephone & Data Systems, Inc. | | | 5,738 | | | | 159,516 | |
T-Mobile US, Inc. (1) | | | 4,222 | | | | 268,139 | |
| Verizon Communications, Inc. | | | 35,611 | | | | 1,884,890 | |
| | | | | | | | 3,236,995 | |
| Utilities — 1.1% | | | | | | | | |
| AES Corp./VA | | | 932 | | | | 10,094 | |
| American Electric Power Co., Inc. | | | 5,711 | | | | 420,158 | |
| CenterPoint Energy, Inc. | | | 22,402 | | | | 635,321 | |
| Exelon Corp. | | | 31,384 | | | | 1,236,843 | |
| Vectren Corp. | | | 11,175 | | | | 726,599 | |
The accompanying notes are an integral part of these financial statements.
Page 38 | 2017 Annual Report | December 31, 2017 |
Schedule of Investments
December 31, 2017
| Balanced Fund |
| Security Description | | Shares, Contracts or
Principal
Amount ($) | | Fair
Value ($) |
| Common Stocks — continued |
Vistra Energy Corp. (1) | | | 3,342 | | | | 61,226 | |
| | | | | | | | 3,090,241 | |
| | | | | | | | | |
| Total Common Stocks (Cost $122,225,048) | | | | | | | 135,479,024 | |
| | | | | | | | | |
| Registered Investment Companies — 33.4% |
| Baird Core Plus Bond Fund - Class I | | | 368,382 | | | | 4,133,241 | |
| DoubleLine Total Return Bond Fund - Class I | | | 238,865 | | | | 2,539,130 | |
| Frost Total Return Bond Fund - Class I | | | 311,120 | | | | 3,244,980 | |
| Guggenheim Total Return Bond Fund - Class I | | | 127,604 | | | | 3,473,390 | |
iShares 1-3 Year Treasury Bond ETF (5) | | | 24,653 | | | | 2,067,154 | |
iShares 3-7 Year Treasury Bond ETF (5) | | | 83,895 | | | | 10,248,613 | |
iShares 7-10 Year Treasury Bond ETF (5) | | | 113,689 | | | | 12,002,046 | |
iShares Core U.S. Aggregate Bond ETF (5) | | | 106,132 | | | | 11,603,412 | |
iShares iBoxx $ High Yield Corporate Bond ETF (5) | | | 28,426 | | | | 2,480,453 | |
iShares JP Morgan USD Emerging Markets Bond ETF (5) | | | 40,523 | | | | 4,704,720 | |
iShares Russell 2000 Growth ETF (5) | | | 44,683 | | | | 8,342,316 | |
| JPMorgan Core Plus Bond Fund - Class L | | | 510,954 | | | | 4,225,586 | |
| Lord Abbett High Yield Fund - Class I | | | 542,762 | | | | 4,200,980 | |
| Metropolitan West Total Return Bond Fund - Class I | | | 280,707 | | | | 2,992,337 | |
| PIMCO Investment Grade Corporate Bond Fund - Class I | | | 142,007 | | | | 1,496,749 | |
| Pioneer Bond Fund - Class Y | | | 294,084 | | | | 2,834,969 | |
| Prudential Total Return Bond Fund - Class Z | | | 324,197 | | | | 4,726,794 | |
SPDR Bloomberg Barclays High Yield Bond ETF (5) | | | 65,481 | | | | 2,404,462 | |
| TCW Emerging Markets Income Fund - Class I | | | 403,732 | | | | 3,447,871 | |
Vanguard Total Bond Market ETF (5) | | | 24,400 | | | | 1,990,307 | |
| Total Registered Investment Companies (Cost $91,649,456) | | | | | | | 93,159,510 | |
| | | | | | | | | |
| Money Market Registered Investment Companies — 16.6% |
Meeder Institutional Prime Money Market Fund, 1.32% (2) | | | 46,170,294 | | | | 46,165,677 | |
| Total Money Market Registered Investment Companies (Cost $46,166,058) | | | | | | | 46,165,677 | |
| | | | | | | | | |
| Bank Obligations — 0.5% | | | | | | | | |
Bank Midwest Deposit Account, 1.00%, 1/2/2018 (3) | | | 248,989 | | | | 248,989 | |
First Merchants Bank Deposit Account, 1.00%, 1/2/2018 (3) | | | 248,190 | | | | 248,190 | |
Metro City Bank Deposit Account, 1.00%, 1/2/2018 (3) | | | 248,000 | | | | 248,000 | |
Pacific Mercantile Bank Deposit Account, 1.21%, 1/2/2018 (3) | | | 249,127 | | | | 249,127 | |
Pacific Premier Bank Deposit Account, 1.05%, 1/2/2018 (3) | | | 249,198 | | | | 249,198 | |
Seacoast Community Bank Deposit Account, 1.00%, 1/2/2018 (3) | | | 249,000 | | | | 249,000 | |
Trans Pacific National Bank Deposit Account, 1.00%, 1/2/2018 (3) | | | 184 | | | | 184 | |
| Total Bank Obligations (Cost $1,492,688) | | | | | | | 1,492,688 | |
| Total Investments — 99.1% (Cost $261,533,250) | | | | | | | 276,296,899 | |
| Other Assets less Liabilities — 0.9% | | | | | | | 2,542,404 | |
| Total Net Assets — 100.0% | | | | | | | 278,839,303 | |
| | | | | | | | | |
Trustee Deferred Compensation (4) | | | | | | | | |
| Meeder Aggressive Allocation Fund | | | 4,168 | | | | 43,556 | |
| Meeder Balanced Fund | | | 2,147 | | | | 24,927 | |
| Meeder Dynamic Allocation Fund | | | 1,464 | | | | 15,884 | |
| Meeder Muirfield Fund | | | 2,106 | | | | 15,879 | |
| Meeder Conservative Allocation Fund | | | 597 | | | | 13,456 | |
| Total Trustee Deferred Compensation (Cost $101,066) | | | | | | | 113,702 | |
The accompanying notes are an integral part of these financial statements.
2017 Annual Report | December 31, 2017 | Page 39 |
Schedule of Investments
December 31, 2017
| Balanced Fund |
| | | Contracts | | Expiration Date | | Notional Value of Contracts ($) | | Value and Unrealized Appreciation (Depreciation) ($) |
| Futures Contracts |
| Index Futures | | | | | | | | | | | | | | |
| Mini MSCI EAFE Index Futures | | | 109 | | | 3/16/2018 | | | 11,147,975 | | | | 159,606 | |
| Mini MSCI Emerging Markets Index Futures | | | 32 | | | 3/16/2018 | | | 1,861,920 | | | | 71,447 | |
| Standard & Poors 500 Mini Futures | | | 194 | | | 3/16/2018 | | | 25,957,200 | | | | (172,822 | ) |
| Total Futures Contracts | | | 335 | | | | | | 38,967,095 | | | | 58,231 | |
(1) | Represents non-income producing securities. |
(2) | Investment in affiliate. The yield shown represents the 7-day yield in effect at December 31, 2017. |
(3) | Variable rate security. Securities payable at par including accrued interest (usually within seven days notice) and unconditionally secured as to principal and interest by letters of credit or other credit support agreements from major banks. The interest rates are adjustable and are not based on a published reference rate and spread but are determined by the issuer or agent and are based on current market conditions. These securities do not indicate a reference rate and spread in their description above. The rate shown represents the rate in effect at December 31, 2017. The maturity date shown, if applicable, reflects the earlier of the next demand date or stated maturity date. |
(4) | Assets of affiliates to the Balanced Fund held for the benefit of the Fund’s Trustees in connection with the Trustee Deferred Compensation Plan. |
The accompanying notes are an integral part of these financial statements.
Page 40 | 2017 Annual Report | December 31, 2017 |
Schedule of Investments
December 31, 2017
| Global Allocation Fund |
| Security Description | | Shares or
Principal
Amount ($) | | Fair
Value ($) |
| Common Stocks — 41.3% |
| Consumer Discretionary — 3.6% | | | | | | | | |
| Aaron's, Inc. | | | 82 | | | | 3,268 | |
Amazon.com, Inc. (1) | | | 428 | | | | 500,533 | |
American Axle & Manufacturing Holdings, Inc. (1) | | | 269 | | | | 4,581 | |
| American Eagle Outfitters, Inc. | | | 73 | | | | 1,372 | |
American Public Education, Inc. (1) | | | 3 | | | | 75 | |
| Aramark | | | 201 | | | | 8,591 | |
Asbury Automotive Group, Inc. (1) | | | 55 | | | | 3,520 | |
Ascena Retail Group, Inc. (1) | | | 123 | | | | 289 | |
Ascent Capital Group, Inc. (1) | | | 27 | | | | 310 | |
AutoNation, Inc. (1) | | | 33 | | | | 1,694 | |
| Bassett Furniture Industries, Inc. | | | 194 | | | | 7,294 | |
Beazer Homes USA, Inc. (1) | | | 176 | | | | 3,381 | |
| Bed Bath & Beyond, Inc. | | | 612 | | | | 13,458 | |
| Best Buy Co., Inc. | | | 426 | | | | 29,168 | |
| Big Lots, Inc. | | | 357 | | | | 20,046 | |
| Bloomin' Brands, Inc. | | | 353 | | | | 7,533 | |
Bridgepoint Education, Inc. (1) | | | 238 | | | | 1,975 | |
| Buckle, Inc./The | | | 12 | | | | 285 | |
Buffalo Wild Wings, Inc. (1) | | | 6 | | | | 938 | |
Burlington Stores, Inc. (1) | | | 50 | | | | 6,152 | |
Cambium Learning Group, Inc. (1) | | | 260 | | | | 1,477 | |
| Capella Education Co. | | | 7 | | | | 542 | |
| Carter's, Inc. | | | 26 | | | | 3,055 | |
| Cato Corp./The | | | 106 | | | | 1,688 | |
Century Casinos, Inc. (1) | | | 310 | | | | 2,830 | |
| Chico's FAS, Inc. | | | 48 | | | | 423 | |
| Children's Place, Inc./The | | | 21 | | | | 3,052 | |
| Citi Trends, Inc. | | | 83 | | | | 2,196 | |
| Collectors Universe, Inc. | | | 24 | | | | 687 | |
| Comcast Corp. | | | 3,377 | | | | 135,249 | |
Cooper-Standard Holdings, Inc. (1) | | | 59 | | | | 7,228 | |
| Dana, Inc. | | | 421 | | | | 13,476 | |
Denny's Corp. (1) | | | 172 | | | | 2,277 | |
| Dillard's, Inc. | | | 24 | | | | 1,441 | |
| Dollar General Corp. | | | 2,644 | | | | 245,918 | |
Dollar Tree, Inc. (1) | | | 1,324 | | | | 142,078 | |
| DSW, Inc. | | | 55 | | | | 1,178 | |
| Entravision Communications Corp. | | | 396 | | | | 2,831 | |
| Extended Stay America, Inc. | | | 269 | | | | 5,111 | |
| Finish Line, Inc./The | | | 118 | | | | 1,715 | |
| Flexsteel Industries, Inc. | | | 7 | | | | 327 | |
Francesca's Holdings Corp. (1) | | | 636 | | | | 4,649 | |
FTD Cos., Inc. (1) | | | 150 | | | | 1,079 | |
| GameStop Corp. | | | 997 | | | | 17,896 | |
| Gannett Co., Inc. | | | 713 | | | | 8,264 | |
| Gap, Inc./The | | | 624 | | | | 21,253 | |
| General Motors Co. | | | 7,008 | | | | 287,258 | |
Genesco, Inc. (1) | | | 1 | | | | 33 | |
| GNC Holdings, Inc. | | | 117 | | | | 432 | |
| Graham Holdings Co. | | | 3 | | | | 1,675 | |
Grand Canyon Education, Inc. (1) | | | 85 | | | | 7,610 | |
Gray Television, Inc. (1) | | | 342 | | | | 5,729 | |
| Group 1 Automotive, Inc. | | | 7 | | | | 497 | |
| Hamilton Beach Brands Holding Co. | | | 60 | | | | 1,541 | |
| Haverty Furniture Cos., Inc. | | | 23 | | | | 521 | |
Hibbett Sports, Inc. (1) | | | 40 | | | | 816 | |
| Home Depot, Inc./The | | | 1,944 | | | | 368,446 | |
| Hooker Furniture Corp. | | | 48 | | | | 2,038 | |
| HSN, Inc. | | | 59 | | | | 2,381 | |
Iconix Brand Group, Inc. (1) | | | 52 | | | | 67 | |
J Alexander's Holdings, Inc. (1) | | | 200 | | | | 1,940 | |
J. Jill, Inc. (1) | | | 180 | | | | 1,404 | |
| Jack in the Box, Inc. | | | 42 | | | | 4,121 | |
K12, Inc. (1) | | | 19 | | | | 302 | |
Kirkland's, Inc. (1) | | | 24 | | | | 287 | |
| Kohl's Corp. | | | 184 | | | | 9,978 | |
| LCI Industries | | | 5 | | | | 650 | |
| Lear Corp. | | | 1,327 | | | | 234,428 | |
Liberty Interactive Corp. QVC Group (1) | | | 350 | | | | 8,547 | |
| Liberty Tax, Inc. | | | 52 | | | | 572 | |
| Lifetime Brands, Inc. | | | 11 | | | | 182 | |
Live Nation Entertainment, Inc. (1) | | | 98 | | | | 4,172 | |
M/I Homes, Inc. (1) | | | 102 | | | | 3,509 | |
MCBC Holdings, Inc. (1) | | | 127 | | | | 2,822 | |
| McDonald's Corp. | | | 205 | | | | 35,285 | |
MDC Partners, Inc. (1) | | | 215 | | | | 2,096 | |
Michael Kors Holdings, Ltd. (1) | | | 1,292 | | | | 81,331 | |
Michaels Cos., Inc./The (1) | | | 276 | | | | 6,676 | |
Modine Manufacturing Co. (1) | | | 186 | | | | 3,757 | |
Monarch Casino & Resort, Inc. (1) | | | 81 | | | | 3,630 | |
| New Media Investment Group, Inc. | | | 274 | | | | 4,598 | |
| NIKE, Inc. | | | 444 | | | | 27,772 | |
| Nordstrom, Inc. | | | 67 | | | | 3,174 | |
Norwegian Cruise Line Holdings, Ltd. (1) | | | 27 | | | | 1,438 | |
| Nutrisystem, Inc. | | | 1 | | | | 53 | |
NVR, Inc. (1) | | | 3 | | | | 10,525 | |
| Office Depot, Inc. | | | 1,996 | | | | 7,066 | |
Ollie's Bargain Outlet Holdings, Inc. (1) | | | 20 | | | | 1,065 | |
Overstock.com, Inc. (1) | | | 16 | | | | 1,022 | |
Penn National Gaming, Inc. (1) | | | 345 | | | | 10,809 | |
| Pier 1 Imports, Inc. | | | 381 | | | | 1,577 | |
Pinnacle Entertainment, Inc. (1) | | | 204 | | | | 6,677 | |
The accompanying notes are an integral part of these financial statements.
2017 Annual Report | December 31, 2017 | Page 41 |
Schedule of Investments
December 31, 2017
| Global Allocation Fund |
| Security Description | | Shares or
Principal
Amount ($) | | Fair
Value ($) |
| Common Stocks — continued |
| PulteGroup, Inc. | | | 460 | | | | 15,295 | |
| RCI Hospitality Holdings, Inc. | | | 7 | | | | 196 | |
Regis Corp. (1) | | | 9 | | | | 138 | |
RH (1) | | | 26 | | | | 2,241 | |
| Ross Stores, Inc. | | | 296 | | | | 23,754 | |
| Ruth's Hospitality Group, Inc. | | | 998 | | | | 21,607 | |
| Salem Media Group, Inc. | | | 266 | | | | 1,197 | |
| Shoe Carnival, Inc. | | | 23 | | | | 615 | |
| Signet Jewelers, Ltd. | | | 252 | | | | 14,251 | |
Skechers U.S.A., Inc. (1) | | | 507 | | | | 19,185 | |
Sleep Number Corp. (1) | | | 318 | | | | 11,954 | |
| Speedway Motorsports, Inc. | | | 6 | | | | 113 | |
Steven Madden, Ltd. (1) | | | 70 | | | | 3,269 | |
Stoneridge, Inc. (1) | | | 258 | | | | 5,898 | |
| Strayer Education, Inc. | | | 1 | | | | 90 | |
| Tailored Brands, Inc. | | | 86 | | | | 1,877 | |
| Target Corp. | | | 217 | | | | 14,159 | |
Taylor Morrison Home Corp. (1) | | | 965 | | | | 23,614 | |
| Thor Industries, Inc. | | | 228 | | | | 34,364 | |
| Tilly's, Inc. | | | 288 | | | | 4,251 | |
| Time, Inc. | | | 111 | | | | 2,048 | |
| TJX Cos., Inc./The | | | 64 | | | | 4,893 | |
TopBuild Corp. (1) | | | 113 | | | | 8,559 | |
| Tower International, Inc. | | | 147 | | | | 4,491 | |
Townsquare Media, Inc. (1) | | | 476 | | | | 3,656 | |
tronc, Inc. (1) | | | 362 | | | | 6,368 | |
Visteon Corp. (1) | | | 9 | | | | 1,126 | |
Vitamin Shoppe, Inc. (1) | | | 29 | | | | 128 | |
| Weyco Group, Inc. | | | 59 | | | | 1,753 | |
| Yum China Holdings, Inc. | | | 585 | | | | 23,412 | |
ZAGG, Inc. (1) | | | 37 | | | | 683 | |
| | | | | | | | 2,658,077 | |
| | | | | | | | | |
| Consumer Staples — 2.3% | | | | | | | | |
| Archer-Daniels-Midland Co. | | | 189 | | | | 7,575 | |
Central Garden & Pet Co. (1) | | | 48 | | | | 1,810 | |
| Costco Wholesale Corp. | | | 30 | | | | 5,584 | |
| CVS Health Corp. | | | 4,298 | | | | 311,605 | |
| Ingles Markets, Inc. | | | 13 | | | | 450 | |
| Kroger Co./The | | | 1,931 | | | | 53,006 | |
| Lamb Weston Holdings, Inc. | | | 287 | | | | 16,201 | |
| Medifast, Inc. | | | 46 | | | | 3,211 | |
| Natural Health Trends Corp. | | | 108 | | | | 1,641 | |
| Nu Skin Enterprises, Inc. | | | 153 | | | | 10,439 | |
| PepsiCo, Inc. | | | 2,970 | | | | 356,162 | |
Performance Food Group Co. (1) | | | 643 | | | | 21,283 | |
Pilgrim's Pride Corp. (1) | | | 166 | | | | 5,156 | |
| Sanderson Farms, Inc. | | | 109 | | | | 15,127 | |
Sprouts Farmers Market, Inc. (1) | | | 328 | | | | 7,987 | |
SUPERVALU, Inc. (1) | | | 19 | | | | 410 | |
| Sysco Corp. | | | 1,573 | | | | 95,528 | |
| Tyson Foods, Inc. | | | 1,689 | | | | 136,927 | |
US Foods Holding Corp. (1) | | | 12 | | | | 383 | |
USANA Health Sciences, Inc. (1) | | | 78 | | | | 5,776 | |
| Village Super Market, Inc. | | | 427 | | | | 9,791 | |
| Walgreens Boots Alliance, Inc. | | | 3,734 | | | | 271,163 | |
| Wal-Mart Stores, Inc. | | | 3,454 | | | | 341,083 | |
| | | | | | | | 1,678,298 | |
| | | | | | | | | |
| Energy — 2.4% | | | | | | | | |
| Andeavor | | | 1,934 | | | | 221,134 | |
| Archrock, Inc. | | | 88 | | | | 924 | |
| Ardmore Shipping Corp. | | | 38 | | | | 304 | |
| Cabot Oil & Gas Corp. | | | 292 | | | | 8,351 | |
| Chevron Corp. | | | 1,738 | | | | 217,580 | |
CONSOL Energy, Inc. (1) | | | 52 | | | | 2,055 | |
| CVR Energy, Inc. | | | 107 | | | | 3,985 | |
| Delek US Holdings, Inc. | | | 268 | | | | 9,364 | |
Exterran Corp. (1) | | | 532 | | | | 16,726 | |
| Exxon Mobil Corp. | | | 3,950 | | | | 330,378 | |
| HollyFrontier Corp. | | | 520 | | | | 26,634 | |
Mammoth Energy Services, Inc. (1) | | | 23 | | | | 451 | |
| Marathon Petroleum Corp. | | | 4,004 | | | | 264,184 | |
Matrix Service Co. (1) | | | 275 | | | | 4,895 | |
McDermott International, Inc. (1) | | | 2,696 | | | | 17,740 | |
Midstates Petroleum Co., Inc. (1) | | | 366 | | | | 6,068 | |
Natural Gas Services Group, Inc. (1) | | | 87 | | | | 2,279 | |
Newpark Resources, Inc. (1) | | | 63 | | | | 542 | |
Pacific Ethanol, Inc. (1) | | | 18 | | | | 82 | |
Par Pacific Holdings, Inc. (1) | | | 269 | | | | 5,186 | |
| PBF Energy, Inc. | | | 462 | | | | 16,378 | |
Peabody Energy Corp. (1) | | | 183 | | | | 7,205 | |
| Phillips 66 | | | 2,741 | | | | 277,252 | |
ProPetro Holding Corp. (1) | | | 30 | | | | 605 | |
RigNet, Inc. (1) | | | 59 | | | | 882 | |
Rowan Cos. Plc (1) | | | 545 | | | | 8,535 | |
| RPC, Inc. | | | 960 | | | | 24,509 | |
SandRidge Energy, Inc. (1) | | | 428 | | | | 9,018 | |
SilverBow Resources, Inc. (1) | | | 82 | | | | 2,437 | |
Southwestern Energy Co. (1) | | | 264 | | | | 1,473 | |
Stone Energy Corp. (1) | | | 113 | | | | 3,634 | |
TETRA Technologies, Inc. (1) | | | 146 | | | | 623 | |
Unit Corp. (1) | | | 115 | | | | 2,530 | |
| Valero Energy Corp. | | | 2,985 | | | | 274,351 | |
The accompanying notes are an integral part of these financial statements.
Page 42 | 2017 Annual Report | December 31, 2017 |
Schedule of Investments
December 31, 2017
| Global Allocation Fund |
| Security Description | | Shares or
Principal
Amount ($) | | Fair
Value ($) |
| Common Stocks — continued |
W&T Offshore, Inc. (1) | | | 1,513 | | | | 5,008 | |
Westmoreland Coal Co. (1) | | | 533 | | | | 645 | |
| World Fuel Services Corp. | | | 87 | | | | 2,448 | |
| | | | | | | | 1,776,395 | |
| | | | | | | | | |
| Financials — 6.9% | | | | | | | | |
| Ally Financial, Inc. | | | 351 | | | | 10,235 | |
| American Equity Investment Life Holding Co. | | | 573 | | | | 17,608 | |
| Annaly Capital Management, Inc. | | | 5,287 | | | | 62,862 | |
| Artisan Partners Asset Management, Inc. | | | 344 | | | | 13,588 | |
Atlas Financial Holdings, Inc. (1) | | | 33 | | | | 678 | |
| Banco Latinoamericano de Comercio Exterior SA | | | 15 | | | | 404 | |
| Bank of America Corp. | | | 18,548 | | | | 547,537 | |
| Bank of New York Mellon Corp./The | | | 3,101 | | | | 167,020 | |
| Bank of NT Butterfield & Son, Ltd./The | | | 329 | | | | 11,939 | |
| BB&T Corp. | | | 5,482 | | | | 272,565 | |
Berkshire Hathaway, Inc. (1) | | | 3,293 | | | | 652,738 | |
| BGC Partners, Inc. | | | 1,156 | | | | 17,467 | |
Cannae Holdings, Inc. (1) | | | 880 | | | | 14,986 | |
| Carolina Financial Corp. | | | 8 | | | | 297 | |
| Central Valley Community Bancorp | | | 182 | | | | 3,673 | |
| Century Bancorp, Inc./MA | | | 8 | | | | 626 | |
| Citigroup, Inc. | | | 6,022 | | | | 448,097 | |
| Citizens Financial Group, Inc. | | | 1,318 | | | | 55,330 | |
| CNB Financial Corp./PA | | | 268 | | | | 7,032 | |
| CNO Financial Group, Inc. | | | 245 | | | | 6,049 | |
| Columbia Banking System, Inc. | | | 14 | | | | 608 | |
| Comerica, Inc. | | | 905 | | | | 78,563 | |
| Diamond Hill Investment Group, Inc. | | | 8 | | | | 1,653 | |
| Dynex Capital, Inc. | | | 722 | | | | 5,061 | |
Eagle Bancorp, Inc. (1) | | | 186 | | | | 10,769 | |
Encore Capital Group, Inc. (1) | | | 152 | | | | 6,399 | |
Enova International, Inc. (1) | | | 277 | | | | 4,210 | |
| Erie Indemnity Co. | | | 19 | | | | 2,315 | |
Essent Group, Ltd. (1) | | | 1,239 | | | | 53,797 | |
| Evercore, Inc. | | | 284 | | | | 25,560 | |
EZCORP, Inc. (1) | | | 75 | | | | 915 | |
| Fidelity Southern Corp. | | | 660 | | | | 14,388 | |
| Fifth Third Bancorp | | | 8,292 | | | | 251,579 | |
| First American Financial Corp. | | | 981 | | | | 54,975 | |
| First Bancorp/Southern Pines NC | | | 762 | | | | 26,906 | |
| First Busey Corp. | | | 744 | | | | 22,275 | |
| First Mid-Illinois Bancshares, Inc. | | | 3 | | | | 116 | |
| FirstCash, Inc. | | | 569 | | | | 38,379 | |
| FNB Bancorp/CA | | | 65 | | | | 2,372 | |
Genworth Financial, Inc. (1) | | | 556 | | | | 1,729 | |
Green Dot Corp. (1) | | | 40 | | | | 2,410 | |
Health Insurance Innovations, Inc. (1) | | | 39 | | | | 973 | |
| Heritage Commerce Corp. | | | 870 | | | | 13,328 | |
| Heritage Financial Corp./WA | | | 117 | | | | 3,604 | |
| Houlihan Lokey, Inc. | | | 676 | | | | 30,711 | |
| Huntington Bancshares, Inc./OH | | | 15,771 | | | | 229,626 | |
| Independence Holding Co. | | | 1 | | | | 27 | |
| Infinity Property & Casualty Corp. | | | 4 | | | | 424 | |
INTL. FCStone, Inc. (1) | | | 113 | | | | 4,806 | |
| Invesco Mortgage Capital, Inc. | | | 933 | | | | 16,635 | |
| JPMorgan Chase & Co. | | | 3,878 | | | | 414,713 | |
| Kemper Corp. | | | 72 | | | | 4,961 | |
| Kinsale Capital Group, Inc. | | | 34 | | | | 1,530 | |
| Lazard, Ltd. | | | 700 | | | | 36,750 | |
| MB Financial, Inc. | | | 224 | | | | 9,972 | |
MBIA, Inc. (1) | | | 148 | | | | 1,083 | |
MGIC Investment Corp. (1) | | | 5,764 | | | | 81,330 | |
| Moelis & Co. | | | 284 | | | | 13,774 | |
| Morningstar, Inc. | | | 13 | | | | 1,261 | |
| MSCI, Inc. | | | 67 | | | | 8,478 | |
| New Residential Investment Corp. | | | 2,893 | | | | 51,727 | |
NewStar Financial, Inc. Contingent Value Rights (1) (5) | | | 34 | | | | 0 | |
Nicolet Bankshares, Inc. (1) | | | 92 | | | | 5,036 | |
NMI Holdings, Inc. (1) | | | 242 | | | | 4,114 | |
| Northeast Bancorp | | | 15 | | | | 347 | |
| Northrim BanCorp, Inc. | | | 225 | | | | 7,616 | |
| Oppenheimer Holdings, Inc. | | | 157 | | | | 4,208 | |
Pacific Mercantile Bancorp (1) | | | 52 | | | | 455 | |
PennyMac Financial Services, Inc. (1) | | | 420 | | | | 9,387 | |
| People's Utah Bancorp | | | 31 | | | | 939 | |
| Piper Jaffray Cos. | | | 27 | | | | 2,329 | |
| PNC Financial Services Group, Inc./The | | | 2,119 | | | | 305,751 | |
| Premier Financial Bancorp, Inc. | | | 113 | | | | 2,269 | |
| Provident Financial Holdings, Inc. | | | 59 | | | | 1,086 | |
| Pzena Investment Management, Inc. | | | 376 | | | | 4,012 | |
| Radian Group, Inc. | | | 348 | | | | 7,172 | |
Regional Management Corp. (1) | | | 25 | | | | 658 | |
| Regions Financial Corp. | | | 12,261 | | | | 211,870 | |
| Riverview Bancorp, Inc. | | | 152 | | | | 1,318 | |
| Santander Consumer USA Holdings, Inc. | | | 289 | | | | 5,381 | |
| SEI Investments Co. | | | 272 | | | | 19,546 | |
| Selective Insurance Group, Inc. | | | 20 | | | | 1,174 | |
| Shore Bancshares, Inc. | | | 139 | | | | 2,321 | |
| Silvercrest Asset Management Group, Inc. | | | 80 | | | | 1,284 | |
| Stewart Information Services Corp. | | | 43 | | | | 1,819 | |
The accompanying notes are an integral part of these financial statements.
2017 Annual Report | December 31, 2017 | Page 43 |
Schedule of Investments
December 31, 2017
| Global Allocation Fund |
| Security Description | | Shares or
Principal
Amount ($) | | Fair
Value ($) |
| Common Stocks — continued |
| Synovus Financial Corp. | | | 1,048 | | | | 50,241 | |
| T Rowe Price Group, Inc. | | | 2,174 | | | | 228,118 | |
| TCF Financial Corp. | | | 218 | | | | 4,469 | |
Third Point Reinsurance, Ltd. (1) | | | 366 | | | | 5,362 | |
| Timberland Bancorp, Inc./WA | | | 9 | | | | 239 | |
| TriCo Bancshares | | | 342 | | | | 12,948 | |
Triumph Bancorp, Inc. (1) | | | 80 | | | | 2,520 | |
| Umpqua Holdings Corp. | | | 1,831 | | | | 38,085 | |
| United Security Bancshares/Fresno CA | | | 76 | | | | 836 | |
| Universal Insurance Holdings, Inc. | | | 23 | | | | 629 | |
| Univest Corp. of Pennsylvania | | | 12 | | | | 337 | |
Walker & Dunlop, Inc. (1) | | | 64 | | | | 3,040 | |
| WashingtonFirst Bankshares, Inc. | | | 27 | | | | 925 | |
| Wells Fargo & Co. | | | 4,040 | | | | 245,107 | |
| West Bancorporation, Inc. | | | 25 | | | | 629 | |
Western Alliance Bancorp (1) | | | 34 | | | | 1,925 | |
Wins Finance Holdings, Inc. (1) | | | 86 | | | | 15,480 | |
| Wintrust Financial Corp. | | | 141 | | | | 11,614 | |
World Acceptance Corp. (1) | | | 25 | | | | 2,018 | |
| | | | | | | | 5,066,037 | |
| | | | | | | | | |
| Healthcare — 7.6% | | | | | | | | |
| Abbott Laboratories | | | 2,505 | | | | 142,960 | |
| AbbVie, Inc. | | | 3,084 | | | | 298,254 | |
Abeona Therapeutics, Inc. (1) | | | 72 | | | | 1,141 | |
ABIOMED, Inc. (1) | | | 104 | | | | 19,491 | |
Acceleron Pharma, Inc. (1) | | | 62 | | | | 2,631 | |
Achillion Pharmaceuticals, Inc. (1) | | | 132 | | | | 380 | |
Acorda Therapeutics, Inc. (1) | | | 262 | | | | 5,620 | |
Adamas Pharmaceuticals, Inc. (1) | | | 53 | | | | 1,796 | |
Aduro Biotech, Inc. (1) | | | 131 | | | | 983 | |
| Aetna, Inc. | | | 1,296 | | | | 233,785 | |
| Agilent Technologies, Inc. | | | 756 | | | | 50,629 | |
Aimmune Therapeutics, Inc. (1) | | | 130 | | | | 4,917 | |
Alexion Pharmaceuticals, Inc. (1) | | | 522 | | | | 62,426 | |
Align Technology, Inc. (1) | | | 604 | | | | 134,203 | |
Alnylam Pharmaceuticals, Inc. (1) | | | 167 | | | | 21,217 | |
AMAG Pharmaceuticals, Inc. (1) | | | 251 | | | | 3,326 | |
| Amgen, Inc. | | | 2,073 | | | | 360,495 | |
Amphastar Pharmaceuticals, Inc. (1) | | | 58 | | | | 1,116 | |
AnaptysBio, Inc. (1) | | | 25 | | | | 2,518 | |
Anavex Life Sciences Corp. (1) | | | 132 | | | | 425 | |
AngioDynamics, Inc. (1) | | | 34 | | | | 565 | |
ANI Pharmaceuticals, Inc. (1) | | | 6 | | | | 387 | |
| Anthem, Inc. | | | 1,308 | | | | 294,313 | |
Ardelyx, Inc. (1) | | | 16 | | | | 106 | |
Arena Pharmaceuticals, Inc. (1) | | | 140 | | | | 4,756 | |
Assembly Biosciences, Inc. (1) | | | 7 | | | | 317 | |
Asterias Biotherapeutics, Inc. (1) | | | 71 | | | | 160 | |
Audentes Therapeutics, Inc. (1) | | | 29 | | | | 906 | |
Avexis, Inc. (1) | | | 72 | | | | 7,968 | |
| Baxter International, Inc. | | | 1,237 | | | | 79,960 | |
Biogen, Inc. (1) | | | 955 | | | | 304,234 | |
Bio-Rad Laboratories, Inc. (1) | | | 7 | | | | 1,671 | |
BioSpecifics Technologies Corp. (1) | | | 124 | | | | 5,373 | |
BioTime, Inc. (1) | | | 142 | | | | 305 | |
Bioverativ, Inc. (1) | | | 446 | | | | 24,048 | |
Bluebird Bio, Inc. (1) | | | 75 | | | | 13,358 | |
Blueprint Medicines Corp. (1) | | | 52 | | | | 3,921 | |
Boston Scientific Corp. (1) | | | 816 | | | | 20,229 | |
| Bristol-Myers Squibb Co. | | | 1,420 | | | | 87,018 | |
Calithera Biosciences, Inc. (1) | | | 98 | | | | 818 | |
Catalent, Inc. (1) | | | 541 | | | | 22,224 | |
Catalyst Pharmaceuticals, Inc. (1) | | | 383 | | | | 1,498 | |
Celgene Corp. (1) | | | 1,853 | | | | 193,379 | |
Centene Corp. (1) | | | 1,629 | | | | 164,334 | |
Cerner Corp. (1) | | | 826 | | | | 55,664 | |
Charles River Laboratories International, Inc. (1) | | | 47 | | | | 5,144 | |
ChemoCentryx, Inc. (1) | | | 41 | | | | 244 | |
Chimerix, Inc. (1) | | | 81 | | | | 375 | |
| Cigna Corp. | | | 1,065 | | | | 216,291 | |
Conatus Pharmaceuticals, Inc. (1) | | | 336 | | | | 1,552 | |
Concert Pharmaceuticals, Inc. (1) | | | 73 | | | | 1,889 | |
Corbus Pharmaceuticals Holdings, Inc. (1) | | | 34 | | | | 241 | |
Corcept Therapeutics, Inc. (1) | | | 223 | | | | 4,027 | |
Corvus Pharmaceuticals, Inc. (1) | | | 10 | | | | 104 | |
Curis, Inc. (1) | | | 295 | | | | 207 | |
Cutera, Inc. (1) | | | 6 | | | | 272 | |
CytomX Therapeutics, Inc. (1) | | | 174 | | | | 3,673 | |
Dynavax Technologies Corp. (1) | | | 168 | | | | 3,142 | |
Eagle Pharmaceuticals, Inc./DE (1) | | | 32 | | | | 1,709 | |
Edge Therapeutics, Inc. (1) | | | 70 | | | | 656 | |
Editas Medicine, Inc. (1) | | | 64 | | | | 1,967 | |
| Eli Lilly & Co. | | | 100 | | | | 8,446 | |
Emergent BioSolutions, Inc. (1) | | | 329 | | | | 15,289 | |
Enanta Pharmaceuticals, Inc. (1) | | | 82 | | | | 4,812 | |
Encompass Health Corp. (1) | | | 182 | | | | 8,993 | |
Enzo Biochem, Inc. (1) | | | 269 | | | | 2,192 | |
Esperion Therapeutics, Inc. (1) | | | 60 | | | | 3,950 | |
Exact Sciences Corp. (1) | | | 319 | | | | 16,760 | |
Exactech, Inc. (1) | | | 12 | | | | 593 | |
Exelixis, Inc. (1) | | | 429 | | | | 13,042 | |
FibroGen, Inc. (1) | | | 165 | | | | 7,821 | |
The accompanying notes are an integral part of these financial statements.
Page 44 | 2017 Annual Report | December 31, 2017 |
Schedule of Investments
December 31, 2017
| Global Allocation Fund |
| Security Description | | Shares or
Principal
Amount ($) | | Fair
Value ($) |
| Common Stocks — continued |
Five Prime Therapeutics, Inc. (1) | | | 22 | | | | 482 | |
FONAR Corp. (1) | | | 63 | | | | 1,534 | |
Foundation Medicine, Inc. (1) | | | 40 | | | | 2,728 | |
Genocea Biosciences, Inc. (1) | | | 70 | | | | 81 | |
Genomic Health, Inc. (1) | | | 448 | | | | 15,322 | |
| Gilead Sciences, Inc. | | | 4,425 | | | | 317,007 | |
Global Blood Therapeutics, Inc. (1) | | | 69 | | | | 2,715 | |
Globus Medical, Inc. (1) | | | 6 | | | | 247 | |
Haemonetics Corp. (1) | | | 114 | | | | 6,621 | |
| Hill-Rom Holdings, Inc. | | | 13 | | | | 1,096 | |
| Humana, Inc. | | | 1,086 | | | | 269,404 | |
Idera Pharmaceuticals, Inc. (1) | | | 94 | | | | 198 | |
Ignyta, Inc. (1) | | | 65 | | | | 1,736 | |
Immune Design Corp. (1) | | | 2 | | | | 8 | |
Immunomedics, Inc. (1) | | | 89 | | | | 1,438 | |
Incyte Corp. (1) | | | 100 | | | | 9,471 | |
Insmed, Inc. (1) | | | 96 | | | | 2,993 | |
Integer Holdings Corp. (1) | | | 172 | | | | 7,792 | |
Intellia Therapeutics, Inc. (1) | | | 40 | | | | 769 | |
Intersect ENT, Inc. (1) | | | 76 | | | | 2,462 | |
Intuitive Surgical, Inc. (1) | | | 751 | | | | 274,070 | |
Ionis Pharmaceuticals, Inc. (1) | | | 56 | | | | 2,817 | |
Iovance Biotherapeutics, Inc. (1) | | | 142 | | | | 1,136 | |
IQVIA Holdings, Inc. (1) | | | 66 | | | | 6,461 | |
| Johnson & Johnson | | | 3,052 | | | | 426,425 | |
Juno Therapeutics, Inc. (1) | | | 114 | | | | 5,211 | |
Kura Oncology, Inc. (1) | | | 33 | | | | 505 | |
Lannett Co., Inc. (1) | | | 21 | | | | 487 | |
Lantheus Holdings, Inc. (1) | | | 10 | | | | 205 | |
LHC Group, Inc. (1) | | | 67 | | | | 4,104 | |
Ligand Pharmaceuticals, Inc. (1) | | | 32 | | | | 4,382 | |
LivaNova PLC (1) | | | 43 | | | | 3,437 | |
| Luminex Corp. | | | 328 | | | | 6,462 | |
Madrigal Pharmaceuticals, Inc. (1) | | | 19 | | | | 1,744 | |
Mallinckrodt PLC (1) | | | 156 | | | | 3,519 | |
Masimo Corp. (1) | | | 29 | | | | 2,459 | |
Matinas BioPharma Holdings, Inc. (1) | | | 240 | | | | 278 | |
| McKesson Corp. | | | 491 | | | | 76,571 | |
MediciNova, Inc. (1) | | | 68 | | | | 440 | |
Melinta Therapeutics, Inc. (1) | | | 64 | | | | 1,011 | |
| Merck & Co., Inc. | | | 1,381 | | | | 77,709 | |
| Meridian Bioscience, Inc. | | | 101 | | | | 1,414 | |
Mettler-Toledo International, Inc. (1) | | | 29 | | | | 17,966 | |
MiMedx Group, Inc. (1) | | | 131 | | | | 1,652 | |
Minerva Neurosciences, Inc. (1) | | | 85 | | | | 514 | |
Molina Healthcare, Inc. (1) | | | 4 | | | | 307 | |
Momenta Pharmaceuticals, Inc. (1) | | | 78 | | | | 1,088 | |
Mylan NV (1) | | | 678 | | | | 28,686 | |
MyoKardia, Inc. (1) | | | 20 | | | | 842 | |
Myriad Genetics, Inc. (1) | | | 184 | | | | 6,319 | |
NantKwest, Inc. (1) | | | 197 | | | | 885 | |
Natera, Inc. (1) | | | 95 | | | | 854 | |
Nektar Therapeutics (1) | | | 212 | | | | 12,661 | |
Neurocrine Biosciences, Inc. (1) | | | 132 | | | | 10,242 | |
Novelion Therapeutics, Inc. (1) | | | 58 | | | | 181 | |
Oncocyte Corp. (1) | | | 10 | | | | 47 | |
OPKO Health, Inc. (1) | | | 274 | | | | 1,343 | |
Organovo Holdings, Inc. (1) | | | 124 | | | | 166 | |
Orthofix International NV (1) | | | 61 | | | | 3,337 | |
Otonomy, Inc. (1) | | | 53 | | | | 294 | |
| Owens & Minor, Inc. | | | 82 | | | | 1,548 | |
PDL BioPharma, Inc. (1) | | | 1,635 | | | | 4,480 | |
| Perrigo Co. PLC | | | 167 | | | | 14,556 | |
| Pfizer, Inc. | | | 4,721 | | | | 170,995 | |
| Phibro Animal Health Corp. | | | 217 | | | | 7,270 | |
Pieris Pharmaceuticals, Inc. (1) | | | 417 | | | | 3,148 | |
Portola Pharmaceuticals, Inc. (1) | | | 50 | | | | 2,434 | |
Premier, Inc. (1) | | | 1,004 | | | | 29,307 | |
Progenics Pharmaceuticals, Inc. (1) | | | 95 | | | | 565 | |
Protagonist Therapeutics, Inc. (1) | | | 46 | | | | 957 | |
Prothena Corp. PLC (1) | | | 77 | | | | 2,887 | |
Providence Service Corp./The (1) | | | 34 | | | | 2,018 | |
PTC Therapeutics, Inc. (1) | | | 30 | | | | 500 | |
Puma Biotechnology, Inc. (1) | | | 48 | | | | 4,745 | |
Quality Systems, Inc. (1) | | | 327 | | | | 4,441 | |
RadNet, Inc. (1) | | | 299 | | | | 3,020 | |
Recro Pharma, Inc. (1) | | | 328 | | | | 3,034 | |
Regeneron Pharmaceuticals, Inc. (1) | | | 183 | | | | 68,801 | |
REGENXBIO, Inc. (1) | | | 60 | | | | 1,995 | |
Repligen Corp. (1) | | | 78 | | | | 2,830 | |
Retrophin, Inc. (1) | | | 94 | | | | 1,981 | |
Rigel Pharmaceuticals, Inc. (1) | | | 267 | | | | 1,036 | |
Sage Therapeutics, Inc. (1) | | | 48 | | | | 7,906 | |
Sangamo Therapeutics, Inc. (1) | | | 189 | | | | 3,100 | |
Spectrum Pharmaceuticals, Inc. (1) | | | 228 | | | | 4,321 | |
Stemline Therapeutics, Inc. (1) | | | 82 | | | | 1,279 | |
Supernus Pharmaceuticals, Inc. (1) | | | 112 | | | | 4,463 | |
Syros Pharmaceuticals, Inc. (1) | | | 22 | | | | 214 | |
Tabula Rasa HealthCare, Inc. (1) | | | 3 | | | | 84 | |
TherapeuticsMD, Inc. (1) | | | 105 | | | | 634 | |
Trevena, Inc. (1) | | | 121 | | | | 194 | |
Triple-S Management Corp. (1) | | | 153 | | | | 3,802 | |
Ultragenyx Pharmaceutical, Inc. (1) | | | 74 | | | | 3,432 | |
United Therapeutics Corp. (1) | | | 159 | | | | 23,524 | |
The accompanying notes are an integral part of these financial statements.
2017 Annual Report | December 31, 2017 | Page 45 |
Schedule of Investments
December 31, 2017
| Global Allocation Fund |
| Security Description | | Shares or
Principal
Amount ($) | | Fair
Value ($) |
| Common Stocks — continued |
| UnitedHealth Group, Inc. | | | 1,253 | | | | 276,236 | |
Vanda Pharmaceuticals, Inc. (1) | | | 394 | | | | 5,989 | |
VBI Vaccines, Inc. (1) | | | 115 | | | | 491 | |
Veracyte, Inc. (1) | | | 398 | | | | 2,599 | |
Versartis, Inc. (1) | | | 79 | | | | 174 | |
Vertex Pharmaceuticals, Inc. (1) | | | 1,666 | | | | 249,667 | |
Voyager Therapeutics, Inc. (1) | | | 20 | | | | 332 | |
WellCare Health Plans, Inc. (1) | | | 451 | | | | 90,701 | |
Xencor, Inc. (1) | | | 45 | | | | 986 | |
Zogenix, Inc. (1) | | | 53 | | | | 2,123 | |
| | | | | | | | 5,606,350 | |
| | | | | | | | | |
| Industrials — 3.8% | | | | | | | | |
Aegion Corp. (1) | | | 225 | | | | 5,722 | |
| Aircastle, Ltd. | | | 287 | | | | 6,713 | |
| Allison Transmission Holdings, Inc. | | | 599 | | | | 25,799 | |
| Applied Industrial Technologies, Inc. | | | 497 | | | | 33,846 | |
ARC Document Solutions, Inc. (1) | | | 542 | | | | 1,382 | |
| ArcBest Corp. | | | 146 | | | | 5,220 | |
| Argan, Inc. | | | 228 | | | | 10,260 | |
| Barnes Group, Inc. | | | 10 | | | | 633 | |
Beacon Roofing Supply, Inc. (1) | | | 85 | | | | 5,420 | |
| BG Staffing, Inc. | | | 4 | | | | 64 | |
Blue Bird Corp. (1) | | | 281 | | | | 5,592 | |
BMC Stock Holdings, Inc. (1) | | | 35 | | | | 886 | |
| Boeing Co./The | | | 1,398 | | | | 412,284 | |
| Briggs & Stratton Corp. | | | 94 | | | | 2,385 | |
| Brink's Co./The | | | 140 | | | | 11,018 | |
Builders FirstSource, Inc. (1) | | | 445 | | | | 9,697 | |
| BWX Technologies, Inc. | | | 31 | | | | 1,875 | |
CAI International, Inc. (1) | | | 3 | | | | 85 | |
Casella Waste Systems, Inc. (1) | | | 40 | | | | 921 | |
| Comfort Systems USA, Inc. | | | 138 | | | | 6,024 | |
Commercial Vehicle Group, Inc. (1) | | | 70 | | | | 748 | |
Continental Building Products, Inc. (1) | | | 235 | | | | 6,615 | |
| Copa Holdings SA | | | 43 | | | | 5,765 | |
| Costamare, Inc. | | | 120 | | | | 692 | |
Covenant Transportation Group, Inc. (1) | | | 119 | | | | 3,419 | |
CSW Industrials, Inc. (1) | | | 13 | | | | 597 | |
| Cummins, Inc. | | | 1,483 | | | | 261,957 | |
| Curtiss-Wright Corp. | | | 122 | | | | 14,866 | |
| Delta Air Lines, Inc. | | | 3,086 | | | | 172,816 | |
Ducommun, Inc. (1) | | | 44 | | | | 1,252 | |
DXP Enterprises, Inc./TX (1) | | | 14 | | | | 414 | |
| Eaton Corp. PLC | | | 891 | | | | 70,398 | |
| EMCOR Group, Inc. | | | 328 | | | | 26,814 | |
| Emerson Electric Co. | | | 100 | | | | 6,969 | |
Engility Holdings, Inc. (1) | | | 56 | | | | 1,589 | |
| EnPro Industries, Inc. | | | 173 | | | | 16,177 | |
| Global Brass & Copper Holdings, Inc. | | | 213 | | | | 7,050 | |
GMS, Inc. (1) | | | 151 | | | | 5,684 | |
| Greenbrier Cos., Inc./The | | | 169 | | | | 9,008 | |
| H&E Equipment Services, Inc. | | | 64 | | | | 2,602 | |
Harsco Corp. (1) | | | 260 | | | | 4,849 | |
| Hawaiian Holdings, Inc. | | | 62 | | | | 2,471 | |
HD Supply Holdings, Inc. (1) | | | 139 | | | | 5,564 | |
| Hexcel Corp. | | | 50 | | | | 3,093 | |
| Hillenbrand, Inc. | | | 374 | | | | 16,718 | |
| Hubbell, Inc. | | | 32 | | | | 4,331 | |
| Huntington Ingalls Industries, Inc. | | | 429 | | | | 101,115 | |
| Hyster-Yale Materials Handling, Inc. | | | 18 | | | | 1,533 | |
| Illinois Tool Works, Inc. | | | 1,716 | | | | 286,315 | |
| Ingersoll-Rand PLC | | | 348 | | | | 31,038 | |
| Interface, Inc. | | | 308 | | | | 7,746 | |
| JB Hunt Transport Services, Inc. | | | 167 | | | | 19,202 | |
JetBlue Airways Corp. (1) | | | 2,030 | | | | 45,350 | |
| Kadant, Inc. | | | 95 | | | | 9,538 | |
| Kansas City Southern | | | 479 | | | | 50,400 | |
| KBR, Inc. | | | 512 | | | | 10,153 | |
| Kelly Services, Inc. | | | 117 | | | | 3,191 | |
| Kforce, Inc. | | | 56 | | | | 1,414 | |
| Korn/Ferry International | | | 364 | | | | 15,062 | |
| Landstar System, Inc. | | | 67 | | | | 6,975 | |
| LSC Communications, Inc. | | | 120 | | | | 1,818 | |
Lydall, Inc. (1) | | | 12 | | | | 609 | |
| Matson, Inc. | | | 70 | | | | 2,089 | |
Meritor, Inc. (1) | | | 247 | | | | 5,795 | |
| Miller Industries, Inc./TN | | | 316 | | | | 8,153 | |
Moog, Inc. (1) | | | 176 | | | | 15,286 | |
| National Presto Industries, Inc. | | | 27 | | | | 2,685 | |
| Old Dominion Freight Line, Inc. | | | 255 | | | | 33,545 | |
| Orbital ATK, Inc. | | | 64 | | | | 8,416 | |
| Owens Corning | | | 1,601 | | | | 147,196 | |
| Park-Ohio Holdings Corp. | | | 72 | | | | 3,308 | |
| Primoris Services Corp. | | | 10 | | | | 272 | |
| Quad/Graphics, Inc. | | | 76 | | | | 1,718 | |
Quanta Services, Inc. (1) | | | 449 | | | | 17,560 | |
| Regal Beloit Corp. | | | 33 | | | | 2,528 | |
| Robert Half International, Inc. | | | 264 | | | | 14,663 | |
| Rockwell Automation, Inc. | | | 676 | | | | 132,733 | |
| RPX Corp. | | | 679 | | | | 9,126 | |
Rush Enterprises, Inc. - Class A (1) | | | 204 | | | | 10,365 | |
| Ryder System, Inc. | | | 399 | | | | 33,584 | |
Safe Bulkers, Inc. (1) | | | 87 | | | | 281 | |
The accompanying notes are an integral part of these financial statements.
Page 46 | 2017 Annual Report | December 31, 2017 |
Schedule of Investments
December 31, 2017
| Global Allocation Fund |
| Security Description | | Shares or
Principal
Amount ($) | | Fair
Value ($) |
| Common Stocks — continued |
Saia, Inc. (1) | | | 25 | | | | 1,769 | |
SP Plus Corp. (1) | | | 56 | | | | 2,078 | |
| Spirit AeroSystems Holdings, Inc. | | | 725 | | | | 63,256 | |
SPX FLOW, Inc. (1) | | | 49 | | | | 2,330 | |
Sterling Construction Co., Inc. (1) | | | 233 | | | | 3,793 | |
| Toro Co./The | | | 107 | | | | 6,980 | |
| Triton International, Ltd./Bermuda | | | 124 | | | | 4,644 | |
TrueBlue, Inc. (1) | | | 393 | | | | 10,808 | |
| Union Pacific Corp. | | | 2,566 | | | | 344,101 | |
United Continental Holdings, Inc. (1) | | | 612 | | | | 41,249 | |
United Rentals, Inc. (1) | | | 46 | | | | 7,908 | |
| Universal Forest Products, Inc. | | | 77 | | | | 2,897 | |
| Valmont Industries, Inc. | | | 16 | | | | 2,654 | |
Vectrus, Inc. (1) | | | 101 | | | | 3,116 | |
Veritiv Corp. (1) | | | 2 | | | | 58 | |
| Wabash National Corp. | | | 17 | | | | 369 | |
WABCO Holdings, Inc. (1) | | | 45 | | | | 6,458 | |
| Watsco, Inc. | | | 163 | | | | 27,717 | |
| Werner Enterprises, Inc. | | | 13 | | | | 502 | |
WESCO International, Inc. (1) | | | 322 | | | | 21,944 | |
| | | | | | | | 2,793,677 | |
| | | | | | | | | |
| Information Technology — 11.2% | | | | | | | | |
Adobe Systems, Inc. (1) | | | 1,863 | | | | 326,472 | |
| ADTRAN, Inc. | | | 209 | | | | 4,044 | |
Advanced Energy Industries, Inc. (1) | | | 174 | | | | 11,742 | |
Alpha & Omega Semiconductor, Ltd. (1) | | | 35 | | | | 573 | |
Alphabet, Inc. - Class A (1) | | | 145 | | | | 152,743 | |
Alphabet, Inc. - Class C (1) | | | 503 | | | | 526,339 | |
Amkor Technology, Inc. (1) | | | 2,286 | | | | 22,974 | |
ANSYS, Inc. (1) | | | 72 | | | | 10,626 | |
| Apple, Inc. | | | 6,149 | | | | 1,040,595 | |
| Applied Materials, Inc. | | | 5,641 | | | | 288,368 | |
Applied Optoelectronics, Inc. (1) | | | 6 | | | | 227 | |
Arista Networks, Inc. (1) | | | 90 | | | | 21,202 | |
ARRIS International PLC (1) | | | 1,409 | | | | 36,197 | |
Arrow Electronics, Inc. (1) | | | 109 | | | | 8,765 | |
Aspen Technology, Inc. (1) | | | 1,799 | | | | 119,094 | |
Avid Technology, Inc. (1) | | | 200 | | | | 1,078 | |
| Avnet, Inc. | | | 109 | | | | 4,319 | |
Axcelis Technologies, Inc. (1) | | | 22 | | | | 631 | |
Benchmark Electronics, Inc. (1) | | | 26 | | | | 757 | |
| Brooks Automation, Inc. | | | 82 | | | | 1,956 | |
| CA, Inc. | | | 1,662 | | | | 55,311 | |
| Cabot Microelectronics Corp. | | | 15 | | | | 1,411 | |
Cadence Design Systems, Inc. (1) | | | 5,412 | | | | 226,330 | |
Ciena Corp. (1) | | | 635 | | | | 13,291 | |
Cirrus Logic, Inc. (1) | | | 392 | | | | 20,329 | |
| Cisco Systems, Inc. | | | 7,309 | | | | 279,935 | |
| Cognex Corp. | | | 526 | | | | 32,170 | |
| Cohu, Inc. | | | 133 | | | | 2,919 | |
| Comtech Telecommunications Corp. | | | 142 | | | | 3,141 | |
Control4 Corp. (1) | | | 32 | | | | 952 | |
Dell Technologies, Inc. Class V (1) | | | 671 | | | | 54,539 | |
DHI Group, Inc. (1) | | | 156 | | | | 296 | |
Diodes, Inc. (1) | | | 81 | | | | 2,322 | |
| DXC Technology Co. | | | 1 | | | | 95 | |
Eastman Kodak Co. (1) | | | 102 | | | | 316 | |
Electro Scientific Industries, Inc. (1) | | | 78 | | | | 1,672 | |
Electronic Arts, Inc. (1) | | | 2,431 | | | | 255,401 | |
EMCORE Corp. (1) | | | 57 | | | | 368 | |
| Entegris, Inc. | | | 42 | | | | 1,279 | |
| EVERTEC, Inc. | | | 5 | | | | 68 | |
Extreme Networks, Inc. (1) | | | 84 | | | | 1,052 | |
F5 Networks, Inc. (1) | | | 411 | | | | 53,931 | |
Facebook, Inc. (1) | | | 2,909 | | | | 513,322 | |
First Solar, Inc. (1) | | | 135 | | | | 9,115 | |
FormFactor, Inc. (1) | | | 52 | | | | 814 | |
| HP, Inc. | | | 12,682 | | | | 266,449 | |
IAC/InterActiveCorp (1) | | | 670 | | | | 81,928 | |
Ichor Holdings, Ltd. (1) | | | 1 | | | | 25 | |
Impinj, Inc. (1) | | | 19 | | | | 428 | |
Instructure, Inc. (1) | | | 7 | | | | 232 | |
| Intel Corp. | | | 6,591 | | | | 304,241 | |
| International Business Machines Corp. | | | 351 | | | | 53,850 | |
| Intuit, Inc. | | | 1,721 | | | | 271,539 | |
IPG Photonics Corp. (1) | | | 70 | | | | 14,989 | |
| Jabil, Inc. | | | 1,182 | | | | 31,028 | |
| Juniper Networks, Inc. | | | 1,245 | | | | 35,483 | |
KEMET Corp. (1) | | | 113 | | | | 1,702 | |
Kimball Electronics, Inc. (1) | | | 231 | | | | 4,216 | |
| KLA-Tencor Corp. | | | 171 | | | | 17,967 | |
| Lam Research Corp. | | | 1,411 | | | | 259,723 | |
Limelight Networks, Inc. (1) | | | 18 | | | | 79 | |
| Marvell Technology Group, Ltd. | | | 333 | | | | 7,150 | |
| Mastercard, Inc. | | | 822 | | | | 124,418 | |
| Maxim Integrated Products, Inc. | | | 239 | | | | 12,495 | |
| Methode Electronics, Inc. | | | 248 | | | | 9,945 | |
Micron Technology, Inc. (1) | | | 6,633 | | | | 272,749 | |
| Microsoft Corp. | | | 8,987 | | | | 768,748 | |
| MKS Instruments, Inc. | | | 119 | | | | 11,246 | |
NCR Corp. (1) | | | 278 | | | | 9,449 | |
NETGEAR, Inc. (1) | | | 73 | | | | 4,289 | |
| NVIDIA Corp. | | | 1,801 | | | | 348,494 | |
The accompanying notes are an integral part of these financial statements.
2017 Annual Report | December 31, 2017 | Page 47 |
Schedule of Investments
December 31, 2017
| Global Allocation Fund |
| Security Description | | Shares or
Principal
Amount ($) | | Fair
Value ($) |
| Common Stocks — continued |
Oclaro, Inc. (1) | | | 77 | | | | 519 | |
ON Semiconductor Corp. (1) | | | 1,215 | | | | 25,442 | |
| Oracle Corp. | | | 3,695 | | | | 174,700 | |
OSI Systems, Inc. (1) | | | 36 | | | | 2,318 | |
| PC Connection, Inc. | | | 119 | | | | 3,119 | |
PCM, Inc. (1) | | | 9 | | | | 89 | |
Perficient, Inc. (1) | | | 131 | | | | 2,498 | |
Plexus Corp. (1) | | | 22 | | | | 1,336 | |
| Progress Software Corp. | | | 175 | | | | 7,450 | |
Quantum Corp. (1) | | | 19 | | | | 107 | |
QuinStreet, Inc. (1) | | | 47 | | | | 394 | |
Red Hat, Inc. (1) | | | 1,034 | | | | 124,183 | |
Rosetta Stone, Inc. (1) | | | 165 | | | | 2,058 | |
Rudolph Technologies, Inc. (1) | | | 113 | | | | 2,701 | |
Sanmina Corp. (1) | | | 501 | | | | 16,533 | |
ScanSource, Inc. (1) | | | 257 | | | | 9,201 | |
Semtech Corp. (1) | | | 80 | | | | 2,736 | |
| Skyworks Solutions, Inc. | | | 785 | | | | 74,536 | |
Stamps.com, Inc. (1) | | | 6 | | | | 1,128 | |
Synaptics, Inc. (1) | | | 19 | | | | 759 | |
Synopsys, Inc. (1) | | | 2,300 | | | | 196,052 | |
Take-Two Interactive Software, Inc. (1) | | | 395 | | | | 43,363 | |
Tech Data Corp. (1) | | | 182 | | | | 17,831 | |
| Teradyne, Inc. | | | 204 | | | | 8,541 | |
| Texas Instruments, Inc. | | | 3,314 | | | | 346,114 | |
| Travelport Worldwide, Ltd. | | | 1,680 | | | | 21,958 | |
Ultra Clean Holdings, Inc. (1) | | | 40 | | | | 924 | |
USA Technologies, Inc. (1) | | | 48 | | | | 468 | |
Vishay Precision Group, Inc. (1) | | | 89 | | | | 2,238 | |
Web.com Group, Inc. (1) | | | 224 | | | | 4,883 | |
| Western Digital Corp. | | | 2,865 | | | | 227,853 | |
Xcerra Corp. (1) | | | 59 | | | | 578 | |
| Xerox Corp. | | | 737 | | | | 21,484 | |
XO Group, Inc. (1) | | | 147 | | | | 2,714 | |
| | | | | | | | 8,368,751 | |
| | | | | | | | | |
| Materials — 0.9% | | | | | | | | |
| A. Schulman, Inc. | | | 43 | | | | 1,602 | |
AdvanSix, Inc. (1) | | | 23 | | | | 968 | |
| Alcoa Corp. | | | 725 | | | | 39,056 | |
| Avery Dennison Corp. | | | 70 | | | | 8,040 | |
| Cabot Corp. | | | 171 | | | | 10,532 | |
Crown Holdings, Inc. (1) | | | 584 | | | | 32,850 | |
Freeport-McMoRan, Inc. (1) | | | 1,179 | | | | 22,354 | |
| Huntsman Corp. | | | 133 | | | | 4,428 | |
Ingevity Corp. (1) | | | 11 | | | | 775 | |
| Kaiser Aluminum Corp. | | | 9 | | | | 962 | |
Koppers Holdings, Inc. (1) | | | 65 | | | | 3,309 | |
Kraton Corp. (1) | | | 85 | | | | 4,094 | |
| Kronos Worldwide, Inc. | | | 589 | | | | 15,179 | |
Louisiana-Pacific Corp. (1) | | | 1,771 | | | | 46,506 | |
| LyondellBasell Industries NV | | | 2,453 | | | | 270,615 | |
| Materion Corp. | | | 93 | | | | 4,520 | |
| Newmont Mining Corp. | | | 774 | | | | 29,040 | |
| Nucor Corp. | | | 260 | | | | 16,531 | |
OMNOVA Solutions, Inc. (1) | | | 93 | | | | 930 | |
Owens-Illinois, Inc. (1) | | | 1,218 | | | | 27,003 | |
| Reliance Steel & Aluminum Co. | | | 322 | | | | 27,624 | |
| Schnitzer Steel Industries, Inc. | | | 126 | | | | 4,221 | |
| Southern Copper Corp. | | | 37 | | | | 1,756 | |
| Steel Dynamics, Inc. | | | 1,087 | | | | 46,882 | |
| Stepan Co. | | | 32 | | | | 2,527 | |
SunCoke Energy, Inc. (1) | | | 190 | | | | 2,278 | |
| Trinseo SA | | | 461 | | | | 33,469 | |
| Valhi, Inc. | | | 106 | | | | 654 | |
Verso Corp. (1) | | | 117 | | | | 2,056 | |
| Warrior Met Coal, Inc. | | | 19 | | | | 478 | |
| | | | | | | | 661,239 | |
| | | | | | | | | |
| Real Estate Investment Trust — 1.6% | | | | | | | | |
| Apple Hospitality REIT, Inc. | | | 5,142 | | | | 100,835 | |
| Cedar Realty Trust, Inc. | | | 690 | | | | 4,195 | |
| CubeSmart | | | 1,246 | | | | 36,034 | |
| DDR Corp. | | | 961 | | | | 8,611 | |
| Gaming and Leisure Properties, Inc. | | | 1,155 | | | | 42,735 | |
| Global Net Lease, Inc. | | | 542 | | | | 11,154 | |
| Hospitality Properties Trust | | | 2,255 | | | | 67,312 | |
| Host Hotels & Resorts, Inc. | | | 6,645 | | | | 131,903 | |
| Kite Realty Group Trust | | | 332 | | | | 6,507 | |
| Liberty Property Trust | | | 1,814 | | | | 78,020 | |
| New Senior Investment Group, Inc. | | | 645 | | | | 4,876 | |
| Prologis, Inc. | | | 4,041 | | | | 260,685 | |
SBA Communications Corp. (1) | | | 267 | | | | 43,617 | |
| Simon Property Group, Inc. | | | 1,694 | | | | 290,928 | |
| VEREIT, Inc. | | | 10,137 | | | | 78,967 | |
| | | | | | | | 1,166,379 | |
| | | | | | | | | |
| Telecommunication Services — 0.4% | | | | | | | | |
| AT&T, Inc. | | | 1,845 | | | | 71,734 | |
| Frontier Communications Corp. | | | 51 | | | | 345 | |
Intelsat SA (1) | | | 66 | | | | 224 | |
| Verizon Communications, Inc. | | | 3,895 | | | | 206,162 | |
| | | | | | | | 278,465 | |
The accompanying notes are an integral part of these financial statements.
Page 48 | 2017 Annual Report | December 31, 2017 |
Schedule of Investments
December 31, 2017
| Global Allocation Fund |
| Security Description | | Shares or
Principal
Amount ($) | | Fair
Value ($) |
| Common Stocks — continued |
| Utilities — 0.6% | | | | | | | | |
| CenterPoint Energy, Inc. | | | 3,947 | | | | 111,937 | |
| NRG Energy, Inc. | | | 139 | | | | 3,959 | |
| NRG Yield, Inc. | | | 160 | | | | 3,016 | |
| UGI Corp. | | | 4,771 | | | | 223,998 | |
| Vectren Corp. | | | 1,405 | | | | 91,353 | |
Vistra Energy Corp. (1) | | | 671 | | | | 12,272 | |
| | | | | | | | 446,535 | |
| | | | | | | | | |
| Total Common Stocks (Cost $28,315,180) | | | | | | | 30,500,203 | |
| | | | | | | | | |
| Registered Investment Companies — 39.9% |
| Baird Core Plus Bond Fund - Class I | | | 23,568 | | | | 264,436 | |
| DoubleLine Total Return Bond Fund - Class I | | | 13,928 | | | | 148,051 | |
| Frost Total Return Bond Fund - Class I | | | 21,134 | | | | 220,432 | |
| Goldman Sachs Emerging Markets Equity Insights Fund - Class I | | | 177,977 | | | | 1,909,690 | |
| Guggenheim Total Return Bond Fund - Class I | | | 9,473 | | | | 257,868 | |
iShares 1-3 Year Treasury Bond ETF (6) | | | 2,500 | | | | 209,625 | |
iShares 3-7 Year Treasury Bond ETF (6) | | | 9,555 | | | | 1,167,239 | |
iShares 7-10 Year Treasury Bond ETF (6) | | | 12,850 | | | | 1,356,575 | |
iShares Core MSCI EAFE ETF (6) | | | 247,280 | | | | 16,342,735 | |
iShares Core MSCI Emerging Markets ETF (6) | | | 61,482 | | | | 3,498,326 | |
iShares Core U.S. Aggregate Bond ETF (6) | | | 9,293 | | | | 1,016,004 | |
iShares iBoxx $ High Yield Corporate Bond ETF (6) | | | 2,115 | | | | 184,555 | |
iShares JP Morgan USD Emerging Markets Bond ETF (6) | | | 4,070 | | | | 472,527 | |
| JPMorgan Core Plus Bond Fund - Class L | | | 31,211 | | | | 258,117 | |
| Lord Abbett High Yield Fund - Class I | | | 56,073 | | | | 434,009 | |
| Metropolitan West Total Return Bond Fund - Class I | | | 10,830 | | | | 115,450 | |
| PIMCO Investment Grade Corporate Bond Fund - Class I | | | 12,411 | | | | 130,807 | |
| Pioneer Bond Fund - Class Y | | | 18,333 | | | | 176,731 | |
| Prudential Total Return Bond Fund - Class Z | | | 20,608 | | | | 300,469 | |
SPDR Bloomberg Barclays High Yield Bond ETF (6) | | | 5,030 | | | | 184,702 | |
| TCW Emerging Markets Income Fund - Class I | | | 48,731 | | | | 416,165 | |
Vanguard Total Bond Market ETF (6) | | | 5,729 | | | | 467,313 | |
| Total Registered Investment Companies (Cost $25,926,579) | | | | | | | 29,531,826 | |
| | | | | | | | | |
| Money Market Registered Investment Companies — 15.8% |
Meeder Institutional Prime Money Market Fund, 1.32% (2) | | | 11,709,159 | | | | 11,707,988 | |
| Total Money Market Registered Investment Companies (Cost $11,709,003) | | | | | | | 11,707,988 | |
| | | | | | | | | |
| Bank Obligations — 2.0% | | | | | | | | |
Bank Midwest Deposit Account, 1.00%, 1/2/2018 (3) | | | 248,989 | | | | 248,989 | |
First Merchants Bank Deposit Account, 1.00%, 1/2/2018 (3) | | | 248,190 | | | | 248,190 | |
Metro City Bank Deposit Account, 1.00%, 1/2/2018 (3) | | | 248,000 | | | | 248,000 | |
Pacific Mercantile Bank Deposit Account, 1.21%, 1/2/2018 (3) | | | 249,127 | | | | 249,127 | |
Pacific Premier Bank Deposit Account, 1.05%, 1/2/2018 (3) | | | 249,198 | | | | 249,198 | |
Seacoast Community Bank Deposit Account, 1.00%, 1/2/2018 (3) | | | 249,000 | | | | 249,000 | |
Trans Pacific National Bank Deposit Account, 1.00%, 1/2/2018 (3) | | | 184 | | | | 184 | |
| Total Bank Obligations (Cost $1,492,688) | | | | | | | 1,492,688 | |
| Total Investments — 99.0% (Cost $67,443,450) | | | | | | | 73,232,705 | |
| Other Assets less Liabilities — 1.0% | | | | | | | 705,521 | |
| Total Net Assets — 100.0% | | | | | | | 73,938,226 | |
| | | | | | | | | |
Trustee Deferred Compensation (4) | | | | | | | | |
| Meeder Aggressive Allocation Fund | | | 3,161 | | | | 33,032 | |
| Meeder Balanced Fund | | | 1,609 | | | | 18,680 | |
| Meeder Dynamic Allocation Fund | | | 1,107 | | | | 12,011 | |
| Meeder Muirfield Fund | | | 1,538 | | | | 11,597 | |
| Meeder Conservative Allocation Fund | | | 445 | | | | 10,030 | |
| Total Trustee Deferred Compensation (Cost $75,127) | | | | | | | 85,350 | |
The accompanying notes are an integral part of these financial statements.
2017 Annual Report | December 31, 2017 | Page 49 |
Schedule of Investments
December 31, 2017
| Global Allocation Fund |
| | | Contracts | | Expiration Date | | Notional Value of Contracts ($) | | Value and Unrealized Appreciation (Depreciation) ($) |
| Futures Contracts |
| Index Futures | | | | | | | | | | | | | | |
| Mini MSCI EAFE Index Futures | | | 92 | | | 3/16/2018 | | | 9,409,300 | | | | 150,148 | |
| Mini MSCI Emerging Markets Index Futures | | | 10 | | | 3/16/2018 | | | 581,850 | | | | 23,420 | |
| Russell 2000 Mini Index Futures | | | 6 | | | 3/16/2018 | | | 460,950 | | | | 3,808 | |
| Standard & Poors 500 Mini Futures | | | 19 | | | 3/16/2018 | | | 2,542,200 | | | | 32,009 | |
| E-mini Standard & Poors MidCap 400 Futures | | | 5 | | | 3/16/2018 | | | 951,200 | | | | 7,486 | |
| Total Futures Contracts | | | 132 | | | | | | 13,945,500 | | | | 216,871 | |
(1) | Represents non-income producing securities. |
(2) | Investment in affiliate. The yield shown represents the 7-day yield in effect at December 31, 2017. |
(3) | Variable rate security. Securities payable at par including accrued interest (usually within seven days notice) and unconditionally secured as to principal and interest by letters of credit or other credit support agreements from major banks. The interest rates are adjustable and are not based on a published reference rate and spread but are determined by the issuer or agent and are based on current market conditions. These securities do not indicate a reference rate and spread in their description above. The rate shown represents the rate in effect at December 31, 2017. The maturity date shown, if applicable, reflects the earlier of the next demand date or stated maturity date. |
(4) | Assets of affiliates to the Global Allocation Fund held for the benefit of the Fund’s Trustees in connection with the Trustee Deferred Compensation Plan. |
(5) | Fair valued security deemed as Level 3 security. |
The accompanying notes are an integral part of these financial statements.
Page 50 | 2017 Annual Report | December 31, 2017 |
Schedule of Investments
December 31, 2017
| Spectrum Fund |
| Security Description | | Shares or
Principal
Amount ($) | | Fair
Value ($) |
| Common Stocks - Long — 95.8% |
| Consumer Discretionary — 8.8% | | | | | | | | |
1-800-Flowers.com, Inc. (1) | | | 766 | | | | 8,196 | |
| Aaron's, Inc. | | | 267 | | | | 10,640 | |
| Adient PLC | | | 674 | | | | 53,044 | |
Amazon.com, Inc. (1) (4) | | | 1,144 | | | | 1,337,874 | |
AMC Networks, Inc. (1) | | | 429 | | | | 23,200 | |
American Axle & Manufacturing Holdings, Inc. (1) | | | 2,230 | | | | 37,977 | |
| American Eagle Outfitters, Inc. | | | 580 | | | | 10,904 | |
American Public Education, Inc. (1) | | | 130 | | | | 3,257 | |
| Aptiv PLC | | | 1,924 | | | | 163,213 | |
| Aramark | | | 6,884 | | | | 294,222 | |
Asbury Automotive Group, Inc. (1) | | | 122 | | | | 7,808 | |
Ascena Retail Group, Inc. (1) | | | 1,091 | | | | 2,564 | |
Ascent Capital Group, Inc. (1) | | | 657 | | | | 7,549 | |
| Barnes & Noble, Inc. | | | 1,162 | | | | 7,785 | |
| Bassett Furniture Industries, Inc. | | | 279 | | | | 10,490 | |
Beazer Homes USA, Inc. (1) | | | 692 | | | | 13,293 | |
| Bed Bath & Beyond, Inc. | | | 2,259 | | | | 49,675 | |
Best Buy Co., Inc. (4) | | | 2,304 | | | | 157,755 | |
| Big 5 Sporting Goods Corp. | | | 381 | | | | 2,896 | |
| Big Lots, Inc. | | | 702 | | | | 39,417 | |
| BJ's Restaurants, Inc. | | | 602 | | | | 21,913 | |
| Bloomin' Brands, Inc. | | | 1,444 | | | | 30,815 | |
Bojangles', Inc. (1) | | | 161 | | | | 1,900 | |
Bridgepoint Education, Inc. (1) | | | 1,507 | | | | 12,508 | |
| Brinker International, Inc. | | | 1,006 | | | | 39,073 | |
| Brunswick Corp./DE | | | 284 | | | | 15,682 | |
| Buckle, Inc./The | | | 156 | | | | 3,705 | |
Buffalo Wild Wings, Inc. (1) | | | 48 | | | | 7,505 | |
Burlington Stores, Inc. (1) | | | 545 | | | | 67,051 | |
| Cable One, Inc. | | | 35 | | | | 24,617 | |
Cambium Learning Group, Inc. (1) | | | 1,554 | | | | 8,827 | |
| Camping World Holdings, Inc. | | | 124 | | | | 5,547 | |
| Capella Education Co. | | | 154 | | | | 11,920 | |
| Carnival Corp. | | | 6,917 | | | | 459,081 | |
Carrols Restaurant Group, Inc. (1) | | | 157 | | | | 1,908 | |
| Carter's, Inc. | | | 558 | | | | 65,559 | |
| Cato Corp./The | | | 346 | | | | 5,508 | |
Cavco Industries, Inc. (1) | | | 23 | | | | 3,510 | |
Central European Media Enterprises, Ltd. (1) | | | 600 | | | | 2,790 | |
Century Casinos, Inc. (1) | | | 1,063 | | | | 9,705 | |
Charter Communications, Inc. (1) | | | 441 | | | | 148,158 | |
| Cheesecake Factory, Inc./The | | | 139 | | | | 6,697 | |
| Chico's FAS, Inc. | | | 1,253 | | | | 11,051 | |
| Children's Place, Inc./The | | | 37 | | | | 5,378 | |
| Citi Trends, Inc. | | | 249 | | | | 6,589 | |
| Collectors Universe, Inc. | | | 213 | | | | 6,100 | |
Comcast Corp. (4) | | | 14,159 | | | | 567,068 | |
Cooper-Standard Holdings, Inc. (1) | | | 609 | | | | 74,603 | |
| Cracker Barrel Old Country Store, Inc. | | | 105 | | | | 16,683 | |
Crocs, Inc. (1) | | | 113 | | | | 1,428 | |
| CSS Industries, Inc. | | | 275 | | | | 7,653 | |
| Dana, Inc. | | | 1,435 | | | | 45,934 | |
Dave & Buster's Entertainment, Inc. (1) | | | 170 | | | | 9,379 | |
Del Frisco's Restaurant Group, Inc. (1) | | | 690 | | | | 10,523 | |
Del Taco Restaurants, Inc. (1) | | | 841 | | | | 10,193 | |
Delta Apparel, Inc. (1) | | | 40 | | | | 808 | |
Denny's Corp. (1) | | | 4,287 | | | | 56,760 | |
Destination XL Group, Inc. (1) | | | 1,017 | | | | 2,237 | |
| Dillard's, Inc. | | | 65 | | | | 3,903 | |
Discovery Communications, Inc. (1) | | | 4,950 | | | | 104,792 | |
| Dollar General Corp. | | | 5,021 | | | | 467,003 | |
Dollar Tree, Inc. (1) | | | 2,901 | | | | 311,306 | |
| Domino's Pizza, Inc. | | | 337 | | | | 63,680 | |
| DSW, Inc. | | | 467 | | | | 9,998 | |
El Pollo Loco Holdings, Inc. (1) | | | 691 | | | | 6,841 | |
| Entravision Communications Corp. | | | 2,122 | | | | 15,172 | |
Express, Inc. (1) | | | 83 | | | | 842 | |
| Extended Stay America, Inc. | | | 4,660 | | | | 88,540 | |
| Finish Line, Inc./The | | | 536 | | | | 7,788 | |
| Flexsteel Industries, Inc. | | | 202 | | | | 9,450 | |
Fogo De Chao, Inc. (1) | | | 175 | | | | 2,030 | |
| Foot Locker, Inc. | | | 170 | | | | 7,970 | |
| Ford Motor Co. | | | 25,815 | | | | 322,429 | |
Fox Factory Holding Corp. (1) | | | 143 | | | | 5,556 | |
Francesca's Holdings Corp. (1) | | | 1,794 | | | | 13,114 | |
FTD Cos., Inc. (1) | | | 1,152 | | | | 8,283 | |
Funko, Inc. (1) | | | 163 | | | | 1,084 | |
| GameStop Corp. | | | 1,419 | | | | 25,471 | |
| Gannett Co., Inc. | | | 2,321 | | | | 26,900 | |
| Gap, Inc./The | | | 1,173 | | | | 39,952 | |
General Motors Co. (4) | | | 19,463 | | | | 797,788 | |
Genesco, Inc. (1) | | | 73 | | | | 2,373 | |
| GNC Holdings, Inc. | | | 1,659 | | | | 6,122 | |
| Graham Holdings Co. | | | 18 | | | | 10,050 | |
Grand Canyon Education, Inc. (1) | | | 347 | | | | 31,067 | |
Gray Television, Inc. (1) | | | 1,442 | | | | 24,154 | |
| Group 1 Automotive, Inc. | | | 38 | | | | 2,697 | |
| H&R Block, Inc. | | | 534 | | | | 14,001 | |
| Hamilton Beach Brands Holding Co. | | | 364 | | | | 9,351 | |
| Haverty Furniture Cos., Inc. | | | 101 | | | | 2,288 | |
Hibbett Sports, Inc. (1) | | | 247 | | | | 5,039 | |
The accompanying notes are an integral part of these financial statements.
2017 Annual Report | December 31, 2017 | Page 51 |
Schedule of Investments
December 31, 2017
| Spectrum Fund |
| Security Description | | Shares or
Principal
Amount ($) | | Fair
Value ($) |
| Common Stocks - Long — continued |
Hilton Grand Vacations, Inc. (1) | | | 429 | | | | 17,997 | |
Home Depot, Inc./The (4) | | | 5,462 | | | | 1,035,213 | |
| Hooker Furniture Corp. | | | 274 | | | | 11,631 | |
Hovnanian Enterprises, Inc. (1) | | | 3,862 | | | | 12,938 | |
| HSN, Inc. | | | 463 | | | | 18,682 | |
Iconix Brand Group, Inc. (1) | | | 1,375 | | | | 1,774 | |
| Interpublic Group of Cos., Inc./The | | | 989 | | | | 19,938 | |
J Alexander's Holdings, Inc. (1) | | | 729 | | | | 7,071 | |
J. Jill, Inc. (1) | | | 931 | | | | 7,262 | |
| Jack in the Box, Inc. | | | 940 | | | | 92,223 | |
JAKKS Pacific, Inc. (1) | | | 1,699 | | | | 3,993 | |
| John Wiley & Sons, Inc. | | | 481 | | | | 31,626 | |
| Johnson Outdoors, Inc. | | | 51 | | | | 3,167 | |
K12, Inc. (1) | | | 693 | | | | 11,019 | |
Kirkland's, Inc. (1) | | | 525 | | | | 6,282 | |
| Kohl's Corp. | | | 1,733 | | | | 93,981 | |
Kona Grill, Inc. (1) | | | 1,331 | | | | 2,329 | |
| La-Z-Boy, Inc. | | | 781 | | | | 24,367 | |
| LCI Industries | | | 90 | | | | 11,700 | |
| Lear Corp. | | | 2,627 | | | | 464,086 | |
| Libbey, Inc. | | | 487 | | | | 3,662 | |
Liberty Interactive Corp. QVC Group (1) | | | 4,130 | | | | 100,855 | |
Liberty Media Corp-Liberty SiriusXM - Class A (1) | | | 114 | | | | 4,521 | |
| Liberty Tax, Inc. | | | 377 | | | | 4,147 | |
Liberty TripAdvisor Holdings, Inc. (1) | | | 776 | | | | 7,314 | |
Live Nation Entertainment, Inc. (1) | | | 3,070 | | | | 130,690 | |
| Lowe's Cos., Inc. | | | 1,983 | | | | 184,300 | |
Luby's, Inc. (1) | | | 2,452 | | | | 6,473 | |
Lululemon Athletica, Inc. (1) | | | 736 | | | | 57,842 | |
M/I Homes, Inc. (1) | | | 344 | | | | 11,834 | |
| Marine Products Corp. | | | 126 | | | | 1,605 | |
MCBC Holdings, Inc. (1) | | | 993 | | | | 22,064 | |
| McDonald's Corp. | | | 3,108 | | | | 534,949 | |
| MDC Holdings, Inc. | | | 526 | | | | 16,769 | |
MDC Partners, Inc. (1) | | | 1,297 | | | | 12,646 | |
| Meredith Corp. | | | 28 | | | | 1,849 | |
Michael Kors Holdings, Ltd. (1) (4) | | | 2,333 | | | | 146,862 | |
Michaels Cos., Inc./The (1) | | | 2,354 | | | | 56,943 | |
Modine Manufacturing Co. (1) | | | 1,333 | | | | 26,927 | |
Monarch Casino & Resort, Inc. (1) | | | 41 | | | �� | 1,838 | |
MSG Networks, Inc. (1) | | | 1,843 | | | | 37,321 | |
| Nathan's Famous, Inc. | | | 80 | | | | 6,040 | |
| National CineMedia, Inc. | | | 1,344 | | | | 9,220 | |
Nautilus, Inc. (1) | | | 672 | | | | 8,971 | |
| New Media Investment Group, Inc. | | | 2,552 | | | | 42,823 | |
| New York Times Co./The | | | 2,394 | | | | 44,289 | |
| Nordstrom, Inc. | | | 404 | | | | 19,142 | |
Norwegian Cruise Line Holdings, Ltd. (1) | | | 131 | | | | 6,976 | |
| Nutrisystem, Inc. | | | 71 | | | | 3,735 | |
NVR, Inc. (1) | | | 53 | | | | 185,936 | |
| Office Depot, Inc. | | | 6,048 | | | | 21,410 | |
Overstock.com, Inc. (1) | | | 53 | | | | 3,387 | |
| Papa John's International, Inc. | | | 451 | | | | 25,306 | |
Penn National Gaming, Inc. (1) | | | 1,945 | | | | 60,937 | |
| Pier 1 Imports, Inc. | | | 1,938 | | | | 8,023 | |
Pinnacle Entertainment, Inc. (1) | | | 1,735 | | | | 56,787 | |
Potbelly Corp. (1) | | | 1,039 | | | | 12,780 | |
| PulteGroup, Inc. | | | 9,434 | | | | 313,681 | |
Red Robin Gourmet Burgers, Inc. (1) | | | 57 | | | | 3,215 | |
| Regal Entertainment Group | | | 355 | | | | 8,169 | |
Regis Corp. (1) | | | 543 | | | | 8,340 | |
RH (1) | | | 25 | | | | 2,155 | |
Ross Stores, Inc. (4) | | | 4,046 | | | | 324,692 | |
| Royal Caribbean Cruises, Ltd. | | | 1,810 | | | | 215,897 | |
| Ruth's Hospitality Group, Inc. | | | 1,463 | | | | 31,674 | |
| Salem Media Group, Inc. | | | 525 | | | | 2,363 | |
Sally Beauty Holdings, Inc. (1) | | | 1,768 | | | | 33,168 | |
| Scripps Networks Interactive, Inc. | | | 3,057 | | | | 261,007 | |
| Shoe Carnival, Inc. | | | 153 | | | | 4,093 | |
Shutterfly, Inc. (1) | | | 389 | | | | 19,353 | |
| Signet Jewelers, Ltd. | | | 675 | | | | 38,171 | |
Skechers U.S.A., Inc. (1) | | | 1,218 | | | | 46,089 | |
Sleep Number Corp. (1) | | | 351 | | | | 13,194 | |
| Sonic Corp. | | | 307 | | | | 8,436 | |
| Speedway Motorsports, Inc. | | | 242 | | | | 4,567 | |
| Stein Mart, Inc. | | | 3,114 | | | | 3,612 | |
Steven Madden, Ltd. (1) | | | 563 | | | | 26,292 | |
Stoneridge, Inc. (1) | | | 867 | | | | 19,820 | |
| Tailored Brands, Inc. | | | 491 | | | | 10,719 | |
| Target Corp. | | | 5,489 | | | | 358,157 | |
Taylor Morrison Home Corp. (1) | | | 5,654 | | | | 138,353 | |
Tenneco, Inc. (4) | | | 941 | | | | 55,086 | |
| Texas Roadhouse, Inc. | | | 463 | | | | 24,391 | |
| Thor Industries, Inc. | | | 908 | | | | 136,854 | |
| Tile Shop Holdings, Inc. | | | 95 | | | | 912 | |
| Tilly's, Inc. | | | 419 | | | | 6,184 | |
| Time, Inc. | | | 313 | | | | 5,775 | |
| TJX Cos., Inc./The | | | 5,119 | | | | 391,399 | |
TopBuild Corp. (1) | | | 486 | | | | 36,810 | |
| Tower International, Inc. | | | 581 | | | | 17,750 | |
Townsquare Media, Inc. (1) | | | 1,206 | | | | 9,262 | |
TripAdvisor, Inc. (1) | | | 131 | | | | 4,514 | |
tronc, Inc. (1) | | | 1,697 | | | | 29,850 | |
The accompanying notes are an integral part of these financial statements.
Page 52 | 2017 Annual Report | December 31, 2017 |
Schedule of Investments
December 31, 2017
| Spectrum Fund |
| Security Description | | Shares or
Principal
Amount ($) | | Fair
Value ($) |
| Common Stocks - Long — continued |
Tuesday Morning Corp. (1) | | | 970 | | | | 2,668 | |
| Tupperware Brands Corp. | | | 257 | | | | 16,114 | |
Urban One, Inc. (1) | | | 1,660 | | | | 2,905 | |
Urban Outfitters, Inc. (1) | | | 173 | | | | 6,065 | |
| VF Corp. | | | 2,133 | | | | 157,842 | |
Vince Holding Corp. (1) | | | 907 | | | | 5,614 | |
Visteon Corp. (1) | | | 162 | | | | 20,273 | |
Vitamin Shoppe, Inc. (1) | | | 696 | | | | 3,062 | |
| Walt Disney Co./The | | | 916 | | | | 98,479 | |
| Weyco Group, Inc. | | | 592 | | | | 17,594 | |
| Whirlpool Corp. | | | 958 | | | | 161,557 | |
| Winmark Corp. | | | 7 | | | | 906 | |
Workhorse Group, Inc. (1) | | | 2,355 | | | | 6,029 | |
| Wyndham Worldwide Corp. | | | 157 | | | | 18,192 | |
| Yum China Holdings, Inc. | | | 2,508 | | | | 100,370 | |
| Yum! Brands, Inc. | | | 2,731 | | | | 222,877 | |
ZAGG, Inc. (1) | | | 44 | | | | 812 | |
Zumiez, Inc. (1) | | | 48 | | | | 1,000 | |
| | | | | | | | 13,695,974 | |
| | | | | | | | | |
| Consumer Staples — 6.3% | | | | | | | | |
Archer-Daniels-Midland Co. (4) | | | 17,923 | | | | 718,354 | |
Avon Products, Inc. (1) | | | 8,971 | | | | 19,288 | |
Boston Beer Co., Inc./The (1) | | | 174 | | | | 33,251 | |
Bunge, Ltd. (4) | | | 847 | | | | 56,817 | |
| Campbell Soup Co. | | | 1,950 | | | | 93,815 | |
Central Garden & Pet Co. (1) | | | 1,357 | | | | 51,172 | |
| Coca-Cola Bottling Co. Consolidated | | | 38 | | | | 8,180 | |
| Colgate-Palmolive Co. | | | 5,963 | | | | 449,908 | |
| Conagra Brands, Inc. | | | 4,286 | | | | 161,454 | |
| Costco Wholesale Corp. | | | 315 | | | | 58,628 | |
CVS Health Corp. (4) | | | 11,009 | | | | 798,153 | |
Darling Ingredients, Inc. (1) | | | 761 | | | | 13,797 | |
| Dean Foods Co. | | | 1,263 | | | | 14,600 | |
| Dr Pepper Snapple Group, Inc. | | | 1,833 | | | | 177,911 | |
| Energizer Holdings, Inc. | | | 62 | | | | 2,975 | |
| Estee Lauder Cos., Inc./The | | | 5,791 | | | | 736,847 | |
| Flowers Foods, Inc. | | | 2,950 | | | | 56,965 | |
| General Mills, Inc. | | | 3,262 | | | | 193,404 | |
Herbalife, Ltd. (1) | | | 64 | | | | 4,334 | |
| Hershey Co./The | | | 794 | | | | 90,127 | |
| Ingles Markets, Inc. | | | 151 | | | | 5,225 | |
| Ingredion, Inc. | | | 1,109 | | | | 155,038 | |
| John B Sanfilippo & Son, Inc. | | | 583 | | | | 36,875 | |
Kimberly-Clark Corp. (4) | | | 6,485 | | | | 782,480 | |
Kroger Co./The (4) | | | 8,285 | | | | 227,423 | |
| Lamb Weston Holdings, Inc. | | | 4,757 | | | | 268,533 | |
Lifevantage Corp. (1) | | | 600 | | | | 2,856 | |
| Medifast, Inc. | | | 118 | | | | 8,238 | |
| Molson Coors Brewing Co. | | | 4,104 | | | | 336,815 | |
| National Beverage Corp. | | | 89 | | | | 8,672 | |
| Natural Health Trends Corp. | | | 271 | | | | 4,116 | |
| Nu Skin Enterprises, Inc. | | | 1,424 | | | | 97,160 | |
| Oil-Dri Corp of America | | | 107 | | | | 4,441 | |
PepsiCo, Inc. (4) | | | 9,977 | | | | 1,196,442 | |
Performance Food Group Co. (1) | | | 1,186 | | | | 39,257 | |
Pilgrim's Pride Corp. (1) | | | 2,234 | | | | 69,388 | |
Post Holdings, Inc. (1) | | | 334 | | | | 26,463 | |
| Sanderson Farms, Inc. | | | 322 | | | | 44,687 | |
| SpartanNash Co. | | | 101 | | | | 2,695 | |
Sprouts Farmers Market, Inc. (1) | | | 1,398 | | | | 34,041 | |
SUPERVALU, Inc. (1) | | | 323 | | | | 6,977 | |
| Sysco Corp. | | | 6,594 | | | | 400,454 | |
Tyson Foods, Inc. (4) | | | 9,079 | | | | 736,035 | |
US Foods Holding Corp. (1) | | | 1,173 | | | | 37,454 | |
USANA Health Sciences, Inc. (1) | | | 524 | | | | 38,802 | |
| Village Super Market, Inc. | | | 1,000 | | | | 22,930 | |
| Walgreens Boots Alliance, Inc. | | | 9,851 | | | | 715,380 | |
Wal-Mart Stores, Inc. (4) | | | 6,814 | | | | 672,883 | |
| | | | | | | | 9,721,740 | |
| | | | | | | | | |
| Energy — 4.8% | | | | | | | | |
Abraxas Petroleum Corp. (1) | | | 3,540 | | | | 8,708 | |
| Adams Resources & Energy, Inc. | | | 148 | | | | 6,438 | |
| Andeavor | | | 3,443 | | | | 393,673 | |
| Arch Coal, Inc. | | | 581 | | | | 54,126 | |
| Archrock, Inc. | | | 2,544 | | | | 26,712 | |
| Ardmore Shipping Corp. | | | 839 | | | | 6,712 | |
Basic Energy Services, Inc. (1) | | | 155 | | | | 3,638 | |
Bill Barrett Corp. (1) | | | 753 | | | | 3,863 | |
| Cabot Oil & Gas Corp. | | | 8,149 | | | | 233,061 | |
California Resources Corp. (1) | | | 184 | | | | 3,577 | |
Chevron Corp. (4) | | | 6,844 | | | | 856,800 | |
| Cimarex Energy Co. | | | 1,248 | | | | 152,268 | |
Cloud Peak Energy, Inc. (1) | | | 476 | | | | 2,118 | |
CNX Resources Corp. (1) | | | 2,867 | | | | 41,944 | |
Cobalt International Energy, Inc. (1) | | | 3,264 | | | | 3,019 | |
Concho Resources, Inc. (1) | | | 405 | | | | 60,839 | |
| ConocoPhillips | | | 292 | | | | 16,028 | |
CONSOL Energy, Inc. (1) | | | 300 | | | | 11,853 | |
Contango Oil & Gas Co. (1) | | | 455 | | | | 2,143 | |
| CVR Energy, Inc. | | | 520 | | | | 19,365 | |
| Delek US Holdings, Inc. | | | 1,290 | | | | 45,073 | |
Diamond Offshore Drilling, Inc. (1) | | | 266 | | | | 4,945 | |
The accompanying notes are an integral part of these financial statements.
2017 Annual Report | December 31, 2017 | Page 53 |
Schedule of Investments
December 31, 2017
| Spectrum Fund |
| Security Description | | Shares or
Principal
Amount ($) | | Fair
Value ($) |
| Common Stocks - Long — continued |
Diamondback Energy, Inc. (1) | | | 39 | | | | 4,924 | |
Earthstone Energy, Inc. (1) | | | 352 | | | | 3,742 | |
Eclipse Resources Corp. (1) | | | 406 | | | | 974 | |
Energen Corp. (1) | | | 962 | | | | 55,382 | |
Energy XXI Gulf Coast, Inc. (1) | | | 172 | | | | 987 | |
| EQT Corp. | | | 1,122 | | | | 63,864 | |
Era Group, Inc. (1) | | | 331 | | | | 3,558 | |
Erin Energy Corp. (1) | | | 1,187 | | | | 3,264 | |
| Evolution Petroleum Corp. | | | 1,357 | | | | 9,295 | |
EXCO Resources, Inc. (1) (2) | | | 2,302 | | | | 483 | |
Exterran Corp. (1) | | | 1,505 | | | | 47,317 | |
Exxon Mobil Corp. (4) | | | 14,461 | | | | 1,209,518 | |
Gastar Exploration, Inc. (1) | | | 871 | | | | 915 | |
Gulfport Energy Corp. (1) | | | 72 | | | | 919 | |
Halcon Resources Corp. (1) | | | 119 | | | | 901 | |
| Hallador Energy Co. | | | 449 | | | | 2,734 | |
| Halliburton Co. | | | 8,253 | | | | 403,324 | |
| HollyFrontier Corp. | | | 1,977 | | | | 101,262 | |
Key Energy Services, Inc. (1) | | | 89 | | | | 1,049 | |
Kosmos Energy, Ltd. (1) | | | 3,241 | | | | 22,201 | |
Mammoth Energy Services, Inc. (1) | | | 243 | | | | 4,770 | |
Marathon Petroleum Corp. (4) | | | 12,021 | | | | 793,146 | |
Matrix Service Co. (1) | | | 927 | | | | 16,501 | |
McDermott International, Inc. (1) | | | 8,497 | | | | 55,910 | |
Midstates Petroleum Co., Inc. (1) | | | 730 | | | | 12,103 | |
Natural Gas Services Group, Inc. (1) | | | 642 | | | | 16,820 | |
NCS Multistage Holdings, Inc. (1) | | | 87 | | | | 1,282 | |
Newfield Exploration Co. (1) | | | 716 | | | | 22,575 | |
Newpark Resources, Inc. (1) | | | 1,911 | | | | 16,435 | |
Northern Oil and Gas, Inc. (1) | | | 2,187 | | | | 4,483 | |
Oasis Petroleum, Inc. (1) | | | 177 | | | | 1,489 | |
| Occidental Petroleum Corp. | | | 2,183 | | | | 160,800 | |
| Oceaneering International, Inc. | | | 748 | | | | 15,813 | |
| ONEOK, Inc. | | | 1,760 | | | | 94,072 | |
Overseas Shipholding Group, Inc. (1) | | | 1,135 | | | | 3,110 | |
Pacific Ethanol, Inc. (1) | | | 2,291 | | | | 10,424 | |
| Panhandle Oil and Gas, Inc. | | | 540 | | | | 11,097 | |
Par Pacific Holdings, Inc. (1) | | | 1,371 | | | | 26,433 | |
| PBF Energy, Inc. | | | 1,577 | | | | 55,905 | |
Peabody Energy Corp. (1) | | | 1,657 | | | | 65,236 | |
Penn Virginia Corp. (1) | | | 152 | | | | 5,945 | |
Phillips 66 (4) | | | 7,926 | | | | 801,715 | |
ProPetro Holding Corp. (1) | | | 972 | | | | 19,596 | |
QEP Resources, Inc. (1) | | | 171 | | | | 1,636 | |
Ranger Energy Services, Inc. (1) | | | 487 | | | | 4,495 | |
Renewable Energy Group, Inc. (1) | | | 346 | | | | 4,083 | |
REX American Resources Corp. (1) | | | 42 | | | | 3,477 | |
RigNet, Inc. (1) | | | 703 | | | | 10,510 | |
Rowan Cos. Plc (1) | | | 1,235 | | | | 19,340 | |
| RPC, Inc. | | | 5,310 | | | | 135,564 | |
SandRidge Energy, Inc. (1) | | | 1,103 | | | | 23,240 | |
| Schlumberger, Ltd. | | | 537 | | | | 36,188 | |
Seadrill, Ltd. (1) | | | 3,452 | | | | 798 | |
SilverBow Resources, Inc. (1) | | | 369 | | | | 10,967 | |
Southwestern Energy Co. (1) | | | 3,767 | | | | 21,020 | |
SRC Energy, Inc. (1) | | | 1,775 | | | | 15,141 | |
Stone Energy Corp. (1) | | | 461 | | | | 14,826 | |
| Teekay Tankers, Ltd. | | | 626 | | | | 876 | |
TETRA Technologies, Inc. (1) | | | 1,195 | | | | 5,103 | |
Ultra Petroleum Corp. (1) | | | 2,334 | | | | 21,146 | |
Unit Corp. (1) | | | 852 | | | | 18,744 | |
Valero Energy Corp. (4) | | | 9,872 | | | | 907,336 | |
W&T Offshore, Inc. (1) | | | 5,969 | | | | 19,757 | |
Westmoreland Coal Co. (1) | | | 3,373 | | | | 4,081 | |
Willbros Group, Inc. (1) | | | 2,946 | | | | 4,183 | |
| World Fuel Services Corp. | | | 1,111 | | | | 31,264 | |
| | | | | | | | 7,422,951 | |
| | | | | | | | | |
| Financials — 20.7% | | | | | | | | |
| 1st Source Corp. | | | 1,798 | | | | 88,911 | |
| ACNB Corp. | | | 406 | | | | 11,997 | |
Aflac, Inc. (4) | | | 8,236 | | | | 722,956 | |
| AG Mortgage Investment Trust, Inc. | | | 2,113 | | | | 40,168 | |
| AGNC Investment Corp. | | | 14,325 | | | | 289,222 | |
Allstate Corp./The (4) | | | 7,503 | | | | 785,639 | |
| Ally Financial, Inc. | | | 3,799 | | | | 110,779 | |
| American Equity Investment Life Holding Co. | | | 3,177 | | | | 97,629 | |
| American National Bankshares, Inc. | | | 592 | | | | 22,674 | |
| Ameriprise Financial, Inc. | | | 2,295 | | | | 388,934 | |
| AMERISAFE, Inc. | | | 33 | | | | 2,033 | |
Annaly Capital Management, Inc. (4) | | | 57,338 | | | | 681,749 | |
| ARMOUR Residential REIT, Inc. | | | 2,016 | | | | 51,852 | |
| Arthur J Gallagher & Co. | | | 472 | | | | 29,868 | |
| Artisan Partners Asset Management, Inc. | | | 1,112 | | | | 43,924 | |
| Associated Banc-Corp | | | 3,176 | | | | 80,670 | |
| Assurant, Inc. | | | 921 | | | | 92,874 | |
| Assured Guaranty, Ltd. | | | 1,804 | | | | 61,101 | |
Atlas Financial Holdings, Inc. (1) | | | 664 | | | | 13,645 | |
| Banco Latinoamericano de Comercio Exterior SA | | | 2,492 | | | | 67,035 | |
Bancorp, Inc./The (1) | | | 408 | | | | 4,031 | |
| BancorpSouth Bank | | | 4,415 | | | | 138,852 | |
| Bank Mutual Corp. | | | 336 | | | | 3,578 | |
The accompanying notes are an integral part of these financial statements.
Page 54 | 2017 Annual Report | December 31, 2017 |
Schedule of Investments
December 31, 2017
| Spectrum Fund |
| Security Description | | Shares or
Principal
Amount ($) | | Fair
Value ($) |
| Common Stocks - Long — continued |
Bank of America Corp. (4) | | | 28,049 | | | | 828,006 | |
| Bank of Commerce Holdings | | | 177 | | | | 2,036 | |
| Bank of Marin Bancorp | | | 140 | | | | 9,520 | |
Bank of New York Mellon Corp./The (4) | | | 15,241 | | | | 820,880 | |
| Bank of NT Butterfield & Son, Ltd./The | | | 2,714 | | | | 98,491 | |
| Bankwell Financial Group, Inc. | | | 252 | | | | 8,654 | |
| Banner Corp. | | | 2,142 | | | | 118,067 | |
BB&T Corp. (4) | | | 15,465 | | | | 768,920 | |
Berkshire Hathaway, Inc. (1) (4) | | | 9,342 | | | | 1,851,771 | |
| Berkshire Hills Bancorp, Inc. | | | 138 | | | | 5,051 | |
| BGC Partners, Inc. | | | 5,706 | | | | 86,218 | |
| Boston Private Financial Holdings, Inc. | | | 4,366 | | | | 67,455 | |
| Brown & Brown, Inc. | | | 277 | | | | 14,254 | |
| Bryn Mawr Bank Corp. | | | 747 | | | | 33,017 | |
| C&F Financial Corp. | | | 538 | | | | 31,204 | |
Cadence BanCorp (1) | | | 2,197 | | | | 59,583 | |
| California First National Bancorp | | | 172 | | | | 2,594 | |
| Camden National Corp. | | | 531 | | | | 22,371 | |
Cannae Holdings, Inc. (1) | | | 2,565 | | | | 43,682 | |
| Capital City Bank Group, Inc. | | | 1,266 | | | | 29,042 | |
| Carolina Financial Corp. | | | 1,889 | | | | 70,176 | |
| Cathay General Bancorp | | | 3,852 | | | | 162,439 | |
| Cboe Global Markets, Inc. | | | 170 | | | | 21,180 | |
| Central Pacific Financial Corp. | | | 1,757 | | | | 52,411 | |
| Central Valley Community Bancorp | | | 1,513 | | | | 30,532 | |
| Century Bancorp, Inc./MA | | | 172 | | | | 13,459 | |
| Charter Financial Corp./MD | | | 704 | | | | 12,348 | |
| Chemung Financial Corp. | | | 326 | | | | 15,681 | |
| Cherry Hill Mortgage Investment Corp. | | | 1,049 | | | | 18,872 | |
Chimera Investment Corp. (4) | | | 8,083 | | | | 149,374 | |
Citigroup, Inc. (4) | | | 10,875 | | | | 809,209 | |
| Citizens & Northern Corp. | | | 550 | | | | 13,200 | |
Citizens Financial Group, Inc. (4) | | | 15,304 | | | | 642,462 | |
| Civista Bancshares, Inc. | | | 73 | | | | 1,606 | |
| CNA Financial Corp. | | | 3,326 | | | | 176,444 | |
| CNB Financial Corp./PA | | | 1,781 | | | | 46,733 | |
| CNO Financial Group, Inc. | | | 5,217 | | | | 128,808 | |
| CoBiz Financial, Inc. | | | 1,454 | | | | 29,065 | |
| Codorus Valley Bancorp, Inc. | | | 600 | | | | 16,518 | |
| Columbia Banking System, Inc. | | | 3,915 | | | | 170,068 | |
Comerica, Inc. (4) | | | 8,485 | | | | 736,583 | |
Community Bankers Trust Corp. (1) | | | 1,427 | | | | 11,630 | |
| Community Financial Corp./The | | | 154 | | | | 5,898 | |
| Community Trust Bancorp, Inc. | | | 869 | | | | 40,930 | |
| County Bancorp, Inc. | | | 106 | | | | 3,155 | |
| Crawford & Co. | | | 290 | | | | 2,790 | |
| Diamond Hill Investment Group, Inc. | | | 5 | | | | 1,033 | |
| DNB Financial Corp. | | | 118 | | | | 3,977 | |
| Donegal Group, Inc. | | | 633 | | | | 10,951 | |
Donnelley Financial Solutions, Inc. (1) | | | 178 | | | | 3,469 | |
| Dynex Capital, Inc. | | | 7,821 | | | | 54,825 | |
Eagle Bancorp, Inc. (1) | | | 2,234 | | | | 129,349 | |
| East West Bancorp, Inc. | | | 5,743 | | | | 349,347 | |
Elevate Credit, Inc. (1) | | | 851 | | | | 6,408 | |
| Employers Holdings, Inc. | | | 786 | | | | 34,898 | |
Encore Capital Group, Inc. (1) | | | 309 | | | | 13,009 | |
Enova International, Inc. (1) | | | 1,206 | | | | 18,331 | |
Entegra Financial Corp. (1) | | | 200 | | | | 5,850 | |
| Enterprise Financial Services Corp. | | | 639 | | | | 28,851 | |
| Erie Indemnity Co. | | | 127 | | | | 15,474 | |
| ESSA Bancorp, Inc. | | | 179 | | | | 2,805 | |
Essent Group, Ltd. (1) (4) | | | 2,758 | | | | 119,752 | |
| Evercore, Inc. | | | 1,496 | | | | 134,640 | |
EZCORP, Inc. (1) | | | 758 | | | | 9,248 | |
| Farmers Capital Bank Corp. | | | 56 | | | | 2,156 | |
| Farmers National Banc Corp. | | | 954 | | | | 14,072 | |
| Federal Agricultural Mortgage Corp. | | | 177 | | | | 13,848 | |
| Federated National Holding Co. | | | 102 | | | | 1,690 | |
| Fidelity Southern Corp. | | | 3,901 | | | | 85,042 | |
| Fifth Street Asset Management, Inc. | | | 11,759 | | | | 15,522 | |
Fifth Third Bancorp (4) | | | 23,439 | | | | 711,139 | |
| First American Financial Corp. | | | 6,054 | | | | 339,266 | |
First BanCorp/Puerto Rico (1) | | | 175 | | | | 893 | |
| First Bancorp/Southern Pines NC | | | 4,276 | | | | 150,986 | |
| First Bancshares, Inc./The | | | 195 | | | | 6,669 | |
| First Busey Corp. | | | 10,648 | | | | 318,801 | |
| First Business Financial Services, Inc. | | | 78 | | | | 1,725 | |
| First Citizens BancShares, Inc./NC | | | 64 | | | | 25,792 | |
| First Commonwealth Financial Corp. | | | 8,882 | | | | 127,190 | |
| First Community Bancshares, Inc./VA | | | 529 | | | | 15,198 | |
| First Connecticut Bancorp, Inc./Farmington CT | | | 236 | | | | 6,171 | |
| First Defiance Financial Corp. | | | 383 | | | | 19,905 | |
| First Financial Corp./IN | | | 740 | | | | 33,559 | |
| First Financial Northwest, Inc. | | | 332 | | | | 5,149 | |
| First Internet Bancorp | | | 61 | | | | 2,327 | |
| First Interstate BancSystem, Inc. | | | 1,477 | | | | 59,154 | |
| First Merchants Corp. | | | 2,993 | | | | 125,886 | |
| First Mid-Illinois Bancshares, Inc. | | | 866 | | | | 33,376 | |
First Northwest Bancorp (1) | | | 963 | | | | 15,697 | |
| FirstCash, Inc. | | | 2,381 | | | | 160,598 | |
| Flushing Financial Corp. | | | 372 | | | | 10,230 | |
| FNB Bancorp/CA | | | 294 | | | | 10,728 | |
| GAIN Capital Holdings, Inc. | | | 140 | | | | 1,400 | |
The accompanying notes are an integral part of these financial statements.
2017 Annual Report | December 31, 2017 | Page 55 |
Schedule of Investments
December 31, 2017
| Spectrum Fund |
| Security Description | | Shares or
Principal
Amount ($) | | Fair
Value ($) |
| Common Stocks - Long — continued |
| GAMCO Investors, Inc. | | | 2,519 | | | | 74,688 | |
Genworth Financial, Inc. (1) | | | 1,570 | | | | 4,883 | |
| Great Ajax Corp. | | | 800 | | | | 11,056 | |
| Great Southern Bancorp, Inc. | | | 1,981 | | | | 102,319 | |
Green Bancorp, Inc. (1) | | | 347 | | | | 7,044 | |
| Guaranty Bancorp | | | 1,833 | | | | 50,682 | |
Hallmark Financial Services, Inc. (1) | | | 763 | | | | 7,958 | |
| Hanover Insurance Group, Inc./The | | | 558 | | | | 60,309 | |
| HCI Group, Inc. | | | 51 | | | | 1,525 | |
Health Insurance Innovations, Inc. (1) | | | 162 | | | | 4,042 | |
| Heartland Financial USA, Inc. | | | 1,894 | | | | 101,613 | |
| Heritage Commerce Corp. | | | 6,493 | | | | 99,473 | |
| Heritage Financial Corp./WA | | | 2,518 | | | | 77,554 | |
| Heritage Insurance Holdings, Inc. | | | 52 | | | | 937 | |
| Home Bancorp, Inc. | | | 349 | | | | 15,084 | |
HomeStreet, Inc. (1) | | | 390 | | | | 11,291 | |
| Horizon Bancorp/IN | | | 2,374 | | | | 65,997 | |
| Houlihan Lokey, Inc. | | | 2,895 | | | | 131,520 | |
| Huntington Bancshares, Inc./OH | | | 48,200 | | | | 701,792 | |
| Independence Holding Co. | | | 374 | | | | 10,266 | |
| Independent Bank Corp./MI | | | 2,359 | | | | 52,724 | |
| Infinity Property & Casualty Corp. | | | 200 | | | | 21,200 | |
| International Bancshares Corp. | | | 3,091 | | | | 122,713 | |
INTL. FCStone, Inc. (1) | | | 725 | | | | 30,834 | |
| Invesco Mortgage Capital, Inc. | | | 9,425 | | | | 168,048 | |
| James River Group Holdings, Ltd. | | | 686 | | | | 27,447 | |
JPMorgan Chase & Co. (4) | | | 8,330 | | | | 890,810 | |
| Kemper Corp. | | | 650 | | | | 44,785 | |
KeyCorp (4) | | | 30,013 | | | | 605,362 | |
| Kinsale Capital Group, Inc. | | | 326 | | | | 14,670 | |
| Ladenburg Thalmann Financial Services, Inc. | | | 1,500 | | | | 4,740 | |
Lazard, Ltd. (4) | | | 3,872 | | | | 203,280 | |
| LCNB Corp. | | | 123 | | | | 2,515 | |
LendingTree, Inc. (1) | | | 36 | | | | 12,256 | |
| Leucadia National Corp. | | | 2,390 | | | | 63,311 | |
| LPL Financial Holdings, Inc. | | | 1,096 | | | | 62,625 | |
| M&T Bank Corp. | | | 2,491 | | | | 425,936 | |
| Macatawa Bank Corp. | | | 1,717 | | | | 17,170 | |
| MainSource Financial Group, Inc. | | | 2,459 | | | | 89,286 | |
| Manning & Napier, Inc. | | | 552 | | | | 1,987 | |
| Marlin Business Services Corp. | | | 204 | | | | 4,570 | |
Marsh & McLennan Cos., Inc. (4) | | | 8,903 | | | | 724,615 | |
| MB Financial, Inc. | | | 3,561 | | | | 158,536 | |
| Medley Management, Inc. | | | 764 | | | | 4,966 | |
| Mercantile Bank Corp. | | | 887 | | | | 31,373 | |
Metropolitan Bank Holding Corp. (1) | | | 281 | | | | 11,830 | |
MFA Financial, Inc. (4) | | | 6,413 | | | | 50,791 | |
MGIC Investment Corp. (1) (4) | | | 11,607 | | | | 163,775 | |
| Midland States Bancorp, Inc. | | | 547 | | | | 17,767 | |
| MidWestOne Financial Group, Inc. | | | 73 | | | | 2,448 | |
| Moelis & Co. | | | 1,465 | | | | 71,053 | |
| MSCI, Inc. | | | 1,214 | | | | 153,620 | |
| MTGE Investment Corp. | | | 2,389 | | | | 44,197 | |
| MutualFirst Financial, Inc. | | | 423 | | | | 16,307 | |
National Commerce Corp. (1) | | | 941 | | | | 37,875 | |
Nationstar Mortgage Holdings, Inc. (1) | | | 1,434 | | | | 26,529 | |
| Navient Corp. | | | 1,856 | | | | 24,722 | |
| Nelnet, Inc. | | | 45 | | | | 2,465 | |
| New Residential Investment Corp. | | | 26,499 | | | | 473,802 | |
NewStar Financial, Inc. Contingent Value Rights (1) (8) | | | 95 | | | | 0 | |
Nicolet Bankshares, Inc. (1) | | | 957 | | | | 52,386 | |
NMI Holdings, Inc. (1) | | | 1,630 | | | | 27,710 | |
| Northeast Bancorp | | | 124 | | | | 2,871 | |
| Northrim BanCorp, Inc. | | | 984 | | | | 33,308 | |
| Norwood Financial Corp. | | | 213 | | | | 7,029 | |
| Ohio Valley Banc Corp. | | | 41 | | | | 1,656 | |
| Old National Bancorp/IN | | | 7,324 | | | | 127,804 | |
| Old Point Financial Corp. | | | 168 | | | | 4,998 | |
| Old Republic International Corp. | | | 4,598 | | | | 98,305 | |
| Old Second Bancorp, Inc. | | | 1,209 | | | | 16,503 | |
| OM Asset Management Plc | | | 818 | | | | 13,702 | |
OneMain Holdings, Inc. (1) | | | 557 | | | | 14,476 | |
| Oppenheimer Holdings, Inc. | | | 537 | | | | 14,392 | |
| Orrstown Financial Services, Inc. | | | 236 | | | | 5,959 | |
Pacific Mercantile Bancorp (1) | | | 1,386 | | | | 12,128 | |
Paragon Commercial Corp. (1) | | | 185 | | | | 9,844 | |
| Parke Bancorp, Inc. | | | 413 | | | | 8,487 | |
| Peapack Gladstone Financial Corp. | | | 480 | | | | 16,810 | |
| Penns Woods Bancorp, Inc. | | | 102 | | | | 4,751 | |
PennyMac Financial Services, Inc. (1) | | | 2,220 | | | | 49,617 | |
| Peoples Bancorp, Inc./OH | | | 922 | | | | 30,076 | |
| Peoples Bancorp of North Carolina, Inc. | | | 143 | | | | 4,389 | |
| Peoples Financial Services Corp. | | | 99 | | | | 4,611 | |
| People's Utah Bancorp | | | 868 | | | | 26,300 | |
PHH Corp. (1) | | | 798 | | | | 8,219 | |
| Piper Jaffray Cos. | | | 490 | | | | 42,263 | |
PNC Financial Services Group, Inc./The (4) | | | 6,001 | | | | 865,884 | |
| Preferred Bank/Los Angeles CA | | | 634 | | | | 37,267 | |
| Premier Financial Bancorp, Inc. | | | 1,305 | | | | 26,204 | |
Progressive Corp./The (4) | | | 14,536 | | | | 818,668 | |
| Provident Financial Holdings, Inc. | | | 2,098 | | | | 38,603 | |
| Provident Financial Services, Inc. | | | 194 | | | | 5,232 | |
The accompanying notes are an integral part of these financial statements.
Page 56 | 2017 Annual Report | December 31, 2017 |
Schedule of Investments
December 31, 2017
| Spectrum Fund |
| Security Description | | Shares or
Principal
Amount ($) | | Fair
Value ($) |
| Common Stocks - Long — continued |
| Pzena Investment Management, Inc. | | | 1,217 | | | | 12,985 | |
| QCR Holdings, Inc. | | | 719 | | | | 30,809 | |
| Radian Group, Inc. | | | 5,926 | | | | 122,135 | |
| Raymond James Financial, Inc. | | | 2,697 | | | | 240,842 | |
| RBB Bancorp | | | 1,866 | | | | 51,072 | |
Regional Management Corp. (1) | | | 425 | | | | 11,182 | |
Regions Financial Corp. (4) | | | 42,685 | | | | 737,597 | |
Reinsurance Group of America, Inc. (4) | | | 1,351 | | | | 210,661 | |
| Renasant Corp. | | | 175 | | | | 7,156 | |
| Republic Bancorp, Inc./KY | | | 1,357 | | | | 51,593 | |
| Riverview Bancorp, Inc. | | | 2,074 | | | | 17,982 | |
S&P Global, Inc. (4) | | | 5,012 | | | | 849,033 | |
| Safety Insurance Group, Inc. | | | 626 | | | | 50,330 | |
| Sandy Spring Bancorp, Inc. | | | 117 | | | | 4,565 | |
| Santander Consumer USA Holdings, Inc. | | | 545 | | | | 10,148 | |
| SEI Investments Co. | | | 7,822 | | | | 562,089 | |
| Selective Insurance Group, Inc. | | | 516 | | | | 30,289 | |
| Shore Bancshares, Inc. | | | 1,760 | | | | 29,392 | |
| SI Financial Group, Inc. | | | 497 | | | | 7,306 | |
| Sierra Bancorp | | | 1,476 | | | | 39,203 | |
| Silvercrest Asset Management Group, Inc. | | | 443 | | | | 7,110 | |
| Simmons First National Corp. | | | 124 | | | | 7,080 | |
| South State Corp. | | | 171 | | | | 14,903 | |
Southern First Bancshares, Inc. (1) | | | 393 | | | | 16,211 | |
| Southern Missouri Bancorp, Inc. | | | 27 | | | | 1,015 | |
| State Bank Financial Corp. | | | 3,168 | | | | 94,533 | |
| Stewart Information Services Corp. | | | 1,280 | | | | 54,144 | |
| Summit Financial Group, Inc. | | | 547 | | | | 14,397 | |
Sunshine Bancorp, Inc. (1) | | | 187 | | | | 4,290 | |
SunTrust Banks, Inc. (4) | | | 11,825 | | | | 763,777 | |
| Sutherland Asset Management Corp. | | | 1,022 | | | | 15,483 | |
| Synovus Financial Corp. | | | 10,592 | | | | 507,780 | |
| T Rowe Price Group, Inc. | | | 7,040 | | | | 738,707 | |
| TCF Financial Corp. | | | 4,119 | | | | 84,440 | |
| Territorial Bancorp, Inc. | | | 514 | | | | 15,867 | |
Third Point Reinsurance, Ltd. (1) | | | 2,848 | | | | 41,723 | |
| Timberland Bancorp, Inc./WA | | | 289 | | | | 7,673 | |
| Towne Bank/Portsmouth VA | | | 28 | | | | 861 | |
| Travelers Cos., Inc./The | | | 947 | | | | 128,451 | |
| TriCo Bancshares | | | 2,885 | | | | 109,226 | |
Triumph Bancorp, Inc. (1) | | | 1,313 | | | | 41,360 | |
| TrustCo Bank Corp. NY | | | 3,835 | | | | 35,282 | |
| Two River Bancorp | | | 273 | | | | 4,949 | |
| Umpqua Holdings Corp. | | | 20,662 | | | | 429,770 | |
| United Community Banks, Inc./GA | | | 3,298 | | | | 92,806 | |
| United Community Financial Corp./OH | | | 823 | | | | 7,514 | |
| United Financial Bancorp, Inc. | | | 3,379 | | | | 59,606 | |
| United Fire Group, Inc. | | | 33 | | | | 1,504 | |
| United Security Bancshares/Fresno CA | | | 1,090 | | | | 11,990 | |
| Unity Bancorp, Inc. | | | 824 | | | | 16,274 | |
| Universal Insurance Holdings, Inc. | | | 263 | | | | 7,193 | |
| Univest Corp of Pennsylvania | | | 1,812 | | | | 50,827 | |
| Unum Group | | | 537 | | | | 29,476 | |
| US Bancorp | | | 600 | | | | 32,148 | |
Walker & Dunlop, Inc. (1) | | | 445 | | | | 21,138 | |
Walter Investment Management Corp. (1) | | | 2,439 | | | | 2,056 | |
| Washington Trust Bancorp, Inc. | | | 469 | | | | 24,974 | |
| WashingtonFirst Bankshares, Inc. | | | 1,511 | | | | 51,767 | |
| Waterstone Financial, Inc. | | | 2,355 | | | | 40,153 | |
Wells Fargo & Co. (4) | | | 10,447 | | | | 633,819 | |
| West Bancorporation, Inc. | | | 1,595 | | | | 40,114 | |
Western Alliance Bancorp (1) | | | 3,634 | | | | 205,757 | |
| Western New England Bancorp, Inc. | | | 659 | | | | 7,183 | |
| Westwood Holdings Group, Inc. | | | 261 | | | | 17,281 | |
| Wintrust Financial Corp. | | | 2,338 | | | | 192,581 | |
WMIH Corp. (1) | | | 1,200 | | | | 1,019 | |
World Acceptance Corp. (1) | | | 178 | | | | 14,368 | |
Xenith Bankshares, Inc. (1) | | | 791 | | | | 26,760 | |
| | | | | | | | 32,026,028 | |
| | | | | | | | | |
| Healthcare — 12.0% | | | | | | | | |
| Abbott Laboratories | | | 15,682 | | | | 894,972 | |
AbbVie, Inc. (4) | | | 6,003 | | | | 580,550 | |
Abeona Therapeutics, Inc. (1) | | | 67 | | | | 1,062 | |
ABIOMED, Inc. (1) | | | 215 | | | | 40,293 | |
ACADIA Pharmaceuticals, Inc. (1) | | | 124 | | | | 3,734 | |
Acceleron Pharma, Inc. (1) | | | 169 | | | | 7,172 | |
AcelRx Pharmaceuticals, Inc. (1) (2) | | | 1,300 | | | | 2,633 | |
Achillion Pharmaceuticals, Inc. (1) | | | 1,015 | | | | 2,923 | |
Acorda Therapeutics, Inc. (1) | | | 559 | | | | 11,991 | |
Adamas Pharmaceuticals, Inc. (1) | | | 209 | | | | 7,083 | |
Advaxis, Inc. (1) | | | 428 | | | | 1,216 | |
Adverum Biotechnologies, Inc. (1) | | | 1,546 | | | | 5,411 | |
Aetna, Inc. (4) | | | 4,217 | | | | 760,705 | |
Aevi Genomic Medicine, Inc. (1) | | | 3,424 | | | | 4,109 | |
Agile Therapeutics, Inc. (1) | | | 1,934 | | | | 5,202 | |
Agilent Technologies, Inc. (4) | | | 6,696 | | | | 448,431 | |
Aimmune Therapeutics, Inc. (1) | | | 295 | | | | 11,157 | |
Akebia Therapeutics, Inc. (1) | | | 220 | | | | 3,271 | |
Alexion Pharmaceuticals, Inc. (1) | | | 2,123 | | | | 253,890 | |
Align Technology, Inc. (1) (4) | | | 488 | | | | 108,429 | |
Alkermes PLC (1) | | | 324 | | | | 17,733 | |
| Allergan PLC | | | 1,398 | | | | 228,685 | |
Alnylam Pharmaceuticals, Inc. (1) | | | 195 | | | | 24,775 | |
The accompanying notes are an integral part of these financial statements.
2017 Annual Report | December 31, 2017 | Page 57 |
Schedule of Investments
December 31, 2017
| Spectrum Fund |
| Security Description | | Shares or
Principal
Amount ($) | | Fair
Value ($) |
| Common Stocks - Long — continued |
AMAG Pharmaceuticals, Inc. (1) | | | 892 | | | | 11,819 | |
Amedisys, Inc. (1) | | | 36 | | | | 1,898 | |
Amgen, Inc. (4) | | | 3,752 | | | | 652,473 | |
Amphastar Pharmaceuticals, Inc. (1) | | | 586 | | | | 11,275 | |
Ampio Pharmaceuticals, Inc. (1) | | | 468 | | | | 1,905 | |
| Analogic Corp. | | | 163 | | | | 13,651 | |
Anavex Life Sciences Corp. (1) | | | 781 | | | | 2,515 | |
AngioDynamics, Inc. (1) | | | 1,169 | | | | 19,440 | |
ANI Pharmaceuticals, Inc. (1) | | | 190 | | | | 12,246 | |
| Anthem, Inc. | | | 2,841 | | | | 639,253 | |
Anthera Pharmaceuticals, Inc. (1) | | | 2,983 | | | | 4,922 | |
Applied Genetic Technologies Corp./DE (1) | | | 795 | | | | 2,862 | |
Aptevo Therapeutics, Inc. (1) | | | 224 | | | | 950 | |
Ardelyx, Inc. (1) | | | 281 | | | | 1,855 | |
Arena Pharmaceuticals, Inc. (1) | | | 238 | | | | 8,085 | |
Argos Therapeutics, Inc. (1) (2) | | | 22,439 | | | | 3,366 | |
Assembly Biosciences, Inc. (1) | | | 26 | | | | 1,177 | |
Asterias Biotherapeutics, Inc. (1) (2) | | | 388 | | | | 873 | |
Athersys, Inc. (1) | | | 959 | | | | 1,736 | |
| Atrion Corp. | | | 2 | | | | 1,261 | |
Audentes Therapeutics, Inc. (1) | | | 222 | | | | 6,938 | |
Avexis, Inc. (1) | | | 65 | | | | 7,194 | |
Avinger, Inc. (1) | | | 11,194 | | | | 2,037 | |
Axsome Therapeutics, Inc. (1) | | | 1,354 | | | | 7,582 | |
Baxter International, Inc. (4) | | | 12,131 | | | | 784,148 | |
| Becton Dickinson and Co. | | | 749 | | | | 160,331 | |
Biogen, Inc. (1) | | | 1,805 | | | | 575,019 | |
BioMarin Pharmaceutical, Inc. (1) | | | 527 | | | | 46,993 | |
Bio-Path Holdings, Inc. (1) | | | 6,592 | | | | 1,335 | |
Bio-Rad Laboratories, Inc. (1) | | | 108 | | | | 25,776 | |
BioSpecifics Technologies Corp. (1) | | | 275 | | | | 11,916 | |
Bioverativ, Inc. (1) | | | 808 | | | | 43,567 | |
Bluebird Bio, Inc. (1) | | | 140 | | | | 24,934 | |
Blueprint Medicines Corp. (1) | | | 92 | | | | 6,938 | |
Boston Scientific Corp. (1) | | | 11,020 | | | | 273,186 | |
| Bristol-Myers Squibb Co. | | | 13,152 | | | | 805,955 | |
| Bruker Corp. | | | 480 | | | | 16,474 | |
Calithera Biosciences, Inc. (1) | | | 110 | | | | 919 | |
Cambrex Corp. (1) | | | 178 | | | | 8,544 | |
Cardinal Health, Inc. (4) | | | 1,108 | | | | 67,887 | |
Catalent, Inc. (1) | | | 1,652 | | | | 67,864 | |
Catalyst Pharmaceuticals, Inc. (1) | | | 269 | | | | 1,052 | |
Celgene Corp. (1) | | | 2,140 | | | | 223,330 | |
Celldex Therapeutics, Inc. (1) | | | 359 | | | | 1,020 | |
Cellular Biomedicine Group, Inc. (1) | | | 549 | | | | 6,176 | |
Centene Corp. (1) | | | 2,006 | | | | 202,365 | |
Cerner Corp. (1) | | | 7,011 | | | | 472,471 | |
Charles River Laboratories International, Inc. (1) | | | 498 | | | | 54,506 | |
| Chemed Corp. | | | 37 | | | | 8,992 | |
ChemoCentryx, Inc. (1) | | | 657 | | | | 3,909 | |
ChromaDex Corp. (1) | | | 252 | | | | 1,482 | |
Cidara Therapeutics, Inc. (1) | | | 679 | | | | 4,617 | |
| Cigna Corp. | | | 1,742 | | | | 353,783 | |
Coherus Biosciences, Inc. (1) | | | 99 | | | | 871 | |
Collegium Pharmaceutical, Inc. (1) | | | 50 | | | | 923 | |
Conatus Pharmaceuticals, Inc. (1) | | | 2,031 | | | | 9,383 | |
ConforMIS, Inc. (1) | | | 380 | | | | 904 | |
| CONMED Corp. | | | 244 | | | | 12,437 | |
| Cooper Cos., Inc./The | | | 84 | | | | 18,302 | |
Corbus Pharmaceuticals Holdings, Inc. (1) | | | 161 | | | | 1,143 | |
CorVel Corp. (1) | | | 266 | | | | 14,071 | |
Corvus Pharmaceuticals, Inc. (1) | | | 88 | | | | 912 | |
Cross Country Healthcare, Inc. (1) | | | 445 | | | | 5,678 | |
CryoLife, Inc. (1) | | | 180 | | | | 3,447 | |
Curis, Inc. (1) | | | 1,260 | | | | 882 | |
Cytokinetics, Inc. (1) | | | 474 | | | | 3,863 | |
CytomX Therapeutics, Inc. (1) | | | 390 | | | | 8,233 | |
CytRx Corp. (1) | | | 2,001 | | | | 3,382 | |
Depomed, Inc. (1) | | | 553 | | | | 4,452 | |
Diplomat Pharmacy, Inc. (1) | | | 43 | | | | 863 | |
Durect Corp. (1) | | | 2,764 | | | | 2,548 | |
Dyax Corp. Contingent Value Rights (1) (8) | | | 7,373 | | | | 0 | |
Dynavax Technologies Corp. (1) | | | 111 | | | | 2,076 | |
Eagle Pharmaceuticals, Inc./DE (1) | | | 101 | | | | 5,395 | |
Edge Therapeutics, Inc. (1) | | | 253 | | | | 2,371 | |
Editas Medicine, Inc. (1) | | | 168 | | | | 5,163 | |
Edwards Lifesciences Corp. (1) | | | 822 | | | | 92,648 | |
Egalet Corp. (1) | | | 6,100 | | | | 6,100 | |
Eiger BioPharmaceuticals, Inc. (1) | | | 515 | | | | 7,184 | |
| Eli Lilly & Co. | | | 2,640 | | | | 222,974 | |
Emergent BioSolutions, Inc. (1) | | | 678 | | | | 31,507 | |
Enanta Pharmaceuticals, Inc. (1) | | | 163 | | | | 9,565 | |
Encompass Health Corp. (1) | | | 1,265 | | | | 62,504 | |
Endo International PLC (1) | | | 1,637 | | | | 12,687 | |
Endocyte, Inc. (1) | | | 235 | | | | 1,006 | |
Enzo Biochem, Inc. (1) | | | 1,119 | | | | 9,120 | |
Epizyme, Inc. (1) | | | 73 | | | | 916 | |
Esperion Therapeutics, Inc. (1) | | | 30 | | | | 1,975 | |
Exact Sciences Corp. (1) | | | 468 | | | | 24,589 | |
Exactech, Inc. (1) | | | 33 | | | | 1,632 | |
Exelixis, Inc. (1) | | | 638 | | | | 19,395 | |
Fate Therapeutics, Inc. (1) | | | 198 | | | | 1,210 | |
FibroGen, Inc. (1) | | | 47 | | | | 2,228 | |
The accompanying notes are an integral part of these financial statements.
Page 58 | 2017 Annual Report | December 31, 2017 |
Schedule of Investments
December 31, 2017
| Spectrum Fund |
| Security Description | | Shares or
Principal
Amount ($) | | Fair
Value ($) |
| Common Stocks - Long — continued |
Five Prime Therapeutics, Inc. (1) | | | 208 | | | | 4,559 | |
Flex Pharma, Inc. (1) | | | 1,259 | | | | 4,394 | |
FONAR Corp. (1) | | | 92 | | | | 2,240 | |
Fortress Biotech, Inc. (1) | | | 343 | | | | 1,369 | |
Foundation Medicine, Inc. (1) | | | 40 | | | | 2,728 | |
Genesis Healthcare, Inc. (1) | | | 2,592 | | | | 1,977 | |
Genocea Biosciences, Inc. (1) | | | 1,598 | | | | 1,854 | |
Genomic Health, Inc. (1) | | | 1,166 | | | | 39,877 | |
Gilead Sciences, Inc. (4) | | | 7,464 | | | | 534,721 | |
Globus Medical, Inc. (1) | | | 87 | | | | 3,576 | |
GlycoMimetics, Inc. (1) | | | 54 | | | | 907 | |
Haemonetics Corp. (1) | | | 683 | | | | 39,669 | |
Halyard Health, Inc. (1) | | | 455 | | | | 21,012 | |
HCA Healthcare, Inc. (1) | | | 256 | | | | 22,487 | |
HealthStream, Inc. (1) | | | 86 | | | | 1,992 | |
Heska Corp. (1) | | | 21 | | | | 1,684 | |
Hill-Rom Holdings, Inc. (4) | | | 1,008 | | | | 84,964 | |
Horizon Pharma Plc (1) | | | 500 | | | | 7,300 | |
Humana, Inc. (4) | | | 2,750 | | | | 682,193 | |
Idera Pharmaceuticals, Inc. (1) | | | 1,393 | | | | 2,939 | |
IDEXX Laboratories, Inc. (1) (4) | | | 358 | | | | 55,984 | |
Ignyta, Inc. (1) | | | 127 | | | | 3,391 | |
Immune Design Corp. (1) | | | 231 | | | | 901 | |
Impax Laboratories, Inc. (1) | | | 361 | | | | 6,011 | |
Incyte Corp. (1) | | | 1,077 | | | | 102,003 | |
Infinity Pharmaceuticals, Inc. (1) | | | 994 | | | | 2,018 | |
Innoviva, Inc. (1) | | | 552 | | | | 7,833 | |
Inovio Pharmaceuticals, Inc. (1) | | | 534 | | | | 2,205 | |
Insmed, Inc. (1) | | | 28 | | | | 873 | |
Insys Therapeutics, Inc. (1) | | | 355 | | | | 3,415 | |
Integer Holdings Corp. (1) | | | 583 | | | | 26,410 | |
Intellia Therapeutics, Inc. (1) | | | 198 | | | | 3,806 | |
Intrexon Corp. (1) | | | 315 | | | | 3,629 | |
Intuitive Surgical, Inc. (1) | | | 1,970 | | | | 718,932 | |
InVivo Therapeutics Holdings Corp. (1) (2) | | | 4,500 | | | | 3,465 | |
Ionis Pharmaceuticals, Inc. (1) | | | 222 | | | | 11,167 | |
Iovance Biotherapeutics, Inc. (1) | | | 850 | | | | 6,800 | |
IQVIA Holdings, Inc. (1) | | | 2,113 | | | | 206,863 | |
Johnson & Johnson (4) | | | 8,811 | | | | 1,231,073 | |
Juno Therapeutics, Inc. (1) | | | 235 | | | | 10,742 | |
Kadmon Holdings, Inc. (1) | | | 1,646 | | | | 5,959 | |
| Kindred Healthcare, Inc. | | | 218 | | | | 2,115 | |
Lannett Co., Inc. (1) | | | 143 | | | | 3,318 | |
Lantheus Holdings, Inc. (1) | | | 138 | | | | 2,822 | |
| LeMaitre Vascular, Inc. | | | 91 | | | | 2,897 | |
LHC Group, Inc. (1) | | | 244 | | | | 14,945 | |
LifePoint Health, Inc. (1) | | | 108 | | | | 5,378 | |
Lipocine, Inc. (1) | | | 2,520 | | | | 8,669 | |
LivaNova PLC (1) | | | 160 | | | | 12,787 | |
| Luminex Corp. | | | 1,331 | | | | 26,221 | |
Madrigal Pharmaceuticals, Inc. (1) | | | 53 | | | | 4,865 | |
Magellan Health, Inc. (1) | | | 189 | | | | 18,248 | |
Mallinckrodt PLC (1) | | | 543 | | | | 12,250 | |
Masimo Corp. (1) | | | 289 | | | | 24,507 | |
Matinas BioPharma Holdings, Inc. (1) | | | 1,795 | | | | 2,082 | |
| McKesson Corp. | | | 2,573 | | | | 401,259 | |
MediciNova, Inc. (1) | | | 837 | | | | 5,415 | |
Medtronic PLC (4) | | | 4,295 | | | | 346,821 | |
Melinta Therapeutics, Inc. (1) | | | 659 | | | | 10,412 | |
Merck & Co., Inc. (4) | | | 10,898 | | | | 613,230 | |
| Meridian Bioscience, Inc. | | | 799 | | | | 11,186 | |
Mettler-Toledo International, Inc. (1) | | | 423 | | | | 262,057 | |
MiMedx Group, Inc. (1) | | | 576 | | | | 7,263 | |
Minerva Neurosciences, Inc. (1) | | | 481 | | | | 2,910 | |
Molina Healthcare, Inc. (1) | | | 102 | | | | 7,821 | |
Momenta Pharmaceuticals, Inc. (1) | | | 551 | | | | 7,686 | |
Mylan NV (1) | | | 2,928 | | | | 123,884 | |
MyoKardia, Inc. (1) | | | 66 | | | | 2,779 | |
Myovant Sciences, Ltd. (1) | | | 80 | | | | 1,011 | |
Myriad Genetics, Inc. (1) | | | 210 | | | | 7,212 | |
NantKwest, Inc. (1) | | | 667 | | | | 2,995 | |
Natera, Inc. (1) | | | 826 | | | | 7,426 | |
Nektar Therapeutics (1) | | | 462 | | | | 27,591 | |
NewLink Genetics Corp. (1) | | | 125 | | | | 1,014 | |
Novan, Inc. (1) | | | 1,129 | | | | 4,764 | |
Novavax, Inc. (1) | | | 795 | | | | 986 | |
Novelion Therapeutics, Inc. (1) | | | 706 | | | | 2,203 | |
Novus Therapeutics, Inc. (1) | | | 1,084 | | | | 4,401 | |
OncoMed Pharmaceuticals, Inc. (1) | | | 1,096 | | | | 4,494 | |
Ophthotech Corp. (1) | | | 2,134 | | | | 6,658 | |
OPKO Health, Inc. (1) | | | 1,146 | | | | 5,615 | |
Optinose, Inc. (1) | | | 46 | | | | 869 | |
Organovo Holdings, Inc. (1) | | | 1,325 | | | | 1,776 | |
Orthofix International NV (1) | | | 535 | | | | 29,265 | |
Otonomy, Inc. (1) | | | 703 | | | | 3,902 | |
OvaScience, Inc. (1) | | | 4,858 | | | | 6,801 | |
Ovid therapeutics, Inc. (1) | | | 88 | | | | 869 | |
| Owens & Minor, Inc. | | | 760 | | | | 14,349 | |
PDL BioPharma, Inc. (1) | | | 2,870 | | | | 7,864 | |
| PerkinElmer, Inc. | | | 156 | | | | 11,407 | |
| Perrigo Co. PLC | | | 711 | | | | 61,971 | |
Pfenex, Inc. (1) | | | 1,598 | | | | 4,251 | |
Pfizer, Inc. (4) | | | 20,575 | | | | 745,227 | |
| Phibro Animal Health Corp. | | | 181 | | | | 6,064 | |
The accompanying notes are an integral part of these financial statements.
2017 Annual Report | December 31, 2017 | Page 59 |
Schedule of Investments
December 31, 2017
| Spectrum Fund |
| Security Description | | Shares or
Principal
Amount ($) | | Fair
Value ($) |
| Common Stocks - Long — continued |
Pieris Pharmaceuticals, Inc. (1) | | | 198 | | | | 1,495 | |
PRA Health Sciences, Inc. (1) | | | 327 | | | | 29,780 | |
Premier, Inc. (1) | | | 3,872 | | | | 113,024 | |
Progenics Pharmaceuticals, Inc. (1) | | | 852 | | | | 5,069 | |
Protagonist Therapeutics, Inc. (1) | | | 304 | | | | 6,323 | |
Proteostasis Therapeutics, Inc. (1) | | | 932 | | | | 5,434 | |
Prothena Corp. PLC (1) | | | 25 | | | | 937 | |
Providence Service Corp./The (1) | | | 345 | | | | 20,472 | |
PTC Therapeutics, Inc. (1) | | | 400 | | | | 6,672 | |
Puma Biotechnology, Inc. (1) | | | 63 | | | | 6,228 | |
Quality Systems, Inc. (1) | | | 1,769 | | | | 24,023 | |
Quest Diagnostics, Inc. (4) | | | 458 | | | | 45,108 | |
Quorum Health Corp. (1) | | | 755 | | | | 4,711 | |
RadNet, Inc. (1) | | | 871 | | | | 8,797 | |
Reata Pharmaceuticals, Inc. (1) | | | 53 | | | | 1,501 | |
Recro Pharma, Inc. (1) | | | 1,759 | | | | 16,271 | |
Regeneron Pharmaceuticals, Inc. (1) | | | 647 | | | | 243,246 | |
REGENXBIO, Inc. (1) | | | 247 | | | | 8,213 | |
Regulus Therapeutics, Inc. (1) | | | 8,981 | | | | 9,340 | |
Repligen Corp. (1) | | | 341 | | | | 12,371 | |
Restoration Robotics, Inc. (1) | | | 587 | | | | 2,700 | |
Retrophin, Inc. (1) | | | 327 | | | | 6,890 | |
Revance Therapeutics, Inc. (1) | | | 127 | | | | 4,540 | |
Rhythm Pharmaceuticals, Inc. (1) | | | 215 | | | | 6,248 | |
Rigel Pharmaceuticals, Inc. (1) | | | 683 | | | | 2,650 | |
Rocket Pharmaceuticals, Inc. (1) | | | 1,574 | | | | 4,108 | |
Sage Therapeutics, Inc. (1) | | | 94 | | | | 15,483 | |
Sangamo Therapeutics, Inc. (1) | | | 271 | | | | 4,444 | |
Sarepta Therapeutics, Inc. (1) | | | 30 | | | | 1,669 | |
Second Sight Medical Products, Inc. (1) | | | 1,978 | | | | 3,778 | |
SELLAS Life Sciences Group, Inc. (1) | | | 16,983 | | | | 4,450 | |
Sorrento Therapeutics, Inc. (1) | | | 1,307 | | | | 4,967 | |
Spectrum Pharmaceuticals, Inc. (1) | | | 228 | | | | 4,321 | |
STAAR Surgical Co. (1) | | | 112 | | | | 1,736 | |
Stemline Therapeutics, Inc. (1) | | | 189 | | | | 2,948 | |
| STERIS PLC | | | 279 | | | | 24,404 | |
Sucampo Pharmaceuticals, Inc. (1) | | | 76 | | | | 1,364 | |
Supernus Pharmaceuticals, Inc. (1) | | | 180 | | | | 7,173 | |
Surmodics, Inc. (1) | | | 34 | | | | 952 | |
Synthetic Biologics, Inc. (1) | | | 4,981 | | | | 2,530 | |
Syros Pharmaceuticals, Inc. (1) | | | 321 | | | | 3,123 | |
Tandem Diabetes Care, Inc. (1) | | | 866 | | | | 2,044 | |
Teligent, Inc./NJ (1) | | | 536 | | | | 1,946 | |
Titan Pharmaceuticals, Inc. (1) | | | 1,235 | | | | 1,636 | |
Trevena, Inc. (1) | | | 1,162 | | | | 1,859 | |
Triple-S Management Corp. (1) | | | 318 | | | | 7,902 | |
Trovagene, Inc. (1) (2) | | | 5,433 | | | | 1,671 | |
United Therapeutics Corp. (1) | | | 397 | | | | 58,736 | |
UnitedHealth Group, Inc. (4) | | | 3,589 | | | | 791,231 | |
Vanda Pharmaceuticals, Inc. (1) | | | 1,491 | | | | 22,663 | |
VBI Vaccines, Inc. (1) | | | 255 | | | | 1,089 | |
Veeva Systems, Inc. (1) | | | 191 | | | | 10,558 | |
Veracyte, Inc. (1) | | | 2,292 | | | | 14,967 | |
Versartis, Inc. (1) | | | 1,510 | | | | 3,322 | |
Vertex Pharmaceuticals, Inc. (1) | | | 1,404 | | | | 210,403 | |
Vital Therapies, Inc. (1) | | | 760 | | | | 4,522 | |
Voyager Therapeutics, Inc. (1) | | | 149 | | | | 2,473 | |
WellCare Health Plans, Inc. (1) | | | 549 | | | | 110,409 | |
| West Pharmaceutical Services, Inc. | | | 52 | | | | 5,131 | |
Zafgen, Inc. (1) | | | 1,487 | | | | 6,870 | |
| Zoetis, Inc. | | | 2,270 | | | | 163,531 | |
Zogenix, Inc. (1) | | | 128 | | | | 5,126 | |
| | | | | | | | 18,611,084 | |
| | | | | | | | | |
| Industrials — 11.7% | | | | | | | | |
| AAR Corp. | | | 61 | | | | 2,397 | |
ACCO Brands Corp. (1) | | | 569 | | | | 6,942 | |
Aegion Corp. (1) | | | 788 | | | | 20,039 | |
Aerovironment, Inc. (1) | | | 81 | | | | 4,549 | |
| Aircastle, Ltd. | | | 2,160 | | | | 50,522 | |
| Alamo Group, Inc. | | | 308 | | | | 34,764 | |
| Allied Motion Technologies, Inc. | | | 60 | | | | 1,985 | |
| Allison Transmission Holdings, Inc. | | | 2,619 | | | | 112,800 | |
| Altra Industrial Motion Corp. | | | 344 | | | | 17,338 | |
| Applied Industrial Technologies, Inc. | | | 2,965 | | | | 201,917 | |
Aqua Metals, Inc. (1) | | | 600 | | | | 1,278 | |
ARC Document Solutions, Inc. (1) | | | 2,313 | | | | 5,898 | |
| ArcBest Corp. | | | 637 | | | | 22,773 | |
| Argan, Inc. | | | 523 | | | | 23,535 | |
Babcock & Wilcox Enterprises, Inc. (1) | | | 232 | | | | 1,318 | |
| Barnes Group, Inc. | | | 557 | | | | 35,241 | |
| Barrett Business Services, Inc. | | | 326 | | | | 21,024 | |
Beacon Roofing Supply, Inc. (1) | | | 825 | | | | 52,602 | |
| BG Staffing, Inc. | | | 295 | | | | 4,702 | |
Blue Bird Corp. (1) | | | 1,956 | | | | 38,924 | |
BMC Stock Holdings, Inc. (1) | | | 1,048 | | | | 26,514 | |
Boeing Co./The (4) | | | 3,753 | | | | 1,106,797 | |
| Brady Corp. | | | 265 | | | | 10,044 | |
| Briggs & Stratton Corp. | | | 1,791 | | | | 45,438 | |
| Brink's Co./The | | | 117 | | | | 9,208 | |
Builders FirstSource, Inc. (1) | | | 2,177 | | | | 47,437 | |
| BWX Technologies, Inc. | | | 439 | | | | 26,555 | |
Caesarstone, Ltd. (1) | | | 495 | | | | 10,890 | |
Casella Waste Systems, Inc. (1) | | | 928 | | | | 21,363 | |
The accompanying notes are an integral part of these financial statements.
Page 60 | 2017 Annual Report | December 31, 2017 |
Schedule of Investments
December 31, 2017
| Spectrum Fund |
| Security Description | | Shares or
Principal
Amount ($) | | Fair
Value ($) |
| Common Stocks - Long — continued |
| CECO Environmental Corp. | | | 781 | | | | 4,007 | |
| Celadon Group, Inc. | | | 204 | | | | 1,306 | |
| Columbus McKinnon Corp./NY | | | 62 | | | | 2,479 | |
| Comfort Systems USA, Inc. | | | 372 | | | | 16,238 | |
Commercial Vehicle Group, Inc. (1) | | | 202 | | | | 2,159 | |
Continental Building Products, Inc. (1) | | | 1,985 | | | | 55,878 | |
| Copa Holdings SA | | | 377 | | | | 50,541 | |
Copart, Inc. (1) | | | 1,227 | | | | 52,994 | |
| Costamare, Inc. | | | 1,653 | | | | 9,538 | |
Covenant Transportation Group, Inc. (1) | | | 530 | | | | 15,227 | |
| CRA International, Inc. | | | 205 | | | | 9,215 | |
| Crane Co. | | | 749 | | | | 66,826 | |
CSW Industrials, Inc. (1) | | | 136 | | | | 6,249 | |
CSX Corp. (4) | | | 2,509 | | | | 138,020 | |
Cummins, Inc. (4) | | | 4,099 | | | | 724,047 | |
| Curtiss-Wright Corp. | | | 968 | | | | 117,951 | |
| Delta Air Lines, Inc. | | | 13,755 | | | | 770,280 | |
| Douglas Dynamics, Inc. | | | 116 | | | | 4,385 | |
| Dover Corp. | | | 1,225 | | | | 123,713 | |
Ducommun, Inc. (1) | | | 374 | | | | 10,640 | |
DXP Enterprises, Inc./TX (1) | | | 131 | | | | 3,874 | |
| Eastern Co./The | | | 120 | | | | 3,138 | |
Eaton Corp. PLC (4) | | | 9,859 | | | | 778,960 | |
| EMCOR Group, Inc. | | | 1,731 | | | | 141,509 | |
Emerson Electric Co. (4) | | | 11,701 | | | | 815,443 | |
| Encore Wire Corp. | | | 124 | | | | 6,033 | |
Energous Corp. (1) | | | 99 | | | | 1,926 | |
| EnerSys | | | 124 | | | | 8,634 | |
Engility Holdings, Inc. (1) | | | 941 | | | | 26,696 | |
| Ennis, Inc. | | | 1,055 | | | | 21,891 | |
| EnPro Industries, Inc. | | | 672 | | | | 62,839 | |
| Essendant, Inc. | | | 1,288 | | | | 11,940 | |
Esterline Technologies Corp. (1) | | | 398 | | | | 29,731 | |
| Forrester Research, Inc. | | | 792 | | | | 35,006 | |
| Forward Air Corp. | | | 1,981 | | | | 113,789 | |
FuelCell Energy, Inc. (1) | | | 2,695 | | | | 4,582 | |
Genco Shipping & Trading, Ltd. (1) | | | 221 | | | | 2,944 | |
Gencor Industries, Inc. (1) | | | 372 | | | | 6,157 | |
| General Cable Corp. | | | 141 | | | | 4,174 | |
General Dynamics Corp. (4) | | | 2,938 | | | | 597,736 | |
| Global Brass & Copper Holdings, Inc. | | | 948 | | | | 31,379 | |
GMS, Inc. (1) | | | 1,270 | | | | 47,803 | |
| Graco, Inc. | | | 2,979 | | | | 134,710 | |
| Greenbrier Cos., Inc./The | | | 616 | | | | 32,833 | |
| H&E Equipment Services, Inc. | | | 269 | | | | 10,935 | |
Harsco Corp. (1) | | | 1,509 | | | | 28,143 | |
| Hawaiian Holdings, Inc. | | | 475 | | | | 18,929 | |
HD Supply Holdings, Inc. (1) | | | 1,631 | | | | 65,289 | |
HEICO Corp. (4) | | | 8,498 | | | | 671,767 | |
Heritage-Crystal Clean, Inc. (1) | | | 348 | | | | 7,569 | |
| Herman Miller, Inc. | | | 1,319 | | | | 52,826 | |
| Hexcel Corp. | | | 412 | | | | 25,482 | |
| Hillenbrand, Inc. | | | 2,964 | | | | 132,491 | |
| HNI Corp. | | | 558 | | | | 21,522 | |
| Hubbell, Inc. | | | 949 | | | | 128,438 | |
Huntington Ingalls Industries, Inc. (4) | | | 1,578 | | | | 371,935 | |
| Hurco Cos., Inc. | | | 159 | | | | 6,710 | |
| Hyster-Yale Materials Handling, Inc. | | | 353 | | | | 30,061 | |
ICF International, Inc. (1) | | | 568 | | | | 29,820 | |
Illinois Tool Works, Inc. (4) | | | 4,862 | | | | 811,225 | |
Ingersoll-Rand PLC (4) | | | 5,014 | | | | 447,199 | |
InnerWorkings, Inc. (1) | | | 159 | | | | 1,595 | |
| Interface, Inc. | | | 2,256 | | | | 56,738 | |
| ITT, Inc. | | | 469 | | | | 25,031 | |
| JB Hunt Transport Services, Inc. | | | 1,456 | | | | 167,411 | |
JetBlue Airways Corp. (1) | | | 8,697 | | | | 194,291 | |
| Kadant, Inc. | | | 202 | | | | 20,281 | |
| Kansas City Southern | | | 2,600 | | | | 273,572 | |
| KBR, Inc. | | | 1,574 | | | | 31,212 | |
| Kelly Services, Inc. | | | 808 | | | | 22,034 | |
| Kforce, Inc. | | | 520 | | | | 13,130 | |
| Kimball International, Inc. | | | 1,093 | | | | 20,406 | |
| Korn/Ferry International | | | 1,814 | | | | 75,063 | |
| Landstar System, Inc. | | | 635 | | | | 66,104 | |
Lawson Products, Inc./DE (1) | | | 112 | | | | 2,772 | |
LB Foster Co. (1) | | | 412 | | | | 11,186 | |
| Lincoln Electric Holdings, Inc. | | | 66 | | | | 6,044 | |
| LSC Communications, Inc. | | | 874 | | | | 13,241 | |
| LSI Industries, Inc. | | | 567 | | | | 3,901 | |
Lydall, Inc. (1) | | | 399 | | | | 20,249 | |
ManpowerGroup, Inc. (4) | | | 1,983 | | | | 250,076 | |
| Marten Transport, Ltd. | | | 1,803 | | | | 36,601 | |
| Masco Corp. | | | 13,124 | | | | 576,669 | |
Masonite International Corp. (1) | | | 236 | | | | 17,499 | |
| Matson, Inc. | | | 898 | | | | 26,796 | |
| McGrath RentCorp | | | 283 | | | | 13,295 | |
Meritor, Inc. (1) | | | 893 | | | | 20,950 | |
| Miller Industries, Inc./TN | | | 1,198 | | | | 30,908 | |
Moog, Inc. (1) | | | 928 | | | | 80,597 | |
| MSA Safety, Inc. | | | 173 | | | | 13,411 | |
| MSC Industrial Direct Co., Inc. | | | 325 | | | | 31,415 | |
| National Presto Industries, Inc. | | | 178 | | | | 17,702 | |
Navios Maritime Holdings, Inc. (1) | | | 688 | | | | 826 | |
Nexeo Solutions, Inc. (1) | | | 732 | | | | 6,661 | |
The accompanying notes are an integral part of these financial statements.
2017 Annual Report | December 31, 2017 | Page 61 |
Schedule of Investments
December 31, 2017
| Spectrum Fund |
| Security Description | | Shares or
Principal
Amount ($) | | Fair
Value ($) |
| Common Stocks - Long — continued |
| Norfolk Southern Corp. | | | 3,404 | | | | 493,240 | |
| Northrop Grumman Corp. | | | 2,226 | | | | 683,182 | |
| Old Dominion Freight Line, Inc. | | | 1,459 | | | | 191,931 | |
| Omega Flex, Inc. | | | 24 | | | | 1,714 | |
On Assignment, Inc. (1) | | | 467 | | | | 30,014 | |
| Orbital ATK, Inc. | | | 181 | | | | 23,802 | |
| Oshkosh Corp. | | | 415 | | | | 37,719 | |
| Owens Corning | | | 3,035 | | | | 279,038 | |
| PACCAR, Inc. | | | 3,643 | | | | 258,944 | |
PAM Transportation Services, Inc. (1) | | | 88 | | | | 3,030 | |
| Park-Ohio Holdings Corp. | | | 648 | | | | 29,776 | |
PGT Innovations, Inc. (1) | | | 828 | | | | 13,952 | |
| Pitney Bowes, Inc. | | | 2,753 | | | | 30,779 | |
Ply Gem Holdings, Inc. (1) | | | 1,570 | | | | 29,045 | |
| Powell Industries, Inc. | | | 55 | | | | 1,576 | |
| Preformed Line Products Co. | | | 12 | | | | 853 | |
| Primoris Services Corp. | | | 1,042 | | | | 28,332 | |
| Quad/Graphics, Inc. | | | 1,227 | | | | 27,730 | |
Quanta Services, Inc. (1) | | | 1,859 | | | | 72,705 | |
Radiant Logistics, Inc. (1) | | | 409 | | | | 1,881 | |
| Regal Beloit Corp. | | | 735 | | | | 56,301 | |
| Resources Connection, Inc. | | | 338 | | | | 5,222 | |
Rexnord Corp. (1) | | | 316 | | | | 8,222 | |
| Robert Half International, Inc. | | | 3,753 | | | | 208,442 | |
Rockwell Automation, Inc. (4) | | | 3,667 | | | | 720,015 | |
| RPX Corp. | | | 1,861 | | | | 25,012 | |
| RR Donnelley & Sons Co. | | | 1,477 | | | | 13,736 | |
Rush Enterprises, Inc. - Class A (1) | | | 715 | | | | 36,329 | |
Rush Enterprises, Inc. - Class B (1) | | | 124 | | | | 5,978 | |
| Ryder System, Inc. | | | 2,382 | | | | 200,493 | |
Safe Bulkers, Inc. (1) | | | 272 | | | | 879 | |
Saia, Inc. (1) | | | 459 | | | | 32,474 | |
SP Plus Corp. (1) | | | 607 | | | | 22,520 | |
| Spartan Motors, Inc. | | | 160 | | | | 2,520 | |
Spirit AeroSystems Holdings, Inc. (4) | | | 4,027 | | | | 351,356 | |
SPX FLOW, Inc. (1) | | | 544 | | | | 25,867 | |
| Steelcase, Inc. | | | 3,026 | | | | 45,995 | |
Sterling Construction Co., Inc. (1) | | | 84 | | | | 1,368 | |
| Terex Corp. | | | 25 | | | | 1,206 | |
| Textron, Inc. | | | 754 | | | | 42,669 | |
| Timken Co./The | | | 1,204 | | | | 59,177 | |
Titan Machinery, Inc. (1) | | | 49 | | | | 1,037 | |
| Toro Co./The | | | 1,516 | | | | 98,889 | |
TPI Composites, Inc. (1) | | | 101 | | | | 2,066 | |
TriMas Corp. (1) | | | 33 | | | | 883 | |
| Triton International, Ltd./Bermuda | | | 92 | | | | 3,445 | |
TrueBlue, Inc. (1) | | | 1,865 | | | | 51,288 | |
| Union Pacific Corp. | | | 5,720 | | | | 767,052 | |
United Continental Holdings, Inc. (1) (4) | | | 3,597 | | | | 242,438 | |
| Universal Forest Products, Inc. | | | 1,245 | | | | 46,837 | |
| Universal Logistics Holdings, Inc. | | | 370 | | | | 8,788 | |
| Valmont Industries, Inc. | | | 70 | | | | 11,610 | |
Vectrus, Inc. (1) | | | 364 | | | | 11,229 | |
Veritiv Corp. (1) | | | 305 | | | | 8,815 | |
| Viad Corp. | | | 439 | | | | 24,321 | |
Vicor Corp. (1) | | | 225 | | | | 4,703 | |
| VSE Corp. | | | 18 | | | | 872 | |
| Wabash National Corp. | | | 469 | | | | 10,177 | |
WABCO Holdings, Inc. (1) | | | 883 | | | | 126,711 | |
| Watsco, Inc. | | | 1,736 | | | | 295,189 | |
| Werner Enterprises, Inc. | | | 1,015 | | | | 39,230 | |
WESCO International, Inc. (1) | | | 2,068 | | | | 140,934 | |
Willis Lease Finance Corp. (1) | | | 438 | | | | 10,937 | |
YRC Worldwide, Inc. (1) | | | 1,379 | | | | 19,830 | |
| | | | | | | | 18,110,527 | |
| | | | | | | | | |
| Information Technology — 19.4% | | | | | | | | |
Accenture PLC (4) | | | 6,221 | | | | 952,373 | |
Adobe Systems, Inc. (1) (4) | | | 4,031 | | | | 706,392 | |
| ADTRAN, Inc. | | | 1,387 | | | | 26,838 | |
Advanced Energy Industries, Inc. (1) | | | 373 | | | | 25,170 | |
ALJ Regional Holdings, Inc. (1) | | | 2,125 | | | | 6,694 | |
Alpha & Omega Semiconductor, Ltd. (1) | | | 1,000 | | | | 16,360 | |
Alphabet, Inc. - Class A (1) (4) | | | 340 | | | | 358,156 | |
Alphabet, Inc. - Class C (1) (4) | | | 1,397 | | | | 1,461,821 | |
Amber Road, Inc. (1) | | | 189 | | | | 1,387 | |
| Amdocs, Ltd. | | | 294 | | | | 19,251 | |
| American Software, Inc./GA | | | 1,306 | | | | 15,189 | |
Amkor Technology, Inc. (1) | | | 4,499 | | | | 45,215 | |
Anixter International, Inc. (1) | | | 515 | | | | 39,140 | |
ANSYS, Inc. (1) | | | 1,416 | | | | 208,987 | |
Apple, Inc. (4) | | | 16,572 | | | | 2,804,480 | |
Applied Materials, Inc. (4) | | | 17,277 | | | | 883,200 | |
Apptio, Inc. (1) | | | 132 | | | | 3,105 | |
Arista Networks, Inc. (1) | | | 113 | | | | 26,621 | |
ARRIS International PLC (1) (4) | | | 7,494 | | | | 192,521 | |
Arrow Electronics, Inc. (1) | | | 2,417 | | | | 194,351 | |
Aspen Technology, Inc. (1) | | | 3,810 | | | | 252,222 | |
AutoWeb, Inc. (1) | | | 339 | | | | 3,054 | |
Avid Technology, Inc. (1) | | | 873 | | | | 4,705 | |
| Avnet, Inc. | | | 550 | | | | 21,791 | |
| Bel Fuse, Inc. | | | 232 | | | | 5,841 | |
Benchmark Electronics, Inc. (1) | | | 1,478 | | | | 43,010 | |
| Black Box Corp. | | | 1,753 | | | | 6,223 | |
The accompanying notes are an integral part of these financial statements.
Page 62 | 2017 Annual Report | December 31, 2017 |
Schedule of Investments
December 31, 2017
| Spectrum Fund |
| Security Description | | Shares or
Principal
Amount ($) | | Fair
Value ($) |
| Common Stocks - Long — continued |
Black Knight, Inc. (1) (4) | | | 4,057 | | | | 179,117 | |
Blucora, Inc. (1) | | | 292 | | | | 6,453 | |
Booz Allen Hamilton Holding Corp. (4) | | | 2,524 | | | | 96,240 | |
Bottomline Technologies de, Inc. (1) | | | 721 | | | | 25,004 | |
| Broadridge Financial Solutions, Inc. | | | 611 | | | | 55,344 | |
| Brooks Automation, Inc. | | | 244 | | | | 5,819 | |
CA, Inc. (4) | | | 15,361 | | | | 511,214 | |
| Cabot Microelectronics Corp. | | | 94 | | | | 8,844 | |
CACI International, Inc. (1) | | | 585 | | | | 77,425 | |
Cadence Design Systems, Inc. (1) (4) | | | 11,224 | | | | 469,388 | |
CalAmp Corp. (1) | | | 470 | | | | 10,072 | |
Carbonite, Inc. (1) | | | 565 | | | | 14,182 | |
Cardtronics PLC (1) | | | 116 | | | | 2,148 | |
| CDK Global, Inc. | | | 80 | | | | 5,702 | |
| CDW Corp./DE | | | 210 | | | | 14,593 | |
ChannelAdvisor Corp. (1) | | | 154 | | | | 1,386 | |
Ciena Corp. (1) | | | 3,114 | | | | 65,176 | |
Cirrus Logic, Inc. (1) | | | 1,523 | | | | 78,983 | |
Cisco Systems, Inc. (4) | | | 24,397 | | | | 934,405 | |
Citrix Systems, Inc. (1) (4) | | | 861 | | | | 75,768 | |
| Cognex Corp. | | | 744 | | | | 45,503 | |
| Cognizant Technology Solutions Corp. | | | 5,715 | | | | 405,879 | |
| Cohu, Inc. | | | 189 | | | | 4,149 | |
CommerceHub, Inc. (1) | | | 648 | | | | 13,342 | |
CommVault Systems, Inc. (1) | | | 436 | | | | 22,890 | |
| Comtech Telecommunications Corp. | | | 319 | | | | 7,056 | |
| Convergys Corp. | | | 3,631 | | | | 85,329 | |
CoreLogic, Inc./United States (1) | | | 1,739 | | | | 80,359 | |
Corning, Inc. (4) | | | 20,811 | | | | 665,744 | |
| CPI Card Group, Inc. | | | 804 | | | | 2,951 | |
| CSG Systems International, Inc. | | | 710 | | | | 31,112 | |
| CSRA, Inc. | | | 546 | | | | 16,336 | |
| Daktronics, Inc. | | | 110 | | | | 1,004 | |
Dell Technologies, Inc. Class V (1) | | | 5,861 | | | | 476,382 | |
DHI Group, Inc. (1) | | | 2,917 | | | | 5,542 | |
Digi International, Inc. (1) | | | 407 | | | | 3,887 | |
Diodes, Inc. (1) | | | 658 | | | | 18,865 | |
| Dolby Laboratories, Inc. | | | 395 | | | | 24,490 | |
DSP Group, Inc. (1) | | | 261 | | | | 3,263 | |
| DST Systems, Inc. | | | 175 | | | | 10,862 | |
| DXC Technology Co. | | | 4,340 | | | | 411,866 | |
Eastman Kodak Co. (1) | | | 1,182 | | | | 3,664 | |
eBay, Inc. (1) (4) | | | 19,177 | | | | 723,740 | |
EchoStar Corp. (1) | | | 76 | | | | 4,552 | |
Electro Scientific Industries, Inc. (1) | | | 43 | | | | 921 | |
Electronic Arts, Inc. (1) (4) | | | 7,076 | | | | 743,405 | |
Electronics For Imaging, Inc. (1) | | | 306 | | | | 9,036 | |
EMCORE Corp. (1) | | | 772 | | | | 4,979 | |
Endurance International Group Holdings, Inc. (1) | | | 2,363 | | | | 19,849 | |
| Entegris, Inc. | | | 540 | | | | 16,443 | |
ePlus, Inc. (1) | | | 61 | | | | 4,587 | |
Etsy, Inc. (1) | | | 167 | | | | 3,415 | |
Everi Holdings, Inc. (1) | | | 980 | | | | 7,389 | |
| EVERTEC, Inc. | | | 1,803 | | | | 24,611 | |
ExlService Holdings, Inc. (1) | | | 913 | | | | 55,100 | |
Extreme Networks, Inc. (1) | | | 70 | | | | 876 | |
F5 Networks, Inc. (1) | | | 2,264 | | | | 297,082 | |
Facebook, Inc. (1) (4) | | | 8,327 | | | | 1,469,382 | |
| Fair Isaac Corp. | | | 449 | | | | 68,787 | |
First Solar, Inc. (1) | | | 209 | | | | 14,112 | |
Five9, Inc. (1) | | | 748 | | | | 18,610 | |
| FLIR Systems, Inc. | | | 431 | | | | 20,093 | |
FormFactor, Inc. (1) | | | 788 | | | | 12,332 | |
Fortinet, Inc. (1) | | | 624 | | | | 27,263 | |
| Hackett Group, Inc./The | | | 1,694 | | | | 26,613 | |
HP, Inc. (4) | | | 38,826 | | | | 815,734 | |
IAC/InterActiveCorp (1) | | | 996 | | | | 121,791 | |
Insight Enterprises, Inc. (1) | | | 353 | | | | 13,516 | |
Instructure, Inc. (1) | | | 584 | | | | 19,330 | |
Intel Corp. (4) | | | 16,017 | | | | 739,345 | |
| InterDigital, Inc./PA | | | 126 | | | | 9,595 | |
International Business Machines Corp. (4) | | | 2,702 | | | | 414,541 | |
Intevac, Inc. (1) | | | 307 | | | | 2,103 | |
Intuit, Inc. (4) | | | 5,085 | | | | 802,311 | |
IPG Photonics Corp. (1) | | | 214 | | | | 45,824 | |
Itron, Inc. (1) | | | 245 | | | | 16,709 | |
Jabil, Inc. (4) | | | 4,914 | | | | 128,993 | |
| Juniper Networks, Inc. | | | 6,555 | | | | 186,818 | |
Kimball Electronics, Inc. (1) | | | 962 | | | | 17,557 | |
KLA-Tencor Corp. (4) | | | 1,180 | | | | 123,983 | |
KVH Industries, Inc. (1) | | | 84 | | | | 869 | |
| Lam Research Corp. | | | 969 | | | | 178,364 | |
| Leidos Holdings, Inc. | | | 583 | | | | 37,644 | |
Limelight Networks, Inc. (1) | | | 192 | | | | 847 | |
LivePerson, Inc. (1) | | | 674 | | | | 7,751 | |
Majesco (1) | | | 182 | | | | 977 | |
Manhattan Associates, Inc. (1) | | | 245 | | | | 12,137 | |
| ManTech International Corp./VA | | | 222 | | | | 11,142 | |
| Marvell Technology Group, Ltd. | | | 1,568 | | | | 33,665 | |
Mastercard, Inc. (4) | | | 3,441 | | | | 520,830 | |
Maxim Integrated Products, Inc. (4) | | | 1,017 | | | | 53,169 | |
| MAXIMUS, Inc. | | | 315 | | | | 22,548 | |
| Methode Electronics, Inc. | | | 1,163 | | | | 46,636 | |
The accompanying notes are an integral part of these financial statements.
2017 Annual Report | December 31, 2017 | Page 63 |
Schedule of Investments
December 31, 2017
| Spectrum Fund |
| Security Description | | Shares or
Principal
Amount ($) | | Fair
Value ($) |
| Common Stocks - Long — continued |
Micron Technology, Inc. (1) (4) | | | 7,654 | | | | 314,732 | |
Microsoft Corp. (4) | | | 24,742 | | | | 2,116,431 | |
Mitek Systems, Inc. (1) | | | 329 | | | | 2,945 | |
| MKS Instruments, Inc. | | | 432 | | | | 40,824 | |
MoneyGram International, Inc. (1) | | | 83 | | | | 1,094 | |
| Motorola Solutions, Inc. | | | 2,171 | | | | 196,128 | |
Nanometrics, Inc. (1) | | | 375 | | | | 9,345 | |
NCR Corp. (1) | | | 1,978 | | | | 67,232 | |
NetApp, Inc. (4) | | | 1,746 | | | | 96,589 | |
NETGEAR, Inc. (1) | | | 749 | | | | 44,004 | |
NetScout Systems, Inc. (1) | | | 273 | | | | 8,313 | |
| NIC, Inc. | | | 129 | | | | 2,141 | |
Nuance Communications, Inc. (1) | | | 601 | | | | 9,826 | |
| NVE Corp. | | | 58 | | | | 4,988 | |
NVIDIA Corp. (4) | | | 2,247 | | | | 434,795 | |
Oclaro, Inc. (1) | | | 825 | | | | 5,561 | |
Ominto, Inc. (1) | | | 232 | | | | 786 | |
ON Semiconductor Corp. (1) | | | 4,722 | | | | 98,879 | |
Oracle Corp. (4) | | | 11,872 | | | | 561,308 | |
OSI Systems, Inc. (1) | | | 479 | | | | 30,838 | |
PayPal Holdings, Inc. (1) | | | 1,244 | | | | 91,583 | |
| PC Connection, Inc. | | | 493 | | | | 12,922 | |
PCM, Inc. (1) | | | 181 | | | | 1,792 | |
Perficient, Inc. (1) | | | 3,252 | | | | 62,016 | |
PFSweb, Inc. (1) | | | 1,866 | | | | 13,864 | |
Photronics, Inc. (1) | | | 696 | | | | 5,933 | |
| Plantronics, Inc. | | | 522 | | | | 26,298 | |
Plexus Corp. (1) | | | 762 | | | | 46,269 | |
| Progress Software Corp. | | | 2,240 | | | | 95,357 | |
Pure Storage, Inc. (1) | | | 511 | | | | 8,104 | |
| QAD, Inc. | | | 423 | | | | 16,434 | |
Qualys, Inc. (1) | | | 95 | | | | 5,638 | |
Quantum Corp. (1) | | | 1,200 | | | | 6,756 | |
Radisys Corp. (1) | | | 1,602 | | | | 1,610 | |
RealPage, Inc. (1) | | | 468 | | | | 20,732 | |
Red Hat, Inc. (1) | | | 5,599 | | | | 672,440 | |
Ribbon Communications, Inc. (1) | | | 673 | | | | 5,202 | |
RingCentral, Inc. (1) | | | 647 | | | | 31,315 | |
Rosetta Stone, Inc. (1) | | | 2,064 | | | | 25,738 | |
Rubicon Project, Inc./The (1) | | | 557 | | | | 1,042 | |
Rudolph Technologies, Inc. (1) | | | 1,193 | | | | 28,513 | |
Sanmina Corp. (1) | | | 2,375 | | | | 78,375 | |
ScanSource, Inc. (1) | | | 798 | | | | 28,568 | |
Semtech Corp. (1) | | | 662 | | | | 22,640 | |
| Skyworks Solutions, Inc. | | | 2,901 | | | | 275,450 | |
SPS Commerce, Inc. (1) | | | 50 | | | | 2,430 | |
Stamps.com, Inc. (1) | | | 43 | | | | 8,084 | |
StarTek, Inc. (1) | | | 219 | | | | 2,183 | |
Sykes Enterprises, Inc. (1) | | | 2,186 | | | | 68,750 | |
Synaptics, Inc. (1) | | | 297 | | | | 11,862 | |
Synchronoss Technologies, Inc. (1) | | | 917 | | | | 8,198 | |
Synopsys, Inc. (1) (4) | | | 8,455 | | | | 720,704 | |
Syntel, Inc. (1) | | | 1,590 | | | | 36,554 | |
Take-Two Interactive Software, Inc. (1) | | | 748 | | | | 82,115 | |
Tech Data Corp. (1) | | | 769 | | | | 75,339 | |
TechTarget, Inc. (1) | | | 172 | | | | 2,394 | |
| TeleTech Holdings, Inc. | | | 653 | | | | 26,283 | |
| Teradyne, Inc. | | | 1,879 | | | | 78,674 | |
Texas Instruments, Inc. (4) | | | 9,468 | | | | 988,838 | |
| TiVo Corp. | | | 1,857 | | | | 28,969 | |
| Travelport Worldwide, Ltd. | | | 11,051 | | | | 144,437 | |
Unisys Corp. (1) | | | 2,075 | | | | 16,911 | |
USA Technologies, Inc. (1) | | | 119 | | | | 1,160 | |
Varonis Systems, Inc. (1) | | | 199 | | | | 9,661 | |
Verint Systems, Inc. (1) | | | 681 | | | | 28,500 | |
| Versum Materials, Inc. | | | 475 | | | | 17,979 | |
Vishay Precision Group, Inc. (1) | | | 252 | | | | 6,338 | |
Web.com Group, Inc. (1) | | | 1,286 | | | | 28,035 | |
| Western Digital Corp. | | | 3,680 | | | | 292,670 | |
Xcerra Corp. (1) | | | 167 | | | | 1,635 | |
| Xerox Corp. | | | 4,832 | | | | 140,853 | |
| Xilinx, Inc. | | | 930 | | | | 62,701 | |
XO Group, Inc. (1) | | | 1,513 | | | | 27,930 | |
Yelp, Inc. (1) | | | 329 | | | | 13,805 | |
Zix Corp. (1) | | | 2,030 | | | | 8,891 | |
Zynga, Inc. (1) | | | 5,312 | | | | 21,248 | |
| | | | | | | | 29,855,222 | |
| | | | | | | | | |
| Materials — 3.0% | | | | | | | | |
| A. Schulman, Inc. | | | 533 | | | | 19,854 | |
| Advanced Emissions Solutions, Inc. | | | 99 | | | | 956 | |
AdvanSix, Inc. (1) | | | 155 | | | | 6,521 | |
| Alcoa Corp. | | | 1,393 | | | | 75,041 | |
| Ardagh Group SA | | | 129 | | | | 2,722 | |
| Avery Dennison Corp. | | | 2,324 | | | | 266,935 | |
Berry Global Group, Inc. (1) | | | 1,376 | | | | 80,730 | |
| Boise Cascade Co. | | | 374 | | | | 14,923 | |
| Cabot Corp. | | | 2,004 | | | | 123,426 | |
| Celanese Corp. | | | 863 | | | | 92,410 | |
| Chemours Co./The | | | 264 | | | | 13,216 | |
| Core Molding Technologies, Inc. | | | 168 | | | | 3,646 | |
Crown Holdings, Inc. (1) | | | 9,543 | | | | 536,794 | |
| Domtar Corp. | | | 1,420 | | | | 70,318 | |
| Eastman Chemical Co. | | | 4,154 | | | | 384,827 | |
The accompanying notes are an integral part of these financial statements.
Page 64 | 2017 Annual Report | December 31, 2017 |
Schedule of Investments
December 31, 2017
| Spectrum Fund |
| Security Description | | Shares or
Principal
Amount ($) | | Fair
Value ($) |
| Common Stocks - Long — continued |
Ferro Corp. (1) | | | 373 | | | | 8,799 | |
Freeport-McMoRan, Inc. (1) | | | 10,173 | | | | 192,880 | |
| Graphic Packaging Holding Co. | | | 1,699 | | | | 26,250 | |
| Hawkins, Inc. | | | 261 | | | | 9,187 | |
| Huntsman Corp. | | | 3,434 | | | | 114,318 | |
Ingevity Corp. (1) | | | 408 | | | | 28,752 | |
| Innophos Holdings, Inc. | | | 1,447 | | | | 67,618 | |
| Innospec, Inc. | | | 251 | | | | 17,721 | |
| Kaiser Aluminum Corp. | | | 326 | | | | 34,833 | |
Koppers Holdings, Inc. (1) | | | 434 | | | | 22,091 | |
Kraton Corp. (1) | | | 440 | | | | 21,195 | |
Louisiana-Pacific Corp. (1) | | | 2,921 | | | | 76,705 | |
LyondellBasell Industries NV (4) | | | 7,646 | | | | 843,507 | |
| Materion Corp. | | | 46 | | | | 2,236 | |
| Myers Industries, Inc. | | | 452 | | | | 8,814 | |
Neenah, Inc. (1) | | | 648 | | | | 58,741 | |
| Newmont Mining Corp. | | | 3,388 | | | | 127,118 | |
Nucor Corp. (4) | | | 4,963 | | | | 315,548 | |
| Olin Corp. | | | 1,074 | | | | 38,213 | |
OMNOVA Solutions, Inc. (1) | | | 1,514 | | | | 15,140 | |
Owens-Illinois, Inc. (1) | | | 1,609 | | | | 35,672 | |
| Packaging Corp of America | | | 1,636 | | | | 197,220 | |
| PolyOne Corp. | | | 690 | | | | 30,015 | |
| Rayonier Advanced Materials, Inc. | | | 44 | | | | 900 | |
Reliance Steel & Aluminum Co. (4) | | | 1,250 | | | | 107,238 | |
Ryerson Holding Corp. (1) | | | 511 | | | | 5,314 | |
| Schnitzer Steel Industries, Inc. | | | 538 | | | | 18,023 | |
| Schweitzer-Mauduit International, Inc. | | | 131 | | | | 5,942 | |
| Southern Copper Corp. | | | 3,060 | | | | 145,197 | |
Steel Dynamics, Inc. (4) | | | 3,533 | | | | 152,378 | |
| Stepan Co. | | | 827 | | | | 65,308 | |
SunCoke Energy, Inc. (1) | | | 327 | | | | 3,921 | |
| Tredegar Corp. | | | 856 | | | | 16,435 | |
| Trinseo SA | | | 870 | | | | 63,162 | |
UFP Technologies, Inc. (1) | | | 548 | | | | 15,234 | |
| United States Lime & Minerals, Inc. | | | 243 | | | | 18,735 | |
| Valhi, Inc. | | | 1,058 | | | | 6,528 | |
Verso Corp. (1) | | | 186 | | | | 3,268 | |
| Worthington Industries, Inc. | | | 266 | | | | 11,720 | |
| | | | | | | | 4,624,195 | |
| | | | | | | | | |
| Real Estate Investment Trust — 3.9% | | | | | | | | |
Altisource Portfolio Solutions SA (1) | | | 322 | | | | 9,016 | |
| Altisource Residential Corp. | | | 2,314 | | | | 27,444 | |
| American Homes 4 Rent | | | 2,468 | | | | 53,901 | |
| American Tower Corp. | | | 1,780 | | | | 253,953 | |
| Apple Hospitality REIT, Inc. | | | 7,672 | | | | 150,448 | |
| Armada Hoffler Properties, Inc. | | | 855 | | | | 13,278 | |
| Bluerock Residential Growth REIT, Inc. | | | 624 | | | | 6,309 | |
| Brandywine Realty Trust | | | 478 | | | | 8,695 | |
| Brixmor Property Group, Inc. | | | 8,002 | | | | 149,317 | |
| CareTrust REIT, Inc. | | | 136 | | | | 2,279 | |
| CatchMark Timber Trust, Inc. | | | 128 | | | | 1,681 | |
CBL & Associates Properties, Inc. (2) | | | 2,583 | | | | 14,620 | |
| Cedar Realty Trust, Inc. | | | 6,824 | | | | 41,490 | |
| Chatham Lodging Trust | | | 45 | | | | 1,024 | |
| Clipper Realty, Inc. | | | 1,050 | | | | 10,490 | |
| Corporate Office Properties Trust | | | 1,556 | | | | 45,435 | |
| CubeSmart | | | 3,507 | | | | 101,422 | |
| DCT Industrial Trust, Inc. | | | 563 | | | | 33,093 | |
| DDR Corp. | | | 5,663 | | | | 50,740 | |
| Duke Realty Corp. | | | 2,603 | | | | 70,828 | |
| Easterly Government Properties, Inc. | | | 1,302 | | | | 27,785 | |
| Essex Property Trust, Inc. | | | 1,354 | | | | 326,815 | |
| Extra Space Storage, Inc. | | | 933 | | | | 81,591 | |
| Farmland Partners, Inc. | | | 928 | | | | 8,055 | |
| First Industrial Realty Trust, Inc. | | | 261 | | | | 8,214 | |
| Forest City Realty Trust, Inc. | | | 932 | | | | 22,461 | |
Gaming and Leisure Properties, Inc. (4) | | | 5,790 | | | | 214,230 | |
| Global Medical REIT, Inc. | | | 105 | | | | 861 | |
| Global Net Lease, Inc. | | | 3,328 | | | | 68,490 | |
| Hospitality Properties Trust | | | 5,368 | | | | 160,235 | |
| Host Hotels & Resorts, Inc. | | | 9,465 | | | | 187,880 | |
| Investors Real Estate Trust | | | 6,226 | | | | 35,364 | |
| Invitation Homes, Inc. | | | 5,864 | | | | 138,214 | |
| Kennedy-Wilson Holdings, Inc. | | | 593 | | | | 10,289 | |
| Kilroy Realty Corp. | | | 162 | | | | 12,093 | |
| Kite Realty Group Trust | | | 3,959 | | | | 77,596 | |
| Lamar Advertising Co. | | | 974 | | | | 72,310 | |
Lexington Realty Trust (4) | | | 14,163 | | | | 136,673 | |
Liberty Property Trust (4) | | | 6,082 | | | | 261,587 | |
| Macerich Co./The | | | 1,160 | | | | 76,189 | |
| Monmouth Real Estate Investment Corp. | | | 1,880 | | | | 33,464 | |
National Health Investors, Inc. (4) | | | 722 | | | | 54,424 | |
| National Storage Affiliates Trust | | | 136 | | | | 3,707 | |
| New Senior Investment Group, Inc. | | | 7,548 | | | | 57,063 | |
| NorthStar Realty Europe Corp. | | | 508 | | | | 6,822 | |
| One Liberty Properties, Inc. | | | 426 | | | | 11,042 | |
| Outfront Media, Inc. | | | 1,879 | | | | 43,593 | |
| Pennsylvania Real Estate Investment Trust | | | 1,495 | | | | 17,776 | |
| Piedmont Office Realty Trust, Inc. | | | 1,721 | | | | 33,749 | |
Prologis, Inc. (4) | | | 10,693 | | | | 689,805 | |
| RAIT Financial Trust | | | 7,789 | | | | 2,921 | |
| Ramco-Gershenson Properties Trust | | | 1,228 | | | | 18,088 | |
The accompanying notes are an integral part of these financial statements.
2017 Annual Report | December 31, 2017 | Page 65 |
Schedule of Investments
December 31, 2017
| Spectrum Fund |
| Security Description | | Shares or
Principal
Amount ($) | | Fair
Value ($) |
| Common Stocks - Long — continued |
| Retail Properties of America, Inc. | | | 8,877 | | | | 119,307 | |
| Saul Centers, Inc. | | | 111 | | | | 6,854 | |
SBA Communications Corp. (1) | | | 1,756 | | | | 286,860 | |
| Seritage Growth Properties | | | 847 | | | | 34,270 | |
Simon Property Group, Inc. (4) | | | 4,542 | | | | 780,043 | |
| Spirit Realty Capital, Inc. | | | 13,706 | | | | 117,597 | |
St Joe Co./The (1) | | | 114 | | | | 2,058 | |
| STORE Capital Corp. | | | 507 | | | | 13,202 | |
| Summit Hotel Properties, Inc. | | | 496 | | | | 7,554 | |
| Tanger Factory Outlet Centers, Inc. | | | 121 | | | | 3,208 | |
| Taubman Centers, Inc. | | | 518 | | | | 33,893 | |
Tejon Ranch Co. (1) | | | 414 | | | | 8,595 | |
| Tier REIT, Inc. | | | 943 | | | | 19,228 | |
Trinity Place Holdings, Inc. (1) | | | 1,990 | | | | 13,831 | |
| Uniti Group, Inc. | | | 1,826 | | | | 32,485 | |
| VEREIT, Inc. | | | 30,228 | | | | 235,476 | |
| Vornado Realty Trust | | | 5,015 | | | | 392,073 | |
| Washington Prime Group, Inc. | | | 3,787 | | | | 26,963 | |
| Whitestone REIT | | | 274 | | | | 3,948 | |
| | | | | | | | 6,082,294 | |
| | | | | | | | | |
| Telecommunication Services — 1.1% | | | | | | | | |
AT&T, Inc. (4) | | | 13,445 | | | | 522,742 | |
| ATN International, Inc. | | | 169 | | | | 9,339 | |
| CenturyLink, Inc. | | | 960 | | | | 16,013 | |
Cincinnati Bell, Inc. (1) | | | 396 | | | | 8,257 | |
| Cogent Communications Holdings, Inc. | | | 176 | | | | 7,973 | |
| Consolidated Communications Holdings, Inc. | | | 318 | | | | 3,876 | |
| Frontier Communications Corp. | | | 1,089 | | | | 7,362 | |
General Communication, Inc. (1) | | | 83 | | | | 3,239 | |
Hawaiian Telcom Holdco, Inc. (1) | | | 675 | | | | 20,831 | |
| IDT Corp. | | | 372 | | | | 3,943 | |
Intelsat SA (1) | | | 923 | | | | 3,129 | |
NII Holdings, Inc. (1) | | | 5,052 | | | | 2,144 | |
Ooma, Inc. (1) | | | 552 | | | | 6,596 | |
ORBCOMM, Inc. (1) | | | 87 | | | | 886 | |
Telephone & Data Systems, Inc. (4) | | | 1,223 | | | | 33,999 | |
T-Mobile US, Inc. (1) (4) | | | 6,227 | | | | 395,477 | |
Verizon Communications, Inc. (4) | | | 13,123 | | | | 694,600 | |
Vonage Holdings Corp. (1) | | | 2,291 | | | | 23,299 | |
| Windstream Holdings, Inc. | | | 1,457 | | | | 2,695 | |
| | | | | | | | 1,766,400 | |
| Utilities — 4.1% | | | | | | | | |
AES Corp./VA (4) | | | 13,585 | | | | 147,126 | |
| ALLETE, Inc. | | | 732 | | | | 54,432 | |
| American States Water Co. | | | 2,144 | | | | 124,159 | |
| American Water Works Co., Inc. | | | 7,095 | | | | 649,122 | |
| Artesian Resources Corp. | | | 498 | | | | 19,203 | |
Atlantic Power Corp. (1) | | | 6,062 | | | | 14,246 | |
Calpine Corp. (1) | | | 1,132 | | | | 17,127 | |
CenterPoint Energy, Inc. (4) | | | 23,060 | | | | 653,982 | |
| Consolidated Water Co., Ltd. | | | 572 | | | | 7,207 | |
Dynegy, Inc. (1) | | | 1,193 | | | | 14,137 | |
| El Paso Electric Co. | | | 2,560 | | | | 141,696 | |
Exelon Corp. (4) | | | 19,419 | | | | 765,303 | |
| MDU Resources Group, Inc. | | | 7,660 | | | | 205,901 | |
| National Fuel Gas Co. | | | 2,714 | | | | 149,026 | |
| New Jersey Resources Corp. | | | 4,172 | | | | 167,714 | |
| NorthWestern Corp. | | | 3,393 | | | | 202,562 | |
| NRG Energy, Inc. | | | 3,818 | | | | 108,737 | |
| NRG Yield, Inc. | | | 6,760 | | | | 127,426 | |
| ONE Gas, Inc. | | | 395 | | | | 28,938 | |
| Ormat Technologies, Inc. | | | 541 | | | | 34,602 | |
| Otter Tail Corp. | | | 390 | | | | 17,336 | |
| PNM Resources, Inc. | | | 4,846 | | | | 196,021 | |
| Portland General Electric Co. | | | 5,374 | | | | 244,947 | |
| SCANA Corp. | | | 1,187 | | | | 47,219 | |
| SJW Group | | | 725 | | | | 46,277 | |
Southwest Gas Holdings, Inc. (4) | | | 1,342 | | | | 108,004 | |
UGI Corp. (4) | | | 14,540 | | | | 682,653 | |
| Unitil Corp. | | | 657 | | | | 29,972 | |
Vectren Corp. (4) | | | 10,341 | | | | 672,372 | |
Vistra Energy Corp. (1) | | | 7,760 | | | | 142,163 | |
| Xcel Energy, Inc. | | | 11,638 | | | | 559,863 | |
| | | | | | | | 6,379,473 | |
| | | | | | | | | |
| Total Common Stocks - Long (Cost $129,807,367) | | | | | | | 148,295,888 | |
| | | | | | | | | |
| Money Market Registered Investment Companies — 3.8% |
Morgan Stanley Government Institutional Fund, 1.20% (3) | | | 17,071 | | | | 17,071 | |
Meeder Institutional Prime Money Market Fund, 1.32% (5) | | | 5,835,492 | | | | 5,834,908 | |
| Total Money Market Registered Investment Companies (Cost $5,852,483) | | | | | | | 5,851,979 | |
| | | | | | | | | |
| Bank Obligations — 0.6% | | | | | | | | |
Bank Midwest Deposit Account, 1.00%, 1/2/2018 (6) | | | 248,989 | | | | 248,989 | |
Metro City Bank Deposit Account, 1.00%, 1/2/2018 (6) | | | 248,000 | | | | 248,000 | |
The accompanying notes are an integral part of these financial statements.
Page 66 | 2017 Annual Report | December 31, 2017 |
Schedule of Investments
December 31, 2017
| Spectrum Fund |
| Security Description | | Shares or
Principal
Amount ($) | | Fair
Value ($) |
| Bank Obligations — continued | | | | | | | | |
Pacific Premier Bank Deposit Account, 1.05%, 1/2/2018 (6) | | | 249,198 | | | | 249,198 | |
Seacoast Community Bank Deposit Account, 1.00%, 1/2/2018 (6) | | | 249,000 | | | | 249,000 | |
| Total Bank Obligations (Cost $995,187) | | | | | | | 995,187 | |
| Total Investments - Long — 100.2% (Cost $136,655,037) | | | | | | | 155,143,054 | |
| Total Securities Sold Short — (40.1%) (Proceeds Received $59,362,567) | | | | | | | (62,041,798 | ) |
| Other Assets less Liabilities — 39.9% | | | | | | | 61,773,001 | |
| Total Net Assets — 100.0% | | | | | | | 154,874,257 | |
| | | | | | | | | |
| Common Stocks - Short — (40.1%) |
| Consumer Discretionary — (3.2%) | | | | | | | | |
| Acushnet Holdings Corp. | | | (986 | ) | | | (20,785 | ) |
| Advance Auto Parts, Inc. | | | (431 | ) | | | (42,966 | ) |
| AMC Entertainment Holdings, Inc. | | | (303 | ) | | | (4,575 | ) |
America's Car-Mart, Inc./TX (1) | | | (163 | ) | | | (7,278 | ) |
At Home Group, Inc. (1) | | | (287 | ) | | | (8,722 | ) |
AV Homes, Inc. (1) | | | (903 | ) | | | (15,035 | ) |
| Beasley Broadcast Group, Inc. | | | (602 | ) | | | (8,067 | ) |
Belmond, Ltd. (1) | | | (3,442 | ) | | | (42,165 | ) |
Biglari Holdings, Inc. (1) | | | (20 | ) | | | (8,288 | ) |
Boot Barn Holdings, Inc. (1) | | | (220 | ) | | | (3,654 | ) |
| Callaway Golf Co. | | | (820 | ) | | | (11,423 | ) |
CarMax, Inc. (1) | | | (568 | ) | | | (36,426 | ) |
| Carriage Services, Inc. | | | (702 | ) | | | (18,048 | ) |
Carvana Co. (1) | | | (58 | ) | | | (1,109 | ) |
Century Communities, Inc. (1) | | | (986 | ) | | | (30,665 | ) |
Chegg, Inc. (1) | | | (2,942 | ) | | | (48,013 | ) |
Chipotle Mexican Grill, Inc. (1) | | | (123 | ) | | | (35,551 | ) |
Chuy's Holdings, Inc. (1) | | | (31 | ) | | | (870 | ) |
Clarus Corp. (1) | | | (1,787 | ) | | | (14,028 | ) |
Conn's, Inc. (1) | | | (145 | ) | | | (5,155 | ) |
| Cooper Tire & Rubber Co. | | | (681 | ) | | | (24,073 | ) |
| Core-Mark Holding Co., Inc. | | | (709 | ) | | | (22,390 | ) |
Daily Journal Corp. (1) | | | (73 | ) | | | (16,806 | ) |
Delphi Technologies PLC (1) | | | (667 | ) | | | (34,997 | ) |
| DineEquity, Inc. | | | (232 | ) | | | (11,769 | ) |
Discovery Communications, Inc. (1) | | | (6,649 | ) | | | (148,805 | ) |
DISH Network Corp. (1) | | | (3,815 | ) | | | (182,166 | ) |
Dorman Products, Inc. (1) | | | (57 | ) | | | (3,485 | ) |
Eldorado Resorts, Inc. (1) | | | (727 | ) | | | (24,100 | ) |
| Emerald Expositions Events, Inc. | | | (1,881 | ) | | | (38,260 | ) |
Empire Resorts, Inc. (1) | | | (299 | ) | | | (8,073 | ) |
EW Scripps Co./The (1) | | | (763 | ) | | | (11,926 | ) |
Floor & Decor Holdings, Inc. (1) | | | (809 | ) | | | (39,382 | ) |
Gaia, Inc. (1) | | | (440 | ) | | | (5,456 | ) |
G-III Apparel Group, Ltd. (1) | | | (815 | ) | | | (30,065 | ) |
Green Brick Partners, Inc. (1) | | | (685 | ) | | | (7,741 | ) |
| Guess?, Inc. | | | (52 | ) | | | (878 | ) |
| Hanesbrands, Inc. | | | (1,729 | ) | | | (36,153 | ) |
| Harley-Davidson, Inc. | | | (2,184 | ) | | | (111,122 | ) |
| Hilton Worldwide Holdings, Inc. | | | (9,198 | ) | | | (734,552 | ) |
Horizon Global Corp. (1) | | | (280 | ) | | | (3,926 | ) |
Houghton Mifflin Harcourt Co. (1) | | | (804 | ) | | | (7,477 | ) |
IMAX Corp. (1) | | | (286 | ) | | | (6,621 | ) |
iRobot Corp. (1) | | | (61 | ) | | | (4,679 | ) |
Laureate Education, Inc. (1) | | | (971 | ) | | | (13,167 | ) |
| Lennar Corp. | | | (2,984 | ) | | | (188,708 | ) |
LGI Homes, Inc. (1) | | | (553 | ) | | | (41,492 | ) |
Liberty Broadband Corp. (1) | | | (2,440 | ) | | | (207,790 | ) |
Liberty Media Corp-Liberty Braves - Class A (1) | | | (1,180 | ) | | | (26,019 | ) |
Liberty Media Corp-Liberty Braves - Class C (1) | | | (1,970 | ) | | | (43,773 | ) |
Liberty Media Corp-Liberty Formula One - Class A (1) | | | (5,247 | ) | | | (171,682 | ) |
Liberty Media Corp-Liberty Formula One - Class C (1) | | | (501 | ) | | | (17,114 | ) |
Liberty Ventures (1) | | | (1,772 | ) | | | (96,113 | ) |
Lindblad Expeditions Holdings, Inc. (1) | | | (1,520 | ) | | | (14,881 | ) |
| Lithia Motors, Inc. | | | (99 | ) | | | (11,245 | ) |
Lumber Liquidators Holdings, Inc. (1) | | | (562 | ) | | | (17,641 | ) |
Malibu Boats, Inc. (1) | | | (417 | ) | | | (12,397 | ) |
| Marriott Vacations Worldwide Corp. | | | (93 | ) | | | (12,575 | ) |
| Mattel, Inc. | | | (2,975 | ) | | | (45,756 | ) |
| MGM Resorts International | | | (5,715 | ) | | | (190,824 | ) |
| Monro, Inc. | | | (591 | ) | | | (33,657 | ) |
Motorcar Parts of America, Inc. (1) | | | (321 | ) | | | (8,022 | ) |
Netflix, Inc. (1) | | | (1,636 | ) | | | (314,047 | ) |
| Newell Brands, Inc. | | | (2,671 | ) | | | (82,534 | ) |
| Nexstar Media Group, Inc. | | | (257 | ) | | | (20,097 | ) |
Party City Holdco, Inc. (1) | | | (1,003 | ) | | | (13,992 | ) |
| Penske Automotive Group, Inc. | | | (353 | ) | | | (16,891 | ) |
| PICO Holdings, Inc. | | | (555 | ) | | | (7,104 | ) |
Planet Fitness, Inc. (1) | | | (1,434 | ) | | | (49,659 | ) |
| Polaris Industries, Inc. | | | (361 | ) | | | (44,760 | ) |
| Pool Corp. | | | (277 | ) | | | (35,913 | ) |
Red Lion Hotels Corp. (1) | | | (854 | ) | | | (8,412 | ) |
| Red Rock Resorts, Inc. | | | (874 | ) | | | (29,489 | ) |
Sequential Brands Group, Inc. (1) | | | (982 | ) | | | (1,748 | ) |
| Service Corp International/US | | | (3,431 | ) | | | (128,045 | ) |
Shake Shack, Inc. (1) | | | (1,287 | ) | | | (55,598 | ) |
The accompanying notes are an integral part of these financial statements.
2017 Annual Report | December 31, 2017 | Page 67 |
Schedule of Investments
December 31, 2017
| Spectrum Fund |
| Security Description | | Shares or
Principal
Amount ($) | | Fair
Value ($) |
| Common Stocks - Short — continued |
Sotheby's (1) | | | (864 | ) | | | (44,582 | ) |
Sportsman's Warehouse Holdings, Inc. (1) | | | (1,599 | ) | | | (10,569 | ) |
| Superior Industries International, Inc. | | | (1,510 | ) | | | (22,424 | ) |
| TEGNA, Inc. | | | (4,680 | ) | | | (65,894 | ) |
Tesla, Inc. (1) | | | (1,968 | ) | | | (612,737 | ) |
TRI Pointe Group, Inc. (1) | | | (366 | ) | | | (6,559 | ) |
| Tribune Media Co. | | | (2,112 | ) | | | (89,697 | ) |
| Twenty-First Century Fox, Inc. | | | (763 | ) | | | (26,034 | ) |
Under Armour, Inc. (1) | | | (4,280 | ) | | | (61,760 | ) |
Universal Electronics, Inc. (1) | | | (312 | ) | | | (14,742 | ) |
| Viacom, Inc. | | | (258 | ) | | | (9,004 | ) |
VOXX International Corp. (1) | | | (412 | ) | | | (2,307 | ) |
Wayfair, Inc. (1) | | | (574 | ) | | | (46,075 | ) |
| Wendy's Co./The | | | (2,165 | ) | | | (35,549 | ) |
| Wingstop, Inc. | | | (200 | ) | | | (7,796 | ) |
| Wolverine World Wide, Inc. | | | (756 | ) | | | (24,101 | ) |
| World Wrestling Entertainment, Inc. | | | (62 | ) | | | (1,896 | ) |
Zoe's Kitchen, Inc. (1) | | | (211 | ) | | | (3,528 | ) |
| | | | | | | | (4,924,124 | ) |
| �� | | | | | | | | |
| Consumer Staples — (2.5%) | | | | | | | | |
| Alico, Inc. | | | (356 | ) | | | (10,502 | ) |
| Altria Group, Inc. | | | (868 | ) | | | (61,984 | ) |
| Andersons, Inc./The | | | (944 | ) | | | (29,406 | ) |
| B&G Foods, Inc. | | | (901 | ) | | | (31,670 | ) |
| Calavo Growers, Inc. | | | (1,143 | ) | | | (96,469 | ) |
Cal-Maine Foods, Inc. (1) | | | (1,322 | ) | | | (58,763 | ) |
Castle Brands, Inc. (1) | | | (2,689 | ) | | | (3,281 | ) |
Chefs' Warehouse, Inc./The (1) | | | (85 | ) | | | (1,743 | ) |
| Church & Dwight Co., Inc. | | | (11,177 | ) | | | (560,750 | ) |
| Clorox Co./The | | | (1,518 | ) | | | (225,787 | ) |
| Coty, Inc. | | | (7,512 | ) | | | (149,414 | ) |
Craft Brew Alliance, Inc. (1) | | | (725 | ) | | | (13,920 | ) |
elf Beauty, Inc. (1) | | | (662 | ) | | | (14,769 | ) |
Farmer Brothers Co. (1) | | | (287 | ) | | | (9,227 | ) |
Freshpet, Inc. (1) | | | (1,516 | ) | | | (28,728 | ) |
Hain Celestial Group, Inc./The (1) | | | (670 | ) | | | (28,401 | ) |
Hostess Brands, Inc. (1) | | | (141 | ) | | | (2,088 | ) |
HRG Group, Inc. (1) | | | (323 | ) | | | (5,475 | ) |
| Kellogg Co. | | | (725 | ) | | | (49,286 | ) |
| Kraft Heinz Co./The | | | (8,360 | ) | | | (650,074 | ) |
Landec Corp. (1) | | | (680 | ) | | | (8,568 | ) |
Lifeway Foods, Inc. (1) | | | (221 | ) | | | (1,768 | ) |
| McCormick & Co., Inc./MD | | | (6,051 | ) | | | (616,657 | ) |
| MGP Ingredients, Inc. | | | (103 | ) | | | (7,919 | ) |
| Mondelez International, Inc. | | | (11,671 | ) | | | (499,519 | ) |
| Philip Morris International, Inc. | | | (592 | ) | | | (62,545 | ) |
| PriceSmart, Inc. | | | (1,059 | ) | | | (91,180 | ) |
Primo Water Corp. (1) | | | (892 | ) | | | (11,212 | ) |
Seneca Foods Corp. (1) | | | (96 | ) | | | (2,952 | ) |
Smart & Final Stores, Inc. (1) | | | (372 | ) | | | (3,181 | ) |
| Snyder's-Lance, Inc. | | | (1,827 | ) | | | (91,496 | ) |
| Spectrum Brands Holdings, Inc. | | | (225 | ) | | | (25,290 | ) |
| Tootsie Roll Industries, Inc. | | | (4,771 | ) | | | (173,664 | ) |
TreeHouse Foods, Inc. (1) | | | (319 | ) | | | (15,778 | ) |
| Turning Point Brands, Inc. | | | (472 | ) | | | (9,973 | ) |
| Universal Corp./VA | | | (385 | ) | | | (20,213 | ) |
| Vector Group, Ltd. | | | (2,633 | ) | | | (58,927 | ) |
| WD-40 Co. | | | (1,602 | ) | | | (189,036 | ) |
| | | | | | | | (3,921,615 | ) |
| | | | | | | | | |
| Energy — (0.9%) | | | | | | | | |
| Anadarko Petroleum Corp. | | | (2,579 | ) | | | (138,338 | ) |
Antero Resources Corp. (1) | | | (884 | ) | | | (16,796 | ) |
| Apache Corp. | | | (3,876 | ) | | | (163,645 | ) |
| Baker Hughes a GE Co. | | | (967 | ) | | | (30,596 | ) |
Callon Petroleum Co. (1) | | | (787 | ) | | | (9,562 | ) |
CARBO Ceramics, Inc. (1) | | | (106 | ) | | | (1,079 | ) |
Centennial Resource Development, Inc./DE (1) | | | (1,010 | ) | | | (19,998 | ) |
Chesapeake Energy Corp. (1) | | | (511 | ) | | | (2,024 | ) |
Clean Energy Fuels Corp. (1) | | | (1,151 | ) | | | (2,337 | ) |
Continental Resources, Inc./OK (1) | | | (2,759 | ) | | | (146,144 | ) |
| DHT Holdings, Inc. | | | (3,422 | ) | | | (12,285 | ) |
| Ensco PLC | | | (855 | ) | | | (5,053 | ) |
Extraction Oil & Gas, Inc. (1) | | | (474 | ) | | | (6,783 | ) |
| Frank's International NV | | | (1,753 | ) | | | (11,657 | ) |
Geospace Technologies Corp. (1) | | | (123 | ) | | | (1,595 | ) |
| Golar LNG, Ltd. | | | (1,478 | ) | | | (44,059 | ) |
| Gulf Island Fabrication, Inc. | | | (494 | ) | | | (6,632 | ) |
| Hess Corp. | | | (3,259 | ) | | | (154,705 | ) |
International Seaways, Inc. (1) | | | (305 | ) | | | (5,630 | ) |
Jones Energy, Inc. (1) | | | (1 | ) | | | (1 | ) |
| NACCO Industries, Inc. | | | (186 | ) | | | (7,003 | ) |
| National Oilwell Varco, Inc. | | | (683 | ) | | | (24,602 | ) |
| Noble Energy, Inc. | | | (11,313 | ) | | | (329,661 | ) |
Parsley Energy, Inc. (1) | | | (1,674 | ) | | | (49,283 | ) |
PDC Energy, Inc. (1) | | | (153 | ) | | | (7,886 | ) |
| Pioneer Natural Resources Co. | | | (183 | ) | | | (31,632 | ) |
| Range Resources Corp. | | | (547 | ) | | | (9,332 | ) |
SEACOR Holdings, Inc. (1) | | | (56 | ) | | | (2,588 | ) |
SEACOR Marine Holdings, Inc. (1) | | | (441 | ) | | | (5,160 | ) |
Select Energy Services, Inc. (1) | | | (1,616 | ) | | | (29,476 | ) |
| SemGroup Corp. | | | (300 | ) | | | (9,060 | ) |
The accompanying notes are an integral part of these financial statements.
Page 68 | 2017 Annual Report | December 31, 2017 |
Schedule of Investments
December 31, 2017
| Spectrum Fund |
| Security Description | | Shares or
Principal
Amount ($) | | Fair
Value ($) |
| Common Stocks - Short — continued |
| SM Energy Co. | | | (134 | ) | | | (2,959 | ) |
Tellurian, Inc. (1) | | | (809 | ) | | | (7,880 | ) |
Weatherford International PLC (1) | | | (3,388 | ) | | | (14,128 | ) |
WildHorse Resource Development Corp. (1) | | | (841 | ) | | | (15,483 | ) |
| | | | | | | | (1,325,052 | ) |
| | | | | | | | | |
| Financials — (12.7%) | | | | | | | | |
Alleghany Corp. (1) | | | (460 | ) | | | (274,201 | ) |
Allegiance Bancshares, Inc. (1) | | | (64 | ) | | | (2,410 | ) |
Ambac Financial Group, Inc. (1) | | | (1,839 | ) | | | (29,387 | ) |
| American International Group, Inc. | | | (10,949 | ) | | | (652,341 | ) |
| Ameris Bancorp | | | (2,231 | ) | | | (107,534 | ) |
| AmTrust Financial Services, Inc. | | | (1,894 | ) | | | (19,073 | ) |
Arch Capital Group, Ltd. (1) | | | (2,160 | ) | | | (196,063 | ) |
| Arlington Asset Investment Corp. | | | (1,833 | ) | | | (21,593 | ) |
| Arrow Financial Corp. | | | (26 | ) | | | (883 | ) |
| Associated Capital Group, Inc. | | | (1,363 | ) | | | (46,478 | ) |
| B. Riley Financial, Inc. | | | (442 | ) | | | (8,000 | ) |
| BancFirst Corp. | | | (689 | ) | | | (35,242 | ) |
| Bank of Hawaii Corp. | | | (7,515 | ) | | | (644,036 | ) |
| Bank of the Ozarks | | | (10,819 | ) | | | (524,181 | ) |
| BankUnited, Inc. | | | (1,095 | ) | | | (44,588 | ) |
| Bear State Financial, Inc. | | | (292 | ) | | | (2,987 | ) |
| BlackRock, Inc. | | | (1,413 | ) | | | (725,872 | ) |
| Blue Capital Reinsurance Holdings, Ltd. | | | (168 | ) | | | (2,024 | ) |
BofI Holding, Inc. (1) | | | (2,238 | ) | | | (66,916 | ) |
| Bridge Bancorp, Inc. | | | (1,770 | ) | | | (61,950 | ) |
Brighthouse Financial, Inc. (1) | | | (1,021 | ) | | | (59,871 | ) |
| Brookline Bancorp, Inc. | | | (473 | ) | | | (7,426 | ) |
| Capitol Federal Financial, Inc. | | | (204 | ) | | | (2,736 | ) |
Capstar Financial Holdings, Inc. (1) | | | (629 | ) | | | (13,064 | ) |
| Capstead Mortgage Corp. | | | (17,341 | ) | | | (150,000 | ) |
| Charles Schwab Corp./The | | | (13,402 | ) | | | (688,461 | ) |
| Chubb, Ltd. | | | (1,141 | ) | | | (166,734 | ) |
| Cincinnati Financial Corp. | | | (264 | ) | | | (19,792 | ) |
| CIT Group, Inc. | | | (4,910 | ) | | | (241,719 | ) |
Citizens, Inc./TX (1) | | | (447 | ) | | | (3,285 | ) |
| Clifton Bancorp, Inc. | | | (299 | ) | | | (5,113 | ) |
| Community Bank System, Inc. | | | (9,644 | ) | | | (518,365 | ) |
| ConnectOne Bancorp, Inc. | | | (1,301 | ) | | | (33,501 | ) |
Cowen, Inc. (1) | | | (600 | ) | | | (8,190 | ) |
Customers Bancorp, Inc. (1) | | | (913 | ) | | | (23,729 | ) |
| CVB Financial Corp. | | | (21,446 | ) | | | (505,268 | ) |
| CYS Investments, Inc. | | | (16,852 | ) | | | (135,322 | ) |
| Ellington Residential Mortgage REIT | | | (3,890 | ) | | | (46,836 | ) |
| Financial Engines, Inc. | | | (2,466 | ) | | | (74,720 | ) |
| First Financial Bankshares, Inc. | | | (13,649 | ) | | | (614,887 | ) |
| First Horizon National Corp. | | | (14,779 | ) | | | (295,432 | ) |
| First Republic Bank/CA | | | (6,503 | ) | | | (563,420 | ) |
Flagstar Bancorp, Inc. (1) | | | (1,368 | ) | | | (51,191 | ) |
| FNB Corp./PA | | | (7,756 | ) | | | (107,188 | ) |
Franklin Financial Network, Inc. (1) | | | (455 | ) | | | (15,516 | ) |
| Glacier Bancorp, Inc. | | | (2,697 | ) | | | (106,235 | ) |
Global Indemnity, Ltd. (1) | | | (774 | ) | | | (32,523 | ) |
| Goldman Sachs Group, Inc./The | | | (2,547 | ) | | | (648,874 | ) |
| Granite Point Mortgage Trust, Inc. | | | (2,334 | ) | | | (41,405 | ) |
| Greenhill & Co., Inc. | | | (338 | ) | | | (6,591 | ) |
| Guaranty Bancshares, Inc./TX | | | (767 | ) | | | (23,509 | ) |
| Hamilton Lane, Inc. | | | (589 | ) | | | (20,845 | ) |
| Hannon Armstrong Sustainable Infrastructure Capital, Inc. | | | (5,781 | ) | | | (139,091 | ) |
HarborOne Bancorp, Inc. (1) | | | (2,825 | ) | | | (54,127 | ) |
| Hilltop Holdings, Inc. | | | (555 | ) | | | (14,058 | ) |
| Home BancShares, Inc./AR | | | (8,494 | ) | | | (197,486 | ) |
| IBERIABANK Corp. | | | (6,098 | ) | | | (472,595 | ) |
Impac Mortgage Holdings, Inc. (1) | | | (440 | ) | | | (4,470 | ) |
| Independent Bank Group, Inc. | | | (246 | ) | | | (16,630 | ) |
| Investar Holding Corp. | | | (623 | ) | | | (15,014 | ) |
| Investors Bancorp, Inc. | | | (12,375 | ) | | | (171,765 | ) |
| Kearny Financial Corp./MD | | | (1,686 | ) | | | (24,363 | ) |
| KKR Real Estate Finance Trust, Inc. | | | (11,275 | ) | | | (225,613 | ) |
| LegacyTexas Financial Group, Inc. | | | (253 | ) | | | (10,679 | ) |
LendingClub Corp. (1) | | | (1,623 | ) | | | (6,703 | ) |
| Live Oak Bancshares, Inc. | | | (2,341 | ) | | | (55,833 | ) |
Markel Corp. (1) | | | (367 | ) | | | (418,061 | ) |
| MarketAxess Holdings, Inc. | | | (202 | ) | | | (40,754 | ) |
| MetLife, Inc. | | | (12,846 | ) | | | (649,494 | ) |
| MidSouth Bancorp, Inc. | | | (1,518 | ) | | | (20,114 | ) |
| NBT Bancorp, Inc. | | | (1,293 | ) | | | (47,582 | ) |
| New York Community Bancorp, Inc. | | | (27,938 | ) | | | (363,753 | ) |
| New York Mortgage Trust, Inc. | | | (24,445 | ) | | | (150,826 | ) |
NI Holdings, Inc. (1) | | | (4,772 | ) | | | (81,029 | ) |
| Northfield Bancorp, Inc. | | | (1,794 | ) | | | (30,642 | ) |
Ocwen Financial Corp. (1) | | | (941 | ) | | | (2,945 | ) |
| OFG Bancorp | | | (205 | ) | | | (1,927 | ) |
On Deck Capital, Inc. (1) | | | (1,567 | ) | | | (8,995 | ) |
| Orchid Island Capital, Inc. | | | (11,348 | ) | | | (105,309 | ) |
| Owens Realty Mortgage, Inc. | | | (275 | ) | | | (4,403 | ) |
PCSB Financial Corp. (1) | | | (5,301 | ) | | | (100,984 | ) |
| People's United Financial, Inc. | | | (31,795 | ) | | | (594,567 | ) |
| Pinnacle Financial Partners, Inc. | | | (9,040 | ) | | | (599,352 | ) |
PRA Group, Inc. (1) | | | (610 | ) | | | (20,252 | ) |
| Primerica, Inc. | | | (494 | ) | | | (50,166 | ) |
| Prosperity Bancshares, Inc. | | | (7,201 | ) | | | (504,574 | ) |
The accompanying notes are an integral part of these financial statements.
2017 Annual Report | December 31, 2017 | Page 69 |
Schedule of Investments
December 31, 2017
| Spectrum Fund |
| Security Description | | Shares or
Principal
Amount ($) | | Fair
Value ($) |
| Common Stocks - Short — continued |
| Prudential Bancorp, Inc. | | | (167 | ) | | | (2,939 | ) |
| Redwood Trust, Inc. | | | (6,181 | ) | | | (91,602 | ) |
| RenaissanceRe Holdings, Ltd. | | | (917 | ) | | | (115,166 | ) |
Republic First Bancorp, Inc. (1) | | | (8,398 | ) | | | (70,963 | ) |
| Resource Capital Corp. | | | (4,199 | ) | | | (39,345 | ) |
| RLI Corp. | | | (4,648 | ) | | | (281,948 | ) |
Safeguard Scientifics, Inc. (1) | | | (1,160 | ) | | | (12,992 | ) |
| ServisFirst Bancshares, Inc. | | | (7,858 | ) | | | (326,107 | ) |
Signature Bank/New York NY (1) | | | (3,009 | ) | | | (413,015 | ) |
SLM Corp. (1) | | | (3,434 | ) | | | (38,804 | ) |
| South State Corp. | | | (171 | ) | | | (14,903 | ) |
| Southern National Bancorp of Virginia, Inc. | | | (1,575 | ) | | | (25,247 | ) |
| Southside Bancshares, Inc. | | | (1,885 | ) | | | (63,487 | ) |
| Starwood Property Trust, Inc. | | | (30,092 | ) | | | (642,464 | ) |
| State Auto Financial Corp. | | | (1,078 | ) | | | (31,391 | ) |
| Sterling Bancorp/DE | | | (12,059 | ) | | | (296,651 | ) |
| Stock Yards Bancorp, Inc. | | | (1,303 | ) | | | (49,123 | ) |
| TD Ameritrade Holding Corp. | | | (8,543 | ) | | | (436,804 | ) |
Texas Capital Bancshares, Inc. (1) | | | (2,732 | ) | | | (242,875 | ) |
| TFS Financial Corp. | | | (41,628 | ) | | | (621,922 | ) |
| Tiptree, Inc. | | | (673 | ) | | | (4,004 | ) |
| Tompkins Financial Corp. | | | (1,225 | ) | | | (99,654 | ) |
TriState Capital Holdings, Inc. (1) | | | (1,458 | ) | | | (33,534 | ) |
| Two Harbors Investment Corp. | | | (6,675 | ) | | | (108,536 | ) |
| UMB Financial Corp. | | | (547 | ) | | | (39,340 | ) |
| Union Bankshares Corp. | | | (1,270 | ) | | | (45,936 | ) |
| United Bankshares, Inc./WV | | | (11,249 | ) | | | (390,903 | ) |
| United Insurance Holdings Corp. | | | (1,068 | ) | | | (18,423 | ) |
| Validus Holdings, Ltd. | | | (1,771 | ) | | | (83,095 | ) |
Veritex Holdings, Inc. (1) | | | (2,417 | ) | | | (66,685 | ) |
| Virtu Financial, Inc. | | | (1,863 | ) | | | (34,093 | ) |
| Virtus Investment Partners, Inc. | | | (653 | ) | | | (75,128 | ) |
| Voya Financial, Inc. | | | (3,640 | ) | | | (180,071 | ) |
| Waddell & Reed Financial, Inc. | | | (368 | ) | | | (8,221 | ) |
| Webster Financial Corp. | | | (4,415 | ) | | | (247,946 | ) |
| Westamerica Bancorporation | | | (6,114 | ) | | | (364,089 | ) |
| Western Asset Mortgage Capital Corp. | | | (2,637 | ) | | | (26,238 | ) |
| WisdomTree Investments, Inc. | | | (3,245 | ) | | | (40,725 | ) |
| WR Berkley Corp. | | | (306 | ) | | | (21,925 | ) |
| Zions Bancorporation | | | (796 | ) | | | (40,461 | ) |
| | | | | | | | (19,648,418 | ) |
| | | | | | | | | |
| Healthcare — (0.8%) | | | | | | | | |
| Abaxis, Inc. | | | (338 | ) | | | (16,738 | ) |
Acadia Healthcare Co., Inc. (1) | | | (216 | ) | | | (7,048 | ) |
Accelerate Diagnostics, Inc. (1) | | | (505 | ) | | | (13,231 | ) |
Agios Pharmaceuticals, Inc. (1) | | | (139 | ) | | | (7,947 | ) |
Akcea Therapeutics, Inc. (1) | | | (222 | ) | | | (3,854 | ) |
Allscripts Healthcare Solutions, Inc. (1) | | | (709 | ) | | | (10,316 | ) |
Amicus Therapeutics, Inc. (1) | | | (1,030 | ) | | | (14,822 | ) |
Anika Therapeutics, Inc. (1) | | | (19 | ) | | | (1,024 | ) |
Atara Biotherapeutics, Inc. (1) | | | (72 | ) | | | (1,303 | ) |
athenahealth, Inc. (1) | | | (260 | ) | | | (34,590 | ) |
AtriCure, Inc. (1) | | | (391 | ) | | | (7,132 | ) |
| Becton Dickinson and Co. | | | (2,905 | ) | | | (621,844 | ) |
BioScrip, Inc. (1) | | | (1,725 | ) | | | (5,020 | ) |
BioTime, Inc. (1) | | | (385 | ) | | | (828 | ) |
Brookdale Senior Living, Inc. (1) | | | (857 | ) | | | (8,313 | ) |
Capital Senior Living Corp. (1) | | | (366 | ) | | | (4,937 | ) |
Castlight Health, Inc. (1) | | | (1,560 | ) | | | (5,850 | ) |
Cerus Corp. (1) | | | (951 | ) | | | (3,214 | ) |
Corindus Vascular Robotics, Inc. (1) | | | (1,034 | ) | | | (1,044 | ) |
Dermira, Inc. (1) | | | (161 | ) | | | (4,477 | ) |
DexCom, Inc. (1) | | | (1,005 | ) | | | (57,677 | ) |
Dova Pharmaceuticals, Inc. (1) | | | (68 | ) | | | (1,958 | ) |
| Ensign Group, Inc./The | | | (100 | ) | | | (2,220 | ) |
Envision Healthcare Corp. (1) | | | (657 | ) | | | (22,706 | ) |
Evolent Health, Inc. (1) | | | (587 | ) | | | (7,220 | ) |
G1 Therapeutics, Inc. (1) | | | (259 | ) | | | (5,139 | ) |
Halozyme Therapeutics, Inc. (1) | | | (128 | ) | | | (2,593 | ) |
Heron Therapeutics, Inc. (1) | | | (47 | ) | | | (851 | ) |
Intra-Cellular Therapies, Inc. (1) | | | (65 | ) | | | (941 | ) |
| Invacare Corp. | | | (315 | ) | | | (5,308 | ) |
iRhythm Technologies, Inc. (1) | | | (316 | ) | | | (17,712 | ) |
Kala Pharmaceuticals, Inc. (1) | | | (151 | ) | | | (2,792 | ) |
Karyopharm Therapeutics, Inc. (1) | | | (378 | ) | | | (3,629 | ) |
Keryx Biopharmaceuticals, Inc. (1) | | | (489 | ) | | | (2,274 | ) |
La Jolla Pharmaceutical Co. (1) | | | (137 | ) | | | (4,409 | ) |
MacroGenics, Inc. (1) | | | (54 | ) | | | (1,026 | ) |
Medicines Co./The (1) | | | (891 | ) | | | (24,360 | ) |
Medidata Solutions, Inc. (1) | | | (241 | ) | | | (15,272 | ) |
Natus Medical, Inc. (1) | | | (164 | ) | | | (6,265 | ) |
NeoGenomics, Inc. (1) | | | (522 | ) | | | (4,625 | ) |
Nevro Corp. (1) | | | (524 | ) | | | (36,177 | ) |
Oxford Immunotec Global PLC (1) | | | (261 | ) | | | (3,646 | ) |
Paratek Pharmaceuticals, Inc. (1) | | | (192 | ) | | | (3,437 | ) |
| Patterson Cos., Inc. | | | (103 | ) | | | (3,721 | ) |
Penumbra, Inc. (1) | | | (156 | ) | | | (14,680 | ) |
R1 RCM, Inc. (1) | | | (3,901 | ) | | | (17,203 | ) |
Ra Pharmaceuticals, Inc. (1) | | | (108 | ) | | | (918 | ) |
Rockwell Medical, Inc. (1) | | | (322 | ) | | | (1,874 | ) |
Sienna Biopharmaceuticals, Inc. (1) | | | (266 | ) | | | (4,828 | ) |
Sientra, Inc. (1) | | | (376 | ) | | | (5,287 | ) |
| Simulations Plus, Inc. | | | (203 | ) | | | (3,268 | ) |
The accompanying notes are an integral part of these financial statements.
Page 70 | 2017 Annual Report | December 31, 2017 |
Schedule of Investments
December 31, 2017
| Spectrum Fund |
| Security Description | | Shares or
Principal
Amount ($) | | Fair
Value ($) |
| Common Stocks - Short — continued |
Surgery Partners, Inc. (1) | | | (84 | ) | | | (1,016 | ) |
Syneos Health, Inc. (1) | | | (213 | ) | | | (9,287 | ) |
Teladoc, Inc. (1) | | | (847 | ) | | | (29,518 | ) |
Tenet Healthcare Corp. (1) | | | (118 | ) | | | (1,789 | ) |
Tetraphase Pharmaceuticals, Inc. (1) | | | (784 | ) | | | (4,939 | ) |
TG Therapeutics, Inc. (1) | | | (99 | ) | | | (812 | ) |
Theravance Biopharma, Inc. (1) | | | (293 | ) | | | (8,172 | ) |
Tocagen, Inc. (1) | | | (518 | ) | | | (5,310 | ) |
Varian Medical Systems, Inc. (1) | | | (384 | ) | | | (42,682 | ) |
ViewRay, Inc. (1) | | | (1,086 | ) | | | (10,056 | ) |
Vocera Communications, Inc. (1) | | | (503 | ) | | | (15,201 | ) |
vTv Therapeutics, Inc. (1) | | | (215 | ) | | | (1,292 | ) |
Wright Medical Group NV (1) | | | (1,566 | ) | | | (34,765 | ) |
| | | | | | | | (1,222,387 | ) |
| | | | | | | | | |
| Industrials — (5.6%) | | | | | | | | |
| AAON, Inc. | | | (4,703 | ) | | | (172,600 | ) |
| Actuant Corp. | | | (2,683 | ) | | | (67,880 | ) |
Advanced Disposal Services, Inc. (1) | | | (411 | ) | | | (9,839 | ) |
| Advanced Drainage Systems, Inc. | | | (1,532 | ) | | | (36,538 | ) |
| Alaska Air Group, Inc. | | | (1,218 | ) | | | (89,535 | ) |
| Allegiant Travel Co. | | | (438 | ) | | | (67,781 | ) |
| AMERCO | | | (61 | ) | | | (23,053 | ) |
Ameresco, Inc. (1) | | | (300 | ) | | | (2,580 | ) |
| American Airlines Group, Inc. | | | (2,925 | ) | | | (152,188 | ) |
| American Railcar Industries, Inc. | | | (763 | ) | | | (31,771 | ) |
| AO Smith Corp. | | | (2,596 | ) | | | (159,083 | ) |
| Apogee Enterprises, Inc. | | | (836 | ) | | | (38,230 | ) |
| Arconic, Inc. | | | (13,729 | ) | | | (374,115 | ) |
Armstrong Flooring, Inc. (1) | | | (1,295 | ) | | | (21,911 | ) |
| Astec Industries, Inc. | | | (332 | ) | | | (19,422 | ) |
Avis Budget Group, Inc. (1) | | | (41 | ) | | | (1,799 | ) |
Axon Enterprise, Inc. (1) | | | (1,626 | ) | | | (43,089 | ) |
| Carlisle Cos., Inc. | | | (312 | ) | | | (35,459 | ) |
| CH Robinson Worldwide, Inc. | | | (1,009 | ) | | | (89,892 | ) |
Chart Industries, Inc. (1) | | | (1,001 | ) | | | (46,907 | ) |
| Cintas Corp. | | | (1,029 | ) | | | (160,349 | ) |
| CIRCOR International, Inc. | | | (565 | ) | | | (27,504 | ) |
Clean Harbors, Inc. (1) | | | (256 | ) | | | (13,875 | ) |
Colfax Corp. (1) | | | (1,691 | ) | | | (66,997 | ) |
| CompX International, Inc. | | | (103 | ) | | | (1,370 | ) |
| Covanta Holding Corp. | | | (3,682 | ) | | | (62,226 | ) |
| Cubic Corp. | | | (182 | ) | | | (10,729 | ) |
Daseke, Inc. (1) | | | (1,253 | ) | | | (17,905 | ) |
| Deere & Co. | | | (520 | ) | | | (81,385 | ) |
| Deluxe Corp. | | | (200 | ) | | | (15,368 | ) |
Energy Recovery, Inc. (1) | | | (648 | ) | | | (5,670 | ) |
| Equifax, Inc. | | | (3,166 | ) | | | (373,335 | ) |
| ESCO Technologies, Inc. | | | (261 | ) | | | (15,725 | ) |
| Flowserve Corp. | | | (4,399 | ) | | | (185,330 | ) |
Franklin Covey Co. (1) | | | (1,337 | ) | | | (27,743 | ) |
Gardner Denver Holdings, Inc. (1) | | | (3,408 | ) | | | (115,633 | ) |
| General Electric Co. | | | (1,666 | ) | | | (29,072 | ) |
Genesee & Wyoming, Inc. (1) | | | (3,779 | ) | | | (297,521 | ) |
Gibraltar Industries, Inc. (1) | | | (1,010 | ) | | | (33,330 | ) |
| Graham Corp. | | | (103 | ) | | | (2,156 | ) |
HC2 Holdings, Inc. (1) | | | (403 | ) | | | (2,398 | ) |
| Healthcare Services Group, Inc. | | | (148 | ) | | | (7,803 | ) |
| Heartland Express, Inc. | | | (2,279 | ) | | | (53,192 | ) |
| HEICO Corp. | | | (7,174 | ) | | | (676,867 | ) |
Herc Holdings, Inc. (1) | | | (485 | ) | | | (30,366 | ) |
Hertz Global Holdings, Inc. (1) | | | (39 | ) | | | (862 | ) |
Hudson Technologies, Inc. (1) | | | (1,030 | ) | | | (6,252 | ) |
Huron Consulting Group, Inc. (1) | | | (698 | ) | | | (28,234 | ) |
Huttig Building Products, Inc. (1) | | | (365 | ) | | | (2,427 | ) |
| Insteel Industries, Inc. | | | (248 | ) | | | (7,023 | ) |
| John Bean Technologies Corp. | | | (1,275 | ) | | | (141,270 | ) |
| Johnson Controls International plc | | | (17,343 | ) | | | (660,942 | ) |
KeyW Holding Corp./The (1) | | | (202 | ) | | | (1,186 | ) |
Kirby Corp. (1) | | | (177 | ) | | | (11,824 | ) |
| Knight-Swift Transportation Holdings, Inc. | | | (9,968 | ) | | | (435,801 | ) |
Kratos Defense & Security Solutions, Inc. (1) | | | (3,566 | ) | | | (37,764 | ) |
Layne Christensen Co. (1) | | | (654 | ) | | | (8,208 | ) |
| Lennox International, Inc. | | | (558 | ) | | | (116,209 | ) |
| Lindsay Corp. | | | (459 | ) | | | (40,484 | ) |
| Macquarie Infrastructure Corp. | | | (1,648 | ) | | | (105,802 | ) |
Manitowoc Co., Inc./The (1) | | | (122 | ) | | | (4,799 | ) |
Middleby Corp./The (1) | | | (399 | ) | | | (53,845 | ) |
| Mobile Mini, Inc. | | | (1,061 | ) | | | (36,605 | ) |
MRC Global, Inc. (1) | | | (630 | ) | | | (10,660 | ) |
| Multi-Color Corp. | | | (126 | ) | | | (9,431 | ) |
Navistar International Corp. (1) | | | (1,984 | ) | | | (85,074 | ) |
| Nielsen Holdings PLC | | | (3,602 | ) | | | (131,113 | ) |
| Nordson Corp. | | | (997 | ) | | | (145,961 | ) |
Northwest Pipe Co. (1) | | | (685 | ) | | | (13,111 | ) |
NOW, Inc. (1) | | | (1,110 | ) | | | (12,243 | ) |
Plug Power, Inc. (1) | | | (1,025 | ) | | | (2,419 | ) |
Proto Labs, Inc. (1) | | | (152 | ) | | | (15,656 | ) |
| Raven Industries, Inc. | | | (331 | ) | | | (11,370 | ) |
RBC Bearings, Inc. (1) | | | (51 | ) | | | (6,446 | ) |
| REV Group, Inc. | | | (2,469 | ) | | | (80,317 | ) |
Roadrunner Transportation Systems, Inc. (1) | | | (665 | ) | | | (5,127 | ) |
The accompanying notes are an integral part of these financial statements.
2017 Annual Report | December 31, 2017 | Page 71 |
Schedule of Investments
December 31, 2017
| Spectrum Fund |
| Security Description | | Shares or
Principal
Amount ($) | | Fair
Value ($) |
| Common Stocks - Short — continued |
| Roper Technologies, Inc. | | | (2,526 | ) | | | (654,234 | ) |
Sensata Technologies Holding NV (1) | | | (177 | ) | | | (9,046 | ) |
| Simpson Manufacturing Co., Inc. | | | (269 | ) | | | (15,443 | ) |
SiteOne Landscape Supply, Inc. (1) | | | (134 | ) | | | (10,278 | ) |
| SkyWest, Inc. | | | (761 | ) | | | (40,409 | ) |
| Snap-on, Inc. | | | (755 | ) | | | (131,597 | ) |
Spirit Airlines, Inc. (1) | | | (2,112 | ) | | | (94,723 | ) |
Stericycle, Inc. (1) | | | (718 | ) | | | (48,817 | ) |
| Sun Hydraulics Corp. | | | (18 | ) | | | (1,164 | ) |
Sunrun, Inc. (1) | | | (2,205 | ) | | | (13,010 | ) |
| Tennant Co. | | | (484 | ) | | | (35,163 | ) |
| Titan International, Inc. | | | (1,713 | ) | | | (22,063 | ) |
| TransDigm Group, Inc. | | | (2,219 | ) | | | (609,382 | ) |
Tutor Perini Corp. (1) | | | (34 | ) | | | (862 | ) |
Twin Disc, Inc. (1) | | | (225 | ) | | | (5,978 | ) |
Verisk Analytics, Inc. (1) | | | (2,158 | ) | | | (207,168 | ) |
Vivint Solar, Inc. (1) | | | (330 | ) | | | (1,337 | ) |
| Wabtec Corp./DE | | | (6,482 | ) | | | (527,829 | ) |
WageWorks, Inc. (1) | | | (1,768 | ) | | | (109,616 | ) |
Welbilt, Inc. (1) | | | (3,346 | ) | | | (78,664 | ) |
Wesco Aircraft Holdings, Inc. (1) | | | (259 | ) | | | (1,917 | ) |
Willdan Group, Inc. (1) | | | (162 | ) | | | (3,878 | ) |
| | | | | | | | (8,648,564 | ) |
| | | | | | | | | |
| Information Technology — (5.2%) | | | | | | | | |
2U, Inc. (1) | | | (329 | ) | | | (21,224 | ) |
3D Systems Corp. (1) | | | (165 | ) | | | (1,426 | ) |
A10 Networks, Inc. (1) | | | (767 | ) | | | (5,921 | ) |
ACI Worldwide, Inc. (1) | | | (424 | ) | | | (9,612 | ) |
Acxiom Corp. (1) | | | (3,526 | ) | | | (97,177 | ) |
Advanced Micro Devices, Inc. (1) | | | (11,775 | ) | | | (121,047 | ) |
Altaba, Inc. (1) | | | (6,944 | ) | | | (485,038 | ) |
Alteryx, Inc. (1) | | | (252 | ) | | | (6,368 | ) |
| Analog Devices, Inc. | | | (7,317 | ) | | | (651,433 | ) |
| Automatic Data Processing, Inc. | | | (5,560 | ) | | | (651,576 | ) |
AXT, Inc. (1) | | | (450 | ) | | | (3,915 | ) |
| Belden, Inc. | | | (624 | ) | | | (48,154 | ) |
Benefitfocus, Inc. (1) | | | (324 | ) | | | (8,748 | ) |
Black Knight, Inc. (1) | | | (4,057 | ) | | | (179,117 | ) |
| Blackbaud, Inc. | | | (830 | ) | | | (78,427 | ) |
Blackhawk Network Holdings, Inc. (1) | | | (451 | ) | | | (16,078 | ) |
Blackline, Inc. (1) | | | (1,389 | ) | | | (45,559 | ) |
Box, Inc. (1) | | | (493 | ) | | | (10,412 | ) |
Cars.com, Inc. (1) | | | (1,443 | ) | | | (41,616 | ) |
Cavium, Inc. (1) | | | (62 | ) | | | (5,197 | ) |
Cloudera, Inc. (1) | | | (2,175 | ) | | | (35,931 | ) |
Conduent, Inc. (1) | | | (6,370 | ) | | | (102,939 | ) |
Cornerstone OnDemand, Inc. (1) | | | (236 | ) | | | (8,338 | ) |
Coupa Software, Inc. (1) | | | (106 | ) | | | (3,309 | ) |
Cree, Inc. (1) | | | (806 | ) | | | (29,935 | ) |
Digimarc Corp. (1) | | | (320 | ) | | | (11,568 | ) |
| Ebix, Inc. | | | (382 | ) | | | (30,274 | ) |
Ellie Mae, Inc. (1) | | | (778 | ) | | | (69,553 | ) |
| Fidelity National Information Services, Inc. | | | (875 | ) | | | (82,329 | ) |
FireEye, Inc. (1) | | | (6,860 | ) | | | (97,412 | ) |
Fitbit, Inc. (1) | | | (2,116 | ) | | | (12,082 | ) |
Gartner, Inc. (1) | | | (5,263 | ) | | | (648,138 | ) |
| Global Payments, Inc. | | | (1,916 | ) | | | (192,060 | ) |
Glu Mobile, Inc. (1) | | | (284 | ) | | | (1,034 | ) |
Gogo, Inc. (1) | | | (964 | ) | | | (10,874 | ) |
GrubHub, Inc. (1) | | | (212 | ) | | | (15,222 | ) |
GSI Technology, Inc. (1) | | | (1,202 | ) | | | (9,568 | ) |
GTT Communications, Inc. (1) | | | (211 | ) | | | (9,906 | ) |
Guidewire Software, Inc. (1) | | | (221 | ) | | | (16,411 | ) |
Harmonic, Inc. (1) | | | (225 | ) | | | (945 | ) |
Hortonworks, Inc. (1) | | | (525 | ) | | | (10,558 | ) |
HubSpot, Inc. (1) | | | (740 | ) | | | (65,416 | ) |
Immersion Corp. (1) | | | (265 | ) | | | (1,871 | ) |
Impinj, Inc. (1) | | | (86 | ) | | | (1,938 | ) |
Infinera Corp. (1) | | | (3,444 | ) | | | (21,801 | ) |
Inphi Corp. (1) | | | (1,405 | ) | | | (51,423 | ) |
Internap Corp. (1) | | | (190 | ) | | | (2,985 | ) |
Iteris, Inc. (1) | | | (115 | ) | | | (802 | ) |
| Jack Henry & Associates, Inc. | | | (492 | ) | | | (57,544 | ) |
Keysight Technologies, Inc. (1) | | | (554 | ) | | | (23,046 | ) |
Knowles Corp. (1) | | | (3,217 | ) | | | (47,161 | ) |
Kopin Corp. (1) | | | (2,788 | ) | | | (8,922 | ) |
Leaf Group, Ltd. (1) | | | (1,455 | ) | | | (14,405 | ) |
MACOM Technology Solutions Holdings, Inc. (1) | | | (393 | ) | | | (12,788 | ) |
Match Group, Inc. (1) | | | (1,667 | ) | | | (52,194 | ) |
MaxLinear, Inc. (1) | | | (1,352 | ) | | | (35,720 | ) |
Maxwell Technologies, Inc. (1) | | | (780 | ) | | | (4,493 | ) |
| Mesa Laboratories, Inc. | | | (65 | ) | | | (8,080 | ) |
| Microchip Technology, Inc. | | | (7,375 | ) | | | (648,115 | ) |
MicroVision, Inc. (1) | | | (1,166 | ) | | | (1,901 | ) |
MINDBODY, Inc. (1) | | | (252 | ) | | | (7,673 | ) |
MobileIron, Inc. (1) | | | (712 | ) | | | (2,777 | ) |
Model N, Inc. (1) | | | (1,442 | ) | | | (22,712 | ) |
| Monolithic Power Systems, Inc. | | | (148 | ) | | | (16,629 | ) |
| MTS Systems Corp. | | | (201 | ) | | | (10,794 | ) |
Napco Security Technologies, Inc. (1) | | | (134 | ) | | | (1,173 | ) |
Nutanix, Inc. (1) | | | (571 | ) | | | (20,145 | ) |
Okta, Inc. (1) | | | (1,147 | ) | | | (29,375 | ) |
The accompanying notes are an integral part of these financial statements.
Page 72 | 2017 Annual Report | December 31, 2017 |
Schedule of Investments
December 31, 2017
| Spectrum Fund |
| Security Description | | Shares or
Principal
Amount ($) | | Fair
Value ($) |
| Common Stocks - Short — continued |
Park City Group, Inc. (1) | | | (446 | ) | | | (4,259 | ) |
| Paychex, Inc. | | | (3,010 | ) | | | (204,921 | ) |
Paycom Software, Inc. (1) | | | (359 | ) | | | (28,838 | ) |
Paylocity Holding Corp. (1) | | | (712 | ) | | | (33,578 | ) |
PDF Solutions, Inc. (1) | | | (475 | ) | | | (7,458 | ) |
Presidio, Inc. (1) | | | (616 | ) | | | (11,809 | ) |
Proofpoint, Inc. (1) | | | (2,108 | ) | | | (187,211 | ) |
PROS Holdings, Inc. (1) | | | (621 | ) | | | (16,425 | ) |
PTC, Inc. (1) | | | (80 | ) | | | (4,862 | ) |
Quantenna Communications, Inc. (1) | | | (246 | ) | | | (3,001 | ) |
Rapid7, Inc. (1) | | | (458 | ) | | | (8,546 | ) |
RealNetworks, Inc. (1) | | | (2,904 | ) | | | (9,932 | ) |
| Sabre Corp. | | | (3,528 | ) | | | (72,324 | ) |
salesforce.com, Inc. (1) | | | (6,262 | ) | | | (640,164 | ) |
SecureWorks Corp. (1) | | | (862 | ) | | | (7,646 | ) |
Sigma Designs, Inc. (1) | | | (1,313 | ) | | | (9,125 | ) |
Silver Spring Networks, Inc. (1) | | | (461 | ) | | | (7,487 | ) |
Splunk, Inc. (1) | | | (1,849 | ) | | | (153,171 | ) |
Square, Inc. (1) | | | (2,955 | ) | | | (102,450 | ) |
SunPower Corp. (1) | | | (244 | ) | | | (2,057 | ) |
| Systemax, Inc. | | | (30 | ) | | | (998 | ) |
Tableau Software, Inc. (1) | | | (344 | ) | | | (23,805 | ) |
Telenav, Inc. (1) | | | (1,781 | ) | | | (9,796 | ) |
Teradata Corp. (1) | | | (1,341 | ) | | | (51,575 | ) |
Trade Desk, Inc./The (1) | | | (162 | ) | | | (7,408 | ) |
TrueCar, Inc. (1) | | | (199 | ) | | | (2,229 | ) |
Tucows, Inc. (1) | | | (466 | ) | | | (32,643 | ) |
Twilio, Inc. (1) | | | (740 | ) | | | (17,464 | ) |
Tyler Technologies, Inc. (1) | | | (95 | ) | | | (16,820 | ) |
Ultimate Software Group, Inc./The (1) | | | (475 | ) | | | (103,659 | ) |
Veeco Instruments, Inc. (1) | | | (237 | ) | | | (3,519 | ) |
VeriFone Systems, Inc. (1) | | | (799 | ) | | | (14,150 | ) |
ViaSat, Inc. (1) | | | (3,338 | ) | | | (249,849 | ) |
WEX, Inc. (1) | | | (2,399 | ) | | | (338,811 | ) |
Workday, Inc. (1) | | | (4,806 | ) | | | (488,962 | ) |
Yext, Inc. (1) | | | (729 | ) | | | (8,770 | ) |
Zendesk, Inc. (1) | | | (578 | ) | | | (19,560 | ) |
Zillow Group, Inc. (1) | | | (2,615 | ) | | | (107,006 | ) |
| | | | | | | | (8,070,602 | ) |
| | | | | | | | | |
| Materials — (3.3%) | | | | | | | | |
AgroFresh Solutions, Inc. (1) | | | (1,421 | ) | | | (10,515 | ) |
AK Steel Holding Corp. (1) | | | (263 | ) | | | (1,489 | ) |
| Albemarle Corp. | | | (635 | ) | | | (81,210 | ) |
Allegheny Technologies, Inc. (1) | | | (611 | ) | | | (14,750 | ) |
| Ampco-Pittsburgh Corp. | | | (382 | ) | | | (4,737 | ) |
| AptarGroup, Inc. | | | (82 | ) | | | (7,075 | ) |
| Ashland Global Holdings, Inc. | | | (4,443 | ) | | | (316,342 | ) |
| Balchem Corp. | | | (3,076 | ) | | | (247,926 | ) |
| Ball Corp. | | | (15,372 | ) | | | (581,830 | ) |
| Bemis Co., Inc. | | | (238 | ) | | | (11,374 | ) |
| Calgon Carbon Corp. | | | (612 | ) | | | (13,036 | ) |
| Carpenter Technology Corp. | | | (221 | ) | | | (11,269 | ) |
Century Aluminum Co. (1) | | | (153 | ) | | | (3,005 | ) |
| CF Industries Holdings, Inc. | | | (1,435 | ) | | | (61,045 | ) |
Clearwater Paper Corp. (1) | | | (51 | ) | | | (2,315 | ) |
Codexis, Inc. (1) | | | (1,330 | ) | | | (11,106 | ) |
Coeur Mining, Inc. (1) | | | (614 | ) | | | (4,605 | ) |
| Compass Minerals International, Inc. | | | (1,060 | ) | | | (76,585 | ) |
| Ecolab, Inc. | | | (4,683 | ) | | | (628,365 | ) |
Ferroglobe PLC Contingent Value Rights (1) (8) | | | (2,326 | ) | | | 0 | |
| FMC Corp. | | | (686 | ) | | | (64,937 | ) |
GCP Applied Technologies, Inc. (1) | | | (2,237 | ) | | | (71,360 | ) |
| Gold Resource Corp. | | | (213 | ) | | | (937 | ) |
| Greif, Inc. | | | (1,864 | ) | | | (112,921 | ) |
| Haynes International, Inc. | | | (501 | ) | | | (16,057 | ) |
| Hecla Mining Co. | | | (2,303 | ) | | | (9,143 | ) |
| International Paper Co. | | | (11,308 | ) | | | (655,186 | ) |
Intrepid Potash, Inc. (1) | | | (2,553 | ) | | | (12,152 | ) |
Klondex Mines, Ltd. (1) | | | (1,784 | ) | | | (4,656 | ) |
| KMG Chemicals, Inc. | | | (123 | ) | | | (8,128 | ) |
LSB Industries, Inc. (1) | | | (534 | ) | | | (4,678 | ) |
| Martin Marietta Materials, Inc. | | | (700 | ) | | | (154,728 | ) |
| Mosaic Co./The | | | (5,420 | ) | | | (139,077 | ) |
| PH Glatfelter Co. | | | (1,518 | ) | | | (32,546 | ) |
Platform Specialty Products Corp. (1) | | | (249 | ) | | | (2,470 | ) |
Ramaco Resources, Inc. (1) | | | (456 | ) | | | (3,137 | ) |
| Sealed Air Corp. | | | (6,750 | ) | | | (332,775 | ) |
| Sherwin-Williams Co./The | | | (1,496 | ) | | | (613,420 | ) |
| Sonoco Products Co. | | | (3,204 | ) | | | (170,261 | ) |
TimkenSteel Corp. (1) | | | (1,128 | ) | | | (17,134 | ) |
Trecora Resources (1) | | | (1,180 | ) | | | (15,930 | ) |
| Vulcan Materials Co. | | | (4,812 | ) | | | (617,716 | ) |
| Warrior Met Coal, Inc. | | | (92 | ) | | | (2,314 | ) |
| | | | | | | | (5,150,242 | ) |
| | | | | | | | | |
| Real Estate Investment Trust — (1.7%) | | | | | | | | |
| Acadia Realty Trust | | | (785 | ) | | | (21,478 | ) |
| American Campus Communities, Inc. | | | (3,350 | ) | | | (137,451 | ) |
CBRE Group, Inc. (1) | | | (7,616 | ) | | | (329,849 | ) |
| Colony NorthStar, Inc. | | | (6,574 | ) | | | (75,009 | ) |
| Crown Castle International Corp. | | | (5,392 | ) | | | (598,566 | ) |
| CyrusOne, Inc. | | | (70 | ) | | | (4,167 | ) |
The accompanying notes are an integral part of these financial statements.
2017 Annual Report | December 31, 2017 | Page 73 |
Schedule of Investments
December 31, 2017
| Spectrum Fund |
| Security Description | | Shares or
Principal
Amount ($) | | Fair
Value ($) |
| Common Stocks - Short — continued |
| Digital Realty Trust, Inc. | | | (3,779 | ) | | | (430,428 | ) |
| Equinix, Inc. | | | (291 | ) | | | (131,887 | ) |
Equity Commonwealth (1) | | | (2,646 | ) | | | (80,729 | ) |
Forestar Group, Inc. (1) | | | (449 | ) | | | (9,878 | ) |
| Four Corners Property Trust, Inc. | | | (1,000 | ) | | | (25,700 | ) |
| GEO Group, Inc./The | | | (1,444 | ) | | | (34,078 | ) |
| Getty Realty Corp. | | | (606 | ) | | | (16,459 | ) |
| Government Properties Income Trust | | | (2,949 | ) | | | (54,674 | ) |
| Hersha Hospitality Trust | | | (352 | ) | | | (6,125 | ) |
| HFF, Inc. | | | (840 | ) | | | (40,858 | ) |
| Highwoods Properties, Inc. | | | (3,550 | ) | | | (180,731 | ) |
| InfraREIT, Inc. | | | (292 | ) | | | (5,425 | ) |
iStar, Inc. (1) | | | (303 | ) | | | (3,424 | ) |
| Mack-Cali Realty Corp. | | | (454 | ) | | | (9,788 | ) |
Maui Land & Pineapple Co., Inc. (1) | | | (271 | ) | | | (4,688 | ) |
| Medical Properties Trust, Inc. | | | (618 | ) | | | (8,516 | ) |
| Paramount Group, Inc. | | | (234 | ) | | | (3,709 | ) |
| Preferred Apartment Communities, Inc. | | | (178 | ) | | | (3,605 | ) |
| Rayonier, Inc. | | | (2,431 | ) | | | (76,893 | ) |
| Regency Centers Corp. | | | (2,998 | ) | | | (207,402 | ) |
| RMR Group, Inc./The | | | (174 | ) | | | (10,318 | ) |
| Safety, Inc.ome & Growth, Inc. | | | (4,141 | ) | | | (72,882 | ) |
| Terreno Realty Corp. | | | (970 | ) | | | (34,008 | ) |
Transcontinental Realty Investors, Inc. (1) | | | (86 | ) | | | (2,694 | ) |
| UMH Properties, Inc. | | | (210 | ) | | | (3,129 | ) |
| Urban Edge Properties | | | (1,772 | ) | | | (45,168 | ) |
| | | | | | | | (2,669,716 | ) |
| | | | | | | | | |
| Telecommunication Services — (0.4%) | | | | | | | | |
Boingo Wireless, Inc. (1) | | | (60 | ) | | | (1,350 | ) |
Globalstar, Inc. (1) | | | (2,135 | ) | | | (2,797 | ) |
Iridium Communications, Inc. (1) | | | (1,420 | ) | | | (16,756 | ) |
| Shenandoah Telecommunications Co. | | | (744 | ) | | | (25,147 | ) |
Sprint Corp. (1) | | | (90,011 | ) | | | (530,165 | ) |
United States Cellular Corp. (1) | | | (141 | ) | | | (5,306 | ) |
| | | | | | | | (581,521 | ) |
| | | | | | | | | |
| Utilities — (3.8%) | | | | | | | | |
| Alliant Energy Corp. | | | (13,445 | ) | | | (572,891 | ) |
| Aqua America, Inc. | | | (1,967 | ) | | | (77,165 | ) |
AquaVenture Holdings, Ltd. (1) | | | (379 | ) | | | (5,882 | ) |
| Avista Corp. | | | (945 | ) | | | (48,658 | ) |
| Black Hills Corp. | | | (4,586 | ) | | | (275,664 | ) |
Cadiz, Inc. (1) | | | (1,199 | ) | | | (17,086 | ) |
| Chesapeake Utilities Corp. | | | (221 | ) | | | (17,360 | ) |
| Connecticut Water Service, Inc. | | | (419 | ) | | | (24,055 | ) |
Dominion Energy, Inc. (1) | | | (8,082 | ) | | | (655,127 | ) |
| Global Water Resources, Inc. | | | (1,344 | ) | | | (12,553 | ) |
| Great Plains Energy, Inc. | | | (12,036 | ) | | | (388,041 | ) |
| Hawaiian Electric Industries, Inc. | | | (16,568 | ) | | | (598,933 | ) |
| MGE Energy, Inc. | | | (269 | ) | | | (16,974 | ) |
| NiSource, Inc. | | | (25,829 | ) | | | (663,030 | ) |
| Public Service Enterprise Group, Inc. | | | (6,702 | ) | | | (345,153 | ) |
Pure Cycle Corp. (1) | | | (1,122 | ) | | | (9,369 | ) |
| Sempra Energy | | | (5,123 | ) | | | (547,751 | ) |
| South Jersey Industries, Inc. | | | (4,711 | ) | | | (147,125 | ) |
| Southern Co./The | | | (13,568 | ) | | | (652,485 | ) |
| TerraForm Power, Inc. | | | (1,059 | ) | | | (12,666 | ) |
| Westar Energy, Inc. | | | (5,729 | ) | | | (302,491 | ) |
| WGL Holdings, Inc. | | | (5,698 | ) | | | (489,098 | ) |
| | | | | | | | (5,879,557 | ) |
| | | | | | | | | |
| Total Securities Sold Short (Proceeds Received $59,362,567) | | | | | | | (62,041,798 | ) |
| | | | | | | | | |
Trustee Deferred Compensation (7) | | | | | | | | |
| Meeder Aggressive Allocation Fund | | | 442 | | | | 4,619 | |
| Meeder Balanced Fund | | | 250 | | | | 2,903 | |
| Meeder Dynamic Allocation Fund | | | 160 | | | | 1,736 | |
| Meeder Muirfield Fund | | | 303 | | | | 2,285 | |
| Meeder Conservative Allocation Fund | | | 72 | | | | 1,623 | |
| Total Trustee Deferred Compensation (Cost $12,572) | | | | | | | 13,166 | |
The accompanying notes are an integral part of these financial statements.
Page 74 | 2017 Annual Report | December 31, 2017 |
Schedule of Investments
December 31, 2017
| Spectrum Fund |
| | | Contracts | | Expiration Date | | Notional Value of Contracts ($) | | Value and Unrealized Appreciation (Depreciation) ($) |
| Futures Contracts |
| Index Futures | | | | | | | | | | | | | | |
| Mini MSCI EAFE Index Futures | | | 89 | | | 3/16/2018 | | | 9,102,475 | | | | 140,375 | |
| Mini MSCI Emerging Markets Index Futures | | | 26 | | | 3/16/2018 | | | 1,512,810 | | | | 60,018 | |
| Standard & Poors 500 Mini Futures | | | 354 | | | 3/16/2018 | | | 47,365,200 | | | | 465,855 | |
| Total Futures Contracts | | | 469 | | | | | | 57,980,485 | | | | 666,248 | |
(1) | Represents non-income producing securities. |
(2) | All or a portion of the security is on loan. |
(3) | Investment purchased with cash received as securities lending collateral. The yield shown represents the 7-day yield in effect at December 31, 2017. |
(4) | All or a portion of the security is held as collateral for securities sold short. The total fair value of this collateral on December 31, 2017 was $63,145,588. |
(5) | Investment in affiliate. The yield shown represents the 7-day yield in effect at December 31, 2017. |
(6) | Variable rate security. Securities payable at par including accrued interest (usually within seven days notice) and unconditionally secured as to principal and interest by letters of credit or other credit support agreements from major banks. The interest rates are adjustable and are not based on a published reference rate and spread but are determined by the issuer or agent and are based on current market conditions. These securities do not indicate a reference rate and spread in their description above. The rate shown represents the rate in effect at December 31, 2017. The maturity date shown, if applicable, reflects the earlier of the next demand date or stated maturity date. |
(7) | Assets of affiliates to the Spectrum Fund held for the benefit of the Fund’s Trustees in connection with the Trustee Deferred Compensation Plan. |
(8) | Fair valued security deemed as Level 3 security. |
The accompanying notes are an integral part of these financial statements.
2017 Annual Report | December 31, 2017 | Page 75 |
Schedule of Investments
December 31, 2017
| Quantex Fund |
| Security Description | | Shares or
Principal
Amount ($) | | Fair
Value ($) |
| Common Stocks — 92.5% |
| Consumer Discretionary — 32.5% | | | | | | | | |
| Aaron's, Inc. | | | 22,878 | | | | 911,688 | |
| Adtalem Global Education, Inc. | | | 23,457 | | | | 986,367 | |
AutoNation, Inc. (1) | | | 19,104 | | | | 980,608 | |
| Bed Bath & Beyond, Inc. | | | 2,295 | | | | 50,467 | |
| Big Lots, Inc. | | | 14,576 | | | | 818,442 | |
| BorgWarner, Inc. | | | 18,556 | | | | 948,026 | |
| Chico's FAS, Inc. | | | 14,560 | | | | 128,419 | |
| Darden Restaurants, Inc. | | | 10,064 | | | | 966,345 | |
Deckers Outdoor Corp. (1) | | | 13,213 | | | | 1,060,343 | |
| Gap, Inc./The | | | 32,614 | | | | 1,110,833 | |
| Goodyear Tire & Rubber Co./The | | | 23,708 | | | | 766,005 | |
| H&R Block, Inc. | | | 31,834 | | | | 834,687 | |
| Hanesbrands, Inc. | | | 33,930 | | | | 709,476 | |
Helen of Troy, Ltd. (1) | | | 8,666 | | | | 834,969 | |
| International Speedway Corp. | | | 19,888 | | | | 792,537 | |
| KB Home | | | 46,291 | | | | 1,478,997 | |
| Kohl's Corp. | | | 14,821 | | | | 803,743 | |
| Leggett & Platt, Inc. | | | 14,973 | | | | 714,661 | |
Michael Kors Holdings, Ltd. (1) | | | 17,028 | | | | 1,071,913 | |
| New York Times Co./The | | | 55,027 | | | | 1,018,000 | |
| News Corp. | | | 63,862 | | | | 1,035,203 | |
| Nordstrom, Inc. | | | 15,269 | | | | 723,445 | |
| PulteGroup, Inc. | | | 39,818 | | | | 1,323,949 | |
| PVH Corp. | | | 8,110 | | | | 1,112,773 | |
| Ralph Lauren Corp. | | | 8,103 | | | | 840,200 | |
RH (1) | | | 23,839 | | | | 2,055,160 | |
| Signet Jewelers, Ltd. | | | 7,764 | | | | 439,054 | |
Sotheby's (1) | | | 18,361 | | | | 947,428 | |
| TEGNA, Inc. | | | 34,215 | | | | 481,747 | |
TRI Pointe Group, Inc. (1) | | | 47,809 | | | | 856,737 | |
TripAdvisor, Inc. (1) | | | 18,291 | | | | 630,308 | |
Urban Outfitters, Inc. (1) | | | 6,347 | | | | 222,526 | |
Vista Outdoor, Inc. (1) | | | 37,352 | | | | 544,219 | |
| Wyndham Worldwide Corp. | | | 9,583 | | | | 1,110,382 | |
| Wynn Resorts, Ltd. | | | 8,460 | | | | 1,426,271 | |
| | | | | | | | 30,735,928 | |
| | | | | | | | | |
| Consumer Staples — 1.3% | | | | | | | | |
Boston Beer Co., Inc./The (1) | | | 4,309 | | | | 823,450 | |
| Dean Foods Co. | | | 33,602 | | | | 388,439 | |
| | | | | | | | 1,211,889 | |
| | | | | | | | | |
| Energy — 3.6% | | | | | | | | |
Dril-Quip, Inc. (1) | | | 12,188 | | | | 581,368 | |
| Helmerich & Payne, Inc. | | | 9,456 | | | | 611,236 | |
| Murphy Oil Corp. | | | 33,396 | | | | 1,036,946 | |
Newfield Exploration Co. (1) | | | 18,071 | | | | 569,779 | |
Oil States International, Inc. (1) | | | 52 | | | | 1,472 | |
| Range Resources Corp. | | | 37,492 | | | | 639,614 | |
| | | | | | | | 3,440,415 | |
| | | | | | | | | |
| Financials — 5.6% | | | | | | | | |
| Assurant, Inc. | | | 7,881 | | | | 794,720 | |
| Kemper Corp. | | | 16,521 | | | | 1,138,297 | |
| Leucadia National Corp. | | | 31,478 | | | | 833,852 | |
| People's United Financial, Inc. | | | 40,879 | | | | 764,437 | |
| Torchmark Corp. | | | 9,922 | | | | 900,025 | |
Wells Fargo & Co. Preferred (1) (5) | | | 1 | | | | 0 | |
| Zions Bancorporation | | | 17,004 | | | | 864,313 | |
| | | | | | | | 5,295,644 | |
| | | | | | | | | |
| Healthcare — 10.0% | | | | | | | | |
Allscripts Healthcare Solutions, Inc. (1) | | | 71,681 | | | | 1,042,959 | |
| Cooper Cos., Inc./The | | | 4,184 | | | | 911,610 | |
Endo International PLC (1) | | | 44,436 | | | | 344,379 | |
Envision Healthcare Corp. (1) | | | 14,205 | | | | 490,925 | |
Halyard Health, Inc. (1) | | | 19,791 | | | | 913,948 | |
LifePoint Health, Inc. (1) | | | 12,885 | | | | 641,673 | |
LivaNova PLC (1) | | | 13,380 | | | | 1,069,330 | |
Mallinckrodt PLC (1) | | | 14,690 | | | | 331,406 | |
| Owens & Minor, Inc. | | | 20,738 | | | | 391,533 | |
| Patterson Cos., Inc. | | | 19,385 | | | | 700,380 | |
| PerkinElmer, Inc. | | | 14,034 | | | | 1,026,166 | |
Tenet Healthcare Corp. (1) | | | 49,317 | | | | 747,646 | |
Varian Medical Systems, Inc. (1) | | | 8,152 | | | | 906,095 | |
| | | | | | | | 9,518,050 | |
| | | | | | | | | |
| Industrials — 14.8% | | | | | | | | |
| Allegion PLC | | | 11,435 | | | | 909,769 | |
| Dun & Bradstreet Corp./The | | | 6,032 | | | | 714,249 | |
| Flowserve Corp. | | | 21,658 | | | | 912,452 | |
| Fluor Corp. | | | 13,935 | | | | 719,743 | |
| Fortune Brands Home & Security, Inc. | | | 13,690 | | | | 936,944 | |
FTI Consulting, Inc. (1) | | | 16,235 | | | | 697,456 | |
| Granite Construction, Inc. | | | 15,813 | | | | 1,003,019 | |
| Herman Miller, Inc. | | | 21,399 | | | | 857,030 | |
| Jacobs Engineering Group, Inc. | | | 12,840 | | | | 846,926 | |
NOW, Inc. (1) | | | 35,753 | | | | 394,356 | |
Quanta Services, Inc. (1) | | | 21,000 | | | | 821,310 | |
| Robert Half International, Inc. | | | 15,003 | | | | 833,267 | |
| Ryder System, Inc. | | | 9,832 | | | | 827,559 | |
Stericycle, Inc. (1) | | | 9,606 | | | | 653,112 | |
| Triumph Group, Inc. | | | 27,617 | | | | 751,182 | |
The accompanying notes are an integral part of these financial statements.
Page 76 | 2017 Annual Report | December 31, 2017 |
Schedule of Investments
December 31, 2017
| Quantex Fund |
| Security Description | | Shares or
Principal
Amount ($) | | Fair
Value ($) |
| Common Stocks — continued |
| Werner Enterprises, Inc. | | | 27,156 | | | | 1,049,579 | |
| Xylem, Inc./NY | | | 14,779 | | | | 1,007,928 | |
| | | | | | | | 13,935,881 | |
| | | | | | | | | |
| Information Technology — 11.9% | | | | | | | | |
ACI Worldwide, Inc. (1) | | | 40,323 | | | | 914,122 | |
Acxiom Corp. (1) | | | 27,308 | | | | 752,608 | |
Cars.com, Inc. (1) | | | 11,404 | | | | 328,891 | |
CommVault Systems, Inc. (1) | | | 14,239 | | | | 747,548 | |
| Convergys Corp. | | | 29,799 | | | | 700,277 | |
First Solar, Inc. (1) | | | 22,495 | | | | 1,518,861 | |
| FLIR Systems, Inc. | | | 20,223 | | | | 942,796 | |
| Plantronics, Inc. | | | 13,365 | | | | 673,329 | |
Teradata Corp. (1) | | | 17,536 | | | | 674,435 | |
| Total System Services, Inc. | | | 14,927 | | | | 1,180,576 | |
VeriFone Systems, Inc. (1) | | | 45,967 | | | | 814,076 | |
VeriSign, Inc. (1) | | | 9,621 | | | | 1,101,027 | |
| Xerox Corp. | | | 29,274 | | | | 853,337 | |
| | | | | | | | 11,201,883 | |
| | | | | | | | | |
| Materials — 4.5% | | | | | | | | |
| Avery Dennison Corp. | | | 10,422 | | | | 1,197,071 | |
| CF Industries Holdings, Inc. | | | 23,135 | | | | 984,163 | |
| FMC Corp. | | | 12,940 | | | | 1,224,900 | |
| Sealed Air Corp. | | | 17,948 | | | | 884,836 | |
| | | | | | | | 4,290,970 | |
| | | | | | | | | |
| Real Estate Investment Trust — 3.0% | | | | | | | | |
| Alexander & Baldwin, Inc. | | | 16,311 | | | | 452,467 | |
| Apartment Investment & Management Co. | | | 16,103 | | | | 703,862 | |
| Iron Mountain, Inc. | | | 22,533 | | | | 850,170 | |
| Potlatch Corp. | | | 17,572 | | | | 876,843 | |
| | | | | | | | 2,883,342 | |
| | | | | | | | | |
| Telecommunication Services — 0.1% | | | | | | | | |
| Frontier Communications Corp. | | | 14,435 | | | | 97,581 | |
| | | | | | | | 97,581 | |
| | | | | | | | | |
| Utilities — 5.2% | | | | | | | | |
| AES Corp./VA | | | 62,983 | | | | 682,106 | |
| Alliant Energy Corp. | | | 20,763 | | | | 884,711 | |
| NiSource, Inc. | | | 33,056 | | | | 848,548 | |
| NRG Energy, Inc. | | | 59,695 | | | | 1,700,114 | |
| Pinnacle West Capital Corp. | | | 9,379 | | | | 798,903 | |
| | | | | | | | 4,914,382 | |
| | | | | | | | | |
| Total Common Stocks (Cost $68,143,140) | | | | | | | 87,525,965 | |
| | | | | | | | | |
| Money Market Registered Investment Companies — 5.5% |
Meeder Institutional Prime Money Market Fund, 1.32% (2) | | | 5,258,514 | | | | 5,257,988 | |
| Total Money Market Registered Investment Companies (Cost $5,258,349) | | | | | | | 5,257,988 | |
| | | | | | | | | |
| Bank Obligations — 1.5% | | | | | | | | |
Bank Midwest Deposit Account, 1.00%, 1/2/2018 (3) | | | 248,989 | | | | 248,989 | |
First Merchants Bank Deposit Account, 1.00%, 1/2/2018 (3) | | | 248,190 | | | | 248,190 | |
Metro City Bank Deposit Account, 1.00%, 1/2/2018 (3) | | | 220,090 | | | | 220,090 | |
Pacific Mercantile Bank Deposit Account, 1.21%, 1/2/2018 (3) | | | 249,127 | | | | 249,127 | |
Pacific Premier Bank Deposit Account, 1.05%, 1/2/2018 (3) | | | 249,199 | | | | 249,199 | |
Seacoast Community Bank Deposit Account, 1.00%, 1/2/2018 (3) | | | 249,000 | | | | 249,000 | |
Trans Pacific National Bank Deposit Account, 1.00%, 1/2/2018 (3) | | | 184 | | | | 184 | |
| Total Bank Obligations (Cost $1,464,779) | | | | | | | 1,464,779 | |
| Total Investments — 99.5% (Cost $74,866,268) | | | | | | | 94,248,732 | |
| Other Assets less Liabilities — 0.5% | | | | | | | 515,813 | |
| Total Net Assets — 100.0% | | | | | | | 94,764,545 | |
| | | | | | | | | |
Trustee Deferred Compensation (4) | | | | | | | | |
| Meeder Aggressive Allocation Fund | | | 1,747 | | | | 18,256 | |
| Meeder Balanced Fund | | | 892 | | | | 10,356 | |
| Meeder Dynamic Allocation Fund | | | 611 | | | | 6,629 | |
| Meeder Muirfield Fund | | | 876 | | | | 6,605 | |
| Meeder Conservative Allocation Fund | | | 249 | | | | 5,612 | |
| Total Trustee Deferred Compensation (Cost $42,016) | | | | | | | 47,458 | |
The accompanying notes are an integral part of these financial statements.
2017 Annual Report | December 31, 2017 | Page 77 |
Schedule of Investments
December 31, 2017
| Quantex Fund |
| | | Contracts | | Expiration Date | | Notional Value of Contracts ($) | | Value and Unrealized Appreciation (Depreciation) ($) |
| Futures Contracts |
| Index Futures | | | | | | | | | | | | | | |
| E-mini Standard & Poors MidCap 400 Futures | | | 37 | | | 3/16/2018 | | | 7,038,880 | | | | 53,886 | |
| Total Futures Contracts | | | 37 | | | | | | 7,038,880 | | | | 53,886 | |
(1) | Represents non-income producing securities. |
(2) | Investment in affiliate. The yield shown represents the 7-day yield in effect at December 31, 2017. |
(3) | Variable rate security. Securities payable at par including accrued interest (usually within seven days notice) and unconditionally secured as to principal and interest by letters of credit or other credit support agreements from major banks. The interest rates are adjustable and are not based on a published reference rate and spread but are determined by the issuer or agent and are based on current market conditions. These securities do not indicate a reference rate and spread in their description above. The rate shown represents the rate in effect at December 31, 2017. The maturity date shown, if applicable, reflects the earlier of the next demand date or stated maturity date. |
(4) | Assets of affiliates to the Quantex Fund held for the benefit of the Fund’s Trustees in connection with the Trustee Deferred Compensation Plan. |
(5) | Fair valued security deemed as Level 3 security. |
The accompanying notes are an integral part of these financial statements.
Page 78 | 2017 Annual Report | December 31, 2017 |
Schedule of Investments
December 31, 2017
| Conservative Allocation Fund |
| Security Description | | Shares or
Principal
Amount ($) | | Fair
Value ($) |
| Common Stocks — 25.6% |
| Consumer Discretionary — 2.5% | | | | | | | | |
1-800-Flowers.com, Inc. (1) | | | 3 | | | | 32 | |
Amazon.com, Inc. (1) | | | 88 | | | | 102,913 | |
Asbury Automotive Group, Inc. (1) | | | 30 | | | | 1,920 | |
| Bassett Furniture Industries, Inc. | | | 23 | | | | 865 | |
Beazer Homes USA, Inc. (1) | | | 29 | | | | 557 | |
| Bed Bath & Beyond, Inc. | | | 99 | | | | 2,177 | |
| Best Buy Co., Inc. | | | 101 | | | | 6,915 | |
| Big Lots, Inc. | | | 92 | | | | 5,166 | |
| Bloomin' Brands, Inc. | | | 79 | | | | 1,686 | |
Bridgepoint Education, Inc. (1) | | | 91 | | | | 755 | |
| Buckle, Inc./The | | | 2 | | | | 48 | |
Buffalo Wild Wings, Inc. (1) | | | 4 | | | | 625 | |
Cambium Learning Group, Inc. (1) | | | 94 | | | | 534 | |
| Carter's, Inc. | | | 22 | | | | 2,585 | |
| Cato Corp./The | | | 62 | | | | 987 | |
Century Casinos, Inc. (1) | | | 130 | | | | 1,187 | |
| Chico's FAS, Inc. | | | 55 | | | | 485 | |
| Children's Place, Inc./The | | | 10 | | | | 1,454 | |
| Citi Trends, Inc. | | | 30 | | | | 794 | |
| Comcast Corp. | | | 528 | | | | 21,146 | |
Cooper-Standard Holdings, Inc. (1) | | | 35 | | | | 4,288 | |
| Dana, Inc. | | | 129 | | | | 4,129 | |
| Dollar General Corp. | | | 584 | | | | 54,318 | |
Dollar Tree, Inc. (1) | | | 457 | | | | 49,041 | |
| DSW, Inc. | | | 16 | | | | 343 | |
| Entravision Communications Corp. | | | 69 | | | | 493 | |
| Extended Stay America, Inc. | | | 54 | | | | 1,026 | |
| Finish Line, Inc./The | | | 29 | | | | 421 | |
Francesca's Holdings Corp. (1) | | | 34 | | | | 249 | |
FTD Cos., Inc. (1) | | | 17 | | | | 122 | |
| GameStop Corp. | | | 165 | | | | 2,962 | |
| Gannett Co., Inc. | | | 140 | | | | 1,623 | |
| Gap, Inc./The | | | 53 | | | | 1,805 | |
| General Motors Co. | | | 1,451 | | | | 59,476 | |
| GNC Holdings, Inc. | | | 26 | | | | 96 | |
Grand Canyon Education, Inc. (1) | | | 36 | | | | 3,223 | |
Gray Television, Inc. (1) | | | 38 | | | | 637 | |
| Hamilton Beach Brands Holding Co. | | | 13 | | | | 334 | |
| Haverty Furniture Cos., Inc. | | | 36 | | | | 815 | |
Hibbett Sports, Inc. (1) | | | 19 | | | | 388 | |
| Home Depot, Inc./The | | | 498 | | | | 94,386 | |
| Hooker Furniture Corp. | | | 29 | | | | 1,231 | |
| HSN, Inc. | | | 23 | | | | 928 | |
Iconix Brand Group, Inc. (1) | | | 40 | | | | 52 | |
J Alexander's Holdings, Inc. (1) | | | 56 | | | | 543 | |
J. Jill, Inc. (1) | | | 83 | | | | 647 | |
Kirkland's, Inc. (1) | | | 27 | | | | 323 | |
| Kohl's Corp. | | | 66 | | | | 3,579 | |
| La-Z-Boy, Inc. | | | 12 | | | | 374 | |
| Lear Corp. | | | 174 | | | | 30,739 | |
Liberty Interactive Corp. QVC Group (1) | | | 200 | | | | 4,884 | |
Liberty TripAdvisor Holdings, Inc. (1) | | | 25 | | | | 236 | |
Live Nation Entertainment, Inc. (1) | | | 79 | | | | 3,363 | |
MCBC Holdings, Inc. (1) | | | 29 | | | | 644 | |
MDC Partners, Inc. (1) | | | 15 | | | | 146 | |
Michael Kors Holdings, Ltd. (1) | | | 171 | | | | 10,764 | |
Michaels Cos., Inc./The (1) | | | 38 | | | | 919 | |
Modine Manufacturing Co. (1) | | | 62 | | | | 1,252 | |
Monarch Casino & Resort, Inc. (1) | | | 10 | | | | 448 | |
| New Media Investment Group, Inc. | | | 52 | | | | 873 | |
NVR, Inc. (1) | | | 3 | | | | 10,525 | |
| Office Depot, Inc. | | | 543 | | | | 1,922 | |
Overstock.com, Inc. (1) | | | 5 | | | | 320 | |
Penn National Gaming, Inc. (1) | | | 152 | | | | 4,762 | |
| PetMed Express, Inc. | | | 1 | | | | 46 | |
| Pier 1 Imports, Inc. | | | 221 | | | | 915 | |
Pinnacle Entertainment, Inc. (1) | | | 92 | | | | 3,011 | |
| PulteGroup, Inc. | | | 554 | | | | 18,421 | |
| RCI Hospitality Holdings, Inc. | | | 15 | | | | 420 | |
Regis Corp. (1) | | | 22 | | | | 338 | |
RH (1) | | | 8 | | | | 690 | |
| Ross Stores, Inc. | | | 109 | | | | 8,747 | |
| Ruth's Hospitality Group, Inc. | | | 10 | | | | 217 | |
Scientific Games Corp. (1) | | | 1 | | | | 51 | |
| Shoe Carnival, Inc. | | | 10 | | | | 268 | |
| Signet Jewelers, Ltd. | | | 23 | | | | 1,301 | |
Skechers U.S.A., Inc. (1) | | | 88 | | | | 3,330 | |
Sleep Number Corp. (1) | | | 56 | | | | 2,105 | |
Stoneridge, Inc. (1) | | | 72 | | | | 1,646 | |
| Tailored Brands, Inc. | | | 20 | | | | 437 | |
| Target Corp. | | | 212 | | | | 13,833 | |
Taylor Morrison Home Corp. (1) | | | 184 | | | | 4,502 | |
| Thor Industries, Inc. | | | 62 | | | | 9,345 | |
| Tilly's, Inc. | | | 40 | | | | 590 | |
| Time, Inc. | | | 25 | | | | 461 | |
TopBuild Corp. (1) | | | 6 | | | | 454 | |
| Tower International, Inc. | | | 42 | | | | 1,283 | |
Townsquare Media, Inc. (1) | | | 44 | | | | 338 | |
tronc, Inc. (1) | | | 66 | | | | 1,161 | |
| VF Corp. | | | 384 | | | | 28,416 | |
Weight Watchers International, Inc. (1) | | | 1 | | | | 44 | |
| Weyco Group, Inc. | | | 11 | | | | 327 | |
| Yum China Holdings, Inc. | | | 12 | | | | 480 | |
The accompanying notes are an integral part of these financial statements.
2017 Annual Report | December 31, 2017 | Page 79 |
Schedule of Investments
December 31, 2017
| Conservative Allocation Fund |
| Security Description | | Shares or
Principal
Amount ($) | | Fair
Value ($) |
| Common Stocks — continued |
ZAGG, Inc. (1) | | | 18 | | | | 332 | |
| | | | | | | | 615,989 | |
| | | | | | | | | |
| Consumer Staples — 1.6% | | | | | | | | |
| Archer-Daniels-Midland Co. | | | 194 | | | | 7,776 | |
| Costco Wholesale Corp. | | | 216 | | | | 40,202 | |
| CVS Health Corp. | | | 890 | | | | 64,525 | |
| Estee Lauder Cos., Inc./The | | | 314 | | | | 39,953 | |
| Kroger Co./The | | | 116 | | | | 3,184 | |
| Lamb Weston Holdings, Inc. | | | 35 | | | | 1,976 | |
| Medifast, Inc. | | | 1 | | | | 70 | |
| Nu Skin Enterprises, Inc. | | | 16 | | | | 1,092 | |
| PepsiCo, Inc. | | | 429 | | | | 51,446 | |
Performance Food Group Co. (1) | | | 197 | | | | 6,521 | |
Pilgrim's Pride Corp. (1) | | | 52 | | | | 1,615 | |
Rite Aid Corp. (1) | | | 152 | | | | 299 | |
| Sanderson Farms, Inc. | | | 14 | | | | 1,943 | |
Sprouts Farmers Market, Inc. (1) | | | 90 | | | | 2,192 | |
| Sysco Corp. | | | 144 | | | | 8,745 | |
| Tyson Foods, Inc. | | | 653 | | | | 52,939 | |
USANA Health Sciences, Inc. (1) | | | 5 | | | | 370 | |
| Village Super Market, Inc. | | | 119 | | | | 2,729 | |
| Walgreens Boots Alliance, Inc. | | | 860 | | | | 62,453 | |
| Wal-Mart Stores, Inc. | | | 648 | | | | 63,990 | |
| Weis Markets, Inc. | | | 23 | | | | 952 | |
| | | | | | | | 414,972 | |
| | | | | | | | | |
| Energy — 1.5% | | | | | | | | |
Abraxas Petroleum Corp. (1) | | | 168 | | | | 413 | |
| Andeavor | | | 226 | | | | 25,841 | |
| Arch Coal, Inc. | | | 9 | | | | 838 | |
| Cabot Oil & Gas Corp. | | | 374 | | | | 10,696 | |
| Chevron Corp. | | | 311 | | | | 38,934 | |
Cloud Peak Energy, Inc. (1) | | | 11 | | | | 49 | |
CONSOL Energy, Inc. (1) | | | 17 | | | | 672 | |
| CVR Energy, Inc. | | | 44 | | | | 1,639 | |
| Delek US Holdings, Inc. | | | 84 | | | | 2,935 | |
| Evolution Petroleum Corp. | | | 7 | | | | 48 | |
Exterran Corp. (1) | | | 120 | | | | 3,773 | |
| Exxon Mobil Corp. | | | 879 | | | | 73,520 | |
| HollyFrontier Corp. | | | 102 | | | | 5,224 | |
Mammoth Energy Services, Inc. (1) | | | 10 | | | | 196 | |
| Marathon Petroleum Corp. | | | 832 | | | | 54,895 | |
Matrix Service Co. (1) | | | 77 | | | | 1,371 | |
McDermott International, Inc. (1) | | | 587 | | | | 3,862 | |
Midstates Petroleum Co., Inc. (1) | | | 98 | | | | 1,625 | |
Natural Gas Services Group, Inc. (1) | | | 18 | | | | 472 | |
Pacific Ethanol, Inc. (1) | | | 26 | | | | 118 | |
Par Pacific Holdings, Inc. (1) | | | 64 | | | | 1,234 | |
| PBF Energy, Inc. | | | 111 | | | | 3,935 | |
Peabody Energy Corp. (1) | | | 12 | | | | 472 | |
| Phillips 66 | | | 575 | | | | 58,161 | |
RigNet, Inc. (1) | | | 20 | | | | 299 | |
| RPC, Inc. | | | 305 | | | | 7,787 | |
SandRidge Energy, Inc. (1) | | | 103 | | | | 2,170 | |
SilverBow Resources, Inc. (1) | | | 44 | | | | 1,308 | |
Stone Energy Corp. (1) | | | 22 | | | | 708 | |
Unit Corp. (1) | | | 39 | | | | 858 | |
| Valero Energy Corp. | | | 625 | | | | 57,444 | |
W&T Offshore, Inc. (1) | | | 347 | | | | 1,149 | |
Westmoreland Coal Co. (1) | | | 184 | | | | 223 | |
| World Fuel Services Corp. | | | 59 | | | | 1,660 | |
| | | | | | | | 364,529 | |
| | | | | | | | | |
| Financials — 4.0% | | | | | | | | |
| AG Mortgage Investment Trust, Inc. | | | 4 | | | | 76 | |
| American Equity Investment Life Holding Co. | | | 195 | | | | 5,992 | |
| Annaly Capital Management, Inc. | | | 1,037 | | | | 12,330 | |
| Artisan Partners Asset Management, Inc. | | | 50 | | | | 1,975 | |
| Banco Latinoamericano de Comercio Exterior SA | | | 130 | | | | 3,497 | |
| Bank of America Corp. | | | 3,424 | | | | 101,076 | |
| Bank of New York Mellon Corp./The | | | 1,125 | | | | 60,593 | |
| BB&T Corp. | | | 1,145 | | | | 56,929 | |
Berkshire Hathaway, Inc. (1) | | | 643 | | | | 127,455 | |
| BGC Partners, Inc. | | | 291 | | | | 4,397 | |
Cannae Holdings, Inc. (1) | | | 153 | | | | 2,606 | |
| Central Valley Community Bancorp | | | 13 | | | | 262 | |
| Century Bancorp, Inc./MA | | | 23 | | | | 1,800 | |
| Citigroup, Inc. | | | 1,260 | | | | 93,757 | |
| CNB Financial Corp./PA | | | 43 | | | | 1,128 | |
Community Bankers Trust Corp. (1) | | | 3 | | | | 24 | |
| Dynex Capital, Inc. | | | 68 | | | | 477 | |
Eagle Bancorp, Inc. (1) | | | 3 | | | | 174 | |
Encore Capital Group, Inc. (1) | | | 11 | | | | 463 | |
Enova International, Inc. (1) | | | 52 | | | | 790 | |
Essent Group, Ltd. (1) | | | 123 | | | | 5,341 | |
| Evercore, Inc. | | | 80 | | | | 7,200 | |
EZCORP, Inc. (1) | | | 10 | | | | 122 | |
| Fidelity Southern Corp. | | | 161 | | | | 3,510 | |
| Fifth Third Bancorp | | | 1,732 | | | | 52,549 | |
| First American Financial Corp. | | | 85 | | | | 4,763 | |
| First Bancorp/Southern Pines NC | | | 238 | | | | 8,404 | |
The accompanying notes are an integral part of these financial statements.
Page 80 | 2017 Annual Report | December 31, 2017 |
Schedule of Investments
December 31, 2017
| Conservative Allocation Fund |
| Security Description | | Shares or
Principal
Amount ($) | | Fair
Value ($) |
| Common Stocks — continued |
| First Busey Corp. | | | 247 | | | | 7,395 | |
| First Mid-Illinois Bancshares, Inc. | | | 30 | | | | 1,156 | |
| FirstCash, Inc. | | | 19 | | | | 1,282 | |
Genworth Financial, Inc. (1) | | | 116 | | | | 361 | |
| Great Southern Bancorp, Inc. | | | 25 | | | | 1,291 | |
Green Dot Corp. (1) | | | 9 | | | | 542 | |
Health Insurance Innovations, Inc. (1) | | | 12 | | | | 299 | |
| Heritage Commerce Corp. | | | 228 | | | | 3,493 | |
| Houlihan Lokey, Inc. | | | 158 | | | | 7,178 | |
| Huntington Bancshares, Inc./OH | | | 3,539 | | | | 51,528 | |
INTL. FCStone, Inc. (1) | | | 10 | | | | 425 | |
| Invesco Mortgage Capital, Inc. | | | 169 | | | | 3,013 | |
| JPMorgan Chase & Co. | | | 766 | | | | 81,916 | |
| Kemper Corp. | | | 6 | | | | 413 | |
| Lazard, Ltd. | | | 80 | | | | 4,200 | |
LendingTree, Inc. (1) | | | 1 | | | | 340 | |
MGIC Investment Corp. (1) | | | 690 | | | | 9,736 | |
| Moelis & Co. | | | 66 | | | | 3,201 | |
| MSCI, Inc. | | | 11 | | | | 1,392 | |
| MutualFirst Financial, Inc. | | | 15 | | | | 578 | |
| New Residential Investment Corp. | | | 1,504 | | | | 26,892 | |
NewStar Financial, Inc. Contingent Value Rights (1)(5) | | | 8 | | | | 0 | |
Nicolet Bankshares, Inc. (1) | | | 38 | | | | 2,080 | |
NMI Holdings, Inc. (1) | | | 102 | | | | 1,734 | |
| Northeast Bancorp | | | 33 | | | | 764 | |
| Northrim BanCorp, Inc. | | | 61 | | | | 2,065 | |
| Oppenheimer Holdings, Inc. | | | 33 | | | | 884 | |
Pacific Mercantile Bancorp (1) | | | 29 | | | | 254 | |
PennyMac Financial Services, Inc. (1) | | | 111 | | | | 2,481 | |
| People's Utah Bancorp | | | 34 | | | | 1,030 | |
| Piper Jaffray Cos. | | | 5 | | | | 431 | |
| PNC Financial Services Group, Inc./The | | | 359 | | | | 51,800 | |
| Premier Financial Bancorp, Inc. | | | 70 | | | | 1,406 | |
| Provident Financial Holdings, Inc. | | | 71 | | | | 1,306 | |
| Pzena Investment Management, Inc. | | | 56 | | | | 598 | |
| Radian Group, Inc. | | | 251 | | | | 5,173 | |
| Regions Financial Corp. | | | 3,043 | | | | 52,583 | |
| Riverview Bancorp, Inc. | | | 76 | | | | 659 | |
| SEI Investments Co. | | | 65 | | | | 4,671 | |
| Shore Bancshares, Inc. | | | 48 | | | | 802 | |
| Stewart Information Services Corp. | | | 27 | | | | 1,142 | |
| Sutherland Asset Management Corp. | | | 80 | | | | 1,212 | |
| T Rowe Price Group, Inc. | | | 348 | | | | 36,516 | |
Third Point Reinsurance, Ltd. (1) | | | 13 | | | | 190 | |
| Timberland Bancorp, Inc./WA | | | 31 | | | | 823 | |
| TriCo Bancshares | | | 149 | | | | 5,641 | |
Triumph Bancorp, Inc. (1) | | | 55 | | | | 1,733 | |
| Umpqua Holdings Corp. | | | 498 | | | | 10,358 | |
| Univest Corp of Pennsylvania | | | 3 | | | | 84 | |
| Wells Fargo & Co. | | | 939 | | | | 56,969 | |
| | | | | | | | 1,009,710 | |
| | | | | | | | | |
| Healthcare — 4.7% | | | | | | | | |
| Abbott Laboratories | | | 726 | | | | 41,433 | |
| AbbVie, Inc. | | | 591 | | | | 57,156 | |
Abeona Therapeutics, Inc. (1) | | | 14 | | | | 222 | |
ABIOMED, Inc. (1) | | | 60 | | | | 11,245 | |
Acorda Therapeutics, Inc. (1) | | | 36 | | | | 772 | |
Adamas Pharmaceuticals, Inc. (1) | | | 10 | | | | 339 | |
Aerie Pharmaceuticals, Inc. (1) | | | 3 | | | | 179 | |
| Aetna, Inc. | | | 341 | | | | 61,513 | |
| Agilent Technologies, Inc. | | | 462 | | | | 30,940 | |
Aimmune Therapeutics, Inc. (1) | | | 1 | | | | 38 | |
Alexion Pharmaceuticals, Inc. (1) | | | 52 | | | | 6,219 | |
Align Technology, Inc. (1) | | | 58 | | | | 12,887 | |
Alnylam Pharmaceuticals, Inc. (1) | | | 66 | | | | 8,385 | |
AMAG Pharmaceuticals, Inc. (1) | | | 33 | | | | 437 | |
| Amgen, Inc. | | | 176 | | | | 30,606 | |
AnaptysBio, Inc. (1) | | | 5 | | | | 504 | |
ANI Pharmaceuticals, Inc. (1) | | | 5 | | | | 322 | |
| Anthem, Inc. | | | 273 | | | | 61,428 | |
Arena Pharmaceuticals, Inc. (1) | | | 8 | | | | 272 | |
Assembly Biosciences, Inc. (1) | | | 5 | | | | 226 | |
Audentes Therapeutics, Inc. (1) | | | 3 | | | | 94 | |
| Baxter International, Inc. | | | 856 | | | | 55,332 | |
Biogen, Inc. (1) | | | 130 | | | | 41,414 | |
Bio-Rad Laboratories, Inc. (1) | | | 4 | | | | 955 | |
Bioverativ, Inc. (1) | | | 88 | | | | 4,745 | |
Bluebird Bio, Inc. (1) | | | 17 | | | | 3,028 | |
Blueprint Medicines Corp. (1) | | | 23 | | | | 1,734 | |
| Bristol-Myers Squibb Co. | | | 1,169 | | | | 71,636 | |
| Bruker Corp. | | | 33 | | | | 1,133 | |
Calithera Biosciences, Inc. (1) | | | 25 | | | | 209 | |
Catalent, Inc. (1) | | | 143 | | | | 5,874 | |
Catalyst Pharmaceuticals, Inc. (1) | | | 68 | | | | 266 | |
Celgene Corp. (1) | | | 63 | | | | 6,575 | |
Centene Corp. (1) | | | 226 | | | | 22,799 | |
Cerner Corp. (1) | | | 561 | | | | 37,806 | |
| Chemed Corp. | | | 5 | | | | 1,215 | |
| Cigna Corp. | | | 292 | | | | 59,302 | |
Conatus Pharmaceuticals, Inc. (1) | | | 9 | | | | 42 | |
Concert Pharmaceuticals, Inc. (1) | | | 11 | | | | 285 | |
Corcept Therapeutics, Inc. (1) | | | 83 | | | | 1,499 | |
The accompanying notes are an integral part of these financial statements.
2017 Annual Report | December 31, 2017 | Page 81 |
Schedule of Investments
December 31, 2017
| Conservative Allocation Fund |
| Security Description | | Shares or
Principal
Amount ($) | | Fair
Value ($) |
| Common Stocks — continued |
CorVel Corp. (1) | | | 31 | | | | 1,640 | |
Cutera, Inc. (1) | | | 4 | | | | 181 | |
Cytokinetics, Inc. (1) | | | 5 | | | | 41 | |
CytomX Therapeutics, Inc. (1) | | | 40 | | | | 844 | |
Dynavax Technologies Corp. (1) | | | 38 | | | | 711 | |
Eagle Pharmaceuticals, Inc./DE (1) | | | 3 | | | | 160 | |
Editas Medicine, Inc. (1) | | | 4 | | | | 123 | |
Emergent BioSolutions, Inc. (1) | | | 67 | | | | 3,113 | |
Enanta Pharmaceuticals, Inc. (1) | | | 20 | | | | 1,174 | |
Encompass Health Corp. (1) | | | 65 | | | | 3,212 | |
Endo International PLC (1) | | | 34 | | | | 264 | |
Enzo Biochem, Inc. (1) | | | 118 | | | | 962 | |
Esperion Therapeutics, Inc. (1) | | | 11 | | | | 724 | |
Exact Sciences Corp. (1) | | | 153 | | | | 8,039 | |
Exactech, Inc. (1) | | | 3 | | | | 148 | |
Exelixis, Inc. (1) | | | 66 | | | | 2,006 | |
FibroGen, Inc. (1) | | | 85 | | | | 4,029 | |
FONAR Corp. (1) | | | 2 | | | | 49 | |
Foundation Medicine, Inc. (1) | | | 4 | | | | 273 | |
Genomic Health, Inc. (1) | | | 61 | | | | 2,086 | |
| Gilead Sciences, Inc. | | | 427 | | | | 30,590 | |
Global Blood Therapeutics, Inc. (1) | | | 2 | | | | 79 | |
Haemonetics Corp. (1) | | | 15 | | | | 871 | |
| Hill-Rom Holdings, Inc. | | | 52 | | | | 4,383 | |
| Humana, Inc. | | | 229 | | | | 56,808 | |
Ignyta, Inc. (1) | | | 3 | | | | 80 | |
Immunomedics, Inc. (1) | | | 3 | | | | 48 | |
Impax Laboratories, Inc. (1) | | | 8 | | | | 133 | |
Inogen, Inc. (1) | | | 1 | | | | 119 | |
Insmed, Inc. (1) | | | 7 | | | | 218 | |
Integer Holdings Corp. (1) | | | 50 | | | | 2,265 | |
Intellia Therapeutics, Inc. (1) | | | 15 | | | | 288 | |
Intersect ENT, Inc. (1) | | | 31 | | | | 1,004 | |
Intuitive Surgical, Inc. (1) | | | 157 | | | | 57,296 | |
Ionis Pharmaceuticals, Inc. (1) | | | 18 | | | | 905 | |
Iovance Biotherapeutics, Inc. (1) | | | 9 | | | | 72 | |
| Johnson & Johnson | | | 679 | | | | 94,870 | |
Juno Therapeutics, Inc. (1) | | | 27 | | | | 1,234 | |
| Kindred Healthcare, Inc. | | | 3 | | | | 29 | |
Kura Oncology, Inc. (1) | | | 12 | | | | 184 | |
Lannett Co., Inc. (1) | | | 2 | | | | 46 | |
Lantheus Holdings, Inc. (1) | | | 2 | | | | 41 | |
LHC Group, Inc. (1) | | | 26 | | | | 1,593 | |
LivaNova PLC (1) | | | 34 | | | | 2,717 | |
| Luminex Corp. | | | 110 | | | | 2,167 | |
Madrigal Pharmaceuticals, Inc. (1) | | | 5 | | | | 459 | |
Mallinckrodt PLC (1) | | | 54 | | | | 1,218 | |
Masimo Corp. (1) | | | 14 | | | | 1,187 | |
| McKesson Corp. | | | 200 | | | | 31,190 | |
| Merck & Co., Inc. | | | 54 | | | | 3,039 | |
| Meridian Bioscience, Inc. | | | 25 | | | | 350 | |
Mettler-Toledo International, Inc. (1) | | | 2 | | | | 1,239 | |
Momenta Pharmaceuticals, Inc. (1) | | | 4 | | | | 56 | |
Mylan NV (1) | | | 59 | | | | 2,496 | |
MyoKardia, Inc. (1) | | | 5 | | | | 211 | |
Myriad Genetics, Inc. (1) | | | 22 | | | | 756 | |
| National HealthCare Corp. | | | 4 | | | | 244 | |
| National Research Corp. | | | 9 | | | | 336 | |
Nektar Therapeutics (1) | | | 47 | | | | 2,807 | |
Novocure, Ltd. (1) | | | 3 | | | | 61 | |
Omeros Corp. (1) | | | 5 | | | | 97 | |
Orthofix International NV (1) | | | 34 | | | | 1,860 | |
PDL BioPharma, Inc. (1) | | | 183 | | | | 501 | |
| Pfizer, Inc. | | | 752 | | | | 27,237 | |
| Phibro Animal Health Corp. | | | 17 | | | | 570 | |
Pieris Pharmaceuticals, Inc. (1) | | | 73 | | | | 551 | |
Portola Pharmaceuticals, Inc. (1) | | | 35 | | | | 1,704 | |
Premier, Inc. (1) | | | 247 | | | | 7,210 | |
Protagonist Therapeutics, Inc. (1) | | | 5 | | | | 104 | |
Prothena Corp. PLC (1) | | | 6 | | | | 225 | |
Providence Service Corp./The (1) | | | 39 | | | | 2,314 | |
Puma Biotechnology, Inc. (1) | | | 26 | | | | 2,570 | |
Quality Systems, Inc. (1) | | | 66 | | | | 896 | |
RadNet, Inc. (1) | | | 82 | | | | 828 | |
Recro Pharma, Inc. (1) | | | 71 | | | | 657 | |
Regeneron Pharmaceuticals, Inc. (1) | | | 52 | | | | 19,550 | |
Sage Therapeutics, Inc. (1) | | | 5 | | | | 824 | |
Sangamo Therapeutics, Inc. (1) | | | 39 | | | | 640 | |
Spectrum Pharmaceuticals, Inc. (1) | | | 45 | | | | 853 | |
Supernus Pharmaceuticals, Inc. (1) | | | 19 | | | | 757 | |
Syros Pharmaceuticals, Inc. (1) | | | 4 | | | | 39 | |
Tabula Rasa HealthCare, Inc. (1) | | | 4 | | | | 112 | |
Triple-S Management Corp. (1) | | | 42 | | | | 1,044 | |
United Therapeutics Corp. (1) | | | 29 | | | | 4,291 | |
| UnitedHealth Group, Inc. | | | 341 | | | | 75,177 | |
Vanda Pharmaceuticals, Inc. (1) | | | 78 | | | | 1,186 | |
Veracyte, Inc. (1) | | | 76 | | | | 496 | |
Vertex Pharmaceuticals, Inc. (1) | | | 220 | | | | 32,969 | |
Voyager Therapeutics, Inc. (1) | | | 5 | | | | 83 | |
WellCare Health Plans, Inc. (1) | | | 70 | | | | 14,078 | |
Zogenix, Inc. (1) | | | 18 | | | | 721 | |
| | | | | | | | 1,174,678 | |
The accompanying notes are an integral part of these financial statements.
Page 82 | 2017 Annual Report | December 31, 2017 |
Schedule of Investments
December 31, 2017
| Conservative Allocation Fund |
| Security Description | | Shares or
Principal
Amount ($) | | Fair
Value ($) |
| Common Stocks — continued |
| Industrials — 2.5% | | | | | | | | |
Aegion Corp. (1) | | | 45 | | | | 1,144 | |
| Aircastle, Ltd. | | | 45 | | | | 1,053 | |
| Alamo Group, Inc. | | | 13 | | | | 1,467 | |
| Allison Transmission Holdings, Inc. | | | 129 | | | | 5,556 | |
| Applied Industrial Technologies, Inc. | | | 132 | | | | 8,989 | |
ARC Document Solutions, Inc. (1) | | | 105 | | | | 268 | |
| ArcBest Corp. | | | 27 | | | | 965 | |
| Argan, Inc. | | | 43 | | | | 1,935 | |
Beacon Roofing Supply, Inc. (1) | | | 9 | | | | 574 | |
Blue Bird Corp. (1) | | | 30 | | | | 597 | |
BMC Stock Holdings, Inc. (1) | | | 18 | | | | 455 | |
| Boeing Co./The | | | 293 | | | | 86,409 | |
| Briggs & Stratton Corp. | | | 68 | | | | 1,725 | |
Builders FirstSource, Inc. (1) | | | 104 | | | | 2,266 | |
| BWX Technologies, Inc. | | | 33 | | | | 1,996 | |
| Comfort Systems USA, Inc. | | | 25 | | | | 1,091 | |
Commercial Vehicle Group, Inc. (1) | | | 17 | | | | 182 | |
Continental Building Products, Inc. (1) | | | 62 | | | | 1,745 | |
| Copa Holdings SA | | | 11 | | | | 1,475 | |
| Costamare, Inc. | | | 20 | | | | 115 | |
Covenant Transportation Group, Inc. (1) | | | 23 | | | | 661 | |
| CRA International, Inc. | | | 7 | | | | 315 | |
| CSX Corp. | | | 469 | | | | 25,800 | |
| Delta Air Lines, Inc. | | | 737 | | | | 41,272 | |
| Eaton Corp. PLC | | | 726 | | | | 57,361 | |
| EMCOR Group, Inc. | | | 50 | | | | 4,088 | |
| EnPro Industries, Inc. | | | 31 | | | | 2,899 | |
| Global Brass & Copper Holdings, Inc. | | | 37 | | | | 1,225 | |
GMS, Inc. (1) | | | 25 | | | | 941 | |
| Greenbrier Cos., Inc./The | | | 24 | | | | 1,279 | |
| H&E Equipment Services, Inc. | | | 12 | | | | 488 | |
| Hardinge, Inc. | | | 3 | | | | 52 | |
| Herman Miller, Inc. | | | 18 | | | | 721 | |
| Hillenbrand, Inc. | | | 117 | | | | 5,230 | |
| Huntington Ingalls Industries, Inc. | | | 118 | | | | 27,813 | |
| Illinois Tool Works, Inc. | | | 359 | | | | 59,899 | |
| Interface, Inc. | | | 111 | | | | 2,792 | |
| JB Hunt Transport Services, Inc. | | | 5 | | | | 575 | |
JetBlue Airways Corp. (1) | | | 621 | | | | 13,873 | |
| Kansas City Southern | | | 154 | | | | 16,204 | |
| KBR, Inc. | | | 52 | | | | 1,031 | |
| Kelly Services, Inc. | | | 12 | | | | 327 | |
| Kforce, Inc. | | | 5 | | | | 126 | |
| Kimball International, Inc. | | | 24 | | | | 448 | |
| Korn/Ferry International | | | 92 | | | | 3,807 | |
| Landstar System, Inc. | | | 1 | | | | 104 | |
| LSC Communications, Inc. | | | 100 | | | | 1,515 | |
| ManpowerGroup, Inc. | | | 30 | | | | 3,783 | |
| Matson, Inc. | | | 31 | | | | 925 | |
Meritor, Inc. (1) | | | 47 | | | | 1,103 | |
| Miller Industries, Inc./TN | | | 66 | | | | 1,703 | |
| National Presto Industries, Inc. | | | 4 | | | | 398 | |
| Norfolk Southern Corp. | | | 267 | | | | 38,688 | |
| Old Dominion Freight Line, Inc. | | | 11 | | | | 1,447 | |
| Orbital ATK, Inc. | | | 13 | | | | 1,710 | |
| Owens Corning | | | 101 | | | | 9,286 | |
| Park-Ohio Holdings Corp. | | | 12 | | | | 551 | |
| Primoris Services Corp. | | | 1 | | | | 27 | |
| Quad/Graphics, Inc. | | | 19 | | | | 429 | |
Quanta Services, Inc. (1) | | | 19 | | | | 743 | |
| Robert Half International, Inc. | | | 116 | | | | 6,443 | |
| Rockwell Automation, Inc. | | | 277 | | | | 54,389 | |
| RPX Corp. | | | 65 | | | | 874 | |
Rush Enterprises, Inc. - Class A (1) | | | 34 | | | | 1,728 | |
| Ryder System, Inc. | | | 98 | | | | 8,249 | |
Safe Bulkers, Inc. (1) | | | 30 | | | | 97 | |
Saia, Inc. (1) | | | 3 | | | | 212 | |
SP Plus Corp. (1) | | | 25 | | | | 928 | |
| Spartan Motors, Inc. | | | 17 | | | | 268 | |
| Spirit AeroSystems Holdings, Inc. | | | 178 | | | | 15,531 | |
SPX Corp. (1) | | | 1 | | | | 31 | |
Sterling Construction Co., Inc. (1) | | | 21 | | | | 342 | |
| Toro Co./The | | | 12 | | | | 783 | |
Trex Co., Inc. (1) | | | 2 | | | | 217 | |
TrueBlue, Inc. (1) | | | 106 | | | | 2,915 | |
| Union Pacific Corp. | | | 541 | | | | 72,548 | |
| Universal Forest Products, Inc. | | | 8 | | | | 301 | |
Vectrus, Inc. (1) | | | 17 | | | | 524 | |
WABCO Holdings, Inc. (1) | | | 7 | | | | 1,005 | |
| Watsco, Inc. | | | 6 | | | | 1,020 | |
WESCO International, Inc. (1) | | | 88 | | | | 5,997 | |
| | | | | | | | 626,048 | |
| | | | | | | | | |
| Information Technology — 6.5% | | | | | | | | |
Adobe Systems, Inc. (1) | | | 391 | | | | 68,519 | |
| ADTRAN, Inc. | | | 31 | | | | 600 | |
Advanced Energy Industries, Inc. (1) | | | 36 | | | | 2,429 | |
Alphabet, Inc. - Class A (1) | | | 71 | | | | 74,791 | |
Alphabet, Inc. - Class C (1) | | | 63 | | | | 65,923 | |
Amkor Technology, Inc. (1) | | | 157 | | | | 1,578 | |
ANSYS, Inc. (1) | | | 92 | | | | 13,578 | |
| Apple, Inc. | | | 1,261 | | | | 213,399 | |
| Applied Materials, Inc. | | | 1,191 | | | | 60,884 | |
The accompanying notes are an integral part of these financial statements.
2017 Annual Report | December 31, 2017 | Page 83 |
Schedule of Investments
December 31, 2017
| Conservative Allocation Fund |
| Security Description | | Shares or
Principal
Amount ($) | | Fair
Value ($) |
| Common Stocks — continued |
Applied Optoelectronics, Inc. (1) | | | 2 | | | | 76 | |
Arista Networks, Inc. (1) | | | 48 | | | | 11,308 | |
ARRIS International PLC (1) | | | 315 | | | | 8,092 | |
Aspen Technology, Inc. (1) | | | 227 | | | | 15,027 | |
Atlassian Corp. PLC (1) | | | 1 | | | | 46 | |
Avid Technology, Inc. (1) | | | 66 | | | | 356 | |
Axcelis Technologies, Inc. (1) | | | 7 | | | | 201 | |
| CA, Inc. | | | 823 | | | | 27,389 | |
| Cabot Microelectronics Corp. | | | 1 | | | | 94 | |
Cadence Design Systems, Inc. (1) | | | 786 | | | | 32,871 | |
Care.com, Inc. (1) | | | 5 | | | | 90 | |
Ciena Corp. (1) | | | 164 | | | | 3,433 | |
Cirrus Logic, Inc. (1) | | | 86 | | | | 4,460 | |
| Cisco Systems, Inc. | | | 2,034 | | | | 77,902 | |
| Cognex Corp. | | | 133 | | | | 8,134 | |
| Cohu, Inc. | | | 15 | | | | 329 | |
CommerceHub, Inc. (1) | | | 20 | | | | 412 | |
| Comtech Telecommunications Corp. | | | 59 | | | | 1,305 | |
Control4 Corp. (1) | | | 12 | | | | 357 | |
| Corning, Inc. | | | 517 | | | | 16,539 | |
Dell Technologies, Inc. Class V (1) | | | 156 | | | | 12,680 | |
DHI Group, Inc. (1) | | | 96 | | | | 182 | |
eBay, Inc. (1) | | | 440 | | | | 16,606 | |
Electro Scientific Industries, Inc. (1) | | | 20 | | | | 429 | |
Electronic Arts, Inc. (1) | | | 53 | | | | 5,568 | |
Electronics For Imaging, Inc. (1) | | | 16 | | | | 472 | |
EMCORE Corp. (1) | | | 22 | | | | 142 | |
ePlus, Inc. (1) | | | 9 | | | | 677 | |
Extreme Networks, Inc. (1) | | | 49 | | | | 613 | |
F5 Networks, Inc. (1) | | | 134 | | | | 17,583 | |
Facebook, Inc. (1) | | | 653 | | | | 115,228 | |
| Fair Isaac Corp. | | | 6 | | | | 919 | |
First Solar, Inc. (1) | | | 9 | | | | 608 | |
FormFactor, Inc. (1) | | | 14 | | | | 219 | |
| HP, Inc. | | | 2,655 | | | | 55,782 | |
IAC/InterActiveCorp (1) | | | 21 | | | | 2,568 | |
Ichor Holdings, Ltd. (1) | | | 1 | | | | 25 | |
Instructure, Inc. (1) | | | 6 | | | | 199 | |
| Intel Corp. | | | 1,348 | | | | 62,224 | |
| International Business Machines Corp. | | | 24 | | | | 3,682 | |
| Intuit, Inc. | | | 262 | | | | 41,338 | |
IPG Photonics Corp. (1) | | | 26 | | | | 5,567 | |
| Jabil, Inc. | | | 347 | | | | 9,109 | |
| Juniper Networks, Inc. | | | 88 | | | | 2,508 | |
KEMET Corp. (1) | | | 22 | | | | 331 | |
Kimball Electronics, Inc. (1) | | | 69 | | | | 1,259 | |
| Lam Research Corp. | | | 299 | | | | 55,037 | |
Limelight Networks, Inc. (1) | | | 100 | | | | 441 | |
LivePerson, Inc. (1) | | | 10 | | | | 115 | |
| Mastercard, Inc. | | | 5 | | | | 757 | |
| Methode Electronics, Inc. | | | 49 | | | | 1,965 | |
Micron Technology, Inc. (1) | | | 1,454 | | | | 59,788 | |
| Microsoft Corp. | | | 2,007 | | | | 171,679 | |
| MKS Instruments, Inc. | | | 29 | | | | 2,741 | |
| NetApp, Inc. | | | 45 | | | | 2,489 | |
NETGEAR, Inc. (1) | | | 1 | | | | 59 | |
| NVIDIA Corp. | | | 333 | | | | 64,436 | |
Oclaro, Inc. (1) | | | 20 | | | | 135 | |
ON Semiconductor Corp. (1) | | | 257 | | | | 5,382 | |
| Oracle Corp. | | | 1,160 | | | | 54,845 | |
OSI Systems, Inc. (1) | | | 5 | | | | 322 | |
Perficient, Inc. (1) | | | 34 | | | | 648 | |
Pixelworks, Inc. (1) | | | 7 | | | | 44 | |
| Progress Software Corp. | | | 125 | | | | 5,321 | |
Pure Storage, Inc. (1) | | | 20 | | | | 317 | |
Quantum Corp. (1) | | | 4 | | | | 23 | |
QuinStreet, Inc. (1) | | | 24 | | | | 201 | |
Quotient Technology, Inc. (1) | | | 18 | | | | 212 | |
Red Hat, Inc. (1) | | | 440 | | | | 52,844 | |
RingCentral, Inc. (1) | | | 17 | | | | 823 | |
Rosetta Stone, Inc. (1) | | | 94 | | | | 1,172 | |
Sanmina Corp. (1) | | | 107 | | | | 3,531 | |
ScanSource, Inc. (1) | | | 39 | | | | 1,396 | |
| Skyworks Solutions, Inc. | | | 143 | | | | 13,578 | |
Synchronoss Technologies, Inc. (1) | | | 9 | | | | 80 | |
Synopsys, Inc. (1) | | | 143 | | | | 12,189 | |
Take-Two Interactive Software, Inc. (1) | | | 47 | | | | 5,160 | |
Tech Data Corp. (1) | | | 27 | | | | 2,645 | |
| Teradyne, Inc. | | | 62 | | | | 2,596 | |
| TiVo Corp. | | | 99 | | | | 1,544 | |
| Travelport Worldwide, Ltd. | | | 413 | | | | 5,398 | |
Ultra Clean Holdings, Inc. (1) | | | 14 | | | | 323 | |
| Universal Display Corp. | | | 2 | | | | 345 | |
Vishay Precision Group, Inc. (1) | | | 29 | | | | 729 | |
Web.com Group, Inc. (1) | | | 78 | | | | 1,700 | |
| Western Digital Corp. | | | 342 | | | | 27,199 | |
Xcerra Corp. (1) | | | 12 | | | | 117 | |
| Xerox Corp. | | | 156 | | | | 4,547 | |
XO Group, Inc. (1) | | | 70 | | | | 1,292 | |
Zynga, Inc. (1) | | | 189 | | | | 756 | |
| | | | | | | | 1,633,561 | |
| | | | | | | | | |
| Materials — 0.8% | | | | | | | | |
| A. Schulman, Inc. | | | 18 | | | | 671 | |
The accompanying notes are an integral part of these financial statements.
Page 84 | 2017 Annual Report | December 31, 2017 |
Schedule of Investments
December 31, 2017
| Conservative Allocation Fund |
| Security Description | | Shares or
Principal
Amount ($) | | Fair
Value ($) |
| Common Stocks — continued |
AdvanSix, Inc. (1) | | | 20 | | | | 841 | |
| Alcoa Corp. | | | 116 | | | | 6,249 | |
| Avery Dennison Corp. | | | 12 | | | | 1,378 | |
| Cabot Corp. | | | 41 | | | | 2,525 | |
Crown Holdings, Inc. (1) | | | 356 | | | | 20,025 | |
| Domtar Corp. | | | 85 | | | | 4,209 | |
| Eastman Chemical Co. | | | 6 | | | | 556 | |
Freeport-McMoRan, Inc. (1) | | | 142 | | | | 2,692 | |
| Huntsman Corp. | | | 27 | | | | 899 | |
Ingevity Corp. (1) | | | 15 | | | | 1,057 | |
Koppers Holdings, Inc. (1) | | | 6 | | | | 305 | |
Kraton Corp. (1) | | | 9 | | | | 434 | |
Louisiana-Pacific Corp. (1) | | | 234 | | | | 6,145 | |
| LyondellBasell Industries NV | | | 513 | | | | 56,594 | |
| Materion Corp. | | | 7 | | | | 340 | |
| Newmont Mining Corp. | | | 447 | | | | 16,771 | |
| Nucor Corp. | | | 118 | | | | 7,502 | |
OMNOVA Solutions, Inc. (1) | | | 7 | | | | 70 | |
Owens-Illinois, Inc. (1) | | | 18 | | | | 399 | |
| Reliance Steel & Aluminum Co. | | | 8 | | | | 686 | |
| Southern Copper Corp. | | | 1,052 | | | | 49,917 | |
| Steel Dynamics, Inc. | | | 164 | | | | 7,073 | |
SunCoke Energy, Inc. (1) | | | 11 | | | | 132 | |
| Trinseo SA | | | 50 | | | | 3,630 | |
| Tronox, Ltd. | | | 9 | | | | 185 | |
| Valhi, Inc. | | | 53 | | | | 327 | |
Verso Corp. (1) | | | 24 | | | | 422 | |
| | | | | | | | 192,034 | |
| | | | | | | | | |
| Real Estate Investment Trust — 1.0% | | | | | | | | |
| Apple Hospitality REIT, Inc. | | | 188 | | | | 3,687 | |
| Brixmor Property Group, Inc. | | | 43 | | | | 802 | |
| CBL & Associates Properties, Inc. | | | 20 | | | | 113 | |
| Cedar Realty Trust, Inc. | | | 559 | | | | 3,399 | |
| CubeSmart | | | 249 | | | | 7,201 | |
| DDR Corp. | | | 219 | | | | 1,962 | |
| Essex Property Trust, Inc. | | | 98 | | | | 23,654 | |
| Gaming and Leisure Properties, Inc. | | | 105 | | | | 3,885 | |
| Hospitality Properties Trust | | | 114 | | | | 3,403 | |
| Host Hotels & Resorts, Inc. | | | 388 | | | | 7,702 | |
| Kite Realty Group Trust | | | 191 | | | | 3,744 | |
| Lamar Advertising Co. | | | 53 | | | | 3,935 | |
| Lexington Realty Trust | | | 349 | | | | 3,368 | |
| Liberty Property Trust | | | 104 | | | | 4,473 | |
| Macerich Co./The | | | 16 | | | | 1,051 | |
| Monmouth Real Estate Investment Corp. | | | 262 | | | | 4,664 | |
| New Senior Investment Group, Inc. | | | 445 | | | | 3,364 | |
| One Liberty Properties, Inc. | | | 6 | | | | 156 | |
| Outfront Media, Inc. | | | 8 | | | | 186 | |
| Pennsylvania Real Estate Investment Trust | | | 51 | | | | 606 | |
| Prologis, Inc. | | | 819 | | | | 52,834 | |
| Retail Properties of America, Inc. | | | 300 | | | | 4,032 | |
SBA Communications Corp. (1) | | | 49 | | | | 8,005 | |
| Simon Property Group, Inc. | | | 356 | | | | 61,139 | |
| Spirit Realty Capital, Inc. | | | 423 | | | | 3,629 | |
| Summit Hotel Properties, Inc. | | | 1 | | | | 15 | |
| Taubman Centers, Inc. | | | 12 | | | | 785 | |
| Tier REIT, Inc. | | | 34 | | | | 693 | |
| Uniti Group, Inc. | | | 23 | | | | 409 | |
| VEREIT, Inc. | | | 506 | | | | 3,942 | |
| Vornado Realty Trust | | | 291 | | | | 22,750 | |
| Washington Prime Group, Inc. | | | 96 | | | | 684 | |
| | | | | | | | 240,272 | |
| | | | | | | | | |
| Telecommunication Services — 0.2% | | | | | | | | |
| AT&T, Inc. | | | 244 | | | | 9,487 | |
| Frontier Communications Corp. | | | 11 | | | | 74 | |
General Communication, Inc. (1) | | | 4 | | | | 156 | |
Straight Path Communications, Inc. (1) | | | 1 | | | | 182 | |
| Verizon Communications, Inc. | | | 761 | | | | 40,280 | |
| | | | | | | | 50,179 | |
| | | | | | | | | |
| Utilities — 0.3% | | | | | | | | |
| American States Water Co. | | | 73 | | | | 4,227 | |
| NRG Energy, Inc. | | | 217 | | | | 6,180 | |
| NRG Yield, Inc. | | | 35 | | | | 660 | |
| SJW Group | | | 12 | | | | 766 | |
| UGI Corp. | | | 1,075 | | | | 50,471 | |
Vistra Energy Corp. (1) | | | 311 | | | | 5,694 | |
| | | | | | | | 67,998 | |
| | | | | | | | | |
| Total Common Stocks (Cost $6,309,062) | | | | | | | 6,389,970 | |
| | | | | | | | | |
| Registered Investment Companies — 70.6% |
| Baird Core Plus Bond Fund - Class I | | | 60,845 | | | | 682,685 | |
| DoubleLine Total Return Bond Fund - Class I | | | 35,978 | | | | 382,444 | |
| Frost Total Return Bond Fund - Class I | | | 54,763 | | | | 571,178 | |
| Guggenheim Total Return Bond Fund - Class I | | | 24,444 | | | | 665,359 | |
iShares 1-3 Year Treasury Bond ETF (6) | | | 5,658 | | | | 474,423 | |
iShares 3-7 Year Treasury Bond ETF (6) | | | 21,494 | | | | 2,625,707 | |
iShares 7-10 Year Treasury Bond ETF (6) | | | 28,648 | | | | 3,024,374 | |
The accompanying notes are an integral part of these financial statements.
2017 Annual Report | December 31, 2017 | Page 85 |
Schedule of Investments
December 31, 2017
| Conservative Allocation Fund |
| Security Description | | Shares or
Principal
Amount ($) | | Fair
Value ($) |
| Registered Investment Companies — continued |
iShares Core U.S. Aggregate Bond ETF (6) | | | 17,286 | | | | 1,889,878 | |
iShares iBoxx $High Yield Corporate Bond ETF (6) | | | 4,664 | | | | 406,981 | |
iShares JP Morgan USD Emerging Markets Bond ETF (6) | | | 8,124 | | | | 943,196 | |
| JPMorgan Core Plus Bond Fund - Class L | | | 80,302 | | | | 664,097 | |
| Lord Abbett High Yield Fund - Class I | | | 124,594 | | | | 964,354 | |
| Metropolitan West Total Return Bond Fund - Class I | | | 27,592 | | | | 294,134 | |
| PIMCO Investment Grade Corporate Bond Fund - Class I | | | 31,018 | | | | 326,924 | |
| Pioneer Bond Fund - Class Y | | | 47,296 | | | | 455,937 | |
| Prudential Total Return Bond Fund - Class Z | | | 53,167 | | | | 775,180 | |
SPDR Bloomberg Barclays High Yield Bond ETF (6) | | | 11,099 | | | | 407,555 | |
| TCW Emerging Markets Income Fund - Class I | | | 113,675 | | | | 970,782 | |
Vanguard Total Bond Market ETF (6) | | | 13,529 | | | | 1,103,563 | |
| Total Registered Investment Companies (Cost $17,639,713) | | | | | | | 17,628,751 | |
| | | | | | | | | |
| Money Market Registered Investment Companies — 1.4% |
Meeder Institutional Prime Money Market Fund, 1.32% (2) | | | 349,562 | | | | 349,527 | |
| Total Money Market Registered Investment Companies (Cost $349,527) | | | | | | | 349,527 | |
| | | | | | | | | |
| Bank Obligations — 2.0% | | | | | | | | |
Bank Midwest Deposit Account, 1.00%, 1/2/2018 (3) | | | 248,989 | | | | 248,989 | |
Pacific Premier Bank Deposit Account, 1.05%, 1/2/2018 (3) | | | 249,199 | | | | 249,199 | |
| Total Bank Obligations (Cost $498,189) | | | | | | | 498,188 | |
| Total Investments — 99.6% (Cost $24,796,491) | | | | | | | 24,866,436 | |
| Other Assets less Liabilities — 0.4% | | | | | | | 99,253 | |
| Total Net Assets — 100.0% | | | | | | | 24,965,689 | |
| | | | | | | | | |
Trustee Deferred Compensation (4) | | | | | | | | |
| Meeder Aggressive Allocation Fund | | | 1,763 | | | | 18,423 | |
| Meeder Balanced Fund | | | 886 | | | | 10,286 | |
| Meeder Dynamic Allocation Fund | | | 611 | | | | 6,629 | |
| Meeder Muirfield Fund | | | 834 | | | | 6,288 | |
| Meeder Conservative Allocation Fund | | | 245 | | | | 5,522 | |
| Total Trustee Deferred Compensation (Cost $40,885) | | | | | | | 47,148 | |
| Conservative Allocation Fund |
| | | Contracts | | Expiration Date | | Notional Value of Contracts ($) | | Value and Unrealized Appreciation (Depreciation) ($) |
| Futures Contracts |
| Index Futures | | | | | | | | | | | | | | |
| Mini MSCI EAFE Index Futures | | | 4 | | | 3/16/2018 | | | 409,100 | | | | 5,309 | |
| Mini MSCI Emerging Markets Index Futures | | | 2 | | | 3/16/2018 | | | 116,370 | | | | 3,809 | |
| Standard & Poors 500 Mini Futures | | | 1 | | | 3/16/2018 | | | 133,800 | | | | (690 | ) |
| Total Futures Contracts | | | 7 | | | | | | 659,270 | | | | 8,428 | |
(1) | Represents non-income producing securities. |
(2) | Investment in affiliate. The yield shown represents the 7-day yield in effect at December 31, 2017. |
(3) | Variable rate security. Securities payable at par including accrued interest (usually within seven days notice) and unconditionally secured as to principal and interest by letters of credit or other credit support agreements from major banks. The interest rates are adjustable and are not based on a published reference rate and spread but are determined by the issuer or agent and are based on current market conditions. These securities do not indicate a reference rate and spread in their description above. The rate shown represents the rate in effect at December 31, 2017. The maturity date shown, if applicable, reflects the earlier of the next demand date or stated maturity date. |
(4) | Assets of affiliates to the Conservative Allocation Fund held for the benefit of the Fund’s Trustees in connection with the Trustees Deferred Compensation Plan. |
(5) | Fair valued security deemed as Level 3 security. |
The accompanying notes are an integral part of these financial statements.
Page 86 | 2017 Annual Report | December 31, 2017 |
Schedule of Investments
December 31, 2017
| Moderate Allocation Fund |
| Security Description | | Shares or
Principal
Amount ($) | | Fair
Value ($) |
| Common Stocks — 43.1% |
| Consumer Discretionary — 4.2% | | | | | | | | |
1-800-Flowers.com, Inc. (1) | | | 123 | | | | 1,316 | |
| Aaron's, Inc. | | | 86 | | | | 3,427 | |
| Abercrombie & Fitch Co. | | | 4 | | | | 70 | |
| Adient PLC | | | 88 | | | | 6,926 | |
Amazon.com, Inc. (1) | | | 412 | | | | 481,822 | |
American Axle & Manufacturing Holdings, Inc. (1) | | | 433 | | | | 7,374 | |
| Aramark | | | 818 | | | | 34,961 | |
Asbury Automotive Group, Inc. (1) | | | 4 | | | | 256 | |
Ascena Retail Group, Inc. (1) | | | 212 | | | | 498 | |
Ascent Capital Group, Inc. (1) | | | 79 | | | | 908 | |
| Barnes & Noble, Inc. | | | 38 | | | | 255 | |
| Bassett Furniture Industries, Inc. | | | 37 | | | | 1,391 | |
Beazer Homes USA, Inc. (1) | | | 87 | | | | 1,671 | |
| Bed Bath & Beyond, Inc. | | | 710 | | | | 15,613 | |
| Best Buy Co., Inc. | | | 464 | | | | 31,770 | |
| Big Lots, Inc. | | | 373 | | | | 20,944 | |
| BJ's Restaurants, Inc. | | | 31 | | | | 1,128 | |
| Bloomin' Brands, Inc. | | | 59 | | | | 1,259 | |
Bridgepoint Education, Inc. (1) | | | 401 | | | | 3,328 | |
Buffalo Wild Wings, Inc. (1) | | | 16 | | | | 2,502 | |
Burlington Stores, Inc. (1) | | | 188 | | | | 23,130 | |
Cambium Learning Group, Inc. (1) | | | 279 | | | | 1,585 | |
| Capella Education Co. | | | 17 | | | | 1,316 | |
| Carter's, Inc. | | | 110 | | | | 12,924 | |
| Cato Corp./The | | | 92 | | | | 1,465 | |
Century Casinos, Inc. (1) | | | 185 | | | | 1,689 | |
| Chico's FAS, Inc. | | | 304 | | | | 2,681 | |
| Children's Place, Inc./The | | | 40 | | | | 5,814 | |
| Citi Trends, Inc. | | | 60 | | | | 1,588 | |
| Comcast Corp. | | | 3,156 | | | | 126,398 | |
Cooper-Standard Holdings, Inc. (1) | | | 117 | | | | 14,333 | |
| Dana, Inc. | | | 787 | | | | 25,192 | |
Denny's Corp. (1) | | | 79 | | | | 1,046 | |
| Dollar General Corp. | | | 2,608 | | | | 242,570 | |
Dollar Tree, Inc. (1) | | | 1,186 | | | | 127,270 | |
| DSW, Inc. | | | 182 | | | | 3,897 | |
| Entravision Communications Corp. | | | 278 | | | | 1,988 | |
| Extended Stay America, Inc. | | | 366 | | | | 6,954 | |
| Finish Line, Inc./The | | | 28 | | | | 407 | |
| Foot Locker, Inc. | | | 12 | | | | 563 | |
Francesca's Holdings Corp. (1) | | | 345 | | | | 2,522 | |
FTD Cos., Inc. (1) | | | 24 | | | | 173 | |
Funko, Inc. (1) | | | 55 | | | | 366 | |
GameStop Corp. (2) | | | 510 | | | | 9,155 | |
| Gannett Co., Inc. | | | 317 | | | | 3,674 | |
| Gap, Inc./The | | | 467 | | | | 15,906 | |
| General Motors Co. | | | 6,548 | | | | 268,403 | |
| GNC Holdings, Inc. | | | 198 | | | | 731 | |
Grand Canyon Education, Inc. (1) | | | 175 | | | | 15,668 | |
Gray Television, Inc. (1) | | | 209 | | | | 3,501 | |
| Group 1 Automotive, Inc. | | | 17 | | | | 1,206 | |
| H&R Block, Inc. | | | 207 | | | | 5,428 | |
| Hamilton Beach Brands Holding Co. | | | 8 | | | | 206 | |
| Haverty Furniture Cos., Inc. | | | 9 | | | | 204 | |
Hibbett Sports, Inc. (1) | | | 47 | | | | 959 | |
Hilton Grand Vacations, Inc. (1) | | | 14 | | | | 587 | |
| Home Depot, Inc./The | | | 2,359 | | | | 447,101 | |
| Hooker Furniture Corp. | | | 24 | | | | 1,019 | |
| HSN, Inc. | | | 11 | | | | 444 | |
Iconix Brand Group, Inc. (1) | | | 220 | | | | 284 | |
J Alexander's Holdings, Inc. (1) | | | 144 | | | | 1,397 | |
J. Jill, Inc. (1) | | | 232 | | | | 1,810 | |
| Jack in the Box, Inc. | | | 141 | | | | 13,834 | |
Kirkland's, Inc. (1) | | | 40 | | | | 479 | |
| Kohl's Corp. | | | 378 | | | | 20,499 | |
| LCI Industries | | | 14 | | | | 1,820 | |
| Lear Corp. | | | 543 | | | | 95,926 | |
Liberty Interactive Corp. QVC Group (1) | | | 877 | | | | 21,416 | |
| Liberty Tax, Inc. | | | 4 | | | | 44 | |
Liberty TripAdvisor Holdings, Inc. (1) | | | 32 | | | | 302 | |
Live Nation Entertainment, Inc. (1) | | | 309 | | | | 13,154 | |
Lululemon Athletica, Inc. (1) | | | 154 | | | | 12,103 | |
| Macy's, Inc. | | | 31 | | | | 781 | |
MCBC Holdings, Inc. (1) | | | 51 | | | | 1,133 | |
MDC Partners, Inc. (1) | | | 177 | | | | 1,726 | |
Michael Kors Holdings, Ltd. (1) | | | 593 | | | | 37,329 | |
Michaels Cos., Inc./The (1) | | | 306 | | | | 7,402 | |
Modine Manufacturing Co. (1) | | | 194 | | | | 3,919 | |
Monarch Casino & Resort, Inc. (1) | | | 13 | | | | 583 | |
| Nutrisystem, Inc. | | | 32 | | | | 1,683 | |
NVR, Inc. (1) | | | 14 | | | | 49,115 | |
| Office Depot, Inc. | | | 2,293 | | | | 8,117 | |
Ollie's Bargain Outlet Holdings, Inc. (1) | | | 52 | | | | 2,769 | |
Overstock.com, Inc. (1) | | | 23 | | | | 1,470 | |
Penn National Gaming, Inc. (1) | | | 595 | | | | 18,641 | |
| Pier 1 Imports, Inc. | | | 403 | | | | 1,668 | |
Pinnacle Entertainment, Inc. (1) | | | 258 | | | | 8,444 | |
| PulteGroup, Inc. | | | 2,072 | | | | 68,894 | |
| RCI Hospitality Holdings, Inc. | | | 20 | | | | 560 | |
Regis Corp. (1) | | | 46 | | | | 707 | |
RH (1) | | | 34 | | | | 2,931 | |
| Ross Stores, Inc. | | | 860 | | | | 69,015 | |
The accompanying notes are an integral part of these financial statements.
2017 Annual Report | December 31, 2017 | Page 87 |
Schedule of Investments
December 31, 2017
| Moderate Allocation Fund |
| Security Description | | Shares or
Principal
Amount ($) | | Fair
Value ($) |
| Common Stocks — continued |
| Royal Caribbean Cruises, Ltd. | | | 27 | | | | 3,221 | |
| Ruth's Hospitality Group, Inc. | | | 256 | | | | 5,542 | |
| Salem Media Group, Inc. | | | 32 | | | | 144 | |
Sally Beauty Holdings, Inc. (1) | | | 208 | | | | 3,902 | |
| Shoe Carnival, Inc. | | | 50 | | | | 1,338 | |
| Signet Jewelers, Ltd. | | | 207 | | | | 11,706 | |
Skechers U.S.A., Inc. (1) | | | 327 | | | | 12,374 | |
Sleep Number Corp. (1) | | | 201 | | | | 7,556 | |
Steven Madden, Ltd. (1) | | | 11 | | | | 514 | |
Stoneridge, Inc. (1) | | | 229 | | | | 5,235 | |
| Tailored Brands, Inc. | | | 126 | | | | 2,751 | |
| Target Corp. | | | 1,717 | | | | 112,034 | |
Taylor Morrison Home Corp. (1) | | | 761 | | | | 18,622 | |
| Thor Industries, Inc. | | | 216 | | | | 32,556 | |
| Tilly's, Inc. | | | 93 | | | | 1,373 | |
| Time, Inc. | | | 102 | | | | 1,882 | |
TopBuild Corp. (1) | | | 60 | | | | 4,544 | |
| Tower International, Inc. | | | 121 | | | | 3,697 | |
Townsquare Media, Inc. (1) | | | 59 | | | | 453 | |
| Tractor Supply Co. | | | 19 | | | | 1,420 | |
tronc, Inc. (1) | | | 22 | | | | 387 | |
| VF Corp. | | | 857 | | | | 63,418 | |
Weight Watchers International, Inc. (1) | | | 31 | | | | 1,373 | |
| Weyco Group, Inc. | | | 11 | | | | 327 | |
| Yum China Holdings, Inc. | | | 451 | | | | 18,049 | |
ZAGG, Inc. (1) | | | 25 | | | | 461 | |
Zumiez, Inc. (1) | | | 2 | | | | 42 | |
| | | | | | | | 2,782,358 | |
| | | | | | | | | |
| Consumer Staples — 2.3% | | | | | | | | |
| Archer-Daniels-Midland Co. | | | 971 | | | | 38,918 | |
| Casey's General Stores, Inc. | | | 28 | | | | 3,134 | |
| Costco Wholesale Corp. | | | 1,078 | | | | 200,637 | |
| CVS Health Corp. | | | 4,016 | | | | 291,160 | |
| Kroger Co./The | | | 3,015 | | | | 82,762 | |
| PepsiCo, Inc. | | | 79 | | | | 9,474 | |
Performance Food Group Co. (1) | | | 828 | | | | 27,407 | |
Pilgrim's Pride Corp. (1) | | | 61 | | | | 1,895 | |
| Sanderson Farms, Inc. | | | 46 | | | | 6,384 | |
Sprouts Farmers Market, Inc. (1) | | | 466 | | | | 11,347 | |
| Sysco Corp. | | | 555 | | | | 33,705 | |
| Tyson Foods, Inc. | | | 2,929 | | | | 237,454 | |
| Village Super Market, Inc. | | | 282 | | | | 6,466 | |
| Walgreens Boots Alliance, Inc. | | | 3,862 | | | | 280,458 | |
| Wal-Mart Stores, Inc. | | | 3,059 | | | | 302,076 | |
| | | | | | | | 1,533,277 | |
| | | | | | | | | |
| Energy — 2.2% | | | | | | | | |
Abraxas Petroleum Corp. (1) | | | 400 | | | | 984 | |
| Adams Resources & Energy, Inc. | | | 45 | | | | 1,958 | |
| Andeavor | | | 620 | | | | 70,891 | |
| Arch Coal, Inc. | | | 128 | | | | 11,924 | |
| Cabot Oil & Gas Corp. | | | 1,356 | | | | 38,782 | |
| Chevron Corp. | | | 1,065 | | | | 133,327 | |
CNX Resources Corp. (1) | | | 474 | | | | 6,935 | |
CONSOL Energy, Inc. (1) | | | 52 | | | | 2,055 | |
| CVR Energy, Inc. | | | 86 | | | | 3,203 | |
| Delek US Holdings, Inc. | | | 276 | | | | 9,643 | |
Exterran Corp. (1) | | | 441 | | | | 13,865 | |
| Exxon Mobil Corp. | | | 4,277 | | | | 357,728 | |
| HollyFrontier Corp. | | | 671 | | | | 34,369 | |
Isramco, Inc. (1) | | | 32 | | | | 3,349 | |
Mammoth Energy Services, Inc. (1) | | | 49 | | | | 962 | |
| Marathon Petroleum Corp. | | | 3,742 | | | | 246,897 | |
Matrix Service Co. (1) | | | 151 | | | | 2,688 | |
McDermott International, Inc. (1) | | | 2,147 | | | | 14,127 | |
Midstates Petroleum Co., Inc. (1) | | | 178 | | | | 2,951 | |
Natural Gas Services Group, Inc. (1) | | | 81 | | | | 2,122 | |
Overseas Shipholding Group, Inc. (1) | | | 322 | | | | 882 | |
Pacific Ethanol, Inc. (1) | | | 296 | | | | 1,347 | |
Par Pacific Holdings, Inc. (1) | | | 228 | | | | 4,396 | |
| PBF Energy, Inc. | | | 311 | | | | 11,025 | |
Peabody Energy Corp. (1) | | | 225 | | | | 8,858 | |
PHI, Inc. (1) | | | 6 | | | | 69 | |
| Phillips 66 | | | 1,751 | | | | 177,114 | |
ProPetro Holding Corp. (1) | | | 245 | | | | 4,939 | |
RigNet, Inc. (1) | | | 78 | | | | 1,166 | |
Rowan Cos. Plc (1) | | | 176 | | | | 2,756 | |
| RPC, Inc. | | | 1,007 | | | | 25,709 | |
SandRidge Energy, Inc. (1) | | | 300 | | | | 6,321 | |
SilverBow Resources, Inc. (1) | | | 23 | | | | 684 | |
Solaris Oilfield Infrastructure, Inc. (1) | | | 35 | | | | 749 | |
Southwestern Energy Co. (1) | | | 596 | | | | 3,326 | |
Stone Energy Corp. (1) | | | 81 | | | | 2,605 | |
Unit Corp. (1) | | | 55 | | | | 1,210 | |
| Valero Energy Corp. | | | 2,789 | | | | 256,337 | |
W&T Offshore, Inc. (1) | | | 1,200 | | | | 3,972 | |
Westmoreland Coal Co. (1) | | | 985 | | | | 1,192 | |
| World Fuel Services Corp. | | | 74 | | | | 2,082 | |
| | | | | | | | 1,475,499 | |
| | | | | | | | | |
| Financials — 8.0% | | | | | | | | |
| Allstate Corp./The | | | 1,667 | | | | 174,552 | |
| Ally Financial, Inc. | | | 646 | | | | 18,837 | |
The accompanying notes are an integral part of these financial statements.
Page 88 | 2017 Annual Report | December 31, 2017 |
Schedule of Investments
December 31, 2017
| Moderate Allocation Fund |
| Security Description | | Shares or
Principal
Amount ($) | | Fair
Value ($) |
| Common Stocks — continued |
| American Equity Investment Life Holding Co. | | | 541 | | | | 16,625 | |
| Annaly Capital Management, Inc. | | | 18,003 | | | | 214,056 | |
| Artisan Partners Asset Management, Inc. | | | 267 | | | | 10,547 | |
| Banco Latinoamericano de Comercio Exterior SA | | | 257 | | | | 6,913 | |
| Bank of America Corp. | | | 16,445 | | | | 485,456 | |
| Bank of New York Mellon Corp./The | | | 131 | | | | 7,056 | |
| Bank of NT Butterfield & Son, Ltd./The | | | 611 | | | | 22,173 | |
| Banner Corp. | | | 11 | | | | 606 | |
| BB&T Corp. | | | 5,123 | | | | 254,716 | |
Berkshire Hathaway, Inc. (1) | | | 3,086 | | | | 611,707 | |
| BGC Partners, Inc. | | | 1,938 | | | | 29,283 | |
| C&F Financial Corp. | | | 65 | | | | 3,770 | |
Cannae Holdings, Inc. (1) | | | 728 | | | | 12,398 | |
| Carolina Financial Corp. | | | 155 | | | | 5,758 | |
| Cboe Global Markets, Inc. | | | 205 | | | | 25,541 | |
| Central Valley Community Bancorp | | | 244 | | | | 4,924 | |
| Century Bancorp, Inc./MA | | | 36 | | | | 2,817 | |
| Chimera Investment Corp. | | | 806 | | | | 14,895 | |
| Citigroup, Inc. | | | 5,627 | | | | 418,705 | |
| Citizens Financial Group, Inc. | | | 13 | | | | 546 | |
| CNB Financial Corp./PA | | | 124 | | | | 3,254 | |
| CNO Financial Group, Inc. | | | 622 | | | | 15,357 | |
| Columbia Banking System, Inc. | | | 163 | | | | 7,081 | |
| Comerica, Inc. | | | 558 | | | | 48,440 | |
Eagle Bancorp, Inc. (1) | | | 201 | | | | 11,638 | |
| Employers Holdings, Inc. | | | 4 | | | | 178 | |
Encore Capital Group, Inc. (1) | | | 188 | | | | 7,915 | |
Enova International, Inc. (1) | | | 209 | | | | 3,177 | |
Essent Group, Ltd. (1) | | | 703 | | | | 30,524 | |
| Evans Bancorp, Inc. | | | 69 | | | | 2,891 | |
| Evercore, Inc. | | | 312 | | | | 28,080 | |
EZCORP, Inc. (1) | | | 73 | | | | 891 | |
| Fidelity Southern Corp. | | | 554 | | | | 12,077 | |
| Fifth Third Bancorp | | | 7,749 | | | | 235,105 | |
| First American Financial Corp. | | | 1,511 | | | | 84,676 | |
| First Bancorp/Southern Pines NC | | | 798 | | | | 28,177 | |
| First Busey Corp. | | | 1,429 | | | | 42,784 | |
| First Community Bancshares, Inc./VA | | | 31 | | | | 891 | |
| FirstCash, Inc. | | | 496 | | | | 33,455 | |
Genworth Financial, Inc. (1) | | | 519 | | | | 1,614 | |
| Great Southern Bancorp, Inc. | | | 109 | | | | 5,630 | |
Green Dot Corp. (1) | | | 85 | | | | 5,122 | |
| Guaranty Bancorp | | | 41 | | | | 1,134 | |
Health Insurance Innovations, Inc. (1) | | | 34 | | | | 848 | |
| Heartland Financial USA, Inc. | | | 113 | | | | 6,062 | |
| Heritage Commerce Corp. | | | 509 | | | | 7,798 | |
| Heritage Financial Corp./WA | | | 204 | | | | 6,283 | |
| Houlihan Lokey, Inc. | | | 684 | | | | 31,074 | |
| Huntington Bancshares, Inc./OH | | | 15,863 | | | | 230,965 | |
| Independent Bank Corp./MI | | | 63 | | | | 1,408 | |
| Infinity Property & Casualty Corp. | | | 14 | | | | 1,484 | |
| Invesco Mortgage Capital, Inc. | | | 1,549 | | | | 27,619 | |
| JPMorgan Chase & Co. | | | 4,863 | | | | 520,049 | |
| Kemper Corp. | | | 116 | | | | 7,992 | |
| Kinsale Capital Group, Inc. | | | 36 | | | | 1,620 | |
| Lazard, Ltd. | | | 697 | | | | 36,593 | |
LendingTree, Inc. (1) | | | 8 | | | | 2,724 | |
| MainSource Financial Group, Inc. | | | 38 | | | | 1,380 | |
MGIC Investment Corp. (1) | | | 2,241 | | | | 31,621 | |
| Moelis & Co. | | | 296 | | | | 14,356 | |
| MSCI, Inc. | | | 229 | | | | 28,978 | |
| New Residential Investment Corp. | | | 3,515 | | | | 62,848 | |
NewStar Financial, Inc. Contingent Value Rights (1) (7) | | | 31 | | | | 0 | |
Nicolet Bankshares, Inc. (1) | | | 121 | | | | 6,624 | |
NMI Holdings, Inc. (1) | | | 291 | | | | 4,947 | |
| Northeast Bancorp | | | 69 | | | | 1,597 | |
| Northrim BanCorp, Inc. | | | 145 | | | | 4,908 | |
| Old Republic International Corp. | | | 5 | | | | 107 | |
| OM Asset Management Plc | | | 38 | | | | 637 | |
| Oppenheimer Holdings, Inc. | | | 127 | | | | 3,404 | |
PennyMac Financial Services, Inc. (1) | | | 368 | | | | 8,225 | |
| Peoples Bancorp of North Carolina, Inc. | | | 37 | | | | 1,136 | |
| People's Utah Bancorp | | | 109 | | | | 3,303 | |
| Piper Jaffray Cos. | | | 75 | | | | 6,469 | |
| PNC Financial Services Group, Inc./The | | | 1,987 | | | | 286,704 | |
| Preferred Bank/Los Angeles CA | | | 27 | | | | 1,587 | |
| Premier Financial Bancorp, Inc. | | | 158 | | | | 3,173 | |
| Progressive Corp./The | | | 85 | | | | 4,787 | |
| Pzena Investment Management, Inc. | | | 255 | | | | 2,721 | |
| Radian Group, Inc. | | | 938 | | | | 19,332 | |
| RBB Bancorp | | | 64 | | | | 1,752 | |
Regional Management Corp. (1) | | | 15 | | | | 395 | |
| Regions Financial Corp. | | | 12,132 | | | | 209,641 | |
| Safety Insurance Group, Inc. | | | 16 | | | | 1,286 | |
| Santander Consumer USA Holdings, Inc. | | | 15 | | | | 279 | |
| SEI Investments Co. | | | 1,179 | | | | 84,723 | |
| Selective Insurance Group, Inc. | | | 80 | | | | 4,696 | |
| Shore Bancshares, Inc. | | | 134 | | | | 2,238 | |
| Sierra Bancorp | | | 13 | | | | 345 | |
| Silvercrest Asset Management Group, Inc. | | | 106 | | | | 1,701 | |
| Stewart Information Services Corp. | | | 56 | | | | 2,369 | |
The accompanying notes are an integral part of these financial statements.
2017 Annual Report | December 31, 2017 | Page 89 |
Schedule of Investments
December 31, 2017
| Moderate Allocation Fund |
| Security Description | | Shares or
Principal
Amount ($) | | Fair
Value ($) |
| Common Stocks — continued |
| Summit Financial Group, Inc. | | | 22 | | | | 579 | |
| Synovus Financial Corp. | | | 329 | | | | 15,772 | |
| T Rowe Price Group, Inc. | | | 2,198 | | | | 230,636 | |
Third Point Reinsurance, Ltd. (1) | | | 472 | | | | 6,915 | |
| Timberland Bancorp, Inc./WA | | | 3 | | | | 80 | |
| TriCo Bancshares | | | 418 | | | | 15,825 | |
Triumph Bancorp, Inc. (1) | | | 249 | | | | 7,844 | |
| Umpqua Holdings Corp. | | | 3,052 | | | | 63,482 | |
| United Security Bancshares/Fresno CA | | | 68 | | | | 748 | |
| Unity Bancorp, Inc. | | | 17 | | | | 336 | |
| Univest Corp of Pennsylvania | | | 4 | | | | 112 | |
Walker & Dunlop, Inc. (1) | | | 17 | | | | 808 | |
| WashingtonFirst Bankshares, Inc. | | | 146 | | | | 5,002 | |
| Wells Fargo & Co. | | | 4,788 | | | | 290,488 | |
Western Alliance Bancorp (1) | | | 196 | | | | 11,098 | |
| Wintrust Financial Corp. | | | 175 | | | | 14,415 | |
World Acceptance Corp. (1) | | | 60 | | | | 4,843 | |
| | | | | | | | 5,311,743 | |
| | | | | | | | | |
| Healthcare — 7.9% | | | | | | | | |
| Abbott Laboratories | | | 597 | | | | 34,071 | |
| AbbVie, Inc. | | | 2,063 | | | | 199,513 | |
Abeona Therapeutics, Inc. (1) | | | 67 | | | | 1,062 | |
ABIOMED, Inc. (1) | | | 144 | | | | 26,987 | |
Acorda Therapeutics, Inc. (1) | | | 112 | | | | 2,402 | |
Adamas Pharmaceuticals, Inc. (1) | | | 47 | | | | 1,593 | |
| Aetna, Inc. | | | 1,521 | | | | 274,373 | |
| Agilent Technologies, Inc. | | | 1,431 | | | | 95,834 | |
Aimmune Therapeutics, Inc. (1) | | | 79 | | | | 2,988 | |
Alexion Pharmaceuticals, Inc. (1) | | | 485 | | | | 58,001 | |
Align Technology, Inc. (1) | | | 142 | | | | 31,551 | |
Almost Family, Inc. (1) | | | 15 | | | | 830 | |
Alnylam Pharmaceuticals, Inc. (1) | | | 165 | | | | 20,963 | |
AMAG Pharmaceuticals, Inc. (1) | | | 225 | | | | 2,981 | |
| Amgen, Inc. | | | 569 | | | | 98,949 | |
Amphastar Pharmaceuticals, Inc. (1) | | | 113 | | | | 2,174 | |
AnaptysBio, Inc. (1) | | | 26 | | | | 2,619 | |
ANI Pharmaceuticals, Inc. (1) | | | 26 | | | | 1,676 | |
| Anthem, Inc. | | | 1,222 | | | | 274,962 | |
Arena Pharmaceuticals, Inc. (1) | | | 66 | | | | 2,242 | |
Assembly Biosciences, Inc. (1) | | | 25 | | | | 1,131 | |
Audentes Therapeutics, Inc. (1) | | | 35 | | | | 1,094 | |
AxoGen, Inc. (1) | | | 17 | | | | 481 | |
| Baxter International, Inc. | | | 3,741 | | | | 241,818 | |
Biogen, Inc. (1) | | | 893 | | | | 284,483 | |
Bio-Rad Laboratories, Inc. (1) | | | 54 | | | | 12,888 | |
BioSpecifics Technologies Corp. (1) | | | 88 | | | | 3,813 | |
Bioverativ, Inc. (1) | | | 303 | | | | 16,338 | |
Bluebird Bio, Inc. (1) | | | 71 | | | | 12,645 | |
Blueprint Medicines Corp. (1) | | | 62 | | | | 4,675 | |
| Bristol-Myers Squibb Co. | | | 3,617 | | | | 221,650 | |
| Bruker Corp. | | | 268 | | | | 9,198 | |
Calithera Biosciences, Inc. (1) | | | 181 | | | | 1,511 | |
Catalent, Inc. (1) | | | 471 | | | | 19,349 | |
Catalyst Pharmaceuticals, Inc. (1) | | | 306 | | | | 1,196 | |
Centene Corp. (1) | | | 737 | | | | 74,349 | |
Cerner Corp. (1) | | | 1,701 | | | | 114,630 | |
Charles River Laboratories International, Inc. (1) | | | 113 | | | | 12,368 | |
| Chemed Corp. | | | 50 | | | | 12,151 | |
ChemoCentryx, Inc. (1) | | | 18 | | | | 107 | |
| Cigna Corp. | | | 1,106 | | | | 224,618 | |
Concert Pharmaceuticals, Inc. (1) | | | 46 | | | | 1,190 | |
| Cooper Cos., Inc./The | | | 30 | | | | 6,536 | |
Corcept Therapeutics, Inc. (1) | | | 193 | | | | 3,486 | |
CorVel Corp. (1) | | | 18 | | | | 952 | |
Cutera, Inc. (1) | | | 2 | | | | 91 | |
CytomX Therapeutics, Inc. (1) | | | 139 | | | | 2,934 | |
Dynavax Technologies Corp. (1) | | | 121 | | | | 2,263 | |
Eagle Pharmaceuticals, Inc./DE (1) | | | 46 | | | | 2,457 | |
Editas Medicine, Inc. (1) | | | 47 | | | | 1,444 | |
Emergent BioSolutions, Inc. (1) | | | 284 | | | | 13,197 | |
Enanta Pharmaceuticals, Inc. (1) | | | 56 | | | | 3,286 | |
Encompass Health Corp. (1) | | | 412 | | | | 20,357 | |
Endo International PLC (1) | | | 263 | | | | 2,038 | |
Enzo Biochem, Inc. (1) | | | 285 | | | | 2,323 | |
Esperion Therapeutics, Inc. (1) | | | 13 | | | | 856 | |
Exact Sciences Corp. (1) | | | 291 | | | | 15,289 | |
Exactech, Inc. (1) | | | 11 | | | | 544 | |
Exelixis, Inc. (1) | | | 534 | | | | 16,234 | |
Fate Therapeutics, Inc. (1) | | | 19 | | | | 116 | |
FibroGen, Inc. (1) | | | 6 | | | | 284 | |
FONAR Corp. (1) | | | 41 | | | | 998 | |
Foundation Medicine, Inc. (1) | | | 35 | | | | 2,387 | |
Genomic Health, Inc. (1) | | | 163 | | | | 5,575 | |
| Gilead Sciences, Inc. | | | 2,805 | | | | 200,950 | |
Global Blood Therapeutics, Inc. (1) | | | 26 | | | | 1,023 | |
Globus Medical, Inc. (1) | | | 87 | | | | 3,576 | |
Haemonetics Corp. (1) | | | 161 | | | | 9,351 | |
| Hill-Rom Holdings, Inc. | | | 198 | | | | 16,689 | |
| Humana, Inc. | | | 1,015 | | | | 251,791 | |
Idera Pharmaceuticals, Inc. (1) | | | 516 | | | | 1,089 | |
Ignyta, Inc. (1) | | | 35 | | | | 935 | |
Illumina, Inc. (1) | | | 44 | | | | 9,614 | |
The accompanying notes are an integral part of these financial statements.
Page 90 | 2017 Annual Report | December 31, 2017 |
Schedule of Investments
December 31, 2017
| Moderate Allocation Fund |
| Security Description | | Shares or
Principal
Amount ($) | | Fair
Value ($) |
| Common Stocks — continued |
ImmunoGen, Inc. (1) | | | 30 | | | | 192 | |
Immunomedics, Inc. (1) | | | 15 | | | | 242 | |
Impax Laboratories, Inc. (1) | | | 44 | | | | 733 | |
Incyte Corp. (1) | | | 15 | | | | 1,421 | |
Inogen, Inc. (1) | | | 6 | | | | 714 | |
Insmed, Inc. (1) | | | 45 | | | | 1,403 | |
Integer Holdings Corp. (1) | | | 167 | | | | 7,565 | |
Intellia Therapeutics, Inc. (1) | | | 42 | | | | 807 | |
Intersect ENT, Inc. (1) | | | 86 | | | | 2,786 | |
Intuitive Surgical, Inc. (1) | | | 756 | | | | 275,895 | |
Ionis Pharmaceuticals, Inc. (1) | | | 13 | | | | 654 | |
Iovance Biotherapeutics, Inc. (1) | | | 106 | | | | 848 | |
IQVIA Holdings, Inc. (1) | | | 542 | | | | 53,062 | |
| Johnson & Johnson | | | 3,327 | | | | 464,848 | |
Juno Therapeutics, Inc. (1) | | | 114 | | | | 5,211 | |
Kura Oncology, Inc. (1) | | | 33 | | | | 505 | |
Lannett Co., Inc. (1) | | | 50 | | | | 1,160 | |
Lantheus Holdings, Inc. (1) | | | 25 | | | | 511 | |
LHC Group, Inc. (1) | | | 98 | | | | 6,003 | |
LivaNova PLC (1) | | | 106 | | | | 8,472 | |
| Luminex Corp. | | | 363 | | | | 7,151 | |
Madrigal Pharmaceuticals, Inc. (1) | | | 30 | | | | 2,754 | |
Magellan Health, Inc. (1) | | | 1 | | | | 97 | |
Masimo Corp. (1) | | | 30 | | | | 2,544 | |
| McKesson Corp. | | | 770 | | | | 120,082 | |
MediciNova, Inc. (1) | | | 22 | | | | 142 | |
| Merck & Co., Inc. | | | 845 | | | | 47,548 | |
Merit Medical Systems, Inc. (1) | | | 7 | | | | 302 | |
Mersana Therapeutics, Inc. (1) | | | 22 | | | | 361 | |
Mettler-Toledo International, Inc. (1) | | | 62 | | | | 38,410 | |
Molina Healthcare, Inc. (1) | | | 102 | | | | 7,821 | |
Momenta Pharmaceuticals, Inc. (1) | | | 64 | | | | 893 | |
Mylan NV (1) | | | 797 | | | | 33,721 | |
MyoKardia, Inc. (1) | | | 38 | | | | 1,600 | |
Myriad Genetics, Inc. (1) | | | 136 | | | | 4,671 | |
NantKwest, Inc. (1) | | | 88 | | | | 395 | |
Nektar Therapeutics (1) | | | 202 | | | | 12,063 | |
Omeros Corp. (1) | | | 29 | | | | 563 | |
Orthofix International NV (1) | | | 106 | | | | 5,798 | |
PDL BioPharma, Inc. (1) | | | 1,025 | | | | 2,809 | |
| PerkinElmer, Inc. | | | 269 | | | | 19,669 | |
| Perrigo Co. PLC | | | 92 | | | | 8,019 | |
| Pfizer, Inc. | | | 6,706 | | | | 242,891 | |
| Phibro Animal Health Corp. | | | 55 | | | | 1,843 | |
Pieris Pharmaceuticals, Inc. (1) | | | 188 | | | | 1,419 | |
Premier, Inc. (1) | | | 910 | | | | 26,563 | |
Protagonist Therapeutics, Inc. (1) | | | 46 | | | | 957 | |
Providence Service Corp./The (1) | | | 98 | | | | 5,815 | |
Puma Biotechnology, Inc. (1) | | | 30 | | | | 2,966 | |
Quality Systems, Inc. (1) | | | 238 | | | | 3,232 | |
RadNet, Inc. (1) | | | 226 | | | | 2,283 | |
Recro Pharma, Inc. (1) | | | 149 | | | | 1,378 | |
Regeneron Pharmaceuticals, Inc. (1) | | | 153 | | | | 57,522 | |
REGENXBIO, Inc. (1) | | | 49 | | | | 1,629 | |
Rhythm Pharmaceuticals, Inc. (1) | | | 10 | | | | 291 | |
Rigel Pharmaceuticals, Inc. (1) | | | 139 | | | | 539 | |
Sage Therapeutics, Inc. (1) | | | 32 | | | | 5,271 | |
Sangamo Therapeutics, Inc. (1) | | | 175 | | | | 2,870 | |
Select Medical Holdings Corp. (1) | | | 93 | | | | 1,641 | |
Spectrum Pharmaceuticals, Inc. (1) | | | 245 | | | | 4,643 | |
Stemline Therapeutics, Inc. (1) | | | 73 | | | | 1,139 | |
Supernus Pharmaceuticals, Inc. (1) | | | 105 | | | | 4,184 | |
Tabula Rasa HealthCare, Inc. (1) | | | 14 | | | | 393 | |
| Teleflex, Inc. | | | 1 | | | | 249 | |
Triple-S Management Corp. (1) | | | 103 | | | | 2,560 | |
United Therapeutics Corp. (1) | | | 170 | | | | 25,152 | |
| UnitedHealth Group, Inc. | | | 1,458 | | | | 321,431 | |
Vanda Pharmaceuticals, Inc. (1) | | | 236 | | | | 3,587 | |
VBI Vaccines, Inc. (1) | | | 71 | | | | 303 | |
Veracyte, Inc. (1) | | | 239 | | | | 1,561 | |
Vertex Pharmaceuticals, Inc. (1) | | | 1,560 | | | | 233,782 | |
Waters Corp. (1) | | | 102 | | | | 19,705 | |
WaVe Life Sciences, Ltd. (1) | | | 2 | | | | 70 | |
WellCare Health Plans, Inc. (1) | | | 301 | | | | 60,534 | |
| Zoetis, Inc. | | | 681 | | | | 49,059 | |
Zogenix, Inc. (1) | | | 66 | | | | 2,643 | |
| | | | | | | | 5,246,669 | |
| | | | | | | | | |
| Industrials — 3.7% | | | | | | | | |
Aegion Corp. (1) | | | 143 | | | | 3,636 | |
| Aircastle, Ltd. | | | 198 | | | | 4,631 | |
| Alamo Group, Inc. | | | 32 | | | | 3,612 | |
| Allison Transmission Holdings, Inc. | | | 413 | | | | 17,788 | |
| Applied Industrial Technologies, Inc. | | | 387 | | | | 26,355 | |
ARC Document Solutions, Inc. (1) | | | 335 | | | | 854 | |
| ArcBest Corp. | | | 99 | | | | 3,539 | |
| Argan, Inc. | | | 140 | | | | 6,300 | |
Beacon Roofing Supply, Inc. (1) | | | 141 | | | | 8,990 | |
Blue Bird Corp. (1) | | | 296 | | | | 5,890 | |
| Boeing Co./The | | | 1,307 | | | | 385,447 | |
| Briggs & Stratton Corp. | | | 138 | | | | 3,501 | |
| Brink's Co./The | | | 23 | | | | 1,810 | |
Builders FirstSource, Inc. (1) | | | 384 | | | | 8,367 | |
| BWX Technologies, Inc. | | | 180 | | | | 10,888 | |
The accompanying notes are an integral part of these financial statements.
2017 Annual Report | December 31, 2017 | Page 91 |
Schedule of Investments
December 31, 2017
| Moderate Allocation Fund |
| Security Description | | Shares or
Principal
Amount ($) | | Fair
Value ($) |
| Common Stocks — continued |
Caesarstone, Ltd. (1) | | | 30 | | | | 660 | |
CAI International, Inc. (1) | | | 7 | | | | 198 | |
Casella Waste Systems, Inc. (1) | | | 65 | | | | 1,496 | |
| Comfort Systems USA, Inc. | | | 182 | | | | 7,944 | |
Commercial Vehicle Group, Inc. (1) | | | 83 | | | | 887 | |
Continental Building Products, Inc. (1) | | | 233 | | | | 6,559 | |
| Copa Holdings SA | | | 109 | | | | 14,613 | |
| Costamare, Inc. | | | 81 | | | | 467 | |
Covenant Transportation Group, Inc. (1) | | | 58 | | | | 1,666 | |
| CSX Corp. | | | 668 | | | | 36,747 | |
| Cummins, Inc. | | | 421 | | | | 74,365 | |
| Curtiss-Wright Corp. | | | 16 | | | | 1,950 | |
| Delta Air Lines, Inc. | | | 704 | | | | 39,424 | |
| Eaton Corp. PLC | | | 3,243 | | | | 256,229 | |
| EMCOR Group, Inc. | | | 340 | | | | 27,795 | |
| EnPro Industries, Inc. | | | 77 | | | | 7,200 | |
| Forward Air Corp. | | | 35 | | | | 2,010 | |
Genco Shipping & Trading, Ltd. (1) | | | 24 | | | | 320 | |
| Global Brass & Copper Holdings, Inc. | | | 128 | | | | 4,237 | |
GMS, Inc. (1) | | | 246 | | | | 9,259 | |
| Graco, Inc. | | | 195 | | | | 8,818 | |
| Greenbrier Cos., Inc./The | | | 113 | | | | 6,023 | |
| H&E Equipment Services, Inc. | | | 54 | | | | 2,195 | |
| Hardinge, Inc. | | | 12 | | | | 209 | |
| Hawaiian Holdings, Inc. | | | 105 | | | | 4,184 | |
HD Supply Holdings, Inc. (1) | | | 183 | | | | 7,325 | |
| Herman Miller, Inc. | | | 33 | | | | 1,322 | |
| Hillenbrand, Inc. | | | 382 | | | | 17,075 | |
| Hubbell, Inc. | | | 84 | | | | 11,369 | |
| Huntington Ingalls Industries, Inc. | | | 848 | | | | 199,874 | |
| Hyster-Yale Materials Handling, Inc. | | | 45 | | | | 3,832 | |
| Illinois Tool Works, Inc. | | | 404 | | | | 67,407 | |
| Ingersoll-Rand PLC | | | 26 | | | | 2,319 | |
| Interface, Inc. | | | 243 | | | | 6,111 | |
| JB Hunt Transport Services, Inc. | | | 92 | | | | 10,578 | |
JetBlue Airways Corp. (1) | | | 2,044 | | | | 45,663 | |
| Kansas City Southern | | | 701 | | | | 73,759 | |
| KBR, Inc. | | | 398 | | | | 7,892 | |
| Kelly Services, Inc. | | | 90 | | | | 2,454 | |
| Korn/Ferry International | | | 363 | | | | 15,021 | |
| LSC Communications, Inc. | | | 104 | | | | 1,576 | |
| ManpowerGroup, Inc. | | | 132 | | | | 16,647 | |
Masonite International Corp. (1) | | | 8 | | | | 593 | |
| Matson, Inc. | | | 131 | | | | 3,909 | |
Meritor, Inc. (1) | | | 281 | | | | 6,592 | |
| Miller Industries, Inc./TN | | | 144 | | | | 3,715 | |
| MSC Industrial Direct Co., Inc. | | | 9 | | | | 870 | |
| National Presto Industries, Inc. | | | 14 | | | | 1,392 | |
| Old Dominion Freight Line, Inc. | | | 371 | | | | 48,805 | |
| Orbital ATK, Inc. | | | 59 | | | | 7,759 | |
| Owens Corning | | | 689 | | | | 63,347 | |
| Park-Ohio Holdings Corp. | | | 42 | | | | 1,930 | |
| Primoris Services Corp. | | | 10 | | | | 272 | |
| Quad/Graphics, Inc. | | | 51 | | | | 1,153 | |
Quanta Services, Inc. (1) | | | 564 | | | | 22,058 | |
| Robert Half International, Inc. | | | 459 | | | | 25,493 | |
| Rockwell Automation, Inc. | | | 722 | | | | 141,765 | |
| RPX Corp. | | | 21 | | | | 282 | |
Rush Enterprises, Inc. - Class A (1) | | | 214 | | | | 10,873 | |
| Ryder System, Inc. | | | 382 | | | | 32,153 | |
Safe Bulkers, Inc. (1) | | | 214 | | | | 691 | |
| Scorpio Bulkers, Inc. | | | 58 | | | | 429 | |
SP Plus Corp. (1) | | | 15 | | | | 557 | |
| Spartan Motors, Inc. | | | 48 | | | | 756 | |
| Spirit AeroSystems Holdings, Inc. | | | 786 | | | | 68,579 | |
Sterling Construction Co., Inc. (1) | | | 111 | | | | 1,807 | |
| Toro Co./The | | | 117 | | | | 7,632 | |
| Triton International, Ltd./Bermuda | | | 48 | | | | 1,798 | |
TrueBlue, Inc. (1) | | | 356 | | | | 9,790 | |
| Union Pacific Corp. | | | 2,398 | | | | 321,572 | |
United Continental Holdings, Inc. (1) | | | 298 | | | | 20,085 | |
| Universal Forest Products, Inc. | | | 90 | | | | 3,386 | |
| Valmont Industries, Inc. | | | 27 | | | | 4,478 | |
Vectrus, Inc. (1) | | | 55 | | | | 1,697 | |
| Wabash National Corp. | | | 62 | | | | 1,345 | |
WABCO Holdings, Inc. (1) | | | 129 | | | | 18,512 | |
| Watsco, Inc. | | | 312 | | | | 53,052 | |
WESCO International, Inc. (1) | | | 433 | | | | 29,509 | |
| | | | | | | | 2,415,923 | |
| | | | | | | | | |
| Information Technology — 12.0% | | | | | | | | |
Adobe Systems, Inc. (1) | | | 1,740 | | | | 304,918 | |
| ADTRAN, Inc. | | | 283 | | | | 5,476 | |
Advanced Energy Industries, Inc. (1) | | | 156 | | | | 10,527 | |
Alphabet, Inc. - Class A (1) | | | 513 | | | | 540,394 | |
Alphabet, Inc. - Class C (1) | | | 84 | | | | 87,898 | |
| American Software, Inc./GA | | | 116 | | | | 1,349 | |
Amkor Technology, Inc. (1) | | | 608 | | | | 6,110 | |
ANSYS, Inc. (1) | | | 453 | | | | 66,858 | |
Appfolio, Inc. (1) | | | 6 | | | | 249 | |
| Apple, Inc. | | | 6,179 | | | | 1,045,672 | |
| Applied Materials, Inc. | | | 5,271 | | | | 269,454 | |
Applied Optoelectronics, Inc. (1) | | | 18 | | | | 681 | |
Arista Networks, Inc. (1) | | | 126 | | | | 29,683 | |
The accompanying notes are an integral part of these financial statements.
Page 92 | 2017 Annual Report | December 31, 2017 |
Schedule of Investments
December 31, 2017
| Moderate Allocation Fund |
| Security Description | | Shares or
Principal
Amount ($) | | Fair
Value ($) |
| Common Stocks — continued |
ARRIS International PLC (1) | | | 2,327 | | | | 59,781 | |
Arrow Electronics, Inc. (1) | | | 111 | | | | 8,926 | |
Aspen Technology, Inc. (1) | | | 830 | | | | 54,946 | |
Avid Technology, Inc. (1) | | | 226 | | | | 1,218 | |
Axcelis Technologies, Inc. (1) | | | 86 | | | | 2,468 | |
| Bel Fuse, Inc. | | | 9 | | | | 227 | |
Benchmark Electronics, Inc. (1) | | | 212 | | | | 6,169 | |
Bottomline Technologies de, Inc. (1) | | | 86 | | | | 2,982 | |
| Brooks Automation, Inc. | | | 98 | | | | 2,337 | |
| CA, Inc. | | | 3,495 | | | | 116,314 | |
| Cabot Microelectronics Corp. | | | 17 | | | | 1,599 | |
CACI International, Inc. (1) | | | 15 | | | | 1,985 | |
Cadence Design Systems, Inc. (1) | | | 2,678 | | | | 111,994 | |
CalAmp Corp. (1) | | | 8 | | | | 171 | |
Callidus Software, Inc. (1) | | | 31 | | | | 888 | |
Carbonite, Inc. (1) | | | 88 | | | | 2,209 | |
Care.com, Inc. (1) | | | 31 | | | | 559 | |
| CDK Global, Inc. | | | 45 | | | | 3,208 | |
Ciena Corp. (1) | | | 863 | | | | 18,063 | |
Cirrus Logic, Inc. (1) | | | 442 | | | | 22,922 | |
| Cisco Systems, Inc. | | | 9,650 | | | | 369,595 | |
| Cognex Corp. | | | 492 | | | | 30,091 | |
| Cohu, Inc. | | | 192 | | | | 4,214 | |
CommerceHub, Inc. (1) | | | 100 | | | | 2,059 | |
| Comtech Telecommunications Corp. | | | 161 | | | | 3,561 | |
Control4 Corp. (1) | | | 40 | | | | 1,190 | |
| Convergys Corp. | | | 288 | | | | 6,768 | |
| Corning, Inc. | | | 158 | | | | 5,054 | |
Dell Technologies, Inc. Class V (1) | | | 1,055 | | | | 85,750 | |
DHI Group, Inc. (1) | | | 650 | | | | 1,235 | |
Digi International, Inc. (1) | | | 51 | | | | 487 | |
Diodes, Inc. (1) | | | 69 | | | | 1,978 | |
| Dolby Laboratories, Inc. | | | 52 | | | | 3,224 | |
Eastman Kodak Co. (1) | | | 434 | | | | 1,345 | |
eBay, Inc. (1) | | | 1,880 | | | | 70,951 | |
Electro Scientific Industries, Inc. (1) | | | 72 | | | | 1,543 | |
Electronic Arts, Inc. (1) | | | 756 | | | | 79,425 | |
Endurance International Group Holdings, Inc. (1) | | | 80 | | | | 672 | |
| Entegris, Inc. | | | 141 | | | | 4,293 | |
ePlus, Inc. (1) | | | 35 | | | | 2,632 | |
Etsy, Inc. (1) | | | 24 | | | | 491 | |
Everi Holdings, Inc. (1) | | | 126 | | | | 950 | |
Extreme Networks, Inc. (1) | | | 196 | | | | 2,454 | |
F5 Networks, Inc. (1) | | | 456 | | | | 59,836 | |
Facebook, Inc. (1) | | | 3,099 | | | | 546,850 | |
| Fair Isaac Corp. | | | 70 | | | | 10,724 | |
First Solar, Inc. (1) | | | 125 | | | | 8,440 | |
Five9, Inc. (1) | | | 164 | | | | 4,080 | |
FormFactor, Inc. (1) | | | 186 | | | | 2,911 | |
Fortinet, Inc. (1) | | | 21 | | | | 917 | |
| HP, Inc. | | | 11,850 | | | | 248,969 | |
IAC/InterActiveCorp (1) | | | 193 | | | | 23,600 | |
Instructure, Inc. (1) | | | 119 | | | | 3,939 | |
| Intel Corp. | | | 6,909 | | | | 318,919 | |
| International Business Machines Corp. | | | 133 | | | | 20,405 | |
Intevac, Inc. (1) | | | 178 | | | | 1,219 | |
| Intuit, Inc. | | | 1,578 | | | | 248,977 | |
IPG Photonics Corp. (1) | | | 123 | | | | 26,338 | |
| Jabil, Inc. | | | 1,170 | | | | 30,713 | |
| Juniper Networks, Inc. | | | 1,574 | | | | 44,859 | |
KEMET Corp. (1) | | | 104 | | | | 1,566 | |
Kimball Electronics, Inc. (1) | | | 227 | | | | 4,143 | |
| Lam Research Corp. | | | 1,328 | | | | 244,445 | |
Limelight Networks, Inc. (1) | | | 283 | | | | 1,248 | |
LivePerson, Inc. (1) | | | 17 | | | | 196 | |
| Marvell Technology Group, Ltd. | | | 355 | | | | 7,622 | |
| Methode Electronics, Inc. | | | 251 | | | | 10,065 | |
Micron Technology, Inc. (1) | | | 6,198 | | | | 254,862 | |
| Microsoft Corp. | | | 9,981 | | | | 853,775 | |
Mitek Systems, Inc. (1) | | | 95 | | | | 850 | |
| MKS Instruments, Inc. | | | 157 | | | | 14,837 | |
NCR Corp. (1) | | | 311 | | | | 10,571 | |
| NetApp, Inc. | | | 142 | | | | 7,855 | |
NETGEAR, Inc. (1) | | | 54 | | | | 3,173 | |
| NVIDIA Corp. | | | 1,547 | | | | 299,345 | |
ON Semiconductor Corp. (1) | | | 1,724 | | | | 36,101 | |
| Oracle Corp. | | | 5,083 | | | | 240,324 | |
OSI Systems, Inc. (1) | | | 112 | | | | 7,211 | |
| PC Connection, Inc. | | | 61 | | | | 1,599 | |
Perficient, Inc. (1) | | | 150 | | | | 2,861 | |
Pixelworks, Inc. (1) | | | 33 | | | | 209 | |
| Progress Software Corp. | | | 503 | | | | 21,413 | |
Pure Storage, Inc. (1) | | | 330 | | | | 5,234 | |
Qualys, Inc. (1) | | | 43 | | | | 2,552 | |
QuinStreet, Inc. (1) | | | 76 | | | | 637 | |
Red Hat, Inc. (1) | | | 2,017 | | | | 242,242 | |
RingCentral, Inc. (1) | | | 156 | | | | 7,550 | |
Rogers Corp. (1) | | | 4 | | | | 648 | |
Rosetta Stone, Inc. (1) | | | 325 | | | | 4,053 | |
Rudolph Technologies, Inc. (1) | | | 182 | | | | 4,350 | |
Sanmina Corp. (1) | | | 547 | | | | 18,051 | |
ScanSource, Inc. (1) | | | 225 | | | | 8,055 | |
Semtech Corp. (1) | | | 132 | | | | 4,514 | |
The accompanying notes are an integral part of these financial statements.
2017 Annual Report | December 31, 2017 | Page 93 |
Schedule of Investments
December 31, 2017
| Moderate Allocation Fund |
| Security Description | | Shares or
Principal
Amount ($) | | Fair
Value ($) |
| Common Stocks — continued |
| Skyworks Solutions, Inc. | | | 760 | | | | 72,162 | |
SMART Global Holdings, Inc. (1) | | | 2 | | | | 67 | |
Stamps.com, Inc. (1) | | | 22 | | | | 4,136 | |
Synopsys, Inc. (1) | | | 1,169 | | | | 99,646 | |
Take-Two Interactive Software, Inc. (1) | | | 271 | | | | 29,750 | |
Tech Data Corp. (1) | | | 214 | | | | 20,966 | |
| Teradyne, Inc. | | | 461 | | | | 19,302 | |
| Texas Instruments, Inc. | | | 1,115 | | | | 116,451 | |
| TiVo Corp. | | | 425 | | | | 6,630 | |
| Travelport Worldwide, Ltd. | | | 1,553 | | | | 20,298 | |
Ultra Clean Holdings, Inc. (1) | | | 88 | | | | 2,032 | |
| Universal Display Corp. | | | 36 | | | | 6,215 | |
USA Technologies, Inc. (1) | | | 164 | | | | 1,599 | |
Varonis Systems, Inc. (1) | | | 47 | | | | 2,282 | |
Verint Systems, Inc. (1) | | | 134 | | | | 5,608 | |
| Versum Materials, Inc. | | | 19 | | | | 719 | |
Vishay Precision Group, Inc. (1) | | | 66 | | | | 1,660 | |
Web.com Group, Inc. (1) | | | 227 | | | | 4,949 | |
| Western Digital Corp. | | | 920 | | | | 73,168 | |
Xcerra Corp. (1) | | | 55 | | | | 538 | |
| Xerox Corp. | | | 1,071 | | | | 31,220 | |
XO Group, Inc. (1) | | | 223 | | | | 4,117 | |
Yelp, Inc. (1) | | | 117 | | | | 4,909 | |
Zynga, Inc. (1) | | | 782 | | | | 3,128 | |
| | | | | | | | 7,923,602 | |
| | | | | | | | | |
| Materials — 1.1% | | | | | | | | |
| A. Schulman, Inc. | | | 7 | | | | 261 | |
AdvanSix, Inc. (1) | | | 44 | | | | 1,851 | |
| Alcoa Corp. | | | 464 | | | | 24,996 | |
| Avery Dennison Corp. | | | 167 | | | | 19,182 | |
| Boise Cascade Co. | | | 21 | | | | 838 | |
| Cabot Corp. | | | 166 | | | | 10,224 | |
Crown Holdings, Inc. (1) | | | 1,451 | | | | 81,619 | |
| Domtar Corp. | | | 123 | | | | 6,091 | |
| Eastman Chemical Co. | | | 60 | | | | 5,558 | |
Freeport-McMoRan, Inc. (1) | | | 1,543 | | | | 29,255 | |
| Huntsman Corp. | | | 493 | | | | 16,412 | |
Ingevity Corp. (1) | | | 21 | | | | 1,480 | |
| Innophos Holdings, Inc. | | | 44 | | | | 2,056 | |
Koppers Holdings, Inc. (1) | | | 15 | | | | 764 | |
Kraton Corp. (1) | | | 79 | | | | 3,805 | |
Louisiana-Pacific Corp. (1) | | | 642 | | | | 16,859 | |
| LyondellBasell Industries NV | | | 2,292 | | | | 252,853 | |
| Newmont Mining Corp. | | | 2,060 | | | | 77,291 | |
| Nucor Corp. | | | 542 | | | | 34,460 | |
OMNOVA Solutions, Inc. (1) | | | 217 | | | | 2,170 | |
| Reliance Steel & Aluminum Co. | | | 130 | | | | 11,153 | |
| Southern Copper Corp. | | | 1,201 | | | | 56,987 | |
| Steel Dynamics, Inc. | | | 679 | | | | 29,285 | |
| Trinseo SA | | | 173 | | | | 12,560 | |
| Valhi, Inc. | | | 133 | | | | 821 | |
Verso Corp. (1) | | | 124 | | | | 2,179 | |
| Warrior Met Coal, Inc. | | | 24 | | | | 604 | |
| | | | | | | | 701,614 | |
| | | | | | | | | |
| Real Estate Investment Trust — 0.8% | | | | | | | | |
| Apple Hospitality REIT, Inc. | | | 12 | | | | 235 | |
| Brixmor Property Group, Inc. | | | 846 | | | | 15,786 | |
| CBL & Associates Properties, Inc. | | | 143 | | | | 809 | |
| Cedar Realty Trust, Inc. | | | 1,335 | | | | 8,117 | |
| CubeSmart | | | 791 | | | | 22,876 | |
| DDR Corp. | | | 918 | | | | 8,225 | |
| Essex Property Trust, Inc. | | | 301 | | | | 72,652 | |
| Gaming and Leisure Properties, Inc. | | | 85 | | | | 3,145 | |
| Global Net Lease, Inc. | | | 16 | | | | 329 | |
| Hospitality Properties Trust | | | 223 | | | | 6,657 | |
| Host Hotels & Resorts, Inc. | | | 651 | | | | 12,922 | |
| Investors Real Estate Trust | | | 295 | | | | 1,676 | |
| Invitation Homes, Inc. | | | 280 | | | | 6,600 | |
| Kite Realty Group Trust | | | 248 | | | | 4,861 | |
| Lamar Advertising Co. | | | 154 | | | | 11,433 | |
| Lexington Realty Trust | | | 1,186 | | | | 11,445 | |
| Liberty Property Trust | | | 669 | | | | 28,774 | |
| Monmouth Real Estate Investment Corp. | | | 258 | | | | 4,592 | |
| New Senior Investment Group, Inc. | | | 503 | | | | 3,803 | |
| Pennsylvania Real Estate Investment Trust | | | 149 | | | | 1,772 | |
| Prologis, Inc. | | | 985 | | | | 63,542 | |
| RAIT Financial Trust | | | 1,688 | | | | 633 | |
| RE/MAX Holdings, Inc. | | | 4 | | | | 194 | |
| Realogy Holdings Corp. | | | 145 | | | | 3,843 | |
Redfin Corp. (1) | | | 35 | | | | 1,096 | |
| Retail Properties of America, Inc. | | | 648 | | | | 8,709 | |
SBA Communications Corp. (1) | | | 156 | | | | 25,484 | |
| Simon Property Group, Inc. | | | 296 | | | | 50,835 | |
| SL Green Realty Corp. | | | 40 | | | | 4,037 | |
| Spirit Realty Capital, Inc. | | | 358 | | | | 3,072 | |
| Taubman Centers, Inc. | | | 97 | | | | 6,347 | |
| Tier REIT, Inc. | | | 166 | | | | 3,385 | |
| VEREIT, Inc. | | | 5,129 | | | | 39,955 | |
| Vornado Realty Trust | | | 1,082 | | | | 84,591 | |
| Washington Prime Group, Inc. | | | 505 | | | | 3,596 | |
| | | | | | | | 526,028 | |
The accompanying notes are an integral part of these financial statements.
Page 94 | 2017 Annual Report | December 31, 2017 |
Schedule of Investments
December 31, 2017
| Moderate Allocation Fund |
| Security Description | | Shares or
Principal
Amount ($) | | Fair
Value ($) |
| Common Stocks — continued |
| Telecommunication Services — 0.3% | | | | | | | | |
| Verizon Communications, Inc. | | | 3,733 | | | | 197,588 | |
| | | | | | | | 197,588 | |
| | | | | | | | | |
| Utilities — 0.6% | | | | | | | | |
| American States Water Co. | | | 17 | | | | 984 | |
Atlantic Power Corp. (1) | | | 1,380 | | | | 3,243 | |
| CenterPoint Energy, Inc. | | | 5,114 | | | | 145,033 | |
Dynegy, Inc. (1) | | | 150 | | | | 1,778 | |
| NRG Energy, Inc. | | | 845 | | | | 24,066 | |
| NRG Yield, Inc. | | | 843 | | | | 15,891 | |
| UGI Corp. | | | 3,461 | | | | 162,494 | |
| Vectren Corp. | | | 487 | | | | 31,665 | |
Vistra Energy Corp. (1) | | | 1,775 | | | | 32,499 | |
| | | | | | | | 417,653 | |
| | | | | | | | | |
| Total Common Stocks (Cost $26,652,134) | | | | | | | 28,531,954 | |
| | | | | | | | | |
| Registered Investment Companies — 50.5% |
| Baird Core Plus Bond Fund - Class I | | | 106,326 | | | | 1,192,974 | |
| DoubleLine Total Return Bond Fund - Class I | | | 61,931 | | | | 658,327 | |
| Frost Total Return Bond Fund - Class I | | | 95,262 | | | | 993,584 | |
| Guggenheim Total Return Bond Fund - Class I | | | 42,421 | | | | 1,154,697 | |
iShares 1-3 Year Treasury Bond ETF (8) | | | 9,932 | | | | 832,798 | |
iShares 3-7 Year Treasury Bond ETF (8) | | | 40,607 | | | | 4,960,551 | |
iShares 7-10 Year Treasury Bond ETF (8) | | | 54,441 | | | | 5,747,336 | |
iShares Core U.S. Aggregate Bond ETF (8) | | | 44,149 | | | | 4,826,810 | |
iShares iBoxx $ High Yield Corporate Bond ETF (8) | | | 9,559 | | | | 834,118 | |
iShares JP Morgan USD Emerging Markets Bond ETF (8) | | | 16,382 | | | | 1,901,950 | |
| JPMorgan Core Plus Bond Fund - Class L | | | 140,149 | | | | 1,159,033 | |
| Lord Abbett High Yield Fund - Class I | | | 216,688 | | | | 1,677,164 | |
| Metropolitan West Total Return Bond Fund - Class I | | | 50,647 | | | | 539,896 | |
| PIMCO Investment Grade Corporate Bond Fund - Class I | | | 53,539 | | | | 564,296 | |
| Pioneer Bond Fund - Class Y | | | 83,080 | | | | 800,894 | |
| Prudential Total Return Bond Fund - Class Z | | | 93,057 | | | | 1,356,767 | |
SPDR Bloomberg Barclays High Yield Bond ETF (8) | | | 22,916 | | | | 841,476 | |
| TCW Emerging Markets Income Fund - Class I | | | 200,302 | | | | 1,710,580 | |
Vanguard Total Bond Market ETF (8) | | | 19,707 | | | | 1,607,500 | |
| Total Registered Investment Companies (Cost $33,389,951) | | | | | | | 33,360,751 | |
| | | | | | | | | |
| Money Market Registered Investment Companies — 4.3% |
Morgan Stanley Government Institutional Fund, 1.20% (3) | | | 7,413 | | | | 7,413 | |
Meeder Institutional Prime Money Market Fund, 1.32% (4) | | | 2,822,928 | | | | 2,822,646 | |
| Total Money Market Registered Investment Companies (Cost $2,830,059) | | | | | | | 2,830,059 | |
| | | | | | | | | |
| Bank Obligations — 1.5% |
Bank Midwest Deposit Account, 1.00%, 1/2/2018 (5) | | | 248,990 | | | | 248,990 | |
Metro City Bank Deposit Account, 1.00%, 1/2/2018 (5) | | | 248,000 | | | | 248,000 | |
Pacific Premier Bank Deposit Account, 1.05%, 1/2/2018 (5) | | | 249,198 | | | | 249,198 | |
Seacoast Community Bank Deposit Account, 1.00%, 1/2/2018 (5) | | | 249,000 | | | | 249,000 | |
| Total Bank Obligations (Cost $995,188) | | | | | | | 995,188 | |
| Total Investments — 99.4% (Cost $63,867,332) | | | | | | | 65,717,952 | |
| Other Assets less Liabilities — 0.6% | | | | | | | 401,034 | |
| Total Net Assets — 100.0% | | | | | | | 66,118,986 | |
| | | | | | | | | |
| Trustee Deferred Compensation (6) |
| Meeder Aggressive Allocation Fund | | | 177 | | | | 1,850 | |
| Meeder Balanced Fund | | | 100 | | | | 1,161 | |
| Meeder Dynamic Allocation Fund | | | 64 | | | | 694 | |
| Meeder Muirfield Fund | | | 126 | | | | 950 | |
| Meeder Conservative Allocation Fund | | | 29 | | | | 654 | |
| Total Trustee Deferred Compensation (Cost $5,079) | | | | | | | 5,309 | |
The accompanying notes are an integral part of these financial statements.
2017 Annual Report | December 31, 2017 | Page 95 |
Schedule of Investments
December 31, 2017
| Moderate Allocation Fund |
| | | Contracts | | Expiration Date | | Notional Value of Contracts ($) | | Value and Unrealized Appreciation (Depreciation) ($) |
| Futures Contracts |
| Index Futures | | | | | | | | | | | | | | |
| Mini MSCI EAFE Index Futures | | | 19 | | | 3/16/2018 | | | 1,943,225 | | | | 29,779 | |
| Mini MSCI Emerging Markets Index Futures | | | 7 | | | 3/16/2018 | | | 407,295 | | | | 15,565 | |
| Standard & Poors 500 Mini Futures | | | 6 | | | 3/16/2018 | | | 802,800 | | | | (5,345 | ) |
| Total Futures Contracts | | | 32 | | | | | | 3,153,320 | | | | 39,999 | |
(1) | Represents non-income producing securities. |
(2) | All or a portion of this security is on loan. |
(3) | Investment purchased as securities lending collateral. The yield shown represents the 7-day yield in effect at December 31, 2017. |
(4) | Investment in affiliate. The yield shown represents the 7-day yield in effect at December 31, 2017. |
(5) | Variable rate security. Securities payable at par including accrued interest (usually within seven days notice) and unconditionally secured as to principal and interest by letters of credit or other credit support agreements from major banks. The interest rates are adjustable and are not based on a published reference rate and spread but are determined by the issuer or agent and are based on current market conditions. These securities do not indicate a reference rate and spread in their description above. The rate shown represents the rate in effect at December 31, 2017. The maturity date shown, if applicable, reflects the earlier of the next demand date or stated maturity date. |
(6) | Assets of affiliates to the Moderate Allocation Fund held for the benefit of the Fund’s Trustees in connection with the Trustee Deferred Compensation Plan. |
(7) | Fair valued security deemed as Level 3 security. |
The accompanying notes are an integral part of these financial statements.
Page 96 | 2017 Annual Report | December 31, 2017 |
Schedule of Investments
December 31, 2017
| Total Return Bond Fund |
| Security Description | | Shares or
Principal
Amount ($) | | Fair
Value ($) |
| Registered Investment Companies — 95.9% |
| Baird Core Plus Bond Fund - Class I | | | 667,630 | | | | 7,490,811 | |
| DoubleLine Total Return Bond Fund - Class I | | | 394,068 | | | | 4,188,947 | |
| Frost Total Return Bond Fund - Class I | | | 599,304 | | | | 6,250,743 | |
| Guggenheim Total Return Bond Fund - Class I | | | 270,057 | | | | 7,350,953 | |
iShares 1-3 Year Treasury Bond ETF (4) | | | 50,061 | | | | 4,197,615 | |
iShares 3-7 Year Treasury Bond ETF (4) | | | 207,271 | | | | 25,320,225 | |
iShares 7-10 Year Treasury Bond ETF (4) | | | 280,487 | | | | 29,611,013 | |
iShares Core U.S. Aggregate Bond ETF (4) | | | 183,021 | | | | 20,009,686 | |
iShares iBoxx $ High Yield Corporate Bond ETF (4) | | | 104,285 | | | | 9,099,909 | |
iShares JP Morgan USD Emerging Markets Bond ETF (4) | | | 107,843 | | | | 12,520,572 | |
| JPMorgan Core Plus Bond Fund - Class L | | | 888,581 | | | | 7,348,564 | |
| Lord Abbett High Yield Fund - Class I | | | 258,938 | | | | 2,004,182 | |
| Metropolitan West Total Return Bond Fund - Class I | | | 302,493 | | | | 3,224,578 | |
| PIMCO Investment Grade Corporate Bond Fund - Class I | | | 341,832 | | | | 3,602,910 | |
| Pioneer Bond Fund - Class Y | | | 520,294 | | | | 5,015,633 | |
| Prudential Total Return Bond Fund - Class Z | | | 586,766 | | | | 8,555,051 | |
SPDR Bloomberg Barclays High Yield Bond ETF (4) | | | 243,822 | | | | 8,953,144 | |
| TCW Emerging Markets Income Fund - Class I | | | 760,198 | | | | 6,492,090 | |
Vanguard Total Bond Market ETF (4) | | | 115,100 | | | | 9,388,708 | |
| Total Registered Investment Companies (Cost $180,472,484) | | | | | | | 180,625,334 | |
| | | | | | | | | |
| Money Market Registered Investment Companies — 3.1% |
Meeder Institutional Prime Money Market Fund, 1.32% (1) | | | 5,928,231 | | | | 5,927,638 | |
| Total Money Market Registered Investment Companies (Cost $5,927,756) | | | | | | | 5,927,638 | |
| | | | | | | | | |
| Bank Obligations — 0.8% |
Bank Midwest Deposit Account, 1.00%, 1/2/2018 (2) | | | 248,990 | | | | 248,990 | |
First Merchants Bank Deposit Account, 1.00%, 1/2/2018 (2) | | | 248,190 | | | | 248,190 | |
Metro City Bank Deposit Account, 1.00%, 1/2/2018 (2) | | | 248,000 | | | | 248,000 | |
Pacific Mercantile Bank Deposit Account, 1.21%, 1/2/2018 (2) | | | 249,127 | | | | 249,127 | |
Pacific Premier Bank Deposit Account, 1.05%, 1/2/2018 (2) | | | 249,198 | | | | 249,198 | |
Seacoast Community Bank Deposit Account, 1.00%, 1/2/2018 (2) | | | 249,001 | | | | 249,001 | |
Trans Pacific National Bank Deposit Account, 1.00%, 1/2/2018 (2) | | | 191 | | | | 191 | |
| Total Bank Obligations (Cost $1,492,697) | | | | | | | 1,492,697 | |
| | | | | | | | | |
| U.S. Government Obligations — 0.0% |
| Government National Mortgage Association, 6.50%, due 7/20/2038 | | | 44,875 | | | | 57,933 | |
| Total U.S. Government Obligations (Cost $51,157) | | | | | | | 57,933 | |
| Total Investments — 99.8% (Cost $187,944,094) | | | | | | | 188,103,602 | |
| Other Assets less Liabilities — 0.2% | | | | | | | 452,149 | |
| Total Net Assets — 100.0% | | | | | | | 188,555,751 | |
| | | | | | | | | |
| Trustee Deferred Compensation (3) |
| Meeder Aggressive Allocation Fund | | | 1,899 | | | | 19,845 | |
| Meeder Balanced Fund | | | 1,012 | | | | 11,749 | |
| Meeder Dynamic Allocation Fund | | | 696 | | | | 7,552 | |
| Meeder Muirfield Fund | | | 1,064 | | | | 8,023 | |
| Meeder Conservative Allocation Fund | | | 288 | | | | 6,492 | |
| Total Trustee Deferred Compensation (Cost $50,555) | | | | | | | 53,661 | |
(1) | Investment in affiliate. The yield shown represents the 7-day yield in effect at December 31, 2017. |
(2) | Variable rate security. Securities payable at par including accrued interest (usually within seven days notice) and unconditionally secured as to principal and interest by letters of credit or other credit support agreements from major banks. The interest rates are adjustable and are not based on a published reference rate and spread but are determined by the issuer or agent and are based on current market conditions. These securities do not indicate a reference rate and spread in their description above. The rate shown represents the rate in effect at December 31, 2017. The maturity date shown, if applicable, reflects the earlier of the next demand date or stated maturity date. |
(3) | Assets of affiliates to the Total Return Bond Fund held for the benefit of the Fund’s Trustees in connection with the Trustee Deferred Compensation Plan. |
The accompanying notes are an integral part of these financial statements.
2017 Annual Report | December 31, 2017 | Page 97 |
Schedule of Investments
December 31, 2017
| Prime Money Market Fund |
| Security Description | | Coupon/Yield | | Maturity/Demand Date | | Principal Amount ($) or Shares | | Fair
Value ($) |
| Bank Obligations — 2.8% |
| Columbus First Bank Deposit Account | | | 1.00 | %(1) | | 01/02/18 | | | 248,668 | | | | 248,668 | |
| First Merchants Bank Deposit Account | | | 1.00 | %(1) | | 01/02/18 | | | 248,347 | | | | 248,347 | |
| Pacific Mercantile Bank Deposit Account | | | 1.21 | %(1) | | 01/02/18 | | | 248,672 | | | | 248,672 | |
| Pacific Premier Bank Deposit Account | | | 1.05 | %(1) | | 01/02/18 | | | 248,650 | | | | 248,650 | |
| Total Bank Obligations (Cost $994,337) | | | | | | | | | | | | | 994,337 | |
| | | | | | | | | | | | | | | |
| Certificates of Deposit — 8.5% |
| Banco Estado Chile Yankee CD | | | 1.42 | % | | 02/08/18 | | | 250,000 | | | | 250,000 | |
| Banco Estado Chile Yankee CD | | | 1.39 | % | | 03/02/18 | | | 250,000 | | | | 250,000 | |
| Banco Estado Chile Yankee CD | | | 1.57 | % | | 05/29/18 | | | 250,000 | | | | 250,000 | |
| Bank of Montreal Yankee CD (Quarterly U.S. LIBOR + 0.21%) | | | 1.69 | %(2) | | 03/01/18 | | | 500,000 | | | | 500,100 | |
| Bank of Montreal Yankee CD | | | 1.40 | % | | 04/10/18 | | | 500,000 | | | | 499,911 | |
| Bank of Montreal Yankee CD (Monthly U.S. LIBOR + 0.37%) | | | 1.81 | %(2) | | 01/12/18 | | | 250,000 | | | | 250,294 | |
| Canadian Imperial Bank of NY Yankee CD(Quarterly U.S. LIBOR + 0.13%) | | | 1.51 | %(2) | | 01/26/18 | | | 500,000 | | | | 499,746 | |
Westpac Banking Corp. Yankee CD
(Monthly U.S. LIBOR + 0.52%) | | | 1.95 | %(2) | | 01/09/18 | | | 500,000 | | | | 500,048 | |
| Total Certificates of Deposit (Cost $3,000,099) | | | | | | | | | | | | | 3,000,099 | |
| | | | | | | | | | | | | | | |
| Commercial Paper — 32.0% |
| Bank of Tokyo-Mitsubishi UFJ, Ltd./New York, NY | | | 1.37 | % | | 01/24/18 | | | 270,000 | | | | 269,765 | |
| Bank of Tokyo-Mitsubishi UFJ, Ltd./New York, NY | | | 1.47 | % | | 03/16/18 | | | 250,000 | | | | 249,255 | |
| Banque et Caisse d'Epargne de l'Etat | | | 1.35 | % | | 01/10/18 | | | 250,000 | | | | 249,916 | |
| Banque et Caisse d'Epargne de l'Etat | | | 1.30 | % | | 01/23/18 | | | 250,000 | | | | 249,801 | |
| Banque et Caisse d'Epargne de l'Etat | | | 1.41 | % | | 02/01/18 | | | 250,000 | | | | 249,699 | |
| Banque et Caisse d'Epargne de l'Etat | | | 1.39 | % | | 03/01/18 | | | 250,000 | | | | 249,435 | |
| Banque et Caisse d'Epargne de l'Etat | | | 1.43 | % | | 04/03/18 | | | 250,000 | | | | 249,093 | |
| Banque et Caisse d'Epargne de l'Etat | | | 1.41 | % | | 04/06/18 | | | 250,000 | | | | 249,076 | |
| Canadian Imperial Holdings, Inc. | | | 1.32 | % | | 01/02/18 | | | 500,000 | | | | 499,982 | |
| Canadian Imperial Holdings, Inc. | | | 1.42 | % | | 03/23/18 | | | 250,000 | | | | 249,213 | |
| Caterpillar, Inc. | | | 1.63 | % | | 01/05/18 | | | 250,000 | | | | 249,956 | |
| Caterpillar, Inc. | | | 1.52 | % | | 01/08/18 | | | 250,000 | | | | 249,920 | |
| Caterpillar, Inc. | | | 1.53 | % | | 01/22/18 | | | 250,000 | | | | 249,800 | |
| Cooperatieve Rabobank UA/NY | | | 1.39 | % | | 02/26/18 | | | 500,000 | | | | 498,931 | |
| Credit Agricole Corporate and Investment Bank/New York | | | 1.47 | % | | 02/09/18 | | | 250,000 | | | | 249,605 | |
| Credit Agricole Corporate and Investment Bank/New York | | | 1.40 | % | | 02/12/18 | | | 250,000 | | | | 249,595 | |
| Credit Agricole Corporate and Investment Bank/New York | | | 1.61 | % | | 03/16/18 | | | 250,000 | | | | 249,178 | |
| Credit Agricole Corporate and Investment Bank/New York | | | 1.65 | % | | 06/18/18 | | | 250,000 | | | | 248,098 | |
| Credit Suisse AG/New York NY | | | 1.40 | % | | 02/09/18 | | | 250,000 | | | | 249,624 | |
| Credit Suisse AG/New York NY | | | 1.70 | % | | 07/17/18 | | | 250,000 | | | | 247,702 | |
| Credit Suisse AG/New York NY | | | 1.88 | % | | 08/30/18 | | | 250,000 | | | | 246,904 | |
| Dexia Credit Local SA/New York, NY | | | 1.37 | % | | 03/09/18 | | | 250,000 | | | | 249,367 | |
| Dexia Credit Local SA/New York, NY | | | 1.43 | % | | 03/13/18 | | | 250,000 | | | | 249,300 | |
| Dexia Credit Local SA/New York, NY | | | 1.37 | % | | 03/29/18 | | | 250,000 | | | | 249,178 | |
| GE Capital Treasury Services | | | 1.63 | % | | 06/04/18 | | | 250,000 | | | | 248,268 | |
| ING US Funding LLC | | | 1.45 | % | | 02/01/18 | | | 400,000 | | | | 399,501 | |
| ING US Funding LLC | | | 1.55 | % | | 05/11/18 | | | 250,000 | | | | 248,610 | |
| ING US Funding LLC | | | 1.72 | % | | 07/02/18 | | | 250,000 | | | | 247,851 | |
| JP Morgan Securities LLC | | | 1.60 | % | | 05/30/18 | | | 350,000 | | | | 347,711 | |
| JP Morgan Securities LLC | | | 1.77 | % | | 06/15/18 | | | 310,000 | | | | 307,514 | |
The accompanying notes are an integral part of these financial statements.
Page 98 | 2017 Annual Report | December 31, 2017 |
Schedule of Investments
December 31, 2017
| Prime Money Market Fund |
| Security Description | | Coupon/Yield | | Maturity/Demand Date | | Principal Amount ($) or Shares | | Fair
Value ($) |
| Commercial Paper — continued |
| JP Morgan Securities LLC | | | 1.74 | % | | 06/25/18 | | | 250,000 | | | | 247,910 | |
| JP Morgan Securities LLC | | | 1.82 | % | | 07/13/18 | | | 100,000 | | | | 99,035 | |
| JP Morgan Securities LLC | | | 1.97 | % | | 07/20/18 | | | 215,000 | | | | 212,671 | |
| JP Morgan Securities LLC | | | 1.84 | % | | 08/27/18 | | | 250,000 | | | | 247,008 | |
| Natixis SA/New York, NY | | | 1.43 | % | | 02/07/18 | | | 250,000 | | | | 249,635 | |
| Natixis SA/New York, NY | | | 1.64 | % | | 06/13/18 | | | 250,000 | | | | 248,166 | |
| Swedbank AB | | | 1.38 | % | | 02/20/18 | | | 250,000 | | | | 249,503 | |
| Swedbank AB | | | 1.44 | % | | 02/21/18 | | | 150,000 | | | | 149,695 | |
| Swedbank AB | | | 1.39 | % | | 03/15/18 | | | 250,000 | | | | 249,300 | |
| Swedbank AB | | | 1.51 | % | | 03/20/18 | | | 250,000 | | | | 249,188 | |
| Swedbank AB | | | 1.51 | % | | 03/21/18 | | | 250,000 | | | | 249,177 | |
| Toyota Motor Credit Corp. | | | 1.52 | % | | 05/07/18 | | | 250,000 | | | | 248,688 | |
| Toyota Motor Credit Corp. | | | 1.53 | % | | 05/23/18 | | | 250,000 | | | | 248,498 | |
| Total Commercial Paper (Cost $11,250,322) | | | | | | | | | | | | | 11,250,322 | |
| | | | | | | | | | | | | | | |
| Corporate Obligations — 6.4% |
| Royal Bank of Canada | | | 1.50 | % | | 01/16/18 | | | 500,000 | | | | 500,001 | |
| Royal Bank of Canada (Monthly U.S. LIBOR + 0.18%) | | | 1.73 | %(2) | | 01/25/18 | | | 500,000 | | | | 500,000 | |
| Royal Bank of Canada | | | 1.50 | % | | 06/07/18 | | | 250,000 | | | | 249,950 | |
| UBS AG Stamford, CT (Quarterly U.S. LIBOR + 0.70%) | | | 2.37 | %(2) | | 03/26/18 | | | 500,000 | | | | 500,730 | |
| Westpac Banking Corp. | | | 1.60 | % | | 01/12/18 | | | 500,000 | | | | 500,028 | |
| Total Corporate Obligations (Cost $2,250,709) | | | | | | | | | | | | | 2,250,709 | |
| | | | | | | | | | | | | | | |
| Repurchase Agreements — 19.9% |
| INTL FCStone (Collateralized by $7,304,613 various FNMAs and FHLMCs, 2.23% - 3.99%, due 9/25/20 - 5/25/42, fair value $7,140,001)(proceeds $7,001,089), purchase date 12/29/17 | | | 1.40 | % | | 01/02/18 | | | 7,000,000 | | | | 7,000,000 | |
| Total Repurchase Agreements (Cost $7,000,000) | | | | | | | | | | | | | 7,000,000 | |
| Prime Money Market Fund |
| Security Description | | Shares or
Principal
Amount ($) | | Fair
Value ($) |
| Money Market Registered Investment Companies — 30.4% |
Fidelity Prime Institutional Money Market Portfolio, 1.45% (3) | | | 6,997,151 | | | | 6,999,950 | |
Morgan Stanley Government Institutional Fund, 1.20% (3) | | | 3,709,021 | | | | 3,709,021 | |
| Total Money Market Registered Investment Companies (Cost $10,708,971) | | | | | | | 10,708,971 | |
| Total Investments — 100.0% (Cost $35,204,438) | | | | | | | 35,204,438 | |
| Other Assets less Liabilities — 0.0% | | | | | | | 6,268 | |
| Total Net Assets — 100.0% | | | | | | | 35,210,706 | |
| | | | | | | | | |
| Trustee Deferred Compensation (4) |
| Meeder Aggressive Allocation Fund | | | 1,251 | | | | 13,073 | |
| Meeder Balanced Fund | | | 624 | | | | 7,245 | |
| Meeder Dynamic Allocation Fund | | | 431 | | | | 4,676 | |
| Meeder Muirfield Fund | | | 587 | | | | 4,426 | |
| Meeder Conservative Allocation Fund | | | 173 | | | | 3,899 | |
| Total Trustee Deferred Compensation (Cost $28,507) | | | | | | | 33,319 | |
(1) | Variable rate security. Securities payable at par including accrued interest (usually within seven days notice) and unconditionally secured as to principal and interest by letters of credit or other credit support agreements from major banks. The interest rates are adjustable and are not based on a published reference rate and spread but are determined by the issuer or agent and are based on current market conditions. These securities do not indicate a reference rate and spread in their description above. The rate shown represents the rate in effect at December 31, 2017. The maturity date shown, if applicable, reflects the earlier of the next demand date or stated maturity date. |
(2) | Floating rate security. Interest rates reset periodically. The reference rate and spread are indicated in the description above. The rate shown represents the rate in effect at December 31, 2017. The maturity date shown reflects the earlier of the next demand date or stated maturity date. |
(3) | 7-day yield as of December 31, 2017. The Fund may invest a significant portion of its assets in shares of one or more investment companies, including money market mutual funds. The Fund will incur additional indirect expenses (acquired fund fees and expenses) to the extent it invests in shares of other investment companies. |
(4) | Assets of affiliates to the Prime Money Market Fund held for the benefit of the Fund’s Trustees in connection with the Trustee Deferred Compensation Plan. |
The accompanying notes are an integral part of these financial statements.
2017 Annual Report | December 31, 2017 | Page 99 |
Schedule of Investments
December 31, 2017
| Institutional Prime Money Market Fund |
| | | | | | | | | |
| Security Description | | Coupon/Yield | | Maturity/Demand Date | | Principal Amount ($) or Shares | | Fair
Value ($) |
| Bank Obligations — 0.3% |
| Columbus First Bank Deposit Account | | | 1.00 | %(1) | | 01/02/18 | | | 248,668 | | | | 248,668 | |
| First Merchants Bank Deposit Account | | | 1.00 | %(1) | | 01/02/18 | | | 248,347 | | | | 248,347 | |
| Pacific Mercantile Bank Deposit Account | | | 1.21 | %(1) | | 01/02/18 | | | 248,672 | | | | 248,672 | |
| Pacific Premier Bank Deposit Account | | | 1.05 | %(1) | | 01/02/18 | | | 248,650 | | | | 248,650 | |
| Total Bank Obligations (Cost $994,337) | | | | | | | | | | | | | 994,337 | |
| | | | | | | | | | | | | | | |
| Certificates of Deposit — 9.0% |
| Banco Estado Chile Yankee CD | | | 1.37 | % | | 01/26/18 | | | 1,000,000 | | | | 999,843 | |
| Banco Estado Chile Yankee CD | | | 1.35 | % | | 02/02/18 | | | 1,000,000 | | | | 999,775 | |
| Banco Estado Chile Yankee CD | | | 1.42 | % | | 02/08/18 | | | 1,000,000 | | | | 999,799 | |
| Banco Estado Chile Yankee CD | | | 1.39 | % | | 03/02/18 | | | 1,000,000 | | | | 999,579 | |
| Banco Estado Chile Yankee CD | | | 1.39 | % | | 03/06/18 | | | 1,000,000 | | | | 999,537 | |
| Banco Estado Chile Yankee CD | | | 1.53 | % | | 04/11/18 | | | 1,000,000 | | | | 999,503 | |
| Banco Estado Chile Yankee CD | | | 1.50 | % | | 05/03/18 | | | 1,000,000 | | | | 999,204 | |
| Banco Estado Chile Yankee CD | | | 1.57 | % | | 05/29/18 | | | 1,000,000 | | | | 999,140 | |
| Banco Estado Chile Yankee CD | | | 1.60 | % | | 08/03/18 | | | 1,000,000 | | | | 998,425 | |
| Bank of Montreal Yankee CD (Monthly U.S. LIBOR + 0.13%) | | | 1.68 | %(2) | | 01/26/18 | | | 1,000,000 | | | | 1,000,188 | |
| Bank of Montreal Yankee CD (Quarterly U.S. LIBOR + 0.21%) | | | 1.69 | %(2) | | 03/01/18 | | | 2,000,000 | | | | 2,000,676 | |
| Bank of Montreal Yankee CD | | | 1.40 | % | | 04/10/18 | | | 1,562,000 | | | | 1,559,994 | |
| Bank of Montreal Yankee CD (Monthly U.S. LIBOR + 0.37%) | | | 1.81 | %(2) | | 01/12/18 | | | 1,250,000 | | | | 1,251,341 | |
| Canadian Imperial Bank Yankee CD (Quarterly U.S. LIBOR + 0.39%) | | | 1.69 | %(2) | | 01/16/18 | | | 2,000,000 | | | | 2,001,260 | |
| Canadian Imperial Bank Yankee CD (Quarterly U.S. LIBOR + 0.36%) | | | 1.76 | %(2) | | 02/08/18 | | | 1,000,000 | | | | 1,000,651 | |
| Canadian Imperial Bank Yankee CD (Quarterly U.S. LIBOR + 0.13%) | | | 1.51 | %(2) | | 01/26/18 | | | 2,000,000 | | | | 1,999,414 | |
| Natixis SA/New York, NY Yankee CD (Monthly U.S. LIBOR + 0.14%) | | | 1.58 | %(2) | | 01/12/18 | | | 2,000,000 | | | | 2,000,250 | |
| Royal Bank of Canada Yankee CD (Monthly U.S. LIBOR + 0.14%) | | | 1.69 | %(2) | | 01/26/18 | | | 2,000,000 | | | | 2,000,104 | |
| Royal Bank of Canada Yankee CD (Monthly U.S. LIBOR + 0.18%) | | | 1.67 | %(2) | | 01/18/18 | | | 2,000,000 | | | | 1,999,554 | |
| Westpac Banking Corp. Yankee CD (Monthly U.S. LIBOR + 0.52%) | | | 1.95 | %(2) | | 01/09/18 | | | 1,000,000 | | | | 1,000,170 | |
| Total Certificates of Deposit (Cost $26,817,897) | | | | | | | | | | | | | 26,808,407 | |
| | | | | | | | | | | | | | | |
| Commercial Paper — 41.7% |
| American Honda Finance Corp. | | | 1.38 | % | | 01/11/18 | | | 5,000,000 | | | | 4,997,405 | |
| American Honda Finance Corp. | | | 1.56 | % | | 02/07/18 | | | 2,000,000 | | | | 1,996,696 | |
| Bank of Tokyo-Mitsubishi UFJ Ltd/New York, NY | | | 1.47 | % | | 01/04/18 | | | 2,000,000 | | | | 1,999,492 | |
| Bank of Tokyo-Mitsubishi UFJ Ltd/New York, NY | | | 1.57 | % | | 01/08/18 | | | 2,000,000 | | | | 1,999,146 | |
| Bank of Tokyo-Mitsubishi UFJ Ltd/New York, NY | | | 1.57 | % | | 01/11/18 | | | 2,000,000 | | | | 1,998,882 | |
| Bank of Tokyo-Mitsubishi UFJ Ltd/New York, NY | | | 1.46 | % | | 01/12/18 | | | 1,900,000 | | | | 1,898,854 | |
| Bank of Tokyo-Mitsubishi UFJ Ltd/New York, NY | | | 1.36 | % | | 01/25/18 | | | 1,000,000 | | | | 998,807 | |
| Bank of Tokyo-Mitsubishi UFJ Ltd/New York, NY | | | 1.45 | % | | 02/26/18 | | | 1,000,000 | | | | 997,330 | |
| Bank of Tokyo-Mitsubishi UFJ Ltd/New York, NY | | | 1.51 | % | | 03/09/18 | | | 500,000 | | | | 498,399 | |
| Bank of Tokyo-Mitsubishi UFJ Ltd/New York, NY | | | 1.47 | % | | 03/16/18 | | | 1,000,000 | | | | 996,454 | |
| Bank of Tokyo-Mitsubishi UFJ Ltd/New York, NY | | | 1.86 | % | | 05/11/18 | | | 700,000 | | | | 695,508 | |
The accompanying notes are an integral part of these financial statements.
Page 100 | 2017 Annual Report | December 31, 2017 |
Schedule of Investments
December 31, 2017
| Institutional Prime Money Market Fund |
| Security Description | | Coupon/Yield | | Maturity/Demand Date | | Principal Amount ($) or Shares | | Fair
Value ($) |
| Commercial Paper — continued |
| Banque et Caisse d'Epargne de l'Etat | | | 1.38 | % | | 01/04/18 | | | 1,000,000 | | | | 999,757 | |
| Banque et Caisse d'Epargne de l'Etat | | | 1.35 | % | | 01/10/18 | | | 1,000,000 | | | | 999,511 | |
| Banque et Caisse d'Epargne de l'Etat | | | 1.39 | % | | 01/12/18 | | | 1,000,000 | | | | 999,429 | |
| Banque et Caisse d'Epargne de l'Etat | | | 1.40 | % | | 01/16/18 | | | 1,000,000 | | | | 999,261 | |
| Banque et Caisse d'Epargne de l'Etat | | | 1.30 | % | | 01/18/18 | | | 1,000,000 | | | | 999,176 | |
| Banque et Caisse d'Epargne de l'Etat | | | 1.30 | % | | 01/23/18 | | | 1,000,000 | | | | 998,960 | |
| Banque et Caisse d'Epargne de l'Etat | | | 1.41 | % | | 02/01/18 | | | 1,000,000 | | | | 998,571 | |
| Banque et Caisse d'Epargne de l'Etat | | | 1.39 | % | | 03/01/18 | | | 1,000,000 | | | | 997,362 | |
| Banque et Caisse d'Epargne de l'Etat | | | 1.39 | % | | 03/09/18 | | | 2,000,000 | | | | 1,994,012 | |
| Banque et Caisse d'Epargne de l'Etat | | | 1.43 | % | | 04/03/18 | | | 1,000,000 | | | | 995,875 | |
| Banque et Caisse d'Epargne de l'Etat | | | 1.41 | % | | 04/06/18 | | | 1,000,000 | | | | 995,740 | |
| Banque et Caisse d'Epargne de l'Etat | | | 1.76 | % | | 04/11/18 | | | 1,000,000 | | | | 995,511 | |
| BNP Paribas SA/New York, NY | | | 1.67 | % | | 05/14/18 | | | 480,000 | | | | 476,897 | |
| Canadian Imperial Holdings, Inc. | | | 1.32 | % | | 01/02/18 | | | 1,000,000 | | | | 999,836 | |
| Canadian Imperial Holdings, Inc. | | | 1.42 | % | | 03/23/18 | | | 1,000,000 | | | | 996,327 | |
| Canadian Imperial Holdings, Inc. | | | 1.42 | % | | 04/13/18 | | | 1,000,000 | | | | 995,363 | |
| Caterpillar, Inc. | | | 1.58 | % | | 01/05/18 | | | 2,000,000 | | | | 1,999,366 | |
| Caterpillar, Inc. | | | 1.37 | % | | 01/22/18 | | | 1,000,000 | | | | 998,879 | |
| Cooperatieve Rabobank UA/NY | | | 1.39 | % | | 02/26/18 | | | 1,500,000 | | | | 1,496,192 | |
| Credit Agricole Corporate and Investment Bank/New York | | | 1.25 | % | | 01/03/18 | | | 1,000,000 | | | | 999,802 | |
| Credit Agricole Corporate and Investment Bank/New York | | | 1.25 | % | | 01/10/18 | | | 1,000,000 | | | | 999,520 | |
| Credit Agricole Corporate and Investment Bank/New York | | | 1.31 | % | | 01/17/18 | | | 1,000,000 | | | | 999,234 | |
| Credit Agricole Corporate and Investment Bank/New York | | | 1.33 | % | | 02/02/18 | | | 1,000,000 | | | | 998,563 | |
| Credit Agricole Corporate and Investment Bank/New York | | | 1.40 | % | | 02/12/18 | | | 1,000,000 | | | | 998,131 | |
| Credit Agricole Corporate and Investment Bank/New York | | | 1.37 | % | | 02/14/18 | | | 1,000,000 | | | | 998,044 | |
| Credit Agricole Corporate and Investment Bank/New York | | | 1.41 | % | | 03/08/18 | | | 1,000,000 | | | | 997,006 | |
| Credit Agricole Corporate and Investment Bank/New York | | | 1.44 | % | | 03/20/18 | | | 1,000,000 | | | | 996,360 | |
| Credit Agricole Corporate and Investment Bank/New York | | | 1.62 | % | | 05/10/18 | | | 1,000,000 | | | | 993,620 | |
| Credit Agricole Corporate and Investment Bank/New York | | | 1.65 | % | | 05/30/18 | | | 1,000,000 | | | | 992,514 | |
| Credit Agricole Corporate and Investment Bank/New York | | | 1.65 | % | | 06/18/18 | | | 1,000,000 | | | | 991,460 | |
| Credit Suisse AG/New York, NY | | | 1.42 | % | | 02/01/18 | | | 1,000,000 | | | | 998,513 | |
| Credit Suisse AG/New York, NY | | | 1.40 | % | | 02/09/18 | | | 1,000,000 | | | | 998,154 | |
| Credit Suisse AG/New York, NY | | | 1.51 | % | | 03/29/18 | | | 1,000,000 | | | | 995,750 | |
| Credit Suisse AG/New York, NY | | | 1.52 | % | | 04/16/18 | | | 1,000,000 | | | | 994,828 | |
| Credit Suisse AG/New York, NY | | | 1.51 | % | | 04/18/18 | | | 1,000,000 | | | | 994,723 | |
| Credit Suisse AG/New York, NY | | | 1.52 | % | | 04/23/18 | | | 1,000,000 | | | | 994,464 | |
| Credit Suisse AG/New York, NY | | | 1.53 | % | | 04/27/18 | | | 1,000,000 | | | | 994,252 | |
| Credit Suisse AG/New York, NY | | | 1.64 | % | | 05/15/18 | | | 1,000,000 | | | | 993,272 | |
| Credit Suisse AG/New York, NY | | | 1.58 | % | | 06/15/18 | | | 1,000,000 | | | | 991,507 | |
| Credit Suisse AG/New York, NY | | | 1.67 | % | | 07/05/18 | | | 1,000,000 | | | | 990,323 | |
| Credit Suisse AG/New York, NY | | | 1.70 | % | | 07/17/18 | | | 1,000,000 | | | | 989,594 | |
| Credit Suisse AG/New York, NY | | | 1.73 | % | | 07/19/18 | | | 1,000,000 | | | | 989,468 | |
The accompanying notes are an integral part of these financial statements.
2017 Annual Report | December 31, 2017 | Page 101 |
Schedule of Investments
December 31, 2017
| Institutional Prime Money Market Fund |
| Security Description | | Coupon/Yield | | Maturity/Demand Date | | Principal Amount ($) or Shares | | Fair
Value ($) |
| Commercial Paper — continued |
| Credit Suisse AG/New York, NY | | | 1.88 | % | | 08/30/18 | | | 1,000,000 | | | | 986,804 | |
| Dexia Credit Local SA/New York, NY | | | 1.35 | % | | 01/31/18 | | | 1,000,000 | | | | 998,678 | |
| Dexia Credit Local SA/New York, NY | | | 1.37 | % | | 02/20/18 | | | 1,000,000 | | | | 997,858 | |
| Dexia Credit Local SA/New York, NY | | | 1.37 | % | | 03/09/18 | | | 1,000,000 | | | | 997,128 | |
| Dexia Credit Local SA/New York, NY | | | 1.43 | % | | 03/13/18 | | | 1,000,000 | | | | 996,952 | |
| Dexia Credit Local SA/New York, NY | | | 1.37 | % | | 03/29/18 | | | 1,000,000 | | | | 996,225 | |
| Dexia Credit Local SA/New York, NY | | | 1.46 | % | | 04/30/18 | | | 1,000,000 | | | | 994,602 | |
| GE Capital Treasury Services | | | 1.34 | % | | 02/12/18 | | | 1,000,000 | | | | 998,144 | |
| GE Capital Treasury Services | | | 1.34 | % | | 02/21/18 | | | 1,000,000 | | | | 997,750 | |
| GE Capital Treasury Services | | | 1.34 | % | | 03/05/18 | | | 1,000,000 | | | | 997,212 | |
| GE Capital Treasury Services | | | 1.39 | % | | 03/12/18 | | | 1,000,000 | | | | 996,891 | |
| GE Capital Treasury Services | | | 1.43 | % | | 04/12/18 | | | 1,000,000 | | | | 995,412 | |
| GE Capital Treasury Services | | | 1.50 | % | | 05/02/18 | | | 1,000,000 | | | | 994,410 | |
| GE Capital Treasury Services | | | 1.63 | % | | 06/04/18 | | | 1,000,000 | | | | 992,665 | |
| ING US Funding LLC | | | 1.41 | % | | 02/05/18 | | | 1,000,000 | | | | 998,348 | |
| ING US Funding LLC | | | 1.41 | % | | 02/06/18 | | | 2,000,000 | | | | 1,996,608 | |
| ING US Funding LLC | | | 1.46 | % | | 04/10/18 | | | 1,000,000 | | | | 995,416 | |
| ING US Funding LLC | | | 1.55 | % | | 05/01/18 | | | 1,000,000 | | | | 994,404 | |
| ING US Funding LLC | | | 1.55 | % | | 05/11/18 | | | 1,000,000 | | | | 993,849 | |
| ING US Funding LLC | | | 1.72 | % | | 07/02/18 | | | 1,850,000 | | | | 1,833,182 | |
| JP Morgan Securities LLC | | | 1.42 | % | | 02/15/18 | | | 1,000,000 | | | | 997,904 | |
| JP Morgan Securities LLC | | | 1.51 | % | | 03/16/18 | | | 1,500,000 | | | | 1,494,749 | |
| JP Morgan Securities LLC | | | 1.78 | % | | 04/24/18 | | | 1,000,000 | | | | 994,641 | |
| JP Morgan Securities LLC | | | 1.58 | % | | 05/01/18 | | | 1,000,000 | | | | 994,315 | |
| JP Morgan Securities LLC | | | 1.54 | % | | 05/04/18 | | | 1,000,000 | | | | 994,162 | |
| JP Morgan Securities LLC | | | 1.54 | % | | 05/09/18 | | | 1,000,000 | | | | 993,905 | |
| JP Morgan Securities LLC | | | 1.69 | % | | 06/01/18 | | | 1,000,000 | | | | 992,689 | |
| JP Morgan Securities LLC | | | 1.69 | % | | 06/06/18 | | | 1,000,000 | | | | 992,399 | |
| JP Morgan Securities LLC | | | 1.82 | % | | 06/19/18 | | | 1,000,000 | | | | 991,634 | |
| JP Morgan Securities LLC | | | 1.74 | % | | 06/25/18 | | | 1,000,000 | | | | 991,273 | |
| JP Morgan Securities LLC | | | 1.77 | % | | 07/06/18 | | | 1,050,000 | | | | 1,040,183 | |
| JP Morgan Securities LLC | | | 1.97 | % | | 07/20/18 | | | 1,000,000 | | | | 989,861 | |
| JP Morgan Securities LLC | | | 1.84 | % | | 08/27/18 | | | 1,000,000 | | | | 987,789 | |
| National Rural Utilities | | | 1.58 | % | | 01/25/18 | | | 2,000,000 | | | | 1,997,540 | |
| Natixis SA/New York, NY | | | 1.34 | % | | 01/08/18 | | | 1,000,000 | | | | 999,611 | |
| Natixis SA/New York, NY | | | 1.43 | % | | 02/07/18 | | | 1,000,000 | | | | 998,411 | |
| Natixis SA/New York, NY | | | 1.37 | % | | 02/16/18 | | | 1,000,000 | | | | 998,041 | |
| Natixis SA/New York, NY | | | 1.43 | % | | 03/07/18 | | | 1,000,000 | | | | 997,165 | |
| Natixis SA/New York, NY | | | 1.44 | % | | 03/21/18 | | | 1,000,000 | | | | 996,381 | |
| Natixis SA/New York, NY | | | 1.61 | % | | 05/16/18 | | | 1,000,000 | | | | 993,591 | |
| Natixis SA/New York, NY | | | 1.56 | % | | 05/29/18 | | | 1,000,000 | | | | 992,949 | |
| Natixis SA/New York, NY | | | 1.64 | % | | 06/13/18 | | | 1,000,000 | | | | 992,203 | |
| Natixis SA/New York, NY | | | 1.72 | % | | 07/10/18 | | | 1,000,000 | | | | 990,784 | |
| Swedbank AB | | | 1.37 | % | | 02/12/18 | | | 805,000 | | | | 803,596 | |
| Swedbank AB | | | 1.38 | % | | 02/20/18 | | | 2,000,000 | | | | 1,995,868 | |
| Swedbank AB | | | 1.44 | % | | 02/21/18 | | | 1,000,000 | | | | 997,894 | |
| Swedbank AB | | | 1.43 | % | | 02/22/18 | | | 1,000,000 | | | | 997,853 | |
| Swedbank AB | | | 1.41 | % | | 03/01/18 | | | 950,000 | | | | 947,690 | |
| Swedbank AB | | | 1.39 | % | | 03/15/18 | | | 1,000,000 | | | | 996,990 | |
| Swedbank AB | | | 1.51 | % | | 03/20/18 | | | 1,000,000 | | | | 996,780 | |
| Toyota Motor Credit Corp. | | | 1.36 | % | | 01/05/18 | | | 1,000,000 | | | | 999,739 | |
| Toyota Motor Credit Corp. | | | 1.39 | % | | 01/18/18 | | | 1,500,000 | | | | 1,498,827 | |
| Toyota Motor Credit Corp. | | | 1.32 | % | | 01/19/18 | | | 1,000,000 | | | | 999,176 | |
| Toyota Motor Credit Corp. | | | 1.37 | % | | 02/26/18 | | | 1,000,000 | | | | 997,496 | |
| Toyota Motor Credit Corp. | | | 1.52 | % | | 05/07/18 | | | 1,000,000 | | | | 994,055 | |
| Toyota Motor Credit Corp. | | | 1.53 | % | | 05/23/18 | | | 1,000,000 | | | | 993,252 | |
| Total Commercial Paper (Cost $123,329,384) | | | | | | | | | | | | | 123,286,034 | |
The accompanying notes are an integral part of these financial statements.
Page 102 | 2017 Annual Report | December 31, 2017 |
Schedule of Investments
December 31, 2017
| Institutional Prime Money Market Fund |
| Security Description | | Coupon/Yield | | Maturity/Demand Date | | Principal Amount ($) or Shares | | Fair
Value ($) |
| Corporate Obligations — 3.3% |
| Royal Bank of Canada | | | 1.50 | % | | 01/16/18 | | | 1,000,000 | | | | 999,910 | |
| Royal Bank of Canada (Monthly U.S. LIBOR + 0.18%) | | | 1.73 | %(2) | | 01/25/18 | | | 1,000,000 | | | | 1,000,175 | |
| Royal Bank of Canada | | | 1.50 | % | | 06/07/18 | | | 1,000,000 | | | | 998,004 | |
| Royal Bank of Canada | | | 2.20 | % | | 01/27/18 | | | 408,000 | | | | 408,599 | |
| Royal Bank of Canada (Quarterly U.S. LIBOR + 0.13%) | | | 1.50 | % (2) | | 01/29/18 | | | 500,000 | | | | 499,724 | |
| UBS AG Stamford, CT (Quarterly U.S. LIBOR + 0.70%) | | | 2.37 | % (2) | | 03/26/18 | | | 2,000,000 | | | | 2,002,857 | |
| Westpac Banking Corp. | | | 1.60 | % | | 01/12/18 | | | 1,000,000 | | | | 999,967 | |
| Westpac Banking Corp. | | | 1.55 | % | | 05/25/18 | | | 900,000 | | | | 899,921 | |
| Westpac Banking Corp. (Quarterly U.S. LIBOR + 0.43%) | | | 1.89 | % (2) | | 02/26/18 | | | 2,020,000 | | | | 2,022,175 | |
| Total Corporate Obligations (Cost $9,835,599) | | | | | | | | | | | | | 9,831,332 | |
| | | | | | | | | | | | | | | |
| Repurchase Agreements — 28.0% |
| INTL FCStone (Collateralized by $93,115,583 various FNMAs, FHLMCs, and GNMAs, 0.00% - 4.50%, due 9/25/20 - 4/25/44, fair value $23,460,000)(proceeds $23,003,578), purchase date 12/29/17 | | | 1.40 | % | | 01/02/18 | | | 23,000,000 | | | | 23,000,000 | |
| South Street (Collateralized by $288,838,401 various FNMAs, FHLMCs, FHLBs, FFCBs, GNMAs, and US Treasury Notes, 1.23% - 6.50%, due 9/1/18 - 12/20/47, fair value $61,200,010)(proceeds $60,011,000), purchase date 12/29/17 | | | 1.65 | % | | 01/02/18 | | | 60,000,000 | | | | 60,000,000 | |
| Total Repurchase Agreements (Cost $83,000,000) | | | | | | | | | | | | | 83,000,000 | |
| Security Description | | Shares or
Principal
Amount ($) | | Fair
Value ($) |
| Money Market Registered Investment Companies — 17.8% |
Fidelity Prime Institutional Money Market Portfolio, 1.45% (3) | | | 29,988,005 | | | | 29,997,001 | |
Morgan Stanley Government Institutional Fund, 1.20% (3) | | | 22,823,433 | | | | 22,823,433 | |
| Total Money Market Registered Investment Companies (Cost $52,823,433) | | | | | | | 52,820,434 | |
| Total Investments — 100.1% (Cost $296,800,650) | | | | | | | 296,740,544 | |
| Liabilities less Other Assets — (0.1%) | | | | | | | (193,093 | ) |
| Total Net Assets — 100.0% | | | | | | | 296,547,451 | |
| | | | | | | | | |
| Trustee Deferred Compensation (4) |
| Meeder Aggressive Allocation Fund | | | 32 | | | | 334 | |
| Meeder Balanced Fund | | | 18 | | | | 209 | |
| Meeder Dynamic Allocation Fund | | | 11 | | | | 119 | |
| Meeder Muirfield Fund | | | 29 | | | | 219 | |
| Meeder Conservative Allocation Fund | | | 5 | | | | 113 | |
| Total Trustee Deferred Compensation (Cost $1,009) | | | | | | | 994 | |
(1) | Variable rate security. Securities payable at par including accrued interest (usually within seven days notice) and unconditionally secured as to principal and interest by letters of credit or other credit support agreements from major banks. The interest rates are adjustable and are not based on a published reference rate and spread but are determined by the issuer or agent and are based on current market conditions. These securities do not indicate a reference rate and spread in their description above. The rate shown represents the rate in effect at December 31, 2017. The maturity date shown, if applicable, reflects the earlier of the next demand date or stated maturity date. |
(2) | Floating rate security. Interest rates reset periodically. The reference rate and spread are indicated in the description above. The rate shown represents the rate in effect at December 31, 2017. The maturity date shown reflects the earlier of the next demand date or stated maturity date. |
(3) | 7-day yield as of December 31, 2017. The Fund may invest a significant portion of its assets in shares of one or more investment companies, including money market mutual funds. The Fund will incur additional indirect expenses (acquired fund fees and expenses) to the extent it invests in shares of other investment companies. |
(4) | Assets of affiliates to the Institutional Prime Money Market Fund held for the benefit of the Fund’s Trustees in connection with the Trustee Deferred Compensation Plan. |
The accompanying notes are an integral part of these financial statements.
2017 Annual Report | December 31, 2017 | Page 103 |
Statements of Assets & Liabilities
December 31, 2017 |
| | | Muirfield
Fund | | Dynamic
Allocation Fund | | Aggressive
Allocation Fund |
| Assets | | | | | | |
| Investments, at fair value (1)(2) | | $ | 321,461,650 | | | $ | 108,656,126 | | | $ | 34,035,491 | |
| Repurchase agreements, at fair value (1) | | | — | | | | — | | | | — | |
| Investments in affiliates, at fair value (1) | | | 151,740,645 | | | | 21,160,222 | | | | 6,809,597 | |
| Trustee deferred compensation investments, at fair value | | | 171,736 | | | | 106,499 | | | | 59,094 | |
| Cash | | | — | | | | — | | | | — | |
| Deposits at broker for futures contracts (3) | | | 4,285,313 | | | | 1,030,940 | | | | 380,694 | |
| Cash held at broker for collateral on securities sold short | | | — | | | | — | | | | — | |
| Receivable for securities sold | | | 1,281 | | | | 1,775,952 | | | | 11 | |
| Receivable for capital stock issued | | | 868,547 | | | | 109,939 | | | | 23,090 | |
| Receivable from investment advisor | | | — | | | | — | | | | — | |
| Interest and dividend receivable | | | 485,865 | | | | 107,983 | | | | 61,835 | |
| Receivable from securities lending agent (See Note #5) | | | 16 | | | | — | | | | 8 | |
| Receivable for commissions recaptured | | | 232,452 | | | | 63,949 | | | | 36,676 | |
| Prepaid expenses/other assets | | | 107,654 | | | | 29,567 | | | | 34,125 | |
| Total Assets | | | 479,355,159 | | | | 133,041,177 | | | | 41,440,621 | |
| | | | | | | | | | | | | |
| Liabilities | | | | | | | | | | | | |
| Securities sold short at fair value (proceeds $59,362,567) | | | — | | | | — | | | | — | |
| Payable for securities purchased | | | — | | | | 1,803,760 | | | | — | |
| Payable for collateral on securities loaned | | | 290,975 | | | | — | | | | — | |
| Payable for Trustee Deferred Compensation Plan | | | 171,736 | | | | 106,499 | | | | 59,094 | |
| Payable for capital stock redeemed | | | 230,321 | | | | 33,150 | | | | 6,004 | |
| Dividends payable | | | 69,214 | | | | 2,859 | | | | 34 | |
| Dividend expense payable on short positions | | | — | | | | — | | | | — | |
| Payable to investment advisor | | | 253,930 | | | | 69,964 | | | | 16,999 | |
| Accrued distribution plan (12b-1) and shareholder service plan fees | | | 286,737 | | | | 66,479 | | | | 24,532 | |
| Accrued transfer agent, fund accounting, CCO, and administrative fees | | | 38,971 | | | | 26,986 | | | | 6,907 | |
| Accrued trustee fees | | | 4,035 | | | | 1,463 | | | | 551 | |
| Other accrued liabilities | | | 47,078 | | | | 32,374 | | | | 25,240 | |
| Total Liabilities | | | 1,392,997 | | | | 2,143,534 | | | | 139,361 | |
| | | | | | | | | | | | | |
| Net Assets | | $ | 477,962,162 | | | $ | 130,897,643 | | | $ | 41,301,260 | |
| | | | | | | | | | | | | |
| Net Assets | | | | | | | | | | | | |
| Capital | | $ | 436,926,860 | | | $ | 116,926,452 | | | $ | 37,990,919 | |
| Accumulated undistributed (distributions in excess of) net investment income | | | (141,039 | ) | | | (87,708 | ) | | | (51,811 | ) |
| Accumulated undistributed net realized gain (loss) from investments and futures contracts | | | 380,803 | | | | (242,397 | ) | | | (157,228 | ) |
| Net unrealized appreciation (depreciation) of investments and futures contracts | | | 40,795,538 | | | | 14,301,296 | | | | 3,519,380 | |
| Total Net Assets | | $ | 477,962,162 | | | $ | 130,897,643 | | | $ | 41,301,260 | |
| | | | | | | | | | | | | |
| Net Asset Value Per Share | | | | | | | | | | | | |
| Retail Class | | | | | | | | | | | | |
| Net Assets | | $ | 250,321,961 | | | $ | 50,569,939 | | | $ | 18,731,758 | |
| Shares Outstanding | | | 33,217,590 | | | | 4,662,673 | | | | 1,792,610 | |
| Net Asset Value, Offering and Redemption Price Per Share | | $ | 7.54 | | | $ | 10.85 | | | $ | 10.45 | |
| | | | | | | | | | | | | |
| Adviser Class | | | | | | | | | | | | |
| Net Assets | | $ | 41,440,135 | | | $ | 10,140,412 | | | $ | 1,430,834 | |
| Shares Outstanding | | | 5,471,795 | | | | 932,227 | | | | 136,868 | |
| Net Asset Value, Offering and Redemption Price Per Share | | $ | 7.57 | | | $ | 10.88 | | | $ | 10.45 | |
| | | | | | | | | | | | | |
| Institutional Class | | | | | | | | | | | | |
| Net Assets | | $ | 186,200,066 | | | $ | 70,187,292 | | | $ | 21,138,668 | |
| Shares Outstanding | | | 24,605,123 | | | | 6,461,411 | | | | 2,021,233 | |
| Net Asset Value, Offering and Redemption Price Per Share | | $ | 7.57 | | | $ | 10.86 | | | $ | 10.46 | |
| | | | | | | | | | | | | |
| Net Asset Value Per Share - Money Market Funds | | | | | | | | | | | | |
| Net Assets | | | | | | | | | | | | |
| Shares Outstanding | | | | | | | | | | | | |
| Net Asset Value, Offering and Redemption Price Per Share | | | | | | | | | | | | |
| | | | | | | | | | | | | |
| (1) Investments and affiliated investments at cost | | $ | 434,005,363 | | | $ | 115,983,412 | | | $ | 37,490,935 | |
| (2) Fair value of securities loaned included in investments at fair value (See Note #2 and Note #5) | | $ | 281,815 | | | $ | — | | | $ | — | |
| (3) Required margin held as collateral for futures contracts | | $ | 4,377,500 | | | $ | 819,400 | | | $ | 289,100 | |
The accompanying notes are an integral part of these financial statements.
Page 104 | 2017 Annual Report | December 31, 2017 |
| |
Balanced
Fund | | Global Allocation Fund | | Spectrum
Fund | | Quantex
Fund | | Conservative Allocation
Fund | | Moderate Allocation Fund | | Total Return Bond Fund | | Prime Money Market Fund | | Institutional Prime Money Market Fund |
| | | | | | | | | | | | | | | | | |
| $ | 230,131,222 | | | $ | 61,524,717 | | | $ | 149,308,146 | | | $ | 88,990,744 | | | $ | 24,516,909 | | | $ | 62,895,306 | | | $ | 182,175,964 | | | $ | 28,204,438 | | | $ | 213,740,544 | |
| | — | | | | — | | | | — | | | | — | | | | — | | | | — | | | | — | | | | 7,000,000 | | | | 83,000,000 | |
| | 46,165,677 | | | | 11,707,988 | | | | 5,834,908 | | | | 5,257,988 | | | | 349,527 | | | | 2,822,646 | | | | 5,927,638 | | | | — | | | | — | |
| | 113,702 | | | | 85,350 | | | | 13,166 | | | | 47,458 | | | | 47,148 | | | | 5,309 | | | | 53,661 | | | | 33,319 | | | | 994 | |
| | — | | | | — | | | | — | | | | — | | | | — | | | | — | | | | — | | | | — | | | | 1,117 | |
| | 1,490,003 | | | | 596,259 | | | | 1,964,507 | | | | 251,989 | | | | 53,095 | | | | 209,362 | | | | — | | | | — | | | | — | |
| | — | | | | — | | | | 59,138,150 | | | | — | | | | — | | | | — | | | | — | | | | — | | | | — | |
| | — | | | | 916,045 | | | | 2,841,842 | | | | — | | | | 15 | | | | 859,237 | | | | — | | | | — | | | | — | |
| | 1,252,159 | | | | 47,325 | | | | 361,819 | | | | 58,426 | | | | 12,609 | | | | 156,100 | | | | 682,452 | | | | — | | | | — | |
| | — | | | | — | | | | — | | | | — | | | | 86,437 | | | | — | | | | — | | | | 5,782 | | | | 9,175 | |
| | 246,693 | | | | 46,725 | | | | 173,769 | | | | 331,390 | | | | 29,678 | | | | 52,780 | | | | 103,352 | | | | 26,612 | | | | 150,590 | |
| | — | | | | — | | | | 300 | | | | 5,155 | | | | 81 | | | | 7 | | | | — | | | | — | | | | — | |
| | 101,657 | | | | 51,327 | | | | 121,495 | | | | 36,355 | | | | 28,427 | | | | 83,784 | | | | 604 | | | | — | | | | — | |
| | 83,786 | | | | 58,809 | | | | 74,783 | | | | 19,996 | | | | 22,646 | | | | 40,680 | | | | 31,201 | | | | 12,934 | | | | 14,898 | |
| | 279,584,899 | | | | 75,034,545 | | | | 219,832,885 | | | | 94,999,501 | | | | 25,146,572 | | | | 67,125,211 | | | | 188,974,872 | | | | 35,283,085 | | | | 296,917,318 | |
| | | | | | | | | | | | | | | | | | | | | | | | | | | | | | | | | | | |
| | | | | | | | | | | | | | | | | | | | | | | | | | | | | | | | | | | |
| | — | | | | — | | | | 62,041,798 | | | | — | | | | — | | | | — | | | | — | | | | — | | | | — | |
| | 52,305 | | | | 898,154 | | | | 2,556,233 | | | | — | | | | 9,108 | | | | 868,523 | | | | 71,531 | | | | — | | | | — | |
| | — | | | | — | | | | 17,071 | | | | — | | | | — | | | | 7,413 | | | | — | | | | — | | | | — | |
| | 113,702 | | | | 85,350 | | | | 13,166 | | | | 47,458 | | | | 47,148 | | | | 5,309 | | | | 53,661 | | | | 33,319 | | | | 994 | |
| | 233,390 | | | | 4,170 | | | | 52,381 | | | | 41,852 | | | | 79,602 | | | | 33,505 | | | | 102,434 | | | | — | | | | — | |
| | 7,243 | | | | 1,104 | | | | — | | | | 1,832 | | | | 6,663 | | | | 922 | | | | 3,028 | | | | 804 | | | | 281,898 | |
| | — | | | | — | | | | 91,313 | | | | — | | | | — | | | | — | | | | — | | | | — | | | | — | |
| | 149,183 | | | | 45,897 | | | | 92,315 | | | | 58,853 | | | | — | | | | 21,533 | | | | 37,929 | | | | — | | | | — | |
| | 129,590 | | | | 21,566 | | | | 75,174 | | | | 38,536 | | | | 4,022 | | | | 29,731 | | | | 86,113 | | | | 7,681 | | | | 14,684 | |
| | 22,958 | | | | 9,779 | | | | 15,383 | | | | 13,674 | | | | 4,476 | | | | 8,870 | | | | 28,895 | | | | 8,165 | | | | 42,685 | |
| | 2,403 | | | | 953 | | | | 1,343 | | | | 1,106 | | | | 334 | | | | 693 | | | | 2,240 | | | | 332 | | | | 290 | |
| | 34,822 | | | | 29,346 | | | | 2,451 | | | | 31,645 | | | | 29,530 | | | | 29,726 | | | | 33,290 | | | | 22,078 | | | | 29,316 | |
| | 745,596 | | | | 1,096,319 | | | | 64,958,628 | | | | 234,956 | | | | 180,883 | | | | 1,006,225 | | | | 419,121 | | | | 72,379 | | | | 369,867 | |
| | | | | | | | | | | | | | | | | | | | | | | | | | | | | | | | | | | |
| $ | 278,839,303 | | | $ | 73,938,226 | | | $ | 154,874,257 | | | $ | 94,764,545 | | | $ | 24,965,689 | | | $ | 66,118,986 | | | $ | 188,555,751 | | | $ | 35,210,706 | | | $ | 296,547,451 | |
| | | | | | | | | | | | | | | | | | | | | | | | | | | | | | | | | | | |
| | | | | | | | | | | | | | | | | | | | | | | | | | | | | | | | | | | |
| $ | 263,954,197 | | | $ | 65,833,673 | | | $ | 138,093,833 | | | $ | 76,355,701 | | | $ | 22,753,450 | | | $ | 59,470,258 | | | $ | 198,923,277 | | | $ | 35,210,706 | | | $ | 296,608,778 | |
| | (97,184 | ) | | | (52,959 | ) | | | (12,572 | ) | | | 3,453 | | | | (10,056 | ) | | | (5,079 | ) | | | (50,555 | ) | | | — | | | | 105 | |
| | 160,410 | | | | 2,151,386 | | | | 317,458 | | | | (1,030,960 | ) | | | 2,143,922 | | | | 4,763,188 | | | | (10,476,479 | ) | | | — | | | | (1,326 | ) |
| | 14,821,880 | | | | 6,006,126 | | | | 16,475,538 | | | | 19,436,351 | | | | 78,373 | | | | 1,890,619 | | | | 159,508 | | | | — | | | | (60,106 | ) |
| $ | 278,839,303 | | | $ | 73,938,226 | | | $ | 154,874,257 | | | $ | 94,764,545 | | | $ | 24,965,689 | | | $ | 66,118,986 | | | $ | 188,555,751 | | | $ | 35,210,706 | | | $ | 296,547,451 | |
| | | | | | | | | | | | | | | | | | | | | | | | | | | | | | | | | | | |
| | | | | | | | | | | | | | | | | | | | | | | | | | | | | | | | | | | |
| | | | | | | | | | | | | | | | | | | | | | | | | | | | | | | | | | | |
| $ | 97,116,173 | | | $ | 35,512,198 | | | $ | 59,440,698 | | | $ | 60,161,392 | | | $ | 12,544,858 | | | $ | 24,635,354 | | | $ | 67,985,777 | | | | | | | | | |
| | 8,367,275 | | | | 3,079,232 | | | | 5,179,421 | | | | 1,636,644 | | | | 556,449 | | | | 2,113,497 | | | | 7,256,956 | | | | | | | | | |
| $ | 11.61 | | | $ | 11.53 | | | $ | 11.48 | | | $ | 36.76 | | | $ | 22.54 | | | $ | 11.66 | | | $ | 9.37 | | | | | | | | | |
| | | | | | | | | | | | | | | | | | | | | | | | | | | | | | | | | | | |
| | | | | | | | | | | | | | | | | | | | | | | | | | | | | | | | | | | |
| $ | 12,136,920 | | | $ | 1,056,885 | | | $ | 12,920,538 | | | $ | 2,113,713 | | | $ | 682,292 | | | $ | 3,538,442 | | | $ | 9,896,150 | | | | | | | | | |
| | 1,038,946 | | | | 91,584 | | | | 1,120,774 | | | | 57,467 | | | | 29,901 | | | | 303,528 | | | | 1,055,187 | | | | | | | | | |
| $ | 11.68 | | | $ | 11.54 | | | $ | 11.53 | | | $ | 36.78 | | | $ | 22.82 | | | $ | 11.66 | | | $ | 9.38 | | | | | | | | | |
| | | | | | | | | | | | | | | | | | | | | | | | | | | | | | | | | | | |
| | | | | | | | | | | | | | | | | | | | | | | | | | | | | | | | | | | |
| $ | 169,586,210 | | | $ | 37,369,143 | | | $ | 82,513,021 | | | $ | 32,489,440 | | | $ | 11,738,539 | | | $ | 37,945,190 | | | $ | 110,673,824 | | | | | | | | | |
| | 14,523,820 | | | | 3,235,743 | | | | 7,148,515 | | | | 883,656 | | | | 513,674 | | | | 3,249,622 | | | | 11,800,297 | | | | | | | | | |
| $ | 11.68 | | | $ | 11.55 | | | $ | 11.54 | | | $ | 36.77 | | | $ | 22.85 | | | $ | 11.68 | | | $ | 9.38 | | | | | | | | | |
| | | | | | | | | | | | | | | | | | | | | | | | | | | | | | | | | | | |
| | | | | | | | | | | | | | | | | | | | | | | | | | | | | | | | | | | |
| | | | | | | | | | | | | | | | | | | | | | | | | | | | | $ | 35,210,706 | | | $ | 296,547,451 | |
| | | | | | | | | | | | | | | | | | | | | | | | | | | | | | 35,210,706 | | | | 296,591,482 | |
| | | | | | | | | | | | | | | | | | | | | | | | | | | | | $ | 1.00 | | | $ | 0.9999 | |
| | | | | | | | | | | | | | | | | | | | | | | | | | | | | | | | | | | |
| $ | 261,533,250 | | | $ | 67,443,450 | | | $ | 136,655,037 | | | $ | 74,866,268 | | | $ | 24,796,491 | | | $ | 63,867,332 | | | $ | 187,944,094 | | | $ | 35,204,438 | | | $ | 296,800,650 | |
| $ | — | | | $ | — | | | $ | 16,647 | | | $ | — | | | $ | — | | | $ | 7,180 | | | $ | — | | | $ | — | | | $ | — | |
| $ | 1,334,200 | | | $ | 485,900 | | | $ | 1,969,300 | | | $ | 222,000 | | | $ | 23,200 | | | $ | 110,450 | | | $ | — | | | $ | — | | | $ | — | |
The accompanying notes are an integral part of these financial statements.
2017 Annual Report | December 31, 2017 | Page 105 |
Statements of Operations
For the Year Ended December 31, 2017 |
| | | Muirfield
Fund | | Dynamic
Allocation Fund | | Aggressive
Allocation Fund |
| Investment Income | | | | | | | | | | | | |
| Interest | | $ | 23,794 | | | $ | 12,660 | | | $ | 5,555 | |
| Income from affiliates | | | 1,006,163 | | | | 168,357 | | | | 59,157 | |
| Dividends | | | 6,118,612 | | | | 2,288,578 | | | | 688,801 | |
| Total Investment Income | | | 7,148,569 | | | | 2,469,595 | | | | 753,513 | |
| | | | | | | | | | | | | |
| Fund Expenses | | | | | | | | | | | | |
| Investment advisor | | | 2,725,856 | | | | 921,115 | | | | 319,162 | |
| Transfer agent - Retail Class | | | 358,297 | | | | 85,051 | | | | 30,203 | |
| Transfer agent - Adviser Class | | | 21,465 | | | | 6,349 | | | | 895 | |
| Transfer agent - Institutional Class | | | 110,410 | | | | 55,979 | | | | 19,968 | |
| Transfer agent - Money Market Funds | | | | | | | | | | | | |
| Fund accounting | | | 77,848 | | | | 49,282 | | | | 37,511 | |
| Administrative | | | 336,781 | | | | 108,252 | | | | 42,555 | |
| Trustee | | | 19,093 | | | | 6,448 | | | | 1,837 | |
| Audit | | | 18,603 | | | | 18,603 | | | | 18,603 | |
| Legal | | | 3,680 | | | | 3,680 | | | | 3,680 | |
| Custody | | | 39,776 | | | | 11,473 | | | | 3,730 | |
| Printing | | | 15,451 | | | | 4,680 | | | | 1,743 | |
| Distribution plan (12b-1) - Retail Class (1) | | | 597,162 | | | | 177,189 | | | | 62,923 | |
| Distribution plan (12b-1) - Money Market Funds | | | | | | | | | | | | |
| Shareholder service plan - Retail Class | | | 525,317 | | | | 141,751 | | | | 50,338 | |
| Shareholder service plan - Adviser Class | | | 43,432 | | | | 12,783 | | | | 1,790 | |
| Shareholder service plan - Institutional Class | | | 39,503 | | | | 7,371 | | | | 1,159 | |
| Postage | | | 18,324 | | | | 12,514 | | | | 2,355 | |
| Registration and filing | | | 68,888 | | | | 56,356 | | | | 50,243 | |
| Insurance | | | 34,633 | | | | 8,224 | | | | 4,081 | |
| Chief Compliance Officer | | | 4,808 | | | | 4,808 | | | | 4,808 | |
| Dividend expense on securities sold short | | | — | | | | — | | | | — | |
| Other | | | 32,085 | | | | 23,999 | | | | 21,665 | |
| Total Expenses Before Reductions | | | 5,091,413 | | | | 1,715,907 | | | | 679,249 | |
| | | | | | | | | | | | | |
| Expenses voluntarily reimbursed/waived by investment advisor (See Note #5) | | | — | | | | — | | | | (8,514 | ) |
| Expenses contractually reimbursed/waived by investment advisor (See Note #5) | | | — | | | | (87,290 | ) | | | — | |
| Commissions recaptured (See Note #5) | | | (231,438 | ) | | | (139,047 | ) | | | (104,745 | ) |
| Securities lending credit (See Note #5) | | | (2,570 | ) | | | (2,776 | ) | | | (864 | ) |
| Transfer agent expenses voluntarily waived (See Note #5) | | | (98,904 | ) | | | — | | | | (20,863 | ) |
| | | | | | | | | | | | | |
| Net Expenses | | | 4,758,501 | | | | 1,486,794 | | | | 544,263 | |
| | | | | | | | | | | | | |
| Net Investment Income (Loss) | | | 2,390,068 | | | | 982,801 | | | | 209,250 | |
| | | | | | | | | | | | | |
| Net Realized and Unrealized Gain (Loss) from Investments | | | | | | | | | | | | |
| Net realized gains (losses) from unaffiliated investments | | | 30,259,753 | | | | 9,258,134 | | | | 2,645,345 | |
| Net realized gains (losses) from affiliated investments | | | (215 | ) | | | (1,271 | ) | | | (626 | ) |
| Net realized gains (losses) from closed short positions | | | — | | | | — | | | | — | |
| Net realized gains (losses) from futures contracts | | | 15,163,165 | | | | 3,325,435 | | | | 947,413 | |
| Distributions of long-term realized gains by other investment companies | | | — | | | | — | | | | — | |
| Net Realized Gains (Losses) from Investment Transactions, Futures Contracts, and Distributions of Long-term Realized Gains by Other Investment Companies | | | 45,422,703 | | | | 12,582,298 | | | | 3,592,132 | |
| | | | | | | | | | | | | |
| Net change in unrealized appreciation (depreciation) of unaffiliated investments | | | 25,854,902 | | | | 9,716,052 | | | | 1,144,695 | |
| Net change in unrealized appreciation (depreciation) of affiliated investments | | | (22,604 | ) | | | (2,606 | ) | | | (856 | ) |
| Net change in unrealized appreciation (depreciation) of short positions | | | — | | | | — | | | | — | |
| Net change in unrealized appreciation (depreciation) of futures contracts | | | 2,136,128 | | | | 517,185 | | | | 287,584 | |
| Net Change in Unrealized Appreciation (Depreciation) of Investment Transactions and Futures Contracts | | | 27,968,426 | | | | 10,230,631 | | | | 1,431,423 | |
| | | | | | | | | | | | | |
| Net Realized and Unrealized Gain (Loss) from Investments | | | 73,391,129 | | | | 22,812,929 | | | | 5,023,555 | |
| | | | | | | | | | | | | |
| Net Change in Net Assets Resulting from Operations | | $ | 75,781,197 | | | $ | 23,795,730 | | | $ | 5,232,805 | |
(1) | Only the Retail Class of shares has adopted a Rule 12b-1 Plan. See Footnote #5 of the Notes to Financial Statements. |
The accompanying notes are an integral part of these financial statements.
Page 106 | 2017 Annual Report | December 31, 2017 |
| |
Balanced
Fund | | Global Allocation Fund | | Spectrum
Fund | | Quantex
Fund | | Conservative Allocation
Fund | | Moderate Allocation Fund | | Total Return Bond Fund | | Prime Money Market Fund | | Institutional Prime Money Market Fund |
| | | | | | | | | | | | | | | | | |
| $ | 13,043 | | | $ | 10,715 | | | $ | 14,232 | | | $ | 9,977 | | | $ | 3,485 | | | $ | 6,482 | | | $ | 11,767 | | | $ | 412,796 | | | $ | 2,542,351 | |
| | 329,744 | | | | 106,010 | | | | 37,357 | | | | 61,590 | | | | 10,298 | | | | 47,714 | | | | 52,667 | | | | — | | | | — | |
| | 4,706,925 | | | | 1,341,631 | | | | 2,402,357 | | | | 1,369,546 | | | | 552,326 | | | | 1,160,612 | | | | 7,025,374 | | | | — | | | | — | |
| | 5,049,712 | | | | 1,458,356 | | | | 2,453,946 | | | | 1,441,113 | | | | 566,109 | | | | 1,214,808 | | | | 7,089,808 | | | | 412,796 | | | | 2,542,351 | |
| | | | | | | | | | | | | | | | | | | | | | | | | | | | | | | | | | | |
| | | | | | | | | | | | | | | | | | | | | | | | | | | | | | | | | | | |
| | 1,654,020 | | | | 570,523 | | | | 989,184 | | | | 796,807 | | | | 201,057 | | | | 428,886 | | | | 585,742 | | | | 144,451 | | | | 686,305 | |
| | 178,894 | | | | 50,025 | | | | 102,410 | | | | 79,394 | | | | 34,380 | | | | 47,837 | | | | 99,491 | | | | | | | | | |
| | 7,367 | | | | 677 | | | | 7,925 | | | | 1,335 | | | | 436 | | | | 2,174 | | | | 4,045 | | | | | | | | | |
| | 84,544 | | | | 40,582 | | | | 47,936 | | | | 26,762 | | | | 4,818 | | | | 25,047 | | | | 50,758 | | | | | | | | | |
| | | | | | | | | | | | | | | | | | | | | | | | | | | | | | 30,074 | | | | 171,658 | |
| | 59,567 | | | | 44,214 | | | | 50,189 | | | | 45,957 | | | | 25,106 | | | | 40,437 | | | | 56,287 | | | | 36,223 | | | | 58,452 | |
| | 190,536 | | | | 70,856 | | | | 115,513 | | | | 81,659 | | | | 20,106 | | | | 55,748 | | | | 164,297 | | | | 36,113 | | | | 181,618 | |
| | 9,246 | | | | 3,438 | | | | 5,899 | | | | 5,022 | | | | 1,029 | | | | 3,244 | | | | 9,102 | | | | 1,245 | | | | 1,055 | |
| | 18,603 | | | | 18,603 | | | | 19,712 | | | | 18,603 | | | | 16,228 | | | | 18,603 | | | | 16,228 | | | | 13,113 | | | | 13,113 | |
| | 3,680 | | | | 3,680 | | | | 3,585 | | | | 3,680 | | | | 3,680 | | | | 3,680 | | | | 3,680 | | | | 3,585 | | | | 4,060 | |
| | 21,743 | | | | 6,878 | | | | 11,758 | | | | 8,702 | | | | 1,604 | | | | 5,104 | | | | 18,862 | | | | 2,409 | | | | 16,807 | |
| | 9,431 | | | | 3,300 | | | | 4,905 | | | | 3,063 | | | | 2,512 | | | | 1,947 | | | | 6,856 | | | | 2,987 | | | | 7,955 | |
| | 372,695 | | | | 104,165 | | | | 213,353 | | | | 132,323 | | | | 39,316 | | | | 86,251 | | | | 310,917 | | | | | | | | | |
| | | | | | | | | | | | | | | | | | | | | | | | | | | | | | 6,701 | | | | 19,189 | |
| | 298,156 | | | | 83,375 | | | | 170,683 | | | | 102,055 | | | | 20,445 | | | | 69,001 | | | | 248,733 | | | | | | | | | |
| | 14,787 | | | | 1,333 | | | | 15,960 | | | | 2,592 | | | | 874 | | | | 4,372 | | | | 12,194 | | | | | | | | | |
| | 37,047 | | | | 2,239 | | | | 19,808 | | | | 7,027 | | | | 1,908 | | | | 5,064 | | | | 32,713 | | | | | | | | | |
| | 11,633 | | | | 7,124 | | | | 10,934 | | | | 12,436 | | | | 15,295 | | | | 12,854 | | | | 9,662 | | | | 941 | | | | 3,916 | |
| | 52,908 | | | | 50,984 | | | | 53,316 | | | | 53,906 | | | | 52,732 | | | | 51,446 | | | | 55,776 | | | | 26,637 | | | | 3,833 | |
| | 24,007 | | | | 6,320 | | | | 13,852 | | | | 6,538 | | | | 1,601 | | | | 3,988 | | | | 18,613 | | | | 11,963 | | | | 7,718 | |
| | 4,808 | | | | 4,808 | | | | 4,808 | | | | 4,808 | | | | 4,808 | | | | 4,808 | | | | 4,808 | | | | 4,808 | | | | 4,808 | |
| | — | | | | — | | | | 817,333 | | | | — | | | | — | | | | — | | | | — | | | | — | | | | — | |
| | 28,552 | | | | 22,341 | | | | 24,170 | | | | 22,537 | | | | 19,312 | | | | 20,829 | | | | 26,078 | | | | 39,059 | | | | 27,889 | |
| | 3,082,224 | | | | 1,095,465 | | | | 2,703,233 | | | | 1,415,206 | | | | 467,248 | | | | 891,321 | | | | 1,734,842 | | | | 360,309 | | | | 1,208,376 | |
| | | | | | | | | | | | | | | | | | | | | | | | | | | | | | | | | | | |
| | — | | | | — | | | | — | | | | — | | | | (115,431 | ) | | | (13,194 | ) | | | — | | | | (182,577 | ) | | | (796,890 | ) |
| | — | | | | — | | | | — | | | | (125,000 | ) | | | (40,881 | ) | | | (10,668 | ) | | | (12,658 | ) | | | — | | | | — | |
| | (170,556 | ) | | | (117,184 | ) | | | (317,004 | ) | | | (111,068 | ) | | | (29,085 | ) | | | (118,450 | ) | | | (45,344 | ) | | | — | | | | — | |
| | (18,203 | ) | | | (336 | ) | | | (6,188 | ) | | | (80,930 | ) | | | (179 | ) | | | — | | | | — | | | | — | | | | — | |
| | (68,534 | ) | | | (38,042 | ) | | | (55,861 | ) | | | (7,126 | ) | | | (20,763 | ) | | | (31,358 | ) | | | (1,412 | ) | | | (8,406 | ) | | | (42,945 | ) |
| | | | | | | | | | | | | | | | | | | | | | | | | | | | | | | | | | | |
| | 2,824,931 | | | | 939,903 | | | | 2,324,180 | | | | 1,091,082 | | | | 260,909 | | | | 717,651 | | | | 1,675,428 | | | | 169,326 | | | | 368,541 | |
| | | | | | | | | | | | | | | | | | | | | | | | | | | | | | | | | | | |
| | 2,224,781 | | | | 518,453 | | | | 129,766 | | | | 350,031 | | | | 305,200 | | | | 497,157 | | | | 5,414,380 | | | | 243,470 | | | | 2,173,810 | |
| | | | | | | | | | | | | | | | | | | | | | | | | | | | | | | | | | | |
| | | | | | | | | | | | | | | | | | | | | | | | | | | | | | | | | | | |
| | 13,268,317 | | | | 7,770,359 | | | | 7,210,660 | | | | (2,216,936 | ) | | | 2,600,368 | | | | 7,373,360 | | | | 1,948,775 | | | | — | | | | (232 | ) |
| | (6,353 | ) | | | (1,506 | ) | | | (961 | ) | | | (215 | ) | | | (112 | ) | | | (1,006 | ) | | | (1,013 | ) | | | — | | | | — | |
| | — | | | | — | | | | (6,021,320 | ) | | | — | | | | — | | | | — | | | | — | | | | — | | | | — | |
| | 5,646,364 | | | | 1,741,210 | | | | 8,811,275 | | | | 779,570 | | | | 260,594 | | | | 1,144,374 | | | | — | | | | — | | | | — | |
| | 10,289 | | | | 17,950 | | | | — | | | | — | | | | 1,812 | | | | 729 | | | | 25,080 | | | | — | | | | — | |
| | 18,918,617 | | | | 9,528,013 | | | | 9,999,654 | | | | (1,437,581 | ) | | | 2,862,662 | | | | 8,517,457 | | | | 1,972,842 | | | | — | | | | (232 | ) |
| | | | | | | | | | | | | | | | | | | | | | | | | | | | | | | | | | | |
| | 9,897,756 | | | | 5,282,080 | | | | 14,473,951 | | | | 12,255,828 | | | | (1,723,863 | ) | | | (444,064 | ) | | | 187,596 | | | | — | | | | (63,366 | ) |
| | (398 | ) | | | (1,287 | ) | | | (28 | ) | | | (940 | ) | | | (1 | ) | | | (103 | ) | | | (346 | ) | | | — | | | | — | |
| | — | | | | — | | | | (1,912,524 | ) | | | — | | | | — | | | | — | | | | — | | | | — | | | | — | |
| | 232,463 | | | | 274,235 | | | | 879,702 | | | | 353,812 | | | | 18,970 | | | | 58,613 | | | | — | | | | — | | | | — | |
| | 10,129,821 | | | | 5,555,028 | | | | 13,441,101 | | | | 12,608,700 | | | | (1,704,894 | ) | | | (385,554 | ) | | | 187,250 | | | | — | | | | (63,366 | ) |
| | | | | | | | | | | | | | | | | | | | | | | | | | | | | | | | | | | |
| | 29,048,438 | | | | 15,083,041 | | | | 23,440,755 | | | | 11,171,119 | | | | 1,157,768 | | | | 8,131,903 | | | | 2,160,092 | | | | — | | | | (63,598 | ) |
| | | | | | | | | | | | | | | | | | | | | | | | | | | | | | | | | | | |
| $ | 31,273,219 | | | $ | 15,601,494 | | | $ | 23,570,521 | | | $ | 11,521,150 | | | $ | 1,462,968 | | | $ | 8,629,060 | | | $ | 7,574,472 | | | $ | 243,470 | | | $ | 2,110,212 | |
The accompanying notes are an integral part of these financial statements.
2017 Annual Report | December 31, 2017 | Page 107 |
Statements of Changes in Net Assets
For the Year Ended December 31, |
| | | Muirfield Fund | | Dynamic Allocation Fund |
| | | 2017 | | 2016 | | 2017 | | 2016 |
| Operations | | | | | | | | |
| Net investment income (loss) | | $ | 2,390,068 | | | $ | 2,843,302 | | | $ | 982,801 | | | $ | 1,168,224 | |
| Net realized gain (loss) from investment transactions, futures contracts, and distributions of long-term realized gains by other investment companies | | | 45,422,703 | | | | 8,909,457 | | | | 12,582,298 | | | | 1,191,815 | |
| Net change in unrealized appreciation (depreciation) of investment transactions and futures contracts | | | 27,968,426 | | | | 10,119,598 | | | | 10,230,631 | | | | 3,129,274 | |
| Net change in net assets resulting from operations | | | 75,781,197 | | | | 21,872,357 | | | | 23,795,730 | | | | 5,489,313 | |
| | | | | | | | | | | | | | | | | |
| Distributions to Shareholders | | | | | | | | | | | | | | | | |
| From net investment income: | | | | | | | | | | | | | | | | |
| Retail Class | | | (1,373,870 | ) | | | (2,928,064 | ) | | | (385,009 | ) | | | (1,179,811 | ) |
| Adviser Class | | | (125,710 | ) | | | (335 | ) | | | (46,717 | ) | | | (105 | ) |
| Institutional Class | | | (800,089 | ) | | | (2,155 | ) | | | (499,738 | ) | | | (1,385 | ) |
| From net realized gain from investment transactions: | | | | | | | | | | | | | | | | |
| Retail Class | | | (18,095,918 | ) | | | — | | | | (3,679,737 | ) | | | (566,878 | ) |
| Adviser Class | | | (2,688,959 | ) | | | — | | | | (735,907 | ) | | | (225 | ) |
| Institutional Class | | | (12,180,495 | ) | | | — | | | | (5,051,812 | ) | | | (2,968 | ) |
| Net change in net assets resulting from distributions | | | (35,265,041 | ) | | | (2,930,554 | ) | | | (10,398,920 | ) | | | (1,751,372 | ) |
| | | | | | | | | | | | | | | | | |
| Capital Transactions: | | | | | | | | | | | | | | | | |
| Issued | | | 308,551,786 | | | | 135,904,696 | | | | 94,289,003 | | | | 52,208,011 | |
| Reinvested | | | 33,614,056 | | | | 2,838,323 | | | | 10,347,670 | | | | 1,750,198 | |
| Redeemed | | | (296,536,002 | ) | | | (156,813,790 | ) | | | (106,068,784 | ) | | | (55,322,607 | ) |
| Net change in net assets resulting from capital transactions | | | 45,629,840 | | | | (18,070,771 | ) | | | (1,432,111 | ) | | | (1,364,398 | ) |
| | | | | | | | | | | | | | | | | |
| Total Change in Net Assets | | | 86,145,996 | | | | 871,032 | | | | 11,964,699 | | | | 2,373,543 | |
| | | | | | | | | | | | | | | | | |
| Net Assets - Beginning of Year | | | 391,816,166 | | | | 390,945,134 | | | | 118,932,944 | | | | 116,559,401 | |
| | | | | | | | | | | | | | | | | |
| Net Assets - End of Year | | $ | 477,962,162 | | | $ | 391,816,166 | | | $ | 130,897,643 | | | $ | 118,932,944 | |
| | | | | | | | | | | | | | | | | |
| Accumulated undistributed (distributions in excess of) net investment income | | $ | (141,039 | ) | | $ | — | | | $ | (87,708 | ) | | $ | — | |
| | | | | | | | | | | | | | | | | |
| Share Transactions: | | | | | | | | | | | | | | | | |
| Issued | | | 41,583,017 | | | | 20,962,657 | | | | 9,115,839 | | | | 5,547,887 | |
| Reinvested | | | 4,470,775 | | | | 428,665 | | | | 957,539 | | | | 182,450 | |
| Redeemed | | | (40,445,977 | ) | | | (24,105,739 | ) | | | (10,248,519 | ) | | | (5,956,619 | ) |
| Net change in shares | | | 5,607,815 | | | | (2,714,417 | ) | | | (175,141 | ) | | | (226,282 | ) |
The accompanying notes are an integral part of these financial statements.
Page 108 | 2017 Annual Report | December 31, 2017 |
| |
| Aggressive Allocation Fund | | Balanced Fund | | Global Allocation Fund | | Spectrum Fund |
| 2017 | | 2016 | | 2017 | | 2016 | | 2017 | | 2016 | | 2017 | | 2016 |
| | | | | | | | | | | | | | | |
| $ | 209,250 | | | $ | 500,958 | | | $ | 2,224,781 | | | $ | 2,741,585 | | | $ | 518,453 | | | $ | 878,663 | | | $ | 129,766 | | | $ | 196,468 | |
| | 3,592,132 | | | | 1,400,806 | | | | 18,918,617 | | | | 3,056,390 | | | | 9,528,013 | | | | (2,265,626 | ) | | | 9,999,654 | | | | 4,775,916 | |
| | 1,431,423 | | | | 1,991,855 | | | | 10,129,821 | | | | 6,956,644 | | | | 5,555,028 | | | | 3,437,192 | | | | 13,441,101 | | | | 3,628,533 | |
| | 5,232,805 | | | | 3,893,619 | | | | 31,273,219 | | | | 12,754,619 | | | | 15,601,494 | | | | 2,050,229 | | | | 23,570,521 | | | | 8,600,917 | |
| | | | | | | | | | | | | | | | | | | | | | | | | | | | | | | |
| | | | | | | | | | | | | | | | | | | | | | | | | | | | | | | |
| | | | | | | | | | | | | | | | | | | | | | | | | | | | | | | |
| | (40,200 | ) | | | (514,879 | ) | | | (1,150,685 | ) | | | (2,762,407 | ) | | | (102,129 | ) | | | (920,975 | ) | | | — | | | | (229,819 | ) |
| | (5,122 | ) | | | (26 | ) | | | (68,028 | ) | | | (336 | ) | | | (7,418 | ) | | | (189 | ) | | | — | | | | (85 | ) |
| | (137,029 | ) | | | (384 | ) | | | (932,696 | ) | | | (754 | ) | | | (344,681 | ) | | | (1,716 | ) | | | — | | | | (978 | ) |
| | | | | | | | | | | | | | | | | | | | | | | | | | | | | | | |
| | (1,929,131 | ) | | | — | | | | (4,750,204 | ) | | | — | | | | (396,993 | ) | | | — | | | | (3,769,641 | ) | | | (1,322,992 | ) |
| | (145,037 | ) | | | — | | | | (570,082 | ) | | | — | | | | (11,523 | ) | | | — | | | | (802,354 | ) | | | (512 | ) |
| | (2,163,460 | ) | | | — | | | | (6,054,681 | ) | | | — | | | | (420,412 | ) | | | — | | | | (4,636,571 | ) | | | (5,890 | ) |
| | (4,419,979 | ) | | | (515,289 | ) | | | (13,526,376 | ) | | | (2,763,497 | ) | | | (1,283,156 | ) | | | (922,880 | ) | | | (9,208,566 | ) | | | (1,560,276 | ) |
| | | | | | | | | | | | | | | | | | | | | | | | | | | | | | | |
| | | | | | | | | | | | | | | | | | | | | | | | | | | | | | | |
| | 27,642,366 | | | | 16,210,649 | | | | 225,356,251 | | | | 79,755,921 | | | | 49,118,154 | | | | 19,568,280 | | | | 119,341,484 | | | | 41,463,179 | |
| | 4,414,660 | | | | 515,052 | | | | 13,375,715 | | | | 2,759,403 | | | | 1,280,093 | | | | 921,716 | | | | 9,102,305 | | | | 1,559,046 | |
| | (37,649,782 | ) | | | (52,233,584 | ) | | | (207,685,297 | ) | | | (151,263,770 | ) | | | (66,796,194 | ) | | | (52,021,124 | ) | | | (112,449,372 | ) | | | (51,142,012 | ) |
| | (5,592,756 | ) | | | (35,507,883 | ) | | | 31,046,669 | | | | (68,748,446 | ) | | | (16,397,947 | ) | | | (31,531,128 | ) | | | 15,994,417 | | | | (8,119,787 | ) |
| | | | | | | | | | | | | | | | | | | | | | | | | | | | | | | |
| | (4,779,930 | ) | | | (32,129,553 | ) | | | 48,793,512 | | | | (58,757,324 | ) | | | (2,079,609 | ) | | | (30,403,779 | ) | | | 30,356,372 | | | | (1,079,146 | ) |
| | | | | | | | | | | | | | | | | | | | | | | | | | | | | | | |
| | 46,081,190 | | | | 78,210,743 | | | | 230,045,791 | | | | 288,803,115 | | | | 76,017,835 | | | | 106,421,614 | | | | 124,517,885 | | | | 125,597,031 | |
| | | | | | | | | | | | | | | | | | | | | | | | | | | | | | | |
| $ | 41,301,260 | | | $ | 46,081,190 | | | $ | 278,839,303 | | | $ | 230,045,791 | | | $ | 73,938,226 | | | $ | 76,017,835 | | | $ | 154,874,257 | | | $ | 124,517,885 | |
| | | | | | | | | | | | | | | | | | | | | | | | | | | | | | | |
| $ | (51,811 | ) | | $ | — | | | $ | (97,184 | ) | | $ | — | | | $ | (52,959 | ) | | $ | — | | | $ | (12,572 | ) | | $ | — | |
| | | | | | | | | | | | | | | | | | | | | | | | | | | | | | | |
| | | | | | | | | | | | | | | | | | | | | | | | | | | | | | | |
| | 2,624,774 | | | | 1,705,205 | | | | 19,574,841 | | | | 7,682,584 | | | | 4,905,373 | | | | 2,140,082 | | | | 10,719,123 | | | | 4,276,333 | |
| | 425,667 | | | | 53,363 | | | | 1,151,420 | | | | 260,363 | | | | 112,132 | | | | 97,608 | | | | 794,665 | | | | 150,043 | |
| | (3,556,913 | ) | | | (5,415,390 | ) | | | (18,224,269 | ) | | | (14,401,906 | ) | | | (6,563,852 | ) | | | (5,676,548 | ) | | | (10,173,190 | ) | | | (5,226,636 | ) |
| | (506,472 | ) | | | (3,656,822 | ) | | | 2,501,992 | | | | (6,458,959 | ) | | | (1,546,347 | ) | | | (3,438,858 | ) | | | 1,340,598 | | | | (800,260 | ) |
The accompanying notes are an integral part of these financial statements.
2017 Annual Report | December 31, 2017 | Page 109 |
Statements of Changes in Net Assets
For the Periods Ended December 31, |
| | | Quantex
Fund | | Conservative
Allocation Fund |
| | | 2017 | | 2016 | | 2017 | | 2016 |
| Operations | | | | | | | | |
| Net investment income (loss) | | $ | 350,031 | | | $ | 324,146 | | | $ | 305,200 | | | $ | 108,305 | |
| Net realized gain (loss) from investment transactions, futures contracts, and distributions of long-term realized gains by other investment companies | | | (1,437,581 | ) | | | 3,915,275 | | | | 2,862,662 | | | | (379,889 | ) |
| Net change in unrealized appreciation (depreciation) of investment transactions and futures contracts | | | 12,608,700 | | | | 10,155,720 | | | | (1,704,894 | ) | | | 3,752,341 | |
| Net change in net assets resulting from operations | | | 11,521,150 | | | | 14,395,141 | | | | 1,462,968 | | | | 3,480,757 | |
| | | | | | | | | | | | | | | | | |
| Distributions to Shareholders | | | | | | | | | | | | | | | | |
| From net investment income: | | | | | | | | | | | | | | | | |
| Retail Class | | | (99,127 | ) | | | (359,961 | ) | | | (223,576 | ) | | | — | |
| Adviser Class | | | (6,183 | ) | | | (38 | ) | | | (6,728 | ) | | | — | |
| Institutional Class | | | (156,324 | ) | | | (1,160 | ) | | | (112,007 | ) | | | — | |
| From net realized gain from investment transactions: | | | | | | | | | | | | | | | | |
| Retail Class | | | (1,617,757 | ) | | | (1,234,598 | ) | | | — | | | | (194,130 | ) |
| Adviser Class | | | (54,620 | ) | | | (445 | ) | | | — | | | | (71 | ) |
| Institutional Class | | | (857,186 | ) | | | (13,585 | ) | | | — | | | | (2,418 | ) |
| From return of capital: | | | | | | | | | | | | | | | | |
| Retail Class | | | — | | | | — | | | | — | | | | (234,294 | ) |
| Adviser Class | | | — | | | | — | | | | — | | | | (10 | ) |
| Institutional Class | | | — | | | | — | | | | — | | | | (324 | ) |
| Net change in net assets resulting from distributions | | | (2,791,197 | ) | | | (1,609,787 | ) | | | (342,311 | ) | | | (431,247 | ) |
| | | | | | | | | | | | | | | | | |
| Distributions to Shareholders - Money Market Funds | | | | | | | | | | | | | | | | |
| From net investment income | | | | | | | | | | | | | | | | |
| From net investment income (Retail Class) | | | | | | | | | | | | | | | | |
| From net investment income (Institutional Class) | | | | | | | | | | | | | | | | |
| Net change in net assets resulting from distributions | | | | | | | | | | | | | | | | |
| | | | | | | | | | | | | | | | | |
| Capital Transactions: | | | | | | | | | | | | | | | | |
| Issued | | | 54,392,703 | | | | 40,428,525 | | | | 18,785,464 | | | | 6,512,856 | |
| Reinvested | | | 2,776,308 | | | | 1,605,609 | | | | 335,648 | | | | 410,682 | |
| Redeemed | | | (57,352,179 | ) | | | (27,484,256 | ) | | | (16,038,502 | ) | | | (9,244,777 | ) |
| Net change in net assets resulting from capital transactions | | | (183,168 | ) | | | 14,549,878 | | | | 3,082,610 | | | | (2,321,239 | ) |
| | | | | | | | | | | | | | | | | |
| Total Change in Net Assets | | | 8,546,785 | | | | 27,335,232 | | | | 4,203,267 | | | | 728,271 | |
| | | | | | | | | | | | | | | | | |
| Net Assets - Beginning of Year | | | 86,217,760 | | | | 58,882,528 | | | | 20,762,422 | | | | 20,035 | |
| | | | | | | | | | | | | | | | | |
| Net Assets - End of Year | | $ | 94,764,545 | | | $ | 86,217,760 | | | $ | 24,965,689 | | | $ | 20,762,422 | |
| | | | | | | | | | | | | | | | | |
| Accumulated undistributed (distributions in excess of) net investment income | | $ | 3,453 | | | $ | — | | | $ | (10,056 | ) | | $ | (4,243 | ) |
| | | | | | | | | | | | | | | | | |
| Share Transactions: | | | | | | | | | | | | | | | | |
| Issued | | | 1,586,527 | | | | 1,330,055 | | | | 836,566 | | | | 314,588 | |
| Reinvested | | | 75,618 | | | | 48,133 | | | | 14,821 | | | | 19,734 | |
| Redeemed | | | (1,668,761 | ) | | | (909,010 | ) | | | (725,363 | ) | | | (462,854 | ) |
| Net change in shares | | | (6,616 | ) | | | 469,178 | | | | 126,024 | | | | (128,532 | ) |
(1) | Commenced operations on October 7, 2016. |
The accompanying notes are an integral part of these financial statements.
Page 110 | 2017 Annual Report | December 31, 2017 |
| |
Moderate
Allocation Fund | | Total Return
Bond Fund | | Prime Money
Market Fund | | Institutional Prime
Money Market Fund(1) |
| 2017 | | 2016 | | 2017 | | 2016 | | 2017 | | 2016 | | 2017 | | 2016 |
| | | | | | | | | | | | | | | |
| $ | 497,157 | | | $ | 735,115 | | | $ | 5,414,380 | | | $ | 6,265,031 | | | $ | 243,470 | | | $ | 545,581 | | | $ | 2,173,810 | | | $ | 171,971 | |
| | 8,517,457 | | | | 1,198,154 | | | | 1,972,842 | | | | (2,055,911 | ) | | | — | | | | — | | | | (232 | ) | | | (1,094 | ) |
| | (385,554 | ) | | | 3,412,365 | | | | 187,250 | | | | 4,922,395 | | | | — | | | | — | | | | (63,366 | ) | | | 3,260 | |
| | 8,629,060 | | | | 5,345,634 | | | | 7,574,472 | | | | 9,131,515 | | | | 243,470 | | | | 545,581 | | | | 2,110,212 | | | | 174,137 | |
| | | | | | | | | | | | | | | | | | | | | | | | | | | | | | | |
| | | | | | | | | | | | | | | | | | | | | | | | | | | | | | | |
| | | | | | | | | | | | | | | | | | | | | | | | | | | | | | | |
| | (152,200 | ) | | | (777,037 | ) | | | (3,220,595 | ) | | | (6,263,758 | ) | | | | | | | | | | | | | | | | |
| | (14,920 | ) | | | (71 | ) | | | (147,366 | ) | | | (726 | ) | | | | | | | | | | | | | | | | |
| | (226,553 | ) | | | (459 | ) | | | (2,053,634 | ) | | | (557 | ) | | | | | | | | | | | | | | | | |
| | | | | | | | | | | | | | | | | | | | | | | | | | | | | | | |
| | (849,212 | ) | | | — | | | | — | | | | — | | | | | | | | | | | | | | | | | |
| | (118,465 | ) | | | — | | | | — | | | | — | | | | | | | | | | | | | | | | | |
| | (1,134,939 | ) | | | — | | | | — | | | | — | | | | | | | | | | | | | | | | | |
| | | | | | | | | | | | | | | | | | | | | | | | | | | | | | | |
| | — | | | | — | | | | — | | | | — | | | | | | | | | | | | | | | | | |
| | — | | | | — | | | | — | | | | — | | | | | | | | | | | | | | | | | |
| | — | | | | — | | | | — | | | | — | | | | | | | | | | | | | | | | | |
| | (2,496,289 | ) | | | (777,567 | ) | | | (5,421,595 | ) | | | (6,265,041 | ) | | | | | | | | | | | | | | | | |
| | | | | | | | | | | | | | | | | | | | | | | | | | | | | | | |
| | | | | | | | | | | | | | | | | | | | | | | | | | | | | | | |
| | | | | | | | | | | | | | | | | | (243,470 | ) | | | (28,501 | ) | | | (2,173,717 | ) | | | (171,959 | ) |
| | | | | | | | | | | | | | | | | | — | | | | (113,390 | ) | | | — | | | | — | |
| | | | | | | | | | | | | | | | | | — | | | | (403,691 | ) | | | — | | | | — | |
| | | | | | | | | | | | | | | | | | (243,470 | ) | | | (545,582 | ) | | | (2,173,717 | ) | | | (171,959 | ) |
| | | | | | | | | | | | | | | | | | | | | | | | | | | | | | | |
| | | | | | | | | | | | | | | | | | | | | | | | | | | | | | | |
| | 48,367,764 | | | | 30,149,567 | | | | 174,937,272 | | | | 90,469,480 | | | | 29,723,424 | | | | 587,186,878 | | | | 485,340,979 | | | | 304,118,416 | |
| | 2,483,463 | | | | 777,204 | | | | 5,385,499 | | | | 6,255,443 | | | | 236,626 | | | | 137,783 | | | | 225,080 | | | | 14,473 | |
| | (47,860,164 | ) | | | (20,598,293 | ) | | | (208,828,722 | ) | | | (99,300,344 | ) | | | (31,415,171 | ) | | | (775,361,263 | ) | | | (386,435,339 | ) | | | (106,654,831 | ) |
| | 2,991,063 | | | | 10,328,478 | | | | (28,505,951 | ) | | | (2,575,421 | ) | | | (1,455,121 | ) | | | (188,036,602 | ) | | | 99,130,720 | | | | 197,478,058 | |
| | | | | | | | | | | | | | | | | | | | | | | | | | | | | | | |
| | 9,123,834 | | | | 14,896,545 | | | | (26,353,074 | ) | | | 291,053 | | | | (1,455,121 | ) | | | (188,036,603 | ) | | | 99,067,215 | | | | 197,480,236 | |
| | | | | | | | | | | | | | | | | | | | | | | | | | | | | | | |
| | 56,995,152 | | | | 42,098,607 | | | | 214,908,825 | | | | 214,617,772 | | | | 36,665,827 | | | | 224,702,430 | | | | 197,480,236 | | | | — | |
| | | | | | | | | | | | | | | | | | | | | | | | | | | | | | | |
| $ | 66,118,986 | | | $ | 56,995,152 | | | $ | 188,555,751 | | | $ | 214,908,825 | | | $ | 35,210,706 | | | $ | 36,665,827 | | | $ | 296,547,451 | | | $ | 197,480,236 | |
| | | | | | | | | | | | | | | | | | | | | | | | | | | | | | | |
| $ | (5,079 | ) | | $ | — | | | $ | (50,555 | ) | | $ | — | | | $ | — | | | $ | — | | | $ | 105 | | | $ | 12 | |
| | | | | | | | | | | | | | | | | | | | | | | | | | | | | | | |
| | | | | | | | | | | | | | | | | | | | | | | | | | | | | | | |
| | 4,418,490 | | | | 3,043,488 | | | | 18,549,332 | | | | 9,651,192 | | | | 29,723,424 | | | | 587,186,878 | | | | 485,328,584 | | | | 304,102,698 | |
| | 214,661 | | | | 79,378 | | | | 572,232 | | | | 668,172 | | | | 236,626 | | | | 137,783 | | | | 225,073 | | | | 14,472 | |
| | (4,414,246 | ) | | | (2,106,832 | ) | | | (22,170,849 | ) | | | (10,641,622 | ) | | | (31,415,171 | ) | | | (775,361,263 | ) | | | (386,423,004 | ) | | | (106,647,341 | ) |
| | 218,905 | | | | 1,016,034 | | | | (3,049,285 | ) | | | (322,258 | ) | | | (1,455,121 | ) | | | (188,036,602 | ) | | | 99,130,653 | | | | 197,469,829 | |
The accompanying notes are an integral part of these financial statements.
2017 Annual Report | December 31, 2017 | Page 111 |
Financial Highlights
For the Periods Ended December 31, |
| | | | | Income from Investment Operations | | Less Distributions |
| | | Net Asset Value, Beginning of Period | | Net Investment Income
(Loss) (4) | | Net gains (losses) on securities and futures (both realized and unrealized) | | Total from Investment Operations | | From Net Investment Income | | From Net Capital Gains | | From Return of Capital | | Total
Distributions |
| Muirfield Fund - Retail Class (1)(2) |
| 2017 | | | $ | 6.79 | | | | 0.04 | | | | 1.34 | | | | 1.38 | | | | (0.04 | ) | | | (0.59 | ) | | | 0.00 | | | | (0.63 | ) |
| 2016 | | | $ | 6.47 | | | | 0.05 | | | | 0.32 | | | | 0.37 | | | | (0.05 | ) | | | 0.00 | | | | 0.00 | | | | (0.05 | ) |
| 2015 | | | $ | 7.03 | | | | 0.02 | | | | (0.41 | ) | | | (0.39 | ) | | | (0.02 | ) | | | (0.15 | ) | | | 0.00 | | | | (0.17 | ) |
| 2014 | | | $ | 6.95 | | | | 0.01 | | | | 0.81 | | | | 0.82 | | | | (0.18 | ) | | | (0.56 | ) | | | 0.00 | | | | (0.74 | ) |
| 2013 | | | $ | 5.81 | | | | 0.01 | | | | 1.75 | | | | 1.76 | | | | (0.01 | ) | | | (0.61 | ) | | | 0.00 | | | | (0.62 | ) |
| Muirfield Fund - Adviser Class (1)(2)(3) |
| 2017 | | | $ | 6.80 | | | | 0.05 | | | | 1.34 | | | | 1.39 | | | | (0.03 | ) | | | (0.59 | ) | | | 0.00 | | | | (0.62 | ) |
2016 (5) | | | $ | 6.51 | | | | 0.01 | | | | 0.29 | | | | 0.30 | | | | (0.01 | ) | | | 0.00 | | | | 0.00 | | | | (0.01 | ) |
| Muirfield Fund - Institutional Class (1)(2)(3) |
| 2017 | | | $ | 6.80 | | | | 0.07 | | | | 1.33 | | | | 1.40 | | | | (0.04 | ) | | | (0.59 | ) | | | 0.00 | | | | (0.63 | ) |
2016 (5) | | | $ | 6.51 | | | | 0.02 | | | | 0.29 | | | | 0.31 | | | | (0.02 | ) | | | 0.00 | | | | 0.00 | | | | (0.02 | ) |
| Dynamic Allocation Fund - Retail Class (1)(2) |
| 2017 | | | $ | 9.72 | | | | 0.06 | | | | 1.99 | | | | 2.05 | | | | (0.07 | ) | | | (0.85 | ) | | | 0.00 | | | | (0.92 | ) |
| 2016 | | | $ | 9.36 | | | | 0.10 | | | | 0.40 | | | | 0.50 | | | | (0.09 | ) | | | (0.05 | ) | | | 0.00 | | | | (0.14 | ) |
| 2015 | | | $ | 10.02 | | | | 0.05 | | | | (0.40 | ) | | | (0.35 | ) | | | (0.05 | ) | | | (0.26 | ) | | | 0.00 | | | | (0.31 | ) |
| 2014 | | | $ | 10.35 | | | | 0.04 | | | | 1.25 | | | | 1.29 | | | | (0.30 | ) | | | (1.32 | ) | | | 0.00 | | | | (1.62 | ) |
| 2013 | | | $ | 8.80 | | | | 0.02 | | | | 2.74 | | | | 2.76 | | | | (0.02 | ) | | | (1.19 | ) | | | 0.00 | | | | (1.21 | ) |
| Dynamic Allocation Fund - Adviser Class (1)(2)(3) |
| 2017 | | | $ | 9.73 | | | | 0.10 | | �� | | 1.97 | | | | 2.07 | | | | (0.07 | ) | | | (0.85 | ) | | | 0.00 | | | | (0.92 | ) |
2016 (5) | | | $ | 9.34 | | | | 0.02 | | | | 0.44 | | | | 0.46 | | | | (0.02 | ) | | | (0.05 | ) | | | 0.00 | | | | (0.07 | ) |
| Dynamic Allocation Fund - Institutional Class (1)(2)(3) |
| 2017 | | | $ | 9.72 | | | | 0.12 | | | | 1.97 | | | | 2.09 | | | | (0.10 | ) | | | (0.85 | ) | | | 0.00 | | | | (0.95 | ) |
2016 (5) | | | $ | 9.34 | | | | 0.02 | | | | 0.43 | | | | 0.45 | | | | (0.02 | ) | | | (0.05 | ) | | | 0.00 | | | | (0.07 | ) |
| Aggressive Allocation Fund - Retail Class (1)(2) |
| 2017 | | | $ | 10.34 | | | | 0.02 | | | | 1.31 | | | | 1.33 | | | | (0.02 | ) | | | (1.20 | ) | | | 0.00 | | | | (1.22 | ) |
| 2016 | | | $ | 9.64 | | | | 0.07 | | | | 0.72 | | | | 0.79 | | | | (0.09 | ) | | | 0.00 | | | | 0.00 | | | | (0.09 | ) |
| 2015 | | | $ | 10.47 | | | | 0.03 | | | | (0.48 | ) | | | (0.45 | ) | | | (0.03 | ) | | | (0.35 | ) | | | 0.00 | | | | (0.38 | ) |
| 2014 | | | $ | 10.91 | | | | 0.00 | | | | 1.43 | | | | 1.43 | | | | (0.08 | ) | | | (1.79 | ) | | | 0.00 | | | | (1.87 | ) |
| 2013 | | | $ | 8.44 | | | | (0.00 | )* | | | 2.56 | | | | 2.56 | | | | 0.00 | | | | (0.09 | ) | | | 0.00 | | | | (0.09 | ) |
| Aggressive Allocation Fund - Adviser Class (1)(2)(3) |
| 2017 | | | $ | 10.35 | | | | 0.07 | | | | 1.29 | | | | 1.36 | | | | (0.06 | ) | | | (1.20 | ) | | | 0.00 | | | | (1.26 | ) |
2016 (5) | | | $ | 9.53 | | | | 0.01 | | | | 0.82 | | | | 0.83 | | | | (0.01 | ) | | | 0.00 | | | | 0.00 | | | | (0.01 | ) |
| Aggressive Allocation Fund - Institutional Class (1)(2)(3) |
| 2017 | | | $ | 10.35 | | | | 0.10 | | | | 1.29 | | | | 1.39 | | | | (0.08 | ) | | | (1.20 | ) | | | 0.00 | | | | (1.28 | ) |
2016 (5) | | | $ | 9.53 | | | | 0.01 | | | | 0.82 | | | | 0.83 | | | | (0.01 | ) | | | 0.00 | | | | 0.00 | | | | (0.01 | ) |
|
1 | Ratio of net expenses to average net assets, ratio of net investment income (loss) to average net assets, ratio of expenses to average net assets after reductions, excluding commissions recaptured and fees received from custodian, and ratio of expenses to average net assets before reductions do not include impact of expenses of the underlying security holdings as represented in the schedule of investments. |
2 | Recognition of net investment income by the Fund is affected by the timing of the declaration of dividends by the underlying investment companies in which the Fund invests. |
3 | Ratio of net expenses to average net assets, ratio of net investment income (loss) to average net assets, ratio of expenses to average net assets after reductions, excluding commissions recaptured and fees received from custodian, and ratio of expenses to average net assets before reductions are annualized for periods of less than one full year. Total return is not annualized. |
The accompanying notes are an integral part of these financial statements.
Page 112 | 2017 Annual Report | December 31, 2017 |
| | | | | Ratios/Supplemental Data |
| Net Asset Value, End of Period | | Total Return (Assumes Reinvestment of Distributions) | | Net Assets, End of Period ($000) | | Ratio of Net Investment Income (Loss) to Average Net Assets | | Ratio of Net Expenses to Average Net Assets | | Ratio of Expenses to Average Net Assets after Reductions, Excluding Commissions Recaptured and Fees Received from Custodian | | Ratio of Expenses to Average Net Assets Before Reductions or Recoupment of Fees | | Portfolio Turnover Rate |
| |
| $ | 7.54 | | | | 20.29 | % | | $ | 250,322 | | | | 0.49 | % | | | 1.27 | % | | | 1.33 | % | | | 1.33 | % | | | 276 | % |
| $ | 6.79 | | | | 5.72 | % | | $ | 390,817 | | | | 0.73 | % | | | 1.05 | % | | | 1.36 | % | | | 1.35 | % | | | 414 | % |
| $ | 6.47 | | | | (5.50 | %) | | $ | 390,945 | | | | 0.33 | % | | | 1.03 | % | | | 1.35 | % | | | 1.37 | % | | | 277 | % |
| $ | 7.03 | | | | 12.12 | % | | $ | 297,861 | | | | 0.22 | % | | | 1.22 | % | | | 1.44 | % | | | 1.44 | % | | | 238 | % |
| $ | 6.95 | | | | 30.46 | % | | $ | 161,823 | | | | 0.14 | % | | | 1.22 | % | | | 1.42 | % | | | 1.54 | % | | | 260 | % |
|
| $ | 7.57 | | | | 20.50 | % | | $ | 41,440 | | | | 0.71 | % | | | 1.05 | % | | | 1.11 | % | | | 1.20 | % | | | 276 | % |
| $ | 6.80 | | | | 4.68 | % | | $ | 154 | | | | 1.32 | % | | | 0.73 | % | | | 0.99 | % | | | 0.99 | % | | | 414 | % |
|
| $ | 7.57 | | | | 20.60 | % | | $ | 186,200 | | | | 0.88 | % | | | 0.85 | % | | | 0.91 | % | | | 1.00 | % | | | 276 | % |
| $ | 6.80 | | | | 4.72 | % | | $ | 845 | | | | 1.33 | % | | | 0.72 | % | | | 0.98 | % | | | 0.98 | % | | | 414 | % |
|
| $ | 10.85 | | | | 21.20 | % | | $ | 50,570 | | | | 0.59 | % | | | 1.39 | % | | | 1.51 | % | | | 1.58 | % | | | 252 | % |
| $ | 9.72 | | | | 5.37 | % | | $ | 118,293 | | | | 1.04 | % | | | 1.05 | % | | | 1.42 | % | | | 1.56 | % | | | 369 | % |
| $ | 9.36 | | | | (3.46 | %) | | $ | 116,559 | | | | 0.47 | % | | | 1.19 | % | | | 1.48 | % | | | 1.54 | % | | | 245 | % |
| $ | 10.02 | | | | 12.80 | % | | $ | 141,638 | | | | 0.40 | % | | | 1.22 | % | | | 1.45 | % | | | 1.54 | % | | | 230 | % |
| $ | 10.35 | | | | 31.61 | % | | $ | 102,926 | | | | 0.20 | % | | | 1.22 | % | | | 1.39 | % | | | 1.58 | % | | | 276 | % |
|
| $ | 10.88 | | | | 21.42 | % | | $ | 10,140 | | | | 0.87 | % | | | 1.16 | % | | | 1.27 | % | | | 1.34 | % | | | 252 | % |
| $ | 9.73 | | | | 4.89 | % | | $ | 48 | | | | 1.33 | % | | | 0.81 | % | | | 1.12 | % | | | 1.12 | % | | | 369 | % |
|
| $ | 10.86 | | | | 21.61 | % | | $ | 70,187 | | | | 1.10 | % | | | 0.94 | % | | | 1.05 | % | | | 1.12 | % | | | 252 | % |
| $ | 9.72 | | | | 4.80 | % | | $ | 592 | | | | 1.33 | % | | | 0.80 | % | | | 1.11 | % | | | 1.11 | % | | | 369 | % |
|
| $ | 10.45 | | | | 12.91 | % | | $ | 18,732 | | | | 0.22 | % | | | 1.50 | % | | | 1.74 | % | | | 1.76 | % | | | 253 | % |
| $ | 10.34 | | | | 8.26 | % | | $ | 45,718 | | | | 0.77 | % | | | 1.16 | % | | | 1.60 | % | | | 1.63 | % | | | 361 | % |
| $ | 9.64 | | | | (4.35 | %) | | $ | 78,211 | | | | 0.24 | % | | | 1.18 | % | | | 1.56 | % | | | 1.58 | % | | | 283 | % |
| $ | 10.47 | | | | 13.49 | % | | $ | 84,847 | | | | 0.00 | % | | | 1.33 | % | | | 1.59 | % | | | 1.60 | % | | | 239 | % |
| $ | 10.91 | | | | 30.40 | % | | $ | 64,608 | | | | (0.03 | %) | | | 1.35 | % | | | 1.57 | % | | | 1.65 | % | | | 272 | % |
|
| $ | 10.45 | | | | 13.22 | % | | $ | 1,431 | | | | 0.65 | % | | | 1.24 | % | | | 1.45 | % | | | 1.59 | % | | | 253 | % |
| $ | 10.35 | | | | 8.75 | % | | $ | 19 | | | | 0.85 | % | | | 0.91 | % | | | 1.24 | % | | | 1.24 | % | | | 361 | % |
|
| $ | 10.46 | | | | 13.52 | % | | $ | 21,139 | | | | 0.90 | % | | | 0.94 | % | | | 1.21 | % | | | 1.35 | % | | | 253 | % |
| $ | 10.35 | | | | 8.73 | % | | $ | 345 | | | | 0.83 | % | | | 0.93 | % | | | 1.25 | % | | | 1.25 | % | | | 361 | % |
|
4 | Except for the Money Market Funds, net investment income per share is based on average shares outstanding during the period. |
5 | Commenced operations on October 31, 2016. |
* | Actual amounts were less than one-half of a cent per share |
The accompanying notes are an integral part of these financial statements.
2017 Annual Report | December 31, 2017 | Page 113 |
Financial Highlights
For the Periods Ended December 31, |
| | | | | Income from Investment Operations | | Less Distributions |
| | | Net Asset Value, Beginning of Period | | Net Investment Income
(Loss) (4) | | Net gains (losses) on securities and futures (both realized and unrealized) | | Total from Investment Operations | | From Net Investment Income | | From Net Capital Gains | | From Return of Capital | | Total
Distributions |
| Balanced Fund - Retail Class (1)(2) |
| 2017 | | | $ | 10.74 | | | | 0.09 | | | | 1.49 | | | | 1.58 | | | | (0.11 | ) | | | (0.60 | ) | | | 0.00 | | | | (0.71 | ) |
| 2016 | | | $ | 10.36 | | | | 0.11 | | | | 0.39 | | | | 0.50 | | | | (0.12 | ) | | | 0.00 | | | | 0.00 | | | | (0.12 | ) |
| 2015 | | | $ | 10.98 | | | | 0.09 | | | | (0.58 | ) | | | (0.49 | ) | | | (0.08 | ) | | | (0.05 | ) | | | 0.00 | | | | (0.13 | ) |
| 2014 | | | $ | 11.10 | | | | 0.10 | | | | 0.84 | | | | 0.94 | | | | (0.27 | ) | | | (0.79 | ) | | | 0.00 | | | | (1.06 | ) |
| 2013 | | | $ | 10.06 | | | | 0.09 | | | | 1.89 | | | | 1.98 | | | | (0.09 | ) | | | (0.85 | ) | | | 0.00 | | | | (0.94 | ) |
| Balanced Fund - Adviser Class (1)(2)(3) |
| 2017 | | | $ | 10.74 | | | | 0.13 | | | | 1.50 | | | | 1.63 | | | | (0.09 | ) | | | (0.60 | ) | | | 0.00 | | | | (0.69 | ) |
2016 (6) | | | $ | 10.49 | | | | 0.04 | | | | 0.25 | | | | 0.29 | | | | (0.04 | ) | | | 0.00 | | | | 0.00 | | | | (0.04 | ) |
| Balanced Fund - Institutional Class (1)(2)(3) |
| 2017 | | | $ | 10.75 | | | | 0.16 | | | | 1.47 | | | | 1.63 | | | | (0.10 | ) | | | (0.60 | ) | | | 0.00 | | | | (0.70 | ) |
2016 (6) | | | $ | 10.49 | | | | 0.04 | | | | 0.26 | | | | 0.30 | | | | (0.04 | ) | | | 0.00 | | | | 0.00 | | | | (0.04 | ) |
| Global Allocation Fund - Retail Class (1)(2) |
| 2017 | | | $ | 9.56 | | | | 0.04 | | | | 2.09 | | | | 2.13 | | | | (0.03 | ) | | | (0.13 | ) | | | 0.00 | | | | (0.16 | ) |
| 2016 | | | $ | 9.34 | | | | 0.09 | | | | 0.24 | | | | 0.33 | | | | (0.11 | ) | | | 0.00 | | | | 0.00 | | | | (0.11 | ) |
| 2015 | | | $ | 10.38 | | | | 0.04 | | | | (0.79 | ) | | | (0.75 | ) | | | (0.04 | ) | | | (0.25 | ) | | | 0.00 | | | | (0.29 | ) |
| 2014 | | | $ | 11.36 | | | | 0.06 | | | | 0.58 | | | | 0.64 | | | | (0.16 | ) | | | (1.46 | ) | | | 0.00 | | | | (1.62 | ) |
| 2013 | | | $ | 10.07 | | | | 0.04 | | | | 2.34 | | | | 2.38 | | | | (0.05 | ) | | | (1.04 | ) | | | 0.00 | | | | (1.09 | ) |
| Global Allocation Fund - Adviser Class (1)(2)(3) |
| 2017 | | | $ | 9.57 | | | | 0.15 | | | | 2.03 | | | | 2.18 | | | | (0.08 | ) | | | (0.13 | ) | | | 0.00 | | | | (0.21 | ) |
2016 (6) | | | $ | 9.41 | | | | 0.06 | | | | 0.16 | | | | 0.22 | | | | (0.06 | ) | | | 0.00 | | | | 0.00 | | | | (0.06 | ) |
| Global Allocation Fund - Institutional Class (1)(2)(3) |
| 2017 | | | $ | 9.58 | | | | 0.12 | | | | 2.09 | | | | 2.21 | | | | (0.11 | ) | | | (0.13 | ) | | | 0.00 | | | | (0.24 | ) |
2016 (6) | | | $ | 9.41 | | | | 0.06 | | | | 0.16 | | | | 0.22 | | | | (0.05 | ) | | | 0.00 | | | | 0.00 | | | | (0.05 | ) |
| Spectrum Fund - Retail Class (1)(2)(3) |
| 2017 | | | $ | 10.28 | | | | (0.01 | ) | | | 1.99 | | | | 1.98 | | | | 0.00 | | | | (0.78 | ) | | | 0.00 | | | | (0.78 | ) |
| 2016 | | | $ | 9.73 | | | | 0.02 | | | | 0.66 | | | | 0.68 | | | | (0.02 | ) | | | (0.11 | ) | | | 0.00 | | | | (0.13 | ) |
2015 (5) | | | $ | 10.00 | | | | (0.04 | ) | | | (0.08 | ) | | | (0.12 | ) | | | 0.00 | | | | (0.13 | ) | | | (0.02 | ) | | | (0.15 | ) |
| Spectrum Fund - Adviser Class (1)(2)(3) |
| 2017 | | | $ | 10.29 | | | | 0.02 | | | | 2.00 | | | | 2.02 | | | | 0.00 | | | | (0.78 | ) | | | 0.00 | | | | (0.78 | ) |
2016 (6) | | | $ | 9.97 | | | | 0.02 | | | | 0.43 | | | | 0.45 | | | | (0.02 | ) | | | (0.11 | ) | | | 0.00 | | | | (0.13 | ) |
| Spectrum Fund - Institutional Class (1)(2)(3) |
| 2017 | | | $ | 10.29 | | | | 0.05 | | | | 1.98 | | | | 2.03 | | | | 0.00 | | | | (0.78 | ) | | | 0.00 | | | | (0.78 | ) |
2016 (6) | | | $ | 9.97 | | | | 0.02 | | | | 0.43 | | | | 0.45 | | | | (0.02 | ) | | | (0.11 | ) | | | 0.00 | | | | (0.13 | ) |
|
1 | Ratio of net expenses to average net assets, ratio of net investment income (loss) to average net assets, ratio of expenses to average net assets after reductions, excluding commissions recaptured and fees received from custodian, and ratio of expenses to average net assets before reductions do not include impact of expenses of the underlying security holdings as represented in the schedule of investments. |
2 | Recognition of net investment income by the Fund is affected by the timing of the declaration of dividends by the underlying investment companies in which the Fund invests. |
3 | Ratio of net expenses to average net assets, ratio of net investment income (loss) to average net assets, ratio of expenses to average net assets after reductions, excluding commissions recaptured and fees received from custodian, and ratio of expenses to average net assets before reductions are annualized for periods of less than one full year. Total return is not annualized. |
The accompanying notes are an integral part of these financial statements.
Page 114 | 2017 Annual Report | December 31, 2017 |
| | | | | Ratios/Supplemental Data |
| Net Asset Value, End of Period | | Total Return (Assumes Reinvestment of Distributions) | | Net Assets, End of Period ($000) | | Ratio of Net Investment Income (Loss) to Average Net Assets | | Ratio of Net Expenses to Average Net Assets | | Ratio of Expenses to Average Net Assets after Reductions, Excluding Commissions Recaptured and Fees Received from Custodian | | Ratio of Expenses to Average Net Assets Before Reductions or Recoupment of Fees | | Portfolio Turnover Rate |
| |
| $ | 11.61 | | | | 14.74 | % | | $ | 97,116 | | | | 0.81 | % | | | 1.41 | % | | | 1.49 | % | | | 1.49 | % | | | 226 | % |
| $ | 10.74 | | | | 4.84 | % | | $ | 229,738 | | | | 1.02 | % | | | 1.22 | % | | | 1.46 | % | | | 1.46 | % | | | 322 | % |
| $ | 10.36 | | | | (4.47 | %) | | $ | 288,803 | | | | 0.81 | % | | | 1.22 | % | | | 1.47 | % | | | 1.48 | % | | | 246 | % |
| $ | 10.98 | | | | 8.61 | % | | $ | 175,534 | | | | 0.94 | % | | | 1.33 | % | | | 1.50 | % | | | 1.54 | % | | | 180 | % |
| $ | 11.10 | | | | 19.79 | % | | $ | 105,642 | | | | 0.85 | % | | | 1.33 | % | | | 1.47 | % | | | 1.57 | % | | | 217 | % |
|
| $ | 11.68 | | | | 15.21 | % | | $ | 12,137 | | | | 1.13 | % | | | 1.12 | % | | | 1.21 | % | | | 1.30 | % | | | 226 | % |
| $ | 10.74 | | | | 2.77 | % | | $ | 89 | | | | 2.42 | % | | | 0.85 | % | | | 1.06 | % | | | 1.06 | % | | | 322 | % |
|
| $ | 11.68 | | | | 15.25 | % | | $ | 169,586 | | | | 1.35 | % | | | 0.93 | % | | | 1.02 | % | | | 1.11 | % | | | 226 | % |
| $ | 10.75 | | | | 2.83 | % | | $ | 219 | | | | 2.42 | % | | | 0.85 | % | | | 1.07 | % | | | 1.07 | % | | | 322 | % |
|
| $ | 11.53 | | | | 22.33 | % | | $ | 35,512 | | | | 0.35 | % | | | 1.48 | % | | | 1.63 | % | | | 1.63 | % | | | 179 | % |
| $ | 9.56 | | | | 3.54 | % | | $ | 75,657 | | | | 1.00 | % | | | 1.16 | % | | | 1.41 | % | | | 1.54 | % | | | 169 | % |
| $ | 9.34 | | | | (7.21 | %) | | $ | 106,422 | | | | 0.42 | % | | | 1.19 | % | | | 1.42 | % | | | 1.50 | % | | | 170 | % |
| $ | 10.38 | | | | 5.87 | % | | $ | 109,845 | | | | 0.54 | % | | | 1.23 | % | | | 1.37 | % | | | 1.51 | % | | | 143 | % |
| $ | 11.36 | | | | 23.82 | % | | $ | 91,769 | | | | 0.36 | % | | | 1.23 | % | | | 1.40 | % | | | 1.58 | % | | | 231 | % |
|
| $ | 11.54 | | | | 22.84 | % | | $ | 1,057 | | | | 1.38 | % | | | 1.20 | % | | | 1.33 | % | | | 1.44 | % | | | 179 | % |
| $ | 9.57 | | | | 2.34 | % | | $ | 30 | | | | 3.79 | % | | | 1.01 | % | | | 1.17 | % | | | 1.17 | % | | | 169 | % |
|
| $ | 11.55 | | | | 23.07 | % | | $ | 37,369 | | | | 1.13 | % | | | 0.94 | % | | | 1.10 | % | | | 1.21 | % | | | 179 | % |
| $ | 9.58 | | | | 2.34 | % | | $ | 330 | | | | 3.76 | % | | | 1.02 | % | | | 1.18 | % | | | 1.18 | % | | | 169 | % |
|
| $ | 11.48 | | | | 19.28 | % | | $ | 59,441 | | | | (0.08 | %) | | | 1.91 | % | | | 2.16 | % | | | 2.16 | % | | | 120 | % |
| $ | 10.28 | | | | 6.97 | % | | $ | 124,009 | | | | 0.16 | % | | | 1.49 | % | | | 1.99 | % | | | 1.99 | % | | | 235 | % |
| $ | 9.73 | | | | (1.21 | %) | | $ | 125,597 | | | | (0.36 | %) | | | 1.49 | % | | | 2.12 | % | | | 2.19 | % | | | 161 | % |
|
| $ | 11.53 | | | | 19.65 | % | | $ | 12,921 | | | | 0.21 | % | | | 1.68 | % | | | 1.89 | % | | | 2.01 | % | | | 120 | % |
| $ | 10.29 | | | | 4.49 | % | | $ | 48 | | | | 1.07 | % | | | 1.38 | % | | | 1.88 | % | | | 1.88 | % | | | 235 | % |
|
| $ | 11.54 | | | | 19.75 | % | | $ | 82,513 | | | | 0.45 | % | | | 1.45 | % | | | 1.70 | % | | | 1.82 | % | | | 120 | % |
| $ | 10.29 | | | | 4.52 | % | | $ | 461 | | | | 1.07 | % | | | 1.38 | % | | | 1.87 | % | | | 1.87 | % | | | 235 | % |
|
4 | Except for the Money Market Funds, net investment income per share is based on average shares outstanding during the period. |
5 | Commenced operations on January 1, 2015. |
6 | Commenced operations on October 31, 2016. |
The accompanying notes are an integral part of these financial statements.
2017 Annual Report | December 31, 2017 | Page 115 |
Financial Highlights
For the Periods Ended December 31, |
| | | | | Income from Investment Operations | | Less Distributions |
| | | Net Asset Value, Beginning of Period | | Net Investment Income (Loss) (4) | | Net gains (losses) on securities and futures (both realized and unrealized) | | Total from Investment Operations | | From Net Investment Income | | From Net Capital Gains | | From Return of Capital | | Total
Distributions |
| Quantex Fund - Retail Class (1)(2) |
| 2017 | | | $ | 33.36 | | | | 0.09 | | | | 4.38 | | | | 4.47 | | | | (0.06 | ) | | | (1.01 | ) | | | 0.00 | | | | (1.07 | ) |
| 2016 | | | $ | 27.84 | | | | 0.14 | | | | 6.02 | | | | 6.16 | | | | (0.16 | ) | | | (0.48 | ) | | | 0.00 | | | | (0.64 | ) |
| 2015 | | | $ | 35.20 | | | | 0.17 | | | | (2.78 | ) | | | (2.61 | ) | | | (0.17 | ) | | | (4.58 | ) | | | 0.00 | | | | (4.75 | ) |
| 2014 | | | $ | 35.04 | | | | 0.13 | | | | 3.11 | | | | 3.24 | | | | (0.40 | ) | | | (2.68 | ) | | | 0.00 | | | | (3.08 | ) |
| 2013 | | | $ | 25.46 | | | | 0.09 | | | | 10.45 | | | | 10.54 | | | | (0.08 | ) | | | (0.88 | ) | | | 0.00 | | | | (0.96 | ) |
| Quantex Fund - Adviser Class (1)(2)(3) |
| 2017 | | | $ | 33.37 | | | | 0.21 | | | | 4.35 | | | | 4.56 | | | | (0.14 | ) | | | (1.01 | ) | | | 0.00 | | | | (1.15 | ) |
2016 (6) | | | $ | 30.67 | | | | 0.04 | | | | 3.18 | | | | 3.22 | | | | (0.04 | ) | | | (0.48 | ) | | | 0.00 | | | | (0.52 | ) |
| Quantex - Institutional Class (1)(2)(3) |
| 2017 | | | $ | 33.37 | | | | 0.26 | | | | 4.35 | | | | 4.61 | | | | (0.20 | ) | | | (1.01 | ) | | | 0.00 | | | | (1.21 | ) |
2016 (6) | | | $ | 30.67 | | | | 0.04 | | | | 3.18 | | | | 3.22 | | | | (0.04 | ) | | | (0.48 | ) | | | 0.00 | | | | (0.52 | ) |
| Conservative Allocation Fund - Retail Class (1)(2) |
| 2017 | | | $ | 21.32 | | | | 0.27 | | | | 1.36 | | | | 1.63 | | | | (0.41 | ) | | | 0.00 | | | | 0.00 | | | | (0.41 | ) |
| 2016 | | | $ | 18.17 | | | | 0.11 | | | | 3.48 | | | | 3.59 | | | | 0.00 | | | | (0.20 | ) | | | (0.24 | ) | | | (0.44 | ) |
| 2015 | | | $ | 30.45 | | | | 0.17 | | | | (5.40 | ) | | | (5.23 | ) | | | (0.25 | ) | | | (6.80 | ) | | | 0.00 | | | | (7.05 | ) |
| 2014 | | | $ | 30.98 | | | | 0.19 | | | | 2.64 | | | | 2.83 | | | | (0.83 | ) | | | (2.53 | ) | | | 0.00 | | | | (3.36 | ) |
| 2013 | | | $ | 24.17 | | | | 0.17 | | | | 6.81 | | | | 6.98 | | | | (0.17 | ) | | | 0.00 | | | | 0.00 | | | | (0.17 | ) |
| Conservative Allocation Fund - Adviser Class (1)(2)(3) |
| 2017 | | | $ | 21.34 | | | | 0.36 | | | | 1.35 | | | | 1.71 | | | | (0.23 | ) | | | 0.00 | | | | 0.00 | | | | (0.23 | ) |
2016 (6) | | | $ | 21.02 | | | | 0.00 | * | | | 0.55 | | | | 0.55 | | | | 0.00 | | | | (0.20 | ) | | | (0.03 | ) | | | (0.23 | ) |
| Conservative Allocation Fund - Institutional Class (1)(2)(3) |
| 2017 | | | $ | 21.34 | | | | 0.59 | | | | 1.14 | | | | 1.73 | | | | (0.22 | ) | | | 0.00 | | | | 0.00 | | | | (0.22 | ) |
2016 (6) | | | $ | 21.02 | | | | 0.00 | * | | | 0.55 | | | | 0.55 | | | | 0.00 | | | | (0.20 | ) | | | (0.03 | ) | | | (0.23 | ) |
| Moderate Allocation Fund - Retail Class (1)(2)(3) |
| 2017 | | | $ | 10.46 | | | | 0.07 | | | | 1.60 | | | | 1.67 | | | | (0.05 | ) | | | (0.42 | ) | | | 0.00 | | | | (0.47 | ) |
| 2016 | | | $ | 9.50 | | | | 0.16 | | | | 0.97 | | | | 1.13 | | | | (0.17 | ) | | | 0.00 | | | | 0.00 | | | | (0.17 | ) |
2015 (5) | | | $ | 10.00 | | | | 0.18 | | | | (0.59 | ) | | | (0.41 | ) | | | (0.09 | ) | | | 0.00 | | | | 0.00 | | | | (0.09 | ) |
| Moderate Allocation Fund - Adviser Class (1)(2)(3) |
| 2017 | | | $ | 10.46 | | | | 0.12 | | | | 1.59 | | | | 1.71 | | | | (0.09 | ) | | | (0.42 | ) | | | 0.00 | | | | (0.51 | ) |
2016 (6) | | | $ | 9.87 | | | | 0.03 | | | | 0.59 | | | | 0.62 | | | | (0.03 | ) | | | 0.00 | | | | 0.00 | | | | (0.03 | ) |
| Moderate Allocation Fund - Institutional Class (1)(2)(3) |
| 2017 | | | $ | 10.47 | | | | 0.14 | | | | 1.59 | | | | 1.73 | | | | (0.10 | ) | | | (0.42 | ) | | | 0.00 | | | | (0.52 | ) |
2016 (6) | | | $ | 9.87 | | | | 0.03 | | | | 0.59 | | | | 0.62 | | | | (0.02 | ) | | | 0.00 | | | | 0.00 | | | | (0.02 | ) |
|
1 | Ratio of net expenses to average net assets, ratio of net investment income (loss) to average net assets, ratio of expenses to average net assets after reductions, excluding commissions recaptured and fees received from custodian, and ratio of expenses to average net assets before reductions do not include impact of expenses of the underlying security holdings as represented in the schedule of investments. |
2 | Recognition of net investment income by the Fund is affected by the timing of the declaration of dividends by the underlying investment companies in which the Fund invests. |
3 | Ratio of net expenses to average net assets, ratio of net investment income (loss) to average net assets, ratio of expenses to average net assets after reductions, excluding commissions recaptured and fees received from custodian, and ratio of expenses to average net assets before reductions are annualized for periods of less than one full year. Total return is not annualized. |
The accompanying notes are an integral part of these financial statements.
Page 116 | 2017 Annual Report | December 31, 2017 |
| | | | | Ratios/Supplemental Data |
| Net Asset Value, End of Period | | Total Return (Assumes Reinvestment of Distributions) | | Net Assets, End of Period ($000) | | Ratio of Net Investment Income (Loss) to Average Net Assets | | Ratio of Net Expenses to Average Net Assets | | Ratio of Expenses to Average Net Assets after Reductions, Excluding Commissions Recaptured and Fees Received from Custodian | | Ratio of Expenses to Average Net Assets Before Reductions or Recoupment of Fees | | Portfolio Turnover Rate |
| |
| $ | 36.76 | | | | 13.42 | % | | $ | 60,161 | | | | 0.27 | % | | | 1.29 | % | | | 1.52 | % | | | 1.66 | % | | | 72 | % |
| $ | 33.36 | | | | 22.14 | % | | $ | 85,235 | | | | 0.47 | % | | | 1.18 | % | | | 1.52 | % | | | 1.77 | % | | | 91 | % |
| $ | 27.84 | | | | (7.68 | %) | | $ | 58,883 | | | | 0.46 | % | | | 1.09 | % | | | 1.26 | % | | | 1.75 | % | | | 87 | % |
| $ | 35.20 | | | | 9.48 | % | | $ | 61,834 | | | | 0.36 | % | | | 1.44 | % | | | 1.52 | % | | | 1.78 | % | | | 29 | % |
| $ | 35.04 | | | | 41.54 | % | | $ | 44,476 | | | | 0.27 | % | | | 1.52 | % | | | 1.58 | % | | | 1.94 | % | | | 25 | % |
|
| $ | 36.78 | | | | 13.68 | % | | $ | 2,114 | | | | 0.59 | % | | | 1.19 | % | | | 1.39 | % | | | 1.56 | % | | | 72 | % |
| $ | 33.37 | | | | 10.48 | % | | $ | 31 | | | | 0.75 | % | | | 1.10 | % | | | 1.15 | % | | | 1.40 | % | | | 91 | % |
|
| $ | 36.77 | | | | 13.84 | % | | $ | 32,489 | | | | 0.75 | % | | | 1.00 | % | | | 1.18 | % | | | 1.35 | % | | | 72 | % |
| $ | 33.37 | | | | 10.48 | % | | $ | 951 | | | | 0.75 | % | | | 1.09 | % | | | 1.15 | % | | | 1.40 | % | | | 91 | % |
|
| $ | 22.54 | | | | 7.64 | % | | $ | 12,545 | | | | 1.24 | % | | | 1.58 | % | | | 1.70 | % | | | 2.57 | % | | | 135 | % |
| $ | 21.32 | | | | 19.87 | % | | $ | 20,450 | | | | 0.55 | % | | | 2.15 | % | | | 2.17 | % | | | 2.55 | % | | | 44 | % |
| $ | 18.17 | | | | (16.92 | %) | | $ | 20,034 | | | | 0.56 | % | | | 1.98 | % | | | 1.98 | % | | | 2.01 | % | | | 54 | % |
| $ | 30.45 | | | | 9.42 | % | | $ | 46,746 | | | | 0.63 | % | | | 1.88 | % | | | 1.88 | % | | | 1.89 | % | | | 34 | % |
| $ | 30.98 | | | | 28.96 | % | | $ | 37,988 | | | | 0.62 | % | | | 1.87 | % | | | 1.87 | % | | | 1.99 | % | | | 19 | % |
|
| $ | 22.82 | | | | 8.01 | % | | $ | 682 | | | | 1.63 | % | | | 0.81 | % | | | 1.07 | % | | | 1.97 | % | | | 135 | % |
| $ | 21.34 | | | | 2.64 | % | | $ | 7 | | | | 0.11 | % | | | 1.87 | % | | | 1.93 | % | | | 2.18 | % | | | 44 | % |
|
| $ | 22.85 | | | | 8.10 | % | | $ | 11,739 | | | | 2.65 | % | | | 0.25 | % | | | 0.49 | % | | | 1.39 | % | | | 135 | % |
| $ | 21.34 | | | | 2.62 | % | | $ | 305 | | | | 0.08 | % | | | 1.90 | % | | | 1.96 | % | | | 2.21 | % | | | 44 | % |
|
| $ | 11.66 | | | | 15.99 | % | | $ | 24,635 | | | | 0.61 | % | | | 1.47 | % | | | 1.67 | % | | | 1.73 | % | | | 349 | % |
| $ | 10.46 | | | | 12.06 | % | | $ | 56,744 | | | | 1.62 | % | | | 1.26 | % | | | 1.61 | % | | | 1.80 | % | | | 250 | % |
| $ | 9.50 | | | | (4.15 | %) | | $ | 42,099 | | | | 1.80 | % | | | 1.26 | % | | | 1.66 | % | | | 1.85 | % | | | 70 | % |
|
| $ | 11.66 | | | | 16.40 | % | | $ | 3,538 | | | | 1.03 | % | | | 1.11 | % | | | 1.35 | % | | | 1.50 | % | | | 349 | % |
| $ | 10.46 | | | | 6.32 | % | | $ | 22 | | | | 1.92 | % | | | 0.97 | % | | | 1.21 | % | | | 1.21 | % | | | 250 | % |
|
| $ | 11.68 | | | | 16.55 | % | | $ | 37,945 | | | | 1.29 | % | | | 0.91 | % | | | 1.13 | % | | | 1.28 | % | | | 349 | % |
| $ | 10.47 | | | | 6.31 | % | | $ | 229 | | | | 1.92 | % | | | 1.00 | % | | | 1.24 | % | | | 1.24 | % | | | 250 | % |
|
4 | Except for the Money Market Funds, net investment income per share is based on average shares outstanding during the period. |
5 | Commenced operations on June 30, 2015. |
6 | Commenced operations on October 31, 2016. |
* | Actual amounts were less than one-half of a cent per share |
The accompanying notes are an integral part of these financial statements.
2017 Annual Report | December 31, 2017 | Page 117 |
Financial Highlights
For the Periods Ended December 31, |
| | | | | Income from Investment Operations | | Less Distributions |
| | | Net Asset Value, Beginning of Period | | Net Investment Income (Loss) (4) | | Net gains (losses) on securities and futures (both realized and unrealized) | | Total from Investment Operations | | From Net Investment Income | | From Net Capital Gains | | From Return of Capital | | Total
Distributions |
| Total Return Bond Fund - Retail Class (1)(2) |
| 2017 | | | $ | 9.28 | | | | 0.24 | | | | 0.10 | | | | 0.34 | | | | (0.25 | ) | | | 0.00 | | | | 0.00 | | | | (0.25 | ) |
| 2016 | | | $ | 9.14 | | | | 0.27 | | | | 0.14 | | | | 0.41 | | | | (0.27 | ) | | | 0.00 | | | | 0.00 | | | | (0.27 | ) |
| 2015 | | | $ | 9.63 | | | | 0.27 | | | | (0.51 | ) | | | (0.24 | ) | | | (0.25 | ) | | | 0.00 | | | | 0.00 | | | | (0.25 | ) |
| 2014 | | | $ | 9.77 | | | | 0.33 | | | | (0.15 | ) | | | 0.18 | | | | (0.32 | ) | | | 0.00 | | | | 0.00 | | | | (0.32 | ) |
| 2013 | | | $ | 10.15 | | | | 0.38 | | | | (0.38 | ) | | | (0.00 | ) | | | (0.38 | ) | | | 0.00 | | | | 0.00 | | | | (0.38 | ) |
| Total Return Bond Fund - Adviser Class (1)(2)(3) |
| 2017 | | | $ | 9.28 | | | | 0.28 | | | | 0.10 | | | | 0.38 | | | | (0.28 | ) | | | 0.00 | | | | 0.00 | | | | (0.28 | ) |
2016 (6) | | | $ | 9.46 | | | | 0.09 | | | | (0.19 | ) | | | (0.10 | ) | | | (0.08 | ) | | | 0.00 | | | | 0.00 | | | | (0.08 | ) |
| Total Return Bond Fund - Institutional Class (1)(2)(3) |
| 2017 | | | $ | 9.28 | | | | 0.31 | | | | 0.08 | | | | 0.39 | | | | (0.29 | ) | | | 0.00 | | | | 0.00 | | | | (0.29 | ) |
2016 (6) | | | $ | 9.46 | | | | 0.08 | | | | (0.18 | ) | | | (0.10 | ) | | | (0.08 | ) | | | 0.00 | | | | 0.00 | | | | (0.08 | ) |
| Prime Money Market Fund (1)(2) |
| 2017 | | | $ | 1.00 | | | | 0.007 | | | | N/A | | | | 0.007 | | | | (0.007 | ) | | | 0.000 | | | | 0.000 | | | | (0.007 | ) |
| 2016 | | | $ | 1.00 | | | | 0.003 | | | | N/A | | | | 0.003 | | | | (0.003 | ) | | | 0.000 | | | | 0.000 | | | | (0.003 | ) |
| 2015 | | | $ | 1.00 | | | | 0.001 | | | | N/A | | | | 0.001 | | | | (0.001 | ) | | | 0.000 | | | | 0.000 | | | | (0.001 | ) |
| 2014 | | | $ | 1.00 | | | | 0.001 | | | | N/A | | | | 0.001 | | | | (0.001 | ) | | | 0.000 | | | | 0.000 | | | | (0.001 | ) |
| 2013 | | | $ | 1.00 | | | | 0.001 | | | | N/A | | | | 0.001 | | | | (0.001 | ) | | | 0.000 | | | | 0.000 | | | | (0.001 | ) |
| Institutional Prime Money Market Fund (1)(2)(3) |
| 2017 | | | $ | 1.0001 | | | | 0.0101 | | | | (0.0003 | ) | | | 0.0098 | | | | (0.0100 | ) | | | 0.0000 | | | | 0.0000 | | | | (0.0100 | ) |
2016 (5) | | | $ | 1.0000 | | | | 0.0010 | | | | 0.0001 | | | | 0.0011 | | | | (0.0010 | ) | | | 0.0000 | | | | 0.0000 | | | | (0.0010 | ) |
|
1 | Ratio of net expenses to average net assets, ratio of net investment income (loss) to average net assets, ratio of expenses to average net assets after reductions, excluding commissions recaptured and fees received from custodian, and ratio of expenses to average net assets before reductions do not include impact of expenses of the underlying security holdings as represented in the schedule of investments. |
2 | Recognition of net investment income by the Fund is affected by the timing of the declaration of dividends by the underlying investment companies in which the Fund invests. |
3 | Ratio of net expenses to average net assets, ratio of net investment income (loss) to average net assets, ratio of expenses to average net assets after reductions, excluding commissions recaptured and fees received from custodian, and ratio of expenses to average net assets before reductions are annualized for periods of less than one full year. Total return is not annualized. |
The accompanying notes are an integral part of these financial statements.
Page 118 | 2017 Annual Report | December 31, 2017 |
| | | | | Ratios/Supplemental Data |
| Net Asset Value, End of Period | | Total Return (Assumes Reinvestment of Distributions) | | Net Assets, End of Period ($000) | | Ratio of Net Investment Income (Loss) to Average Net Assets | | Ratio of Net Expenses to Average Net Assets | | Ratio of Expenses to Average Net Assets after Reductions, Excluding Commissions Recaptured and Fees Received from Custodian | | Ratio of Expenses to Average Net Assets Before Reductions or Recoupment of Fees | | Portfolio Turnover Rate |
| |
| $ | 9.37 | | | | 3.72 | % | | $ | 67,986 | | | | 2.59 | % | | | 1.01 | % | | | 1.02 | % | | | 1.03 | % | | | 133 | % |
| $ | 9.28 | | | | 4.49 | % | | $ | 214,755 | | | | 2.87 | % | | | 0.88 | % | | | 0.98 | % | | | 1.00 | % | | | 217 | % |
| $ | 9.14 | | | | (2.51 | %) | | $ | 214,618 | | | | 2.71 | % | | | 0.88 | % | | | 1.01 | % | | | 1.03 | % | | | 295 | % |
| $ | 9.63 | | | | 1.78 | % | | $ | 143,046 | | | | 3.39 | % | | | 0.99 | % | | | 1.02 | % | | | 1.13 | % | | | 82 | % |
| $ | 9.77 | | | | 0.01 | % | | $ | 90,080 | | | | 3.87 | % | | | 0.99 | % | | | 1.01 | % | | | 1.19 | % | �� | | 79 | % |
|
| $ | 9.38 | | | | 4.07 | % | | $ | 9,896 | | | | 2.95 | % | | | 0.79 | % | | | 0.83 | % | | | 0.84 | % | | | 133 | % |
| $ | 9.28 | | | | (1.05 | %) | | $ | 84 | | | | 5.49 | % | | | 0.52 | % | | | 0.53 | % | | | 0.53 | % | | | 217 | % |
|
| $ | 9.38 | | | | 4.20 | % | | $ | 110,674 | | | | 3.27 | % | | | 0.60 | % | | | 0.64 | % | | | 0.65 | % | | | 133 | % |
| $ | 9.28 | | | | (1.08 | %) | | $ | 70 | | | | 5.35 | % | | | 0.51 | % | | | 0.53 | % | | | 0.53 | % | | | 217 | % |
|
| $ | 1.00 | | | | 0.68 | % | | $ | 35,211 | | | | 0.67 | % | | | 0.47 | % | | | 0.47 | % | | | 1.00 | % | | | N/A |
| $ | 1.00 | | | | 0.29 | % | | $ | 36,666 | | | | 0.28 | % | | | 0.32 | % | | | 0.32 | % | | | 0.69 | % | | | N/A |
| $ | 1.00 | | | | 0.07 | % | | $ | 56,530 | | | | 0.07 | % | | | 0.18 | % | | | 0.18 | % | | | 0.58 | % | | | N/A |
| $ | 1.00 | | | | 0.06 | % | | $ | 54,927 | | | | 0.06 | % | | | 0.16 | % | | | 0.16 | % | | | 0.67 | % | | | N/A |
| $ | 1.00 | | | | 0.08 | % | | $ | 61,288 | | | | 0.08 | % | | | 0.22 | % | | | 0.22 | % | | | 0.90 | % | | | N/A |
|
| $ | 0.9999 | | | | 0.96 | % | | $ | 296,600 | | | | 1.01 | % | | | 0.17 | % | | | 0.17 | % | | | 0.56 | % | | | N/A |
| $ | 1.0001 | | | | 0.11 | % | | $ | 197,480 | | | | 0.43 | % | | | 0.24 | % | | | 0.24 | % | | | 0.62 | % | | | N/A |
|
4 | Except for the Money Market Funds, net investment income per share is based on average shares outstanding during the period. |
5 | Commenced operations on October 7, 2016. |
6 | Commenced operations on October 31, 2016. |
The accompanying notes are an integral part of these financial statements.
2017 Annual Report | December 31, 2017 | Page 119 |
Notes to Financial Statements
December 31, 2017
1. Organization
Meeder Funds (the Trust) is organized as a Massachusetts business trust and is registered under the Investment Company Act of 1940, as amended (the 1940 Act), as a diversified, open-end management investment company. The Trust offers twelve separate series, all of which are included in this report: Muirfield Fund (Muirfield), Dynamic Allocation Fund (Dynamic), Aggressive Allocation Fund (Aggressive), Balanced Fund (Balanced), Global Allocation Fund (Global), Spectrum Fund (Spectrum), Quantex Fund (Quantex), Conservative Allocation Fund (Conservative), Moderate Allocation Fund (Moderate), Total Return Bond Fund (Bond), Prime Money Market Fund (Prime Money Market), and Institutional Prime Money Market Fund (Institutional Prime Money Market)(the Funds).
Each Fund, except Prime Money Market and Institutional Prime Money Market, offers three classes of shares: Retail Class, Adviser Class, and Institutional Class. Prime Money Market and Institutional Prime Money Market offer only one class of shares. The share classes differ with respect to distribution fees, service fees, and other expenses allocated to each class. Eligibility to purchase Adviser and Institutional Class shares is generally limited to customers of financial intermediaries who enter into special arrangements with the Funds or who meet certain initial investment minimums.
Prime Money Market operates as a retail money market fund. The Fund maintains a stable net asset value of $1.00, is only available for purchase in accounts beneficially owned by natural persons, and may impose liquidity fees or redemption gates in certain circumstances. Institutional Prime Money Market operates as an institutional money market fund open to all forms of investors. Its net asset value fluctuates based upon changes in the value of its investments and the value of its shares is calculated daily to four decimal places.
Effective November 20, 2017, Dynamic Growth Fund, Aggressive Growth Fund, Global Opportunities Fund, Infrastructure Fund, and Dividend Opportunities Fund changed their names to Dynamic Allocation Fund, Aggressive Allocation Fund, Global Allocation Fund, Conservative Allocation Fund, and Moderate Allocation Fund, respectively. Each Fund, except Aggressive Allocation Fund and Dynamic Allocation Fund, also made changes to their investment strategies to better align the investment strategies of the Funds with the tactical asset allocation expertise of the Funds’ adviser, Meeder Asset Management, Inc.
For more information regarding the Funds’ objectives, strategies, and differences in share classes, please refer to the Funds’ prospectus.
2. Significant Accounting Policies
In October 2016, the U.S. Securities and Exchange Commission (the SEC) adopted amendments to Regulation S-X, which impact financial statement presentation, particularly the presentation of derivative investments. The Funds have adopted these amendments, which were effective August 1, 2017, with these financial statements.
The Funds’ financial statements are prepared in conformity with accounting principles generally accepted in the United States of America (GAAP), which require management to make certain estimates and assumptions that affect the reported amounts of assets and liabilities and disclosure of contingent assets and liabilities at the date of the financial statements. The Trust is an investment company and applies the accounting and reporting guidance of the Financial Accounting Standards Board (FASB) Accounting Standards Codification Topic 946 Financial Services Companies. The following summarizes the significant accounting policies of the Trust and the Funds:
Securities valuation. All investments in securities are recorded at their estimated fair value, as described in Note #2.
Repurchase agreements. Each Fund may engage in repurchase agreement transactions whereby the Fund takes possession of an underlying debt instrument subject to an obligation of the seller to repurchase the instrument from the Fund and an obligation of the Fund to resell the instrument at an agreed upon price and term. At all times, the Fund maintains the fair value of collateral, including accrued interest, of at least 100% of the amount of the repurchase agreement, plus accrued interest. If the seller defaults or the fair value of the collateral declines, realization of the collateral by the Fund may be delayed or limited.
Short sales. Spectrum may enter into short sales as part of its overall portfolio management strategy or to offset a potential decline in value of a security. The Fund may engage in short sales with respect to various types of securities, including ETFs. A short sale involves the sale of a security that is borrowed from a broker or other institution to complete the sale. The Fund may engage in short sales with respect to securities it owns, as well as securities that it does not own. Short sales expose the Fund to the risk that it will be required to acquire, convert or exchange securities to replace the borrowed securities (also known as “covering” the short position) at a time when the securities sold short have appreciated in value, thus resulting in a loss to the Fund. The Fund’s investment performance may also suffer if the Fund is required to close out a short position earlier than it had intended. The Fund must segregate assets determined to be liquid in accordance with procedures established by the Board, or otherwise cover its position in a permissible manner. The Fund will be required to pledge its liquid assets to the broker in order to secure its performance on short sales. As a result, the assets pledged may not be available to meet the Fund’s needs for immediate cash or other liquidity. In addition, the Fund may be subject to expenses
Page 120 | 2017 Annual Report | December 31, 2017 |
related to short sales that are not typically associated with investing in securities directly, such as costs of borrowing and margin account maintenance costs associated with the Fund’s open short positions. These types of short sales expenses are sometimes referred to as the “negative cost of carry,” and will tend to cause the Fund to lose money on a short sale even in instances where the price of the underlying security sold short does not change over the duration of the short sale. Dividend expenses on securities sold short and borrowing costs will be borne by the Fund.
Futures & options. Each Fund, except the Money Market Funds, may engage in transactions in financial futures contracts and options contracts in order to manage the risk of unanticipated changes in market values of securities held in the Fund, or which it intends to purchase. The futures and options contracts are adjusted by the daily exchange rate of the underlying currency, or index, and any gains or losses are recorded for financial statement purposes as unrealized gains or losses in the statement of assets and liabilities and the statement of operations until the contract settlement date, at which time realized gains and losses are included in the statement of operations.
To the extent that the Fund enters into futures contracts on an index or group of securities, the Fund exposes itself to an indeterminate liability and will be required to pay or receive a sum of money measured by the change in the fair value of the index. Upon entering into a futures contract, the Fund is required to deposit an initial margin, which is either cash or securities (disclosed as pledged as collateral on the Schedules of Investments) in an amount equal to a certain percentage of the contract value. Subsequently, margin movements, which are equal to changes in the daily price or last sale price on the exchanges where futures contracts trade, are recorded as unrealized gains or losses until the contract is closed. When the contract is closed, the Fund records a realized gain or loss equal to the difference between the proceeds from (or cost of) the closing transaction and the Fund’s basis in the contract. Should market conditions move unexpectedly, the Fund may not achieve the anticipated benefits of the futures contract and may realize a loss. The use of futures transactions involves the risk of imperfect correlation in movements in the price of futures contracts, interest rates, and the underlying hedged assets. With futures, there is minimal counterparty credit risk to the Fund since futures are exchange traded and the exchange’s clearinghouse, as counterparty to all exchange traded futures, guarantees the futures against default. Except for the Money Market Funds, it is normal practice for each Fund to invest in futures contracts on a daily basis. The Funds, except for Bond and the Money Market Funds, typically utilize equity index futures contracts to equitize cash positions or adjust targeted stock market exposure. Except for the Money Market Funds, the fixed income portion of any Fund can utilize Treasury futures contracts in order to adjust duration.
Call and put option contracts involve the payment of a premium for the right to purchase or sell an individual security or index aggregate at a specified price until the expiration of the contract. Such transactions expose the Fund to the loss of the premium paid if the Fund does not sell or exercise the contract prior to the expiration date. In the case of a call option, sufficient cash or money market instruments will be segregated to complete the purchase. Options are fair valued on the basis of the daily settlement price or last sale on the exchanges where they trade and the changes in fair value are recorded as unrealized appreciation or depreciation until closed, exercised or expired. For the year ended December 31, 2017, the average notional value of purchased put options for Muirfield, Balanced, and Spectrum was $22,020, $8,258, and $6,881, respectively. There were no other call or put options transacted for any other Fund.
The Funds may write covered call or put options for which premiums received are recorded as liabilities and are subsequently adjusted to the current value of the options written. When written options are closed or exercised, premiums received are offset against the proceeds paid, and the Fund records realized gains or losses for the difference. When written options expire, the liability is eliminated, and the Fund records realized gains for the entire amount of premiums received. Although permitted, it is currently not normal practice for the Funds to write call and put options and none were written during the year ended December 31, 2017.
The fair value of derivative instruments, not accounted for as hedging instruments, as reported within the Statements of Assets and Liabilities as of December 31, 2017 was as follows:
| Amount of Deposits at Broker and Unrealized Appreciation (Depreciation) on Derivatives |
| |
| | | Type of
Derivative/
Risk | | Statements of Assets & Liabilities Location | | Fair Value of
Deposits at
Broker for Futures
Contracts | | Value of
Unrealized
Appreciation
(Depreciation) |
| Muirfield | | Equity contracts | | Assets, Deposits at broker for futures contracts; Net Assets, Net unrealized appreciation (depreciation) of investments and futures contracts | | $ | 4,285,313 | | | $ | 1,598,606 | |
| Dynamic | | Equity contracts | | Assets, Deposits at broker for futures contracts; Net Assets, Net unrealized appreciation (depreciation) of investments and futures contracts | | | 1,030,940 | | | | 468,360 | |
| Aggressive | | Equity contracts | | Assets, Deposits at broker for futures contracts; Net Assets, Net unrealized appreciation (depreciation) of investments and futures contracts | | | 380,694 | | | | 165,227 | |
| Balanced | | Equity contracts | | Assets, Deposits at broker for futures contracts; Net Assets, Net unrealized appreciation (depreciation) of investments and futures contracts | | | 1,490,003 | | | | 58,231 | |
| Global | | Equity contracts | | Assets, Deposits at broker for futures contracts; Net Assets, Net unrealized appreciation (depreciation) of investments and futures contracts | | | 596,259 | | | | 216,871 | |
2017 Annual Report | December 31, 2017 | Page 121 |
| Amount of Deposits at Broker and Unrealized Appreciation (Depreciation) on Derivatives |
| |
| | | Type of
Derivative/
Risk | | Statements of Assets & Liabilities Location | | Fair Value of
Deposits at
Broker for Futures
Contracts | | Value of
Unrealized
Appreciation
(Depreciation) |
| Spectrum | | Equity contracts | | Assets, Deposits at broker for futures contracts; Net Assets, Net unrealized appreciation (depreciation) of investments and futures contracts | | $ | 1,964,507 | | | $ | 666,248 | |
| Quantex | | Equity contracts | | Assets, Deposits at broker for futures contracts; Net Assets, Net unrealized appreciation (depreciation) of investments and futures contracts | | | 251,989 | | | | 53,886 | |
| Moderate | | Equity contracts | | Assets, Deposits at broker for futures contracts; Net Assets, Net unrealized appreciation (depreciation) of investments and futures contracts | | | 209,362 | | | | 39,999 | |
| Conservative | | Equity contracts | | Assets, Deposits at broker for futures contracts; Net Assets, Net unrealized appreciation (depreciation) of investments and futures contracts | | | 53,095 | | | | 8,428 | |
The effect of derivative instruments on the Statements of Operations for the year ended December 31, 2017 was as follows:
| Amount of Realized Gain (Loss) on Derivatives Recognized in Income |
| |
| | | Type of Derivative/ Risk | | Contracts as of December 31, 2016 | | Long and Short Contracts Opened During the Period | | Long and Short Contracts Closed/ Expired During the Period | | Contracts as of
December 31,
2017 | | Statement of Operations Location | | For the Year Ended December 31, 2017 |
| Muirfield | | Equity contracts | | | 610 | | | | 6,064 | | | | 5,604 | | | | 1,070 | | | Net realized gains (losses) from futures contracts | | $ | 15,163,165 | |
| Dynamic | | Equity contracts | | | 160 | | | | 1,489 | | | | 1,395 | | | | 254 | | | Net realized gains (losses) from futures contracts | | | 3,325,435 | |
| Aggressive | | Equity contracts | | | 54 | | | | 592 | | | | 556 | | | | 90 | | | Net realized gains (losses) from futures contracts | | | 947,413 | |
| Balanced | | Equity contracts | | | 181 | | | | 2,480 | | | | 2,326 | | | | 335 | | | Net realized gains (losses) from futures contracts | | | 5,646,364 | |
| Global | | Equity contracts | | | 34 | | | | 897 | | | | 799 | | | | 132 | | | Net realized gains (losses) from futures contracts | | | 1,741,210 | |
| Spectrum | | Equity contracts | | | 392 | | | | 2,719 | | | | 2,642 | | | | 469 | | | Net realized gains (losses) from futures contracts | | | 8,811,275 | |
| Quantex | | Equity contracts | | | 89 | | | | 285 | | | | 337 | | | | 37 | | | Net realized gains (losses) from futures contracts | | | 779,570 | |
| Moderate | | Equity contracts | | | 61 | | | | 471 | | | | 500 | | | | 32 | | | Net realized gains (losses) from futures contracts | | | 1,144,374 | |
| Conservative | | Equity contracts | | | 15 | | | | 110 | | | | 118 | | | | 7 | | | Net realized gains (losses) from futures contracts | | | 260,594 | |
| Change in Unrealized Gain or (Loss) on Derivatives Recognized in Income |
| |
| | | Type of Derivative/
Risk | | Statement of Operations Location | | | For the Year Ended December 31, 2017 | |
| Muirfield | | Equity contracts | | Net change in unrealized appreciation (depreciation) of futures contracts | | $ | 2,136,128 | |
| Dynamic | | Equity contracts | | Net change in unrealized appreciation (depreciation) of futures contracts | | | 517,185 | |
| Aggressive | | Equity contracts | | Net change in unrealized appreciation (depreciation) of futures contracts | | | 287,584 | |
| Balanced | | Equity contracts | | Net change in unrealized appreciation (depreciation) of futures contracts | | | 232,463 | |
| Global | | Equity contracts | | Net change in unrealized appreciation (depreciation) of futures contracts | | | 274,235 | |
| Spectrum | | Equity contracts | | Net change in unrealized appreciation (depreciation) of futures contracts | | | 879,702 | |
| Quantex | | Equity contracts | | Net change in unrealized appreciation (depreciation) of futures contracts | | | 353,812 | |
| Moderate | | Equity contracts | | Net change in unrealized appreciation (depreciation) of futures contracts | | | 58,613 | |
| Conservative | | Equity contracts | | Net change in unrealized appreciation (depreciation) of futures contracts | | | 18,970 | |
Page 122 | 2017 Annual Report | December 31, 2017 |
Federal income taxes. It is each Fund’s policy to continue to comply with the requirements of Subchapter M of the Internal Revenue Code applicable to regulated investment companies and to distribute substantially all of its taxable income and net capital gains to its shareholders. Therefore, no federal income tax provision is required. The Funds recognize the tax benefits or expenses of uncertain tax positions only where the position is “more likely than not” to be sustained assuming examination by tax authorities. Management has reviewed tax positions taken on Federal income tax returns for all open tax years (tax years ended December 31, 2014 through December 31, 2017) and has concluded that no provision for unrecognized tax benefits or expenses is required in these financial statements. Each Fund identifies its major tax jurisdictions as U.S. Federal and certain State tax authorities; however the Funds are not aware of any tax positions for which it is reasonably possible that the total amounts of unrecognized tax benefits will change materially in the next twelve months. The Funds recognize interest and penalties, if any, related to unrecognized tax benefits as income tax expense in the Statements of Operations as incurred. During the year ended December 31, 2017, the Funds did not incur any material interest or penalties.
Distributions to shareholders. Distributions to shareholders are recorded on the ex-dividend date. Muirfield, Quantex, Dynamic, Aggressive, Balanced, Global, Moderate, Conservative, and Spectrum declare and pay dividends from net investment income, if any, on a quarterly basis. Bond declares and pays dividends from net investment income on a monthly basis. The Money Market Funds declare dividends from net investment income on a daily basis and pay such dividends on a monthly basis. Each Fund distributes net capital gains, if any, on an annual basis.
Distributions from net investment income and from net capital gains are determined in accordance with income tax regulations, which may differ from GAAP. Permanent differences relate to reclassification of commissions recapture, partnership basis adjustments, and redemptions treated as distributions for tax purposes (i.e. equalization). Accordingly, timing differences relating to shareholder distributions are reflected in the components of net assets and permanent book and tax differences have been reclassified within the components of net assets based on their ultimate characterization for federal income tax purposes. For the year ended December 31, 2017, the Funds made the following reclassifications to increase/(decrease) the components of net assets:
| | | Capital | | Accumulated Undistributed (Distributions in Excess of) Net Investment Income | | Accumulated Undistributed Net Realized Gain (Loss) from Investments and Futures Contracts |
Muirfield | | | $ | 11,169,236 | | | $ | (231,438 | ) | | $ | (10,937,798 | ) |
Dynamic | | | | 3,306,444 | | | | (139,045 | ) | | | (3,167,399 | ) |
Aggressive | | | | (843 | ) | | | (78,710 | ) | | | 79,553 | |
Balanced | | | | 5,995,449 | | | | (170,556 | ) | | | (5,824,893 | ) |
Global | | | | — | | | | (117,184 | ) | | | 117,184 | |
Spectrum | | | | 2,621,862 | | | | (142,338 | ) | | | (2,479,524 | ) |
Quantex | | | | — | | | | (84,944 | ) | | | 84,944 | |
Conservative | | | | 67,241 | | | | 31,298 | | | | (98,539 | ) |
Moderate | | | | 958,754 | | | | (108,563 | ) | | | (850,191 | ) |
Bond | | | | (2,004 | ) | | | (43,340 | ) | | | 45,344 | |
Investment income & expenses. For all Funds, except the Money Market Funds, income and expenses (other than expenses attributable to a specific class) are allocated to each class of shares based on its relative net assets. Expenses incurred by the Trust that do not specifically relate to an individual Fund of the Trust are allocated to the Funds based on each Fund’s relative net assets or other appropriate basis.
Capital Share Transactions. All Funds, except the Money Market Funds, are authorized to issue an unlimited number of shares in the Retail Class, the Adviser Class, and the Institutional Class. Transactions in the capital shares of the Funds for the year ended December 31, 2017 and the period ended December 31, 2016 were as follows:
| | | Issued | | Reinvested |
| | | Amount | | Shares | | Amount | | Shares |
| Year Ended December 31, 2017 | | | | | | | | |
| Muirfield - Retail | | $ | 69,224,338 | | | | 9,392,928 | | | $ | 18,274,233 | | | | 2,436,224 | |
| Muirfield - Adviser | | | 43,200,633 | | | | 5,772,167 | | | | 2,814,669 | | | | 373,234 | |
| Muirfield - Institutional | | | 196,126,815 | | | | 26,417,922 | | | | 12,525,154 | | | | 1,661,317 | |
| Dynamic - Retail | | | 12,488,746 | | | | 1,207,246 | | | | 4,060,526 | | | | 376,589 | |
| Dynamic - Adviser | | | 10,819,161 | | | | 1,016,257 | | | | 782,624 | | | | 72,269 | |
| Dynamic - Institutional | | | 70,981,096 | | | | 6,892,336 | | | | 5,504,520 | | | | 508,681 | |
| Aggressive - Retail | | | 3,226,502 | | | | 303,535 | | | | 1,967,782 | | | | 190,244 | |
| Aggressive - Adviser | | | 1,446,318 | | | | 134,695 | | | | 150,159 | | | | 14,477 | |
| Aggressive - Institutional | | | 22,969,546 | | | | 2,186,544 | | | | 2,296,719 | | | | 220,946 | |
| Balanced - Retail | | | 26,306,979 | | | | 2,323,085 | | | | 5,871,578 | | | | 507,403 | |
2017 Annual Report | December 31, 2017 | Page 123 |
| | | Issued | | Reinvested |
| | | Amount | | Shares | | Amount | | Shares |
| Balanced - Adviser | | $ | 13,252,680 | | | | 1,148,364 | | | $ | 638,110 | | | | 54,695 | |
| Balanced - Institutional | | | 185,796,592 | | | | 16,103,392 | | | | 6,866,027 | | | | 589,322 | |
| Global - Retail | | | 4,290,027 | | | | 414,217 | | | | 498,987 | | | | 43,704 | |
| Global - Adviser | | | 1,122,959 | | | | 105,925 | | | | 18,941 | | | | 1,662 | |
| Global - Institutional | | | 43,705,168 | | | | 4,385,231 | | | | 762,165 | | | | 66,766 | |
| Spectrum - Retail | | | 17,727,645 | | | | 1,618,032 | | | | 3,759,826 | | | | 329,231 | |
| Spectrum - Adviser | | | 13,785,585 | | | | 1,240,035 | | | | 802,353 | | | | 69,953 | |
| Spectrum - Institutional | | | 87,828,254 | | | | 7,861,056 | | | | 4,540,126 | | | | 395,481 | |
| Quantex - Retail | | | 15,894,719 | | | | 463,602 | | | | 1,715,006 | | | | 46,714 | |
| Quantex - Adviser | | | 2,330,634 | | | | 68,459 | | | | 60,803 | | | | 1,654 | |
| Quantex - Institutional | | | 36,167,350 | | | | 1,054,466 | | | | 1,000,499 | | | | 27,250 | |
| Conservative - Retail | | | 3,066,122 | | | | 140,500 | | | | 217,793 | | | | 9,663 | |
| Conservative - Adviser | | | 790,658 | | | | 35,430 | | | | 6,728 | | | | 295 | |
| Conservative - Institutional | | | 14,928,684 | | | | 660,636 | | | | 111,127 | | | | 4,863 | |
| Moderate - Retail | | | 5,411,114 | | | | 497,051 | | | | 999,860 | | | | 86,853 | |
| Moderate - Adviser | | | 3,672,006 | | | | 337,942 | | | | 133,385 | | | | 11,486 | |
| Moderate - Institutional | | | 39,284,644 | | | | 3,583,497 | | | | 1,350,218 | | | | 116,322 | |
| Bond - Retail | | | 25,785,784 | | | | 2,743,003 | | | | 3,211,909 | | | | 341,738 | |
| Bond - Adviser | | | 11,199,739 | | | | 1,181,978 | | | | 147,366 | | | | 15,628 | |
| Bond - Institutional | | | 137,951,749 | | | | 14,624,351 | | | | 2,026,224 | | | | 214,866 | |
| Prime Money Market | | | 29,723,424 | | | | 29,723,424 | | | | 236,626 | | | | 236,626 | |
| Institutional Prime Money Market | | | 485,340,979 | | | | 485,328,584 | | | | 225,080 | | | | 225,073 | |
| | | | | | | | | | | | | | | | | |
| Period Ended December 31, 2016 | | | | | | | | | | | | | | | | |
| Muirfield - Retail | | $ | 134,775,425 | | | | 20,789,278 | | | $ | 2,835,833 | | | | 428,299 | |
| Muirfield - Adviser | | | 147,432 | | | | 22,647 | | | | 335 | | | | 49 | |
| Muirfield - Institutional | | | 981,839 | | | | 150,732 | | | | 2,155 | | | | 317 | |
| Dynamic - Retail | | | 51,549,145 | | | | 5,477,401 | | | | 1,745,515 | | | | 181,974 | |
| Dynamic - Adviser | | | 45,886 | | | | 4,913 | | | | 330 | | | | 34 | |
| Dynamic - Institutional | | | 612,980 | | | | 65,573 | | | | 4,353 | | | | 442 | |
| Aggressive - Retail | | | 15,870,787 | | | | 1,670,120 | | | | 514,642 | | | | 53,324 | |
| Aggressive - Adviser | | | 17,233 | | | | 1,808 | | | | 26 | | | | 2 | |
| Aggressive - Institutional | | | 322,629 | | | | 33,277 | | | | 384 | | | | 37 | |
| Balanced - Retail | | | 79,447,530 | | | | 7,653,253 | | | | 2,758,313 | | | | 260,262 | |
| Balanced - Adviser | | | 86,679 | | | | 8,263 | | | | 336 | | | | 31 | |
| Balanced - Institutional | | | 221,712 | | | | 21,068 | | | | 754 | | | | 70 | |
| Global - Retail | | | 19,207,912 | | | | 2,101,934 | | | | 919,811 | | | | 97,409 | |
| Global - Adviser | | | 29,425 | | | | 3,127 | | | | 189 | | | | 20 | |
| Global - Institutional | | | 330,943 | | | | 35,021 | | | | 1,716 | | | | 179 | |
| Spectrum - Retail | | | 40,881,075 | | | | 4,217,974 | | | | 1,551,581 | | | | 149,326 | |
| Spectrum - Adviser | | | 46,246 | | | | 4,639 | | | | 597 | | | | 57 | |
| Spectrum - Institutional | | | 535,858 | | | | 53,720 | | | | 6,868 | | | | 660 | |
| Quantex - Retail | | | 39,531,805 | | | | 1,300,850 | | | | 1,590,381 | | | | 47,686 | |
| Quantex - Adviser | | | 28,190 | | | | 919 | | | | 483 | | | | 14 | |
| Quantex - Institutional | | | 868,530 | | | | 28,286 | | | | 14,745 | | | | 433 | |
| Conservative - Retail | | | 6,207,005 | | | | 300,083 | | | | 407,859 | | | | 19,601 | |
| Conservative - Adviser | | | 7,305 | | | | 347 | | | | 81 | | | | 4 | |
| Conservative - Institutional | | | 298,546 | | | | 14,158 | | | | 2,742 | | | | 129 | |
| Moderate - Retail | | | 29,907,824 | | | | 3,019,540 | | | | 776,674 | | | | 79,327 | |
| Moderate - Adviser | | | 21,143 | | | | 2,142 | | | | 72 | | | | 7 | |
| Moderate - Institutional | | | 220,600 | | | | 21,806 | | | | 458 | | | | 44 | |
| Bond - Retail | | | 90,300,352 | | | | 9,633,295 | | | | 6,254,160 | | | | 668,034 | |
| Bond - Adviser | | | 84,879 | | | | 8,973 | | | | 726 | | | | 78 | |
| Bond - Institutional | | | 84,249 | | | | 8,924 | | | | 557 | | | | 60 | |
| Prime Money Market | | | 9,599,544 | | | | 9,599,543 | | | | 28,851 | | | | 28,851 | |
Page 124 | 2017 Annual Report | December 31, 2017 |
| | | Issued | | Reinvested |
| | | Amount | | Shares | | Amount | | Shares |
| Institutional Prime Money Market** | | $ | 304,118,416 | | | | 304,102,698 | | | $ | 14,473 | | | | 14,472 | |
| Money Market - Retail*/** | | | 83,963,435 | | | | 83,963,435 | | | | 104,345 | | | | 104,345 | |
| Money Market - Institutional*/** | | | 493,623,899 | | | | 493,623,899 | | | | 4,587 | | | | 4,587 | |
| | | Redeemed | | Net Increase (Decrease) |
| | | Amount | | Shares | | Amount | | Shares |
| Year Ended December 31, 2017 | | | | | | | | |
| Muirfield - Retail | | $ | (263,903,006 | ) | | | (36,151,315 | ) | | $ | (176,404,435 | ) | | | (24,322,163 | ) |
| Muirfield - Adviser | | | (5,289,800 | ) | | | (696,300 | ) | | | 40,725,502 | | | | 5,449,101 | |
| Muirfield - Institutional | | | (27,343,196 | ) | | | (3,598,362 | ) | | | 181,308,773 | | | | 24,480,877 | |
| Dynamic - Retail | | | (93,457,320 | ) | | | (9,086,760 | ) | | | (76,908,048 | ) | | | (7,502,925 | ) |
| Dynamic - Adviser | | | (1,754,203 | ) | | | (161,245 | ) | | | 9,847,582 | | | | 927,281 | |
| Dynamic - Institutional | | | (10,857,261 | ) | | | (1,000,514 | ) | | | 65,628,355 | | | | 6,400,503 | |
| Aggressive - Retail | | | (32,907,582 | ) | | | (3,123,228 | ) | | | (27,713,298 | ) | | | (2,629,449 | ) |
| Aggressive - Adviser | | | (154,198 | ) | | | (14,114 | ) | | | 1,442,279 | | | | 135,058 | |
| Aggressive - Institutional | | | (4,588,002 | ) | | | (419,571 | ) | | | 20,678,263 | | | | 1,987,919 | |
| Balanced - Retail | | | (180,115,210 | ) | | | (15,862,623 | ) | | | (147,936,653 | ) | | | (13,032,135 | ) |
| Balanced - Adviser | | | (2,009,926 | ) | | | (172,407 | ) | | | 11,880,864 | | | | 1,030,652 | |
| Balanced - Institutional | | | (25,560,161 | ) | | | (2,189,239 | ) | | | 167,102,458 | | | | 14,503,475 | |
| Global - Retail | | | (53,076,539 | ) | | | (5,293,945 | ) | | | (48,287,525 | ) | | | (4,836,024 | ) |
| Global - Adviser | | | (207,804 | ) | | | (19,150 | ) | | | 934,096 | | | | 88,437 | |
| Global - Institutional | | | (13,511,851 | ) | | | (1,250,757 | ) | | | 30,955,482 | | | | 3,201,240 | |
| Spectrum - Retail | | | (96,970,103 | ) | | | (8,826,443 | ) | | | (75,482,632 | ) | | | (6,879,180 | ) |
| Spectrum - Adviser | | | (2,202,940 | ) | | | (193,909 | ) | | | 12,384,998 | | | | 1,116,079 | |
| Spectrum - Institutional | | | (13,276,329 | ) | | | (1,152,838 | ) | | | 79,092,051 | | | | 7,103,699 | |
| Quantex - Retail | | | (48,833,388 | ) | | | (1,428,616 | ) | | | (31,223,663 | ) | | | (918,300 | ) |
| Quantex - Adviser | | | (471,246 | ) | | | (13,580 | ) | | | 1,920,191 | | | | 56,533 | |
| Quantex - Institutional | | | (8,047,545 | ) | | | (226,565 | ) | | | 29,120,304 | | | | 855,151 | |
| Conservative - Retail | | | (12,108,043 | ) | | | (553,076 | ) | | | (8,824,128 | ) | | | (402,913 | ) |
| Conservative - Adviser | | | (139,084 | ) | | | (6,175 | ) | | | 658,302 | | | | 29,550 | |
| Conservative - Institutional | | | (3,791,375 | ) | | | (166,112 | ) | | | 11,248,436 | | | | 499,387 | |
| Moderate - Retail | | | (42,009,943 | ) | | | (3,894,151 | ) | | | (35,598,969 | ) | | | (3,310,247 | ) |
| Moderate - Adviser | | | (537,829 | ) | | | (48,048 | ) | | | 3,267,562 | | | | 301,380 | |
| Moderate - Institutional | | | (5,312,392 | ) | | | (472,047 | ) | | | 35,322,470 | | | | 3,227,772 | |
| Bond - Retail | | | (178,660,569 | ) | | | (18,972,930 | ) | | | (149,662,876 | ) | | | (15,888,189 | ) |
| Bond - Adviser | | | (1,432,225 | ) | | | (151,470 | ) | | | 9,914,880 | | | | 1,046,136 | |
| Bond - Institutional | | | (28,735,928 | ) | | | (3,046,449 | ) | | | 111,242,045 | | | | 11,792,768 | |
| Prime Money Market | | | (31,415,171 | ) | | | (31,415,171 | ) | | | (1,455,121 | ) | | | (1,455,121 | ) |
| Institutional Prime Money Market | | | (386,435,339 | ) | | | (386,423,004 | ) | | | 99,130,720 | | | | 99,130,653 | |
| | | | | | | | | | | | | | | | | |
| Period Ended December 31, 2016 | | | | | | | | | | | | | | | | |
| Muirfield - Retail | | $ | (156,631,222 | ) | | | (24,078,934 | ) | | $ | (19,019,964 | ) | | | (2,861,357 | ) |
| Muirfield - Adviser | | | (10 | ) | | | (1 | ) | | | 147,757 | | | | 22,695 | |
| Muirfield - Institutional | | | (182,558 | ) | | | (26,804 | ) | | | 801,436 | | | | 124,245 | |
| Dynamic - Retail | | | (55,272,607 | ) | | | (5,951,512 | ) | | | (1,977,947 | ) | | | (292,137 | ) |
| Dynamic - Adviser | | | — | | | | — | | | | 46,216 | | | | 4,947 | |
| Dynamic - Institutional | | | (50,000 | ) | | | (5,107 | ) | | | 567,333 | | | | 60,908 | |
| Aggressive - Retail | | | (52,233,584 | ) | | | (5,415,390 | ) | | | (35,848,155 | ) | | | (3,691,946 | ) |
| Aggressive - Adviser | | | — | | | | — | | | | 17,259 | | | | 1,810 | |
| Aggressive - Institutional | | | — | | | | — | | | | 323,013 | | | | 33,314 | |
| Balanced - Retail | | | (151,255,303 | ) | | | (14,401,113 | ) | | | (69,049,460 | ) | | | (6,487,598 | ) |
| Balanced - Adviser | | | — | | | | — | | | | 87,015 | | | | 8,294 | |
| Balanced - Institutional | | | (8,467 | ) | | | (793 | ) | | | 213,999 | | | | 20,345 | |
| Global - Retail | | | (52,014,518 | ) | | | (5,675,851 | ) | | | (31,886,795 | ) | | | (3,476,508 | ) |
2017 Annual Report | December 31, 2017 | Page 125 |
| | | Redeemed | | Net Increase (Decrease) |
| | | Amount | | Shares | | Amount | | Shares |
| Global - Adviser | | $ | — | | | | — | | | $ | 29,614 | | | | 3,147 | |
| Global - Institutional | | | (6,606 | ) | | | (697 | ) | | | 326,053 | | | | 34,503 | |
| Spectrum - Retail | | | (51,043,012 | ) | | | (5,217,071 | ) | | | (8,610,356 | ) | | | (849,771 | ) |
| Spectrum - Adviser | | | — | | | | — | | | | 46,843 | | | | 4,696 | |
| Spectrum - Institutional | | | (99,000 | ) | | | (9,565 | ) | | | 443,726 | | | | 44,815 | |
| Quantex - Retail | | | (27,477,066 | ) | | | (908,796 | ) | | | 13,645,120 | | | | 439,740 | |
| Quantex - Adviser | | | — | | | | — | | | | 28,673 | | | | 933 | |
| Quantex - Institutional | | | (7,190 | ) | | | (214 | ) | | | 876,085 | | | | 28,505 | |
| Conservative - Retail | | | (9,244,777 | ) | | | (462,854 | ) | | | (2,629,913 | ) | | | (143,170 | ) |
| Conservative - Adviser | | | — | | | | — | | | | 7,386 | | | | 351 | |
| Conservative - Institutional | | | — | | | | — | | | | 301,288 | | | | 14,287 | |
| Moderate - Retail | | | (20,598,293 | ) | | | (2,106,832 | ) | | | 10,086,205 | | | | 992,035 | |
| Moderate - Adviser | | | — | | | | — | | | | 21,215 | | | | 2,149 | |
| Moderate - Institutional | | | — | | | | — | | | | 221,058 | | | | 21,850 | |
| Bond - Retail | | | (99,286,839 | ) | | | (10,640,167 | ) | | | (2,732,327 | ) | | | (338,838 | ) |
| Bond - Adviser | | | — | | | | — | | | | 85,605 | | | | 9,051 | |
| Bond - Institutional | | | (13,505 | ) | | | (1,455 | ) | | | 71,301 | | | | 7,529 | |
| Prime Money Market | | | (24,978,383 | ) | | | (24,978,383 | ) | | | (15,349,988 | ) | | | (15,349,989 | ) |
| Institutional Prime Money Market** | | | (106,654,831 | ) | | | (106,647,341 | ) | | | 197,478,058 | | | | 197,469,829 | |
| Money Market - Retail*/** | | | (88,582,452 | ) | | | (88,582,452 | ) | | | (4,514,672 | ) | | | (4,514,672 | ) |
| Money Market - Institutional*/** | | | (661,800,428 | ) | | | (661,800,428 | ) | | | (168,171,942 | ) | | | (168,171,942 | ) |
* | Capital stock transactions reflect amounts when the Fund offered multiple classes of shares. |
** | On October 7, 2016, $131,014,084 was transferred in-kind from Prime Money Market Fund to Institutional Prime Money Market Fund. Therefore capital and shares redeemed for Prime Money Market Fund include this in-kind transfer, whereas capital and shares issued for Institutional Prime Money Market Fund include this amount as an initial contribution. |
Offsetting Assets & Liabilities. The Funds are party to enforceable master netting arrangements between counter parties, such as the securities lending agreement, which provides for the right of offset under certain circumstances, such as the event of default. The securities lending transactions have an overnight and continuous contractual maturity. Risks arise from the possible inability of counterparties to meet the terms of their contracts. The table below reflects the offsetting assets and liabilities relating to securities lending, futures contracts, and repurchase agreements shown on the Statements of Assets and Liabilities at December 31, 2017.
| | | | | | | | Gross Amounts Not Offset in the Statements of Assets and Liabilities | | |
| Description/ Fund | | | Gross Amounts of Recognized Assets/ Liabilities | | | | Gross Amounts Offset in the Statements of Assets and Liabilities | | | | Net Amounts Presented in the Statements of Assets and Liabilities | | | | Financial Instruments* | | | | Collateral Pledged (Received)* | | | | Net Amount | |
| Assets: | | | | | | | | | | | | | | | | | | | | | | | | |
| Securities Loaned | | | | | | | | | | | | | | | | | | | | | | | | |
| Muirfield | | $ | 281,815 | | | $ | — | | | $ | 281,815 | | | $ | — | | | $ | (281,815 | ) | | $ | — | |
| Spectrum | | | 16,647 | | | | — | | | | 16,647 | | | | — | | | | (16,647 | ) | | | — | |
| Moderate | | | 7,180 | | | | — | | | | 7,180 | | | | — | | | | (7,180 | ) | | | — | |
| | | | | | | | | | | | | | | | | | | | | | | | | |
| Futures Contracts | | | | | | | | | | | | | | | | | | | | | | | | |
| Muirfield | | $ | 1,598,606 | | | $ | — | | | $ | 1,598,606 | | | $ | — | | | $ | — | | | $ | 1,598,606 | |
| Dynamic | | | 468,010 | | | | — | | | | 468,010 | | | | — | | | | — | | | | 468,010 | |
| Aggressive | | | 165,227 | | | | — | | | | 165,227 | | | | — | | | | — | | | | 165,227 | |
| Balanced | | | 58,231 | | | | — | | | | 58,231 | | | | — | | | | — | | | | 58,231 | |
| Global | | | 216,871 | | | | — | | | | 216,871 | | | | — | | | | — | | | | 216,871 | |
| Spectrum | | | 666,248 | | | | — | | | | 666,248 | | | | — | | | | — | | | | 666,248 | |
| Quantex | | | 53,886 | | | | — | | | | 53,886 | | | | — | | | | — | | | | 53,886 | |
| Moderate | | | 39,999 | | | | — | | | | 39,999 | | | | — | | | | — | | | | 39,999 | |
| Conservative | | | 8,428 | | | | — | | | | 8,428 | | | | — | | | | — | | | | 8,428 | |
Page 126 | 2017 Annual Report | December 31, 2017 |
| | | | | | | | Gross Amounts Not Offset in the Statements of Assets and Liabilities | | |
| Description/ Fund | | | Gross Amounts of Recognized Assets/ Liabilities | | | | Gross Amounts Offset in the Statements of Assets and Liabilities | | | | Net Amounts Presented in the Statements of Assets and Liabilities | | | | Financial Instruments* | | | | Collateral Pledged (Received)* | | | | Net Amount | |
| Repurchase Agreements | | | | | | | | | | | | | | | | | | | | | | | | |
| Prime Money Market | | $ | 7,000,000 | | | $ | — | | | $ | 7,000,000 | | | $ | (7,000,000 | ) | | $ | — | | | $ | — | |
| Institutional Prime Money Market | | | 83,000,000 | | | | — | | | | 83,000,000 | | | | (83,000,000 | ) | | | — | | | | — | |
| | | | | | | | | | | | | | | | | | | | | | | | | |
| Liabilities: | | | | | | | | | | | | | | | | | | | | | | | | |
| N/A | | | N/A | | | | N/A | | | | N/A | | | | N/A | | | | N/A | | | | N/A | |
* | The amount is limited to the net amounts of financial assets and liabilities and accordingly does not include excess collateral pledged. |
Other. The Funds record security transactions on the trade date. Gains and losses realized from the sale of securities are determined on the specific identification basis. Dividend income and dividend expenses are recognized on the ex-dividend date and interest income (including amortization of premium and accretion of discount) is recognized as earned. Short-term capital gain distributions from underlying funds are classified as dividend income for financial reporting purposes. Long-term capital gains distributions are separately stated. Discounts and premiums are amortized using the effective yield over the lives of the respective securities. Distributions received from partnerships are recorded as return of capital distributions. Withholding taxes on foreign dividends, if applicable, have been provided for in accordance with the Funds’ understanding of the applicable country’s tax rules and rates.
3. Securities Valuations
The Funds utilize various methods to measure the fair value of their investments on a recurring basis. GAAP establishes a hierarchy that prioritizes inputs to valuation methods. The three levels of inputs are as follows:
Level 1 – Unadjusted quoted prices in active markets for identical assets or liabilities that the Funds have the ability to access.
Level 2 – Observable inputs other than quoted prices included in level 1 that are observable for the asset or liability, either directly or indirectly. These inputs may include quoted prices for the identical instrument on an inactive market, prices for similar instruments, interest rates, prepayment speeds, credit risk, yield curves, default rates and similar data.
Level 3 – Significant unobservable inputs for the asset or liability, to the extent relevant observable inputs are not available, representing the Funds’ own assumptions about the assumptions a market participant would use in valuing the asset or liability, and would be based on the best information available.
The availability of observable inputs can vary from security to security and is affected by a wide variety of factors, including, for example, the type of security, whether the security is new and not yet established in the marketplace, the liquidity of markets, and other characteristics particular to the security. To the extent that valuation is based on models or inputs that are less observable or unobservable in the market, the determination of fair value requires more judgment. Accordingly, the degree of judgment exercised in determining fair value is greatest for instruments categorized in level 3.
The inputs used to measure fair value may fall into different levels of the fair value hierarchy. In such cases, for disclosure purposes, the level in the fair value hierarchy within which the fair value measurement falls in its entirety, is determined based on the lowest level input that is significant to the fair value measurement in its entirety.
A description of the valuation techniques applied to the Funds’ major categories of assets and liabilities measured at fair value on a recurring basis follows.
Equity securities (including publicly traded partnerships, real estate investment trusts, American depositary receipts, exchange traded funds, and common stock). Securities traded on a national securities exchange (or reported on the NASDAQ national market) are stated at the last reported sales price on the day of valuation and are categorized in level 1 of the fair value hierarchy.
Investments in registered open-end investment companies, including money market funds, are valued at the daily redemption value as reported by the underlying fund and are categorized in level 1 of the fair value hierarchy.
Short-term notes (including bank obligations, commercial paper, corporate obligations, repurchase agreements, U.S. government agency obligations, and floating rate demand notes). Short-term notes held in the Funds, except Prime Money Market, maturing more than sixty days after the valuation date, are valued at the last sales price as of the close of business on the day of valuation, or, lacking any sales, at the most recent
2017 Annual Report | December 31, 2017 | Page 127 |
bid price or yield equivalent as obtained from dealers that make markets in such securities. When valued at last sales price, the securities will be categorized as level 1. When using bid prices or yield equivalents, they will be categorized as level 2. When such securities are valued within sixty days or less to maturity, the difference between the valuation existing on the sixty-first day before maturity and maturity value is amortized on a straight-line basis to maturity and will be categorized as level 2.
All securities held in Prime Money Market, other than money market funds, are valued at amortized cost, which approximates fair value, and will be categorized as level 2.
Certificates of deposit. Except for Institutional Money Market, certificates of deposit are valued at acquisition cost, which approximates fair value, and will be categorized as level 2. For Institutional Money Market, certificates of deposit are normally valued using a model that incorporates market observable data such as reported sales of similar securities, broker quotes, yields, bids, offers, and reference data, and will be categorized as level 2.
U.S. government obligations. U.S. government obligations are normally valued using a model that incorporates market observable data such as reported sales of similar securities, broker quotes, yields, bids, offers, and reference data. Certain securities are valued principally using dealer quotations. In either case, these securities will be categorized as level 2.
Restricted securities (equity and debt). Restricted securities for which quotations are not readily available are valued at fair value as determined by the Trustees. Depending on the relative significance of valuation inputs, these instruments may be classified in either level 2 or level 3 of the fair value hierarchy.
Derivative instruments (futures contracts). Listed derivative instruments that are actively traded, including futures contracts, are valued based on quoted prices from the exchange and are categorized in level 1 of the fair value hierarchy.
For the year ended December 31, 2017, the Funds did not hold any assets at any time in which significant unobservable inputs were used in determining fair value. Therefore, no reconciliation of level 3 securities is provided. Also, there were no transfers between level 1 and level 2 securities. The Funds recognize transfers between fair value hierarchy levels at the end of the reporting period. The following table summarizes the inputs used to value the Funds’ assets and liabilities measured at fair value as of December 31, 2017.
| Muirfield – Assets/(Liabilities) | | Level 1 | | Level 2 | | Level 3 | | Total |
| Common stocks* | | $ | 302,681,555 | | | $ | — | | | $ | — | | | $ | 302,681,555 | |
| Registered investment companies | | | 16,996,235 | | | | — | | | | — | | | | 16,996,235 | |
| Money market registered investment companies | | | 152,031,620 | | | | — | | | | — | | | | 152,031,620 | |
| Bank obligations | | | — | | | | 1,492,885 | | | | — | | | | 1,492,885 | |
| Total | | $ | 471,709,410 | | | $ | 1,492,885 | | | $ | — | | | $ | 473,202,295 | |
| Trustee deferred compensation*** | | $ | 171,736 | | | $ | — | | | $ | — | | | $ | 171,736 | |
| Futures contracts** | | $ | 1,598,606 | | | $ | — | | | $ | — | | | $ | 1,598,606 | |
| Dynamic – Assets/(Liabilities) | | Level 1 | | Level 2 | | Level 3 | | Total |
| Common stocks* | | $ | 89,812,701 | | | $ | — | | | $ | — | | | $ | 89,812,701 | |
| Registered investment companies | | | 17,350,547 | | | | — | | | | — | | | | 17,350,547 | |
| Money market registered investment companies | | | 21,160,222 | | | | — | | | | — | | | | 21,160,222 | |
| Bank obligations | | | — | | | | 1,492,878 | | | | — | | | | 1,492,878 | |
| Total | | $ | 128,323,470 | | | $ | 1,492,878 | | | $ | — | | | $ | 129,816,348 | |
| Trustee deferred compensation*** | | $ | 106,499 | | | $ | — | | | $ | — | | | $ | 106,499 | |
| Futures contracts** | | $ | 468,360 | | | $ | — | | | $ | — | | | $ | 468,360 | |
| Aggressive – Assets/(Liabilities) | | Level 1 | | Level 2 | | Level 3 | | Total |
| Common stocks* | | $ | 28,155,013 | | | $ | — | | | $ | — | | | $ | 28,155,013 | |
| Registered investment companies | | | 4,885,911 | | | | — | | | | — | | | | 4,885,911 | |
| Money market registered investment companies | | | 6,809,597 | | | | — | | | | — | | | | 6,809,597 | |
| Bank obligations | | | — | | | | 994,567 | | | | — | | | | 994,567 | |
| Total | | $ | 39,850,521 | | | $ | 994,567 | | | $ | — | | | $ | 40,845,088 | |
| Trustee deferred compensation*** | | $ | 59,094 | | | $ | — | | | $ | — | | | $ | 59,094 | |
| Futures contracts** | | $ | 165,227 | | | $ | — | | | $ | — | | | $ | 165,227 | |
Page 128 | 2017 Annual Report | December 31, 2017 |
| Balanced – Assets/(Liabilities) | | Level 1 | | Level 2 | | Level 3 | | Total |
| Common stocks* | | $ | 135,479,024 | | | $ | — | | | $ | — | | | $ | 135,479,024 | |
| Registered investment companies | | | 93,159,510 | | | | — | | | | — | | | | 93,159,510 | |
| Money market registered investment companies | | | 46,165,677 | | | | — | | | | — | | | | 46,165,677 | |
| Bank obligations | | | — | | | | 1,492,688 | | | | — | | | | 1,492,688 | |
| Total | | $ | 274,804,211 | | | $ | 1,492,688 | | | $ | — | | | $ | 276,296,899 | |
| Trustee deferred compensation*** | | $ | 113,702 | | | $ | — | | | $ | — | | | $ | 113,702 | |
| Futures contracts** | | $ | 58,231 | | | $ | — | | | $ | — | | | $ | 58,231 | |
| Global – Assets/(Liabilities) | | Level 1 | | Level 2 | | Level 3 | | Total |
| Common stocks* | | $ | 30,500,203 | | | $ | — | | | $ | — | | | $ | 30,500,203 | |
| Registered investment companies | | | 29,531,826 | | | | — | | | | — | | | | 29,531,826 | |
| Money market registered investment companies | | | 11,707,988 | | | | — | | | | — | | | | 11,707,988 | |
| Bank obligations | | | — | | | | 1,492,688 | | | | — | | | | 1,492,688 | |
| Total | | $ | 71,740,017 | | | $ | 1,492,688 | | | $ | — | | | $ | 73,232,705 | |
| Trustee deferred compensation*** | | $ | 85,350 | | | $ | — | | | $ | — | | | $ | 85,350 | |
| Futures contracts** | | $ | 216,871 | | | $ | — | | | $ | — | | | $ | 216,871 | |
| Spectrum – Assets/(Liabilities) | | Level 1 | | Level 2 | | Level 3 | | Total |
| Common stocks – Long* | | $ | 148,295,888 | | | $ | — | | | $ | — | | | $ | 148,295,888 | |
| Money market registered investment companies | | | 5,851,979 | | | | — | | | | — | | | | 5,851,979 | |
| Bank obligations | | | — | | | | 995,187 | | | | — | | | | 995,187 | |
| Total – Long investments | | $ | 154,147,867 | | | $ | 995,187 | | | $ | — | | | $ | 155,143,054 | |
| Common stocks – Short* | | $ | (62,041,798 | ) | | $ | — | | | $ | — | | | $ | (62,041,798 | ) |
| Trustee deferred compensation*** | | $ | 13,166 | | | $ | — | | | $ | — | | | $ | 13,166 | |
| Futures contracts** | | $ | 666,248 | | | $ | — | | | $ | — | | | $ | 666,248 | |
| Quantex – Assets/(Liabilities) | | Level 1 | | Level 2 | | Level 3 | | Total |
| Common stocks* | | $ | 87,525,965 | | | $ | — | | | $ | — | | | $ | 87,525,965 | |
| Money market registered investment companies | | | 5,257,988 | | | | — | | | | — | | | | 5,257,988 | |
| Bank obligations | | | — | | | | 1,464,779 | | | | — | | | | 1,464,779 | |
| Total | | $ | 92,783,953 | | | $ | 1,464,779 | | | $ | — | | | $ | 94,248,732 | |
| Trustee deferred compensation*** | | $ | 47,458 | | | $ | — | | | $ | — | | | $ | 47,458 | |
| Futures contracts** | | $ | 53,886 | | | $ | — | | | $ | — | | | $ | 53,886 | |
| Conservative – Assets/(Liabilities) | | Level 1 | | Level 2 | | Level 3 | | Total |
| Common stocks* | | $ | 6,389,970 | | | $ | — | | | $ | — | | | $ | 6,389,970 | |
| Registered investment companies | | | 17,628,751 | | | | — | | | | — | | | | 17,628,751 | |
| Money market registered investment companies | | | 349,527 | | | | — | | | | — | | | | 349,527 | |
| Bank obligations | | | — | | | | 498,188 | | | | — | | | | 498,188 | |
| Total | | $ | 24,368,248 | | | $ | 498,188 | | | $ | — | | | $ | 24,866,436 | |
| Trustee deferred compensation*** | | $ | 47,148 | | | $ | — | | | $ | — | | | $ | 47,148 | |
| Futures contracts** | | $ | 8,428 | | | $ | — | | | $ | — | | | $ | 8,428 | |
2017 Annual Report | December 31, 2017 | Page 129 |
| Moderate – Assets/(Liabilities) | | Level 1 | | Level 2 | | Level 3 | | Total |
| Common stocks* | | $ | 28,531,954 | | | $ | — | | | $ | — | | | $ | 28,531,954 | |
| Registered investment companies | | | 33,360,751 | | | | — | | | | — | | | | 33,360,751 | |
| Money market registered investment companies | | | 2,830,059 | | | | — | | | | — | | | | 2,830,059 | |
| Bank obligations | | | — | | | | 995,188 | | | | — | | | | 995,188 | |
| Total | | $ | 64,722,764 | | | $ | 995,188 | | | $ | — | | | $ | 65,717,952 | |
| Trustee deferred compensation*** | | $ | 5,309 | | | $ | — | | | $ | — | | | $ | 5,309 | |
| Futures contracts** | | $ | 39,999 | | | $ | — | | | $ | — | | | $ | 39,999 | |
| Bond – Assets/(Liabilities) | | Level 1 | | Level 2 | | Level 3 | | Total |
| Registered investment companies | | $ | 180,625,334 | | | $ | — | | | $ | — | | | $ | 180,625,334 | |
| Money market registered investment companies | | | 5,927,638 | | | | — | | | | — | | | | 5,927,638 | |
| Bank obligations | | | — | | | | 1,492,697 | | | | — | | | | 1,492,697 | |
| U.S. government obligations | | | — | | | | 57,933 | | | | — | | | | 57,933 | |
| Total | | $ | 186,552,972 | | | $ | 1,550,630 | | | $ | — | | | $ | 188,103,602 | |
| Trustee deferred compensation*** | | $ | 53,661 | | | $ | — | | | $ | — | | | $ | 53,661 | |
| Prime Money Market – Assets/(Liabilities) | | Level 1 | | Level 2 | | Level 3 | | Total |
| Bank obligations | | $ | — | | | $ | 994,337 | | | $ | — | | | $ | 994,337 | |
| Certificates of deposit | | | — | | | | 3,000,099 | | | | — | | | | 3,000,099 | |
| Commercial paper | | | — | | | | 11,250,322 | | | | — | | | | 11,250,322 | |
| Corporate obligations | | | — | | | | 2,250,709 | | | | — | | | | 2,250,709 | |
| Repurchase agreements | | | — | | | | 7,000,000 | | | | — | | | | 7,000,000 | |
| Money Market registered investment companies | | | 10,708,971 | | | | — | | | | — | | | | 10,708,971 | |
| Total | | $ | 10,708,971 | | | $ | 24,495,467 | | | $ | — | | | $ | 35,204,438 | |
| Trustee deferred compensation*** | | $ | 33,319 | | | $ | — | | | $ | — | | | $ | 33,319 | |
| Institutional Prime Money Market – Assets/(Liabilities) | | Level 1 | | Level 2 | | Level 3 | | Total |
| Bank obligations | | $ | — | | | $ | 994,337 | | | $ | — | | | $ | 994,337 | |
| Certificates of deposit | | | — | | | | 26,808,407 | | | | — | | | | 26,808,407 | |
| Commercial paper | | | — | | | | 123,286,034 | | | | — | | | | 123,286,034 | |
| Corporate obligations | | | — | | | | 9,831,332 | | | | — | | | | 9,831,332 | |
| Repurchase agreements | | | — | | | | 83,000,000 | | | | — | | | | 83,000,000 | |
| Money Market registered investment companies | | | 52,820,434 | | | | — | | | | — | | | | 52,820,434 | |
| Total | | $ | 52,820,434 | | | $ | 243,920,110 | | | $ | — | | | $ | 296,740,544 | |
| Trustee deferred compensation*** | | $ | 994 | | | $ | — | | | $ | — | | | $ | 994 | |
* | See schedule of investments for industry classifications. |
** | Futures contracts include unrealized gain/loss on contracts open at December 31, 2017. |
*** | A corresponding liability exists that is marked to market and is fair valued under the Level 1 hierarchy. |
Page 130 | 2017 Annual Report | December 31, 2017 |
4. Investment Transactions
For the year ended December 31, 2017, the cost of purchases and proceeds from sales or maturities of long-term investments for the Funds, excluding U.S. Government investments and short positions, were as follows:
| | | Purchases | | Sales |
| Muirfield | | $ | 817,956,476 | | | $ | 848,436,099 | |
| Dynamic | | | 256,166,250 | | | | 268,856,821 | |
| Aggressive | | | 89,234,766 | | | | 100,209,248 | |
| Balanced | | | 437,845,626 | | | | 427,418,664 | |
| Global | | | 113,937,844 | | | | 138,690,326 | |
| Spectrum | | | 159,572,838 | | | | 147,776,597 | |
| Quantex | | | 63,225,373 | | | | 57,115,635 | |
| Conservative | | | 29,447,486 | | | | 24,892,779 | |
| Moderate | | | 182,274,974 | | | | 177,200,612 | |
| Bond | | | 247,326,516 | | | | 277,088,058 | |
For the year ended December 31, 2017, the cost of purchases and proceeds from sales or maturities of long-term U.S. Government investments for the Funds are as follows:
| | | Purchases | | Sales |
Bond | | | $ | 2,817 | | | $ | — | |
5. Investment Advisory Fees and Other Transactions with Affiliates and Non-Affiliates
Meeder Asset Management, Inc. (“MAM”), a wholly-owned subsidiary of Meeder Investment Management, Inc. (“Meeder”), provides the Funds with investment management, research, statistical and advisory services pursuant to the terms of an Investment Advisory Agreement. The services of MAM will terminate automatically if assigned and may be terminated without penalty at any time upon 60 days prior written notice by majority vote of the Fund, by the Trustees of the Fund, or by MAM. For such services the Funds pay a fee at the following annual rates:
| | Percentage of Average Daily Net Assets up to $50 Million | Percentage of Average Daily Net Assets Exceeding $50 Million up to $100 Million | Percentage of Average Daily Net Assets up to $100 Million | Percentage of Average Daily Net Assets up to $200 Million | Percentage of Average Daily Net Assets Exceeding $100 Million | Percentage of Average Daily Net Assets Exceeding $200 Million |
Muirfield | 1.00% | 0.75% | N/A | N/A | 0.60% | N/A |
Quantex | 1.00% | 0.75% | N/A | N/A | 0.60% | N/A |
Conservative | 1.00% | 0.75% | N/A | N/A | 0.60% | N/A |
Dynamic | N/A | N/A | N/A | 0.75% | N/A | 0.60% |
Aggressive | N/A | N/A | N/A | 0.75% | N/A | 0.60% |
Balanced | N/A | N/A | N/A | 0.75% | N/A | 0.60% |
Global | N/A | N/A | N/A | 0.75% | N/A | 0.60% |
Spectrum | N/A | N/A | N/A | 0.75% | N/A | 0.60% |
Moderate | N/A | N/A | N/A | 0.75% | N/A | 0.60% |
Bond | N/A | N/A | 0.40% | N/A | 0.20% | N/A |
Prime Money Market | N/A | N/A | 0.40% | N/A | 0.25% | N/A |
Institutional Prime Money Market | N/A | N/A | 0.40% | N/A | 0.25% | N/A |
Fee Waivers & Expense Limitation Agreements. MAM has contractually agreed to reduce its advisory fees or limit total annual ordinary fund operating expenses for certain Funds pursuant to written agreements that may only be amended or terminated with the approval of the Board. The sums waived or reimbursed under these agreements are not subject to recoupment.
During 2017, MAM contractually agreed to reduce its investment advisory fee by 0.25% for Quantex for average daily net assets up to $50 million. During the year ended December 31, 2017, $125,000 of investment advisory fees were waived in Quantex.
2017 Annual Report | December 31, 2017 | Page 131 |
Between April 18, 2017 through November 19, 2017, MAM contractually agreed to reduce its investment advisory fee by 0.25% for Conservative for average daily net assets up to $50 million. Effective November 20, 2017, MAM contractually agreed to reduce its investment advisory fee for Conservative to 0.50% and to reimburse management fees or other fund expenses sufficient to limit total annual ordinary fund operating expenses (excluding interest, taxes, brokerage commissions, acquired fund fees and expenses, and extraordinary items) as a percentage of daily assets to 1.32% for the Retail Class, 1.12% for the Adviser Class and 0.92% for the Institutional Class. During the year ended December 31, 2017, $40,881 of investment advisory fees were waived in Conservative.
Effective April 18, 2017, MAM contractually agreed to reduce its investment advisory fee by 0.10% for Dynamic for average daily net assets up to $200 million. During the year ended December 31, 2017, $87,290 of investment advisory fees were waived in Dynamic.
Effective November 20, 2017, MAM contractually agreed to reduce its investment advisory fee for Moderate to 0.60% and to reimburse management fees or other fund expenses sufficient to limit total annual ordinary fund operating expenses (excluding interest, taxes, brokerage commissions, acquired fund fees and expenses, and extraordinary items) as a percentage of daily assets to 1.42% for the Retail Class, 1.22% for the Adviser Class and 1.02% for the Institutional Class. During the year ended December 31, 2017, $10,668 of investment advisory fees were waived in Moderate.
Effective November 20, 2017, MAM contractually agreed to reduce its investment advisory fee by 0.11% for Bond for average daily net assets up to $100 million. During the year ended December 31, 2017, $12,658 of investment advisory fees were waived in Bond.
During 2017, MAM contractually agreed to reduce and/or reimburse expenses for Institutional Prime Money Market to the extent necessary to limit the total operating expenses of the Fund (excluding interest, taxes, brokerage commissions, acquired fund fees and expenses, and extraordinary items) to no more than 0.60% of average daily net assets. During the year ended December 31, 2017, no investment advisory fees were waived and no expenses were reimbursed in Institutional Prime Money Market.
Mutual Funds Service Co. (“MFSCo”), a wholly-owned subsidiary of Meeder, serves as stock transfer, dividend disbursing and shareholder services agent for each Fund. In compensation for such services, each Fund pays MFSCo an annual fee equal to the greater of the following:
| | | Minimum Fee | | Percentage of Average Daily Net Assets |
| Muirfield | | $ | 4,000 | | | | 0.12 | % |
| Quantex | | | 4,000 | | | | 0.12 | % |
| Conservative | | | 4,000 | | | | 0.12 | % |
| Dynamic | | | 4,000 | | | | 0.12 | % |
| Aggressive | | | 4,000 | | | | 0.12 | % |
| Balanced | | | 4,000 | | | | 0.12 | % |
| Global | | | 4,000 | | | | 0.12 | % |
| Spectrum | | | 4,000 | | | | 0.12 | % |
| Moderate | | | 4,000 | | | | 0.12 | % |
| Bond | | | 4,000 | | | | 0.08 | % |
| Prime Money Market | | | 4,000 | | | | 0.08 | % |
| Institutional Prime Money Market | | | 4,000 | | | | 0.08 | % |
Page 132 | 2017 Annual Report | December 31, 2017 |
Effective April 18, 2017, a $15 per active shareholder account fee was eliminated from the calculation for Conservative and Moderate. Effective September 21, 2017, except for the Money Market Funds, the $15 per active shareholder account fee was eliminated from the calculation for the remaining Funds, while a $20 per active shareholder account fee was eliminated for the Money Market Funds. For fixed income Funds (Bond, Prime Money Market, and Institutional Prime Money Market) that are subject to an expense cap and which are above the expense cap, the basis point fee will be contractually reduced by 0.02%. During the year ended December 31, 2017, MFSCo waived the following transfer agent fees:
| | | Voluntary Transfer Agent Fees Reimbursements | | Impact of Voluntary Transfer Agent Fees Reimbursements to Average Net Assets – Retail Class | | Impact of Voluntary Transfer Agent Fees Reimbursements to Average Net Assets – Adviser Class | | Impact of Voluntary Transfer Agent Fees Reimbursements to Average Net Assets – Institutional Class | | Impact of Voluntary Transfer Agent Fees Reimbursements to Average Net Assets - Money Market Funds |
| Muirfield | | $ | 98,904 | | | | N/A | | | | 0.09 | % | | | 0.09 | % | | | N/A | |
| Quantex | | | 7,126 | | | | N/A | | | | 0.03 | % | | | 0.03 | % | | | N/A | |
| Conservative | | | 20,763 | | | | 0.10 | % | | | 0.12 | % | | | 0.12 | % | | | N/A | |
| Dynamic | | | — | | | | N/A | | | | N/A | | | | N/A | | | | N/A | |
| Aggressive | | | 20,863 | | | | N/A | | | | 0.12 | % | | | 0.12 | % | | | N/A | |
| Balanced | | | 68,534 | | | | N/A | | | | 0.09 | % | | | 0.09 | % | | | N/A | |
| Global | | | 38,042 | | | | N/A | | | | 0.11 | % | | | 0.11 | % | | | N/A | |
| Spectrum | | | 55,861 | | | | N/A | | | | 0.12 | % | | | 0.12 | % | | | N/A | |
| Moderate | | | 31,358 | | | | 0.02 | % | | | 0.11 | % | | | 0.11 | % | | | N/A | |
| Bond | | | 1,412 | | | | N/A | | | | N/A | | | | N/A | | | | N/A | |
| Prime Money Market | | | 8,406 | | | | N/A | | | | N/A | | | | N/A | | | | 0.02 | % |
| Institutional Prime Money Market | | | 42,945 | | | | N/A | | | | N/A | | | | N/A | | | | 0.02 | % |
MFSCo provides the Trust with certain administrative services. In compensation for such services, each Fund pays MFSCo at the following annual rates:
| | Percentage of Average Daily Net Assets up to $50 Million | Percentage of Average Daily Net Assets Exceeding $50 Million |
Muirfield | 0.10% | 0.08% |
Quantex | 0.10% | 0.08% |
Conservative | 0.10% | 0.08% |
Dynamic | 0.10% | 0.08% |
Aggressive | 0.10% | 0.08% |
Balanced | 0.10% | 0.08% |
Global | 0.10% | 0.08% |
Spectrum | 0.10% | 0.08% |
Moderate | 0.10% | 0.08% |
Bond | 0.10% | 0.08% |
Prime Money Market | 0.10% | 0.08% |
Institutional Prime Money Market | 0.10% | 0.08% |
2017 Annual Report | December 31, 2017 | Page 133 |
MFSCo serves as accounting services agent for each Fund. In compensation for such services, each Fund pays MFSCo an annual fee equal to the greater of a minimum fee or at a rate based on the percentage of average daily net assets. The annual rates are as follows:
| | | Minimum Fee | | Percentage of
Average
Daily Net
Assets up to $10
Million | | Percentage of
Average
Daily Net
Assets Exceeding
$10 Million up to
$30 Million | | Percentage of
Average
Daily Net
Assets Exceeding
$30 Million up to
$80 Million | | Percentage of
Average
Daily Net
Assets Exceeding
$80 Million |
| Muirfield | | $ | 7,500 | | | | 0.15 | % | | | 0.10 | % | | | 0.02 | % | | | 0.01 | % |
| Quantex | | | 7,500 | | | | 0.15 | % | | | 0.10 | % | | | 0.02 | % | | | 0.01 | % |
| Conservative | | | 7,500 | | | | 0.15 | % | | | 0.10 | % | | | 0.02 | % | | | 0.01 | % |
| Dynamic | | | 7,500 | | | | 0.15 | % | | | 0.10 | % | | | 0.02 | % | | | 0.01 | % |
| Aggressive | | | 7,500 | | | | 0.15 | % | | | 0.10 | % | | | 0.02 | % | | | 0.01 | % |
| Balanced | | | 7,500 | | | | 0.15 | % | | | 0.10 | % | | | 0.02 | % | | | 0.01 | % |
| Global | | | 7,500 | | | | 0.15 | % | | | 0.10 | % | | | 0.02 | % | | | 0.01 | % |
| Spectrum | | | 7,500 | | | | 0.15 | % | | | 0.10 | % | | | 0.02 | % | | | 0.01 | % |
| Moderate | | | 7,500 | | | | 0.15 | % | | | 0.10 | % | | | 0.02 | % | | | 0.01 | % |
| Bond | | | 7,500 | | | | 0.15 | % | | | 0.10 | % | | | 0.02 | % | | | 0.01 | % |
| Prime Money Market | | | 30,000 | | | | 0.15 | % | | | 0.10 | % | | | 0.02 | % | | | 0.01 | % |
| Institutional Prime Money Market | | | 30,000 | | | | 0.15 | % | | | 0.10 | % | | | 0.02 | % | | | 0.01 | % |
For the year ended December 31, 2017, MAM and MFSCo agreed to voluntarily waive and/or reimburse investment advisory fees and transfer agent fees, respectively. The cumulative amounts voluntarily waived and/or reimbursed and the impact to the net expense ratio (excluding brokerage fees and commissions, taxes, interest, and extraordinary or non-recurring expenses) for each Fund are as follows:
| | | Voluntary Expense
Reimbursements | | Impact of Voluntary
Waivers to Average
Net Assets | | Impact of Voluntary
Waivers to Average
Net Assets – Retail
Class | | Impact of Voluntary
Waivers to Average
Net Assets –
Adviser Class | | Impact of Voluntary
Waivers to Average
Net Assets –
Institutional Class |
| Muirfield | | $ | 98,904 | | | | N/A | | | | N/A | | | | 0.09 | % | | | 0.09 | % |
| Quantex | | | 7,126 | | | | N/A | | | | N/A | | | | 0.03 | % | | | 0.03 | % |
| Conservative | | | 136,194 | | | | N/A | | | | 0.67 | % | | | 0.69 | % | | | 0.69 | % |
| Dynamic | | | — | | | | N/A | | | | N/A | | | | N/A | | | | N/A | |
| Aggressive | | | 29,377 | | | | N/A | | | | 0.02 | % | | | 0.14 | % | | | 0.14 | % |
| Balanced | | | 68,534 | | | | N/A | | | | N/A | | | | 0.09 | % | | | 0.09 | % |
| Global | | | 38,042 | | | | N/A | | | | N/A | | | | 0.11 | % | | | 0.11 | % |
| Spectrum | | | 55,861 | | | | N/A | | | | N/A | | | | 0.12 | % | | | 0.12 | % |
| Moderate | | | 44,552 | | | | N/A | | | | 0.04 | % | | | 0.13 | % | | | 0.13 | % |
| Bond | | | 1,412 | | | | N/A | | | | N/A | | | | N/A | | | | N/A | |
| Prime Money Market | | | 190,983 | | | | 0.55 | % | | | N/A | | | | N/A | | | | N/A | |
| Institutional Prime Money Market | | | 839,835 | | | | 0.41 | % | | | N/A | | | | N/A | | | | N/A | |
Page 134 | 2017 Annual Report | December 31, 2017 |
Certain Funds have entered into securities lending arrangements with HNB. Under the terms of the agreement, HNB is authorized to loan securities on behalf of the Funds to approved brokers. In exchange, under normal market conditions, the Funds receive cash collateral in the amount of at least 102% of the value of securities loaned. The cash collateral is invested in short term instruments as noted in the Schedules of Investments. Although risk is mitigated by the collateral, the Funds could experience a delay in recovering their securities and possible loss of income or value if the borrower fails to return the borrowed securities. In addition, the Funds bear the risk of loss associated with the investment of cash collateral received. After predetermined rebates to brokers, a percentage of the net securities lending revenue is credited to the Funds to be used as an offset against charges incurred by the Funds. HNB is paid a fee for administering the securities lending program for the Funds, equal to the remaining percentage of the net securities lending revenues generated under the agreement. As of December 31, 2017, Muirfield, Spectrum, and Moderate had loaned securities that were collateralized by cash. The cash collateral received was invested in securities as listed in each Fund’s Schedule of Investments. For the year ended December 31, 2017, income earned through securities lending arrangements was as follows:
| | | Amount Received to Reduce Gross Expenses |
Muirfield | | | $ | 2,570 | |
Dynamic | | | | 2,776 | |
Aggressive | | | | 864 | |
Balanced | | | | 18,203 | |
Global | | | | 336 | |
Spectrum | | | | 6,188 | |
Quantex | | | | 80,930 | |
Conservative | | | | 179 | |
Certain Funds have entered into directed brokerage arrangements with unaffiliated brokers whereby the brokers have agreed to pay a portion of the Funds’ operating expenses using part of the commissions generated by the Funds. All expenses paid with directed brokerage and commission recapture credits are shown in full on the Statements of Operations and the amount credited is shown as a reduction in total expenses. In the absence of the directed brokerage arrangement, the Funds could have invested some of the amounts paid for commissions to generate income or capital gain; however, the Funds would have paid more in expenses. The following table identifies each category of expense that was paid using directed brokerage and commission recapture credits and the total credits received by each Fund during the year ended December 31, 2017:
| | | Registration | | Other | | Audit | | Custody | | Insurance | | Postage | | Printing | | Legal | | Short Dividend | | Total
Credits Received |
Muirfield | | | $ | 68,888 | | | $ | 32,085 | | | $ | 18,603 | | | $ | 39,776 | | | $ | 34,633 | | | $ | 18,324 | | | $ | 15,451 | | | $ | 3,678 | | | $ | — | | | $ | 231,438 | |
Dynamic | | | | 56,356 | | | | 23,999 | | | | 18,603 | | | | 11,473 | | | | 8,224 | | | | 12,514 | | | | 4,680 | | | | 3,198 | | | | — | | | | 139,047 | |
Aggressive | | | | 50,243 | | | | 21,665 | | | | 18,603 | | | | 3,730 | | | | 4,081 | | | | 2,355 | | | | 1,743 | | | | 2,325 | | | | — | | | | 104,745 | |
Balanced | | | | 52,908 | | | | 28,552 | | | | 18,603 | | | | 21,743 | | | | 24,007 | | | | 11,633 | | | | 9,431 | | | | 3,679 | | | | — | | | | 170,556 | |
Global | | | | 50,984 | | | | 22,341 | | | | 18,603 | | | | 6,878 | | | | 6,320 | | | | 7,124 | | | | 3,300 | | | | 1,634 | | | | — | | | | 117,184 | |
Spectrum | | | | 53,316 | | | | 24,170 | | | | 19,712 | | | | 11,758 | | | | 13,852 | | | | 10,934 | | | | 4,905 | | | | 3,585 | | | | 174,772 | | | | 317,004 | |
Quantex | | | | 53,906 | | | | 22,537 | | | | 18,603 | | | | 8,702 | | | | 6,538 | | | | 782 | | | | — | | | | — | | | | — | | | | 111,068 | |
Conservative | | | | 29,085 | | | | — | | | | — | | | | — | | | | — | | | | — | | | | — | | | | — | | | | — | | | | 29,085 | |
Moderate | | | | 51,446 | | | | 20,829 | | | | 18,603 | | | | 5,104 | | | | 3,988 | | | | 12,854 | | | | 1,947 | | | | 3,679 | | | | — | | | | 118,450 | |
Bond | | | | 45,344 | | | | — | | | | — | | | | — | | | | — | | | | — | | | | — | | | | — | | | | — | | | | 45,344 | |
2017 Annual Report | December 31, 2017 | Page 135 |
The Funds have adopted a written plan pursuant to Rule 12b-1 of the 1940 Act that allows the Funds to pay fees for the sale and distribution of Fund shares and for services provided to Fund shareholders. 12b-1 fees are paid by the Funds to financial intermediaries, securities brokers, investment advisers, and other persons, including affiliates of MAM. The annual adopted 12b-1 plan maximum limitations, along with 12b-1 plan expense payments made to the Funds’ affiliated distributor for the year ended December 31, 2017, are as follows:
| | | Maximum
Annual 12b-1
Plan Expense as
a Percentage of
Average Daily
Net Assets | | Maximum Annual
12b-1 Plan Expense
as a Percentage
of Average Daily
Net Assets – Retail
Class | | Maximum Annual
12b-1 Plan Expense
as a Percentage of
Average Daily Net
Assets – Adviser
Class | | Maximum Annual
12b-1 Plan Expense
as a Percentage
of Average Daily
Net Assets –
Institutional Class | | 12b-1 Plan Expense
Payments Made
to Affiliates |
| Muirfield | | | N/A | | | 0.20% | | N/A | | N/A | | $ | 54,932 | |
| Quantex | | | N/A | | | 0.20% | | N/A | | N/A | | | 21,741 | |
| Conservative | | | N/A | | | 0.25% | | N/A | | N/A | | | 9,505 | |
| Dynamic | | | N/A | | | 0.25% | | N/A | | N/A | | | 15,347 | |
| Aggressive | | | N/A | | | 0.25% | | N/A | | N/A | | | 12,427 | |
| Balanced | | | N/A | | | 0.25% | | N/A | | N/A | | | 48,024 | |
| Global | | | N/A | | | 0.25% | | N/A | | N/A | | | 10,781 | |
| Spectrum | | | N/A | | | 0.25% | | N/A | | N/A | | | 16,369 | |
| Moderate | | | N/A | | | 0.25% | | N/A | | N/A | | | 6,270 | |
| Bond | | | N/A | | | 0.25% | | N/A | | N/A | | | 42,679 | |
| Prime Money Market | | | 0.20% | | | N/A | | N/A | | N/A | | | N/A | |
| Institutional Prime Money Market | | | 0.20% | | | N/A | | N/A | | N/A | | | N/A | |
The Funds (other than the Money Market Funds) have adopted a shareholder services plan that allows the Funds to pay financial intermediaries and other persons, including “platforms,” for providing shareholder and administrative services to Fund shareholders and maintaining shareholder accounts. The annual adopted shareholder services plan maximum limitations for the year ended December 31, 2017 are as follows:
| | Maximum Annual Shareholder Services Plan Expense as a Percentage of Average Daily Net Assets – Retail Class | Maximum Annual Shareholder Services Plan Expense as a Percentage of Average Daily Net Assets – Adviser Class | Maximum Annual Shareholder Services Plan Expense as a Percentage of Average Daily Net Assets – Institutional Class |
Muirfield | 0.20% | 0.25% | 0.10% |
Quantex | 0.20% | 0.25% | 0.10% |
Conservative | 0.20% | 0.25% | 0.10% |
Dynamic | 0.20% | 0.25% | 0.10% |
Aggressive | 0.20% | 0.25% | 0.10% |
Balanced | 0.20% | 0.25% | 0.10% |
Global | 0.20% | 0.25% | 0.10% |
Spectrum | 0.20% | 0.25% | 0.10% |
Moderate | 0.20% | 0.25% | 0.10% |
Bond | 0.20% | 0.25% | 0.10% |
The Funds have adopted a Deferred Compensation Plan (the “Plan”) for the independent Trustees. Under the Plan, each eligible Trustee is permitted to defer all or a portion of the trustees fees payable by any of the Funds as an investment into any combination of Funds until a specified point of time. The investment into the Funds is recorded as an asset however an offsetting liability is also recorded for the deferred payment. Amounts deferred under the Plan may be distributed, in a lump sum or generally equal annual installments over a period of up to ten (10) years, to the eligible Trustee(s). The Funds may terminate this Plan at any time.
Page 136 | 2017 Annual Report | December 31, 2017 |
During the year ended December 31, 2017, several of the Funds invested in the Institutional Prime Money Market Fund, an affiliate, as described in Section 2(a)(3) of the Investment Company Act of 1940. The purchases/sales amounts in the following table are presented on a gross basis, while the statement of changes in net assets shows subscriptions and redemptions into and out of the Fund on a net basis. The Funds’ investments in the Institutional Prime Money Market Fund, which had a 7-day yield of 1.32% on December 31, 2017, were as follows:
| | | 12/31/16
Fair Value | | Purchases | | Sales | | Realized Gains | | 12/31/17
Cost | | Change in Unrealized | | Income | | 12/31/17
Fair Value |
Muirfield | | | $ | 93,992,266 | | | $ | 138,974,550 | | | $ | (81,203,352 | ) | | $ | (215 | ) | | $ | 151,760,070 | | | $ | (22,604 | ) | | $ | 1,006,163 | | | $ | 151,740,645 | |
Dynamic | | | | 15,270,106 | | | | 45,807,150 | | | | (39,913,157 | ) | | | (1,271 | ) | | | 21,162,809 | | | | (2,606 | ) | | | 168,357 | | | | 21,160,222 | |
Aggressive | | | | 5,095,423 | | | | 20,186,661 | | | | (18,471,005 | ) | | | (626 | ) | | | 6,810,424 | | | | (856 | ) | | | 59,157 | | | | 6,809,597 | |
Balanced | | | | 32,884,113 | | | | 112,973,322 | | | | (99,685,007 | ) | | | (6,353 | ) | | | 46,166,058 | | | | (398 | ) | | | 329,744 | | | | 46,165,677 | |
Global | | | | 3,120,423 | | | | 38,710,319 | | | | (30,119,961 | ) | | | (1,506 | ) | | | 11,709,003 | | | | (1,287 | ) | | | 106,010 | | | | 11,707,988 | |
Spectrum | | | | 7,075,401 | | | | 52,270,654 | | | | (53,510,158 | ) | | | (961 | ) | | | 5,834,908 | | | | (28 | ) | | | 37,357 | | | | 5,834,908 | |
Quantex | | | | 11,729,999 | | | | 33,677,651 | | | | (40,148,507 | ) | | | (215 | ) | | | 5,258,349 | | | | (940 | ) | | | 61,590 | | | | 5,257,988 | |
Conservative | | | | 1,891,662 | | | | 15,736,974 | | | | (17,278,996 | ) | | | (112 | ) | | | 349,527 | | | | (1 | ) | | | 10,298 | | | | 349,527 | |
Moderate | | | | 5,488,862 | | | | 17,045,776 | | | | (19,710,883 | ) | | | (1,006 | ) | | | 2,822,646 | | | | (103 | ) | | | 47,714 | | | | 2,822,646 | |
Bond | | | | 6,125,641 | | | | 83,654,829 | | | | (83,851,473 | ) | | | (1,013 | ) | | | 5,927,756 | | | | (346 | ) | | | 52,667 | | | | 5,927,638 | |
6. Federal Tax Information
The following information is computed on a tax basis for each item as of December 31, 2017:
| | | Tax Cost of Portfolio Investments | | Gross Unrealized Appreciation | | Gross Unrealized Depreciation | | Net Unrealized Appreciation/ (Depreciation) |
| Muirfield | | $ | 437,303,143 | | | $ | 40,103,982 | | | $ | (4,204,830 | ) | | $ | 35,899,152 | |
| Dynamic | | | 116,683,557 | | | | 14,103,901 | | | | (971,110 | ) | | | 13,132,791 | |
| Aggressive | | | 37,549,605 | | | | 3,666,545 | | | | (371,062 | ) | | | 3,295,483 | |
| Balanced | | | 263,125,763 | | | | 15,832,790 | | | | (2,661,654 | ) | | | 13,171,136 | |
| Global | | | 67,531,787 | | | | 6,073,743 | | | | (372,825 | ) | | | 5,700,918 | |
| Spectrum | | | 137,774,232 | | | | 21,245,194 | | | | (6,555,099 | ) | | | 14,690,095 | |
| Quantex | | | 74,945,719 | | | | 21,489,744 | | | | (2,186,730 | ) | | | 19,303,014 | |
| Conservative | | | 24,823,898 | | | | 171,462 | | | | (128,924 | ) | | | 42,538 | |
| Moderate | | | 64,032,285 | | | | 2,131,479 | | | | (445,810 | ) | | | 1,685,669 | |
| Bond | | | 188,221,912 | | | | 1,406,748 | | | | (1,525,058 | ) | | | (118,310 | ) |
| Prime Money Market | | | 35,204,438 | | | | — | | | | — | | | | — | |
| Institutional Prime Money Market | | | 296,800,650 | | | | — | | | | (60,106 | ) | | | (60,106 | ) |
The tax characteristics of dividends paid by the Funds during the period ended December 31, 2017 were as follows:
| | | Ordinary Income | | Net Short-Term Capital Gains | | Net Long-Term Capital Gains | | Total Dividends Paid* |
| Muirfield | | $ | 2,259,367 | | | $ | 29,232,859 | | | $ | 3,732,513 | | | $ | 35,224,739 | |
| Dynamic | | | 928,733 | | | | 8,074,316 | | | | 1,393,140 | | | | 10,396,189 | |
| Aggressive | | | 156,251 | | | | 2,963,952 | | | | 1,299,711 | | | | 4,419,914 | |
| Balanced | | | 2,145,554 | | | | 11,374,967 | | | | — | | | | 13,520,521 | |
| Global | | | 453,751 | | | | — | | | | 828,928 | | | | 1,282,679 | |
| Spectrum | | | 198 | | | | 3,646,436 | | | | 5,562,130 | | | | 9,208,764 | |
| Quantex | | | 233,961 | | | | 2,013,070 | | | | 542,617 | | | | 2,789,648 | |
| Conservative | | | 336,521 | | | | — | | | | — | | | | 336,521 | |
| Moderate | | | 382,921 | | | | 1,907,148 | | | | 205,355 | | | | 2,495,424 | |
| Bond | | | 5,420,405 | | | | — | | | | — | | | | 5,420,405 | |
| Prime Money Market | | | 243,527 | | | | — | | | | — | | | | 243,527 | |
| Institutional Prime Money Market | | | 1,977,385 | | | | — | | | | — | | | | 1,977,385 | |
2017 Annual Report | December 31, 2017 | Page 137 |
The tax characteristics of dividends paid by the Funds during the year ended December 31, 2016 were as follows:
| | | Ordinary Income | | Net Short-Term Capital Gains | | Net Long-Term Capital Gains | | Tax Return of Capital | | Total Dividends Paid* |
| Muirfield | | $ | 2,921,928 | | | $ | — | | | $ | — | | | $ | — | | | $ | 2,921,928 | |
| Dynamic | | | 1,181,295 | | | | — | | | | 570,071 | | | | — | | | | 1,751,366 | |
| Aggressive | | | 515,324 | | | | — | | | | — | | | | — | | | | 515,324 | |
| Balanced | | | 2,762,245 | | | | — | | | | — | | | | — | | | | 2,762,245 | |
| Global | | | 922,270 | | | | — | | | | — | | | | — | | | | 922,270 | |
| Spectrum | | | 230,684 | | | | — | | | | 1,329,394 | | | | — | | | | 1,560,078 | |
| Quantex | | | 361,262 | | | | 871,863 | | | | 376,765 | | | | — | | | | 1,609,890 | |
| Conservative | | | 29,976 | | | | — | | | | 196,619 | | | | 221,929 | | | | 448,524 | |
| Moderate | | | 777,516 | | | | — | | | | — | | | | — | | | | 777,516 | |
| Bond | | | 6,263,564 | | | | — | | | | — | | | | — | | | | 6,263,564 | |
| Prime Money Market | | | 567,140 | | | | — | | | | — | | | | — | | | | 567,140 | |
| Institutional Prime Money Market | | | 86,393 | | | | — | | | | — | | | | — | | | | 86,393 | |
As of December 31, 2017, the components of accumulated earnings/(deficit) on a tax basis for the Funds were as follows:
| | | Undistributed Ordinary Income | | Undistributed Capital Gain | | Accumulated Capital and Other Gains and (Losses) | | Unrealized Appreciation/ (Depreciation)** | | Total Accumulated Earnings/(Deficit) |
| Muirfield | | $ | 2,011,090 | | | $ | 3,276,617 | | | $ | (151,557 | ) | | $ | 35,899,152 | | | $ | 41,035,302 | |
| Dynamic | | | 542,528 | | | | 387,472 | | | | (91,600 | ) | | | 13,132,791 | | | | 13,971,191 | |
| Aggressive | | | — | | | | 66,669 | | | | (51,811 | ) | | | 3,295,483 | | | | 3,310,341 | |
| Balanced | | | 1,733,804 | | | | 81,232 | | | | (101,066 | ) | | | 13,171,136 | | | | 14,885,106 | |
| Global | | | 272,649 | | | | 2,206,113 | | | | (75,127 | ) | | | 5,700,918 | | | | 8,104,553 | |
| Spectrum | | | — | | | | 2,128,127 | | | | (37,798 | ) | | | 14,690,095 | | | | 16,780,424 | |
| Quantex | | | 45,469 | | | | — | | | | (939,639 | ) | | | 19,303,014 | | | | 18,408,844 | |
| Conservative | | | 30,829 | | | | 2,179,757 | | | | (40,885 | ) | | | 42,538 | | | | 2,212,239 | |
| Moderate | | | 3,763,671 | | | | 1,204,467 | | | | (5,079 | ) | | | 1,685,669 | | | | 6,648,728 | |
| Bond | | | — | | | | — | | | | (10,249,216 | ) | | | (118,310 | ) | | | (10,367,526 | ) |
| Institutional Prime Money Market | | | 1,114 | | | | �� | | | | (2,335 | ) | | | (60,106 | ) | | | (61,327 | ) |
* | Total dividends paid may differ from the amount reported in the Statement of Changes in Net Assets because for tax purposes dividends are recognized when actually paid. |
** | The differences between book- and tax-basis unrealized appreciation/(depreciation) are attributable primarily to: wash sales and the realization for tax purposes of unrealized gains/(losses) on certain derivative instruments. |
For federal income tax purposes, the following Funds have capital loss carryforwards as of December 31, 2017, which are not subject to expiration and are available to offset future capital gains, if any. To the extent that these carryforwards are used to offset future capital gains, it is probable that the gains that are offset will not be distributed to shareholders:
| Capital Loss Carryforwards | | Short Term
Capital Loss Carryforward | | Long Term
Capital Loss Carryforward | | Capital Loss Carryforward
Utilized |
| Balanced | | $ | — | | | $ | — | | | $ | 82,095 | |
| Global | | | — | | | | — | | | | 6,488,111 | |
| Quantex | | | — | | | | 897,624 | | | | — | |
| Conservative | | | — | | | | — | | | | 646,435 | |
| Moderate | | | — | | | | — | | | | 635,467 | |
| Bond | | | 7,595,523 | | | | 2,603,138 | | | | 1,343,276 | |
| Institutional Prime Money Market | | | 1,326 | | | | — | | | | — | |
Page 138 | 2017 Annual Report | December 31, 2017 |
7. Control Ownership
The beneficial ownership, either directly or indirectly, of more than 25% of the voting securities of a fund creates a presumption of control of the fund under Section 2(a)(9) of the 1940 Act. As of December 31, 2017, beneficial owners that held more than 25% of the voting securities of the Funds and may be deemed to control the Funds are as follows:
Fund | | Beneficial Owner | | Percent of Voting Securities |
Institutional Prime Money Market | | Meeder Muirfield Fund | | 51% |
8. Contingencies and Commitments
The Funds indemnify the Trust’s officers and Trustees for certain liabilities that might arise from their performance of their duties to the Funds. Additionally, in the normal course of business the Funds enter into contracts that contain a variety of representations and warranties and which provide general indemnifications. The Funds’ maximum exposure under these arrangements is unknown, as this would involve future claims that may be made against the Funds that have not yet occurred. However, based on experience, the Funds expect the risk of loss to be remote.
9. Subsequent Events
Management evaluated subsequent events through the date these financial statements were issued and concluded no subsequent events required recognition or disclosure in these financial statements.
2017 Annual Report | December 31, 2017 | Page 139 |
Report of Independent Registered Public Accounting Firm
To the Shareholders and Board of Trustees of
Meeder Funds
Opinion on the Financial Statements
We have audited the accompanying statements of assets and liabilities, including the schedules of investments, of Meeder Funds, comprising Muirfield Fund, Dynamic Allocation Fund, Aggressive Allocation Fund, Balanced Fund, Global Allocation Fund, Spectrum Fund, Quantex Fund, Conservative Allocation Fund, Moderate Allocation Fund, Total Return Bond Fund, Prime Money Market Fund, and Institutional Prime Money Market Fund (the “Funds”), as of December 31, 2017, and the related statements of operations, the statements of changes in net assets, including the related notes, and the financial highlights for each of the periods presented (collectively referred to as the “financial statements”). In our opinion, the financial statements present fairly, in all material respects, the financial position of each of the Funds as of December 31, 2017, the results of their operations, the changes in their net assets, and the financial highlights for each of the periods presented, in conformity with accounting principles generally accepted in the United States of America.
Basis for Opinion
These financial statements are the responsibility of the Funds’ management. Our responsibility is to express an opinion on the Funds’ financial statements based on our audits. We are a public accounting firm registered with the Public Company Accounting Oversight Board (United States) (“PCAOB”) and are required to be independent with respect to the Funds in accordance with the U.S. federal securities laws and the applicable rules and regulations of the Securities and Exchange Commission and the PCAOB.
We conducted our audits in accordance with the standards of the PCAOB. Those standards require that we plan and perform the audit to obtain reasonable assurance about whether the financial statements are free of material misstatement, whether due to error or fraud.
Our audits include performing procedures to assess the risks of material misstatement of the financial statements, whether due to error or fraud, and performing procedures that respond to those risks. Such procedures include examining, on a test basis, evidence regarding the amounts and disclosures in the financial statements and confirmation of securities owned as of December 31, 2017, by correspondence with the custodian and brokers. Our audits also included evaluating the accounting principles used and significant estimates made by management, as well as evaluating the overall presentation of the financial statements. We believe that our audits provide a reasonable basis for our opinion.
We have served as the Funds’ auditor since 2004.
COHEN & COMPANY, LTD.
Cleveland, Ohio
February 28, 2018
Page 140 | 2017 Annual Report | December 31, 2017 |
Trustees and Officers (unaudited)
Certain trustees and officers of the Funds are also officers or directors of Meeder, MAM, and MFSCo. The Trustees oversee the management of the Trust and elect its officers. The officers are responsible for the Funds’ day-to-day operations. The Trustees’ and officers’ names, addresses, years of birth, positions held with the Trust, and length of service with the Meeder Funds are listed below. Also included is each Board member’s principal occupation during, at least, the past five years. Except as indicated, each individual has held the office shown or other offices in the same company for the last five years. Those Trustees who are “interested persons”, as defined in the 1940 Act, by virtue of their affiliation with the Trust, are indicated by an asterisk (*).
Name, Address1,
and Year of Birth | Year First Elected a Trustee or Officer of the Trust | Position and Number
of Funds Overseen2 | Principal Occupation During
Past Five Years and Other
Directorships Held |
Robert S. Meeder, Jr.* Year of Birth: 1961 | 1992 | Trustee and President | President, Meeder Investment Management, Inc. |
Stuart M. Allen**
Year of Birth: 1961 | 2006 | Trustee | President of Gardiner Allen DeRoberts Insurance LLC, an insurance agency. |
Anthony J. D’Angelo** Year of Birth: 1959 | 2006 | Trustee | General Manager, WSYX ABC 6 /WTTE-TV Fox 28 /WWHO television stations, Columbus, Ohio, operated by Sinclair Broadcast Group (2014 – present); Director of Sales (2004 – 2014); Lead Trustee of the Trust. |
Jeffrey R. Provence**
Year of Birth: 1969 | 2017 | Trustee | CEO, Premier Fund Solutions, Inc. (2001 – present); General Partner & Portfolio Manager, Value Trend Capital Management, L.P. (1995 – present); Director, Blue Chip Investor Funds; Director, PFS Funds; Chairman of the Trust’s Audit Committee. |
Dale W. Smith
Year of Birth: 1959 | 2006 | Vice President | Co-Chief Investment Officer, Meeder Investment Management, Inc. (2006-present); Chief Financial Officer, Meeder Asset Management, Inc. (2005 – 2017). |
Susan E. Meeder
Year of Birth: 1963 | 2014 | Vice President | Chief Administrative Officer, Meeder Investment Management, Inc. (2017 – present); Chief Operating Officer of Meeder Investment Management, Inc. (2009 – 2017). |
Douglas R. Jennings
Year of Birth: 1962 | 2016 | Chief Compliance Officer | Chief Compliance Officer, Meeder Investment Management, Inc. (2016 – present); Partner, Carlile Patchen & Murphy, LLP (2010 – 2016). |
Bruce E. McKibben
Year of Birth: 1969 | 2002 | Treasurer | Director of Fund Accounting, Mutual Funds Service Co., (1997 – present). |
Alaina Salonsky
Year of Birth: 1967 | 2017 | Secretary | Compliance Specialist, Meeder Investment Management, Inc. (2017 – present); Teacher, Big Walnut School District, Sunbury, Ohio (2013 – 2017). |
1 | The address of each Trustee is 6125 Memorial Drive, Dublin, OH 43017. |
2 | Each Trustee serves for an indefinite term, until his or her resignation, death, or removal. Each Trustee oversees all twelve Funds in the Trust. |
* | Robert S. Meeder, Jr. is deemed an “interested person” of the Trust by virtue of his position as President of Meeder Asset Management, Inc., the Adviser of the Trust. |
** | Each independent Trustee is a member of the Trust’s Audit Committee, Compensation Committee, and Nominating Committee. |
The Statement of Additional Information includes additional information about each Trustee and is available without charge. To obtain a copy of the Statement of Additional Information, please contact your financial representative or call toll free 1-800-325-3539.
2017 Annual Report | December 31, 2017 | Page 141 |
Board Review and Approval of Investment Advisory Agreement (unaudited)
At a meeting held September 21, 2017, the Board of Trustees (“Board”), including a majority of its Independent Trustees, met in person to consider the renewal of the investment advisory agreements (“Agreements”) between the Funds and Meeder Asset Management, Inc. (“Manager”).
Approval Process. Pursuant to the Investment Company Act of 1940 (“1940 Act”), the Board is required to consider the continuation of the Funds’ investment advisory agreement on an annual basis. Prior to the meeting, the Board reviewed materials sent to each Trustee in advance of the meeting in response to the Funds’ independent legal counsel’s supplemental written request pursuant to Section 15(c) of the 1940 Act for the provision to the Trustees of appropriately updated and amended information necessary or appropriate to assist the Trustees in their deliberations concerning renewal of the Agreements between the Manager and each of the Funds. In reaching the decision to renew the Agreements, the Board also took into account information furnished throughout the year at regular Board meetings. Information furnished and discussed throughout the year included investment performance reports and related financial information for the Funds, as well as periodic reports on shareholder services, legal compliance, pricing, brokerage commissions, execution and other services provided by the Manager and its affiliates.
Information furnished specifically in connection with the renewal process included a report for the Funds prepared by Broadridge Financial Solutions, Ltd. (“Broadridge”), an independent organization, as well as a Funds’ profitability analysis prepared by the Manager. The Broadridge report compared each Fund’s management fees and expenses with those of other mutual funds deemed comparable to the Fund. The Funds’ profitability analysis discussed the profitability to the Manager and Mutual Funds Service Co., an affiliate of the Manager, from the overall Funds’ operations, as well as an analysis based on the profitability resulting from the operation of each individual Fund, utilizing expense allocation methodologies deemed reasonable by the Manager.
In considering such materials, the Independent Board Members also received assistance and advice from and met separately with the Funds’ independent legal counsel and the chief compliance officer prior to the meeting. In their deliberations, the Board considered the terms of the existing Agreements between the Funds and the Manager as well as the terms of the proposed amended and consolidated agreement, and it determined that no change was being made to the fees charged for the Manager’s services or to the nature or level of the services provided. While attention was given to all of the information furnished, the Board made the following specific findings in connection with its decision to renew the Agreements:
Nature, Extent and Quality of Services. The Board continues to be satisfied with the nature and quality of the overall services provided by the Manager and its affiliates to the Funds and their shareholders. In addition to investment performance and expenses discussed earlier, the Board’s opinion was based in part upon periodic reports furnished them showing that the investment policies and restrictions for each Fund were consistently complied with as well as other reports periodically furnished the Board. Other factors taken into account by the Board were the Manager’s compliance procedures and the qualifications of the Manager’s chief compliance officer. Consideration was also given to the experience of each Fund’s portfolio management team. The Board also took into account the transfer agent, fund accounting agent and administrative services provided to Fund shareholders by an affiliate of the Manager, noting continuing expenditures by management to increase and improve the scope of such services. The Board concluded that the nature, extent and quality of the services provided by the Manager have benefited and should continue to benefit each Fund and its shareholders.
Investment Performance. The Board placed emphasis on the investment performance of each Fund in view of its importance to shareholders. While consideration was given to performance reports and discussions with portfolio managers at Board meetings during the year, particular attention in assessing performance was given to the Broadridge reports furnished for the Agreement renewals. The Broadridge report prepared for each Fund showed the investment performance of the Fund for the one-, three-, five-, and ten-year periods, as applicable, ended June 30, 2017 (the “relevant periods”) in comparison with a performance universe similar to each Fund’s investment objectives. The Board noted that the investment results of each Fund compared reasonably with each index used and with the Lipper indices, recognizing that none of the indices are perfect comparisons given each Fund’s specific characteristics. The Board concluded that the Funds’ investment results have been satisfactory for renewal of the Agreements and that the Manager’s record in managing the Funds indicated that its continued management should benefit the Funds and their shareholders.
Comparative Expenses. Consideration was given to a comparative analysis of the management fees and total expense ratios of each Fund compared with those of a group of other relevant funds. The Board observed that the Funds’ advisory fees and expenses compared reasonably to those of other similar funds included in the comparable reports. The Board also considered an analysis comparing the Funds’ management fees with the fees charged by the Manager to private clients, but noted the significant investment, operational, regulatory, and market differences between advising the Funds and the private clients. The Board concluded that the Funds’ cost structures were fair and reasonable in relation to the services provided, and that the Funds’ shareholders receive reasonable value in return for the advisory fees and other amounts paid to the Manager by the Funds.
Management Profitability. The Board also considered the level of profits realized by the Manager and its affiliates in connection with the operation of the Funds. In this respect, the Board reviewed the Funds’ profitability analysis that addresses the overall profitability of the Meeder Funds’ business as well as the profitability resulting from the operation of each Fund. The Board also considered the extent to which the Manager and its affiliates might derive ancillary benefits from fund operations, including potential benefits resulting from allocation of fund brokerage and the use of “soft” commission dollars to pay for research. The Board also took into account management’s expenditures in improving shareholder services provided to the Funds, as well as the need to meet additional regulatory and compliance requirements resulting from recent SEC requirements. The Board determined that the level of profits realized by the Manager under its Agreements with the Funds was not excessive in view of the nature, quality and extent of services provided. The Board took the Manager’s profitability and ancillary benefits into account in evaluating the reasonableness of the advisory fees and other amounts paid to the Manager by the Funds.
Page 142 | 2017 Annual Report | December 31, 2017 |
Economies of Scale. The Board also considered whether economies of scale are realized by the Manager as the Funds grow larger and the extent to which this is reflected in the level of management fees charged. While recognizing that any precise determination is inherently subjective, the Board noted that based upon the Funds’ profitability analysis, it appears that as some Funds get larger, at some point economies of scale do result in the Manager realizing a larger profit margin on management services provided to such a Fund. The Board also noted that economies of scale are shared with each Fund and its shareholders through management fee breakpoints so that as a Fund grows in size, its effective management fee rate declines. Further, the Board noted that investments in the Fund business made by Meeder, and the resulting improvements in Fund operations and shareholder services, was an additional way in which any potential economies of scale were shared with each Fund and its shareholders. The Board reviewed and expressed continued satisfaction with each Fund’s fee structure under its Agreement.
Conclusion. Based upon the foregoing findings as well as all of the information provided by the Manager, the Board, including a majority of its Independent Trustees, was satisfied that the terms of the proposed agreement, including the existing management fee structure, was fair and reasonable and in the best interest of the Funds and their shareholders. The Board, including a majority of its Independent Trustees, therefore approved the consolidation of the Funds’ separate investment advisory agreements into a single amended and restated investment advisory agreement effective for a one-year term ending September 30, 2018.
Other Information
The Funds file their complete schedules of portfolios holdings with the Securities and Exchange Commission (“SEC”) for the first and third quarters of each fiscal year on Form N-Q. In addition, Prime Money Market Fund and Institutional Prime Money Market Fund file their complete schedules of portfolio holdings with the SEC each month on Form N-MFP. The Funds’ Forms N-Q and N-MFP are available on the SEC’s website at http://www.sec.gov and may be reviewed and copied at the SEC’s Public Reference Room in Washington, DC. Information on the operation of the Public Reference Room may be obtained by calling 1-800-SEC-0330. The Funds’ schedules of positions are also available on the Funds’ website at www.meederfunds.com.
A description of the policies and procedures that the Funds use to determine how to vote proxies related to portfolio securities, and information regarding how the Funds voted these proxies for the 12-month period ended June 30, 2017, is available on the SEC’s website at http://www/sec.gov, or, without charge, upon request by calling toll-free 1-800-325-3539.
2017 Annual Report | December 31, 2017 | Page 143 |

Privacy Policy
Meeder Investment Management and the Meeder Funds are committed to maintaining the financial privacy of our current, former and prospective customers. This policy explains how we protect the security and confidentiality of our customer’s information.
PERSONAL INFORMATION WE COLLECT
We may collect information about Meeder customers from a variety of sources, including:
| | ● | Information provided by you or your representative on applications or forms, such as your name, address, date of birth, social security number and investment objectives; |
| | ● | Information about the transactions in your account, such as your account balance and transaction history; and |
| | ● | Information we obtain from third parties regarding you, to verify your identity or transfer your account. |
INFORMATION WE SHARE WITH OUR AFFILIATES
Our affiliates are financial service providers that offer transfer agency, customer accounting, customer servicing, investment advisory, and other financial services. We share information with our affiliates to service your account. In addition, we may also share information with our affiliates to alert you to other products or services offered by Meeder to the extent provided by law. Information collected from customers whose accounts are opened through investment professionals is not shared with Meeder affiliates for marketing purposes.
INFORMATION WE SHARE WITH THIRD PARTIES
On occasion, we share information we collect about you with unaffiliated third parties to perform services in connection with your account, such as processing transactions, preparing and mailing account statements, and other forms of customer servicing. Information provided to third parties may not be used for any other purpose and Meeder does not permit unaffiliated third parties to use customer information to market their products or services.
HOW WE PROTECT INFORMATION ABOUT YOU
We maintain policies, and require all unaffiliated third parties to maintain policies, to safeguard customer information. We restrict access to nonpublic personal information about you to those persons who need to know that information in order to provide products and services to you. We also maintain physical, electronic, and procedural safeguards to guard your nonpublic personal information.
WHO THIS POLICY APPLIES TO
This policy applies to customers who open relationships directly with Meeder. It applies to Meeder Funds and Meeder’s affiliated companies, including Meeder Asset Management, Meeder Advisory Services, Meeder Public Funds, Adviser Dealer Services and Mutual Funds Service Company.
QUESTIONS
Contact us at 800-325-3539 or visit us online at www.meederinvestment.com
Page 144 | 2017 Annual Report | December 31, 2017 |
Manager and Investment Adviser
Meeder Asset Management, Inc.
6125 Memorial Drive
P.O. Box 7177
Dublin, Ohio 43017
Board of Trustees
Stuart M. Allen
Anthony J. D’Angelo
Robert S. Meeder, Jr.
Jeffrey R. Provence
Custodian
The Huntington National Bank
Columbus, Ohio 43215
Transfer Agent & Dividend Disbursing Agent
Mutual Funds Service Co.
6125 Memorial Drive
Dublin, Ohio 43017
Distributor
Adviser Dealer Services, Inc.
6125 Memorial Drive
Dublin, Ohio 43017
Independent Registered Public Accounting Firm
Cohen & Company, Ltd.
1350 Euclid Ave., Suite 800
Cleveland, Ohio 44115
Item 2. Code of Ethics.
The registrant has adopted a code of ethics that applies to the registrant’s principal executive officer, principal financial officer, comptroller or principal accounting officer, and any person who performs a similar function. There were no amendments made to, or waivers granted from, the code of ethics during the fiscal year.
Item 3. Audit Committee Financial Expert.
The Board of Trustees of the Trust has determined that Jeffrey R. Provence is an audit committee financial expert, as defined in Item 3 of Form N-CSR. Mr. Provence is independent for purposes of Item 3 of form N-CSR.
Item 4. Principal Accountant Fees and Services.
(a) – (d) Aggregate fees billed to the registrant for the last two fiscal years for professional services rendered by the registrant’s principal accountant were as follows:
| | | 2017 | | | 2016 | |
| Audit Fees | | $ | 122,500 | | | $ | 105,750 | |
| Audit-Related Fees | | | 300 | | | | 300 | |
| Tax Fees | | | 64,500 | | | | 38,500 | |
| All Other Fees | | | 2,500 | | | | 1,650 | |
Audit fees include amounts related to the audit of the registrant’s annual financial statements and services normally provided by the accountant in connection with statutory and regulatory filings. Audit-related fees include amounts reasonably related to the performance of the audit of the registrant’s financial statements, including, but not limited to, mileage, lodging, and meals. Tax fees include amounts related to tax compliance, tax planning, and tax advice, including the review and preparation of the Funds’ income tax returns, the review and preparation of the Funds’ excise tax returns, the review of supporting schedules and documentation provided by management, the review and recalculation of the Funds’ estimated distribution calculations, and the review of wash sales for reasonableness. All other fees include amounts related to the registrant’s annual filing of Form N1A.
(e)(1) A purpose of the Audit Committee is to approve the engagement of the registrant’s independent auditors (i) to render audit and non-audit services for the registrant in accordance with Rule 2-01(c)(7)(i) of Regulation S-X, subject to the waiver provisions set forth in Rule 2-01(c)(7)(i)(C) of Regulation S-X, and (ii) to render non-audit services for the registrant’s investment advisors (other than a sub-advisor whose role is primarily portfolio management and is subcontracted or overseen by another investment advisor) and any other entity controlling by, or under common control with the investment advisor that provides ongoing services to the registrant, in each case under (ii) if the engagement relates directly to the operations and financial reporting of the registrant, in accordance with Rule 2-01(c)(7)(ii) of Regulation S-X, subject to waiver provisions set forth in Rule 2-01(c)(7)(ii) of Regulation S-X.
(e)(2) 0% of services included in (b) – (d) above were approved pursuant to Rule 2-01(c)(7)(i)(C) of Regulation S-X.
(f) Not applicable.
(g) The aggregate fees billed for the most recent fiscal year and the preceding fiscal year by the registrant’s principal accountant for non-audit services rendered to the registrant, its investment advisor, and any entity controlling, controlled by, or under common control with the investment advisor that provides ongoing services to the registrant were $58,070 and $54,500 respectively.
(h) The registrant’s audit committee of the board of directors has considered whether the provision of non-audit services that were rendered to the registrant’s investment adviser (not including any sub-adviser whose role is primarily portfolio management and is subcontracted with or overseen by another investment adviser), and any entity controlling, controlled by, or under common control with the investment adviser that provides ongoing services to the registrant that were not pre-approved pursuant to paragraph (c)(7)(ii) of Rule 2-01 of Regulation S-X is compatible with maintaining the principal accountant’s independence.
Items 5. Audit Committee of Listed Registrants.
Not applicable.
Item 6. Schedule of Investments.
Not applicable.
Item 7. Disclosure of Proxy Voting Policies and Procedures for Closed-End Management Investment Companies.
Not applicable.
Item 8. Portfolio Managers of Closed-End Management Investment Companies.
Not applicable.
Item 9. Purchases of Equity Securities by Closed-End Management Investment Company and Affiliated Purchasers.
Not applicable.
Item 10. Submission of Matters to a Vote of Security Holders.
Not applicable.
Item 11. Controls and Procedures.
(a) Based on our evaluation conducted within 90 days of the filing date, hereof, the design and operation of the registrant's disclosure controls and procedures are effective to ensure that material information relating to the registrant is made known to the certifying officers by others within the appropriate entities, particularly during the period in which Forms N-CSR are being prepared, and the registrant's disclosure controls and procedures allow timely preparation and review of the information for the registrant's Form N-CSR and the officer certifications of such Form N-CSR.
(b) There were no significant changes in the registrant's internal controls or in other factors that could significantly affect these controls subsequent to the date of their evaluation, including any corrective actions with regard to significant deficiencies and material weaknesses.
Item 12. Exhibits.
(a)(1) Code of Ethics filed herewith as EX-99.CODE ETH.
(a)(2) A separate certification for each principal executive and principal financial officer of the registrant as required by Rule 30a-2(a) under the Act(17 CFR270.30a-2(a)). Filed herewith as EX-99.CERT.
(b) Certifications of principal executive officer and principal financial officer, under Section 906 of the Sarbanes-Oxley Act of 2002, and 18 U.S.C. ss.1350. Filed herewith as EX-99.906 CERT.
SIGNATURES
Pursuant to the requirements of the Securities Exchange Act of 1934 and the Investment Company Act of 1940, the registrant has duly caused this report to be signed on its behalf by the undersigned, thereunto duly authorized.
| Meeder Funds | |
| | | |
| By: | /s/ Bruce E. McKibben | |
| | Bruce E. McKibben, Treasurer | |
| | | |
| Date: | March 6, 2018 | |
Pursuant to the requirements of the Securities Exchange Act of 1934 and the Investment Company Act of 1940, this report has been signed below by the following persons on behalf of the registrant and in the capacities and on the dates indicated.
| By: | /s/ Bruce E. McKibben | |
| | Bruce E. McKibben, Treasurer | |
| | | |
| Date: | March 6, 2018 | |
| By: | /s/ Robert S. Meeder, Jr. | |
| | Robert S. Meeder, Jr., President | |
| | | |
| Date: | March 6, 2018 | |