UNITED STATES SECURITIES AND EXCHANGE COMMISSION
Washington, D.C. 20549
FORM N-CSR
CERTIFIED SHAREHOLDER REPORT
OF REGISTERED MANAGEMENT INVESTMENT COMPANIES
Investment Company Act file number 811-03462
Meeder Funds Trust
6125 Memorial Drive
Dublin, OH 43017
Bruce McKibben
c/o Meeder Funds Trust
6125 Memorial Drive
Dublin, OH 43017
Registrant’s telephone number, including area code: 800-325-3539
Date of fiscal year end: December 31, 2018
Date of reporting period: December 31, 2018
Item 1. Report to Stockholders.
Beginning on January 1, 2021, as permitted by regulations adopted by the U.S. Securities and Exchange Commission, paper copies of the Funds’ annual and semiannual shareholder reports will no longer be sent by mail, unless you specifically request paper copies of the reports. Instead, the reports will be made available on the Funds’ website (www.meederinvestment.com), and you will be notified by mail each time a report is posted and provided with a website link to access the report.
If you already elected to receive shareholder reports electronically, you will not be affected by this change and you need not take any action. You may elect to receive shareholder reports and other communications from a Fund electronically anytime by contacting your financial intermediary (such as a broker-dealer or bank) or, if you are a direct investor, by calling 1-800-325-3539 or by sending an email request tomeederfunds@meederinvestment.com.
Beginning on January 1, 2019, you may elect to receive all future reports in paper free of charge. If you invest through a financial intermediary, you can contact your financial intermediary to request that you continue to receive paper copies of your shareholder reports. If you invest directly with a Fund, you can call 1-800-325-3539 or send an email request tomeederfunds@meederinvestment.com to let the Fund know you wish to continue receiving paper copies of your shareholder reports. Your election to receive reports in paper will apply to all Funds held in your account if you invest through your financial intermediary or all Funds held with the Fund complex if you invest directly with a Fund.
TABLE OF CONTENTS
Letter to Shareholders | 1 |
Fund Summaries | |
Muirfield Fund | 3 |
Spectrum Fund | 5 |
Global Allocation Fund | 7 |
Balanced Fund | 9 |
Moderate Allocation Fund | 11 |
Conservative Allocation Fund | 13 |
Dynamic Allocation Fund | 15 |
Quantex Fund | 17 |
Total Return Bond Fund | 19 |
Prime Money Market Fund | 21 |
Institutional Prime Money Market Fund | 23 |
Shareholder Expense Analysis | 25 |
Financial Statements | |
Schedules of Investments | 28 |
Statements of Assets and Liabilities | 118 |
Statements of Operations | 120 |
Statements of Changes in Net Assets | 122 |
Financial Highlights | 126 |
Notes to Financial Statements | 134 |
Report of Independent Registered Public Accounting Firm | 153 |
Management of the Trust | 154 |
Other Items | 156 |
Privacy Policy | 157 |
This Annual Report is prepared and distributed for the general information of the shareholders of the Funds. This material is not authorized for distribution to prospective investors unless preceded or accompanied by a prospectus. Investors are advised to consider carefully the investment objectives, risks, charges and expenses of the Fund before investing. The prospectus contains this and other information about the Funds.
Meeder Funds are distributed by Adviser Dealer Services, Inc. (Member FINRA), an affiliate of Meeder Investment Management. An affiliated registered investment adviser, Meeder Asset Management, Inc., serves as the investment adviser to Meeder Funds and is paid a fee for its services.
LETTER TO SHAREHOLDERSDecember 31, 2018
Patience is a Virtue
Throughout 2018, we shared with you several times that typically when there is a significant decline in the stock market, it needs to go through a base-building process or consolidation. The market’s consolidation following the decline in 2015 and 2016 is a great example of this process. During consolidations, our investment team monitors numerous factors to determine the quality or health of the consolidation. We believe healthy consolidations typically lead to a sustainable advance and unhealthy consolidations typically lead to a continuation of the decline.
I have often made the comparison of a declining stock market to a person who has been injured. Hypothetically, when someone breaks their leg, the doctor doesn’t just set the bone in place and the patient is good to go. Rather, the bone should be reset, the leg has to be put into a cast, and then the patient needs to rest and recover. Once the cast is removed, the patient then should go through rehabilitation before they are ready to fully recover. How the patient does during this process typically determines their long-term outcome. Additionally, if the patient doesn’t get adequate rest and doesn’t do the proper rehabilitation, the patient can be vulnerable to an unsuccessful recovery. This kind of injury and subsequent recovery has played out in the market many times for multiple decades.
As we shared with you after the February 2018 market decline of 10%, we believed a consolidation or base- building process would most likely occur, which it did. Also, in July, we shared with you that we believed it would be a healthy or successful consolidation that was going to lead to a more favorable stock market environment. This seemed to happen, as the stock market made new all-time highs in late September and early October. Then, in early October, we shared with you that we were witnessing a crack in the foundation of the stock market with a short-term negative divergence in the NYSE advance/decline line. This was followed by another decline in the stock market from mid- October to mid-November. In mid-November, though, we communicated that there were potential positive factors developing, but our quantitative models, which drive our decision-making, indicated that it was premature to start increasing exposure to the stock market. So, we continued to maintain our significant underweight to stocks, which continues today.
So, where are we today? As of December 31, 2018, based upon the significant downturn, the patient—the market—is still feeling the pain. At best, the patient will need time to recover from the wounds that have been inflicted, before it can re-enter into a sustainable advance. The stock market may experience significant rallies, but these rallies may just be part of the recovery or base-building process. If this occurs, there could be a significant buying opportunity, but it will take time before the patient can get to a lower risk buying opportunity. What will ultimately continue to drive our investment decisions are our multi-discipline/ multi-factor process and our quantitative models.
Celebrating 30 Years: Meeder Muirfield Fund
The Meeder Muirfield Fund reached a significant milestone on August 10, 2018. The Fund celebrated its 30th anniversary, making it one of the oldest mutual funds in Morningstar’s Tactical Allocation category with one of the longest portfolio manager tenures in the industry.
Our flagship Muirfield Fund was launched in 1988 to provide mutual fund investors with access to our Defensive Equity Strategy, a separate account strategy which has been in place since the firm’s inception in 1974. There aren’t many tactical allocation funds that have withstood the test of time and multiple market cycles as the Muirfield Fund has.
We believe that our approach to managing volatility in the Muirfield Fund, and our other tactical funds and portfolios, provides a smoother ride for investors while helping them remain committed to their investment goals through a full market cycle. I have been part of the Fund since day one and, as I reflect back on the last 30 years, I am grateful to all who have contributed to the Fund’s success, including our associates, and you—the shareholders—who have placed their trust and confidence in us. I feel a real sense of accomplishment that our team has been able to help thousands of investors achieve their financial goals through their investment in the Muirfield Fund.
Looking Ahead
The stock market has experienced a significant injury and, we believe, will need to go through a period of rehabilitation or a consolidation before it displays more favorable risk/reward characteristics. It will take patience and time for the stock market to recover.
While we cannot predict the future, we can continue to maintain a disciplined, highly quantitative multi- factor approach to our decision-making while avoiding emotional or subjective responses to such painful equity markets. We believe this is the right course of action to ultimately heal the patient and help our clients meet their long-term financial goals and investment objectives.
For nearly 45 years, we have learned how to navigate these types of financial markets as we work on and through the healing process. On behalf of all of us at Meeder Investment Management, we thank you for your continued trust and confidence in our investment management services.

Robert S. Meeder
President and CEO
Meeder Asset Management, Inc.
2018 Annual Report | December 31, 2018 | Page 1 |
2018 Annual Report
Fund Summaries
Muirfield Fund
The Meeder Muirfield Fund Institutional Class returned -3.17% during the year ended December 31, 2018, compared to the Morningstar Moderate Target Risk Index return of -4.76%.
We began 2018 with our equity exposure essentially fully invested, following positive trend factors and low market volatility. The S&P 500 Index reached its high on January 28th and then slid over 10% until bottoming on February 8th. Markets plunged on the news as fears of inflation, as well as speculation about the future impact that global trade wars could have on the U.S. economy. Our models showed deterioration due to trend and breadth factors and we gradually reduced our equity exposure to as low as 68% before becoming fully invested again in the middle of July. In early October, the Federal Reserve Bank (“the Fed”) worried that the economy was starting to show signs of overheating and took a more hawkish tone. This sent shockwaves through markets and spiked volatility and the S&P 500 fell over 5% in just two days. Our short-term model factors turned negative and led us to gradually reduce our equity exposure to 69% by the end of October. Throughout November, our measure for market risk continued to increase and our intermediate-term model showed a weakening institutional demand for stocks. We reduced exposure further to end November with 40% invested in stocks. We continued to gradually reduce our equity exposure to 15% as volatility increased through the end of the year. Relative to the benchmark, our adjustments to equity exposure benefited performance.
Our shifts within equity markets include international versus domestic holdings, as well as allocating among market capitalization ranges in addition to sector overweight and/or underweight positions. As we progressed through 2018, we gradually reduced our exposure to international holdings among both developed international and emerging market securities due primarily to momentum factors in our model favoring a shift toward domestic exposure. Our reduced exposure to international markets contributed to performance relative to the benchmark for 2018.
Within our stock selection process, we attempt to gain exposure to companies with strong profitability, that are priced at reasonable valuations relative to their industry peers and are trading with positive price momentum. For the year ending 2018, securities with exposure to medium-term momentum and strong profitability contributed to performance while companies with value characteristics, such as high earnings yield, detracted from performance.
In the portfolio, we will often use equity index derivatives in the Fund, such as stock index futures, to efficiently equitize our cash positions as well as manage the equity exposure of the Fund. In regard to equitizing cash positions, these derivatives are designed to track their respective stock index, so there was no discernible impact to the Fund’s relative performance. The use of stock index futures to manage the equity exposure of the Fund had a positive impact on the performance of the Fund relative to the benchmark Index during 2018.
Investment Objective
The investment objective of the Fund is to provide long-term capital appreciation.
Average Annual Total Returns
as of December 31, 2018
| 1
Year | 5
Year | 10
Year |
Muirfield Fund Retail Class | -3.66% | 5.36% | 8.96% |
Muirfield Fund Institutional Class | -3.17% | — | — |
Muirfield Fund Adviser Class | -3.39% | — | — |
Morningstar Moderate Target Risk Index | -4.76% | 4.08% | 7.97% |
S&P 500 Index | -4.38% | 8.49% | 13.12% |
Blended Index | -1.68% | 5.42% | 8.08% |
Top 10 Holdings
as of December 31, 2018
1. | Microsoft Corp. | 2.1% |
2. | Apple, Inc. | 2.0% |
3. | Amazon.com, Inc. | 1.6% |
4. | Berkshire Hathaway, Inc. - Class B | 1.3% |
5. | Alphabet, Inc. - Class C | 1.2% |
6. | Verizon Communications, Inc. | 1.1% |
7. | Bank of America Corp. | 1.0% |
8. | Pfizer, Inc. | 1.0% |
9. | Cisco Systems, Inc. | 1.0% |
10. | Johnson & Johnson | 1.0% |
As a percentage of total net assets. Holdings exclude short-term investments and derivatives.
Sector Concentration
as of December 31, 2018
Information Technology | 22.1% |
Healthcare | 20.1% |
Financials | 12.6% |
Communication Services | 9.4% |
Consumer Discretionary | 7.8% |
Industrials | 7.7% |
Energy | 6.2% |
Utilities | 4.1% |
Real Estate Investment Trust | 3.8% |
Consumer Staples | 3.7% |
Materials | 2.5% |
Total | 100.0% |
As a percentage of total common stocks. Concentrations are subject to change.
Asset Allocation
as of December 31, 2018
Common Stocks | 63.8% |
Money Market Registered Investment Companies | 33.3% |
Bank Obligations | 0.2% |
Other Assets/Liabilities (Net) | 2.7% |
Total | 100.0% |
As a percentage of total net assets. The Fund has invested in stock index futures contracts in order to equitize cash balances held in the Fund.
2018 Annual Report | December 31, 2018 | Page 3 |
Growth of $10,000
as of December 31, 2018
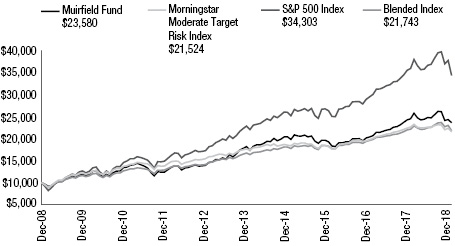
The Growth of $10,000 chart compares the performance of the Fund’s Retail Share Class over the period shown with dividends and capital gains reinvested to the Fund’s benchmarks. Benchmark indices are unmanaged and do not reflect the deduction of expenses associated with a mutual fund, such as investment management and accounting fees.
Investment performance assumes reinvestment of all dividend and capital gain distributions. The results do not reflect the effect of taxes a shareholder would pay on Fund distributions or on the redemption of Fund shares. Historical performance attributed to the Institutional and Adviser Share Classes prior to their inception dates is based on the performance of the Retail Share Class. No adjustment has been made to reflect class-specific distribution or servicing fees. Returns may reflect the effect of voluntary fee waivers or expense reimbursements over the period shown. Without these waivers, performance would have been lower.
The performance data shown represents past performance, which does not guarantee future results. The investment return and principal value of an investment will fluctuate so that an investor’s shares, when redeemed, may be worth more or less than their original cost. Current performance may be lower or higher than the performance data quoted. For current month-end performance data, please visit our website atwww.meederfunds.com.
Effective April 30, 2018, the Fund’s primary benchmark was changed to the Morningstar Moderate Target Risk Index. The Adviser believes this index is a more appropriate benchmark for the Fund.
The Blended Index is comprised 60% of the S&P 500 Index and 40% of 90-day T-bills.
Page 4 | 2018 Annual Report | December 31, 2018 |
Spectrum Fund
The Meeder Spectrum Fund Institutional Class returned -3.51% for the year ended December 31, 2018, compared to the Morningstar Moderate Target Risk Index return of -4.76%.
We began 2018 with our equity exposure essentially fully invested, following positive trend factors and low market volatility. The S&P 500 Index reached its high on January 28th and then slid over 10% until bottoming on February 8th. Markets plunged on the news as fears of inflation, as well as speculation about the future impact that global trade wars could have on the U.S. economy. Our models showed deterioration due to trend and breadth factors and we gradually reduced our equity exposure to as low as 68% before becoming fully invested again in the middle of July. In early October, the Fed worried that the economy was starting to show signs of overheating and took a more hawkish tone. This sent shockwaves through markets and spiked volatility and the S&P 500 fell over 5% in just two days. Our short-term model factors turned negative and led us to gradually reduce our equity exposure to 69% by the end of October. Throughout November, our measure for market risk continued to increase and our intermediate-term model showed a weakening institutional demand for stocks. We reduced exposure further to end November with 40% invested in stocks. We continued to gradually reduce our equity exposure to 15% as volatility increased through the end of the year. Relative to the benchmark, our adjustments to equity exposure benefited performance.
Our shifts within equity markets include international versus domestic holdings, as well as allocating among market capitalization ranges in addition to sector overweight and/or underweight positions. As we progressed through 2018, we gradually reduced our exposure to international holdings among both developed international and emerging market securities due primarily to momentum factors in our model favoring a shift toward domestic exposure. Our reduced exposure to international markets contributed to performance relative to the benchmark for 2018.
Within our stock selection process, we attempt to gain exposure to companies with strong profitability, that are priced at reasonable valuations relative to their industry peers and are trading with positive price momentum. For the year ending 2018, securities with exposure to medium-term momentum and strong profitability contributed to performance while companies with value characteristics, such as high earnings yield, detracted from performance.
In the portfolio, we will often use equity index derivatives in the Fund, such as stock index futures, to efficiently equitize our cash positions as well as manage the equity exposure of the Fund. In regard to equitizing cash positions, these derivatives are designed to track their respective stock index, so there was no discernible impact to the Fund’s relative performance. The use of stock index futures to manage the equity exposure of the Fund had a positive impact on the performance of the Fund relative to the benchmark Index during 2018.
Investment Objective
The investment objective of the Fund is to provide long-term capital appreciation.
Average Annual Total Returns
as of December 31, 2018
| 1
Year | Since
Inception | Inception
Date |
Spectrum Fund Retail Class | -3.97% | 4.90% | 1/1/15 |
Spectrum Fund Institutional Class | -3.51% | 5.16% | — |
Spectrum Fund Adviser Class | -3.67% | 5.08% | — |
Morningstar Moderate Target Risk Index | -4.76% | 3.90% | — |
S&P 500 Index | -4.38% | 7.25% | — |
Blended Index | -1.68% | 4.77% | — |
Top 10 Holdings
as of December 31, 2018
1. | Microsoft Corp. | 1.7% |
2. | Apple, Inc. | 1.7% |
3. | Amazon.com, Inc. | 1.4% |
4. | Berkshire Hathaway, Inc. - Class B | 1.1% |
5. | Alphabet, Inc. - Class C | 0.9% |
6. | Verizon Communications, Inc. | 0.9% |
7. | Johnson & Johnson | 0.8% |
8. | Cisco Systems, Inc. | 0.8% |
9. | Pfizer, Inc. | 0.8% |
10. | Merck & Co., Inc. | 0.7% |
As a percentage of total net assets. Holdings exclude short-term investments and derivatives.
Sector Concentration
as of December 31, 2018
Long Positions | |
Financials | 18.1% |
Information Technology | 16.6% |
Healthcare | 14.2% |
Industrials | 11.3% |
Consumer Discretionary | 9.3% |
Utilities | 7.2% |
Communication Services | 6.6% |
Energy | 4.9% |
Consumer Staples | 4.5% |
Materials | 3.8% |
Real Estate Investment Trust | 3.5% |
Total Long | 100.0% |
Short Positions | |
Financials | 32.6% |
Industrials | 17.6% |
Utilities | 17.2% |
Consumer Discretionary | 8.7% |
Information Technology | 7.7% |
Materials | 4.6% |
Communication Services | 3.7% |
Real Estate Investment Trust | 2.8% |
Consumer Staples | 2.6% |
Energy | 1.5% |
Healthcare | 1.0% |
Total Short | 100.0% |
Total long as a percentage of total long common stocks. Total short as a percentage of total short common stocks. Concentrations are subject to change.
2018 Annual Report | December 31, 2018 | Page 5 |
Asset Allocation
as of December 31, 2018
Long Common Stocks | 88.6% |
Short Common Stocks | (33.0%) |
Money Market Registered Investment Companies | 5.8% |
Other Assets/Liabilities (Net) | 38.6% |
Total | 100.0% |
As a percentage of total net assets. The Fund has invested in stock index futures contracts in order to equitize cash balances held in the Fund.
Growth of $10,000
as of December 31, 2018
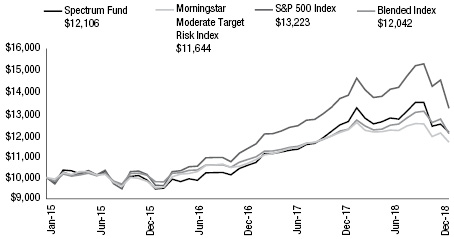
The Growth of $10,000 chart compares the performance of the Fund’s Retail Share Class over the period shown with dividends and capital gains reinvested to the Fund’s benchmarks. Benchmark indices are unmanaged and do not reflect the deduction of expenses associated with a mutual fund, such as investment management and accounting fees.
Investment performance assumes reinvestment of all dividend and capital gain distributions. The results do not reflect the effect of taxes a shareholder would pay on Fund distributions or on the redemption of Fund shares. Historical performance attributed to the Institutional and Adviser Share Classes prior to their inception dates is based on the performance of the Retail Share Class. No adjustment has been made to reflect class-specific distribution or servicing fees. Returns may reflect the effect of voluntary fee waivers or expense reimbursements over the period shown. Without these waivers, performance would have been lower.
The performance data shown represents past performance, which does not guarantee future results. The investment return and principal value of an investment will fluctuate so that an investor’s shares, when redeemed, may be worth more or less than their original cost. Current performance may be lower or higher than the performance data quoted. For current month-end performance data, please visit our website atwww.meederfunds.com.
Effective April 30, 2018, the Fund’s primary benchmark was changed to the Morningstar Moderate Target Risk Index. The Adviser believes this index is a more appropriate benchmark for the Fund.
The Blended Index is comprised 60% of the S&P 500 Index and 40% of 90-day T-bills.
Page 6 | 2018 Annual Report | December 31, 2018 |
Global Allocation Fund
The Meeder Global Allocation Fund Institutional Class returned -6.57% for the year ended December 31, 2018, compared to the Morningstar Global Allocation Index benchmark return of -5.56%.
The Fund invests in domestic equity markets but will generally hold securities in emerging market and developed international equities as well. We alter the allocation to the international markets based on indications from our quantitative models. Additionally, the strategy can reduce equity exposure when it is deemed to be a high-risk market environment. We began 2018 with our equity exposure essentially fully invested, following positive trend factors and low market volatility. The S&P 500 Index reached its high on January 28th and then slid over 10% until bottoming on February 8th. Markets plunged on the news as fears of inflation, as well as speculation about the future impact that global trade wars could have on the U.S. economy. Our models showed deterioration due to trend and breadth factors and we gradually reduced our equity exposure to as low as 68% before becoming fully invested again in the middle of July. In early October, the Fed worried that the economy was starting to show signs of overheating and took a more hawkish tone. This sent shockwaves through markets and spiked volatility and the S&P 500 fell over 5% in just two days. Our short-term model factors turned negative and led us to gradually reduce our equity exposure to 69% by the end of October. Throughout November, our measure for market risk continued to increase and our intermediate-term model showed a weakening institutional demand for stocks. We reduced exposure further to end November with 40% invested in stocks. We continued to gradually reduce our equity exposure to 15% as volatility increased through the end of the year. Relative to the benchmark, our adjustments to equity exposure contributed to relative performance.
Our shifts within equity markets include international versus domestic holdings, as well as allocating among market capitalization ranges in addition to sector overweight and/or underweight positions. As we progressed through 2018, we gradually reduced our exposure to international holdings among both developed international and emerging market securities due primarily to momentum factors in our model favoring a shift toward domestic exposure. Our tactical exposure to international markets detracted from performance relative to the benchmark for 2018.
2018 was a volatile year for fixed income markets. Stronger economic growth from tax cuts and higher fiscal spending continued to support a decline in the unemployment rate and a rise in year-over-year average hourly wages. This had the Federal Reserve concerned about a rise in inflation and led them to increase the federal funds rate by 0.25% each quarter, rather than the three rate hikes that the market had expected in 2018. However, market volatility made a comeback in 2018 and the inflation rate remained rather muted, as the Fed’s favored inflation gauge, core PCE, remained below their target of 2%. The U.S. trade tensions with China and the uncertainty around tariffs added to volatility, along with the global economic slowdown in EU due to political pressures and an economic slowdown in China, all the while commodity and oil prices saw big declines. Another source of volatility was a decline in market liquidity as the Federal Reserve continued its balance sheet reduction plan, allowing more than $300B of treasuries and mortgages to roll off during the year. The frequent shift between market strength and economic slowdown concerns caused U.S. treasury yields to fluctuate throughout the year. Our tactical fixed income portfolios, following their model-driven sector allocation process, remained largely allocated to investment-grade securities during 2018. As volatility and treasury yields began to spike during the first quarter, momentum and spread factors signaled us to reduce exposure to high yield and emerging markets. During the year we tactically added brief exposure to high yield in the second quarter and again in the second half of the year, as this sector showed relative strength compared to other fixed income sectors. A weakening U.S. Dollar and positive trend momentum in our models led us to allocate assets to emerging market debt during the third quarter, although we subsequently reduced this position as market volatility increased early in the fourth quarter. Our tactical fixed income sector positions detracted from performance during the second half of the year, affecting our relative performance to the benchmark in 2018. The overall portfolio and treasury allocation maintained a slightly shorter duration than the benchmark throughout the year.
Within our stock selection process, we attempt to gain exposure to companies with strong profitability, that are priced at reasonable valuations relative to their industry peers and are trading with positive price momentum. For the year ending 2018, securities with exposure to medium-term momentum and strong profitability contributed to performance while companies with value characteristics, such as high earnings yield, detracted from performance.
In the portfolio, we will often use equity index derivatives in the Fund, such as stock index futures, to efficiently equitize our cash positions as well as manage the equity exposure of the Fund. In regard to equitizing cash positions, these derivatives are designed to track their respective stock index, so there was no discernible impact to the Fund’s relative performance. The use of stock index futures to manage the equity exposure of the Fund had a positive impact on the performance of the Fund relative to the benchmark Index during 2018.
2018 Annual Report | December 31, 2018 | Page 7 |
Investment Objective
The investment objective of the Fund is to provide long-term capital appreciation.
Average Annual Total Returns
as of December 31, 2018
| 1
Year | 5
Year | 10
Year |
Global Allocation Fund Retail Class | -6.94% | 2.98% | 9.25% |
Global Allocation Fund Institutional Class | -6.57% | — | — |
Global Allocation Fund Adviser Class | -6.73% | — | — |
Morningstar Global Allocation Index | -5.56% | 3.76% | 7.53% |
MSCI ACWI Index | -9.42% | 4.26% | 9.46% |
Blended Index | -4.29% | 2.94% | 5.80% |
Growth of $10,000
as of December 31, 2018
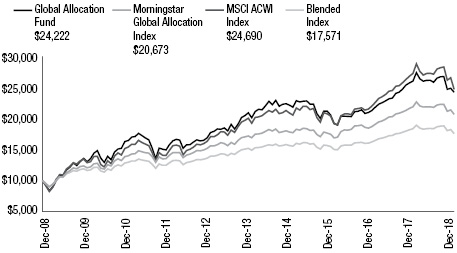
The Growth of $10,000 chart compares the performance of the Fund’s Retail Share Class over the period shown with dividends and capital gains reinvested to the Fund’s benchmarks. Benchmark indices are unmanaged and do not reflect the deduction of expenses associated with a mutual fund, such as investment management and accounting fees.
Investment performance assumes reinvestment of all dividend and capital gain distributions. The results do not reflect the effect of taxes a shareholder would pay on Fund distributions or on the redemption of Fund shares. Historical performance attributed to the Institutional and Adviser Share Classes prior to their inception dates is based on the performance of the Retail Share Class. No adjustment has been made to reflect class-specific distribution or servicing fees. Returns may reflect the effect of voluntary fee waivers or expense reimbursements over the period shown. Without these waivers, performance would have been lower.
The performance data shown represents past performance, which does not guarantee future results. The investment return and principal value of an investment will fluctuate so that an investor’s shares, when redeemed, may be worth more or less than their original cost. Current performance may be lower or higher than the performance data quoted. For current month-end performance data, please visit our website atwww.meederfunds.com.
Effective April 30, 2018, the Fund’s primary benchmark was changed to the Morningstar Global Allocation Index. The Adviser believes this index is a more appropriate benchmark for the Fund.
The Blended Index is comprised of 54% MSCI ACWI, 36% of 90 day T-Bills and 10% Bloomberg Barclays US Aggregate Bond Index.
Top 10 Holdings
as of December 31, 2018
1. | iShares Core MSCI EAFE ETF | 5.4% |
2. | iShares Core MSCI Emerging Markets ETF | 1.2% |
3. | iShares Core U.S. Aggregate Bond ETF | 1.2% |
4. | Microsoft Corp. | 1.2% |
5. | Apple, Inc. | 1.1% |
6. | TCW Emerging Markets Income Fund - Class I | 1.1% |
7. | Vanguard Total Bond Market ETF | 1.1% |
8. | Amazon.com, Inc. | 0.9% |
9. | Berkshire Hathaway, Inc. - Class B | 0.8% |
10. | Alphabet, Inc. - Class C | 0.7% |
As a percentage of total net assets. Holdings exclude short-term investments and derivatives.
Sector Concentration
as of December 31, 2018
Information Technology | 20.3% |
Healthcare | 20.1% |
Financials | 13.1% |
Communication Services | 9.1% |
Consumer Discretionary | 8.2% |
Energy | 7.5% |
Industrials | 7.3% |
Consumer Staples | 4.6% |
Real Estate Investment Trust | 3.8% |
Utilities | 3.8% |
Materials | 2.2% |
Total | 100.0% |
As a percentage of total common stocks. Concentrations are subject to change.
Asset Allocation
as of December 31, 2018
Common Stocks | 36.3% |
Equity Registered Investment Companies | 6.7% |
Fixed Income Registered Investment Companies | 10.0% |
Money Market Registered Investment Companies | 43.8% |
Bank Obligations | 2.1% |
U.S. Government Obligations | 0.8% |
Other Assets/Liabilities (Net) | 0.3% |
Total | 100.0% |
As a percentage of total net assets. The Fund has invested in stock index futures contracts in order to equitize cash balances held in the Fund.
Page 8 | 2018 Annual Report | December 31, 2018 |
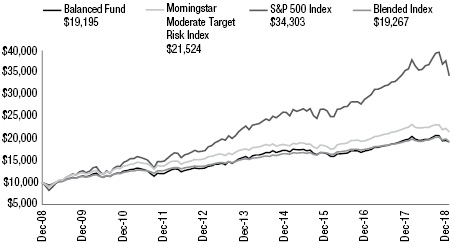
Balanced Fund
The Meeder Balanced Fund Institutional Class returned -2.85% for the year ended December 31, 2018, compared to the Morningstar Moderate Target Risk Index return of -4.76%. The Fund maintains exposure to both equity and fixed income.
We began 2018 with our equity exposure essentially fully invested, following positive trend factors and low market volatility. The S&P 500 Index reached its high on January 28th and then slid over 10% until bottoming on February 8th. Markets plunged on the news as fears of inflation, as well as speculation about the future impact that global trade wars could have on the U.S. economy. Our models showed deterioration due to trend and breadth factors and we gradually reduced our equity exposure to as low as 68% before becoming fully invested again in the middle of July. In early October, the Fed worried that the economy was starting to show signs of overheating and took a more hawkish tone. This sent shockwaves through markets and spiked volatility and the S&P 500 fell over 5% in just two days. Our short-term model factors turned negative and led us to gradually reduce our equity exposure to 69% by the end of October. Throughout November, our measure for market risk continued to increase and our intermediate-term model showed a weakening institutional demand for stocks. We reduced exposure further to end November with 40% invested in stocks. We continued to gradually reduce our equity exposure to 15% as volatility increased through the end of the year. Relative to the benchmark, our adjustments to equity exposure contributed to relative performance.
Our shifts within equity markets include international versus domestic holdings, as well as allocating among market capitalization ranges in addition to sector overweight and/or underweight positions. As we progressed through 2018, we gradually reduced our exposure to international holdings among both developed international and emerging market securities due primarily to momentum factors in our model favoring a shift toward domestic exposure. Our reduced exposure to international markets contributed to performance relative to the benchmark for 2018.
2018 was a volatile year for fixed income markets. Stronger economic growth from tax cuts and higher fiscal spending continued to support a decline in the unemployment rate and a rise in year-over-year average hourly wages. This had the Federal Reserve concerned about a rise in inflation and led them to increase the federal funds rate by 0.25% each quarter, rather than the three rate hikes that the market had expected in 2018. However, market volatility made a comeback in 2018 and the inflation rate remained rather muted, as the Fed’s favored inflation gauge, core PCE, remained below their target of 2%. The U.S. trade tensions with China and the uncertainty around tariffs added to volatility, along with the global economic slowdown in EU due to political pressures and an economic slowdown in China, all the while commodity and oil prices saw big declines. Another source of volatility was a decline in market liquidity as the Federal Reserve continued its balance sheet reduction plan, allowing more than $300B of treasuries and mortgages to roll off during the year. The frequent shift between market strength and economic slowdown concerns caused U.S. treasury yields to fluctuate throughout the year. Our tactical fixed income portfolios, following their model-driven sector allocation process, remained largely allocated to investment-grade securities during 2018. As volatility and treasury yields began to spike during the first quarter, momentum and spread factors signaled us to reduce exposure to high yield and emerging markets. During the year we tactically added brief exposure to high yield in the second quarter and again in the second half of the year, as this sector showed relative strength compared to other fixed income sectors. A weakening U.S. Dollar and positive trend momentum in our models led us to allocate assets to emerging market debt during the third quarter, although we subsequently reduced this position as market volatility increased early in the fourth quarter. Our tactical fixed income sector positions detracted from performance during the second half of the year, affecting our relative performance to the benchmark in 2018. The overall portfolio and treasury allocation maintained a slightly shorter duration than the benchmark throughout the year.
Within our stock selection process, we attempt to gain exposure to companies with strong profitability, that are priced at reasonable valuations relative to their industry peers and are trading with positive price momentum. For the year ending 2018, securities with exposure to medium-term momentum and strong profitability contributed to performance while companies with value characteristics, such as high earnings yield, detracted from performance.
In the portfolio, we will often use equity index derivatives in the Fund, such as stock index futures, to efficiently equitize our cash positions as well as manage the equity exposure of the Fund. In regard to equitizing cash positions, these derivatives are designed to track their respective stock index, so there was no discernible impact to the Fund’s relative performance. The use of stock index futures to manage the equity exposure of the Fund had a positive impact on the performance of the Fund relative to the benchmark index during 2018.
Investment Objective
The investment objective of the Fund is to provide income and long-term capital appreciation.
Average Annual Total Returns
as of December 31, 2018
| 1
Year | 5
Year | 10
Year |
Balanced Fund Retail Class | -3.25% | 3.84% | 6.74% |
Balanced Fund Institutional Class | -2.85% | — | — |
Balanced Fund Adviser Class | -2.99% | — | — |
Morningstar Moderate Target Risk Index | -4.76% | 4.08% | 7.97% |
S&P 500 Index | -4.38% | 8.49% | 13.12% |
Blended Index | -1.01% | 4.63% | 6.78% |
Top 10 Holdings
as of December 31, 2018
1. | iShares Core U.S. Aggregate Bond ETF | 3.4% |
2. | TCW Emerging Markets Income Fund - Class I | 3.1% |
3. | Vanguard Total Bond Market ETF | 3.1% |
4. | DoubleLine Total Return Bond Fund - Class I | 1.9% |
5. | Pioneer Bond Fund - Class Y | 1.9% |
6. | Guggenheim Total Return Bond Fund - Class I | 1.9% |
7. | Dodge & Cox Income Fund | 1.9% |
8. | Frost Total Return Bond Fund - Class I | 1.9% |
9. | Lord Abbett High Yield Fund - Class I | 1.7% |
10. | Baird Core Plus Bond Fund - Class I | 1.5% |
As a percentage of total net assets. Holdings exclude short-term investments and derivatives.
2018 Annual Report | December 31, 2018 | Page 9 |
Sector Concentration
as of December 31, 2018
Information Technology | 22.2% |
Healthcare | 20.1% |
Financials | 12.6% |
Communication Services | 9.3% |
Consumer Discretionary | 7.7% |
Industrials | 7.7% |
Energy | 6.2% |
Utilities | 4.1% |
Real Estate Investment Trust | 3.8% |
Consumer Staples | 3.7% |
Materials | 2.6% |
Total | 100.0% |
As a percentage of total common stocks. Concentrations are subject to change.
Asset Allocation
as of December 31, 2018
Common Stocks | 44.8% |
Fixed Income Registered Investment Companies | 28.4% |
Money Market Registered Investment Companies | 22.2% |
Bank Obligations | 0.4% |
U.S. Government Obligations | 2.2% |
Other Assets/Liabilities (Net) | 2.0% |
Total | 100.0% |
As a percentage of total net assets. The Fund has invested in stock index futures contracts in order to equitize cash balances held in the Fund.
Growth of $10,000
as of December 31, 2018
The Growth of $10,000 chart compares the performance of the Fund’s Retail Share Class over the period shown with dividends and capital gains reinvested to the Fund’s benchmarks. Benchmark indices are unmanaged and do not reflect the deduction of expenses associated with a mutual fund, such as investment management and accounting fees.
Investment performance assumes reinvestment of all dividend and capital gain distributions. The results do not reflect the effect of taxes a shareholder would pay on Fund distributions or on the redemption of Fund shares. Historical performance attributed to the Institutional and Adviser Share Classes prior to their inception dates is based on the performance of the Retail Share Class. No adjustment has been made to reflect class-specific distribution or servicing fees. Returns may reflect the effect of voluntary fee waivers or expense reimbursements over the period shown. Without these waivers, performance would have been lower.
The performance data shown represents past performance, which does not guarantee future results. The investment return and principal value of an investment will fluctuate so that an investor’s shares, when redeemed, may be worth more or less than their original cost. Current performance may be lower or higher than the performance data quoted. For current month-end performance data, please visit our website atwww.meederfunds.com.
Effective April 30, 2018, the Fund’s primary benchmark was changed to the Morningstar Moderate Target Risk Index. The Adviser believes this index is a more appropriate benchmark for the Fund.
The Blended Index is comprised 42% of the S&P 500 Index, 28% of the average 90-day T-bills, and 30% of the Bloomberg Barclays US Aggregate Bond Index.
Page 10 | 2018 Annual Report | December 31, 2018 |
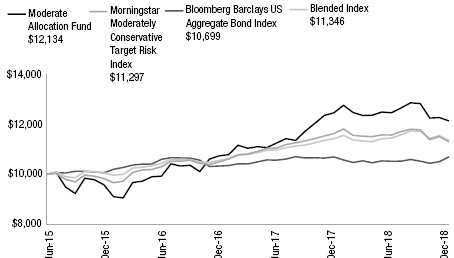
Moderate Allocation Fund
The Meeder Moderate Allocation Fund Institutional Class returned -2.20% for the year ended December 31, 2018, compared to the Morningstar Moderate Conservative Target Risk Index return of -2.87%.
We began 2018 with our equity exposure essentially fully invested, following positive trend factors and low market volatility. The S&P 500 Index reached its high on January 28th and then slid over 10% until bottoming on February 8th. Markets plunged on the news as fears of inflation, as well as speculation about the future impact that global trade wars could have on the U.S. economy. Our models showed deterioration due to trend and breadth factors and we gradually reduced our equity exposure to as low as 68% before becoming fully invested again in the middle of July. In early October, the Fed worried that the economy was starting to show signs of overheating and took a more hawkish tone. This sent shockwaves through markets and spiked volatility and the S&P 500 fell over 5% in just two days. Our short-term model factors turned negative and led us to gradually reduce our equity exposure to 69% by the end of October. Throughout November, our measure for market risk continued to increase and our intermediate-term model showed a weakening institutional demand for stocks. We reduced exposure further to end November with 40% invested in stocks. We continued to gradually reduce our equity exposure to 15% as volatility increased through the end of the year. Relative to the benchmark, our adjustments to equity exposure contributed to relative performance.
Our shifts within equity markets include international versus domestic holdings, as well as allocating among market capitalization ranges in addition to sector overweight and/or underweight positions. As we progressed through 2018, we gradually reduced our exposure to international holdings among both developed international and emerging market securities due primarily to momentum factors in our model favoring a shift toward domestic exposure. Our reduced exposure to international markets contributed to performance relative to the benchmark for 2018.
2018 was a volatile year for fixed income markets. Stronger economic growth from tax cuts and higher fiscal spending continued to support a decline in the unemployment rate and a rise in year-over-year average hourly wages. This had the Federal Reserve concerned about a rise in inflation and led them to increase the federal funds rate by 0.25% each quarter, rather than the three rate hikes that the market had expected in 2018. However, market volatility made a comeback in 2018 and the inflation rate remained rather muted, as the Fed’s favored inflation gauge, core PCE, remained below their target of 2%. The U.S. trade tensions with China and the uncertainty around tariffs added to volatility, along with the global economic slowdown in EU due to political pressures and an economic slowdown in China, all the while commodity and oil prices saw big declines. Another source of volatility was a decline in market liquidity as the Federal Reserve continued its balance sheet reduction plan, allowing more than $300B of treasuries and mortgages to roll off during the year. The frequent shift between market strength and economic slowdown concerns caused U.S. treasury yields to fluctuate throughout the year. Our tactical fixed income portfolios, following their model-driven sector allocation process, remained largely allocated to investment-grade securities during 2018. As volatility and treasury yields began to spike during the first quarter, momentum and spread factors signaled us to reduce exposure to high yield and emerging markets. During the year we tactically added brief exposure to high yield in the second quarter and again in the second half of the year, as this sector showed relative strength compared to other fixed income sectors. A weakening U.S. Dollar and positive trend momentum in our models led us to allocate assets to emerging market debt during the third quarter, although we subsequently reduced this position as market volatility increased early in the fourth quarter. Our tactical fixed income sector positions detracted from performance during the second half of the year, affecting our relative performance to the benchmark in 2018. The overall portfolio and treasury allocation maintained a slightly shorter duration than the benchmark throughout the year.
Within our stock selection process, we attempt to gain exposure to companies with strong profitability, that are priced at reasonable valuations relative to their industry peers and are trading with positive price momentum. For the year ending 2018, securities with exposure to medium-term momentum and strong profitability contributed to performance while companies with value characteristics, such as high earnings yield, detracted from performance.
In the portfolio, we will often use equity index derivatives in the Fund, such as stock index futures, to efficiently equitize our cash positions as well as manage the equity exposure of the Fund. In regard to equitizing cash positions, these derivatives are designed to track their respective stock index, so there was no discernible impact to the Fund’s relative performance. The use of stock index futures to manage the equity exposure of the Fund had a positive impact on the performance of the Fund relative to the benchmark index during 2018.
2018 Annual Report | December 31, 2018 | Page 11 |
Investment Objective
The investment objective of the Fund is to provide total return, including capital appreciation, and current income.
Average Annual Total Returns
as of December 31, 2018
| 1
Year | Since
Inception | Inception
Date |
Moderate Allocation Fund Retail Class | -2.60% | 5.67% | 6/30/15 |
Moderate Allocation Fund Institutional Class | -2.20% | 5.97% | — |
Moderate Allocation Fund Adviser Class | -2.47% | 5.84% | — |
Morningstar Moderately Conservative Target Risk Index | -2.87% | 3.54% | — |
Bloomberg Barclays US Aggregate Bond Index | 0.01% | 1.95% | — |
Blended Index | -0.67% | 3.67% | — |
Growth of $10,000
as of December 31, 2018
The Growth of $10,000 chart compares the performance of the Fund’s Retail Share Class over the period shown with dividends and capital gains reinvested to the Fund’s benchmarks. Benchmark indices are unmanaged and do not reflect the deduction of expenses associated with a mutual fund, such as investment management and accounting fees.
Investment performance assumes reinvestment of all dividend and capital gain distributions. The results do not reflect the effect of taxes a shareholder would pay on Fund distributions or on the redemption of Fund shares. Historical performance attributed to the Institutional and Adviser Share Classes prior to their inception dates is based on the performance of the Retail Share Class. No adjustment has been made to reflect class-specific distribution or servicing fees. Returns may reflect the effect of voluntary fee waivers or expense reimbursements over the period shown. Without these waivers, performance would have been lower.
The performance data shown represents past performance, which does not guarantee future results. The investment return and principal value of an investment will fluctuate so that an investor’s shares, when redeemed, may be worth more or less than their original cost. Current performance may be lower or higher than the performance data quoted. For current month-end performance data, please visit our website atwww.meederfunds.com.
Top 10 Holdings
as of December 31, 2018
1. | iShares Core U.S. Aggregate Bond ETF | 5.5% |
2. | TCW Emerging Markets Income Fund - Class I | 5.0% |
3. | Vanguard Total Bond Market ETF | 5.0% |
4. | Dodge & Cox Income Fund | 3.1% |
5. | DoubleLine Total Return Bond Fund - Class I | 3.1% |
6. | Pioneer Bond Fund - Class Y | 3.1% |
7. | Guggenheim Total Return Bond Fund - Class I | 3.1% |
8. | Frost Total Return Bond Fund - Class I | 3.1% |
9. | Lord Abbett High Yield Fund - Class I | 2.8% |
10. | Baird Core Plus Bond Fund - Class I | 2.6% |
As a percentage of total net assets. Holdings exclude short-term investments and derivatives.
Sector Concentration
as of December 31, 2018
Information Technology | 20.2% |
Healthcare | 20.1% |
Financials | 13.1% |
Communication Services | 9.1% |
Consumer Discretionary | 8.3% |
Energy | 7.6% |
Industrials | 7.2% |
Consumer Staples | 4.5% |
Real Estate Investment Trust | 3.8% |
Utilities | 3.8% |
Materials | 2.3% |
Total | 100.0% |
As a percentage of total common stocks. Concentrations are subject to change.
Asset Allocation
as of December 31, 2018
Common Stocks | 29.1% |
Fixed Income Registered Investment Companies | 47.2% |
Money Market Registered Investment Companies | 18.5% |
Bank Obligations | 0.5% |
U.S. Government Obligations | 3.5% |
Other Assets/Liabilities (Net) | 1.2% |
Total | 100.0% |
As a percentage of total net assets. The Fund has invested in stock index futures contracts in order to equitize cash balances held in the Fund.
Effective April 30, 2018, the Fund’s primary benchmark was changed to the Morningstar Moderately Conservative Target Risk Index. The Adviser believes this index is a more appropriate benchmark for the Fund.
The Blended Index is comprised 30% of the S&P 500 Index, 20% of the average 90-day T-bills, and 50% of the Bloomberg Barclays US Aggregate Bond Index.
Page 12 | 2018 Annual Report | December 31, 2018 |
Conservative Allocation Fund
The Meeder Conservative Allocation Fund Institutional Class returned -2.28% for the year ended December 31, 2018, compared to the Morningstar Conservative Target Risk Index return of -1.20%.
We began 2018 with our equity exposure essentially fully invested, following positive trend factors and low market volatility. The S&P 500 Index reached its high on January 28th and then slid over 10% until bottoming on February 8th. Markets plunged on the news as fears of inflation, as well as speculation about the future impact that global trade wars could have on the U.S. economy. Our models showed deterioration due to trend and breadth factors and we gradually reduced our equity exposure to as low as 68% before becoming fully invested again in the middle of July. In early October, the Fed worried that the economy was starting to show signs of overheating and took a more hawkish tone. This sent shockwaves through markets and spiked volatility and the S&P 500 fell over 5% in just two days. Our short-term model factors turned negative and led us to gradually reduce our equity exposure to 69% by the end of October. Throughout November, our measure for market risk continued to increase and our intermediate-term model showed a weakening institutional demand for stocks. We reduced exposure further to end November with 40% invested in stocks. We continued to gradually reduce our equity exposure to 15% as volatility increased through the end of the year. Relative to the benchmark, our adjustments to equity exposure contributed to relative performance.
Our shifts within equity markets include international versus domestic holdings, as well as allocating among market capitalization ranges in addition to sector overweight and/or underweight positions. As we progressed through 2018, we gradually reduced our exposure to international holdings among both developed international and emerging market securities due primarily to momentum factors in our model favoring a shift toward domestic exposure. Our reduced exposure to international markets contributed to performance relative to the benchmark for 2018.
2018 was a volatile year for fixed income markets. Stronger economic growth from tax cuts and higher fiscal spending continued to support a decline in the unemployment rate and a rise in year-over-year average hourly wages. This had the Federal Reserve concerned about a rise in inflation and led them to increase the federal funds rate by 0.25% each quarter, rather than the three rate hikes that the market had expected in 2018. However, market volatility made a comeback in 2018 and the inflation rate remained rather muted, as the Fed’s favored inflation gauge, core PCE, remained below their target of 2%. The U.S. trade tensions with China and the uncertainty around tariffs added to volatility, along with the global economic slowdown in EU due to political pressures and an economic slowdown in China, all the while commodity and oil prices saw big declines. Another source of volatility was a decline in market liquidity as the Federal Reserve continued its balance sheet reduction plan, allowing more than $300B of treasuries and mortgages to roll off during the year. The frequent shift between market strength and economic slowdown concerns caused U.S. treasury yields to fluctuate throughout the year. Our tactical fixed income portfolios, following their model-driven sector allocation process, remained largely allocated to investment-grade securities during 2018. As volatility and treasury yields began to spike during the first quarter, momentum and spread factors signaled us to reduce exposure to high yield and emerging markets. During the year we tactically added brief exposure to high yield in the second quarter and again in the second half of the year, as this sector showed relative strength compared to other fixed income sectors. A weakening U.S. Dollar and positive trend momentum in our models led us to allocate assets to emerging market debt during the third quarter, although we subsequently reduced this position as market volatility increased early in the fourth quarter. Our tactical fixed income sector positions detracted from performance during the second half of the year, affecting our relative performance to the benchmark in 2018. The overall portfolio and treasury allocation maintained a slightly shorter duration than the benchmark throughout the year.
Within our stock selection process, we attempt to gain exposure to companies with strong profitability, that are priced at reasonable valuations relative to their industry peers and are trading with positive price momentum. For the year ending 2018, securities with exposure to medium-term momentum and strong profitability contributed to performance while companies with value characteristics, such as high earnings yield, detracted from performance.
In the portfolio, we will often use equity index derivatives in the Fund, such as stock index futures, to efficiently equitize our cash positions as well as manage the equity exposure of the Fund. In regard to equitizing cash positions, these derivatives are designed to track their respective stock index, so there was no discernible impact to the Fund’s relative performance. The use of stock index futures to manage the equity exposure of the Fund had a positive impact on the performance of the Fund relative to the benchmark index during 2018.
2018 Annual Report | December 31, 2018 | Page 13 |
Investment Objective
The investment objective of the Fund is to provide income and long-term capital appreciation.
Average Annual Total Returns
as of December 31, 2018
| 1
Year | 5
Year | 10
Year |
Conservative Allocation Fund Retail Class | -2.62% | 2.70% | 8.76% |
Conservative Allocation Fund Institutional Class | -2.28% | — | — |
Conservative Allocation Fund Adviser Class | -2.50% | — | — |
Morningstar Conservative Target Risk Index | -1.20% | 2.54% | 4.37% |
Bloomberg Barclays US Aggregate Bond Index | 0.01% | 2.52% | 3.48% |
Blended Index | -0.37% | 3.45% | 4.93% |
Growth of $10,000
as of December 31, 2018

The Growth of $10,000 chart compares the performance of the Fund’s Retail Share Class over the period shown with dividends and capital gains reinvested to the Fund’s benchmarks. Benchmark indices are unmanaged and do not reflect the deduction of expenses associated with a mutual fund, such as investment management and accounting fees.
Investment performance assumes reinvestment of all dividend and capital gain distributions. The results do not reflect the effect of taxes a shareholder would pay on Fund distributions or on the redemption of Fund shares. Historical performance attributed to the Institutional and Adviser Share Classes prior to their inception dates is based on the performance of the Retail Share Class. No adjustment has been made to reflect class-specific distribution or servicing fees. Returns may reflect the effect of voluntary fee waivers or expense reimbursements over the period shown. Without these waivers, performance would have been lower.
The performance data shown represents past performance, which does not guarantee future results. The investment return and principal value of an investment will fluctuate so that an investor’s shares, when redeemed, may be worth more or less than their original cost. Current performance may be lower or higher than the performance data quoted. For current month-end performance data, please visit our website atwww.meederfunds.com.
Effective April 30, 2018, the Fund’s primary benchmark was changed to the Morningstar Conservative Target Risk Index. The Adviser believes this index is a more appropriate benchmark for the Fund.
The Blended Index is comprised 18% of the S&P 500 Index, 12% of the average 90-day T-bills, and 70% of the Bloomberg Barclays US Aggregate Bond Index.
Top 10 Holdings
as of December 31, 2018
1. | iShares Core U.S. Aggregate Bond ETF | 7.8% |
2. | Vanguard Total Bond Market ETF | 7.1% |
3. | TCW Emerging Markets Income Fund - Class I | 6.9% |
4. | Pioneer Bond Fund | 4.3% |
5. | Guggenheim Total Return Bond Fund - Class I | 4.3% |
6. | DoubleLine Total Return Bond Fund - Class I | 4.3% |
7. | Dodge & Cox Income Fund | 4.3% |
8. | Frost Total Return Bond Fund - Class I | 4.3% |
9. | Lord Abbett High Yield Fund - Class I | 3.7% |
10. | Baird Core Plus Bond Fund - Class I | 3.6% |
As a percentage of total net assets. Holdings exclude short-term investments and derivatives.
Sector Concentration
as of December 31, 2018
Information Technology | 20.3% |
Healthcare | 20.0% |
Financials | 13.5% |
Communication Services | 9.0% |
Consumer Discretionary | 8.0% |
Industrials | 7.5% |
Energy | 7.5% |
Consumer Staples | 4.2% |
Utilities | 3.9% |
Real Estate Investment Trust | 3.8% |
Materials | 2.3% |
Total | 100.0% |
As a percentage of total common stocks. Concentrations are subject to change.
Asset Allocation
as of December 31, 2018
Common Stocks | 17.8% |
Fixed Income Registered Investment Companies | 65.6% |
Money Market Registered Investment Companies | 10.6% |
Bank Obligations | 0.2% |
U.S. Government Obligations | 4.9% |
Other Assets/Liabilities (Net) | 0.9% |
Total | 100.0% |
As a percentage of total net assets. The Fund has invested in stock index futures contracts in order to equitize cash balances held in the Fund.
Page 14 | 2018 Annual Report | December 31, 2018 |
Dynamic Allocation Fund
The Meeder Dynamic Allocation Fund Institutional Class returned -8.18% for the year ended December 31, 2018, compared to the Morningstar Aggressive Target Risk Index return of -8.17%.
Our shifts within equity markets include international versus domestic holdings, as well as allocating among market capitalization ranges in addition to sector overweight and/or underweight positions. As we progressed through 2018, we gradually reduced our exposure to international holdings among both developed international and emerging market securities due primarily to momentum factors in our model favoring a shift toward domestic exposure. Our reduced exposure to international markets contributed to performance relative to the benchmark for 2018.
We maintain at least a 5% allocation to fixed income in the Fund. During 2018, this allocation was actively managed among investment-grade bonds, high yield, and emerging market debt securities. These allocation changes are driven by the evolution of our credit quality models, which assess various factors including momentum, volatility, and macroeconomic metrics. For 2018, our rotation among credit sectors detracted slightly from the Fund’s performance.
Within our stock selection process, we attempt to gain exposure to companies with better profitability, that are priced at reasonable valuations relative to their industry peers and are trading with positive price momentum. For the year ending 2018, securities with exposure to medium-term momentum and strong profitability contributed to performance while companies with value characteristics, such as a high earnings yield, detracted from performance.
We utilized equity index derivatives in the Fund, such as stock index futures to equitize cash positions. Since these derivatives are designed to track a respective stock index, there was no discernable impact to the Fund’s relative performance in 2018.
Investment Objective
The investment objective of the Fund is to provide long-term capital appreciation.
Average Annual Total Returns
as of December 31, 2018
| 1
Year | 5
Year | 10
Year |
Dynamic Allocation Fund Retail Class | -8.66% | 4.90% | 10.41% |
Dynamic Allocation Fund Institutional Class | -8.18% | — | — |
Dynamic Allocation Fund Adviser Class | -8.49% | — | — |
Morningstar Aggressive Target Risk Index | -8.17% | 5.01% | 10.61% |
S&P 500 Index | -4.38% | 8.49% | 13.12% |
Blended Index | -6.60% | 6.27% | 11.07% |
Top 10 Holdings
as of December 31, 2018
1. | iShares Core U.S. Aggregate Bond ETF | 5.5% |
2. | Microsoft Corp. | 2.2% |
3. | Apple, Inc. | 2.1% |
4. | Amazon.com, Inc. | 1.7% |
5. | Berkshire Hathaway, Inc. - Class B | 1.6% |
6. | Pfizer, Inc. | 1.2% |
7. | Alphabet, Inc. - Class C | 1.1% |
8. | Verizon Communications, Inc. | 1.1% |
9. | Bank of America Corp. | 1.1% |
10. | Walt Disney Co./The | 0.9% |
As a percentage of total net assets. Holdings exclude short-term investments and derivatives.
Sector Concentration
as of December 31, 2018
Healthcare | 19.8% |
Information Technology | 19.1% |
Financials | 13.6% |
Communication Services | 10.6% |
Consumer Discretionary | 8.1% |
Energy | 7.4% |
Industrials | 7.2% |
Consumer Staples | 4.4% |
Real Estate Investment Trust | 3.8% |
Utilities | 3.7% |
Materials | 2.3% |
Total | 100.0% |
As a percentage of total common stocks. Concentrations are subject to change.
Asset Allocation
as of December 31, 2018
Common Stocks | 69.6% |
Equity Registered Investment Companies | 6.0% |
Money Market Registered Investment Companies | 21.9% |
Bank Obligations | 0.7% |
Other Assets/Liabilities (Net) | 1.8% |
Total | 100.0% |
As a percentage of total net assets. The Fund has invested in stock index futures contracts in order to equitize cash balances held in the Fund.
2018 Annual Report | December 31, 2018 | Page 15 |
Growth of $10,000
as of December 31, 2018

The Growth of $10,000 chart compares the performance of the Fund’s Retail Share Class over the period shown with dividends and capital gains reinvested to the Fund’s benchmarks. Benchmark indices are unmanaged and do not reflect the deduction of expenses associated with a mutual fund, such as investment management and accounting fees.
Investment performance assumes reinvestment of all dividend and capital gain distributions. The results do not reflect the effect of taxes a shareholder would pay on Fund distributions or on the redemption of Fund shares. Historical performance attributed to the Institutional and Adviser Share Classes prior to their inception dates is based on the performance of the Retail Share Class. No adjustment has been made to reflect class-specific distribution or servicing fees. Returns may reflect the effect of voluntary fee waivers or expense reimbursements over the period shown. Without these waivers, performance would have been lower.
The performance data shown represents past performance, which does not guarantee future results. The investment return and principal value of an investment will fluctuate so that an investor’s shares, when redeemed, may be worth more or less than their original cost. Current performance may be lower or higher than the performance data quoted. For current month-end performance data, please visit our website atwww.meederfunds.com.
Effective April 30, 2018, the Fund’s primary benchmark was changed to the Morningstar Aggressive Target Risk Index. The Adviser believes this index is a more appropriate benchmark for the Fund.
The Blended Index is comprised of 70% S&P 500 Index, 25% MSCI ACWI ex USA Index, and 5% Bloomberg Barclays US Aggregate Bond Index.
Page 16 | 2018 Annual Report | December 31, 2018 |
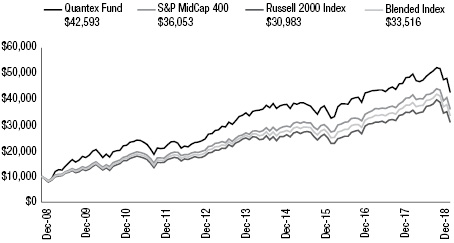
Quantex Fund
For the year ended December 31, 2018, the Meeder Quantex Fund Institutional Class returned -12.05% compared to -11.08% for the S&P Mid Cap 400 Index and -11.01% for the Russell 2000 Index.
We use a quantitative model to identify the capitalization ranges that incorporate our ideal portfolio of small- and mid-capitalization companies with strong growth potential each calendar year. Individual securities for the portfolio are equally weighted at the beginning of the year. Securities are then monitored on an ongoing basis and screened based on various momentum, profitability and value characteristics.
The portfolio’s performance was primarily driven by our sector allocations. Consumer discretionary, Industrials and Financial Services were the largest sector weightings in the portfolio, while our largest underweights relative to the benchmark were in Financials and Utilities. The largest sector contributors were Financials and Utilities, while the biggest individual contributors to performance were XL Group LTD and TripAdvisor. Endo International, Pitney Bowes and Michael Kors were the largest individual detractors to performance.
We utilized equity index derivatives in the Fund, such as stock index futures to equitize cash positions. Since these derivatives are designed to track a respective stock index, there was no discernable impact to the Fund’s relative performance in 2018.
Investment Objective
The investment objective of the Fund is to provide long-term capital appreciation.
Average Annual Total Returns
as of December 31, 2018
| 1
Year | 5
Year | 10
Year |
Quantex Fund Retail Class | -12.35% | 4.18% | 15.59% |
Quantex Fund Institutional Class | -12.05% | — | — |
Quantex Fund Adviser Class | -12.22% | — | — |
S&P MidCap 400 Index | -11.08% | 6.03% | 13.68% |
Russell 2000 Index | -11.01% | 4.41% | 11.97% |
Blended Index | -11.03% | 5.25% | 12.86% |
Top 10 Holdings
as of December 31, 2018
1. | Esterline Technologies Corp. | 1.9% |
2. | Genworth Financial, Inc. | 1.9% |
3. | AES Corp./VA | 1.6% |
4. | NRG Energy, Inc. | 1.6% |
5. | TripAdvisor, Inc. | 1.5% |
6. | Macy's, Inc. | 1.5% |
7. | Boston Beer Co., Inc./The | 1.5% |
8. | Kohl's Corp. | 1.5% |
9. | F5 Networks, Inc. | 1.4% |
10. | Foot Locker, Inc. | 1.4% |
As a percentage of total net assets. Holdings exclude short-term investments and derivatives.
Sector Concentration
as of December 31, 2018
Consumer Discretionary | 26.9% |
Industrials | 14.2% |
Information Technology | 10.9% |
Healthcare | 10.7% |
Financials | 9.5% |
Real Estate Investment Trust | 7.3% |
Materials | 5.5% |
Utilities | 5.5% |
Energy | 4.6% |
Communication Services | 3.1% |
Consumer Staples | 1.8% |
Total | 100.0% |
As a percentage of total common stocks. Concentrations are subject to change.
Asset Allocation
as of December 31, 2018
Common Stocks | 81.2% |
Money Market Registered Investment Companies | 16.3% |
Bank Obligations | 1.9% |
Other Assets/Liabilities (Net) | 0.6% |
Total | 100.0% |
As a percentage of total net assets. The Fund has invested in stock index futures contracts in order to equitize cash balances held in the Fund.
2018 Annual Report | December 31, 2018 | Page 17 |
Growth of $10,000
as of December 31, 2018
The Growth of $10,000 chart compares the performance of the Fund’s Retail Share Class over the period shown with dividends and capital gains reinvested to the Fund’s benchmarks. Benchmark indices are unmanaged and do not reflect the deduction of expenses associated with a mutual fund, such as investment management and accounting fees.
Investment performance assumes reinvestment of all dividend and capital gain distributions. The results do not reflect the effect of taxes a shareholder would pay on Fund distributions or on the redemption of Fund shares. Historical performance attributed to the Institutional and Adviser Share Classes prior to their inception dates is based on the performance of the Retail Share Class. No adjustment has been made to reflect class-specific distribution or servicing fees. Returns may reflect the effect of voluntary fee waivers or expense reimbursements over the period shown. Without these waivers, performance would have been lower.
The performance data shown represents past performance, which does not guarantee future results. The investment return and principal value of an investment will fluctuate so that an investor’s shares, when redeemed, may be worth more or less than their original cost. Current performance may be lower or higher than the performance data quoted. For current month-end performance data, please visit our website atwww.meederfunds.com.
The Blended Index consists of 50% of the Russell 2000 Index and 50% of the S&P MidCap 400 Index.
Page 18 | 2018 Annual Report | December 31, 2018 |
Total Return Bond Fund
The Meeder Total Return Bond Fund Institutional Class returned -1.22% for the year ended December 31, 2018, compared to the Bloomberg Barclays U.S. Aggregate Bond Index which returned 0.01%.
2018 was a volatile year for fixed income markets. Stronger economic growth from tax cuts and higher fiscal spending continued to support a decline in the unemployment rate and a rise in year-over-year average hourly wages. This had the Federal Reserve concerned about a rise in inflation and led them to increase the federal funds rate by 0.25% each quarter, rather than the three rate hikes that the market had expected in 2018. However, market volatility made a comeback in 2018 and the inflation rate remained rather muted, as the Fed’s favored inflation gauge, core PCE, remained below their target of 2%. The U.S. trade tensions with China and the uncertainty around tariffs added to volatility, along with the global economic slowdown in EU due to political pressures and an economic slowdown in China, all the while commodity and oil prices saw big declines. Another source of volatility was a decline in market liquidity as the Federal Reserve continued its balance sheet reduction plan, allowing more than $300B of treasuries and mortgages to roll off during the year. The frequent shift between market strength and economic slowdown concerns caused U.S. treasury yields to fluctuate throughout the year. Our tactical fixed income portfolios, following their model-driven sector allocation process, remained largely allocated to investment-grade securities during 2018. As volatility and treasury yields began to spike during the first quarter, momentum and spread factors signaled us to reduce exposure to high yield and emerging markets. During the year we tactically added brief exposure to high yield in the second quarter and again in the second half of the year, as this sector showed relative strength compared to other fixed income sectors. A weakening U.S. Dollar and positive trend momentum in our models led us to allocate assets to emerging market debt during the third quarter, although we subsequently reduced this position as market volatility increased early in the fourth quarter. Our tactical fixed income sector positions detracted from performance during the second half of the year, affecting our relative performance to the benchmark in 2018. The overall portfolio and treasury allocation maintained a slightly shorter duration than the benchmark throughout the year.
Investment Objective
The investment objective of the Fund is to provide total return, consisting of income and capital growth, consistent with minimizing the risk of loss of capital.
Average Annual Total Returns
as of December 31, 2018
| 1
Year | 5
Year | Since
Inception | Inception
Date |
Total Return Bond Fund Retail Class | -1.67% | 1.12% | 1.83% | 6/30/11 |
Total Return Bond Fund Institutional Class | -1.22% | — | 1.96% | 11/1/16 |
Total Return Bond Fund Adviser Class | -1.45% | — | 1.91% | 11/1/16 |
Bloomberg Barclays US Aggregate Bond Index | 0.01% | 2.52% | 2.62% | — |
Fixed Income Sector Concentration
as of December 31, 2018
Core Intermediate-Term | 80.4% |
U.S. Government | 11.9% |
Emerging Markets Debt | 5.0% |
High-Yield | 2.7% |
Total | 100.00% |
As a percentage of total fixed income securities.
Top 10 Holdings
as of December 31, 2018
1. | iShares Core U.S. Aggregate Bond ETF | 9.8% |
2. | Vanguard Total Bond Market ETF | 9.5% |
3. | DoubleLine Total Return Bond Fund - Class I | 7.2% |
4. | Guggenheim Total Return Bond Fund - Class I | 7.1% |
5. | Dodge & Cox Income Fund | 7.1% |
6. | Frost Total Return Bond Fund - Class I | 7.0% |
7. | Pioneer Bond Fund - Class Y | 6.6% |
8. | U.S. Treasury Note, 2.25%, due 11/15/2025 | 6.3% |
9. | Baird Core Plus Bond Fund - Class I | 6.2% |
10. | Segall Bryant & Hamill Plus Bond Fund - Class I | 6.0% |
As a percentage of total net assets. Holdings exclude short-term investments and derivatives.
2018 Annual Report | December 31, 2018 | Page 19 |
Growth of $10,000
as of December 31, 2018

The Growth of $10,000 chart compares the performance of the Fund’s Retail Share Class over the period shown with dividends and capital gains reinvested to the Fund’s benchmarks. Benchmark indices are unmanaged and do not reflect the deduction of expenses associated with a mutual fund, such as investment management and accounting fees.
Investment performance assumes reinvestment of all dividend and capital gain distributions. The results do not reflect the effect of taxes a shareholder would pay on Fund distributions or on the redemption of Fund shares. Historical performance attributed to the Institutional and Adviser Share Classes prior to their inception dates is based on the performance of the Retail Share Class. No adjustment has been made to reflect class-specific distribution or servicing fees. Returns may reflect the effect of voluntary fee waivers or expense reimbursements over the period shown. Without these waivers, performance would have been lower.
The performance data shown represents past performance, which does not guarantee future results. The investment return and principal value of an investment will fluctuate so that an investor’s shares, when redeemed, may be worth more or less than their original cost. Current performance may be lower or higher than the performance data quoted. For current month-end performance data, please visit our website atwww.meederfunds.com.
Page 20 | 2018 Annual Report | December 31, 2018 |
Prime Money Market Fund
The Meeder Prime Money Market Fund is a constant net asset value (CNAV) fund offered only to natural persons. The objective of this Fund is to maintain a CNAV at $1.00 per share while offering a competitive return to shareholders. The adviser to the Fund accomplishes the objective by investing in short-term, high-quality money market debt obligations. Money market debt obligations may be offered by the U.S. Government and its agencies but may also include obligations of fundamentally sound corporate issuers.
The Money Market Fund industry began 2018 in the midst of a favorable interest rate environment for shareholders. The Federal Open Market Committee (FOMC) policy cycle had been under way for a couple of years with a bulk of the action, to date, taking place in 2017. Expectations for even more increases were anticipated supporting a promising outlook for the year ahead. 2018 also welcomed a new FOMC Chairperson, Jerome Powell, who was expected to stay the course of his predecessor, Janet Yellen. The underpinnings for higher interest rates domestically were an economy on a stable foundation. Strong data from housing, employment and corporate investment were just a few of the indicators fueling an economy supportive of more historically normal interest rates. Internationally, market participants visualized follow through from the FOMC to other central banks around the world as a global lift to economic activity was anticipated. As the year progressed the FOMC did not disappoint increasing the target rate at both the March and June policy meetings. By mid-year though, skeptics became more prevalent as to how high rates could go without disrupting economic progress. Inferences of a trade war with China, speculation that the tax cut stimulus would be short lived, and the ongoing struggle to find an end solution for Brexit began building clouds around the outlook for the second half of the year and beyond. Despite these trepidations, by the end of the year the FOMC had increased its target rate two more times.
Factoring in data at hand and weighing expectations for the year that lay ahead, the advisor fine-tuned tactical strategy to be more advantageous of potential investment opportunities in a rising rate environment. Historically, the Fund has maintained ample liquidity in an effort to provide portfolio safety. Liquidity had also been a solid tool for taking advantage of investment opportunities when they arose. With elevated interest rates throughout 2018, the portfolio management team was afforded an expanded array of investment options with which to add value for shareholders. Where rates ended the year, one could argue they remain accommodative, at least on a historical basis. However, there was growing contention as the year progressed that actions by the FOMC were becoming restrictive to domestic economic growth. A combination of rising rates with global headwinds of trade and geopolitics prompted the advisor to review its strategy again toward the end of the year.
For 2018, the portfolio management team targeted a stable weighted average maturity. This strategy allowed the management team opportunity to alter investments if the environment changed. Currently, we believe the FOMC is contemplating the aforementioned headwinds and may be receptive to altering its rate path slightly. We do anticipate any further interest rate actions to remain drawn out versus historical interest rate cycles. Our sector allocation favors an overweight in high-quality liquid investments. Although with the boost in interest rates, opportunities should remain abundant to explore alternative short-term, high-quality corporate debt product without adding undo risk.
As we completed 2018, our belief was that the Fund should be positioned to maintain strong performance into 2019. In the event the FOMC policy stance changes, we believe the portfolio is positioned to perform in the resulting environment. As we continuously monitor the markets and our strategy, we will remain vigilant and act in the best interests of our shareholders.
Investment Objective
The investment objective of the Fund is to provide current income while maintaining a stable share price of $1.00.
Average Annual Total Returns
as of December 31, 2018
| 1
Year | 5
Year | 10
Year |
Meeder Prime Money Market Fund | 1.59% | 0.54% | 0.38% |
Lipper Average General Purpose Money Market Fund | 1.63% | 0.48% | 0.27% |
Yields
as of December 31, 2018
| 7-Day
Subsidized
Yield | 7-Day
Unsubsidized
Yield |
Meeder Prime Money Market Fund | 2.15% | 1.73% |
Average annual returns for a money market fund should be accompanied by yield figures.
Top 10 Holdings
as of December 31, 2018
1. | INTL FCStone Repo, 3.25%, due 1/2/2019 | 12.2% |
2. | South Street Repo, 3.35%, due 1/2/2019 | 12.2% |
3. | Morgan Stanley Government Institutional Fund, 2.32% | 8.9% |
4. | ExxonMobil, 2.42%, due 1/10/2019 | 3.7% |
5. | Prudential Financial, Inc., 2.45%, due 1/2/2019 | 2.4% |
6. | Federal Home Loan Bank, 2.32%, due 1/9/2019 | 2.4% |
7. | United States Treasury Bill, 2.41%, due 1/22/2019 | 2.4% |
8. | Bank of Montreal, 3.38%, due 12/12/2019 | 1.8% |
9. | IBM Credit, LLC, 2.89%, due 9/6/2019 | 1.6% |
10. | Fidelity Prime Institutional Money Market Portfolio, 2.47% | 1.5% |
As a percentage of total net assets.
2018 Annual Report | December 31, 2018 | Page 21 |
Sector Concentration
as of December 31, 2018
Commercial Paper | 34.6% |
Repurchase Agreements | 24.5% |
Certificates of Deposit | 15.2% |
Money Market Registered Investment Companies | 10.4% |
Corporate Obligations | 8.0% |
U.S. Government and Agency Obligations | 4.9% |
Bank Obligations | 2.4% |
Total | 100.0% |
As a percentage of total net assets. Concentrations are subject to change.
Annual Returns
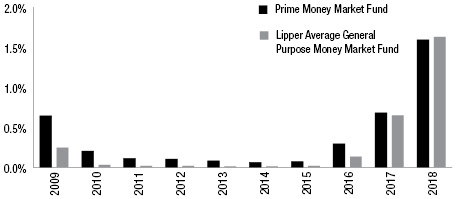
The Fund operates as a retail money market fund and is limited to accounts beneficially owned by natural persons. Investment performance assumes reinvestment of all dividend and capital gain distributions. The results do not reflect the effect of taxes a shareholder would pay on Fund distributions or on the redemption of Fund shares. The subsidized 7-day current yield is the current annualized net yield of the Fund. The unsubsidized 7-day current yield does not reflect the effect of any fee waivers or expense reimbursements made by the Fund’s investment adviser. The 7-day current yield more closely reflects the current earnings of the Fund than total return.
You could lose money by investing in the Fund. Because the share price of the Fund will fluctuate, when you sell your shares they may be worth more or less than what you originally paid for them. The Fund may impose a fee upon sale of your shares or may temporarily suspend your ability to sell shares if the Fund’s liquidity falls below required minimums because of market conditions or other factors. An investment in the Fund is not insured or guaranteed by the Federal Deposit Insurance Corporation or any other government agency. The Fund’s sponsor has no legal obligation to provide financial support to the Fund, and you should not expect that the sponsor will provide financial support to the Fund at any time.
Page 22 | 2018 Annual Report | December 31, 2018 |
Institutional Prime Money Market Fund
The Meeder Institutional Prime Money Market Fund offers a floating net asset value (FNAV). A FNAV fund is characterized by a net asset value which could vary incrementally above or below $1.00 per share. The objective of this Fund is to maintain a FNAV near $1.00 per share while offering a competitive return to shareholders. The adviser to the Fund accomplishes the objective by investing in short-term, high-quality money market debt obligations. Money market debt obligations may be offered by the U.S. Government and its agencies, but may also include obligations of fundamentally sound corporate issuers.
The Money Market Fund industry began 2018 in the midst of a favorable interest rate environment for shareholders. The Federal Open Market Committee (FOMC) policy cycle had been under way for a couple of years with a bulk of the action, to date, taking place in 2017. Expectations for even more increases were anticipated supporting a promising outlook for the year ahead. 2018 also welcomed a new FOMC Chairperson, Jerome Powell, who was expected to stay the course of his predecessor, Janet Yellen. The underpinnings for higher interest rates domestically were an economy on a stable foundation. Strong data from housing, employment and corporate investment were just a few of the indicators fueling an economy supportive of more historically normal interest rates. Internationally, market participants visualized follow through from the FOMC to other central banks around the world as a global lift to economic activity was anticipated. As the year progressed the FOMC did not disappoint increasing the target rate at both the March and June policy meetings. By mid-year though, skeptics became more prevalent as to how high rates could go without disrupting economic progress. Inferences of a trade war with China, speculation that the tax cut stimulus would be short lived, and the ongoing struggle to find an end solution for Brexit began building clouds around the outlook for the second half of the year and beyond. Despite these trepidations, by the end of the year the FOMC had increased its target rate two more times.
Factoring in data at hand and weighing expectations for the year that lay ahead, the advisor fine-tuned tactical strategy to be more advantageous of potential investment opportunities in a rising rate environment. Historically, the Fund has maintained ample liquidity in an effort to provide portfolio safety. Liquidity had also been a solid tool for taking advantage of investment opportunities when they arose. With elevated interest rates throughout 2018, the portfolio management team was afforded an expanded array of investment options with which to add value for shareholders. Where rates ended the year one could argue they remain accommodative, at least on a historical basis. However, there was growing contention as the year progressed that actions by the FOMC were becoming restrictive to domestic economic growth. A combination of rising rates with global headwinds of trade and geopolitics prompted the advisor to review its strategy again toward the end of the year.
For 2018 the portfolio management team targeted a stable weighted average maturity. This strategy allowed the management team opportunity to alter investments if the environment changed. Currently, we believe the FOMC is contemplating the aforementioned headwinds and may be receptive to altering its rate path slightly. We do anticipate any further interest rate actions to remain drawn out versus historical interest rate cycles. Our sector allocation favors an overweight in high-quality liquid investments. Although with the boost in interest rates, opportunities should remain abundant to explore alternative short-term, high-quality corporate debt product without adding undue risk.
As we completed 2018, our belief was that the Fund should be positioned to maintain strong performance into 2019. In the event the FOMC policy stance changes, we believe the portfolio is positioned to perform in the resulting environment. As we continuously monitor the markets and our strategy, we will remain vigilant and act in the best interests of our shareholders.
Investment Objective
The investment objective of the Fund is to provide current income consistent with liquidity and the preservation of capital.
Average Annual Total Returns
as of December 31, 2018
| 1
Year | 5
Year | 10
Year |
Meeder Institutional Prime Money Market Fund | 1.90% | 0.69% | 0.50% |
Lipper Average General Purpose Money Market Fund | 1.63% | 0.48% | 0.27% |
Yields
as of December 31, 2018
| 7-Day
Subsidized
Yield | 7-Day
Unsubsidized
Yield |
Meeder Institutional Prime Money Market Fund | 2.43% | 2.13% |
Average annual returns for a money market fund should be accompanied by yield figures.
Top 10 Holdings
as of December 31, 2018
1. | Morgan Stanley Government Institutional Fund, 2.32% | 12.8% |
2. | South Street Repo, 3.25%, due 1/2/2019 | 10.6% |
3. | South Street Repo, 3.35%, due 1/2/2019 | 6.4% |
4. | INTL FCStone Repo, 3.25%, due 7/2/2018 | 5.3% |
5. | Prudential Financial, Inc., 2.45%, due 1/2/2019 | 3.0% |
6. | Federal Home Loan Bank, 2.32%, due 1/9/2019 | 2.1% |
7. | ExxonMobil, 2.42%, due 1/10/2019 | 2.1% |
8. | United States Treasury Bill, 2.41%, due 1/22/2019 | 2.1% |
9. | BNP Paribas Fortis, Inc., 2.53%, due 2/20/2019 | 1.3% |
10. | Fidelity Prime Institutional Money Market Portfolio, 2.47% | 1.1% |
As a percentage of total net assets.
2018 Annual Report | December 31, 2018 | Page 23 |
Sector Concentration
as of December 31, 2018
Commercial Paper | 39.4% |
Repurchase Agreements | 22.3% |
Certificates of Deposit | 14.2% |
Money Market Registered Investment Companies | 13.9% |
U.S. Government and Agency Obligations | 4.9% |
Corporate Obligations | 5.2% |
Bank Obligations | 0.2% |
Other Assets/Liabilities (Net) | (0.1%) |
Total | 100.0% |
As a percentage of total net assets. Concentrations are subject to change.
Annual Returns
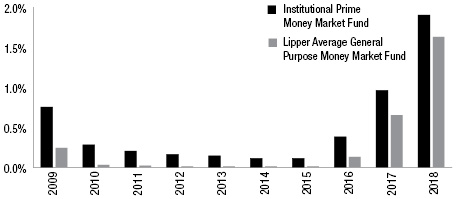
Investment performance assumes reinvestment of all dividend and capital gain distributions. The results do not reflect the effect of taxes a shareholder would pay on Fund distributions or on the redemption of Fund shares. The Fund’s performance prior to October 7, 2016 reflects the performance of a predecessor fund, the Institutional Class of the Meeder Prime Money Market Fund, which was distributed and transferred to the Institutional Prime Money Market Fund upon its inception. The subsidized 7-day current yield is the current annualized net yield of the Fund. The unsubsidized 7-day current yield does not reflect the effect of any fee waivers or expense reimbursements made by the Fund’s investment adviser. The 7-day current yield more closely reflects the current earnings of the Fund than total return.
You could lose money by investing in the Fund. Because the share price of the Fund will fluctuate, when you sell your shares they may be worth more or less than what you originally paid for them. The Fund may impose a fee upon sale of your shares or may temporarily suspend your ability to sell shares if the Fund’s liquidity falls below required minimums because of market conditions or other factors. An investment in the Fund is not insured or guaranteed by the Federal Deposit Insurance Corporation or any other government agency. The Fund’s sponsor has no legal obligation to provide financial support to the Fund, and you should not expect that the sponsor will provide financial support to the Fund at any time.
Page 24 | 2018 Annual Report | December 31, 2018 |
Shareholder Expense Analysis(Unaudited)
Shareholders of mutual funds pay ongoing expenses, such as advisory fees, distribution and service fees (12b-1 fees) and other fund expenses. The following examples are intended to help you understand your ongoing costs (in dollars) of investing in the Funds and to compare these costs with the ongoing costs of investing in other mutual funds.
The examples below are based on an investment of $1,000 invested at the beginning of the period and held for the six-month period from June 30, 2018 to December 31, 2018.
ACTUAL EXPENSES: You may use actual account values and actual expenses, along with the amount you invested, to estimate the expenses that you paid over the period. Simply divide your account value by $1,000 (e.g.: an $8,600 account value divided by $1,000 = 8.6), then multiply the result by the number in the line under the heading “Expenses Paid During the Period” to estimate the expenses you paid on your account during this period.
HYPOTHETICAL EXAMPLE FOR COMPARISON PURPOSES: Hypothetical account values and hypothetical expenses are based on the Funds’ actual expense ratios and assume rates of return of 5% per year before expenses, which are not the Funds’ actual returns. The hypothetical account values and expenses may not be used to estimate the actual ending account balance or expenses you paid for the period. You may use this information to compare the ongoing costs of investing in the Funds to other funds. To do so, compare this 5% hypothetical example with the 5% hypothetical examples that appear in the shareholder reports of the other funds.
| | | Beginning
Account Value
(6/30/18) | Ending
Account Value
(12/31/18) | Expenses Paid
During Period1
(6/30/18 -
12/31/18) | Expense Ratio2
(Annualized) |
Muirfield Fund - Retail Class | Actual | $1,000.00 | $955.80 | $6.46 | 1.31% |
| | Hypothetical | 1,000.00 | 1,018.60 | 6.67 | 1.31% |
Spectrum Fund - Retail Class | Actual | 1,000.00 | 952.10 | 9.45 | 1.92% |
| | Hypothetical | 1,000.00 | 1,015.53 | 9.75 | 1.92% |
Global Allocation Fund - Retail Class | Actual | 1,000.00 | 937.50 | 7.96 | 1.63% |
| | Hypothetical | 1,000.00 | 1,016.99 | 8.29 | 1.63% |
Balanced Fund - Retail Class | Actual | 1,000.00 | 968.30 | 7.04 | 1.42% |
| | Hypothetical | 1,000.00 | 1,018.05 | 7.22 | 1.42% |
Moderate Allocation Fund - Retail Class | Actual | 1,000.00 | 974.00 | 6.87 | 1.38% |
| | Hypothetical | 1,000.00 | 1,018.25 | 7.02 | 1.38% |
Conservative Allocation Fund - Retail Class | Actual | 1,000.00 | 983.90 | 6.35 | 1.27% |
| | Hypothetical | 1,000.00 | 1,018.80 | 6.46 | 1.27% |
Dynamic Allocation Fund - Retail Class | Actual | 1,000.00 | 905.90 | 6.97 | 1.45% |
| | Hypothetical | 1,000.00 | 1,017.90 | 7.37 | 1.45% |
Quantex Fund - Retail Class | Actual | 1,000.00 | 850.80 | 7.32 | 1.57% |
| | Hypothetical | 1,000.00 | 1,017.29 | 7.98 | 1.57% |
Total Return Bond Fund - Retail Class | Actual | 1,000.00 | 1,004.10 | 5.86 | 1.16% |
| | Hypothetical | 1,000.00 | 1,019.36 | 5.90 | 1.16% |
Prime Money Market Fund | Actual | 1,000.00 | 1,009.20 | 2.23 | 0.44% |
| | Hypothetical | 1,000.00 | 1,022.99 | 2.24 | 0.44% |
Institutional Prime Money Market Fund | Actual | 1,000.00 | 1,010.60 | 0.86 | 0.17% |
| | Hypothetical | 1,000.00 | 1,024.35 | 0.87 | 0.17% |
Muirfield Fund - Adviser Class | Actual | 1,000.00 | 957.20 | 5.03 | 1.02% |
| | Hypothetical | 1,000.00 | 1,020.06 | 5.19 | 1.02% |
Spectrum Fund - Adviser Class | Actual | 1,000.00 | 954.20 | 8.52 | 1.73% |
| | Hypothetical | 1,000.00 | 1,016.48 | 8.79 | 1.73% |
Global Allocation Fund - Adviser Class | Actual | 1,000.00 | 938.40 | 7.18 | 1.47% |
| | Hypothetical | 1,000.00 | 1,017.80 | 7.48 | 1.47% |
Balanced Fund - Adviser Class | Actual | 1,000.00 | 969.30 | 5.86 | 1.18% |
| | Hypothetical | 1,000.00 | 1,019.26 | 6.01 | 1.18% |
2018 Annual Report | December 31, 2018 | Page 25 |
| | | Beginning
Account Value
(6/30/18) | Ending
Account Value
(12/31/18) | Expenses Paid
During Period1
(6/30/18 -
12/31/18) | Expense Ratio2
(Annualized) |
Moderate Allocation Fund - Adviser Class | Actual | $1,000.00 | $974.50 | $5.87 | 1.18% |
| | Hypothetical | 1,000.00 | 1,019.26 | 6.01 | 1.18% |
Conservative Allocation Fund - Adviser Class | Actual | 1,000.00 | 984.50 | 5.55 | 1.11% |
| | Hypothetical | 1,000.00 | 1,019.61 | 5.65 | 1.11% |
Dynamic Allocation Fund - Adviser Class | Actual | 1,000.00 | 906.70 | 5.91 | 1.23% |
| | Hypothetical | 1,000.00 | 1,019.00 | 6.26 | 1.23% |
Quantex Fund - Adviser Class | Actual | 1,000.00 | 851.40 | 6.63 | 1.42% |
| | Hypothetical | 1,000.00 | 1,018.05 | 7.22 | 1.42% |
Total Return Bond Fund - Adviser Class | Actual | 1,000.00 | 1,005.40 | 4.80 | 0.95% |
| | Hypothetical | 1,000.00 | 1,020.42 | 4.84 | 0.95% |
Muirfield Fund - Institutional Class | Actual | 1,000.00 | 959.50 | 4.00 | 0.81% |
| | Hypothetical | 1,000.00 | 1,021.12 | 4.13 | 0.81% |
Spectrum Fund - Institutional Class | Actual | 1,000.00 | 954.20 | 7.44 | 1.51% |
| | Hypothetical | 1,000.00 | 1,017.59 | 7.68 | 1.51% |
Global Allocation Fund - Institutional Class | Actual | 1,000.00 | 939.20 | 5.91 | 1.21% |
| | Hypothetical | 1,000.00 | 1,019.11 | 6.16 | 1.21% |
Balanced Fund - Institutional Class | Actual | 1,000.00 | 970.60 | 4.87 | 0.98% |
| | Hypothetical | 1,000.00 | 1,020.27 | 4.99 | 0.98% |
Moderate Allocation Fund - Institutional Class | Actual | 1,000.00 | 976.40 | 5.08 | 1.02% |
| | Hypothetical | 1,000.00 | 1,020.06 | 5.19 | 1.02% |
Conservative Allocation Fund - Institutional Class | Actual | 1,000.00 | 985.40 | 4.60 | 0.92% |
| | Hypothetical | 1,000.00 | 1,020.57 | 4.69 | 0.92% |
Dynamic Allocation Fund - Institutional Class | Actual | 1,000.00 | 908.10 | 4.91 | 1.02% |
| | Hypothetical | 1,000.00 | 1,020.06 | 5.19 | 1.02% |
Quantex Fund - Institutional Class | Actual | 1,000.00 | 852.20 | 5.70 | 1.22% |
| | Hypothetical | 1,000.00 | 1,019.06 | 6.21 | 1.22% |
Total Return Bond Fund - Institutional Class | Actual | 1,000.00 | 1,006.70 | 3.79 | 0.75% |
| | Hypothetical | 1,000.00 | 1,021.42 | 3.82 | 0.75% |
Please note that the expenses shown in the tables are meant to highlight your ongoing costs only and do not reflect any transactional costs, such as redemption fees or exchange fees. Therefore, hypothetical information is useful in comparing ongoing costs only, and will not help you determine the relative total costs of owning different funds. In addition, if any transactional costs were included, your costs would have been higher.
1 | Expenses are equal to the Funds’ annualized expense ratios, multiplied by the average account value over the period by 184/365 (to reflect the total number of days in the six-month period). |
2 | Does not include the effects of acquired fund fees and expenses. May be influenced by the timing of reimbursements made to the Fund. |
Page 26 | 2018 Annual Report | December 31, 2018 |
2018 Annual Report
Fund Holdings & Financial Statements
Schedule of Investments
December 31, 2018
Muirfield Fund |
Security Description | | Shares,
Contracts
or Principal
Amount ($) | | | Fair
Value ($) | |
Common Stocks — 63.8% |
Communication Services — 6.0% | | | | | | | | |
Alphabet, Inc. - Class A(1) | | | 677 | | | | 707,438 | |
Alphabet, Inc. - Class C(1) | | | 6,884 | | | | 7,129,139 | |
AMC Entertainment Holdings, Inc. | | | 9,184 | | | | 112,780 | |
AMC Networks, Inc.(1) | | | 3,263 | | | | 179,073 | |
AT&T, Inc. | | | 109,932 | | | | 3,137,459 | |
ATN International, Inc. | | | 229 | | | | 16,380 | |
Beasley Broadcast Group, Inc. | | | 373 | | | | 1,399 | |
Cable One, Inc. | | | 740 | | | | 606,874 | |
Cincinnati Bell, Inc.(1) | | | 1,708 | | | | 13,288 | |
Cinemark Holdings, Inc. | | | 3,782 | | | | 135,396 | |
Comcast Corp. - Class A | | | 65,210 | | | | 2,220,401 | |
Discovery, Inc.(1) | | | 13,249 | | | | 305,787 | |
EW Scripps Co./The | | | 568 | | | | 8,935 | |
Facebook, Inc.(1) | | | 27,070 | | | | 3,548,606 | |
Frontier Communications Corp. | | | 11,987 | | | | 28,529 | |
Gannett Co., Inc. | | | 543 | | | | 4,632 | |
Gray Television, Inc.(1) | | | 7,416 | | | | 109,312 | |
Intelsat SA(1) | | | 1,656 | | | | 35,422 | |
Interpublic Group of Cos., Inc./The | | | 7,183 | | | | 148,185 | |
Liberty TripAdvisor Holdings, Inc.(1) | | | 1,221 | | | | 19,402 | |
Marcus Corp./The | | | 4,338 | | | | 171,351 | |
MDC Partners, Inc.(1) | | | 6,658 | | | | 17,377 | |
National CineMedia, Inc. | | | 3,026 | | | | 19,608 | |
Nexstar Media Group, Inc. | | | 2,076 | | | | 163,257 | |
NII Holdings, Inc.(1) | | | 3,034 | | | | 13,380 | |
Ooma, Inc.(1) | | | 881 | | | | 12,228 | |
Rosetta Stone, Inc.(1) | | | 1,143 | | | | 18,745 | |
Scholastic Corp. | | | 471 | | | | 18,962 | |
Spok Holdings, Inc. | | | 6,068 | | | | 80,462 | |
Sprint Corp.(1) | | | 53,320 | | | | 310,322 | |
TechTarget, Inc.(1) | | | 508 | | | | 6,203 | |
TEGNA, Inc. | | | 16,022 | | | | 174,159 | |
Telephone & Data Systems, Inc. | | | 8,212 | | | | 267,218 | |
T-Mobile US, Inc.(1) | | | 50,115 | | | | 3,187,815 | |
Tribune Publishing Co.(1) | | | 3,234 | | | | 36,674 | |
Twenty-First Century Fox, Inc. - Class A | | | 25,970 | | | | 1,249,676 | |
United States Cellular Corp.(1) | | | 1,388 | | | | 72,134 | |
Verizon Communications, Inc. | | | 115,704 | | | | 6,504,879 | |
Viacom, Inc. | | | 30,828 | | | | 792,280 | |
Vonage Holdings Corp.(1) | | | 4,431 | | | | 38,683 | |
Walt Disney Co./The | | | 45,127 | | | | 4,948,176 | |
WideOpenWest, Inc.(1) | | | 3,568 | | | | 25,440 | |
| | | | | | | | 36,597,466 | |
| | | | | | | | | |
Consumer Discretionary — 5.0% | | | | | | | | |
Aaron's, Inc. | | | 2,741 | | | | 115,259 | |
Amazon.com, Inc.(1) | | | 6,480 | | | | 9,732,766 | |
Ascena Retail Group, Inc.(1) | | | 3,354 | | | | 8,419 | |
Barnes & Noble Education, Inc.(1) | | | 210 | | | | 842 | |
Bassett Furniture Industries, Inc. | | | 3,989 | | | | 79,940 | |
Bed Bath & Beyond, Inc.(2) | | | 12,972 | | | | 146,843 | |
Best Buy Co., Inc. | | | 16,550 | | | | 876,488 | |
Bloomin' Brands, Inc. | | | 3,889 | | | | 69,574 | |
Bojangles', Inc.(1) | | | 266 | | | | 4,277 | |
Booking Holdings, Inc.(1) | | | 1,028 | | | | 1,770,648 | |
Brinker International, Inc. | | | 1,764 | | | | 77,581 | |
Burlington Stores, Inc.(1) | | | 949 | | | | 154,374 | |
Callaway Golf Co. | | | 4,967 | | | | 75,995 | |
Capri Holdings, Ltd.(1) | | | 12,695 | | | | 481,394 | |
Cato Corp./The | | | 110 | | | | 1,570 | |
Chico's FAS, Inc. | | | 2,657 | | | | 14,932 | |
Clarus Corp. | | | 2,828 | | | | 28,619 | |
Crocs, Inc.(1) | | | 1,657 | | | | 43,049 | |
Darden Restaurants, Inc. | | | 3,772 | | | | 376,672 | |
Dave & Buster's Entertainment, Inc. | | | 1,290 | | | | 57,482 | |
Deckers Outdoor Corp.(1) | | | 1,003 | | | | 128,334 | |
Dine Brands Global, Inc. | | | 170 | | | | 11,448 | |
Domino's Pizza, Inc. | | | 771 | | | | 191,200 | |
Dunkin' Brands Group, Inc. | | | 1,056 | | | | 67,711 | |
Ethan Allen Interiors, Inc. | | | 4,091 | | | | 71,961 | |
Etsy, Inc.(1) | | | 1,831 | | | | 87,101 | |
Express, Inc.(1) | | | 5,644 | | | | 28,841 | |
Extended Stay America, Inc. | | | 13,183 | | | | 204,337 | |
Five Below, Inc.(1) | | | 127 | | | | 12,995 | |
Foot Locker, Inc. | | | 4,801 | | | | 255,413 | |
Ford Motor Co. | | | 104,197 | | | | 797,107 | |
Fox Factory Holding Corp.(1) | | | 663 | | | | 39,031 | |
Gentex Corp. | | | 16,716 | | | | 337,830 | |
G-III Apparel Group, Ltd.(1) | | | 218 | | | | 6,080 | |
H&R Block, Inc. | | | 10,275 | | | | 260,677 | |
Helen of Troy, Ltd.(1) | | | 392 | | | | 51,423 | |
Hooker Furniture Corp. | | | 1,880 | | | | 49,519 | |
J Alexander's Holdings, Inc.(1) | | | 4,450 | | | | 36,624 | |
Lands' End, Inc.(1) | | | 391 | | | | 5,556 | |
La-Z-Boy, Inc. | | | 1,912 | | | | 52,982 | |
Lear Corp. | | | 4,865 | | | | 597,714 | |
Liberty Expedia Holdings, Inc.(1) | | | 15,342 | | | | 600,026 | |
Lululemon Athletica, Inc.(1) | | | 3,554 | | | | 432,202 | |
M/I Homes, Inc.(1) | | | 5,605 | | | | 117,817 | |
Malibu Boats, Inc.(1) | | | 408 | | | | 14,198 | |
The accompanying notes are an integral part of these financial statements.
Page 28 | 2018 Annual Report | December 31, 2018 |
Schedule of Investments
December 31, 2018
Muirfield Fund |
Security Description | | Shares,
Contracts
or Principal
Amount ($) | | | Fair
Value ($) | |
Common Stocks — continued |
MasterCraft Boat Holdings, Inc.(1) | | | 1,305 | | | | 24,404 | |
McDonald's Corp. | | | 2,171 | | | | 385,504 | |
MDC Holdings, Inc. | | | 2,987 | | | | 83,965 | |
NIKE, Inc. - Class B | | | 45 | | | | 3,336 | |
Norwegian Cruise Line Holdings, Ltd.(1) | | | 4,980 | | | | 211,102 | |
Nutrisystem, Inc. | | | 187 | | | | 8,206 | |
NVR, Inc.(1) | | | 175 | | | | 426,473 | |
Office Depot, Inc. | | | 370 | | | | 955 | |
Oxford Industries, Inc. | | | 331 | | | | 23,514 | |
Penn National Gaming, Inc.(1) | | | 2,389 | | | | 44,985 | |
Qurate Retail, Inc.(1) | | | 7,307 | | | | 142,633 | |
Rent-A-Center, Inc./TX(1) | | | 379 | | | | 6,136 | |
Ross Stores, Inc. | | | 2,119 | | | | 176,301 | |
RTW RetailWinds, Inc.(1) | | | 1,971 | | | | 5,578 | |
Signet Jewelers, Ltd. | | | 1,513 | | | | 48,068 | |
Speedway Motorsports, Inc. | | | 502 | | | | 8,168 | |
Starbucks Corp. | | | 29,921 | | | | 1,926,912 | |
Stoneridge, Inc.(1) | | | 667 | | | | 16,442 | |
Tailored Brands, Inc. | | | 82 | | | | 1,118 | |
Target Corp. | | | 17,073 | | | | 1,128,355 | |
Taylor Morrison Home Corp.(1) | | | 6,217 | | | | 98,850 | |
Thor Industries, Inc. | | | 2,568 | | | | 133,536 | |
TJX Cos., Inc./The | | | 82,582 | | | | 3,694,719 | |
Tower International, Inc. | | | 1,692 | | | | 40,270 | |
Town Sports International Holdings, Inc.(1) | | | 227 | | | | 1,453 | |
Turtle Beach Corp.(1) | | | 332 | | | | 4,738 | |
Ulta Beauty, Inc.(1) | | | 622 | | | | 152,290 | |
Vera Bradley, Inc.(1) | | | 2,452 | | | | 21,014 | |
Wendy's Co./The | | | 9,876 | | | | 154,164 | |
Wyndham Hotels & Resorts, Inc. | | | 18,660 | | | | 846,604 | |
Yum! Brands, Inc. | | | 21,987 | | | | 2,021,045 | |
| | | | | | | | 30,415,689 | |
| | | | | | | | | |
Consumer Staples — 2.3% | | | | | | | | |
Church & Dwight Co., Inc. | | | 4,002 | | | | 263,172 | |
Coca-Cola Co./The | | | 5,315 | | | | 251,665 | |
Conagra Brands, Inc. | | | 18,607 | | | | 397,446 | |
Costco Wholesale Corp. | | | 4,065 | | | | 828,081 | |
Flowers Foods, Inc. | | | 144 | | | | 2,660 | |
Hershey Co./The | | | 2,375 | | | | 254,553 | |
Kellogg Co. | | | 890 | | | | 50,739 | |
Keurig Dr Pepper, Inc. | | | 61,435 | | | | 1,575,193 | |
Kroger Co./The | | | 28,622 | | | | 787,105 | |
Lamb Weston Holdings, Inc. | | | 5,682 | | | | 417,968 | |
Molson Coors Brewing Co. | | | 10,744 | | | | 603,383 | |
PepsiCo, Inc. | | | 31,794 | | | | 3,512,601 | |
Procter & Gamble Co./The | | | 27,759 | | | | 2,551,607 | |
Simply Good Foods Co./The(1) | | | 1,822 | | | | 34,436 | |
SpartanNash Co. | | | 624 | | | | 10,720 | |
Sprouts Farmers Market, Inc.(1) | | | 4,139 | | | | 97,308 | |
Tyson Foods, Inc. | | | 8,599 | | | | 459,187 | |
Walgreens Boots Alliance, Inc. | | | 11,853 | | | | 809,915 | |
Walmart, Inc. | | | 15,435 | | | | 1,437,770 | |
| | | | | | | | 14,345,509 | |
| | | | | | | | | |
Energy — 3.9% | | | | | | | | |
Adams Resources & Energy, Inc. | | | 252 | | | | 9,755 | |
Anadarko Petroleum Corp. | | | 6,665 | | | | 292,194 | |
Arch Coal, Inc. - Class A | | | 801 | | | | 66,475 | |
Archrock, Inc. | | | 10,642 | | | | 79,709 | |
Cactus, Inc.(1) | | | 4,334 | | | | 118,795 | |
Chesapeake Energy Corp.(1)(2) | | | 20,521 | | | | 43,094 | |
Chevron Corp. | | | 16,998 | | | | 1,849,212 | |
ConocoPhillips | | | 63,557 | | | | 3,962,779 | |
CONSOL Energy, Inc.(1) | | | 544 | | | | 17,250 | |
Covia Holdings Corp.(1)(2) | | | 16,701 | | | | 57,117 | |
CVR Energy, Inc. | | | 1,365 | | | | 47,065 | |
Delek US Holdings, Inc. | | | 1,898 | | | | 61,704 | |
Denbury Resources, Inc.(1) | | | 6,400 | | | | 10,944 | |
Earthstone Energy, Inc.(1) | | | 2,969 | | | | 13,420 | |
Era Group, Inc.(1) | | | 1,136 | | | | 9,929 | |
Evolution Petroleum Corp. | | | 5,668 | | | | 38,656 | |
Exxon Mobil Corp. | | | 61,403 | | | | 4,187,071 | |
Gulfport Energy Corp.(1) | | | 7,795 | | | | 51,057 | |
Hallador Energy Co. | | | 5,664 | | | | 28,716 | |
Helix Energy Solutions Group, Inc.(1) | | | 1,961 | | | | 10,609 | |
Helmerich & Payne, Inc. | | | 4,748 | | | | 227,619 | |
HollyFrontier Corp. | | | 7,673 | | | | 392,244 | |
Keane Group, Inc.(1) | | | 10,826 | | | | 88,557 | |
KLX Energy Services Holdings, Inc.(1) | | | 489 | | | | 11,467 | |
Mammoth Energy Services, Inc. | | | 1,738 | | | | 31,249 | |
Marathon Oil Corp. | | | 55,229 | | | | 791,984 | |
Marathon Petroleum Corp. | | | 35,319 | | | | 2,084,174 | |
Matrix Service Co.(1) | | | 6,372 | | | | 114,314 | |
Northern Oil and Gas, Inc.(1) | | | 1,543 | | | | 3,487 | |
Occidental Petroleum Corp. | | | 48,883 | | | | 3,000,439 | |
Overseas Shipholding Group, Inc.(1) | | | 2,573 | | | | 4,271 | |
PBF Energy, Inc. | | | 7,736 | | | | 252,735 | |
Peabody Energy Corp. | | | 6,053 | | | | 184,495 | |
Penn Virginia Corp.(1) | | | 543 | | | | 29,355 | |
Phillips 66 | | | 38,522 | | | | 3,318,670 | |
Profire Energy, Inc.(1) | | | 5,201 | | | | 7,541 | |
The accompanying notes are an integral part of these financial statements.
2018 Annual Report | December 31, 2018 | Page 29 |
Schedule of Investments
December 31, 2018
Muirfield Fund |
Security Description | | Shares,
Contracts
or Principal
Amount ($) | | | Fair
Value ($) | |
Common Stocks — continued |
ProPetro Holding Corp.(1) | | | 6,582 | | | | 81,090 | |
Renewable Energy Group, Inc.(1) | | | 585 | | | | 15,035 | |
SEACOR Holdings, Inc.(1) | | | 82 | | | | 3,034 | |
SilverBow Resources, Inc.(1) | | | 1,461 | | | | 34,538 | |
Southwestern Energy Co.(1) | | | 18,369 | | | | 62,638 | |
Targa Resources Corp. | | | 5,984 | | | | 215,544 | |
Unit Corp.(1) | | | 1,455 | | | | 20,777 | |
Valero Energy Corp. | | | 27,072 | | | | 2,029,588 | |
W&T Offshore, Inc.(1) | | | 6,066 | | | | 24,992 | |
WildHorse Resource Development Corp.(1) | | | 2,929 | | | | 41,328 | |
World Fuel Services Corp. | | | 3,667 | | | | 78,510 | |
| | | | | | | | 24,105,226 | |
| | | | | | | | | |
Financials — 8.0% | | | | | | | | |
American Equity Investment Life Holding Co. | | | 601 | | | | 16,792 | |
Arbor Realty Trust, Inc. | | | 16,509 | | | | 166,246 | |
Arthur J Gallagher & Co. | | | 5,126 | | | | 377,786 | |
Bancorp, Inc./The(1) | | | 13,437 | | | | 106,959 | |
Bank of America Corp. | | | 256,261 | | | | 6,314,271 | |
Bank of NT Butterfield & Son, Ltd./The | | | 2,851 | | | | 89,379 | |
BankUnited, Inc. | | | 494 | | | | 14,790 | |
BB&T Corp. | | | 29,773 | | | | 1,289,766 | |
Berkshire Hathaway, Inc. - Class B(1) | | | 40,298 | | | | 8,228,046 | |
Cherry Hill Mortgage Investment Corp. | | | 1,226 | | | | 21,504 | |
CIT Group, Inc. | | | 3,953 | | | | 151,281 | |
Cullen/Frost Bankers, Inc. | | | 520 | | | | 45,729 | |
Discover Financial Services | | | 15,878 | | | | 936,484 | |
Essent Group, Ltd.(1) | | | 5,908 | | | | 201,935 | |
Fidelity National Financial, Inc. | | | 11,371 | | | | 357,504 | |
Fifth Third Bancorp | | | 67,571 | | | | 1,589,946 | |
First BanCorp/Puerto Rico | | | 7,140 | | | | 61,404 | |
FirstCash, Inc. | | | 2,903 | | | | 210,032 | |
Genworth Financial, Inc.(1) | | | 7,703 | | | | 35,896 | |
Goosehead Insurance, Inc.(1) | | | 1,032 | | | | 27,131 | |
Health Insurance Innovations, Inc. - Class A(1) | | | 1,254 | | | | 33,519 | |
Huntington Bancshares, Inc./OH | | | 166,782 | | | | 1,988,041 | |
Independence Holding Co. | | | 386 | | | | 13,587 | |
Independent Bank Corp./MI | | | 462 | | | | 9,711 | |
Investment Technology Group, Inc. | | | 501 | | | | 15,150 | |
JPMorgan Chase & Co. | | | 40,341 | | | | 3,938,088 | |
KeyCorp | | | 137,184 | | | | 2,027,580 | |
Ladder Capital Corp. | | | 24,926 | | | | 385,605 | |
Loews Corp. | | | 3,624 | | | | 164,964 | |
Marlin Business Services Corp. | | | 595 | | | | 13,286 | |
MB Financial, Inc. | | | 22,135 | | | | 877,210 | |
MBT Financial Corp. | | | 3,275 | | | | 30,458 | |
Medley Management, Inc. | | | 1,292 | | | | 4,987 | |
MGIC Investment Corp.(1) | | | 14,415 | | | | 150,781 | |
Moelis & Co. | | | 3,888 | | | | 133,669 | |
Mr Cooper Group, Inc.(1) | | | 5,778 | | | | 67,429 | |
National General Holdings Corp. | | | 2,843 | | | | 68,829 | |
New Residential Investment Corp. | | | 88,419 | | | | 1,256,434 | |
NMI Holdings, Inc. - Class A(1) | | | 2,880 | | | | 51,408 | |
Northrim BanCorp, Inc. | | | 1,600 | | | | 52,592 | |
OFG Bancorp | | | 2,099 | | | | 34,550 | |
Old Republic International Corp. | | | 27,479 | | | | 565,243 | |
On Deck Capital, Inc.(1) | | | 4,057 | | | | 23,936 | |
Oppenheimer Holdings, Inc. | | | 8,312 | | | | 212,372 | |
PacWest Bancorp | | | 24,798 | | | | 825,277 | |
Parke Bancorp, Inc. | | | 303 | | | | 5,671 | |
PennyMac Financial Services, Inc. | | | 7,750 | | | | 164,765 | |
Popular, Inc. | | | 8,498 | | | | 401,276 | |
Progressive Corp./The | | | 49,613 | | | | 2,993,152 | |
Pzena Investment Management, Inc. | | | 8,733 | | | | 75,540 | |
Radian Group, Inc. | | | 20,642 | | | | 337,703 | |
Ready Capital Corp. | | | 620 | | | | 8,575 | |
Regions Financial Corp. | | | 169,350 | | | | 2,265,903 | |
Reinsurance Group of America, Inc. | | | 2,875 | | | | 403,161 | |
Safety Insurance Group, Inc. | | | 1,416 | | | | 115,843 | |
Silvercrest Asset Management Group, Inc. | | | 157 | | | | 2,077 | |
Stewart Information Services Corp. | | | 10,342 | | | | 428,159 | |
SunTrust Banks, Inc. | | | 64,550 | | | | 3,255,902 | |
Synchrony Financial | | | 1,660 | | | | 38,944 | |
TCF Financial Corp. | | | 41,628 | | | | 811,330 | |
Universal Insurance Holdings, Inc. | | | 1,917 | | | | 72,693 | |
US Bancorp | | | 6,123 | | | | 279,821 | |
Waddell & Reed Financial, Inc. | | | 836 | | | | 15,115 | |
Walker & Dunlop, Inc. | | | 3,875 | | | | 167,594 | |
Wells Fargo & Co. | | | 88,409 | | | | 4,073,887 | |
| | | | | | | | 49,104,698 | |
| | | | | | | | | |
Healthcare — 12.9% | | | | | | | | |
Abbott Laboratories | | | 18,508 | | | | 1,338,684 | |
AbbVie, Inc. | | | 17,978 | | | | 1,657,392 | |
ABIOMED, Inc.(1) | | | 1,507 | | | | 489,835 | |
ACADIA Pharmaceuticals, Inc.(1) | | | 454 | | | | 7,341 | |
Achillion Pharmaceuticals, Inc.(1) | | | 10,923 | | | | 17,368 | |
Acorda Therapeutics, Inc.(1) | | | 6,444 | | | | 100,398 | |
Aeglea BioTherapeutics, Inc.(1) | | | 2,549 | | | | 19,092 | |
AgeX Therapeutics, Inc.(1) | | | 75 | | | | 224 | |
The accompanying notes are an integral part of these financial statements.
Page 30 | 2018 Annual Report | December 31, 2018 |
Schedule of Investments
December 31, 2018
Muirfield Fund |
Security Description | | Shares,
Contracts
or Principal
Amount ($) | | | Fair
Value ($) | |
Common Stocks — continued |
Agilent Technologies, Inc. | | | 3,503 | | | | 236,312 | |
Aldeyra Therapeutics, Inc.(1) | | | 4,205 | | | | 34,902 | |
Alexion Pharmaceuticals, Inc.(1) | | | 8,679 | | | | 844,987 | |
Alkermes PLC(1) | | | 697 | | | | 20,568 | |
Allergan PLC | | | 11,266 | | | | 1,505,814 | |
AMAG Pharmaceuticals, Inc.(1) | | | 3,487 | | | | 52,968 | |
Amedisys, Inc.(1) | | | 183 | | | | 21,431 | |
AmerisourceBergen Corp. | | | 5,928 | | | | 441,043 | |
Amgen, Inc. | | | 19,132 | | | | 3,724,426 | |
Amphastar Pharmaceuticals, Inc.(1) | | | 2,370 | | | | 47,163 | |
Ampio Pharmaceuticals, Inc.(1) | | | 90 | | | | 36 | |
Aquestive Therapeutics, Inc.(1) | | | 1,165 | | | | 7,340 | |
Arena Pharmaceuticals, Inc.(1) | | | 2,930 | | | | 114,124 | |
ArQule, Inc.(1) | | | 7,216 | | | | 19,988 | |
Arrowhead Pharmaceuticals, Inc.(1) | | | 3,348 | | | | 41,582 | |
Assertio Therapeutics, Inc.(1) | | | 2,927 | | | | 10,566 | |
Atara Biotherapeutics, Inc.(1) | | | 2,142 | | | | 74,413 | |
Avid Bioservices, Inc.(1) | | | 6,007 | | | | 24,629 | |
Baxter International, Inc. | | | 52,125 | | | | 3,430,868 | |
Biogen, Inc.(1) | | | 9,397 | | | | 2,827,745 | |
BioSpecifics Technologies Corp.(1) | | | 1,067 | | | | 64,660 | |
Bio-Techne Corp. | | | 755 | | | | 109,264 | |
BioTelemetry, Inc.(1) | | | 897 | | | | 53,569 | |
Bristol-Myers Squibb Co. | | | 42,243 | | | | 2,195,791 | |
Bruker Corp. | | | 7,800 | | | | 232,206 | |
Calithera Biosciences, Inc.(1) | | | 2,659 | | | | 10,663 | |
Cardinal Health, Inc. | | | 8,635 | | | | 385,121 | |
CareDx, Inc.(1) | | | 2,845 | | | | 71,523 | |
CASI Pharmaceuticals, Inc.(1) | | | 3,344 | | | | 13,443 | |
Catalent, Inc.(1) | | | 15,116 | | | | 471,317 | |
Catalyst Pharmaceuticals, Inc.(1) | | | 14,602 | | | | 28,036 | |
Celcuity, Inc.(1) | | | 720 | | | | 17,273 | |
Celgene Corp.(1) | | | 5,106 | | | | 327,244 | |
Cellular Biomedicine Group, Inc.(1) | | | 1,775 | | | | 31,347 | |
Centene Corp.(1) | | | 1,826 | | | | 210,538 | |
Cerner Corp.(1) | | | 28,818 | | | | 1,511,216 | |
Charles River Laboratories International, Inc.(1) | | | 691 | | | | 78,207 | |
Chemed Corp. | | | 982 | | | | 278,181 | |
ChemoCentryx, Inc.(1) | | | 1,680 | | | | 18,329 | |
Codexis, Inc.(1) | | | 93 | | | | 1,553 | |
Collegium Pharmaceutical, Inc.(1) | | | 1,062 | | | | 18,235 | |
CONMED Corp. | | | 1,950 | | | | 125,190 | |
Cooper Cos., Inc./The | | | 1,250 | | | | 318,125 | |
Corium International Contingent Value Rights(1)(7) | | | 409 | | | | — | |
CVS Health Corp. | | | 8,822 | | | | 578,017 | |
Danaher Corp. | | | 836 | | | | 86,208 | |
DexCom, Inc.(1) | | | 1,540 | | | | 184,492 | |
Durect Corp.(1) | | | 379 | | | | 183 | |
Eli Lilly & Co. | | | 23,482 | | | | 2,717,337 | |
Emergent BioSolutions, Inc.(1) | | | 4,900 | | | | 290,472 | |
Enanta Pharmaceuticals, Inc.(1) | | | 913 | | | | 64,668 | |
Encompass Health Corp. | | | 3,989 | | | | 246,121 | |
Endo International PLC(1) | | | 8,502 | | | | 62,065 | |
Ensign Group, Inc./The | | | 381 | | | | 14,779 | |
Evolus, Inc.(1) | | | 568 | | | | 6,759 | |
Exact Sciences Corp.(1) | | | 1,439 | | | | 90,801 | |
Exelixis, Inc.(1) | | | 10,457 | | | | 205,689 | |
Fennec Pharmaceuticals, Inc.(1) | | | 4,773 | | | | 30,452 | |
FONAR Corp.(1) | | | 1,971 | | | | 39,893 | |
Fortress Biotech, Inc.(1) | | | 16,011 | | | | 13,769 | |
G1 Therapeutics, Inc.(1) | | | 2,538 | | | | 48,603 | |
Genomic Health, Inc.(1) | | | 1,540 | | | | 99,191 | |
Gilead Sciences, Inc. | | | 34,603 | | | | 2,164,418 | |
Globus Medical, Inc.(1) | | | 4,783 | | | | 207,008 | |
Halozyme Therapeutics, Inc.(1) | | | 479 | | | | 7,008 | |
Harvard Bioscience, Inc.(1) | | | 3,886 | | | | 12,357 | |
HCA Healthcare, Inc. | | | 22,020 | | | | 2,740,389 | |
Hill-Rom Holdings, Inc. | | | 8,178 | | | | 724,162 | |
Hologic, Inc.(1) | | | 929 | | | | 38,182 | |
Horizon Pharma Plc(1) | | | 4,547 | | | | 88,848 | |
Humana, Inc. | | | 5,240 | | | | 1,501,155 | |
ICU Medical, Inc.(1) | | | 697 | | | | 160,052 | |
IDEXX Laboratories, Inc.(1) | | | 4,657 | | | | 866,295 | |
Incyte Corp.(1) | | | 2,647 | | | | 168,323 | |
Innovate Biopharmaceuticals, Inc.(1) | | | 842 | | | | 1,945 | |
Inovio Pharmaceuticals, Inc.(1) | | | 5,943 | | | | 23,772 | |
Integer Holdings Corp.(1) | | | 1,505 | | | | 114,771 | |
Intercept Pharmaceuticals, Inc.(1) | | | 69 | | | | 6,955 | |
Intersect ENT, Inc.(1) | | | 2,621 | | | | 73,860 | |
IntriCon Corp.(1) | | | 183 | | | | 4,828 | |
Invitae Corp.(1) | | | 7,323 | | | | 80,992 | |
IQVIA Holdings, Inc.(1) | | | 3,451 | | | | 400,903 | |
Jazz Pharmaceuticals PLC(1) | | | 1,306 | | | | 161,892 | |
Johnson & Johnson | | | 46,010 | | | | 5,937,591 | |
Kindred Biosciences, Inc.(1) | | | 4,516 | | | | 49,450 | |
Lannett Co., Inc.(1)(2) | | | 139 | | | | 689 | |
Lantheus Holdings, Inc.(1) | | | 813 | | | | 12,723 | |
LivaNova PLC(1) | | | 723 | | | | 66,133 | |
Loxo Oncology, Inc.(1) | | | 183 | | | | 25,633 | |
Luminex Corp. | | | 2,501 | | | | 57,798 | |
The accompanying notes are an integral part of these financial statements.
2018 Annual Report | December 31, 2018 | Page 31 |
Schedule of Investments
December 31, 2018
Muirfield Fund |
Security Description | | Shares,
Contracts
or Principal
Amount ($) | | | Fair
Value ($) | |
Common Stocks — continued |
MacroGenics, Inc.(1) | | | 6,913 | | | | 87,795 | |
Madrigal Pharmaceuticals, Inc.(1) | | | 274 | | | | 30,885 | |
Mallinckrodt PLC(1) | | | 3,394 | | | | 53,625 | |
Marinus Pharmaceuticals, Inc.(1) | | | 4,365 | | | | 12,528 | |
Masimo Corp.(1) | | | 3,918 | | | | 420,676 | |
MediciNova, Inc.(1) | | | 29 | | | | 237 | |
Medtronic PLC | | | 52,882 | | | | 4,810,147 | |
Merck & Co., Inc. | | | 73,181 | | | | 5,591,760 | |
Minerva Neurosciences, Inc.(1) | | | 6,470 | | | | 43,608 | |
Mirati Therapeutics, Inc.(1) | | | 970 | | | | 41,147 | |
Molina Healthcare, Inc.(1) | | | 899 | | | | 104,482 | |
Momenta Pharmaceuticals, Inc.(1) | | | 1,839 | | | | 20,303 | |
Mustang Bio, Inc.(1) | | | 3,806 | | | | 11,190 | |
Mylan NV(1) | | | 48,559 | | | | 1,330,517 | |
Myriad Genetics, Inc.(1) | | | 153 | | | | 4,448 | |
Natera, Inc.(1) | | | 2,943 | | | | 41,084 | |
NeoGenomics, Inc.(1) | | | 316 | | | | 3,985 | |
Neurocrine Biosciences, Inc.(1) | | | 3,125 | | | | 223,156 | |
Omnicell, Inc.(1) | | | 229 | | | | 14,024 | |
Orthofix Medical, Inc.(1) | | | 3,714 | | | | 194,948 | |
Owens & Minor, Inc. | | | 2,928 | | | | 18,534 | |
Pacira Pharmaceuticals, Inc./DE(1) | | | 2,197 | | | | 94,515 | |
Palatin Technologies, Inc.(1) | | | 3,590 | | | | 2,543 | |
PDL BioPharma, Inc.(1) | | | 16,793 | | | | 48,700 | |
Perrigo Co. PLC | | | 10,847 | | | | 420,321 | |
Pfizer, Inc. | | | 139,734 | | | | 6,099,389 | |
Phibro Animal Health Corp. | | | 2,897 | | | | 93,168 | |
Pieris Pharmaceuticals, Inc.(1) | | | 1,241 | | | | 3,301 | |
PRA Health Sciences, Inc.(1) | | | 3,878 | | | | 356,621 | |
Premier, Inc. - Class A(1) | | | 9,078 | | | | 339,063 | |
Prestige Consumer Healthcare, Inc.(1) | | | 1,626 | | | | 50,211 | |
Proteostasis Therapeutics, Inc.(1) | | | 4,895 | | | | 15,860 | |
PTC Therapeutics, Inc.(1) | | | 442 | | | | 15,169 | |
Ra Pharmaceuticals, Inc.(1) | | | 2,542 | | | | 46,264 | |
Reata Pharmaceuticals, Inc.(1) | | | 807 | | | | 45,273 | |
Regeneron Pharmaceuticals, Inc.(1) | | | 5,289 | | | | 1,975,442 | |
REGENXBIO, Inc.(1) | | | 1,378 | | | | 57,807 | |
Repligen Corp.(1) | | | 2,619 | | | | 138,126 | |
Rhythm Pharmaceuticals, Inc.(1) | | | 286 | | | | 7,688 | |
Sarepta Therapeutics, Inc.(1) | | | 1,521 | | | | 165,987 | |
SIGA Technologies, Inc.(1) | | | 12,794 | | | | 101,073 | |
Spring Bank Pharmaceuticals, Inc.(1) | | | 1,205 | | | | 12,520 | |
STAAR Surgical Co.(1) | | | 542 | | | | 17,295 | |
STERIS PLC | | | 1,030 | | | | 110,056 | |
Supernus Pharmaceuticals, Inc.(1) | | | 363 | | | | 12,059 | |
Surface Oncology, Inc.(1) | | | 2,347 | | | | 9,951 | |
Syneos Health, Inc.(1) | | | 2,831 | | | | 111,400 | |
Tandem Diabetes Care, Inc.(1) | | | 1,998 | | | | 75,864 | |
Tenet Healthcare Corp.(1) | | | 1,558 | | | | 26,704 | |
Thermo Fisher Scientific, Inc. | | | 613 | | | | 137,183 | |
Tocagen, Inc.(1) | | | 4,324 | | | | 35,500 | |
United Therapeutics Corp.(1) | | | 4,169 | | | | 454,004 | |
UnitedHealth Group, Inc. | | | 15,023 | | | | 3,742,530 | |
Universal Health Services, Inc. | | | 746 | | | | 86,954 | |
Vanda Pharmaceuticals, Inc.(1) | | | 4,225 | | | | 110,399 | |
Varian Medical Systems, Inc.(1) | | | 3,111 | | | | 352,507 | |
Veeva Systems, Inc.(1) | | | 3,236 | | | | 289,040 | |
Veracyte, Inc.(1) | | | 3,247 | | | | 40,847 | |
Vericel Corp.(1) | | | 3,091 | | | | 53,783 | |
Vertex Pharmaceuticals, Inc.(1) | | | 16,797 | | | | 2,783,431 | |
Viking Therapeutics, Inc.(1) | | | 3,772 | | | | 28,856 | |
Vital Therapies, Inc.(1) | | | 2,686 | | | | 500 | |
WaVe Life Sciences, Ltd.(1) | | | 61 | | | | 2,564 | |
West Pharmaceutical Services, Inc. | | | 3,024 | | | | 296,443 | |
Xencor, Inc.(1) | | | 1,573 | | | | 56,880 | |
Zafgen, Inc.(1) | | | 3,742 | | | | 18,523 | |
Zimmer Biomet Holdings, Inc. | | | 2,823 | | | | 292,802 | |
Zoetis, Inc. | | | 21,225 | | | | 1,815,587 | |
| | | | | | | | 78,269,683 | |
| | | | | | | | | |
Industrials — 4.9% | | | | | | | | |
ACCO Brands Corp. | | | 11,162 | | | | 75,678 | |
Albany International Corp. | | | 812 | | | | 50,693 | |
Allison Transmission Holdings, Inc. | | | 17,408 | | | | 764,385 | |
Ameresco, Inc. - Class A(1) | | | 845 | | | | 11,915 | |
ArcBest Corp. | | | 949 | | | | 32,513 | |
Armstrong World Industries, Inc. | | | 4,097 | | | | 238,486 | |
Atkore International Group, Inc.(1) | | | 3,886 | | | | 77,098 | |
Boeing Co./The | | | 1,136 | | | | 366,360 | |
Brady Corp. | | | 2,926 | | | | 127,164 | |
Casella Waste Systems, Inc.(1) | | | 1,078 | | | | 30,712 | |
Cintas Corp. | | | 1,723 | | | | 289,447 | |
Comfort Systems USA, Inc. | | | 3,306 | | | | 144,406 | |
Commercial Vehicle Group, Inc.(1) | | | 6,935 | | | | 39,530 | |
Continental Building Products, Inc.(1) | | | 234 | | | | 5,955 | |
Copart, Inc.(1) | | | 6,224 | | | | 297,383 | |
Covenant Transportation Group, Inc.(1) | | | 1,668 | | | | 32,026 | |
Crane Co. | | | 4,020 | | | | 290,164 | |
CSX Corp. | | | 57,789 | | | | 3,590,431 | |
Cummins, Inc. | | | 1,597 | | | | 213,423 | |
Delta Air Lines, Inc. | | | 28,144 | | | | 1,404,386 | |
Donaldson Co., Inc. | | | 1,694 | | | | 73,503 | |
The accompanying notes are an integral part of these financial statements.
Page 32 | 2018 Annual Report | December 31, 2018 |
Schedule of Investments
December 31, 2018
Muirfield Fund |
Security Description | | Shares,
Contracts
or Principal
Amount ($) | | | Fair
Value ($) | |
Common Stocks — continued |
Ducommun, Inc.(1) | | | 1,215 | | | | 44,129 | |
Eagle Bulk Shipping, Inc.(1) | | | 6,588 | | | | 30,371 | |
Emerson Electric Co. | | | 2,551 | | | | 152,422 | |
EnerSys | | | 3,308 | | | | 256,734 | |
Federal Signal Corp. | | | 3,940 | | | | 78,406 | |
Foundation Building Materials, Inc.(1) | | | 3,299 | | | | 27,415 | |
Global Brass & Copper Holdings, Inc. | | | 4,690 | | | | 117,954 | |
Graco, Inc. | | | 3,978 | | | | 166,479 | |
Harsco Corp.(1) | | | 5,140 | | | | 102,080 | |
Hawaiian Holdings, Inc. | | | 183 | | | | 4,833 | |
HD Supply Holdings, Inc.(1) | | | 4,467 | | | | 167,602 | |
Heidrick & Struggles International, Inc. | | | 655 | | | | 20,429 | |
Hillenbrand, Inc. | | | 8,381 | | | | 317,891 | |
HNI Corp. | | | 300 | | | | 10,629 | |
Huntington Ingalls Industries, Inc. | | | 3,734 | | | | 710,618 | |
Hurco Cos., Inc. | | | 1,119 | | | | 39,948 | |
Infrastructure and Energy Alternatives, Inc.(1) | | | 3,016 | | | | 24,701 | |
Ingersoll-Rand PLC | | | 8,971 | | | | 818,424 | |
Insperity, Inc. | | | 663 | | | | 61,898 | |
Kadant, Inc. | | | 552 | | | | 44,966 | |
KBR, Inc. | | | 4,791 | | | | 72,727 | |
Kelly Services, Inc. - Class A | | | 759 | | | | 15,544 | |
Kennametal, Inc. | | | 1,792 | | | | 59,638 | |
Kimball International, Inc. - Class B | | | 2,430 | | | | 34,482 | |
Landstar System, Inc. | | | 4,101 | | | | 392,343 | |
LB Foster Co. - Class A(1) | | | 71 | | | | 1,129 | |
LSC Communications, Inc. | | | 2,325 | | | | 16,275 | |
ManpowerGroup, Inc. | | | 304 | | | | 19,699 | |
Masonite International Corp.(1) | | | 4,868 | | | | 218,232 | |
Matson, Inc. | | | 5,826 | | | | 186,549 | |
Miller Industries, Inc./TN | | | 2,535 | | | | 68,445 | |
MSC Industrial Direct Co., Inc. | | | 2,981 | | | | 229,299 | |
Navigant Consulting, Inc. | | | 2,118 | | | | 50,938 | |
NCI Building Systems, Inc.(1) | | | 11,914 | | | | 86,377 | |
Nexeo Solutions, Inc.(1) | | | 2,695 | | | | 23,150 | |
Norfolk Southern Corp. | | | 23,652 | | | | 3,536,920 | |
Old Dominion Freight Line, Inc. | | | 941 | | | | 116,204 | |
Oshkosh Corp. | | | 6,559 | | | | 402,132 | |
PACCAR, Inc. | | | 31,771 | | | | 1,815,395 | |
Park-Ohio Holdings Corp. | | | 711 | | | | 21,821 | |
Patrick Industries, Inc.(1) | | | 2,080 | | | | 61,589 | |
Pitney Bowes, Inc. | | | 6,576 | | | | 38,864 | |
Quad/Graphics, Inc. | | | 4,677 | | | | 57,621 | |
Quanex Building Products Corp. | | | 947 | | | | 12,870 | |
Quanta Services, Inc. | | | 5,611 | | | | 168,891 | |
Radiant Logistics, Inc.(1) | | | 3,720 | | | | 15,810 | |
RBC Bearings, Inc.(1) | | | 402 | | | | 52,702 | |
Regal Beloit Corp. | | | 75 | | | | 5,254 | |
Republic Services, Inc. | | | 9,344 | | | | 673,609 | |
Rollins, Inc. | | | 14,116 | | | | 509,588 | |
RR Donnelley & Sons Co. | | | 6,474 | | | | 25,637 | |
Spirit AeroSystems Holdings, Inc. | | | 2,407 | | | | 173,521 | |
Steelcase, Inc. - Class A | | | 6,619 | | | | 98,160 | |
Teledyne Technologies, Inc.(1) | | | 695 | | | | 143,914 | |
Tetra Tech, Inc. | | | 510 | | | | 26,403 | |
Timken Co./The | | | 2,000 | | | | 74,640 | |
Toro Co./The | | | 10,590 | | | | 591,769 | |
TriMas Corp.(1) | | | 3,365 | | | | 91,831 | |
UniFirst Corp./MA | | | 903 | | | | 129,192 | |
Union Pacific Corp. | | | 32,139 | | | | 4,442,574 | |
United Continental Holdings, Inc.(1) | | | 25,194 | | | | 2,109,494 | |
Universal Logistics Holdings, Inc. | | | 885 | | | | 16,010 | |
US Xpress Enterprises, Inc.(1) | | | 3,340 | | | | 18,737 | |
Vectrus, Inc.(1) | | | 3,101 | | | | 66,920 | |
Wabash National Corp. | | | 8,312 | | | | 108,721 | |
Waste Management, Inc. | | | 13,646 | | | | 1,214,358 | |
WW Grainger, Inc. | | | 686 | | | | 193,699 | |
| | | | | | | | 29,843,264 | |
| | | | | | | | | |
Information Technology — 14.1% | | | | | | | | |
Accenture PLC | | | 5,810 | | | | 819,268 | |
ACI Worldwide, Inc.(1) | | | 2,013 | | | | 55,700 | |
Adobe, Inc.(1) | | | 15,944 | | | | 3,607,171 | |
Advanced Micro Devices, Inc.(1) | | | 24,959 | | | | 460,743 | |
Agilysys, Inc.(1) | | | 1,220 | | | | 17,495 | |
Amkor Technology, Inc.(1) | | | 19,548 | | | | 128,235 | |
ANSYS, Inc.(1) | | | 188 | | | | 26,873 | |
Apple, Inc. | | | 75,764 | | | | 11,951,013 | |
Applied Materials, Inc. | | | 3,089 | | | | 101,134 | |
ARRIS International PLC(1) | | | 2,524 | | | | 77,159 | |
Arrow Electronics, Inc.(1) | | | 2,203 | | | | 151,897 | |
Aspen Technology, Inc.(1) | | | 4,236 | | | | 348,114 | |
Autodesk, Inc.(1) | | | 5,159 | | | | 663,499 | |
Avaya Holdings Corp.(1) | | | 6,632 | | | | 96,562 | |
Avnet, Inc. | | | 19,375 | | | | 699,438 | |
Booz Allen Hamilton Holding Corp. | | | 5,906 | | | | 266,183 | |
Bottomline Technologies DE, Inc.(1) | | | 3,474 | | | | 166,752 | |
Broadcom, Inc. | | | 3,749 | | | | 953,296 | |
Cabot Microelectronics Corp. | | | 2,781 | | | | 265,168 | |
CACI International, Inc. - Class A(1) | | | 1,723 | | | | 248,164 | |
Cadence Design Systems, Inc.(1) | | | 16,724 | | | | 727,160 | |
The accompanying notes are an integral part of these financial statements.
2018 Annual Report | December 31, 2018 | Page 33 |
Schedule of Investments
December 31, 2018
Muirfield Fund |
Security Description | | Shares,
Contracts
or Principal
Amount ($) | | | Fair
Value ($) | |
Common Stocks — continued |
CDK Global, Inc. | | | 2,053 | | | | 98,298 | |
CDW Corp./DE | | | 7,202 | | | | 583,722 | |
Ciena Corp.(1) | | | 6,941 | | | | 235,369 | |
Cirrus Logic, Inc.(1) | | | 1,981 | | | | 65,730 | |
Cisco Systems, Inc. | | | 137,895 | | | | 5,974,990 | |
CommVault Systems, Inc.(1) | | | 1,991 | | | | 117,648 | |
Comtech Telecommunications Corp. | | | 3,034 | | | | 73,848 | |
Dell Technologies, Inc. - Class C(1) | | | 24,372 | | | | 1,191,060 | |
Dolby Laboratories, Inc. | | | 3,114 | | | | 192,570 | |
DXC Technology Co. | | | 12,328 | | | | 655,480 | |
Electro Scientific Industries, Inc.(1) | | | 205 | | | | 6,142 | |
Euronet Worldwide, Inc.(1) | | | 2,433 | | | | 249,091 | |
EVERTEC, Inc. | | | 3,894 | | | | 111,758 | |
F5 Networks, Inc.(1) | | | 8,817 | | | | 1,428,619 | |
Fabrinet(1) | | | 3,686 | | | | 189,129 | |
Fair Isaac Corp.(1) | | | 193 | | | | 36,091 | |
Fortinet, Inc.(1) | | | 9,035 | | | | 636,335 | |
Hackett Group, Inc./The | | | 159 | | | | 2,546 | |
Hewlett Packard Enterprise Co. | | | 123,063 | | | | 1,625,662 | |
HP, Inc. | | | 135,815 | | | | 2,778,775 | |
Immersion Corp.(1) | | | 2,746 | | | | 24,604 | |
Insight Enterprises, Inc.(1) | | | 4,240 | | | | 172,780 | |
Integrated Device Technology, Inc.(1) | | | 1,982 | | | | 95,988 | |
Intel Corp. | | | 84,910 | | | | 3,984,826 | |
InterDigital, Inc. | | | 6,343 | | | | 421,365 | |
International Business Machines Corp. | | | 15,311 | | | | 1,740,401 | |
Intuit, Inc. | | | 18,552 | | | | 3,651,961 | |
j2 Global, Inc. | | | 2,372 | | | | 164,569 | |
Jabil, Inc. | | | 15,471 | | | | 383,526 | |
Juniper Networks, Inc. | | | 50,749 | | | | 1,365,656 | |
KEMET Corp. | | | 68 | | | | 1,193 | |
KLA-Tencor Corp. | | | 4,024 | | | | 360,108 | |
Lam Research Corp. | | | 7,146 | | | | 973,071 | |
Leidos Holdings, Inc. | | | 4,592 | | | | 242,090 | |
LivePerson, Inc.(1) | | | 2,718 | | | | 51,261 | |
LiveRamp Holdings, Inc.(1) | | | 176 | | | | 6,799 | |
Majesco(1) | | | 115 | | | | 815 | |
Mastercard, Inc. | | | 22,135 | | | | 4,175,768 | |
MAXIMUS, Inc. | | | 8 | | | | 521 | |
Micron Technology, Inc.(1) | | | 75,331 | | | | 2,390,253 | |
Microsoft Corp. | | | 124,478 | | | | 12,643,230 | |
MicroStrategy, Inc.(1) | | | 216 | | | | 27,594 | |
Mitek Systems, Inc.(1) | | | 1,055 | | | | 11,405 | |
MKS Instruments, Inc. | | | 1,085 | | | | 70,102 | |
MoneyGram International, Inc.(1) | | | 16,313 | | | | 32,626 | |
Motorola Solutions, Inc. | | | 3,298 | | | | 379,402 | |
Nanometrics, Inc.(1) | | | 3,115 | | | | 85,133 | |
Napco Security Technologies, Inc.(1) | | | 1,310 | | | | 20,633 | |
National Instruments Corp. | | | 1,363 | | | | 61,853 | |
NetApp, Inc. | | | 16,370 | | | | 976,798 | |
Nuance Communications, Inc.(1) | | | 24,450 | | | | 323,474 | |
NVE Corp. | | | 38 | | | | 3,327 | |
Oracle Corp. | | | 62,790 | | | | 2,834,969 | |
PC Connection, Inc. | | | 1,832 | | | | 54,465 | |
Photronics, Inc.(1) | | | 10,469 | | | | 101,340 | |
Progress Software Corp. | | | 2,876 | | | | 102,069 | |
PTC, Inc.(1) | | | 3,704 | | | | 307,062 | |
Quantenna Communications, Inc.(1) | | | 4,660 | | | | 66,871 | |
SailPoint Technologies Holding, Inc.(1) | | | 1,060 | | | | 24,899 | |
ScanSource, Inc.(1) | | | 352 | | | | 12,102 | |
Semtech Corp.(1) | | | 2,470 | | | | 113,299 | |
SendGrid, Inc.(1) | | | 2,010 | | | | 86,772 | |
SMART Global Holdings, Inc.(1)(2) | | | 1,783 | | | | 52,955 | |
SPS Commerce, Inc.(1) | | | 5 | | | | 412 | |
Symantec Corp. | | | 26,061 | | | | 492,423 | |
Synopsys, Inc.(1) | | | 10,948 | | | | 922,260 | |
Tableau Software, Inc.(1) | | | 2,666 | | | | 319,920 | |
Tech Data Corp.(1) | | | 2,493 | | | | 203,952 | |
Texas Instruments, Inc. | | | 44,317 | | | | 4,187,957 | |
TiVo Corp. | | | 846 | | | | 7,961 | |
Trade Desk, Inc./The(1) | | | 1,426 | | | | 165,502 | |
Ubiquiti Networks, Inc. | | | 1,068 | | | | 106,170 | |
Unisys Corp.(1) | | | 1,643 | | | | 19,108 | |
Verint Systems, Inc.(1) | | | 7,145 | | | | 302,305 | |
Visa, Inc. | | | 6,589 | | | | 869,353 | |
Vishay Precision Group, Inc.(1) | | | 666 | | | | 20,133 | |
Workiva, Inc.(1) | | | 619 | | | | 22,216 | |
Xilinx, Inc. | | | 19,377 | | | | 1,650,339 | |
Zebra Technologies Corp. - Class A(1) | | | 1,844 | | | | 293,620 | |
Zix Corp.(1) | | | 2,886 | | | | 16,537 | |
| | | | | | | | 86,283,990 | |
| | | | | | | | | |
Materials — 1.6% | | | | | | | | |
CF Industries Holdings, Inc. | | | 8,988 | | | | 391,068 | |
Chemours Co./The | | | 11,626 | | | | 328,086 | |
Eagle Materials, Inc. | | | 10,450 | | | | 637,764 | |
Ecolab, Inc. | | | 2,243 | | | | 330,506 | |
FutureFuel Corp. | | | 5,712 | | | | 90,592 | |
Greif, Inc. - Class A | | | 4,775 | | | | 177,200 | |
Huntsman Corp. | | | 2,860 | | | | 55,169 | |
International Paper Co. | | | 22,961 | | | | 926,706 | |
Louisiana-Pacific Corp. | | | 20,755 | | | | 461,176 | |
The accompanying notes are an integral part of these financial statements.
Page 34 | 2018 Annual Report | December 31, 2018 |
Schedule of Investments
December 31, 2018
Muirfield Fund |
Security Description | | Shares,
Contracts
or Principal
Amount ($) | | | Fair
Value ($) | |
Common Stocks — continued |
LyondellBasell Industries NV | | | 38,959 | | | | 3,239,830 | |
Mosaic Co./The | | | 13,162 | | | | 384,462 | |
Nucor Corp. | | | 23,150 | | | | 1,199,402 | |
PPG Industries, Inc. | | | 5,339 | | | | 545,806 | |
Reliance Steel & Aluminum Co. | | | 4,862 | | | | 346,029 | |
Steel Dynamics, Inc. | | | 16,316 | | | | 490,133 | |
Trinseo SA | | | 5,478 | | | | 250,783 | |
Verso Corp.(1) | | | 857 | | | | 19,197 | |
| | | | | | | | 9,873,909 | |
| | | | | | | | | |
Real Estate Investment Trust — 2.5% | | | | | | | | |
American Assets Trust, Inc. | | | 7,490 | | | | 300,873 | |
American Tower Corp. | | | 5,875 | | | | 929,366 | |
Bluerock Residential Growth REIT, Inc. | | | 452 | | | | 4,077 | |
CatchMark Timber Trust, Inc. | | | 10,485 | | | | 74,444 | |
CoreCivic, Inc. | | | 8,263 | | | | 147,329 | |
CubeSmart | | | 6,357 | | | | 182,382 | |
Essex Property Trust, Inc. | | | 12,297 | | | | 3,015,347 | |
Front Yard Residential Corp. | | | 1,673 | | | | 14,605 | |
Gaming and Leisure Properties, Inc. | | | 4,434 | | | | 143,263 | |
GEO Group, Inc./The | | | 8,785 | | | | 173,065 | |
Gladstone Commercial Corp. | | | 198 | | | | 3,548 | |
Hospitality Properties Trust | | | 15,507 | | | | 370,307 | |
Host Hotels & Resorts, Inc. | | | 53,492 | | | | 891,712 | |
Lamar Advertising Co. | | | 9,492 | | | | 656,657 | |
New Senior Investment Group, Inc. | | | 10,402 | | | | 42,856 | |
Pebblebrook Hotel Trust | | | 191 | | | | 5,407 | |
Pennsylvania Real Estate Investment Trust | | | 6,096 | | | | 36,210 | |
Piedmont Office Realty Trust, Inc. | | | 26,879 | | | | 458,018 | |
PotlatchDeltic Corp. | | | 2,361 | | | | 74,702 | |
PS Business Parks, Inc. | | | 3,568 | | | | 467,408 | |
Redfin Corp.(1) | | | 2,018 | | | | 29,059 | |
Retail Properties of America, Inc. | | | 6,577 | | | | 71,360 | |
Retail Value, Inc. | | | 4,906 | | | | 125,545 | |
SBA Communications Corp.(1) | | | 632 | | | | 102,314 | |
Simon Property Group, Inc. | | | 21,152 | | | | 3,553,324 | |
Tanger Factory Outlet Centers, Inc. | | | 8,931 | | | | 180,585 | |
UDR, Inc. | | | 73,124 | | | | 2,897,173 | |
Urstadt Biddle Properties, Inc. | | | 2,233 | | | | 42,918 | |
| | | | | | | | 14,993,854 | |
| | | | | | | | | |
Utilities — 2.6% | | | | | | | | |
AES Corp./VA | | | 68,222 | | | | 986,490 | |
CenterPoint Energy, Inc. | | | 108,389 | | | | 3,059,821 | |
Clearway Energy, Inc. | | | 1,310 | | | | 22,165 | |
DTE Energy Co. | | | 593 | | | | 65,408 | |
Exelon Corp. | | | 77,431 | | | | 3,492,138 | |
MDU Resources Group, Inc. | | | 5,516 | | | | 131,501 | |
NextEra Energy, Inc. | | | 23,690 | | | | 4,117,797 | |
NorthWestern Corp. | | | 2,340 | | | | 139,090 | |
NRG Energy, Inc. | | | 14,105 | | | | 558,558 | |
OGE Energy Corp. | | | 9,260 | | | | 362,899 | |
Portland General Electric Co. | | | 1,032 | | | | 47,317 | |
UGI Corp. | | | 55,050 | | | | 2,936,897 | |
| | | | | | | | 15,920,081 | |
| | | | | | | | | |
Total Common Stocks (Cost $393,296,868) | | | | | | | 389,753,369 | |
| | | | | | | | | |
Money Market Registered Investment Companies — 33.3% |
Morgan Stanley Government Institutional Fund, 2.32%(3) | | | 210,386 | | | | 210,386 | |
Meeder Institutional Prime Money Market Fund, 2.43%(4) | | | 203,148,660 | | | | 203,128,346 | |
Total Money Market Registered Investment Companies (Cost $203,341,211) | | | | | | | 203,338,732 | |
| | | | | | | | | |
Bank Obligations — 0.2% | | | | | | | | |
First Merchants Bank Deposit Account, 2.10%, 1/2/2019(5) | | | 249,221 | | | | 249,221 | |
Metro City Bank Deposit Account, 2.10%, 1/2/2019(5) | | | 249,212 | | | | 249,212 | |
Pacific Mercantile Bank Deposit Account, 2.20%, 1/2/2019(5) | | | 249,289 | | | | 249,289 | |
Pacific Premier Bank Deposit Account, 2.30%, 1/2/2019(5) | | | 249,192 | | | | 249,192 | |
Seacoast Community Bank Deposit Account, 2.00%, 1/2/2019(5) | | | 249,192 | | | | 249,192 | |
Total Bank Obligations (Cost $1,246,106) | | | | | | | 1,246,106 | |
Total Investments — 97.3%(Cost $597,884,185) | | | | | | | 594,338,207 | |
Other Assets less Liabilities — 2.7% | | | | | | | 16,670,889 | |
Total Net Assets — 100.0% | | | | | | | 611,009,096 | |
The accompanying notes are an integral part of these financial statements.
2018 Annual Report | December 31, 2018 | Page 35 |
Schedule of Investments
December 31, 2018
Muirfield Fund |
Security Description | | Shares,
Contracts
or Principal
Amount ($) | | | Fair
Value ($) | |
Trustee Deferred Compensation(6) |
Meeder Balanced Fund | | | 3,539 | | | | 39,212 | |
Meeder Dynamic Allocation Fund | | | 8,884 | | | | 86,974 | |
Meeder Muirfield Fund | | | 4,483 | | | | 32,098 | |
Meeder Conservative Allocation Fund | | | 1,031 | | | | 21,837 | |
Total Trustee Deferred Compensation (Cost $182,327) | | | | | | | 180,121 | |
| | | Long
(Short)
Contracts | | | Expiration
Date | | | Notional
Value of
Contracts
($) | | | Value and
Unrealized
Appreciation
(Depreciation)
($) | |
Futures Contracts |
Index Futures | | | | | | | | | | | | | | | | |
Mini MSCI EAFE Index Futures | | | 61 | | | | 3/15/2019 | | | | 5,233,800 | | | | (78,483 | ) |
Mini MSCI Emerging Markets Index Futures | | | 35 | | | | 3/15/2019 | | | | 1,691,900 | | | | (5,223 | ) |
Russell 2000 Mini Index Futures | | | (392 | ) | | | 3/15/2019 | | | | (26,440,400 | ) | | | 568,126 | |
Standard & Poors 500 Mini Futures | | | (1,753 | ) | | | 3/15/2019 | | | | (219,580,780 | ) | | | 2,553,225 | |
E-mini Standard & Poors MidCap 400 Futures | | | (351 | ) | | | 3/15/2019 | | | | (58,343,220 | ) | | | 827,190 | |
Total Futures Contracts | | | (2,400 | ) | | | | | | | (297,438,700 | ) | | | 3,864,835 | |
(1) | Represents non-income producing securities. |
(2) | All or a portion of this security is on loan. |
(3) | Investment purchased with cash received as securities lending collateral. The yield shown represents the 7-day yield in effect at December 31, 2018. |
(4) | Investment in affiliate. The yield shown represents the 7-day yield in effect at December 31, 2018. |
(5) | Variable rate security. Securities payable at par including accrued interest (usually within seven days notice) and unconditionally secured as to principal and interest by letters of credit or other credit support agreements from major banks. The interest rates are adjustable and are not based on a published reference rate and spread but are determined by the issuer or agent and are based on current market conditions. These securities do not indicate a reference rate and spread in their description above. The rate shown represents the rate in effect at December 31, 2018. The maturity date shown, if applicable, reflects the earlier of the next demand date or stated maturity date. |
(6) | Assets of affiliates to the Muirfield Fund held for the benefit of the Fund’s Trustees in connection with the Trustee Deferred Compensation Plan. |
(7) | Fair valued security deemed as Level 3 security. |
The accompanying notes are an integral part of these financial statements.
Page 36 | 2018 Annual Report | December 31, 2018 |
Schedule of Investments
December 31, 2018
Spectrum Fund |
Security Description | | Shares or
Principal
Amount ($) | | | Fair
Value ($) | |
Common Stocks - Long — 88.6% |
Communication Services — 5.9% | | | | | | | | |
Alphabet, Inc. - Class A(1)(4) | | | 517 | | | | 540,244 | |
Alphabet, Inc. - Class C(1)(4) | | | 1,581 | | | | 1,637,299 | |
AMC Entertainment Holdings, Inc. | | | 3,950 | | | | 48,506 | |
AMC Networks, Inc.(1) | | | 1,170 | | | | 64,210 | |
AT&T, Inc.(4) | | | 27,814 | | | | 793,812 | |
ATN International, Inc. | | | 186 | | | | 13,305 | |
AutoWeb, Inc.(1) | | | 3,646 | | | | 11,120 | |
Bazaarvoice, Inc.(1) | | | 316 | | | | 3,226 | |
Beasley Broadcast Group, Inc. | | | 308 | | | | 1,155 | |
Boingo Wireless, Inc.(1) | | | 272 | | | | 5,595 | |
Cable One, Inc. | | | 215 | | | | 176,322 | |
Care.com, Inc.(1) | | | 570 | | | | 11,007 | |
Cars.com, Inc.(1) | | | 552 | | | | 11,868 | |
Cincinnati Bell, Inc.(1) | | | 1,775 | | | | 13,810 | |
Cinemark Holdings, Inc. | | | 4,118 | | | | 147,424 | |
Clear Channel Outdoor Holdings, Inc. - Class A | | | 6,234 | | | | 32,354 | |
Comcast Corp. - Class A(4) | | | 21,060 | | | | 717,093 | |
Discovery, Inc.(1) | | | 5,234 | | | | 120,801 | |
Entravision Communications Corp. | | | 390 | | | | 1,135 | |
EW Scripps Co./The | | | 1,902 | | | | 29,918 | |
Facebook, Inc.(1)(4) | | | 8,712 | | | | 1,142,056 | |
Frontier Communications Corp. | | | 6,454 | | | | 15,361 | |
Gannett Co., Inc. | | | 2,750 | | | | 23,458 | |
Global Eagle Entertainment, Inc.(1) | | | 2,676 | | | | 5,967 | |
Glu Mobile, Inc.(1) | | | 917 | | | | 7,400 | |
Gray Television, Inc.(1) | | | 2,509 | | | | 36,983 | |
IAC/InterActiveCorp(1) | | | 151 | | | | 27,639 | |
IDT Corp. - Class B | | | 635 | | | | 3,931 | |
IMAX Corp.(1) | | | 571 | | | | 10,741 | |
Intelsat SA(1) | | | 392 | | | | 8,385 | |
Interpublic Group of Cos., Inc./The | | | 4,610 | | | | 95,104 | |
John Wiley & Sons, Inc. | | | 373 | | | | 17,520 | |
Liberty Latin America, Ltd. - Class A(1) | | | 146 | | | | 2,114 | |
Liberty Latin America, Ltd. - Class C(1) | | | 2,591 | | | | 37,751 | |
Liberty Media Corp-Liberty SiriusXM(1) | | | 6,005 | | | | 222,065 | |
Liberty TripAdvisor Holdings, Inc.(1) | | | 1,015 | | | | 16,128 | |
Lions Gate Entertainment Corp. - Class B | | | 2,477 | | | | 36,858 | |
LiveXLive Media, Inc.(1) | | | 540 | | | | 2,673 | |
Marcus Corp./The | | | 1,441 | | | | 56,920 | |
MDC Partners, Inc.(1) | | | 2,965 | | | | 7,739 | |
Meet Group, Inc./The(1) | | | 1,186 | | | | 5,491 | |
MSG Networks, Inc.(1) | | | 874 | | | | 20,591 | |
National CineMedia, Inc. | | | 738 | | | | 4,782 | |
Nexstar Media Group, Inc. | | | 1,163 | | | | 91,458 | |
NII Holdings, Inc.(1) | | | 608 | | | | 2,681 | |
Ooma, Inc.(1) | | | 598 | | | | 8,300 | |
ORBCOMM, Inc.(1) | | | 638 | | | | 5,270 | |
pdvWireless, Inc.(1) | | | 31 | | | | 1,159 | |
QuinStreet, Inc.(1) | | | 340 | | | | 5,518 | |
Rosetta Stone, Inc.(1) | | | 1,035 | | | | 16,974 | |
Scholastic Corp. | | | 1,604 | | | | 64,577 | |
Shenandoah Telecommunications Co. | | | 427 | | | | 18,895 | |
Spok Holdings, Inc. | | | 2,275 | | | | 30,167 | |
Take-Two Interactive Software, Inc.(1) | | | 753 | | | | 77,514 | |
TechTarget, Inc.(1) | | | 552 | | | | 6,740 | |
TEGNA, Inc. | | | 3,068 | | | | 33,349 | |
Telephone & Data Systems, Inc. | | | 967 | | | | 31,466 | |
T-Mobile US, Inc.(1) | | | 14,226 | | | | 904,916 | |
Tribune Publishing Co.(1) | | | 1,636 | | | | 18,552 | |
Twenty-First Century Fox, Inc. - Class A | | | 1,226 | | | | 58,995 | |
Urban One, Inc.(1) | | | 760 | | | | 1,224 | |
Verizon Communications, Inc.(4) | | | 28,205 | | | | 1,585,685 | |
Viacom, Inc. | | | 9,162 | | | | 235,463 | |
Vonage Holdings Corp.(1) | | | 4,831 | | | | 42,175 | |
Walt Disney Co./The(4) | | | 11,056 | | | | 1,212,290 | |
WideOpenWest, Inc.(1) | | | 3,346 | | | | 23,857 | |
Windstream Holdings, Inc.(1)(2) | | | 2,728 | | | | 5,702 | |
World Wrestling Entertainment, Inc. | | | 273 | | | | 20,399 | |
Zayo Group Holdings, Inc.(1) | | | 1,284 | | | | 29,327 | |
Zillow Group, Inc.(1) | | | 801 | | | | 25,175 | |
Zynga, Inc.(1) | | | 5,014 | | | | 19,705 | |
| | | | | | | | 10,765,394 | |
| | | | | | | | | |
Consumer Discretionary — 8.2% | | | | | | | | |
1-800-Flowers.com, Inc.(1) | | | 788 | | | | 9,637 | |
Aaron's, Inc. | | | 604 | | | | 25,398 | |
Abercrombie & Fitch Co. | | | 190 | | | | 3,810 | |
Amazon.com, Inc.(1)(4) | | | 1,674 | | | | 2,514,298 | |
American Axle & Manufacturing Holdings, Inc.(1) | | | 4,184 | | | | 46,442 | |
American Eagle Outfitters, Inc. | | | 1,157 | | | | 22,365 | |
American Outdoor Brands Corp.(1) | | | 667 | | | | 8,578 | |
America's Car-Mart, Inc./TX(1) | | | 64 | | | | 4,637 | |
Ascena Retail Group, Inc.(1) | | | 1,671 | | | | 4,194 | |
AutoZone, Inc.(1) | | | 130 | | | | 108,984 | |
Barnes & Noble Education, Inc.(1) | | | 2,537 | | | | 10,173 | |
Barnes & Noble, Inc. | | | 461 | | | | 3,268 | |
Bassett Furniture Industries, Inc. | | | 1,226 | | | | 24,569 | |
Bed Bath & Beyond, Inc.(2) | | | 3,528 | | | | 39,937 | |
Best Buy Co., Inc. | | | 4,085 | | | | 216,342 | |
Big Lots, Inc. | | | 36 | | | | 1,041 | |
Bloomin' Brands, Inc. | | | 1,486 | | | | 26,585 | |
The accompanying notes are an integral part of these financial statements.
2018 Annual Report | December 31, 2018 | Page 37 |
Schedule of Investments
December 31, 2018
Spectrum Fund |
Security Description | | Shares or
Principal
Amount ($) | | | Fair
Value ($) | |
Common Stocks - Long — continued |
Booking Holdings, Inc.(1)(4) | | | 443 | | | | 763,032 | |
Boot Barn Holdings, Inc.(1) | | | 75 | | | | 1,277 | |
BorgWarner, Inc. | | | 270 | | | | 9,380 | |
Boyd Gaming Corp. | | | 740 | | | | 15,377 | |
Brinker International, Inc. | | | 442 | | | | 19,439 | |
Brunswick Corp./DE | | | 383 | | | | 17,790 | |
Burlington Stores, Inc.(1) | | | 711 | | | | 115,658 | |
Caleres, Inc. | | | 700 | | | | 19,481 | |
Callaway Golf Co. | | | 2,834 | | | | 43,360 | |
Capri Holdings, Ltd.(1) | | | 4,361 | | | | 165,369 | |
Carriage Services, Inc. | | | 129 | | | | 2,000 | |
Carrols Restaurant Group, Inc.(1) | | | 1,185 | | | | 11,660 | |
Carter's, Inc. | | | 731 | | | | 59,664 | |
Cato Corp./The | | | 105 | | | | 1,498 | |
Chico's FAS, Inc. | | | 1,973 | | | | 11,088 | |
Children's Place, Inc./The | | | 43 | | | | 3,874 | |
Chipotle Mexican Grill, Inc.(1) | | | 113 | | | | 48,792 | |
Citi Trends, Inc. | | | 58 | | | | 1,183 | |
Clarus Corp. | | | 2,335 | | | | 23,630 | |
Cooper-Standard Holdings, Inc.(1) | | | 649 | | | | 40,316 | |
Core-Mark Holding Co., Inc. | | | 85 | | | | 1,976 | |
Crocs, Inc.(1) | | | 1,505 | | | | 39,100 | |
Culp, Inc. | | | 89 | | | | 1,682 | |
Darden Restaurants, Inc. | | | 508 | | | | 50,729 | |
Dave & Buster's Entertainment, Inc. | | | 376 | | | | 16,755 | |
Deckers Outdoor Corp.(1) | | | 542 | | | | 69,349 | |
Del Frisco's Restaurant Group, Inc.(1) | | | 228 | | | | 1,630 | |
Denny's Corp.(1) | | | 2,152 | | | | 34,884 | |
Destination XL Group, Inc.(1) | | | 1,017 | | | | 2,207 | |
Dick's Sporting Goods, Inc. | | | 844 | | | | 26,333 | |
Dine Brands Global, Inc. | | | 63 | | | | 4,242 | |
Dollar General Corp. | | | 4,610 | | | | 498,249 | |
Domino's Pizza, Inc. | | | 687 | | | | 170,369 | |
DR Horton, Inc. | | | 417 | | | | 14,453 | |
DSW, Inc. | | | 757 | | | | 18,698 | |
Dunkin' Brands Group, Inc. | | | 932 | | | | 59,760 | |
El Pollo Loco Holdings, Inc.(1) | | | 199 | | | | 3,019 | |
Ethan Allen Interiors, Inc. | | | 713 | | | | 12,542 | |
Etsy, Inc.(1) | | | 618 | | | | 29,398 | |
Express, Inc.(1) | | | 2,555 | | | | 13,056 | |
Extended Stay America, Inc. | | | 6,972 | | | | 108,066 | |
Five Below, Inc.(1) | | | 185 | | | | 18,929 | |
Flexsteel Industries, Inc. | | | 128 | | | | 2,826 | |
Foot Locker, Inc. | | | 1,286 | | | | 68,415 | |
Ford Motor Co. | | | 76,489 | | | | 585,141 | |
Fox Factory Holding Corp.(1) | | | 407 | | | | 23,960 | |
FTD Cos., Inc.(1) | | | 4,890 | | | | 7,237 | |
GameStop Corp.(2) | | | 1,033 | | | | 13,036 | |
General Motors Co. | | | 30,815 | | | | 1,030,762 | |
Genesco, Inc.(1) | | | 603 | | | | 26,713 | |
Gentex Corp. | | | 7,220 | | | | 145,916 | |
Gentherm, Inc.(1) | | | 392 | | | | 15,672 | |
G-III Apparel Group, Ltd.(1) | | | 985 | | | | 27,472 | |
GNC Holdings, Inc.(1) | | | 951 | | | | 2,254 | |
Golden Entertainment, Inc.(1) | | | 64 | | | | 1,025 | |
Goodyear Tire & Rubber Co./The | | | 2,347 | | | | 47,902 | |
Graham Holdings Co. | | | 143 | | | | 91,603 | |
Group 1 Automotive, Inc. | | | 256 | | | | 13,496 | |
Groupon, Inc.(1) | | | 2,118 | | | | 6,778 | |
GrubHub, Inc.(1) | | | 279 | | | | 21,430 | |
H&R Block, Inc. | | | 3,766 | | | | 95,543 | |
Hamilton Beach Brands Holding Co. - Class A | | | 78 | | | | 1,830 | |
Helen of Troy, Ltd.(1) | | | 69 | | | | 9,051 | |
Hibbett Sports, Inc.(1) | | | 349 | | | | 4,991 | |
Home Depot, Inc./The(4) | | | 4,533 | | | | 778,860 | |
Hooker Furniture Corp. | | | 251 | | | | 6,611 | |
Houghton Mifflin Harcourt Co.(1) | | | 117 | | | | 1,037 | |
Inspired Entertainment, Inc.(1) | | | 1,010 | | | | 4,848 | |
Installed Building Products, Inc.(1) | | | 36 | | | | 1,213 | |
International Game Technology PLC | | | 199 | | | | 2,911 | |
International Speedway Corp. | | | 300 | | | | 13,158 | |
J Alexander's Holdings, Inc.(1) | | | 1,916 | | | | 15,769 | |
J. Jill, Inc.(1) | | | 812 | | | | 4,328 | |
Jack in the Box, Inc. | | | 75 | | | | 5,822 | |
JAKKS Pacific, Inc.(1) | | | 4,642 | | | | 6,824 | |
Johnson Outdoors, Inc. | | | 18 | | | | 1,057 | |
K12, Inc.(1) | | | 389 | | | | 9,643 | |
KB Home | | | 1,424 | | | | 27,198 | |
Kirkland's, Inc.(1) | | | 301 | | | | 2,869 | |
Kohl's Corp. | | | 721 | | | | 47,831 | |
Kona Grill, Inc.(1) | | | 3,523 | | | | 3,699 | |
L Brands, Inc. | | | 40 | | | | 1,027 | |
Lands' End, Inc.(1) | | | 202 | | | | 2,870 | |
Las Vegas Sands Corp. | | | 6,484 | | | | 337,492 | |
Laureate Education, Inc.(1) | | | 1,369 | | | | 20,864 | |
Leaf Group, Ltd.(1) | | | 743 | | | | 5,090 | |
Lear Corp. | | | 2,811 | | | | 345,359 | |
Liberty Expedia Holdings, Inc.(1) | | | 4,597 | | | | 179,789 | |
Luby's, Inc.(1) | | | 8,241 | | | | 9,889 | |
Lululemon Athletica, Inc.(1) | | | 581 | | | | 70,655 | |
M/I Homes, Inc.(1) | | | 1,500 | | | | 31,530 | |
Macy's, Inc. | | | 658 | | | | 19,595 | |
Malibu Boats, Inc.(1) | | | 648 | | | | 22,550 | |
The accompanying notes are an integral part of these financial statements.
Page 38 | 2018 Annual Report | December 31, 2018 |
Schedule of Investments
December 31, 2018
Spectrum Fund |
Security Description | | Shares or
Principal
Amount ($) | | | Fair
Value ($) | |
Common Stocks - Long — continued |
Marine Products Corp. | | | 571 | | | | 9,656 | |
MasterCraft Boat Holdings, Inc.(1) | | | 606 | | | | 11,332 | |
McDonald's Corp. | | | 729 | | | | 129,449 | |
MDC Holdings, Inc. | | | 214 | | | | 6,016 | |
Meritage Homes Corp.(1) | | | 707 | | | | 25,961 | |
MGM Resorts International | | | 500 | | | | 12,130 | |
Michaels Cos., Inc./The(1) | | | 407 | | | | 5,511 | |
Nathan's Famous, Inc. | | | 17 | | | | 1,130 | |
Nautilus, Inc.(1) | | | 96 | | | | 1,046 | |
Newell Brands, Inc. | | | 3,403 | | | | 63,262 | |
NIKE, Inc. - Class B | | | 670 | | | | 49,674 | |
Nordstrom, Inc. | | | 208 | | | | 9,695 | |
Norwegian Cruise Line Holdings, Ltd.(1) | | | 2,805 | | | | 118,904 | |
Nutrisystem, Inc. | | | 372 | | | | 16,323 | |
NVR, Inc.(1) | | | 101 | | | | 246,136 | |
Office Depot, Inc. | | | 9,222 | | | | 23,793 | |
Overstock.com, Inc.(1) | | | 77 | | | | 1,046 | |
Oxford Industries, Inc. | | | 253 | | | | 17,973 | |
Papa John's International, Inc. | | | 94 | | | | 3,742 | |
Penn National Gaming, Inc.(1) | | | 4,496 | | | | 84,660 | |
Planet Fitness, Inc.(1) | | | 570 | | | | 30,563 | |
PulteGroup, Inc. | | | 3,177 | | | | 82,570 | |
PVH Corp. | | | 1,600 | | | | 148,720 | |
Qurate Retail, Inc.(1) | | | 2,744 | | | | 53,563 | |
RCI Hospitality Holdings, Inc. | | | 430 | | | | 9,602 | |
Remark Holdings, Inc.(1) | | | 888 | | | | 1,074 | |
Rent-A-Center, Inc./TX(1) | | | 67 | | | | 1,085 | |
Ross Stores, Inc. | | | 6,988 | | | | 581,402 | |
Sally Beauty Holdings, Inc.(1) | | | 630 | | | | 10,742 | |
SeaWorld Entertainment, Inc.(1) | | | 151 | | | | 3,336 | |
Shoe Carnival, Inc. | | | 34 | | | | 1,139 | |
Shutterstock, Inc. | | | 404 | | | | 14,548 | |
Signet Jewelers, Ltd. | | | 778 | | | | 24,717 | |
Skechers U.S.A., Inc.(1) | | | 200 | | | | 4,578 | |
Sleep Number Corp.(1) | | | 358 | | | | 11,359 | |
Speedway Motorsports, Inc. | | | 784 | | | | 12,756 | |
Sportsman's Warehouse Holdings, Inc.(1) | | | 373 | | | | 1,634 | |
Stamps.com, Inc.(1) | | | 119 | | | | 18,521 | |
Standard Motor Products, Inc. | | | 323 | | | | 15,643 | |
Starbucks Corp. | | | 3,857 | | | | 248,391 | |
Steven Madden, Ltd. | | | 788 | | | | 23,845 | |
Stoneridge, Inc.(1) | | | 941 | | | | 23,196 | |
Sturm Ruger & Co., Inc. | | | 296 | | | | 15,753 | |
Superior Industries International, Inc. | | | 947 | | | | 4,555 | |
Tailored Brands, Inc. | | | 519 | | | | 7,079 | |
Tapestry, Inc. | | | 3,103 | | | | 104,726 | |
Target Corp. | | | 8,848 | | | | 584,764 | |
Taylor Morrison Home Corp.(1) | | | 5,776 | | | | 91,838 | |
Tenneco, Inc. | | | 1,990 | | | | 54,506 | |
Texas Roadhouse, Inc. | | | 273 | | | | 16,298 | |
Thor Industries, Inc. | | | 298 | | | | 15,496 | |
Tilly's, Inc. - Class A | | | 124 | | | | 1,347 | |
TJX Cos., Inc./The(4) | | | 20,730 | | | | 927,460 | |
Toll Brothers, Inc. | | | 794 | | | | 26,146 | |
TopBuild Corp.(1) | | | 212 | | | | 9,540 | |
Tower International, Inc. | | | 733 | | | | 17,445 | |
Town Sports International Holdings, Inc.(1) | | | 314 | | | | 2,010 | |
Tractor Supply Co. | | | 98 | | | | 8,177 | |
Ulta Beauty, Inc.(1) | | | 273 | | | | 66,841 | |
Under Armour, Inc. - Class C(1) | | | 8,857 | | | | 143,218 | |
Urban Outfitters, Inc.(1) | | | 941 | | | | 31,241 | |
Vera Bradley, Inc.(1) | | | 2,172 | | | | 18,614 | |
Vista Outdoor, Inc.(1) | | | 913 | | | | 10,363 | |
Wayfair, Inc.(1) | | | 136 | | | | 12,251 | |
Wendy's Co./The | | | 2,519 | | | | 39,322 | |
Weyco Group, Inc. | | | 361 | | | | 10,530 | |
Whirlpool Corp. | | | 734 | | | | 78,443 | |
Wyndham Hotels & Resorts, Inc. | | | 5,801 | | | | 263,191 | |
Yum! Brands, Inc. | | | 4,871 | | | | 447,742 | |
ZAGG, Inc.(1) | | | 119 | | | | 1,164 | |
Zumiez, Inc.(1) | | | 100 | | | | 1,917 | |
| | | | | | | | 15,035,393 | |
| | | | | | | | | |
Consumer Staples — 4.0% | | | | | | | | |
Altria Group, Inc.(4) | | | 4,728 | | | | 233,516 | |
Avon Products, Inc.(1) | | | 7,695 | | | | 11,696 | |
Boston Beer Co., Inc./The(1) | | | 59 | | | | 14,210 | |
Cal-Maine Foods, Inc. | | | 994 | | | | 42,046 | |
Church & Dwight Co., Inc. | | | 1,194 | | | | 78,517 | |
Clorox Co./The | | | 171 | | | | 26,358 | |
Coca-Cola Co./The | | | 1,720 | | | | 81,442 | |
Conagra Brands, Inc. | | | 12,884 | | | | 275,202 | |
Constellation Brands, Inc. | | | 1,752 | | | | 281,757 | |
Costco Wholesale Corp. | | | 443 | | | | 90,244 | |
Energizer Holdings, Inc. | | | 808 | | | | 36,481 | |
Flowers Foods, Inc. | | | 7,542 | | | | 139,301 | |
Herbalife Nutrition, Ltd.(1) | | | 1,559 | | | | 91,903 | |
Hershey Co./The | | | 2,208 | | | | 236,653 | |
Ingredion, Inc. | | | 727 | | | | 66,448 | |
J&J Snack Foods Corp. | | | 57 | | | | 8,242 | |
JM Smucker Co./The | | | 469 | | | | 43,847 | |
John B Sanfilippo & Son, Inc. | | | 42 | | | | 2,338 | |
Kellogg Co. | | | 7,325 | | | | 417,598 | |
Keurig Dr Pepper, Inc. | | | 38,197 | | | | 979,371 | |
The accompanying notes are an integral part of these financial statements.
2018 Annual Report | December 31, 2018 | Page 39 |
Schedule of Investments
December 31, 2018
Spectrum Fund |
Security Description | | Shares or
Principal
Amount ($) | | | Fair
Value ($) | |
Common Stocks - Long — continued |
Kimberly-Clark Corp. | | | 291 | | | | 33,157 | |
Kroger Co./The | | | 9,191 | | | | 252,753 | |
Lamb Weston Holdings, Inc. | | | 3,864 | | | | 284,236 | |
Lancaster Colony Corp. | | | 395 | | | | 69,860 | |
Molson Coors Brewing Co. | | | 2,913 | | | | 163,594 | |
Mondelez International, Inc. | | | 6,589 | | | | 263,758 | |
National Beverage Corp. | | | 112 | | | | 8,038 | |
Natural Health Trends Corp. | | | 80 | | | | 1,479 | |
Nature's Sunshine Products, Inc.(1) | | | 247 | | | | 2,013 | |
PepsiCo, Inc.(4) | | | 9,045 | | | | 999,292 | |
Philip Morris International, Inc. | | | 1,604 | | | | 107,083 | |
Post Holdings, Inc.(1) | | | 1,287 | | | | 114,710 | |
Procter & Gamble Co./The | | | 7,020 | | | | 645,278 | |
Simply Good Foods Co./The(1) | | | 1,602 | | | | 30,278 | |
Smart & Final Stores, Inc.(1) | | | 296 | | | | 1,403 | |
SpartanNash Co. | | | 598 | | | | 10,274 | |
Sprouts Farmers Market, Inc.(1) | | | 1,348 | | | | 31,691 | |
TreeHouse Foods, Inc.(1) | | | 342 | | | | 17,343 | |
Turning Point Brands, Inc. | | | 85 | | | | 2,314 | |
Tyson Foods, Inc. | | | 13,313 | | | | 710,914 | |
US Foods Holding Corp.(1) | | | 387 | | | | 12,245 | |
Walmart, Inc.(4) | | | 4,032 | | | | 375,581 | |
| | | | | | | | 7,294,464 | |
| | | | | | | | | |
Energy — 4.4% | | | | | | | | |
Adams Resources & Energy, Inc. | | | 148 | | | | 5,729 | |
Anadarko Petroleum Corp. | | | 7,936 | | | | 347,914 | |
Apergy Corp.(1) | | | 202 | | | | 5,470 | |
Arch Coal, Inc. - Class A | | | 379 | | | | 31,453 | |
Archrock, Inc. | | | 3,338 | | | | 25,002 | |
Ardmore Shipping Corp.(1) | | | 1,636 | | | | 7,640 | |
Baker Hughes a GE Co. | | | 1,623 | | | | 34,895 | |
Basic Energy Services, Inc.(1) | | | 2,972 | | | | 11,412 | |
Bristow Group, Inc.(1) | | | 1,405 | | | | 3,414 | |
C&J Energy Services, Inc.(1) | | | 2,111 | | | | 28,499 | |
Cabot Oil & Gas Corp. | | | 2,528 | | | | 56,501 | |
Cactus, Inc.(1) | | | 566 | | | | 15,514 | |
California Resources Corp.(1) | | | 621 | | | | 10,582 | |
CARBO Ceramics, Inc.(1) | | | 496 | | | | 1,726 | |
Carrizo Oil & Gas, Inc.(1) | | | 533 | | | | 6,018 | |
Cheniere Energy, Inc.(1) | | | 1,153 | | | | 68,246 | |
Chesapeake Energy Corp.(1) | | | 5,657 | | | | 11,880 | |
Chevron Corp.(4) | | | 7,509 | | | | 816,904 | |
ConocoPhillips(4) | | | 16,029 | | | | 999,408 | |
CONSOL Energy, Inc.(1) | | | 42 | | | | 1,332 | |
Contango Oil & Gas Co.(1) | | | 1,707 | | | | 5,548 | |
Continental Resources, Inc./OK(1) | | | 1,235 | | | | 49,635 | |
Covia Holdings Corp.(1) | | | 5,577 | | | | 19,073 | |
CVR Energy, Inc. | | | 389 | | | | 13,413 | |
Dawson Geophysical Co.(1) | | | 817 | | | | 2,761 | |
Delek US Holdings, Inc. | | | 281 | | | | 9,135 | |
Denbury Resources, Inc.(1) | | | 1,406 | | | | 2,404 | |
Devon Energy Corp. | | | 423 | | | | 9,534 | |
DHT Holdings, Inc. | | | 420 | | | | 1,646 | |
Diamondback Energy, Inc. | | | 1,026 | | | | 95,110 | |
Earthstone Energy, Inc.(1) | | | 2,288 | | | | 10,342 | |
Energy Fuels, Inc./Canada(1) | | | 531 | | | | 1,513 | |
EOG Resources, Inc.(4) | | | 2,132 | | | | 185,932 | |
EQT Corp. | | | 153 | | | | 2,890 | |
Evolution Petroleum Corp. | | | 714 | | | | 4,869 | |
Exterran Corp.(1) | | | 203 | | | | 3,593 | |
Exxon Mobil Corp.(4) | | | 18,441 | | | | 1,257,492 | |
Frontline, Ltd./Bermuda(1) | | | 186 | | | | 1,029 | |
FTS International, Inc.(1) | | | 1,753 | | | | 12,464 | |
Goodrich Petroleum Corp.(1) | | | 330 | | | | 4,455 | |
Gulfport Energy Corp.(1) | | | 2,244 | | | | 14,698 | |
Hallador Energy Co. | | | 1,020 | | | | 5,171 | |
Helix Energy Solutions Group, Inc.(1) | | | 1,480 | | | | 8,007 | |
Helmerich & Payne, Inc. | | | 1,794 | | | | 86,004 | |
Hess Corp. | | | 2,668 | | | | 108,054 | |
HollyFrontier Corp. | | | 608 | | | | 31,081 | |
Independence Contract Drilling, Inc.(1) | | | 2,307 | | | | 7,198 | |
International Seaways, Inc.(1) | | | 148 | | | | 2,492 | |
Keane Group, Inc.(1) | | | 2,665 | | | | 21,800 | |
Key Energy Services, Inc.(1) | | | 1,019 | | | | 2,109 | |
KLX Energy Services Holdings, Inc.(1) | | | 370 | | | | 8,677 | |
Laredo Petroleum, Inc.(1) | | | 1,908 | | | | 6,907 | |
Liberty Oilfield Services, Inc. | | | 688 | | | | 8,910 | |
Marathon Oil Corp. | | | 11,468 | | | | 164,451 | |
Marathon Petroleum Corp. | | | 9,861 | | | | 581,898 | |
Matrix Service Co.(1) | | | 1,571 | | | | 28,184 | |
McDermott International, Inc.(1) | | | 4 | | | | 26 | |
Midstates Petroleum Co., Inc.(1) | | | 3,270 | | | | 24,558 | |
Murphy Oil Corp. | | | 775 | | | | 18,127 | |
Natural Gas Services Group, Inc.(1) | | | 155 | | | | 2,548 | |
Newfield Exploration Co.(1) | | | 1,935 | | | | 28,367 | |
Nine Energy Service, Inc.(1) | | | 233 | | | | 5,252 | |
Noble Corp. plc(1) | | | 1,302 | | | | 3,411 | |
Nordic American Tankers, Ltd. | | | 1,523 | | | | 3,046 | |
Northern Oil and Gas, Inc.(1) | | | 908 | | | | 2,052 | |
Oasis Petroleum, Inc.(1) | | | 2,139 | | | | 11,829 | |
Occidental Petroleum Corp.(4) | | | 9,532 | | | | 585,074 | |
Overseas Shipholding Group, Inc.(1) | | | 625 | | | | 1,038 | |
Par Pacific Holdings, Inc.(1) | | | 670 | | | | 9,501 | |
The accompanying notes are an integral part of these financial statements.
Page 40 | 2018 Annual Report | December 31, 2018 |
Schedule of Investments
December 31, 2018
Spectrum Fund |
Security Description | | Shares or
Principal
Amount ($) | | | Fair
Value ($) | |
Common Stocks - Long — continued |
Parsley Energy, Inc.(1) | | | 844 | | | | 13,487 | |
Patterson-UTI Energy, Inc. | | | 6,706 | | | | 69,407 | |
PBF Energy, Inc. | | | 319 | | | | 10,422 | |
PDC Energy, Inc.(1) | | | 736 | | | | 21,903 | |
Peabody Energy Corp. | | | 987 | | | | 30,084 | |
Penn Virginia Corp.(1) | | | 38 | | | | 2,054 | |
Phillips 66 | | | 8,329 | | | | 717,543 | |
Pioneer Energy Services Corp.(1) | | | 1,774 | | | | 2,182 | |
Pioneer Natural Resources Co. | | | 576 | | | | 75,756 | |
ProPetro Holding Corp.(1) | | | 1,390 | | | | 17,125 | |
QEP Resources, Inc.(1) | | | 3,625 | | | | 20,409 | |
Quintana Energy Services, Inc.(1) | | | 652 | | | | 2,256 | |
RigNet, Inc.(1) | | | 533 | | | | 6,737 | |
Rowan Cos. Plc(1) | | | 2,149 | | | | 18,030 | |
SandRidge Energy, Inc.(1) | | | 2,800 | | | | 21,308 | |
SEACOR Holdings, Inc.(1) | | | 302 | | | | 11,174 | |
Select Energy Services, Inc.(1) | | | 508 | | | | 3,211 | |
SilverBow Resources, Inc.(1) | | | 142 | | | | 3,357 | |
SM Energy Co. | | | 259 | | | | 4,009 | |
Southwestern Energy Co.(1) | | | 5,204 | | | | 17,746 | |
Superior Energy Services, Inc.(1) | | | 950 | | | | 3,183 | |
Talos Energy, Inc.(1) | | | 764 | | | | 12,468 | |
Targa Resources Corp. | | | 725 | | | | 26,115 | |
TETRA Technologies, Inc.(1) | | | 742 | | | | 1,247 | |
Tidewater, Inc.(1) | | | 920 | | | | 17,600 | |
Transocean, Ltd.(1) | | | 1,411 | | | | 9,792 | |
Unit Corp.(1) | | | 1,041 | | | | 14,865 | |
Valero Energy Corp. | | | 9,872 | | | | 740,104 | |
W&T Offshore, Inc.(1) | | | 803 | | | | 3,308 | |
Whiting Petroleum Corp.(1) | | | 1,243 | | | | 28,204 | |
WildHorse Resource Development Corp.(1) | | | 1,071 | | | | 15,112 | |
World Fuel Services Corp. | | | 1,057 | | | | 22,630 | |
WPX Energy, Inc.(1) | | | 6,422 | | | | 72,890 | |
| | | | | | | | 7,998,565 | |
| | | | | | | | | |
Financials — 16.1% | | | | | | | | |
1st Source Corp. | | | 1,878 | | | | 75,759 | |
ACNB Corp. | | | 1,044 | | | | 40,977 | |
Aflac, Inc. | | | 18,995 | | | | 865,412 | |
AG Mortgage Investment Trust, Inc. | | | 1,719 | | | | 27,384 | |
Allstate Corp./The | | | 7,405 | | | | 611,875 | |
Ally Financial, Inc. | | | 108 | | | | 2,447 | |
American Equity Investment Life Holding Co. | | | 592 | | | | 16,540 | |
American Express Co. | | | 1,611 | | | | 153,561 | |
American National Bankshares, Inc. | | | 379 | | | | 11,108 | |
Annaly Capital Management, Inc. | | | 25,497 | | | | 250,381 | |
Apollo Commercial Real Estate Finance, Inc. | | | 2,100 | | | | 34,986 | |
Arbor Realty Trust, Inc. | | | 10,021 | | | | 100,911 | |
Ares Commercial Real Estate Corp. | | | 3,917 | | | | 51,078 | |
Argo Group International Holdings, Ltd. | | | 185 | | | | 12,441 | |
Arthur J Gallagher & Co. | | | 2,835 | | | | 208,940 | |
Artisan Partners Asset Management, Inc. | | | 927 | | | | 20,496 | |
Ashford, Inc.(1) | | | 45 | | | | 2,336 | |
Auburn National Bancorporation, Inc. | | | 51 | | | | 1,615 | |
BancFirst Corp. | | | 2,261 | | | | 112,824 | |
Bancorp, Inc./The(1) | | | 6,885 | | | | 54,805 | |
Bank of America Corp.(4) | | | 45,538 | | | | 1,122,056 | |
Bank of Commerce Holdings | | | 638 | | | | 6,992 | |
Bank of Marin Bancorp | | | 280 | | | | 11,547 | |
Bank of NT Butterfield & Son, Ltd./The | | | 1,673 | | | | 52,449 | |
BankFinancial Corp. | | | 2,398 | | | | 35,850 | |
BankUnited, Inc. | | | 4,662 | | | | 139,580 | |
Banner Corp. | | | 2,128 | | | | 113,805 | |
Baycom Corp.(1) | | | 1,018 | | | | 23,506 | |
BB&T Corp. | | | 21,446 | | | | 929,041 | |
Beneficial Bancorp, Inc. | | | 2,967 | | | | 42,398 | |
Berkshire Hathaway, Inc. - Class B(1)(4) | | | 9,814 | | | | 2,003,823 | |
Berkshire Hills Bancorp, Inc. | | | 2,793 | | | | 75,327 | |
Blucora, Inc.(1) | | | 559 | | | | 14,892 | |
Blue Hills Bancorp, Inc. | | | 879 | | | | 18,758 | |
Brown & Brown, Inc. | | | 11,927 | | | | 328,708 | |
Bryn Mawr Bank Corp. | | | 554 | | | | 19,058 | |
BSB Bancorp, Inc./MA(1) | | | 437 | | | | 12,262 | |
Byline Bancorp, Inc.(1) | | | 211 | | | | 3,515 | |
C&F Financial Corp. | | | 538 | | | | 28,627 | |
Cannae Holdings, Inc.(1) | | | 2,372 | | | | 40,609 | |
Cboe Global Markets, Inc. | | | 1,818 | | | | 177,855 | |
CenterState Bank Corp. | | | 789 | | | | 16,601 | |
Central Valley Community Bancorp | | | 536 | | | | 10,114 | |
Chemung Financial Corp. | | | 92 | | | | 3,801 | |
Cherry Hill Mortgage Investment Corp. | | | 4,938 | | | | 86,613 | |
Chimera Investment Corp. | | | 20,161 | | | | 359,269 | |
CIT Group, Inc. | | | 7,566 | | | | 289,551 | |
Citizens Financial Group, Inc. | | | 16,354 | | | | 486,204 | |
Civista Bancshares, Inc. | | | 497 | | | | 8,658 | |
CNA Financial Corp. | | | 600 | | | | 26,490 | |
CNB Financial Corp./PA | | | 903 | | | | 20,724 | |
Codorus Valley Bancorp, Inc. | | | 549 | | | | 11,666 | |
Comerica, Inc. | | | 8,285 | | | | 569,097 | |
Commerce Bancshares, Inc./MO | | | 4,888 | | | | 275,537 | |
Community Bankers Trust Corp.(1) | | | 436 | | | | 3,148 | |
Community Trust Bancorp, Inc. | | | 869 | | | | 34,421 | |
The accompanying notes are an integral part of these financial statements.
2018 Annual Report | December 31, 2018 | Page 41 |
Schedule of Investments
December 31, 2018
Spectrum Fund |
Security Description | | Shares or
Principal
Amount ($) | | | Fair
Value ($) | |
Common Stocks - Long — continued |
Cowen, Inc.(1) | | | 1,712 | | | | 22,838 | |
Credit Acceptance Corp.(1) | | | 39 | | | | 14,889 | |
Cullen/Frost Bankers, Inc. | | | 6,209 | | | | 546,019 | |
Curo Group Holdings Corp.(1) | | | 336 | | | | 3,189 | |
Customers Bancorp, Inc.(1) | | | 1,213 | | | | 22,077 | |
Diamond Hill Investment Group, Inc. | | | 8 | | | | 1,196 | |
Discover Financial Services | | | 10,954 | | | | 646,067 | |
Ditech Holding Corp. Warrants - Class A(1)(7) | | | 228 | | | | — | |
Ditech Holding Corp. Warrants - Class B(1)(7) | | | 181 | | | | — | |
DNB Financial Corp. | | | 160 | | | | 4,558 | |
Donnelley Financial Solutions, Inc.(1) | | | 1,026 | | | | 14,395 | |
Dynex Capital, Inc. | | | 3,889 | | | | 22,245 | |
Elevate Credit, Inc.(1) | | | 805 | | | | 3,606 | |
EMC Insurance Group, Inc. | | | 37 | | | | 1,178 | |
Employers Holdings, Inc. | | | 279 | | | | 11,710 | |
Entegra Financial Corp.(1) | | | 63 | | | | 1,307 | |
Enterprise Financial Services Corp. | | | 2,735 | | | | 102,918 | |
Equity Bancshares, Inc.(1) | | | 432 | | | | 15,228 | |
Erie Indemnity Co. | | | 127 | | | | 16,930 | |
ESSA Bancorp, Inc. | | | 344 | | | | 5,370 | |
Essent Group, Ltd.(1) | | | 3,616 | | | | 123,595 | |
Evercore, Inc. | | | 1,323 | | | | 94,674 | |
Exantas Capital Corp. | | | 3,355 | | | | 33,617 | |
FactSet Research Systems, Inc. | | | 31 | | | | 6,204 | |
Farmers National Banc Corp. | | | 1,340 | | | | 17,072 | |
FB Financial Corp. | | | 1,517 | | | | 53,125 | |
Federal Agricultural Mortgage Corp. | | | 31 | | | | 1,874 | |
Fidelity National Financial, Inc. | | | 3,819 | | | | 120,069 | |
Fidelity Southern Corp. | | | 400 | | | | 10,408 | |
Fifth Street Asset Management, Inc.(1) | | | 5,767 | | | | 7,670 | |
Fifth Third Bancorp | | | 35,341 | | | | 831,574 | |
Financial Institutions, Inc. | | | 1,122 | | | | 28,835 | |
First American Financial Corp. | | | 4,079 | | | | 182,087 | |
First BanCorp/Puerto Rico | | | 9,323 | | | | 80,178 | |
First Bancorp/Southern Pines NC | | | 3,658 | | | | 119,470 | |
First Busey Corp. | | | 8,068 | | | | 197,989 | |
First Business Financial Services, Inc. | | | 1,514 | | | | 29,538 | |
First Citizens BancShares, Inc./NC | | | 247 | | | | 93,131 | |
First Commonwealth Financial Corp. | | | 2,275 | | | | 27,482 | |
First Community Bankshares, Inc. | | | 321 | | | | 10,105 | |
First Defiance Financial Corp. | | | 766 | | | | 18,775 | |
First Financial Northwest, Inc. | | | 300 | | | | 4,641 | |
First Interstate BancSystem, Inc. | | | 4,457 | | | | 162,948 | |
First Merchants Corp. | | | 3,822 | | | | 130,980 | |
First Midwest Bancorp, Inc./IL | | | 4,983 | | | | 98,713 | |
First Northwest Bancorp | | | 171 | | | | 2,536 | |
First United Corp. | | | 186 | | | | 2,961 | |
FirstCash, Inc. | | | 1,134 | | | | 82,045 | |
FNB Corp./PA | | | 18,292 | | | | 179,993 | |
Fulton Financial Corp. | | | 147 | | | | 2,276 | |
Genworth Financial, Inc.(1) | | | 1,854 | | | | 8,640 | |
Goosehead Insurance, Inc.(1) | | | 372 | | | | 9,780 | |
Granite Point Mortgage Trust, Inc. | | | 1,804 | | | | 32,526 | |
Great Ajax Corp. | | | 1,768 | | | | 21,304 | |
Great Southern Bancorp, Inc. | | | 1,773 | | | | 81,611 | |
Green Dot Corp.(1) | | | 543 | | | | 43,179 | |
Greenhill & Co., Inc. | | | 852 | | | | 20,789 | |
Hamilton Lane, Inc. | | | 567 | | | | 20,979 | |
Hanover Insurance Group, Inc./The | | | 834 | | | | 97,386 | |
Health Insurance Innovations, Inc. - Class A(1) | | | 295 | | | | 7,885 | |
Heartland Financial USA, Inc. | | | 1,382 | | | | 60,739 | |
Heritage Commerce Corp. | | | 2,482 | | | | 28,146 | |
Hilltop Holdings, Inc. | | | 5,336 | | | | 95,141 | |
Home Bancorp, Inc. | | | 349 | | | | 12,355 | |
HomeStreet, Inc.(1) | | | 629 | | | | 13,354 | |
Horizon Bancorp, Inc./IN | | | 1,732 | | | | 27,331 | |
Houlihan Lokey, Inc. | | | 2,109 | | | | 77,611 | |
Huntington Bancshares, Inc./OH | | | 63,963 | | | | 762,439 | |
Independence Holding Co. | | | 283 | | | | 9,962 | |
Independent Bank Corp./MI | | | 4,557 | | | | 95,788 | |
International Bancshares Corp. | | | 6,103 | | | | 209,943 | |
INTL. FCStone, Inc.(1) | | | 908 | | | | 33,215 | |
Investment Technology Group, Inc. | | | 131 | | | | 3,961 | |
James River Group Holdings, Ltd. | | | 912 | | | | 33,324 | |
JPMorgan Chase & Co.(4) | | | 8,003 | | | | 781,253 | |
Kemper Corp. | | | 1,262 | | | | 83,772 | |
KeyCorp | | | 49,026 | | | | 724,604 | |
Kingstone Cos., Inc. | | | 340 | | | | 6,015 | |
KKR Real Estate Finance Trust, Inc. | | | 2,937 | | | | 56,244 | |
Ladder Capital Corp. | | | 13,542 | | | | 209,495 | |
Ladenburg Thalmann Financial Services, Inc. | | | 3,295 | | | | 7,677 | |
Lazard, Ltd. | | | 2,958 | | | | 109,180 | |
Legg Mason, Inc. | | | 1,530 | | | | 39,030 | |
Live Oak Bancshares, Inc. | | | 90 | | | | 1,333 | |
Loews Corp. | | | 4,251 | | | | 193,506 | |
LPL Financial Holdings, Inc. | | | 1,291 | | | | 78,854 | |
Macatawa Bank Corp. | | | 797 | | | | 7,667 | |
Maiden Holdings, Ltd. | | | 1,634 | | | | 2,696 | |
MarketAxess Holdings, Inc. | | | 384 | | | | 81,143 | |
Marlin Business Services Corp. | | | 571 | | | | 12,750 | |
The accompanying notes are an integral part of these financial statements.
Page 42 | 2018 Annual Report | December 31, 2018 |
Schedule of Investments
December 31, 2018
Spectrum Fund |
Security Description | | Shares or
Principal
Amount ($) | | | Fair
Value ($) | |
Common Stocks - Long — continued |
MB Financial, Inc. | | | 9,019 | | | | 357,423 | |
MBT Financial Corp. | | | 2,569 | | | | 23,892 | |
Medley Management, Inc. | | | 1,174 | | | | 4,532 | |
Mercantile Bank Corp. | | | 887 | | | | 25,067 | |
Merchants Bancorp/IN | | | 292 | | | | 5,828 | |
Metropolitan Bank Holding Corp.(1) | | | 776 | | | | 23,940 | |
MFA Financial, Inc. | | | 7,935 | | | | 53,006 | |
MGIC Investment Corp.(1) | | | 14,032 | | | | 146,775 | |
Middlefield Banc Corp. | | | 27 | | | | 1,146 | |
Moelis & Co. | | | 1,533 | | | | 52,705 | |
Morningstar, Inc. | | | 597 | | | | 65,574 | |
Mr Cooper Group, Inc.(1) | | | 3,402 | | | | 39,701 | |
MSCI, Inc. | | | 623 | | | | 91,849 | |
Nasdaq, Inc. | | | 943 | | | | 76,921 | |
National Commerce Corp.(1) | | | 487 | | | | 17,532 | |
National General Holdings Corp. | | | 4,037 | | | | 97,736 | |
Navient Corp. | | | 3,556 | | | | 31,328 | |
Nelnet, Inc. - Class A | | | 21 | | | | 1,099 | |
New Residential Investment Corp. | | | 38,242 | | | | 543,419 | |
NewStar Financial Contingent Value Rights(1)(7) | | | 95 | | | | — | |
Nicolet Bankshares, Inc.(1) | | | 1,105 | | | | 53,924 | |
NMI Holdings, Inc. - Class A(1) | | | 1,668 | | | | 29,774 | |
Northrim BanCorp, Inc. | | | 1,983 | | | | 65,181 | |
Norwood Financial Corp. | | | 213 | | | | 7,029 | |
Ocwen Financial Corp.(1) | | | 8,040 | | | | 10,774 | |
OFG Bancorp | | | 941 | | | | 15,489 | |
Ohio Valley Banc Corp. | | | 55 | | | | 1,946 | |
Old Republic International Corp. | | | 19,220 | | | | 395,355 | |
Old Second Bancorp, Inc. | | | 3,989 | | | | 51,857 | |
On Deck Capital, Inc.(1) | | | 2,318 | | | | 13,676 | |
OneMain Holdings, Inc.(1) | | | 2,142 | | | | 52,029 | |
Oppenheimer Holdings, Inc. | | | 2,406 | | | | 61,473 | |
Pacific City Financial Corp. | | | 248 | | | | 3,881 | |
Pacific Mercantile Bancorp(1) | | | 3,988 | | | | 28,514 | |
PacWest Bancorp | | | 12,875 | | | | 428,480 | |
Parke Bancorp, Inc. | | | 1,455 | | | | 27,230 | |
Penns Woods Bancorp, Inc. | | | 28 | | | | 1,127 | |
PennyMac Financial Services, Inc. | | | 3,480 | | | | 73,985 | |
PennyMac Mortgage Investment Trust | | | 4,546 | | | | 84,647 | |
Peoples Bancorp of North Carolina, Inc. | | | 143 | | | | 3,498 | |
Piper Jaffray Cos. | | | 1,138 | | | | 74,926 | |
PJT Partners, Inc. | | | 1,304 | | | | 50,543 | |
PNC Financial Services Group, Inc./The(4) | | | 8,718 | | | | 1,019,221 | |
Popular, Inc. | | | 4,224 | | | | 199,457 | |
Premier Financial Bancorp, Inc. | | | 1,736 | | | | 25,884 | |
Progressive Corp./The | | | 14,891 | | | | 898,374 | |
Protective Insurance Corp. | | | 907 | | | | 15,102 | |
Provident Bancorp, Inc.(1) | | | 159 | | | | 3,447 | |
Provident Financial Holdings, Inc. | | | 962 | | | | 14,911 | |
Prudential Financial, Inc. | | | 8,313 | | | | 677,925 | |
Pzena Investment Management, Inc. | | | 4,229 | | | | 36,581 | |
Radian Group, Inc. | | | 9,256 | | | | 151,428 | |
Ready Capital Corp. | | | 2,798 | | | | 38,696 | |
Regional Management Corp.(1) | | | 543 | | | | 13,059 | |
Regions Financial Corp. | | | 55,262 | | | | 739,406 | |
Reinsurance Group of America, Inc. | | | 1,462 | | | | 205,016 | |
Renasant Corp. | | | 456 | | | | 13,762 | |
Republic Bancorp, Inc./KY | | | 1,357 | | | | 52,543 | |
Riverview Bancorp, Inc. | | | 2,099 | | | | 15,281 | |
Safeguard Scientifics, Inc.(1) | | | 140 | | | | 1,207 | |
Safety Insurance Group, Inc. | | | 850 | | | | 69,539 | |
Santander Consumer USA Holdings, Inc. | | | 3,157 | | | | 55,532 | |
Selective Insurance Group, Inc. | | | 150 | | | | 9,141 | |
Shore Bancshares, Inc. | | | 1,269 | | | | 18,451 | |
SI Financial Group, Inc. | | | 200 | | | | 2,546 | |
Sierra Bancorp | | | 3,644 | | | | 87,565 | |
Silvercrest Asset Management Group, Inc. | | | 899 | | | | 11,894 | |
Southern First Bancshares, Inc.(1) | | | 762 | | | | 24,437 | |
Southern Missouri Bancorp, Inc. | | | 34 | | | | 1,153 | |
Southern National Bancorp of Virginia, Inc. | | | 1,325 | | | | 17,517 | |
Spirit of Texas Bancshares, Inc.(1) | | | 510 | | | | 11,618 | |
State Bank Financial Corp. | | | 2,688 | | | | 58,034 | |
Stewart Information Services Corp. | | | 3,091 | | | | 127,967 | |
Summit Financial Group, Inc. | | | 689 | | | | 13,305 | |
SunTrust Banks, Inc. | | | 15,585 | | | | 786,107 | |
Synchrony Financial | | | 14,584 | | | | 342,141 | |
TCF Financial Corp. | | | 15,434 | | | | 300,809 | |
Timberland Bancorp, Inc./WA | | | 807 | | | | 17,996 | |
Tiptree, Inc. | | | 1,725 | | | | 9,643 | |
TPG RE Finance Trust, Inc. | | | 624 | | | | 11,407 | |
TrustCo Bank Corp. NY | | | 8,252 | | | | 56,609 | |
Two Harbors Investment Corp. | | | 4,693 | | | | 60,258 | |
Umpqua Holdings Corp. | | | 16,944 | | | | 269,410 | |
United Community Financial Corp./OH | | | 539 | | | | 4,770 | |
United Financial Bancorp, Inc. | | | 357 | | | | 5,248 | |
United Security Bancshares/Fresno CA | | | 2,470 | | | | 23,663 | |
Unity Bancorp, Inc. | | | 1,232 | | | | 25,576 | |
Universal Insurance Holdings, Inc. | | | 176 | | | | 6,674 | |
Waddell & Reed Financial, Inc. | | | 682 | | | | 12,331 | |
Walker & Dunlop, Inc. | | | 1,442 | | | | 62,367 | |
Webster Financial Corp. | | | 1,697 | | | | 83,645 | |
Wells Fargo & Co.(4) | | | 20,483 | | | | 943,857 | |
WesBanco, Inc. | | | 128 | | | | 4,696 | |
The accompanying notes are an integral part of these financial statements.
2018 Annual Report | December 31, 2018 | Page 43 |
Schedule of Investments
December 31, 2018
Spectrum Fund |
Security Description | | Shares or
Principal
Amount ($) | | | Fair
Value ($) | |
Common Stocks - Long — continued |
West Bancorporation, Inc. | | | 969 | | | | 18,498 | |
Western New England Bancorp, Inc. | | | 1,027 | | | | 10,311 | |
World Acceptance Corp.(1) | | | 137 | | | | 14,010 | |
| | | | | | | | 29,366,156 | |
| | | | | | | | | |
Healthcare — 12.5% | | | | | | | | |
AAC Holdings, Inc.(1) | | | 714 | | | | 1,000 | |
Abbott Laboratories(4) | | | 4,723 | | | | 341,615 | |
AbbVie, Inc.(4) | | | 5,809 | | | | 535,532 | |
Abeona Therapeutics, Inc.(1) | | | 151 | | | | 1,078 | |
ABIOMED, Inc.(1) | | | 215 | | | | 69,884 | |
ACADIA Pharmaceuticals, Inc.(1) | | | 1,110 | | | | 17,949 | |
Acceleron Pharma, Inc.(1) | | | 123 | | | | 5,357 | |
Accuray, Inc.(1) | | | 1,214 | | | | 4,140 | |
AcelRx Pharmaceuticals, Inc.(1) | | | 1,318 | | | | 3,045 | |
Achillion Pharmaceuticals, Inc.(1) | | | 4,180 | | | | 6,646 | |
Aclaris Therapeutics, Inc.(1) | | | 1,180 | | | | 8,720 | |
Acorda Therapeutics, Inc.(1) | | | 754 | | | | 11,747 | |
Addus HomeCare Corp.(1) | | | 85 | | | | 5,770 | |
ADMA Biologics, Inc.(1) | | | 462 | | | | 1,104 | |
Aduro Biotech, Inc.(1) | | | 1,127 | | | | 2,975 | |
Adverum Biotechnologies, Inc.(1) | | | 2,042 | | | | 6,432 | |
Aeglea BioTherapeutics, Inc.(1) | | | 494 | | | | 3,700 | |
Aerie Pharmaceuticals, Inc.(1) | | | 453 | | | | 16,353 | |
Aevi Genomic Medicine, Inc.(1) | | | 605 | | | | 424 | |
Agenus, Inc.(1) | | | 1,728 | | | | 4,113 | |
AgeX Therapeutics, Inc.(1) | | | 446 | | | | 1,334 | |
Agilent Technologies, Inc. | | | 1,774 | | | | 119,674 | |
Aimmune Therapeutics, Inc.(1) | | | 475 | | | | 11,362 | |
Akebia Therapeutics, Inc.(1) | | | 2,805 | | | | 15,512 | |
Akorn, Inc.(1) | | | 1,217 | | | | 4,126 | |
Albireo Pharma, Inc.(1) | | | 191 | | | | 4,685 | |
Aldeyra Therapeutics, Inc.(1) | | | 480 | | | | 3,984 | |
Alexion Pharmaceuticals, Inc.(1) | | | 2,986 | | | | 290,717 | |
Align Technology, Inc.(1) | | | 342 | | | | 71,625 | |
Alkermes PLC(1) | | | 254 | | | | 7,496 | |
Allena Pharmaceuticals, Inc.(1) | | | 194 | | | | 1,057 | |
Allergan PLC(4) | | | 1,859 | | | | 248,474 | |
Allscripts Healthcare Solutions, Inc.(1) | | | 3,368 | | | | 32,468 | |
Alnylam Pharmaceuticals, Inc.(1) | | | 79 | | | | 5,760 | |
AMAG Pharmaceuticals, Inc.(1) | | | 450 | | | | 6,836 | |
AmerisourceBergen Corp. | | | 1,466 | | | | 109,070 | |
Amgen, Inc.(4) | | | 4,369 | | | | 850,513 | |
Amneal Pharmaceuticals, Inc.(1) | | | 1,317 | | | | 17,819 | |
Amphastar Pharmaceuticals, Inc.(1) | | | 55 | | | | 1,095 | |
Anavex Life Sciences Corp.(1) | | | 2,600 | | | | 4,056 | |
Anthem, Inc.(4) | | | 495 | | | | 130,002 | |
Apellis Pharmaceuticals, Inc.(1) | | | 265 | | | | 3,495 | |
Applied Genetic Technologies Corp./DE(1) | | | 397 | | | | 989 | |
Aquestive Therapeutics, Inc.(1) | | | 757 | | | | 4,769 | |
Aratana Therapeutics, Inc.(1) | | | 1,454 | | | | 8,913 | |
Aravive, Inc.(1) | | | 1,058 | | | | 3,724 | |
Arbutus Biopharma Corp.(1) | | | 652 | | | | 2,497 | |
Ardelyx, Inc.(1) | | | 1,813 | | | | 3,245 | |
Arena Pharmaceuticals, Inc.(1) | | | 817 | | | | 31,822 | |
ArQule, Inc.(1) | | | 779 | | | | 2,158 | |
Array BioPharma, Inc.(1) | | | 798 | | | | 11,372 | |
Arrowhead Pharmaceuticals, Inc.(1) | | | 505 | | | | 6,272 | |
Arsanis, Inc.(1) | | | 1,396 | | | | 3,239 | |
Assembly Biosciences, Inc.(1) | | | 480 | | | | 10,858 | |
Assertio Therapeutics, Inc.(1) | | | 1,398 | | | | 5,047 | |
Atara Biotherapeutics, Inc.(1) | | | 31 | | | | 1,077 | |
athenahealth, Inc.(1) | | | 160 | | | | 21,109 | |
Athersys, Inc.(1) | | | 2,021 | | | | 2,910 | |
Atrion Corp. | | | 2 | | | | 1,482 | |
Audentes Therapeutics, Inc.(1) | | | 291 | | | | 6,204 | |
AVEO Pharmaceuticals, Inc.(1)(2) | | | 1,636 | | | | 2,618 | |
Avid Bioservices, Inc.(1) | | | 852 | | | | 3,493 | |
Axsome Therapeutics, Inc.(1) | | | 2,533 | | | | 7,143 | |
Baxter International, Inc. | | | 13,229 | | | | 870,733 | |
Biogen, Inc.(1)(4) | | | 1,828 | | | | 550,082 | |
BioMarin Pharmaceutical, Inc.(1) | | | 211 | | | | 17,967 | |
Bio-Rad Laboratories, Inc.(1) | | | 137 | | | | 31,814 | |
BioScrip, Inc.(1) | | | 2,554 | | | | 9,118 | |
BioSpecifics Technologies Corp.(1) | | | 204 | | | | 12,362 | |
Bio-Techne Corp. | | | 188 | | | | 27,207 | |
BioTelemetry, Inc.(1) | | | 26 | | | | 1,553 | |
Blueprint Medicines Corp.(1) | | | 94 | | | | 5,068 | |
Bristol-Myers Squibb Co.(4) | | | 10,795 | | | | 561,124 | |
Bruker Corp. | | | 1,653 | | | | 49,210 | |
Calithera Biosciences, Inc.(1) | | | 2,303 | | | | 9,235 | |
Calyxt, Inc.(1) | | | 304 | | | | 3,149 | |
Cantel Medical Corp. | | | 169 | | | | 12,582 | |
Cardinal Health, Inc. | | | 5,592 | | | | 249,403 | |
CareDx, Inc.(1) | | | 321 | | | | 8,070 | |
CASI Pharmaceuticals, Inc.(1) | | | 1,395 | | | | 5,608 | |
Catalent, Inc.(1) | | | 2,921 | | | | 91,077 | |
Catalyst Biosciences, Inc.(1) | | | 1,159 | | | | 9,145 | |
Catalyst Pharmaceuticals, Inc.(1) | | | 3,548 | | | | 6,812 | |
Celgene Corp.(1)(4) | | | 4,770 | | | | 305,709 | |
Cellular Biomedicine Group, Inc.(1) | | | 307 | | | | 5,422 | |
Cerner Corp.(1) | | | 12,457 | | | | 653,245 | |
Charles River Laboratories International, Inc.(1) | | | 400 | | | | 45,272 | |
The accompanying notes are an integral part of these financial statements.
Page 44 | 2018 Annual Report | December 31, 2018 |
Schedule of Investments
December 31, 2018
Spectrum Fund |
Security Description | | Shares or
Principal
Amount ($) | | | Fair
Value ($) | |
Common Stocks - Long — continued |
Chemed Corp. | | | 285 | | | | 80,735 | |
Chimerix, Inc.(1) | | | 6,185 | | | | 15,895 | |
Cidara Therapeutics, Inc.(1) | | | 2,900 | | | | 6,815 | |
Cigna Holding Co. | | | 1,550 | | | | 294,376 | |
Civitas Solutions, Inc.(1) | | | 64 | | | | 1,121 | |
Clovis Oncology, Inc.(1) | | | 401 | | | | 7,202 | |
Codexis, Inc.(1) | | | 84 | | | | 1,403 | |
Cohbar, Inc.(1) | | | 358 | | | | 1,113 | |
Collegium Pharmaceutical, Inc.(1) | | | 816 | | | | 14,011 | |
Community Health Systems, Inc.(1) | | | 928 | | | | 2,617 | |
Computer Programs & Systems, Inc. | | | 416 | | | | 10,442 | |
Conatus Pharmaceuticals, Inc.(1) | | | 2,425 | | | | 4,195 | |
Concert Pharmaceuticals, Inc.(1) | | | 137 | | | | 1,719 | |
CONMED Corp. | | | 496 | | | | 31,843 | |
Cooper Cos., Inc./The | | | 119 | | | | 30,286 | |
Corbus Pharmaceuticals Holdings, Inc.(1) | | | 424 | | | | 2,476 | |
Corcept Therapeutics, Inc.(1) | | | 610 | | | | 8,150 | |
Corium International Contingent Value Rights(1)(7) | | | 106 | | | | — | |
Corvus Pharmaceuticals, Inc.(1) | | | 296 | | | | 1,086 | |
CTI BioPharma Corp.(1) | | | 1,410 | | | | 1,034 | |
Cue Biopharma, Inc.(1) | | | 905 | | | | 4,254 | |
Cutera, Inc.(1) | | | 269 | | | | 4,578 | |
CVS Health Corp. | | | 476 | | | | 31,188 | |
Cymabay Therapeutics, Inc.(1) | | | 697 | | | | 5,485 | |
Cytokinetics, Inc.(1) | | | 613 | | | | 3,874 | |
Danaher Corp.(4) | | | 5,083 | | | | 524,159 | |
Denali Therapeutics, Inc.(1) | | | 318 | | | | 6,570 | |
Dermira, Inc.(1) | | | 575 | | | | 4,134 | |
Dicerna Pharmaceuticals, Inc.(1) | | | 308 | | | | 3,293 | |
Dova Pharmaceuticals, Inc.(1) | | | 308 | | | | 2,335 | |
Editas Medicine, Inc.(1) | | | 571 | | | | 12,990 | |
Edwards Lifesciences Corp.(1) | | | 287 | | | | 43,960 | |
Eidos Therapeutics, Inc.(1) | | | 245 | | | | 3,371 | |
Eiger BioPharmaceuticals, Inc.(1) | | | 910 | | | | 9,246 | |
ElectroCore, Inc.(1) | | | 227 | | | | 1,421 | |
Eli Lilly & Co.(4) | | | 4,416 | | | | 511,020 | |
Emergent BioSolutions, Inc.(1) | | | 533 | | | | 31,596 | |
Encompass Health Corp. | | | 657 | | | | 40,537 | |
Endo International PLC(1) | | | 2,033 | | | | 14,841 | |
Enzo Biochem, Inc.(1) | | | 406 | | | | 1,129 | |
Esperion Therapeutics, Inc.(1) | | | 98 | | | | 4,508 | |
Evolus, Inc.(1) | | | 155 | | | | 1,845 | |
Exact Sciences Corp.(1) | | | 259 | | | | 16,343 | |
Exelixis, Inc.(1) | | | 2,018 | | | | 39,694 | |
Fate Therapeutics, Inc.(1) | | | 94 | | | | 1,206 | |
Fennec Pharmaceuticals, Inc.(1) | | | 1,492 | | | | 9,519 | |
FibroGen, Inc.(1) | | | 614 | | | | 28,416 | |
Five Prime Therapeutics, Inc.(1) | | | 322 | | | | 2,995 | |
FONAR Corp.(1) | | | 404 | | | | 8,177 | |
Forty Seven, Inc.(1) | | | 158 | | | | 2,484 | |
G1 Therapeutics, Inc.(1) | | | 56 | | | | 1,072 | |
Geron Corp.(1)(2) | | | 1,301 | | | | 1,301 | |
Gilead Sciences, Inc.(4) | | | 11,735 | | | | 734,024 | |
Global Blood Therapeutics, Inc.(1) | | | 315 | | | | 12,931 | |
Globus Medical, Inc.(1) | | | 225 | | | | 9,738 | |
Harvard Bioscience, Inc.(1) | | | 447 | | | | 1,421 | |
HCA Healthcare, Inc. | | | 6,751 | | | | 840,162 | |
HealthEquity, Inc.(1) | | | 86 | | | | 5,130 | |
HealthStream, Inc. | | | 428 | | | | 10,336 | |
Helius Medical Technologies, Inc.(1) | | | 132 | | | | 1,209 | |
Hill-Rom Holdings, Inc. | | | 1,959 | | | | 173,469 | |
Hologic, Inc.(1) | | | 4,141 | | | | 170,195 | |
Homology Medicines, Inc.(1) | | | 191 | | | | 4,271 | |
Horizon Pharma Plc(1) | | | 703 | | | | 13,737 | |
Humana, Inc. | | | 2,502 | | | | 716,773 | |
ICU Medical, Inc.(1) | | | 150 | | | | 34,445 | |
Idera Pharmaceuticals, Inc.(1) | | | 773 | | | | 2,141 | |
IDEXX Laboratories, Inc.(1) | | | 820 | | | | 152,536 | |
Illumina, Inc.(1) | | | 1,047 | | | | 314,027 | |
Immune Design Corp.(1) | | | 1,818 | | | | 2,363 | |
ImmunoGen, Inc.(1) | | | 939 | | | | 4,507 | |
Incyte Corp.(1) | | | 536 | | | | 34,084 | |
Infinity Pharmaceuticals, Inc.(1) | | | 1,761 | | | | 2,078 | |
Innovate Biopharmaceuticals, Inc.(1) | | | 484 | | | | 1,118 | |
Inovio Pharmaceuticals, Inc.(1) | | | 2,673 | | | | 10,692 | |
Insmed, Inc.(1) | | | 188 | | | | 2,467 | |
Insys Therapeutics, Inc.(1) | | | 567 | | | | 1,985 | |
Integer Holdings Corp.(1) | | | 179 | | | | 13,651 | |
Intercept Pharmaceuticals, Inc.(1) | | | 58 | | | | 5,846 | |
Intersect ENT, Inc.(1) | | | 736 | | | | 20,740 | |
Intra-Cellular Therapies, Inc.(1) | | | 739 | | | | 8,417 | |
Intuitive Surgical, Inc.(1)(4) | | | 1,857 | | | | 889,354 | |
Invacare Corp. | | | 1,193 | | | | 5,130 | |
Invitae Corp.(1) | | | 1,144 | | | | 12,653 | |
InVivo Therapeutics Holdings Corp.(1) | | | 2,958 | | | | 4,467 | |
Iovance Biotherapeutics, Inc.(1) | | | 1,017 | | | | 9,000 | |
IQVIA Holdings, Inc.(1) | | | 1,578 | | | | 183,316 | |
Ironwood Pharmaceuticals, Inc.(1) | | | 464 | | | | 4,807 | |
Jazz Pharmaceuticals PLC(1) | | | 467 | | | | 57,889 | |
Johnson & Johnson(4) | | | 11,644 | | | | 1,502,658 | |
Jounce Therapeutics, Inc.(1) | | | 1,443 | | | | 4,863 | |
Kadmon Holdings, Inc.(1) | | | 1,942 | | | | 4,039 | |
Kala Pharmaceuticals, Inc.(1) | | | 1,916 | | | | 9,369 | |
The accompanying notes are an integral part of these financial statements.
2018 Annual Report | December 31, 2018 | Page 45 |
Schedule of Investments
December 31, 2018
Spectrum Fund |
Security Description | | Shares or
Principal
Amount ($) | | | Fair
Value ($) | |
Common Stocks - Long — continued |
Kindred Biosciences, Inc.(1) | | | 1,013 | | | | 11,092 | |
Kura Oncology, Inc.(1) | | | 1,044 | | | | 14,658 | |
La Jolla Pharmaceutical Co.(1) | | | 106 | | | | 1,000 | |
Lannett Co., Inc.(1)(2) | | | 2,117 | | | | 10,500 | |
Lantheus Holdings, Inc.(1) | | | 395 | | | | 6,182 | |
Lipocine, Inc.(1) | | | 6,404 | | | | 8,325 | |
LivaNova PLC(1) | | | 340 | | | | 31,100 | |
MacroGenics, Inc.(1) | | | 720 | | | | 9,144 | |
Madrigal Pharmaceuticals, Inc.(1) | | | 29 | | | | 3,269 | |
Magellan Health, Inc.(1) | | | 104 | | | | 5,917 | |
Mallinckrodt PLC(1) | | | 64 | | | | 1,011 | |
MannKind Corp.(1) | | | 953 | | | | 1,010 | |
Marinus Pharmaceuticals, Inc.(1) | | | 1,689 | | | | 4,847 | |
Masimo Corp.(1) | | | 1,345 | | | | 144,413 | |
McKesson Corp. | | | 556 | | | | 61,421 | |
MediciNova, Inc.(1) | | | 131 | | | | 1,070 | |
MEDNAX, Inc.(1) | | | 31 | | | | 1,023 | |
Medtronic PLC(4) | | | 12,952 | | | | 1,178,114 | |
MeiraGTx Holdings plc(1) | | | 459 | | | | 4,425 | |
Melinta Therapeutics, Inc.(1) | | | 1,586 | | | | 1,257 | |
Menlo Therapeutics, Inc.(1) | | | 1,174 | | | | 4,837 | |
Merck & Co., Inc.(4) | | | 17,249 | | | | 1,317,996 | |
Meridian Bioscience, Inc. | | | 246 | | | | 4,271 | |
Mettler-Toledo International, Inc.(1) | | | 183 | | | | 103,501 | |
Minerva Neurosciences, Inc.(1) | | | 667 | | | | 4,496 | |
Miragen Therapeutics, Inc.(1) | | | 975 | | | | 2,954 | |
Mirati Therapeutics, Inc.(1) | | | 88 | | | | 3,733 | |
Molecular Templates, Inc.(1) | | | 1,860 | | | | 7,514 | |
Molina Healthcare, Inc.(1) | | | 259 | | | | 30,101 | |
Momenta Pharmaceuticals, Inc.(1) | | | 661 | | | | 7,297 | |
Mustang Bio, Inc.(1) | | | 2,350 | | | | 6,909 | |
Mylan NV(1) | | | 9,445 | | | | 258,793 | |
MyoKardia, Inc.(1) | | | 132 | | | | 6,450 | |
Myriad Genetics, Inc.(1) | | | 384 | | | | 11,163 | |
Natera, Inc.(1) | | | 277 | | | | 3,867 | |
National Research Corp. | | | 62 | | | | 2,365 | |
Nektar Therapeutics(1) | | | 319 | | | | 10,486 | |
Neos Therapeutics, Inc.(1) | | | 2,290 | | | | 3,779 | |
Neurocrine Biosciences, Inc.(1) | | | 60 | | | | 4,285 | |
NewLink Genetics Corp.(1) | | | 2,377 | | | | 3,613 | |
NextGen Healthcare, Inc.(1) | | | 98 | | | | 1,485 | |
Novan, Inc.(1) | | | 1,452 | | | | 1,205 | |
Novavax, Inc.(1) | | | 2,078 | | | | 3,824 | |
Novus Therapeutics, Inc.(1) | | | 1,223 | | | | 1,957 | |
NuVasive, Inc.(1) | | | 260 | | | | 12,886 | |
Ocular Therapeutix, Inc.(1) | | | 2,069 | | | | 8,235 | |
Odonate Therapeutics, Inc.(1) | | | 84 | | | | 1,183 | |
Omeros Corp.(1) | | | 403 | | | | 4,489 | |
OPKO Health, Inc.(1) | | | 3,759 | | | | 11,315 | |
OraSure Technologies, Inc.(1) | | | 907 | | | | 10,594 | |
Orthofix Medical, Inc.(1) | | | 633 | | | | 33,226 | |
Otonomy, Inc.(1) | | | 5,886 | | | | 10,889 | |
Ovid therapeutics, Inc.(1) | | | 716 | | | | 1,733 | |
Owens & Minor, Inc. | | | 3,280 | | | | 20,762 | |
Pacira Pharmaceuticals, Inc./DE(1) | | | 312 | | | | 13,422 | |
Paratek Pharmaceuticals, Inc.(1) | | | 603 | | | | 3,093 | |
PDL BioPharma, Inc.(1) | | | 7,065 | | | | 20,489 | |
Penumbra, Inc.(1) | | | 9 | | | | 1,100 | |
Perrigo Co. PLC | | | 1,308 | | | | 50,685 | |
Pfenex, Inc.(1) | | | 309 | | | | 986 | |
Pfizer, Inc.(4) | | | 32,875 | | | | 1,434,994 | |
Phibro Animal Health Corp. | | | 353 | | | | 11,352 | |
Pieris Pharmaceuticals, Inc.(1) | | | 1,439 | | | | 3,828 | |
PRA Health Sciences, Inc.(1) | | | 498 | | | | 45,796 | |
Premier, Inc. - Class A(1) | | | 2,450 | | | | 91,508 | |
Progenics Pharmaceuticals, Inc.(1) | | | 1,375 | | | | 5,775 | |
Protagonist Therapeutics, Inc.(1) | | | 917 | | | | 6,171 | |
Proteostasis Therapeutics, Inc.(1) | | | 1,125 | | | | 3,645 | |
Providence Service Corp./The(1) | | | 79 | | | | 4,742 | |
Pulse Biosciences, Inc.(1) | | | 133 | | | | 1,524 | |
Puma Biotechnology, Inc.(1) | | | 140 | | | | 2,849 | |
Quidel Corp.(1) | | | 152 | | | | 7,421 | |
Quorum Health Corp.(1) | | | 479 | | | | 1,384 | |
Ra Pharmaceuticals, Inc.(1) | | | 437 | | | | 7,953 | |
Radius Health, Inc.(1) | | | 410 | | | | 6,761 | |
Reata Pharmaceuticals, Inc.(1) | | | 58 | | | | 3,254 | |
Recro Pharma, Inc.(1) | | | 1,092 | | | | 7,753 | |
Regeneron Pharmaceuticals, Inc.(1) | | | 1,096 | | | | 409,356 | |
REGENXBIO, Inc.(1) | | | 29 | | | | 1,217 | |
ResMed, Inc. | | | 204 | | | | 23,229 | |
Revance Therapeutics, Inc.(1) | | | 614 | | | | 12,360 | |
Rhythm Pharmaceuticals, Inc.(1) | | | 165 | | | | 4,435 | |
Rigel Pharmaceuticals, Inc.(1) | | | 1,351 | | | | 3,107 | |
RTI Surgical, Inc.(1) | | | 1,760 | | | | 6,512 | |
Sangamo Therapeutics, Inc.(1) | | | 738 | | | | 8,472 | |
Savara, Inc.(1) | | | 262 | | | | 1,983 | |
scPharmaceuticals, Inc.(1) | | | 275 | | | | 1,034 | |
SeaSpine Holdings Corp.(1) | | | 107 | | | | 1,952 | |
SELLAS Life Sciences Group, Inc.(1) | | | 2,548 | | | | 3,134 | |
Sienna Biopharmaceuticals, Inc.(1) | | | 1,476 | | | | 3,424 | |
SIGA Technologies, Inc.(1) | | | 662 | | | | 5,230 | |
Simulations Plus, Inc. | | | 65 | | | | 1,294 | |
Spectrum Pharmaceuticals, Inc.(1) | | | 745 | | | | 6,519 | |
Spring Bank Pharmaceuticals, Inc.(1) | | | 532 | | | | 5,527 | |
The accompanying notes are an integral part of these financial statements.
Page 46 | 2018 Annual Report | December 31, 2018 |
Schedule of Investments
December 31, 2018
Spectrum Fund |
Security Description | | Shares or
Principal
Amount ($) | | | Fair
Value ($) | |
Common Stocks - Long — continued |
Stemline Therapeutics, Inc.(1) | | | 790 | | | | 7,505 | |
STERIS PLC | | | 414 | | | | 44,236 | |
Surface Oncology, Inc.(1) | | | 1,271 | | | | 5,389 | |
Syneos Health, Inc.(1) | | | 419 | | | | 16,488 | |
Synlogic, Inc.(1) | | | 302 | | | | 2,117 | |
Syros Pharmaceuticals, Inc.(1) | | | 585 | | | | 3,258 | |
T2 Biosystems, Inc.(1) | | | 338 | | | | 1,017 | |
Tabula Rasa HealthCare, Inc.(1) | | | 121 | | | | 7,715 | |
Tandem Diabetes Care, Inc.(1) | | | 316 | | | | 11,999 | |
Tenet Healthcare Corp.(1) | | | 1,275 | | | | 21,854 | |
TESARO, Inc.(1) | | | 63 | | | | 4,678 | |
Tetraphase Pharmaceuticals, Inc.(1) | | | 5,078 | | | | 5,738 | |
Tocagen, Inc.(1) | | | 1,038 | | | | 8,522 | |
Translate Bio, Inc.(1) | | | 377 | | | | 2,828 | |
Triple-S Management Corp.(1) | | | 733 | | | | 12,747 | |
Tyme Technologies, Inc.(1) | | | 1,296 | | | | 4,782 | |
Ultragenyx Pharmaceutical, Inc.(1) | | | 142 | | | | 6,174 | |
United Therapeutics Corp.(1) | | | 496 | | | | 54,014 | |
UnitedHealth Group, Inc.(4) | | | 3,998 | | | | 995,982 | |
Universal Health Services, Inc. | | | 322 | | | | 37,532 | |
Unum Therapeutics, Inc.(1) | | | 553 | | | | 2,433 | |
Utah Medical Products, Inc. | | | 14 | | | | 1,163 | |
Vanda Pharmaceuticals, Inc.(1) | | | 162 | | | | 4,233 | |
Varex Imaging Corp.(1) | | | 542 | | | | 12,835 | |
Varian Medical Systems, Inc.(1) | | | 653 | | | | 73,991 | |
VBI Vaccines, Inc.(1)(2) | | | 4,548 | | | | 7,277 | |
Veracyte, Inc.(1) | | | 394 | | | | 4,957 | |
Vericel Corp.(1) | | | 349 | | | | 6,073 | |
Vertex Pharmaceuticals, Inc.(1) | | | 3,188 | | | | 528,283 | |
Voyager Therapeutics, Inc.(1) | | | 271 | | | | 2,547 | |
WaVe Life Sciences, Ltd.(1) | | | 97 | | | | 4,078 | |
WellCare Health Plans, Inc.(1) | | | 124 | | | | 29,275 | |
West Pharmaceutical Services, Inc. | | | 24 | | | | 2,353 | |
XOMA Corp.(1) | | | 279 | | | | 3,529 | |
Zafgen, Inc.(1) | | | 1,316 | | | | 6,514 | |
Zimmer Biomet Holdings, Inc. | | | 3,760 | | | | 389,987 | |
ZIOPHARM Oncology, Inc.(1) | | | 622 | | | | 1,163 | |
Zoetis, Inc. | | | 4,432 | | | | 379,113 | |
Zogenix, Inc.(1) | | | 249 | | | | 9,079 | |
| | | | | | | | 22,937,449 | |
| | | | | | | | | |
Industrials — 10.0% | | | | | | | | |
AAR Corp. | | | 258 | | | | 9,634 | |
ACCO Brands Corp. | | | 6,855 | | | | 46,477 | |
Acuity Brands, Inc. | | | 71 | | | | 8,161 | |
ADT, Inc. | | | 924 | | | | 5,553 | |
Advanced Disposal Services, Inc.(1) | | | 1,076 | | | | 25,759 | |
Advanced Drainage Systems, Inc. | | | 795 | | | | 19,279 | |
Albany International Corp. | | | 388 | | | | 24,223 | |
Allison Transmission Holdings, Inc. | | | 5,406 | | | | 237,377 | |
Altra Industrial Motion Corp. | | | 632 | | | | 15,895 | |
Ameresco, Inc. - Class A(1) | | | 103 | | | | 1,452 | |
Aqua Metals, Inc.(1) | | | 3,585 | | | | 6,525 | |
ARC Document Solutions, Inc.(1) | | | 3,268 | | | | 6,699 | |
ArcBest Corp. | | | 681 | | | | 23,331 | |
Arcosa, Inc. | | | 397 | | | | 10,993 | |
Armstrong Flooring, Inc.(1) | | | 424 | | | | 5,020 | |
Armstrong World Industries, Inc. | | | 1,400 | | | | 81,494 | |
Atkore International Group, Inc.(1) | | | 1,322 | | | | 26,228 | |
Barrett Business Services, Inc. | | | 272 | | | | 15,572 | |
BMC Stock Holdings, Inc.(1) | | | 930 | | | | 14,396 | |
Boeing Co./The(4) | | | 2,732 | | | | 881,070 | |
Brady Corp. | | | 1,754 | | | | 76,229 | |
Builders FirstSource, Inc.(1) | | | 2,056 | | | | 22,431 | |
Casella Waste Systems, Inc.(1) | | | 1,212 | | | | 34,530 | |
Caterpillar, Inc. | | | 545 | | | | 69,253 | |
CBIZ, Inc.(1) | | | 691 | | | | 13,613 | |
CECO Environmental Corp.(1) | | | 293 | | | | 1,978 | |
Cintas Corp. | | | 1,221 | | | | 205,116 | |
Comfort Systems USA, Inc. | | | 609 | | | | 26,601 | |
Commercial Vehicle Group, Inc.(1) | | | 1,221 | | | | 6,960 | |
Continental Building Products, Inc.(1) | | | 2,457 | | | | 62,531 | |
Copart, Inc.(1) | | | 4,869 | | | | 232,641 | |
Covenant Transportation Group, Inc.(1) | | | 775 | | | | 14,880 | |
Crane Co. | | | 2,149 | | | | 155,115 | |
CSW Industrials, Inc.(1) | | | 432 | | | | 20,887 | |
CSX Corp.(4) | | | 9,460 | | | | 587,750 | |
Cummins, Inc. | | | 1,798 | | | | 240,285 | |
Curtiss-Wright Corp. | | | 225 | | | | 22,977 | |
Delta Air Lines, Inc. | | | 3,104 | | | | 154,890 | |
Deluxe Corp. | | | 718 | | | | 27,600 | |
DMC Global, Inc. | | | 33 | | | | 1,159 | |
Ducommun, Inc.(1) | | | 245 | | | | 8,898 | |
Eagle Bulk Shipping, Inc.(1) | | | 6,325 | | | | 29,158 | |
Eastern Co./The | | | 66 | | | | 1,596 | |
Eaton Corp. PLC | | | 9,859 | | | | 676,919 | |
EMCOR Group, Inc. | | | 273 | | | | 16,295 | |
Emerson Electric Co. | | | 13,127 | | | | 784,338 | |
Encore Wire Corp. | | | 279 | | | | 14,000 | |
Energous Corp.(1) | | | 219 | | | | 1,268 | |
EnerSys | | | 561 | | | | 43,539 | |
Engility Holdings, Inc.(1) | | | 450 | | | | 12,807 | |
Ennis, Inc. | | | 828 | | | | 15,939 | |
EnPro Industries, Inc. | | | 274 | | | | 16,467 | |
The accompanying notes are an integral part of these financial statements.
2018 Annual Report | December 31, 2018 | Page 47 |
Schedule of Investments
December 31, 2018
Spectrum Fund |
Security Description | | Shares or
Principal
Amount ($) | | | Fair
Value ($) | |
Common Stocks - Long — continued |
Essendant, Inc. | | | 90 | | | | 1,132 | |
Esterline Technologies Corp.(1) | | | 52 | | | | 6,315 | |
Expeditors International of Washington, Inc. | | | 718 | | | | 48,889 | |
Fastenal Co. | | | 317 | | | | 16,576 | |
Federal Signal Corp. | | | 3,081 | | | | 61,312 | |
Fortune Brands Home & Security, Inc. | | | 1,895 | | | | 71,991 | |
Forward Air Corp. | | | 425 | | | | 23,311 | |
Foundation Building Materials, Inc.(1) | | | 479 | | | | 3,980 | |
Gardner Denver Holdings, Inc.(1) | | | 168 | | | | 3,436 | |
Genco Shipping & Trading, Ltd.(1) | | | 186 | | | | 1,468 | |
Global Brass & Copper Holdings, Inc. | | | 1,559 | | | | 39,209 | |
GMS, Inc.(1) | | | 221 | | | | 3,284 | |
Gorman-Rupp Co./The | | | 335 | | | | 10,857 | |
Graco, Inc. | | | 7,022 | | | | 293,871 | |
Greenbrier Cos., Inc./The | | | 214 | | | | 8,462 | |
Griffon Corp. | | | 984 | | | | 10,283 | |
H&E Equipment Services, Inc. | | | 683 | | | | 13,947 | |
Harris Corp. | | | 921 | | | | 124,013 | |
Harsco Corp.(1) | | | 1,359 | | | | 26,990 | |
Hawaiian Holdings, Inc. | | | 594 | | | | 15,688 | |
HD Supply Holdings, Inc.(1) | | | 8,689 | | | | 326,011 | |
HEICO Corp. - Class A | | | 9,705 | | | | 611,415 | |
Heidrick & Struggles International, Inc. | | | 235 | | | | 7,330 | |
Heritage-Crystal Clean, Inc.(1) | | | 533 | | | | 12,264 | |
Herman Miller, Inc. | | | 2,644 | | | | 79,981 | |
Hexcel Corp. | | | 741 | | | | 42,489 | |
Hillenbrand, Inc. | | | 2,756 | | | | 104,535 | |
HNI Corp. | | | 510 | | | | 18,069 | |
Hub Group, Inc.(1) | | | 627 | | | | 23,243 | |
Hubbell, Inc. | | | 349 | | | | 34,670 | |
Huntington Ingalls Industries, Inc. | | | 1,410 | | | | 268,337 | |
Hurco Cos., Inc. | | | 313 | | | | 11,174 | |
Huron Consulting Group, Inc.(1) | | | 872 | | | | 44,742 | |
Hyster-Yale Materials Handling, Inc. | | | 168 | | | | 10,409 | |
ICF International, Inc. | | | 407 | | | | 26,365 | |
IDEX Corp. | | | 422 | | | | 53,282 | |
Infrastructure and Energy Alternatives, Inc.(1) | | | 1,685 | | | | 13,800 | |
Ingersoll-Rand PLC | | | 9,948 | | | | 907,556 | |
Insteel Industries, Inc. | | | 155 | | | | 3,763 | |
Interface, Inc. | | | 645 | | | | 9,191 | |
ITT, Inc. | | | 1,773 | | | | 85,583 | |
JB Hunt Transport Services, Inc. | | | 1,493 | | | | 138,909 | |
JetBlue Airways Corp.(1) | | | 7,750 | | | | 124,465 | |
Kadant, Inc. | | | 113 | | | | 9,205 | |
Kansas City Southern | | | 664 | | | | 63,379 | |
KAR Auction Services, Inc. | | | 1,025 | | | | 48,913 | |
KBR, Inc. | | | 830 | | | | 12,599 | |
Kelly Services, Inc. - Class A | | | 1,431 | | | | 29,307 | |
Kennametal, Inc. | | | 1,224 | | | | 40,735 | |
Kforce, Inc. | | | 186 | | | | 5,751 | |
Kimball International, Inc. - Class B | | | 4,543 | | | | 64,465 | |
Knoll, Inc. | | | 1,015 | | | | 16,727 | |
Landstar System, Inc. | | | 2,676 | | | | 256,013 | |
Lawson Products, Inc./DE(1) | | | 177 | | | | 5,593 | |
LB Foster Co. - Class A(1) | | | 410 | | | | 6,519 | |
Lincoln Electric Holdings, Inc. | | | 1,656 | | | | 130,576 | |
LSC Communications, Inc. | | | 1,745 | | | | 12,215 | |
LSI Industries, Inc. | | | 1,663 | | | | 5,272 | |
ManpowerGroup, Inc. | | | 1,776 | | | | 115,085 | |
Marten Transport, Ltd. | | | 692 | | | | 11,203 | |
Masco Corp. | | | 5,357 | | | | 156,639 | |
Masonite International Corp.(1) | | | 2,792 | | | | 125,165 | |
Matson, Inc. | | | 965 | | | | 30,899 | |
Maxar Technologies, Ltd. | | | 565 | | | | 6,757 | |
McGrath RentCorp | | | 317 | | | | 16,319 | |
Meritor, Inc.(1) | | | 1,305 | | | | 22,068 | |
Milacron Holdings Corp.(1) | | | 2,170 | | | | 25,801 | |
Miller Industries, Inc./TN | | | 1,100 | | | | 29,700 | |
Mistras Group, Inc.(1) | | | 1,133 | | | | 16,293 | |
Moog, Inc. | | | 253 | | | | 19,602 | |
MSC Industrial Direct Co., Inc. | | | 1,511 | | | | 116,226 | |
Mueller Industries, Inc. | | | 635 | | | | 14,834 | |
Mueller Water Products, Inc. | | | 1,066 | | | | 9,701 | |
MYR Group, Inc.(1) | | | 39 | | | | 1,099 | |
Navigant Consulting, Inc. | | | 2,036 | | | | 48,966 | |
NCI Building Systems, Inc.(1) | | | 3,539 | | | | 25,658 | |
Nexeo Solutions, Inc.(1) | | | 647 | | | | 5,558 | |
Norfolk Southern Corp. | | | 5,432 | | | | 812,301 | |
NV5 Global, Inc.(1) | | | 57 | | | | 3,451 | |
nVent Electric PLC | | | 50 | | | | 1,123 | |
Old Dominion Freight Line, Inc. | | | 2,026 | | | | 250,191 | |
Omega Flex, Inc. | | | 24 | | | | 1,298 | |
Oshkosh Corp. | | | 3,956 | | | | 242,542 | |
PACCAR, Inc. | | | 15,949 | | | | 911,326 | |
Park-Ohio Holdings Corp. | | | 648 | | | | 19,887 | |
Patrick Industries, Inc.(1) | | | 908 | | | | 26,886 | |
Pitney Bowes, Inc. | | | 2,643 | | | | 15,620 | |
Proto Labs, Inc.(1) | | | 380 | | | | 42,860 | |
Quad/Graphics, Inc. | | | 1,500 | | | | 18,480 | |
Quanex Building Products Corp. | | | 633 | | | | 8,602 | |
Quanta Services, Inc. | | | 7,821 | | | | 235,412 | |
Radiant Logistics, Inc.(1) | | | 1,454 | | | | 6,180 | |
RBC Bearings, Inc.(1) | | | 141 | | | | 18,485 | |
The accompanying notes are an integral part of these financial statements.
Page 48 | 2018 Annual Report | December 31, 2018 |
Schedule of Investments
December 31, 2018
Spectrum Fund |
Security Description | | Shares or
Principal
Amount ($) | | | Fair
Value ($) | |
Common Stocks - Long — continued |
Regal Beloit Corp. | | | 56 | | | | 3,923 | |
Resources Connection, Inc. | | | 893 | | | | 12,681 | |
Rollins, Inc. | | | 1,486 | | | | 53,645 | |
RR Donnelley & Sons Co. | | | 2,741 | | | | 10,854 | |
Rush Enterprises, Inc. | | | 124 | | | | 4,414 | |
Rush Enterprises, Inc. | | | 774 | | | | 26,688 | |
Ryder System, Inc. | | | 470 | | | | 22,631 | |
Safe Bulkers, Inc.(1) | | | 3,964 | | | | 7,056 | |
Saia, Inc.(1) | | | 743 | | | | 41,474 | |
Snap-on, Inc. | | | 545 | | | | 79,183 | |
Southwest Airlines Co. | | | 6,560 | | | | 304,909 | |
SP Plus Corp.(1) | | | 1,002 | | | | 29,599 | |
Spirit AeroSystems Holdings, Inc. | | | 2,826 | | | | 203,726 | |
Spirit Airlines, Inc.(1) | | | 203 | | | | 11,758 | |
SPX FLOW, Inc.(1) | | | 792 | | | | 24,093 | |
Steelcase, Inc. - Class A | | | 2,308 | | | | 34,228 | |
Systemax, Inc. | | | 409 | | | | 9,771 | |
Teledyne Technologies, Inc.(1) | | | 531 | | | | 109,954 | |
Terex Corp. | | | 179 | | | | 4,935 | |
Tetra Tech, Inc. | | | 342 | | | | 17,705 | |
Textron, Inc. | | | 6,379 | | | | 293,370 | |
Timken Co./The | | | 3,472 | | | | 129,575 | |
Titan Machinery, Inc.(1) | | | 215 | | | | 2,827 | |
Toro Co./The | | | 4,751 | | | | 265,486 | |
Trex Co., Inc.(1) | | | 927 | | | | 55,027 | |
TriMas Corp.(1) | | | 2,101 | | | | 57,336 | |
Triton International, Ltd./Bermuda | | | 797 | | | | 24,763 | |
TrueBlue, Inc.(1) | | | 465 | | | | 10,346 | |
UniFirst Corp./MA | | | 728 | | | | 104,155 | |
Union Pacific Corp.(4) | | | 8,198 | | | | 1,133,210 | |
United Continental Holdings, Inc.(1) | | | 9,105 | | | | 762,362 | |
United Rentals, Inc.(1) | | | 2,020 | | | | 207,111 | |
Univar, Inc.(1) | | | 472 | | | | 8,373 | |
Universal Forest Products, Inc. | | | 1,382 | | | | 35,877 | |
Universal Logistics Holdings, Inc. | | | 180 | | | | 3,256 | |
Upwork, Inc.(1) | | | 253 | | | | 4,582 | |
US Xpress Enterprises, Inc.(1) | | | 1,752 | | | | 9,829 | |
USA Truck, Inc.(1) | | | 116 | | | | 1,737 | |
Vectrus, Inc.(1) | | | 300 | | | | 6,474 | |
Viad Corp. | | | 249 | | | | 12,472 | |
Wabash National Corp. | | | 3,132 | | | | 40,967 | |
WABCO Holdings, Inc.(1) | | | 17 | | | | 1,825 | |
Waste Management, Inc. | | | 7,889 | | | | 702,042 | |
WESCO International, Inc.(1) | | | 2,385 | | | | 114,480 | |
WW Grainger, Inc. | | | 889 | | | | 251,018 | |
Xylem, Inc./NY | | | 722 | | | | 48,172 | |
YRC Worldwide, Inc.(1) | | | 377 | | | | 1,188 | |
| | | | | | | | 18,226,958 | |
| | | | | | | | | |
Information Technology — 14.6% | | | | | | | | |
A10 Networks, Inc.(1) | | | 2,509 | | | | 15,656 | |
Accenture PLC(4) | | | 5,301 | | | | 747,494 | |
ACI Worldwide, Inc.(1) | | | 760 | | | | 21,029 | |
Adobe, Inc.(1)(4) | | | 4,142 | | | | 937,086 | |
Advanced Energy Industries, Inc.(1) | | | 450 | | | | 19,319 | |
Advanced Micro Devices, Inc.(1) | | | 6,236 | | | | 115,117 | |
Agilysys, Inc.(1) | | | 256 | | | | 3,671 | |
ALJ Regional Holdings, Inc.(1) | | | 892 | | | | 1,169 | |
Alliance Data Systems Corp. | | | 370 | | | | 55,530 | |
Altair Engineering, Inc.(1) | | | 115 | | | | 3,172 | |
Amber Road, Inc.(1) | | | 249 | | | | 2,049 | |
Amdocs, Ltd. | | | 715 | | | | 41,885 | |
American Software, Inc./GA | | | 487 | | | | 5,089 | |
Amkor Technology, Inc.(1) | | | 9,491 | | | | 62,261 | |
Anixter International, Inc.(1) | | | 178 | | | | 9,667 | |
ANSYS, Inc.(1) | | | 208 | | | | 29,732 | |
Apple, Inc.(4) | | | 19,703 | | | | 3,107,951 | |
Applied Materials, Inc. | | | 13,602 | | | | 445,329 | |
ARRIS International PLC(1) | | | 658 | | | | 20,115 | |
Arrow Electronics, Inc.(1) | | | 1,860 | | | | 128,247 | |
Aspen Technology, Inc.(1) | | | 2,016 | | | | 165,675 | |
Atlassian Corp. PLC(1) | | | 561 | | | | 49,918 | |
Autodesk, Inc.(1) | | | 1,628 | | | | 209,377 | |
Avalara, Inc.(1) | | | 136 | | | | 4,236 | |
Avaya Holdings Corp.(1) | | | 995 | | | | 14,487 | |
Avid Technology, Inc.(1) | | | 903 | | | | 4,289 | |
Avnet, Inc. | | | 4,145 | | | | 149,635 | |
Badger Meter, Inc. | | | 278 | | | | 13,680 | |
Benefitfocus, Inc.(1) | | | 258 | | | | 11,796 | |
Black Knight, Inc.(1) | | | 607 | | | | 27,351 | |
Booz Allen Hamilton Holding Corp. | | | 3,954 | | | | 178,207 | |
Bottomline Technologies DE, Inc.(1) | | | 518 | | | | 24,864 | |
Broadcom, Inc.(4) | | | 1,092 | | | | 277,674 | |
Broadridge Financial Solutions, Inc. | | | 934 | | | | 89,898 | |
Brooks Automation, Inc. | | | 810 | | | | 21,206 | |
Cabot Microelectronics Corp. | | | 587 | | | | 55,970 | |
CACI International, Inc. - Class A(1) | | | 734 | | | | 105,718 | |
Cadence Design Systems, Inc.(1) | | | 7,914 | | | | 344,101 | |
Calix, Inc.(1) | | | 895 | | | | 8,726 | |
Cardtronics PLC(1) | | | 251 | | | | 6,526 | |
CDK Global, Inc. | | | 1,333 | | | | 63,824 | |
CDW Corp./DE | | | 1,238 | | | | 100,340 | |
CEVA, Inc.(1) | | | 104 | | | | 2,297 | |
The accompanying notes are an integral part of these financial statements.
2018 Annual Report | December 31, 2018 | Page 49 |
Schedule of Investments
December 31, 2018
Spectrum Fund |
Security Description | | Shares or
Principal
Amount ($) | | | Fair
Value ($) | |
Common Stocks - Long — continued |
ChannelAdvisor Corp.(1) | | | 128 | | | | 1,453 | |
Ciena Corp.(1) | | | 2,523 | | | | 85,555 | |
Cirrus Logic, Inc.(1) | | | 1,133 | | | | 37,593 | |
Cisco Systems, Inc.(4) | | | 34,253 | | | | 1,484,182 | |
Cision, Ltd.(1) | | | 1,146 | | | | 13,408 | |
Citrix Systems, Inc. | | | 2,106 | | | | 215,781 | |
Cohu, Inc. | | | 746 | | | | 11,988 | |
CommScope Holding Co., Inc.(1) | | | 4,408 | | | | 72,247 | |
CommVault Systems, Inc.(1) | | | 526 | | | | 31,081 | |
Comtech Telecommunications Corp. | | | 357 | | | | 8,689 | |
Conduent, Inc.(1) | | | 4,471 | | | | 47,527 | |
Control4 Corp.(1) | | | 298 | | | | 5,245 | |
CoreLogic, Inc./United States(1) | | | 767 | | | | 25,633 | |
Corning, Inc. | | | 10,294 | | | | 310,982 | |
Coupa Software, Inc.(1) | | | 70 | | | | 4,400 | |
CPI Card Group, Inc.(1) | | | 2,863 | | | | 6,556 | |
Cypress Semiconductor Corp. | | | 1,320 | | | | 16,790 | |
DASAN Zhone Solutions, Inc.(1) | | | 336 | | | | 4,674 | |
Dell Technologies, Inc. - Class C(1) | | | 7,557 | | | | 369,311 | |
Diebold Nixdorf, Inc. | | | 1,495 | | | | 3,723 | |
Digi International, Inc.(1) | | | 407 | | | | 4,107 | |
Diodes, Inc.(1) | | | 288 | | | | 9,291 | |
Dolby Laboratories, Inc. | | | 1,060 | | | | 65,550 | |
Domo, Inc.(1) | | | 235 | | | | 4,613 | |
DXC Technology Co. | | | 7,115 | | | | 378,305 | |
EchoStar Corp.(1) | | | 1,994 | | | | 73,220 | |
Electro Scientific Industries, Inc.(1) | | | 127 | | | | 3,805 | |
Endurance International Group Holdings, Inc.(1) | | | 1,239 | | | | 8,239 | |
Entegris, Inc. | | | 189 | | | | 5,272 | |
EPAM Systems, Inc.(1) | | | 51 | | | | 5,917 | |
ePlus, Inc.(1) | | | 491 | | | | 34,944 | |
Euronet Worldwide, Inc.(1) | | | 907 | | | | 92,859 | |
Everi Holdings, Inc.(1) | | | 1,313 | | | | 6,762 | |
EVERTEC, Inc. | | | 427 | | | | 12,255 | |
Exela Technologies, Inc.(1) | | | 746 | | | | 2,902 | |
Extreme Networks, Inc.(1) | | | 644 | | | | 3,928 | |
F5 Networks, Inc.(1) | | | 1,594 | | | | 258,276 | |
Fabrinet(1) | | | 755 | | | | 38,739 | |
Fair Isaac Corp.(1) | | | 570 | | | | 106,590 | |
Fidelity National Information Services, Inc. | | | 1,087 | | | | 111,472 | |
FLIR Systems, Inc. | | | 322 | | | | 14,020 | |
FormFactor, Inc.(1) | | | 1,119 | | | | 15,767 | |
Fortinet, Inc.(1) | | | 1,318 | | | | 92,827 | |
Fusion Connect, Inc.(1) | | | 682 | | | | 1,146 | |
Hackett Group, Inc./The | | | 774 | | | | 12,392 | |
Hewlett Packard Enterprise Co. | | | 29,729 | | | | 392,720 | |
Hortonworks, Inc.(1) | | | 920 | | | | 13,266 | |
HP, Inc. | | | 41,395 | | | | 846,942 | |
I3 Verticals, Inc.(1) | | | 403 | | | | 9,712 | |
Ichor Holdings, Ltd.(1) | | | 298 | | | | 4,857 | |
Immersion Corp.(1) | | | 571 | | | | 5,116 | |
Imperva, Inc.(1) | | | 127 | | | | 7,073 | |
Information Services Group, Inc.(1) | | | 3,086 | | | | 13,085 | |
Insight Enterprises, Inc.(1) | | | 974 | | | | 39,691 | |
Integrated Device Technology, Inc.(1) | | | 510 | | | | 24,699 | |
Intel Corp.(4) | | | 21,592 | | | | 1,013,313 | |
InterDigital, Inc. | | | 1,400 | | | | 93,002 | |
Internap Corp.(1) | | | 419 | | | | 1,739 | |
International Business Machines Corp.(4) | | | 5,745 | | | | 653,034 | |
Intevac, Inc.(1) | | | 2,033 | | | | 10,633 | |
Intuit, Inc. | | | 5,085 | | | | 1,000,982 | |
j2 Global, Inc. | | | 838 | | | | 58,140 | |
Jabil, Inc. | | | 4,591 | | | | 113,811 | |
Juniper Networks, Inc. | | | 17,176 | | | | 462,206 | |
KEMET Corp. | | | 634 | | | | 11,120 | |
Keysight Technologies, Inc.(1) | | | 1,269 | | | | 78,780 | |
Kimball Electronics, Inc.(1) | | | 841 | | | | 13,027 | |
KLA-Tencor Corp. | | | 1,922 | | | | 172,000 | |
Lam Research Corp. | | | 862 | | | | 117,379 | |
Lattice Semiconductor Corp.(1) | | | 1,965 | | | | 13,598 | |
Leidos Holdings, Inc. | | | 3,233 | | | | 170,444 | |
Limelight Networks, Inc.(1) | | | 2,700 | | | | 6,318 | |
LivePerson, Inc.(1) | | | 460 | | | | 8,676 | |
LiveRamp Holdings, Inc.(1) | | | 1 | | | | 39 | |
LogMeIn, Inc. | | | 179 | | | | 14,601 | |
Lumentum Holdings, Inc.(1) | | | 598 | | | | 25,122 | |
Majesco(1) | | | 182 | | | | 1,290 | |
ManTech International Corp./VA | | | 30 | | | | 1,569 | |
Mastercard, Inc.(4) | | | 3,774 | | | | 711,965 | |
Maxim Integrated Products, Inc. | | | 1,078 | | | | 54,816 | |
MAXIMUS, Inc. | | | 696 | | | | 45,303 | |
Maxwell Technologies, Inc.(1) | | | 1,452 | | | | 3,006 | |
Micron Technology, Inc.(1) | | | 10,565 | | | | 335,227 | |
Microsoft Corp.(4) | | | 30,664 | | | | 3,114,542 | |
MicroStrategy, Inc.(1) | | | 604 | | | | 77,161 | |
Mitek Systems, Inc.(1) | | | 889 | | | | 9,610 | |
MKS Instruments, Inc. | | | 1,013 | | | | 65,450 | |
MobileIron, Inc.(1) | | | 1,690 | | | | 7,757 | |
MoneyGram International, Inc.(1) | | | 12,314 | | | | 24,628 | |
Monolithic Power Systems, Inc. | | | 310 | | | | 36,038 | |
Monotype Imaging Holdings, Inc. | | | 1,318 | | | | 20,455 | |
Motorola Solutions, Inc. | | | 1,506 | | | | 173,250 | |
MTS Systems Corp. | | | 407 | | | | 16,333 | |
The accompanying notes are an integral part of these financial statements.
Page 50 | 2018 Annual Report | December 31, 2018 |
Schedule of Investments
December 31, 2018
Spectrum Fund |
Security Description | | Shares or
Principal
Amount ($) | | | Fair
Value ($) | |
Common Stocks - Long — continued |
Nanometrics, Inc.(1) | | | 534 | | | | 14,594 | |
Napco Security Technologies, Inc.(1) | | | 415 | | | | 6,536 | |
National Instruments Corp. | | | 351 | | | | 15,928 | |
NCR Corp.(1) | | | 1,812 | | | | 41,821 | |
NeoPhotonics Corp.(1) | | | 727 | | | | 4,711 | |
NetApp, Inc. | | | 2,386 | | | | 142,373 | |
NetScout Systems, Inc.(1) | | | 230 | | | | 5,435 | |
NIC, Inc. | | | 916 | | | | 11,432 | |
Novanta, Inc.(1) | | | 212 | | | | 13,356 | |
Nuance Communications, Inc.(1) | | | 7,084 | | | | 93,721 | |
NVE Corp. | | | 58 | | | | 5,077 | |
NVIDIA Corp.(4) | | | 1,175 | | | | 156,863 | |
NXP Semiconductors NV | | | 1,061 | | | | 77,750 | |
ON Semiconductor Corp.(1) | | | 3,300 | | | | 54,483 | |
Oracle Corp.(4) | | | 16,163 | | | | 729,759 | |
PC Connection, Inc. | | | 82 | | | | 2,438 | |
Perficient, Inc.(1) | | | 1,195 | | | | 26,601 | |
Perspecta, Inc. | | | 1,299 | | | | 22,369 | |
PFSweb, Inc.(1) | | | 1,044 | | | | 5,356 | |
Photronics, Inc.(1) | | | 2,524 | | | | 24,432 | |
Power Integrations, Inc. | | | 889 | | | | 54,211 | |
Presidio, Inc. | | | 2,190 | | | | 28,580 | |
Progress Software Corp. | | | 1,986 | | | | 70,483 | |
PTC, Inc.(1) | | | 668 | | | | 55,377 | |
Pure Storage, Inc.(1) | | | 2,581 | | | | 41,502 | |
QAD, Inc. - Class A | | | 47 | | | | 1,849 | |
Quantenna Communications, Inc.(1) | | | 1,601 | | | | 22,974 | |
Quantum Corp.(1) | | | 3,699 | | | | 7,398 | |
Rambus, Inc.(1) | | | 346 | | | | 2,654 | |
Rapid7, Inc.(1) | | | 279 | | | | 8,694 | |
RingCentral, Inc. - Class A(1) | | | 551 | | | | 45,424 | |
Rubicon Project, Inc./The(1) | | | 466 | | | | 1,738 | |
Rudolph Technologies, Inc.(1) | | | 735 | | | | 15,045 | |
Sabre Corp. | | | 3,731 | | | | 80,739 | |
SailPoint Technologies Holding, Inc.(1) | | | 868 | | | | 20,389 | |
Sanmina Corp.(1) | | | 359 | | | | 8,638 | |
ScanSource, Inc.(1) | | | 295 | | | | 10,142 | |
Science Applications International Corp. | | | 851 | | | | 54,209 | |
Semtech Corp.(1) | | | 940 | | | | 43,118 | |
SendGrid, Inc.(1) | | | 485 | | | | 20,937 | |
Skyworks Solutions, Inc. | | | 301 | | | | 20,173 | |
SMART Global Holdings, Inc.(1) | | | 514 | | | | 15,266 | |
SPS Commerce, Inc.(1) | | | 31 | | | | 2,554 | |
SS&C Technologies Holdings, Inc. | | | 497 | | | | 22,420 | |
SVMK, Inc.(1) | | | 1,297 | | | | 15,914 | |
Sykes Enterprises, Inc.(1) | | | 43 | | | | 1,063 | |
Symantec Corp. | | | 5,823 | | | | 110,026 | |
Synaptics, Inc.(1) | | | 204 | | | | 7,591 | |
SYNNEX Corp. | | | 731 | | | | 59,094 | |
Synopsys, Inc.(1) | | | 3,038 | | | | 255,921 | |
Tableau Software, Inc.(1) | | | 491 | | | | 58,920 | |
Tech Data Corp.(1) | | | 1,173 | | | | 95,963 | |
Telaria, Inc.(1) | | | 1,982 | | | | 5,411 | |
Texas Instruments, Inc.(4) | | | 10,448 | | | | 987,336 | |
TiVo Corp. | | | 1,735 | | | | 16,326 | |
Trade Desk, Inc./The(1) | | | 118 | | | | 13,695 | |
Travelport Worldwide, Ltd. | | | 499 | | | | 7,794 | |
Twilio, Inc.(1) | | | 57 | | | | 5,090 | |
Tyler Technologies, Inc.(1) | | | 423 | | | | 78,602 | |
Unisys Corp.(1) | | | 243 | | | | 2,826 | |
Upland Software, Inc.(1) | | | 632 | | | | 17,178 | |
USA Technologies, Inc.(1) | | | 1,427 | | | | 5,551 | |
Varonis Systems, Inc.(1) | | | 21 | | | | 1,111 | |
Veeco Instruments, Inc.(1) | | | 198 | | | | 1,467 | |
Verint Systems, Inc.(1) | | | 2,041 | | | | 86,355 | |
Veritone, Inc.(1) | | | 338 | | | | 1,284 | |
Versum Materials, Inc. | | | 964 | | | | 26,722 | |
Viavi Solutions, Inc.(1) | | | 3,103 | | | | 31,185 | |
Visa, Inc. | | | 2,274 | | | | 300,032 | |
Vishay Precision Group, Inc.(1) | | | 307 | | | | 9,281 | |
Western Digital Corp. | | | 3,027 | | | | 111,908 | |
Western Union Co./The | | | 6,394 | | | | 109,082 | |
Workiva, Inc.(1) | | | 526 | | | | 18,878 | |
Xerox Corp. | | | 3,448 | | | | 68,132 | |
Xilinx, Inc. | | | 2,239 | | | | 190,696 | |
Xperi Corp. | | | 1,275 | | | | 23,447 | |
Yext, Inc.(1) | | | 149 | | | | 2,213 | |
Zebra Technologies Corp. - Class A(1) | | | 431 | | | | 68,628 | |
Zix Corp.(1) | | | 2,376 | | | | 13,614 | |
| | | | | | | | 26,832,789 | |
| | | | | | | | | |
Materials — 3.4% | | | | | | | | |
AdvanSix, Inc.(1) | | | 746 | | | | 18,158 | |
Air Products & Chemicals, Inc. | | | 2,180 | | | | 348,909 | |
Alcoa Corp.(1) | | | 802 | | | | 21,317 | |
Amyris, Inc.(1) | | | 367 | | | | 1,226 | |
AptarGroup, Inc. | | | 194 | | | | 18,250 | |
Ashland Global Holdings, Inc. | | | 291 | | | | 20,649 | |
Berry Global Group, Inc.(1) | | | 823 | | | | 39,117 | |
Cabot Corp. | | | 1,049 | | | | 45,044 | |
CF Industries Holdings, Inc. | | | 1,668 | | | | 72,575 | |
Chemours Co./The | | | 4,314 | | | | 121,741 | |
Domtar Corp. | | | 336 | | | | 11,804 | |
Eagle Materials, Inc. | | | 2,625 | | | | 160,204 | |
The accompanying notes are an integral part of these financial statements.
2018 Annual Report | December 31, 2018 | Page 51 |
Schedule of Investments
December 31, 2018
Spectrum Fund |
Security Description | | Shares or
Principal
Amount ($) | | | Fair
Value ($) | |
Common Stocks - Long — continued |
Eastman Chemical Co. | | | 5,394 | | | | 394,355 | |
Ecolab, Inc. | | | 3,185 | | | | 469,310 | |
Flotek Industries, Inc.(1) | | | 1,755 | | | | 1,913 | |
Forterra, Inc.(1) | | | 677 | | | | 2,546 | |
Freeport-McMoRan, Inc. | | | 17,027 | | | | 175,548 | |
FutureFuel Corp. | | | 1,997 | | | | 31,672 | |
Greif, Inc. - Class A | | | 1,166 | | | | 43,270 | |
Greif, Inc. - Class B | | | 519 | | | | 23,044 | |
Havilah Mining Corp.(1) | | | 157 | | | | 31 | |
Hawkins, Inc. | | | 171 | | | | 7,002 | |
Huntsman Corp. | | | 7,660 | | | | 147,761 | |
Ingevity Corp.(1) | | | 751 | | | | 62,851 | |
Innophos Holdings, Inc. | | | 263 | | | | 6,451 | |
Innospec, Inc. | | | 486 | | | | 30,015 | |
International Paper Co. | | | 17,551 | | | | 708,358 | |
Kraton Corp.(1) | | | 902 | | | | 19,700 | |
Kronos Worldwide, Inc. | | | 1,807 | | | | 20,817 | |
Louisiana-Pacific Corp. | | | 3,906 | | | | 86,791 | |
LyondellBasell Industries NV | | | 10,534 | | | | 876,007 | |
Mosaic Co./The | | | 1,692 | | | | 49,423 | |
Nucor Corp. | | | 11,275 | | | | 584,158 | |
Olin Corp. | | | 4,729 | | | | 95,100 | |
OMNOVA Solutions, Inc.(1) | | | 2,474 | | | | 18,134 | |
Packaging Corp. of America | | | 2,183 | | | | 182,193 | |
PolyOne Corp. | | | 1,996 | | | | 57,086 | |
PPG Industries, Inc. | | | 2,257 | | | | 230,733 | |
Quaker Chemical Corp. | | | 61 | | | | 10,840 | |
Rayonier Advanced Materials, Inc. | | | 532 | | | | 5,666 | |
Reliance Steel & Aluminum Co. | | | 2,407 | | | | 171,306 | |
RPM International, Inc. | | | 1,768 | | | | 103,923 | |
Sonoco Products Co. | | | 1,330 | | | | 70,663 | |
Steel Dynamics, Inc. | | | 5,019 | | | | 150,771 | |
Stepan Co. | | | 409 | | | | 30,266 | |
Tredegar Corp. | | | 1,128 | | | | 17,890 | |
Trinseo SA | | | 1,018 | | | | 46,604 | |
UFP Technologies, Inc.(1) | | | 175 | | | | 5,257 | |
United States Lime & Minerals, Inc. | | | 243 | | | | 17,253 | |
US Concrete, Inc.(1) | | | 75 | | | | 2,646 | |
Valvoline, Inc. | | | 2,633 | | | | 50,949 | |
Westlake Chemical Corp. | | | 716 | | | | 47,378 | |
Westrock Co. | | | 5,755 | | | | 217,309 | |
| | | | | | | | 6,151,984 | |
| | | | | | | | | |
Real Estate Investment Trust — 3.1% | | | | | | | | |
American Assets Trust, Inc. | | | 4,992 | | | | 200,529 | |
American Homes 4 Rent | | | 360 | | | | 7,146 | |
American Tower Corp. | | | 274 | | | | 43,344 | |
Ashford Hospitality Trust, Inc. | | | 1,270 | | | | 5,080 | |
Bluerock Residential Growth REIT, Inc. | | | 4,689 | | | | 42,295 | |
Brixmor Property Group, Inc. | | | 534 | | | | 7,844 | |
Brookfield Property Partners LP | | | 2,850 | | | | 45,942 | |
CatchMark Timber Trust, Inc. | | | 6,813 | | | | 48,372 | |
CBL & Associates Properties, Inc. | | | 1,193 | | | | 2,291 | |
Cedar Realty Trust, Inc. | | | 1,156 | | | | 3,630 | |
Clipper Realty, Inc. | | | 229 | | | | 2,993 | |
Colony Capital, Inc. | | | 8,306 | | | | 38,872 | |
CoreCivic, Inc. | | | 1,296 | | | | 23,108 | |
Corporate Office Properties Trust | | | 1,730 | | | | 36,382 | |
CubeSmart | | | 1,065 | | | | 30,555 | |
Empire State Realty Trust, Inc. | | | 304 | | | | 4,326 | |
Essex Property Trust, Inc. | | | 3,312 | | | | 812,136 | |
Farmland Partners, Inc.(2) | | | 1,080 | | | | 4,903 | |
Front Yard Residential Corp. | | | 2,916 | | | | 25,457 | |
Gaming and Leisure Properties, Inc. | | | 1,067 | | | | 34,475 | |
GEO Group, Inc./The | | | 2,049 | | | | 40,365 | |
Global Medical REIT, Inc. | | | 121 | | | | 1,076 | |
Hersha Hospitality Trust | | | 586 | | | | 10,278 | |
Highwoods Properties, Inc. | | | 662 | | | | 25,613 | |
Hospitality Properties Trust | | | 1,398 | | | | 33,384 | |
Host Hotels & Resorts, Inc. | | | 14,338 | | | | 239,014 | |
Kite Realty Group Trust | | | 4,106 | | | | 57,854 | |
Lamar Advertising Co. | | | 1,758 | | | | 121,618 | |
Lexington Realty Trust | | | 5,018 | | | | 41,198 | |
Liberty Property Trust | | | 234 | | | | 9,800 | |
Macerich Co./The | | | 1,643 | | | | 71,109 | |
Maui Land & Pineapple Co., Inc.(1) | | | 470 | | | | 4,662 | |
National Health Investors, Inc. | | | 862 | | | | 65,115 | |
New Senior Investment Group, Inc. | | | 6,468 | | | | 26,648 | |
Newmark Group, Inc. | | | 1,353 | | | | 10,851 | |
Omega Healthcare Investors, Inc. | | | 274 | | | | 9,631 | |
Pebblebrook Hotel Trust | | | 2,896 | | | | 81,986 | |
Pennsylvania Real Estate Investment Trust | | | 2,723 | | | | 16,175 | |
Piedmont Office Realty Trust, Inc. | | | 6,298 | | | | 107,318 | |
PotlatchDeltic Corp. | | | 1,029 | | | | 32,558 | |
Preferred Apartment Communities, Inc. | | | 186 | | | | 2,615 | |
PS Business Parks, Inc. | | | 1,149 | | | | 150,519 | |
Public Storage | | | 1,271 | | | | 257,263 | |
Rayonier, Inc. | | | 1,584 | | | | 43,861 | |
RE/MAX Holdings, Inc. | | | 245 | | | | 7,534 | |
Realogy Holdings Corp. | | | 539 | | | | 7,913 | |
Redfin Corp.(1) | | | 1,201 | | | | 17,294 | |
Retail Properties of America, Inc. | | | 8,081 | | | | 87,679 | |
Retail Value, Inc. | | | 2,757 | | | | 70,552 | |
SBA Communications Corp.(1) | | | 118 | | | | 19,103 | |
The accompanying notes are an integral part of these financial statements.
Page 52 | 2018 Annual Report | December 31, 2018 |
Schedule of Investments
December 31, 2018
Spectrum Fund |
Security Description | | Shares or
Principal
Amount ($) | | | Fair
Value ($) | |
Common Stocks - Long — continued |
Simon Property Group, Inc. | | | 6,218 | | | | 1,044,562 | |
SITE Centers Corp. | | | 2,574 | | | | 28,494 | |
Spirit MTA REIT | | | 630 | | | | 4,492 | |
STORE Capital Corp. | | | 2,374 | | | | 67,208 | |
Summit Hotel Properties, Inc. | | | 618 | | | | 6,013 | |
Tanger Factory Outlet Centers, Inc. | | | 4,331 | | | | 87,573 | |
Tier REIT, Inc. | | | 1,002 | | | | 20,671 | |
Trinity Place Holdings, Inc.(1) | | | 3,358 | | | | 14,574 | |
UDR, Inc. | | | 21,891 | | | | 867,321 | |
Urstadt Biddle Properties, Inc. | | | 2,121 | | | | 40,766 | |
VEREIT, Inc. | | | 12,425 | | | | 88,839 | |
Vornado Realty Trust | | | 2,524 | | | | 156,564 | |
Washington Prime Group, Inc. | | | 468 | | | | 2,274 | |
WP Carey, Inc. | | | 1,219 | | | | 79,649 | |
| | | | | | | | 5,599,266 | |
Utilities — 6.4% | | | | | | | | |
AES Corp./VA | | | 28,117 | | | | 406,572 | |
Ameren Corp. | | | 12,333 | | | | 804,482 | |
American States Water Co. | | | 1,085 | | | | 72,738 | |
Artesian Resources Corp. | | | 295 | | | | 10,287 | |
Atlantic Power Corp.(1) | | | 20,956 | | | | 45,475 | |
Atmos Energy Corp. | | | 4,819 | | | | 446,818 | |
Avista Corp. | | | 261 | | | | 11,087 | |
Black Hills Corp. | | | 652 | | | | 40,933 | |
CenterPoint Energy, Inc. | | | 34,215 | | | | 965,889 | |
Clearway Energy, Inc. | | | 4,262 | | | | 72,113 | |
Consolidated Water Co., Ltd. | | | 1,054 | | | | 12,290 | |
DTE Energy Co. | | | 4,134 | | | | 455,980 | |
Evergy, Inc. | | | 1,437 | | | | 81,578 | |
Eversource Energy | | | 3,804 | | | | 247,412 | |
Exelon Corp. | | | 24,825 | | | | 1,119,609 | |
IDACORP, Inc. | | | 1,747 | | | | 162,576 | |
MDU Resources Group, Inc. | | | 25,931 | | | | 618,195 | |
Middlesex Water Co. | | | 108 | | | | 5,762 | |
New Jersey Resources Corp. | | | 3,811 | | | | 174,048 | |
NextEra Energy, Inc.(4) | | | 7,260 | | | | 1,261,933 | |
NorthWestern Corp. | | | 12,903 | | | | 766,954 | |
NRG Energy, Inc. | | | 11,062 | | | | 438,055 | |
OGE Energy Corp. | | | 20,279 | | | | 794,734 | |
ONE Gas, Inc. | | | 14 | | | | 1,114 | |
Otter Tail Corp. | | | 541 | | | | 26,855 | |
Pinnacle West Capital Corp. | | | 1,152 | | | | 98,150 | |
Portland General Electric Co. | | | 11,038 | | | | 506,092 | |
Public Service Enterprise Group, Inc. | | | 16,974 | | | | 883,497 | |
SJW Group | | | 584 | | | | 32,482 | |
Southwest Gas Holdings, Inc. | | | 825 | | | | 63,113 | |
UGI Corp. | | | 16,769 | | | | 894,626 | |
Vistra Energy Corp.(1) | | | 6,659 | | | | 152,425 | |
Xcel Energy, Inc. | | | 900 | | | | 44,316 | |
| | | | | | | | 11,718,190 | |
| | | | | | | | | |
Total Common Stocks - Long
(Cost $163,665,412) | | | | | | | 161,926,608 | |
| | | | | | | | | |
Money Market Registered Investment Companies — 5.8% |
Morgan Stanley Government Institutional Fund, 2.32%(3) | | | 61,791 | | | | 61,791 | |
Meeder Institutional Prime Money Market Fund, 2.43%(5) | | | 10,510,294 | | | | 10,509,243 | |
Total Money Market Registered Investment Companies (Cost $10,571,034) | | | | | | | 10,571,034 | |
Total Investments - Long — 94.4%(Cost $174,236,446) | | | | | | | 172,497,642 | |
Total Securities Sold Short - (33.0%) (Proceeds Received $67,941,343) | | | | | | | (60,259,673 | ) |
Other Assets less Liabilities — 38.6% | | | | | | | 70,496,440 | |
Total Net Assets — 100.0% | | | | | | | 182,734,409 | |
| | | | | | | | | |
Common Stocks - Short — (33.0%) |
Communication Services — (1.2%) | | | | | | | | |
Activision Blizzard, Inc. | | | (5,225 | ) | | | (243,328 | ) |
Boston Omaha Corp.(1) | | | (57 | ) | | | (1,334 | ) |
Cardlytics, Inc.(1) | | | (158 | ) | | | (1,711 | ) |
Central European Media Enterprises, Ltd.(1) | | | (1,650 | ) | | | (4,587 | ) |
Consolidated Communications Holdings, Inc. | | | (104 | ) | | | (1,028 | ) |
Daily Journal Corp.(1) | | | (73 | ) | | | (17,082 | ) |
Entercom Communications Corp. | | | (1,345 | ) | | | (7,680 | ) |
Eros International PLC(1) | | | (715 | ) | | | (5,927 | ) |
GCI Liberty, Inc. - Class A(1) | | | (3,412 | ) | | | (140,438 | ) |
Iridium Communications, Inc.(1) | | | (524 | ) | | | (9,668 | ) |
Liberty Broadband Corp.(1) | | | (8,549 | ) | | | (615,784 | ) |
Liberty Media Corp-Liberty Formula One - Class A(1) | | | (740 | ) | | | (21,993 | ) |
Liberty Media Corp-Liberty Formula One - Class C(1) | | | (1,275 | ) | | | (39,143 | ) |
Liberty Media Corp-Liberty SiriusXM(1) | | | (2,285 | ) | | | (84,088 | ) |
Madison Square Garden Co./The(1) | | | (715 | ) | | | (191,406 | ) |
Match Group, Inc. | | | (1,364 | ) | | | (58,338 | ) |
Meredith Corp. | | | (1,670 | ) | | | (86,740 | ) |
Netflix, Inc.(1) | | | (1,344 | ) | | | (359,735 | ) |
New Media Investment Group, Inc. | | | (89 | ) | | | (1,030 | ) |
The accompanying notes are an integral part of these financial statements.
2018 Annual Report | December 31, 2018 | Page 53 |
Schedule of Investments
December 31, 2018
Spectrum Fund |
Security Description | | Shares or
Principal
Amount ($) | | | Fair
Value ($) | |
Common Stocks - Short — continued |
Pandora Media, Inc.(1) | | | (7,989 | ) | | | (64,631 | ) |
TripAdvisor, Inc.(1) | | | (74 | ) | | | (3,992 | ) |
TrueCar, Inc.(1) | | | (5,242 | ) | | | (47,493 | ) |
Twitter, Inc.(1) | | | (3,860 | ) | | | (110,936 | ) |
Yelp, Inc.(1) | | | (622 | ) | | | (21,764 | ) |
Zillow Group, Inc.(1) | | | (3,530 | ) | | | (111,477 | ) |
| | | | | | | | (2,251,333 | ) |
| | | | | | | | | |
Consumer Discretionary — (2.9%) | | | | | | | | |
Adient PLC | | | (693 | ) | | | (10,437 | ) |
Adtalem Global Education, Inc.(1) | | | (174 | ) | | | (8,234 | ) |
Aptiv PLC | | | (11,430 | ) | | | (703,745 | ) |
At Home Group, Inc.(1) | | | (160 | ) | | | (2,986 | ) |
AutoNation, Inc.(1) | | | (3,258 | ) | | | (116,311 | ) |
Belmond, Ltd.(1) | | | (448 | ) | | | (11,213 | ) |
Big 5 Sporting Goods Corp. | | | (394 | ) | | | (1,020 | ) |
Biglari Holdings, Inc. - Class A(1) | | | (2 | ) | | | (1,175 | ) |
Caesars Entertainment Corp.(1) | | | (6,563 | ) | | | (44,563 | ) |
Camping World Holdings, Inc. | | | (552 | ) | | | (6,331 | ) |
Career Education Corp.(1) | | | (819 | ) | | | (9,353 | ) |
CarMax, Inc.(1) | | | (4,067 | ) | | | (255,123 | ) |
Carvana Co.(1) | | | (619 | ) | | | (20,247 | ) |
Century Communities, Inc.(1) | | | (2,610 | ) | | | (45,049 | ) |
Chegg, Inc.(1) | | | (3,391 | ) | | | (96,372 | ) |
Chuy's Holdings, Inc.(1) | | | (468 | ) | | | (8,302 | ) |
Container Store Group, Inc./The(1) | | | (705 | ) | | | (3,363 | ) |
Del Taco Restaurants, Inc.(1) | | | (103 | ) | | | (1,029 | ) |
Dillard's, Inc. | | | (112 | ) | | | (6,755 | ) |
Dollar Tree, Inc.(1) | | | (3,656 | ) | | | (330,210 | ) |
Dorman Products, Inc.(1) | | | (613 | ) | | | (55,182 | ) |
Drive Shack, Inc.(1) | | | (604 | ) | | | (2,368 | ) |
Floor & Decor Holdings, Inc.(1) | | | (354 | ) | | | (9,169 | ) |
Fossil Group, Inc.(1) | | | (111 | ) | | | (1,746 | ) |
Gap, Inc./The | | | (373 | ) | | | (9,608 | ) |
Garrett Motion, Inc.(1) | | | (1,334 | ) | | | (16,462 | ) |
GoPro, Inc.(1) | | | (1,604 | ) | | | (6,801 | ) |
Green Brick Partners, Inc.(1) | | | (1,267 | ) | | | (9,173 | ) |
Hanesbrands, Inc. | | | (6,335 | ) | | | (79,378 | ) |
Hasbro, Inc. | | | (1,727 | ) | | | (140,319 | ) |
Hilton Grand Vacations, Inc.(1) | | | (1,246 | ) | | | (32,882 | ) |
iRobot Corp.(1) | | | (46 | ) | | | (3,852 | ) |
LCI Industries | | | (18 | ) | | | (1,202 | ) |
Lennar Corp. | | | (1,058 | ) | | | (41,421 | ) |
Lithia Motors, Inc. | | | (293 | ) | | | (22,365 | ) |
LKQ Corp.(1) | | | (7,874 | ) | | | (186,850 | ) |
Lovesac Co./The(1) | | | (334 | ) | | | (7,662 | ) |
Lumber Liquidators Holdings, Inc.(1) | | | (744 | ) | | | (7,083 | ) |
Marriott Vacations Worldwide Corp. | | | (337 | ) | | | (23,762 | ) |
Mattel, Inc.(1) | | | (9,166 | ) | | | (91,568 | ) |
Modine Manufacturing Co.(1) | | | (491 | ) | | | (5,308 | ) |
Monro, Inc. | | | (422 | ) | | | (29,013 | ) |
Motorcar Parts of America, Inc.(1) | | | (1,051 | ) | | | (17,489 | ) |
Movado Group, Inc. | | | (119 | ) | | | (3,763 | ) |
National Vision Holdings, Inc.(1) | | | (36 | ) | | | (1,014 | ) |
New Home Co., Inc./The(1) | | | (484 | ) | | | (2,531 | ) |
PlayAGS, Inc.(1) | | | (337 | ) | | | (7,751 | ) |
Polaris Industries, Inc. | | | (223 | ) | | | (17,100 | ) |
Pool Corp. | | | (1,794 | ) | | | (266,678 | ) |
Potbelly Corp.(1) | | | (665 | ) | | | (5,353 | ) |
Quotient Technology, Inc.(1) | | | (1,617 | ) | | | (17,270 | ) |
Red Robin Gourmet Burgers, Inc.(1) | | | (86 | ) | | | (2,298 | ) |
Red Rock Resorts, Inc. | | | (363 | ) | | | (7,373 | ) |
Service Corp. International/US | | | (1,748 | ) | | | (70,374 | ) |
ServiceMaster Global Holdings, Inc.(1) | | | (4,384 | ) | | | (161,068 | ) |
Shake Shack, Inc.(1) | | | (729 | ) | | | (33,111 | ) |
Skyline Champion Corp. | | | (888 | ) | | | (13,045 | ) |
Sonic Automotive, Inc. | | | (516 | ) | | | (7,100 | ) |
Sotheby's(1) | | | (1,394 | ) | | | (55,398 | ) |
Tempur Sealy International, Inc.(1) | | | (476 | ) | | | (19,706 | ) |
Tesla, Inc.(1) | | | (1,620 | ) | | | (539,136 | ) |
Tile Shop Holdings, Inc. | | | (975 | ) | | | (5,343 | ) |
Under Armour, Inc. - Class A(1) | | | (15,247 | ) | | | (269,414 | ) |
Unifi, Inc.(1) | | | (1,298 | ) | | | (29,646 | ) |
Universal Electronics, Inc.(1) | | | (385 | ) | | | (9,733 | ) |
VF Corp. | | | (10,692 | ) | | | (762,767 | ) |
Visteon Corp.(1) | | | (229 | ) | | | (13,804 | ) |
Weight Watchers International, Inc.(1) | | | (277 | ) | | | (10,678 | ) |
William Lyon Homes(1) | | | (124 | ) | | | (1,326 | ) |
Wolverine World Wide, Inc. | | | (4,810 | ) | | | (153,391 | ) |
Wyndham Destinations, Inc. | | | (5,398 | ) | | | (193,464 | ) |
Wynn Resorts, Ltd. | | | (326 | ) | | | (32,245 | ) |
Yum China Holdings, Inc. | | | (1,374 | ) | | | (46,070 | ) |
| | | | | | | | (5,240,431 | ) |
| | | | | | | | | |
Consumer Staples — (0.9%) | | | | | | | | |
Alico, Inc. | | | (845 | ) | | | (24,928 | ) |
Andersons, Inc./The | | | (1,803 | ) | | | (53,892 | ) |
Bunge, Ltd. | | | (3,067 | ) | | | (163,900 | ) |
Calavo Growers, Inc. | | | (528 | ) | | | (38,523 | ) |
Campbell Soup Co. | | | (8,905 | ) | | | (293,776 | ) |
Castle Brands, Inc.(1) | | | (4,512 | ) | | | (3,837 | ) |
Central Garden & Pet Co.(1) | | | (638 | ) | | | (21,979 | ) |
Chefs' Warehouse, Inc./The(1) | | | (241 | ) | | | (7,707 | ) |
Coca-Cola Consolidated, Inc. | | | (50 | ) | | | (8,869 | ) |
The accompanying notes are an integral part of these financial statements.
Page 54 | 2018 Annual Report | December 31, 2018 |
Schedule of Investments
December 31, 2018
Spectrum Fund |
Security Description | | Shares or
Principal
Amount ($) | | | Fair
Value ($) | |
Common Stocks - Short — continued |
Coty, Inc. | | | (3,687 | ) | | | (24,187 | ) |
Dean Foods Co. | | | (447 | ) | | | (1,703 | ) |
Estee Lauder Cos., Inc./The | | | (989 | ) | | | (128,669 | ) |
Farmer Brothers Co.(1) | | | (1,726 | ) | | | (40,268 | ) |
Hain Celestial Group, Inc./The(1) | | | (3,446 | ) | | | (54,654 | ) |
Medifast, Inc. | | | (29 | ) | | | (3,626 | ) |
MGP Ingredients, Inc. | | | (437 | ) | | | (24,931 | ) |
Pilgrim's Pride Corp.(1) | | | (5,398 | ) | | | (83,723 | ) |
PriceSmart, Inc. | | | (1,704 | ) | | | (100,706 | ) |
Primo Water Corp.(1) | | | (239 | ) | | | (3,348 | ) |
Rite Aid Corp.(1) | | | (2,473 | ) | | | (1,752 | ) |
Sanderson Farms, Inc. | | | (763 | ) | | | (75,758 | ) |
Seaboard Corp. | | | (15 | ) | | | (53,070 | ) |
Seneca Foods Corp.(1) | | | (38 | ) | | | (1,072 | ) |
Spectrum Brands Holdings, Inc. | | | (182 | ) | | | (7,690 | ) |
Tootsie Roll Industries, Inc. | | | (5,652 | ) | | | (188,777 | ) |
United Natural Foods, Inc.(1) | | | (1,041 | ) | | | (11,024 | ) |
Vector Group, Ltd. | | | (3,500 | ) | | | (34,055 | ) |
WD-40 Co. | | | (529 | ) | | | (96,945 | ) |
| | | | | | | | (1,553,369 | ) |
| | | | | | | | | |
Energy — (0.5%) | | | | | | | | |
Alta Mesa Resources, Inc.(1) | | | (2,303 | ) | | | (2,303 | ) |
Antero Resources Corp.(1) | | | (2,467 | ) | | | (23,165 | ) |
Bonanza Creek Energy, Inc.(1) | | | (245 | ) | | | (5,064 | ) |
Callon Petroleum Co.(1) | | | (5,151 | ) | | | (33,430 | ) |
Dril-Quip, Inc.(1) | | | (260 | ) | | | (7,808 | ) |
Extraction Oil & Gas, Inc.(1) | | | (955 | ) | | | (4,097 | ) |
Forum Energy Technologies, Inc.(1) | | | (1,981 | ) | | | (8,182 | ) |
Golar LNG, Ltd. | | | (709 | ) | | | (15,428 | ) |
Halcon Resources Corp.(1) | | | (6,456 | ) | | | (10,975 | ) |
Halliburton Co. | | | (19,810 | ) | | | (526,550 | ) |
HighPoint Resources Corp.(1) | | | (1,600 | ) | | | (3,984 | ) |
Jagged Peak Energy, Inc.(1) | | | (635 | ) | | | (5,791 | ) |
Matador Resources Co.(1) | | | (975 | ) | | | (15,142 | ) |
McDermott International, Inc.(1) | | | (4 | ) | | | (26 | ) |
NACCO Industries, Inc. | | | (368 | ) | | | (12,475 | ) |
National Oilwell Varco, Inc. | | | (896 | ) | | | (23,027 | ) |
NCS Multistage Holdings, Inc.(1) | | | (2,105 | ) | | | (10,714 | ) |
Newpark Resources, Inc.(1) | | | (1,047 | ) | | | (7,193 | ) |
Oil States International, Inc.(1) | | | (842 | ) | | | (12,024 | ) |
Panhandle Oil and Gas, Inc. | | | (796 | ) | | | (12,338 | ) |
REX American Resources Corp.(1) | | | (388 | ) | | | (26,427 | ) |
Ring Energy, Inc.(1) | | | (253 | ) | | | (1,285 | ) |
RPC, Inc. | | | (4,977 | ) | | | (49,123 | ) |
SemGroup Corp. | | | (3,225 | ) | | | (44,441 | ) |
Smart Sand, Inc.(1) | | | (530 | ) | | | (1,177 | ) |
Solaris Oilfield Infrastructure, Inc. | | | (1,063 | ) | | | (12,852 | ) |
Teekay Corp. | | | (1,194 | ) | | | (3,988 | ) |
Tellurian, Inc.(1) | | | (554 | ) | | | (3,850 | ) |
Tidewater, Inc.(1) | | | (313 | ) | | | (5,988 | ) |
| | | | | | | | (888,847 | ) |
| | | | | | | | | |
Financials — (10.8%) | | | | | | | | |
Access National Corp. | | | (1,210 | ) | | | (25,809 | ) |
AGNC Investment Corp. | | | (6,200 | ) | | | (108,748 | ) |
Amalgamated Bank | | | (3,717 | ) | | | (72,482 | ) |
Ambac Financial Group, Inc.(1) | | | (341 | ) | | | (5,879 | ) |
American International Group, Inc. | | | (20,590 | ) | | | (811,452 | ) |
Ameris Bancorp | | | (2,843 | ) | | | (90,038 | ) |
Anworth Mortgage Asset Corp. | | | (23,152 | ) | | | (93,534 | ) |
Arlington Asset Investment Corp. | | | (1,499 | ) | | | (10,853 | ) |
ARMOUR Residential REIT, Inc. | | | (1,498 | ) | | | (30,709 | ) |
Aspen Insurance Holdings, Ltd. | | | (3,428 | ) | | | (143,942 | ) |
Associated Capital Group, Inc. | | | (30 | ) | | | (1,057 | ) |
Atlantic Capital Bancshares, Inc.(1) | | | (911 | ) | | | (14,913 | ) |
Axos Financial, Inc.(1) | | | (1,753 | ) | | | (44,141 | ) |
Banc of California, Inc. | | | (4,985 | ) | | | (66,350 | ) |
Banco Latinoamericano de Comercio Exterior SA | | | (1,009 | ) | | | (17,456 | ) |
BancorpSouth Bank | | | (1,473 | ) | | | (38,504 | ) |
Bank of Hawaii Corp. | | | (8,144 | ) | | | (548,254 | ) |
Bank of Princeton/The | | | (1,009 | ) | | | (28,151 | ) |
Bank OZK | | | (3,284 | ) | | | (74,974 | ) |
Bankwell Financial Group, Inc. | | | (350 | ) | | | (10,049 | ) |
BlackRock, Inc. | | | (2,017 | ) | | | (792,318 | ) |
Blackstone Mortgage Trust, Inc. | | | (12,740 | ) | | | (405,896 | ) |
Boston Private Financial Holdings, Inc. | | | (2,574 | ) | | | (27,207 | ) |
Bridge Bancorp, Inc. | | | (2,524 | ) | | | (64,337 | ) |
Brighthouse Financial, Inc.(1) | | | (5,909 | ) | | | (180,106 | ) |
Brookline Bancorp, Inc. | | | (74 | ) | | | (1,023 | ) |
Business First Bancshares, Inc. | | | (2,286 | ) | | | (55,390 | ) |
Camden National Corp. | | | (276 | ) | | | (9,928 | ) |
Capitol Federal Financial, Inc. | | | (499 | ) | | | (6,372 | ) |
Capstar Financial Holdings, Inc. | | | (726 | ) | | | (10,694 | ) |
Capstead Mortgage Corp. | | | (18,128 | ) | | | (120,914 | ) |
Carolina Financial Corp. | | | (394 | ) | | | (11,658 | ) |
CBTX, Inc. | | | (166 | ) | | | (4,880 | ) |
Central Pacific Financial Corp. | | | (1,096 | ) | | | (26,688 | ) |
Century Bancorp, Inc./MA | | | (233 | ) | | | (15,781 | ) |
Charles Schwab Corp./The | | | (5,266 | ) | | | (218,697 | ) |
Chubb, Ltd. | | | (4,815 | ) | | | (622,002 | ) |
Citigroup, Inc. | | | (13,884 | ) | | | (722,801 | ) |
Citizens, Inc./TX(1) | | | (2,281 | ) | | | (17,153 | ) |
The accompanying notes are an integral part of these financial statements.
2018 Annual Report | December 31, 2018 | Page 55 |
Schedule of Investments
December 31, 2018
Spectrum Fund |
Security Description | | Shares or
Principal
Amount ($) | | | Fair
Value ($) | |
Common Stocks - Short — continued |
CNO Financial Group, Inc. | | | (3,876 | ) | | | (57,675 | ) |
Cohen & Steers, Inc. | | | (1,012 | ) | | | (34,732 | ) |
Colony Credit Real Estate, Inc. | | | (623 | ) | | | (9,837 | ) |
Columbia Banking System, Inc. | | | (3,957 | ) | | | (143,600 | ) |
Columbia Financial, Inc.(1) | | | (14,924 | ) | | | (228,188 | ) |
Community Financial Corp./The | | | (114 | ) | | | (3,333 | ) |
ConnectOne Bancorp, Inc. | | | (3,030 | ) | | | (55,964 | ) |
County Bancorp, Inc. | | | (345 | ) | | | (5,993 | ) |
CVB Financial Corp. | | | (22,974 | ) | | | (464,764 | ) |
Eagle Bancorp, Inc.(1) | | | (1,095 | ) | | | (53,337 | ) |
Encore Capital Group, Inc.(1) | | | (147 | ) | | | (3,455 | ) |
Enstar Group, Ltd.(1) | | | (1,163 | ) | | | (194,884 | ) |
EZCORP, Inc. - Class A(1) | | | (725 | ) | | | (5,604 | ) |
FBL Financial Group, Inc. | | | (348 | ) | | | (22,846 | ) |
FCB Financial Holdings, Inc.(1) | | | (4,922 | ) | | | (165,281 | ) |
Federated Investors, Inc. | | | (1,710 | ) | | | (45,401 | ) |
FGL Holdings(1) | | | (14,209 | ) | | | (94,632 | ) |
First Bank/Hamilton NJ | | | (1,623 | ) | | | (19,671 | ) |
First Foundation, Inc.(1) | | | (3,664 | ) | | | (47,119 | ) |
First Hawaiian, Inc. | | | (340 | ) | | | (7,653 | ) |
First Internet Bancorp | | | (1,696 | ) | | | (34,666 | ) |
First Mid-Illinois Bancshares, Inc. | | | (600 | ) | | | (19,152 | ) |
First of Long Island Corp./The | | | (5,403 | ) | | | (107,790 | ) |
First Republic Bank/CA | | | (9,547 | ) | | | (829,634 | ) |
Flagstar Bancorp, Inc.(1) | | | (1,700 | ) | | | (44,880 | ) |
Flushing Financial Corp. | | | (1,228 | ) | | | (26,439 | ) |
Focus Financial Partners, Inc.(1) | | | (680 | ) | | | (17,904 | ) |
Franklin Financial Network, Inc.(1) | | | (1,052 | ) | | | (27,741 | ) |
Franklin Resources, Inc. | | | (12,009 | ) | | | (356,187 | ) |
GAIN Capital Holdings, Inc. | | | (2,932 | ) | | | (18,061 | ) |
GAMCO Investors, Inc. | | | (1,354 | ) | | | (22,869 | ) |
German American Bancorp, Inc. | | | (3,073 | ) | | | (85,337 | ) |
Glacier Bancorp, Inc. | | | (4,109 | ) | | | (162,799 | ) |
Goldman Sachs Group, Inc./The | | | (4,606 | ) | | | (769,432 | ) |
Guaranty Bancshares, Inc./TX | | | (338 | ) | | | (10,079 | ) |
HarborOne Bancorp, Inc.(1) | | | (2,823 | ) | | | (44,857 | ) |
Hartford Financial Services Group, Inc./The | | | (10,863 | ) | | | (482,860 | ) |
Heritage Financial Corp./WA | | | (1,848 | ) | | | (54,923 | ) |
Heritage Insurance Holdings, Inc. | | | (744 | ) | | | (10,952 | ) |
Home BancShares, Inc./AR | | | (2,133 | ) | | | (34,853 | ) |
Horace Mann Educators Corp. | | | (3,046 | ) | | | (114,073 | ) |
Howard Bancorp, Inc.(1) | | | (1,545 | ) | | | (22,094 | ) |
Independent Bank Group, Inc. | | | (3,804 | ) | | | (174,109 | ) |
Interactive Brokers Group, Inc. | | | (1,214 | ) | | | (66,345 | ) |
Invesco, Ltd. | | | (5,225 | ) | | | (87,467 | ) |
Invesco Mortgage Capital, Inc. | | | (14,176 | ) | | | (205,268 | ) |
Jefferies Financial Group, Inc. | | | (7,701 | ) | | | (133,689 | ) |
Kearny Financial Corp./MD | | | (1,301 | ) | | | (16,679 | ) |
Lakeland Bancorp, Inc. | | | (4,123 | ) | | | (61,062 | ) |
Lakeland Financial Corp. | | | (3,965 | ) | | | (159,234 | ) |
LCNB Corp. | | | (470 | ) | | | (7,121 | ) |
LegacyTexas Financial Group, Inc. | | | (1,107 | ) | | | (35,524 | ) |
LendingClub Corp.(1) | | | (735 | ) | | | (1,933 | ) |
Lincoln National Corp. | | | (2,554 | ) | | | (131,046 | ) |
MBIA, Inc.(1) | | | (1,762 | ) | | | (15,717 | ) |
Meridian Bancorp, Inc. | | | (3,709 | ) | | | (53,113 | ) |
Meta Financial Group, Inc. | | | (2,327 | ) | | | (45,121 | ) |
MetLife, Inc. | | | (9,153 | ) | | | (375,822 | ) |
Midland States Bancorp, Inc. | | | (259 | ) | | | (5,786 | ) |
MidSouth Bancorp, Inc. | | | (98 | ) | | | (1,039 | ) |
Moody's Corp. | | | (5,516 | ) | | | (772,461 | ) |
National Bank Holdings Corp. | | | (2,334 | ) | | | (72,051 | ) |
NBT Bancorp, Inc. | | | (1,387 | ) | | | (47,976 | ) |
New York Community Bancorp, Inc. | | | (39,363 | ) | | | (370,406 | ) |
New York Mortgage Trust, Inc. | | | (57,779 | ) | | | (340,318 | ) |
NI Holdings, Inc.(1) | | | (559 | ) | | | (8,793 | ) |
Northfield Bancorp, Inc. | | | (2,897 | ) | | | (39,254 | ) |
Old Line Bancshares, Inc. | | | (68 | ) | | | (1,790 | ) |
Opus Bank | | | (827 | ) | | | (16,201 | ) |
Orchid Island Capital, Inc. | | | (4,954 | ) | | | (31,656 | ) |
Origin Bancorp, Inc. | | | (1,807 | ) | | | (61,583 | ) |
Oritani Financial Corp. | | | (3,366 | ) | | | (49,649 | ) |
Pacific Premier Bancorp, Inc.(1) | | | (1,057 | ) | | | (26,975 | ) |
Park National Corp. | | | (728 | ) | | | (61,844 | ) |
Peapack Gladstone Financial Corp. | | | (1,006 | ) | | | (25,331 | ) |
People's Utah Bancorp | | | (100 | ) | | | (3,015 | ) |
Pinnacle Financial Partners, Inc. | | | (6,952 | ) | | | (320,487 | ) |
PRA Group, Inc.(1) | | | (1,466 | ) | | | (35,726 | ) |
Preferred Bank/Los Angeles CA | | | (845 | ) | | | (36,631 | ) |
Prosperity Bancshares, Inc. | | | (3,655 | ) | | | (227,707 | ) |
Provident Financial Services, Inc. | | | (822 | ) | | | (19,835 | ) |
Raymond James Financial, Inc. | | | (186 | ) | | | (13,840 | ) |
RBB Bancorp | | | (135 | ) | | | (2,372 | ) |
Redwood Trust, Inc. | | | (12,170 | ) | | | (183,402 | ) |
Reliant Bancorp, Inc. | | | (1,012 | ) | | | (23,316 | ) |
RenaissanceRe Holdings, Ltd. | | | (1,431 | ) | | | (191,325 | ) |
Republic First Bancorp, Inc.(1) | | | (9,371 | ) | | | (55,945 | ) |
S&T Bancorp, Inc. | | | (445 | ) | | | (16,839 | ) |
SB One Bancorp | | | (819 | ) | | | (16,740 | ) |
SEI Investments Co. | | | (1,740 | ) | | | (80,388 | ) |
ServisFirst Bancshares, Inc. | | | (9,083 | ) | | | (289,475 | ) |
Signature Bank/New York NY | | | (2,930 | ) | | | (301,233 | ) |
SLM Corp.(1) | | | (12,066 | ) | | | (100,268 | ) |
South State Corp. | | | (1,988 | ) | | | (119,181 | ) |
The accompanying notes are an integral part of these financial statements.
Page 56 | 2018 Annual Report | December 31, 2018 |
Schedule of Investments
December 31, 2018
Spectrum Fund |
Security Description | | Shares or
Principal
Amount ($) | | | Fair
Value ($) | |
Common Stocks - Short — continued |
Southside Bancshares, Inc. | | | (1,979 | ) | | | (62,833 | ) |
Starwood Property Trust, Inc. | | | (13,860 | ) | | | (273,181 | ) |
State Auto Financial Corp. | | | (1,706 | ) | | | (58,072 | ) |
State Street Corp. | | | (9,434 | ) | | | (595,002 | ) |
Sterling Bancorp/DE | | | (17,343 | ) | | | (286,333 | ) |
Stock Yards Bancorp, Inc. | | | (442 | ) | | | (14,498 | ) |
Synovus Financial Corp.(1) | | | (1,200 | ) | | | (38,388 | ) |
Texas Capital Bancshares, Inc.(1) | | | (4,667 | ) | | | (238,437 | ) |
TFS Financial Corp. | | | (13,173 | ) | | | (212,480 | ) |
Tompkins Financial Corp. | | | (1,225 | ) | | | (91,887 | ) |
Triumph Bancorp, Inc.(1) | | | (380 | ) | | | (11,286 | ) |
Trupanion, Inc.(1) | | | (501 | ) | | | (12,755 | ) |
UMB Financial Corp. | | | (3,037 | ) | | | (185,166 | ) |
Union Bankshares Corp. | | | (600 | ) | | | (16,938 | ) |
United Insurance Holdings Corp. | | | (1,955 | ) | | | (32,492 | ) |
Univest Financial Corp. | | | (900 | ) | | | (19,413 | ) |
Unum Group | | | (3,131 | ) | | | (91,989 | ) |
Valley National Bancorp | | | (14,741 | ) | | | (130,900 | ) |
Value Line, Inc. | | | (120 | ) | | | (3,121 | ) |
Veritex Holdings, Inc.(1) | | | (1,127 | ) | | | (24,095 | ) |
Virtus Investment Partners, Inc. | | | (654 | ) | | | (51,947 | ) |
Voya Financial, Inc. | | | (10,108 | ) | | | (405,735 | ) |
Washington Federal, Inc. | | | (5,096 | ) | | | (136,114 | ) |
Westamerica Bancorporation | | | (8,996 | ) | | | (500,897 | ) |
WisdomTree Investments, Inc. | | | (5,588 | ) | | | (37,160 | ) |
WSFS Financial Corp. | | | (1,831 | ) | | | (69,413 | ) |
| | | | | | | | (19,653,311 | ) |
| | | | | | | | | |
Healthcare — (0.3%) | | | | | | | | |
Accelerate Diagnostics, Inc.(1) | | | (549 | ) | | | (6,314 | ) |
Alder Biopharmaceuticals, Inc.(1) | | | (1,083 | ) | | | (11,101 | ) |
American Renal Associates Holdings, Inc.(1) | | | (83 | ) | | | (956 | ) |
Anika Therapeutics, Inc.(1) | | | (413 | ) | | | (13,881 | ) |
Antares Pharma, Inc.(1) | | | (726 | ) | | | (1,975 | ) |
Apollo Medical Holdings, Inc.(1) | | | (63 | ) | | | (1,251 | ) |
Avrobio, Inc.(1) | | | (76 | ) | | | (1,265 | ) |
Cara Therapeutics, Inc.(1) | | | (403 | ) | | | (5,239 | ) |
Castlight Health, Inc.(1) | | | (482 | ) | | | (1,046 | ) |
Cerus Corp.(1) | | | (3,366 | ) | | | (17,066 | ) |
Coherus Biosciences, Inc.(1) | | | (589 | ) | | | (5,330 | ) |
Diplomat Pharmacy, Inc.(1) | | | (786 | ) | | | (10,580 | ) |
Evolent Health, Inc.(1) | | | (588 | ) | | | (11,731 | ) |
Fluidigm Corp.(1) | | | (896 | ) | | | (7,724 | ) |
Genesis Healthcare, Inc.(1) | | | (2,247 | ) | | | (2,651 | ) |
GenMark Diagnostics, Inc.(1) | | | (265 | ) | | | (1,288 | ) |
Genomic Health, Inc.(1) | | | (43 | ) | | | (2,770 | ) |
Glaukos Corp.(1) | | | (196 | ) | | | (11,009 | ) |
GlycoMimetics, Inc.(1) | | | (232 | ) | | | (2,197 | ) |
Inovalon Holdings, Inc.(1) | | | (1,300 | ) | | | (18,434 | ) |
Inspire Medical Systems, Inc.(1) | | | (508 | ) | | | (21,463 | ) |
Insulet Corp.(1) | | | (1,222 | ) | | | (96,929 | ) |
Intrexon Corp.(1) | | | (814 | ) | | | (5,324 | ) |
Kiniksa Pharmaceuticals, Ltd.(1) | | | (102 | ) | | | (2,865 | ) |
Liquidia Technologies, Inc.(1) | | | (228 | ) | | | (4,938 | ) |
Medidata Solutions, Inc.(1) | | | (811 | ) | | | (54,678 | ) |
NanoString Technologies, Inc.(1) | | | (969 | ) | | | (14,370 | ) |
Neuronetics, Inc.(1) | | | (436 | ) | | | (8,437 | ) |
Nevro Corp.(1) | | | (88 | ) | | | (3,422 | ) |
Nuvectra Corp.(1) | | | (961 | ) | | | (15,703 | ) |
OrthoPediatrics Corp.(1) | | | (89 | ) | | | (3,104 | ) |
Pacific Biosciences of California, Inc.(1) | | | (551 | ) | | | (4,077 | ) |
PetIQ, Inc.(1) | | | (126 | ) | | | (2,957 | ) |
Quanterix Corp.(1) | | | (373 | ) | | | (6,830 | ) |
Selecta Biosciences, Inc.(1) | | | (347 | ) | | | (923 | ) |
Senseonics Holdings, Inc.(1) | | | (1,462 | ) | | | (3,787 | ) |
Sientra, Inc.(1) | | | (813 | ) | | | (10,333 | ) |
Surmodics, Inc.(1) | | | (370 | ) | | | (17,486 | ) |
Teladoc Health, Inc.(1) | | | (1,574 | ) | | | (78,023 | ) |
Tivity Health, Inc.(1) | | | (603 | ) | | | (14,960 | ) |
ViewRay, Inc.(1) | | | (591 | ) | | | (3,587 | ) |
Vocera Communications, Inc.(1) | | | (182 | ) | | | (7,162 | ) |
Wright Medical Group NV(1) | | | (3,860 | ) | | | (105,069 | ) |
| | | | | | | | (620,235 | ) |
| | | | | | | | | |
Industrials — (5.8%) | | | | | | | | |
3M Co. | | | (3,901 | ) | | | (743,297 | ) |
AAON, Inc. | | | (1,037 | ) | | | (36,357 | ) |
ABM Industries, Inc. | | | (837 | ) | | | (26,876 | ) |
Actuant Corp. | | | (2,441 | ) | | | (51,237 | ) |
Aerojet Rocketdyne Holdings, Inc.(1) | | | (566 | ) | | | (19,940 | ) |
Air Lease Corp. | | | (6,545 | ) | | | (197,724 | ) |
Air Transport Services Group, Inc.(1) | | | (1,244 | ) | | | (28,376 | ) |
Alaska Air Group, Inc. | | | (2,261 | ) | | | (137,582 | ) |
Allegiant Travel Co. | | | (625 | ) | | | (62,638 | ) |
Allegion PLC | | | (2,799 | ) | | | (223,108 | ) |
AMERCO | | | (68 | ) | | | (22,311 | ) |
American Airlines Group, Inc. | | | (11,113 | ) | | | (356,838 | ) |
American Woodmark Corp.(1) | | | (175 | ) | | | (9,744 | ) |
AO Smith Corp. | | | (878 | ) | | | (37,491 | ) |
Apogee Enterprises, Inc. | | | (308 | ) | | | (9,194 | ) |
Arconic, Inc. | | | (7,041 | ) | | | (118,711 | ) |
Argan, Inc. | | | (210 | ) | | | (7,946 | ) |
Astec Industries, Inc. | | | (1,298 | ) | | | (39,187 | ) |
The accompanying notes are an integral part of these financial statements.
2018 Annual Report | December 31, 2018 | Page 57 |
Schedule of Investments
December 31, 2018
Spectrum Fund |
Security Description | | Shares or
Principal
Amount ($) | | | Fair
Value ($) | |
Common Stocks - Short — continued |
Astronics Corp.(1) | | | (298 | ) | | | (9,074 | ) |
Atlas Air Worldwide Holdings, Inc.(1) | | | (1,571 | ) | | | (66,280 | ) |
Avis Budget Group, Inc.(1) | | | (1,533 | ) | | | (34,462 | ) |
Axon Enterprise, Inc.(1) | | | (715 | ) | | | (31,281 | ) |
Beacon Roofing Supply, Inc.(1) | | | (1,572 | ) | | | (49,864 | ) |
BlueLinx Holdings, Inc.(1) | | | (243 | ) | | | (6,005 | ) |
Briggs & Stratton Corp. | | | (1,300 | ) | | | (17,004 | ) |
Brink's Co./The | | | (1,576 | ) | | | (101,888 | ) |
BWX Technologies, Inc. | | | (1,218 | ) | | | (46,564 | ) |
Caesarstone, Ltd. | | | (361 | ) | | | (4,902 | ) |
CAI International, Inc.(1) | | | (713 | ) | | | (16,563 | ) |
CH Robinson Worldwide, Inc. | | | (1,625 | ) | | | (136,646 | ) |
Charah Solutions, Inc.(1) | | | (174 | ) | | | (1,453 | ) |
CIRCOR International, Inc. | | | (1,612 | ) | | | (34,336 | ) |
Colfax Corp.(1) | | | (2,003 | ) | | | (41,863 | ) |
CompX International, Inc. | | | (89 | ) | | | (1,211 | ) |
CoStar Group, Inc.(1) | | | (888 | ) | | | (299,558 | ) |
Covanta Holding Corp. | | | (4,225 | ) | | | (56,700 | ) |
Cubic Corp. | | | (381 | ) | | | (20,475 | ) |
Daseke, Inc.(1) | | | (3,019 | ) | | | (11,110 | ) |
Deere & Co. | | | (1,730 | ) | | | (258,064 | ) |
Douglas Dynamics, Inc. | | | (83 | ) | | | (2,979 | ) |
Dover Corp. | | | (1,154 | ) | | | (81,876 | ) |
Dycom Industries, Inc.(1) | | | (765 | ) | | | (41,341 | ) |
Echo Global Logistics, Inc.(1) | | | (1,257 | ) | | | (25,555 | ) |
Energy Recovery, Inc.(1) | | | (1,959 | ) | | | (13,184 | ) |
Equifax, Inc. | | | (858 | ) | | | (79,906 | ) |
Evoqua Water Technologies Corp.(1) | | | (3,224 | ) | | | (30,950 | ) |
Flowserve Corp. | | | (229 | ) | | | (8,707 | ) |
Fortive Corp. | | | (10,820 | ) | | | (732,081 | ) |
Franklin Covey Co.(1) | | | (1,101 | ) | | | (24,585 | ) |
Franklin Electric Co., Inc. | | | (276 | ) | | | (11,835 | ) |
FreightCar America, Inc.(1) | | | (1,796 | ) | | | (12,015 | ) |
Gates Industrial Corp. PLC(1) | | | (8,937 | ) | | | (118,326 | ) |
General Dynamics Corp. | | | (1,905 | ) | | | (299,485 | ) |
General Electric Co. | | | (62,091 | ) | | | (470,029 | ) |
General Finance Corp.(1) | | | (108 | ) | | | (1,092 | ) |
Gibraltar Industries, Inc.(1) | | | (876 | ) | | | (31,177 | ) |
Graham Corp. | | | (468 | ) | | | (10,689 | ) |
Granite Construction, Inc. | | | (716 | ) | | | (28,840 | ) |
HC2 Holdings, Inc.(1) | | | (5,536 | ) | | | (14,615 | ) |
Healthcare Services Group, Inc. | | | (3,770 | ) | | | (151,479 | ) |
Heartland Express, Inc. | | | (1,947 | ) | | | (35,630 | ) |
HEICO Corp. | | | (5,217 | ) | | | (404,213 | ) |
Herc Holdings, Inc.(1) | | | (133 | ) | | | (3,457 | ) |
Hertz Global Holdings, Inc.(1) | | | (1,044 | ) | | | (14,251 | ) |
IHS Markit, Ltd.(1) | | | (7,196 | ) | | | (345,192 | ) |
InnerWorkings, Inc.(1) | | | (1,603 | ) | | | (5,995 | ) |
JELD-WEN Holding, Inc.(1) | | | (3,214 | ) | | | (45,671 | ) |
John Bean Technologies Corp. | | | (997 | ) | | | (71,595 | ) |
KeyW Holding Corp./The(1) | | | (3,238 | ) | | | (21,662 | ) |
Kirby Corp.(1) | | | (669 | ) | | | (45,064 | ) |
Knight-Swift Transportation Holdings, Inc. | | | (1,533 | ) | | | (38,432 | ) |
Kratos Defense & Security Solutions, Inc.(1) | | | (2,021 | ) | | | (28,476 | ) |
Lindsay Corp. | | | (821 | ) | | | (79,021 | ) |
Lockheed Martin Corp. | | | (189 | ) | | | (49,488 | ) |
Macquarie Infrastructure Corp. | | | (295 | ) | | | (10,785 | ) |
Manitex International, Inc.(1) | | | (1,562 | ) | | | (8,872 | ) |
Manitowoc Co., Inc./The(1) | | | (1,093 | ) | | | (16,144 | ) |
MasTec, Inc.(1) | | | (1,585 | ) | | | (64,288 | ) |
Matthews International Corp. | | | (549 | ) | | | (22,300 | ) |
Mercury Systems, Inc.(1) | | | (880 | ) | | | (41,615 | ) |
Mesa Air Group, Inc.(1) | | | (666 | ) | | | (5,135 | ) |
Middleby Corp./The(1) | | | (966 | ) | | | (99,237 | ) |
Mobile Mini, Inc. | | | (979 | ) | | | (31,083 | ) |
MRC Global, Inc.(1) | | | (1,792 | ) | | | (21,916 | ) |
Multi-Color Corp. | | | (1,267 | ) | | | (44,459 | ) |
Nielsen Holdings PLC | | | (4,009 | ) | | | (93,530 | ) |
NN, Inc. | | | (2,766 | ) | | | (18,560 | ) |
NOW, Inc.(1) | | | (1,074 | ) | | | (12,501 | ) |
Pentair PLC | | | (16,916 | ) | | | (639,086 | ) |
PICO Holdings, Inc.(1) | | | (2,811 | ) | | | (25,693 | ) |
REV Group, Inc. | | | (1,779 | ) | | | (13,360 | ) |
Roper Technologies, Inc. | | | (2,904 | ) | | | (773,974 | ) |
Schneider National, Inc. | | | (122 | ) | | | (2,278 | ) |
Scorpio Bulkers, Inc. | | | (1,026 | ) | | | (5,674 | ) |
Simpson Manufacturing Co., Inc. | | | (119 | ) | | | (6,441 | ) |
SiteOne Landscape Supply, Inc.(1) | | | (1,012 | ) | | | (55,933 | ) |
SPX Corp.(1) | | | (4,797 | ) | | | (134,364 | ) |
Standex International Corp. | | | (36 | ) | | | (2,418 | ) |
Stericycle, Inc.(1) | | | (2,962 | ) | | | (108,676 | ) |
Sun Hydraulics Corp. | | | (2,140 | ) | | | (71,027 | ) |
Team, Inc.(1) | | | (1,415 | ) | | | (20,730 | ) |
Tennant Co. | | | (20 | ) | | | (1,042 | ) |
Textainer Group Holdings, Ltd.(1) | | | (109 | ) | | | (1,086 | ) |
Titan International, Inc. | | | (2,290 | ) | | | (10,671 | ) |
TransDigm Group, Inc.(1) | | | (41 | ) | | | (13,942 | ) |
TransUnion | | | (2,997 | ) | | | (170,230 | ) |
TriNet Group, Inc.(1) | | | (2,113 | ) | | | (88,640 | ) |
Trinity Industries, Inc. | | | (3,724 | ) | | | (76,677 | ) |
Triumph Group, Inc. | | | (150 | ) | | | (1,725 | ) |
Tutor Perini Corp.(1) | | | (2,913 | ) | | | (46,521 | ) |
United Parcel Service, Inc. - Class B | | | (1,719 | ) | | | (167,654 | ) |
The accompanying notes are an integral part of these financial statements.
Page 58 | 2018 Annual Report | December 31, 2018 |
Schedule of Investments
December 31, 2018
Spectrum Fund |
Security Description | | Shares or
Principal
Amount ($) | | | Fair
Value ($) | |
Common Stocks - Short — continued |
USG Corp. | | | (10,068 | ) | | | (429,501 | ) |
Vicor Corp.(1) | | | (78 | ) | | | (2,948 | ) |
Vivint Solar, Inc.(1) | | | (261 | ) | | | (994 | ) |
Wabtec Corp. | | | (1,100 | ) | | | (77,275 | ) |
WageWorks, Inc.(1) | | | (793 | ) | | | (21,538 | ) |
Watsco, Inc. | | | (173 | ) | | | (24,071 | ) |
Welbilt, Inc.(1) | | | (5,027 | ) | | | (55,850 | ) |
Werner Enterprises, Inc. | | | (684 | ) | | | (20,205 | ) |
Wesco Aircraft Holdings, Inc.(1) | | | (3,309 | ) | | | (26,141 | ) |
Willdan Group, Inc.(1) | | | (158 | ) | | | (5,527 | ) |
WillScot Corp.(1) | | | (6,818 | ) | | | (64,226 | ) |
Woodward, Inc. | | | (246 | ) | | | (18,275 | ) |
XPO Logistics, Inc.(1) | | | (2,658 | ) | | | (151,612 | ) |
| | | | | | | | (10,579,183 | ) |
| | | | | | | | | |
Information Technology — (2.5%) | | | | | | | | |
2U, Inc.(1) | | | (1,564 | ) | | | (77,762 | ) |
3D Systems Corp.(1) | | | (184 | ) | | | (1,871 | ) |
Acacia Communications, Inc.(1) | | | (95 | ) | | | (3,610 | ) |
ACM Research, Inc.(1) | | | (645 | ) | | | (7,018 | ) |
Aerohive Networks, Inc.(1) | | | (582 | ) | | | (1,897 | ) |
Akamai Technologies, Inc.(1) | | | (1,701 | ) | | | (103,897 | ) |
Ambarella, Inc.(1) | | | (556 | ) | | | (19,449 | ) |
Appfolio, Inc.(1) | | | (116 | ) | | | (6,870 | ) |
Applied Optoelectronics, Inc.(1) | | | (242 | ) | | | (3,734 | ) |
Apptio, Inc. - Class A(1) | | | (881 | ) | | | (33,443 | ) |
Aquantia Corp.(1) | | | (572 | ) | | | (5,016 | ) |
Arlo Technologies, Inc.(1) | | | (92 | ) | | | (918 | ) |
Asure Software, Inc.(1) | | | (302 | ) | | | (1,534 | ) |
Automatic Data Processing, Inc. | | | (907 | ) | | | (118,926 | ) |
AXT, Inc.(1) | | | (305 | ) | | | (1,327 | ) |
Black Knight, Inc.(1) | | | (5,174 | ) | | | (233,140 | ) |
Blackbaud, Inc. | | | (1,293 | ) | | | (81,330 | ) |
Box, Inc.(1) | | | (4,586 | ) | | | (77,412 | ) |
Brightcove, Inc.(1) | | | (834 | ) | | | (5,871 | ) |
Carbon Black, Inc.(1) | | | (866 | ) | | | (11,622 | ) |
Carbonite, Inc.(1) | | | (1,110 | ) | | | (28,039 | ) |
Ceridian HCM Holding, Inc.(1) | | | (2,379 | ) | | | (82,052 | ) |
Cognex Corp. | | | (2,054 | ) | | | (79,428 | ) |
Coherent, Inc.(1) | | | (21 | ) | | | (2,220 | ) |
Daktronics, Inc. | | | (857 | ) | | | (6,342 | ) |
DocuSign, Inc.(1) | | | (44 | ) | | | (1,764 | ) |
Ebix, Inc. | | | (158 | ) | | | (6,724 | ) |
Ellie Mae, Inc.(1) | | | (1,606 | ) | | | (100,905 | ) |
Evo Payments, Inc.(1) | | | (1,071 | ) | | | (26,422 | ) |
ExlService Holdings, Inc.(1) | | | (1,003 | ) | | | (52,778 | ) |
FARO Technologies, Inc.(1) | | | (214 | ) | | | (8,697 | ) |
FireEye, Inc.(1) | | | (502 | ) | | | (8,137 | ) |
First Solar, Inc.(1) | | | (1,159 | ) | | | (49,205 | ) |
Fitbit, Inc.(1) | | | (803 | ) | | | (3,991 | ) |
ForeScout Technologies, Inc.(1) | | | (724 | ) | | | (18,817 | ) |
Gartner, Inc.(1) | | | (2,369 | ) | | | (302,853 | ) |
Global Payments, Inc. | | | (793 | ) | | | (81,782 | ) |
GoDaddy, Inc.(1) | | | (4,587 | ) | | | (300,999 | ) |
Guidewire Software, Inc.(1) | | | (400 | ) | | | (32,092 | ) |
Infinera Corp.(1) | | | (2,764 | ) | | | (11,028 | ) |
Inphi Corp.(1) | | | (482 | ) | | | (15,496 | ) |
IPG Photonics Corp.(1) | | | (417 | ) | | | (47,242 | ) |
Iteris, Inc.(1) | | | (1,868 | ) | | | (6,968 | ) |
Itron, Inc.(1) | | | (2,230 | ) | | | (105,457 | ) |
Knowles Corp.(1) | | | (440 | ) | | | (5,856 | ) |
MACOM Technology Solutions Holdings, Inc.(1) | | | (333 | ) | | | (4,832 | ) |
MaxLinear, Inc.(1) | | | (1,048 | ) | | | (18,445 | ) |
Mesa Laboratories, Inc. | | | (43 | ) | | | (8,961 | ) |
Microchip Technology, Inc. | | | (10,557 | ) | | | (759,259 | ) |
MINDBODY, Inc.(1) | | | (391 | ) | | | (14,232 | ) |
Nutanix, Inc. - Class A(1) | | | (597 | ) | | | (24,829 | ) |
OSI Systems, Inc.(1) | | | (1,206 | ) | | | (88,400 | ) |
Palo Alto Networks, Inc.(1) | | | (2,276 | ) | | | (428,685 | ) |
PAR Technology Corp.(1) | | | (279 | ) | | | (6,068 | ) |
Park City Group, Inc.(1) | | | (321 | ) | | | (1,916 | ) |
Park Electrochemical Corp. | | | (1,957 | ) | | | (35,363 | ) |
PDF Solutions, Inc.(1) | | | (676 | ) | | | (5,699 | ) |
Pluralsight, Inc.(1) | | | (1,482 | ) | | | (34,901 | ) |
PROS Holdings, Inc.(1) | | | (417 | ) | | | (13,094 | ) |
Q2 Holdings, Inc.(1) | | | (1,900 | ) | | | (94,145 | ) |
Qorvo, Inc.(1) | | | (263 | ) | | | (15,972 | ) |
RealPage, Inc.(1) | | | (121 | ) | | | (5,831 | ) |
Ribbon Communications, Inc.(1) | | | (1,078 | ) | | | (5,196 | ) |
Rogers Corp.(1) | | | (409 | ) | | | (40,516 | ) |
ServiceSource International, Inc.(1) | | | (1,846 | ) | | | (1,994 | ) |
Silicon Laboratories, Inc.(1) | | | (1,830 | ) | | | (144,222 | ) |
Square, Inc.(1) | | | (1,403 | ) | | | (78,694 | ) |
Switch, Inc. | | | (4,342 | ) | | | (30,394 | ) |
Telenav, Inc.(1) | | | (339 | ) | | | (1,376 | ) |
Teradata Corp.(1) | | | (2,209 | ) | | | (84,737 | ) |
Tucows, Inc.(1) | | | (404 | ) | | | (24,264 | ) |
Universal Display Corp. | | | (130 | ) | | | (12,164 | ) |
ViaSat, Inc.(1) | | | (3,918 | ) | | | (230,966 | ) |
Workday, Inc.(1) | | | (987 | ) | | | (157,604 | ) |
Worldpay, Inc.(1) | | | (1,215 | ) | | | (92,862 | ) |
Zscaler, Inc.(1) | | | (253 | ) | | | (9,920 | ) |
| | | | | | | | (4,657,482 | ) |
The accompanying notes are an integral part of these financial statements.
2018 Annual Report | December 31, 2018 | Page 59 |
Schedule of Investments
December 31, 2018
Spectrum Fund |
Security Description | | Shares or
Principal
Amount ($) | | | Fair
Value ($) | |
Common Stocks - Short — continued |
Materials — (1.5%) | | | | | | | | |
Advanced Emissions Solutions, Inc. | | | (1,125 | ) | | | (11,869 | ) |
AK Steel Holding Corp.(1) | | | (4,256 | ) | | | (9,576 | ) |
Albemarle Corp. | | | (3,091 | ) | | | (238,223 | ) |
Allegheny Technologies, Inc.(1) | | | (5,401 | ) | | | (117,580 | ) |
American Vanguard Corp. | | | (649 | ) | | | (9,858 | ) |
Ardagh Group SA | | | (344 | ) | | | (3,812 | ) |
Bemis Co., Inc. | | | (65 | ) | | | (2,984 | ) |
Century Aluminum Co.(1) | | | (1,768 | ) | | | (12,924 | ) |
Clearwater Paper Corp.(1) | | | (40 | ) | | | (975 | ) |
Coeur Mining, Inc.(1) | | | (1,371 | ) | | | (6,128 | ) |
Compass Minerals International, Inc. | | | (234 | ) | | | (9,755 | ) |
Crown Holdings, Inc.(1) | | | (9,069 | ) | | | (376,998 | ) |
Ferro Corp.(1) | | | (221 | ) | | | (3,465 | ) |
Ferroglobe PLC Contingent Value Rights(1)(7) | | | (2,326 | ) | | | — | |
FMC Corp. | | | (3,325 | ) | | | (245,917 | ) |
GCP Applied Technologies, Inc.(1) | | | (2,441 | ) | | | (59,927 | ) |
Graphic Packaging Holding Co. | | | (23,169 | ) | | | (246,518 | ) |
Havilah Mining Corp.(1) | | | (157 | ) | | | (33 | ) |
Haynes International, Inc. | | | (873 | ) | | | (23,047 | ) |
HB Fuller Co. | | | (1,516 | ) | | | (64,688 | ) |
Hecla Mining Co. | | | (10,206 | ) | | | (24,086 | ) |
International Flavors & Fragrances, Inc. | | | (3,822 | ) | | | (513,180 | ) |
Intrepid Potash, Inc.(1) | | | (980 | ) | | | (2,548 | ) |
Myers Industries, Inc. | | | (2,305 | ) | | | (34,829 | ) |
Neenah, Inc.(1) | | | (746 | ) | | | (43,954 | ) |
Owens-Illinois, Inc. | | | (1,200 | ) | | | (20,688 | ) |
PH Glatfelter Co. | | | (2,901 | ) | | | (28,314 | ) |
Platform Specialty Products Corp.(1) | | | (4,058 | ) | | | (41,919 | ) |
Ramaco Resources, Inc.(1) | | | (672 | ) | | | (3,326 | ) |
Royal Gold, Inc. | | | (604 | ) | | | (51,733 | ) |
Ryerson Holding Corp.(1) | | | (160 | ) | | | (1,014 | ) |
Schweitzer-Mauduit International, Inc. | | | (2,533 | ) | | | (63,452 | ) |
Scotts Miracle-Gro Co./The | | | (814 | ) | | | (50,028 | ) |
Sealed Air Corp. | | | (4,106 | ) | | | (143,053 | ) |
Sensient Technologies Corp. | | | (3,470 | ) | | | (193,800 | ) |
Southern Copper Corp. | | | (169 | ) | | | (5,200 | ) |
Summit Materials, Inc.(1) | | | (2,331 | ) | | | (28,904 | ) |
Synalloy Corp. | | | (135 | ) | | | (2,240 | ) |
Tahoe Resources, Inc.(1) | | | (1,356 | ) | | | (4,949 | ) |
TimkenSteel Corp.(1) | | | (3,520 | ) | | | (30,765 | ) |
Tronox, Ltd. | | | (1,548 | ) | | | (12,043 | ) |
Universal Stainless & Alloy Products, Inc.(1) | | | (96 | ) | | | (1,556 | ) |
Valhi, Inc. | | | (822 | ) | | | (1,586 | ) |
| | | | | | | | (2,747,444 | ) |
| | | | | | | | | |
Real Estate Investment Trust — (0.9%) | | | | | | | | |
Acadia Realty Trust | | | (1,301 | ) | | | (30,912 | ) |
Alexander & Baldwin, Inc.(1) | | | (3,326 | ) | | | (61,132 | ) |
Alexandria Real Estate Equities, Inc. | | | (18 | ) | | | (2,074 | ) |
Braemar Hotels & Resorts, Inc. | | | (695 | ) | | | (6,206 | ) |
Brandywine Realty Trust | | | (4,794 | ) | | | (61,699 | ) |
City Office REIT, Inc. | | | (3,724 | ) | | | (38,171 | ) |
CorEnergy Infrastructure Trust, Inc. | | | (1,215 | ) | | | (40,192 | ) |
Crown Castle International Corp. | | | (4,666 | ) | | | (506,868 | ) |
Easterly Government Properties, Inc. | | | (3,512 | ) | | | (55,068 | ) |
Equity Commonwealth | | | (8,424 | ) | | | (252,804 | ) |
First Industrial Realty Trust, Inc. | | | (2,921 | ) | | | (84,300 | ) |
Healthcare Trust of America, Inc. - Class A | | | (1,618 | ) | | | (40,952 | ) |
JBG SMITH Properties | | | (3,305 | ) | | | (115,047 | ) |
Medical Properties Trust, Inc. | | | (3,313 | ) | | | (53,273 | ) |
NorthStar Realty Europe Corp. | | | (249 | ) | | | (3,620 | ) |
One Liberty Properties, Inc. | | | (600 | ) | | | (14,532 | ) |
Rexford Industrial Realty, Inc. | | | (1,338 | ) | | | (39,431 | ) |
RMR Group, Inc./The | | | (174 | ) | | | (9,236 | ) |
Sabra Health Care REIT, Inc. | | | (13,554 | ) | | | (223,370 | ) |
STAG Industrial, Inc. | | | (1,546 | ) | | | (38,464 | ) |
Uniti Group, Inc. | | | (302 | ) | | | (4,702 | ) |
VICI Properties, Inc. | | | (933 | ) | | | (17,522 | ) |
| | | | | | | | (1,699,575 | ) |
| | | | | | | | | |
Utilities — (5.7%) | | | | | | | | |
Alliant Energy Corp. | | | (589 | ) | | | (24,885 | ) |
Aqua America, Inc. | | | (102 | ) | | | (3,487 | ) |
Avangrid, Inc. | | | (16,948 | ) | | | (848,925 | ) |
Clearway Energy, Inc. | | | (59 | ) | | | (1,018 | ) |
Consolidated Edison, Inc. | | | (9,866 | ) | | | (754,354 | ) |
Dominion Energy, Inc.(1) | | | (12,642 | ) | | | (903,397 | ) |
Edison International | | | (13,452 | ) | | | (763,670 | ) |
El Paso Electric Co. | | | (250 | ) | | | (12,533 | ) |
Entergy Corp. | | | (9,707 | ) | | | (835,481 | ) |
FirstEnergy Corp. | | | (23,993 | ) | | | (900,937 | ) |
Hawaiian Electric Industries, Inc. | | | (22,054 | ) | | | (807,617 | ) |
NiSource, Inc. | | | (33,746 | ) | | | (855,461 | ) |
Northwest Natural Holding Co. | | | (5,208 | ) | | | (314,876 | ) |
Ormat Technologies, Inc. | | | (978 | ) | | | (51,149 | ) |
Pattern Energy Group, Inc. | | | (2,596 | ) | | | (48,338 | ) |
PG&E Corp.(1) | | | (1,983 | ) | | | (47,096 | ) |
PNM Resources, Inc. | | | (3,698 | ) | | | (151,951 | ) |
PPL Corp. | | | (30,337 | ) | | | (859,447 | ) |
RGC Resources, Inc. | | | (239 | ) | | | (7,160 | ) |
Sempra Energy | | | (7,811 | ) | | | (845,072 | ) |
South Jersey Industries, Inc. | | | (13,508 | ) | | | (375,522 | ) |
The accompanying notes are an integral part of these financial statements.
Page 60 | 2018 Annual Report | December 31, 2018 |
Schedule of Investments
December 31, 2018
Spectrum Fund |
Security Description | | Shares or
Principal
Amount ($) | | | Fair
Value ($) | |
Common Stocks - Short — continued |
Southern Co./The | | | (18,440 | ) | | | (809,885 | ) |
Spire, Inc. | | | (178 | ) | | | (13,186 | ) |
TerraForm Power, Inc. | | | (11,741 | ) | | | (131,734 | ) |
York Water Co./The | | | (40 | ) | | | (1,282 | ) |
| | | | | | | | (10,368,463 | ) |
| | | | | | | | | |
Total Securities Sold Short
(Proceeds Received $67,941,343) | | | | | | | (60,259,673 | ) |
| | | | | | | | | |
Trustee Deferred Compensation(6) | | | | | | | | |
Meeder Balanced Fund | | | 345 | | | | 3,823 | |
Meeder Dynamic Allocation Fund | | | 797 | | | | 7,803 | |
Meeder Muirfield Fund | | | 699 | | | | 5,005 | |
Meeder Conservative Allocation Fund | | | 105 | | | | 2,224 | |
Total Trustee Deferred Compensation (Cost $20,382) | | | | | | | 18,855 | |
Spectrum Fund |
| | | Long
(Short)
Contracts | | | Expiration
Date | | | Notional
Value of
Contracts
($) | | | Value and
Unrealized
Appreciation
(Depreciation)
($) | |
Futures Contracts |
Index Futures | | | | | | | | | | | | | | | | |
Mini MSCI EAFE Index Futures | | | 20 | | | | 3/15/2019 | | | | 1,716,000 | | | | (24,659 | ) |
Mini MSCI Emerging Markets Index Futures | | | 10 | | | | 3/15/2019 | | | | 483,400 | | | | (1,712 | ) |
Russell 2000 Mini Index Futures | | | (87 | ) | | | 3/15/2019 | | | | (5,868,150 | ) | | | 114,387 | |
Standard & Poors 500 Mini Futures | | | (442 | ) | | | 3/15/2019 | | | | (55,364,920 | ) | | | 589,805 | |
E-mini Standard & Poors MidCap 400 Futures | | | (89 | ) | | | 3/15/2019 | | | | (14,793,580 | ) | | | 202,464 | |
Total Futures Contracts | | | (588 | ) | | | | | | | (73,827,250 | ) | | | 880,285 | |
(1) | Represents non-income producing securities. |
(2) | All or a portion of the security is on loan. |
(3) | Investment purchased with cash received as securities lending collateral. The yield shown represents the 7-day yield in effect at December 31, 2018. |
(4) | All or a portion of the security is held as collateral for securities sold short. The total fair value of this collateral on December 31, 2018 was $43,453,149. |
(5) | Investment in affiliate. The yield shown represents the 7-day yield in effect at December 31, 2018. |
(6) | Assets of affiliates to the Spectrum Fund held for the benefit of the Fund’s Trustees in connection with the Trustee Deferred Compensation Plan. |
(7) | Fair valued security deemed as Level 3 security. |
The accompanying notes are an integral part of these financial statements.
2018 Annual Report | December 31, 2018 | Page 61 |
Schedule of Investments
December 31, 2018
Global Allocation Fund |
Security Description | | Shares or
Principal
Amount ($) | | | Fair
Value ($) | |
Common Stocks — 36.3% |
Communication Services — 3.3% | | | | | | | | |
Alphabet, Inc. - Class A(1) | | | 8 | | | | 8,360 | |
Alphabet, Inc. - Class C(1) | | | 407 | | | | 421,493 | |
AMC Entertainment Holdings, Inc. | | | 423 | | | | 5,194 | |
AMC Networks, Inc.(1) | | | 185 | | | | 10,153 | |
AT&T, Inc. | | | 5,976 | | | | 170,555 | |
ATN International, Inc. | | | 24 | | | | 1,717 | |
Beasley Broadcast Group, Inc. | | | 5 | | | | 19 | |
Cable One, Inc. | | | 35 | | | | 28,704 | |
Cincinnati Bell, Inc.(1) | | | 198 | | | | 1,540 | |
Cinemark Holdings, Inc. | | | 287 | | | | 10,275 | |
Comcast Corp. - Class A | | | 2,867 | | | | 97,621 | |
Discovery, Inc.(1) | | | 696 | | | | 16,064 | |
EW Scripps Co./The | | | 57 | | | | 897 | |
Facebook, Inc.(1) | | | 1,485 | | | | 194,669 | |
Frontier Communications Corp. | | | 692 | | | | 1,647 | |
Gray Television, Inc.(1) | | | 346 | | | | 5,100 | |
Intelsat SA(1) | | | 88 | | | | 1,882 | |
Interpublic Group of Cos., Inc./The | | | 192 | | | | 3,961 | |
Liberty TripAdvisor Holdings, Inc.(1) | | | 57 | | | | 906 | |
Marcus Corp./The | | | 228 | | | | 9,006 | |
MDC Partners, Inc.(1) | | | 426 | | | | 1,112 | |
National CineMedia, Inc. | | | 136 | | | | 881 | |
Nexstar Media Group, Inc. | | | 170 | | | | 13,369 | |
NII Holdings, Inc.(1) | | | 102 | | | | 450 | |
Ooma, Inc.(1) | | | 10 | | | | 139 | |
Rosetta Stone, Inc.(1) | | | 108 | | | | 1,771 | |
Scholastic Corp. | | | 12 | | | | 483 | |
Shenandoah Telecommunications Co. | | | 17 | | | | 752 | |
Spok Holdings, Inc. | | | 431 | | | | 5,715 | |
Telephone & Data Systems, Inc. | | | 499 | | | | 16,237 | |
T-Mobile US, Inc.(1) | | | 2,706 | | | | 172,129 | |
Tribune Publishing Co.(1) | | | 177 | | | | 2,007 | |
Twenty-First Century Fox, Inc. - Class A | | | 1,109 | | | | 53,365 | |
United States Cellular Corp.(1) | | | 42 | | | | 2,183 | |
Verizon Communications, Inc. | | | 5,874 | | | | 330,236 | |
Viacom, Inc. | | | 1,780 | | | | 45,746 | |
Vonage Holdings Corp.(1) | | | 231 | | | | 2,017 | |
Walt Disney Co./The | | | 2,539 | | | | 278,401 | |
WideOpenWest, Inc.(1) | | | 91 | | | | 649 | |
| | | | | | | | 1,917,405 | |
| | | | | | | | | |
Consumer Discretionary — 3.0% | | | | | | | | |
Aaron's, Inc. | | | 31 | | | | 1,304 | |
Amazon.com, Inc.(1) | | | 354 | | | | 531,697 | |
Ascena Retail Group, Inc.(1) | | | 281 | | | | 705 | |
Ascent Capital Group, Inc.(1) | | | 392 | | | | 153 | |
Bassett Furniture Industries, Inc. | | | 254 | | | | 5,090 | |
Bed Bath & Beyond, Inc. | | | 292 | | | | 3,305 | |
Best Buy Co., Inc. | | | 1,188 | | | | 62,916 | |
BJ's Restaurants, Inc. | | | 22 | | | | 1,113 | |
Bloomin' Brands, Inc. | | | 139 | | | | 2,487 | |
Bojangles', Inc.(1) | | | 14 | | | | 225 | |
Brinker International, Inc. | | | 98 | | | | 4,310 | |
Callaway Golf Co. | | | 335 | | | | 5,126 | |
Capri Holdings, Ltd.(1) | | | 556 | | | | 21,084 | |
Carrols Restaurant Group, Inc.(1) | | | 46 | | | | 453 | |
Cato Corp./The | | | 29 | | | | 414 | |
Cavco Industries, Inc.(1) | | | 3 | | | | 391 | |
Chico's FAS, Inc. | | | 230 | | | | 1,293 | |
Clarus Corp. | | | 135 | | | | 1,366 | |
Crocs, Inc.(1) | | | 27 | | | | 701 | |
Darden Restaurants, Inc. | | | 233 | | | | 23,267 | |
Dave & Buster's Entertainment, Inc. | | | 60 | | | | 2,674 | |
Deckers Outdoor Corp.(1) | | | 65 | | | | 8,317 | |
Dick's Sporting Goods, Inc. | | | 101 | | | | 3,151 | |
Dine Brands Global, Inc. | | | 14 | | | | 943 | |
Domino's Pizza, Inc. | | | 70 | | | | 17,359 | |
Dunkin' Brands Group, Inc. | | | 50 | | | | 3,206 | |
El Pollo Loco Holdings, Inc.(1) | | | 12 | | | | 182 | |
Ethan Allen Interiors, Inc. | | | 268 | | | | 4,714 | |
Etsy, Inc.(1) | | | 148 | | | | 7,040 | |
Express, Inc.(1) | | | 420 | | | | 2,146 | |
Extended Stay America, Inc. | | | 409 | | | | 6,340 | |
Five Below, Inc.(1) | | | 6 | | | | 614 | |
Flexsteel Industries, Inc. | | | 66 | | | | 1,457 | |
Foot Locker, Inc. | | | 234 | | | | 12,449 | |
Ford Motor Co. | | | 3,654 | | | | 27,953 | |
Fox Factory Holding Corp.(1) | | | 87 | | | | 5,122 | |
Gentex Corp. | | | 757 | | | | 15,299 | |
G-III Apparel Group, Ltd.(1) | | | 49 | | | | 1,367 | |
H&R Block, Inc. | | | 412 | | | | 10,452 | |
Habit Restaurants, Inc./The(1) | | | 19 | | | | 200 | |
Helen of Troy, Ltd.(1) | | | 38 | | | | 4,985 | |
Hooker Furniture Corp. | | | 138 | | | | 3,635 | |
J Alexander's Holdings, Inc.(1) | | | 280 | | | | 2,304 | |
Lands' End, Inc.(1) | | | 10 | | | | 142 | |
La-Z-Boy, Inc. | | | 150 | | | | 4,157 | |
Lear Corp. | | | 98 | | | | 12,040 | |
Liberty Expedia Holdings, Inc.(1) | | | 669 | | | | 26,165 | |
Lululemon Athletica, Inc.(1) | | | 217 | | | | 26,389 | |
M/I Homes, Inc.(1) | | | 296 | | | | 6,222 | |
Macy's, Inc. | | | 68 | | | | 2,025 | |
Malibu Boats, Inc.(1) | | | 32 | | | | 1,114 | |
The accompanying notes are an integral part of these financial statements.
Page 62 | 2018 Annual Report | December 31, 2018 |
Schedule of Investments
December 31, 2018
Global Allocation Fund |
Security Description | | Shares or
Principal
Amount ($) | | | Fair
Value ($) | |
Common Stocks — continued |
MasterCraft Boat Holdings, Inc.(1) | | | 86 | | | | 1,608 | |
MDC Holdings, Inc. | | | 179 | | | | 5,032 | |
Norwegian Cruise Line Holdings, Ltd.(1) | | | 43 | | | | 1,823 | |
NVR, Inc.(1) | | | 8 | | | | 19,496 | |
Oxford Industries, Inc. | | | 7 | | | | 497 | |
Penn National Gaming, Inc.(1) | | | 166 | | | | 3,126 | |
RCI Hospitality Holdings, Inc. | | | 53 | | | | 1,183 | |
Ross Stores, Inc. | | | 826 | | | | 68,723 | |
RTW RetailWinds, Inc.(1) | | | 66 | | | | 187 | |
Signet Jewelers, Ltd. | | | 30 | | | | 953 | |
Starbucks Corp. | | | 2,678 | | | | 172,463 | |
Stoneridge, Inc.(1) | | | 138 | | | | 3,402 | |
Superior Industries International, Inc. | | | 4 | | | | 19 | |
Target Corp. | | | 2,660 | | | | 175,799 | |
Taylor Morrison Home Corp.(1) | | | 158 | | | | 2,512 | |
Thor Industries, Inc. | | | 74 | | | | 3,848 | |
TJX Cos., Inc./The | | | 4,606 | | | | 206,072 | |
Tower International, Inc. | | | 100 | | | | 2,380 | |
Town Sports International Holdings, Inc.(1) | | | 37 | | | | 237 | |
Turtle Beach Corp.(1) | | | 13 | | | | 186 | |
Vera Bradley, Inc.(1) | | | 61 | | | | 523 | |
Wendy's Co./The | | | 288 | | | | 4,496 | |
Wyndham Hotels & Resorts, Inc. | | | 866 | | | | 39,290 | |
Yum! Brands, Inc. | | | 1,483 | | | | 136,317 | |
ZAGG, Inc.(1) | | | 28 | | | | 274 | |
| | | | | | | | 1,738,009 | |
| | | | | | | | | |
Consumer Staples — 1.7% | | | | | | | | |
Church & Dwight Co., Inc. | | | 16 | | | | 1,052 | |
Coca-Cola Co./The | | | 234 | | | | 11,080 | |
Conagra Brands, Inc. | | | 834 | | | | 17,814 | |
Costco Wholesale Corp. | | | 484 | | | | 98,596 | |
Flowers Foods, Inc. | | | 95 | | | | 1,755 | |
Hershey Co./The | | | 70 | | | | 7,503 | |
Keurig Dr Pepper, Inc. | | | 5,766 | | | | 147,840 | |
Kroger Co./The | | | 1,617 | | | | 44,468 | |
Lamb Weston Holdings, Inc. | | | 293 | | | | 21,553 | |
Molson Coors Brewing Co. | | | 541 | | | | 30,383 | |
PepsiCo, Inc. | | | 1,878 | | | | 207,481 | |
Procter & Gamble Co./The | | | 1,256 | | | | 115,452 | |
Simply Good Foods Co./The(1) | | | 35 | | | | 662 | |
SpartanNash Co. | | | 23 | | | | 395 | |
Sprouts Farmers Market, Inc.(1) | | | 391 | | | | 9,192 | |
Tyson Foods, Inc. | | | 1,260 | | | | 67,284 | |
Walgreens Boots Alliance, Inc. | | | 1,633 | | | | 111,583 | |
Walmart, Inc. | | | 862 | | | | 80,295 | |
| | | | | | | | 974,388 | |
Energy — 2.7% | | | | | | | | |
Abraxas Petroleum Corp.(1) | | | 313 | | | | 341 | |
Adams Resources & Energy, Inc. | | | 25 | | | | 968 | |
Anadarko Petroleum Corp. | | | 1,046 | | | | 45,857 | |
Arch Coal, Inc. - Class A | | | 40 | | | | 3,320 | |
Archrock, Inc. | | | 816 | | | | 6,112 | |
Cactus, Inc.(1) | | | 194 | | | | 5,318 | |
Chesapeake Energy Corp.(1) | | | 1,001 | | | | 2,102 | |
Chevron Corp. | | | 988 | | | | 107,485 | |
ConocoPhillips | | | 3,511 | | | | 218,911 | |
CONSOL Energy, Inc.(1) | | | 51 | | | | 1,617 | |
Covia Holdings Corp.(1) | | | 770 | | | | 2,633 | |
CVR Energy, Inc. | | | 88 | | | | 3,034 | |
Denbury Resources, Inc.(1) | | | 524 | | | | 896 | |
Earthstone Energy, Inc.(1) | | | 137 | | | | 619 | |
EOG Resources, Inc. | | | 382 | | | | 33,314 | |
Era Group, Inc.(1) | | | 120 | | | | 1,049 | |
Evolution Petroleum Corp. | | | 281 | | | | 1,916 | |
Exxon Mobil Corp. | | | 3,674 | | | | 250,530 | |
Gulfport Energy Corp.(1) | | | 370 | | | | 2,424 | |
Hallador Energy Co. | | | 176 | | | | 892 | |
Helix Energy Solutions Group, Inc.(1) | | | 175 | | | | 947 | |
Helmerich & Payne, Inc. | | | 425 | | | | 20,375 | |
HollyFrontier Corp. | | | 364 | | | | 18,608 | |
Keane Group, Inc.(1) | | | 491 | | | | 4,016 | |
KLX Energy Services Holdings, Inc.(1) | | | 14 | | | | 328 | |
Mammoth Energy Services, Inc. | | | 79 | | | | 1,420 | |
Marathon Oil Corp. | | | 2,803 | | | | 40,195 | |
Marathon Petroleum Corp. | | | 3,237 | | | | 191,015 | |
Matrix Service Co.(1) | | | 328 | | | | 5,884 | |
Northern Oil and Gas, Inc.(1) | | | 131 | | | | 296 | |
Occidental Petroleum Corp. | | | 3,171 | | | | 194,636 | |
Overseas Shipholding Group, Inc.(1) | | | 123 | | | | 204 | |
Pacific Ethanol, Inc.(1) | | | 350 | | | | 301 | |
PBF Energy, Inc. | | | 405 | | | | 13,231 | |
Peabody Energy Corp. | | | 329 | | | | 10,028 | |
Penn Virginia Corp.(1) | | | 6 | | | | 324 | |
Phillips 66 | | | 2,199 | | | | 189,444 | |
Pioneer Energy Services Corp.(1) | | | 90 | | | | 111 | |
Profire Energy, Inc.(1) | | | 268 | | | | 389 | |
ProPetro Holding Corp.(1) | | | 359 | | | | 4,423 | |
Renewable Energy Group, Inc.(1) | | | 42 | | | | 1,079 | |
RigNet, Inc.(1) | | | 7 | | | | 88 | |
SEACOR Holdings, Inc.(1) | | | 10 | | | | 370 | |
SilverBow Resources, Inc.(1) | | | 20 | | | | 473 | |
Southwestern Energy Co.(1) | | | 989 | | | | 3,372 | |
Targa Resources Corp. | | | 219 | | | | 7,888 | |
The accompanying notes are an integral part of these financial statements.
2018 Annual Report | December 31, 2018 | Page 63 |
Schedule of Investments
December 31, 2018
Global Allocation Fund |
Security Description | | Shares or
Principal
Amount ($) | | | Fair
Value ($) | |
Common Stocks — continued |
Unit Corp.(1) | | | 111 | | | | 1,585 | |
Valero Energy Corp. | | | 2,458 | | | | 184,276 | |
W&T Offshore, Inc.(1) | | | 474 | | | | 1,953 | |
Westmoreland Coal Co.(1) | | | 539 | | | | 7 | |
WildHorse Resource Development Corp.(1) | | | 191 | | | | 2,695 | |
World Fuel Services Corp. | | | 249 | | | | 5,331 | |
| | | | | | | | 1,594,630 | |
| | | | | | | | | |
Financials — 4.7% | | | | | | | | |
American Equity Investment Life Holding Co. | | | 23 | | | | 643 | |
Arbor Realty Trust, Inc. | | | 765 | | | | 7,704 | |
Arthur J Gallagher & Co. | | | 214 | | | | 15,772 | |
Bancorp, Inc./The(1) | | | 580 | | | | 4,617 | |
Bank of America Corp. | | | 13,999 | | | | 344,935 | |
Bank of NT Butterfield & Son, Ltd./The | | | 118 | | | | 3,699 | |
BankUnited, Inc. | | | 58 | | | | 1,737 | |
BB&T Corp. | | | 2,075 | | | | 89,889 | |
Berkshire Hathaway, Inc. - Class B(1) | | | 2,177 | | | | 444,500 | |
Cherry Hill Mortgage Investment Corp. | | | 99 | | | | 1,736 | |
CIT Group, Inc. | | | 242 | | | | 9,261 | |
Citizens Financial Group, Inc. | | | 779 | | | | 23,160 | |
Discover Financial Services | | | 1,197 | | | | 70,599 | |
Essent Group, Ltd.(1) | | | 306 | | | | 10,459 | |
FB Financial Corp. | | | 49 | | | | 1,716 | |
Fidelity National Financial, Inc. | | | 461 | | | | 14,494 | |
Fifth Third Bancorp | | | 4,214 | | | | 99,155 | |
First BanCorp/Puerto Rico | | | 255 | | | | 2,193 | |
FirstCash, Inc. | | | 163 | | | | 11,793 | |
Genworth Financial, Inc.(1) | | | 420 | | | | 1,957 | |
Goosehead Insurance, Inc.(1) | | | 52 | | | | 1,367 | |
Health Insurance Innovations, Inc. - Class A(1) | | | 82 | | | | 2,192 | |
Huntington Bancshares, Inc./OH | | | 8,929 | | | | 106,434 | |
Independent Bank Corp./MI | | | 44 | | | | 925 | |
Investment Technology Group, Inc. | | | 27 | | | | 816 | |
JPMorgan Chase & Co. | | | 2,063 | | | | 201,390 | |
KeyCorp | | | 8,437 | | | | 124,699 | |
Ladder Capital Corp. | | | 1,085 | | | | 16,785 | |
MB Financial, Inc. | | | 1,062 | | | | 42,087 | |
MBT Financial Corp. | | | 224 | | | | 2,083 | |
Medley Management, Inc. | | | 40 | | | | 154 | |
MGIC Investment Corp.(1) | | | 1,065 | | | | 11,140 | |
Moelis & Co. | | | 283 | | | | 9,730 | |
Mr Cooper Group, Inc.(1) | | | 243 | | | | 2,836 | |
National General Holdings Corp. | | | 177 | | | | 4,285 | |
New Residential Investment Corp. | | | 3,986 | | | | 56,641 | |
NewStar Financial Contingent Value Rights(1)(7) | | | 34 | | | | 0 | |
NMI Holdings, Inc. - Class A(1) | | | 196 | | | | 3,499 | |
Northrim BanCorp, Inc. | | | 71 | | | | 2,334 | |
OFG Bancorp | | | 18 | | | | 296 | |
Old Republic International Corp. | | | 1,803 | | | | 37,088 | |
On Deck Capital, Inc.(1) | | | 246 | | | | 1,451 | |
Oppenheimer Holdings, Inc. | | | 402 | | | | 10,271 | |
PacWest Bancorp | | | 1,076 | | | | 35,809 | |
PennyMac Financial Services, Inc. | | | 367 | | | | 7,802 | |
Popular, Inc. | | | 382 | | | | 18,038 | |
Progressive Corp./The | | | 3,095 | | | | 186,721 | |
Protective Insurance Corp. | | | 72 | | | | 1,199 | |
Pzena Investment Management, Inc. | | | 458 | | | | 3,962 | |
Radian Group, Inc. | | | 1,014 | | | | 16,589 | |
Ready Capital Corp. | | | 68 | | | | 940 | |
Regions Financial Corp. | | | 11,022 | | | | 147,474 | |
Reinsurance Group of America, Inc. | | | 229 | | | | 32,113 | |
Safety Insurance Group, Inc. | | | 139 | | | | 11,372 | |
Santander Consumer USA Holdings, Inc. | | | 234 | | | | 4,116 | |
Siebert Financial Corp.(1) | | | 2 | | | | 29 | |
Silvercrest Asset Management Group, Inc. | | | 80 | | | | 1,058 | |
Stewart Information Services Corp. | | | 427 | | | | 17,678 | |
SunTrust Banks, Inc. | | | 3,127 | | | | 157,726 | |
Synchrony Financial | | | 1,860 | | | | 43,636 | |
TCF Financial Corp. | | | 1,915 | | | | 37,323 | |
United Security Bancshares/Fresno CA | | | 230 | | | | 2,203 | |
Universal Insurance Holdings, Inc. | | | 75 | | | | 2,844 | |
US Bancorp | | | 109 | | | | 4,981 | |
Waddell & Reed Financial, Inc. | | | 1 | | | | 18 | |
Walker & Dunlop, Inc. | | | 141 | | | | 6,098 | |
Wells Fargo & Co. | | | 4,866 | | | | 224,225 | |
Wins Finance Holdings, Inc.(1) | | | 37 | | | | 796 | |
| | | | | | | | 2,763,272 | |
| | | | | | | | | |
Healthcare — 7.4% | | | | | | | | |
Abbott Laboratories | | | 947 | | | | 68,497 | |
AbbVie, Inc. | | | 1,210 | | | | 111,550 | |
ABIOMED, Inc.(1) | | | 88 | | | | 28,604 | |
ACADIA Pharmaceuticals, Inc.(1) | | | 145 | | | | 2,345 | |
Acceleron Pharma, Inc.(1) | | | 13 | | | | 566 | |
Achillion Pharmaceuticals, Inc.(1) | | | 668 | | | | 1,062 | |
Acorda Therapeutics, Inc.(1) | | | 221 | | | | 3,443 | |
Adverum Biotechnologies, Inc.(1) | | | 55 | | | | 173 | |
Aeglea BioTherapeutics, Inc.(1) | | | 125 | | | | 936 | |
Akebia Therapeutics, Inc.(1) | | | 9 | | | | 50 | |
Aldeyra Therapeutics, Inc.(1) | | | 247 | | | | 2,050 | |
The accompanying notes are an integral part of these financial statements.
Page 64 | 2018 Annual Report | December 31, 2018 |
Schedule of Investments
December 31, 2018
Global Allocation Fund |
Security Description | | Shares or
Principal
Amount ($) | | | Fair
Value ($) | |
Common Stocks — continued |
Alexion Pharmaceuticals, Inc.(1) | | | 677 | | | | 65,913 | |
Allergan PLC | | | 707 | | | | 94,498 | |
AMAG Pharmaceuticals, Inc.(1) | | | 208 | | | | 3,160 | |
Amedisys, Inc.(1) | | | 25 | | | | 2,928 | |
Amgen, Inc. | | | 1,164 | | | | 226,596 | |
Amphastar Pharmaceuticals, Inc.(1) | | | 144 | | | | 2,866 | |
Ampio Pharmaceuticals, Inc.(1) | | | 157 | | | | 62 | |
Apellis Pharmaceuticals, Inc.(1) | | | 17 | | | | 224 | |
Aquestive Therapeutics, Inc.(1) | | | 66 | | | | 416 | |
Aratana Therapeutics, Inc.(1) | | | 31 | | | | 190 | |
Arbutus Biopharma Corp.(1) | | | 62 | | | | 237 | |
Arena Pharmaceuticals, Inc.(1) | | | 148 | | | | 5,765 | |
ArQule, Inc.(1) | | | 490 | | | | 1,357 | |
Array BioPharma, Inc.(1) | | | 139 | | | | 1,981 | |
Arrowhead Pharmaceuticals, Inc.(1) | | | 202 | | | | 2,509 | |
Assertio Therapeutics, Inc.(1) | | | 293 | | | | 1,058 | |
Atara Biotherapeutics, Inc.(1) | | | 77 | | | | 2,675 | |
AVEO Pharmaceuticals, Inc.(1) | | | 112 | | | | 179 | |
Avid Bioservices, Inc.(1) | | | 315 | | | | 1,292 | |
Baxter International, Inc. | | | 1,825 | | | | 120,122 | |
BioCryst Pharmaceuticals, Inc.(1) | | | 83 | | | | 670 | |
Biogen, Inc.(1) | | | 687 | | | | 206,732 | |
BioSpecifics Technologies Corp.(1) | | | 132 | | | | 7,999 | |
BioTelemetry, Inc.(1) | | | 27 | | | | 1,612 | |
Bristol-Myers Squibb Co. | | | 194 | | | | 10,084 | |
Bruker Corp. | | | 587 | | | | 17,475 | |
Calithera Biosciences, Inc.(1) | | | 283 | | | | 1,135 | |
Cardinal Health, Inc. | | | 614 | | | | 27,384 | |
CareDx, Inc.(1) | | | 149 | | | | 3,746 | |
CASI Pharmaceuticals, Inc.(1) | | | 297 | | | | 1,194 | |
Catalent, Inc.(1) | | | 703 | | | | 21,920 | |
Catalyst Pharmaceuticals, Inc.(1) | | | 832 | | | | 1,597 | |
Celcuity, Inc.(1) | | | 1 | | | | 24 | |
Cellular Biomedicine Group, Inc.(1) | | | 90 | | | | 1,589 | |
Cerner Corp.(1) | | | 1,422 | | | | 74,570 | |
Charles River Laboratories International, Inc.(1) | | | 60 | | | | 6,791 | |
Chemed Corp. | | | 58 | | | | 16,430 | |
ChemoCentryx, Inc.(1) | | | 40 | | | | 436 | |
Chimerix, Inc.(1) | | | 176 | | | | 452 | |
Codexis, Inc.(1) | | | 34 | | | | 568 | |
Collegium Pharmaceutical, Inc.(1) | | | 127 | | | | 2,181 | |
CONMED Corp. | | | 115 | | | | 7,383 | |
Cooper Cos., Inc./The | | | 5 | | | | 1,273 | |
Corium International Contingent Value Rights(1)(7) | | | 22 | | | | — | |
CVS Health Corp. | | | 172 | | | | 11,269 | |
DexCom, Inc.(1) | | | 49 | | | | 5,870 | |
Dicerna Pharmaceuticals, Inc.(1) | | | 111 | | | | 1,187 | |
Durect Corp.(1) | | | 457 | | | | 221 | |
Eli Lilly & Co. | | | 1,090 | | | | 126,135 | |
Emergent BioSolutions, Inc.(1) | | | 266 | | | | 15,768 | |
Enanta Pharmaceuticals, Inc.(1) | | | 48 | | | | 3,400 | |
Encompass Health Corp. | | | 137 | | | | 8,453 | |
Endo International PLC(1) | | | 426 | | | | 3,110 | |
Ensign Group, Inc./The | | | 5 | | | | 194 | |
Evolus, Inc.(1) | | | 32 | | | | 381 | |
Exact Sciences Corp.(1) | | | 59 | | | | 3,723 | |
Exelixis, Inc.(1) | | | 398 | | | | 7,829 | |
Fate Therapeutics, Inc.(1) | | | 70 | | | | 898 | |
Fennec Pharmaceuticals, Inc.(1) | | | 246 | | | | 1,569 | |
FONAR Corp.(1) | | | 153 | | | | 3,097 | |
Fortress Biotech, Inc.(1) | | | 476 | | | | 409 | |
G1 Therapeutics, Inc.(1) | | | 89 | | | | 1,704 | |
Genomic Health, Inc.(1) | | | 75 | | | | 4,831 | |
Gilead Sciences, Inc. | | | 2,674 | | | | 167,259 | |
Globus Medical, Inc.(1) | | | 288 | | | | 12,465 | |
Haemonetics Corp.(1) | | | 25 | | | | 2,501 | |
Halozyme Therapeutics, Inc.(1) | | | 23 | | | | 336 | |
Harvard Bioscience, Inc.(1) | | | 151 | | | | 480 | |
HCA Healthcare, Inc. | | | 1,455 | | | | 181,075 | |
Hill-Rom Holdings, Inc. | | | 497 | | | | 44,009 | |
HMS Holdings Corp.(1) | | | 23 | | | | 647 | |
Horizon Pharma Plc(1) | | | 331 | | | | 6,468 | |
Humana, Inc. | | | 637 | | | | 182,488 | |
ICU Medical, Inc.(1) | | | 46 | | | | 10,563 | |
Innovate Biopharmaceuticals, Inc.(1) | | | 47 | | | | 109 | |
Inovio Pharmaceuticals, Inc.(1) | | | 265 | | | | 1,060 | |
Integer Holdings Corp.(1) | | | 72 | | | | 5,491 | |
Intercept Pharmaceuticals, Inc.(1) | | | 3 | | | | 302 | |
Intersect ENT, Inc.(1) | | | 123 | | | | 3,466 | |
IntriCon Corp.(1) | | | 10 | | | | 264 | |
Invitae Corp.(1) | | | 390 | | | | 4,313 | |
Iovance Biotherapeutics, Inc.(1) | | | 4 | | | | 35 | |
IQVIA Holdings, Inc.(1) | | | 209 | | | | 24,280 | |
iRadimed Corp.(1) | | | 5 | | | | 122 | |
Jazz Pharmaceuticals PLC(1) | | | 44 | | | | 5,454 | |
Johnson & Johnson | | | 2,351 | | | | 303,397 | |
Jounce Therapeutics, Inc.(1) | | | 78 | | | | 263 | |
Kindred Biosciences, Inc.(1) | | | 268 | | | | 2,935 | |
Lannett Co., Inc.(1) | | | 9 | | | | 45 | |
Lantheus Holdings, Inc.(1) | | | 3 | | | | 47 | |
LivaNova PLC(1) | | | 22 | | | | 2,012 | |
Loxo Oncology, Inc.(1) | | | 15 | | | | 2,101 | |
The accompanying notes are an integral part of these financial statements.
2018 Annual Report | December 31, 2018 | Page 65 |
Schedule of Investments
December 31, 2018
Global Allocation Fund |
Security Description | | Shares or
Principal
Amount ($) | | | Fair
Value ($) | |
Common Stocks — continued |
Luminex Corp. | | | 116 | | | | 2,681 | |
MacroGenics, Inc.(1) | | | 275 | | | | 3,493 | |
Madrigal Pharmaceuticals, Inc.(1) | | | 18 | | | | 2,029 | |
Mallinckrodt PLC(1) | | | 220 | | | | 3,476 | |
Marinus Pharmaceuticals, Inc.(1) | | | 352 | | | | 1,010 | |
Masimo Corp.(1) | | | 193 | | | | 20,722 | |
MediciNova, Inc.(1) | | | 114 | | | | 931 | |
Medtronic PLC | | | 2,873 | | | | 261,328 | |
Merck & Co., Inc. | | | 4,066 | | | | 310,683 | |
Meridian Bioscience, Inc. | | | 91 | | | | 1,580 | |
Minerva Neurosciences, Inc.(1) | | | 279 | | | | 1,880 | |
Mirati Therapeutics, Inc.(1) | | | 61 | | | | 2,588 | |
Molecular Templates, Inc.(1) | | | 158 | | | | 638 | |
Molina Healthcare, Inc.(1) | | | 78 | | | | 9,065 | |
Momenta Pharmaceuticals, Inc.(1) | | | 55 | | | | 607 | |
Mustang Bio, Inc.(1) | | | 157 | | | | 462 | |
Mylan NV(1) | | | 2,338 | | | | 64,061 | |
Myriad Genetics, Inc.(1) | | | 63 | | | | 1,831 | |
Natera, Inc.(1) | | | 103 | | | | 1,438 | |
NeoGenomics, Inc.(1) | | | 33 | | | | 416 | |
Neurocrine Biosciences, Inc.(1) | | | 127 | | | | 9,069 | |
NuVasive, Inc.(1) | | | 38 | | | | 1,883 | |
Omnicell, Inc.(1) | | | 30 | | | | 1,837 | |
OPKO Health, Inc.(1) | | | 229 | | | | 689 | |
OraSure Technologies, Inc.(1) | | | 5 | | | | 58 | |
Orthofix Medical, Inc.(1) | | | 126 | | | | 6,614 | |
Owens & Minor, Inc. | | | 47 | | | | 298 | |
Pacira Pharmaceuticals, Inc./DE(1) | | | 126 | | | | 5,421 | |
PDL BioPharma, Inc.(1) | | | 1,102 | | | | 3,196 | |
Perrigo Co. PLC | | | 436 | | | | 16,895 | |
Pfizer, Inc. | | | 7,984 | | | | 348,502 | |
Phibro Animal Health Corp. | | | 112 | | | | 3,602 | |
Pieris Pharmaceuticals, Inc.(1) | | | 286 | | | | 761 | |
PRA Health Sciences, Inc.(1) | | | 73 | | | | 6,713 | |
Premier, Inc. - Class A(1) | | | 335 | | | | 12,512 | |
Prestige Consumer Healthcare, Inc.(1) | | | 68 | | | | 2,100 | |
Proteostasis Therapeutics, Inc.(1) | | | 299 | | | | 969 | |
PTC Therapeutics, Inc.(1) | | | 31 | | | | 1,064 | |
Quidel Corp.(1) | | | 19 | | | | 928 | |
Ra Pharmaceuticals, Inc.(1) | | | 133 | | | | 2,421 | |
Reata Pharmaceuticals, Inc.(1) | | | 32 | | | | 1,795 | |
Recro Pharma, Inc.(1) | | | 56 | | | | 398 | |
Regeneron Pharmaceuticals, Inc.(1) | | | 497 | | | | 185,630 | |
REGENXBIO, Inc.(1) | | | 64 | | | | 2,685 | |
Repligen Corp.(1) | | | 104 | | | | 5,485 | |
Sarepta Therapeutics, Inc.(1) | | | 43 | | | | 4,693 | |
SeaSpine Holdings Corp.(1) | | | 36 | | | | 657 | |
Sienna Biopharmaceuticals, Inc.(1) | | | 60 | | | | 139 | |
SIGA Technologies, Inc.(1) | | | 564 | | | | 4,456 | |
Spring Bank Pharmaceuticals, Inc.(1) | | | 39 | | | | 405 | |
STAAR Surgical Co.(1) | | | 30 | | | | 957 | |
STERIS PLC | | | 261 | | | | 27,888 | |
Supernus Pharmaceuticals, Inc.(1) | | | 55 | | | | 1,827 | |
Surface Oncology, Inc.(1) | | | 168 | | | | 712 | |
Syneos Health, Inc.(1) | | | 183 | | | | 7,201 | |
Tandem Diabetes Care, Inc.(1) | | | 102 | | | | 3,873 | |
Tenet Healthcare Corp.(1) | | | 186 | | | | 3,188 | |
Tocagen, Inc.(1) | | | 299 | | | | 2,455 | |
United Therapeutics Corp.(1) | | | 198 | | | | 21,562 | |
UnitedHealth Group, Inc. | | | 699 | | | | 174,135 | |
Universal Health Services, Inc. | | | 187 | | | | 21,797 | |
Vanda Pharmaceuticals, Inc.(1) | | | 218 | | | | 5,696 | |
Varian Medical Systems, Inc.(1) | | | 132 | | | | 14,957 | |
Veeva Systems, Inc.(1) | | | 10 | | | | 893 | |
Veracyte, Inc.(1) | | | 150 | | | | 1,887 | |
Vericel Corp.(1) | | | 134 | | | | 2,332 | |
Vertex Pharmaceuticals, Inc.(1) | | | 1,181 | | | | 195,704 | |
Viking Therapeutics, Inc.(1) | | | 183 | | | | 1,400 | |
Vital Therapies, Inc.(1) | | | 224 | | | | 42 | |
West Pharmaceutical Services, Inc. | | | 213 | | | | 20,880 | |
Xencor, Inc.(1) | | | 89 | | | | 3,218 | |
Zafgen, Inc.(1) | | | 245 | | | | 1,213 | |
Zoetis, Inc. | | | 988 | | | | 84,514 | |
| | | | | | | | 4,251,709 | |
| | | | | | | | | |
Industrials — 2.6% | | | | | | | | |
ACCO Brands Corp. | | | 793 | | | | 5,377 | |
Albany International Corp. | | | 44 | | | | 2,747 | |
Allison Transmission Holdings, Inc. | | | 991 | | | | 43,515 | |
Ameresco, Inc. - Class A(1) | | | 51 | | | | 719 | |
ArcBest Corp. | | | 88 | | | | 3,015 | |
Armstrong World Industries, Inc. | | | 235 | | | | 13,679 | |
Atkore International Group, Inc.(1) | | | 242 | | | | 4,801 | |
Barrett Business Services, Inc. | | | 30 | | | | 1,718 | |
Brady Corp. | | | 194 | | | | 8,431 | |
Casella Waste Systems, Inc.(1) | | | 82 | | | | 2,336 | |
CBIZ, Inc.(1) | | | 21 | | | | 414 | |
Cintas Corp. | | | 84 | | | | 14,111 | |
Comfort Systems USA, Inc. | | | 107 | | | | 4,674 | |
Commercial Vehicle Group, Inc.(1) | | | 307 | | | | 1,750 | |
Copart, Inc.(1) | | | 352 | | | | 16,819 | |
Covenant Transportation Group, Inc.(1) | | | 79 | | | | 1,517 | |
Crane Co. | | | 343 | | | | 24,758 | |
CSX Corp. | | | 3,206 | | | | 199,189 | |
The accompanying notes are an integral part of these financial statements.
Page 66 | 2018 Annual Report | December 31, 2018 |
Schedule of Investments
December 31, 2018
Global Allocation Fund |
Security Description | | Shares or
Principal
Amount ($) | | | Fair
Value ($) | |
Common Stocks — continued |
Delta Air Lines, Inc. | | | 1,346 | | | | 67,165 | |
DMC Global, Inc. | | | 1 | | | | 35 | |
Eagle Bulk Shipping, Inc.(1) | | | 640 | | | | 2,950 | |
EnerSys | | | 200 | | | | 15,522 | |
Esterline Technologies Corp.(1) | | | 15 | | | | 1,822 | |
Federal Signal Corp. | | | 291 | | | | 5,791 | |
Foundation Building Materials, Inc.(1) | | | 62 | | | | 515 | |
Global Brass & Copper Holdings, Inc. | | | 276 | | | | 6,941 | |
Graco, Inc. | | | 337 | | | | 14,103 | |
GrafTech International, Ltd. | | | 122 | | | | 1,396 | |
Harsco Corp.(1) | | | 256 | | | | 5,084 | |
HD Supply Holdings, Inc.(1) | | | 318 | | | | 11,931 | |
Heidrick & Struggles International, Inc. | | | 32 | | | | 998 | |
Hillenbrand, Inc. | | | 401 | | | | 15,210 | |
Huntington Ingalls Industries, Inc. | | | 112 | | | | 21,315 | |
Hurco Cos., Inc. | | | 116 | | | | 4,141 | |
Huron Consulting Group, Inc.(1) | | | 33 | | | | 1,693 | |
Hyster-Yale Materials Handling, Inc. | | | 16 | | | | 991 | |
Infrastructure and Energy Alternatives, Inc.(1) | | | 150 | | | | 1,229 | |
Ingersoll-Rand PLC | | | 522 | | | | 47,622 | |
Kadant, Inc. | | | 37 | | | | 3,014 | |
KBR, Inc. | | | 435 | | | | 6,603 | |
Kelly Services, Inc. - Class A | | | 62 | | | | 1,270 | |
Kennametal, Inc. | | | 95 | | | | 3,162 | |
Kforce, Inc. | | | 34 | | | | 1,051 | |
Kimball International, Inc. - Class B | | | 292 | | | | 4,143 | |
Landstar System, Inc. | | | 234 | | | | 22,387 | |
LB Foster Co. - Class A(1) | | | 18 | | | | 286 | |
LSC Communications, Inc. | | | 100 | | | | 700 | |
LSI Industries, Inc. | | | 177 | | | | 561 | |
ManpowerGroup, Inc. | | | 17 | | | | 1,102 | |
Masonite International Corp.(1) | | | 218 | | | | 9,773 | |
Matson, Inc. | | | 259 | | | | 8,293 | |
Miller Industries, Inc./TN | | | 271 | | | | 7,317 | |
MSC Industrial Direct Co., Inc. | | | 211 | | | | 16,230 | |
Navigant Consulting, Inc. | | | 260 | | | | 6,253 | |
NCI Building Systems, Inc.(1) | | | 647 | | | | 4,691 | |
Nexeo Solutions, Inc.(1) | | | 306 | | | | 2,629 | |
Norfolk Southern Corp. | | | 1,290 | | | | 192,907 | |
Old Dominion Freight Line, Inc. | | | 40 | | | | 4,940 | |
Oshkosh Corp. | | | 135 | | | | 8,277 | |
PACCAR, Inc. | | | 1,408 | | | | 80,453 | |
Park-Ohio Holdings Corp. | | | 70 | | | | 2,148 | |
Patrick Industries, Inc.(1) | | | 76 | | | | 2,250 | |
Pitney Bowes, Inc. | | | 7 | | | | 41 | |
Quad/Graphics, Inc. | | | 173 | | | | 2,131 | |
Quanex Building Products Corp. | | | 107 | | | | 1,454 | |
Quanta Services, Inc. | | | 48 | | | | 1,445 | |
Radiant Logistics, Inc.(1) | | | 191 | | | | 812 | |
Regal Beloit Corp. | | | 5 | | | | 350 | |
RR Donnelley & Sons Co. | | | 338 | | | | 1,338 | |
Spirit AeroSystems Holdings, Inc. | | | 52 | | | | 3,749 | |
Steelcase, Inc. - Class A | | | 443 | | | | 6,570 | |
Tetra Tech, Inc. | | | 37 | | | | 1,915 | |
Timken Co./The | | | 104 | | | | 3,881 | |
Toro Co./The | | | 329 | | | | 18,385 | |
UniFirst Corp./MA | | | 24 | | | | 3,434 | |
Union Pacific Corp. | | | 1,760 | | | | 243,285 | |
United Continental Holdings, Inc.(1) | | | 2,047 | | | | 171,395 | |
Universal Logistics Holdings, Inc. | | | 68 | | | | 1,230 | |
US Xpress Enterprises, Inc.(1) | | | 153 | | | | 858 | |
Vectrus, Inc.(1) | | | 166 | | | | 3,582 | |
Vivint Solar, Inc.(1) | | | 10 | | | | 38 | |
Wabash National Corp. | | | 505 | | | | 6,605 | |
Waste Management, Inc. | | | 913 | | | | 81,248 | |
Willis Lease Finance Corp.(1) | | | 16 | | | | 554 | |
WW Grainger, Inc. | | | 93 | | | | 26,259 | |
| | | | | | | | 1,547,023 | |
| | | | | | | | | |
Information Technology — 7.3% | | | | | | | | |
ACI Worldwide, Inc.(1) | | | 243 | | | | 6,724 | |
Adobe, Inc.(1) | | | 719 | | | | 162,667 | |
Advanced Micro Devices, Inc.(1) | | | 871 | | | | 16,079 | |
Agilysys, Inc.(1) | | | 36 | | | | 516 | |
Amkor Technology, Inc.(1) | | | 869 | | | | 5,701 | |
Apple, Inc. | | | 4,144 | | | | 653,675 | |
ARRIS International PLC(1) | | | 137 | | | | 4,188 | |
Arrow Electronics, Inc.(1) | | | 213 | | | | 14,686 | |
Aspen Technology, Inc.(1) | | | 113 | | | | 9,286 | |
Avaya Holdings Corp.(1) | | | 285 | | | | 4,150 | |
Avnet, Inc. | | | 954 | | | | 34,439 | |
Booz Allen Hamilton Holding Corp. | | | 375 | | | | 16,901 | |
Bottomline Technologies DE, Inc.(1) | | | 98 | | | | 4,704 | |
Cabot Microelectronics Corp. | | | 149 | | | | 14,207 | |
CACI International, Inc. - Class A(1) | | | 43 | | | | 6,193 | |
Cadence Design Systems, Inc.(1) | | | 1,143 | | | | 49,698 | |
Calix, Inc.(1) | | | 34 | | | | 332 | |
CDK Global, Inc. | | | 36 | | | | 1,724 | |
CDW Corp./DE | | | 151 | | | | 12,239 | |
Ciena Corp.(1) | | | 590 | | | | 20,007 | |
Cirrus Logic, Inc.(1) | | | 225 | | | | 7,466 | |
Cisco Systems, Inc. | | | 7,486 | | | | 324,368 | |
Comtech Telecommunications Corp. | | | 107 | | | | 2,604 | |
The accompanying notes are an integral part of these financial statements.
2018 Annual Report | December 31, 2018 | Page 67 |
Schedule of Investments
December 31, 2018
Global Allocation Fund |
Security Description | | Shares or
Principal
Amount ($) | | | Fair
Value ($) | |
Common Stocks — continued |
Dell Technologies, Inc. - Class C(1) | | | 1,519 | | | | 74,234 | |
Dolby Laboratories, Inc. | | | 274 | | | | 16,944 | |
DXC Technology Co. | | | 453 | | | | 24,086 | |
Electro Scientific Industries, Inc.(1) | | | 27 | | | | 809 | |
ePlus, Inc.(1) | | | 39 | | | | 2,776 | |
Euronet Worldwide, Inc.(1) | | | 60 | | | | 6,143 | |
EVERTEC, Inc. | | | 63 | | | | 1,808 | |
F5 Networks, Inc.(1) | | | 524 | | | | 84,904 | |
Fabrinet(1) | | | 153 | | | | 7,850 | |
Fortinet, Inc.(1) | | | 600 | | | | 42,258 | |
Hackett Group, Inc./The | | | 48 | | | | 768 | |
Hewlett Packard Enterprise Co. | | | 3,088 | | | | 40,792 | |
HP, Inc. | | | 7,311 | | | | 149,583 | |
Immersion Corp.(1) | | | 178 | | | | 1,595 | |
Information Services Group, Inc.(1) | | | 45 | | | | 191 | |
Insight Enterprises, Inc.(1) | | | 255 | | | | 10,391 | |
Integrated Device Technology, Inc.(1) | | | 108 | | | | 5,230 | |
Intel Corp. | | | 4,076 | | | | 191,287 | |
InterDigital, Inc. | | | 277 | | | | 18,401 | |
Intuit, Inc. | | | 1,007 | | | | 198,228 | |
j2 Global, Inc. | | | 129 | | | | 8,950 | |
Jabil, Inc. | | | 490 | | | | 12,147 | |
Juniper Networks, Inc. | | | 3,021 | | | | 81,295 | |
KEMET Corp. | | | 43 | | | | 754 | |
KLA-Tencor Corp. | | | 127 | | | | 11,365 | |
Lam Research Corp. | | | 53 | | | | 7,217 | |
Leidos Holdings, Inc. | | | 157 | | | | 8,277 | |
LivePerson, Inc.(1) | | | 111 | | | | 2,093 | |
Majesco(1) | | | 43 | | | | 305 | |
Mastercard, Inc. | | | 1,249 | | | | 235,624 | |
Micron Technology, Inc.(1) | | | 5,666 | | | | 179,782 | |
Microsoft Corp. | | | 6,698 | | | | 680,316 | |
MicroStrategy, Inc.(1) | | | 6 | | | | 767 | |
Mitek Systems, Inc.(1) | | | 99 | | | | 1,070 | |
MKS Instruments, Inc. | | | 118 | | | | 7,624 | |
MoneyGram International, Inc.(1) | | | 882 | | | | 1,764 | |
Monotype Imaging Holdings, Inc. | | | 43 | | | | 667 | |
Motorola Solutions, Inc. | | | 13 | | | | 1,496 | |
Nanometrics, Inc.(1) | | | 170 | | | | 4,646 | |
Napco Security Technologies, Inc.(1) | | | 100 | | | | 1,575 | |
National Instruments Corp. | | | 12 | | | | 545 | |
NetApp, Inc. | | | 1,492 | | | | 89,028 | |
Novanta, Inc.(1) | | | 22 | | | | 1,386 | |
Nuance Communications, Inc.(1) | | | 1,399 | | | | 18,509 | |
NVE Corp. | | | 9 | | | | 788 | |
Oracle Corp. | | | 2,983 | | | | 134,682 | |
PC Connection, Inc. | | | 142 | | | | 4,222 | |
Photronics, Inc.(1) | | | 595 | | | | 5,760 | |
Progress Software Corp. | | | 243 | | | | 8,624 | |
PTC, Inc.(1) | | | 58 | | | | 4,808 | |
Quantenna Communications, Inc.(1) | | | 349 | | | | 5,008 | |
SailPoint Technologies Holding, Inc.(1) | | | 141 | | | | 3,312 | |
ScanSource, Inc.(1) | | | 15 | | | | 516 | |
Semtech Corp.(1) | | | 104 | | | | 4,770 | |
SendGrid, Inc.(1) | | | 116 | | | | 5,008 | |
SMART Global Holdings, Inc.(1) | | | 72 | | | | 2,138 | |
Symantec Corp. | | | 1,198 | | | | 22,636 | |
Synopsys, Inc.(1) | | | 736 | | | | 62,001 | |
Tableau Software, Inc.(1) | | | 73 | | | | 8,760 | |
Tech Data Corp.(1) | | | 152 | | | | 12,435 | |
Texas Instruments, Inc. | | | 2,483 | | | | 234,644 | |
Trade Desk, Inc./The(1) | | | 47 | | | | 5,455 | |
Ubiquiti Networks, Inc. | | | 36 | | | | 3,579 | |
Unisys Corp.(1) | | | 128 | | | | 1,489 | |
Verint Systems, Inc.(1) | | | 396 | | | | 16,755 | |
Versum Materials, Inc. | | | 9 | | | | 249 | |
Visa, Inc. | | | 154 | | | | 20,319 | |
Vishay Precision Group, Inc.(1) | | | 52 | | | | 1,572 | |
Workiva, Inc.(1) | | | 54 | | | | 1,938 | |
Xilinx, Inc. | | | 1,071 | | | | 91,217 | |
Zebra Technologies Corp. - Class A(1) | | | 94 | | | | 14,968 | |
Zix Corp.(1) | | | 253 | | | | 1,450 | |
| | | | | | | | 4,287,137 | |
| | | | | | | | | |
Materials — 0.8% | | | | | | | | |
CF Industries Holdings, Inc. | | | 405 | | | | 17,622 | |
Chemours Co./The | | | 460 | | | | 12,981 | |
Eagle Materials, Inc. | | | 467 | | | | 28,501 | |
FutureFuel Corp. | | | 277 | | | | 4,393 | |
Greif, Inc. - Class A | | | 235 | | | | 8,721 | |
Huntsman Corp. | | | 177 | | | | 3,414 | |
International Paper Co. | | | 1,581 | | | | 63,809 | |
Louisiana-Pacific Corp. | | | 822 | | | | 18,265 | |
LyondellBasell Industries NV | | | 2,114 | | | | 175,800 | |
Mosaic Co./The | | | 485 | | | | 14,167 | |
Nucor Corp. | | | 1,409 | | | | 73,000 | |
PPG Industries, Inc. | | | 113 | | | | 11,552 | |
Reliance Steel & Aluminum Co. | | | 96 | | | | 6,832 | |
Schnitzer Steel Industries, Inc. | | | 16 | | | | 345 | |
Steel Dynamics, Inc. | | | 673 | | | | 20,217 | |
Trinseo SA | | | 223 | | | | 10,209 | |
Verso Corp.(1) | | | 78 | | | | 1,747 | |
| | | | | | | | 471,575 | |
The accompanying notes are an integral part of these financial statements.
Page 68 | 2018 Annual Report | December 31, 2018 |
Schedule of Investments
December 31, 2018
Global Allocation Fund |
Security Description | | Shares or
Principal
Amount ($) | | | Fair
Value ($) | |
Common Stocks — continued |
Real Estate Investment Trust — 1.4% | | | | | | | | |
American Assets Trust, Inc. | | | 104 | | | | 4,178 | |
American Tower Corp. | | | 226 | | | | 35,751 | |
Bluerock Residential Growth REIT, Inc. | | | 235 | | | | 2,120 | |
CatchMark Timber Trust, Inc. | | | 594 | | | | 4,217 | |
CoreCivic, Inc. | | | 378 | | | | 6,740 | |
CubeSmart | | | 357 | | | | 10,242 | |
Essex Property Trust, Inc. | | | 669 | | | | 164,045 | |
Farmland Partners, Inc. | | | 102 | | | | 463 | |
Front Yard Residential Corp. | | | 248 | | | | 2,165 | |
Gaming and Leisure Properties, Inc. | | | 215 | | | | 6,947 | |
GEO Group, Inc./The | | | 333 | | | | 6,560 | |
Gladstone Commercial Corp. | | | 274 | | | | 4,910 | |
Hospitality Properties Trust | | | 984 | | | | 23,498 | |
Host Hotels & Resorts, Inc. | | | 3,487 | | | | 58,128 | |
Lamar Advertising Co. | | | 555 | | | | 38,395 | |
Maui Land & Pineapple Co., Inc.(1) | | | 17 | | | | 169 | |
New Senior Investment Group, Inc. | | | 296 | | | | 1,220 | |
Pebblebrook Hotel Trust | | | 272 | | | | 7,700 | |
Pennsylvania Real Estate Investment Trust | | | 371 | | | | 2,204 | |
Piedmont Office Realty Trust, Inc. | | | 1,977 | | | | 33,688 | |
PotlatchDeltic Corp. | | | 85 | | | | 2,689 | |
PS Business Parks, Inc. | | | 163 | | | | 21,353 | |
RAIT Financial Trust(1) | | | 222 | | | | 124 | |
Redfin Corp.(1) | | | 164 | | | | 2,362 | |
Retail Properties of America, Inc. | | | 214 | | | | 2,322 | |
Retail Value, Inc. | | | 267 | | | | 6,833 | |
Simon Property Group, Inc. | | | 1,157 | | | | 194,364 | |
Tanger Factory Outlet Centers, Inc. | | | 572 | | | | 11,566 | |
Trinity Place Holdings, Inc.(1) | | | 331 | | | | 1,437 | |
UDR, Inc. | | | 3,946 | | | | 156,341 | |
Urstadt Biddle Properties, Inc. | | | 101 | | | | 1,941 | |
| | | | | | | | 814,672 | |
| | | | | | | | | |
Utilities — 1.4% | | | | | | | | |
AES Corp./VA | | | 3,711 | | | | 53,661 | |
Atlantic Power Corp.(1) | | | 547 | | | | 1,187 | |
CenterPoint Energy, Inc. | | | 5,121 | | | | 144,566 | |
DTE Energy Co. | | | 18 | | | | 1,985 | |
Exelon Corp. | | | 4,207 | | | | 189,736 | |
MDU Resources Group, Inc. | | | 452 | | | | 10,776 | |
NextEra Energy, Inc. | | | 1,287 | | | | 223,707 | |
NorthWestern Corp. | | | 45 | | | | 2,675 | |
NRG Energy, Inc. | | | 469 | | | | 18,572 | |
OGE Energy Corp. | | | 618 | | | | 24,219 | |
Portland General Electric Co. | | | 114 | | | | 5,227 | |
SJW Group | | | 14 | | | | 779 | |
UGI Corp. | | | 2,475 | | | | 132,033 | |
| | | | | | | | 809,123 | |
| | | | | | | | | |
Total Common Stocks (Cost $21,377,264) | | | | | | | 21,168,943 | |
| | | | | | | | | |
Registered Investment Companies — 16.7% |
American Beacon SiM High Yield Opportunities Fund - Class I | | | 30,113 | | | | 271,925 | |
Baird Core Plus Bond Fund - Class I | | | 28,457 | | | | 307,909 | |
Dodge & Cox Income Fund | | | 28,447 | | | | 377,207 | |
DoubleLine Total Return Bond Fund - Class I | | | 36,817 | | | | 383,631 | |
Frost Total Return Bond Fund - Class I | | | 37,100 | | | | 378,421 | |
Guggenheim Total Return Bond Fund - Class I | | | 14,345 | | | | 381,432 | |
iShares Core MSCI EAFE ETF(8) | | | 57,608 | | | | 3,168,440 | |
iShares Core MSCI Emerging Markets ETF(2)(8) | | | 15,422 | | | | 727,147 | |
iShares Core U.S. Aggregate Bond ETF(8) | | | 6,514 | | | | 693,676 | |
Lord Abbett High Yield Fund - Class I | | | 49,734 | | | | 344,156 | |
Payden Emerging Markets Bond Fund - Class I | | | 25,988 | | | | 324,589 | |
PGIM Total Return Bond Fund - Class R6 | | | 15,214 | | | | 211,930 | |
PIMCO Investment Grade Credit Bond Fund - Class I | | | 11,160 | | | | 110,599 | |
Pioneer Bond Fund - Class Y | | | 41,217 | | | | 382,081 | |
Segall Bryant & Hamill Plus Bond Fund - Class I | | | 22,599 | | | | 231,185 | |
TCW Emerging Markets Income Fund - Class I | | | 84,033 | | | | 644,530 | |
Vanguard Intermediate-Term Corporate Bond ETF(8) | | | 2,275 | | | | 188,507 | |
Vanguard Total Bond Market ETF(8) | | | 7,906 | | | | 626,234 | |
Total Registered Investment Companies (Cost $9,702,466) | | | | | | | 9,753,599 | |
| | | | | | | | | |
Money Market Registered Investment Companies — 43.8% |
Morgan Stanley Government Institutional Fund, 2.32%(3) | | | 2,019,370 | | | | 2,019,370 | |
Meeder Institutional Prime Money Market Fund, 2.43%(4) | | | 23,575,166 | | | | 23,572,809 | |
Total Money Market Registered Investment Companies (Cost $25,591,368) | | | | | | | 25,592,179 | |
The accompanying notes are an integral part of these financial statements.
2018 Annual Report | December 31, 2018 | Page 69 |
Schedule of Investments
December 31, 2018
Global Allocation Fund |
Security Description | | Shares or
Principal
Amount ($) | | | Fair
Value ($) | |
Bank Obligations — 2.1% | | | | | | | | |
First Merchants Bank Deposit Account, 2.10%, 1/2/2019(5) | | | 249,221 | | | | 249,221 | |
Metro City Bank Deposit Account, 2.10%, 1/2/2019(5) | | | 249,212 | | | | 249,212 | |
Pacific Mercantile Bank Deposit Account, 2.20%, 1/2/2019(5) | | | 249,288 | | | | 249,288 | |
Pacific Premier Bank Deposit Account, 2.30%, 1/2/2019(5) | | | 249,192 | | | | 249,192 | |
Seacoast Community Bank Deposit Account, 2.00%, 1/2/2019(5) | | | 249,193 | | | | 249,193 | |
Total Bank Obligations (Cost $1,246,106) | | | | | | | 1,246,106 | |
| | | | | | | | | |
U.S. Government Obligations — 0.8% | | | | | | | | |
U.S. Treasury Note, 2.25%, due 11/15/2025 | | | 275,000 | | | | 268,931 | |
U.S. Treasury Note, 1.88%, due 12/31/2019 | | | 103,000 | | | | 102,251 | |
U.S. Treasury Note, 2.13%, due 12/31/2022 | | | 93,000 | | | | 91,689 | |
Total U.S. Government Obligations
(Cost $459,665) | | | | | | | 462,871 | |
Total Investments — 99.7%(Cost $58,376,869) | | | | | | | 58,223,698 | |
Other Assets less Liabilities — 0.3% | | | | | | | 186,007 | |
Total Net Assets — 100.0% | | | | | | | 58,409,705 | |
| | | | | | | | | |
Trustee Deferred Compensation(6) | | | | | | | | |
Meeder Balanced Fund | | | 1,673 | | | | 18,537 | |
Meeder Dynamic Allocation Fund | | | 4,212 | | | | 41,235 | |
Meeder Muirfield Fund | | | 1,736 | | | | 12,430 | |
Meeder Conservative Allocation Fund | | | 474 | | | | 10,039 | |
Total Trustee Deferred Compensation (Cost $82,548) | | | | | | | 82,241 | |
Global Allocation Fund |
| | | Long
(Short)
Contracts | | | Expiration
Date | | | Notional
Value of
Contracts
($) | | | Value and
Unrealized
Appreciation
(Depreciation)
($) | |
Futures Contracts |
Index Futures | | | | | | | | | | | | | | | | |
Russell 2000 Mini Index Futures | | | (15 | ) | | | 3/15/2019 | | | | (1,011,750 | ) | | | 23,780 | |
Standard & Poors 500 Mini Futures | | | (91 | ) | | | 3/15/2019 | | | | (11,398,660 | ) | | | 134,460 | |
E-mini Standard & Poors MidCap 400 Futures | | | (21 | ) | | | 3/15/2019 | | | | (3,490,620 | ) | | | 47,036 | |
Total Futures Contracts | | | (127 | ) | | | | | | | (15,901,030 | ) | | | 205,276 | |
(1) | Represents non-income producing securities. |
(2) | All or a portion of this security is on loan. |
(3) | Investment purchased with cash received as securities lending collateral. The yield shown represents the 7-day yield in effect at December 31, 2018. |
(4) | Investment in affiliate. The yield shown represents the 7-day yield in effect at December 31, 2018. |
(5) | Variable rate security. Securities payable at par including accrued interest (usually within seven days notice) and unconditionally secured as to principal and interest by letters of credit or other credit support agreements from major banks. The interest rates are adjustable and are not based on a published reference rate and spread but are determined by the issuer or agent and are based on current market conditions. These securities do not indicate a reference rate and spread in their description above. The rate shown represents the rate in effect at December 31, 2018. The maturity date shown, if applicable, reflects the earlier of the next demand date or stated maturity date. |
(6) | Assets of affiliates to the Global Allocation Fund held for the benefit of the Fund’s Trustees in connection with the Trustee Deferred Compensation Plan. |
(7) | Fair valued security deemed as Level 3 security. |
The accompanying notes are an integral part of these financial statements.
Page 70 | 2018 Annual Report | December 31, 2018 |
Schedule of Investments
December 31, 2018
Balanced Fund |
Security Description | | Shares,
Contracts
or Principal
Amount ($) | | | Fair
Value ($) | |
Common Stocks — 44.8% |
Communication Services — 4.2% | | | | | | | | |
Alphabet, Inc. - Class A(1) | | | 149 | | | | 155,699 | |
Alphabet, Inc. - Class C(1) | | | 2,875 | | | | 2,977,379 | |
AMC Entertainment Holdings, Inc. | | | 3,749 | | | | 46,038 | |
AMC Networks, Inc.(1) | | | 1,455 | | | | 79,850 | |
AT&T, Inc. | | | 42,792 | | | | 1,221,284 | |
ATN International, Inc. | | | 86 | | | | 6,152 | |
Beasley Broadcast Group, Inc. | | | 215 | | | | 806 | |
Cable One, Inc. | | | 287 | | | | 235,369 | |
Cincinnati Bell, Inc.(1) | | | 836 | | | | 6,504 | |
Cinemark Holdings, Inc. | | | 1,630 | | | | 58,354 | |
Comcast Corp. - Class A | | | 25,681 | | | | 874,438 | |
Discovery, Inc.(1) | | | 5,500 | | | | 126,940 | |
EW Scripps Co./The | | | 306 | | | | 4,813 | |
Facebook, Inc.(1) | | | 10,841 | | | | 1,421,147 | |
Frontier Communications Corp. | | | 5,029 | | | | 11,969 | |
Gannett Co., Inc. | | | 143 | | | | 1,220 | |
Gray Television, Inc.(1) | | | 2,877 | | | | 42,407 | |
Intelsat SA(1) | | | 649 | | | | 13,882 | |
Interpublic Group of Cos., Inc./The | | | 2,692 | | | | 55,536 | |
Liberty TripAdvisor Holdings, Inc.(1) | | | 565 | | | | 8,978 | |
Marcus Corp./The | | | 1,827 | | | | 72,167 | |
MDC Partners, Inc.(1) | | | 2,822 | | | | 7,365 | |
National CineMedia, Inc. | | | 853 | | | | 5,527 | |
Nexstar Media Group, Inc. | | | 633 | | | | 49,779 | |
NII Holdings, Inc.(1) | | | 1,195 | | | | 5,270 | |
Ooma, Inc.(1) | | | 434 | | | | 6,024 | |
Rosetta Stone, Inc.(1) | | | 467 | | | | 7,659 | |
Scholastic Corp. | | | 282 | | | | 11,353 | |
Spok Holdings, Inc. | | | 2,158 | | | | 28,615 | |
Sprint Corp.(1) | | | 18,433 | | | | 107,280 | |
TechTarget, Inc.(1) | | | 313 | | | | 3,822 | |
TEGNA, Inc. | | | 6,838 | | | | 74,329 | |
Telephone & Data Systems, Inc. | | | 3,257 | | | | 105,983 | |
T-Mobile US, Inc.(1) | | | 19,960 | | | | 1,269,656 | |
Tribune Publishing Co.(1) | | | 1,227 | | | | 13,914 | |
Twenty-First Century Fox, Inc. - Class A | | | 9,574 | | | | 460,701 | |
United States Cellular Corp.(1) | | | 753 | | | | 39,133 | |
Verizon Communications, Inc. | | | 46,368 | | | | 2,606,809 | |
Viacom, Inc. | | | 12,447 | | | | 319,888 | |
Vonage Holdings Corp.(1) | | | 1,582 | | | | 13,811 | |
Walt Disney Co./The | | | 18,123 | | | | 1,987,187 | |
WideOpenWest, Inc.(1) | | | 1,460 | | | | 10,410 | |
| | | | | | | | 14,555,447 | |
| | | | | | | | | |
Consumer Discretionary — 3.5% | | | | | | | | |
Aaron's, Inc. | | | 1,032 | | | | 43,396 | |
Amazon.com, Inc.(1) | | | 2,595 | | | | 3,897,612 | |
Ascena Retail Group, Inc.(1) | | | 1,241 | | | | 3,115 | |
Bassett Furniture Industries, Inc. | | | 1,542 | | | | 30,902 | |
Bed Bath & Beyond, Inc.(2) | | | 5,404 | | | | 61,173 | |
Best Buy Co., Inc. | | | 6,711 | | | | 355,415 | |
Bloomin' Brands, Inc. | | | 1,733 | | | | 31,003 | |
Bojangles', Inc.(1) | | | 107 | | | | 1,721 | |
Booking Holdings, Inc.(1) | | | 390 | | | | 671,744 | |
Brinker International, Inc. | | | 711 | | | | 31,270 | |
Burlington Stores, Inc.(1) | | | 306 | | | | 49,777 | |
Callaway Golf Co. | | | 2,462 | | | | 37,669 | |
Capri Holdings, Ltd.(1) | | | 4,939 | | | | 187,287 | |
Cato Corp./The | | | 44 | | | | 628 | |
Chico's FAS, Inc. | | | 1,546 | | | | 8,689 | |
Clarus Corp. | | | 1,265 | | | | 12,802 | |
Crocs, Inc.(1) | | | 719 | | | | 18,680 | |
Darden Restaurants, Inc. | | | 1,310 | | | | 130,817 | |
Dave & Buster's Entertainment, Inc. | | | 434 | | | | 19,339 | |
Deckers Outdoor Corp.(1) | | | 361 | | | | 46,190 | |
Dine Brands Global, Inc. | | | 73 | | | | 4,916 | |
Domino's Pizza, Inc. | | | 281 | | | | 69,685 | |
Dunkin' Brands Group, Inc. | | | 260 | | | | 16,671 | |
Ethan Allen Interiors, Inc. | | | 1,503 | | | | 26,438 | |
Etsy, Inc.(1) | | | 733 | | | | 34,869 | |
Express, Inc.(1) | | | 2,480 | | | | 12,673 | |
Extended Stay America, Inc. | | | 5,299 | | | | 82,135 | |
Five Below, Inc.(1) | | | 166 | | | | 16,985 | |
Foot Locker, Inc. | | | 2,016 | | | | 107,251 | |
Ford Motor Co. | | | 36,529 | | | | 279,447 | |
Fox Factory Holding Corp.(1) | | | 261 | | | | 15,365 | |
Gentex Corp. | | | 6,793 | | | | 137,287 | |
G-III Apparel Group, Ltd.(1) | | | 97 | | | | 2,705 | |
H&R Block, Inc. | | | 3,702 | | | | 93,920 | |
Helen of Troy, Ltd.(1) | | | 98 | | | | 12,856 | |
Hooker Furniture Corp. | | | 739 | | | | 19,465 | |
J Alexander's Holdings, Inc.(1) | | | 1,453 | | | | 11,958 | |
Lands' End, Inc.(1) | | | 143 | | | | 2,032 | |
La-Z-Boy, Inc. | | | 930 | | | | 25,770 | |
Lear Corp. | | | 2,027 | | | | 249,037 | |
Liberty Expedia Holdings, Inc.(1) | | | 6,062 | | | | 237,085 | |
Lululemon Athletica, Inc.(1) | | | 1,444 | | | | 175,605 | |
M/I Homes, Inc.(1) | | | 2,409 | | | | 50,637 | |
Macy's, Inc. | | | 663 | | | | 19,744 | |
Malibu Boats, Inc.(1) | | | 106 | | | | 3,689 | |
The accompanying notes are an integral part of these financial statements.
2018 Annual Report | December 31, 2018 | Page 71 |
Schedule of Investments
December 31, 2018
Balanced Fund |
Security Description | | Shares,
Contracts
or Principal
Amount ($) | | | Fair
Value ($) | |
Common Stocks — continued |
MasterCraft Boat Holdings, Inc.(1) | | | 635 | | | | 11,875 | |
McDonald's Corp. | | | 522 | | | | 92,692 | |
MDC Holdings, Inc. | | | 1,547 | | | | 43,486 | |
NIKE, Inc. - Class B | | | 7 | | | | 519 | |
Norwegian Cruise Line Holdings, Ltd.(1) | | | 2,249 | | | | 95,335 | |
Nutrisystem, Inc. | | | 163 | | | | 7,152 | |
NVR, Inc.(1) | | | 69 | | | | 168,152 | |
Office Depot, Inc. | | | 130 | | | | 335 | |
Oxford Industries, Inc. | | | 96 | | | | 6,820 | |
Penn National Gaming, Inc.(1) | | | 656 | | | | 12,352 | |
Qurate Retail, Inc.(1) | | | 3,423 | | | | 66,817 | |
Rent-A-Center, Inc./TX(1) | | | 154 | | | | 2,493 | |
Ross Stores, Inc. | | | 73 | | | | 6,074 | |
RTW RetailWinds, Inc.(1) | | | 1,226 | | | | 3,470 | |
Signet Jewelers, Ltd. | | | 726 | | | | 23,065 | |
Starbucks Corp. | | | 12,040 | | | | 775,376 | |
Stoneridge, Inc.(1) | | | 253 | | | | 6,236 | |
Tailored Brands, Inc. | | | 45 | | | | 614 | |
Target Corp. | | | 7,118 | | | | 470,429 | |
Taylor Morrison Home Corp.(1) | | | 2,610 | | | | 41,499 | |
Thor Industries, Inc. | | | 1,035 | | | | 53,820 | |
TJX Cos., Inc./The | | | 33,981 | | | | 1,520,310 | |
Tower International, Inc. | | | 448 | | | | 10,662 | |
Town Sports International Holdings, Inc.(1) | | | 142 | | | | 909 | |
Turtle Beach Corp.(1) | | | 125 | | | | 1,784 | |
Ulta Beauty, Inc.(1) | | | 190 | | | | 46,520 | |
Vera Bradley, Inc.(1) | | | 807 | | | | 6,916 | |
Wendy's Co./The | | | 4,341 | | | | 67,763 | |
Wyndham Hotels & Resorts, Inc. | | | 7,048 | | | | 319,768 | |
Yum! Brands, Inc. | | | 8,943 | | | | 822,041 | |
| | | | | | | | 12,032,738 | |
| | | | | | | | | |
Consumer Staples — 1.7% | | | | | | | | |
Church & Dwight Co., Inc. | | | 1,731 | | | | 113,831 | |
Coca-Cola Co./The | | | 1,637 | | | | 77,512 | |
Conagra Brands, Inc. | | | 7,065 | | | | 150,908 | |
Costco Wholesale Corp. | | | 1,831 | | | | 372,993 | |
Hershey Co./The | | | 995 | | | | 106,644 | |
Kellogg Co. | | | 349 | | | | 19,896 | |
Keurig Dr Pepper, Inc. | | | 24,377 | | | | 625,026 | |
Kroger Co./The | | | 11,039 | | | | 303,573 | |
Lamb Weston Holdings, Inc. | | | 2,074 | | | | 152,563 | |
Molson Coors Brewing Co. | | | 4,564 | | | | 256,314 | |
PepsiCo, Inc. | | | 12,957 | | | | 1,431,489 | |
Procter & Gamble Co./The | | | 11,000 | | | | 1,011,120 | |
Simply Good Foods Co./The(1) | | | 690 | | | | 13,041 | |
SpartanNash Co. | | | 207 | | | | 3,556 | |
Sprouts Farmers Market, Inc.(1) | | | 1,931 | | | | 45,398 | |
Tyson Foods, Inc. | | | 3,781 | | | | 201,905 | |
Walgreens Boots Alliance, Inc. | | | 4,878 | | | | 333,314 | |
Walmart, Inc. | | | 6,455 | | | | 601,283 | |
| | | | | | | | 5,820,366 | |
| | | | | | | | | |
Energy — 2.8% | | | | | | | | |
Adams Resources & Energy, Inc. | | | 116 | | | | 4,490 | |
Anadarko Petroleum Corp. | | | 2,825 | | | | 123,848 | |
Arch Coal, Inc. - Class A | | | 380 | | | | 31,536 | |
Archrock, Inc. | | | 4,877 | | | | 36,529 | |
Cactus, Inc.(1) | | | 1,808 | | | | 49,557 | |
Chesapeake Energy Corp.(1) | | | 8,323 | | | | 17,478 | |
Chevron Corp. | | | 6,871 | | | | 747,496 | |
ConocoPhillips | | | 25,475 | | | | 1,588,366 | |
CONSOL Energy, Inc.(1) | | | 248 | | | | 7,864 | |
Covia Holdings Corp.(1) | | | 6,437 | | | | 22,015 | |
CVR Energy, Inc. | | | 700 | | | | 24,136 | |
Delek US Holdings, Inc. | | | 1,043 | | | | 33,908 | |
Denbury Resources, Inc.(1) | | | 2,487 | | | | 4,253 | |
Earthstone Energy, Inc.(1) | | | 1,278 | | | | 5,777 | |
EOG Resources, Inc. | | | 358 | | | | 31,221 | |
Era Group, Inc.(1) | | | 403 | | | | 3,522 | |
Evolution Petroleum Corp. | | | 2,249 | | | | 15,338 | |
Exxon Mobil Corp. | | | 25,168 | | | | 1,716,206 | |
Gulfport Energy Corp.(1) | | | 3,014 | | | | 19,742 | |
Hallador Energy Co. | | | 2,195 | | | | 11,129 | |
Helix Energy Solutions Group, Inc.(1) | | | 573 | | | | 3,100 | |
Helmerich & Payne, Inc. | | | 2,284 | | | | 109,495 | |
HollyFrontier Corp. | | | 3,027 | | | | 154,740 | |
Keane Group, Inc.(1) | | | 4,145 | | | | 33,906 | |
KLX Energy Services Holdings, Inc.(1) | | | 244 | | | | 5,722 | |
Mammoth Energy Services, Inc. | | | 579 | | | | 10,410 | |
Marathon Oil Corp. | | | 20,086 | | | | 288,033 | |
Marathon Petroleum Corp. | | | 13,449 | | | | 793,625 | |
Matrix Service Co.(1) | | | 2,409 | | | | 43,217 | |
Northern Oil and Gas, Inc.(1) | | | 966 | | | | 2,183 | |
Occidental Petroleum Corp. | | | 19,699 | | | | 1,209,125 | |
Overseas Shipholding Group, Inc.(1) | | | 1,368 | | | | 2,271 | |
PBF Energy, Inc. | | | 2,987 | | | | 97,585 | |
Peabody Energy Corp. | | | 2,306 | | | | 70,287 | |
Penn Virginia Corp.(1) | | | 206 | | | | 11,136 | |
Phillips 66 | | | 14,986 | | | | 1,291,044 | |
Profire Energy, Inc.(1) | | | 2,322 | | | | 3,367 | |
ProPetro Holding Corp.(1) | | | 2,565 | | | | 31,601 | |
The accompanying notes are an integral part of these financial statements.
Page 72 | 2018 Annual Report | December 31, 2018 |
Schedule of Investments
December 31, 2018
Balanced Fund |
Security Description | | Shares,
Contracts
or Principal
Amount ($) | | | Fair
Value ($) | |
Common Stocks — continued |
Renewable Energy Group, Inc.(1) | | | 222 | | | | 5,705 | |
SEACOR Holdings, Inc.(1) | | | 60 | | | | 2,220 | |
SilverBow Resources, Inc.(1) | | | 589 | | | | 13,924 | |
Southwestern Energy Co.(1) | | | 7,241 | | | | 24,692 | |
Targa Resources Corp. | | | 2,900 | | | | 104,458 | |
Unit Corp.(1) | | | 545 | | | | 7,783 | |
Valero Energy Corp. | | | 10,558 | | | | 791,533 | |
W&T Offshore, Inc.(1) | | | 2,711 | | | | 11,169 | |
WildHorse Resource Development Corp.(1) | | | 1,096 | | | | 15,465 | |
World Fuel Services Corp. | | | 1,665 | | | | 35,648 | |
| | | | | | | | 9,667,855 | |
| | | | | | | | | |
Financials — 5.6% | | | | | | | | |
American Equity Investment Life Holding Co. | | | 514 | | | | 14,361 | |
Arbor Realty Trust, Inc. | | | 7,433 | | | | 74,850 | |
Arthur J Gallagher & Co. | | | 1,834 | | | | 135,166 | |
Bancorp, Inc./The(1) | | | 4,926 | | | | 39,211 | |
Bank of America Corp. | | | 103,121 | | | | 2,540,901 | |
Bank of NT Butterfield & Son, Ltd./The | | | 1,114 | | | | 34,924 | |
BB&T Corp. | | | 9,759 | | | | 422,760 | |
Berkshire Hathaway, Inc. - Class B(1) | | | 16,106 | | | | 3,288,523 | |
Cherry Hill Mortgage Investment Corp. | | | 712 | | | | 12,488 | |
CIT Group, Inc. | | | 1,463 | | | | 55,989 | |
Discover Financial Services | | | 6,949 | | | | 409,852 | |
Essent Group, Ltd.(1) | | | 2,189 | | | | 74,820 | |
FB Financial Corp. | | | 133 | | | | 4,658 | |
Fidelity National Financial, Inc. | | | 4,908 | | | | 154,308 | |
Fifth Third Bancorp | | | 27,014 | | | | 635,639 | |
First BanCorp/Puerto Rico | | | 2,259 | | | | 19,427 | |
FirstCash, Inc. | | | 1,218 | | | | 88,122 | |
Genworth Financial, Inc.(1) | | | 3,089 | | | | 14,395 | |
Goosehead Insurance, Inc.(1) | | | 409 | | | | 10,753 | |
Health Insurance Innovations, Inc. - Class A(1) | | | 504 | | | | 13,472 | |
Huntington Bancshares, Inc./OH | | | 72,396 | | | | 862,960 | |
Independence Holding Co. | | | 52 | | | | 1,830 | |
Independent Bank Corp./MI | | | 268 | | | | 5,633 | |
Investment Technology Group, Inc. | | | 201 | | | | 6,078 | |
JPMorgan Chase & Co. | | | 16,140 | | | | 1,575,587 | |
KeyCorp | | | 57,791 | | | | 854,151 | |
Ladder Capital Corp. | | | 10,032 | | | | 155,195 | |
Loews Corp. | | | 1,469 | | | | 66,869 | |
Marlin Business Services Corp. | | | 267 | | | | 5,962 | |
MB Financial, Inc. | | | 9,804 | | | | 388,533 | |
MBT Financial Corp. | | | 1,766 | | | | 16,424 | |
Medley Management, Inc. | | | 402 | | | | 1,552 | |
MGIC Investment Corp.(1) | | | 5,006 | | | | 52,363 | |
Moelis & Co. | | | 1,962 | | | | 67,454 | |
Mr Cooper Group, Inc.(1) | | | 2,126 | | | | 24,810 | |
National General Holdings Corp. | | | 825 | | | | 19,973 | |
New Residential Investment Corp. | | | 32,916 | | | | 467,736 | |
NMI Holdings, Inc. - Class A(1) | | | 1,054 | | | | 18,814 | |
Northrim BanCorp, Inc. | | | 450 | | | | 14,792 | |
OFG Bancorp | | | 662 | | | | 10,897 | |
Old Republic International Corp. | | | 10,251 | | | | 210,863 | |
On Deck Capital, Inc.(1) | | | 1,719 | | | | 10,142 | |
Oppenheimer Holdings, Inc. | | | 3,195 | | | | 81,632 | |
PacWest Bancorp | | | 11,043 | | | | 367,511 | |
Parke Bancorp, Inc. | | | 136 | | | | 2,545 | |
PennyMac Financial Services, Inc. | | | 3,203 | | | | 68,096 | |
Popular, Inc. | | | 2,866 | | | | 135,333 | |
Progressive Corp./The | | | 19,329 | | | | 1,166,119 | |
Pzena Investment Management, Inc. | | | 3,513 | | | | 30,387 | |
Radian Group, Inc. | | | 8,520 | | | | 139,387 | |
Ready Capital Corp. | | | 623 | | | | 8,616 | |
Regions Financial Corp. | | | 65,732 | | | | 879,494 | |
Reinsurance Group of America, Inc. | | | 1,737 | | | | 243,580 | |
Safety Insurance Group, Inc. | | | 455 | | | | 37,224 | |
Silvercrest Asset Management Group, Inc. | | | 296 | | | | 3,916 | |
Stewart Information Services Corp. | | | 4,260 | | | | 176,364 | |
SunTrust Banks, Inc. | | | 25,887 | | | | 1,305,740 | |
TCF Financial Corp. | | | 16,098 | | | | 313,750 | |
Universal Insurance Holdings, Inc. | | | 687 | | | | 26,051 | |
US Bancorp | | | 1,802 | | | | 82,351 | |
Waddell & Reed Financial, Inc. | | | 308 | | | | 5,569 | |
Walker & Dunlop, Inc. | | | 1,585 | | | | 68,551 | |
Wells Fargo & Co. | | | 35,260 | | | | 1,624,781 | |
| | | | | | | | 19,650,234 | |
| | | | | | | | | |
Healthcare — 9.0% | | | | | | | | |
Abbott Laboratories | | | 7,500 | | | | 542,475 | |
AbbVie, Inc. | | | 7,116 | | | | 656,024 | |
ABIOMED, Inc.(1) | | | 625 | | | | 203,150 | |
ACADIA Pharmaceuticals, Inc.(1) | | | 208 | | | | 3,363 | |
Achillion Pharmaceuticals, Inc.(1) | | | 4,383 | | | | 6,969 | |
Acorda Therapeutics, Inc.(1) | | | 2,484 | | | | 38,701 | |
Aeglea BioTherapeutics, Inc.(1) | | | 968 | | | | 7,250 | |
AgeX Therapeutics, Inc.(1) | | | 32 | | | | 96 | |
Agilent Technologies, Inc. | | | 1,625 | | | | 109,623 | |
Aldeyra Therapeutics, Inc.(1) | | | 1,793 | | | | 14,882 | |
Alexion Pharmaceuticals, Inc.(1) | | | 2,744 | | | | 267,156 | |
The accompanying notes are an integral part of these financial statements.
2018 Annual Report | December 31, 2018 | Page 73 |
Schedule of Investments
December 31, 2018
Balanced Fund |
Security Description | | Shares,
Contracts
or Principal
Amount ($) | | | Fair
Value ($) | |
Common Stocks — continued |
Alkermes PLC(1) | | | 308 | | | | 9,089 | |
Allergan PLC | | | 4,761 | | | | 636,355 | |
AMAG Pharmaceuticals, Inc.(1) | | | 1,396 | | | | 21,205 | |
Amedisys, Inc.(1) | | | 49 | | | | 5,738 | |
AmerisourceBergen Corp. | | | 2,701 | | | | 200,954 | |
Amgen, Inc. | | | 7,652 | | | | 1,489,615 | |
Amphastar Pharmaceuticals, Inc.(1) | | | 822 | | | | 16,358 | |
Ampio Pharmaceuticals, Inc.(1) | | | 1,765 | | | | 697 | |
Aquestive Therapeutics, Inc.(1) | | | 489 | | | | 3,081 | |
Arena Pharmaceuticals, Inc.(1) | | | 1,142 | | | | 44,481 | |
ArQule, Inc.(1) | | | 2,867 | | | | 7,942 | |
Arrowhead Pharmaceuticals, Inc.(1) | | | 1,482 | | | | 18,406 | |
Assertio Therapeutics, Inc.(1) | | | 978 | | | | 3,531 | |
Atara Biotherapeutics, Inc.(1) | | | 793 | | | | 27,549 | |
Avid Bioservices, Inc.(1) | | | 2,373 | | | | 9,729 | |
Baxter International, Inc. | | | 20,886 | | | | 1,374,717 | |
BioCryst Pharmaceuticals, Inc.(1) | | | 39 | | | | 315 | |
Biogen, Inc.(1) | | | 3,992 | | | | 1,201,273 | |
BioSpecifics Technologies Corp.(1) | | | 441 | | | | 26,725 | |
Bio-Techne Corp. | | | 113 | | | | 16,353 | |
BioTelemetry, Inc.(1) | | | 350 | | | | 20,902 | |
Bristol-Myers Squibb Co. | | | 16,271 | | | | 845,767 | |
Bruker Corp. | | | 2,843 | | | | 84,636 | |
Calithera Biosciences, Inc.(1) | | | 761 | | | | 3,052 | |
Cardinal Health, Inc. | | | 3,516 | | | | 156,814 | |
CareDx, Inc.(1) | | | 1,142 | | | | 28,710 | |
CASI Pharmaceuticals, Inc.(1) | | | 1,589 | | | | 6,388 | |
Catalent, Inc.(1) | | | 6,137 | | | | 191,352 | |
Catalyst Pharmaceuticals, Inc.(1) | | | 6,308 | | | | 12,111 | |
Celcuity, Inc.(1) | | | 180 | | | | 4,318 | |
Celgene Corp.(1) | | | 1,496 | | | | 95,879 | |
Cellular Biomedicine Group, Inc.(1) | | | 708 | | | | 12,503 | |
Centene Corp.(1) | | | 1,359 | | | | 156,693 | |
Cerner Corp.(1) | | | 11,219 | | | | 588,324 | |
Charles River Laboratories International, Inc.(1) | | | 21 | | | | 2,377 | |
Chemed Corp. | | | 421 | | | | 119,261 | |
ChemoCentryx, Inc.(1) | | | 741 | | | | 8,084 | |
Collegium Pharmaceutical, Inc.(1) | | | 589 | | | | 10,113 | |
CONMED Corp. | | | 749 | | | | 48,086 | |
Cooper Cos., Inc./The | | | 353 | | | | 89,839 | |
Corium International Contingent Value Rights(1)(7) | | | 164 | | | | 0 | |
CVS Health Corp. | | | 3,768 | | | | 246,879 | |
DexCom, Inc.(1) | | | 493 | | | | 59,061 | |
Dicerna Pharmaceuticals, Inc.(1) | | | 34 | | | | 363 | |
Durect Corp.(1) | | | 366 | | | | 177 | |
Eli Lilly & Co. | | | 9,276 | | | | 1,073,419 | |
Emergent BioSolutions, Inc.(1) | | | 1,963 | | | | 116,367 | |
Enanta Pharmaceuticals, Inc.(1) | | | 366 | | | | 25,924 | |
Encompass Health Corp. | | | 1,387 | | | | 85,578 | |
Endo International PLC(1) | | | 3,440 | | | | 25,112 | |
Ensign Group, Inc./The | | | 102 | | | | 3,957 | |
Evolus, Inc.(1) | | | 220 | | | | 2,618 | |
Exact Sciences Corp.(1) | | | 652 | | | | 41,141 | |
Exelixis, Inc.(1) | | | 4,346 | | | | 85,486 | |
Fate Therapeutics, Inc.(1) | | | 189 | | | | 2,425 | |
Fennec Pharmaceuticals, Inc.(1) | | | 1,921 | | | | 12,256 | |
FONAR Corp.(1) | | | 743 | | | | 15,038 | |
Fortress Biotech, Inc.(1) | | | 6,503 | | | | 5,593 | |
G1 Therapeutics, Inc.(1) | | | 986 | | | | 18,882 | |
Genomic Health, Inc.(1) | | | 643 | | | | 41,416 | |
Gilead Sciences, Inc. | | | 13,841 | | | | 865,755 | |
Globus Medical, Inc.(1) | | | 1,934 | | | | 83,704 | |
Halozyme Therapeutics, Inc.(1) | | | 240 | | | | 3,511 | |
Harvard Bioscience, Inc.(1) | | | 1,607 | | | | 5,110 | |
HCA Healthcare, Inc. | | | 8,829 | | | | 1,098,769 | |
Hill-Rom Holdings, Inc. | | | 3,437 | | | | 304,346 | |
Horizon Pharma Plc(1) | | | 1,590 | | | | 31,069 | |
Humana, Inc. | | | 1,629 | | | | 466,676 | |
ICU Medical, Inc.(1) | | | 267 | | | | 61,311 | |
IDEXX Laboratories, Inc.(1) | | | 1,899 | | | | 353,252 | |
Incyte Corp.(1) | | | 1,487 | | | | 94,558 | |
Innovate Biopharmaceuticals, Inc.(1) | | | 369 | | | | 852 | |
Inovio Pharmaceuticals, Inc.(1) | | | 2,628 | | | | 10,512 | |
Integer Holdings Corp.(1) | | | 651 | | | | 49,645 | |
Intersect ENT, Inc.(1) | | | 992 | | | | 27,955 | |
IntriCon Corp.(1) | | | 67 | | | | 1,767 | |
Invitae Corp.(1) | | | 2,989 | | | | 33,058 | |
IQVIA Holdings, Inc.(1) | | | 1,307 | | | | 151,834 | |
Jazz Pharmaceuticals PLC(1) | | | 474 | | | | 58,757 | |
Johnson & Johnson | | | 18,144 | | | | 2,341,483 | |
Kindred Biosciences, Inc.(1) | | | 1,823 | | | | 19,962 | |
Lannett Co., Inc.(1)(2) | | | 59 | | | | 293 | |
Lantheus Holdings, Inc.(1) | | | 308 | | | | 4,820 | |
LivaNova PLC(1) | | | 310 | | | | 28,356 | |
Loxo Oncology, Inc.(1) | | | 110 | | | | 15,408 | |
Luminex Corp. | | | 1,082 | | | | 25,005 | |
MacroGenics, Inc.(1) | | | 2,300 | | | | 29,210 | |
Madrigal Pharmaceuticals, Inc.(1) | | | 115 | | | | 12,963 | |
Mallinckrodt PLC(1) | | | 1,292 | | | | 20,414 | |
Marinus Pharmaceuticals, Inc.(1) | | | 1,727 | | | | 4,956 | |
The accompanying notes are an integral part of these financial statements.
Page 74 | 2018 Annual Report | December 31, 2018 |
Schedule of Investments
December 31, 2018
Balanced Fund |
Security Description | | Shares,
Contracts
or Principal
Amount ($) | | | Fair
Value ($) | |
Common Stocks — continued |
Masimo Corp.(1) | | | 1,522 | | | | 163,417 | |
MediciNova, Inc.(1) | | | 3 | | | | 25 | |
Medtronic PLC | | | 21,192 | | | | 1,927,624 | |
Merck & Co., Inc. | | | 30,082 | | | | 2,298,566 | |
Minerva Neurosciences, Inc.(1) | | | 2,590 | | | | 17,457 | |
Mirati Therapeutics, Inc.(1) | | | 446 | | | | 18,919 | |
Molina Healthcare, Inc.(1) | | | 487 | | | | 56,599 | |
Momenta Pharmaceuticals, Inc.(1) | | | 689 | | | | 7,607 | |
Mustang Bio, Inc.(1) | | | 1,418 | | | | 4,169 | |
Mylan NV(1) | | | 19,251 | | | | 527,477 | |
Myriad Genetics, Inc.(1) | | | 106 | | | | 3,081 | |
Natera, Inc.(1) | | | 1,223 | | | | 17,073 | |
NeoGenomics, Inc.(1) | | | 50 | | | | 631 | |
Neurocrine Biosciences, Inc.(1) | | | 1,253 | | | | 89,477 | |
Omnicell, Inc.(1) | | | 90 | | | | 5,512 | |
OPKO Health, Inc.(1) | | | 101 | | | | 304 | |
Orthofix Medical, Inc.(1) | | | 1,528 | | | | 80,205 | |
Owens & Minor, Inc. | | | 944 | | | | 5,976 | |
Pacira Pharmaceuticals, Inc./DE(1) | | | 864 | | | | 37,169 | |
Palatin Technologies, Inc.(1) | | | 1,699 | | | | 1,204 | |
PDL BioPharma, Inc.(1) | | | 6,674 | | | | 19,355 | |
Perrigo Co. PLC | | | 4,668 | | | | 180,885 | |
Pfizer, Inc. | | | 56,246 | | | | 2,455,138 | |
Phibro Animal Health Corp. | | | 1,283 | | | | 41,261 | |
Pieris Pharmaceuticals, Inc.(1) | | | 534 | | | | 1,420 | |
PRA Health Sciences, Inc.(1) | | | 1,905 | | | | 175,184 | |
Premier, Inc. - Class A(1) | | | 3,883 | | | | 145,030 | |
Prestige Consumer Healthcare, Inc.(1) | | | 628 | | | | 19,393 | |
Proteostasis Therapeutics, Inc.(1) | | | 2,110 | | | | 6,836 | |
PTC Therapeutics, Inc.(1) | | | 255 | | | | 8,752 | |
Ra Pharmaceuticals, Inc.(1) | | | 1,032 | | | | 18,782 | |
Reata Pharmaceuticals, Inc.(1) | | | 318 | | | | 17,840 | |
Regeneron Pharmaceuticals, Inc.(1) | | | 1,937 | | | | 723,470 | |
REGENXBIO, Inc.(1) | | | 563 | | | | 23,618 | |
Repligen Corp.(1) | | | 1,000 | | | | 52,740 | |
Rhythm Pharmaceuticals, Inc.(1) | | | 113 | | | | 3,037 | |
Sarepta Therapeutics, Inc.(1) | | | 583 | | | | 63,623 | |
SIGA Technologies, Inc.(1) | | | 5,145 | | | | 40,646 | |
Spring Bank Pharmaceuticals, Inc.(1) | | | 500 | | | | 5,195 | |
STAAR Surgical Co.(1) | | | 220 | | | | 7,020 | |
STERIS PLC | | | 700 | | | | 74,795 | |
Supernus Pharmaceuticals, Inc.(1) | | | 115 | | | | 3,820 | |
Surface Oncology, Inc.(1) | | | 947 | | | | 4,015 | |
Syneos Health, Inc.(1) | | | 1,115 | | | | 43,875 | |
Tandem Diabetes Care, Inc.(1) | | | 803 | | | | 30,490 | |
Tenet Healthcare Corp.(1) | | | 612 | | | | 10,490 | |
Thermo Fisher Scientific, Inc. | | | 101 | | | | 22,603 | |
Tocagen, Inc.(1) | | | 1,679 | | | | 13,785 | |
United Therapeutics Corp.(1) | | | 1,663 | | | | 181,101 | |
UnitedHealth Group, Inc. | | | 6,109 | | | | 1,521,874 | |
Universal Health Services, Inc. | | | 287 | | | | 33,453 | |
Unum Therapeutics, Inc.(1) | | | 8 | | | | 35 | |
Vanda Pharmaceuticals, Inc.(1) | | | 1,773 | | | | 46,328 | |
Varian Medical Systems, Inc.(1) | | | 1,137 | | | | 128,833 | |
Veeva Systems, Inc.(1) | | | 1,513 | | | | 135,141 | |
Veracyte, Inc.(1) | | | 1,302 | | | | 16,379 | |
Vericel Corp.(1) | | | 1,262 | | | | 21,959 | |
Vertex Pharmaceuticals, Inc.(1) | | | 6,845 | | | | 1,134,285 | |
Viking Therapeutics, Inc.(1) | | | 1,595 | | | | 12,202 | |
Vital Therapies, Inc.(1) | | | 1,434 | | | | 267 | |
WaVe Life Sciences, Ltd.(1) | | | 35 | | | | 1,471 | |
West Pharmaceutical Services, Inc. | | | 1,307 | | | | 128,125 | |
Xencor, Inc.(1) | | | 643 | | | | 23,251 | |
Zafgen, Inc.(1) | | | 1,394 | | | | 6,900 | |
Zimmer Biomet Holdings, Inc. | | | 1,423 | | | | 147,594 | |
Zoetis, Inc. | | | 9,729 | | | | 832,219 | |
| | | | | | | | 31,363,021 | |
| | | | | | | | | |
Industrials — 3.4% | | | | | | | | |
ACCO Brands Corp. | | | 4,950 | | | | 33,561 | |
Albany International Corp. | | | 259 | | | | 16,169 | |
Allison Transmission Holdings, Inc. | | | 6,978 | | | | 306,404 | |
Ameresco, Inc. - Class A(1) | | | 274 | | | | 3,863 | |
ArcBest Corp. | | | 262 | | | | 8,976 | |
Armstrong World Industries, Inc. | | | 1,399 | | | | 81,436 | |
Atkore International Group, Inc.(1) | | | 1,390 | | | | 27,578 | |
Boeing Co./The | | | 430 | | | | 138,675 | |
Brady Corp. | | | 1,273 | | | | 55,325 | |
Casella Waste Systems, Inc.(1) | | | 660 | | | | 18,803 | |
Cintas Corp. | | | 80 | | | | 13,439 | |
Comfort Systems USA, Inc. | | | 1,339 | | | | 58,488 | |
Commercial Vehicle Group, Inc.(1) | | | 2,554 | | | | 14,558 | |
Continental Building Products, Inc.(1) | | | 22 | | | | 560 | |
Copart, Inc.(1) | | | 2,248 | | | | 107,409 | |
Covenant Transportation Group, Inc.(1) | | | 243 | | | | 4,666 | |
Crane Co. | | | 1,898 | | | | 136,998 | |
CSX Corp. | | | 23,121 | | | | 1,436,508 | |
Cummins, Inc. | | | 858 | | | | 114,663 | |
Delta Air Lines, Inc. | | | 10,836 | | | | 540,716 | |
Donaldson Co., Inc. | | | 558 | | | | 24,212 | |
Ducommun, Inc.(1) | | | 460 | | | | 16,707 | |
Eagle Bulk Shipping, Inc.(1) | | | 2,825 | | | | 13,023 | |
The accompanying notes are an integral part of these financial statements.
2018 Annual Report | December 31, 2018 | Page 75 |
Schedule of Investments
December 31, 2018
Balanced Fund |
Security Description | | Shares,
Contracts
or Principal
Amount ($) | | | Fair
Value ($) | |
Common Stocks — continued |
EnerSys | | | 1,644 | | | | 127,591 | |
Federal Signal Corp. | | | 1,660 | | | | 33,034 | |
Foundation Building Materials, Inc.(1) | | | 1,271 | | | | 10,562 | |
Global Brass & Copper Holdings, Inc. | | | 1,991 | | | | 50,074 | |
Graco, Inc. | | | 1,923 | | | | 80,478 | |
GrafTech International, Ltd. | | | 134 | | | | 1,533 | |
Harsco Corp.(1) | | | 2,474 | | | | 49,134 | |
Hawaiian Holdings, Inc. | | | 92 | | | | 2,430 | |
HD Supply Holdings, Inc.(1) | | | 2,026 | | | | 76,016 | |
Heidrick & Struggles International, Inc. | | | 229 | | | | 7,143 | |
Hillenbrand, Inc. | | | 3,142 | | | | 119,176 | |
HNI Corp. | | | 185 | | | | 6,555 | |
Huntington Ingalls Industries, Inc. | | | 1,441 | | | | 274,237 | |
Hurco Cos., Inc. | | | 123 | | | | 4,391 | |
Infrastructure and Energy Alternatives, Inc.(1) | | | 1,224 | | | | 10,025 | |
Ingersoll-Rand PLC | | | 3,118 | | | | 284,455 | |
Insperity, Inc. | | | 103 | | | | 9,616 | |
Kadant, Inc. | | | 146 | | | | 11,893 | |
KBR, Inc. | | | 1,822 | | | | 27,658 | |
Kelly Services, Inc. - Class A | | | 571 | | | | 11,694 | |
Kennametal, Inc. | | | 655 | | | | 21,798 | |
Kimball International, Inc. - Class B | | | 160 | | | | 2,270 | |
Landstar System, Inc. | | | 1,558 | | | | 149,054 | |
LB Foster Co. - Class A(1) | | | 27 | | | | 429 | |
LSC Communications, Inc. | | | 877 | | | | 6,139 | |
ManpowerGroup, Inc. | | | 122 | | | | 7,906 | |
Masonite International Corp.(1) | | | 2,046 | | | | 91,722 | |
Matson, Inc. | | | 2,226 | | | | 71,277 | |
Miller Industries, Inc./TN | | | 1,034 | | | | 27,918 | |
MSC Industrial Direct Co., Inc. | | | 1,495 | | | | 114,995 | |
Navigant Consulting, Inc. | | | 1,062 | | | | 25,541 | |
NCI Building Systems, Inc.(1) | | | 5,038 | | | | 36,526 | |
Nexeo Solutions, Inc.(1) | | | 877 | | | | 7,533 | |
Norfolk Southern Corp. | | | 9,489 | | | | 1,418,985 | |
Old Dominion Freight Line, Inc. | | | 356 | | | | 43,962 | |
Oshkosh Corp. | | | 2,699 | | | | 165,476 | |
PACCAR, Inc. | | | 14,255 | | | | 814,531 | |
Park-Ohio Holdings Corp. | | | 220 | | | | 6,752 | |
Patrick Industries, Inc.(1) | | | 737 | | | | 21,823 | |
Pitney Bowes, Inc. | | | 2,327 | | | | 13,753 | |
Quad/Graphics, Inc. | | | 1,708 | | | | 21,043 | |
Quanex Building Products Corp. | | | 489 | | | | 6,646 | |
Quanta Services, Inc. | | | 2,380 | | | | 71,638 | |
Radiant Logistics, Inc.(1) | | | 1,425 | | | | 6,056 | |
RBC Bearings, Inc.(1) | | | 129 | | | | 16,912 | |
Regal Beloit Corp. | | | 35 | | | | 2,452 | |
Republic Services, Inc. | | | 4,748 | | | | 342,283 | |
Rollins, Inc. | | | 6,315 | | | | 227,972 | |
RR Donnelley & Sons Co. | | | 2,469 | | | | 9,777 | |
Spirit AeroSystems Holdings, Inc. | | | 765 | | | | 55,149 | |
Steelcase, Inc. - Class A | | | 2,303 | | | | 34,153 | |
Teledyne Technologies, Inc.(1) | | | 236 | | | | 48,869 | |
Timken Co./The | | | 745 | | | | 27,803 | |
Toro Co./The | | | 4,740 | | | | 264,871 | |
TriMas Corp.(1) | | | 1,394 | | | | 38,042 | |
UniFirst Corp./MA | | | 261 | | | | 37,341 | |
Union Pacific Corp. | | | 12,893 | | | | 1,782,199 | |
United Continental Holdings, Inc.(1) | | | 10,282 | | | | 860,912 | |
Universal Logistics Holdings, Inc. | | | 331 | | | | 5,988 | |
US Xpress Enterprises, Inc.(1) | | | 1,202 | | | | 6,743 | |
Vectrus, Inc.(1) | | | 1,220 | | | | 26,328 | |
Wabash National Corp. | | | 3,192 | | | | 41,751 | |
Waste Management, Inc. | | | 6,155 | | | | 547,733 | |
WW Grainger, Inc. | | | 216 | | | | 60,990 | |
| | | | | | | | 11,962,473 | |
| | | | | | | | | |
Information Technology — 10.0% | | | | | | | | |
Accenture PLC | | | 3,075 | | | | 433,606 | |
ACI Worldwide, Inc.(1) | | | 1,301 | | | | 35,999 | |
Adobe, Inc.(1) | | | 6,453 | | | | 1,459,927 | |
Advanced Micro Devices, Inc.(1) | | | 9,704 | | | | 179,136 | |
Agilysys, Inc.(1) | | | 483 | | | | 6,926 | |
Amkor Technology, Inc.(1) | | | 7,137 | | | | 46,819 | |
ANSYS, Inc.(1) | | | 83 | | | | 11,864 | |
Apple, Inc. | | | 30,360 | | | | 4,788,986 | |
ARRIS International PLC(1) | | | 1,011 | | | | 30,906 | |
Arrow Electronics, Inc.(1) | | | 1,636 | | | | 112,802 | |
Aspen Technology, Inc.(1) | | | 1,253 | | | | 102,972 | |
Autodesk, Inc.(1) | | | 2,234 | | | | 287,315 | |
Avaya Holdings Corp.(1) | | | 2,440 | | | | 35,526 | |
Avnet, Inc. | | | 7,195 | | | | 259,740 | |
Booz Allen Hamilton Holding Corp. | | | 2,255 | | | | 101,633 | |
Bottomline Technologies DE, Inc.(1) | | | 1,491 | | | | 71,568 | |
Broadcom, Inc. | | | 1,487 | | | | 378,114 | |
Cabot Microelectronics Corp. | | | 1,192 | | | | 113,657 | |
CACI International, Inc. - Class A(1) | | | 669 | | | | 96,356 | |
Cadence Design Systems, Inc.(1) | | | 7,141 | | | | 310,491 | |
CDK Global, Inc. | | | 588 | | | | 28,153 | |
CDW Corp./DE | | | 3,009 | | | | 243,879 | |
Ciena Corp.(1) | | | 3,016 | | | | 102,273 | |
Cirrus Logic, Inc.(1) | | | 908 | | | | 30,127 | |
The accompanying notes are an integral part of these financial statements.
Page 76 | 2018 Annual Report | December 31, 2018 |
Schedule of Investments
December 31, 2018
Balanced Fund |
Security Description | | Shares,
Contracts
or Principal
Amount ($) | | | Fair
Value ($) | |
Common Stocks — continued |
Cisco Systems, Inc. | | | 55,253 | | | | 2,394,112 | |
CommVault Systems, Inc.(1) | | | 322 | | | | 19,027 | |
Comtech Telecommunications Corp. | | | 1,281 | | | | 31,180 | |
Dell Technologies, Inc. - Class C(1) | | | 9,336 | | | | 456,250 | |
Dolby Laboratories, Inc. | | | 1,608 | | | | 99,439 | |
DXC Technology Co. | | | 4,061 | | | | 215,923 | |
Electro Scientific Industries, Inc.(1) | | | 186 | | | | 5,573 | |
Euronet Worldwide, Inc.(1) | | | 917 | | | | 93,882 | |
EVERTEC, Inc. | | | 1,457 | | | | 41,816 | |
F5 Networks, Inc.(1) | | | 3,283 | | | | 531,944 | |
Fabrinet(1) | | | 1,376 | | | | 70,603 | |
Fortinet, Inc.(1) | | | 3,788 | | | | 266,789 | |
Hackett Group, Inc./The | | | 4 | | | | 64 | |
Hewlett Packard Enterprise Co. | | | 48,469 | | | | 640,275 | |
HP, Inc. | | | 56,409 | | | | 1,154,128 | |
Immersion Corp.(1) | | | 956 | | | | 8,566 | |
Insight Enterprises, Inc.(1) | | | 1,795 | | | | 73,146 | |
Integrated Device Technology, Inc.(1) | | | 795 | | | | 38,502 | |
Intel Corp. | | | 34,175 | | | | 1,603,833 | |
InterDigital, Inc. | | | 2,246 | | | | 149,202 | |
International Business Machines Corp. | | | 6,669 | | | | 758,065 | |
Intuit, Inc. | | | 7,434 | | | | 1,463,383 | |
j2 Global, Inc. | | | 761 | | | | 52,798 | |
Jabil, Inc. | | | 6,232 | | | | 154,491 | |
Juniper Networks, Inc. | | | 19,881 | | | | 534,998 | |
KLA-Tencor Corp. | | | 2,040 | | | | 182,560 | |
Lam Research Corp. | | | 3,020 | | | | 411,233 | |
Leidos Holdings, Inc. | | | 2,343 | | | | 123,523 | |
LivePerson, Inc.(1) | | | 934 | | | | 17,615 | |
LiveRamp Holdings, Inc.(1) | | | 24 | | | | 927 | |
Majesco(1) | | | 67 | | | | 475 | |
Mastercard, Inc. | | | 8,989 | | | | 1,695,775 | |
Micron Technology, Inc.(1) | | | 29,881 | | | | 948,124 | |
Microsoft Corp. | | | 49,510 | | | | 5,028,629 | |
MicroStrategy, Inc.(1) | | | 83 | | | | 10,603 | |
Mitek Systems, Inc.(1) | | | 416 | | | | 4,497 | |
MKS Instruments, Inc. | | | 369 | | | | 23,841 | |
MoneyGram International, Inc.(1) | | | 6,043 | | | | 12,086 | |
Motorola Solutions, Inc. | | | 1,259 | | | | 144,835 | |
Nanometrics, Inc.(1) | | | 1,233 | | | | 33,698 | |
Napco Security Technologies, Inc.(1) | | | 481 | | | | 7,576 | |
National Instruments Corp. | | | 28 | | | | 1,271 | |
NetApp, Inc. | | | 6,558 | | | | 391,316 | |
Nuance Communications, Inc.(1) | | | 9,732 | | | | 128,754 | |
NVE Corp. | | | 30 | | | | 2,626 | |
Oracle Corp. | | | 24,522 | | | | 1,107,168 | |
PC Connection, Inc. | | | 858 | | | | 25,508 | |
Photronics, Inc.(1) | | | 3,942 | | | | 38,159 | |
Progress Software Corp. | | | 1,219 | | | | 43,262 | |
PTC, Inc.(1) | | | 1,866 | | | | 154,691 | |
Quantenna Communications, Inc.(1) | | | 2,563 | | | | 36,779 | |
SailPoint Technologies Holding, Inc.(1) | | | 749 | | | | 17,594 | |
ScanSource, Inc.(1) | | | 142 | | | | 4,882 | |
Semtech Corp.(1) | | | 1,037 | | | | 47,567 | |
SendGrid, Inc.(1) | | | 806 | | | | 34,795 | |
SMART Global Holdings, Inc.(1) | | | 703 | | | | 20,879 | |
Symantec Corp. | | | 10,605 | | | | 200,381 | |
Synopsys, Inc.(1) | | | 5,230 | | | | 440,575 | |
Tableau Software, Inc.(1) | | | 1,248 | | | | 149,760 | |
Tech Data Corp.(1) | | | 1,096 | | | | 89,664 | |
Texas Instruments, Inc. | | | 18,066 | | | | 1,707,237 | |
TiVo Corp. | | | 40 | | | | 376 | |
Trade Desk, Inc./The(1) | | | 532 | | | | 61,744 | |
Ubiquiti Networks, Inc. | | | 383 | | | | 38,074 | |
Unisys Corp.(1) | | | 709 | | | | 8,246 | |
Verint Systems, Inc.(1) | | | 3,035 | | | | 128,411 | |
Visa, Inc. | | | 2,922 | | | | 385,529 | |
Vishay Precision Group, Inc.(1) | | | 217 | | | | 6,560 | |
Workiva, Inc.(1) | | | 293 | | | | 10,516 | |
Xilinx, Inc. | | | 7,132 | | | | 607,432 | |
Zebra Technologies Corp. - Class A(1) | | | 634 | | | | 100,952 | |
Zix Corp.(1) | | | 1,168 | | | | 6,693 | |
| | | | | | | | 34,770,162 | |
| | | | | | | | | |
Materials — 1.1% | | | | | | | | |
CF Industries Holdings, Inc. | | | 3,483 | | | | 151,545 | |
Chemours Co./The | | | 4,201 | | | | 118,552 | |
Eagle Materials, Inc. | | | 4,407 | | | | 268,959 | |
Ecolab, Inc. | | | 1,117 | | | | 164,590 | |
FutureFuel Corp. | | | 2,903 | | | | 46,042 | |
Greif, Inc. - Class A | | | 1,796 | | | | 66,650 | |
Huntsman Corp. | | | 1,212 | | | | 23,379 | |
International Paper Co. | | | 8,682 | | | | 350,406 | |
Louisiana-Pacific Corp. | | | 8,159 | | | | 181,293 | |
LyondellBasell Industries NV | | | 15,627 | | | | 1,299,541 | |
Mosaic Co./The | | | 4,668 | | | | 136,352 | |
Nucor Corp. | | | 9,843 | | | | 509,966 | |
PPG Industries, Inc. | | | 2,637 | | | | 269,581 | |
Reliance Steel & Aluminum Co. | | | 1,529 | | | | 108,819 | |
Steel Dynamics, Inc. | | | 5,978 | | | | 179,579 | |
Trinseo SA | | | 2,262 | | | | 103,554 | |
The accompanying notes are an integral part of these financial statements.
2018 Annual Report | December 31, 2018 | Page 77 |
Schedule of Investments
December 31, 2018
Balanced Fund |
Security Description | | Shares,
Contracts
or Principal
Amount ($) | | | Fair
Value ($) | |
Common Stocks — continued |
Verso Corp.(1) | | | 281 | | | | 6,294 | |
| | | | | | | | 3,985,102 | |
| | | | | | | | | |
Real Estate Investment Trust — 1.7% | | | | | | | | |
American Assets Trust, Inc. | | | 2,904 | | | | 116,654 | |
American Tower Corp. | | | 2,403 | | | | 380,131 | |
Bluerock Residential Growth REIT, Inc. | | | 113 | | | | 1,019 | |
CatchMark Timber Trust, Inc. | | | 4,813 | | | | 34,172 | |
CoreCivic, Inc. | | | 2,950 | | | | 52,599 | |
CubeSmart | | | 2,749 | | | | 78,869 | |
Essex Property Trust, Inc. | | | 4,929 | | | | 1,208,640 | |
Front Yard Residential Corp. | | | 752 | | | | 6,565 | |
Gaming and Leisure Properties, Inc. | | | 1,568 | | | | 50,662 | |
GEO Group, Inc./The | | | 3,416 | | | | 67,295 | |
Gladstone Commercial Corp. | | | 105 | | | | 1,882 | |
Hospitality Properties Trust | | | 6,820 | | | | 162,862 | |
Host Hotels & Resorts, Inc. | | | 19,739 | | | | 329,049 | |
Lamar Advertising Co. | | | 4,083 | | | | 282,462 | |
New Senior Investment Group, Inc. | | | 4,400 | | | | 18,128 | |
Pennsylvania Real Estate Investment Trust | | | 2,242 | | | | 13,317 | |
Piedmont Office Realty Trust, Inc. | | | 11,763 | | | | 200,442 | |
PotlatchDeltic Corp. | | | 872 | | | | 27,590 | |
PS Business Parks, Inc. | | | 1,294 | | | | 169,514 | |
Redfin Corp.(1) | | | 916 | | | | 13,190 | |
Retail Properties of America, Inc. | | | 2,482 | | | | 26,930 | |
Retail Value, Inc. | | | 2,110 | | | | 53,995 | |
SBA Communications Corp.(1) | | | 114 | | | | 18,455 | |
Simon Property Group, Inc. | | | 8,482 | | | | 1,424,891 | |
Tanger Factory Outlet Centers, Inc. | | | 3,399 | | | | 68,728 | |
UDR, Inc. | | | 29,718 | | | | 1,177,427 | |
Urstadt Biddle Properties, Inc. | | | 1,241 | | | | 23,852 | |
| | | | | | | | 6,009,320 | |
Utilities — 1.8% | | | | | | | | |
AES Corp./VA | | | 27,844 | | | | 402,624 | |
CenterPoint Energy, Inc. | | | 43,436 | | | | 1,226,198 | |
Clearway Energy, Inc. | | | 38 | | | | 643 | |
Exelon Corp. | | | 31,030 | | | | 1,399,453 | |
MDU Resources Group, Inc. | | | 3,134 | | | | 74,715 | |
NextEra Energy, Inc. | | | 9,494 | | | | 1,650,247 | |
NorthWestern Corp. | | | 685 | | | | 40,716 | |
NRG Energy, Inc. | | | 5,633 | | | | 223,067 | |
OGE Energy Corp. | | | 3,798 | | | | 148,844 | |
Portland General Electric Co. | | | 630 | | | | 28,886 | |
UGI Corp. | | | 22,076 | | | | 1,177,742 | |
| | | | | | | | 6,373,135 | |
| | | | | | | | | |
Total Common Stocks (Cost $157,456,304) | | | | | | | 156,189,853 | |
| | | | | | | | | |
Registered Investment Companies — 28.4% |
American Beacon SiM High Yield Opportunities Fund - Class I | | | 521,424 | | | | 4,708,459 | |
Baird Core Plus Bond Fund - Class I | | | 492,976 | | | | 5,334,000 | |
Dodge & Cox Income Fund | | | 488,203 | | | | 6,473,574 | |
DoubleLine Total Return Bond Fund - Class I | | | 626,925 | | | | 6,532,556 | |
Frost Total Return Bond Fund - Class I | | | 633,758 | | | | 6,464,333 | |
Guggenheim Total Return Bond Fund - Class I | | | 244,168 | | | | 6,492,433 | |
iShares Core U.S. Aggregate Bond ETF(8) | | | 110,200 | | | | 11,735,198 | |
Lord Abbett High Yield Fund - Class I | | | 834,037 | | | | 5,771,536 | |
Payden Emerging Markets Bond Fund - Class I | | | 426,674 | | | | 5,329,155 | |
PGIM Total Return Bond Fund - Class R6 | | | 266,922 | | | | 3,718,229 | |
PIMCO Investment Grade Credit Bond Fund - Class I | | | 177,626 | | | | 1,760,271 | |
Pioneer Bond Fund - Class Y | | | 702,995 | | | | 6,516,762 | |
Segall Bryant & Hamill Plus Bond Fund - Class I | | | 363,808 | | | | 3,721,761 | |
TCW Emerging Markets Income Fund - Class I | | | 1,394,971 | | | | 10,699,428 | |
Vanguard Intermediate-Term Corporate Bond ETF(8) | | | 37,075 | | | | 3,072,035 | |
Vanguard Total Bond Market ETF(8) | | | 134,792 | | | | 10,676,874 | |
Total Registered Investment Companies (Cost $101,038,080) | | | | | | | 99,006,604 | |
| | | | | | | | | |
Money Market Registered Investment Companies — 22.2% |
Morgan Stanley Government Institutional Fund, 2.32%(3) | | | 65,486 | | | | 65,486 | |
Meeder Institutional Prime Money Market Fund, 2.43%(4) | | | 77,428,377 | | | | 77,420,634 | |
Total Money Market Registered Investment Companies (Cost $77,484,246) | | | | | | | 77,486,120 | |
The accompanying notes are an integral part of these financial statements.
Page 78 | 2018 Annual Report | December 31, 2018 |
Schedule of Investments
December 31, 2018
Balanced Fund |
Security Description | | Shares,
Contracts
or Principal
Amount ($) | | | Fair
Value ($) | |
Bank Obligations — 0.4% | | | | | | | | |
First Merchants Bank Deposit Account, 2.10%, 1/2/2019(5) | | | 249,221 | | | | 249,221 | |
Metro City Bank Deposit Account, 2.10%, 1/2/2019(5) | | | 249,212 | | | | 249,212 | |
Pacific Mercantile Bank Deposit Account, 2.20%, 1/2/2019(5) | | | 249,289 | | | | 249,289 | |
Pacific Premier Bank Deposit Account, 2.30%, 1/2/2019(5) | | | 249,192 | | | | 249,192 | |
Seacoast Community Bank Deposit Account, 2.00%, 1/2/2019(5) | | | 249,192 | | | | 249,192 | |
Total Bank Obligations (Cost $1,246,106) | | | | | | | 1,246,106 | |
| | | | | | | | | |
U.S. Government Obligations — 2.2% | | | | | | | | |
U.S. Treasury Note, 2.25%, due 11/15/2025 | | | 4,550,000 | | | | 4,449,580 | |
U.S. Treasury Note, 1.88%, due 12/31/2019 | | | 1,684,000 | | | | 1,671,765 | |
U.S. Treasury Note, 2.13%, due 12/31/2022 | | | 1,637,000 | | | | 1,613,916 | |
Total U.S. Government Obligations
(Cost $7,654,094) | | | | | | | 7,735,261 | |
Total Investments — 98.0%(Cost $344,878,830) | | | | | | | 341,663,944 | |
Other Assets less Liabilities — 2.0% | | | | | | | 7,144,860 | |
Total Net Assets — 100.0% | | | | | | | 348,808,804 | |
| | | | | | | | | |
Trustee Deferred Compensation(6) | | | | | | | | |
Meeder Balanced Fund | | | 2,351 | | | | 26,049 | |
Meeder Dynamic Allocation Fund | | | 5,842 | | | | 57,193 | |
Meeder Muirfield Fund | | | 2,880 | | | | 20,621 | |
Meeder Conservative Allocation Fund | | | 676 | | | | 14,318 | |
Total Trustee Deferred Compensation (Cost $120,263) | | | | | | | 118,181 | |
Balanced Fund |
| | | Long
(Short)
Contracts | | | Expiration
Date | | | Notional
Value of
Contracts
($) | | | Value and
Unrealized
Appreciation
(Depreciation)
($) | |
Futures Contracts |
Index Futures | | | | | | | | | | | | | | | | |
Mini MSCI EAFE Index Futures | | | 25 | | | | 3/15/2019 | | | | 2,145,000 | | | | (31,569 | ) |
Mini MSCI Emerging Markets Index Futures | | | 17 | | | | 3/15/2019 | | | | 821,780 | | | | (2,095 | ) |
Russell 2000 Mini Index Futures | | | (151 | ) | | | 3/15/2019 | | | | (10,184,950 | ) | | | 209,901 | |
Standard & Poors 500 Mini Futures | | | (704 | ) | | | 3/15/2019 | | | | (88,183,040 | ) | | | 993,086 | |
E-mini Standard & Poors MidCap 400 Futures | | | (143 | ) | | | 3/15/2019 | | | | (23,769,460 | ) | | | 351,535 | |
Total Futures Contracts | | | (956 | ) | | | | | | | (119,170,670 | ) | | | 1,520,858 | |
(1) | Represents non-income producing securities. |
(2) | All or a portion of this security is on loan. |
(3) | Investment purchased with cash received as securities lending collateral. The yield shown represents the 7-day yield in effect at December 31, 2018. |
(4) | Investment in affiliate. The yield shown represents the 7-day yield in effect at December 31, 2018. |
(5) | Variable rate security. Securities payable at par including accrued interest (usually within seven days notice) and unconditionally secured as to principal and interest by letters of credit or other credit support agreements from major banks. The interest rates are adjustable and are not based on a published reference rate and spread but are determined by the issuer or agent and are based on current market conditions. These securities do not indicate a reference rate and spread in their description above. The rate shown represents the rate in effect at December 31, 2018. The maturity date shown, if applicable, reflects the earlier of the next demand date or stated maturity date. |
(6) | Assets of affiliates to the Balanced Fund held for the benefit of the Fund’s Trustees in connection with the Trustee Deferred Compensation Plan. |
(7) | Fair valued security deemed as Level 3 security. |
The accompanying notes are an integral part of these financial statements.
2018 Annual Report | December 31, 2018 | Page 79 |
Schedule of Investments
December 31, 2018
| Moderate Allocation Fund |
| Security Description | | Shares or
Principal
Amount ($) | | | Fair
Value ($) | |
Common Stocks — 29.1% |
| Communication Services — 2.6% | | | | | | | | |
Alphabet, Inc. - Class A(1) | | | 380 | | | | 397,085 | |
Alphabet, Inc. - Class C(1) | | | 556 | | | | 575,799 | |
| AMC Entertainment Holdings, Inc. | | | 939 | | | | 11,531 | |
AMC Networks, Inc.(1) | | | 392 | | | | 21,513 | |
| AT&T, Inc. | | | 13,269 | | | | 378,697 | |
| ATN International, Inc. | | | 47 | | | | 3,362 | |
| Beasley Broadcast Group, Inc. | | | 2 | | | | 8 | |
| Cable One, Inc. | | | 76 | | | | 62,328 | |
Cincinnati Bell, Inc.(1) | | | 428 | | | | 3,330 | |
| Cinemark Holdings, Inc. | | | 721 | | | | 25,812 | |
| Comcast Corp. - Class A | | | 6,353 | | | | 216,320 | |
Discovery, Inc.(1) | | | 1,538 | | | | 35,497 | |
| EW Scripps Co./The | | | 124 | | | | 1,951 | |
Facebook, Inc.(1) | | | 3,285 | | | | 430,631 | |
| Frontier Communications Corp. | | | 1,532 | | | | 3,646 | |
Gray Television, Inc.(1) | | | 758 | | | | 11,173 | |
Intelsat SA(1) | | | 201 | | | | 4,299 | |
| Interpublic Group of Cos., Inc./The | | | 419 | | | | 8,644 | |
Liberty TripAdvisor Holdings, Inc.(1) | | | 106 | | | | 1,684 | |
| Marcus Corp./The | | | 504 | | | | 19,908 | |
MDC Partners, Inc.(1) | | | 941 | | | | 2,456 | |
| National CineMedia, Inc. | | | 299 | | | | 1,938 | |
| Nexstar Media Group, Inc. | | | 376 | | | | 29,569 | |
NII Holdings, Inc.(1) | | | 225 | | | | 992 | |
Ooma, Inc.(1) | | | 27 | | | | 375 | |
Rosetta Stone, Inc.(1) | | | 241 | | | | 3,952 | |
| Scholastic Corp. | | | 31 | | | | 1,248 | |
| Shenandoah Telecommunications Co. | | | 20 | | | | 885 | |
| Spok Holdings, Inc. | | | 915 | | | | 12,133 | |
| Telephone & Data Systems, Inc. | | | 1,102 | | | | 35,859 | |
T-Mobile US, Inc.(1) | | | 6,042 | | | | 384,332 | |
Tribune Publishing Co.(1) | | | 380 | | | | 4,309 | |
| Twenty-First Century Fox, Inc. - Class A | | | 2,822 | | | | 135,795 | |
United States Cellular Corp.(1) | | | 94 | | | | 4,885 | |
| Verizon Communications, Inc. | | | 12,973 | | | | 729,342 | |
| Viacom, Inc. | | | 3,940 | | | | 101,258 | |
Vonage Holdings Corp.(1) | | | 507 | | | | 4,426 | |
| Walt Disney Co./The | | | 5,630 | | | | 617,330 | |
WideOpenWest, Inc.(1) | | | 296 | | | | 2,110 | |
| | | | | | | | 4,286,412 | |
| | | | | | | | | |
| Consumer Discretionary — 2.4% | | | | | | | | |
| Aaron's, Inc. | | | 55 | | | | 2,313 | |
Amazon.com, Inc.(1) | | | 788 | | | | 1,183,552 | |
Ascena Retail Group, Inc.(1) | | | 614 | | | | 1,541 | |
Ascent Capital Group, Inc.(1) | | | 897 | | | | 350 | |
| Bassett Furniture Industries, Inc. | | | 562 | | | | 11,262 | |
| Bed Bath & Beyond, Inc. | | | 674 | | | | 7,630 | |
| Best Buy Co., Inc. | | | 2,896 | | | | 153,372 | |
| BJ's Restaurants, Inc. | | | 50 | | | | 2,529 | |
| Bloomin' Brands, Inc. | | | 313 | | | | 5,600 | |
Bojangles', Inc.(1) | | | 32 | | | | 515 | |
| Brinker International, Inc. | | | 222 | | | | 9,764 | |
| Callaway Golf Co. | | | 723 | | | | 11,062 | |
Capri Holdings, Ltd.(1) | | | 1,263 | | | | 47,893 | |
Carrols Restaurant Group, Inc.(1) | | | 89 | | | | 876 | |
| Cato Corp./The | | | 46 | | | | 656 | |
Cavco Industries, Inc.(1) | | | 2 | | | | 261 | |
| Chico's FAS, Inc. | | | 458 | | | | 2,574 | |
| Clarus Corp. | | | 273 | | | | 2,763 | |
Crocs, Inc.(1) | | | 63 | | | | 1,637 | |
| Darden Restaurants, Inc. | | | 542 | | | | 54,124 | |
| Dave & Buster's Entertainment, Inc. | | | 142 | | | | 6,328 | |
Deckers Outdoor Corp.(1) | | | 144 | | | | 18,425 | |
| Dick's Sporting Goods, Inc. | | | 224 | | | | 6,989 | |
| Dine Brands Global, Inc. | | | 34 | | | | 2,290 | |
| Domino's Pizza, Inc. | | | 158 | | | | 39,182 | |
| Dunkin' Brands Group, Inc. | | | 136 | | | | 8,720 | |
El Pollo Loco Holdings, Inc.(1) | | | 24 | | | | 364 | |
| Ethan Allen Interiors, Inc. | | | 592 | | | | 10,413 | |
Etsy, Inc.(1) | | | 328 | | | | 15,603 | |
Express, Inc.(1) | | | 918 | | | | 4,691 | |
| Extended Stay America, Inc. | | | 1,037 | | | | 16,074 | |
Five Below, Inc.(1) | | | 9 | | | | 921 | |
| Flexsteel Industries, Inc. | | | 146 | | | | 3,224 | |
| Foot Locker, Inc. | | | 490 | | | | 26,068 | |
| Ford Motor Co. | | | 10,232 | | | | 78,275 | |
Fox Factory Holding Corp.(1) | | | 193 | | | | 11,362 | |
| Gentex Corp. | | | 1,685 | | | | 34,054 | |
G-III Apparel Group, Ltd.(1) | | | 112 | | | | 3,124 | |
| H&R Block, Inc. | | | 940 | | | | 23,848 | |
Habit Restaurants, Inc./The(1) | | | 39 | | | | 410 | |
Helen of Troy, Ltd.(1) | | | 76 | | | | 9,970 | |
| Hooker Furniture Corp. | | | 314 | | | | 8,271 | |
J Alexander's Holdings, Inc.(1) | | | 612 | | | | 5,037 | |
Lands' End, Inc.(1) | | | 31 | | | | 441 | |
| La-Z-Boy, Inc. | | | 302 | | | | 8,368 | |
| Lear Corp. | | | 236 | | | | 28,995 | |
Liberty Expedia Holdings, Inc.(1) | | | 1,473 | | | | 57,609 | |
Lululemon Athletica, Inc.(1) | | | 437 | | | | 53,144 | |
M/I Homes, Inc.(1) | | | 661 | | | | 13,894 | |
| Macy's, Inc. | | | 101 | | | | 3,008 | |
Malibu Boats, Inc.(1) | | | 65 | | | | 2,262 | |
The accompanying notes are an integral part of these financial statements.
Page 80 | 2018 Annual Report | December 31, 2018 |
Schedule of Investments
December 31, 2018
| Moderate Allocation Fund |
| Security Description | | Shares or
Principal
Amount ($) | | | Fair
Value ($) | |
Common Stocks — continued |
MasterCraft Boat Holdings, Inc.(1) | | | 191 | | | | 3,572 | |
| MDC Holdings, Inc. | | | 367 | | | | 10,316 | |
Norwegian Cruise Line Holdings, Ltd.(1) | | | 109 | | | | 4,621 | |
NVR, Inc.(1) | | | 19 | | | | 46,303 | |
| Oxford Industries, Inc. | | | 16 | | | | 1,137 | |
Penn National Gaming, Inc.(1) | | | 337 | | | | 6,346 | |
| RCI Hospitality Holdings, Inc. | | | 118 | | | | 2,635 | |
| Ross Stores, Inc. | | | 1,910 | | | | 158,912 | |
RTW RetailWinds, Inc.(1) | | | 125 | | | | 354 | |
| Signet Jewelers, Ltd. | | | 85 | | | | 2,700 | |
| Starbucks Corp. | | | 6,254 | | | | 402,758 | |
Stoneridge, Inc.(1) | | | 308 | | | | 7,592 | |
| Target Corp. | | | 5,929 | | | | 391,848 | |
Taylor Morrison Home Corp.(1) | | | 651 | | | | 10,351 | |
| Thor Industries, Inc. | | | 164 | | | | 8,528 | |
| TJX Cos., Inc./The | | | 10,284 | | | | 460,106 | |
| Tower International, Inc. | | | 210 | | | | 4,998 | |
Town Sports International Holdings, Inc.(1) | | | 92 | | | | 589 | |
Turtle Beach Corp.(1) | | | 26 | | | | 371 | |
Vera Bradley, Inc.(1) | | | 146 | | | | 1,251 | |
| Wendy's Co./The | | | 597 | | | | 9,319 | |
| Wyndham Hotels & Resorts, Inc. | | | 1,957 | | | | 88,789 | |
| Yum! Brands, Inc. | | | 3,095 | | | | 284,492 | |
ZAGG, Inc.(1) | | | 50 | | | | 489 | |
| | | | | | | | 3,910,015 | |
| | | | | | | | | |
| Consumer Staples — 1.3% | | | | | | | | |
| Church & Dwight Co., Inc. | | | 9 | | | | 592 | |
| Coca-Cola Co./The | | | 585 | | | | 27,700 | |
| Conagra Brands, Inc. | | | 1,967 | | | | 42,015 | |
| Costco Wholesale Corp. | | | 904 | | | | 184,154 | |
| Flowers Foods, Inc. | | | 208 | | | | 3,842 | |
| Hershey Co./The | | | 157 | | | | 16,827 | |
| Keurig Dr Pepper, Inc. | | | 12,809 | | | | 328,423 | |
| Kroger Co./The | | | 4,037 | | | | 111,018 | |
| Lamb Weston Holdings, Inc. | | | 638 | | | | 46,931 | |
| Molson Coors Brewing Co. | | | 1,236 | | | | 69,414 | |
| PepsiCo, Inc. | | | 4,112 | | | | 454,294 | |
| Procter & Gamble Co./The | | | 2,715 | | | | 249,563 | |
Simply Good Foods Co./The(1) | | | 87 | | | | 1,644 | |
| SpartanNash Co. | | | 59 | | | | 1,014 | |
Sprouts Farmers Market, Inc.(1) | | | 815 | | | | 19,161 | |
| Tyson Foods, Inc. | | | 2,469 | | | | 131,845 | |
| Walgreens Boots Alliance, Inc. | | | 4,021 | | | | 274,755 | |
| Walmart, Inc. | | | 1,900 | | | | 176,985 | |
| | | | | | | | 2,140,177 | |
| | | | | | | | | |
| Energy — 2.2% | | | | | | | | |
Abraxas Petroleum Corp.(1) | | | 540 | | | | 589 | |
| Adams Resources & Energy, Inc. | | | 54 | | | | 2,090 | |
| Anadarko Petroleum Corp. | | | 2,470 | | | | 108,285 | |
| Arch Coal, Inc. - Class A | | | 85 | | | | 7,054 | |
| Archrock, Inc. | | | 1,800 | | | | 13,482 | |
Cactus, Inc.(1) | | | 437 | | | | 11,978 | |
Chesapeake Energy Corp.(1) | | | 2,237 | | | | 4,698 | |
| Chevron Corp. | | | 2,272 | | | | 247,171 | |
| ConocoPhillips | | | 7,838 | | | | 488,699 | |
CONSOL Energy, Inc.(1) | | | 109 | | | | 3,456 | |
Covia Holdings Corp.(1) | | | 1,712 | | | | 5,855 | |
| CVR Energy, Inc. | | | 184 | | | | 6,344 | |
Denbury Resources, Inc.(1) | | | 1,249 | | | | 2,136 | |
Earthstone Energy, Inc.(1) | | | 347 | | | | 1,568 | |
| EOG Resources, Inc. | | | 891 | | | | 77,704 | |
Era Group, Inc.(1) | | | 245 | | | | 2,141 | |
| Evolution Petroleum Corp. | | | 585 | | | | 3,990 | |
| Exxon Mobil Corp. | | | 8,196 | | | | 558,885 | |
Gulfport Energy Corp.(1) | | | 821 | | | | 5,378 | |
| Hallador Energy Co. | | | 365 | | | | 1,851 | |
Helix Energy Solutions Group, Inc.(1) | | | 394 | | | | 2,132 | |
| Helmerich & Payne, Inc. | | | 934 | | | | 44,776 | |
| HollyFrontier Corp. | | | 928 | | | | 47,439 | |
Keane Group, Inc.(1) | | | 1,111 | | | | 9,088 | |
KLX Energy Services Holdings, Inc.(1) | | | 32 | | | | 750 | |
| Mammoth Energy Services, Inc. | | | 163 | | | | 2,931 | |
| Marathon Oil Corp. | | | 6,410 | | | | 91,919 | |
| Marathon Petroleum Corp. | | | 7,239 | | | | 427,173 | |
Matrix Service Co.(1) | | | 717 | | | | 12,863 | |
Northern Oil and Gas, Inc.(1) | | | 191 | | | | 432 | |
| Occidental Petroleum Corp. | | | 7,081 | | | | 434,632 | |
Overseas Shipholding Group, Inc.(1) | | | 239 | | | | 397 | |
Pacific Ethanol, Inc.(1) | | | 783 | | | | 674 | |
| PBF Energy, Inc. | | | 916 | | | | 29,926 | |
| Peabody Energy Corp. | | | 729 | | | | 22,220 | |
Penn Virginia Corp.(1) | | | 16 | | | | 865 | |
| Phillips 66 | | | 4,910 | | | | 422,997 | |
Pioneer Energy Services Corp.(1) | | | 210 | | | | 258 | |
Profire Energy, Inc.(1) | | | 543 | | | | 787 | |
ProPetro Holding Corp.(1) | | | 805 | | | | 9,918 | |
Renewable Energy Group, Inc.(1) | | | 94 | | | | 2,416 | |
RigNet, Inc.(1) | | | 14 | | | | 177 | |
SEACOR Holdings, Inc.(1) | | | 22 | | | | 814 | |
SilverBow Resources, Inc.(1) | | | 37 | | | | 875 | |
Southwestern Energy Co.(1) | | | 2,252 | | | | 7,679 | |
| Targa Resources Corp. | | | 314 | | | | 11,310 | |
The accompanying notes are an integral part of these financial statements.
2018 Annual Report | December 31, 2018 | Page 81 |
Schedule of Investments
December 31, 2018
| Moderate Allocation Fund |
| Security Description | | Shares or
Principal
Amount ($) | | | Fair
Value ($) | |
Common Stocks — continued |
Unit Corp.(1) | | | 270 | | | | 3,856 | |
| Valero Energy Corp. | | | 5,480 | | | | 410,836 | |
W&T Offshore, Inc.(1) | | | 1,054 | | | | 4,342 | |
Westmoreland Coal Co.(1) | | | 773 | | | | 10 | |
WildHorse Resource Development Corp.(1) | | | 440 | | | | 6,208 | |
| World Fuel Services Corp. | | | 556 | | | | 11,904 | |
| | | | | | | | 3,575,958 | |
| | | | | | | | | |
| Financials — 3.8% | | | | | | | | |
| American Equity Investment Life Holding Co. | | | 58 | | | | 1,621 | |
| Arbor Realty Trust, Inc. | | | 2,216 | | | | 22,315 | |
| Arthur J Gallagher & Co. | | | 430 | | | | 31,691 | |
Bancorp, Inc./The(1) | | | 1,331 | | | | 10,595 | |
| Bank of America Corp. | | | 31,207 | | | | 768,940 | |
| Bank of NT Butterfield & Son, Ltd./The | | | 308 | | | | 9,656 | |
| BankUnited, Inc. | | | 94 | | | | 2,814 | |
| BB&T Corp. | | | 5,743 | | | | 248,787 | |
Berkshire Hathaway, Inc. - Class B(1) | | | 4,873 | | | | 994,969 | |
| C&F Financial Corp. | | | 65 | | | | 3,459 | |
| Cherry Hill Mortgage Investment Corp. | | | 312 | | | | 5,472 | |
| CIT Group, Inc. | | | 593 | | | | 22,694 | |
| Citizens Financial Group, Inc. | | | 1,591 | | | | 47,300 | |
Credit Acceptance Corp.(1) | | | 4 | | | | 1,527 | |
| Discover Financial Services | | | 2,129 | | | | 125,568 | |
Essent Group, Ltd.(1) | | | 676 | | | | 23,106 | |
| FB Financial Corp. | | | 113 | | | | 3,957 | |
| Fidelity National Financial, Inc. | | | 528 | | | | 16,600 | |
| Fifth Third Bancorp | | | 9,928 | | | | 233,606 | |
| First BanCorp/Puerto Rico | | | 449 | | | | 3,861 | |
| FirstCash, Inc. | | | 359 | | | | 25,974 | |
Genworth Financial, Inc.(1) | | | 938 | | | | 4,371 | |
Goosehead Insurance, Inc.(1) | | | 118 | | | | 3,102 | |
Health Insurance Innovations, Inc. - Class A(1) | | | 187 | | | | 4,999 | |
| Huntington Bancshares, Inc./OH | | | 18,516 | | | | 220,711 | |
| Independent Bank Corp./MI | | | 110 | | | | 2,312 | |
| Investment Technology Group, Inc. | | | 61 | | | | 1,845 | |
| JPMorgan Chase & Co. | | | 4,761 | | | | 464,769 | |
| KeyCorp | | | 18,176 | | | | 268,641 | |
| Ladder Capital Corp. | | | 2,640 | | | | 40,841 | |
| MB Financial, Inc. | | | 2,445 | | | | 96,895 | |
| MBT Financial Corp. | | | 503 | | | | 4,678 | |
| Medley Management, Inc. | | | 75 | | | | 290 | |
MGIC Investment Corp.(1) | | | 2,429 | | | | 25,407 | |
| Moelis & Co. | | | 625 | | | | 21,488 | |
Mr Cooper Group, Inc.(1) | | | 541 | | | | 6,313 | |
| National General Holdings Corp. | | | 450 | | | | 10,895 | |
| New Residential Investment Corp. | | | 8,537 | | | | 121,311 | |
NewStar Financial Contingent Value Rights(1)(5) | | | 31 | | | | — | |
NMI Holdings, Inc. - Class A(1) | | | 446 | | | | 7,961 | |
| Northrim BanCorp, Inc. | | | 194 | | | | 6,377 | |
| OFG Bancorp | | | 24 | | | | 395 | |
| Old Republic International Corp. | | | 4,005 | | | | 82,383 | |
On Deck Capital, Inc.(1) | | | 549 | | | | 3,239 | |
| Oppenheimer Holdings, Inc. | | | 908 | | | | 23,199 | |
| PacWest Bancorp | | | 2,321 | | | | 77,243 | |
| Parke Bancorp, Inc. | | | 66 | | | | 1,235 | |
| PennyMac Financial Services, Inc. | | | 837 | | | | 17,795 | |
| Popular, Inc. | | | 831 | | | | 39,240 | |
| Premier Financial Bancorp, Inc. | | | 16 | | | | 239 | |
| Progressive Corp./The | | | 6,911 | | | | 416,941 | |
| Protective Insurance Corp. | | | 126 | | | | 2,098 | |
| Pzena Investment Management, Inc. | | | 934 | | | | 8,079 | |
| Radian Group, Inc. | | | 2,345 | | | | 38,364 | |
| Ready Capital Corp. | | | 112 | | | | 1,549 | |
| Regions Financial Corp. | | | 24,565 | | | | 328,680 | |
| Reinsurance Group of America, Inc. | | | 579 | | | | 81,193 | |
| Safety Insurance Group, Inc. | | | 320 | | | | 26,179 | |
| Santander Consumer USA Holdings, Inc. | | | 472 | | | | 8,302 | |
Siebert Financial Corp.(1) | | | 7 | | | | 101 | |
| Silvercrest Asset Management Group, Inc. | | | 106 | | | | 1,402 | |
| Stewart Information Services Corp. | | | 890 | | | | 36,846 | |
| SunTrust Banks, Inc. | | | 6,972 | | | | 351,668 | |
| Synchrony Financial | | | 4,097 | | | | 96,116 | |
| TCF Financial Corp. | | | 4,305 | | | | 83,904 | |
| United Security Bancshares/Fresno CA | | | 568 | | | | 5,441 | |
| Universal Insurance Holdings, Inc. | | | 165 | | | | 6,257 | |
| US Bancorp | | | 592 | | | | 27,054 | |
| Waddell & Reed Financial, Inc. | | | 8 | | | | 145 | |
| Walker & Dunlop, Inc. | | | 319 | | | | 13,797 | |
| Wells Fargo & Co. | | | 10,812 | | | | 498,217 | |
| | | | | | | | 6,195,019 | |
| | | | | | | | | |
| Healthcare — 5.9% | | | | | | | | |
| Abbott Laboratories | | | 2,150 | | | | 155,510 | |
| AbbVie, Inc. | | | 2,713 | | | | 250,111 | |
ABIOMED, Inc.(1) | | | 178 | | | | 57,857 | |
ACADIA Pharmaceuticals, Inc.(1) | | | 329 | | | | 5,320 | |
Acceleron Pharma, Inc.(1) | | | 29 | | | | 1,263 | |
Achillion Pharmaceuticals, Inc.(1) | | | 1,452 | | | | 2,309 | |
Acorda Therapeutics, Inc.(1) | | | 488 | | | | 7,603 | |
Adverum Biotechnologies, Inc.(1) | | | 67 | | | | 211 | |
The accompanying notes are an integral part of these financial statements.
Page 82 | 2018 Annual Report | December 31, 2018 |
Schedule of Investments
December 31, 2018
| Moderate Allocation Fund |
| Security Description | | Shares or
Principal
Amount ($) | | | Fair
Value ($) | |
Common Stocks — continued |
Aeglea BioTherapeutics, Inc.(1) | | | 287 | | | | 2,150 | |
Akebia Therapeutics, Inc.(1) | | | 26 | | | | 144 | |
Aldeyra Therapeutics, Inc.(1) | | | 546 | | | | 4,532 | |
Alexion Pharmaceuticals, Inc.(1) | | | 1,485 | | | | 144,580 | |
Alkermes PLC(1) | | | 3 | | | | 89 | |
| Allergan PLC | | | 1,615 | | | | 215,861 | |
AMAG Pharmaceuticals, Inc.(1) | | | 468 | | | | 7,109 | |
Amedisys, Inc.(1) | | | 58 | | | | 6,792 | |
| Amgen, Inc. | | | 2,598 | | | | 505,753 | |
Amphastar Pharmaceuticals, Inc.(1) | | | 324 | | | | 6,448 | |
Ampio Pharmaceuticals, Inc.(1) | | | 339 | | | | 134 | |
Apellis Pharmaceuticals, Inc.(1) | | | 40 | | | | 528 | |
Aquestive Therapeutics, Inc.(1) | | | 150 | | | | 945 | |
Aratana Therapeutics, Inc.(1) | | | 62 | | | | 380 | |
Arbutus Biopharma Corp.(1) | | | 112 | | | | 429 | |
Arena Pharmaceuticals, Inc.(1) | | | 334 | | | | 13,009 | |
ArQule, Inc.(1) | | | 1,080 | | | | 2,992 | |
Array BioPharma, Inc.(1) | | | 285 | | | | 4,061 | |
Arrowhead Pharmaceuticals, Inc.(1) | | | 460 | | | | 5,713 | |
Assertio Therapeutics, Inc.(1) | | | 644 | | | | 2,325 | |
Atara Biotherapeutics, Inc.(1) | | | 167 | | | | 5,802 | |
AVEO Pharmaceuticals, Inc.(1) | | | 222 | | | | 355 | |
Avid Bioservices, Inc.(1) | | | 721 | | | | 2,956 | |
| Baxter International, Inc. | | | 4,176 | | | | 274,864 | |
BioCryst Pharmaceuticals, Inc.(1) | | | 168 | | | | 1,356 | |
Biogen, Inc.(1) | | | 1,533 | | | | 461,310 | |
BioSpecifics Technologies Corp.(1) | | | 293 | | | | 17,756 | |
BioTelemetry, Inc.(1) | | | 64 | | | | 3,822 | |
| Bristol-Myers Squibb Co. | | | 664 | | | | 34,515 | |
| Bruker Corp. | | | 1,281 | | | | 38,135 | |
Calithera Biosciences, Inc.(1) | | | 651 | | | | 2,611 | |
| Cardinal Health, Inc. | | | 1,359 | | | | 60,611 | |
CareDx, Inc.(1) | | | 329 | | | | 8,271 | |
CASI Pharmaceuticals, Inc.(1) | | | 668 | | | | 2,685 | |
Catalent, Inc.(1) | | | 1,598 | | | | 49,826 | |
Catalyst Pharmaceuticals, Inc.(1) | | | 1,878 | | | | 3,606 | |
Celcuity, Inc.(1) | | | 82 | | | | 1,967 | |
Cellular Biomedicine Group, Inc.(1) | | | 197 | | | | 3,479 | |
Cerner Corp.(1) | | | 3,150 | | | | 165,186 | |
Charles River Laboratories International, Inc.(1) | | | 178 | | | | 20,146 | |
| Chemed Corp. | | | 109 | | | | 30,878 | |
ChemoCentryx, Inc.(1) | | | 90 | | | | 982 | |
Chimerix, Inc.(1) | | | 398 | | | | 1,023 | |
Codexis, Inc.(1) | | | 85 | | | | 1,420 | |
Collegium Pharmaceutical, Inc.(1) | | | 285 | | | | 4,893 | |
| CONMED Corp. | | | 255 | | | | 16,371 | |
| Cooper Cos., Inc./The | | | 14 | | | | 3,563 | |
Corium International Contingent Value Rights(1)(5) | | | 50 | | | | — | |
| CVS Health Corp. | | | 425 | | | | 27,846 | |
DexCom, Inc.(1) | | | 105 | | | | 12,579 | |
Dicerna Pharmaceuticals, Inc.(1) | | | 242 | | | | 2,587 | |
Durect Corp.(1) | | | 798 | | | | 386 | |
| Eli Lilly & Co. | | | 2,547 | | | | 294,739 | |
Emergent BioSolutions, Inc.(1) | | | 582 | | | | 34,501 | |
Enanta Pharmaceuticals, Inc.(1) | | | 103 | | | | 7,295 | |
| Encompass Health Corp. | | | 400 | | | | 24,680 | |
Endo International PLC(1) | | | 951 | | | | 6,942 | |
| Ensign Group, Inc./The | | | 11 | | | | 427 | |
Evolus, Inc.(1) | | | 72 | | | | 857 | |
Exact Sciences Corp.(1) | | | 135 | | | | 8,519 | |
Exelixis, Inc.(1) | | | 903 | | | | 17,762 | |
Fate Therapeutics, Inc.(1) | | | 156 | | | | 2,001 | |
Fennec Pharmaceuticals, Inc.(1) | | | 534 | | | | 3,407 | |
FONAR Corp.(1) | | | 360 | | | | 7,286 | |
Fortress Biotech, Inc.(1) | | | 1,064 | | | | 915 | |
G1 Therapeutics, Inc.(1) | | | 195 | | | | 3,734 | |
Genomic Health, Inc.(1) | | | 169 | | | | 10,885 | |
| Gilead Sciences, Inc. | | | 5,385 | | | | 336,832 | |
Globus Medical, Inc.(1) | | | 651 | | | | 28,175 | |
Haemonetics Corp.(1) | | | 59 | | | | 5,903 | |
Halozyme Therapeutics, Inc.(1) | | | 53 | | | | 775 | |
Harvard Bioscience, Inc.(1) | | | 391 | | | | 1,243 | |
| HCA Healthcare, Inc. | | | 3,244 | | | | 403,716 | |
| Hill-Rom Holdings, Inc. | | | 1,093 | | | | 96,785 | |
HMS Holdings Corp.(1) | | | 50 | | | | 1,407 | |
Horizon Pharma Plc(1) | | | 738 | | | | 14,421 | |
| Humana, Inc. | | | 1,421 | | | | 407,088 | |
ICU Medical, Inc.(1) | | | 107 | | | | 24,570 | |
Innovate Biopharmaceuticals, Inc.(1) | | | 107 | | | | 247 | |
Inovio Pharmaceuticals, Inc.(1) | | | 571 | | | | 2,284 | |
Integer Holdings Corp.(1) | | | 151 | | | | 11,515 | |
Intercept Pharmaceuticals, Inc.(1) | | | 5 | | | | 504 | |
Intersect ENT, Inc.(1) | | | 279 | | | | 7,862 | |
IntriCon Corp.(1) | | | 24 | | | | 633 | |
Invitae Corp.(1) | | | 871 | | | | 9,633 | |
Iovance Biotherapeutics, Inc.(1) | | | 1 | | | | 9 | |
IQVIA Holdings, Inc.(1) | | | 432 | | | | 50,185 | |
iRadimed Corp.(1) | | | 12 | | | | 294 | |
Jazz Pharmaceuticals PLC(1) | | | 89 | | | | 11,032 | |
| Johnson & Johnson | | | 5,257 | | | | 678,416 | |
Jounce Therapeutics, Inc.(1) | | | 140 | | | | 472 | |
Kindred Biosciences, Inc.(1) | | | 593 | | | | 6,493 | |
The accompanying notes are an integral part of these financial statements.
2018 Annual Report | December 31, 2018 | Page 83 |
Schedule of Investments
December 31, 2018
| Moderate Allocation Fund |
| Security Description | | Shares or
Principal
Amount ($) | | | Fair
Value ($) | |
Common Stocks — continued |
Lannett Co., Inc.(1) | | | 21 | | | | 104 | |
Lantheus Holdings, Inc.(1) | | | 2 | | | | 31 | |
LivaNova PLC(1) | | | 38 | | | | 3,476 | |
Loxo Oncology, Inc.(1) | | | 26 | | | | 3,642 | |
| Luminex Corp. | | | 245 | | | | 5,662 | |
MacroGenics, Inc.(1) | | | 606 | | | | 7,696 | |
Madrigal Pharmaceuticals, Inc.(1) | | | 33 | | | | 3,720 | |
Mallinckrodt PLC(1) | | | 495 | | | | 7,821 | |
Marinus Pharmaceuticals, Inc.(1) | | | 766 | | | | 2,198 | |
Masimo Corp.(1) | | | 432 | | | | 46,384 | |
MediciNova, Inc.(1) | | | 250 | | | | 2,043 | |
| Medtronic PLC | | | 6,415 | | | | 583,508 | |
| Merck & Co., Inc. | | | 8,972 | | | | 685,551 | |
| Meridian Bioscience, Inc. | | | 186 | | | | 3,229 | |
Minerva Neurosciences, Inc.(1) | | | 628 | | | | 4,233 | |
Mirati Therapeutics, Inc.(1) | | | 138 | | | | 5,854 | |
Molecular Templates, Inc.(1) | | | 359 | | | | 1,450 | |
Molina Healthcare, Inc.(1) | | | 175 | | | | 20,339 | |
Momenta Pharmaceuticals, Inc.(1) | | | 103 | | | | 1,137 | |
Mustang Bio, Inc.(1) | | | 322 | | | | 947 | |
Mylan NV(1) | | | 5,430 | | | | 148,782 | |
Myriad Genetics, Inc.(1) | | | 139 | | | | 4,041 | |
Natera, Inc.(1) | | | 222 | | | | 3,099 | |
| National Research Corp. | | | 55 | | | | 2,098 | |
NeoGenomics, Inc.(1) | | | 55 | | | | 694 | |
Neurocrine Biosciences, Inc.(1) | | | 283 | | | | 20,209 | |
NuVasive, Inc.(1) | | | 81 | | | | 4,014 | |
Omnicell, Inc.(1) | | | 64 | | | | 3,919 | |
OPKO Health, Inc.(1) | | | 468 | | | �� | 1,409 | |
Orthofix Medical, Inc.(1) | | | 276 | | | | 14,487 | |
| Owens & Minor, Inc. | | | 76 | | | | 481 | |
Pacira Pharmaceuticals, Inc./DE(1) | | | 291 | | | | 12,519 | |
PDL BioPharma, Inc.(1) | | | 2,395 | | | | 6,946 | |
| Perrigo Co. PLC | | | 969 | | | | 37,549 | |
| Pfizer, Inc. | | | 17,879 | | | | 780,418 | |
| Phibro Animal Health Corp. | | | 351 | | | | 11,288 | |
Pieris Pharmaceuticals, Inc.(1) | | | 630 | | | | 1,676 | |
PRA Health Sciences, Inc.(1) | | | 203 | | | | 18,668 | |
Premier, Inc. - Class A(1) | | | 737 | | | | 27,527 | |
Prestige Consumer Healthcare, Inc.(1) | | | 145 | | | | 4,478 | |
Proteostasis Therapeutics, Inc.(1) | | | 660 | | | | 2,138 | |
PTC Therapeutics, Inc.(1) | | | 69 | | | | 2,368 | |
Quidel Corp.(1) | | | 45 | | | | 2,197 | |
Ra Pharmaceuticals, Inc.(1) | | | 298 | | | | 5,424 | |
Reata Pharmaceuticals, Inc.(1) | | | 78 | | | | 4,376 | |
Recro Pharma, Inc.(1) | | | 124 | | | | 880 | |
Regeneron Pharmaceuticals, Inc.(1) | | | 1,110 | | | | 414,585 | |
REGENXBIO, Inc.(1) | | | 140 | | | | 5,873 | |
Repligen Corp.(1) | | | 224 | | | | 11,814 | |
Sarepta Therapeutics, Inc.(1) | | | 93 | | | | 10,149 | |
SeaSpine Holdings Corp.(1) | | | 103 | | | | 1,879 | |
Sienna Biopharmaceuticals, Inc.(1) | | | 142 | | | | 329 | |
SIGA Technologies, Inc.(1) | | | 1,239 | | | | 9,788 | |
Spring Bank Pharmaceuticals, Inc.(1) | | | 101 | | | | 1,049 | |
STAAR Surgical Co.(1) | | | 75 | | | | 2,393 | |
| STERIS PLC | | | 575 | | | | 61,439 | |
Supernus Pharmaceuticals, Inc.(1) | | | 126 | | | | 4,186 | |
Surface Oncology, Inc.(1) | | | 366 | | | | 1,552 | |
Syneos Health, Inc.(1) | | | 422 | | | | 16,606 | |
Tandem Diabetes Care, Inc.(1) | | | 233 | | | | 8,847 | |
Tenet Healthcare Corp.(1) | | | 420 | | | | 7,199 | |
Tocagen, Inc.(1) | | | 668 | | | | 5,484 | |
United Therapeutics Corp.(1) | | | 426 | | | | 46,391 | |
| UnitedHealth Group, Inc. | | | 1,563 | | | | 389,375 | |
| Universal Health Services, Inc. | | | 424 | | | | 49,421 | |
Vanda Pharmaceuticals, Inc.(1) | | | 475 | | | | 12,412 | |
Varian Medical Systems, Inc.(1) | | | 324 | | | | 36,712 | |
Veeva Systems, Inc.(1) | | | 39 | | | | 3,483 | |
Veracyte, Inc.(1) | | | 328 | | | | 4,126 | |
Vericel Corp.(1) | | | 296 | | | | 5,150 | |
Vertex Pharmaceuticals, Inc.(1) | | | 2,635 | | | | 436,646 | |
Viking Therapeutics, Inc.(1) | | | 407 | | | | 3,114 | |
Vital Therapies, Inc.(1) | | | 597 | | | | 111 | |
| West Pharmaceutical Services, Inc. | | | 477 | | | | 46,760 | |
Xencor, Inc.(1) | | | 190 | | | | 6,870 | |
Zafgen, Inc.(1) | | | 557 | | | | 2,757 | |
| Zoetis, Inc. | | | 2,173 | | | | 185,878 | |
| | | | | | | | 9,493,477 | |
| | | | | | | | | |
| Industrials — 2.1% | | | | | | | | |
| ACCO Brands Corp. | | | 1,843 | | | | 12,496 | |
| Albany International Corp. | | | 83 | | | | 5,182 | |
| Allison Transmission Holdings, Inc. | | | 2,074 | | | | 91,069 | |
Ameresco, Inc. - Class A(1) | | | 101 | | | | 1,424 | |
| ArcBest Corp. | | | 206 | | | | 7,058 | |
| Armstrong World Industries, Inc. | | | 524 | | | | 30,502 | |
Atkore International Group, Inc.(1) | | | 566 | | | | 11,229 | |
| Barrett Business Services, Inc. | | | 31 | | | | 1,775 | |
| Brady Corp. | | | 417 | | | | 18,123 | |
Casella Waste Systems, Inc.(1) | | | 191 | | | | 5,442 | |
CBIZ, Inc.(1) | | | 187 | | | | 3,684 | |
| Cintas Corp. | | | 159 | | | | 26,710 | |
| Comfort Systems USA, Inc. | | | 248 | | | | 10,833 | |
Commercial Vehicle Group, Inc.(1) | | | 727 | | | | 4,144 | |
The accompanying notes are an integral part of these financial statements.
Page 84 | 2018 Annual Report | December 31, 2018 |
Schedule of Investments
December 31, 2018
| Moderate Allocation Fund |
| Security Description | | Shares or
Principal
Amount ($) | | | Fair
Value ($) | |
Common Stocks — continued |
Copart, Inc.(1) | | | 842 | | | | 40,231 | |
Covenant Transportation Group, Inc.(1) | | | 174 | | | | 3,341 | |
| Crane Co. | | | 808 | | | | 58,321 | |
| CSX Corp. | | | 7,159 | | | | 444,789 | |
| Delta Air Lines, Inc. | | | 2,904 | | | | 144,910 | |
| DMC Global, Inc. | | | 6 | | | | 211 | |
Eagle Bulk Shipping, Inc.(1) | | | 1,431 | | | | 6,597 | |
| EnerSys | | | 452 | | | | 35,080 | |
Esterline Technologies Corp.(1) | | | 34 | | | | 4,129 | |
| Federal Signal Corp. | | | 635 | | | | 12,637 | |
Foundation Building Materials, Inc.(1) | | | 138 | | | | 1,147 | |
General Finance Corp.(1) | | | 10 | | | | 101 | |
| Global Brass & Copper Holdings, Inc. | | | 599 | | | | 15,065 | |
| Graco, Inc. | | | 674 | | | | 28,207 | |
| GrafTech International, Ltd. | | | 289 | | | | 3,306 | |
Harsco Corp.(1) | | | 611 | | | | 12,134 | |
HD Supply Holdings, Inc.(1) | | | 692 | | | | 25,964 | |
| Heidrick & Struggles International, Inc. | | | 79 | | | | 2,464 | |
| Hillenbrand, Inc. | | | 904 | | | | 34,289 | |
| Huntington Ingalls Industries, Inc. | | | 263 | | | | 50,052 | |
| Hurco Cos., Inc. | | | 218 | | | | 7,783 | |
Huron Consulting Group, Inc.(1) | | | 63 | | | | 3,233 | |
| Hyster-Yale Materials Handling, Inc. | | | 26 | | | | 1,611 | |
Infrastructure and Energy Alternatives, Inc.(1) | | | 341 | | | | 2,793 | |
| Ingersoll-Rand PLC | | | 1,130 | | | | 103,090 | |
| Kadant, Inc. | | | 85 | | | | 6,924 | |
| KBR, Inc. | | | 969 | | | | 14,709 | |
| Kelly Services, Inc. - Class A | | | 155 | | | | 3,174 | |
| Kennametal, Inc. | | | 242 | | | | 8,054 | |
| Kforce, Inc. | | | 76 | | | | 2,350 | |
| Kimball International, Inc. - Class B | | | 498 | | | | 7,067 | |
| Landstar System, Inc. | | | 527 | | | | 50,418 | |
LB Foster Co. - Class A(1) | | | 31 | | | | 493 | |
| LSC Communications, Inc. | | | 236 | | | | 1,652 | |
| ManpowerGroup, Inc. | | | 43 | | | | 2,786 | |
Masonite International Corp.(1) | | | 496 | | | | 22,236 | |
| Matson, Inc. | | | 575 | | | | 18,412 | |
| Miller Industries, Inc./TN | | | 606 | | | | 16,362 | |
| MSC Industrial Direct Co., Inc. | | | 565 | | | | 43,460 | |
| Navigant Consulting, Inc. | | | 570 | | | | 13,709 | |
NCI Building Systems, Inc.(1) | | | 1,449 | | | | 10,505 | |
Nexeo Solutions, Inc.(1) | | | 717 | | | | 6,159 | |
| Norfolk Southern Corp. | | | 2,880 | | | | 430,675 | |
| Old Dominion Freight Line, Inc. | | | 90 | | | | 11,114 | |
| Oshkosh Corp. | | | 320 | | | | 19,619 | |
| PACCAR, Inc. | | | 3,208 | | | | 183,305 | |
| Park-Ohio Holdings Corp. | | | 140 | | | | 4,297 | |
Patrick Industries, Inc.(1) | | | 172 | | | | 5,093 | |
| Pitney Bowes, Inc. | | | 81 | | | | 479 | |
| Quad/Graphics, Inc. | | | 390 | | | | 4,805 | |
| Quanex Building Products Corp. | | | 237 | | | | 3,221 | |
| Quanta Services, Inc. | | | 120 | | | | 3,612 | |
Radiant Logistics, Inc.(1) | | | 437 | | | | 1,857 | |
| Regal Beloit Corp. | | | 11 | | | | 771 | |
| RR Donnelley & Sons Co. | | | 774 | | | | 3,065 | |
| Spirit AeroSystems Holdings, Inc. | | | 89 | | | | 6,416 | |
| Steelcase, Inc. - Class A | | | 983 | | | | 14,578 | |
| Tetra Tech, Inc. | | | 106 | | | | 5,488 | |
| Timken Co./The | | | 238 | | | | 8,882 | |
| Toro Co./The | | | 774 | | | | 43,251 | |
TriMas Corp.(1) | | | 17 | | | | 464 | |
| UniFirst Corp./MA | | | 53 | | | | 7,583 | |
| Union Pacific Corp. | | | 3,922 | | | | 542,138 | |
United Continental Holdings, Inc.(1) | | | 4,562 | | | | 381,976 | |
| Universal Logistics Holdings, Inc. | | | 142 | | | | 2,569 | |
US Xpress Enterprises, Inc.(1) | | | 363 | | | | 2,036 | |
Vectrus, Inc.(1) | | | 373 | | | | 8,049 | |
Vivint Solar, Inc.(1) | | | 30 | | | | 114 | |
| Wabash National Corp. | | | 1,172 | | | | 15,330 | |
| Waste Management, Inc. | | | 1,527 | | | | 135,888 | |
Willis Lease Finance Corp.(1) | | | 4 | | | | 138 | |
| WW Grainger, Inc. | | | 212 | | | | 59,860 | |
| | | | | | | | 3,406,299 | |
| | | | | | | | | |
| Information Technology — 5.9% | | | | | | | | |
ACI Worldwide, Inc.(1) | | | 525 | | | | 14,527 | |
Adobe, Inc.(1) | | | 1,623 | | | | 367,188 | |
Advanced Micro Devices, Inc.(1) | | | 1,966 | | | | 36,292 | |
Agilysys, Inc.(1) | | | 41 | | | | 588 | |
Amkor Technology, Inc.(1) | | | 1,923 | | | | 12,615 | |
| Apple, Inc. | | | 9,233 | | | | 1,456,413 | |
ARRIS International PLC(1) | | | 306 | | | | 9,354 | |
Arrow Electronics, Inc.(1) | | | 444 | | | | 30,614 | |
Aspen Technology, Inc.(1) | | | 254 | | | | 20,874 | |
Avaya Holdings Corp.(1) | | | 634 | | | | 9,231 | |
| Avnet, Inc. | | | 2,159 | | | | 77,940 | |
| Booz Allen Hamilton Holding Corp. | | | 913 | | | | 41,149 | |
Bottomline Technologies DE, Inc.(1) | | | 225 | | | | 10,800 | |
| Cabot Microelectronics Corp. | | | 326 | | | | 31,084 | |
CACI International, Inc. - Class A(1) | | | 90 | | | | 12,963 | |
Cadence Design Systems, Inc.(1) | | | 2,331 | | | | 101,352 | |
Calix, Inc.(1) | | | 50 | | | | 488 | |
| CDK Global, Inc. | | | 79 | | | | 3,783 | |
The accompanying notes are an integral part of these financial statements.
2018 Annual Report | December 31, 2018 | Page 85 |
Schedule of Investments
December 31, 2018
| Moderate Allocation Fund |
| Security Description | | Shares or
Principal
Amount ($) | | | Fair
Value ($) | |
Common Stocks — continued |
| CDW Corp./DE | | | 330 | | | | 26,747 | |
Ciena Corp.(1) | | | 1,332 | | | | 45,168 | |
Cirrus Logic, Inc.(1) | | | 517 | | | | 17,154 | |
| Cisco Systems, Inc. | | | 16,716 | | | | 724,304 | |
| Comtech Telecommunications Corp. | | | 308 | | | | 7,497 | |
Dell Technologies, Inc. - Class C(1) | | | 3,284 | | | | 160,489 | |
| Dolby Laboratories, Inc. | | | 606 | | | | 37,475 | |
| DXC Technology Co. | | | 1,025 | | | | 54,499 | |
Electro Scientific Industries, Inc.(1) | | | 59 | | | | 1,768 | |
ePlus, Inc.(1) | | | 80 | | | | 5,694 | |
Euronet Worldwide, Inc.(1) | | | 136 | | | | 13,924 | |
| EVERTEC, Inc. | | | 116 | | | | 3,329 | |
F5 Networks, Inc.(1) | | | 1,087 | | | | 176,127 | |
Fabrinet(1) | | | 358 | | | | 18,369 | |
Fortinet, Inc.(1) | | | 1,510 | | | | 106,349 | |
| Hackett Group, Inc./The | | | 101 | | | | 1,617 | |
| Hewlett Packard Enterprise Co. | | | 7,358 | | | | 97,199 | |
| HP, Inc. | | | 15,786 | | | | 322,982 | |
Immersion Corp.(1) | | | 421 | | | | 3,772 | |
Information Services Group, Inc.(1) | | | 30 | | | | 127 | |
Insight Enterprises, Inc.(1) | | | 588 | | | | 23,961 | |
Integrated Device Technology, Inc.(1) | | | 241 | | | | 11,672 | |
| Intel Corp. | | | 9,201 | | | | 431,803 | |
| InterDigital, Inc. | | | 655 | | | | 43,512 | |
| Intuit, Inc. | | | 2,249 | | | | 442,716 | |
| j2 Global, Inc. | | | 276 | | | | 19,149 | |
| Jabil, Inc. | | | 1,084 | | | | 26,872 | |
| Juniper Networks, Inc. | | | 6,891 | | | | 185,437 | |
| KEMET Corp. | | | 101 | | | | 1,772 | |
| KLA-Tencor Corp. | | | 283 | | | | 25,326 | |
| Lam Research Corp. | | | 149 | | | | 20,289 | |
| Leidos Holdings, Inc. | | | 367 | | | | 19,348 | |
LivePerson, Inc.(1) | | | 253 | | | | 4,772 | |
Majesco(1) | | | 78 | | | | 553 | |
| Mastercard, Inc. | | | 2,798 | | | | 527,843 | |
Micron Technology, Inc.(1) | | | 12,631 | | | | 400,782 | |
| Microsoft Corp. | | | 14,884 | | | | 1,511,768 | |
MicroStrategy, Inc.(1) | | | 14 | | | | 1,789 | |
Mitek Systems, Inc.(1) | | | 231 | | | | 2,497 | |
| MKS Instruments, Inc. | | | 280 | | | | 18,091 | |
MoneyGram International, Inc.(1) | | | 1,982 | | | | 3,964 | |
| Monotype Imaging Holdings, Inc. | | | 50 | | | | 776 | |
| Motorola Solutions, Inc. | | | 24 | | | | 2,761 | |
Nanometrics, Inc.(1) | | | 386 | | | | 10,549 | |
Napco Security Technologies, Inc.(1) | | | 220 | | | | 3,465 | |
| National Instruments Corp. | | | 32 | | | | 1,452 | |
| NetApp, Inc. | | | 3,393 | | | | 202,460 | |
Novanta, Inc.(1) | | | 69 | | | | 4,347 | |
Nuance Communications, Inc.(1) | | | 3,163 | | | | 41,846 | |
| NVE Corp. | | | 17 | | | | 1,488 | |
| Oracle Corp. | | | 6,627 | | | | 299,209 | |
| PC Connection, Inc. | | | 291 | | | | 8,651 | |
Photronics, Inc.(1) | | | 1,339 | | | | 12,962 | |
| Progress Software Corp. | | | 529 | | | | 18,774 | |
PTC, Inc.(1) | | | 127 | | | | 10,528 | |
Quantenna Communications, Inc.(1) | | | 780 | | | | 11,193 | |
SailPoint Technologies Holding, Inc.(1) | | | 335 | | | | 7,869 | |
ScanSource, Inc.(1) | | | 36 | | | | 1,238 | |
Semtech Corp.(1) | | | 231 | | | | 10,596 | |
SendGrid, Inc.(1) | | | 253 | | | | 10,922 | |
SMART Global Holdings, Inc.(1) | | | 161 | | | | 4,782 | |
| Symantec Corp. | | | 2,713 | | | | 51,262 | |
Synopsys, Inc.(1) | | | 1,640 | | | | 138,154 | |
Tableau Software, Inc.(1) | | | 169 | | | | 20,280 | |
Tech Data Corp.(1) | | | 335 | | | | 27,406 | |
| Texas Instruments, Inc. | | | 5,544 | | | | 523,908 | |
Trade Desk, Inc./The(1) | | | 100 | | | | 11,606 | |
| Ubiquiti Networks, Inc. | | | 81 | | | | 8,052 | |
Unisys Corp.(1) | | | 254 | | | | 2,954 | |
Verint Systems, Inc.(1) | | | 870 | | | | 36,810 | |
| Versum Materials, Inc. | | | 23 | | | | 638 | |
| Visa, Inc. | | | 315 | | | | 41,561 | |
Vishay Precision Group, Inc.(1) | | | 126 | | | | 3,809 | |
Workiva, Inc.(1) | | | 128 | | | | 4,594 | |
| Xilinx, Inc. | | | 2,358 | | | | 200,831 | |
Zebra Technologies Corp. - Class A(1) | | | 224 | | | | 35,668 | |
Zix Corp.(1) | | | 543 | | | | 3,111 | |
| | | | | | | | 9,562,273 | |
| | | | | | | | | |
| Materials — 0.7% | | | | | | | | |
| CF Industries Holdings, Inc. | | | 917 | | | | 39,899 | |
| Chemours Co./The | | | 1,052 | | | | 29,687 | |
| Eagle Materials, Inc. | | | 1,034 | | | | 63,105 | |
| FutureFuel Corp. | | | 637 | | | | 10,103 | |
| Greif, Inc. - Class A | | | 531 | | | | 19,705 | |
| Huntsman Corp. | | | 400 | | | | 7,716 | |
| International Paper Co. | | | 3,584 | | | | 144,650 | |
| Louisiana-Pacific Corp. | | | 1,885 | | | | 41,885 | |
| LyondellBasell Industries NV | | | 4,712 | | | | 391,850 | |
| Mosaic Co./The | | | 1,144 | | | | 33,416 | |
| Nucor Corp. | | | 3,296 | | | | 170,766 | |
| PPG Industries, Inc. | | | 236 | | | | 24,126 | |
| Reliance Steel & Aluminum Co. | | | 185 | | | | 13,166 | |
Ryerson Holding Corp.(1) | | | 9 | | | | 57 | |
The accompanying notes are an integral part of these financial statements.
Page 86 | 2018 Annual Report | December 31, 2018 |
Schedule of Investments
December 31, 2018
| Moderate Allocation Fund |
| Security Description | | Shares or
Principal
Amount ($) | | | Fair
Value ($) | |
Common Stocks — continued |
| Schnitzer Steel Industries, Inc. | | | 36 | | | | 776 | |
| Steel Dynamics, Inc. | | | 1,469 | | | | 44,129 | |
| Trinseo SA | | | 497 | | | | 22,753 | |
Verso Corp.(1) | | | 169 | | | | 3,786 | |
| | | | | | | | 1,061,575 | |
| | | | | | | | | |
| Real Estate Investment Trust — 1.1% | | | | | | | | |
| American Assets Trust, Inc. | | | 340 | | | | 13,658 | |
| American Tower Corp. | | | 568 | | | | 89,852 | |
| Bluerock Residential Growth REIT, Inc. | | | 457 | | | | 4,122 | |
| CatchMark Timber Trust, Inc. | | | 1,342 | | | | 9,528 | |
| CoreCivic, Inc. | | | 819 | | | | 14,603 | |
| CubeSmart | | | 684 | | | | 19,624 | |
| Essex Property Trust, Inc. | | | 1,495 | | | | 366,589 | |
| Farmland Partners, Inc. | | | 149 | | | | 676 | |
| Front Yard Residential Corp. | | | 554 | | | | 4,836 | |
| Gaming and Leisure Properties, Inc. | | | 558 | | | | 18,029 | |
| GEO Group, Inc./The | | | 723 | | | | 14,243 | |
| Gladstone Commercial Corp. | | | 538 | | | | 9,641 | |
| Hospitality Properties Trust | | | 2,138 | | | | 51,055 | |
| Host Hotels & Resorts, Inc. | | | 7,827 | | | | 130,476 | |
| Lamar Advertising Co. | | | 1,196 | | | | 82,739 | |
Maui Land & Pineapple Co., Inc.(1) | | | 56 | | | | 556 | |
| New Senior Investment Group, Inc. | | | 667 | | | | 2,748 | |
| Pebblebrook Hotel Trust | | | 555 | | | | 15,712 | |
| Pennsylvania Real Estate Investment Trust | | | 803 | | | | 4,770 | |
| Piedmont Office Realty Trust, Inc. | | | 4,219 | | | | 71,892 | |
| PotlatchDeltic Corp. | | | 169 | | | | 5,347 | |
| PS Business Parks, Inc. | | | 351 | | | | 45,981 | |
RAIT Financial Trust(1) | | | 493 | | | | 276 | |
Redfin Corp.(1) | | | 381 | | | | 5,486 | |
| Retail Properties of America, Inc. | | | 409 | | | | 4,438 | |
| Retail Value, Inc. | | | 611 | | | | 15,635 | |
| Simon Property Group, Inc. | | | 2,581 | | | | 433,582 | |
| Tanger Factory Outlet Centers, Inc. | | | 1,252 | | | | 25,315 | |
Trinity Place Holdings, Inc.(1) | | | 645 | | | | 2,799 | |
| UDR, Inc. | | | 8,835 | | | | 350,043 | |
| Urstadt Biddle Properties, Inc. | | | 199 | | | | 3,825 | |
| | | | | | | | 1,818,076 | |
| | | | | | | | | |
| Utilities — 1.1% | | | | | | | | |
| AES Corp./VA | | | 8,055 | | | | 116,475 | |
Atlantic Power Corp.(1) | | | 1,158 | | | | 2,513 | |
| CenterPoint Energy, Inc. | | | 11,294 | | | | 318,830 | |
| Exelon Corp. | | | 9,393 | | | | 423,624 | |
| MDU Resources Group, Inc. | | | 878 | | | | 20,932 | |
| NextEra Energy, Inc. | | | 2,874 | | | | 499,559 | |
| NRG Energy, Inc. | | | 1,013 | | | | 40,115 | |
| OGE Energy Corp. | | | 1,093 | | | | 42,835 | |
| Portland General Electric Co. | | | 205 | | | | 9,399 | |
| SJW Group | | | 19 | | | | 1,057 | |
| UGI Corp. | | | 6,441 | | | | 343,605 | |
| | | | | | | | 1,818,944 | |
| | | | | | | | | |
| Total Common Stocks (Cost $48,956,009) | | | | | | | 47,268,225 | |
| | | | | | | | | |
| Registered Investment Companies — 47.2% |
| American Beacon SiM High Yield Opportunities Fund - Class I | | | 408,594 | | | | 3,689,600 | |
| Baird Core Plus Bond Fund - Class I | | | 385,179 | | | | 4,167,635 | |
| Dodge & Cox Income Fund | | | 382,230 | | | | 5,068,376 | |
| DoubleLine Total Return Bond Fund - Class I | | | 484,424 | | | | 5,047,698 | |
| Frost Total Return Bond Fund - Class I | | | 488,412 | | | | 4,981,802 | |
| Guggenheim Total Return Bond Fund - Class I | | | 188,031 | | | | 4,999,743 | |
iShares Core U.S. Aggregate Bond ETF(6) | | | 83,249 | | | | 8,865,186 | |
| Lord Abbett High Yield Fund - Class I | | | 653,668 | | | | 4,523,384 | |
| Payden Emerging Markets Bond Fund - Class I | | | 326,308 | | | | 4,075,588 | |
| PGIM Total Return Bond Fund - Class R6 | | | 207,960 | | | | 2,896,887 | |
| PIMCO Investment Grade Credit Bond Fund - Class I | | | 140,295 | | | | 1,390,326 | |
| Pioneer Bond Fund - Class Y | | | 541,822 | | | | 5,022,691 | |
| Segall Bryant & Hamill Plus Bond Fund - Class I | | | 287,651 | | | | 2,942,668 | |
| TCW Emerging Markets Income Fund - Class I | | | 1,062,982 | | | | 8,153,070 | |
Vanguard Intermediate-Term Corporate Bond ETF(6) | | | 29,050 | | | | 2,407,083 | |
Vanguard Total Bond Market ETF(6) | | | 102,198 | | | | 8,095,104 | |
| Total Registered Investment Companies (Cost $78,124,651) | | | | | | | 76,326,841 | |
| | | | | | | | | |
| Money Market Registered Investment Companies — 18.5% |
Meeder Institutional Prime Money Market Fund, 2.43%(2) | | | 29,910,462 | | | | 29,907,471 | |
| Total Money Market Registered Investment Companies (Cost $29,905,717) | | | | | | | 29,907,471 | |
The accompanying notes are an integral part of these financial statements.
2018 Annual Report | December 31, 2018 | Page 87 |
Schedule of Investments
December 31, 2018
| Moderate Allocation Fund |
| Security Description | | Shares or
Principal
Amount ($) | | | Fair
Value ($) | |
| Bank Obligations — 0.5% | | | | | | | | |
Metro City Bank Deposit Account, 2.10%, 1/2/2019(3) | | | 249,212 | | | | 249,212 | |
Pacific Premier Bank Deposit Account, 2.30%, 1/2/2019(3) | | | 249,191 | | | | 249,191 | |
Seacoast Community Bank Deposit Account, 2.00%, 1/2/2019(3) | | | 249,193 | | | | 249,193 | |
| Total Bank Obligations (Cost $747,596) | | | | | | | 747,596 | |
| | | | | | | | | |
| U.S. Government Obligations — 3.5% | | | | | | | | |
| U.S. Treasury Note, 2.25%, due 11/15/2025 | | | 3,305,000 | | | | 3,232,057 | |
| U.S. Treasury Note, 1.88%, due 12/31/2019 | | | 1,251,000 | | | | 1,241,911 | |
| U.S. Treasury Note, 2.13%, due 12/31/2022 | | | 1,162,000 | | | | 1,145,614 | |
Total U.S. Government Obligations
(Cost $5,561,006) | | | | | | | 5,619,582 | |
| Total Investments — 98.8% (Cost $163,294,979) | | | | | | | 159,869,715 | |
| Other Assets less Liabilities — 1.2% | | | | | | | 1,992,855 | |
| Total Net Assets — 100.0% | | | | | | | 161,862,570 | |
| | | | | | | | | |
Trustee Deferred Compensation(4) | | | | | | | | |
| Meeder Balanced Fund | | | 181 | | | | 2,005 | |
| Meeder Dynamic Allocation Fund | | | 420 | | | | 4,112 | |
| Meeder Muirfield Fund | | | 468 | | | | 3,351 | |
| Meeder Conservative Allocation Fund | | | 56 | | | | 1,186 | |
| Total Trustee Deferred Compensation (Cost $11,573) | | | | | | | 10,654 | |
Moderate Allocation Fund |
| | | Long
(Short)
Contracts | | | Expiration
Date | | | Notional
Value of
Contracts
($) | | | Value and
Unrealized
Appreciation
(Depreciation)
($) | |
Futures Contracts |
Index Futures | | | | | | | | | | | | | | | | |
Mini MSCI EAFE Index Futures | | | 9 | | | | 3/15/2019 | | | | 772,200 | | | | (12,582 | ) |
Mini MSCI Emerging Markets Index Futures | | | 3 | | | | 3/15/2019 | | | | 145,020 | | | | (560 | ) |
Russell 2000 Mini Index Futures | | | (44 | ) | | | 3/15/2019 | | | | (2,967,800 | ) | | | 63,221 | |
Standard & Poors 500 Mini Futures | | | (212 | ) | | | 3/15/2019 | | | | (26,555,120 | ) | | | 293,984 | |
E-mini Standard & Poors MidCap 400 Futures | | | (39 | ) | | | 3/15/2019 | | | | (6,482,580 | ) | | | 88,439 | |
Total Futures Contracts | | | (283 | ) | | | | | | | (35,088,280 | ) | | | 432,502 | |
(1) | Represents non-income producing securities. |
(2) | Investment in affiliate. The yield shown represents the 7-day yield in effect at December 31, 2018. |
(3) | Variable rate security. Securities payable at par including accrued interest (usually within seven days notice) and unconditionally secured as to principal and interest by letters of credit or other credit support agreements from major banks. The interest rates are adjustable and are not based on a published reference rate and spread but are determined by the issuer or agent and are based on current market conditions. These securities do not indicate a reference rate and spread in their description above. The rate shown represents the rate in effect at December 31, 2018. The maturity date shown, if applicable, reflects the earlier of the next demand date or stated maturity date. |
(4) | Assets of affiliates to the Moderate Allocation Fund held for the benefit of the Fund’s Trustees in connection with the Trustee Deferred Compensation Plan. |
(5) | Fair valued security deemed as Level 3 security. |
The accompanying notes are an integral part of these financial statements.
Page 88 | 2018 Annual Report | December 31, 2018 |
Schedule of Investments
December 31, 2018
Conservative Allocation Fund |
Security Description | | Shares or
Principal
Amount ($) | | | Fair
Value ($) | |
Common Stocks — 17.8% |
Communication Services — 1.6% | | | | | | | | |
Alphabet, Inc. - Class A(1) | | | 7 | | | | 7,315 | |
Alphabet, Inc. - Class C(1) | | | 443 | | | | 458,775 | |
AMC Entertainment Holdings, Inc. | | | 453 | | | | 5,563 | |
AMC Networks, Inc.(1) | | | 150 | | | | 8,232 | |
AT&T, Inc. | | | 5,044 | | | | 143,956 | |
ATN International, Inc. | | | 9 | | | | 644 | |
Beasley Broadcast Group, Inc. | | | 65 | | | | 244 | |
Cable One, Inc. | | | 33 | | | | 27,063 | |
Cincinnati Bell, Inc.(1) | | | 206 | | | | 1,603 | |
Cinemark Holdings, Inc. | | | 272 | | | | 9,738 | |
Comcast Corp. - Class A | | | 2,967 | | | | 101,026 | |
Discovery, Inc.(1) | | | 801 | | | | 18,487 | |
EW Scripps Co./The | | | 44 | | | | 692 | |
Facebook, Inc.(1) | | | 1,620 | | | | 212,366 | |
Frontier Communications Corp. | | | 624 | | | | 1,485 | |
Gray Television, Inc.(1) | | | 375 | | | | 5,528 | |
Intelsat SA(1) | | | 85 | | | | 1,818 | |
Interpublic Group of Cos., Inc./The | | | 449 | | | | 9,263 | |
Liberty TripAdvisor Holdings, Inc.(1) | | | 79 | | | | 1,255 | |
Marcus Corp./The | | | 224 | | | | 8,848 | |
MDC Partners, Inc.(1) | | | 398 | | | | 1,039 | |
National CineMedia, Inc. | | | 159 | | | | 1,030 | |
Nexstar Media Group, Inc. | | | 91 | | | | 7,156 | |
NII Holdings, Inc.(1) | | | 161 | | | | 710 | |
Ooma, Inc.(1) | | | 87 | | | | 1,208 | |
Rosetta Stone, Inc.(1) | | | 103 | | | | 1,689 | |
Scholastic Corp. | | | 6 | | | | 242 | |
Spok Holdings, Inc. | | | 323 | | | | 4,283 | |
TechTarget, Inc.(1) | | | 105 | | | | 1,282 | |
TEGNA, Inc. | | | 991 | | | | 10,772 | |
Telephone & Data Systems, Inc. | | | 445 | | | | 14,480 | |
T-Mobile US, Inc.(1) | | | 2,945 | | | | 187,331 | |
Tribune Publishing Co.(1) | | | 163 | | | | 1,848 | |
Twenty-First Century Fox, Inc. - Class A | | | 1,276 | | | | 61,401 | |
United States Cellular Corp.(1) | | | 140 | | | | 7,276 | |
Verizon Communications, Inc. | | | 6,766 | | | | 380,385 | |
Viacom, Inc. | | | 1,900 | | | | 48,830 | |
Vonage Holdings Corp.(1) | | | 233 | | | | 2,034 | |
Walt Disney Co./The | | | 2,917 | | | | 319,849 | |
WideOpenWest, Inc.(1) | | | 122 | | | | 870 | |
| | | | | | | | 2,077,616 | |
| | | | | | | | | |
Consumer Discretionary — 1.3% | | | | | | | | |
Aaron's, Inc. | | | 40 | | | | 1,682 | |
Amazon.com, Inc.(1) | | | 382 | | | | 573,753 | |
Ascena Retail Group, Inc.(1) | | | 174 | | | | 437 | |
Ascent Capital Group, Inc.(1) | | | 486 | | | | 190 | |
Bassett Furniture Industries, Inc. | | | 270 | | | | 5,411 | |
Bed Bath & Beyond, Inc. | | | 470 | | | | 5,320 | |
Best Buy Co., Inc. | | | 1,166 | | | | 61,751 | |
BJ's Restaurants, Inc. | | | 12 | | | | 607 | |
Bloomin' Brands, Inc. | | | 182 | | | | 3,256 | |
Bojangles', Inc.(1) | | | 16 | | | | 257 | |
Brinker International, Inc. | | | 102 | | | | 4,486 | |
Callaway Golf Co. | | | 369 | | | | 5,646 | |
Capri Holdings, Ltd.(1) | | | 605 | | | | 22,942 | |
Carrols Restaurant Group, Inc.(1) | | | 51 | | | | 502 | |
Cato Corp./The | | | 20 | | | | 285 | |
Chico's FAS, Inc. | | | 255 | | | | 1,433 | |
Clarus Corp. | | | 211 | | | | 2,135 | |
Crocs, Inc.(1) | | | 123 | | | | 3,196 | |
Darden Restaurants, Inc. | | | 290 | | | | 28,959 | |
Dave & Buster's Entertainment, Inc. | | | 82 | | | | 3,654 | |
Deckers Outdoor Corp.(1) | | | 77 | | | | 9,852 | |
Dine Brands Global, Inc. | | | 11 | | | | 741 | |
Domino's Pizza, Inc. | | | 33 | | | | 8,184 | |
Dunkin' Brands Group, Inc. | | | 65 | | | | 4,168 | |
El Pollo Loco Holdings, Inc.(1) | | | 21 | | | | 319 | |
Ethan Allen Interiors, Inc. | | | 302 | | | | 5,312 | |
Etsy, Inc.(1) | | | 129 | | | | 6,137 | |
Express, Inc.(1) | | | 383 | | | | 1,957 | |
Extended Stay America, Inc. | | | 407 | | | | 6,309 | |
Five Below, Inc.(1) | | | 9 | | | | 921 | |
Flexsteel Industries, Inc. | | | 40 | | | | 883 | |
Foot Locker, Inc. | | | 256 | | | | 13,619 | |
Ford Motor Co. | | | 2,766 | | | | 21,160 | |
Fox Factory Holding Corp.(1) | | | 43 | | | | 2,531 | |
Gentex Corp. | | | 1,050 | | | | 21,221 | |
G-III Apparel Group, Ltd.(1) | | | 50 | | | | 1,395 | |
H&R Block, Inc. | | | 469 | | | | 11,899 | |
Helen of Troy, Ltd.(1) | | | 36 | | | | 4,722 | |
Hooker Furniture Corp. | | | 126 | | | | 3,319 | |
J Alexander's Holdings, Inc.(1) | | | 182 | | | | 1,498 | |
Kohl's Corp. | | | 143 | | | | 9,487 | |
Lands' End, Inc.(1) | | | 9 | | | | 128 | |
La-Z-Boy, Inc. | | | 148 | | | | 4,101 | |
Lear Corp. | | | 196 | | | | 24,081 | |
Liberty Expedia Holdings, Inc.(1) | | | 731 | | | | 28,589 | |
Lululemon Athletica, Inc.(1) | | | 157 | | | | 19,093 | |
M/I Homes, Inc.(1) | | | 427 | | | | 8,976 | |
Macy's, Inc. | | | 222 | | | | 6,611 | |
Malibu Boats, Inc.(1) | | | 24 | | | | 835 | |
MasterCraft Boat Holdings, Inc.(1) | | | 86 | | | | 1,608 | |
The accompanying notes are an integral part of these financial statements.
2018 Annual Report | December 31, 2018 | Page 89 |
Schedule of Investments
December 31, 2018
Conservative Allocation Fund |
Security Description | | Shares or
Principal
Amount ($) | | | Fair
Value ($) | |
Common Stocks — continued |
MDC Holdings, Inc. | | | 189 | | | | 5,313 | |
Norwegian Cruise Line Holdings, Ltd.(1) | | | 112 | | | | 4,748 | |
NVR, Inc.(1) | | | 9 | | | | 21,933 | |
Penn National Gaming, Inc.(1) | | | 110 | | | | 2,071 | |
Qurate Retail, Inc.(1) | | | 452 | | | | 8,823 | |
RCI Hospitality Holdings, Inc. | | | 51 | | | | 1,139 | |
Ross Stores, Inc. | | | 1,128 | | | | 93,850 | |
Signet Jewelers, Ltd. | | | 75 | | | | 2,383 | |
Speedway Motorsports, Inc. | | | 52 | | | | 846 | |
Starbucks Corp. | | | 2,211 | | | | 142,388 | |
Stoneridge, Inc.(1) | | | 83 | | | | 2,046 | |
Target Corp. | | | 2,916 | | | | 192,718 | |
Taylor Morrison Home Corp.(1) | | | 336 | | | | 5,342 | |
Thor Industries, Inc. | | | 84 | | | | 4,368 | |
TJX Cos., Inc./The | | | 5,015 | | | | 224,371 | |
Tower International, Inc. | | | 126 | | | | 2,999 | |
Town Sports International Holdings, Inc.(1) | | | 39 | | | | 250 | |
Turtle Beach Corp.(1) | | | 13 | | | | 186 | |
Vera Bradley, Inc.(1) | | | 40 | | | | 343 | |
Wendy's Co./The | | | 339 | | | | 5,292 | |
Wyndham Hotels & Resorts, Inc. | | | 1,076 | | | | 48,818 | |
Yum! Brands, Inc. | | | 1,358 | | | | 124,827 | |
| | | | | | | | 1,850,612 | |
| | | | | | | | | |
Consumer Staples — 0.8% | | | | | | | | |
Church & Dwight Co., Inc. | | | 97 | | | | 6,379 | |
Coca-Cola Co./The | | | 550 | | | | 26,043 | |
Conagra Brands, Inc. | | | 1,571 | | | | 33,557 | |
Costco Wholesale Corp. | | | 480 | | | | 97,781 | |
Flowers Foods, Inc. | | | 226 | | | | 4,174 | |
Hershey Co./The | | | 127 | | | | 13,612 | |
Kellogg Co. | | | 4 | | | | 228 | |
Keurig Dr Pepper, Inc. | | | 2,824 | | | | 72,407 | |
Kroger Co./The | | | 2,169 | | | | 59,648 | |
Lamb Weston Holdings, Inc. | | | 319 | | | | 23,466 | |
Molson Coors Brewing Co. | | | 572 | | | | 32,124 | |
PepsiCo, Inc. | | | 1,724 | | | | 190,468 | |
Procter & Gamble Co./The | | | 1,591 | | | | 146,245 | |
Simply Good Foods Co./The(1) | | | 37 | | | | 699 | |
Sprouts Farmers Market, Inc.(1) | | | 412 | | | | 9,686 | |
Tyson Foods, Inc. | | | 594 | | | | 31,720 | |
Walgreens Boots Alliance, Inc. | | | 1,761 | | | | 120,329 | |
Walmart, Inc. | | | 1,128 | | | | 105,073 | |
| | | | | | | | 973,639 | |
| | | | | | | | | |
Energy — 1.3% | | | | | | | | |
Adams Resources & Energy, Inc. | | | 26 | | | | 1,006 | |
Anadarko Petroleum Corp. | | | 1,110 | | | | 48,662 | |
Arch Coal, Inc. - Class A | | | 44 | | | | 3,652 | |
Archrock, Inc. | | | 756 | | | | 5,662 | |
Cactus, Inc.(1) | | | 207 | | | | 5,674 | |
Chesapeake Energy Corp.(1) | | | 1,447 | | | | 3,039 | |
Chevron Corp. | | | 1,203 | | | | 130,874 | |
ConocoPhillips | | | 3,814 | | | | 237,803 | |
CONSOL Energy, Inc.(1) | | | 26 | | | | 824 | |
Covia Holdings Corp.(1) | | | 841 | | | | 2,876 | |
CVR Energy, Inc. | | | 125 | | | | 4,310 | |
Delek US Holdings, Inc. | | | 152 | | | | 4,942 | |
Denbury Resources, Inc.(1) | | | 513 | | | | 877 | |
Earthstone Energy, Inc.(1) | | | 133 | | | | 601 | |
EOG Resources, Inc. | | | 109 | | | | 9,506 | |
Era Group, Inc.(1) | | | 82 | | | | 717 | |
Evolution Petroleum Corp. | | | 253 | | | | 1,725 | |
Exxon Mobil Corp. | | | 3,948 | | | | 269,214 | |
Gulfport Energy Corp.(1) | | | 342 | | | | 2,240 | |
Hallador Energy Co. | | | 211 | | | | 1,070 | |
Helix Energy Solutions Group, Inc.(1) | | | 201 | | | | 1,087 | |
Helmerich & Payne, Inc. | | | 448 | | | | 21,477 | |
HollyFrontier Corp. | | | 450 | | | | 23,004 | |
Keane Group, Inc.(1) | | | 582 | | | | 4,761 | |
KLX Energy Services Holdings, Inc.(1) | | | 28 | | | | 657 | |
Mammoth Energy Services, Inc. | | | 90 | | | | 1,618 | |
Marathon Oil Corp. | | | 3,717 | | | | 53,302 | |
Marathon Petroleum Corp. | | | 3,530 | | | | 208,305 | |
Matrix Service Co.(1) | | | 342 | | | | 6,135 | |
Northern Oil and Gas, Inc.(1) | | | 162 | | | | 366 | |
Occidental Petroleum Corp. | | | 3,449 | | | | 211,700 | |
Overseas Shipholding Group, Inc.(1) | | | 97 | | | | 161 | |
Pacific Ethanol, Inc.(1) | | | 394 | | | | 339 | |
PBF Energy, Inc. | | | 361 | | | | 11,794 | |
Peabody Energy Corp. | | | 312 | | | | 9,510 | |
Penn Virginia Corp.(1) | | | 24 | | | | 1,297 | |
Phillips 66 | | | 2,246 | | | | 193,493 | |
Pioneer Energy Services Corp.(1) | | | 12 | | | | 15 | |
Profire Energy, Inc.(1) | | | 281 | | | | 407 | |
ProPetro Holding Corp.(1) | | | 440 | | | | 5,421 | |
Renewable Energy Group, Inc.(1) | | | 21 | | | | 540 | |
SEACOR Holdings, Inc.(1) | | | 9 | | | | 333 | |
SilverBow Resources, Inc.(1) | | | 39 | | | | 922 | |
Southwestern Energy Co.(1) | | | 925 | | | | 3,154 | |
Targa Resources Corp. | | | 378 | | | | 13,616 | |
Unit Corp.(1) | | | 67 | | | | 957 | |
Valero Energy Corp. | | | 2,688 | | | | 201,519 | |
W&T Offshore, Inc.(1) | | | 561 | | | | 2,311 | |
The accompanying notes are an integral part of these financial statements.
Page 90 | 2018 Annual Report | December 31, 2018 |
Schedule of Investments
December 31, 2018
Conservative Allocation Fund |
Security Description | | Shares or
Principal
Amount ($) | | | Fair
Value ($) | |
Common Stocks — continued |
Westmoreland Coal Co.(1) | | | 410 | | | | 5 | |
WildHorse Resource Development Corp.(1) | | | 157 | | | | 2,215 | |
World Fuel Services Corp. | | | 215 | | | | 4,603 | |
| | | | | | | | 1,720,298 | |
| | | | | | | | | |
Financials — 2.4% | | | | | | | | |
American Equity Investment Life Holding Co. | | | 121 | | | | 3,381 | |
Arbor Realty Trust, Inc. | | | 623 | | | | 6,274 | |
Arthur J Gallagher & Co. | | | 121 | | | | 8,918 | |
Bancorp, Inc./The(1) | | | 735 | | | | 5,851 | |
Bank of America Corp. | | | 15,358 | | | | 378,421 | |
Bank of NT Butterfield & Son, Ltd./The | | | 141 | | | | 4,420 | |
BankUnited, Inc. | | | 59 | | | | 1,766 | |
BB&T Corp. | | | 2,839 | | | | 122,985 | |
Berkshire Hathaway, Inc. - Class B(1) | | | 2,374 | | | | 484,723 | |
Blucora, Inc.(1) | | | 18 | | | | 480 | |
Cherry Hill Mortgage Investment Corp. | | | 169 | | | | 2,964 | |
CIT Group, Inc. | | | 74 | | | | 2,832 | |
Cullen/Frost Bankers, Inc. | | | 3 | | | | 264 | |
Discover Financial Services | | | 1,573 | | | | 92,776 | |
Essent Group, Ltd.(1) | | | 318 | | | | 10,869 | |
FB Financial Corp. | | | 40 | | | | 1,401 | |
Fidelity National Financial, Inc. | | | 655 | | | | 20,593 | |
Fifth Third Bancorp | | | 5,506 | | | | 129,556 | |
First BanCorp/Puerto Rico | | | 146 | | | | 1,256 | |
FirstCash, Inc. | | | 215 | | | | 15,555 | |
Genworth Financial, Inc.(1) | | | 457 | | | | 2,130 | |
Goosehead Insurance, Inc.(1) | | | 70 | | | | 1,840 | |
HCI Group, Inc. | | | 3 | | | | 152 | |
Health Insurance Innovations, Inc. - Class A(1) | | | 94 | | | | 2,513 | |
Huntington Bancshares, Inc./OH | | | 11,288 | | | | 134,553 | |
Independence Holding Co. | | | 35 | | | | 1,232 | |
Independent Bank Corp./MI | | | 66 | | | | 1,387 | |
Investment Technology Group, Inc. | | | 30 | | | | 907 | |
JPMorgan Chase & Co. | | | 2,797 | | | | 273,043 | |
KeyCorp | | | 9,709 | | | | 143,499 | |
Ladder Capital Corp. | | | 1,255 | | | | 19,415 | |
Marlin Business Services Corp. | | | 26 | | | | 581 | |
MB Financial, Inc. | | | 1,388 | | | | 55,006 | |
MBT Financial Corp. | | | 285 | | | | 2,651 | |
Medley Management, Inc. | | | 19 | | | | 73 | |
MGIC Investment Corp.(1) | | | 1,166 | | | | 12,196 | |
Moelis & Co. | | | 370 | | | | 12,721 | |
Mr Cooper Group, Inc.(1) | | | 277 | | | | 3,233 | |
National General Holdings Corp. | | | 184 | | | | 4,455 | |
New Residential Investment Corp. | | | 3,833 | | | | 54,467 | |
NewStar Financial Contingent Value Rights(1)(7) | | | 8 | | | | — | |
NMI Holdings, Inc. - Class A(1) | | | 196 | | | | 3,499 | |
Northrim BanCorp, Inc. | | | 51 | | | | 1,676 | |
OFG Bancorp | | | 58 | | | | 955 | |
Old Republic International Corp. | | | 1,289 | | | | 26,515 | |
On Deck Capital, Inc.(1) | | | 247 | | | | 1,457 | |
Oppenheimer Holdings, Inc. | | | 437 | | | | 11,165 | |
PacWest Bancorp | | | 1,432 | | | | 47,657 | |
PennyMac Financial Services, Inc. | | | 450 | | | | 9,567 | |
Piper Jaffray Cos. | | | 13 | | | | 856 | |
Popular, Inc. | | | 358 | | | | 16,905 | |
Progressive Corp./The | | | 3,368 | | | | 203,191 | |
Pzena Investment Management, Inc. | | | 475 | | | | 4,109 | |
Radian Group, Inc. | | | 1,105 | | | | 18,078 | |
Ready Capital Corp. | | | 167 | | | | 2,310 | |
Regions Financial Corp. | | | 12,270 | | | | 164,173 | |
Reinsurance Group of America, Inc. | | | 311 | | | | 43,612 | |
Safety Insurance Group, Inc. | | | 59 | | | | 4,827 | |
Siebert Financial Corp.(1) | | | 3 | | | | 43 | |
Silvercrest Asset Management Group, Inc. | | | 79 | | | | 1,045 | |
Stewart Information Services Corp. | | | 602 | | | | 24,923 | |
SunTrust Banks, Inc. | | | 3,798 | | | | 191,571 | |
TCF Financial Corp. | | | 2,258 | | | | 44,008 | |
United Security Bancshares/Fresno CA | | | 377 | | | | 3,612 | |
Universal Insurance Holdings, Inc. | | | 109 | | | | 4,133 | |
Waddell & Reed Financial, Inc. | | | 53 | | | | 958 | |
Walker & Dunlop, Inc. | | | 183 | | | | 7,915 | |
Wells Fargo & Co. | | | 5,616 | | | | 258,785 | |
| | | | | | | | 3,118,884 | |
| | | | | | | | | |
Healthcare — 3.6% | | | | | | | | |
Abbott Laboratories | | | 402 | | | | 29,077 | |
AbbVie, Inc. | | | 1,326 | | | | 122,244 | |
ABIOMED, Inc.(1) | | | 98 | | | | 31,854 | |
ACADIA Pharmaceuticals, Inc.(1) | | | 152 | | | | 2,458 | |
Acceleron Pharma, Inc.(1) | | | 19 | | | | 827 | |
Achillion Pharmaceuticals, Inc.(1) | | | 565 | | | | 898 | |
Acorda Therapeutics, Inc.(1) | | | 239 | | | | 3,724 | |
ADMA Biologics, Inc.(1) | | | 57 | | | | 136 | |
Adverum Biotechnologies, Inc.(1) | | | 1 | | | | 3 | |
Aeglea BioTherapeutics, Inc.(1) | | | 159 | | | | 1,191 | |
AgeX Therapeutics, Inc.(1) | | | 4 | | | | 12 | |
Aldeyra Therapeutics, Inc.(1) | | | 260 | | | | 2,158 | |
Alexion Pharmaceuticals, Inc.(1) | | | 569 | | | | 55,398 | |
Allergan PLC | | | 706 | | | | 94,364 | |
The accompanying notes are an integral part of these financial statements.
2018 Annual Report | December 31, 2018 | Page 91 |
Schedule of Investments
December 31, 2018
Conservative Allocation Fund |
Security Description | | Shares or
Principal
Amount ($) | | | Fair
Value ($) | |
Common Stocks — continued |
AMAG Pharmaceuticals, Inc.(1) | | | 218 | | | | 3,311 | |
Amedisys, Inc.(1) | | | 23 | | | | 2,694 | |
AmerisourceBergen Corp. | | | 154 | | | | 11,458 | |
Amgen, Inc. | | | 1,185 | | | | 230,684 | |
Amphastar Pharmaceuticals, Inc.(1) | | | 129 | | | | 2,567 | |
Ampio Pharmaceuticals, Inc.(1) | | | 98 | | | | 39 | |
Apellis Pharmaceuticals, Inc.(1) | | | 20 | | | | 264 | |
Aquestive Therapeutics, Inc.(1) | | | 72 | | | | 454 | |
Aratana Therapeutics, Inc.(1) | | | 13 | | | | 80 | |
Arbutus Biopharma Corp.(1) | | | 16 | | | | 61 | |
Arena Pharmaceuticals, Inc.(1) | | | 156 | | | | 6,076 | |
ArQule, Inc.(1) | | | 509 | | | | 1,410 | |
Array BioPharma, Inc.(1) | | | 134 | | | | 1,910 | |
Arrowhead Pharmaceuticals, Inc.(1) | | | 221 | | | | 2,745 | |
Assertio Therapeutics, Inc.(1) | | | 118 | | | | 426 | |
Atara Biotherapeutics, Inc.(1) | | | 83 | | | | 2,883 | |
Avid Bioservices, Inc.(1) | | | 344 | | | | 1,410 | |
Baxter International, Inc. | | | 3,081 | | | | 202,791 | |
BioCryst Pharmaceuticals, Inc.(1) | | | 104 | | | | 839 | |
Biogen, Inc.(1) | | | 747 | | | | 224,787 | |
BioSpecifics Technologies Corp.(1) | | | 135 | | | | 8,181 | |
Bio-Techne Corp. | | | 12 | | | | 1,737 | |
BioTelemetry, Inc.(1) | | | 42 | | | | 2,508 | |
Bristol-Myers Squibb Co. | | | 928 | | | | 48,237 | |
Bruker Corp. | | | 338 | | | | 10,062 | |
Calithera Biosciences, Inc.(1) | | | 295 | | | | 1,183 | |
Cardinal Health, Inc. | | | 773 | | | | 34,476 | |
CareDx, Inc.(1) | | | 150 | | | | 3,771 | |
CASI Pharmaceuticals, Inc.(1) | | | 315 | | | | 1,266 | |
Catalent, Inc.(1) | | | 750 | | | | 23,385 | |
Catalyst Pharmaceuticals, Inc.(1) | | | 929 | | | | 1,784 | |
Celcuity, Inc.(1) | | | 35 | | | | 840 | |
Cellular Biomedicine Group, Inc.(1) | | | 87 | | | | 1,536 | |
Cerner Corp.(1) | | | 1,590 | | | | 83,380 | |
Chemed Corp. | | | 73 | | | | 20,679 | |
ChemoCentryx, Inc.(1) | | | 106 | | | | 1,156 | |
Chimerix, Inc.(1) | | | 34 | | | | 87 | |
Codexis, Inc.(1) | | | 26 | | | | 434 | |
Collegium Pharmaceutical, Inc.(1) | | | 129 | | | | 2,215 | |
CONMED Corp. | | | 137 | | | | 8,795 | |
Corium International Contingent Value Rights(1)(7) | | | 24 | | | | — | |
CVS Health Corp. | | | 389 | | | | 25,487 | |
DexCom, Inc.(1) | | | 46 | | | | 5,511 | |
Dicerna Pharmaceuticals, Inc.(1) | | | 148 | | | | 1,582 | |
Dova Pharmaceuticals, Inc.(1) | | | 12 | | | | 91 | |
Durect Corp.(1) | | | 337 | | | | 163 | |
Eli Lilly & Co. | | | 1,218 | | | | 140,947 | |
Emergent BioSolutions, Inc.(1) | | | 248 | | | | 14,701 | |
Enanta Pharmaceuticals, Inc.(1) | | | 50 | | | | 3,542 | |
Encompass Health Corp. | | | 175 | | | | 10,798 | |
Endo International PLC(1) | | | 457 | | | | 3,336 | |
Ensign Group, Inc./The | | | 7 | | | | 272 | |
Evolus, Inc.(1) | | | 33 | | | | 393 | |
Exact Sciences Corp.(1) | | | 67 | | | | 4,228 | |
Exelixis, Inc.(1) | | | 559 | | | | 10,996 | |
Fate Therapeutics, Inc.(1) | | | 74 | | | | 949 | |
Fennec Pharmaceuticals, Inc.(1) | | | 309 | | | | 1,971 | |
FONAR Corp.(1) | | | 142 | | | | 2,874 | |
Fortress Biotech, Inc.(1) | | | 925 | | | | 796 | |
G1 Therapeutics, Inc.(1) | | | 102 | | | | 1,953 | |
Genomic Health, Inc.(1) | | | 66 | | | | 4,251 | |
Gilead Sciences, Inc. | | | 3,354 | | | | 209,793 | |
Globus Medical, Inc.(1) | | | 194 | | | | 8,396 | |
Halozyme Therapeutics, Inc.(1) | | | 27 | | | | 395 | |
Harvard Bioscience, Inc.(1) | | | 165 | | | | 525 | |
HCA Healthcare, Inc. | | | 1,604 | | | | 199,618 | |
Hill-Rom Holdings, Inc. | | | 518 | | | | 45,869 | |
HMS Holdings Corp.(1) | | | 39 | | | | 1,097 | |
Horizon Pharma Plc(1) | | | 356 | | | | 6,956 | |
Humana, Inc. | | | 263 | | | | 75,344 | |
ICU Medical, Inc.(1) | | | 49 | | | | 11,252 | |
IDEXX Laboratories, Inc.(1) | | | 126 | | | | 23,439 | |
Innovate Biopharmaceuticals, Inc.(1) | | | 56 | | | | 129 | |
Inovio Pharmaceuticals, Inc.(1) | | | 605 | | | | 2,420 | |
Integer Holdings Corp.(1) | | | 79 | | | | 6,025 | |
Intersect ENT, Inc.(1) | | | 125 | | | | 3,523 | |
IntriCon Corp.(1) | | | 12 | | | | 317 | |
Invitae Corp.(1) | | | 425 | | | | 4,701 | |
Iovance Biotherapeutics, Inc.(1) | | | 28 | | | | 248 | |
IQVIA Holdings, Inc.(1) | | | 414 | | | | 48,094 | |
Jazz Pharmaceuticals PLC(1) | | | 52 | | | | 6,446 | |
Johnson & Johnson | | | 2,418 | | | | 312,043 | |
Kindred Biosciences, Inc.(1) | | | 289 | | | | 3,165 | |
Lannett Co., Inc.(1)(2) | | | 9 | | | | 45 | |
LivaNova PLC(1) | | | 20 | | | | 1,829 | |
Loxo Oncology, Inc.(1) | | | 4 | | | | 560 | |
Luminex Corp. | | | 109 | | | | 2,519 | |
MacroGenics, Inc.(1) | | | 290 | | | | 3,683 | |
Madrigal Pharmaceuticals, Inc.(1) | | | 16 | | | | 1,804 | |
Mallinckrodt PLC(1) | | | 232 | | | | 3,666 | |
Marinus Pharmaceuticals, Inc.(1) | | | 238 | | | | 683 | |
Masimo Corp.(1) | | | 215 | | | | 23,085 | |
MediciNova, Inc.(1) | | | 2 | | | | 16 | |
The accompanying notes are an integral part of these financial statements.
Page 92 | 2018 Annual Report | December 31, 2018 |
Schedule of Investments
December 31, 2018
Conservative Allocation Fund |
Security Description | | Shares or
Principal
Amount ($) | | | Fair
Value ($) | |
Common Stocks — continued |
Medtronic PLC | | | 3,126 | | | | 284,341 | |
Merck & Co., Inc. | | | 4,194 | | | | 320,464 | |
Minerva Neurosciences, Inc.(1) | | | 307 | | | | 2,069 | |
Mirati Therapeutics, Inc.(1) | | | 69 | | | | 2,927 | |
Molecular Templates, Inc.(1) | | | 172 | | | | 695 | |
Molina Healthcare, Inc.(1) | | | 74 | | | | 8,600 | |
Momenta Pharmaceuticals, Inc.(1) | | | 94 | | | | 1,038 | |
Mustang Bio, Inc.(1) | | | 150 | | | | 441 | |
Mylan NV(1) | | | 2,775 | | | | 76,035 | |
Myriad Genetics, Inc.(1) | | | 62 | | | | 1,802 | |
Natera, Inc.(1) | | | 158 | | | | 2,206 | |
National Research Corp. | | | 28 | | | | 1,068 | |
NeoGenomics, Inc.(1) | | | 20 | | | | 252 | |
Neurocrine Biosciences, Inc.(1) | | | 208 | | | | 14,853 | |
NuVasive, Inc.(1) | | | 4 | | | | 198 | |
Omnicell, Inc.(1) | | | 25 | | | | 1,531 | |
OPKO Health, Inc.(1) | | | 12 | | | | 36 | |
OraSure Technologies, Inc.(1) | | | 1 | | | | 12 | |
Orthofix Medical, Inc.(1) | | | 212 | | | | 11,128 | |
Owens & Minor, Inc. | | | 96 | | | | 608 | |
Pacira Pharmaceuticals, Inc./DE(1) | | | 97 | | | | 4,173 | |
Palatin Technologies, Inc.(1) | | | 584 | | | | 414 | |
PDL BioPharma, Inc.(1) | | | 1,084 | | | | 3,144 | |
Perrigo Co. PLC | | | 489 | | | | 18,949 | |
Pfenex, Inc.(1) | | | 8 | | | | 26 | |
Pfizer, Inc. | | | 8,759 | | | | 382,330 | |
Phibro Animal Health Corp. | | | 123 | | | | 3,956 | |
Pieris Pharmaceuticals, Inc.(1) | | | 231 | | | | 614 | |
PRA Health Sciences, Inc.(1) | | | 261 | | | | 24,002 | |
Premier, Inc. - Class A(1) | | | 376 | | | | 14,044 | |
Prestige Consumer Healthcare, Inc.(1) | | | 68 | | | | 2,100 | |
Proteostasis Therapeutics, Inc.(1) | | | 294 | | | | 953 | |
PTC Therapeutics, Inc.(1) | | | 45 | | | | 1,544 | |
Quidel Corp.(1) | | | 13 | | | | 635 | |
Ra Pharmaceuticals, Inc.(1) | | | 148 | | | | 2,694 | |
Reata Pharmaceuticals, Inc.(1) | | | 34 | | | | 1,907 | |
Recro Pharma, Inc.(1) | | | 53 | | | | 376 | |
Regeneron Pharmaceuticals, Inc.(1) | | | 541 | | | | 202,064 | |
REGENXBIO, Inc.(1) | | | 68 | | | | 2,853 | |
Repligen Corp.(1) | | | 88 | | | | 4,641 | |
Rhythm Pharmaceuticals, Inc.(1) | | | 19 | | | | 511 | |
Sarepta Therapeutics, Inc.(1) | | | 70 | | | | 7,639 | |
SeaSpine Holdings Corp.(1) | | | 12 | | | | 219 | |
Sienna Biopharmaceuticals, Inc.(1) | | | 81 | | | | 188 | |
SIGA Technologies, Inc.(1) | | | 599 | | | | 4,732 | |
Solid Biosciences, Inc.(1) | | | 2 | | | | 54 | |
Spring Bank Pharmaceuticals, Inc.(1) | | | 44 | | | | 457 | |
STAAR Surgical Co.(1) | | | 42 | | | | 1,340 | |
STERIS PLC | | | 228 | | | | 24,362 | |
Supernus Pharmaceuticals, Inc.(1) | | | 19 | | | | 631 | |
Surface Oncology, Inc.(1) | | | 189 | | | | 801 | |
Syneos Health, Inc.(1) | | | 215 | | | | 8,460 | |
Tandem Diabetes Care, Inc.(1) | | | 118 | | | | 4,480 | |
Tenet Healthcare Corp.(1) | | | 153 | | | | 2,622 | |
Tocagen, Inc.(1) | | | 295 | | | | 2,422 | |
United Therapeutics Corp.(1) | | | 232 | | | | 25,265 | |
UnitedHealth Group, Inc. | | | 852 | | | | 212,250 | |
Universal Health Services, Inc. | | | 123 | | | | 14,337 | |
Unum Therapeutics, Inc.(1) | | | 22 | | | | 97 | |
Vanda Pharmaceuticals, Inc.(1) | | | 226 | | | | 5,905 | |
Varian Medical Systems, Inc.(1) | | | 118 | | | | 13,371 | |
Veeva Systems, Inc.(1) | | | 15 | | | | 1,340 | |
Veracyte, Inc.(1) | | | 178 | | | | 2,239 | |
Vericel Corp.(1) | | | 172 | | | | 2,993 | |
Vertex Pharmaceuticals, Inc.(1) | | | 1,283 | | | | 212,606 | |
Viking Therapeutics, Inc.(1) | | | 209 | | | | 1,599 | |
Vital Therapies, Inc.(1) | | | 184 | | | | 34 | |
WaVe Life Sciences, Ltd.(1) | | | 15 | | | | 631 | |
West Pharmaceutical Services, Inc. | | | 182 | | | | 17,841 | |
Xencor, Inc.(1) | | | 70 | | | | 2,531 | |
Zafgen, Inc.(1) | | | 266 | | | | 1,317 | |
Zoetis, Inc. | | | 1,237 | | | | 105,813 | |
| | | | | | | | 4,620,281 | |
| | | | | | | | | |
Industrials — 1.3% | | | | | | | | |
ACCO Brands Corp. | | | 650 | | | | 4,407 | |
Allied Motion Technologies, Inc. | | | 2 | | | | 89 | |
Allison Transmission Holdings, Inc. | | | 1,047 | | | | 45,974 | |
Ameresco, Inc. - Class A(1) | | | 51 | | | | 719 | |
ArcBest Corp. | | | 41 | | | | 1,405 | |
Armstrong World Industries, Inc. | | | 228 | | | | 13,272 | |
Atkore International Group, Inc.(1) | | | 212 | | | | 4,206 | |
Barrett Business Services, Inc. | | | 23 | | | | 1,317 | |
Brady Corp. | | | 271 | | | | 11,778 | |
Casella Waste Systems, Inc.(1) | | | 68 | | | | 1,937 | |
Cintas Corp. | | | 50 | | | | 8,400 | |
Comfort Systems USA, Inc. | | | 162 | | | | 7,076 | |
Commercial Vehicle Group, Inc.(1) | | | 377 | | | | 2,149 | |
Copart, Inc.(1) | | | 294 | | | | 14,047 | |
Covenant Transportation Group, Inc.(1) | | | 88 | | | | 1,690 | |
Crane Co. | | | 383 | | | | 27,645 | |
CSW Industrials, Inc.(1) | | | 4 | | | | 193 | |
CSX Corp. | | | 3,490 | | | | 216,834 | |
Delta Air Lines, Inc. | | | 2,364 | | | | 117,964 | |
The accompanying notes are an integral part of these financial statements.
2018 Annual Report | December 31, 2018 | Page 93 |
Schedule of Investments
December 31, 2018
Conservative Allocation Fund |
Security Description | | Shares or
Principal
Amount ($) | | | Fair
Value ($) | |
Common Stocks — continued |
DMC Global, Inc. | | | 10 | | | | 351 | |
Donaldson Co., Inc. | | | 22 | | | | 955 | |
Ducommun, Inc.(1) | | | 67 | | | | 2,433 | |
Eagle Bulk Shipping, Inc.(1) | | | 602 | | | | 2,775 | |
EnerSys | | | 215 | | | | 16,686 | |
Federal Signal Corp. | | | 349 | | | | 6,945 | |
Foundation Building Materials, Inc.(1) | | | 160 | | | | 1,330 | |
Global Brass & Copper Holdings, Inc. | | | 315 | | | | 7,922 | |
Graco, Inc. | | | 337 | | | | 14,103 | |
Harsco Corp.(1) | | | 376 | | | | 7,467 | |
Hawaiian Holdings, Inc. | | | 7 | | | | 185 | |
HD Supply Holdings, Inc.(1) | | | 374 | | | | 14,032 | |
Heidrick & Struggles International, Inc. | | | 43 | | | | 1,341 | |
Hillenbrand, Inc. | | | 633 | | | | 24,010 | |
HNI Corp. | | | 5 | | | | 177 | |
Huntington Ingalls Industries, Inc. | | | 153 | | | | 29,117 | |
Hurco Cos., Inc. | | | 89 | | | | 3,177 | |
Hyster-Yale Materials Handling, Inc. | | | 21 | | | | 1,301 | |
Infrastructure and Energy Alternatives, Inc.(1) | | | 172 | | | | 1,409 | |
Ingersoll-Rand PLC | | | 77 | | | | 7,025 | |
ITT, Inc. | | | 25 | | | | 1,207 | |
JB Hunt Transport Services, Inc. | | | 69 | | | | 6,420 | |
Kadant, Inc. | | | 34 | | | | 2,770 | |
KBR, Inc. | | | 335 | | | | 5,085 | |
Kelly Services, Inc. - Class A | | | 56 | | | | 1,147 | |
Kennametal, Inc. | | | 120 | | | | 3,994 | |
Kforce, Inc. | | | 15 | | | | 464 | |
Kimball International, Inc. - Class B | | | 127 | | | | 1,802 | |
Landstar System, Inc. | | | 214 | | | | 20,473 | |
LB Foster Co. - Class A(1) | | | 17 | | | | 270 | |
LSC Communications, Inc. | | | 107 | | | | 749 | |
LSI Industries, Inc. | | | 62 | | | | 197 | |
ManpowerGroup, Inc. | | | 15 | | | | 972 | |
Masonite International Corp.(1) | | | 270 | | | | 12,104 | |
Matson, Inc. | | | 333 | | | | 10,663 | |
Miller Industries, Inc./TN | | | 276 | | | | 7,452 | |
MSC Industrial Direct Co., Inc. | | | 140 | | | | 10,769 | |
Navigant Consulting, Inc. | | | 310 | | | | 7,456 | |
NCI Building Systems, Inc.(1) | | | 677 | | | | 4,908 | |
Nexeo Solutions, Inc.(1) | | | 202 | | | | 1,735 | |
Norfolk Southern Corp. | | | 1,405 | | | | 210,104 | |
Old Dominion Freight Line, Inc. | | | 58 | | | | 7,162 | |
Oshkosh Corp. | | | 92 | | | | 5,641 | |
PACCAR, Inc. | | | 1,630 | | | | 93,138 | |
Park-Ohio Holdings Corp. | | | 68 | | | | 2,087 | |
Patrick Industries, Inc.(1) | | | 98 | | | | 2,902 | |
Pitney Bowes, Inc. | | | 33 | | | | 195 | |
Quad/Graphics, Inc. | | | 233 | | | | 2,871 | |
Quanex Building Products Corp. | | | 96 | | | | 1,305 | |
Quanta Services, Inc. | | | 162 | | | | 4,876 | |
Radiant Logistics, Inc.(1) | | | 165 | | | | 701 | |
RBC Bearings, Inc.(1) | | | 31 | | | | 4,064 | |
Regal Beloit Corp. | | | 5 | | | | 350 | |
Republic Services, Inc. | | | 608 | | | | 43,831 | |
Rollins, Inc. | | | 373 | | | | 13,465 | |
RR Donnelley & Sons Co. | | | 301 | | | | 1,192 | |
Spirit AeroSystems Holdings, Inc. | | | 109 | | | | 7,858 | |
Steelcase, Inc. - Class A | | | 396 | | | | 5,873 | |
Systemax, Inc. | | | 4 | | | | 96 | |
Tetra Tech, Inc. | | | 40 | | | | 2,071 | |
Timken Co./The | | | 89 | | | | 3,321 | |
Toro Co./The | | | 406 | | | | 22,687 | |
TriMas Corp.(1) | | | 205 | | | | 5,594 | |
UniFirst Corp./MA | | | 26 | | | | 3,720 | |
Union Pacific Corp. | | | 1,909 | | | | 263,881 | |
United Continental Holdings, Inc.(1) | | | 2,165 | | | | 181,275 | |
Universal Logistics Holdings, Inc. | | | 66 | | | | 1,194 | |
US Xpress Enterprises, Inc.(1) | | | 163 | | | | 914 | |
Vectrus, Inc.(1) | | | 189 | | | | 4,079 | |
Vivint Solar, Inc.(1) | | | 21 | | | | 80 | |
Wabash National Corp. | | | 381 | | | | 4,983 | |
Waste Management, Inc. | | | 1,206 | | | | 107,322 | |
WW Grainger, Inc. | | | 15 | | | | 4,235 | |
| | | | | | | | 1,737,547 | |
| | | | | | | | | |
Information Technology — 3.7% | | | | | | | | |
ACI Worldwide, Inc.(1) | | | 270 | | | | 7,471 | |
Adobe, Inc.(1) | | | 741 | | | | 167,644 | |
Advanced Micro Devices, Inc.(1) | | | 817 | | | | 15,082 | |
Agilysys, Inc.(1) | | | 65 | | | | 932 | |
Amkor Technology, Inc.(1) | | | 1,065 | | | | 6,986 | |
ANSYS, Inc.(1) | | | 3 | | | | 429 | |
Apple, Inc. | | | 4,529 | | | | 714,404 | |
ARRIS International PLC(1) | | | 149 | | | | 4,555 | |
Arrow Electronics, Inc.(1) | | | 229 | | | | 15,790 | |
Aspen Technology, Inc.(1) | | | 101 | | | | 8,300 | |
Avaya Holdings Corp.(1) | | | 308 | | | | 4,484 | |
Avnet, Inc. | | | 930 | | | | 33,573 | |
Booz Allen Hamilton Holding Corp. | | | 232 | | | | 10,456 | |
Bottomline Technologies DE, Inc.(1) | | | 185 | | | | 8,880 | |
Cabot Microelectronics Corp. | | | 146 | | | | 13,921 | |
CACI International, Inc. - Class A(1) | | | 88 | | | | 12,675 | |
Cadence Design Systems, Inc.(1) | | | 958 | | | | 41,654 | |
The accompanying notes are an integral part of these financial statements.
Page 94 | 2018 Annual Report | December 31, 2018 |
Schedule of Investments
December 31, 2018
Conservative Allocation Fund |
Security Description | | Shares or
Principal
Amount ($) | | | Fair
Value ($) | |
Common Stocks — continued |
CDK Global, Inc. | | | 46 | | | | 2,202 | |
CDW Corp./DE | | | 188 | | | | 15,237 | |
ChannelAdvisor Corp.(1) | | | 51 | | | | 579 | |
Ciena Corp.(1) | | | 561 | | | | 19,024 | |
Cirrus Logic, Inc.(1) | | | 198 | | | | 6,570 | |
Cisco Systems, Inc. | | | 8,149 | | | | 353,096 | |
Cision, Ltd.(1) | | | 21 | | | | 246 | |
Comtech Telecommunications Corp. | | | 142 | | | | 3,456 | |
Dell Technologies, Inc. - Class C(1) | | | 1,241 | | | | 60,648 | |
Dolby Laboratories, Inc. | | | 235 | | | | 14,532 | |
DXC Technology Co. | | | 773 | | | | 41,100 | |
Electro Scientific Industries, Inc.(1) | | | 21 | | | | 629 | |
ePlus, Inc.(1) | | | 6 | | | | 427 | |
Euronet Worldwide, Inc.(1) | | | 63 | | | | 6,450 | |
EVERTEC, Inc. | | | 75 | | | | 2,153 | |
F5 Networks, Inc.(1) | | | 523 | | | | 84,742 | |
Fabrinet(1) | | | 196 | | | | 10,057 | |
Fair Isaac Corp.(1) | | | 33 | | | | 6,171 | |
Fortinet, Inc.(1) | | | 664 | | | | 46,766 | |
Hewlett Packard Enterprise Co. | | | 9,959 | | | | 131,558 | |
HP, Inc. | | | 7,276 | | | | 148,867 | |
Immersion Corp.(1) | | | 102 | | | | 914 | |
Insight Enterprises, Inc.(1) | | | 236 | | | | 9,617 | |
Integrated Device Technology, Inc.(1) | | | 117 | | | | 5,666 | |
Intel Corp. | | | 4,883 | | | | 229,159 | |
InterDigital, Inc. | | | 297 | | | | 19,730 | |
Intuit, Inc. | | | 1,096 | | | | 215,748 | |
j2 Global, Inc. | | | 138 | | | | 9,574 | |
Jabil, Inc. | | | 533 | | | | 13,213 | |
Juniper Networks, Inc. | | | 3,162 | | | | 85,089 | |
KEMET Corp. | | | 41 | | | | 719 | |
KLA-Tencor Corp. | | | 131 | | | | 11,723 | |
Lam Research Corp. | | | 126 | | | | 17,157 | |
Leidos Holdings, Inc. | | | 167 | | | | 8,804 | |
LivePerson, Inc.(1) | | | 194 | | | | 3,659 | |
Majesco(1) | | | 18 | | | | 128 | |
Mastercard, Inc. | | | 1,197 | | | | 225,814 | |
Micron Technology, Inc.(1) | | | 6,106 | | | | 193,743 | |
Microsoft Corp. | | | 7,229 | | | | 734,250 | |
MicroStrategy, Inc.(1) | | | 11 | | | | 1,405 | |
Mitek Systems, Inc.(1) | | | 92 | | | | 995 | |
MKS Instruments, Inc. | | | 140 | | | | 9,045 | |
MoneyGram International, Inc.(1) | | | 898 | | | | 1,796 | |
Monotype Imaging Holdings, Inc. | | | 31 | | | | 481 | |
Nanometrics, Inc.(1) | | | 197 | | | | 5,384 | |
Napco Security Technologies, Inc.(1) | | | 68 | | | | 1,071 | |
National Instruments Corp. | | | 35 | | | | 1,588 | |
NetApp, Inc. | | | 1,186 | | | | 70,769 | |
Novanta, Inc.(1) | | | 44 | | | | 2,772 | |
Nuance Communications, Inc.(1) | | | 1,268 | | | | 16,776 | |
NVE Corp. | | | 5 | | | | 438 | |
Oracle Corp. | | | 3,194 | | | | 144,209 | |
PC Connection, Inc. | | | 154 | | | | 4,578 | |
Photronics, Inc.(1) | | | 554 | | | | 5,363 | |
Progress Software Corp. | | | 293 | | | | 10,399 | |
PTC, Inc.(1) | | | 82 | | | | 6,798 | |
Quantenna Communications, Inc.(1) | | | 314 | | | | 4,506 | |
SailPoint Technologies Holding, Inc.(1) | | | 133 | | | | 3,124 | |
ScanSource, Inc.(1) | | | 29 | | | | 997 | |
Semtech Corp.(1) | | | 199 | | | | 9,128 | |
SendGrid, Inc.(1) | | | 128 | | | | 5,526 | |
SMART Global Holdings, Inc.(1) | | | 99 | | | | 2,940 | |
Symantec Corp. | | | 1,248 | | | | 23,581 | |
Synopsys, Inc.(1) | | | 647 | | | | 54,503 | |
Tableau Software, Inc.(1) | | | 36 | | | | 4,320 | |
Tech Data Corp.(1) | | | 136 | | | | 11,126 | |
Texas Instruments, Inc. | | | 2,703 | | | | 255,434 | |
Trade Desk, Inc./The(1) | | | 68 | | | | 7,892 | |
Ubiquiti Networks, Inc. | | | 48 | | | | 4,772 | |
Unisys Corp.(1) | | | 149 | | | | 1,733 | |
Verint Systems, Inc.(1) | | | 381 | | | | 16,120 | |
Versum Materials, Inc. | | | 13 | | | | 360 | |
Visa, Inc. | | | 141 | | | | 18,604 | |
Vishay Precision Group, Inc.(1) | | | 51 | | | | 1,542 | |
Workiva, Inc.(1) | | | 51 | | | | 1,830 | |
Xilinx, Inc. | | | 1,060 | | | | 90,280 | |
Zebra Technologies Corp. - Class A(1) | | | 86 | | | | 13,694 | |
Zix Corp.(1) | | | 165 | | | | 945 | |
| | | | | | | | 4,623,277 | |
| | | | | | | | | |
Materials — 0.4% | | | | | | | | |
CF Industries Holdings, Inc. | | | 476 | | | | 20,711 | |
Chemours Co./The | | | 558 | | | | 15,747 | |
Eagle Materials, Inc. | | | 600 | | | | 36,618 | |
FutureFuel Corp. | | | 380 | | | | 6,027 | |
Greif, Inc. - Class A | | | 250 | | | | 9,278 | |
Huntsman Corp. | | | 144 | | | | 2,778 | |
International Paper Co. | | | 1,233 | | | | 49,764 | |
Louisiana-Pacific Corp. | | | 801 | | | | 17,798 | |
LyondellBasell Industries NV | | | 2,320 | | | | 192,931 | |
Mosaic Co./The | | | 696 | | | | 20,330 | |
Nucor Corp. | | | 1,671 | | | | 86,575 | |
PPG Industries, Inc. | | | 337 | | | | 34,452 | |
Reliance Steel & Aluminum Co. | | | 94 | | | | 6,690 | |
The accompanying notes are an integral part of these financial statements.
2018 Annual Report | December 31, 2018 | Page 95 |
Schedule of Investments
December 31, 2018
Conservative Allocation Fund |
Security Description | | Shares or
Principal
Amount ($) | | | Fair
Value ($) | |
Common Stocks — continued |
Steel Dynamics, Inc. | | | 840 | | | | 25,234 | |
Trinseo SA | | | 293 | | | | 13,414 | |
Verso Corp.(1) | | | 59 | | | | 1,322 | |
| | | | | | | | 539,669 | |
| | | | | | | | | |
Real Estate Investment Trust — 0.7% | | | | | | | | |
American Assets Trust, Inc. | | | 429 | | | | 17,233 | |
American Tower Corp. | | | 255 | | | | 40,338 | |
Bluerock Residential Growth REIT, Inc. | | | 251 | | | | 2,264 | |
CatchMark Timber Trust, Inc. | | | 686 | | | | 4,871 | |
Cedar Realty Trust, Inc. | | | 53 | | | | 166 | |
CoreCivic, Inc. | | | 326 | | | | 5,813 | |
CubeSmart | | | 528 | | | | 15,148 | |
Essex Property Trust, Inc. | | | 728 | | | | 178,513 | |
Farmland Partners, Inc. | | | 130 | | | | 590 | |
Front Yard Residential Corp. | | | 76 | | | | 663 | |
Gaming and Leisure Properties, Inc. | | | 335 | | | | 10,824 | |
GEO Group, Inc./The | | | 344 | | | | 6,777 | |
Hospitality Properties Trust | | | 1,028 | | | | 24,549 | |
Host Hotels & Resorts, Inc. | | | 4,078 | | | | 67,980 | |
Lamar Advertising Co. | | | 506 | | | | 35,005 | |
Maui Land & Pineapple Co., Inc.(1) | | | 12 | | | | 119 | |
New Senior Investment Group, Inc. | | | 581 | | | | 2,394 | |
Pebblebrook Hotel Trust | | | 136 | | | | 3,850 | |
Pennsylvania Real Estate Investment Trust | | | 436 | | | | 2,590 | |
Piedmont Office Realty Trust, Inc. | | | 1,763 | | | | 30,042 | |
PotlatchDeltic Corp. | | | 117 | | | | 3,702 | |
PS Business Parks, Inc. | | | 97 | | | | 12,707 | |
RAIT Financial Trust(1) | | | 218 | | | | 122 | |
Redfin Corp.(1) | | | 200 | | | | 2,880 | |
Retail Properties of America, Inc. | | | 178 | | | | 1,931 | |
Retail Value, Inc. | | | 308 | | | | 7,882 | |
Simon Property Group, Inc. | | | 1,259 | | | | 211,499 | |
Tanger Factory Outlet Centers, Inc. | | | 623 | | | | 12,597 | |
Trinity Place Holdings, Inc.(1) | | | 367 | | | | 1,593 | |
UDR, Inc. | | | 4,389 | | | | 173,892 | |
Urstadt Biddle Properties, Inc. | | | 411 | | | | 7,899 | |
| | | | | | | | 886,433 | |
| | | | | | | | | |
Utilities — 0.7% | | | | | | | | |
AES Corp./VA | | | 3,605 | | | | 52,128 | |
Atlantic Power Corp.(1) | | | 537 | | | | 1,165 | |
CenterPoint Energy, Inc. | | | 5,391 | | | | 152,188 | |
Exelon Corp. | | | 4,578 | | | | 206,464 | |
MDU Resources Group, Inc. | | | 518 | | | | 12,349 | |
NextEra Energy, Inc. | | | 1,401 | | | | 243,522 | |
NorthWestern Corp. | | | 15 | | | | 892 | |
NRG Energy, Inc. | | | 696 | | | | 27,562 | |
OGE Energy Corp. | | | 713 | | | | 27,942 | |
Portland General Electric Co. | | | 122 | | | | 5,594 | |
UGI Corp. | | | 3,157 | | | | 168,411 | |
| | | | | | | | 898,217 | |
| | | | | | | | | |
Total Common Stocks (Cost $24,272,725) | | | | | | | 23,046,473 | |
| | | | | | | | | |
Registered Investment Companies — 65.6% |
American Beacon SiM High Yield Opportunities Fund - Class I | | | 446,417 | | | | 4,031,149 | |
Baird Core Plus Bond Fund - Class I | | | 425,236 | | | | 4,601,059 | |
Dodge & Cox Income Fund | | | 420,061 | | | | 5,570,003 | |
DoubleLine Total Return Bond Fund - Class I | | | 538,492 | | | | 5,611,087 | |
Frost Total Return Bond Fund - Class I | | | 542,319 | | | | 5,531,651 | |
Guggenheim Total Return Bond Fund - Class I | | | 211,191 | | | | 5,615,562 | |
iShares Core U.S. Aggregate Bond ETF(8) | | | 94,729 | | | | 10,087,691 | |
Lord Abbett High Yield Fund - Class I | | | 699,841 | | | | 4,842,898 | |
Payden Emerging Markets Bond Fund - Class I | | | 356,981 | | | | 4,458,696 | |
PGIM Total Return Bond Fund - Class R6 | | | 228,818 | | | | 3,187,429 | |
PIMCO Investment Grade Credit Bond Fund - Class I | | | 161,267 | | | | 1,598,153 | |
Pioneer Bond Fund - Class Y | | | 606,549 | | | | 5,622,710 | |
Segall Bryant & Hamill Plus Bond Fund - Class I | | | 314,644 | | | | 3,218,804 | |
TCW Emerging Markets Income Fund - Class I | | | 1,167,106 | | | | 8,951,704 | |
Vanguard Intermediate-Term Corporate Bond ETF(8) | | | 31,990 | | | | 2,650,691 | |
Vanguard Total Bond Market ETF(8) | | | 115,800 | | | | 9,172,517 | |
Total Registered Investment Companies (Cost $86,858,667) | | | | | | | 84,751,804 | |
| | | | | | | | | |
Money Market Registered Investment Companies — 10.6% |
Morgan Stanley Government Institutional Fund, 2.32%(3) | | | 520 | | | | 520 | |
Meeder Institutional Prime Money Market Fund, 2.43%(4) | | | 13,764,158 | | | | 13,762,782 | |
Total Money Market Registered Investment Companies (Cost $13,763,076) | | | | | | | 13,763,302 | |
The accompanying notes are an integral part of these financial statements.
Page 96 | 2018 Annual Report | December 31, 2018 |
Schedule of Investments
December 31, 2018
Conservative Allocation Fund |
Security Description | | Shares or
Principal
Amount ($) | | | Fair
Value ($) | |
Bank Obligations — 0.2% | | | | | | | | |
Pacific Premier Bank Deposit Account, 2.30%, 1/2/2019(5) | | | 249,192 | | | | 249,192 | |
Total Bank Obligations (Cost $249,192) | | | | | | | 249,192 | |
| | | | | | | | | |
U.S. Government Obligations — 4.9% | | | | | | | | |
U.S. Treasury Note, 2.25%, due 11/15/2025 | | | 3,793,000 | | | | 3,709,287 | |
U.S. Treasury Note, 1.88%, due 12/31/2019 | | | 1,391,000 | | | | 1,380,894 | |
U.S. Treasury Note, 2.13%, due 12/31/2022 | | | 1,299,000 | | | | 1,280,682 | |
Total U.S. Government Obligations (Cost $6,311,403) | | | | | | | 6,370,863 | |
Total Investments — 99.1%(Cost $131,455,063) | | | | | | | 128,181,634 | |
Other Assets less Liabilities — 0.9% | | | | | | | 1,099,253 | |
Total Net Assets — 100.0% | | | | | | | 129,280,887 | |
| | | | | | | | | |
Trustee Deferred Compensation(6) | | | | | | | | |
Meeder Balanced Fund | | | 967 | | | | 10,714 | |
Meeder Dynamic Allocation Fund | | | 2,449 | | | | 23,976 | |
Meeder Muirfield Fund | | | 1,137 | | | | 8,141 | |
Meeder Conservative Allocation Fund | | | 277 | | | | 5,867 | |
Total Trustee Deferred Compensation (Cost $48,549) | | | | | | | 48,698 | |
Conservative Allocation |
| | | Long
(Short)
Contracts | | | Expiration
Date | | | Notional
Value of
Contracts
($) | | | Value and
Unrealized
Appreciation
(Depreciation)
($) | |
Futures Contracts |
Index Futures | | | | | | | | | | | | | | | | |
Mini MSCI EAFE Index Futures | | | 3 | | | | 3/15/2019 | | | | 257,400 | | | | (4,146 | ) |
Mini MSCI Emerging Markets Index Futures | | | 4 | | | | 3/15/2019 | | | | 193,360 | | | | (685 | ) |
Russell 2000 Mini Index Futures | | | (16 | ) | | | 3/15/2019 | | | | (1,079,200 | ) | | | 26,336 | |
Standard & Poors 500 Mini Futures | | | (104 | ) | | | 3/15/2019 | | | | (13,027,040 | ) | | | 153,010 | |
E-mini Standard & Poors MidCap 400 Futures | | | (21 | ) | | | 3/15/2019 | | | | (3,490,620 | ) | | | 45,233 | |
Total Futures Contracts | | | (134 | ) | | | | | | | (17,146,100 | ) | | | 219,748 | |
(1) | Represents non-income producing securities. |
(2) | All or a portion of this security is on loan. |
(3) | Investment purchased with cash received as securities lending collateral. The yield shown represents the 7-day yield in effect at December 31, 2018. |
(4) | Investment in affiliate. The yield shown represents the 7-day yield in effect at December 31, 2018. |
(5) | Variable rate security. Securities payable at par including accrued interest (usually within seven days notice) and unconditionally secured as to principal and interest by letters of credit or other credit support agreements from major banks. The interest rates are adjustable and are not based on a published reference rate and spread but are determined by the issuer or agent and are based on current market conditions. These securities do not indicate a reference rate and spread in their description above. The rate shown represents the rate in effect at December 31, 2018. The maturity date shown, if applicable, reflects the earlier of the next demand date or stated maturity date. |
(6) | Assets of affiliates to the Conservative Allocation Fund held for the benefit of the Fund’s Trustees in connection with the Trustees Deferred Compensation Plan. |
(7) | Fair valued security deemed as Level 3 security. |
The accompanying notes are an integral part of these financial statements.
2018 Annual Report | December 31, 2018 | Page 97 |
Schedule of Investments
December 31, 2018
Dynamic Allocation Fund |
Security Description | | Shares or
Principal
Amount ($) | | | Fair
Value ($) | |
Common Stocks — 69.6% |
Communication Services — 7.4% | | | | | | | | |
Alphabet, Inc. - Class A(1) | | | 571 | | | | 596,672 | |
Alphabet, Inc. - Class C(1) | | | 1,886 | | | | 1,953,160 | |
AMC Entertainment Holdings, Inc. | | | 2,604 | | | | 31,977 | |
AMC Networks, Inc.(1) | | | 1,884 | | | | 103,394 | |
AT&T, Inc. | | | 22,580 | | | | 644,433 | |
ATN International, Inc. | | | 7 | | | | 501 | |
Cable One, Inc. | | | 298 | | | | 244,390 | |
Cincinnati Bell, Inc.(1) | | | 927 | | | | 7,212 | |
Cinemark Holdings, Inc. | | | 2,814 | | | | 100,741 | |
Comcast Corp. - Class A | | | 18,890 | | | | 643,205 | |
Discovery, Inc.(1) | | | 7,955 | | | | 183,601 | |
EW Scripps Co./The | | | 283 | | | | 4,452 | |
Facebook, Inc.(1) | | | 8,641 | | | | 1,132,749 | |
Frontier Communications Corp. | | | 3,685 | | | | 8,770 | |
Gray Television, Inc.(1) | | | 2,303 | | | | 33,946 | |
Intelsat SA(1) | | | 391 | | | | 8,363 | |
Interpublic Group of Cos., Inc./The | | | 1,470 | | | | 30,326 | |
Liberty TripAdvisor Holdings, Inc.(1) | | | 525 | | | | 8,342 | |
Marcus Corp./The | | | 736 | | | | 29,072 | |
MDC Partners, Inc.(1) | | | 1,414 | | | | 3,691 | |
MSG Networks, Inc.(1) | | | 173 | | | | 4,076 | |
National CineMedia, Inc. | | | 921 | | | | 5,968 | |
Nexstar Media Group, Inc. | | | 829 | | | | 65,193 | |
NII Holdings, Inc.(1) | | | 511 | | | | 2,254 | |
Ooma, Inc.(1) | | | 110 | | | | 1,527 | |
Rosetta Stone, Inc.(1) | | | 550 | | | | 9,020 | |
Shenandoah Telecommunications Co. | | | 422 | | | | 18,674 | |
Spok Holdings, Inc. | | | 1,876 | | | | 24,876 | |
Telephone & Data Systems, Inc. | | | 2,567 | | | | 83,530 | |
T-Mobile US, Inc.(1) | | | 15,569 | | | | 990,344 | |
Travelzoo(1) | | | 49 | | | | 482 | |
Tribune Publishing Co.(1) | | | 499 | | | | 5,659 | |
Twenty-First Century Fox, Inc. - Class A | | | 22,929 | | | | 1,103,343 | |
Twenty-First Century Fox, Inc. - Class B | | | 16,243 | | | | 776,091 | |
United States Cellular Corp.(1) | | | 800 | | | | 41,576 | |
Verizon Communications, Inc. | | | 34,604 | | | | 1,945,437 | |
Viacom, Inc. | | | 10,755 | | | | 276,404 | |
Vonage Holdings Corp.(1) | | | 1,171 | | | | 10,223 | |
Walt Disney Co./The | | | 15,054 | | | | 1,650,671 | |
WideOpenWest, Inc.(1) | | | 2,250 | | | | 16,043 | |
| | | | | | | | 12,800,388 | |
| | | | | | | | | |
Consumer Discretionary — 5.7% | | | | | | | | |
Aaron's, Inc. | | | 449 | | | | 18,880 | |
Amazon.com, Inc.(1) | | | 1,971 | | | | 2,960,383 | |
Bassett Furniture Industries, Inc. | | | 936 | | | | 18,757 | |
Bed Bath & Beyond, Inc.(2) | | | 2,441 | | | | 27,632 | |
Best Buy Co., Inc. | | | 6,273 | | | | 332,218 | |
BJ's Restaurants, Inc. | | | 54 | | | | 2,731 | |
Bloomin' Brands, Inc. | | | 935 | | | | 16,727 | |
Bojangles', Inc.(1) | | | 83 | | | | 1,335 | |
Brinker International, Inc. | | | 502 | | | | 22,078 | |
Callaway Golf Co. | | | 2,619 | | | | 40,071 | |
Capri Holdings, Ltd.(1) | | | 4,430 | | | | 167,986 | |
Carrols Restaurant Group, Inc.(1) | | | 602 | | | | 5,924 | |
Clarus Corp. | | | 853 | | | | 8,632 | |
Darden Restaurants, Inc. | | | 1,573 | | | | 157,080 | |
Dave & Buster's Entertainment, Inc. | | | 474 | | | | 21,121 | |
Deckers Outdoor Corp.(1) | | | 138 | | | | 17,657 | |
Dick's Sporting Goods, Inc. | | | 480 | | | | 14,976 | |
Dine Brands Global, Inc. | | | 14 | | | | 943 | |
Domino's Pizza, Inc. | | | 923 | | | | 228,895 | |
Dunkin' Brands Group, Inc. | | | 218 | | | | 13,978 | |
El Pollo Loco Holdings, Inc.(1) | | | 61 | | | | 925 | |
Ethan Allen Interiors, Inc. | | | 1,966 | | | | 34,582 | |
Etsy, Inc.(1) | | | 616 | | | | 29,303 | |
Express, Inc.(1) | | | 661 | | | | 3,378 | |
Extended Stay America, Inc. | | | 3,305 | | | | 51,228 | |
Flexsteel Industries, Inc. | | | 131 | | | | 2,892 | |
Foot Locker, Inc. | | | 1,022 | | | | 54,370 | |
Ford Motor Co. | | | 28,909 | | | | 221,154 | |
Fox Factory Holding Corp.(1) | | | 355 | | | | 20,899 | |
Garmin, Ltd. | | | 1,017 | | | | 64,396 | |
Gentex Corp. | | | 5,087 | | | | 102,808 | |
H&R Block, Inc. | | | 2,374 | | | | 60,228 | |
Helen of Troy, Ltd.(1) | | | 121 | | | | 15,873 | |
J Alexander's Holdings, Inc.(1) | | | 655 | | | | 5,391 | |
Kohl's Corp. | | | 730 | | | | 48,428 | |
Lands' End, Inc.(1) | | | 110 | | | | 1,563 | |
La-Z-Boy, Inc. | | | 669 | | | | 18,538 | |
Lear Corp. | | | 996 | | | | 122,369 | |
Liberty Expedia Holdings, Inc.(1) | | | 2,676 | | | | 104,658 | |
Lululemon Athletica, Inc.(1) | | | 1,680 | | | | 204,305 | |
M/I Homes, Inc.(1) | | | 857 | | | | 18,014 | |
Macy's, Inc. | | | 1,974 | | | | 58,786 | |
Malibu Boats, Inc.(1) | | | 170 | | | | 5,916 | |
MasterCraft Boat Holdings, Inc.(1) | | | 226 | | | | 4,226 | |
MDC Holdings, Inc. | | | 697 | | | | 19,593 | |
NIKE, Inc. - Class B | | | 598 | | | | 44,336 | |
Norwegian Cruise Line Holdings, Ltd.(1) | | | 2,690 | | | | 114,029 | |
Nutrisystem, Inc. | | | 11 | | | | 483 | |
NVR, Inc.(1) | | | 71 | | | | 173,026 | |
Office Depot, Inc. | | | 1,729 | | | | 4,461 | |
The accompanying notes are an integral part of these financial statements.
Page 98 | 2018 Annual Report | December 31, 2018 |
Schedule of Investments
December 31, 2018
Dynamic Allocation Fund |
Security Description | | Shares or
Principal
Amount ($) | | | Fair
Value ($) | |
Common Stocks — continued |
Penn National Gaming, Inc.(1) | | | 842 | | | | 15,855 | |
Ross Stores, Inc. | | | 4,371 | | | | 363,667 | |
Signet Jewelers, Ltd. | | | 134 | | | | 4,257 | |
Speedway Motorsports, Inc. | | | 489 | | | | 7,956 | |
Starbucks Corp. | | | 10,232 | | | | 658,941 | |
Stoneridge, Inc.(1) | | | 410 | | | | 10,107 | |
Superior Industries International, Inc. | | | 84 | | | | 404 | |
Target Corp. | | | 13,147 | | | | 868,885 | |
Taylor Morrison Home Corp.(1) | | | 2,916 | | | | 46,364 | |
Thor Industries, Inc. | | | 329 | | | | 17,108 | |
TJX Cos., Inc./The | | | 26,344 | | | | 1,178,631 | |
Tower International, Inc. | | | 670 | | | | 15,946 | |
Turtle Beach Corp.(1) | | | 117 | | | | 1,670 | |
Vera Bradley, Inc.(1) | | | 1,284 | | | | 11,004 | |
Wendy's Co./The | | | 813 | | | | 12,691 | |
Wyndham Hotels & Resorts, Inc. | | | 4,805 | | | | 218,003 | |
Yum! Brands, Inc. | | | 7,875 | | | | 723,870 | |
ZAGG, Inc.(1) | | | 12 | | | | 117 | |
| | | | | | | | 9,843,638 | |
| | | | | | | | | |
Consumer Staples — 3.0% | | | | | | | | |
Boston Beer Co., Inc./The(1) | | | 8 | | | | 1,927 | |
Church & Dwight Co., Inc. | | | 1,169 | | | | 76,873 | |
Conagra Brands, Inc. | | | 3,241 | | | | 69,228 | |
Costco Wholesale Corp. | | | 1,111 | | | | 226,322 | |
Flowers Foods, Inc. | | | 2,101 | | | | 38,805 | |
Hershey Co./The | | | 1,616 | | | | 173,203 | |
Keurig Dr Pepper, Inc. | | | 1,354 | | | | 34,717 | |
Kroger Co./The | | | 7,509 | | | | 206,498 | |
Lamb Weston Holdings, Inc. | | | 2,863 | | | | 210,602 | |
Medifast, Inc. | | | 20 | | | | 2,500 | |
Molson Coors Brewing Co. | | | 4,210 | | | | 236,434 | |
Natural Grocers by Vitamin Cottage, Inc.(1) | | | 196 | | | | 3,005 | |
PepsiCo, Inc. | | | 14,481 | | | | 1,599,861 | |
Procter & Gamble Co./The | | | 8,993 | | | | 826,637 | |
Simply Good Foods Co./The(1) | | | 1,053 | | | | 19,902 | |
SpartanNash Co. | | | 43 | | | | 739 | |
Sprouts Farmers Market, Inc.(1) | | | 1,984 | | | | 46,644 | |
Tyson Foods, Inc. | | | 5,512 | | | | 294,341 | |
Village Super Market, Inc. | | | 688 | | | | 18,397 | |
Walgreens Boots Alliance, Inc. | | | 10,679 | | | | 729,696 | |
Walmart, Inc. | | | 5,148 | | | | 479,536 | |
| | | | | | | | 5,295,867 | |
| | | | | | | | | |
Energy — 5.1% | | | | | | | | |
Anadarko Petroleum Corp. | | | 5,923 | | | | 259,664 | |
Arch Coal, Inc. - Class A | | | 243 | | | | 20,167 | |
Archrock, Inc. | | | 3,495 | | | | 26,178 | |
C&J Energy Services, Inc.(1) | | | 18 | | | | 243 | |
Cactus, Inc.(1) | | | 1,040 | | | | 28,506 | |
Chesapeake Energy Corp.(1) | | | 8,518 | | | | 17,888 | |
Chevron Corp. | | | 6,093 | | | | 662,857 | |
ConocoPhillips | | | 19,436 | | | | 1,211,835 | |
CONSOL Energy, Inc.(1) | | | 249 | | | | 7,896 | |
Covia Holdings Corp.(1) | | | 4,938 | | | | 16,888 | |
CVR Energy, Inc. | | | 357 | | | | 12,309 | |
Denbury Resources, Inc.(1) | | | 509 | | | | 870 | |
Earthstone Energy, Inc.(1) | | | 1,287 | | | | 5,817 | |
EOG Resources, Inc. | | | 1,060 | | | | 92,443 | |
Evolution Petroleum Corp. | | | 1,241 | | | | 8,464 | |
Exxon Mobil Corp. | | | 20,907 | | | | 1,425,648 | |
Gulfport Energy Corp.(1) | | | 2,129 | | | | 13,945 | |
Hallador Energy Co. | | | 447 | | | | 2,266 | |
Helix Energy Solutions Group, Inc.(1) | | | 723 | | | | 3,911 | |
Helmerich & Payne, Inc. | | | 1,939 | | | | 92,956 | |
HollyFrontier Corp. | | | 3,937 | | | | 201,259 | |
Keane Group, Inc.(1) | | | 3,551 | | | | 29,047 | |
KLX Energy Services Holdings, Inc.(1) | | | 112 | | | | 2,626 | |
Mammoth Energy Services, Inc. | | | 510 | | | | 9,170 | |
Marathon Oil Corp. | | | 26,084 | | | | 374,045 | |
Marathon Petroleum Corp. | | | 18,542 | | | | 1,094,163 | |
Matrix Service Co.(1) | | | 1,604 | | | | 28,776 | |
Northern Oil and Gas, Inc.(1) | | | 2,334 | | | | 5,275 | |
Occidental Petroleum Corp. | | | 15,899 | | | | 975,881 | |
Overseas Shipholding Group, Inc.(1) | | | 381 | | | | 632 | |
PBF Energy, Inc. | | | 3,112 | | | | 101,669 | |
Peabody Energy Corp. | | | 1,483 | | | | 45,202 | |
Penn Virginia Corp.(1) | | | 91 | | | | 4,919 | |
Phillips 66 | | | 12,432 | | | | 1,071,017 | |
Pioneer Energy Services Corp.(1) | | | 281 | | | | 346 | |
Profire Energy, Inc.(1) | | | 562 | | | | 815 | |
ProPetro Holding Corp.(1) | | | 1,822 | | | | 22,447 | |
Renewable Energy Group, Inc.(1) | | | 177 | | | | 4,549 | |
SEACOR Holdings, Inc.(1) | | | 117 | | | | 4,329 | |
Southwestern Energy Co.(1) | | | 3,857 | | | | 13,152 | |
Targa Resources Corp. | | | 833 | | | | 30,005 | |
Unit Corp.(1) | | | 708 | | | | 10,110 | |
Valero Energy Corp. | | | 12,249 | | | | 918,308 | |
W&T Offshore, Inc.(1) | | | 2,805 | | | | 11,557 | |
WildHorse Resource Development Corp.(1) | | | 731 | | | | 10,314 | |
World Fuel Services Corp. | | | 1,242 | | | | 26,591 | |
| | | | | | | | 8,906,955 | |
The accompanying notes are an integral part of these financial statements.
2018 Annual Report | December 31, 2018 | Page 99 |
Schedule of Investments
December 31, 2018
Dynamic Allocation Fund |
Security Description | | Shares or
Principal
Amount ($) | | | Fair
Value ($) | |
Common Stocks — continued |
Financials — 9.4% | | | | | | | | |
American Equity Investment Life Holding Co. | | | 720 | | | | 20,117 | |
Arbor Realty Trust, Inc. | | | 6,562 | | | | 66,079 | |
Arthur J Gallagher & Co. | | | 766 | | | | 56,454 | |
Bancorp, Inc./The(1) | | | 4,832 | | | | 38,463 | |
Bank of America Corp. | | | 76,703 | | | | 1,889,962 | |
Bank of NT Butterfield & Son, Ltd./The | | | 1,559 | | | | 48,875 | |
BankUnited, Inc. | | | 276 | | | | 8,263 | |
Baycom Corp.(1) | | | 87 | | | | 2,009 | |
BB&T Corp. | | | 8,090 | | | | 350,459 | |
Berkshire Hathaway, Inc. - Class B(1) | | | 13,428 | | | | 2,741,729 | |
Blucora, Inc.(1) | | | 203 | | | | 5,408 | |
Cherry Hill Mortgage Investment Corp. | | | 5,546 | | | | 97,277 | |
CIT Group, Inc. | | | 144 | | | | 5,511 | |
Citizens Financial Group, Inc. | | | 3,659 | | | | 108,782 | |
Credit Acceptance Corp.(1) | | | 168 | | | | 64,136 | |
Discover Financial Services | | | 14,480 | | | | 854,030 | |
Essent Group, Ltd.(1) | | | 94 | | | | 3,213 | |
FB Financial Corp. | | | 228 | | | | 7,985 | |
Fidelity National Financial, Inc. | | | 977 | | | | 30,717 | |
Fifth Third Bancorp | | | 21,049 | | | | 495,283 | |
First BanCorp/Puerto Rico | | | 10,008 | | | | 86,069 | |
First Bancorp/Southern Pines NC | | | 407 | | | | 13,293 | |
First Interstate BancSystem, Inc. | | | 574 | | | | 20,985 | |
FirstCash, Inc. | | | 811 | | | | 58,676 | |
Genworth Financial, Inc.(1) | | | 1,151 | | | | 5,364 | |
Goosehead Insurance, Inc.(1) | | | 232 | | | | 6,099 | |
Health Insurance Innovations, Inc. - Class A(1) | | | 425 | | | | 11,360 | |
Huntington Bancshares, Inc./OH | | | 32,602 | | | | 388,616 | |
Independent Bank Corp./MI | | | 672 | | | | 14,125 | |
Investment Technology Group, Inc. | | | 156 | | | | 4,717 | |
JPMorgan Chase & Co. | | | 16,302 | | | | 1,591,401 | |
KeyCorp | | | 3,600 | | | | 53,208 | |
Ladder Capital Corp. | | | 6,086 | | | | 94,150 | |
Loews Corp. | | | 720 | | | | 32,774 | |
MB Financial, Inc. | | | 8,130 | | | | 322,192 | |
MBT Financial Corp. | | | 2,395 | | | | 22,274 | |
MGIC Investment Corp.(1) | | | 4,601 | | | | 48,126 | |
Moelis & Co. | | | 1,507 | | | | 51,811 | |
Mr Cooper Group, Inc.(1) | | | 1,185 | | | | 13,829 | |
National General Holdings Corp. | | | 1,750 | | | | 42,368 | |
New Residential Investment Corp. | | | 25,538 | | | | 362,895 | |
NewStar Financial Contingent Value Rights(1)(7) | | | 179 | | | | — | |
NMI Holdings, Inc. - Class A(1) | | | 750 | | | | 13,388 | |
Northrim BanCorp, Inc. | | | 585 | | | | 19,229 | |
OFG Bancorp | | | 1,571 | | | | 25,859 | |
Old Republic International Corp. | | | 15,474 | | | | 318,300 | |
On Deck Capital, Inc.(1) | | | 1,152 | | | | 6,797 | |
Oppenheimer Holdings, Inc. | | | 2,469 | | | | 63,083 | |
PacWest Bancorp | | | 7,017 | | | | 233,526 | |
PennyMac Financial Services, Inc. | | | 1,360 | | | | 28,914 | |
Popular, Inc. | | | 4,580 | | | | 216,268 | |
Progressive Corp./The | | | 17,703 | | | | 1,068,022 | |
Prudential Financial, Inc. | | | 8,392 | | | | 684,368 | |
Pzena Investment Management, Inc. | | | 1,736 | | | | 15,016 | |
Radian Group, Inc. | | | 5,723 | | | | 93,628 | |
Regions Financial Corp. | | | 55,154 | | | | 737,961 | |
Reinsurance Group of America, Inc. | | | 1,736 | | | | 243,439 | |
Santander Consumer USA Holdings, Inc. | | | 1,068 | | | | 18,786 | |
Stewart Information Services Corp. | | | 2,136 | | | | 88,430 | |
SunTrust Banks, Inc. | | | 17,639 | | | | 889,711 | |
Synchrony Financial | | | 4,168 | | | | 97,781 | |
TCF Financial Corp. | | | 15,930 | | | | 310,476 | |
Universal Insurance Holdings, Inc. | | | 618 | | | | 23,435 | |
Waddell & Reed Financial, Inc. | | | 157 | | | | 2,839 | |
Walker & Dunlop, Inc. | | | 1,039 | | | | 44,937 | |
Wells Fargo & Co. | | | 22,759 | | | | 1,048,735 | |
| | | | | | | | 16,432,012 | |
| | | | | | | | | |
Healthcare — 13.9% | | | | | | | | |
Abbott Laboratories | | | 4,913 | | | | 355,357 | |
AbbVie, Inc. | | | 6,981 | | | | 643,578 | |
ABIOMED, Inc.(1) | | | 641 | | | | 208,351 | |
ACADIA Pharmaceuticals, Inc.(1) | | | 1,211 | | | | 19,582 | |
Acceleron Pharma, Inc.(1) | | | 168 | | | | 7,316 | |
Achillion Pharmaceuticals, Inc.(1) | | | 4,305 | | | | 6,845 | |
Acorda Therapeutics, Inc.(1) | | | 1,388 | | | | 21,625 | |
ADMA Biologics, Inc.(1) | | | 310 | | | | 741 | |
Adverum Biotechnologies, Inc.(1) | | | 832 | | | | 2,621 | |
Aeglea BioTherapeutics, Inc.(1) | | | 534 | | | | 4,000 | |
Akebia Therapeutics, Inc.(1) | | | 468 | | | | 2,588 | |
Aldeyra Therapeutics, Inc.(1) | | | 1,357 | | | | 11,263 | |
Alexion Pharmaceuticals, Inc.(1) | | | 2,832 | | | | 275,724 | |
Alkermes PLC(1) | | | 548 | | | | 16,171 | |
Allena Pharmaceuticals, Inc.(1) | | | 347 | | | | 1,891 | |
Allergan PLC | | | 3,646 | | | | 487,324 | |
AMAG Pharmaceuticals, Inc.(1) | | | 1,345 | | | | 20,431 | |
Amedisys, Inc.(1) | | | 139 | | | | 16,278 | |
AmerisourceBergen Corp. | | | 554 | | | | 41,218 | |
Amgen, Inc. | | | 7,597 | | | | 1,478,908 | |
Amphastar Pharmaceuticals, Inc.(1) | | | 787 | | | | 15,661 | |
The accompanying notes are an integral part of these financial statements.
Page 100 | 2018 Annual Report | December 31, 2018 |
Schedule of Investments
December 31, 2018
Dynamic Allocation Fund |
Security Description | | Shares or
Principal
Amount ($) | | | Fair
Value ($) | |
Common Stocks — continued |
Ampio Pharmaceuticals, Inc.(1) | | | 2,450 | | | | 967 | |
Apellis Pharmaceuticals, Inc.(1) | | | 97 | | | | 1,279 | |
AquaBounty Technologies, Inc.(1) | | | 3,494 | | | | 7,163 | |
Aquestive Therapeutics, Inc.(1) | | | 594 | | | | 3,742 | |
Aratana Therapeutics, Inc.(1) | | | 90 | | | | 552 | |
Arbutus Biopharma Corp.(1) | | | 286 | | | | 1,095 | |
Arena Pharmaceuticals, Inc.(1) | | | 864 | | | | 33,653 | |
ArQule, Inc.(1) | | | 2,902 | | | | 8,039 | |
Array BioPharma, Inc.(1) | | | 741 | | | | 10,559 | |
Arrowhead Pharmaceuticals, Inc.(1) | | | 690 | | | | 8,570 | |
Assertio Therapeutics, Inc.(1) | | | 1,454 | | | | 5,249 | |
Atara Biotherapeutics, Inc.(1) | | | 378 | | | | 13,132 | |
AVEO Pharmaceuticals, Inc.(1) | | | 501 | | | | 802 | |
Avid Bioservices, Inc.(1) | | | 1,479 | | | | 6,064 | |
Baxter International, Inc. | | | 16,189 | | | | 1,065,560 | |
BioCryst Pharmaceuticals, Inc.(1) | | | 392 | | | | 3,163 | |
Biogen, Inc.(1) | | | 3,734 | | | | 1,123,635 | |
Bio-Techne Corp. | | | 113 | | | | 16,353 | |
BioTelemetry, Inc.(1) | | | 371 | | | | 22,156 | |
Bruker Corp. | | | 1,247 | | | | 37,123 | |
Calithera Biosciences, Inc.(1) | | | 2,486 | | | | 9,969 | |
Cardinal Health, Inc. | | | 6,440 | | | | 287,224 | |
CareDx, Inc.(1) | | | 756 | | | | 19,006 | |
CASI Pharmaceuticals, Inc.(1) | | | 1,971 | | | | 7,923 | |
Catalent, Inc.(1) | | | 3,810 | | | | 118,796 | |
Catalyst Biosciences, Inc.(1) | | | 21 | | | | 166 | |
Catalyst Pharmaceuticals, Inc.(1) | | | 6,140 | | | | 11,789 | |
Celgene Corp.(1) | | | 16,904 | | | | 1,083,377 | |
Cellular Biomedicine Group, Inc.(1) | | | 282 | | | | 4,980 | |
Cerner Corp.(1) | | | 5,010 | | | | 262,724 | |
Charles River Laboratories International, Inc.(1) | | | 40 | | | | 4,527 | |
Chemed Corp. | | | 14 | | | | 3,966 | |
ChemoCentryx, Inc.(1) | | | 378 | | | | 4,124 | |
Chimerix, Inc.(1) | | | 620 | | | | 1,593 | |
Collegium Pharmaceutical, Inc.(1) | | | 664 | | | | 11,401 | |
CONMED Corp. | | | 789 | | | | 50,654 | |
Cooper Cos., Inc./The | | | 77 | | | | 19,597 | |
CVS Health Corp. | | | 1,624 | | | | 106,404 | |
DexCom, Inc.(1) | | | 34 | | | | 4,073 | |
Dicerna Pharmaceuticals, Inc.(1) | | | 322 | | | | 3,442 | |
Dova Pharmaceuticals, Inc.(1) | | | 96 | | | | 728 | |
Eli Lilly & Co. | | | 4,326 | | | | 500,605 | |
Emergent BioSolutions, Inc.(1) | | | 1,113 | | | | 65,979 | |
Enanta Pharmaceuticals, Inc.(1) | | | 275 | | | | 19,478 | |
Encompass Health Corp. | | | 1,576 | | | | 97,239 | |
Endo International PLC(1) | | | 2,304 | | | | 16,819 | |
Ensign Group, Inc./The | | | 246 | | | | 9,542 | |
Evolus, Inc.(1) | | | 83 | | | | 988 | |
Exact Sciences Corp.(1) | | | 299 | | | | 18,867 | |
Exelixis, Inc.(1) | | | 2,727 | | | | 53,640 | |
Fate Therapeutics, Inc.(1) | | | 228 | | | | 2,925 | |
Fennec Pharmaceuticals, Inc.(1) | | | 465 | | | | 2,967 | |
Fortress Biotech, Inc.(1) | | | 3,561 | | | | 3,062 | |
G1 Therapeutics, Inc.(1) | | | 518 | | | | 9,920 | |
Genomic Health, Inc.(1) | | | 398 | | | | 25,635 | |
Gilead Sciences, Inc. | | | 18,587 | | | | 1,162,617 | |
Globus Medical, Inc.(1) | | | 923 | | | | 39,947 | |
Haemonetics Corp.(1) | | | 405 | | | | 40,520 | |
Halozyme Therapeutics, Inc.(1) | | | 161 | | | | 2,355 | |
HCA Healthcare, Inc. | | | 8,261 | | | | 1,028,081 | |
Hill-Rom Holdings, Inc. | | | 2,546 | | | | 225,448 | |
HMS Holdings Corp.(1) | | | 247 | | | | 6,948 | |
Hologic, Inc.(1) | | | 268 | | | | 11,015 | |
Homology Medicines, Inc.(1) | | | 59 | | | | 1,319 | |
Horizon Pharma Plc(1) | | | 1,682 | | | | 32,866 | |
Humana, Inc. | | | 997 | | | | 285,621 | |
ICU Medical, Inc.(1) | | | 259 | | | | 59,474 | |
Incyte Corp.(1) | | | 417 | | | | 26,517 | |
Innovate Biopharmaceuticals, Inc.(1) | | | 667 | | | | 1,541 | |
Inovio Pharmaceuticals, Inc.(1) | | | 2,033 | | | | 8,132 | |
Integer Holdings Corp.(1) | | | 675 | | | | 51,476 | |
Intersect ENT, Inc.(1) | | | 728 | | | | 20,515 | |
IntriCon Corp.(1) | | | 48 | | | | 1,266 | |
Invitae Corp.(1) | | | 2,498 | | | | 27,628 | |
IQVIA Holdings, Inc.(1) | | | 4,943 | | | | 574,228 | |
Jazz Pharmaceuticals PLC(1) | | | 165 | | | | 20,453 | |
Johnson & Johnson | | | 12,432 | | | | 1,604,350 | |
Jounce Therapeutics, Inc.(1) | | | 1,159 | | | | 3,906 | |
Kala Pharmaceuticals, Inc.(1) | | | 89 | | | | 435 | |
Kindred Biosciences, Inc.(1) | | | 1,714 | | | | 18,768 | |
Kura Oncology, Inc.(1) | | | 201 | | | | 2,822 | |
Lannett Co., Inc.(1) | | | 78 | | | | 387 | |
LivaNova PLC(1) | | | 179 | | | | 16,373 | |
Luminex Corp. | | | 381 | | | | 8,805 | |
MacroGenics, Inc.(1) | | | 929 | | | | 11,798 | |
Madrigal Pharmaceuticals, Inc.(1) | | | 72 | | | | 8,116 | |
Mallinckrodt PLC(1) | | | 1,218 | | | | 19,244 | |
Marinus Pharmaceuticals, Inc.(1) | | | 1,682 | | | | 4,827 | |
Masimo Corp.(1) | | | 1,446 | | | | 155,257 | |
McKesson Corp. | | | 195 | | | | 21,542 | |
Medtronic PLC | | | 16,065 | | | | 1,461,272 | |
Merck & Co., Inc. | | | 13,396 | | | | 1,023,588 | |
Minerva Neurosciences, Inc.(1) | | | 1,926 | | | | 12,981 | |
The accompanying notes are an integral part of these financial statements.
2018 Annual Report | December 31, 2018 | Page 101 |
Schedule of Investments
December 31, 2018
Dynamic Allocation Fund |
Security Description | | Shares or
Principal
Amount ($) | | | Fair
Value ($) | |
Common Stocks — continued |
Mirati Therapeutics, Inc.(1) | | | 315 | | | | 13,362 | |
Molecular Templates, Inc.(1) | | | 1,426 | | | | 5,761 | |
Molina Healthcare, Inc.(1) | | | 359 | | | | 41,723 | |
Momenta Pharmaceuticals, Inc.(1) | | | 533 | | | | 5,884 | |
Mustang Bio, Inc.(1) | | | 1,392 | | | | 4,092 | |
Mylan NV(1) | | | 6,129 | | | | 167,935 | |
Myriad Genetics, Inc.(1) | | | 364 | | | | 10,581 | |
Natera, Inc.(1) | | | 390 | | | | 5,444 | |
Neurocrine Biosciences, Inc.(1) | | | 935 | | | | 66,768 | |
NuVasive, Inc.(1) | | | 1 | | | | 50 | |
Omnicell, Inc.(1) | | | 110 | | | | 6,736 | |
OPKO Health, Inc.(1) | | | 3,687 | | | | 11,098 | |
OraSure Technologies, Inc.(1) | | | 366 | | | | 4,275 | |
Orthofix Medical, Inc.(1) | | | 875 | | | | 45,929 | |
Owens & Minor, Inc. | | | 1,866 | | | | 11,812 | |
Pacira Pharmaceuticals, Inc./DE(1) | | | 716 | | | | 30,802 | |
PDL BioPharma, Inc.(1) | | | 6,535 | | | | 18,952 | |
Perrigo Co. PLC | | | 2,751 | | | | 106,601 | |
Pfizer, Inc. | | | 48,203 | | | | 2,104,061 | |
Phibro Animal Health Corp. | | | 771 | | | | 24,795 | |
Pieris Pharmaceuticals, Inc.(1) | | | 1,686 | | | | 4,485 | |
PRA Health Sciences, Inc.(1) | | | 444 | | | | 40,830 | |
Premier, Inc. - Class A(1) | | | 2,744 | | | | 102,488 | |
Prestige Consumer Healthcare, Inc.(1) | | | 542 | | | | 16,737 | |
Proteostasis Therapeutics, Inc.(1) | | | 1,710 | | | | 5,540 | |
Providence Service Corp./The(1) | | | 172 | | | | 10,323 | |
PTC Therapeutics, Inc.(1) | | | 226 | | | | 7,756 | |
Quidel Corp.(1) | | | 111 | | | | 5,419 | |
Ra Pharmaceuticals, Inc.(1) | | | 721 | | | | 13,122 | |
Reata Pharmaceuticals, Inc.(1) | | | 142 | | | | 7,966 | |
Recro Pharma, Inc.(1) | | | 422 | | | | 2,996 | |
Regeneron Pharmaceuticals, Inc.(1) | | | 2,505 | | | | 935,618 | |
REGENXBIO, Inc.(1) | | | 336 | | | | 14,095 | |
Repligen Corp.(1) | | | 580 | | | | 30,589 | |
RTI Surgical, Inc.(1) | | | 108 | | | | 400 | |
Sarepta Therapeutics, Inc.(1) | | | 255 | | | | 27,828 | |
SeaSpine Holdings Corp.(1) | | | 211 | | | | 3,849 | |
Sienna Biopharmaceuticals, Inc.(1) | | | 515 | | | | 1,195 | |
SIGA Technologies, Inc.(1) | | | 409 | | | | 3,231 | |
Solid Biosciences, Inc.(1) | | | 11 | | | | 295 | |
Spring Bank Pharmaceuticals, Inc.(1) | | | 217 | | | | 2,255 | |
STAAR Surgical Co.(1) | | | 279 | | | | 8,903 | |
STERIS PLC | | | 615 | | | | 65,713 | |
Supernus Pharmaceuticals, Inc.(1) | | | 202 | | | | 6,710 | |
Surface Oncology, Inc.(1) | | | 1,568 | | | | 6,648 | |
Surmodics, Inc.(1) | | | 101 | | | | 4,773 | |
Syneos Health, Inc.(1) | | | 1,032 | | | | 40,609 | |
Tandem Diabetes Care, Inc.(1) | | | 449 | | | | 17,049 | |
Tenet Healthcare Corp.(1) | | | 724 | | | | 12,409 | |
Tocagen, Inc.(1) | | | 1,658 | | | | 13,612 | |
United Therapeutics Corp.(1) | | | 1,594 | | | | 173,587 | |
UnitedHealth Group, Inc. | | | 6,267 | | | | 1,561,235 | |
Universal Health Services, Inc. | | | 518 | | | | 60,378 | |
Unum Therapeutics, Inc.(1) | | | 98 | | | | 431 | |
Vanda Pharmaceuticals, Inc.(1) | | | 1,039 | | | | 27,149 | |
Varian Medical Systems, Inc.(1) | | | 97 | | | | 10,991 | |
Veeva Systems, Inc.(1) | | | 114 | | | | 10,182 | |
Veracyte, Inc.(1) | | | 833 | | | | 10,479 | |
Vericel Corp.(1) | | | 461 | | | | 8,021 | |
Vertex Pharmaceuticals, Inc.(1) | | | 3,497 | | | | 579,488 | |
Viking Therapeutics, Inc.(1) | | | 1,143 | | | | 8,744 | |
Vital Therapies, Inc.(1) | | | 929 | | | | 173 | |
WaVe Life Sciences, Ltd.(1) | | | 135 | | | | 5,675 | |
West Pharmaceutical Services, Inc. | | | 649 | | | | 63,621 | |
Xencor, Inc.(1) | | | 345 | | | | 12,475 | |
Zafgen, Inc.(1) | | | 1,598 | | | | 7,910 | |
Zimmer Biomet Holdings, Inc. | | | 4,462 | | | | 462,799 | |
Zoetis, Inc. | | | 2,387 | | | | 204,184 | |
| | | | | | | | 24,160,522 | |
| | | | | | | | | |
Industrials — 5.0% | | | | | | | | |
ACCO Brands Corp. | | | 4,055 | | | | 27,493 | |
Albany International Corp. | | | 279 | | | | 17,418 | |
Allison Transmission Holdings, Inc. | | | 4,616 | | | | 202,689 | |
Ameresco, Inc. - Class A(1) | | | 372 | | | | 5,245 | |
ArcBest Corp. | | | 442 | | | | 15,143 | |
Armstrong World Industries, Inc. | | | 1,733 | | | | 100,878 | |
Atkore International Group, Inc.(1) | | | 1,303 | | | | 25,852 | |
Brady Corp. | | | 1,647 | | | | 71,579 | |
Casella Waste Systems, Inc.(1) | | | 573 | | | | 16,325 | |
CBIZ, Inc.(1) | | | 478 | | | | 9,417 | |
Comfort Systems USA, Inc. | | | 1,300 | | | | 56,784 | |
Commercial Vehicle Group, Inc.(1) | | | 1,217 | | | | 6,937 | |
Covenant Transportation Group, Inc.(1) | | | 412 | | | | 7,910 | |
Crane Co. | | | 1,772 | | | | 127,903 | |
CSX Corp. | | | 18,342 | | | | 1,139,588 | |
Delta Air Lines, Inc. | | | 5,206 | | | | 259,779 | |
Donaldson Co., Inc. | | | 429 | | | | 18,614 | |
Eagle Bulk Shipping, Inc.(1) | | | 1,907 | | | | 8,791 | |
EnerSys | | | 1,131 | | | | 87,777 | |
ESCO Technologies, Inc. | | | 8 | | | | 528 | |
Esterline Technologies Corp.(1) | | | 65 | | | | 7,894 | |
Federal Signal Corp. | | | 2,122 | | | | 42,228 | |
Forward Air Corp. | | | 1,046 | | | | 57,373 | |
The accompanying notes are an integral part of these financial statements.
Page 102 | 2018 Annual Report | December 31, 2018 |
Schedule of Investments
December 31, 2018
Dynamic Allocation Fund |
Security Description | | Shares or
Principal
Amount ($) | | | Fair
Value ($) | |
Common Stocks — continued |
Foundation Building Materials, Inc.(1) | | | 454 | | | | 3,773 | |
Global Brass & Copper Holdings, Inc. | | | 1,110 | | | | 27,917 | |
Gorman-Rupp Co./The | | | 458 | | | | 14,844 | |
Graco, Inc. | | | 1,248 | | | | 52,229 | |
Harsco Corp.(1) | | | 1,517 | | | | 30,128 | |
Hawaiian Holdings, Inc. | | | 21 | | | | 555 | |
HD Supply Holdings, Inc.(1) | | | 1,568 | | | | 58,831 | |
Herman Miller, Inc. | | | 510 | | | | 15,428 | |
Hillenbrand, Inc. | | | 2,713 | | | | 102,904 | |
HNI Corp. | | | 100 | | | | 3,543 | |
Huntington Ingalls Industries, Inc. | | | 611 | | | | 116,279 | |
Hyster-Yale Materials Handling, Inc. | | | 182 | | | | 11,277 | |
Ingersoll-Rand PLC | | | 1,633 | | | | 148,979 | |
Insperity, Inc. | | | 270 | | | | 25,207 | |
ITT, Inc. | | | 506 | | | | 24,425 | |
Kadant, Inc. | | | 287 | | | | 23,379 | |
KAR Auction Services, Inc. | | | 1,351 | | | | 64,470 | |
KBR, Inc. | | | 1,323 | | | | 20,083 | |
Kelly Services, Inc. - Class A | | | 911 | | | | 18,657 | |
Kennametal, Inc. | | | 952 | | | | 31,683 | |
Kforce, Inc. | | | 719 | | | | 22,231 | |
Kimball International, Inc. - Class B | | | 1,100 | | | | 15,609 | |
Landstar System, Inc. | | | 1,321 | | | | 126,380 | |
LSC Communications, Inc. | | | 643 | | | | 4,501 | |
ManpowerGroup, Inc. | | | 35 | | | | 2,268 | |
Masonite International Corp.(1) | | | 380 | | | | 17,035 | |
Matson, Inc. | | | 2,014 | | | | 64,488 | |
Milacron Holdings Corp.(1) | | | 142 | | | | 1,688 | |
Miller Industries, Inc./TN | | | 726 | | | | 19,602 | |
MSC Industrial Direct Co., Inc. | | | 1,543 | | | | 118,688 | |
Navigant Consulting, Inc. | | | 1,643 | | | | 39,514 | |
NCI Building Systems, Inc.(1) | | | 3,730 | | | | 27,043 | |
Nexeo Solutions, Inc.(1) | | | 2,560 | | | | 21,990 | |
Norfolk Southern Corp. | | | 7,378 | | | | 1,103,306 | |
nVent Electric PLC | | | 291 | | | | 6,536 | |
Old Dominion Freight Line, Inc. | | | 123 | | | | 15,189 | |
Oshkosh Corp. | | | 1,152 | | | | 70,629 | |
PACCAR, Inc. | | | 10,482 | | | | 598,941 | |
Park-Ohio Holdings Corp. | | | 22 | | | | 675 | |
Patrick Industries, Inc.(1) | | | 337 | | | | 9,979 | |
Pitney Bowes, Inc. | | | 97 | | | | 573 | |
Quad/Graphics, Inc. | | | 1,020 | | | | 12,566 | |
Quanex Building Products Corp. | | | 500 | | | | 6,795 | |
Quanta Services, Inc. | | | 2,407 | | | | 72,451 | |
Radiant Logistics, Inc.(1) | | | 1,258 | | | | 5,347 | |
Regal Beloit Corp. | | | 41 | | | | 2,872 | |
Rollins, Inc. | | | 336 | | | | 12,130 | |
RR Donnelley & Sons Co. | | | 2,037 | | | | 8,067 | |
Spirit AeroSystems Holdings, Inc. | | | 1,065 | | | | 76,776 | |
Steelcase, Inc. - Class A | | | 2,263 | | | | 33,560 | |
Tetra Tech, Inc. | | | 253 | | | | 13,098 | |
Timken Co./The | | | 796 | | | | 29,707 | |
Toro Co./The | | | 2,583 | | | | 144,338 | |
TriMas Corp.(1) | | | 25 | | | | 682 | |
UniFirst Corp./MA | | | 157 | | | | 22,462 | |
Union Pacific Corp. | | | 9,598 | | | | 1,326,732 | |
United Continental Holdings, Inc.(1) | | | 10,830 | | | | 906,796 | |
Universal Logistics Holdings, Inc. | | | 2 | | | | 36 | |
US Xpress Enterprises, Inc.(1) | | | 1,353 | | | | 7,590 | |
Vectrus, Inc.(1) | | | 845 | | | | 18,235 | |
Wabash National Corp. | | | 2,830 | | | | 37,016 | |
Waste Management, Inc. | | | 5,198 | | | | 462,570 | |
WW Grainger, Inc. | | | 329 | | | | 92,896 | |
| | | | | | | | 8,688,323 | |
| | | | | | | | | |
Information Technology — 13.3% | | | | | | | | |
Accenture PLC | | | 8,643 | | | | 1,218,749 | |
ACI Worldwide, Inc.(1) | | | 1,340 | | | | 37,078 | |
Adobe, Inc.(1) | | | 4,084 | | | | 923,964 | |
Advanced Micro Devices, Inc.(1) | | | 4,335 | | | | 80,024 | |
Amkor Technology, Inc.(1) | | | 4,907 | | | | 32,190 | |
Apple, Inc. | | | 23,372 | | | | 3,686,699 | |
ARRIS International PLC(1) | | | 784 | | | | 23,967 | |
Arrow Electronics, Inc.(1) | | | 1,007 | | | | 69,433 | |
Aspen Technology, Inc.(1) | | | 813 | | | | 66,812 | |
Avaya Holdings Corp.(1) | | | 1,156 | | | | 16,831 | |
Avnet, Inc. | | | 4,833 | | | | 174,471 | |
Booz Allen Hamilton Holding Corp. | | | 3,016 | | | | 135,931 | |
Bottomline Technologies DE, Inc.(1) | | | 700 | | | | 33,600 | |
Cabot Microelectronics Corp. | | | 230 | | | | 21,931 | |
CACI International, Inc. - Class A(1) | | | 342 | | | | 49,258 | |
Cadence Design Systems, Inc.(1) | | | 7,138 | | | | 310,360 | |
CDK Global, Inc. | | | 460 | | | | 22,025 | |
CDW Corp./DE | | | 824 | | | | 66,785 | |
Ciena Corp.(1) | | | 2,604 | | | | 88,302 | |
Cirrus Logic, Inc.(1) | | | 1,329 | | | | 44,096 | |
Cisco Systems, Inc. | | | 27,884 | | | | 1,208,214 | |
Citrix Systems, Inc. | | | 425 | | | | 43,546 | |
CommVault Systems, Inc.(1) | | | 80 | | | | 4,727 | |
Comtech Telecommunications Corp. | | | 1,271 | | | | 30,936 | |
Dell Technologies, Inc. - Class C(1) | | | 5,750 | | | | 281,003 | |
Dolby Laboratories, Inc. | | | 1,715 | | | | 106,056 | |
DXC Technology Co. | | | 4,933 | | | | 262,288 | |
Electro Scientific Industries, Inc.(1) | | | 149 | | | | 4,464 | |
The accompanying notes are an integral part of these financial statements.
2018 Annual Report | December 31, 2018 | Page 103 |
Schedule of Investments
December 31, 2018
Dynamic Allocation Fund |
Security Description | | Shares or
Principal
Amount ($) | | | Fair
Value ($) | |
Common Stocks — continued |
Euronet Worldwide, Inc.(1) | | | 304 | | | | 31,124 | |
EVERTEC, Inc. | | | 338 | | | | 9,701 | |
F5 Networks, Inc.(1) | | | 1,380 | | | | 223,601 | |
Fabrinet(1) | | | 920 | | | | 47,205 | |
Fair Isaac Corp.(1) | | | 38 | | | | 7,106 | |
Fortinet, Inc.(1) | | | 5,880 | | | | 414,128 | |
Hackett Group, Inc./The | | | 165 | | | | 2,642 | |
HP, Inc. | | | 44,805 | | | | 916,710 | |
Immersion Corp.(1) | | | 1,101 | | | | 9,865 | |
Insight Enterprises, Inc.(1) | | | 722 | | | | 29,422 | |
Integrated Device Technology, Inc.(1) | | | 338 | | | | 16,369 | |
Intel Corp. | | | 23,753 | | | | 1,114,728 | |
InterDigital, Inc. | | | 1,582 | | | | 105,092 | |
International Business Machines Corp. | | | 732 | | | | 83,206 | |
Intuit, Inc. | | | 5,762 | | | | 1,134,250 | |
j2 Global, Inc. | | | 803 | | | | 55,712 | |
Jabil, Inc. | | | 2,900 | | | | 71,891 | |
Juniper Networks, Inc. | | | 11,049 | | | | 297,329 | |
KEMET Corp. | | | 111 | | | | 1,947 | |
KLA-Tencor Corp. | | | 892 | | | | 79,825 | |
Lam Research Corp. | | | 448 | | | | 61,004 | |
Leidos Holdings, Inc. | | | 1,501 | | | | 79,133 | |
LivePerson, Inc.(1) | | | 593 | | | | 11,184 | |
Mastercard, Inc. | | | 5,942 | | | | 1,120,958 | |
Micron Technology, Inc.(1) | | | 30,059 | | | | 953,772 | |
Microsoft Corp. | | | 37,930 | | | | 3,852,550 | |
Mitek Systems, Inc.(1) | | | 498 | | | | 5,383 | |
MKS Instruments, Inc. | | | 670 | | | | 43,289 | |
MoneyGram International, Inc.(1) | | | 8,173 | | | | 16,346 | |
Monotype Imaging Holdings, Inc. | | | 996 | | | | 15,458 | |
Motorola Solutions, Inc. | | | 66 | | | | 7,593 | |
Nanometrics, Inc.(1) | | | 262 | | | | 7,160 | |
National Instruments Corp. | | | 20 | | | | 908 | |
NetApp, Inc. | | | 6,471 | | | | 386,125 | |
Nuance Communications, Inc.(1) | | | 10,887 | | | | 144,035 | |
Oracle Corp. | | | 24,639 | | | | 1,112,451 | |
PC Connection, Inc. | | | 370 | | | | 11,000 | |
Perficient, Inc.(1) | | | 363 | | | | 8,080 | |
Photronics, Inc.(1) | | | 2,913 | | | | 28,198 | |
Progress Software Corp. | | | 1,414 | | | | 50,183 | |
PTC, Inc.(1) | | | 91 | | | | 7,544 | |
Quantenna Communications, Inc.(1) | | | 2,030 | | | | 29,131 | |
SailPoint Technologies Holding, Inc.(1) | | | 457 | | | | 10,735 | |
Semtech Corp.(1) | | | 501 | | | | 22,981 | |
SendGrid, Inc.(1) | | | 668 | | | | 28,838 | |
SMART Global Holdings, Inc.(1) | | | 277 | | | | 8,227 | |
SPS Commerce, Inc.(1) | | | 111 | | | | 9,144 | |
SS&C Technologies Holdings, Inc. | | | 304 | | | | 13,713 | |
Symantec Corp. | | | 7,170 | | | | 135,477 | |
Synopsys, Inc.(1) | | | 2,814 | | | | 237,051 | |
Tableau Software, Inc.(1) | | | 231 | | | | 27,720 | |
Tech Data Corp.(1) | | | 790 | | | | 64,630 | |
Trade Desk, Inc./The(1) | | | 176 | | | | 20,427 | |
Ubiquiti Networks, Inc. | | | 151 | | | | 15,011 | |
Ultimate Software Group, Inc./The(1) | | | 23 | | | | 5,632 | |
Unisys Corp.(1) | | | 1,063 | | | | 12,363 | |
Verint Systems, Inc.(1) | | | 2,665 | | | | 112,756 | |
Versum Materials, Inc. | | | 32 | | | | 887 | |
Visa, Inc. | | | 887 | | | | 117,031 | |
Vishay Precision Group, Inc.(1) | | | 321 | | | | 9,704 | |
Workiva, Inc.(1) | | | 179 | | | | 6,424 | |
Xilinx, Inc. | | | 3,442 | | | | 293,155 | |
Zebra Technologies Corp. - Class A(1) | | | 1,727 | | | | 274,990 | |
Zix Corp.(1) | | | 1,491 | | | | 8,543 | |
| | | | | | | | 23,082,517 | |
| | | | | | | | | |
Materials — 1.6% | | | | | | | | |
A. Schulman, Inc. Contingent Value Rights(1)(7) | | | 98 | | | | — | |
CF Industries Holdings, Inc. | | | 2,365 | | | | 102,901 | |
Chemours Co./The | | | 2,216 | | | | 62,536 | |
Eagle Materials, Inc. | | | 2,696 | | | | 164,537 | |
Forterra, Inc.(1) | | | 28 | | | | 105 | |
FutureFuel Corp. | | | 759 | | | | 12,038 | |
Greif, Inc. - Class A | | | 1,778 | | | | 65,982 | |
Huntsman Corp. | | | 940 | | | | 18,133 | |
International Paper Co. | | | 7,942 | | | | 320,539 | |
Kraton Corp.(1) | | | 94 | | | | 2,053 | |
Louisiana-Pacific Corp. | | | 2,840 | | | | 63,105 | |
LyondellBasell Industries NV | | | 11,558 | | | | 961,163 | |
Materion Corp. | | | 75 | | | | 3,374 | |
Mosaic Co./The | | | 1,828 | | | | 53,396 | |
Nucor Corp. | | | 8,521 | | | | 441,473 | |
PPG Industries, Inc. | | | 1,736 | | | | 177,471 | |
Reliance Steel & Aluminum Co. | | | 852 | | | | 60,637 | |
Schnitzer Steel Industries, Inc. | | | 565 | | | | 12,176 | |
Steel Dynamics, Inc. | | | 5,546 | | | | 166,602 | |
Stepan Co. | | | 139 | | | | 10,286 | |
Trinseo SA | | | 738 | | | | 33,786 | |
Verso Corp.(1) | | | 753 | | | | 16,867 | |
| | | | | | | | 2,749,160 | |
The accompanying notes are an integral part of these financial statements.
Page 104 | 2018 Annual Report | December 31, 2018 |
Schedule of Investments
December 31, 2018
Dynamic Allocation Fund |
Security Description | | Shares or
Principal
Amount ($) | | | Fair
Value ($) | |
Common Stocks — continued |
Real Estate Investment Trust — 2.7% | | | | | | | | |
American Assets Trust, Inc. | | | 1,436 | | | | 57,684 | |
American Tower Corp. | | | 1,551 | | | | 245,353 | |
Camden Property Trust | | | 96 | | | | 8,453 | |
CatchMark Timber Trust, Inc. | | | 3,440 | | | | 24,424 | |
CoreCivic, Inc. | | | 4,063 | | | | 72,443 | |
CubeSmart | | | 2,076 | | | | 59,560 | |
Essex Property Trust, Inc. | | | 3,814 | | | | 935,231 | |
Front Yard Residential Corp. | | | 9 | | | | 79 | |
Gaming and Leisure Properties, Inc. | | | 389 | | | | 12,569 | |
GEO Group, Inc./The | | | 1,181 | | | | 23,266 | |
Gladstone Commercial Corp. | | | 461 | | | | 8,261 | |
Hospitality Properties Trust | | | 7,753 | | | | 185,142 | |
Host Hotels & Resorts, Inc. | | | 13,604 | | | | 226,779 | |
Kite Realty Group Trust | | | 2,170 | | | | 30,575 | |
Lamar Advertising Co. | | | 3,695 | | | | 255,620 | |
Liberty Property Trust | | | 743 | | | | 31,117 | |
National Health Investors, Inc. | | | 755 | | | | 57,033 | |
Pebblebrook Hotel Trust | | | 1,302 | | | | 36,860 | |
Piedmont Office Realty Trust, Inc. | | | 6,315 | | | | 107,608 | |
PotlatchDeltic Corp. | | | 56 | | | | 1,772 | |
PS Business Parks, Inc. | | | 816 | | | | 106,896 | |
Rayonier, Inc. | | | 38 | | | | 1,052 | |
Realogy Holdings Corp. | | | 286 | | | | 4,198 | |
Redfin Corp.(1) | | | 194 | | | | 2,794 | |
Retail Properties of America, Inc. | | | 6,549 | | | | 71,057 | |
Retail Value, Inc. | | | 1,883 | | | | 48,186 | |
Simon Property Group, Inc. | | | 6,389 | | | | 1,073,288 | |
Tanger Factory Outlet Centers, Inc. | | | 4,154 | | | | 83,994 | |
Trinity Place Holdings, Inc.(1) | | | 97 | | | | 421 | |
UDR, Inc. | | | 21,861 | | | | 866,133 | |
Urstadt Biddle Properties, Inc. | | | 772 | | | | 14,838 | |
| | | | | | | | 4,652,686 | |
| | | | | | | | | |
Utilities — 2.5% | | | | | | | | |
AES Corp./VA | | | 3,371 | | | | 48,745 | |
CenterPoint Energy, Inc. | | | 21,546 | | | | 608,244 | |
Clearway Energy, Inc. | | | 466 | | | | 7,885 | |
DTE Energy Co. | | | 417 | | | | 45,995 | |
Exelon Corp. | | | 24,061 | | | | 1,085,151 | |
MDU Resources Group, Inc. | | | 4,261 | | | | 101,582 | |
NextEra Energy, Inc. | | | 7,361 | | | | 1,279,489 | |
NorthWestern Corp. | | | 481 | | | | 28,591 | |
NRG Energy, Inc. | | | 5,280 | | | | 209,088 | |
OGE Energy Corp. | | | 9,199 | | | | 360,509 | |
Portland General Electric Co. | | | 532 | | | | 24,392 | |
SJW Group | | | 218 | | | | 12,125 | |
UGI Corp. | | | 11,622 | | | | 620,028 | |
| | | | | | | | 4,431,824 | |
| | | | | | | | | |
Total Common Stocks (Cost $121,566,239) | | | | | | | 121,043,892 | |
| | | | | | | | | |
Registered Investment Companies — 6.0% |
iShares Core MSCI EAFE ETF(8) | | | 15,725 | | | | 864,875 | |
iShares Core U.S. Aggregate Bond ETF(8) | | | 89,591 | | | | 9,540,546 | |
Total Registered Investment Companies (Cost $10,322,401) | | | | | | | 10,405,421 | |
| | | | | | | | | |
Money Market Registered Investment Companies — 21.9% |
Morgan Stanley Government Institutional Fund, 2.32%(3) | | | 26,838 | | | | 26,838 | |
Meeder Institutional Prime Money Market Fund, 2.43%(4) | | | 38,102,700 | | | | 38,098,890 | |
Total Money Market Registered Investment Companies (Cost $38,125,020) | | | | | | | 38,125,728 | |
| | | | | | | | | |
Bank Obligations — 0.7% | | | | | | | | |
First Merchants Bank Deposit Account, 2.10%, 1/2/2019(5) | | | 249,321 | | | | 249,321 | |
Metro City Bank Deposit Account, 2.10%, 1/2/2019(5) | | | 249,313 | | | | 249,313 | |
Pacific Mercantile Bank Deposit Account, 2.20%, 1/2/2019(5) | | | 249,289 | | | | 249,289 | |
Pacific Premier Bank Deposit Account, 2.30%, 1/2/2019(5) | | | 249,290 | | | | 249,290 | |
Seacoast Community Bank Deposit Account, 2.00%, 1/2/2019(5) | | | 249,193 | | | | 249,193 | |
Total Bank Obligations (Cost $1,246,406) | | | | | | | 1,246,406 | |
Total Investments — 98.2%(Cost $171,260,066) | | | | | | | 170,821,447 | |
Other Assets less Liabilities — 1.8% | | | | | | | 3,073,620 | |
Total Net Assets — 100.0% | | | | | | | 173,895,067 | |
| | | | | | | | | |
Trustee Deferred Compensation(6) | | | | | | | | |
Meeder Balanced Fund | | | 3,228 | | | | 35,766 | |
Meeder Dynamic Allocation Fund | | | 8,254 | | | | 80,807 | |
Meeder Muirfield Fund | | | 3,447 | | | | 24,681 | |
Meeder Conservative Allocation Fund | | | 930 | | | | 19,697 | |
Total Trustee Deferred Compensation (Cost $159,345) | | | | | | | 160,951 | |
The accompanying notes are an integral part of these financial statements.
2018 Annual Report | December 31, 2018 | Page 105 |
Schedule of Investments
December 31, 2018
Dynamic Allocation Fund |
| | | Long
(Short)
Contracts | | | Expiration
Date | | | Notional
Value of
Contracts
($) | | | Value and
Unrealized
Appreciation
(Depreciation)
($) | |
Futures Contracts |
Index Futures | | | | | | | | | | | | | | | | |
Mini MSCI EAFE Index Futures | | | 309 | | | | 3/15/2019 | | | | 26,512,200 | | | | (420,511 | ) |
Mini MSCI Emerging Markets Index Futures | | | 142 | | | | 3/15/2019 | | | | 6,864,280 | | | | (23,448 | ) |
Russell 2000 Mini Index Futures | | | 11 | | | | 3/15/2019 | | | | 741,950 | | | | (30,412 | ) |
Standard & Poors 500 Mini Futures | | | 49 | | | | 3/15/2019 | | | | 6,137,740 | | | | (185,125 | ) |
E-mini Standard & Poors MidCap 400 Futures | | | 11 | | | | 3/15/2019 | | | | 1,828,420 | | | | (65,990 | ) |
Total Futures Contracts | | | 522 | | | | | | | | 42,084,590 | | | | (725,486 | ) |
(1) | Represents non-income producing securities. |
(2) | All or a portion of this security is on loan. |
(3) | Investment purchased with cash received as securities lending collateral. The yield shown represents the 7-day yield in effect at December 31, 2018. |
(4) | Investment in affiliate. The yield shown represents the 7-day yield in effect at December 31, 2018. |
(5) | Variable rate security. Securities payable at par including accrued interest (usually within seven days notice) and unconditionally secured as to principal and interest by letters of credit or other credit support agreements from major banks. The interest rates are adjustable and are not based on a published reference rate and spread but are determined by the issuer or agent and are based on current market conditions. These securities do not indicate a reference rate and spread in their description above. The rate shown represents the rate in effect at December 31, 2018. The maturity date shown, if applicable, reflects the earlier of the next demand date or stated maturity date. |
(6) | Assets of affiliates to the Dynamic Allocation Fund held for the benefit of the Fund’s Trustees in connection with the Trustee Deferred Compensation Plan. |
(7) | Fair valued security deemed as Level 3 security. |
The accompanying notes are an integral part of these financial statements.
Page 106 | 2018 Annual Report | December 31, 2018 |
Schedule of Investments
December 31, 2018
Quantex Fund |
Security Description | | Shares or
Principal
Amount ($) | | | Fair
Value ($) | |
Common Stocks — 81.2% |
Communication Services — 2.5% | | | | | | | | |
Interpublic Group of Cos., Inc./The | | | 30,684 | | | | 633,011 | |
TripAdvisor, Inc.(1) | | | 18,549 | | | | 1,000,533 | |
| | | | | | | | 1,633,544 | |
| | | | | | | | | |
Consumer Discretionary — 21.7% | | | | | | | | |
Advance Auto Parts, Inc. | | | 5,551 | | | | 874,060 | |
Big Lots, Inc.(2) | | | 12,479 | | | | 360,893 | |
BorgWarner, Inc. | | | 11,126 | | | | 386,517 | |
Brinker International, Inc. | | | 19,666 | | | | 864,911 | |
Capri Holdings, Ltd.(1) | | | 12,632 | | | | 479,005 | |
Cheesecake Factory, Inc./The | | | 14,399 | | | | 626,500 | |
Dillard's, Inc.(2) | | | 11,686 | | | | 704,783 | |
Foot Locker, Inc. | | | 17,433 | | | | 927,436 | |
Goodyear Tire & Rubber Co./The | | | 17,667 | | | | 360,583 | |
H&R Block, Inc. | | | 28,426 | | | | 721,168 | |
Harley-Davidson, Inc. | | | 16,685 | | | | 569,292 | |
International Speedway Corp. | | | 19,634 | | | | 861,147 | |
Kohl's Corp. | | | 14,455 | | | | 958,945 | |
Leggett & Platt, Inc. | | | 16,460 | | | | 589,926 | |
Macy's, Inc. | | | 32,645 | | | | 972,168 | |
Nordstrom, Inc. | | | 16,293 | | | | 759,417 | |
Papa John's International, Inc. | | | 8,769 | | | | 349,094 | |
PulteGroup, Inc. | | | 23,461 | | | | 609,751 | |
PVH Corp. | | | 4,767 | | | | 443,093 | |
Ralph Lauren Corp. | | | 7,236 | | | | 748,637 | |
Tractor Supply Co. | | | 10,391 | | | | 867,025 | |
| | | | | | | | 14,034,351 | |
| | | | | | | | | |
Consumer Staples — 1.5% | | | | | | | | |
Boston Beer Co., Inc./The(1) | | | 4,013 | | | | 966,491 | |
| | | | | | | | 966,491 | |
| | | | | | | | | |
Energy — 3.8% | | | | | | | | |
Gulfport Energy Corp.(1) | | | 41,563 | | | | 272,238 | |
Helmerich & Payne, Inc. | | | 12,004 | | | | 575,472 | |
Newfield Exploration Co.(1) | | | 16,600 | | | | 243,356 | |
Oceaneering International, Inc.(1) | | | 34,346 | | | | 415,587 | |
QEP Resources, Inc.(1) | | | 41,179 | | | | 231,838 | |
Rowan Cos. Plc(1) | | | 32,598 | | | | 273,497 | |
World Fuel Services Corp. | | | 19,700 | | | | 421,777 | |
| | | | | | | | 2,433,765 | |
| | | | | | | | | |
Financials — 7.7% | | | | | | | | |
Assurant, Inc. | | | 8,052 | | | | 720,171 | |
Everest Re Group, Ltd. | | | 3,090 | | | | 672,878 | |
Genworth Financial, Inc.(1) | | | 256,959 | | | | 1,197,429 | |
People's United Financial, Inc. | | | 30,302 | | | | 437,258 | |
Torchmark Corp. | | | 8,860 | | | | 660,336 | |
Trustmark Corp. | | | 24,604 | | | | 699,492 | |
Wells Fargo & Co.(1)(7) | | | 1 | | | | — | |
Zions Bancorp NA | | | 14,565 | | | | 593,378 | |
| | | | | | | | 4,980,942 | |
| | | | | | | | | |
Healthcare — 8.7% | | | | | | | | |
Avanos Medical, Inc.(1) | | | 16,343 | | | | 732,003 | |
Cooper Cos., Inc./The | | | 3,325 | | | | 846,213 | |
Endo International PLC(1) | | | 48,135 | | | | 351,386 | |
Mallinckrodt PLC(1) | | | 34,814 | | | | 550,061 | |
Patterson Cos., Inc. | | | 15,009 | | | | 295,077 | |
PerkinElmer, Inc. | | | 10,353 | | | | 813,228 | |
Prestige Consumer Healthcare, Inc.(1) | | | 12,936 | | | | 399,464 | |
Universal Health Services, Inc. | | | 7,022 | | | | 818,484 | |
Varian Medical Systems, Inc.(1) | | | 7,280 | | | | 824,897 | |
| | | | | | | | 5,630,813 | |
| | | | | | | | | |
Industrials — 11.5% | | | | | | | | |
AO Smith Corp. | | | 8,495 | | | | 362,737 | |
Esterline Technologies Corp.(1) | | | 9,879 | | | | 1,199,805 | |
Fluor Corp. | | | 14,812 | | | | 476,946 | |
Fortune Brands Home & Security, Inc. | | | 11,334 | | | | 430,579 | |
GATX Corp. | | | 11,116 | | | | 787,124 | |
Herman Miller, Inc. | | | 19,108 | | | | 578,017 | |
HNI Corp. | | | 18,800 | | | | 666,084 | |
Jacobs Engineering Group, Inc. | | | 11,465 | | | | 670,244 | |
Pitney Bowes, Inc. | | | 49,438 | | | | 292,179 | |
Quanta Services, Inc. | | | 18,752 | | | | 564,435 | |
Robert Half International, Inc. | | | 13,397 | | | | 766,308 | |
Snap-on, Inc. | | | 4,517 | | | | 656,275 | |
| | | | | | | | 7,450,733 | |
| | | | | | | | | |
Information Technology — 8.9% | | | | | | | | |
CommVault Systems, Inc.(1) | | | 10,947 | | | | 646,858 | |
F5 Networks, Inc.(1) | | | 5,763 | | | | 933,779 | |
FLIR Systems, Inc. | | | 14,966 | | | | 651,620 | |
Juniper Networks, Inc. | | | 19,360 | | | | 520,978 | |
LiveRamp Holdings, Inc.(1) | | | 18,022 | | | | 696,190 | |
Qorvo, Inc.(1) | | | 10,779 | | | | 654,609 | |
Synaptics, Inc.(1) | | | 16,387 | | | | 609,760 | |
Western Union Co./The | | | 29,317 | | | | 500,148 | |
Xerox Corp. | | | 26,140 | | | | 516,526 | |
| | | | | | | | 5,730,468 | |
The accompanying notes are an integral part of these financial statements.
2018 Annual Report | December 31, 2018 | Page 107 |
Schedule of Investments
December 31, 2018
Quantex Fund |
Security Description | | Shares or
Principal
Amount ($) | | | Fair
Value ($) | |
Common Stocks — continued |
Materials — 4.5% | | | | | | | | |
Avery Dennison Corp. | | | 6,712 | | | | 602,939 | |
Carpenter Technology Corp. | | | 14,905 | | | | 530,767 | |
CF Industries Holdings, Inc. | | | 19,111 | | | | 831,520 | |
Minerals Technologies, Inc. | | | 7,215 | | | | 370,418 | |
Mosaic Co./The | | | 19,406 | | | | 566,849 | |
| | | | | | | | 2,902,493 | |
| | | | | | | | | |
Real Estate Investment Trust — 5.9% | | | | | | | | |
Apartment Investment & Management Co. | | | 18,555 | | | | 814,193 | |
Duke Realty Corp. | | | 28,589 | | | | 740,455 | |
Kimco Realty Corp. | | | 19,640 | | | | 287,726 | |
PotlatchDeltic Corp. | | | 17,196 | | | | 544,081 | |
SL Green Realty Corp. | | | 7,648 | | | | 604,804 | |
UDR, Inc. | | | 20,848 | | | | 825,998 | |
| | | | | | | | 3,817,257 | |
| | | | | | | | | |
Utilities — 4.5% | | | | | | | | |
AES Corp./VA | | | 72,315 | | | | 1,045,674 | |
NRG Energy, Inc. | | | 26,360 | | | | 1,043,856 | |
Pinnacle West Capital Corp. | | | 9,415 | | | | 802,155 | |
| | | | | | | | 2,891,685 | |
| | | | | | | | | |
Total Common Stocks (Cost $49,397,351) | | | | | | | 52,472,542 | |
| | | | | | | | | |
Money Market Registered Investment Companies — 16.3% |
Morgan Stanley Government Institutional Fund, 2.32%(3) | | | 912,691 | | | | 912,691 | |
Meeder Institutional Prime Money Market Fund, 2.43%(4) | | | 9,651,759 | | | | 9,650,794 | |
Total Money Market Registered Investment Companies (Cost $10,563,485) | | | | | | | 10,563,485 | |
| | | | | | | | | |
Bank Obligations — 1.9% | | | | | | | | |
First Merchants Bank Deposit Account, 2.10%, 1/2/2019(5) | | | 249,221 | | | | 249,221 | |
Metro City Bank Deposit Account, 2.10%, 1/2/2019(5) | | | 223,635 | | | | 223,635 | |
Pacific Mercantile Bank Deposit Account, 2.20%, 1/2/2019(5) | | | 249,288 | | | | 249,288 | |
Pacific Premier Bank Deposit Account, 2.30%, 1/2/2019(5) | | | 249,192 | | | | 249,192 | |
Seacoast Community Bank Deposit Account, 2.00%, 1/2/2019(5) | | | 249,193 | | | | 249,193 | |
Total Bank Obligations (Cost $1,220,529) | | | | | | | 1,220,529 | |
Total Investments — 99.4%(Cost $61,181,365) | | | | | | | 64,256,556 | |
Other Assets less Liabilities — 0.6% | | | | | | | 399,842 | |
Total Net Assets — 100.0% | | | | | | | 64,656,398 | |
| | | | | | | | | |
Trustee Deferred Compensation(6) | | | | | | | | |
Meeder Balanced Fund | | | 950 | | | | 10,526 | |
Meeder Dynamic Allocation Fund | | | 2,379 | | | | 23,290 | |
Meeder Muirfield Fund | | | 1,082 | | | | 7,747 | |
Meeder Conservative Allocation Fund | | | 273 | | | | 5,782 | |
Total Trustee Deferred Compensation (Cost $47,890) | | | | | | | 47,345 | |
| | | Long
(Short)
Contracts | | | Expiration
Date | | | Notional
Value of
Contracts
($) | | | Value and
Unrealized
Appreciation
(Depreciation)
($) | |
Futures Contracts |
Index Futures | | | | | | | | | | | | | | | | |
E-mini Standard & Poors MidCap 400 Futures | | | 71 | | | | 3/15/2019 | | | | 11,801,620 | | | | (511,843 | ) |
Total Futures Contracts | | | 71 | | | | | | | | 11,801,620 | | | | (511,843 | ) |
(1) | Represents non-income producing securities. |
(2) | All or a portion of this security is on loan. |
(3) | Investment purchased with cash received as securities lending collateral. The yield shown represents the 7-day yield in effect at December 31, 2018. |
(4) | Investment in affiliate. The yield shown represents the 7-day yield in effect at December 31, 2018. |
(5) | Variable rate security. Securities payable at par including accrued interest (usually within seven days notice) and unconditionally secured as to principal and interest by letters of credit or other credit support agreements from major banks. The interest rates are adjustable and are not based on a published reference rate and spread but are determined by the issuer or agent and are based on current market conditions. These securities do not indicate a reference rate and spread in their description above. The rate shown represents the rate in effect at December 31, 2018. The maturity date shown, if applicable, reflects the earlier of the next demand date or stated maturity date. |
(6) | Assets of affiliates to the Quantex Fund held for the benefit of the Fund’s Trustees in connection with the Trustee Deferred Compensation Plan. |
(7) | Fair valued security deemed as Level 3 security. |
The accompanying notes are an integral part of these financial statements.
Page 108 | 2018 Annual Report | December 31, 2018 |
Schedule of Investments
December 31, 2018
| Total Return Bond Fund |
| Security Description | | Shares or
Principal
Amount ($) | | | Fair
Value ($) | |
| Registered Investment Companies — 84.3% |
| American Beacon SiM High Yield Opportunities Fund - Class I | | | 96,187 | | | | 868,573 | |
| Baird Core Plus Bond Fund - Class I | | | 384,700 | | | | 4,162,458 | |
| Dodge & Cox Income Fund | | | 357,281 | | | | 4,737,548 | |
| DoubleLine Total Return Bond Fund - Class I | | | 460,162 | | | | 4,794,888 | |
| Frost Total Return Bond Fund - Class I | | | 460,070 | | | | 4,692,711 | |
| Guggenheim Total Return Bond Fund - Class I | | | 178,397 | | | | 4,743,572 | |
iShares Core U.S. Aggregate Bond ETF(3) | | | 61,396 | | | | 6,538,060 | |
| Lord Abbett High Yield Fund - Class I | | | 121,327 | | | | 839,580 | |
| Payden Emerging Markets Bond Fund - Class I | | | 100,886 | | | | 1,260,066 | |
| PGIM Total Return Bond Fund - Class R6 | | | 194,648 | | | | 2,711,444 | |
| PIMCO Investment Grade Credit Bond Fund - Class I | | | 116,878 | | | | 1,158,261 | |
| Pioneer Bond Fund - Class Y | | | 473,761 | | | | 4,391,764 | |
| Segall Bryant & Hamill Plus Bond Fund - Class I | | | 392,937 | | | | 4,019,745 | |
| TCW Emerging Markets Income Fund - Class I | | | 256,742 | | | | 1,969,212 | |
Vanguard Intermediate-Term Corporate Bond ETF(3) | | | 39,375 | | | | 3,262,613 | |
Vanguard Total Bond Market ETF(3) | | | 80,018 | | | | 6,338,226 | |
| Total Registered Investment Companies (Cost $57,352,443) | | | | | | | 56,488,721 | |
| | | | | | | | | |
| Money Market Registered Investment Companies — 4.3% |
Meeder Institutional Prime Money Market Fund, 2.43%(1) | | | 2,872,017 | | | | 2,871,730 | |
| Total Money Market Registered Investment Companies (Cost $2,871,423) | | | | | | | 2,871,730 | |
| | | | | | | | | |
| U.S. Government Obligations — 11.5% |
| Government National Mortgage Association, 6.50%, due 7/20/2038 | | | 47,880 | | | | 59,056 | |
| U.S. Treasury Note, 2.25%, due 11/15/2025 | | | 4,294,000 | | | | 4,199,230 | |
| U.S. Treasury Note, 1.88%, due 12/31/2019 | | | 999,000 | | | | 991,742 | |
| U.S. Treasury Note, 2.13%, due 12/31/2022 | | | 2,456,000 | | | | 2,421,366 | |
Total U.S. Government Obligations
(Cost $7,684,703) | | | | | | | 7,671,394 | |
| Total Investments — 100.1% (Cost $67,908,569) | | | | | | | 67,031,845 | |
| Liabilities less Other Assets - (0.1%) | | | | | | | (92,720 | ) |
| Total Net Assets — 100.0% | | | | | | | 66,939,125 | |
| | | | | | | | | |
Trustee Deferred Compensation(2) | | | | | | | | |
| Meeder Balanced Fund | | | 1,065 | | | | 11,800 | |
| Meeder Dynamic Allocation Fund | | | 2,597 | | | | 25,425 | |
| Meeder Muirfield Fund | | | 1,249 | | | | 8,943 | |
| Meeder Conservative Allocation Fund | | | 312 | | | | 6,608 | |
| Total Trustee Deferred Compensation (Cost $56,217) | | | | | | | 52,776 | |
(1) | Investment in affiliate. The yield shown represents the 7-day yield in effect at December 31, 2018. |
(2) | Assets of affiliates to the Total Return Bond Fund held for the benefit of the Fund’s Trustees in connection with the Trustee Deferred Compensation Plan. |
The accompanying notes are an integral part of these financial statements.
2018 Annual Report | December 31, 2018 | Page 109 |
Schedule of Investments
December 31, 2018
Prime Money Market Fund |
Security Description | | Coupon/
Yield | | Maturity/
Demand
Date | | Principal
Amount ($)
or Shares | | | Fair
Value ($) | |
Bank Obligations — 2.4% |
First Merchants Bank Deposit Account | | | 2.10 | %(1) | 01/02/19 | | | 248,429 | | | | 248,429 | |
Mid America Bank Deposit Account | | | 2.25 | %(1) | 01/02/19 | | | 248,000 | | | | 248,000 | |
Pacific Mercantile Bank Deposit Account | | | 2.20 | %(1) | 01/02/19 | | | 248,442 | | | | 248,442 | |
Pacific Premier Bank Deposit Account | | | 2.30 | %(1) | 01/02/19 | | | 248,419 | | | | 248,419 | |
Total Bank Obligations (Cost $993,290) | | | 993,290 | |
| | | | | | | | | | | | | | |
Certificates of Deposit — 15.2% |
Banco Estado Chile Yankee CD | | | 2.59 | % | 02/04/19 | | | 250,000 | | | | 250,000 | |
Banco Estado Chile Yankee CD | | | 2.59 | % | 02/12/19 | | | 250,000 | | | | 250,000 | |
Banco Estado Chile Yankee CD | | | 2.55 | % | 02/14/19 | | | 250,000 | | | | 250,000 | |
Banco Estado Chile Yankee CD | | | 2.67 | % | 03/06/19 | | | 250,000 | | | | 250,000 | |
Banco Estado Chile Yankee CD | | | 2.51 | % | 03/13/19 | | | 250,000 | | | | 250,000 | |
Bank of Montreal Yankee CD (Monthly U.S. LIBOR + 0.27%) | | | 2.78 | %(2) | 01/28/19 | | | 250,000 | | | | 249,991 | |
Bank of Montreal Yankee CD (Quarterly U.S. LIBOR + 0.33%) | | | 3.11 | %(2) | 03/12/19 | | | 250,000 | | | | 250,318 | |
Bank of Nova Scotia Yankee CD (Quarterly U.S. LIBOR + 0.21%) | | | 2.92 | %(2) | 02/28/19 | | | 350,000 | | | | 350,098 | |
Bank of Nova Scotia Yankee CD (Quarterly U.S. LIBOR + 0.20%) | | | 2.61 | %(2) | 01/10/19 | | | 500,000 | | | | 500,013 | |
Bank of Nova Scotia Yankee CD (Quarterly U.S. LIBOR + 0.26%) | | | 2.85 | %(2) | 02/08/19 | | | 500,000 | | | | 500,610 | |
Bank of Nova Scotia Yankee CD (Quarterly U.S. LIBOR + 0.25%) | | | 2.57 | %(2) | 02/18/19 | | | 250,000 | | | | 250,091 | |
Canadian Imperial Bank of NY Yankee CD (Quarterly U.S. LIBOR + 0.235%) | | | 2.63 | %(2) | 01/03/19 | | | 500,000 | | | | 500,002 | |
Canadian Imperial Bank of NY Yankee CD (Quarterly U.S. LIBOR + 0.18%) | | | 2.62 | %(2) | 01/18/19 | | | 250,000 | | | | 250,041 | |
Canadian Imperial Bank of NY Yankee CD (Quarterly U.S. LIBOR + 0.41%) | | | 3.20 | %(2) | 03/20/19 | | | 250,000 | | | | 250,344 | |
Cooperatieve Rabobank (Monthly U.S. LIBOR + 0.22%) | | | 2.69 | %(2) | 01/21/19 | | | 250,000 | | | | 249,999 | |
Royal Bank of Canada Yankee CD (Monthly U.S. LIBOR + 0.25%) | | | 2.65 | %(2) | 01/11/19 | | | 250,000 | | | | 250,000 | |
Royal Bank of Canada Yankee CD (Quarterly U.S. LIBOR + 0.14%) | | | 2.72 | %(2) | 02/04/19 | | | 548,000 | | | | 548,050 | |
Toronto Dominion Bank/New York, NY Yankee CD (Monthly U.S LIBOR + .14%) | | | 2.61 | %(2) | 01/21/19 | | | 300,000 | | | | 299,982 | |
Toronto Dominion Bank/New York, NY Yankee CD (Quarterly U.S LIBOR + .21%) | | | 2.95 | %(2) | 03/04/19 | | | 500,000 | | | | 500,000 | |
Total Certificates of Deposit (Cost $6,199,539) | | | 6,199,539 | |
| | | | | | | | | | | | | | |
Commercial Paper — 34.6% |
American Honda Finance Corp. | | | 2.42 | % | 01/23/19 | | | 500,000 | | | | 499,262 | |
American Honda Finance Corp. | | | 2.57 | % | 02/21/19 | | | 250,000 | | | | 249,097 | |
BNP Paribas Fortis | | | 2.53 | % | 02/20/19 | | | 500,000 | | | | 498,160 | |
Canadian Imperial Holdings, Inc. | | | 2.74 | % | 04/15/19 | | | 250,000 | | | | 248,043 | |
Caterpillar, Inc. | | | 2.72 | % | 02/19/19 | | | 500,000 | | | | 498,163 | |
Caterpillar, Inc. | | | 2.72 | % | 03/04/19 | | | 250,000 | | | | 248,838 | |
Cooperatieve Rabobank | | | 2.43 | % | 02/11/19 | | | 250,000 | | | | 249,314 | |
Cooperatieve Rabobank (Monthly U.S. LIBOR + 0.15%) | | | 2.66 | %(2) | 01/28/19 | | | 500,000 | | | | 500,000 | |
Credit Agricole Corporate and Investment Bank/New York | | | 2.46 | % | 01/24/19 | | | 250,000 | | | | 249,610 | |
Credit Agricole Corporate and Investment Bank/New York | | | 2.57 | % | 02/22/19 | | | 250,000 | | | | 249,079 | |
ExxonMobil | | | 2.42 | % | 01/10/19 | | | 1,500,000 | | | | 1,499,090 | |
ING US Funding, LLC | | | 2.52 | % | 02/08/19 | | | 250,000 | | | | 249,340 | |
ING US Funding, LLC | | | 2.47 | % | 02/21/19 | | | 250,000 | | | | 249,136 | |
ING US Funding, LLC | | | 2.48 | % | 03/05/19 | | | 500,000 | | | | 497,861 | |
JP Morgan Securities, LLC | | | 2.54 | % | 01/17/19 | | | 250,000 | | | | 249,722 | |
JP Morgan Securities, LLC | | | 2.56 | % | 02/19/19 | | | 250,000 | | | | 249,143 | |
The accompanying notes are an integral part of these financial statements.
Page 110 | 2018 Annual Report | December 31, 2018 |
Schedule of Investments
December 31, 2018
Prime Money Market Fund |
Security Description | | Coupon/
Yield | | Maturity/
Demand
Date | | Principal
Amount ($)
or Shares | | | Fair
Value ($) | |
Commercial Paper — continued |
JP Morgan Securities, LLC | | | 2.58 | % | 03/20/19 | | | 250,000 | | | | 248,619 | |
JP Morgan Securities, LLC | | | 2.83 | % | 03/22/19 | | | 204,000 | | | | 202,731 | |
JP Morgan Securities, LLC | | | 2.78 | % | 04/03/19 | | | 250,000 | | | | 248,243 | |
JP Morgan Securities, LLC | | | 2.88 | % | 04/29/19 | | | 250,000 | | | | 247,665 | |
Mitsubishi International Corp | | | 2.64 | % | 02/12/19 | | | 500,000 | | | | 498,472 | |
Mitsubishi International Corp | | | 2.72 | % | 03/08/19 | | | 500,000 | | | | 497,525 | |
MUFG Bank LTD/New York, NY | | | 2.67 | % | 02/13/19 | | | 250,000 | | | | 249,209 | |
National Rural Utilities | | | 2.50 | % | 01/07/19 | | | 500,000 | | | | 499,792 | |
National Rural Utilities | | | 2.42 | % | 01/09/19 | | | 250,000 | | | | 249,866 | |
National Rural Utilities | | | 2.58 | % | 01/22/19 | | | 500,000 | | | | 499,250 | |
National Rural Utilities | | | 2.58 | % | 01/30/19 | | | 250,000 | | | | 249,482 | |
Natixis SA/ New York, NY | | | 2.61 | % | 01/31/19 | | | 500,000 | | | | 498,917 | |
Natixis SA/ New York, NY | | | 2.49 | % | 02/20/19 | | | 250,000 | | | | 249,146 | |
Natixis SA/ New York, NY | | | 2.70 | % | 03/07/19 | | | 250,000 | | | | 248,790 | |
Natixis SA/ New York, NY | | | 2.58 | % | 03/15/19 | | | 250,000 | | | | 248,707 | |
Paccar Financial Corp | | | 2.44 | % | 01/16/19 | | | 250,000 | | | | 249,747 | |
Paccar Financial Corp | | | 2.45 | % | 02/07/19 | | | 250,000 | | | | 249,376 | |
Prudential Financial, Inc. | | | 2.45 | % | 01/02/19 | | | 1,000,000 | | | | 999,932 | |
Royal Bank of Canada (Monthly U.S. LIBOR + 0.28%) | | | 2.75 | %(2) | 01/22/19 | | | 500,000 | | | | 500,000 | |
Toyota Motor Credit Corp. | | | 2.49 | % | 03/11/19 | | | 250,000 | | | | 248,821 | |
Toyota Motor Credit Corp. | | | 2.54 | % | 04/01/19 | | | 250,000 | | | | 248,431 | |
Toyota Motor Credit Corp. | | | 2.94 | % | 06/13/19 | | | 250,000 | | | | 246,714 | |
Total Commercial Paper (Cost $14,163,293) | | | 14,163,293 | |
| | | | | | | | | | | | | | |
Corporate Obligations — 8.0% |
Bank of Montreal (Quarterly U.S. LIBOR + 0.60%) | | | 3.38 | %(2) | 03/12/19 | | | 752,000 | | | | 755,263 | |
IBM Credit, LLC (Quarterly U.S. LIBOR + .15%) | | | 2.89 | %(2) | 03/06/19 | | | 670,000 | | | | 669,337 | |
Royal Bank of Canada (Quarterly U.S. LIBOR + 0.24%) | | | 2.95 | %(2) | 03/01/19 | | | 330,000 | | | | 330,262 | |
Toyota Motor Credit Corp. (Quarterly U.S. LIBOR + 0.10%) | | | 2.59 | %(2) | 01/25/19 | | | 500,000 | | | | 499,969 | |
US Bancorp (Quarterly U.S LIBOR + 0.40%) | | | 2.89 | %(2) | 01/25/19 | | | 250,000 | | | | 250,239 | |
U.S. Bank N.A. Cincinnati (Quarterly U.S. LIBOR + 0.12%) | | | 2.73 | %(2) | 02/14/19 | | | 500,000 | | | | 500,057 | |
Walt Disney Company (Quarterly U.S. LIBOR + 0.31%) | | | 3.02 | %(2) | 02/28/19 | | | 250,000 | | | | 250,317 | |
Total Corporate Obligations (Cost $3,255,444) | | | 3,255,444 | |
| | | | | | | | | | | | | | |
Repurchase Agreements — 24.5% |
INTL FCStone (Collateralized by $22,541,686 various GNMAs, FNMAs, and FMACs, 0.00% - 5.50%, due 2/1/19 - 2/16/59, fair value $5,103,559)(proceeds $5,000,903), purchase date 12/31/18 | | | 3.25 | % | 01/02/19 | | | 5,000,000 | | | | 5,000,000 | |
South Street (Collateralized by $27,806,974 various FNMAs, FHLBs, FMACs, GNMAs, and SBAs, 2.38% - 6.63%, due 6/14/19 - 8/15/59, fair value $5,116,064)(proceeds $5,000,931), purchase date 12/31/18 | | | 3.35 | % | 01/02/19 | | | 5,000,000 | | | | 5,000,000 | |
Total Repurchase Agreements (Cost $10,000,000) | | | 10,000,000 | |
The accompanying notes are an integral part of these financial statements.
2018 Annual Report | December 31, 2018 | Page 111 |
Schedule of Investments
December 31, 2018
Prime Money Market Fund |
Security Description | | Coupon/
Yield | | Maturity/
Demand
Date | | Principal
Amount ($)
or Shares | | | Fair
Value ($) | |
U.S. Government and Agency Obligations — 4.9% |
Federal Home Loan Bank | | | 2.32 | % | 01/09/19 | | | 1,000,000 | | | | 999,484 | |
United States Treasury Bill | | | 2.41 | % | 01/22/19 | | | 1,000,000 | | | | 998,618 | |
Total U.S. Government and Agency Obligations (Cost $1,998,102) | | | 1,998,102 | |
Prime Money Market Fund |
Security Description | | Shares or
Principal
Amount ($) | | | Fair
Value ($) | |
Money Market Registered Investment Companies — 10.4% |
Fidelity Prime Institutional Money Market Portfolio, 2.47%(3) | | | 599,161 | | | | 599,400 | |
Morgan Stanley Government Institutional Fund, 2.32%(3) | | | 3,654,615 | | | | 3,654,615 | |
Total Money Market Registered Investment Companies (Cost $4,254,015) | | | | | | | 4,254,015 | |
Total Investments — 100.0%(Cost $40,863,683) | | | | | | | 40,863,683 | |
Other Assets less Liabilities — 0.0% | | | | | | | 17,131 | |
Total Net Assets — 100.0% | | | | | | | 40,880,814 | |
| | | | | | | | | |
Trustee Deferred Compensation(4) |
Meeder Balanced Fund | | | 646 | | | | 7,158 | |
Meeder Dynamic Allocation Fund | | | 1,653 | | | | 16,183 | |
Meeder Muirfield Fund | | | 652 | | | | 4,668 | |
Meeder Conservative Allocation Fund | | | 184 | | | | 3,897 | |
Total Trustee Deferred Compensation (Cost $31,195) | | | | | | | 31,906 | |
(1) | Variable rate security. Securities payable at par including accrued interest (usually within seven days notice) and unconditionally secured as to principal and interest by letters of credit or other credit support agreements from major banks. The interest rates are adjustable and are not based on a published reference rate and spread but are determined by the issuer or agent and are based on current market conditions. These securities do not indicate a reference rate and spread in their description above. The rate shown represents the rate in effect at December 31, 2018. The maturity date shown, if applicable, reflects the earlier of the next demand date or stated maturity date. |
(2) | Floating rate security. Interest rates reset periodically. The reference rate and spread are indicated in the description above. The rate shown represents the rate in effect at December 31, 2018. The maturity date shown reflects the earlier of the next demand date or stated maturity date. |
(3) | 7-day yield as of December 31, 2018. The Fund may invest a significant portion of its assets in shares of one or more investment companies, including money market mutual funds. The Fund will incur additional indirect expenses (acquired fund fees and expenses) to the extent it invests in shares of other investment companies. |
(4) | Assets of affiliates to the Prime Money Market Fund held for the benefit of the Fund’s Trustees in connection with the Trustee Deferred Compensation Plan. |
The accompanying notes are an integral part of these financial statements.
Page 112 | 2018 Annual Report | December 31, 2018 |
Schedule of Investments
December 31, 2018
Institutional Prime Money Market Fund |
Security Description | | Coupon/
Yield | | Maturity/
Demand
Date | | Principal
Amount ($)
or Shares | | | Fair
Value ($) | |
Bank Obligations — 0.2% |
First Merchants Bank Deposit Account | | | 2.10 | %(1) | 01/02/19 | | | 248,429 | | | | 248,429 | |
Mid America Bank Deposit Account | | | 2.25 | %(1) | 01/02/19 | | | 248,000 | | | | 248,000 | |
Pacific Mercantile Bank Deposit Account | | | 2.20 | %(1) | 01/02/19 | | | 248,442 | | | | 248,442 | |
Pacific Premier Bank Deposit Account | | | 2.30 | %(1) | 01/02/19 | | | 248,418 | | | | 248,418 | |
Total Bank Obligations (Cost $993,289) | | | 993,289 | |
| | | | | | | | | | | | | | |
Certificates of Deposit — 14.2% |
Banco Estado Chile Yankee CD | | | 2.59 | % | 02/04/19 | | | 3,000,000 | | | | 3,000,093 | |
Banco Estado Chile Yankee CD | | | 2.59 | % | 02/12/19 | | | 3,000,000 | | | | 3,000,006 | |
Banco Estado Chile Yankee CD | | | 2.55 | % | 02/14/19 | | | 3,000,000 | | | | 2,999,856 | |
Banco Estado Chile Yankee CD | | | 2.67 | % | 03/06/19 | | | 3,000,000 | | | | 2,999,994 | |
Banco Estado Chile Yankee CD | | | 2.51 | % | 03/13/19 | | | 3,000,000 | | | | 2,998,743 | |
Bank of Montreal Yankee CD (Monthly U.S. LIBOR + 0.27%) | | | 2.78 | %(2) | 01/28/19 | | | 1,365,000 | | | | 1,365,444 | |
Bank of Montreal Yankee CD (Quarterly U.S. LIBOR + 0.33%) | | | 3.11 | %(2) | 03/12/19 | | | 1,250,000 | | | | 1,251,243 | |
Bank of Montreal Yankee CD (Monthly U.S. LIBOR + 0.30%) | | | 2.73 | %(2) | 01/14/19 | | | 2,000,000 | | | | 1,999,998 | |
Bank of Nova Scotia Yankee CD (Quarterly U.S. LIBOR + 0.20%) | | | 2.61 | %(2) | 01/10/19 | | | 5,000,000 | | | | 5,001,060 | |
Bank of Nova Scotia Yankee CD (Quarterly U.S. LIBOR + 0.26%) | | | 2.85 | %(2) | 02/08/19 | | | 4,500,000 | | | | 4,502,223 | |
Bank of Nova Scotia Yankee CD (Quarterly U.S. LIBOR + 0.25%) | | | 2.57 | %(2) | 02/18/19 | | | 5,000,000 | | | | 5,002,170 | |
Canadian Imperial Bank Yankee CD (Quarterly U.S. LIBOR + 0.235%) | | | 2.63 | %(2) | 01/03/19 | | | 2,200,000 | | | | 2,200,000 | |
Canadian Imperial Bank Yankee CD (Quarterly U.S. LIBOR + 0.18%) | | | 2.62 | %(2) | 01/18/19 | | | 3,500,000 | | | | 3,500,696 | |
Canadian Imperial Bank Yankee CD (Quarterly U.S. LIBOR + 0.20%) | | | 2.74 | %(2) | 02/01/19 | | | 2,000,000 | | | | 2,000,542 | |
Canadian Imperial Bank Yankee CD (Quarterly U.S. LIBOR + 0.32%) | | | 2.73 | %(2) | 01/07/19 | | | 1,020,000 | | | | 1,020,871 | |
Canadian Imperial Bank Yankee CD (Monthly U.S. LIBOR + 0.33%) | | | 2.76 | %(2) | 01/14/19 | | | 1,000,000 | | | | 1,000,019 | |
Canadian Imperial Bank Yankee CD (Quarterly U.S. LIBOR + 0.41%) | | | 3.20 | %(2) | 03/20/19 | | | 1,250,000 | | | | 1,252,010 | |
Cooperatieve Rabobank UA/NY (Monthly U.S. LIBOR + 0.22%) | | | 2.69 | %(2) | 01/21/19 | | | 3,000,000 | | | | 2,998,386 | |
Credit Suisse AG/New York, NY (Quarterly U.S. LIBOR + 0.34%) | | | 2.75 | %(2) | 01/09/19 | | | 1,000,000 | | | | 1,000,633 | |
MUFG Bank LTD/New York, NY (Monthly U.S. LIBOR + 0.20%) | | | 2.72 | %(2) | 01/31/19 | | | 3,000,000 | | | | 3,000,633 | |
Royal Bank of Canada Yankee CD (Monthly U.S. LIBOR + 0.25%) | | | 2.65 | %(2) | 01/11/19 | | | 2,750,000 | | | | 2,750,173 | |
Royal Bank of Canada Yankee CD (Quarterly U.S. LIBOR + 0.16%) | | | 2.76 | %(2) | 02/07/19 | | | 1,000,000 | | | | 1,000,113 | |
Swedbank AB Yankee CD (Monthly U.S. LIBOR + 0.20%) | | | 2.71 | %(2) | 01/25/19 | | | 2,000,000 | | | | 1,999,856 | |
Toronto Dominion Bank/New York, NY Yankee CD | | | 2.42 | % | 01/18/19 | | | 3,000,000 | | | | 2,999,919 | |
Toronto Dominion Bank/New York, NY Yankee CD (Quarterly U.S LIBOR + .21%) | | | 2.95 | %(2) | 03/04/19 | | | 5,000,000 | | | | 4,999,965 | |
Westpac Banking Corp Yankee CD (Quarterly U.S. LIBOR + 0.15%) | | | 2.79 | %(2) | 02/19/19 | | | 1,000,000 | | | | 1,000,330 | |
Total Certificates of Deposit (Cost $66,849,072) | | | 66,844,976 | |
| | | | | | | | | | | | | | |
Commercial Paper — 39.4% |
American Honda Finance Corp. | | | 2.42 | % | 01/23/19 | | | 3,000,000 | | | | 2,995,014 | |
American Honda Finance Corp. | | | 2.57 | % | 02/21/19 | | | 3,000,000 | | | | 2,988,678 | |
American Honda Finance Corp. | | | 2.59 | % | 02/22/19 | | | 3,000,000 | | | | 2,988,441 | |
BNP Paribas Fortis | | | 2.53 | % | 02/20/19 | | | 6,069,000 | | | | 6,046,879 | |
Canadian Imperial Holdings, Inc. | | | 2.74 | % | 04/15/19 | | | 3,000,000 | | | | 2,975,676 | |
Caterpillar, Inc. | | | 2.46 | % | 01/07/19 | | | 5,000,000 | | | | 4,997,510 | |
Caterpillar, Inc. | | | 2.72 | % | 02/19/19 | | | 3,000,000 | | | | 2,988,387 | |
The accompanying notes are an integral part of these financial statements.
2018 Annual Report | December 31, 2018 | Page 113 |
Schedule of Investments
December 31, 2018
Institutional Prime Money Market Fund |
Security Description | | Coupon/
Yield | | Maturity/
Demand
Date | | Principal
Amount ($)
or Shares | | | Fair
Value ($) | |
Commercial Paper — continued |
Caterpillar, Inc. | | | 2.72 | % | 03/04/19 | | | 3,000,000 | | | | 2,985,069 | |
Cooperatieve Rabobank | | | 2.43 | % | 02/11/19 | | | 2,000,000 | | | | 1,994,050 | |
Cooperatieve Rabobank | | | 2.48 | % | 03/22/19 | | | 1,000,000 | | | | 994,033 | |
Cooperatieve Rabobank (Monthly U.S. LIBOR + 0.15%) | | | 2.66 | %(2) | 01/28/19 | | | 5,000,000 | | | | 4,997,555 | |
Credit Agricole Corporate and Investment Bank/New York | | | 2.46 | % | 01/24/19 | | | 2,000,000 | | | | 1,996,682 | |
Credit Agricole Corporate and Investment Bank/New York | | | 2.55 | % | 02/05/19 | | | 5,000,000 | | | | 4,987,330 | |
Credit Agricole Corporate and Investment Bank/New York | | | 2.57 | % | 02/22/19 | | | 2,000,000 | | | | 1,992,422 | |
Credit Agricole Corporate and Investment Bank/New York | | | 2.72 | % | 03/07/19 | | | 3,000,000 | | | | 2,985,534 | |
Credit Agricole Corporate and Investment Bank/New York | | | 2.75 | % | 03/28/19 | | | 2,000,000 | | | | 1,986,612 | |
Credit Suisse AG/New York, NY | | | 2.59 | % | 01/25/19 | | | 2,350,000 | | | | 2,345,904 | |
ExxonMobil | | | 2.42 | % | 01/10/19 | | | 10,000,000 | | | | 9,993,240 | |
ING US Funding, LLC | | | 2.50 | % | 01/11/19 | | | 1,150,000 | | | | 1,149,139 | |
ING US Funding, LLC | | | 2.52 | % | 02/08/19 | | | 3,000,000 | | | | 2,991,519 | |
ING US Funding, LLC | | | 2.47 | % | 02/21/19 | | | 2,000,000 | | | | 1,992,296 | |
ING US Funding, LLC | | | 2.48 | % | 03/05/19 | | | 4,750,000 | | | | 4,726,905 | |
JP Morgan Securities, LLC | | | 2.56 | % | 01/07/19 | | | 925,000 | | | | 924,566 | |
JP Morgan Securities, LLC | | | 2.54 | % | 01/17/19 | | | 3,000,000 | | | | 2,996,481 | |
JP Morgan Securities, LLC | | | 2.46 | % | 02/06/19 | | | 1,000,000 | | | | 997,325 | |
JP Morgan Securities, LLC | | | 2.45 | % | 02/11/19 | | | 1,000,000 | | | | 996,943 | |
JP Morgan Securities, LLC | | | 2.56 | % | 02/19/19 | | | 2,000,000 | | | | 1,992,648 | |
JP Morgan Securities, LLC | | | 2.51 | % | 03/08/19 | | | 1,000,000 | | | | 994,934 | |
JP Morgan Securities, LLC | | | 2.51 | % | 03/12/19 | | | 1,000,000 | | | | 994,584 | |
JP Morgan Securities, LLC | | | 2.58 | % | 03/20/19 | | | 2,000,000 | | | | 1,987,738 | |
JP Morgan Securities, LLC | | | 2.78 | % | 04/03/19 | | | 2,000,000 | | | | 1,985,224 | |
JP Morgan Securities, LLC | | | 2.88 | % | 04/29/19 | | | 2,325,000 | | | | 2,303,019 | |
JP Morgan Securities, LLC | | | 2.88 | % | 05/16/19 | | | 750,000 | | | | 741,897 | |
JP Morgan Securities, LLC | | | 3.07 | % | 08/02/19 | | | 2,000,000 | | | | 1,964,392 | |
Mitsubishi International Corp | | | 2.46 | % | 01/15/19 | | | 5,000,000 | | | | 4,994,885 | |
Mitsubishi International Corp | | | 2.64 | % | 02/12/19 | | | 5,000,000 | | | | 4,984,390 | |
Mitsubishi International Corp | | | 2.72 | % | 03/08/19 | | | 5,000,000 | | | | 4,974,455 | |
MUFG Bank LTD/New York, NY | | | 2.67 | % | 02/13/19 | | | 4,750,000 | | | | 4,734,957 | |
National Rural Utilities | | | 2.50 | % | 01/07/19 | | | 4,000,000 | | | | 3,998,140 | |
National Rural Utilities | | | 2.42 | % | 01/09/19 | | | 3,000,000 | | | | 2,998,197 | |
National Rural Utilities | | | 2.58 | % | 01/22/19 | | | 5,000,000 | | | | 4,992,370 | |
National Rural Utilities | | | 2.58 | % | 01/30/19 | | | 5,000,000 | | | | 4,989,375 | |
National Rural Utilities | | | 2.51 | % | 02/06/19 | | | 5,000,000 | | | | 4,986,780 | |
Natixis SA/ New York, NY | | | 2.61 | % | 01/31/19 | | | 3,000,000 | | | | 2,993,526 | |
Natixis SA/ New York, NY | | | 2.55 | % | 02/13/19 | | | 3,000,000 | | | | 2,990,526 | |
Natixis SA/ New York, NY | | | 2.49 | % | 02/20/19 | | | 2,000,000 | | | | 1,992,560 | |
Natixis SA/ New York, NY | | | 2.70 | % | 03/07/19 | | | 3,000,000 | | | | 2,985,063 | |
Natixis SA/ New York, NY | | | 2.58 | % | 03/15/19 | | | 1,000,000 | | | | 994,318 | |
Natixis SA/ New York, NY | | | 2.76 | % | 03/27/19 | | | 2,000,000 | | | | 1,986,450 | |
Natixis SA/ New York, NY | | | 2.60 | % | 04/02/19 | | | 3,000,000 | | | | 2,978,073 | |
Paccar Financial Corp | | | 2.44 | % | 01/16/19 | | | 3,000,000 | | | | 2,996,724 | |
Paccar Financial Corp | | | 2.45 | % | 02/07/19 | | | 3,000,000 | | | | 2,991,840 | |
Prudential Financial, Inc. | | | 2.45 | % | 01/02/19 | | | 14,000,000 | | | | 13,999,047 | |
Royal Bank of Canada (Monthly U.S. LIBOR + 0.28%) | | | 2.75 | %(2) | 01/22/19 | | | 4,500,000 | | | | 4,500,257 | |
Swedbank AB | | | 2.42 | % | 02/11/19 | | | 1,000,000 | | | | 997,081 | |
Swedbank AB | | | 2.47 | % | 02/25/19 | | | 2,000,000 | | | | 1,992,100 | |
Toyota Motor Credit Corp. | | | 2.36 | % | 01/18/19 | | | 2,000,000 | | | | 1,997,608 | |
Toyota Motor Credit Corp. | | | 2.49 | % | 03/11/19 | | | 3,000,000 | | | | 2,984,541 | |
Toyota Motor Credit Corp. | | | 2.54 | % | 04/01/19 | | | 2,000,000 | | | | 1,985,896 | |
Total Commercial Paper (Cost $186,028,003) | | | 185,997,785 | |
The accompanying notes are an integral part of these financial statements.
Page 114 | 2018 Annual Report | December 31, 2018 |
Schedule of Investments
December 31, 2018
Institutional Prime Money Market Fund |
Security Description | | Coupon/
Yield | | Maturity/
Demand
Date | | Principal
Amount ($)
or Shares | | | Fair
Value ($) | |
Corporate Obligations — 5.2% |
Bank of Montreal (Quarterly U.S. LIBOR + 0.60%) | | | 3.38 | %(2) | 03/12/19 | | | 5,000,000 | | | | 5,011,465 | |
Bank of Nova Scotia (Quarterly U.S. LIBOR + 0.66%) | | | 3.44 | %(2) | 03/14/19 | | | 2,000,000 | | | | 2,004,194 | |
IBM Credit LLC (Quarterly U.S. LIBOR + .15%) | | | 2.89 | %(2) | 03/06/19 | | | 3,000,000 | | | | 2,994,396 | |
Royal Bank of Canada (Quarterly U.S. LIBOR + 0.24%) | | | 2.95 | %(2) | 03/01/19 | | | 3,000,000 | | | | 2,999,352 | |
Toyota Motor Credit Corp. (Quarterly U.S. LIBOR + 0.10%) | | | 2.59 | %(2) | 01/25/19 | | | 3,500,000 | | | | 3,499,202 | |
US Bancorp (Quarterly U.S LIBOR + 0.40%) | | | 2.89 | %(2) | 01/25/19 | | | 2,525,000 | | | | 2,525,727 | |
U.S. Bank N.A. Cincinnati (Quarterly U.S. LIBOR + 0.12%) | | | 2.73 | %(2) | 02/14/19 | | | 2,355,000 | | | | 2,354,430 | |
Walt Disney Company (Quarterly U.S. LIBOR + 0.31%) | | | 3.02 | %(2) | 02/28/19 | | | 3,150,000 | | | | 3,152,356 | |
Total Corporate Obligations (Cost $24,562,128) | | | 24,541,122 | |
| | | | | | | | | | | | | | |
Repurchase Agreements — 22.3% |
INTL FCStone (Collateralized by $62,462,877 various GNMAs, FMACs, FNMAs, Treasury Notes, & Treasury Bills, 0.00% - 9.00%, due 2/1/19 - 2/16/59 fair value $25,501,525)(proceeds $25,004,514), purchase date 12/31/18 | | | 3.25 | % | 01/02/19 | | | 25,000,000 | | | | 25,000,000 | |
South Street (Collateralized by $166,841,845 various FNMAs, FHLBS, FMACs, GNMAS, and SBAs, 2.38% - 6.63%, due 6/14/19 - 8/15/59, fair value $30,696,383)(proceeds $30,005,583), purchase date 12/31/18 | | | 3.35 | % | 01/02/19 | | | 30,000,000 | | | | 30,000,000 | |
South Street (Collateralized by $284,499,307 various FNMAs and FMACs, 1.97% - 5.00%, due 3/1/19 - 9/1/48, fair value $51,000,000)(proceeds $50,009,028), purchase date 12/31/18 | | | 3.25 | % | 01/02/19 | | | 50,000,000 | | | | 50,000,000 | |
Total Repurchase Agreements (Cost $105,000,000) | | | 105,000,000 | |
| | | | | | | | | | | | | | |
U.S. Government and Agency Obligations — 4.9% |
Federal Home Loan Bank | | | 2.44 | % | 01/04/19 | | | 3,000,000 | | | | 2,999,604 | |
Federal Home Loan Bank | | | 2.32 | % | 01/09/19 | | | 10,000,000 | | | | 9,994,844 | |
United States Treasury Bill | | | 2.41 | % | 01/22/19 | | | 10,000,000 | | | | 9,987,160 | |
Total U.S. Government and Agency Obligations (Cost $22,980,419) | | | 22,981,608 | |
The accompanying notes are an integral part of these financial statements.
2018 Annual Report | December 31, 2018 | Page 115 |
Schedule of Investments
December 31, 2018
Institutional Prime Money Market Fund |
Security Description | | Shares or
Principal
Amount ($) | | | Fair
Value ($) | |
Money Market Registered Investment Companies — 13.9% |
Fidelity Prime Institutional Money Market Portfolio, 2.47%(3) | | | 5,095,962 | | | | 5,097,491 | |
Morgan Stanley Government Institutional Fund, 2.32% (3) | | | 60,512,257 | | | | 60,512,257 | |
Total Money Market Registered Investment Companies (Cost $65,610,258) | | | | | | | 65,609,748 | |
Total Investments — 100.1%(Cost $472,023,169) | | | | | | | 471,968,528 | |
Liabilities less Other Assets - (0.1%) | | | | | | | (366,020 | ) |
Total Net Assets — 100.0% | | | | | | | 471,602,508 | |
| | | | | | | | | |
Trustee Deferred Compensation(4) |
Meeder Balanced Fund | | | 32 | | | | 355 | |
Meeder Dynamic Allocation Fund | | | 73 | | | | 715 | |
Meeder Muirfield Fund | | | 86 | | | | 616 | |
Meeder Conservative Allocation Fund | | | 10 | | | | 212 | |
Total Trustee Deferred Compensation (Cost $2,095) | | | | | | | 1,898 | |
(1) | Variable rate security. Securities payable at par including accrued interest (usually within seven days notice) and unconditionally secured as to principal and interest by letters of credit or other credit support agreements from major banks. The interest rates are adjustable and are not based on a published reference rate and spread but are determined by the issuer or agent and are based on current market conditions. These securities do not indicate a reference rate and spread in their description above. The rate shown represents the rate in effect at December 31, 2018. The maturity date shown, if applicable, reflects the earlier of the next demand date or stated maturity date. |
(2) | Floating rate security. Interest rates reset periodically. The reference rate and spread are indicated in the description above. The rate shown represents the rate in effect at December 31, 2018. The maturity date shown reflects the earlier of the next demand date or stated maturity date. |
(3) | 7-day yield as of December 31, 2018. The Fund may invest a significant portion of its assets in shares of one or more investment companies, including money market mutual funds. The Fund will incur additional indirect expenses (acquired fund fees and expenses) to the extent it invests in shares of other investment companies. |
(4) | Assets of affiliates to the Institutional Prime Money Market Fund held for the benefit of the Fund’s Trustees in connection with the Trustee Deferred Compensation Plan. |
The accompanying notes are an integral part of these financial statements.
Page 116 | 2018 Annual Report | December 31, 2018 |
[This page intentionally left blank]
Statements of Assets & Liabilities
December 31, 2018 |
| | | Muirfield
Fund | | | Spectrum
Fund | | | Global
Allocation
Fund | |
Assets | | | | | | | | | | | | |
Investments, at fair value (1)(2) | | $ | 391,209,861 | | | $ | 161,988,399 | | | $ | 34,650,889 | |
Repurchase agreements, at fair value (1) | | | — | | | | — | | | | — | |
Investments in affiliates, at fair value (1) | | | 203,128,346 | | | | 10,509,243 | | | | 23,572,809 | |
Trustee deferred compensation investments, at fair value | | | 180,121 | | | | 18,855 | | | | 82,241 | |
Cash | | | 4,775 | | | | 5,358 | | | | 279 | |
Deposits at broker for futures contracts (3) | | | 15,135,425 | | | | 3,446,268 | | | | 760,151 | |
Cash held at broker for collateral on securities sold short | | | — | | | | 66,359,258 | | | | — | |
Receivable for securities sold | | | 3,707,186 | | | | 1,274,105 | | | | 1,556,908 | |
Receivable for capital stock issued | | | 1,570,263 | | | | 454,015 | | | | 39,679 | |
Receivable from investment advisor | | | — | | | | — | | | | — | |
Interest and dividend receivable | | | 895,272 | | | | 306,643 | | | | 74,487 | |
Receivable from securities lending agent (See Note #5) | | | 53 | | | | 66 | | | | 106 | |
Receivable for commissions recaptured | | | 182,373 | | | | 82,439 | | | | 10,916 | |
Prepaid expenses/other assets | | | 284,210 | | | | 133,707 | | | | 28,372 | |
Total Assets | | | 616,297,885 | | | | 244,578,356 | | | | 60,776,837 | |
| | | | | | | | | | | | | |
Liabilities | | | | | | | | | | | | |
Securities sold short at fair value (proceeds $67,941,343) | | | — | | | | 60,259,673 | | | | — | |
Payable for securities purchased | | | 3,752,062 | | | | 1,177,939 | | | | 220,631 | |
Payable for collateral on securities loaned | | | 209,544 | | | | 61,024 | | | | 2,004,412 | |
Payable for Trustee Deferred Compensation Plan | | | 180,121 | | | | 18,855 | | | | 82,241 | |
Payable for capital stock redeemed | | | 608,325 | | | | 46,411 | | | | 271 | |
Dividends payable | | | — | | | | — | | | | — | |
Dividend expense payable on short positions | | | — | | | | 111,751 | | | | — | |
Payable to investment advisor | | | 139,997 | | | | 50,055 | | | | 15,744 | |
Accrued distribution plan (12b-1) and shareholder service plan fees | | | 315,450 | | | | 62,250 | | | | 7,621 | |
Accrued transfer agent, fund accounting, CCO, and administrative fees | | | 23,617 | | | | 17,927 | | | | 8,110 | |
Accrued trustee fees | | | 5,159 | | | | 1,610 | | | | 683 | |
Other accrued liabilities | | | 54,514 | | | | 36,452 | | | | 27,419 | |
Total Liabilities | | | 5,288,789 | | | | 61,843,947 | | | | 2,367,132 | |
| | | | | | | | | | | | | |
Net Assets | | $ | 611,009,096 | | | $ | 182,734,409 | | | $ | 58,409,705 | |
| | | | | | | | | | | | | |
Net Assets | | | | | | | | | | | | |
Capital | | $ | 607,123,426 | | | $ | 176,390,877 | | | $ | 58,096,334 | |
Distributable Earnings (Accumulated Deficit) | | | 3,885,670 | | | | 6,343,532 | | | | 313,371 | |
Total Net Assets | | $ | 611,009,096 | | | $ | 182,734,409 | | | $ | 58,409,705 | |
| | | | | | | | | | | | | |
Net Asset Value Per Share | | | | | | | | | | | | |
Retail Class | | | | | | | | | | | | |
Net Assets | | $ | 203,286,874 | | | $ | 51,082,675 | | | $ | 13,809,532 | |
Shares Outstanding | | | 28,389,640 | | | | 4,688,834 | | | | 1,351,195 | |
Net Asset Value, Offering and Redemption Price Per Share | | $ | 7.16 | | | $ | 10.89 | | | $ | 10.22 | |
| | | | | | | | | | | | | |
Adviser Class | | | | | | | | | | | | |
Net Assets | | $ | 61,158,805 | | | $ | 14,485,840 | | | $ | 1,624,069 | |
Shares Outstanding | | | 8,489,596 | | | | 1,323,439 | | | | 158,648 | |
Net Asset Value, Offering and Redemption Price Per Share | | $ | 7.20 | | | $ | 10.95 | | | $ | 10.24 | |
| | | | | | | | | | | | | |
Institutional Class | | | | | | | | | | | | |
Net Assets | | $ | 346,563,417 | | | $ | 117,165,894 | | | $ | 42,976,104 | |
Shares Outstanding | | | 48,097,159 | | | | 10,687,932 | | | | 4,195,833 | |
Net Asset Value, Offering and Redemption Price Per Share | | $ | 7.21 | | | $ | 10.96 | | | $ | 10.24 | |
| | | | | | | | | | | | | |
Net Asset Value Per Share - Money Market Funds | | | | | | | | | | | | |
Net Assets | | | | | | | | | | | | |
Shares Outstanding | | | | | | | | | | | | |
Net Asset Value, Offering and Redemption Price Per Share | | | | | | | | | | | | |
| | | | | | | | | | | | | |
(1) Investments and affiliated investments at cost | | $ | 597,884,185 | | | $ | 174,236,446 | | | $ | 58,376,869 | |
(2) Fair value of securities loaned included in investments at fair value (See Note #2, Note #3, and Note #5) | | $ | 204,786 | | | $ | 60,676 | | | $ | 1,975,585 | |
(3) Required margin held as collateral for futures contracts | | $ | 15,153,300 | | | $ | 3,806,650 | | | $ | 771,450 | |
The accompanying notes are an integral part of these financial statements.
Page 118 | 2018 Annual Report | December 31, 2018 |
| |
Balanced
Fund | | | Moderate
Allocation
Fund | | | Conservative
Allocation
Fund | | | Dynamic
Allocation
Fund | | | Quantex
Fund | | | Total Return
Bond Fund | | | Prime Money
Market Fund | | | Institutional
Prime Money
Market Fund | |
| | | | | | | | | | | | | | | | | | | | | | | | | | | | | | | |
| $ | 264,243,310 | | | $ | 129,962,244 | | | $ | 114,418,852 | | | $ | 132,722,557 | | | $ | 54,605,762 | | | $ | 64,160,115 | | | $ | 30,863,683 | | | $ | 366,968,528 | |
| | — | | | | — | | | | — | | | | — | | | | — | | | | — | | | | 10,000,000 | | | | 105,000,000 | |
| | 77,420,634 | | | | 29,907,471 | | | | 13,762,782 | | | | 38,098,890 | | | | 9,650,794 | | | | 2,871,730 | | | | — | | | | — | |
| | 118,181 | | | | 10,654 | | | | 48,698 | | | | 160,951 | | | | 47,345 | | | | 52,776 | | | | 31,906 | | | | 1,898 | |
| | 1,671 | | | | 599 | | | | 56 | | | | — | | | | 874 | | | | — | | | | — | | | | 6,423 | |
| | 6,060,178 | | | | 1,898,712 | | | | 923,332 | | | | 2,795,815 | | | | 1,003,150 | | | | — | | | | — | | | | — | |
| | — | | | | — | | | | — | | | | — | | | | — | | | | — | | | | — | | | | — | |
| | 1,482,749 | | | | 445,038 | | | | 219,299 | | | | 1,142,143 | | | | 5,527 | | | | — | | | | — | | | | — | |
| | 931,879 | | | | 248,929 | | | | 203,868 | | | | 292,527 | | | | 302,200 | | | | 18,487 | | | | — | | | | — | |
| | — | | | | — | | | | — | | | | — | | | | — | | | | — | | | | 4,429 | | | | 35,366 | |
| | 383,893 | | | | 129,339 | | | | 75,687 | | | | 255,981 | | | | 81,101 | | | | 22,674 | | | | 41,837 | | | | 365,645 | |
| | 131 | | | | 4 | | | | 3 | | | | 1 | | | | 131 | | | | — | | | | — | | | | — | |
| | 76,330 | | | | 26,010 | | | | 13,147 | | | | 66,793 | | | | — | | | | 704 | | | | — | | | | — | |
| | 111,639 | | | | 30,308 | | | | 31,527 | | | | 34,598 | | | | 22,875 | | | | 22,301 | | | | 12,445 | | | | 13,360 | |
| | 350,830,595 | | | | 162,659,308 | | | | 129,697,251 | | | | 175,570,256 | | | | 65,719,759 | | | | 67,148,787 | | | | 40,954,300 | | | | 472,391,220 | |
| | | | | | | | | | | | | | | | | | | | | | | | | | | | | | | |
| | | | | | | | | | | | | | | | | | | | | | | | | | | | | | | |
| | — | | | | — | | | | — | | | | — | | | | — | | | | — | | | | — | | | | — | |
| | 1,519,783 | | | | 458,826 | | | | 227,879 | | | | 1,151,912 | | | | — | | | | — | | | | — | | | | — | |
| | 65,160 | | | | — | | | | 497 | | | | 26,768 | | | | 918,218 | | | | — | | | | — | | | | — | |
| | 118,181 | | | | 10,654 | | | | 48,698 | | | | 160,951 | | | | 47,345 | | | | 52,776 | | | | 31,906 | | | | 1,898 | |
| | 30,708 | | | | 189,327 | | | | 40,169 | | | | 173,172 | | | | 3,195 | | | | 96,176 | | | | — | | | | — | |
| | — | | | | — | | | | — | | | | — | | | | — | | | | — | | | | 8,796 | | | | 717,933 | |
| | — | | | | — | | | | — | | | | — | | | | — | | | | — | | | | — | | | | — | |
| | 85,762 | | | | 34,999 | | | | 23,447 | | | | 40,825 | | | | 17,188 | | | | 7,259 | | | | — | | | | — | |
| | 142,299 | | | | 54,849 | | | | 35,892 | | | | 64,670 | | | | 38,823 | | | | 17,828 | | | | 6,552 | | | | 10,810 | |
| | 14,376 | | | | 15,635 | | | | 8,401 | | | | 17,517 | | | | 7,708 | | | | 7,440 | | | | 9,376 | | | | 29,626 | |
| | 3,075 | | | | 1,395 | | | | 1,170 | | | | 1,391 | | | | 893 | | | | 660 | | | | 179 | | | | 255 | |
| | 42,447 | | | | 31,053 | | | | 30,211 | | | | 37,983 | | | | 29,991 | | | | 27,523 | | | | 16,677 | | | | 28,190 | |
| | 2,021,791 | | | | 796,738 | | | | 416,364 | | | | 1,675,189 | | | | 1,063,361 | | | | 209,662 | | | | 73,486 | | | | 788,712 | |
| | | | | | | | | | | | | | | | | | | | | | | | | | | | | | | |
| $ | 348,808,804 | | | $ | 161,862,570 | | | $ | 129,280,887 | | | $ | 173,895,067 | | | $ | 64,656,398 | | | $ | 66,939,125 | | | $ | 40,880,814 | | | $ | 471,602,508 | |
| | | | | | | | | | | | | | | | | | | | | | | | | | | | | | | |
| | | | | | | | | | | | | | | | | | | | | | | | | | | | | | | |
| $ | 352,216,672 | | | $ | 167,496,234 | | | $ | 135,666,795 | | | $ | 179,993,806 | | | $ | 61,854,188 | | | $ | 80,206,147 | | | $ | 40,880,814 | | | $ | 471,660,371 | |
| | (3,407,868 | ) | | | (5,633,664 | ) | | | (6,385,908 | ) | | | (6,098,739 | ) | | | 2,802,210 | | | | (13,267,022 | ) | | | — | | | | (57,863 | ) |
| $ | 348,808,804 | | | $ | 161,862,570 | | | $ | 129,280,887 | | | $ | 173,895,067 | | | $ | 64,656,398 | | | $ | 66,939,125 | | | $ | 40,880,814 | | | $ | 471,602,508 | |
| | | | | | | | | | | | | | | | | | | | | | | | | | | | | | | |
| | | | | | | | | | | | | | | | | | | | | | | | | | | | | | | |
| | | | | | | | | | | | | | | | | | | | | | | | | | | | | | | |
| $ | 90,133,462 | | | $ | 32,502,100 | | | $ | 30,758,828 | | | $ | 40,731,711 | | | $ | 28,318,588 | | | $ | 14,931,792 | | | | | | | | | |
| | 8,132,788 | | | | 2,999,267 | | | | 1,452,009 | | | | 4,160,164 | | | | 878,965 | | | | 1,653,915 | | | | | | | | | |
| $ | 11.08 | | | $ | 10.84 | | | $ | 21.18 | | | $ | 9.79 | | | $ | 32.22 | | | $ | 9.03 | | | | | | | | | |
| | | | | | | | | | | | | | | | | | | | | | | | | | | | | | | |
| | | | | | | | | | | | | | | | | | | | | | | | | | | | | | | |
| $ | 19,300,793 | | | $ | 9,479,771 | | | $ | 6,109,940 | | | $ | 11,198,050 | | | $ | 923,339 | | | $ | 3,569,970 | | | | | | | | | |
| | 1,730,507 | | | | 873,320 | | | | 284,925 | | | | 1,139,807 | | | | 28,602 | | | | 394,937 | | | | | | | | | |
| $ | 11.15 | | | $ | 10.85 | | | $ | 21.44 | | | $ | 9.82 | | | $ | 32.28 | | | $ | 9.04 | | | | | | | | | |
| | | | | | | | | | | | | | | | | | | | | | | | | | | | | | | |
| | | | | | | | | | | | | | | | | | | | | | | | | | | | | | | |
| $ | 239,374,549 | | | $ | 119,880,699 | | | $ | 92,412,119 | | | $ | 121,965,306 | | | $ | 35,414,471 | | | $ | 48,437,363 | | | | | | | | | |
| | 21,463,369 | | | | 11,023,206 | | | | 4,300,219 | | | | 12,421,868 | | | | 1,096,774 | | | | 5,359,997 | | | | | | | | | |
| $ | 11.15 | | | $ | 10.88 | | | $ | 21.49 | | | $ | 9.82 | | | $ | 32.29 | | | $ | 9.04 | | | | | | | | | |
| | | | | | | | | | | | | | | | | | | | | | | | | | | | | | | |
| | | | | | | | | | | | | | | | | | | | | | | | | | | | | | | |
| | | | | | | | | | | | | | | | | | | | | | | | | $ | 40,880,814 | | | $ | 471,602,508 | |
| | | | | | | | | | | | | | | | | | | | | | | | | | 40,880,814 | | | | 471,671,302 | |
| | | | | | | | | | | | | | | | | | | | | | | | | $ | 1.00 | | | $ | 0.9999 | |
| | | | | | | | | | | | | | | | | | | | | | | | | | | | | | | |
| $ | 344,878,830 | | | $ | 163,294,979 | | | $ | 131,455,063 | | | $ | 171,260,066 | | | $ | 61,181,365 | | | $ | 67,908,569 | | | $ | 40,863,683 | | | $ | 472,023,169 | |
| $ | 63,468 | | | $ | — | | | $ | 496 | | | $ | 26,036 | | | $ | 912,297 | | | $ | — | | | $ | — | | | $ | — | |
| $ | 6,089,350 | | | $ | 1,796,300 | | | $ | 876,900 | | | $ | 2,182,950 | | | $ | 582,200 | | | $ | — | | | $ | — | | | $ | — | |
The accompanying notes are an integral part of these financial statements.
2018 Annual Report | December 31, 2018 | Page 119 |
Statements of Operations
For the Year Ended December 31, 2018 |
| | | Muirfield
Fund | | | Spectrum
Fund | | | Global
Allocation
Fund | |
Investment Income | | | | | | | | | | | | |
Interest | | $ | 21,869 | | | $ | 9,222 | | | $ | 56,422 | |
Income from affiliates | | | 3,068,451 | | | | 233,930 | | | | 298,014 | |
Dividends | | | 7,004,232 | | | | 3,204,514 | | | | 1,133,096 | |
Total Investment Income | | | 10,094,552 | | | | 3,447,666 | | | | 1,487,532 | |
| | | | | | | | | | | | | |
Fund Expenses | | | | | | | | | | | | |
Investment advisor | | | 3,578,189 | | | | 1,279,218 | | | | 546,420 | |
Transfer agent - Retail Class | | | 279,391 | | | | 65,420 | | | | 29,324 | |
Transfer agent - Adviser Class | | | 65,540 | | | | 16,124 | | | | 2,000 | |
Transfer agent - Institutional Class | | | 315,692 | | | | 123,130 | | | | 56,103 | |
Transfer agent - Money Market Funds | | | | | | | | | | | | |
Fund accounting | | | 92,053 | | | | 54,056 | | | | 43,474 | |
Administrative | | | 450,425 | | | | 146,450 | | | | 68,285 | |
Trustee | | | 28,268 | | | | 9,028 | | | | 3,766 | |
Audit | | | 15,560 | | | | 17,037 | | | | 13,103 | |
Legal | | | 4,989 | | | | 5,017 | | | | 4,989 | |
Custody | | | 55,549 | | | | 17,443 | | | | 7,568 | |
Printing | | | 18,101 | | | | 5,402 | | | | 2,178 | |
Distribution plan (12b-1) - Retail Class (1) | | | 465,652 | | | | 136,293 | | | | 61,092 | |
Distribution plan (12b-1) - Money Market Funds | | | | | | | | | | | | |
Shareholder service plan - Retail Class | | | 465,652 | | | | 109,034 | | | | 48,873 | |
Shareholder service plan - Adviser Class | | | 136,547 | | | | 33,592 | | | | 4,167 | |
Shareholder service plan - Institutional Class | | | 151,358 | | | | 49,353 | | | | 881 | |
Postage | | | 23,114 | | | | 14,293 | | | | 1,953 | |
Registration and filing | | | 82,930 | | | | 62,768 | | | | 55,847 | |
Insurance | | | 35,709 | | | | 10,886 | | | | 6,188 | |
Chief Compliance Officer | | | 6,407 | | | | 6,407 | | | | 6,407 | |
Dividend expense on securities sold short | | | — | | | | 614,570 | | | | — | |
Other | | | 31,072 | | | | 23,048 | | | | 20,613 | |
Total Expenses Before Reductions | | | 6,302,198 | | | | 2,798,569 | | | | 983,231 | |
| | | | | | | | | | | | | |
Expenses voluntarily reimbursed/waived by investment advisor (See Note #5) | | | — | | | | — | | | | — | |
Expenses contractually reimbursed/waived by investment advisor (See Note #5) | | | — | | | | — | | | | — | |
Commissions recaptured (See Note #5) | | | (267,024 | ) | | | (289,044 | ) | | | (53,133 | ) |
Securities lending credit (See Note #5) | | | (5,489 | ) | | | (1,690 | ) | | | (9,218 | ) |
Transfer agent expenses voluntarily waived (See Note #5) | | | (251,485 | ) | | | — | | | | — | |
| | | | | | | | | | | | | |
Net Expenses | | | 5,778,200 | | | | 2,507,835 | | | | 920,880 | |
| | | | | | | | | | | | | |
Net Investment Income (Loss) | | | 4,316,352 | | | | 939,831 | | | | 566,652 | |
| | | | | | | | | | | | | |
Net Realized and Unrealized Gain (Loss) from Investments | | | | | | | | | | | | |
Net realized gains (losses) from unaffiliated investments | | | 5,867,999 | | | | 5,220,139 | | | | 1,535,917 | |
Net realized gains (losses) from affiliated investments | | | (12,418 | ) | | | 4,136 | | | | (836 | ) |
Net realized gains (losses) from closed short positions | | | — | | | | (4,189,954 | ) | | | — | |
Net realized gains (losses) from futures contracts | | | 5,834,457 | | | | 481,556 | | | | (421,324 | ) |
Distributions of long-term realized gains by other investment companies | | | — | | | | — | | | | 1,480 | |
Net Realized Gains (Losses) from Investment Transactions, Futures Contracts, and Distributions of Long-term Realized Gains by Other Investment Companies | | | 11,690,038 | | | | 1,515,878 | | | | 1,115,237 | |
| | | | | | | | | | | | | |
Net change in unrealized appreciation (depreciation) of unaffiliated investments | | | (42,759,857 | ) | | | (20,227,326 | ) | | | (5,944,252 | ) |
Net change in unrealized appreciation (depreciation) of affiliated investments | | | 16,947 | | | | 1 | | | | 1,826 | |
Net change in unrealized appreciation (depreciation) of short positions | | | — | | | | 10,360,901 | | | | — | |
Net change in unrealized appreciation (depreciation) of futures contracts | | | 2,266,229 | | | | 214,037 | | | | (11,595 | ) |
Net Change in Unrealized Appreciation (Depreciation) of Investment Transactions and Futures Contracts | | | (40,476,681 | ) | | | (9,652,387 | ) | | | (5,954,021 | ) |
| | | | | | | | | | | | | |
Net Realized and Unrealized Gain (Loss) from Investments | | | (28,786,643 | ) | | | (8,136,509 | ) | | | (4,838,784 | ) |
| | | | | | | | | | | | | |
Net Change in Net Assets Resulting from Operations | | $ | (24,470,291 | ) | | $ | (7,196,678 | ) | | $ | (4,272,132 | ) |
(1) | Only the Retail Class of shares has adopted a Rule 12b-1 Plan. See #5 of the Notes to Financial Statements. |
The accompanying notes are an integral part of these financial statements.
Page 120 | 2018 Annual Report | December 31, 2018 |
| |
Balanced
Fund | | | Moderate
Allocation
Fund | | | Conservative
Allocation
Fund | | | Dynamic
Allocation
Fund | | | Quantex
Fund | | | Total Return
Bond Fund | | | Prime Money
Market Fund | | | Institutional
Prime Money
Market Fund | |
| | | | | | | | | | | | | | | | | | | | | | | | | | | | | | | |
| $ | 434,712 | | | $ | 312,088 | | | $ | 357,294 | | | $ | 7,863 | | | $ | 22,064 | | | $ | 261,899 | | | $ | 717,118 | | | $ | 7,784,519 | |
| | 1,220,696 | | | | 386,716 | | | | 186,284 | | | | 566,035 | | | | 113,469 | | | | 67,440 | | | | — | | | | — | |
| | 6,405,733 | | | | 3,360,117 | | | | 3,354,669 | | | | 2,418,777 | | | | 1,067,297 | | | | 1,887,261 | | | | — | | | | — | |
| | 8,061,141 | | | | 4,058,921 | | | | 3,898,247 | | | | 2,992,675 | | | | 1,202,830 | | | | 2,216,600 | | | | 717,118 | | | | 7,784,519 | |
| | | | | | | | | | | | | | | | | | | | | | | | | | | | | | | |
| | | | | | | | | | | | | | | | | | | | | | | | | | | | | | | |
| | 2,293,998 | | | | 929,517 | | | | 729,385 | | | | 1,135,922 | | | | 645,342 | | | | 285,304 | | | | 141,215 | | | | 1,094,972 | |
| | 115,635 | | | | 44,574 | | | | 40,616 | | | | 55,872 | | | | 48,507 | | | | 16,893 | | | | | | | | | |
| | 22,071 | | | | 9,853 | | | | 6,990 | | | | 12,619 | | | | 1,290 | | | | 2,529 | | | | | | | | | |
| | 261,086 | | | | 118,832 | | | | 97,421 | | | | 113,267 | | | | 46,937 | | | | 38,129 | | | | | | | | | |
| | | | | | | | | | | | | | | | | | | | | | | | | | 28,242 | | | | 302,350 | |
| | 70,233 | | | | 51,402 | | | | 48,829 | | | | 52,146 | | | | 44,840 | | | | 43,031 | | | | 36,061 | | | | 74,799 | |
| | 275,867 | | | | 125,506 | | | | 106,551 | | | | 131,172 | | | | 74,490 | | | | 67,550 | | | | 35,304 | | | | 312,391 | |
| | 17,044 | | | | 7,959 | | | | 6,859 | | | | 8,108 | | | | 4,277 | | | | 2,987 | | | | 1,142 | | | | 1,261 | |
| | 15,560 | | | | 15,781 | | | | 15,472 | | | | 15,560 | | | | 13,103 | | | | 14,387 | | | | 12,795 | | | | 12,592 | |
| | 4,991 | | | | 5,008 | | | | 4,987 | | | | 4,991 | | | | 4,989 | | | | 4,981 | | | | 5,117 | | | | 5,143 | |
| | 34,111 | | | | 14,675 | | | | 12,364 | | | | 14,586 | | | | 8,570 | | | | 6,865 | | | | 2,911 | | | | 27,269 | |
| | 11,031 | | | | 5,539 | | | | 3,307 | | | | 5,159 | | | | 2,154 | | | | 953 | | | | — | | | | 10,702 | |
| | 240,906 | | | | 92,863 | | | | 84,617 | | | | 116,399 | | | | 80,845 | | | | 52,790 | | | | | | | | | |
| | | | | | | | | | | | | | | | | | | | | | | | | | 4 | | | | 4 | |
| | 192,725 | | | | 74,291 | | | | 54,155 | | | | 93,119 | | | | 80,845 | | | | 42,232 | | | | | | | | | |
| | 45,983 | | | | 20,526 | | | | 14,564 | | | | 26,290 | | | | 2,687 | | | | 7,904 | | | | | | | | | |
| | 156,479 | | | | 65,660 | | | | 56,092 | | | | 20,575 | | | | 14,062 | | | | 23,808 | | | | | | | | | |
| | 16,385 | | | | 6,817 | | | | 7,920 | | | | 7,751 | | | | 3,739 | | | | 2,192 | | | | 312 | | | | 3,295 | |
| | 64,746 | | | | 58,333 | | | | 58,860 | | | | 59,305 | | | | 53,277 | | | | 56,494 | | | | 24,419 | | | | 16,112 | |
| | 19,822 | | | | 6,900 | | | | 4,205 | | | | 10,852 | | | | 7,350 | | | | 11,901 | | | | 1,130 | | | | 21,790 | |
| | 6,407 | | | | 6,407 | | | | 6,407 | | | | 6,407 | | | | 6,407 | | | | 6,407 | | | | 6,407 | | | | 6,407 | |
| | — | | | | — | | | | — | | | | — | | | | — | | | | — | | | | — | | | | — | |
| | 25,810 | | | | 20,474 | | | | 19,393 | | | | 23,000 | | | | 21,581 | | | | 25,125 | | | | 36,463 | | | | 40,400 | |
| | 3,890,891 | | | | 1,680,917 | | | | 1,378,994 | | | | 1,913,100 | | | | 1,165,292 | | | | 712,462 | | | | 331,522 | | | | 1,929,487 | |
| | | | | | | | | | | | | | | | | | | | | | | | | | | | | | | |
| | — | | | | (3,079 | ) | | | (5,679 | ) | | | — | | | | — | | | | — | | | | (167,903 | ) | | | (1,257,164 | ) |
| | — | | | | (63,223 | ) | | | (125,099 | ) | | | (151,397 | ) | | | (40,753 | ) | | | (79,133 | ) | | | — | | | | — | |
| | (192,457 | ) | | | (133,529 | ) | | | (119,944 | ) | | | (141,205 | ) | | | (101,969 | ) | | | (56,188 | ) | | | — | | | | — | |
| | (92,173 | ) | | | (63,948 | ) | | | (77,616 | ) | | | (25,432 | ) | | | (20,572 | ) | | | — | | | | — | | | | — | |
| | (78,213 | ) | | | — | | | | (4,699 | ) | | | — | | | | — | | | | — | | | | (7,060 | ) | | | (75,557 | ) |
| | | | | | | | | | | | | | | | | | | | | | | | | | | | | | | |
| | 3,528,048 | | | | 1,417,138 | | | | 1,045,957 | | | | 1,595,066 | | | | 1,001,998 | | | | 577,141 | | | | 156,559 | | | | 596,766 | |
| | | | | | | | | | | | | | | | | | | | | | | | | | | | | | | |
| | 4,533,093 | | | | 2,641,783 | | | | 2,852,290 | | | | 1,397,609 | | | | 200,832 | | | | 1,639,459 | | | | 560,559 | | | | 7,187,753 | |
| | | | | | | | | | | | | | | | | | | | | | | | | | | | | | | |
| | | | | | | | | | | | | | | | | | | | | | | | | | | | | | | |
| | (865,440 | ) | | | (3,096,081 | ) | | | (3,590,901 | ) | | | 1,207,431 | | | | 8,266,507 | | | | (1,950,784 | ) | | | — | | | | (1,999 | ) |
| | (180 | ) | | | (346 | ) | | | 263 | | | | (4,159 | ) | | | (786 | ) | | | (324 | ) | | | — | | | | — | |
| | — | | | | — | | | | — | | | | — | | | | — | | | | — | | | | — | | | | — | |
| | 1,118,813 | | | | 457,188 | | | | 51,484 | | | | (3,873,970 | ) | | | (322,655 | ) | | | — | | | | — | | | | — | |
| | 24,176 | | | | 18,390 | | | | 20,600 | | | | — | | | | — | | | | 21,056 | | | | — | | | | — | |
| | 277,369 | | | | (2,620,849 | ) | | | (3,518,554 | ) | | | (2,670,698 | ) | | | 7,943,066 | | | | (1,930,052 | ) | | | — | | | | (1,999 | ) |
| | | | | | | | | | | | | | | | | | | | | | | | | | | | | | | |
| | (17,980,790 | ) | | | (5,277,638 | ) | | | (3,343,600 | ) | | | (14,964,403 | ) | | | (16,307,635 | ) | | | (1,036,656 | ) | | | — | | | | 5,465 | |
| | 2,255 | | | | 1,754 | | | | 226 | | | | 3,180 | | | | 361 | | | | 424 | | | | — | | | | — | |
| | — | | | | — | | | | — | | | | — | | | | — | | | | — | | | | — | | | | — | |
| | 1,462,627 | | | | 392,503 | | | | 211,320 | | | | (1,074,917 | ) | | | (565,729 | ) | | | — | | | | — | | | | — | |
| | (16,515,908 | ) | | | (4,883,381 | ) | | | (3,132,054 | ) | | | (16,036,140 | ) | | | (16,873,003 | ) | | | (1,036,232 | ) | | | — | | | | 5,465 | |
| | | | | | | | | | | | | | | | | | | | | | | | | | | | | | | |
| | (16,238,539 | ) | | | (7,504,230 | ) | | | (6,650,608 | ) | | | (18,706,838 | ) | | | (8,929,937 | ) | | | (2,966,284 | ) | | | — | | | | 3,466 | |
| | | | | | | | | | | | | | | | | | | | | | | | | | | | | | | |
| $ | (11,705,446 | ) | | $ | (4,862,447 | ) | | $ | (3,798,318 | ) | | $ | (17,309,229 | ) | | $ | (8,729,105 | ) | | $ | (1,326,825 | ) | | $ | 560,559 | | | $ | 7,191,219 | |
The accompanying notes are an integral part of these financial statements.
2018 Annual Report | December 31, 2018 | Page 121 |
Statements of Changes in Net Assets
For the Years Ended December 31, |
| | | Muirfield Fund | | | Spectrum Fund | |
| | | 2018 | | | 2017 | | | 2018 | | | 2017 | |
Operations | | | | | | | | | | | | | | | | |
Net investment income (loss) | | $ | 4,316,352 | | | $ | 2,390,068 | | | $ | 939,831 | | | $ | 129,766 | |
Net realized gain (loss) from investment transactions, futures contracts, and distributions of long-term realized gains by other investment companies | | | 11,690,038 | | | | 45,422,703 | | | | 1,515,878 | | | | 9,999,654 | |
Net change in unrealized appreciation (depreciation) of investment transactions and futures contracts | | | (40,476,681 | ) | | | 27,968,426 | | | | (9,652,387 | ) | | | 13,441,101 | |
Net change in net assets resulting from operations | | | (24,470,291 | ) | | | 75,781,197 | | | | (7,196,678 | ) | | | 23,570,521 | |
| | | | | | | | | | | | | | | | | |
Distributions to Shareholders (1) | | | | | | | | | | | | | | | | |
Retail Class | | | (3,029,797 | ) | | | (19,469,788 | ) | | | (634,850 | ) | | | (3,769,641 | ) |
Adviser Class | | | (976,171 | ) | | | (2,814,669 | ) | | | (205,754 | ) | | | (802,354 | ) |
Institutional Class | | | (5,553,367 | ) | | | (12,980,584 | ) | | | (1,832,352 | ) | | | (4,636,571 | ) |
Money Market Funds | | | | | | | | | | | | | | | | |
Net change in net assets resulting from distributions | | | (9,559,335 | ) | | | (35,265,041 | ) | | | (2,672,956 | ) | | | (9,208,566 | ) |
| | | | | | | | | | | | | | | | | |
Capital Transactions: | | | | | | | | | | | | | | | | |
Issued | | | 377,780,674 | | | | 308,551,786 | | | | 93,858,412 | | | | 119,341,484 | |
Reinvested | | | 9,280,425 | | | | 33,614,056 | | | | 2,661,072 | | | | 9,102,305 | |
Redeemed | | | (219,984,539 | ) | | | (296,536,002 | ) | | | (58,789,698 | ) | | | (112,449,372 | ) |
Net change in net assets resulting from capital transactions | | | 167,076,560 | | | | 45,629,840 | | | | 37,729,786 | | | | 15,994,417 | |
| | | | | | | | | | | | | | | | | |
Total Change in Net Assets | | | 133,046,934 | | | | 86,145,996 | | | | 27,860,152 | | | | 30,356,372 | |
| | | | | | | | | | | | | | | | | |
Net Assets - Beginning of Year | | | 477,962,162 | | | | 391,816,166 | | | | 154,874,257 | | | | 124,517,885 | |
| | | | | | | | | | | | | | | | | |
Net Assets - End of Year | | $ | 611,009,096 | | | $ | 477,962,162 | | | $ | 182,734,409 | | | $ | 154,874,257 | |
| | | | | | | | | | | | | | | | | |
Share Transactions: | | | | | | | | | | | | | | | | |
Issued | | | 49,143,680 | | | | 41,583,017 | | | | 7,993,833 | | | | 10,719,123 | |
Reinvested | | | 1,258,674 | | | | 4,470,775 | | | | 239,817 | | | | 794,665 | |
Redeemed | | | (28,720,467 | ) | | | (40,445,977 | ) | | | (4,982,155 | ) | | | (10,173,190 | ) |
Net change in shares | | | 21,681,887 | | | | 5,607,815 | | | | 3,251,495 | | | | 1,340,598 | |
(1) | Current and prior year distributions to shareholders have been reclassified and conform to amended GAAP presentation under Regulation S-X (See #9 of the Notes to Financial Statements). |
The accompanying notes are an integral part of these financial statements.
Page 122 | 2018 Annual Report | December 31, 2018 |
| |
Global Allocation Fund | | | Balanced Fund | | | Moderate
Allocation Fund | | | Conservative
Allocation Fund | |
2018 | | | 2017 | | | 2018 | | | 2017 | | | 2018 | | | 2017 | | | 2018 | | | 2017 | |
| | | | | | | | | | | | | | | | | | | | | | | | | | | | | | | |
| $ | 566,652 | | | $ | 518,453 | | | $ | 4,533,093 | | | $ | 2,224,781 | | | $ | 2,641,783 | | | $ | 497,157 | | | $ | 2,852,290 | | | $ | 305,200 | |
| | 1,115,237 | | | | 9,528,013 | | | | 277,369 | | | | 18,918,617 | | | | (2,620,849 | ) | | | 8,517,457 | | | | (3,518,554 | ) | | | 2,862,662 | |
| | (5,954,021 | ) | | | 5,555,028 | | | | (16,515,908 | ) | | | 10,129,821 | | | | (4,883,381 | ) | | | (385,554 | ) | | | (3,132,054 | ) | | | (1,704,894 | ) |
| | (4,272,132 | ) | | | 15,601,494 | | | | (11,705,446 | ) | | | 31,273,219 | | | | (4,862,447 | ) | | | 8,629,060 | | | | (3,798,318 | ) | | | 1,462,968 | |
| | | | | | | | | | | | | | | | | | | | | | | | | | | | | | | |
| | | | | | | | | | | | | | | | | | | | | | | | | | | | | | | |
| | (694,187 | ) | | | (499,122 | ) | | | (1,273,976 | ) | | | (5,900,889 | ) | | | (1,589,145 | ) | | | (1,001,412 | ) | | | (1,147,450 | ) | | | (223,576 | ) |
| | (80,880 | ) | | | (18,941 | ) | | | (307,223 | ) | | | (638,110 | ) | | | (435,680 | ) | | | (133,385 | ) | | | (226,427 | ) | | | (6,728 | ) |
| | (2,231,829 | ) | | | (765,093 | ) | | | (4,102,139 | ) | | | (6,987,377 | ) | | | (5,395,120 | ) | | | (1,361,492 | ) | | | (3,425,952 | ) | | | (112,007 | ) |
| | | | | | | | | | | | | | | | | | | | | | | | | | | | | | | |
| | (3,006,896 | ) | | | (1,283,156 | ) | | | (5,683,338 | ) | | | (13,526,376 | ) | | | (7,419,945 | ) | | | (2,496,289 | ) | | | (4,799,829 | ) | | | (342,311 | ) |
| | | | | | | | | | | | | | | | | | | | | | | | | | | | | | | |
| | | | | | | | | | | | | | | | | | | | | | | | | | | | | | | |
| | 39,142,473 | | | | 49,118,154 | | | | 245,111,176 | | | | 225,356,251 | | | | 179,582,098 | | | | 48,367,764 | | | | 146,267,121 | | | | 18,785,464 | |
| | 3,001,909 | | | | 1,280,093 | | | | 5,665,161 | | | | 13,375,715 | | | | 7,391,639 | | | | 2,483,463 | | | | 4,785,255 | | | | 335,648 | |
| | (50,393,875 | ) | | | (66,796,194 | ) | | | (163,418,052 | ) | | | (207,685,297 | ) | | | (78,947,761 | ) | | | (47,860,164 | ) | | | (38,139,031 | ) | | | (16,038,502 | ) |
| | (8,249,493 | ) | | | (16,397,947 | ) | | | 87,358,285 | | | | 31,046,669 | | | | 108,025,976 | | | | 2,991,063 | | | | 112,913,345 | | | | 3,082,610 | |
| | | | | | | | | | | | | | | | | | | | | | | | | | | | | | | |
| | (15,528,521 | ) | | | (2,079,609 | ) | | | 69,969,501 | | | | 48,793,512 | | | | 95,743,584 | | | | 9,123,834 | | | | 104,315,198 | | | | 4,203,267 | |
| | | | | | | | | | | | | | | | | | | | | | | | | | | | | | | |
| | 73,938,226 | | | | 76,017,835 | | | | 278,839,303 | | | | 230,045,791 | | | | 66,118,986 | | | | 56,995,152 | | | | 24,965,689 | | | | 20,762,422 | |
| | | | | | | | | | | | | | | | | | | | | | | | | | | | | | | |
| $ | 58,409,705 | | | $ | 73,938,226 | | | $ | 348,808,804 | | | $ | 278,839,303 | | | $ | 161,862,570 | | | $ | 66,118,986 | | | $ | 129,280,887 | | | $ | 24,965,689 | |
| | | | | | | | | | | | | | | | | | | | | | | | | | | | | | | |
| | | | | | | | | | | | | | | | | | | | | | | | | | | | | | | |
| | 3,354,047 | | | | 4,905,373 | | | | 20,814,984 | | | | 19,574,841 | | | | 15,299,240 | | | | 4,418,490 | | | | 6,417,751 | | | | 836,566 | |
| | 286,815 | | | | 112,132 | | | | 496,215 | | | | 1,151,420 | | | | 665,473 | | | | 214,661 | | | | 218,857 | | | | 14,821 | |
| | (4,341,745 | ) | | | (6,563,852 | ) | | | (13,914,576 | ) | | | (18,224,269 | ) | | | (6,735,567 | ) | | | (4,414,246 | ) | | | (1,699,479 | ) | | | (725,363 | ) |
| | (700,883 | ) | | | (1,546,347 | ) | | | 7,396,623 | | | | 2,501,992 | | | | 9,229,146 | | | | 218,905 | | | | 4,937,129 | | | | 126,024 | |
The accompanying notes are an integral part of these financial statements.
2018 Annual Report | December 31, 2018 | Page 123 |
Statements of Changes in Net Assets
For the Years Ended December 31, |
| | | Dynamic
Allocation Fund | | | Quantex Fund | |
| | | 2018 | | | 2017 | | | 2018 | | | 2017 | |
Operations | | | | | | | | | | | | | | | | |
Net investment income (loss) | | $ | 1,397,609 | | | $ | 982,801 | | | $ | 200,832 | | | $ | 350,031 | |
Net realized gain (loss) from investment transactions, futures contracts, and distributions of long-term realized gains by other investment companies | | | (2,670,698 | ) | | | 12,582,298 | | | | 7,943,066 | | | | (1,437,581 | ) |
Net change in unrealized appreciation (depreciation) of investment transactions and futures contracts | | | (16,036,140 | ) | | | 10,230,631 | | | | (16,873,003 | ) | | | 12,608,700 | |
Net change in net assets resulting from operations | | | (17,309,229 | ) | | | 23,795,730 | | | | (8,729,105 | ) | | | 11,521,150 | |
| | | | | | | | | | | | | | | | | |
Distributions to Shareholders (1) | | | | | | | | | | | | | | | | |
Retail Class | | | (521,444 | ) | | | (4,064,746 | ) | | | — | | | | (1,716,884 | ) |
Adviser Class | | | (154,361 | ) | | | (782,624 | ) | | | (104 | ) | | | (60,803 | ) |
Institutional Class | | | (1,746,253 | ) | | | (5,551,550 | ) | | | (66,917 | ) | | | (1,013,510 | ) |
Money Market Funds | | | | | | | | | | | | | | | | |
Net change in net assets resulting from distributions | | | (2,422,058 | ) | | | (10,398,920 | ) | | | (67,021 | ) | | | (2,791,197 | ) |
| | | | | | | | | | | | | | | | | |
Capital Transactions: | | | | | | | | | | | | | | | | |
Issued | | | 113,204,066 | | | | 94,289,003 | | | | 47,785,941 | | | | 54,392,703 | |
Reinvested | | | 2,415,959 | | | | 10,347,670 | | | | 42,224 | | | | 2,776,308 | |
Redeemed | | | (52,891,314 | ) | | | (106,068,784 | ) | | | (69,140,186 | ) | | | (57,352,179 | ) |
Net change in net assets resulting from capital transactions | | | 62,728,711 | | | | (1,432,111 | ) | | | (21,312,021 | ) | | | (183,168 | ) |
| | | | | | | | | | | | | | | | | |
Total Change in Net Assets | | | 42,997,424 | | | | 11,964,699 | | | | (30,108,147 | ) | | | 8,546,785 | |
| | | | | | | | | | | | | | | | | |
Net Assets - Beginning of Year | | | 130,897,643 | | | | 118,932,944 | | | | 94,764,545 | | | | 86,217,760 | |
| | | | | | | | | | | | | | | | | |
Net Assets - End of Year | | $ | 173,895,067 | | | $ | 130,897,643 | | | $ | 64,656,398 | | | $ | 94,764,545 | |
| | | | | | | | | | | | | | | | | |
Share Transactions: | | | | | | | | | | | | | | | | |
Issued | | | 10,226,217 | | | | 9,115,839 | | | | 1,293,841 | | | | 1,586,527 | |
Reinvested | | | 234,222 | | | | 957,539 | | | | 1,112 | | | | 75,618 | |
Redeemed | | | (4,794,911 | ) | | | (10,248,519 | ) | | | (1,868,379 | ) | | | (1,668,761 | ) |
Net change in shares | | | 5,665,528 | | | | (175,141 | ) | | | (573,426 | ) | | | (6,616 | ) |
(1) | Current and prior year distributions to shareholders have been reclassified and conform to amended GAAP presentation under Regulation S-X (See #9 of the Notes to Financial Statements). |
The accompanying notes are an integral part of these financial statements.
Page 124 | 2018 Annual Report | December 31, 2018 |
| |
Total Return
Bond Fund | | | Prime Money
Market Fund | | | Institutional Prime
Money Market Fund | |
2018 | | | 2017 | | | 2018 | | | 2017 | | | 2018 | | | 2017 | |
| | | | | | | | | | | | | | | | | | | | | | | |
| $ | 1,639,459 | | | $ | 5,414,380 | | | $ | 560,559 | | | $ | 243,470 | | | $ | 7,187,753 | | | $ | 2,173,810 | |
| | (1,930,052 | ) | | | 1,972,842 | | | | — | | | | — | | | | (1,999 | ) | | | (232 | ) |
| | (1,036,232 | ) | | | 187,250 | | | | — | | | | — | | | | 5,465 | | | | (63,366 | ) |
| | (1,326,825 | ) | | | 7,574,472 | | | | 560,559 | | | | 243,470 | | | | 7,191,219 | | | | 2,110,212 | |
| | | | | | | | | | | | | | | | | | | | | | | |
| | | | | | | | | | | | | | | | | | | | | | | |
| | (370,637 | ) | | | (3,220,595 | ) | | | | | | | | | | | | | | | | |
| | (69,633 | ) | | | (147,366 | ) | | | | | | | | | | | | | | | | |
| | (1,132,401 | ) | | | (2,053,634 | ) | | | | | | | | | | | | | | | | |
| | | | | | | | | | (560,559 | ) | | | (243,470 | ) | | | (7,187,755 | ) | | | (2,173,717 | ) |
| | (1,572,671 | ) | | | (5,421,595 | ) | | | (560,559 | ) | | | (243,470 | ) | | | (7,187,755 | ) | | | (2,173,717 | ) |
| | | | | | | | | | | | | | | | | | | | | | | |
| | | | | | | | | | | | | | | | | | | | | | | |
| | 30,712,205 | | | | 174,937,272 | | | | 36,584,300 | | | | 29,723,424 | | | | 655,634,899 | | | | 485,340,979 | |
| | 1,565,286 | | | | 5,385,499 | | | | 520,240 | | | | 236,626 | | | | 770,570 | | | | 225,080 | |
| | (150,994,621 | ) | | | (208,828,722 | ) | | | (31,434,432 | ) | | | (31,415,171 | ) | | | (481,353,876 | ) | | | (386,435,339 | ) |
| | (118,717,130 | ) | | | (28,505,951 | ) | | | 5,670,108 | | | | (1,455,121 | ) | | | 175,051,593 | | | | 99,130,720 | |
| | | | | | | | | | | | | | | | | | | | | | | |
| | (121,616,626 | ) | | | (26,353,074 | ) | | | 5,670,108 | | | | (1,455,121 | ) | | | 175,055,057 | | | | 99,067,215 | |
| | | | | | | | | | | | | | | | | | | | | | | |
| | 188,555,751 | | | | 214,908,825 | | | | 35,210,706 | | | | 36,665,827 | | | | 296,547,451 | | | | 197,480,236 | |
| | | | | | | | | | | | | | | | | | | | | | | |
| $ | 66,939,125 | | | $ | 188,555,751 | | | $ | 40,880,814 | | | $ | 35,210,706 | | | $ | 471,602,508 | | | $ | 296,547,451 | |
| | | | | | | | | | | | | | | | | | | | | | | |
| | | | | | | | | | | | | | | | | | | | | | | |
| | 3,353,494 | | | | 18,549,332 | | | | 36,584,300 | | | | 29,723,424 | | | | 655,689,013 | | | | 485,328,584 | |
| | 172,277 | | | | 572,232 | | | | 520,240 | | | | 236,626 | | | | 770,617 | | | | 225,073 | |
| | (16,229,362 | ) | | | (22,170,849 | ) | | | (31,434,432 | ) | | | (31,415,171 | ) | | | (481,379,810 | ) | | | (386,423,004 | ) |
| | (12,703,591 | ) | | | (3,049,285 | ) | | | 5,670,108 | | | | (1,455,121 | ) | | | 175,079,820 | | | | 99,130,653 | |
The accompanying notes are an integral part of these financial statements.
2018 Annual Report | December 31, 2018 | Page 125 |
Financial Highlights
For the Periods Ended December 31, | |
| | | | | | | Income from Investment Operations | | | Less Distributions | |
| | | | Net Asset Value, Beginning of Period | | | Net Investment Income (Loss) (5) | | | Net gains (losses) on securities and futures (both realized and unrealized) | | | Total from Investment Operations | | | From Net Investment Income | | | From Net Capital Gains | | | From Return of Capital | | | Total
Distributions | |
| Muirfield Fund - Retail Class (1)(2) | |
| 2018 | | | $ | 7.54 | | | | 0.04 | | | | (0.31 | ) | | | (0.27 | ) | | | (0.04 | ) | | | (0.07 | ) | | | 0.00 | | | | (0.11 | ) |
| 2017 | | | $ | 6.79 | | | | 0.04 | | | | 1.34 | | | | 1.38 | | | | (0.04 | ) | | | (0.59 | ) | | | 0.00 | | | | (0.63 | ) |
| 2016 | | | $ | 6.47 | | | | 0.05 | | | | 0.32 | | | | 0.37 | | | | (0.05 | ) | | | 0.00 | | | | 0.00 | | | | (0.05 | ) |
| 2015 | | | $ | 7.03 | | | | 0.02 | | | | (0.41 | ) | | | (0.39 | ) | | | (0.02 | ) | | | (0.15 | ) | | | 0.00 | | | | (0.17 | ) |
| 2014 | | | $ | 6.95 | | | | 0.01 | | | | 0.81 | | | | 0.82 | | | | (0.18 | ) | | | (0.56 | ) | | | 0.00 | | | | (0.74 | ) |
| Muirfield Fund - Adviser Class (1)(2)(3)(4) |
| 2018 | | | $ | 7.57 | | | | 0.06 | | | | (0.31 | ) | | | (0.25 | ) | | | (0.05 | ) | | | (0.07 | ) | | | 0.00 | | | | (0.12 | ) |
| 2017 | | | $ | 6.80 | | | | 0.05 | | | | 1.34 | | | | 1.39 | | | | (0.03 | ) | | | (0.59 | ) | | | 0.00 | | | | (0.62 | ) |
| 2016 (9) | | | $ | 6.51 | | | | 0.01 | | | | 0.29 | | | | 0.30 | | | | (0.01 | ) | | | 0.00 | | | | 0.00 | | | | (0.01 | ) |
| Muirfield Fund - Institutional Class (1)(2)(3)(4) |
| 2018 | | | $ | 7.57 | | | | 0.08 | | | | (0.31 | ) | | | (0.23 | ) | | | (0.06 | ) | | | (0.07 | ) | | | 0.00 | | | | (0.13 | ) |
| 2017 | | | $ | 6.80 | | | | 0.07 | | | | 1.33 | | | | 1.40 | | | | (0.04 | ) | | | (0.59 | ) | | | 0.00 | | | | (0.63 | ) |
| 2016 (9) | | | $ | 6.51 | | | | 0.02 | | | | 0.29 | | | | 0.31 | | | | (0.02 | ) | | | 0.00 | | | | 0.00 | | | | (0.02 | ) |
| Spectrum Fund - Retail Class (1)(2)(3)(4) |
| 2018 | | | $ | 11.48 | | | | 0.03 | | | | (0.49 | ) | | | (0.46 | ) | | | 0.00 | | | | (0.13 | ) | | | 0.00 | | | | (0.13 | ) |
| 2017 | | | $ | 10.28 | | | | (0.01 | ) | | | 1.99 | | | | 1.98 | | | | 0.00 | | | | (0.78 | ) | | | 0.00 | | | | (0.78 | ) |
| 2016 | | | $ | 9.73 | | | | 0.02 | | | | 0.66 | | | | 0.68 | | | | (0.02 | ) | | | (0.11 | ) | | | 0.00 | | | | (0.13 | ) |
| 2015 (6) | | | $ | 10.00 | | | | (0.04 | ) | | | (0.08 | ) | | | (0.12 | ) | | | 0.00 | | | | (0.13 | ) | | | (0.02 | ) | | | (0.15 | ) |
| Spectrum Fund - Adviser Class (1)(2)(3)(4) |
| 2018 | | | $ | 11.53 | | | | 0.06 | | | | (0.48 | ) | | | (0.42 | ) | | | (0.03 | ) | | | (0.13 | ) | | | 0.00 | | | | (0.16 | ) |
| 2017 | | | $ | 10.29 | | | | 0.02 | | | | 2.00 | | | | 2.02 | | | | 0.00 | | | | (0.78 | ) | | | 0.00 | | | | (0.78 | ) |
| 2016 (9) | | | $ | 9.97 | | | | 0.02 | | | | 0.43 | | | | 0.45 | | | | (0.02 | ) | | | (0.11 | ) | | | 0.00 | | | | (0.13 | ) |
| Spectrum Fund - Institutional Class (1)(2)(3)(4) |
| 2018 | | | $ | 11.54 | | | | 0.08 | | | | (0.49 | ) | | | (0.41 | ) | | | (0.04 | ) | | | (0.13 | ) | | | 0.00 | | | | (0.17 | ) |
| 2017 | | | $ | 10.29 | | | | 0.05 | | | | 1.98 | | | | 2.03 | | | | 0.00 | | | | (0.78 | ) | | | 0.00 | | | | (0.78 | ) |
| 2016 (9) | | | $ | 9.97 | | | | 0.02 | | | | 0.43 | | | | 0.45 | | | | (0.02 | ) | | | (0.11 | ) | | | 0.00 | | | | (0.13 | ) |
| Global Allocation Fund - Retail Class (1)(2) |
| 2018 | | | $ | 11.53 | | | | 0.05 | | | | (0.85 | ) | | | (0.80 | ) | | | (0.06 | ) | | | (0.45 | ) | | | 0.00 | | | | (0.51 | ) |
| 2017 | | | $ | 9.56 | | | | 0.04 | | | | 2.09 | | | | 2.13 | | | | (0.03 | ) | | | (0.13 | ) | | | 0.00 | | | | (0.16 | ) |
| 2016 | | | $ | 9.34 | | | | 0.09 | | | | 0.24 | | | | 0.33 | | | | (0.11 | ) | | | 0.00 | | | | 0.00 | | | | (0.11 | ) |
| 2015 | | | $ | 10.38 | | | | 0.04 | | | | (0.79 | ) | | | (0.75 | ) | | | (0.04 | ) | | | (0.25 | ) | | | 0.00 | | | | (0.29 | ) |
| 2014 | | | $ | 11.36 | | | | 0.06 | | | | 0.58 | | | | 0.64 | | | | (0.16 | ) | | | (1.46 | ) | | | 0.00 | | | | (1.62 | ) |
| Global Allocation Fund - Adviser Class (1)(2)(3)(4) |
| 2018 | | | $ | 11.54 | | | | 0.09 | | | | (0.86 | ) | | | (0.77 | ) | | | (0.08 | ) | | | (0.45 | ) | | | 0.00 | | | | (0.53 | ) |
| 2017 | | | $ | 9.57 | | | | 0.15 | | | | 2.03 | | | | 2.18 | | | | (0.08 | ) | | | (0.13 | ) | | | 0.00 | | | | (0.21 | ) |
| 2016 (9) | | | $ | 9.41 | | | | 0.06 | | | | 0.16 | | | | 0.22 | | | | (0.06 | ) | | | 0.00 | | | | 0.00 | | | | (0.06 | ) |
| Global Allocation Fund - Institutional Class (1)(2)(3)(4) |
| 2018 | | | $ | 11.55 | | | | 0.11 | | | | (0.86 | ) | | | (0.75 | ) | | | (0.11 | ) | | | (0.45 | ) | | | 0.00 | | | | (0.56 | ) |
| 2017 | | | $ | 9.58 | | | | 0.12 | | | | 2.09 | | | | 2.21 | | | | (0.11 | ) | | | (0.13 | ) | | | 0.00 | | | | (0.24 | ) |
| 2016 (9) | | | $ | 9.41 | | | | 0.06 | | | | 0.16 | | | | 0.22 | | | | (0.05 | ) | | | 0.00 | | | | 0.00 | | | | (0.05 | ) |
See footnotes on pages 132 and 133.
The accompanying notes are an integral part of these financial statements.
Page 126 | 2018 Annual Report | December 31, 2018 |
| |
| | | | | | | Ratios/Supplemental Data | |
| Net Asset Value, End of Period | | | Total Return (Assumes Reinvestment of Distributions) | | | Net Assets, End of Period ($000) | | | Ratio of Net Investment Income (Loss) to Average Net Assets | | | Ratio of Expenses to Average Net Assets After Fee Reductions (10) | | | Ratio of Expenses to Average Net Assets Before Fee Reductions (11) | | | Portfolio Turnover Rate | |
| | |
| $ | 7.16 | | | | (3.66 | %) | | $ | 203,287 | | | | 0.54 | % | | | 1.32 | %(12) | | | 1.32 | % | | | 225 | % |
| $ | 7.54 | | | | 20.29 | % | | $ | 250,322 | | | | 0.49 | % | | | 1.33 | % | | | 1.33 | % | | | 276 | % |
| $ | 6.79 | | | | 5.72 | % | | $ | 390,817 | | | | 0.73 | % | | | 1.36 | % | | | 1.35 | % | | | 414 | % |
| $ | 6.47 | | | | (5.50 | %) | | $ | 390,945 | | | | 0.33 | % | | | 1.35 | % | | | 1.37 | % | | | 277 | % |
| $ | 7.03 | | | | 12.12 | % | | $ | 297,861 | | | | 0.22 | % | | | 1.44 | % | | | 1.44 | % | | | 238 | % |
| | | | | | | | | | | | | | | | | | | | | | | | | | | |
| $ | 7.20 | | | | (3.39 | %) | | $ | 61,159 | | | | 0.79 | % | | | 1.10 | %(12) | | | 1.17 | % | | | 225 | % |
| $ | 7.57 | | | | 20.50 | % | | $ | 41,440 | | | | 0.71 | % | | | 1.11 | % | | | 1.20 | % | | | 276 | % |
| $ | 6.80 | | | | 4.68 | % | | $ | 154 | | | | 1.32 | % | | | 0.99 | % | | | 0.99 | % | | | 414 | % |
| | | | | | | | | | | | | | | | | | | | | | | | | | | |
| $ | 7.21 | | | | (3.17 | %) | | $ | 346,563 | | | | 1.00 | % | | | 0.90 | %(12) | | | 0.98 | % | | | 225 | % |
| $ | 7.57 | | | | 20.60 | % | | $ | 186,200 | | | | 0.88 | % | | | 0.91 | % | | | 1.00 | % | | | 276 | % |
| $ | 6.80 | | | | 4.72 | % | | $ | 845 | | | | 1.33 | % | | | 0.98 | % | | | 0.98 | % | | | 414 | % |
| | | | | | | | | | | | | | | | | | | | | | | | | | | |
| $ | 10.89 | | | | (3.97 | %) | | $ | 51,083 | | | | 0.26 | % | | | 1.89 | %(12) | | | 1.89 | % | | | 97 | % |
| $ | 11.48 | | | | 19.28 | % | | $ | 59,441 | | | | (0.08 | %) | | | 2.16 | % | | | 2.16 | % | | | 120 | % |
| $ | 10.28 | | | | 6.97 | % | | $ | 124,009 | | | | 0.16 | % | | | 1.99 | % | | | 1.99 | % | | | 235 | % |
| $ | 9.73 | | | | (1.21 | %) | | $ | 125,597 | | | | (0.36 | %) | | | 2.12 | % | | | 2.19 | % | | | 161 | % |
| | | | | | | | | | | | | | | | | | | | | | | | | | | |
| $ | 10.95 | | | | (3.67 | %) | | $ | 14,486 | | | | 0.49 | % | | | 1.70 | %(12) | | | 1.70 | % | | | 97 | % |
| $ | 11.53 | | | | 19.65 | % | | $ | 12,921 | | | | 0.21 | % | | | 1.89 | % | | | 2.01 | % | | | 120 | % |
| $ | 10.29 | | | | 4.49 | % | | $ | 48 | | | | 1.07 | % | | | 1.88 | % | | | 1.88 | % | | | 235 | % |
| | | | | | | | | | | | | | | | | | | | | | | | | | | |
| $ | 10.96 | | | | (3.51 | %) | | $ | 117,166 | | | | 0.71 | % | | | 1.50 | %(12) | | | 1.50 | % | | | 97 | % |
| $ | 11.54 | | | | 19.75 | % | | $ | 82,513 | | | | 0.45 | % | | | 1.70 | % | | | 1.82 | % | | | 120 | % |
| $ | 10.29 | | | | 4.52 | % | | $ | 461 | | | | 1.07 | % | | | 1.87 | % | | | 1.87 | % | | | 235 | % |
| | | | | | | | | | | | | | | | | | | | | | | | | | | |
| $ | 10.22 | | | | (6.94 | %) | | $ | 13,810 | | | | 0.47 | % | | | 1.63 | %(12) | | | 1.63 | % | | | 163 | % |
| $ | 11.53 | | | | 22.33 | % | | $ | 35,512 | | | | 0.35 | % | | | 1.63 | % | | | 1.63 | % | | | 179 | % |
| $ | 9.56 | | | | 3.54 | % | | $ | 75,657 | | | | 1.00 | % | | | 1.41 | % | | | 1.54 | % | | | 169 | % |
| $ | 9.34 | | | | (7.21 | %) | | $ | 106,422 | | | | 0.42 | % | | | 1.42 | % | | | 1.50 | % | | | 170 | % |
| $ | 10.38 | | | | 5.87 | % | | $ | 109,845 | | | | 0.54 | % | | | 1.37 | % | | | 1.51 | % | | | 143 | % |
| | | | | | | | | | | | | | | | | | | | | | | | | | | |
| $ | 10.24 | | | | (6.73 | %) | | $ | 1,624 | | | | 0.75 | % | | | 1.44 | %(12) | | | 1.44 | % | | | 163 | % |
| $ | 11.54 | | | | 22.84 | % | | $ | 1,057 | | | | 1.38 | % | | | 1.33 | % | | | 1.44 | % | | | 179 | % |
| $ | 9.57 | | | | 2.34 | % | | $ | 30 | | | | 3.79 | % | | | 1.17 | % | | | 1.17 | % | | | 169 | % |
| | | | | | | | | | | | | | | | | | | | | | | | | | | |
| $ | 10.24 | | | | (6.57 | %) | | $ | 42,976 | | | | 0.94 | % | | | 1.20 | %(12) | | | 1.20 | % | | | 163 | % |
| $ | 11.55 | | | | 23.07 | % | | $ | 37,369 | | | | 1.13 | % | | | 1.10 | % | | | 1.21 | % | | | 179 | % |
| $ | 9.58 | | | | 2.34 | % | | $ | 330 | | | | 3.76 | % | | | 1.18 | % | | | 1.18 | % | | | 169 | % |
See footnotes on pages 132 and 133.
The accompanying notes are an integral part of these financial statements.
2018 Annual Report | December 31, 2018 | Page 127 |
Financial Highlights
For the Periods Ended December 31, | |
| | | | | | | Income from Investment Operations | | | Less Distributions | |
| | | | Net Asset Value, Beginning of Period | | | Net Investment Income (Loss) (5) | | | Net gains (losses) on securities and futures (both realized and unrealized) | | | Total from Investment Operations | | | From Net Investment Income | | | From Net Capital Gains | | | From Return of Capital | | | Total
Distributions | |
| Balanced Fund - Retail Class (1)(2) | |
| 2018 | | | $ | 11.61 | | | | 0.12 | | | | (0.49 | ) | | | (0.37 | ) | | | (0.10 | ) | | | (0.06 | ) | | | 0.00 | | | | (0.16 | ) |
| 2017 | | | $ | 10.74 | | | | 0.09 | | | | 1.49 | | | | 1.58 | | | | (0.11 | ) | | | (0.60 | ) | | | 0.00 | | | | (0.71 | ) |
| 2016 | | | $ | 10.36 | | | | 0.11 | | | | 0.39 | | | | 0.50 | | | | (0.12 | ) | | | 0.00 | | | | 0.00 | | | | (0.12 | ) |
| 2015 | | | $ | 10.98 | | | | 0.09 | | | | (0.58 | ) | | | (0.49 | ) | | | (0.08 | ) | | | (0.05 | ) | | | 0.00 | | | | (0.13 | ) |
| 2014 | | | $ | 11.10 | | | | 0.10 | | | | 0.84 | | | | 0.94 | | | | (0.27 | ) | | | (0.79 | ) | | | 0.00 | | | | (1.06 | ) |
| Balanced Fund - Adviser Class (1)(2)(3)(4) |
| 2018 | | | $ | 11.68 | | | | 0.15 | | | | (0.49 | ) | | | (0.34 | ) | | | (0.13 | ) | | | (0.06 | ) | | | 0.00 | | | | (0.19 | ) |
| 2017 | | | $ | 10.74 | | | | 0.13 | | | | 1.50 | | | | 1.63 | | | | (0.09 | ) | | | (0.60 | ) | | | 0.00 | | | | (0.69 | ) |
| 2016 (9) | | | $ | 10.49 | | | | 0.04 | | | | 0.25 | | | | 0.29 | | | | (0.04 | ) | | | 0.00 | | | | 0.00 | | | | (0.04 | ) |
| Balanced Fund - Institutional Class (1)(2)(3)(4) |
| 2018 | | | $ | 11.68 | | | | 0.18 | | | | (0.51 | ) | | | (0.33 | ) | | | (0.14 | ) | | | (0.06 | ) | | | 0.00 | | | | (0.20 | ) |
| 2017 | | | $ | 10.75 | | | | 0.16 | | | | 1.47 | | | | 1.63 | | | | (0.10 | ) | | | (0.60 | ) | | | 0.00 | | | | (0.70 | ) |
| 2016 (9) | | | $ | 10.49 | | | | 0.04 | | | | 0.26 | | | | 0.30 | | | | (0.04 | ) | | | 0.00 | | | | 0.00 | | | | (0.04 | ) |
| Moderate Allocation Fund - Retail Class (1)(2)(3)(4) |
| 2018 | | | $ | 11.66 | | | | 0.18 | | | | (0.48 | ) | | | (0.30 | ) | | | (0.16 | ) | | | (0.36 | ) | | | 0.00 | | | | (0.52 | ) |
| 2017 | | | $ | 10.46 | | | | 0.07 | | | | 1.60 | | | | 1.67 | | | | (0.05 | ) | | | (0.42 | ) | | | 0.00 | | | | (0.47 | ) |
| 2016 | | | $ | 9.50 | | | | 0.16 | | | | 0.97 | | | | 1.13 | | | | (0.17 | ) | | | 0.00 | | | | 0.00 | | | | (0.17 | ) |
| 2015 (7) | | | $ | 10.00 | | | | 0.18 | | | | (0.59 | ) | | | (0.41 | ) | | | (0.09 | ) | | | 0.00 | | | | 0.00 | | | | (0.09 | ) |
| Moderate Allocation Fund - Adviser Class (1)(2)(3)(4) |
| 2018 | | | $ | 11.66 | | | | 0.21 | | | | (0.49 | ) | | | (0.28 | ) | | | (0.17 | ) | | | (0.36 | ) | | | 0.00 | | | | (0.53 | ) |
| 2017 | | | $ | 10.46 | | | | 0.12 | | | | 1.59 | | | | 1.71 | | | | (0.09 | ) | | | (0.42 | ) | | | 0.00 | | | | (0.51 | ) |
| 2016 (9) | | | $ | 9.87 | | | | 0.03 | | | | 0.59 | | | | 0.62 | | | | (0.03 | ) | | | 0.00 | | | | 0.00 | | | | (0.03 | ) |
| Moderate Allocation Fund - Institutional Class (1)(2)(3)(4) |
| 2018 | | | $ | 11.68 | | | | 0.23 | | | | (0.48 | ) | | | (0.25 | ) | | | (0.19 | ) | | | (0.36 | ) | | | 0.00 | | | | (0.55 | ) |
| 2017 | | | $ | 10.47 | | | | 0.14 | | | | 1.59 | | | | 1.73 | | | | (0.10 | ) | | | (0.42 | ) | | | 0.00 | | | | (0.52 | ) |
| 2016 (9) | | | $ | 9.87 | | | | 0.03 | | | | 0.59 | | | | 0.62 | | | | (0.02 | ) | | | 0.00 | | | | 0.00 | | | | (0.02 | ) |
| Conservative Allocation Fund - Retail Class (1)(2) |
| 2018 | | | $ | 22.54 | | | | 0.46 | | | | (1.04 | ) | | | (0.58 | ) | | | (0.40 | ) | | | (0.38 | ) | | | 0.00 | | | | (0.78 | ) |
| 2017 | | | $ | 21.32 | | | | 0.27 | | | | 1.36 | | | | 1.63 | | | | (0.41 | ) | | | 0.00 | | | | 0.00 | | | | (0.41 | ) |
| 2016 | | | $ | 18.17 | | | | 0.11 | | | | 3.48 | | | | 3.59 | | | | 0.00 | | | | (0.20 | ) | | | (0.24 | ) | | | (0.44 | ) |
| 2015 | | | $ | 30.45 | | | | 0.17 | | | | (5.40 | ) | | | (5.23 | ) | | | (0.25 | ) | | | (6.80 | ) | | | 0.00 | | | | (7.05 | ) |
| 2014 | | | $ | 30.98 | | | | 0.19 | | | | 2.64 | | | | 2.83 | | | | (0.83 | ) | | | (2.53 | ) | | | 0.00 | | | | (3.36 | ) |
| Conservative Allocation Fund - Adviser Class (1)(2)(3)(4) |
| 2018 | | | $ | 22.82 | | | | 0.52 | | | | (1.08 | ) | | | (0.56 | ) | | | (0.44 | ) | | | (0.38 | ) | | | 0.00 | | | | (0.82 | ) |
| 2017 | | | $ | 21.34 | | | | 0.36 | | | | 1.35 | | | | 1.71 | | | | (0.23 | ) | | | 0.00 | | | | 0.00 | | | | (0.23 | ) |
| 2016 (9) | | | $ | 21.02 | | | | 0.00 | * | | | 0.55 | | | | 0.55 | | | | 0.00 | | | | (0.20 | ) | | | (0.03 | ) | | | (0.23 | ) |
| Conservative Allocation Fund - Institutional Class (1)(2)(3)(4) |
| 2018 | | | $ | 22.85 | | | | 0.56 | | | | (1.07 | ) | | | (0.51 | ) | | | (0.47 | ) | | | (0.38 | ) | | | 0.00 | | | | (0.85 | ) |
| 2017 | | | $ | 21.34 | | | | 0.59 | | | | 1.14 | | | | 1.73 | | | | (0.22 | ) | | | 0.00 | | | | 0.00 | | | | (0.22 | ) |
| 2016 (9) | | | $ | 21.02 | | | | 0.00 | * | | | 0.55 | | | | 0.55 | | | | 0.00 | | | | (0.20 | ) | | | (0.03 | ) | | | (0.23 | ) |
See footnotes on pages 132 and 133.
The accompanying notes are an integral part of these financial statements.
Page 128 | 2018 Annual Report | December 31, 2018 |
| |
| | | | | | | Ratios/Supplemental Data | |
| Net Asset Value, End of Period | | | Total Return (Assumes Reinvestment of Distributions) | | | Net Assets, End of Period ($000) | | | Ratio of Net Investment Income (Loss) to Average Net Assets | | | Ratio of Expenses to Average Net Assets After Fee Reductions (10) | | | Ratio of Expenses to Average Net Assets Before Fee Reductions (11) | | | Portfolio Turnover Rate | |
| | | | | | | | | | | | | | | | | | | | |
| $ | 11.08 | | | | (3.25 | %) | | $ | 90,133 | | | | 1.06 | % | | | 1.43 | %(12) | | | 1.43 | % | | | 218 | % |
| $ | 11.61 | | | | 14.74 | % | | $ | 97,116 | | | | 0.81 | % | | | 1.49 | % | | | 1.49 | % | | | 226 | % |
| $ | 10.74 | | | | 4.84 | % | | $ | 229,738 | | | | 1.02 | % | | | 1.46 | % | | | 1.46 | % | | | 322 | % |
| $ | 10.36 | | | | (4.47 | %) | | $ | 288,803 | | | | 0.81 | % | | | 1.47 | % | | | 1.48 | % | | | 246 | % |
| $ | 10.98 | | | | 8.61 | % | | $ | 175,534 | | | | 0.94 | % | | | 1.50 | % | | | 1.54 | % | | | 180 | % |
| | | | | | | | | | | | | | | | | | | | | | | | | | | |
| $ | 11.15 | | | | (2.99 | %) | | $ | 19,301 | | | | 1.31 | % | | | 1.21 | %(12) | | | 1.23 | % | | | 218 | % |
| $ | 11.68 | | | | 15.21 | % | | $ | 12,137 | | | | 1.13 | % | | | 1.21 | % | | | 1.30 | % | | | 226 | % |
| $ | 10.74 | | | | 2.77 | % | | $ | 89 | | | | 2.42 | % | | | 1.06 | % | | | 1.06 | % | | | 322 | % |
| | | | | | | | | | | | | | | | | | | | | | | | | | | |
| $ | 11.15 | | | | (2.85 | %) | | $ | 239,375 | | | | 1.51 | % | | | 1.02 | %(12) | | | 1.05 | % | | | 218 | % |
| $ | 11.68 | | | | 15.25 | % | | $ | 169,586 | | | | 1.35 | % | | | 1.02 | % | | | 1.11 | % | | | 226 | % |
| $ | 10.75 | | | | 2.83 | % | | $ | 219 | | | | 2.42 | % | | | 1.07 | % | | | 1.07 | % | | | 322 | % |
| | | | | | | | | | | | | | | | | | | | | | | | | | | |
| $ | 10.84 | | | | (2.60 | %) | | $ | 32,502 | | | | 1.51 | % | | | 1.39 | %(12) | | | 1.44 | % | | | 213 | % |
| $ | 11.66 | | | | 15.99 | % | | $ | 24,635 | | | | 0.61 | % | | | 1.67 | % | | | 1.73 | % | | | 349 | % |
| $ | 10.46 | | | | 12.06 | % | | $ | 56,744 | | | | 1.62 | % | | | 1.61 | % | | | 1.80 | % | | | 250 | % |
| $ | 9.50 | | | | (4.15 | %) | | $ | 42,099 | | | | 1.80 | % | | | 1.66 | % | | | 1.85 | % | | | 70 | % |
| | | | | | | | | | | | | | | | | | | | | | | | | | | |
| $ | 10.85 | | | | (2.47 | %) | | $ | 9,480 | | | | 1.78 | % | | | 1.19 | %(12) | | | 1.24 | % | | | 213 | % |
| $ | 11.66 | | | | 16.40 | % | | $ | 3,538 | | | | 1.03 | % | | | 1.35 | % | | | 1.50 | % | | | 349 | % |
| $ | 10.46 | | | | 6.32 | % | | $ | 22 | | | | 1.92 | % | | | 1.21 | % | | | 1.21 | % | | | 250 | % |
| | | | | | | | | | | | | | | | | | | | | | | | | | | |
| $ | 10.88 | | | | (2.20 | %) | | $ | 119,881 | | | | 1.97 | % | | | 1.01 | %(12) | | | 1.05 | % | | | 213 | % |
| $ | 11.68 | | | | 16.55 | % | | $ | 37,945 | | | | 1.29 | % | | | 1.13 | % | | | 1.28 | % | | | 349 | % |
| $ | 10.47 | | | | 6.31 | % | | $ | 229 | | | | 1.92 | % | | | 1.24 | % | | | 1.24 | % | | | 250 | % |
| | | | | | | | | | | | | | | | | | | | | | | | | | | |
| $ | 21.18 | | | | (2.62 | %) | | $ | 30,759 | | | | 2.09 | % | | | 1.27 | %(12) | | | 1.38 | % | | | 185 | % |
| $ | 22.54 | | | | 7.64 | % | | $ | 12,545 | | | | 1.24 | % | | | 1.70 | % | | | 2.57 | % | | | 135 | % |
| $ | 21.32 | | | | 19.87 | % | | $ | 20,450 | | | | 0.55 | % | | | 2.17 | % | | | 2.55 | % | | | 44 | % |
| $ | 18.17 | | | | (16.92 | %) | | $ | 20,034 | | | | 0.56 | % | | | 1.98 | % | | | 2.01 | % | | | 54 | % |
| $ | 30.45 | | | | 9.42 | % | | $ | 46,746 | | | | 0.63 | % | | | 1.88 | % | | | 1.89 | % | | | 34 | % |
| | | | | | | | | | | | | | | | | | | | | | | | | | | |
| $ | 21.44 | | | | (2.50 | %) | | $ | 6,110 | | | | 2.29 | % | | | 1.12 | %(12) | | | 1.22 | % | | | 185 | % |
| $ | 22.82 | | | | 8.01 | % | | $ | 682 | | | | 1.63 | % | | | 1.07 | % | | | 1.97 | % | | | 135 | % |
| $ | 21.34 | | | | 2.64 | % | | $ | 7 | | | | 0.11 | % | | | 1.93 | % | | | 2.18 | % | | | 44 | % |
| | | | | | | | | | | | | | | | | | | | | | | | | | | |
| $ | 21.49 | | | | (2.28 | %) | | $ | 92,412 | | | | 2.50 | % | | | 0.92 | %(12) | | | 1.04 | % | | | 185 | % |
| $ | 22.85 | | | | 8.10 | % | | $ | 11,739 | | | | 2.65 | % | | | 0.49 | % | | | 1.39 | % | | | 135 | % |
| $ | 21.34 | | | | 2.62 | % | | $ | 305 | | | | 0.08 | % | | | 1.96 | % | | | 2.21 | % | | | 44 | % |
See footnotes on pages 132 and 133.
The accompanying notes are an integral part of these financial statements.
2018 Annual Report | December 31, 2018 | Page 129 |
Financial Highlights
For the Periods Ended December 31, | |
| | | | | | | Income from Investment Operations | | | Less Distributions | |
| | | | Net Asset Value, Beginning of Period | | | Net Investment Income (Loss) (5) | | | Net gains (losses) on securities and futures (both realized and unrealized) | | | Total from Investment Operations | | | From Net Investment Income | | | From Net Capital Gains | | | From Return of Capital | | | Total
Distributions | |
| Dynamic Allocation Fund - Retail Class (1)(2) | |
| 2018 | | | $ | 10.85 | | | | 0.07 | | | | (1.00 | ) | | | (0.93 | ) | | | (0.06 | ) | | | (0.07 | ) | | | 0.00 | | | | (0.13 | ) |
| 2017 | | | $ | 9.72 | | | | 0.06 | | | | 1.99 | | | | 2.05 | | | | (0.07 | ) | | | (0.85 | ) | | | 0.00 | | | | (0.92 | ) |
| 2016 | | | $ | 9.36 | | | | 0.10 | | | | 0.40 | | | | 0.50 | | | | (0.09 | ) | | | (0.05 | ) | | | 0.00 | | | | (0.14 | ) |
| 2015 | | | $ | 10.02 | | | | 0.05 | | | | (0.40 | ) | | | (0.35 | ) | | | (0.05 | ) | | | (0.26 | ) | | | 0.00 | | | | (0.31 | ) |
| 2014 | | | $ | 10.35 | | | | 0.04 | | | | 1.25 | | | | 1.29 | | | | (0.30 | ) | | | (1.32 | ) | | | 0.00 | | | | (1.62 | ) |
| Dynamic Allocation Fund - Adviser Class (1)(2)(3)(4) |
| 2018 | | | $ | 10.88 | | | | 0.09 | | | | (1.00 | ) | | | (0.91 | ) | | | (0.08 | ) | | | (0.07 | ) | | | 0.00 | | | | (0.15 | ) |
| 2017 | | | $ | 9.73 | | | | 0.10 | | | | 1.97 | | | | 2.07 | | | | (0.07 | ) | | | (0.85 | ) | | | 0.00 | | | | (0.92 | ) |
| 2016 (9) | | | $ | 9.34 | | | | 0.02 | | | | 0.44 | | | | 0.46 | | | | (0.02 | ) | | | (0.05 | ) | | | 0.00 | | | | (0.07 | ) |
| Dynamic Allocation Fund - Institutional Class (1)(2)(3)(4) |
| 2018 | | | $ | 10.86 | | | | 0.12 | | | | (1.00 | ) | | | (0.88 | ) | | | (0.09 | ) | | | (0.07 | ) | | | 0.00 | | | | (0.16 | ) |
| 2017 | | | $ | 9.72 | | | | 0.12 | | | | 1.97 | | | | 2.09 | | | | (0.10 | ) | | | (0.85 | ) | | | 0.00 | | | | (0.95 | ) |
| 2016 (9) | | | $ | 9.34 | | | | 0.02 | | | | 0.43 | | | | 0.45 | | | | (0.02 | ) | | | (0.05 | ) | | | 0.00 | | | | (0.07 | ) |
| Quantex Fund - Retail Class (1)(2) |
| 2018 | | | $ | 36.76 | | | | (0.01 | ) | | | (4.53 | ) | | | (4.54 | ) | | | 0.00 | | | | 0.00 | | | | 0.00 | | | | 0.00 | |
| 2017 | | | $ | 33.36 | | | | 0.09 | | | | 4.38 | | | | 4.47 | | | | (0.06 | ) | | | (1.01 | ) | | | 0.00 | | | | (1.07 | ) |
| 2016 | | | $ | 27.84 | | | | 0.14 | | | | 6.02 | | | | 6.16 | | | | (0.16 | ) | | | (0.48 | ) | | | 0.00 | | | | (0.64 | ) |
| 2015 | | | $ | 35.20 | | | | 0.17 | | | | (2.78 | ) | | | (2.61 | ) | | | (0.17 | ) | | | (4.58 | ) | | | 0.00 | | | | (4.75 | ) |
| 2014 | | | $ | 35.04 | | | | 0.13 | | | | 3.11 | | | | 3.24 | | | | (0.40 | ) | | | (2.68 | ) | | | 0.00 | | | | (3.08 | ) |
| Quantex Fund - Adviser Class (1)(2)(3)(4) |
| 2018 | | | $ | 36.78 | | | | 0.10 | | | | (4.60 | ) | | | (4.50 | ) | | | 0.00 | | | | 0.00 | | | | 0.00 | | | | 0.00 | |
| 2017 | | | $ | 33.37 | | | | 0.21 | | | | 4.35 | | | | 4.56 | | | | (0.14 | ) | | | (1.01 | ) | | | 0.00 | | | | (1.15 | ) |
| 2016 (9) | | | $ | 30.67 | | | | 0.04 | | | | 3.18 | | | | 3.22 | | | | (0.04 | ) | | | (0.48 | ) | | | 0.00 | | | | (0.52 | ) |
| Quantex - Institutional Class (1)(2)(3)(4) |
| 2018 | | | $ | 36.77 | | | | 0.20 | | | | (4.62 | ) | | | (4.42 | ) | | | (0.06 | ) | | | 0.00 | | | | 0.00 | | | | (0.06 | ) |
| 2017 | | | $ | 33.37 | | | | 0.26 | | | | 4.35 | | | | 4.61 | | | | (0.20 | ) | | | (1.01 | ) | | | 0.00 | | | | (1.21 | ) |
| 2016 (9) | | | $ | 30.67 | | | | 0.04 | | | | 3.18 | | | | 3.22 | | | | (0.04 | ) | | | (0.48 | ) | | | 0.00 | | | | (0.52 | ) |
See footnotes on pages 132 and 133.
The accompanying notes are an integral part of these financial statements.
Page 130 | 2018 Annual Report | December 31, 2018 |
| |
| | | | | | | Ratios/Supplemental Data | |
| Net Asset Value, End of Period | | | Total Return (Assumes Reinvestment of Distributions) | | | Net Assets, End of Period ($000) | | | Ratio of Net Investment Income (Loss) to Average Net Assets | | | Ratio of Expenses to Average Net Assets After Fee Reductions (10) | | | Ratio of Expenses to Average Net Assets Before Fee Reductions (11) | | | Portfolio Turnover Rate | |
| | | | | | | | | | | | | | | | | | | | |
| $ | 9.79 | | | | (8.66 | %) | | $ | 40,732 | | | | 0.62 | % | | | 1.45 | %(12) | | | 1.55 | % | | | 273 | % |
| $ | 10.85 | | | | 21.20 | % | | $ | 50,570 | | | | 0.59 | % | | | 1.51 | % | | | 1.58 | % | | | 252 | % |
| $ | 9.72 | | | | 5.37 | % | | $ | 118,293 | | | | 1.04 | % | | | 1.42 | % | | | 1.56 | % | | | 369 | % |
| $ | 9.36 | | | | (3.46 | %) | | $ | 116,559 | | | | 0.47 | % | | | 1.48 | % | | | 1.54 | % | | | 245 | % |
| $ | 10.02 | | | | 12.80 | % | | $ | 141,638 | | | | 0.40 | % | | | 1.45 | % | | | 1.54 | % | | | 230 | % |
| | | | | | | | | | | | | | | | | | | | | | | | | | | |
| $ | 9.82 | | | | (8.49 | %) | | $ | 11,198 | | | | 0.84 | % | | | 1.23 | %(12) | | | 1.33 | % | | | 273 | % |
| $ | 10.88 | | | | 21.42 | % | | $ | 10,140 | | | | 0.87 | % | | | 1.27 | % | | | 1.34 | % | | | 252 | % |
| $ | 9.73 | | | | 4.89 | % | | $ | 48 | | | | 1.33 | % | | | 1.12 | % | | | 1.12 | % | | | 369 | % |
| | | | | | | | | | | | | | | | | | | | | | | | | | | |
| $ | 9.82 | | | | (8.18 | %) | | $ | 121,965 | | | | 1.08 | % | | | 1.01 | %(12) | | | 1.11 | % | | | 273 | % |
| $ | 10.86 | | | | 21.61 | % | | $ | 70,187 | | | | 1.10 | % | | | 1.05 | % | | | 1.12 | % | | | 252 | % |
| $ | 9.72 | | | | 4.80 | % | | $ | 592 | | | | 1.33 | % | | | 1.11 | % | | | 1.11 | % | | | 369 | % |
| | | | | | | | | | | | | | | | | | | | | | | | | | | |
| $ | 32.22 | | | | (12.35 | %) | | $ | 28,319 | | | | (0.03 | %) | | | 1.57 | %(12) | | | 1.62 | % | | | 116 | % |
| $ | 36.76 | | | | 13.42 | % | | $ | 60,161 | | | | 0.27 | % | | | 1.52 | % | | | 1.66 | % | | | 72 | % |
| $ | 33.36 | | | | 22.14 | % | | $ | 85,235 | | | | 0.47 | % | | | 1.52 | % | | | 1.77 | % | | | 91 | % |
| $ | 27.84 | | | | (7.68 | %) | | $ | 58,883 | | | | 0.46 | % | | | 1.26 | % | | | 1.75 | % | | | 87 | % |
| $ | 35.20 | | | | 9.48 | % | | $ | 61,834 | | | | 0.36 | % | | | 1.52 | % | | | 1.78 | % | | | 29 | % |
| | | | | | | | | | | | | | | | | | | | | | | | | | | |
| $ | 32.28 | | | | (12.22 | %) | | $ | 923 | | | | 0.28 | % | | | 1.42 | %(12) | | | 1.47 | % | | | 116 | % |
| $ | 36.78 | | | | 13.68 | % | | $ | 2,114 | | | | 0.59 | % | | | 1.39 | % | | | 1.56 | % | | | 72 | % |
| $ | 33.37 | | | | 10.48 | % | | $ | 31 | | | | 0.75 | % | | | 1.15 | % | | | 1.40 | % | | | 91 | % |
| | | | | | | | | | | | | | | | | | | | | | | | | | | |
| $ | 32.29 | | | | (12.05 | %) | | $ | 35,414 | | | | 0.54 | % | | | 1.21 | %(12) | | | 1.26 | % | | | 116 | % |
| $ | 36.77 | | | | 13.84 | % | | $ | 32,489 | | | | 0.75 | % | | | 1.18 | % | | | 1.35 | % | | | 72 | % |
| $ | 33.37 | | | | 10.48 | % | | $ | 951 | | | | 0.75 | % | | | 1.15 | % | | | 1.40 | % | | | 91 | % |
See footnotes on pages 132 and 133.
The accompanying notes are an integral part of these financial statements.
2018 Annual Report | December 31, 2018 | Page 131 |
Financial Highlights
For the Periods Ended December 31, | |
| | | | | | | Income from Investment Operations | | | Less Distributions | |
| | | | Net Asset Value, Beginning of Period | | | Net Investment Income (Loss) (5) | | | Net gains (losses) on securities and futures (both realized and unrealized) | | | Total from Investment Operations | | | From Net Investment Income | | | From Net Capital Gains | | | From Return of Capital | | | Total
Distributions | |
| Total Return Bond Fund - Retail Class (1)(2) | |
| 2018 | | | $ | 9.37 | | | | 0.17 | | | | (0.33 | ) | | | (0.16 | ) | | | (0.18 | ) | | | 0.00 | | | | 0.00 | | | | (0.18 | ) |
| 2017 | | | $ | 9.28 | | | | 0.24 | | | | 0.10 | | | | 0.34 | | | | (0.25 | ) | | | 0.00 | | | | 0.00 | | | | (0.25 | ) |
| 2016 | | | $ | 9.14 | | | | 0.27 | | | | 0.14 | | | | 0.41 | | | | (0.27 | ) | | | 0.00 | | | | 0.00 | | | | (0.27 | ) |
| 2015 | | | $ | 9.63 | | | | 0.27 | | | | (0.51 | ) | | | (0.24 | ) | | | (0.25 | ) | | | 0.00 | | | | 0.00 | | | | (0.25 | ) |
| 2014 | | | $ | 9.77 | | | | 0.33 | | | | (0.15 | ) | | | 0.18 | | | | (0.32 | ) | | | 0.00 | | | | 0.00 | | | | (0.32 | ) |
| Total Return Bond Fund - Adviser Class (1)(2)(3)(4) |
| 2018 | | | $ | 9.38 | | | | 0.21 | | | | (0.35 | ) | | | (0.14 | ) | | | (0.20 | ) | | | 0.00 | | | | 0.00 | | | | (0.20 | ) |
| 2017 | | | $ | 9.28 | | | | 0.28 | | | | 0.10 | | | | 0.38 | | | | (0.28 | ) | | | 0.00 | | | | 0.00 | | | | (0.28 | ) |
| 2016 (9) | | | $ | 9.46 | | | | 0.09 | | | | (0.19 | ) | | | (0.10 | ) | | | (0.08 | ) | | | 0.00 | | | | 0.00 | | | | (0.08 | ) |
| Total Return Bond Fund - Institutional Class (1)(2)(3)(4) |
| 2018 | | | $ | 9.38 | | | | 0.23 | | | | (0.35 | ) | | | (0.12 | ) | | | (0.22 | ) | | | 0.00 | | | | 0.00 | | | | (0.22 | ) |
| 2017 | | | $ | 9.28 | | | | 0.31 | | | | 0.08 | | | | 0.39 | | | | (0.29 | ) | | | 0.00 | | | | 0.00 | | | | (0.29 | ) |
| 2016 (9) | | | $ | 9.46 | | | | 0.08 | | | | (0.18 | ) | | | (0.10 | ) | | | (0.08 | ) | | | 0.00 | | | | 0.00 | | | | (0.08 | ) |
| Prime Money Market Fund (1)(2) |
| 2018 | | | $ | 1.00 | | | | 0.016 | | | | N/A | | | | 0.016 | | | | (0.016 | ) | | | 0.000 | | | | 0.000 | | | | (0.016 | ) |
| 2017 | | | $ | 1.00 | | | | 0.007 | | | | N/A | | | | 0.007 | | | | (0.007 | ) | | | 0.000 | | | | 0.000 | | | | (0.007 | ) |
| 2016 | | | $ | 1.00 | | | | 0.003 | | | | N/A | | | | 0.003 | | | | (0.003 | ) | | | 0.000 | | | | 0.000 | | | | (0.003 | ) |
| 2015 | | | $ | 1.00 | | | | 0.001 | | | | N/A | | | | 0.001 | | | | (0.001 | ) | | | 0.000 | | | | 0.000 | | | | (0.001 | ) |
| 2014 | | | $ | 1.00 | | | | 0.001 | | | | N/A | | | | 0.001 | | | | (0.001 | ) | | | 0.000 | | | | 0.000 | | | | (0.001 | ) |
| Institutional Prime Money Market Fund (1)(2)(3)(4) |
| 2018 | | | $ | 0.9999 | | | | 0.0190 | | | | 0.0000 | | | | 0.0190 | | | | (0.0190 | ) | | | 0.0000 | | | | 0.0000 | | | | (0.0190 | ) |
| 2017 | | | $ | 1.0001 | | | | 0.0101 | | | | (0.0003 | ) | | | 0.0098 | | | | (0.0100 | ) | | | 0.0000 | | | | 0.0000 | | | | (0.0100 | ) |
| 2016 (8) | | | $ | 1.0000 | | | | 0.0010 | | | | 0.0001 | | | | 0.0011 | | | | (0.0010 | ) | | | 0.0000 | | | | 0.0000 | | | | (0.0010 | ) |
1 | Ratio of net investment income (loss) to average net assets, ratio of expenses to average net assets after fee reductions, and ratio of expenses to average net assets before fee reductions do not include impact of expenses of the underlying security holdings as represented in the schedule of investments. |
2 | Recognition of net investment income by the Fund is affected by the timing of the declaration of dividends by the underlying investment companies in which the Fund invests. |
3 | Total return and portfolio turnover rate are not annualized for periods of less than one full year. |
4 | Ratio of net investment income (loss) to average net assets, ratio of expenses to average net assets after fee reductions, and ratio of expenses to average net assets before fee reductions are annualized for periods of less than one full year. |
5 | Except for the Money Market Funds, net investment income per share is based on average shares outstanding during the period. |
6 | Commenced operations on January 1, 2015. |
7 | Commenced operations on June 30, 2015. |
8 | Commenced operations on October 7, 2016. |
9 | Commenced operations on October 31, 2016. |
The accompanying notes are an integral part of these financial statements.
Page 132 | 2018 Annual Report | December 31, 2018 |
| |
| | | | | | | Ratios/Supplemental Data | |
| Net Asset Value, End of Period | | | Total Return (Assumes Reinvestment of Distributions) | | | Net Assets, End of Period ($000) | | | Ratio of Net Investment Income (Loss) to Average Net Assets | | | Ratio of Expenses to Average Net Assets After Fee Reductions (10) | | | Ratio of Expenses to Average Net Assets Before Fee Reductions (11) | | | Portfolio Turnover Rate | |
| | | | | | | | | | | | | | | | | | | | |
| $ | 9.03 | | | | (1.67 | %) | | $ | 14,932 | | | | 1.88 | % | | | 1.15 | %(12) | | | 1.26 | % | | | 102 | % |
| $ | 9.37 | | | | 3.72 | % | | $ | 67,986 | | | | 2.59 | % | | | 1.02 | % | | | 1.03 | % | | | 133 | % |
| $ | 9.28 | | | | 4.49 | % | | $ | 214,755 | | | | 2.87 | % | | | 0.98 | % | | | 1.00 | % | | | 217 | % |
| $ | 9.14 | | | | (2.51 | %) | | $ | 214,618 | | | | 2.71 | % | | | 1.01 | % | | | 1.03 | % | | | 295 | % |
| $ | 9.63 | | | | 1.78 | % | | $ | 143,046 | | | | 3.39 | % | | | 1.02 | % | | | 1.13 | % | | | 82 | % |
| | | | | | | | | | | | | | | | | | | | | | | | | | | |
| $ | 9.04 | | | | (1.45 | %) | | $ | 3,570 | | | | 2.33 | % | | | 0.95 | %(12) | | | 1.06 | % | | | 102 | % |
| $ | 9.38 | | | | 4.07 | % | | $ | 9,896 | | | | 2.95 | % | | | 0.83 | % | | | 0.84 | % | | | 133 | % |
| $ | 9.28 | | | | (1.05 | %) | | $ | 84 | | | | 5.49 | % | | | 0.53 | % | | | 0.53 | % | | | 217 | % |
| | | | | | | | | | | | | | | | | | | | | | | | | | | |
| $ | 9.04 | | | | (1.22 | %) | | $ | 48,437 | | | | 2.50 | % | | | 0.76 | %(12) | | | 0.87 | % | | | 102 | % |
| $ | 9.38 | | | | 4.20 | % | | $ | 110,674 | | | | 3.27 | % | | | 0.64 | % | | | 0.65 | % | | | 133 | % |
| $ | 9.28 | | | | (1.08 | %) | | $ | 70 | | | | 5.35 | % | | | 0.53 | % | | | 0.53 | % | | | 217 | % |
| | | | | | | | | | | | | | | | | | | | | | | | | | | |
| $ | 1.00 | | | | 1.59 | % | | $ | 40,881 | | | | 1.59 | % | | | 0.44 | % | | | 0.94 | % | | | N/A | |
| $ | 1.00 | | | | 0.68 | % | | $ | 35,211 | | | | 0.67 | % | | | 0.47 | % | | | 1.00 | % | | | N/A | |
| $ | 1.00 | | | | 0.29 | % | | $ | 36,666 | | | | 0.28 | % | | | 0.32 | % | | | 0.69 | % | | | N/A | |
| $ | 1.00 | | | | 0.07 | % | | $ | 56,530 | | | | 0.07 | % | | | 0.18 | % | | | 0.58 | % | | | N/A | |
| $ | 1.00 | | | | 0.06 | % | | $ | 54,927 | | | | 0.06 | % | | | 0.16 | % | | | 0.67 | % | | | N/A | |
| | | | | | | | | | | | | | | | | | | | | | | | | | | |
| $ | 0.9999 | | | | 1.90 | % | | $ | 471,603 | | | | 1.90 | % | | | 0.16 | % | | | 0.51 | % | | | N/A | |
| $ | 0.9999 | | | | 0.96 | % | | $ | 296,547 | | | | 1.01 | % | | | 0.17 | % | | | 0.56 | % | | | N/A | |
| $ | 1.0001 | | | | 0.11 | % | | $ | 197,480 | | | | 0.43 | % | | | 0.24 | % | | | 0.62 | % | | | N/A | |
10 | Ratio of expenses to average net assets after fee reductions reflects contractual or voluntary waivers and reimbursements of expenses by the investment adviser and transfer agent. |
11 | Ratio of expenses to average net assets before fee reductions reflects the total expenses before reductions reported in the Statements of Operations. |
12 | The ratio of net expenses to average net assets after fee reductions was calculated without reduction for commissions recaptured and securities lending credits. After taking these items into account, the net expense ratios are 1.27%, 1.05%, and 0.85% for Muirfield Retail Class, Adviser Class, and Institutional Class, respectively; 1.73%, 1.53%, and 1.33% for Spectrum Retail Class, Adviser Class, and Institutional Class, respectively; 1.55%, 1.36%, and 1.11% for Global Retail Class, Adviser Class, and Institutional Class, respectively; 1.34%, 1.12%, and 0.93% for Balanced Retail Class, Adviser Class, and Institutional Class, respectively; 1.26%, 1.06%, and 0.87% for Moderate Retail Class, Adviser Class, and Institutional Class, respectively; 1.10%, 0.94%, and 0.76% for Conservative Retail Class, Adviser Class, and Institutional Class, respectively; 1.34%, 1.13%, and 0.91% for Dynamic Retail Class, Adviser Class, and Institutional Class, respectively; 1.41%, 1.25%, and 1.07% for Quantex Retail Class, Adviser Class, and Institutional Class, respectively; and 1.06%, 0.88%, and 0.68% for Bond Retail Class, Adviser Class, and Institutional Class, respectively, for the year ended December 31, 2018. |
* | Actual amounts were less than one-half of a cent per share |
The accompanying notes are an integral part of these financial statements.
2018 Annual Report | December 31, 2018 | Page 133 |
Notes to Financial Statements
December 31, 2018
Meeder Funds (the Trust) is organized as a Massachusetts business trust and is registered under the Investment Company Act of 1940, as amended (the 1940 Act), as a diversified, open-end management investment company. The Trust offers eleven separate series, all of which are included in this report: Muirfield Fund (Muirfield), Spectrum Fund (Spectrum), Global Allocation Fund (Global), Balanced Fund (Balanced), Moderate Allocation Fund (Moderate), Conservative Allocation Fund (Conservative), Dynamic Allocation Fund (Dynamic), Quantex Fund (Quantex), Total Return Bond Fund (Bond), Prime Money Market Fund (Prime Money Market), and Institutional Prime Money Market Fund (Institutional Prime Money Market)(the Funds).
Each Fund, except Prime Money Market and Institutional Prime Money Market, offers three classes of shares: Retail Class, Adviser Class, and Institutional Class. Prime Money Market and Institutional Prime Money Market offer only one class of shares. The share classes differ with respect to distribution fees, service fees, and other expenses allocated to each class. Eligibility to purchase Adviser and Institutional Class shares is generally limited to customers of financial intermediaries who enter into special arrangements with the Funds or who meet certain initial investment minimums.
Prime Money Market operates as a retail money market fund. The Fund maintains a stable net asset value of $1.00 and is only available for purchase in accounts beneficially owned by natural persons. Institutional Prime Money Market operates as an institutional money market fund open to all forms of investors. Its net asset value fluctuates based upon changes in the value of its investments and the value of its shares is calculated daily to four decimal places. Prime Money Market and Institutional Prime Money Market have adopted policies and procedures to impose liquidity fees on redemptions or temporary redemption gates in the event that the Funds’ weekly liquid assets fall below designated thresholds and the Board of Trustees determines that such liquidity fees or redemption gates are in the best interests of the Fund.
For more information regarding the Funds’ objectives, strategies, and differences in share classes, please refer to the Funds’ prospectus.
| 2. | Significant Accounting Policies |
The Funds’ financial statements are prepared in conformity with accounting principles generally accepted in the United States of America (GAAP), which require management to make certain estimates and assumptions that affect the reported amounts of assets and liabilities and disclosure of contingent assets and liabilities at the date of the financial statements. The Trust is an investment company and applies the accounting and reporting guidance of the Financial Accounting Standards Board (FASB) Accounting Standards Codification Topic 946 Financial Services Companies. The following summarizes the significant accounting policies of the Trust and the Funds:
Securities valuation. All investments in securities are recorded at their estimated fair value, as described in Note #3.
Repurchase agreements.Each Fund may engage in repurchase agreement transactions whereby the Fund takes possession of an underlying debt instrument subject to an obligation of the seller to repurchase the instrument from the Fund and an obligation of the Fund to resell the instrument at an agreed upon price and term. At all times, the Fund maintains the fair value of collateral, including accrued interest, of at least 100% of the amount of the repurchase agreement, plus accrued interest. If the seller defaults or the fair value of the collateral declines, realization of the collateral by the Fund may be delayed or limited.
Short sales.Spectrum may enter into short sales as part of its overall portfolio management strategy or to offset a potential decline in value of a security. The Fund may engage in short sales with respect to various types of securities, including ETFs. A short sale involves the sale of a security that is borrowed from a broker or other institution to complete the sale. The Fund may engage in short sales with respect to securities it owns, as well as securities that it does not own. Short sales expose the Fund to the risk that it will be required to acquire, convert or exchange securities to replace the borrowed securities (also known as “covering” the short position) at a time when the securities sold short have appreciated in value, thus resulting in a loss to the Fund. The Fund’s investment performance may also suffer if the Fund is required to close out a short position earlier than it had intended. The Fund must segregate assets determined to be liquid in accordance with procedures established by the Board, or otherwise cover its position in a permissible manner. The Fund will be required to pledge its liquid assets to the broker in order to secure its performance on short sales. As a result, the assets pledged may not be available to meet the Fund’s needs for immediate cash or other liquidity. In addition, the Fund may be subject to expenses related to short sales that are not typically associated with investing in securities directly, such as costs of borrowing and margin account maintenance costs associated with the Fund’s open short positions. These types of short sales expenses are sometimes referred to as the “negative cost of carry,” and will tend to cause the Fund to lose money on a short sale even in instances where the price of the underlying security sold short does not change over the duration of the short sale. Dividend expenses on securities sold short and borrowing costs will be borne by the Fund and are reflected in the Statements of Operations.
Futures & options.Each Fund, except the Money Market Funds, may engage in transactions in financial futures contracts and options contracts in order to manage the risk of unanticipated changes in market values of securities held in the Fund, or which it intends to purchase. The futures and options contracts are adjusted by the daily exchange rate of the underlying currency, or index, and any gains or losses are recorded for financial statement purposes as unrealized gains or losses in the statement of assets and liabilities and the statement of operations until the contract settlement date, at which time realized gains and losses are included in the statement of operations.
Page 134 | 2018 Annual Report | December 31, 2018 |
To the extent that the Fund enters into futures contracts on an index or group of securities, the Fund exposes itself to an indeterminate liability and will be required to pay or receive a sum of money measured by the change in the fair value of the index. Upon entering into a futures contract, the Fund is required to deposit an initial margin, which is either cash or securities (disclosed as pledged as collateral on the Schedules of Investments) in an amount equal to a certain percentage of the contract value. Subsequently, margin movements, which are equal to changes in the daily price or last sale price on the exchanges where futures contracts trade, are recorded as unrealized gains or losses until the contract is closed. When the contract is closed, the Fund records a realized gain or loss equal to the difference between the proceeds from (or cost of) the closing transaction and the Fund’s basis in the contract. Should market conditions move unexpectedly, the Fund may not achieve the anticipated benefits of the futures contract and may realize a loss. The use of futures transactions involves the risk of imperfect correlation in movements in the price of futures contracts, interest rates, and the underlying hedged assets. With futures, there is minimal counterparty credit risk to the Fund since futures are exchange traded and the exchange’s clearinghouse, as counterparty to all exchange traded futures, guarantees the futures against default. Except for the Money Market Funds, it is normal practice for each Fund to invest in futures contracts on a daily basis. The Funds, except for Bond and the Money Market Funds, typically utilize equity index futures contracts to equitize cash positions or adjust targeted stock market exposure. Except for the Money Market Funds, the fixed income portion of any Fund can utilize Treasury futures contracts in order to adjust duration.
Call and put option contracts involve the payment of a premium for the right to purchase or sell an individual security or index aggregate at a specified price until the expiration of the contract. Such transactions expose the Fund to the loss of the premium paid if the Fund does not sell or exercise the contract prior to the expiration date. In the case of a call option, sufficient cash or money market instruments will be segregated to complete the purchase. Options are fair valued on the basis of the daily settlement price or last sale on the exchanges where they trade and the changes in fair value are recorded as unrealized appreciation or depreciation until closed, exercised or expired. For the year ended December 31, 2018, there were no call or put options transacted for any of the Funds.
The Funds may write covered call or put options for which premiums received are recorded as liabilities and are subsequently adjusted to the current value of the options written. When written options are closed or exercised, premiums received are offset against the proceeds paid, and the Fund records realized gains or losses for the difference. When written options expire, the liability is eliminated, and the Fund records realized gains for the entire amount of premiums received. Although permitted, it is currently not normal practice for the Funds to write call and put options and none were written during the year ended December 31, 2018.
The fair value of derivative instruments, not accounted for as hedging instruments, as reported within the Statements of Assets and Liabilities as of December 31, 2018 was as follows:
Amount of Deposits at Broker and Unrealized Appreciation (Depreciation) on Derivatives |
| | Type of
Derivative/
Risk | Statements of Assets & Liabilities Location | | Fair Value of
Deposits at
Broker for Futures
Contracts | | | Value of
Unrealized
Appreciation
(Depreciation) | |
Muirfield | Equity contracts | Assets, Deposits at broker for futures contracts; Net Assets, Distributable Earnings (Accumulated Deficit) | | $ | 15,135,425 | | | $ | 3,864,835 | |
Spectrum | Equity contracts | Assets, Deposits at broker for futures contracts; Net Assets, Distributable Earnings (Accumulated Deficit) | | | 3,446,268 | | | | 880,285 | |
Global | Equity contracts | Assets, Deposits at broker for futures contracts; Net Assets, Distributable Earnings (Accumulated Deficit) | | | 760,151 | | | | 205,276 | |
Balanced | Equity contracts | Assets, Deposits at broker for futures contracts; Net Assets, Distributable Earnings (Accumulated Deficit) | | | 6,060,178 | | | | 1,520,858 | |
Moderate | Equity contracts | Assets, Deposits at broker for futures contracts; Net Assets, Distributable Earnings (Accumulated Deficit) | | | 1,898,712 | | | | 432,502 | |
Conservative | Equity contracts | Assets, Deposits at broker for futures contracts; Net Assets, Distributable Earnings (Accumulated Deficit) | | | 923,332 | | | | 219,748 | |
Dynamic | Equity contracts | Assets, Deposits at broker for futures contracts; Net Assets, Distributable Earnings (Accumulated Deficit) | | | 2,795,815 | | | | (725,486 | ) |
Quantex | Equity contracts | Assets, Deposits at broker for futures contracts; Net Assets, Distributable Earnings (Accumulated Deficit) | | | 1,003,150 | | | | (511,843 | ) |
2018 Annual Report | December 31, 2018 | Page 135 |
The effect of derivative instruments on the Statements of Operations for the year ended December 31, 2018 was as follows:
| Amount of Realized Gain (Loss) on Derivatives Recognized in Income |
| | | Type of
Derivative/
Risk | | Long and
Short
Contracts
Opened
During the
Period** | | | Long and
Short
Contracts
Closed/
Expired
During the
Period** | | | Long (Short) Contracts as of
December 31, 2018 | | | Statement of Operations
Location | | For the Year Ended December 31, 2018 | |
| Muirfield | | Equity contracts | | | 16,042 | | | | 14,520 | | | | (2,400 | ) | | Net realized gains (losses) from futures contracts | | $ | 5,834,457 | |
| Spectrum | | Equity contracts | | | 5,391 | | | | 5,212 | | | | (588 | ) | | Net realized gains (losses) from futures contracts | | | 481,556 | |
| Global | | Equity contracts | | | 1,721 | | | | 1,726 | | | | (127 | ) | | Net realized gains (losses) from futures contracts | | | (421,324 | ) |
| Balanced | | Equity contracts | | | 6,808 | | | | 6,103 | | | | (956 | ) | | Net realized gains (losses) from futures contracts | | | 1,118,813 | |
| Moderate | | Equity contracts | | | 2,253 | | | | 1,978 | | | | (283 | ) | | Net realized gains (losses) from futures contracts | | | 457,188 | |
| Conservative | | Equity contracts | | | 1,165 | | | | 1,024 | | | | (134 | ) | | Net realized gains (losses) from futures contracts | | | 51,484 | |
| Dynamic | | Equity contracts | | | 2,165 | * | | | 1,897 | | | | 522 | | | Net realized gains (losses) from futures contracts | | | (3,873,970 | ) |
| Quantex | | Equity contracts | | | 389 | | | | 355 | | | | 71 | | | Net realized gains (losses) from futures contracts | | | (322,655 | ) |
* | Amount includes 76 contracts acquired as a result of merger (See Note #2). |
** | Amounts include gross long and short contracts. |
Change in Unrealized Gain or (Loss) on Derivatives Recognized in Income |
| | Type of
Derivative/
Risk | Statement of Operations Location | | For the Year Ended
December 31, 2018 | |
Muirfield | Equity contracts | Net change in unrealized appreciation (depreciation) of futures contracts | | $ | 2,266,229 | |
Spectrum | Equity contracts | Net change in unrealized appreciation (depreciation) of futures contracts | | | 214,037 | |
Global | Equity contracts | Net change in unrealized appreciation (depreciation) of futures contracts | | | (11,595 | ) |
Balanced | Equity contracts | Net change in unrealized appreciation (depreciation) of futures contracts | | | 1,462,627 | |
Moderate | Equity contracts | Net change in unrealized appreciation (depreciation) of futures contracts | | | 392,503 | |
Conservative | Equity contracts | Net change in unrealized appreciation (depreciation) of futures contracts | | | 211,320 | |
Dynamic | Equity contracts | Net change in unrealized appreciation (depreciation) of futures contracts | | | (1,074,917 | ) |
Quantex | Equity contracts | Net change in unrealized appreciation (depreciation) of futures contracts | | | (565,729 | ) |
Federal income taxes.It is each Fund’s policy to continue to comply with the requirements of Subchapter M of the Internal Revenue Code applicable to regulated investment companies and to distribute substantially all of its taxable income and net capital gains to its shareholders. Therefore, no federal income tax provision is required. The Funds recognize the tax benefits or expenses of uncertain tax positions only where the position is “more likely than not” to be sustained assuming examination by tax authorities. Management has reviewed tax positions taken on Federal income tax returns for all open tax years (tax years ended December 31, 2015 through December 31, 2018) and has concluded that no provision for unrecognized tax benefits or expenses is required in these financial statements. Each Fund identifies its major tax jurisdictions as U.S. Federal and certain State tax authorities; however the Funds are not aware of any tax positions for which it is reasonably possible that the total amounts of unrecognized tax benefits will change materially in the next twelve months. The Funds recognize interest and penalties, if any, related to unrecognized tax benefits as income tax expense in the Statements of Operations as incurred. During the year ended December 31, 2018, the Funds did not incur any material interest or penalties.
Distributions to shareholders. Distributions to shareholders are recorded on the ex-dividend date. Muirfield, Spectrum, Global, Balanced, Moderate, Conservative, Dynamic, and Quantex declare and pay dividends from net investment income, if any, on a quarterly basis. Bond declares and pays dividends from net investment income on a monthly basis. The Money Market Funds declare dividends from net investment income on a daily basis and pay such dividends on a monthly basis. Each Fund distributes net capital gains, if any, on an annual basis.
Page 136 | 2018 Annual Report | December 31, 2018 |
Distributions from net investment income and from net capital gains are determined in accordance with income tax regulations, which may differ from GAAP. Permanent differences relate to redemptions treated as distributions for tax purposes (i.e. equalization). Accordingly, timing differences relating to shareholder distributions are reflected in the components of net assets and permanent book and tax differences have been reclassified within the components of net assets based on their ultimate characterization for federal income tax purposes. For the year ended December 31, 2018, the Funds made the following reclassifications to increase/(decrease) the components of net assets:
| | | Capital | | | Distributable Earnings
(Accumulated Deficit) | |
Muirfield | | $ | 3,120,006 | | | $ | (3,120,006 | ) |
Spectrum | | | 567,258 | | | | (567,258 | ) |
Global | | | 512,154 | | | | (512,154 | ) |
Balanced | | | 904,190 | | | | (904,190 | ) |
Moderate | | | — | | | | — | |
Conservative | | | — | | | | — | |
Dynamic | | | 909,382 | | | | (909,382 | ) |
Quantex | | | 6,810,508 | | | | (6,810,508 | ) |
Bond | | | — | | | | — | |
Investment income & expenses.For all Funds, except the Money Market Funds, income and expenses (other than expenses attributable to a specific class) are allocated to each class of shares based on its relative net assets. Expenses incurred by the Trust that do not specifically relate to an individual Fund of the Trust are allocated to the Funds based on each Fund’s relative net assets or other appropriate basis.
Capital Share Transactions.All Funds, except the Money Market Funds, are authorized to issue an unlimited number of shares in the Retail Class, the Adviser Class, and the Institutional Class. Transactions in the capital shares of the Funds for the year ended December 31, 2018 and the year ended December 31, 2017 were as follows:
| | | Issued | | | Reinvested | |
Share Class | | Amount | | | Shares | | | Amount | | | Shares | |
Year Ended December 31, 2018 | | | | | | | | | | | | | | | | |
Muirfield - Retail | | $ | 81,607,430 | | | | 10,591,064 | | | $ | 2,838,289 | | | | 386,039 | |
Muirfield - Adviser | | | 45,772,169 | | | | 5,912,961 | | | | 976,171 | | | | 132,373 | |
Muirfield - Institutional | | | 250,401,075 | | | | 32,639,655 | | | | 5,465,965 | | | | 740,262 | |
Spectrum - Retail | | | 15,316,571 | | | | 1,306,662 | | | | 634,335 | | | | 57,336 | |
Spectrum - Adviser | | | 6,709,846 | | | | 572,286 | | | | 205,755 | | | | 18,534 | |
Spectrum - Institutional | | | 71,831,995 | | | | 6,114,885 | | | | 1,820,982 | | | | 163,947 | |
Global - Retail | | | 7,387,903 | | | | 625,162 | | | | 693,907 | | | | 66,424 | |
Global - Adviser | | | 1,666,708 | | | | 141,659 | | | | 80,880 | | | | 7,739 | |
Global - Institutional | | | 30,087,889 | | | | 2,587,226 | | | | 2,227,122 | | | | 212,652 | |
Balanced - Retail | | | 53,335,958 | | | | 4,526,600 | | | | 1,270,759 | | | | 111,704 | |
Balanced - Adviser | | | 15,554,044 | | | | 1,316,644 | | | | 307,224 | | | | 26,889 | |
Balanced - Institutional | | | 176,221,306 | | | | 14,971,740 | | | | 4,087,178 | | | | 357,622 | |
Moderate - Retail | | | 38,800,866 | | | | 3,283,431 | | | | 1,586,555 | | | | 143,168 | |
Moderate - Adviser | | | 11,337,112 | | | | 964,690 | | | | 435,680 | | | | 39,317 | |
Moderate - Institutional | | | 129,444,120 | | | | 11,051,119 | | | | 5,369,404 | | | | 482,988 | |
Conservative - Retail | | | 35,154,545 | | | | 1,550,412 | | | | 1,138,735 | | | | 52,592 | |
Conservative - Adviser | | | 7,718,877 | | | | 337,733 | | | | 226,424 | | | | 10,341 | |
Conservative - Institutional | | | 103,393,699 | | | | 4,529,606 | | | | 3,420,096 | | | | 155,924 | |
Dynamic - Retail | | | 23,731,139 | | | | 2,147,604 | | | | 521,063 | | | | 50,501 | |
Dynamic - Adviser | | | 5,731,267 | | | | 520,691 | | | | 154,361 | | | | 14,924 | |
Dynamic - Institutional | | | 83,741,660 | | | | 7,557,922 | | | | 1,740,535 | | | | 168,797 | |
Quantex - Retail | | | 13,035,850 | | | | 350,178 | | | | 1 | | | | — | |
Quantex - Adviser | | | 1,055,587 | | | | 28,146 | | | | 104 | | | | 3 | |
Quantex - Institutional | | | 33,694,504 | | | | 915,517 | | | | 42,119 | | | | 1,109 | |
Bond - Retail | | | 3,804,576 | | | | 412,911 | | | | 368,119 | | | | 40,486 | |
Bond - Adviser | | | 2,503,637 | | | | 274,289 | | | | 69,633 | | | | 7,671 | |
2018 Annual Report | December 31, 2018 | Page 137 |
| | | Issued | | | Reinvested | |
Share Class | | Amount | | | Shares | | | Amount | | | Shares | |
Bond - Institutional | | $ | 24,403,992 | | | | 2,666,294 | | | $ | 1,127,534 | | | | 124,120 | |
Prime Money Market | | | 36,584,300 | | | | 36,584,300 | | | | 520,240 | | | | 520,240 | |
Institutional Prime Money Market | | | 655,634,899 | | | | 655,689,013 | | | | 770,570 | | | | 770,617 | |
Year Ended December 31, 2017 | | | | | | | | | | | | | | | | |
Muirfield - Retail | | $ | 69,224,338 | | | | 9,392,928 | | | $ | 18,274,233 | | | | 2,436,224 | |
Muirfield - Adviser | | | 43,200,633 | | | | 5,772,167 | | | | 2,814,669 | | | | 373,234 | |
Muirfield - Institutional | | | 196,126,815 | | | | 26,417,922 | | | | 12,525,154 | | | | 1,661,317 | |
Spectrum - Retail | | | 17,727,645 | | | | 1,618,032 | | | | 3,759,826 | | | | 329,231 | |
Spectrum - Adviser | | | 13,785,585 | | | | 1,240,035 | | | | 802,353 | | | | 69,953 | |
Spectrum - Institutional | | | 87,828,254 | | | | 7,861,056 | | | | 4,540,126 | | | | 395,481 | |
Global - Retail | | | 4,290,027 | | | | 414,217 | | | | 498,987 | | | | 43,704 | |
Global - Adviser | | | 1,122,959 | | | | 105,925 | | | | 18,941 | | | | 1,662 | |
Global - Institutional | | | 43,705,168 | | | | 4,385,231 | | | | 762,165 | | | | 66,766 | |
Balanced - Retail | | | 26,306,979 | | | | 2,323,085 | | | | 5,871,578 | | | | 507,403 | |
Balanced - Adviser | | | 13,252,680 | | | | 1,148,364 | | | | 638,110 | | | | 54,695 | |
Balanced - Institutional | | | 185,796,592 | | | | 16,103,392 | | | | 6,866,027 | | | | 589,322 | |
Moderate - Retail | | | 5,411,114 | | | | 497,051 | | | | 999,860 | | | | 86,853 | |
Moderate - Adviser | | | 3,672,006 | | | | 337,942 | | | | 133,385 | | | | 11,486 | |
Moderate - Institutional | | | 39,284,644 | | | | 3,583,497 | | | | 1,350,218 | | | | 116,322 | |
Conservative - Retail | | | 3,066,122 | | | | 140,500 | | | | 217,793 | | | | 9,663 | |
Conservative - Adviser | | | 790,658 | | | | 35,430 | | | | 6,728 | | | | 295 | |
Conservative - Institutional | | | 14,928,684 | | | | 660,636 | | | | 111,127 | | | | 4,863 | |
Dynamic - Retail | | | 12,488,746 | | | | 1,207,246 | | | | 4,060,526 | | | | 376,589 | |
Dynamic - Adviser | | | 10,819,161 | | | | 1,016,257 | | | | 782,624 | | | | 72,269 | |
Dynamic - Institutional | | | 70,981,096 | | | | 6,892,336 | | | | 5,504,520 | | | | 508,681 | |
Quantex - Retail | | | 15,894,719 | | | | 463,602 | | | | 1,715,006 | | | | 46,714 | |
Quantex - Adviser | | | 2,330,634 | | | | 68,459 | | | | 60,803 | | | | 1,654 | |
Quantex - Institutional | | | 36,167,350 | | | | 1,054,466 | | | | 1,000,499 | | | | 27,250 | |
Bond - Retail | | | 25,785,784 | | | | 2,743,003 | | | | 3,211,909 | | | | 341,738 | |
Bond - Adviser | | | 11,199,739 | | | | 1,181,978 | | | | 147,366 | | | | 15,628 | |
Bond - Institutional | | | 137,951,749 | | | | 14,624,351 | | | | 2,026,224 | | | | 214,866 | |
Prime Money Market | | | 29,723,424 | | | | 29,723,424 | | | | 236,626 | | | | 236,626 | |
Institutional Prime Money Market | | | 485,340,979 | | | | 485,328,584 | | | | 225,080 | | | | 225,073 | |
| | | Redeemed | | | Net Increase (Decrease) | |
Share Class | | Amount | | | Shares | | | Amount | | | Shares | |
Year Ended December 31, 2018 | | | | | | | | | | | | | | | | |
Muirfield - Retail | | $ | (120,344,713 | ) | | | (15,805,053 | ) | | $ | (35,898,994 | ) | | | (4,827,950 | ) |
Muirfield - Adviser | | | (23,177,083 | ) | | | (3,027,534 | ) | | | 23,571,257 | | | | 3,017,800 | |
Muirfield - Institutional | | | (76,462,743 | ) | | | (9,887,880 | ) | | | 179,404,297 | | | | 23,492,037 | |
Spectrum - Retail | | | (21,651,506 | ) | | | (1,854,585 | ) | | | (5,700,600 | ) | | | (490,587 | ) |
Spectrum - Adviser | | | (4,581,453 | ) | | | (388,155 | ) | | | 2,334,148 | | | | 202,665 | |
Spectrum - Institutional | | | (32,556,739 | ) | | | (2,739,415 | ) | | | 41,096,238 | | | | 3,539,417 | |
Global - Retail | | | (27,936,806 | ) | | | (2,419,624 | ) | | | (19,854,996 | ) | | | (1,728,038 | ) |
Global - Adviser | | | (966,321 | ) | | | (82,334 | ) | | | 781,267 | | | | 67,064 | |
Global - Institutional | | | (21,490,748 | ) | | | (1,839,787 | ) | | | 10,824,263 | | | | 960,091 | |
Balanced - Retail | | | (57,110,196 | ) | | | (4,872,793 | ) | | | (2,503,479 | ) | | | (234,489 | ) |
Balanced - Adviser | | | (7,711,363 | ) | | | (651,971 | ) | | | 8,149,905 | | | | 691,562 | |
Balanced - Institutional | | | (98,596,493 | ) | | | (8,389,812 | ) | | | 81,711,991 | | | | 6,939,550 | |
Moderate - Retail | | | (29,729,790 | ) | | | (2,540,828 | ) | | | 10,657,631 | | | | 885,771 | |
Moderate - Adviser | | | (5,106,044 | ) | | | (434,215 | ) | | | 6,666,748 | | | | 569,792 | |
Moderate - Institutional | | | (44,111,927 | ) | | | (3,760,524 | ) | | | 90,701,597 | | | | 7,773,583 | |
Conservative - Retail | | | (15,769,100 | ) | | | (707,441 | ) | | | 20,524,180 | | | | 895,563 | |
Conservative - Adviser | | | (2,106,654 | ) | | | (93,049 | ) | | | 5,838,647 | | | | 255,025 | |
Page 138 | 2018 Annual Report | December 31, 2018 |
| | | Redeemed | | | Net Increase (Decrease) | |
Share Class | | Amount | | | Shares | | | Amount | | | Shares | |
Conservative - Institutional | | $ | (20,263,277 | ) | | | (898,989 | ) | | $ | 86,550,518 | | | | 3,786,541 | |
Dynamic - Retail | | | (29,718,729 | ) | | | (2,700,614 | ) | | | (5,615,341 | ) | | | (502,509 | ) |
Dynamic - Adviser | | | (3,637,896 | ) | | | (328,036 | ) | | | 2,211,335 | | | | 207,579 | |
Dynamic - Institutional | | | (19,534,689 | ) | | | (1,766,261 | ) | | | 65,561,978 | | | | 5,960,458 | |
Quantex - Retail | | | (40,590,059 | ) | | | (1,107,858 | ) | | | (27,554,208 | ) | | | (757,680 | ) |
Quantex - Adviser | | | (2,143,773 | ) | | | (57,014 | ) | | | (1,088,082 | ) | | | (28,865 | ) |
Quantex - Institutional | | | (26,406,354 | ) | | | (703,507 | ) | | | 7,330,269 | | | | 213,119 | |
Bond - Retail | | | (56,261,664 | ) | | | (6,056,440 | ) | | | (52,088,969 | ) | | | (5,603,043 | ) |
Bond - Adviser | | | (8,796,720 | ) | | | (942,209 | ) | | | (6,223,450 | ) | | | (660,249 | ) |
Bond - Institutional | | | (85,936,237 | ) | | | (9,230,713 | ) | | | (60,404,711 | ) | | | (6,440,299 | ) |
Prime Money Market | | | (31,434,432 | ) | | | (31,434,432 | ) | | | 5,670,108 | | | | 5,670,108 | |
Institutional Prime Money Market | | | (481,353,876 | ) | | | (481,379,810 | ) | | | 175,051,593 | | | | 175,079,820 | |
| | | | | | | | | | | | | | | | | |
Year Ended December 31, 2017 | | | | | | | | | | | | | | | | |
Muirfield - Retail | | $ | (263,903,006 | ) | | | (36,151,315 | ) | | $ | (176,404,435 | ) | | | (24,322,163 | ) |
Muirfield - Adviser | | | (5,289,800 | ) | | | (696,300 | ) | | | 40,725,502 | | | | 5,449,101 | |
Muirfield - Institutional | | | (27,343,196 | ) | | | (3,598,362 | ) | | | 181,308,773 | | | | 24,480,877 | |
Spectrum - Retail | | | (96,970,103 | ) | | | (8,826,443 | ) | | | (75,482,632 | ) | | | (6,879,180 | ) |
Spectrum - Adviser | | | (2,202,940 | ) | | | (193,909 | ) | | | 12,384,998 | | | | 1,116,079 | |
Spectrum - Institutional | | | (13,276,329 | ) | | | (1,152,838 | ) | | | 79,092,051 | | | | 7,103,699 | |
Global - Retail | | | (53,076,539 | ) | | | (5,293,945 | ) | | | (48,287,525 | ) | | | (4,836,024 | ) |
Global - Adviser | | | (207,804 | ) | | | (19,150 | ) | | | 934,096 | | | | 88,437 | |
Global - Institutional | | | (13,511,851 | ) | | | (1,250,757 | ) | | | 30,955,482 | | | | 3,201,240 | |
Balanced - Retail | | | (180,115,210 | ) | | | (15,862,623 | ) | | | (147,936,653 | ) | | | (13,032,135 | ) |
Balanced - Adviser | | | (2,009,926 | ) | | | (172,407 | ) | | | 11,880,864 | | | | 1,030,652 | |
Balanced - Institutional | | | (25,560,161 | ) | | | (2,189,239 | ) | | | 167,102,458 | | | | 14,503,475 | |
Moderate - Retail | | | (42,009,943 | ) | | | (3,894,151 | ) | | | (35,598,969 | ) | | | (3,310,247 | ) |
Moderate - Adviser | | | (537,829 | ) | | | (48,048 | ) | | | 3,267,562 | | | | 301,380 | |
Moderate - Institutional | | | (5,312,392 | ) | | | (472,047 | ) | | | 35,322,470 | | | | 3,227,772 | |
Conservative - Retail | | | (12,108,043 | ) | | | (553,076 | ) | | | (8,824,128 | ) | | | (402,913 | ) |
Conservative - Adviser | | | (139,084 | ) | | | (6,175 | ) | | | 658,302 | | | | 29,550 | |
Conservative - Institutional | | | (3,791,375 | ) | | | (166,112 | ) | | | 11,248,436 | | | | 499,387 | |
Dynamic - Retail | | | (93,457,320 | ) | | | (9,086,760 | ) | | | (76,908,048 | ) | | | (7,502,925 | ) |
Dynamic - Adviser | | | (1,754,203 | ) | | | (161,245 | ) | | | 9,847,582 | | | | 927,281 | |
Dynamic - Institutional | | | (10,857,261 | ) | | | (1,000,514 | ) | | | 65,628,355 | | | | 6,400,503 | |
Quantex - Retail | | | (48,833,388 | ) | | | (1,428,616 | ) | | | (31,223,663 | ) | | | (918,300 | ) |
Quantex - Adviser | | | (471,246 | ) | | | (13,580 | ) | | | 1,920,191 | | | | 56,533 | |
Quantex - Institutional | | | (8,047,545 | ) | | | (226,565 | ) | | | 29,120,304 | | | | 855,151 | |
Bond - Retail | | | (178,660,569 | ) | | | (18,972,930 | ) | | | (149,662,876 | ) | | | (15,888,189 | ) |
Bond - Adviser | | | (1,432,225 | ) | | | (151,470 | ) | | | 9,914,880 | | | | 1,046,136 | |
Bond - Institutional | | | (28,735,928 | ) | | | (3,046,449 | ) | | | 111,242,045 | | | | 11,792,768 | |
Prime Money Market | | | (31,415,171 | ) | | | (31,415,171 | ) | | | (1,455,121 | ) | | | (1,455,121 | ) |
Institutional Prime Money Market | | | (386,435,339 | ) | | | (386,423,004 | ) | | | 99,130,720 | | | | 99,130,653 | |
2018 Annual Report | December 31, 2018 | Page 139 |
Offsetting Assets & Liabilities. The Funds are party to enforceable master netting arrangements between counter parties, such as the securities lending agreement, which provides for the right of offset under certain circumstances, such as the event of default. The securities lending transactions have an overnight and continuous contractual maturity. Risks arise from the possible inability of counterparties to meet the terms of their contracts. The table below reflects the offsetting assets and liabilities relating to securities lending, futures contracts, and repurchase agreements shown on the Statements of Assets and Liabilities at December 31, 2018.
| | | | | | | | | | | | | | | Gross Amounts Not Offset in the
Statements of Assets and Liabilities | | | | | |
Description/ Fund | | Gross Amounts
of Recognized
Assets/
Liabilities | | | Gross Amounts
Offset in the
Statements
of Assets and
Liabilities | | | Net Amounts
Presented in
the Statements
of Assets and
Liabilities | | | Financial
Instruments* | | | Collateral
Pledged
(Received)* | | | Net Amount | |
Assets: | | | | | | | | | | | | | | | | | | | | | | | | |
Securities Loaned | | | | | | | | | | | | | | | | | | | | | | | | |
Muirfield | | $ | 204,786 | | | $ | — | | | $ | 204,786 | | | $ | — | | | $ | (204,786 | ) | | $ | — | |
Spectrum | | | 60,676 | | | | — | | | | 60,676 | | | | — | | | | (60,676 | ) | | | — | |
Global | | | 1,975,585 | | | | — | | | | 1,975,585 | | | | — | | | | (1,975,585 | ) | | | — | |
Balanced | | | 63,468 | | | | — | | | | 63,468 | | | | — | | | | (63,468 | ) | | | — | |
Conservative | | | 496 | | | | — | | | | 496 | | | | — | | | | (496 | ) | | | — | |
Dynamic | | | 26,036 | | | | — | | | | 26,036 | | | | — | | | | (26,036 | ) | | | — | |
Quantex | | | 912,297 | | | | — | | | | 912,297 | | | | — | | | | (912,297 | ) | | | — | |
| | | | | | | | | | | | | | | | | | | | | | | | | |
Futures Contracts | | | | | | | | | | | | | | | | | | | | | | | | |
Muirfield | | $ | 3,948,541 | | | $ | 83,706 | | | $ | 3,864,835 | | | $ | — | | | $ | — | | | $ | 3,864,835 | |
Spectrum | | | 906,656 | | | | 26,371 | | | | 880,285 | | | | — | | | | — | | | | 880,285 | |
Global | | | 205,276 | | | | — | | | | 205,276 | | | | — | | | | — | | | | 205,276 | |
Balanced | | | 1,554,522 | | | | 33,664 | | | | 1,520,858 | | | | — | | | | — | | | | 1,520,858 | |
Moderate | | | 445,644 | | | | 13,142 | | | | 432,502 | | | | — | | | | — | | | | 432,502 | |
Conservative | | | 224,579 | | | | 4,831 | | | | 219,748 | | | | — | | | | — | | | | 219,748 | |
| | | | | | | | | | | | | | | | | | | | | | | | | |
Repurchase Agreements | | | | | | | | | | | | | | | | | | | | | | | | |
Prime Money Market | | $ | 10,000,000 | | | $ | — | | | $ | 10,000,000 | | | $ | (10,000,000 | ) | | $ | — | | | $ | — | |
Institutional Prime Money Market | | | 105,000,000 | | | | — | | | | 105,000,000 | | | | (105,000,000 | ) | | | — | | | | — | |
| | | | | | | | | | | | | | | | | | | | | | | | | |
Liabilities: | | | | | | | | | | | | | | | | | | | | | | | | |
Futures Contracts | | | | | | | | | | | | | | | | | | | | | | | | |
Dynamic | | $ | (725,486 | ) | | $ | — | | | $ | (725,486 | ) | | $ | — | | | $ | 725,486 | | | $ | — | |
Quantex | | | (511,843 | ) | | | — | | | | (511,843 | ) | | | — | | | | 511,843 | | | | — | |
* | The amount is limited to the net amounts of financial assets and liabilities and accordingly does not include excess collateral pledged. |
Agreement and Plan of Reorganization.On September 28, 2018, the Board of Trustees of Aggressive Allocation Fund – Retail Class, Adviser Class, and Institutional Class, together “Aggressive,” approved the reorganization of Aggressive with and into Dynamic Allocation Fund – Retail Class, Adviser Class, and Institutional Class, together “Dynamic.” The purpose of the reorganization was to combine two funds managed by Meeder Asset Management, Inc., the investment adviser of both funds, with comparable investment objectives and strategies. The reorganization provided for the transfer of assets of Aggressive to Dynamic and the assumption of the liabilities of Aggressive by Dynamic. The reorganization was effective as of the close of business on November 30, 2018. For each share of Aggressive Allocation Fund – Retail Class, Adviser Class, and Institutional Class, shareholders received 0.848925377 share, 0.847134663 share, and 0.849743253 share, respectively, of Dynamic Allocation Fund – Retail Class, Adviser Class, and Institutional Class. The following table illustrates the specifics of the reorganization:
| | Aggressive Net
Assets(1) | Shares Issued to
Shareholders of
Aggressive | Dynamic Net Assets | Combined Net Assets | Tax Status of Transfer |
Retail Class | $6,889,013 | 639,541 | $37,181,153 | $44,070,166 | Non-taxable |
Adviser Class | 1,171,410 | 108,309 | 10,971,899 | 12,143,309 | Non-taxable |
Institutional Class | 11,436,898 | 1,057,687 | 119,774,455 | 131,211,353 | Non-taxable |
(1) | Includes net unrealized appreciation on investments in the amount of $570,739. |
Page 140 | 2018 Annual Report | December 31, 2018 |
For financial reporting purposes, assets received and shares issued by Dynamic were recorded at fair value; however, the cost basis of the investments received from Aggressive was carried forward to align ongoing reporting of Dynamic’s realized and unrealized gains and losses with amounts distributable to shareholders for tax purposes.
Assuming the reorganization had been completed on January 1, 2018, the beginning of the reporting period, the pro forma results of operations for the year ended December 31, 2018 would have been as follows:
Net investment income | | $ | 1,537,715 | |
Net realized gain on investments | | | 276,699 | |
Change in net unrealized depreciation on investments | | | (18,423,949 | ) |
Net decrease in net assets resulting from operations | | $ | (16,609,535 | ) |
Because Dynamic has been managed as a single integrated portfolio since the reorganization was completed, it is not practicable to separate the amounts of revenue and earnings of Aggressive and Dynamic Funds that have been included in Dynamic’s Statements of Operations since November 30, 2018.
Other.The Funds record security transactions on the trade date. Gains and losses realized from the sale of securities are determined on the specific identification basis. Dividend income and dividend expenses are recognized on the ex-dividend date and interest income (including amortization of premium and accretion of discount) is recognized as earned. Short-term capital gain distributions from underlying funds are classified as dividend income for financial reporting purposes. Long-term capital gains distributions are separately stated. Discounts and premiums are amortized using the effective yield over the lives of the respective securities. Distributions received from partnerships are recorded as return of capital distributions. Withholding taxes on foreign dividends, if applicable, have been provided for in accordance with the Funds’ understanding of the applicable country’s tax rules and rates.
Distributions received from the Funds’ investments in real estate investment trusts (“REITs”) may be characterized as ordinary income, net capital gain, or return of capital. The proper characterization of REIT distributions is generally not known until after the end of each calendar year. As such, the Funds must use estimates in reporting the character of their income and distributions for financial statement purposes. The actual character of distributions to the Funds’ shareholders will be reflected on the Form 1099 received by shareholders after the end of the calendar year. Due to the nature of REIT investments, a portion of the distributions received by the Funds’ shareholders may represent a return of capital.
The Funds utilize various methods to measure the fair value of their investments on a recurring basis. GAAP establishes a hierarchy that prioritizes inputs to valuation methods. The three levels of inputs are as follows:
Level 1 – Unadjusted quoted prices in active markets for identical assets or liabilities that the Funds have the ability to access.
Level 2 – Observable inputs other than quoted prices included in level 1 that are observable for the asset or liability, either directly or indirectly. These inputs may include quoted prices for the identical instrument on an inactive market, prices for similar instruments, interest rates, prepayment speeds, credit risk, yield curves, default rates and similar data.
Level 3 – Significant unobservable inputs for the asset or liability, to the extent relevant observable inputs are not available, representing the Funds’ own assumptions about the assumptions a market participant would use in valuing the asset or liability, and would be based on the best information available.
The availability of observable inputs can vary from security to security and is affected by a wide variety of factors, including, for example, the type of security, whether the security is new and not yet established in the marketplace, the liquidity of markets, and other characteristics particular to the security. To the extent that valuation is based on models or inputs that are less observable or unobservable in the market, the determination of fair value requires more judgment. Accordingly, the degree of judgment exercised in determining fair value is greatest for instruments categorized in level 3.
The inputs used to measure fair value may fall into different levels of the fair value hierarchy. In such cases, for disclosure purposes, the level in the fair value hierarchy within which the fair value measurement falls in its entirety, is determined based on the lowest level input that is significant to the fair value measurement in its entirety.
A description of the valuation techniques applied to the Funds’ major categories of assets and liabilities measured at fair value on a recurring basis follows.
Equity securities (including publicly traded partnerships, real estate investment trusts, American depositary receipts, exchange traded funds, and common stock). Securities traded on a national securities exchange (or reported on the NASDAQ national market) are stated at the last reported sales price on the day of valuation and are categorized in level 1 of the fair value hierarchy.
Investments in registered open-end investment companies, including money market funds, are valued at the daily redemption net asset value as reported by the underlying fund and are categorized in level 1 of the fair value hierarchy.
2018 Annual Report | December 31, 2018 | Page 141 |
Short-term notes (including bank obligations, commercial paper, corporate obligations, repurchase agreements, U.S. government agency obligations, and floating rate demand notes). Short-term notes held in the Funds, except Prime Money Market, maturing more than sixty days after the valuation date, are valued at the last sales price as of the close of business on the day of valuation, or, lacking any sales, at the most recent bid price or yield equivalent as obtained from dealers that make markets in such securities. When valued at last sales price, the securities will be categorized as level 1. When using bid prices or yield equivalents, they will be categorized as level 2. When such securities are valued within sixty days or less to maturity, the difference between the valuation existing on the sixty-first day before maturity and maturity value is amortized on a straight-line basis to maturity and will be categorized as level 2.
All securities held in Prime Money Market, other than money market funds, are valued at amortized cost, which approximates fair value, and will be categorized as level 2.
Certificates of deposit.Except for Institutional Money Market, certificates of deposit are valued at acquisition cost, which approximates fair value, and will be categorized as level 2. For Institutional Money Market, certificates of deposit are normally valued using a model that incorporates market observable data such as reported sales of similar securities, broker quotes, yields, bids, offers, and reference data, and will be categorized as level 2.
U.S. government obligations. U.S. government obligations are normally valued using a model that incorporates market observable data such as reported sales of similar securities, broker quotes, yields, bids, offers, and reference data. Certain securities are valued principally using dealer quotations. In either case, these securities will be categorized as level 2.
Restricted securities (equity and debt).Restricted securities for which quotations are not readily available are valued at fair value as determined by the Trustees. Depending on the relative significance of valuation inputs, these instruments may be classified in either level 2 or level 3 of the fair value hierarchy.
Derivative instruments (futures contracts).Listed derivative instruments that are actively traded, including futures contracts, are valued based on quoted prices from the exchange and are categorized in level 1 of the fair value hierarchy.
For the year ended December 31, 2018, the Funds did not hold any assets at any time in which significant unobservable inputs were used in determining fair value. Therefore, no reconciliation of level 3 securities is provided. Also, there were no transfers between level 1 and level 2 securities. The Funds recognize transfers between fair value hierarchy levels at the end of the reporting period. The following table summarizes the inputs used to value the Funds’ assets and liabilities measured at fair value as of December 31, 2018.
Muirfield – Assets/(Liabilities) | | Level 1 | | | Level 2 | | | Level 3 | | | Total | |
Common stocks* | | $ | 389,753,369 | | | $ | — | | | $ | — | | | $ | 389,753,369 | |
Money market registered investment companies | | | 203,338,732 | | | | — | | | | — | | | | 203,338,732 | |
Bank obligations | | | — | | | | 1,246,106 | | | | — | | | | 1,246,106 | |
Total | | $ | 593,092,101 | | | $ | 1,246,106 | | | $ | — | | | $ | 594,338,207 | |
Trustee deferred compensation*** | | $ | 180,121 | | | $ | — | | | $ | — | | | $ | 180,121 | |
Futures contracts** | | $ | 3,864,835 | | | $ | — | | | $ | — | | | $ | 3,864,835 | |
Spectrum - Assets/(Liabilities) | | Level 1 | | | Level 2 | | | Level 3 | | | Total | |
Common stocks - Long* | | $ | 161,926,608 | | | $ | — | | | $ | — | | | $ | 161,926,608 | |
Money market registered investment companies | | | 10,571,034 | | | | — | | | | — | | | | 10,571,034 | |
Total - Long investments | | $ | 172,497,642 | | | $ | — | | | $ | — | | | $ | 172,497,642 | |
Common stocks - Short* | | $ | (60,259,673 | ) | | $ | — | | | $ | — | | | $ | (60,259,673 | ) |
Trustee deferred compensation*** | | $ | 18,855 | | | $ | — | | | $ | — | | | $ | 18,855 | |
Futures contracts** | | $ | 880,285 | | | $ | — | | | $ | — | | | $ | 880,285 | |
Global - Assets/(Liabilities) | | Level 1 | | | Level 2 | | | Level 3 | | | Total | |
Common stocks* | | $ | 21,168,943 | | | $ | — | | | $ | — | | | $ | 21,168,943 | |
Registered investment companies | | | 9,753,599 | | | | — | | | | — | | | | 9,753,599 | |
Money market registered investment companies | | | 25,592,179 | | | | — | | | | — | | | | 25,592,179 | |
Bank obligations | | | — | | | | 1,246,106 | | | | — | | | | 1,246,106 | |
U.S. government obligations | | | — | | | | 462,871 | | | | — | | | | 462,871 | |
Total | | $ | 56,514,721 | | | $ | 1,708,977 | | | $ | — | | | $ | 58,223,698 | |
Trustee deferred compensation*** | | $ | 82,241 | | | $ | — | | | $ | — | | | $ | 82,241 | |
Futures contracts** | | $ | 205,276 | | | $ | — | | | $ | — | | | $ | 205,276 | |
Page 142 | 2018 Annual Report | December 31, 2018 |
Balanced - Assets/(Liabilities) | | Level 1 | | | Level 2 | | | Level 3 | | | Total | |
Common stocks* | | $ | 156,189,853 | | | $ | — | | | $ | — | | | $ | 156,189,853 | |
Registered investment companies | | | 99,006,604 | | | | — | | | | — | | | | 99,006,604 | |
Money market registered investment companies | | | 77,486,120 | | | | — | | | | — | | | | 77,486,120 | |
Bank obligations | | | — | | | | 1,246,106 | | | | — | | | | 1,246,106 | |
U.S. government obligations | | | — | | | | 7,735,261 | | | | — | | | | 7,735,261 | |
Total | | $ | 332,682,577 | | | $ | 8,981,367 | | | $ | — | | | $ | 341,663,944 | |
Trustee deferred compensation*** | | $ | 118,181 | | | $ | — | | | $ | — | | | $ | 118,181 | |
Futures contracts** | | $ | 1,520,858 | | | $ | — | | | $ | — | | | $ | 1,520,858 | |
Moderate - Assets/(Liabilities) | | Level 1 | | | Level 2 | | | Level 3 | | | Total | |
Common stocks* | | $ | 47,268,225 | | | $ | — | | | $ | — | | | $ | 47,268,225 | |
Registered investment companies | | | 76,326,841 | | | | — | | | | — | | | | 76,326,841 | |
Money market registered investment companies | | | 29,907,471 | | | | — | | | | — | | | | 29,907,471 | |
Bank obligations | | | — | | | | 747,596 | | | | — | | | | 747,596 | |
U.S. government obligations | | | — | | | | 5,619,582 | | | | — | | | | 5,619,582 | |
Total | | $ | 153,502,537 | | | $ | 6,367,178 | | | $ | — | | | $ | 159,869,715 | |
Trustee deferred compensation*** | | $ | 10,654 | | | $ | — | | | $ | — | | | $ | 10,654 | |
Futures contracts** | | $ | 432,502 | | | $ | — | | | $ | — | | | $ | 432,502 | |
Conservative - Assets/(Liabilities) | | Level 1 | | | Level 2 | | | Level 3 | | | Total | |
Common stocks* | | $ | 23,046,473 | | | $ | — | | | $ | — | | | $ | 23,046,473 | |
Registered investment companies | | | 84,751,804 | | | | — | | | | — | | | | 84,751,804 | |
Money market registered investment companies | | | 13,763,302 | | | | — | | | | — | | | | 13,763,302 | |
Bank obligations | | | — | | | | 249,192 | | | | — | | | | 249,192 | |
U.S. government obligations | | | — | | | | 6,370,863 | | | | — | | | | 6,370,863 | |
Total | | $ | 121,561,579 | | | $ | 6,620,055 | | | $ | — | | | $ | 128,181,634 | |
Trustee deferred compensation*** | | $ | 48,698 | | | $ | — | | | $ | — | | | $ | 48,698 | |
Futures contracts** | | $ | 219,748 | | | $ | — | | | $ | — | | | $ | 219,748 | |
Dynamic - Assets/(Liabilities) | | Level 1 | | | Level 2 | | | Level 3 | | | Total | |
Common stocks* | | $ | 121,043,892 | | | $ | — | | | $ | — | | | $ | 121,043,892 | |
Registered investment companies | | | 10,405,421 | | | | — | | | | — | | | | 10,405,421 | |
Money market registered investment companies | | | 38,125,728 | | | | — | | | | — | | | | 38,125,728 | |
Bank obligations | | | — | | | | 1,246,406 | | | | — | | | | 1,246,406 | |
Total | | $ | 169,575,041 | | | $ | 1,246,406 | | | $ | — | | | $ | 170,821,447 | |
Trustee deferred compensation*** | | $ | 160,951 | | | $ | — | | | $ | — | | | $ | 160,951 | |
Futures contracts** | | $ | (725,486 | ) | | $ | — | | | $ | — | | | $ | (725,486 | ) |
Quantex - Assets/(Liabilities) | | Level 1 | | | Level 2 | | | Level 3 | | | Total | |
Common stocks* | | $ | 52,472,542 | | | $ | — | | | $ | — | | | $ | 52,472,542 | |
Money market registered investment companies | | | 10,563,485 | | | | — | | | | — | | | | 10,563,485 | |
Bank obligations | | | — | | | | 1,220,529 | | | | — | | | | 1,220,529 | |
Total | | $ | 63,036,027 | | | $ | 1,220,529 | | | $ | — | | | $ | 64,256,556 | |
Trustee deferred compensation*** | | $ | 47,345 | | | $ | — | | | $ | — | | | $ | 47,345 | |
Futures contracts** | | $ | (511,843 | ) | | $ | — | | | $ | — | | | $ | (511,843 | ) |
2018 Annual Report | December 31, 2018 | Page 143 |
Bond - Assets/(Liabilities) | | Level 1 | | | Level 2 | | | Level 3 | | | Total | |
Registered investment companies | | $ | 56,488,721 | | | $ | — | | | $ | — | | | $ | 56,488,721 | |
Money market registered investment companies | | | 2,871,730 | | | | — | | | | — | | | | 2,871,730 | |
U.S. government obligations | | | — | | | | 7,671,394 | | | | — | | | | 7,671,394 | |
Total | | $ | 59,360,451 | | | $ | 7,671,394 | | | $ | — | | | $ | 67,031,845 | |
Trustee deferred compensation*** | | $ | 52,776 | | | $ | — | | | $ | — | | | $ | 52,776 | |
Prime Money Market - Assets/(Liabilities) | | Level 1 | | | Level 2 | | | Level 3 | | | Total | |
Bank obligations | | $ | — | | | $ | 993,290 | | | $ | — | | | $ | 993,290 | |
Certificates of deposit | | | — | | | | 6,199,539 | | | | — | | | | 6,199,539 | |
Commercial paper | | | — | | | | 14,163,293 | | | | — | | | | 14,163,293 | |
Corporate obligations | | | — | | | | 3,255,444 | | | | — | | | | 3,255,444 | |
Repurchase agreements | | | — | | | | 10,000,000 | | | | — | | | | 10,000,000 | |
U.S. government and agency obligations | | | — | | | | 1,998,102 | | | | — | | | | 1,998,102 | |
Money market registered investment companies | | | 4,254,015 | | | | — | | | | — | | | | 4,254,015 | |
Total | | $ | 4,254,015 | | | $ | 36,609,668 | | | $ | — | | | $ | 40,863,683 | |
Trustee deferred compensation*** | | $ | 31,906 | | | $ | — | | | $ | — | | | $ | 31,906 | |
Institutional Prime Money Market - Assets/(Liabilities) | | Level 1 | | | Level 2 | | | Level 3 | | | Total | |
Bank obligations | | $ | — | | | $ | 993,289 | | | $ | — | | | $ | 993,289 | |
Certificates of deposit | | | — | | | | 66,844,976 | | | | — | | | | 66,844,976 | |
Commercial paper | | | — | | | | 185,997,785 | | | | — | | | | 185,997,785 | |
Corporate obligations | | | — | | | | 24,541,122 | | | | — | | | | 24,541,122 | |
Repurchase agreements | | | — | | | | 105,000,000 | | | | — | | | | 105,000,000 | |
U.S. government and agency obligations | | | — | | | | 22,981,608 | | | | — | | | | 22,981,608 | |
Money market registered investment companies | | | 65,609,748 | | | | — | | | | — | | | | 65,609,748 | |
Total | | $ | 65,609,748 | | | $ | 406,358,780 | | | $ | — | | | $ | 471,968,528 | |
Trustee deferred compensation*** | | $ | 1,898 | | | $ | — | | | $ | — | | | $ | 1,898 | |
| * | See schedules of investments for industry classifications. |
| ** | Futures contracts include unrealized gain/loss on contracts open at December 31, 2018. |
| *** | A corresponding liability exists that is marked to market and is considered Level 1 in the fair value hierarchy. |
| 4. | Investment Transactions |
For the year ended December 31, 2018, the cost of purchases and proceeds from sales or maturities of long-term investments for the Funds, excluding U.S. Government investments and short positions, were as follows:
| | | Purchases | | | Sales | |
Muirfield | | $ | 929,125,754 | | | $ | 821,711,735 | |
Spectrum | | | 169,646,635 | | | | 140,877,628 | |
Global | | | 83,640,396 | | | | 108,371,165 | |
Balanced | | | 571,248,828 | | | | 526,070,663 | |
Moderate | | | 301,275,200 | | | | 231,448,026 | |
Conservative | | | 263,604,416 | | | | 173,201,384 | |
Dynamic | | | 339,022,236 | | | | 312,861,279 | |
Quantex | | | 79,487,766 | | | | 106,395,316 | |
Bond | | | 59,386,657 | | | | 180,763,211 | |
Page 144 | 2018 Annual Report | December 31, 2018 |
For the year ended December 31, 2018, the cost of purchases and proceeds from sales or maturities of long-term U.S. Government investments for the Funds are as follows:
| | | Purchases | | | Sales | |
Global | | $ | 2,723,102 | | | $ | 2,220,723 | |
Balanced | | | 33,721,582 | | | | 25,610,567 | |
Moderate | | | 24,496,110 | | | | 18,615,033 | |
Conservative | | | 28,278,999 | | | | 21,626,113 | |
Bond | | | 17,832,426 | | | | 10,017,391 | |
5. Investment Advisory Fees and Other Transactions with Affiliates and Non-Affiliates
Meeder Asset Management, Inc. (“MAM”), a wholly-owned subsidiary of Meeder Investment Management, Inc. (“Meeder”), provides the Funds with investment management, research, statistical and advisory services pursuant to the terms of an Investment Advisory Agreement. The services of MAM will terminate automatically if assigned and may be terminated without penalty at any time upon 60 days prior written notice by majority vote of the Fund, by the Trustees of the Fund, or by MAM. For such services the Funds pay a fee at the following annual rates:
| | Percentage of Average
Daily Net Assets up to
$50 Million | Percentage of Average
Daily Net Assets
Exceeding $50 Million up
to $100 Million | Percentage of Average
Daily Net Assets
Exceeding $100 Million
up to $200 Million | Percentage of Average
Daily Net Assets
Exceeding $200 Million |
Muirfield | 1.00% | 0.75% | 0.60% | 0.60% |
Spectrum | 0.75% | 0.75% | 0.75% | 0.60% |
Global | 0.75% | 0.75% | 0.75% | 0.60% |
Balanced | 0.75% | 0.75% | 0.75% | 0.60% |
Moderate | 0.60% | 0.60% | 0.60% | 0.60% |
Conservative | 0.50% | 0.50% | 0.50% | 0.50% |
Dynamic | 0.75% | 0.75% | 0.75% | 0.60% |
Quantex | 0.75% | 0.75% | 0.60% | 0.60% |
Bond | 0.40% | 0.40% | 0.20% | 0.20% |
Prime Money Market | 0.40% | 0.40% | 0.25% | 0.25% |
Institutional Prime Money Market | 0.40% | 0.40% | 0.25% | 0.25% |
Fee Waivers & Expense Limitation Agreements.MAM has contractually agreed to reduce its advisory fees or limit total annual ordinary fund operating expenses for certain Funds pursuant to written agreements that may only be amended or terminated with the approval of the board. The sums waived or reimbursed under these agreements are not subject to recoupment.
Effective April 30, 2018, MAM contractually agreed to reimburse management fees or other fund expenses for Spectrum sufficient to limit total annual ordinary fund operating expenses (excluding interest, taxes, brokerage commissions, acquired fund fees and expenses, and extraordinary items) as a percentage of daily assets to 2.06% for the Retail Class, 1.91% for the Adviser Class and 1.72% for the Institutional Class.
For the period January 1, 2018 through April 29, 2018, MAM contractually agreed to reduce its investment advisory fee for Moderate to 0.60%. For the year ended December 31, 2018, MAM contractually agreed to reimburse management fees or other fund expenses for Moderate sufficient to limit total annual ordinary fund operating expenses (excluding interest, taxes, brokerage commissions, acquired fund fees and expenses, and extraordinary items) as a percentage of daily assets to 1.42% for the Retail Class, 1.22% for the Adviser Class and 1.02% for the Institutional Class. During the year ended December 31, 2018, $63,223 of investment advisory fees were waived in Moderate.
For the period January 1, 2018 through April 29, 2018, MAM contractually agreed to reduce its investment advisory fee for Conservative to 0.50%. For the year ended December 31, 2018, MAM contractually agreed to reimburse management fees or other fund expenses sufficient to limit total annual ordinary fund operating expenses (excluding interest, taxes, brokerage commissions, acquired fund fees and expenses, and extraordinary items) as a percentage of daily assets to 1.32% for the Retail Class, 1.12% for the Adviser Class and 0.92% for the Institutional Class. During the year ended December 31, 2018, $125,099 of investment advisory fees were waived in Conservative.
MAM contractually agreed to reduce its investment advisory fee by 0.10% for Dynamic for average daily net assets up to $200 million. During the year ended December 31, 2018, $151,397 of investment advisory fees were waived in Dynamic.
For the period January 1, 2018 through April 29, 2018, MAM contractually agreed to reduce its investment advisory fee by 0.25% for Quantex for average daily net assets up to $50 million. During the year ended December 31, 2018, $40,753 of investment advisory fees were waived in Quantex.
MAM contractually agreed to reduce its investment advisory fee by 0.11% for Bond for average daily net assets up to $100 million. During the year ended December 31, 2018, $79,133 of investment advisory fees were waived in Bond.
2018 Annual Report | December 31, 2018 | Page 145 |
For the period January 1, 2018 through April 30, 2018, MAM contractually agreed to reduce and/or reimburse expenses for Institutional Prime Money Market to the extent necessary to limit the total operating expenses of the Fund (excluding interest, taxes, brokerage commissions, acquired fund fees and expenses, and extraordinary items) to no more than 0.60% of average daily net assets. During the year ended December 31, 2018, no investment advisory fees were contractually waived and no expenses were contractually reimbursed in Institutional Prime Money Market.
Mutual Funds Service Co. (“MFSCo”), a wholly-owned subsidiary of Meeder, serves as stock transfer, dividend disbursing and shareholder services agent for each Fund. In compensation for such services, each Fund pays MFSCo an annual fee equal to the greater of the following:
| | | Minimum Fee | | | Percentage of Average
Daily Net Assets | |
Muirfield | | $ | 4,000 | | | | 0.12 | % |
Spectrum | | | 4,000 | | | | 0.12 | % |
Global | | | 4,000 | | | | 0.12 | % |
Balanced | | | 4,000 | | | | 0.12 | % |
Moderate | | | 4,000 | | | | 0.12 | % |
Conservative | | | 4,000 | | | | 0.12 | % |
Dynamic | | | 4,000 | | | | 0.12 | % |
Quantex | | | 4,000 | | | | 0.12 | % |
Bond | | | 4,000 | | | | 0.08 | % |
Prime Money Market | | | 4,000 | | | | 0.08 | % |
Institutional Prime Money Market | | | 4,000 | | | | 0.08 | % |
For fixed income Funds (Bond, Prime Money Market, and Institutional Prime Money Market) that are subject to an expense cap and which are above the expense cap, the basis point fee is reduced by 0.02%. Management may voluntarily waive fees for any Fund. During the year ended December 31, 2018, MFSCo waived the following transfer agent fees:
| | | Voluntary Transfer
Agent Fees
Reimbursements | | | Impact of Voluntary
Transfer Agent Fees
Reimbursements to
Average Net Assets
- Retail Class | | | Impact of Voluntary
Transfer Agent Fees
Reimbursements to
Average Net Assets
- Adviser Class | | | Impact of Voluntary
Transfer Agent Fees
Reimbursements to
Average Net Assets
- Institutional Class | | | Impact of Voluntary
Transfer Agent Fees
Reimbursements to
Average Net Assets
- Money Market
Funds | |
Muirfield | | $ | 251,485 | | | | N/A | | | | 0.07 | % | | | 0.08 | % | | | N/A | |
Spectrum | | | — | | | | N/A | | | | N/A | | | | N/A | | | | N/A | |
Global | | | — | | | | N/A | | | | N/A | | | | N/A | | | | N/A | |
Balanced | | | 78,213 | | | | N/A | | | | 0.02 | % | | | 0.03 | % | | | N/A | |
Moderate | | | — | | | | N/A | | | | N/A | | | | N/A | | | | N/A | |
Conservative | | | 4,699 | | | | N/A | | | | N/A | | | | 0.01 | % | | | N/A | |
Dynamic | | | — | | | | N/A | | | | N/A | | | | N/A | | | | N/A | |
Quantex | | | — | | | | N/A | | | | N/A | | | | N/A | | | | N/A | |
Bond | | | — | | | | N/A | | | | N/A | | | | N/A | | | | N/A | |
Prime Money Market | | | 7,060 | | | | N/A | | | | N/A | | | | N/A | | | | 0.02 | % |
Institutional Prime Money Market | | | 75,557 | | | | N/A | | | | N/A | | | | N/A | | | | 0.02 | % |
Page 146 | 2018 Annual Report | December 31, 2018 |
MFSCo provides the Trust with certain administrative services. In compensation for such services, each Fund pays MFSCo at the following annual rates:
| | Percentage of Average
Daily Net Assets up to
$50 Million | Percentage of Average
Daily Net Assets
Exceeding $50 Million |
Muirfield | 0.10% | 0.08% |
Spectrum | 0.10% | 0.08% |
Global | 0.10% | 0.08% |
Balanced | 0.10% | 0.08% |
Moderate | 0.10% | 0.08% |
Conservative | 0.10% | 0.08% |
Dynamic | 0.10% | 0.08% |
Quantex | 0.10% | 0.08% |
Bond | 0.10% | 0.08% |
Prime Money Market | 0.10% | 0.08% |
Institutional Prime Money Market | 0.10% | 0.08% |
MFSCo serves as accounting services agent for each Fund. In compensation for such services, each Fund pays MFSCo an annual fee equal to the greater of a minimum fee or at a rate based on the percentage of average daily net assets. The annual rates are as follows:
| | | Minimum Fee | | | Percentage of
Average Daily Net
Assets up to $10
Million | | | Percentage of
Average Daily Net
Assets Exceeding
$10 Million up to
$30 Million | | | Percentage of
Average Daily Net
Assets Exceeding
$30 Million up to
$80 Million | | | Percentage of
Average Daily Net
Assets Exceeding
$80 Million | |
Muirfield | | $ | 7,500 | | | | 0.15 | % | | | 0.10 | % | | | 0.02 | % | | | 0.01 | % |
Spectrum | | | 7,500 | | | | 0.15 | % | | | 0.10 | % | | | 0.02 | % | | | 0.01 | % |
Global | | | 7,500 | | | | 0.15 | % | | | 0.10 | % | | | 0.02 | % | | | 0.01 | % |
Balanced | | | 7,500 | | | | 0.15 | % | | | 0.10 | % | | | 0.02 | % | | | 0.01 | % |
Moderate | | | 7,500 | | | | 0.15 | % | | | 0.10 | % | | | 0.02 | % | | | 0.01 | % |
Conservative | | | 7,500 | | | | 0.15 | % | | | 0.10 | % | | | 0.02 | % | | | 0.01 | % |
Dynamic | | | 7,500 | | | | 0.15 | % | | | 0.10 | % | | | 0.02 | % | | | 0.01 | % |
Quantex | | | 7,500 | | | | 0.15 | % | | | 0.10 | % | | | 0.02 | % | | | 0.01 | % |
Bond | | | 7,500 | | | | 0.15 | % | | | 0.10 | % | | | 0.02 | % | | | 0.01 | % |
Prime Money Market | | | 30,000 | | | | 0.15 | % | | | 0.10 | % | | | 0.02 | % | | | 0.01 | % |
Institutional Prime Money Market | | | 30,000 | | | | 0.15 | % | | | 0.10 | % | | | 0.02 | % | | | 0.01 | % |
For the year ended December 31, 2018, MAM and MFSCo agreed to voluntarily waive and/or reimburse investment advisory fees and/or transfer agent fees, respectively. The cumulative amounts voluntarily waived and/or reimbursed and the impact to the net expense ratio (excluding brokerage fees and commissions, taxes, interest, and extraordinary or non-recurring expenses) for each Fund are as follows:
| | | Voluntary Expense
Reimbursements | | | Impact of Voluntary
Waivers to Average
Net Assets | | | Impact of Voluntary
Waivers to Average
Net Assets - Retail
Class | | | Impact of Voluntary
Waivers to Average
Net Assets -
Adviser Class | | | Impact of Voluntary
Waivers to Average
Net Assets -
Institutional Class | |
Muirfield | | $ | 251,485 | | | | N/A | | | | 0.07 | % | | | 0.08 | % | | | N/A | |
Spectrum | | | — | | | | N/A | | | | N/A | | | | N/A | | | | N/A | |
Global | | | — | | | | N/A | | | | N/A | | | | N/A | | | | N/A | |
Balanced | | | 78,213 | | | | N/A | | | | 0.02 | % | | | 0.03 | % | | | N/A | |
Moderate | | | 3,079 | | | | N/A | | | | 0.01 | % | | | 0.01 | % | | | 0.01 | % |
Conservative | | | 10,378 | | | | N/A | | | | 0.01 | % | | | 0.01 | % | | | 0.02 | % |
Dynamic | | | — | | | | N/A | | | | N/A | | | | N/A | | | | N/A | |
Quantex | | | — | | | | N/A | | | | N/A | | | | N/A | | | | N/A | |
Bond | | | — | | | | N/A | | | | N/A | | | | N/A | | | | N/A | |
Prime Money Market | | | 174,963 | | | | 0.50 | % | | | N/A | | | | N/A | | | | N/A | |
Institutional Prime Money Market | | | 1,332,721 | | | | 0.35 | % | | | N/A | | | | N/A | | | | N/A | |
2018 Annual Report | December 31, 2018 | Page 147 |
Certain Funds have entered into securities lending arrangements with Huntington National Bank (“HNB”). Under the terms of the agreement, HNB is authorized to loan securities on behalf of the Funds to approved brokers. In exchange, under normal market conditions, the Funds receive cash collateral in the amount of at least 102% of the value of securities loaned. The cash collateral is invested in short-term instruments as noted in the Schedules of Investments. Although risk is mitigated by the collateral, the Funds could experience a delay in recovering their securities and possible loss of income or value if the borrower fails to return the borrowed securities. In addition, the Funds bear the risk of loss associated with the investment of cash collateral received. After predetermined rebates to brokers, a percentage of the net securities lending revenue is credited to the Funds to be used as an offset against charges incurred by the Funds. HNB is paid a fee for administering the securities lending program for the Funds, equal to the remaining percentage of the net securities lending revenues generated under the agreement. As of December 31, 2018, Muirfield, Spectrum, Global, Balanced, Conservative, Dynamic, and Quantex had loaned securities that were collateralized by cash. The cash collateral received was invested in securities as listed in each Fund’s Schedule of Investments. For the year ended December 31, 2018, income earned through securities lending arrangements was as follows:
| | | Amount Received
to Reduce Gross
Expenses | |
Muirfield | | $ | 5,489 | |
Spectrum | | | 1,690 | |
Global | | | 9,218 | |
Balanced | | | 92,173 | |
Moderate | | | 63,948 | |
Conservative | | | 77,616 | |
Dynamic | | | 25,432 | |
Quantex | | | 20,572 | |
Certain Funds have entered into directed brokerage arrangements with unaffiliated brokers whereby the brokers have agreed to pay a portion of the Funds’ operating expenses using part of the commissions generated by the Funds. All expenses paid with directed brokerage and commission recapture credits are shown in full on the Statements of Operations and the amount credited is shown as a reduction in total expenses. In the absence of the directed brokerage arrangement, the Funds could have invested some of the amounts paid for commissions to generate income or capital gain; however, the Funds would have paid more in expenses. The following table identifies each category of expense that was paid using directed brokerage and commission recapture credits and the total credits received by each Fund during the year ended December 31, 2018:
| | | Registration | | | Other | | | Custody | | | Audit | | | Insurance | | | Postage | | | Legal | | | Printing | | | Short
Dividend | | | Total
Credits
Received | |
Muirfield | | $ | 82,930 | | | $ | 31,072 | | | $ | 55,549 | | | $ | 15,560 | | | $ | 35,709 | | | $ | 23,114 | | | $ | 4,989 | | | $ | 18,101 | | | $ | — | | | $ | 267,024 | |
Spectrum | | | 62,768 | | | | 23,048 | | | | 17,443 | | | | 17,037 | | | | 10,886 | | | | 14,293 | | | | 5,017 | | | | 5,402 | | | | 133,150 | | | | 289,044 | |
Global | | | 53,133 | | | | — | | | | — | | | | — | | | | — | | | | — | | | | — | | | | — | | | | — | | | | 53,133 | |
Balanced | | | 64,746 | | | | 25,810 | | | | 34,111 | | | | 15,560 | | | | 19,822 | | | | 16,385 | | | | 4,991 | | | | 11,032 | | | | — | | | | 192,457 | |
Moderate | | | 58,333 | | | | 20,474 | | | | 14,675 | | | | 15,781 | | | | 6,900 | | | | 6,817 | | | | 5,008 | | | | 5,541 | | | | — | | | | 133,529 | |
Conservative | | | 58,860 | | | | 19,393 | | | | 12,364 | | | | 15,472 | | | | 4,205 | | | | 7,920 | | | | 1,730 | | | | — | | | | — | | | | 119,944 | |
Dynamic | | | 59,305 | | | | 23,000 | | | | 14,586 | | | | 15,560 | | | | 10,852 | | | | 7,751 | | | | 4,991 | | | | 5,160 | | | | — | | | | 141,205 | |
Quantex | | | 53,277 | | | | 21,581 | | | | 8,570 | | | | 13,103 | | | | 5,438 | | | | — | | | | — | | | | — | | | | — | | | | 101,969 | |
Bond | | | 56,188 | | | | — | | | | — | | | | — | | | | — | | | | — | | | | — | | | | — | | | | — | | | | 56,188 | |
Page 148 | 2018 Annual Report | December 31, 2018 |
The Funds have adopted a written plan pursuant to Rule 12b-1 of the 1940 Act that allows the Funds to pay fees for the sale and distribution of Fund shares and for services provided to Fund shareholders. 12b-1 fees are paid by the Funds to financial intermediaries, securities brokers, investment advisers, and other persons, including affiliates of MAM. The annual adopted 12b-1 plan maximum limitations, along with 12b-1 plan expense payments made to the Funds’ affiliated distributor for the year ended December 31, 2018, are as follows:
| | | Maximum
Annual 12b-1
Plan Expense as
a Percentage of
Average Daily
Net Assets | | | Maximum Annual
12b-1 Plan Expense
as a Percentage
of Average Daily
Net Assets - Retail
Class | | | Maximum Annual
12b-1 Plan Expense
as a Percentage of
Average Daily Net
Assets - Adviser
Class | | | Maximum Annual
12b-1 Plan Expense
as a Percentage
of Average Daily
Net Assets -
Institutional Class | | | 12b-1 Plan Expense
Payments Made
to Affiliates | |
Muirfield | | | N/A | | | | 0.20 | % | | | N/A | | | | N/A | | | $ | 41,848 | |
Spectrum | | | N/A | | | | 0.25 | % | | | N/A | | | | N/A | | | | 2,822 | |
Global | | | N/A | | | | 0.25 | % | | | N/A | | | | N/A | | | | 766 | |
Balanced | | | N/A | | | | 0.25 | % | | | N/A | | | | N/A | | | | 5,089 | |
Moderate | | | N/A | | | | 0.25 | % | | | N/A | | | | N/A | | | | 1,660 | |
Conservative | | | N/A | | | | 0.25 | % | | | N/A | | | | N/A | | | | 2,924 | |
Dynamic | | | N/A | | | | 0.25 | % | | | N/A | | | | N/A | | | | 6,989 | |
Quantex | | | N/A | | | | 0.20 | % | | | N/A | | | | N/A | | | | 18,193 | |
Bond | | | N/A | | | | 0.25 | % | | | N/A | | | | N/A | | | | 2,765 | |
Prime Money Market | | | 0.20 | % | | | N/A | | | | N/A | | | | N/A | | | | N/A | |
Institutional Prime Money Market | | | 0.20 | % | | | N/A | | | | N/A | | | | N/A | | | | N/A | |
The Funds (other than the Money Market Funds) have adopted a shareholder services plan that allows the Funds to pay financial intermediaries and other persons, including “platforms,” for providing shareholder and administrative services to Fund shareholders and maintaining shareholder accounts. The annual adopted shareholder services plan maximum limitations for the year ended December 31, 2018 are as follows:
| | Maximum Annual
Shareholder Services
Plan Expense as a
Percentage of Average
Daily Net Assets -
Retail Class | Maximum Annual
Shareholder Services
Plan Expense as a
Percentage of Average
Daily Net Assets -
Adviser Class | Maximum Annual
Shareholder Services
Plan Expense as a
Percentage of Average
Daily Net Assets -
Institutional Class |
Muirfield | 0.20% | 0.25% | 0.10% |
Spectrum | 0.20% | 0.25% | 0.10% |
Global | 0.20% | 0.25% | 0.10% |
Balanced | 0.20% | 0.25% | 0.10% |
Moderate | 0.20% | 0.25% | 0.10% |
Conservative | 0.20% | 0.25% | 0.10% |
Dynamic | 0.20% | 0.25% | 0.10% |
Quantex | 0.20% | 0.25% | 0.10% |
Bond | 0.20% | 0.25% | 0.10% |
The Funds have adopted a Deferred Compensation Plan (the “Plan”) for the independent Trustees. Under the Plan, each eligible Trustee is permitted to defer all or a portion of the trustees fees payable by any of the Funds as an investment into any combination of Funds until a specified point of time. The investment into the Funds is recorded as an asset however an offsetting liability is also recorded for the deferred payment. Amounts deferred under the Plan may be distributed in a lump sum or generally equal annual installments over a period of up to ten (10) years to the eligible Trustee(s). The Funds may terminate this Plan at any time.
Certain trustees and officers of the Funds are also officers or directors of Meeder, MAM, and MFSCo.
2018 Annual Report | December 31, 2018 | Page 149 |
During the year ended December 31, 2018, several of the Funds invested in the Institutional Prime Money Market Fund, an affiliate, as described in Section 2(a)(3) of the Investment Company Act of 1940. The purchases/sales amounts in the following table are presented on a gross basis, while the statement of changes in net assets shows subscriptions and redemptions into and out of the Fund on a net basis. The Funds’ investments in the Institutional Prime Money Market Fund, which had a 7-day yield of 2.43% on December 31, 2018, were as follows:
| | | 12/31/17
Fair Value | | | Purchases | | | Sales | | | Realized
Gains | | | 12/31/18
Cost | | | Change in
Unrealized | | | Income | | | 12/31/18
Fair Value | |
Muirfield | | $ | 151,740,645 | | | $ | 191,848,196 | | | $ | (140,465,024 | ) | | $ | (12,418 | ) | | $ | 203,130,824 | | | $ | 16,947 | | | $ | 3,068,451 | | | $ | 203,128,346 | |
Spectrum | | | 5,834,908 | | | | 83,958,772 | | | | (79,288,574 | ) | | | 4,136 | | | | 10,509,243 | | | | 1 | | | | 233,930 | | | | 10,509,243 | |
Global | | | 11,707,988 | | | | 46,460,647 | | | | (34,596,816 | ) | | | (836 | ) | | | 23,571,998 | | | | 1,826 | | | | 298,014 | | | | 23,572,809 | |
Balanced | | | 46,165,677 | | | | 124,191,218 | | | | (92,938,336 | ) | | | (180 | ) | | | 77,418,760 | | | | 2,255 | | | | 1,220,696 | | | | 77,420,634 | |
Moderate | | | 2,822,646 | | | | 106,981,784 | | | | (79,898,367 | ) | | | (346 | ) | | | 29,905,717 | | | | 1,754 | | | | 386,716 | | | | 29,907,471 | |
Conservative | | | 349,527 | | | | 88,239,442 | | | | (74,826,676 | ) | | | 263 | | | | 13,762,556 | | | | 226 | | | | 186,284 | | | | 13,762,782 | |
Dynamic | | | 21,160,222 | | | | 82,327,514 | * | | | (65,387,867 | ) | | | (4,159 | ) | | | 38,098,182 | | | | 3,180 | | | | 566,035 | | | | 38,098,890 | |
Quantex | | | 5,257,988 | | | | 52,672,992 | | | | (48,279,761 | ) | | | (786 | ) | | | 9,650,794 | | | | 361 | | | | 113,469 | | | | 9,650,794 | |
Bond | | | 5,927,638 | | | | 33,079,545 | | | | (36,135,553 | ) | | | (324 | ) | | | 2,871,423 | | | | 424 | | | | 67,440 | | | | 2,871,730 | |
* | Amount includes cost of $6,889,924 of position acquired as a result of merger (See Note #2). |
6. Federal Tax Information
The following information is computed on a tax basis for each item as of December 31, 2018:
| | | Tax Cost of
Portfolio
Investments | | | Gross Unrealized
Appreciation | | | Gross Unrealized
Depreciation | | | Net Unrealized
Appreciation/
Depreciation | |
Muirfield | | $ | 605,588,561 | | | $ | 22,246,883 | | | $ | (33,497,237 | ) | | $ | (11,250,354 | ) |
Spectrum | | | 107,932,925 | | | | 20,721,930 | | | | (16,416,886 | ) | | | 4,305,044 | |
Global | | | 58,721,526 | | | | 1,497,061 | | | | (1,994,889 | ) | | | (497,828 | ) |
Balanced | | | 348,257,843 | | | | 9,615,800 | | | | (16,209,699 | ) | | | (6,593,899 | ) |
Moderate | | | 164,431,099 | | | | 2,138,691 | | | | (6,700,075 | ) | | | (4,561,384 | ) |
Conservative | | | 132,072,070 | | | | 213,074 | | | | (4,103,510 | ) | | | (3,890,436 | ) |
Dynamic | | | 173,145,762 | | | | 6,766,446 | | | | (9,090,761 | ) | | | (2,324,315 | ) |
Quantex | | | 61,214,598 | | | | 7,208,733 | | | | (4,166,775 | ) | | | 3,041,958 | |
Bond | | | 68,122,743 | | | | 9,447 | | | | (1,100,345 | ) | | | (1,090,898 | ) |
Prime Money Market | | | 40,863,683 | | | | — | | | | — | | | | — | |
Institutional Prime Money Market | | | 472,023,169 | | | | 6,312 | | | | (60,953 | ) | | | (54,641 | ) |
The tax characteristics of dividends paid by the Funds during the year ended December 31, 2018 were as follows:
| | | Ordinary Income | | | Net Short-Term
Capital Gains | | | Net Long-Term
Capital Gains | | | Total Dividends
Paid* | |
Muirfield | | $ | 4,158,041 | | | $ | 1,999,996 | | | $ | 3,470,512 | | | $ | 9,628,549 | |
Spectrum | | | 525,534 | | | | — | | | | 2,147,422 | | | | 2,672,956 | |
Global | | | 547,173 | | | | 252,504 | | | | 2,206,115 | | | | 3,005,792 | |
Balanced | | | 3,879,662 | | | | 1,729,689 | | | | 81,230 | | | | 5,690,581 | |
Moderate | | | 2,437,338 | | | | 3,777,218 | | | | 1,204,467 | | | | 7,419,023 | |
Conservative | | | 2,595,679 | | | | — | | | | 2,210,813 | | | | 4,806,492 | |
Dynamic | | | 1,272,412 | | | | 536,466 | | | | 616,039 | | | | 2,424,917 | |
Quantex | | | 68,853 | | | | — | | | | — | | | | 68,853 | |
Bond | | | 1,575,699 | | | | — | | | | — | | | | 1,575,699 | |
Prime Money Market | | | 552,567 | | | | — | | | | — | | | | 552,567 | |
Institutional Prime Money Market | | | 6,751,720 | | | | — | | | | — | | | | 6,751,720 | |
Page 150 | 2018 Annual Report | December 31, 2018 |
The tax characteristics of dividends paid by the Funds during the year ended December 31, 2017 were as follows:
| | | Ordinary Income | | | Net Short-Term
Capital Gains | | | Net Long-Term
Capital Gains | | | Total Dividends
Paid* | |
| Muirfield | | $ | 2,259,367 | | | $ | 29,232,859 | | | $ | 3,732,513 | | | $ | 35,224,739 | |
| Spectrum | | | 198 | | | | 3,646,436 | | | | 5,562,130 | | | | 9,208,764 | |
| Global | | | 453,751 | | | | — | | | | 828,928 | | | | 1,282,679 | |
| Balanced | | | 2,145,554 | | | | 11,374,967 | | | | — | | | | 13,520,521 | |
| Moderate | | | 382,921 | | | | 1,907,148 | | | | 205,355 | | | | 2,495,424 | |
| Conservative | | | 336,521 | | | | — | | | | — | | | | 336,521 | |
| Dynamic | | | 928,733 | | | | 8,074,316 | | | | 1,393,140 | | | | 10,396,189 | |
| Quantex | | | 233,961 | | | | 2,013,070 | | | | 542,617 | | | | 2,789,648 | |
| Bond | | | 5,420,405 | | | | — | | | | — | | | | 5,420,405 | |
| Prime Money Market | | | 243,527 | | | | — | | | | — | | | | 243,527 | |
| Institutional Prime Money Market | | | 1,977,385 | | | | — | | | | — | | | | 1,977,385 | |
As of December 31, 2018, the components of Distributable Earnings (Accumulated Deficit) on a tax basis for the Funds were as follows:
| | | Undistributed
Ordinary Income | | | Undistributed
Capital Gain | | | Accumulated
Capital and Other
Gains and (Losses) | | | Unrealized
Appreciation/
(Depreciation)** | | | TotalDistributable
Earnings/
(Accumulated
Deficit) | |
Muirfield | | $ | — | | | $ | 15,318,351 | | | $ | (182,327 | ) | | $ | (11,250,354 | ) | | $ | 3,885,670 | |
Spectrum | | | 137,162 | | | | 1,931,973 | | | | (30,647 | ) | | | 4,305,044 | | | | 6,343,532 | |
Global | | | 279,432 | | | | 614,315 | | | | (82,548 | ) | | | (497,828 | ) | | | 313,371 | |
Balanced | | | 487,926 | | | | 2,818,368 | | | | (120,263 | ) | | | (6,593,899 | ) | | | (3,407,868 | ) |
Moderate | | | 86,224 | | | | — | | | | (1,158,504 | ) | | | (4,561,384 | ) | | | (5,633,664 | ) |
Conservative | | | 150,700 | | | | — | | | | (2,646,172 | ) | | | (3,890,436 | ) | | | (6,385,908 | ) |
Dynamic | | | — | | | | — | | | | (3,774,424 | ) | | | (2,324,315 | ) | | | (6,098,739 | ) |
Quantex | | | 83,104 | | | | — | | | | (322,852 | ) | | | 3,041,958 | | | | 2,802,210 | |
Bond | | | 16,262 | | | | — | | | | (12,192,386 | ) | | | (1,090,898 | ) | | | (13,267,022 | ) |
Institutional Prime Money Market | | | 2,198 | | | | — | | | | (5,420 | ) | | | (54,641 | ) | | | (57,863 | ) |
* | Total dividends paid may differ from the amount reported in the Statements of Changes in Net Assets because for tax purposes dividends are recognized when actually paid. Short-term capital gains distributions are taxed as ordinary income. |
** | The differences between book- and tax-basis unrealized appreciation/(depreciation) are attributable primarily to: wash sales and the realization for tax purposes of unrealized gains/(losses) on certain derivative instruments. |
For federal income tax purposes, the following Funds have capital loss carryforwards as of December 31, 2018, which are not subject to expiration and are available to offset future capital gains, if any. To the extent that these carryforwards are used to offset future capital gains, it is probable that the gains that are offset will not be distributed to shareholders:
| | | Short-Term
Capital Loss
Carryforward | | | Long-Term
Capital Loss
Carryforward | | | Capital Loss
Carryforward
Utilized | |
Moderate | | $ | 1,146,931 | | | $ | — | | | $ | — | |
Conservative | | | 2,597,623 | | | | — | | | | — | |
Quantex | | | — | | | | — | | | | 897,624 | |
Bond | | | 9,229,984 | | | | 2,906,185 | | | | — | |
Institutional Prime Money Market | | | 1,821 | | | | 1,504 | | | | — | |
Under the current tax law, capital losses realized after October 31 may be deferred and treated as occurring on the first day of the following fiscal year. As presented in the table below, the following Funds elected to defer capital losses for the fiscal year ended December 31, 2018:
| | | | Short-Term Post-
October Loss Deferral | | | Long-Term Post-
October Loss Deferral | | | Total Late Year
Loss Deferral | |
| | Dynamic | | | $ | 3,335,151 | | | $ | 279,928 | | | $ | 3,615,079 | |
| | Quantex | | | | 23,904 | | | | 251,058 | | | | 274,962 | |
2018 Annual Report | December 31, 2018 | Page 151 |
7. Control Ownership
The beneficial ownership, either directly or indirectly, of more than 25% of the voting securities of a fund creates a presumption of control of the fund under Section 2(a)(9) of the 1940 Act. As of December 31, 2018, beneficial owners that held more than 25% of the voting securities of the Funds and may be deemed to control the Funds are as follows:
Fund | Beneficial Owner | Percent of Voting
Securities |
Institutional Prime Money Market | Meeder Muirfield Fund | 43% |
8. Contingencies and Commitments
The Funds indemnify the Trust’s officers and Trustees for certain liabilities that might arise from their performance of their duties to the Funds. Additionally, in the normal course of business the Funds enter into contracts that contain a variety of representations and warranties and which provide general indemnifications. The Funds’ maximum exposure under these arrangements is unknown, as this would involve future claims that may be made against the Funds that have not yet occurred. However, based on experience, the Funds expect the risk of loss to be remote.
9. Recent Accounting Pronouncement
In August 2018, the SEC adopted amendments to certain financial statement disclosure requirements to conform them to GAAP for investment companies. These amendments made certain disclosure requirements effective under Regulation S-X. The Funds’ adoption of these amendments, effective with the financial statements prepared as of December 31, 2018, had no effect on the Funds’ net assets or results of operations. As a result of adopting these amendments, the distributions to shareholders in the December 31, 2017 Statements of Changes in Net Assets presented herein have been reclassified to conform to the current year presentation, which includes all distributions to each class of shareholders, other than tax basis return of capital distributions, in one line item per share class. Distributions to shareholders for the year ended December 31, 2017 from net investment income and net realized gains in the Funds were as follows:
| | | Distributions to Shareholders from Net Investment Income - Retail Class | | | Distributions to Shareholders from Net Investment Income - Adviser Class | | | Distributions to Shareholders from Net Investment Income - Institutional Class | | | Distributions to Shareholders from Net Investment Income - Money Market Funds | | | Distributions to Shareholders from Net Realized Gains - Retail Class | | | Distributions to Shareholders from Net Realized Gains - Adviser Class | | | Distributions to Shareholders from Net Realized Gains - Institutional Class | | | Accumulated Undistributed (Distributions in Excess of) Net Investment Income | |
| Muirfield | | $ | (1,373,870 | ) | | $ | (125,710 | ) | | $ | (800,089 | ) | | $ | — | | | $ | (18,095,918 | ) | | $ | (2,688,959 | ) | | $ | (12,180,495 | ) | | $ | (141,039 | ) |
| Spectrum | | | — | | | | — | | | | — | | | | — | | | | (3,769,641 | ) | | | (802,354 | ) | | | (4,636,571 | ) | | | (12,572 | ) |
| Global | | | (102,129 | ) | | | (7,418 | ) | | | (344,681 | ) | | | — | | | | (396,993 | ) | | | (11,523 | ) | | | (420,412 | ) | | | (52,959 | ) |
| Balanced | | | (1,150,685 | ) | | | (68,028 | ) | | | (932,696 | ) | | | — | | | | (4,750,204 | ) | | | (570,082 | ) | | | (6,054,681 | ) | | | (97,184 | ) |
| Moderate | | | (152,200 | ) | | | (14,920 | ) | | | (226,553 | ) | | | — | | | | (849,212 | ) | | | (118,465 | ) | | | (1,134,939 | ) | | | (5,079 | ) |
| Conservative | | | (223,576 | ) | | | (6,728 | ) | | | (112,007 | ) | | | — | | | | — | | | | — | | | | — | | | | (10,056 | ) |
| Dynamic | | | (385,009 | ) | | | (46,717 | ) | | | (499,738 | ) | | | — | | | | (3,679,737 | ) | | | (735,907 | ) | | | (5,051,812 | ) | | | (87,708 | ) |
| Quantex | | | (99,127 | ) | | | (6,183 | ) | | | (156,324 | ) | | | — | | | | (1,617,757 | ) | | | (54,620 | ) | | | (857,186 | ) | | | 3,453 | |
| Bond | | | (3,220,595 | ) | | | (147,366 | ) | | | (2,053,634 | ) | | | — | | | | — | | | | — | | | | — | | | | (50,555 | ) |
| Prime Money Market | | | — | | | | — | | | | — | | | | (243,470 | ) | | | — | | | | — | | | | — | | | | — | |
| Institutional Prime Money Market | | | — | | | | — | | | | — | | | | (2,173,717 | ) | | | — | | | | — | | | | — | | | | 105 | |
In August 2018, FASB issued ASU 2018-13, Fair Value Measurement (Topic 820): Disclosure Framework – Changes to the Disclosure Requirements for Fair Value Measurement (“ASU 2018-13”). The primary focus of ASU 2018-13 is to improve the effectiveness of the disclosure requirements for fair value measurements. The changes affect all companies that are required to include fair value measurement disclosures. In general, the amendments in ASU 2018-13 are effective for all entities for fiscal years and interim periods within those fiscal years, beginning after December 15, 2019. An entity is permitted to early adopt the removed or modified disclosures upon the issuance of ASU 2018-13 and may delay adoption of the additional disclosures, which are required for public companies only, until their effective date. Management is currently evaluating the impact these changes will have on the Funds’ financial statements and disclosures.
10. Subsequent Events
Management evaluated subsequent events through the date these financial statements were issued and concluded no subsequent events required recognition or disclosure in these financial statements.
Page 152 | 2018 Annual Report | December 31, 2018 |
Report of Independent Registered Public Accounting Firm
To the Shareholders and Board of Trustees of
Meeder Funds
Opinion on the Financial Statements
We have audited the accompanying statements of assets and liabilities, including the schedules of investments, of Meeder Funds, comprising Muirfield Fund, Spectrum Fund, Global Allocation Fund, Balanced Fund, Moderate Allocation Fund, Conservative Allocation Fund, Dynamic Allocation Fund, Quantex Fund, Total Return Bond Fund, Prime Money Market Fund, and Institutional Prime Money Market Fund (the “Funds”) as of December 31, 2018, and the related statements of operations for the year then ended, the statements of changes in net assets, including the related notes, and the financial highlights for each of the periods presented (collectively referred to as the “financial statements”). In our opinion, the financial statements present fairly, in all material respects, the financial position of each of the Funds as of December 31, 2018, the results of their operations, the changes in their net assets, and the financial highlights for each of the periods presented, in conformity with accounting principles generally accepted in the United States of America.
Basis for Opinion
These financial statements are the responsibility of the Funds’ management. Our responsibility is to express an opinion on the Funds’ financial statements based on our audits. We are a public accounting firm registered with the Public Company Accounting Oversight Board (United States) (“PCAOB”) and are required to be independent with respect to the Funds in accordance with the U.S. federal securities laws and the applicable rules and regulations of the Securities and Exchange Commission and the PCAOB.
We conducted our audits in accordance with the standards of the PCAOB. Those standards require that we plan and perform the audit to obtain reasonable assurance about whether the financial statements are free of material misstatement, whether due to error or fraud.
Our audits included performing procedures to assess the risks of material misstatement of the financial statements, whether due to error or fraud, and performing procedures that respond to those risks. Such procedures included examining, on a test basis, evidence regarding the amounts and disclosures in the financial statements. Our procedures included confirmation of securities owned as of December 31, 2018, by correspondence with the custodian and brokers. Our audits also included evaluating the accounting principles used and significant estimates made by management, as well as evaluating the overall presentation of the financial statements. We believe that our audits provide a reasonable basis for our opinion.
We have served as the Funds’ auditor since 2004.
COHEN & COMPANY, LTD.
Cleveland, Ohio
February 26, 2019
2018 Annual Report | December 31, 2018 | Page 153 |
Trustees and Officers (unaudited)
Certain trustees and officers of the Funds are also officers or directors of Meeder, MAM, and MFSCo. The Trustees oversee the management of the Trust and elect its officers. The officers are responsible for the Funds’ day-to-day operations. The Trustees’ and officers’ names, addresses, years of birth, positions held with the Trust, and length of service with the Meeder Funds, are listed below. Also included is each Board member’s principal occupation during, at least, the past five years. Except as indicated, each individual has held the office shown or other offices in the same company for the last five years. Those Trustees who are “interested persons”, as defined in the 1940 Act, by virtue of their affiliation with the Trust, are indicated by an asterisk (*).
Name, Address1,
and Year of Birth | Year First Elected a
Trustee or Officer of
the Trust | Position and Number
of Funds Overseen2 | Principal Occupation During
Past Five Years and Other
Directorships Held |
Robert S. Meeder, Jr.*
Year of Birth: 1961 | 1992 | Trustee and President | President, Meeder Investment Management, Inc. |
Stuart M. Allen**
Year of Birth: 1961 | 2006 | Trustee | President of Gardiner Allen DeRoberts Insurance LLC, an insurance agency. |
Anthony V. D’Angelo**
Year of Birth: 1959 | 2006 | Trustee | General Manager, WSYX ABC 6 /WTTE-TV Fox 28 /WWHO television stations, Columbus, Ohio, operated by Sinclair Broadcast Group (2014 – present); Director of Sales (2004 – 2014); Lead Trustee of the Trust. |
Jeffrey R. Provence**
Year of Birth: 1969 | 2017 | Trustee | CEO, Premier Fund Solutions, Inc. (2001 – present); General Partner & Portfolio Manager, Value Trend Capital Management, L.P. (1995 – present); Director, Blue Chip Investor Funds; Director, PFS Funds; Chairman of the Trust’s Audit Committee. |
Dale W. Smith
Year of Birth: 1959 | 2006 | Vice President | Co-Chief Investment Officer, Meeder Investment Management, Inc. (2006-present); Chief Financial Officer, Meeder Asset Management, Inc. (2005 - 2017). |
Douglas R. Jennings
Year of Birth: 1962 | 2017 | Chief Compliance Officer | Chief Compliance Officer, Meeder Investment Management, Inc. (2016 – present); Assistant General Counsel; Partner, Carlile Patchen & Murphy, LLP (2010 – 2016). |
Bruce E. McKibben
Year of Birth: 1969 | 2002 | Treasurer | Director of Fund Accounting, Mutual Funds Service Co. (1997 – present). |
Alaina Salonsky
Year of Birth: 1967 | 2017 | Secretary | Compliance Specialist, Meeder Investment Management, Inc. (2017 – present); Teacher, Big Walnut School District, Sunbury, Ohio (2013 – 2017). |
1 | The address of each Trustee is 6125 Memorial Drive, Dublin, OH 43017. |
2 | Each Trustee serves for an indefinite term, until his or her resignation, death, or removal. Each Trustee oversees all eleven Funds in the Trust. |
* | Robert S. Meeder, Jr. is deemed an “interested person” of the Trust by virtue of his position as President of Meeder Asset Management, Inc., the Adviser of the Trust. |
** | Each independent Trustee is a member of the Trust’s Audit Committee, Compensation Committee, and Nominating Committee. |
The Statement of Additional Information includes additional information about each Trustee and is available without charge. To obtain a copy of the Statement of Additional Information, please contact your financial representative or call toll free 1-800-325-3539.
Page 154 | 2018 Annual Report | December 31, 2018 |
Board Review and Approval of Investment Advisory Agreement (unaudited)
At a meeting held September 13, 2018, the Board of Trustees (“Board”), including a majority of its Independent Trustees, met in person to consider the renewal of the investment advisory agreement (“Agreement”) between the Trust and Meeder Asset Management, Inc. (“Adviser”).
Approval Process.Pursuant to the Investment Company Act of 1940 (“1940 Act”), the Board is required to consider the continuation of the Trusts’ investment advisory agreement on an annual basis. Prior to the meeting, the Board reviewed materials sent to each Trustee in advance of the meeting in response to the Funds’ independent legal counsel’s written request pursuant to Section 15(c) of the 1940 Act for the provision to the Trustees of appropriately updated and amended information necessary or appropriate to assist the Trustees in their deliberations concerning renewal of the Agreement between the Adviser and each of the Funds. In reaching the decision to renew the Agreement, the Board also took into account information furnished throughout the year at regular Board meetings. Information furnished and discussed throughout the year included investment performance reports and related financial information for the Funds, as well as periodic reports on shareholder services, legal compliance, pricing, brokerage commissions, execution and other services provided by the Adviser and its affiliates.
Information furnished specifically in connection with the renewal process included a report for the Funds prepared by Broadridge Financial Solutions, Ltd. (“Broadridge”), an independent organization, as well as the Funds’ profitability analysis prepared by the Adviser. The Broadridge report compared each Fund’s advisory fees and expenses with those of other mutual funds deemed comparable to the Fund. The Funds’ profitability analysis discussed the profitability to the Adviser and Mutual Funds Service Co., an affiliate of the Adviser, from the overall Funds’ operations, as well as an analysis based on the profitability resulting from the operation of each individual Fund, utilizing expense allocation methodologies deemed reasonable by the Adviser.
In considering such materials, the Independent Trustees also received assistance and advice from and met separately with the Funds’ independent legal counsel and the chief compliance officer prior to the meeting. In their deliberations, the Board considered the terms of the existing Agreement between the Funds and the Adviser. While attention was given to all of the information furnished, the Board made the following specific findings in connection with its decision to renew the Agreement:
Nature, Extent and Quality of Services.The Board considered the nature, extent and quality of the services provided by the Adviser and its affiliates, including the reputation, qualifications, experience and capabilities of the personnel performing these services. The Board considered the qualifications of the investment management team and the resources committed to maintaining and improving the Adviser’s quantitative models. The Board noted that the Adviser and its affiliates provide a series of additional administrative services for the Funds, including fund accounting, transfer agency and compliance services, and recognized the continuing expenditures made to support and improve the scope of those services. Consideration was also given to the Adviser’s compliance resources and policies, including the periodic reporting provided to the Board. In making its judgment, the Board also considered the Adviser’s continual management of investment, operational, enterprise, legal and regulatory risk as it relates to the Funds as well as the manner in which the Adviser addressed new regulatory burdens that became effective during the preceding year. The Board concluded that the nature, extent and quality of the services provided by the Adviser have benefited and should continue to benefit each Fund and its shareholders.
Investment Performance.The Board placed emphasis on the investment performance of each Fund in view of its importance to shareholders. While consideration was given to performance reports and discussions with portfolio managers at Board meetings during the year, particular attention in assessing performance was given to the Broadridge reports furnished for the Agreement renewal. The Broadridge report prepared for each Fund showed the investment performance of the Fund for the one-, three-, five-, and ten-year periods, as applicable, ended June 30, 2018 in comparison with the performance of a peer group of funds with investment objectives similar to that of each Fund. The Board evaluated performance in light of the investment strategy pursued by the Adviser, measures of investment risk, and steps taken by the Adviser to mitigate risk through active management of the portfolio. The Board was generally satisfied with the performance of the Funds over the period reviewed. All of the Funds but one fell within the top half of their peer group during the preceding year. While the Total Return Bond Fund underperformed its peer group for the period, the Board noted the Adviser’s diligent efforts to improve performance of this fund through review of its quantitative models and consideration of other mechanisms to improve performance or lower costs. The Board considered the Adviser’s responsiveness with respect to performance and was satisfied with efforts undertaken by the Adviser to address these issues. The Board concluded that the Funds’ investment results have been satisfactory for renewal of the Agreement and that the Adviser’s record in managing the Funds indicated that its continued management should benefit the Funds and their shareholders.
Costs of Services.Consideration was given to a comparative analysis of the advisory fees and expense ratios of each Fund compared with those of a group of other relevant funds. The Board observed that the Funds’ advisory fees and expenses were within the range of those of other similar funds included in the comparable reports. The Board also considered an analysis comparing the Funds’ advisory fees with the fees charged by the Adviser to private clients, but noted the significant investment, operational, regulatory, and market differences between advising the Funds and advising private clients. The Board was satisfied with the Adviser’s continued efforts to reduce fees and expenses, including newly adopted reductions of the advisory fee charged to several of the Funds, advisory fee limitation agreements, and voluntary reimbursements of advisory fees charged or expenses incurred. The Board also noted that the Adviser has taken steps to merge one of the funds having the highest expense ratios with a larger similarly managed fund that has a lower expense ratio. The Board concluded that the Funds’ cost structures were fair and reasonable in relation to the services provided, and that the Funds’ shareholders receive reasonable value in return for the advisory fees and other amounts paid to the Adviser by the Funds.
2018 Annual Report | December 31, 2018 | Page 155 |
Management Profitability.The Board also considered the level of profits realized by the Adviser and its affiliates in connection with the operation of the Funds. In this respect, the Board reviewed the Funds’ profitability analysis that addresses the overall profitability of the Meeder Funds’ business as well as the profitability resulting from the operation of each Fund. The Board also took into account management’s expenditures in improving shareholder services provided to the Funds, as well as the need to meet additional regulatory and compliance requirements resulting from recent SEC requirements. The Board determined that the level of profits realized by the Adviser under its Agreement with the Funds was not excessive in view of the nature, quality and extent of services provided.
Economies of Scale.The Board also considered whether economies of scale are realized as the Funds grow larger and the extent to which this is reflected in the level of advisory fees charged. While recognizing that any precise determination is inherently subjective, the Board noted that economies of scale may develop for certain Funds as their assets increase and their Fund level expenses decline as a percentage of assets. The Board also considered whether the advisory fee rate is reasonable in relation to the asset size of each Fund and any economies of scale that may exist. The Board acknowledged that the advisory fee structure for each Fund is reasonable and in most instances is tiered by assets under management, allowing the shareholders to benefit from economies of scale as the Funds grow in size. The Board expressed continued satisfaction with each Fund’s fee structure under its Agreement.
Ancillary Benefits.The Board also considered ancillary benefits received by the Adviser as a result of its relationship with the Trust, including its access to research that benefits other clients and the service of its affiliates as transfer agent, administrator and distributor for the Funds. The fees for these services were considered separately in the profitability analysis and the Board considered the revenue and expenses incurred by the Adviser and its affiliates in providing these services. The Board also considered the benefits derived by the Adviser from soft dollar arrangements, noting that these arrangements are subject to regular reporting and oversight. The Board took the ancillary benefits into account in evaluating the reasonableness of the advisory fees and other amounts paid to the Adviser by the Funds.
Conclusion. Based upon the foregoing findings as well as all of the information provided by the Adviser, the Board, including a majority of its Independent Trustees, was satisfied that the terms of the Agreement, including the existing advisory fee structure, were fair and reasonable and in the best interest of the Funds and their shareholders. The Board, including a majority of its Independent Trustees, therefore approved the continuation of the Agreement effective for a one-year term ending September 30, 2019.
Other Information
The Funds file their complete schedules of portfolios holdings with the Securities and Exchange Commission (“SEC”) for the first and third quarters of each fiscal year on Form N-Q. In addition, Prime Money Market Fund and Institutional Prime Money Market Fund file their complete schedules of portfolio holdings with the SEC each month on Form N-MFP. The Funds’ Forms N-Q and N-MFP are available on the SEC’s website at http://www.sec.gov and may be reviewed and copied at the SEC’s Public Reference Room in Washington, DC. Information on the operation of the Public Reference Room may be obtained by calling 1-800-SEC-0330. The Funds’ schedules of positions are also available on the Funds’ website at www.meederfunds.com.
A description of the policies and procedures that the Funds use to determine how to vote proxies related to portfolio securities, and information regarding how the Funds voted these proxies for the 12-month period ended June 30, 2018, is available on the SEC’s website at http://www/sec.gov, or, without charge, upon request by calling toll-free 1-800-325-3539.
Page 156 | 2018 Annual Report | December 31, 2018 |

Privacy Policy
Meeder Investment Management and the Meeder Funds are committed to maintaining the financial privacy of our current, former and prospective customers. This policy explains how we protect the security and confidentiality of our customer’s information.
PERSONAL INFORMATION WE COLLECT
We may collect information about Meeder customers from a variety of sources, including:
| | ● | Information provided by you or your representative on applications or forms, such as your name, address, date of birth, social security number and investment objectives; |
| | ● | Information about the transactions in your account, such as your account balance and transaction history; and |
| | ● | Information we obtain from third parties regarding you, to verify your identity or transfer your account. |
INFORMATION WE SHARE WITH OUR AFFILIATES
Our affiliates are financial service providers that offer transfer agency, customer accounting, customer servicing, investment advisory, and other financial services. We share information with our affiliates to service your account. In addition, we may also share information with our affiliates to alert you to other products or services offered by Meeder to the extent provided by law. Information collected from customers whose accounts are opened through investment professionals is not shared with Meeder affiliates for marketing purposes.
INFORMATION WE SHARE WITH THIRD PARTIES
On occasion, we share information we collect about you with unaffiliated third parties to perform services in connection with your account, such as processing transactions, preparing and mailing account statements, and other forms of customer servicing. Information provided to third parties may not be used for any other purpose and Meeder does not permit unaffiliated third parties to use customer information to market their products or services.
HOW WE PROTECT INFORMATION ABOUT YOU
We maintain policies, and require all unaffiliated third parties to maintain policies, to safeguard customer information. We restrict access to nonpublic personal information about you to those persons who need to know that information in order to provide products and services to you. We also maintain physical, electronic, and procedural safeguards to guard your nonpublic personal information.
WHO THIS POLICY APPLIES TO
This policy applies to customers who open relationships directly with Meeder. It applies to Meeder Funds and Meeder’s affiliated companies, including Meeder Asset Management, Meeder Advisory Services, Meeder Public Funds, Adviser Dealer Services and Mutual Funds Service Company.
QUESTIONS
Contact us at 800-325-3539 or visit us online at www.meederinvestment.com
2018 Annual Report | December 31, 2018 | Page 157 |
[This page intentionally left blank]
[This page intentionally left blank]
[This page intentionally left blank]
Manager and Investment Adviser
Meeder Asset Management, Inc.
6125 Memorial Drive
P.O. Box 7177
Dublin, Ohio 43017
Board of Trustees
Stuart M. Allen
Anthony V. D’Angelo
Robert S. Meeder, Jr.
Jeffrey R. Provence
Custodian
The Huntington National Bank
Columbus, Ohio 43215
Transfer Agent & Dividend Disbursing Agent
Mutual Funds Service Co.
6125 Memorial Drive
Dublin, Ohio 43017
Distributor
Adviser Dealer Services, Inc.
6125 Memorial Drive
Dublin, Ohio 43017
Independent Registered Public Accounting Firm
Cohen & Company, Ltd.
1350 Euclid Ave., Suite 800
Cleveland, Ohio 44115

Item 2. Code of Ethics.
The registrant has adopted a code of ethics that applies to the registrant’s principal executive officer, principal financial officer, comptroller or principal accounting officer, and any person who performs a similar function. There were no amendments made to, or waivers granted from, the code of ethics during the fiscal year.
Item 3. Audit Committee Financial Expert.
The Board of Trustees of the Trust has determined that Jeffrey R. Provence is an audit committee financial expert, as defined in Item 3 of Form N-CSR. Mr. Provence is independent for purposes of Item 3 of Form N-CSR.
Item 4. Principal Accountant Fees and Services.
(a) – (d) Aggregate fees billed to the registrant for the last two fiscal years for professional services rendered by the registrant’s principal accountant were as follows:
| | | 2018 | | | 2017 | |
| Audit Fees | | $ | 128,500 | | | $ | 122,500 | |
| Audit-Related Fees | | | 300 | | | | 300 | |
| Tax Fees | | | 54,500 | | | | 64,500 | |
| All Other Fees | | | 2,200 | | | | 2,500 | |
Audit fees include amounts related to the audit of the registrant’s annual financial statements and services normally provided by the accountant in connection with statutory and regulatory filings. Audit-related fees include amounts reasonably related to the performance of the audit of the registrant’s financial statements, including, but not limited to, mileage, lodging, and meals. Tax fees include amounts related to tax compliance, tax planning, and tax advice, including the review and preparation of the Funds’ income tax returns, the review and preparation of the Funds’ excise tax returns, the review of supporting schedules and documentation provided by management, the review and recalculation of the Funds’ estimated distribution calculations, and the review of wash sales for reasonableness. All other fees include amounts related to the registrant’s annual filing of Form N1A.
(e)(1) A purpose of the Audit Committee is to approve the engagement of the registrant’s independent auditors (i) to render audit and non-audit services for the registrant in accordance with Rule 2-01(c)(7)(i) of Regulation S-X, subject to the waiver provisions set forth in Rule 2-01(c)(7)(i)(C) of Regulation S-X, and (ii) to render non-audit services for the registrant’s investment advisors (other than a sub-advisor whose role is primarily portfolio management and is subcontracted or overseen by another investment advisor) and any other entity controlling by, or under common control with the investment advisor that provides ongoing services to the registrant, in each case under (ii) if the engagement relates directly to the operations and financial reporting of the registrant, in accordance with Rule 2-01(c)(7)(ii) of Regulation S-X, subject to waiver provisions set forth in Rule 2-01(c)(7)(ii) of Regulation S-X.
(e)(2) 0% of services included in (b) – (d) above were approved pursuant to Rule 2-01(c)(7)(i)(C) of Regulation S-X.
(f) Not applicable.
(g) The aggregate fees billed for the most recent fiscal year and the preceding fiscal year by the registrant’s principal accountant for non-audit services rendered to the registrant, its investment advisor, and any entity controlling, controlled by, or under common control with the investment advisor that provides ongoing services to the registrant were $69,450 and $58,070 respectively.
(h) The registrant’s audit committee of the board of directors has considered whether the provision of non-audit services that were rendered to the registrant’s investment adviser (not including any sub-adviser whose role is primarily portfolio management and is subcontracted with or overseen by another investment adviser), and any entity controlling, controlled by, or under common control with the investment adviser that provides ongoing services to the registrant that were not pre-approved pursuant to paragraph (c)(7)(ii) of Rule 2-01 of Regulation S-X is compatible with maintaining the principal accountant’s independence.
Items 5. Audit Committee of Listed Registrants.
Not applicable.
Item 6. Schedule of Investments.
Not applicable.
Item 7. Disclosure of Proxy Voting Policies and Procedures for Closed-End Management Investment Companies.
Not applicable.
Item 8. Portfolio Managers of Closed-End Management Investment Companies.
Not applicable.
Item 9. Purchases of Equity Securities by Closed-End Management Investment Company and Affiliated Purchasers.
Not applicable.
Item 10. Submission of Matters to a Vote of Security Holders.
Not applicable.
Item 11. Controls and Procedures.
(a) Based on our evaluation conducted within 90 days of the filing date, hereof, the design and operation of the registrant's disclosure controls and procedures are effective to ensure that material information relating to the registrant is made known to the certifying officers by others within the appropriate entities, particularly during the period in which Forms N-CSR are being prepared, and the registrant's disclosure controls and procedures allow timely preparation and review of the information for the registrant's Form N-CSR and the officer certifications of such Form N-CSR.
(b) There were no significant changes in the registrant's internal controls or in other factors that could significantly affect these controls subsequent to the date of their evaluation, including any corrective actions with regard to significant deficiencies and material weaknesses.
Item 12. Disclosure of Securities Lending Activities for Closed-End Management Investment Companies.
Not applicable.
Item 13. Exhibits.
(a)(1) Code of Ethics filed herewith as EX-99.CODE ETH.
(a)(2) A separate certification for each principal executive and principal financial officer of the registrant as required by Rule 30a-2(a) under the Act(17 CFR270.30a-2(a)). Filed herewith as EX-99.CERT.
(b) Certifications of principal executive officer and principal financial officer, under Section 906 of the Sarbanes-Oxley Act of 2002, and 18 U.S.C. ss.1350. Filed herewith as EX-99.906 CERT.
SIGNATURES
Pursuant to the requirements of the Securities Exchange Act of 1934 and the Investment Company Act of 1940, the registrant has duly caused this report to be signed on its behalf by the undersigned, thereunto duly authorized.
| Meeder Funds | |
| | | |
| By: | /s/ Bruce E. McKibben | |
| | Bruce E. McKibben, Treasurer | |
| | | |
| Date: | March 6, 2019 | |
| | | |
| Pursuant to the requirements of the Securities Exchange Act of 1934 and the Investment Company Act of 1940, this report has been signed below by the following persons on behalf of the registrant and in the capacities and on the dates indicated. |
| | | |
| By: | /s/ Bruce E. McKibben | |
| | Bruce E. McKibben, Treasurer | |
| | | |
| Date: | March 6, 2019 | |
| | | |
| By: | /s/ Robert S. Meeder, Jr. | |
| | Robert S. Meeder, Jr., President | |
| | | |
| Date: | March 6, 2019 | |