UNITED STATES SECURITIES AND EXCHANGE COMMISSION
Washington, D.C. 20549
FORM N-CSR
CERTIFIED SHAREHOLDER REPORT
OF REGISTERED MANAGEMENT INVESTMENT COMPANIES
Investment Company Act file number 811-03462
Meeder Funds Trust
6125 Memorial Drive
Dublin, OH 43017
Bruce McKibben
c/o Meeder Funds Trust
6125 Memorial Drive
Dublin, OH 43017
Registrant’s telephone number, including area code: 800-325-3539
Date of fiscal year end: December 31, 2021
Date of reporting period: December 31, 2021
Item 1. Report to Stockholders.

TABLE OF CONTENTS
| | |
Letter to Shareholders | 1 |
Fund Summaries (Unaudited) | |
Muirfield Fund | 3 |
Spectrum Fund | 5 |
Global Allocation Fund | 7 |
Balanced Fund | 9 |
Moderate Allocation Fund | 11 |
Conservative Allocation Fund | 13 |
Dynamic Allocation Fund | 15 |
Quantex Fund | 17 |
Tactical Income Fund | 19 |
Institutional Prime Money Market Fund | 21 |
Financial Statements | |
Schedule of Investments | 24 |
Statements of Assets and Liabilities | 104 |
Statements of Operations | 106 |
Statements of Changes in Net Assets | 108 |
Financial Highlights | 112 |
Notes to Financial Statements | 122 |
Report of Independent Registered Public Accounting Firm | 140 |
Shareholder Expense Analysis | 141 |
Management of the Trust | 143 |
Other Items | 144 |
This Annual Report is prepared and distributed for the general information of the shareholders of the Funds. This material is not authorized for distribution to prospective investors unless preceded or accompanied by a prospectus. Investors are advised to consider carefully the investment objectives, risks, charges and expenses of the Fund before investing. The prospectus contains this and other information about the Funds.
Meeder Funds are distributed by Meeder Distribution Services, Inc. (Member FINRA), an affiliate of Meeder Investment Management. An affiliated registered investment adviser, Meeder Asset Management, Inc., serves as the investment adviser to Meeder Funds and is paid a fee for its services.
Letter to Shareholders December 31, 2021
A Historic Year of Transition for Investors
2021 was a year of transition for the global capital markets. While countries have moved away from widespread economic shutdowns, 2021 brought the highest inflation we have experienced in decades, upward pressure on interest rates, supply chain challenges, and lackluster labor participation. Despite these challenges, equities recorded above-average gains with little volatility—while only certain pockets of the bond market were able to avoid negative returns.
Inflation took center stage during the year, with the US Personal Consumption Expenditure (PCE) Index growing at a 7.4% YOY growth rate in December, its highest level since the early 1980s. A combination of massive fiscal-stimulated consumer demand, global supply chain issues, and labor shortages have all contributed to rising inflation.
The beginning of a new Federal Reserve (“the Fed”) tightening cycle is also nearing. While the Fed continued to taper during the fourth quarter, we expect the Fed to increase the federal funds rate shortly after the March FOMC meeting followed by two more rate increases during 2022. This should bring the central bank’s lending rate to just under 1% by the end of the year, with this monetary tightening cycle likely to continue well into 2024.
Our Investment Philosophy
At Meeder, we manage our funds using a systematic approach that guides us in our allocation decisions. A systematic, quantitative process allows for a repeatable and efficient method to achieve long-term appreciation while avoiding common emotional biases. We also apply a holistic approach to investing—analyzing fundamental, technical, macroeconomic, and sentiment factors.
Many of our funds utilize our time-tested Defensive Equity strategy, which follows a rules-based and data-driven approach, based on the Meeder Investment Positioning (IPS) model. This model is used to determine the reward relative to the risk of the stock market and identifies when a respective fund should be increasing or decreasing its equity allocation relative to other asset classes. In addition to our Defensive Equity strategy, we also provide active management for shareholders through global allocation, individual equity selection, and fixed income exposure.
While the degree in which each Meeder Fund utilizes these strategies can vary based on its respective investment strategy and objective, our commitment to providing an unemotional and systematic assessment of the market remains consistent across all our Funds.
Commitment to Improvement
One of the enduring goals throughout Meeder’s history has been to improve investor outcomes by helping investors remain committed to their investment strategy through a full market cycle. While most our Funds performed well in 2021 relative to their respective benchmarks, we want to highlight the notable longer-term performance of one of our oldest funds. Per the 10-year rankings as of December 31, 2021, the Muirfield Fund ranked in the top 3 percent of open-ended mutual funds among the 128 strategies ranked in the Tactical Allocation category, according to Morningstar. While focusing on short-term performance is never a winning strategy, we believe this performance is a validation of our investment process and our commitment to continuous improvement.
As we turn the corner to a new year, we maintain our commitment to continually improve our investment strategies, evolve our offerings, and always maintain a focus on serving our shareholders. Our investment team never stops looking for ways to improve our decision-making process.
With that said, investors enter 2022 with many concerns—including rising interest rates, inflation, uncertainty of future tax rates, and persistent COVID-19 cases. While there is never certainty when it comes to the future, we feel optimistic that our quantitative approach, based on thoughtful research and historical probabilities, will continue to provide a systematic assessment of the market as we navigate the new year.
Sincerely,

Robert S. Meeder
President & CEO
Meeder Asset Management, Inc.
2021 Annual Report | December 31, 2021 | Page 1 |
2021 Annual Report
Fund Summaries
Muirfield Fund
The Meeder Muirfield Fund Institutional Class returned 20.55% for the year ended December 31, 2021, compared to the Morningstar Moderate Target Risk Index benchmark return of 10.19%.
This fund uses our Defensive Equity strategy, which follows a rules-based and data-driven approach to using the Meeder Investment Positioning (IPS) model. This model is used to determine the reward relative to the risk of the stock market and identifies when a respective fund should be increasing or decreasing its equity allocation.
Muirfield achieved positive performance relative to its benchmark in 2021, primarily driven by the Defensive Equity Strategy and its overweight to equities throughout the year. The Defensive Equity Strategy remained 100% invested in equities for the majority of the first six months of 2021, a period of positive momentum for the asset class. During the second half of the year, the fund decreased its equity exposure, finishing the year 67% invested in equities. While the Defensive Equity Strategy maintained a defensive posture to end the year, relative to its benchmark, the strategy remained slightly overweight equities.
Our global equity allocation was a positive contributor to performance this year as well. The fund allocates to different regions of the global equity markets, including U.S., Developed International ex-US., and Emerging Markets. Within Muirfield’s equity allocation, it maintained an overweight to U.S. and an underweight to both Developed International ex-U.S. and Emerging Markets equities relative to its benchmark. Given the outperformance of U.S. equities compared to their international counterparts, the fund’s global equity allocation benefited performance.
The performance of our stock selection strategy was strong in 2021. Within the U.S. portion of Muirfield’s equity allocation, we use a proprietary equity selection model that selects stocks based on value, momentum, quality, stability, and sentiment factors. In general, we favor companies that display positive momentum relative to their peers, strong balance sheets, consistent earnings growth, along with attractive valuations and positive near-term sentiment. Our overweight to stocks displaying strong momentum and profitability were the two primary drivers of positive performance. From a sector perspective, the overweight to Information Technology and Healthcare sectors positively contributed to performance throughout the year, while the increase in allocation to Energy and Financial stocks in the second half of the year also generated positive returns.
The Fund often maintains significant holdings in a proprietary money market fund. We use equity index derivatives, such as stock index futures, to efficiently equitize these cash positions and manage the equity exposure of the portfolio. These derivatives are designed to track their respective market indexes. Investments in equity index derivatives were additive to performance over the past year.
Investment Objective
The investment objective of the Fund is to provide long-term capital appreciation.
Average Annual Total Returns
as of December 31, 2021
| 1
Year | 5
Year | 10
Year | Share Class
Inception
Date |
Muirfield Fund Retail Class | 20.20% | 10.54% | 10.49% | 8/10/88 |
Muirfield Fund Institutional Class | 20.55% | 10.93% | 10.70% | 10/31/16 |
Muirfield Fund Adviser Class | 20.61% | 10.83% | 10.65% | 10/31/16 |
Morningstar Moderate Target Risk Index | 10.19% | 10.07% | 8.75% | — |
Blended Index | 16.59% | 11.53% | 10.13% | — |
Top 10 Holdings
as of December 31, 2021
1. | Microsoft Corp. | 4.0% |
2. | Apple, Inc. | 3.1% |
3. | Amazon.com, Inc. | 1.9% |
4. | Alphabet, Inc. - Class C | 1.6% |
5. | Alphabet, Inc. - Class A | 1.4% |
6. | Tesla, Inc. | 1.3% |
7. | Meta Platforms, Inc. | 1.2% |
8. | Johnson & Johnson | 1.2% |
9. | NVIDIA Corp. | 1.1% |
10. | UnitedHealth Group, Inc. | 1.1% |
As a percentage of total net assets. Holdings exclude short-term investments and derivatives.
2021 Annual Report | December 31, 2021 | Page 3 |
Growth of $10,000
as of December 31, 2021
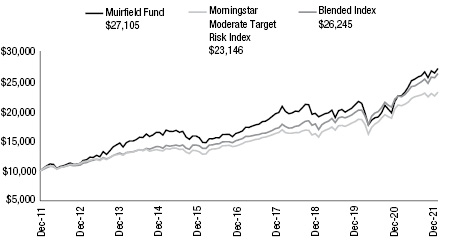
The Growth of $10,000 chart compares the performance of the Fund’s Retail Share Class over the period shown with dividends and capital gains reinvested to the Fund’s benchmarks. Benchmark indices are unmanaged and do not reflect the deduction of expenses associated with a mutual fund, such as investment management and accounting fees.
Investment performance assumes reinvestment of all dividend and capital gain distributions. The results do not reflect the effect of taxes a shareholder would pay on Fund distributions or on the redemption of Fund shares. Historical performance attributed to the Institutional and Adviser Share Classes prior to their inception dates is based on the performance of the Retail Share Class. No adjustment has been made to reflect class-specific distribution or servicing fees. Returns may reflect the effect of voluntary fee waivers or expense reimbursements over the period shown. Without these waivers, performance would have been lower.
The performance data shown represents past performance, which does not guarantee future results. The investment return and principal value of an investment will fluctuate so that an investor’s shares, when redeemed, may be worth more or less than their original cost. Current performance may be lower or higher than the performance data quoted. For current month-end performance data, please visit our website at www.meederfunds.com.
Sector Concentration
as of December 31, 2021
Information Technology | 29.5% |
Healthcare | 18.7% |
Financials | 11.9% |
Consumer Discretionary | 11.0% |
Communication Services | 8.8% |
Industrials | 6.5% |
Real Estate Investment Trust | 3.6% |
Energy | 3.6% |
Consumer Staples | 3.0% |
Utilities | 2.2% |
Materials | 1.2% |
Total | 100.0% |
As a percentage of total common stocks. Concentrations are subject to change.
Asset Allocation
as of December 31, 2021
Common Stocks (United States) | 66.9% |
Money Market Registered Investment Companies | 31.6% |
Bank Obligations | 0.1% |
Other Assets/Liabilities (Net) | 1.4% |
Total | 100.0% |
As a percentage of total net assets. The Fund has invested in stock index futures contracts in order to equitize cash balances it holds in a proprietary money market fund.
The Blended Index is comprised 60% of the S&P 500 Index and 40% of 90-day T-bills.
Page 4 | 2021 Annual Report | December 31, 2021 |
Spectrum Fund
The Meeder Spectrum Fund Institutional Class returned 20.98% for the year ended December 31, 2021, compared to the Morningstar Moderate Target Risk Index benchmark return of 10.19%.
This fund uses our Defensive Equity strategy, which follows a rules-based and data-driven approach to using the Meeder Investment Positioning (IPS) model. This model is used to determine the reward relative to the risk of the stock market and identifies when a respective fund should be increasing or decreasing its equity allocation. In addition, the fund also can use derivatives to allocate up to 130% to equities during extremely low risk periods.
The Meeder Spectrum Fund achieved positive performance relative to its benchmark in 2021, primarily driven by the Defensive Equity Strategy and its overweight to equities throughout the year. The Defensive Equity Strategy remained 100% invested in equities for the majority of the first six months of 2021, a period of positive momentum for the asset class. During the second half of the year, the fund decreased its equity exposure, finishing the year 67% invested in equities. While the Defensive Equity Strategy maintained a defensive posture to end the year, relative to its benchmark, the strategy remained slightly overweight equities.
Our global equity allocation was a positive contributor to performance this year as well. The fund allocates to different regions of the global equity markets, including U.S., Developed International ex-US., and Emerging Markets. Within Spectrum’s equity allocation, it maintained an overweight to U.S. and an underweight to both Developed International ex-U.S. and Emerging Markets equities relative to its benchmark. Given the outperformance of U.S. equities compared to their international counterparts, the fund’s global equity allocation benefited performance.
The performance of our stock selection strategy was also strong in 2021. Within the U.S. portion of Spectrum’s equity allocation, we use a proprietary equity selection model that selects stocks based on value, momentum, quality, stability, and sentiment factors. In general, we favor companies that display positive momentum relative to their peers, strong balance sheets, consistent earnings growth, along with attractive valuations and positive near-term sentiment. Our overweight to stocks displaying strong momentum and profitability were the two primary drivers of positive performance. From a sector perspective, the overweight to Information Technology and Healthcare sectors positively contributed to performance throughout the year, while the increase in allocation to Energy and Financial stocks in the second half of the year also generated positive returns.
The Fund often maintains significant holdings in a proprietary money market fund. We use equity index derivatives, such as stock index futures, to efficiently equitize these cash positions and manage the equity exposure of the portfolio. These derivatives are designed to track their respective market indexes. Investments in equity index derivatives were additive to performance over the past year.
Investment Objective
The investment objective of the Fund is to provide long-term capital appreciation.
Average Annual Total Returns
as of December 31, 2021
| 1
Year | 5
Year | Since
Inception | Share Class
Inception
Date |
Spectrum Fund Retail Class | 20.58% | 9.27% | 7.39% | 1/2/15 |
Spectrum Fund Institutional Class | 20.98% | 9.72% | 7.72% | 10/31/16 |
Spectrum Fund Adviser Class | 21.07% | 9.61% | 7.64% | 10/31/16 |
Morningstar Moderate Target Risk Index | 10.19% | 10.07% | 8.10% | — |
Blended Index | 16.59% | 11.53% | 9.37% | — |
Top 10 Holdings
as of December 31, 2021
1. | Microsoft Corp. | 5.8% |
2. | Apple, Inc. | 2.5% |
3. | Alphabet, Inc. - Class C | 2.5% |
4. | Amazon.com, Inc. | 2.0% |
5. | Johnson & Johnson | 1.8% |
6. | Tesla, Inc. | 1.4% |
7. | Intuit, Inc. | 1.4% |
8. | Meta Platforms, Inc. | 1.4% |
9. | NVIDIA Corp. | 1.1% |
10. | Lowe’s Cos., Inc. | 1.0% |
As a percentage of total net assets. Holdings exclude short-term investments and derivatives.
2021 Annual Report | December 31, 2021 | Page 5 |
Growth of $10,000
as of December 31, 2021
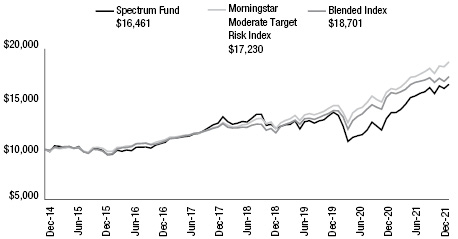
The Growth of $10,000 chart compares the performance of the Fund’s Retail Share Class over the period shown with dividends and capital gains reinvested to the Fund’s benchmarks. Benchmark indices are unmanaged and do not reflect the deduction of expenses associated with a mutual fund, such as investment management and accounting fees.
Investment performance assumes reinvestment of all dividend and capital gain distributions. The results do not reflect the effect of taxes a shareholder would pay on Fund distributions or on the redemption of Fund shares. Historical performance attributed to the Institutional and Adviser Share Classes prior to their inception dates is based on the performance of the Retail Share Class. No adjustment has been made to reflect class-specific distribution or servicing fees. Returns may reflect the effect of voluntary fee waivers or expense reimbursements over the period shown. Without these waivers, performance would have been lower.
The performance data shown represents past performance, which does not guarantee future results. The investment return and principal value of an investment will fluctuate so that an investor’s shares, when redeemed, may be worth more or less than their original cost. Current performance may be lower or higher than the performance data quoted. For current month-end performance data, please visit our website at www.meederfunds.com.
Sector Concentration
as of December 31, 2021
Information Technology | 30.0% |
Healthcare | 19.6% |
Consumer Discretionary | 10.2% |
Financials | 12.4% |
Communication Services | 8.1% |
Industrials | 6.2% |
Real Estate Investment Trust | 3.6% |
Energy | 4.0% |
Consumer Staples | 2.9% |
Utilities | 1.8% |
Materials | 1.2% |
Total | 100.0% |
As a percentage of total common stocks. Concentrations are subject to change.
Asset Allocation
as of December 31, 2021
Common Stocks (United States) | 72.6% |
Money Market Registered Investment Companies | 25.6% |
Other Assets/Liabilities (Net) | 1.8% |
Total | 100.0% |
As a percentage of total net assets. The Fund has invested in stock index futures contracts in order to equitize cash balances it holds in a proprietary money market fund.
The Blended Index is comprised 60% of the S&P 500 Index and 40% of 90-day T-bills.
Page 6 | 2021 Annual Report | December 31, 2021 |
Global Allocation Fund
The Meeder Global Allocation Fund Institutional Class returned 13.05% for the year ended December 31, 2021, compared to the Morningstar Global Allocation Index benchmark return of 9.31%.
A portion (90%) of the fund uses our Defensive Equity strategy, which follows a rules-based and data-driven approach to using the Meeder Investment Positioning (IPS) model. This model is used to determine the reward relative to the risk of the stock market and identifies when a respective fund should be increasing or decreasing its equity allocation. The remaining portion (10%) of the fund is allocated to fixed income securities.
The Meeder Global Allocation Fund achieved positive performance relative to its benchmark in 2021, primarily driven by the Defensive Equity Strategy and its overweight to equities throughout the year. The fund remained 90% invested in equities for the majority of the first six months of 2021, a period of positive momentum for the asset class. During the second half of the year, the Global Allocation Fund decreased its equity exposure, finishing the year 67% invested in equities.
Our global equity allocation was a positive contributor to performance this year as well. The fund allocates to different regions of the global equity markets, including U.S., Developed International ex-US., and Emerging Markets. Within the Global Allocation Fund’s equity allocation, it maintained an overweight to U.S. and an underweight to both Developed International ex-U.S. and Emerging Markets equities relative to its benchmark. Given the outperformance of U.S. equities compared to their international counterparts, the fund’s global equity allocation benefited performance.
The performance of our stock selection strategy was also strong in 2021. Within the U.S. portion of the Global Allocation Fund’s equity allocation, we use a proprietary equity selection model that selects stocks based on value, momentum, quality, stability, and sentiment factors. In general, we favor companies that display positive momentum relative to their peers, strong balance sheets, consistent earnings growth, along with attractive valuations and positive near-term sentiment. Our overweight to stocks displaying strong momentum and profitability were the two primary drivers of positive performance. From a sector perspective, the overweight to Information Technology and Healthcare sectors positively contributed to performance throughout the year, while the increase in allocation to Energy and Financial stocks in the second half of the year also generated positive returns.
While fixed income returns were negative, the Global Allocation Fund’s fixed income allocation outperformed the fixed income portion of the benchmark. The fund’s allocation to fixed income tactically shifts portfolio exposure utilizing quantitative models designed to actively manage the credit quality, emerging market bond exposure, and duration of U.S. Treasury holdings. The rise in interest rates throughout the year led to negative returns in both U.S. Investment Grade and U.S. Treasury holdings, as 2021 proved to be a challenging year for most fixed income assets. Relative to the benchmark, exposure to High Yield bonds, security selection in Investment Grade bonds, and duration positioning in U.S. Treasuries contributed to its outperformance.
The Fund often maintains significant holdings in a proprietary money market fund. We use equity index derivatives, such as stock index futures, to efficiently equitize these cash positions and manage the equity exposure of the portfolio. These derivatives are designed to track their respective market indexes. Investments in equity index derivatives were additive to performance over the past year.
Investment Objective
The investment objective of the Fund is to provide long-term capital appreciation.
Average Annual Total Returns
as of December 31, 2021
| 1
Year | 5
Year | 10
Year | Share Class
Inception
Date |
Global Allocation Fund Retail Class | 12.58% | 8.35% | 7.85% | 1/31/06 |
Global Allocation Fund Institutional Class | 13.05% | 8.85% | 8.10% | 10/31/16 |
Global Allocation Fund Adviser Class | 12.90% | 8.68% | 8.02% | 10/31/16 |
Morningstar Global Allocation Index | 9.31% | 10.23% | 8.44% | — |
Blended Index | 9.61% | 8.66% | 7.02% | — |
Top 10 Holdings
as of December 31, 2021
1. | iShares Core MSCI EAFE ETF | 7.0% |
2. | iShares 3-7 Year Treasury Bond ETF | 2.6% |
3. | Microsoft Corp. | 2.1% |
4. | iShares Core MSCI Emerging Markets ETF | 1.6% |
5. | Apple, Inc. | 1.6% |
6. | Vanguard Short-Term Bond ETF | 1.2% |
7. | iShares JP Morgan USD Emerging Markets Bond ETF | 1.0% |
8. | Amazon.com, Inc. | 0.9% |
9. | Alphabet, Inc. - Class C | 0.8% |
10. | Alphabet, Inc. - Class A | 0.7% |
As a percentage of total net assets. Holdings exclude short-term investments and derivatives.
2021 Annual Report | December 31, 2021 | Page 7 |
Growth of $10,000
as of December 31, 2021

The Growth of $10,000 chart compares the performance of the Fund’s Retail Share Class over the period shown with dividends and capital gains reinvested to the Fund’s benchmarks. Benchmark indices are unmanaged and do not reflect the deduction of expenses associated with a mutual fund, such as investment management and accounting fees.
Investment performance assumes reinvestment of all dividend and capital gain distributions. The results do not reflect the effect of taxes a shareholder would pay on Fund distributions or on the redemption of Fund shares. Historical performance attributed to the Institutional and Adviser Share Classes prior to their inception dates is based on the performance of the Retail Share Class. No adjustment has been made to reflect class-specific distribution or servicing fees. Returns may reflect the effect of voluntary fee waivers or expense reimbursements over the period shown. Without these waivers, performance would have been lower.
The performance data shown represents past performance, which does not guarantee future results. The investment return and principal value of an investment will fluctuate so that an investor’s shares, when redeemed, may be worth more or less than their original cost. Current performance may be lower or higher than the performance data quoted. For current month-end performance data, please visit our website at www.meederfunds.com.
Sector Concentration
as of December 31, 2021
Information Technology | 28.7% |
Healthcare | 18.6% |
Financials | 11.7% |
Consumer Discretionary | 11.1% |
Communication Services | 8.8% |
Industrials | 6.5% |
Energy | 4.7% |
Real Estate Investment Trust | 3.6% |
Consumer Staples | 3.0% |
Utilities | 2.1% |
Materials | 1.2% |
Total | 100.0% |
As a percentage of total common stocks. Concentrations are subject to change.
Registered Investment Company Geographic Concentration
as of December 31, 2021
U.S. Fixed Income | 42.2% |
International Fixed Income | 5.8% |
International Equity | 52.0% |
Total | 100.0% |
As a percentage of total registered investment companies. Concentrations are subject to change.
Asset Allocation
as of December 31, 2021
Common Stocks (United States) | 34.3% |
Equity Registered Investment Companies | 8.6% |
Fixed Income Registered Investment Companies | 8.0% |
Money Market Registered Investment Companies | 43.8% |
Bank Obligations | 1.6% |
Other Assets/Liabilities (Net) | 3.7% |
Total | 100.0% |
As a percentage of total net assets. The Fund has invested in stock index futures contracts in order to equitize cash balances it holds in a proprietary money market fund.
The Blended Index is comprised of 54% MSCI ACWI Index, 36% of 90 day T-Bills and 10% Bloomberg U.S. Aggregate Bond Index.
Page 8 | 2021 Annual Report | December 31, 2021 |
Balanced Fund
The Meeder Balanced Fund Institutional Class returned 13.71% for the year ended December 31, 2021, compared to the Morningstar Moderate Target Risk Index benchmark return of 10.19%.
A portion (70%) of the fund uses our Defensive Equity strategy, which follows a rules-based and data-driven approach to using the Meeder Investment Positioning (IPS) model. This model is used to determine the reward relative to the risk of the stock market and identifies when a respective fund should be increasing or decreasing its equity allocation. The remaining portion (30%) of the fund is allocated to fixed income securities.
The Meeder Balanced Fund achieved positive performance relative to its benchmark in 2021, primarily driven by the Defensive Equity Strategy and its overweight to equities throughout the year. The fund remained 70% invested in equities for the majority of the first six months of 2021, a period of positive momentum for the asset class. During the second half of the year, the Balanced Fund decreased its equity exposure, finishing the year 48% invested in equities. While it finished the year underweight equities relative to its benchmark, the overweight for most of 2021 was a primary driver of its outperformance.
Our global equity allocation was a positive contributor to performance this year as well. The fund allocates to different regions of the global equity markets, including U.S., Developed International ex-US., and Emerging Markets. Within the Balanced Fund’s equity allocation, it maintained an overweight to U.S. and an underweight to both Developed International ex-U.S. and Emerging Markets equities relative to its benchmark. Given the outperformance of U.S. equities compared to their international counterparts, the fund’s global equity allocation benefited performance.
The performance of our stock selection strategy was also strong in 2021. Within the U.S. portion of the Balanced Fund’s equity allocation, we use a proprietary equity selection model that selects stocks based on value, momentum, quality, stability, and sentiment factors. In general, we favor companies that display positive momentum relative to their peers, strong balance sheets, consistent earnings growth, along with attractive valuations and positive near-term sentiment. Our overweight to stocks displaying strong momentum and profitability were the two primary drivers of positive performance. From a sector perspective, the overweight to Information Technology and Healthcare sectors positively contributed to performance throughout the year, while the increase in allocation to Energy and Financial stocks in the second half of the year also generated positive returns.
While fixed income returns were negative, the Balanced Fund’s fixed income allocation outperformed the fixed income portion of the benchmark. The fund’s allocation to fixed income tactically shifts portfolio exposure utilizing quantitative models designed to actively manage the credit quality, emerging market bond exposure, and duration of U.S. Treasury holdings. The rise in interest rates throughout the year led to negative returns in both U.S. Investment Grade and U.S. Treasury holdings, as 2021 proved to be a challenging year for most fixed income assets. Relative to the benchmark, exposure to High Yield bonds, security selection in Investment Grade bonds, and duration positioning in U.S. Treasuries contributed to its outperformance.
The Fund often maintains significant holdings in a proprietary money market fund. We use equity index derivatives, such as stock index futures, to efficiently equitize these cash positions and manage the equity exposure of the portfolio. These derivatives are designed to track their respective market indexes. Investments in equity index derivatives were additive to performance over the past year.
Investment Objective
The investment objective of the Fund is to provide income and long-term capital appreciation.
Average Annual Total Returns
as of December 31, 2021
| 1
Year | 5
Year | 10
Year | Share Class
Inception
Date |
Balanced Fund Retail Class | 13.23% | 8.24% | 7.89% | 1/31/06 |
Balanced Fund Institutional Class | 13.71% | 8.70% | 8.13% | 10/31/16 |
Balanced Fund Adviser Class | 13.71% | 8.62% | 8.08% | 10/31/16 |
Morningstar Moderate Target Risk Index | 10.19% | 10.07% | 8.75% | — |
Blended Index | 10.90% | 9.20% | 8.00% | — |
Top 10 Holdings
as of December 31, 2021
1. | iShares 3-7 Year Treasury Bond ETF | 8.1% |
2. | Vanguard Short-Term Bond ETF | 3.5% |
3. | iShares JP Morgan USD Emerging Markets Bond ETF | 3.0% |
4. | Microsoft Corp. | 2.9% |
5. | Apple, Inc. | 2.4% |
6. | Amazon.com, Inc. | 1.4% |
7. | Frost Total Return Bond Fund - Class I | 1.2% |
8. | Lord Abbett High Yield Fund - Class I | 1.2% |
9. | Alphabet, Inc. - Class C | 1.2% |
10. | Alphabet, Inc. - Class A | 1.1% |
As a percentage of total net assets. Holdings exclude short-term investments and derivatives.
2021 Annual Report | December 31, 2021 | Page 9 |
Growth of $10,000
as of December 31, 2021

The Growth of $10,000 chart compares the performance of the Fund’s Retail Share Class over the period shown with dividends and capital gains reinvested to the Fund’s benchmarks. Benchmark indices are unmanaged and do not reflect the deduction of expenses associated with a mutual fund, such as investment management and accounting fees.
Investment performance assumes reinvestment of all dividend and capital gain distributions. The results do not reflect the effect of taxes a shareholder would pay on Fund distributions or on the redemption of Fund shares. Historical performance attributed to the Institutional and Adviser Share Classes prior to their inception dates is based on the performance of the Retail Share Class. No adjustment has been made to reflect class-specific distribution or servicing fees. Returns may reflect the effect of voluntary fee waivers or expense reimbursements over the period shown. Without these waivers, performance would have been lower.
The performance data shown represents past performance, which does not guarantee future results. The investment return and principal value of an investment will fluctuate so that an investor’s shares, when redeemed, may be worth more or less than their original cost. Current performance may be lower or higher than the performance data quoted. For current month-end performance data, please visit our website at www.meederfunds.com.
Sector Concentration
as of December 31, 2021
Information Technology | 29.2% |
Healthcare | 18.7% |
Financials | 12.1% |
Consumer Discretionary | 10.8% |
Communication Services | 9.3% |
Industrials | 6.4% |
Real Estate Investment Trust | 3.6% |
Energy | 3.4% |
Consumer Staples | 3.1% |
Utilities | 2.2% |
Materials | 1.2% |
Total | 100.0% |
As a percentage of total common stocks. Concentrations are subject to change.
Registered Investment Company Geographic Concentration
as of December 31, 2021
U.S. Fixed Income | 87.9% |
International Fixed Income | 12.1% |
Total | 100.0% |
As a percentage of total registered investment companies. Concentrations are subject to change.
Asset Allocation
as of December 31, 2021
Common Stocks (United States) | 48.8% |
Fixed Income Registered Investment Companies | 24.4% |
Money Market Registered Investment Companies | 25.4% |
Bank Obligations | 0.2% |
Other Assets/Liabilities (Net) | 1.2% |
Total | 100.0% |
As a percentage of total net assets. The Fund has invested in stock index futures contracts in order to equitize cash balances it holds in a proprietary money market fund.
The Blended Index is comprised 42% of the S&P 500 Index, 28% of the average 90-day T-bills, and 30% of the Bloomberg U.S. Aggregate Bond Index.
Page 10 | 2021 Annual Report | December 31, 2021 |
Moderate Allocation Fund
The Meeder Moderate Fund Institutional Class returned 9.05% for the year ended December 31, 2021, compared to the Morningstar Moderate Conservative Target Risk Index benchmark return of 6.36%.
A portion (50%) of the fund uses our Defensive Equity strategy, which follows a rules-based and data-driven approach to using the Meeder Investment Positioning (IPS) model. This model is used to determine the reward relative to the risk of the stock market and identifies when a respective fund should be increasing or decreasing its equity allocation. The remaining portion (50%) of the fund is allocated to fixed income securities.
The Meeder Moderate Fund achieved positive performance relative to its benchmark in 2021, primarily driven by the Defensive Equity Strategy and its overweight to equities throughout the year. The fund remained 50% invested in equities for the majority of the first six months of 2021, a period of positive momentum for the asset class. During the second half of the year, the Moderate Fund decreased its equity exposure, finishing the year 35% invested in equities. While it finished the year underweight equities relative to its benchmark, the overweight for most of 2021 was a primary driver of its outperformance.
Our global equity allocation was a positive contributor to performance this year as well. The fund allocates to different regions of the global equity markets, including U.S., Developed International ex-US., and Emerging Markets. Within the Moderate Fund’s equity allocation, it maintained an overweight to U.S. and an underweight to both Developed International ex-U.S. and Emerging Markets equities relative to its benchmark. Given the outperformance of U.S. equities compared to their international counterparts, the fund’s global equity allocation benefited performance.
The performance of our stock selection strategy was also strong in 2021. Within the U.S. portion of the Moderate Fund’s equity allocation, we use a proprietary equity selection model that selects stocks based on value, momentum, quality, stability, and sentiment factors. In general, we favor companies that display positive momentum relative to their peers, strong balance sheets, consistent earnings growth, along with attractive valuations and positive near-term sentiment. Our overweight to stocks displaying strong momentum and profitability were the two primary drivers of positive performance. From a sector perspective, the overweight to Information Technology and Healthcare sectors positively contributed to performance throughout the year, while the increase in allocation to Energy and Financial stocks in the second half of the year also generated positive returns.
While fixed income returns were negative, the Moderate Allocation Fund’s fixed income allocation outperformed the fixed income portion of the benchmark. The fund’s allocation to fixed income tactically shifts portfolio exposure utilizing quantitative models designed to actively manage the credit quality, emerging market bond exposure, and duration of U.S. Treasury holdings. The rise in interest rates throughout the year led to negative returns in both U.S. Investment Grade and U.S. Treasury holdings, as 2021 proved to be a challenging year for most fixed income assets. Relative to the benchmark, exposure to High Yield bonds, security selection in Investment Grade bonds, and duration positioning in U.S. Treasuries contributed to its outperformance.
The Fund often maintains significant holdings in a proprietary money market fund. We use equity index derivatives, such as stock index futures, to efficiently equitize these cash positions and manage the equity exposure of the portfolio. These derivatives are designed to track their respective market indexes. Investments in equity index derivatives were additive to performance over the past year.
Investment Objective
The investment objective of the Fund is to provide total return, including capital appreciation, and current income.
Average Annual Total Returns
as of December 31, 2021
| 1
Year | 5
Year | Since
Inception | Share Class
Inception
Date |
Moderate Allocation Fund Retail Class | 8.74% | 7.58% | 6.94% | 6/30/15 |
Moderate Allocation Fund Institutional Class | 9.05% | 8.00% | 7.28% | 10/31/16 |
Moderate Allocation Fund Adviser Class | 9.15% | 7.93% | 7.22% | 10/31/16 |
Morningstar Moderate Conservative Target Risk Index | 6.36% | 8.11% | 6.96% | — |
Blended Index | 7.23% | 7.61% | 6.68% | — |
Top 10 Holdings
as of December 31, 2021
1. | iShares 3-7 Year Treasury Bond ETF | 13.6% |
2. | Vanguard Short-Term Bond ETF | 5.9% |
3. | iShares JP Morgan USD Emerging Markets Bond ETF | 5.0% |
4. | Microsoft Corp. | 2.1% |
5. | Frost Total Return Bond Fund - Class I | 2.0% |
6. | Lord Abbett High Yield Fund - Class I | 2.0% |
7. | Segall Bryant & Hamill Plus Bond Fund - Class I | 1.8% |
8. | DoubleLine Total Return Bond Fund - Class I | 1.7% |
9. | SPDR Bloomberg Barclays Short Term High Yield Bond ETF | 1.7% |
10. | Apple, Inc. | 1.6% |
As a percentage of total net assets. Holdings exclude short-term investments and derivatives.
2021 Annual Report | December 31, 2021 | Page 11 |
Growth of $10,000
as of December 31, 2021

The Growth of $10,000 chart compares the performance of the Fund’s Retail Share Class over the period shown with dividends and capital gains reinvested to the Fund’s benchmarks. Benchmark indices are unmanaged and do not reflect the deduction of expenses associated with a mutual fund, such as investment management and accounting fees.
Investment performance assumes reinvestment of all dividend and capital gain distributions. The results do not reflect the effect of taxes a shareholder would pay on Fund distributions or on the redemption of Fund shares. Historical performance attributed to the Institutional and Adviser Share Classes prior to their inception dates is based on the performance of the Retail Share Class. No adjustment has been made to reflect class-specific distribution or servicing fees. Returns may reflect the effect of voluntary fee waivers or expense reimbursements over the period shown. Without these waivers, performance would have been lower.
The performance data shown represents past performance, which does not guarantee future results. The investment return and principal value of an investment will fluctuate so that an investor’s shares, when redeemed, may be worth more or less than their original cost. Current performance may be lower or higher than the performance data quoted. For current month-end performance data, please visit our website at www.meederfunds.com.
Sector Concentration
as of December 31, 2021
Information Technology | 28.7% |
Healthcare | 18.7% |
Consumer Discretionary | 11.5% |
Financials | 11.3% |
Communication Services | 8.8% |
Industrials | 6.8% |
Energy | 4.9% |
Real Estate Investment Trust | 3.6% |
Consumer Staples | 2.8% |
Utilities | 1.7% |
Materials | 1.2% |
Total | 100.0% |
As a percentage of total common stocks. Concentrations are subject to change.
Registered Investment Company Geographic Concentration
as of December 31, 2021
U.S. Fixed Income | 87.8% |
International Fixed Income | 12.2% |
Total | 100.0% |
As a percentage of total registered investment companies. Concentrations are subject to change.
Asset Allocation
as of December 31, 2021
Common Stocks (United States) | 34.4% |
Fixed Income Registered Investment Companies | 40.8% |
Money Market Registered Investment Companies | 23.6% |
Bank Obligations | 0.1% |
Other Assets/Liabilities (Net) | 1.1% |
Total | 100.0% |
As a percentage of total net assets. The Fund has invested in stock index futures contracts in order to equitize cash balances it holds in a proprietary money market fund.
The Blended Index is comprised 30% of the S&P 500 Index, 20% of the average 90-day T-bills, and 50% of the Bloomberg U.S. Aggregate Bond Index.
Page 12 | 2021 Annual Report | December 31, 2021 |
Conservative Allocation Fund
The Meeder Conservative Fund Institutional Class returned 4.94% for the year ended December 31, 2021, compared to the Morningstar Conservative Target Risk Index benchmark return of 2.26%.
A portion (30%) of the fund uses our Defensive Equity strategy, which follows a rules-based and data-driven approach to using the Meeder Investment Positioning (IPS) model. This model is used to determine the reward relative to the risk of the stock market and identifies when a respective fund should be increasing or decreasing its equity allocation. The remaining portion (70%) of the fund is allocated to fixed income securities.
The Meeder Conservative Fund achieved positive performance relative to its benchmark in 2021, primarily driven by the Defensive Equity Strategy and its overweight to equities throughout the year. The fund remained 30% invested in equities for the majority of the first six months of 2021, a period of positive momentum for the asset class. During the second half of the year, the Conservative Fund decreased its equity exposure, finishing the year 22% invested in equities.
Our global equity allocation was a positive contributor to performance this year as well. The fund allocates to different regions of the global equity markets, including U.S., Developed International ex-US., and Emerging Markets. Within Conservative Fund’s equity allocation, it maintained an overweight to U.S. and an underweight to both Developed International ex-U.S. and Emerging Markets equities relative to its benchmark. Given the outperformance of U.S. equities compared to their international counterparts, the fund’s global equity allocation benefited performance.
The performance of our stock selection strategy was also strong in 2021. Within the U.S. portion of the Conservative Fund’s equity allocation, we use a proprietary equity selection model that selects stocks based on value, momentum, quality, stability, and sentiment factors. In general, we favor companies that display positive momentum relative to their peers, strong balance sheets, consistent earnings growth, along with attractive valuations and positive near-term sentiment. Our overweight to stocks displaying strong momentum and profitability were the two primary drivers of positive performance. From a sector perspective, the overweight to Information Technology and Healthcare sectors positively contributed to performance throughout the year, while the increase in allocation to Energy and Financial stocks in the second half of the year also generated positive returns.
While fixed income returns were negative, the Conservative Allocation Fund’s fixed income allocation outperformed the fixed income portion of the benchmark. The fund’s allocation to fixed income tactically shifts portfolio exposure utilizing quantitative models designed to actively manage the credit quality, emerging market bond exposure, and duration of U.S. Treasury holdings. The rise in interest rates throughout the year led to negative returns in both U.S. Investment Grade and U.S. Treasury holdings, as 2021 proved to be a challenging year for most fixed income assets. Relative to the benchmark, exposure to High Yield bonds, security selection in Investment Grade bonds, and duration positioning in U.S. Treasuries contributed to its outperformance.
The Fund often maintains significant holdings in a proprietary money market fund. We use equity index derivatives, such as stock index futures, to efficiently equitize these cash positions and manage the equity exposure of the portfolio. These derivatives are designed to track their respective market indexes. Investments in equity index derivatives were additive to performance over the past year.
Investment Objective
The investment objective of the Fund is to provide income and long-term capital appreciation.
Average Annual Total Returns
as of December 31, 2021
| 1
Year | 5
Year | 10
Year | Share Class
Inception
Date |
Conservative Allocation Fund Retail Class | 4.64% | 5.15% | 6.25% | 6/21/95 |
Conservative Allocation Fund Institutional Class | 4.94% | 5.52% | 6.45% | 10/31/16 |
Conservative Allocation Fund Adviser Class | 5.04% | 5.45% | 6.41% | 10/31/16 |
Morningstar Conservative Target Risk Index | 2.26% | 5.70% | 4.57% | — |
Blended Index | 3.65% | 6.00% | 5.10% | — |
Top 10 Holdings
as of December 31, 2021
1. | iShares 3-7 Year Treasury Bond ETF | 19.2% |
2. | Vanguard Short-Term Bond ETF | 8.4% |
3. | iShares JP Morgan USD Emerging Markets Bond ETF | 7.0% |
4. | Frost Total Return Bond Fund - Class I | 2.9% |
5. | Lord Abbett High Yield Fund - Class I | 2.8% |
6. | Segall Bryant & Hamill Plus Bond Fund - Class I | 2.5% |
7. | DoubleLine Total Return Bond Fund - Class I | 2.4% |
8. | SPDR Bloomberg Barclays Short Term High Yield Bond ETF | 2.4% |
9. | iShares 0-5 Year High Yield Corporate Bond ETF | 2.1% |
10. | Pioneer Bond Fund - Class K | 2.1% |
As a percentage of total net assets. Holdings exclude short-term investments and derivatives.
2021 Annual Report | December 31, 2021 | Page 13 |
Growth of $10,000
as of December 31, 2021
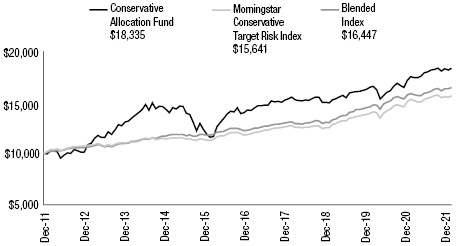
The Growth of $10,000 chart compares the performance of the Fund’s Retail Share Class over the period shown with dividends and capital gains reinvested to the Fund’s benchmarks. Benchmark indices are unmanaged and do not reflect the deduction of expenses associated with a mutual fund, such as investment management and accounting fees.
Investment performance assumes reinvestment of all dividend and capital gain distributions. The results do not reflect the effect of taxes a shareholder would pay on Fund distributions or on the redemption of Fund shares. Historical performance attributed to the Institutional and Adviser Share Classes prior to their inception dates is based on the performance of the Retail Share Class. No adjustment has been made to reflect class-specific distribution or servicing fees. Returns may reflect the effect of voluntary fee waivers or expense reimbursements over the period shown. Without these waivers, performance would have been lower.
The performance data shown represents past performance, which does not guarantee future results. The investment return and principal value of an investment will fluctuate so that an investor’s shares, when redeemed, may be worth more or less than their original cost. Current performance may be lower or higher than the performance data quoted. For current month-end performance data, please visit our website at www.meederfunds.com.
Sector Concentration
as of December 31, 2021
Information Technology | 29.0% |
Healthcare | 18.6% |
Financials | 11.9% |
Consumer Discretionary | 10.9% |
Communication Services | 8.6% |
Industrials | 6.4% |
Energy | 4.9% |
Real Estate Investment Trust | 3.6% |
Consumer Staples | 2.9% |
Utilities | 2.0% |
Materials | 1.2% |
Total | 100.0% |
As a percentage of total common stocks. Concentrations are subject to change.
Registered Investment Company Geographic Concentration
as of December 31, 2021
U.S. Fixed Income | 87.9% |
International Fixed Income | 12.1% |
Total | 100.0% |
As a percentage of total registered investment companies. Concentrations are subject to change.
Asset Allocation
as of December 31, 2021
Common Stocks (United States) | 19.2% |
Fixed Income Registered Investment Companies | 57.6% |
Money Market Registered Investment Companies | 22.4% |
Other Assets/Liabilities (Net) | 0.8% |
Total | 100.0% |
As a percentage of total net assets. The Fund has invested in stock index futures contracts in order to equitize cash balances it holds in a proprietary money market fund.
The Blended Index is comprised 18% of the S&P 500 Index, 12% of the average 90-day T-bills, and 70% of the Bloomberg U.S. Aggregate Bond Index.
Page 14 | 2021 Annual Report | December 31, 2021 |
Dynamic Allocation Fund
The Meeder Dynamic Allocation Fund Institutional Class returned 19.88% for the year ended December 31, 2021, compared to the Morningstar Aggressive Target Index benchmark return of 17.30%.
Dynamic Allocation maintains a more aggressive objective and remains nearly fully invested (95%) in the stock market. Our global equity allocation was a positive contributor to performance this year. The fund allocates to different regions of the global equity markets, including U.S., Developed International ex-US., and Emerging Markets. Within the Dynamic Allocation Fund’s equity allocation, it maintained an overweight to U.S. and underweight to both Developed International ex-U.S. and Emerging Markets equities relative to its benchmark. Given the outperformance of U.S. equities compared to their international counterparts, the fund’s global equity allocation benefited performance.
The performance of our stock selection strategy for this fund was also strong in 2021. Within the U.S. portion of the Dynamic Allocation Fund’s equity allocation, we use a proprietary equity selection model that selects stocks based on value, momentum, quality, stability, and sentiment factors. In general, we favor companies that display positive momentum relative to their peers, strong balance sheets, consistent earnings growth, along with attractive valuations and positive near-term sentiment. Our overweight to stocks displaying strong momentum and profitability were the two primary drivers of positive performance. From a sector perspective, the overweight to Information Technology and Healthcare sectors positively contributed to performance throughout the year, while the increase in allocation to Energy and Financial stocks in the second half of the year also generated positive returns.
A small portion of the fund (5%) is allocated to fixed income. While fixed income returns were negative, the Dynamic Allocation Fund’s fixed income allocation outperformed the fixed income portion of the benchmark. The fund’s allocation to fixed income tactically shifts portfolio exposure utilizing quantitative models designed to actively manage credit quality and emerging market bond exposure. The rise in interest rates throughout the year led to negative returns in U.S. Investment Grade holdings, as 2021 proved to be a challenging year for most fixed income assets. Relative to the benchmark, exposure to High Yield bonds contributed to its outperformance during the year.
The Fund often maintains significant holdings in a proprietary money market fund. We use equity index derivatives, such as stock index futures, to efficiently equitize these cash positions and manage the equity exposure of the portfolio. These derivatives are designed to track their respective market indexes. Investments in equity index derivatives were additive to performance over the past year.
Investment Objective
The investment objective of the Fund is to provide long-term capital appreciation.
Average Annual Total Returns
as of December 31, 2021
| 1
Year | 5
Year | 10
Year | Share Class
Inception
Date |
Dynamic Allocation Fund Retail Class | 19.54% | 13.62% | 12.60% | 2/29/00 |
Dynamic Allocation Fund Institutional Class | 19.88% | 14.06% | 12.82% | 10/31/16 |
Dynamic Allocation Fund Adviser Class | 20.02% | 13.94% | 12.77% | 10/31/16 |
Morningstar Aggressive Target Risk Index | 17.30% | 13.38% | 11.93% | — |
Blended Index | 21.63% | 15.54% | 13.57% | — |
Top 10 Holdings
as of December 31, 2021
1. | Microsoft Corp. | 4.0% |
2. | Apple, Inc. | 3.0% |
3. | iShares JP Morgan USD Emerging Markets Bond ETF | 2.2% |
4. | iShares Core U.S. Aggregate Bond ETF | 2.2% |
5. | Amazon.com, Inc. | 1.8% |
6. | Alphabet, Inc. - Class C | 1.6% |
7. | Alphabet, Inc. - Class A | 1.5% |
8. | Tesla, Inc. | 1.4% |
9. | UnitedHealth Group, Inc. | 1.2% |
10. | Johnson & Johnson | 1.2% |
As a percentage of total net assets. Holdings exclude short-term investments and derivatives.
2021 Annual Report | December 31, 2021 | Page 15 |
Sector Concentration
as of December 31, 2021
Information Technology | 28.8% |
Healthcare | 18.7% |
Financials | 11.8% |
Consumer Discretionary | 11.2% |
Communication Services | 8.6% |
Industrials | 6.7% |
Energy | 4.8% |
Real Estate Investment Trust | 3.6% |
Consumer Staples | 2.8% |
Utilities | 1.8% |
Materials | 1.2% |
Total | 100.0% |
As a percentage of total common stocks. Concentrations are subject to change.
Registered Investment Company Geographic Concentration
as of December 31, 2021
U.S. Fixed Income | 45.0% |
International Fixed Income | 45.1% |
International Equity | 9.9% |
Total | 100.0% |
As a percentage of total registered investment companies. Concentrations are subject to change.
Asset Allocation
as of December 31, 2021
Common Stocks (United States) | 66.9% |
Fixed Income Registered Investment Companies | 4.5% |
Equity Registered Investment Companies | 0.5% |
Money Market Registered Investment Companies | 24.5% |
Bank Obligations | 0.3% |
Other Assets/Liabilities (Net) | 3.3% |
Total | 100.0% |
As a percentage of total net assets. The Fund has invested in stock index futures contracts in order to equitize cash balances it holds in a proprietary money market fund.
Growth of $10,000
as of December 31, 2021
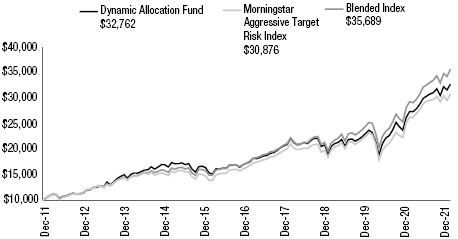
The Growth of $10,000 chart compares the performance of the Fund’s Retail Share Class over the period shown with dividends and capital gains reinvested to the Fund’s benchmarks. Benchmark indices are unmanaged and do not reflect the deduction of expenses associated with a mutual fund, such as investment management and accounting fees.
Investment performance assumes reinvestment of all dividend and capital gain distributions. The results do not reflect the effect of taxes a shareholder would pay on Fund distributions or on the redemption of Fund shares. Historical performance attributed to the Institutional and Adviser Share Classes prior to their inception dates is based on the performance of the Retail Share Class. No adjustment has been made to reflect class-specific distribution or servicing fees. Returns may reflect the effect of voluntary fee waivers or expense reimbursements over the period shown. Without these waivers, performance would have been lower.
The performance data shown represents past performance, which does not guarantee future results. The investment return and principal value of an investment will fluctuate so that an investor’s shares, when redeemed, may be worth more or less than their original cost. Current performance may be lower or higher than the performance data quoted. For current month-end performance data, please visit our website at www.meederfunds.com.
The Blended Index is comprised of 70% S&P 500 Index, 25% MSCI ACWI ex USA Index, and 5% Bloomberg U.S. Aggregate Bond Index.
Page 16 | 2021 Annual Report | December 31, 2021 |
Quantex Fund
The Meeder Quantex Fund Institutional Class returned 27.63% for the year ended December 31, 2021, compared to the S&P Midcap 400 Index benchmark return of 24.76%.
The fund maintains a more aggressive objective and remains fully invested (100%) in the U.S. stock market, primarily in U.S. midcap stocks. While the fund utilizes a quantitative strategy to identify small- and mid-cap stocks that have significant growth potential, it can also tactically allocate up to 40% of the portfolio to U.S. large-cap equities based on our expectations of market cap segments.
The performance of our stock selection strategy for this fund was good in 2021, allowing the fund to outperform its benchmark. With value stocks outperforming, the fund’s holdings in the Energy sector were profitable, including positions in Devon Energy, Marathon Oil, and Diamondback Energy. Our overweight to Chemicals and Equity REIT stocks were also positive contributors to performance. Travel stocks Wynn Resorts and Norwegian Cruise Line Holdings were among the detractors during the year. Our tactical exposure to U.S. large-cap equities during the second half of the year slightly detracted from performance, as US mid-cap stocks outperformed their large-cap peers between August through mid-November, with large-cap stocks regaining ground through the end of the year.
The Fund often maintains significant holdings in a proprietary money market fund. We use equity index derivatives, such as stock index futures, to efficiently equitize these cash positions and manage the equity exposure of the portfolio. These derivatives are designed to track their respective market indexes. Investments in equity index derivatives were additive to performance over the past year.
Investment Objective
The investment objective of the Fund is to provide long-term capital appreciation.
Average Annual Total Returns
as of December 31, 2021
| 1
Year | 5
Year | 10
Year | Share Class
Inception
Date |
Quantex Fund Retail Class | 27.34% | 7.26% | 11.24% | 3/20/85 |
Quantex Fund Institutional Class | 27.63% | 7.55% | 11.40% | 10/31/16 |
Quantex Fund Adviser Class | 27.68% | 7.44% | 11.34% | 10/31/16 |
S&P MidCap 400 Index | 24.76% | 13.09% | 14.20% | — |
Russell 2000 Index | 14.82% | 12.02% | 13.23% | — |
Blended Index | 19.79% | 12.59% | 13.76% | — |
Top 10 Holdings
as of December 31, 2021
1. | CF Industries Holdings, Inc. | 0.9% |
2. | Devon Energy Corp. | 0.8% |
3. | Marathon Oil Corp. | 0.8% |
4. | Diamondback Energy, Inc. | 0.8% |
5. | F5, Inc. | 0.8% |
6. | Juniper Networks, Inc. | 0.8% |
7. | Comerica, Inc. | 0.8% |
8. | CH Robinson Worldwide, Inc. | 0.8% |
9. | A O Smith Corp. | 0.8% |
10. | Quanta Services, Inc. | 0.8% |
As a percentage of total net assets. Holdings exclude short-term investments and derivatives.
2021 Annual Report | December 31, 2021 | Page 17 |
Growth of $10,000
as of December 31, 2021

The Growth of $10,000 chart compares the performance of the Fund’s Retail Share Class over the period shown with dividends and capital gains reinvested to the Fund’s benchmarks. Benchmark indices are unmanaged and do not reflect the deduction of expenses associated with a mutual fund, such as investment management and accounting fees.
Investment performance assumes reinvestment of all dividend and capital gain distributions. The results do not reflect the effect of taxes a shareholder would pay on Fund distributions or on the redemption of Fund shares. Historical performance attributed to the Institutional and Adviser Share Classes prior to their inception dates is based on the performance of the Retail Share Class. No adjustment has been made to reflect class-specific distribution or servicing fees. Returns may reflect the effect of voluntary fee waivers or expense reimbursements over the period shown. Without these waivers, performance would have been lower.
The performance data shown represents past performance, which does not guarantee future results. The investment return and principal value of an investment will fluctuate so that an investor’s shares, when redeemed, may be worth more or less than their original cost. Current performance may be lower or higher than the performance data quoted. For current month-end performance data, please visit our website at www.meederfunds.com.
Sector Concentration
as of December 31, 2021
Consumer Discretionary | 19.1% |
Industrials | 16.5% |
Financials | 15.1% |
Information Technology | 8.7% |
Real Estate Investment Trust | 7.9% |
Energy | 7.8% |
Materials | 7.5% |
Utilities | 7.1% |
Healthcare | 4.4% |
Communication Services | 4.1% |
Consumer Staples | 1.8% |
Total | 100.0% |
As a percentage of total common stocks. Concentrations are subject to change.
Asset Allocation
as of December 31, 2021
Common Stocks (United States) | 64.0% |
Money Market Registered Investment Companies | 32.6% |
Other Assets/Liabilities (Net) | 3.4% |
Total | 100.0% |
As a percentage of total net assets. The Fund has invested in stock index futures contracts in order to equitize cash balances it holds in a proprietary money market fund.
The Blended Index consists of 50% of the Russell 2000 Index and 50% of the S&P MidCap 400 Index.
Page 18 | 2021 Annual Report | December 31, 2021 |
Tactical Income Fund
The Meeder Tactical Income Institutional Class returned -1.62% for the year ended December 31, 2021, compared to the Bloomberg U.S. Treasury Bill 1-3 Month Index benchmark return of 0.04%. In April, the fund altered its name, strategy, and principal benchmark to reflect a change in strategy from one that emphasized investment grade securities to one in which the adviser tactically manages the portfolio across foreign or domestic fixed income securities of any credit quality or duration. In connection with the change in strategy, the fund changed its benchmark from the Bloomberg U.S. Aggregate Total Return Index to the Bloomberg U.S. Treasury Bill 1-3 Month Index.
With the new strategy, this fund tactically shifts portfolio exposure utilizing quantitative models designed to actively manage the credit quality, emerging market bond exposure, and duration of U.S. Treasury holdings. The fund significantly decreased its duration after the portfolio shift, ending the year at 3.9 years. Since the strategy was introduced, the Tactical Income Institutional Class returned 0.71% from April 6 through December 31, 2021, compared to the Bloomberg U.S. Treasury Bill 1-3 Month Index benchmark return of 0.02%.
The rise in interest rates throughout the year led to negative returns in both U.S. Investment Grade and U.S. Treasury holdings, as 2021 proved to be a challenging year for most fixed income assets. Relative to the benchmark, exposure to High Yield bonds and security selection in Investment Grade bonds contributed to performance, while exposure to Emerging Market bonds and U.S. Treasuries detracted from performance since June 1.
Investment Objective
The investment objective of the Fund is to provide long-term total return and income.
Average Annual Total Returns
as of December 31, 2021
| 1
Year | 5
Year | 10
Year | Share Class
Inception
Date |
Tactical Income Fund Retail Class | -2.01% | 2.86% | 2.66% | 6/30/11 |
Tactical Income Fund Institutional Class | -1.62% | 3.30% | 2.89% | 10/31/16 |
Tactical Income Fund Adviser Class | -1.60% | 3.20% | 2.84% | 10/31/16 |
Bloomberg 1-3 Month U.S. Treasury Bill Index | 0.04% | 1.08% | 0.58% | — |
Bloomberg U.S. Aggregate Bond Index | -1.54% | 3.57% | 2.90% | — |
Top 10 Holdings
as of December 31, 2021
1. | iShares 3-7 Year Treasury Bond ETF | 27.4% |
2. | Vanguard Short-Term Bond ETF | 10.3% |
3. | iShares JP Morgan USD Emerging Markets Bond ETF | 10.0% |
4. | Lord Abbett High Yield Fund | 4.0% |
5. | Frost Total Return Bond Fund - Class I | 3.9% |
6. | Segall Bryant & Hamill Plus Bond Fund - Class I | 3.5% |
7. | DoubleLine Total Return Bond Fund - Class I | 3.5% |
8. | SPDR Bloomberg Barclays Short Term High Yield Bond ETF | 3.5% |
9. | Pioneer Bond Fund - Class K | 3.0% |
10. | iShares 0-5 Year High Yield Corporate Bond ETF | 3.0% |
As a percentage of total net assets. Holdings exclude short-term investments and derivatives.
2021 Annual Report | December 31, 2021 | Page 19 |
Growth of $10,000
as of December 31, 2021
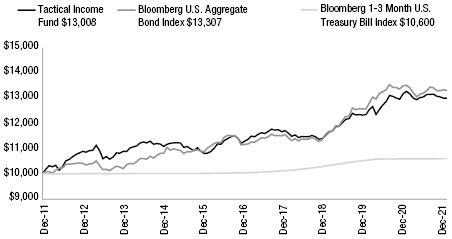
The Growth of $10,000 chart compares the performance of the Fund’s Retail Share Class over the period shown with dividends and capital gains reinvested to the Fund’s benchmarks. Benchmark indices are unmanaged and do not reflect the deduction of expenses associated with a mutual fund, such as investment management and accounting fees.
Investment performance assumes reinvestment of all dividend and capital gain distributions. The results do not reflect the effect of taxes a shareholder would pay on Fund distributions or on the redemption of Fund shares. Historical performance attributed to the Institutional and Adviser Share Classes prior to their inception dates is based on the performance of the Retail Share Class. No adjustment has been made to reflect class-specific distribution or servicing fees. Returns may reflect the effect of voluntary fee waivers or expense reimbursements over the period shown. Without these waivers, performance would have been lower.
The performance data shown represents past performance, which does not guarantee future results. The investment return and principal value of an investment will fluctuate so that an investor’s shares, when redeemed, may be worth more or less than their original cost. Current performance may be lower or higher than the performance data quoted. For current month-end performance data, please visit our website at www.meederfunds.com.
Fixed Income Sector Concentration
as of December 31, 2021
Investment Grade | 32.5% |
U.S. Government | 27.5% |
Cash & Equivalents | 19.6% |
High-Yield | 10.4% |
Emerging Markets | 10.0% |
Total | 100.0% |
As a percentage of total fixed income securities. Concentrations are subject to change.
Page 20 | 2021 Annual Report | December 31, 2021 |
Institutional Prime Money Market Fund
The Meeder Institutional Prime Money Market Fund (the Fund) offers a floating net asset value (FNAV). A FNAV fund is characterized by a net asset value which could vary incrementally above or below $1.00 per share. The objective of this fund is to maintain a FNAV near $1.00 per share while offering competitive returns to shareholders. The adviser to the Fund accomplishes the objective by investing in short-term, high-quality money market debt obligations. Money market debt obligations may be offered by the U.S. Government and its agencies but may also include obligations of fundamentally sound corporate issuers.
Over the years, investors have demonstrated confidence in the money market fund industry because of a couple key features. Safety and liquidity are at the core of money fund investment strategy. Safety is expressed through the selection of investments which are anticipated to provide minimal principal volatility, while liquidity is generated by maintaining ample funds to accommodate investor requests to redeem shares. These attributes would prove important once again as the industry was challenged by an accommodative Federal Open Market Committee’s (FOMC) zero bound interest rate policy.
In 2021, the U.S. economy was on a steady path of recovery but was still faced with headwinds attributed to the Covid-19 pandemic and its variants. This would keep the FOMC on the sideline for the year favoring caution when setting and communicating policy. The stance was proven appropriate as virus variants named Delta and Omicron made their presence felt. But with vaccines in hand (arm), the workforce was more engaged filling job openings in sectors of the economy which were essentially closed the previous year. Consumers continued to showcase their financial health and need for normalcy by traveling, home buying, and welcoming back special events like concerts and festivals. As a result, with every action there is a reaction and, in this case, it would be the emergence of inflation. Supply chain interruptions and businesses struggling with a greater need for workers kick-started the need to raise wages and pay more for goods and services.
By the second half of 2021, market participants were eager to start the conversation surrounding a liftoff from an interest rate target range of 0.00% to 0.25%. It was these conversations and ones which followed that provided for more attractive investment options for money market investment managers. With government securities tied to the actions of the FOMC, high-quality corporate obligations began to offer attractive returns to fund managers. Throughout the year the advisor to the Fund built ample liquidity for opportunities such as this. Investment holdings in the Fund were overweight short-term securities, including but not limited to collateralized obligations. This provided abundant resources for the advisor to deploy assets to high-quality corporate obligations.
During the year, the portfolio management team targeted a weighted average maturity that accommodated the environment. Compliance metrics were well within regulated parameters. This strategy allowed the management team opportunity to alter investments as markets evolved. Currently, we believe the FOMC will start the process of lifting interest rates in 2022 embarking on a new policy cycle which may realize multiple actions throughout the year. We will be monitoring the economy and the FOMC closely for any potential deviations which would alter our strategy. Our sector allocation favors an overweight to high-quality liquid investments which provides the best opportunity to explore investment alternatives in short-term, high-quality corporate debt products without adding undo risk.
As we completed 2021, our belief was that the Fund should be positioned to maintain strong performance into 2022. In the event FOMC policy changes, we believe the portfolio will be positioned to perform in the resulting environment. Going forward we will continuously monitor strategy relative to market opportunities and act in the best interest of our shareholders.
Investment Objective
The investment objective of the Fund is to provide current income consistent with liquidity and the preservation of capital.
Average Annual Total Returns
as of December 31, 2021
| 1
Year | 5
Year | 10
Year |
Institutional Prime Money Market Fund | 0.03% | 1.15% | 0.67% |
Yields
as of December 31, 2021
| | 7-Day
Subsidized
Yield | 7-Day
Unsubsidized
Yield |
Institutional Prime Money Market Fund | 0.05% | -0.30% |
Top 10 Holdings
as of December 31, 2021
1. | South Street Repo, 0.04%, due 1/3/2022 | 10.4% |
2. | StoneX Repo, 0.19%, due 1/3/2022 | 7.2% |
3. | Ebury Finance, LLC, 0.07%, due 1/3/2022 | 4.8% |
4. | South Street Repo, 0.09%, due 1/3/2022 | 3.2% |
5. | Caterpillar Financial Power Investment Floating Rate Demand Note, 0.20% | 2.7% |
6. | Cedar Springs Capital, 0.25%, due 3/21/2022 | 2.4% |
7. | Federated Hermes Government Obligations Fund, 0.03% | 2.0% |
8. | Banco Santander Yankee CD, 0.22%, due 2/7/2022 | 1.6% |
9. | Sumitomo Mitsui Trust Bank LTD/New York, NY Yankee CD, 0.18%, due 2/9/2022 | 1.6% |
10. | MUFG Bank, LTD/New York, NY, 0.09%, due 1/3/2022 | 1.6% |
As a percentage of total net assets.
2021 Annual Report | December 31, 2021 | Page 21 |
Investment performance assumes reinvestment of all dividend and capital gain distributions. The results do not reflect the effect of taxes a shareholder would pay on Fund distributions or on the redemption of Fund shares. The Fund’s performance prior to October 7, 2016 reflects the performance of a predecessor fund, the Institutional Class of the Meeder Prime Money Market Fund, which was distributed and transferred to the Institutional Prime Money Market Fund upon its inception. The subsidized 7-day current yield is the current annualized net yield of the Fund. The unsubsidized 7-day current yield does not reflect the effect of any fee waivers or expense reimbursements made by the Fund’s investment adviser. The 7-day current yield more closely reflects the current earnings of the Fund than total return.
You could lose money by investing in the Fund. Because the share price of the Fund will fluctuate, when you sell your shares they may be worth more or less than what you originally paid for them. The Fund may impose a fee upon sale of your shares or may temporarily suspend your ability to sell shares if the Fund’s liquidity falls below required minimums because of market conditions or other factors. An investment in the Fund is not insured or guaranteed by the Federal Deposit Insurance Corporation or any other government agency. The Fund’s sponsor has no legal obligation to provide financial support to the Fund, and you should not expect that the sponsor will provide financial support to the Fund at any time.
Sector Concentration
as of December 31, 2021
Commercial Paper | 50.9% |
Repurchase Agreements | 21.5% |
Variable Rate Demand Notes | 10.5% |
Corporate Obligations | 7.4% |
Certificates of Deposit | 5.3% |
Money Market Registered Investment Companies | 2.4% |
U.S. Government and Agency Obligations | 1.5% |
Bank Obligations | 0.5% |
Total | 100.0% |
As a percentage of total net assets. Concentrations are subject to change.
Page 22 | 2021 Annual Report | December 31, 2021 |
2021 Annual Report
Fund Holdings & Financial Statements
Schedule of Investments
December 31, 2021
Muirfield Fund |
Security Description | | Shares,
Contracts
or Principal
Amount ($) | | | Fair
Value ($) | |
Common Stocks (United States) — 66.9% |
Communication Services — 5.9% | | | | | | | | |
Activision Blizzard, Inc. | | | 16,161 | | | | 1,075,191 | |
Alphabet, Inc. - Class C (1) | | | 3,949 | | | | 11,426,787 | |
Alphabet, Inc. - Class A (1) | | | 3,583 | | | | 10,380,094 | |
AMC Entertainment Holdings, Inc. (1) | | | 5,331 | | | | 145,003 | |
AT&T, Inc. | | | 333 | | | | 8,192 | |
Audacy, Inc. (1) | | | 8 | | | | 21 | |
Cargurus, Inc. (1) | | | 2,132 | | | | 71,720 | |
Cars.com, Inc. (1) | | | 2,700 | | | | 43,443 | |
Cinemark Holdings, Inc. (1) | | | 4,135 | | | | 66,656 | |
DHI Group, Inc. (1) | | | 3,808 | | | | 23,762 | |
DISH Network Corp. (1) | | | 246 | | | | 7,980 | |
Electronic Arts, Inc. | | | 6,076 | | | | 801,424 | |
Emerald Holding, Inc. (1) | | | 8 | | | | 32 | |
Entravision Communications Corp. | | | 1,882 | | | | 12,760 | |
Fox Corp. | | | 250 | | | | 9,225 | |
Gannett Co., Inc. (1) | | | 48 | | | | 256 | |
Globalstar, Inc. (1) | | | 43 | | | | 50 | |
Gogo, Inc. (1) | | | 772 | | | | 10,445 | |
Gray Television, Inc. | | | 3,165 | | | | 63,806 | |
IDT Corp. (1) | | | 466 | | | | 20,579 | |
iHeartMedia, Inc. (1) | | | 47 | | | | 989 | |
IMAX Corp. (1) | | | 1,294 | | | | 23,085 | |
Integral Ad Science Holding Corp. (1) | | | 909 | | | | 20,189 | |
Interpublic Group of Cos., Inc./The | | | 24,019 | | | | 899,512 | |
Liberty Latin America, Ltd. - Class A (1) | | | 3 | | | | 35 | |
Liberty Latin America, Ltd. - Class C (1) | | | 1 | | | | 11 | |
Liberty Media Corp.-Liberty Braves - Class A (1) | | | 1,445 | | | | 41,544 | |
Liberty Media Corp.-Liberty Braves - Class C (1) | | | 2,825 | | | | 79,383 | |
Liberty TripAdvisor Holdings, Inc. (1) | | | 8,364 | | | | 18,150 | |
Lions Gate Entertainment Corp. (1) | | | 3,995 | | | | 66,477 | |
Live Nation Entertainment, Inc. (1) | | | 578 | | | | 69,181 | |
LiveOne, Inc. (1) | | | 32 | | | | 41 | |
Lumen Technologies, Inc. | | | 10 | | | | 126 | |
Meta Platforms, Inc. (1) | | | 26,523 | | | | 8,921,011 | |
Netflix, Inc. (1) | | | 4,998 | | | | 3,010,995 | |
News Corp. | | | 2,658 | | | | 59,300 | |
Nexstar Media Group, Inc. | | | 15 | | | | 2,265 | |
Outbrain, Inc. (1) | | | 21 | | | | 294 | |
Pinterest, Inc. (1) | | | 1,117 | | | | 40,603 | |
Playtika Holding Corp. (1) | | | 3 | | | | 52 | |
Roku, Inc. (1) | | | 485 | | | | 110,677 | |
Sinclair Broadcast Group, Inc. | | | 1,522 | | | | 40,226 | |
TEGNA, Inc. | | | 4,421 | | | | 82,054 | |
Muirfield Fund |
Security Description | | Shares,
Contracts
or Principal
Amount ($) | | | Fair
Value ($) | |
Common Stocks (United States) — continued |
Thryv Holdings, Inc. (1) | | | 15 | | | | 617 | |
Twitter, Inc. (1) | | | 10,589 | | | | 457,657 | |
Verizon Communications, Inc. | | | 64,647 | | | | 3,359,058 | |
Vimeo, Inc. (1) | | | 2 | | | | 36 | |
WideOpenWest, Inc. (1) | | | 5,688 | | | | 122,406 | |
World Wrestling Entertainment, Inc. | | | 1,054 | | | | 52,004 | |
Yelp, Inc. (1) | | | 4,712 | | | | 170,763 | |
Ziff Davis, Inc. (1) | | | 4,871 | | | | 539,999 | |
| | | | | | | | 42,356,166 | |
| | | | | | | | | |
Consumer Discretionary — 7.4% | | | | | | | | |
Abercrombie & Fitch Co. (1) | | | 871 | | | | 30,337 | |
Academy Sports & Outdoors, Inc. (1) | | | 3,874 | | | | 170,069 | |
Adient PLC (1) | | | 1,317 | | | | 63,058 | |
Amazon.com, Inc. (1) | | | 4,022 | | | | 13,410,715 | |
American Axle & Manufacturing Holdings, Inc. (1) | | | 2,692 | | | | 25,116 | |
American Eagle Outfitters, Inc. | | | 1,683 | | | | 42,614 | |
Aptiv PLC (1) | | | 1,001 | | | | 165,115 | |
Aramark | | | 6,659 | | | | 245,384 | |
Asbury Automotive Group, Inc. (1) | | | 788 | | | | 136,111 | |
AutoNation, Inc. (1) | | | 866 | | | | 101,192 | |
AutoZone, Inc. (1) | | | 543 | | | | 1,138,340 | |
Barnes & Noble Education, Inc. (1) | | | 1 | | | | 7 | |
Bath & Body Works, Inc. | | | 1,639 | | | | 114,386 | |
Best Buy Co., Inc. | | | 5,782 | | | | 587,451 | |
Big 5 Sporting Goods Corp. (2) | | | 1,144 | | | | 21,747 | |
Big Lots, Inc. | | | 1,331 | | | | 59,962 | |
Biglari Holdings, Inc. (1) | | | 106 | | | | 15,112 | |
Boyd Gaming Corp. (1) | | | 3,123 | | | | 204,775 | |
Brinker International, Inc. (1) | | | 1,189 | | | | 43,506 | |
Buckle, Inc./The | | | 2 | | | | 85 | |
Caleres, Inc. | | | 1,221 | | | | 27,692 | |
Capri Holdings, Ltd. (1) | | | 3,570 | | | | 231,729 | |
Carriage Services, Inc. | | | 6 | | | | 387 | |
Cato Corp./The | | | 8 | | | | 137 | |
Cavco Industries, Inc. (1) | | | 1 | | | | 318 | |
Century Communities, Inc. | | | 2 | | | | 164 | |
Chico’s FAS, Inc. (1) | | | 295 | | | | 1,587 | |
Clarus Corp. | | | 15 | | | | 416 | |
Conn’s, Inc. (1) | | | 243 | | | | 5,715 | |
Container Store Group, Inc./The (1) | | | 66 | | | | 659 | |
Crocs, Inc. (1) | | | 3,473 | | | | 445,308 | |
Dana, Inc. | | | 4,876 | | | | 111,270 | |
Designer Brands, Inc. (1) | | | 1,028 | | | | 14,608 | |
Dick’s Sporting Goods, Inc. | | | 3,654 | | | | 420,173 | |
The accompanying notes are an integral part of these financial statements.
Page 24 | 2021 Annual Report | December 31, 2021 |
Schedule of Investments
December 31, 2021
Muirfield Fund |
Security Description | | Shares,
Contracts
or Principal
Amount ($) | | | Fair
Value ($) | |
Common Stocks (United States) — continued |
Dollar Tree, Inc. (1) | | | 989 | | | | 138,974 | |
Drive Shack, Inc. (1) | | | 11 | | | | 16 | |
eBay, Inc. | | | 8,726 | | | | 580,279 | |
Ethan Allen Interiors, Inc. | | | 34 | | | | 894 | |
Etsy, Inc. (1) | | | 596 | | | | 130,488 | |
Everi Holdings, Inc. (1) | | | 4,402 | | | | 93,983 | |
Fisker, Inc. (1) | | | 3 | | | | 47 | |
Flexsteel Industries, Inc. | | | 4 | | | | 107 | |
Foot Locker, Inc. | | | 5,761 | | | | 251,352 | |
Ford Motor Co. | | | 43,803 | | | | 909,788 | |
Fossil Group, Inc. (1) | | | 1,196 | | | | 12,307 | |
GameStop Corp. (1) | | | 618 | | | | 91,705 | |
Gap, Inc./The | | | 2,651 | | | | 46,790 | |
Garmin, Ltd. | | | 10,336 | | | | 1,407,453 | |
General Motors Co. (1) | | | 16,729 | | | | 980,821 | |
Genesco, Inc. (1) | | | 2 | | | | 128 | |
Genius Brands International, Inc. (1) | | | 1,129 | | | | 1,185 | |
Gentherm, Inc. (1) | | | 1 | | | | 87 | |
Golden Entertainment, Inc. (1) | | | 21 | | | | 1,061 | |
Goodyear Tire & Rubber Co./The (1) | | | 6,327 | | | | 134,892 | |
GoPro, Inc. (1) | | | 9 | | | | 93 | |
Greenlane Holdings, Inc. (1) | | | 4,051 | | | | 3,906 | |
Group 1 Automotive, Inc. | | | 319 | | | | 62,275 | |
Guess?, Inc. | | | 2,630 | | | | 62,278 | |
Harley-Davidson, Inc. | | | 1 | | | | 38 | |
Hibbett, Inc. | | | 547 | | | | 39,346 | |
Home Depot, Inc./The | | | 16,692 | | | | 6,927,347 | |
Houghton Mifflin Harcourt Co. (1) | | | 1,171 | | | | 18,853 | |
Hovnanian Enterprises, Inc. (1) | | | 10 | | | | 1,273 | |
International Game Technology PLC | | | 11,233 | | | | 324,746 | |
JOANN, Inc. | | | 641 | | | | 6,654 | |
Kohl’s Corp. | | | 6,929 | | | | 342,223 | |
Kura Sushi USA, Inc. (1) | | | 4 | | | | 323 | |
Lands’ End, Inc. (1) | | | 1,028 | | | | 20,180 | |
Lazydays Holdings, Inc. (1) | | | 18 | | | | 388 | |
Lear Corp. | | | 1,366 | | | | 249,910 | |
Legacy Housing Corp. (1) | | | 1 | | | | 26 | |
Lifetime Brands, Inc. | | | 5 | | | | 80 | |
Liquidity Services, Inc. (1) | | | 377 | | | | 8,324 | |
LKQ Corp. | | | 552 | | | | 33,137 | |
Lovesac Co./The (1) | | | 327 | | | | 21,667 | |
Lowe’s Cos., Inc. | | | 17,637 | | | | 4,558,812 | |
Lululemon Athletica, Inc. (1) | | | 1,254 | | | | 490,878 | |
Macy’s, Inc. | | | 4,516 | | | | 118,229 | |
MGM Resorts International | | | 7,730 | | | | 346,922 | |
Movado Group, Inc. | | | 23 | | | | 962 | |
Muirfield Fund |
Security Description | | Shares,
Contracts
or Principal
Amount ($) | | | Fair
Value ($) | |
Common Stocks (United States) — continued |
Murphy USA, Inc. | | | 1,322 | | | | 263,395 | |
Newell Brands, Inc. | | | 4 | | | | 87 | |
Nordstrom, Inc. (1) | | | 1,476 | | | | 33,387 | |
ODP Corp./The (1) | | | 1,135 | | | | 44,583 | |
ONE Group Hospitality, Inc./The (1) | | | 2 | | | | 25 | |
OneWater Marine, Inc. | | | 2,429 | | | | 148,096 | |
O’Reilly Automotive, Inc. (1) | | | 2,293 | | | | 1,619,385 | |
Overstock.com, Inc. (1) | | | 45 | | | | 2,655 | |
Party City Holdco, Inc. (1) | | | 7,551 | | | | 42,059 | |
Penn National Gaming, Inc. (1) | | | 245 | | | | 12,703 | |
Penske Automotive Group, Inc. | | | 449 | | | | 48,142 | |
Perdoceo Education Corp. (1) | | | 8 | | | | 94 | |
Qurate Retail, Inc. | | | 9,361 | | | | 71,144 | |
RCI Hospitality Holdings, Inc. | | | 392 | | | | 30,529 | |
Red Robin Gourmet Burgers, Inc. (1) | | | 3,432 | | | | 56,731 | |
Red Rock Resorts, Inc. | | | 2,628 | | | | 144,566 | |
Revolve Group, Inc. (1) | | | 2,708 | | | | 151,756 | |
Sally Beauty Holdings, Inc. (1) | | | 1 | | | | 18 | |
Scientific Games Corp. (1) | | | 1,541 | | | | 102,985 | |
SeaWorld Entertainment, Inc. (1) | | | 1,210 | | | | 78,481 | |
Shoe Carnival, Inc. | | | 2 | | | | 78 | |
Shutterstock, Inc. | | | 1,470 | | | | 162,994 | |
Signet Jewelers, Ltd. | | | 189 | | | | 16,449 | |
Skyline Champion Corp. (1) | | | 1,154 | | | | 91,143 | |
Smith & Wesson Brands, Inc. | | | 3,137 | | | | 55,839 | |
Sonos, Inc. (1) | | | 10,545 | | | | 314,241 | |
Steven Madden, Ltd. | | | 3,743 | | | | 173,937 | |
StoneMor, Inc. (1) | | | 2 | | | | 5 | |
Tapestry, Inc. | | | 7,221 | | | | 293,173 | |
Target Corp. | | | 7,017 | | | | 1,624,014 | |
Target Hospitality Corp. (1) | | | 20 | | | | 71 | |
Tempur Sealy International, Inc. | | | 2,655 | | | | 124,865 | |
Tenneco, Inc. (1) | | | 5,612 | | | | 63,416 | |
Terminix Global Holdings, Inc. (1) | | | 2 | | | | 90 | |
Tesla, Inc. (1) | | | 8,973 | | | | 9,482,487 | |
Thor Industries, Inc. | | | 2,779 | | | | 288,377 | |
Tilly’s, Inc. | | | 10 | | | | 161 | |
TopBuild Corp. (1) | | | 1 | | | | 276 | |
Town Sports International Holdings, Inc. (1) | | | 4,613 | | | | 2 | |
Tractor Supply Co. | | | 1 | | | | 239 | |
Tupperware Brands Corp. (1) | | | 1,570 | | | | 24,005 | |
Ulta Beauty, Inc. (1) | | | 464 | | | | 191,326 | |
Urban Outfitters, Inc. (1) | | | 1,106 | | | | 32,472 | |
Vera Bradley, Inc. (1) | | | 18 | | | | 153 | |
Vista Outdoor, Inc. (1) | | | 321 | | | | 14,788 | |
Waitr Holdings, Inc. (1) | | | 4,213 | | | | 3,118 | |
The accompanying notes are an integral part of these financial statements.
2021 Annual Report | December 31, 2021 | Page 25 |
Schedule of Investments
December 31, 2021
Muirfield Fund |
Security Description | | Shares,
Contracts
or Principal
Amount ($) | | | Fair
Value ($) | |
Common Stocks (United States) — continued |
Weber, Inc. | | | 5,744 | | | | 74,270 | |
Williams-Sonoma, Inc. | | | 1,677 | | | | 283,631 | |
Winnebago Industries, Inc. | | | 7,732 | | | | 579,281 | |
XPEL, Inc. (1) | | | 418 | | | | 28,541 | |
| | | | | | | | 53,030,735 | |
| | | | | | | | | |
Consumer Staples — 2.0% | | | | | | | | |
Albertsons Cos., Inc. | | | 22,234 | | | | 671,244 | |
BJ’s Wholesale Club Holdings, Inc. (1) | | | 30 | | | | 2,009 | |
Bunge, Ltd. | | | 36,297 | | | | 3,388,688 | |
Celsius Holdings, Inc. (1) | | | 304 | | | | 22,669 | |
Coca-Cola Co./The | | | 23,359 | | | | 1,383,086 | |
Coca-Cola Consolidated, Inc. | | | 1 | | | | 619 | |
Costco Wholesale Corp. | | | 5,050 | | | | 2,866,885 | |
Coty, Inc. (1) | | | 3 | | | | 32 | |
Darling Ingredients, Inc. (1) | | | 549 | | | | 38,040 | |
Fresh Del Monte Produce, Inc. | | | 451 | | | | 12,448 | |
General Mills, Inc. | | | 1,616 | | | | 108,886 | |
Hershey Co./The | | | 14,452 | | | | 2,796,028 | |
Hostess Brands, Inc. (1) | | | 2 | | | | 41 | |
Ingles Markets, Inc. | | | 182 | | | | 15,714 | |
Kroger Co./The | | | 1 | | | | 45 | |
NewAge, Inc. (1) | | | 14 | | | | 14 | |
PepsiCo, Inc. | | | 12,368 | | | | 2,148,445 | |
Pilgrim’s Pride Corp. (1) | | | 17 | | | | 479 | |
Rite Aid Corp. (1) | | | 1 | | | | 15 | |
Simply Good Foods Co./The (1) | | | 2,573 | | | | 106,960 | |
SpartanNash Co. | | | 1 | | | | 26 | |
Spectrum Brands Holdings, Inc. | | | 1,741 | | | | 177,095 | |
Tyson Foods, Inc. | | | 4,157 | | | | 362,324 | |
Walgreens Boots Alliance, Inc. | | | 4,104 | | | | 214,065 | |
Walmart, Inc. | | | 1,999 | | | | 289,235 | |
| | | | | | | | 14,605,092 | |
| | | | | | | | | |
Energy — 2.4% | | | | | | | | |
Alto Ingredients, Inc. (1) | | | 706 | | | | 3,396 | |
Altus Midstream Co. | | | 264 | | | | 16,186 | |
Amplify Energy Corp. (1) | | | 9 | | | | 28 | |
Antero Midstream Corp. | | | 50 | | | | 484 | |
Antero Resources Corp. (1) | | | 1,231 | | | | 21,543 | |
APA Corp. | | | 7,418 | | | | 199,470 | |
Ardmore Shipping Corp. (1) | | | 2,145 | | | | 7,250 | |
Berry Corp. | | | 2,368 | | | | 19,939 | |
Bristow Group, Inc. (1) | | | 510 | | | | 16,152 | |
Cactus, Inc. | | | 1,649 | | | | 62,876 | |
California Resources Corp. | | | 10 | | | | 427 | |
Muirfield Fund |
Security Description | | Shares,
Contracts
or Principal
Amount ($) | | | Fair
Value ($) | |
Common Stocks (United States) — continued |
Cheniere Energy, Inc. | | | 113 | | | | 11,460 | |
Chevron Corp. | | | 25,684 | | | | 3,014,017 | |
CNX Resources Corp. (1) | | | 13 | | | | 179 | |
Comstock Resources, Inc. (1) | | | 65 | | | | 526 | |
ConocoPhillips | | | 16,982 | | | | 1,225,761 | |
CONSOL Energy, Inc. (1) | | | 4 | | | | 91 | |
Coterra Energy, Inc. | | | 16 | | | | 304 | |
Crescent Energy, Inc. (1) | | | 1 | | | | 13 | |
CVR Energy, Inc. | | | 113 | | | | 1,900 | |
Delek US Holdings, Inc. (1) | | | 5,848 | | | | 87,662 | |
Denbury, Inc. (1) | | | 6 | | | | 460 | |
Devon Energy Corp. | | | 14,147 | | | | 623,175 | |
DHT Holdings, Inc. | | | 2,371 | | | | 12,305 | |
Diamondback Energy, Inc. | | | 2,560 | | | | 276,096 | |
Dorian LPG, Ltd. | | | 11 | | | | 140 | |
DT Midstream, Inc. | | | 21 | | | | 1,008 | |
Energy Fuels, Inc./Canada (1) | | | 41 | | | | 313 | |
EOG Resources, Inc. | | | 6,570 | | | | 583,613 | |
Expro Group Holdings NV (1) | | | 1,366 | | | | 19,602 | |
Exxon Mobil Corp. | | | 64,997 | | | | 3,977,166 | |
Falcon Minerals Corp. | | | 29 | | | | 141 | |
Frontline, Ltd./Bermuda (1) | | | 10 | | | | 71 | |
FTS International, Inc. (1) | | | 5 | | | | 131 | |
Golar LNG, Ltd. (1) | | | 10 | | | | 124 | |
Hess Corp. | | | 2,449 | | | | 181,299 | |
HollyFrontier Corp. | | | 36 | | | | 1,180 | |
Kinder Morgan, Inc. | | | 25 | | | | 397 | |
Kosmos Energy, Ltd. (1) | | | 30 | | | | 104 | |
Laredo Petroleum, Inc. (1) | | | 273 | | | | 16,415 | |
Magnolia Oil & Gas Corp. | | | 1 | | | | 19 | |
Marathon Oil Corp. | | | 3 | | | | 49 | |
Marathon Petroleum Corp. | | | 34,583 | | | | 2,212,966 | |
Nabors Industries, Ltd. (1) | | | 825 | | | | 66,899 | |
Newpark Resources, Inc. (1) | | | 9 | | | | 26 | |
NextDecade Corp. (1) | | | 2,035 | | | | 5,800 | |
NexTier Oilfield Solutions, Inc. (1) | | | 15 | | | | 53 | |
Nine Energy Service, Inc. (1) | | | 9,485 | | | | 9,485 | |
Nordic American Tankers, Ltd. | | | 18 | | | | 30 | |
Northern Oil and Gas, Inc. | | | 592 | | | | 12,183 | |
Occidental Petroleum Corp. | | | 29,718 | | | | 861,525 | |
Oceaneering International, Inc. (1) | | | 5,044 | | | | 57,048 | |
ONEOK, Inc. | | | 18,615 | | | | 1,093,817 | |
Ovintiv, Inc. | | | 4,837 | | | | 163,007 | |
Par Pacific Holdings, Inc. (1) | | | 15 | | | | 247 | |
Patterson-UTI Energy, Inc. | | | 2 | | | | 17 | |
Peabody Energy Corp. (1) | | | 2,650 | | | | 26,686 | |
The accompanying notes are an integral part of these financial statements.
Page 26 | 2021 Annual Report | December 31, 2021 |
Schedule of Investments
December 31, 2021
Muirfield Fund |
Security Description | | Shares,
Contracts
or Principal
Amount ($) | | | Fair
Value ($) | |
Common Stocks (United States) — continued |
Phillips 66 | | | 10,082 | | | | 730,542 | |
Pioneer Natural Resources Co. | | | 1,173 | | | | 213,345 | |
Profire Energy, Inc. (1) | | | 59 | | | | 63 | |
Range Resources Corp. (1) | | | 1,124 | | | | 20,041 | |
REX American Resources Corp. (1) | | | 1 | | | | 96 | |
Schlumberger NV | | | 18,642 | | | | 558,328 | |
SCorp.io Tankers, Inc. | | | 830 | | | | 10,632 | |
SFL Corp., Ltd. | | | 19 | | | | 155 | |
SM Energy Co. | | | 2,445 | | | | 72,079 | |
Southwestern Energy Co. (1) | | | 11,390 | | | | 53,077 | |
Talos Energy, Inc. (1) | | | 2,767 | | | | 27,117 | |
Targa Resources Corp. | | | 2,252 | | | | 117,644 | |
Teekay Corp. (1) | | | 3,592 | | | | 11,279 | |
Teekay Tankers, Ltd. (1) | | | 922 | | | | 10,050 | |
Tellurian, Inc. (1) | | | 9 | | | | 28 | |
TETRA Technologies, Inc. (1) | | | 27 | | | | 77 | |
Uranium Energy Corp. (1) | | | 1,185 | | | | 3,970 | |
Ur-Energy, Inc. (1) | | | 29 | | | | 35 | |
Valero Energy Corp. | | | 4,105 | | | | 308,327 | |
W&T Offshore, Inc. (1) | | | 747 | | | | 2,413 | |
Whiting Petroleum Corp. (1) | | | 1 | | | | 65 | |
Williams Cos., Inc./The | | | 1 | | | | 26 | |
World Fuel Services Corp. | | | 2,956 | | | | 78,245 | |
| | | | | | | | 17,110,895 | |
| | | | | | | | | |
Financials — 8.0% | | | | | | | | |
Affiliated Managers Group, Inc. | | | 1,173 | | | | 192,970 | |
Aflac, Inc. | | | 3,677 | | | | 214,700 | |
Alerus Financial Corp. | | | 1 | | | | 29 | |
Allstate Corp./The | | | 21,049 | | | | 2,476,415 | |
Ally Financial, Inc. | | | 4,051 | | | | 192,868 | |
American Express Co. | | | 1,748 | | | | 285,973 | |
American Financial Group, Inc./OH | | | 2,414 | | | | 331,490 | |
American International Group, Inc. | | | 67,342 | | | | 3,829,066 | |
American National Insurance Co. (1) | | | 341 | | | | 64,394 | |
Ameris BanCorp. | | | 3,426 | | | | 170,204 | |
Arch Capital Group, Ltd. (1) | | | 1 | | | | 44 | |
Ares Commercial Real Estate Corp. | | | 7 | | | | 102 | |
Argo Group International Holdings, Ltd. | | | 1 | | | | 58 | |
Assurant, Inc. | | | 1 | | | | 156 | |
Athene Holding, Ltd. (1) | | | 19,402 | | | | 1,616,769 | |
Atlanticus Holdings Corp. (1) | | | 129 | | | | 9,200 | |
BanCorp, Inc./The (1) | | | 5 | | | | 127 | |
Bank of America Corp. | | | 77,398 | | | | 3,443,437 | |
Bank of New York Mellon Corp./The | | | 17,080 | | | | 992,006 | |
Bank OZK | | | 1,888 | | | | 87,849 | |
Muirfield Fund |
Security Description | | Shares,
Contracts
or Principal
Amount ($) | | | Fair
Value ($) | |
Common Stocks (United States) — continued |
Berkshire Hathaway, Inc. (1) | | | 21,949 | | | | 6,562,751 | |
Berkshire Hills BanCorp., Inc. | | | 3 | | | | 85 | |
BGC Partners, Inc. | | | 1,329 | | | | 6,180 | |
Blackstone, Inc. | | | 10,985 | | | | 1,421,349 | |
Blue Ridge Bankshares, Inc. | | | 27 | | | | 483 | |
Bridgewater Bancshares, Inc. (1) | | | 2 | | | | 35 | |
Brighthouse Financial, Inc. (1) | | | 2,235 | | | | 115,773 | |
Brightsphere Investment Group, Inc. | | | 1 | | | | 26 | |
Byline BanCorp., Inc. | | | 15 | | | | 410 | |
Cambridge BanCorp. | | | 1 | | | | 94 | |
Capital BanCorp., Inc. | | | 246 | | | | 6,445 | |
Capital One Financial Corp. | | | 8,931 | | | | 1,295,799 | |
Capstar Financial Holdings, Inc. | | | 12 | | | | 252 | |
Carlyle Group, Inc./The | | | 23 | | | | 1,263 | |
Charles Schwab Corp./The | | | 19,234 | | | | 1,617,579 | |
Chimera Investment Corp. | | | 49,306 | | | | 743,534 | |
Chubb, Ltd. | | | 3 | | | | 580 | |
CIT Group, Inc. | | | 2,049 | | | | 105,196 | |
Citigroup, Inc. | | | 22,533 | | | | 1,360,768 | |
Citizens Financial Group, Inc. | | | 7,232 | | | | 341,712 | |
Civista Bancshares, Inc. | | | 1,275 | | | | 31,110 | |
CNA Financial Corp. | | | 3 | | | | 132 | |
CNO Financial Group, Inc. | | | 1 | | | | 24 | |
Cohen & Steers, Inc. | | | 1 | | | | 93 | |
Comerica, Inc. | | | 586 | | | | 50,982 | |
Curo Group Holdings Corp. | | | 3,141 | | | | 50,287 | |
Diamond Hill Investment Group, Inc. | | | 1 | | | | 194 | |
East West BanCorp., Inc. | | | 5,414 | | | | 425,974 | |
Ellington Financial, Inc. | | | 13,923 | | | | 237,944 | |
Enstar Group, Ltd. (1) | | | 1 | | | | 248 | |
Equity Bancshares, Inc. | | | 11 | | | | 373 | |
Evercore, Inc. | | | 4,914 | | | | 667,567 | |
Everest Re Group, Ltd. | | | 1 | | | | 274 | |
Fidelity National Financial, Inc. | | | 44,116 | | | | 2,301,973 | |
Fifth Third BanCorp. | | | 21,939 | | | | 955,443 | |
Financial Institutions, Inc. | | | 5 | | | | 159 | |
First American Financial Corp. | | | 21,291 | | | | 1,665,595 | |
First BanCorp./Puerto Rico | | | 47 | | | | 648 | |
First Bank/Hamilton NJ | | | 7 | | | | 102 | |
First Community Bankshares, Inc. | | | 5 | | | | 167 | |
Five Star BanCorp. | | | 1 | | | | 30 | |
Flagstar BanCorp., Inc. | | | 1 | | | | 48 | |
FS BanCorp., Inc. | | | 3 | | | | 101 | |
GAMCO Investors, Inc. | | | 3 | | | | 75 | |
Genworth Financial, Inc. (1) | | | 26 | | | | 105 | |
Goldman Sachs Group, Inc./The | | | 294 | | | | 112,470 | |
The accompanying notes are an integral part of these financial statements.
2021 Annual Report | December 31, 2021 | Page 27 |
Schedule of Investments
December 31, 2021
Muirfield Fund |
Security Description | | Shares,
Contracts
or Principal
Amount ($) | | | Fair
Value ($) | |
Common Stocks (United States) — continued |
Great Western BanCorp., Inc. | | | 2 | | | | 68 | |
Hancock Whitney Corp. | | | 2,115 | | | | 105,792 | |
Hanmi Financial Corp. | | | 11 | | | | 260 | |
Hanover Insurance Group, Inc./The | | | 1 | | | | 131 | |
HarborOne BanCorp., Inc. | | | 22 | | | | 326 | |
Hartford Financial Services Group, Inc./The | | | 5,375 | | | | 371,090 | |
HBT Financial, Inc. | | | 1 | | | | 19 | |
Home BanCorp., Inc. | | | 4 | | | | 166 | |
HomeTrust Bancshares, Inc. | | | 1 | | | | 31 | |
Invesco, Ltd. | | | 9,836 | | | | 226,425 | |
Investors BanCorp., Inc. | | | 1 | | | | 15 | |
Investors Title Co. | | | 1 | | | | 197 | |
Janus Henderson Group PLC | | | 4,678 | | | | 196,195 | |
Jefferies Financial Group, Inc. | | | 3,403 | | | | 132,036 | |
JPMorgan Chase & Co. | | | 19,193 | | | | 3,039,212 | |
Kearny Financial Corp./MD | | | 6 | | | | 80 | |
KeyCorp. | | | 3 | | | | 69 | |
KKR & Co., Inc. | | | 14,074 | | | | 1,048,513 | |
LendingClub Corp. (1) | | | 1,381 | | | | 33,393 | |
Lincoln National Corp. | | | 5 | | | | 341 | |
Loews Corp. | | | 1 | | | | 58 | |
Luther Burbank Corp. | | | 6 | | | | 84 | |
Maiden Holdings, Ltd. (1) | | | 61 | | | | 187 | |
Marlin Business Services Corp. | | | 2,308 | | | | 53,730 | |
Marsh & McLennan Cos., Inc. | | | 7,133 | | | | 1,239,858 | |
MBIA, Inc. (1) | | | 1,925 | | | | 30,396 | |
Medley Management, Inc. (1) | | | 235 | | | | 2 | |
Merchants BanCorp./IN | | | 3 | | | | 142 | |
Meta Financial Group, Inc. | | | 1,943 | | | | 115,919 | |
MetLife, Inc. | | | 16,911 | | | | 1,056,768 | |
Metrocity Bankshares, Inc. | | | 5 | | | | 138 | |
Metropolitan Bank Holding Corp. (1) | | | 4 | | | | 426 | |
MFA Financial, Inc. | | | 33 | | | | 150 | |
MGIC Investment Corp. | | | 4 | | | | 58 | |
Moelis & Co. | | | 4,983 | | | | 311,487 | |
Morgan Stanley | | | 27,162 | | | | 2,666,222 | |
Mr Cooper Group, Inc. (1) | | | 1,667 | | | | 69,364 | |
MVB Financial Corp. | | | 5 | | | | 208 | |
New Residential Investment Corp. | | | 3 | | | | 32 | |
New York Mortgage Trust, Inc. | | | 27 | | | | 100 | |
Northfield BanCorp., Inc. | | | 13 | | | | 210 | |
Northrim BanCorp., Inc. | | | 3,140 | | | | 136,464 | |
Old Republic International Corp. | | | 105 | | | | 2,581 | |
OneMain Holdings, Inc. | | | 3,080 | | | | 154,123 | |
PacWest BanCorp. | | | 4,000 | | | | 180,680 | |
Pinnacle Financial Partners, Inc. | | | 222 | | | | 21,201 | |
Muirfield Fund |
Security Description | | Shares,
Contracts
or Principal
Amount ($) | | | Fair
Value ($) | |
Common Stocks (United States) — continued |
Pioneer BanCorp., Inc./NY (1) | | | 2 | | | | 23 | |
Piper Sandler Cos. | | | 947 | | | | 169,049 | |
PNC Financial Services Group, Inc./The | | | 3,350 | | | | 671,742 | |
Popular, Inc. | | | 3,075 | | | | 252,273 | |
Premier Financial Corp. | | | 1 | | | | 31 | |
Provident BanCorp., Inc. | | | 10 | | | | 186 | |
Provident Financial Services, Inc. | | | 10 | | | | 242 | |
Prudential Financial, Inc. | | | 4,976 | | | | 538,602 | |
Pzena Investment Management, Inc. | | | 7,983 | | | | 75,599 | |
QCR Holdings, Inc. | | | 1 | | | | 56 | |
Raymond James Financial, Inc. | | | 1,757 | | | | 176,403 | |
RBB BanCorp. | | | 6,287 | | | | 164,719 | |
Redwood Trust, Inc. | | | 4,699 | | | | 61,980 | |
Regional Management Corp. | | | 10 | | | | 575 | |
Regions Financial Corp. | | | 32,846 | | | | 716,043 | |
Rocket Cos., Inc. | | | 3 | | | | 42 | |
Safety Insurance Group, Inc. | | | 1 | | | | 85 | |
Santander Consumer USA Holdings, Inc. | | | 8,221 | | | | 345,446 | |
Sculptor Capital Management, Inc. | | | 49 | | | | 1,046 | |
Siebert Financial Corp. (1) | | | 993 | | | | 2,304 | |
Signature Bank/New York NY | | | 927 | | | | 299,857 | |
Silvercrest Asset Management Group, Inc. | | | 129 | | | | 2,215 | |
Simmons First National Corp. | | | 1 | | | | 30 | |
SLM Corp. | | | 12,530 | | | | 246,465 | |
SmartFinancial, Inc. | | | 6 | | | | 164 | |
South Plains Financial, Inc. | | | 7 | | | | 195 | |
Southern First Bancshares, Inc. (1) | | | 3 | | | | 187 | |
Southern Missouri BanCorp., Inc. | | | 2 | | | | 104 | |
Spirit of Texas Bancshares, Inc. | | | 8 | | | | 230 | |
StepStone Group, Inc. | | | 862 | | | | 35,833 | |
Stewart Information Services Corp. | | | 13,930 | | | | 1,110,639 | |
Summit Financial Group, Inc. | | | 2 | | | | 55 | |
SVB Financial Group (1) | | | 403 | | | | 273,331 | |
Synchrony Financial | | | 29,524 | | | | 1,369,618 | |
Synovus Financial Corp. | | | 1,518 | | | | 72,667 | |
Tiptree, Inc. | | | 258 | | | | 3,568 | |
Towne Bank/Portsmouth VA | | | 8 | | | | 253 | |
Travelers Cos., Inc./The | | | 3 | | | | 469 | |
Truist Financial Corp. | | | 13,277 | | | | 777,368 | |
Umpqua Holdings Corp. | | | 18,473 | | | | 355,421 | |
Universal Insurance Holdings, Inc. | | | 1 | | | | 17 | |
Upstart Holdings, Inc. (1) | | | 416 | | | | 62,941 | |
US BanCorp. | | | 18,861 | | | | 1,059,422 | |
Value Line, Inc. | | | 1 | | | | 47 | |
Velocity Financial, Inc. (1) | | | 10 | | | | 137 | |
Virtus Investment Partners, Inc. | | | 1 | | | | 297 | |
The accompanying notes are an integral part of these financial statements.
Page 28 | 2021 Annual Report | December 31, 2021 |
Schedule of Investments
December 31, 2021
Muirfield Fund |
Security Description | | Shares,
Contracts
or Principal
Amount ($) | | | Fair
Value ($) | |
Common Stocks (United States) — continued |
Walker & Dunlop, Inc. | | | 3,075 | | | | 463,956 | |
Washington Federal, Inc. | | | 2 | | | | 67 | |
Wells Fargo & Co. | | | 44,760 | | | | 2,147,585 | |
West BanCorp., Inc. | | | 4 | | | | 124 | |
Western Alliance BanCorp. | | | 1,529 | | | | 164,597 | |
Zions BanCorp. NA | | | 9,426 | | | | 595,346 | |
| | | | | | | | 57,404,887 | |
| | | | | | | | | |
Healthcare — 12.5% | | | | | | | | |
89bio, Inc. (1) | | | 6 | | | | 78 | |
Abbott Laboratories | | | 2,576 | | | | 362,546 | |
AbbVie, Inc. | | | 47,152 | | | | 6,384,381 | |
Abeona Therapeutics, Inc. (1) | | | 1,696 | | | | 572 | |
ADMA Biologics, Inc. (1) | | | 658 | | | | 928 | |
Adverum Biotechnologies, Inc. (1) | | | 24 | | | | 42 | |
Aeglea BioTherapeutics, Inc. (1) | | | 7 | | | | 33 | |
Affimed NV (1) | | | 3,391 | | | | 18,718 | |
Agenus, Inc. (1) | | | 13 | | | | 42 | |
Agilent Technologies, Inc. | | | 12,855 | | | | 2,052,301 | |
Agiliti, Inc. (1) | | | 333 | | | | 7,712 | |
Akebia Therapeutics, Inc. (1) | | | 18 | | | | 41 | |
Akoya Biosciences, Inc. (1) | | | 3 | | | | 46 | |
Alector, Inc. (1) | | | 608 | | | | 12,555 | |
Alkermes PLC (1) | | | 4,209 | | | | 97,901 | |
Allakos, Inc. (1) | | | 717 | | | | 7,019 | |
Alnylam Pharmaceuticals, Inc. (1) | | | 1,404 | | | | 238,090 | |
Alpha Teknova, Inc. (1) | | | 4 | | | | 82 | |
AmerisourceBergen Corp. | | | 7,517 | | | | 998,934 | |
Amgen, Inc. | | | 19,274 | | | | 4,336,072 | |
Amicus Therapeutics, Inc. (1) | | | 2,175 | | | | 25,121 | |
AMN Healthcare Services, Inc. (1) | | | 61 | | | | 7,462 | |
Amneal Pharmaceuticals, Inc. (1) | | | 7,487 | | | | 35,863 | |
Ampio Pharmaceuticals, Inc. (1) | | | 13 | | | | 7 | |
Anavex Life Sciences Corp. (1) | | | 183 | | | | 3,173 | |
ANI Pharmaceuticals, Inc. (1) | | | 17 | | | | 783 | |
Anthem, Inc. | | | 5,867 | | | | 2,719,589 | |
Apellis Pharmaceuticals, Inc. (1) | | | 283 | | | | 13,380 | |
Apollo Medical Holdings, Inc. (1) | | | 848 | | | | 62,311 | |
Applied Therapeutics, Inc. (1) | | | 415 | | | | 3,714 | |
Apria, Inc. (1) | | | 38 | | | | 1,239 | |
Arbutus Biopharma Corp. (1) | | | 6,765 | | | | 26,316 | |
Arcutis Biotherapeutics, Inc. (1) | | | 1,741 | | | | 36,108 | |
Arrowhead Pharmaceuticals, Inc. (1) | | | 1,436 | | | | 95,207 | |
Arvinas, Inc. (1) | | | 1,282 | | | | 105,303 | |
Asensus Surgical, Inc. (1) | | | 15 | | | | 17 | |
Assertio Holdings, Inc. (1) | | | 3,562 | | | | 7,765 | |
Muirfield Fund |
Security Description | | Shares,
Contracts
or Principal
Amount ($) | | | Fair
Value ($) | |
Common Stocks (United States) — continued |
Atara Biotherapeutics, Inc. (1) | | | 1 | | | | 16 | |
Avalo Therapeutics, Inc. (1) | | | 9,142 | | | | 15,541 | |
Aveanna Healthcare Holdings, Inc. (1) | | | 26 | | | | 192 | |
Avid Bioservices, Inc. (1) | | | 7,154 | | | | 208,754 | |
Beam Therapeutics, Inc. (1) | | | 843 | | | | 67,179 | |
Beyondspring, Inc. (1) | | | 962 | | | | 4,358 | |
BioCryst Pharmaceuticals, Inc. (1) | | | 5,753 | | | | 79,679 | |
Biohaven Pharmaceutical Holding Co., Ltd. (1) | | | 141 | | | | 19,431 | |
Biomea Fusion, Inc. (1) | | | 1 | | | | 7 | |
Bio-Rad Laboratories, Inc. (1) | | | 593 | | | | 448,053 | |
Blueprint Medicines Corp. (1) | | | 993 | | | | 106,360 | |
Bridgebio Pharma, Inc. (1) | | | 1,117 | | | | 18,632 | |
Bristol-Myers Squibb Co. | | | 47,439 | | | | 2,957,822 | |
Brooklyn ImmunoTherapeutics, Inc. (1) | | | 5 | | | | 21 | |
Bruker Corp. | | | 4,294 | | | | 360,310 | |
Cardinal Health, Inc. | | | 22,608 | | | | 1,164,086 | |
CareDx, Inc. (1) | | | 1,029 | | | | 46,799 | |
CASI Pharmaceuticals, Inc. (1) | | | 1,497 | | | | 1,198 | |
Cassava Sciences, Inc. (1) | | | 526 | | | | 22,986 | |
Castlight Health, Inc. (1) | | | 21 | | | | 32 | |
Catalent, Inc. (1) | | | 4,491 | | | | 574,983 | |
Catalyst Pharmaceuticals, Inc. (1) | | | 8,266 | | | | 55,961 | |
Celcuity, Inc. (1) | | | 67 | | | | 884 | |
Celldex Therapeutics, Inc. (1) | | | 32 | | | | 1,236 | |
Centene Corp. (1) | | | 1,109 | | | | 91,382 | |
Centogene NV (1) | | | 2,360 | | | | 12,339 | |
Cerevel Therapeutics Holdings, Inc. (1) | | | 1,746 | | | | 56,605 | |
Cerner Corp. | | | 28,314 | | | | 2,629,521 | |
Charles River Laboratories International, Inc. (1) | | | 1,147 | | | | 432,167 | |
Clene, Inc. (1) | | | 11 | | | | 45 | |
Codexis, Inc. (1) | | | 152 | | | | 4,753 | |
Community Health Systems, Inc. (1) | | | 3,389 | | | | 45,108 | |
Computer Programs and Systems, Inc. (1) | | | 9 | | | | 264 | |
Cross Country Healthcare, Inc. (1) | | | 162 | | | | 4,497 | |
Curis, Inc. (1) | | | 28 | | | | 133 | |
CVS Health Corp. | | | 21,999 | | | | 2,269,417 | |
Cyteir Therapeutics, Inc. (1) | | | 3 | | | | 34 | |
Cytokinetics, Inc. (1) | | | 171 | | | | 7,794 | |
Danaher Corp. | | | 12,851 | | | | 4,228,108 | |
Denali Therapeutics, Inc. (1) | | | 598 | | | | 26,671 | |
Durect Corp. (1) | | | 15 | | | | 15 | |
Dynavax Technologies Corp. (1) | | | 1,398 | | | | 19,670 | |
Dyne Therapeutics, Inc. (1) | | | 4 | | | | 48 | |
Editas Medicine, Inc. (1) | | | 1,239 | | | | 32,895 | |
Edwards Lifesciences Corp. (1) | | | 2 | | | | 259 | |
The accompanying notes are an integral part of these financial statements.
2021 Annual Report | December 31, 2021 | Page 29 |
Schedule of Investments
December 31, 2021
Muirfield Fund |
Security Description | | Shares,
Contracts
or Principal
Amount ($) | | | Fair
Value ($) | |
Common Stocks (United States) — continued |
Eiger BioPharmaceuticals, Inc. (1) | | | 6 | | | | 31 | |
Eli Lilly & Co. | | | 11,674 | | | | 3,224,592 | |
Eloxx Pharmaceuticals, Inc. (1) | | | 11,839 | | | | 8,361 | |
Enanta Pharmaceuticals, Inc. (1) | | | 115 | | | | 8,600 | |
Endo International PLC (1) | | | 4,548 | | | | 17,100 | |
Enochian Biosciences, Inc. (1) | | | 1 | | | | 7 | |
Evolent Health, Inc. (1) | | | 336 | | | | 9,297 | |
Exact Sciences Corp. (1) | | | 430 | | | | 33,467 | |
Forte Biosciences, Inc. (1) | | | 2 | | | | 4 | |
Fulcrum Therapeutics, Inc. (1) | | | 2 | | | | 35 | |
Fulgent Genetics, Inc. (1) | | | 1 | | | | 101 | |
Galectin Therapeutics, Inc. (1) | | | 3,817 | | | | 7,901 | |
Genprex, Inc. (1) | | | 4,483 | | | | 5,873 | |
Gilead Sciences, Inc. | | | 42,000 | | | | 3,049,620 | |
Globus Medical, Inc. (1) | | | 6,470 | | | | 467,134 | |
Greenwich Lifesciences, Inc. (1) | | | 3 | | | | 73 | |
HCA Healthcare, Inc. | | | 4,869 | | | | 1,250,943 | |
Horizon Therapeutics Plc (1) | | | 6,508 | | | | 701,302 | |
Humanigen, Inc. (1) | | | 17 | | | | 63 | |
iBio, Inc. (1) | | | 23 | | | | 13 | |
Ideaya Biosciences, Inc. (1) | | | 1 | | | | 24 | |
Illumina, Inc. (1) | | | 328 | | | | 124,784 | |
ImmunoGen, Inc. (1) | | | 19 | | | | 141 | |
, Inc.yte Corp. (1) | | | 7,089 | | | | 520,333 | |
Infinity Pharmaceuticals, Inc. (1) | | | 24 | | | | 54 | |
Innoviva, Inc. (1) | | | 3 | | | | 52 | |
Inotiv, Inc. (1) | | | 973 | | | | 40,934 | |
Instil Bio, Inc. (1) | | | 3 | | | | 51 | |
Intellia Therapeutics, Inc. (1) | | | 832 | | | | 98,376 | |
Johnson & Johnson | | | 48,560 | | | | 8,307,159 | |
Jounce Therapeutics, Inc. (1) | | | 1,370 | | | | 11,440 | |
Kezar Life Sciences, Inc. (1) | | | 1,780 | | | | 29,762 | |
Kronos Bio, Inc. (1) | | | 3 | | | | 41 | |
La Jolla Pharmaceutical Co. (1) | | | 1,666 | | | | 7,747 | |
Laboratory Corp. of America Holdings (1) | | | 1 | | | | 314 | |
Lexicon Pharmaceuticals, Inc. (1) | | | 82 | | | | 323 | |
MannKind Corp. (1) | | | 7,895 | | | | 34,501 | |
Maravai LifeSciences Holdings, Inc. (1) | | | 680 | | | | 28,492 | |
Marinus Pharmaceuticals, Inc. (1) | | | 3 | | | | 36 | |
McKesson Corp. | | | 7,797 | | | | 1,938,100 | |
Medtronic PLC | | | 25,872 | | | | 2,676,458 | |
MeiraGTx Holdings plc (1) | | | 2 | | | | 47 | |
Merck & Co., Inc. | | | 54,547 | | | | 4,180,482 | |
Mirati Therapeutics, Inc. (1) | | | 597 | | | | 87,574 | |
Moderna, Inc. (1) | | | 4,412 | | | | 1,120,560 | |
Morphic Holding, Inc. (1) | | | 4 | | | | 190 | |
Muirfield Fund |
Security Description | | Shares,
Contracts
or Principal
Amount ($) | | | Fair
Value ($) | |
Common Stocks (United States) — continued |
Multiplan Corp. (1) | | | 13 | | | | 58 | |
Myriad Genetics, Inc. (1) | | | 1,192 | | | | 32,899 | |
Natera, Inc. (1) | | | 1,553 | | | | 145,035 | |
National HealthCare Corp. | | | 2 | | | | 136 | |
National Research Corp. | | | 1 | | | | 42 | |
Nektar Therapeutics (1) | | | 5 | | | | 68 | |
NextGen Healthcare, Inc. (1) | | | 5 | | | | 89 | |
Novavax, Inc. (1) | | | 738 | | | | 105,586 | |
Oak Street Health, Inc. (1) | | | 1 | | | | 33 | |
Ocugen, Inc. (1) | | | 2,207 | | | | 10,042 | |
Oncocyte Corp. (1) | | | 1,690 | | | | 3,667 | |
OPKO Health, Inc. (1) | | | 12 | | | | 58 | |
OptimizeRx Corp. (1) | | | 492 | | | | 30,558 | |
Oramed Pharmaceuticals, Inc. (1) | | | 2,302 | | | | 32,873 | |
Organogenesis Holdings, Inc. (1) | | | 64 | | | | 591 | |
Organon & Co. | | | 8,013 | | | | 243,996 | |
Palatin Technologies, Inc. (1) | | | 15,677 | | | | 8,020 | |
PerkinElmer, Inc. | | | 3,368 | | | | 677,170 | |
Perrigo Co. PLC | | | 12,659 | | | | 492,435 | |
Pfizer, Inc. | | | 71,036 | | | | 4,194,676 | |
Phreesia, Inc. (1) | | | 1 | | | | 42 | |
Precigen, Inc. (1) | | | 6,606 | | | | 24,508 | |
Precision BioSciences, Inc. (1) | | | 19 | | | | 141 | |
Premier, Inc. | | | 4 | | | | 165 | |
Prothena Corp. PLC (1) | | | 427 | | | | 21,094 | |
Puma Biotechnology, Inc. (1) | | | 1,619 | | | | 4,922 | |
Quest Diagnostics, Inc. | | | 4,054 | | | | 701,383 | |
Quidel Corp. (1) | | | 660 | | | | 89,093 | |
Radius Health, Inc. (1) | | | 634 | | | | 4,387 | |
Regeneron Pharmaceuticals, Inc. (1) | | | 5,229 | | | | 3,302,218 | |
REGENXBIO, Inc. (1) | | | 2 | | | | 65 | |
Rocket Pharmaceuticals, Inc. (1) | | | 143 | | | | 3,122 | |
Sage Therapeutics, Inc. (1) | | | 761 | | | | 32,373 | |
Sangamo Therapeutics, Inc. (1) | | | 4 | | | | 30 | |
Select Medical Holdings Corp. | | | 3 | | | | 88 | |
Senseonics Holdings, Inc. (1) | | | 13 | | | | 35 | |
Sesen Bio, Inc. (1) | | | 5,807 | | | | 4,733 | |
Solid Biosciences, Inc. (1) | | | 17 | | | | 30 | |
Sorrento Therapeutics, Inc. (1) | | | 2,630 | | | | 12,230 | |
Spectrum Pharmaceuticals, Inc. (1) | | | 16 | | | | 20 | |
SpringWorks Therapeutics, Inc. (1) | | | 532 | | | | 32,973 | |
STAAR Surgical Co. (1) | | | 845 | | | | 77,149 | |
Surface Oncology, Inc. (1) | | | 2 | | | | 10 | |
Sutro Biopharma, Inc. (1) | | | 1,316 | | | | 19,582 | |
Talaris Therapeutics, Inc. (1) | | | 4 | | | | 61 | |
Tenet Healthcare Corp. (1) | | | 996 | | | | 81,363 | |
The accompanying notes are an integral part of these financial statements.
Page 30 | 2021 Annual Report | December 31, 2021 |
Schedule of Investments
December 31, 2021
Muirfield Fund |
Security Description | | Shares,
Contracts
or Principal
Amount ($) | | | Fair
Value ($) | |
Common Stocks (United States) — continued |
Thermo Fisher Scientific, Inc. | | | 6,371 | | | | 4,250,986 | |
TransMedics Group, Inc. (1) | | | 2 | | | | 38 | |
Triple-S Management Corp. (1) | | | 1,198 | | | | 42,745 | |
Twist Bioscience Corp. (1) | | | 766 | | | | 59,281 | |
Tyme Technologies, Inc. (1) | | | 1,924 | | | | 1,160 | |
Ultragenyx Pharmaceutical, Inc. (1) | | | 854 | | | | 71,813 | |
UnitedHealth Group, Inc. | | | 15,114 | | | | 7,589,344 | |
Universal Health Services, Inc. | | | 2,004 | | | | 259,839 | |
Veracyte, Inc. (1) | | | 2,304 | | | | 94,925 | |
Verastem, Inc. (1) | | | 20 | | | | 41 | |
Verrica Pharmaceuticals, Inc. (1) | | | 1 | | | | 9 | |
Viatris, Inc. | | | 29,587 | | | | 400,312 | |
Viemed Healthcare, Inc. (1) | | | 16 | | | | 84 | |
ViewRay, Inc. (1) | | | 2,321 | | | | 12,789 | |
Viking Therapeutics, Inc. (1) | | | 7 | | | | 32 | |
VistaGen Therapeutics, Inc. (1) | | | 40 | | | | 78 | |
Voyager Therapeutics, Inc. (1) | | | 65 | | | | 176 | |
Waters Corp. (1) | | | 1 | | | | 373 | |
WaVe Life Sciences, Ltd. (1) | | | 156 | | | | 490 | |
West Pharmaceutical Services, Inc. | | | 3,853 | | | | 1,807,096 | |
XOMA Corp. (1) | | | 3 | | | | 63 | |
Zentalis Pharmaceuticals, Inc. (1) | | | 858 | | | | 72,123 | |
ZIOPHARM Oncology, Inc. (1) | | | 1,891 | | | | 2,061 | |
Zoetis, Inc. | | | 14,291 | | | | 3,487,433 | |
| | | | | | | | 90,213,328 | |
| | | | | | | | | |
Industrials — 4.4% | | | | | | | | |
ACCO Brands Corp. | | | 9 | | | | 74 | |
Acuity Brands, Inc. | | | 1,371 | | | | 290,268 | |
AGCO Corp. | | | 2,349 | | | | 272,531 | |
Altra Industrial Motion Corp. | | | 1 | | | | 52 | |
Ameresco, Inc. (1) | | | 338 | | | | 27,527 | |
ArcBest Corp. | | | 432 | | | | 51,775 | |
Atkore, Inc. (1) | | | 1,186 | | | | 131,871 | |
Atlas Air Worldwide Holdings, Inc. (1) | | | 2,004 | | | | 188,616 | |
Avis Budget Group, Inc. (1) | | | 518 | | | | 107,418 | |
Axon Enterprise, Inc. (1) | | | 470 | | | | 73,790 | |
AZZ, Inc. | | | 3,303 | | | | 182,623 | |
Babcock & Wilcox Enterprises, Inc. (1) | | | 14 | | | | 126 | |
Boise Cascade Co. | | | 12,845 | | | | 914,564 | |
Builders FirstSource, Inc. (1) | | | 2,458 | | | | 210,675 | |
Carrier Global Corp. | | | 4,276 | | | | 231,930 | |
Caterpillar, Inc. | | | 1,076 | | | | 222,452 | |
Cintas Corp. | | | 1,152 | | | | 510,532 | |
Clean Harbors, Inc. (1) | | | 3 | | | | 299 | |
CompX International, Inc. | | | 4 | | | | 90 | |
Muirfield Fund |
Security Description | | Shares,
Contracts
or Principal
Amount ($) | | | Fair
Value ($) | |
Common Stocks (United States) — continued |
Concrete Pumping Holdings, Inc. (1) | | | 12 | | | | 98 | |
Copart, Inc. (1) | | | 6,310 | | | | 956,722 | |
Core & Main, Inc. (1) | | | 260 | | | | 7,888 | |
Covenant Logistics Group, Inc. (1) | | | 1,146 | | | | 30,289 | |
Crane Co. | | | 1 | | | | 102 | |
CSX Corp. | | | 20,830 | | | | 783,208 | |
Dover Corp. | | | 2,521 | | | | 457,814 | |
Eaton Corp. PLC | | | 7,381 | | | | 1,275,584 | |
EMCOR Group, Inc. | | | 2,837 | | | | 361,405 | |
Emerson Electric Co. | | | 10,481 | | | | 974,419 | |
Encore Wire Corp. | | | 383 | | | | 54,807 | |
EnerSys | | | 128 | | | | 10,120 | |
Fastenal Co. | | | 2 | | | | 128 | |
Franklin Covey Co. (1) | | | 5 | | | | 232 | |
Franklin Electric Co., Inc. | | | 705 | | | | 66,665 | |
FTC Solar, Inc. (1) | | | 208 | | | | 1,572 | |
FuelCell Energy, Inc. (1) | | | 1,149 | | | | 5,975 | |
Genco Shipping & Trading, Ltd. | | | 4,344 | | | | 69,504 | |
Generac Holdings, Inc. (1) | | | 2,447 | | | | 861,148 | |
General Dynamics Corp. | | | 10,076 | | | | 2,100,544 | |
GrafTech International, Ltd. | | | 6,600 | | | | 78,078 | |
Granite Construction, Inc. | | | 3 | | | | 116 | |
Helios Technologies, Inc. | | | 126 | | | | 13,251 | |
Herc Holdings, Inc. | | | 1,889 | | | | 295,723 | |
Heritage-Crystal Clean, Inc. (1) | | | 3 | | | | 96 | |
Hertz Global Holdings, Inc. (1) | | | 48 | | | | 1,200 | |
Hillenbrand, Inc. | | | 2,804 | | | | 145,780 | |
HireQuest, Inc. | | | 4 | | | | 81 | |
Hub Group, Inc. (1) | | | 601 | | | | 50,628 | |
Hubbell, Inc. | | | 3,022 | | | | 629,392 | |
Huntington Ingalls Industries, Inc. | | | 5,641 | | | | 1,053,400 | |
Ideanomics, Inc. (1) | | | 21 | | | | 25 | |
Interface, Inc. | | | 14 | | | | 223 | |
JB Hunt Transport Services, Inc. | | | 2,679 | | | | 547,588 | |
Johnson Controls International plc | | | 32,394 | | | | 2,633,956 | |
Kadant, Inc. | | | 1 | | | | 230 | |
Karat Packaging, Inc. (1) | | | 307 | | | | 6,204 | |
Korn Ferry | | | 1 | | | | 76 | |
L3Harris Technologies, Inc. | | | 240 | | | | 51,178 | |
Lawson Products, Inc./DE (1) | | | 1 | | | | 55 | |
Luxfer Holdings PLC | | | 5 | | | | 97 | |
Manitowoc Co., Inc./The (1) | | | 5,284 | | | | 98,230 | |
ManpowerGroup, Inc. | | | 10,290 | | | | 1,001,526 | |
Matson, Inc. | | | 51 | | | | 4,592 | |
Mayville Engineering Co., Inc. (1) | | | 2 | | | | 30 | |
Meritor, Inc. (1) | | | 578 | | | | 14,323 | |
The accompanying notes are an integral part of these financial statements.
2021 Annual Report | December 31, 2021 | Page 31 |
Schedule of Investments
December 31, 2021
Muirfield Fund |
Security Description | | Shares,
Contracts
or Principal
Amount ($) | | | Fair
Value ($) | |
Common Stocks (United States) — continued |
Mesa Air Group, Inc. (1) | | | 3,006 | | | | 16,834 | |
Miller Industries, Inc./TN | | | 4,237 | | | | 141,516 | |
Mistras Group, Inc. (1) | | | 5 | | | | 37 | |
Montrose Environmental Group, Inc. (1) | | | 1 | | | | 71 | |
Mueller Industries, Inc. | | | 6,082 | | | | 361,028 | |
MYR Group, Inc. (1) | | | 755 | | | | 83,465 | |
NL Industries, Inc. | | | 8 | | | | 59 | |
Norfolk Southern Corp. | | | 187 | | | | 55,672 | |
Northrop Grumman Corp. | | | 2,093 | | | | 810,138 | |
nVent Electric PLC | | | 4,725 | | | | 179,550 | |
Old Dominion Freight Line, Inc. | | | 1,934 | | | | 693,107 | |
Oshkosh Corp. | | | 1 | | | | 113 | |
Owens Corning | | | 3,444 | | | | 311,682 | |
PAM Transportation Services, Inc. (1) | | | 6 | | | | 426 | |
Plug Power, Inc. (1) | | | 4,450 | | | | 125,624 | |
Quad/Graphics, Inc. (1) | | | 7,050 | | | | 28,200 | |
Quanta Services, Inc. | | | 28,269 | | | | 3,241,324 | |
Raytheon Technologies Corp. | | | 16,723 | | | | 1,439,181 | |
Regal Rexnord Corp. | | | 2,681 | | | | 456,253 | |
Republic Services, Inc. | | | 2 | | | | 279 | |
Resideo Technologies, Inc. (1) | | | 2,285 | | | | 59,479 | |
REV Group, Inc. | | | 16 | | | | 226 | |
RR Donnelley & Sons Co. (1) | | | 73 | | | | 822 | |
Rush Enterprises, Inc. | | | 883 | | | | 49,130 | |
Ryder System, Inc. | | | 7,661 | | | | 631,496 | |
Saia, Inc. (1) | | | 514 | | | | 173,233 | |
Schneider National, Inc. | | | 2,248 | | | | 60,494 | |
Sensata Technologies Holding PLC (1) | | | 1 | | | | 62 | |
Shyft Group, Inc./The | | | 1,662 | | | | 81,654 | |
SkyWest, Inc. (1) | | | 6,982 | | | | 274,393 | |
Sterling Construction Co., Inc. (1) | | | 4 | | | | 105 | |
Terex Corp. | | | 6,234 | | | | 273,984 | |
Textainer Group Holdings, Ltd. | | | 2,525 | | | | 90,168 | |
Textron, Inc. | | | 13,666 | | | | 1,055,015 | |
Titan International, Inc. (1) | | | 3,941 | | | | 43,193 | |
Triton International, Ltd. | | | 3,310 | | | | 199,361 | |
Triumph Group, Inc. (1) | | | 22 | | | | 408 | |
TrueBlue, Inc. (1) | | | 901 | | | | 24,931 | |
UFP Industries, Inc. | | | 1 | | | | 92 | |
United Parcel Service, Inc. | | | 6,957 | | | | 1,491,163 | |
United Rentals, Inc. (1) | | | 224 | | | | 74,433 | |
Valmont Industries, Inc. | | | 1,779 | | | | 445,640 | |
Vectrus, Inc. (1) | | | 1,245 | | | | 56,984 | |
Vicor Corp. (1) | | | 429 | | | | 54,474 | |
Waste Management, Inc. | | | 1 | | | | 167 | |
Watts Water Technologies, Inc. | | | 1 | | | | 194 | |
Muirfield Fund |
Security Description | | Shares,
Contracts
or Principal
Amount ($) | | | Fair
Value ($) | |
Common Stocks (United States) — continued |
WESCO International, Inc. (1) | | | 2,010 | | | | 264,496 | |
WillScot Mobile Mini Holdings Corp. (1) | | | 3 | | | | 123 | |
Yellow Corp. (1) | | | 1,096 | | | | 13,799 | |
| | | | | | | | 31,425,793 | |
| | | | | | | | | |
Information Technology — 19.6% | | | | | | | | |
3D Systems Corp. (1) | | | 378 | | | | 8,142 | |
A10 Networks, Inc. | | | 218 | | | | 3,614 | |
Accenture PLC | | | 2,979 | | | | 1,234,944 | |
ACI Worldwide, Inc. (1) | | | 4,532 | | | | 157,260 | |
Adobe, Inc. (1) | | | 7,077 | | | | 4,013,084 | |
Advanced Micro Devices, Inc. (1) | | | 16,182 | | | | 2,328,590 | |
Alliance Data Systems Corp. | | | 4,781 | | | | 318,271 | |
Alpha & Omega Semiconductor, Ltd. (1) | | | 6 | | | | 363 | |
Ambarella, Inc. (1) | | | 536 | | | | 108,749 | |
American Software, Inc./GA | | | 1,658 | | | | 43,390 | |
Amkor Technology, Inc. | | | 6,889 | | | | 170,778 | |
Amphenol Corp. | | | 2 | | | | 175 | |
Analog Devices, Inc. | | | 3,688 | | | | 648,240 | |
Apple, Inc. | | | 127,610 | | | | 22,659,708 | |
Applied Materials, Inc. | | | 29,765 | | | | 4,683,820 | |
Arrow Electronics, Inc. (1) | | | 9,085 | | | | 1,219,843 | |
Asana, Inc. (1) | | | 2,311 | | | | 172,285 | |
Atlassian Corp. PLC (1) | | | 1,972 | | | | 751,904 | |
Autodesk, Inc. (1) | | | 1,436 | | | | 403,789 | |
Aviat Networks, Inc. (1) | | | 3,061 | | | | 98,197 | |
Avnet, Inc. | | | 8,225 | | | | 339,117 | |
Axcelis Technologies, Inc. (1) | | | 2,247 | | | | 167,536 | |
Belden, Inc. | | | 544 | | | | 35,757 | |
Bill.com Holdings, Inc. (1) | | | 860 | | | | 214,269 | |
Box, Inc. (1) | | | 1,946 | | | | 50,966 | |
Broadcom, Inc. | | | 3,186 | | | | 2,119,996 | |
Cadence Design Systems, Inc. (1) | | | 11,219 | | | | 2,090,661 | |
Calix, Inc. (1) | | | 2,814 | | | | 225,036 | |
CDK Global, Inc. | | | 11,029 | | | | 460,350 | |
CDW Corp./DE | | | 10,306 | | | | 2,110,463 | |
ChannelAdvisor Corp. (1) | | | 5,031 | | | | 124,165 | |
Cisco Systems, Inc./Delaware | | | 62,831 | | | | 3,981,600 | |
Cloudflare, Inc. (1) | | | 3,554 | | | | 467,351 | |
Cognex Corp. | | | 180 | | | | 13,997 | |
CommVault Systems, Inc. (1) | | | 1,665 | | | | 114,752 | |
Concentrix Corp. | | | 743 | | | | 132,715 | |
Conduent, Inc. (1) | | | 10,910 | | | | 58,259 | |
Consensus Cloud Solutions, Inc. (1) | | | 5 | | | | 289 | |
Crowdstrike Holdings, Inc. (1) | | | 2,098 | | | | 429,566 | |
Datadog, Inc. (1) | | | 1,253 | | | | 223,172 | |
The accompanying notes are an integral part of these financial statements.
Page 32 | 2021 Annual Report | December 31, 2021 |
Schedule of Investments
December 31, 2021
Muirfield Fund |
Security Description | | Shares,
Contracts
or Principal
Amount ($) | | | Fair
Value ($) | |
Common Stocks (United States) — continued |
Dell Technologies, Inc. (1) | | | 1 | | | | 56 | |
Diebold Nixdorf, Inc. (1) | | | 4 | | | | 36 | |
Digital Turbine, Inc. (1) | | | 2,175 | | | | 132,653 | |
Diodes, Inc. (1) | | | 2,707 | | | | 297,256 | |
Dolby Laboratories, Inc. | | | 2,125 | | | | 202,343 | |
Dropbox, Inc. (1) | | | 25,057 | | | | 614,899 | |
Duck Creek Technologies, Inc. (1) | | | 1 | | | | 30 | |
DXC Technology Co. (1) | | | 5,551 | | | | 178,687 | |
Dynatrace, Inc. (1) | | | 3,237 | | | | 195,353 | |
DZS, Inc. (1) | | | 3 | | | | 49 | |
Ebix, Inc. | | | 803 | | | | 24,411 | |
EMCORE Corp. (1) | | | 12 | | | | 84 | |
EPAM Systems, Inc. (1) | | | 2,694 | | | | 1,800,804 | |
Extreme Networks, Inc. (1) | | | 3 | | | | 47 | |
First Solar, Inc. (1) | | | 1 | | | | 87 | |
Fortinet, Inc. (1) | | | 4,243 | | | | 1,524,934 | |
Gartner, Inc. (1) | | | 7,525 | | | | 2,515,758 | |
GreenSky, Inc. (1) | | | 22 | | | | 250 | |
Grid Dynamics Holdings, Inc. (1) | | | 697 | | | | 26,465 | |
GTY Technology Holdings, Inc. (1) | | | 2 | | | | 13 | |
Hewlett Packard Enterprise Co. | | | 26,424 | | | | 416,706 | |
HP, Inc. | | | 60,677 | | | | 2,285,703 | |
HubSpot, Inc. (1) | | | 846 | | | | 557,641 | |
IBEX Holdings, Ltd. (1) | | | 5 | | | | 64 | |
Identiv, Inc. (1) | | | 3 | | | | 84 | |
Intel Corp. | | | 53,773 | | | | 2,769,310 | |
Intuit, Inc. | | | 7,685 | | | | 4,943,146 | |
Iteris, Inc. (1) | | | 4 | | | | 16 | |
Jabil, Inc. | | | 22,184 | | | | 1,560,644 | |
Juniper Networks, Inc. | | | 1 | | | | 36 | |
Keysight Technologies, Inc. (1) | | | 1 | | | | 207 | |
Kimball Electronics, Inc. (1) | | | 1,364 | | | | 29,681 | |
KLA Corp. | | | 9,583 | | | | 4,121,744 | |
Kulicke & Soffa Industries, Inc. | | | 2,806 | | | | 169,875 | |
Kyndryl Holdings, Inc. (1) | | | 3,465 | | | | 62,717 | |
Lam Research Corp. | | | 1,537 | | | | 1,105,334 | |
Lattice Semiconductor Corp. (1) | | | 4,631 | | | | 356,865 | |
Manhattan Associates, Inc. (1) | | | 4,712 | | | | 732,669 | |
Marathon Digital Holdings, Inc. (1) | | | 1,225 | | | | 40,254 | |
MaxLinear, Inc. (1) | | | 5 | | | | 377 | |
McAfee Corp. | | | 11,721 | | | | 302,285 | |
MeridianLink, Inc. (1) | | | 1 | | | | 22 | |
Methode Electronics, Inc. | | | 10 | | | | 492 | |
Micron Technology, Inc. | | | 11,443 | | | | 1,065,915 | |
Microsoft Corp. | | | 86,416 | | | | 29,063,415 | |
Mimecast, Ltd. (1) | | | 2,782 | | | | 221,364 | |
Muirfield Fund |
Security Description | | Shares,
Contracts
or Principal
Amount ($) | | | Fair
Value ($) | |
Common Stocks (United States) — continued |
MoneyGram International, Inc. (1) | | | 4,914 | | | | 38,771 | |
MongoDB, Inc. (1) | | | 312 | | | | 165,157 | |
Monolithic Power Systems, Inc. | | | 47 | | | | 23,187 | |
N-able, Inc. (1) | | | 11 | | | | 122 | |
Napco Security Technologies, Inc. (1) | | | 2 | | | | 100 | |
NCR Corp. (1) | | | 7,204 | | | | 289,601 | |
NortonLifeLock, Inc. | | | 20,591 | | | | 534,954 | |
NVIDIA Corp. | | | 26,731 | | | | 7,861,854 | |
NXP Semiconductors NV | | | 1,199 | | | | 273,108 | |
ON Semiconductor Corp. (1) | | | 2,268 | | | | 154,043 | |
Onto Innovation, Inc. (1) | | | 3 | | | | 304 | |
Oracle Corp. | | | 29,755 | | | | 2,594,934 | |
Palo Alto Networks, Inc. (1) | | | 3,465 | | | | 1,929,173 | |
Paycom Software, Inc. (1) | | | 1,803 | | | | 748,588 | |
Paylocity Holding Corp. (1) | | | 827 | | | | 195,304 | |
Perficient, Inc. (1) | | | 818 | | | | 105,759 | |
Photronics, Inc. (1) | | | 18 | | | | 339 | |
Plantronics, Inc. (1) | | | 816 | | | | 23,941 | |
Power Integrations, Inc. | | | 805 | | | | 74,776 | |
Priority Technology Holdings, Inc. (1) | | | 1,615 | | | | 11,434 | |
Progress Software Corp. | | | 8,052 | | | | 388,670 | |
Qorvo, Inc. (1) | | | 360 | | | | 56,300 | |
Rimini Street, Inc. (1) | | | 2,393 | | | | 14,286 | |
Riot Blockchain, Inc. (1) | | | 1,483 | | | | 33,115 | |
salesforce.com, Inc. (1) | | | 9,235 | | | | 2,346,891 | |
Sanmina Corp. (1) | | | 1,561 | | | | 64,719 | |
ScanSource, Inc. (1) | | | 25 | | | | 877 | |
SecureWorks Corp. (1) | | | 648 | | | | 10,349 | |
SiTime Corp. (1) | | | 152 | | | | 44,466 | |
SMART Global Holdings, Inc. (1) | | | 413 | | | | 29,319 | |
Smartsheet, Inc. (1) | | | 687 | | | | 53,208 | |
Sprout Social, Inc. (1) | | | 3,693 | | | | 334,918 | |
SPS Commerce, Inc. (1) | | | 5,506 | | | | 783,779 | |
SS&C Technologies Holdings, Inc. | | | 45,761 | | | | 3,751,487 | |
StarTek, Inc. (1) | | | 2,933 | | | | 15,310 | |
Stratasys, Ltd. (1) | | | 1,038 | | | | 25,421 | |
Synaptics, Inc. (1) | | | 1,022 | | | | 295,879 | |
Synopsys, Inc. (1) | | | 131 | | | | 48,274 | |
Teradata Corp. (1) | | | 3,058 | | | | 129,873 | |
Teradyne, Inc. | | | 1,645 | | | | 269,007 | |
Texas Instruments, Inc. | | | 15,378 | | | | 2,898,292 | |
Trade Desk, Inc./The (1) | | | 4,044 | | | | 370,592 | |
Trimble, Inc. (1) | | | 4,530 | | | | 394,971 | |
TTEC Holdings, Inc. | | | 366 | | | | 33,141 | |
Ultra Clean Holdings, Inc. (1) | | | 77 | | | | 4,417 | |
Veritone, Inc. (1) | | | 224 | | | | 5,036 | |
The accompanying notes are an integral part of these financial statements.
2021 Annual Report | December 31, 2021 | Page 33 |
Schedule of Investments
December 31, 2021
Muirfield Fund |
Security Description | | Shares,
Contracts
or Principal
Amount ($) | | | Fair
Value ($) | |
Common Stocks (United States) — continued |
Viant Technology, Inc. (1) | | | 6,174 | | | | 59,919 | |
Visa, Inc. | | | 5,823 | | | | 1,261,902 | |
VMware, Inc. | | | 4,170 | | | | 483,220 | |
Workday, Inc. (1) | | | 2,226 | | | | 608,099 | |
Workiva, Inc. (1) | | | 1,820 | | | | 237,492 | |
Xilinx, Inc. | | | 1,325 | | | | 280,940 | |
Xperi Holding Corp. | | | 11,416 | | | | 215,877 | |
Zebra Technologies Corp. (1) | | | 1,483 | | | | 882,682 | |
Zscaler, Inc. (1) | | | 675 | | | | 216,898 | |
| | | | | | | | 141,381,019 | |
| | | | | | | | | |
Materials — 0.8% | | | | | | | | |
Albemarle Corp. | | | 1,399 | | | | 327,044 | |
Alcoa Corp. | | | 2,369 | | | | 141,145 | |
Amyris, Inc. (1) | | | 1,074 | | | | 5,810 | |
Avient Corp. | | | 1,639 | | | | 91,702 | |
Berry Global Group, Inc. (1) | | | 7,262 | | | | 535,790 | |
Celanese Corp. | | | 3,358 | | | | 564,345 | |
Century Aluminum Co. (1) | | | 308 | | | | 5,100 | |
Chemours Co./The | | | 813 | | | | 27,284 | |
Cleveland-Cliffs, Inc. (1) | | | 4,902 | | | | 106,717 | |
Commercial Metals Co. | | | 2 | | | | 73 | |
Constellium SE (1) | | | 1 | | | | 18 | |
Dow, Inc. | | | 9,647 | | | | 547,178 | |
Element Solutions, Inc. | | | 203 | | | | 4,929 | |
Freeport-McMoRan, Inc. | | | 17,047 | | | | 711,371 | |
Hawkins, Inc. | | | 978 | | | | 38,582 | |
Huntsman Corp. | | | 7,166 | | | | 249,950 | |
International Paper Co. | | | 2 | | | | 94 | |
Koppers Holdings, Inc. (1) | | | 3,033 | | | | 94,933 | |
Louisiana-Pacific Corp. | | | 5,712 | | | | 447,535 | |
LyondellBasell Industries NV | | | 5,943 | | | | 548,123 | |
Marrone Bio Innovations, Inc. (1) | | | 22 | | | | 16 | |
Mosaic Co./The | | | 6,082 | | | | 238,962 | |
Nucor Corp. | | | 4,392 | | | | 501,347 | |
O-I Glass, Inc. (1) | | | 1,487 | | | | 17,889 | |
Olin Corp. | | | 1,988 | | | | 114,350 | |
Orion Engineered Carbons SA | | | 1 | | | | 18 | |
Rayonier Advanced Materials, Inc. (1) | | | 940 | | | | 5,367 | |
Ryerson Holding Corp. | | | 760 | | | | 19,798 | |
Southern Copper Corp. | | | 1 | | | | 62 | |
Steel Dynamics, Inc. | | | 2,882 | | | | 178,886 | |
SunCoke Energy, Inc. | | | 1,316 | | | | 8,672 | |
Trinseo PLC | | | 1,669 | | | | 87,556 | |
Tronox Holdings PLC | | | 2,217 | | | | 53,275 | |
United States Steel Corp. | | | 2,775 | | | | 66,073 | |
Muirfield Fund |
Security Description | | Shares,
Contracts
or Principal
Amount ($) | | | Fair
Value ($) | |
Common Stocks (United States) — continued |
Verso Corp. | | | 15 | | | | 405 | |
Warrior Met Coal, Inc. | | | 1 | | | | 26 | |
Westlake Chemical Corp. | | | 1,919 | | | | 186,392 | |
| | | | | | | | 5,926,817 | |
| | | | | | | | | |
Real Estate Investment Trust — 2.4% | | | | | | | | |
Altisource Portfolio Solutions SA (1) | | | 3,736 | | | | 41,918 | |
American Campus Communities, Inc. | | | 1 | | | | 57 | |
American Homes 4 Rent | | | 13,032 | | | | 568,326 | |
Armada Hoffler Properties, Inc. | | | 16 | | | | 244 | |
Ashford Hospitality Trust, Inc. (1) | | | 3,023 | | | | 29,021 | |
Braemar Hotels & Resorts, Inc. (1) | | | 18 | | | | 92 | |
Brixmor Property Group, Inc. | | | 4 | | | | 102 | |
Broadstone Net Lease, Inc. | | | 5 | | | | 124 | |
Camden Property Trust | | | 5,547 | | | | 991,138 | |
CareTrust REIT, Inc. | | | 35,123 | | | | 801,858 | |
CatchMark Timber Trust, Inc. | | | 6,011 | | | | 52,356 | |
CBL & Associates Properties, Inc. (1) | | | 107 | | | | 3,338 | |
Centerspace | | | 1 | | | | 111 | |
City Office REIT, Inc. | | | 1 | | | | 20 | |
Clipper Realty, Inc. | | | 2 | | | | 20 | |
CorEnergy Infrastructure Trust, Inc. | | | 13,457 | | | | 42,120 | |
Corporate Office Properties Trust | | | 13,455 | | | | 376,336 | |
CubeSmart | | | 18,760 | | | | 1,067,632 | |
CyrusOne, Inc. | | | 318 | | | | 28,531 | |
DiamondRock Hospitality Co. (1) | | | 1,461 | | | | 14,040 | |
Easterly Government Properties, Inc. | | | 14 | | | | 321 | |
EastGroup Properties, Inc. | | | 8,177 | | | | 1,863,129 | |
Equity LifeStyle Properties, Inc. | | | 1 | | | | 88 | |
Essential Properties Realty Trust, Inc. | | | 1 | | | | 29 | |
Essex Property Trust, Inc. | | | 1,690 | | | | 595,269 | |
Extra Space Storage, Inc. | | | 1,073 | | | | 243,281 | |
Fathom Holdings, Inc. (1) | | | 3 | | | | 61 | |
First Industrial Realty Trust, Inc. | | | 1 | | | | 66 | |
Forestar Group, Inc. (1) | | | 1 | | | | 22 | |
FRP Holdings, Inc. (1) | | | 2 | | | | 116 | |
Gaming and Leisure Properties, Inc. | | | 2 | | | | 97 | |
GEO Group, Inc./The | | | 1 | | | | 8 | |
Gladstone Commercial Corp. | | | 4,972 | | | | 128,128 | |
Healthcare Trust of America, Inc. | | | 17,679 | | | | 590,302 | |
Host Hotels & Resorts, Inc. (1) | | | 10 | | | | 174 | |
Hudson Pacific Properties, Inc. | | | 16 | | | | 395 | |
Indus Realty Trust, Inc. | | | 1 | | | | 81 | |
Invitation Homes, Inc. | | | 9,534 | | | | 432,272 | |
Kilroy Realty Corp. | | | 1 | | | | 66 | |
Kimco Realty Corp. | | | 1 | | | | 25 | |
The accompanying notes are an integral part of these financial statements.
Page 34 | 2021 Annual Report | December 31, 2021 |
Schedule of Investments
December 31, 2021
Muirfield Fund |
Security Description | | Shares,
Contracts
or Principal
Amount ($) | | | Fair
Value ($) | |
Common Stocks (United States) — continued |
Lamar Advertising Co. | | | 19,784 | | | | 2,399,799 | |
Life Storage, Inc. | | | 953 | | | | 145,981 | |
LXP Industrial Trust | | | 2 | | | | 31 | |
Mid-America Apartment Communities, Inc. | | | 5,156 | | | | 1,182,993 | |
National Retail Properties, Inc. | | | 11 | | | | 529 | |
Omega Healthcare Investors, Inc. | | | 23,017 | | | | 681,073 | |
One Liberty Properties, Inc. | | | 6 | | | | 212 | |
Physicians Realty Trust | | | 26,408 | | | | 497,263 | |
PotlatchDeltic Corp. | | | 1,768 | | | | 106,469 | |
PS Business Parks, Inc. | | | 2,036 | | | | 374,970 | |
Public Storage | | | 4,614 | | | | 1,728,220 | |
Realty Income Corp. | | | 2 | | | | 143 | |
Regency Centers Corp. | | | 4,599 | | | | 346,535 | |
Retail Opportunity Investments Corp. | | | 12,811 | | | | 251,096 | |
Sabra Health Care REIT, Inc. | | | 8 | | | | 108 | |
SBA Communications Corp. | | | 324 | | | | 126,042 | |
SITE Centers Corp. | | | 6 | | | | 95 | |
SL Green Realty Corp. | | | 4,308 | | | | 308,884 | |
Spirit MTA REIT Liquidating Trust (1)(7) | | | 9,151 | | | | 0 | |
Stratus Properties, Inc. (1) | | | 721 | | | | 26,367 | |
UDR, Inc. | | | 5,158 | | | | 309,428 | |
Universal Health Realty Income Trust | | | 2,179 | | | | 129,585 | |
Weyerhaeuser Co. | | | 13,216 | | | | 544,235 | |
WP Carey, Inc. | | | 1 | | | | 82 | |
Zillow Group, Inc. (1) | | | 2,874 | | | | 183,505 | |
| | | | | | | | 17,214,959 | |
| | | | | | | | | |
Utilities — 1.5% | | | | | | | | |
Chesapeake Utilities Corp. | | | 1 | | | | 146 | |
Duke Energy Corp. | | | 836 | | | | 87,696 | |
Evergy, Inc. | | | 19,600 | | | | 1,344,756 | |
Exelon Corp. | | | 75,427 | | | | 4,356,764 | |
IDACorp., Inc. | | | 665 | | | | 75,351 | |
MDU Resources Group, Inc. | | | 46,025 | | | | 1,419,411 | |
National Fuel Gas Co. | | | 5,434 | | | | 347,450 | |
NRG Energy, Inc. | | | 29,084 | | | | 1,252,939 | |
Portland General Electric Co. | | | 15,537 | | | | 822,218 | |
UGI Corp. | | | 20,638 | | | | 947,491 | |
| | | | | | | | 10,654,222 | |
Total Common Stocks (United States) (Cost $321,780,430) | | | | | | | 481,323,913 | |
| | | | | | | | | |
Muirfield Fund |
Security Description | | Shares,
Contracts
or Principal
Amount ($) | | | Fair
Value ($) | |
Preferred Stock (United States) — 0.0% |
WESCO International, Inc. Series A Variable Preferred (8) | | | 2,612 | | | | 80,058 | |
Total Preferred Stock (United States) (Cost $65,288) | | | | | | | 80,058 | |
| | | | | | | | | |
Warrants (United States) — 0.0% |
Chaparral Energy, Inc. A Warrants, Expiration Date 10/14/2024 (1)(7) | | | 7 | | | | 0 | |
Chaparral Energy, Inc. B Warrants, Expiration Date 10/14/2025 (1)(7) | | | 7 | | | | 0 | |
Civitas Solutions, Inc. A Warrants, Expiration Date 1/20/2025 (1)(7) | | | 57 | | | | 0 | |
Civitas Solutions, Inc. B Warrants, Expiration Date 1/20/2026 (1)(7) | | | 28 | | | | 0 | |
Hertz Global Holdings, Inc. Warrants, Expiration Date 6/30/2051 (1) | | | 349 | | | | 5,567 | |
Nabors Industries, Ltd. Warrants, Expiration Date 6/11/2026 (1) | | | 122 | | | | 455 | |
Oasis Petroleum, Inc. Warrants, Expiration Date 11/19/2024 (1)(7) | | | 23 | | | | 0 | |
Whiting Petroleum Corp. A Warrants, Expiration Date 9/1/2024 (1) | | | 128 | | | | 1,774 | |
Whiting Petroleum Corp. B Warrants, Expiration Date 9/1/2025 (1) | | | 63 | | | | 743 | |
Total Warrants (United States) (Cost $8,512) | | | | | | | 8,539 | |
| | | | | | | | | |
Money Market Registered Investment Companies — 31.6% |
Meeder Institutional Prime Money Market Fund, 0.05% (4) | | | 227,860,851 | | | | 227,883,637 | |
Morgan Stanley Government Institutional Fund, 0.03% (3) | | | 19,737 | | | | 19,737 | |
Total Money Market Registered Investment Companies (Cost $227,903,628) | | | | | | | 227,903,374 | |
| | | | | | | | | |
The accompanying notes are an integral part of these financial statements.
2021 Annual Report | December 31, 2021 | Page 35 |
Schedule of Investments
December 31, 2021
Muirfield Fund |
Security Description | | Shares,
Contracts
or Principal
Amount ($) | | | Fair
Value ($) | |
Bank Obligations — 0.1% |
First Merchants Bank Deposit Account, 0.20%, 1/3/2022 (5) | | | 249,093 | | | | 249,093 | |
Metro City Bank Deposit Account, 0.05%, 1/3/2022 (5) | | | 248,445 | | | | 248,445 | |
Pacific Mercantile Bank Deposit Account, 0.10%, 1/3/2022 (5) | | | 247,072 | | | | 247,072 | |
Total Bank Obligations (Cost $744,610) | | | | | | | 744,610 | |
Total Investments — 98.6% (Cost $550,502,468) | | | | | | | 710,060,494 | |
Other Assets less Liabilities — 1.4% | | | | | | | 10,411,072 | |
Total Net Assets — 100.0% | | | | | | | 720,471,566 | |
| | | | | | | | | |
Trustee Deferred Compensation (6) |
Meeder Balanced Fund - Retail Class | | | 4,981 | | | | 66,845 | |
Meeder Dynamic Allocation Fund - Retail Class | | | 13,358 | | | | 186,077 | |
Meeder Muirfield Fund - Retail Class | | | 8,517 | | | | 81,167 | |
Meeder Conservative Allocation Fund - Retail Class | | | 1,467 | | | | 34,680 | |
Total Trustee Deferred Compensation (Cost $316,771) | | | | | | | 368,769 | |
| | | Long
(Short)
Contracts | | | Expiration
Date | | | Notional
Value of
Contracts
($) | | | Value and
Unrealized
Appreciation
(Depreciation)
($) | |
Futures Contracts |
Index Futures | | | | | | | | | | | | | | | | |
E-mini Standard & Poors MidCap 400 Futures | | | (71 | ) | | | 3/18/2022 | | | | (20,147,670 | ) | | | (150,852 | ) |
Mini MSCI EAFE Index Futures | | | 483 | | | | 3/18/2022 | | | | 56,071,470 | | | | 1,616,615 | |
Mini MSCI Emerging Markets Index Futures | | | 177 | | | | 3/18/2022 | | | | 10,852,755 | | | | 98,594 | |
Standard & Poors 500 Mini Futures | | | (228 | ) | | | 3/18/2022 | | | | (54,246,900 | ) | | | (1,175,459 | ) |
Total Futures Contracts | | | 361 | | | | | | | | (7,470,345 | ) | | | 388,898 | |
(1) | Represents non-income producing securities. |
(2) | All or a portion of this security is on loan. |
(3) | Investment purchased with cash received as securities lending collateral. The yield shown represents the 7-day yield in effect at December 31, 2021. |
(4) | Investment in affiliate. The yield shown represents the 7-day yield in effect at December 31, 2021. |
(5) | Variable rate security. Securities payable at par including accrued interest (usually within seven days notice) and unconditionally secured as to principal and interest by letters of credit or other credit support agreements from major banks. The interest rates are adjustable and are not based on a published reference rate and spread but are determined by the issuer or agent and are based on current market conditions. These securities do not indicate a reference rate and spread in their description above. The rate shown represents the rate in effect at December 31, 2021. The maturity date shown, if applicable, reflects the earlier of the next demand date or stated maturity date. |
(6) | Assets of affiliates to the Muirfield Fund held for the benefit of the Fund’s Trustees in connection with the Trustee Deferred Compensation Plan. |
(7) | Fair valued security deemed a Level 3 security. Security is not part of the investment strategy of the Fund. |
The accompanying notes are an integral part of these financial statements.
Page 36 | 2021 Annual Report | December 31, 2021 |
Schedule of Investments
December 31, 2021
Spectrum Fund |
Security Description | | Shares or
Principal
Amount ($) | | | Fair
Value ($) | |
Common Stocks (United States) - Long — 72.6% |
Communication Services — 5.9% | | | | | | | | |
Activision Blizzard, Inc. | | | 7,457 | | | | 496,114 | |
Alphabet, Inc. - Class C (1) | | | 1,812 | | | | 5,243,185 | |
Alphabet, Inc. - Class A (1) | | | 654 | | | | 1,894,664 | |
AMC Entertainment Holdings, Inc. (1) | | | 1,697 | | | | 46,158 | |
Cargurus, Inc. (1) | | | 183 | | | | 6,156 | |
Cinemark Holdings, Inc. (1) | | | 1,457 | | | | 23,487 | |
DHI Group, Inc. (1) | | | 1,552 | | | | 9,684 | |
DISH Network Corp. (1) | | | 769 | | | | 24,946 | |
Entravision Communications Corp. | | | 1,225 | | | | 8,306 | |
Fox Corp. | | | 178 | | | | 6,568 | |
Gogo, Inc. (1) | | | 217 | | | | 2,936 | |
Gray Television, Inc. | | | 1,279 | | | | 25,785 | |
IDT Corp. (1) | | | 54 | | | | 2,385 | |
iHeartMedia, Inc. (1) | | | 435 | | | | 9,152 | |
IMAX Corp. (1) | | | 863 | | | | 15,396 | |
Interpublic Group of Cos., Inc./The | | | 10,594 | | | | 396,745 | |
Liberty Media Corp.-Liberty Braves - Class A (1) | | | 175 | | | | 5,031 | |
Liberty Media Corp.-Liberty Braves - Class C (1) | | | 1,046 | | | | 29,393 | |
Liberty TripAdvisor Holdings, Inc. (1) | | | 2,709 | | | | 5,879 | |
Lions Gate Entertainment Corp. (1) | | | 1,110 | | | | 18,470 | |
Live Nation Entertainment, Inc. (1) | | | 280 | | | | 33,513 | |
Lumen Technologies, Inc. | | | 2,856 | | | | 35,843 | |
Magnite, Inc. (1) | | | 13 | | | | 228 | |
Meta Platforms, Inc. (1) | | | 8,519 | | | | 2,865,366 | |
Netflix, Inc. (1) | | | 1,413 | | | | 851,248 | |
Pinterest, Inc. (1) | | | 702 | | | | 25,518 | |
Roku, Inc. (1) | | | 102 | | | | 23,276 | |
Sinclair Broadcast Group, Inc. | | | 1,012 | | | | 26,747 | |
TEGNA, Inc. | | | 1,939 | | | | 35,988 | |
Twitter, Inc. (1) | | | 3,469 | | | | 149,930 | |
Vimeo, Inc. (1) | | | 359 | | | | 6,448 | |
WideOpenWest, Inc. (1) | | | 501 | | | | 10,782 | |
World Wrestling Entertainment, Inc. | | | 361 | | | | 17,812 | |
Yelp, Inc. (1) | | | 954 | | | | 34,573 | |
| | | | | | | | 12,387,712 | |
| | | | | | | | | |
Consumer Discretionary — 7.4% | | | | | | | | |
Abercrombie & Fitch Co. (1) | | | 262 | | | | 9,125 | |
Academy Sports & Outdoors, Inc. (1) | | | 2,365 | | | | 103,824 | |
Adient PLC (1) | | | 685 | | | | 32,798 | |
Amazon.com, Inc. (1) | | | 1,235 | | | | 4,117,910 | |
American Axle & Manufacturing Holdings, Inc. (1) | | | 866 | | | | 8,080 | |
American Eagle Outfitters, Inc. | | | 522 | | | | 13,217 | |
Spectrum Fund |
Security Description | | Shares or
Principal
Amount ($) | | | Fair
Value ($) | |
Common Stocks (United States) - Long — continued |
Aptiv PLC (1) | | | 501 | | | | 82,640 | |
Aramark | | | 2,221 | | | | 81,844 | |
Asbury Automotive Group, Inc. (1) | | | 233 | | | | 40,246 | |
AutoNation, Inc. (1) | | | 231 | | | | 26,992 | |
AutoZone, Inc. (1) | | | 156 | | | | 327,037 | |
Bath & Body Works, Inc. | | | 406 | | | | 28,335 | |
Best Buy Co., Inc. | | | 1,863 | | | | 189,281 | |
Big 5 Sporting Goods Corp. | | | 347 | | | | 6,596 | |
Big Lots, Inc. | | | 325 | | | | 14,641 | |
Biglari Holdings, Inc. (1) | | | 24 | | | | 3,422 | |
Boyd Gaming Corp. (1) | | | 1,050 | | | | 68,849 | |
Brinker International, Inc. (1) | | | 457 | | | | 16,722 | |
Buckle, Inc./The | | | 147 | | | | 6,220 | |
Caleres, Inc. | | | 399 | | | | 9,049 | |
Capri Holdings, Ltd. (1) | | | 1,003 | | | | 65,105 | |
Chico’s FAS, Inc. (1) | | | 382 | | | | 2,055 | |
Conn’s, Inc. (1) | | | 126 | | | | 2,964 | |
Crocs, Inc. (1) | | | 1,184 | | | | 151,812 | |
Dana, Inc. | | | 1,133 | | | | 25,855 | |
Dave & Buster’s Entertainment, Inc. (1) | | | 248 | | | | 9,523 | |
Designer Brands, Inc. (1) | | | 494 | | | | 7,020 | |
Dick’s Sporting Goods, Inc. | | | 876 | | | | 100,731 | |
Dollar Tree, Inc. (1) | | | 425 | | | | 59,721 | |
eBay, Inc. | | | 1,926 | | | | 128,079 | |
Ethan Allen Interiors, Inc. | | | 206 | | | | 5,416 | |
Etsy, Inc. (1) | | | 75 | | | | 16,421 | |
Everi Holdings, Inc. (1) | | | 1,379 | | | | 29,442 | |
Foot Locker, Inc. | | | 1,601 | | | | 69,852 | |
Ford Motor Co. | | | 14,484 | | | | 300,833 | |
Fossil Group, Inc. (1) | | | 509 | | | | 5,238 | |
GameStop Corp. (1) | | | 196 | | | | 29,084 | |
Gap, Inc./The | | | 496 | | | | 8,754 | |
Garmin, Ltd. | | | 1,257 | | | | 171,166 | |
General Motors Co. (1) | | | 4,677 | | | | 274,213 | |
Genesco, Inc. (1) | | | 44 | | | | 2,823 | |
Genius Brands International, Inc. (1) | | | 295 | | | | 310 | |
Goodyear Tire & Rubber Co./The (1) | | | 1,954 | | | | 41,659 | |
GoPro, Inc. (1) | | | 131 | | | | 1,351 | |
Greenlane Holdings, Inc. (1) | | | 2,908 | | | | 2,804 | |
Group 1 Automotive, Inc. | | | 98 | | | | 19,132 | |
Guess?, Inc. | | | 1,149 | | | | 27,208 | |
Hibbett, Inc. | | | 152 | | | | 10,933 | |
Home Depot, Inc./The | | | 3,453 | | | | 1,433,030 | |
Houghton Mifflin Harcourt Co. (1) | | | 266 | | | | 4,283 | |
International Game Technology PLC | | | 2,289 | | | | 66,175 | |
JOANN, Inc. | | | 38 | | | | 394 | |
Kirkland’s, Inc. (1) | | | 37 | | | | 552 | |
The accompanying notes are an integral part of these financial statements.
2021 Annual Report | December 31, 2021 | Page 37 |
Schedule of Investments
December 31, 2021
Spectrum Fund |
Security Description | | Shares or
Principal
Amount ($) | | | Fair
Value ($) | |
Common Stocks (United States) - Long — continued |
Kohl’s Corp. | | | 2,107 | | | | 104,065 | |
Kontoor Brands, Inc. | | | 78 | | | | 3,998 | |
Lands’ End, Inc. (1) | | | 453 | | | | 8,892 | |
Lear Corp. | | | 361 | | | | 66,045 | |
Liquidity Services, Inc. (1) | | | 62 | | | | 1,369 | |
Lovesac Co./The (1) | | | 116 | | | | 7,686 | |
Lowe’s Cos., Inc. | | | 8,326 | | | | 2,152,104 | |
Lululemon Athletica, Inc. (1) | | | 420 | | | | 164,409 | |
Macy’s, Inc. | | | 1,529 | | | | 40,029 | |
MGM Resorts International | | | 1,973 | | | | 88,548 | |
Nathan’s Famous, Inc. | | | 42 | | | | 2,452 | |
Nordstrom, Inc. (1) | | | 601 | | | | 13,595 | |
ODP Corp./The (1) | | | 277 | | | | 10,881 | |
OneWater Marine, Inc. | | | 1,248 | | | | 76,091 | |
O’Reilly Automotive, Inc. (1) | | | 154 | | | | 108,759 | |
Overstock.com, Inc. (1) | | | 85 | | | | 5,016 | |
Party City Holdco, Inc. (1) | | | 2,197 | | | | 12,237 | |
Penn National Gaming, Inc. (1) | | | 127 | | | | 6,585 | |
Penske Automotive Group, Inc. | | | 539 | | | | 57,792 | |
Qurate Retail, Inc. | | | 2,706 | | | | 20,566 | |
RCI Hospitality Holdings, Inc. | | | 108 | | | | 8,411 | |
Red Robin Gourmet Burgers, Inc. (1) | | | 1,305 | | | | 21,572 | |
Red Rock Resorts, Inc. | | | 758 | | | | 41,698 | |
Revolve Group, Inc. (1) | | | 540 | | | | 30,262 | |
Scientific Games Corp. (1) | | | 481 | | | | 32,145 | |
SeaWorld Entertainment, Inc. (1) | | | 474 | | | | 30,744 | |
Shoe Carnival, Inc. | | | 79 | | | | 3,087 | |
Shutterstock, Inc. | | | 251 | | | | 27,831 | |
Signet Jewelers, Ltd. | | | 64 | | | | 5,570 | |
Skyline Champion Corp. (1) | | | 488 | | | | 38,542 | |
Smith & Wesson Brands, Inc. | | | 865 | | | | 15,397 | |
Steven Madden, Ltd. | | | 1,599 | | | | 74,306 | |
Tapestry, Inc. | | | 2,473 | | | | 100,404 | |
Target Corp. | | | 2,083 | | | | 482,090 | |
Tempur Sealy International, Inc. | | | 1,038 | | | | 48,817 | |
Tenneco, Inc. (1) | | | 1,673 | | | | 18,905 | |
Tesla, Inc. (1) | | | 2,887 | | | | 3,050,924 | |
Thor Industries, Inc. | | | 1,441 | | | | 149,533 | |
TopBuild Corp. (1) | | | 10 | | | | 2,759 | |
Tupperware Brands Corp. (1) | | | 579 | | | | 8,853 | |
Urban Outfitters, Inc. (1) | | | 439 | | | | 12,889 | |
Vera Bradley, Inc. (1) | | | 64 | | | | 545 | |
Vista Outdoor, Inc. (1) | | | 38 | | | | 1,751 | |
Vuzix Corp. (1) | | | 51 | | | | 442 | |
Waitr Holdings, Inc. (1) | | | 1,878 | | | | 1,390 | |
Weber, Inc. | | | 2,102 | | | | 27,179 | |
Williams-Sonoma, Inc. | | | 455 | | | | 76,954 | |
Spectrum Fund |
Security Description | | Shares or
Principal
Amount ($) | | | Fair
Value ($) | |
Common Stocks (United States) - Long — continued |
Winnebago Industries, Inc. | | | 993 | | | | 74,396 | |
Great Wolf Resorts, Inc. (1) | | | 104 | | | | 11,624 | |
XPEL, Inc. (1) | | | 45 | | | | 3,073 | |
| | | | | | | | 15,613,978 | |
| | | | | | | | | |
Consumer Staples — 2.1% | | | | | | | | |
Albertsons Cos., Inc. | | | 4,897 | | | | 147,840 | |
Bunge, Ltd. | | | 16,525 | | | | 1,542,774 | |
Celsius Holdings, Inc. (1) | | | 77 | | | | 5,742 | |
Coca-Cola Co./The | | | 1,542 | | | | 91,302 | |
Costco Wholesale Corp. | | | 600 | | | | 340,620 | |
Darling Ingredients, Inc. (1) | | | 3,366 | | | | 233,230 | |
Hershey Co./The | | | 2,107 | | | | 407,641 | |
PepsiCo, Inc. | | | 3,363 | | | | 584,187 | |
Rite Aid Corp. (1) | | | 111 | | | | 1,631 | |
Spectrum Brands Holdings, Inc. | | | 716 | | | | 72,832 | |
Tyson Foods, Inc. | | | 474 | | | | 41,314 | |
Walgreens Boots Alliance, Inc. | | | 1,352 | | | | 70,520 | |
Walmart, Inc. | | | 6,337 | | | | 916,901 | |
| | | | | | | | 4,456,534 | |
| | | | | | | | | |
Energy — 2.9% | | | | | | | | |
Alto Ingredients, Inc. (1) | | | 215 | | | | 1,034 | |
Altus Midstream Co. | | | 76 | | | | 4,660 | |
Antero Resources Corp. (1) | | | 878 | | | | 15,365 | |
APA Corp. | | | 3,444 | | | | 92,609 | |
Ardmore Shipping Corp. (1) | | | 720 | | | | 2,434 | |
Berry Corp. | | | 842 | | | | 7,090 | |
Bristow Group, Inc. (1) | | | 230 | | | | 7,284 | |
Cactus, Inc. | | | 318 | | | | 12,125 | |
Chevron Corp. | | | 4,061 | | | | 476,558 | |
ConocoPhillips | | | 5,174 | | | | 373,459 | |
CONSOL Energy, Inc. (1) | | | 77 | | | | 1,749 | |
CVR Energy, Inc. | | | 442 | | | | 7,430 | |
Delek US Holdings, Inc. (1) | | | 1,637 | | | | 24,539 | |
Devon Energy Corp. | | | 3,908 | | | | 172,147 | |
DHT Holdings, Inc. | | | 1,154 | | | | 5,989 | |
Diamondback Energy, Inc. | | | 666 | | | | 71,828 | |
EOG Resources, Inc. | | | 1,969 | | | | 174,906 | |
Expro Group Holdings NV (1) | | | 410 | | | | 5,884 | |
Exxon Mobil Corp. | | | 28,246 | | | | 1,728,373 | |
Hess Corp. | | | 792 | | | | 58,632 | |
HollyFrontier Corp. | | | 420 | | | | 13,768 | |
ION Geophysical Corp. (1) | | | 2,321 | | | | 2,042 | |
Laredo Petroleum, Inc. (1) | | | 87 | | | | 5,231 | |
Marathon Oil Corp. | | | 3,999 | | | | 65,664 | |
Marathon Petroleum Corp. | | | 24,920 | | | | 1,594,631 | |
The accompanying notes are an integral part of these financial statements.
Page 38 | 2021 Annual Report | December 31, 2021 |
Schedule of Investments
December 31, 2021
Spectrum Fund |
Security Description | | Shares or
Principal
Amount ($) | | | Fair
Value ($) | |
Common Stocks (United States) - Long — continued |
Nabors Industries, Ltd. (1) | | | 233 | | | | 18,894 | |
NextDecade Corp. (1) | | | 563 | | | | 1,605 | |
Nine Energy Service, Inc. (1) | | | 3,105 | | | | 3,105 | |
Northern Oil and Gas, Inc. | | | 40 | | | | 823 | |
Occidental Petroleum Corp. | | | 6,786 | | | | 196,726 | |
Oceaneering International, Inc. (1) | | | 1,179 | | | | 13,334 | |
ONEOK, Inc. | | | 4,025 | | | | 236,509 | |
Overseas Shipholding Group, Inc. (1) | | | 808 | | | | 1,519 | |
Ovintiv, Inc. | | | 1,774 | | | | 59,784 | |
Par Pacific Holdings, Inc. (1) | | | 279 | | | | 4,601 | |
Patterson-UTI Energy, Inc. | | | 8 | | | | 68 | |
PDC Energy, Inc. | | | 56 | | | | 2,732 | |
Peabody Energy Corp. (1) | | | 566 | | | | 5,700 | |
Phillips 66 | | | 2,161 | | | | 156,586 | |
Pioneer Natural Resources Co. | | | 449 | | | | 81,664 | |
Range Resources Corp. (1) | | | 370 | | | | 6,597 | |
Schlumberger NV | | | 6,200 | | | | 185,690 | |
Scorpio Tankers, Inc. | | | 260 | | | | 3,331 | |
SM Energy Co. | | | 529 | | | | 15,595 | |
Southwestern Energy Co. (1) | | | 3,512 | | | | 16,366 | |
Talos Energy, Inc. (1) | | | 1,317 | | | | 12,907 | |
Targa Resources Corp. | | | 1,808 | | | | 94,450 | |
Teekay Corp. (1) | | | 1,555 | | | | 4,883 | |
Teekay Tankers, Ltd. (1) | | | 22 | | | | 240 | |
Uranium Energy Corp. (1) | | | 468 | | | | 1,568 | |
Valero Energy Corp. | | | 1,229 | | | | 92,310 | |
W&T Offshore, Inc. (1) | | | 147 | | | | 475 | |
World Fuel Services Corp. | | | 472 | | | | 12,494 | |
| | | | | | | | 6,155,987 | |
| | | | | | | | | |
Financials — 9.0% | | | | | | | | |
Affiliated Managers Group, Inc. | | | 371 | | | | 61,033 | |
Aflac, Inc. | | | 360 | | | | 21,020 | |
Allstate Corp./The | | | 4,550 | | | | 535,308 | |
Ally Financial, Inc. | | | 1,158 | | | | 55,132 | |
American Express Co. | | | 634 | | | | 103,722 | |
American Financial Group, Inc./OH | | | 604 | | | | 82,941 | |
American International Group, Inc. | | | 31,439 | | | | 1,787,622 | |
Ameris Bancorp | | | 1,177 | | | | 58,473 | |
Athene Holding, Ltd. (1) | | | 11,193 | | | | 932,713 | |
Bank of America Corp. | | | 24,995 | | | | 1,112,028 | |
Bank of New York Mellon Corp./The | | | 3,239 | | | | 188,121 | |
Bank OZK | | | 956 | | | | 44,483 | |
Berkshire Hathaway, Inc. (1) | | | 6,827 | | | | 2,041,273 | |
BGC Partners, Inc. | | | 1,027 | | | | 4,776 | |
Blackstone, Inc. | | | 7,140 | | | | 923,845 | |
Brighthouse Financial, Inc. (1) | | | 210 | | | | 10,878 | |
Spectrum Fund |
Security Description | | Shares or
Principal
Amount ($) | | | Fair
Value ($) | |
Common Stocks (United States) - Long — continued |
Capital Bancorp, Inc. | | | 1,243 | | | | 32,567 | |
Capital One Financial Corp. | | | 2,498 | | | | 362,435 | |
Charles Schwab Corp./The | | | 6,368 | | | | 535,549 | |
Chimera Investment Corp. | | | 16,318 | | | | 246,075 | |
Citigroup, Inc. | | | 7,358 | | | | 444,350 | |
Citizens Financial Group, Inc. | | | 2,097 | | | | 99,083 | |
Civista Bancshares, Inc. | | | 10 | | | | 244 | |
Comerica, Inc. | | | 400 | | | | 34,800 | |
Crawford & Co. | | | 792 | | | | 5,932 | |
East West Bancorp, Inc. | | | 1,461 | | | | 114,951 | |
Ellington Financial, Inc. | | | 163 | | | | 2,786 | |
Evercore, Inc. | | | 1,684 | | | | 228,771 | |
Fidelity National Financial, Inc. | | | 8,287 | | | | 432,416 | |
Fifth Third Bancorp | | | 6,487 | | | | 282,509 | |
First American Financial Corp. | | | 7,485 | | | | 585,552 | |
Goldman Sachs Group, Inc./The | | | 307 | | | | 117,443 | |
Hancock Whitney Corp. | | | 1,140 | | | | 57,023 | |
Hartford Financial Services Group, Inc./The | | | 1,798 | | | | 124,134 | |
Invesco, Ltd. | | | 2,892 | | | | 66,574 | |
Investors Title Co. | | | 43 | | | | 8,477 | |
Janus Henderson Group PLC | | | 2,426 | | | | 101,746 | |
Jefferies Financial Group, Inc. | | | 321 | | | | 12,455 | |
JPMorgan Chase & Co. | | | 6,617 | | | | 1,047,802 | |
KKR & Co., Inc. | | | 2,674 | | | | 199,213 | |
LendingClub Corp. (1) | | | 375 | | | | 9,068 | |
LPL Financial Holdings, Inc. | | | 417 | | | | 66,758 | |
Marlin Business Services Corp. | | | 2,475 | | | | 57,618 | |
MBIA, Inc. (1) | | | 754 | | | | 11,906 | |
Meta Financial Group, Inc. | | | 561 | | | | 33,469 | |
MetLife, Inc. | | | 1,496 | | | | 93,485 | |
Moelis & Co. | | | 1,501 | | | | 93,828 | |
Morgan Stanley | | | 8,128 | | | | 797,844 | |
Mr Cooper Group, Inc. (1) | | | 629 | | | | 26,173 | |
MVB Financial Corp. | | | 634 | | | | 26,324 | |
Northrim BanCorp, Inc. | | | 1,376 | | | | 59,801 | |
Old Republic International Corp. | | | 3,159 | | | | 77,648 | |
OneMain Holdings, Inc. | | | 528 | | | | 26,421 | |
PacWest Bancorp | | | 3 | | | | 136 | |
Pinnacle Financial Partners, Inc. | | | 292 | | | | 27,886 | |
PNC Financial Services Group, Inc./The | | | 1,178 | | | | 236,213 | |
Popular, Inc. | | | 353 | | | | 28,960 | |
Prudential Financial, Inc. | | | 955 | | | | 103,369 | |
Pzena Investment Management, Inc. | | | 3,069 | | | | 29,063 | |
Raymond James Financial, Inc. | | | 652 | | | | 65,461 | |
RBB Bancorp | | | 1,472 | | | | 38,566 | |
Redwood Trust, Inc. | | | 422 | | | | 5,566 | |
Regions Financial Corp. | | | 9,985 | | | | 217,673 | |
The accompanying notes are an integral part of these financial statements.
2021 Annual Report | December 31, 2021 | Page 39 |
Schedule of Investments
December 31, 2021
Spectrum Fund |
Security Description | | Shares or
Principal
Amount ($) | | | Fair
Value ($) | |
Common Stocks (United States) - Long — continued |
Santander Consumer USA Holdings, Inc. | | | 1,680 | | | | 70,594 | |
Siebert Financial Corp. (1) | | | 252 | | | | 585 | |
Signature Bank/New York NY | | | 303 | | | | 98,011 | |
SLM Corp. | | | 1,656 | | | | 32,574 | |
Stewart Information Services Corp. | | | 2,427 | | | | 193,505 | |
SVB Financial Group (1) | | | 162 | | | | 109,875 | |
Synchrony Financial | | | 31,841 | | | | 1,477,104 | |
Synovus Financial Corp. | | | 1,146 | | | | 54,859 | |
Tiptree, Inc. | | | 420 | | | | 5,809 | |
Truist Financial Corp. | | | 4,530 | | | | 265,232 | |
Umpqua Holdings Corp. | | | 6,077 | | | | 116,921 | |
Upstart Holdings, Inc. (1) | | | 134 | | | | 20,274 | |
US Bancorp | | | 6,157 | | | | 345,839 | |
Walker & Dunlop, Inc. | | | 670 | | | | 101,090 | |
Wells Fargo & Co. | | | 14,140 | | | | 678,437 | |
Western Alliance Bancorp | | | 443 | | | | 47,689 | |
Zions Bancorp NA | | | 1,980 | | | | 125,057 | |
| | | | | | | | 18,982,946 | |
| | | | | | | | | |
Healthcare — 14.3% | | | | | | | | |
AbbVie, Inc. | | | 14,562 | | | | 1,971,695 | |
Abeona Therapeutics, Inc. (1) | | | 619 | | | | 209 | |
Adagio Therapeutics, Inc. (1) | | | 30 | | | | 218 | |
Affimed NV (1) | | | 1,108 | | | | 6,116 | |
Agilent Technologies, Inc. | | | 3,612 | | | | 576,656 | |
Alector, Inc. (1) | | | 203 | | | | 4,192 | |
Alkermes PLC (1) | | | 601 | | | | 13,979 | |
Allakos, Inc. (1) | | | 252 | | | | 2,467 | |
Alnylam Pharmaceuticals, Inc. (1) | | | 279 | | | | 47,313 | |
Amedisys, Inc. (1) | | | 35 | | | | 5,666 | |
AmerisourceBergen Corp. | | | 2,877 | | | | 382,325 | |
Amgen, Inc. | | | 4,980 | | | | 1,120,351 | |
Amicus Therapeutics, Inc. (1) | | | 1,271 | | | | 14,680 | |
AMN Healthcare Services, Inc. (1) | | | 76 | | | | 9,297 | |
Amneal Pharmaceuticals, Inc. (1) | | | 1,938 | | | | 9,283 | |
ANI Pharmaceuticals, Inc. (1) | | | 66 | | | | 3,041 | |
Anthem, Inc. | | | 2,043 | | | | 947,012 | |
Apellis Pharmaceuticals, Inc. (1) | | | 186 | | | | 8,794 | |
Apollo Medical Holdings, Inc. (1) | | | 464 | | | | 34,095 | |
Applied Therapeutics, Inc. (1) | | | 661 | | | | 5,916 | |
Arbutus Biopharma Corp. (1) | | | 2,397 | | | | 9,324 | |
Arcutis Biotherapeutics, Inc. (1) | | | 574 | | | | 11,905 | |
Arrowhead Pharmaceuticals, Inc. (1) | | | 440 | | | | 29,172 | |
Arvinas, Inc. (1) | | | 209 | | | | 17,167 | |
Atara Biotherapeutics, Inc. (1) | | | 386 | | | | 6,083 | |
Avalo Therapeutics, Inc. (1) | | | 2,238 | | | | 3,805 | |
Avid Bioservices, Inc. (1) | | | 1,059 | | | | 30,902 | |
Spectrum Fund |
Security Description | | Shares or
Principal
Amount ($) | | | Fair
Value ($) | |
Common Stocks (United States) - Long — continued |
Beam Therapeutics, Inc. (1) | | | 266 | | | | 21,198 | |
Beyondspring, Inc. (1) | | | 327 | | | | 1,481 | |
BioCryst Pharmaceuticals, Inc. (1) | | | 646 | | | | 8,947 | |
BioDelivery Sciences International, Inc. (1) | | | 1,345 | | | | 4,170 | |
Biogen, Inc. (1) | | | 4,966 | | | | 1,191,443 | |
Biohaven Pharmaceutical Holding Co., Ltd. (1) | | | 220 | | | | 30,318 | |
Bio-Techne Corp. | | | 458 | | | | 236,942 | |
Blueprint Medicines Corp. (1) | | | 258 | | | | 27,634 | |
Bridgebio Pharma, Inc. (1) | | | 321 | | | | 5,354 | |
Bristol-Myers Squibb Co. | | | 12,974 | | | | 808,929 | |
Bruker Corp. | | | 2,022 | | | | 169,666 | |
Calyxt, Inc. (1) | | | 634 | | | | 1,350 | |
Cardinal Health, Inc. | | | 3,762 | | | | 193,705 | |
CareDx, Inc. (1) | | | 248 | | | | 11,279 | |
CASI Pharmaceuticals, Inc. (1) | | | 1,242 | | | | 994 | |
Cassava Sciences, Inc. (1) | | | 504 | | | | 22,025 | |
Catalent, Inc. (1) | | | 789 | | | | 101,016 | |
Catalyst Pharmaceuticals, Inc. (1) | | | 2,184 | | | | 14,786 | |
Celcuity, Inc. (1) | | | 3 | | | | 40 | |
Centogene NV (1) | | | 664 | | | | 3,472 | |
Cerevel Therapeutics Holdings, Inc. (1) | | | 157 | | | | 5,090 | |
Cerner Corp. | | | 5,758 | | | | 534,745 | |
Charles River Laboratories International, Inc. (1) | | | 164 | | | | 61,792 | |
Checkpoint Therapeutics, Inc. (1) | | | 915 | | | | 2,846 | |
Community Health Systems, Inc. (1) | | | 1,017 | | | | 13,536 | |
Computer Programs and Systems, Inc. (1) | | | 797 | | | | 23,352 | |
Cortexyme, Inc. (1) | | | 9 | | | | 114 | |
Corvus Pharmaceuticals, Inc. (1) | | | 354 | | | | 853 | |
Cross Country Healthcare, Inc. (1) | | | 109 | | | | 3,026 | |
CVS Health Corp. | | | 5,974 | | | | 616,278 | |
Danaher Corp. | | | 4,196 | | | | 1,380,526 | |
Denali Therapeutics, Inc. (1) | | | 77 | | | | 3,434 | |
Dynavax Technologies Corp. (1) | | | 492 | | | | 6,922 | |
Editas Medicine, Inc. (1) | | | 445 | | | | 11,815 | |
Elanco Animal Health, Inc. Contingent Value Rights (1)(4) | | | 2,012 | | | | 0 | |
Eli Lilly & Co. | | | 3,678 | | | | 1,015,937 | |
Eloxx Pharmaceuticals, Inc. (1) | | | 3,173 | | | | 2,241 | |
Enanta Pharmaceuticals, Inc. (1) | | | 109 | | | | 8,151 | |
Endo International PLC (1) | | | 1,253 | | | | 4,711 | |
Evolent Health, Inc. (1) | | | 276 | | | | 7,637 | |
Exact Sciences Corp. (1) | | | 283 | | | | 22,026 | |
Exelixis, Inc. (1) | | | 2,008 | | | | 36,706 | |
Fate Therapeutics, Inc. (1) | | | 35 | | | | 2,048 | |
Fulgent Genetics, Inc. (1) | | | 8 | | | | 805 | |
Galectin Therapeutics, Inc. (1) | | | 1,059 | | | | 2,192 | |
The accompanying notes are an integral part of these financial statements.
Page 40 | 2021 Annual Report | December 31, 2021 |
Schedule of Investments
December 31, 2021
Spectrum Fund |
Security Description | | Shares or
Principal
Amount ($) | | | Fair
Value ($) | |
Common Stocks (United States) - Long — continued |
Genprex, Inc. (1) | | | 1,467 | | | | 1,922 | |
Gilead Sciences, Inc. | | | 7,659 | | | | 556,120 | |
Globus Medical, Inc. (1) | | | 1,146 | | | | 82,741 | |
HCA Healthcare, Inc. | | | 1,288 | | | | 330,913 | |
Horizon Therapeutics Plc (1) | | | 4,005 | | | | 431,579 | |
Humanigen, Inc. (1) | | | 153 | | | | 569 | |
Idera Pharmaceuticals, Inc. (1) | | | 833 | | | | 475 | |
Illumina, Inc. (1) | | | 108 | | | | 41,088 | |
Incyte Corp. (1) | | | 4,368 | | | | 320,611 | |
Inotiv, Inc. (1) | | | 269 | | | | 11,317 | |
Intellia Therapeutics, Inc. (1) | | | 250 | | | | 29,560 | |
Intra-Cellular Therapies, Inc. (1) | | | 13 | | | | 680 | |
iRhythm Technologies, Inc. (1) | | | 42 | | | | 4,943 | |
Johnson & Johnson | | | 22,348 | | | | 3,823,072 | |
Jounce Therapeutics, Inc. (1) | | | 541 | | | | 4,517 | |
Karuna Therapeutics, Inc. (1) | | | 3 | | | | 393 | |
Kezar Life Sciences, Inc. (1) | | | 504 | | | | 8,427 | |
La Jolla Pharmaceutical Co. (1) | | | 873 | | | | 4,059 | |
Mallinckrodt PLC (1) | | | 2,967 | | | | 371 | |
MannKind Corp. (1) | | | 2,811 | | | | 12,284 | |
Maravai LifeSciences Holdings, Inc. (1) | | | 556 | | | | 23,296 | |
Marinus Pharmaceuticals, Inc. (1) | | | 429 | | | | 5,097 | |
McKesson Corp. | | | 2,395 | | | | 595,325 | |
Medtronic PLC | | | 965 | | | | 99,829 | |
Merck & Co., Inc. | | | 23,209 | | | | 1,778,738 | |
Mirati Therapeutics, Inc. (1) | | | 224 | | | | 32,859 | |
Moderna, Inc. (1) | | | 2,835 | | | | 720,033 | |
Molina Healthcare, Inc. (1) | | | 79 | | | | 25,128 | |
Morphic Holding, Inc. (1) | | | 15 | | | | 711 | |
Myriad Genetics, Inc. (1) | | | 317 | | | | 8,749 | |
Natera, Inc. (1) | | | 441 | | | | 41,185 | |
Nektar Therapeutics (1) | | | 191 | | | | 2,580 | |
NextGen Healthcare, Inc. (1) | | | 402 | | | | 7,152 | |
Novavax, Inc. (1) | | | 249 | | | | 35,624 | |
Ocugen, Inc. (1) | | | 521 | | | | 2,371 | |
Oncocyte Corp. (1) | | | 905 | | | | 1,964 | |
OptimizeRx Corp. (1) | | | 55 | | | | 3,416 | |
Oramed Pharmaceuticals, Inc. (1) | | | 412 | | | | 5,883 | |
Organon & Co. | | | 1,829 | | | | 55,693 | |
Otonomy, Inc. (1) | | | 2,774 | | | | 5,770 | |
PerkinElmer, Inc. | | | 1,026 | | | | 206,288 | |
Perrigo Co. PLC | | | 2,749 | | | | 106,936 | |
Pfizer, Inc. | | | 22,447 | | | | 1,325,495 | |
Precigen, Inc. (1) | | | 2,335 | | | | 8,663 | |
Prothena Corp. PLC (1) | | | 227 | | | | 11,214 | |
Puma Biotechnology, Inc. (1) | | | 1,219 | | | | 3,706 | |
Quest Diagnostics, Inc. | | | 602 | | | | 104,152 | |
Spectrum Fund |
Security Description | | Shares or
Principal
Amount ($) | | | Fair
Value ($) | |
Common Stocks (United States) - Long — continued |
Quidel Corp. (1) | | | 286 | | | | 38,607 | |
Radius Health, Inc. (1) | | | 196 | | | | 1,356 | |
Regeneron Pharmaceuticals, Inc. (1) | | | 3,346 | | | | 2,113,066 | |
REGENXBIO, Inc. (1) | | | 75 | | | | 2,453 | |
ResMed, Inc. | | | 68 | | | | 17,713 | |
Rocket Pharmaceuticals, Inc. (1) | | | 170 | | | | 3,711 | |
Seres Therapeutics, Inc. (1) | | | 121 | | | | 1,008 | |
Sesen Bio, Inc. (1) | | | 1,760 | | | | 1,434 | |
Sorrento Therapeutics, Inc. (1) | | | 1,491 | | | | 6,933 | |
SpringWorks Therapeutics, Inc. (1) | | | 156 | | | | 9,669 | |
STAAR Surgical Co. (1) | | | 314 | | | | 28,668 | |
Sutro Biopharma, Inc. (1) | | | 308 | | | | 4,583 | |
Tenet Healthcare Corp. (1) | | | 331 | | | | 27,039 | |
Thermo Fisher Scientific, Inc. | | | 2,559 | | | | 1,707,467 | |
TransMedics Group, Inc. (1) | | | 201 | | | | 3,851 | |
Triple-S Management Corp. (1) | | | 492 | | | | 17,555 | |
Twist Bioscience Corp. (1) | | | 189 | | | | 14,627 | |
Tyme Technologies, Inc. (1) | | | 549 | | | | 331 | |
Ultragenyx Pharmaceutical, Inc. (1) | | | 174 | | | | 14,632 | |
UnitedHealth Group, Inc. | | | 4,068 | | | | 2,042,706 | |
Universal Health Services, Inc. | | | 442 | | | | 57,310 | |
Vanda Pharmaceuticals, Inc. (1) | | | 432 | | | | 6,778 | |
Veracyte, Inc. (1) | | | 517 | | | | 21,300 | |
Viatris, Inc. | | | 9,003 | | | | 121,811 | |
ViewRay, Inc. (1) | | | 1,316 | | | | 7,251 | |
WaVe Life Sciences, Ltd. (1) | | | 636 | | | | 1,997 | |
West Pharmaceutical Services, Inc. | | | 2,147 | | | | 1,006,964 | |
Zentalis Pharmaceuticals, Inc. (1) | | | 280 | | | | 23,537 | |
ZIOPHARM Oncology, Inc. (1) | | | 1,005 | | | | 1,095 | |
| | | | | | | | 30,082,145 | |
| | | | | | | | | |
Industrials — 4.5% | | | | | | | | |
Acuity Brands, Inc. | | | 378 | | | | 80,030 | |
AGCO Corp. | | | 881 | | | | 102,214 | |
Altra Industrial Motion Corp. | | | 206 | | | | 10,623 | |
ArcBest Corp. | | | 160 | | | | 19,176 | |
Atkore, Inc. (1) | | | 169 | | | | 18,791 | |
Atlas Air Worldwide Holdings, Inc. (1) | | | 469 | | | | 44,142 | |
Avis Budget Group, Inc. (1) | | | 165 | | | | 34,216 | |
Axon Enterprise, Inc. (1) | | | 198 | | | | 31,086 | |
AZZ, Inc. | | | 621 | | | | 34,335 | |
BlueLinx Holdings, Inc. (1) | | | 8 | | | | 766 | |
Boise Cascade Co. | | | 2,619 | | | | 186,473 | |
Builders FirstSource, Inc. (1) | | | 786 | | | | 67,368 | |
Carrier Global Corp. | | | 1,174 | | | | 63,678 | |
Caterpillar, Inc. | | | 1,228 | | | | 253,877 | |
ChargePoint Holdings, Inc. (1) | | | 215 | | | | 4,096 | |
The accompanying notes are an integral part of these financial statements.
2021 Annual Report | December 31, 2021 | Page 41 |
Schedule of Investments
December 31, 2021
Spectrum Fund |
Security Description | | Shares or
Principal
Amount ($) | | | Fair
Value ($) | |
Common Stocks (United States) - Long — continued |
Clean Harbors, Inc. (1) | | | 116 | | | | 11,573 | |
Copart, Inc. (1) | | | 761 | | | | 115,383 | |
Core & Main, Inc. (1) | | | 172 | | | | 5,218 | |
Covenant Logistics Group, Inc. (1) | | | 417 | | | | 11,021 | |
CSX Corp. | | | 6,364 | | | | 239,286 | |
Dover Corp. | | | 2,403 | | | | 436,385 | |
Eaton Corp. PLC | | | 806 | | | | 139,293 | |
Emerson Electric Co. | | | 2,941 | | | | 273,425 | |
Encore Wire Corp. | | | 19 | | | | 2,719 | |
EnerSys | | | 232 | | | | 18,342 | |
Fluor Corp. (1) | | | 255 | | | | 6,316 | |
Franklin Electric Co., Inc. | | | 430 | | | | 40,661 | |
FTC Solar, Inc. (1) | | | 535 | | | | 4,045 | |
FuelCell Energy, Inc. (1) | | | 1,309 | | | | 6,807 | |
Genco Shipping & Trading, Ltd. | | | 629 | | | | 10,064 | |
Generac Holdings, Inc. (1) | | | 648 | | | | 228,044 | |
General Dynamics Corp. | | | 2,918 | | | | 608,315 | |
GrafTech International, Ltd. | | | 1,684 | | | | 19,922 | |
Granite Construction, Inc. | | | 61 | | | | 2,361 | |
Helios Technologies, Inc. | | | 85 | | | | 8,939 | |
Herc Holdings, Inc. | | | 539 | | | | 84,380 | |
Hertz Global Holdings, Inc. (1) | | | 11 | | | | 300 | |
Hillenbrand, Inc. | | | 780 | | | | 40,552 | |
Hub Group, Inc. (1) | | | 327 | | | | 27,546 | |
Hubbell, Inc. | | | 1,334 | | | | 277,832 | |
Huntington Ingalls Industries, Inc. | | | 1,198 | | | | 223,715 | |
JB Hunt Transport Services, Inc. | | | 956 | | | | 195,406 | |
Johnson Controls International plc | | | 11,746 | | | | 955,067 | |
Karat Packaging, Inc. (1) | | | 140 | | | | 2,829 | |
Lyft, Inc. (1) | | | 143 | | | | 6,110 | |
Manitowoc Co., Inc./The (1) | | | 1,591 | | | | 29,577 | |
ManpowerGroup, Inc. | | | 2,297 | | | | 223,567 | |
Matson, Inc. | | | 99 | | | | 8,913 | |
Meritor, Inc. (1) | | | 851 | | | | 21,088 | |
Miller Industries, Inc./TN | | | 161 | | | | 5,377 | |
Mueller Industries, Inc. | | | 3,073 | | | | 182,413 | |
MYR Group, Inc. (1) | | | 138 | | | | 15,256 | |
Norfolk Southern Corp. | | | 14 | | | | 4,168 | |
NOW, Inc. (1) | | | 276 | | | | 2,357 | |
nVent Electric PLC | | | 1,709 | | | | 64,942 | |
Old Dominion Freight Line, Inc. | | | 594 | | | | 212,878 | |
Oshkosh Corp. | | | 254 | | | | 28,628 | |
Owens Corning | | | 1,685 | | | | 152,493 | |
Plug Power, Inc. (1) | | | 1,602 | | | | 45,224 | |
Quad/Graphics, Inc. (1) | | | 1,710 | | | | 6,840 | |
Quanta Services, Inc. | | | 9,777 | | | | 1,121,031 | |
Raytheon Technologies Corp. | | | 3,354 | | | | 288,645 | |
Spectrum Fund |
Security Description | | Shares or
Principal
Amount ($) | | | Fair
Value ($) | |
Common Stocks (United States) - Long — continued |
Regal Rexnord Corp. | | | 1,388 | | | | 236,210 | |
Resideo Technologies, Inc. (1) | | | 1,140 | | | | 29,674 | |
REV Group, Inc. | | | 510 | | | | 7,217 | |
Robert Half International, Inc. | | | 191 | | | | 21,300 | |
Ryder System, Inc. | | | 2,381 | | | | 196,266 | |
Saia, Inc. (1) | | | 190 | | | | 64,036 | |
Schneider National, Inc. | | | 116 | | | | 3,122 | |
Shyft Group, Inc./The | | | 388 | | | | 19,062 | |
SkyWest, Inc. (1) | | | 1,871 | | | | 73,530 | |
Sterling Construction Co., Inc. (1) | | | 6 | | | | 158 | |
Terex Corp. | | | 2,140 | | | | 94,053 | |
Textainer Group Holdings, Ltd. | | | 691 | | | | 24,676 | |
Textron, Inc. | | | 5,522 | | | | 426,298 | |
Titan International, Inc. (1) | | | 1,776 | | | | 19,465 | |
Triton International, Ltd. | | | 843 | | | | 50,774 | |
TrueBlue, Inc. (1) | | | 550 | | | | 15,219 | |
United Parcel Service, Inc. | | | 2,354 | | | | 504,556 | |
United Rentals, Inc. (1) | | | 191 | | | | 63,467 | |
Valmont Industries, Inc. | | | 228 | | | | 57,114 | |
Vectrus, Inc. (1) | | | 888 | | | | 40,644 | |
Veritiv Corp. (1) | | | 12 | | | | 1,471 | |
Vicor Corp. (1) | | | 169 | | | | 21,460 | |
WESCO International, Inc. (1) | | | 655 | | | | 86,191 | |
Yellow Corp. (1) | | | 478 | | | | 6,018 | |
| | | | | | | | 9,428,105 | |
| | | | | | | | | |
Information Technology — 21.7% | | | | | | | | |
3D Systems Corp. (1) | | | 269 | | | | 5,794 | |
Accenture PLC | | | 557 | | | | 230,904 | |
ACI Worldwide, Inc. (1) | | | 1,700 | | | | 58,990 | |
Adobe, Inc. (1) | | | 1,910 | | | | 1,083,085 | |
Advanced Micro Devices, Inc. (1) | | | 4,678 | | | | 673,164 | |
Alliance Data Systems Corp. | | | 1,289 | | | | 85,809 | |
Ambarella, Inc. (1) | | | 183 | | | | 37,129 | |
American Software, Inc./GA | | | 438 | | | | 11,462 | |
Amkor Technology, Inc. | | | 1,640 | | | | 40,656 | |
Analog Devices, Inc. | | | 1,290 | | | | 226,743 | |
Apple, Inc. | | | 29,696 | | | | 5,273,119 | |
Applied Materials, Inc. | | | 12,477 | | | | 1,963,381 | |
Arrow Electronics, Inc. (1) | | | 2,715 | | | | 364,543 | |
Asana, Inc. (1) | | | 680 | | | | 50,694 | |
Atlassian Corp. PLC (1) | | | 312 | | | | 118,962 | |
Autodesk, Inc. (1) | | | 402 | | | | 113,038 | |
Aviat Networks, Inc. (1) | | | 514 | | | | 16,489 | |
Avid Technology, Inc. (1) | | | 8 | | | | 261 | |
Avnet, Inc. | | | 4,145 | | | | 170,898 | |
Belden, Inc. | | | 309 | | | | 20,311 | |
The accompanying notes are an integral part of these financial statements.
Page 42 | 2021 Annual Report | December 31, 2021 |
Schedule of Investments
December 31, 2021
Spectrum Fund |
Security Description | | Shares or
Principal
Amount ($) | | | Fair
Value ($) | |
Common Stocks (United States) - Long — continued |
Bill.com Holdings, Inc. (1) | | | 264 | | | | 65,776 | |
Box, Inc. (1) | | | 803 | | | | 21,031 | |
Broadcom, Inc. | | | 408 | | | | 271,487 | |
Cadence Design Systems, Inc. (1) | | | 989 | | | | 184,300 | |
Calix, Inc. (1) | | | 1,035 | | | | 82,769 | |
CDK Global, Inc. | | | 3,646 | | | | 152,184 | |
CDW Corp./DE | | | 1,930 | | | | 395,225 | |
ChannelAdvisor Corp. (1) | | | 1,751 | | | | 43,215 | |
Cisco Systems, Inc./Delaware | | | 16,077 | | | | 1,018,799 | |
Cloudflare, Inc. (1) | | | 1,078 | | | | 141,757 | |
Cognex Corp. | | | 442 | | | | 34,370 | |
Concentrix Corp. | | | 337 | | | | 60,195 | |
Conduent, Inc. (1) | | | 4,642 | | | | 24,788 | |
Crowdstrike Holdings, Inc. (1) | | | 638 | | | | 130,631 | |
Datadog, Inc. (1) | | | 440 | | | | 78,368 | |
Diebold Nixdorf, Inc. (1) | | | 774 | | | | 7,005 | |
Diodes, Inc. (1) | | | 806 | | | | 88,507 | |
Dolby Laboratories, Inc. | | | 1,302 | | | | 123,976 | |
Dropbox, Inc. (1) | | | 9,284 | | | | 227,829 | |
DXC Technology Co. (1) | | | 1,849 | | | | 59,519 | |
Dynatrace, Inc. (1) | | | 726 | | | | 43,814 | |
Ebix, Inc. | | | 404 | | | | 12,282 | |
EPAM Systems, Inc. (1) | | | 150 | | | | 100,268 | |
Extreme Networks, Inc. (1) | | | 1,152 | | | | 18,086 | |
Fortinet, Inc. (1) | | | 1,105 | | | | 397,137 | |
Gartner, Inc. (1) | | | 2,583 | | | | 863,549 | |
Hewlett Packard Enterprise Co. | | | 9,667 | | | | 152,449 | |
HP, Inc. | | | 13,999 | | | | 527,342 | |
HubSpot, Inc. (1) | | | 204 | | | | 134,467 | |
Intel Corp. | | | 16,505 | | | | 850,008 | |
Intuit, Inc. | | | 4,528 | | | | 2,912,500 | |
Jabil, Inc. | | | 8,485 | | | | 596,920 | |
Kimball Electronics, Inc. (1) | | | 606 | | | | 13,187 | |
KLA Corp. | | | 4,373 | | | | 1,880,871 | |
Kulicke & Soffa Industries, Inc. | | | 434 | | | | 26,274 | |
Kyndryl Holdings, Inc. (1) | | | 95 | | | | 1,720 | |
Lam Research Corp. | | | 454 | | | | 326,494 | |
Lattice Semiconductor Corp. (1) | | | 1,847 | | | | 142,330 | |
Manhattan Associates, Inc. (1) | | | 1,311 | | | | 203,847 | |
Marathon Digital Holdings, Inc. (1) | | | 394 | | | | 12,947 | |
MaxLinear, Inc. (1) | | | 148 | | | | 11,158 | |
McAfee Corp. | | | 3,602 | | | | 92,896 | |
Micron Technology, Inc. | | | 3,842 | | | | 357,882 | |
Microsoft Corp. | | | 36,718 | | | | 12,348,972 | |
Mimecast, Ltd. (1) | | | 460 | | | | 36,602 | |
MoneyGram International, Inc. (1) | | | 2,167 | | | | 17,098 | |
MongoDB, Inc. (1) | | | 131 | | | | 69,345 | |
Spectrum Fund |
Security Description | | Shares or
Principal
Amount ($) | | | Fair
Value ($) | |
Common Stocks (United States) - Long — continued |
Monolithic Power Systems, Inc. | | | 57 | | | | 28,120 | |
NCR Corp. (1) | | | 2,222 | | | | 89,324 | |
NortonLifeLock, Inc. | | | 5,428 | | | | 141,019 | |
NVIDIA Corp. | | | 8,165 | | | | 2,401,408 | |
NXP Semiconductors NV | | | 737 | | | | 167,874 | |
ON Semiconductor Corp. (1) | | | 1,282 | | | | 87,073 | |
Oracle Corp. | | | 9,503 | | | | 828,757 | |
Palantir Technologies, Inc. (1) | | | 2,020 | | | | 36,784 | |
Palo Alto Networks, Inc. (1) | | | 1,438 | | | | 800,621 | |
Paycom Software, Inc. (1) | | | 317 | | | | 131,615 | |
Perficient, Inc. (1) | | | 187 | | | | 24,177 | |
Plantronics, Inc. (1) | | | 242 | | | | 7,100 | |
Power Integrations, Inc. | | | 266 | | | | 24,709 | |
Priority Technology Holdings, Inc. (1) | | | 395 | | | | 2,797 | |
Progress Software Corp. | | | 2,452 | | | | 118,358 | |
Qorvo, Inc. (1) | | | 213 | | | | 33,311 | |
Rimini Street, Inc. (1) | | | 688 | | | | 4,107 | |
Riot Blockchain, Inc. (1) | | | 429 | | | | 9,580 | |
salesforce.com, Inc. (1) | | | 3,005 | | | | 763,661 | |
Sanmina Corp. (1) | | | 369 | | | | 15,299 | |
ScanSource, Inc. (1) | | | 307 | | | | 10,770 | |
SecureWorks Corp. (1) | | | 246 | | | | 3,929 | |
Semtech Corp. (1) | | | 29 | | | | 2,579 | |
SiTime Corp. (1) | | | 43 | | | | 12,579 | |
SMART Global Holdings, Inc. (1) | | | 47 | | | | 3,337 | |
Smartsheet, Inc. (1) | | | 438 | | | | 33,923 | |
Sprout Social, Inc. (1) | | | 708 | | | | 64,209 | |
SPS Commerce, Inc. (1) | | | 412 | | | | 58,648 | |
SS&C Technologies Holdings, Inc. | | | 16,839 | | | | 1,380,461 | |
StarTek, Inc. (1) | | | 2,176 | | | | 11,359 | |
Synaptics, Inc. (1) | | | 498 | | | | 144,176 | |
Synopsys, Inc. (1) | | | 202 | | | | 74,437 | |
Teradata Corp. (1) | | | 905 | | | | 38,435 | |
Teradyne, Inc. | | | 343 | | | | 56,091 | |
Texas Instruments, Inc. | | | 4,469 | | | | 842,272 | |
Trade Desk, Inc./The (1) | | | 1,399 | | | | 128,204 | |
Trimble, Inc. (1) | | | 1,337 | | | | 116,573 | |
TTEC Holdings, Inc. | | | 188 | | | | 17,023 | |
Ultra Clean Holdings, Inc. (1) | | | 156 | | | | 8,948 | |
Veritone, Inc. (1) | | | 282 | | | | 6,339 | |
Viant Technology, Inc. (1) | | | 1,628 | | | | 15,800 | |
Visa, Inc. | | | 2,576 | | | | 558,245 | |
VMware, Inc. | | | 1,496 | | | | 173,356 | |
Workday, Inc. (1) | | | 435 | | | | 118,833 | |
Workiva, Inc. (1) | | | 399 | | | | 52,066 | |
Xilinx, Inc. | | | 285 | | | | 60,429 | |
Xperi Holding Corp. | | | 2,972 | | | | 56,201 | |
The accompanying notes are an integral part of these financial statements.
2021 Annual Report | December 31, 2021 | Page 43 |
Schedule of Investments
December 31, 2021
Spectrum Fund |
Security Description | | Shares or
Principal
Amount ($) | | | Fair
Value ($) | |
Common Stocks (United States) - Long — continued |
Zebra Technologies Corp. (1) | | | 448 | | | | 266,650 | |
Zscaler, Inc. (1) | | | 239 | | | | 76,798 | |
| | | | | | | | 46,015,972 | |
| | | | | | | | | |
Materials — 0.9% | | | | | | | | |
Albemarle Corp. | | | 534 | | | | 124,833 | |
Alcoa Corp. | | | 1,131 | | | | 67,385 | |
Amyris, Inc. (1) | | | 380 | | | | 2,056 | |
Avient Corp. | | | 413 | | | | 23,107 | |
Berry Global Group, Inc. (1) | | | 1,199 | | | | 88,462 | |
Celanese Corp. | | | 1,030 | | | | 173,102 | |
Century Aluminum Co. (1) | | | 373 | | | | 6,177 | |
Chemours Co./The | | | 685 | | | | 22,989 | |
Cleveland-Cliffs, Inc. (1) | | | 1,622 | | | | 35,311 | |
Dow, Inc. | | | 3,077 | | | | 174,527 | |
Element Solutions, Inc. | | | 686 | | | | 16,656 | |
Ferroglobe PLC Contingent Value Rights (1)(4)(6) | | | (2,326 | ) | | | 0 | |
Freeport-McMoRan, Inc. | | | 5,563 | | | | 232,144 | |
Hawkins, Inc. | | | 266 | | | | 10,494 | |
Huntsman Corp. | | | 1,797 | | | | 62,679 | |
Koppers Holdings, Inc. (1) | | | 378 | | | | 11,831 | |
Louisiana-Pacific Corp. | | | 1,945 | | | | 152,391 | |
LyondellBasell Industries NV | | | 1,644 | | | | 151,626 | |
Mosaic Co./The | | | 2,168 | | | | 85,181 | |
Nucor Corp. | | | 1,431 | | | | 163,349 | |
O-I Glass, Inc. (1) | | | 709 | | | | 8,529 | |
Olin Corp. | | | 672 | | | | 38,653 | |
Rayonier Advanced Materials, Inc. (1) | | | 443 | | | | 2,530 | |
Steel Dynamics, Inc. | | | 707 | | | | 43,883 | |
SunCoke Energy, Inc. | | | 659 | | | | 4,343 | |
Trinseo PLC | | | 612 | | | | 32,106 | |
Tronox Holdings PLC | | | 693 | | | | 16,653 | |
United States Steel Corp. | | | 956 | | | | 22,762 | |
Westlake Chemical Corp. | | | 658 | | | | 63,912 | |
| | | | | | | | 1,837,671 | |
| | | | | | | | | |
Real Estate Investment Trust — 2.6% | | | | | | | | |
Altisource Portfolio Solutions SA (1) | | | 967 | | | | 10,850 | |
American Homes 4 Rent | | | 2,929 | | | | 127,734 | |
Ashford Hospitality Trust, Inc. (1) | | | 951 | | | | 9,130 | |
Camden Property Trust | | | 1,783 | | | | 318,586 | |
CareTrust REIT, Inc. | | | 2,908 | | | | 66,390 | |
CatchMark Timber Trust, Inc. | | | 2,934 | | | | 25,555 | |
Clipper Realty, Inc. | | | 38 | | | | 378 | |
CorEnergy Infrastructure Trust, Inc. | | | 5,027 | | | | 15,735 | |
Corporate Office Properties Trust | | | 3,420 | | | | 95,657 | |
Spectrum Fund |
Security Description | | Shares or
Principal
Amount ($) | | | Fair
Value ($) | |
Common Stocks (United States) - Long — continued |
CubeSmart | | | 7,335 | | | | 417,435 | |
Cushman & Wakefield PLC (1) | | | 868 | | | | 19,304 | |
DiamondRock Hospitality Co. (1) | | | 404 | | | | 3,882 | |
EastGroup Properties, Inc. | | | 2,489 | | | | 567,119 | |
Essex Property Trust, Inc. | | | 457 | | | | 160,969 | |
eXp World Holdings, Inc. | | | 223 | | | | 7,513 | |
Extra Space Storage, Inc. | | | 30 | | | | 6,802 | |
First Industrial Realty Trust, Inc. | | | 4,300 | | | | 284,660 | |
Forestar Group, Inc. (1) | | | 196 | | | | 4,263 | |
GEO Group, Inc./The | | | 917 | | | | 7,107 | |
Gladstone Commercial Corp. | | | 1,770 | | | | 45,613 | |
Healthcare Trust of America, Inc. | | | 4,406 | | | | 147,116 | |
Host Hotels & Resorts, Inc. (1) | | | 396 | | | | 6,886 | |
Hudson Pacific Properties, Inc. | | | 3 | | | | 74 | |
Invitation Homes, Inc. | | | 592 | | | | 26,841 | |
Lamar Advertising Co. | | | 7,067 | | | | 857,227 | |
Maui Land & Pineapple Co., Inc. (1) | | | 314 | | | | 3,127 | |
Mid-America Apartment Communities, Inc. | | | 1,175 | | | | 269,592 | |
Omega Healthcare Investors, Inc. | | | 4,540 | | | | 134,339 | |
PotlatchDeltic Corp. | | | 1,085 | | | | 65,339 | |
PS Business Parks, Inc. | | | 612 | | | | 112,712 | |
Public Storage | | | 1,703 | | | | 637,876 | |
Rafael Holdings, Inc. (1) | | | 210 | | | | 1,071 | |
Regency Centers Corp. | | | 7,470 | | | | 562,865 | |
SL Green Realty Corp. | | | 1,908 | | | | 136,804 | |
Stratus Properties, Inc. (1) | | | 205 | | | | 7,497 | |
Tanger Factory Outlet Centers, Inc. | | | 438 | | | | 8,445 | |
Trinity Place Holdings, Inc. (1) | | | 3,358 | | | | 6,179 | |
UDR, Inc. | | | 1,843 | | | | 110,562 | |
Universal Health Realty Income Trust | | | 614 | | | | 36,515 | |
Weyerhaeuser Co. | | | 2,553 | | | | 105,133 | |
Zillow Group, Inc. (1) | | | 1,010 | | | | 64,489 | |
| | | | | | | | 5,495,371 | |
Utilities — 1.3% | | | | | | | | |
Duke Energy Corp. | | | 1,139 | | | | 119,481 | |
Evergy, Inc. | | | 5,632 | | | | 386,412 | |
Exelon Corp. | | | 19,380 | | | | 1,119,392 | |
MDU Resources Group, Inc. | | | 4,942 | | | | 152,411 | |
NRG Energy, Inc. | | | 15,971 | | | | 688,031 | |
Portland General Electric Co. | | | 5,207 | | | | 275,554 | |
UGI Corp. | | | 2,014 | | | | 92,463 | |
| | | | | | | | 2,833,744 | |
Total Common Stocks (United States) - Long (Cost $104,572,356) | | | | | | | 153,290,165 | |
| | | | | | | | | |
The accompanying notes are an integral part of these financial statements.
Page 44 | 2021 Annual Report | December 31, 2021 |
Schedule of Investments
December 31, 2021
Spectrum Fund |
Security Description | | Shares or
Principal
Amount ($) | | | Fair
Value ($) | |
Preferred Stock (United States) — 0.0% |
WESCO International, Inc. Series A Variable Preferred (5) | | | 198 | | | | 6,069 | |
Total Preferred Stock (United States) (Cost $4,949) | | | | | | | 6,069 | |
| | | | | | | | | |
Warrants (United States) — 0.0% |
Chaparral Energy, Inc. A Warrants, Expiration Date 10/14/2024 (1)(4) | | | 1 | | | | 0 | |
Chaparral Energy, Inc. B Warrants, Expiration Date 10/14/2025 (1)(4) | | | 1 | | | | 0 | |
Civitas Solutions, Inc. A Warrants, Expiration Date 1/20/2025 (1)(4) | | | 13 | | | | 0 | |
Civitas Solutions, Inc. B Warrants, Expiration Date 1/20/2026 (1)(4) | | | 6 | | | | 0 | |
Hertz Global Holdings, Inc. Warrants, Expiration Date 6/30/2051 (1) | | | 86 | | | | 1,372 | |
Nabors Industries, Ltd. Warrants, Expiration Date 6/11/2026 (1) | | | 29 | | | | 108 | |
Oasis Petroleum, Inc. Warrants, Expiration Date 11/19/2024 (1)(4) | | | 7 | | | | 0 | |
Whiting Petroleum Corp. A Warrants, Expiration Date 9/1/2024 (1) | | | 47 | | | | 651 | |
Whiting Petroleum Corp. B Warrants, Expiration Date 9/1/2025 (1) | | | 23 | | | | 271 | |
Total Warrants (United States) (Cost $2,899) | | | | | | | 2,402 | |
| | | | | | | | | |
Money Market Registered Investment Companies — 25.6% |
Meeder Institutional Prime Money Market Fund, 0.05% (2) | | | 54,062,927 | | | | 54,068,333 | |
Total Money Market Registered Investment Companies (Cost 54,066,090) | | | | | | | 54,068,333 | |
Total Investments - Long — 98.2% (Cost $158,646,294) | | | | | | | 207,366,969 | |
Other Assets less Liabilities — 1.8% | | | | | | | 3,736,785 | |
Total Net Assets — 100.0% | | | | | | | 211,103,754 | |
| | | | | | | | | |
Trustee Deferred Compensation (3) |
Meeder Balanced Fund - Retail Class | | | 725 | | | | 9,730 | |
Meeder Dynamic Allocation Fund - Retail Class | | | 1,817 | | | | 25,311 | |
Meeder Muirfield Fund - Retail Class | | | 1,956 | | | | 18,641 | |
Meeder Conservative Allocation Fund - Retail Class | | | 223 | | | | 5,272 | |
Total Trustee Deferred Compensation (Cost $51,460) | | | | | | | 58,954 | |
| | | | | | | | | |
| | | Long
(Short)
Contracts | | | Expiration
Date | | | Notional
Value of
Contracts
($) | | | Value and
Unrealized
Appreciation
(Depreciation)
($) | |
Futures Contracts |
Index Futures | | | | | | | | | | | | | | | | |
E-mini Standard & Poors MidCap 400 Futures | | | (35 | ) | | | 3/18/2022 | | | | (9,931,950 | ) | | | (191,772 | ) |
Mini MSCI EAFE Index Futures | | | 141 | | | | 3/18/2022 | | | | 16,368,690 | | | | 471,931 | |
Mini MSCI Emerging Markets Index Futures | | | 52 | | | | 3/18/2022 | | | | 3,188,380 | | | | 28,966 | |
Russell 2000 Mini Index Futures | | | 12 | | | | 3/18/2022 | | | | 1,345,680 | | | | 39,596 | |
Standard & Poors 500 Mini Futures | | | (107 | ) | | | 3/18/2022 | | | | (25,457,975 | ) | | | (526,193 | ) |
Total Futures Contracts | | | 63 | | | | | | | | (14,487,175 | ) | | | (177,472 | ) |
(1) | Represents non-income producing securities. |
(2) | Investment in affiliate. The yield shown represents the 7-day yield in effect at December 31, 2021. |
(3) | Assets of affiliates to the Spectrum Fund held for the benefit of the Fund’s Trustees in connection with the Trustee Deferred Compensation Plan. |
(4) | Fair valued security deemed a Level 3 security. Security is not part of the investment strategy of the Fund. |
The accompanying notes are an integral part of these financial statements.
2021 Annual Report | December 31, 2021 | Page 45 |
Schedule of Investments
December 31, 2021
Global Allocation Fund |
Security Description | | Shares or
Principal
Amount ($) | | | Fair
Value ($) | |
Common Stocks (United States) — 34.3% |
Communication Services — 3.0% | | | | | | | | |
Alphabet, Inc. - Class C (1) | | | 128 | | | | 370,380 | |
Alphabet, Inc. - Class A (1) | | | 114 | | | | 330,263 | |
AMC Entertainment Holdings, Inc. (1) | | | 172 | | | | 4,678 | |
AT&T, Inc. | | | 944 | | | | 23,222 | |
Cargurus, Inc. (1) | | | 34 | | | | 1,144 | |
Cars.com, Inc. (1) | | | 34 | | | | 547 | |
Cinemark Holdings, Inc. (1) | | | 147 | | | | 2,370 | |
DHI Group, Inc. (1) | | | 193 | | | | 1,204 | |
DISH Network Corp. (1) | | | 60 | | | | 1,946 | |
Entravision Communications Corp. | | | 144 | | | | 976 | |
Gogo, Inc. (1) | | | 22 | | | | 298 | |
Gray Television, Inc. | | | 124 | | | | 2,500 | |
IDT Corp. (1) | | | 16 | | | | 707 | |
iHeartMedia, Inc. (1) | | | 20 | | | | 421 | |
IMAX Corp. (1) | | | 86 | | | | 1,534 | |
Interpublic Group of Cos., Inc./The | | | 1,593 | | | | 59,658 | |
Liberty Media Corp.-Liberty Braves (1) | | | 288 | | | | 8,093 | |
Liberty TripAdvisor Holdings, Inc. (1) | | | 262 | | | | 569 | |
Lions Gate Entertainment Corp. (1) | | | 123 | | | | 2,047 | |
Live Nation Entertainment, Inc. (1) | | | 16 | | | | 1,915 | |
Meta Platforms, Inc. (1) | | | 968 | | | | 325,587 | |
Netflix, Inc. (1) | | | 144 | | | | 86,751 | |
News Corp. | | | 90 | | | | 2,008 | |
Pinterest, Inc. (1) | | | 19 | | | | 691 | |
Roku, Inc. (1) | | | 5 | | | | 1,141 | |
Sinclair Broadcast Group, Inc. | | | 100 | | | | 2,643 | |
TEGNA, Inc. | | | 180 | | | | 3,341 | |
Twitter, Inc. (1) | | | 346 | | | | 14,954 | |
Verizon Communications, Inc. | | | 1,568 | | | | 81,473 | |
Vimeo, Inc. (1) | | | 16 | | | | 287 | |
World Wrestling Entertainment, Inc. | | | 37 | | | | 1,826 | |
Yelp, Inc. (1) | | | 91 | | | | 3,298 | |
Ziff Davis, Inc. (1) | | | 205 | | | | 22,726 | |
| | | | | | | | 1,361,198 | |
| | | | | | | | | |
Consumer Discretionary — 3.8% | | | | | | | | |
Abercrombie & Fitch Co. (1) | | | 33 | | | | 1,149 | |
Academy Sports & Outdoors, Inc. (1) | | | 117 | | | | 5,136 | |
Adient PLC (1) | | | 69 | | | | 3,304 | |
Amazon.com, Inc. (1) | | | 125 | | | | 416,793 | |
American Axle & Manufacturing Holdings, Inc. (1) | | | 119 | | | | 1,110 | |
American Eagle Outfitters, Inc. | | | 70 | | | | 1,772 | |
Aptiv PLC (1) | | | 26 | | | | 4,289 | |
Aramark | | | 185 | | | | 6,817 | |
Asbury Automotive Group, Inc. (1) | | | 28 | | | | 4,836 | |
Global Allocation Fund |
Security Description | | Shares or
Principal
Amount ($) | | | Fair
Value ($) | |
Common Stocks (United States) — continued |
AutoNation, Inc. (1) | | | 30 | | | | 3,506 | |
AutoZone, Inc. (1) | | | 14 | | | | 29,349 | |
Bath & Body Works, Inc. | | | 26 | | | | 1,815 | |
Best Buy Co., Inc. | | | 273 | | | | 27,737 | |
Big 5 Sporting Goods Corp. | | | 18 | | | | 342 | |
Big Lots, Inc. | | | 83 | | | | 3,739 | |
Biglari Holdings, Inc. (1) | | | 9 | | | | 1,283 | |
Boyd Gaming Corp. (1) | | | 115 | | | | 7,541 | |
Brinker International, Inc. (1) | | | 45 | | | | 1,647 | |
Buckle, Inc./The | | | 25 | | | | 1,058 | |
Caleres, Inc. | | | 44 | | | | 998 | |
Capri Holdings, Ltd. (1) | | | 102 | | | | 6,621 | |
Chico’s FAS, Inc. (1) | | | 42 | | | | 226 | |
Conn’s, Inc. (1) | | | 14 | | | | 329 | |
Container Store Group, Inc./The (1) | | | 1 | | | | 10 | |
Crocs, Inc. (1) | | | 144 | | | | 18,464 | |
Dana, Inc. | | | 99 | | | | 2,259 | |
Dave & Buster’s Entertainment, Inc. (1) | | | 4 | | | | 154 | |
Designer Brands, Inc. (1) | | | 57 | | | | 810 | |
Dick’s Sporting Goods, Inc. | | | 85 | | | | 9,774 | |
Dollar Tree, Inc. (1) | | | 22 | | | | 3,091 | |
eBay, Inc. | | | 234 | | | | 15,561 | |
Ethan Allen Interiors, Inc. | | | 10 | | | | 263 | |
Everi Holdings, Inc. (1) | | | 155 | | | | 3,309 | |
Foot Locker, Inc. | | | 161 | | | | 7,024 | |
Ford Motor Co. | | | 1,534 | | | | 31,861 | |
Fossil Group, Inc. (1) | | | 54 | | | | 556 | |
GameStop Corp. (1) | | | 20 | | | | 2,968 | |
Gap, Inc./The | | | 61 | | | | 1,077 | |
Garmin, Ltd. | | | 392 | | | | 53,379 | |
General Motors Co. (1) | | | 583 | | | | 34,181 | |
Genius Brands International, Inc. (1) | | | 51 | | | | 54 | |
Goodyear Tire & Rubber Co./The (1) | | | 139 | | | | 2,963 | |
Greenlane Holdings, Inc. (1) | | | 217 | | | | 209 | |
Group 1 Automotive, Inc. | | | 11 | | | | 2,147 | |
Guess?, Inc. | | | 123 | | | | 2,913 | |
Hibbett, Inc. | | | 16 | | | | 1,151 | |
Home Depot, Inc./The | | | 628 | | | | 260,626 | |
Houghton Mifflin Harcourt Co. (1) | | | 46 | | | | 741 | |
International Game Technology PLC | | | 261 | | | | 7,546 | |
Kohl’s Corp. | | | 213 | | | | 10,520 | |
Lands’ End, Inc. (1) | | | 48 | | | | 942 | |
Lear Corp. | | | 33 | | | | 6,037 | |
Liquidity Services, Inc. (1) | | | 17 | | | | 375 | |
LKQ Corp. | | | 1 | | | | 60 | |
Lovesac Co./The (1) | | | 14 | | | | 928 | |
Lowe’s Cos., Inc. | | | 692 | | | | 178,868 | |
The accompanying notes are an integral part of these financial statements.
Page 46 | 2021 Annual Report | December 31, 2021 |
Schedule of Investments
December 31, 2021
Global Allocation Fund |
Security Description | | Shares or
Principal
Amount ($) | | | Fair
Value ($) | |
Common Stocks (United States) — continued |
Lululemon Athletica, Inc. (1) | | | 42 | | | | 16,441 | |
Macy’s, Inc. | | | 154 | | | | 4,032 | |
MGM Resorts International | | | 146 | | | | 6,552 | |
Nordstrom, Inc. (1) | | | 56 | | | | 1,267 | |
ODP Corp./The (1) | | | 30 | | | | 1,178 | |
OneWater Marine, Inc. | | | 144 | | | | 8,780 | |
O’Reilly Automotive, Inc. (1) | | | 44 | | | | 31,074 | |
Overstock.com, Inc. (1) | | | 5 | | | | 295 | |
Party City Holdco, Inc. (1) | | | 247 | | | | 1,376 | |
Qurate Retail, Inc. | | | 315 | | | | 2,394 | |
RCI Hospitality Holdings, Inc. | | | 12 | | | | 935 | |
Red Robin Gourmet Burgers, Inc. (1) | | | 139 | | | | 2,298 | |
Red Rock Resorts, Inc. | | | 88 | | | | 4,841 | |
Revolve Group, Inc. (1) | | | 33 | | | | 1,849 | |
Scientific Games Corp. (1) | | | 50 | | | | 3,342 | |
SeaWorld Entertainment, Inc. (1) | | | 51 | | | | 3,308 | |
Shoe Carnival, Inc. | | | 5 | | | | 195 | |
Shutterstock, Inc. | | | 32 | | | | 3,548 | |
Signet Jewelers, Ltd. | | | 14 | | | | 1,218 | |
Skyline Champion Corp. (1) | | | 46 | | | | 3,633 | |
Smith & Wesson Brands, Inc. | | | 102 | | | | 1,816 | |
Sonos, Inc. (1) | | | 279 | | | | 8,314 | |
Steven Madden, Ltd. | | | 176 | | | | 8,179 | |
Tapestry, Inc. | | | 274 | | | | 11,124 | |
Target Corp. | | | 224 | | | | 51,843 | |
Tempur Sealy International, Inc. | | | 82 | | | | 3,856 | |
Tenneco, Inc. (1) | | | 148 | | | | 1,672 | |
Tesla, Inc. (1) | | | 297 | | | | 313,864 | |
Thor Industries, Inc. | | | 156 | | | | 16,188 | |
Town Sports International Holdings, Inc. (1) | | | 378 | | | | 0 | |
Tupperware Brands Corp. (1) | | | 58 | | | | 887 | |
Urban Outfitters, Inc. (1) | | | 44 | | | | 1,292 | |
Vera Bradley, Inc. (1) | | | 4 | | | | 34 | |
Vista Outdoor, Inc. (1) | | | 13 | | | | 599 | |
Waitr Holdings, Inc. (1) | | | 187 | | | | 138 | |
Weber, Inc. | | | 125 | | | | 1,616 | |
Williams-Sonoma, Inc. | | | 49 | | | | 8,287 | |
XPEL, Inc. (1) | | | 20 | | | | 1,366 | |
| | | | | | | | 1,721,849 | |
| | | | | | | | | |
Consumer Staples — 1.0% | | | | | | | | |
Albertsons Cos., Inc. | | | 430 | | | | 12,982 | |
Bunge, Ltd. | | | 1,243 | | | | 116,046 | |
Celsius Holdings, Inc. (1) | | | 15 | | | | 1,119 | |
Coca-Cola Co./The | | | 79 | | | | 4,678 | |
Costco Wholesale Corp. | | | 87 | | | | 49,390 | |
Darling Ingredients, Inc. (1) | | | 250 | | | | 17,323 | |
Global Allocation Fund |
Security Description | | Shares or
Principal
Amount ($) | | | Fair
Value ($) | |
Common Stocks (United States) — continued |
Hershey Co./The | | | 424 | | | | 82,031 | |
PepsiCo, Inc. | | | 401 | | | | 69,658 | |
Spectrum Brands Holdings, Inc. | | | 76 | | | | 7,731 | |
Tyson Foods, Inc. | | | 45 | | | | 3,922 | |
Walgreens Boots Alliance, Inc. | | | 170 | | | | 8,867 | |
Walmart, Inc. | | | 612 | | | | 88,550 | |
| | | | | | | | 462,297 | |
| | | | | | | | | |
Energy — 1.6% | | | | | | | | |
Alto Ingredients, Inc. (1) | | | 7 | | | | 34 | |
Altus Midstream Co. | | | 9 | | | | 552 | |
Antero Resources Corp. (1) | | | 88 | | | | 1,540 | |
APA Corp. | | | 334 | | | | 8,981 | |
Ardmore Shipping Corp. (1) | | | 46 | | | | 155 | |
Berry Corp. | | | 67 | | | | 564 | |
Bristow Group, Inc. (1) | | | 22 | | | | 697 | |
Cactus, Inc. | | | 32 | | | | 1,220 | |
Cheniere Energy, Inc. | | | 6 | | | | 609 | |
Chevron Corp. | | | 1,317 | | | | 154,550 | |
ConocoPhillips | | | 565 | | | | 40,782 | |
CONSOL Energy, Inc. (1) | | | 9 | | | | 204 | |
CVR Energy, Inc. | | | 29 | | | | 487 | |
Delek US Holdings, Inc. (1) | | | 161 | | | | 2,413 | |
Devon Energy Corp. | | | 457 | | | | 20,131 | |
DHT Holdings, Inc. | | | 83 | | | | 431 | |
Diamondback Energy, Inc. | | | 87 | | | | 9,383 | |
EOG Resources, Inc. | | | 196 | | | | 17,411 | |
Expro Group Holdings NV (1) | | | 33 | | | | 474 | |
Exxon Mobil Corp. | | | 3,089 | | | | 189,016 | |
Hess Corp. | | | 77 | | | | 5,700 | |
Laredo Petroleum, Inc. (1) | | | 9 | | | | 541 | |
Marathon Oil Corp. | | | 17 | | | | 279 | |
Marathon Petroleum Corp. | | | 2,006 | | | | 128,364 | |
Nabors Industries, Ltd. (1) | | | 26 | | | | 2,108 | |
NextDecade Corp. (1) | | | 57 | | | | 162 | |
Nine Energy Service, Inc. (1) | | | 309 | | | | 309 | |
Northern Oil and Gas, Inc. | | | 7 | | | | 144 | |
Occidental Petroleum Corp. | | | 764 | | | | 22,148 | |
Oceaneering International, Inc. (1) | | | 99 | | | | 1,120 | |
ONEOK, Inc. | | | 1,051 | | | | 61,757 | |
Ovintiv, Inc. | | | 262 | | | | 8,829 | |
Par Pacific Holdings, Inc. (1) | | | 1 | | | | 16 | |
PDC Energy, Inc. | | | 5 | | | | 244 | |
Peabody Energy Corp. (1) | | | 78 | | | | 785 | |
Phillips 66 | | | 184 | | | | 13,333 | |
Pioneer Natural Resources Co. | | | 44 | | | | 8,003 | |
Range Resources Corp. (1) | | | 29 | | | | 517 | |
The accompanying notes are an integral part of these financial statements.
2021 Annual Report | December 31, 2021 | Page 47 |
Schedule of Investments
December 31, 2021
Global Allocation Fund |
Security Description | | Shares or
Principal
Amount ($) | | | Fair
Value ($) | |
Common Stocks (United States) — continued |
Schlumberger NV | | | 574 | | | | 17,191 | |
Scorpio Tankers, Inc. | | | 8 | | | | 102 | |
SM Energy Co. | | | 76 | | | | 2,240 | |
Southwestern Energy Co. (1) | | | 354 | | | | 1,650 | |
Talos Energy, Inc. (1) | | | 123 | | | | 1,205 | |
Targa Resources Corp. | | | 166 | | | | 8,672 | |
Teekay Corp. (1) | | | 121 | | | | 380 | |
Uranium Energy Corp. (1) | | | 53 | | | | 178 | |
W&T Offshore, Inc. (1) | | | 22 | | | | 71 | |
Westmoreland Coal Co. (1) | | | 539 | | | | 0 | |
World Fuel Services Corp. | | | 36 | | | | 953 | |
| | | | | | | | 736,635 | |
| | | | | | | | | |
Financials — 4.0% | | | | | | | | |
Affiliated Managers Group, Inc. | | | 44 | | | | 7,238 | |
Aflac, Inc. | | | 272 | | | | 15,882 | |
Allstate Corp./The | | | 552 | | | | 64,943 | |
Ally Financial, Inc. | | | 298 | | | | 14,188 | |
American Express Co. | | | 20 | | | | 3,272 | |
American Financial Group, Inc./OH | | | 68 | | | | 9,338 | |
American International Group, Inc. | | | 2,237 | | | | 127,196 | |
Ameris Bancorp | | | 144 | | | | 7,154 | |
Athene Holding, Ltd. (1) | | | 1,209 | | | | 100,746 | |
Bank of America Corp. | | | 2,538 | | | | 112,916 | |
Bank of New York Mellon Corp./The | | | 648 | | | | 37,636 | |
Bank OZK | | | 110 | | | | 5,118 | |
Berkshire Hathaway, Inc. (1) | | | 789 | | | | 235,911 | |
BGC Partners, Inc. | | | 99 | | | | 460 | |
Blackstone, Inc. | | | 90 | | | | 11,645 | |
Capital One Financial Corp. | | | 289 | | | | 41,931 | |
Charles Schwab Corp./The | | | 661 | | | | 55,590 | |
Chimera Investment Corp. | | | 1,546 | | | | 23,314 | |
Citigroup, Inc. | | | 761 | | | | 45,957 | |
Citizens Financial Group, Inc. | | | 277 | | | | 13,088 | |
Comerica, Inc. | | | 33 | | | | 2,871 | |
East West Bancorp, Inc. | | | 163 | | | | 12,825 | |
Ellington Financial, Inc. | | | 247 | | | | 4,221 | |
Evercore, Inc. | | | 160 | | | | 21,736 | |
Fidelity National Financial, Inc. | | | 308 | | | | 16,071 | |
Fifth Third Bancorp | | | 770 | | | | 33,534 | |
First American Financial Corp. | | | 584 | | | | 45,686 | |
Goldman Sachs Group, Inc./The | | | 14 | | | | 5,356 | |
Hancock Whitney Corp. | | | 76 | | | | 3,802 | |
Hartford Financial Services Group, Inc./The | | | 189 | | | | 13,049 | |
Invesco, Ltd. | | | 211 | | | | 4,857 | |
Janus Henderson Group PLC | | | 143 | | | | 5,997 | |
JPMorgan Chase & Co. | | | 716 | | | | 113,379 | |
Global Allocation Fund |
Security Description | | Shares or
Principal
Amount ($) | | | Fair
Value ($) | |
Common Stocks (United States) — continued |
KKR & Co., Inc. | | | 416 | | | | 30,992 | |
LendingClub Corp. (1) | | | 41 | | | | 991 | |
LPL Financial Holdings, Inc. | | | 33 | | | | 5,283 | |
Marlin Business Services Corp. | | | 173 | | | | 4,027 | |
MBIA, Inc. (1) | | | 123 | | | | 1,942 | |
Medley Management, Inc. (1) | | | 21 | | | | 0 | |
Meta Financial Group, Inc. | | | 52 | | | | 3,102 | |
MetLife, Inc. | | | 252 | | | | 15,747 | |
Moelis & Co. | | | 166 | | | | 10,377 | |
Morgan Stanley | | | 864 | | | | 84,810 | |
Northrim BanCorp, Inc. | | | 125 | | | | 5,433 | |
OneMain Holdings, Inc. | | | 83 | | | | 4,153 | |
PacWest Bancorp | | | 101 | | | | 4,562 | |
Pinnacle Financial Partners, Inc. | | | 38 | | | | 3,629 | |
Piper Sandler Cos. | | | 93 | | | | 16,601 | |
PNC Financial Services Group, Inc./The | | | 113 | | | | 22,659 | |
Popular, Inc. | | | 53 | | | | 4,348 | |
Prudential Financial, Inc. | | | 131 | | | | 14,179 | |
Pzena Investment Management, Inc. | | | 268 | | | | 2,538 | |
RBB Bancorp | | | 42 | | | | 1,100 | |
Redwood Trust, Inc. | | | 27 | | | | 356 | |
Regions Financial Corp. | | | 631 | | | | 13,756 | |
Santander Consumer USA Holdings, Inc. | | | 121 | | | | 5,084 | |
Siebert Financial Corp. (1) | | | 14 | | | | 32 | |
Signature Bank/New York NY | | | 33 | | | | 10,675 | |
Silvercrest Asset Management Group, Inc. | | | 39 | | | | 670 | |
SLM Corp. | | | 170 | | | | 3,344 | |
Stewart Information Services Corp. | | | 407 | | | | 32,450 | |
SVB Financial Group (1) | | | 14 | | | | 9,495 | |
Synchrony Financial | | | 2,423 | | | | 112,403 | |
Synovus Financial Corp. | | | 58 | | | | 2,776 | |
Tiptree, Inc. | | | 16 | | | | 221 | |
Truist Financial Corp. | | | 421 | | | | 24,650 | |
Umpqua Holdings Corp. | | | 522 | | | | 10,043 | |
Upstart Holdings, Inc. (1) | | | 14 | | | | 2,118 | |
US Bancorp | | | 684 | | | | 38,420 | |
Walker & Dunlop, Inc. | | | 69 | | | | 10,411 | |
Wells Fargo & Co. | | | 1,426 | | | | 68,419 | |
Western Alliance Bancorp | | | 56 | | | | 6,028 | |
Zions Bancorp NA | | | 183 | | | | 11,558 | |
| | | | | | | | 1,816,289 | |
| | | | | | | | | |
Healthcare — 6.4% | | | | | | | | |
AbbVie, Inc. | | | 1,548 | | | | 209,599 | |
Abeona Therapeutics, Inc. (1) | | | 95 | | | | 32 | |
AcelRx Pharmaceuticals, Inc. (1) | | | 50 | | | | 28 | |
ADMA Biologics, Inc. (1) | | | 28 | | | | 39 | |
The accompanying notes are an integral part of these financial statements.
Page 48 | 2021 Annual Report | December 31, 2021 |
Schedule of Investments
December 31, 2021
Global Allocation Fund |
Security Description | | Shares or
Principal
Amount ($) | | | Fair
Value ($) | |
Common Stocks (United States) — continued |
Affimed NV (1) | | | 134 | | | | 740 | |
AgeX Therapeutics, Inc. (1) | | | 13 | | | | 14 | |
Agilent Technologies, Inc. | | | 551 | | | | 87,967 | |
Alector, Inc. (1) | | | 21 | | | | 434 | |
Alkermes PLC (1) | | | 91 | | | | 2,117 | |
Allakos, Inc. (1) | | | 25 | | | | 245 | |
Alnylam Pharmaceuticals, Inc. (1) | | | 19 | | | | 3,222 | |
AmerisourceBergen Corp. | | | 268 | | | | 35,615 | |
Amgen, Inc. | | | 631 | | | | 141,956 | |
Amicus Therapeutics, Inc. (1) | | | 122 | | | | 1,409 | |
AMN Healthcare Services, Inc. (1) | | | 26 | | | | 3,181 | |
Amneal Pharmaceuticals, Inc. (1) | | | 233 | | | | 1,116 | |
Anavex Life Sciences Corp. (1) | | | 19 | | | | 329 | |
ANI Pharmaceuticals, Inc. (1) | | | 13 | | | | 599 | |
Anthem, Inc. | | | 192 | | | | 89,000 | |
Apellis Pharmaceuticals, Inc. (1) | | | 11 | | | | 520 | |
Apollo Medical Holdings, Inc. (1) | | | 41 | | | | 3,013 | |
Applied Therapeutics, Inc. (1) | | | 57 | | | | 510 | |
Arbutus Biopharma Corp. (1) | | | 206 | | | | 801 | |
Arcutis Biotherapeutics, Inc. (1) | | | 57 | | | | 1,182 | |
Arrowhead Pharmaceuticals, Inc. (1) | | | 46 | | | | 3,050 | |
Arvinas, Inc. (1) | | | 24 | | | | 1,971 | |
Assertio Holdings, Inc. (1) | | | 132 | | | | 288 | |
Atara Biotherapeutics, Inc. (1) | | | 10 | | | | 158 | |
Avalo Therapeutics, Inc. (1) | | | 260 | | | | 442 | |
Avid Bioservices, Inc. (1) | | | 11 | | | | 321 | |
Beam Therapeutics, Inc. (1) | | | 25 | | | | 1,992 | |
Beyondspring, Inc. (1) | | | 34 | | | | 154 | |
BioCryst Pharmaceuticals, Inc. (1) | | | 43 | | | | 596 | |
BioDelivery Sciences International, Inc. (1) | | | 595 | | | | 1,845 | |
Biohaven Pharmaceutical Holding Co., Ltd. (1) | | | 23 | | | | 3,170 | |
Bio-Rad Laboratories, Inc. (1) | | | 22 | | | | 16,623 | |
Bio-Techne Corp. | | | 24 | | | | 12,416 | |
Blueprint Medicines Corp. (1) | | | 25 | | | | 2,678 | |
Bridgebio Pharma, Inc. (1) | | | 29 | | | | 484 | |
Bristol-Myers Squibb Co. | | | 1,530 | | | | 95,396 | |
Bruker Corp. | | | 166 | | | | 13,929 | |
Calyxt, Inc. (1) | | | 65 | | | | 138 | |
Cardinal Health, Inc. | | | 401 | | | | 20,647 | |
CareDx, Inc. (1) | | | 27 | | | | 1,228 | |
CASI Pharmaceuticals, Inc. (1) | | | 17 | | | | 14 | |
Cassava Sciences, Inc. (1) | | | 43 | | | | 1,879 | |
Catalent, Inc. (1) | | | 95 | | | | 12,163 | |
Catalyst Pharmaceuticals, Inc. (1) | | | 308 | | | | 2,085 | |
cbdMD, Inc. (1) | | | 7 | | | | 8 | |
Centogene NV (1) | | | 74 | | | | 387 | |
Global Allocation Fund |
Security Description | | Shares or
Principal
Amount ($) | | | Fair
Value ($) | |
Common Stocks (United States) — continued |
Cerevel Therapeutics Holdings, Inc. (1) | | | 14 | | | | 454 | |
Cerner Corp. | | | 513 | | | | 47,642 | |
Community Health Systems, Inc. (1) | | | 115 | | | | 1,531 | |
Computer Programs and Systems, Inc. (1) | | | 34 | | | | 996 | |
Conformis, Inc. (1) | | | 10 | | | | 8 | |
Cross Country Healthcare, Inc. (1) | | | 4 | | | | 111 | |
CVS Health Corp. | | | 543 | | | | 56,016 | |
Danaher Corp. | | | 553 | | | | 181,943 | |
Deciphera Pharmaceuticals, Inc. (1) | | | 4 | | | | 39 | |
Dynavax Technologies Corp. (1) | | | 67 | | | | 943 | |
Editas Medicine, Inc. (1) | | | 41 | | | | 1,089 | |
Elanco Animal Health, Inc. Contingent Value Rights (1)(5) | | | 99 | | | | 0 | |
Eli Lilly & Co. | | | 351 | | | | 96,953 | |
Eloxx Pharmaceuticals, Inc. (1) | | | 273 | | | | 193 | |
Enanta Pharmaceuticals, Inc. (1) | | | 15 | | | | 1,122 | |
Endo International PLC (1) | | | 141 | | | | 530 | |
Evolent Health, Inc. (1) | | | 21 | | | | 581 | |
Exact Sciences Corp. (1) | | | 11 | | | | 856 | |
Exelixis, Inc. (1) | | | 180 | | | | 3,290 | |
Galectin Therapeutics, Inc. (1) | | | 63 | | | | 130 | |
Genprex, Inc. (1) | | | 180 | | | | 236 | |
Gilead Sciences, Inc. | | | 1,319 | | | | 95,773 | |
Globus Medical, Inc. (1) | | | 105 | | | | 7,581 | |
HCA Healthcare, Inc. | | | 142 | | | | 36,483 | |
Horizon Therapeutics Plc (1) | | | 485 | | | | 52,264 | |
Humanigen, Inc. (1) | | | 9 | | | | 33 | |
Illumina, Inc. (1) | | | 2 | | | | 761 | |
Incyte Corp. (1) | | | 409 | | | | 30,021 | |
Inotiv, Inc. (1) | | | 26 | | | | 1,094 | |
Intellia Therapeutics, Inc. (1) | | | 26 | | | | 3,074 | |
Johnson & Johnson | | | 1,570 | | | | 268,580 | |
Jounce Therapeutics, Inc. (1) | | | 56 | | | | 468 | |
Kezar Life Sciences, Inc. (1) | | | 51 | | | | 853 | |
La Jolla Pharmaceutical Co. (1) | | | 56 | | | | 260 | |
Mallinckrodt PLC (1) | | | 22 | | | | 3 | |
MannKind Corp. (1) | | | 298 | | | | 1,302 | |
Maravai LifeSciences Holdings, Inc. (1) | | | 40 | | | | 1,676 | |
Marinus Pharmaceuticals, Inc. (1) | | | 40 | | | | 475 | |
McKesson Corp. | | | 254 | | | | 63,137 | |
Merck & Co., Inc. | | | 2,054 | | | | 157,419 | |
Mirati Therapeutics, Inc. (1) | | | 22 | | | | 3,227 | |
Moderna, Inc. (1) | | | 292 | | | | 74,162 | |
Myriad Genetics, Inc. (1) | | | 30 | | | | 828 | |
Natera, Inc. (1) | | | 45 | | | | 4,203 | |
Novavax, Inc. (1) | | | 25 | | | | 3,577 | |
Ocugen, Inc. (1) | | | 59 | | | | 268 | |
The accompanying notes are an integral part of these financial statements.
2021 Annual Report | December 31, 2021 | Page 49 |
Schedule of Investments
December 31, 2021
Global Allocation Fund |
Security Description | | Shares or
Principal
Amount ($) | | | Fair
Value ($) | |
Common Stocks (United States) — continued |
Oncocyte Corp. (1) | | | 95 | | | | 206 | |
Oramed Pharmaceuticals, Inc. (1) | | | 30 | | | | 428 | |
Organogenesis Holdings, Inc. (1) | | | 12 | | | | 111 | |
Organon & Co. | | | 176 | | | | 5,359 | |
Palatin Technologies, Inc. (1) | | | 689 | | | | 352 | |
PerkinElmer, Inc. | | | 85 | | | | 17,090 | |
Perrigo Co. PLC | | | 540 | | | | 21,006 | |
Pfizer, Inc. | | | 2,693 | | | | 159,022 | |
PolarityTE, Inc. (1) | | | 3 | | | | 2 | |
Precigen, Inc. (1) | | | 240 | | | | 890 | |
Prothena Corp. PLC (1) | | | 23 | | | | 1,136 | |
Puma Biotechnology, Inc. (1) | | | 125 | | | | 380 | |
Quest Diagnostics, Inc. | | | 109 | | | | 18,858 | |
Quidel Corp. (1) | | | 22 | | | | 2,970 | |
Radius Health, Inc. (1) | | | 31 | | | | 215 | |
Regeneron Pharmaceuticals, Inc. (1) | | | 208 | | | | 131,356 | |
REGENXBIO, Inc. (1) | | | 8 | | | | 262 | |
Rocket Pharmaceuticals, Inc. (1) | | | 8 | | | | 175 | |
Sage Therapeutics, Inc. (1) | | | 61 | | | | 2,595 | |
Seres Therapeutics, Inc. (1) | | | 1 | | | | 8 | |
Sesen Bio, Inc. (1) | | | 240 | | | | 196 | |
Sorrento Therapeutics, Inc. (1) | | | 146 | | | | 679 | |
SpringWorks Therapeutics, Inc. (1) | | | 16 | | | | 992 | |
STAAR Surgical Co. (1) | | | 26 | | | | 2,374 | |
Sutro Biopharma, Inc. (1) | | | 38 | | | | 565 | |
Tenet Healthcare Corp. (1) | | | 32 | | | | 2,614 | |
Thermo Fisher Scientific, Inc. | | | 248 | | | | 165,476 | |
TransMedics Group, Inc. (1) | | | 11 | | | | 211 | |
Twist Bioscience Corp. (1) | | | 19 | | | | 1,470 | |
Tyme Technologies, Inc. (1) | | | 70 | | | | 42 | |
Ultragenyx Pharmaceutical, Inc. (1) | | | 13 | | | | 1,093 | |
UnitedHealth Group, Inc. | | | 456 | | | | 228,976 | |
Universal Health Services, Inc. | | | 43 | | | | 5,575 | |
Vanda Pharmaceuticals, Inc. (1) | | | 40 | | | | 628 | |
Veracyte, Inc. (1) | | | 54 | | | | 2,225 | |
Viatris, Inc. | | | 1,031 | | | | 13,949 | |
ViewRay, Inc. (1) | | | 163 | | | | 898 | |
WaVe Life Sciences, Ltd. (1) | | | 98 | | | | 308 | |
West Pharmaceutical Services, Inc. | | | 119 | | | | 55,812 | |
Zentalis Pharmaceuticals, Inc. (1) | | | 25 | | | | 2,102 | |
ZIOPHARM Oncology, Inc. (1) | | | 104 | | | | 113 | |
Zoetis, Inc. | | | 264 | | | | 64,424 | |
| | | | | | | | 2,893,058 | |
| | | | | | | | | |
Industrials — 2.2% | | | | | | | | |
Acuity Brands, Inc. | | | 52 | | | | 11,009 | |
AGCO Corp. | | | 66 | | | | 7,657 | |
Global Allocation Fund |
Security Description | | Shares or
Principal
Amount ($) | | | Fair
Value ($) | |
Common Stocks (United States) — continued |
ArcBest Corp. | | | 16 | | | | 1,918 | |
Atkore, Inc. (1) | | | 35 | | | | 3,892 | |
Atlas Air Worldwide Holdings, Inc. (1) | | | 54 | | | | 5,082 | |
Avis Budget Group, Inc. (1) | | | 17 | | | | 3,525 | |
Axon Enterprise, Inc. (1) | | | 17 | | | | 2,669 | |
AZZ, Inc. | | | 50 | | | | 2,765 | |
Boise Cascade Co. | | | 254 | | | | 18,085 | |
Builders FirstSource, Inc. (1) | | | 90 | | | | 7,714 | |
Carrier Global Corp. | | | 77 | | | | 4,176 | |
Caterpillar, Inc. | | | 79 | | | | 16,332 | |
Clean Harbors, Inc. (1) | | | 4 | | | | 399 | |
Copart, Inc. (1) | | | 63 | | | | 9,552 | |
Core & Main, Inc. (1) | | | 14 | | | | 425 | |
Covenant Logistics Group, Inc. (1) | | | 31 | | | | 819 | |
CSX Corp. | | | 536 | | | | 20,154 | |
Dover Corp. | | | 51 | | | | 9,262 | |
Eaton Corp. PLC | | | 126 | | | | 21,775 | |
EMCOR Group, Inc. | | | 269 | | | | 34,268 | |
Emerson Electric Co. | | | 339 | | | | 31,517 | |
Encore Wire Corp. | | | 10 | | | | 1,431 | |
EnerSys | | | 6 | | | | 474 | |
Franklin Electric Co., Inc. | | | 49 | | | | 4,633 | |
FTC Solar, Inc. (1) | | | 28 | | | | 212 | |
FuelCell Energy, Inc. (1) | | | 90 | | | | 468 | |
Genco Shipping & Trading, Ltd. | | | 100 | | | | 1,600 | |
Generac Holdings, Inc. (1) | | | 71 | | | | 24,986 | |
General Dynamics Corp. | | | 442 | | | | 92,144 | |
GrafTech International, Ltd. | | | 188 | | | | 2,224 | |
Granite Construction, Inc. | | | 2 | | | | 77 | |
Helios Technologies, Inc. | | | 9 | | | | 947 | |
Herc Holdings, Inc. | | | 27 | | | | 4,227 | |
Hillenbrand, Inc. | | | 58 | | | | 3,015 | |
Hub Group, Inc. (1) | | | 35 | | | | 2,948 | |
Huntington Ingalls Industries, Inc. | | | 126 | | | | 23,529 | |
JB Hunt Transport Services, Inc. | | | 90 | | | | 18,396 | |
Johnson Controls International plc | | | 1,698 | | | | 138,064 | |
Karat Packaging, Inc. (1) | | | 15 | | | | 303 | |
Korn Ferry | | | 1 | | | | 76 | |
Manitowoc Co., Inc./The (1) | | | 176 | | | | 3,272 | |
ManpowerGroup, Inc. | | | 287 | | | | 27,934 | |
Matson, Inc. | | | 11 | | | | 990 | |
Meritor, Inc. (1) | | | 54 | | | | 1,338 | |
Mesa Air Group, Inc. (1) | | | 264 | | | | 1,478 | |
Miller Industries, Inc./TN | | | 8 | | | | 267 | |
Mueller Industries, Inc. | | | 309 | | | | 18,342 | |
MYR Group, Inc. (1) | | | 10 | | | | 1,106 | |
NL Industries, Inc. | | | 11 | | | | 81 | |
The accompanying notes are an integral part of these financial statements.
Page 50 | 2021 Annual Report | December 31, 2021 |
Schedule of Investments
December 31, 2021
Global Allocation Fund |
Security Description | | Shares or
Principal
Amount ($) | | | Fair
Value ($) | |
Common Stocks (United States) — continued |
nVent Electric PLC | | | 215 | | | | 8,170 | |
Old Dominion Freight Line, Inc. | | | 71 | | | | 25,445 | |
Oshkosh Corp. | | | 71 | | | | 8,002 | |
Owens Corning | | | 111 | | | | 10,046 | |
Plug Power, Inc. (1) | | | 146 | | | | 4,122 | |
Quad/Graphics, Inc. (1) | | | 230 | | | | 920 | |
Quanta Services, Inc. | | | 945 | | | | 108,354 | |
Raytheon Technologies Corp. | | | 499 | | | | 42,944 | |
Regal Rexnord Corp. | | | 166 | | | | 28,250 | |
Resideo Technologies, Inc. (1) | | | 120 | | | | 3,124 | |
REV Group, Inc. | | | 30 | | | | 425 | |
Robert Half International, Inc. | | | 4 | | | | 446 | |
Rush Enterprises, Inc. | | | 4 | | | | 223 | |
Ryder System, Inc. | | | 233 | | | | 19,206 | |
Saia, Inc. (1) | | | 19 | | | | 6,404 | |
Shyft Group, Inc./The | | | 44 | | | | 2,162 | |
SkyWest, Inc. (1) | | | 202 | | | | 7,939 | |
Terex Corp. | | | 224 | | | | 9,845 | |
Textainer Group Holdings, Ltd. | | | 54 | | | | 1,928 | |
Textron, Inc. | | | 574 | | | | 44,313 | |
Titan International, Inc. (1) | | | 199 | | | | 2,181 | |
Triton International, Ltd. | | | 106 | | | | 6,384 | |
TrueBlue, Inc. (1) | | | 48 | | | | 1,328 | |
United Parcel Service, Inc. | | | 216 | | | | 46,297 | |
United Rentals, Inc. (1) | | | 30 | | | | 9,969 | |
Valmont Industries, Inc. | | | 36 | | | | 9,018 | |
Vectrus, Inc. (1) | | | 46 | | | | 2,105 | |
Veritiv Corp. (1) | | | 1 | | | | 123 | |
Vicor Corp. (1) | | | 14 | | | | 1,778 | |
WESCO International, Inc. (1) | | | 64 | | | | 8,422 | |
Yellow Corp. (1) | | | 38 | | | | 478 | |
| | | | | | | | 1,007,908 | |
| | | | | | | | | |
Information Technology — 10.0% | | | | | | | | |
3D Systems Corp. (1) | | | 19 | | | | 409 | |
Accenture PLC | | | 83 | | | | 34,408 | |
ACI Worldwide, Inc. (1) | | | 164 | | | | 5,691 | |
Adobe, Inc. (1) | | | 222 | | | | 125,887 | |
Advanced Micro Devices, Inc. (1) | | | 501 | | | | 72,094 | |
Alliance Data Systems Corp. | | | 141 | | | | 9,386 | |
Ambarella, Inc. (1) | | | 21 | | | | 4,261 | |
American Software, Inc./GA | | | 94 | | | | 2,460 | |
Amkor Technology, Inc. | | | 219 | | | | 5,429 | |
Analog Devices, Inc. | | | 101 | | | | 17,753 | |
Apple, Inc. | | | 4,023 | | | | 714,364 | |
Applied Materials, Inc. | | | 1,022 | | | | 160,822 | |
Arrow Electronics, Inc. (1) | | | 349 | | | | 46,860 | |
Global Allocation Fund |
Security Description | | Shares or
Principal
Amount ($) | | | Fair
Value ($) | |
Common Stocks (United States) — continued |
Asana, Inc. (1) | | | 75 | | | | 5,591 | |
Atlassian Corp. PLC (1) | | | 48 | | | | 18,302 | |
Autodesk, Inc. (1) | | | 36 | | | | 10,123 | |
Aviat Networks, Inc. (1) | | | 3 | | | | 96 | |
Avid Technology, Inc. (1) | | | 1 | | | | 33 | |
Avnet, Inc. | | | 503 | | | | 20,739 | |
Belden, Inc. | | | 25 | | | | 1,643 | |
Bill.com Holdings, Inc. (1) | | | 26 | | | | 6,478 | |
Box, Inc. (1) | | | 86 | | | | 2,252 | |
Broadcom, Inc. | | | 78 | | | | 51,902 | |
Calix, Inc. (1) | | | 79 | | | | 6,318 | |
CDK Global, Inc. | | | 516 | | | | 21,538 | |
CDW Corp./DE | | | 300 | | | | 61,434 | |
ChannelAdvisor Corp. (1) | | | 155 | | | | 3,825 | |
Cisco Systems, Inc./Delaware | | | 2,089 | | | | 132,380 | |
Cloudflare, Inc. (1) | | | 111 | | | | 14,597 | |
Cognex Corp. | | | 35 | | | | 2,722 | |
Concentrix Corp. | | | 34 | | | | 6,073 | |
Conduent, Inc. (1) | | | 454 | | | | 2,424 | |
Crowdstrike Holdings, Inc. (1) | | | 65 | | | | 13,309 | |
Datadog, Inc. (1) | | | 32 | | | | 5,700 | |
Diebold Nixdorf, Inc. (1) | | | 48 | | | | 434 | |
Diodes, Inc. (1) | | | 96 | | | | 10,542 | |
Dolby Laboratories, Inc. | | | 846 | | | | 80,556 | |
Dropbox, Inc. (1) | | | 918 | | | | 22,528 | |
DXC Technology Co. (1) | | | 173 | | | | 5,569 | |
Dynatrace, Inc. (1) | | | 79 | | | | 4,768 | |
Ebix, Inc. | | | 43 | | | | 1,307 | |
EPAM Systems, Inc. (1) | | | 56 | | | | 37,433 | |
Extreme Networks, Inc. (1) | | | 16 | | | | 251 | |
Fortinet, Inc. (1) | | | 143 | | | | 51,394 | |
Gartner, Inc. (1) | | | 208 | | | | 69,539 | |
Hewlett Packard Enterprise Co. | | | 642 | | | | 10,124 | |
HP, Inc. | | | 1,546 | | | | 58,238 | |
HubSpot, Inc. (1) | | | 21 | | | | 13,842 | |
Intel Corp. | | | 1,800 | | | | 92,700 | |
Intuit, Inc. | | | 248 | | | | 159,519 | |
Jabil, Inc. | | | 609 | | | | 42,843 | |
Kimball Electronics, Inc. (1) | | | 31 | | | | 675 | |
KLA Corp. | | | 327 | | | | 140,646 | |
Kulicke & Soffa Industries, Inc. | | | 63 | | | | 3,814 | |
Kyndryl Holdings, Inc. (1) | | | 60 | | | | 1,086 | |
Lam Research Corp. | | | 30 | | | | 21,575 | |
Lattice Semiconductor Corp. (1) | | | 199 | | | | 15,335 | |
Manhattan Associates, Inc. (1) | | | 148 | | | | 23,013 | |
Marathon Digital Holdings, Inc. (1) | | | 41 | | | | 1,347 | |
MaxLinear, Inc. (1) | | | 1 | | | | 75 | |
The accompanying notes are an integral part of these financial statements.
2021 Annual Report | December 31, 2021 | Page 51 |
Schedule of Investments
December 31, 2021
Global Allocation Fund |
Security Description | | Shares or
Principal
Amount ($) | | | Fair
Value ($) | |
Common Stocks (United States) — continued |
McAfee Corp. | | | 400 | | | | 10,316 | |
Micron Technology, Inc. | | | 375 | | | | 34,931 | |
Microsoft Corp. | | | 2,794 | | | | 939,669 | |
Mimecast, Ltd. (1) | | | 44 | | | | 3,501 | |
MoneyGram International, Inc. (1) | | | 193 | | | | 1,523 | |
MongoDB, Inc. (1) | | | 9 | | | | 4,764 | |
Monolithic Power Systems, Inc. | | | 9 | | | | 4,440 | |
NCR Corp. (1) | | | 228 | | | | 9,166 | |
NortonLifeLock, Inc. | | | 657 | | | | 17,069 | |
NVIDIA Corp. | | | 843 | | | | 247,935 | |
NXP Semiconductors NV | | | 50 | | | | 11,389 | |
ON Semiconductor Corp. (1) | | | 119 | | | | 8,082 | |
Oracle Corp. | | | 998 | | | | 87,036 | |
Palantir Technologies, Inc. (1) | | | 33 | | | | 601 | |
Palo Alto Networks, Inc. (1) | | | 167 | | | | 92,979 | |
Paycom Software, Inc. (1) | | | 36 | | | | 14,947 | |
Perficient, Inc. (1) | | | 25 | | | | 3,232 | |
Plantronics, Inc. (1) | | | 25 | | | | 734 | |
Power Integrations, Inc. | | | 31 | | | | 2,880 | |
Priority Technology Holdings, Inc. (1) | | | 59 | | | | 418 | |
Progress Software Corp. | | | 257 | | | | 12,405 | |
Qorvo, Inc. (1) | | | 33 | | | | 5,161 | |
Rimini Street, Inc. (1) | | | 68 | | | | 406 | |
Riot Blockchain, Inc. (1) | | | 50 | | | | 1,117 | |
salesforce.com, Inc. (1) | | | 311 | | | | 79,034 | |
ScanSource, Inc. (1) | | | 26 | | | | 912 | |
SecureWorks Corp. (1) | | | 30 | | | | 479 | |
SiTime Corp. (1) | | | 5 | | | | 1,463 | |
SMART Global Holdings, Inc. (1) | | | 11 | | | | 781 | |
Smartsheet, Inc. (1) | | | 29 | | | | 2,246 | |
Sonim Technologies, Inc. (1) | | | 18 | | | | 17 | |
Sprout Social, Inc. (1) | | | 72 | | | | 6,530 | |
SPS Commerce, Inc. (1) | | | 22 | | | | 3,132 | |
SS&C Technologies Holdings, Inc. | | | 1,514 | | | | 124,118 | |
StarTek, Inc. (1) | | | 131 | | | | 684 | |
Stratasys, Ltd. (1) | | | 31 | | | | 759 | |
Synaptics, Inc. (1) | | | 34 | | | | 9,843 | |
Synopsys, Inc. (1) | | | 46 | | | | 16,951 | |
Teradata Corp. (1) | | | 100 | | | | 4,247 | |
Teradyne, Inc. | | | 39 | | | | 6,378 | |
TESSCO Technologies, Inc. (1) | | | 18 | | | | 114 | |
Texas Instruments, Inc. | | | 473 | | | | 89,146 | |
Trade Desk, Inc./The (1) | | | 132 | | | | 12,096 | |
Trimble, Inc. (1) | | | 137 | | | | 11,945 | |
Ultra Clean Holdings, Inc. (1) | | | 13 | | | | 746 | |
Veritone, Inc. (1) | | | 13 | | | | 292 | |
Viant Technology, Inc. (1) | | | 160 | | | | 1,553 | |
Global Allocation Fund |
Security Description | | Shares or
Principal
Amount ($) | | | Fair
Value ($) | |
Common Stocks (United States) — continued |
Visa, Inc. | | | 194 | | | | 42,042 | |
VMware, Inc. | | | 177 | | | | 20,511 | |
Workday, Inc. (1) | | | 37 | | | | 10,108 | |
Workiva, Inc. (1) | | | 47 | | | | 6,133 | |
Xilinx, Inc. | | | 12 | | | | 2,544 | |
Xperi Holding Corp. | | | 268 | | | | 5,068 | |
Zebra Technologies Corp. (1) | | | 50 | | | | 29,760 | |
Zscaler, Inc. (1) | | | 23 | | | | 7,391 | |
| | | | | | | | 4,468,180 | |
| | | | | | | | | |
Materials — 0.4% | | | | | | | | |
Albemarle Corp. | | | 58 | | | | 13,559 | |
Alcoa Corp. | | | 97 | | | | 5,779 | |
Amyris, Inc. (1) | | | 46 | | | | 249 | |
Avient Corp. | | | 33 | | | | 1,846 | |
Berry Global Group, Inc. (1) | | | 122 | | | | 9,001 | |
Celanese Corp. | | | 103 | | | | 17,310 | |
Century Aluminum Co. (1) | | | 25 | | | | 414 | |
Chemours Co./The | | | 52 | | | | 1,745 | |
Cleveland-Cliffs, Inc. (1) | | | 147 | | | | 3,200 | |
Dow, Inc. | | | 312 | | | | 17,697 | |
Element Solutions, Inc. | | | 46 | | | | 1,117 | |
Flotek Industries, Inc. (1) | | | 208 | | | | 235 | |
Freeport-McMoRan, Inc. | | | 575 | | | | 23,995 | |
Hawkins, Inc. | | | 13 | | | | 513 | |
Huntsman Corp. | | | 158 | | | | 5,511 | |
Intrepid Potash, Inc. (1) | | | 5 | | | | 214 | |
Koppers Holdings, Inc. (1) | | | 45 | | | | 1,409 | |
Louisiana-Pacific Corp. | | | 204 | | | | 15,983 | |
LyondellBasell Industries NV | | | 181 | | | | 16,694 | |
Mosaic Co./The | | | 228 | | | | 8,958 | |
Nucor Corp. | | | 168 | | | | 19,177 | |
O-I Glass, Inc. (1) | | | 57 | | | | 686 | |
Olin Corp. | | | 79 | | | | 4,544 | |
Rayonier Advanced Materials, Inc. (1) | | | 33 | | | | 188 | |
Ryerson Holding Corp. | | | 34 | | | | 886 | |
Steel Dynamics, Inc. | | | 75 | | | | 4,655 | |
SunCoke Energy, Inc. | | | 38 | | | | 250 | |
Trinseo PLC | | | 54 | | | | 2,833 | |
Tronox Holdings PLC | | | 70 | | | | 1,682 | |
United States Steel Corp. | | | 79 | | | | 1,881 | |
Westlake Chemical Corp. | | | 69 | | | | 6,702 | |
| | | | | | | | 188,913 | |
| | | | | | | | | |
Real Estate Investment Trust — 1.2% | | | | | | | | |
Altisource Portfolio Solutions SA (1) | | | 115 | | | | 1,290 | |
American Homes 4 Rent | | | 341 | | | | 14,871 | |
The accompanying notes are an integral part of these financial statements.
Page 52 | 2021 Annual Report | December 31, 2021 |
Schedule of Investments
December 31, 2021
Global Allocation Fund |
Security Description | | Shares or
Principal
Amount ($) | | | Fair
Value ($) | |
Common Stocks (United States) — continued |
Ashford Hospitality Trust, Inc. (1) | | | 112 | | | | 1,075 | |
Camden Property Trust | | | 168 | | | | 30,018 | |
CareTrust REIT, Inc. | | | 492 | | | | 11,232 | |
CatchMark Timber Trust, Inc. | | | 326 | | | | 2,839 | |
CBL & Associates Properties, Inc. (1) | | | 4 | | | | 125 | |
CorEnergy Infrastructure Trust, Inc. | | | 596 | | | | 1,865 | |
Corporate Office Properties Trust | | | 406 | | | | 11,356 | |
CubeSmart | | | 825 | | | | 46,951 | |
CyrusOne, Inc. | | | 1 | | | | 90 | |
DiamondRock Hospitality Co. (1) | | | 51 | | | | 490 | |
Easterly Government Properties, Inc. | | | 1 | | | | 23 | |
EastGroup Properties, Inc. | | | 148 | | | | 33,722 | |
Essex Property Trust, Inc. | | | 40 | | | | 14,089 | |
Extra Space Storage, Inc. | | | 7 | | | | 1,587 | |
First Industrial Realty Trust, Inc. | | | 695 | | | | 46,009 | |
Healthcare Trust of America, Inc. | | | 446 | | | | 14,892 | |
Host Hotels & Resorts, Inc. (1) | | | 23 | | | | 400 | |
Invitation Homes, Inc. | | | 341 | | | | 15,461 | |
Lamar Advertising Co. | | | 660 | | | | 80,058 | |
Life Storage, Inc. | | | 14 | | | | 2,145 | |
Maui Land & Pineapple Co., Inc. (1) | | | 8 | | | | 80 | |
Mid-America Apartment Communities, Inc. | | | 129 | | | | 29,598 | |
National Health Investors, Inc. | | | 55 | | | | 3,161 | |
Omega Healthcare Investors, Inc. | | | 646 | | | | 19,115 | |
PotlatchDeltic Corp. | | | 137 | | | | 8,250 | |
Public Storage | | | 189 | | | | 70,792 | |
RAIT Financial Trust (1)(5) | | | 287 | | | | 0 | |
Regency Centers Corp. | | | 595 | | | | 44,833 | |
SL Green Realty Corp. | | | 161 | | | | 11,544 | |
Spirit MTA REIT Liquidating Trust (1)(5) | | | 385 | | | | 0 | |
Stratus Properties, Inc. (1) | | | 29 | | | | 1,061 | |
Tanger Factory Outlet Centers, Inc. | | | 60 | | | | 1,157 | |
Trinity Place Holdings, Inc. (1) | | | 331 | | | | 609 | |
UDR, Inc. | | | 140 | | | | 8,399 | |
Universal Health Realty Income Trust | | | 81 | | | | 4,817 | |
Weyerhaeuser Co. | | | 368 | | | | 15,154 | |
Zillow Group, Inc. (1) | | | 103 | | | | 6,577 | |
| | | | | | | | 555,735 | |
| | | | | | | | | |
Utilities — 0.7% | | | | | | | | |
Evergy, Inc. | | | 937 | | | | 64,288 | |
Exelon Corp. | | | 2,439 | | | | 140,844 | |
MDU Resources Group, Inc. | | | 944 | | | | 29,113 | |
NRG Energy, Inc. | | | 802 | | | | 34,550 | |
Portland General Electric Co. | | | 702 | | | | 37,150 | |
Global Allocation Fund |
Security Description | | Shares or
Principal
Amount ($) | | | Fair
Value ($) | |
Common Stocks (United States) — continued |
UGI Corp. | | | 462 | | | | 21,210 | |
| | | | | | | | 327,155 | |
| | | | | | | | | |
Total Common Stocks (United States) (Cost $10,685,686) | | | | | | | 15,539,217 | |
| | | | | | | | | |
Preferred Stock (United States) — 0.0% |
WESCO International, Inc. Series A Variable Preferred (6) | | | 81 | | | | 2,483 | |
Total Preferred Stock (United States) (Cost $2,025) | | | | | | | 2,483 | |
| | | | | | | | | |
Warrants (United States) — 0.0% |
Civitas Solutions, Inc. A Warrants, Expiration Date 1/20/2025 (1)(5) | | | 2 | | | | 0 | |
Civitas Solutions, Inc. B Warrants, Expiration Date 1/20/2026 (1)(5) | | | 1 | | | | 0 | |
Hertz Global Holdings, Inc. Warrants, Expiration Date 6/30/2051 (1) | | | 11 | | | | 191 | |
Nabors Industries, Ltd. Warrants, Expiration Date 6/11/2026 (1) | | | 4 | | | | 15 | |
Whiting Petroleum Corp. A Warrants, Expiration Date 9/1/2024 (1) | | | 12 | | | | 166 | |
Whiting Petroleum Corp. B Warrants, Expiration Date 9/1/2025 (1) | | | 9 | | | | 106 | |
Total Warrants (United States) (Cost $96) | | | | | | | 478 | |
| | | | | | | | | |
Registered Investment Companies — 16.6% |
U.S. Fixed Income — 7.0% | | | | | | | | |
Baird Core Plus Bond Fund - Class I | | | 9,847 | | | | 114,916 | |
Dodge & Cox Income Fund | | | 9,396 | | | | 132,108 | |
DoubleLine Total Return Bond Fund - Class I | | | 14,457 | | | | 150,351 | |
Frost Total Return Bond Fund - Class I | | | 17,857 | | | | 184,103 | |
Guggenheim Total Return Bond Fund - Class I | | | 2,304 | | | | 65,796 | |
iShares 0-5 Year High Yield Corporate Bond ETF (7) | | | 2,989 | | | | 135,402 | |
iShares 3-7 Year Treasury Bond ETF (7) | | | 9,213 | | | | 1,185,435 | |
Lord Abbett High Yield Fund - Class I | | | 22,950 | | | | 172,813 | |
PGIM Short-Term Corporate Bond Fund - Class Q | | | 5,777 | | | | 64,529 | |
Pioneer Bond Fund - Class K | | | 13,699 | | | | 133,019 | |
Segall Bryant & Hamill Plus Bond Fund - Class I | | | 14,333 | | | | 153,932 | |
SPDR Bloomberg Barclays Short Term High Yield Bond ETF (7) | | | 5,582 | | | | 151,551 | |
The accompanying notes are an integral part of these financial statements.
2021 Annual Report | December 31, 2021 | Page 53 |
Schedule of Investments
December 31, 2021
Global Allocation Fund |
Security Description | | Shares or
Principal
Amount ($) | | | Fair
Value ($) | |
Registered Investment Companies — continued |
Vanguard Short-Term Bond ETF (7) | | | 6,449 | | | | 521,273 | |
| | | | | | | | 3,165,228 | |
| | | | | | | | | |
International Fixed Income — 1.0% | | | | | | | | |
iShares JP Morgan USD Emerging Markets Bond ETF (7) | | | 3,978 | | | | 433,841 | |
| | | | | | | | 433,841 | |
| | | | | | | | | |
International Equity — 8.6% | | | | | | | | |
iShares Core MSCI EAFE ETF (7) | | | 42,298 | | | | 3,157,123 | |
iShares Core MSCI Emerging Markets ETF (7) | | | 12,312 | | | | 736,996 | |
| | | | | | | | 3,894,119 | |
Total Registered Investment Companies (Cost $6,308,978) | | | | | | | 7,493,188 | |
| | | | | | | | | |
Money Market Registered Investment Companies — 43.8% |
Meeder Institutional Prime Money Market Fund, 0.05% (2) | | | 19,821,069 | | | | 19,823,051 | |
Total Money Market Registered Investment Companies (Cost $19,820,547) | | | | | | | 19,823,051 | |
| | | | | | | | | |
Bank Obligations — 1.6% |
First Merchants Bank Deposit Account, 0.20%, 1/3/2022 (3) | | | 249,093 | | | | 249,093 | |
Metro City Bank Deposit Account, 0.05%, 1/3/2022 (3) | | | 248,445 | | | | 248,445 | |
Pacific Mercantile Bank Deposit Account, 0.10%, 1/3/2022 (3) | | | 247,072 | | | | 247,072 | |
Total Bank Obligations (Cost $744,610) | | | | | | | 744,610 | |
Total Investments — 96.3% (Cost $37,561,941) | | | | | | | 43,603,027 | |
Other Assets less Liabilities — 3.7% | | | | | | | 1,652,772 | |
Total Net Assets — 100.0% | | | | | | | 45,255,799 | |
| | | | | | | | | |
Trustee Deferred Compensation (4) |
Meeder Balanced Fund - Retail Class | | | 1,947 | | | | 26,129 | |
Meeder Dynamic Allocation Fund - Retail Class | | | 5,307 | | | | 73,927 | |
Meeder Muirfield Fund - Retail Class | | | 2,209 | | | | 21,052 | |
Meeder Conservative Allocation Fund - Retail Class | | | 552 | | | | 13,049 | |
Total Trustee Deferred Compensation (Cost $106,472) | | | | | | | 134,157 | |
| | | Long
(Short)
Contracts | | | Expiration
Date | | | Notional
Value of
Contracts
($) | | | Value and
Unrealized
Appreciation
(Depreciation)
($) | |
Futures Contracts |
Index Futures | | | | | | | | | | | | | | | | |
E-mini Standard & Poors MidCap 400 Futures | | | (2 | ) | | | 3/18/2022 | | | | (567,540 | ) | | | 440 | |
Mini MSCI EAFE Index Futures | | | 80 | | | | 3/18/2022 | | | | 9,287,200 | | | | 267,762 | |
Mini MSCI Emerging Markets Index Futures | | | 32 | | | | 3/18/2022 | | | | 1,962,080 | | | | 17,825 | |
Russell 2000 Mini Index Futures | | | 3 | | | | 3/18/2022 | | | | 336,420 | | | | 9,899 | |
Standard & Poors 500 Mini Futures | | | (3 | ) | | | 3/18/2022 | | | | (713,775 | ) | | | (21,460 | ) |
Total Futures Contracts | | | 110 | | | | | | | | 10,304,385 | | | | 274,466 | |
(1) | Represents non-income producing securities. |
(2) | Investment in affiliate. The yield shown represents the 7-day yield in effect at December 31, 2021. |
(3) | Variable rate security. Securities payable at par including accrued interest (usually within seven days notice) and unconditionally secured as to principal and interest by letters of credit or other credit support agreements from major banks. The interest rates are adjustable and are not based on a published reference rate and spread but are determined by the issuer or agent and are based on current market conditions. These securities do not indicate a reference rate and spread in their description above. The rate shown represents the rate in effect at December 31, 2021. The maturity date shown, if applicable, reflects the earlier of the next demand date or stated maturity date. |
(4) | Assets of affiliates to the Global Allocation Fund held for the benefit of the Fund’s Trustees in connection with the Trustee Deferred Compensation Plan. |
(5) | Fair valued security deemed a Level 3 security. Security is not part of the investment strategy of the Fund. |
The accompanying notes are an integral part of these financial statements.
Page 54 | 2021 Annual Report | December 31, 2021 |
Schedule of Investments
December 31, 2021
Balanced Fund |
Security Description | | Shares,
Contracts
or Principal
Amount ($) | | | Fair
Value ($) | |
Common Stocks (United States) — 48.8% |
Communication Services — 4.6% | | | | | | | | |
Activision Blizzard, Inc. | | | 5,863 | | | | 390,065 | |
Alphabet, Inc. - Class C (1) | | | 1,558 | | | | 4,508,213 | |
Alphabet, Inc. - Class A (1) | | | 1,473 | | | | 4,267,340 | |
AMC Entertainment Holdings, Inc. (1) | | | 2,096 | | | | 57,011 | |
AT&T, Inc. | | | 2,866 | | | | 70,504 | |
Cargurus, Inc. (1) | | | 903 | | | | 30,377 | |
Cars.com, Inc. (1) | | | 659 | | | | 10,603 | |
Cinemark Holdings, Inc. (1) | | | 1,600 | | | | 25,792 | |
Cumulus Media, Inc. (1) | | | 9 | | | | 101 | |
DHI Group, Inc. (1) | | | 2,509 | | | | 15,656 | |
DISH Network Corp. (1) | | | 532 | | | | 17,258 | |
Electronic Arts, Inc. | | | 727 | | | | 95,891 | |
Emerald Holding, Inc. (1) | | | 1 | | | | 4 | |
Entravision Communications Corp. | | | 1,381 | | | | 9,363 | |
Eros STX Global Corp. (1) | | | 9 | | | | 2 | |
Gannett Co., Inc. (1) | | | 9 | | | | 48 | |
Globalstar, Inc. (1) | | | 5 | | | | 6 | |
Gogo, Inc. (1) | | | 238 | | | | 3,220 | |
Gray Television, Inc. | | | 1,422 | | | | 28,668 | |
IDT Corp. (1) | | | 155 | | | | 6,845 | |
iHeartMedia, Inc. (1) | | | 105 | | | | 2,209 | |
IMAX Corp. (1) | | | 698 | | | | 12,452 | |
Integral Ad Science Holding Corp. (1) | | | 181 | | | | 4,020 | |
Interpublic Group of Cos., Inc./The | | | 10,252 | | | | 383,937 | |
Liberty Latin America, Ltd. - Class A (1) | | | 1 | | | | 12 | |
Liberty Latin America, Ltd. - Class C (1) | | | 1 | | | | 11 | |
Liberty Media Corp.-Liberty Braves - Class A (1) | | | 986 | | | | 28,348 | |
Liberty Media Corp.-Liberty Braves - Class C (1) | | | 3,109 | | | | 87,363 | |
Liberty TripAdvisor Holdings, Inc. (1) | | | 4,039 | | | | 8,765 | |
Lions Gate Entertainment Corp. - Class A (1) | | | 1,466 | | | | 24,394 | |
Lions Gate Entertainment Corp. - Class B (1) | | | 1 | | | | 15 | |
Live Nation Entertainment, Inc. (1) | | | 240 | | | | 28,726 | |
LiveOne, Inc. (1) | | | 2 | | | | 3 | |
Lumen Technologies, Inc. | | | 3 | | | | 38 | |
Meta Platforms, Inc. (1) | | | 12,413 | | | | 4,175,113 | |
Netflix, Inc. (1) | | | 1,930 | | | | 1,162,709 | |
News Corp. | | | 1 | | | | 22 | |
Outbrain, Inc. (1) | | | 2 | | | | 28 | |
Pinterest, Inc. (1) | | | 303 | | | | 11,014 | |
Roku, Inc. (1) | | | 99 | | | | 22,592 | |
Sinclair Broadcast Group, Inc. | | | 597 | | | | 15,779 | |
TEGNA, Inc. | | | 1,859 | | | | 34,503 | |
Thryv Holdings, Inc. (1) | | | 1 | | | | 41 | |
Balanced Fund |
Security Description | | Shares,
Contracts
or Principal
Amount ($) | | | Fair
Value ($) | |
Common Stocks (United States) — continued |
Twitter, Inc. (1) | | | 3,906 | | | | 168,817 | |
Verizon Communications, Inc. | | | 27,758 | | | | 1,442,306 | |
Vimeo, Inc. (1) | | | 20 | | | | 359 | |
WideOpenWest, Inc. (1) | | | 5,668 | | | | 121,975 | |
World Wrestling Entertainment, Inc. | | | 337 | | | | 16,628 | |
Yelp, Inc. (1) | | | 1,062 | | | | 38,487 | |
Ziff Davis, Inc. (1) | | | 2,942 | | | | 326,150 | |
| | | | | | | | 17,653,783 | |
| | | | | | | | | |
Consumer Discretionary — 5.3% | | | | | | | | |
Abercrombie & Fitch Co. (1) | | | 434 | | | | 15,116 | |
Academy Sports & Outdoors, Inc. (1) | | | 419 | | | | 18,394 | |
Adient PLC (1) | | | 830 | | | | 39,740 | |
Amazon.com, Inc. (1) | | | 1,569 | | | | 5,231,579 | |
American Axle & Manufacturing Holdings, Inc. (1) | | | 1,410 | | | | 13,155 | |
American Eagle Outfitters, Inc. | | | 811 | | | | 20,535 | |
Aptiv PLC (1) | | | 383 | | | | 63,176 | |
Aramark | | | 2,250 | | | | 82,913 | |
Asbury Automotive Group, Inc. (1) | | | 277 | | | | 47,846 | |
AutoNation, Inc. (1) | | | 305 | | | | 35,639 | |
AutoZone, Inc. (1) | | | 213 | | | | 446,531 | |
Barnes & Noble Education, Inc. (1) | | | 3 | | | | 20 | |
Bath & Body Works, Inc. | | | 400 | | | | 27,916 | |
Best Buy Co., Inc. | | | 2,546 | | | | 258,674 | |
Big 5 Sporting Goods Corp. | | | 528 | | | | 10,037 | |
Big Lots, Inc. | | | 342 | | | | 15,407 | |
Biglari Holdings, Inc. (1) | | | 39 | | | | 5,560 | |
Boyd Gaming Corp. (1) | | | 1,384 | | | | 90,749 | |
Brinker International, Inc. (1) | | | 623 | | | | 22,796 | |
Caleres, Inc. | | | 494 | | | | 11,204 | |
Capri Holdings, Ltd. (1) | | | 1,221 | | | | 79,255 | |
Cato Corp./The | | | 2 | | | | 34 | |
Chico’s FAS, Inc. (1) | | | 323 | | | | 1,738 | |
Clarus Corp. | | | 2 | | | | 55 | |
Conn’s, Inc. (1) | | | 174 | | | | 4,092 | |
Container Store Group, Inc./The (1) | | | 45 | | | | 449 | |
Crocs, Inc. (1) | | | 1,256 | | | | 161,044 | |
Dana, Inc. | | | 2,305 | | | | 52,600 | |
Designer Brands, Inc. (1) | | | 465 | | | | 6,608 | |
Dick’s Sporting Goods, Inc. | | | 1,392 | | | | 160,066 | |
Dollar Tree, Inc. (1) | | | 367 | | | | 51,571 | |
eBay, Inc. | | | 3,133 | | | | 208,345 | |
Ethan Allen Interiors, Inc. | | | 151 | | | | 3,970 | |
Etsy, Inc. (1) | | | 258 | | | | 56,487 | |
Everi Holdings, Inc. (1) | | | 1,905 | | | | 40,672 | |
The accompanying notes are an integral part of these financial statements.
2021 Annual Report | December 31, 2021 | Page 55 |
Schedule of Investments
December 31, 2021
Balanced Fund |
Security Description | | Shares,
Contracts
or Principal
Amount ($) | | | Fair
Value ($) | |
Common Stocks (United States) — continued |
Foot Locker, Inc. | | | 2,761 | | | | 120,462 | |
Ford Motor Co. | | | 20,270 | | | | 421,008 | |
Fossil Group, Inc. (1) | | | 629 | | | | 6,472 | |
Funko, Inc. (1) | | | 1 | | | | 19 | |
GameStop Corp. (1) | | | 246 | | | | 36,504 | |
Gap, Inc./The | | | 464 | | | | 8,190 | |
Garmin, Ltd. | | | 2,917 | | | | 397,208 | |
General Motors Co. (1) | | | 5,764 | | | | 337,943 | |
Genesco, Inc. (1) | | | 12 | | | | 770 | |
Genius Brands International, Inc. (1) | | | 475 | | | | 499 | |
Golden Entertainment, Inc. (1) | | | 191 | | | | 9,651 | |
Goodyear Tire & Rubber Co./The (1) | | | 3,060 | | | | 65,239 | |
GoPro, Inc. (1) | | | 3 | | | | 31 | |
Greenlane Holdings, Inc. (1) | | | 2,139 | | | | 2,062 | |
Group 1 Automotive, Inc. | | | 110 | | | | 21,474 | |
Guess?, Inc. | | | 1,276 | | | | 30,216 | |
H&R Block, Inc. | | | 4 | | | | 94 | |
Harley-Davidson, Inc. | | | 158 | | | | 5,955 | |
Hibbett, Inc. | | | 113 | | | | 8,128 | |
Home Depot, Inc./The | | | 6,548 | | | | 2,717,485 | |
Houghton Mifflin Harcourt Co. (1) | | | 337 | | | | 5,426 | |
International Game Technology PLC | | | 3,194 | | | | 92,339 | |
JOANN, Inc. | | | 140 | | | | 1,453 | |
Kirkland’s, Inc. (1) | | | 94 | | | | 1,403 | |
Kohl’s Corp. | | | 2,407 | | | | 118,882 | |
Lands’ End, Inc. (1) | | | 392 | | | | 7,695 | |
Lazydays Holdings, Inc. (1) | | | 1 | | | | 22 | |
Lear Corp. | | | 513 | | | | 93,853 | |
Lifetime Brands, Inc. | | | 1 | | | | 16 | |
Liquidity Services, Inc. (1) | | | 126 | | | | 2,782 | |
LKQ Corp. | | | 2 | | | | 120 | |
Lovesac Co./The (1) | | | 119 | | | | 7,885 | |
Lowe’s Cos., Inc. | | | 6,860 | | | | 1,773,173 | |
Lululemon Athletica, Inc. (1) | | | 470 | | | | 183,982 | |
Macy’s, Inc. | | | 2,141 | | | | 56,051 | |
MGM Resorts International | | | 3,183 | | | | 142,853 | |
Movado Group, Inc. | | | 1 | | | | 42 | |
Murphy USA, Inc. | | | 200 | | | | 39,848 | |
Newell Brands, Inc. | | | 1 | | | | 22 | |
Noodles & Co. (1) | | | 1 | | | | 9 | |
Nordstrom, Inc. (1) | | | 457 | | | | 10,337 | |
ODP Corp./The (1) | | | 394 | | | | 15,476 | |
ONE Group Hospitality, Inc./The (1) | | | 4 | | | | 50 | |
OneWater Marine, Inc. | | | 1,215 | | | | 74,079 | |
O’Reilly Automotive, Inc. (1) | | | 843 | | | | 595,352 | |
Overstock.com, Inc. (1) | | | 27 | | | | 1,593 | |
Balanced Fund |
Security Description | | Shares,
Contracts
or Principal
Amount ($) | | | Fair
Value ($) | |
Common Stocks (United States) — continued |
Party City Holdco, Inc. (1) | | | 2,964 | | | | 16,509 | |
Penn National Gaming, Inc. (1) | | | 48 | | | | 2,489 | |
Perdoceo Education Corp. (1) | | | 1 | | | | 12 | |
Qurate Retail, Inc. | | | 4,275 | | | | 32,490 | |
RCI Hospitality Holdings, Inc. | | | 229 | | | | 17,835 | |
Red Robin Gourmet Burgers, Inc. (1) | | | 1,342 | | | | 22,183 | |
Red Rock Resorts, Inc. | | | 1,069 | | | | 58,806 | |
Revolve Group, Inc. (1) | | | 700 | | | | 39,228 | |
Scientific Games Corp. (1) | | | 645 | | | | 43,105 | |
SeaWorld Entertainment, Inc. (1) | | | 555 | | | | 35,997 | |
Shoe Carnival, Inc. | | | 124 | | | | 4,846 | |
Shutterstock, Inc. | | | 533 | | | | 59,099 | |
Signet Jewelers, Ltd. | | | 43 | | | | 3,742 | |
Skyline Champion Corp. (1) | | | 832 | | | | 65,711 | |
Smith & Wesson Brands, Inc. | | | 1,266 | | | | 22,535 | |
Sonos, Inc. (1) | | | 3,999 | | | | 119,170 | |
Steven Madden, Ltd. | | | 1,512 | | | | 70,263 | |
StoneMor, Inc. (1) | | | 3 | | | | 7 | |
Tapestry, Inc. | | | 3,169 | | | | 128,661 | |
Target Corp. | | | 3,225 | | | | 746,394 | |
Target Hospitality Corp. (1) | | | 1 | | | | 4 | |
Tempur Sealy International, Inc. | | | 1,444 | | | | 67,911 | |
Tenneco, Inc. (1) | | | 2,668 | | | | 30,148 | |
Tesla, Inc. (1) | | | 3,446 | | | | 3,641,664 | |
Thor Industries, Inc. | | | 1,445 | | | | 149,948 | |
Tilly’s, Inc. | | | 7 | | | | 113 | |
Town Sports International Holdings, Inc. (1) | | | 1,777 | | | | 1 | |
Tupperware Brands Corp. (1) | | | 549 | | | | 8,394 | |
Ulta Beauty, Inc. (1) | | | 160 | | | | 65,974 | |
Urban Outfitters, Inc. (1) | | | 491 | | | | 14,416 | |
Vera Bradley, Inc. (1) | | | 3 | | | | 26 | |
Waitr Holdings, Inc. (1) | | | 1,612 | | | | 1,193 | |
Weber, Inc. | | | 2,514 | | | | 32,506 | |
Williams-Sonoma, Inc. | | | 614 | | | | 103,846 | |
Winnebago Industries, Inc. | | | 1,584 | | | | 118,673 | |
XPEL, Inc. (1) | | | 156 | | | | 10,652 | |
| | | | | | | | 20,432,677 | |
| | | | | | | | | |
Consumer Staples — 1.5% | | | | | | | | |
Albertsons Cos., Inc. | | | 5,437 | | | | 164,143 | |
BJ’s Wholesale Club Holdings, Inc. (1) | | | 2 | | | | 134 | |
Bunge, Ltd. | | | 15,174 | | | | 1,416,645 | |
Celsius Holdings, Inc. (1) | | | 105 | | | | 7,830 | |
Coca-Cola Co./The | | | 11,453 | | | | 678,132 | |
Costco Wholesale Corp. | | | 1,856 | | | | 1,053,651 | |
Coty, Inc. (1) | | | 1 | | | | 11 | |
The accompanying notes are an integral part of these financial statements.
Page 56 | 2021 Annual Report | December 31, 2021 |
Schedule of Investments
December 31, 2021
Balanced Fund |
Security Description | | Shares,
Contracts
or Principal
Amount ($) | | | Fair
Value ($) | |
Common Stocks (United States) — continued |
Darling Ingredients, Inc. (1) | | | 420 | | | | 29,102 | |
Fresh Del Monte Produce, Inc. | | | 191 | | | | 5,272 | |
General Mills, Inc. | | | 1,065 | | | | 71,760 | |
Hershey Co./The | | | 5,527 | | | | 1,069,309 | |
Hostess Brands, Inc. (1) | | | 1 | | | | 20 | |
NewAge, Inc. (1) | | | 1 | | | | 1 | |
PepsiCo, Inc. | | | 4,208 | | | | 730,972 | |
Pilgrim’s Pride Corp. (1) | | | 3 | | | | 85 | |
Simply Good Foods Co./The (1) | | | 2,026 | | | | 84,221 | |
Spectrum Brands Holdings, Inc. | | | 1,031 | | | | 104,873 | |
Tyson Foods, Inc. | | | 1,811 | | | | 157,847 | |
Walgreens Boots Alliance, Inc. | | | 1,782 | | | | 92,949 | |
Walmart, Inc. | | | 1,052 | | | | 152,214 | |
| | | | | | | | 5,819,171 | |
| | | | | | | | | |
Energy — 1.6% | | | | | | | | |
Alto Ingredients, Inc. (1) | | | 226 | | | | 1,087 | |
Altus Midstream Co. | | | 144 | | | | 8,829 | |
Amplify Energy Corp. (1) | | | 155 | | | | 482 | |
Antero Midstream Corp. | | | 5 | | | | 48 | |
Antero Resources Corp. (1) | | | 1,220 | | | | 21,350 | |
APA Corp. | | | 3,531 | | | | 94,949 | |
Ardmore Shipping Corp. (1) | | | 586 | | | | 1,981 | |
Berry Corp. | | | 183 | | | | 1,541 | |
Bristow Group, Inc. (1) | | | 175 | | | | 5,542 | |
Cactus, Inc. | | | 619 | | | | 23,602 | |
California Resources Corp. | | | 1 | | | | 43 | |
Centennial Resource Development, Inc./DE (1) | | | 1 | | | | 6 | |
Cheniere Energy, Inc. | | | 227 | | | | 23,022 | |
Chevron Corp. | | | 5,958 | | | | 699,171 | |
CNX Resources Corp. (1) | | | 1 | | | | 14 | |
Comstock Resources, Inc. (1) | | | 7 | | | | 57 | |
ConocoPhillips | | | 7,770 | | | | 560,839 | |
CONSOL Energy, Inc. (1) | | | 117 | | | | 2,657 | |
Coterra Energy, Inc. | | | 8 | | | | 152 | |
CVR Energy, Inc. | | | 308 | | | | 5,177 | |
Delek US Holdings, Inc. (1) | | | 2,263 | | | | 33,922 | |
Devon Energy Corp. | | | 2,808 | | | | 123,692 | |
DHT Holdings, Inc. | | | 996 | | | | 5,169 | |
Diamondback Energy, Inc. | | | 267 | | | | 28,796 | |
Dorian LPG, Ltd. | | | 97 | | | | 1,231 | |
DT Midstream, Inc. | | | 2 | | | | 96 | |
Energy Fuels, Inc./Canada (1) | | | 7 | | | | 53 | |
EOG Resources, Inc. | | | 2,575 | | | | 228,737 | |
Equitrans Midstream Corp. | | | 2 | | | | 21 | |
Balanced Fund |
Security Description | | Shares,
Contracts
or Principal
Amount ($) | | | Fair
Value ($) | |
Common Stocks (United States) — continued |
Expro Group Holdings NV (1) | | | 459 | | | | 6,587 | |
Exxon Mobil Corp. | | | 27,307 | | | | 1,670,915 | |
Falcon Minerals Corp. | | | 4 | | | | 19 | |
Frontline, Ltd./Bermuda (1) | | | 1 | | | | 7 | |
Golar LNG, Ltd. (1) | | | 4 | | | | 50 | |
Hess Corp. | | | 994 | | | | 73,586 | |
HollyFrontier Corp. | | | 400 | | | | 13,112 | |
Kinder Morgan, Inc. | | | 3 | | | | 48 | |
Kosmos Energy, Ltd. (1) | | | 8 | | | | 28 | |
Laredo Petroleum, Inc. (1) | | | 183 | | | | 11,004 | |
Magnolia Oil & Gas Corp. | | | 2 | | | | 38 | |
Marathon Oil Corp. | | | 481 | | | | 7,898 | |
Marathon Petroleum Corp. | | | 13,552 | | | | 867,192 | |
Nabors Industries, Ltd. (1) | | | 324 | | | | 26,273 | |
Newpark Resources, Inc. (1) | | | 3 | | | | 9 | |
NextDecade Corp. (1) | | | 1,003 | | | | 2,859 | |
NexTier Oilfield Solutions, Inc. (1) | | | 1 | | | | 4 | |
Nine Energy Service, Inc. (1) | | | 3,965 | | | | 3,965 | |
Nordic American Tankers, Ltd. | | | 2 | | | | 3 | |
Northern Oil and Gas, Inc. | | | 139 | | | | 2,861 | |
NOV, Inc. | | | 1 | | | | 14 | |
Occidental Petroleum Corp. | | | 7,862 | | | | 227,919 | |
Oceaneering International, Inc. (1) | | | 1,778 | | | | 20,109 | |
ONEOK, Inc. | | | 6,839 | | | | 401,860 | |
Ovintiv, Inc. | | | 2,462 | | | | 82,969 | |
Par Pacific Holdings, Inc. (1) | | | 263 | | | | 4,337 | |
Patterson-UTI Energy, Inc. | | | 1 | | | | 8 | |
PDC Energy, Inc. | | | 51 | | | | 2,488 | |
Peabody Energy Corp. (1) | | | 1,173 | | | | 11,812 | |
Phillips 66 | | | 4,483 | | | | 324,838 | |
Pioneer Natural Resources Co. | | | 591 | | | | 107,491 | |
Range Resources Corp. (1) | | | 481 | | | | 8,576 | |
Schlumberger NV | | | 7,157 | | | | 214,352 | |
Scorpio Tankers, Inc. | | | 628 | | | | 8,045 | |
SFL Corp., Ltd. | | | 2 | | | | 16 | |
SM Energy Co. | | | 776 | | | | 22,876 | |
Southwestern Energy Co. (1) | | | 4,675 | | | | 21,786 | |
Talos Energy, Inc. (1) | | | 1,679 | | | | 16,454 | |
Targa Resources Corp. | | | 1,823 | | | | 95,234 | |
Teekay Corp. (1) | | | 1,513 | | | | 4,751 | |
Teekay Tankers, Ltd. (1) | | | 241 | | | | 2,627 | |
Tellurian, Inc. (1) | | | 1 | | | | 3 | |
TETRA Technologies, Inc. (1) | | | 3 | | | | 9 | |
Uranium Energy Corp. (1) | | | 510 | | | | 1,709 | |
Ur-Energy, Inc. (1) | | | 2 | | | | 2 | |
Valero Energy Corp. | | | 2,593 | | | | 194,760 | |
The accompanying notes are an integral part of these financial statements.
2021 Annual Report | December 31, 2021 | Page 57 |
Schedule of Investments
December 31, 2021
Balanced Fund |
Security Description | | Shares,
Contracts
or Principal
Amount ($) | | | Fair
Value ($) | |
Common Stocks (United States) — continued |
W&T Offshore, Inc. (1) | | | 497 | | | | 1,605 | |
World Fuel Services Corp. | | | 1,167 | | | | 30,890 | |
| | | | | | | | 6,366,264 | |
| | | | | | | | | |
Financials — 5.9% | | | | | | | | |
Affiliated Managers Group, Inc. | | | 522 | | | | 85,874 | |
Aflac, Inc. | | | 4,574 | | | | 267,076 | |
Allstate Corp./The | | | 6,551 | | | | 770,725 | |
Ally Financial, Inc. | | | 1,654 | | | | 78,747 | |
American Express Co. | | | 666 | | | | 108,958 | |
American Financial Group, Inc./OH | | | 1,106 | | | | 151,876 | |
American International Group, Inc. | | | 27,132 | | | | 1,542,726 | |
American National Insurance Co. (1) | | | 35 | | | | 6,609 | |
Ameris Bancorp | | | 1,557 | | | | 77,352 | |
Apollo Commercial Real Estate Finance, Inc. | | | 1 | | | | 13 | |
Arbor Realty Trust, Inc. | | | 1 | | | | 18 | |
Ares Commercial Real Estate Corp. | | | 418 | | | | 6,078 | |
Athene Holding, Ltd. (1) | | | 10,073 | | | | 839,383 | |
Atlanticus Holdings Corp. (1) | | | 52 | | | | 3,709 | |
Bank of America Corp. | | | 30,713 | | | | 1,366,421 | |
Bank of New York Mellon Corp./The | | | 7,818 | | | | 454,069 | |
Bank OZK | | | 796 | | | | 37,038 | |
Berkshire Hathaway, Inc. (1) | | | 8,448 | | | | 2,525,952 | |
Berkshire Hills Bancorp, Inc. | | | 1 | | | | 28 | |
BGC Partners, Inc. | | | 627 | | | | 2,916 | |
Blackstone, Inc. | | | 5,045 | | | | 652,773 | |
Blue Ridge Bankshares, Inc. | | | 4 | | | | 72 | |
Byline Bancorp, Inc. | | | 1 | | | | 27 | |
Capital Bancorp, Inc. | | | 131 | | | | 3,432 | |
Capital One Financial Corp. | | | 2,986 | | | | 433,239 | |
Capstar Financial Holdings, Inc. | | | 1 | | | | 21 | |
Carlyle Group, Inc./The | | | 1 | | | | 55 | |
Charles Schwab Corp./The | | | 7,347 | | | | 617,883 | |
Chimera Investment Corp. | | | 21,230 | | | | 320,148 | |
CIT Group, Inc. | | | 409 | | | | 20,998 | |
Citigroup, Inc. | | | 9,856 | | | | 595,204 | |
Citizens Financial Group, Inc. | | | 3,473 | | | | 164,099 | |
Civista Bancshares, Inc. | | | 661 | | | | 16,128 | |
Comerica, Inc. | | | 367 | | | | 31,929 | |
Curo Group Holdings Corp. | | | 1 | | | | 16 | |
East West Bancorp, Inc. | | | 1,711 | | | | 134,621 | |
Ellington Financial, Inc. | | | 3,216 | | | | 54,961 | |
Equity Bancshares, Inc. | | | 1 | | | | 34 | |
Evercore, Inc. | | | 2,109 | | | | 286,508 | |
EZCORP, Inc. (1) | | | 1 | | | | 7 | |
Balanced Fund |
Security Description | | Shares,
Contracts
or Principal
Amount ($) | | | Fair
Value ($) | |
Common Stocks (United States) — continued |
Farmers National Banc Corp. | | | 1 | | | | 19 | |
Fidelity National Financial, Inc. | | | 19,710 | | | | 1,028,468 | |
Fifth Third Bancorp | | | 8,523 | | | | 371,177 | |
First American Financial Corp. | | | 9,542 | | | | 746,471 | |
First BanCorp/Puerto Rico | | | 3 | | | | 41 | |
First Bank/Hamilton NJ | | | 1 | | | | 15 | |
Genworth Financial, Inc. (1) | | | 5 | | | | 20 | |
Goldman Sachs Group, Inc./The | | | 279 | | | | 106,731 | |
Great Ajax Corp. | | | 2 | | | | 26 | |
Great Western Bancorp, Inc. | | | 1 | | | | 34 | |
Hancock Whitney Corp. | | | 755 | | | | 37,765 | |
Hanmi Financial Corp. | | | 1 | | | | 24 | |
HarborOne Bancorp, Inc. | | | 1 | | | | 15 | |
Hartford Financial Services Group, Inc./The | | | 2,606 | | | | 179,918 | |
Hilltop Holdings, Inc. | | | 1 | | | | 35 | |
Invesco, Ltd. | | | 3,730 | | | | 85,865 | |
Janus Henderson Group PLC | | | 2,447 | | | | 102,627 | |
Jefferies Financial Group, Inc. | | | 953 | | | | 36,976 | |
JPMorgan Chase & Co. | | | 7,301 | | | | 1,156,113 | |
Kearny Financial Corp./MD | | | 1 | | | | 13 | |
KKR & Co., Inc. | | | 5,246 | | | | 390,827 | |
LendingClub Corp. (1) | | | 544 | | | | 13,154 | |
Loews Corp. | | | 1 | | | | 58 | |
LPL Financial Holdings, Inc. | | | 236 | | | | 37,781 | |
Luther Burbank Corp. | | | 1 | | | | 14 | |
Maiden Holdings, Ltd. (1) | | | 2 | | | | 6 | |
Marlin Business Services Corp. | | | 2,299 | | | | 53,521 | |
Marsh & McLennan Cos., Inc. | | | 3,717 | | | | 646,089 | |
MBIA, Inc. (1) | | | 1,231 | | | | 19,437 | |
Medley Management, Inc. (1) | | | 101 | | | | 1 | |
Meta Financial Group, Inc. | | | 836 | | | | 49,876 | |
MetLife, Inc. | | | 6,098 | | | | 381,064 | |
Metrocity Bankshares, Inc. | | | 1 | | | | 28 | |
MFA Financial, Inc. | | | 3 | | | | 14 | |
MGIC Investment Corp. | | | 1 | | | | 14 | |
Moelis & Co. | | | 1,079 | | | | 67,448 | |
Morgan Stanley | | | 11,599 | | | | 1,138,558 | |
Mr Cooper Group, Inc. (1) | | | 1,502 | | | | 62,498 | |
New Residential Investment Corp. | | | 4 | | | | 43 | |
New York Mortgage Trust, Inc. | | | 3 | | | | 11 | |
Northrim BanCorp, Inc. | | | 1,347 | | | | 58,541 | |
Old Republic International Corp. | | | 340 | | | | 8,357 | |
OneMain Holdings, Inc. | | | 1,224 | | | | 61,249 | |
PacWest Bancorp | | | 906 | | | | 40,924 | |
Pinnacle Financial Partners, Inc. | | | 195 | | | | 18,623 | |
PNC Financial Services Group, Inc./The | | | 1,521 | | | | 304,991 | |
The accompanying notes are an integral part of these financial statements.
Page 58 | 2021 Annual Report | December 31, 2021 |
Schedule of Investments
December 31, 2021
Balanced Fund |
Security Description | | Shares,
Contracts
or Principal
Amount ($) | | | Fair
Value ($) | |
Common Stocks (United States) — continued |
Popular, Inc. | | | 550 | | | | 45,122 | |
Provident Bancorp, Inc. | | | 1 | | | | 19 | |
Provident Financial Services, Inc. | | | 1 | | | | 24 | |
Prudential Financial, Inc. | | | 1,775 | | | | 192,126 | |
Pzena Investment Management, Inc. | | | 3,247 | | | | 30,749 | |
RBB Bancorp | | | 2,647 | | | | 69,351 | |
Redwood Trust, Inc. | | | 1,506 | | | | 19,864 | |
Regional Management Corp. | | | 1 | | | | 57 | |
Regions Financial Corp. | | | 8,452 | | | | 184,254 | |
Sandy Spring Bancorp, Inc. | | | 872 | | | | 41,926 | |
Santander Consumer USA Holdings, Inc. | | | 831 | | | | 34,919 | |
Sculptor Capital Management, Inc. | | | 7 | | | | 149 | |
Siebert Financial Corp. (1) | | | 475 | | | | 1,102 | |
Signature Bank/New York NY | | | 383 | | | | 123,889 | |
Silvercrest Asset Management Group, Inc. | | | 274 | | | | 4,705 | |
SLM Corp. | | | 5,271 | | | | 103,681 | |
SmartFinancial, Inc. | | | 1 | | | | 27 | |
South Plains Financial, Inc. | | | 1 | | | | 28 | |
Spirit of Texas Bancshares, Inc. | | | 1 | | | | 29 | |
StepStone Group, Inc. | | | 181 | | | | 7,524 | |
Stewart Information Services Corp. | | | 6,018 | | | | 479,815 | |
StoneX Group, Inc. (1) | | | 81 | | | | 4,961 | |
SVB Financial Group (1) | | | 168 | | | | 113,944 | |
Synchrony Financial | | | 9,242 | | | | 428,736 | |
Synovus Financial Corp. | | | 371 | | | | 17,760 | |
Tiptree, Inc. | | | 154 | | | | 2,130 | |
Towne Bank/Portsmouth VA | | | 2 | | | | 63 | |
Truist Financial Corp. | | | 4,637 | | | | 271,496 | |
Umpqua Holdings Corp. | | | 7,499 | | | | 144,281 | |
Universal Insurance Holdings, Inc. | | | 1 | | | | 17 | |
Univest Financial Corp. | | | 1 | | | | 30 | |
Upstart Holdings, Inc. (1) | | | 164 | | | | 24,813 | |
US Bancorp | | | 8,565 | | | | 481,096 | |
Velocity Financial, Inc. (1) | | | 1 | | | | 14 | |
Virtus Investment Partners, Inc. | | | 29 | | | | 8,616 | |
Walker & Dunlop, Inc. | | | 1,260 | | | | 190,109 | |
Wells Fargo & Co. | | | 17,692 | | | | 848,862 | |
Western Alliance Bancorp | | | 621 | | | | 66,851 | |
Zions Bancorp NA | | | 2,099 | | | | 132,573 | |
| | | | | | | | 22,938,915 | |
| | | | | | | | | |
Healthcare — 9.2% | | | | | | | | |
89bio, Inc. (1) | | | 2 | | | | 26 | |
Abbott Laboratories | | | 738 | | | | 103,866 | |
AbbVie, Inc. | | | 17,994 | | | | 2,436,388 | |
Abeona Therapeutics, Inc. (1) | | | 931 | | | | 314 | |
Balanced Fund |
Security Description | | Shares,
Contracts
or Principal
Amount ($) | | | Fair
Value ($) | |
Common Stocks (United States) — continued |
ADMA Biologics, Inc. (1) | | | 114 | | | | 161 | |
Adverum Biotechnologies, Inc. (1) | | | 2 | | | | 4 | |
Aeglea BioTherapeutics, Inc. (1) | | | 1 | | | | 5 | |
Affimed NV (1) | | | 1,756 | | | | 9,693 | |
Agenus, Inc. (1) | | | 4 | | | | 13 | |
Agilent Technologies, Inc. | | | 6,787 | | | | 1,083,545 | |
Agiliti, Inc. (1) | | | 208 | | | | 4,817 | |
Akebia Therapeutics, Inc. (1) | | | 2 | | | | 5 | |
Alector, Inc. (1) | | | 240 | | | | 4,956 | |
Alkermes PLC (1) | | | 1,977 | | | | 45,985 | |
Allakos, Inc. (1) | | | 273 | | | | 2,673 | |
Alnylam Pharmaceuticals, Inc. (1) | | | 589 | | | | 99,883 | |
AmerisourceBergen Corp. | | | 2,176 | | | | 289,169 | |
Amgen, Inc. | | | 7,892 | | | | 1,775,463 | |
Amicus Therapeutics, Inc. (1) | | | 767 | | | | 8,859 | |
AMN Healthcare Services, Inc. (1) | | | 191 | | | | 23,365 | |
Amneal Pharmaceuticals, Inc. (1) | | | 1,892 | | | | 9,063 | |
Ampio Pharmaceuticals, Inc. (1) | | | 1 | | | | 1 | |
Anavex Life Sciences Corp. (1) | | | 71 | | | | 1,231 | |
ANI Pharmaceuticals, Inc. (1) | | | 136 | | | | 6,267 | |
Antares Pharma, Inc. (1) | | | 1 | | | | 4 | |
Anthem, Inc. | | | 1,997 | | | | 925,689 | |
Apellis Pharmaceuticals, Inc. (1) | | | 92 | | | | 4,350 | |
Apollo Medical Holdings, Inc. (1) | | | 89 | | | | 6,540 | |
Applied Therapeutics, Inc. (1) | | | 406 | | | | 3,634 | |
Apria, Inc. (1) | | | 5 | | | | 163 | |
Arbutus Biopharma Corp. (1) | | | 3,211 | | | | 12,491 | |
Arcutis Biotherapeutics, Inc. (1) | | | 658 | | | | 13,647 | |
Arrowhead Pharmaceuticals, Inc. (1) | | | 549 | | | | 36,399 | |
Arvinas, Inc. (1) | | | 532 | | | | 43,698 | |
Asensus Surgical, Inc. (1) | | | 1 | | | | 1 | |
Assertio Holdings, Inc. (1) | | | 2 | | | | 4 | |
Avalo Therapeutics, Inc. (1) | | | 4,399 | | | | 7,478 | |
Aveanna Healthcare Holdings, Inc. (1) | | | 6 | | | | 44 | |
Avid Bioservices, Inc. (1) | | | 2,591 | | | | 75,605 | |
Beam Therapeutics, Inc. (1) | | | 310 | | | | 24,704 | |
Beyondspring, Inc. (1) | | | 355 | | | | 1,608 | |
BioCryst Pharmaceuticals, Inc. (1) | | | 2,605 | | | | 36,079 | |
BioDelivery Sciences International, Inc. (1) | | | 4,462 | | | | 13,832 | |
Biohaven Pharmaceutical Holding Co., Ltd. (1) | | | 241 | | | | 33,212 | |
Bio-Rad Laboratories, Inc. (1) | | | 128 | | | | 96,713 | |
Blueprint Medicines Corp. (1) | | | 289 | | | | 30,955 | |
Bridgebio Pharma, Inc. (1) | | | 339 | | | | 5,655 | |
Bristol-Myers Squibb Co. | | | 22,794 | | | | 1,421,206 | |
Bruker Corp. | | | 2,396 | | | | 201,048 | |
The accompanying notes are an integral part of these financial statements.
2021 Annual Report | December 31, 2021 | Page 59 |
Schedule of Investments
December 31, 2021
Balanced Fund |
Security Description | | Shares,
Contracts
or Principal
Amount ($) | | | Fair
Value ($) | |
Common Stocks (United States) — continued |
Cardinal Health, Inc. | | | 10,190 | | | | 524,683 | |
CareDx, Inc. (1) | | | 281 | | | | 12,780 | |
CASI Pharmaceuticals, Inc. (1) | | | 693 | | | | 554 | |
Cassava Sciences, Inc. (1) | | | 177 | | | | 7,735 | |
Castlight Health, Inc. (1) | | | 3 | | | | 5 | |
Catalent, Inc. (1) | | | 1,390 | | | | 177,962 | |
Catalyst Pharmaceuticals, Inc. (1) | | | 2,151 | | | | 14,562 | |
Celldex Therapeutics, Inc. (1) | | | 1 | | | | 39 | |
Centogene NV (1) | | | 1,078 | | | | 5,636 | |
Cerevel Therapeutics Holdings, Inc. (1) | | | 598 | | | | 19,387 | |
Cerner Corp. | | | 16,143 | | | | 1,499,200 | |
Charles River Laboratories International, Inc. (1) | | | 227 | | | | 85,529 | |
Citius Pharmaceuticals, Inc. (1) | | | 1 | | | | 2 | |
Clene, Inc. (1) | | | 1 | | | | 4 | |
Codexis, Inc. (1) | | | 1 | | | | 31 | |
Community Health Systems, Inc. (1) | | | 1,456 | | | | 19,379 | |
Cross Country Healthcare, Inc. (1) | | | 23 | | | | 638 | |
Curis, Inc. (1) | | | 2 | | | | 10 | |
CVS Health Corp. | | | 8,495 | | | | 876,344 | |
Cytokinetics, Inc. (1) | | | 1 | | | | 46 | |
Danaher Corp. | | | 5,511 | | | | 1,813,174 | |
Dynavax Technologies Corp. (1) | | | 707 | | | | 9,947 | |
Editas Medicine, Inc. (1) | | | 474 | | | | 12,585 | |
Eiger BioPharmaceuticals, Inc. (1) | | | 1 | | | | 5 | |
Elanco Animal Health, Inc. Contingent Value Rights (1)(5) | | | 1,792 | | | | 0 | |
Eli Lilly & Co. | | | 4,253 | | | | 1,174,764 | |
Eloxx Pharmaceuticals, Inc. (1) | | | 6,431 | | | | 4,542 | |
Enanta Pharmaceuticals, Inc. (1) | | | 201 | | | | 15,031 | |
Endo International PLC (1) | | | 1,042 | | | | 3,918 | |
Evelo Biosciences, Inc. (1) | | | 1 | | | | 6 | |
Evolent Health, Inc. (1) | | | 238 | | | | 6,585 | |
Exact Sciences Corp. (1) | | | 121 | | | | 9,417 | |
Exelixis, Inc. (1) | | | 1,646 | | | | 30,089 | |
Fulcrum Therapeutics, Inc. (1) | | | 1 | | | | 18 | |
Galectin Therapeutics, Inc. (1) | | | 1,815 | | | | 3,757 | |
Genprex, Inc. (1) | | | 2,205 | | | | 2,889 | |
Geron Corp. (1) | | | 3 | | | | 4 | |
Gilead Sciences, Inc. | | | 17,886 | | | | 1,298,702 | |
Globus Medical, Inc. (1) | | | 1,722 | | | | 124,328 | |
HCA Healthcare, Inc. | | | 1,839 | | | | 472,476 | |
Horizon Therapeutics Plc (1) | | | 2,830 | | | | 304,961 | |
Humanigen, Inc. (1) | | | 3 | | | | 11 | |
iBio, Inc. (1) | | | 2 | | | | 1 | |
IDEXX Laboratories, Inc. (1) | | | 4 | | | | 2,634 | |
Illumina, Inc. (1) | | | 55 | | | | 20,924 | |
Balanced Fund |
Security Description | | Shares,
Contracts
or Principal
Amount ($) | | | Fair
Value ($) | |
Common Stocks (United States) — continued |
ImmunoGen, Inc. (1) | | | 2 | | | | 15 | |
Incyte Corp. (1) | | | 2,871 | | | | 210,731 | |
Infinity Pharmaceuticals, Inc. (1) | | | 3 | | | | 7 | |
Innoviva, Inc. (1) | | | 2 | | | | 35 | |
Inotiv, Inc. (1) | | | 214 | | | | 9,003 | |
Intellia Therapeutics, Inc. (1) | | | 325 | | | | 38,428 | |
Intra-Cellular Therapies, Inc. (1) | | | 1 | | | | 52 | |
Johnson & Johnson | | | 19,079 | | | | 3,263,845 | |
Jounce Therapeutics, Inc. (1) | | | 8 | | | | 67 | |
Kezar Life Sciences, Inc. (1) | | | 708 | | | | 11,838 | |
La Jolla Pharmaceutical Co. (1) | | | 704 | | | | 3,274 | |
Lexicon Pharmaceuticals, Inc. (1) | | | 2 | | | | 8 | |
Lineage Cell Therapeutics, Inc. (1) | | | 2 | | | | 5 | |
MannKind Corp. (1) | | | 3,018 | | | | 13,189 | |
Maravai LifeSciences Holdings, Inc. (1) | | | 370 | | | | 15,503 | |
McKesson Corp. | | | 3,262 | | | | 810,835 | |
Medtronic PLC | | | 10,482 | | | | 1,084,363 | |
MeiraGTx Holdings plc (1) | | | 1 | | | | 24 | |
Merck & Co., Inc. | | | 20,828 | | | | 1,596,258 | |
Mirati Therapeutics, Inc. (1) | | | 205 | | | | 30,071 | |
Moderna, Inc. (1) | | | 1,694 | | | | 430,242 | |
Multiplan Corp. (1) | | | 2 | | | | 9 | |
Myriad Genetics, Inc. (1) | | | 262 | | | | 7,231 | |
NantHealth, Inc. (1) | | | 1 | | | | 1 | |
Natera, Inc. (1) | | | 579 | | | | 54,073 | |
Nektar Therapeutics (1) | | | 1 | | | | 14 | |
Neurocrine Biosciences, Inc. (1) | | | 1 | | | | 85 | |
NextGen Healthcare, Inc. (1) | | | 3 | | | | 53 | |
Novavax, Inc. (1) | | | 286 | | | | 40,918 | |
Ocugen, Inc. (1) | | | 897 | | | | 4,081 | |
Oncocyte Corp. (1) | | | 426 | | | | 924 | |
OPKO Health, Inc. (1) | | | 2 | | | | 10 | |
OptimizeRx Corp. (1) | | | 1 | | | | 62 | |
Oramed Pharmaceuticals, Inc. (1) | | | 663 | | | | 9,468 | |
Organogenesis Holdings, Inc. (1) | | | 2 | | | | 18 | |
Organon & Co. | | | 3,335 | | | | 101,551 | |
Palatin Technologies, Inc. (1) | | | 3,025 | | | | 1,548 | |
PerkinElmer, Inc. | | | 1,118 | | | | 224,785 | |
Perrigo Co. PLC | | | 3,785 | | | | 147,237 | |
Pfizer, Inc. | | | 28,881 | | | | 1,705,423 | |
Precigen, Inc. (1) | | | 2,485 | | | | 9,219 | |
Precision BioSciences, Inc. (1) | | | 3 | | | | 22 | |
Premier, Inc. | | | 2 | | | | 82 | |
Prothena Corp. PLC (1) | | | 104 | | | | 5,138 | |
Puma Biotechnology, Inc. (1) | | | 1,427 | | | | 4,338 | |
Quest Diagnostics, Inc. | | | 1,673 | | | | 289,446 | |
The accompanying notes are an integral part of these financial statements.
Page 60 | 2021 Annual Report | December 31, 2021 |
Schedule of Investments
December 31, 2021
Balanced Fund |
Security Description | | Shares,
Contracts
or Principal
Amount ($) | | | Fair
Value ($) | |
Common Stocks (United States) — continued |
Quidel Corp. (1) | | | 208 | | | | 28,078 | |
Radius Health, Inc. (1) | | | 141 | | | | 976 | |
Regeneron Pharmaceuticals, Inc. (1) | | | 2,530 | | | | 1,597,746 | |
REGENXBIO, Inc. (1) | | | 185 | | | | 6,050 | |
Sage Therapeutics, Inc. (1) | | | 1,355 | | | | 57,642 | |
Sangamo Therapeutics, Inc. (1) | | | 1 | | | | 8 | |
Senseonics Holdings, Inc. (1) | | | 2 | | | | 5 | |
Sesen Bio, Inc. (1) | | | 2,572 | | | | 2,096 | |
Shockwave Medical, Inc. (1) | | | 86 | | | | 15,336 | |
Sorrento Therapeutics, Inc. (1) | | | 434 | | | | 2,018 | |
SpringWorks Therapeutics, Inc. (1) | | | 67 | | | | 4,153 | |
STAAR Surgical Co. (1) | | | 281 | | | | 25,655 | |
Surface Oncology, Inc. (1) | | | 1 | | | | 5 | |
Sutro Biopharma, Inc. (1) | | | 339 | | | | 5,044 | |
Tenet Healthcare Corp. (1) | | | 580 | | | | 47,380 | |
TherapeuticsMD, Inc. (1) | | | 1 | | | | 0 | |
Thermo Fisher Scientific, Inc. | | | 2,942 | | | | 1,963,020 | |
Tonix Pharmaceuticals Holding Corp. (1) | | | 2 | | | | 1 | |
TransMedics Group, Inc. (1) | | | 18 | | | | 345 | |
Triple-S Management Corp. (1) | | | 168 | | | | 5,994 | |
Twist Bioscience Corp. (1) | | | 204 | | | | 15,788 | |
Tyme Technologies, Inc. (1) | | | 752 | | | | 454 | |
Ultragenyx Pharmaceutical, Inc. (1) | | | 74 | | | | 6,223 | |
UnitedHealth Group, Inc. | | | 5,059 | | | | 2,540,326 | |
Universal Health Services, Inc. | | | 556 | | | | 72,091 | |
Veracyte, Inc. (1) | | | 789 | | | | 32,507 | |
Verastem, Inc. (1) | | | 2 | | | | 4 | |
Viatris, Inc. | | | 3,138 | | | | 42,457 | |
Viemed Healthcare, Inc. (1) | | | 146 | | | | 762 | |
ViewRay, Inc. (1) | | | 1,344 | | | | 7,405 | |
Viking Therapeutics, Inc. (1) | | | 2 | | | | 9 | |
VistaGen Therapeutics, Inc. (1) | | | 6 | | | | 12 | |
WaVe Life Sciences, Ltd. (1) | | | 1,742 | | | | 5,470 | |
West Pharmaceutical Services, Inc. | | | 1,239 | | | | 581,103 | |
Zentalis Pharmaceuticals, Inc. (1) | | | 329 | | | | 27,656 | |
ZIOPHARM Oncology, Inc. (1) | | | 959 | | | | 1,045 | |
Zoetis, Inc. | | | 3,263 | | | | 796,270 | |
| | | | | | | | 35,470,468 | |
| | | | | | | | | |
Industrials — 3.1% | | | | | | | | |
ACCO Brands Corp. | | | 1 | | | | 8 | |
Acuity Brands, Inc. | | | 618 | | | | 130,843 | |
AGCO Corp. | | | 835 | | | | 96,877 | |
Ameresco, Inc. (1) | | | 31 | | | | 2,525 | |
ArcBest Corp. | | | 182 | | | | 21,813 | |
Atkore, Inc. (1) | | | 194 | | | | 21,571 | |
Balanced Fund |
Security Description | | Shares,
Contracts
or Principal
Amount ($) | | | Fair
Value ($) | |
Common Stocks (United States) — continued |
Atlas Air Worldwide Holdings, Inc. (1) | | | 738 | | | | 69,461 | |
Avis Budget Group, Inc. (1) | | | 205 | | | | 42,511 | |
Axon Enterprise, Inc. (1) | | | 185 | | | | 29,045 | |
AZZ, Inc. | | | 1,398 | | | | 77,295 | |
Babcock & Wilcox Enterprises, Inc. (1) | | | 1 | | | | 9 | |
BlueLinx Holdings, Inc. (1) | | | 11 | | | | 1,053 | |
Boise Cascade Co. | | | 5,061 | | | | 360,343 | |
Builders FirstSource, Inc. (1) | | | 1,124 | | | | 96,338 | |
Carrier Global Corp. | | | 918 | | | | 49,792 | |
Caterpillar, Inc. | | | 447 | | | | 92,413 | |
ChargePoint Holdings, Inc. (1) | | | 72 | | | | 1,372 | |
Cintas Corp. | | | 490 | | | | 217,153 | |
Clean Harbors, Inc. (1) | | | 163 | | | | 16,263 | |
Concrete Pumping Holdings, Inc. (1) | | | 3 | | | | 25 | |
Copart, Inc. (1) | | | 1,787 | | | | 270,945 | |
Core & Main, Inc. (1) | | | 112 | | | | 3,398 | |
Cornerstone Building Brands, Inc. (1) | | | 1 | | | | 17 | |
Costamare, Inc. | | | 1 | | | | 13 | |
Covenant Logistics Group, Inc. (1) | | | 713 | | | | 18,845 | |
CSX Corp. | | | 8,654 | | | | 325,390 | |
Dover Corp. | | | 380 | | | | 69,008 | |
Eaton Corp. PLC | | | 1,445 | | | | 249,725 | |
EMCOR Group, Inc. | | | 2,091 | | | | 266,372 | |
Emerson Electric Co. | | | 4,307 | | | | 400,422 | |
Encore Wire Corp. | | | 69 | | | | 9,874 | |
EnerSys | | | 174 | | | | 13,756 | |
Franklin Electric Co., Inc. | | | 704 | | | | 66,570 | |
FTC Solar, Inc. (1) | | | 296 | | | | 2,238 | |
FuelCell Energy, Inc. (1) | | | 1,045 | | | | 5,434 | |
Genco Shipping & Trading, Ltd. | | | 1,901 | | | | 30,416 | |
Generac Holdings, Inc. (1) | | | 1,134 | | | | 399,077 | |
General Dynamics Corp. | | | 2,754 | | | | 574,126 | |
GrafTech International, Ltd. | | | 2,097 | | | | 24,808 | |
Granite Construction, Inc. | | | 4 | | | | 155 | |
Helios Technologies, Inc. | | | 71 | | | | 7,467 | |
Herc Holdings, Inc. | | | 750 | | | | 117,413 | |
Heritage-Crystal Clean, Inc. (1) | | | 2 | | | | 64 | |
Hertz Global Holdings, Inc. (1) | | | 21 | | | | 550 | |
Hillenbrand, Inc. | | | 1,088 | | | | 56,565 | |
Hub Group, Inc. (1) | | | 266 | | | | 22,408 | |
Huntington Ingalls Industries, Inc. | | | 2,135 | | | | 398,690 | |
Ideanomics, Inc. (1) | | | 5 | | | | 6 | |
Interface, Inc. | | | 3 | | | | 48 | |
JB Hunt Transport Services, Inc. | | | 1,112 | | | | 227,293 | |
Johnson Controls International plc | | | 14,788 | | | | 1,202,412 | |
Karat Packaging, Inc. (1) | | | 183 | | | | 3,698 | |
The accompanying notes are an integral part of these financial statements.
2021 Annual Report | December 31, 2021 | Page 61 |
Schedule of Investments
December 31, 2021
Balanced Fund |
Security Description | | Shares,
Contracts
or Principal
Amount ($) | | | Fair
Value ($) | |
Common Stocks (United States) — continued |
L3Harris Technologies, Inc. | | | 154 | | | | 32,839 | |
Luxfer Holdings PLC | | | 1 | | | | 19 | |
Manitowoc Co., Inc./The (1) | | | 2,111 | | | | 39,243 | |
ManpowerGroup, Inc. | | | 3,889 | | | | 378,516 | |
Matson, Inc. | | | 101 | | | | 9,093 | |
Meritor, Inc. (1) | | | 249 | | | | 6,170 | |
Mesa Air Group, Inc. (1) | | | 1,926 | | | | 10,786 | |
Miller Industries, Inc./TN | | | 716 | | | | 23,914 | |
Mueller Industries, Inc. | | | 3,865 | | | | 229,426 | |
Mueller Water Products, Inc. | | | 2 | | | | 29 | |
MYR Group, Inc. (1) | | | 422 | | | | 46,652 | |
NL Industries, Inc. | | | 1 | | | | 7 | |
Norfolk Southern Corp. | | | 1 | | | | 298 | |
Northrop Grumman Corp. | | | 685 | | | | 265,143 | |
nVent Electric PLC | | | 2,209 | | | | 83,942 | |
Old Dominion Freight Line, Inc. | | | 770 | | | | 275,953 | |
Owens Corning | | | 1,462 | | | | 132,311 | |
PAM Transportation Services, Inc. (1) | | | 1 | | | | 71 | |
Plug Power, Inc. (1) | | | 1,742 | | | | 49,177 | |
Quad/Graphics, Inc. (1) | | | 2,910 | | | | 11,640 | |
Quanta Services, Inc. | | | 11,432 | | | | 1,310,793 | |
Raytheon Technologies Corp. | | | 6,362 | | | | 547,514 | |
Regal Rexnord Corp. | | | 1,264 | | | | 215,108 | |
Resideo Technologies, Inc. (1) | | | 1,086 | | | | 28,269 | |
REV Group, Inc. | | | 99 | | | | 1,401 | |
Robert Half International, Inc. | | | 206 | | | | 22,973 | |
RR Donnelley & Sons Co. (1) | | | 20 | | | | 225 | |
Rush Enterprises, Inc. | | | 1,675 | | | | 93,197 | |
Ryder System, Inc. | | | 2,827 | | | | 233,030 | |
Safe Bulkers, Inc. (1) | | | 1 | | | | 4 | |
Saia, Inc. (1) | | | 208 | | | | 70,102 | |
Schneider National, Inc. | | | 83 | | | | 2,234 | |
Shyft Group, Inc./The | | | 381 | | | | 18,719 | |
SkyWest, Inc. (1) | | | 2,902 | | | | 114,049 | |
Terex Corp. | | | 2,525 | | | | 110,974 | |
Textainer Group Holdings, Ltd. | | | 1,152 | | | | 41,138 | |
Textron, Inc. | | | 6,398 | | | | 493,926 | |
Titan International, Inc. (1) | | | 1,951 | | | | 21,383 | |
Triton International, Ltd. | | | 1,211 | | | | 72,939 | |
Triumph Group, Inc. (1) | | | 3 | | | | 56 | |
TrueBlue, Inc. (1) | | | 873 | | | | 24,156 | |
United Parcel Service, Inc. | | | 2,785 | | | | 596,937 | |
United Rentals, Inc. (1) | | | 128 | | | | 42,533 | |
Valmont Industries, Inc. | | | 497 | | | | 124,499 | |
Vectrus, Inc. (1) | | | 629 | | | | 28,789 | |
Veritiv Corp. (1) | | | 9 | | | | 1,103 | |
Balanced Fund |
Security Description | | Shares,
Contracts
or Principal
Amount ($) | | | Fair
Value ($) | |
Common Stocks (United States) — continued |
Vicor Corp. (1) | | | 224 | | | | 28,444 | |
WESCO International, Inc. (1) | | | 820 | | | | 107,904 | |
Yellow Corp. (1) | | | 482 | | | | 6,068 | |
| | | | | | | | 12,047,609 | |
| | | | | | | | | |
Information Technology — 14.2% | | | | | | | | |
3D Systems Corp. (1) | | | 176 | | | | 3,791 | |
A10 Networks, Inc. | | | 441 | | | | 7,312 | |
Accenture PLC | | | 1,503 | | | | 623,069 | |
ACI Worldwide, Inc. (1) | | | 1,558 | | | | 54,063 | |
Adobe, Inc. (1) | | | 2,738 | | | | 1,552,610 | |
Advanced Micro Devices, Inc. (1) | | | 5,944 | | | | 855,342 | |
Alliance Data Systems Corp. | | | 1,708 | | | | 113,702 | |
Alpha & Omega Semiconductor, Ltd. (1) | | | 2 | | | | 121 | |
Ambarella, Inc. (1) | | | 244 | | | | 49,505 | |
American Software, Inc./GA | | | 718 | | | | 18,790 | |
Amkor Technology, Inc. | | | 2,823 | | | | 69,982 | |
Analog Devices, Inc. | | | 1,270 | | | | 223,228 | |
Apple, Inc. | | | 52,255 | | | | 9,278,920 | |
Applied Materials, Inc. | | | 12,344 | | | | 1,942,452 | |
Arrow Electronics, Inc. (1) | | | 3,762 | | | | 505,124 | |
Asana, Inc. (1) | | | 952 | | | | 70,972 | |
Atlassian Corp. PLC (1) | | | 723 | | | | 275,673 | |
Autodesk, Inc. (1) | | | 488 | | | | 137,221 | |
Aviat Networks, Inc. (1) | | | 1,710 | | | | 54,857 | |
Avid Technology, Inc. (1) | | | 3 | | | | 98 | |
Avnet, Inc. | | | 7,482 | | | | 308,483 | |
Axcelis Technologies, Inc. (1) | | | 603 | | | | 44,960 | |
Belden, Inc. | | | 194 | | | | 12,752 | |
Bill.com Holdings, Inc. (1) | | | 336 | | | | 83,714 | |
Box, Inc. (1) | | | 724 | | | | 18,962 | |
Broadcom, Inc. | | | 1,176 | | | | 782,522 | |
Cadence Design Systems, Inc. (1) | | | 3,703 | | | | 690,054 | |
Calix, Inc. (1) | | | 897 | | | | 71,733 | |
CDK Global, Inc. | | | 2,177 | | | | 90,868 | |
CDW Corp./DE | | | 5,067 | | | | 1,037,620 | |
ChannelAdvisor Corp. (1) | | | 2,300 | | | | 56,764 | |
Cisco Systems, Inc./Delaware | | | 26,514 | | | | 1,680,192 | |
Cloudflare, Inc. (1) | | | 1,590 | | | | 209,085 | |
Cognex Corp. | | | 239 | | | | 18,585 | |
CommVault Systems, Inc. (1) | | | 1,823 | | | | 125,641 | |
Concentrix Corp. | | | 366 | | | | 65,375 | |
Conduent, Inc. (1) | | | 5,169 | | | | 27,602 | |
Consensus Cloud Solutions, Inc. (1) | | | 425 | | | | 24,595 | |
Crowdstrike Holdings, Inc. (1) | | | 903 | | | | 184,889 | |
Datadog, Inc. (1) | | | 499 | | | | 88,877 | |
The accompanying notes are an integral part of these financial statements.
Page 62 | 2021 Annual Report | December 31, 2021 |
Schedule of Investments
December 31, 2021
Balanced Fund |
Security Description | | Shares,
Contracts
or Principal
Amount ($) | | | Fair
Value ($) | |
Common Stocks (United States) — continued |
Dell Technologies, Inc. (1) | | | 348 | | | | 19,547 | |
Diebold Nixdorf, Inc. (1) | | | 235 | | | | 2,127 | |
Digital Turbine, Inc. (1) | | | 1,023 | | | | 62,393 | |
Diodes, Inc. (1) | | | 1,196 | | | | 131,333 | |
Dolby Laboratories, Inc. | | | 630 | | | | 59,989 | |
Dropbox, Inc. (1) | | | 9,594 | | | | 235,437 | |
DXC Technology Co. (1) | | | 1,896 | | | | 61,032 | |
Dynatrace, Inc. (1) | | | 787 | | | | 47,495 | |
Ebix, Inc. | | | 520 | | | | 15,808 | |
EMCORE Corp. (1) | | | 2 | | | | 14 | |
EPAM Systems, Inc. (1) | | | 992 | | | | 663,102 | |
Extreme Networks, Inc. (1) | | | 6 | | | | 94 | |
Fortinet, Inc. (1) | | | 1,092 | | | | 392,465 | |
Gartner, Inc. (1) | | | 2,620 | | | | 875,918 | |
GreenSky, Inc. (1) | | | 10 | | | | 114 | |
Grid Dynamics Holdings, Inc. (1) | | | 400 | | | | 15,188 | |
GTY Technology Holdings, Inc. (1) | | | 1 | | | | 7 | |
Hewlett Packard Enterprise Co. | | | 8,312 | | | | 131,080 | |
HP, Inc. | | | 15,568 | | | | 586,447 | |
HubSpot, Inc. (1) | | | 325 | | | | 214,224 | |
Identiv, Inc. (1) | | | 3 | | | | 84 | |
Intel Corp. | | | 25,249 | | | | 1,300,324 | |
Intuit, Inc. | | | 3,019 | | | | 1,941,881 | |
Iteris, Inc. (1) | | | 1 | | | | 4 | |
Jabil, Inc. | | | 10,056 | | | | 707,440 | |
Kimball Electronics, Inc. (1) | | | 558 | | | | 12,142 | |
KLA Corp. | | | 3,941 | | | | 1,695,064 | |
Kulicke & Soffa Industries, Inc. | | | 904 | | | | 54,728 | |
Kyndryl Holdings, Inc. (1) | | | 1,180 | | | | 21,358 | |
Lam Research Corp. | | | 221 | | | | 158,932 | |
Lattice Semiconductor Corp. (1) | | | 2,722 | | | | 209,757 | |
Manhattan Associates, Inc. (1) | | | 1,800 | | | | 279,882 | |
Marathon Digital Holdings, Inc. (1) | | | 480 | | | | 15,773 | |
MaxLinear, Inc. (1) | | | 3 | | | | 226 | |
McAfee Corp. | | | 4,752 | | | | 122,554 | |
Micron Technology, Inc. | | | 4,539 | | | | 422,808 | |
Microsoft Corp. | | | 33,950 | | | | 11,418,056 | |
Mimecast, Ltd. (1) | | | 1,023 | | | | 81,400 | |
Mitek Systems, Inc. (1) | | | 1 | | | | 18 | |
MoneyGram International, Inc. (1) | | | 2,160 | | | | 17,042 | |
MongoDB, Inc. (1) | | | 108 | | | | 57,170 | |
Monolithic Power Systems, Inc. | | | 34 | | | | 16,773 | |
N-able, Inc. (1) | | | 2 | | | | 22 | |
NCR Corp. (1) | | | 2,870 | | | | 115,374 | |
NortonLifeLock, Inc. | | | 10,341 | | | | 268,659 | |
NVIDIA Corp. | | | 10,408 | | | | 3,061,097 | |
Balanced Fund |
Security Description | | Shares,
Contracts
or Principal
Amount ($) | | | Fair
Value ($) | |
Common Stocks (United States) — continued |
NXP Semiconductors NV | | | 615 | | | | 140,085 | |
ON Semiconductor Corp. (1) | | | 1,451 | | | | 98,552 | |
Oracle Corp. | | | 9,286 | | | | 809,832 | |
Palantir Technologies, Inc. (1) | | | 686 | | | | 12,492 | |
Palo Alto Networks, Inc. (1) | | | 1,349 | | | | 751,069 | |
Paycom Software, Inc. (1) | | | 679 | | | | 281,914 | |
Paylocity Holding Corp. (1) | | | 650 | | | | 153,504 | |
Perficient, Inc. (1) | | | 175 | | | | 22,626 | |
Photronics, Inc. (1) | | | 7 | | | | 132 | |
Plantronics, Inc. (1) | | | 294 | | | | 8,626 | |
Power Integrations, Inc. | | | 430 | | | | 39,943 | |
Priority Technology Holdings, Inc. (1) | | | 852 | | | | 6,032 | |
Progress Software Corp. | | | 3,945 | | | | 190,425 | |
Qorvo, Inc. (1) | | | 59 | | | | 9,227 | |
Ribbon Communications, Inc. (1) | | | 1 | | | | 6 | |
Rimini Street, Inc. (1) | | | 1,222 | | | | 7,295 | |
Riot Blockchain, Inc. (1) | | | 549 | | | | 12,259 | |
salesforce.com, Inc. (1) | | | 3,820 | | | | 970,777 | |
Sanmina Corp. (1) | | | 283 | | | | 11,733 | |
ScanSource, Inc. (1) | | | 1 | | | | 35 | |
SecureWorks Corp. (1) | | | 287 | | | | 4,583 | |
SiTime Corp. (1) | | | 57 | | | | 16,675 | |
SMART Global Holdings, Inc. (1) | | | 128 | | | | 9,087 | |
Smartsheet, Inc. (1) | | | 264 | | | | 20,447 | |
Sprout Social, Inc. (1) | | | 1,565 | | | | 141,930 | |
SPS Commerce, Inc. (1) | | | 1,247 | | | | 177,510 | |
SS&C Technologies Holdings, Inc. | | | 18,406 | | | | 1,508,924 | |
StarTek, Inc. (1) | | | 1,275 | | | | 6,656 | |
Stratasys, Ltd. (1) | | | 400 | | | | 9,796 | |
Synaptics, Inc. (1) | | | 291 | | | | 84,247 | |
Synopsys, Inc. (1) | | | 8 | | | | 2,948 | |
Teradata Corp. (1) | | | 1,405 | | | | 59,670 | |
Teradyne, Inc. | | | 607 | | | | 99,263 | |
TESSCO Technologies, Inc. (1) | | | 127 | | | | 801 | |
Texas Instruments, Inc. | | | 4,576 | | | | 862,439 | |
Trade Desk, Inc./The (1) | | | 1,591 | | | | 145,799 | |
Trimble, Inc. (1) | | | 1,616 | | | | 140,899 | |
TTEC Holdings, Inc. | | | 135 | | | | 12,224 | |
Ultra Clean Holdings, Inc. (1) | | | 179 | | | | 10,267 | |
Veritone, Inc. (1) | | | 185 | | | | 4,159 | |
Viant Technology, Inc. (1) | | | 2,783 | | | | 27,009 | |
Visa, Inc. | | | 2,117 | | | | 458,775 | |
VMware, Inc. | | | 1,634 | | | | 189,348 | |
Workday, Inc. (1) | | | 814 | | | | 222,369 | |
Workiva, Inc. (1) | | | 723 | | | | 94,344 | |
Xilinx, Inc. | | | 528 | | | | 111,952 | |
The accompanying notes are an integral part of these financial statements.
2021 Annual Report | December 31, 2021 | Page 63 |
Schedule of Investments
December 31, 2021
Balanced Fund |
Security Description | | Shares,
Contracts
or Principal
Amount ($) | | | Fair
Value ($) | |
Common Stocks (United States) — continued |
Xperi Holding Corp. | | | 4,502 | | | | 85,133 | |
Zebra Technologies Corp. (1) | | | 530 | | | | 315,456 | |
Zscaler, Inc. (1) | | | 289 | | | | 92,864 | |
| | | | | | | | 55,394,625 | |
| | | | | | | | | |
Materials — 0.6% | | | | | | | | |
Albemarle Corp. | | | 588 | | | | 137,457 | |
Alcoa Corp. | | | 1,117 | | | | 66,551 | |
Amyris, Inc. (1) | | | 400 | | | | 2,164 | |
Avient Corp. | | | 499 | | | | 27,919 | |
Berry Global Group, Inc. (1) | | | 2,696 | | | | 198,911 | |
Celanese Corp. | | | 882 | | | | 148,229 | |
Century Aluminum Co. (1) | | | 135 | | | | 2,236 | |
Chemours Co./The | | | 439 | | | | 14,733 | |
Cleveland-Cliffs, Inc. (1) | | | 1,548 | | | | 33,700 | |
Dow, Inc. | | | 4,377 | | | | 248,263 | |
Element Solutions, Inc. | | | 303 | | | | 7,357 | |
Freeport-McMoRan, Inc. | | | 6,996 | | | | 291,943 | |
Hawkins, Inc. | | | 461 | | | | 18,186 | |
Huntsman Corp. | | | 2,026 | | | | 70,667 | |
Intrepid Potash, Inc. (1) | | | 2 | | | | 85 | |
Koppers Holdings, Inc. (1) | | | 232 | | | | 7,262 | |
Louisiana-Pacific Corp. | | | 2,115 | | | | 165,710 | |
LyondellBasell Industries NV | | | 2,467 | | | | 227,531 | |
Marrone Bio Innovations, Inc. (1) | | | 1 | | | | 1 | |
Mosaic Co./The | | | 2,246 | | | | 88,245 | |
Nucor Corp. | | | 1,836 | | | | 209,579 | |
O-I Glass, Inc. (1) | | | 834 | | | | 10,033 | |
Olin Corp. | | | 913 | | | | 52,516 | |
Rayonier Advanced Materials, Inc. (1) | | | 5 | | | | 29 | |
Ryerson Holding Corp. | | | 461 | | | | 12,009 | |
Steel Dynamics, Inc. | | | 767 | | | | 47,608 | |
SunCoke Energy, Inc. | | | 5 | | | | 33 | |
Trinseo PLC | | | 658 | | | | 34,519 | |
Tronox Holdings PLC | | | 975 | | | | 23,429 | |
United States Steel Corp. | | | 1,093 | | | | 26,024 | |
Verso Corp. | | | 3 | | | | 81 | |
Warrior Met Coal, Inc. | | | 1 | | | | 26 | |
Westlake Chemical Corp. | | | 389 | | | | 37,784 | |
| | | | | | | | 2,210,820 | |
| | | | | | | | | |
Real Estate Investment Trust — 1.7% | | | | | | | | |
Altisource Portfolio Solutions SA (1) | | | 1,497 | | | | 16,796 | |
American Homes 4 Rent | | | 4,225 | | | | 184,252 | |
Armada Hoffler Properties, Inc. | | | 4 | | | | 61 | |
Ashford Hospitality Trust, Inc. (1) | | | 1,215 | | | | 11,664 | |
Balanced Fund |
Security Description | | Shares,
Contracts
or Principal
Amount ($) | | | Fair
Value ($) | |
Common Stocks (United States) — continued |
Braemar Hotels & Resorts, Inc. (1) | | | 2 | | | | 10 | |
Camden Property Trust | | | 2,081 | | | | 371,833 | |
CareTrust REIT, Inc. | | | 6,528 | | | | 149,034 | |
CatchMark Timber Trust, Inc. | | | 1,555 | | | | 13,544 | |
CBL & Associates Properties, Inc. (1) | | | 41 | | | | 1,279 | |
Clipper Realty, Inc. | | | 27 | | | | 268 | |
CorEnergy Infrastructure Trust, Inc. | | | 5,756 | | | | 18,016 | |
Corporate Office Properties Trust | | | 4 | | | | 112 | |
CubeSmart | | | 8,521 | | | | 484,930 | |
Cushman & Wakefield PLC (1) | | | 4 | | | | 89 | |
CyrusOne, Inc. | | | 460 | | | | 41,271 | |
Easterly Government Properties, Inc. | | | 9 | | | | 206 | |
EastGroup Properties, Inc. | | | 4,117 | | | | 938,058 | |
Essex Property Trust, Inc. | | | 803 | | | | 282,841 | |
eXp World Holdings, Inc. | | | 31 | | | | 1,044 | |
Extra Space Storage, Inc. | | | 450 | | | | 102,029 | |
First Industrial Realty Trust, Inc. | | | 689 | | | | 45,612 | |
Forestar Group, Inc. (1) | | | 1 | | | | 22 | |
Getty Realty Corp. | | | 1,101 | | | | 35,331 | |
Gladstone Commercial Corp. | | | 1,810 | | | | 46,644 | |
Healthcare Trust of America, Inc. | | | 8,406 | | | | 280,676 | |
Highwoods Properties, Inc. | | | 242 | | | | 10,791 | |
Hudson Pacific Properties, Inc. | | | 2 | | | | 49 | |
Invitation Homes, Inc. | | | 4,535 | | | | 205,617 | |
Lamar Advertising Co. | | | 8,613 | | | | 1,044,757 | |
Life Storage, Inc. | | | 252 | | | | 38,601 | |
LXP Industrial Trust | | | 2 | | | | 31 | |
Mid-America Apartment Communities, Inc. | | | 1,964 | | | | 450,620 | |
National Health Investors, Inc. | | | 1,626 | | | | 93,446 | |
Omega Healthcare Investors, Inc. | | | 8,855 | | | | 262,019 | |
Opendoor Technologies, Inc. (1) | | | 3 | | | | 44 | |
Physicians Realty Trust | | | 1 | | | | 19 | |
PotlatchDeltic Corp. | | | 1,403 | | | | 84,489 | |
Prologis, Inc. | | | 1 | | | | 168 | |
PS Business Parks, Inc. | | | 26 | | | | 4,788 | |
Public Storage | | | 1,992 | | | | 746,124 | |
Regency Centers Corp. | | | 1,452 | | | | 109,408 | |
Sabra Health Care REIT, Inc. | | | 2 | | | | 27 | |
SBA Communications Corp. | | | 69 | | | | 26,842 | |
SITE Centers Corp. | | | 10 | | | | 158 | |
SL Green Realty Corp. | | | 1,350 | | | | 96,795 | |
Spirit MTA REIT Liquidating Trust (1)(5) | | | 3,461 | | | | 0 | |
Tanger Factory Outlet Centers, Inc. | | | 533 | | | | 10,276 | |
UDR, Inc. | | | 1,614 | | | | 96,824 | |
Universal Health Realty Income Trust | | | 599 | | | | 35,623 | |
Weyerhaeuser Co. | | | 8,730 | | | | 359,501 | |
The accompanying notes are an integral part of these financial statements.
Page 64 | 2021 Annual Report | December 31, 2021 |
Schedule of Investments
December 31, 2021
Balanced Fund |
Security Description | | Shares,
Contracts
or Principal
Amount ($) | | | Fair
Value ($) | |
Common Stocks (United States) — continued |
Zillow Group, Inc. - Class A (1) | | | 10 | | | | 622 | |
Zillow Group, Inc. - Class C (1) | | | 855 | | | | 54,592 | |
| | | | | | | | 6,757,853 | |
Utilities — 1.1% | | | | | | | | |
AES Corp./The | | | 1 | | | | 24 | |
Duke Energy Corp. | | | 355 | | | | 37,240 | |
Evergy, Inc. | | | 7,479 | | | | 513,134 | |
Exelon Corp. | | | 29,633 | | | | 1,711,514 | |
MDU Resources Group, Inc. | | | 17,429 | | | | 537,510 | |
National Fuel Gas Co. | | | 1,775 | | | | 113,494 | |
NRG Energy, Inc. | | | 14,727 | | | | 634,439 | |
Portland General Electric Co. | | | 3,586 | | | | 189,771 | |
UGI Corp. | | | 8,240 | | | | 378,298 | |
| | | | | | | | 4,115,424 | |
| | | | | | | | | |
Total Common Stocks (United States) (Cost $124,686,790) | | | | | | | 189,207,609 | |
| | | | | | | | | |
Preferred Stock (United States) — 0.0% |
WESCO International, Inc. Series A Variable Preferred (6) | | | 994 | | | | 30,466 | |
Total Preferred Stock (United States) (Cost $24,845) | | | | | | | 30,466 | |
| | | | | | | | | |
Warrants (United States) — 0.0% |
Chaparral Energy, Inc. A Warrants, Expiration Date 10/14/2024 (1)(5) | | | 3 | | | | 0 | |
Chaparral Energy, Inc. B Warrants, Expiration Date 10/14/2025 (1)(5) | | | 3 | | | | 0 | |
Civitas Solutions, Inc. A Warrants, Expiration Date 1/20/2025 (1)(5) | | | 22 | | | | 0 | |
Civitas Solutions, Inc. B Warrants, Expiration Date 1/20/2026 (1)(5) | | | 12 | | | | 0 | |
Hertz Global Holdings, Inc. Warrants, Expiration Date 6/30/2051 (1) | | | 157 | | | | 2,504 | |
Nabors Industries, Ltd. Warrants, Expiration Date 6/11/2026 (1) | | | 57 | | | | 213 | |
Oasis Petroleum, Inc. Warrants, Expiration Date 11/19/2024 (1)(5) | | | 9 | | | | 0 | |
Whiting Petroleum Corp. A Warrants, Expiration Date 9/1/2024 (1) | | | 56 | | | | 776 | |
Whiting Petroleum Corp. B Warrants, Expiration Date 9/1/2025 (1) | | | 28 | | | | 330 | |
Total Warrants (United States) (Cost $941) | | | | | | | 3,823 | |
| | | | | | | | | |
Balanced Fund |
Security Description | | Shares,
Contracts
or Principal
Amount ($) | | | Fair
Value ($) | |
Registered Investment Companies — 24.4% |
U.S. Fixed Income — 21.4% | | | | | | | | |
Baird Core Plus Bond Fund - Class I | | | 250,105 | | | | 2,918,724 | |
Dodge & Cox Income Fund | | | 244,340 | | | | 3,435,420 | |
DoubleLine Total Return Bond Fund - Class I | | | 385,468 | | | | 4,008,863 | |
Frost Total Return Bond Fund - Class I | | | 456,707 | | | | 4,708,644 | |
Guggenheim Total Return Bond Fund - Class I | | | 58,486 | | | | 1,670,352 | |
iShares 0-5 Year High Yield Corporate Bond ETF (7) | | | 76,701 | | | | 3,474,555 | |
iShares 3-7 Year Treasury Bond ETF (7) | | | 244,532 | | | | 31,463,933 | |
Lord Abbett High Yield Fund - Class I | | | 605,245 | | | | 4,557,493 | |
PGIM Short-Term Corporate Bond Fund - Class Q | | | 150,983 | | | | 1,686,483 | |
Pioneer Bond Fund - Class K | | | 356,092 | | | | 3,457,649 | |
Segall Bryant & Hamill Plus Bond Fund - Class I | | | 374,901 | | | | 4,026,436 | |
SPDR Bloomberg Barclays Short Term High Yield Bond ETF (7) | | | 147,671 | | | | 4,009,268 | |
Vanguard Short-Term Bond ETF (7) | | | 168,966 | | | | 13,657,522 | |
| | | | | | | | 83,075,342 | |
| | | | | | | | | |
International Fixed Income — 3.0% | | | | | | | | |
iShares JP Morgan USD Emerging Markets Bond ETF (7) | | | 105,210 | | | | 11,474,203 | |
| | | | | | | | 11,474,203 | |
Total Registered Investment Companies (Cost $93,832,243) | | | | | | | 94,549,545 | |
| | | | | | | | | |
Money Market Registered Investment Companies — 25.4% |
Meeder Institutional Prime Money Market Fund, 0.05% (2) | | | 98,234,004 | | | | 98,243,827 | |
Total Money Market Registered Investment Companies (Cost $98,230,468) | | | | | | | 98,243,827 | |
| | | | | | | | | |
The accompanying notes are an integral part of these financial statements.
2021 Annual Report | December 31, 2021 | Page 65 |
Schedule of Investments
December 31, 2021
Balanced Fund |
Security Description | | Shares,
Contracts
or Principal
Amount ($) | | | Fair
Value ($) | |
Bank Obligations — 0.2% |
First Merchants Bank Deposit Account, 0.20%, 1/3/2022 (3) | | | 249,093 | | | | 249,093 | |
Metro City Bank Deposit Account, 0.05%, 1/3/2022 (3) | | | 248,445 | | | | 248,445 | |
Pacific Mercantile Bank Deposit Account, 0.10%, 1/3/2022 (3) | | | 247,072 | | | | 247,072 | |
Total Bank Obligations (Cost $744,610) | | | | | | | 744,610 | |
Total Investments — 98.8% (Cost $317,519,897) | | | | | | | 382,779,880 | |
Other Assets less Liabilities — 1.2% | | | | | | | 4,469,944 | |
Total Net Assets — 100.0% | | | | | | | 387,249,824 | |
| | | | | | | | | |
Trustee Deferred Compensation (4) |
Meeder Balanced Fund - Retail Class | | | 3,262 | | | | 43,776 | |
Meeder Dynamic Allocation Fund - Retail Class | | | 8,676 | | | | 120,857 | |
Meeder Muirfield Fund - Retail Class | | | 5,446 | | | | 51,900 | |
Meeder Conservative Allocation Fund - Retail Class | | | 951 | | | | 22,482 | |
Total Trustee Deferred Compensation (Cost $196,612) | | | | | | | 239,015 | |
| | | Net Long
(Short)
Contracts | | | Expiration
Date | | | Notional
Value of
Contracts
($) | | | Value and
Unrealized
Appreciation
(Depreciation)
($) | |
Futures Contracts |
Index Futures | | | | | | | | | | | | | | | | |
E-mini Standard & Poors MidCap 400 Futures | | | (30 | ) | | | 3/18/2022 | | | | (8,513,100 | ) | | | (96,646 | ) |
Mini MSCI EAFE Index Futures | | | 184 | | | | 3/18/2022 | | | | 21,360,560 | | | | 615,854 | |
Mini MSCI Emerging Markets Index Futures | | | 68 | | | | 3/18/2022 | | | | 4,169,420 | | | | 37,878 | |
Standard & Poors 500 Mini Futures | | | (105 | ) | | | 3/18/2022 | | | | (24,982,125 | ) | | | (555,179 | ) |
Total Futures Contracts | | | 117 | | | | | | | | (7,965,245 | ) | | | 1,907 | |
(1) | Represents non-income producing securities. |
(2) | Investment in affiliate. The yield shown represents the 7-day yield in effect at December 31, 2021. |
(3) | Variable rate security. Securities payable at par including accrued interest (usually within seven days notice) and unconditionally secured as to principal and interest by letters of credit or other credit support agreements from major banks. The interest rates are adjustable and are not based on a published reference rate and spread but are determined by the issuer or agent and are based on current market conditions. These securities do not indicate a reference rate and spread in their description above. The rate shown represents the rate in effect at December 31, 2021. The maturity date shown, if applicable, reflects the earlier of the next demand date or stated maturity date. |
(4) | Assets of affiliates to the Balanced Fund held for the benefit of the Fund’s Trustees in connection with the Trustee Deferred Compensation Plan. |
(5) | Fair valued security deemed a Level 3 security. Security is not part of the investment strategy of the Fund. |
The accompanying notes are an integral part of these financial statements.
Page 66 | 2021 Annual Report | December 31, 2021 |
Schedule of Investments
December 31, 2021
Moderate Allocation Fund |
Security Description | | Shares or
Principal
Amount ($) | | | Fair
Value ($) | |
Common Stocks (United States) — 34.4% |
Communication Services — 3.0% | | | | | | | | |
Activision Blizzard, Inc. | | | 4,190 | | | | 278,761 | |
Alphabet, Inc. - Class C (1) | | | 489 | | | | 1,414,966 | |
Alphabet, Inc. - Class A (1) | | | 426 | | | | 1,234,139 | |
AMC Entertainment Holdings, Inc. (1) | | | 659 | | | | 17,925 | |
AT&T, Inc. | | | 1,471 | | | | 36,187 | |
Cargurus, Inc. (1) | | | 167 | | | | 5,618 | |
Cars.com, Inc. (1) | | | 360 | | | | 5,792 | |
Cinemark Holdings, Inc. (1) | | | 552 | | | | 8,898 | |
DHI Group, Inc. (1) | | | 577 | | | | 3,600 | |
DISH Network Corp. (1) | | | 235 | | | | 7,623 | |
Entravision Communications Corp. | | | 537 | | | | 3,641 | |
Fox Corp. | | | 47 | | | | 1,734 | |
Gogo, Inc. (1) | | | 104 | | | | 1,407 | |
Gray Television, Inc. | | | 378 | | | | 7,620 | |
IDT Corp. (1) | | | 44 | | | | 1,943 | |
iHeartMedia, Inc. (1) | | | 83 | | | | 1,746 | |
IMAX Corp. (1) | | | 340 | | | | 6,066 | |
Integral Ad Science Holding Corp. (1) | | | 2 | | | | 44 | |
Interpublic Group of Cos., Inc./The | | | 2,027 | | | | 75,911 | |
Liberty Media Corp.-Liberty Braves (1) | | | 530 | | | | 14,893 | |
Liberty TripAdvisor Holdings, Inc. (1) | | | 971 | | | | 2,107 | |
Lions Gate Entertainment Corp. (1) | | | 432 | | | | 7,188 | |
Live Nation Entertainment, Inc. (1) | | | 24 | | | | 2,873 | |
Meta Platforms, Inc. (1) | | | 4,095 | | | | 1,377,353 | |
Netflix, Inc. (1) | | | 563 | | | | 339,174 | |
News Corp. | | | 1 | | | | 22 | |
Pinterest, Inc. (1) | | | 92 | | | | 3,344 | |
Roku, Inc. (1) | | | 15 | | | | 3,423 | |
Sinclair Broadcast Group, Inc. | | | 271 | | | | 7,163 | |
TEGNA, Inc. | | | 625 | | | | 11,600 | |
Twitter, Inc. (1) | | | 1,289 | | | | 55,711 | |
Vimeo, Inc. (1) | | | 155 | | | | 2,784 | |
Walt Disney Co./The (1) | | | 1,400 | | | | 216,846 | |
World Wrestling Entertainment, Inc. | | | 142 | | | | 7,006 | |
Yelp, Inc. (1) | | | 360 | | | | 13,046 | |
Ziff Davis, Inc. (1) | | | 387 | | | | 42,903 | |
| | | | | | | | 5,221,057 | |
| | | | | | | | | |
Consumer Discretionary — 4.0% | | | | | | | | |
Abercrombie & Fitch Co. (1) | | | 128 | | | | 4,458 | |
Academy Sports & Outdoors, Inc. (1) | | | 419 | | | | 18,394 | |
Adient PLC (1) | | | 239 | | | | 11,443 | |
Amazon.com, Inc. (1) | | | 477 | | | | 1,590,480 | |
American Axle & Manufacturing Holdings, Inc. (1) | | | 489 | | | | 4,562 | |
American Eagle Outfitters, Inc. | | | 224 | | | | 5,672 | |
Moderate Allocation Fund |
Security Description | | Shares or
Principal
Amount ($) | | | Fair
Value ($) | |
Common Stocks (United States) — continued |
Aptiv PLC (1) | | | 110 | | | | 18,145 | |
Aramark | | | 768 | | | | 28,301 | |
Asbury Automotive Group, Inc. (1) | | | 118 | | | | 20,382 | |
AutoNation, Inc. (1) | | | 134 | | | | 15,658 | |
AutoZone, Inc. (1) | | | 77 | | | | 161,422 | |
Bath & Body Works, Inc. | | | 103 | | | | 7,188 | |
Best Buy Co., Inc. | | | 970 | | | | 98,552 | |
Big 5 Sporting Goods Corp. | | | 99 | | | | 1,882 | |
Big Lots, Inc. | | | 244 | | | | 10,992 | |
Biglari Holdings, Inc. (1) | | | 2 | | | | 285 | |
Boyd Gaming Corp. (1) | | | 408 | | | | 26,753 | |
Brinker International, Inc. (1) | | | 170 | | | | 6,220 | |
Buckle, Inc./The | | | 120 | | | | 5,077 | |
Caleres, Inc. | | | 166 | | | | 3,765 | |
Capri Holdings, Ltd. (1) | | | 399 | | | | 25,899 | |
Chico’s FAS, Inc. (1) | | | 107 | | | | 576 | |
Conn’s, Inc. (1) | | | 47 | | | | 1,105 | |
Crocs, Inc. (1) | | | 517 | | | | 66,290 | |
Dana, Inc. | | | 534 | | | | 12,186 | |
Dave & Buster’s Entertainment, Inc. (1) | | | 39 | | | | 1,498 | |
Designer Brands, Inc. (1) | | | 224 | | | | 3,183 | |
Dick’s Sporting Goods, Inc. | | | 416 | | | | 47,836 | |
Dollar Tree, Inc. (1) | | | 102 | | | | 14,333 | |
eBay, Inc. | | | 928 | | | | 61,712 | |
Ethan Allen Interiors, Inc. | | | 10 | | | | 263 | |
Etsy, Inc. (1) | | | 7 | | | | 1,533 | |
Everi Holdings, Inc. (1) | | | 582 | | | | 12,426 | |
Foot Locker, Inc. | | | 648 | | | | 28,272 | |
Ford Motor Co. | | | 5,519 | | | | 114,630 | |
Fossil Group, Inc. (1) | | | 207 | | | | 2,130 | |
GameStop Corp. (1) | | | 74 | | | | 10,981 | |
Gap, Inc./The | | | 135 | | | | 2,383 | |
Garmin, Ltd. | | | 2,108 | | | | 287,046 | |
General Motors Co. (1) | | | 2,076 | | | | 121,716 | |
Genius Brands International, Inc. (1) | | | 198 | | | | 208 | |
Goodyear Tire & Rubber Co./The (1) | | | 826 | | | | 17,610 | |
Greenlane Holdings, Inc. (1) | | | 900 | | | | 868 | |
Group 1 Automotive, Inc. | | | 46 | | | | 8,980 | |
Guess?, Inc. | | | 482 | | | | 11,414 | |
Hibbett, Inc. | | | 44 | | | | 3,165 | |
Home Depot, Inc./The | | | 2,411 | | | | 1,000,589 | |
Houghton Mifflin Harcourt Co. (1) | | | 140 | | | | 2,254 | |
International Game Technology PLC | | | 982 | | | | 28,390 | |
Kirkland’s, Inc. (1) | | | 33 | | | | 493 | |
Kohl’s Corp. | | | 817 | | | | 40,352 | |
Lands’ End, Inc. (1) | | | 201 | | | | 3,946 | |
Lear Corp. | | | 110 | | | | 20,125 | |
The accompanying notes are an integral part of these financial statements.
2021 Annual Report | December 31, 2021 | Page 67 |
Schedule of Investments
December 31, 2021
Moderate Allocation Fund |
Security Description | | Shares or
Principal
Amount ($) | | | Fair
Value ($) | |
Common Stocks (United States) — continued |
Liquidity Services, Inc. (1) | | | 52 | | | | 1,148 | |
LKQ Corp. | | | 1,503 | | | | 90,225 | |
Lovesac Co./The (1) | | | 51 | | | | 3,379 | |
Lowe’s Cos., Inc. | | | 2,656 | | | | 686,523 | |
Lululemon Athletica, Inc. (1) | | | 156 | | | | 61,066 | |
Macy’s, Inc. | | | 600 | | | | 15,708 | |
MGM Resorts International | | | 635 | | | | 28,499 | |
Nathan’s Famous, Inc. | | | 23 | | | | 1,343 | |
Nordstrom, Inc. (1) | | | 228 | | | | 5,157 | |
ODP Corp./The (1) | | | 136 | | | | 5,342 | |
OneWater Marine, Inc. | | | 476 | | | | 29,022 | |
O’Reilly Automotive, Inc. (1) | | | 226 | | | | 159,608 | |
Overstock.com, Inc. (1) | | | 21 | | | | 1,239 | |
Party City Holdco, Inc. (1) | | | 961 | | | | 5,353 | |
Qurate Retail, Inc. | | | 1,113 | | | | 8,459 | |
RCI Hospitality Holdings, Inc. | | | 42 | | | | 3,271 | |
Red Robin Gourmet Burgers, Inc. (1) | | | 557 | | | | 9,207 | |
Red Rock Resorts, Inc. | | | 330 | | | | 18,153 | |
Revolve Group, Inc. (1) | | | 196 | | | | 10,984 | |
Scientific Games Corp. (1) | | | 190 | | | | 12,698 | |
SeaWorld Entertainment, Inc. (1) | | | 193 | | | | 12,518 | |
Shoe Carnival, Inc. | | | 21 | | | | 821 | |
Shutterstock, Inc. | | | 142 | | | | 15,745 | |
Signet Jewelers, Ltd. | | | 18 | | | | 1,567 | |
Skyline Champion Corp. (1) | | | 181 | | | | 14,295 | |
Smith & Wesson Brands, Inc. | | | 341 | | | | 6,070 | |
Sonos, Inc. (1) | | | 1,082 | | | | 32,244 | |
Steven Madden, Ltd. | | | 495 | | | | 23,003 | |
Tapestry, Inc. | | | 1,014 | | | | 41,168 | |
Target Corp. | | | 922 | | | | 213,388 | |
Tempur Sealy International, Inc. | | | 335 | | | | 15,755 | |
Tenneco, Inc. (1) | | | 696 | | | | 7,865 | |
Tesla, Inc. (1) | | | 1,132 | | | | 1,196,275 | |
Thor Industries, Inc. | | | 743 | | | | 77,101 | |
Tilly’s, Inc. | | | 2 | | | | 32 | |
Town Sports International Holdings, Inc. (1) | | | 961 | | | | 0 | |
Tupperware Brands Corp. (1) | | | 240 | | | | 3,670 | |
Urban Outfitters, Inc. (1) | | | 161 | | | | 4,727 | |
Vera Bradley, Inc. (1) | | | 8 | | | | 68 | |
Vista Outdoor, Inc. (1) | | | 7 | | | | 322 | |
Waitr Holdings, Inc. (1) | | | 737 | | | | 545 | |
Weber, Inc. | | | 477 | | | | 6,168 | |
Williams-Sonoma, Inc. | | | 189 | | | | 31,966 | |
Winnebago Industries, Inc. | | | 76 | | | | 5,694 | |
Great Wolf Resorts, Inc. (1) | | | 5 | | | | 559 | |
XPEL, Inc. (1) | | | 68 | | | | 4,643 | |
| | | | | | | | 6,866,616 | |
| | | | | | | | | |
Moderate Allocation Fund |
Security Description | | Shares or
Principal
Amount ($) | | | Fair
Value ($) | |
Common Stocks (United States) — continued |
Consumer Staples — 1.0% | | | | | | | | |
Albertsons Cos., Inc. | | | 2,407 | | | | 72,667 | |
Bunge, Ltd. | | | 4,761 | | | | 444,487 | |
Celsius Holdings, Inc. (1) | | | 45 | | | | 3,356 | |
Coca-Cola Co./The | | | 1,299 | | | | 76,914 | |
Costco Wholesale Corp. | | | 397 | | | | 225,377 | |
Darling Ingredients, Inc. (1) | | | 410 | | | | 28,409 | |
Hershey Co./The | | | 817 | | | | 158,065 | |
PepsiCo, Inc. | | | 1,575 | | | | 273,593 | |
Spectrum Brands Holdings, Inc. | | | 290 | | | | 29,499 | |
Tyson Foods, Inc. | | | 202 | | | | 17,606 | |
Walgreens Boots Alliance, Inc. | | | 192 | | | | 10,015 | |
Walmart, Inc. | | | 2,160 | | | | 312,530 | |
| | | | | | | | 1,652,518 | |
| | | | | | | | | |
Energy — 1.7% | | | | | | | | |
Altus Midstream Co. | | | 36 | | | | 2,207 | |
Antero Resources Corp. (1) | | | 283 | | | | 4,953 | |
APA Corp. | | | 1,263 | | | | 33,962 | |
Ardmore Shipping Corp. (1) | | | 238 | | | | 804 | |
Berry Corp. | | | 301 | | | | 2,534 | |
Bristow Group, Inc. (1) | | | 51 | | | | 1,615 | |
Cactus, Inc. | | | 127 | | | | 4,843 | |
Chevron Corp. | | | 6,199 | | | | 727,453 | |
ConocoPhillips | | | 2,299 | | | | 165,942 | |
CONSOL Energy, Inc. (1) | | | 24 | | | | 545 | |
Coterra Energy, Inc. | | | 3 | | | | 57 | |
CVR Energy, Inc. | | | 121 | | | | 2,034 | |
Delek US Holdings, Inc. (1) | | | 624 | | | | 9,354 | |
Devon Energy Corp. | | | 1,657 | | | | 72,991 | |
DHT Holdings, Inc. | | | 256 | | | | 1,329 | |
Diamondback Energy, Inc. | | | 257 | | | | 27,717 | |
EOG Resources, Inc. | | | 725 | | | | 64,402 | |
Expro Group Holdings NV (1) | | | 170 | | | | 2,440 | |
Exxon Mobil Corp. | | | 10,130 | | | | 619,855 | |
Hess Corp. | | | 346 | | | | 25,614 | |
Laredo Petroleum, Inc. (1) | | | 36 | | | | 2,165 | |
Marathon Oil Corp. | | | 20 | | | | 328 | |
Marathon Petroleum Corp. | | | 7,692 | | | | 492,211 | |
Nabors Industries, Ltd. (1) | | | 102 | | | | 8,271 | |
NextDecade Corp. (1) | | | 258 | | | | 735 | |
Nine Energy Service, Inc. (1) | | | 1,235 | | | | 1,235 | |
Northern Oil and Gas, Inc. | | | 5 | | | | 103 | |
Occidental Petroleum Corp. | | | 3,159 | | | | 91,579 | |
Oceaneering International, Inc. (1) | | | 520 | | | | 5,881 | |
ONEOK, Inc. | | | 4,276 | | | | 251,258 | |
Ovintiv, Inc. | | | 821 | | | | 27,668 | |
The accompanying notes are an integral part of these financial statements.
Page 68 | 2021 Annual Report | December 31, 2021 |
Schedule of Investments
December 31, 2021
Moderate Allocation Fund |
Security Description | | Shares or
Principal
Amount ($) | | | Fair
Value ($) | |
Common Stocks (United States) — continued |
Par Pacific Holdings, Inc. (1) | | | 4 | | | | 66 | |
PDC Energy, Inc. | | | 2 | | | | 98 | |
Peabody Energy Corp. (1) | | | 273 | | | | 2,749 | |
Phillips 66 | | | 1,000 | | | | 72,460 | |
Pioneer Natural Resources Co. | | | 145 | | | | 26,373 | |
Profire Energy, Inc. (1) | | | 10 | | | | 11 | |
Range Resources Corp. (1) | | | 111 | | | | 1,979 | |
Schlumberger NV | | | 2,090 | | | | 62,596 | |
Scorpio Tankers, Inc. | | | 20 | | | | 256 | |
SM Energy Co. | | | 249 | | | | 7,341 | |
Southwestern Energy Co. (1) | | | 1,291 | | | | 6,016 | |
Talos Energy, Inc. (1) | | | 502 | | | | 4,920 | |
Targa Resources Corp. | | | 1,079 | | | | 56,367 | |
Teekay Corp. (1) | | | 502 | | | | 1,576 | |
Uranium Energy Corp. (1) | | | 177 | | | | 593 | |
Valero Energy Corp. | | | 44 | | | | 3,305 | |
W&T Offshore, Inc. (1) | | | 91 | | | | 294 | |
Westmoreland Coal Co. (1) | | | 773 | | | | 0 | |
World Fuel Services Corp. | | | 171 | | | | 4,526 | |
| | | | | | | | 2,903,611 | |
| | | | | | | | | |
Financials — 3.9% | | | | | | | | |
Affiliated Managers Group, Inc. | | | 109 | | | | 17,932 | |
Aflac, Inc. | | | 617 | | | | 36,027 | |
Allstate Corp./The | | | 1,638 | | | | 192,711 | |
Ally Financial, Inc. | | | 503 | | | | 23,948 | |
American Financial Group, Inc./OH | | | 277 | | | | 38,038 | |
American International Group, Inc. | | | 8,610 | | | | 489,565 | |
Ameris Bancorp | | | 536 | | | | 26,628 | |
Athene Holding, Ltd. (1) | | | 4,958 | | | | 413,150 | |
Bank of America Corp. | | | 10,182 | | | | 452,997 | |
Bank of New York Mellon Corp./The | | | 1,958 | | | | 113,721 | |
Bank OZK | | | 368 | | | | 17,123 | |
Berkshire Hathaway, Inc. (1) | | | 2,440 | | | | 729,560 | |
BGC Partners, Inc. | | | 226 | | | | 1,051 | |
Blackstone, Inc. | | | 661 | | | | 85,527 | |
Capital One Financial Corp. | | | 1,169 | | | | 169,610 | |
Charles Schwab Corp./The | | | 2,493 | | | | 209,661 | |
Chimera Investment Corp. | | | 5,254 | | | | 79,230 | |
Citigroup, Inc. | | | 3,037 | | | | 183,404 | |
Citizens Financial Group, Inc. | | | 692 | | | | 32,697 | |
Comerica, Inc. | | | 172 | | | | 14,964 | |
East West Bancorp, Inc. | | | 609 | | | | 47,916 | |
Ellington Financial, Inc. | | | 1,370 | | | | 23,413 | |
Evercore, Inc. | | | 681 | | | | 92,514 | |
Fidelity National Financial, Inc. | | | 2,646 | | | | 138,068 | |
Fifth Third Bancorp | | | 2,809 | | | | 122,332 | |
Moderate Allocation Fund |
Security Description | | Shares or
Principal
Amount ($) | | | Fair
Value ($) | |
Common Stocks (United States) — continued |
First American Financial Corp. | | | 1,752 | | | | 137,059 | |
Goldman Sachs Group, Inc./The | | | 101 | | | | 38,638 | |
Hancock Whitney Corp. | | | 391 | | | | 19,558 | |
Hartford Financial Services Group, Inc./The | | | 778 | | | | 53,713 | |
Invesco, Ltd. | | | 865 | | | | 19,912 | |
Janus Henderson Group PLC | | | 669 | | | | 28,058 | |
JPMorgan Chase & Co. | | | 2,697 | | | | 427,070 | |
KKR & Co., Inc. | | | 2,212 | | | | 164,794 | |
LendingClub Corp. (1) | | | 165 | | | | 3,990 | |
LPL Financial Holdings, Inc. | | | 185 | | | | 29,617 | |
Marlin Business Services Corp. | | | 691 | | | | 16,086 | |
MBIA, Inc. (1) | | | 533 | | | | 8,416 | |
Medley Management, Inc. (1) | | | 27 | | | | 0 | |
Meta Financial Group, Inc. | | | 206 | | | | 12,290 | |
MetLife, Inc. | | | 1,552 | | | | 96,984 | |
Moelis & Co. | | | 554 | | | | 34,631 | |
Morgan Stanley | | | 3,657 | | | | 358,971 | |
Mr Cooper Group, Inc. (1) | | | 199 | | | | 8,280 | |
Northrim BanCorp, Inc. | | | 388 | | | | 16,862 | |
OneMain Holdings, Inc. | | | 346 | | | | 17,314 | |
PacWest Bancorp | | | 420 | | | | 18,971 | |
Pinnacle Financial Partners, Inc. | | | 11 | | | | 1,051 | |
Piper Sandler Cos. | | | 274 | | | | 48,912 | |
PNC Financial Services Group, Inc./The | | | 366 | | | | 73,390 | |
Popular, Inc. | | | 220 | | | | 18,049 | |
Prudential Financial, Inc. | | | 432 | | | | 46,760 | |
Pzena Investment Management, Inc. | | | 929 | | | | 8,798 | |
RBB Bancorp | | | 83 | | | | 2,175 | |
Redwood Trust, Inc. | | | 233 | | | | 3,073 | |
Regions Financial Corp. | | | 3,424 | | | | 74,643 | |
Santander Consumer USA Holdings, Inc. | | | 361 | | | | 15,169 | |
Siebert Financial Corp. (1) | | | 81 | | | | 188 | |
Signature Bank/New York NY | | | 104 | | | | 33,641 | |
SLM Corp. | | | 1,591 | | | | 31,295 | |
Stewart Information Services Corp. | | | 1,873 | | | | 149,334 | |
SVB Financial Group (1) | | | 52 | | | | 35,268 | |
Synchrony Financial | | | 5,078 | | | | 235,568 | |
Synovus Financial Corp. | | | 163 | | | | 7,803 | |
Tiptree, Inc. | | | 146 | | | | 2,019 | |
Truist Financial Corp. | | | 1,503 | | | | 88,001 | |
Umpqua Holdings Corp. | | | 1,841 | | | | 35,421 | |
Upstart Holdings, Inc. (1) | | | 53 | | | | 8,019 | |
US Bancorp | | | 2,495 | | | | 140,144 | |
Virtus Investment Partners, Inc. | | | 11 | | | | 3,268 | |
Walker & Dunlop, Inc. | | | 298 | | | | 44,962 | |
Wells Fargo & Co. | | | 5,653 | | | | 271,231 | |
Western Alliance Bancorp | | | 186 | | | | 20,023 | |
The accompanying notes are an integral part of these financial statements.
2021 Annual Report | December 31, 2021 | Page 69 |
Schedule of Investments
December 31, 2021
Moderate Allocation Fund |
Security Description | | Shares or
Principal
Amount ($) | | | Fair
Value ($) | |
Common Stocks (United States) — continued |
Zions Bancorp NA | | | 906 | | | | 57,223 | |
| | | | | | | | 6,718,429 | |
| | | | | | | | | |
Healthcare — 6.4% | | | | | | | | |
AbbVie, Inc. | | | 5,937 | | | | 803,870 | |
Abeona Therapeutics, Inc. (1) | | | 291 | | | | 98 | |
AcelRx Pharmaceuticals, Inc. (1) | | | 67 | | | | 38 | |
ADMA Biologics, Inc. (1) | | | 80 | | | | 113 | |
Affimed NV (1) | | | 534 | | | | 2,948 | |
AgeX Therapeutics, Inc. (1) | | | 108 | | | | 118 | |
Agilent Technologies, Inc. | | | 1,430 | | | | 228,300 | |
Agiliti, Inc. (1) | | | 51 | | | | 1,181 | |
Alector, Inc. (1) | | | 77 | | | | 1,590 | |
Alkermes PLC (1) | | | 935 | | | | 21,748 | |
Allakos, Inc. (1) | | | 93 | | | | 910 | |
Alnylam Pharmaceuticals, Inc. (1) | | | 25 | | | | 4,240 | |
AmerisourceBergen Corp. | | | 928 | | | | 123,322 | |
Amgen, Inc. | | | 2,386 | | | | 536,778 | |
Amicus Therapeutics, Inc. (1) | | | 405 | | | | 4,678 | |
AMN Healthcare Services, Inc. (1) | | | 69 | | | | 8,441 | |
Amneal Pharmaceuticals, Inc. (1) | | | 960 | | | | 4,598 | |
Anavex Life Sciences Corp. (1) | | | 121 | | | | 2,098 | |
ANI Pharmaceuticals, Inc. (1) | | | 48 | | | | 2,212 | |
Anthem, Inc. | | | 944 | | | | 437,582 | |
Apellis Pharmaceuticals, Inc. (1) | | | 41 | | | | 1,938 | |
Apollo Medical Holdings, Inc. (1) | | | 145 | | | | 10,655 | |
Applied Therapeutics, Inc. (1) | | | 236 | | | | 2,112 | |
Arbutus Biopharma Corp. (1) | | | 798 | | | | 3,104 | |
Arcutis Biotherapeutics, Inc. (1) | | | 207 | | | | 4,293 | |
Arrowhead Pharmaceuticals, Inc. (1) | | | 162 | | | | 10,741 | |
Arvinas, Inc. (1) | | | 93 | | | | 7,639 | |
Asensus Surgical, Inc. (1) | | | 268 | | | | 297 | |
Assertio Holdings, Inc. (1) | | | 218 | | | | 475 | |
Atara Biotherapeutics, Inc. (1) | | | 18 | | | | 284 | |
Avalo Therapeutics, Inc. (1) | | | 929 | | | | 1,579 | |
Avid Bioservices, Inc. (1) | | | 263 | | | | 7,674 | |
Beam Therapeutics, Inc. (1) | | | 106 | | | | 8,447 | |
Beyondspring, Inc. (1) | | | 114 | | | | 516 | |
BioCryst Pharmaceuticals, Inc. (1) | | | 735 | | | | 10,180 | |
BioDelivery Sciences International, Inc. (1) | | | 1,905 | | | | 5,906 | |
Biohaven Pharmaceutical Holding Co., Ltd. (1) | | | 85 | | | | 11,714 | |
Bio-Rad Laboratories, Inc. (1) | | | 8 | | | | 6,045 | |
Bio-Techne Corp. | | | 100 | | | | 51,734 | |
Blueprint Medicines Corp. (1) | | | 86 | | | | 9,211 | |
Bridgebio Pharma, Inc. (1) | | | 115 | | | | 1,918 | |
Bristol-Myers Squibb Co. | | | 5,892 | | | | 367,366 | |
Moderate Allocation Fund |
Security Description | | Shares or
Principal
Amount ($) | | | Fair
Value ($) | |
Common Stocks (United States) — continued |
Bruker Corp. | | | 369 | | | | 30,963 | |
Calyxt, Inc. (1) | | | 216 | | | | 460 | |
Cardinal Health, Inc. | | | 1,170 | | | | 60,243 | |
CareDx, Inc. (1) | | | 99 | | | | 4,503 | |
CASI Pharmaceuticals, Inc. (1) | | | 102 | | | | 82 | |
Cassava Sciences, Inc. (1) | | | 60 | | | | 2,622 | |
Catalent, Inc. (1) | | | 276 | | | | 35,336 | |
Catalyst Pharmaceuticals, Inc. (1) | | | 1,053 | | | | 7,129 | |
cbdMD, Inc. (1) | | | 26 | | | | 28 | |
Celcuity, Inc. (1) | | | 3 | | | | 40 | |
Centogene NV (1) | | | 308 | | | | 1,610 | |
Cerevel Therapeutics Holdings, Inc. (1) | | | 92 | | | | 2,983 | |
Cerner Corp. | | | 2,469 | | | | 229,296 | |
Charles River Laboratories International, Inc. (1) | | | 12 | | | | 4,521 | |
Community Health Systems, Inc. (1) | | | 439 | | | | 5,843 | |
Computer Programs and Systems, Inc. (1) | | | 83 | | | | 2,432 | |
Conformis, Inc. (1) | | | 569 | | | | 433 | |
Cross Country Healthcare, Inc. (1) | | | 28 | | | | 777 | |
CVS Health Corp. | | | 2,231 | | | | 230,150 | |
Danaher Corp. | | | 2,135 | | | | 702,436 | |
Deciphera Pharmaceuticals, Inc. (1) | | | 9 | | | | 88 | |
Dynavax Technologies Corp. (1) | | | 259 | | | | 3,644 | |
Editas Medicine, Inc. (1) | | | 170 | | | | 4,514 | |
Elanco Animal Health, Inc. Contingent Value Rights (1)(5) | | | 162 | | | | 0 | |
ElectroCore, Inc. (1) | | | 30 | | | | 17 | |
Eli Lilly & Co. | | | 1,319 | | | | 364,334 | |
Eloxx Pharmaceuticals, Inc. (1) | | | 1,526 | | | | 1,078 | |
Enanta Pharmaceuticals, Inc. (1) | | | 45 | | | | 3,365 | |
Endo International PLC (1) | | | 518 | | | | 1,948 | |
Evolent Health, Inc. (1) | | | 109 | | | | 3,016 | |
Exact Sciences Corp. (1) | | | 26 | | | | 2,024 | |
Exelixis, Inc. (1) | | | 776 | | | | 14,185 | |
Fulgent Genetics, Inc. (1) | | | 13 | | | | 1,308 | |
Galectin Therapeutics, Inc. (1) | | | 237 | | | | 491 | |
Genprex, Inc. (1) | | | 631 | | | | 827 | |
Geron Corp. (1) | | | 314 | | | | 383 | |
Gilead Sciences, Inc. | | | 5,080 | | | | 368,859 | |
Globus Medical, Inc. (1) | | | 549 | | | | 39,638 | |
HCA Healthcare, Inc. | | | 554 | | | | 142,334 | |
Horizon Therapeutics Plc (1) | | | 1,252 | | | | 134,916 | |
Humanigen, Inc. (1) | | | 5 | | | | 19 | |
Illumina, Inc. (1) | | | 6 | | | | 2,283 | |
Incyte Corp. (1) | | | 2,532 | | | | 185,849 | |
Inotiv, Inc. (1) | | | 100 | | | | 4,207 | |
Intellia Therapeutics, Inc. (1) | | | 100 | | | | 11,824 | |
The accompanying notes are an integral part of these financial statements.
Page 70 | 2021 Annual Report | December 31, 2021 |
Schedule of Investments
December 31, 2021
Moderate Allocation Fund |
Security Description | | Shares or
Principal
Amount ($) | | | Fair
Value ($) | |
Common Stocks (United States) — continued |
iRhythm Technologies, Inc. (1) | | | 1 | | | | 118 | |
Johnson & Johnson | | | 6,020 | | | | 1,029,841 | |
Jounce Therapeutics, Inc. (1) | | | 203 | | | | 1,695 | |
Kezar Life Sciences, Inc. (1) | | | 195 | | | | 3,260 | |
La Jolla Pharmaceutical Co. (1) | | | 292 | | | | 1,358 | |
Lexicon Pharmaceuticals, Inc. (1) | | | 25 | | | | 99 | |
Mallinckrodt PLC (1) | | | 30 | | | | 4 | |
MannKind Corp. (1) | | | 1,083 | | | | 4,733 | |
Maravai LifeSciences Holdings, Inc. (1) | | | 271 | | | | 11,355 | |
Marinus Pharmaceuticals, Inc. (1) | | | 123 | | | | 1,461 | |
McKesson Corp. | | | 1,237 | | | | 307,481 | |
Merck & Co., Inc. | | | 7,872 | | | | 603,310 | |
Mirati Therapeutics, Inc. (1) | | | 78 | | | | 11,442 | |
Moderna, Inc. (1) | | | 776 | | | | 197,088 | |
Myriad Genetics, Inc. (1) | | | 122 | | | | 3,367 | |
Natera, Inc. (1) | | | 168 | | | | 15,690 | |
Novavax, Inc. (1) | | | 93 | | | | 13,306 | |
Ocugen, Inc. (1) | | | 250 | | | | 1,138 | |
Oncocyte Corp. (1) | | | 240 | | | | 521 | |
Oramed Pharmaceuticals, Inc. (1) | | | 256 | | | | 3,656 | |
Organogenesis Holdings, Inc. (1) | | | 1 | | | | 9 | |
Organon & Co. | | | 791 | | | | 24,086 | |
Palatin Technologies, Inc. (1) | | | 1,854 | | | | 949 | |
PerkinElmer, Inc. | | | 451 | | | | 90,678 | |
Perrigo Co. PLC | | | 1,684 | | | | 65,508 | |
Pfizer, Inc. | | | 8,880 | | | | 524,364 | |
PolarityTE, Inc. (1) | | | 252 | | | | 148 | |
Precigen, Inc. (1) | | | 912 | | | | 3,384 | |
Prothena Corp. PLC (1) | | | 104 | | | | 5,138 | |
Puma Biotechnology, Inc. (1) | | | 566 | | | | 1,721 | |
Quest Diagnostics, Inc. | | | 399 | | | | 69,031 | |
Quidel Corp. (1) | | | 105 | | | | 14,174 | |
Radius Health, Inc. (1) | | | 134 | | | | 927 | |
Regeneron Pharmaceuticals, Inc. (1) | | | 799 | | | | 504,584 | |
REGENXBIO, Inc. (1) | | | 22 | | | | 719 | |
Rocket Pharmaceuticals, Inc. (1) | | | 31 | | | | 677 | |
Sesen Bio, Inc. (1) | | | 981 | | | | 800 | |
Sorrento Therapeutics, Inc. (1) | | | 501 | | | | 2,330 | |
SpringWorks Therapeutics, Inc. (1) | | | 49 | | | | 3,037 | |
STAAR Surgical Co. (1) | | | 125 | | | | 11,413 | |
Sutro Biopharma, Inc. (1) | | | 135 | | | | 2,009 | |
Tenet Healthcare Corp. (1) | | | 136 | | | | 11,110 | |
Thermo Fisher Scientific, Inc. | | | 964 | | | | 643,219 | |
TransMedics Group, Inc. (1) | | | 68 | | | | 1,303 | |
Twist Bioscience Corp. (1) | | | 79 | | | | 6,114 | |
Tyme Technologies, Inc. (1) | | | 244 | | | | 147 | |
Ultragenyx Pharmaceutical, Inc. (1) | | | 18 | | | | 1,514 | |
Moderate Allocation Fund |
Security Description | | Shares or
Principal
Amount ($) | | | Fair
Value ($) | |
Common Stocks (United States) — continued |
UnitedHealth Group, Inc. | | | 2,149 | | | | 1,079,099 | |
Universal Health Services, Inc. | | | 88 | | | | 11,410 | |
Vanda Pharmaceuticals, Inc. (1) | | | 74 | | | | 1,161 | |
Veracyte, Inc. (1) | | | 148 | | | | 6,098 | |
Viatris, Inc. | | | 3,418 | | | | 46,246 | |
ViewRay, Inc. (1) | | | 693 | | | | 3,818 | |
Voyager Therapeutics, Inc. (1) | | | 24 | | | | 65 | |
WaVe Life Sciences, Ltd. (1) | | | 196 | | | | 615 | |
West Pharmaceutical Services, Inc. | | | 683 | | | | 320,334 | |
Zentalis Pharmaceuticals, Inc. (1) | | | 107 | | | | 8,994 | |
ZIOPHARM Oncology, Inc. (1) | | | 379 | | | | 413 | |
Zoetis, Inc. | | | 688 | | | | 167,893 | |
| | | | | | | | 11,167,891 | |
| | | | | | | | | |
Industrials — 2.3% | | | | | | | | |
Acuity Brands, Inc. | | | 137 | | | | 29,006 | |
AGCO Corp. | | | 308 | | | | 35,734 | |
Altra Industrial Motion Corp. | | | 1 | | | | 52 | |
ArcBest Corp. | | | 51 | | | | 6,112 | |
Atkore, Inc. (1) | | | 98 | | | | 10,897 | |
Atlas Air Worldwide Holdings, Inc. (1) | | | 207 | | | | 19,483 | |
Avis Budget Group, Inc. (1) | | | 64 | | | | 13,272 | |
Axon Enterprise, Inc. (1) | | | 56 | | | | 8,792 | |
AZZ, Inc. | | | 273 | | | | 15,094 | |
Boise Cascade Co. | | | 1,103 | | | | 78,534 | |
Builders FirstSource, Inc. (1) | | | 338 | | | | 28,970 | |
Carrier Global Corp. | | | 408 | | | | 22,130 | |
Caterpillar, Inc. | | | 232 | | | | 47,964 | |
Clean Harbors, Inc. (1) | | | 3 | | | | 299 | |
Copart, Inc. (1) | | | 501 | | | | 75,962 | |
Core & Main, Inc. (1) | | | 31 | | | | 941 | |
Covenant Logistics Group, Inc. (1) | | | 170 | | | | 4,493 | |
CSX Corp. | | | 2,577 | | | | 96,895 | |
Eaton Corp. PLC | | | 645 | | | | 111,469 | |
EMCOR Group, Inc. | | | 957 | | | | 121,912 | |
Emerson Electric Co. | | | 1,418 | | | | 131,831 | |
Encore Wire Corp. | | | 26 | | | | 3,721 | |
Franklin Electric Co., Inc. | | | 247 | | | | 23,356 | |
FTC Solar, Inc. (1) | | | 124 | | | | 937 | |
FuelCell Energy, Inc. (1) | | | 368 | | | | 1,914 | |
Genco Shipping & Trading, Ltd. | | | 331 | | | | 5,296 | |
Generac Holdings, Inc. (1) | | | 270 | | | | 95,018 | |
General Dynamics Corp. | | | 1,896 | | | | 395,259 | |
GrafTech International, Ltd. | | | 682 | | | | 8,068 | |
Granite Construction, Inc. | | | 21 | | | | 813 | |
Helios Technologies, Inc. | | | 33 | | | | 3,471 | |
Herc Holdings, Inc. | | | 208 | | | | 32,562 | |
The accompanying notes are an integral part of these financial statements.
2021 Annual Report | December 31, 2021 | Page 71 |
Schedule of Investments
December 31, 2021
Moderate Allocation Fund |
Security Description | | Shares or
Principal
Amount ($) | | | Fair
Value ($) | |
Common Stocks (United States) — continued |
Hertz Global Holdings, Inc. (1) | | | 7 | | | | 150 | |
Hillenbrand, Inc. | | | 217 | | | | 11,282 | |
Hub Group, Inc. (1) | | | 94 | | | | 7,919 | |
Hubbell, Inc. | | | 79 | | | | 16,453 | |
Huntington Ingalls Industries, Inc. | | | 465 | | | | 86,834 | |
JB Hunt Transport Services, Inc. | | | 367 | | | | 75,015 | |
Johnson Controls International plc | | | 6,517 | | | | 529,897 | |
Karat Packaging, Inc. (1) | | | 58 | | | | 1,172 | |
Manitowoc Co., Inc./The (1) | | | 699 | | | | 12,994 | |
ManpowerGroup, Inc. | | | 1,191 | | | | 115,920 | |
Matson, Inc. | | | 39 | | | | 3,511 | |
Meritor, Inc. (1) | | | 196 | | | | 4,857 | |
Mesa Air Group, Inc. (1) | | | 186 | | | | 1,042 | |
Miller Industries, Inc./TN | | | 7 | | | | 234 | |
Mueller Industries, Inc. | | | 1,132 | | | | 67,196 | |
Mueller Water Products, Inc. | | | 1 | | | | 14 | |
MYR Group, Inc. (1) | | | 132 | | | | 14,593 | |
NL Industries, Inc. | | | 1 | | | | 7 | |
nVent Electric PLC | | | 1,021 | | | | 38,798 | |
Old Dominion Freight Line, Inc. | | | 228 | | | | 81,711 | |
Oshkosh Corp. | | | 134 | | | | 15,103 | |
Owens Corning | | | 480 | | | | 43,440 | |
Plug Power, Inc. (1) | | | 564 | | | | 15,922 | |
Quad/Graphics, Inc. (1) | | | 810 | | | | 3,240 | |
Quanta Services, Inc. | | | 3,618 | | | | 414,840 | |
Raytheon Technologies Corp. | | | 2,741 | | | | 235,890 | |
Regal Rexnord Corp. | | | 497 | | | | 84,579 | |
Resideo Technologies, Inc. (1) | | | 495 | | | | 12,885 | |
REV Group, Inc. | | | 24 | | | | 340 | |
Robert Half International, Inc. | | | 252 | | | | 28,103 | |
Ryder System, Inc. | | | 1,006 | | | | 82,925 | |
Saia, Inc. (1) | | | 74 | | | | 24,940 | |
Schneider National, Inc. | | | 1 | | | | 27 | |
Shyft Group, Inc./The | | | 162 | | | | 7,959 | |
SkyWest, Inc. (1) | | | 816 | | | | 32,069 | |
Terex Corp. | | | 905 | | | | 39,775 | |
Textainer Group Holdings, Ltd. | | | 264 | | | | 9,427 | |
Textron, Inc. | | | 2,126 | | | | 164,127 | |
Titan International, Inc. (1) | | | 794 | | | | 8,702 | |
Triton International, Ltd. | | | 333 | | | | 20,057 | |
Triumph Group, Inc. (1) | | | 54 | | | | 1,001 | |
TrueBlue, Inc. (1) | | | 223 | | | | 6,170 | |
United Parcel Service, Inc. | | | 852 | | | | 182,618 | |
United Rentals, Inc. (1) | | | 154 | | | | 51,173 | |
Valmont Industries, Inc. | | | 72 | | | | 18,036 | |
Vectrus, Inc. (1) | | | 159 | | | | 7,277 | |
Veritiv Corp. (1) | | | 1 | | | | 123 | |
Moderate Allocation Fund |
Security Description | | Shares or
Principal
Amount ($) | | | Fair
Value ($) | |
Common Stocks (United States) — continued |
Vicor Corp. (1) | | | 43 | | | | 5,460 | |
WESCO International, Inc. (1) | | | 229 | | | | 30,134 | |
Yellow Corp. (1) | | | 133 | | | | 1,674 | |
| | | | | | | | 4,047,872 | |
| | | | | | | | | |
Information Technology — 9.9% | | | | | | | | |
3D Systems Corp. (1) | | | 71 | | | | 1,529 | |
Accenture PLC | | | 191 | | | | 79,179 | |
ACI Worldwide, Inc. (1) | | | 514 | | | | 17,836 | |
Adobe, Inc. (1) | | | 799 | | | | 453,081 | |
Advanced Micro Devices, Inc. (1) | | | 1,970 | | | | 283,483 | |
Alliance Data Systems Corp. | | | 556 | | | | 37,013 | |
Ambarella, Inc. (1) | | | 78 | | | | 15,825 | |
American Software, Inc./GA | | | 379 | | | | 9,918 | |
Amkor Technology, Inc. | | | 832 | | | | 20,625 | |
Analog Devices, Inc. | | | 402 | | | | 70,660 | |
Apple, Inc. | | | 15,565 | | | | 2,763,877 | |
Applied Materials, Inc. | | | 3,945 | | | | 620,785 | |
Arrow Electronics, Inc. (1) | | | 1,165 | | | | 156,425 | |
Asana, Inc. (1) | | | 293 | | | | 21,843 | |
Atlassian Corp. PLC (1) | | | 147 | | | | 56,050 | |
Autodesk, Inc. (1) | | | 125 | | | | 35,149 | |
Avnet, Inc. | | | 2,163 | | | | 89,180 | |
Belden, Inc. | | | 110 | | | | 7,230 | |
Bill.com Holdings, Inc. (1) | | | 101 | | | | 25,164 | |
Box, Inc. (1) | | | 243 | | | | 6,364 | |
Broadcom, Inc. | | | 325 | | | | 216,258 | |
Calix, Inc. (1) | | | 211 | | | | 16,874 | |
CDK Global, Inc. | | | 2,478 | | | | 103,432 | |
CDW Corp./DE | �� | | 1,350 | | | | 276,453 | |
ChannelAdvisor Corp. (1) | | | 729 | | | | 17,992 | |
Cisco Systems, Inc./Delaware | | | 7,513 | | | | 476,099 | |
Cloudflare, Inc. (1) | | | 431 | | | | 56,677 | |
Cognex Corp. | | | 134 | | | | 10,420 | |
Concentrix Corp. | | | 87 | | | | 15,540 | |
Conduent, Inc. (1) | | | 1,795 | | | | 9,585 | |
Crowdstrike Holdings, Inc. (1) | | | 259 | | | | 53,030 | |
Datadog, Inc. (1) | | | 131 | | | | 23,332 | |
Diebold Nixdorf, Inc. (1) | | | 234 | | | | 2,118 | |
Diodes, Inc. (1) | | | 324 | | | | 35,578 | |
Dolby Laboratories, Inc. | | | 1,566 | | | | 149,115 | |
Dropbox, Inc. (1) | | | 3,768 | | | | 92,467 | |
DXC Technology Co. (1) | | | 705 | | | | 22,694 | |
Dynatrace, Inc. (1) | | | 300 | | | | 18,105 | |
Ebix, Inc. | | | 166 | | | | 5,046 | |
EPAM Systems, Inc. (1) | | | 376 | | | | 251,337 | |
First Solar, Inc. (1) | | | 7 | | | | 610 | |
The accompanying notes are an integral part of these financial statements.
Page 72 | 2021 Annual Report | December 31, 2021 |
Schedule of Investments
December 31, 2021
Moderate Allocation Fund |
Security Description | | Shares or
Principal
Amount ($) | | | Fair
Value ($) | |
Common Stocks (United States) — continued |
Fortinet, Inc. (1) | | | 542 | | | | 194,795 | |
Gartner, Inc. (1) | | | 1,007 | | | | 336,660 | |
Hewlett Packard Enterprise Co. | | | 2,237 | | | | 35,277 | |
HP, Inc. | | | 5,419 | | | | 204,134 | |
HubSpot, Inc. (1) | | | 81 | | | | 53,391 | |
Intel Corp. | | | 6,878 | | | | 354,217 | |
Intuit, Inc. | | | 953 | | | | 612,989 | |
Jabil, Inc. | | | 2,696 | | | | 189,664 | |
Kimball Electronics, Inc. (1) | | | 118 | | | | 2,568 | |
KLA Corp. | | | 1,256 | | | | 540,218 | |
Kulicke & Soffa Industries, Inc. | | | 212 | | | | 12,834 | |
Kyndryl Holdings, Inc. (1) | | | 227 | | | | 4,109 | |
Lam Research Corp. | | | 179 | | | | 128,728 | |
Lattice Semiconductor Corp. (1) | | | 870 | | | | 67,042 | |
Manhattan Associates, Inc. (1) | | | 490 | | | | 76,190 | |
Marathon Digital Holdings, Inc. (1) | | | 156 | | | | 5,126 | |
McAfee Corp. | | | 1,248 | | | | 32,186 | |
Micron Technology, Inc. | | | 1,407 | | | | 131,062 | |
Microsoft Corp. | | | 10,716 | | | | 3,603,992 | |
Mimecast, Ltd. (1) | | | 269 | | | | 21,404 | |
MoneyGram International, Inc. (1) | | | 792 | | | | 6,249 | |
MongoDB, Inc. (1) | | | 37 | | | | 19,586 | |
NCR Corp. (1) | | | 883 | | | | 35,497 | |
NortonLifeLock, Inc. | | | 2,526 | | | | 65,625 | |
NVIDIA Corp. | | | 3,258 | | | | 958,210 | |
NXP Semiconductors NV | | | 243 | | | | 55,351 | |
ON Semiconductor Corp. (1) | | | 451 | | | | 30,632 | |
Oracle Corp. | | | 3,698 | | | | 322,503 | |
Palantir Technologies, Inc. (1) | | | 212 | | | | 3,861 | |
Palo Alto Networks, Inc. (1) | | | 774 | | | | 430,932 | |
Paycom Software, Inc. (1) | | | 174 | | | | 72,243 | |
Perficient, Inc. (1) | | | 85 | | | | 10,990 | |
Photronics, Inc. (1) | | | 1 | | | | 19 | |
Plantronics, Inc. (1) | | | 94 | | | | 2,758 | |
Power Integrations, Inc. | | | 97 | | | | 9,010 | |
Priority Technology Holdings, Inc. (1) | | | 198 | | | | 1,402 | |
Progress Software Corp. | | | 1,040 | | | | 50,201 | |
Qorvo, Inc. (1) | | | 31 | | | | 4,848 | |
Rimini Street, Inc. (1) | | | 252 | | | | 1,504 | |
Riot Blockchain, Inc. (1) | | | 180 | | | | 4,019 | |
salesforce.com, Inc. (1) | | | 1,184 | | | | 300,890 | |
SecureWorks Corp. (1) | | | 114 | | | | 1,821 | |
SiTime Corp. (1) | | | 19 | | | | 5,558 | |
SMART Global Holdings, Inc. (1) | | | 29 | | | | 2,059 | |
Smartsheet, Inc. (1) | | | 138 | | | | 10,688 | |
Sonim Technologies, Inc. (1) | | | 32 | | | | 30 | |
Sprout Social, Inc. (1) | | | 245 | | | | 22,219 | |
Moderate Allocation Fund |
Security Description | | Shares or
Principal
Amount ($) | | | Fair
Value ($) | |
Common Stocks (United States) — continued |
SPS Commerce, Inc. (1) | | | 255 | | | | 36,299 | |
SS&C Technologies Holdings, Inc. | | | 5,808 | | | | 476,140 | |
StarTek, Inc. (1) | | | 631 | | | | 3,294 | |
Stratasys, Ltd. (1) | | | 121 | | | | 2,963 | |
Synaptics, Inc. (1) | | | 249 | | | | 72,088 | |
Teradata Corp. (1) | | | 423 | | | | 17,965 | |
Teradyne, Inc. | | | 253 | | | | 41,373 | |
TESSCO Technologies, Inc. (1) | | | 90 | | | | 568 | |
Texas Instruments, Inc. | | | 1,873 | | | | 353,004 | |
Trade Desk, Inc./The (1) | | | 498 | | | | 45,637 | |
Trimble, Inc. (1) | | | 546 | | | | 47,606 | |
Ultra Clean Holdings, Inc. (1) | | | 31 | | | | 1,778 | |
Veritone, Inc. (1) | | | 96 | | | | 2,158 | |
Viant Technology, Inc. (1) | | | 756 | | | | 7,337 | |
Visa, Inc. | | | 588 | | | | 127,425 | |
VMware, Inc. | | | 604 | | | | 69,992 | |
Workday, Inc. (1) | | | 182 | | | | 49,719 | |
Workiva, Inc. (1) | | | 183 | | | | 23,880 | |
Xilinx, Inc. | | | 42 | | | | 8,905 | |
Xperi Holding Corp. | | | 1,123 | | | | 21,236 | |
Zebra Technologies Corp. (1) | | | 169 | | | | 100,589 | |
Zscaler, Inc. (1) | | | 88 | | | | 28,277 | |
| | | | | | | | 17,197,502 | |
| | | | | | | | | |
Materials — 0.4% | | | | | | | | |
Albemarle Corp. | | | 199 | | | | 46,520 | |
Alcoa Corp. | | | 411 | | | | 24,487 | |
Amyris, Inc. (1) | | | 195 | | | | 1,055 | |
Avient Corp. | | | 104 | | | | 5,819 | |
Berry Global Group, Inc. (1) | | | 554 | | | | 40,874 | |
Celanese Corp. | | | 397 | | | | 66,720 | |
Century Aluminum Co. (1) | | | 115 | | | | 1,904 | |
Chemours Co./The | | | 169 | | | | 5,672 | |
Cleveland-Cliffs, Inc. (1) | | | 657 | | | | 14,303 | |
Dow, Inc. | | | 1,285 | | | | 72,885 | |
Element Solutions, Inc. | | | 16 | | | | 388 | |
Flotek Industries, Inc. (1) | | | 676 | | | | 764 | |
Freeport-McMoRan, Inc. | | | 2,160 | | | | 90,137 | |
Hawkins, Inc. | | | 116 | | | | 4,576 | |
Huntsman Corp. | | | 644 | | | | 22,463 | |
Intrepid Potash, Inc. (1) | | | 10 | | | | 427 | |
Koppers Holdings, Inc. (1) | | | 81 | | | | 2,535 | |
Louisiana-Pacific Corp. | | | 833 | | | | 65,266 | |
LyondellBasell Industries NV | | | 659 | | | | 60,780 | |
Mosaic Co./The | | | 928 | | | | 36,461 | |
Nucor Corp. | | | 601 | | | | 68,604 | |
O-I Glass, Inc. (1) | | | 279 | | | | 3,356 | |
The accompanying notes are an integral part of these financial statements.
2021 Annual Report | December 31, 2021 | Page 73 |
Schedule of Investments
December 31, 2021
Moderate Allocation Fund |
Security Description | | Shares or
Principal
Amount ($) | | | Fair
Value ($) | |
Common Stocks (United States) — continued |
Olin Corp. | | | 283 | | | | 16,278 | |
Rayonier Advanced Materials, Inc. (1) | | | 38 | | | | 217 | |
Ryerson Holding Corp. | | | 23 | | | | 599 | |
Steel Dynamics, Inc. | | | 280 | | | | 17,380 | |
SunCoke Energy, Inc. | | | 111 | | | | 731 | |
Trinseo PLC | | | 238 | | | | 12,485 | |
Tronox Holdings PLC | | | 270 | | | | 6,488 | |
United States Steel Corp. | | | 319 | | | | 7,595 | |
Westlake Chemical Corp. | | | 233 | | | | 22,631 | |
| | | | | | | | 720,400 | |
| | | | | | | | | |
Real Estate Investment Trust — 1.2% | | | | | | | | |
Altisource Portfolio Solutions SA (1) | | | 467 | | | | 5,240 | |
American Homes 4 Rent | | | 1,140 | | | | 49,715 | |
Ashford Hospitality Trust, Inc. (1) | | | 429 | | | | 4,118 | |
Camden Property Trust | | | 677 | | | | 120,966 | |
CareTrust REIT, Inc. | | | 2,013 | | | | 45,957 | |
CatchMark Timber Trust, Inc. | | | 879 | | | | 7,656 | |
CBL & Associates Properties, Inc. (1) | | | 10 | | | | 312 | |
CorEnergy Infrastructure Trust, Inc. | | | 2,243 | | | | 7,021 | |
Corporate Office Properties Trust | | | 1,500 | | | | 41,955 | |
CubeSmart | | | 2,913 | | | | 165,779 | |
CyrusOne, Inc. | | | 12 | | | | 1,077 | |
DiamondRock Hospitality Co. (1) | | | 170 | | | | 1,634 | |
Easterly Government Properties, Inc. | | | 2 | | | | 46 | |
EastGroup Properties, Inc. | | | 947 | | | | 215,774 | |
Essex Property Trust, Inc. | | | 159 | | | | 56,005 | |
eXp World Holdings, Inc. | | | 44 | | | | 1,482 | |
Extra Space Storage, Inc. | | | 224 | | | | 50,788 | |
First Industrial Realty Trust, Inc. | | | 2,201 | | | | 145,706 | |
Getty Realty Corp. | | | 739 | | | | 23,715 | |
Gladstone Commercial Corp. | | | 1,082 | | | | 27,883 | |
Healthcare Trust of America, Inc. | | | 843 | | | | 28,148 | |
Invitation Homes, Inc. | | | 1,190 | | | | 53,955 | |
Lamar Advertising Co. | | | 2,390 | | | | 289,907 | |
Mid-America Apartment Communities, Inc. | | | 609 | | | | 139,729 | |
Omega Healthcare Investors, Inc. | | | 1,758 | | | | 52,019 | |
PotlatchDeltic Corp. | | | 520 | | | | 31,314 | |
Public Storage | | | 615 | | | | 230,354 | |
RAIT Financial Trust (1)(5) | | | 751 | | | | 0 | |
Regency Centers Corp. | | | 2,195 | | | | 165,393 | |
SL Green Realty Corp. | | | 606 | | | | 43,450 | |
Spirit MTA REIT Liquidating Trust (1)(5) | | | 1,024 | | | | 0 | |
Stratus Properties, Inc. (1) | | | 106 | | | | 3,876 | |
Tanger Factory Outlet Centers, Inc. | | | 212 | | | | 4,087 | |
Trinity Place Holdings, Inc. (1) | | | 645 | | | | 1,187 | |
UDR, Inc. | | | 591 | | | | 35,454 | |
Moderate Allocation Fund |
Security Description | | Shares or
Principal
Amount ($) | | | Fair
Value ($) | |
Common Stocks (United States) — continued |
Universal Health Realty Income Trust | | | 226 | | | | 13,440 | |
Weyerhaeuser Co. | | | 1,163 | | | | 47,892 | |
Zillow Group, Inc. (1) | | | 390 | | | | 24,902 | |
| | | | | | | | 2,137,936 | |
| | | | | | | | | |
Utilities — 0.6% | | | | | | | | |
Evergy, Inc. | | | 1,478 | | | | 101,406 | |
Exelon Corp. | | | 9,354 | | | | 540,291 | |
MDU Resources Group, Inc. | | | 2,810 | | | | 86,660 | |
NRG Energy, Inc. | | | 2,727 | | | | 117,479 | |
Portland General Electric Co. | | | 2,059 | | | | 108,962 | |
UGI Corp. | | | 1,525 | | | | 70,013 | |
| | | | | | | | 1,024,811 | |
| | | | | | | | | |
Total Common Stocks (United States) (Cost $41,675,892) | | | | | | | 59,658,643 | |
| | | | | | | | | |
Preferred Stock (United States) — 0.0% |
WESCO International, Inc. Series A Variable Preferred (6) | | | 252 | | | | 7,724 | |
Total Preferred Stock (United States) (Cost $6,299) | | | | | | | 7,724 | |
| | | | | | | | | |
Warrants (United States) — 0.0% |
Chaparral Energy, Inc. A Warrants, Expiration Date 10/14/2024 (1)(5) | | | 1 | | | | 0 | |
Chaparral Energy, Inc. B Warrants, Expiration Date 10/14/2025 (1)(5) | | | 1 | | | | 0 | |
Civitas Solutions, Inc. A Warrants, Expiration Date 1/20/2025 (1)(5) | | | 7 | | | | 0 | |
Civitas Solutions, Inc. B Warrants, Expiration Date 1/20/2026 (1)(5) | | | 3 | | | | 0 | |
Hertz Global Holdings, Inc. Warrants, Expiration Date 6/30/2051 (1) | | | 48 | | | | 766 | |
Nabors Industries, Ltd. Warrants, Expiration Date 6/11/2026 (1) | | | 15 | | | | 56 | |
Oasis Petroleum, Inc. Warrants, Expiration Date 11/19/2024 (1)(5) | | | 3 | | | | 0 | |
Whiting Petroleum Corp. A Warrants, Expiration Date 9/1/2024 (1) | | | 26 | | | | 360 | |
Whiting Petroleum Corp. B Warrants, Expiration Date 9/1/2025 (1) | | | 13 | | | | 153 | |
Total Warrants (United States) (Cost $941) | | | | | | | 1,335 | |
| | | | | | | | | |
The accompanying notes are an integral part of these financial statements.
Page 74 | 2021 Annual Report | December 31, 2021 |
Schedule of Investments
December 31, 2021
Moderate Allocation Fund |
Security Description | | Shares or
Principal
Amount ($) | | | Fair
Value ($) | |
Registered Investment Companies — 40.8% |
U.S. Fixed Income — 35.8% | | | | | | | | |
Baird Core Plus Bond Fund - Class I | | | 193,078 | | | | 2,253,216 | |
Dodge & Cox Income Fund | | | 178,015 | | | | 2,502,887 | |
DoubleLine Total Return Bond Fund - Class I | | | 288,373 | | | | 2,999,082 | |
Frost Total Return Bond Fund - Class I | | | 342,791 | | | | 3,534,178 | |
Guggenheim Total Return Bond Fund - Class I | | | 43,834 | | | | 1,251,890 | |
iShares 0-5 Year High Yield Corporate Bond ETF (7) | | | 57,435 | | | | 2,601,806 | |
iShares 3-7 Year Treasury Bond ETF (7) | | | 184,045 | | | | 23,681,070 | |
Lord Abbett High Yield Fund - Class I | | | 450,841 | | | | 3,394,836 | |
PGIM Short-Term Corporate Bond Fund - Class Q | | | 112,364 | | | | 1,255,110 | |
Pioneer Bond Fund - Class K | | | 266,369 | | | | 2,586,447 | |
Segall Bryant & Hamill Plus Bond Fund - Class I | | | 288,021 | | | | 3,093,347 | |
SPDR Bloomberg Barclays Short Term High Yield Bond ETF (7) | | | 109,473 | | | | 2,972,192 | |
Vanguard Short-Term Bond ETF (7) | | | 125,840 | | | | 10,171,647 | |
| | | | | | | | 62,297,708 | |
| | | | | | | | | |
International Fixed Income — 5.0% | | | | | | | | |
iShares JP Morgan USD Emerging Markets Bond ETF (7) | | | 79,137 | | | | 8,630,681 | |
| | | | | | | | 8,630,681 | |
Total Registered Investment Companies (Cost $70,424,219) | | | | | | | 70,928,389 | |
| | | | | | | | | |
Money Market Registered Investment Companies — 23.6% |
Meeder Institutional Prime Money Market Fund, 0.05% (2) | | | 41,081,046 | | | | 41,085,154 | |
Total Money Market Registered Investment Companies (Cost $41,079,351) | | | | | | | 41,085,154 | |
| | | | | | | | | |
Bank Obligations — 0.1% |
Metro City Bank Deposit Account, 0.05%, 1/3/2022 (3) | | | 248,445 | | | | 248,445 | |
Total Bank Obligations (Cost $248,445) | | | | | | | 248,445 | |
Total Investments — 98.9% (Cost $153,435,147) | | | | | | | 171,929,690 | |
Other Assets less Liabilities — 1.1% | | | | | | | 1,828,554 | |
Total Net Assets — 100.0% | | | | | | | 173,758,244 | |
Moderate Allocation Fund |
Security Description | | Shares or
Principal
Amount ($) | | | Fair
Value ($) | |
Trustee Deferred Compensation (4) |
Meeder Balanced Fund - Retail Class | | | 507 | | | | 6,804 | |
Meeder Dynamic Allocation Fund - Retail Class | | | 1,268 | | | | 17,663 | |
Meeder Muirfield Fund - Retail Class | | | 1,589 | | | | 15,143 | |
Meeder Conservative Allocation Fund - Retail Class | | | 158 | | | | 3,735 | |
Total Trustee Deferred Compensation (Cost $38,133) | | | | | | | 43,345 | |
| | | | | | | | | |
| | | Long
(Short)
Contracts | | | Expiration
Date | | | Notional
Value of
Contracts
($) | | | Value and
Unrealized
Appreciation
(Depreciation)
($) | |
Futures Contracts |
Index Futures | | | | | | | | | | | | | | | | |
E-mini Standard & Poors MidCap 400 Futures | | | (10 | ) | | | 3/18/2022 | | | | (2,837,700 | ) | | | (25,980 | ) |
Mini MSCI EAFE Index Futures | | | 58 | | | | 3/18/2022 | | | | 6,733,220 | | | | 194,128 | |
Mini MSCI Emerging Markets Index Futures | | | 21 | | | | 3/18/2022 | | | | 1,287,615 | | | | 11,698 | |
Russell 2000 Mini Index Futures | | | 5 | | | | 3/18/2022 | | | | 560,700 | | | | 16,498 | |
Standard & Poors 500 Mini Futures | | | (35 | ) | | | 3/18/2022 | | | | (8,327,375 | ) | | | (156,713 | ) |
Total Futures Contracts | | | 39 | | | | | | | | (2,583,540 | ) | | | 39,631 | |
(1) | Represents non-income producing securities. |
(2) | Investment in affiliate. The yield shown represents the 7-day yield in effect at December 31, 2021. |
(3) | Variable rate security. Securities payable at par including accrued interest (usually within seven days notice) and unconditionally secured as to principal and interest by letters of credit or other credit support agreements from major banks. The interest rates are adjustable and are not based on a published reference rate and spread but are determined by the issuer or agent and are based on current market conditions. These securities do not indicate a reference rate and spread in their description above. The rate shown represents the rate in effect at December 31, 2021. The maturity date shown, if applicable, reflects the earlier of the next demand date or stated maturity date. |
(4) | Assets of affiliates to the Moderate Allocation Fund held for the benefit of the Fund’s Trustees in connection with the Trustee Deferred Compensation Plan. |
The accompanying notes are an integral part of these financial statements.
2021 Annual Report | December 31, 2021 | Page 75 |
Schedule of Investments
December 31, 2021
(5) | Fair valued security deemed a Level 3 security. Security is not part of the investment strategy of the Fund. |
The accompanying notes are an integral part of these financial statements.
Page 76 | 2021 Annual Report | December 31, 2021 |
Schedule of Investments
December 31, 2021
Conservative Allocation |
Security Description | | Shares or
Principal
Amount ($) | | | Fair
Value ($) | |
Common Stocks (United States) — 19.2% |
Communication Services — 1.6% | | | | | | | | |
Activision Blizzard, Inc. | | | 2,400 | | | | 159,672 | |
Alphabet, Inc. - Class C (1) | | | 212 | | | | 613,441 | |
Alphabet, Inc. - Class A (1) | | | 185 | | | | 535,952 | |
AMC Entertainment Holdings, Inc. (1) | | | 286 | | | | 7,779 | |
AT&T, Inc. | | | 702 | | | | 17,269 | |
Cargurus, Inc. (1) | | | 44 | | | | 1,480 | |
Cars.com, Inc. (1) | | | 1 | | | | 16 | |
Cinemark Holdings, Inc. (1) | | | 243 | | | | 3,917 | |
DHI Group, Inc. (1) | | | 319 | | | | 1,991 | |
DISH Network Corp. (1) | | | 112 | | | | 3,633 | |
Entravision Communications Corp. | | | 260 | | | | 1,763 | |
Eros STX Global Corp. (1) | | | 1 | | | | 0 | |
Fox Corp. | | | 36 | | | | 1,328 | |
Gannett Co., Inc. (1) | | | 1 | | | | 5 | |
Globalstar, Inc. (1) | | | 1 | | | | 1 | |
Gogo, Inc. (1) | | | 44 | | | | 595 | |
Gray Television, Inc. | | | 181 | | | | 3,649 | |
IDT Corp. (1) | | | 23 | | | | 1,016 | |
iHeartMedia, Inc. (1) | | | 42 | | | | 884 | |
IMAX Corp. (1) | | | 149 | | | | 2,658 | |
Integral Ad Science Holding Corp. (1) | | | 1 | | | | 22 | |
Interpublic Group of Cos., Inc./The | | | 1,919 | | | | 71,867 | |
Liberty Media Corp.-Liberty Braves (1) | | | 446 | | | | 12,533 | |
Liberty TripAdvisor Holdings, Inc. (1) | | | 449 | | | | 974 | |
Lions Gate Entertainment Corp. (1) | | | 202 | | | | 3,361 | |
Live Nation Entertainment, Inc. (1) | | | 24 | | | | 2,873 | |
Meta Platforms, Inc. (1) | | | 1,615 | | | | 543,205 | |
Netflix, Inc. (1) | | | 240 | | | | 144,586 | |
News Corp. | | | 107 | | | | 2,387 | |
Pinterest, Inc. (1) | | | 50 | | | | 1,818 | |
Roku, Inc. (1) | | | 11 | | | | 2,510 | |
Sinclair Broadcast Group, Inc. | | | 174 | | | | 4,599 | |
TEGNA, Inc. | | | 298 | | | | 5,531 | |
Twitter, Inc. (1) | | | 586 | | | | 25,327 | |
Verizon Communications, Inc. | | | 100 | | | | 5,196 | |
Vimeo, Inc. (1) | | | 20 | | | | 359 | |
World Wrestling Entertainment, Inc. | | | 64 | | | | 3,158 | |
Yelp, Inc. (1) | | | 168 | | | | 6,088 | |
Ziff Davis, Inc. (1) | | | 215 | | | | 23,835 | |
| | | | | | | | 2,217,278 | |
| | | | | | | | | |
Consumer Discretionary — 2.0% | | | | | | | | |
Abercrombie & Fitch Co. (1) | | | 60 | | | | 2,090 | |
Academy Sports & Outdoors, Inc. (1) | | | 246 | | | | 10,799 | |
Adient PLC (1) | | | 106 | | | | 5,075 | |
Amazon.com, Inc. (1) | | | 208 | | | | 693,543 | |
Conservative Allocation |
Security Description | | Shares or
Principal
Amount ($) | | | Fair
Value ($) | |
Common Stocks (United States) — continued |
American Axle & Manufacturing Holdings, Inc. (1) | | | 199 | | | | 1,857 | |
American Eagle Outfitters, Inc. | | | 109 | | | | 2,760 | |
Aptiv PLC (1) | | | 45 | | | | 7,423 | |
Aramark | | | 322 | | | | 11,866 | |
Asbury Automotive Group, Inc. (1) | | | 47 | | | | 8,118 | |
AutoNation, Inc. (1) | | | 49 | | | | 5,726 | |
AutoZone, Inc. (1) | | | 24 | | | | 50,313 | |
Bath & Body Works, Inc. | | | 50 | | | | 3,490 | |
Best Buy Co., Inc. | | | 376 | | | | 38,202 | |
Big 5 Sporting Goods Corp. | | | 41 | | | | 779 | |
Big Lots, Inc. | | | 135 | | | | 6,082 | |
Biglari Holdings, Inc. (1) | | | 5 | | | | 713 | |
Boyd Gaming Corp. (1) | | | 183 | | | | 11,999 | |
Brinker International, Inc. (1) | | | 76 | | | | 2,781 | |
Buckle, Inc./The | | | 44 | | | | 1,862 | |
Caleres, Inc. | | | 76 | | | | 1,724 | |
Capri Holdings, Ltd. (1) | | | 171 | | | | 11,100 | |
Chico’s FAS, Inc. (1) | | | 62 | | | | 334 | |
Conn’s, Inc. (1) | | | 21 | | | | 494 | |
Crocs, Inc. (1) | | | 244 | | | | 31,286 | |
Dana, Inc. | | | 184 | | | | 4,199 | |
Dave & Buster’s Entertainment, Inc. (1) | | | 11 | | | | 422 | |
Designer Brands, Inc. (1) | | | 99 | | | | 1,407 | |
Dick’s Sporting Goods, Inc. | | | 139 | | | | 15,984 | |
Dollar Tree, Inc. (1) | | | 36 | | | | 5,059 | |
eBay, Inc. | | | 362 | | | | 24,073 | |
Ethan Allen Interiors, Inc. | | | 12 | | | | 315 | |
Everi Holdings, Inc. (1) | | | 260 | | | | 5,551 | |
Foot Locker, Inc. | | | 283 | | | | 12,347 | |
Ford Motor Co. | | | 2,599 | | | | 53,981 | |
Fossil Group, Inc. (1) | | | 94 | | | | 967 | |
GameStop Corp. (1) | | | 33 | | | | 4,897 | |
Gap, Inc./The | | | 60 | | | | 1,059 | |
Garmin, Ltd. | | | 557 | | | | 75,847 | |
General Motors Co. (1) | | | 941 | | | | 55,171 | |
Genius Brands International, Inc. (1) | | | 99 | | | | 104 | |
Goodyear Tire & Rubber Co./The (1) | | | 282 | | | | 6,012 | |
Greenlane Holdings, Inc. (1) | | | 404 | | | | 390 | |
Group 1 Automotive, Inc. | | | 17 | | | | 3,319 | |
Guess?, Inc. | | | 199 | | | | 4,712 | |
H&R Block, Inc. | | | 1 | | | | 24 | |
Hibbett, Inc. | | | 33 | | | | 2,374 | |
Home Depot, Inc./The | | | 993 | | | | 412,105 | |
Houghton Mifflin Harcourt Co. (1) | | | 68 | | | | 1,095 | |
International Game Technology PLC | | | 434 | | | | 12,547 | |
Kirkland’s, Inc. (1) | | | 1 | | | | 15 | |
The accompanying notes are an integral part of these financial statements.
2021 Annual Report | December 31, 2021 | Page 77 |
Schedule of Investments
December 31, 2021
Conservative Allocation |
Security Description | | Shares or
Principal
Amount ($) | | | Fair
Value ($) | |
Common Stocks (United States) — continued |
Kohl’s Corp. | | | 331 | | | | 16,348 | |
Lands’ End, Inc. (1) | | | 82 | | | | 1,610 | |
Lear Corp. | | | 63 | | | | 11,526 | |
Liquidity Services, Inc. (1) | | | 33 | | | | 729 | |
Lovesac Co./The (1) | | | 23 | | | | 1,524 | |
Lowe’s Cos., Inc. | | | 1,143 | | | | 295,443 | |
Lululemon Athletica, Inc. (1) | | | 68 | | | | 26,619 | |
Macy’s, Inc. | | | 263 | | | | 6,885 | |
MGM Resorts International | | | 249 | | | | 11,175 | |
Nordstrom, Inc. (1) | | | 96 | | | | 2,172 | |
ODP Corp./The (1) | | | 55 | | | | 2,160 | |
OneWater Marine, Inc. | | | 237 | | | | 14,450 | |
O’Reilly Automotive, Inc. (1) | | | 56 | | | | 39,549 | |
Overstock.com, Inc. (1) | | | 9 | | | | 531 | |
Party City Holdco, Inc. (1) | | | 414 | | | | 2,306 | |
Qurate Retail, Inc. | | | 420 | | | | 3,192 | |
RCI Hospitality Holdings, Inc. | | | 26 | | | | 2,025 | |
Red Robin Gourmet Burgers, Inc. (1) | | | 229 | | | | 3,785 | |
Red Rock Resorts, Inc. | | | 147 | | | | 8,086 | |
Revolve Group, Inc. (1) | | | 47 | | | | 2,634 | |
Scientific Games Corp. (1) | | | 86 | | | | 5,747 | |
SeaWorld Entertainment, Inc. (1) | | | 85 | | | | 5,513 | |
Shutterstock, Inc. | | | 48 | | | | 5,322 | |
Signet Jewelers, Ltd. | | | 24 | | | | 2,089 | |
Skyline Champion Corp. (1) | | | 69 | | | | 5,450 | |
Smith & Wesson Brands, Inc. | | | 166 | | | | 2,955 | |
Sonos, Inc. (1) | | | 462 | | | | 13,768 | |
Steven Madden, Ltd. | | | 289 | | | | 13,430 | |
Tapestry, Inc. | | | 443 | | | | 17,986 | |
Target Corp. | | | 382 | | | | 88,410 | |
Tempur Sealy International, Inc. | | | 139 | | | | 6,537 | |
Tenneco, Inc. (1) | | | 231 | | | | 2,610 | |
Tesla, Inc. (1) | | | 495 | | | | 523,106 | |
Thor Industries, Inc. | | | 247 | | | | 25,631 | |
Tilly’s, Inc. | | | 6 | | | | 97 | |
Town Sports International Holdings, Inc. (1) | | | 464 | | | | 0 | |
Tupperware Brands Corp. (1) | | | 105 | | | | 1,605 | |
Urban Outfitters, Inc. (1) | | | 73 | | | | 2,143 | |
Vera Bradley, Inc. (1) | | | 1 | | | | 9 | |
Vista Outdoor, Inc. (1) | | | 21 | | | | 967 | |
Waitr Holdings, Inc. (1) | | | 332 | | | | 246 | |
Weber, Inc. | | | 243 | | | | 3,142 | |
Williams-Sonoma, Inc. | | | 78 | | | | 13,192 | |
Winnebago Industries, Inc. | | | 1 | | | | 75 | |
XPEL, Inc. (1) | | | 27 | | | | 1,844 | |
| | | | | | | | 2,809,015 | |
| | | | | | | | | |
Conservative Allocation |
Security Description | | Shares or
Principal
Amount ($) | | | Fair
Value ($) | |
Common Stocks (United States) — continued |
Consumer Staples — 0.6% | | | | | | | | |
Albertsons Cos., Inc. | | | 819 | | | | 24,726 | |
Bunge, Ltd. | | | 2,063 | | | | 192,602 | |
Celsius Holdings, Inc. (1) | | | 28 | | | | 2,088 | |
Costco Wholesale Corp. | | | 119 | | | | 67,556 | |
Darling Ingredients, Inc. (1) | | | 267 | | | | 18,500 | |
Hershey Co./The | | | 678 | | | | 131,173 | |
PepsiCo, Inc. | | | 696 | | | | 120,902 | |
Spectrum Brands Holdings, Inc. | | | 130 | | | | 13,224 | |
Tyson Foods, Inc. | | | 52 | | | | 4,532 | |
Walgreens Boots Alliance, Inc. | | | 218 | | | | 11,371 | |
Walmart, Inc. | | | 1,100 | | | | 159,159 | |
| | | | | | | | 745,833 | |
| | | | | | | | | |
Energy — 0.9% | | | | | | | | |
Alto Ingredients, Inc. (1) | | | 9 | | | | 43 | |
Altus Midstream Co. | | | 16 | | | | 981 | |
Antero Resources Corp. (1) | | | 144 | | | | 2,520 | |
APA Corp. | | | 584 | | | | 15,704 | |
Ardmore Shipping Corp. (1) | | | 3 | | | | 10 | |
Berry Corp. | | | 95 | | | | 800 | |
Bristow Group, Inc. (1) | | | 36 | | | | 1,140 | |
Cactus, Inc. | | | 49 | | | | 1,868 | |
Cheniere Energy, Inc. | | | 23 | | | | 2,333 | |
Chevron Corp. | | | 2,385 | | | | 279,880 | |
ConocoPhillips | | | 957 | | | | 69,076 | |
CONSOL Energy, Inc. (1) | | | 16 | | | | 363 | |
Coterra Energy, Inc. | | | 2 | | | | 38 | |
CVR Energy, Inc. | | | 50 | | | | 841 | |
Delek US Holdings, Inc. (1) | | | 277 | | | | 4,152 | |
Devon Energy Corp. | | | 741 | | | | 32,641 | |
DHT Holdings, Inc. | | | 98 | | | | 509 | |
Diamondback Energy, Inc. | | | 132 | | | | 14,236 | |
EOG Resources, Inc. | | | 331 | | | | 29,403 | |
Expro Group Holdings NV (1) | | | 60 | | | | 861 | |
Exxon Mobil Corp. | | | 5,028 | | | | 307,663 | �� |
Hess Corp. | | | 128 | | | | 9,476 | |
Laredo Petroleum, Inc. (1) | | | 17 | | | | 1,022 | |
Marathon Petroleum Corp. | | | 3,330 | | | | 213,087 | |
Nabors Industries, Ltd. (1) | | | 44 | | | | 3,568 | |
NextDecade Corp. (1) | | | 91 | | | | 259 | |
Nine Energy Service, Inc. (1) | | | 535 | | | | 535 | |
Northern Oil and Gas, Inc. | | | 13 | | | | 268 | |
Occidental Petroleum Corp. | | | 1,218 | | | | 35,310 | |
Oceaneering International, Inc. (1) | | | 189 | | | | 2,138 | |
ONEOK, Inc. | | | 2,013 | | | | 118,284 | |
Ovintiv, Inc. | | | 458 | | | | 15,435 | |
The accompanying notes are an integral part of these financial statements.
Page 78 | 2021 Annual Report | December 31, 2021 |
Schedule of Investments
December 31, 2021
Conservative Allocation |
Security Description | | Shares or
Principal
Amount ($) | | | Fair
Value ($) | |
Common Stocks (United States) — continued |
Par Pacific Holdings, Inc. (1) | | | 11 | | | | 181 | |
PDC Energy, Inc. | | | 5 | | | | 244 | |
Peabody Energy Corp. (1) | | | 124 | | | | 1,249 | |
Phillips 66 | | | 271 | | | | 19,637 | |
Pioneer Natural Resources Co. | | | 69 | | | | 12,550 | |
Profire Energy, Inc. (1) | | | 3 | | | | 3 | |
Range Resources Corp. (1) | | | 58 | | | | 1,034 | |
Schlumberger NV | | | 932 | | | | 27,913 | |
Scorpio Tankers, Inc. | | | 15 | | | | 192 | |
SM Energy Co. | | | 120 | | | | 3,538 | |
Southwestern Energy Co. (1) | | | 596 | | | | 2,777 | |
Talos Energy, Inc. (1) | | | 216 | | | | 2,117 | |
Targa Resources Corp. | | | 262 | | | | 13,687 | |
Teekay Corp. (1) | | | 255 | | | | 801 | |
Uranium Energy Corp. (1) | | | 77 | | | | 258 | |
W&T Offshore, Inc. (1) | | | 56 | | | | 181 | |
Westmoreland Coal Co. (1) | | | 410 | | | | 0 | |
World Fuel Services Corp. | | | 78 | | | | 2,065 | |
| | | | | | | | 1,252,871 | |
| | | | | | | | | |
Financials — 2.3% | | | | | | | | |
Affiliated Managers Group, Inc. | | | 82 | | | | 13,490 | |
Aflac, Inc. | | | 223 | | | | 13,021 | |
Allstate Corp./The | | | 931 | | | | 109,532 | |
Ally Financial, Inc. | | | 462 | | | | 21,996 | |
American Express Co. | | | 21 | | | | 3,436 | |
American Financial Group, Inc./OH | | | 124 | | | | 17,028 | |
American International Group, Inc. | | | 3,715 | | | | 211,235 | |
Ameris Bancorp | | | 223 | | | | 11,079 | |
Athene Holding, Ltd. (1) | | | 2,173 | | | | 181,076 | |
Bank of America Corp. | | | 4,248 | | | | 188,994 | |
Bank of New York Mellon Corp./The | | | 1,034 | | | | 60,055 | |
Bank OZK | | | 111 | | | | 5,165 | |
Berkshire Hathaway, Inc. (1) | | | 1,283 | | | | 383,617 | |
BGC Partners, Inc. | | | 161 | | | | 749 | |
Blackstone, Inc. | | | 180 | | | | 23,290 | |
Capital One Financial Corp. | | | 479 | | | | 69,498 | |
Charles Schwab Corp./The | | | 1,091 | | | | 91,753 | |
Chimera Investment Corp. | | | 2,476 | | | | 37,338 | |
Citigroup, Inc. | | | 1,306 | | | | 78,869 | |
Citizens Financial Group, Inc. | | | 400 | | | | 18,900 | |
Comerica, Inc. | | | 55 | | | | 4,785 | |
East West Bancorp, Inc. | | | 260 | | | | 20,457 | |
Ellington Financial, Inc. | | | 471 | | | | 8,049 | |
Evercore, Inc. | | | 296 | | | | 40,212 | |
Fidelity National Financial, Inc. | | | 544 | | | | 28,386 | |
Fifth Third Bancorp | | | 1,403 | | | | 61,101 | |
Conservative Allocation |
Security Description | | Shares or
Principal
Amount ($) | | | Fair
Value ($) | |
Common Stocks (United States) — continued |
First American Financial Corp. | | | 892 | | | | 69,781 | |
Genworth Financial, Inc. (1) | | | 1 | | | | 4 | |
Goldman Sachs Group, Inc./The | | | 26 | | | | 9,946 | |
Hancock Whitney Corp. | | | 150 | | | | 7,503 | |
Hartford Financial Services Group, Inc./The | | | 357 | | | | 24,647 | |
Invesco, Ltd. | | | 375 | | | | 8,633 | |
Janus Henderson Group PLC | | | 244 | | | | 10,233 | |
JPMorgan Chase & Co. | | | 1,187 | | | | 187,961 | |
KKR & Co., Inc. | | | 628 | | | | 46,786 | |
LendingClub Corp. (1) | | | 69 | | | | 1,668 | |
LPL Financial Holdings, Inc. | | | 46 | | | | 7,364 | |
Marlin Business Services Corp. | | | 292 | | | | 6,798 | |
MBIA, Inc. (1) | | | 134 | | | | 2,116 | |
Medley Management, Inc. (1) | | | 25 | | | | 0 | |
Meta Financial Group, Inc. | | | 76 | | | | 4,534 | |
MetLife, Inc. | | | 366 | | | | 22,871 | |
MFA Financial, Inc. | | | 1 | | | | 5 | |
Moelis & Co. | | | 275 | | | | 17,190 | |
Morgan Stanley | | | 1,474 | | | | 144,688 | |
Northrim BanCorp, Inc. | | | 202 | | | | 8,779 | |
Old Republic International Corp. | | | 2,142 | | | | 52,650 | |
OneMain Holdings, Inc. | | | 149 | | | | 7,456 | |
PacWest Bancorp | | | 229 | | | | 10,344 | |
Pinnacle Financial Partners, Inc. | | | 61 | | | | 5,826 | |
Piper Sandler Cos. | | | 170 | | | | 30,347 | |
PNC Financial Services Group, Inc./The | | | 201 | | | | 40,305 | |
Popular, Inc. | | | 100 | | | | 8,204 | |
Prudential Financial, Inc. | | | 155 | | | | 16,777 | |
Pzena Investment Management, Inc. | | | 433 | | | | 4,101 | |
Redwood Trust, Inc. | | | 94 | | | | 1,240 | |
Regions Financial Corp. | | | 953 | | | | 20,775 | |
Santander Consumer USA Holdings, Inc. | | | 194 | | | | 8,152 | |
Siebert Financial Corp. (1) | | | 18 | | | | 42 | |
Signature Bank/New York NY | | | 58 | | | | 18,761 | |
SLM Corp. | | | 318 | | | | 6,255 | |
Stewart Information Services Corp. | | | 927 | | | | 73,910 | |
SVB Financial Group (1) | | | 25 | | | | 16,956 | |
Synchrony Financial | | | 3,932 | | | | 182,405 | |
Synovus Financial Corp. | | | 66 | | | | 3,159 | |
Tiptree, Inc. | | | 70 | | | | 968 | |
Truist Financial Corp. | | | 715 | | | | 41,863 | |
Umpqua Holdings Corp. | | | 823 | | | | 15,835 | |
Upstart Holdings, Inc. (1) | | | 25 | | | | 3,783 | |
US Bancorp | | | 1,116 | | | | 62,686 | |
Walker & Dunlop, Inc. | | | 110 | | | | 16,597 | |
Wells Fargo & Co. | | | 2,296 | | | | 110,162 | |
Western Alliance Bancorp | | | 88 | | | | 9,473 | |
The accompanying notes are an integral part of these financial statements.
2021 Annual Report | December 31, 2021 | Page 79 |
Schedule of Investments
December 31, 2021
Conservative Allocation |
Security Description | | Shares or
Principal
Amount ($) | | | Fair
Value ($) | |
Common Stocks (United States) — continued |
Zions Bancorp NA | | | 324 | | | | 20,464 | |
| | | | | | | | 3,074,114 | |
| | | | | | | | | |
Healthcare — 3.6% | | | | | | | | |
9 Meters Biopharma, Inc. (1) | | | 1 | | | | 1 | |
AbbVie, Inc. | | | 2,570 | | | | 347,978 | |
Abeona Therapeutics, Inc. (1) | | | 149 | | | | 50 | |
AcelRx Pharmaceuticals, Inc. (1) | | | 58 | | | | 32 | |
ADMA Biologics, Inc. (1) | | | 55 | | | | 78 | |
Affimed NV (1) | | | 227 | | | | 1,253 | |
Agilent Technologies, Inc. | | | 715 | | | | 114,150 | |
Agiliti, Inc. (1) | | | 1 | | | | 23 | |
Akebia Therapeutics, Inc. (1) | | | 1 | | | | 2 | |
Alector, Inc. (1) | | | 34 | | | | 702 | |
Alkermes PLC (1) | | | 183 | | | | 4,257 | |
Allakos, Inc. (1) | | | 39 | | | | 382 | |
Alnylam Pharmaceuticals, Inc. (1) | | | 34 | | | | 5,766 | |
AmerisourceBergen Corp. | | | 449 | | | | 59,668 | |
Amgen, Inc. | | | 976 | | | | 219,571 | |
Amicus Therapeutics, Inc. (1) | | | 206 | | | | 2,379 | |
AMN Healthcare Services, Inc. (1) | | | 36 | | | | 4,404 | |
Amneal Pharmaceuticals, Inc. (1) | | | 442 | | | | 2,117 | |
Anavex Life Sciences Corp. (1) | | | 62 | | | | 1,075 | |
ANI Pharmaceuticals, Inc. (1) | | | 20 | | | | 922 | |
Anthem, Inc. | | | 358 | | | | 165,947 | |
Apellis Pharmaceuticals, Inc. (1) | | | 17 | | | | 804 | |
Apollo Medical Holdings, Inc. (1) | | | 63 | | | | 4,629 | |
Applied Therapeutics, Inc. (1) | | | 87 | | | | 779 | |
Apria, Inc. (1) | | | 2 | | | | 65 | |
Arbutus Biopharma Corp. (1) | | | 316 | | | | 1,229 | |
Arcutis Biotherapeutics, Inc. (1) | | | 94 | | | | 1,950 | |
Arrowhead Pharmaceuticals, Inc. (1) | | | 75 | | | | 4,973 | |
Arvinas, Inc. (1) | | | 32 | | | | 2,628 | |
Assertio Holdings, Inc. (1) | | | 266 | | | | 580 | |
Atara Biotherapeutics, Inc. (1) | | | 12 | | | | 189 | |
Avalo Therapeutics, Inc. (1) | | | 355 | | | | 604 | |
Aveanna Healthcare Holdings, Inc. (1) | | | 1 | | | | 7 | |
Avid Bioservices, Inc. (1) | | | 43 | | | | 1,255 | |
Beam Therapeutics, Inc. (1) | | | 42 | | | | 3,347 | |
Beyondspring, Inc. (1) | | | 56 | | | | 254 | |
BioDelivery Sciences International, Inc. (1) | | | 969 | | | | 3,004 | |
Biohaven Pharmaceutical Holding Co., Ltd. (1) | | | 37 | | | | 5,099 | |
Bio-Techne Corp. | | | 42 | | | | 21,728 | |
Blueprint Medicines Corp. (1) | | | 40 | | | | 4,284 | |
Bridgebio Pharma, Inc. (1) | | | 50 | | | | 834 | |
Bristol-Myers Squibb Co. | | | 2,736 | | | | 170,590 | |
Conservative Allocation |
Security Description | | Shares or
Principal
Amount ($) | | | Fair
Value ($) | |
Common Stocks (United States) — continued |
Bruker Corp. | | | 285 | | | | 23,914 | |
Calyxt, Inc. (1) | | | 133 | | | | 283 | |
Cardinal Health, Inc. | | | 585 | | | | 30,122 | |
CareDx, Inc. (1) | | | 45 | | | | 2,047 | |
CASI Pharmaceuticals, Inc. (1) | | | 45 | | | | 36 | |
Cassava Sciences, Inc. (1) | | | 67 | | | | 2,928 | |
Catalent, Inc. (1) | | | 153 | | | | 19,589 | |
Catalyst Pharmaceuticals, Inc. (1) | | | 585 | | | | 3,960 | |
Centogene NV (1) | | | 138 | | | | 722 | |
Cerevel Therapeutics Holdings, Inc. (1) | | | 20 | | | | 648 | |
Cerner Corp. | | | 1,199 | | | | 111,351 | |
Community Health Systems, Inc. (1) | | | 190 | | | | 2,529 | |
Computer Programs and Systems, Inc. (1) | | | 110 | | | | 3,223 | |
Cross Country Healthcare, Inc. (1) | | | 8 | | | | 222 | |
CVS Health Corp. | | | 927 | | | | 95,629 | |
Danaher Corp. | | | 593 | | | | 195,103 | |
Dynavax Technologies Corp. (1) | | | 110 | | | | 1,548 | |
Editas Medicine, Inc. (1) | | | 67 | | | | 1,779 | |
Elanco Animal Health, Inc. Contingent Value Rights (1)(4) | | | 32 | | | | 0 | |
Eli Lilly & Co. (1) | | | 562 | | | | 155,236 | |
Eloxx Pharmaceuticals, Inc. (1) | | | 571 | | | | 403 | |
Enanta Pharmaceuticals, Inc. (1) | | | 22 | | | | 1,645 | |
Endo International PLC (1) | | | 217 | | | | 816 | |
Evolent Health, Inc. (1) | | | 38 | | | | 1,051 | |
Exact Sciences Corp. (1) | | | 27 | | | | 2,101 | |
Exelixis, Inc. (1) | | | 335 | | | | 6,124 | |
Fulgent Genetics, Inc. (1) | | | 1 | | | | 101 | |
Galectin Therapeutics, Inc. (1) | | | 118 | | | | 244 | |
Genprex, Inc. | | | 306 | | | | 401 | |
Gilead Sciences, Inc. (1) | | | 2,326 | | | | 168,891 | |
Globus Medical, Inc. | | | 153 | | | | 11,047 | |
HCA Healthcare, Inc. (1) | | | 245 | | | | 62,945 | |
Horizon Therapeutics Plc (1) | | | 733 | | | | 78,988 | |
Humanigen, Inc. (1) | | | 17 | | | | 63 | |
iBio, Inc. (1) | | | 1 | | | | 1 | |
Illumina, Inc. (1) | | | 4 | | | | 1,522 | |
Incyte Corp. (1) | | | 825 | | | | 60,555 | |
Infinity Pharmaceuticals, Inc. (1) | | | 1 | | | | 2 | |
Inotiv, Inc. (1) | | | 44 | | | | 1,851 | |
Intellia Therapeutics, Inc. | | | 44 | | | | 5,203 | |
Johnson & Johnson (1) | | | 2,606 | | | | 445,808 | |
Jounce Therapeutics, Inc. (1) | | | 84 | | | | 701 | |
Kezar Life Sciences, Inc. (1) | | | 77 | | | | 1,287 | |
La Jolla Pharmaceutical Co. (1) | | | 153 | | | | 711 | |
Lexicon Pharmaceuticals, Inc. (1) | | | 13 | | | | 51 | |
Lineage Cell Therapeutics, Inc. (1) | | | 1 | | | | 2 | |
The accompanying notes are an integral part of these financial statements.
Page 80 | 2021 Annual Report | December 31, 2021 |
Schedule of Investments
December 31, 2021
Conservative Allocation |
Security Description | | Shares or
Principal
Amount ($) | | | Fair
Value ($) | |
Common Stocks (United States) — continued |
Mallinckrodt PLC (1) | | | 20 | | | | 3 | |
MannKind Corp. (1) | | | 538 | | | | 2,351 | |
Maravai LifeSciences Holdings, Inc. (1) | | | 53 | | | | 2,221 | |
Marinus Pharmaceuticals, Inc. | | | 61 | | | | 725 | |
McKesson Corp. | | | 452 | | | | 112,354 | |
Medtronic PLC | | | 89 | | | | 9,207 | |
Merck & Co., Inc. (1) | | | 3,410 | | | | 261,342 | |
Mirati Therapeutics, Inc. (1) | | | 36 | | | | 5,281 | |
Moderna, Inc. (1) | | | 549 | | | | 139,435 | |
Molina Healthcare, Inc. (1) | | | 9 | | | | 2,863 | |
Myriad Genetics, Inc. (1) | | | 44 | | | | 1,214 | |
Natera, Inc. (1) | | | 73 | | | | 6,817 | |
Novavax, Inc. (1) | | | 41 | | | | 5,866 | |
Ocugen, Inc. (1) | | | 90 | | | | 410 | |
Oncocyte Corp. (1) | | | 99 | | | | 215 | |
OptimizeRx Corp. (1) | | | 1 | | | | 62 | |
Oramed Pharmaceuticals, Inc. (1) | | | 43 | | | | 614 | |
Organogenesis Holdings, Inc. | | | 3 | | | | 28 | |
Organon & Co. (1) | | | 308 | | | | 9,379 | |
Palatin Technologies, Inc. | | | 859 | | | | 439 | |
PerkinElmer, Inc. | | | 192 | | | | 38,604 | |
Perrigo Co. PLC | | | 874 | | | | 33,999 | |
Pfizer, Inc. (1) | | | 4,365 | | | | 257,753 | |
Precigen, Inc. (1) | | | 399 | | | | 1,480 | |
Precision BioSciences, Inc. (1) | | | 1 | | | | 7 | |
Prothena Corp. PLC (1) | | | 41 | | | | 2,025 | |
Puma Biotechnology, Inc. | | | 168 | | | | 511 | |
Quest Diagnostics, Inc. (1) | | | 252 | | | | 43,599 | |
Quidel Corp. (1) | | | 34 | | | | 4,590 | |
Radius Health, Inc. (1) | | | 34 | | | | 235 | |
Regeneron Pharmaceuticals, Inc. (1) | | | 346 | | | | 218,506 | |
REGENXBIO, Inc. (1) | | | 9 | | | | 294 | |
Rocket Pharmaceuticals, Inc. (1) | | | 17 | | | | 371 | |
Sage Therapeutics, Inc. (1) | | | 78 | | | | 3,318 | |
Sesen Bio, Inc. (1) | | | 382 | | | | 311 | |
Sorrento Therapeutics, Inc. (1) | | | 262 | | | | 1,218 | |
SpringWorks Therapeutics, Inc. (1) | | | 25 | | | | 1,550 | |
STAAR Surgical Co. (1) | | | 44 | | | | 4,017 | |
Sutro Biopharma, Inc. (1) | | | 55 | | | | 818 | |
Tenet Healthcare Corp. | | | 51 | | | | 4,166 | |
Thermo Fisher Scientific, Inc. (1) | | | 456 | | | | 304,261 | |
Tonix Pharmaceuticals Holding Corp. (1) | | | 1 | | | | 0 | |
TransMedics Group, Inc. (1) | | | 23 | | | | 441 | |
Twist Bioscience Corp. (1) | | | 31 | | | | 2,399 | |
Tyme Technologies, Inc. (1) | | | 115 | | | | 69 | |
Ultragenyx Pharmaceutical, Inc. | | | 14 | | | | 1,177 | |
UnitedHealth Group, Inc. | | | 930 | | | | 466,990 | |
Conservative Allocation |
Security Description | | Shares or
Principal
Amount ($) | | | Fair
Value ($) | |
Common Stocks (United States) — continued |
Universal Health Services, Inc. (1) | | | 65 | | | | 8,428 | |
Vanda Pharmaceuticals, Inc. (1) | | | 20 | | | | 314 | |
Veracyte, Inc. | | | 88 | | | | 3,626 | |
Viatris, Inc. (1) | | | 1,834 | | | | 24,814 | |
ViewRay, Inc. (1) | | | 260 | | | | 1,433 | |
VistaGen Therapeutics, Inc. (1) | | | 1 | | | | 2 | |
WaVe Life Sciences, Ltd. | | | 141 | | | | 443 | |
West Pharmaceutical Services, Inc. (1) | | | 229 | | | | 107,403 | |
Zentalis Pharmaceuticals, Inc. (1) | | | 40 | | | | 3,362 | |
ZIOPHARM Oncology, Inc. | | | 193 | | | | 210 | |
Zoetis, Inc. | | | 175 | | | | 42,705 | |
| | | | | | | | 4,809,247 | |
| | | | | | | | | |
Industrials — 1.2% | | | | | | | | |
Acuity Brands, Inc. | | | 73 | | | | 15,456 | |
AGCO Corp. | | | 112 | | | | 12,994 | |
ArcBest Corp. | | | 29 | | | | 3,476 | |
Atkore, Inc. (1) | | | 56 | | | | 6,227 | |
Atlas Air Worldwide Holdings, Inc. (1) | | | 93 | | | | 8,753 | |
Avis Budget Group, Inc. (1) | | | 28 | | | | 5,806 | |
Axon Enterprise, Inc. (1) | | | 30 | | | | 4,710 | |
AZZ, Inc. | | | 108 | | | | 5,971 | |
Boise Cascade Co. | | | 479 | | | | 34,105 | |
Builders FirstSource, Inc. (1) | | | 145 | | | | 12,428 | |
Carrier Global Corp. | | | 94 | | | | 5,099 | |
Caterpillar, Inc. | | | 126 | | | | 26,049 | |
Clean Harbors, Inc. (1) | | | 2 | | | | 200 | |
Copart, Inc. (1) | | | 131 | | | | 19,862 | |
Core & Main, Inc. (1) | | | 27 | | | | 819 | |
Covenant Logistics Group, Inc. (1) | | | 48 | | | | 1,269 | |
CSX Corp. | | | 739 | | | | 27,786 | |
Eaton Corp. PLC | | | 154 | | | | 26,614 | |
EMCOR Group, Inc. | | | 371 | | | | 47,262 | |
Emerson Electric Co. | | | 588 | | | | 54,666 | |
Encore Wire Corp. | | | 16 | | | | 2,290 | |
EnerSys | | | 29 | | | | 2,293 | |
Franklin Electric Co., Inc. | | | 73 | | | | 6,903 | |
FTC Solar, Inc. (1) | | | 59 | | | | 446 | |
FuelCell Energy, Inc. (1) | | | 155 | | | | 806 | |
Genco Shipping & Trading, Ltd. | | | 172 | | | | 2,752 | |
Generac Holdings, Inc. (1) | | | 119 | | | | 41,878 | |
General Dynamics Corp. | | | 826 | | | | 172,196 | |
GrafTech International, Ltd. | | | 315 | | | | 3,726 | |
Granite Construction, Inc. | | | 27 | | | | 1,045 | |
Helios Technologies, Inc. | | | 14 | | | | 1,472 | |
Herc Holdings, Inc. | | | 52 | | | | 8,141 | |
Hertz Global Holdings, Inc. (1) | | | 3 | | | | 75 | |
The accompanying notes are an integral part of these financial statements.
2021 Annual Report | December 31, 2021 | Page 81 |
Schedule of Investments
December 31, 2021
Conservative Allocation |
Security Description | | Shares or
Principal
Amount ($) | | | Fair
Value ($) | |
Common Stocks (United States) — continued |
Hillenbrand, Inc. | | | 129 | | | | 6,707 | |
Hub Group, Inc. (1) | | | 55 | | | | 4,633 | |
Huntington Ingalls Industries, Inc. | | | 227 | | | | 42,390 | |
JB Hunt Transport Services, Inc. | | | 147 | | | | 30,047 | |
Johnson Controls International plc | | | 2,781 | | | | 226,123 | |
Karat Packaging, Inc. (1) | | | 29 | | | | 586 | |
Manitowoc Co., Inc./The (1) | | | 300 | | | | 5,577 | |
ManpowerGroup, Inc. | | | 426 | | | | 41,463 | |
Matson, Inc. | | | 15 | | | | 1,350 | |
Meritor, Inc. (1) | | | 102 | | | | 2,528 | |
Miller Industries, Inc./TN | | | 30 | | | | 1,002 | |
Mueller Industries, Inc. | | | 544 | | | | 32,292 | |
Mueller Water Products, Inc. | | | 1 | | | | 14 | |
NL Industries, Inc. | | | 12 | | | | 89 | |
nVent Electric PLC | | | 356 | | | | 13,528 | |
Old Dominion Freight Line, Inc. | | | 112 | | | | 40,139 | |
Oshkosh Corp. | | | 122 | | | | 13,751 | |
Owens Corning | | | 174 | | | | 15,747 | |
Plug Power, Inc. (1) | | | 241 | | | | 6,803 | |
Quad/Graphics, Inc. (1) | | | 376 | | | | 1,504 | |
Quanta Services, Inc. | | | 1,568 | | | | 179,787 | |
Raytheon Technologies Corp. | | | 840 | | | | 72,290 | |
Regal Rexnord Corp. | | | 232 | | | | 39,482 | |
Resideo Technologies, Inc. (1) | | | 211 | | | | 5,492 | |
REV Group, Inc. | | | 56 | | | | 792 | |
RR Donnelley & Sons Co. (1) | | | 1 | | | | 11 | |
Rush Enterprises, Inc. | | | 3 | | | | 167 | |
Ryder System, Inc. | | | 406 | | | | 33,467 | |
Saia, Inc. (1) | | | 30 | | | | 10,111 | |
Shyft Group, Inc./The | | | 74 | | | | 3,636 | |
SkyWest, Inc. (1) | | | 339 | | | | 13,323 | |
Terex Corp. | | | 379 | | | | 16,657 | |
Textainer Group Holdings, Ltd. | | | 87 | | | | 3,107 | |
Textron, Inc. | | | 845 | | | | 65,234 | |
Titan International, Inc. (1) | | | 332 | | | | 3,639 | |
Triton International, Ltd. | | | 138 | | | | 8,312 | |
TrueBlue, Inc. (1) | | | 91 | | | | 2,518 | |
United Parcel Service, Inc. | | | 359 | | | | 76,948 | |
United Rentals, Inc. (1) | | | 39 | | | | 12,959 | |
Valmont Industries, Inc. | | | 96 | | | | 24,048 | |
Vectrus, Inc. (1) | | | 101 | | | | 4,623 | |
Veritiv Corp. (1) | | | 1 | | | | 123 | |
Vicor Corp. (1) | | | 27 | | | | 3,428 | |
WESCO International, Inc. (1) | | | 112 | | | | 14,738 | |
Yellow Corp. (1) | | | 62 | | | | 781 | |
| | | | | | | | 1,645,521 | |
| | | | | | | | | |
Conservative Allocation |
Security Description | | Shares or
Principal
Amount ($) | | | Fair
Value ($) | |
Common Stocks (United States) — continued |
Information Technology — 5.7% | | | | | | | | |
3D Systems Corp. (1) | | | 34 | | | | 732 | |
Accenture PLC | | | 150 | | | | 62,183 | |
ACI Worldwide, Inc. (1) | | | 266 | | | | 9,230 | |
Adobe, Inc. (1) | | | 368 | | | | 208,678 | |
Advanced Micro Devices, Inc. (1) | | | 850 | | | | 122,315 | |
Alliance Data Systems Corp. | | | 240 | | | | 15,977 | |
Ambarella, Inc. (1) | | | 35 | | | | 7,101 | |
American Software, Inc./GA | | | 149 | | | | 3,899 | |
Amkor Technology, Inc. | | | 390 | | | | 9,668 | |
Analog Devices, Inc. | | | 180 | | | | 31,639 | |
Apple, Inc. | | | 6,806 | | | | 1,208,541 | |
Applied Materials, Inc. | | | 1,708 | | | | 268,771 | |
Arrow Electronics, Inc. (1) | | | 572 | | | | 76,802 | |
Asana, Inc. (1) | | | 126 | | | | 9,393 | |
Atlassian Corp. PLC (1) | | | 65 | | | | 24,784 | |
Autodesk, Inc. (1) | | | 69 | | | | 19,402 | |
Aviat Networks, Inc. (1) | | | 4 | | | | 128 | |
Avnet, Inc. | | | 734 | | | | 30,263 | |
Belden, Inc. | | | 35 | | | | 2,301 | |
Bill.com Holdings, Inc. (1) | | | 45 | | | | 11,212 | |
Box, Inc. (1) | | | 174 | | | | 4,557 | |
Broadcom, Inc. | | | 111 | | | | 73,861 | |
Calix, Inc. (1) | | | 138 | | | | 11,036 | |
CDK Global, Inc. | | | 784 | | | | 32,724 | |
CDW Corp./DE | | | 503 | | | | 103,004 | |
ChannelAdvisor Corp. (1) | | | 273 | | | | 6,738 | |
Cisco Systems, Inc./Delaware | | | 3,471 | | | | 219,957 | |
Cloudflare, Inc. (1) | | | 186 | | | | 24,459 | |
Cognex Corp. | | | 52 | | | | 4,044 | |
Concentrix Corp. | | | 52 | | | | 9,288 | |
Conduent, Inc. (1) | | | 735 | | | | 3,925 | |
Crowdstrike Holdings, Inc. (1) | | | 112 | | | | 22,932 | |
Datadog, Inc. (1) | | | 52 | | | | 9,262 | |
Diebold Nixdorf, Inc. (1) | | | 87 | | | | 787 | |
Diodes, Inc. (1) | | | 180 | | | | 19,766 | |
Dolby Laboratories, Inc. | | | 1,389 | | | | 132,261 | |
Dropbox, Inc. (1) | | | 1,468 | | | | 36,025 | |
DXC Technology Co. (1) | | | 306 | | | | 9,850 | |
Dynatrace, Inc. (1) | | | 131 | | | | 7,906 | |
Ebix, Inc. | | | 74 | | | | 2,250 | |
EPAM Systems, Inc. (1) | | | 69 | | | | 46,123 | |
Extreme Networks, Inc. (1) | | | 26 | | | | 408 | |
Fortinet, Inc. (1) | | | 242 | | | | 86,975 | |
Gartner, Inc. (1) | | | 329 | | | | 109,991 | |
Hewlett Packard Enterprise Co. | | | 893 | | | | 14,083 | |
HP, Inc. | | | 2,677 | | | | 100,843 | |
The accompanying notes are an integral part of these financial statements.
Page 82 | 2021 Annual Report | December 31, 2021 |
Schedule of Investments
December 31, 2021
Conservative Allocation |
Security Description | | Shares or
Principal
Amount ($) | | | Fair
Value ($) | |
Common Stocks (United States) — continued |
HubSpot, Inc. (1) | | | 36 | | | | 23,729 | |
Intel Corp. | | | 2,882 | | | | 148,423 | |
Intuit, Inc. | | | 412 | | | | 265,007 | |
Jabil, Inc. | | | 1,138 | | | | 80,058 | |
Kimball Electronics, Inc. (1) | | | 39 | | | | 849 | |
KLA Corp. | | | 544 | | | | 233,980 | |
Kulicke & Soffa Industries, Inc. | | | 108 | | | | 6,538 | |
Kyndryl Holdings, Inc. (1) | | | 112 | | | | 2,027 | |
Lam Research Corp. | | | 68 | | | | 48,902 | |
Lattice Semiconductor Corp. (1) | | | 302 | | | | 23,272 | |
Manhattan Associates, Inc. (1) | | | 217 | | | | 33,741 | |
Marathon Digital Holdings, Inc. (1) | | | 69 | | | | 2,267 | |
MaxLinear, Inc. (1) | | | 2 | | | | 151 | |
McAfee Corp. | | | 659 | | | | 16,996 | |
Micron Technology, Inc. | | | 631 | | | | 58,778 | |
Microsoft Corp. | | | 4,640 | | | | 1,560,514 | |
Mimecast, Ltd. (1) | | | 29 | | | | 2,308 | |
MoneyGram International, Inc. (1) | | | 342 | | | | 2,698 | |
MongoDB, Inc. (1) | | | 16 | | | | 8,470 | |
Monolithic Power Systems, Inc. | | | 17 | | | | 8,387 | |
NCR Corp. (1) | | | 396 | | | | 15,919 | |
NortonLifeLock, Inc. | | | 1,248 | | | | 32,423 | |
NVIDIA Corp. | | | 1,413 | | | | 415,577 | |
NXP Semiconductors NV | | | 92 | | | | 20,956 | |
ON Semiconductor Corp. (1) | | | 204 | | | | 13,856 | |
Oracle Corp. | | | 1,636 | | | | 142,676 | |
Palantir Technologies, Inc. (1) | | | 82 | | | | 1,493 | |
Palo Alto Networks, Inc. (1) | | | 277 | | | | 154,223 | |
Paycom Software, Inc. (1) | | | 61 | | | | 25,327 | |
Perficient, Inc. (1) | | | 39 | | | | 5,042 | |
Photronics, Inc. (1) | | | 1 | | | | 19 | |
Plantronics, Inc. (1) | | | 41 | | | | 1,203 | |
Power Integrations, Inc. | | | 55 | | | | 5,109 | |
Priority Technology Holdings, Inc. (1) | | | 125 | | | | 885 | |
Progress Software Corp. | | | 423 | | | | 20,418 | |
Qorvo, Inc. (1) | | | 78 | | | | 12,198 | |
Rimini Street, Inc. (1) | | | 118 | | | | 704 | |
Riot Blockchain, Inc. (1) | | | 82 | | | | 1,831 | |
salesforce.com, Inc. (1) | | | 502 | | | | 127,573 | |
Sanmina Corp. (1) | | | 14 | | | | 580 | |
ScanSource, Inc. (1) | | | 96 | | | | 3,368 | |
SecureWorks Corp. (1) | | | 56 | | | | 894 | |
SiTime Corp. (1) | | | 9 | | | | 2,633 | |
SMART Global Holdings, Inc. (1) | | | 19 | | | | 1,349 | |
Smartsheet, Inc. (1) | | | 56 | | | | 4,337 | |
Sonim Technologies, Inc. (1) | | | 21 | | | | 19 | |
Sprout Social, Inc. (1) | | | 108 | | | | 9,795 | |
Conservative Allocation |
Security Description | | Shares or
Principal
Amount ($) | | | Fair
Value ($) | |
Common Stocks (United States) — continued |
SPS Commerce, Inc. (1) | | | 31 | | | | 4,413 | |
SS&C Technologies Holdings, Inc. | | | 2,514 | | | | 206,098 | |
StarTek, Inc. (1) | | | 239 | | | | 1,248 | |
Stratasys, Ltd. (1) | | | 58 | | | | 1,420 | |
Synaptics, Inc. (1) | | | 40 | | | | 11,580 | |
Synopsys, Inc. (1) | | | 248 | | | | 91,388 | |
Teradata Corp. (1) | | | 172 | | | | 7,305 | |
Teradyne, Inc. | | | 35 | | | | 5,724 | |
TESSCO Technologies, Inc. (1) | | | 26 | | | | 164 | |
Texas Instruments, Inc. | | | 716 | | | | 134,945 | |
Trade Desk, Inc./The (1) | | | 221 | | | | 20,252 | |
Trimble, Inc. (1) | | | 222 | | | | 19,356 | |
TTEC Holdings, Inc. | | | 5 | | | | 453 | |
Ultra Clean Holdings, Inc. (1) | | | 27 | | | | 1,549 | |
Veritone, Inc. (1) | | | 31 | | | | 697 | |
Viant Technology, Inc. (1) | | | 247 | | | | 2,397 | |
Visa, Inc. | | | 367 | | | | 79,533 | |
VMware, Inc. | | | 324 | | | | 37,545 | |
Workday, Inc. (1) | | | 69 | | | | 18,849 | |
Workiva, Inc. (1) | | | 83 | | | | 10,831 | |
Xilinx, Inc. | | | 25 | | | | 5,301 | |
Xperi Holding Corp. | | | 475 | | | | 8,982 | |
Zebra Technologies Corp. (1) | | | 85 | | | | 50,592 | |
Zscaler, Inc. (1) | | | 37 | | | | 11,889 | |
| | | | | | | | 7,496,087 | |
| | | | | | | | | |
Materials — 0.2% | | | | | | | | |
Albemarle Corp. | | | 100 | | | | 23,377 | |
Alcoa Corp. | | | 170 | | | | 10,129 | |
Amyris, Inc. (1) | | | 84 | | | | 454 | |
Avient Corp. | | | 57 | | | | 3,189 | |
Berry Global Group, Inc. (1) | | | 218 | | | | 16,084 | |
Celanese Corp. | | | 139 | | | | 23,360 | |
Century Aluminum Co. (1) | | | 41 | | | | 679 | |
Chemours Co./The | | | 88 | | | | 2,953 | |
Cleveland-Cliffs, Inc. (1) | | | 254 | | | | 5,530 | |
Dow, Inc. | | | 526 | | | | 29,835 | |
Element Solutions, Inc. | | | 79 | | | | 1,918 | |
Freeport-McMoRan, Inc. | | | 947 | | | | 39,518 | |
Hawkins, Inc. | | | 45 | | | | 1,775 | |
Huntsman Corp. | | | 263 | | | | 9,173 | |
Intrepid Potash, Inc. (1) | | | 6 | | | | 256 | |
Koppers Holdings, Inc. (1) | | | 114 | | | | 3,568 | |
Louisiana-Pacific Corp. | | | 333 | | | | 26,091 | |
LyondellBasell Industries NV | | | 305 | | | | 28,130 | |
Mosaic Co./The | | | 386 | | | | 15,166 | |
Nucor Corp. | | | 283 | | | | 32,304 | |
The accompanying notes are an integral part of these financial statements.
2021 Annual Report | December 31, 2021 | Page 83 |
Schedule of Investments
December 31, 2021
Conservative Allocation |
Security Description | | Shares or
Principal
Amount ($) | | | Fair
Value ($) | |
Common Stocks (United States) — continued |
O-I Glass, Inc. (1) | | | 92 | | | | 1,107 | |
Olin Corp. | | | 128 | | | | 7,363 | |
Rayonier Advanced Materials, Inc. (1) | | | 26 | | | | 148 | |
Steel Dynamics, Inc. | | | 134 | | | | 8,317 | |
SunCoke Energy, Inc. | | | 36 | | | | 237 | |
Trinseo PLC | | | 92 | | | | 4,826 | |
Tronox Holdings PLC | | | 120 | | | | 2,884 | |
United States Steel Corp. | | | 136 | | | | 3,238 | |
Westlake Chemical Corp. | | | 119 | | | | 11,558 | |
| | | | | | | | 313,167 | |
| | | | | | | | | |
Real Estate Investment Trust — 0.7% | | | | | | | | |
Altisource Portfolio Solutions SA (1) | | | 195 | | | | 2,188 | |
American Homes 4 Rent | | | 647 | | | | 28,216 | |
Armada Hoffler Properties, Inc. | | | 1 | | | | 15 | |
Ashford Hospitality Trust, Inc. (1) | | | 186 | | | | 1,786 | |
Braemar Hotels & Resorts, Inc. (1) | | | 1 | | | | 5 | |
Camden Property Trust | | | 298 | | | | 53,247 | |
CareTrust REIT, Inc. | | | 709 | | | | 16,186 | |
CatchMark Timber Trust, Inc. | | | 639 | | | | 5,566 | |
CBL & Associates Properties, Inc. (1) | | | 5 | | | | 156 | |
CorEnergy Infrastructure Trust, Inc. | | | 999 | | | | 3,127 | |
Corporate Office Properties Trust | | | 646 | | | | 18,069 | |
CubeSmart | | | 1,364 | | | | 77,625 | |
CyrusOne, Inc. | | | 1 | | | | 90 | |
DiamondRock Hospitality Co. (1) | | | 73 | | | | 702 | |
Easterly Government Properties, Inc. | | | 6 | | | | 138 | |
EastGroup Properties, Inc. | | | 238 | | | | 54,228 | |
Essential Properties Realty Trust, Inc. | | | 5 | | | | 144 | |
Essex Property Trust, Inc. | | | 89 | | | | 31,348 | |
eXp World Holdings, Inc. | | | 12 | | | | 404 | |
Extra Space Storage, Inc. | | | 17 | | | | 3,854 | |
First Industrial Realty Trust, Inc. | | | 696 | | | | 46,075 | |
Gladstone Commercial Corp. | | | 139 | | | | 3,582 | |
Healthcare Trust of America, Inc. | | | 25 | | | | 835 | |
Host Hotels & Resorts, Inc. (1) | | | 81 | | | | 1,409 | |
Invitation Homes, Inc. | | | 544 | | | | 24,665 | |
Lamar Advertising Co. | | | 1,556 | | | | 188,743 | |
Life Storage, Inc. | | | 10 | | | | 1,532 | |
LXP Industrial Trust | | | 1 | | | | 16 | |
Maui Land & Pineapple Co., Inc. (1) | | | 4 | | | | 40 | |
Mid-America Apartment Communities, Inc. | | | 245 | | | | 56,213 | |
Omega Healthcare Investors, Inc. | | | 978 | | | | 28,939 | |
PotlatchDeltic Corp. | | | 228 | | | | 13,730 | |
Public Storage | | | 323 | | | | 120,983 | |
RAIT Financial Trust (1)(4) | | | 368 | | | | 0 | |
Regency Centers Corp. | | | 834 | | | | 62,842 | |
Conservative Allocation |
Security Description | | Shares or
Principal
Amount ($) | | | Fair
Value ($) | |
Common Stocks (United States) — continued |
Sabra Health Care REIT, Inc. | | | 1 | | | | 14 | |
SITE Centers Corp. | | | 1 | | | | 16 | |
SL Green Realty Corp. | | | 286 | | | | 20,506 | |
Spirit MTA REIT Liquidating Trust (1)(4) | | | 477 | | | | 0 | |
Stratus Properties, Inc. (1) | | | 56 | | | | 2,048 | |
Tanger Factory Outlet Centers, Inc. | | | 96 | | | | 1,851 | |
Trinity Place Holdings, Inc. (1) | | | 366 | | | | 673 | |
UDR, Inc. | | | 283 | | | | 16,977 | |
Universal Health Realty Income Trust | | | 153 | | | | 9,099 | |
Weyerhaeuser Co. | | | 410 | | | | 16,884 | |
Zillow Group, Inc. (1) | | | 155 | | | | 9,897 | |
| | | | | | | | 924,663 | |
| | | | | | | | | |
Utilities — 0.4% | | | | | | | | |
Evergy, Inc. | | | 1,586 | | | | 108,815 | |
Exelon Corp. | | | 4,050 | | | | 233,930 | |
MDU Resources Group, Inc. | | | 1,410 | | | | 43,484 | |
NRG Energy, Inc. | | | 1,087 | | | | 46,828 | |
Portland General Electric Co. | | | 1,157 | | | | 61,228 | |
UGI Corp. | | | 754 | | | | 34,616 | |
| | | | | | | | 528,901 | |
| | | | | | | | | |
Total Common Stocks (United States) (Cost $17,971,694) | | | | | | | 25,816,697 | |
| | | | | | | | | |
Preferred Stock (United States) — 0.0% |
WESCO International, Inc. Series A Variable Preferred (5) | | | 153 | | | | 4,689 | |
Total Preferred Stock (United States) (Cost $3,824) | | | | | | | 4,689 | |
| | | | | | | | | |
Warrants (United States) — 0.0% |
Civitas Solutions, Inc. A Warrants, Expiration Date 1/20/2025 (1)(4) | | | 4 | | | | 0 | |
Civitas Solutions, Inc. B Warrants, Expiration Date 1/20/2026 (1)(4) | | | 1 | | | | 0 | |
Hertz Global Holdings, Inc. Warrants, Expiration Date 6/30/2051 (1) | | | 21 | | | | 335 | |
Nabors Industries, Ltd. Warrants, Expiration Date 6/11/2026 (1) | | | 6 | | | | 22 | |
Oasis Petroleum, Inc. Warrants, Expiration Date 11/19/2024 (1)(4) | | | 1 | | | | 0 | |
Whiting Petroleum Corp. A Warrants, Expiration Date 9/1/2024 (1) | | | 8 | | | | 111 | |
Whiting Petroleum Corp. B Warrants, Expiration Date 9/1/2025 (1) | | | 2 | | | | 24 | |
Total Warrants (United States) (Cost $374) | | | | | | | 492 | |
The accompanying notes are an integral part of these financial statements.
Page 84 | 2021 Annual Report | December 31, 2021 |
Schedule of Investments
December 31, 2021
Conservative Allocation |
Security Description | | Shares or
Principal
Amount ($) | | | Fair
Value ($) | |
Registered Investment Companies — 57.6% |
U.S. Fixed Income — 50.6% | | | | | | | | |
Baird Core Plus Bond Fund - Class I | | | 207,951 | | | | 2,426,787 | |
Dodge & Cox Income Fund | | | 198,531 | | | | 2,791,343 | |
DoubleLine Total Return Bond Fund - Class I | | | 315,203 | | | | 3,278,108 | |
Frost Total Return Bond Fund - Class I | | | 374,781 | | | | 3,863,996 | |
Guggenheim Total Return Bond Fund - Class I | | | 49,078 | | | | 1,401,665 | |
iShares 0-5 Year High Yield Corporate Bond ETF (6) | | | 62,320 | | | | 2,823,096 | |
iShares 3-7 Year Treasury Bond ETF (6) | | | 200,189 | | | | 25,758,318 | |
Lord Abbett High Yield Fund - Class I | | | 498,001 | | | | 3,749,946 | |
PGIM Short-Term Corporate Bond Fund - Class Q | | | 124,781 | | | | 1,393,805 | |
Pioneer Bond Fund - Class K | | | 288,330 | | | | 2,799,689 | |
Segall Bryant & Hamill Plus Bond Fund - Class I | | | 312,341 | | | | 3,354,547 | |
SPDR Bloomberg Barclays Short Term High Yield Bond ETF (6) | | | 119,876 | | | | 3,254,633 | |
Vanguard Short-Term Bond ETF (6) | | | 139,107 | | | | 11,244,019 | |
| | | | | | | | 68,139,952 | |
| | | | | | | | | |
International Fixed Income — 7.0% | | | | | | | | |
iShares JP Morgan USD Emerging Markets Bond ETF (6) | | | 85,994 | | | | 9,378,506 | |
| | | | | | | | 9,378,506 | |
Total Registered Investment Companies (Cost $76,929,130) | | | | | | | 77,518,458 | |
| | | | | | | | | |
Money Market Registered Investment Companies — 22.4% |
Meeder Institutional Prime Money Market Fund, 0.05% (2) | | | 30,117,090 | | | | 30,120,101 | |
Total Money Market Registered Investment Companies (Cost $30,116,946) | | | | | | | 30,120,101 | |
Total Investments — 99.2% (Cost $125,021,968) | | | | | | | 133,460,437 | |
Other Assets less Liabilities — 0.8% | | | | | | | 1,009,146 | |
Total Net Assets — 100.0% | | | | | | | 134,469,583 | |
| | | | | | | | | |
Trustee Deferred Compensation (3) |
Meeder Balanced Fund - Retail Class | | | 1,316 | | | | 17,661 | |
Meeder Dynamic Allocation Fund - Retail Class | | | 3,561 | | | | 49,605 | |
Meeder Muirfield Fund - Retail Class | | | 2,101 | | | | 20,023 | |
Meeder Conservative Allocation Fund - Retail Class | | | 382 | | | | 9,030 | |
Total Trustee Deferred Compensation (Cost $77,958) | | | | | | | 96,319 | |
| | | Long
(Short)
Contracts | | | Expiration
Date | | | Notional
Value of
Contracts
($) | | | Value and
Unrealized
Appreciation
(Depreciation)
($) | |
Futures Contracts |
Index Futures | | | | | | | | | | | | | | | | |
E-mini Standard & Poors MidCap 400 Futures | | | (5 | ) | | | 3/18/2022 | | | | (1,418,850 | ) | | | (7,867 | ) |
Mini MSCI EAFE Index Futures | | | 27 | | | | 3/18/2022 | | | | 3,134,430 | | | | 90,370 | |
Mini MSCI Emerging Markets Index Futures | | | 10 | | | | 3/18/2022 | | | | 613,150 | | | | 5,570 | |
Russell 2000 Mini Index Futures | | | 7 | | | | 3/18/2022 | | | | 784,980 | | | | 23,097 | |
Standard & Poors 500 Mini Futures | | | (10 | ) | | | 3/18/2022 | | | | (2,379,250 | ) | | | (34,742 | ) |
Total Futures Contracts | | | 29 | | | | | | | | 734,460 | | | | 76,428 | |
(1) | Represents non-income producing securities. |
(2) | Investment in affiliate. The yield shown represents the 7-day yield in effect at December 31, 2021. |
(3) | Assets of affiliates to the Conservative Allocation Fund held for the benefit of the Fund’s Trustees in connection with the Trustees Deferred Compensation Plan. |
(4) | Fair valued security deemed a Level 3 security. Security is not part of the investment strategy of the Fund. |
The accompanying notes are an integral part of these financial statements.
2021 Annual Report | December 31, 2021 | Page 85 |
Schedule of Investments
December 31, 2021
Dynamic Allocation Fund |
Security Description | | Shares or
Principal
Amount ($) | | | Fair
Value ($) | |
Common Stocks (United States) — 66.9% |
Communication Services — 5.8% | | | | | | | | |
Activision Blizzard, Inc. | | | 10,772 | | | | 716,661 | |
Alphabet, Inc. - Class C (1) | | | 1,324 | | | | 3,831,113 | |
Alphabet, Inc. - Class A (1) | | | 1,222 | | | | 3,540,183 | |
AMC Entertainment Holdings, Inc. (1) | | | 1,762 | | | | 47,926 | |
AT&T, Inc. | | | 3,198 | | | | 78,671 | |
Cargurus, Inc. (1) | | | 481 | | | | 16,181 | |
Cars.com, Inc. (1) | | | 303 | | | | 4,875 | |
Cinemark Holdings, Inc. (1) | | | 1,554 | | | | 25,050 | |
DHI Group, Inc. (1) | | | 2,040 | | | | 12,730 | |
DISH Network Corp. (1) | | | 650 | | | | 21,086 | |
Entravision Communications Corp. | | | 1,206 | | | | 8,177 | |
Fox Corp. | | | 89 | | | | 3,284 | |
Gogo, Inc. (1) | | | 231 | | | | 3,125 | |
Gray Television, Inc. | | | 1,373 | | | | 27,680 | |
IDT Corp. (1) | | | 44 | | | | 1,943 | |
iHeartMedia, Inc. (1) | | | 125 | | | | 2,630 | |
IMAX Corp. (1) | | | 684 | | | | 12,203 | |
Integral Ad Science Holding Corp. (1) | | | 45 | | | | 999 | |
Interpublic Group of Cos., Inc./The | | | 7,913 | | | | 296,342 | |
Liberty Media Corp.-Liberty Braves - Class A (1) | | | 494 | | | | 14,203 | |
Liberty Media Corp.-Liberty Braves - Class C (1) | | | 2,115 | | | | 59,432 | |
Liberty TripAdvisor Holdings, Inc. (1) | | | 2,077 | | | | 4,507 | |
Lions Gate Entertainment Corp. (1) | | | 1,178 | | | | 19,602 | |
Live Nation Entertainment, Inc. (1) | | | 109 | | | | 13,046 | |
Meta Platforms, Inc. (1) | | | 8,059 | | | | 2,710,645 | |
Netflix, Inc. (1) | | | 1,519 | | | | 915,106 | |
News Corp. | | | 587 | | | | 13,096 | |
Nexstar Media Group, Inc. | | | 26 | | | | 3,925 | |
Pinterest, Inc. (1) | | | 544 | | | | 19,774 | |
Roku, Inc. (1) | | | 43 | | | | 9,813 | |
Sinclair Broadcast Group, Inc. | | | 1,015 | | | | 26,826 | |
TEGNA, Inc. | | | 1,399 | | | | 25,965 | |
Twitter, Inc. (1) | | | 3,709 | | | | 160,303 | |
Verizon Communications, Inc. | | | 7,554 | | | | 392,506 | |
Vimeo, Inc. (1) | | | 382 | | | | 6,861 | |
Walt Disney Co./The (1) | | | 2,929 | | | | 453,673 | |
World Wrestling Entertainment, Inc. | | | 335 | | | | 16,529 | |
Yelp, Inc. (1) | | | 1,065 | | | | 38,596 | |
Ziff Davis, Inc. (1) | | | 1,368 | | | | 151,656 | |
| | | | | | | | 13,706,923 | |
| | | | | | | | | |
Consumer Discretionary — 7.5% | | | | | | | | |
Abercrombie & Fitch Co. (1) | | | 356 | | | | 12,399 | |
Academy Sports & Outdoors, Inc. (1) | | | 1,866 | | | | 81,917 | |
Dynamic Allocation Fund |
Security Description | | Shares or
Principal
Amount ($) | | | Fair
Value ($) | |
Common Stocks (United States) — continued |
Adient PLC (1) | | | 603 | | | | 28,872 | |
Amazon.com, Inc. (1) | | | 1,295 | | | | 4,317,970 | |
American Axle & Manufacturing Holdings, Inc. (1) | | | 1,496 | | | | 13,958 | |
American Eagle Outfitters, Inc. | | | 597 | | | | 15,116 | |
Aptiv PLC (1) | | | 313 | | | | 51,629 | |
Aramark | | | 2,063 | | | | 76,022 | |
Asbury Automotive Group, Inc. (1) | | | 296 | | | | 51,128 | |
AutoNation, Inc. (1) | | | 343 | | | | 40,080 | |
AutoZone, Inc. (1) | | | 179 | | | | 375,254 | |
Bath & Body Works, Inc. | | | 544 | | | | 37,966 | |
Best Buy Co., Inc. | | | 2,572 | | | | 261,315 | |
Big 5 Sporting Goods Corp. | | | 350 | | | | 6,654 | |
Big Lots, Inc. | | | 912 | | | | 41,086 | |
Biglari Holdings, Inc. (1) | | | 41 | | | | 5,845 | |
Boyd Gaming Corp. (1) | | | 1,076 | | | | 70,553 | |
Brinker International, Inc. (1) | | | 415 | | | | 15,185 | |
Buckle, Inc./The | | | 270 | | | | 11,424 | |
Caleres, Inc. | | | 410 | | | | 9,299 | |
Capri Holdings, Ltd. (1) | | | 1,149 | | | | 74,582 | |
Chico’s FAS, Inc. (1) | | | 358 | | | | 1,926 | |
Conn’s, Inc. (1) | | | 106 | | | | 2,493 | |
Container Store Group, Inc./The (1) | | | 4 | | | | 40 | |
Crocs, Inc. (1) | | | 1,690 | | | | 216,692 | |
Dana, Inc. | | | 1,459 | | | | 33,294 | |
Dave & Buster’s Entertainment, Inc. (1) | | | 114 | | | | 4,378 | |
Designer Brands, Inc. (1) | | | 460 | | | | 6,537 | |
Dick’s Sporting Goods, Inc. | | | 1,346 | | | | 154,777 | |
Dollar Tree, Inc. (1) | | | 311 | | | | 43,702 | |
eBay, Inc. | | | 2,388 | | | | 158,802 | |
Etsy, Inc. (1) | | | 1 | | | | 219 | |
Everi Holdings, Inc. (1) | | | 1,856 | | | | 39,626 | |
Foot Locker, Inc. | | | 1,908 | | | | 83,246 | |
Ford Motor Co. | | | 12,106 | | | | 251,442 | |
Fossil Group, Inc. (1) | | | 557 | | | | 5,732 | |
GameStop Corp. (1) | | | 200 | | | | 29,678 | |
Gap, Inc./The | | | 524 | | | | 9,249 | |
Garmin, Ltd. | | | 3,901 | | | | 531,199 | |
General Motors Co. (1) | | | 5,604 | | | | 328,563 | |
Genesco, Inc. (1) | | | 39 | | | | 2,503 | |
Genius Brands International, Inc. (1) | | | 366 | | | | 384 | |
Goodyear Tire & Rubber Co./The (1) | | | 1,676 | | | | 35,732 | |
GoPro, Inc. (1) | | | 1 | | | | 10 | |
Greenlane Holdings, Inc. (1) | | | 2,439 | | | | 2,351 | |
Group 1 Automotive, Inc. | | | 113 | | | | 22,060 | |
Guess?, Inc. | | | 1,161 | | | | 27,492 | |
Hibbett, Inc. | | | 198 | | | | 14,242 | |
The accompanying notes are an integral part of these financial statements.
Page 86 | 2021 Annual Report | December 31, 2021 |
Schedule of Investments
December 31, 2021
Dynamic Allocation Fund |
Security Description | | Shares or
Principal
Amount ($) | | | Fair
Value ($) | |
Common Stocks (United States) — continued |
Home Depot, Inc./The | | | 6,438 | | | | 2,671,834 | |
Houghton Mifflin Harcourt Co. (1) | | | 445 | | | | 7,165 | |
International Game Technology PLC | | | 2,618 | | | | 75,686 | |
Kirkland’s, Inc. (1) | | | 16 | | | | 239 | |
Kohl’s Corp. | | | 2,185 | | | | 107,917 | |
Kontoor Brands, Inc. | | | 16 | | | | 820 | |
Lands’ End, Inc. (1) | | | 505 | | | | 9,913 | |
Lear Corp. | | | 391 | | | | 71,533 | |
Liquidity Services, Inc. (1) | | | 141 | | | | 3,113 | |
LKQ Corp. | | | 823 | | | | 49,405 | |
Lovesac Co./The (1) | | | 140 | | | | 9,276 | |
Lowe’s Cos., Inc. | | | 7,093 | | | | 1,833,399 | |
Lululemon Athletica, Inc. (1) | | | 428 | | | | 167,541 | |
Macy’s, Inc. | | | 1,630 | | | | 42,673 | |
MGM Resorts International | | | 1,690 | | | | 75,847 | |
Nordstrom, Inc. (1) | | | 595 | | | | 13,459 | |
ODP Corp./The (1) | | | 316 | | | | 12,412 | |
OneWater Marine, Inc. | | | 709 | | | | 43,228 | |
O’Reilly Automotive, Inc. (1) | | | 589 | | | | 415,969 | |
Overstock.com, Inc. (1) | | | 63 | | | | 3,718 | |
Party City Holdco, Inc. (1) | | | 2,485 | | | | 13,841 | |
Penske Automotive Group, Inc. | | | 2 | | | | 214 | |
Qurate Retail, Inc. | | | 2,529 | | | | 19,220 | |
RCI Hospitality Holdings, Inc. | | | 128 | | | | 9,969 | |
Red Robin Gourmet Burgers, Inc. (1) | | | 1,397 | | | | 23,092 | |
Red Rock Resorts, Inc. | | | 868 | | | | 47,749 | |
Revolve Group, Inc. (1) | | | 389 | | | | 21,800 | |
Scientific Games Corp. (1) | | | 579 | | | | 38,695 | |
SeaWorld Entertainment, Inc. (1) | | | 490 | | | | 31,781 | |
Shoe Carnival, Inc. | | | 183 | | | | 7,152 | |
Shutterstock, Inc. | | | 370 | | | | 41,026 | |
Signet Jewelers, Ltd. | | | 102 | | | | 8,877 | |
Skyline Champion Corp. (1) | | | 473 | | | | 37,358 | |
Smith & Wesson Brands, Inc. | | | 849 | | | | 15,112 | |
Sonos, Inc. (1) | | | 2,702 | | | | 80,520 | |
Steven Madden, Ltd. | | | 1,625 | | | | 75,514 | |
StoneMor, Inc. (1) | | | 1 | | | | 2 | |
Tapestry, Inc. | | | 2,685 | | | | 109,011 | |
Target Corp. | | | 2,153 | | | | 498,290 | |
Tempur Sealy International, Inc. | | | 850 | | | | 39,976 | |
Tenneco, Inc. (1) | | | 1,635 | | | | 18,476 | |
Tesla, Inc. (1) | | | 3,069 | | | | 3,243,258 | |
Thor Industries, Inc. | | | 1,413 | | | | 146,627 | |
Tilly’s, Inc. | | | 53 | | | | 854 | |
Town Sports International Holdings, Inc. (1) | | | 2,090 | | | | 1 | |
Tupperware Brands Corp. (1) | | | 606 | | | | 9,266 | |
Urban Outfitters, Inc. (1) | | | 492 | | | | 14,445 | |
Dynamic Allocation Fund |
Security Description | | Shares or
Principal
Amount ($) | | | Fair
Value ($) | |
Common Stocks (United States) — continued |
Vera Bradley, Inc. (1) | | | 1 | | | | 9 | |
Vista Outdoor, Inc. (1) | | | 196 | | | | 9,030 | |
Waitr Holdings, Inc. (1) | | | 2,060 | | | | 1,524 | |
Weber, Inc. | | | 1,357 | | | | 17,546 | |
Williams-Sonoma, Inc. | | | 493 | | | | 83,381 | |
Winnebago Industries, Inc. | | | 416 | | | | 31,167 | |
XPEL, Inc. (1) | | | 9 | | | | 615 | |
| | | | | | | | 17,915,168 | |
| | | | | | | | | |
Consumer Staples — 1.9% | | | | | | | | |
Albertsons Cos., Inc. | | | 9,994 | | | | 301,719 | |
Archer-Daniels-Midland Co. | | | 98 | | | | 6,624 | |
Bunge, Ltd. | | | 11,928 | | | | 1,113,598 | |
Celsius Holdings, Inc. (1) | | | 129 | | | | 9,620 | |
Coca-Cola Co./The | | | 2,372 | | | | 140,446 | |
Costco Wholesale Corp. | | | 1,943 | | | | 1,103,041 | |
Coty, Inc. (1) | | | 2 | | | | 21 | |
Darling Ingredients, Inc. (1) | | | 1,862 | | | | 129,018 | |
Hershey Co./The | | | 3,773 | | | | 729,962 | |
PepsiCo, Inc. | | | 3,550 | | | | 616,671 | |
Rite Aid Corp. (1) | | | 1 | | | | 15 | |
Spectrum Brands Holdings, Inc. | | | 833 | | | | 84,733 | |
Tyson Foods, Inc. | | | 474 | | | | 41,314 | |
Walgreens Boots Alliance, Inc. | | | 1,215 | | | | 63,374 | |
Walmart, Inc. | | | 517 | | | | 74,805 | |
| | | | | | | | 4,414,961 | |
| | | | | | | | | |
Energy — 3.2% | | | | | | | | |
Alto Ingredients, Inc. (1) | | | 257 | | | | 1,236 | |
Altus Midstream Co. | | | 88 | | | | 5,395 | |
Amplify Energy Corp. (1) | | | 119 | | | | 370 | |
Antero Resources Corp. (1) | | | 1,249 | | | | 21,858 | |
APA Corp. | | | 3,545 | | | | 95,325 | |
Ardmore Shipping Corp. (1) | | | 259 | | | | 875 | |
Berry Corp. | | | 1,448 | | | | 12,192 | |
Bristow Group, Inc. (1) | | | 201 | | | | 6,366 | |
Cactus, Inc. | | | 433 | | | | 16,510 | |
ChampionX Corp. (1) | | | 2 | | | | 40 | |
Cheniere Energy, Inc. | | | 46 | | | | 4,665 | |
Chevron Corp. | | | 11,603 | | | | 1,361,612 | |
Comstock Resources, Inc. (1) | | | 2 | | | | 16 | |
ConocoPhillips | | | 5,654 | | | | 408,106 | |
CONSOL Energy, Inc. (1) | | | 87 | | | | 1,976 | |
Coterra Energy, Inc. | | | 3 | | | | 57 | |
CVR Energy, Inc. | | | 338 | | | | 5,682 | |
Delek US Holdings, Inc. (1) | | | 1,654 | | | | 24,793 | |
Devon Energy Corp. | | | 4,482 | | | | 197,432 | |
The accompanying notes are an integral part of these financial statements.
2021 Annual Report | December 31, 2021 | Page 87 |
Schedule of Investments
December 31, 2021
Dynamic Allocation Fund |
Security Description | | Shares or
Principal
Amount ($) | | | Fair
Value ($) | |
Common Stocks (United States) — continued |
DHT Holdings, Inc. | | | 1,234 | | | | 6,404 | |
Diamondback Energy, Inc. | | | 791 | | | | 85,309 | |
EOG Resources, Inc. | | | 1,952 | | | | 173,396 | |
Expro Group Holdings NV (1) | | | 382 | | | | 5,482 | |
Exxon Mobil Corp. | | | 31,092 | | | | 1,902,519 | |
Hess Corp. | | | 828 | | | | 61,297 | |
HollyFrontier Corp. | | | 4 | | | | 131 | |
Kosmos Energy, Ltd. (1) | | | 2 | | | | 7 | |
Laredo Petroleum, Inc. (1) | | | 121 | | | | 7,276 | |
Marathon Oil Corp. | | | 338 | | | | 5,550 | |
Marathon Petroleum Corp. | | | 20,534 | | | | 1,313,971 | |
Nabors Industries, Ltd. (1) | | | 263 | | | | 21,327 | |
NextDecade Corp. (1) | | | 528 | | | | 1,505 | |
Nine Energy Service, Inc. (1) | | | 3,291 | | | | 3,291 | |
Northern Oil and Gas, Inc. | | | 55 | | | | 1,132 | |
Occidental Petroleum Corp. | | | 7,761 | | | | 224,991 | |
Oceaneering International, Inc. (1) | | | 1,089 | | | | 12,317 | |
ONEOK, Inc. | | | 14,529 | | | | 853,724 | |
Ovintiv, Inc. | | | 1,573 | | | | 53,010 | |
Par Pacific Holdings, Inc. (1) | | | 127 | | | | 2,094 | |
PDC Energy, Inc. | | | 28 | | | | 1,366 | |
Peabody Energy Corp. (1) | | | 825 | | | | 8,308 | |
Phillips 66 | | | 2,295 | | | | 166,296 | |
Pioneer Natural Resources Co. | | | 492 | | | | 89,485 | |
Profire Energy, Inc. (1) | | | 10 | | | | 11 | |
Range Resources Corp. (1) | | | 377 | | | | 6,722 | |
Schlumberger NV | | | 6,131 | | | | 183,623 | |
Scorpio Tankers, Inc. | | | 372 | | | | 4,765 | |
SM Energy Co. | | | 786 | | | | 23,171 | |
Southwestern Energy Co. (1) | | | 3,700 | | | | 17,242 | |
Talos Energy, Inc. (1) | | | 1,254 | | | | 12,289 | |
Targa Resources Corp. | | | 2,383 | | | | 124,488 | |
Teekay Corp. (1) | | | 1,127 | | | | 3,539 | |
Uranium Energy Corp. (1) | | | 770 | | | | 2,580 | |
Valero Energy Corp. | | | 267 | | | | 20,054 | |
W&T Offshore, Inc. (1) | | | 204 | | | | 659 | |
World Fuel Services Corp. | | | 465 | | | | 12,309 | |
| | | | | | | | 7,576,146 | |
| | | | | | | | | |
Financials — 7.9% | | | | | | | | |
Affiliated Managers Group, Inc. | | | 452 | | | | 74,359 | |
Aflac, Inc. | | | 3,354 | | | | 195,840 | |
Allstate Corp./The | | | 6,022 | | | | 708,488 | |
Ally Financial, Inc. | | | 2,643 | | | | 125,833 | |
American Express Co. | | | 325 | | | | 53,170 | |
American Financial Group, Inc./OH | | | 532 | | | | 73,054 | |
American International Group, Inc. | | | 22,976 | | | | 1,306,415 | |
Dynamic Allocation Fund |
Security Description | | Shares or
Principal
Amount ($) | | | Fair
Value ($) | |
Common Stocks (United States) — continued |
Ameris Bancorp | | | 1,350 | | | | 67,068 | |
Arbor Realty Trust, Inc. | | | 1 | | | | 18 | |
Athene Holding, Ltd. (1) | | | 8,890 | �� | | | 740,804 | |
Atlanticus Holdings Corp. (1) | | | 26 | | | | 1,854 | |
Bank of America Corp. | | | 25,994 | | | | 1,156,473 | |
Bank of New York Mellon Corp./The | | | 3,484 | | | | 202,351 | |
Bank OZK | | | 853 | | | | 39,690 | |
Berkshire Hathaway, Inc. (1) | | | 7,843 | | | | 2,345,057 | |
BGC Partners, Inc. | | | 917 | | | | 4,264 | |
Blackstone, Inc. | | | 2,006 | | | | 259,556 | |
Brighthouse Financial, Inc. (1) | | | 25 | | | | 1,295 | |
Capital One Financial Corp. | | | 2,994 | | | | 434,399 | |
Charles Schwab Corp./The | | | 6,711 | | | | 564,395 | |
Chimera Investment Corp. | | | 13,924 | | | | 209,974 | |
CIT Group, Inc. | | | 371 | | | | 19,047 | |
Citigroup, Inc. | | | 6,498 | | | | 392,414 | |
Citizens Financial Group, Inc. | | | 2,430 | | | | 114,818 | |
Civista Bancshares, Inc. | | | 396 | | | | 9,662 | |
Comerica, Inc. | | | 214 | | | | 18,618 | |
East West Bancorp, Inc. | | | 1,583 | | | | 124,550 | |
Elevate Credit, Inc. (1) | | | 1 | | | | 3 | |
Ellington Financial, Inc. | | | 3,534 | | | | 60,396 | |
Evercore, Inc. | | | 1,435 | | | | 194,945 | |
Fidelity National Financial, Inc. | | | 7,115 | | | | 371,261 | |
Fifth Third Bancorp | | | 5,948 | | | | 259,035 | |
First American Financial Corp. | | | 5,843 | | | | 457,098 | |
Genworth Financial, Inc. (1) | | | 2 | | | | 8 | |
Goldman Sachs Group, Inc./The | | | 164 | | | | 62,738 | |
Granite Point Mortgage Trust, Inc. | | | 2 | | | | 23 | |
Hancock Whitney Corp. | | | 1,106 | | | | 55,322 | |
Hartford Financial Services Group, Inc./The | | | 1,482 | | | | 102,317 | |
Invesco, Ltd. | | | 3,151 | | | | 72,536 | |
Janus Henderson Group PLC | | | 1,815 | | | | 76,121 | |
Jefferies Financial Group, Inc. | | | 944 | | | | 36,627 | |
JPMorgan Chase & Co. | | | 7,332 | | | | 1,161,022 | |
KKR & Co., Inc. | | | 5,027 | | | | 374,512 | |
LendingClub Corp. (1) | | | 429 | | | | 10,373 | |
Lincoln National Corp. | | | 4 | | | | 273 | |
Loews Corp. | | | 1 | | | | 58 | |
LPL Financial Holdings, Inc. | | | 787 | | | | 125,991 | |
Maiden Holdings, Ltd. (1) | | | 598 | | | | 1,830 | |
Marlin Business Services Corp. | | | 1,997 | | | | 46,490 | |
MBIA, Inc. (1) | | | 1,427 | | | | 22,532 | |
Meta Financial Group, Inc. | | | 545 | | | | 32,515 | |
MetLife, Inc. | | | 4,989 | | | | 311,763 | |
Moelis & Co. | | | 1,528 | | | | 95,515 | |
Morgan Stanley | | | 8,697 | | | | 853,698 | |
The accompanying notes are an integral part of these financial statements.
Page 88 | 2021 Annual Report | December 31, 2021 |
Schedule of Investments
December 31, 2021
Dynamic Allocation Fund |
Security Description | | Shares or
Principal
Amount ($) | | | Fair
Value ($) | |
Common Stocks (United States) — continued |
Mr Cooper Group, Inc. (1) | | | 1,986 | | | | 82,637 | |
Northrim BanCorp, Inc. | | | 898 | | | | 39,027 | |
Old Republic International Corp. | | | 4 | | | | 98 | |
OneMain Holdings, Inc. | | | 813 | | | | 40,683 | |
PacWest Bancorp | | | 1,393 | | | | 62,922 | |
Pinnacle Financial Partners, Inc. | | | 299 | | | | 28,555 | |
Piper Sandler Cos. | | | 642 | | | | 114,603 | |
PNC Financial Services Group, Inc./The | | | 1,218 | | | | 244,233 | |
Popular, Inc. | | | 819 | | | | 67,191 | |
Prudential Financial, Inc. | | | 936 | | | | 101,313 | |
Pzena Investment Management, Inc. | | | 2,462 | | | | 23,315 | |
RBB Bancorp | | | 711 | | | | 18,628 | |
Redwood Trust, Inc. | | | 2,135 | | | | 28,161 | |
Regions Financial Corp. | | | 8,919 | | | | 194,434 | |
Sandy Spring Bancorp, Inc. | | | 723 | | | | 34,762 | |
Santander Consumer USA Holdings, Inc. | | | 2,876 | | | | 120,850 | |
Siebert Financial Corp. (1) | | | 170 | | | | 394 | |
Signature Bank/New York NY | | | 322 | | | | 104,157 | |
SLM Corp. | | | 3,532 | | | | 69,474 | |
Stewart Information Services Corp. | | | 4,581 | | | | 365,243 | |
SVB Financial Group (1) | | | 146 | | | | 99,023 | |
Synchrony Financial | | | 23,726 | | | | 1,100,649 | |
Synovus Financial Corp. | | | 622 | | | | 29,775 | |
Tiptree, Inc. | | | 259 | | | | 3,582 | |
Truist Financial Corp. | | | 4,785 | | | | 280,162 | |
Umpqua Holdings Corp. | | | 5,390 | | | | 103,704 | |
Upstart Holdings, Inc. (1) | | | 150 | | | | 22,695 | |
US Bancorp | | | 7,040 | | | | 395,437 | |
Walker & Dunlop, Inc. | | | 820 | | | | 123,722 | |
Wells Fargo & Co. | | | 14,668 | | | | 703,771 | |
Western Alliance Bancorp | | | 546 | | | | 58,777 | |
Zions Bancorp NA | | | 2,184 | | | | 137,941 | |
| | | | | | | | 18,828,386 | |
| | | | | | | | | |
Healthcare — 12.5% | | | | | | | | |
AbbVie, Inc. | | | 15,844 | | | | 2,145,278 | |
Abeona Therapeutics, Inc. (1) | | | 802 | | | | 270 | |
AcelRx Pharmaceuticals, Inc. (1) | | | 89 | | | | 50 | |
ADMA Biologics, Inc. (1) | | | 184 | | | | 259 | |
Affimed NV (1) | | | 1,116 | | | | 6,160 | |
Agilent Technologies, Inc. | | | 4,167 | | | | 665,262 | |
Agiliti, Inc. (1) | | | 5 | | | | 116 | |
Alector, Inc. (1) | | | 222 | | | | 4,584 | |
Alkermes PLC (1) | | | 1,063 | | | | 24,725 | |
Allakos, Inc. (1) | | | 256 | | | | 2,506 | |
Alnylam Pharmaceuticals, Inc. (1) | | | 128 | | | | 21,706 | |
AmerisourceBergen Corp. | | | 1,981 | | | | 263,255 | |
Dynamic Allocation Fund |
Security Description | | Shares or
Principal
Amount ($) | | | Fair
Value ($) | |
Common Stocks (United States) — continued |
Amgen, Inc. | | | 7,086 | | | | 1,594,137 | |
Amicus Therapeutics, Inc. (1) | | | 1,318 | | | | 15,223 | |
AMN Healthcare Services, Inc. (1) | | | 237 | | | | 28,992 | |
Amneal Pharmaceuticals, Inc. (1) | | | 1,968 | | | | 9,427 | |
Anavex Life Sciences Corp. (1) | | | 135 | | | | 2,341 | |
ANI Pharmaceuticals, Inc. (1) | | | 135 | | | | 6,221 | |
Anthem, Inc. | | | 2,602 | | | | 1,206,131 | |
Apellis Pharmaceuticals, Inc. (1) | | | 114 | | | | 5,390 | |
Apollo Medical Holdings, Inc. (1) | | | 167 | | | | 12,271 | |
Applied Therapeutics, Inc. (1) | | | 564 | | | | 5,048 | |
Arbutus Biopharma Corp. (1) | | | 2,168 | | | | 8,434 | |
Arcutis Biotherapeutics, Inc. (1) | | | 598 | | | | 12,403 | |
Arrowhead Pharmaceuticals, Inc. (1) | | | 459 | | | | 30,432 | |
Arvinas, Inc. (1) | | | 291 | | | | 23,903 | |
Atara Biotherapeutics, Inc. (1) | | | 153 | | | | 2,411 | |
Avalo Therapeutics, Inc. (1) | | | 2,320 | | | | 3,944 | |
Avid Bioservices, Inc. (1) | | | 624 | | | | 18,208 | |
Beam Therapeutics, Inc. (1) | | | 266 | | | | 21,198 | |
Beyondspring, Inc. (1) | | | 327 | | | | 1,481 | |
BioCryst Pharmaceuticals, Inc. (1) | | | 52 | | | | 720 | |
BioDelivery Sciences International, Inc. (1) | | | 4,109 | | | | 12,738 | |
Biohaven Pharmaceutical Holding Co., Ltd. (1) | | | 167 | | | | 23,014 | |
Bio-Rad Laboratories, Inc. (1) | | | 48 | | | | 36,267 | |
Bio-Techne Corp. | | | 165 | | | | 85,361 | |
Blueprint Medicines Corp. (1) | | | 259 | | | | 27,741 | |
Bridgebio Pharma, Inc. (1) | | | 354 | | | | 5,905 | |
Bristol-Myers Squibb Co. | | | 15,215 | | | | 948,655 | |
Bruker Corp. | | | 2,523 | | | | 211,705 | |
Calyxt, Inc. (1) | | | 724 | | | | 1,542 | |
Cardinal Health, Inc. | | | 2,557 | | | | 131,660 | |
CareDx, Inc. (1) | | | 275 | | | | 12,507 | |
CASI Pharmaceuticals, Inc. (1) | | | 471 | | | | 377 | |
Cassava Sciences, Inc. (1) | | | 267 | | | | 11,668 | |
Catalent, Inc. (1) | | | 915 | | | | 117,147 | |
Catalyst Pharmaceuticals, Inc. (1) | | | 2,743 | | | | 18,570 | |
Centene Corp. (1) | | | 346 | | | | 28,510 | |
Centogene NV (1) | | | 546 | | | | 2,855 | |
Cerevel Therapeutics Holdings, Inc. (1) | | | 155 | | | | 5,025 | |
Cerner Corp. | | | 5,991 | | | | 556,384 | |
Codexis, Inc. (1) | | | 1 | | | | 31 | |
Community Health Systems, Inc. (1) | | | 1,175 | | | | 15,639 | |
Computer Programs and Systems, Inc. (1) | | | 362 | | | | 10,607 | |
Cross Country Healthcare, Inc. (1) | | | 27 | | | | 750 | |
CVS Health Corp. | | | 7,225 | | | | 745,331 | |
Danaher Corp. | | | 4,064 | | | | 1,337,097 | |
Deciphera Pharmaceuticals, Inc. (1) | | | 148 | | | | 1,446 | |
The accompanying notes are an integral part of these financial statements.
2021 Annual Report | December 31, 2021 | Page 89 |
Schedule of Investments
December 31, 2021
Dynamic Allocation Fund |
Security Description | | Shares or
Principal
Amount ($) | | | Fair
Value ($) | |
Common Stocks (United States) — continued |
Dynavax Technologies Corp. (1) | | | 692 | | | | 9,736 | |
Editas Medicine, Inc. (1) | | | 437 | | | | 11,602 | |
Elanco Animal Health, Inc. Contingent Value Rights (1)(5) | | | 1,625 | | | | 0 | |
Eli Lilly & Co. | | | 3,565 | | | | 984,724 | |
Eloxx Pharmaceuticals, Inc. (1) | | | 2,853 | | | | 2,015 | |
Enanta Pharmaceuticals, Inc. (1) | | | 136 | | | | 10,170 | |
Endo International PLC (1) | | | 1,246 | | | | 4,685 | |
Evolent Health, Inc. (1) | | | 306 | | | | 8,467 | |
Exact Sciences Corp. (1) | | | 133 | | | | 10,351 | |
Exelixis, Inc. (1) | | | 1,534 | | | | 28,042 | |
Fulgent Genetics, Inc. (1) | | | 20 | | | | 2,012 | |
Galectin Therapeutics, Inc. (1) | | | 753 | | | | 1,559 | |
Genprex, Inc. (1) | | | 1,399 | | | | 1,833 | |
Gilead Sciences, Inc. | | | 15,544 | | | | 1,128,650 | |
Globus Medical, Inc. (1) | | | 1,220 | | | | 88,084 | |
HCA Healthcare, Inc. | | | 1,435 | | | | 368,680 | |
Horizon Therapeutics Plc (1) | | | 3,989 | | | | 429,855 | |
Humanigen, Inc. (1) | | | 22 | | | | 82 | |
Illumina, Inc. (1) | | | 27 | | | | 10,272 | |
Incyte Corp. (1) | | | 5,258 | | | | 385,937 | |
Inotiv, Inc. (1) | | | 263 | | | | 11,064 | |
Intellia Therapeutics, Inc. (1) | | | 268 | | | | 31,688 | |
Intra-Cellular Therapies, Inc. (1) | | | 81 | | | | 4,240 | |
iRhythm Technologies, Inc. (1) | | | 9 | | | | 1,059 | |
Johnson & Johnson | | | 16,072 | | | | 2,749,437 | |
Kezar Life Sciences, Inc. (1) | | | 474 | | | | 7,925 | |
La Jolla Pharmaceutical Co. (1) | | | 567 | | | | 2,637 | |
Lineage Cell Therapeutics, Inc. (1) | | | 2 | | | | 5 | |
Mallinckrodt PLC (1) | | | 92 | | | | 12 | |
MannKind Corp. (1) | | | 2,373 | | | | 10,370 | |
Maravai LifeSciences Holdings, Inc. (1) | | | 405 | | | | 16,970 | |
Marinus Pharmaceuticals, Inc. (1) | | | 594 | | | | 7,057 | |
McKesson Corp. | | | 3,114 | | | | 774,047 | |
MeiraGTx Holdings plc (1) | | | 1 | | | | 24 | |
Merck & Co., Inc. | | | 16,052 | | | | 1,230,225 | |
Mirati Therapeutics, Inc. (1) | | | 233 | | | | 34,179 | |
Moderna, Inc. (1) | | | 2,796 | | | | 710,128 | |
Myriad Genetics, Inc. (1) | | | 3 | | | | 83 | |
Natera, Inc. (1) | | | 476 | | | | 44,454 | |
Nektar Therapeutics (1) | | | 182 | | | | 2,459 | |
Novavax, Inc. (1) | | | 251 | | | | 35,911 | |
Ocugen, Inc. (1) | | | 445 | | | | 2,025 | |
Oncocyte Corp. (1) | | | 435 | | | | 944 | |
Oramed Pharmaceuticals, Inc. (1) | | | 264 | | | | 3,770 | |
Organogenesis Holdings, Inc. (1) | | | 2 | | | | 18 | |
Organon & Co. | | | 1,436 | | | | 43,726 | |
Dynamic Allocation Fund |
Security Description | | Shares or
Principal
Amount ($) | | | Fair
Value ($) | |
Common Stocks (United States) — continued |
Palatin Technologies, Inc. (1) | | | 4,631 | | | | 2,369 | |
PerkinElmer, Inc. | | | 1,001 | | | | 201,261 | |
Perrigo Co. PLC | | | 3,023 | | | | 117,595 | |
Pfizer, Inc. | | | 25,271 | | | | 1,492,253 | |
Precigen, Inc. (1) | | | 2,463 | | | | 9,138 | |
Prothena Corp. PLC (1) | | | 82 | | | | 4,051 | |
Puma Biotechnology, Inc. (1) | | | 1,487 | | | | 4,520 | |
Quest Diagnostics, Inc. | | | 1,109 | | | | 191,868 | |
Quidel Corp. (1) | | | 242 | | | | 32,668 | |
Radius Health, Inc. (1) | | | 345 | | | | 2,387 | |
Regeneron Pharmaceuticals, Inc. (1) | | | 2,133 | | | | 1,347,032 | |
REGENXBIO, Inc. (1) | | | 85 | | | | 2,780 | |
Rocket Pharmaceuticals, Inc. (1) | | | 138 | | | | 3,013 | |
Seres Therapeutics, Inc. (1) | | | 2 | | | | 17 | |
Sesen Bio, Inc. (1) | | | 1,979 | | | | 1,613 | |
Sorrento Therapeutics, Inc. (1) | | | 1,683 | | | | 7,826 | |
SpringWorks Therapeutics, Inc. (1) | | | 107 | | | | 6,632 | |
STAAR Surgical Co. (1) | | | 323 | | | | 29,490 | |
Sutro Biopharma, Inc. (1) | | | 364 | | | | 5,416 | |
Tenet Healthcare Corp. (1) | | | 253 | | | | 20,668 | |
Thermo Fisher Scientific, Inc. | | | 2,138 | | | | 1,426,559 | |
TransMedics Group, Inc. (1) | | | 128 | | | | 2,452 | |
Triple-S Management Corp. (1) | | | 9 | | | | 321 | |
Twist Bioscience Corp. (1) | | | 214 | | | | 16,561 | |
Tyme Technologies, Inc. (1) | | | 543 | | | | 327 | |
Ultragenyx Pharmaceutical, Inc. (1) | | | 160 | | | | 13,454 | |
UnitedHealth Group, Inc. | | | 5,579 | | | | 2,801,439 | |
Universal Health Services, Inc. | | | 595 | | | | 77,148 | |
Vanda Pharmaceuticals, Inc. (1) | | | 12 | | | | 188 | |
Veracyte, Inc. (1) | | | 499 | | | | 20,559 | |
Viatris, Inc. | | | 7,895 | | | | 106,819 | |
ViewRay, Inc. (1) | | | 1,815 | | | | 10,001 | |
Voyager Therapeutics, Inc. (1) | | | 281 | | | | 762 | |
WaVe Life Sciences, Ltd. (1) | | | 1,006 | | | | 3,159 | |
West Pharmaceutical Services, Inc. | | | 2,876 | | | | 1,348,873 | |
Zentalis Pharmaceuticals, Inc. (1) | | | 349 | | | | 29,337 | |
ZIOPHARM Oncology, Inc. (1) | | | 863 | | | | 941 | |
Zoetis, Inc. | | | 2,993 | | | | 730,382 | |
| | | | | | | | 29,774,110 | |
| | | | | | | | | |
Industrials — 4.5% | | | | | | | | |
Acuity Brands, Inc. | | | 449 | | | | 95,062 | |
AGCO Corp. | | | 706 | | | | 81,910 | |
Altra Industrial Motion Corp. | | | 37 | | | | 1,908 | |
ArcBest Corp. | | | 143 | | | | 17,139 | |
Atkore, Inc. (1) | | | 332 | | | | 36,915 | |
Atlas Air Worldwide Holdings, Inc. (1) | | | 545 | | | | 51,295 | |
The accompanying notes are an integral part of these financial statements.
Page 90 | 2021 Annual Report | December 31, 2021 |
Schedule of Investments
December 31, 2021
Dynamic Allocation Fund |
Security Description | | Shares or
Principal
Amount ($) | | | Fair
Value ($) | |
Common Stocks (United States) — continued |
Avis Budget Group, Inc. (1) | | | 169 | | | | 35,046 | |
Axon Enterprise, Inc. (1) | | | 182 | | | | 28,574 | |
AZZ, Inc. | | | 482 | | | | 26,650 | |
Boise Cascade Co. | | | 3,073 | | | | 218,798 | |
Builders FirstSource, Inc. (1) | | | 962 | | | | 82,453 | |
Carrier Global Corp. | | | 1,251 | | | | 67,854 | |
Caterpillar, Inc. | | | 636 | | | | 131,487 | |
Clean Harbors, Inc. (1) | | | 16 | | | | 1,596 | |
Copart, Inc. (1) | | | 985 | | | | 149,346 | |
Core & Main, Inc. (1) | | | 91 | | | | 2,761 | |
Covenant Logistics Group, Inc. (1) | | | 285 | | | | 7,533 | |
CSX Corp. | | | 6,314 | | | | 237,406 | |
Eaton Corp. PLC | | | 1,196 | | | | 206,693 | |
EMCOR Group, Inc. | | | 961 | | | | 122,422 | |
Emerson Electric Co. | | | 5,339 | | | | 496,367 | |
Encore Wire Corp. | | | 72 | | | | 10,303 | |
Fluor Corp. (1) | | | 41 | | | | 1,016 | |
Franklin Electric Co., Inc. | | | 584 | | | | 55,223 | |
FTC Solar, Inc. (1) | | | 191 | | | | 1,444 | |
FuelCell Energy, Inc. (1) | | | 902 | | | | 4,690 | |
Genco Shipping & Trading, Ltd. | | | 1,380 | | | | 22,080 | |
Generac Holdings, Inc. (1) | | | 709 | | | | 249,511 | |
General Dynamics Corp. | | | 5,140 | | | | 1,071,536 | |
GrafTech International, Ltd. | | | 1,758 | | | | 20,797 | |
Granite Construction, Inc. | | | 250 | | | | 9,675 | |
Helios Technologies, Inc. | | | 94 | | | | 9,886 | |
Herc Holdings, Inc. | | | 411 | | | | 64,342 | |
Hertz Global Holdings, Inc. (1) | | | 15 | | | | 325 | |
Hillenbrand, Inc. | | | 512 | | | | 26,619 | |
Hub Group, Inc. (1) | | | 256 | | | | 21,565 | |
Hubbell, Inc. | | | 872 | | | | 181,611 | |
Huntington Ingalls Industries, Inc. | | | 1,519 | | | | 283,658 | |
JB Hunt Transport Services, Inc. | | | 1,083 | | | | 221,365 | |
Johnson Controls International plc | | | 17,404 | | | | 1,415,119 | |
Karat Packaging, Inc. (1) | | | 111 | | | | 2,243 | |
Manitowoc Co., Inc./The (1) | | | 1,755 | | | | 32,625 | |
ManpowerGroup, Inc. | | | 2,980 | | | | 290,043 | |
Matson, Inc. | | | 119 | | | | 10,714 | |
Meritor, Inc. (1) | | | 573 | | | | 14,199 | |
Mesa Air Group, Inc. (1) | | | 1,659 | | | | 9,290 | |
Miller Industries, Inc./TN | | | 582 | | | | 19,439 | |
Mueller Industries, Inc. | | | 2,910 | | | | 172,738 | |
Mueller Water Products, Inc. | | | 1 | | | | 14 | |
MYR Group, Inc. (1) | | | 289 | | | | 31,949 | |
NL Industries, Inc. | | | 83 | | | | 614 | |
Norfolk Southern Corp. | | | 1 | | | | 298 | |
NOW, Inc. (1) | | | 1 | | | | 9 | |
Dynamic Allocation Fund |
Security Description | | Shares or
Principal
Amount ($) | | | Fair
Value ($) | |
Common Stocks (United States) — continued |
nVent Electric PLC | | | 2,743 | | | | 104,234 | |
Old Dominion Freight Line, Inc. | | | 730 | | | | 261,617 | |
Oshkosh Corp. | | | 597 | | | | 67,288 | |
Owens Corning | | | 2,816 | | | | 254,848 | |
Plug Power, Inc. (1) | | | 1,527 | | | | 43,107 | |
Quad/Graphics, Inc. (1) | | | 2,699 | | | | 10,796 | |
Quanta Services, Inc. | | | 8,249 | | | | 945,830 | |
Raytheon Technologies Corp. | | | 6,002 | | | | 516,532 | |
Regal Rexnord Corp. | | | 1,505 | | | | 256,121 | |
Resideo Technologies, Inc. (1) | | | 1,301 | | | | 33,865 | |
REV Group, Inc. | | | 182 | | | | 2,575 | |
Robert Half International, Inc. | | | 361 | | | | 40,259 | |
RR Donnelley & Sons Co. (1) | | | 4 | | | | 45 | |
Rush Enterprises, Inc. | | | 157 | | | | 8,735 | |
Ryder System, Inc. | | | 2,241 | | | | 184,726 | |
Saia, Inc. (1) | | | 195 | | | | 65,721 | |
Schneider National, Inc. | | | 2 | | | | 54 | |
Shyft Group, Inc./The | | | 451 | | | | 22,158 | |
SkyWest, Inc. (1) | | | 2,018 | | | | 79,307 | |
Terex Corp. | | | 2,236 | | | | 98,272 | |
Textainer Group Holdings, Ltd. | | | 649 | | | | 23,176 | |
Textron, Inc. | | | 5,414 | | | | 417,961 | |
Titan International, Inc. (1) | | | 2,005 | | | | 21,975 | |
Triton International, Ltd. | | | 897 | | | | 54,026 | |
Triumph Group, Inc. (1) | | | 60 | | | | 1,112 | |
TrueBlue, Inc. (1) | | | 632 | | | | 17,487 | |
United Parcel Service, Inc. | | | 2,326 | | | | 498,555 | |
United Rentals, Inc. (1) | | | 368 | | | | 122,283 | |
Valmont Industries, Inc. | | | 317 | | | | 79,409 | |
Vectrus, Inc. (1) | | | 211 | | | | 9,657 | |
Veritiv Corp. (1) | | | 4 | | | | 490 | |
Vicor Corp. (1) | | | 131 | | | | 16,634 | |
WESCO International, Inc. (1) | | | 642 | | | | 84,481 | |
Yellow Corp. (1) | | | 334 | | | | 4,205 | |
| | | | | | | | 10,701,696 | |
| | | | | | | | | |
Information Technology — 19.2% | | | | | | | | |
3D Systems Corp. (1) | | | 196 | | | | 4,222 | |
A10 Networks, Inc. | | | 4 | | | | 66 | |
Accenture PLC | | | 889 | | | | 368,535 | |
ACI Worldwide, Inc. (1) | | | 1,646 | | | | 57,116 | |
Adobe, Inc. (1) | | | 2,373 | | | | 1,345,633 | |
Advanced Micro Devices, Inc. (1) | | | 5,139 | | | | 739,502 | |
Alliance Data Systems Corp. | | | 1,512 | | | | 100,654 | |
Ambarella, Inc. (1) | | | 184 | | | | 37,332 | |
American Software, Inc./GA | | | 810 | | | | 21,198 | |
Amkor Technology, Inc. | | | 2,060 | | | | 51,067 | |
The accompanying notes are an integral part of these financial statements.
2021 Annual Report | December 31, 2021 | Page 91 |
Schedule of Investments
December 31, 2021
Dynamic Allocation Fund |
Security Description | | Shares or
Principal
Amount ($) | | | Fair
Value ($) | |
Common Stocks (United States) — continued |
Analog Devices, Inc. | | | 1,013 | | | | 178,055 | |
Apple, Inc. | | | 40,765 | | | | 7,238,641 | |
Applied Materials, Inc. | | | 10,529 | | | | 1,656,843 | |
Arrow Electronics, Inc. (1) | | | 2,768 | | | | 371,659 | |
Asana, Inc. (1) | | | 792 | | | | 59,044 | |
Atlassian Corp. PLC (1) | | | 376 | | | | 143,365 | |
Autodesk, Inc. (1) | | | 456 | | | | 128,223 | |
Aviat Networks, Inc. (1) | | | 593 | | | | 19,023 | |
Avnet, Inc. | | | 4,923 | | | | 202,975 | |
Belden, Inc. | | | 259 | | | | 17,024 | |
Bill.com Holdings, Inc. (1) | | | 276 | | | | 68,765 | |
Box, Inc. (1) | | | 1,095 | | | | 28,678 | |
Broadcom, Inc. | | | 1,214 | | | | 807,808 | |
Calix, Inc. (1) | | | 520 | | | | 41,584 | |
CDK Global, Inc. | | | 3,575 | | | | 149,221 | |
CDW Corp./DE | | | 1,944 | | | | 398,092 | |
ChannelAdvisor Corp. (1) | | | 1,240 | | | | 30,603 | |
Cisco Systems, Inc./Delaware | | | 20,974 | | | | 1,329,122 | |
Cloudflare, Inc. (1) | | | 1,156 | | | | 152,014 | |
Cognex Corp. | | | 295 | | | | 22,939 | |
Concentrix Corp. | | | 298 | | | | 53,229 | |
Conduent, Inc. (1) | | | 4,329 | | | | 23,117 | |
Consensus Cloud Solutions, Inc. (1) | | | 1 | | | | 58 | |
Crowdstrike Holdings, Inc. (1) | | | 712 | | | | 145,782 | |
Datadog, Inc. (1) | | | 373 | | | | 66,435 | |
Diebold Nixdorf, Inc. (1) | | | 504 | | | | 4,561 | |
Diodes, Inc. (1) | | | 921 | | | | 101,135 | |
Dolby Laboratories, Inc. | | | 2,480 | | | | 236,146 | |
Dropbox, Inc. (1) | | | 11,152 | | | | 273,670 | |
DXC Technology Co. (1) | | | 1,870 | | | | 60,195 | |
Dynatrace, Inc. (1) | | | 808 | | | | 48,763 | |
Ebix, Inc. | | | 432 | | | | 13,133 | |
EPAM Systems, Inc. (1) | | | 702 | | | | 469,252 | |
Extreme Networks, Inc. (1) | | | 1 | | | | 16 | |
Fortinet, Inc. (1) | | | 1,260 | | | | 452,844 | |
Gartner, Inc. (1) | | | 3,595 | | | | 1,201,880 | |
Hewlett Packard Enterprise Co. | | | 4,941 | | | | 77,920 | |
HP, Inc. | | | 16,615 | | | | 625,887 | |
HubSpot, Inc. (1) | | | 218 | | | | 143,695 | |
Intel Corp. | | | 24,448 | | | | 1,259,072 | |
Intuit, Inc. | | | 2,545 | | | | 1,636,995 | |
Jabil, Inc. | | | 7,015 | | | | 493,505 | |
Kimball Electronics, Inc. (1) | | | 294 | | | | 6,397 | |
KLA Corp. | | | 3,355 | | | | 1,443,019 | |
Kulicke & Soffa Industries, Inc. | | | 514 | | | | 31,118 | |
Kyndryl Holdings, Inc. (1) | | | 727 | | | | 13,159 | |
Lam Research Corp. | | | 374 | | | | 268,962 | |
Dynamic Allocation Fund |
Security Description | | Shares or
Principal
Amount ($) | | | Fair
Value ($) | |
Common Stocks (United States) — continued |
Lattice Semiconductor Corp. (1) | | | 2,650 | | | | 204,209 | |
Manhattan Associates, Inc. (1) | | | 1,385 | | | | 215,354 | |
Marathon Digital Holdings, Inc. (1) | | | 424 | | | | 13,933 | |
MaxLinear, Inc. (1) | | | 2 | | | | 151 | |
McAfee Corp. | | | 3,900 | | | | 100,581 | |
Micron Technology, Inc. | | | 3,650 | | | | 339,998 | |
Microsoft Corp. | | | 28,617 | | | | 9,624,460 | |
Mimecast, Ltd. (1) | | | 632 | | | | 50,288 | |
MoneyGram International, Inc. (1) | | | 2,056 | | | | 16,222 | |
MongoDB, Inc. (1) | | | 100 | | | | 52,935 | |
Monolithic Power Systems, Inc. | | | 2 | | | | 987 | |
NCR Corp. (1) | | | 2,363 | | | | 94,993 | |
NortonLifeLock, Inc. | | | 6,065 | | | | 157,569 | |
NVIDIA Corp. | | | 8,631 | | | | 2,538,463 | |
NXP Semiconductors NV | | | 482 | | | | 109,790 | |
ON Semiconductor Corp. (1) | | | 1,123 | | | | 76,274 | |
Oracle Corp. | | | 10,732 | | | | 935,938 | |
Palantir Technologies, Inc. (1) | | | 729 | | | | 13,275 | |
Palo Alto Networks, Inc. (1) | | | 1,741 | | | | 969,319 | |
Paycom Software, Inc. (1) | | | 472 | | | | 195,970 | |
Perficient, Inc. (1) | | | 248 | | | | 32,064 | |
Plantronics, Inc. (1) | | | 235 | | | | 6,895 | |
Power Integrations, Inc. | | | 275 | | | | 25,545 | |
Priority Technology Holdings, Inc. (1) | | | 316 | | | | 2,237 | |
Progress Software Corp. | | | 3,039 | | | | 146,693 | |
Qorvo, Inc. (1) | | | 238 | | | | 37,221 | |
Rimini Street, Inc. (1) | | | 734 | | | | 4,382 | |
Riot Blockchain, Inc. (1) | | | 484 | | | | 10,808 | |
salesforce.com, Inc. (1) | | | 2,918 | | | | 741,551 | |
Sanmina Corp. (1) | | | 1 | | | | 41 | |
SecureWorks Corp. (1) | | | 338 | | | | 5,398 | |
SiTime Corp. (1) | | | 41 | | | | 11,994 | |
SMART Global Holdings, Inc. (1) | | | 70 | | | | 4,969 | |
Smartsheet, Inc. (1) | | | 451 | | | | 34,930 | |
Sprout Social, Inc. (1) | | | 757 | | | | 68,652 | |
SPS Commerce, Inc. (1) | | | 862 | | | | 122,706 | |
SS&C Technologies Holdings, Inc. | | | 15,506 | | | | 1,271,182 | |
StarTek, Inc. (1) | | | 1,628 | | | | 8,498 | |
Stratasys, Ltd. (1) | | | 335 | | | | 8,204 | |
Synopsys, Inc. (1) | | | 201 | | | | 74,069 | |
Teradata Corp. (1) | | | 1,017 | | | | 43,192 | |
Teradyne, Inc. | | | 419 | | | | 68,519 | |
TESSCO Technologies, Inc. (1) | | | 72 | | | | 454 | |
Texas Instruments, Inc. | | | 4,999 | | | | 942,162 | |
Trade Desk, Inc./The (1) | | | 1,370 | | | | 125,547 | |
Trimble, Inc. (1) | | | 1,876 | | | | 163,568 | |
TTEC Holdings, Inc. | | | 184 | | | | 16,661 | |
The accompanying notes are an integral part of these financial statements.
Page 92 | 2021 Annual Report | December 31, 2021 |
Schedule of Investments
December 31, 2021
Dynamic Allocation Fund |
Security Description | | Shares or
Principal
Amount ($) | | | Fair
Value ($) | |
Common Stocks (United States) — continued |
Ultra Clean Holdings, Inc. (1) | | | 89 | | | | 5,105 | |
Veritone, Inc. (1) | | | 233 | | | | 5,238 | |
Viant Technology, Inc. (1) | | | 1,450 | | | | 14,072 | |
Visa, Inc. | | | 1,407 | | | | 304,911 | |
VMware, Inc. | | | 1,916 | | | | 222,026 | |
Workday, Inc. (1) | | | 566 | | | | 154,620 | |
Workiva, Inc. (1) | | | 496 | | | | 64,723 | |
Xilinx, Inc. | | | 184 | | | | 39,014 | |
Xperi Holding Corp. | | | 3,051 | | | | 57,694 | |
Zebra Technologies Corp. (1) | | | 504 | | | | 299,981 | |
Zscaler, Inc. (1) | | | 232 | | | | 74,549 | |
| | | | | | | | 45,849,732 | |
| | | | | | | | | |
Materials — 0.8% | | | | | | | | |
Albemarle Corp. | | | 558 | | | | 130,444 | |
Alcoa Corp. | | | 1,174 | | | | 69,947 | |
Amyris, Inc. (1) | | | 614 | | | | 3,322 | |
Avient Corp. | | | 357 | | | | 19,974 | |
Berry Global Group, Inc. (1) | | | 1,499 | | | | 110,596 | |
Celanese Corp. | | | 732 | | | | 123,020 | |
Century Aluminum Co. (1) | | | 385 | | | | 6,376 | |
CF Industries Holdings, Inc. | | | 2 | | | | 142 | |
Chemours Co./The | | | 533 | | | | 17,887 | |
Clearwater Paper Corp. (1) | | | 8 | | | | 293 | |
Cleveland-Cliffs, Inc. (1) | | | 1,686 | | | | 36,704 | |
Dow, Inc. | | | 2,953 | | | | 167,494 | |
Element Solutions, Inc. | | | 388 | | | | 9,421 | |
Freeport-McMoRan, Inc. | | | 5,726 | | | | 238,946 | |
Hawkins, Inc. | | | 329 | | | | 12,979 | |
Huntsman Corp. | | | 1,804 | | | | 62,924 | |
Intrepid Potash, Inc. (1) | | | 7 | | | | 299 | |
Koppers Holdings, Inc. (1) | | | 803 | | | | 25,134 | |
Louisiana-Pacific Corp. | | | 1,720 | | | | 134,762 | |
LyondellBasell Industries NV | | | 1,988 | | | | 183,353 | |
Mosaic Co./The | | | 2,374 | | | | 93,274 | |
Nucor Corp. | | | 1,364 | | | | 155,701 | |
O-I Glass, Inc. (1) | | | 556 | | | | 6,689 | |
Olin Corp. | | | 772 | | | | 44,405 | |
Rayonier Advanced Materials, Inc. (1) | | | 561 | | | | 3,203 | |
Ryerson Holding Corp. | | | 140 | | | | 3,647 | |
Steel Dynamics, Inc. | | | 901 | | | | 55,925 | |
SunCoke Energy, Inc. | | | 733 | | | | 4,830 | |
Trinseo PLC | | | 562 | | | | 29,483 | |
Tronox Holdings PLC | | | 766 | | | | 18,407 | |
United States Steel Corp. | | | 942 | | | | 22,429 | |
Westlake Chemical Corp. | | | 668 | | | | 64,883 | |
| | | | | | | | 1,856,893 | |
| | | | | | | | | |
Dynamic Allocation Fund |
Security Description | | Shares or
Principal
Amount ($) | | | Fair
Value ($) | |
Common Stocks (United States) — continued |
Real Estate Investment Trust — 2.4% | | | | | | | | |
Altisource Portfolio Solutions SA (1) | | | 1,046 | | | | 11,736 | |
American Homes 4 Rent | | | 2,988 | | | | 130,307 | |
Ashford Hospitality Trust, Inc. (1) | | | 1,116 | | | | 10,714 | |
Camden Property Trust | | | 2,599 | | | | 464,389 | |
CareTrust REIT, Inc. | | | 3,961 | | | | 90,430 | |
CatchMark Timber Trust, Inc. | | | 1,826 | | | | 15,904 | |
CBL & Associates Properties, Inc. (1) | | | 28 | | | | 874 | |
Clipper Realty, Inc. | | | 438 | | | | 4,354 | |
CorEnergy Infrastructure Trust, Inc. | | | 5,683 | | | | 17,788 | |
Corporate Office Properties Trust | | | 3,457 | | | | 96,692 | |
CubeSmart | | | 6,316 | | | | 359,444 | |
Cushman & Wakefield PLC (1) | | | 288 | | | | 6,405 | |
CyrusOne, Inc. | | | 1 | | | | 90 | |
DiamondRock Hospitality Co. (1) | | | 274 | | | | 2,633 | |
Easterly Government Properties, Inc. | | | 2 | | | | 46 | |
EastGroup Properties, Inc. | | | 3,100 | | | | 706,335 | |
Essex Property Trust, Inc. | | | 660 | | | | 232,472 | |
eXp World Holdings, Inc. | | | 141 | | | | 4,750 | |
Extra Space Storage, Inc. | | | 109 | | | | 24,714 | |
First Industrial Realty Trust, Inc. | | | 2,645 | | | | 175,099 | |
Forestar Group, Inc. (1) | | | 1 | | | | 22 | |
Getty Realty Corp. | | | 501 | | | | 16,077 | |
Gladstone Commercial Corp. | | | 1,527 | | | | 39,351 | |
Healthcare Trust of America, Inc. | | | 128 | | | | 4,274 | |
Host Hotels & Resorts, Inc. (1) | | | 453 | | | | 7,878 | |
Invitation Homes, Inc. | | | 2,241 | | | | 101,607 | |
Lamar Advertising Co. | | | 7,323 | | | | 888,280 | |
Life Storage, Inc. | | | 415 | | | | 63,570 | |
LXP Industrial Trust | | | 2 | | | | 31 | |
Mid-America Apartment Communities, Inc. | | | 1,495 | | | | 343,013 | |
National Health Investors, Inc. | | | 329 | | | | 18,908 | |
Omega Healthcare Investors, Inc. | | | 6,887 | | | | 203,786 | |
PotlatchDeltic Corp. | | | 1,310 | | | | 78,888 | |
PS Business Parks, Inc. | | | 169 | | | | 31,125 | |
Public Storage | | | 1,716 | | | | 642,745 | |
Rafael Holdings, Inc. (1) | | | 1 | | | | 5 | |
Regency Centers Corp. | | | 4,732 | | | | 356,556 | |
Sabra Health Care REIT, Inc. | | | 2 | | | | 27 | |
SBA Communications Corp. | | | 127 | | | | 49,406 | |
SITE Centers Corp. | | | 7 | | | | 111 | |
SL Green Realty Corp. | | | 1,907 | | | | 136,732 | |
Spirit MTA REIT Liquidating Trust (1)(5) | | | 3,134 | | | | 0 | |
Stratus Properties, Inc. (1) | | | 211 | | | | 7,716 | |
Tanger Factory Outlet Centers, Inc. | | | 540 | | | | 10,411 | |
Trinity Place Holdings, Inc. (1) | | | 97 | | | | 178 | |
UDR, Inc. | | | 2,036 | | | | 122,140 | |
The accompanying notes are an integral part of these financial statements.
2021 Annual Report | December 31, 2021 | Page 93 |
Schedule of Investments
December 31, 2021
Dynamic Allocation Fund |
Security Description | | Shares or
Principal
Amount ($) | | | Fair
Value ($) | |
Common Stocks (United States) — continued |
Universal Health Realty Income Trust | | | 687 | | | | 40,856 | |
Weyerhaeuser Co. | | | 3,497 | | | | 144,006 | |
Zillow Group, Inc. - Class A (1) | | | 5 | | | | 311 | |
Zillow Group, Inc. - Class C (1) | | | 732 | | | | 46,738 | |
| | | | | | | | 5,709,924 | |
| | | | | | | | | |
Utilities — 1.2% | | | | | | | | |
Duke Energy Corp. | | | 173 | | | | 18,148 | |
Evergy, Inc. | | | 5,040 | | | | 345,794 | |
Exelon Corp. | | | 24,979 | | | | 1,442,826 | |
MDU Resources Group, Inc. | | | 9,195 | | | | 283,574 | |
National Fuel Gas Co. | | | 1 | | | | 64 | |
NRG Energy, Inc. | | | 8,499 | | | | 366,137 | |
Portland General Electric Co. | | | 5,465 | | | | 289,208 | |
UGI Corp. | | | 4,257 | | | | 195,439 | |
| | | | | | | | 2,941,190 | |
| | | | | | | | | |
Total Common Stocks (United States) (Cost $111,981,757) | | | | | | | 159,275,129 | |
| | | | | | | | | |
Preferred Stock (United States) — 0.0% |
WESCO International, Inc. Series A Variable Preferred (6) | | | 610 | | | | 18,697 | |
Total Preferred Stock (United States) (Cost $15,247) | | | | | | | 18,697 | |
| | | | | | | | | |
Warrants (United States) — 0.0% |
Chaparral Energy, Inc. A Warrants, Expiration Date 10/14/2024 (1)(5) | | | 2 | | | | 0 | |
Chaparral Energy, Inc. B Warrants, Expiration Date 10/14/2025 (1)(5) | | | 2 | | | | 0 | |
Civitas Solutions, Inc. A Warrants, Expiration Date 1/20/2025 (1)(5) | | | 15 | | | | 0 | |
Civitas Solutions, Inc. B Warrants, Expiration Date 1/20/2026 (1)(5) | | | 8 | | | | 0 | |
Hertz Global Holdings Inc. Warrants, Expiration Date 6/30/2051 (1) | | | 92 | | | | 1,467 | |
Nabors Industries, Ltd. Warrants, Expiration Date 6/11/2026 (1) | | | 27 | | | | 101 | |
Oasis Petroleum, Inc. Warrants, Expiration Date 11/19/2024 (1)(5) | | | 7 | | | | 0 | |
Whiting Petroleum Corp. A Warrants, Expiration Date 9/1/2024 (1) | | | 45 | | | | 624 | |
Whiting Petroleum Corp. B Warrants, Expiration Date 9/1/2025 (1) | | | 22 | | | | 260 | |
Total Warrants (United States) (Cost $2,721) | | | | | | | 2,452 | |
| | | | | | | | | |
Dynamic Allocation Fund |
Security Description | | Shares or
Principal
Amount ($) | | | Fair
Value ($) | |
Registered Investment Companies — 5.0% |
U.S. Fixed Income — 2.2% | | | | | | | | |
iShares Core U.S. Aggregate Bond ETF (7) | | | 46,615 | | | | 5,317,839 | |
| | | | | | | | 5,317,839 | |
| | | | | | | | | |
International Fixed Income — 2.3% | | | | | | | | |
iShares JP Morgan USD Emerging Markets Bond ETF (7) | | | 48,816 | | | | 5,323,873 | |
| | | | | | | | 5,323,873 | |
| | | | | | | | | |
International Equity — 0.5% | | | | | | | | |
iShares Core MSCI EAFE ETF (7) | | | 15,725 | | | | 1,173,714 | |
| | | | | | | | 1,173,714 | |
Total Registered Investment Companies (Cost $11,553,451) | | | | | | | 11,815,426 | |
| | | | | | | | | |
Money Market Registered Investment Companies — 24.5% |
Meeder Institutional Prime Money Market Fund, 0.05% (2) | | | 58,143,867 | | | | 58,149,681 | |
Total Money Market Registered Investment Companies (Cost $58,149,328) | | | | | | | 58,149,681 | |
| | | | | | | | | |
Bank Obligations — 0.3% |
First Merchants Bank Deposit Account, 0.20%, 1/3/2022 (3) | | | 249,093 | | | | 249,093 | |
Metro City Bank Deposit Account, 0.05%, 1/3/2022 (3) | | | 248,445 | | | | 248,445 | |
Pacific Mercantile Bank Deposit Account, 0.10%, 1/3/2022 (3) | | | 247,072 | | | | 247,072 | |
Total Bank Obligations (Cost $744,610) | | | | | | | 744,610 | |
Total Investments — 96.7% (Cost $182,447,114) | | | | | | | 230,005,995 | |
Other Assets less Liabilities — 3.3% | | | | | | | 7,725,420 | |
Total Net Assets — 100.0% | | | | | | | 237,731,415 | |
| | | | | | | | | |
Trustee Deferred Compensation (4) |
Meeder Balanced Fund - Retail Class | | | 3,917 | | | | 52,566 | |
Meeder Dynamic Allocation Fund - Retail Class | | | 10,794 | | | | 150,360 | |
Meeder Muirfield Fund - Retail Class | | | 4,893 | | | | 46,630 | |
Meeder Conservative Allocation Fund - Retail Class | | | 1,131 | | | | 26,737 | |
Total Trustee Deferred Compensation (Cost $218,928) | | | | | | | 276,293 | |
| | | | | | | | | |
The accompanying notes are an integral part of these financial statements.
Page 94 | 2021 Annual Report | December 31, 2021 |
Schedule of Investments
December 31, 2021
| | | Long
(Short)
Contracts | | | Expiration
Date | | | Notional
Value of
Contracts
($) | | | Value and
Unrealized
Appreciation
(Depreciation)
($) | |
Futures Contracts |
Index Futures | | | | | | | | | | | | | | | | |
E-mini Standard & Poors MidCap 400 Futures | | | (18 | ) | | | 3/18/2022 | | | | (5,107,860 | ) | | | 293 | |
Mini MSCI EAFE Index Futures | | | 299 | | | | 3/18/2022 | | | | 34,710,910 | | | | 1,000,762 | |
Mini MSCI Emerging Markets Index Futures | | | 116 | | | | 3/18/2022 | | | | 7,112,540 | | | | 64,615 | |
Russell 2000 Mini Index Futures | | | 48 | | | | 3/18/2022 | | | | 5,382,720 | | | | 158,382 | |
Standard & Poors 500 Mini Futures | | | 3 | | | | 3/18/2022 | | | | 713,775 | | | | (4,934 | ) |
Total Futures Contracts | | | 448 | | | | | | | | 42,812,085 | | | | 1,219,118 | |
(1) | Represents non-income producing securities. |
(2) | Investment in affiliate. The yield shown represents the 7-day yield in effect at December 31, 2021. |
(3) | Variable rate security. Securities payable at par including accrued interest (usually within seven days notice) and unconditionally secured as to principal and interest by letters of credit or other credit support agreements from major banks. The interest rates are adjustable and are not based on a published reference rate and spread but are determined by the issuer or agent and are based on current market conditions. These securities do not indicate a reference rate and spread in their description above. The rate shown represents the rate in effect at December 31, 2021. The maturity date shown, if applicable, reflects the earlier of the next demand date or stated maturity date. |
(4) | Assets of affiliates to the Dynamic Allocation Fund held for the benefit of the Fund’s Trustees in connection with the Trustee Deferred Compensation Plan. |
(5) | Fair valued security deemed a Level 3 security. Security is not part of the investment strategy of the Fund. |
The accompanying notes are an integral part of these financial statements.
2021 Annual Report | December 31, 2021 | Page 95 |
Schedule of Investments
December 31, 2021
Quantex Fund |
Security Description | | Shares or
Principal
Amount ($) | | | Fair
Value ($) | |
Common Stocks (United States) — 64.0% |
Communication Services — 2.7% | | | | | | | | |
Interpublic Group of Cos., Inc./The | | | 7,487 | | | | 280,388 | |
Lumen Technologies, Inc. | | | 23,039 | | | | 289,139 | |
News Corp. - Class B | | | 12,267 | | | | 276,008 | |
News Corp. - Class A | | | 12,125 | | | | 270,509 | |
| | | | | | | | 1,116,044 | |
| | | | | | | | | |
Consumer Discretionary — 12.2% | | | | | | | | |
Advance Auto Parts, Inc. | | | 1,297 | | | | 311,124 | |
Bath & Body Works, Inc. | | | 4,126 | | | | 287,954 | |
BorgWarner, Inc. | | | 6,356 | | | | 286,465 | |
Gap, Inc./The | | | 9,857 | | | | 173,976 | |
Hanesbrands, Inc. | | | 14,530 | | | | 242,942 | |
Hasbro, Inc. | | | 2,852 | | | | 290,277 | |
Leggett & Platt, Inc. | | | 5,764 | | | | 237,246 | |
LKQ Corp. | | | 5,317 | | | | 319,180 | |
Mohawk Industries, Inc. (1) | | | 1,373 | | | | 250,133 | |
Newell Brands, Inc. | | | 11,219 | | | | 245,023 | |
Norwegian Cruise Line Holdings, Ltd. (1) | | | 11,720 | | | | 243,073 | |
Penn National Gaming, Inc. (1) | | | 4,361 | | | | 226,118 | |
PulteGroup, Inc. | | | 5,224 | | | | 298,604 | |
PVH Corp. | | | 2,565 | | | | 273,557 | |
Ralph Lauren Corp. | | | 2,353 | | | | 279,678 | |
Tapestry, Inc. | | | 6,728 | | | | 273,157 | |
Under Armour, Inc. - Class C (1) | | | 14,187 | | | | 255,933 | |
Under Armour, Inc. - Class A (1) | | | 11,953 | | | | 253,284 | |
Victoria’s Secret & Co. (1) | | | 1,440 | | | | 79,978 | |
Whirlpool Corp. | | | 1,233 | | | | 289,336 | |
Wynn Resorts, Ltd. (1) | | | 137 | | | | 11,650 | |
| | | | | | | | 5,128,688 | |
| | | | | | | | | |
Consumer Staples — 1.1% | | | | | | | | |
Campbell Soup Co. | | | 4,951 | | | | 215,170 | |
Lamb Weston Holdings, Inc. | | | 18 | | | | 1,141 | |
Molson Coors Beverage Co. | | | 5,625 | | | | 260,719 | |
| | | | | | | | 477,030 | |
| | | | | | | | | |
Energy — 5.0% | | | | | | | | |
APA Corp. | | | 11,354 | | | | 305,309 | |
ConocoPhillips | | | 4,210 | | | | 303,878 | |
Coterra Energy, Inc. | | | 16,368 | | | | 310,992 | |
Devon Energy Corp. | | | 7,986 | | | | 351,783 | |
Diamondback Energy, Inc. | | | 3,180 | | | | 342,963 | |
HollyFrontier Corp. | | | 4,535 | | | | 148,657 | |
Marathon Oil Corp. | | | 20,926 | | | | 343,605 | |
| | | | | | | | 2,107,187 | |
| | | | | | | | | |
Quantex Fund |
Security Description | | Shares or
Principal
Amount ($) | | | Fair
Value ($) | |
Common Stocks (United States) — continued |
Financials — 9.7% | | | | | | | | |
Assurant, Inc. | | | 1,653 | | | | 257,637 | |
Cboe Global Markets, Inc. | | | 2,118 | | | | 276,187 | |
Comerica, Inc. | | | 3,812 | | | | 331,644 | |
Everest Re Group, Ltd. | | | 996 | | | | 272,824 | |
Federal Realty Investment Trust (1) | | | 2,345 | | | | 319,670 | |
Franklin Resources, Inc. | | | 8,818 | | | | 295,315 | |
Globe Life, Inc. | | | 2,849 | | | | 267,008 | |
Huntington Bancshares, Inc./OH | | | 18,486 | | | | 285,054 | |
Invesco, Ltd. | | | 11,540 | | | | 265,651 | |
Lincoln National Corp. | | | 4,133 | | | | 282,119 | |
Loews Corp. | | | 4,946 | | | | 285,681 | |
People’s United Financial, Inc. | | | 17,247 | | | | 307,342 | |
W R Berkley Corp. | | | 3,577 | | | | 294,709 | |
Wells Fargo & Co. (1)(5) | | | 1 | | | | 0 | |
Zions Bancorp NA | | | 5,083 | | | | 321,042 | |
| | | | | | | | 4,061,883 | |
| | | | | | | | | |
Healthcare — 2.8% | | | | | | | | |
DaVita, Inc. (1) | | | 1,887 | | | | 214,665 | |
DENTSPLY SIRONA, Inc. | | | 4,514 | | | | 251,836 | |
Henry Schein, Inc. (1) | | | 3,568 | | | | 276,627 | |
Organon & Co. | | | 7,177 | | | | 218,540 | |
Universal Health Services, Inc. | | | 1,792 | | | | 232,351 | |
| | | | | | | | 1,194,019 | |
| | | | | | | | | |
Industrials — 10.5% | | | | | | | | |
A O Smith Corp. | | | 3,843 | | | | 329,922 | |
Alaska Air Group, Inc. (1) | | | 5,007 | | | | 260,865 | |
Allegion plc | | | 1,928 | | | | 255,344 | |
American Airlines Group, Inc. (1) | | | 14,430 | | | | 259,163 | |
CH Robinson Worldwide, Inc. | | | 3,080 | | | | 331,500 | |
Fortune Brands Home & Security, Inc. | | | 2,775 | | | | 296,648 | |
Howmet Aerospace, Inc. | | | 8,512 | | | | 270,937 | |
Huntington Ingalls Industries, Inc. | | | 1,351 | | | | 252,286 | |
Leidos Holdings, Inc. | | | 2,421 | | | | 215,227 | |
Nielsen Holdings PLC | | | 12,012 | | | | 246,366 | |
Pentair PLC | | | 3,452 | | | | 252,100 | |
Quanta Services, Inc. | | | 2,819 | | | | 323,227 | |
Robert Half International, Inc. | | | 2,660 | | | | 296,643 | |
Snap-on, Inc. | | | 1,249 | | | | 269,010 | |
Textron, Inc. | | | 3,870 | | | | 298,764 | |
United Airlines Holdings, Inc. (1) | | | 6,152 | | | | 269,335 | |
| | | | | | | | 4,427,337 | |
| | | | | | | | | |
The accompanying notes are an integral part of these financial statements.
Page 96 | 2021 Annual Report | December 31, 2021 |
Schedule of Investments
December 31, 2021
Quantex Fund |
Security Description | | Shares or
Principal
Amount ($) | | | Fair
Value ($) | |
Common Stocks (United States) — continued |
Information Technology — 5.7% | | | | | | | | |
Citrix Systems, Inc. | | | 2,207 | | | | 208,760 | |
DXC Technology Co. (1) | | | 7,654 | | | | 246,382 | |
F5, Inc. (1) | | | 1,366 | | | | 334,274 | |
IPG Photonics Corp. (1) | | | 1,608 | | | | 276,801 | |
Jack Henry & Associates, Inc. | | | 1,534 | | | | 256,163 | |
Juniper Networks, Inc. | | | 9,313 | | | | 332,564 | |
NortonLifeLock, Inc. | | | 10,463 | | | | 271,829 | |
Teledyne Technologies, Inc. (1) | | | 606 | | | | 264,755 | |
Xerox Holdings Corp. | | | 6,402 | | | | 144,941 | |
| | | | | | | | 2,336,469 | |
| | | | | | | | | |
Materials — 4.8% | | | | | | | | |
Avery Dennison Corp. | | | 1,255 | | | | 271,795 | |
CF Industries Holdings, Inc. | | | 5,115 | | | | 362,040 | |
International Flavors & Fragrances, Inc. | | | 1,809 | | | | 272,526 | |
Mosaic Co./The | | | 8,014 | | | | 314,870 | |
Packaging Corp. of America | | | 1,863 | | | | 253,647 | |
Sealed Air Corp. | | | 4,574 | | | | 308,608 | |
Westrock Co. | | | 5,540 | | | | 245,754 | |
| | | | | | | | 2,029,240 | |
| | | | | | | | | |
Real Estate Investment Trust — 5.0% | | | | | | | | |
Host Hotels & Resorts, Inc. (1) | | | 18,187 | | | | 316,272 | |
Iron Mountain, Inc. | | | 5,903 | | | | 308,904 | |
Kimco Realty Corp. | | | 12,827 | | | | 316,186 | |
Regency Centers Corp. | | | 4,197 | | | | 316,244 | |
SL Green Realty Corp. | | | 3,833 | | | | 274,826 | |
UDR, Inc. | | | 5,100 | | | | 305,949 | |
Vornado Realty Trust | | | 6,613 | | | | 276,820 | |
| | | | | | | | 2,115,201 | |
| | | | | | | | | |
Utilities — 4.5% | | | | | | | | |
Alliant Energy Corp. | | | 4,396 | | | | 270,222 | |
Atmos Energy Corp. | | | 2,740 | | | | 287,070 | |
CenterPoint Energy, Inc. | | | 10,427 | | | | 291,018 | |
Evergy, Inc. | | | 3,940 | | | | 270,323 | |
NiSource, Inc. | | | 10,599 | | | | 292,641 | |
NRG Energy, Inc. | | | 6,334 | | | | 272,869 | |
Pinnacle West Capital Corp. | | | 3,063 | | | | 216,217 | |
| | | | | | | | 1,900,360 | |
| | | | | | | | | |
Total Common Stocks (United States) (Cost $19,573,252) | | | | | | | 26,893,458 | |
| | | | | | | | | |
Quantex Fund |
Security Description | | Shares or
Principal
Amount ($) | | | Fair
Value ($) | |
Money Market Registered Investment Companies — 32.6% |
Meeder Institutional Prime Money Market Fund, 0.05% (2) | | | 13,686,540 | | | | 13,687,909 | |
Total Money Market Registered Investment Companies (Cost $13,689,208) | | | | | | | 13,687,909 | |
| | | | | | | | | |
Bank Obligations — 0.0% |
First Merchants Bank Deposit Account, 0.20%, 1/3/2022 (3) | | | 8,180 | | | | 8,180 | |
Metro City Bank Deposit Account, 0.05%, 1/3/2022 (3) | | | 19 | | | | 19 | |
Pacific Mercantile Bank Deposit Account, 0.10%, 1/3/2022 (3) | | | 20 | | | | 20 | |
Total Bank Obligations (Cost $8,219) | | | | | | | 8,219 | |
Total Investments — 96.6% (Cost $33,270,679) | | | | | | | 40,589,586 | |
Other Assets less Liabilities — 3.4% | | | | | | | 1,437,306 | |
Total Net Assets — 100.0% | | | | | | | 42,026,892 | |
| | | | | | | | | |
Trustee Deferred Compensation (4) |
Meeder Balanced Fund - Retail Class | | | 1,150 | | | | 15,433 | |
Meeder Dynamic Allocation Fund - Retail Class | | | 3,109 | | | | 43,308 | |
Meeder Muirfield Fund - Retail Class | | | 1,521 | | | | 14,495 | |
Meeder Conservative Allocation Fund - Retail Class | | | 331 | | | | 7,825 | |
Total Trustee Deferred Compensation (Cost $66,097) | | | | | | | 81,061 | |
| | | | | | | | | |
The accompanying notes are an integral part of these financial statements.
2021 Annual Report | December 31, 2021 | Page 97 |
Schedule of Investments
December 31, 2021
| | | Long
(Short)
Contracts | | | Expiration
Date | | | Notional
Value of
Contracts
($) | | | Value and
Unrealized
Appreciation
(Depreciation)
($) | |
Futures Contracts |
Index Futures | | | | | | | | | | | | | | | | |
Standard & Poors 500 Mini Futures | | | 43 | | | | 3/18/2022 | | | | 10,230,775 | | | | 232,815 | |
Total Futures Contracts | | | 43 | | | | | | | | 10,230,775 | | | | 232,815 | |
(1) | Represents non-income producing securities. |
(2) | Investment in affiliate. The yield shown represents the 7-day yield in effect at December 31, 2021. |
(3) | Variable rate security. Securities payable at par including accrued interest (usually within seven days notice) and unconditionally secured as to principal and interest by letters of credit or other credit support agreements from major banks. The interest rates are adjustable and are not based on a published reference rate and spread but are determined by the issuer or agent and are based on current market conditions. These securities do not indicate a reference rate and spread in their description above. The rate shown represents the rate in effect at December 31, 2021. The maturity date shown, if applicable, reflects the earlier of the next demand date or stated maturity date. |
(4) | Assets of affiliates to the Quantex Fund held for the benefit of the Fund’s Trustees in connection with the Trustee Deferred Compensation Plan. |
(5) | Fair valued security deemed a Level 3 security. Security is not part of the investment strategy of the Fund. |
The accompanying notes are an integral part of these financial statements.
Page 98 | 2021 Annual Report | December 31, 2021 |
Schedule of Investments
December 31, 2021
Tactical Income Fund |
Security Description | | Shares or
Principal
Amount ($) | | | Fair
Value ($) | |
Registered Investment Companies (U.S. Fixed Income) — 80.3% |
Baird Core Plus Bond Fund - Class I | | | 142,754 | | | | 1,665,940 | |
Dodge & Cox Income Fund | | | 147,068 | | | | 2,067,779 | |
DoubleLine Total Return Bond Fund - Class I | | | 232,157 | | | | 2,414,435 | |
Frost Total Return Bond Fund - Class I | | | 263,695 | | | | 2,718,699 | |
Guggenheim Total Return Bond Fund - Class I | | | 35,676 | | | | 1,018,893 | |
iShares 0-5 Year High Yield Corporate Bond ETF (3) | | | 45,686 | | | | 2,069,576 | |
iShares 3-7 Year Treasury Bond ETF (3)(4) | | | 147,667 | | | | 19,000,314 | |
iShares JP Morgan USD Emerging Markets Bond ETF (3) | | | 63,594 | | | | 6,935,562 | |
Lord Abbett High Yield Fund | | | 363,953 | | | | 2,740,563 | |
PGIM Short-Term Corporate Bond Fund - Class Q | | | 88,832 | | | | 992,259 | |
Pioneer Bond Fund - Class K | | | 214,698 | | | | 2,084,719 | |
Segall Bryant & Hamill Plus Bond Fund - Class I | | | 227,570 | | | | 2,444,097 | |
SPDR Bloomberg Barclays Short Term High Yield Bond ETF (3) | | | 88,423 | | | | 2,400,684 | |
Vanguard Short-Term Bond ETF (3) | | | 87,956 | | | | 7,109,483 | |
Total Registered Investment Companies (U.S. Fixed Income) (Cost $55,334,096) | | | | | | | 55,663,003 | |
| | | | | | | | | |
Money Market Registered Investment Companies — 19.6% |
Meeder Institutional Prime Money Market Fund, 0.05% (1) | | | 13,583,305 | | | | 13,584,663 | |
Total Money Market Registered Investment Companies (Cost $13,584,148) | | | | | | | 13,584,663 | |
| | | | | | | | | |
U.S. Government Obligations — 0.1% |
Government National Mortgage Association, 6.50%, due 7/20/2038 | | | 58,158 | | | | 62,256 | |
Total U.S. Government Obligations (Cost $62,256) | | | | | | | 62,256 | |
Total Investments — 100.0% (Cost $68,980,500) | | | | | | | 69,309,922 | |
Other Assets less Liabilities — 0.0% | | | | | | | 31,194 | |
Total Net Assets — 100.0% | | | | | | | 69,341,116 | |
| | | | | | | | | |
Tactical Income Fund |
Security Description | | Shares or
Principal
Amount ($) | | | Fair
Value ($) | |
Trustee Deferred Compensation (2) |
Meeder Balanced Fund - Retail Class | | | 1,308 | | | | 17,553 | |
Meeder Dynamic Allocation Fund - Retail Class | | | 3,448 | | | | 48,031 | |
Meeder Muirfield Fund - Retail Class | | | 1,798 | | | | 17,135 | |
Meeder Conservative Allocation Fund - Retail Class | | | 383 | | | | 9,054 | |
Total Trustee Deferred Compensation (Cost $76,835) | | | | | | | 91,773 | |
(1) | Investment in affiliate. The yield shown represents the 7-day yield in effect at December 31, 2021. |
(2) | Assets of affiliates to the Tactical Income Fund held for the benefit of the Fund’s Trustees in connection with the Trustee Deferred Compensation Plan. |
(4) | Additional information, including current Prospectus and Annual Reports, is available at https://www.ishares.com/prospectus. |
The accompanying notes are an integral part of these financial statements.
2021 Annual Report | December 31, 2021 | Page 99 |
Schedule of Investments
December 31, 2021
Institutional Prime Money Market Fund |
Security Description | | Coupon/
Yield | | | Maturity/
Demand
Date | | | Principal
Amount ($)
or Shares | | | Fair
Value ($) | |
Bank Obligations — 0.2% |
Bank Midwest Deposit Account | | | 0.55 | %(1) | | | 01/03/22 | | | | 247,531 | | | | 247,531 | |
CIBC Bank Deposit Account | | | 0.20 | %(1) | | | 01/03/22 | | | | 245,830 | | | | 245,830 | |
First Merchants Bank Deposit Account | | | 0.20 | %(1) | | | 01/03/22 | | | | 249,093 | | | | 249,093 | |
Metro City Bank Deposit Account | | | 0.05 | %(1) | | | 01/03/22 | | | | 246,457 | | | | 246,457 | |
State Bank of India Deposit Account | | | 0.10 | %(1) | | | 01/03/22 | | | | 246,626 | | | | 246,626 | |
TIAA Bank Deposit Account | | | 0.15 | %(1) | | | 01/03/22 | | | | 245,825 | | | | 245,825 | |
Total Bank Obligations (Cost $1,481,362) | | | 1,481,362 | |
| | | | | |
Certificates of Deposit — 14.0% |
Banco Santander Yankee CD | | | 0.22 | % | | | 02/07/22 | | | | 10,000,000 | | | | 10,001,040 | |
Bank of Montreal Chicago Yankee CD | | | 0.24 | % | | | 04/06/22 | | | | 3,725,000 | | | | 3,725,056 | |
Bank of Montreal Chicago Yankee CD | | | 0.20 | % | | | 08/19/22 | | | | 1,500,000 | | | | 1,498,230 | |
Bank of Montreal Chicago Yankee CD | | | 0.29 | % | | | 12/01/22 | | | | 5,000,000 | | | | 4,998,465 | |
Bank of Nova Scotia Yankee CD | | | 0.20 | % | | | 01/07/22 | | | | 6,000,000 | | | | 6,000,138 | |
Canadian Imperial Holdings, Inc. (Secured Overnight Financing Rate + 0.30%) | | | 0.35 | %(2) | | | 01/06/22 | | | | 5,000,000 | | | | 4,999,742 | |
Canadian Imperial Holdings, Inc. (Secured Overnight Financing Rate + 0.21%) | | | 0.26 | %(2) | | | 01/03/22 | | | | 5,000,000 | | | | 4,996,610 | |
Loyds Bank Corp. Mkts/NY Yankee CD | | | 0.24 | % | | | 02/22/22 | | | | 1,349,000 | | | | 1,349,236 | |
Mizuho Bank LTD/NY Yankee CD | | | 0.25 | % | | | 05/18/22 | | | | 2,000,000 | | | | 1,999,692 | |
Mizuho Bank LTD/NY Yankee CD | | | 0.33 | % | | | 07/15/22 | | | | 5,000,000 | | | | 4,999,535 | |
MUFG Bank LTD/New York, NY Yankee CD | | | 0.23 | % | | | 07/15/22 | | | | 2,000,000 | | | | 1,998,822 | |
Natixis SA/New York, NY Yankee CD | | | 0.23 | % | | | 02/09/22 | | | | 500,000 | | | | 500,072 | |
Nordea Bank ABP NY Yankee CD | | | 0.16 | % | | | 04/26/22 | | | | 5,000,000 | | | | 5,000,805 | |
Nordea Bank ABP NY Yankee CD | | | 0.21 | % | | | 05/11/22 | | | | 1,000,000 | | | | 1,000,323 | |
Institutional Prime Money Market Fund |
Security Description | | Coupon/
Yield | | | Maturity/
Demand
Date | | | Principal
Amount ($)
or Shares | | | Fair
Value ($) | |
Certificates of Deposit — continued |
Nordea Bank ABP NY Yankee CD | | | 0.19 | % | | | 06/24/22 | | | | 2,220,000 | | | | 2,220,269 | |
Royal Bank of Canada (Secured Overnight Financing Rate + 0.15%) | | | 0.20 | %(2) | | | 02/09/22 | | | | 5,000,000 | | | | 4,997,730 | |
Standard Chartered Bank NY Yankee CD | | | 0.24 | % | | | 03/04/22 | | | | 2,100,000 | | | | 2,099,889 | |
Sumitomo Mitsui Trust Bank LTD/New York, NY Yankee CD | | | 0.18 | % | | | 02/09/22 | | | | 10,000,000 | | | | 10,000,670 | |
Sumitomo Mitsui Trust Bank LTD/New York, NY Yankee CD | | | 0.25 | % | | | 05/12/22 | | | | 2,000,000 | | | | 1,999,794 | |
Svenska Handelsbanken Yankee CD | | | 0.13 | % | | | 01/06/22 | | | | 875,000 | | | | 875,007 | |
Toronto Dominion Bank/New York, NY Yankee CD | | | 0.23 | % | | | 03/17/22 | | | | 1,500,000 | | | | 1,500,183 | |
Toronto Dominion Bank/New York, NY Yankee CD | | | 0.27 | % | | | 10/20/22 | | | | 1,000,000 | | | | 998,790 | |
Toronto Dominion Bank/New York, NY (Secured Overnight Financing Rate + 0.12%) | | | 0.17 | %(2) | | | 01/22/22 | | | | 5,000,000 | | | | 5,000,000 | |
Toronto Dominion Bank/New York, NY (Secured Overnight Financing Rate + 0.14%) | | | 0.19 | %(2) | | | 02/05/22 | | | | 5,000,000 | | | | 5,000,000 | |
Total Certificates of Deposit (Cost $87,768,989) | | | 87,760,098 | |
| | | | | |
Commercial Paper — 54.4% |
Anglesea Funding | | | 0.15 | % | | | 01/05/22 | | | | 5,000,000 | | | | 4,999,945 | |
Anglesea Funding | | | 0.14 | % | | | 01/11/22 | | | | 5,000,000 | | | | 4,999,875 | |
Anglesea Funding | | | 0.09 | % | | | 02/01/22 | | | | 5,000,000 | | | | 4,999,405 | |
Anglesea Funding | | | 0.16 | % | | | 02/04/22 | | | | 10,000,000 | | | | 9,998,640 | |
ANZ New Zealand Int’l, LTD | | | 0.10 | % | | | 04/04/22 | | | | 2,000,000 | | | | 1,999,248 | |
Aust & NZ Banking | | | 0.06 | % | | | 03/29/22 | | | | 3,000,000 | | | | 2,998,989 | |
Bank of Nova Scotia | | | 0.09 | % | | | 03/03/22 | | | | 2,000,000 | | | | 1,999,470 | |
Bank of Nova Scotia | | | 0.03 | % | | | 05/03/22 | | | | 1,550,000 | | | | 1,548,724 | |
Bank of Nova Scotia | | | 0.11 | % | | | 06/23/22 | | | | 2,000,000 | | | | 1,997,120 | |
Bank of Nova Scotia | | | 0.04 | % | | | 07/27/22 | | | | 2,000,000 | | | | 1,996,094 | |
Bank of Nova Scotia | | | 0.04 | % | | | 07/29/22 | | | | 2,000,000 | | | | 1,996,034 | |
Bank of Nova Scotia | | | 0.11 | % | | | 10/03/22 | | | | 1,450,000 | | | | 1,445,476 | |
Banque et Caisse d’Epargne de l’Etat | | | 0.03 | % | | | 02/15/22 | | | | 2,000,000 | | | | 1,999,714 | |
The accompanying notes are an integral part of these financial statements.
Page 100 | 2021 Annual Report | December 31, 2021 |
Schedule of Investments
December 31, 2021
Institutional Prime Money Market Fund |
Security Description | | Coupon/
Yield | | | Maturity/
Demand
Date | | | Principal
Amount ($)
or Shares | | | Fair
Value ($) | |
Commercial Paper — continued |
Barclays Capital, Inc. | | | 0.03 | % | | | 01/18/22 | | | | 250,000 | | | | 249,989 | |
Barclays Capital, Inc. | | | 0.06 | % | | | 08/08/22 | | | | 3,750,000 | | | | 3,740,651 | |
Bedford Row Funding | | | 0.29 | % | | | 08/18/22 | | | | 3,000,000 | | | | 2,992,332 | |
Canadian Imperial Holdings, Inc. | | | 0.02 | % | | | 03/04/22 | | | | 3,000,000 | | | | 2,999,445 | |
Canadian Imperial Holdings, Inc. | | | 0.02 | % | | | 03/07/22 | | | | 4,500,000 | | | | 4,499,078 | |
Cedar Springs Capital | | | 0.25 | % | | | 03/21/22 | | | | 15,231,000 | | | | 15,223,110 | |
Chesham Finance, LLC | | | 0.15 | % | | | 01/06/22 | | | | 5,000,000 | | | | 4,999,935 | |
Chesham Finance, LLC | | | 0.16 | % | | | 01/21/22 | | | | 5,000,000 | | | | 4,999,740 | |
Chesham Finance, LLC | | | 0.38 | % | | | 06/29/22 | | | | 10,000,000 | | | | 9,981,000 | |
Collateralized Commercial Paper V Co. | | | 0.03 | % | | | 02/09/22 | | | | 3,000,000 | | | | 2,999,499 | |
Collateralized Commercial Paper V Co. | | | 0.20 | % | | | 03/28/22 | | | | 4,500,000 | | | | 4,497,336 | |
CommonWealth Bank | | | 0.10 | % | | | 01/04/22 | | | | 5,000,000 | | | | 4,999,965 | |
CommonWealth Bank | | | 0.04 | % | | | 03/24/22 | | | | 5,000,000 | | | | 4,998,030 | |
CommonWealth Bank | | | 0.18 | % | | | 07/15/22 | | | | 2,000,000 | | | | 1,996,668 | |
Crown Point Capital | | | 0.09 | % | | | 02/03/22 | | | | 10,000,000 | | | | 9,998,620 | |
Crown Point Capital | | | 0.05 | % | | | 02/25/22 | | | | 10,000,000 | | | | 9,996,360 | |
DZ Bank AG | | | 0.08 | % | | | 01/21/22 | | | | 5,000,000 | | | | 4,999,765 | |
Ebury Finance, LLC | | | 0.07 | % | | | 01/03/22 | | | | 30,000,000 | | | | 29,999,790 | |
Glencove Funding, LLC | | | 0.25 | % | | | 03/09/22 | | | | 7,000,000 | | | | 6,997,186 | |
Great Bear Funding | | | 0.16 | % | | | 01/12/22 | | | | 10,000,000 | | | | 9,999,720 | |
Halkin Finance, LLC | | | 0.18 | % | | | 02/03/22 | | | | 5,000,000 | | | | 4,999,350 | |
ING US Funding, LLC | | | 0.04 | % | | | 03/21/22 | | | | 5,000,000 | | | | 4,997,890 | |
JP Morgan Securities, LLC | | | 0.17 | % | | | 05/19/22 | | | | 5,000,000 | | | | 4,994,150 | |
JP Morgan Securities, LLC (Secured Overnight Financing Rate + 0.19%) | | | 0.19 | %(2) | | | 01/25/22 | | | | 4,750,000 | | | | 4,750,219 | |
Longship Funding, LLC | | | 0.14 | % | | | 01/10/22 | | | | 6,500,000 | | | | 6,499,779 | |
Loyds Bank Corp. Mkts/NY | | | 0.05 | % | | | 02/07/22 | | | | 1,030,000 | | | | 1,029,885 | |
Macquarie Bank, LTD/Australia | | | 0.04 | % | | | 01/10/22 | | | | 4,000,000 | | | | 3,999,912 | |
Macquarie Bank, LTD/Australia | | | 0.03 | % | | | 02/02/22 | | | | 4,250,000 | | | | 4,249,524 | |
Macquarie Bank, LTD/Australia | | | 0.07 | % | | | 03/01/22 | | | | 2,000,000 | | | | 1,999,334 | |
Macquarie Bank, LTD/Australia | | | 0.20 | % | | | 03/02/22 | | | | 9,000,000 | | | | 8,996,922 | |
Macquarie Bank, LTD/Australia | | | 0.21 | % | | | 03/18/22 | | | | 1,150,000 | | | | 1,149,425 | |
Macquarie Bank, LTD/Australia | | | 0.07 | % | | | 04/06/22 | | | | 2,000,000 | | | | 1,998,582 | |
Institutional Prime Money Market Fund |
Security Description | | Coupon/
Yield | | | Maturity/
Demand
Date | | | Principal
Amount ($)
or Shares | | | Fair
Value ($) | |
Commercial Paper — continued |
Macquarie Bank, LTD/Australia | | | 0.11 | % | | | 04/18/22 | | | | 5,500,000 | | | | 5,495,413 | |
Macquarie Bank, LTD/Australia | | | 0.13 | % | | | 05/04/22 | | | | 1,500,000 | | | | 1,498,487 | |
Metlife Short Term | | | 0.08 | % | | | 01/04/22 | | | | 4,750,000 | | | | 4,749,972 | |
Mizuho Bank, LTD/NY | | | 0.06 | % | | | 02/01/22 | | | | 1,400,000 | | | | 1,399,906 | |
Mizuho Bank, LTD/NY | | | 0.05 | % | | | 02/18/22 | | | | 1,000,000 | | | | 999,835 | |
MUFG Bank, LTD/New York, NY | | | 0.09 | % | | | 01/03/22 | | | | 10,000,000 | | | | 9,999,960 | |
Natixis SA/New York, NY | | | 0.03 | % | | | 02/03/22 | | | | 3,000,000 | | | | 2,999,763 | |
Ridgefield Funding Co. | | | 0.21 | % | | | 02/03/22 | | | | 1,900,000 | | | | 1,899,753 | |
Ridgefield Funding Co. | | | 0.21 | % | | | 02/08/22 | | | | 3,350,000 | | | | 3,349,464 | |
Ridgefield Funding Co. | | | 0.25 | % | | | 03/01/22 | | | | 1,000,000 | | | | 999,667 | |
Royal Bank of Canada | | | 0.05 | % | | | 03/18/22 | | | | 4,000,000 | | | | 3,998,416 | |
Royal Bank of Canada | | | 0.05 | % | | | 03/23/22 | | | | 3,000,000 | | | | 2,998,641 | |
Royal Bank of Canada | | | 0.07 | % | | | 05/06/22 | | | | 1,025,000 | | | | 1,024,096 | |
Royal Bank of Canada | | | 0.04 | % | | | 07/06/22 | | | | 2,000,000 | | | | 1,996,624 | |
Royal Bank of Canada | | | 0.18 | % | | | 10/04/22 | | | | 2,650,000 | | | | 2,641,478 | |
Royal Bank of Canada | | | 0.10 | % | | | 10/12/22 | | | | 2,000,000 | | | | 1,993,224 | |
Royal Bank of Canada | | | 0.28 | % | | | 11/14/22 | | | | 1,000,000 | | | | 995,778 | |
Santander UK PLC | | | 0.03 | % | | | 02/01/22 | | | | 2,000,000 | | | | 1,999,850 | |
Skandinav Enskilda Bank | | | 0.18 | % | | | 03/15/22 | | | | 2,000,000 | | | | 1,999,330 | |
Skandinav Enskilda Bank | | | 0.09 | % | | | 04/21/22 | | | | 7,000,000 | | | | 6,995,233 | |
Standard Chartered Bank NY | | | 0.07 | % | | | 04/06/22 | | | | 2,000,000 | | | | 1,998,592 | |
Standard Chartered Bank NY | | | 0.04 | % | | | 07/27/22 | | | | 2,700,000 | | | | 2,694,743 | |
Standard Chartered Bank NY | | | 0.32 | % | | | 10/14/22 | | | | 900,000 | | | | 896,828 | |
Sumitomo Mitsui Trust Bank, LTD/New York, NY | | | 0.05 | % | | | 01/26/22 | | | | 5,000,000 | | | | 4,999,655 | |
Sumitomo Mitsui Trust Bank, LTD/New York, NY | | | 0.26 | % | | | 04/18/22 | | | | 10,000,000 | | | | 9,992,800 | |
Svenska Handelsbanken | | | 0.16 | % | | | 05/27/22 | | | | 4,500,000 | | | | 4,496,364 | |
Svenska Handelsbanken | | | 0.22 | % | | | 06/03/22 | | | | 5,000,000 | | | | 4,995,465 | |
Toronto Dominion Bank/New York, NY | | | 0.08 | % | | | 04/19/22 | | | | 4,500,000 | | | | 4,497,152 | |
Toronto Dominion Bank/New York, NY | | | 0.25 | % | | | 05/03/22 | | | | 5,000,000 | | | | 4,996,190 | |
Westpac Banking Corp. (Quarterly U.S. LIBOR + 0.01%) | | | 0.14 | %(2) | | | 01/14/22 | | | | 4,750,000 | | | | 4,750,033 | |
The accompanying notes are an integral part of these financial statements.
2021 Annual Report | December 31, 2021 | Page 101 |
Schedule of Investments
December 31, 2021
Institutional Prime Money Market Fund |
Security Description | | Coupon/
Yield | | | Maturity/
Demand
Date | | | Principal
Amount ($)
or Shares | | | Fair
Value ($) | |
Commercial Paper — continued |
Westpac Securities | | | 0.24 | % | | | 08/18/22 | | | | 2,500,000 | | | | 2,494,730 | |
Total Commercial Paper (Cost $340,681,727) | | | 340,659,367 | |
| | | | | |
Corporate Obligations — 2.1% |
ANZ New Zealand Int’l, LTD | | | 2.87 | % | | | 01/25/22 | | | | 3,600,000 | | | | 3,604,874 | |
Mizuho Financial Group, Inc. | | | 0.17 | % | | | 04/06/22 | | | | 4,500,000 | | | | 4,499,015 | |
Westpac Banking Corp. (Secured Overnight Financing Rate + 0.13%) | | | 0.18 | %(2) | | | 01/10/22 | | | | 5,000,000 | | | | 4,999,963 | |
Total Corporate Obligations (Cost $13,106,195) | | | 13,103,852 | |
| | | | | |
Repurchase Agreements — 20.7% |
StoneX (Collateralized by $118,667,200 various Corporate Bonds, FMACs, GNMAs, FNMAs, and U.S. Treasury Notes, 0.14% - 8.50%, due 2/1/22 - 1/24/77, fair value $46,079,385)(proceeds $45,000,713) purchase date 12/31/21 | | | 0.19 | % | | | 01/03/22 | | | | 45,000,000 | | | | 45,000,000 | |
South Street (Collateralized by $62,680,190 various FMACs, FNMAs, and U.S Treasury Notes, 0.13% - 6.00%, due 8/1/22 - 4/1/51, fair value $66,321,182)(proceeds $65,000,217), purchase date 12/31/21 | | | 0.04 | % | | | 01/03/22 | | | | 65,000,000 | | | | 65,000,000 | |
Institutional Prime Money Market Fund |
Security Description | | Coupon/
Yield | | | Maturity/
Demand
Date | | | Principal
Amount ($)
or Shares | | | Fair
Value ($) | |
Repurchase Agreements — continued |
South Street (Collateralized by $18,786,424 various FMACs, FNMAs, SBAs, and U.S Treasury Notes, 0.38% - 6.00%, due 12/31/23 - 10/1/50, fair value $20,398,508)(proceeds $20,000,150), purchase date 12/31/21 | | | 0.09 | % | | | 01/03/22 | | | | 20,000,000 | | | | 20,000,000 | |
Total Repurchase Agreements (Cost $130,000,000) | | | 130,000,000 | |
| | | | | |
U.S. Government and Agency Obligations — 0.7% |
Federal Agricultural Mortgage Corp. (Federal Reserve Bank Prime Loan Rate - 0.310%) | | | 0.15 | %(2) | | | 01/07/22 | | | | 4,500,000 | | | | 4,500,050 | |
Total U.S. Government and Agency Obligations (Cost $4,500,000) | | | 4,500,050 | |
| | | | | |
Variable Rate Demand Notes — 5.2% |
Caterpillar Financial Power Investment Floating Rate Demand Note | | | 0.20 | %(1) | | | 01/03/22 | | | | 17,060,192 | | | | 17,060,192 | |
Metro Transport Authority NY Revenue | | | 0.14 | %(1) | | | 01/06/22 | | | | 3,000,000 | | | | 3,000,000 | |
Michigan State Finance Authority Revenue | | | 0.09 | %(1) | | | 01/06/22 | | | | 4,500,000 | | | | 4,500,000 | |
Ohio State Special Obligation | | | 0.12 | %(1) | | | 01/05/22 | | | | 2,000,000 | | | | 2,000,000 | |
Pittsburgh & Allegheny County PA Sports & Exhibition Authority | | | 0.15 | %(1) | | | 01/06/22 | | | | 1,715,000 | | | | 1,715,000 | |
Triborough NY Bridge & Tunnel Authority Revenues | | | 0.12 | %(1) | | | 01/05/22 | | | | 1,400,000 | | | | 1,400,000 | |
Triborough NY Bridge & Tunnel Authority Revenues | | | 0.14 | %(1) | | | 01/06/22 | | | | 3,000,000 | | | | 3,000,000 | |
Total Variable Rate Demand Notes (Cost $32,675,192) | | | 32,675,192 | |
| | | | | |
The accompanying notes are an integral part of these financial statements.
Page 102 | 2021 Annual Report | December 31, 2021 |
Schedule of Investments
December 31, 2021
| Institutional Prime Money Market Fund |
| Security Description | | Principal
Amount ($)
or Shares | | | Fair
Value ($) | |
| Money Market Registered Investment Companies — 2.0% |
Federated Hermes Government Obligations Fund, 0.03% (3) | | | 12,268,566 | | | | 12,268,566 | |
| Total Money Market Registered Investment Companies (Cost $12,268,566) | | | | | | | 12,268,566 | |
| Total Investments — 99.3% (Cost $622,482,031) | | | | | | | 622,448,487 | |
| Other Assets less Liabilities — 0.7% | | | | | | | 4,544,924 | |
| Total Net Assets — 100.0% | | | | | | | 626,993,411 | |
| | | | | | | | | |
| Trustee Deferred Compensation (4) |
| Meeder Balanced Fund - Retail Class | | | 80 | | | | 1,074 | |
| Meeder Dynamic Allocation Fund - Retail Class | | | 200 | | | | 2,786 | |
| Meeder Muirfield Fund - Retail Class | | | 252 | | | | 2,402 | |
| Meeder Conservative Allocation Fund - Retail Class | | | 25 | | | | 591 | |
| Total Trustee Deferred Compensation (Cost $6,033) | | | | | | | 6,853 | |
(1) | Variable rate security. Securities payable at par including accrued interest (usually within seven days notice) and unconditionally secured as to principal and interest by letters of credit or other credit support agreements from major banks. The interest rates are adjustable and are not based on a published reference rate and spread but are determined by the issuer or agent and are based on current market conditions. These securities do not indicate a reference rate and spread in their description above. The rate shown represents the rate in effect at December 31, 2021. The maturity date shown, if applicable, reflects the earlier of the next demand date or stated maturity date. |
(2) | Floating rate security. Interest rates reset periodically. The reference rate and spread are indicated in the description above. The rate shown represents the rate in effect at December 31, 2021. The maturity date shown reflects the earlier of the next demand date or stated maturity date. |
(3) | 7-day yield as of December 31, 2021. The Fund may invest a significant portion of its assets in shares of one or more investment companies, including money market mutual funds. The Fund will incur additional indirect expenses (acquired fund fees and expenses) to the extent it invests in shares of other investment companies. |
(4) | Assets of affiliates to the Institutional Prime Money Market Fund held for the benefit of the Fund’s Trustees in connection with the Trustee Deferred Compensation Plan. |
The accompanying notes are an integral part of these financial statements.
2021 Annual Report | December 31, 2021 | Page 103 |
Statements of Assets and Liabilities
December 31, 2021 | |
| | | Muirfield
Fund | | | Spectrum
Fund | |
Assets | | | | | | | | |
Investments, at fair value (1)(2) | | $ | 482,176,857 | | | $ | 153,298,636 | |
Repurchase agreements, at fair value (1) | | | — | | | | — | |
Investments in affiliates, at fair value (1) | | | 227,883,637 | | | | 54,068,333 | |
Trustee deferred compensation investments, at fair value | | | 368,769 | | | | 58,954 | |
Cash | | | — | | | | — | |
Deposits at broker for futures contracts (3) | | | 8,499,843 | | | | 3,167,580 | |
Cash held at broker for collateral on securities sold short | | | — | | | | 995 | |
Receivable for securities sold | | | — | | | | — | |
Receivable for capital stock issued | | | 2,289,124 | | | | 724,534 | |
Receivable from investment adviser | | | — | | | | — | |
Interest and dividend receivable | | | 373,872 | | | | 107,865 | |
Prepaid expenses/other assets | | | 105,354 | | | | 42,221 | |
Total Assets | | | 721,697,456 | | | | 211,469,118 | |
| | | | | | | | | |
Liabilities | | | | | | | | |
Payable for securities purchased | | | 51 | | | | — | |
Payable for collateral on securities loaned | | | 19,686 | | | | — | |
Payable for Trustee Deferred Compensation Plan | | | 368,769 | | | | 58,954 | |
Payable for capital stock redeemed | | | 185,770 | | | | 70,583 | |
Dividends payable | | | — | | | | — | |
Payable to investment adviser | | | 375,713 | | | | 127,226 | |
Accrued distribution plan (12b-1) and shareholder service plan fees | | | 102,307 | | | | 23,976 | |
Accrued transfer agent, fund accounting, CCO, and administrative fees | | | 104,831 | | | | 41,332 | |
Accrued trustee fees | | | 12,530 | | | | 4,164 | |
Other accrued liabilities | | | 56,233 | | | | 39,129 | |
Total Liabilities | | | 1,225,890 | | | | 365,364 | |
| | | | | | | | | |
Net Assets | | $ | 720,471,566 | | | $ | 211,103,754 | |
| | | | | | | | | |
Net Assets | | | | | | | | |
Capital | | $ | 551,891,823 | | | $ | 159,499,301 | |
Distributable Earnings (Accumulated Deficit) | | | 168,579,743 | | | | 51,604,453 | |
Total Net Assets | | $ | 720,471,566 | | | $ | 211,103,754 | |
| | | | | | | | | |
Net Asset Value Per Share | | | | | | | | |
Retail Class | | | | | | | | |
Net Assets | | $ | 43,353,182 | | | $ | 2,525,517 | |
Shares Outstanding | | | 4,550,642 | | | | 181,989 | |
Net Asset Value, Offering and Redemption Price Per Share | | $ | 9.53 | | | $ | 13.88 | |
| | | | | | | | | |
Adviser Class | | | | | | | | |
Net Assets | | $ | 104,299,870 | | | $ | 38,190,092 | |
Shares Outstanding | | | 10,834,395 | | | | 2,736,037 | |
Net Asset Value, Offering and Redemption Price Per Share | | $ | 9.63 | | | $ | 13.96 | |
| | | | | | | | | |
Institutional Class | | | | | | | | |
Net Assets | | $ | 572,818,514 | | | $ | 170,388,145 | |
Shares Outstanding | | | 59,385,274 | | | | 12,166,150 | |
Net Asset Value, Offering and Redemption Price Per Share | | $ | 9.65 | | | $ | 14.01 | |
| | | | | | | | | |
Net Asset Value Per Share - Money Market Fund | | | | | | | | |
Net Assets | | | | | | | | |
Shares Outstanding | | | | | | | | |
Net Asset Value, Offering and Redemption Price Per Share | | | | | | | | |
| | | | | | | | | |
(1) Investments and affiliated investments at cost | | $ | 550,502,468 | | | $ | 158,646,294 | |
(2) Fair value of securities loaned included in investments at fair value (See Note #2, Note #3, and Note #5) | | $ | 19,010 | | | $ | — | |
(3) Required margin held as collateral for futures contracts | | $ | 7,152,870 | | | $ | 2,720,367 | |
The accompanying notes are an integral part of these financial statements.
Page 104 | 2021 Annual Report | December 31, 2021 |
| | Global
Allocation
Fund | | | Balanced
Fund | | | Moderate
Allocation
Fund | | | Conservative
Allocation
Fund | | | Dynamic
Allocation
Fund | | | Quantex
Fund | | | Tactical
Income Fund | | | Institutional
Prime Money
Market Fund | |
| | | | | | | | | | | | | | | | | | | | | | | | | | | | | | | | |
| | $ | 23,779,976 | | | $ | 284,536,053 | | | $ | 130,844,536 | | | $ | 103,340,336 | | | $ | 171,856,314 | | | $ | 26,901,677 | | | $ | 55,725,259 | | | $ | 492,448,487 | |
| | | — | | | | — | | | | — | | | | — | | | | — | | | | — | | | | — | | | | 130,000,000 | |
| | | 19,823,051 | | | | 98,243,827 | | | | 41,085,154 | | | | 30,120,101 | | | | 58,149,681 | | | | 13,687,909 | | | | 13,584,663 | | | | — | |
| | | 134,157 | | | | 239,015 | | | | 43,345 | | | | 96,319 | | | | 276,293 | | | | 81,061 | | | | 91,773 | | | | 6,853 | |
| | | — | | | | — | | | | — | | | | — | | | | — | | | | — | | | | — | | | | 4,501,362 | |
| | | 1,594,873 | | | | 3,886,522 | | | | 1,626,080 | | | | 863,397 | | | | 4,742,410 | | | | 1,301,223 | | | | — | | | | — | |
| | | — | | | | — | | | | — | | | | — | | | | — | | | | — | | | | — | | | | — | |
| | | — | | | | — | | | | — | | | | — | | | | — | | | | 1,263,712 | | | | — | | | | — | |
| | | 75,227 | | | | 809,499 | | | | 319,495 | | | | 239,299 | | | | 3,106,487 | | | | 195,318 | | | | 51,866 | | | | — | |
| | | — | | | | — | | | | — | | | | — | | | | — | | | | — | | | | — | | | | 41,557 | |
| | | 24,342 | | | | 168,019 | | | | 68,011 | | | | 46,506 | | | | 111,209 | | | | 50,253 | | | | 20,854 | | | | 118,547 | |
| | | 29,211 | | | | 132,753 | | | | 34,015 | | | | 33,484 | | | | 38,677 | | | | 23,695 | | | | 28,315 | | | | 26,811 | |
| | | 45,460,837 | | | | 388,015,688 | | | | 174,020,636 | | | | 134,739,442 | | | | 238,281,071 | | | | 43,504,848 | | | | 69,502,730 | | | | 627,143,617 | |
| | | | | | | | | | | | | | | | | | | | | | | | | | | | | | | | |
| | | | | | | | | | | | | | | | | | | | | | | | | | | | | | | | |
| | | — | | | | — | | | | — | | �� | | — | | | | — | | | | 1,301,415 | | | | — | | | | — | |
| | | — | | | | — | | | | — | | | | — | | | | — | | | | — | | | | — | | | | — | |
| | | 134,157 | | | | 239,015 | | | | 43,345 | | | | 96,319 | | | | 276,293 | | | | 81,061 | | | | 91,773 | | | | 6,853 | |
| | | — | | | | 141,877 | | | | 40,312 | | | | 34,170 | | | | 41,305 | | | | 13,656 | | | | 1,619 | | | | — | |
| | | — | | | | — | | | | — | | | | — | | | | — | | | | — | | | | — | | | | 22,360 | |
| | | 27,801 | | | | 209,606 | | | | 85,521 | | | | 55,337 | | | | 124,000 | | | | 25,784 | | | | 16,528 | | | | — | |
| | | 3,912 | | | | 48,712 | | | | 20,285 | | | | 19,257 | | | | 22,068 | | | | 17,165 | | | | 9,067 | | | | 53 | |
| | | 12,460 | | | | 72,164 | | | | 35,147 | | | | 28,350 | | | | 45,781 | | | | 11,805 | | | | 14,713 | | | | 83,371 | |
| | | 1,117 | | | | 8,341 | | | | 3,609 | | | | 2,899 | | | | 4,267 | | | | 1,023 | | | | 1,472 | | | | 471 | |
| | | 25,591 | | | | 46,149 | | | | 34,173 | | | | 33,527 | | | | 35,942 | | | | 26,047 | | | | 26,442 | | | | 37,098 | |
| | | 205,038 | | | | 765,864 | | | | 262,392 | | | | 269,859 | | | | 549,656 | | | | 1,477,956 | | | | 161,614 | | | | 150,206 | |
| | | | | | | | | | | | | | | | | | | | | | | | | | | | | | | | |
| | $ | 45,255,799 | | | $ | 387,249,824 | | | $ | 173,758,244 | | | $ | 134,469,583 | | | $ | 237,731,415 | | | $ | 42,026,892 | | | $ | 69,341,116 | | | $ | 626,993,411 | |
| | | | | | | | | | | | | | | | | | | | | | | | | | | | | | | | |
| | | | | | | | | | | | | | | | | | | | | | | | | | | | | | | | |
| | $ | 39,306,565 | | | $ | 313,450,861 | | | $ | 152,969,949 | | | $ | 125,722,822 | | | $ | 185,112,438 | | | $ | 34,009,021 | | | $ | 78,517,277 | | | $ | 627,029,331 | |
| | | 5,949,234 | | | | 73,798,963 | | | | 20,788,295 | | | | 8,746,761 | | | | 52,618,977 | | | | 8,017,871 | | | | (9,176,161 | ) | | | (35,920 | ) |
| | $ | 45,255,799 | | | $ | 387,249,824 | | | $ | 173,758,244 | | | $ | 134,469,583 | | | $ | 237,731,415 | | | $ | 42,026,892 | | | $ | 69,341,116 | | | $ | 626,993,411 | |
| | | | | | | | | | | | | | | | | | | | | | | | | | | | | | | | |
| | | | | | | | | | | | | | | | | | | | | | | | | | | | | | | | |
| | | | | | | | | | | | | | | | | | | | | | | | | | | | | | | | |
| | $ | 3,566,966 | | | $ | 7,086,032 | | | $ | 1,189,778 | | | $ | 6,879,425 | | | $ | 9,849,620 | | | $ | 16,405,793 | | | $ | 2,720,515 | | | | | |
| | | 308,837 | | | | 527,840 | | | | 94,157 | | | | 290,967 | | | | 707,060 | | | | 421,864 | | | | 282,425 | | | | | |
| | $ | 11.55 | | | $ | 13.42 | | | $ | 12.64 | | | $ | 23.64 | | | $ | 13.93 | | | $ | 38.89 | | | $ | 9.63 | | | | | |
| | | | | | | | | | | | | | | | | | | | | | | | | | | | | | | | |
| | | | | | | | | | | | | | | | | | | | | | | | | | | | | | | | |
| | $ | 5,098,706 | | | $ | 71,033,604 | | | $ | 29,780,711 | | | $ | 22,282,948 | | | $ | 28,128,839 | | | $ | 4,574,904 | | | $ | 8,982,258 | | | | | |
| | | 439,065 | | | | 5,251,800 | | | | 2,352,796 | | | | 932,100 | | | | 1,999,559 | | | | 116,841 | | | | 931,691 | | | | | |
| | $ | 11.61 | | | $ | 13.53 | | | $ | 12.66 | | | $ | 23.91 | | | $ | 14.07 | | | $ | 39.15 | | | $ | 9.64 | | | | | |
| | | | | | | | | | | | | | | | | | | | | | | | | | | | | | | | |
| | | | | | | | | | | | | | | | | | | | | | | | | | | | | | | | |
| | $ | 36,590,127 | | | $ | 309,130,188 | | | $ | 142,787,755 | | | $ | 105,307,210 | | | $ | 199,752,956 | | | $ | 21,046,195 | | | $ | 57,638,343 | | | | | |
| | | 3,159,971 | | | | 22,801,661 | | | | 11,259,277 | | | | 4,394,937 | | | | 14,222,432 | | | | 538,627 | | | | 5,982,106 | | | | | |
| | $ | 11.58 | | | $ | 13.56 | | | $ | 12.68 | | | $ | 23.96 | | | $ | 14.04 | | | $ | 39.07 | | | $ | 9.64 | | | | | |
| | | | | | | | | | | | | | | | | | | | | | | | | | | | | | | | |
| | | | | | | | | | | | | | | | | | | | | | | | | | | | | | | | |
| | | | | | | | | | | | | | | | | | | | | | | | | | | | | | $ | 626,993,411 | |
| | | | | | | | | | | | | | | | | | | | | | | | | | | | | | | 626,922,968 | |
| | | | | | | | | | | | | | | | | | | | | | | | | | | | | | $ | 1.0001 | |
| | | | | | | | | | | | | | | | | | | | | | | | | | | | | | | | |
| | $ | 37,561,941 | | | $ | 317,519,897 | | | $ | 153,435,147 | | | $ | 125,021,968 | | | $ | 182,447,114 | | | $ | 33,270,679 | | | $ | 68,980,500 | | | $ | 622,482,031 | |
| | $ | — | | | $ | — | | | $ | — | | | $ | — | | | $ | — | | | $ | — | | | $ | — | | | $ | — | |
| | $ | 656,313 | | | $ | 2,975,488 | | | $ | 954,426 | | | $ | 367,008 | | | $ | 2,430,187 | | | $ | 494,500 | | | $ | — | | | $ | — | |
The accompanying notes are an integral part of these financial statements.
2021 Annual Report | December 31, 2021 | Page 105 |
Statements of Operations
For the Year Ended December 31, 2021 | |
| | | Muirfield
Fund | | | Spectrum
Fund | |
Investment Income | | | | | | | | |
Interest | | $ | — | | | $ | — | |
Income from affiliates | | | 63,424 | | | | 18,295 | |
Dividends | | | 7,493,898 | | | | 2,316,028 | |
Total Investment Income | | | 7,557,322 | | | | 2,334,323 | |
| | | | | | | | | |
Fund Expenses | | | | | | | | |
Investment adviser | | | 4,020,198 | | | | 1,477,651 | |
Transfer agent - Retail Class | | | 48,974 | | | | 6,073 | |
Transfer agent - Adviser Class | | | 101,534 | | | | 42,723 | |
Transfer agent - Institutional Class | | | 486,752 | | | | 188,080 | |
Transfer agent - Money Market Fund | | | | | | | | |
Fund accounting | | | 99,420 | | | | 56,740 | |
Administrative | | | 447,260 | | | | 167,917 | |
Trustee | | | 31,667 | | | | 10,531 | |
Audit and tax services | | | 14,791 | | | | 14,790 | |
Legal | | | 4,042 | | | | 4,029 | |
Custody | | | 58,629 | | | | 18,766 | |
Printing | | | — | | | | 2,612 | |
Distribution plan (12b-1) - Retail Class (1) | | | 95,410 | | | | 12,411 | |
Shareholder service plan - Retail Class | | | 64,147 | | | | 9,929 | |
Shareholder service plan - Adviser Class | | | 17,960 | | | | 5,983 | |
Shareholder service plan - Institutional Class | | | 337,201 | | | | 103,521 | |
Postage | | | 20,339 | | | | 13,459 | |
Registration and filing | | | 69,275 | | | | 51,425 | |
Insurance | | | 31,122 | | | | 10,152 | |
Chief Compliance Officer | | | 6,818 | | | | 6,818 | |
Short sales expense | | | — | | | | 4 | |
Other | | | 45,187 | | | | 36,661 | |
Total Expenses Before Reductions | | | 6,000,726 | | | | 2,240,275 | |
| | | | | | | | | |
Expenses voluntarily reimbursed/waived by investment adviser (See Note #5) | | | — | | | | — | |
Expenses contractually reimbursed/waived by investment adviser (See Note #5) | | | — | | | | — | |
Securities lending credit (See Note #5) | | | (1,027 | ) | | | (286 | ) |
Short sales credit | | | — | | | | 1 | |
Transfer agent expenses voluntarily waived (See Note #5) | | | (38,000 | ) | | | — | |
| | | | | | | | | |
Net Expenses | | | 5,961,699 | | | | 2,239,990 | |
| | | | | | | | | |
Net Investment Income (Loss) | | | 1,595,623 | | | | 94,333 | |
| | | | | | | | | |
Net Realized and Unrealized Gain (Loss) from Investments | | | | | | | | |
Net realized gains (losses) from unaffiliated investments | | | 85,622,148 | | | | 30,948,643 | |
Net realized gains (losses) from affiliated investments | | | (6,224 | ) | | | (1,254 | ) |
Net realized gains (losses) from futures contracts | | | 3,847,186 | | | | 1,502,180 | |
Distributions of long-term realized gains by other investment companies | | | — | | | | — | |
Net Realized Gains (Losses) from Investment Transactions, Futures Contracts, and Distributions of Long-term Realized Gains by Other Investment Companies | | | 89,463,110 | | | | 32,449,569 | |
| | | | | | | | | |
Net change in unrealized appreciation (depreciation) of unaffiliated investments | | | 24,613,343 | | | | 5,535,981 | |
Net change in unrealized appreciation (depreciation) of affiliated investments | | | (24,624 | ) | | | (6,561 | ) |
Net change in unrealized appreciation (depreciation) of futures contracts | | | (2,402,630 | ) | | | (978,267 | ) |
Net Change in Unrealized Appreciation (Depreciation) of Investment Transactions and Futures Contracts | | | 22,186,089 | | | | 4,551,153 | |
| | | | | | | | | |
Net Realized and Unrealized Gain (Loss) from Investments | | | 111,649,199 | | | | 37,000,722 | |
| | | | | | | | | |
Net Change in Net Assets Resulting from Operations | | $ | 113,244,822 | | | $ | 37,095,055 | |
(1) | Only the Retail Class of shares has adopted a Rule 12b-1 Plan. See #5 of the Notes to Financial Statements. |
The accompanying notes are an integral part of these financial statements.
Page 106 | 2021 Annual Report | December 31, 2021 |
| | Global
Allocation
Fund | | | Balanced
Fund | | | Moderate
Allocation
Fund | | | Conservative
Allocation
Fund | | | Dynamic
Allocation
Fund | | | Quantex
Fund | | | Tactical
Income Fund | | | Institutional
Prime Money
Market Fund | |
| | | | | | | | | | | | | | | | | | | | | | | | | | | | | | | | |
| | $ | 4,815 | | | $ | 133,753 | | | $ | 95,556 | | | $ | 107,045 | | | $ | — | | | $ | — | | | $ | 115,285 | | | $ | 582,516 | |
| | | 10,184 | | | | 30,933 | | | | 11,687 | | | | 7,492 | | | | 26,221 | | | | 3,549 | | | | 2,273 | | | | — | |
| | | 513,537 | | | | 6,678,260 | | | | 3,382,991 | | | | 3,145,605 | | | | 2,529,030 | | | | 682,135 | | | | 1,693,625 | | | | — | |
| | | 528,536 | | | | 6,842,946 | | | | 3,490,234 | | | | 3,260,142 | | | | 2,555,251 | | | | 685,684 | | | | 1,811,183 | | | | 582,516 | |
| | | | | | | | | | | | | | | | | | | | | | | | | | | | | | | | |
| | | | | | | | | | | | | | | | | | | | | | | | | | | | | | | | |
| | | 346,838 | | | | 2,740,828 | | | | 1,055,002 | | | | 701,747 | | | | 1,566,597 | | | | 328,390 | | | | 270,949 | | | | 1,072,641 | |
| | | 5,136 | | | | 14,341 | | | | 4,053 | | | | 10,004 | | | | 14,562 | | | | 20,853 | | | | 2,618 | | | | | |
| | | 6,009 | | | | 80,666 | | | | 34,241 | | | | 25,670 | | | | 33,435 | | | | 5,294 | | | | 7,350 | | | | | |
| | | 44,349 | | | | 393,158 | | | | 172,706 | | | | 132,745 | | | | 205,333 | | | | 26,395 | | | | 44,222 | | | | | |
| | | | | | | | | | | | | | | | | | | | | | | | | | | | | | | 287,766 | |
| | | 38,249 | | | | 77,680 | | | | 54,583 | | | | 51,035 | | | | 58,111 | | | | 37,757 | | | | 42,547 | | | | 73,906 | |
| | | 46,245 | | | | 335,444 | | | | 150,667 | | | | 122,280 | | | | 178,887 | | | | 43,785 | | | | 64,190 | | | | 297,766 | |
| | | 2,967 | | | | 21,441 | | | | 9,449 | | | | 7,662 | | | | 11,316 | | | | 2,811 | | | | 3,907 | | | | 1,289 | |
| | | 14,791 | | | | 14,790 | | | | 14,789 | | | | 14,789 | | | | 17,290 | | | | 14,791 | | | | 14,780 | | | | 13,780 | |
| | | 4,025 | | | | 4,036 | | | | 4,029 | | | | 4,027 | | | | 4,029 | | | | 4,025 | | | | 4,026 | | | | 4,035 | |
| | | 4,236 | | | | 39,988 | | | | 17,219 | | | | 14,015 | | | | 19,956 | | | | 4,267 | | | | 6,785 | | | | 26,094 | |
| | | — | | | | — | | | | — | | | | 727 | | | | 562 | | | | — | | | | — | | | | 3 | |
| | | 10,667 | | | | 29,403 | | | | 8,242 | | | | 20,691 | | | | 30,143 | | | | 34,731 | | | | 8,115 | | | | | |
| | | 7,519 | | | | 20,830 | | | | 6,594 | | | | 10,784 | | | | 16,334 | | | | 15,171 | | | | 5,570 | | | | | |
| | | 888 | | | | 10,953 | | | | 4,789 | | | | 3,586 | | | | 5,447 | | | | 737 | | | | 1,729 | | | | | |
| | | 2,954 | | | | 237,231 | | | | 98,818 | | | | 76,581 | | | | 69,136 | | | | 10,752 | | | | 33,138 | | | | | |
| | | 224 | | | | 16,837 | | | | 8,884 | | | | 9,044 | | | | 10,704 | | | | 740 | | | | 5,655 | | | | 32 | |
| | | 46,556 | | | | 61,647 | | | | 50,679 | | | | 50,883 | | | | 54,787 | | | | 46,104 | | | | 55,813 | | | | 4,505 | |
| | | 2,346 | | | | 21,299 | | | | 9,312 | | | | 7,534 | | | | 10,234 | | | | 2,049 | | | | 3,468 | | | | 16,774 | |
| | | 6,818 | | | | 6,818 | | | | 6,818 | | | | 6,818 | | | | 6,818 | | | | 6,818 | | | | 6,818 | | | | 6,749 | |
| | | — | | | | — | | | | — | | | | — | | | | — | | | | — | | | | — | | | | — | |
| | | 30,501 | | | | 40,891 | | | | 35,468 | | | | 34,552 | | | | 36,072 | | | | 31,785 | | | | 34,386 | | | | 50,350 | |
| | | 621,318 | | | | 4,168,281 | | | | 1,746,342 | | | | 1,305,174 | | | | 2,349,753 | | | | 637,255 | | | | 616,066 | | | | 1,855,690 | |
| | | | | | | | | | | | | | | | | | | | | | | | | | | | | | | | |
| | | — | | | | — | | | | — | | | | — | | | | — | | | | — | | | | — | | | | (1,466,650 | ) |
| | | — | | | | — | | | | — | | | | — | | | | (200,000 | ) | | | — | | | | (74,511 | ) | | | — | |
| | | (793 | ) | | | (19,340 | ) | | | (17,018 | ) | | | (20,910 | ) | | | (387 | ) | | | (745 | ) | | | — | | | | — | |
| | | — | | | | — | | | | — | | | | — | | | | — | | | | — | | | | — | | | | — | |
| | | — | | | | (75,000 | ) | | | — | | | | — | | | | — | | | | — | | | | — | | | | — | |
| | | | | | | | | | | | | | | | | | | | | | | | | | | | | | | | |
| | | 620,525 | | | | 4,073,941 | | | | 1,729,324 | | | | 1,284,264 | | | | 2,149,366 | | | | 636,510 | | | | 541,555 | | | | 389,040 | |
| | | | | | | | | | | | | | | | | | | | | | | | | | | | | | | | |
| | | (91,989 | ) | | | 2,769,005 | | | | 1,760,910 | | | | 1,975,878 | | | | 405,885 | | | | 49,174 | | | | 1,269,628 | | | | 193,476 | |
| | | | | | | | | | | | | | | | | | | | | | | | | | | | | | | | |
| | | | | | | | | | | | | | | | | | | | | | | | | | | | | | | | |
| | | 4,263,223 | | | | 53,374,285 | | | | 16,058,977 | | | | 9,694,990 | | | | 28,386,163 | | | | 9,626,445 | | | | 1,947,170 | | | | 229 | |
| | | (530 | ) | | | (32 | ) | | | (307 | ) | | | 657 | | | | (3,934 | ) | | | (301 | ) | | | 425 | | | | — | |
| | | 1,927,157 | | | | 3,575,274 | | | | 2,299,481 | | | | 1,471,407 | | | | 4,744,545 | | | | 1,017,967 | | | | — | | | | — | |
| | | 7,455 | | | | 193,843 | | | | 145,112 | | | | 159,019 | | | | — | | | | — | | | | 113,737 | | | | — | |
| | | 6,197,305 | | | | 57,143,370 | | | | 18,503,263 | | | | 11,326,073 | | | | 33,126,774 | | | | 10,644,111 | | | | 2,061,332 | | | | 229 | |
| | | | | | | | | | | | | | | | | | | | | | | | | | | | | | | | |
| | | (313,852 | ) | | | (6,065,493 | ) | | | (4,351,743 | ) | | | (6,269,512 | ) | | | 3,851,618 | | | | (417,671 | ) | | | (4,498,545 | ) | | | (67,755 | ) |
| | | (2,718 | ) | | | (13,277 | ) | | | (4,833 | ) | | | (3,818 | ) | | | (5,652 | ) | | | (1,300 | ) | | | (1,633 | ) | | | — | |
| | | (109,012 | ) | | | (1,374,463 | ) | | | (560,757 | ) | | | (190,415 | ) | | | 451,421 | | | | 205,159 | | | | — | | | | — | |
| | | (425,582 | ) | | | (7,453,233 | ) | | | (4,917,333 | ) | | | (6,463,745 | ) | | | 4,297,387 | | | | (213,812 | ) | | | (4,500,178 | ) | | | (67,755 | ) |
| | | | | | | | | | | | | | | | | | | | | | | | | | | | | | | | |
| | | 5,771,723 | | | | 49,690,137 | | | | 13,585,930 | | | | 4,862,328 | | | | 37,424,161 | | | | 10,430,299 | | | | (2,438,846 | ) | | | (67,526 | ) |
| | | | | | | | | | | | | | | | | | | | | | | | | | | | | | | | |
| | $ | 5,679,734 | | | $ | 52,459,142 | | | $ | 15,346,840 | | | $ | 6,838,206 | | | $ | 37,830,046 | | | $ | 10,479,473 | | | $ | (1,169,218 | ) | | $ | 125,950 | |
The accompanying notes are an integral part of these financial statements.
2021 Annual Report | December 31, 2021 | Page 107 |
Statements of Changes in Net Assets
For the Years Ended December 31, | |
| | | Muirfield Fund | | | Spectrum Fund | |
| | | 2021 | | | 2020 | | | 2021 | | | 2020 | |
Operations | | | | | | | | | | | | | | | | |
Net investment income (loss) | | $ | 1,595,623 | | | $ | 3,585,998 | | | $ | 94,333 | | | $ | 453,822 | |
Net realized gain (loss) from investment transactions, futures contracts, and distributions of long-term realized gains by other investment companies | | | 89,463,110 | | | | (31,461,989 | ) | | | 32,449,569 | | | | (8,645,657 | ) |
Net change in unrealized appreciation (depreciation) of investment transactions and futures contracts | | | 22,186,089 | | | | 41,737,561 | | | | 4,551,153 | | | | 6,143,213 | |
Net change in net assets resulting from operations | | | 113,244,822 | | | | 13,861,570 | | | | 37,095,055 | | | | (2,048,622 | ) |
| | | | | | | | | | | | | | | | | |
Distributions to Shareholders | | | | | | | | | | | | | | | | |
Retail Class | | | (1,428,738 | ) | | | (891,986 | ) | | | (133,412 | ) | | | (34,997 | ) |
Adviser Class | | | (3,472,675 | ) | | | (476,110 | ) | | | (2,008,809 | ) | | | (119,760 | ) |
Institutional Class | | | (18,608,096 | ) | | | (3,575,015 | ) | | | (8,934,801 | ) | | | (1,287,213 | ) |
Money Market Fund | | | | | | | | | | | | | | | | |
Change in net assets resulting from distributions | | | (23,509,509 | ) | | | (4,943,111 | ) | | | (11,077,022 | ) | | | (1,441,970 | ) |
| | | | | | | | | | | | | | | | | |
Capital Transactions: | | | | | | | | | | | | | | | | |
Issued | | | 317,995,936 | | | | 119,150,871 | | | | 81,698,993 | | | | 33,621,402 | |
Reinvested | | | 22,813,672 | | | | 4,887,303 | | | | 11,042,182 | | | | 1,436,609 | |
Redeemed | | | (283,898,369 | ) | | | (240,559,569 | ) | | | (92,934,007 | ) | | | (59,355,574 | ) |
Net change in net assets resulting from capital transactions | | | 56,911,239 | | | | (116,521,395 | ) | | | (192,832 | ) | | | (24,297,563 | ) |
| | | | | | | | | | | | | | | | | |
Total Change in Net Assets | | | 146,646,552 | | | | (107,602,936 | ) | | | 25,825,201 | | | | (27,788,155 | ) |
| | | | | | | | | | | | | | | | | |
Net Assets - Beginning of Year | | | 573,825,014 | | | | 681,427,950 | | | | 185,278,553 | | | | 213,066,708 | |
| | | | | | | | | | | | | | | | | |
Net Assets - End of Year | | $ | 720,471,566 | | | $ | 573,825,014 | | | $ | 211,103,754 | | | $ | 185,278,553 | |
| | | | | | | | | | | | | | | | | |
Share Transactions: | | | | | | | | | | | | | | | | |
Issued | | | 35,009,621 | | | | 16,391,709 | | | | 6,207,988 | | | | 3,112,011 | |
Reinvested | | | 2,375,480 | | | | 673,995 | | | | 787,831 | | | | 129,657 | |
Redeemed | | | (32,086,333 | ) | | | (33,137,060 | ) | | | (7,098,087 | ) | | | (5,408,355 | ) |
Net change in shares | | | 5,298,768 | | | | (16,071,356 | ) | | | (102,268 | ) | | | (2,166,687 | ) |
The accompanying notes are an integral part of these financial statements.
Page 108 | 2021 Annual Report | December 31, 2021 |
| | Global
Allocation Fund | | | Balanced Fund | | | Moderate
Allocation Fund | | | Conservative
Allocation Fund | |
| | 2021 | | | 2020 | | | 2021 | | | 2020 | | | 2021 | | | 2020 | | | 2021 | | | 2020 | |
| | | | | | | | | | | | | | | | | | | | | | | | | | | | | | | | |
| | $ | (91,989 | ) | | $ | 35,443 | | | $ | 2,769,005 | | | $ | 3,743,361 | | | $ | 1,760,910 | | | $ | 2,227,297 | | | $ | 1,975,878 | | | $ | 2,405,756 | |
| | | 6,197,305 | | | | (1,015,703 | ) | | | 57,143,370 | | | | (14,521,799 | ) | | | 18,503,263 | | | | (3,857,730 | ) | | | 11,326,073 | | | | (1,828,524 | ) |
| | | (425,582 | ) | | | 1,760,992 | | | | (7,453,233 | ) | | | 31,078,961 | | | | (4,917,333 | ) | | | 11,375,436 | | | | (6,463,745 | ) | | | 8,226,540 | |
| | | 5,679,734 | | | | 780,732 | | | | 52,459,142 | | | | 20,300,523 | | | | 15,346,840 | | | | 9,745,003 | | | | 6,838,206 | | | | 8,803,772 | |
| | | | | | | | | | | | | | | | | | | | | | | | | | | | | | | | |
| | | | | | | | | | | | | | | | | | | | | | | | | | | | | | | | |
| | | (355,386 | ) | | | (197,994 | ) | | | (539,513 | ) | | | (508,216 | ) | | | (71,385 | ) | | | (348,167 | ) | | | (378,811 | ) | | | (460,327 | ) |
| | | (507,971 | ) | | | (44,862 | ) | | | (5,644,094 | ) | | | (178,375 | ) | | | (1,909,611 | ) | | | (139,338 | ) | | | (1,342,034 | ) | | | (131,623 | ) |
| | | (3,659,013 | ) | | | (1,068,177 | ) | | | (24,757,476 | ) | | | (2,678,233 | ) | | | (9,206,005 | ) | | | (1,881,646 | ) | | | (6,369,177 | ) | | | (1,888,631 | ) |
| | | | | | | | | | | | | | | | | | | | | | | | | | | | | | | | |
| | | (4,522,370 | ) | | | (1,311,033 | ) | | | (30,941,083 | ) | | | (3,364,824 | ) | | | (11,187,001 | ) | | | (2,369,151 | ) | | | (8,090,022 | ) | | | (2,480,581 | ) |
| | | | | | | | | | | | | | | | | | | | | | | | | | | | | | | | |
| | | | | | | | | | | | | | | | | | | | | | | | | | | | | | | | |
| | | 11,805,911 | | | | 4,855,089 | | | | 153,194,019 | | | | 85,229,485 | | | | 66,121,514 | | | | 37,550,739 | | | | 54,257,997 | | | | 31,767,589 | |
| | | 4,521,300 | | | | 1,310,881 | | | | 30,784,411 | | | | 3,350,773 | | | | 11,120,325 | | | | 2,352,800 | | | | 8,047,628 | | | | 2,468,367 | |
| | | (17,810,709 | ) | | | (11,477,267 | ) | | | (214,744,638 | ) | | | (117,215,009 | ) | | | (83,908,176 | ) | | | (49,054,750 | ) | | | (68,102,776 | ) | | | (36,972,468 | ) |
| | | (1,483,498 | ) | | | (5,311,297 | ) | | | (30,766,208 | ) | | | (28,634,751 | ) | | | (6,666,337 | ) | | | (9,151,211 | ) | | | (5,797,151 | ) | | | (2,736,512 | ) |
| | | | | | | | | | | | | | | | | | | | | | | | | | | | | | | | |
| | | (326,134 | ) | | | (5,841,598 | ) | | | (9,248,149 | ) | | | (11,699,052 | ) | | | (2,506,498 | ) | | | (1,775,359 | ) | | | (7,048,967 | ) | | | 3,586,679 | |
| | | | | | | | | | | | | | | | | | | | | | | | | | | | | | | | |
| | | 45,581,933 | | | | 51,423,531 | | | | 396,497,973 | | | | 408,197,025 | | | | 176,264,742 | | | | 178,040,101 | | | | 141,518,550 | | | | 137,931,871 | |
| | | | | | | | | | | | | | | | | | | | | | | | | | | | | | | | |
| | $ | 45,255,799 | | | $ | 45,581,933 | | | $ | 387,249,824 | | | $ | 396,497,973 | | | $ | 173,758,244 | | | $ | 176,264,742 | | | $ | 134,469,583 | | | $ | 141,518,550 | |
| | | | | | | | | | | | | | | | | | | | | | | | | | | | | | | | |
| | | | | | | | | | | | | | | | | | | | | | | | | | | | | | | | |
| | | 982,056 | | | | 468,221 | | | | 11,296,376 | | | | 7,344,043 | | | | 5,159,224 | | | | 3,278,868 | | | | 2,206,952 | | | | 1,396,311 | |
| | | 390,033 | | | | 118,509 | | | | 2,261,914 | | | | 288,516 | | | | 873,520 | | | | 202,735 | | | | 333,814 | | | | 107,211 | |
| | | (1,467,025 | ) | | | (1,115,719 | ) | | | (15,681,027 | ) | | | (10,012,960 | ) | | | (6,532,488 | ) | | | (4,264,615 | ) | | | (2,774,610 | ) | | | (1,623,114 | ) |
| | | (94,936 | ) | | | (528,989 | ) | | | (2,122,737 | ) | | | (2,380,401 | ) | | | (499,744 | ) | | | (783,012 | ) | | | (233,844 | ) | | | (119,592 | ) |
The accompanying notes are an integral part of these financial statements.
2021 Annual Report | December 31, 2021 | Page 109 |
Statements of Changes in Net Assets
For the Years Ended December 31, | |
| | | Dynamic
Allocation Fund | | |
| | | 2021 | | | 2020 | |
Operations | | | | | | | | |
Net investment income (loss) | | $ | 405,885 | | | $ | 1,051,949 | |
Net realized gain (loss) from investment transactions, futures contracts, and distributions of long-term realized gains by other investment companies | | | 33,126,774 | | | | 7,756,721 | |
Net change in unrealized appreciation (depreciation) of investment transactions and futures contracts | | | 4,297,387 | | | | 17,561,498 | |
Net change in net assets resulting from operations | | | 37,830,046 | | | | 26,370,168 | |
| | | | | | | | | |
Distributions to Shareholders | | | | | | | | |
Retail Class | | | (1,288,985 | ) | | | (825,448 | ) |
Adviser Class | | | (3,644,420 | ) | | | (322,349 | ) |
Institutional Class | | | (25,897,027 | ) | | | (3,697,919 | ) |
Money Market Fund | | | | | | | | |
Change in net assets resulting from distributions | | | (30,830,432 | ) | | | (4,845,716 | ) |
| | | | | | | | | |
Capital Transactions: | | | | | | | | |
Issued | | | 108,187,090 | | | | 39,358,423 | |
Reinvested | | | 30,789,232 | | | | 4,838,177 | |
Redeemed | | | (107,524,267 | ) | | | (66,674,299 | ) |
Net change in net assets resulting from capital transactions | | | 31,452,055 | | | | (22,477,699 | ) |
| | | | | | | | | |
Total Change in Net Assets | | | 38,451,669 | | | | (953,247 | ) |
| | | | | | | | | |
Net Assets - Beginning of Year | | | 199,279,746 | | | | 200,232,993 | |
| | | | | | | | | |
Net Assets - End of Year | | $ | 237,731,415 | | | $ | 199,279,746 | |
| | | | | | | | | |
Share Transactions: | | | | | | | | |
Issued | | | 7,360,966 | | | | 3,361,299 | |
Reinvested | | | 2,185,338 | | | | 374,002 | |
Redeemed | | | (7,446,963 | ) | | | (5,737,165 | ) |
Net change in shares | | | 2,099,341 | | | | (2,001,864 | ) |
The accompanying notes are an integral part of these financial statements.
Page 110 | 2021 Annual Report | December 31, 2021 |
| | Quantex Fund | | | Tactical Income Fund | | | Institutional Prime Money Market Fund | |
| | 2021 | | | 2020 | | | 2021 | | | 2020 | | | 2021 | | | 2020 | |
| | | | | | | | | | | | | | | | | | | | | | |
| $ | 49,174 | | $ | 320,722 | | | $ | 1,269,628 | | | $ | 1,406,923 | | | $ | 193,476 | | | $ | 1,871,667 | |
| | 10,644,111 | | | (2,627,253) | | | | 2,061,332 | | | | 299,375 | | | | 229 | | | | 638 | |
| | (213,812) | | | (5,074,570) | | | | (4,500,178 | ) | | | 3,078,543 | | | | (67,755 | ) | | | 14,914 | |
| | 10,479,473 | | | (7,381,101) | | | | (1,169,218 | ) | | | 4,784,841 | | | | 125,950 | | | | 1,887,219 | |
| | | | | | | | | | | | | | | | | | | | | | |
| | | | | | | | | | | | | | | | | | | | | | |
| | (2,350,162) | | | (107,170) | | | | (40,103 | ) | | | (221,612 | ) | | | | | | | | |
| | (649,230) | | | (5,977) | | | | (185,140 | ) | | | (112,411 | ) | | | | | | | | |
| | (3,059,421) | | | (179,516) | | | | (1,070,555 | ) | | | (1,069,932 | ) | | | | | | | | |
| | | | | | | | | | | | | | | | | (193,478 | ) | | | (1,871,668 | ) |
| | (6,058,813) | | | (292,663) | | | | (1,295,798 | ) | | | (1,403,955 | ) | | | (193,478 | ) | | | (1,871,668 | ) |
| | | | | | | | | | | | | | | | | | | | | | |
| | | | | | | | | | | | | | | | | | | | | | |
| | 16,768,435 | | | 7,663,727 | | | | 36,170,527 | | | | 23,336,398 | | | | 1,011,642,367 | | | | 472,288,464 | |
| | 6,046,958 | | | 278,503 | | | | 1,288,487 | | | | 1,392,130 | | | | 35,042 | | | | 307,362 | |
| | (25,302,418) | | | (22,913,934) | | | | (33,757,101 | ) | | | (21,837,670 | ) | | | (721,061,508 | ) | | | (506,286,355 | ) |
| | (2,487,025) | | | (14,971,704) | | | | 3,701,913 | | | | 2,890,858 | | | | 290,615,901 | | | | (33,690,529 | ) |
| | | | | | | | | | | | | | | | | | | | | | |
| | 1,933,635 | | | (22,645,468) | | | | 1,236,897 | | | | 6,271,744 | | | | 290,548,373 | | | | (33,674,978 | ) |
| | | | | | | | | | | | | | | | | | | | | | |
| | 40,093,257 | | | 62,738,725 | | | | 68,104,219 | | | | 61,832,475 | | | | 336,445,038 | | | | 370,120,016 | |
| | | | | | | | | | | | | | | | | | | | | | |
| $ | 42,026,892 | | $ | 40,093,257 | | | $ | 69,341,116 | | | $ | 68,104,219 | | | $ | 626,993,411 | | | $ | 336,445,038 | |
| | | | | | | | | | | | | | | | | | | | | | |
| | | | | | | | | | | | | | | | | | | | | | |
| | 415,083 | | | 270,380 | | | | 3,681,061 | | | | 2,397,112 | | | | 1,011,455,624 | | | | 472,214,087 | |
| | 154,992 | | | 9,772 | | | | 132,173 | | | | 141,988 | | | | 35,036 | | | | 307,353 | |
| | (616,603) | | | (808,586) | | | | (3,434,958 | ) | | | (2,253,945 | ) | | | (720,922,007 | ) | | | (506,302,922 | ) |
| | (46,528) | | | (528,434) | | | | 378,276 | | | | 285,155 | | | | 290,568,653 | | | | (33,781,482 | ) |
The accompanying notes are an integral part of these financial statements.
2021 Annual Report | December 31, 2021 | Page 111 |
Financial Highlights
For the Years Ended December 31, | |
| | | | | | | Income
from
Investment Operations | | | Less
Distributions | |
| | Net Asset
Value,
Beginning
of Period | | | Net
Investment
Income
(Loss) (5) | | | Net gains (losses)
on securities and
futures (both realized
and unrealized) | | | Total from
Investment
Operations | | | From Net
Investment
Income | | | From Net
Capital
Gains | | | From
Return of
Capital | | | Total
Distributions | |
Muirfield Fund - Retail Class (1)(2)(3)(4) |
2021 | | $ | 8.20 | | | | (0.01 | ) | | | 1.66 | | | | 1.65 | | | | (0.07 | ) | | | (0.25 | ) | | | 0.00 | | | | (0.32 | ) |
2020 | | $ | 7.91 | | | | 0.03 | | | | 0.31 | | | | 0.34 | | | | (0.05 | ) | | | 0.00 | | | | 0.00 | | | | (0.05 | ) |
2019 | | $ | 7.16 | | | | 0.07 | | | | 0.89 | | | | 0.96 | | | | (0.03 | ) | | | (0.18 | ) | | | 0.00 | | | | (0.21 | ) |
2018 | | $ | 7.54 | | | | 0.04 | | | | (0.31 | ) | | | (0.27 | ) | | | (0.04 | ) | | | (0.07 | ) | | | 0.00 | | | | (0.11 | ) |
2017 | | $ | 6.79 | | | | 0.04 | | | | 1.34 | | | | 1.38 | | | | (0.04 | ) | | | (0.59 | ) | | | 0.00 | | | | (0.63 | ) |
Muirfield Fund - Adviser Class (1)(2)(3)(4) |
2021 | | $ | 8.26 | | | | 0.03 | | | | 1.67 | | | | 1.70 | | | | (0.08 | ) | | | (0.25 | ) | | | 0.00 | | | | (0.33 | ) |
2020 | | $ | 7.97 | | | | 0.05 | | | | 0.31 | | | | 0.36 | | | | (0.07 | ) | | | 0.00 | | | | 0.00 | | | | (0.07 | ) |
2019 | | $ | 7.20 | | | | 0.09 | | | | 0.90 | | | | 0.99 | | | | (0.04 | ) | | | (0.18 | ) | | | 0.00 | | | | (0.22 | ) |
2018 | | $ | 7.57 | | | | 0.06 | | | | (0.31 | ) | | | (0.25 | ) | | | (0.05 | ) | | | (0.07 | ) | | | 0.00 | | | | (0.12 | ) |
2017 | | $ | 6.80 | | | | 0.05 | | | | 1.34 | | | | 1.39 | | | | (0.03 | ) | | | (0.59 | ) | | | 0.00 | | | | (0.62 | ) |
Muirfield Fund - Institutional Class (1)(2)(3)(4) |
2021 | | $ | 8.28 | | | | 0.03 | | | | 1.66 | | | | 1.69 | | | | (0.07 | ) | | | (0.25 | ) | | | 0.00 | | | | (0.32 | ) |
2020 | | $ | 7.99 | | | | 0.05 | | | | 0.31 | | | | 0.36 | | | | (0.07 | ) | | | 0.00 | | | | 0.00 | | | | (0.07 | ) |
2019 | | $ | 7.21 | | | | 0.10 | | | | 0.90 | | | | 1.00 | | | | (0.04 | ) | | | (0.18 | ) | | | 0.00 | | | | (0.22 | ) |
2018 | | $ | 7.57 | | | | 0.08 | | | | (0.31 | ) | | | (0.23 | ) | | | (0.06 | ) | | | (0.07 | ) | | | 0.00 | | | | (0.13 | ) |
2017 | | $ | 6.80 | | | | 0.07 | | | | 1.33 | | | | 1.40 | | | | (0.04 | ) | | | (0.59 | ) | | | 0.00 | | | | (0.63 | ) |
Spectrum Fund - Retail Class (1)(2)(3)(4) |
2021 | | $ | 12.15 | | | | (0.06 | ) | | | 2.56 | | | | 2.50 | | | | (0.03 | ) | | | (0.74 | ) | | | 0.00 | | | | (0.77 | ) |
2020 | | $ | 12.19 | | | | (0.00 | ) | | | (0.03 | ) | | | (0.03 | ) | | | (0.01 | ) | | | 0.00 | | | | 0.00 | | | | (0.01 | ) |
2019 | | $ | 10.89 | | | | 0.04 | | | | 1.38 | | | | 1.42 | | | | (0.01 | ) | | | (0.11 | ) | | | 0.00 | | | | (0.12 | ) |
2018 | | $ | 11.48 | | | | 0.03 | | | | (0.49 | ) | | | (0.46 | ) | | | 0.00 | | | | (0.13 | ) | | | 0.00 | | | | (0.13 | ) |
2017 | | $ | 10.28 | | | | (0.01 | ) | | | 1.99 | | | | 1.98 | | | | 0.00 | | | | (0.78 | ) | | | 0.00 | | | | (0.78 | ) |
Spectrum Fund - Adviser Class (1)(2)(3)(4) |
2021 | | $ | 12.17 | | | | 0.02 | | | | 2.54 | | | | 2.56 | | | | (0.03 | ) | | | (0.74 | ) | | | 0.00 | | | | (0.77 | ) |
2020 | | $ | 12.27 | | | | 0.03 | | | | (0.02 | ) | | | 0.01 | | | | (0.11 | ) | | | 0.00 | | | | 0.00 | | | | (0.11 | ) |
2019 | | $ | 10.95 | | | | 0.07 | | | | 1.37 | | | | 1.44 | | | | (0.01 | ) | | | (0.11 | ) | | | 0.00 | | | | (0.12 | ) |
2018 | | $ | 11.53 | | | | 0.06 | | | | (0.48 | ) | | | (0.42 | ) | | | (0.03 | ) | | | (0.13 | ) | | | 0.00 | | | | (0.16 | ) |
2017 | | $ | 10.29 | | | | 0.02 | | | | 2.00 | | | | 2.02 | | | | 0.00 | | | | (0.78 | ) | | | 0.00 | | | | (0.78 | ) |
Spectrum Fund - Institutional Class (1)(2)(3)(4) |
2021 | | $ | 12.22 | | | | 0.01 | | | | 2.55 | | | | 2.56 | | | | (0.03 | ) | | | (0.74 | ) | | | 0.00 | | | | (0.77 | ) |
2020 | | $ | 12.31 | | | | 0.04 | | | | (0.02 | ) | | | 0.02 | | | | (0.11 | ) | | | 0.00 | | | | 0.00 | | | | (0.11 | ) |
2019 | | $ | 10.96 | | | | 0.09 | | | | 1.38 | | | | 1.47 | | | | (0.01 | ) | | | (0.11 | ) | | | 0.00 | | | | (0.12 | ) |
2018 | | $ | 11.54 | | | | 0.08 | | | | (0.49 | ) | | | (0.41 | ) | | | (0.04 | ) | | | (0.13 | ) | | | 0.00 | | | | (0.17 | ) |
2017 | | $ | 10.29 | | | | 0.05 | | | | 1.98 | | | | 2.03 | | | | 0.00 | | | | (0.78 | ) | | | 0.00 | | | | (0.78 | ) |
|
See footnotes on pages 120 and 121.
The accompanying notes are an integral part of these financial statements.
Page 112 | 2021 Annual Report | December 31, 2021 |
| | | | | | | | | | Ratios/
Supplemental
Data | |
| | Net Asset
Value, End
of Period | | | Total Return
(Assumes
Reinvestment of
Distributions) | | | Net Assets,
End of Period
($000) | | | Ratio of Net
Investment
Income (Loss)
to Average
Net Assets | | | Ratio of Expenses to
Average Net Assets
After Fee Reductions (6) | | | Ratio of Expenses
to Average Net
Assets Before Fee
Reductions (7) | | | Portfolio
Turnover
Rate | |
| | | | |
| | $ | 9.53 | | | | 20.20 | % | | $ | 43,353 | | | | (0.06 | %) | | | 1.21 | % | | | 1.21 | % | | | 197 | % |
| | $ | 8.20 | | | | 4.36 | % | | $ | 134,240 | | | | 0.35 | % | | | 1.28 | % | | | 1.28 | % | | | 225 | % |
| | $ | 7.91 | | | | 13.53 | % | | $ | 189,105 | | | | 0.94 | % | | | 1.28 | % | | | 1.28 | % | | | 222 | % |
| | $ | 7.16 | | | | (3.66 | %) | | $ | 203,287 | | | | 0.54 | % | | | 1.32 | % | | | 1.32 | % | | | 225 | % |
| | $ | 7.54 | | | | 20.29 | % | | $ | 250,322 | | | | 0.49 | % | | | 1.33 | % | | | 1.33 | % | | | 276 | % |
| | | |
| | $ | 9.63 | | | | 20.61 | % | | $ | 104,300 | | | | 0.33 | % | | | 0.90 | % | | | 0.90 | % | | | 197 | % |
| | $ | 8.26 | | | | 4.67 | % | | $ | 48,953 | | | | 0.64 | % | | | 0.98 | % | | | 0.98 | % | | | 225 | % |
| | $ | 7.97 | | | | 13.81 | % | | $ | 60,024 | | | | 1.14 | % | | | 1.09 | % | | | 1.09 | % | | | 222 | % |
| | $ | 7.20 | | | | (3.39 | %) | | $ | 61,159 | | | | 0.79 | % | | | 1.10 | % | | | 1.17 | % | | | 225 | % |
| | $ | 7.57 | | | | 20.50 | % | | $ | 41,440 | | | | 0.71 | % | | | 1.11 | % | | | 1.20 | % | | | 276 | % |
| | | |
| | $ | 9.65 | | | | 20.55 | % | | $ | 572,819 | | | | 0.27 | % | | | 0.94 | % | | | 0.95 | % | | | 197 | % |
| | $ | 8.28 | | | | 4.66 | % | | $ | 390,632 | | | | 0.73 | % | | | 0.88 | % | | | 0.97 | % | | | 225 | % |
| | $ | 7.99 | | | | 14.01 | % | | $ | 432,299 | | | | 1.35 | % | | | 0.87 | % | | | 0.98 | % | | | 222 | % |
| | $ | 7.21 | | | | (3.17 | %) | | $ | 346,563 | | | | 1.00 | % | | | 0.90 | % | | | 0.98 | % | | | 225 | % |
| | $ | 7.57 | | | | 20.60 | % | | $ | 186,200 | | | | 0.88 | % | | | 0.91 | % | | | 1.00 | % | | | 276 | % |
| | | |
| | $ | 13.88 | | | | 20.58 | % | | $ | 2,526 | | | | (0.43 | %) | | | 1.49 | % | | | 1.49 | % | | | 200 | % |
| | $ | 12.15 | | | | (0.23 | %) | | $ | 36,604 | | | | (0.04 | %) | | | 1.73 | % | | | 1.73 | % | | | 182 | % |
| | $ | 12.19 | | | | 13.03 | % | | $ | 51,060 | | | | 0.37 | % | | | 1.77 | % | | | 1.77 | % | | | 74 | % |
| | $ | 10.89 | | | | (3.97 | %) | | $ | 51,083 | | | | 0.26 | % | | | 1.89 | % | | | 1.89 | % | | | 97 | % |
| | $ | 11.48 | | | | 19.28 | % | | $ | 59,441 | | | | (0.08 | %) | | | 2.16 | % | | | 2.16 | % | | | 120 | % |
| | | |
| | $ | 13.96 | | | | 21.07 | % | | $ | 38,190 | | | | 0.11 | % | | | 1.09 | % | | | 1.09 | % | | | 200 | % |
| | $ | 12.17 | | | | 0.18 | % | | $ | 12,475 | | | | 0.32 | % | | | 1.36 | % | | | 1.36 | % | | | 182 | % |
| | $ | 12.27 | | | | 13.17 | % | | $ | 15,564 | | | | 0.63 | % | | | 1.51 | % | | | 1.51 | % | | | 74 | % |
| | $ | 10.95 | | | | (3.67 | %) | | $ | 14,486 | | | | 0.49 | % | | | 1.70 | % | | | 1.70 | % | | | 97 | % |
| | $ | 11.53 | | | | 19.65 | % | | $ | 12,921 | | | | 0.21 | % | | | 1.89 | % | | | 2.01 | % | | | 120 | % |
| | | |
| | $ | 14.01 | | | | 20.98 | % | | $ | 170,388 | | | | 0.05 | % | | | 1.13 | % | | | 1.13 | % | | | 200 | % |
| | $ | 12.22 | | | | 0.25 | % | | $ | 136,200 | | | | 0.33 | % | | | 1.32 | % | | | 1.33 | % | | | 182 | % |
| | $ | 12.31 | | | | 13.44 | % | | $ | 146,443 | | | | 0.77 | % | | | 1.38 | % | | | 1.40 | % | | | 74 | % |
| | $ | 10.96 | | | | (3.51 | %) | | $ | 117,166 | | | | 0.71 | % | | | 1.50 | % | | | 1.50 | % | | | 97 | % |
| | $ | 11.54 | | | | 19.75 | % | | $ | 82,513 | | | | 0.45 | % | | | 1.70 | % | | | 1.82 | % | | | 120 | % |
| | | |
See footnotes on pages 120 and 121.
The accompanying notes are an integral part of these financial statements.
2021 Annual Report | December 31, 2021 | Page 113 |
Financial Highlights
For the Years Ended December 31, | |
| | | | | | | Income
from
Investment Operations | | | Less
Distributions | |
| | Net Asset
Value,
Beginning
of Period | | | Net
Investment
Income
(Loss) (5) | | | Net gains (losses)
on securities and
futures (both realized
and unrealized) | | | Total from
Investment
Operations | | | From Net
Investment
Income | | | From Net
Capital
Gains | | | From
Return of
Capital | | | Total
Distributions | |
Global Allocation Fund - Retail Class (1)(2)(3)(4) |
2021 | | $ | 11.40 | | | | (0.08 | ) | | | 1.52 | | | | 1.44 | | | | 0.00 | | | | (1.29 | ) | | | 0.00 | | | | (1.29 | ) |
2020 | | $ | 11.32 | | | | (0.02 | ) | | | 0.35 | | | | 0.33 | | | | 0.00 | | | | (0.25 | ) | | | 0.00 | | | | (0.25 | ) |
2019 | | $ | 10.22 | | | | 0.08 | | | | 1.26 | | | | 1.34 | | | | (0.04 | ) | | | (0.20 | ) | | | 0.00 | | | | (0.24 | ) |
2018 | | $ | 11.53 | | | | 0.05 | | | | (0.85 | ) | | | (0.80 | ) | | | (0.06 | ) | | | (0.45 | ) | | | 0.00 | | | | (0.51 | ) |
2017 | | $ | 9.56 | | | | 0.04 | | | | 2.09 | | | | 2.13 | | | | (0.03 | ) | | | (0.13 | ) | | | 0.00 | | | | (0.16 | ) |
Global Allocation Fund - Adviser Class (1)(2)(3)(4) |
2021 | | $ | 11.42 | | | | (0.02 | ) | | | 1.50 | | | | 1.48 | | | | 0.00 | | | | (1.29 | ) | | | 0.00 | | | | (1.29 | ) |
2020 | | $ | 11.35 | | | | 0.01 | | | | 0.37 | | | | 0.38 | | | | (0.06 | ) | | | (0.25 | ) | | | 0.00 | | | | (0.31 | ) |
2019 | | $ | 10.24 | | | | 0.11 | | | | 1.25 | | | | 1.36 | | | | (0.05 | ) | | | (0.20 | ) | | | 0.00 | | | | (0.25 | ) |
2018 | | $ | 11.54 | | | | 0.09 | | | | (0.86 | ) | | | (0.77 | ) | | | (0.08 | ) | | | (0.45 | ) | | | 0.00 | | | | (0.53 | ) |
2017 | | $ | 9.57 | | | | 0.15 | | | | 2.03 | | | | 2.18 | | | | (0.08 | ) | | | (0.13 | ) | | | 0.00 | | | | (0.21 | ) |
Global Allocation Fund - Institutional Class (1)(2)(3)(4) |
2021 | | $ | 11.38 | | | | (0.02 | ) | | | 1.51 | | | | 1.49 | | | | 0.00 | | | | (1.29 | ) | | | 0.00 | | | | (1.29 | ) |
2020 | | $ | 11.36 | | | | 0.02 | | | | 0.35 | | | | 0.37 | | | | (0.10 | ) | | | (0.25 | ) | | | 0.00 | | | | (0.35 | ) |
2019 | | $ | 10.24 | | | | 0.13 | | | | 1.26 | | | | 1.39 | | | | (0.07 | ) | | | (0.20 | ) | | | 0.00 | | | | (0.27 | ) |
2018 | | $ | 11.55 | | | | 0.11 | | | | (0.86 | ) | | | (0.75 | ) | | | (0.11 | ) | | | (0.45 | ) | | | 0.00 | | | | (0.56 | ) |
2017 | | $ | 9.58 | | | | 0.12 | | | | 2.09 | | | | 2.21 | | | | (0.11 | ) | | | (0.13 | ) | | | 0.00 | | | | (0.24 | ) |
Balanced Fund - Retail Class (1)(2)(3)(4) |
2021 | | $ | 12.82 | | | | (0.01 | ) | | | 1.71 | | | | 1.70 | | | | (0.16 | ) | | | (0.94 | ) | | | 0.00 | | | | (1.10 | ) |
2020 | | $ | 12.26 | | | | 0.08 | | | | 0.56 | | | | 0.64 | | | | (0.08 | ) | | | 0.00 | | | | 0.00 | | | | (0.08 | ) |
2019 | | $ | 11.08 | | | | 0.16 | | | | 1.20 | | | | 1.36 | | | | (0.09 | ) | | | (0.09 | ) | | | 0.00 | | | | (0.18 | ) |
2018 | | $ | 11.61 | | | | 0.12 | | | | (0.49 | ) | | | (0.37 | ) | | | (0.10 | ) | | | (0.06 | ) | | | 0.00 | | | | (0.16 | ) |
2017 | | $ | 10.74 | | | | 0.09 | | | | 1.49 | | | | 1.58 | | | | (0.11 | ) | | | (0.60 | ) | | | 0.00 | | | | (0.71 | ) |
Balanced Fund - Adviser Class (1)(2)(3)(4) |
2021 | | $ | 12.92 | | | | 0.11 | | | | 1.66 | | | | 1.77 | | | | (0.22 | ) | | | (0.94 | ) | | | 0.00 | | | | (1.16 | ) |
2020 | | $ | 12.35 | | | | 0.13 | | | | 0.56 | | | | 0.69 | | | | (0.12 | ) | | | 0.00 | | | | 0.00 | | | | (0.12 | ) |
2019 | | $ | 11.15 | | | | 0.19 | | | | 1.21 | | | | 1.40 | | | | (0.11 | ) | | | (0.09 | ) | | | 0.00 | | | | (0.20 | ) |
2018 | | $ | 11.68 | | | | 0.15 | | | | (0.49 | ) | | | (0.34 | ) | | | (0.13 | ) | | | (0.06 | ) | | | 0.00 | | | | (0.19 | ) |
2017 | | $ | 10.74 | | | | 0.13 | | | | 1.50 | | | | 1.63 | | | | (0.09 | ) | | | (0.60 | ) | | | 0.00 | | | | (0.69 | ) |
Balanced Fund - Institutional Class (1)(2)(3)(4) |
2021 | | $ | 12.94 | | | | 0.10 | | | | 1.67 | | | | 1.77 | | | | (0.21 | ) | | | (0.94 | ) | | | 0.00 | | | | (1.15 | ) |
2020 | | $ | 12.36 | | | | 0.14 | | | | 0.55 | | | | 0.69 | | | | (0.11 | ) | | | 0.00 | | | | 0.00 | | | | (0.11 | ) |
2019 | | $ | 11.15 | | | | 0.21 | | | | 1.21 | | | | 1.42 | | | | (0.12 | ) | | | (0.09 | ) | | | 0.00 | | | | (0.21 | ) |
2018 | | $ | 11.68 | | | | 0.18 | | | | (0.51 | ) | | | (0.33 | ) | | | (0.14 | ) | | | (0.06 | ) | | | 0.00 | | | | (0.20 | ) |
2017 | | $ | 10.75 | | | | 0.16 | | | | 1.47 | | | | 1.63 | | | | (0.10 | ) | | | (0.60 | ) | | | 0.00 | | | | (0.70 | ) |
|
See footnotes on pages 120 and 121.
The accompanying notes are an integral part of these financial statements.
Page 114 | 2021 Annual Report | December 31, 2021 |
| | | | | | | | | | Ratios/
Supplemental
Data | |
| | Net Asset
Value, End
of Period | | | Total Return
(Assumes
Reinvestment of
Distributions) | | | Net Assets,
End of Period
($000) | | | Ratio of Net
Investment
Income (Loss)
to Average
Net Assets | | | Ratio of Expenses to
Average Net Assets
After Fee Reductions (6) | | | Ratio of Expenses
to Average Net
Assets Before Fee
Reductions (7) | | | Portfolio
Turnover
Rate | |
| | | |
| | $ | 11.55 | | | | 12.58 | % | | $ | 3,567 | | | | (0.63 | %) | | | 1.72 | % | | | 1.72 | % | | | 173 | % |
| | $ | 11.40 | | | | 2.96 | % | | $ | 9,001 | | | | (0.25 | %) | | | 1.74 | % | | | 1.74 | % | | | 179 | % |
| | $ | 11.32 | | | | 13.17 | % | | $ | 11,154 | | | | 0.76 | % | | | 1.68 | % | | | 1.68 | % | | | 185 | % |
| | $ | 10.22 | | | | (6.94 | %) | | $ | 13,810 | | | | 0.47 | % | | | 1.63 | % | | | 1.63 | % | | | 163 | % |
| | $ | 11.53 | | | | 22.33 | % | | $ | 35,512 | | | | 0.35 | % | | | 1.63 | % | | | 1.63 | % | | | 179 | % |
| | | |
| | $ | 11.61 | | | | 12.90 | % | | $ | 5,099 | | | | (0.14 | %) | | | 1.31 | % | | | 1.31 | % | | | 173 | % |
| | $ | 11.42 | | | | 3.42 | % | | $ | 1,740 | | | | 0.09 | % | | | 1.40 | % | | | 1.40 | % | | | 179 | % |
| | $ | 11.35 | | | | 13.34 | % | | $ | 1,772 | | | | 1.01 | % | | | 1.45 | % | | | 1.45 | % | | | 185 | % |
| | $ | 10.24 | | | | (6.73 | %) | | $ | 1,624 | | | | 0.75 | % | | | 1.44 | % | | | 1.44 | % | | | 163 | % |
| | $ | 11.54 | | | | 22.84 | % | | $ | 1,057 | | | | 1.38 | % | | | 1.33 | % | | | 1.44 | % | | | 179 | % |
| | | |
| | $ | 11.58 | | | | 13.05 | % | | $ | 36,590 | | | | (0.16 | %) | | | 1.30 | % | | | 1.30 | % | | | 173 | % |
| | $ | 11.38 | | | | 3.43 | % | | $ | 34,841 | | | | 0.17 | % | | | 1.31 | % | | | 1.31 | % | | | 179 | % |
| | $ | 11.36 | | | | 13.66 | % | | $ | 38,497 | | | | 1.19 | % | | | 1.25 | % | | | 1.25 | % | | | 185 | % |
| | $ | 10.24 | | | | (6.57 | %) | | $ | 42,976 | | | | 0.94 | % | | | 1.20 | % | | | 1.20 | % | | | 163 | % |
| | $ | 11.55 | | | | 23.07 | % | | $ | 37,369 | | | | 1.13 | % | | | 1.10 | % | | | 1.21 | % | | | 179 | % |
| | | |
| | $ | 13.42 | | | | 13.23 | % | | $ | 7,086 | | | | (0.09 | %) | | | 1.36 | % | | | 1.36 | % | | | 205 | % |
| | $ | 12.82 | | | | 5.27 | % | | $ | 75,449 | | | | 0.65 | % | | | 1.41 | % | | | 1.41 | % | | | 189 | % |
| | $ | 12.26 | | | | 12.29 | % | | $ | 92,815 | | | | 1.34 | % | | | 1.41 | % | | | 1.41 | % | | | 180 | % |
| | $ | 11.08 | | | | (3.25 | %) | | $ | 90,133 | | | | 1.06 | % | | | 1.43 | % | | | 1.43 | % | | | 218 | % |
| | $ | 11.61 | | | | 14.74 | % | | $ | 97,116 | | | | 0.81 | % | | | 1.49 | % | | | 1.49 | % | | | 226 | % |
| | | |
| | $ | 13.53 | | | | 13.71 | % | | $ | 71,034 | | | | 0.78 | % | | | 0.97 | % | | | 0.97 | % | | | 205 | % |
| | $ | 12.92 | | | | 5.66 | % | | $ | 18,699 | | | | 1.03 | % | | | 1.04 | % | | | 1.04 | % | | | 189 | % |
| | $ | 12.35 | | | | 12.59 | % | | $ | 20,182 | | | | 1.61 | % | | | 1.14 | % | | | 1.14 | % | | | 180 | % |
| | $ | 11.15 | | | | (2.99 | %) | | $ | 19,301 | | | | 1.31 | % | | | 1.21 | % | | | 1.23 | % | | | 218 | % |
| | $ | 11.68 | | | | 15.21 | % | | $ | 12,137 | | | | 1.13 | % | | | 1.21 | % | | | 1.30 | % | | | 226 | % |
| | | |
| | $ | 13.56 | | | | 13.71 | % | | $ | 309,130 | | | | 0.69 | % | | | 1.00 | % | | | 1.02 | % | | | 205 | % |
| | $ | 12.94 | | | | 5.71 | % | | $ | 302,350 | | | | 1.09 | % | | | 0.98 | % | | | 1.03 | % | | | 189 | % |
| | $ | 12.36 | | | | 12.77 | % | | $ | 295,200 | | | | 1.79 | % | | | 0.96 | % | | | 1.04 | % | | | 180 | % |
| | $ | 11.15 | | | | (2.85 | %) | | $ | 239,375 | | | | 1.51 | % | | | 1.02 | % | | | 1.05 | % | | | 218 | % |
| | $ | 11.68 | | | | 15.25 | % | | $ | 169,586 | | | | 1.35 | % | | | 1.02 | % | | | 1.11 | % | | | 226 | % |
| | | |
See footnotes on pages 120 and 121.
The accompanying notes are an integral part of these financial statements.
2021 Annual Report | December 31, 2021 | Page 115 |
Financial Highlights
For the Years Ended December 31, | |
| | | | | | | Income
from
Investment Operations | | | Less
Distributions | |
| | Net Asset
Value,
Beginning
of Period | | | Net
Investment
Income
(Loss) (5) | | | Net gains (losses)
on securities and
futures (both realized
and unrealized) | | | Total from
Investment
Operations | | | From Net
Investment
Income | | | From Net
Capital
Gains | | | From
Return of
Capital | | | Total
Distributions | |
Moderate Allocation Fund - Retail Class (1)(2)(3)(4) |
2021 | | $ | 12.37 | | | | (0.02 | ) | | | 1.10 | | | | 1.08 | | | | (0.05 | ) | | | (0.76 | ) | | | 0.00 | | | | (0.81 | ) |
2020 | | $ | 11.85 | | | | 0.13 | | | | 0.52 | | | | 0.65 | | | | (0.13 | ) | | | 0.00 | | | | 0.00 | | | | (0.13 | ) |
2019 | | $ | 10.84 | | | | 0.20 | | | | 1.00 | | | | 1.20 | | | | (0.19 | ) | | | 0.00 | | | | 0.00 | | | | (0.19 | ) |
2018 | | $ | 11.66 | | | | 0.18 | | | | (0.48 | ) | | | (0.30 | ) | | | (0.16 | ) | | | (0.36 | ) | | | 0.00 | | | | (0.52 | ) |
2017 | | $ | 10.46 | | | | 0.07 | | | | 1.60 | | | | 1.67 | | | | (0.05 | ) | | | (0.42 | ) | | | 0.00 | | | | (0.47 | ) |
Moderate Allocation Fund - Adviser Class (1)(2)(3)(4) |
2021 | | $ | 12.39 | | | | 0.16 | | | | 0.97 | | | | 1.13 | | | | (0.10 | ) | | | (0.76 | ) | | | 0.00 | | | | (0.86 | ) |
2020 | | $ | 11.86 | | | | 0.17 | | | | 0.53 | | | | 0.70 | | | | (0.17 | ) | | | 0.00 | | | | 0.00 | | | | (0.17 | ) |
2019 | | $ | 10.85 | | | | 0.24 | | | | 1.00 | | | | 1.24 | | | | (0.23 | ) | | | 0.00 | | | | 0.00 | | | | (0.23 | ) |
2018 | | $ | 11.66 | | | | 0.21 | | | | (0.49 | ) | | | (0.28 | ) | | | (0.17 | ) | | | (0.36 | ) | | | 0.00 | | | | (0.53 | ) |
2017 | | $ | 10.46 | | | | 0.12 | | | | 1.59 | | | | 1.71 | | | | (0.09 | ) | | | (0.42 | ) | | | 0.00 | | | | (0.51 | ) |
Moderate Allocation Fund - Institutional Class (1)(2)(3)(4) |
2021 | | $ | 12.42 | | | | 0.14 | | | | 0.98 | | | | 1.12 | | | | (0.10 | ) | | | (0.76 | ) | | | 0.00 | | | | (0.86 | ) |
2020 | | $ | 11.89 | | | | 0.17 | | | | 0.53 | | | | 0.70 | | | | (0.17 | ) | | | 0.00 | | | | 0.00 | | | | (0.17 | ) |
2019 | | $ | 10.88 | | | | 0.25 | | | | 1.00 | | | | 1.25 | | | | (0.24 | ) | | | 0.00 | | | | 0.00 | | | | (0.24 | ) |
2018 | | $ | 11.68 | | | | 0.23 | | | | (0.48 | ) | | | (0.25 | ) | | | (0.19 | ) | | | (0.36 | ) | | | 0.00 | | | | (0.55 | ) |
2017 | | $ | 10.47 | | | | 0.14 | | | | 1.59 | | | | 1.73 | | | | (0.10 | ) | | | (0.42 | ) | | | 0.00 | | | | (0.52 | ) |
Conservative Allocation Fund - Retail Class (1)(2)(3)(4) |
2021 | | $ | 23.91 | | | | 0.22 | | | | 0.89 | | | | 1.11 | | | | (0.24 | ) | | | (1.14 | ) | | | 0.00 | | | | (1.38 | ) |
2020 | | $ | 22.85 | | | | 0.37 | | | | 1.04 | | | | 1.41 | | | | (0.35 | ) | | | 0.00 | | | | 0.00 | | | | (0.35 | ) |
2019 | | $ | 21.18 | | | | 0.51 | | | | 1.65 | | | | 2.16 | | | | (0.49 | ) | | | 0.00 | | | | 0.00 | | | | (0.49 | ) |
2018 | | $ | 22.54 | | | | 0.46 | | | | (1.04 | ) | | | (0.58 | ) | | | (0.40 | ) | | | (0.38 | ) | | | 0.00 | | | | (0.78 | ) |
2017 | | $ | 21.32 | | | | 0.27 | | | | 1.36 | | | | 1.63 | | | | (0.41 | ) | | | 0.00 | | | | 0.00 | | | | (0.41 | ) |
Conservative Allocation Fund - Adviser Class (1)(2)(3)(4) |
2021 | | $ | 24.21 | | | | 0.41 | | | | 0.81 | | | | 1.22 | | | | (0.38 | ) | | | (1.14 | ) | | | 0.00 | | | | (1.52 | ) |
2020 | | $ | 23.13 | | | | 0.46 | | | | 1.06 | | | | 1.52 | | | | (0.44 | ) | | | 0.00 | | | | 0.00 | | | | (0.44 | ) |
2019 | | $ | 21.44 | | | | 0.57 | | | | 1.67 | | | | 2.24 | | | | (0.55 | ) | | | 0.00 | | | | 0.00 | | | | (0.55 | ) |
2018 | | $ | 22.82 | | | | 0.52 | | | | (1.08 | ) | | | (0.56 | ) | | | (0.44 | ) | | | (0.38 | ) | | | 0.00 | | | | (0.82 | ) |
2017 | | $ | 21.34 | | | | 0.36 | | | | 1.35 | | | | 1.71 | | | | (0.23 | ) | | | 0.00 | | | | 0.00 | | | | (0.23 | ) |
Conservative Allocation Fund - Institutional Class (1)(2)(3)(4) |
2021 | | $ | 24.26 | | | | 0.38 | | | | 0.81 | | | | 1.19 | | | | (0.35 | ) | | | (1.14 | ) | | | 0.00 | | | | (1.49 | ) |
2020 | | $ | 23.18 | | | | 0.46 | | | | 1.06 | | | | 1.52 | | | | (0.44 | ) | | | 0.00 | | | | 0.00 | | | | (0.44 | ) |
2019 | | $ | 21.49 | | | | 0.59 | | | | 1.68 | | | | 2.27 | | | | (0.58 | ) | | | 0.00 | | | | 0.00 | | | | (0.58 | ) |
2018 | | $ | 22.85 | | | | 0.56 | | | | (1.07 | ) | | | (0.51 | ) | | | (0.47 | ) | | | (0.38 | ) | | | 0.00 | | | | (0.85 | ) |
2017 | | $ | 21.34 | | | | 0.59 | | | | 1.14 | | | | 1.73 | | | | (0.22 | ) | | | 0.00 | | | | 0.00 | | | | (0.22 | ) |
|
See footnotes on pages 120 and 121.
The accompanying notes are an integral part of these financial statements.
Page 116 | 2021 Annual Report | December 31, 2021 |
| | | | | | | | | | Ratios/
Supplemental
Data | |
| | Net Asset
Value, End
of Period | | | Total Return
(Assumes
Reinvestment of
Distributions) | | | Net Assets,
End of Period
($000) | | | Ratio of Net
Investment
Income (Loss)
to Average
Net Assets | | | Ratio of Expenses to
Average Net Assets
After Fee Reductions (6) | | | Ratio of Expenses
to Average Net
Assets Before Fee
Reductions (7) | | | Portfolio
Turnover
Rate | |
| | | |
| | $ | 12.64 | | | | 8.74 | % | | $ | 1,190 | | | | (0.22 | %) | | | 1.34 | % | | | 1.34 | % | | | 211 | % |
| | $ | 12.37 | | | | 5.55 | % | | $ | 30,930 | | | | 1.00 | % | | | 1.38 | % | | | 1.38 | % | | | 160 | % |
| | $ | 11.85 | | | | 11.13 | % | | $ | 35,460 | | | | 1.73 | % | | | 1.38 | % | | | 1.38 | % | | | 155 | % |
| | $ | 10.84 | | | | (2.60 | %) | | $ | 32,502 | | | | 1.51 | % | | | 1.39 | % | | | 1.44 | % | | | 213 | % |
| | $ | 11.66 | | | | 15.99 | % | | $ | 24,635 | | | | 0.61 | % | | | 1.67 | % | | | 1.73 | % | | | 349 | % |
| | | |
| | $ | 12.66 | | | | 9.15 | % | | $ | 29,781 | | | | 1.13 | % | | | 0.94 | % | | | 0.94 | % | | | 211 | % |
| | $ | 12.39 | | | | 6.04 | % | | $ | 9,823 | | | | 1.39 | % | | | 1.00 | % | | | 1.00 | % | | | 160 | % |
| | $ | 11.86 | | | | 11.45 | % | | $ | 10,080 | | | | 2.00 | % | | | 1.11 | % | | | 1.11 | % | | | 155 | % |
| | $ | 10.85 | | | | (2.47 | %) | | $ | 9,480 | | | | 1.78 | % | | | 1.19 | % | | | 1.24 | % | | | 213 | % |
| | $ | 11.66 | | | | 16.40 | % | | $ | 3,538 | | | | 1.03 | % | | | 1.35 | % | | | 1.50 | % | | | 349 | % |
| | | |
| | $ | 12.68 | | | | 9.05 | % | | $ | 142,788 | | | | 1.01 | % | | | 0.99 | % | | | 0.99 | % | | | 211 | % |
| | $ | 12.42 | | | | 6.02 | % | | $ | 135,512 | | | | 1.40 | % | | | 0.99 | % | | | 0.99 | % | | | 160 | % |
| | $ | 11.89 | | | | 11.52 | % | | $ | 132,500 | | | | 2.10 | % | | | 1.01 | % | | | 1.01 | % | | | 155 | % |
| | $ | 10.88 | | | | (2.20 | %) | | $ | 119,881 | | | | 1.97 | % | | | 1.01 | % | | | 1.05 | % | | | 213 | % |
| | $ | 11.68 | | | | 16.55 | % | | $ | 37,945 | | | | 1.29 | % | | | 1.13 | % | | | 1.28 | % | | | 349 | % |
| | | |
| | $ | 23.64 | | | | 4.64 | % | | $ | 6,879 | | | | 0.78 | % | | | 1.22 | % | | | 1.23 | % | | | 210 | % |
| | $ | 23.91 | | | | 6.28 | % | | $ | 29,034 | | | | 1.46 | % | | | 1.28 | % | | | 1.28 | % | | | 139 | % |
| | $ | 22.85 | | | | 10.25 | % | | $ | 31,688 | | | | 2.19 | % | | | 1.28 | % | | | 1.28 | % | | | 136 | % |
| | $ | 21.18 | | | | (2.62 | %) | | $ | 30,759 | | | | 2.09 | % | | | 1.27 | % | | | 1.38 | % | | | 185 | % |
| | $ | 22.54 | | | | 7.64 | % | | $ | 12,545 | | | | 1.24 | % | | | 1.70 | % | | | 2.57 | % | | | 135 | % |
| | | |
| | $ | 23.91 | | | | 5.04 | % | | $ | 22,283 | | | | 1.56 | % | | | 0.87 | % | | | 0.88 | % | | | 210 | % |
| | $ | 24.21 | | | | 6.69 | % | | $ | 7,082 | | | | 1.85 | % | | | 0.92 | % | | | 0.92 | % | | | 139 | % |
| | $ | 23.13 | | | | 10.51 | % | | $ | 6,787 | | | | 2.44 | % | | | 1.04 | % | | | 1.04 | % | | | 136 | % |
| | $ | 21.44 | | | | (2.50 | %) | | $ | 6,110 | | | | 2.29 | % | | | 1.12 | % | | | 1.22 | % | | | 185 | % |
| | $ | 22.82 | | | | 8.01 | % | | $ | 682 | | | | 1.63 | % | | | 1.07 | % | | | 1.97 | % | | | 135 | % |
| | | |
| | $ | 23.96 | | | | 4.94 | % | | $ | 105,307 | | | | 1.42 | % | | | 0.92 | % | | | 0.93 | % | | | 210 | % |
| | $ | 24.26 | | | | 6.68 | % | | $ | 105,403 | | | | 1.87 | % | | | 0.92 | % | | | 0.92 | % | | | 139 | % |
| | $ | 23.18 | | | | 10.61 | % | | $ | 99,456 | | | | 2.54 | % | | | 0.94 | % | | | 0.94 | % | | | 136 | % |
| | $ | 21.49 | | | | (2.28 | %) | | $ | 92,412 | | | | 2.50 | % | | | 0.92 | % | | | 1.04 | % | | | 185 | % |
| | $ | 22.85 | | | | 8.10 | % | | $ | 11,739 | | | | 2.65 | % | | | 0.49 | % | | | 1.39 | % | | | 135 | % |
| | | |
See footnotes on pages 120 and 121.
The accompanying notes are an integral part of these financial statements.
2021 Annual Report | December 31, 2021 | Page 117 |
Financial Highlights
For the Years Ended December 31, | |
| | | | | | | Income
from
Investment Operations | | | Less
Distributions | |
| | Net Asset
Value,
Beginning
of Period | | | Net
Investment
Income
(Loss) (5) | | | Net gains (losses)
on securities and
futures (both realized
and unrealized) | | | Total from
Investment
Operations | | | From Net
Investment
Income | | | From Net
Capital
Gains | | | From
Return of
Capital | | | Total
Distributions | |
Dynamic Allocation Fund - Retail Class (1)(2)(3)(4) |
2021 | | $ | 13.39 | | | | (0.03 | ) | | | 2.65 | | | | 2.62 | | | | (0.08 | ) | | | (2.00 | ) | | | 0.00 | | | | (2.08 | ) |
2020 | | $ | 11.87 | | | | 0.03 | | | | 1.79 | | | | 1.82 | | | | (0.03 | ) | | | (0.27 | ) | | | 0.00 | | | | (0.30 | ) |
2019 | | $ | 9.79 | | | | 0.11 | | | | 2.23 | | | | 2.34 | | | | (0.08 | ) | | | (0.18 | ) | | | 0.00 | | | | (0.26 | ) |
2018 | | $ | 10.85 | | | | 0.07 | | | | (1.00 | ) | | | (0.93 | ) | | | (0.06 | ) | | | (0.07 | ) | | | 0.00 | | | | (0.13 | ) |
2017 | | $ | 9.72 | | | | 0.06 | | | | 1.99 | | | | 2.05 | | | | (0.07 | ) | | | (0.85 | ) | | | 0.00 | | | | (0.92 | ) |
Dynamic Allocation Fund - Adviser Class (1)(2)(3)(4) |
2021 | | $ | 13.46 | | | | 0.04 | | | | 2.65 | | | | 2.69 | | | | (0.08 | ) | | | (2.00 | ) | | | 0.00 | | | | (2.08 | ) |
2020 | | $ | 11.91 | | | | 0.07 | | | | 1.81 | | | | 1.88 | | | | (0.06 | ) | | | (0.27 | ) | | | 0.00 | | | | (0.33 | ) |
2019 | | $ | 9.82 | | | | 0.13 | | | | 2.24 | | | | 2.37 | | | | (0.10 | ) | | | (0.18 | ) | | | 0.00 | | | | (0.28 | ) |
2018 | | $ | 10.88 | | | | 0.09 | | | | (1.00 | ) | | | (0.91 | ) | | | (0.08 | ) | | | (0.07 | ) | | | 0.00 | | | | (0.15 | ) |
2017 | | $ | 9.73 | | | | 0.10 | | | | 1.97 | | | | 2.07 | | | | (0.07 | ) | | | (0.85 | ) | | | 0.00 | | | | (0.92 | ) |
Dynamic Allocation Fund - Institutional Class (1)(2)(3)(4) |
2021 | | $ | 13.45 | | | | 0.03 | | | | 2.64 | | | | 2.67 | | | | (0.08 | ) | | | (2.00 | ) | | | 0.00 | | | | (2.08 | ) |
2020 | | $ | 11.90 | | | | 0.08 | | | | 1.80 | | | | 1.88 | | | | (0.06 | ) | | | (0.27 | ) | | | 0.00 | | | | (0.33 | ) |
2019 | | $ | 9.82 | | | | 0.15 | | | | 2.23 | | | | 2.38 | | | | (0.12 | ) | | | (0.18 | ) | | | 0.00 | | | | (0.30 | ) |
2018 | | $ | 10.86 | | | | 0.12 | | | | (1.00 | ) | | | (0.88 | ) | | | (0.09 | ) | | | (0.07 | ) | | | 0.00 | | | | (0.16 | ) |
2017 | | $ | 9.72 | | | | 0.12 | | | | 1.97 | | | | 2.09 | | | | (0.10 | ) | | | (0.85 | ) | | | 0.00 | | | | (0.95 | ) |
Quantex Fund - Retail Class (1)(2)(3)(4) |
2021 | | $ | 35.64 | | | | (0.02 | ) | | | 9.77 | | | | 9.75 | | | | (0.02 | ) | | | (6.48 | ) | | | 0.00 | | | | (6.50 | ) |
2020 | | $ | 37.91 | | | | 0.20 | | | | (2.28 | ) | | | (2.08 | ) | | | (0.19 | ) | | | 0.00 | | | | 0.00 | | | | (0.19 | ) |
2019 | | $ | 32.22 | | | | 0.19 | | | | 5.75 | | | | 5.94 | | | | (0.25 | ) | | | 0.00 | | | | 0.00 | | | | (0.25 | ) |
2018 | | $ | 36.76 | | | | (0.01 | ) | | | (4.53 | ) | | | (4.54 | ) | | | 0.00 | | | | 0.00 | | | | 0.00 | | | | 0.00 | |
2017 | | $ | 33.36 | | | | 0.09 | | | | 4.38 | | | | 4.47 | | | | (0.06 | ) | | | (1.01 | ) | | | 0.00 | | | | (1.07 | ) |
Quantex Fund - Adviser Class (1)(2)(3)(4) |
2021 | | $ | 35.75 | | | | 0.13 | | | | 9.77 | | | | 9.90 | | | | (0.02 | ) | | | (6.48 | ) | | | 0.00 | | | | (6.50 | ) |
2020 | | $ | 38.01 | | | | 0.23 | | | | (2.28 | ) | | | (2.05 | ) | | | (0.21 | ) | | | 0.00 | | | | 0.00 | | | | (0.21 | ) |
2019 | | $ | 32.28 | | | | 0.24 | | | | 5.76 | | | | 6.00 | | | | (0.27 | ) | | | 0.00 | | | | 0.00 | | | | (0.27 | ) |
2018 | | $ | 36.78 | | | | 0.10 | | | | (4.60 | ) | | | (4.50 | ) | | | 0.00 | | | | 0.00 | | | | 0.00 | | | | 0.00 | |
2017 | | $ | 33.37 | | | | 0.21 | | | | 4.35 | | | | 4.56 | | | | (0.14 | ) | | | (1.01 | ) | | | 0.00 | | | | (1.15 | ) |
Quantex - Institutional Class (1)(2)(3)(4) |
2021 | | $ | 35.70 | | | | 0.09 | | | | 9.78 | | | | 9.87 | | | | (0.02 | ) | | | (6.48 | ) | | | 0.00 | | | | (6.50 | ) |
2020 | | $ | 38.01 | | | | 0.26 | | | | (2.31 | ) | | | (2.05 | ) | | | (0.26 | ) | | | 0.00 | | | | 0.00 | | | | (0.26 | ) |
2019 | | $ | 32.29 | | | | 0.29 | | | | 5.77 | | | | 6.06 | | | | (0.34 | ) | | | 0.00 | | | | 0.00 | | | | (0.34 | ) |
2018 | | $ | 36.77 | | | | 0.20 | | | | (4.62 | ) | | | (4.42 | ) | | | (0.06 | ) | | | 0.00 | | | | 0.00 | | | | (0.06 | ) |
2017 | | $ | 33.37 | | | | 0.26 | | | | 4.35 | | | | 4.61 | | | | (0.20 | ) | | | (1.01 | ) | | | 0.00 | | | | (1.21 | ) |
|
See footnotes on pages 120 and 121.
The accompanying notes are an integral part of these financial statements.
Page 118 | 2021 Annual Report | December 31, 2021 |
| | | | | | | | | | Ratios/
Supplemental
Data | |
| | et Asset
Value, End
of Period | | | Total Return
(Assumes
Reinvestment of
Distributions) | | | Net Assets,
End of Period
($000) | | | Ratio of Net
Investment
Income (Loss)
to Average
Net Assets | | | Ratio of Expenses to
Average Net Assets
After Fee Reductions (6) | | | Ratio of Expenses
to Average Net
Assets Before Fee
Reductions (7) | | | Portfolio
Turnover
Rate | |
| | | | |
| | $ | 13.93 | | | | 19.54 | % | | $ | 9,850 | | | | (0.21 | %) | | | 1.34 | % | | | 1.43 | % | | | 213 | % |
| | $ | 13.39 | | | | 15.37 | % | | $ | 37,392 | | | | 0.27 | % | | | 1.41 | % | | | 1.51 | % | | | 236 | % |
| | $ | 11.87 | | | | 24.00 | % | | $ | 40,977 | | | | 0.97 | % | | | 1.41 | % | | | 1.51 | % | | | 265 | % |
| | $ | 9.79 | | | | (8.66 | %) | | $ | 40,732 | | | | 0.62 | % | | | 1.45 | % | | | 1.55 | % | | | 273 | % |
| | $ | 10.85 | | | | 21.20 | % | | $ | 50,570 | | | | 0.59 | % | | | 1.51 | % | | | 1.58 | % | | | 252 | % |
| | | |
| | $ | 14.07 | | | | 20.02 | % | | $ | 28,129 | | | | 0.25 | % | | | 0.98 | % | | | 1.07 | % | | | 213 | % |
| | $ | 13.46 | | | | 15.85 | % | | $ | 13,322 | | | | 0.61 | % | | | 1.06 | % | | | 1.16 | % | | | 236 | % |
| | $ | 11.91 | | | | 24.29 | % | | $ | 13,137 | | | | 1.20 | % | | | 1.18 | % | | | 1.28 | % | | | 265 | % |
| | $ | 9.82 | | | | (8.49 | %) | | $ | 11,198 | | | | 0.84 | % | | | 1.23 | % | | | 1.33 | % | | | 273 | % |
| | $ | 10.88 | | | | 21.42 | % | | $ | 10,140 | | | | 0.87 | % | | | 1.27 | % | | | 1.34 | % | | | 252 | % |
| | | |
| | $ | 14.04 | | | | 19.88 | % | | $ | 199,753 | | | | 0.21 | % | | | 1.00 | % | | | 1.09 | % | | | 213 | % |
| | $ | 13.45 | | | | 15.94 | % | | $ | 148,566 | | | | 0.67 | % | | | 1.01 | % | | | 1.11 | % | | | 236 | % |
| | $ | 11.90 | | | | 24.40 | % | | $ | 146,119 | | | | 1.38 | % | | | 1.00 | % | | | 1.10 | % | | | 265 | % |
| | $ | 9.82 | | | | (8.18 | %) | | $ | 121,965 | | | | 1.08 | % | | | 1.01 | % | | | 1.11 | % | | | 273 | % |
| | $ | 10.86 | | | | 21.61 | % | | $ | 70,187 | | | | 1.10 | % | | | 1.05 | % | | | 1.12 | % | | | 252 | % |
| | | |
| | $ | 38.89 | | | | 27.34 | % | | $ | 16,406 | | | | (0.05 | %) | | | 1.60 | % | | | 1.60 | % | | | 64 | % |
| | $ | 35.64 | | | | (5.36 | %) | | $ | 18,352 | | | | 0.65 | % | | | 1.53 | % | | | 1.53 | % | | | 88 | % |
| | $ | 37.91 | | | | 18.48 | % | | $ | 24,979 | | | | 0.52 | % | | | 1.53 | % | | | 1.53 | % | | | 82 | % |
| | $ | 32.22 | | | | (12.35 | %) | | $ | 28,319 | | | | (0.03 | %) | | | 1.57 | % | | | 1.62 | % | | | 116 | % |
| | $ | 36.76 | | | | 13.42 | % | | $ | 60,161 | | | | 0.27 | % | | | 1.52 | % | | | 1.66 | % | | | 72 | % |
| | | |
| | $ | 39.15 | | | | 27.68 | % | | $ | 4,575 | | | | 0.31 | % | | | 1.33 | % | | | 1.33 | % | | | 64 | % |
| | $ | 35.75 | | | | (5.25 | %) | | $ | 986 | | | | 0.77 | % | | | 1.41 | % | | | 1.41 | % | | | 88 | % |
| | $ | 38.01 | | | | 18.63 | % | | $ | 1,113 | | | | 0.67 | % | | | 1.41 | % | | | 1.41 | % | | | 82 | % |
| | $ | 32.28 | | | | (12.22 | %) | | $ | 923 | | | | 0.28 | % | | | 1.42 | % | | | 1.47 | % | | | 116 | % |
| | $ | 36.78 | | | | 13.68 | % | | $ | 2,114 | | | | 0.59 | % | | | 1.39 | % | | | 1.56 | % | | | 72 | % |
| | | |
| | $ | 39.07 | | | | 27.63 | % | | $ | 21,046 | | | | 0.20 | % | | | 1.36 | % | | | 1.36 | % | | | 64 | % |
| | $ | 35.70 | | | | (5.22 | %) | | $ | 20,756 | | | | 0.85 | % | | | 1.37 | % | | | 1.37 | % | | | 88 | % |
| | $ | 38.01 | | | | 18.81 | % | | $ | 36,646 | | | | 0.82 | % | | | 1.25 | % | | | 1.25 | % | | | 82 | % |
| | $ | 32.29 | | | | (12.05 | %) | | $ | 35,414 | | | | 0.54 | % | | | 1.21 | % | | | 1.26 | % | | | 116 | % |
| | $ | 36.77 | | | | 13.84 | % | | $ | 32,489 | | | | 0.75 | % | | | 1.18 | % | | | 1.35 | % | | | 72 | % |
| | | |
See footnotes on pages 120 and 121.
The accompanying notes are an integral part of these financial statements.
2021 Annual Report | December 31, 2021 | Page 119 |
Financial Highlights
For the Years Ended December 31, | |
| | | | | | | Income
from
Investment Operations | | | Less
Distributions | |
| | Net Asset
Value,
Beginning
of Period | | | Net
Investment
Income
(Loss) (5) | | | Net gains (losses)
on securities and
futures (both realized
and unrealized) | | | Total from
Investment
Operations | | | From Net
Investment
Income | | | From Net
Capital
Gains | | | From
Return of
Capital | | | Total
Distributions | |
Tactical Income Fund - Retail Class (1)(2)(3)(4) |
2021 | | $ | 9.98 | | | | 0.13 | | | | (0.33 | ) | | | (0.20 | ) | | | (0.15 | ) | | | 0.00 | | | | 0.00 | | | | (0.15 | ) |
2020 | | $ | 9.46 | | | | 0.21 | | | | 0.49 | | | | 0.70 | | | | (0.18 | ) | | | 0.00 | | | | 0.00 | | | | (0.18 | ) |
2019 | | $ | 9.03 | | | | 0.23 | | | | 0.42 | | | | 0.65 | | | | (0.22 | ) | | | 0.00 | | | | 0.00 | | | | (0.22 | ) |
2018 | | $ | 9.37 | | | | 0.17 | | | | (0.33 | ) | | | (0.16 | ) | | | (0.18 | ) | | | 0.00 | | | | 0.00 | | | | (0.18 | ) |
2017 | | $ | 9.28 | | | | 0.24 | | | | 0.10 | | | | 0.34 | | | | (0.25 | ) | | | 0.00 | | | | 0.00 | | | | (0.25 | ) |
Tactical Income Fund - Adviser Class (1)(2)(3)(4) |
2021 | | $ | 9.99 | | | | 0.21 | | | | (0.37 | ) | | | (0.16 | ) | | | (0.19 | ) | | | 0.00 | | | | 0.00 | | | | (0.19 | ) |
2020 | | $ | 9.47 | | | | 0.25 | | | | 0.49 | | | | 0.74 | | | | (0.22 | ) | | | 0.00 | | | | 0.00 | | | | (0.22 | ) |
2019 | | $ | 9.04 | | | | 0.26 | | | | 0.42 | | | | 0.68 | | | | (0.25 | ) | | | 0.00 | | | | 0.00 | | | | (0.25 | ) |
2018 | | $ | 9.38 | | | | 0.21 | | | | (0.35 | ) | | | (0.14 | ) | | | (0.20 | ) | | | 0.00 | | | | 0.00 | | | | (0.20 | ) |
2017 | | $ | 9.28 | | | | 0.28 | | | | 0.10 | | | | 0.38 | | | | (0.28 | ) | | | 0.00 | | | | 0.00 | | | | (0.28 | ) |
Tactical Income Fund - Institutional Class (1)(2)(3)(4) |
2021 | | $ | 9.99 | | | | 0.20 | | | | (0.36 | ) | | | (0.16 | ) | | | (0.19 | ) | | | 0.00 | | | | 0.00 | | | | (0.19 | ) |
2020 | | $ | 9.47 | | | | 0.24 | | | | 0.50 | | | | 0.74 | | | | (0.22 | ) | | | 0.00 | | | | 0.00 | | | | (0.22 | ) |
2019 | | $ | 9.04 | | | | 0.27 | | | | 0.42 | | | | 0.69 | | | | (0.26 | ) | | | 0.00 | | | | 0.00 | | | | (0.26 | ) |
2018 | | $ | 9.38 | | | | 0.23 | | | | (0.35 | ) | | | (0.12 | ) | | | (0.22 | ) | | | 0.00 | | | | 0.00 | | | | (0.22 | ) |
2017 | | $ | 9.28 | | | | 0.31 | | | | 0.08 | | | | 0.39 | | | | (0.29 | ) | | | 0.00 | | | | 0.00 | | | | (0.29 | ) |
Institutional Prime Money Market Fund (1)(2)(3)(4) |
2021 | | $ | 1.0003 | | | | 0.0005 | | | | 0.0003 | | | | 0.0008 | | | | (0.0010 | ) | | | 0.0000 | | | | 0.0000 | | | | (0.0010 | ) |
2020 | | $ | 1.0000 | | | | 0.0058 | | | | (0.0005 | ) | | | 0.0053 | | | | (0.0050 | ) | | | 0.0000 | | | | 0.0000 | | | | (0.0050 | ) |
2019 | | $ | 0.9999 | | | | 0.0231 | | | | 0.0000 | | | | 0.0231 | | | | (0.0230 | ) | | | 0.0000 | | | | 0.0000 | | | | (0.0230 | ) |
2018 | | $ | 0.9999 | | | | 0.0190 | | | | 0.0000 | | | | 0.0190 | | | | (0.0190 | ) | | | 0.0000 | | | | 0.0000 | | | | (0.0190 | ) |
2017 | | $ | 1.0001 | | | | 0.0101 | | | | (0.0003 | ) | | | 0.0098 | | | | (0.0100 | ) | | | 0.0000 | | | | 0.0000 | | | | (0.0100 | ) |
|
1 | Ratio of net investment income (loss) to average net assets, ratio of expenses to average net assets after fee reductions, and ratio of expenses to average net assets before fee reductions do not include impact of expenses of the underlying security holdings as represented in the schedule of investments. |
2 | Recognition of net investment income by the Fund is affected by the timing of the declaration of dividends by the underlying investment companies in which the Fund invests. |
3 | Total return and portfolio turnover rate are not annualized for periods of less than one full year. |
4 | Ratio of net investment income (loss) to average net assets, ratio of expenses to average net assets after fee reductions, and ratio of expenses to average net assets before fee reductions are annualized for periods of less than one full year. |
5 | Except for the Money Market Fund, net investment income per share is based on average shares outstanding during the period. |
The accompanying notes are an integral part of these financial statements.
Page 120 | 2021 Annual Report | December 31, 2021 |
| | | | | | | | | | Ratios/
Supplemental
Data | |
| | Net Asset
Value, End
of Period | | | Total Return
(Assumes
Reinvestment of
Distributions) | | | Net Assets,
End of Period
($000) | | | Ratio of Net
Investment
Income (Loss)
to Average
Net Assets | | | Ratio of Expenses to
Average Net Assets
After Fee Reductions (6) | | | Ratio of Expenses
to Average Net
Assets Before Fee
Reductions (7) | | | Portfolio
Turnover
Rate | |
| | | | |
| | $ | 9.63 | | | | (2.01 | %) | | $ | 2,721 | | | | 1.10 | % | | | 1.14 | % | | | 1.25 | % | | | 250 | % |
| | $ | 9.98 | | | | 7.46 | % | | $ | 12,231 | | | | 1.87 | % | | | 1.15 | % | | | 1.26 | % | | | 69 | % |
| | $ | 9.46 | | | | 7.24 | % | | $ | 11,137 | | | | 2.27 | % | | | 1.14 | % | | | 1.25 | % | | | 95 | % |
| | $ | 9.03 | | | | (1.67 | %) | | $ | 14,932 | | | | 1.88 | % | | | 1.15 | % | | | 1.26 | % | | | 102 | % |
| | $ | 9.37 | | | | 3.72 | % | | $ | 67,986 | | | | 2.59 | % | | | 1.02 | % | | | 1.03 | % | | | 133 | % |
| | | |
| | $ | 9.64 | | | | (1.60 | %) | | $ | 8,982 | | | | 1.98 | % | | | 0.75 | % | | | 0.86 | % | | | 250 | % |
| | $ | 9.99 | | | | 7.86 | % | | $ | 5,463 | | | | 2.28 | % | | | 0.79 | % | | | 0.90 | % | | | 69 | % |
| | $ | 9.47 | | | | 7.54 | % | | $ | 4,205 | | | | 2.64 | % | | | 0.88 | % | | | 0.99 | % | | | 95 | % |
| | $ | 9.04 | | | | (1.45 | %) | | $ | 3,570 | | | | 2.33 | % | | | 0.95 | % | | | 1.06 | % | | | 102 | % |
| | $ | 9.38 | | | | 4.07 | % | | $ | 9,896 | | | | 2.95 | % | | | 0.83 | % | | | 0.84 | % | | | 133 | % |
| | | |
| | $ | 9.64 | | | | (1.62 | %) | | $ | 57,638 | | | | 1.90 | % | | | 0.79 | % | | | 0.90 | % | | | 250 | % |
| | $ | 9.99 | | | | 7.86 | % | | $ | 50,410 | | | | 2.25 | % | | | 0.77 | % | | | 0.88 | % | | | 69 | % |
| | $ | 9.47 | | | | 7.67 | % | | $ | 46,490 | | | | 2.72 | % | | | 0.76 | % | | | 0.87 | % | | | 95 | % |
| | $ | 9.04 | | | | (1.22 | %) | | $ | 48,437 | | | | 2.50 | % | | | 0.76 | % | | | 0.87 | % | | | 102 | % |
| | $ | 9.38 | | | | 4.20 | % | | $ | 110,674 | | | | 3.27 | % | | | 0.64 | % | | | 0.65 | % | | | 133 | % |
| | | |
| | $ | 1.0001 | | | | 0.03 | % | | $ | 626,993 | | | | 0.05 | % | | | 0.11 | % | | | 0.50 | % | | | N/A | |
| | $ | 1.0003 | | | | 0.57 | % | | $ | 336,445 | | | | 0.57 | % | | | 0.15 | % | | | 0.52 | % | | | N/A | |
| | $ | 1.0000 | | | | 2.31 | % | | $ | 370,120 | | | | 2.30 | % | | | 0.13 | % | | | 0.50 | % | | | N/A | |
| | $ | 0.9999 | | | | 1.90 | % | | $ | 471,603 | | | | 1.90 | % | | | 0.16 | % | | | 0.51 | % | | | N/A | |
| | $ | 0.9999 | | | | 0.96 | % | | $ | 296,547 | | | | 1.01 | % | | | 0.17 | % | | | 0.56 | % | | | N/A | |
| | | |
6 | Ratio of expenses to average net assets after fee reductions reflects contractual or voluntary waivers and reimbursements of expenses by the investment adviser and transfer agent. |
7 | Ratio of expenses to average net assets before fee reductions reflects the total expenses before reductions reported in the statements of operations. |
* | Actual amounts were less than one-half of a cent per share |
The accompanying notes are an integral part of these financial statements.
2021 Annual Report | December 31, 2021 | Page 121 |
Notes to Financial Statements
December 31, 2021
1. Organization
Meeder Funds (the Trust) is organized as a Massachusetts business trust and is registered under the Investment Company Act of 1940, as amended (the 1940 Act), as a diversified, open-end management investment company. The Trust offers ten separate series, all of which are included in this report: Muirfield Fund (Muirfield), Spectrum Fund (Spectrum), Global Allocation Fund (Global), Balanced Fund (Balanced), Moderate Allocation Fund (Moderate), Conservative Allocation Fund (Conservative), Dynamic Allocation Fund (Dynamic), Quantex Fund (Quantex), Tactical Income Fund (Income), and Institutional Prime Money Market Fund (Money Market)(the Funds).
Each Fund, except Money Market, offers three classes of shares: Retail Class, Adviser Class, and Institutional Class. Money Market offers only one class of shares. The share classes differ with respect to distribution fees, service fees, and other expenses allocated to each class. Eligibility to purchase Adviser and Institutional Class shares is generally limited to customers of financial intermediaries who enter into special arrangements with the Funds or who meet certain initial investment minimums.
Money Market operates as an institutional money market fund open to all forms of investors. Its net asset value fluctuates based upon changes in the value of its investments and the value of its shares is calculated daily to four decimal places. Money Market has adopted policies and procedures to impose liquidity fees on redemptions or temporary redemption gates in the event that the Fund’s weekly liquid assets fall below designated thresholds and the Board of Trustees determines that such liquidity fees or redemption gates are in the best interests of the Fund.
Effective April 16, 2021, Total Return Bond Fund changed its name to Tactical Income Fund to better align with its new principal investment strategies and new investment objective of “total return, consisting of income and long-term capital growth.” In addition, Quantex Fund changed its principal investment strategies to better align with the Fund’s adviser’s (Meeder Asset Management, Inc.) quantitative models and assessment of economic and market conditions.
On November 2, 2021, the Board of Trustees of the Meeder Funds determined that it was in the best interest of shareholders to liquidate the Prime Money Market Fund, a former series of the Trust, pursuant to a plan of liquidation approved by the Board. The liquidation payment to shareholders took place on December 28, 2021.
For more information regarding the Funds’ objectives, strategies, and differences in share classes, please refer to the Funds’ prospectus.
2. Significant Accounting Policies
The Funds’ financial statements are prepared in conformity with accounting principles generally accepted in the United States of America (GAAP), which require management to make certain estimates and assumptions that affect the reported amounts of assets and liabilities and disclosure of contingent assets and liabilities at the date of the financial statements. The Trust is an investment company and applies the accounting and reporting guidance of the Financial Accounting Standards Board (FASB) Accounting Standards Codification Topic 946 Financial Services Companies. The following summarizes the significant accounting policies of the Trust and the Funds:
Securities valuation. All investments in securities are recorded at their estimated fair value, as described in Note #3.
Repurchase agreements. Each Fund may engage in repurchase agreement transactions whereby the Fund takes possession of an underlying debt instrument subject to an obligation of the seller to repurchase the instrument from the Fund and an obligation of the Fund to resell the instrument at an agreed upon price and term. At all times, the Fund maintains the fair value of collateral, including accrued interest, of at least 100% of the amount of the repurchase agreement, plus accrued interest. If the seller defaults or the fair value of the collateral declines, realization of the collateral by the Fund may be delayed or limited.
Short sales. Spectrum may enter into short sales as part of its overall portfolio management strategy or to offset a potential decline in value of a security. The Fund may engage in short sales with respect to various types of securities, including ETFs. A short sale involves the sale of a security that is borrowed from a broker or other institution to complete the sale. The Fund may engage in short sales with respect to securities it owns, as well as securities that it does not own. Short sales expose the Fund to the risk that it will be required to acquire, convert, or exchange securities to replace the borrowed securities (also known as “covering” the short position) at a time when the securities sold short have appreciated in value, thus resulting in a loss to the Fund. The Fund’s investment performance may also suffer if the Fund is required to close out a short position earlier than it had intended. The Fund must segregate assets determined to be liquid in accordance with procedures established by the Board, or otherwise cover its position in a permissible manner. The Fund will be required to pledge its liquid assets to the broker in order to secure its performance on short sales. As a result, the assets pledged may not be available to meet the Fund’s needs for immediate cash or other liquidity. In addition, the Fund may be subject to expenses related to short sales that are not typically associated with investing in securities directly, such as costs of borrowing and margin account maintenance costs associated with the Fund’s open short positions. These types of short sales expenses are sometimes referred to as the “negative cost of carry,” and will tend to cause the Fund to lose money on a short sale even in instances where the price of the underlying security sold short does not change over the duration of the short sale. Dividend expenses on securities sold short and borrowing costs will be borne by the Fund and are reflected in the Statements of Operations.
Page 122 | 2021 Annual Report | December 31, 2021 |
Futures & options. Each Fund, except Money Market, may engage in transactions in financial futures contracts and options contracts in order to manage the risk of unanticipated changes in market values of securities held in the Fund, or which it intends to purchase. The futures and options contracts are adjusted by the daily exchange rate of the underlying currency, or index, and any gains or losses are recorded for financial statement purposes as unrealized gains or losses in the Statements of Assets and Liabilities and the Statements of Operations until the contract settlement date, at which time amounts are reflected as realized gains and losses in the Statements of Operations.
To the extent that a Fund enters into futures contracts on an index or group of securities, the Fund exposes itself to an indeterminate liability and will be required to pay or receive a sum of money measured by the change in the fair value of the index. Upon entering into a futures contract, the Fund is required to deposit an initial margin, which is either cash or securities (disclosed as pledged as collateral on the Schedules of Investments) in an amount equal to a certain percentage of the contract value. Subsequently, margin movements, which are equal to changes in the daily price or last sale price on the exchanges where futures contracts trade, are recorded as unrealized gains or losses until the contract is closed. When the contract is closed, the Fund records a realized gain or loss equal to the difference between the proceeds from (or cost of) the closing transaction and the Fund’s basis in the contract. Should market conditions move unexpectedly, the Fund may not achieve the anticipated benefits of the futures contract and may realize a loss. The use of futures transactions involves the risk of imperfect correlation in movements in the price of futures contracts, interest rates, and the underlying hedged assets. With futures, there is minimal counterparty credit risk to the Fund since futures are exchange traded and the exchange’s clearinghouse, as counterparty to all exchange traded futures, guarantees the futures against default. Except for Money Market, it is normal practice for each Fund to invest in futures contracts on a daily basis. The Funds, except for Income and Money Market, typically utilize equity index futures contracts to equitize cash positions or adjust targeted stock market exposure. Except for Money Market, the fixed income portion of any Fund can utilize Treasury futures contracts in order to adjust duration.
Call and put option contracts involve the payment of a premium for the right to purchase or sell an individual security or index aggregate at a specified price until the expiration of the contract. Such transactions expose the Fund to the loss of the premium paid if the Fund does not sell or exercise the contract prior to the expiration date. In the case of a call option, sufficient cash or money market instruments will be segregated to complete the purchase. Options are fair valued on the basis of the daily settlement price or last sale on the exchanges where they trade and the changes in fair value are recorded as unrealized appreciation or depreciation until closed, exercised or expired. For the year ended December 31, 2021, there were no call or put options transacted for any of the Funds.
The Funds may write covered call or put options for which premiums received are recorded as liabilities and are subsequently adjusted to the current value of the options written. When written options are closed or exercised, premiums received are offset against the proceeds paid, and the Fund records realized gains or losses for the difference. When written options expire, the liability is eliminated, and the Fund records realized gains for the entire amount of premiums received. Although permitted, it is currently not normal practice for the Funds to write call and put options and none were written during the year ended December 31, 2021.
The fair value of derivative instruments, not accounted for as hedging instruments, as reported within the Statements of Assets and Liabilities as of December 31, 2021 was as follows:
Amount of Deposits at Broker and Unrealized Appreciation (Depreciation) on Derivatives |
| | Type of
Derivative/
Risk | Statements of Assets & Liabilities Location | | Fair Value of
Deposits at
Broker for Futures
Contracts | | | Value of
Unrealized
Appreciation
(Depreciation) | |
Muirfield | Equity contracts | Assets, Deposits at broker for futures contracts; Net Assets, Distributable Earnings (Accumulated Deficit) | | $ | 8,499,843 | | | $ | 388,898 | |
Spectrum | Equity contracts | Assets, Deposits at broker for futures contracts; Net Assets, Distributable Earnings (Accumulated Deficit) | | | 3,167,580 | | | | (177,472 | ) |
Global | Equity contracts | Assets, Deposits at broker for futures contracts; Net Assets, Distributable Earnings (Accumulated Deficit) | | | 1,594,873 | | | | 274,466 | |
Balanced | Equity contracts | Assets, Deposits at broker for futures contracts; Net Assets, Distributable Earnings (Accumulated Deficit) | | | 3,886,522 | | | | 1,907 | |
Moderate | Equity contracts | Assets, Deposits at broker for futures contracts; Net Assets, Distributable Earnings (Accumulated Deficit) | | | 1,626,080 | | | | 39,631 | |
Conservative | Equity contracts | Assets, Deposits at broker for futures contracts; Net Assets, Distributable Earnings (Accumulated Deficit) | | | 863,397 | | | | 76,428 | |
Dynamic | Equity contracts | Assets, Deposits at broker for futures contracts; Net Assets, Distributable Earnings (Accumulated Deficit) | | | 4,742,410 | | | | 1,219,118 | |
Quantex | Equity contracts | Assets, Deposits at broker for futures contracts; Net Assets, Distributable Earnings (Accumulated Deficit) | | | 1,301,223 | | | | 232,815 | |
2021 Annual Report | December 31, 2021 | Page 123 |
The effect of derivative instruments on the Statements of Operations for the year ended December 31, 2021 and related activity was as follows:
Amount of Realized Gain (Loss) on Derivatives Recognized in Income |
| | Type of
Derivative/
Risk | | Contracts as of
December 31,
2020 | | | Long and
Short
Contracts
Opened
During the
Period | | | Long and
Short
Contracts
Closed/
Expired
During the
Period | | | Net Long
Contracts as of
December 31,
2021 | | Statement of Operations
Location | | For the
Year Ended
December 31,
2021 | |
Muirfield | Equity contracts | | | 991 | | | | 7,297 | | | | 7,927 | | | | 361 | | Net realized gains (losses) from futures contracts | | $ | 3,847,186 | |
Spectrum | Equity contracts | | | 299 | | | | 2,493 | | | | 2,729 | | | | 63 | | Net realized gains (losses) from futures contracts | | | 1,502,180 | |
Global | Equity contracts | | | 189 | | | | 1,001 | | | | 1,080 | | | | 110 | | Net realized gains (losses) from futures contracts | | | 1,927,157 | |
Balanced | Equity contracts | | | 487 | | | | 3,489 | | | | 3,859 | | | | 117 | | Net realized gains (losses) from futures contracts | | | 3,575,274 | |
Moderate | Equity contracts | | | 184 | | | | 1,080 | | | | 1,225 | | | | 39 | | Net realized gains (losses) from futures contracts | | | 2,299,481 | |
Conservative | Equity contracts | | | 86 | | | | 580 | | | | 637 | | | | 29 | | Net realized gains (losses) from futures contracts | | | 1,471,407 | |
Dynamic | Equity contracts | | | 456 | | | | 3,120 | | | | 3,128 | | | | 448 | | Net realized gains (losses) from futures contracts | | | 4,744,545 | |
Quantex | Equity contracts | | | 20 | | | | 361 | | | | 338 | | | | 43 | | Net realized gains (losses) from futures contracts | | | 1,017,967 | |
Change in Unrealized Gain or (Loss) on Derivatives Recognized in Income |
| | Type of
Derivative/ Risk | Statement of Operations Location | | For the
Year Ended
December 31, 2021 | |
Muirfield | Equity contracts | Net change in unrealized appreciation (depreciation) of futures contracts | | $ | (2,402,630 | ) |
Spectrum | Equity contracts | Net change in unrealized appreciation (depreciation) of futures contracts | | | (978,267 | ) |
Global | Equity contracts | Net change in unrealized appreciation (depreciation) of futures contracts | | | (109,012 | ) |
Balanced | Equity contracts | Net change in unrealized appreciation (depreciation) of futures contracts | | | (1,374,463 | ) |
Moderate | Equity contracts | Net change in unrealized appreciation (depreciation) of futures contracts | | | (560,757 | ) |
Conservative | Equity contracts | Net change in unrealized appreciation (depreciation) of futures contracts | | | (190,415 | ) |
Dynamic | Equity contracts | Net change in unrealized appreciation (depreciation) of futures contracts | | | 451,421 | |
Quantex | Equity contracts | Net change in unrealized appreciation (depreciation) of futures contracts | | | 205,159 | |
Federal income taxes. It is each Fund’s policy to continue to comply with the requirements of Subchapter M of the Internal Revenue Code applicable to regulated investment companies and to distribute substantially all of its taxable income and net capital gains to its shareholders. Therefore, no federal income tax provision is required. The Funds recognize the tax benefits or expenses of uncertain tax positions only where the position is “more likely than not” to be sustained assuming examination by tax authorities. Management has reviewed tax positions taken on Federal income tax returns for all open tax years (tax years ended December 31, 2018 through December 31, 2021) and has concluded that no provision for unrecognized tax benefits or expenses is required in these financial statements. Each Fund identifies its major tax jurisdictions as U.S. Federal and certain State tax authorities; however the Funds are not aware of any tax positions for which it is reasonably possible that the total amounts of unrecognized tax benefits will change materially in the next twelve months. The Funds recognize interest and penalties, if any, related to unrecognized tax benefits as income tax expense in the Statements of Operations as incurred. During the year ended December 31, 2021, the Funds did not incur any material interest or penalties.
Distributions to shareholders. Distributions to shareholders are recorded on the ex-dividend date. Muirfield, Spectrum, Global, Balanced, Moderate, Conservative, Dynamic, and Quantex declare and pay dividends from net investment income, if any, on a quarterly basis. Income declares and pays dividends from net investment income on a monthly basis. Money Market declares dividends from net investment income on a daily basis and pays such dividends on a monthly basis. Each Fund distributes net capital gains, if any, on an annual basis.
Page 124 | 2021 Annual Report | December 31, 2021 |
Distributions from net investment income and from net capital gains are determined in accordance with income tax regulations, which may differ from GAAP. Permanent differences relate to redemptions treated as distributions for tax purposes (i.e. equalization). Accordingly, timing differences relating to shareholder distributions are reflected in the components of net assets and permanent book and tax differences have been reclassified within the components of net assets based on their ultimate characterization for federal income tax purposes. For the year ended December 31, 2021, the Funds made the following reclassifications to increase/(decrease) the components of net assets:
| | | Capital | | | Distributable Earnings
(Accumulated Deficit) | |
Muirfield | | $ | 749,141 | | | $ | (749,141 | ) |
Spectrum | | | 506,238 | | | | (506,238 | ) |
Global | | | 521,611 | | | | (521,611 | ) |
Balanced | | | 1,002,057 | | | | (1,002,057 | ) |
Moderate | | | 540,869 | | | | (540,869 | ) |
Conservative | | | 315,068 | | | | (315,068 | ) |
Dynamic | | | 3,831,331 | | | | (3,831,331 | ) |
Quantex | | | 1,397,895 | | | | (1,397,895 | ) |
Investment income & expenses allocation. For all Funds, except Money Market, income and expenses (other than expenses attributable to a specific class) are allocated to each class of shares based on its relative net assets. Expenses incurred by the Trust that do not specifically relate to an individual Fund of the Trust are allocated to the Funds based on each Fund’s relative net assets or other appropriate basis.
Capital Share Transactions. All Funds are authorized to issue an unlimited number of shares. Transactions in the capital shares of the Funds for the year ended December 31, 2021 and the year ended December 31, 2020 were as follows:
| | | Issued | | | Reinvested | |
Share Class | | Amount | | | Shares | | | Amount | | | Shares | |
Year Ended December 31, 2021 | | | | | | | | | | | | | | | | |
Muirfield - Retail | | $ | 6,469,284 | | | | 694,953 | | | $ | 1,389,369 | | | | 146,318 | |
Muirfield - Adviser | | | 105,372,752 | | | | 12,157,906 | | | | 3,472,316 | | | | 362,120 | |
Muirfield - Institutional | | | 206,153,900 | | | | 22,156,762 | | | | 17,951,987 | | | | 1,867,042 | |
Spectrum - Retail | | | 812,426 | | | | 62,421 | | | | 133,412 | | | | 9,600 | |
Spectrum - Adviser | | | 38,585,700 | | | | 3,016,241 | | | | 2,008,738 | | | | 143,722 | |
Spectrum - Institutional | | | 42,300,867 | | | | 3,129,326 | | | | 8,900,032 | | | | 634,509 | |
Global - Retail | | | 464,829 | | | | 37,814 | | | | 355,386 | | | | 30,743 | |
Global - Adviser | | | 5,718,573 | | | | 480,145 | | | | 507,971 | | | | 43,678 | |
Global - Institutional | | | 5,622,509 | | | | 464,097 | | | | 3,657,943 | | | | 315,612 | |
Balanced - Retail | | | 1,419,522 | | | | 103,666 | | | | 536,279 | | | | 39,803 | |
Balanced - Adviser | | | 75,167,324 | | | | 5,639,400 | | | | 5,644,455 | | | | 415,494 | |
Balanced - Institutional | | | 76,607,173 | | | | 5,553,310 | | | | 24,603,677 | | | | 1,806,617 | |
Moderate - Retail | | | 243,792 | | | | 19,203 | | | | 68,964 | | | | 5,442 | |
Moderate - Adviser | | | 32,545,012 | | | | 2,569,740 | | | | 1,909,210 | | | | 150,181 | |
Moderate - Institutional | | | 33,332,710 | | | | 2,570,281 | | | | 9,142,151 | | | | 717,897 | |
Conservative - Retail | | | 834,351 | | | | 34,357 | | | | 373,133 | | | | 15,690 | |
Conservative - Adviser | | | 24,966,663 | | | | 1,019,612 | | | | 1,341,555 | | | | 55,711 | |
Conservative - Institutional | | | 28,456,983 | | | | 1,152,983 | | | | 6,332,940 | | | | 262,413 | |
Dynamic - Retail | | | 826,784 | | | | 56,185 | | | | 1,280,969 | | | | 91,616 | |
Dynamic - Adviser | | | 30,927,011 | | | | 2,198,166 | | | | 3,644,409 | | | | 258,053 | |
Dynamic - Institutional | | | 76,433,295 | | | | 5,106,615 | | | | 25,863,854 | | | | 1,835,669 | |
Quantex - Retail | | | 4,529,307 | | | | 104,989 | | | | 2,342,181 | | | | 60,226 | |
Quantex - Adviser | | | 4,794,010 | | | | 125,606 | | | | 649,231 | | | | 16,579 | |
Quantex - Institutional | | | 7,445,118 | | | | 184,488 | | | | 3,055,546 | | | | 78,187 | |
Income - Retail | | | 573,050 | | | | 58,803 | | | | 39,594 | | | | 4,065 | |
Income - Adviser | | | 10,993,038 | | | | 1,108,656 | | | | 185,116 | | | | 18,972 | |
Income - Institutional | | | 24,604,439 | | | | 2,513,602 | | | | 1,063,777 | | | | 109,136 | |
Money Market | | | 1,011,642,367 | | | | 1,011,455,624 | | | | 35,042 | | | | 35,036 | |
| | | | | | | | | | | | | | | | | |
2021 Annual Report | December 31, 2021 | Page 125 |
| | | Issued | | | Reinvested | |
Share Class | | Amount | | | Shares | | | Amount | | | Shares | |
Year Ended December 31, 2020 | | | | | | | | | | | | | | | | |
Muirfield - Retail | | $ | 11,650,273 | | | | 1,616,852 | | | $ | 884,595 | | | | 122,946 | |
Muirfield - Adviser | | | 12,562,031 | | | | 1,731,428 | | | | 475,878 | | | | 65,587 | |
Muirfield - Institutional | | | 94,938,567 | | | | 13,043,429 | | | | 3,526,830 | | | | 485,462 | |
Spectrum - Retail | | | 3,339,517 | | | | 312,463 | | | | 34,980 | | | | 3,171 | |
Spectrum - Adviser | | | 2,993,068 | | | | 271,967 | | | | 119,760 | | | | 10,835 | |
Spectrum - Institutional | | | 27,288,817 | | | | 2,527,581 | | | | 1,281,869 | | | | 115,651 | |
Global - Retail | | | 1,166,292 | | | | 111,446 | | | | 197,994 | | | | 17,568 | |
Global - Adviser | | | 446,417 | | | | 43,133 | | | | 44,862 | | | | 4,032 | |
Global - Institutional | | | 3,242,380 | | | | 313,642 | | | | 1,068,025 | | | | 96,909 | |
Balanced - Retail | | | 7,397,073 | | | | 647,576 | | | | 507,680 | | | | 44,045 | |
Balanced - Adviser | | | 4,253,014 | | | | 362,514 | | | | 178,375 | | | | 15,347 | |
Balanced - Institutional | | | 73,579,398 | | | | 6,333,953 | | | | 2,664,718 | | | | 229,124 | |
Moderate - Retail | | | 3,670,705 | | | | 326,818 | | | | 347,588 | | | | 30,030 | |
Moderate - Adviser | | | 2,910,988 | | | | 254,996 | | | | 139,338 | | | | 12,040 | |
Moderate - Institutional | | | 30,969,046 | | | | 2,697,054 | | | | 1,865,874 | | | | 160,665 | |
Conservative - Retail | | | 3,996,383 | | | | 181,208 | | | | 458,804 | | | | 20,189 | |
Conservative - Adviser | | | 2,271,362 | | | | 99,923 | | | | 131,623 | | | | 5,705 | |
Conservative - Institutional | | | 25,499,844 | | | | 1,115,180 | | | | 1,877,940 | | | | 81,317 | |
Dynamic - Retail | | | 3,823,098 | | | | 347,512 | | | | 824,823 | | | | 63,418 | |
Dynamic - Adviser | | | 3,509,483 | | | | 301,817 | | | | 322,349 | | | | 24,972 | |
Dynamic - Institutional | | | 32,025,842 | | | | 2,711,970 | | | | 3,691,005 | | | | 285,612 | |
Quantex - Retail | | | 2,189,011 | | | | 80,196 | | | | 106,638 | | | | 3,742 | |
Quantex - Adviser | | | 276,382 | | | | 9,230 | | | | 5,977 | | | | 209 | |
Quantex - Institutional | | | 5,198,334 | | | | 180,954 | | | | 165,888 | | | | 5,821 | |
Income - Retail | | | 3,539,918 | | | | 367,315 | | | | 219,807 | | | | 22,431 | |
Income - Adviser | | | 4,032,049 | | | | 414,412 | | | | 112,411 | | | | 11,455 | |
Income - Institutional | | | 15,764,431 | | | | 1,615,385 | | | | 1,059,912 | | | | 108,102 | |
Money Market | | | 472,288,464 | | | | 472,214,087 | | | | 307,362 | | | | 307,353 | |
| | | Redeemed | | | Net Increase (Decrease) | |
Share Class | | Amount | | | Shares | | | Amount | | | Shares | |
Year Ended December 31, 2021 | | | | | | | | | | | | | | | | |
Muirfield - Retail | | $ | (108,680,649 | ) | | | (12,662,814 | ) | | $ | (100,821,996 | ) | | | (11,821,543 | ) |
Muirfield - Adviser | | | (66,608,139 | ) | | | (7,612,443 | ) | | | 42,236,929 | | | | 4,907,583 | |
Muirfield - Institutional | | | (108,609,581 | ) | | | (11,811,076 | ) | | | 115,496,306 | | | | 12,212,728 | |
Spectrum - Retail | | | (36,841,554 | ) | | | (2,901,721 | ) | | | (35,895,716 | ) | | | (2,829,700 | ) |
Spectrum - Adviser | | | (18,737,374 | ) | | | (1,448,581 | ) | | | 21,857,064 | | | | 1,711,382 | |
Spectrum - Institutional | | | (37,355,079 | ) | | | (2,747,785 | ) | | | 13,845,820 | | | | 1,016,050 | |
Global - Retail | | | (6,568,484 | ) | | | (548,993 | ) | | | (5,748,269 | ) | | | (480,436 | ) |
Global - Adviser | | | (2,862,018 | ) | | | (237,195 | ) | | | 3,364,526 | | | | 286,628 | |
Global - Institutional | | | (8,380,207 | ) | | | (680,837 | ) | | | 900,245 | | | | 98,872 | |
Balanced - Retail | | | (72,534,298 | ) | | | (5,502,556 | ) | | | (70,578,497 | ) | | | (5,359,087 | ) |
Balanced - Adviser | | | (30,358,104 | ) | | | (2,250,733 | ) | | | 50,453,675 | | | | 3,804,161 | |
Balanced - Institutional | | | (111,852,236 | ) | | | (7,927,738 | ) | | | (10,641,386 | ) | | | (567,811 | ) |
Moderate - Retail | | | (30,629,325 | ) | | | (2,430,279 | ) | | | (30,316,569 | ) | | | (2,405,634 | ) |
Moderate - Adviser | | | (14,748,469 | ) | | | (1,159,942 | ) | | | 19,705,753 | | | | 1,559,979 | |
Moderate - Institutional | | | (38,530,382 | ) | | | (2,942,267 | ) | | | 3,944,479 | | | | 345,911 | |
Conservative - Retail | | | (23,494,226 | ) | | | (973,256 | ) | | | (22,286,742 | ) | | | (923,209 | ) |
Conservative - Adviser | | | (10,649,934 | ) | | | (435,766 | ) | | | 15,658,284 | | | | 639,557 | |
Conservative - Institutional | | | (33,958,616 | ) | | | (1,365,588 | ) | | | 831,307 | | | | 49,808 | |
Dynamic - Retail | | | (31,238,886 | ) | | | (2,232,902 | ) | | | (29,131,133 | ) | | | (2,085,101 | ) |
Dynamic - Adviser | | | (20,640,401 | ) | | | (1,446,686 | ) | | | 13,931,019 | | | | 1,009,533 | |
Dynamic - Institutional | | | (55,644,980 | ) | | | (3,767,375 | ) | | | 46,652,169 | | | | 3,174,909 | |
Page 126 | 2021 Annual Report | December 31, 2021 |
| | | Redeemed | | | Net Increase (Decrease) | |
Share Class | | Amount | | | Shares | | | Amount | | | Shares | |
Quantex - Retail | | $ | (10,498,344 | ) | | $ | (258,266 | ) | | $ | (3,626,856 | ) | | $ | (93,051 | ) |
Quantex - Adviser | | | (2,204,605 | ) | | | (52,908 | ) | | | 3,238,636 | | | | 89,277 | |
Quantex - Institutional | | | (12,599,469 | ) | | | (305,429 | ) | | | (2,098,805 | ) | | | (42,754 | ) |
Income - Retail | | | (9,978,652 | ) | | | (1,005,571 | ) | | | (9,366,008 | ) | | | (942,703 | ) |
Income - Adviser | | | (7,285,187 | ) | | | (742,788 | ) | | | 3,892,967 | | | | 384,840 | |
Income - Institutional | | | (16,493,262 | ) | | | (1,686,599 | ) | | | 9,174,954 | | | | 936,139 | |
Money Market | | | (721,061,508 | ) | | | (720,922,007 | ) | | | 290,615,901 | | | | 290,568,653 | |
| | | | | | | | | | | | | | | | | |
Year Ended December 31, 2020 | | | | | | | | | | | | | | | | |
Muirfield - Retail | | $ | (66,817,586 | ) | | | (9,261,883 | ) | | $ | (54,282,718 | ) | | | (7,522,085 | ) |
Muirfield - Adviser | | | (24,726,534 | ) | | | (3,396,916 | ) | | | (11,688,625 | ) | | | (1,599,901 | ) |
Muirfield - Institutional | | | (149,015,449 | ) | | | (20,478,261 | ) | | | (50,550,052 | ) | | | (6,949,370 | ) |
Spectrum - Retail | | | (16,054,832 | ) | | | (1,493,176 | ) | | | (12,680,335 | ) | | | (1,177,542 | ) |
Spectrum - Adviser | | | (5,661,594 | ) | | | (526,084 | ) | | | (2,548,766 | ) | | | (243,282 | ) |
Spectrum - Institutional | | | (37,639,148 | ) | | | (3,389,095 | ) | | | (9,068,462 | ) | | | (745,863 | ) |
Global - Retail | | | (3,342,556 | ) | | | (325,492 | ) | | | (1,978,270 | ) | | | (196,478 | ) |
Global - Adviser | | | (514,491 | ) | | | (50,884 | ) | | | (23,212 | ) | | | (3,719 | ) |
Global - Institutional | | | (7,620,220 | ) | | | (739,343 | ) | | | (3,309,815 | ) | | | (328,792 | ) |
Balanced - Retail | | | (27,794,588 | ) | | | (2,375,037 | ) | | | (19,889,835 | ) | | | (1,683,416 | ) |
Balanced - Adviser | | | (6,642,344 | ) | | | (564,264 | ) | | | (2,210,955 | ) | | | (186,403 | ) |
Balanced - Institutional | | | (82,778,077 | ) | | | (7,073,659 | ) | | | (6,533,961 | ) | | | (510,582 | ) |
Moderate - Retail | | | (9,844,841 | ) | | | (850,289 | ) | | | (5,826,548 | ) | | | (493,441 | ) |
Moderate - Adviser | | | (3,716,438 | ) | | | (323,871 | ) | | | (666,112 | ) | | | (56,835 | ) |
Moderate - Institutional | | | (35,493,471 | ) | | | (3,090,455 | ) | | | (2,658,551 | ) | | | (232,736 | ) |
Conservative - Retail | | | (8,490,522 | ) | | | (374,117 | ) | | | (4,035,335 | ) | | | (172,720 | ) |
Conservative - Adviser | | | (2,433,929 | ) | | | (106,506 | ) | | | (30,944 | ) | | | (878 | ) |
Conservative - Institutional | | | (26,048,017 | ) | | | (1,142,491 | ) | | | 1,329,767 | | | | 54,006 | |
Dynamic - Retail | | | (12,417,374 | ) | | | (1,072,111 | ) | | | (7,769,453 | ) | | | (661,181 | ) |
Dynamic - Adviser | | | (5,090,584 | ) | | | (439,774 | ) | | | (1,258,752 | ) | | | (112,985 | ) |
Dynamic - Institutional | | | (49,166,341 | ) | | | (4,225,280 | ) | | | (13,449,494 | ) | | | (1,227,698 | ) |
Quantex - Retail | | | (6,470,912 | ) | | | (227,906 | ) | | | (4,175,263 | ) | | | (143,968 | ) |
Quantex - Adviser | | | (317,629 | ) | | | (11,169 | ) | | | (35,270 | ) | | | (1,730 | ) |
Quantex - Institutional | | | (16,125,393 | ) | | | (569,511 | ) | | | (10,761,171 | ) | | | (382,736 | ) |
Income - Retail | | | (3,315,674 | ) | | | (341,917 | ) | | | 444,051 | | | | 47,829 | |
Income - Adviser | | | (3,126,254 | ) | | | (323,216 | ) | | | 1,018,206 | | | | 102,651 | |
Income - Institutional | | | (15,395,742 | ) | | | (1,588,812 | ) | | | 1,428,601 | | | | 134,675 | |
Money Market | | | (506,286,355 | ) | | | (506,302,922 | ) | | | (33,690,529 | ) | | | (33,781,482 | ) |
2021 Annual Report | December 31, 2021 | Page 127 |
Offsetting Assets & Liabilities. The Funds are party to enforceable master netting arrangements between counter parties, such as the securities lending agreement, which provides for the right of offset under certain circumstances, such as the event of default. The securities lending transactions have an overnight and continuous contractual maturity. Risks arise from the possible inability of counterparties to meet the terms of their contracts. The table below reflects the offsetting assets and liabilities relating to securities lending, futures contracts, and repurchase agreements shown on the Statements of Assets and Liabilities at December 31, 2021.
| | | | | | | | | | | | | | | Gross Amounts Not Offset in the
Statements of Assets and Liabilities | | | | | |
Description/ Fund | | Gross Amounts
of Recognized
Assets/
Liabilities | | | Gross Amounts
Offset in the
Statements
of Assets and
Liabilities | | | Net Amounts
Presented in
the Statements
of Assets and
Liabilities | | | Financial
Instruments* | | | Collateral
Pledged
(Received)* | | | Net Amount | |
Assets: | | | | | | | | | | | | | | | | | | | | | | | | |
Securities Loaned | | | | | | | | | | | | | | | | | | | | | | | | |
Muirfield | | $ | 19,010 | | | $ | — | | | $ | 19,010 | | | $ | — | | | $ | (19,010 | ) | | $ | — | |
| | | | | | | | | | | | | | | | | | | | | | | | | |
Futures Contracts | | | | | | | | | | | | | | | | | | | | | | | | |
Muirfield | | $ | 1,715,209 | | | $ | (1,326,311 | ) | | $ | 388,898 | | | $ | — | | | $ | — | | | $ | 388,898 | |
Global | | | 295,926 | | | | (21,460 | ) | | | 274,466 | | | | — | | | | — | | | | 274,466 | |
Balanced | | | 653,732 | | | | (651,825 | ) | | | 1,907 | | | | — | | | | — | | | | 1,907 | |
Moderate | | | 222,324 | | | | (182,693 | ) | | | 39,631 | | | | — | | | | — | | | | 39,631 | |
Conservative | | | 119,037 | | | | (42,609 | ) | | | 76,428 | | | | — | | | | — | | | | 76,428 | |
Dynamic | | | 1,224,052 | | | | (4,934 | ) | | | 1,219,118 | | | | — | | | | — | | | | 1,219,118 | |
Quantex | | | 232,815 | | | | — | | | | 232,815 | | | | — | | | | — | | | | 232,815 | |
| | | | | | | | | | | | | | | | | | | | | | | | | |
Repurchase Agreements | | | | | | | | | | | | | | | | | | | | | | | | |
Money Market | | $ | 130,000,000 | | | $ | — | | | $ | 130,000,000 | | | $ | (130,000,000 | ) | | $ | — | | | $ | — | |
| | | | | | | | | | | | | | | | | | | | | | | | | |
Liabilities: | | | | | | | | | | | | | | | | | | | | | | | | |
Futures Contracts | | | | | | | | | | | | | | | | | | | | | | | | |
Spectrum | | $ | (717,965 | ) | | $ | $540,493 | | | $ | (177,472 | ) | | $ | — | | | $ | 177,472 | | | $ | — | |
| | | | | | | | | | | | | | | | | | | | | | | | | |
* | The amount is limited to the net amounts of financial assets and liabilities and accordingly does not include excess collateral pledged. |
Other. The Funds record security transactions on the trade date. Securities purchased or sold on a when-issued or delayed-delivery basis may be settled 15 days or more after the trade date. Gains and losses realized from the sale of securities are determined on the specific identification basis. Dividend income and dividend expenses are recognized on the ex-dividend date and interest income (including amortization of premium and accretion of discount) is recognized as earned. Short-term capital gain distributions from underlying funds are classified as dividend income for financial reporting purposes. Long-term capital gains distributions are separately stated. Discounts and premiums are amortized using the effective yield over the lives of the respective securities. Distributions received from partnerships are recorded as return of capital distributions. Withholding taxes on foreign dividends, if applicable, have been provided for in accordance with the Funds’ understanding of the applicable country’s tax rules and rates.
A Fund may purchase securities on a forward commitment or when-issued basis. A Fund records a when-issued transaction on the trade date and will segregate assets in an amount at least equal in value to the Fund’s commitment to purchase when-issued securities. Securities purchased on a when-issued basis are marked-to-market daily and the Fund begins earning interest on the settlement date. Losses may arise due to changes in the market value of the underlying securities or if the counterparty does not perform under the contract.
Certain Funds may purchase or sell securities on a delayed-delivery basis. These transactions involve a commitment by a Fund to purchase or sell securities for a predetermined price or yield, with payment and delivery taking place beyond the customary settlement period. When delayed-delivery transactions are outstanding, a Fund will designate or receive as collateral liquid assets in an amount sufficient to meet the purchase price or respective obligations. When purchasing a security on a delayed-delivery basis, a Fund assumes the rights and risks of ownership of the security, including the risk of price and yield fluctuations, and takes such fluctuations into account when determining its NAV. A Fund may dispose of or renegotiate a delayed-delivery transaction after it is entered into which may result in a realized gain or loss. When a Fund has sold a security on a delayed-delivery basis, the Fund does not participate in future gains and losses with respect to the security.
Page 128 | 2021 Annual Report | December 31, 2021 |
Distributions received from the Funds’ investments in real estate investment trusts (“REITs”) may be characterized as ordinary income, net capital gain, or return of capital. The proper characterization of REIT distributions is generally not known until after the end of each calendar year. As such, the Funds must use estimates in reporting the character of their income and distributions for financial statement purposes. The actual character of distributions to the Funds’ shareholders will be reflected on the Form 1099 received by shareholders after the end of the calendar year. Due to the nature of REIT investments, a portion of the distributions received by the Funds’ shareholders may represent a return of capital.
3. Securities Valuations
The Funds utilize various methods to measure the fair value of their investments on a recurring basis. GAAP establishes a hierarchy that prioritizes inputs to valuation methods. The three levels of inputs are as follows:
Level 1 – Unadjusted quoted prices in active markets for identical assets or liabilities that the Funds have the ability to access.
Level 2 – Observable inputs other than quoted prices included in level 1 that are observable for the asset or liability, either directly or indirectly. These inputs may include quoted prices for the identical instrument on an inactive market, prices for similar instruments, interest rates, prepayment speeds, credit risk, yield curves, default rates and similar data.
Level 3 – Significant unobservable inputs for the asset or liability, to the extent relevant observable inputs are not available, representing the Funds’ own assumptions about the assumptions a market participant would use in valuing the asset or liability, and would be based on the best information available.
The availability of observable inputs can vary from security to security and is affected by a wide variety of factors, including, for example, the type of security, whether the security is new and not yet established in the marketplace, the liquidity of markets, and other characteristics particular to the security. To the extent that valuation is based on models or inputs that are less observable or unobservable in the market, the determination of fair value requires more judgment. Accordingly, the degree of judgment exercised in determining fair value is greatest for instruments categorized in level 3.
The inputs used to measure fair value may fall into different levels of the fair value hierarchy. In such cases, for disclosure purposes, the level in the fair value hierarchy within which the fair value measurement falls in its entirety, is determined based on the lowest level input that is significant to the fair value measurement in its entirety.
A description of the valuation techniques applied to the Funds’ major categories of assets and liabilities measured at fair value on a recurring basis follows.
Equity securities (including publicly traded partnerships, real estate investment trusts, American depositary receipts, exchange traded funds, and common stock). Securities traded on a national securities exchange (or reported on the NASDAQ national market) are stated at the last reported sales price on the day of valuation and are categorized in level 1 of the fair value hierarchy.
Investments in registered open-end investment companies, including money market funds, are valued at the daily redemption net asset value as reported by the underlying fund and are categorized in level 1 of the fair value hierarchy.
Short-term notes (including bank obligations, commercial paper, corporate obligations, repurchase agreements, U.S. government agency obligations, and floating rate demand notes). Short-term notes held in the Funds maturing more than sixty days after the valuation date, are valued at the last sales price as of the close of business on the day of valuation, or, lacking any sales, at the most recent bid price or yield equivalent as obtained from dealers that make markets in such securities. When valued at last sales price, the securities will be categorized as level 1. When using bid prices or yield equivalents, they will be categorized as level 2. When such securities are valued within sixty days or less to maturity, the difference between the valuation existing on the sixty-first day before maturity and maturity value is amortized on a straight-line basis to maturity and will be categorized as level 2.
Certificates of deposit. Except for Money Market, certificates of deposit are valued at acquisition cost, which approximates fair value, and will be categorized as level 2. For Money Market, certificates of deposit are normally valued using a model that incorporates market observable data such as reported sales of similar securities, broker quotes, yields, bids, offers, and reference data, and will be categorized as level 2.
U.S. government obligations. U.S. government obligations are normally valued using a model that incorporates market observable data such as reported sales of similar securities, broker quotes, yields, bids, offers, and reference data. Certain securities are valued principally using dealer quotations. In either case, these securities will be categorized as level 2.
Restricted securities (equity and debt). Restricted securities for which quotations are not readily available are valued at fair value as determined by the Trustees. Depending on the relative significance of valuation inputs, these instruments may be classified in either level 2 or level 3 of the fair value hierarchy.
Derivative instruments (futures contracts). Listed derivative instruments that are actively traded, including futures contracts, are valued based on quoted prices from the exchange and are categorized in level 1 of the fair value hierarchy.
2021 Annual Report | December 31, 2021 | Page 129 |
For the year ended December 31, 2021, the Funds did not hold any assets at any time in which significant unobservable inputs were used in determining fair value. Therefore, no reconciliation of level 3 securities is provided. However, the Funds have disclosed holding level 3 securities with fair valuations of zero. The following table summarizes the inputs used to value the Funds’ assets and liabilities measured at fair value as of December 31, 2021.
Muirfield - Assets/(Liabilities) | | Level 1 | | | Level 2 | | | Level 3 | | | Total | |
Common stocks* | | $ | 481,323,913 | | | $ | — | | | $ | — | | | $ | 481,323,913 | |
Preferred stocks | | | 80,058 | | | | — | | | | — | | | | 80,058 | |
Warrants | | | 8,539 | | | | — | | | | — | | | | 8,539 | |
Money market registered investment companies | | | 227,903,374 | | | | — | | | | — | | | | 227,903,374 | |
Bank obligations | | | — | | | | 744,610 | | | | — | | | | 744,610 | |
Total | | $ | 709,315,884 | | | $ | 744,610 | | | $ | — | | | $ | 710,060,494 | |
Trustee deferred compensation*** | | $ | 368,769 | | | $ | — | | | $ | — | | | $ | 368,769 | |
Futures contracts** | | $ | 388,898 | | | $ | — | | | $ | — | | | $ | 388,898 | |
Spectrum - Assets/(Liabilities) | | Level 1 | | | Level 2 | | | Level 3 | | | Total | |
Common stocks* | | $ | 153,290,165 | | | $ | — | | | $ | — | | | $ | 153,290,165 | |
Preferred stocks | | | 6,069 | | | | — | | | | — | | | | 6,069 | |
Warrants | | | 2,402 | | | | — | | | | — | | | | 2,402 | |
Money market registered investment companies | | | 54,068,333 | | | | — | | | | — | | | | 54,068,333 | |
Total | | $ | 207,366,969 | | | $ | — | | | $ | — | | | $ | 207,366,969 | |
Trustee deferred compensation*** | | $ | 58,954 | | | $ | — | | | $ | — | | | $ | 58,954 | |
Futures contracts** | | $ | (177,472 | ) | | $ | — | | | $ | — | | | $ | (177,472 | ) |
Global - Assets/(Liabilities) | | Level 1 | | | Level 2 | | | Level 3 | | | Total | |
Common stocks* | | $ | 15,539,217 | | | $ | — | | | $ | — | | | $ | 15,539,217 | |
Preferred stocks | | | 2,483 | | | | — | | | | — | | | | 2,483 | |
Warrants | | | 478 | | | | — | | | | — | | | | 478 | |
Registered investment companies | | | 7,493,188 | | | | — | | | | — | | | | 7,493,188 | |
Money market registered investment companies | | | 19,823,051 | | | | — | | | | — | | | | 19,823,051 | |
Bank obligations | | | — | | | | 744,610 | | | | — | | | | 744,610 | |
Total | | $ | 42,858,417 | | | $ | 744,610 | | | $ | — | | | $ | 43,603,027 | |
Trustee deferred compensation*** | | $ | 134,157 | | | $ | — | | | $ | — | | | $ | 134,157 | |
Futures contracts** | | $ | 274,466 | | | $ | — | | | $ | — | | | $ | 274,466 | |
Balanced - Assets/(Liabilities) | | Level 1 | | | Level 2 | | | Level 3 | | | Total | |
Common stocks* | | $ | 189,207,609 | | | $ | — | | | $ | — | | | $ | 189,207,609 | |
Preferred stocks | | | 30,466 | | | | — | | | | — | | | | 30,466 | |
Warrants | | | 3,823 | | | | — | | | | — | | | | 3,823 | |
Registered investment companies | | | 94,549,545 | | | | — | | | | — | | | | 94,549,545 | |
Money market registered investment companies | | | 98,243,827 | | | | — | | | | — | | | | 98,243,827 | |
Bank obligations | | | — | | | | 744,610 | | | | — | | | | 744,610 | |
Total | | $ | 382,035,270 | | | $ | 744,610 | | | $ | — | | | $ | 382,779,880 | |
Trustee deferred compensation*** | | $ | 239,015 | | | $ | — | | | $ | — | | | $ | 239,015 | |
Futures contracts** | | $ | 1,907 | | | $ | — | | | $ | — | | | $ | 1,907 | |
Page 130 | 2021 Annual Report | December 31, 2021 |
Moderate - Assets/(Liabilities) | | Level 1 | | | Level 2 | | | Level 3 | | | Total | |
Common stocks* | | $ | 59,658,643 | | | $ | — | | | $ | — | | | $ | 59,658,643 | |
Preferred stocks | | | 7,724 | | | | — | | | | — | | | | 7,724 | |
Warrants | | | 1,335 | | | | — | | | | — | | | | 1,335 | |
Registered investment companies | | | 70,928,389 | | | | — | | | | — | | | | 70,928,389 | |
Money market registered investment companies | | | 41,085,154 | | | | — | | | | — | | | | 41,085,154 | |
Bank obligations | | | — | | | | 248,445 | | | | — | | | | 248,445 | |
Total | | $ | 171,681,245 | | | $ | 248,445 | | | $ | — | | | $ | 171,929,690 | |
Trustee deferred compensation*** | | $ | 43,345 | | | $ | — | | | $ | — | | | $ | 43,345 | |
Futures contracts** | | $ | 39,631 | | | $ | — | | | $ | — | | | $ | 39,631 | |
Conservative - Assets/(Liabilities) | | Level 1 | | | Level 2 | | | Level 3 | | | Total | |
Common stocks* | | $ | 25,816,697 | | | $ | — | | | $ | — | | | $ | 25,816,697 | |
Preferred stocks | | | 4,689 | | | | — | | | | — | | | | 4,689 | |
Warrants | | | 492 | | | | — | | | | — | | | | 492 | |
Registered investment companies | | | 77,518,458 | | | | — | | | | — | | | | 77,518,458 | |
Money market registered investment companies | | | 30,120,101 | | | | — | | | | — | | | | 30,120,101 | |
Total | | $ | 133,460,437 | | | $ | — | | | $ | — | | | $ | 133,460,437 | |
Trustee deferred compensation*** | | $ | 96,319 | | | $ | — | | | $ | — | | | $ | 96,319 | |
Futures contracts** | | $ | 76,428 | | | $ | — | | | $ | — | | | $ | 76,428 | |
Dynamic - Assets/(Liabilities) | | Level 1 | | | Level 2 | | | Level 3 | | | Total | |
Common stocks* | | $ | 159,275,129 | | | $ | — | | | $ | — | | | $ | 159,275,129 | |
Preferred stocks | | | 18,697 | | | | — | | | | — | | | | 18,697 | |
Warrants | | | 2,452 | | | | — | | | | — | | | | 2,452 | |
Registered investment companies | | | 11,815,426 | | | | — | | | | — | | | | 11,815,426 | |
Money market registered investment companies | | | 58,149,681 | | | | — | | | | — | | | | 58,149,681 | |
Bank obligations | | | — | | | | 744,610 | | | | — | | | | 744,610 | |
Total | | $ | 229,261,385 | | | $ | 744,610 | | | $ | — | | | $ | 230,005,995 | |
Trustee deferred compensation*** | | $ | 276,293 | | | $ | — | | | $ | — | | | $ | 276,293 | |
Futures contracts** | | $ | 1,219,118 | | | $ | — | | | $ | — | | | $ | 1,219,118 | |
Quantex - Assets/(Liabilities) | | Level 1 | | | Level 2 | | | Level 3 | | | Total | |
Common stocks* | | $ | 26,893,458 | | | $ | — | | | $ | — | | | $ | 26,893,458 | |
Money market registered investment companies | | | 13,687,909 | | | | — | | | | — | | | | 13,687,909 | |
Bank obligations | | | — | | | | 8,219 | | | | — | | | | 8,219 | |
Total | | $ | 40,581,367 | | | $ | 8,219 | | | $ | — | | | $ | 40,589,586 | |
Trustee deferred compensation*** | | $ | 81,061 | | | $ | — | | | $ | — | | | $ | 81,061 | |
Futures contracts** | | $ | 232,815 | | | $ | — | | | $ | — | | | $ | 232,815 | |
Income - Assets/(Liabilities) | | Level 1 | | | Level 2 | | | Level 3 | | | Total | |
Registered investment companies | | $ | 55,663,003 | | | $ | — | | | $ | — | | | $ | 55,663,003 | |
Money market registered investment companies | | | 13,584,663 | | | | — | | | | — | | | | 13,584,663 | |
U.S. government obligations | | | — | | | | 62,256 | | | | — | | | | 62,256 | |
Total | | $ | 69,247,666 | | | $ | 62,256 | | | $ | — | | | $ | 69,309,922 | |
Trustee deferred compensation*** | | $ | 91,773 | | | $ | — | | | $ | — | | | $ | 91,773 | |
2021 Annual Report | December 31, 2021 | Page 131 |
Money Market - Assets/(Liabilities) | | Level 1 | | | Level 2 | | | Level 3 | | | Total | |
Bank obligations | | $ | — | | | $ | 1,481,362 | | | $ | — | | | $ | 1,481,362 | |
Certificates of deposit | | | — | | | | 87,760,098 | | | | — | | | | 87,760,098 | |
Commercial paper | | | — | | | | 340,659,367 | | | | — | | | | 340,659,367 | |
Corporate obligations | | | — | | | | 13,103,852 | | | | — | | | | 13,103,852 | |
Repurchase agreements | | | — | | | | 130,000,000 | | | | — | | | | 130,000,000 | |
U.S. government and agency obligations | | | — | | | | 4,500,050 | | | | — | | | | 4,500,050 | |
Variable rate demand notes | | | — | | | | 32,675,192 | | | | — | | | | 32,675,192 | |
Money market registered investment companies | | | 12,268,566 | | | | — | | | | — | | | | 12,268,566 | |
Total | | $ | 12,268,566 | | | $ | 610,179,921 | | | $ | — | | | $ | 622,448,487 | |
Trustee deferred compensation*** | | $ | 6,853 | | | $ | — | | | $ | — | | | $ | 6,853 | |
* | See schedules of investments for industry classifications. |
** | Futures contracts include unrealized gain/loss on contracts open at December 31, 2021. |
*** | A corresponding liability exists that is marked to market and is considered Level 1 in the fair value hierarchy. |
4. Investment Transactions
For the year ended December 31, 2021, the cost of purchases and proceeds from sales or maturities of long-term investments for the Funds, excluding U.S. Government investments and short positions, were as follows:
| | | Purchases | | | Sales | |
Muirfield | | $ | 950,300,733 | | | $ | 1,037,332,405 | |
Spectrum | | | 310,352,539 | | | | 344,589,118 | |
Global | | | 40,430,592 | | | | 47,546,502 | |
Balanced | | | 620,715,734 | | | | 721,224,936 | |
Moderate | | | 264,141,901 | | | | 296,367,301 | |
Conservative | | | 203,887,973 | | | | 233,629,931 | |
Dynamic | | | 373,297,800 | | | | 329,611,155 | |
Quantex | | | 22,406,742 | | | | 42,217,192 | |
Income | | | 121,657,928 | | | | 122,766,558 | |
For the year ended December 31, 2021, the cost of purchases and proceeds from sales or maturities of long-term U.S. Government investments for the Funds are as follows:
| | | Purchases | | | Sales | |
Global | | $ | 2,426,863 | | | $ | 2,412,392 | |
Balanced | | | 67,769,245 | | | | 67,357,419 | |
Moderate | | | 48,266,617 | | | | 47,972,343 | |
Conservative | | | 53,858,054 | | | | 53,527,825 | |
Income | | | 35,610,201 | | | | 41,885,314 | |
Page 132 | 2021 Annual Report | December 31, 2021 |
5. Investment Advisory Fees and Other Transactions with Affiliates and Non-Affiliates
Meeder Asset Management, Inc. (“MAM”), a wholly-owned subsidiary of Meeder Investment Management, Inc. (“Meeder”), provides the Funds with investment management, research, statistical and advisory services pursuant to the terms of an Investment Advisory Agreement. The services of MAM will terminate automatically if assigned and may be terminated without penalty at any time upon 60 days prior written notice by majority vote of the Fund, by the Trustees of the Fund, or by MAM. For such services the Funds pay a monthly fee at the following annual rates:
| | Percentage of Average
Daily Net Assets up to
$50 Million | Percentage of Average
Daily Net Assets
Exceeding $50 Million up
to $100 Million | Percentage of Average
Daily Net Assets
Exceeding $100 Million
up to $200 Million | Percentage of Average
Daily Net Assets
Exceeding $200 Million |
Muirfield | 1.00% | 0.75% | 0.60% | 0.60% |
Spectrum | 0.75% | 0.75% | 0.75% | 0.60% |
Global | 0.75% | 0.75% | 0.75% | 0.60% |
Balanced | 0.75% | 0.75% | 0.75% | 0.60% |
Moderate | 0.60% | 0.60% | 0.60% | 0.60% |
Conservative | 0.50% | 0.50% | 0.50% | 0.50% |
Dynamic | 0.75% | 0.75% | 0.75% | 0.60% |
Quantex | 0.75% | 0.75% | 0.60% | 0.60% |
Income | 0.40% | 0.40% | 0.20% | 0.20% |
Money Market | 0.40% | 0.40% | 0.25% | 0.25% |
Fee Waivers & Expense Limitation Agreements. MAM has contractually agreed to reduce its advisory fees or limit total annual ordinary fund operating expenses for certain Funds pursuant to written agreements that may only be amended or terminated with the approval of the board. The sums waived or reimbursed under these agreements are not subject to recoupment.
MAM contractually agreed to reduce its investment advisory fee by 0.10% for Dynamic for average daily net assets up to $200 million. During the year ended December 31, 2021, $200,000 of investment advisory fees were waived in Dynamic.
MAM contractually agreed to reduce its investment advisory fee by 0.11% for Income for average daily net assets up to $100 million. During the year ended December 31, 2021, $74,511 of investment advisory fees were waived in Income.
Mutual Funds Service Co. (“MFSCo”), a wholly-owned subsidiary of Meeder, serves as stock transfer, dividend disbursing and shareholder services agent for each Fund. In compensation for such services, each Fund pays MFSCo a monthly fee at an annual rate equal to the greater of the following:
| | | Minimum Fee | | | Percentage of Average
Daily Net Assets up to
$500 Million | | Percentage of Average
Daily Net Assets
Exceeding $500
Million |
Muirfield | | $ | 4,000 | | | | 0.12% | | | 0.03% |
Spectrum | | | 4,000 | | | | 0.12% | | | 0.03% |
Global | | | 4,000 | | | | 0.12% | | | 0.03% |
Balanced | | | 4,000 | | | | 0.12% | | | 0.03% |
Moderate | | | 4,000 | | | | 0.12% | | | 0.03% |
Conservative | | | 4,000 | | | | 0.12% | | | 0.03% |
Dynamic | | | 4,000 | | | | 0.12% | | | 0.03% |
Quantex | | | 4,000 | | | | 0.12% | | | 0.03% |
Income | | | 4,000 | | | | 0.08% | | | 0.03% |
Money Market | | | 4,000 | | | | 0.08% | | | 0.03% |
2021 Annual Report | December 31, 2021 | Page 133 |
Management may voluntarily waive fees for any Fund. During the year ended December 31, 2021, MFSCo waived the following transfer agent fees:
| | | Voluntary Transfer
Agent Fees
Reimbursements | | | Impact of Voluntary
Transfer Agent Fees
Reimbursements to
Average Net Assets
- Retail Class | | | Impact of Voluntary
Transfer Agent Fees
Reimbursements to
Average Net Assets
- Adviser Class | | | Impact of Voluntary
Transfer Agent Fees
Reimbursements to
Average Net Assets
- Institutional Class | | Impact of Voluntary
Transfer Agent Fees
Reimbursements to
Average Net Assets
- Money Market
Funds | |
Muirfield | | $ | 38,000 | | | | N/A | | | | N/A | | | | 0.01% | | | N/A | |
Spectrum | | | — | | | | N/A | | | | N/A | | | | N/A | | | N/A | |
Global | | | — | | | | N/A | | | | N/A | | | | N/A | | | N/A | |
Balanced | | | 75,000 | | | | N/A | | | | N/A | | | | 0.02% | | | N/A | |
Moderate | | | — | | | | N/A | | | | N/A | | | | N/A | | | N/A | |
Conservative | | | — | | | | N/A | | | | N/A | | | | N/A | | | N/A | |
Dynamic | | | — | | | | N/A | | | | N/A | | | | N/A | | | N/A | |
Quantex | | | — | | | | N/A | | | | N/A | | | | N/A | | | N/A | |
Income | | | — | | | | N/A | | | | N/A | | | | N/A | | | N/A | |
Money Market | | | — | | | | N/A | | | | N/A | | | | N/A | | | N/A | |
MFSCo provides the Trust with certain administrative services. In compensation for such services, each Fund pays MFSCo a monthly fee at the following annual rates:
| | | Percentage of
Average Daily Net
Assets up to $50
Million | | Percentage of
Average Daily Net
Assets Exceeding
$50 Million up to
$500 Million | | Percentage of
Average Daily Net
Assets Exceeding
$500 Million |
Muirfield | | | 0.10% | | | 0.08% | | | 0.03% |
Spectrum | | | 0.10% | | | 0.08% | | | 0.03% |
Global | | | 0.10% | | | 0.08% | | | 0.03% |
Balanced | | | 0.10% | | | 0.08% | | | 0.03% |
Moderate | | | 0.10% | | | 0.08% | | | 0.03% |
Conservative | | | 0.10% | | | 0.08% | | | 0.03% |
Dynamic | | | 0.10% | | | 0.08% | | | 0.03% |
Quantex | | | 0.10% | | | 0.08% | | | 0.03% |
Income | | | 0.10% | | | 0.08% | | | 0.03% |
Money Market | | | 0.10% | | | 0.08% | | | 0.03% |
MFSCo serves as accounting services agent for each Fund. In compensation for such services, each Fund pays MFSCo a monthly fee at an annual rate equal to the greater of a minimum fee or at a rate based on the percentage of average daily net assets. The annual rates are as follows:
| | | Minimum Fee | | | Percentage of
Average Daily Net
Assets up to $10
Million | | Percentage of
Average Daily Net
Assets Exceeding
$10 Million up to
$30 Million | | Percentage of
Average Daily Net
Assets Exceeding
$30 Million up to
$80 Million | | Percentage of
Average Daily Net
Assets Exceeding
$80 Million |
Muirfield | | $ | 7,500 | | | | 0.15% | | | 0.10% | | | 0.02% | | | 0.01% |
Spectrum | | | 7,500 | | | | 0.15% | | | 0.10% | | | 0.02% | | | 0.01% |
Global | | | 7,500 | | | | 0.15% | | | 0.10% | | | 0.02% | | | 0.01% |
Balanced | | | 7,500 | | | | 0.15% | | | 0.10% | | | 0.02% | | | 0.01% |
Moderate | | | 7,500 | | | | 0.15% | | | 0.10% | | | 0.02% | | | 0.01% |
Conservative | | | 7,500 | | | | 0.15% | | | 0.10% | | | 0.02% | | | 0.01% |
Dynamic | | | 7,500 | | | | 0.15% | | | 0.10% | | | 0.02% | | | 0.01% |
Quantex | | | 7,500 | | | | 0.15% | | | 0.10% | | | 0.02% | | | 0.01% |
Income | | | 7,500 | | | | 0.15% | | | 0.10% | | | 0.02% | | | 0.01% |
Money Market | | | 30,000 | | | | 0.15% | | | 0.10% | | | 0.02% | | | 0.01% |
Page 134 | 2021 Annual Report | December 31, 2021 |
For the year ended December 31, 2021, MAM agreed to voluntarily waive and/or reimburse investment advisory fees. The amounts voluntarily waived and/or reimbursed and the impact to the net expense ratio (excluding brokerage fees and commissions, taxes, interest, and extraordinary or non-recurring expenses) for each Fund are as follows:
| | | Voluntary
Investment
Advisory Fee
Reimbursements | | | Impact of Voluntary
Investment
Advisory Fee
Reimbursements to
Average Net Assets | | | Impact of Voluntary
Investment
Advisory Fee
Reimbursements to
Average Net Assets
- Retail Class | | | Impact of Voluntary
Investment
Advisory Fee
Reimbursements to
Average Net Assets
- Adviser Class | | | Impact of Voluntary
Investment
Advisory Fee
Reimbursements to
Average Net Assets
- Institutional Class | |
Muirfield | | $ | — | | | | N/A | | | | N/A | | | | N/A | | | | N/A | |
Spectrum | | | — | | | | N/A | | | | N/A | | | | N/A | | | | N/A | |
Global | | | — | | | | N/A | | | | N/A | | | | N/A | | | | N/A | |
Balanced | | | — | | | | N/A | | | | N/A | | | | N/A | | | | N/A | |
Moderate | | | — | | | | N/A | | | | N/A | | | | N/A | | | | N/A | |
Conservative | | | — | | | | N/A | | | | N/A | | | | N/A | | | | N/A | |
Dynamic | | | — | | | | N/A | | | | N/A | | | | N/A | | | | N/A | |
Quantex | | | — | | | | N/A | | | | N/A | | | | N/A | | | | N/A | |
Income | | | — | | | | N/A | | | | N/A | | | | N/A | | | | N/A | |
Money Market | | | 1,466,650 | | | | 0.39% | | | | N/A | | | | N/A | | | | N/A | |
Certain Funds have entered into securities lending arrangements with Huntington National Bank (“HNB”). Under the terms of the agreement, HNB is authorized to loan securities on behalf of the Funds to approved brokers. In exchange, under normal market conditions, the Funds receive cash collateral in the amount of at least 102% of the value of securities loaned. The cash collateral is invested in short term instruments as noted in the Schedules of Investments. Although risk is mitigated by the collateral, the Funds could experience a delay in recovering their securities and possible loss of income or value if the borrower fails to return the borrowed securities. In addition, the Funds bear the risk of loss associated with the investment of cash collateral received. After predetermined rebates to brokers, a percentage of the net securities lending revenue is credited to the Funds to be used as an offset against charges incurred by the Funds. HNB is paid a fee for administering the securities lending program for the Funds, equal to the remaining percentage of the net securities lending revenues generated under the agreement. As of December 31, 2021, Muirfield and Moderate had loaned securities that were collateralized by cash. The cash collateral received was invested in securities as listed in each Fund’s Schedule of Investments. For the year ended December 31, 2021, income earned through securities lending arrangements was as follows:
| | | Amount Received
to Reduce Gross
Expenses | |
Muirfield | | $ | 1,027 | |
Spectrum | | | 286 | |
Global | | | 793 | |
Balanced | | | 19,340 | |
Moderate | | | 17,018 | |
Conservative | | | 20,910 | |
Dynamic | | | 387 | |
Quantex | | | 745 | |
2021 Annual Report | December 31, 2021 | Page 135 |
The Funds have adopted a written plan pursuant to Rule 12b-1 of the 1940 Act that allows the Funds to pay fees for the sale and distribution of Fund shares and for services provided to Fund shareholders. 12b-1 fees are paid by the Funds to financial intermediaries, securities brokers, investment advisers, and other persons, including affiliates of MAM. For the year ended December 31, 2021, total 12b-1 plan expense payments made to the Funds’ affiliated distributor was $92,243. The annual adopted 12b-1 plan maximum limitations for the year ended December 31, 2021, are as follows:
| | Maximum Annual
12b-1 Plan Expense
as a Percentage of
Average Daily Net
Assets | Maximum Annual
12b-1 Plan Expense
as a Percentage of
Average Daily Net
Assets - Retail Class | Maximum Annual
12b-1 Plan Expense
as a Percentage of
Average Daily Net
Assets - Adviser
Class | Maximum Annual
12b-1 Plan Expense
as a Percentage of
Average Daily Net
Assets - Institutional
Class | 12b-1 Plan Expense
Payments Made to
Affiliates |
Muirfield | N/A | 0.20% | N/A | N/A | $ 38,190 |
Spectrum | N/A | 0.25% | N/A | N/A | 2,093 |
Global | N/A | 0.25% | N/A | N/A | 1,926 |
Balanced | N/A | 0.25% | N/A | N/A | 5,803 |
Moderate | N/A | 0.25% | N/A | N/A | 885 |
Conservative | N/A | 0.25% | N/A | N/A | 8,445 |
Dynamic | N/A | 0.25% | N/A | N/A | 11,084 |
Quantex | N/A | 0.20% | N/A | N/A | 21,924 |
Income | N/A | 0.25% | N/A | N/A | 1,893 |
Money Market | 0.20% | N/A | N/A | N/A | N/A |
The Funds (other than Money Market) have adopted a shareholder services plan that allows the Funds to pay financial intermediaries and other persons, including “platforms,” for providing shareholder and administrative services to Fund shareholders and maintaining shareholder accounts. The annual adopted shareholder services plan maximum limitations for the year ended December 31, 2021 are as follows:
| | Maximum Annual
Shareholder Services
Plan Expense as a
Percentage of Average
Daily Net Assets - Retail
Class | Maximum Annual
Shareholder Services
Plan Expense as a
Percentage of Average
Daily Net Assets -
Adviser Class | Maximum Annual
Shareholder Services
Plan Expense as a
Percentage of Average
Daily Net Assets -
Institutional Class |
Muirfield | 0.20% | 0.25% | 0.10% |
Spectrum | 0.20% | 0.25% | 0.10% |
Global | 0.20% | 0.25% | 0.10% |
Balanced | 0.20% | 0.25% | 0.10% |
Moderate | 0.20% | 0.25% | 0.10% |
Conservative | 0.20% | 0.25% | 0.10% |
Dynamic | 0.20% | 0.25% | 0.10% |
Quantex | 0.20% | 0.25% | 0.10% |
Income | 0.20% | 0.25% | 0.10% |
Page 136 | 2021 Annual Report | December 31, 2021 |
The Funds have adopted a Deferred Compensation Plan (the “Plan”) for the independent Trustees. Under the Plan, each eligible Trustee is permitted to defer all or a portion of the trustees fees payable by any of the Funds as an investment into any combination of Funds until a specified point of time. The investment into the Funds is recorded as an asset however an offsetting liability is also recorded for the deferred payment. Amounts deferred under the Plan may be distributed in a lump sum or generally equal annual installments over a period of up to ten (10) years to the eligible Trustee(s). The Funds may terminate this Plan at any time.
Certain Trustees and officers of the Funds are also officers or directors of Meeder, MAM, and MFSCo.
During the year ended December 31, 2021, several of the Funds invested in the Institutional Prime Money Market Fund, an affiliate, as described in Section 2(a)(3) of the Investment Company Act of 1940. The purchases/sales amounts in the following table are presented on a gross basis, while the statement of changes in net assets shows subscriptions and redemptions into and out of the Institutional Prime Money Market Fund on a net basis. The Funds’ investments in the Institutional Prime Money Market Fund, which had a 7-day yield of 0.05% on December 31, 2021, were as follows:
| | | 12/31/20
Fair Value | | | Purchases | | | Sales | | | Realized
Gains
(Losses) | | | 12/31/21
Cost | | | Change in
Unrealized | | | Income | | | 12/31/21
Fair Value | |
Muirfield | | $ | 103,888,380 | | | $ | 208,589,242 | | | $ | (84,563,137 | ) | | $ | (6,224 | ) | | $ | 227,883,891 | | | $ | (24,624 | ) | | $ | 63,424 | | | $ | 227,883,637 | |
Spectrum | | | 29,284,214 | | | | 55,404,009 | | | | (30,612,075 | ) | | | (1,254 | ) | | | 54,066,090 | | | | (6,561 | ) | | | 18,295 | | | | 54,068,333 | |
Global | | | 15,663,819 | | | | 17,998,588 | | | | (13,836,108 | ) | | | (530 | ) | | | 19,820,547 | | | | (2,718 | ) | | | 10,184 | | | | 19,823,051 | |
Balanced | | | 51,634,402 | | | | 266,251,932 | | | | (219,629,198 | ) | | | (32 | ) | | | 98,230,468 | | | | (13,277 | ) | | | 30,933 | | | | 98,243,827 | |
Moderate | | | 21,697,124 | | | | 145,962,268 | | | | (126,569,098 | ) | | | (307 | ) | | | 41,079,351 | | | | (4,833 | ) | | | 11,687 | | | | 41,085,154 | |
Conservative | | | 10,428,429 | | | | 152,130,650 | | | | (132,435,817 | ) | | | 657 | | | | 30,116,946 | | | | (3,818 | ) | | | 7,492 | | | | 30,120,101 | |
Dynamic | | | 36,649,409 | | | | 85,012,772 | | | | (63,502,914 | ) | | | (3,934 | ) | | | 58,149,328 | | | | (5,652 | ) | | | 26,221 | | | | 58,149,681 | |
Quantex | | | 572,132 | | | | 30,259,065 | | | | (17,141,687 | ) | | | (301 | ) | | | 13,689,208 | | | | (1,300 | ) | | | 3,549 | | | | 13,687,909 | |
Income | | | 2,539,651 | | | | 101,584,795 | | | | (90,538,575 | ) | | | 425 | | | | 13,584,148 | | | | (1,633 | ) | | | 2,273 | | | | 13,584,663 | |
6. Federal Tax Information
The following information is computed on a tax basis for each item as of December 31, 2021:
| | | Tax Cost of
Portfolio
Investments | | | Gross Unrealized
Appreciation | | | Gross Unrealized
Depreciation | | | Net Unrealized
Appreciation/
Depreciation | |
Muirfield | | $ | 554,010,792 | | | $ | 165,987,127 | | | $ | (9,937,425 | ) | | $ | 156,049,702 | |
Spectrum | | | 159,796,545 | | | | 51,267,244 | | | | (3,696,820 | ) | | | 47,570,424 | |
Global | | | 37,705,672 | | | | 6,274,282 | | | | (376,927 | ) | | | 5,897,355 | |
Balanced | | | 318,963,323 | | | | 68,355,601 | | | | (4,539,044 | ) | | | 63,816,557 | |
Moderate | | | 153,988,537 | | | | 19,746,150 | | | | (1,804,997 | ) | | | 17,941,153 | |
Conservative | | | 125,329,635 | | | | 9,208,270 | | | | (1,077,468 | ) | | | 8,130,802 | |
Dynamic | | | 183,669,427 | | | | 49,646,392 | | | | (3,309,824 | ) | | | 46,336,568 | |
Quantex | | | 33,293,229 | | | | 7,446,328 | | | | (149,971 | ) | | | 7,296,357 | |
Income | | | 69,014,811 | | | | 582,989 | | | | (287,878 | ) | | | 295,111 | |
Money Market | | | 622,482,031 | | | | 11,886 | | | | (45,430 | ) | | | (33,544 | ) |
The tax characteristics of dividends paid by the Funds during the year ended December 31, 2021 were as follows:
| | | Ordinary Income | | | Net Short-Term
Capital Gains | | | Net Long-Term
Capital Gains | | | Total Dividends
Paid* | |
Muirfield | | $ | 5,065,877 | | | $ | — | | | $ | 18,443,632 | | | $ | 23,509,509 | |
Spectrum | | | 452,969 | | | | 4,113,237 | | | | 6,510,816 | | | | 11,077,022 | |
Global | | | — | | | | 1,360,991 | | | | 3,161,379 | | | | 4,522,370 | |
Balanced | | | 6,001,952 | | | | 1,250,419 | | | | 23,688,712 | | | | 30,941,083 | |
Moderate | | | 1,372,700 | | | | — | | | | 9,814,301 | | | | 11,187,001 | |
Conservative | | | 2,100,379 | | | | — | | | | 5,989,643 | | | | 8,090,022 | |
Dynamic | | | 1,183,701 | | | | 13,748,460 | | | | 15,898,271 | | | | 30,830,432 | |
Quantex | | | 18,344 | | | | 449,273 | | | | 5,591,196 | | | | 6,058,813 | |
Income | | | 1,295,798 | | | | — | | | | — | | | | 1,295,798 | |
Money Market | | | 193,478 | | | | — | | | | — | | | | 193,478 | |
2021 Annual Report | December 31, 2021 | Page 137 |
The tax characteristics of dividends paid by the Funds during the year ended December 31, 2020 were as follows:
| | | Ordinary Income | | | Net Short Term
Capital Gains | | | Net Long Term
Capital Gains | | | Total Dividends
Paid* | |
Muirfield | | $ | 4,943,111 | | | $ | — | | | $ | — | | | $ | 4,943,111 | |
Spectrum | | | 1,441,970 | | | | — | | | | — | | | | 1,441,970 | |
Global | | | 318,203 | | | | 303,373 | | | | 689,457 | | | | 1,311,033 | |
Balanced | | | 3,364,824 | | | | — | | | | — | | | | 3,364,824 | |
Moderate | | | 2,369,151 | | | | — | | | | — | | | | 2,369,151 | |
Conservative | | | 2,480,581 | | | | — | | | | — | | | | 2,480,581 | |
Dynamic | | | 835,596 | | | | 639,520 | | | | 3,370,600 | | | | 4,845,716 | |
Quantex | | | 292,663 | | | | — | | | | — | | | | 292,663 | |
Income | | | 1,403,955 | | | | — | | | | — | | | | 1,403,955 | |
Money Market | | | 2,275,825 | | | | — | | | | — | | | | 2,275,825 | |
As of December 31, 2021, the components of distributable earnings/(accumulated deficit) on a tax basis for the Funds were as follows:
| | | Undistributed
Ordinary Income | | | Undistributed
Long-Term
Capital Gain | | | Accumulated
Capital and Other
Gains and (Losses) | | | Unrealized
Appreciation/
(Depreciation)** | | | Total
Distributable
Earnings/
(Accumulated
Deficit) | |
Muirfield | | $ | 34,575 | | | $ | 12,812,237 | | | $ | (316,771 | ) | | $ | 156,049,702 | | | $ | 168,579,743 | |
Spectrum | | | 474,159 | | | | 3,611,330 | | | | (51,460 | ) | | | 47,570,424 | | | | 51,604,453 | |
Global | | | — | | | | 158,351 | | | | (106,472 | ) | | | 5,897,355 | | | | 5,949,234 | |
Balanced | | | 4,338,740 | | | | 5,840,278 | | | | (196,612 | ) | | | 63,816,557 | | | | 73,798,963 | |
Moderate | | | 1,813,657 | | | | 1,071,618 | | | | (38,133 | ) | | | 17,941,153 | | | | 20,788,295 | |
Conservative | | | — | | | | 693,917 | | | | (77,958 | ) | | | 8,130,802 | | | | 8,746,761 | |
Dynamic | | | — | | | | 6,501,337 | | | | (218,928 | ) | | | 46,336,568 | | | | 52,618,977 | |
Quantex | | | 787,611 | | | | — | | | | (66,097 | ) | | | 7,296,357 | | | | 8,017,871 | |
Income | | | 4,205 | | | | — | | | | (9,475,477 | ) | | | 295,111 | | | | (9,176,161 | ) |
Money Market | | | 6,135 | | | | — | | | | (8,511 | ) | | | (33,544 | ) | | | (35,920 | ) |
* | Total dividends paid may differ from the amount reported in the Statements of Changes in Net Assets because for tax purposes dividends are recognized when actually paid. Short-term capital gains distributions are taxed as ordinary income. |
** | The differences between book- and tax-basis unrealized appreciation/(depreciation) are attributable primarily to: wash sales, return of capital adjustments, and the realization for tax purposes of unrealized gains/(losses) on certain derivative instruments. |
For federal income tax purposes, the following Funds have capital loss carryforwards as of December 31, 2021, which are not subject to expiration and are available to offset future capital gains, if any. To the extent that these carryforwards are used to offset future capital gains, it is probable that the gains that are offset will not be distributed to shareholders:
| | | Short-Term Capital
Loss Carryforward | | | Long-Term Capital
Loss Carryforward | | | Capital Loss
Carryforward Utilized | |
Muirfield | | $ | — | | | $ | — | | | $ | 51,457,537 | |
Spectrum | | | — | | | | — | | | | 15,741,644 | |
Global | | | — | | | | — | | | | 723,513 | |
Balanced | | | — | | | | — | | | | 17,867,307 | |
Moderate | | | — | | | | — | | | | 4,583,845 | |
Conservative | | | — | | | | — | | | | 3,692,056 | |
Quantex | | | — | | | | — | | | | 2,671,091 | |
Income | | | 8,808,448 | | | | 590,194 | | | | 1,906,735 | |
Money Market | | | 974 | | | | 1,504 | | | | 229 | |
Page 138 | 2021 Annual Report | December 31, 2021 |
7. Control Ownership
The beneficial ownership, either directly or indirectly, of more than 25% of the voting securities of a fund creates a presumption of control of the fund under Section 2(a)(9) of the 1940 Act. As of December 31, 2021, beneficial owners that held more than 25% of the voting securities of the Funds and may be deemed to control the Funds are as follows:
Fund | Beneficial Owner | Percent of Voting
Securities |
Money Market | Muirfield | 36% |
8. Contingencies and Commitments
The Funds indemnify the Trust’s officers and Trustees for certain liabilities that might arise from their performance of their duties to the Funds. Additionally, in the normal course of business the Funds enter into contracts that contain a variety of representations and warranties and which provide general indemnifications. The Funds’ maximum exposure under these arrangements is unknown, as this would involve future claims that may be made against the Funds that have not yet occurred. However, based on experience, the Funds expect the risk of loss to be remote.
9. Subsequent Events
Management evaluated subsequent events through the date these financial statements were issued and concluded no subsequent events required recognition or disclosure in these financial statements.
2021 Annual Report | December 31, 2021 | Page 139 |
Report of Independent Registered Public Accounting Firm
To the Shareholders and Board of Trustees of
Meeder Funds
Opinion on the Financial Statements
We have audited the accompanying statements of assets and liabilities, including the schedules of investments, of Meeder Funds comprising Muirfield Fund, Spectrum Fund, Global Allocation Fund, Balanced Fund, Moderate Allocation Fund, Conservative Allocation Fund, Dynamic Allocation Fund, Quantex Fund, Tactical Income Fund, and Institutional Prime Money Market Fund (the “Funds”) as of December 31, 2021, the related statements of operations for the year then ended, the statements of changes in net assets for each of the two years in the period then ended, the related notes, and the financial highlights for each of the five years in the period then ended (collectively referred to as the “financial statements”). In our opinion, the financial statements present fairly, in all material respects, the financial position of each of the Funds as of December 31, 2021, the results of their operations for the year then ended, changes in net assets for each of the two years in the period then ended, and the financial highlights for each of the five years in the period then ended, in conformity with accounting principles generally accepted in the United States of America.
Basis for Opinion
These financial statements are the responsibility of the Funds’ management. Our responsibility is to express an opinion on the Funds’ financial statements based on our audits. We are a public accounting firm registered with the Public Company Accounting Oversight Board (United States) (“PCAOB”) and are required to be independent with respect to the Funds in accordance with the U.S. federal securities laws and the applicable rules and regulations of the Securities and Exchange Commission and the PCAOB.
We conducted our audits in accordance with the standards of the PCAOB. Those standards require that we plan and perform the audit to obtain reasonable assurance about whether the financial statements are free of material misstatement whether due to error or fraud.
Our audits included performing procedures to assess the risks of material misstatement of the financial statements, whether due to error or fraud, and performing procedures that respond to those risks. Such procedures included examining, on a test basis, evidence regarding the amounts and disclosures in the financial statements. Our procedures included confirmation of securities owned as of December 31, 2021, by correspondence with the custodian and brokers. Our audits also included evaluating the accounting principles used and significant estimates made by management, as well as evaluating the overall presentation of the financial statements. We believe that our audits provide a reasonable basis for our opinion.
We have served as the Funds’ auditor since 2004.

COHEN & COMPANY, LTD.
Cleveland, Ohio
March 1, 2022
Page 140 | 2021 Annual Report | December 31, 2021 |
Shareholder Expense Analysis (unaudited)
Shareholders of mutual funds pay ongoing expenses, such as advisory fees, distribution and service fees and other fund operating expenses. The following examples are intended to help you understand your ongoing costs (in dollars) of investing in the Funds and to compare these costs with the ongoing costs of investing in other mutual funds. The examples are based on an investment of $1,000 invested for the period of time indicated in the table below.
The Actual Expense example provides information about actual account values and actual expenses. You may use the information in this line, together with the amount you invested, to estimate the expenses that you paid over the period. Simply divide your account value by $1,000 (e.g.: an $8,600 account value divided by $1,000 = 8.6), then multiply the result by the number in the line under the heading “Expenses Paid During the Period” to estimate the expenses you paid on your account during this period.
The Hypothetical Expense example provides information about hypothetical account values and hypothetical expenses based on each Fund’s actual expense ratio and an assumed rate of return of 5% per year before expenses, which is not the actual return of any Fund. The hypothetical account values and expenses may not be used to estimate the actual ending account balance or expenses you paid for the period. You may use this information to compare the ongoing costs of investing in the Funds to other funds. To do so, compare this 5% hypothetical example with the 5% hypothetical examples that appear in the shareholder reports of the other funds.
| | | Beginning Account Value
June 30, 2021 | | | Ending Account Value
December 31, 2021 | | | Expenses Paid
During Period1 | | | Net Expense
Ratio2 | |
| | | Actual | | | Hypothetical | | | Actual | | | Hypothetical | | | Actual | | | Hypothetical | | | Actual | |
Muirfield Fund | | | | | | | | | | | | | | | | | | | | | | | | | | | | |
Retail Class | | $ | 1,000.00 | | | $ | 1,000.00 | | | $ | 1,055.30 | | | $ | 1,019.26 | | | $ | 6.11 | | | $ | 6.01 | | | | 1.18 | % |
Adviser Class | | | 1,000.00 | | | | 1,000.00 | | | | 1,057.60 | | | | 1,020.77 | | | | 4.56 | | | | 4.48 | | | | 0.88 | % |
Institutional Class | | | 1,000.00 | | | | 1,000.00 | | | | 1,057.30 | | | | 1,020.47 | | | | 4.87 | | | | 4.79 | | | | 0.94 | % |
Spectrum Fund | | | | | | | | | | | | | | | | | | | | | | | | | | | | |
Retail Class | | | 1,000.00 | | | | 1,000.00 | | | | 1,057.00 | | | | 1,017.64 | | | | 7.78 | | | | 7.63 | | | | 1.50 | % |
Adviser Class | | | 1,000.00 | | | | 1,000.00 | | | | 1,059.20 | | | | 1,019.76 | | | | 5.61 | | | | 5.50 | | | | 1.08 | % |
Institutional Class | | | 1,000.00 | | | | 1,000.00 | | | | 1,059.00 | | | | 1,019.51 | | | | 5.86 | | | | 5.75 | | | | 1.13 | % |
Global Allocation Fund | | | | | | | | | | | | | | | | | | | | | | | | | | | | |
Retail Class | | | 1,000.00 | | | | 1,000.00 | | | | 1,019.40 | | | | 1,016.33 | | | | 8.96 | | | | 8.94 | | | | 1.76 | % |
Adviser Class | | | 1,000.00 | | | | 1,000.00 | | | | 1,021.70 | | | | 1,018.55 | | | | 6.73 | | | | 6.72 | | | | 1.32 | % |
Institutional Class | | | 1,000.00 | | | | 1,000.00 | | | | 1,021.80 | | | | 1,018.60 | | | | 6.68 | | | | 6.67 | | | | 1.31 | % |
Balanced Fund | | | | | | | | | | | | | | | | | | | | | | | | | | | | |
Retail Class | | | 1,000.00 | | | | 1,000.00 | | | | 1,036.10 | | | | 1,018.40 | | | | 6.93 | | | | 6.87 | | | | 1.35 | % |
Adviser Class | | | 1,000.00 | | | | 1,000.00 | | | | 1,038.20 | | | | 1,020.42 | | | | 4.88 | | | | 4.84 | | | | 0.95 | % |
Institutional Class | | | 1,000.00 | | | | 1,000.00 | | | | 1,038.40 | | | | 1,020.21 | | | | 5.09 | | | | 5.04 | | | | 0.99 | % |
Moderate Allocation Fund | | | | | | | | | | | | | | | | | | | | | | | | | | | | |
Retail Class | | | 1,000.00 | | | | 1,000.00 | | | | 1,021.30 | | | | 1,018.40 | | | | 6.88 | | | | 6.87 | | | | 1.35 | % |
Adviser Class | | | 1,000.00 | | | | 1,000.00 | | | | 1,023.70 | | | | 1,020.57 | | | | 4.69 | | | | 4.69 | | | | 0.92 | % |
Institutional Class | | | 1,000.00 | | | | 1,000.00 | | | | 1,022.90 | | | | 1,020.11 | | | | 5.15 | | | | 5.14 | | | | 1.01 | % |
Conservative Allocation Fund | | | | | | | | | | | | | | | | | | | | | | | | | | | | |
Retail Class | | | 1,000.00 | | | | 1,000.00 | | | | 1,009.20 | | | | 1,019.26 | | | | 5.98 | | | | 6.01 | | | | 1.18 | % |
Adviser Class | | | 1,000.00 | | | | 1,000.00 | | | | 1,011.00 | | | | 1,020.87 | | | | 4.36 | | | | 4.38 | | | | 0.86 | % |
Institutional Class | | | 1,000.00 | | | | 1,000.00 | | | | 1,010.10 | | | | 1,020.42 | | | | 4.81 | | | | 4.84 | | | | 0.95 | % |
Dynamic Allocation Fund | | | | | | | | | | | | | | | | | | | | | | | | | | | | |
Retail Class | | | 1,000.00 | | | | 1,000.00 | | | | 1,062.20 | | | | 1,018.50 | | | | 6.91 | | | | 6.77 | | | | 1.33 | % |
Adviser Class | | | 1,000.00 | | | | 1,000.00 | | | | 1,064.20 | | | | 1,020.37 | | | | 4.99 | | | | 4.89 | | | | 0.96 | % |
Institutional Class | | | 1,000.00 | | | | 1,000.00 | | | | 1,063.60 | | | | 1,020.21 | | | | 5.15 | | | | 5.04 | | | | 0.99 | % |
2021 Annual Report | December 31, 2021 | Page 141 |
| | | Beginning Account Value
June 30, 2021 | | | Ending Account Value
December 31, 2021 | | | Expenses Paid
During Period1 | | | Net Expense
Ratio2 | |
| | | Actual | | | Hypothetical | | | Actual | | | Hypothetical | | | Actual | | | Hypothetical | | | Actual | |
Quantex Fund | | | | | | | | | | | | | | | | | | | | | | | | | | | | |
Retail Class | | $ | 1,000.00 | | | $ | 1,000.00 | | | $ | 1,017.10 | | | $ | 1,016.74 | | | $ | 8.54 | | | $ | 8.54 | | | | 1.68 | % |
Adviser Class | | | 1,000.00 | | | | 1,000.00 | | | | 1,018.90 | | | | 1,018.45 | | | | 6.82 | | | | 6.82 | | | | 1.34 | % |
Institutional Class | | | 1,000.00 | | | | 1,000.00 | | | | 1,018.60 | | | | 1,018.40 | | | | 6.87 | | | | 6.87 | | | | 1.35 | % |
Tactical Income Fund | | | | | | | | | | | | | | | | | | | | | | | | | | | | |
Retail Class | | | 1,000.00 | | | | 1,000.00 | | | | 989.20 | | | | 1,019.31 | | | | 5.87 | | | | 5.96 | | | | 1.17 | % |
Adviser Class | | | 1,000.00 | | | | 1,000.00 | | | | 991.60 | | | | 1,021.42 | | | | 3.76 | | | | 3.82 | | | | 0.75 | % |
Institutional Class | | | 1,000.00 | | | | 1,000.00 | | | | 991.40 | | | | 1,021.12 | | | | 4.07 | | | | 4.13 | | | | 0.81 | % |
Institutional Prime Money Market Fund | | | 1,000.00 | | | | 1,000.00 | | | | 1,000.20 | | | | 1,024.70 | | | | 0.50 | | | | 0.51 | | | | 0.10 | % |
Please note that the expenses shown in the tables are meant to highlight your ongoing costs only and do not reflect any transactional costs, such as redemption fees or exchange fees. Therefore, hypothetical information is useful in comparing ongoing costs only, and will not help you determine the relative total costs of owning different funds. In addition, if any transactional costs were included, your costs would have been higher.
1 | Expenses are equal to each Fund’s annualized net expense ratio, multiplied by the average account value over the period, multiplied by 184/365 (to reflect the total number of days in the six-month period). |
2 | Annualized net expense ratio reflects contractual or voluntary waivers and reimbursements of expenses by the investment adviser and transfer agent. |
Page 142 | 2021 Annual Report | December 31, 2021 |
Trustees and Officers (unaudited)
Certain trustees and officers of the Funds are also officers or directors of Meeder, MAM, and MFSCo. The Trustees oversee the management of the Trust and elect its officers. The officers are responsible for the Funds’ day-to-day operations. The Trustees’ and officers’ names, addresses, years of birth, positions held with the Trust, and length of service with the Meeder Funds, are listed below. Also included is each Board member’s principal occupation during, at least, the past five years. Except as indicated, each individual has held the office shown or other offices in the same company for the last five years. Those Trustees who are “interested persons”, as defined in the 1940 Act, by virtue of their affiliation with the Trust, are indicated by an asterisk (*).
Name, Address1,
and Year of Birth | Year First Elected a
Trustee or Officer of
the Trust | Position and Number
of Funds Overseen2 | Principal Occupation During
Past Five Years and Other
Directorships Held |
Robert S. Meeder, Jr.*
Year of Birth: 1961 | 1992 | Trustee and President | President, Meeder Investment Management, Inc. |
Stuart M. Allen**
Year of Birth: 1961 | 2006 | Trustee | President of Gardiner Allen DeRoberts Insurance LLC, an insurance agency. |
Anthony V. D’Angelo**
Year of Birth: 1959 | 2006 | Trustee | General Manager, WSYX ABC 6 /WTTE-TV Fox 28 /WWHO television stations, Columbus, Ohio, operated by Sinclair Broadcast Group (2014 – present); Director of Sales (2004 – 2014); Lead Trustee of the Trust. |
Jeffrey R. Provence**
Year of Birth: 1969 | 2017 | Trustee | CEO, Premier Fund Solutions, Inc. (2001 – present); General Partner & Portfolio Manager, Value Trend Capital Management, L.P. (1995 – present); Director, Blue Chip Investor Funds; Director, PFS Funds; Chairman of the Trust’s Audit Committee. |
Douglas R. Jennings
Year of Birth: 1962 | 2017 | Chief Compliance Officer | Chief Compliance Officer, Meeder Investment Management, Inc. (2016 – present); Assistant General Counsel; Partner, Carlile Patchen & Murphy, LLP (2010 – 2016). |
Bruce E. McKibben
Year of Birth: 1969 | 2002 | Treasurer | Director of Fund Accounting, Mutual Funds Service Co. (1997 – present). |
Alaina Salonsky
Year of Birth: 1967 | 2017 | Secretary | Compliance Specialist, Meeder Investment Management, Inc. (2017 – present); Teacher, Big Walnut School District, Sunbury, Ohio (2013 – 2017). |
1 | The address of each Trustee is 6125 Memorial Drive, Dublin, OH 43017. |
2 | Each Trustee serves for an indefinite term, until his or her resignation, death, or removal. Each Trustee oversees all ten Funds in the Trust. |
* | Robert S. Meeder, Jr. is deemed an “interested person” of the Trust by virtue of his position as President of Meeder Asset Management, Inc., the Adviser of the Trust. |
** | Each independent Trustee is a member of the Trust’s Audit Committee, Compensation Committee, and Nominating Committee. |
The Statement of Additional Information includes additional information about each Trustee and is available without charge. To obtain a copy of the Statement of Additional Information, please contact your financial representative or call toll free 1-800-325-3539.
2021 Annual Report | December 31, 2021 | Page 143 |
Board Review and Approval of Investment Advisory Agreement (unaudited)
At a meeting held September 16, 2021, the Board of Trustees (“Board”), including all of the Trustees who are not “interested persons,” as that term is defined in the Investment Company Act of 1940 (“Independent Trustees”), met to consider the renewal of the investment advisory agreement (“Agreement”) between the Funds and Meeder Asset Management, Inc. (“Adviser”).
Approval Process. Pursuant to the Investment Company Act of 1940 (“1940 Act”), the Board is required to consider the continuation of the Funds’ investment advisory agreement on an annual basis. It is the duty of the Board to request as much information as is reasonably necessary to evaluate the terms of the Agreement to determine whether the Agreement is fair to each Fund and its shareholders. Prior to the meeting, the Board requested, and the Adviser provided, both written and oral reports containing information and data related to the following: (i) the nature, extent, and quality of the services provided by the Adviser to the Funds; (ii) the investment performance of the Funds and the Adviser; (iii) the costs of the services to be provided and the profits to be realized by the Adviser from the relationship with the Funds; (iv) the extent to which economies of scale will be realized as a Fund grows; and (v) whether the fee level reflects these economies of scale to the benefit of the Funds’ shareholders. In reaching the decision to renew the Agreement, the Board also took into account information furnished throughout the year at regular Board meetings. Information furnished and discussed throughout the year included investment performance reports and related financial information for the Funds, as well as periodic reports on shareholder services, legal compliance, pricing, brokerage commissions, execution and other services provided by the Adviser and its affiliates. Information furnished specifically in connection with the renewal process included a report for the Funds prepared by Broadridge Financial Solutions, Ltd. (“Broadridge”), an independent organization, as well as the Funds’ profitability analysis prepared by the Adviser. The Broadridge report compared each Fund’s advisory fees and expenses with those of other mutual funds deemed comparable to the Fund. The Funds’ profitability analysis discussed the profitability to the Adviser and Mutual Funds Service Co., an affiliate of the Adviser, from the overall Funds’ operations, as well as an analysis based on the profitability resulting from the operation of each individual Fund, utilizing expense allocation methodologies deemed reasonable by the Adviser. In considering such materials, the Independent Trustees also received assistance and advice from and met separately with the Funds’ Independent Legal Counsel and the Chief Compliance Officer prior to the meeting. In their deliberations, the Board considered the terms of the existing Agreement between the Funds and the Adviser. While attention was given to all of the information furnished, the Board made the following specific findings in connection with its decision to renew the Agreement:
Nature, Extent and Quality of Services. The Board considered the nature, extent and quality of the services provided by the Adviser and its affiliates, including the reputation, qualifications, experience and capabilities of the personnel performing these services. The Board considered the qualifications of the investment management team and the resources committed to maintaining and improving the Adviser’s quantitative models. The Board noted that the Adviser and its affiliates provide a series of additional administrative services for the Funds, including fund accounting, transfer agency and compliance services, and recognized the continuing expenditures made to support and improve the scope of those services. Consideration was also given to the Adviser’s compliance resources and policies, including the periodic reporting provided to the Board. In making its judgment, the Board also considered the Adviser’s continual management of investment, operational, enterprise, legal and regulatory risk as it relates to the Funds as well as the manner in which the Adviser addressed new regulatory burdens that became effective during the preceding year. The Board concluded that the nature, extent and quality of the services provided by the Adviser have benefited and should continue to benefit each Fund and its shareholders.
Investment Performance. The Board placed emphasis on the investment performance of each Fund in view of its importance to shareholders. While consideration was given to performance reports and discussions with portfolio managers at Board meetings during the year, particular attention in assessing performance was given to the Broadridge reports furnished for the Agreement renewal. The Broadridge report prepared for each Fund showed the investment performance of each Fund for the one-, three-, five-, and ten-year periods, as applicable, ended June 30, 2021, in comparison with its benchmark and a performance universe similar to each Fund’s investment objectives. The Board evaluated performance in light of the investment strategy pursued by the Adviser, measures of investment risk, and steps taken by the Adviser to mitigate risk through active management of the portfolio. The Board noted that each Fund outperformed its benchmark index during the one-year period ended June 30, 2021, with the exception of the Dynamic Allocation Fund. The Board was satisfied with the Adviser’s explanation of the factors that contributed to both the short-term and long-term performance of each Fund, noting that each Fund provided positive returns during the one-year period ended June 30, 2021. The Board noted the Adviser’s continued efforts to improve performance and improve the quantitative models. The Board concluded that the Funds’ investment results have been satisfactory for renewal of the Agreement and that the Adviser’s record in managing the Funds indicated that its continued management should benefit the Funds and their shareholders.
Costs of Services. Consideration was given to a comparative analysis of the advisory fees and expense ratios of each Fund compared with those of a group of other relevant funds. The Board observed that the Funds’ advisory fees and expenses were within the range of those of other similar funds included in the comparable reports. The Board also considered an analysis comparing the Funds’ advisory fees with the fees charged by the Adviser to private clients, but noted the significant investment, operational, regulatory, and market differences between advising the Funds and advising private clients. The Board was satisfied with the Adviser’s continued efforts to reduce fees and expenses. The Board concluded that the Funds’ cost structures were fair and reasonable in relation to the services provided, and that the Funds’ shareholders receive reasonable value in return for the advisory fees and other amounts paid to the Adviser by the Funds.
Management Profitability. The Board also considered the level of profits realized by the Adviser and its affiliates in connection with the operation of the Funds. In this respect, the Board reviewed the Funds’ profitability analysis that addresses the overall profitability of the Meeder Funds’ business as well as the profitability resulting from the operation of each Fund. The Board also took into account management’s expenditures in improving shareholder services provided to the Funds, as well as the need to meet additional regulatory and compliance requirements resulting from recent SEC requirements. The Board determined that the level of profits realized by the Adviser under its Agreement with the Funds was not excessive in view of the nature, quality and extent of services provided.
Page 144 | 2021 Annual Report | December 31, 2021 |
Economies of Scale. The Board also considered whether economies of scale are realized as the Funds grow larger and the extent to which this is reflected in the level of advisory fees charged. While recognizing that any precise determination is inherently subjective, the Board noted that economies of scale may develop for certain Funds as their assets increase, and their Fund level expenses decline as a percentage of assets. The Board also considered whether the advisory fee rate is reasonable in relation to the asset size of each Fund and any economies of scale that may exist. The Board acknowledged that the advisory fee structure for each Fund is reasonable and in most instances is tiered by assets under management, allowing the shareholders to benefit from economies of scale as the Funds grow in size. The Board expressed continued satisfaction with each Fund’s fee structure under its Agreement.
Ancillary Benefits. The Board also considered ancillary benefits received by the Adviser as a result of its relationship with the Trust, including its access to research that benefits other clients and the service of its affiliates as transfer agent, administrator and distributor for the Funds. The fees for these services were considered separately in the profitability analysis and the Board considered the revenue and expenses incurred by the Adviser and its affiliates in providing these services. The Board also took into consideration additional contractual breakpoints in certain affiliated service agreements. The Board also considered the benefits derived by the Adviser from soft dollar arrangements, noting that these arrangements are subject to regular reporting and oversight. The Board took the ancillary benefits into account in evaluating the reasonableness of the advisory fees and other amounts paid to the Adviser by the Funds.
Conclusion. Based upon the foregoing findings as well as all of the information provided by the Adviser, the Board, including all of its Independent Trustees, was satisfied that the terms of the Agreement, including the existing advisory fee structure, are fair and reasonable and in the best interest of the Funds and their shareholders. The Board, including all of its Independent Trustees, therefore approved the continuation of the Agreement effective for a one-year term ending September 30, 2022.
Statement Regarding Liquidity Risk Management Program (unaudited)
In accordance with Rule 22e-4 (“Liquidity Rule”) under the 1940 Act, the Funds have adopted and implemented a liquidity risk management program (“Program”). The purpose of the Program is to outline the techniques, tools and arrangements employed for the management of liquidity risk within the Funds, and the terms, contents and frequency of reporting and escalation of any issues to the Board of Trustees. Liquidity is managed taking account of the investment strategy, liquidity profile, and redemption history, with the objective of maintaining a level of liquidity that is appropriate in light of the Funds’ obligations to the Funds’ shareholders. The Program assesses liquidity risk under both normal and stressed market conditions.
The Board of Trustees reviewed the Program during the Funds’ most recent fiscal half-year, including a written report prepared by the Program Administrator. The report reviewed the terms and operation of the Program, investment strategy and liquidity of the Funds, cash flow projections, shareholder concentration and holdings of cash and cash equivalents. The Adviser utilizes quantitative tools that provide daily evaluation of the liquidity of nearly all Funds’ securities. The Program Administrator was satisfied with the design, operation and effectiveness of the Program and reported that there were no liquidity events that materially affected the performance of the Funds or the Funds’ ability to meet their redemption obligations under normal and reasonably foreseeable stressed conditions without dilution to existing shareholders.
The report confirmed that the Funds’ investment strategies utilize highly liquid securities and do not maintain concentrated positions. The Funds also maintain significant holdings of cash and cash equivalents, which were judged suitable to meet redemption needs under ordinary and reasonably stressed market conditions. During the reporting period, the Funds maintained a high level of liquidity and primarily held assets in securities judged highly liquid under the Liquidity Rule. As a result, the Funds see no reason to, and therefore have not adopted a “Highly Liquid Investment Minimum,” as defined under the Liquidity Rule.
There can be no assurance that the Program will achieve its objectives in the future. Further information on liquidity risks of the Funds can be found in the Funds’ prospectus.
Other Information (unaudited)
The Trust files a complete schedule of portfolio holdings for the first and third quarters of each fiscal year on Form N-PORT. In addition, Money Market files its complete schedule of portfolio holdings with the SEC each month on Form N-MFP. Forms N-PORT and N-MFP are available on the SEC’s website at www.sec.gov. Information regarding Fund holdings is also available at www.meederinvestment.com.
The investment adviser is responsible for exercising the voting rights associated with the securities purchased or held by the Funds. A description of the policies and procedures that the adviser uses in fulfilling this responsibility and information regarding how those proxies were voted during the most recent 12-month period ending June 30 are available, without charge, by calling 1-800-325-3539 or on the SEC’s website at www.sec.gov.
2021 Annual Report | December 31, 2021 | Page 145 |

Privacy Policy
Meeder Investment Management and the Meeder Funds are committed to maintaining the financial privacy of our current, former and prospective customers. This policy explains how we protect the security and confidentiality of our customer’s information.
PERSONAL INFORMATION WE COLLECT
We may collect information about Meeder customers from a variety of sources, including:
| | ● | Information provided by you or your representative on applications or forms, such as your name, address, date of birth, social security number and investment objectives; |
| | ● | Information about the transactions in your account, such as your account balance and transaction history; and |
| | ● | Information we obtain from third parties regarding you, to verify your identity or transfer your account. |
INFORMATION WE SHARE WITH OUR AFFILIATES
Our affiliates are financial service providers that offer transfer agency, customer accounting, customer servicing, investment advisory, and other financial services. We share information with our affiliates to service your account. In addition, we may also share information with our affiliates to alert you to other products or services offered by Meeder to the extent provided by law. Information collected from customers whose accounts are opened through investment professionals is not shared with Meeder affiliates for marketing purposes.
INFORMATION WE SHARE WITH THIRD PARTIES
On occasion, we share information we collect about you with unaffiliated third parties to perform services in connection with your account, such as processing transactions, preparing and mailing account statements, and other forms of customer servicing. Information provided to third parties may not be used for any other purpose and Meeder does not permit unaffiliated third parties to use customer information to market their products or services.
HOW WE PROTECT INFORMATION ABOUT YOU
We maintain policies, and require all unaffiliated third parties to maintain policies, to safeguard customer information. We restrict access to nonpublic personal information about you to those persons who need to know that information in order to provide products and services to you. We also maintain physical, electronic, and procedural safeguards to guard your nonpublic personal information.
WHO THIS POLICY APPLIES TO
This policy applies to customers who open relationships directly with Meeder. It applies to Meeder Funds and Meeder’s affiliated companies, including Meeder Asset Management, Meeder Advisory Services, Meeder Public Funds, Meeder Distribution Services, Inc. and Mutual Funds Service Company.
QUESTIONS
Contact us at 800-325-3539 or visit us online at www.meederinvestment.com
Page 146 | 2021 Annual Report | December 31, 2021 |
[This page intentionally left blank]
[This page intentionally left blank]
Manager and Investment Adviser
Meeder Asset Management, Inc.
6125 Memorial Drive
P.O. Box 7177
Dublin, Ohio 43017
Board of Trustees
Stuart M. Allen
Anthony V. D’Angelo
Robert S. Meeder, Jr.
Jeffrey R. Provence
Custodian
The Huntington National Bank
Columbus, Ohio 43215
Transfer Agent & Dividend Disbursing Agent
Mutual Funds Service Co.
6125 Memorial Drive
Dublin, Ohio 43017
Distributor
Meeder Distribution Services, Inc.
6125 Memorial Drive
Dublin, Ohio 43017
Independent Registered Public Accounting Firm
Cohen & Company, Ltd.
1350 Euclid Ave., Suite 800
Cleveland, Ohio 44115

Item 2. Code of Ethics.
The registrant has adopted a code of ethics that applies to the registrant’s principal executive officer, principal financial officer, comptroller or principal accounting officer, and any person who performs a similar function. There were no amendments made to, or waivers granted from, the code of ethics during the fiscal year.
Item 3. Audit Committee Financial Expert.
The Board of Trustees of the Trust has determined that Jeffrey R. Provence is an audit committee financial expert, as defined in Item 3 of Form N-CSR. Mr. Provence is independent for purposes of Item 3 of Form N-CSR.
Item 4. Principal Accountant Fees and Services.
(a) – (d) Aggregate fees billed to the registrant for the last two fiscal years for professional services rendered by the registrant’s principal accountant were as follows:
| | 2021 | 2020 |
| Audit Fees | $119,400 | $119,400 |
| Audit-Related Fees | 0 | 0 |
| Tax Fees | 41,000 | 43,500 |
| All Other Fees | 2,250 | 2,239 |
Audit fees include amounts related to the audit of the registrant’s annual financial statements and services normally provided by the accountant in connection with statutory and regulatory filings. Audit-related fees include amounts reasonably related to the performance of the audit of the registrant’s financial statements, including, but not limited to, mileage, lodging, and meals. Tax fees include amounts related to tax compliance, tax planning, and tax advice, including the review and preparation of the Funds’ income tax returns, the review and preparation of the Funds’ excise tax returns, the review of supporting schedules and documentation provided by management, the review and recalculation of the Funds’ estimated distribution calculations, and the review of wash sales for reasonableness. All other fees include amounts related to the registrant’s annual filing of Form N1A.
(e)(1) A purpose of the Audit Committee is to approve the engagement of the registrant’s independent auditors (i) to render audit and non-audit services for the registrant in accordance with Rule 2-01(c)(7)(i) of Regulation S-X, subject to the waiver provisions set forth in Rule 2-01(c)(7)(i)(C) of Regulation S-X, and (ii) to render non-audit services for the registrant’s investment advisors (other than a sub-advisor whose role is primarily portfolio management and is subcontracted or overseen by another investment advisor) and any other entity controlling by, or under common control with the investment advisor that provides ongoing services to the registrant, in each case under (ii) if the engagement relates directly to the operations and financial reporting of the registrant, in accordance with Rule 2-01(c)(7)(ii) of Regulation S-X, subject to waiver provisions set forth in Rule 2-01(c)(7)(ii) of Regulation S-X.
(e)(2) 0% of services included in (b) – (d) above were approved pursuant to Rule 2-01(c)(7)(i)(C) of Regulation S-X.
(f) Not applicable.
(g) The aggregate fees billed for the most recent fiscal year and the preceding fiscal year by the registrant’s principal accountant for non-audit services rendered to the registrant, its investment advisor, and any entity controlling, controlled by, or under common control with the investment advisor that provides ongoing services to the registrant were $40,600 and $60,000 respectively.
(h) The registrant’s audit committee of the board of directors has considered whether the provision of non-audit services that were rendered to the registrant’s investment adviser (not including any sub-adviser whose role is primarily portfolio management and is subcontracted with or overseen by another investment adviser), and any entity controlling, controlled by, or under common control with the investment adviser that provides ongoing services to the registrant that were not pre-approved pursuant to paragraph (c)(7)(ii) of Rule 2-01 of Regulation S-X is compatible with maintaining the principal accountant’s independence.
Items 5. Audit Committee of Listed Registrants.
Not applicable.
Item 6. Schedule of Investments.
Not applicable.
Item 7. Disclosure of Proxy Voting Policies and Procedures for Closed-End Management Investment Companies.
Not applicable.
Item 8. Portfolio Managers of Closed-End Management Investment Companies.
Not applicable.
Item 9. Purchases of Equity Securities by Closed-End Management Investment Company and Affiliated Purchasers.
Not applicable.
Item 10. Submission of Matters to a Vote of Security Holders.
Not applicable.
Item 11. Controls and Procedures.
(a) Based on our evaluation conducted within 90 days of the filing date, hereof, the design and operation of the registrant's disclosure controls and procedures are effective to ensure that material information relating to the registrant is made known to the certifying officers by others within the appropriate entities, particularly during the period in which Forms N-CSR are being prepared, and the registrant's disclosure controls and procedures allow timely preparation and review of the information for the registrant's Form N-CSR and the officer certifications of such Form N-CSR.
(b) There were no significant changes in the registrant's internal controls or in other factors that could significantly affect these controls subsequent to the date of their evaluation, including any corrective actions with regard to significant deficiencies and material weaknesses.
Item 12. Disclosure of Securities Lending Activities for Closed-End Management Investment Companies.
Not applicable.
Item 13. Exhibits.
(a)(1) Code of Ethics filed herewith as EX-99.CODE ETH.
(a)(2) A separate certification for each principal executive and principal financial officer of the registrant as required by Rule 30a-2(a) under the Act(17 CFR270.30a-2(a)). Filed herewith as EX-99.CERT.
(b) Certifications of principal executive officer and principal financial officer, under Section 906 of the Sarbanes-Oxley Act of 2002, and 18 U.S.C. ss.1350. Filed herewith as EX-99.906 CERT.
SIGNATURES
Pursuant to the requirements of the Securities Exchange Act of 1934 and the Investment Company Act of 1940, the registrant has duly caused this report to be signed on its behalf by the undersigned, thereunto duly authorized.
Meeder Funds
| By: | /s/ Bruce E. McKibben | |
| | Bruce E. McKibben, Treasurer | |
| | | |
| Date: | March 7, 2022 | |
Pursuant to the requirements of the Securities Exchange Act of 1934 and the Investment Company Act of 1940, this report has been signed below by the following persons on behalf of the registrant and in the capacities and on the dates indicated.
| By: | /s/ Bruce E. McKibben | |
| | Bruce E. McKibben, Treasurer | |
| | | |
| Date: | March 7, 2022 | |
| | | |
| By: | /s/ Robert S. Meeder, Jr. | |
| | Robert S. Meeder, Jr., President | |
| | | |
| Date: | March 7, 2022 | |